Embed Size (px)
Citation preview

Research
Genome architecture marked by retrotransposonsmodulates predisposition to DNA methylationin cancerMarcos R.H. Estecio,1,9 Juan Gallegos,2 Celine Vallot,3 Ryan J. Castoro,1 Woonbok Chung,1
Shinji Maegawa,1 Yasuhiro Oki,4 YutakaKondo,5 Jaroslav Jelinek,1 LanlanShen,6 Helge Hartung,7
Peter D. Aplan,7 Bogdan A. Czerniak,8 Shoudan Liang,2 and Jean-Pierre J. Issa1,9
1Department of Leukemia, The University of Texas MD Anderson Cancer Center, Houston, Texas 77030, USA; 2Department
of Bioinformatics and Computational Biology, The University of Texas MD Anderson Cancer Center, Houston, Texas 77030, USA;3CNRS, UMR 144, Institut Curie, 75248 Cedex 05, Paris, France; 4Department of Hematology and Cell Therapy, Aichi Cancer Center
Hospital and Research Institute, Nagoya 464-8681, Japan; 5Division of Molecular Oncology, Aichi Cancer Center Hospital and
Research Institute, Nagoya 464-8681, Japan; 6Department of Pediatrics, Baylor College of Medicine, Houston, Texas 77030, USA;7Genetic Branch, Center for Cancer Research, National Cancer Institute, National Institutes of Health, Bethesda, Maryland 20889,
USA; 8Department of Pathology, The University of Texas MD Anderson Cancer Center, Houston, Texas 77030, USA
Epigenetic silencing plays an important role in cancer development. An attractive hypothesis is that local DNA featuresmay participate in differential predisposition to gene hypermethylation. We found that, compared with methylation-resistant genes, methylation-prone genes have a lower frequency of SINE and LINE retrotransposons near their tran-scription start site. In several large testing sets, this distribution was highly predictive of promoter methylation. Genome-wide analysis showed that 22% of human genes were predicted to be methylation-prone in cancer; these tended to begenes that are down-regulated in cancer and that function in developmental processes. Moreover, retrotransposon dis-tribution marks a larger fraction of methylation-prone genes compared to Polycomb group protein (PcG) marking inembryonic stem cells; indeed, PcG marking and our predictive model based on retrotransposon frequency appear to becorrelated but also complementary. In summary, our data indicate that retrotransposon elements, which are widespreadin our genome, are strongly associated with gene promoter DNA methylation in cancer and may in fact play a role ininfluencing epigenetic regulation in normal and abnormal physiological states.
[Supplemental material is available online at http://www.genome.org.]
DNA methylation, a common cause of gene silencing in human
neoplasia, does not affect the genome homogeneously: While
some genes are frequently found methylated in cancer, others are
never or rarely targeted by such modification. The causes of se-
lective predisposition to methylation are unknown, and two main
explanations have been proposed: (1) DNA methylation happens
randomly, and cells with silencing of genes that promote tumori-
genesis have a selective advantage; and (2) some genes are prefer-
entially targeted by silencing complexes, and thus DNA methyla-
tion occurs through an instructive mechanism (Baylin and Bestor
2002; Jones and Baylin 2002; Feltus et al. 2006). The latter expla-
nation appears more likely because genes with similar function
show differential predisposition to methylation. The DNA repair
genes MLH1 (frequently methylated) and MSH2 (never methylated)
are good examples of genes with similar function but differential
predisposition to hypermethylation in cancer (Kondo et al. 2000).
Previous studieswere conductedtopredict DNA methylation in
individual CpG island promoters based on the instructive mecha-
nism hypothesis, but despite efforts, the cause of such selective
predisposition to aberrant methylation is still incompletely un-
derstood. Most commonly these studies employed support vector
machines to annotate short DNA sequences enriched in methylated
versus nonmethylated gene promoter CpG islands. Although im-
portant, these studies were focused on normal cells (Bock et al. 2006;
Das et al. 2006) or artificially induced methylation (Feltus et al.
2006) rather than cancer cells, which is the main system where
aberrant methylation occurs. An apparent lower frequency of SINE
retrotransposons in methylation-prone genes was noticed in some
of these studies, including a report on hyperconserved CpG do-
mains (Tanay et al. 2007), but this association was not further
evaluated. This is an important observation with possible biological
consequences, because retrotransposons such as long and short
interspersed nuclear elements (LINE and SINE, respectively) are
targeted by epigenetic modifications to suppress their mobilization
(Yoder et al. 1997), have been shown to act as methylation centers
(Yates et al. 1999), and have a strong influence on gene expression in
mammalian cells (Faulkner et al. 2009). In this study, we directly
investigated whether CpG island–associated genes that undergo
frequent aberrant DNA methylation in cancer have a unique dis-
tribution of repetitive elements.
Results
A predictive model of predisposition to DNA methylationin cancer
To answer whether methylation-prone genes in cancer have a dif-
ferent distribution of repetitive elements, we first compared the
9Corresponding authors.E-mail [email protected] [email protected] published online before print. Article and publication date are athttp://www.genome.org/cgi/doi/10.1101/gr.107318.110.
20:1369–1382 � 2010 by Cold Spring Harbor Laboratory Press; ISSN 1088-9051/10; www.genome.org Genome Research 1369www.genome.org

DNA sequence in the 4-kb region sur-
rounding the transcription start site (TSS)
of a training set composed of 36 methyl-
ation-prone and 36 methylation-resistant
genes (Supplemental Table S1). Methyla-
tion analysis of the promoter region of
these genes was done using quantitative
methods (bisulfite-PCR followed by com-
bined bisulfite restriction analysis [CO-
BRA] or pyrosequencing analysis) in nine
cancer cell lines. DNA from peripheral
blood mononuclear cells of a healthy in-
dividual was used as a control (Supple-
mental Table S2). These nine cancer cell
lines were selected because they were
identified as heavily methylated in a pre-
vious study (Shen et al. 2007a). Thus,
genes not found methylated in this group
of cell lines are less likely to be found
methylated elsewhere. The genes included
in the training set were selected from our
database of DNA methylation in cancer,
and the criteria for inclusion were the fol-
lowing: (1) Methylation data were avail-
able for at least two cancer cell lines, (2) the
gene promoter overlapped with or had a
CpG island no more than 200 bp distant
from the TSS, and (3) the CpG island was
not methylated in the normal control.
The classical Gardiner-Frommer definition
of CpG islands was adopted in our study
(Gardiner-Garden and Frommer 1987).
As shown in Figure 1A, SINE and LINE
repeats were approximately half as com-
mon in methylation-prone compared to
methylation-resistant genes. Among the
other repeat classes, both long terminal
repeat (LTR) and DNA elements showed
a lower frequency in methylation-prone
genes; however, this difference was mod-
est and not statistically significant. CpG
island length, GC content, and CpG ratio
were previously shown to be associated
with methylation status in somatic tissues
(Weber et al. 2007), but these variables
were not significantly different between
methylation-resistant and methylation-
prone genes in cancer (Fig. 1B).
To gain further information about
differences in the distribution of SINE
and LINE repeats between methylation-
prone and methylation-resistant genes,
we extended the annotation to a 20-kb
region centered in the TSS in 1-kb non-
overlapping windows. The depletion of
SINE repeats in methylated genes spanned nearly the full 20-kb
region, whereas the depletion of LINE repeats in methylated genes
occurred mainly in a –2-kb to +5-kb window (Fig. 1C; Supple-
mental Fig. S1). We calculated the log-odds score of SINE and LINE
retrotransposons per 1-kb window based on their distribution in
the training set and in the full collection of human promoter CpG
islands (Fig. 2). The sum of log-odds scores in the 20-kb region
allowed us to quantify the similarity in distribution of SINE and
LINE retrotransposons in a single gene promoter compared to the
average distribution of these elements in methylation-prone and
methylation-resistant genes. As a result, we could distinguish three
groups in the training set: (1) genes depleted of both SINE and LINE
repeats, thus predicted to be methylation-prone; (2) genes enriched
for SINE and LINE repeats, predicted to be methylation-resistant; and
Figure 1. Distribution of repetitive elements in methylation-prone versus methylation-resistant genes.(A) The abundance of repetitive elements of different classes was determined for the 4-kb sequencewindow centered in the TSS of 36 methylation-resistant (white) and 36 methylation-prone (black) genes.Retrotranposons of the SINE and LINE classes were found to be depleted in methylation-prone genes. *P <0.02; **P < 0.12 (Student’s t-test). (B) Average length, GC content, and CpG ratio of CpG islands were notsignificantly different between methylation-prone and methylation-resistant genes. Error bars representSEM. (C ) Abundance of SINE and LINE retrotransposons in the 20-kb sequence window centered in theTSS of 36 methylation-prone and 36 methylation-resistant genes. The abundance of SINE and LINE ret-rotransposons in all promoter CpG islands in the human genome is shown in gray. Note that the depletionof LINE retrotransposons is more significant in the �2-kb to +5-kb sequence window.
1370 Genome Researchwww.genome.org
Estecio et al.
(3) genes that were depleted of only one type of repeat. Comparison
of these findings with the methylation data for each one of the
72 studied genes revealed that 19 of 23 genes (83%) predicted to be
methylation-prone were actually hypermethylated in cancer and
23 of 25 genes (92%) predicted to be methylation-resistant were
not or were rarely hypermethylated in cancer (Fig. 3A). Genes with
discordant frequency of SINE and LINE repeats (30 of 72, 42%)
seemed to represent a class of genes of intermediate predisposition to
methylation. We observed that the distribution of retrotransposons
in the core promoter (�1 kb to +2 kb centered in the TSS) is also
predictive of methylation predisposition, however with less accuracy
than the 20-kb region classification (75% of predicted methylation-
prone genes were indeed methylated in cancer, and 63% of the
methylation-resistant genes were unmethylated).
Validation of the model
A major drawback of our model is the limited data set used in its
development. We therefore focused on validation using progres-
sively larger data sets. We first studied 74 methylation-prone and 68
methylation-resistant genes for which data on promoter methyla-
tion in cancer were available (Supplemental Tables S3, S4) from
a variety of tissues (colon, lung, breast, and leukemia, among others).
As shown in Figure 3B, 81% of the predicted methylation-prone
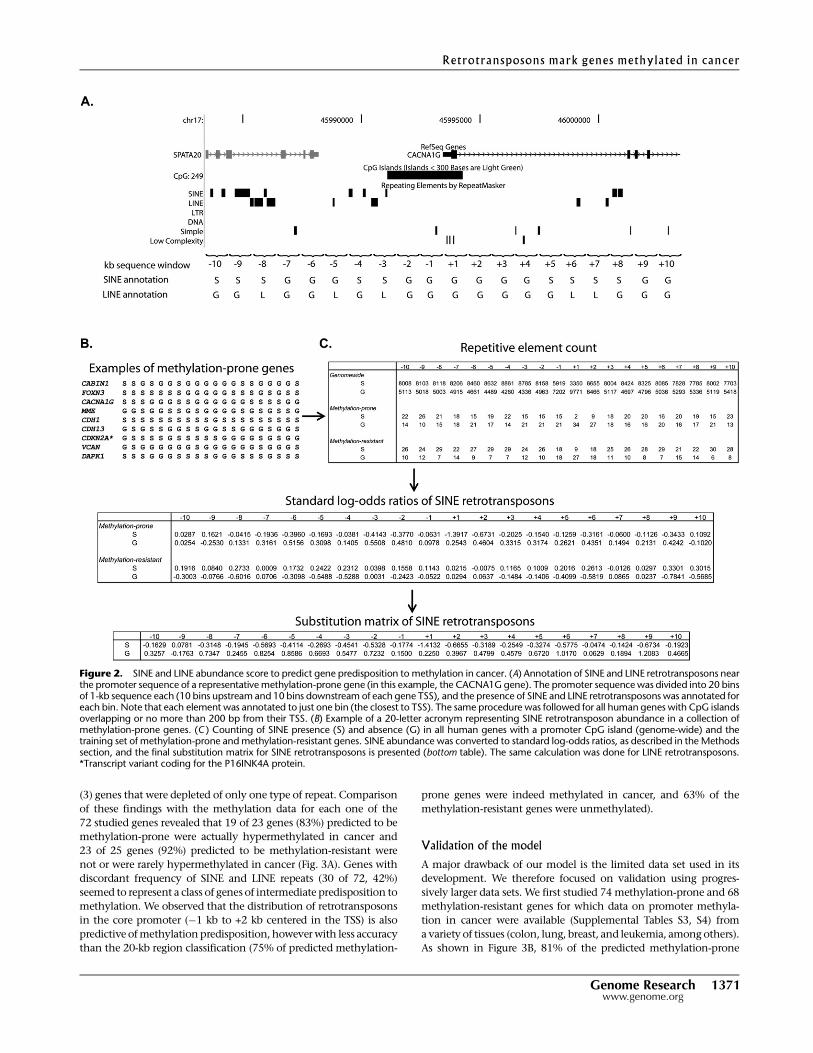
Figure 2. SINE and LINE abundance score to predict gene predisposition to methylation in cancer. (A) Annotation of SINE and LINE retrotransposons nearthe promoter sequence of a representative methylation-prone gene (in this example, the CACNA1G gene). The promoter sequence was divided into 20 binsof 1-kb sequence each (10 bins upstream and 10 bins downstream of each gene TSS), and the presence of SINE and LINE retrotransposons was annotated foreach bin. Note that each element was annotated to just one bin (the closest to TSS). The same procedure was followed for all human genes with CpG islandsoverlapping or no more than 200 bp from their TSS. (B) Example of a 20-letter acronym representing SINE retrotransposon abundance in a collection ofmethylation-prone genes. (C ) Counting of SINE presence (S) and absence (G) in all human genes with a promoter CpG island (genome-wide) and thetraining set of methylation-prone and methylation-resistant genes. SINE abundance was converted to standard log-odds ratios, as described in the Methodssection, and the final substitution matrix for SINE retrotransposons is presented (bottom table). The same calculation was done for LINE retrotransposons.*Transcript variant coding for the P16INK4A protein.
Retrotransposons mark genes methylated in cancer
Genome Research 1371www.genome.org

genes were indeed methylated in cancer, and 75% of the predicted
methylation-resistant genes were not methylated. As expected, we
found a 1:1 ratio of methylated to unmethylated genes in the pre-
dicted methylation-intermediate group (52 of 142 genes, 37%). We
further evaluated whether our predictive model held true in a larger
scale analysis. For this, we used methylation data from 28 cancer cell
lines and 32 primary tissues analyzed by methylated CpG island
amplification microarray (MCAM), a sensitive and specific micro-
array method based on selective amplification of methylated DNA
after restriction enzyme digestion (Estecio et al. 2007; Shen et al.
2007b). As performed, MCAM detects cancer-specific methylation as
a result of the cohybridization of methylation libraries of cancer
versus normal tissues. Thus, all promoter CpG islands identified
by MCAM as methylated in cancer are not methylated in the nor-
mal control. In this large data set, composed of more than 26,000
probes representing around 6600 CpG islands associated with auto-
somal gene promoters, we found that predicted methylation-prone
genes showed the highest average values of measured promoter
Figure 3. Prediction of gene predisposition and resistance to hypermethylation in cancer. (A) SINE and LINE scores of the training set genes. The scoreswere calculated according to the described log-odds ratio method for each gene and are represented as horizontal bars (white bars, SINE score; black bars,LINE score). Methylation status determined by bisulfite PCR methods is shown on the right. Genes with concordant depletion of SINE and LINE retro-transposons (log-odds $ 0) were predominantly methylation-prone, with the opposite found for genes with enrichment of both SINE and LINE repeats.Discordant SINE and LINE scores likely represent a class of genes with intermediate predisposition to methylation. *Transcript variant coding for theP16INK4A protein. **Transcript variant coding for the P14ARF protein. Black rectangles represent methylated genes; white rectangles represent un-methylated genes. (B) The predictive method based on SINE and LINE retrotransposons abundance was applied to a test set composed of 142 genes.The frequency of genes correctly classified according to their DNA methylation status in cancer was 79% for methylation-resistant and 75% for meth-ylation-prone genes. These values were closely related to those found in the training set (gray bars). (C ) Validation of the predictive method in a large setof cancer cell lines and primary cancer tissues. Methylation status of more than 6600 autosomal gene promoters was determined by MCAM. X chro-mosome genes were excluded from this analysis due to their hemimethylated status in female samples. The measured DNA methylation per tissue typewas significantly higher in predicted methylation-prone genes than in predicted methylation-resistant and methylation-intermediate genes. Methylationis presented as the log2 ratio (cancer/control) of all oligonucleotide probes of a predicted methylation status.
Estecio et al.
1372 Genome Researchwww.genome.org

methylation, and the predicted methylation-resistant genes had the
lowest values (Fig. 3C). This pattern was consistent across individual
samples and tissue types, and was observed in 27 of 28 cancer cell
lines (98%) and in all 32 studied primary cancer tissue samples
(Supplemental Fig. S2). Among 740 genes concordantly methylated
across tumor samples (i.e., methylated in at least 30% of the primary
tumors and cell lines), 16% were predicted methylation-resistant,
41% methylation-intermediate, and 43% methylation-prone. Thus,
our predictive method can accurately classify genes in methylation
predisposition groups. In addition, despite the fact that it was gen-
erated from cancer cell lines, the predictive model correctly predicts
methylation predisposition in primary, uncultured cancer cells.
Although structurally different between mice and humans,
retrotransposons are associated with repressed chromatin organi-
zation in both species. Thus, if our model is correct, promoter CpG
islands subjected to hypermethylation in animal models should
also be depleted of retrotransposons. To address this question, we
compared the distribution of SINE and LINE retrotransposons in
a 20-kb region around the TSS of more than 6000 mouse promoter
CpG islands identified by MCAM analysis as methylation-prone
and methylation-resistant in a mouse model for myelodysplastic
syndrome (Lin et al. 2005). Similar to human cancer, SINE repeats
were consistently depleted in methylation-prone genes (Fig. 4A).
However, the difference in frequency of LINE repeats was not sta-
tistically significant between methylation-prone and methylation-
resistant genes. Interestingly, the analysis of distribution of LTR
repeats revealed that these transposons were less frequent in
methylation-prone genes. IAP repeats, a family of LTR repeats
highly successful in mice but not present in humans, also showed
a trend for depletion in methylation-prone genes. The lack of
statistical significance for the differential distribution of IAP re-
peats between the methylation-predisposition groups is likely due
to their low frequency close to gene TSS (<1% of gene promoter
CpG islands). The same general pattern of frequency of SINE, LINE,
and LTR repeats was also observed in an analysis of two additional
recently published methylation data sets (Fig. 4B,C) generated
from chronic lymphocytic leukemia (CLL) and intestinal cancer
mouse models (Hahn et al. 2008; Chen et al. 2009). Additionally,
since age-related methylation accounts for a large fraction of pro-
moter CpG island methylation observed in cancer (Toyota and Issa
1999), we reasoned that age-related methylated genes are also
likely to be depleted of retrotransposons. The DNA methylation
pattern of mouse small intestine tissue was compared between
old (35-mo-old) and young (3-mo-old) animals using MCAM. We
found that, similar to human and mouse promoter CpG islands
predisposed to methylation in cancer, age-related methylated mouse
promoter CpG islands were depleted of SINE, LINE, and LTR repeats
(Fig. 4D). Thus, our data clearly demonstrate that genes predisposed
to age-related methylation share a common genome architecture
with cancer-related methylated genes. Based on these findings, we
revisited the distribution of LTR elements in our large MCAM data set
for human cancers and found that LTRs are also depleted in meth-
ylation-prone genes, albeit to a lesser degree than SINE and LINE
retrotransposons (Supplemental Fig. S3). However, adding LTR dis-
tribution to predict gene predisposition to DNA methylation in
human cancer did not significantly improve our model.
Genome-wide analysis of methylation predisposition
The validation of our predictive model prompted us to apply it
genome-wide. Among 25,489 unique RefSeq genes (NCBI Build
36.1), 16,166 (63.4%) have a promoter CpG island. Of these, 3613
(22.3%) were predicted by our model to be methylation-prone;
7308 (45.2%) were predicted to be moderately predisposed to
methylation (methylation-intermediate); and the remaining 5245
(32.5%) were predicted to be methylation-resistant (Fig. 5A).
The top 50 predicted methylation-prone and methylation-
resistant genes are presented in Tables 1 and 2. Forty-eight percent
(24 of 50) of the top predicted methylation-prone genes have been
described as methylated in cancer according to data in the litera-
ture, and only 6% (3/50) of the top predicted methylation-resistant
genes were described as methylated. Although not present in
Table 1 because they did not rank among the top 50 genes, several
classical genes known to be methylated in cancer and not pre-
viously included in the first validation set were correctly predicted
as methylation-prone (for example RASSF1, GATA4, GATA5, and
SFRP2). In terms of gene function, 39/50 (78%) predicted
methylation-prone genes are directly related to developmental
processes, compared to only 5% of the predicted methylation-
resistant genes (P < 0.001, Fisher’s exact test). Indeed, when applied
genome-wide, Gene Ontology analysis revealed that methylation-
prone genes preferentially participate in developmental processes
(Fig. 5B), an observation in agreement with previous data showing
that repeat-free regions in mammalian genomes are enriched
for genes that function in organogenesis and morphogenesis,
among other functions related to development (Simons et al.
2006). Some of these are multiclusters of neighboring genes with
related function, such as HOX gene clusters. This prompted us to
quantify the propensity of predicted methylation-prone genes to
be correlated in neighboring genes and to find 28 genomic regions
with statistically significant higher frequency of such genes (Sup-
plemental Table S5). These regions were in average 5 Mb long
(ranging from 0.3 to 26 Mb) and had a tendency to be located close
to telomeric regions. Together, these regions cover ;4.5% of the
human genome but contain 15% of the predicted methylation-
prone genes. Twelve (43%) of these regions included multiclusters
of genes with similar function and likely originated from dupli-
cation events.
Two classes of genes with methylated promoter CpG islands
in normal tissues are imprinted and X chromosome–inactivated
genes. Among 30 well-characterized imprinted genes, 12 (40%)
were predicted methylation-prone, 17 (57%) were predicted in-
termediate, and only one was predicted methylation-resistant
(Supplemental Table S6). The frequency of predicted methylation-
prone, resistant, and intermediate genes on the X chromosome
was remarkably similar to the frequency of the predicted classes
genome-wide. There was a moderate, although not significant,
enrichment of predicted methylation-prone genes among genes
that escape X inactivation (P > 0.05, x2 test, Supplemental Fig. S4).
Although we have focused our analysis on promoter CpG is-
lands, nonpromoter CpG islands (both exonic/intronic and
intergenic CpG islands) are also subject to de novo methylation in
cancer. There are scarce data on these CpG islands in the literature,
but we were able to identify 291 nonpromoter CpG islands in our
MCAM database that showed frequent hypermethylation in cell
lines and primary tumors, and 740 methylation-resistant non-
promoter CpG islands. Similarly to promoter CpG islands, meth-
ylation-prone nonpromoter CpG islands were found to be de-
pleted of SINE and LINE retrotransposons (Supplemental Fig. S5).
Although the functional role of these CpG islands remains poorly
defined, our data suggest that the underlying genomic architecture
is closely related between methylation-prone and methylation-
resistant CpG islands regardless of their position relative to tran-
scriptional units.
Retrotransposons mark genes methylated in cancer
Genome Research 1373www.genome.org

Effects on gene expression
To validate the biological implications of our predictive model, we
compared the mRNA expression of predicted methylation-prone
and methylation-resistant promoter CpG island genes in 28 nor-
mal differentiated human tissues and 52 human cancer cell line
samples using public microarray databases (Ross et al. 2000; Su
et al. 2004). As shown in Figure 5C, in normal tissues, predicted
methylation-resistant genes had in general lower expression than
predicted methylation-prone genes. An attractive explanation
for the lower expression of predicted methylation-resistant genes
in normal cells is their higher content of retrotransposons, which
have been implicated in decreased mRNA expression through
impairment of elongation (Han et al. 2004). As would be expected
Figure 4. Frequency of retroelements in methylation-prone and methylation-resistant genes identified in mouse cancer models and old mice. (A)Depletion of SINE and LTR but not LINE repeats near TSS marks methylated promoter CpG islands in a mouse model of myelodysplastic syndrome (MDS).Bone marrow samples of three NUP98-HOXD13 transgene animals that developed MDS (Lin et al. 2005) were studied by MCAM. Bone marrow samplesfrom nontransgene animal of the same mouse strain was used as control, and the methylation status of approximately 6000 CpG island promoter geneswas determined in the MCAM experiments. (B,C ) The same pattern of retroelements depletion is observed in hypermethylated genes in CLL (Chen et al.2009) and intestinal cancer mouse models (Hahn et al. 2008). (D) Depletion of SINE, LINE, and LTR repeats near TSS also marks age-related methylationpromoter CpG islands. Small intestine tissue harvested from young (3-mo-old) and old (35-mo-old) C57BL/6J mice were used in MCAM experiments toidentify age-related methylation.
Estecio et al.
1374 Genome Researchwww.genome.org
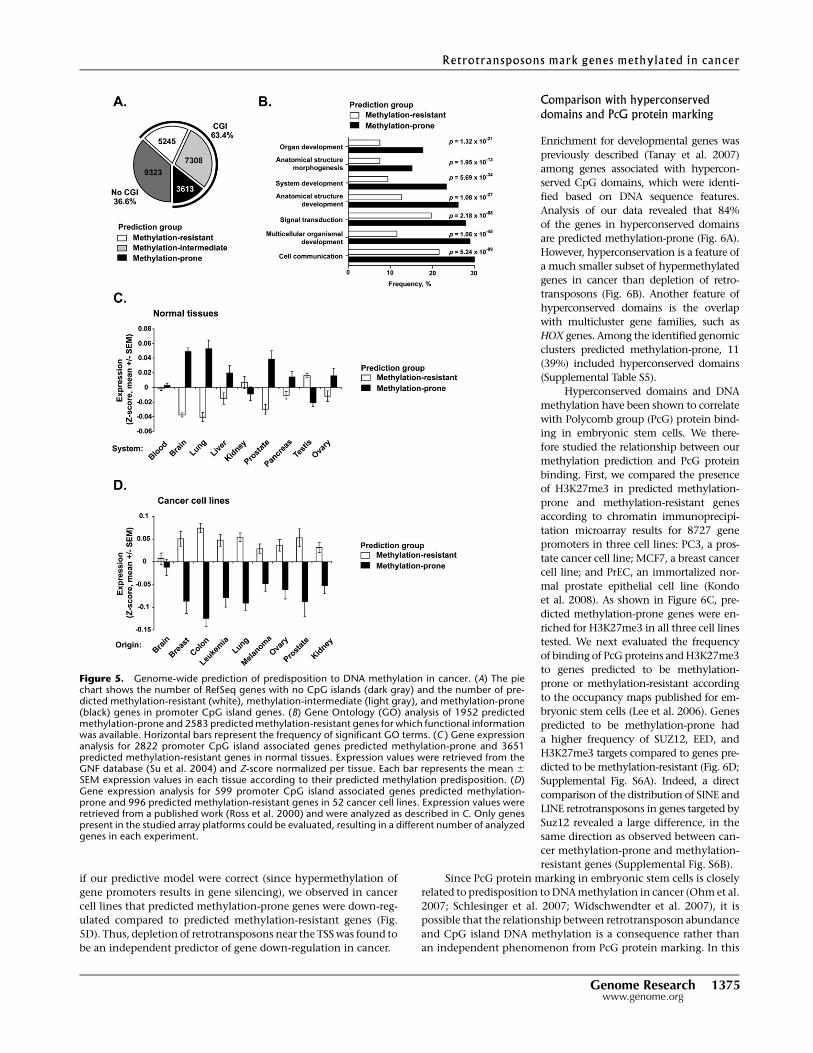
if our predictive model were correct (since hypermethylation of
gene promoters results in gene silencing), we observed in cancer
cell lines that predicted methylation-prone genes were down-reg-
ulated compared to predicted methylation-resistant genes (Fig.
5D). Thus, depletion of retrotransposons near the TSS was found to
be an independent predictor of gene down-regulation in cancer.
Comparison with hyperconserveddomains and PcG protein marking
Enrichment for developmental genes was
previously described (Tanay et al. 2007)
among genes associated with hypercon-
served CpG domains, which were identi-
fied based on DNA sequence features.
Analysis of our data revealed that 84%
of the genes in hyperconserved domains
are predicted methylation-prone (Fig. 6A).
However, hyperconservation is a feature of
a much smaller subset of hypermethylated
genes in cancer than depletion of retro-
transposons (Fig. 6B). Another feature of
hyperconserved domains is the overlap
with multicluster gene families, such as
HOX genes. Among the identified genomic
clusters predicted methylation-prone, 11
(39%) included hyperconserved domains
(Supplemental Table S5).
Hyperconserved domains and DNA
methylation have been shown to correlate
with Polycomb group (PcG) protein bind-
ing in embryonic stem cells. We there-
fore studied the relationship between our
methylation prediction and PcG protein
binding. First, we compared the presence
of H3K27me3 in predicted methylation-
prone and methylation-resistant genes
according to chromatin immunoprecipi-
tation microarray results for 8727 gene
promoters in three cell lines: PC3, a pros-
tate cancer cell line; MCF7, a breast cancer
cell line; and PrEC, an immortalized nor-
mal prostate epithelial cell line (Kondo
et al. 2008). As shown in Figure 6C, pre-
dicted methylation-prone genes were en-
riched for H3K27me3 in all three cell lines
tested. We next evaluated the frequency
of binding of PcG proteins and H3K27me3
to genes predicted to be methylation-
prone or methylation-resistant according
to the occupancy maps published for em-
bryonic stem cells (Lee et al. 2006). Genes
predicted to be methylation-prone had
a higher frequency of SUZ12, EED, and
H3K27me3 targets compared to genes pre-
dicted to be methylation-resistant (Fig. 6D;
Supplemental Fig. S6A). Indeed, a direct
comparison of the distribution of SINE and
LINE retrotransposons in genes targeted by
Suz12 revealed a large difference, in the
same direction as observed between can-
cer methylation-prone and methylation-
resistant genes (Supplemental Fig. S6B).
Since PcG protein marking in embryonic stem cells is closely
related to predisposition to DNA methylation in cancer (Ohm et al.
2007; Schlesinger et al. 2007; Widschwendter et al. 2007), it is
possible that the relationship between retrotransposon abundance
and CpG island DNA methylation is a consequence rather than
an independent phenomenon from PcG protein marking. In this
Figure 5. Genome-wide prediction of predisposition to DNA methylation in cancer. (A) The piechart shows the number of RefSeq genes with no CpG islands (dark gray) and the number of pre-dicted methylation-resistant (white), methylation-intermediate (light gray), and methylation-prone(black) genes in promoter CpG island genes. (B) Gene Ontology (GO) analysis of 1952 predictedmethylation-prone and 2583 predicted methylation-resistant genes for which functional informationwas available. Horizontal bars represent the frequency of significant GO terms. (C ) Gene expressionanalysis for 2822 promoter CpG island associated genes predicted methylation-prone and 3651predicted methylation-resistant genes in normal tissues. Expression values were retrieved from theGNF database (Su et al. 2004) and Z-score normalized per tissue. Each bar represents the mean 6
SEM expression values in each tissue according to their predicted methylation predisposition. (D)Gene expression analysis for 599 promoter CpG island associated genes predicted methylation-prone and 996 predicted methylation-resistant genes in 52 cancer cell lines. Expression values wereretrieved from a published work (Ross et al. 2000) and were analyzed as described in C. Only genespresent in the studied array platforms could be evaluated, resulting in a different number of analyzedgenes in each experiment.
Retrotransposons mark genes methylated in cancer
Genome Research 1375www.genome.org

case, our predictive model would have no additional predictive
value beyond that of PcG protein marking alone. We first exam-
ined the relative contribution of PcG marking and our predictive
model in genes known to be methylated in our training and first
testing set. Out of 110 frequently methylated genes, 25 (23%) are
marked by both PcG and predicted methylation-prone, 31 (28%)
are predicted methylation-prone alone, 15 (14%) are PcG-positive
alone, and 39 (35%) are neither marked by PcG nor predicted
methylation-prone (Fig. 6E). Thus, in this set, PcG marking and our
predictive model based on retrotransposon frequency appear to be
correlated but also complementary. Moreover, these results show
that retrotransposon distribution marks a larger fraction of meth-
ylation-prone genes than PcG protein marking. To examine this in
a larger data set, we turned to MCAM data and divided genes into
predicted methylation-prone and methylation-resistant (exclud-
ing intermediate for clarity). As seen in Figure 6F, both predicted
methylation-prone and PcG-marked genes have significantly higher
levels of measured methylation than methylation-resistant/PcG-
negative subsets. Again, PcG marking alone identifies a smaller subset
of methylated genes compared to our predictive model alone (119
Table 1. Top 50 genes predicted as methylation-prone
Gene symbol Gene nameRefSeqname Chromosome
Transcriptionstart
Sscore
Lscore
ZFPM2 Zinc finger protein, multitype 2 NM_012082 chr 8 106400322 10.0794 2.5599TOX3 TOX high mobility group box family member 3 NM_001080430 chr 16 51138307 9.7349 2.8928TPPP Tubulin polymerization promoting protein NM_007030 chr 5 746510 10.0794 2.4442FOXA1 Forkhead box A1 NM_004496 chr 14 37134240 10.3338 2.1021NKX2-2 NK2 homeobox 2 NM_002509 chr 20 21442664 9.4206 2.9432TCERG1L Transcription elongation regulator 1-like NM_174937 chr 10 132999974 9.0299 3.2956POU3F3 POU class 3 homeobox 3 NM_006236 chr 2 104838400 10.0794 2.2061DUX4 Double homeobox, 4 NM_033178 chr 4 191229360 10.0794 1.978LHX9 LIM homeobox 9 NM_001014434 chr 1 196148257 10.0794 1.9779EBF3 Early B-cell factor 3 NM_001005463 chr 10 131652081 10.0794 1.9779GATA3 GATA binding protein 3 NM_002051 chr 10 8136672 10.0794 1.9779GPR123 G protein-coupled receptor 123 NM_001083909 chr 10 134751398 10.0794 1.9779IGF2 Insulin-like growth factor 2 (somatomedin A) NM_000612 chr 11 2116780 10.0794 1.9779PAX6 Paired box 6 NM_001604 chr 11 31789434 10.0794 1.9779HOXC4 Homeobox C4 NM_014620 chr 12 52696908 10.0794 1.9779HOXC8 Homeobox C8 NM_022658 chr 12 52689156 10.0794 1.9779HOXC9 Homeobox C9 NM_006897 chr 12 52680143 10.0794 1.9779ZIC2 Zic family member 2 (odd-paired homolog,
Drosophila)NM_007129 chr 13 99432319 10.0794 1.9779
ZIC5 Zic family member 5 (odd-paired homolog,Drosophila)
NM_033132 chr 13 99422179 10.0794 1.9779
CRIP2 Cysteine-rich protein 2 NM_001312 chr 14 105012175 10.0794 1.9779SIX1 SIX homeobox 1 NM_005982 chr 14 60185933 10.0794 1.9779NR2F2 Nuclear receptor subfamily 2, group F,
member 2NM_021005 chr 15 94674949 10.0794 1.9779
HOXB4 Homeobox B4 NM_024015 chr 17 44010742 10.0794 1.9779HOXB5 Homeobox B5 NM_002147 chr 17 44026102 10.0794 1.9779ZADH2 Zinc binding alcohol dehydrogenase domain
containing 2NM_175907 chr 18 71050105 10.0794 1.9779
TSHZ3 Teashirt zinc finger homeobox 3 NM_020856 chr 19 36532030 10.0794 1.9779DLX1 Distal-less homeobox 1 NM_178120 chr 2 172658453 10.0794 1.9779HOXD10 Homeobox D10 NM_002148 chr 2 176689737 10.0794 1.9779HOXD11 Homeobox D11 NM_021192 chr 2 176680329 10.0794 1.9779HOXD12 Homeobox D12 NM_021193 chr 2 176672775 10.0794 1.9779HOXD8 Homeobox D8 NM_019558 chr 2 176702722 10.0794 1.9779HOXD9 Homeobox D9 NM_014213 chr 2 176695333 10.0794 1.9779MEIS1 Meis homeobox 1 NM_002398 chr 2 66516035 10.0794 1.9779NR4A2 Nuclear receptor subfamily 4, group A,
member 2NM_006186 chr 2 156897446 10.0794 1.9779
SATB2 SATB homeobox 2 NM_015265 chr 2 200033446 10.0794 1.9779POU4F2 POU class 4 homeobox 2 NM_004575 chr 4 147779494 10.0794 1.9779IRX1 Iroquois homeobox 1 NM_024337 chr 5 3649167 10.0794 1.9779POU3F2 POU class 3 homeobox 2 NM_005604 chr 6 99389300 10.0794 1.9779DLX6 Distal-less homeobox 6 NM_005222 chr 7 96473225 10.0794 1.9779HOXA10 Homeobox A10 (isoform a) NM_018951 chr 7 27186368 10.0794 1.9779HOXA10 Homeobox A10 (isoform b) NM_153715 chr 7 27180480 10.0794 1.9779HOXA5 Homeobox A5 NM_019102 chr 7 27149812 10.0794 1.9779HOXA6 Homeobox A6 NM_024014 chr 7 27153893 10.0794 1.9779HOXA7 Homeobox A7 NM_006896 chr 7 27162821 10.0794 1.9779HOXA9 Homeobox A9 NM_152739 chr 7 27171674 10.0794 1.9779SCRIB Scribbled homolog (Drosophila) NM_182706 chr 8 144969537 10.0794 1.9779SCXB Scleraxis homolog B (mouse) NM_001080514 chr 8 145461410 10.0794 1.9779NFIB Nuclear factor I/B NM_005596 chr 9 14303945 10.0794 1.9779METRNL Meteorin, glial cell differentiation
regulator-likeNM_001004431 chr 17 78630855 9.1408 2.8277
OTP Orthopedia homeobox NM_032109 chr 5 76970278 9.4805 2.4357
Estecio et al.
1376 Genome Researchwww.genome.org

versus 1254 genes). The genes with both PcG marking and retro-
transposon depletion (methylation-prone) had the highest levels of
measured methylation, confirming that the two models complement
each other.
Refinement of the model
Our data suggest that retrotransposon marking is a powerful dis-
criminator of CpG island methylation predisposition in cancer,
and that it compares favorably to models based on hypercon-
servation and PcG marking. However, it does not explain the be-
havior of every single CpG island. Thus, there is room for re-
finement of the model, and combination of retrotransposon
distribution with other features will likely improve its sensitivity
and specificity. An important feature reported to predict methyl-
ation propensity of CpG islands are short DNA motifs discovered
by Feltus et al. (2003, 2006), and recently modeled in a classifier
called PatMan by McCabe et al. (2009). Applied to the first testing
set, composed of genes known to be methylated according to the
literature, PatMan identifies 9/142 genes as methylation-prone, and
five of these (56%) are indeed known to be methylated. Among the
remaining 133 genes classified as methylation-resistant by PatMan,
Table 2. Top 50 genes predicted as methylation-resistant
Gene symbol Gene nameRefSeqname Chrom
Transcriptionstart
Sscore
Lscore
SMYD4 SET and MYND domain containing 4 NM_052928 chr 17 1679925 �7.6213 �7.5946SMN2 Survival of motor neuron 2, centromeric NM_022877 chr 5 70256523 �7.5439 �6.2266SMN1 Survival of motor neuron 1, telomeric NM_000344 chr 5 70256523 �7.5439 �6.2266PPIL2 Peptidylprolyl isomerase (cyclophilin)-like 2 NM_148176 chr 22 20350272 �6.4342 �6.9256RBM44 RNA binding motif protein 44 NM_001080504 chr 2 238372126 �5.5751 �7.7633NOSIP Nitric oxide synthase interacting protein NM_015953 chr 19 54775615 �6.8053 �6.3264ZFP1 Zinc finger protein 1 homolog (mouse) NM_153688 chr 16 73739921 �7.6213 �5.5062PXMP4 Peroxisomal membrane protein 4, 24 kDa NM_007238 chr 20 31771797 �6.8522 �6.1378NHP2L1 NHP2 non-histone chr omosome protein 2-like 1
(S. cerevisiae)NM_005008 chr 22 40408502 �7.6213 �5.3096
DRG1 Developmentally regulated GTP binding protein 1 NM_004147 chr 22 30125538 �7.2939 �5.3636RPA1 Replication protein A1, 70 kDa NM_002945 chr 17 1680094 �7.2939 �5.3193JAGN1 Jagunal homolog 1 (Drosophila) NM_032492 chr 3 9907271 �6.8225 �5.5777EP400 E1A binding protein p400 NM_015409 chr 12 131000460 �6.7769 �5.4792PAAF1 Proteasomal ATPase-associated factor 1 NM_025155 chr 11 73265680 �7.6213 �4.5654TRPV4 Transient receptor potential cation channel, subfamily
V, member 4NM_147204 chr 12 108755595 �7.6213 �4.51
CDK5RAP2 CDK5 regulatory subunit associated protein 2 NM_018249 chr 9 122382258 �7.6213 �4.4664IQCD IQ motif containing D NM_138451 chr 12 112143263 �6.2945 �5.7063C12orf32 Chromosome 12 open reading frame 32 NM_031465 chr 12 2856649 �6.2921 �5.683CYB5RL Cytochr ome b5 reductase-like NM_001031672 chr 1 54438334 �6.5718 �5.3888NPRL3 Nitrogen permease regulator-like 3 (S. cerevisiae) NM_001039476 chr 16 128672 �7.6213 �4.2671CDK5RAP1 CDK5 regulatory subunit associated protein 1 NM_016408 chr 20 31452998 �7.1813 �4.6612CCDC101 Coiled-coil domain containing 101 NM_138414 chr 16 28472757 �6.9085 �4.9031CHCHD8 Coiled-coil-helix-coiled-coil-helix domain containing 8 NM_016565 chr 11 73265538 �7.2895 �4.4949SLC24A6 Solute carrier family 24 (sodium/potassium/calcium
exchanger), member 6NM_024959 chr 12 112257308 �7.6213 �4.1074
DHX37 DEAH (Asp-Glu-Ala-His) box polypeptide 37 NM_032656 chr 12 124039620 �7.6213 �4.0842DNAJC8 DnaJ (Hsp40) homolog, subfamily C, member 8 NM_014280 chr 1 28432129 �7.6213 �4.0769ZNF562 Zinc finger protein 562 NM_017656 chr 19 9646734 �7.8757 �3.8041DRG2 Developmentally regulated GTP binding protein 2 NM_001388 chr 17 17932007 �5.7396 �5.8857C16orf45 Chromosome 16 open reading frame 45 NM_033201 chr 16 15435825 �5.9831 �5.6375PLA2G16 Phospholipase A2, group XVI NM_007069 chr 11 63138469 �7.8757 �3.6817FOXR1 Forkhead box R1 NM_181721 chr 11 118347626 �5.4078 �6.0503KIF3A Kinesin family member 3A NM_007054 chr 5 132101164 �6.4861 �4.9674RNF185 Ring finger protein 185 NM_152267 chr 22 29886178 �7.6213 �3.8222MRPL37 Mitochondrial ribosomal protein L37 NM_016491 chr 1 54438427 �6.2901 �5.1153YIPF1 Yip1 domain family, member 1 NM_018982 chr 1 54128041 �4.4365 �6.8572RAD51L3 RAD51-like 3 (S. cerevisiae) NM_002878 chr 17 30471001 �7.1327 �4.1404DNAL1 Dynein, axonemal, light chain 1 NM_031427 chr 14 73181454 �5.9831 �5.265HLCS Holocarboxylase synthetase [biotin-(proprionyl-
CoA-carboxylase [ATP-hydrolyzing]) ligase]NM_000411 chr 21 37284373 �5.6994 �5.5373
MMP24 Matrix metallopeptidase 24 (membrane-inserted) NM_006690 chr 20 33278116 �6.7495 �4.4684MRPL1 Mitochondrial ribosomal protein L1 NM_020236 chr 4 79002828 �5.4106 �5.7917SETDB1 SET domain, bifurcated 1 NM_012432 chr 1 149165511 �6.9085 �4.291CTNNA1 Catenin (cadherin-associated protein), alpha 1, 102 kDa NM_001903 chr 5 138117005 �5.5787 �5.6172SPNS1 Spinster homolog 1 (Drosophila) NM_032038 chr 16 28893649 �5.9223 �5.233C6orf203 Chromosome 6 open reading frame 203 NM_016487 chr 6 107456109 �7.6213 �3.4953KIF18B Kinesin family member 18B NM_001080443 chr 17 40380608 �6.0268 �5.0785C19orf50 Chromosome 19 open reading frame 50 NM_024069 chr 19 18529603 �7.6213 �3.4712TMEM219 Transmembrane protein 219 NM_001083613 chr 16 29880851 �6.9625 �4.1224SLC29A2 Solute carrier family 29 (nucleoside transporters), member 2 NM_001532 chr 11 65895867 �6.3653 �4.5099ENG Endoglin NM_000118 chr 9 129656805 �7.6213 �3.2082MDM4 Mdm4 p53 binding protein homolog (mouse) NM_002393 chr 1 202752133 �7.6213 �3.1811
Retrotransposons mark genes methylated in cancer
Genome Research 1377www.genome.org

69 are methylated. In comparison, 47/142 genes are classified as
methylation-prone according to retrotransposon marking, and
38 (81%) of these are indeed methylated. Thus, retrotransposon
marking compares favorably to PatMan. In our validation using
MCAM data, PatMan is a good classifier of
methylation-prone genes (Supplemental
Fig. S7A), but it seems to lack the sensi-
tivity of retrotransposon marking, as it
misses a little more than one thousand
methylation-prone CpG islands (Fig. 7A).
PatMan does, however, resolve nearly 200
methylation-intermediate genes into the
methylation-prone group.
Known insulator elements are likely
to play a role in protection of CpG islands
from de novo DNA methylation, espe-
cially if heterochromatin spreading, as
suggested by several authors, is the main
event leading to gene inactivation in can-
cer. To answer whether putative blocking
elements influence gene promoter pre-
disposition to DNA methylation, we com-
pared the average methylation of genes
with and without CTCF binding sites in
the promoter vicinity. A gene promoter
was considered to be bound by CTCF if this
protein was present in the 2-kb window
centered on the gene TSS in at least one out
of five normal adult cell lines investigated
by chromatin immunoprecipitation with
massively parallel sequencing (ChIP-seq)
(Bernstein et al. 2005, 2006; Mikkelsen
et al. 2007). According to this analysis,
;36% of promoter CpG islands are bound
by CTCF. Promoter CpG islands bound by
CTCF seem to be protected from de novo
methylation in cancer, as they present
lower measured DNA methylation by
MCAM compared to genes without CTCF
(Fig. 7B). However, CTCF binding is not
as strong a predictor of methylation pre-
disposition as retrotransposons marking,
since a large fraction of CTCF bound pro-
moters do become methylated in cancer.
When added to the prediction model, the
presence of CTCF binding does not im-
prove the classification of methylation-
resistant genes; even in the absence of
CTCF, retrotransposons mark genes that
do not become methylated in cancer (Sup-
plemental Fig. S7B). However, the presence
of CTCF decreases the methylation pro-
pensity of retrotransposon-poor promoters.
Finally, the breakdown of SINE and
LINE retrotransposons in families and
subfamilies may reveal additional infor-
mation regarding their relationship to
CpG island methylation. To test this pos-
sibility, we further annotated the pres-
ence of Alu and MIR repeats, the two
main families of human SINE, in the
20-kb window centered in the TSS of
methylation-prone and methylation-resistant genes. This compar-
ison revealed that Alu repeats are the main drivers of the difference
in abundance of SINE repeats between methylation-prone and
methylation-resistant genes (Fig. 7C). The difference in frequency
Figure 6. Genome architecture influences on PcG protein binding in embryonic and differentiatedcells. (A) Frequency of predicted methylation groups among hyperconserved domains. (B) Relativecontribution of hyperconserved domains and retrotransposon depletion in marking frequently meth-ylated genes in cancer. MCAM data from 32 primary tissues and 28 cancer cell lines were averaged toidentify frequently methylated genes. *Predicted status. (C ) Enrichment of H3K27me3 mark in pre-dicted methylation-prone genes in cancer (PC3, prostate; MCF7, breast) and normal immortalized(PrEC, prostate epithelium) cell lines. H3K27me3 marking was measured by ChIP with microarray hy-bridization (ChIP-chip) and is quantified as log2 ratio of pull-down signal over no antibody signal (Kondoet al. 2008). (D) Frequency of binding of SUZ12 and EED (PcG proteins) in human embryonic stem cellsto 2583 methylation-resistant, 3655 methylation-intermediate, and 1690 methylation-prone genesbased on our predictive model. Note that genes predicted methylation-prone (thus depleted for SINEand LINE retrotransposons) are preferential targets of PcG proteins. (E ) Comparison of PcG marking andour predictive model in identifying methylation-prone genes from our training and first testing set. (F )Average measured methylation of predicted methylation-prone and methylation-resistant genes in PcGmarked genes. MCAM data from 32 primary tumors and 28 cancer cell lines were averaged per com-parison group, and methylation is presented as log2 ratio (cancer/control). The number of genes percategory is presented above each column.
Estecio et al.
1378 Genome Researchwww.genome.org

of MIR repeats is less evident, but these repeats are, like LINE re-
peats, depleted in the proximal region to TSS (�2 kb to +4 kb).
DiscussionOur data show that a genome architecture marked by depletion
of retrotransposons is strongly correlated to gene predisposition
to DNA methylation in cancer. Moreover, we show that this same
architecture is an independent predictor of gene expression in
cancer and that it is correlated with PcG binding in embryonic
stem cells and adult tissues. These data add to the list of possible
influences of retrotransposons on genome biology. For example,
SINEs are differentially distributed in imprinted (Greally 2002),
tissue-specific (Ganapathi et al. 2005), and monoallelically ex-
pressed genes (Allen et al. 2003). Obviously, there may be overlap
between these states. Indeed, in our study, the frequency of pre-
dicted methylation-prone and methylation-resistant genes among
imprinted genes was significantly different from the genome-wide
distribution of these methylation predisposition groups. These re-
sults were in agreement with previous studies showing that SINE
repeats are less represented in imprinted
genes, resulting in an underrepresenta-
tion of predicted methylation-resistant
genes (Greally 2002). Of note, several
imprinted genes predicted methylation-
prone have been reported as hypermeth-
ylated in cancer (for example, CDKN1C
and DLK1). In contrast, despite reports
of differential distribution of SINE and
LINE retrotransposons on the X chro-
mosome (Jurka et al. 2004; Wang et al.
2006), we did not find the frequency
of methylation-prone and methylation-
resistant genes in the X chromosome to
differ from autosomes. These results are
consistent with the proposed idea that,
if retrotransposons in fact participate in
X inactivation, their action is due to long-
range interactions rather than local, pro-
moter-associated effects. It is important
to note that all these studies are correla-
tive, although they strongly point toward
a role for retrotransposons in epigenetic
regulation.
The depletion of SINE elements in
methylation-prone genes is a paradoxical
finding, since the main family of these
elements (Alu family) is efficient as a
methylation nucleation center in both
plants and mammals (Yates et al. 1999;
Arnaud et al. 2000), and the spreading of
DNA methylation from these repeats into
gene promoters was hypothesized to be
a cause of de novo methylation in cancer
(Jones and Baylin 2002). It is important
to note, however, that an opposite effect
has also been reported for repetitive ele-
ments, some of which have insulator
function (Gdula et al. 1996; Lunyak et al.
2007). Although the exact mechanism by
which the presence of retrotransposons is
associated with protection from de novo
promoter DNA methylation in cancer is unknown, it is possible
that protection is not directly mediated by these repetitive ele-
ments but rather by transcription factors with euchromatin/het-
erochromatin boundary activity, such as CTCF (Bell et al. 1999)
and Sp1 (Mummaneni et al. 1998) transcription factors. In such
cases, genes without binding sites for boundary proteins would be
negatively affected by the insertion of repetitive elements near
their promoters. Thus, the presence of retrotransposons near these
genes would be counterselected during evolution. Indeed, it has
been shown in Arabidopsis thaliana that methylated transposable
elements are preferentially inserted or retained in gene-poor areas,
a feature that likely evolved due to negative selection (Hollister and
Gaut 2009). Also, in agreement with this possibility, we show here
that CTCF binding confers some protection from de novo meth-
ylation. We believe that the performance of CTCF binding alone
as a predictor of methylation fate of gene promoters is somewhat
weak due to two main factors: (1) CTCF binding should be taken
in tissue-specific context, and compared to methylation data on the
same tissue type; and (2) other insulator proteins, for which ge-
nome-wide binding to gene promoters has not yet been extensively
Figure 7. Other genomic features associated with methylation predisposition in cancer. (A) Perfor-mance of PatMan and retrotransposon marking in predicting promoter CpG methylation status in cancer.PatMan�, predicted methylation-resistant genes; PatMan+, predicted methylation-prone genes. Thenumber of genes per category is presented above each column. (B) Measured promoter CpG islandmethylation by MCAM of CTCF bound (CTCF+) and unbound (CTCF�) genes. A gene was consideredbound by CTCF if ChIP-seq data from public databases show binding of this protein in the 2-kb regioncentered in the gene TSS. (C ) Abundance of Alu and MIR retrotransposons in the 20-kb sequence windowcentered in the TSS of 740 methylation-prone and 5658 methylation-resistant genes. Note that the de-pletion of MIR retrotransposons is more significant in the �2-kb to +2-kb sequence window.
Retrotransposons mark genes methylated in cancer
Genome Research 1379www.genome.org

reported (for example, VEZF1), should be taken into consideration
together with CTCF when developing models of protection.
The lack of correlation of LINE repeats with methylation
predisposition in mouse data sets is a puzzling observation, and
a possible explanation resides in the fact that different repeats may
impact the genome differently. Indeed, while SINE and LINE re-
peats are correlated to methylation predispositon, DNA repeats are
not. Among SINE repeats, Alus showed higher correlation to pro-
moter methylation status than MIRs. While not identical, human
Alu and mouse B1 share higher sequence similarity than human
and mouse LINEs. Also, LINE-1 repeats, the main LINE family, are
more variable in mice than in humans. In a direct comparison of
repetitive elements in human and mouse genomes, a strong cor-
relation was observed between the presences of SINE repeats in
orthologous locations, an event quite surprising given the lineage
specificity of these repeats (Mouse Genome Sequencing Consor-
tium 2002). LINE repeats, however, do not show such correlation.
Although these observations do not completely explain why
mouse LINEs are not correlated to methylation predisposition,
they point out that genomic location of different repeats may be
dictated by the repeat structure itself and species-specific factors.
The fact that the frequency of retrotransposons alone can
predict the expression status of thousands of genes in cancer
supports the idea that epigenetic effects in cancer occur through an
instructive mechanism and depend relatively little on gene func-
tion, at least initially. Indeed, the higher average methylation
in PcG marked genes is due to concordant methylation status
across different cell lines and primary tissues studied by MCAM,
indicating that these genes are under a strong program to become
epigenetically silenced. Retrotransposon-depleted genes are more
heterogeneously methylated; their lack of protection from de novo
methylation leaves these genes prone to epigenetic silencing, al-
though it is not a programmed event and may depend on selec-
tion. Thus, as for genetic alterations, many of the methylation
events in cancer are likely to be passengers, not drivers, in carci-
nogenesis. This does not exclude the active participation of a sub-
set of methylation-prone genes with strong tumor-suppression
function as drivers in tumorigenesis. Therefore, epigenetic defects
in cancer are best viewed as a form of molecular instability creating
diversity in gene expression that is exploited by cancers using
classical selection mechanisms.
A possible explanation for the correlation between depletion
of retrotransposons and predisposition to DNA methylation is
that, similarly to PcG marking, retrotransposon depletion marks
regulatory regions of developmental genes, which then might be
especially prone to DNA methylation. Indeed, developmental
genes often have hyperconserved CpG sites (Tanay et al. 2007).
Most genes that have such hyperconservation were found to be
predicted methylation-prone by our model, reinforcing the argu-
ment that retrotransposon depletion marks important essential
genes for development. However, our results in primary bladder
cancer methylation makes evident that tissue-lineage methylation
is not a confounder in our results. In this experiment, bladder
tissues from normal adult individuals were used as a control, thus
eliminating tissue-specific methylation as a confounder. As shown,
our predictive model performs well in this system after tissue-
specific methylation has been removed. Still, these data do not
exclude the possibility that chromatin states in normal tissues may
influence DNA methylation. Indeed, as discussed above, this has
been shown for PcG protein binding. It may be that our predicted
methylation prone genes have a unique chromatin pattern in
normal cells, beyond PcG protein binding, and this should be
addressed in further studies. Independent of the mechanism by
which retrotransposons are associated to or participate in pro-
tection from de novo DNA methylation in cancer, our findings
suggest that the architecture of the genome has much more pro-
found influences on cancer physiology than previously suspected.
Methods
Cell lines and primary cancer samplesA total of 34 cell lines from different tissues were obtained from theNCI Anticancer Drug Screen Panel, the American Type CultureCollection (Manassas, VA) or the University of Texas MD Andersonrepositories (one cell line from breast cancer, 12 from bladder can-cer, one from the central nervous system, four from colon cancer,11 from leukemia, one from melanoma, one from lung cancer, onefrom ovarian cancer, one from prostate cancer, and one from renalcancer) and cultured according to standard methods.
Primary tumor samples from 28 bladder cancer and fouracute myelogenous leukemia patients were collected at the MDAnderson Cancer Center in accordance with institutional policies.All patients provided written informed consent. Tumors were se-lected solely on the basis of availability. Genomic DNA was ex-tracted from all cell lines and primary tissue samples using a stan-dard phenol-chloroform method.
Methylation analyses
DNA methylation status of gene promoter CpG islands was eval-uated using bisulfite-treated DNA followed by PCR amplification,and methylation density of individual genes was determined bypyrosequencing or COBRA assays according to standard protocols(Estecio et al. 2006, 2007). PCR primers are presented in Supple-mental Tables S7 and S8. Genes with at least 15% methylationdensity were considered hypermethylated (a conservative valuechosen based on the detection limits of the methods) and geneshypermethylated in 2/9 tested cancer cell lines were classified asmethylation-prone, given that in our research we intended to findgenome signatures associated with predisposition or resistance tomethylation across tissue types, rather than tissue-specific meth-ylation. It is important to note, however, that the vast majority ofthe genes classified as methylation-prone showed gene methyl-ation of 30% and higher, and in general they were methylated inthree or more cell lines. Analysis of DNA methylation using theMCAM method was performed as previously reported (Estecioet al. 2007; Shen et al. 2007b). Tumor and normal control MCAamplicons were Cy5- and Cy3-labeled, respectively, and cohybrid-ized to the HCGI12K-Human CpG 12K Array (Microarray Center,University Health Network, Toronto, Canada) or to a custom 4 3
44 k oligo array (Agilent Technologies). Methylation analysis ofpromoter CpG island methylation in mice was done using bonemarrow samples of three NUP98-HOXD13 transgene animalsthat developed MDS (Lin et al. 2005). Bone marrow samples froma nontransgene animal of the same mouse strain were used ascontrol in MCAM experiments, and the methylation status ofapproximately 6000 CpG island promoter genes was determinedusing Mouse CpG Island Microarray Kit oligo arrays (AgilentTechnologies). Additional data sets of promoter CpG islandmethylation in mouse tumors were obtained from published re-ports on a mouse model of chronic lymphocytic leukemia (Chenet al. 2009) and intestinal cancer (Hahn et al. 2008). Small intestinetissues isolated from young (3-mo-old) and old (35-mo-old)C57BL/6J mice and tumor samples from a leukemia mouse model(Choi et al. 2008) were used in MCAM experiments to identifycancer and age-related methylation.
Estecio et al.
1380 Genome Researchwww.genome.org

Repetitive element abundance and CpG island characteristics
The DNA sequence flanking the 4-kb sequence region surroundingthe TSS of 36 methylation-prone and 36 methylation-resistantgenes with a promoter CpG island was obtained from the Uni-versity of California Santa Cruz (UCSC) BLAT Genome Browser(http://genome.ucsc.edu/cgi-bin/hgBlat). The TSS for each genewas determined according to RefSeq (NCBI Build 36.1), and re-petitive DNA sequences were annotated using the RepeatMaskersearch engine (http://www.repeatmasker.org). All genome tableswere downloaded from the UCSC Table Browser (http://genome.ucsc.edu/cgi-bin/hgTables; Karolchik et al. 2004). For all statisticalanalysis, CpG island length, GC content, and CpG ratio were cal-culated using the public software CpG Island Searcher (http://www.cpgislands.com; Takai and Jones 2003).
Calculation of a score to predict gene promoter predispositionto DNA methylation
We divided the promoter sequence of 36 methylation-prone and36 methylation-resistant genes into 20 bins of 1-kb sequence each(10 bins upstream and 10 bins downstream of each gene TSS), andannotated the presence SINE and LINE retrotransposons in eachbin (Fig. 2A). In order to avoid a single repeat being counted inmultiple bins, SINE and LINE elements were annotated to theclosest bin to TSS. Done this way, each gene is represented by a20-letter acronym, where S represents a SINE element in the binand G represents the absence of a SINE element (Fig. 2B). Similarly,an independent acronym is generated for LINE repeats, whereL represents a LINE element in the bin and G represents the ab-sence of a LINE element. We compared the average abundance ofSINE and LINE retrotransposons per bin in methylation-proneand methylation-resistant genes to their average abundancegenome-wide in the full collection of human promoter CpG is-lands, and translated the preference to repetitive elements to ascore that differentiates two kinds of promoters.
Such a score is a sum over the bin score, which is a standardlog-odds ratio:
si;r = lnqi;r
pr
� �;
where qi,r is the frequency of observing repeat of type r for the ithbin for the promoters known to be methylated; pr is the back-ground frequency for the repeat r. To account for the low countand avoid taking logarithm of zero, qi,r is replaced by Qi;r =
ci;r + f r
N + 1
derived from ‘‘pseudo-count,’’ where fr is the fraction of the re-peat that is type r: +r f r = 1. N is the total number of promoterswith the known methylation status; ci,r is the number of repeats oftype r in the ith bin: +r ci;r = N. The final value for each letter inthe 20-letter acronym representing the abundance of SINE andLINE elements was calculated as the difference between its valuein methylation-prone and methylation-resistant genes (for exam-ple, s10;S = s10;Smp � s10;Smr , where Smp is the SINE standard log-oddsratio in methylation-prone genes and Smr is the SINE standard log-odds ratio in methylation-resistant genes). The calculation of thelog-odds ratios for SINE elements is illustrated in Figure 2C.
Identification of clusters of methylation-prone genes
To identify clusters of methylation-prone genes, we computed thecorrelation as a function of separation between genes. We denotedthe computed status of whether the ith gene on a chromosome ismethylation-prone by Si, where Si = 1 indicates methylation-proneand Si = 0 indicates methylation-resistance. The following corre-lation function was applied to detect clustering of methylation-prone or methylation-resistance: C(d ) where L is the total number
of genes in the chromosome. We similarly defined the correlationfunction over the genome by averaging over all chromosomes. Ata large gene separation (distance d ), Si and Si+d become in-dependent. If there is a correlation at a short distance, it will resultin an elevated value of C(d) at a shorter distance in comparison toa larger distance. We found that between distances 3 and 60, thecorrelation C(d) can be fitted to an exponential function e
d�l where
l = 20.6 indicates a decay length of about 21 gene separations. Inthese analyses, only genes with promoter CpG islands were com-puted. In order to find the regions of clustering of methylation-prone genes, we look for a string of consecutive methylation-pronegenes (i = 1) in Si. We compared the length of the string with what isallowed by random chance. Let N0 and N1 be the number of 0’s(methylation-resistant) and 1’s in Si, then p1= N1
N0 + N1and p0 = 1� p1.
If 0’s and 1’s are randomly distributed, the chance of having
L �m1’s and m0’s is given by PðLÞ= Lm
� �p L�m
1 pm0 . Let N = N0 = N1,
using very conservative Bonferroni correction for multiple test-ings, when PðLÞ 3 N » 1, there is approximately one string withL � m1’s and 0’s in the entire genome. To control for multiple L
we find the smallest L that satisfies N 3 +N
1=L
PðLÞ # 1. Although P/L
over L does not sum to one, we are summing over very small P/Las an approximation to control for multiple string length tested.So for m = 0 we find all string of 1’s with length $ L (the thresholdvalue in this case is L = 7) and mark this region as significant.Similarly, we mark regions for m up to 10.
Gene expression, ChIP-chip, and PatMan data sets
Gene expression profiles of normal tissues were downloaded fromGNF expression database (http://expression.gnf.org/; Su et al.2004). Raw expression values in each data set were substituted bytheir respective Z-scores ([X� m]/s, where X represents expressiondata of each gene in each sample; m represents mean of expressionof all genes for each sample; and s represents standard deviation).S and L scores were attributed to each gene, and Z-score expressiondata were averaged per predicted methylation status (prone orresistant to methylation) according to tissue of origin. Gene ex-pression profiles of cancer cell lines were downloaded from theNCI60 Cancer Microarray Project website (http://genome-www.stanford.edu/nci60/; Ross et al. 2000) and analyzed as described fornormal tissue expression data. Suz12 and Eed polycomb group(PcG) protein binding and H3K27me3 ChIP data are from humanembryonic stem cells (Lee et al. 2006), and from PC3 (prostate cancercell line), MCF7 (breast cancer cell line), and PrEC (immortalizednormal prostate epithelial cells) (Kondo et al. 2008). CTCF bindingdata are from normal cultured cells (Bernstein et al. 2005, 2006;Mikkelsen et al. 2007). Genome-wide classification of CpG island inmethylation-prone and methylation-resistant genes according tothe PatMan classifier was retrieved from McCabe et al. (2009).
Gene Ontology analysis
We used FatiGO (Al-Shahrour et al. 2006) from Babelomics (http://babelomics.bioinfo.cipf.es/) for Gene Ontology analysis. The sta-tistical significance of frequency of genes per biological process inpredicted methylation-prone and methylation-resistant groupswas calculated using Fisher’s exact test. P-values were adjusted forfalse discovery rate.
AcknowledgmentsThis work was supported by the Leukemia Specialized Program ofResearch Excellence grant P50 CA100632, the National Institutesof Health grants R01 CA098006 and U01 CA085078, and the NIHintramural research program. J.P.J.I. is an American Cancer Society
Retrotransposons mark genes methylated in cancer
Genome Research 1381www.genome.org

Clinical Research Professor. We thank Stephanie P. Deming foreditorial help.
References
Allen E, Horvath S, Tong F, Kraft P, Spiteri E, Riggs AD, Marahrens Y. 2003. Highconcentrations of long interspersed nuclear element sequence distinguishmonoallelically expressed genes. Proc Natl Acad Sci 100: 9940–9945.
Al-Shahrour F, Minguez P, Tarraga J, Montaner D, Alloza E, Vaquerizas JM,Conde L, Blaschke C, Vera J, Dopazo J. 2006. BABELOMICS: A systemsbiology perspective in the functional annotation of genome-scaleexperiments. Nucleic Acids Res 34: W472–W476.
Arnaud P, Goubely C, Pelissier T, Deragon JM. 2000. SINE retroposons can beused in vivo as nucleation centers for de novo methylation. Mol Cell Biol20: 3434–3441.
Baylin S, Bestor TH. 2002. Altered methylation patterns in cancer cellgenomes: Cause or consequence? Cancer Cell 1: 299–305.
Bell AC, West AG, Felsenfeld G. 1999. The protein CTCF is required for theenhancer blocking activity of vertebrate insulators. Cell 98: 387–396.
Bernstein BE, Kamal M, Lindblad-Toh K, Bekiranov S, Bailey DK, Huebert DJ,McMahon S, Karlsson EK, Kulbokas EJ III, Gingeras TR, et al. 2005.Genomic maps and comparative analysis of histone modifications inhuman and mouse. Cell 120: 169–181.
Bernstein BE, Mikkelsen TS, Xie X, Kamal M, Huebert DJ, Cuff J, Fry B,Meissner A, Wernig M, Plath K, et al. 2006. A bivalent chromatinstructure marks key developmental genes in embryonic stem cells. Cell125: 315–326.
Bock C, Paulsen M, Tierling S, Mikeska T, Lengauer T, Walter J. 2006. CpGisland methylation in human lymphocytes is highly correlated withDNA sequence, repeats, and predicted DNA structure. PLoS Genet 2: e26.doi: 10.1371/journal.pgen.0020026.
Chen SS, Raval A, Johnson AJ, Hertlein E, Liu TH, Jin VX, Sherman MH,Liu SJ, Dawson DW, Williams KE, et al. 2009. Epigenetic changesduring disease progression in a murine model of human chroniclymphocytic leukemia. Proc Natl Acad Sci 106: 13433–13438.
Choi CW, Chung YJ, Slape C, Aplan PD. 2008. Impaired differentiation andapoptosis of hematopoietic precursors in a mouse model ofmyelodysplastic syndrome. Haematologica 93: 1394–1397.
Das R, Dimitrova N, Xuan Z, Rollins RA, Haghighi F, Edwards JR, Ju J, BestorTH, Zhang MQ. 2006. Computational prediction of methylation statusin human genomic sequences. Proc Natl Acad Sci 103: 10713–10716.
Estecio MR, Youssef EM, Rahal P, Fukuyama EE, Gois-Filho JF, Maniglia JV,Goloni-Bertollo EM, Issa JP, Tajara EH. 2006. LHX6 is a sensitive methylationmarker in head and neck carcinomas. Oncogene 25: 5018–5026.
Estecio MR, Yan PS, Ibrahim AE, Tellez CS, Shen L, Huang TH, Issa JP. 2007.High-throughput methylation profiling by MCA coupled to CpG islandmicroarray. Genome Res 17: 1529–1536.
Faulkner GJ, Kimura Y, Daub CO, Wani S, Plessy C, Irvine KM, Schroder K,Cloonan N, Steptoe AL, Lassmann T, et al. 2009. The regulatedretrotransposon transcriptome of mammalian cells. Nat Genet 41: 563–571.
Feltus FA, Lee EK, Costello JF, Plass C, Vertino PM. 2003. Predicting aberrantCpG island methylation. Proc Natl Acad Sci 100: 12253–12258.
Feltus FA, Lee EK, Costello JF, Plass C, Vertino PM. 2006. DNA motifsassociated with aberrant CpG island methylation. Genomics 87: 572–579.
Ganapathi M, Srivastava P, Das Sutar SK, Kumar K, Dasgupta D, Pal Singh G,Brahmachari V, Brahmachari SK. 2005. Comparative analysis of chromatinlandscape in regulatory regions of human housekeeping and tissue specificgenes. BMC Bioinformatics 6: 126. doi: 10.1186/1471-2105-6-126.
Gardiner-Garden M, Frommer M. 1987. CpG islands in vertebrate genomes.J Mol Biol 196: 261–282.
Gdula DA, Gerasimova TI, Corces VG. 1996. Genetic and molecular analysisof the gypsy chromatin insulator of Drosophila. Proc Natl Acad Sci 93:9378–9383.
Greally JM. 2002. Short interspersed transposable elements (SINEs) areexcluded from imprinted regions in the human genome. Proc Natl AcadSci 99: 327–332.
Hahn MA, Hahn T, Lee DH, Esworthy RS, Kim BW, Riggs AD, Chu FF, PfeiferGP. 2008. Methylation of polycomb target genes in intestinal cancer ismediated by inflammation. Cancer Res 68: 10280–10289.
Han JS, Szak ST, Boeke JD. 2004. Transcriptional disruption by the L1retrotransposon and implications for mammalian transcriptomes.Nature 429: 268–274.
Hollister JD, Gaut BS. 2009. Epigenetic silencing of transposable elements:A trade-off between reduced transposition and deleterious effects onneighboring gene expression. Genome Res 19: 1419–1428.
Jones PA, Baylin SB. 2002. The fundamental role of epigenetic events incancer. Natl Rev 3: 415–428.
Jurka J, Kohany O, Pavlicek A, Kapitonov VV, Jurka MV. 2004. Duplication,coclustering, and selection of human Alu retrotransposons. Proc NatlAcad Sci 101: 1268–1272.
Karolchik D, Hinrichs AS, Furey TS, Roskin KM, Sugnet CW, Haussler D, KentWJ. 2004. The UCSC Table Browser data retrieval tool. Nucleic Acids Res32: D493–D496.
Kondo E, Furukawa T, Yoshinaga K, Kijima H, Semba S, Yatsuoka T,Yokoyama T, Fukushige S, Horii A. 2000. Not hMSH2 but hMLH1 isfrequently silenced by hypermethylation in endometrial cancer butrarely silenced in pancreatic cancer with microsatellite instability.Int J Oncol 17: 535–541.
Kondo Y, Shen L, Cheng AS, Ahmed S, Boumber Y, Charo C, Yamochi T,Urano T, Furukawa K, Kwabi-Addo B, et al. 2008. Gene silencing incancer by histone H3 lysine 27 trimethylation independent of promoterDNA methylation. Nat Genet 40: 741–750.
Lee TI, Jenner RG, Boyer LA, Guenther MG, Levine SS, Kumar RM, Chevalier B,Johnstone SE, Cole MF, Isono K, et al. 2006. Control of developmentalregulators by Polycomb in human embryonic stem cells. Cell 125: 301–313.
Lin YW, Slape C, Zhang Z, Aplan PD. 2005. NUP98-HOXD13 transgenicmice develop a highly penetrant, severe myelodysplastic syndrome thatprogresses to acute leukemia. Blood 106: 287–295.
Lunyak VV, Prefontaine GG, Nunez E, Cramer T, Ju BG, Ohgi KA, Hutt K, RoyR, Garcıa-Dıaz A, Zhu X, et al. 2007. Developmentally regulatedactivation of a SINE B2 repeat as a domain boundary in organogenesis.Science 317: 248–251.
McCabe MT, Lee EK, Vertino PM. 2009. A multifactorial signature of DNAsequence and polycomb binding predicts aberrant CpG islandmethylation. Cancer Res 69: 282–291.
Mikkelsen TS, Ku M, Jaffe DB, Issac B, Lieberman E, Giannoukos G, Alvarez P,Brockman W, Kim TK, Koche RP, et al. 2007. Genome-wide maps ofchromatin state in pluripotent and lineage-committed cells. Nature448: 553–560.
Mouse Genome Sequencing Consortium. 2002. Initial sequencing andcomparative analysis of the mouse genome. Nature 420: 520–562.
Mummaneni P, Yates P, Simpson J, Rose J, Turker MS. 1998. The primaryfunction of a redundant Sp1 binding site in the mouse aprt gene promoteris to block epigenetic gene inactivation. Nucleic Acids Res 26: 5163–5169.
Ohm JE, McGarvey KM, Yu X, Cheng L, Schuebel KE, Cope L, MohammadHP, Chen W, Daniel VC, Yu W, et al. 2007. A stem cell-like chromatinpattern may predispose tumor suppressor genes to DNAhypermethylation and heritable silencing. Nat Genet 39: 237–242.
Ross DT, Scherf U, Eisen MB, Perou CM, Rees C, Spellman P, Iyer V, Jeffrey SS,Van de Rijn M, Waltham M, et al. 2000. Systematic variation in geneexpression patterns in human cancer cell lines. Nat Genet 24: 227–235.
Schlesinger Y, Straussman R, Keshet I, Farkash S, Hecht M, Zimmerman J,Eden E, Yakhini Z, Ben-Shushan E, Reubinoff BE, et al. 2007. Polycomb-mediated methylation on Lys27 of histone H3 pre-marks genes for denovo methylation in cancer. Nat Genet 39: 232–236.
Shen L, Kondo Y, Ahmed S, Boumber Y, Konishi K, Guo Y, Chen X, VilaythongJN, Issa JP. 2007a. Drug sensitivity prediction by CpG island methylationprofile in the NCI-60 cancer cell line panel. Cancer Res 67: 11335–11343.
Shen L, Kondo Y, Guo Y, Zhang J, Zhang L, Ahmed S, Shu J, Chen X,Waterland RA, Issa JP. 2007b. Genome-wide profiling of DNAmethylation reveals a class of normally methylated CpG islandpromoters. PLoS Genet 3: e181. doi: 10.1371/journal.pgen.0030181.
Simons C, Pheasant M, Makunin IV, Mattick JS. 2006. Transposon-freeregions in mammalian genomes. Genome Res 16: 164–172.
Su AI, Wiltshire T, Batalov S, Lapp H, Ching KA, Block D, Zhang J, Soden R,Hayakawa M, Kreiman G, et al. 2004. A gene atlas of the mouse and humanprotein-encoding transcriptomes. Proc Natl Acad Sci 101: 6062–6067.
Takai D, Jones PA. 2003. The CpG island searcher: A new WWW resource. InSilico Biol 3: 235–240.
Tanay A, O’Donnell AH, Damelin M, Bestor TH. 2007. Hyperconserved CpGdomains underlie Polycomb-binding sites. Proc Natl Acad Sci 104: 5521–5526.
Toyota M, Issa JP. 1999. CpG island methylator phenotypes in aging andcancer. Semin Cancer Biol 9: 349–357.
Wang Z, Willard HF, Mukherjee S, Furey TS. 2006. Evidence of influence ofgenomic DNA sequence on human X chromosome inactivation. PLoSComput Biol 2: e113. doi: 10.1371/journal.pcbi.0020113.
Weber M, Hellmann I, Stadler MB, Ramos L, Paabo S, Rebhan M, Schubeler D.2007. Distribution, silencing potential and evolutionary impact of promoterDNA methylation in the human genome. Nat Genet 39: 457–466.
Widschwendter M, Fiegl H, Egle D, Mueller-Holzner E, Spizzo G, Marth C,Weisenberger DJ, Campan M, Young J, Jacobs I, et al. 2007. Epigeneticstem cell signature in cancer. Nat Genet 39: 157–158.
Yates PA, Burman RW, Mummaneni P, Krussel S, Turker MS. 1999. TandemB1 elements located in a mouse methylation center provide a target forde novo DNA methylation. J Biol Chem 274: 36357–36361.
Yoder JA, Walsh CP, Bestor TH. 1997. Cytosine methylation and the ecologyof intragenomic parasites. Trends Genet 13: 335–340.
Received March 4, 2010; accepted in revised form July 15, 2010.
Estecio et al.
1382 Genome Researchwww.genome.org


