Embed Size (px)
Citation preview
Mycotoxins StudyToxicology, Identification and Control
Printed Edition of the Special Issue Published in Toxins
www.mdpi.com/journal/toxins
Cristina Juan García
Edited by

Mycotoxins Study: Toxicology,Identification and Control

Mycotoxins Study: Toxicology,Identification and Control
Editor
Cristina Juan Garcıa
MDPI • Basel • Beijing • Wuhan • Barcelona • Belgrade • Manchester • Tokyo • Cluj • Tianjin
Editor
Cristina Juan Garcıa
Preventive Medicine and Public
Health, Food Sciencs, Toxicology
and Forensic Medicine
University of Valencia
Valencia
Spain
Editorial Office
MDPI
St. Alban-Anlage 66
4052 Basel, Switzerland
This is a reprint of articles from the Special Issue published online in the open access journal
Toxins (ISSN 2072-6651) (available at: www.mdpi.com/journal/toxins/special issues/Mycotoxins
Control).
For citation purposes, cite each article independently as indicated on the article page online and as
indicated below:
LastName, A.A.; LastName, B.B.; LastName, C.C. Article Title. Journal Name Year, Volume Number,
Page Range.
ISBN 978-3-0365-1416-1 (Hbk)
ISBN 978-3-0365-1415-4 (PDF)
© 2021 by the authors. Articles in this book are Open Access and distributed under the Creative
Commons Attribution (CC BY) license, which allows users to download, copy and build upon
published articles, as long as the author and publisher are properly credited, which ensures maximum
dissemination and a wider impact of our publications.
The book as a whole is distributed by MDPI under the terms and conditions of the Creative Commons
license CC BY-NC-ND.
Contents
About the Editor . . . . . . . . . . . . . . . . . . . . . . . . . . . . . . . . . . . . . . . . . . . . . . vii
Preface to ”Mycotoxins Study: Toxicology, Identification and Control” . . . . . . . . . . . . . . ix
Cristina Juan Garcıa
Mycotoxins: Toxicology, Identification and ControlReprinted from: Toxins 2021, 13, 242, doi:10.3390/toxins13040242 . . . . . . . . . . . . . . . . . . 1
Aicha El Jai, Abdellah Zinedine, Ana Juan-Garcıa, Jordi Manes, Samira Etahiri and Cristina
Juan
Occurrence of Free and Conjugated Mycotoxins in Aromatic and Medicinal Plants and DietaryExposure Assessment in the Moroccan PopulationReprinted from: Toxins 2021, 13, 125, doi:10.3390/toxins13020125 . . . . . . . . . . . . . . . . . . 5
Shabbir Hussain, Muhammad Rafique Asi, Mazhar Iqbal, Nisha Khalid, Syed
Wajih-ul-Hassan and Agustın Arino
Patulin Mycotoxin in Mango and Orange Fruits, Juices, Pulps, and Jams Marketed in PakistanReprinted from: Toxins 2020, 12, 52, doi:10.3390/toxins12010052 . . . . . . . . . . . . . . . . . . . 21
Liliana J. G. Silva, Ana C. Teixeira, Andre M. P. T. Pereira, Angelina Pena and Celeste M.
Lino
Ochratoxin A in Beers Marketed in Portugal: Occurrence and Human Risk AssessmentReprinted from: Toxins 2020, 12, 249, doi:10.3390/toxins12040249 . . . . . . . . . . . . . . . . . . 31
Elena Efremenko, Olga Maslova, Nikolay Stepanov and Anvar Ismailov
Using Cholinesterases and Immobilized Luminescent Photobacteria for the Express-Analysis ofMycotoxins and Estimating the Efficiency of Their Enzymatic HydrolysisReprinted from: Toxins 2021, 13, 34, doi:10.3390/toxins13010034 . . . . . . . . . . . . . . . . . . . 41
Yelko Rodrıguez-Carrasco, Alfonso Narvaez, Luana Izzo, Anna Gaspari, Giulia Graziani and
Alberto Ritieni
Biomonitoring of Enniatin B1 and Its Phase I Metabolites in Human Urine: First Large-ScaleStudyReprinted from: Toxins 2020, 12, 415, doi:10.3390/toxins12060415 . . . . . . . . . . . . . . . . . . 53
Fojan Agahi, Guillermina Font, Cristina Juan and Ana Juan-Garcıa
Individual and Combined Effect of Zearalenone Derivates and Beauvericin Mycotoxins onSH-SY5Y CellsReprinted from: Toxins 2020, 12, 212, doi:10.3390/toxins12040212 . . . . . . . . . . . . . . . . . . 65
Paloma Oliveira da Cruz, Clarisse Jales de Matos, Yuri Mangueira Nascimento, Josean
Fechine Tavares, Evandro Leite de Souza and Hemerson Iury Ferreira Magalhaes
Efficacy of Potentially Probiotic Fruit-Derived Lactobacillus fermentum, L. paracasei and L.plantarum to Remove Aflatoxin M1 In VitroReprinted from: Toxins 2020, 13, 4, doi:10.3390/toxins13010004 . . . . . . . . . . . . . . . . . . . . 81
Atena Abbasi Pirouz, Jinap Selamat, Shahzad Zafar Iqbal and Nik Iskandar Putra Samsudin
Efficient and Simultaneous Chitosan-Mediated Removal of 11 Mycotoxins from Palm KernelCakeReprinted from: Toxins 2020, 12, 115, doi:10.3390/toxins12020115 . . . . . . . . . . . . . . . . . . 91
v
Kai Yang, Ke Li, Lihong Pan, Xiaohu Luo, Jiali Xing, Jing Wang, Li Wang, Ren Wang, Yuheng
Zhai and Zhengxing Chen
Effect of Ozone and Electron Beam Irradiation on Degradation of Zearalenone and OchratoxinAReprinted from: Toxins 2020, 12, 138, doi:10.3390/toxins12020138 . . . . . . . . . . . . . . . . . . 105
Monika Nowak, Przemysław Bernat, Julia Mrozinska and Sylwia Rozalska
Acetamiprid Affects Destruxins Production but Its Accumulation in Metarhizium sp. SporesIncreases Infection Ability of FungiReprinted from: Toxins 2020, 12, 587, doi:10.3390/toxins12090587 . . . . . . . . . . . . . . . . . . 115
Jingjing Wang, Qunfang Weng, Fei Yin and Qiongbo Hu
Interactions of Destruxin A with Silkworms’ Arginine tRNA Synthetase and Lamin-C ProteinsReprinted from: Toxins 2020, 12, 137, doi:10.3390/toxins12020137 . . . . . . . . . . . . . . . . . . 129
Muzi Zhu, Youfei Cen, Wei Ye, Saini Li and Weimin Zhang
Recent Advances on Macrocyclic Trichothecenes, Their Bioactivities and Biosynthetic PathwayReprinted from: Toxins 2020, 12, 417, doi:10.3390/toxins12060417 . . . . . . . . . . . . . . . . . . 139
vi
About the Editor
Cristina Juan Garcıa
Cristina Juan Garcıa PhD is Associate Professor of Food Science at the University of Valencia
(2008). Her active research concerns to develop analytical methods to identify mycotoxins in different
matrices (food, feed, biological matrices, and culture cells) using mass spectrometry equipment
(QqQ, Qtrap, and QTOF). She is author of more than 60 international publications (ORCID:
0000-0002-8923-3219). She has collaborated with research groups of food safety of Prof. Celeste Lino
research group from University of Coimbra in Portugal; Prof. Alberto Ritieni from “Universita degli
Studi di Napoli “Federico II” in Italy; and Prof. Felicia Loghin research groups from University
of Medicine and Pharmacy “Iuliu Hatieganu”of Cluj-Napoca in Rumania. She has been involved
in several research projects supported by the Spanish Ministry of Education and participated as a
member in the European MycoKey project H2020-EU.3.2. –SOCIETAL
vii

Preface to ”Mycotoxins Study: Toxicology,
Identification and Control”
The evaluation of the presence of mycotoxins in different matrices is achieved through
different analytical tools (including quantitative or qualitative determinations). Studies of mycotoxin
isolation, using chromatographyc equipment coupled to spectrometry detectors (QTrap-MS/MS,
MS/MS tandem, QTOF-MS/MS), are the most useful tools to control their presence. All these studies
represent key steps in the establishment of the limits of detection, limits of quantification, points
of identification, accuracy, reproducibility, and repeatability of different procedures. The maximum
permitted or recommended levels for mycotoxins in different matrices are within a wide range
(including the levels tolerated by infants and animals). In addition, decontaminated strategies, as
well as control and evaluation of exposure, are demanded by authorities and food safety systems.
These authorities are not only concerned with the determination of mycotoxin presence but also
with the toxicological effects of mycotoxins, and in vivo or in vitro assays are necessary for a complete
evaluation. In fact, these assays are the basis for the control and prevention of population exposure
to mycotoxins in dietary exposure studies. The most recent surveys focused on regulated mycotoxins
(aflatoxins, fumonisins, trichothecenes, and zearalenones) and emerging toxins, such as enniatins and
beauvericin in adult consumers, while very few studies have monitored mycotoxin levels in infant
products.
This Book of Toxins comprises 11 original contributions and one review. New findings regarding
presence of mycotoxins in aromatic and medicinal plants, mango and orange juice, juices, pulps,
jams, and beer, from Morocco, Pakistan, and Portugal are reported. In these studies, innovative
techniques to study their presence has been developed, including liquid chromatography coupled
with time-of-flight mass spectrometry to analyse mycotoxins and conjugated mycotoxins. Novel
strategies to detect mycotoxin presence and comparisons the characteristics of a rapid quantitative
analysis of different mycotoxins (deoxynivalenol, ochratoxin A, patulin, sterigmatocystin, and
zearalenone) are also presented using acetyl- and butyrylcholinesterases and photobacterial strains
of luminescent cells. Additionally, toxicological effects of zearalenone metabolites and beauvericin
on SH-SY5Y neuronal cells are presented. One important point in the control of mycotoxins
is related to decontaminated strategies, and in this sense the efficacy of potentially probiotic
fruit-derived Lactobacillus isolates in removing aflatoxin M1 (AFM1) is presented. Other mycotoxin
decontaminated techniques included in this book are electron beam irradiation (EBI) and degradation
of zearalenone and ochratoxin A using ozone. Finally, a review that summarizes the newly discovered
macrocyclic trichothecenes and their bioactivities over the last decade is included.
Cristina Juan Garcıa
Editor
ix

toxins
Editorial
Mycotoxins: Toxicology, Identification and Control
Cristina Juan García
���������������
Citation: Juan García, C. Mycotoxins:
Toxicology, Identification and Control.
Toxins 2021, 13, 242. https://doi.org/
10.3390/toxins13040242
Received: 8 March 2021
Accepted: 24 March 2021
Published: 29 March 2021
Publisher’s Note: MDPI stays neutral
with regard to jurisdictional claims in
published maps and institutional affil-
iations.
Copyright: © 2021 by the author.
Licensee MDPI, Basel, Switzerland.
This article is an open access article
distributed under the terms and
conditions of the Creative Commons
Attribution (CC BY) license (https://
creativecommons.org/licenses/by/
4.0/).
Laboratory of Food Chemistry and Toxicology, Faculty of Pharmacy, University of Valencia, Avda. Vicent AndrésEstellés, S/N, 46100 Burjassot-Valencia, Spain; [email protected]
The evaluation of the presence of mycotoxins in different matrices is achieved throughdifferent analytical tools (including quantitative or qualitative determinations). Researchon optimal mycotoxins’ extraction and clean-up methods, combined with chromatographicequipment coupled to mass spectrometric detectors (Triple quadrupole/linear ion trapmass spectrometry, tandem mass spectrometry, quadrupole time-of-flight mass spectrome-try) is of the utmost importance for accurate measurements of mycotoxins in diverse matri-ces. All these techniques and methodologies imply key steps in the establishment of thelimits of detection, limits of quantification, points of identification, accuracy, reproducibil-ity, and/or repeatability of different procedures. The maximum levels or recommendedlevels for mycotoxins in different matrices are comprised within a wide range (includingthe levels tolerated by infants and animals). In addition, their control and evaluation ofexposure are demanded by authorities and food safety systems.
Food and feed authorities are concerned not only with the determination of presenceof mycotoxins but also with the toxicological effects of them, and in vivo or in vitro assaysare necessary for a complete evaluation. In fact, these assays are the basis for the controland prevention of population exposure to mycotoxins in dietary exposure studies. Recentsurveys are focused on regulated mycotoxins (aflatoxins, fumonisins, and trichothecenes)and emerging toxins such as enniatins and beauvericin in adult consumers, while very fewstudies have monitored mycotoxins levels in infant products.
This Special Issue of Toxins comprises 11 original contributions and one review.The issue reports new findings regarding the presence of mycotoxins in aromatic andmedicinal plants, mango and orange juice, juices, pulps, jams and beer, from Morocco,Pakistan, and Portugal. In these studies, innovative techniques to study their presencehave been developed. El Jai et al. [1] used liquid chromatography coupled to time-of-flight mass spectrometry to analyse mycotoxins and conjugated mycotoxins; there were atotal of 14 mycotoxins in 40 samples of aromatic medicinal plants (AMPs) from Morocco.Hussain et al. [2] analyzed patulin in 274 fruit and derived products samples from Pakistan,and Silva et al. [3] evaluated the presence of ochratoxin A in 85 beer samples from Portugal.These results revealed that regular monitoring of cereals or fruits and their products (beer,juices, pulps and jams) during the harvest and processing stages is recommended toenhance the confidence in final consumers.
The Special Issue also presents novel strategies to detect the presence of mycotoxins asreported by Efremenco et al. [4]. They compared the characteristics of a rapid quantitativeanalysis of different mycotoxins (deoxynivalenol, ochratoxin A, patulin, sterigmatocystin,and zearalenone) using acetyl-, butyrylcholinesterases and photobacterial strains of lumi-nescent cells. The best bioindicators in terms of sensitivity and working range (μg/mL)were as follows: Photobacterium sp. 17 cells for analysis of deoxynivalenol (0.8–89) andpatulin (0.2–32); Photobacterium sp. 9.2 cells for analysis of ochratoxin A (0.4–72) andzearalenone (0.2–32); and acetylcholinesterase for analysis of sterigmatocystin (0.12–219).
Related with this highlighted scenario, Rodríguez-Carrasco et al. [5] have evaluatedthe exposure to enniatin B1 by biomonitoring metabolites in urine and identifying asmajor products: hydroxylated metabolites (78% samples) and carbonylated metabolites(66% samples). Also toxicological effects of zearalenone metabolites and beauvericin were
Toxins 2021, 13, 242. https://doi.org/10.3390/toxins13040242 https://www.mdpi.com/journal/toxins
1
Toxins 2021, 13, 242
evaluated by Agahi et al. [6]. They evaluated the metabolism and toxicological effects onSH-SY5Y neuronal cells and IC50 values for the individual and combined treatments of thementioned mycotoxins.
One important point in control of mycotoxins is decontamination strategies, and inthis sense, Oliveria da Cruz et al. (2021) [7] evaluated the efficacy of potentially probioticfruit-derived Lactobacillus isolates to remove aflatoxin M1 (AFM1) from a phosphate buffersolution (PBS; spiked with 0.15 μg/mL AFM1). The authors concluded that L. paracasei 108,L. plantarum 49, and L. fermentum 111 could have potential application to reduce AFM1 tosafe levels in foods and feeds.
Abbasi Pirouz et al. [8] present a simultaneous removal of 11 mycotoxins in palm ker-nel cake (PKC) using chitosan. PKC is used in ruminant feed; its use in poultry, swine, andfish diets is as a valuable source of protein and energy, while chitosan is a polyaminosac-charide and the second most abundant bio-polymers after cellulose. Mycotoxins studiedwere: aflatoxins (AFB1, AFB2, AFG1 and AFG2), ochratoxin A (OTA), zearalenone (ZEN),fumonisins (FB1 and FB2), trichothecenes (deoxynivalenol (DON), HT-2, and T-2 toxin) [8].
Another mycotoxin decontamination technique was tested by Yang et al. [9]. Theyused electron beam irradiation (EBI) and ozone on the degradation of ZEN and OTA. It wasobserved that 2 mL of 50 μg/mL of ZEN and OTA was completely reduced for ZEN andwhen 50 mg/L ozone is used, OTA is reduced at 34%. Acetamiprid was used by Nowaket al. [10] to reduce the production of destruxins produced by Metarhizium sp. Acetamipridat concentrations from 5–50 mg/L did not inhibit the growth of all tested Metarhizium sp.;however, it reduced the level of 19 produced destruxins in direct proportion to the dosageused. Also, Wang et al. [11] studied a destruxin mycotoxin: destruxin A (DA), a cyclodep-sipeptidic mycotoxin with pesticide proprieties involved in regulation of transcription andprotein synthesis. It was suggested that silkworms’ arginine tRNA synthetase (BmArgRS),Lamin-C Proteins (BmLamin-C), and ATP-dependent RNA helicase PRP1 (BmPRP1) werecandidates of DA-binding proteins.
Finally, this Special Issue includes a review by Zhu et al. [12], which summarizes thenewly discovered macrocyclic trichothecenes and their bioactivities over the last decade,as well as identifications of genes tri17 and tri18 involved in the trichothecene biosynthesisand putative biosynthetic pathway [12].
Funding: This research received no external funding.
Acknowledgments: The guest editor of this Special Issue, Cristina Juan García is grateful to theauthors for their contributions and particularly to the referees for their invaluable work. Withouttheir effort this special issue would have not been possible. The valuable contributions, organization,and editorial support of the MDPI management team and staff are greatly appreciated.
References
1. El Jai, A.; Zinedine, A.; Juan-García, A.; Mañes, J.; Etahiri, S.; Juan, C. Occurrence of Free and Conjugated Mycotoxins in Aromaticand Medicinal Plants and Dietary Exposure Assessment in the Moroccan Population. Toxins 2021, 13, 125. [CrossRef]
2. Hussain, S.; Rafique Asi, M.; Iqbal, M.; Khalid, N.; Wajih-ul-Hassan, S.; Ariño, A. Patulin Mycotoxin in Mango and Orange Fruits,Juices, Pulps, and Jams Marketed in Pakistan. Toxins 2020, 12, 52. [CrossRef] [PubMed]
3. Silva, J.G.L.; Teixeira, A.C.; Pereira, A.M.P.T.; Pena, A.; Lino, C.M. Ochratoxin A in Beers Marketed in Portugal: Occurrence andHuman Risk Assessment. Toxins 2020, 12, 249. [CrossRef]
4. Efremenko, E.; Maslova, O.; Stepanov, N.; Ismailov, A. Using Cholinesterases and Immobilized Luminescent Photobacteria forthe Express-Analysis of Mycotoxins and Estimating the Efficiency of Their Enzymatic Hydrolysis. Toxins 2021, 13, 34. [CrossRef]
5. Rodríguez-Carrasco, Y.; Narváez, A.; Izzo, L.; Gaspari, A.; Graziani, G.; Ritieni, A. Biomonitoring of Enniatin B1 and Its Phase IMetabolites in Human Urine: First Large-Scale Study. Toxins 2020, 12, 415. [CrossRef]
6. Agahi, F.; Font, G.; Juan, C.; Juan-García, A. Individual and Combined Effect of Zearalenone Derivates and BeauvericinMycotoxins on SH-SY5Y Cells. Toxins 2020, 12, 212. [CrossRef]
7. Oliveira da Cruz, P.; Jales de Matos, C.; Mangueira Nascimento, Y.; Fechine Tavares, J.; Leite de Souza, E.; Iury Ferreira Magalhães,H. Efficacy of Potentially Probiotic Fruit-Derived Lactobacillus fermentum, L. paracasei and L. plantarum to Remove Aflatoxin M1In Vitro. Toxins 2021, 13, 4. [CrossRef]
8. Abbasi Pirouz, A.; Selamat, J.; Iqbal, S.Z.; Putra Samsudin, N.I. Efficient and Simultaneous Chitosan-Mediated Removal of 11Mycotoxins from Palm Kernel Cake. Toxins 2020, 12, 115. [CrossRef]
2

Toxins 2021, 13, 242
9. Yang, K.; Li, K.; Pan, L.; Luo, X.; Xing, J.; Wang, J.; Wang, L.; Wang, R.; Zhai, Y.; Chen, Z. Effect of Ozone and Electron BeamIrradiation on Degradation of Zearalenone and Ochratoxin A. Toxins 2020, 12, 138. [CrossRef]
10. Nowak, M.; Bernat, P.; Mrozinska, J.; Rózalska, S. Acetamiprid Affects Destruxins Production but Its Accumulation in Metarhiziumsp. Spores Increases Infection Ability of Fungi. Toxins 2020, 12, 587. [CrossRef] [PubMed]
11. Wang, J.; Weng, Q.; Yin, F.; Hu, Q. Interactions of Destruxin A with Silkworms’ Arginine tRNA Synthetase and Lamin-C Proteins.Toxins 2020, 12, 137. [CrossRef] [PubMed]
12. Zhu, M.; Cen, Y.; Ye, W.; Li, S.; Zhang, W. Recent Advances on Macrocyclic Trichothecenes, Their Bioactivities and BiosyntheticPathway. Toxins 2020, 12, 417. [CrossRef] [PubMed]
3

toxins
Article
Occurrence of Free and Conjugated Mycotoxins in Aromaticand Medicinal Plants and Dietary Exposure Assessment in theMoroccan Population
Aicha El Jai 1, Abdellah Zinedine 1,*, Ana Juan-García 2, Jordi Mañes 2, Samira Etahiri 1 and Cristina Juan 2
���������������
Citation: El Jai, A.; Zinedine, A.;
Juan-García, A.; Mañes, J.; Etahiri, S.;
Juan, C. Occurrence of Free and
Conjugated Mycotoxins in Aromatic
and Medicinal Plants and Dietary
Exposure Assessment in the
Moroccan Population. Toxins 2021, 13,
125. https://doi.org/10.3390/
toxins13020125
Received: 8 January 2021
Accepted: 4 February 2021
Published: 8 February 2021
Publisher’s Note: MDPI stays neutral
with regard to jurisdictional claims in
published maps and institutional affil-
iations.
Copyright: © 2021 by the authors.
Licensee MDPI, Basel, Switzerland.
This article is an open access article
distributed under the terms and
conditions of the Creative Commons
Attribution (CC BY) license (https://
creativecommons.org/licenses/by/
4.0/).
1 Laboratory of Marine Biotechnologies and Environment (BIOMARE), Faculty of Sciences, Chouaib DoukkaliUniversity, P.O. Box. 20, El Jadida 24000, Morocco; [email protected] (A.E.J.);[email protected] (S.E.)
2 Laboratory of Food Chemistry and Toxicology, Faculty of Pharmacy, University of Valencia,E-46100 Valencia, Spain; [email protected] (A.J.-G.); [email protected] (J.M.); [email protected] (C.J.)
* Correspondence: [email protected]
Abstract: Aromatic and medicinal plants (AMPs), as herbal material, are subjected to contaminationby various mycotoxin-producing fungi, either free and conjugated. Such a problem is associated withpoor storage practices, and lack of adopting good agricultural practices and good harvesting prac-tices. Nevertheless, AMPs are poorly investigated. The purpose of this study was to investigate theco-occurrence of 15 mycotoxins (four aflatoxins (AFB1, AFB2, AFG1, and AFG2), ochratoxin A (OTA),beauvericin (BEA), four enniatins (ENA, ENA1, ENB, and ENB1), zearalenone (ZEN), alternariol(AOH), tentoxin (TENT), T-2, and HT-2 toxins) in 40 samples of AMPs frequently consumed inMorocco by using liquid chromatography tandem mass spectrometry. Evaluation of conjugatedmycotoxins and their identification using liquid chromatography coupled to time-of-flight mass spec-trometry with ion mass exact was also carried out. Results showed that 90% of the analyzed samplespresented at least one mycotoxin, and 52% presented co-occurrence of them. Mycotoxins detectedwere: AOH (85%), ZEN (27.5%), β-ZEL (22%), AFG1 (17.5%), TENT (17.5%), ENB (10%), AFG2 (7.5%),α-ZEL (5%), ENA1 (2.5%), and HT-2 (2.5%), while the conjugated mycotoxins were ZEN-14-Glc(11%) and ZEN-14-Sulf (9%). The highest observed level was for AOH, with 309 ng/g. Ten samplesexceeded the recommended levels set by the European Pharmacopoeia for AF mycotoxins in plantmaterial (4 ng/g), and three samples exceeded the maximum limits for AFs (10 ng/g) in speciesestablished by the European Commission. Although the co-occurrence of several mycotoxins inAMP samples was observed, the dietary exposure assessment showed that the intake of mycotoxinsthrough the consumption of AMP beverages does not represent a risk for the population.
Keywords: mycotoxins; co-occurrence; Q-TOF-LC/MS; exposure; Morocco
Key Contribution: Aromatic and medicinal plants (AMPs) from Morocco presented levels of myco-toxins including conjugated mycotoxins such as ZEN-14-Glc (11%) and ZEN-14-Sulf (9%).
1. Introduction
Aromatic and medicinal plants (AMPs) are known to contain various compounds thatcan be valorized for several purposes, including preservative, therapeutic, and organolepticproprieties, most of which are precursors for chemo-pharmaceutical semi-synthesis [1,2].AMPs have been widely used to treat and/or prevent diseases and promote health sinceancient times. However, AMPs are frequently exposed to various fungi responsible for thedecrease in market quality, as their growth allows the presence of mycotoxins. Such fungirespond to contamination in soil, or during harvesting, drying, transport, manipulation,or storage [3,4].
Toxins 2021, 13, 125. https://doi.org/10.3390/toxins13020125 https://www.mdpi.com/journal/toxins
5
Toxins 2021, 13, 125
Nowadays, several studies have reported the presence of mycotoxins in herbal plantsand derivative products, considering that this contamination is a global issue, particu-larly in developing countries [5]. In fact, previous investigations reported that, underspecific conditions, toxigenic fungal species from Aspergillus, Penicillium, Fusarium, andAlternaria genus can generate mycotoxins and contaminate herbal medicines. Indeed,these reports described mycotoxin contamination of medicinal herbs and related products,showing that mycotoxins, such as aflatoxins (AFs), ochratoxin A (OTA), zearalenone (ZEN),fumonisins, and trichothecenes are the most commonly present [6]. Another importantpoint is related to the metabolization that can partially suffer from some mycotoxins,such as ZEN and deoxynivalenol (DON), by the fungus producer and by the infectedhost plant. The Phase I and II reactions in the metabolism process aim to eliminate thesecompounds, and this is often accomplished by the attachment of hydrophilic groups.The most indicated enzymatic system in the literature is the UDP-glucosyltransferase(UGT), which is capable of converting ZEN into ZEN-4-glucoside (ZEN-4-Glc) [7–9], or inZearalenone-14-Glucoside (ZEN-14-Glc) and Zearalenone-16-Glucoside (ZEN-16-Glc) [10].Furthermore, α-zearalenol (α-ZEL) and β-zearalenol (β-ZEL) suffer glycosylation as partof the host plant’s metabolism, leading to α–ZEL-14-glucoside (α-ZEL-14-Glc) and β–ZEL-14-glucoside (β-ZEL-14-Glc), respectively [11]. This happens with other mycotoxins, suchas DON, which is converted to DON-3-glucoside (DON-3-Glc) [12,13]. Moreover, duringfungal metabolism, the sulfate form of ZEN, which is partially converted to Zearalenone-4-sulfate (ZEN-4-Sulf), has been found [14,15]. Despite their chemical alteration, there isevidence that metabolites have a similar toxic potential to those of their precursors when itis ingested, as attached functional groups like glycosylic or sulfate residues are likely to beenzymatically cleaved during digestion [14,16]. In most of the analytical approaches pub-lished, the main target of study has been the parental molecules forgetting the detection oftheir metabolites, resulting in an underestimation of the inherent toxicity of a contaminatedsample. Altered metabolites of mycotoxins are also referred to as masked mycotoxins [16],thus, it is important to perform a non-target analysis to study the formation, determination,and significance of masked and other conjugated mycotoxins present in foodstuffs [17].
There is legislation established for mycotoxins in some spices and plants to avoid haz-ardous effects associated with their presence in herbal material [18]. The European Commis-sion has established maximum limits (MLs) for mycotoxins, such as AFB1 (5 ng/g) and AFs(10 ng/g) in various spices (Capsicum spp., Piper spp., Myristica fragrans, Zingiber officinale,and Curcuma longa); however, no MLs have been established for aromatic plants [19]. In theEuropean Pharmacopoeia (2016) [20], MLs have been set for AFs as 2 ng/g for AFB1 inherbal drugs and 4 ng/g for the sum of AFs [21]; while in the US Pharmacopeia (USP),ML of 5 ng/g for AFB1 and 20 ng/g for AFs have been implemented for certain types of rawmedicinal herb materials, as well as their by-products (in powder and/or dry extract) [6].
In Morocco, several reports have evaluated the presence of mycotoxins in spices andherbal materials [22–24]. Recent Moroccan regulations have set MLs for certain mycotoxinsin food products. For example, the ML is set at 5 ng/g for AFB1, 10 ng/g for the sum of AFs,and 15 ng/g for OTA in selected spices, such as Capsicum spp., Piper spp., Myristica fragrans,Zingiber officinale, and Curcuma longa [25]. However, no information is available regardingthe possible co-occurrence of mycotoxins in AMP samples consumed in the country. Thus,the aims of the present study were: (i) to develop a liquid chromatography tandem massspectrometry (LC-MS/MS) method to determinate 15 mycotoxins in AMPs from Morocco;(ii) to develop a liquid chromatography coupled with a time-of-flight mass spectrometry(LC-QTOF-MS) method as the screening tool to obtain not only confirmation, but also thedetection of possible co-occurrence non-target mycotoxins, including masked mycotoxins;and (iii) to apply the developed method in the most consumed Moroccan AMP varietiessupplied from the Moroccan market to investigating their co-occurrence. Data obtainedfrom contamination levels will permit the assessment of the risk of dietary exposure forthe Moroccan population to these mycotoxins through AMP intake.
6
Toxins 2021, 13, 125
2. Results and Discussion
2.1. Validation
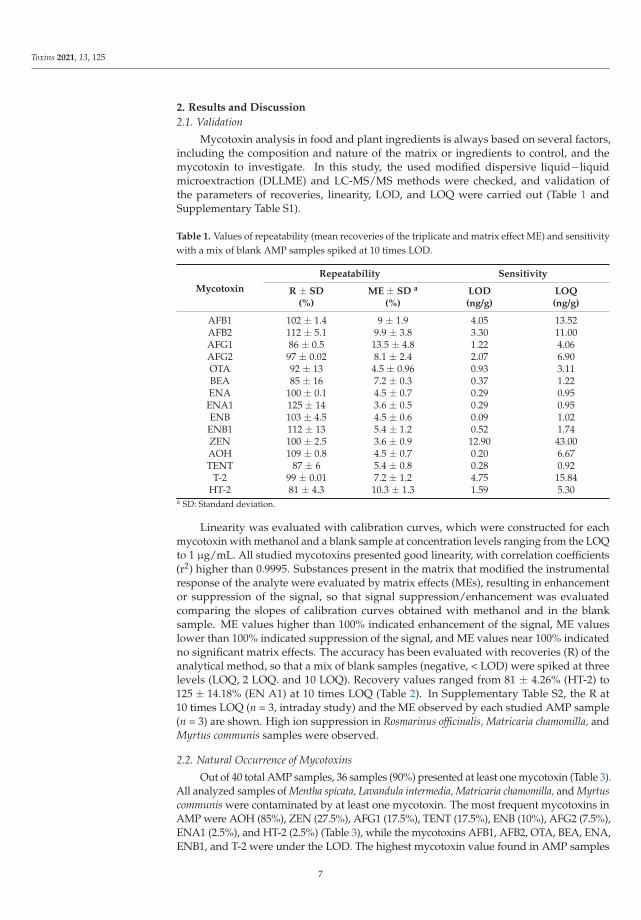
Mycotoxin analysis in food and plant ingredients is always based on several factors,including the composition and nature of the matrix or ingredients to control, and themycotoxin to investigate. In this study, the used modified dispersive liquid−liquidmicroextraction (DLLME) and LC-MS/MS methods were checked, and validation ofthe parameters of recoveries, linearity, LOD, and LOQ were carried out (Table 1 andSupplementary Table S1).
Table 1. Values of repeatability (mean recoveries of the triplicate and matrix effect ME) and sensitivitywith a mix of blank AMP samples spiked at 10 times LOD.
Mycotoxin
Repeatability Sensitivity
R ± SD(%)
ME ± SD a
(%)LOD(ng/g)
LOQ(ng/g)
AFB1 102 ± 1.4 9 ± 1.9 4.05 13.52AFB2 112 ± 5.1 9.9 ± 3.8 3.30 11.00AFG1 86 ± 0.5 13.5 ± 4.8 1.22 4.06AFG2 97 ± 0.02 8.1 ± 2.4 2.07 6.90OTA 92 ± 13 4.5 ± 0.96 0.93 3.11BEA 85 ± 16 7.2 ± 0.3 0.37 1.22ENA 100 ± 0.1 4.5 ± 0.7 0.29 0.95
ENA1 125 ± 14 3.6 ± 0.5 0.29 0.95ENB 103 ± 4.5 4.5 ± 0.6 0.09 1.02
ENB1 112 ± 13 5.4 ± 1.2 0.52 1.74ZEN 100 ± 2.5 3.6 ± 0.9 12.90 43.00AOH 109 ± 0.8 4.5 ± 0.7 0.20 6.67TENT 87 ± 6 5.4 ± 0.8 0.28 0.92
T-2 99 ± 0.01 7.2 ± 1.2 4.75 15.84HT-2 81 ± 4.3 10.3 ± 1.3 1.59 5.30
a SD: Standard deviation.
Linearity was evaluated with calibration curves, which were constructed for eachmycotoxin with methanol and a blank sample at concentration levels ranging from the LOQto 1 μg/mL. All studied mycotoxins presented good linearity, with correlation coefficients(r2) higher than 0.9995. Substances present in the matrix that modified the instrumentalresponse of the analyte were evaluated by matrix effects (MEs), resulting in enhancementor suppression of the signal, so that signal suppression/enhancement was evaluatedcomparing the slopes of calibration curves obtained with methanol and in the blanksample. ME values higher than 100% indicated enhancement of the signal, ME valueslower than 100% indicated suppression of the signal, and ME values near 100% indicatedno significant matrix effects. The accuracy has been evaluated with recoveries (R) of theanalytical method, so that a mix of blank samples (negative, < LOD) were spiked at threelevels (LOQ, 2 LOQ. and 10 LOQ). Recovery values ranged from 81 ± 4.26% (HT-2) to125 ± 14.18% (EN A1) at 10 times LOQ (Table 2). In Supplementary Table S2, the R at10 times LOQ (n = 3, intraday study) and the ME observed by each studied AMP sample(n = 3) are shown. High ion suppression in Rosmarinus officinalis, Matricaria chamomilla, andMyrtus communis samples were observed.
2.2. Natural Occurrence of Mycotoxins
Out of 40 total AMP samples, 36 samples (90%) presented at least one mycotoxin (Table 3).All analyzed samples of Mentha spicata, Lavandula intermedia, Matricaria chamomilla, and Myrtuscommunis were contaminated by at least one mycotoxin. The most frequent mycotoxins inAMP were AOH (85%), ZEN (27.5%), AFG1 (17.5%), TENT (17.5%), ENB (10%), AFG2 (7.5%),ENA1 (2.5%), and HT-2 (2.5%) (Table 3), while the mycotoxins AFB1, AFB2, OTA, BEA, ENA,ENB1, and T-2 were under the LOD. The highest mycotoxin value found in AMP samples
7
Toxins 2021, 13, 125
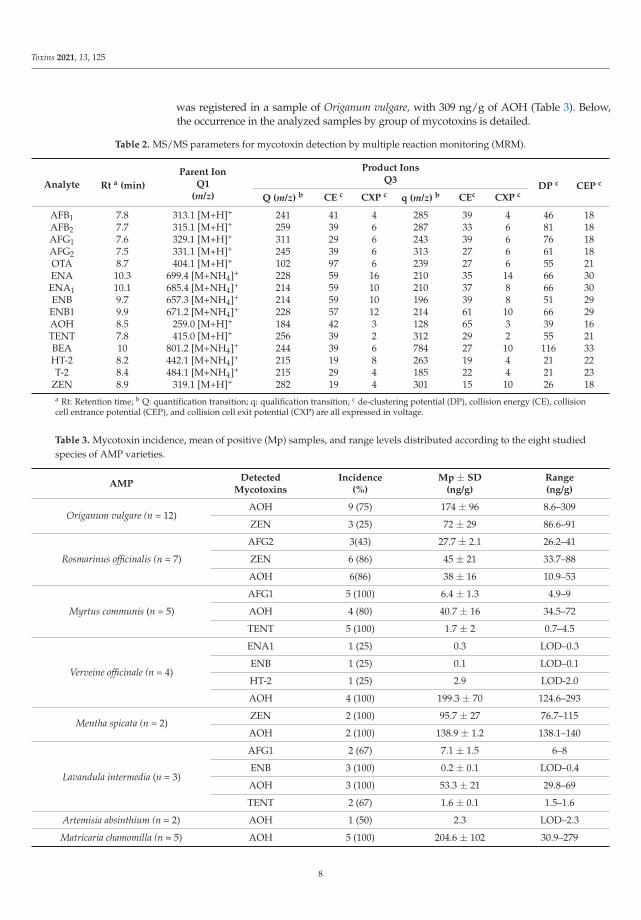
was registered in a sample of Origanum vulgare, with 309 ng/g of AOH (Table 3). Below,the occurrence in the analyzed samples by group of mycotoxins is detailed.
Table 2. MS/MS parameters for mycotoxin detection by multiple reaction monitoring (MRM).
Analyte Rt a (min)
Parent IonQ1
(m/z)
Product IonsQ3
DP c CEP c
Q (m/z) b CE c CXP c q (m/z) b CEc CXP c
AFB1 7.8 313.1 [M+H]+ 241 41 4 285 39 4 46 18AFB2 7.7 315.1 [M+H]+ 259 39 6 287 33 6 81 18AFG1 7.6 329.1 [M+H]+ 311 29 6 243 39 6 76 18AFG2 7.5 331.1 [M+H]+ 245 39 6 313 27 6 61 18OTA 8.7 404.1 [M+H]+ 102 97 6 239 27 6 55 21ENA 10.3 699.4 [M+NH4]+ 228 59 16 210 35 14 66 30ENA1 10.1 685.4 [M+NH4]+ 214 59 10 210 37 8 66 30ENB 9.7 657.3 [M+NH4]+ 214 59 10 196 39 8 51 29
ENB1 9.9 671.2 [M+NH4]+ 228 57 12 214 61 10 66 29AOH 8.5 259.0 [M+H]+ 184 42 3 128 65 3 39 16TENT 7.8 415.0 [M+H]+ 256 39 2 312 29 2 55 21BEA 10 801.2 [M+NH4]+ 244 39 6 784 27 10 116 33HT-2 8.2 442.1 [M+NH4]+ 215 19 8 263 19 4 21 22T-2 8.4 484.1 [M+NH4]+ 215 29 4 185 22 4 21 23
ZEN 8.9 319.1 [M+H]+ 282 19 4 301 15 10 26 18a Rt: Retention time; b Q: quantification transition; q: qualification transition; c de-clustering potential (DP), collision energy (CE), collisioncell entrance potential (CEP), and collision cell exit potential (CXP) are all expressed in voltage.
Table 3. Mycotoxin incidence, mean of positive (Mp) samples, and range levels distributed according to the eight studiedspecies of AMP varieties.
AMPDetected
MycotoxinsIncidence
(%)Mp ± SD
(ng/g)Range(ng/g)
Origanum vulgare (n = 12)AOH 9 (75) 174 ± 96 8.6–309
ZEN 3 (25) 72 ± 29 86.6–91
Rosmarinus officinalis (n = 7)
AFG2 3(43) 27.7 ± 2.1 26.2–41
ZEN 6 (86) 45 ± 21 33.7–88
AOH 6(86) 38 ± 16 10.9–53
Myrtus communis (n = 5)
AFG1 5 (100) 6.4 ± 1.3 4.9–9
AOH 4 (80) 40.7 ± 16 34.5–72
TENT 5 (100) 1.7 ± 2 0.7–4.5
Verveine officinale (n = 4)
ENA1 1 (25) 0.3 LOD–0.3
ENB 1 (25) 0.1 LOD–0.1
HT-2 1 (25) 2.9 LOD-2.0
AOH 4 (100) 199.3 ± 70 124.6–293
Mentha spicata (n = 2)ZEN 2 (100) 95.7 ± 27 76.7–115
AOH 2 (100) 138.9 ± 1.2 138.1–140
Lavandula intermedia (n = 3)
AFG1 2 (67) 7.1 ± 1.5 6–8
ENB 3 (100) 0.2 ± 0.1 LOD–0.4
AOH 3 (100) 53.3 ± 21 29.8–69
TENT 2 (67) 1.6 ± 0.1 1.5–1.6
Artemisia absinthium (n = 2) AOH 1 (50) 2.3 LOD–2.3
Matricaria chamomilla (n = 5) AOH 5 (100) 204.6 ± 102 30.9–279
8
Toxins 2021, 13, 125
Raw tea and herbal infusion materials were reported to contain up to 76 μg/kg offumonisin B1, but no mycotoxins were detected in infusions [25]. In China, the presence ofZEN and its metabolite α-zearalenol (α-ZEL) in 100 widely-consumed foods and medicinalplants was investigated. Authors reported that 12% of these tested samples were contami-nated with ZEN at levels ranging from 5.3 to 295.8 μg/kg [26]. Another study from Spainreported the occurrence of T-2 and HT-2 in seeds of milk thistle (Silybum marianum) at levelsranging from 363 to 453.9 μg/kg and from 826.9 to 943.7 μg/kg, respectively [27]. A studyfrom India reported that dried market samples of stem portions of Tinospora cordifolia,an important medicinal plant, were contaminated with AFB1, AFB2, OTA, patulin, andcitrinine; however, fusarial species and their toxins were not detected in those samples [28].In Latvia, the occurrence of 12 mycotoxins has been recently investigated in 60 herbalteas. Among the dry tea samples, 90% were positive from one to eight mycotoxins. ENB,DON, AFB1, and OTA were the most frequently detected mycotoxins in 55%, 45%, 20%,and 10% of samples, respectively. The authors reported that 32% and 100% of DON andZEN, respectively, present in dry teas were extracted into the infusions ready for its con-sumption [29]. A study from Spain showed the presence of AFB2 (19.1–134.7 μg/L) andAFG2 (2.2 to 13.5 μg/L) in botanical dietary supplement infusion beverages, and ENB intwo samples, although at low levels [30]. More recently, AFs were detected in green teasamples obtained from retail shops and supermarkets in three Moroccan areas; however,the rate transfer of AFs from herbal green tea to infusion was unavailable, as it was notinvestigated [31].
2.2.1. Aflatoxins (AFG1 and AFG2)
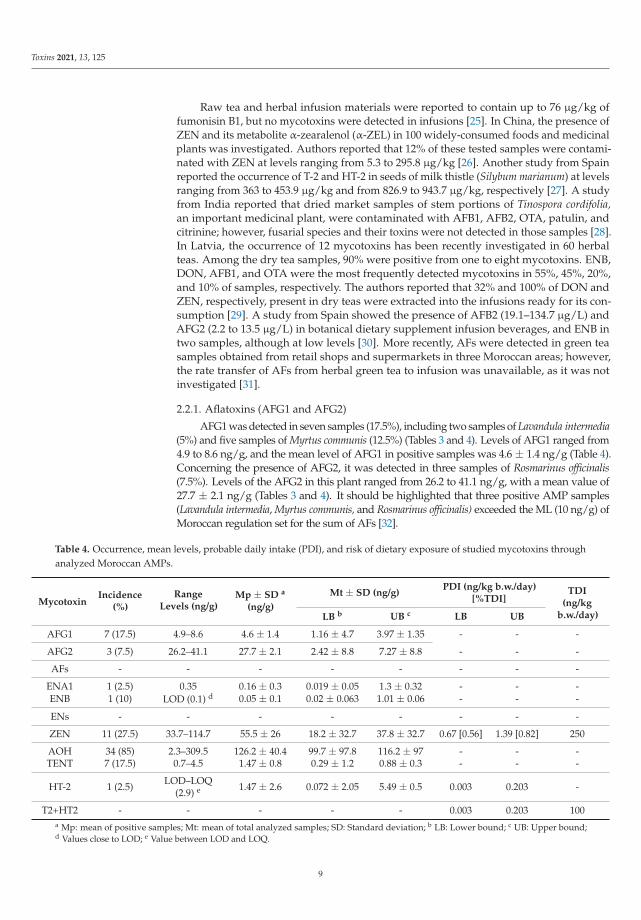
AFG1 was detected in seven samples (17.5%), including two samples of Lavandula intermedia(5%) and five samples of Myrtus communis (12.5%) (Tables 3 and 4). Levels of AFG1 ranged from4.9 to 8.6 ng/g, and the mean level of AFG1 in positive samples was 4.6 ± 1.4 ng/g (Table 4).Concerning the presence of AFG2, it was detected in three samples of Rosmarinus officinalis(7.5%). Levels of the AFG2 in this plant ranged from 26.2 to 41.1 ng/g, with a mean value of27.7 ± 2.1 ng/g (Tables 3 and 4). It should be highlighted that three positive AMP samples(Lavandula intermedia, Myrtus communis, and Rosmarinus officinalis) exceeded the ML (10 ng/g) ofMoroccan regulation set for the sum of AFs [32].
Table 4. Occurrence, mean levels, probable daily intake (PDI), and risk of dietary exposure of studied mycotoxins throughanalyzed Moroccan AMPs.
MycotoxinIncidence
(%)
RangeLevels (ng/g)
Mp ± SD a
(ng/g)
Mt ± SD (ng/g)PDI (ng/kg b.w./day)
[%TDI]TDI
(ng/kgb.w./day)LB b UB c LB UB
AFG1 7 (17.5) 4.9–8.6 4.6 ± 1.4 1.16 ± 4.7 3.97 ± 1.35 - - -
AFG2 3 (7.5) 26.2–41.1 27.7 ± 2.1 2.42 ± 8.8 7.27 ± 8.8 - - -
AFs - - - - - - - -
ENA1 1 (2.5) 0.35 0.16 ± 0.3 0.019 ± 0.05 1.3 ± 0.32 - - -ENB 1 (10) LOD (0.1) d 0.05 ± 0.1 0.02 ± 0.063 1.01 ± 0.06 - - -
ENs - - - - - - - -
ZEN 11 (27.5) 33.7–114.7 55.5 ± 26 18.2 ± 32.7 37.8 ± 32.7 0.67 [0.56] 1.39 [0.82] 250
AOH 34 (85) 2.3–309.5 126.2 ± 40.4 99.7 ± 97.8 116.2 ± 97 - - -TENT 7 (17.5) 0.7–4.5 1.47 ± 0.8 0.29 ± 1.2 0.88 ± 0.3 - - -
HT-2 1 (2.5) LOD–LOQ(2.9) e 1.47 ± 2.6 0.072 ± 2.05 5.49 ± 0.5 0.003 0.203 -
T2+HT2 - - - - - 0.003 0.203 100a Mp: mean of positive samples; Mt: mean of total analyzed samples; SD: Standard deviation; b LB: Lower bound; c UB: Upper bound;d Values close to LOD; e Value between LOD and LOQ.
9
Toxins 2021, 13, 125
2.2.2. Fusarium Toxins (ZEN and HT-2)
Determination of ZEN in AMP samples showed that 27.5% of samples were positivefor this mycotoxin (Table 4) specifically: two samples of Mentha spicata, six samples ofRosmarinus officinalis, and three samples of Origanum vulgare. Levels of ZEN varied between33.7 and 114.7 ng/g, and the mean ZEN level was 55.7 ± 26 ng/g. Recent studies havealso detected ZEN in AMP as Duarte et al., who detected them in 19 herb samples withsmaller ranged values (1.82–19.02 ng/g) than those detected in our analyzed samples [33].Concerning the presence of HT-2, one AMP sample of Verveine officinale (2.5%) containedthis mycotoxin, with levels up to 2.9 ng/g, and a mean level of 1.47 ± 2.6 ng/g.
2.2.3. Emerging Mycotoxins (ENA1 and ENB)
In this survey, only ENA1 and ENB were detected among emerging mycotoxins inAMP samples. Regarding the occurrence of ENA1 in AMP samples, this toxin was detectedonly in one sample (2.5%) of Verveine officinale, with a contamination level up to 0.3 ng/gand a mean level of 0.16 ± 0.3 ng/g. For the presence of ENB in AMP samples, foursamples (10%) were contaminated: one sample of Verveine officinale and three samples ofLavandula intermedia (Table 3). Levels of the ENB were detected in a range of 0.04–0.1 ng/g,and the mean level was 0.05 ± 0.1 ng/g.
2.2.4. Alternaria Toxins (AOH and TENT)
Alternaria mycotoxins gain more and more interest due to their frequent contaminationof food commodities. Indeed, these toxins are often detected in fruits, vegetables, andwines [34]. Besides the estrogenic activity demonstrated in vitro for certain Alternaria toxins,AOH causes DNA damage and cell cycle arrest [35]. In the present survey, 34 samples (85%)presented levels of AOH. Nine of them were Origanum vulgare. Levels of AOH rangedfrom 2.3 to 309 ng/g, and the mean level was 126.2 ± 40.4 ng/g. TENT was detected inseven samples (17.5%) as follows: five samples of Myrtus communis and two samples ofLavandula intermedia. Levels of TENT varied from 0.7 to 4.5 ng/g, and the mean level was1.47 ± 0.85 ng/g.
2.3. Co-Occurrence of Mycotoxins in AMP
The co-presence of mycotoxins in a single sample could be a health concern dueto the exposure of consumers to multiple fungal metabolites, which might exert greatertoxicity than the exposure to a single one. The multi-mycotoxin occurrence in food andfeed could be associated with health and reproductive disorders, lower performance inanimals, and higher medical costs [36]. Concerning the mycotoxins’ co-occurrence in AMPsamples, this happened in 52% of samples. Figure 1 summarizes the data obtained on themulti-contamination of AMP samples, revealing that the ZEN + AOH combination wasthe most commonly present (20%).
Analytical results showed that four mycotoxins co-occurred in samples of Verveine officinale(AOH + HT-2 + ENA1 + ENB) and Lavandula intermedia (AFG1 + ENB + AOH + TENT),three mycotoxins were present in samples of Rosmarinus officinalis (AFG2 + AOH + ZEN),and Myrtus communis (AFG1 + AOH + TENT), while two mycotoxins (AOH + ZEN) co-occurred in Origanum vulgare and Mentha spicata samples (Figure 1). Finally, positive samples ofArtemisia absinthium and Matricaria chamomilla were contaminated individually by AOH.
To the best of our knowledge, limited data have been published on the multi-presenceof mycotoxin in aromatic and medicinal herbs available worldwide. Indeed, a recentinvestigation from Spain was performed to screen the multi-contamination by mycotoxins(AFs, OTA, ZEN, T-2, DON, citrinin, and fumonisins) in 84 samples of aromatic and/ormedicinal herbs, showing that 99% of the samples were contaminated with T-2 (99%), ZEN(98%), AFs (96%), OTA (63%), DON (62%), citrinin (61%), and fumonisins (13%) [37].
10
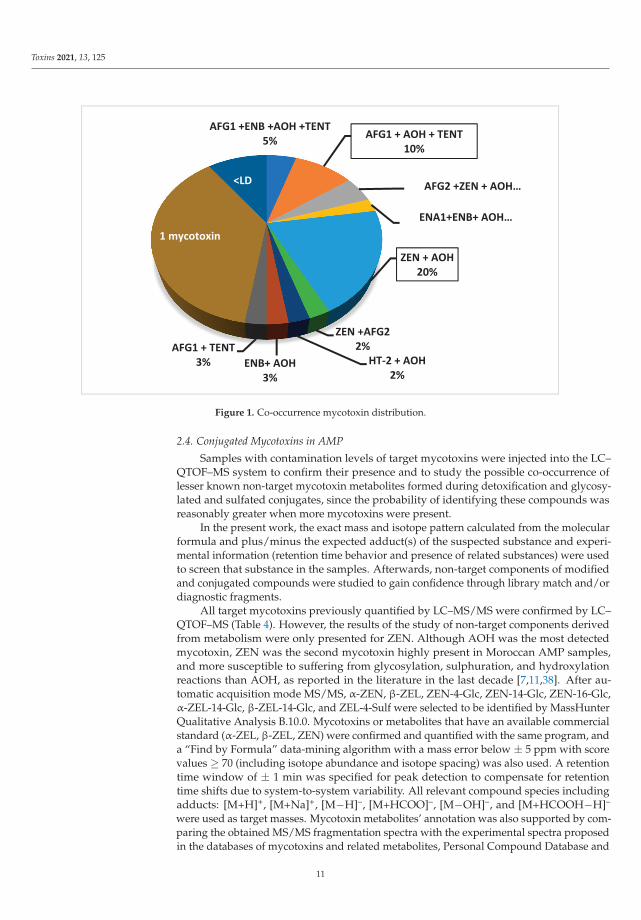
Toxins 2021, 13, 125
Figure 1. Co-occurrence mycotoxin distribution.
2.4. Conjugated Mycotoxins in AMP
Samples with contamination levels of target mycotoxins were injected into the LC–QTOF–MS system to confirm their presence and to study the possible co-occurrence oflesser known non-target mycotoxin metabolites formed during detoxification and glycosy-lated and sulfated conjugates, since the probability of identifying these compounds wasreasonably greater when more mycotoxins were present.
In the present work, the exact mass and isotope pattern calculated from the molecularformula and plus/minus the expected adduct(s) of the suspected substance and experi-mental information (retention time behavior and presence of related substances) were usedto screen that substance in the samples. Afterwards, non-target components of modifiedand conjugated compounds were studied to gain confidence through library match and/ordiagnostic fragments.
All target mycotoxins previously quantified by LC–MS/MS were confirmed by LC–QTOF–MS (Table 4). However, the results of the study of non-target components derivedfrom metabolism were only presented for ZEN. Although AOH was the most detectedmycotoxin, ZEN was the second mycotoxin highly present in Moroccan AMP samples,and more susceptible to suffering from glycosylation, sulphuration, and hydroxylationreactions than AOH, as reported in the literature in the last decade [7,11,38]. After au-tomatic acquisition mode MS/MS, α-ZEN, β-ZEL, ZEN-4-Glc, ZEN-14-Glc, ZEN-16-Glc,α-ZEL-14-Glc, β-ZEL-14-Glc, and ZEL-4-Sulf were selected to be identified by MassHunterQualitative Analysis B.10.0. Mycotoxins or metabolites that have an available commercialstandard (α-ZEL, β-ZEL, ZEN) were confirmed and quantified with the same program, anda “Find by Formula” data-mining algorithm with a mass error below ± 5 ppm with scorevalues ≥ 70 (including isotope abundance and isotope spacing) was also used. A retentiontime window of ± 1 min was specified for peak detection to compensate for retentiontime shifts due to system-to-system variability. All relevant compound species includingadducts: [M+H]+, [M+Na]+, [M−H]–, [M+HCOO]–, [M−OH]–, and [M+HCOOH−H]–
were used as target masses. Mycotoxin metabolites’ annotation was also supported by com-paring the obtained MS/MS fragmentation spectra with the experimental spectra proposedin the databases of mycotoxins and related metabolites, Personal Compound Database and
11
Toxins 2021, 13, 125
Library (PCDL) Manager MassHunter. Metlin Metabolites PCDL MassHunter containsan accurate mass compound database, a collision cross section database, and an MS/MSaccurate mass spectral library for mycotoxins.
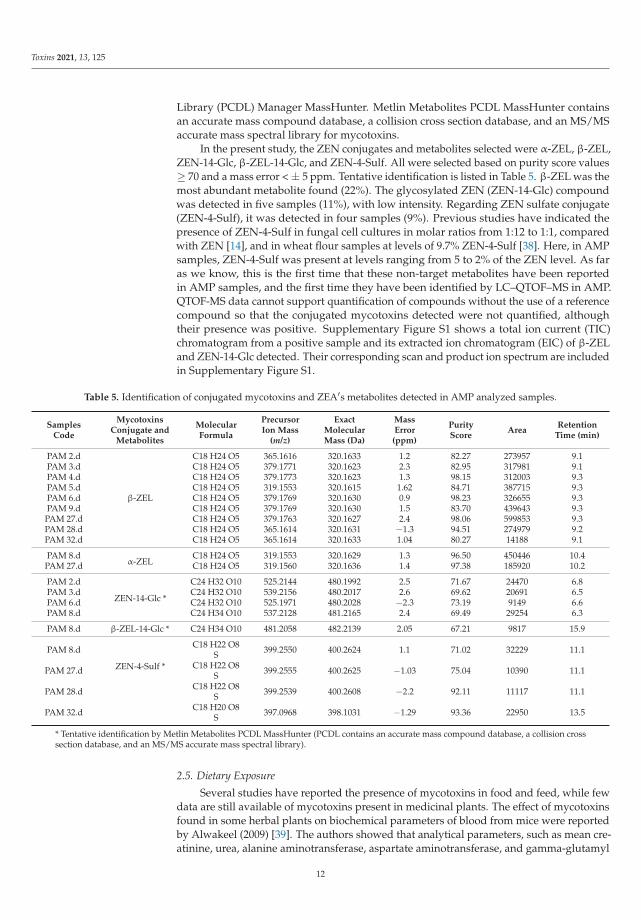
In the present study, the ZEN conjugates and metabolites selected were α-ZEL, β-ZEL,ZEN-14-Glc, β-ZEL-14-Glc, and ZEN-4-Sulf. All were selected based on purity score values≥ 70 and a mass error < ± 5 ppm. Tentative identification is listed in Table 5. β-ZEL was themost abundant metabolite found (22%). The glycosylated ZEN (ZEN-14-Glc) compoundwas detected in five samples (11%), with low intensity. Regarding ZEN sulfate conjugate(ZEN-4-Sulf), it was detected in four samples (9%). Previous studies have indicated thepresence of ZEN-4-Sulf in fungal cell cultures in molar ratios from 1:12 to 1:1, comparedwith ZEN [14], and in wheat flour samples at levels of 9.7% ZEN-4-Sulf [38]. Here, in AMPsamples, ZEN-4-Sulf was present at levels ranging from 5 to 2% of the ZEN level. As faras we know, this is the first time that these non-target metabolites have been reportedin AMP samples, and the first time they have been identified by LC–QTOF–MS in AMP.QTOF-MS data cannot support quantification of compounds without the use of a referencecompound so that the conjugated mycotoxins detected were not quantified, althoughtheir presence was positive. Supplementary Figure S1 shows a total ion current (TIC)chromatogram from a positive sample and its extracted ion chromatogram (EIC) of β-ZELand ZEN-14-Glc detected. Their corresponding scan and product ion spectrum are includedin Supplementary Figure S1.
Table 5. Identification of conjugated mycotoxins and ZEA′s metabolites detected in AMP analyzed samples.
SamplesCode
MycotoxinsConjugate and
Metabolites
MolecularFormula
PrecursorIon Mass
(m/z)
ExactMolecularMass (Da)
MassError(ppm)
PurityScore
AreaRetention
Time (min)
PAM 2.d
β-ZEL
C18 H24 O5 365.1616 320.1633 1.2 82.27 273957 9.1PAM 3.d C18 H24 O5 379.1771 320.1623 2.3 82.95 317981 9.1PAM 4.d C18 H24 O5 379.1773 320.1623 1.3 98.15 312003 9.3PAM 5.d C18 H24 O5 319.1553 320.1615 1.62 84.71 387715 9.3PAM 6.d C18 H24 O5 379.1769 320.1630 0.9 98.23 326655 9.3PAM 9.d C18 H24 O5 379.1769 320.1630 1.5 83.70 439643 9.3
PAM 27.d C18 H24 O5 379.1763 320.1627 2.4 98.06 599853 9.3PAM 28.d C18 H24 O5 365.1614 320.1631 −1.3 94.51 274979 9.2PAM 32.d C18 H24 O5 365.1614 320.1633 1.04 80.27 14188 9.1
PAM 8.dα-ZEL
C18 H24 O5 319.1553 320.1629 1.3 96.50 450446 10.4PAM 27.d C18 H24 O5 319.1560 320.1636 1.4 97.38 185920 10.2
PAM 2.d
ZEN-14-Glc *
C24 H32 O10 525.2144 480.1992 2.5 71.67 24470 6.8PAM 3.d C24 H32 O10 539.2156 480.2017 2.6 69.62 20691 6.5PAM 6.d C24 H32 O10 525.1971 480.2028 −2.3 73.19 9149 6.6PAM 8.d C24 H34 O10 537.2128 481.2165 2.4 69.49 29254 6.3
PAM 8.d β-ZEL-14-Glc * C24 H34 O10 481.2058 482.2139 2.05 67.21 9817 15.9
PAM 8.d
ZEN-4-Sulf *
C18 H22 O8S 399.2550 400.2624 1.1 71.02 32229 11.1
PAM 27.d C18 H22 O8S 399.2555 400.2625 −1.03 75.04 10390 11.1
PAM 28.d C18 H22 O8S 399.2539 400.2608 −2.2 92.11 11117 11.1
PAM 32.d C18 H20 O8S 397.0968 398.1031 −1.29 93.36 22950 13.5
* Tentative identification by Metlin Metabolites PCDL MassHunter (PCDL contains an accurate mass compound database, a collision crosssection database, and an MS/MS accurate mass spectral library).
2.5. Dietary Exposure
Several studies have reported the presence of mycotoxins in food and feed, while fewdata are still available of mycotoxins present in medicinal plants. The effect of mycotoxinsfound in some herbal plants on biochemical parameters of blood from mice were reportedby Alwakeel (2009) [39]. The authors showed that analytical parameters, such as mean cre-atinine, urea, alanine aminotransferase, aspartate aminotransferase, and gamma-glutamyl
12
Toxins 2021, 13, 125
transpeptidase, were higher in the mice group fed or treated with herbal and fungal extractsthan the control group, and the study confirms the implication of the AFs with inductionof nephrotoxicity and hepatoxicity in animals.
No data is currently available on the annual consumption of AMPs in Morocco, andas for estimation, it is assumed that the annual AMP consumption is half of the annual rawtea consumption. According to FAO, the annual consumption per capita of green tea inMorocco averages 1.89 kg/year, so the annual consumption per capita of AMPs in Moroccois supposed to be 0.94 kg/year [40]. The risk of mycotoxins was assessed herein followingboth lower bound (LB) and upper bound (UB) approaches. For the LB approach, meanvalues were obtained by assigning a level of zero to free mycotoxin samples (where nomycotoxins were detected), or at levels below the LOQ (where mycotoxins were detected),whereas, in the UB approach, values equal to the LOD were assigned to samples whereno mycotoxins were detected, and values equal to the LOQ were assigned to samples inwhich mycotoxin levels were below the LOQ.
In this study, mycotoxins AFG1, AFG2, ZEN, HT-2, AOH, TENT, ENA1, and ENB weredetected in positive samples. For the AFs, these substances are confirmed as carcinogenicand classified by IARC in Group 1 (do not have an established TDI), so it is not possibleto determine the threshold levels at which AFs have no effect [41]. It is recommended byJECFA, with regard to the safe level of AFs in foods, that AF levels must be reduced accord-ing to the “As Low As Reasonably Achievable” (ALARA) principle [42]. Furthermore, noTDI values have been established for emerging mycotoxins (BEA and ENs) and Alternariatoxins (AOH and TENT), so a risk assessment is not possible to calculate for these mycotox-ins. For ZEN, the PDIs calculated were 0.67 ± 1.21 ng.kg−1.bw.day−1 (LB approach) and1.39 ± 1.20 ng.kg−1.bw.day−1 (UB approach), and the TDIs (ZEN 250 ng.kg−1.bw.day−1)were 0.56% and 0.82% by the LB and UB approaches, respectively (Table 4).
Risk assessment shows that the intake of mycotoxins through the consumption ofAMP beverages does not represent a risk for the population, except for AFs that areclassified as carcinogenic compounds. Nevertheless, the presence of mycotoxins in AMPscould increase the exposure in large consumers. A focus on plants is relevant to gathermore knowledge on larger spectra of mycotoxin contamination related with AMP handlingconditions, their presence in extracted essential oils, the apparition of any toxic effect, or theeffect on human health.
Another important point is that the conjugated metabolites, as well as their reductiveforms, are not a part of ZEN´s regulations. In vitro analyses of the gastrointestinal digestiveprocess showed no cleavage of ZEN´s conjugates, but in human microbiota fermentation,the conjugates were cleaved by the microbial enzymes [43,44]. Thus, ZEN uptake might beunderestimated, due to the release of absorbable ZEN.
Recently, the EU-CONTAM Panel found it appropriate to set a group TDI for ZENand its modified forms [45]. It must be considered that the estrogenic potency of ZENderivatives differs. Potency factors assigned to these derivatives by the EFSA CONTAMPanel are 0.2 for β-ZEL and 60 for α-ZEL relative to ZEN. Moreover, for sulfate andglucoside conjugates, the same factors as the free forms are proposed. However, to obtainmore data on the occurrence of ZEN metabolites in food and feed, standard compoundsare needed.
3. Conclusions
Mycotoxin analysis showed that 90% of Moroccan AMP samples were positive and52% presented co-occurrence. Besides the high incidence in samples, the concentrationranged from 0.35 ng/g (ENA1) to 309 ng/g (AOH). The most detected were AOH (85%)and ZEN (27.5 %), while ZEN + AOH was the most frequent co-occurrent mycotoxins(20% of positive samples). AFs were present in 25% of samples (Lavandula intermedia,Myrtus communis, and Rosmarinus officinalis), seven of which exceeded the European andMoroccan recommended levels [19,20,32].
13
Toxins 2021, 13, 125
In the present study, a sensitive, rapid, robust, and reliable LC–MS/MS method wasvalidated for the simultaneous determination of 15 target mycotoxins in five differentspecies of AMP: Origanum vulgare, Rosmarinus officinalis, Matricaria chamomilla, Myrtuscommunis, and Verveine officinale. A new LC–QTOF–MS method was applied for thesimultaneous screening of non-target mycotoxins and conjugated mycotoxins in positiveAMP samples. ZEN-14-Glc (11%) and ZEN-14-Sulf (9%) conjugated mycotoxins weredetected in AMP samples. The strategy of combining QTOF–MS and MS/MS detectorswith LC is a powerful approach for the routine monitoring of mycotoxin and conjugatedmycotoxins in contaminated AMPs and other foodstuffs, providing quality and safety tothe food industry and consumers.
4. Material and Methods
4.1. Chemicals and Reagents
Standards of mycotoxins (four aflatoxins (AFB1, AFB2, AFG1 and AFG2), ochratoxinA (OTA), beauvericin (BEA), four enniatins (ENA, ENA1, ENB, and ENB1), zearalenone(ZEN), α-zearalenol (α-ZEL), β-zearalenol (β-ZEL), alternariol (AOH), tentoxin (TENT),T-2, and HT-2 toxins) were purchased from Sigma Aldrich (St. Louis, MO, USA). Individualstock solutions containing a concentration of 1000 μg/mL were prepared in methanol.Working solutions were prepared starting from the appropriate individual stock solutions.All solutions were prepared and stored in the dark at −20 ◦C. Methanol and acetonitrile(≥ 99.9% purity) liquid chromatography tandem mass spectrometry grades (LC-MS/MS)were supplied by VWR international Eurolab (Barcelona, Spain). Formic acid (≥ 98%) wasobtained from Sigma Aldrich (St. Louis, MO, USA ). Ammonium formate (≥ 99.995%)and chloroform (CHCl3) (99%) were obtained from Merck KGaA (Darmstadt, Germany).Ethyl acetate (EtOAc) (HPLC-grade, > 99.5%) was purchased from Alfa Aesar (Karlsruhe,Germany). The water used was purified (≤ 10 MΩ cm−1 resistivity) in the laboratory usinga Milli-Q SP® Reagent water system (Millipore, Bedford, MA, USA).
4.2. Plant Sampling
A total of forty AMP samples were randomly collected in 2019 from local markets (re-tailers and supermarkets) in three different areas of Rabat (Morocco): Témara, Bitat, andKamra. All samples belonged to eight varieties of AMP plants (Origanum vulgare (n = 12),Rosmarinus officinalis (n = 7), Myrtus communis (n = 5), Matricaria chamomilla (n = 5), Verveine of-ficinale (n = 4), Mentha spicata (n = 2), Lavandula Intermedia (n = 3), and Artemisia absinthium(n = 2)). The selection of these plants was based on the criteria that they are among themost traditionally used plants and consumed by the Moroccan population for their aromaticand/or therapeutic properties [46]. The amount of each AMP sample was at least 50 g, packedin bags and stored in a dark and dry place until analysis.
4.3. Mycotoxin Extraction Procedure
The sensitive and accurate analysis of mycotoxins in complicated matrices (e.g., herbs)typically involves challenging sample pretreatment procedures and an efficient detectioninstrument. A modified DLLME method [47] was applied to extract the studied mycotoxins.Firstly, 2 g of AMP samples were boiled with 200 mL of water for 5 min in a glass container.Next, 10 mL of the aqueous solution tea filtrated with Whatman filter paper was placedin a conical polytetrafluoroethyl (PTFE) centrifuge tube (15 mL), and 2 g of NaCl wasadded. Then, 1.9 mL of acetonitrile (dispersion solvent) and 1.24 mL of ethyl acetate(extraction solvent) was added and vortexed for 1 min. It was centrifuged for 5 min at4000 rev/min at 5 ◦C, using Eppendorf centrifuge 5810R (Eppendorf, Hamburg, Germany),and a cloudy solution of the three phases was formed. The organic phase at the top (Tube 1)was recovered and placed in a second PTFE centrifuge tube (15 mL, Tube 2), while theremaining residue (Tube 1) was saved for a second extraction with 3.2 mL of a mixture ofmethanol and chloroform (60:40, v/v). Then, Tube 1 was vortexed for 1 min, and, with a
14
Toxins 2021, 13, 125
centrifugation at 4000 rev/min for 5 min at 5 ◦C, the separated organic phase was recoveredand added to the collected organic phase in Tube 2.
Both separated organic phases in PTFE centrifuge Tube 2 were evaporated to drynessunder a nitrogen stream using a TurboVap LV evaporator (Zymark, Hopkinton, MA).The dried residue was reconstituted with 1 mL of methanol and water (70:30, v/v), andfiltered through a 13 mm/0.22 μm nylon filter (Membrane Solutions, Plano, TX, USA).Next, 20 μL of the filtrate was injected into the LC-MS/MS analysis.
4.4. Analysis of Mycotoxins by LC-MS/MS
Analysis of the mycotoxins was performed using an LC Agilent 1200 with a binarypump and an automatic injector, and coupled to a 3200 QTRAP®ABSCIEX (AppliedBiosystems, Foster City, CA, USA) equipped with a Turbo-VTM source (ESI) interface.The chromatographic separation of the analytes was conducted at 25 ◦C with a reversephase analytical column Gemini® NX-C18 (3 μm, 150 × 2 mm ID) and a guard column C18(4 × 2 mm, ID; 3 μm). The mobile phase was a time programmed gradient using water(0.1% formic acid and 5 mM of ammonium formate) as phase A, and methanol (0.1% formicacid and 5 mM of ammonium formate) as phase B [48]. The following gradient was used:equilibration for 2 min at 90% A, 80–20% A in 3 min, 20% A for 1 min, 20–10% A in 2 min,10% A for 6 min, 10–0% A in 3 min, 100% B for 1 min, 100–50% B in 3 min, return to initialconditions in 2 min and maintain during 2 min. The flow rate was 0.25 mL/min in all steps.The total run time was 21 min.
Regarding mycotoxin analysis, the QTRAP System was used as the triple quadrupolemass spectrometry detector (MS/MS). The Turbo-V™ source was used in a positive mode toanalyze the 15 mycotoxins with the following settings for source/gas parameters: VacuumGauge (10 × 10−5 Torr) 3.1, curtain gas (CUR) 20, ion spray voltage (IS) 5500, sourcetemperature (TEM) 450 ◦C, and ion source gas 1 (GS1) and ion source gas 2 (GS2) 50.The fragments monitored (retention time, quantification, ion, and confirmation ion) andspectrometric parameters (de-clustering potential, collision energy, and cell exit potential)used were those performed previously (Juan et al. 2019), and are shown in Table 1.
4.5. Method Validation
Validation of the LC-MS/MS method was performed for linearity, repeatability (in-traday and inter-day precision), and sensitivity, following the EU Commission Decision2002/657/EC (EC, 2002). Matrix-matched calibration curves were constructed at concen-tration levels between the LOQ to 1 μg/mL. The matrix effect (ME) was assessed for eachanalyte by comparing the slope of the standard calibration curve (standard) with that ofthe matrix-matched calibration curve (matrix) for the same concentration levels. The limitof detection (LOD) and limit of quantification (LOQ) were estimated for a signal-to-noiseratio (S/N) ≥ 3 and ≥ 10, respectively, from chromatograms of samples spiked at thelowest level validated. LOD and LOQ values were established as a mean of the LODand LOQ for each matrix and a mix with all studied matrixes, in this way taking intoaccount the possible heterogeneity of the samples. Accuracy of the studied mycotoxinextraction from AMP samples was determined by a mix blank samples fortification pro-cedure. The mix blank was prepared using each AMP sample studied (Origanum vulgare,Rosmarinus officinalis, Matricaria chamomilla Myrtus communis, Verveine officinale, Menthaspicata, Lavandula Intermedia, and Artemisia absinthium), which initially tested negative,and was fortified before the extraction procedure with three different mycotoxin levels.The concentrations of studied mycotoxins for reproducibility and repeatability studies inAMP samples were at LOQ, 2 LOQ, and 10 LOQ. Three replicates were prepared for eachspiking level. Intra-day precision (repeatability) and inter-day precision (reproducibility)of the method were carried out by spiking the mix blank at the three levels previouslyindicated. Method precision was estimated by calculating the relative standard deviation(RSDR) using the results obtained during intra-day and inter-day replicate analysis (n = 9).
15
Toxins 2021, 13, 125
4.6. Analysis of Mycotoxin Metabolites by LC-QTOF-MS
The QTOF LC/MS analysis was carried out using an Agilent Technologies 1200 InfinitySeries LC coupled with an Agilent Technologies 6540 UHD Accurate-Mass Q-TOF-LC/MS(Agilent Technologies, Santa Clara, CA, USA), equipped with an electrospray ionizationAgilent Technologies Dual Jet Stream ion source (Dual AJS ESI). Chromatographic sepa-ration was achieved on a Gemini® NX-C18 (3 μm, 150 × 2 mm ID) and a guard columnC18 (4 × 2 mm, ID; 3μm). The mobile phase consisted of 0.1% formic acid in water milli-Q(solvent A) and methanol (solvent B) with a 25 min gradient. The mobile phase gradient(10–95% B) steps were applied as follows: 0–2 min, 10% B; 2–5 min, 70% B; 5–7 min, 80% B;7–8 min, 90% B; maintained 4 min at 90% B; 12–16 min, 95% B; 16–18 min, 50% B; 18–22 min,and 10% B. The injection volume was 10 μL.
A mass spectrometry analysis was used with the following QTOF-MS conditions:drying gas flow (N2), 8.0 L min−1; nebulizer pressure, 45 psi; gas drying temperature,370 ◦C; capillary voltage, 3500 V; fragmentor voltage, 130 V; skimmer voltage, 65 V; and oc-topole RF peak, 750 V. The Agilent Dual Jet Stream electrospray ionization (Dual AJS ESI)interface was used in the positive and negative ionization modes, and ions were acquiredin the range of 100–1000 m/z for MS scans, and 50–1000 m/z for auto MS/MS scans, at ascan rate of five spectra/s for MS and three spectra/s for MS/MS, respectively. Automaticacquisition mode MS/MS was carried out using the following collision energy values:m/z, 20 eV; m/z, 30 eV and 40 eV. Internal mass correction was enabled by using tworeference masses at 121.0509 and 922.0098 m/z. Instrument control and data acquisitionwere performed using Agilent MassHunter Workstation software B.08.00. All of the MSand MS/MS data of the validation standards were integrated by MassHunter QualitativeAnalysis B.10.0 and MassHunter Quantitative Analysis B.10.0 (Agilent Technologies).
4.7. Risk of Dietary Exposure
Risk of dietary exposure calculation/evaluation, in the present study, consisted ofmeasuring the presence of mycotoxins in analyzed samples. It also consisted of characteriz-ing the distribution of one or more mycotoxin for estimating population exposure upon theconsumption of average or extremely high amounts [49]. The probable daily intake (PDI,ng.kg−1.bw.day−1) of each mycotoxin through AMP consumption was estimated based onthe concentration of each mycotoxin detected in the samples, the daily consumption rate ofAMPs, and the average body weight of an individual consumer (70 kg). It is important tohighlight that this is for genotoxic substances and substances classified as carcinogenic bythe International Agency for Research on Cancer (IARC) [41] (such as AFs or OTA). EFSA,through a CONTAM Panel, considered the possibility of applying a margin of exposure(MOE) approach, with a benchmark dose lower confidence limit, for a benchmark responseof 10% (BMDL10) [50]. Nonetheless, recent studies from Portugal [26] have conductedthis calculation for AFs by using the TDI of 0.2 ng/kg b.w./day already proposed [51].To characterize the risk for each mycotoxin, the PDIs were compared with the TDIs ofmycotoxins established by JECFA (2001) [52] and SCF (2002) [53]. The percentage of tol-erable daily intake (%TDI) from the consumption of green tea was calculated as follows:%TDI = PDI/TDI × 100.
Supplementary Materials: The following are available online at https://www.mdpi.com/2072-6651/13/2/125/s1, Figure S1: Total ion current (TIC) chromatogram from a positive sample and itsextracted ion chromatogram (EIC) of β-ZEL and ZEN-14-Glc (a), scan and product ion spectrum ofβ-ZEL (b), and scan and product ion spectrum of ZEN-14-Glc (c)., Table S1: Recoveries of intraday(n = 3) study of spiked AMP samples and matrix.
Author Contributions: Data curation, A.E.J.; Formal analysis, C.J.; Funding acquisition, A.Z.;Investigation, A.J.-G. and C.J.; Methodology, C.J.; Project administration, A.Z. and J.M.; Resources,A.E.J. and A.Z.; Supervision, A.Z., A.J.-G., J.M., S.E., and C.J.; Visualization, C.J.; Writing—originaldraft, A.E.J. and C.J.; Writing—review & editing, A.E.J., A.J.-G., and C.J. All authors have read andagreed to the published version of the manuscript.
16
Toxins 2021, 13, 125
Funding: This research was funded by Spanish Ministry of Science and Innovation PID2019-108070RB-I00ALI and the Generalitat Valenciana GVPROMETEO2018-126, Generalitat ValencianaGV 2020/020 and PHC Maghreb project (09MAG20). A. Zinedine would like to thank the CNRST ofMorocco and the Moroccan Ministry of Higher Education and Scientific Research (MENESRSFC) fortheir support.
Institutional Review Board Statement: Not applicable.
Informed Consent Statement: Not applicable.
Conflicts of Interest: The authors declare that there are no conflicts of interest regarding the publica-tion of this paper.
Abbreviations
AFB1 aflatoxin B1AFB2 aflatoxin B2AFG1 aflatoxin G1AFG2 aflatoxin G2AFs aflatoxinsAMP aromatic and medicinal plantsAOH alternariolBEA beauvericinDON-3-G DON-3-glucosideDON deoxynivalenolPDI probable daily intakeENA enniatin AENA1 enniatin A1ENB enniatin BENB1 enniatin B1ENs enniatinsOTA ochratoxin ATENT tentoxinTDI tolerable daily intakeZEN zearalenoneα-ZEL α-zearalenolβ-ZEL β-zearalenolZEN-4-Glc zearalenone-4-glucosideZEN-4-Sulf zearalenone-4-sulfateα-ZEL-14-Glc α–ZEL-14-glucosideβ-ZEL-14-Glc β–ZEL-14-glucosideZEN-16-Glc zearalenone-16-glucoside
References
1. Tripathy, V.; Basak, B.; Varghese, T.S.; Saha, A. Residues and contaminants in medicinal herbs—A review. Phytochem. Lett. 2015,14, 67–78. [CrossRef]
2. WHO. Promotion and Development of Training and Research in Traditional Medicine; World Health Organization: Geneva, Switzerland,1977; pp. 30–49.
3. Calixto, J.B. Efficacy, safety, quality control, marketing and regulatory guidelines for herbal medicines (phytotherapeutic agents).Braz. J. Med Biol. Res. 2000, 33, 179–189. [CrossRef] [PubMed]
4. Rizzo, I.; Vedoya, G.; Maurutto, S.; Haidukowski, M.; Varsavsky, E. Assessment of toxigenic fungi on Argentinean medicinalherbs. Microbiol. Res. 2004, 159, 113–120. [CrossRef] [PubMed]
5. Ałtyn, I.; Twaruzek, M. Mycotoxin Contamination Concerns of Herbs and Medicinal Plants. Toxins 2020, 12, 182. [CrossRef][PubMed]
6. Zhang, L.; Dou, X.-W.; Zhang, C.; Logrieco, A.F.; Yang, M. A Review of Current Methods for Analysis of Mycotoxins in HerbalMedicines. Toxins 2018, 10, 65. [CrossRef] [PubMed]
7. Borzekowski, A.; Drewitz, T.; Keller, J.; Pfeifer, D.; Kunte, H.J.; Koch, M.; Rohn, S.; Maul, R. Biosynthesis and Characterization ofZearalenone-14-Sulfate, Zearalenone-14-Glucoside and Zearalenone-16-Glucoside Using Common Fungal Strains. Toxins 2018,10, 104. [CrossRef]
8. Engelhardt, G.; Ruhland, M.; Wallnofer, P.R. Metabolism of mycotoxins in plants. Adv. Food Sci. 1999, 21, 71–78.
17
Toxins 2021, 13, 125
9. Karlovsky, P. Biological detoxification of fungal toxins and its use in plant breeding, feed and food production. Nat. Toxins 1999, 7,1–23. [CrossRef]
10. Engelhardt, G.; Zill, G.; Wohner, B.; Wallnfer, P.R. Transformation of the Fusarium mycotoxin zearalenone in maize cell suspensioncultures. Naturwissenschaften 1988, 75, 309–310. [CrossRef]
11. Berthiller, F.; Werner, U.; Sulyok, M.; Krska, R.; Hauser, M.-T.; Schuhmacher, R. Liquid chromatography coupled to tandem massspectrometry (LC-MS/MS) determination of phase II metabolites of the mycotoxin zearalenone in the model plant Arabidopsisthaliana. Food Addit. Contam. 2006, 23, 1194–1200. [CrossRef] [PubMed]
12. Sewald, N.; Von Gleissenthall, J.L.; Schuster, M.; Müller, G.; Aplin, R.T. Structure elucidation of a plant metabolite of4-desoxynivalenol. Tetrahedron Asymmetry 1992, 3, 953–960. [CrossRef]
13. Berthiller, F.; Dall’Asta, C.; Schuhmacher, R.; Lemmens, M.; Adam, G.; Krska, R. Masked mycotoxins: Determination of adeoxynivalenol glucoside in artificially and naturally contaminated wheat by liquid chromatography-tandem mass spectrometry.J. Agric. Food Chem. 2005, 53, 3421–3425. [CrossRef]
14. Plasencia, J.; Mirocha, C.J. Isolation and characterization of zearalenone sulfate produced by Fusarium spp. Appl. Environ.Microbiol. 1991, 57, 146–150. [CrossRef] [PubMed]
15. Böswald, C.; Engelhardt, G.; Vogel, H.; Wallnöfer, P.R. Metabolism of the Fusarium mycotoxins zearalenone and deoxynivalenolby yeast strains of technological relevance. Nat. Toxins 1995, 3, 138–144. [CrossRef]
16. Gareis, M.; Bauer, J.; Thiem, J.; Plank, G.; Grabley, S.; Gedek, B. Cleavage of Zearalenone-Glycoside, a “Masked” Mycotoxin,during Digestion in Swine. J. Vet. Med. Ser. B 1990, 37, 236–240. [CrossRef]
17. Berthiller, F.; Hametner, C.; Krenn, P.; Schweiger, W.; Ludwig, R.; Adam, G.; Krska, R.; Schuhmacher, R. Preparation and character-ization of the conjugated Fusarium mycotoxins zearalenone-4-O-β-D-glucopyranoside, α-zearalenol-4-O-β-D-glucopyranosideand β-zearalenol-4-O-β-D-glucopyranoside by MS/MS and two-dimensional NMR. Food Addit. Contam. 2009, 26, 207–213.[CrossRef] [PubMed]
18. Steinhoff, B. Review: Quality of herbal medicinal products: State of the art of purity assessment. Phytomedicine 2019, 60, 153003.[CrossRef] [PubMed]
19. European Commission. Commission Directive 2006/1881/EC of 19 December 2006, setting maximum levels for certain contami-nants in food stuffs. Off. J. Eur. Union 2006, L364, 5–24.
20. European Pharmacopoeia. Determination of Aflatoxin B1 in Herbal drugs. In European Pharmacopoeia 9th Edition 2.8.18; Councilof Europe: Strasbourg, France, 2016; Volume 1, p. 289.
21. European Pharmacopoeia. Council of Europe European Directorate for the Quality of Medicines (EDQM), 7th ed.; European Pharma-copoeia: Strasbourg, France, 2011.
22. Zinedine, A.; Brera, C.; Elakhdari, S.; Catano, C.; Debegnach, F.; Angelini, S.; De Santis, B.; Faid, M.; Benlemlih, M.;Minardi, V.; et al. Natural occurrence of mycotoxins in cereals and spices commercialized in Morocco. Food Control 2006, 17,868–874. [CrossRef]
23. Zinedine, A.; Mañes, J. Occurrence and legislation of mycotoxins in food and feed from Morocco. Food Control 2009, 20, 334–344.[CrossRef]
24. Zinedine, A. Ochratoxin A in Moroccan Foods: Occurrence and Legislation. Toxins 2010, 2, 1121–1133. [CrossRef]25. Monbaliu, S.; Wu, A.; Zhang, D.; Van Peteghem, C.; De Saeger, S. Multimycotoxin UPLC−MS/MS for Tea, Herbal Infusions and
the Derived Drinkable Products. J. Agric. Food Chem. 2010, 58, 12664–12671. [CrossRef] [PubMed]26. Kong, W.-J.; Shen, H.-H.; Zhang, X.-F.; Yang, X.-L.; Qiu, F.; Ou-Yang, Z.; Yang, M.-H. Analysis of zearalenone and α -zearalenol in
100 foods and medicinal plants determined by HPLC-FLD and positive confirmation by LC-MS-MS. J. Sci. Food Agric. 2013, 93,1584–1590. [CrossRef] [PubMed]
27. Arroyo-Manzanares, N.; García-Campaña, A.M.; Gámiz-Gracia, L. Multiclass mycotoxin analysis in Silybum marianum by ultrahigh performance liquid chromatography–tandem mass spectrometry using a procedure based on QuEChERS and dispersiveliquid–liquid microextraction. J. Chromatogr. A 2013, 1282, 11–19. [CrossRef] [PubMed]
28. Sharma, S.K.; Sumbali, G.; Sharma, V. Mycobial contamination and mycotoxinogenesis of Tinospora cordifolia: An importantmedicinal plant of India. Int. J. Agric. Res. Innov. Technol. 2014, 3, 16–21. [CrossRef]
29. Reinholds, I.; Bogdanova, E.; Pugajeva, I.; Bartkevics, V. Mycotoxins in herbal teas marketed in Latvia and dietary exposureassessment. Food Addit. Contam. Part B 2019, 12, 199–208. [CrossRef]
30. Pallarés, N.; Tolosa, J.; Mañes, J.; Ferrer, E. Occurrence of Mycotoxins in Botanical Dietary Supplement Infusion Beverages. J. Nat.Prod. 2019, 82, 403–406. [CrossRef]
31. Mannani, N.; Tabarani, A.; Abdennebi, E.H.; Zinedine, A. Assessment of aflatoxin levels in herbal green tea available on theMoroccan market. Food Control 2020, 108, 106882. [CrossRef]
32. Bulletin Officiel 6514/2016. Arrêté Conjoint du Ministre de l’Agriculture et de la Pêche Maritime et du Ministre de la Santé n◦1643-16 du30 Mai 2016 Fixant les Limites Maximales de Contaminants Autorisées dans ou sur les Produits Primaires et les Produits Alimentaires;Ministre de l’Agriculture et de la Pêche Maritime: Paris, France, 2016; p. 1681.
33. Duarte, S.; Salvador, N.; Machado, F.; Costa, E.; Almeida, A.; Silva, L.J.; Pereira, A.M.; Lino, C.; Pena, A. Mycotoxins in teas andmedicinal plants destined to prepare infusions in Portugal. Food Control 2020, 115, 107290. [CrossRef]
34. Fraeyman, S.; Croubels, S.; Devreese, M.; Antonissen, G. Emerging Fusarium and Alternaria Mycotoxins: Occurrence, Toxicityand Toxicokinetics. Toxins 2017, 9, 228. [CrossRef] [PubMed]
18
Toxins 2021, 13, 125
35. Schoevers, E.J.; Santos, R.R.; Roelen, B.A.J. Alternariol disturbs oocyte maturation and preimplantation development. MycotoxinRes. 2019, 36, 93–101. [CrossRef]
36. Abbas, M. Co-Occurrence of Mycotoxins and Its Detoxification Strategies. In Mycotoxins—Impact and Management Strategies;Njobeh, P.B., Stepman, F., Eds.; IntechOpen: London, UK, 2019. [CrossRef]
37. Santos, L.; Marín, S.; Sanchis, V.; Ramos, A.J. Screening of mycotoxin multicontamination in medicinal and aromatic herbssampled in Spain. J. Sci. Food Agric. 2009, 89, 1802–1807. [CrossRef]
38. Vendl, O.; Crews, C.; MacDonald, S.; Krska, R.; Berthiller, F. Occurrence of free and conjugated Fusarium mycotoxins incereal-based food. Food Addit. Contam. 2010, 27, 1148–1152. [CrossRef]
39. Alwakeel, S.S. The Effect of Mycotoxins found in some Herbal Plants on Biochemical Parameters in Blood of Female Albino Mice.Pak. J. Biol. Sci. 2009, 12, 637–642. [CrossRef] [PubMed]
40. FAO; Committee on Commodity Problems; Intergovernmental Group on Tea. Twenty-Third Session; CCP:TE 18/CRS1; FAO:Hangzhou, China, 2018.
41. IARC (International Agency for Research on Cancer). IARC Monograph on the Evaluation of Carcinogenic Risk to Humans. SomeNaturally Occurring Substances: Food Items and Constituent Heterocyclic Aromatic Amines and Mycotoxins; IARC: Lyon, France, 1993.
42. JECFA (Joint FAO/WHO Expert Committee on Food Additives). Safety Evaluation of Certain Mycotoxins in Food; Series N◦47;JECFA: Geneva, Switzerland, 2011.
43. Kovalsky Paris, M.P.; Schweiger, W.; Hametner, C.; Stückler, R.; Muehlbauer, G.J.; Varga, E.; Krska, R.; Berthiller, F.; Adam, G.Zearalenone-16-O-glucoside: A New Masked Mycotoxin. J. Agric. Food Chem. 2014, 62, 1181–1189. [CrossRef] [PubMed]
44. Dall’Erta, A.; Cirlini, M.; Dall’Asta, M.; Del Rio, D.; Galaverna, G.; Dall’Asta, C. Masked mycotoxins are efficiently hydrolyzed byhuman colonic microbiota releasing their aglycones. Chem. Res. Toxicol. 2013, 26, 305–312. [CrossRef]
45. EFSA. Appropriateness to set a group health-based guidance value for zearalenone and its modified forms. EFSA J. 2016, 14, 4425.46. Tahraoui, A.; El-Hilaly, J.; Israili, Z.H.; Lyoussi, B. Ethnopharmacological survey of plants used in the traditional treatment of
hypertension and diabetes in south-eastern Morocco (Errachidia province). J. Ethnopharm. 2007, 110, 105–117. [CrossRef]47. Pallarés, N.; Font, G.; Mañes, J.; Ferrer, E. Multimycotoxin LC–MS/MS Analysis in Tea Beverages after Dispersive Liquid–Liquid
Microextraction (DLLME). J. Agric. Food Chem. 2017, 65, 10282–10289. [CrossRef] [PubMed]48. Juan, C.; Covarelli, L.; Beccari, G.; Colasante, V.; Mañes, J. Simultaneous analysis of twenty-six mycotoxins in durum wheat grain
from Italy. Food Control 2016, 62, 322–329. [CrossRef]49. European Food Safety Authority. Management of left-censored data in dietary exposure assessment of chemical substances.
EFSA J. 2010, 8, 1557.50. Schrenk, D.; Bignami, M.; Bodin, L.; Chipman, J.K.; del Mazo, J.; Grasl-Kraupp, B.; Wallace, H. European Food Safety Authority
CONTAM Panel (EFSA Panel on Contaminants in the Food Chain). Scientific opinion—Risk assessment of aflatoxins in food.EFSA J. 2020, 18, 112.
51. Kuiper-Goodman, T. Uncertainties in the risk assessment of three mycotoxins: Aflatoxin, ochratoxin, and zearalenone. Can. J.Physiol. Pharmacol. 1990, 68, 1017–1024. [CrossRef] [PubMed]
52. JECFA—Joint FAO/WHO Expert Committee on Food Additives. Safety Evaluation of Certain Mycotoxins in Food Prepared by theFifty Sixth Meeting of the Joint FAO/WHO Expert Committee on Food Additives (Vol. 47); WHO Food Additives Series; FAO Food andNutrition Paper 74; World Health Organization: Geneva, Switzerland, 2001; ISBN1 (FAO) 92 5104664 6. ISBN2 (WH0) 92 41660473. Available online: www.fao.org/3/a-bc528e.pdf (accessed on 8 February 2021).
53. SCF—Scientific Committee on Food. Part. 6: Group Evaluation of T-2 Toxin, HT2 Toxin, Nivalenol and Deoxynivalenol; Opinion of theScientific Committee on Food on Fusarium Toxins; SCF: Brussels, Belgium, 2002; Available online: https://ec.europa.eu/food/sites/food/files/safety/docs/cs_contaminants_catalogue_fusarium_out123_en.pdf (accessed on 27 February 2002).
19

toxins
Article
Patulin Mycotoxin in Mango and Orange Fruits,Juices, Pulps, and Jams Marketed in Pakistan
Shabbir Hussain 1,2, Muhammad Rafique Asi 1,*, Mazhar Iqbal 3,*, Nisha Khalid 1,
Syed Wajih-ul-Hassan 1 and Agustín Ariño 4
1 Food Toxicology Laboratory, Nuclear Institute for Agriculture and Biology College (NIAB-C),Pakistan Institute of Engineering and Applied Sciences (PIEAS), Jhang Road, Faisalabad 38000, Pakistan;[email protected] (S.H.); [email protected] (N.K.); [email protected] (S.W.-u.-H.)
2 Central Analytical Facility Division, Pakistan Institute of Nuclear Science and Technology (PINSTECH),P. O. Nilore, Islamabad 45650, Pakistan
3 Health Biotechnology Division, National Institute for Biotechnology and Genetic EngineeringCollege (NIBGE-C), Pakistan Institute of Engineering and Applied Sciences (PIEAS), Jhang Road,Faisalabad 38000, Pakistan
4 Instituto Agroalimentario de Aragón—IA2 (Universidad de Zaragoza-CITA), Facultad de Veterinaria,50013 Zaragoza, Spain; [email protected]
* Correspondence: [email protected] (M.R.A.); [email protected] (M.I.)
Received: 19 November 2019; Accepted: 13 January 2020; Published: 16 January 2020
Abstract: The objective of the study was to explore the incidence of patulin (PAT) mycotoxin inmango and orange fruits and derived products marketed in Pakistan. A total of 274 samples,including 70 mango fruits, 63 mango-based products (juices, pulp, and jam), 77 orange fruits, and 64orange-based products, were collected. PAT was determined by reverse-phase high-performanceliquid chromatography (HPLC) with UV-Vis detector (276 nm). Linear detector response was observed(R2 > 0.99), the limit of detection (LOD) was 5μg/kg and recovery percentage was 97.4%. The incidenceof PAT in mango samples was 61.7%, and the concentration ranged from <LOD to 6415 μg/kg with amean of 110.9 μg/kg. Our results showed the high susceptibility of mango fruits to patulin, and it wasobserved that decayed mango fruits were most contaminated with PAT. Among the mango samples,PAT concentration was higher in fruits than in processed products such as mango juice, pulp, andjam. Toxin incidence in orange samples was 52.5% with concentrations from <LOD to 61 μg/kg and amean of 6.3 μg/kg. As much as 29 samples of mango (21.8%) contained PAT concentration above theregulatory limit (50 μg/kg), whereas there was only one exceeding orange sample (0.7%). Our resultsshow that PAT seems to be a problem in fruits, juices, and derived solid products, especially frommango, and needs surveillance on regular basis.
Keywords: patulin; mango; orange; fruit-derived products; food safety; regulatory limits
Key Contribution: Patulin mycotoxin was present in more than 50% samples of mango, orange, andfruit-derived products, with a significant number of exceeding samples. Results showed for the firsttime the high susceptibility of mango to patulin.
1. Introduction
Mycotoxins are compounds produced by naturally occurring fungi having toxic nature for animalsand humans [1–3]. It has been considered that approximately 25% of total world food crops annuallyare contaminated with mycotoxins [4]. Patulin mycotoxin (a polyketide lactone 4-hydroxy-4H-furo(3,2c) pyran-2 (6H)-one; Figure 1) [5,6] belongs to a class of toxic compound with low molecular weight(154.121 g/mol) [7,8]. The molecular formula of patulin (PAT) is C7H6O4; it is stable in aqueous media
Toxins 2020, 12, 52; doi:10.3390/toxins12010052 www.mdpi.com/journal/toxins21
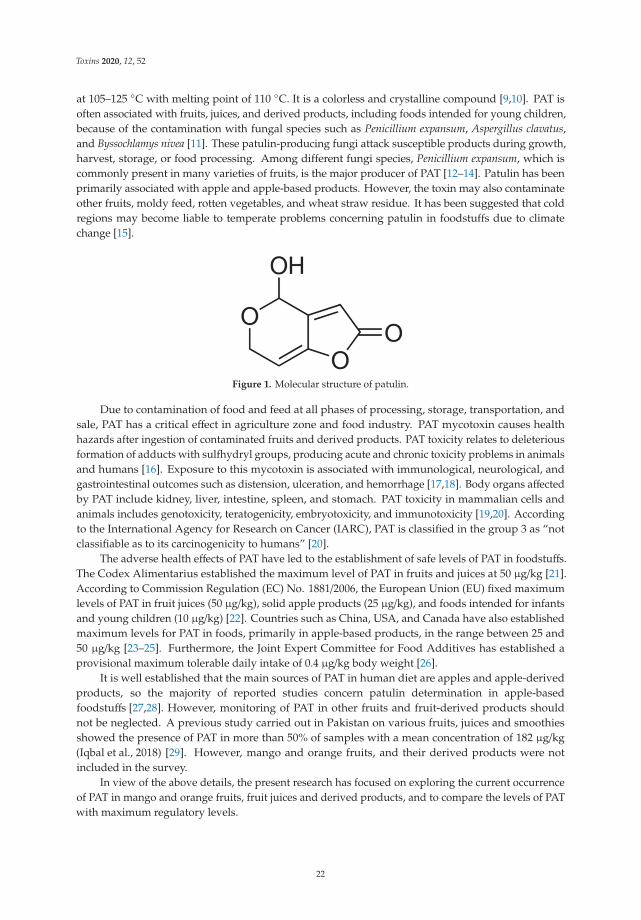
Toxins 2020, 12, 52
at 105–125 ◦C with melting point of 110 ◦C. It is a colorless and crystalline compound [9,10]. PAT isoften associated with fruits, juices, and derived products, including foods intended for young children,because of the contamination with fungal species such as Penicillium expansum, Aspergillus clavatus,and Byssochlamys nivea [11]. These patulin-producing fungi attack susceptible products during growth,harvest, storage, or food processing. Among different fungi species, Penicillium expansum, which iscommonly present in many varieties of fruits, is the major producer of PAT [12–14]. Patulin has beenprimarily associated with apple and apple-based products. However, the toxin may also contaminateother fruits, moldy feed, rotten vegetables, and wheat straw residue. It has been suggested that coldregions may become liable to temperate problems concerning patulin in foodstuffs due to climatechange [15].
Figure 1. Molecular structure of patulin.
Due to contamination of food and feed at all phases of processing, storage, transportation, andsale, PAT has a critical effect in agriculture zone and food industry. PAT mycotoxin causes healthhazards after ingestion of contaminated fruits and derived products. PAT toxicity relates to deleteriousformation of adducts with sulfhydryl groups, producing acute and chronic toxicity problems in animalsand humans [16]. Exposure to this mycotoxin is associated with immunological, neurological, andgastrointestinal outcomes such as distension, ulceration, and hemorrhage [17,18]. Body organs affectedby PAT include kidney, liver, intestine, spleen, and stomach. PAT toxicity in mammalian cells andanimals includes genotoxicity, teratogenicity, embryotoxicity, and immunotoxicity [19,20]. Accordingto the International Agency for Research on Cancer (IARC), PAT is classified in the group 3 as “notclassifiable as to its carcinogenicity to humans” [20].
The adverse health effects of PAT have led to the establishment of safe levels of PAT in foodstuffs.The Codex Alimentarius established the maximum level of PAT in fruits and juices at 50 μg/kg [21].According to Commission Regulation (EC) No. 1881/2006, the European Union (EU) fixed maximumlevels of PAT in fruit juices (50 μg/kg), solid apple products (25 μg/kg), and foods intended for infantsand young children (10 μg/kg) [22]. Countries such as China, USA, and Canada have also establishedmaximum levels for PAT in foods, primarily in apple-based products, in the range between 25 and50 μg/kg [23–25]. Furthermore, the Joint Expert Committee for Food Additives has established aprovisional maximum tolerable daily intake of 0.4 μg/kg body weight [26].
It is well established that the main sources of PAT in human diet are apples and apple-derivedproducts, so the majority of reported studies concern patulin determination in apple-basedfoodstuffs [27,28]. However, monitoring of PAT in other fruits and fruit-derived products shouldnot be neglected. A previous study carried out in Pakistan on various fruits, juices and smoothiesshowed the presence of PAT in more than 50% of samples with a mean concentration of 182 μg/kg(Iqbal et al., 2018) [29]. However, mango and orange fruits, and their derived products were notincluded in the survey.
In view of the above details, the present research has focused on exploring the current occurrenceof PAT in mango and orange fruits, fruit juices and derived products, and to compare the levels of PATwith maximum regulatory levels.
22
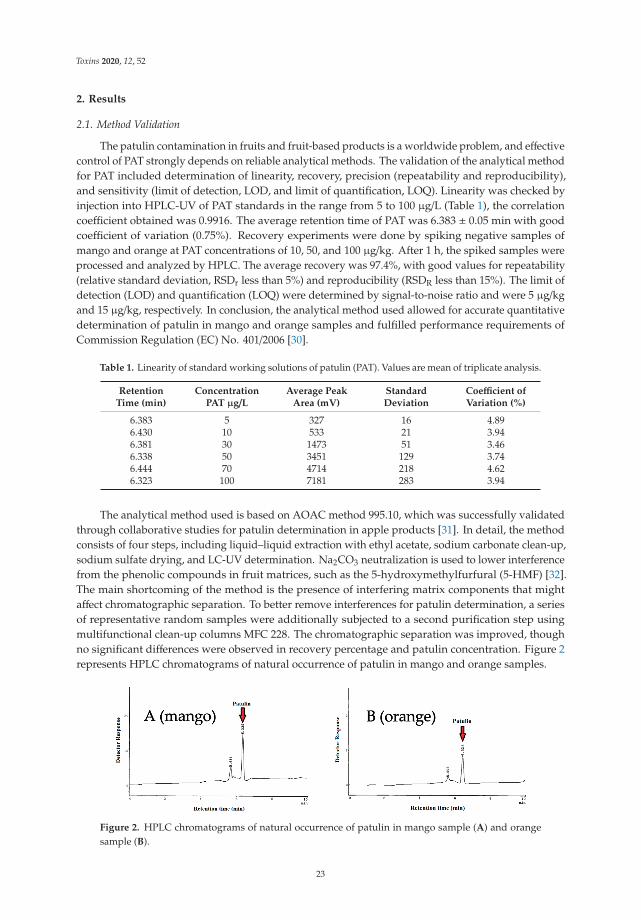
Toxins 2020, 12, 52
2. Results
2.1. Method Validation
The patulin contamination in fruits and fruit-based products is a worldwide problem, and effectivecontrol of PAT strongly depends on reliable analytical methods. The validation of the analytical methodfor PAT included determination of linearity, recovery, precision (repeatability and reproducibility),and sensitivity (limit of detection, LOD, and limit of quantification, LOQ). Linearity was checked byinjection into HPLC-UV of PAT standards in the range from 5 to 100 μg/L (Table 1), the correlationcoefficient obtained was 0.9916. The average retention time of PAT was 6.383 ± 0.05 min with goodcoefficient of variation (0.75%). Recovery experiments were done by spiking negative samples ofmango and orange at PAT concentrations of 10, 50, and 100 μg/kg. After 1 h, the spiked samples wereprocessed and analyzed by HPLC. The average recovery was 97.4%, with good values for repeatability(relative standard deviation, RSDr less than 5%) and reproducibility (RSDR less than 15%). The limit ofdetection (LOD) and quantification (LOQ) were determined by signal-to-noise ratio and were 5 μg/kgand 15 μg/kg, respectively. In conclusion, the analytical method used allowed for accurate quantitativedetermination of patulin in mango and orange samples and fulfilled performance requirements ofCommission Regulation (EC) No. 401/2006 [30].
Table 1. Linearity of standard working solutions of patulin (PAT). Values are mean of triplicate analysis.
RetentionTime (min)
ConcentrationPAT μg/L
Average PeakArea (mV)
StandardDeviation
Coefficient ofVariation (%)
6.383 5 327 16 4.896.430 10 533 21 3.946.381 30 1473 51 3.466.338 50 3451 129 3.746.444 70 4714 218 4.626.323 100 7181 283 3.94
The analytical method used is based on AOAC method 995.10, which was successfully validatedthrough collaborative studies for patulin determination in apple products [31]. In detail, the methodconsists of four steps, including liquid–liquid extraction with ethyl acetate, sodium carbonate clean-up,sodium sulfate drying, and LC-UV determination. Na2CO3 neutralization is used to lower interferencefrom the phenolic compounds in fruit matrices, such as the 5-hydroxymethylfurfural (5-HMF) [32].The main shortcoming of the method is the presence of interfering matrix components that mightaffect chromatographic separation. To better remove interferences for patulin determination, a seriesof representative random samples were additionally subjected to a second purification step usingmultifunctional clean-up columns MFC 228. The chromatographic separation was improved, thoughno significant differences were observed in recovery percentage and patulin concentration. Figure 2represents HPLC chromatograms of natural occurrence of patulin in mango and orange samples.
Figure 2. HPLC chromatograms of natural occurrence of patulin in mango sample (A) and orangesample (B).
23
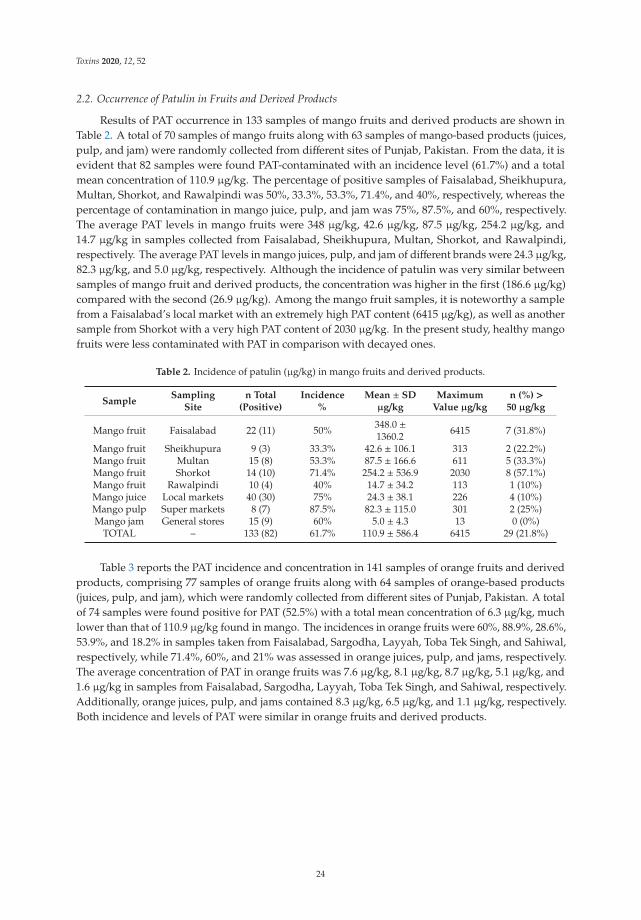
Toxins 2020, 12, 52
2.2. Occurrence of Patulin in Fruits and Derived Products
Results of PAT occurrence in 133 samples of mango fruits and derived products are shown inTable 2. A total of 70 samples of mango fruits along with 63 samples of mango-based products (juices,pulp, and jam) were randomly collected from different sites of Punjab, Pakistan. From the data, it isevident that 82 samples were found PAT-contaminated with an incidence level (61.7%) and a totalmean concentration of 110.9 μg/kg. The percentage of positive samples of Faisalabad, Sheikhupura,Multan, Shorkot, and Rawalpindi was 50%, 33.3%, 53.3%, 71.4%, and 40%, respectively, whereas thepercentage of contamination in mango juice, pulp, and jam was 75%, 87.5%, and 60%, respectively.The average PAT levels in mango fruits were 348 μg/kg, 42.6 μg/kg, 87.5 μg/kg, 254.2 μg/kg, and14.7 μg/kg in samples collected from Faisalabad, Sheikhupura, Multan, Shorkot, and Rawalpindi,respectively. The average PAT levels in mango juices, pulp, and jam of different brands were 24.3 μg/kg,82.3 μg/kg, and 5.0 μg/kg, respectively. Although the incidence of patulin was very similar betweensamples of mango fruit and derived products, the concentration was higher in the first (186.6 μg/kg)compared with the second (26.9 μg/kg). Among the mango fruit samples, it is noteworthy a samplefrom a Faisalabad’s local market with an extremely high PAT content (6415 μg/kg), as well as anothersample from Shorkot with a very high PAT content of 2030 μg/kg. In the present study, healthy mangofruits were less contaminated with PAT in comparison with decayed ones.
Table 2. Incidence of patulin (μg/kg) in mango fruits and derived products.
SampleSampling
Siten Total
(Positive)Incidence
%Mean ± SD
μg/kgMaximum
Value μg/kgn (%) >
50 μg/kg
Mango fruit Faisalabad 22 (11) 50% 348.0 ±1360.2 6415 7 (31.8%)
Mango fruit Sheikhupura 9 (3) 33.3% 42.6 ± 106.1 313 2 (22.2%)Mango fruit Multan 15 (8) 53.3% 87.5 ± 166.6 611 5 (33.3%)Mango fruit Shorkot 14 (10) 71.4% 254.2 ± 536.9 2030 8 (57.1%)Mango fruit Rawalpindi 10 (4) 40% 14.7 ± 34.2 113 1 (10%)Mango juice Local markets 40 (30) 75% 24.3 ± 38.1 226 4 (10%)Mango pulp Super markets 8 (7) 87.5% 82.3 ± 115.0 301 2 (25%)Mango jam General stores 15 (9) 60% 5.0 ± 4.3 13 0 (0%)
TOTAL – 133 (82) 61.7% 110.9 ± 586.4 6415 29 (21.8%)
Table 3 reports the PAT incidence and concentration in 141 samples of orange fruits and derivedproducts, comprising 77 samples of orange fruits along with 64 samples of orange-based products(juices, pulp, and jam), which were randomly collected from different sites of Punjab, Pakistan. A totalof 74 samples were found positive for PAT (52.5%) with a total mean concentration of 6.3 μg/kg, muchlower than that of 110.9 μg/kg found in mango. The incidences in orange fruits were 60%, 88.9%, 28.6%,53.9%, and 18.2% in samples taken from Faisalabad, Sargodha, Layyah, Toba Tek Singh, and Sahiwal,respectively, while 71.4%, 60%, and 21% was assessed in orange juices, pulp, and jams, respectively.The average concentration of PAT in orange fruits was 7.6 μg/kg, 8.1 μg/kg, 8.7 μg/kg, 5.1 μg/kg, and1.6 μg/kg in samples from Faisalabad, Sargodha, Layyah, Toba Tek Singh, and Sahiwal, respectively.Additionally, orange juices, pulp, and jams contained 8.3 μg/kg, 6.5 μg/kg, and 1.1 μg/kg, respectively.Both incidence and levels of PAT were similar in orange fruits and derived products.
24
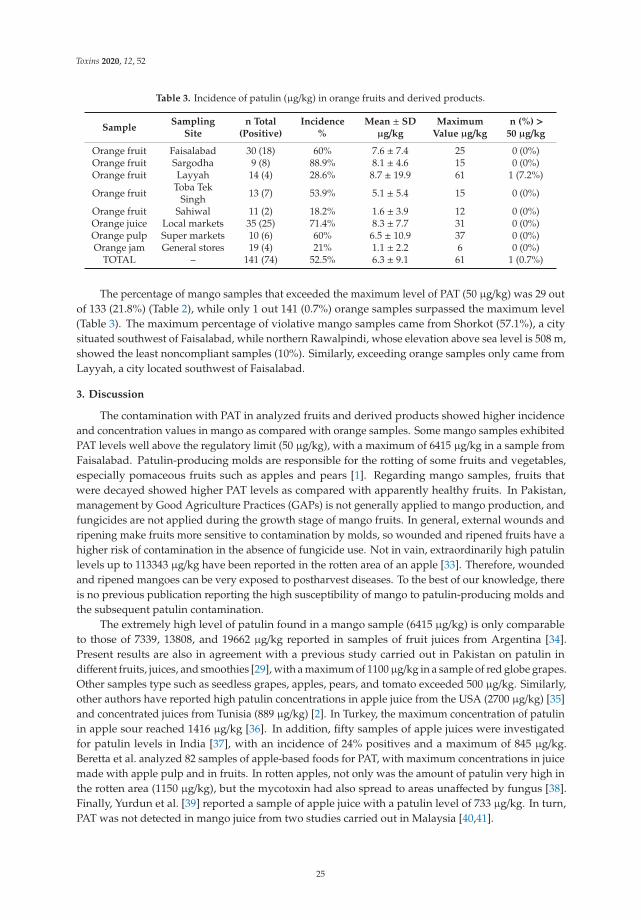
Toxins 2020, 12, 52
Table 3. Incidence of patulin (μg/kg) in orange fruits and derived products.
SampleSampling
Siten Total
(Positive)Incidence
%Mean ± SD
μg/kgMaximum
Value μg/kgn (%) >
50 μg/kg
Orange fruit Faisalabad 30 (18) 60% 7.6 ± 7.4 25 0 (0%)Orange fruit Sargodha 9 (8) 88.9% 8.1 ± 4.6 15 0 (0%)Orange fruit Layyah 14 (4) 28.6% 8.7 ± 19.9 61 1 (7.2%)
Orange fruit Toba TekSingh 13 (7) 53.9% 5.1 ± 5.4 15 0 (0%)
Orange fruit Sahiwal 11 (2) 18.2% 1.6 ± 3.9 12 0 (0%)Orange juice Local markets 35 (25) 71.4% 8.3 ± 7.7 31 0 (0%)Orange pulp Super markets 10 (6) 60% 6.5 ± 10.9 37 0 (0%)Orange jam General stores 19 (4) 21% 1.1 ± 2.2 6 0 (0%)
TOTAL – 141 (74) 52.5% 6.3 ± 9.1 61 1 (0.7%)
The percentage of mango samples that exceeded the maximum level of PAT (50 μg/kg) was 29 outof 133 (21.8%) (Table 2), while only 1 out 141 (0.7%) orange samples surpassed the maximum level(Table 3). The maximum percentage of violative mango samples came from Shorkot (57.1%), a citysituated southwest of Faisalabad, while northern Rawalpindi, whose elevation above sea level is 508 m,showed the least noncompliant samples (10%). Similarly, exceeding orange samples only came fromLayyah, a city located southwest of Faisalabad.
3. Discussion
The contamination with PAT in analyzed fruits and derived products showed higher incidenceand concentration values in mango as compared with orange samples. Some mango samples exhibitedPAT levels well above the regulatory limit (50 μg/kg), with a maximum of 6415 μg/kg in a sample fromFaisalabad. Patulin-producing molds are responsible for the rotting of some fruits and vegetables,especially pomaceous fruits such as apples and pears [1]. Regarding mango samples, fruits thatwere decayed showed higher PAT levels as compared with apparently healthy fruits. In Pakistan,management by Good Agriculture Practices (GAPs) is not generally applied to mango production, andfungicides are not applied during the growth stage of mango fruits. In general, external wounds andripening make fruits more sensitive to contamination by molds, so wounded and ripened fruits have ahigher risk of contamination in the absence of fungicide use. Not in vain, extraordinarily high patulinlevels up to 113343 μg/kg have been reported in the rotten area of an apple [33]. Therefore, woundedand ripened mangoes can be very exposed to postharvest diseases. To the best of our knowledge, thereis no previous publication reporting the high susceptibility of mango to patulin-producing molds andthe subsequent patulin contamination.
The extremely high level of patulin found in a mango sample (6415 μg/kg) is only comparableto those of 7339, 13808, and 19662 μg/kg reported in samples of fruit juices from Argentina [34].Present results are also in agreement with a previous study carried out in Pakistan on patulin indifferent fruits, juices, and smoothies [29], with a maximum of 1100μg/kg in a sample of red globe grapes.Other samples type such as seedless grapes, apples, pears, and tomato exceeded 500 μg/kg. Similarly,other authors have reported high patulin concentrations in apple juice from the USA (2700 μg/kg) [35]and concentrated juices from Tunisia (889 μg/kg) [2]. In Turkey, the maximum concentration of patulinin apple sour reached 1416 μg/kg [36]. In addition, fifty samples of apple juices were investigatedfor patulin levels in India [37], with an incidence of 24% positives and a maximum of 845 μg/kg.Beretta et al. analyzed 82 samples of apple-based foods for PAT, with maximum concentrations in juicemade with apple pulp and in fruits. In rotten apples, not only was the amount of patulin very high inthe rotten area (1150 μg/kg), but the mycotoxin had also spread to areas unaffected by fungus [38].Finally, Yurdun et al. [39] reported a sample of apple juice with a patulin level of 733 μg/kg. In turn,PAT was not detected in mango juice from two studies carried out in Malaysia [40,41].
25
Toxins 2020, 12, 52
In other studies, patulin concentrations attained levels in the range of 5–50μg/kg, such as Al-Hazmiet al. in samples of apple juice from Saudi Arabia [42]. In Greece, a study revealed the presenceof PAT in 100% of the fruit juice samples examined [43]. The mean values of PAT in concentratedfruit juices and in commercial fruit juices were 10.54 μg/kg and 5.57 μg/kg, respectively. The mostcontaminated samples were four concentrated juices, ranging from 18.10 to 36.8 μg/kg. The meanconcentration of patulin in orange juices was 6.80 μg/kg. In South Korea, a study on 72 samples offruit juices reported nine positive for patulin (three apple, two orange, and four grape juices), with amaximum concentration of 30.9 μg/kg in an orange juice sample [44].
In the undertaken study, results on occurrence of PAT in mango and orange fruits and theirderived products, which are consumed in Punjab, Pakistan, depicted higher contamination levels,especially from mango. PAT contamination in fruits and derived products is a burning issue for thehealth implications, so their surveillance is a basic and urgent need. In Pakistan, a variety of fruitswith good flavor and taste are grown in tropical and subtropical climate and are available throughoutthe year. The various varieties of fruits are grown on an area of about 800,000 hectares with worthproduction of 7.05 million tones. During crop season 2017–2018, 10% of the total fruit productionwas exported [45]. Good agriculture practices (GAP) and postharvest control strategies must beadopted to inhibit PAT formation in fruits and derived products for the prevention and reduction ofexposure to this mycotoxin. Proper picking, handling, and packaging operations, as well as storageand transportation of fruits can limit fungal growth and patulin production.
4. Conclusions
Patulin contamination in fruits and derived products is a worldwide problem due to its riskytoxicity. An HPLC method with UV detection for the determination of PAT, which is fast, reliable,and sensitive, was successfully validated and could be applied for routine analysis and monitoring offruits, pulps, juices, and derived products. PAT concentrations were higher in mango than in orangesamples, and greater in whole fruits than in derived products such as juice, pulp, and jam. A significantpercentage of mango samples exceeded the maximum levels established for patulin. Further studiesare needed to develop strategies that are helpful to reduce the presence of patulin-producing fungiin these commodities. Therefore, a better understanding of the underlying mechanisms of patulintoxigenesis in mango is needed. Regular monitoring of fruits and their products during the harvestand processing stages is recommended to enhance the confidence of end users. The results of thepresent study would be highly beneficial for the horticulturists, processors, traders, and consumers.
5. Materials and Methods
5.1. Sampling
A total of 274 samples including 70 mango fruits, 40 mango juice, 8 mango pulp, 15 mango jam,77 orange fruits, 35 orange juice, 10 orange pulp, and 19 orange jam were purchased in different areasof Central Punjab (Pakistan) from January to December 2018. The mango (Mangifera indica) and orange(Citrus sinensis) fruits were collected in supermarkets and local markets from Faisalabad, and fromcities north (Rawalpindi, Sargodha, and Sheikhupura) or south (Multan, Shorkot, Layyah, Toba TekSingh, and Sahiwal) Faisalabad. The mango- and orange-based products (juice, pulp, and jam) werefrom commercial brands of nationwide distribution purchased from supermarkets, local markets, andgeneral stores in Faisalabad district. All samples were stored in their original packages at 4 ºC untilthey were analyzed. The samples were opened and thoroughly homogenized.
5.2. Chemicals and Reagents
Acetonitrile (HPLC grade), glacial acetic acid, sodium chloride, and sodium carbonate werepurchased from Merck. Ethyl acetate, methanol, sodium sulfate anhydrous (analytical grade),5-hydroximethyl furfural (5-HMF), and patulin (5 mg of solid crystalline) were purchased from
26
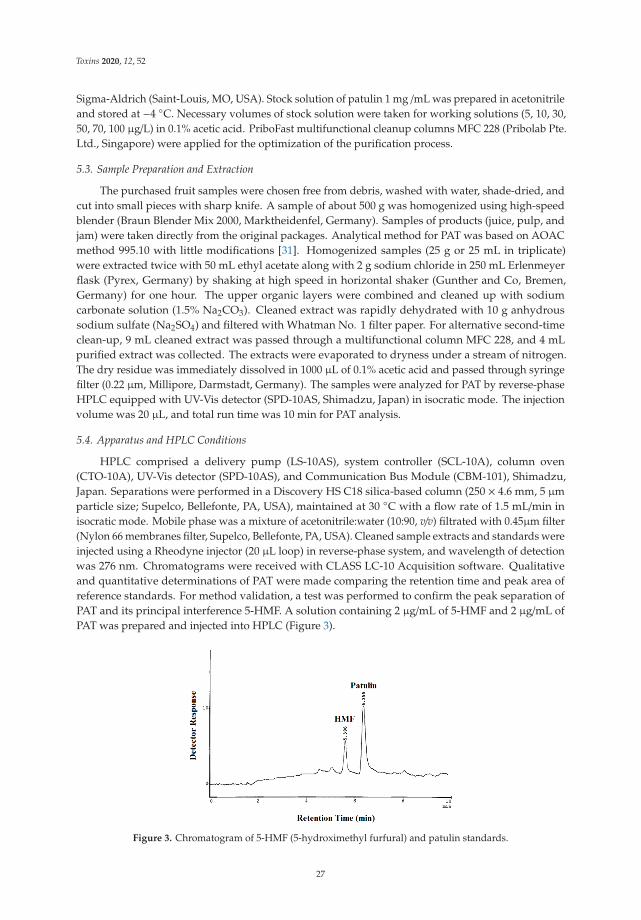
Toxins 2020, 12, 52
Sigma-Aldrich (Saint-Louis, MO, USA). Stock solution of patulin 1 mg /mL was prepared in acetonitrileand stored at −4 ◦C. Necessary volumes of stock solution were taken for working solutions (5, 10, 30,50, 70, 100 μg/L) in 0.1% acetic acid. PriboFast multifunctional cleanup columns MFC 228 (Pribolab Pte.Ltd., Singapore) were applied for the optimization of the purification process.
5.3. Sample Preparation and Extraction
The purchased fruit samples were chosen free from debris, washed with water, shade-dried, andcut into small pieces with sharp knife. A sample of about 500 g was homogenized using high-speedblender (Braun Blender Mix 2000, Marktheidenfel, Germany). Samples of products (juice, pulp, andjam) were taken directly from the original packages. Analytical method for PAT was based on AOACmethod 995.10 with little modifications [31]. Homogenized samples (25 g or 25 mL in triplicate)were extracted twice with 50 mL ethyl acetate along with 2 g sodium chloride in 250 mL Erlenmeyerflask (Pyrex, Germany) by shaking at high speed in horizontal shaker (Gunther and Co, Bremen,Germany) for one hour. The upper organic layers were combined and cleaned up with sodiumcarbonate solution (1.5% Na2CO3). Cleaned extract was rapidly dehydrated with 10 g anhydroussodium sulfate (Na2SO4) and filtered with Whatman No. 1 filter paper. For alternative second-timeclean-up, 9 mL cleaned extract was passed through a multifunctional column MFC 228, and 4 mLpurified extract was collected. The extracts were evaporated to dryness under a stream of nitrogen.The dry residue was immediately dissolved in 1000 μL of 0.1% acetic acid and passed through syringefilter (0.22 μm, Millipore, Darmstadt, Germany). The samples were analyzed for PAT by reverse-phaseHPLC equipped with UV-Vis detector (SPD-10AS, Shimadzu, Japan) in isocratic mode. The injectionvolume was 20 μL, and total run time was 10 min for PAT analysis.
5.4. Apparatus and HPLC Conditions
HPLC comprised a delivery pump (LS-10AS), system controller (SCL-10A), column oven(CTO-10A), UV-Vis detector (SPD-10AS), and Communication Bus Module (CBM-101), Shimadzu,Japan. Separations were performed in a Discovery HS C18 silica-based column (250 × 4.6 mm, 5 μmparticle size; Supelco, Bellefonte, PA, USA), maintained at 30 ◦C with a flow rate of 1.5 mL/min inisocratic mode. Mobile phase was a mixture of acetonitrile:water (10:90, v/v) filtrated with 0.45μm filter(Nylon 66 membranes filter, Supelco, Bellefonte, PA, USA). Cleaned sample extracts and standards wereinjected using a Rheodyne injector (20 μL loop) in reverse-phase system, and wavelength of detectionwas 276 nm. Chromatograms were received with CLASS LC-10 Acquisition software. Qualitativeand quantitative determinations of PAT were made comparing the retention time and peak area ofreference standards. For method validation, a test was performed to confirm the peak separation ofPAT and its principal interference 5-HMF. A solution containing 2 μg/mL of 5-HMF and 2 μg/mL ofPAT was prepared and injected into HPLC (Figure 3).
Figure 3. Chromatogram of 5-HMF (5-hydroximethyl furfural) and patulin standards.
27
Toxins 2020, 12, 52
5.5. Statistical Analysis
The compiled data were subjected to statistical analysis. Triplicate results of PAT in fruits, juices,and derived products were calculated in Excel software, and data were given as mean with standarddeviation. Samples with a concentration of PAT higher than the LOD were considered positive.For samples with a concentration below the LOD, a value of zero was considered for calculatingthe mean. The significance differences in PAT level between the groups were analyzed by one-wayANOVA test (p < 0.05) using SPSS (IBM SPSS Statistics 19, Armonk, NY, USA, 2010).
Author Contributions: M.R.A. conceptualized the work and conceived the experimental design; S.H. collectedsamples and carried out formal analysis; M.I., N.K., and S.W.-u.-H. contributed to the methodology and helpedwith laboratory analyses. S.H. performed statistical analyses and helped in the interpretation of the results. M.R.A.and A.A. contributed to the analysis and interpretation of the results. S.H., M.R.A., and A.A. wrote the paper.All authors read and approved the published version of the document.
Funding: Author Ariño thanks the Government of Aragón and FEDER 2014–2020 (grant Grupo A06_17R)for support.
Acknowledgments: Authors are highly thankful to PAEC and NIAB management to provide the permission andanalytical facilities to carry out PhD study and complete the research work in Food Toxicology Laboratories.
Conflicts of Interest: The authors declare no conflict of interest.
References
1. Marín, S.; Mateo, E.M.; Sanchis, V.; Valle-Algarra, F.M.; Ramos, A.J.; Jiménez, M. Patulin contamination infruit derivatives, including baby food, from the Spanish market. Food Chem. 2011, 124, 563–568. [CrossRef]
2. Zouaoui, N.; Sbaii, N.; Bacha, H.; Abid-Essefi, S. Occurrence of patulin in various fruit juice marketed inTunisia. Food Control 2015, 51, 356–360. [CrossRef]
3. Raiola, A.; Tenore, G.C.; Manyes, L.; Meca, G.; Ritieni, A. Risk analysis of main mycotoxins occurring in foodfor children: An overview. Food Chem. Toxicol. 2015, 84, 169–180. [CrossRef]
4. Negedu, A.; Atawodi, S.E.; Ameh, J.B.; Umoh, V.J.; Tanko, H.Y. Economic and health perspectives ofmycotoxins: A review. Cont. J. Biomed. Sci. 2011, 5, 5–26.
5. Brase, S.; Encinas, A.; Keck, J.; Nising, C.F. Chemistry and biology of mycotoxins and related fungalmetabolites. Chem. Rev. 2009, 109, 3903–3990. [CrossRef] [PubMed]
6. Guo, W.; Pi, F.; Zhang, H.; Sun, J.; Zhang, Y.; Sun, X. A novel molecularly imprinted electrochemical sensormodified with carbon dots, chitosan, gold nanoparticles for the determination of patulin. Biosens. Bioelectron.2017, 98, 299–304. [CrossRef] [PubMed]
7. Tannous, J.; Atoui, A.; El Khoury, A.; Francis, Z.; Oswald, I.P.; Puel, O.; Lteif, R. A study on the physicochemicalparameters for Penicillium expansum growth and patulin production: Effect of temperature, pH, and wateractivity. Food Sci. Nutr. 2016, 4, 611–622. [CrossRef] [PubMed]
8. Magan, N.; Olsen, M. Mycotoxins in Food: Detection and Control; Woodhead Publishing Limited: Cambridge,UK, 2004.
9. González-Osnaya, L.; Soriano, J.M.; Moltó, J.C.; Manes, J. Exposure to patulin from consumption ofapple-based products. Food Addit. Contam. 2007, 24, 1268–1274. [CrossRef]
10. Cunha, S.C.; Faria, M.A.; Pereira, V.L.; Oliveira, T.M.; Lima, A.C.; Pinto, E. Patulin assessment and fungiidentification in organic and conventional fruits and derived products. Food Control 2014, 44, 185–190.[CrossRef]
11. Tannous, J.; Keller, N.P.; Atoui, A.; El Khoury, A.; Lteif, R.; Oswald, I.P.; Puel, O. Secondary metabolism inPenicillium expansum: Emphasis on recent advances in patulin research. Crit. Rev. Food Sci. Nutr. 2018, 58,2082–2098. [CrossRef]
12. Marin, S.; Ramos, A.J.; Cano-Sancho, G.; Sanchis, V. Mycotoxins: Occurrence, toxicology, and exposureassessment. Food Chem. Toxicol. 2013, 60, 218–237. [CrossRef] [PubMed]
13. Moake, M.M.; Padilla-Zakour, O.I.; Worobo, R.W. Comprehensive review of patulin control methods in foods.Compr. Rev. Food Sci. Food Saf. 2005, 4, 8–21. [CrossRef]
28
Toxins 2020, 12, 52
14. Cheraghali, A.M.; Mohammadi, H.R.; Amirahmadi, M.; Yazdanpanah, H.; Abouhossain, G.; Zamanian, F.;Khansari, M.G.; Afshar, M. Incidence of patulin contamination in apple juice produced in Iran. Food Control2005, 16, 165–167. [CrossRef]
15. Paterson, R.R.M.; Lima, N. How will climate change affect mycotoxins in food? Food Res. Int. 2010, 43,1902–1914. [CrossRef]
16. Boussabbeh, M.; Ben Salem, I.; Prola, A.; Guilbert, A.; Bacha, H.; Abid-Essefi, S.; Lemaire, C. Patulin inducesapoptosis through ROS-mediated endoplasmic reticulum stress pathway. Toxicol. Sci. 2015, 144, 328–337.[CrossRef]
17. Pal, S.; Singh, N.; Ansari, K.M. Toxicological effects of patulin mycotoxin on the mammalian system:An overview. Toxicol. Res. 2017, 6, 764–771. [CrossRef]
18. da Rocha, M.E.B.; Freire, F.D.C.O.; Maia, F.E.F.; Guedes, M.I.F.; Rondina, D. Mycotoxins and their effects onhuman and animal health. Food Control 2014, 36, 159–165. [CrossRef]
19. Puel, O.; Galtier, P.; Oswald, I.P. Biosynthesis and toxicological effects of patulin. Toxins 2010, 2, 613–631.[CrossRef]
20. Donmez-Altuntas, H.; Gokalp-Yildiz, P.; Bitgen, N.; Hamurcu, Z. Evaluation of genotoxicity, cytotoxicity andcytostasis in human lymphocytes exposed to patulin by using the cytokinesis-block micronucleus cytome(CBMN cyt) assay. Mycotoxin Res. 2013, 29, 63–70. [CrossRef]
21. Codex Alimentarius Commission (CAC). Codex General Standard for Contaminants and Toxins in Food andFeed. Codex STAN 193-1995; 1995, p. 44. Available online: http://www.fao.org/fao-who-codexalimentarius/codex-texts/list-standards/en/ (accessed on 16 January 2020).
22. European Commission. European Union Commission Regulation No. 1881/2006 setting maximum levels forcertain contaminants in foodstuffs. Off. J. Eur. Union 2006, 364, 5–24.
23. van Egmond, H.P.; Schothorst, R.C.; Jonker, M.A. Regulations relating to mycotoxins in food. Anal. Bioanal.Chem. 2007, 389, 147–157. [CrossRef] [PubMed]
24. Food and Drug Administration (FDA). Compliance policy guidance for FDA staff. Sec. 510.150 Apple juice,apple juice concentrates, and apple juice products, Adulteration with patulin. In Compliance Policy Guide;U.S. Food and Drug Administration: Silver Spring, MD, USA, 2004.
25. Health Canada. Canadian Standards for Various Chemical Contaminants in Foods. In Food and DrugRegulations; Health Canada, Ed.: Ottawa, ON, Canada, 2014.
26. Joint Expert Committee on Food Additives; 44th Report of the JECFA. Technical Report Series 589; World HealthOrganization: Rome, Italy, 1995.
27. Ioi, J.D.; Zhou, T.; Tsao, R.; Marcone, M.F. Mitigation of patulin in fresh and processed foods and beverages.Toxins 2017, 9, 157. [CrossRef] [PubMed]
28. Zhong, L.; Carere, J.; Lu, Z.; Lu, F.; Zhou, T. Patulin in apples and apple-based food products: The burdensand the mitigation strategies. Toxins 2018, 10, 475. [CrossRef] [PubMed]
29. Iqbal, S.Z.; Malik, S.; Asi, M.R.; Selamat, J.; Malik, N. Natural occurrence of patulin in different fruits, juicesand smoothies and evaluation of dietary intake in Punjab, Pakistan. Food Control 2018, 84, 370–374. [CrossRef]
30. European Union Commission Regulation No 401/2006 laying down the methods of sampling and analysisfor the official control of the levels of mycotoxins in foodstuffs. Off. J. Eur. Union 2006, 70, 12–34.
31. AOAC International. AOAC Official Method 995.10 Patulin in apple juice. In Official Methods of Analysis ofAOAC International, 18th ed.; Horwitz, W., Ed.; AOAC International: Gaithersburg, MD, USA, 2005.
32. Li, X.; Li, H.; Li, X.; Zhang, Q. Determination of trace patulin in apple-based food matrices. Food Chem. 2017,233, 290–301. [CrossRef]
33. Majerus, P.; Kapp, K. Assessment of Dietary Intake of Patulin by the Population of EU Member States; Reports onTasks for Scientific Cooperation, Task 3.2.8; SCOOP Report: Brussels, Belgium, 2002.
34. Oteiza, J.M.; Khaneghah, A.M.; Campagnollo, F.B.; Granato, D.; Mahmoudi, M.R.; Sant’Ana, A.S.; Gianuzzi, L.Influence of production on the presence of patulin and ochratoxin A in fruit juices and wines of Argentina.LWT Food Sci. Technol. 2017, 80, 200–207. [CrossRef]
35. Harris, K.L.; Bobe, G.; Bourquin, L.D. Patulin surveillance in apple cider and juice marketed in Michigan.J. Food Prot. 2009, 72, 1255–1261. [CrossRef]
36. Içli, N. Occurrence of patulin and 5-hydroxymethylfurfural in apple sour, which is a traditional product ofKastamonu, Turkey. Food Addit. Contam. Part A 2019, 36, 952–963. [CrossRef]
29
Toxins 2020, 12, 52
37. Saxena, N.; Dwivedi, P.D.; Ansari, K.M.; Das, M. Patulin in apple juices: Incidence and likely intake in anIndian population. Food Addit. Contam. 2008, 1, 140–146. [CrossRef]
38. Beretta, B.; Gaiaschi, A.; Galli, C.L.; Restani, P. Patulin in apple-based foods: Occurrence and safety evaluation.Food Addit. Contam. 2000, 17, 399–406. [CrossRef] [PubMed]
39. Yurdun, T.; Omurtag, G.Z.; Ersoy, O. Incidence of patulin in apple juices marketed in Turkey. J. Food Prot.2001, 64, 1851–1853. [CrossRef] [PubMed]
40. Abu-Bakar, N.B.; Makahleh, A.; Saad, B. Vortex-assisted liquid-liquid microextraction coupled with highperformance liquid chromatography for the determination of furfurals and patulin in fruit juices. Talanta2014, 120, 47–54. [CrossRef] [PubMed]
41. Lee, T.P.; Sakai, R.; Abdul Manaf, N.; Mohd Rodhi, A.; Saad, B. High performance liquid chromatographymethod for the determination of patulin and 5-hydroxymethylfurfural in fruit juices marketed in Malaysia.Food Control 2014, 38, 142–149. [CrossRef]
42. Al-Hazmi, N. Determination of patulin and ochratoxin A using HPLC in apple juice samples in Saudi Arabia.Saudi J. Biol. Sci. 2010, 17, 353–359. [CrossRef]
43. Moukas, A.; Panagiotopoulou, V.; Markaki, P. Determination of patulin in fruit juices using HPLCDAD andGCMSD techniques. Food Chem. 2008, 109, 860–867. [CrossRef]
44. Cho, M.S.; Kim, K.; Seo, E.; Kassim, N.; Mtenga, A.B.; Shim, W.B.; Lee, S.H.; Chung, D.H. Occurrence ofpatulin in various fruit juices from South Korea: An exposure assessment. Food Sci. Biotechnol. 2010, 19, 1–5.[CrossRef]
45. Government of Pakistan. Fruit, Vegetables and Condiments Statistics of Pakistan 2017–2018; Government ofPakistan, Ministry of National Food Security & Research, Economic Wing: Islamabad, Pakistan, 2019.
© 2020 by the authors. Licensee MDPI, Basel, Switzerland. This article is an open accessarticle distributed under the terms and conditions of the Creative Commons Attribution(CC BY) license (http://creativecommons.org/licenses/by/4.0/).
30
toxins
Article
Ochratoxin A in Beers Marketed in Portugal:Occurrence and Human Risk Assessment
Liliana J. G. Silva *, Ana C. Teixeira, André M. P. T. Pereira, Angelina Pena and Celeste M. Lino
LAQV, REQUIMTE, Laboratory of Bromatology and Pharmacognosy, Faculty of Pharmacy,University of Coimbra, Polo III, Azinhaga de Stª Comba, 3000-548 Coimbra, Portugal;[email protected] (A.C.T.); [email protected] (A.M.P.T.P.); [email protected] (A.P.);[email protected] (C.M.L.)* Correspondence: [email protected]
Received: 24 February 2020; Accepted: 11 April 2020; Published: 12 April 2020
Abstract: Ochratoxin A (OTA) is produced by fungi present in several agricultural products withmuch relevance to food safety. Since this mycotoxin is widely found in cereals, beer has a potentialcontamination risk. Therefore, it was deemed essential to quantify, for the first time, the levels ofOTA in beer, a cereal-based product that is marketed in Portugal, as well as to calculate the humanestimated weekly intake (EWI) and risk assessment. A total of 85 samples were analyzed throughimmunoaffinity clean-up, followed by liquid chromatography-fluorescence detection (LC-FD). Thisanalytical methodology allowed a limit of quantification (LOQ) of 0.43 μg/L. The results showedthat 10.6% were contaminated at levels ranging between <LOQ and 11.25 μg/L, with an average of3.14 ± 4.09 μg/L. Samples of industrial production presented lower incidence and contaminationlevels than homemade and craft beers. On what concerns human risk, the calculated EWI wassignificantly lower than the tolerable weekly intake (TWI). However, in the worst case scenario, basedon a high concentration, the rate EWI/TWI was 138.01%.
Keywords: ochratoxin A; beer; immunoaffinity clean-up; LC-FD; human risk assessment
Key Contribution: The first immunoaffinity column (IAC)-LC–FD OTA analysis of beer marketed inPortugal showed that only 10.59% of the samples were positive with a mean of 3.14 ± 4.09 μg/L, withhomemade and craft production beers presenting higher frequencies and levels. Regarding humanrisk assessment, the EWI was considerably lower than the TWI established.
1. Introduction
Mycotoxins, secondary metabolites produced by fungi, affect 25% of crops worldwide [1].Mycotoxin contamination usually takes place during crop growth due to adverse environmentalconditions, inappropriate harvesting, storage, or processing procedures [2].
Ochratoxin A (OTA), the major mycotoxin of the ochratoxins’ group and the one presentinggreat toxicological concern, is produced by Penicillium verrucosum, Aspergillus ochraceus, and rarely bysome strains of Aspergillus niger [3]. OTA has been reported as nephrotoxic, carcinogenic, teratogenic,genotoxic, and immunotoxic. This mycotoxin also disturbs blood coagulation, hinders protein synthesis,endorses cell membrane peroxidation, abolishes calcium homeostasis, and constrains mitochondrialrespiration [4]. In addition, it is epidemiologically associated to the human Balkan endemic nephropathy(BEN) disease and to urinary tract tumors [5,6]. Moreover, it is described as a cumulative mycotoxinsince it is easily assimilated by the digestive tract and is gradually excreted by the urinary system [4].Since 1993, OTA has been described as a possible carcinogen to humans, group 2B, by the InternationalAgency for Research on Cancer (IARC) [7].
Toxins 2020, 12, 249; doi:10.3390/toxins12040249 www.mdpi.com/journal/toxins31
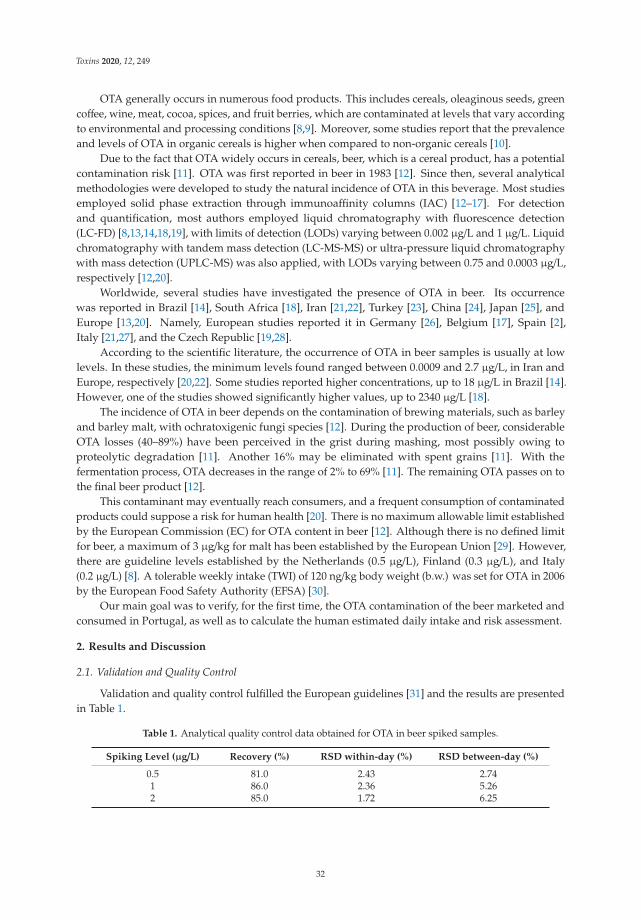
Toxins 2020, 12, 249
OTA generally occurs in numerous food products. This includes cereals, oleaginous seeds, greencoffee, wine, meat, cocoa, spices, and fruit berries, which are contaminated at levels that vary accordingto environmental and processing conditions [8,9]. Moreover, some studies report that the prevalenceand levels of OTA in organic cereals is higher when compared to non-organic cereals [10].
Due to the fact that OTA widely occurs in cereals, beer, which is a cereal product, has a potentialcontamination risk [11]. OTA was first reported in beer in 1983 [12]. Since then, several analyticalmethodologies were developed to study the natural incidence of OTA in this beverage. Most studiesemployed solid phase extraction through immunoaffinity columns (IAC) [12–17]. For detectionand quantification, most authors employed liquid chromatography with fluorescence detection(LC-FD) [8,13,14,18,19], with limits of detection (LODs) varying between 0.002 μg/L and 1 μg/L. Liquidchromatography with tandem mass detection (LC-MS-MS) or ultra-pressure liquid chromatographywith mass detection (UPLC-MS) was also applied, with LODs varying between 0.75 and 0.0003 μg/L,respectively [12,20].
Worldwide, several studies have investigated the presence of OTA in beer. Its occurrencewas reported in Brazil [14], South Africa [18], Iran [21,22], Turkey [23], China [24], Japan [25], andEurope [13,20]. Namely, European studies reported it in Germany [26], Belgium [17], Spain [2],Italy [21,27], and the Czech Republic [19,28].
According to the scientific literature, the occurrence of OTA in beer samples is usually at lowlevels. In these studies, the minimum levels found ranged between 0.0009 and 2.7 μg/L, in Iran andEurope, respectively [20,22]. Some studies reported higher concentrations, up to 18 μg/L in Brazil [14].However, one of the studies showed significantly higher values, up to 2340 μg/L [18].
The incidence of OTA in beer depends on the contamination of brewing materials, such as barleyand barley malt, with ochratoxigenic fungi species [12]. During the production of beer, considerableOTA losses (40–89%) have been perceived in the grist during mashing, most possibly owing toproteolytic degradation [11]. Another 16% may be eliminated with spent grains [11]. With thefermentation process, OTA decreases in the range of 2% to 69% [11]. The remaining OTA passes on tothe final beer product [12].
This contaminant may eventually reach consumers, and a frequent consumption of contaminatedproducts could suppose a risk for human health [20]. There is no maximum allowable limit establishedby the European Commission (EC) for OTA content in beer [12]. Although there is no defined limitfor beer, a maximum of 3 μg/kg for malt has been established by the European Union [29]. However,there are guideline levels established by the Netherlands (0.5 μg/L), Finland (0.3 μg/L), and Italy(0.2 μg/L) [8]. A tolerable weekly intake (TWI) of 120 ng/kg body weight (b.w.) was set for OTA in 2006by the European Food Safety Authority (EFSA) [30].
Our main goal was to verify, for the first time, the OTA contamination of the beer marketed andconsumed in Portugal, as well as to calculate the human estimated daily intake and risk assessment.
2. Results and Discussion
2.1. Validation and Quality Control
Validation and quality control fulfilled the European guidelines [31] and the results are presentedin Table 1.
Table 1. Analytical quality control data obtained for OTA in beer spiked samples.
Spiking Level (μg/L) Recovery (%) RSD within-day (%) RSD between-day (%)
0.5 81.0 2.43 2.741 86.0 2.36 5.262 85.0 1.72 6.25
32
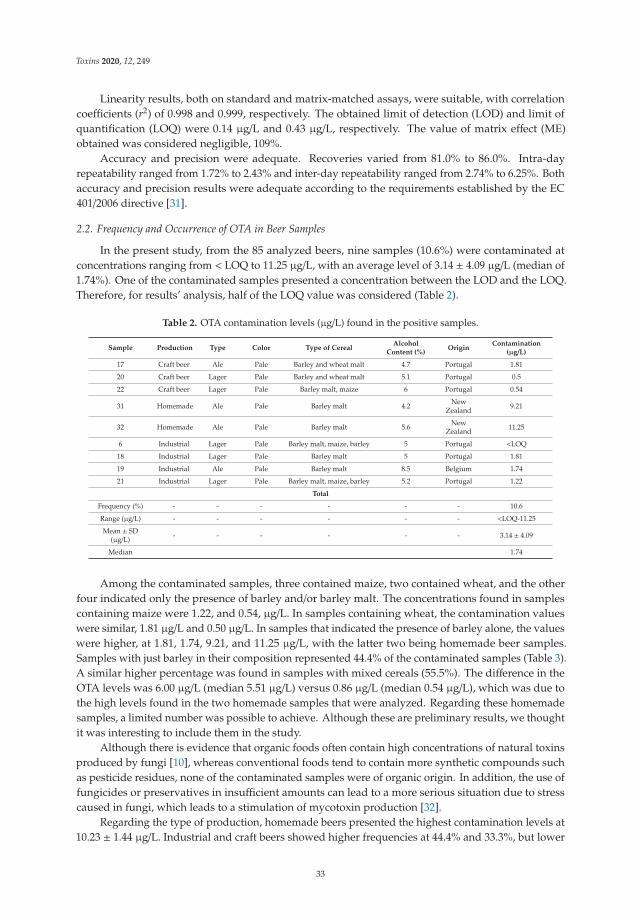
Toxins 2020, 12, 249
Linearity results, both on standard and matrix-matched assays, were suitable, with correlationcoefficients (r2) of 0.998 and 0.999, respectively. The obtained limit of detection (LOD) and limit ofquantification (LOQ) were 0.14 μg/L and 0.43 μg/L, respectively. The value of matrix effect (ME)obtained was considered negligible, 109%.
Accuracy and precision were adequate. Recoveries varied from 81.0% to 86.0%. Intra-dayrepeatability ranged from 1.72% to 2.43% and inter-day repeatability ranged from 2.74% to 6.25%. Bothaccuracy and precision results were adequate according to the requirements established by the EC401/2006 directive [31].
2.2. Frequency and Occurrence of OTA in Beer Samples
In the present study, from the 85 analyzed beers, nine samples (10.6%) were contaminated atconcentrations ranging from < LOQ to 11.25 μg/L, with an average level of 3.14 ± 4.09 μg/L (median of1.74%). One of the contaminated samples presented a concentration between the LOD and the LOQ.Therefore, for results’ analysis, half of the LOQ value was considered (Table 2).
Table 2. OTA contamination levels (μg/L) found in the positive samples.
Sample Production Type Color Type of CerealAlcohol
Content (%)Origin
Contamination(μg/L)
17 Craft beer Ale Pale Barley and wheat malt 4.7 Portugal 1.81
20 Craft beer Lager Pale Barley and wheat malt 5.1 Portugal 0.5
22 Craft beer Lager Pale Barley malt, maize 6 Portugal 0.54
31 Homemade Ale Pale Barley malt 4.2 NewZealand 9.21
32 Homemade Ale Pale Barley malt 5.6 NewZealand 11.25
6 Industrial Lager Pale Barley malt, maize, barley 5 Portugal <LOQ
18 Industrial Lager Pale Barley malt 5 Portugal 1.81
19 Industrial Ale Pale Barley malt 8.5 Belgium 1.74
21 Industrial Lager Pale Barley malt, maize, barley 5.2 Portugal 1.22
Total
Frequency (%) - - - - - - 10.6
Range (μg/L) - - - - - - <LOQ-11.25
Mean ± SD(μg/L) - - - - - - 3.14 ± 4.09
Median 1.74
Among the contaminated samples, three contained maize, two contained wheat, and the otherfour indicated only the presence of barley and/or barley malt. The concentrations found in samplescontaining maize were 1.22, and 0.54, μg/L. In samples containing wheat, the contamination valueswere similar, 1.81 μg/L and 0.50 μg/L. In samples that indicated the presence of barley alone, the valueswere higher, at 1.81, 1.74, 9.21, and 11.25 μg/L, with the latter two being homemade beer samples.Samples with just barley in their composition represented 44.4% of the contaminated samples (Table 3).A similar higher percentage was found in samples with mixed cereals (55.5%). The difference in theOTA levels was 6.00 μg/L (median 5.51 μg/L) versus 0.86 μg/L (median 0.54 μg/L), which was due tothe high levels found in the two homemade samples that were analyzed. Regarding these homemadesamples, a limited number was possible to achieve. Although these are preliminary results, we thoughtit was interesting to include them in the study.
Although there is evidence that organic foods often contain high concentrations of natural toxinsproduced by fungi [10], whereas conventional foods tend to contain more synthetic compounds suchas pesticide residues, none of the contaminated samples were of organic origin. In addition, the use offungicides or preservatives in insufficient amounts can lead to a more serious situation due to stresscaused in fungi, which leads to a stimulation of mycotoxin production [32].
Regarding the type of production, homemade beers presented the highest contamination levels at10.23 ± 1.44 μg/L. Industrial and craft beers showed higher frequencies at 44.4% and 33.3%, but lower
33
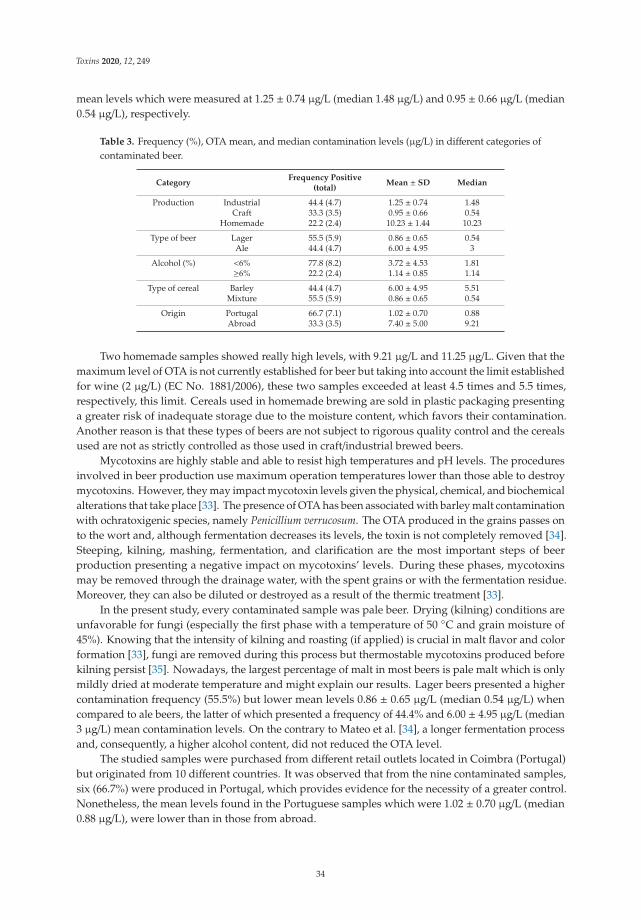
Toxins 2020, 12, 249
mean levels which were measured at 1.25 ± 0.74 μg/L (median 1.48 μg/L) and 0.95 ± 0.66 μg/L (median0.54 μg/L), respectively.
Table 3. Frequency (%), OTA mean, and median contamination levels (μg/L) in different categories ofcontaminated beer.
CategoryFrequency Positive
(total)Mean ± SD Median
Production Industrial 44.4 (4.7) 1.25 ± 0.74 1.48Craft 33.3 (3.5) 0.95 ± 0.66 0.54
Homemade 22.2 (2.4) 10.23 ± 1.44 10.23
Type of beer Lager 55.5 (5.9) 0.86 ± 0.65 0.54Ale 44.4 (4.7) 6.00 ± 4.95 3
Alcohol (%) <6% 77.8 (8.2) 3.72 ± 4.53 1.81≥6% 22.2 (2.4) 1.14 ± 0.85 1.14
Type of cereal Barley 44.4 (4.7) 6.00 ± 4.95 5.51Mixture 55.5 (5.9) 0.86 ± 0.65 0.54
Origin Portugal 66.7 (7.1) 1.02 ± 0.70 0.88Abroad 33.3 (3.5) 7.40 ± 5.00 9.21
Two homemade samples showed really high levels, with 9.21 μg/L and 11.25 μg/L. Given that themaximum level of OTA is not currently established for beer but taking into account the limit establishedfor wine (2 μg/L) (EC No. 1881/2006), these two samples exceeded at least 4.5 times and 5.5 times,respectively, this limit. Cereals used in homemade brewing are sold in plastic packaging presentinga greater risk of inadequate storage due to the moisture content, which favors their contamination.Another reason is that these types of beers are not subject to rigorous quality control and the cerealsused are not as strictly controlled as those used in craft/industrial brewed beers.
Mycotoxins are highly stable and able to resist high temperatures and pH levels. The proceduresinvolved in beer production use maximum operation temperatures lower than those able to destroymycotoxins. However, they may impact mycotoxin levels given the physical, chemical, and biochemicalalterations that take place [33]. The presence of OTA has been associated with barley malt contaminationwith ochratoxigenic species, namely Penicillium verrucosum. The OTA produced in the grains passes onto the wort and, although fermentation decreases its levels, the toxin is not completely removed [34].Steeping, kilning, mashing, fermentation, and clarification are the most important steps of beerproduction presenting a negative impact on mycotoxins’ levels. During these phases, mycotoxinsmay be removed through the drainage water, with the spent grains or with the fermentation residue.Moreover, they can also be diluted or destroyed as a result of the thermic treatment [33].
In the present study, every contaminated sample was pale beer. Drying (kilning) conditions areunfavorable for fungi (especially the first phase with a temperature of 50 ◦C and grain moisture of45%). Knowing that the intensity of kilning and roasting (if applied) is crucial in malt flavor and colorformation [33], fungi are removed during this process but thermostable mycotoxins produced beforekilning persist [35]. Nowadays, the largest percentage of malt in most beers is pale malt which is onlymildly dried at moderate temperature and might explain our results. Lager beers presented a highercontamination frequency (55.5%) but lower mean levels 0.86 ± 0.65 μg/L (median 0.54 μg/L) whencompared to ale beers, the latter of which presented a frequency of 44.4% and 6.00 ± 4.95 μg/L (median3 μg/L) mean contamination levels. On the contrary to Mateo et al. [34], a longer fermentation processand, consequently, a higher alcohol content, did not reduced the OTA level.
The studied samples were purchased from different retail outlets located in Coimbra (Portugal)but originated from 10 different countries. It was observed that from the nine contaminated samples,six (66.7%) were produced in Portugal, which provides evidence for the necessity of a greater control.Nonetheless, the mean levels found in the Portuguese samples which were 1.02 ± 0.70 μg/L (median0.88 μg/L), were lower than in those from abroad.
34
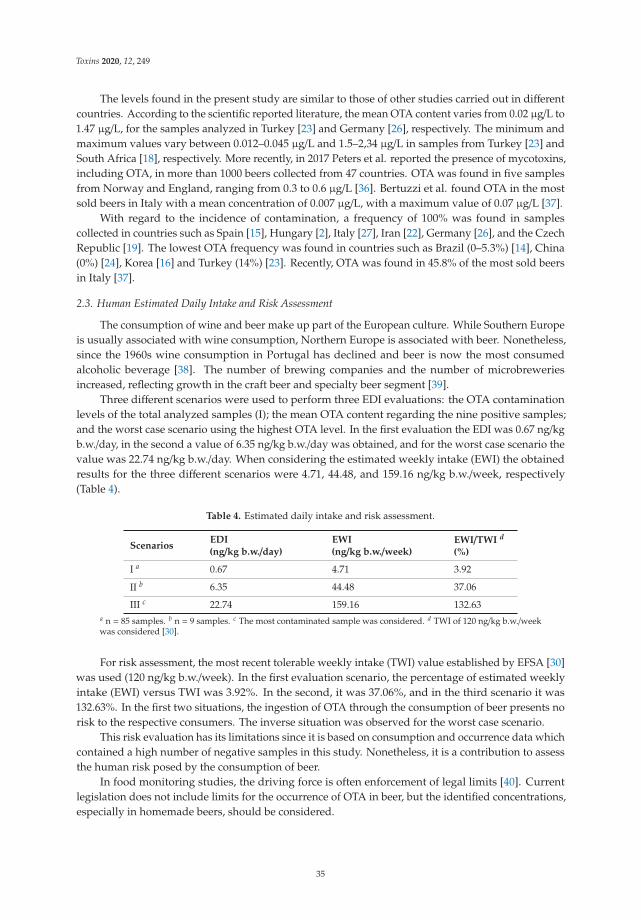
Toxins 2020, 12, 249
The levels found in the present study are similar to those of other studies carried out in differentcountries. According to the scientific reported literature, the mean OTA content varies from 0.02 μg/L to1.47 μg/L, for the samples analyzed in Turkey [23] and Germany [26], respectively. The minimum andmaximum values vary between 0.012–0.045 μg/L and 1.5–2,34 μg/L in samples from Turkey [23] andSouth Africa [18], respectively. More recently, in 2017 Peters et al. reported the presence of mycotoxins,including OTA, in more than 1000 beers collected from 47 countries. OTA was found in five samplesfrom Norway and England, ranging from 0.3 to 0.6 μg/L [36]. Bertuzzi et al. found OTA in the mostsold beers in Italy with a mean concentration of 0.007 μg/L, with a maximum value of 0.07 μg/L [37].
With regard to the incidence of contamination, a frequency of 100% was found in samplescollected in countries such as Spain [15], Hungary [2], Italy [27], Iran [22], Germany [26], and the CzechRepublic [19]. The lowest OTA frequency was found in countries such as Brazil (0–5.3%) [14], China(0%) [24], Korea [16] and Turkey (14%) [23]. Recently, OTA was found in 45.8% of the most sold beersin Italy [37].
2.3. Human Estimated Daily Intake and Risk Assessment
The consumption of wine and beer make up part of the European culture. While Southern Europeis usually associated with wine consumption, Northern Europe is associated with beer. Nonetheless,since the 1960s wine consumption in Portugal has declined and beer is now the most consumedalcoholic beverage [38]. The number of brewing companies and the number of microbreweriesincreased, reflecting growth in the craft beer and specialty beer segment [39].
Three different scenarios were used to perform three EDI evaluations: the OTA contaminationlevels of the total analyzed samples (I); the mean OTA content regarding the nine positive samples;and the worst case scenario using the highest OTA level. In the first evaluation the EDI was 0.67 ng/kgb.w./day, in the second a value of 6.35 ng/kg b.w./day was obtained, and for the worst case scenario thevalue was 22.74 ng/kg b.w./day. When considering the estimated weekly intake (EWI) the obtainedresults for the three different scenarios were 4.71, 44.48, and 159.16 ng/kg b.w./week, respectively(Table 4).
Table 4. Estimated daily intake and risk assessment.
ScenariosEDI(ng/kg b.w./day)
EWI(ng/kg b.w./week)
EWI/TWI d
(%)
I a 0.67 4.71 3.92
II b 6.35 44.48 37.06
III c 22.74 159.16 132.63a n = 85 samples. b n = 9 samples. c The most contaminated sample was considered. d TWI of 120 ng/kg b.w./weekwas considered [30].
For risk assessment, the most recent tolerable weekly intake (TWI) value established by EFSA [30]was used (120 ng/kg b.w./week). In the first evaluation scenario, the percentage of estimated weeklyintake (EWI) versus TWI was 3.92%. In the second, it was 37.06%, and in the third scenario it was132.63%. In the first two situations, the ingestion of OTA through the consumption of beer presents norisk to the respective consumers. The inverse situation was observed for the worst case scenario.
This risk evaluation has its limitations since it is based on consumption and occurrence data whichcontained a high number of negative samples in this study. Nonetheless, it is a contribution to assessthe human risk posed by the consumption of beer.
In food monitoring studies, the driving force is often enforcement of legal limits [40]. Currentlegislation does not include limits for the occurrence of OTA in beer, but the identified concentrations,especially in homemade beers, should be considered.
35
Toxins 2020, 12, 249
3. Conclusions
The proposed analytical methodology, sample pre-treatment with sodium bicarbonate and PBSfollowed by IAC clean-up and LC-FD, enabled low detection and quantification levels and good resultsregarding accuracy and precision.
The application of this method to 85 samples showed that 10.59% were contaminated, two of whichwere homemade and presented considerable concentrations (9.21 and 11.25 μg/L). The discrepancyfound can be explained by the storage of cereals already prepared for homemade brewing that maynot be as strictly controlled as the others.
Three risk assessments were carried out based on three different scenarios. In the first two, theingestion of OTA through the consumption of beer presents no risk to the respective consumers. Theinverse situation was observed for the worst case scenario, where the most contaminated samplewas considered.
The EU established maximum limits for OTA in some products. Current legislation does notinclude limits for the occurrence of OTA in beer, but the identified concentrations, especially inhomemade beers, should be considered. For this reason, it is important to adopt preventive measuresand develop control programs, reviewing the critical points where OTA production can occur in orderto minimize human exposure to OTA.
4. Materials and Methods
4.1. Chemicals and Materials
HPLC grade acetonitrile and methanol and PBS tablets were purchased from Sigma Chemicals Co.(St. Louis, MO, USA). Toluene was acquired from Carlo Erba (Milan, Italy). Acetic acid was obtainedfrom Merck (Darmstadt, Germany) and 98% purity degree OTA was obtained from Sigma ChemicalsCo. (St. Louis, MO, USA).
The OTA stock solution was prepared at 250 μg/mL in toluene-acetic acid (99:1) and stored at−20 ◦C. The intermediate solution was prepared at 10 μg/mL, in mobile phase, and diluted accordinglyto obtain the external calibration solutions.
Bi-distilled water was obtained from a Milli-Q System (Millipore, Bedford, MA, USA). A mixtureof acetonitrile–water–acetic acid (49.5:49.5:1 v/v/v) was used as mobile phase. All chromatographicsolvents were filtered through a 0.20 μm membrane filter (Whatman GmbH, Dassel, Germany)and degassed.
Immunoaffinity columns (IACs) OchraTestTM (Vicam/Waters, Milford, MA, USA) were used forclean-up. Micro-glass fiber paper (150 mm, Munktell & Filtrak GmbH, Bärenstein, Germany), cellulosenitrate (0.45 μm, Sartorius Stedim Biotech GmbH, Göttingen, Germany), and Durapore membranefilter (0.22 μm, GVPP, Millipore, Ireland) were also used.
4.2. Sampling and Sample Characterization
In 2018, 84 bottled commercial beer samples and one draft beer, representing 59 brands, wererandomly acquired from different retail outlets and supermarkets located in Coimbra (Coimbra,Portugal). The samples were classified based on the type of production, type of beer, color, fermentation,alcohol content, and country of origin.
In total, 61 samples were industrial manufactured, 21 were craft beers, and 3 were homemadebeers. Regarding the type of beer, 44 were ale with top-fermentation, and 41 were lager, two of whichwere fruit/vegetable beers with bottom-fermentation. Of all the samples, 59 were of pale color, 2 werepale-red, and 24 were dark beers. Of the 85 beer samples, 30 were strong beers, with an alcohol content≥6% and 55 contained alcohol <6% (3 samples were non-alcoholic, with <1% alcohol).
The majority of the samples (79) were of European origin and six were from abroad. Of allthe beers, 36 were produced in Portugal. The imported beers originated from Belgium (n = 15),
36
Toxins 2020, 12, 249
the Czech Republic (n = 3), Germany (n = 11), Ireland (n = 1), Mexico (n = 1), the Netherlands (n = 5),New Zealand (n = 2), Poland (n = 1), Russia (n = 3), Scotland (n = 2), and Spain (n = 5).
Among these samples, seven were brewed with organically produced materials and were labelledas organic beers. None of the samples was analyzed beyond their expiration date. Until analysis, theywere stored in the dark at 4 ◦C and all the information available on the labels was assembled.
4.3. Experimental Procedure
Based on a previously reported analytical methodology [41], degassed and consecutively filteredbeer samples (10 mL) were added, of 4% sodium bicarbonate (1.25 mL) and 10 mL of PBS. Aftercentrifugation, the extract was loaded into an IAC cartridge for clean-up. After a washing step with5 mL of water, OTA was eluted with 4 mL of methanol. Afterwards, the solvent was evaporatedat 40 ◦C under a gentle nitrogen stream, and the dried residue was stored at −20 ◦C until analysis.For liquid chromatography with fluorescence detection (LC-FD), redissolution was accomplished with1 mL of mobile phase. Following filtration through a Durapore membrane filter, 20 μL were injectedinto the HPLC system that consisted of a 805 manometric module Gilson, and a fluorimetric detectorfrom Jasco (Tokio, Japan) FP-2020 Plus. Excitation and emission wavelengths were 336 nm and 440 nm,respectively. A C18 Nucleosil 5 μm (4.6 × 250 mm i.d.) column (Hichrom, Leicestershire, UK) wasused and the flow rate was set at 1 mL min −1. The total run time was 15 min.
4.4. Validation and Quality Control Assays
Validation and quality control assays were performed as set by European guidelines [31]. Differentparameters were evaluated, including linearity, limit of detection (LOD) and limit of quantification(LOQ), matrix effect (ME), accuracy and precision. Linearity was assessed using standards (2.5–25 μg/L),and matrix-matched solutions (0.25–2.5 μg/L). Sensitivity was evaluated through the matrix-matchedcalibration curve.
The LOD was set as |3.3Sy/x|/b and the LOQ as |10Sy/x|/b, respectively, knowing that b correspondsto the slope and Sy/x corresponds to the residual standard deviation of the linear function.
The ME (%) corresponds to the percentage of the ratio of matrix-matched calibration curve slope(B) and the slope of the standard calibration curve (A). The results were interpreted as follows: 100%signifies an absence of ME; a result higher than 100% corresponds to a signal enhancement; and aresult lower than 100% corresponds to a signal suppression.
Accuracy and precision were evaluated using blanks and fortified samples at three levels (0.5, 1.0,and 2.0 μg/L). Three replicates were made (n = 3), in three different days for each fortification level. Therelative standard deviation (RSD) of intra-day and inter-day repeatability were assessed to evaluatethe precision of the analytical methodology.
4.5. Calculation of the Human Estimated Daily Intake and Risk Assessment
A deterministic method [42] was used to calculate the OTA estimated daily intake (EDI) throughthe consumption of beer through the following equation (1):
EDI = (∑
c).(CN −1 D −1 K −1), (1)
where∑
c is the OTA sum in the positive samples (μg/L), C corresponds to the mean annual beerconsumption estimated per inhabitant, N is the samples’ number, D corresponds to the days of a year,and K is the body weight (kg). According to Statistics Portugal (INE) data, the beer consumptionin 2016 was 50.9 L/inhabitant (C) [43]. The mean body weight considered for the Portuguese adultpopulation was 69 kg (K) [44].
Three different scenarios were used to perform three EDI evaluations. In the first scenario, theOTA contamination levels were taken into consideration for the total of all analyzed samples. For the
37
Toxins 2020, 12, 249
second scenario, the mean OTA content was considered. Finally, the worst case scenario was observedusing the highest OTA level.
Author Contributions: Conceptualization of this study was made by C.M.L. and A.P.; methodology wasoptimized by A.C.T. and L.J.G.S., investigation and data collection were performed by A.C.T., A.M.P.T.P., L.J.G.S.,writing—original draft preparation by A.C.T.; writing, review and editing, C.M.L. and L.J.G.S.; overall supervisionby C.M.L. All authors have read and agreed to the published version of the manuscript.
Funding: Fundação para a Ciência e a Tecnologia: UIDB 50006/2020
Acknowledgments: The authors gratefully acknowledge the Portuguese governmental Fundação para a Ciênciae a Tecnologia—FCT for funding support through the project UIDB 50006/2020.
Conflicts of Interest: The authors declare no conflict of interest.
References
1. Eskola, M.; Kos, G.; Elliott, C.T.; Hajšlová, J.; Mayar, S.; Krska, R. Worldwide contamination of food-cropswith mycotoxins: Validity of the widely cited ‘FAO estimate’ of 25%. Crit. Rev. Food Sci. Nutr. 2019, 0, 1–17.[CrossRef] [PubMed]
2. Soto, J.B.; Fernández-Franzón, M.; Ruiz, M.J.; Juan-García, A. Presence of ochratoxin a (OTA) mycotoxin inalcoholic drinks from southern european countries: Wine and beer. J. Agric. Food Chem. 2014, 62, 7643–7651.[CrossRef] [PubMed]
3. Malir, F.; Ostry, V.; Pfohl-Leszkowicz, A.; Malir, J.; Toman, J. Ochratoxin A: 50 years of research. Toxins 2016,8, 191. [CrossRef]
4. Duarte, S.C.; Pena, A.; Lino, C.M. Human ochratoxin A biomarkers-from exposure to effect. Crit. Rev. Toxicol.2011, 41, 187–212. [CrossRef] [PubMed]
5. Gifford, F.J.; Gifford, R.M.; Eddleston, M.; Dhaun, N. Endemic Nephropathy around the World. Kidney Int.Rep. 2017, 2, 282–292. [CrossRef] [PubMed]
6. Jadot, I.; Declèves, A.E.; Nortier, J.; Caron, N. An integrated view of aristolochic acid nephropathy: Updateof the literature. Int. J. Mol. Sci. 2017, 18, 297. [CrossRef] [PubMed]
7. Ostry, V.; Malir, F.; Toman, J.; Grosse, Y. Mycotoxins as human carcinogens—The IARC Monographsclassification. Mycotoxin Res. 2017, 33, 65–73. [CrossRef]
8. Aresta, A.; Palmisano, F.; Vatinno, R.; Zambonin, C.G. Ochratoxin A determination in beer by solid-phasemicroextraction coupled to liquid chromatography with fluorescence detection: A fast and sensitive methodfor assessment of noncompliance to legal limits. J. Agric. Food Chem. 2006, 54, 1594–1598. [CrossRef]
9. Juan, C.; Mañes, J.; Font, G.; Juan-García, A. Determination of mycotoxins in fruit berry by-products usingQuEChERS extraction method. LWT Food Sci. Technol. 2017, 86, 344–351. [CrossRef]
10. Juan, C.; Moltó, J.C.; Lino, C.M.; Mañes, J. Determination of ochratoxin A in organic and non-organic cerealsand cereal products from Spain and Portugal. Food Chem. 2008, 107, 525–530. [CrossRef]
11. Anli, E.; Alkis, I.M. Ochratoxin A and Brewing Technology: A Review. J. Inst. Brew. 2010, 116, 23–32.[CrossRef]
12. Beláková, S.; Benešová, K.; Mikulíková, R.; Svoboda, Z. Determination of ochratoxin A in brewing materialsand beer by ultra performance liquid chromatography with fluorescence detection. Food Chem. 2011, 126,321–325. [CrossRef]
13. Bertuzzi, T.; Rastelli, S.; Mulazzi, A.; Donadini, G.; Pietri, A. Mycotoxin occurrence in beer produced inseveral European countries. Food Control 2011, 22, 2059–2064. [CrossRef]
14. Kawashima, L.M.; Vieira, A.P.; Valente Soares, L.M. Fumonisin B 1 and ochratoxin A in beers made in BrazilFumonisina B 1 e ocratoxina A em cervejas fabricadas no Brasil. Ciência E Tecnol. Aliment. 2007, 27, 317–323.[CrossRef]
15. Medina, Á.; Jiménez, M.; Gimeno-Adelantado, J.V.; Valle-Algarra, F.M.; Mateo, R. Determination of ochratoxinA in beer marketed in Spain by liquid chromatography with fluorescence detection using lead hydroxyacetateas a clean-up agent. J. Chromatogr. A 2005, 1083, 7–13. [CrossRef] [PubMed]
16. Park, J.W.; Chung, S.H.; Kim, Y.B. Ochratoxin a in Korean food commodities: Occurrence and safetyevaluation. J. Agric. Food Chem. 2005, 53, 4637–4642. [CrossRef] [PubMed]
38
Toxins 2020, 12, 249
17. Tangni, E.K.; Ponchaut, S.; Maudoux, M.; Rozenberg, R.; Larondelle, Y. Ochratoxin A in domestic andimported beers in Belgium: Occurence and exposure assessment. Food Addit. Contam. 2002, 19, 1169–1179.[CrossRef]
18. Odhav, B.; Naicker, V. Mycotoxins in South African traditionally brewed beers. Food Addit. Contam. 2002, 19,55–61. [CrossRef]
19. Lhotská, I.; Šatínský, D.; Havlíková, L.; Solich, P. A fully automated and fast method using direct sampleinjection combined with fused-core column on-line SPE-HPLC for determination of ochratoxin A and citrininin lager beers. Anal. Bioanal. Chem. 2016, 408, 3319–3329. [CrossRef]
20. Rubert, J.; Soler, C.; Marín, R.; James, K.J.; Mañes, J. Mass spectrometry strategies for mycotoxins analysis inEuropean beers. Food Control 2013, 30, 122–128. [CrossRef]
21. Prelle, A.; Spadaro, D.; Denca, A.; Garibaldi, A.; Gullino, M.L. Comparison of clean-up methods for ochratoxina on wine, beer, roasted coffee and chili commercialized in Italy. Toxins 2013, 5, 1827–1844. [CrossRef][PubMed]
22. Mahdavi, R.; Khorrami, S.A.H.; Jabbari, V. Evaluation of ochratoxin A contamination in non alcoholic beersin Iran. Res. J. Biol. Sci. 2007, 2, 546–550.
23. Kabak, B. Ochratoxin A in cereal-derived products in Turkey: Occurrence and exposure assessment. FoodChem. Toxicol. 2009, 47, 348–352. [CrossRef] [PubMed]
24. Wu, J.; Tan, Y.; Wang, Y.; Xu, R. Occurrence of ochratoxin a in wine and beer samples from China. Food Addit.Contam. B Surveill. 2011, 4, 52–56. [CrossRef] [PubMed]
25. Tamura, M.; Uyama, A.; Mochizuki, N. Development of a Multi-mycotoxin Analysis in Beer-based Drinksby a Modified QuEChERS Method and Ultra-High-Performance Liquid Chromatography Coupled withTandem Mass Spectrometry. Anal. Sci. 2011, 27, 629–635. [CrossRef] [PubMed]
26. Reinsch, M.; Töpfer, A.; Lehmann, A.; Nehls, I.; Panne, U. Determination of ochratoxin A in beer byLC-MS/MS ion trap detection. Food Chem. 2007, 100, 312–317. [CrossRef]
27. Novo, P.; Moulas, G.; França Prazeres, D.M.; Chu, V.; Conde, J.P. Detection of ochratoxin A in wine and beerby chemiluminescence-based ELISA in microfluidics with integrated photodiodes. Sens. Actuators B Chem.2013, 176, 232–240. [CrossRef]
28. Ostry, V.; Malir, F.; Dofkova, M.; Skarkova, J.; Pfohl-Leszkowicz, A.; Ruprich, J. Ochratoxin a dietary exposureof ten population groups in the czech republic: Comparison with data over the world. Toxins 2015, 7,3608–3635. [CrossRef]
29. European Commission. Commission Regulation (EC) No 1881/2006. Off. J. Eur. Union 2006, 49, 5–24.30. EFSA. Opinion of the Scientific Panel on Contaminants in the food Chain on a Request from the Commission
Related to Ochratoxin A in Food. Efsa J. 2006, 365, 1–56. [CrossRef]31. European Commission. Commission Regulation (EC) No 401/2006 of 23 February 2006 laying down the
methods of sampling and analysis for the official control of the levels of mycotoxins in foodstuffs. Off. J. Eur.Union 2006, L70, 12–34.
32. Harcz, P.; Tangni, E.K.; Wilmart, O.; Moons, E.; Van Peteghem, C.; De Saeger, S.; Schneider, Y.J.; Larondelle, Y.;Pussemier, L. Intake of ochratoxin A and deoxynivalenol through beer consumption in Belgium. Food Addit.Contam. 2007, 24, 910–916. [CrossRef] [PubMed]
33. Pascari, X.; Ramos, A.J.; Marín, S.; Sanchís, V. Mycotoxins and beer. Impact of beer production process onmycotoxin contamination. A review. Food Res. Int. 2018, 103, 121–129. [CrossRef] [PubMed]
34. Mateo, R.; Medina, Á.; Mateo, E.M.; Mateo, F.; Jiménez, M. An overview of ochratoxin A in beer and wine.Int. J. Food Microbiol. 2007, 119, 79–83. [CrossRef] [PubMed]
35. Mastanjevic, K.; Šarkanj, B.; Krska, R.; Sulyok, M.; Warth, B.; Mastanjevic, K.; Šantek, B.; Krstanovic, V. Frommalt to wheat beer: A comprehensive multi-toxin screening, transfer assessment and its influence on basicfermentation parameters. Food Chem. 2018, 254, 115–121. [CrossRef]
36. Peters, J.; Van Dam, R.; Van Doorn, R.; Katerere, D.; Berthiller, F.; Haasnoot, W.; Nielen, M.W.F. Mycotoxinprofiling of 1000 beer samples with a special focus on craft beer. PLoS ONE 2017, 12, e0185887. [CrossRef]
37. Bertuzzi, T.; Rastelli, S.; Mulazzi, A.; Donadini, G.; Pietri, A. Known and Emerging Mycotoxins in Small- andLarge-Scale Brewed Beer. Beverages 2018, 4, 46. [CrossRef]
38. Silva, A.P.; Jager, G.; Zyl, H.; Van Voss, H.; Hogg, T.; Graaf, C.; De Patricia, A.; Jager, G.; Zyl, H.; Van Voss, H.Cheers, proost, saúde: Cultural, contextual and psychological factors of wine and beer consumption inPortugal and in the Netherlands. Crit. Rev. Food Sci. Nutr. 2017, 57, 1340–1349. [CrossRef]
39
Toxins 2020, 12, 249
39. The Brewers of Europe. The Contribution Made by Beer to the European Economy; The Brewers of Europe:Brussels, Belgium, 2016.
40. De Nijs, M.; Mengelers, M.J.B.; Boon, P.E.; Heyndrickx, E.; Hoogenboom, L.A.P.; Lopez, P.; Mol, H.G.J.Strategies for estimating human exposure to mycotoxins via food. World Mycotoxin J. 2016, 9, 831–845.[CrossRef]
41. Anselme, M.; Tangni, E.K.; Pussemier, L.; Motte, J.C.; Van Hove, F.; Schneider, Y.J.; Van Peteghem, C.;Larondelle, Y. Comparison of ochratoxin A and deoxynivalenol in organically and conventionally producedbeers sold on the Belgian market. Food Addit. Contam. 2006, 23, 910–918. [CrossRef]
42. IPCS. Dietary exposure assessment of chemicals in food. In Principles and Methods for the Risk Assessment ofChemicals in Food; International Programme on Chemical Safety; WHO: Geneve, Switzerland, 2009; p. 98.
43. INE Statistics Portugal. Balança Alimentar Portuguesa 2012–2016; INE Statistics Portugal: Lisbon,Portugal, 2017.
44. Arezes, P.M.; Barroso, M.P.; Cordeiro, P.; Costa, L.G.; Miguel, A.S. Estudo Antropométrico da PopulaçãoPortuguesa, 1st ed.; Instituto para a Segurança, Higiene e Saúde no Trabalho: Lisboa, Portugal, 2006.
© 2020 by the authors. Licensee MDPI, Basel, Switzerland. This article is an open accessarticle distributed under the terms and conditions of the Creative Commons Attribution(CC BY) license (http://creativecommons.org/licenses/by/4.0/).
40
toxins
Article
Using Cholinesterases and Immobilized LuminescentPhotobacteria for the Express-Analysis of Mycotoxins andEstimating the Efficiency of Their Enzymatic Hydrolysis
Elena Efremenko 1,2,*, Olga Maslova 1, Nikolay Stepanov 1,2 and Anvar Ismailov 3
���������������
Citation: Efremenko, E.; Maslova, O.;
Stepanov, N.; Ismailov, A. Using
Cholinesterases and Immobilized
Luminescent Photobacteria for the
Express-Analysis of Mycotoxins and
Estimating the Efficiency of Their
Enzymatic Hydrolysis. Toxins 2021,
13, 34. https://doi.org/10.3390/
toxins13010034
Received: 30 November 2020
Accepted: 4 January 2021
Published: 6 January 2021
Publisher’s Note: MDPI stays neu-
tral with regard to jurisdictional clai-
ms in published maps and institutio-
nal affiliations.
Copyright: © 2021 by the authors. Li-
censee MDPI, Basel, Switzerland.
This article is an open access article
distributed under the terms and con-
ditions of the Creative Commons At-
tribution (CC BY) license (https://
creativecommons.org/licenses/by/
4.0/).
1 Faculty of Chemistry, Lomonosov Moscow State University, Lenin Hills 1/3, 119991 Moscow, Russia;[email protected] (O.M.); [email protected] (N.S.)
2 N.M. Emanuel Institute of Biochemical Physics RAS, Kosigina str., 4, 119334 Moscow, Russia3 Faculty of Biology, Lomonosov Moscow State University, Lenin Hills 1/12, 119234 Moscow, Russia;
[email protected]* Correspondence: [email protected]; Tel.: +7-495-939-3170
Abstract: Novel sensitive analytical agents that can be used for simple, affordable, and rapid analysisof mycotoxins are urgently needed in scientific practice, especially for the screening of perspectivebio-destructors of the toxic contaminants. We compared the characteristics of a rapid quantitativeanalysis of different mycotoxins (deoxynivalenol, ochratoxin A, patulin, sterigmatocystin, and zear-alenone) using acetyl-, butyrylcholinesterases and photobacterial strains of luminescent cells inthe current study. The best bioindicators in terms of sensitivity and working range (μg/mL) weredetermined as follows: Photobacterium sp. 17 cells for analysis of deoxynivalenol (0.8–89) and patulin(0.2–32); Photobacterium sp. 9.2 cells for analysis of ochratoxin A (0.4–72) and zearalenone (0.2–32);acetylcholinesterase for analysis of sterigmatocystin (0.12–219). The cells were found to be moresensitive than enzymes. The assayed strains of photobacterial cells ensured 44%–83% lower limitof detection for deoxynivalenol and sterigmatocystin as compared to the previously known datafor immobilized luminescent cells, and the range of working concentrations was extended by afactor of 1.5–3.5. Calibration curves for the quantitative determination of patulin using immobi-lized photobacteria were presented in this work for the first time. This calibration was appliedto estimate the enzyme efficiency for hydrolyzing mycotoxins using zearalenone and His6-taggedorganophosphorus hydrolase as examples.
Keywords: mycotoxins; bioluminescent bacteria; immobilized cells; cholinesterase-based analysis;analytical characteristics; enzymatic detoxification
Key Contribution: The express-evaluation of enzymatic degradation efficiency of mycotoxins canbe undertaken using inhibition of activity of cholinesterases or bioluminescence of immobilizedphotobacterial cells. The comparison of bioanalytical characteristics of the express analysis of severalmycotoxins was performed.
1. Introduction
Studying mycotoxins is topical and relevant for ensuring food and biological safety [1–3].Analytical approaches to the detection and identification of mycotoxins [4] are beingactively developed, and so are strategies for mycotoxin control and detoxification [5–8].
These are currently the most actively pursued areas: (i) elucidating the mechanismsof toxic effects of mycotoxins on living organisms [5]; (ii) development and testing ofeffective selective and sensitive analytical methods for the detection of mycotoxins infood, agricultural feed, and raw materials for the pharmaceutical industry [9,10]; (iii)search for sorbents capable of removing mycotoxins from raw materials [11]; (iv) thesearch for new methods for the destruction of mycotoxins, especially those involving
Toxins 2021, 13, 34. https://doi.org/10.3390/toxins13010034 https://www.mdpi.com/journal/toxins
41
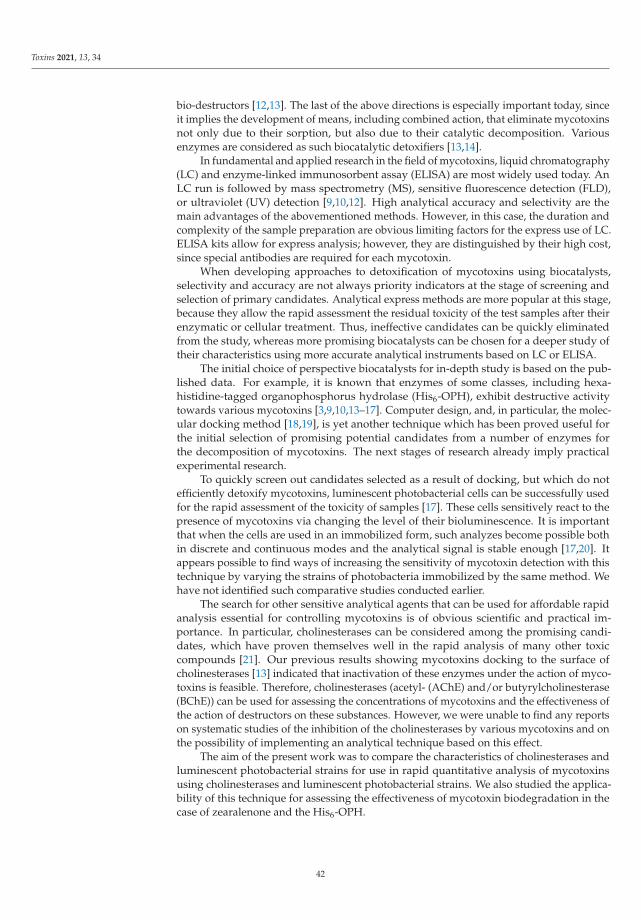
Toxins 2021, 13, 34
bio-destructors [12,13]. The last of the above directions is especially important today, sinceit implies the development of means, including combined action, that eliminate mycotoxinsnot only due to their sorption, but also due to their catalytic decomposition. Variousenzymes are considered as such biocatalytic detoxifiers [13,14].
In fundamental and applied research in the field of mycotoxins, liquid chromatography(LC) and enzyme-linked immunosorbent assay (ELISA) are most widely used today. AnLC run is followed by mass spectrometry (MS), sensitive fluorescence detection (FLD),or ultraviolet (UV) detection [9,10,12]. High analytical accuracy and selectivity are themain advantages of the abovementioned methods. However, in this case, the duration andcomplexity of the sample preparation are obvious limiting factors for the express use of LC.ELISA kits allow for express analysis; however, they are distinguished by their high cost,since special antibodies are required for each mycotoxin.
When developing approaches to detoxification of mycotoxins using biocatalysts,selectivity and accuracy are not always priority indicators at the stage of screening andselection of primary candidates. Analytical express methods are more popular at this stage,because they allow the rapid assessment the residual toxicity of the test samples after theirenzymatic or cellular treatment. Thus, ineffective candidates can be quickly eliminatedfrom the study, whereas more promising biocatalysts can be chosen for a deeper study oftheir characteristics using more accurate analytical instruments based on LC or ELISA.
The initial choice of perspective biocatalysts for in-depth study is based on the pub-lished data. For example, it is known that enzymes of some classes, including hexa-histidine-tagged organophosphorus hydrolase (His6-OPH), exhibit destructive activitytowards various mycotoxins [3,9,10,13–17]. Computer design, and, in particular, the molec-ular docking method [18,19], is yet another technique which has been proved useful forthe initial selection of promising potential candidates from a number of enzymes forthe decomposition of mycotoxins. The next stages of research already imply practicalexperimental research.
To quickly screen out candidates selected as a result of docking, but which do notefficiently detoxify mycotoxins, luminescent photobacterial cells can be successfully usedfor the rapid assessment of the toxicity of samples [17]. These cells sensitively react to thepresence of mycotoxins via changing the level of their bioluminescence. It is importantthat when the cells are used in an immobilized form, such analyzes become possible bothin discrete and continuous modes and the analytical signal is stable enough [17,20]. Itappears possible to find ways of increasing the sensitivity of mycotoxin detection with thistechnique by varying the strains of photobacteria immobilized by the same method. Wehave not identified such comparative studies conducted earlier.
The search for other sensitive analytical agents that can be used for affordable rapidanalysis essential for controlling mycotoxins is of obvious scientific and practical im-portance. In particular, cholinesterases can be considered among the promising candi-dates, which have proven themselves well in the rapid analysis of many other toxiccompounds [21]. Our previous results showing mycotoxins docking to the surface ofcholinesterases [13] indicated that inactivation of these enzymes under the action of myco-toxins is feasible. Therefore, cholinesterases (acetyl- (AChE) and/or butyrylcholinesterase(BChE)) can be used for assessing the concentrations of mycotoxins and the effectiveness ofthe action of destructors on these substances. However, we were unable to find any reportson systematic studies of the inhibition of the cholinesterases by various mycotoxins and onthe possibility of implementing an analytical technique based on this effect.
The aim of the present work was to compare the characteristics of cholinesterases andluminescent photobacterial strains for use in rapid quantitative analysis of mycotoxinsusing cholinesterases and luminescent photobacterial strains. We also studied the applica-bility of this technique for assessing the effectiveness of mycotoxin biodegradation in thecase of zearalenone and the His6-OPH.
42
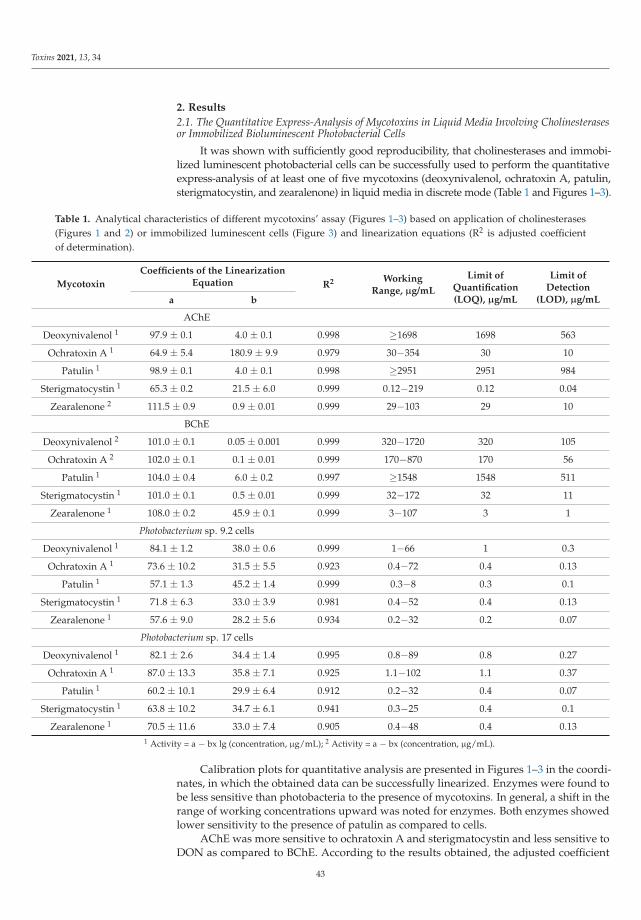
Toxins 2021, 13, 34
2. Results
2.1. The Quantitative Express-Analysis of Mycotoxins in Liquid Media Involving Cholinesterasesor Immobilized Bioluminescent Photobacterial Cells
It was shown with sufficiently good reproducibility, that cholinesterases and immobi-lized luminescent photobacterial cells can be successfully used to perform the quantitativeexpress-analysis of at least one of five mycotoxins (deoxynivalenol, ochratoxin A, patulin,sterigmatocystin, and zearalenone) in liquid media in discrete mode (Table 1 and Figures 1–3).
Table 1. Analytical characteristics of different mycotoxins’ assay (Figures 1–3) based on application of cholinesterases(Figures 1 and 2) or immobilized luminescent cells (Figure 3) and linearization equations (R2 is adjusted coefficientof determination).
Mycotoxin
Coefficients of the LinearizationEquation R2 Working
Range, μg/mL
Limit ofQuantification(LOQ), μg/mL
Limit ofDetection
(LOD), μg/mLa b
AChE
Deoxynivalenol 1 97.9 ± 0.1 4.0 ± 0.1 0.998 ≥1698 1698 563
Ochratoxin A 1 64.9 ± 5.4 180.9 ± 9.9 0.979 30−354 30 10
Patulin 1 98.9 ± 0.1 4.0 ± 0.1 0.998 ≥2951 2951 984
Sterigmatocystin 1 65.3 ± 0.2 21.5 ± 6.0 0.999 0.12−219 0.12 0.04
Zearalenone 2 111.5 ± 0.9 0.9 ± 0.01 0.999 29−103 29 10
BChE
Deoxynivalenol 2 101.0 ± 0.1 0.05 ± 0.001 0.999 320−1720 320 105
Ochratoxin A 2 102.0 ± 0.1 0.1 ± 0.01 0.999 170−870 170 56
Patulin 1 104.0 ± 0.4 6.0 ± 0.2 0.997 ≥1548 1548 511
Sterigmatocystin 1 101.0 ± 0.1 0.5 ± 0.01 0.999 32−172 32 11
Zearalenone 1 108.0 ± 0.2 45.9 ± 0.1 0.999 3−107 3 1
Photobacterium sp. 9.2 cells
Deoxynivalenol 1 84.1 ± 1.2 38.0 ± 0.6 0.999 1−66 1 0.3
Ochratoxin A 1 73.6 ± 10.2 31.5 ± 5.5 0.923 0.4−72 0.4 0.13
Patulin 1 57.1 ± 1.3 45.2 ± 1.4 0.999 0.3−8 0.3 0.1
Sterigmatocystin 1 71.8 ± 6.3 33.0 ± 3.9 0.981 0.4−52 0.4 0.13
Zearalenone 1 57.6 ± 9.0 28.2 ± 5.6 0.934 0.2−32 0.2 0.07
Photobacterium sp. 17 cells
Deoxynivalenol 1 82.1 ± 2.6 34.4 ± 1.4 0.995 0.8−89 0.8 0.27
Ochratoxin A 1 87.0 ± 13.3 35.8 ± 7.1 0.925 1.1−102 1.1 0.37
Patulin 1 60.2 ± 10.1 29.9 ± 6.4 0.912 0.2−32 0.4 0.07
Sterigmatocystin 1 63.8 ± 10.2 34.7 ± 6.1 0.941 0.3−25 0.4 0.1
Zearalenone 1 70.5 ± 11.6 33.0 ± 7.4 0.905 0.4−48 0.4 0.131 Activity = a − bx lg (concentration, μg/mL); 2 Activity = a − bx (concentration, μg/mL).
Calibration plots for quantitative analysis are presented in Figures 1–3 in the coordi-nates, in which the obtained data can be successfully linearized. Enzymes were found tobe less sensitive than photobacteria to the presence of mycotoxins. In general, a shift in therange of working concentrations upward was noted for enzymes. Both enzymes showedlower sensitivity to the presence of patulin as compared to cells.
AChE was more sensitive to ochratoxin A and sterigmatocystin and less sensitive toDON as compared to BChE. According to the results obtained, the adjusted coefficient
43
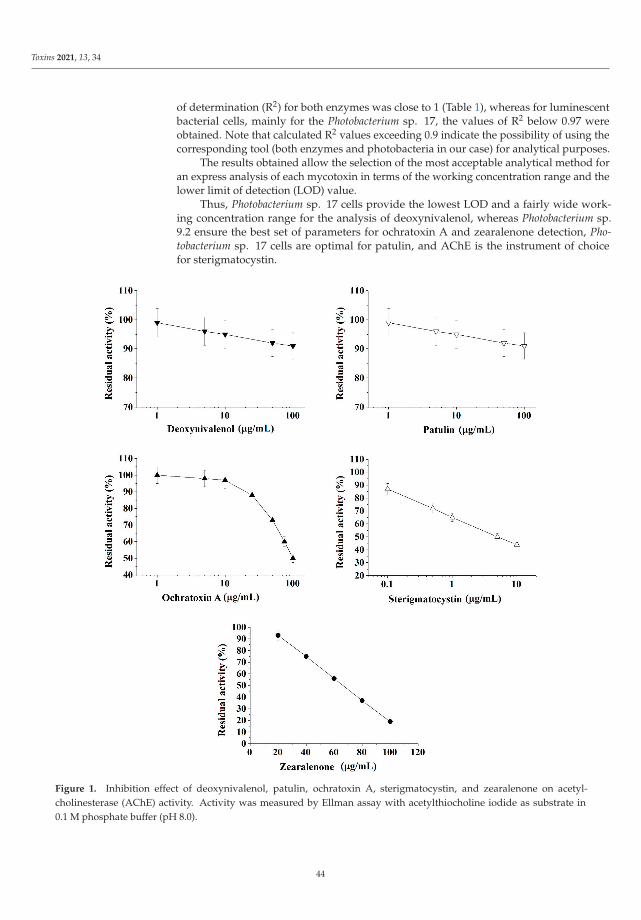
Toxins 2021, 13, 34
of determination (R2) for both enzymes was close to 1 (Table 1), whereas for luminescentbacterial cells, mainly for the Photobacterium sp. 17, the values of R2 below 0.97 wereobtained. Note that calculated R2 values exceeding 0.9 indicate the possibility of using thecorresponding tool (both enzymes and photobacteria in our case) for analytical purposes.
The results obtained allow the selection of the most acceptable analytical method foran express analysis of each mycotoxin in terms of the working concentration range and thelower limit of detection (LOD) value.
Thus, Photobacterium sp. 17 cells provide the lowest LOD and a fairly wide work-ing concentration range for the analysis of deoxynivalenol, whereas Photobacterium sp.9.2 ensure the best set of parameters for ochratoxin A and zearalenone detection, Pho-tobacterium sp. 17 cells are optimal for patulin, and AChE is the instrument of choicefor sterigmatocystin.
Figure 1. Inhibition effect of deoxynivalenol, patulin, ochratoxin A, sterigmatocystin, and zearalenone on acetyl-cholinesterase (AChE) activity. Activity was measured by Ellman assay with acetylthiocholine iodide as substrate in0.1 M phosphate buffer (pH 8.0).
44
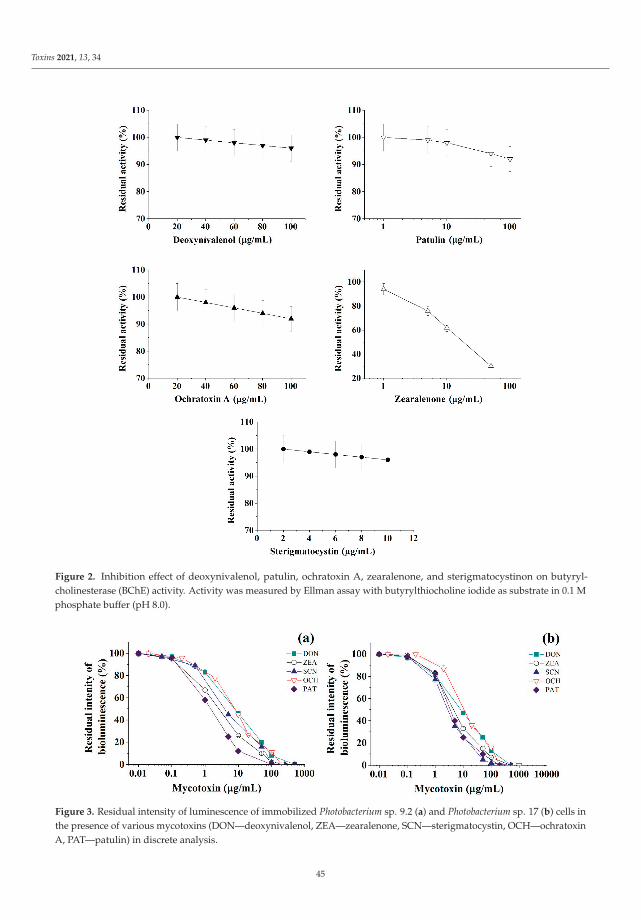
Toxins 2021, 13, 34
Figure 2. Inhibition effect of deoxynivalenol, patulin, ochratoxin A, zearalenone, and sterigmatocystinon on butyryl-cholinesterase (BChE) activity. Activity was measured by Ellman assay with butyrylthiocholine iodide as substrate in 0.1 Mphosphate buffer (pH 8.0).
Figure 3. Residual intensity of luminescence of immobilized Photobacterium sp. 9.2 (a) and Photobacterium sp. 17 (b) cells inthe presence of various mycotoxins (DON—deoxynivalenol, ZEA—zearalenone, SCN—sterigmatocystin, OCH—ochratoxinA, PAT—patulin) in discrete analysis.
45
Toxins 2021, 13, 34
2.2. Assessment of Toxicity of the Reaction Medium Obtained after Hydrolysis of Zearalenone byHis6-OPH in the Media with Different pH
Using acetyl-cholinesterases, photobacterial cells, and ELISA Test Kit as analyticaltools, we have proven the possibility of zearalenone destruction under the action of His6-OPH in a liquid medium at different pH values at an initial mycotoxin concentration of65 ± 3 μg/mL (Table 2). The results of this study agree with those we obtained earlier [17].It was noted that the low sensitivity of enzymes allowed the detection of only the initialconcentration of mycotoxin in the test solution. The residual concentration of zearalenoneafter the action of His6-OPH in the case of enzymatic analytical agents could only bedetermined using BChE for a sample with pH 7.4 (Table 2). Photobacterial cells, however,ensured accuracy high enough to reliably assess the degree of zearalenone destructionunder the action of His6-OPH for different medium pH values. The accuracy of mycotoxindetection with photobacteria was in fact found to be at least as high as that ensured withthe ELISA Test Kit.
Table 2. The residual zearalenone concentrations in the media with hexa-histidine-tagged organophosphorus hydrolase(His6-OPH) after 1 h of enzymatic treatment. The initial zearalenone concentration was 65 ± 3 μg/mL.
Analytical Method *Zearalenone, μg/mL * DH, %
ReferencepH 7.4 pH 8.5 pH 8.5
BChE 3.8 ± 0.1 - - This workPhotobacterium sp. 9.2 4.3 ± 0.1 0.67 ± 0.03 98.8 ± 0.9 This workPhotobacterium sp. 17 4.5 ± 0.1 0.63 ± 0.03 99.0 ± 0.9 This work
MaxSignal® Zearalenone ELISA Test Kit3.8 ± 0.1 0.58 ± 0.02 99.1 ± 0.9 This work3.9 ± 0.2 - - [17]
Photobacterium phosphoreum B-1717 4.1 ± 0.2 - - [17]
* DH is the degree of zearalenone hydrolysis = the percentage of the hydrolyzed zearalenone concentration in relation to its initial level; -:samples were not analyzed.
2.3. Zearalenone Biodegradation in Feed Grain Mixture under the Action of the Enzyme His6-OPH
In a model experiment using enzymes, photobacterial cells, and ELISA Test Kit asanalytical agents, it was possible for the first time to assess detoxification of food rawmaterials (feed grain mixture) initially contaminated with zearalenone at a concentrationof 10 mg/kg. Feed was treated with His6-OPH enzyme to push the toxin concentrationbelow the levels specified in the generally accepted quality standards, so that the resultingcontaminant concentration was below 1 mg/kg (Table 3).
Table 3. Residual concentrations of zearalenone in the feed grain mixture (initial contamination of feed grain mixture byzearalenone was 10 mg/kg) after its treatment with enzyme His6-OPH (ED) during 12 h and without it (NE).
Analytical MethodZearalenone, mg/kg Feed
* R, % ** D, %NE ED
BChE 8.5 ± 0.3 *** 85 ± 4 ***Photobacterium sp. 9.2 8.1 ± 0.3 0.82 ± 0.04 81 ± 4 89.9 ± 4.1Photobacterium sp. 17 8.2 ± 0.3 0.85 ± 0.05 82 ± 4 89.6 ± 4.2
MaxSignal® Zearalenone ELISA Test Kit 7.9 ± 0.3 0.77 ± 0.03 79 ± 4 90.3 ± 4.1
* R is the degree of zearalenone recovery; the percentage of the NE zearalenone concentration to its initial concentration; ** D is the levelof zearalenone detoxification in feed; the percentage of the change in zearalenone concentration in feed grain mixture as the result ofenzymatic destruction (NE-ED) to the non-enzymatic degradation (NE); *** There was no inhibition of BChE activity.
In the case of enzymatic analytical agents, only BChE allowed the determination ofthe concentration of zearalenone in the analytical sample of the raw material with themaximum concentration of zearalenone (Table 3). The use of biological analytical agentsresulted in slightly higher values of toxicant concentration than in case of using the ELISATest Kit. This was probably due to the presence of substances other than zearalenone,which reduce the activity of enzymes in the analytical samples. These substances could
46
Toxins 2021, 13, 34
have originated from the feedstock and been transferred together with zearalenone duringthe extraction stage. It is important that the calculated detoxification degree was similar inthe case of photobacterial cells and ELISA Test Kit (Table 3).
Thus, photobacteria can be efficiently used as analytical agents for evaluating thedetoxification of real raw materials. They can greatly facilitate the search for bio-destructorsof any target mycotoxin, as well as the assessment of the efficiency of detoxificationusing various biological agents. It was shown that an acetonitrile-based extractant canbe recommended for the extraction of zearalenone from the feedstock during samplepreparation. This extractant provides a high degree of recovery of this toxicant (Table 3),which is consistent with the previously published data [22,23].
3. Discussion
The development of new express analytical methods that could reduce the time andcost of research is very topical. Novel efficient techniques are urgently needed both forselecting the potential bio-destructors of mycotoxins and for assessing the effectiveness oftheir action under various conditions. It was shown that cholinesterases and immobilizedluminescent cells of photobacteria give a stable analytical signal in the presence of commonmycotoxins (Table 1).
The key points for choosing a biological analytical agent for the determination ofmycotoxins are LOD and working range. The availability of equipment, the duration of theanalysis, the volume of the sample, the need to use additional reagents, and the range ofanalyzed mycotoxins should also be taken into account. The duration of the analysis (withcalibration graph available) was ca. 2–5 min in the case of using enzymes in this work, and30 min in that of photobacterial cells.
The volume of mycotoxin-containing sample sufficient for the contaminant determina-tion was 10 μL and 4 μL in the cases of cholinesterases or luminescent bacteria, respectively.The analysis of mycotoxins was carried out using generally available laboratory equipment:a spectrophotometer (in the case of enzymes) or a luminometer (in the case of photobacte-ria). In contrast to the case of luminescent bacteria, the enzyme-based analysis required theuse of additional reagents: acetylthiocholine iodide or butyryl-thiocholine iodide was usedas substrate and 5,5′-dithiobis-(2-nitrobenzoic acid) was used as indicator.
The enzymes were found to be less sensitive to the presence of mycotoxins in the ana-lyzed samples. This was probably due to the fact that in the luminescent cells, in additionto the main analytical luminescent system, there is a large number of interconnected enzy-matic systems that are sensitive to the toxicant. Thus, in general, under the conditions ofthe experiments, the enzymatic analytical systems based on AChE and BChE are somewhatinferior in terms of significant parameters to the cells of photobacteria (Table 1).
Among the studied bacterial strains, despite the high degree of phylogenetic homol-ogy, the best analytical characteristics corresponded to Photobacterium sp. 9.2 cells (Table 1).The luminescent Photobacterium sp. 9.2 and Photobacterium sp. 17 cells ensured 44%–83%lower LOD values for zearalenone determination compared to the case of Photobacteriumphosphoreum B-1717 [17], and for deoxynivalenol and sterigmatocystin the range of workingconcentrations was 1.5–3.5 times greater in this study. Calibration curves for the quanti-tative determination of patulin by using photobacterial cells immobilized in poly(vinylalcohol) cryogel are presented in this work for the first time (Table 1).
The use of the studied biological analytical agents (enzymes and cells) specifically forthe direct quantitative determination of mycotoxins in feed is most likely to be inappropri-ate. The reason is that the solvents that are used to extract mycotoxins into an analyticalsample and ensure a high degree of contaminant recovery can themselves be toxic toliving cells and enzymes. For an accurate quantitative analysis, in this case, complexsample preparation and standardization for the secondary toxicant are required; in thiscase, preference is given to liquid chromatography and ELISA [10].
It was shown in this work that the most expedient way to use the photobacteria is theexpress analysis of mycotoxins, which is an important stage in the assessment of the degree
47
Toxins 2021, 13, 34
of detoxification of analytical samples due to the destruction of mycotoxins. The analyticalsamples often contain component toxic to cells other than mycotoxin, e.g., methanol oracetonitrile which are commonly used as extractants-solvents of mycotoxins. In this case itis necessary to account for these additional toxicants when carrying out the calculations,e.g., by appropriate normalization, which was also done in this work.
Despite their somewhat lower sensitivity, enzymes could be used in searching foreffective bio-destructors of some mycotoxins. In this case the destruction products are themost predictable, and additional agents can be introduced (if necessary) into the reactionsystem for directed detoxification of the toxic intermediates of enzymatic mycotoxins’decomposition [5].
The expediency of using the His6-OPH for the destruction of lactone-containing my-cotoxins, like zearalenone, was confirmed in the work (Tables 2 and 3). Using immobilizedcells of photobacteria as analytical agents, it was shown for the first time that a shift in thepH of the medium from 7.4 to 8.5 when using His6-OPH makes it possible to improve thedegree of zearalenone destruction from 93%–94% to 98%–99% (Table 2).
In general, the results obtained are consistent with the literature data on the relativelyhigh hydrolytic activity of lactonases in relation to zearalenone in neutral and slightlyalkaline media [17]; the catalytic activity of the enzyme decreases when the pH is low-ered [12,18]. The established regularity, allows us to draw certain conclusions about theprospects of creating food supplements based on His6-OPH. The controlled release of thisenzyme in the digestive system in the areas with alkaline pH values can ensure efficientdecomposition of mycotoxins that enter the body of animals with nutrition under the actionof His6-OPH. His6-OPH can be potentially introduced into the feed contaminated withzearalenone, as in the case of recombinant lactonohydrolase [12], for mycotoxin detoxifica-tion. Additionally, using His6-OPH in a medium at pH 8.5 provided up to five times fasterdegradation of zearalenone as compared to recombinant lactonohydrolase expressed inPenicillium canescence. This was also demonstrated in this work for the first time.
There is a general consensus that bioanalytical agents such as cholinesterases and pho-tobacterial cells are not selective in their inhibition reactions with various toxins. However,in this work, some obvious preferences were found for bacterial strains, possessing closephylogenetic relations, and cholinesterases in reactions with the same mycotoxins. Thebest bioindicators in terms of sensitivity and working range (μg /mL) were determinedas follows: Photobacterium sp. 17 cells for analysis of deoxynivalenol (0.8–89) and patulin(0.2–32); Photobacterium sp. 9.2 cells-for analysis of ochratoxin A (0.4–72) and zearalenone(0.2–32); AChE for analysis of sterigmatocystin (0.12–219). Cholinesterases were found tobe less sensitive than cells. Calibrations for quantitative determination of patulin usingimmobilized photobacteria are presented in this work for the first time.
Generally, the use of luminescent cells can significantly reduce the time and financialcosts when conducting primary evaluative analyzes of the mycotoxin content in sam-ples during laboratory studies. The efficiency of enzymatic destructors in reactions withmycotoxins can be adequately evaluated using simple equipment and a well-known ap-proach. The information obtained regarding the preferences of bioanalytical agents usedfor the analysis of a particular mycotoxin will be useful for those researchers who areengaged in the scientific search for bio-destructors of mycotoxins, and simplifies theirlaboratory screening.
4. Materials and Methods
4.1. Chemicals and Strains
Mycotoxins (ochratoxin A, sterigmatocystin, zearalenone, deoxynivalenol, and pat-ulin); cholinesterase enzymes (AChE and BChE); 5,5′-dithiobis (2-nitrobenzoic acid),acetylthiocholine iodide, and butyrylthiocholine iodide were purchased from Sigma-Aldrich (St. Louis, MO, USA). For the experiments, concentrated solutions of mycotoxinsin methanol were preliminarily prepared. Solutions of mycotoxins of the required concen-tration were prepared by diluting the original stock solutions of mycotoxins in methanol.
48
Toxins 2021, 13, 34
In the analysis, the quenching of the bioluminescence of the immobilized luminous bacteriaunder the action of the methanol present in the reaction medium was taken into account.Poly(vinyl alcohol) 16/1 (M.w. 84 kDa) was purchased from Sinopec Corp (Beijing, China);peptone and yeast extract were purchased from Difco (Becton, Dickinson and Company,Franklin Lakes, NJ, USA); inorganic salts for Farghaly growth medium and other reagentswere purchased from Chimmed (Moscow, Russia). Photobacterium sp. 9.2 and Photobac-terium sp. 17 were provided by A.D. Ismailov (Lomonosov Moscow State University,Moscow, Russia).
4.2. Growth Cells Conditions, Immobilization and Luminescence Measurements
Phosphoreum sp. cells were grown in the Farghaly growth medium and maintainedin a submerged culture at 18 ◦C at 60 rpm (IRC-1-U temperature-controlled shaker, AdolfKuhner AG Apparatebau, Switzerland). The optical density of the culture medium wasdetermined by spectrophotometry at 660 nm (Agilent UV-853 spectrophotometer, AgilentTechnologies, Waldbronn, Germany), and the cells were cultivated for 22 h to an opticaldensity of 0.73 ± 0.05, separated from the culture medium by centrifugation (5000 rpm,15 min, J2 21 centrifuge, Beckman, Brea, CA, USA), and cell biomass used in the immobi-lization procedure. The procedure for immobilizing the bioluminescent cells in poly (vinylalcohol) (PVA) cryogel was described previously [20]. The cell biomass was mixed witha 10% (w/v) aqueous PVA solution to obtain a 10% (w/w) concentration of bacterial cells.This mixture was pipetted into 96-well microplates (0.2 mL/well), which were placed in afreezer at −20 ◦C for 24 h and then thawed at +4 ◦C. The cylinder granules of PVA cryogel(d = 6.6 ± 0.1 mm, h = 4.8 ± 0.1 mm) formed in this way contained cells immobilized byinclusion. The average wet weight of one granule was 0.172 ± 0.001 g.
Luminescence of immobilized bacteria was measured using a 3560 microluminometer(New Horizons Diagnostics Co, Columbia, MD, USA). Luminescence detection was per-formed in aqueous media based on a 2% NaCl solution at 10 ± 1 ◦C. The maximum levelof luminescence (I0) was determined for 10 s at 10 ◦C after thermal equilibration of theflow-through system. For practical purposes, the residual intensity of luminescence wasused (I/I0), which was expressed as a percentage of the baseline signal (I0). The residualintensity of luminescence (I/I0) was analyzed in a discrete test after the exposure of thecells to a certain mycotoxin for 0.5 h after its addition to medium containing the analyticalagent. The assays were performed in triplicate.
4.3. Mycotoxins Analyses with Cholinesterase Enzymes (AChE and BChE)
The activity of cholinesterases was determined using the Ellman method [24]. Briefly,0.96 mL of 0.1 M phosphate buffer (pH 8.0) in a spectrophotometric cell was supplementedwith 10 μL of 20 mM 5,5′-dithiobis (2-nitrobenzoic acid) in a 0.1 M phosphate buffer(pH 7.0), containing 1.5 g/L Na2CO3. Then, 10 μL of 0.01 mg/mL AChE or 0.2 mg/mLBChE followed by a 10 μL of 0–10 mg/mL mycotoxin in methanol or ethanol was added andvigorously mixed. Reaction was initiated by addition of 10 μL of 50 mM acetylthiocholineiodide or 200 mM butyrylthiocholine iodide for AChE or BChE, respectively.
The rate of formation of 2-nitro-5-thiobenzoic acid at λ = 412 nm was determinedusing the Agilent 8453 UV-visible spectroscopy system (Agilent Technologies, Waldbronn,Germany). All enzymes, substrates, mycotoxins, and other reagents were freshly preparedbefore use.
Enzyme activity without any toxins or solvents was monitored, and results wereadjusted accordingly. One unit of AChE or BChE activity was defined as the enzymeamount that hydrolyzed 1 μmol of substrate per min at 25 ◦C. The experiments wererealized in triplicate.
4.4. Hydrolysis of Zearalenone in Medium with Different pH under the Action of the His6-OPH
For the experiment, the initial concentration of zearalenone in the reaction mediumbased on phosphate buffer (pH 7.4 or 8.5) was 65 ± 3 mg/L. The initial toxicity of this
49
Toxins 2021, 13, 34
solution was evaluated under the conditions indicated above. The solution of the His6-OPH(0.1 mg/mL) with an activity of 200 U/mL was added to zearalenone solution.
The treatment of the mycotoxin was carried out for 1 h at room temperature withoutagitation, and the residual toxicity of the obtained solution was verified using immobilizedluminescent cells or cholinesterases in a discrete mode of analysis (Table 2).
4.5. Hydrolysis of Zearalenone in Feed Grain Mixture under the Action of the His6-OPH
Using 0.1 M phosphate buffer (pH 7.5), a solution of zearalenone with concentration2 g/L was prepared from its concentrated methanol stock solution. The preparation wasinjected (in the form of a spray) into the feed grain mixture for rats using Classic TiTBiT(Dmitrov, Moscow Region, Russia) at the rate of 10 mg of zearalenone per 1 kg of grainmixture. After that, one half of the grain mixture containing zearalenone was sprayed witha solution of His6-OPH, prepared based on 0.1 M phosphate buffer (pH 7.5), at a dose of4000 U/kg of the grain mixture, after which the mixture was mechanically stirred and keptfor 12 h at 25 ◦C.
The procedure for enzyme production and purification was detailed previously [25].The activity of His6-OPH was determined as described previously [26], with 7.8 mMaqueous Paraoxon stock solution at 405 nm using the Agilent 8453 UV-visible spec-troscopy system (Agilent Technology, Waldbronn, Germany) equipped with a thermostatedanalytical cell.
After 12 h, the zearalenone concentration was determined in the feed samples withzearalenone, pretreated with the enzyme or without the pretreatment, as well as in thecontrol sample, without any additives. 15 g of each feed grain mixture sample was groundinto powder in a laboratory mill and was subject to triple extraction with 40 mL of 84%acetonitrile aqueous solution (v/v) by mechanical shaker for 15 min. Fractions obtainedfrom each sample were pooled. Then the extract was filtered through paper filters andevaporated to dryness under nitrogen flow. The obtained weighed portion was dissolved in300 μL of methanol. A total of three samples of methanol stock solution from grain mixturesamples were obtained (Table 3). Next, the required dilution of samples was carried outusing aqueous buffer solutions to a methanol content of no more than 2%–4%, and theconcentration of zearalenone in the samples was determined using cholinesterase enzymes,luminescent cells, or ELISA kit (Table 3).
4.6. Determination of Zearalenone by Enzyme-Linked Immunosorbent Assay (ELISA) Test Kit
Analyses were carried out using MaxSignal® Zearalenone ELISA Test Kit (Bio ScientificCorp, Austin, TX, USA) with sensitivity 0.3 ng/mL Samples were prepared according tothe instructions provided by the manufacturers of the ELISA kits. Optical density wasmeasured at 450 nm using a microplate reader iMark (Bio-Rad Laboratories, Inc., Hercules,CA, USA).
4.7. Calculations
The data were linearized in various plots with OriginPro (ver. 9.4.2, OriginLab Corpo-ration, Northhampton, MA, USA) and the most suitable coordinates were selected. Thelimit of detection (LOD) and limit of quantification (LOQ) for enzymes and photobacterialcells were calculated as a minimal mycotoxin concentration which is distinguishable fromthe blank measurement (i.e., enzymes or cells without inhibitors) by more than three sigmasand ten sigmas (standard deviation, σ) in at least, six independent measurements), respec-tively. All measurements with MaxSignal® Zearalenone ELISA Test Kit were repeated threetimes, and the results were analyzed with the Microplate Manager® 6, version 6.3.
The data are presented as means ± standard deviation (±σ) unless otherwise stated.
5. Patents
RU Patent #2394910 Luminescent biocatalyst for the determination of toxicants.
50
Toxins 2021, 13, 34
RU Patent #2255975 Recombinant plasmid DNA pTES-His-OPH and producer ofoligo-histidine containing organophosphate hydrolase.
Author Contributions: Conceptualization, E.E.; methodology, E.E., A.I.; validation, O.M. and N.S.;formal analysis, O.M.; investigation, O.M. and N.S.; data curation, N.S.; writing—original draft prepa-ration, O.M. and N.S.; writing—review and editing, E.E.; visualization, O.M. and N.S.; supervision,E.E.; project administration, E.E.; funding acquisition, E.E. All authors have read and agreed to thepublished version of the manuscript.
Funding: This work was financially supported by Russian Science Foundation (grant 16-14-00061).
Institutional Review Board Statement: Not applicable.
Informed Consent Statement: Not applicable.
Data Availability Statement: The data presented in this study are available in this article.
Acknowledgments: This research was performed according to the Development program of theInterdisciplinary Scientific and Educational School of Lomonosov Moscow State University “Thefuture of the planet and global environmental change”. The authors thank Ilya Lyagin (ChemistryFaculty, Lomonosov MSU, Moscow, Russia) for his valuable comments on calibration plots obtainedwith cholinesterases.
Conflicts of Interest: The authors declare no conflict of interest E.E. and A.I. are co-inventors andpatent holders of the RU patent #2394910; E.E. is inventor of RU patent #2255975 which involvesproducer of His6-OPH and the plasmid with gene encoding synthesis of the enzyme as a baseactive compound.
References
1. Kluczkovski, A.M. Fungal and mycotoxin problems in the nut industry. Curr. Opin. Food Sci. 2019, 29, 56–63. [CrossRef]2. Janik, E.; Niemcewicz, M.; Ceremuga, M.; Stela, M.; Saluk-Bijak, J.; Siadkowski, A.; Bijak, M. Molecular aspects of mycotoxins—A
serious problem for human health. Int. J. Mol. Sci. 2020, 21, 8187. [CrossRef] [PubMed]3. Mamo, F.T.; Abate, B.A.; Tesfaye, K.; Nie, C.; Wang, G.; Liu, Y. Mycotoxins in Ethiopia: A review on prevalence, economic and
health impacts. Toxins 2020, 12, 648. [CrossRef] [PubMed]4. Kunz, B.M.; Wanko, F.; Kemmlein, S.; Bahlmann, A.; Rohn, S.; Maul, R. Development of a rapid multi-mycotoxin LC-MS/MS
stable isotope dilution analysis for grain legumes and its application on 66 market samples. Food Control 2020, 109, 106949.[CrossRef]
5. Tran, V.N.; Viktorová, J.; Ruml, T. Mycotoxins: Biotransformation and bioavailability assessment using caco-2 cell monolayer.Toxins 2020, 12, 628. [CrossRef]
6. Agriopoulou, S.; Stamatelopoulou, E.; Varzakas, T. Advances in occurrence, importance, and mycotoxin control strategies:Prevention and detoxification in foods. Foods 2020, 9, 137. [CrossRef]
7. Li, P.; Su, R.; Yin, R.; Lai, D.; Wang, M.; Liu, Y.; Zhou, L. Detoxification of mycotoxins through biotransformation. Toxins 2020, 12,121. [CrossRef]
8. Adebiyi, J.A.; Kayitesi, E.; Adebo, O.A.; Changwa, R.; Njobeh, P.B. Food fermentation and mycotoxin detoxification: An Africanperspective. Food Control 2019, 106, 106731. [CrossRef]
9. Narváez, A.; Rodríguez-Carrasco, Y.; Castaldo, L.; Izzo, L.; Ritieni, A. Ultra-high-performance liquid chromatography coupledwith quadrupole Orbitrap high-resolution mass spectrometry for multi-residue analysis of mycotoxins and pesticides in botanicalnutraceuticals. Toxins 2020, 12, 114. [CrossRef]
10. Wu, Y.; Yu, J.; Li, F.; Li, J.; Shen, Z. A calibration curve implanted enzyme-linked immunosorbent assay for simultaneouslyquantitative determination of multiplex mycotoxins in cereal samples, soybean and peanut. Toxins 2020, 12, 718. [CrossRef]
11. Lucci, P.; David, S.; Conchione, C.; Milani, A.; Moret, S.; Pacetti, D.; Conte, L. Molecularly imprinted polymer as selective sorbentfor the extraction of zearalenone in edible vegetable oils. Foods 2020, 9, 1439. [CrossRef] [PubMed]
12. Shcherbakova, L.; Rozhkova, A.; Osipov, D.; Zorov, I.; Mikityuk, O.; Statsyuk, N.; Sinitsyna, O.; Dzhavakhiya, V.; Sinitsyn, A.Effective zearalenone degradation in model solutions and infected wheat grain using a novel heterologous lactonohydrolasesecreted by recombinant Penicillium canescens. Toxins 2020, 12, 475. [CrossRef] [PubMed]
13. Lyagin, I.; Efremenko, E. Enzymes for detoxification of various mycotoxins: Origins and mechanisms of catalytic action. Molecules2019, 24, 2362. [CrossRef] [PubMed]
14. Ben Taheur, F.; Kouidhi, B.; Al Qurashi, Y.M.A.; Ben Salah-Abbès, J.; Chaieb, K. Review: Biotechnology of mycotoxins detoxifica-tion using microorganisms and enzymes. Toxicon 2019, 160, 12–22. [CrossRef] [PubMed]
15. Valera, E.; García-Febrero, R.; Elliott, C.T.; Sánchez-Baeza, F.; Marco, M.P. Electrochemical nanoprobe-based immunosensor fordeoxynivalenol mycotoxin residues analysis in wheat samples. Anal. Bioanal. Chem. 2019, 411, 1915–1926. [CrossRef]
51
Toxins 2021, 13, 34
16. Stadler, D.; Berthiller, F.; Suman, M.; Schuhmacher, R.; Krska, R. Novel analytical methods to study the fate of mycotoxins duringthermal food processing. Anal. Bioanal. Chem. 2020, 412, 9–16. [CrossRef]
17. Senko, O.; Stepanov, N.; Maslova, O.; Akhundov, R.; Ismailov, A.; Efremenko, E. Immobilized luminescent bacteria for thedetection of mycotoxins under discrete and flow-through conditions. Biosensors 2019, 9, 63. [CrossRef]
18. Lin, M.; Tan, J.; Xu, Z.; Huang, J.; Tian, Y.; Chen, B.; Wu, Y.; Tong, Y.; Zhu, Y. Computational design of enhanced detoxificationactivity of a zearalenone lactonase from Clonostachysrosea in acidic medium. RSC Adv. 2019, 9, 31284–31295. [CrossRef]
19. Chen, J.; Ye, J.; Zhang, Y.; Shuai, C.; Yuan, Q. Computer-aid molecular docking technology in cereal mycotoxin analysis. J. FoodSci. Eng. 2019, 9, 244–253. [CrossRef]
20. Efremenko, E.N.; Maslova, O.V.; Kholstov, A.V.; Senko, O.V.; Ismailov, A.D. Biosensitive element in the form of immobilizedluminescent photobacteria for detecting ecotoxicants in aqueous flow–through systems. Luminescence 2016, 31, 1283–1289.[CrossRef]
21. Varfolomeev, S.D.; Efremenko, E.N. Organophosphorus Neurotoxins: Monograph; RIOR Publisher: Moscow, Russia, 2020; p. 380.[CrossRef]
22. Göbel, R.; Lusky, K. Simultaneous determination of aflatoxins, ochratoxin A, and zearalenone in grains by new immunoaffinitycolumn/liquid chromatography. J. AOAC Int. 2004, 87, 411–416. [CrossRef] [PubMed]
23. Huang, B.; Han, Z.; Cai, Z.; Wu, Y.; Ren, Y. Simultaneous determination of aflatoxins B1, B2, G1, G2, M1 and M2 in peanuts andtheir derivative products by ultra-high-performance liquid chromatography–tandem mass spectrometry. Anal. Chim. Acta 2010,662, 62–68. [CrossRef] [PubMed]
24. Ellman, G.L.; Courtney, K.D.; Andres, V., Jr.; Feather-Stone, R.M. A new and rapid colorimetric determination of acetyl-cholinesterase activity. Biochem. Pharmacol. 1961, 7, 88–95. [CrossRef]
25. Efremenko, E.; Votchitseva, Y.; Plieva, F.; Galaev, I.; Mattiasson, B. Purification of His6-organophosphate hydrolase usingmonolithic supermacroporous polyacrylamide cryogels developed for immobilized metal affinity chromatography. Appl.Microbiol. Biotechnol. 2006, 70, 558–563. [CrossRef]
26. Votchitseva, Y.A.; Efremenko, E.N.; Aliev, T.K.; Varfolomeyev, S.D. Properties of hexahistidine-tagged organophosphate hydrolase.Biochemistry 2006, 71, 167–172. [CrossRef]
52
toxins
Article
Biomonitoring of Enniatin B1 and Its Phase IMetabolites in Human Urine: First Large-Scale Study
Yelko Rodríguez-Carrasco 1,*,†, Alfonso Narváez 2,†, Luana Izzo 2, Anna Gaspari 2, Giulia
Graziani 2 and Alberto Ritieni 2
1 Department of Food Chemistry and Toxicology, University of Valencia, Av/Vicent A. Estellés s/n,46100 Valencia, Spain
2 Department of Pharmacy, Università di Napoli Federico II, Via D. Montesano, 49-80131 Napoli, Italy;[email protected] (A.N.); [email protected] (L.I.); [email protected] (A.G.);[email protected] (G.G.); [email protected] (A.R.)
* Correspondence: [email protected]; Tel.: +34-963-544-117; Fax: +34-963-544-954† These authors contributed equally to this work.
Received: 17 May 2020; Accepted: 17 June 2020; Published: 22 June 2020
Abstract: Enniatins (Enns) are mycotoxins produced by Fusarium spp. which are a fungus widelyspread throughout cereals and cereal-based products. Among all the identified enniatins, Enn B1stands as one of the most prevalent analogues in cereals in Europe. Hence, the aim of this study wasto evaluate for the first time the presence of Enn B1 and its phase I metabolites in 300 human urinesamples using an ultrahigh-performance liquid chromatography high resolution mass spectrometry(UHPLC-Q-Orbitrap HRMS) methodology. Enn B1 was detected in 94.3% of samples ranging from0.007 to 0.429 ng/mL (mean value: 0.065 ng/mL). In accordance with previous in vitro and in vivoanalysis, hydroxylated metabolites (78.0% samples) and carbonylated metabolites (66.0% samples)were tentatively identified as the major products. Results from this biomonitoring study point toa frequent intake of Enn B1 in the studied population, suggesting that in-depth toxicological studiesare needed in order to understand the potential effects in humans.
Keywords: Enniatin B1; biomonitoring; in vivo; metabolomics; high resolution mass spectrometry (HRMS)
Key Contribution: The occurrence of the Fusarium mycotoxin Enn B1 and its phase I metabolites wasevaluated for the first time in 300 human urine samples throughout ultrahigh-performance liquidchromatography high resolution mass spectrometry (UHPLC-Q-Orbitrap HRMS).
1. Introduction
Mycotoxins are toxic secondary metabolites mainly produced by the genera Fusarium, Aspergillus,Penicillium, Claviceps, and Alternaria. These compounds can be found in food and feed commodities,and consuming contaminated products can lead to adverse health effects in humans and animals.Fusarium fungi are frequent pathogens of cereal grains and maize, with a large impact in temperateregions of America and Europe [1]. Considering occurrence, toxicity, and consumption data, maximumlimits have been set in foodstuffs for several mycotoxins alongside tolerable daily intakes (TDI) orprovisional TDIs by a Joint Food and Agriculture Organization and World Health Organization(FAO/WHO) Expert Committee on Food Additives [2]. During the last few years attention hasbeen put into emerging Fusarium mycotoxins, such as enniatins (Enns). Its core structure consistsof a cyclohexadepsipeptide with alternating residues of three N-methyl amino acids and threehydroxyisovaleric acid [3]. To date, 29 different enniatins have been isolated as single compounds oras mixtures of homologues, being Enn B, Enn B1, Enn A1, and Enn A, being the most relevant in thatorder [4]. These Enns have been reported in cereal samples from Mediterranean and Scandinavian
Toxins 2020, 12, 415; doi:10.3390/toxins12060415 www.mdpi.com/journal/toxins53
Toxins 2020, 12, 415
countries in concentration levels ranging from μg/kg to mg/kg [5,6] and also Enns carry-over potentialfrom feedstuffs to animals has been suggested [7,8]. However, no maximum limits have been setfor Enns in foodstuffs yet. In 2014, the European Food Safety Authority (EFSA) released a scientificopinion on the risk related to the occurrence of Enns in food and feed, concluding that there might bea concern about chronic exposure but the lack of toxicological studies hampers the risk assessment ofdietary exposure [9]. To date, data is still being collected [10].
The toxicity of Enns is based on its ionophoric properties, being able to integrate themselves inbiological membranes forming cation selective pores. Transport of mono and divalent cations throughthese pores disrupts normal physiological concentrations, leading to a wide range of toxicological effects.In vitro studies have reported phytotoxic, insecticidal, antibacterial, enzyme inhibition, antifungal,and immuno-modulatory activities. Besides, cytotoxic effects have been observed in several animaland cell lines at a low micromolar range [4,11]. Nevertheless, Enns have shown low toxicity in vivo,and rapid metabolization and elimination of Enns might be the main reason [12].
Regarding bioavailability, the Enn analogue with the highest oral absorption is Enn B [13,14].There might also exist a specie-dependent relation, since absolute Enn B1 bioavailability in pigs (91%)is in strong contrast with the one observed in broiler chicken (5%) after single oral application [12,14].Referring to metabolism, transformation of Enn B1 predominantly occurs via cytochrome P-4503A-dependent oxidation reaction. Therefore, only phase I products seem relevant, since no phase IImetabolites have been found yet. After incubation of Enn B1 with human and pig liver microsomes,11 different metabolites were structurally characterized using liquid chromatography coupled to:iontrap mass spectrometry (ITMS), multiple-stage mass fragmentation (MSn), and high resolution massspectrometry (HRMS) coupled to an Orbitrap mass spectrometer [15,16]. Biotransformation processesof Enn B1 consisted in carbonylation, carboxylation, hydroxylation, and N-demethylation, followingthe same pattern observed for Enn B except for carbonylation [15,17].
There is scarce literature referring to the detection of enniatins and its resultant metabolites inbiological samples, making it harder to assess the risk related to enniatins. Recently, the occurrence ofEnn B and its tentative phase I metabolites in human urine was evaluated, finding the parental toxinand some of its tentative metabolites at a concentration of a few ng/mL [18]. Nevertheless, to date,there is no data available concerning the occurrence of Enn B1 and its tentative phase I metabolites inhuman biological fluids. In order to obtain a risk evaluation precisely, mycotoxins potentially presentin foods and its metabolites have to be included in biological studies since the overall toxic profilecould be influenced. Therefore, the aim of the present study was to evaluate for the first time thepresence of Enn B1 and Enn B1 phase I metabolites in 300 urine samples from volunteers residingin southern Italy using ultrahigh-performance liquid chromatography coupled to high resolutionOrbitrap mass spectrometry (UHPLC-Q-Orbitrap HRMS) and to tentatively identify the main Enn B1metabolic pathway for producing scientific evidence on the pharmacokinetics process of this toxin.
2. Results and Discussion
2.1. Evaluation of UHPLC-Q-Orbitrap HRMS Conditions
The Enn B1-dependent tandem mass spectrometry (MS/MS) parameters were optimizedby injection of 1 μg/mL of Enn B1-analytical standard into the UHPLC-Q-Orbitrap instrument.Results revealed a peak at 8.06 min in full scan mass spectrometry (MS), which showed a stable andabundant ammonium adduct (M +NH4)+ at m/z 671.45986 under positive electrospray ionization (ESI)mode corresponding to Enn B1. The mass error of the observed m/z was less than 2.5 ppm indicatingexceptional agreement with the calculated m/z. In addition, product ions (m/z 558, 549, 458, 214 and196) were generated by collision-induced dissociation of the Enn B1 ammonium adduct. These ionscorrespond to the loss of one or various N-methyl-valine, N-methyl-isoleucine, and hydroxyisovalerylresidues leading to the formation of main Enn B1 fragments.
54
Toxins 2020, 12, 415
Apart from the parent compound, in literature, up to 11 metabolic products were detected andtheir structures tentatively characterized through high-performance liquid chromatographic/massspectrometric analyses. In this work, the ammonium adducts of the reported molecular masses weretargeted in the Q-Orbitrap HRMS to evaluate the occurrence of the enniatin B1 metabolites in humanurine samples. Therefore, a qualitative procedure was developed for detecting theoretical masses ofthe metabolites previously reported, whereas the same chromatographic gradient was used since allthe investigated compounds were able to elute in that short run time.
Data for retention times, observed ion mass, and mass accuracy for Enn B1 and its metabolites areshown in Table 1.
Table 1. Retention times, observed mass, and mass accuracy of Enn B1 and its phase I metabolites.
CompoundRetention
Time (min)MolecularFormula
Observed Mass(M + NH4)+
Accuracy(Δppm)
Enn B1 5.75 C34H59N3O9 671.4591 −0.60
M1 4.76 C33H55N3O11 687.4175 −0.78
M2 5.44 C34H59N3O10 687.4532 −1.78M3 5.5 687.4535 −1.34M4 5.55 687.4536 −1.19M5 5.6 687.4540 −0.61
M6 5.61 C34H57N3O10 685.4380 −1.12M7 5.64 685.4384 −0.54M8 5.67 685.4378 −1.42
M9 4.1 C34H57N3O11 701.4328 −1.26M10 4.77 701.4335 −0.26M11 4.79 701.4333 −0.55
2.2. Method Performance
Method results referring to matrix effects, linearity, trueness, repeatability, within-labreproducibility, limit of quantification (LOQ), and limit of detection (LOD) were obtained followingthe guidelines set at Commission Decision 2002/ 657/EC [19] are shown in Table 2. A matrix influencewas observed, leading to a signal suppression effect (63%) for Enn B1 in the urine samples. Hence,matrix-matched calibration was chosen for quantitative purposes. A coefficient of linearity (R2) of0.9997 was obtained within the range from 0.001 to 5 ng/mL. In order to evaluate the carry-over, a blanksample (n = 10) was analyzed just after the highest calibration sample. Since no peaks eluted in thesame Enn B1 retention time area, no carry-over was assumed. Acceptable recoveries, ranging from 78%at 0.5 ng/mL to 95% at 5 ng/mL of spiking levels, were obtained. The RSDr and RSDR were ≤12% for allthe concentrations studied, remarking the satisfactory precision of the developed method. LOQ andLOD values were extracted from matrix-matched solutions, being 0.0005 and 0.001 ng/mL, respectively.The developed method allowed a reliable detection and quantification of Enn B1 at low ppt range(Table 3).
Table 2. Method performance.
Parameters R2 SSE (%) Recovery, % (RSDR, %; n = 9)LOD
(ng/mL)LOQ
(ng/mL)
5 ng/mL 1 ng/mL 0.5 ng/mL 0.1 ng/mL
Enn B1 0.9997 63 95 (7) 88 (6) 78 (7) 84 (12) 0.0005 0.001
R2, coefficient of correlation; RSDR, inter-day relative standard deviation; LOD, limit of detection; LOQ, limitof quantification.
55
Toxins 2020, 12, 415
Table 3. Available methods for measurement of Enn B1 in human urine.
Determination
UrineSamples (n)
OriginPositivesPamples(n, (%))
SamplePreparation
Range(ng/mL)
Sensitivity(LOQ, ng/mL)
Detection Method Reference
10 Italy 1 (10) SPE <LOQ 0.005 QQQ (Thermo FisherScientific) ESI+ SRM mode
Serrano et al.(2015) [20]
10 Spain 6 (60) DLLME <LOQ–0.34 0.1 QQQ (Applied Biosystems)ESI+ SRM mode
Escrivá et al.(2017) [21]
60 China 0 (0) SPE - 0.0002 QQQ (AB SCIEX)ESI+MRM mode
Liu et al.(2020) [22]
300 Italy 283 (94) SALLE <LOQ–0.429 0.001Q-Orbitrap
(Exactive, Thermo FisherScientific) ESI+ HRMS
This work
ESI+, positive ion mode; HRMS, high-resolution MS; SRM, selected reaction monitoring transition; MRM, multiplereaction monitoring transition; LOQ, limit of quantification; QQQ, triple quadrupole; SPE, solid phase extraction;DLLME, dispersive liquid-liquid microextraction; SALLE, salting-out liquid-liquid extraction.
2.3. Occurrence of Enniatin B1 in Human Urines
Enn B1 has been detected in 283 out of 300 urine (94.3%) ranging from <LOQ to 0.429 ng/mL (meanvalue: 0.065 ng/mL; Table 4). In a previous study, Escrivá et al. [21] evaluated the presence of Enn B1 inurine samples from the Spanish population, reporting occurrence in six samples (60%, n = 10), but onlytwo samples could be quantified (0.1–0.34 ng/mL) due to analytical limitations (LOQ = 0.1 ng/mL).Serrano et al. [20] detected Enn B1 in one urine sample (10%, n = 10) collected from Italian volunteers,despite having high instrumental sensitivity (LOQ = 0.005 ng/mL). Differences showed amongthe mentioned studies could be due to the limited sampling. A more recent work, conducted byLiu et al. [22], analyzed 60 urine sample from the Chinese population, reporting the absence of EnnB1 (LOQ = 0.0002 ng/mL). The variation between the Chinese population urinary patterns of EnnB1 and the obtained results could be explained either by dietary habits or the quality of foodstuffs.Wheat has been reported as one of the most susceptible cereals for Fusarium spp. contamination [1]and, according to the data reported by FAO [23], the per capita annual consumption of wheat andwheat-based products during 2017 in Italy (146.22 kg) was more than double the consumption inChina (62.75 kg). Following the same line, the urinary excretion pattern of Enn B, a structurallysimilar mycotoxin, was also reported to vary depending on geographical areas with different dietaryhabits [18]. Recently, strong associations to some cereals and to dietary fiber was reported for EnnB urinary concentration in Sweden [24]. These authors also reported associations to other Fusariummycotoxins, such as deoxynivalenol, in these food categories; nonetheless, Enn B association to rice wasnegative but strong, which indicates that rice was not as contaminated as the other cereals (e.g., wheat).Hence, if rice consumption was increased in the diet, as in the case of the Asiatic people, the occurrenceof Enns in biological fluids would consequently be reduced, which is in line with previous studies [22].Therefore, the occurrence of Enn B1 in the majority of Italian cereals and cereal-based products analyzedby previous studies [25–27] alongside the high consumption of cereals (45–60% kcal per day for anItalian adult) [23] may account for the high incidence reported in the obtained results.
A statistical study for the evaluation of the occurrence of Enn B1 in urines from the three differentpopulation groups was conducted. The highest Enn B1 concentration was observed within the low-agegroup (age ≤ 30 years, mean = 0.071 ng/mL); however, no significant differences were found betweenoccurrence of Enn B1 and age groups (p = 0.93). Similarly, gender did not show any correlation referringto Enn B1 concentrations (p = 0.85) in accordance with previous mycotoxins monitoring studies inurine [28–30].
56
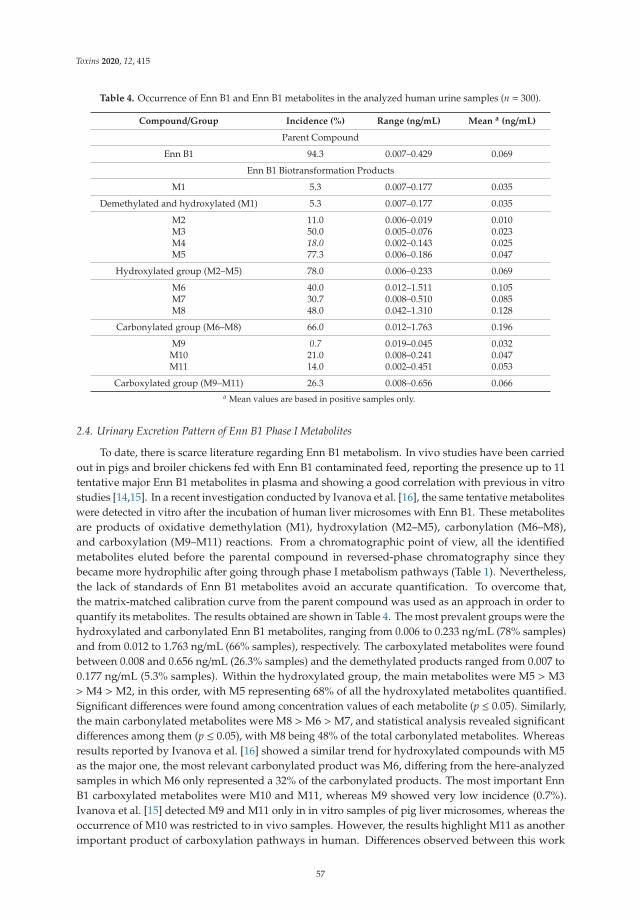
Toxins 2020, 12, 415
Table 4. Occurrence of Enn B1 and Enn B1 metabolites in the analyzed human urine samples (n = 300).
Compound/Group Incidence (%) Range (ng/mL) Mean a (ng/mL)
Parent Compound
Enn B1 94.3 0.007–0.429 0.069
Enn B1 Biotransformation Products
M1 5.3 0.007–0.177 0.035
Demethylated and hydroxylated (M1) 5.3 0.007–0.177 0.035
M2 11.0 0.006–0.019 0.010M3 50.0 0.005–0.076 0.023M4 18.0 0.002–0.143 0.025M5 77.3 0.006–0.186 0.047
Hydroxylated group (M2–M5) 78.0 0.006–0.233 0.069
M6 40.0 0.012–1.511 0.105M7 30.7 0.008–0.510 0.085M8 48.0 0.042–1.310 0.128
Carbonylated group (M6–M8) 66.0 0.012–1.763 0.196
M9 0.7 0.019–0.045 0.032M10 21.0 0.008–0.241 0.047M11 14.0 0.002–0.451 0.053
Carboxylated group (M9–M11) 26.3 0.008–0.656 0.066a Mean values are based in positive samples only.
2.4. Urinary Excretion Pattern of Enn B1 Phase I Metabolites
To date, there is scarce literature regarding Enn B1 metabolism. In vivo studies have been carriedout in pigs and broiler chickens fed with Enn B1 contaminated feed, reporting the presence up to 11tentative major Enn B1 metabolites in plasma and showing a good correlation with previous in vitrostudies [14,15]. In a recent investigation conducted by Ivanova et al. [16], the same tentative metaboliteswere detected in vitro after the incubation of human liver microsomes with Enn B1. These metabolitesare products of oxidative demethylation (M1), hydroxylation (M2–M5), carbonylation (M6–M8),and carboxylation (M9–M11) reactions. From a chromatographic point of view, all the identifiedmetabolites eluted before the parental compound in reversed-phase chromatography since theybecame more hydrophilic after going through phase I metabolism pathways (Table 1). Nevertheless,the lack of standards of Enn B1 metabolites avoid an accurate quantification. To overcome that,the matrix-matched calibration curve from the parent compound was used as an approach in order toquantify its metabolites. The results obtained are shown in Table 4. The most prevalent groups were thehydroxylated and carbonylated Enn B1 metabolites, ranging from 0.006 to 0.233 ng/mL (78% samples)and from 0.012 to 1.763 ng/mL (66% samples), respectively. The carboxylated metabolites were foundbetween 0.008 and 0.656 ng/mL (26.3% samples) and the demethylated products ranged from 0.007 to0.177 ng/mL (5.3% samples). Within the hydroxylated group, the main metabolites were M5 >M3>M4 >M2, in this order, with M5 representing 68% of all the hydroxylated metabolites quantified.Significant differences were found among concentration values of each metabolite (p ≤ 0.05). Similarly,the main carbonylated metabolites were M8 >M6 >M7, and statistical analysis revealed significantdifferences among them (p ≤ 0.05), with M8 being 48% of the total carbonylated metabolites. Whereasresults reported by Ivanova et al. [16] showed a similar trend for hydroxylated compounds with M5as the major one, the most relevant carbonylated product was M6, differing from the here-analyzedsamples in which M6 only represented a 32% of the carbonylated products. The most important EnnB1 carboxylated metabolites were M10 and M11, whereas M9 showed very low incidence (0.7%).Ivanova et al. [15] detected M9 and M11 only in in vitro samples of pig liver microsomes, whereas theoccurrence of M10 was restricted to in vivo samples. However, the results highlight M11 as anotherimportant product of carboxylation pathways in human. Differences observed between this work
57
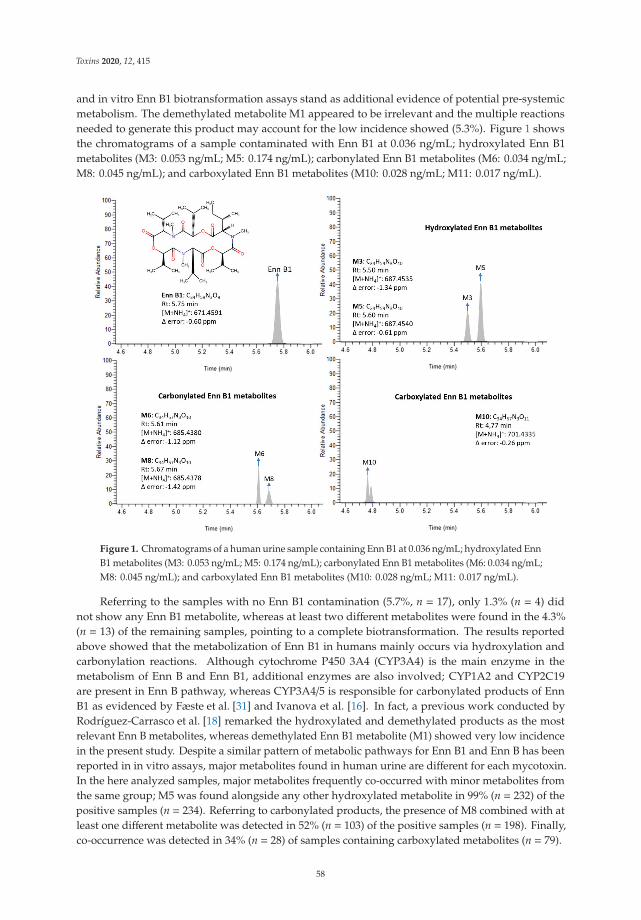
Toxins 2020, 12, 415
and in vitro Enn B1 biotransformation assays stand as additional evidence of potential pre-systemicmetabolism. The demethylated metabolite M1 appeared to be irrelevant and the multiple reactionsneeded to generate this product may account for the low incidence showed (5.3%). Figure 1 showsthe chromatograms of a sample contaminated with Enn B1 at 0.036 ng/mL; hydroxylated Enn B1metabolites (M3: 0.053 ng/mL; M5: 0.174 ng/mL); carbonylated Enn B1 metabolites (M6: 0.034 ng/mL;M8: 0.045 ng/mL); and carboxylated Enn B1 metabolites (M10: 0.028 ng/mL; M11: 0.017 ng/mL).
Figure 1. Chromatograms of a human urine sample containing Enn B1 at 0.036 ng/mL; hydroxylated EnnB1 metabolites (M3: 0.053 ng/mL; M5: 0.174 ng/mL); carbonylated Enn B1 metabolites (M6: 0.034 ng/mL;M8: 0.045 ng/mL); and carboxylated Enn B1 metabolites (M10: 0.028 ng/mL; M11: 0.017 ng/mL).
Referring to the samples with no Enn B1 contamination (5.7%, n = 17), only 1.3% (n = 4) didnot show any Enn B1 metabolite, whereas at least two different metabolites were found in the 4.3%(n = 13) of the remaining samples, pointing to a complete biotransformation. The results reportedabove showed that the metabolization of Enn B1 in humans mainly occurs via hydroxylation andcarbonylation reactions. Although cytochrome P450 3A4 (CYP3A4) is the main enzyme in themetabolism of Enn B and Enn B1, additional enzymes are also involved; CYP1A2 and CYP2C19are present in Enn B pathway, whereas CYP3A4/5 is responsible for carbonylated products of EnnB1 as evidenced by Fæste et al. [31] and Ivanova et al. [16]. In fact, a previous work conducted byRodríguez-Carrasco et al. [18] remarked the hydroxylated and demethylated products as the mostrelevant Enn B metabolites, whereas demethylated Enn B1 metabolite (M1) showed very low incidencein the present study. Despite a similar pattern of metabolic pathways for Enn B1 and Enn B has beenreported in in vitro assays, major metabolites found in human urine are different for each mycotoxin.In the here analyzed samples, major metabolites frequently co-occurred with minor metabolites fromthe same group; M5 was found alongside any other hydroxylated metabolite in 99% (n = 232) of thepositive samples (n = 234). Referring to carbonylated products, the presence of M8 combined with atleast one different metabolite was detected in 52% (n = 103) of the positive samples (n = 198). Finally,co-occurrence was detected in 34% (n = 28) of samples containing carboxylated metabolites (n = 79).
58
Toxins 2020, 12, 415
3. Conclusions
In this study, the occurrence of the Fusarium mycotoxin Enn B1 and its phase I metabolites wasevaluated in 300 human urine samples throughout ultrahigh-performance liquid chromatography highresolution mass spectrometry (UHPLC-Q-Orbitrap HRMS). Results confirmed the presence of EnnB1 in 94.3% of samples ranging from 0.007 to 0.429 ng/mL (mean value: 0.065 ng/mL). Furthermore,the occurrence of Enn B1 metabolites previously found in in vitro and in vivo analysis was evaluatedfor the first time in human urine samples. In accordance with literature, demethylated and oxidatedmetabolite (5.3% samples, mean content = 0.035 ng/mL), hydroxylated metabolites (78.0% samples,mean content = 0.069 ng/mL), carbonylated metabolites (66.0% samples, mean content = 0.196 ng/mL),and carboxylated metabolites (26.3%, mean content = 0.066 ng/mL) were tentatively identified.Statistical analysis confirmed hydroxylated and carbonylated products as the most prevalentmetabolites of Enn B1 in human urine. Differences observed between this work and in vitro EnnB1 biotransformation assays stand as additional evidence of potential pre-systemic metabolism.The characterization of metabolites derived from food contaminants is an important issue whenperforming safety and risk evaluations, and according to the here-obtained results a frequent exposureto Enn B1 is highlighted in Italian population.
4. Materials
4.1. Chemicals, Reagents and Materials
Methanol (MeOH), acetonitrile (AcN), and water for liquid chromatography (LC) mobile phase(HPLC grade) were purchased from Merck (Darmstadt, Germany). Ammonium formate and formic acidwere acquired from Fluka (Milan, Italy). Sodium chloride and C18 were provided from Sigma–Aldrich(Milan, Italy). Syringe filters with polytetrafluoroethylene membrane (PTFE; 15 mm, diameter 0.2 μm)were purchased from Phenomenex (Castel Maggiore, Italy). Analytical standard of Enn B1 (>95%HPLC purity) was obtained from Sigma–Aldrich (Milan, Italy). A stock solution (1 mg/mL in MeOH)was prepared and working standard solutions were built by serial dilution of the stock and storedat −20 ◦C.
4.2. Sampling
During January and February 2018, 300 Italian volunteers residing in Campania region (southernItaly) provided first-spot morning urine samples. The following exclusion criteria were consideredfor the study: (i) only one member per family allowed; (ii) people with severe issues in liver, kidney,or bile were not allowed due to potential interferences in the metabolic processes related to mycotoxins;(iii) people exposed to high amounts of mycotoxins in a different way from food, such as farmers andveterinarians, were not allowed. The use of medication was not an exclusion criterion due to the lackof information available about interferences with mycotoxins. Urine was stored in plastic containersat −20 ◦C within 2 h after collection. All volunteers signed informed consent following the HelsinkiDeclaration on ethical principles for medical research when humans are involved. The present studywas accepted by the University of Valencia Institutional human research Committee and the proceduresand purposes were properly justified and approved. The numerosity of the sampling (n = 300) is inaccordance with the International Federation of Clinical Chemists (IFCC) recommendations [32].
Volunteers were asked to specify their age and gender on their own container, in order to classifythe sample. The sampling tried to keep the gender parity (male: 45.7%, female: 54.3%). Accordingto the age of participants, three different groups were considered for statistical analysis: ≤30 yearsold (n = 94), from 31 to 59 years old (n = 72), and ≥60 years old (n = 134). Samples with undetectedlevels of the analytes of interest were chosen as “blank” and used in spiking and recovery studies.The consumption data were set according to age and gender, following the Guidelines for HealthyItalian Food Supply reported by the National Institute for Food Research and Nutrition [33].
59
Toxins 2020, 12, 415
4.3. Sample Preparation
The sample was processed following a previous procedure slightly modified [34]. Briefly, 1.5 mLof sample was placed into a 2 mL Eppendorf Safe-Lock Microcentrifuge tube and centrifuged for 3 minat 4000 rpm. After that, 1 mL of the supernatant was transferred to a 15 mL screw cap test tube withconical bottom and 1 mL of acetonitrile was added. The mixture was vortexed for 30 s and subsequently30 mg of C18 sorbent and 0.3 g sodium chloride were incorporated to minimize interference frommatrix. The solution was vortexed again for 30 s and centrifuged for 3 min at 4000 rpm and 4 ◦C.Then, the upper layer was collected, evaporated under gentle nitrogen stream in a water bath at 45 ◦C,reconstituted with 0.5 mL of MeOH/H2O (70:30 v/v) and filtered through a 0.2 μm filter before toUHPLC-Q-Orbitrap HRMS analysis.
4.4. UHPLC-Q-Orbitrap HRMS Analysis
Quantitative and qualitative profiles of Enn B1 and Enn B1 phase I metabolites wereacquired through Ultra High Pressure Liquid Chromatograph (UHPLC; Thermo Fisher Scientific,Waltham, MA, USA) equipped with an auto sampler device, a degassing system, a thermostated(T = 30 ◦C) Luna Omega 1.6 μm (50 × 2.1 μm) column, a Dionex Ultimate 3000 a Quaternary UHPLCpump working at 1250 bar.
The eluent consisted of two different phases, both H2O (phase A) and MeOH (phase B) containing0.1% formic acid and 5 mM ammonium formate. The gradient elution program for LC prior to OrbitrapHRMS analysis was developed as follows: 0–1 min–0% of phase B, 2 min–95% of phase B, 2.5 min–95%of phase B, 5 min–75% of phase B, 6 min–60% of phase B, 6.5 min–0% of phase B, and 1.5 min–0% phaseB for equilibrating the column. The flow rate was set at 0.4 mL/min. A total of 5 μL of the sample wasinjected. Detection was performed using a Q-Exactive mass spectrometer. Data were acquired throughfull scan in positive mode at a resolving power of 70,000 FWHM at m/z 200. Ion source parameters inpositive (ESI+) mode were: sheath gas (N2 > 95%) 35, auxiliary gas (N2 > 95%) 10, spray voltage 4 kV,capillary temperature 290 ◦C, auxiliary gas heater temperature 305 ◦C, S-lens RF level 50. Data analysisand processing were carried-out using the Xcalibur software, v. 3.1.66.10 (Thermo Fisher Scientific,Waltham, MA, USA). A scan range of m/z 100–800 was set for the compounds of interest; the injectiontime was set to 200 ms and the automatic gain control (AGC) was selected at 1 × 10⁶. Scan-rate was setat 2 scans/s.
4.5. Metabolomic Data Processing
Data processing and data pretreatment were performed to allow the putative identification ofsignificant metabolites. Screening was done by investigating spectral data collected using a mycotoxinspectral library (version 1.1 for Library View Software, AB Sciex, Framingham, MA, USA) containingspectral data for 245 mycotoxins and other fungal/bacterial metabolites and 236 full MS/MS spectrallibrary entries. The features, defined by their m/z and retention time, and their intensities in differentsamples were used to carry out the statistical analysis. Then, samples were grouped to perform thestatistical analysis.
4.6. Method Validation
An in-house validation study was conducted according to the Commission Decision2002/657/EC [19]. The parameters measured included linearity, matrix effect, trueness, precision,LOQ, and LOD. Linearity was evaluated using solvent and matrix-matched calibration curves,analyzing in triplicate six concentration levels ranging between 0.001–5 ng/mL. The matrix-matchedcalibration curves were prepared spiking aliquots of the corresponding matrices with Enn B1 at similarconcentrations than the calibration curve made in solvent. Signal suppression or enhancement effectdue to matrix co-elution interferences, was evaluated through a comparison between the slope ofpure standard curve with the slope of matrix-matched standard curve following the next equation:
60
Toxins 2020, 12, 415
SSE (%) = Slope matrix-matched calibration/Slope standard in solvent × 100. Trueness and precisionwere assessed using recovery studies since no suitable reference material was available. Recoverymeasurements were performed by spiking blank urines with the standard working solution of Enn B1at the levels of 0.1, 0.5, 1, and 5 ng/mL. Intra-day (RSDr, %) and inter-day precision (RSDR, %) wereexpressed as the relative standard deviation after repeating three measurements per concentrationlevel on the same day and in three non-consecutive days, respectively. LOD was established as theminimum concentration at which the molecular ion can be identified (mass error < 5 ppm) and theLOQ as the lowest concentration of the analyte at which the concentration can be determined withaccuracy and precision ≤20%.
4.7. Statistical Analysis
Statistical analysis of data was carried out using IBM SPSS version 25 statistical software package(SPSS, Chicago, IL, USA). For comparison of categorical data, the Pearson chi-square and Fisher exacttests were evaluated in order to assess whether Enn B1 occurrence in several subgroups (age, gender,cereal consumption) were significantly different. A non-parametric Kruskal–Wallis test was used toevaluate significant differences in Enn B1 metabolites concentrations. A confidence level of 95 % wasassumed for examining data, whereas a p-value below 0.05 was considered as significant.
Author Contributions: Conceptualization, Y.R.-C. and A.R.; methodology, L.I. and A.N.; software, A.G. and G.G.;validation, L.I. and Y.R.-C.; formal analysis, L.I., A.N. and Y.R.-C.; data curation, A.G. and G.G.; writing—originaldraft preparation, A.N.; writing-review and editing, Y.R.-C.; supervision, Y.R.-C and A.R. All authors have readand agreed to the published version of the manuscript.
Funding: This research received no external funding.
Acknowledgments: Authors also acknowledge the technical support of Chiara Piemonte.
Conflicts of Interest: The authors declare no conflict of interest.
References
1. Ferrigo, D.; Raiola, A.; Causin, R. Fusarium toxins in cereals: Occurrence, legislation, factors promoting theappearance and their management. Molecules 2016, 21, 627. [CrossRef]
2. Commission Regulation (EC) No 1881/2006 of 19 December 2006 setting maximum levels for certaincontaminants in foodstuffs. Off. J. Eur. Union 2006, 364, 324–365.
3. Prosperini, A.; Berrada, H.; Ruiz, M.J.; Caloni, F.; Coccini, T.; Spicer, L.J.; Perego, M.C.; Lafranconi, A.A review of the mycotoxin enniatin B. Front. Public Health 2017, 5, 304. [CrossRef]
4. Fraeyman, S.; Croubels, S.; Devreese, M.; Antonissen, G. Emerging Fusarium and Alternaria mycotoxins:Occurrence, toxicity and toxicokinetics. Toxins 2017, 9, 228. [CrossRef]
5. Meca, G.; Zinedine, A.; Blesa, J.; Font, G.; Mañes, J. Further data on the presence of Fusariumemerging mycotoxins enniatins, fusaproliferin and beauvericin in cereals available on the Spanish markets.Food Chem. Toxicol. 2010, 48, 1412–1416. [CrossRef]
6. Gruber-Dorninger, C.; Novak, B.; Nagl, V.; Berthiller, F. Emerging mycotoxins: Beyond traditionallydetermined food contaminants. J. Agric. Food Chem. 2016, 65, 7052–7070. [CrossRef] [PubMed]
7. Jestoi, M.; Rokka, M.; Jarvenpaa, E.; Peltonen, K. Determination of Fusarium mycotoxins beauvericin andenniatins (A, A1, B, B1) in eggs of laying hens using liquid chromatography–tandem mass spectrometry(LC–MS/MS). Food Chem. 2009, 115, 1120–1127. [CrossRef]
8. Johny, A.; Fæste, C.; Bogevik, A.S.; Berge, G.M.; Fernandes, J.M.O.; Ivanova, L. Development and Validation ofa Liquid Chromatography High-Resolution Mass Spectrometry Method for the Simultaneous Determinationof Mycotoxins and Phytoestrogens in Plant-Based Fish Feed and Exposed Fish. Toxins 2019, 11, 222. [CrossRef][PubMed]
9. EFSA. Scientific Opinion on the risks to human and animal health related to the presence of beauvericin andenniatins in food and feed. EFSA J. 2014, 12, 3802. [CrossRef]
10. Maranghi, F.; Tassinari, R.; Narciso, L.; Tait, S.; Rocca, C.L.; Felice, G.D.; Butteroni, C.; Corinti, S.; Barletta, B.;Cordelli, E.; et al. In vivo toxicity and genotoxicity of beauvericin and enniatins. Combined approach to study
61
Toxins 2020, 12, 415
in vivo toxicity and genotoxicity of mycotoxins beauvericin (BEA) and enniatin B (ENNB). EFSA Support. Publ.2018, 15, 1406E. [CrossRef]
11. Huang, C.H.; Wang, F.T.; Chan, W.H. Enniatin B1 exerts embryotoxic effects on mouse blastocysts andinduces oxidative stress and immunotoxicity during embryo development. Environ. Toxicol. 2019, 34, 48–59.[CrossRef] [PubMed]
12. Devreese, M.; Broekaert, N.; De Mil, T.; Fraeyman, S.; De Backer, P.; Croubels, S. Pilot toxicokinetic study andabsolute oral bioavailability of the Fusarium mycotoxin enniatin B1 in pigs. Food Chem. Toxicol. 2014, 63,161–165. [CrossRef] [PubMed]
13. Devreese, M.; De Baere, S.; De Backer, P.; Croubels, S. Quantitative determination of the Fusarium mycotoxinsbeauvericin, enniatin A, A1, B and B1 in pig plasma using high performance liquid chromatography-tandemmass spectrometry. Talanta 2013, 106, 212–219. [CrossRef] [PubMed]
14. Fraeyman, S.; Devreese, M.; Antonissen, G.; De Baere, S.; Rychlik, M.; Croubels, S. Comparative OralBioavailability, Toxicokinetics, and Biotransformation of Enniatin B1 and Enniatin B in Broiler Chickens.J. Agric. Food Chem. 2016, 64, 7259–7264. [CrossRef] [PubMed]
15. Ivanova, L.; Uhlig, S.; Devreese, M.; Croubels, S.; Fæste, C.K. Biotransformation of the mycotoxin enniatin B1in pigs: A comparative in vitro and in vivo approach. Food Chem. Toxicol. 2017, 105, 506–517. [CrossRef][PubMed]
16. Ivanova, L.; Denisov, I.G.; Grinkova, Y.V.; Sligar, S.G.; Fæste, C. Biotransformation of the Mycotoxin EnniatinB1 by CYP P450 3A4 and Potential for Drug-Drug Interactions. Metabolites 2019, 9, 158. [CrossRef]
17. Ivanova, L.; Fæste, C.; Uhlig, S. In vitro phase I metabolism of the depsipeptide enniatin B. Anal. Bioanal. Chem.2011, 400, 2889–2901. [CrossRef]
18. Rodríguez-Carrasco, Y.; Izzo, L.; Gaspari, A.; Graziani, G.; Mañes, J.; Ritieni, A. Urinary levels of enniatin Band its phase I metabolites: First human pilot biomonitoring study. Food Chem. Toxicol. 2018, 118, 454–459.[CrossRef]
19. European Commission. Commission Decision of 12 August 2002 implementing Council Directive 96/23/ECconcerning the performance of analytical methods and the interpretation of results. Off. J. Eur. Communities2002, 221, 8–36.
20. Serrano, A.B.; Capriotti, A.L.; Cavaliere, C.; Piovesana, S.; Samperi, R.; Ventura, S.; Laganà, A. Developmentof a Rapid LC-MS/MS Method for the Determination of Emerging Fusarium mycotoxins Enniatins andBeauvericin in Human Biological Fluids. Toxins 2015, 7, 3554–3571. [CrossRef]
21. Escrivá, L.; Manyes, L.; Font, G.; Berrada, H. Mycotoxin Analysis of Human Urine by LC-MS/MS:A Comparative Extraction Study. Toxins 2017, 9, 330. [CrossRef] [PubMed]
22. Liu, Z.; Zhao, X.; Wu, L.; Zhou, S.; Gong, Z.; Zhao, Y.; Wu, Y. Development of a Sensitive and ReliableUHPLC-MS/MS Method for the Determination of Multiple Urinary Biomarkers of Mycotoxin Exposure.Toxins 2020, 12, 193. [CrossRef] [PubMed]
23. FAO. Food Balance Sheets. Available online: http://www.fao.org/faostat/en/#data/ (accessed on24 March 2020).
24. Lemming, E.W.; Montes, A.M.; Schmidt, J.; Cramer, B.; Humpf, H.-U.; Moraeus, L.; Olsen, M. Mycotoxinsin blood and urine of Swedish adolescents-possible associations to food intake and other backgroundcharacteristics. Mycotoxin Res. 2020, 36, 193–206. [CrossRef] [PubMed]
25. Jestoi, M.; Somma, M.; Kouva, M.; Veijalainen, P.; Rizzo, A.; Ritieni, A.; Peltonen, K. Levels of mycotoxinsand sample cytotoxicity of selected organic and conventional grain-based products purchased from Finnishand Italian markets. Mol. Nutr. Food Res. 2004, 48, 299–307. [CrossRef]
26. Wallin, S.; Gambacorta, L.; Kotova, N.; Warensjö Lemming, E.; Nälsén, C.; Solfrizzo, M.; Olsen, M.Biomonitoring of concurrent mycotoxin exposure among adults in Sweden through urinary multi-biomarkeranalysis. Food Chem. Toxicol. 2015, 83, 133–139. [CrossRef]
27. Ciasca, B.; Pascale, M.; Altieri, V.; Longobardi, F.; Suman, M.; Catellani, D.; Lattanzio, V. In house validationand small scale collaborative study to evaluate analytical performances of multi-mycotoxin screeningmethods based on liquid chromatography-high resolution mass spectrometry: Case study on Fusariumtoxins in wheat. J. Mass. Spectrom. 2018, 53, 743–752. [CrossRef]
28. Rodríguez-Carrasco, Y.; Moltó, J.C.; Mañes, J.; Berrada, H. Development of a GC–MS/MS strategy todetermine 15 mycotoxins and metabolites in human urine. Talanta 2014, 128, 125–131. [CrossRef]
62
Toxins 2020, 12, 415
29. Ali, N.; Degen, G.H. Urinary biomarkers of exposure to the mycoestrogen zearalenone and its modifiedforms in German adults. Arch. Toxicol. 2018, 92, 2691–2700. [CrossRef]
30. Li, C.; Deng, C.; Zhou, S.; Zhao, Y.; Wang, D.; Wang, X.; Gong, Y.Y.; Wu, Y. High-throughput and sensitivedetermination of urinary zearalenone and metabolites by UPLC-MS/MS and its application to a humanexposure study. Anal. Bioanal. Chem. 2018, 410, 5301–5312. [CrossRef]
31. Fæste, C.K.; Ivanova, L.; Uhlig, S. In Vitro Metabolism of the Mycotoxin Enniatin B in Different Species andCytochrome P450 Enzyme Phenotyping by Chemical Inhibitors. Drug Metab. Dispos. 2011, 39, 1768–1776.[CrossRef]
32. Pérez, R.; Domenech, E.; Coscollà, C.; Yusa, V. Human Biomonitoring of food contaminants in Spanishchildren: Design, sampling and lessons learned. Int. J. Hyg. Environ. Health 2017, 220, 1768–1776. [CrossRef][PubMed]
33. INRAN. Dietary Guidelines for Healthy Eating; Revision 2018; National Institute for Food Research andNutrition: Rome, Italy, 2018.
34. Rodríguez-Carrasco, Y.; Moltó, J.C.; Mañes, J.; Berrada, H. Development of microextraction techniquesin combination with GC–MS/MS for the determination of mycotoxins and metabolites in human urine.J. Sep. Sci. 2017, 40, 1572–1582. [CrossRef] [PubMed]
© 2020 by the authors. Licensee MDPI, Basel, Switzerland. This article is an open accessarticle distributed under the terms and conditions of the Creative Commons Attribution(CC BY) license (http://creativecommons.org/licenses/by/4.0/).
63

toxins
Article
Individual and Combined Effect of ZearalenoneDerivates and Beauvericin Mycotoxins on SH-SY5YCells
Fojan Agahi, Guillermina Font, Cristina Juan * and Ana Juan-García
Laboratory of Food Chemistry and Toxicology, Faculty of Pharmacy, University of Valencia, Av. Vicent AndrésEstellés s/n, 46100 Burjassot, València, Spain; [email protected] (F.A.); [email protected] (G.F.);[email protected] (A.J.-G.)* Correspondence: [email protected]
Received: 9 February 2020; Accepted: 25 March 2020; Published: 27 March 2020
Abstract: Beauvericin (BEA) and zearalenone derivatives, α-zearalenol (α-ZEL), and β-zearalenol(β-ZEL), are produced by several Fusarium species. Considering the impact of various mycotoxinson human’s health, this study determined and evaluated the cytotoxic effect of individual,binary, and tertiary mycotoxin treatments consisting of α-ZEL, β-ZEL, and BEA at differentconcentrations over 24, 48, and 72 h on SH-SY5Y neuronal cells, by using the MTT assay(3-(4,5-dimethylthiazol-2-yl)-2,5diphenyltetrazoliumbromide). Subsequently, the isobologram methodwas applied to elucidate if the mixtures produced synergism, antagonism, or additive effects. Ultimately,we determined the amount of mycotoxin recovered from the media after treatment using liquidchromatography coupled with electrospray ionization–quadrupole time-of-flight mass spectrometry(LC–ESI–qTOF-MS). The IC50 values detected at all assayed times ranged from 95 to 0.2 μM for theindividual treatments. The result indicated that β-ZEL was the most cytotoxic mycotoxin when testedindividually. The major effect detected for all combinations assayed was synergism. Among thecombinations assayed, α-ZEL + β-ZEL + BEA and α-ZEL + BEA presented the highest cytotoxicpotential with respect to the IC value. At all assayed times, BEA was the mycotoxin recovered at thehighest concentration in individual form, and β-ZEL + BEA was the combination recovered at thehighest concentration.
Keywords: SH-SY5Y cells; zearalenone derivates; beauvericin; MTT; qTOF–MS/MS
Key Contribution: β-ZEL alone presented the highest cytotoxicological potency than α-ZEL andBEA on SH-SY5Y neuronal cells; α-ZEL + β-ZEL + BEA and α-ZEL + BEA presented the highestcytotoxic potential with respect to the IC value.
1. Introduction
Mycotoxins represent one of the most important categories of biologically produced natural toxinswith potential effects on human and animal health. The worldwide contamination by these naturalproducts of food, feed, and environment, represents a health risk for animals and humans [1].
Several Fusarium species produce toxic substances of considerable concern to livestock andpoultry producers. The mycotoxins beauvericin (BEA) and zearalenone (ZEN) and their derivatives(α-zearalenol (α-ZEL), β-zearalenol (β-ZEL), zeranol, taleranol, and zearalanone) can be produced byseveral Fusarium species (mainly Fusarium graminearum, but also Fusarium culmorum, Fusarium cerealis,Fusarium equiseti, and Fusarium semitectum) that grow on crops in temperate and warm-climate zones [2].These fungi are present in almost all continents, can grow under poor storage conditions, and mainlycontaminate cereal grains, such as maize, wheat, oats, soybeans, and their derived food products [3,4].
Toxins 2020, 12, 212; doi:10.3390/toxins12040212 www.mdpi.com/journal/toxins65
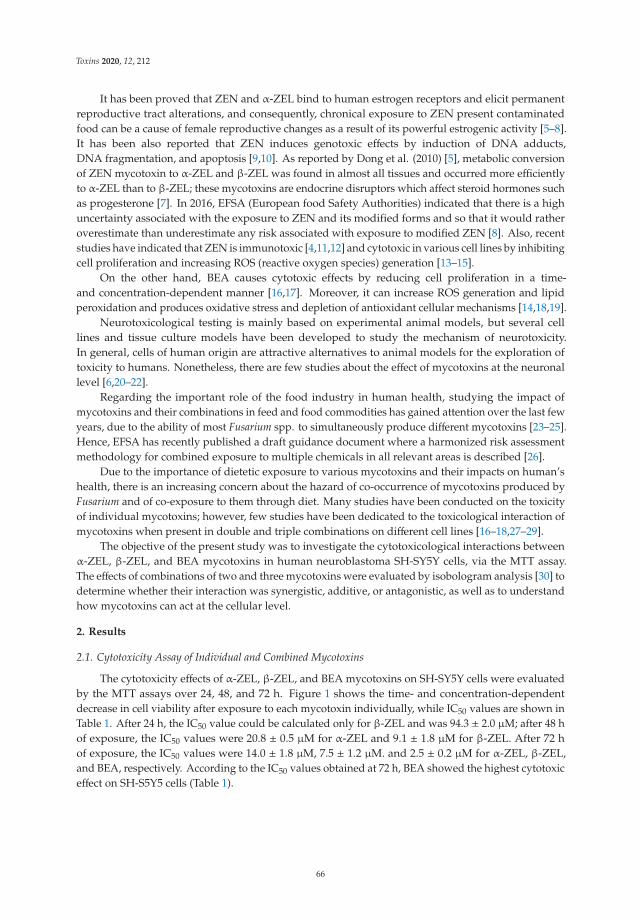
Toxins 2020, 12, 212
It has been proved that ZEN and α-ZEL bind to human estrogen receptors and elicit permanentreproductive tract alterations, and consequently, chronical exposure to ZEN present contaminatedfood can be a cause of female reproductive changes as a result of its powerful estrogenic activity [5–8].It has been also reported that ZEN induces genotoxic effects by induction of DNA adducts,DNA fragmentation, and apoptosis [9,10]. As reported by Dong et al. (2010) [5], metabolic conversionof ZEN mycotoxin to α-ZEL and β-ZEL was found in almost all tissues and occurred more efficientlyto α-ZEL than to β-ZEL; these mycotoxins are endocrine disruptors which affect steroid hormones suchas progesterone [7]. In 2016, EFSA (European food Safety Authorities) indicated that there is a highuncertainty associated with the exposure to ZEN and its modified forms and so that it would ratheroverestimate than underestimate any risk associated with exposure to modified ZEN [8]. Also, recentstudies have indicated that ZEN is immunotoxic [4,11,12] and cytotoxic in various cell lines by inhibitingcell proliferation and increasing ROS (reactive oxygen species) generation [13–15].
On the other hand, BEA causes cytotoxic effects by reducing cell proliferation in a time-and concentration-dependent manner [16,17]. Moreover, it can increase ROS generation and lipidperoxidation and produces oxidative stress and depletion of antioxidant cellular mechanisms [14,18,19].
Neurotoxicological testing is mainly based on experimental animal models, but several celllines and tissue culture models have been developed to study the mechanism of neurotoxicity.In general, cells of human origin are attractive alternatives to animal models for the exploration oftoxicity to humans. Nonetheless, there are few studies about the effect of mycotoxins at the neuronallevel [6,20–22].
Regarding the important role of the food industry in human health, studying the impact ofmycotoxins and their combinations in feed and food commodities has gained attention over the last fewyears, due to the ability of most Fusarium spp. to simultaneously produce different mycotoxins [23–25].Hence, EFSA has recently published a draft guidance document where a harmonized risk assessmentmethodology for combined exposure to multiple chemicals in all relevant areas is described [26].
Due to the importance of dietetic exposure to various mycotoxins and their impacts on human’shealth, there is an increasing concern about the hazard of co-occurrence of mycotoxins produced byFusarium and of co-exposure to them through diet. Many studies have been conducted on the toxicityof individual mycotoxins; however, few studies have been dedicated to the toxicological interaction ofmycotoxins when present in double and triple combinations on different cell lines [16–18,27–29].
The objective of the present study was to investigate the cytotoxicological interactions betweenα-ZEL, β-ZEL, and BEA mycotoxins in human neuroblastoma SH-SY5Y cells, via the MTT assay.The effects of combinations of two and three mycotoxins were evaluated by isobologram analysis [30] todetermine whether their interaction was synergistic, additive, or antagonistic, as well as to understandhow mycotoxins can act at the cellular level.
2. Results
2.1. Cytotoxicity Assay of Individual and Combined Mycotoxins
The cytotoxicity effects of α-ZEL, β-ZEL, and BEA mycotoxins on SH-SY5Y cells were evaluatedby the MTT assays over 24, 48, and 72 h. Figure 1 shows the time- and concentration-dependentdecrease in cell viability after exposure to each mycotoxin individually, while IC50 values are shown inTable 1. After 24 h, the IC50 value could be calculated only for β-ZEL and was 94.3 ± 2.0 μM; after 48 hof exposure, the IC50 values were 20.8 ± 0.5 μM for α-ZEL and 9.1 ± 1.8 μM for β-ZEL. After 72 hof exposure, the IC50 values were 14.0 ± 1.8 μM, 7.5 ± 1.2 μM. and 2.5 ± 0.2 μM for α-ZEL, β-ZEL,and BEA, respectively. According to the IC50 values obtained at 72 h, BEA showed the highest cytotoxiceffect on SH-S5Y5 cells (Table 1).
66
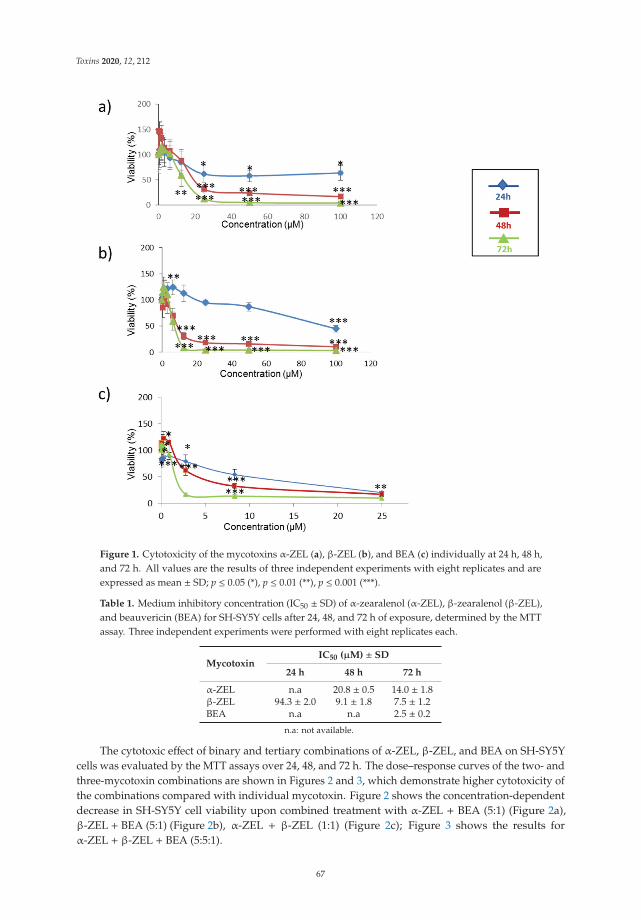
Toxins 2020, 12, 212
Figure 1. Cytotoxicity of the mycotoxins α-ZEL (a), β-ZEL (b), and BEA (c) individually at 24 h, 48 h,and 72 h. All values are the results of three independent experiments with eight replicates and areexpressed as mean ± SD; p ≤ 0.05 (*), p ≤ 0.01 (**), p ≤ 0.001 (***).
Table 1. Medium inhibitory concentration (IC50 ± SD) of α-zearalenol (α-ZEL), β-zearalenol (β-ZEL),and beauvericin (BEA) for SH-SY5Y cells after 24, 48, and 72 h of exposure, determined by the MTTassay. Three independent experiments were performed with eight replicates each.
MycotoxinIC50 (μM) ± SD
24 h 48 h 72 h
α-ZEL n.a 20.8 ± 0.5 14.0 ± 1.8β-ZEL 94.3 ± 2.0 9.1 ± 1.8 7.5 ± 1.2BEA n.a n.a 2.5 ± 0.2
n.a: not available.
The cytotoxic effect of binary and tertiary combinations of α-ZEL, β-ZEL, and BEA on SH-SY5Ycells was evaluated by the MTT assays over 24, 48, and 72 h. The dose–response curves of the two- andthree-mycotoxin combinations are shown in Figures 2 and 3, which demonstrate higher cytotoxicity ofthe combinations compared with individual mycotoxin. Figure 2 shows the concentration-dependentdecrease in SH-SY5Y cell viability upon combined treatment with α-ZEL + BEA (5:1) (Figure 2a),β-ZEL + BEA (5:1) (Figure 2b), α-ZEL + β-ZEL (1:1) (Figure 2c); Figure 3 shows the results forα-ZEL + β-ZEL + BEA (5:5:1).
67
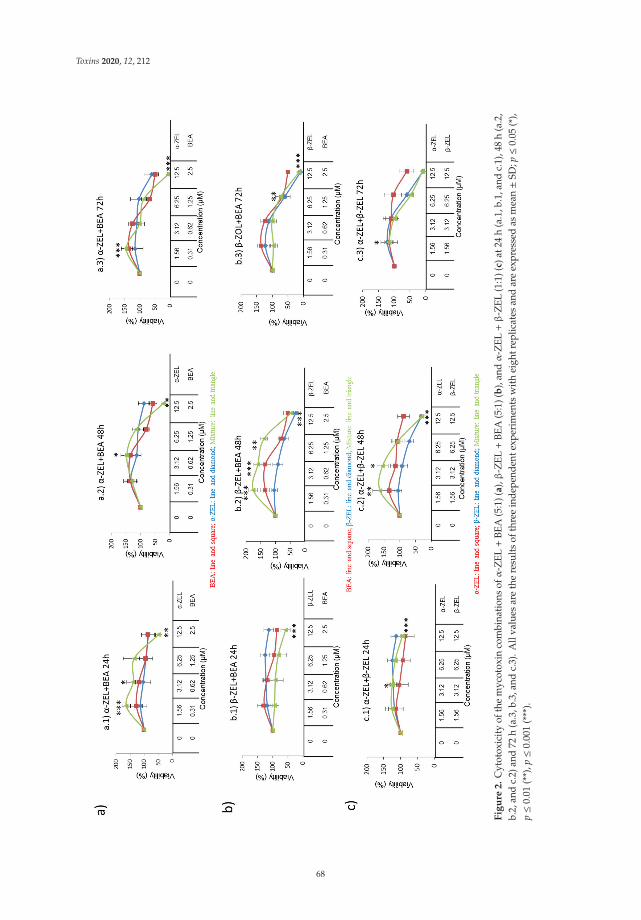
Toxins 2020, 12, 212
Fig
ure
2.
Cyt
otox
icity
ofth
em
ycot
oxin
com
bina
tions
ofα
-ZEL+
BEA
(5:1
)(a
),β
-ZEL+
BEA
(5:1
)(b
),an
dα
-ZEL+β
-ZEL
(1:1
)(c)
at24
h(a
.1,b
.1,a
ndc.
1),4
8h
(a.2
,b.
2,an
dc.
2)an
d72
h(a
.3,b
.3,a
ndc.
3).A
llva
lues
are
the
resu
ltsof
thre
ein
depe
nden
texp
erim
ents
with
eigh
trep
licat
esan
dar
eex
pres
sed
asm
ean±S
D;p≤0
.05
(*),
p≤0
.01
(**)
,p≤0
.001
(***
).
68
Toxins 2020, 12, 212
(a)
(b)
(c)
Figure 3. Cytotoxicity of the mycotoxin combination of α-ZEL + β-ZEL + BEA (5:5:1) at 24 h (a),48 h, (b) and 72 h (c). All values are the results of three independent experiments with eight replicatesand are expressed as mean ± SD; p ≤ 0.05 (*), p ≤ 0.01 (**), p ≤ 0.001 (***). BEA: line and square; β-ZEL:line and diamond; α-ZEL: line and triangle; Mixture: line and ×.
69
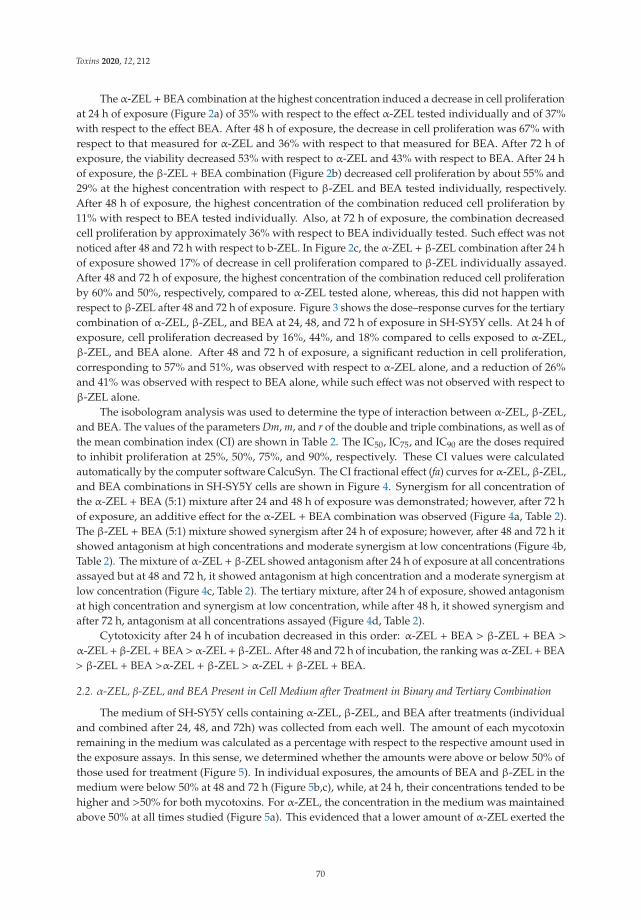
Toxins 2020, 12, 212
The α-ZEL + BEA combination at the highest concentration induced a decrease in cell proliferationat 24 h of exposure (Figure 2a) of 35% with respect to the effect α-ZEL tested individually and of 37%with respect to the effect BEA. After 48 h of exposure, the decrease in cell proliferation was 67% withrespect to that measured for α-ZEL and 36% with respect to that measured for BEA. After 72 h ofexposure, the viability decreased 53% with respect to α-ZEL and 43% with respect to BEA. After 24 hof exposure, the β-ZEL + BEA combination (Figure 2b) decreased cell proliferation by about 55% and29% at the highest concentration with respect to β-ZEL and BEA tested individually, respectively.After 48 h of exposure, the highest concentration of the combination reduced cell proliferation by11% with respect to BEA tested individually. Also, at 72 h of exposure, the combination decreasedcell proliferation by approximately 36% with respect to BEA individually tested. Such effect was notnoticed after 48 and 72 h with respect to b-ZEL. In Figure 2c, the α-ZEL + β-ZEL combination after 24 hof exposure showed 17% of decrease in cell proliferation compared to β-ZEL individually assayed.After 48 and 72 h of exposure, the highest concentration of the combination reduced cell proliferationby 60% and 50%, respectively, compared to α-ZEL tested alone, whereas, this did not happen withrespect to β-ZEL after 48 and 72 h of exposure. Figure 3 shows the dose–response curves for the tertiarycombination of α-ZEL, β-ZEL, and BEA at 24, 48, and 72 h of exposure in SH-SY5Y cells. At 24 h ofexposure, cell proliferation decreased by 16%, 44%, and 18% compared to cells exposed to α-ZEL,β-ZEL, and BEA alone. After 48 and 72 h of exposure, a significant reduction in cell proliferation,corresponding to 57% and 51%, was observed with respect to α-ZEL alone, and a reduction of 26%and 41% was observed with respect to BEA alone, while such effect was not observed with respect toβ-ZEL alone.
The isobologram analysis was used to determine the type of interaction between α-ZEL, β-ZEL,and BEA. The values of the parameters Dm, m, and r of the double and triple combinations, as well as ofthe mean combination index (CI) are shown in Table 2. The IC50, IC75, and IC90 are the doses requiredto inhibit proliferation at 25%, 50%, 75%, and 90%, respectively. These CI values were calculatedautomatically by the computer software CalcuSyn. The CI fractional effect (fa) curves for α-ZEL, β-ZEL,and BEA combinations in SH-SY5Y cells are shown in Figure 4. Synergism for all concentration ofthe α-ZEL + BEA (5:1) mixture after 24 and 48 h of exposure was demonstrated; however, after 72 hof exposure, an additive effect for the α-ZEL + BEA combination was observed (Figure 4a, Table 2).The β-ZEL + BEA (5:1) mixture showed synergism after 24 h of exposure; however, after 48 and 72 h itshowed antagonism at high concentrations and moderate synergism at low concentrations (Figure 4b,Table 2). The mixture of α-ZEL + β-ZEL showed antagonism after 24 h of exposure at all concentrationsassayed but at 48 and 72 h, it showed antagonism at high concentration and a moderate synergism atlow concentration (Figure 4c, Table 2). The tertiary mixture, after 24 h of exposure, showed antagonismat high concentration and synergism at low concentration, while after 48 h, it showed synergism andafter 72 h, antagonism at all concentrations assayed (Figure 4d, Table 2).
Cytotoxicity after 24 h of incubation decreased in this order: α-ZEL + BEA > β-ZEL + BEA >α-ZEL+β-ZEL+ BEA>α-ZEL+β-ZEL. After 48 and 72 h of incubation, the ranking was α-ZEL+ BEA> β-ZEL + BEA >α-ZEL + β-ZEL > α-ZEL + β-ZEL + BEA.
2.2. α-ZEL, β-ZEL, and BEA Present in Cell Medium after Treatment in Binary and Tertiary Combination
The medium of SH-SY5Y cells containing α-ZEL, β-ZEL, and BEA after treatments (individualand combined after 24, 48, and 72h) was collected from each well. The amount of each mycotoxinremaining in the medium was calculated as a percentage with respect to the respective amount used inthe exposure assays. In this sense, we determined whether the amounts were above or below 50% ofthose used for treatment (Figure 5). In individual exposures, the amounts of BEA and β-ZEL in themedium were below 50% at 48 and 72 h (Figure 5b,c), while, at 24 h, their concentrations tended to behigher and >50% for both mycotoxins. For α-ZEL, the concentration in the medium was maintainedabove 50% at all times studied (Figure 5a). This evidenced that a lower amount of α-ZEL exerted the
70
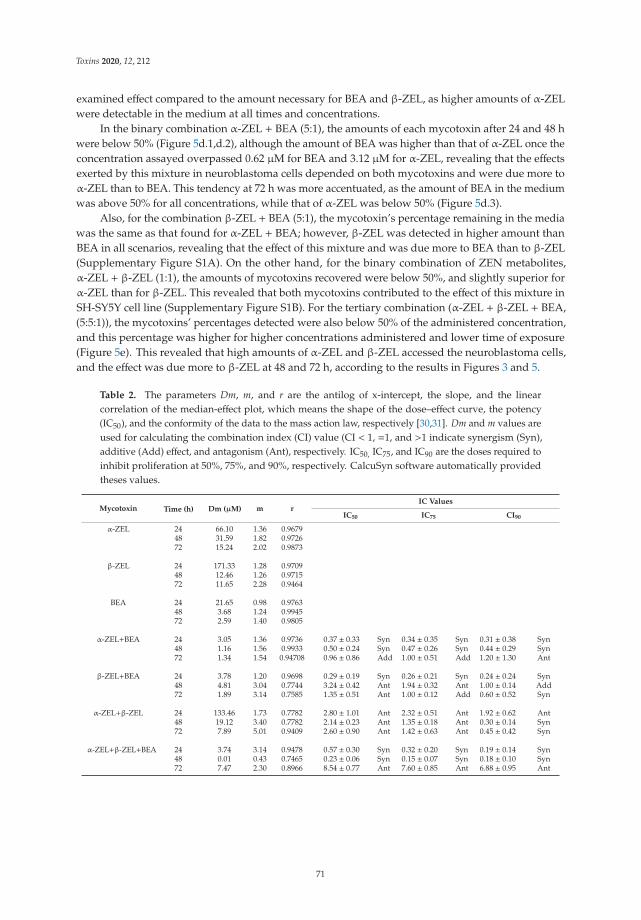
Toxins 2020, 12, 212
examined effect compared to the amount necessary for BEA and β-ZEL, as higher amounts of α-ZELwere detectable in the medium at all times and concentrations.
In the binary combination α-ZEL + BEA (5:1), the amounts of each mycotoxin after 24 and 48 hwere below 50% (Figure 5d.1,d.2), although the amount of BEA was higher than that of α-ZEL once theconcentration assayed overpassed 0.62 μM for BEA and 3.12 μM for α-ZEL, revealing that the effectsexerted by this mixture in neuroblastoma cells depended on both mycotoxins and were due more toα-ZEL than to BEA. This tendency at 72 h was more accentuated, as the amount of BEA in the mediumwas above 50% for all concentrations, while that of α-ZEL was below 50% (Figure 5d.3).
Also, for the combination β-ZEL + BEA (5:1), the mycotoxin’s percentage remaining in the mediawas the same as that found for α-ZEL + BEA; however, β-ZEL was detected in higher amount thanBEA in all scenarios, revealing that the effect of this mixture and was due more to BEA than to β-ZEL(Supplementary Figure S1A). On the other hand, for the binary combination of ZEN metabolites,α-ZEL + β-ZEL (1:1), the amounts of mycotoxins recovered were below 50%, and slightly superior forα-ZEL than for β-ZEL. This revealed that both mycotoxins contributed to the effect of this mixture inSH-SY5Y cell line (Supplementary Figure S1B). For the tertiary combination (α-ZEL + β-ZEL + BEA,(5:5:1)), the mycotoxins’ percentages detected were also below 50% of the administered concentration,and this percentage was higher for higher concentrations administered and lower time of exposure(Figure 5e). This revealed that high amounts of α-ZEL and β-ZEL accessed the neuroblastoma cells,and the effect was due more to β-ZEL at 48 and 72 h, according to the results in Figures 3 and 5.
Table 2. The parameters Dm, m, and r are the antilog of x-intercept, the slope, and the linearcorrelation of the median-effect plot, which means the shape of the dose–effect curve, the potency(IC50), and the conformity of the data to the mass action law, respectively [30,31]. Dm and m values areused for calculating the combination index (CI) value (CI < 1, =1, and >1 indicate synergism (Syn),additive (Add) effect, and antagonism (Ant), respectively. IC50, IC75, and IC90 are the doses required toinhibit proliferation at 50%, 75%, and 90%, respectively. CalcuSyn software automatically providedtheses values.
Mycotoxin Time (h) Dm (μM) m rIC Values
IC50 IC75 CI90
α-ZEL 24 66.10 1.36 0.967948 31.59 1.82 0.972672 15.24 2.02 0.9873
β-ZEL 24 171.33 1.28 0.970948 12.46 1.26 0.971572 11.65 2.28 0.9464
BEA 24 21.65 0.98 0.976348 3.68 1.24 0.994572 2.59 1.40 0.9805
α-ZEL+BEA 24 3.05 1.36 0.9736 0.37 ± 0.33 Syn 0.34 ± 0.35 Syn 0.31 ± 0.38 Syn48 1.16 1.56 0.9933 0.50 ± 0.24 Syn 0.47 ± 0.26 Syn 0.44 ± 0.29 Syn72 1.34 1.54 0.94708 0.96 ± 0.86 Add 1.00 ± 0.51 Add 1.20 ± 1.30 Ant
β-ZEL+BEA 24 3.78 1.20 0.9698 0.29 ± 0.19 Syn 0.26 ± 0.21 Syn 0.24 ± 0.24 Syn48 4.81 3.04 0.7744 3.24 ± 0.42 Ant 1.94 ± 0.32 Ant 1.00 ± 0.14 Add72 1.89 3.14 0.7585 1.35 ± 0.51 Ant 1.00 ± 0.12 Add 0.60 ± 0.52 Syn
α-ZEL+β-ZEL 24 133.46 1.73 0.7782 2.80 ± 1.01 Ant 2.32 ± 0.51 Ant 1.92 ± 0.62 Ant48 19.12 3.40 0.7782 2.14 ± 0.23 Ant 1.35 ± 0.18 Ant 0.30 ± 0.14 Syn72 7.89 5.01 0.9409 2.60 ± 0.90 Ant 1.42 ± 0.63 Ant 0.45 ± 0.42 Syn
α-ZEL+β-ZEL+BEA 24 3.74 3.14 0.9478 0.57 ± 0.30 Syn 0.32 ± 0.20 Syn 0.19 ± 0.14 Syn48 0.01 0.43 0.7465 0.23 ± 0.06 Syn 0.15 ± 0.07 Syn 0.18 ± 0.10 Syn72 7.47 2.30 0.8966 8.54 ± 0.77 Ant 7.60 ± 0.85 Ant 6.88 ± 0.95 Ant
71
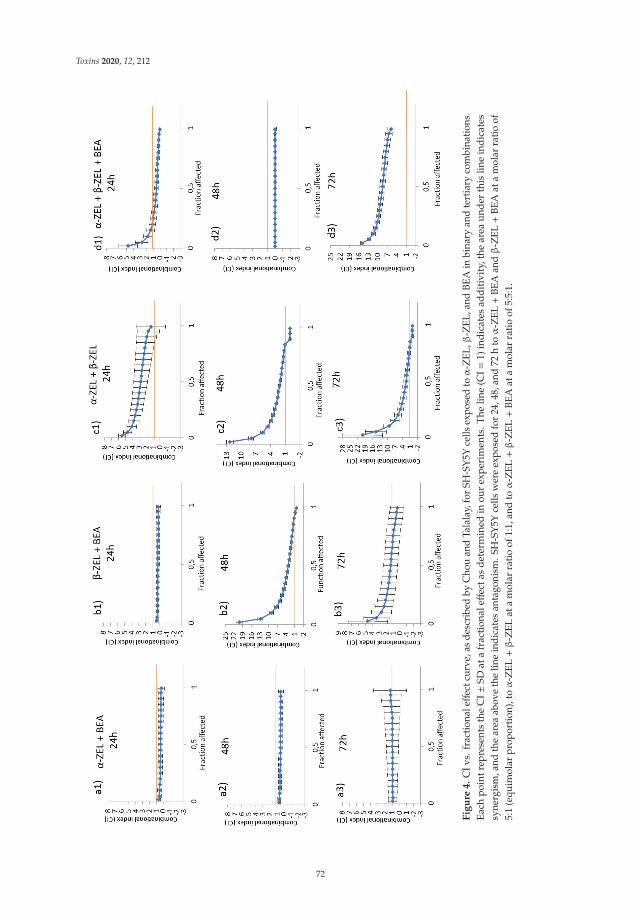
Toxins 2020, 12, 212
Fig
ure
4.
CIv
s.fr
actio
naleff
ectc
urve
,as
desc
ribe
dby
Cho
uan
dTa
lala
y,fo
rSH
-SY
5Yce
llsex
pose
dto
α-Z
EL,β
-ZEL
,and
BEA
inbi
nary
and
tert
iary
com
bina
tions
.E
ach
poin
trep
rese
nts
the
CI±
SDat
afr
acti
onal
effec
tas
det
erm
ined
inou
rex
peri
men
ts.T
helin
e(C
I=1)
ind
icat
esad
dit
ivit
y,th
ear
eaun
der
this
line
ind
icat
essy
nerg
ism
,and
the
area
abov
eth
elin
ein
dica
tes
anta
goni
sm.S
H-S
Y5Y
cells
wer
eex
pose
dfo
r24
,48,
and
72h
toα
-ZEL+
BEA
andβ
-ZEL+
BEA
ata
mol
arra
tioof
5:1
(equ
imol
arpr
opor
tion
),to
α-Z
EL+β
-ZEL
ata
mol
arra
tio
of1:
1,an
dto
α-Z
EL+β
-ZEL+
BEA
ata
mol
arra
tio
of5:
5:1.
72
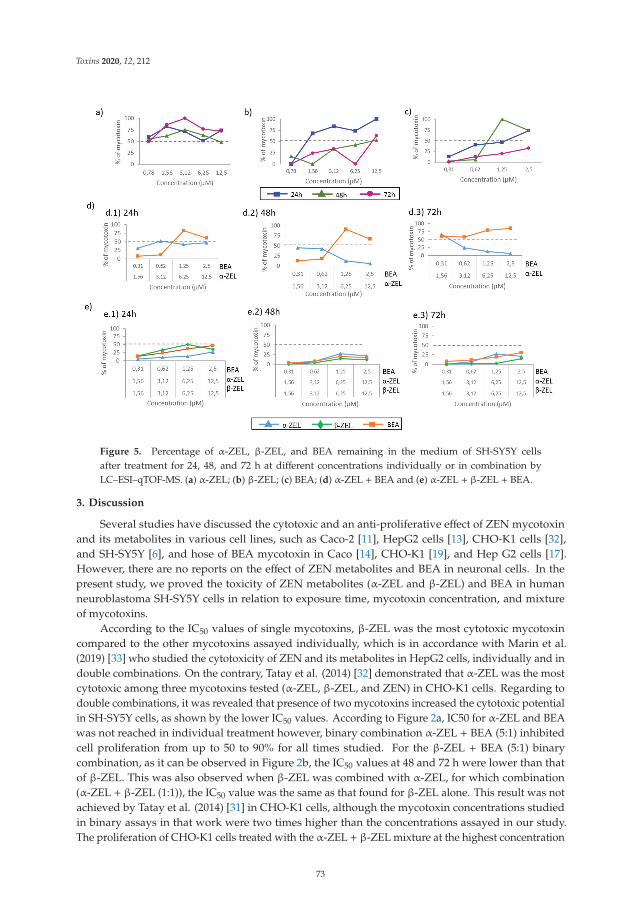
Toxins 2020, 12, 212
Figure 5. Percentage of α-ZEL, β-ZEL, and BEA remaining in the medium of SH-SY5Y cellsafter treatment for 24, 48, and 72 h at different concentrations individually or in combination byLC–ESI–qTOF-MS. (a) α-ZEL; (b) β-ZEL; (c) BEA; (d) α-ZEL + BEA and (e) α-ZEL + β-ZEL + BEA.
3. Discussion
Several studies have discussed the cytotoxic and an anti-proliferative effect of ZEN mycotoxinand its metabolites in various cell lines, such as Caco-2 [11], HepG2 cells [13], CHO-K1 cells [32],and SH-SY5Y [6], and hose of BEA mycotoxin in Caco [14], CHO-K1 [19], and Hep G2 cells [17].However, there are no reports on the effect of ZEN metabolites and BEA in neuronal cells. In thepresent study, we proved the toxicity of ZEN metabolites (α-ZEL and β-ZEL) and BEA in humanneuroblastoma SH-SY5Y cells in relation to exposure time, mycotoxin concentration, and mixtureof mycotoxins.
According to the IC50 values of single mycotoxins, β-ZEL was the most cytotoxic mycotoxincompared to the other mycotoxins assayed individually, which is in accordance with Marin et al.(2019) [33] who studied the cytotoxicity of ZEN and its metabolites in HepG2 cells, individually and indouble combinations. On the contrary, Tatay et al. (2014) [32] demonstrated that α-ZEL was the mostcytotoxic among three mycotoxins tested (α-ZEL, β-ZEL, and ZEN) in CHO-K1 cells. Regarding todouble combinations, it was revealed that presence of two mycotoxins increased the cytotoxic potentialin SH-SY5Y cells, as shown by the lower IC50 values. According to Figure 2a, IC50 for α-ZEL and BEAwas not reached in individual treatment however, binary combination α-ZEL + BEA (5:1) inhibitedcell proliferation from up to 50 to 90% for all times studied. For the β-ZEL + BEA (5:1) binarycombination, as it can be observed in Figure 2b, the IC50 values at 48 and 72 h were lower than thatof β-ZEL. This was also observed when β-ZEL was combined with α-ZEL, for which combination(α-ZEL + β-ZEL (1:1)), the IC50 value was the same as that found for β-ZEL alone. This result was notachieved by Tatay et al. (2014) [31] in CHO-K1 cells, although the mycotoxin concentrations studiedin binary assays in that work were two times higher than the concentrations assayed in our study.The proliferation of CHO-K1 cells treated with the α-ZEL + β-ZEL mixture at the highest concentration
73
Toxins 2020, 12, 212
decreased only by 20% with respect to the values found when each mycotoxin was tested alone.In addition, in that study, the IC50 value was never reached for binary mixtures, whereas in our studyin SH-SY5Y cells, after 48 and 72 h, the α-ZEL + β-ZEL combination inhibited cell proliferation up to70% and 90%, respectively (Figure 2c). For the triple combination (α-ZEL + β-ZEL + BEA, (5:5:1)),cell proliferation inhibition was lower than when β-ZEL was assayed individually, and the same resultwas found for β-ZEL + BEA after 48 and 72 h and for α-ZEL + β-ZEL after 48 h in SH-SY5Y cells.This is in contrast with the results obtained for the tertiary combination of α-ZEL + β-ZEL + ZEN inCHO-K1 cells, as this combination was more cytotoxic than each mycotoxin tested alone [30].
As the co-occurrence of mycotoxins in food and feed is very common, some studies evaluated thetoxicity and cytotoxicity of several mycotoxins, both individually and in combination, in different celllines, using the isobologram model. In these experiments, HepG2 cells were exposed to ochratoxinA (OTA) and BEA [16], to double and triple combinations of alternariol, 3-acetyl-deoxynivalenol, and15-acetyl-deoxynivalenol [28], and to combinations of ZEN and OTA orα-ZEL (tested also individually) [33],CHO-K1 cells in vitro were used to examine the interactions between the mycotoxins beauvericin,deoxynivalenol (DON), and T-2 toxin [26] as well as the combination of BEA, patulin, and ZEN [17],whereas Caco-2 cells were exposed to DON, ZEN, and Aflatoxin B1 [34]. It is important to understandwhether the interaction between mycotoxins shows synergism, additive effects, and/or antagonismconcerning cell viability.
In SH-SY5Y cells, almost all the combinations tested reduced cell viability more than the individualmycotoxins, except the β-ZEL + BEA (5:1), α-ZEL + β-ZEL (1:1), and α-ZEL + β-ZEL + BEA(5:5:1) combinations, for which the reduction in cell viability was not significantly different fromthat obtained when β-ZEL was assayed individually. According to Dong et al. (2010) [5], ZEN isdegraded more efficiently to α-ZEL than to β-ZEL in almost all tissues, whereas it is converted moreefficiently to β-ZEL than to α-ZEL in liver and lungs. Some studies demonstrated that β-ZEL is morecytotoxic than α-ZEL [31,35,36], whereas other studies found that α-ZEL is more cytotoxic [30,35].Hence, there is a necessity to clarify the cytotoxicity of these two mycotoxins with studies of the toxicitymechanisms involved.
The IC50 values obtained by the MTT assay and the amount of mycotoxin detected in the mediaby LC–ESI–qTOF-MS were determined and translated into percentage values as an attempt to calculatethe amount of each mycotoxin involved in the cytotoxic effect and in the type of interaction effect.Hence, the percentage of mycotoxin present in the media was considered in accordance to the IC50
value obtained from the MTT assay (Table 1). The results showed that among the individual mycotoxinsassayed, the amount of α-ZEL that remained in the culture medium was above 50% of the administeredquantity at all times assayed (Figure 5a). This can be related to the effect in Figure 1a, which shows thatthe viability was above 100% for the doses reported in Figure 5. This can be justified by the chemicalstructure of this compound, which might impede its access in the cell. Our results suggest that theavailability and capacity of the tested mycotoxins to get into cells were greater than those of α-ZEL,and as a consequence, the amounts of these mycotoxins detected in the media were lower than thatof α-ZEL. To notice that the higher the amount of mycotoxin in the medium (at 24 h), the higher thecell viability, which might be related to the lower amount of mycotoxin affecting the live cells. On thecontrary, BEA seemed to have easier access the cells, as its percentage in the medium was generallybelow 50%, but cell viability was maintained above 50% for the doses assayed, indicating the lowerpotential toxicity of BEA in SH-SY5Y cells compared to ZEN metabolites. In fact, among all threemycotoxins tested, BEA reached the IC50 values after long exposures times (72 h) (Table 1 and Figure 1c),highlighting again the mild toxic effect of BEA in SHY-SY5Y cells compared to ZEN metabolites.
According to this and when analyzing combinations, the amounts of ZEN metabolites found inthe medium were in most cases below BEA’s amounts, indicating easier access of these compoundsin SH-SY5Y compared to BEA. In detail, for the α-ZEL + BEA combination (Figure 2a), it can beobserved that the lower the amount of α-ZEL in the medium over time (Figure 5d), the lower theviability of SH-SY5Y cells, in particular at 72h. For triple mixtures, the cytotoxic effect was weaker
74
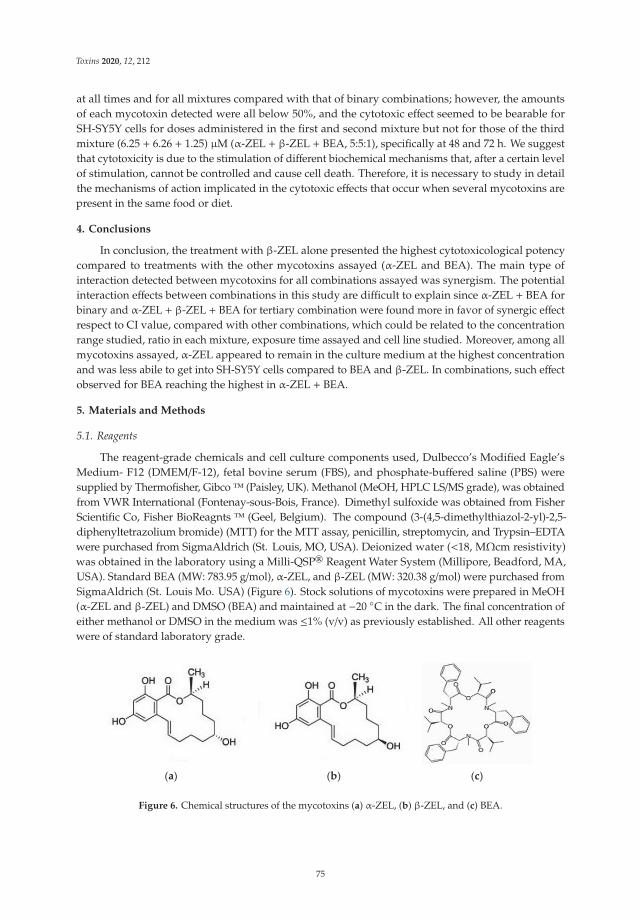
Toxins 2020, 12, 212
at all times and for all mixtures compared with that of binary combinations; however, the amountsof each mycotoxin detected were all below 50%, and the cytotoxic effect seemed to be bearable forSH-SY5Y cells for doses administered in the first and second mixture but not for those of the thirdmixture (6.25 + 6.26 + 1.25) μM (α-ZEL + β-ZEL + BEA, 5:5:1), specifically at 48 and 72 h. We suggestthat cytotoxicity is due to the stimulation of different biochemical mechanisms that, after a certain levelof stimulation, cannot be controlled and cause cell death. Therefore, it is necessary to study in detailthe mechanisms of action implicated in the cytotoxic effects that occur when several mycotoxins arepresent in the same food or diet.
4. Conclusions
In conclusion, the treatment with β-ZEL alone presented the highest cytotoxicological potencycompared to treatments with the other mycotoxins assayed (α-ZEL and BEA). The main type ofinteraction detected between mycotoxins for all combinations assayed was synergism. The potentialinteraction effects between combinations in this study are difficult to explain since α-ZEL + BEA forbinary and α-ZEL + β-ZEL + BEA for tertiary combination were found more in favor of synergic effectrespect to CI value, compared with other combinations, which could be related to the concentrationrange studied, ratio in each mixture, exposure time assayed and cell line studied. Moreover, among allmycotoxins assayed, α-ZEL appeared to remain in the culture medium at the highest concentrationand was less abile to get into SH-SY5Y cells compared to BEA and β-ZEL. In combinations, such effectobserved for BEA reaching the highest in α-ZEL + BEA.
5. Materials and Methods
5.1. Reagents
The reagent-grade chemicals and cell culture components used, Dulbecco’s Modified Eagle’sMedium- F12 (DMEM/F-12), fetal bovine serum (FBS), and phosphate-buffered saline (PBS) weresupplied by Thermofisher, Gibco™ (Paisley, UK). Methanol (MeOH, HPLC LS/MS grade), was obtainedfrom VWR International (Fontenay-sous-Bois, France). Dimethyl sulfoxide was obtained from FisherScientific Co, Fisher BioReagnts ™ (Geel, Belgium). The compound (3-(4,5-dimethylthiazol-2-yl)-2,5-diphenyltetrazolium bromide) (MTT) for the MTT assay, penicillin, streptomycin, and Trypsin–EDTAwere purchased from SigmaAldrich (St. Louis, MO, USA). Deionized water (<18, MΩcm resistivity)was obtained in the laboratory using a Milli-QSP® Reagent Water System (Millipore, Beadford, MA,USA). Standard BEA (MW: 783.95 g/mol), α-ZEL, and β-ZEL (MW: 320.38 g/mol) were purchased fromSigmaAldrich (St. Louis Mo. USA) (Figure 6). Stock solutions of mycotoxins were prepared in MeOH(α-ZEL and β-ZEL) and DMSO (BEA) and maintained at −20 ◦C in the dark. The final concentration ofeither methanol or DMSO in the medium was ≤1% (v/v) as previously established. All other reagentswere of standard laboratory grade.
(a) (b) (c)
Figure 6. Chemical structures of the mycotoxins (a) α-ZEL, (b) β-ZEL, and (c) BEA.
75
Toxins 2020, 12, 212
5.2. Cell Culture
The human neuroblastoma cell line SH-SY5Y was obtained from the American Type CultureCollection (ATCC, Manassas, VA, USA) and cultured in Dulbecco’s Modified Eagle’s Medium/F12(DMEM/F-12), supplemented with 10% FBS, 100 U/mL penicillin, and 100 mg/mL streptomycin. The cellswere sub-cultivated after trypsinization once or twice a week and suspended in complete medium in a1:3 split ratio. The cells were maintained as monolayers in 150 cm2 cell culture flasks with filter screwcaps (TPP, Trasadingen, Switzerland). Cell cultures were incubated at 37 ◦C, 5% CO2 atmosphere.
5.3. Mycotoxin Exposure
Concentration of the mycotoxins and exposure time are two factors that were considered to inthis study. The cells were exposed to α-ZEL, β-ZEL, and BEA mycotoxins individually for 24, 48, and72 h at a concentration in the ranges of 0.39 to 100 μM for α-ZEL and β-ZEL and 0.009 to 25 μM forBEA, all with 1:2 dilution (Table 3). Also, the mycotoxins were assayed in combination in the followingmixtures: α-ZEL + BEA, β-ZEL + BEA, α-ZEL + β-ZEL, and α-ZEL + β-ZEL + BEA at three exposuretimes 24, 48, and 72 h. The concentrations ranged from 1.87 to 25 μM for the binary combinationswere studied and from 3.43 to 27.5 μM for the tertiary combination, including four dilutions of eachmycotoxin: BEA (0.31, 0.62, 1.25, and 2.5 μM), α-ZEL and β-ZEL (1.56, 3.12, 6.25 and 12.5 μM) (Table 3).The dilution ratios of the concentrations for the binary combinations were 5:1 for α-ZEL + BEA andβ-ZEL + BEA, 1:1 for α-ZEL + β-ZEL, and 5:5:1 for the tertiary combination (β-ZEL + α-ZEL + BEA)(Table 3).
Table 3. Concentration range (μM) of mycotoxins studied individually and in combinations.The dilution ratios were 5:1 for the combinationsα-ZEL+BEA andβ-ZEL+BEA, 1:1 forα-ZEL + β-ZEL,and 5:5:1 for α-ZEL + β-ZEL + BEA.
Combination Tested Concentration Range (μM)
α-ZEL (0.39–00)β-ZEL (0.39–100)BEA (0.009–25)α-ZEL + BEA (1.56–2.5) + (0.31–2.5)β-ZEL + BEA (1.56–2.5) + (0.31–2.5)α-ZEL + β-ZEL (1.56–12.5) + (1.56–12.5)α-ZEL + β-ZEL + BEA (1.56–12.5) + (1.56–12.5) + (0.31–2.5)
5.4. MTT Assay
Cytotoxicity was examined by the MTT assay, performed as described by Ruiz et al. (2006) [37],with few modifications. The assay consists in measuring the viability of cells by determining thereduction of the yellow soluble tetrazolium salt only in cells that are metabolically active via amitochondrial reaction to an insoluble purple formazan crystal. Cells were seeded in 96-well cultureplates at 2 × 96 cells/well and allowed to adhere for 18–24 h before mycotoxin additions. Serial dilutionsof α-ZEL, β-ZEL, and BEA at 1:2 dilutions were prepared with supplemented medium and added tothe respective plates (Table 3). Culture medium without mycotoxins and with 1% MeOH or DMSO wasused as a control. After treatment, the medium was removed, and each well received 200 μL of freshmedium containing 50 μL of MTT solution (5 mg/mL; MTT powder dissolved in phosphate-bufferedsaline). After an incubation time of 4 h at 37 ◦C in the darkness, the MTT-containing medium wasremoved, and 200 μL of DMSO and 25 μL of Sorensen’s solution were added to each well beforereading the optical density at 620 nm with the ELISA plate reader Multiskan EX (Thermo Scientific,MA, USA). Each mycotoxin combination plus a control were tested in three independent experiments.Mean inhibition concentration (IC50) values were calculated from full dose–response curves.
76
Toxins 2020, 12, 212
5.5. Experimental Design and Combination Index
The isobologram analysis (Chou–Talalay model) was used to determine the type of interaction(synergism, additive effect, and antagonism) that occurred when the mycotoxins studied werein combination. This model allows characterizing the interactions induced by combinations ofmycotoxins in different cell lines and with different mycotoxins but it does not allow the elucidation ofthe mechanisms by which these types of interaction are produced. The median effect/combinationindex (CI) isobologram equation by Chou (2006) [31] and Chou and Talalay (1984) [30] permittedanalyzing drug combination effects. The isobologram analysis involves plotting the dose–effect curvesfor each compound and its combinations in multiple diluted concentrations. Parameters such as Dm(median effect dose), fa (fraction affected by concentration), and m (coefficient signifying the shape ofthe dose–effect relationship) are relevant in the equation [30]. Therefore, the method considers bothpotency (Dm) and shape (m) parameters.
Chou and Talalay (1984) [30] introduced the term combination index (CI). CI values <1, =1,and >1 indicate synergism, additive effects, and antagonism of the combination, respectively.CalcuSyn software version 2.1. (Biosoft, Cambridge, UK, 1996–2007) was used to study the types ofinteractions assessed by the isobologram analysis. The IC25, IC50, IC75, and IC90 are the doses requiredto produce toxicity at 25%, 50%, 75%, and 90%, respectively.
5.6. Extraction of α-ZEL, β-ZEL, and BEA from the Culture Media
To determine the intracellular accumulation of the mycotoxins studied, an extraction procedure of theculture media was carried out following the method described by Juan-García et al. (2015 and 2016) [27,28],with several modifications. Briefly, 0.8 mL of culture medium was collected and transferred into apolypropylene tube, 1.5 mL of ethyl acetate was added, and the mixture was shaken for 2 min with anUltra-Turrax Ika T18 basic (Staufen, Germany). Afterwards, the mixture as sonicated in an ultrasoundcleaning bath (VWR, USC1700TH) for 10 min. Finally, the mixture was centrifuged at ~5600× gfor 5 min at 22 ◦C (Centrifuge 5810R, Eppendorf, Germany). The supernatant phase was collected.The liquid–liquid extraction process was repeated three times. Finally, the total volume obtained(approx. 4.5 mL) was evaporated to dryness at 45 ◦C in an N2 stream with a TurboVap-LV (Zymark,Allschwil, Switzerland) and then re-dissolved in 0.25 mL of a mixture of methanol and water (70:30,v/v) by vortexing vigorously (15 s), before being transferred into a vial for LC–ESI–qTOF-MS injection.
5.7. Determination of BEA, β-ZEL, and α-ZEL by LC–ESI–qTOF-MS
The analysis was performed using an LC–ESI–qTOF-MS system, consisting of an LC Agilent1200-LC system (Agilent Technologies, Palo Alto, CA, USA) equipped with a vacuum degasser, anautosampler, and a binary pump. The columns were a Gemini NX-C18 column (150 × 2 mm, i.d. 3 μm,Phenomenex, Torrance, California) and a guard column C18 (4 × 2 mm, i.d. 3 μM).
Mobile phases consisted of milli-Q water with 0.1% of formic acid as solvent system A andacetonitrile and 0.1% of formic acid as solvent system B, with the following gradient elution: 3 min,70% B; in 2 min 70–80% B; in 1 min get 90% of B, maintained 4 min; 90–100% B 4 min and maintained2 min; in 2 min decrease to 50% B; in 2 min 90% B, maintained 2 min. The flow rate used was 0.250 mLmin−1, and the total run time was 22 min. The sample volume injected was 20 μL.
MS analysis was carried out using a 6540 Agilent Ultra- High-Definition Accurate-Mass q-TOF-MS,equipped with an Agilent Dual Jet Stream electrospray ionization (Dual AJS ESI) interface in negativeand positive ionization modes. Operation conditions were as follows: sheath gas temperature 350 ◦Cat a flow rate of 8 L/min, capillary voltage 3500 V, nebulizer pressure 45 psig, drying gas 10 L/min,gas temperature 300 ◦C, skimmer voltage 65 V, octopole RF peak 750 V, and fragmentor voltage 130 V.Analyses were performed using AutoMS/MS mode with fixed collision energy (10, 20 and 30) and inmass range of 50–1700 m/z. Acquisition rate was 3 spectra/second. Acquisition data were processedwith Agilent MassHunter Workstation software.
77
Toxins 2020, 12, 212
5.8. Statistical Analysis
Statistical analysis of data was carried out using IBM SPSS Statistic version 23.0 (SPSS, Chicago,Il, USA) statistical software package. Data are expressed as mean ± SD of three independentexperiments. The statistical analysis of the results was performed by student’s T-test for paired samples.Difference between groups were analyzed statistically with ANOVA followed by the Tukey HDSpost-hoc test for multiple comparisons. The level of p ≤ 0.05 was considered statistically significant.
Supplementary Materials: The following are available online at http://www.mdpi.com/2072-6651/12/4/212/s1,Figure S1. Percentage of α-ZEL, β-ZEL, and BEA remaining in the medium of SH-SY5Y cells after treatmentduring 24, 48, and 72 h at different concentrations and combinations by LC–ESI–qTOF-MS. (A) β-ZEL+ BEA and(B) α-ZEL + β-ZEL.
Author Contributions: Data curation, F.A.; Formal analysis, C.J. and A.J.-G.; Funding acquisition, G.F.,C.J., and A.J.-G.; Investigation, F.A., C.J., and A.J.-G.; Methodology, A.J.-G.; Supervision, C.J. and A.J.-G.;Writing—original draft, F.A, C.J. and A.J.-G.; Writing—review & editing, C.J. and A.J.-G. All authors have readand agreed to the published version of the manuscript.
Funding: This research was supported by the Spanish Ministry of Economy and Competitiveness AGL2016-77610-Rand the Generalitat Valencian GVPROMETEO2018-126.
Conflicts of Interest: The authors declare no conflict of interest.
References
1. Zain, M.E. Impact of mycotoxins on humans and animals. J. Saudi Chem. Soc. 2011, 15, 129–144. [CrossRef]2. Mally, A.; Solfrizzo, M.; Degen, G.H. Volume Biomonitoring of the mycotoxin Zearalenone:
Current state-of-the art and application to human exposure assessment. Arch. Toxicol. 2016, 90, 1281–1292.[CrossRef] [PubMed]
3. Richard, J.L. Some major mycotoxins and their mycotoxicoses—An overview. Int. J. Food Microbiol. 2007,119, 3–10. [CrossRef] [PubMed]
4. Hueza, I.M.; Raspantini, P.C.; Raspantini, L.E.; Latorre, A.O.; Górniak, S.L. Zearalenone, an estrogenicmycotoxin, is an immunotoxic compound. Toxins 2014, 6, 1080–1095. [CrossRef]
5. Dong, M.; Tulayakul, P.; Li, J.-Y.; Dong, K.-S.; Manabe, N.; Kumagai, S. Metabolic Conversion of Zearalenoneto α-Zearalenol by Goat Tissues. J. Vet. Med. Sci. 2010, 72, 307–312. [CrossRef]
6. Venkataramana, M.; Chandra Nayaka, S.; Anand, T.; Rajesh, R.; Aiyaz, M.; Divakara, S.T.; Murali, H.S.;Prakash, H.S.; Lakshmana Rao, P.V. Zearalenone induced toxicity in SHSY-5Y cells: The role of oxidativestress evidenced by N-acetyl cysteine. Food Chem. Toxicol. 2014, 65, 335–342. [CrossRef]
7. Gajecka, M.; Zielonka, L.; Gajecki, M. The effect of low monotonic doses of zearalenone on selectedreproductive tissues in pre-pubertal female dogs-a review. Molecules 2015, 20, 20669–20687. [CrossRef]
8. EFSA CONTAM Panel (EFSA Panel on Contaminants in the Food Chain). Scientific opinion on theappropriateness to set a group health-based guidance value for zearalenone and its modified forms. EFSA J.2016, 14, 4425.
9. Wang, J.J.; Wei, Z.K.; Han, Z.; Liu, Z.Y.; Zhu, X.Y.; Li, X.W.; Wang, K.; Yang, Z.T. Zearalenone InducesEstrogen-Receptor-Independent Neutrophil Extracellular Trap Release in Vitro. J. Agric. Food Chem. 2019,67, 4588–4594. [CrossRef]
10. El-Makawy, A.; Hassanane, M.S.; Abd Alla, E.S.A.M. Genotoxic evaluation for the estrogenic mycotoxinzearalenone. Reprod. Nutr. Dev 2001, 41, 79–89. [CrossRef]
11. Abid-Essefi, S.; Baudrimont, I.; Hassen, W.; Ouanes, Z.; Mobio, T.A.; Anane, R.; Creppy, E.E.; Bacha, H.DNA fragmentation, apoptosis and cell cycle arrest induced by zearalenone in cultured DOK, Vero andCaco-2 cells: Prevention by Vitamin E. Toxicology 2003, 192, 237–248. [CrossRef]
12. Cai, G.; Pan, S.; Feng, N.; Zou, H.; Gu, J.; Yuan, Y.; Liu, X.; Liu, Z.; Bian, J. Zearalenone inhibits T cellchemotaxis by inhibiting cell adhesion and migration related proteins. Ecotox. Environ. Safe 2019, 175, 263–271.[CrossRef]
13. Hassen, W.; El Golli, E.; Baudrimont, I.; Mobio, A.T.; Ladjimi, M.M.; Creppy, E.E.; Bacha, H. Cytotoxicity andHsp70 induction in HepG2 cells in response to zearalenone and cytoprotection by sub-lethal heat shock.Toxicology 2005, 207, 293–301. [CrossRef] [PubMed]
78
Toxins 2020, 12, 212
14. Prosperini, A.; Juan-García, A.; Font, G.; Ruiz, M.J. Beauvericin induced cytotoxicity via ROS production andmitochondrial damage in Caco-2 cells. Toxicol. Lett. 2013, 222, 204–211. [CrossRef] [PubMed]
15. Zhang, K.; Tan, X.; Li, Y.; Liang, G.; Ning, Z.; Ma, Y.; Li, Y. Transcriptional profiling analysis ofZearalenone-induced inhibition proliferation on mouse thymic epithelial cell line 1. Ecotox. Environ. Safe2018, 153, 135–141. [CrossRef]
16. Zouaoui, N.; Mallebrera, B.; Berrada, H.; Abid-Essefi, S.; Bacha, H.; Ruiz, M.J. Cytotoxic effects induced bypatulin, sterigmatocystin and beauvericin on CHO–K1 cells. Food Chem. Toxicol. 2016, 89, 92–103. [CrossRef]
17. Juan-García, A.; Tolosa, J.; Juan, C.; Ruiz, M.J. Cytotoxicity, Genotoxicity and Disturbance of Cell Cycle inHepG2 Cells Exposed to OTA and BEA: Single and Combined Actions. Toxins 2019, 11, 341. [CrossRef]
18. Ferrer, E.; Juan-García, A.; Font, G.; Ruiz, M.J. Reactive oxygen species induced by beauvericin, patulin andzearalenone in CHO-K1 cells. Toxicol. In Vitro 2009, 23, 1504–1509. [CrossRef]
19. Mallebrera, B.; Font, G.; Ruiz, M.J. Disturbance of antioxidant capacity produced by beauvericin in CHO-K1cells. Toxicol. Lett. 2014, 226, 337–342. [CrossRef]
20. Stockmann-Juvala, H.; Mikkola, J.; Naarala, J.; Loikkanen, J.; Elovaara, E.; Savolainen, K. Oxidative stressinduced by fumonisin B1 in continuous human and rodent neural cell cultures. Free Radic. Res. 2004,38, 933–942. [CrossRef]
21. Zhang, X.; Boesch-Saadatmandi, C.; Lou, Y.; Wolffram, S.; Huebbe, P.; Rimbach, G. Ochratoxin A inducesapoptosis in neuronal cells. Genes Nutr. 2009, 4, 41–48. [CrossRef]
22. Zingales, V.; Fernández-Franzón, M.; Ruiz, M.J. Sterigmatocystin-induced cytotoxicity via oxidative stressinduction in human neuroblastoma cells. Food Chem. Toxicol. 2020, 136, 110956. [CrossRef]
23. Stanciu, O.; Juan, C.; Miere, D.; Loghin, F.; Mañes, J. Occurrence and co-occurrence of Fusarium mycotoxinsin wheat grains and wheat flour from Romania. Food Control. 2017, 73, 147–155. [CrossRef]
24. Juan, C.; Berrada, H.; Mañes, J.; Oueslati, S. Multi-mycotoxin determination in barley and derived productsfrom Tunisia and estimation of their dietary intake. Food Chem. Toxicol. 2017, 103, 148–156. [CrossRef][PubMed]
25. Oueslati, S.; Berrada, H.; Mañes, J.; Juan, C. Presence of mycotoxins in Tunisian infant foods samples andsubsequent risk assessment. Food Control. 2017, 84, 362–369. [CrossRef]
26. EFSA. Guidance on harmonised methodologies for human health, animal health and ecological riskassessment of combined exposure to multiple chemicals. EFSA J. 2019, 17, 5634. [CrossRef]
27. Ruiz, M.J.; Franzova, P.; Juan-García, A.; Font, G. Toxicological interactions between the mycotoxinsbeauvericin, deoxynivalenol and T-2 toxin in CHO-K1 cells in vitro. Toxicon 2011, 58, 315–326. [CrossRef][PubMed]
28. Juan-García, A.; Juan, C.; König, S.; Ruiz, M.J. Cytotoxic effects and degradation products of three mycotoxins:Alternariol, 3-acetyl-deoxynivalenol and 15-acetyl-deoxynivalenol in liver hepatocelular carcinoma cells.Toxicol. Lett. 2015, 235, 8–16. [CrossRef]
29. Juan-García, A.; Juan, C.; Manyes, L.; Ruiz, M.J. Binary and tertiary combination of alternariol,3-acetyl-deoxynivalenol and 15-acetyl-deoxynivalenol on HepG2 cells: Toxic effects and evaluation ofdegradation products. Toxicol. In Vitro 2016, 34, 264–273. [CrossRef]
30. Chou, T.C.; Talalay, P. Quantitative analysis of dose-effect relationships: The combined effects of multipledrugs or enzyme inhibitors. Adv. Enzyme Regul. 1984, 22, 27–55. [CrossRef]
31. Chou, T.C. Theoretical basis, experimental design, and computerized simulation of synergism and antagonismin drug combination studies. Pharmacol. Rev. 2006, 58, 621–681. [CrossRef] [PubMed]
32. Tatay, E.; Meca, G.; Font, G.; Ruiz, M.J. Interactive effects of zearalenone and its metabolites on cytotoxicityand metabolization in ovarian CHO-K1 cells. Toxicol. In Vitro 2014, 28, 95–103. [CrossRef] [PubMed]
33. Marin, D.E.; Pistol, G.C.; Bulgaru, C.V.; Taranu, I. Cytotoxic and inflammatory effects of individual andcombined exposure of HepG2 cells to zearalenone and its metabolites. N-S. Arch. Pharmacol. 2019,392, 937–947. [CrossRef] [PubMed]
34. Zheng, N.; Gao, Y.N.; Liu, J.; Wang, H.W.; Wang, J.Q. Individual and combined cytotoxicity assessment ofzearalenone with ochratoxin A or α-zearalenol by full factorial design. Food Sci. Biotechnol. 2018, 27, 251–259.[CrossRef] [PubMed]
35. Jia, J.; Wang, Q.; Wud, H.; Xiaa, S.; Guoa, H.; Blaženovicc, I.; Zhanga, Y.; Suna, X. Insights into cellularmetabolic pathways of the combined toxicity responses of Caco-2 cells exposed to deoxynivalenol, zearalenoneand Aflatoxin B1. Food Chem. Toxicol. 2019, 126, 106–112. [CrossRef] [PubMed]
79

Toxins 2020, 12, 212
36. Abid, S.; Bouaziz, C.E.; Golli-Bennour, E.; Ouanes Ben Othmen, Z.; Bacha, H. Comparative study of toxiceffects of zearalenone and its two major metabolites α-zearalenol and β-zearalenol on cultured humanCaco-2 cells. J. Biochem. Mol. Toxic. 2009, 23, 233–243. [CrossRef] [PubMed]
37. Ruiz, M.J.; Festila, L.E.; Fernandez, M. Comparison of basal cytotoxicity of seven carbamates in CHO-K1cells. Environ. Toxicol. Chem. 2006, 88, 345–354. [CrossRef]
© 2020 by the authors. Licensee MDPI, Basel, Switzerland. This article is an open accessarticle distributed under the terms and conditions of the Creative Commons Attribution(CC BY) license (http://creativecommons.org/licenses/by/4.0/).
80
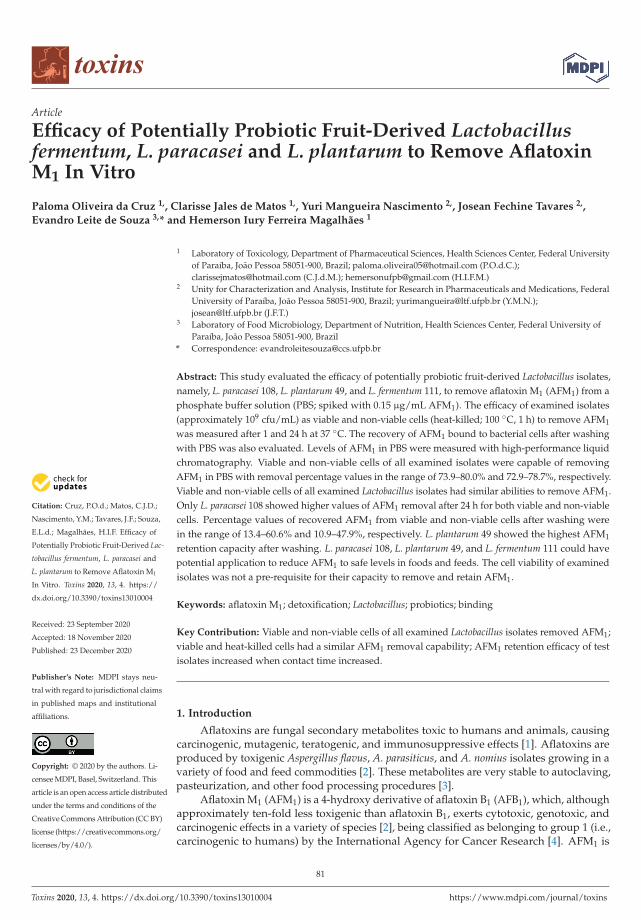
toxins
Article
Efficacy of Potentially Probiotic Fruit-Derived Lactobacillusfermentum, L. paracasei and L. plantarum to Remove AflatoxinM1 In Vitro
Paloma Oliveira da Cruz 1,, Clarisse Jales de Matos 1,, Yuri Mangueira Nascimento 2,, Josean Fechine Tavares 2,,
Evandro Leite de Souza 3,* and Hemerson Iury Ferreira Magalhães 1
���������������
Citation: Cruz, P.O.d.; Matos, C.J.D.;
Nascimento, Y.M.; Tavares, J.F.; Souza,
E.L.d.; Magalhães, H.I.F. Efficacy of
Potentially Probiotic Fruit-Derived Lac-
tobacillus fermentum, L. paracasei and
L. plantarum to Remove Aflatoxin M1
In Vitro. Toxins 2020, 13, 4. https://
dx.doi.org/10.3390/toxins13010004
Received: 23 September 2020
Accepted: 18 November 2020
Published: 23 December 2020
Publisher’s Note: MDPI stays neu-
tral with regard to jurisdictional claims
in published maps and institutional
affiliations.
Copyright: © 2020 by the authors. Li-
censee MDPI, Basel, Switzerland. This
article is an open access article distributed
under the terms and conditions of the
Creative Commons Attribution (CC BY)
license (https://creativecommons.org/
licenses/by/4.0/).
1 Laboratory of Toxicology, Department of Pharmaceutical Sciences, Health Sciences Center, Federal Universityof Paraíba, João Pessoa 58051-900, Brazil; [email protected] (P.O.d.C.);[email protected] (C.J.d.M.); [email protected] (H.I.F.M.)
2 Unity for Characterization and Analysis, Institute for Research in Pharmaceuticals and Medications, FederalUniversity of Paraíba, João Pessoa 58051-900, Brazil; [email protected] (Y.M.N.);[email protected] (J.F.T.)
3 Laboratory of Food Microbiology, Department of Nutrition, Health Sciences Center, Federal University ofParaíba, João Pessoa 58051-900, Brazil
* Correspondence: [email protected]
Abstract: This study evaluated the efficacy of potentially probiotic fruit-derived Lactobacillus isolates,namely, L. paracasei 108, L. plantarum 49, and L. fermentum 111, to remove aflatoxin M1 (AFM1) from aphosphate buffer solution (PBS; spiked with 0.15 μg/mL AFM1). The efficacy of examined isolates(approximately 109 cfu/mL) as viable and non-viable cells (heat-killed; 100 ◦C, 1 h) to remove AFM1
was measured after 1 and 24 h at 37 ◦C. The recovery of AFM1 bound to bacterial cells after washingwith PBS was also evaluated. Levels of AFM1 in PBS were measured with high-performance liquidchromatography. Viable and non-viable cells of all examined isolates were capable of removingAFM1 in PBS with removal percentage values in the range of 73.9–80.0% and 72.9–78.7%, respectively.Viable and non-viable cells of all examined Lactobacillus isolates had similar abilities to remove AFM1.Only L. paracasei 108 showed higher values of AFM1 removal after 24 h for both viable and non-viablecells. Percentage values of recovered AFM1 from viable and non-viable cells after washing werein the range of 13.4–60.6% and 10.9–47.9%, respectively. L. plantarum 49 showed the highest AFM1
retention capacity after washing. L. paracasei 108, L. plantarum 49, and L. fermentum 111 could havepotential application to reduce AFM1 to safe levels in foods and feeds. The cell viability of examinedisolates was not a pre-requisite for their capacity to remove and retain AFM1.
Keywords: aflatoxin M1; detoxification; Lactobacillus; probiotics; binding
Key Contribution: Viable and non-viable cells of all examined Lactobacillus isolates removed AFM1;viable and heat-killed cells had a similar AFM1 removal capability; AFM1 retention efficacy of testisolates increased when contact time increased.
1. Introduction
Aflatoxins are fungal secondary metabolites toxic to humans and animals, causingcarcinogenic, mutagenic, teratogenic, and immunosuppressive effects [1]. Aflatoxins areproduced by toxigenic Aspergillus flavus, A. parasiticus, and A. nomius isolates growing in avariety of food and feed commodities [2]. These metabolites are very stable to autoclaving,pasteurization, and other food processing procedures [3].
Aflatoxin M1 (AFM1) is a 4-hydroxy derivative of aflatoxin B1 (AFB1), which, althoughapproximately ten-fold less toxigenic than aflatoxin B1, exerts cytotoxic, genotoxic, andcarcinogenic effects in a variety of species [2], being classified as belonging to group 1 (i.e.,carcinogenic to humans) by the International Agency for Cancer Research [4]. AFM1 is
Toxins 2020, 13, 4. https://dx.doi.org/10.3390/toxins13010004 https://www.mdpi.com/journal/toxins
81
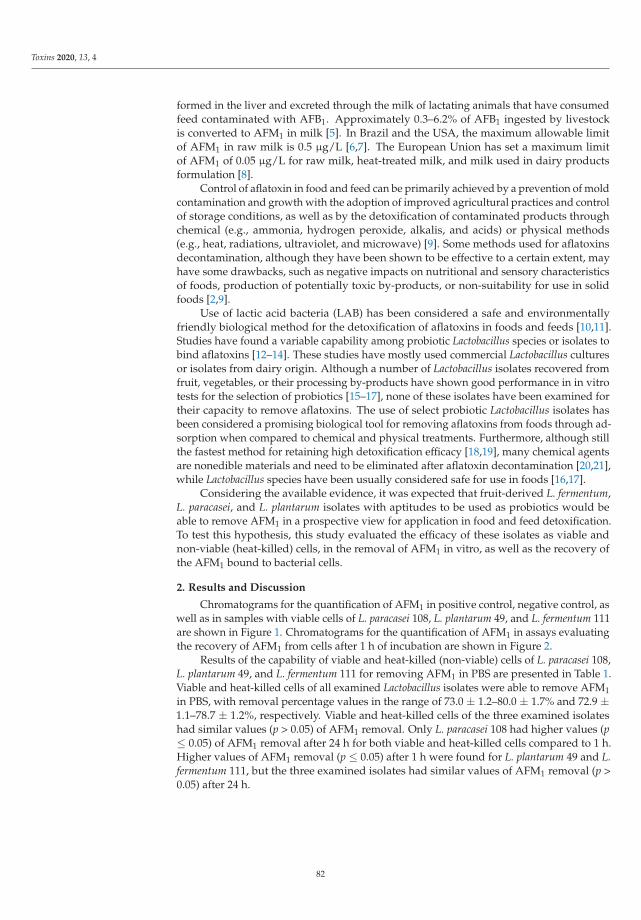
Toxins 2020, 13, 4
formed in the liver and excreted through the milk of lactating animals that have consumedfeed contaminated with AFB1. Approximately 0.3–6.2% of AFB1 ingested by livestockis converted to AFM1 in milk [5]. In Brazil and the USA, the maximum allowable limitof AFM1 in raw milk is 0.5 μg/L [6,7]. The European Union has set a maximum limitof AFM1 of 0.05 μg/L for raw milk, heat-treated milk, and milk used in dairy productsformulation [8].
Control of aflatoxin in food and feed can be primarily achieved by a prevention of moldcontamination and growth with the adoption of improved agricultural practices and controlof storage conditions, as well as by the detoxification of contaminated products throughchemical (e.g., ammonia, hydrogen peroxide, alkalis, and acids) or physical methods(e.g., heat, radiations, ultraviolet, and microwave) [9]. Some methods used for aflatoxinsdecontamination, although they have been shown to be effective to a certain extent, mayhave some drawbacks, such as negative impacts on nutritional and sensory characteristicsof foods, production of potentially toxic by-products, or non-suitability for use in solidfoods [2,9].
Use of lactic acid bacteria (LAB) has been considered a safe and environmentallyfriendly biological method for the detoxification of aflatoxins in foods and feeds [10,11].Studies have found a variable capability among probiotic Lactobacillus species or isolates tobind aflatoxins [12–14]. These studies have mostly used commercial Lactobacillus culturesor isolates from dairy origin. Although a number of Lactobacillus isolates recovered fromfruit, vegetables, or their processing by-products have shown good performance in in vitrotests for the selection of probiotics [15–17], none of these isolates have been examined fortheir capacity to remove aflatoxins. The use of select probiotic Lactobacillus isolates hasbeen considered a promising biological tool for removing aflatoxins from foods through ad-sorption when compared to chemical and physical treatments. Furthermore, although stillthe fastest method for retaining high detoxification efficacy [18,19], many chemical agentsare nonedible materials and need to be eliminated after aflatoxin decontamination [20,21],while Lactobacillus species have been usually considered safe for use in foods [16,17].
Considering the available evidence, it was expected that fruit-derived L. fermentum,L. paracasei, and L. plantarum isolates with aptitudes to be used as probiotics would beable to remove AFM1 in a prospective view for application in food and feed detoxification.To test this hypothesis, this study evaluated the efficacy of these isolates as viable andnon-viable (heat-killed) cells, in the removal of AFM1 in vitro, as well as the recovery ofthe AFM1 bound to bacterial cells.
2. Results and Discussion
Chromatograms for the quantification of AFM1 in positive control, negative control, aswell as in samples with viable cells of L. paracasei 108, L. plantarum 49, and L. fermentum 111are shown in Figure 1. Chromatograms for the quantification of AFM1 in assays evaluatingthe recovery of AFM1 from cells after 1 h of incubation are shown in Figure 2.
Results of the capability of viable and heat-killed (non-viable) cells of L. paracasei 108,L. plantarum 49, and L. fermentum 111 for removing AFM1 in PBS are presented in Table 1.Viable and heat-killed cells of all examined Lactobacillus isolates were able to remove AFM1in PBS, with removal percentage values in the range of 73.0 ± 1.2–80.0 ± 1.7% and 72.9 ±1.1–78.7 ± 1.2%, respectively. Viable and heat-killed cells of the three examined isolateshad similar values (p > 0.05) of AFM1 removal. Only L. paracasei 108 had higher values (p≤ 0.05) of AFM1 removal after 24 h for both viable and heat-killed cells compared to 1 h.Higher values of AFM1 removal (p ≤ 0.05) after 1 h were found for L. plantarum 49 and L.fermentum 111, but the three examined isolates had similar values of AFM1 removal (p >0.05) after 24 h.
82
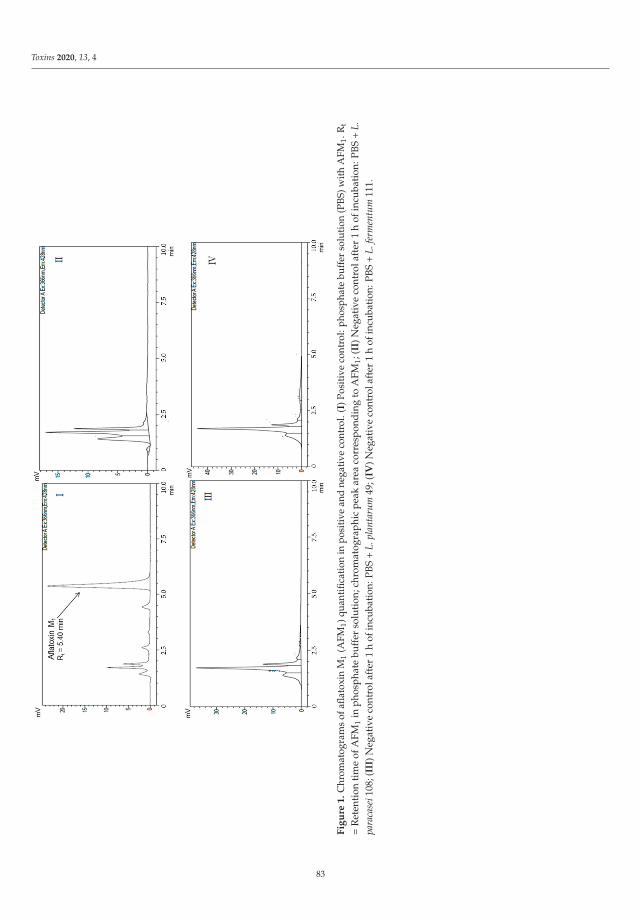
Toxins 2020, 13, 4
Fig
ure
1.
Chr
omat
ogra
ms
ofafl
atox
inM
1(A
FM1)
quan
tifica
tion
inpo
sitiv
ean
dne
gativ
eco
ntro
l.(I
)Pos
itive
cont
rol:
phos
phat
ebu
ffer
solu
tion
(PBS
)with
AFM
1.R
t
=R
eten
tion
tim
eof
AFM
1in
phos
phat
ebu
ffer
solu
tion
;chr
omat
ogra
phic
peak
area
corr
espo
ndin
gto
AFM
1;(I
I)N
egat
ive
cont
rola
fter
1h
ofin
cuba
tion
:PB
S+
L.pa
raca
sei1
08;(
III)
Neg
ativ
eco
ntro
laft
er1
hof
incu
bati
on:P
BS+
L.pl
anta
rum
49;(
IV)N
egat
ive
cont
rola
fter
1h
ofin
cuba
tion
:PBS
+L.
ferm
entu
m11
1.
83
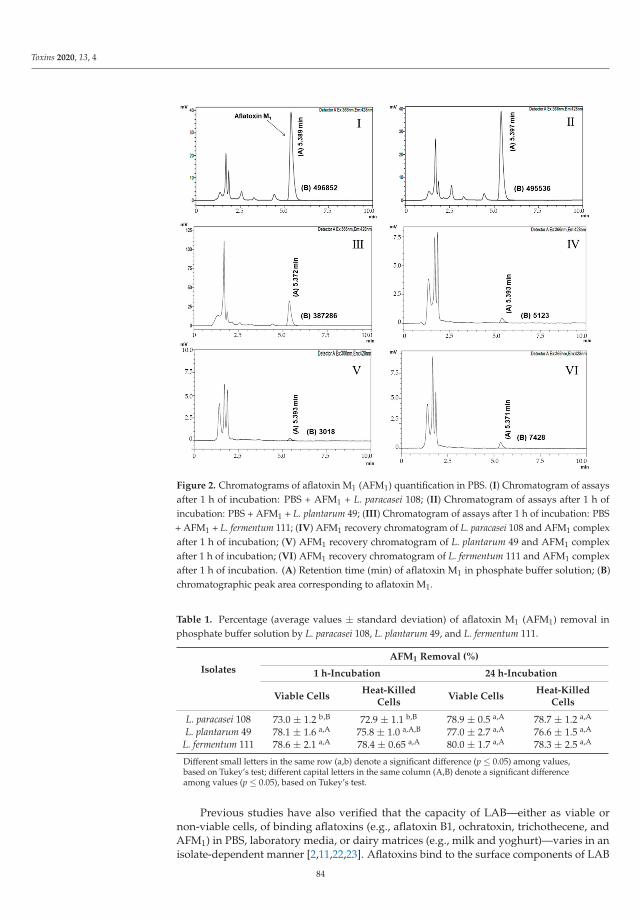
Toxins 2020, 13, 4
Figure 2. Chromatograms of aflatoxin M1 (AFM1) quantification in PBS. (I) Chromatogram of assaysafter 1 h of incubation: PBS + AFM1 + L. paracasei 108; (II) Chromatogram of assays after 1 h ofincubation: PBS + AFM1 + L. plantarum 49; (III) Chromatogram of assays after 1 h of incubation: PBS+ AFM1 + L. fermentum 111; (IV) AFM1 recovery chromatogram of L. paracasei 108 and AFM1 complexafter 1 h of incubation; (V) AFM1 recovery chromatogram of L. plantarum 49 and AFM1 complexafter 1 h of incubation; (VI) AFM1 recovery chromatogram of L. fermentum 111 and AFM1 complexafter 1 h of incubation. (A) Retention time (min) of aflatoxin M1 in phosphate buffer solution; (B)chromatographic peak area corresponding to aflatoxin M1.
Table 1. Percentage (average values ± standard deviation) of aflatoxin M1 (AFM1) removal inphosphate buffer solution by L. paracasei 108, L. plantarum 49, and L. fermentum 111.
Isolates
AFM1 Removal (%)
1 h-Incubation 24 h-Incubation
Viable CellsHeat-Killed
CellsViable Cells
Heat-KilledCells
L. paracasei 108 73.0 ± 1.2 b,B 72.9 ± 1.1 b,B 78.9 ± 0.5 a,A 78.7 ± 1.2 a,A
L. plantarum 49 78.1 ± 1.6 a,A 75.8 ± 1.0 a,A,B 77.0 ± 2.7 a,A 76.6 ± 1.5 a,A
L. fermentum 111 78.6 ± 2.1 a,A 78.4 ± 0.65 a,A 80.0 ± 1.7 a,A 78.3 ± 2.5 a,A
Different small letters in the same row (a,b) denote a significant difference (p ≤ 0.05) among values,based on Tukey’s test; different capital letters in the same column (A,B) denote a significant differenceamong values (p ≤ 0.05), based on Tukey’s test.
Previous studies have also verified that the capacity of LAB—either as viable ornon-viable cells, of binding aflatoxins (e.g., aflatoxin B1, ochratoxin, trichothecene, andAFM1) in PBS, laboratory media, or dairy matrices (e.g., milk and yoghurt)—varies in anisolate-dependent manner [2,11,22,23]. Aflatoxins bind to the surface components of LAB
84
Toxins 2020, 13, 4
cells and variations in aflatoxin’s binding capacities among LAB species or isolates couldbe associated with differences in the bacterial cell wall and cell envelope structures [7].Early investigations have found lower capacity of AFM1 removal by viable and/or heat-killed cells of different LAB (e.g., L. plantarum, L. acidophilus, L. reuteri, L. johnsonii, L.rhamnosus, L. bulgaricus, and Streptococcus thermophilus) [2,22,23], including probiotic L.casei [10], compared to L. paracasei 108, L. plantarum 49, and L. fermentum 111. The efficacy ofAFM1 removal from PBS as high (>60%) as those found for Lactobacillus isolates examinedin this study was reported to L. plantarum MON03 and L. rhamnosus GAF01 after 6 or 24 hof incubation [24].
Results of the AFM1 retention capacity of the viable and heat-killed cells of L. paracasei108, L. plantarum 49, and L. fermentum 111 after washing with PBS are presented in Table2. Percentage values of recovered AFM1 from viable and heat-killed cells were in therange of 13.4 ± 1.5–60.6 ± 1.6% and 10.9 ± 1.2%–47.9 ± 1.5%, respectively. The highestvalues of recovered AFM1 after 1 and 24 h were found for L. fermentum 111 and L. paracasei108, respectively, for both viable and heat-killed cells. Only for L. fermentum 111 did thevalues of recovered AFM1 decrease after 24 h for viable and heat-killed cells; for L. paracasei108 and L. plantarum 49, these values varied with the viability/non-viability of cells andincubation time period. Overall, L. plantarum 49 had the higher AFM1 retention capacityafter washing. Variations in aflatoxin release have been linked to the differences in bindingsites in different LAB isolates, or even in these binding sites being very similar. They couldhave minimal differences depending on each isolate [13,25,26].
Table 2. Percentage (average values ± standard deviation) of recovered aflatoxin M1 (AFM1) insolution after washing with phosphate buffer solution.
Isolates
AFM1 Recovery, %
1 h-Incubation 24 h-Incubation
Viable CellsHeat-Killed
CellsViable Cells
Heat-KilledCells
L. paracasei 108 34.6 ± 1.1 b,B 28.5 ± 1.7 d,C 31.7 ± 1.2 c,A 40.3 ± 1.6 a,A
L. plantarum 49 13.4 ± 1.5 c,C 43.8 ± 1.5 a,B 18.8 ± 1.0 b,B 10.9 ± 1.2 d,C
L. fermentum 111 60.6 ± 1.6 a,A 47.9 ± 1.5 b,A 14.1 ± 1.4 c,C 14.9 ± 1.6 c,B
Different small letters in the same row (a–c) denote a significant difference (p ≤ 0.05) among values,based on Tukey’s test; different capital letters in the same column (A,B) denote a significant differenceamong values (p ≤ 0.05), based on Tukey’s test.
For all examined isolates, the values of recovered AFM1 decreased after 24 h of incu-bation, indicating that AFM1 retention capacity increased when the length of the contacttime increased. There was no clear association between the capability of removing AFM1,initially, and of retaining AFM1 after washing among examined isolates. Interestingly, astudy with different Lactobacillus species found lower AFM1 removal values than thosefound in this study, although the recovery of AFM1 from bacterial cells was lower in theformer [11].
Heat treatment positively affected the capability of retaining AFM1 in L. paracasei 108after 1 h of incubation, as well as of L. plantarum 49 and L. fermentum 111 after 24 h of incuba-tion. Heating could increase the interaction capacity of bacterial cells/aflatoxin complexesby causing an increased exposure of the cell wall components, primarily polysaccharidesand peptidoglycans, which act as binding sites to aflatoxin [14]. However, the destructionof specific components of the bacterial cell wall by heating, causing the denaturation ofproteins and increased cell surface hydrophobicity, has been cited to result in a decreasedcapability of LAB cells of binding AFM1 [7]. An increased capability of removing aflatoxinB1 was also found in L. rhamnosus after heating [27].
The recovery of the AFM1 bound to the cells of examined Lactobacillus isolates afterwashing indicates that the binding was not strong and could not involve a non-covalentweak bond, but probably a physical association of AFM1 with hydrophobic sites in the
85
Toxins 2020, 13, 4
bacterial cell wall [13,20,25]. The lower AFM1 recovery values found for the examinedisolates could be linked to the interaction of AFM1 molecules retained in the bacterial cellwall with other AFM1 molecules retained in adjacent cells, forming a type of cross-linkedmatrix that avoids aflatoxin release during washing [10]. Probably, the efficacy of this typeof cross-linked matrix decreased over time for L. paracasei 108 and L. plantarum 49. Althoughsome authors have reported that a part of non-recovered AFM1 might be degraded orbiotransformed by a Lactobacillus metabolism [2,7], most of the available literature hasindicated that aflatoxins are not removed by the metabolism of LAB, but because of aphysical bound to the molecular components of bacterial cells, primarily peptidoglycansfrom the cell wall [19,21,25].
In agreement with available literature, the results of this study showed that the cellviability of the examined isolates is not a prerequisite for the removal and retaining ofAFM1 [13,28]. Cell concentration as high as 108–109 CFU/mL of viable or non-viable LABis typically needed to reach a level of aflatoxins removal of ≥ 50% [22,28].
3. Conclusions
Results showed that potentially probiotic L. fermentum 111, L. paracasei 108, and L.plantarum 49 isolated from fruit processing by-products are capable of binding AFM1in vitro when assayed as either viable or non-viable cells. The recovery of AFM1 frombacterial cell complexes varied with the examined isolate and contact time. Non-viablecells had a higher capability for retaining AFM1 after 1 or 24 h of incubation. These resultsindicate that Lactobacillus isolates recovered from fruit with performance compatible to useas probiotics could have a satisfactory aflatoxin binding capacity, which could be exploitedas a biological tool for the detoxification of foods and feeds, particularly, for the removaland restoration of AFM1 to safe levels. Further studies are needed to investigate themechanisms involved in removal of AFM1 by these isolates and possible factors affectingthe stability of formed complexes, including when exposed to conditions mimicking thehuman gastrointestinal tract.
4. Materials and Methods
4.1. Chemicals, Bacterial Isolates, and Inoculum Preparation
The AFM1 standard was obtained from Sigma Aldrich (St. Louis, MO, USA). High-performance liquid chromatography (HPLC) grade solvents were obtained from Merck(Darmstadt, Germany).
The isolates Lactobacillus plantarum 49, L. fermentum 111, and L. paracasei 108 wereexamined separately for the removal of AFM1. These isolates were recovered from fruitprocessing by-products, identified with a partial 16S rRNA gene sequence analysis andcharacterized as potential candidates for use as probiotics [17]. Stocks were stored at −20 ◦Cin de Man, Rogosa, and Sharpe (MRS) broth (HiMedia, Mumbai, India) with glycerol(20 mL/100 mL; Sigma-Aldrich, St. Louis, MO, USA). Working cultures were maintainedaerobically on MRS agar (HiMedia, Mumbai, India) at 4 ◦C and transferred to a newmedia monthly. Prior to use in assays, each isolate was cultivated anaerobically (AnaerobicSystem Anaerogen, Oxoid, Hampshire, UK) in MRS broth at 37 ◦C for 20–24 h (to reachthe stationary growth phase), harvested by centrifugation (4500× g, 15 min, 4 ◦C), washedtwice, and resuspended in phosphate buffer solution (PBS; 50 mM K2HPO4/KH2PO4; pH6.9) to obtain cell suspensions with an optical density reading at 660 nm (OD660) of 0.5.This suspension had viable counts of approximately 1.1 × 10⁹ CFU/mL for each isolatewhen plated in MRS agar.
4.2. Evaluation of AFM1 Removal and Recovery of AFM1 from Bacterial Cells
The capability of examined Lactobacillus isolates to remove AFM1 in PBS was assessedwith viable and non-viable bacterial cell suspensions. To obtain non-viable bacterial cells,Lactobacillus cell suspensions were inactivated by boiling at 100 ◦C for 1 h. No visiblecolonies were found when heat-treated cell suspensions (named heat-killed cells) were
86
Toxins 2020, 13, 4
plated onto MRS agar and followed by anaerobic incubation (using Anaerobic SystemAnaerogen, Oxoid, Hampshire, UK) for 48 h. For testing the AFM1 removal capability,1 mL of test isolate suspension (pure culture of viable and heat-killed cells) was mixed with1.5 mL of PBS, previously spiked with 0.15 μg/mL AFM1, and incubated aerobically at37 ◦C [28]. After 1 and 24 h of incubation, the mixture was centrifuged (1500× g, 15 min,4 ◦C) and the AFM1 content in the supernatant was determined by HPLC, as detailed inSection 4.3.
Cell pellets collected from each monitored incubation period (contact time) wereevaluated for the recovery of AFM1 from cell complexes. Obtained pellets were washedwith 1.5 mL of fresh PBS, the cells were re-pelleted (1500× g, 15 min, 4 ◦C), and supernatantwas collected for the quantification of released AFM1 [18]. For each isolate, a positivecontrol consisting of free cells suspended in PBS with 0.15 μg/mL AFM1, and a negativecontrol, consisting of bacterial cells (viable or heat-killed), suspended in PBS were used.
4.3. Quantification of AFM1
The quantification of AFM1 in supernatants was done with high-performance liquidchromatography (HPLC) using a Shimadzu (Prominense, Tokyo, Japan) HPLC system,equipped with an auto sampler SIL 20A HT (Prominense, Shimadzu, Tokyo, Japan), flu-orescence detector RF-20A (Prominense, Shimadzu, Tokyo, Japan), an LC-20AT pump(Prominense, Shimadzu, Tokyo, Japan), oven CTO-20A (Prominense, Shimadzu, Tóquio,Japão), a CBM-20A controller (Prominense, Shimadzu, Tokyo, Japan), a CLC-ODS (M) re-verse phase column (4.6 × 150 mm; Shim-Pack, Prominense, Shimadzu, Tokyo, Japan) andpre-column G-ODS-4 (1.0 × 4.0 mm; Shim-Pack, Prominense, Shimadzu, Tokyo, Japan).
Chromatographic conditions were the same as those described in a previous study [7].Excitation and emission wavelengths were 366 and 428 nm, and the injection volumewas 20 μL. The mobile phase was water:methanol:acetonitrile (6:2:2) and the flow ratewas 1 mL/min. The calibration curve was constructed using six concentrations of AFM1standard diluted in acetonitrile (20–60 ng/mL), performed in triplicate. From this anal-ysis, the equation y = 2E+07x + 873,267 (r2 > 0.99) was obtained. The limit of detection(LOD) and limit of quantification (LOQ) were estimated based on Resolution n◦ 899 of theBrazilian Agency for Health Surveillance [29]. The LOD and LOQ of AFM1 were 0.20 and0.67 ng/mL, respectively.
The percentage of AFM1 removed by each isolate was determined with the Equa-tion (1) [22,27,30]:
100 × [1 − (peak area of chromatographic peak of sample)/area of positive control chromatographic peak)]. (1)
4.4. Statistical Analysis
Assays were done in triplicate in three independent experiments (repetitions). AKolmogorov–Smirnov normality test was run to assess whether obtained results hadnormal distribution. Results (average data ± standard deviation) were submitted to aone-way analysis of variance (ANOVA), followed by Tukey’s test, considering a p value of≤ 0.05 for significance. Statistical analyses were done with IBM SPSS Statistics 20 (Armonk,NY, USA).
Author Contributions: Conceptualization, P.O.d.C., H.I.F.M., E.L.d.S.; methodology, P.O.d.C., H.I.F.M.,E.L.d.S., C.J.d.M., Y.M.N., J.F.T.; validation, P.O.d.C., H.I.F.M., C.J.d.M., Y.M.N., J.F.T.; investigation,P.O.d.C., C.J.d.M., Y.M.N.; writing—original draft preparation, P.O.d.C., H.I.F.M., E.L.d.S.; writing—review and editing; supervision, H.I.F.M.; funding acquisition, H.I.F.M., E.L.d.S., J.F.T. All authorshave read and agreed to the published version of the manuscript.
Funding: This research was partially funded by CAPES (Brazil), finance code 001.
Acknowledgments: Authors thank the Coordenação de Aperfeiçoamento de Pessoal de Nível Supe-rior (CAPES, Brazil) for partial funding of this research.
87
Toxins 2020, 13, 4
Conflicts of Interest: The authors declare no conflict of interest.
References
1. Bhat, R.; Rai, R.V.; Karim, A.A. Mycotoxins in food and feed: Present status and future concerns. Compr. Rev. Food Sci. Food Saf.2010, 59, 57–81. [CrossRef]
2. Elsanhoty, R.M.; Salam, S.A.; Ramadan, M.F.; Badr, F.H. Detoxification of aflatoxin M1 in yoghurt using probiotics and lactic acidbacteria. Food Cont. 2014, 43, 129–134. [CrossRef]
3. Koppen, R.; Koch, M.; Slegel, D. Determination of mycotoxins in foods: Current state of analytical methods and limitations. Appl.Microbiol. Biotechnol. 2010, 86, 1595–1612. [CrossRef] [PubMed]
4. International Agency for Research on Cancer. Some traditional herbal medicine, some mycotoxins and styrene. In Monographs onthe Evaluation of Carginogenic Risks to Humans; International Agency for Research on Cancer: Lyon, France, 2002.
5. Ayar, A.; Sert, D.; Lon, A.H. A study on the occurrence of aflatoxin in raw milk due to feeds. J. Food Saf. 2007, 27, 199–207.[CrossRef]
6. Ministry of Health; National Agency for Health Surveillance; Brazilian Legislation. On the Maximum Tolerated Limit (MTL) forMycotoxins in Foods; Resolution No. 7 of 18 February 2011; National Agency for Health Surveillance: Brasilia, Brazil, 2011.
7. Corassin, C.H.; Bovo, F.; Rossim, R.E.; Oliveira, C.A.F. Efficiency of Saccharomyces cerevisiae and lactic acid bacteria strains to bindaflatoxin M1 in UHT skim milk. Food Cont. 2013, 31, 80–83. [CrossRef]
8. European Commission. Commission Regulation (EC) No 401/2006 of 23 February 2006 laying down the methods of samplingand analysis for the official control of the levels of mycotoxins in foodstuffs. Off. J. Eur. Union 2006, 70, 12–34.
9. Wang, B.; Mahoney, N.E.; Pan, Z.; Khir, R.; Wu, B.; Ma, H.; Zhao, L. Effectiveness of pulsed light treatment for degradation anddetoxification of aflatoxin B1 and B2 in rough rice and rice bran. Food Cont. 2016, 59, 461–467. [CrossRef]
10. Hernandez-Mendoza, A.; Garcia, H.S.; Steele, J.L. Screening of Lactobacillus casei strains for their ability to bind aflatoxin B1. FoodChem. Toxicol. 2009, 47, 1064–1068. [CrossRef] [PubMed]
11. Serrano-Niño, J.C.; Cavazos-Garduño, A.; Hernandez-Mendoza, A.; Applegate, B.; Ferruzzi, M.C.; Martin-González, M.F.S.;García, H.S. Assessment of probiotic strains ability to reduce the bioaccessibility of aflatoxin M1 in artificially contaminated milkusing an in vitro digestive model. Food Cont. 2013, 31, 202–207. [CrossRef]
12. Onilude, A.A.; Fagade, O.E.; Bello, M.M.; Fadahunsi, I.F. Inhibition of aflatoxin-producing aspergilli by lactic acid bacteria isolatesfrom indigenously fermented cereal gruels. Afr. J. Biotechnol. 2005, 4, 1404–1408.
13. Azeem, N.; Nawaz, M.; Anjum, A.A.; Saeed, S.; Sana, S.; Mustafa, A.; Yousuf, M.R. Activity and anti-aflatoxigenic effect ofindigenously characterized probiotic lactobacilli against Aspergillus flavus—A common poultry feed contaminant. Animals 2019,15, 166. [CrossRef] [PubMed]
14. Elsanhoty, R.M.; Ramadan, M.F.; El-Gohery, S.S.; Abol-Ela, M.A.A. Ability of selected microorganisms for removing aflatoxinsin vitro and fate of aflatoxins in contaminated wheat during baladi bread baking. Food Cont. 2013, 33, 287–292. [CrossRef]
15. Naeem, M.; Ilyas, M.; Haider, S.; Baig, S.; Saleem, M. Isolation characterization and identification of lactic acid bacteria from fruitjuices and their efficacy against antibiotics. Pak. J. Bot. 2012, 44, 323–328.
16. Ilha, E.C.; Silva, T.; Lorenz, J.G.; De Oliveira Rocha, G.; Sant’Anna, E.S. Lactobacillus paracasei isolated from grape sourdough:Acid, bile, salt, and heat tolerance after spray drying with skim milk and cheese whey. Eur. Food Res. Technol. 2015, 240, 977–984.[CrossRef]
17. Garcia, E.F.; Luciano, W.A.; Xavier, D.E.; Da Costa, W.C.; De Sousa Oliveira, K.; Franco, O.L.; De Morais, M.A.J.; Lucena, B.T.;Picão, R.C.; Magnani, M.; et al. Identification of lactic acid bacteria in fruit pulp processing byproducts and potential probioticproperties of selected Lactobacillus strains. Front. Microbiol. 2016, 7, 1371. [CrossRef]
18. Ahlberg, S.H.; Joutsjoki, V.; Korhonen, H.J. Potential of lactic acid bacteria in aflatoxin risk mitigation. Int. J. Food Microbiol. 2015,207, 87–102. [CrossRef]
19. Khanian, M.; Karimi-Torshizi, M.A.; Allameh, A. Alleviation of aflatoxin-related oxidative damage to liver and improvement ofgrowth performance in broiler chickens consumed Lactobacillus plantarum 299v for entire growth period. Toxicon 2019, 158, 57–62.[CrossRef]
20. Assaf, J.C.; Nahle, S.; Chokr, A.; Louka, N.; Atoui, A.; El Khoury, A. Assorted methods for decontamination of aflatoxin m1 inmilk using microbial adsorbents. Toxins 2019, 11, 304. [CrossRef]
21. Kim, S.; Lee, H.; Lee, S.; Lee, J.; Ha, J.; Choi, Y.; Yoon, Y.; Choi, K.H. Microbe-mediated aflatoxin decontamination of dairyproducts and feeds. J. Dairy Sci. 2017, 100, 871–880. [CrossRef]
22. El-Nezami, H.; Kankaanpää, P.; Salminen, S.; Ahokas, J. Physicochemical alterations enhance the ability of dairy strains of lacticacid bacteria to remove aflatoxin from contaminated media. J. Food Prot. 1998, 61, 466–468. [CrossRef]
23. Pierides, H.; El-Nezami, K.; Peltonem, S.; Salminem, J.; Ahokas, J.T. Ability of dairy strains of lactic acid bacteria to bind aflatoxinM1 in a food model. J. Food Prot. 2000, 63, 645–650. [CrossRef] [PubMed]
24. Jebali, R.; Abbes, S.; Salah-Abbès, J.B.; Younes, R.B.; Haous, Z.; Oueslati, R. Ability of Lactobacillus plantarum MON03 to mitigateaflatoxins (B1 and M1) immunotoxicities in mice. J. Immunotoxicol. 2014, 12, 290–299. [CrossRef] [PubMed]
25. Panwar, R.; Kumar, N.; Kashyap, V.; Ram, C.; Kapila, R. Aflatoxin M1 detoxification ability of probiotic lactobacilli of Indianorigin in in vitro digestion model. Prob. Antimicrob. Proteins 2019, 11, 460–469. [CrossRef] [PubMed]
88

Toxins 2020, 13, 4
26. Risa, A.; Divinyi, D.M.; Baka, E.; Krifaton, C. Aflatoxin B1 detoxification by cell-free extracts of Rhodococcus strains. Acta Microbiol.et Immunol. Hung. 2017, 64, 423–438. [CrossRef]
27. Abbès, S.; Salah-Abbès, J.B.; Sharafi, H.; Jebali, R.; Noghabi, K.A.; Oueslati, R. Ability of Lactobacillus rhamnosus GAF01 to removeAFM1 in vitro and to counteract AFM1 immunotoxicity in vivo. J. Immunotoxicol. 2013, 10, 279–286. [CrossRef]
28. Bovo, F.; Corassin, C.H.; Rosim, R.E.; De Oliveira, C.A. Efficiency of lactic acid bacteria strains for decontamination of aflatoxinM1 in phosphate buffer saline solution and in skim milk. Food Bioproc. Technol. 2012, 5, 1–5.
29. Brazilian Legislation, Ministry of Health, National Agency for Health Surveillance. Guide for Validation of Analytical and BioanalyticalMethods. National Agency for Health Surveillance. Resolution nº899; National Agency for Health Surveillance: Brasilia, Brazil, 2003.
30. Haskard, C.A.; El-Nezami, H.S.; Kankaanpää, P.E.; Salminen, S.; Ahokas, J.T. Surface binding of aflatoxin B1 by lactic acid bacteria.Appl. Environ. Microbiol. 2001, 67, 3086–3091. [CrossRef]
89

toxins
Article
Efficient and Simultaneous Chitosan-MediatedRemoval of 11 Mycotoxins from Palm Kernel Cake
Atena Abbasi Pirouz 1,2, Jinap Selamat 1,3*, Shahzad Zafar Iqbal 4 and Nik Iskandar Putra
Samsudin 1,3
1 Laboratory of Food Safety and Food Integrity, Institute of Tropical Agriculture and Food Security, UniversitiPutra Malaysia, 43400 UPM Serdang, Selangor, Malaysia; [email protected] (A.A.P.);[email protected] (N.I.P.S.)
2 Faculty of Science, Institute of Biological Science, University of Malaya, 50603 UM Kuala Lumpur, Malaysia3 Department of Food Science, Faculty of Food Science and Technology, Universiti Putra Malaysia, 43400 UPM
Serdang, Selangor, Malaysia4 Department Applied Chemistry, Faculty of Physical Science, Government College University Faisalabad,
38000 Punjab, Pakistan; [email protected]* Correspondence: [email protected]; Tel.: +603-9769-1043
Received: 19 September 2019; Accepted: 29 October 2019; Published: 12 February 2020���������������
Abstract: Mycotoxins are an important class of pollutants that are toxic and hazardous to animaland human health. Consequently, various methods have been explored to abate their effects,among which adsorbent has found prominent application. Liquid chromatography tandem massspectrometry (LC–MS/MS) has recently been applied for the concurrent evaluation of multiplemycotoxins. This study investigated the optimization of the simultaneous removal of mycotoxinsin palm kernel cake (PKC) using chitosan. The removal of 11 mycotoxins such as aflatoxins (AFB1,AFB2, AFG1 and AFG2), ochratoxin A (OTA), zearalenone (ZEA), fumonisins (FB1 and FB2) andtrichothecenes (deoxynivalenol (DON), HT-2 and T-2 toxin) from palm kernel cake (PKC) was studied.The effects of operating parameters such as pH (3–6), temperature (30–50 ◦C) and time (4–8 h) on theremoval of the mycotoxins were investigated using response surface methodology (RSM). Responsesurface models obtained with R2 values ranging from 0.89–0.98 fitted well with the experimental data,except for the trichothecenes. The optimum point was obtained at pH 4, 8 h and 35 ◦C. The maximumremoval achieved with chitosan for AFB1, AFB2, AFG1, AFG2, OTA, ZEA, FB1 and FB2 under theoptimized conditions were 94.35, 45.90, 82.11, 84.29, 90.03, 51.30, 90.53 and 90.18%, respectively.
Keywords: chitosan; mycotoxins; detoxification; LC-MS/MS; optimization
Key Contribution: This study presents for first time the removal of 11 mycotoxins simultaneously byusing chitosan as adsorbent. Chitosan could efficiently adsorb eight mycotoxins simultaneously.
1. Introduction
Mycotoxins constitute a large number of naturally-occurring fungal secondary metabolites withconsiderable toxic impacts in plant and animal products, especially in developing countries [1]. Thesefungi usually attack cereals and other crops on the field or in storage, thereby causing significanteconomic losses and affecting trade globally. Furthermore, the presence of mycotoxins in feed andfood commodities is a major health concern as the toxic effects cause serious problems to the healthof animals, and ultimately humans. The major toxins of concern include aflatoxins (AFB1, AFB2,AFG1, AFG2), ochratoxinA OTA, fumonisins (FB1, FB2) and trichothecenes (ZEA, HT-2, T-2, and DON),which are placed in group 1, group 2 and group 3, respectively. According to the International Agencyof Research on Cancer (IARC), AFB1 has been recognized as a class 1 carcinogen for animals and
Toxins 2020, 12, 115; doi:10.3390/toxins12020115 www.mdpi.com/journal/toxins91
Toxins 2020, 12, 115
humans [2]. Animals often show symptoms of mycotoxicosis even when these mycotoxins are presentbelow permitted levels. This is probably a result of the negative effects of the synergistic interactionsbetween various mycotoxins when they occur simultaneously in the same feed [3].
Although palm kernel cake (PKC) has been commonly used in ruminant feed, its use in poultry,swine, and fish diets is limited due to its high fiber content [4]. While PKC is a valuable source ofprotein and energy, it is susceptible to infection with mycotoxin-producing fungi. It is abundantlyproduced in mainly in the equatorial tropics, including South East Asia, Africa and South America.The incidence and severity of the growing number of reports concerning the presence of mycotoxins infeed and food highlights the heightened need for practical detoxification procedures [3,5,6]. Numerousstrategies involving physical, chemical and biological methods have been explored in order to detoxifymycotoxin-contaminated food and feed materials [7]. The successful removal of mycotoxins fromcontaminated agricultural commodities using biological and chemical methods is hindered by severalissues [8]. Some of these include safety issues, failure to effectively inactivate different mycotoxinssimultaneously, limited efficacy, potential loss of nutritional quality and unfavorable cost implications.Adsorption is one of the most effective and attractive physical processes for mycotoxin removal.Its major advantage is that it has minimal to no detrimental effects on the animal and this oftendoes not outweigh the benefits gained from the high removal efficiency. The efficacy of adsorptionappears to depend on the chemical structure and interactions between the solvent, adsorbate andadsorbent [9]. Several studies have reported the applicability of some inorganic and organic adsorbentssuch as activated charcoal, clay, yeast cell wall, hydrated sodium calcium aluminosilicates (HSCAS)and polymers for the binding and removal of mycotoxins [6,10–13]. In these cases, single adsorbentshave been shown to be effective against one or two specific mycotoxins while few adsorbents may beused for various mycotoxins. However, none of them has been effective against all toxins [3,10,14,15].Amongst numerous adsorbents, chitosan (CTS) is an effective, eco-friendly polymer and low-costadsorbent which is used for the removal of pollutant effluents even at low concentrations because ofits excellent adsorption capability [16].
Chitosan is a polyaminosaccharide that is derived through the deacetylation of chitin and it ispredominantly comprised of unbranched chains of β-(1, 4)-linked 2-deoxy-2-amino-d-glucopyranoseunits. Chitin and CTS are the second most abundant bio- polymers after cellulose. They can beisolated from shells of crustaceans such as crabs, krills, shrimps and cell walls of some fungi [17].Chitosan appears to be more attractive for use as adsorbent because of its beneficial properties suchas hydrophilicity, biodegradability, non-toxic nature and anti-bacterial property. Likewise, CTS is agood scavenger for pollutants binding owing to the presence of amine (–NH2) and hydroxyl (–OH)functional groups in its structure; these function as coordination and reaction sites [18]. In addition,CTS sorbents are conventionally used for adsorption of anionic pollutants from aqueous solutionsbecause of their polycationic nature.
Chitin has very poor solubility in most organic solvents while CTS dissolves readily in diluteacidic solutions [19]. Aqueous acid solutions with pH below 6.0 have been found to be the best solventsfor CTS. Such acids include acetic acid, hydrochloric acid, nitric acid and formic acid. However, sulfuricand phosphoric acids are not suitable solvents for CTS as it is insoluble in them [17]. Numerousarticles have reviewed the application of chitosan and its derivatives in removing contaminants fromwater samples, wastewaters, dye compounds and heavy metals [20–24]. However, to date, thereis limited number of literature on the successful simultaneous removal of mycotoxin with CTS asadsorbent [9,25,26].
To the best our knowledge, this is the first study on the simultaneous removal of 11 toxicmycotoxins in PKC using CTS.
92
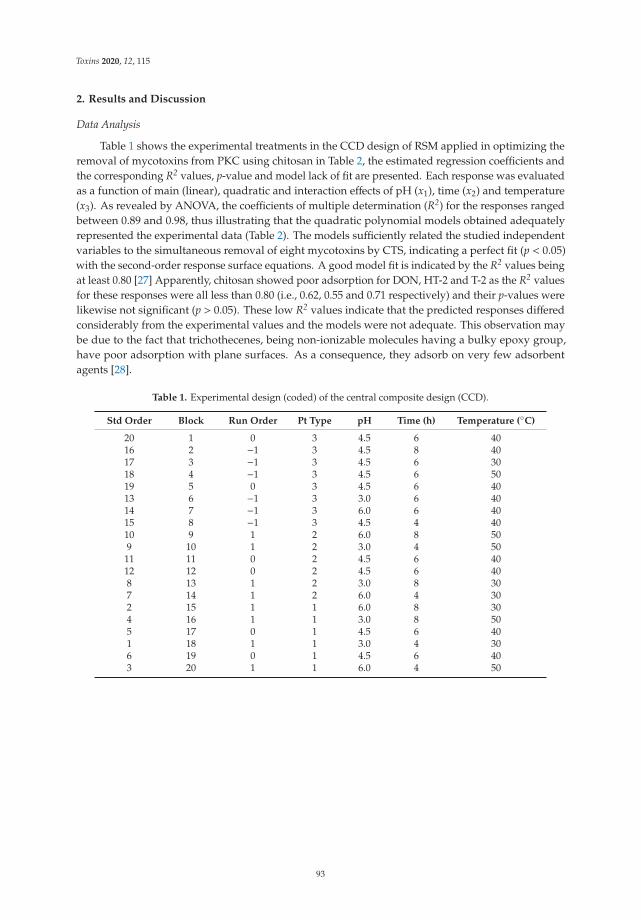
Toxins 2020, 12, 115
2. Results and Discussion
Data Analysis
Table 1 shows the experimental treatments in the CCD design of RSM applied in optimizing theremoval of mycotoxins from PKC using chitosan in Table 2, the estimated regression coefficients andthe corresponding R2 values, p-value and model lack of fit are presented. Each response was evaluatedas a function of main (linear), quadratic and interaction effects of pH (x1), time (x2) and temperature(x3). As revealed by ANOVA, the coefficients of multiple determination (R2) for the responses rangedbetween 0.89 and 0.98, thus illustrating that the quadratic polynomial models obtained adequatelyrepresented the experimental data (Table 2). The models sufficiently related the studied independentvariables to the simultaneous removal of eight mycotoxins by CTS, indicating a perfect fit (p < 0.05)with the second-order response surface equations. A good model fit is indicated by the R2 values beingat least 0.80 [27] Apparently, chitosan showed poor adsorption for DON, HT-2 and T-2 as the R2 valuesfor these responses were all less than 0.80 (i.e., 0.62, 0.55 and 0.71 respectively) and their p-values werelikewise not significant (p > 0.05). These low R2 values indicate that the predicted responses differedconsiderably from the experimental values and the models were not adequate. This observation maybe due to the fact that trichothecenes, being non-ionizable molecules having a bulky epoxy group,have poor adsorption with plane surfaces. As a consequence, they adsorb on very few adsorbentagents [28].
Table 1. Experimental design (coded) of the central composite design (CCD).
Std Order Block Run Order Pt Type pH Time (h) Temperature (◦C)
20 1 0 3 4.5 6 4016 2 −1 3 4.5 8 4017 3 −1 3 4.5 6 3018 4 −1 3 4.5 6 5019 5 0 3 4.5 6 4013 6 −1 3 3.0 6 4014 7 −1 3 6.0 6 4015 8 −1 3 4.5 4 4010 9 1 2 6.0 8 509 10 1 2 3.0 4 50
11 11 0 2 4.5 6 4012 12 0 2 4.5 6 408 13 1 2 3.0 8 307 14 1 2 6.0 4 302 15 1 1 6.0 8 304 16 1 1 3.0 8 505 17 0 1 4.5 6 401 18 1 1 3.0 4 306 19 0 1 4.5 6 403 20 1 1 6.0 4 50
93
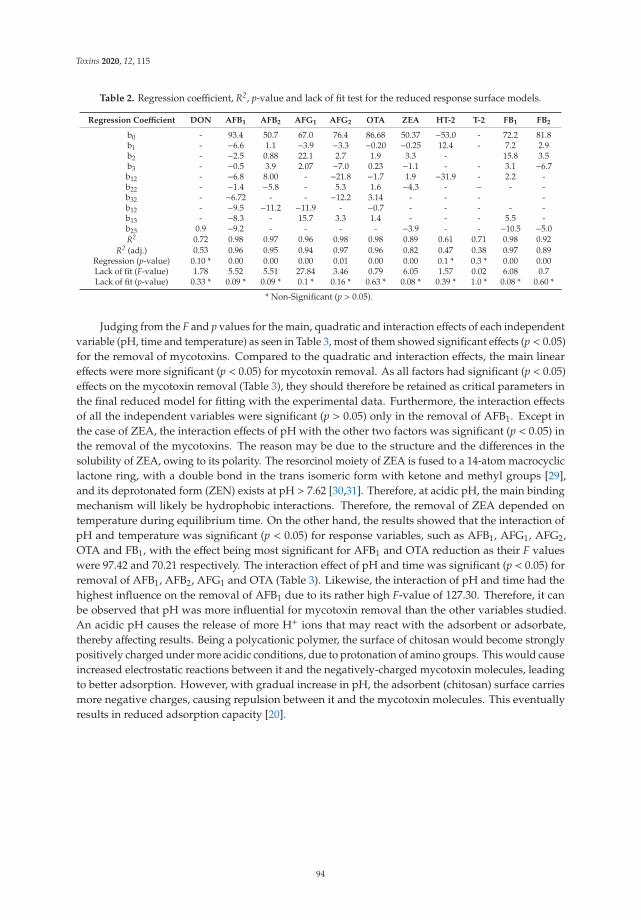
Toxins 2020, 12, 115
Table 2. Regression coefficient, R2, p-value and lack of fit test for the reduced response surface models.
Regression Coefficient DON AFB1 AFB2 AFG1 AFG2 OTA ZEA HT-2 T-2 FB1 FB2
b0 - 93.4 50.7 67.0 76.4 86.68 50.37 −53.0 - 72.2 81.8b1 - −6.6 1.1 −3.9 −3.3 −0.20 −0.25 12.4 - 7.2 2.9b2 - −2.5 0.88 22.1 2.7 1.9 3.3 - 15.8 3.5b3 - −0.5 3.9 2.07 −7.0 0.23 −1.1 - - 3.1 −6.7b12 - −6.8 8.00 - −21.8 −1.7 1.9 −31.9 - 2.2 -b22 - −1.4 −5.8 - 5.3 1.6 −4.3 - – - -b32 - −6.72 - - −12.2 3.14 - - - -b12 - −9.5 −11.2 −11.9 - −0.7 - - - - -b13 - −8.3 - 15.7 3.3 1.4 - - - 5.5 -b23 0.9 −9.2 - - - - −3.9 - - −10.5 −5.0R2 0.72 0.98 0.97 0.96 0.98 0.98 0.89 0.61 0.71 0.98 0.92
R2 (adj.) 0.53 0.96 0.95 0.94 0.97 0.96 0.82 0.47 0.38 0.97 0.89Regression (p-value) 0.10 * 0.00 0.00 0.00 0.01 0.00 0.00 0.1 * 0.3 * 0.00 0.00Lack of fit (F-value) 1.78 5.52 5.51 27.84 3.46 0.79 6.05 1.57 0.02 6.08 0.7Lack of fit (p-value) 0.33 * 0.09 * 0.09 * 0.1 * 0.16 * 0.63 * 0.08 * 0.39 * 1.0 * 0.08 * 0.60 *
* Non-Significant (p > 0.05).
Judging from the F and p values for the main, quadratic and interaction effects of each independentvariable (pH, time and temperature) as seen in Table 3, most of them showed significant effects (p < 0.05)for the removal of mycotoxins. Compared to the quadratic and interaction effects, the main lineareffects were more significant (p < 0.05) for mycotoxin removal. As all factors had significant (p < 0.05)effects on the mycotoxin removal (Table 3), they should therefore be retained as critical parameters inthe final reduced model for fitting with the experimental data. Furthermore, the interaction effectsof all the independent variables were significant (p > 0.05) only in the removal of AFB1. Except inthe case of ZEA, the interaction effects of pH with the other two factors was significant (p < 0.05) inthe removal of the mycotoxins. The reason may be due to the structure and the differences in thesolubility of ZEA, owing to its polarity. The resorcinol moiety of ZEA is fused to a 14-atom macrocycliclactone ring, with a double bond in the trans isomeric form with ketone and methyl groups [29],and its deprotonated form (ZEN) exists at pH > 7.62 [30,31]. Therefore, at acidic pH, the main bindingmechanism will likely be hydrophobic interactions. Therefore, the removal of ZEA depended ontemperature during equilibrium time. On the other hand, the results showed that the interaction ofpH and temperature was significant (p < 0.05) for response variables, such as AFB1, AFG1, AFG2,OTA and FB1, with the effect being most significant for AFB1 and OTA reduction as their F valueswere 97.42 and 70.21 respectively. The interaction effect of pH and time was significant (p < 0.05) forremoval of AFB1, AFB2, AFG1 and OTA (Table 3). Likewise, the interaction of pH and time had thehighest influence on the removal of AFB1 due to its rather high F-value of 127.30. Therefore, it canbe observed that pH was more influential for mycotoxin removal than the other variables studied.An acidic pH causes the release of more H+ ions that may react with the adsorbent or adsorbate,thereby affecting results. Being a polycationic polymer, the surface of chitosan would become stronglypositively charged under more acidic conditions, due to protonation of amino groups. This would causeincreased electrostatic reactions between it and the negatively-charged mycotoxin molecules, leadingto better adsorption. However, with gradual increase in pH, the adsorbent (chitosan) surface carriesmore negative charges, causing repulsion between it and the mycotoxin molecules. This eventuallyresults in reduced adsorption capacity [20].
94
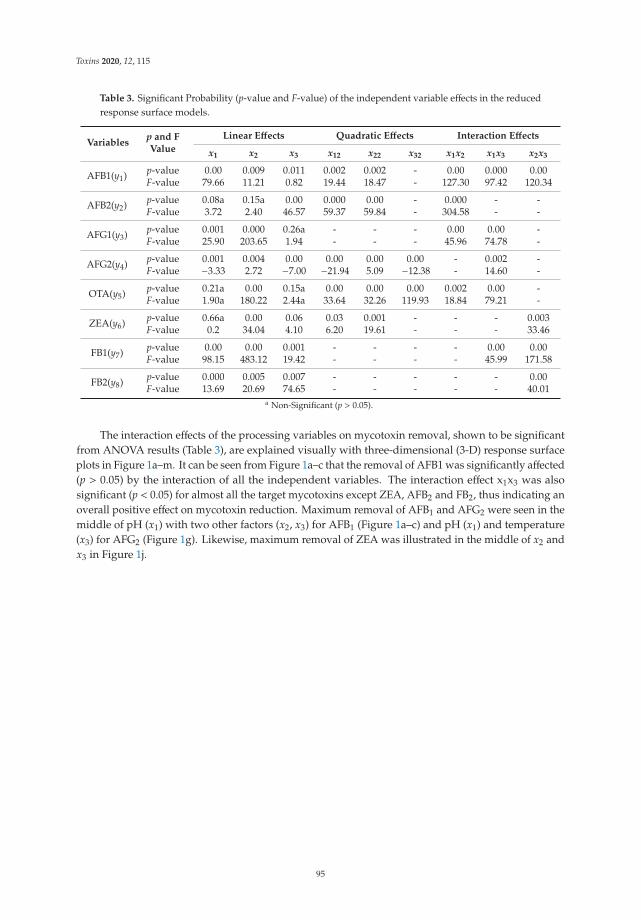
Toxins 2020, 12, 115
Table 3. Significant Probability (p-value and F-value) of the independent variable effects in the reducedresponse surface models.
Variablesp and FValue
Linear Effects Quadratic Effects Interaction Effects
x1 x2 x3 x12 x22 x32 x1x2 x1x3 x2x3
AFB1(y1) p-value 0.00 0.009 0.011 0.002 0.002 - 0.00 0.000 0.00F-value 79.66 11.21 0.82 19.44 18.47 - 127.30 97.42 120.34
AFB2(y2) p-value 0.08a 0.15a 0.00 0.000 0.00 - 0.000 - -F-value 3.72 2.40 46.57 59.37 59.84 - 304.58 - -
AFG1(y3) p-value 0.001 0.000 0.26a - - - 0.00 0.00 -F-value 25.90 203.65 1.94 - - - 45.96 74.78 -
AFG2(y4) p-value 0.001 0.004 0.00 0.00 0.00 0.00 - 0.002 -F-value −3.33 2.72 −7.00 −21.94 5.09 −12.38 - 14.60 -
OTA(y5) p-value 0.21a 0.00 0.15a 0.00 0.00 0.00 0.002 0.00 -F-value 1.90a 180.22 2.44a 33.64 32.26 119.93 18.84 79.21 -
ZEA(y6) p-value 0.66a 0.00 0.06 0.03 0.001 - - - 0.003F-value 0.2 34.04 4.10 6.20 19.61 - - - 33.46
FB1(y7) p-value 0.00 0.00 0.001 - - - - 0.00 0.00F-value 98.15 483.12 19.42 - - - - 45.99 171.58
FB2(y8) p-value 0.000 0.005 0.007 - - - - - 0.00F-value 13.69 20.69 74.65 - - - - - 40.01
a Non-Significant (p > 0.05).
The interaction effects of the processing variables on mycotoxin removal, shown to be significantfrom ANOVA results (Table 3), are explained visually with three-dimensional (3-D) response surfaceplots in Figure 1a–m. It can be seen from Figure 1a–c that the removal of AFB1 was significantly affected(p > 0.05) by the interaction of all the independent variables. The interaction effect x1x3 was alsosignificant (p < 0.05) for almost all the target mycotoxins except ZEA, AFB2 and FB2, thus indicating anoverall positive effect on mycotoxin reduction. Maximum removal of AFB1 and AFG2 were seen in themiddle of pH (x1) with two other factors (x2, x3) for AFB1 (Figure 1a–c) and pH (x1) and temperature(x3) for AFG2 (Figure 1g). Likewise, maximum removal of ZEA was illustrated in the middle of x2 andx3 in Figure 1j.
95
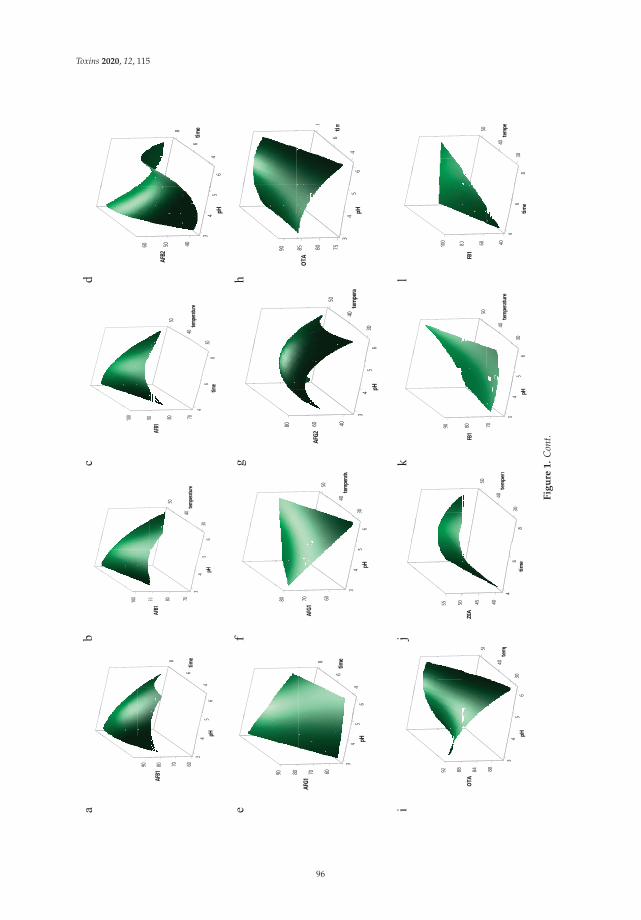
Toxins 2020, 12, 115
Fig
ure
1.
Con
t.
96
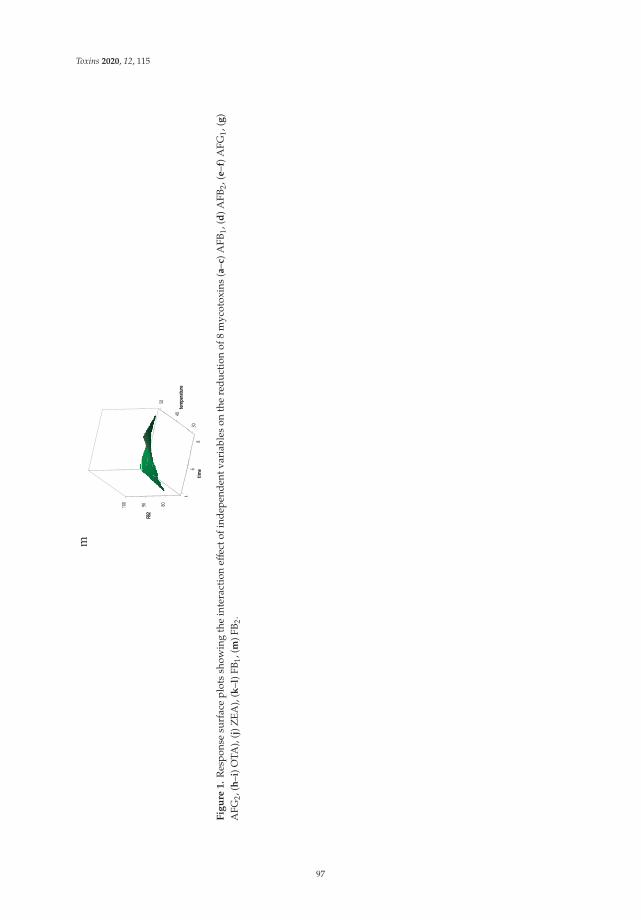
Toxins 2020, 12, 115
Fig
ure
1.
Res
pon
sesu
rfac
ep
lots
show
ing
the
inte
ract
ion
effec
tofi
ndep
end
entv
aria
bles
onth
ere
du
ctio
nof
8m
ycot
oxin
s(a
–c)A
FB1,
(d)A
FB2,
(e–f
)AFG
1,(g
)A
FG2,
(h–i
)OTA
),(j
)ZEA
),(k
–l)F
B 1,(
m)F
B 2.
97
Toxins 2020, 12, 115
3. Statistical Design
Three independent variables, i.e., pH (x1), equilibrium time (x2) and temperature (x3), wereevaluated for their effect on the response variables y1–y11, denoting the removal of DON, AB1, AB2,AG1, AG2, OTA, ZEA, HT-2, T-2 toxin, FB1 and FB2 respectively. These variables were selected for thestudy based on findings from literature and preliminary studies. A composite central design (CCD)with 20 experimental runs was employed to study the main and interaction effects of the variables onthe mycotoxin removal. The range of values applied on the independent variable ranges studied were:pH 3–6, equilibrium time of 3–8 h and 30–50 ◦C temperature, all set at three levels for each variable,as illustrated in Table 4. The center point was replicated six times reproducibility [32].
Table 4. Levels of experimental variables established in accordance with central composite design (CCD).
Independent VariableIndependent Variable Level
Low Center High
pH 3 5 6Time (h) 4 5 8
Temperature (◦C) 30 40 50
4. Statistical Analysis
Regression analysis as well as analysis of variance (ANOVA) was applied to establish the natureof the relationship between the responses and the three independent variables. To fit the regressionmodels to the experimental data with the objective of achieving the overall optimal region for allresponse variables studied [33]. For all tests the p-value adopted was less than 0.05. The generalizedpolynomial model proposed for relating the response to independent variables is given below:
yi = b0+b1x1+b2x2+b3x3+b12x1x2+b13x1x3+b23x2x3+b11x12+b22x22+b33x32 (1)
where yi represents the predicted dependent variables; b0 is the offset term (constant); b1, b2 andb3 are the linear effects; b11, b22 and b33 are quadratic effects; and b12, b13, b23, b31 and b32 are theinteraction effects. The terms xixj and xi
2 (i = 1, 2 or 3) denote the interaction and quadratic termsrespectively [34,35]. The adequacy of the model was tested using model analysis, lack of fit test andcoefficient of determination (R2) analysis.
5. Optimization and Validation Procedure
The final reduced models in optimization can be presented as 3-D response surface plots. Thesecan reveal the significant interactive effects of the independent variables on the response [36]. Here,the relationship of each response to the independent variables was expressed with 3-D plots byfixing two variables at the centre point while varying the third within the chosen experimental range.The levels of the independent variables for achieving the optimum goal of the individual and overallresponses were determined with the aid of the response optimizer.
98
Toxins 2020, 12, 115
The response optimizer allows the attainment of a fair balance in the optimization of severalresponse variables by identifying the best combination of input variable settings that favour maximumvalue of response(s) [37]. It was thus applied in the current study in order to simultaneously reduce the11 target mycotoxins. The final reduced models were verified by conducting five replicate experimentalruns at the optimal settings and comparing the observed results with the predicted responses. Significantdifference between the predicted and experimental results were further confirmed by one sample t-testExperimental design, model generation, prediction and other statistical analysis were done using astatistical package (Minitab 17 software, State College, PA, USA).
6. Adsorption Studies
About 2 kg of fresh representative PKC samples were kept at 4 ◦C ahead of sample extraction andsubsequent analysis. Three different concentrations (5.0, 25.0 and 100.0 ng/g) of AFB1, AFB2, AFG1,AFG2, OTA, ZEA, DON, HT-2, T-2, FB1 and FB2 standards were mixed with approximately 5 g ofPKC, each in triplicate solvent evaporation was allowed to occur in the spiked samples by storingthem overnight in the dark. Preliminary studies conducted within the range of 0.005 to 0.04 g of CTSrevealed that decrease in mycotoxins was not observed beyond 0.035 g. Therefore, this amount wasutilized in the adsorption experiments. In the sorption experiments, 350 mg of CTS adsorbent wasadded to 5 g of mycotoxin-contaminated PKC samples in 50 mL flasks. A 20 mL volume of solvent(acetonitrile/water/formic acid at 70:29:1, v/v/v) was added to the flask and the pH (3–6) was adjustedas needed using 0.01 M HCl. Adsorption was then carried out at controlled temperatures (30–50 ◦C)and at desired equilibrium times (4–8 h) under constant shaking (300 rpm). The mixture of solutionwas centrifuged at 3000 rpm for 10 min and 1 mL of the final solution was mixed with 3 mL of waterfor dilution [38]. The purpose of sample dilution during the sample preparation procedure was toreduce the possible matrix effect [39]. The extract obtained was then filtered with nylon syringe filter(0.22 μm). At the end of this process, residual mycotoxins present were measured using LC/MS-MS [40].Adsorption was estimated based on the initial and final amounts of mycotoxins present in the aqueous,as presented in the following Equation (2) [41]:
E= (C0−Ce)/C0/100
In Equation (2), C0 is the concentration (ng/mL) of the mycotoxin in the blank control and Ce is itsconcentration (ng/mL) in the supernatant.
7. Optimization for Maximum Mycotoxin Removal
To identify the optimum settings of the independent variables for the desired goal of mycotoxinremoval, multiple response optimizations (numerical and visual) were conducted. Two stages may beconsidered in optimization: (a) visualize the significant interaction effects of independent variables onthe response variables and (b) the actual optimization, where the factors are further examined in orderto determine the best applicable conditions. Presented in Figure 2 are the respective response plots forsimultaneous removal of eight mycotoxins obtained with different settings of the studied variables.Maximum removal of all mycotoxins was predicted to occur at the optimal condition of pH 4, time 8 hand temperature 35 ◦C (Figure 2).
99
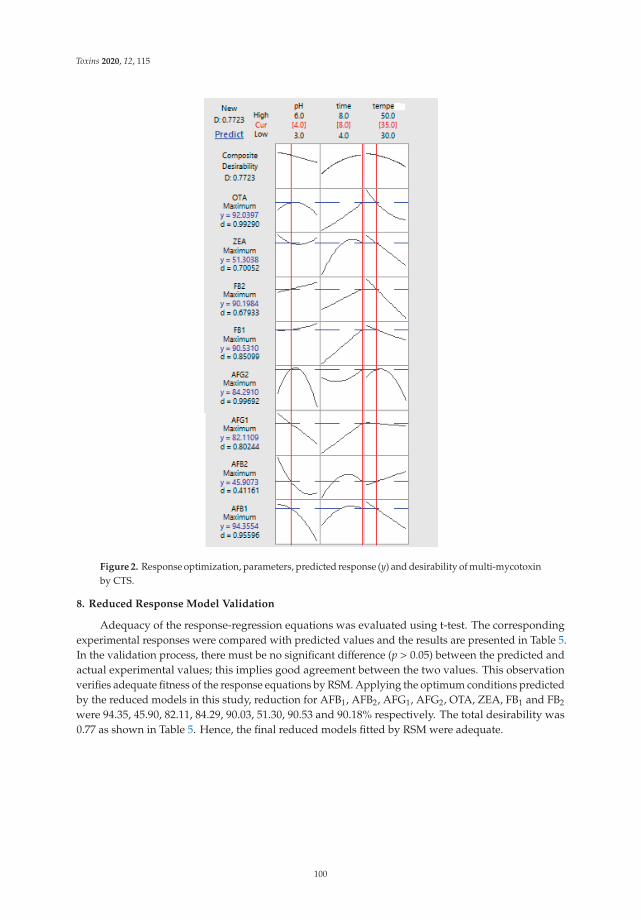
Toxins 2020, 12, 115
Figure 2. Response optimization, parameters, predicted response (y) and desirability of multi-mycotoxinby CTS.
8. Reduced Response Model Validation
Adequacy of the response-regression equations was evaluated using t-test. The correspondingexperimental responses were compared with predicted values and the results are presented in Table 5.In the validation process, there must be no significant difference (p > 0.05) between the predicted andactual experimental values; this implies good agreement between the two values. This observationverifies adequate fitness of the response equations by RSM. Applying the optimum conditions predictedby the reduced models in this study, reduction for AFB1, AFB2, AFG1, AFG2, OTA, ZEA, FB1 and FB2
were 94.35, 45.90, 82.11, 84.29, 90.03, 51.30, 90.53 and 90.18% respectively. The total desirability was0.77 as shown in Table 5. Hence, the final reduced models fitted by RSM were adequate.
100
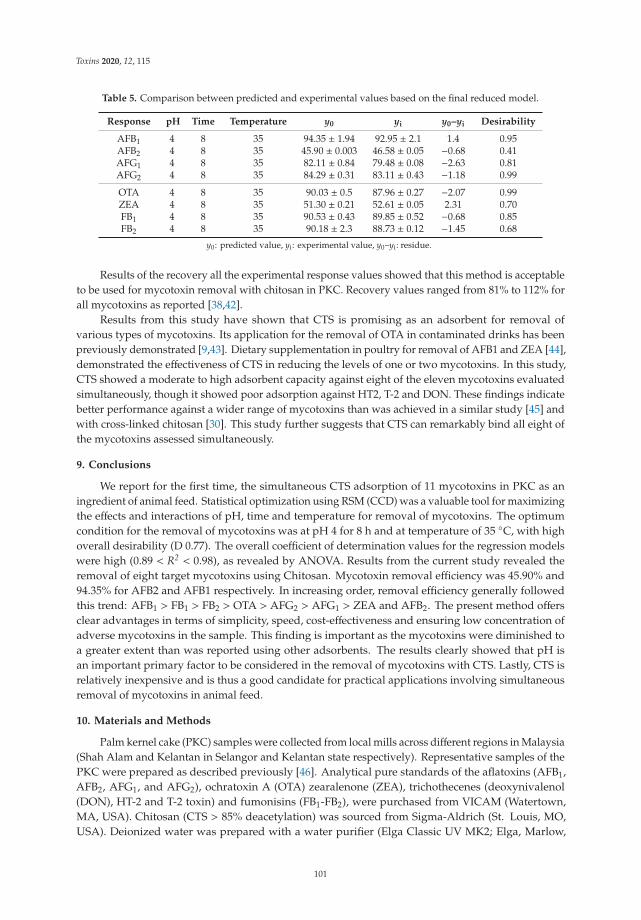
Toxins 2020, 12, 115
Table 5. Comparison between predicted and experimental values based on the final reduced model.
Response pH Time Temperature y0 yi y0–yi Desirability
AFB1 4 8 35 94.35 ± 1.94 92.95 ± 2.1 1.4 0.95AFB2 4 8 35 45.90 ± 0.003 46.58 ± 0.05 −0.68 0.41AFG1 4 8 35 82.11 ± 0.84 79.48 ± 0.08 −2.63 0.81AFG2 4 8 35 84.29 ± 0.31 83.11 ± 0.43 −1.18 0.99
OTA 4 8 35 90.03 ± 0.5 87.96 ± 0.27 −2.07 0.99ZEA 4 8 35 51.30 ± 0.21 52.61 ± 0.05 2.31 0.70FB1 4 8 35 90.53 ± 0.43 89.85 ± 0.52 −0.68 0.85FB2 4 8 35 90.18 ± 2.3 88.73 ± 0.12 −1.45 0.68
y0: predicted value, yi: experimental value, y0–yi: residue.
Results of the recovery all the experimental response values showed that this method is acceptableto be used for mycotoxin removal with chitosan in PKC. Recovery values ranged from 81% to 112% forall mycotoxins as reported [38,42].
Results from this study have shown that CTS is promising as an adsorbent for removal ofvarious types of mycotoxins. Its application for the removal of OTA in contaminated drinks has beenpreviously demonstrated [9,43]. Dietary supplementation in poultry for removal of AFB1 and ZEA [44],demonstrated the effectiveness of CTS in reducing the levels of one or two mycotoxins. In this study,CTS showed a moderate to high adsorbent capacity against eight of the eleven mycotoxins evaluatedsimultaneously, though it showed poor adsorption against HT2, T-2 and DON. These findings indicatebetter performance against a wider range of mycotoxins than was achieved in a similar study [45] andwith cross-linked chitosan [30]. This study further suggests that CTS can remarkably bind all eight ofthe mycotoxins assessed simultaneously.
9. Conclusions
We report for the first time, the simultaneous CTS adsorption of 11 mycotoxins in PKC as aningredient of animal feed. Statistical optimization using RSM (CCD) was a valuable tool for maximizingthe effects and interactions of pH, time and temperature for removal of mycotoxins. The optimumcondition for the removal of mycotoxins was at pH 4 for 8 h and at temperature of 35 ◦C, with highoverall desirability (D 0.77). The overall coefficient of determination values for the regression modelswere high (0.89 < R2 < 0.98), as revealed by ANOVA. Results from the current study revealed theremoval of eight target mycotoxins using Chitosan. Mycotoxin removal efficiency was 45.90% and94.35% for AFB2 and AFB1 respectively. In increasing order, removal efficiency generally followedthis trend: AFB1 > FB1 > FB2 > OTA > AFG2 > AFG1 > ZEA and AFB2. The present method offersclear advantages in terms of simplicity, speed, cost-effectiveness and ensuring low concentration ofadverse mycotoxins in the sample. This finding is important as the mycotoxins were diminished toa greater extent than was reported using other adsorbents. The results clearly showed that pH isan important primary factor to be considered in the removal of mycotoxins with CTS. Lastly, CTS isrelatively inexpensive and is thus a good candidate for practical applications involving simultaneousremoval of mycotoxins in animal feed.
10. Materials and Methods
Palm kernel cake (PKC) samples were collected from local mills across different regions in Malaysia(Shah Alam and Kelantan in Selangor and Kelantan state respectively). Representative samples of thePKC were prepared as described previously [46]. Analytical pure standards of the aflatoxins (AFB1,AFB2, AFG1, and AFG2), ochratoxin A (OTA) zearalenone (ZEA), trichothecenes (deoxynivalenol(DON), HT-2 and T-2 toxin) and fumonisins (FB1-FB2), were purchased from VICAM (Watertown,MA, USA). Chitosan (CTS > 85% deacetylation) was sourced from Sigma-Aldrich (St. Louis, MO,USA). Deionized water was prepared with a water purifier (Elga Classic UV MK2; Elga, Marlow,
101
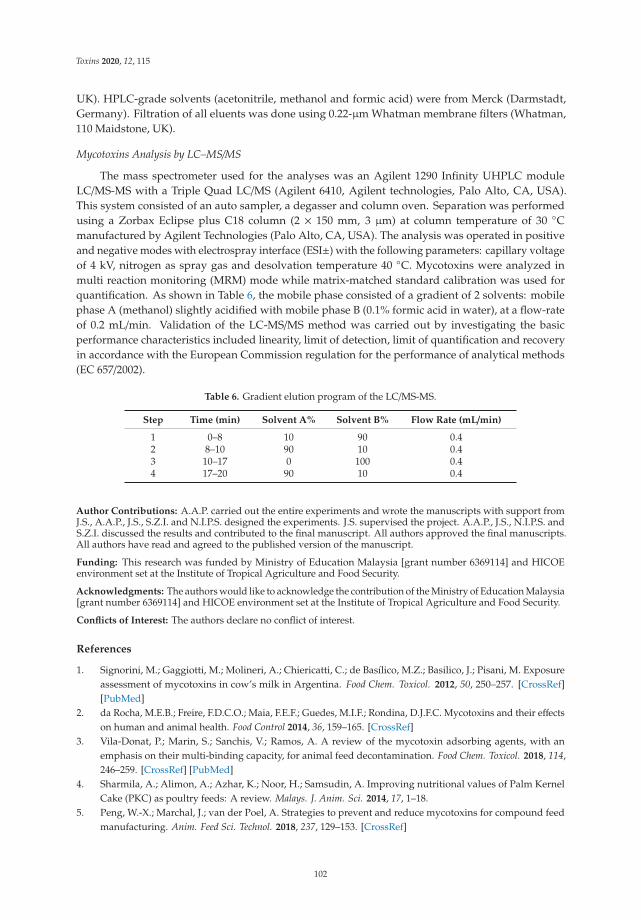
Toxins 2020, 12, 115
UK). HPLC-grade solvents (acetonitrile, methanol and formic acid) were from Merck (Darmstadt,Germany). Filtration of all eluents was done using 0.22-μm Whatman membrane filters (Whatman,110 Maidstone, UK).
Mycotoxins Analysis by LC–MS/MS
The mass spectrometer used for the analyses was an Agilent 1290 Infinity UHPLC moduleLC/MS-MS with a Triple Quad LC/MS (Agilent 6410, Agilent technologies, Palo Alto, CA, USA).This system consisted of an auto sampler, a degasser and column oven. Separation was performedusing a Zorbax Eclipse plus C18 column (2 × 150 mm, 3 μm) at column temperature of 30 ◦Cmanufactured by Agilent Technologies (Palo Alto, CA, USA). The analysis was operated in positiveand negative modes with electrospray interface (ESI±) with the following parameters: capillary voltageof 4 kV, nitrogen as spray gas and desolvation temperature 40 ◦C. Mycotoxins were analyzed inmulti reaction monitoring (MRM) mode while matrix-matched standard calibration was used forquantification. As shown in Table 6, the mobile phase consisted of a gradient of 2 solvents: mobilephase A (methanol) slightly acidified with mobile phase B (0.1% formic acid in water), at a flow-rateof 0.2 mL/min. Validation of the LC-MS/MS method was carried out by investigating the basicperformance characteristics included linearity, limit of detection, limit of quantification and recoveryin accordance with the European Commission regulation for the performance of analytical methods(EC 657/2002).
Table 6. Gradient elution program of the LC/MS-MS.
Step Time (min) Solvent A% Solvent B% Flow Rate (mL/min)
1 0–8 10 90 0.42 8–10 90 10 0.43 10–17 0 100 0.44 17–20 90 10 0.4
Author Contributions: A.A.P. carried out the entire experiments and wrote the manuscripts with support fromJ.S., A.A.P., J.S., S.Z.I. and N.I.P.S. designed the experiments. J.S. supervised the project. A.A.P., J.S., N.I.P.S. andS.Z.I. discussed the results and contributed to the final manuscript. All authors approved the final manuscripts.All authors have read and agreed to the published version of the manuscript.
Funding: This research was funded by Ministry of Education Malaysia [grant number 6369114] and HICOEenvironment set at the Institute of Tropical Agriculture and Food Security.
Acknowledgments: The authors would like to acknowledge the contribution of the Ministry of Education Malaysia[grant number 6369114] and HICOE environment set at the Institute of Tropical Agriculture and Food Security.
Conflicts of Interest: The authors declare no conflict of interest.
References
1. Signorini, M.; Gaggiotti, M.; Molineri, A.; Chiericatti, C.; de Basílico, M.Z.; Basilico, J.; Pisani, M. Exposureassessment of mycotoxins in cow’s milk in Argentina. Food Chem. Toxicol. 2012, 50, 250–257. [CrossRef][PubMed]
2. da Rocha, M.E.B.; Freire, F.D.C.O.; Maia, F.E.F.; Guedes, M.I.F.; Rondina, D.J.F.C. Mycotoxins and their effectson human and animal health. Food Control 2014, 36, 159–165. [CrossRef]
3. Vila-Donat, P.; Marin, S.; Sanchis, V.; Ramos, A. A review of the mycotoxin adsorbing agents, with anemphasis on their multi-binding capacity, for animal feed decontamination. Food Chem. Toxicol. 2018, 114,246–259. [CrossRef] [PubMed]
4. Sharmila, A.; Alimon, A.; Azhar, K.; Noor, H.; Samsudin, A. Improving nutritional values of Palm KernelCake (PKC) as poultry feeds: A review. Malays. J. Anim. Sci. 2014, 17, 1–18.
5. Peng, W.-X.; Marchal, J.; van der Poel, A. Strategies to prevent and reduce mycotoxins for compound feedmanufacturing. Anim. Feed Sci. Technol. 2018, 237, 129–153. [CrossRef]
102
Toxins 2020, 12, 115
6. Jard, G.; Liboz, T.; Mathieu, F.; Guyonvarc’h, A.; Lebrihi, A. Review of mycotoxin reduction in food and feed:from prevention in the field to detoxification by adsorption or transformation. Food Addit. Contam. 2011, 28,1590–1609. [CrossRef]
7. Jans, D.; Pedrosa, K.; Schatzmayr, D.; Bertin, G.; Grenier, B. Mycotoxin Reduction in Animal Diets. In MycotoxinReduction in Grain Chains; Wiley: Hoboken, NJ, USA, 2014; Chapter 8; pp. 101–110.
8. Smith, T.; Girish, C. Prevention and control of animal feed contamination by mycotoxins and reductionof their adverse effects in livestock. In Animal Feed Contamination; Elsevier: Guelph, ON, Canada, 2012;pp. 326–351.
9. Mine Kurtbay, H.; Bekçi, Z.; Merdivan, M.; Yurdakoç, K. Reduction of ochratoxin A levels in red wine bybentonite, modified bentonites, and chitosan. J. Agric. Food Chem. 2008, 56, 2541–2545. [CrossRef]
10. Avantaggiato, G.; Havenaar, R.; Visconti, A. Assessment of the multi-mycotoxin-binding efficacy of acarbon/aluminosilicate-based product in an in vitro gastrointestinal model. J. Agric. Food Chem. 2007, 55,4810–4819. [CrossRef]
11. Phillips, T.; Afriyie-Gyawu, E.; Williams, J.; Huebner, H.; Ankrah, N.-A.; Ofori-Adjei, D.; Jolly, P.; Johnson, N.;Taylor, J. Marroquin-Cardona, A. Reducing human exposure to aflatoxin through the use of clay: A review.Food Addit. Contam. 2008, 25, 134–145. [CrossRef]
12. Kong, C.; Shin, S.Y.; Kim, B.G. Evaluation of mycotoxin sequestering agents for aflatoxin and deoxynivalenol:An in vitro approach. SpringerPlus 2014, 3, 346. [CrossRef]
13. Wielogórska, E.; MacDonald, S.; Elliott, C. A review of the efficacy of mycotoxin detoxifying agents used infeed in light of changing global environment and legislation. World Mycotoxin J. 2016, 9, 419–433. [CrossRef]
14. Kabak, B. Prevention and management of mycotoxins in food and feed. In Mycotoxins in Food, Feed andBioweapons; Springer: Corum, Turkey, 2009; pp. 201–227.
15. Di Gregorio, M.C.; Neeff, D.V.D.; Jager, A.V.; Corassin, C.H.; Carão, Á.C.D.P.; Albuquerque, R.D.;Azevedo, A.C.D.; Oliveira, C.A.F. Mineral adsorbents for prevention of mycotoxins in animal feeds.Toxin Rev. 2014, 33, 125–135. [CrossRef]
16. Azlan, K.; Saime, W.N.W.; Liew, L. Chitosan and chemically modified chitosan beads for acid dyes sorption.J. Environ. Sci. 2009, 21, 296–302. [CrossRef]
17. Yeul, V.S.; Rayalu, S.S. Unprecedented chitin and chitosan: A chemical overview. J. Polym. Environ. 2013, 21,606–614. [CrossRef]
18. Yen, M.-T.; Yang, J.-H.; Mau, J.-L. Antioxidant properties of chitosan from crab shells. Carbohydr. Polym. 2008,74, 840–844. [CrossRef]
19. Pillai, C.; Paul, W.; Sharma, C.P. Chitin and chitosan polymers: Chemistry, solubility and fiber formation.Prog. Polym. Sci. 2009, 34, 641–678. [CrossRef]
20. Ngah, W.W.; Teong, L.; Hanafiah, M.A.K.M. Adsorption of dyes and heavy metal ions by chitosan composites:A review. Carbohydr. Polym. 2011, 83, 1446–1456. [CrossRef]
21. Chatterjee, S.; Chatterjee, T.; Lim, S.R.; Woo, S.H. Adsorption of a cationic dye, methylene blue, on to chitosanhydrogel beads generated by anionic surfactant gelation. Environ. Technol. 2011, 32, 1503–1514. [CrossRef]
22. Chatterjee, S.; Lee, M.W.; Woo, S.H. Adsorption of congo red by chitosan hydrogel beads impregnated withcarbon nanotubes. Bioresour. Technol. 2010, 101, 1800–1806. [CrossRef]
23. Kyzas, G.Z.; Lazaridis, N.K.; Kostoglou, M. Adsorption/desorption of a dye by a chitosan derivative:Experiments and phenomenological modeling. Chem. Eng. J. 2014, 248, 327–336. [CrossRef]
24. Ren, Y.; Abbood, H.A.; He, F.; Peng, H.; Huang, K. Magnetic EDTA-modified chitosan/SiO2/Fe3O4 adsorbent:Preparation, characterization, and application in heavy metal adsorption. Chem. Eng. J. 2013, 226, 300–311.[CrossRef]
25. Peng, X.; Liu, B.; Chen, W.; Li, X.; Wang, Q.; Meng, X.; Wang, D. Effective biosorption of patulin from applejuice by cross-linked xanthated chitosan resin. Food Control 2016, 63, 140–146. [CrossRef]
26. Kaushik, A.; Solanki, P.R.; Ansari, A.A.; Ahmad, S.; Malhotra, B.D. Chitosan–iron oxide nanobiocompositebased immunosensor for ochratoxin-A. Electrochem. Commun. 2008, 10, 1364–1368. [CrossRef]
27. Pirouz, A.; Selamat, J.; Iqbal, S.; Mirhosseini, H.; Karjiban, R.A.; Bakar, F.A. The use of innovative and efficientnanocomposite (magnetic graphene oxide) for the reduction on of Fusarium mycotoxins in palm kernel cake.Sci. Rep. 2017, 7, 12453. [CrossRef] [PubMed]
28. Afsah-Hejri, L.; Jinap, S.; Arzandeh, S.; Mirhosseini, H. Optimization of HPLC conditions for quantitativeanalysis of aflatoxins in contaminated peanut. Food Control 2011, 22, 381–388. [CrossRef]
103
Toxins 2020, 12, 115
29. Ko, W.-C.; Chang, C.-K.; Wang, H.-J.; Wang, S.-J.; Hsieh, C.-W. Process optimization of microencapsulationof curcumin in γ-polyglutamic acid using response surface methodology. Food Chem. 2015, 172, 497–503.[CrossRef]
30. Liu, D.; Xu, H.; Tian, B.; Yuan, K.; Pan, H.; Ma, S.; Yang, X.; Pan, W. Fabrication of carvedilol nanosuspensionsthrough the anti-solvent precipitation–ultrasonication method for the improvement of dissolution rate andoral bioavailability. Aaps Pharmscitech 2012, 13, 295–304. [CrossRef]
31. Huang, Y.; Yuan, Y.; Zhou, Z.; Liang, J.; Chen, Z.; Li, G. Optimization and evaluation of chelerythrinenanoparticles composed of magnetic multiwalled carbon nanotubes by response surface methodology.Appl. Surf. Sci. 2014, 292, 378–386. [CrossRef]
32. Mirhosseini, H.; Tan, C.P.; Taherian, A.R.; Boo, H.C. Modeling the physicochemical properties of orangebeverage emulsion as function of main emulsion components using response surface methodology. Carbohydr.Polym. 2009, 75, 512–520. [CrossRef]
33. Mehrnoush, A.; Tan, C.P.; Hamed, M.; Aziz, N.A.; Ling, T.C. Optimisation of freeze drying conditions forpurified serine protease from mango (Mangifera indicaCv. Chokanan) peel. Food Chem. 2011, 128, 158–164.[CrossRef]
34. Yibadatihan, S.; Jinap, S.; Mahyudin, N.J.F.A. Simultaneous determination of multi-mycotoxins in palmkernel cake (PKC) using liquid chromatography-tandem mass spectrometry (LC-MS/MS). Food Addit. Contam.Part A 2014, 31, 2071–2079. [CrossRef] [PubMed]
35. Patel, D.; Sciences, B. Matrix effect in a view of LC-MS/MS: An overview. Int. J. Pharma Biol. Sci. 2011, 2,559–564.
36. Rubert, J.; Soler, C.; Mañes, J.J.F.C. Application of an HPLC–MS/MS method for mycotoxin analysis incommercial baby foods. Food Chem. 2012, 133, 176–183. [CrossRef]
37. Fan, L.; Luo, C.; Sun, M.; Li, X.; Lu, F.; Qiu, H. Preparation of novel magnetic chitosan/graphene oxidecomposite as effective adsorbents toward methylene blue. Bioresour. Technol. 2012, 114, 703–706. [CrossRef][PubMed]
38. Kathiravan, T.; Nadanasabapathi, S.; Kumar, R. Pigments and antioxidant activity of optimizedReady-to-Drink (RTD) Beetroot (Beta vulgaris L.)-passion fruit (Passiflora edulis var. flavicarpa) juice blend.Croat. J. Food Sci. Technol. 2015, 7, 9–21. [CrossRef]
39. Boudergue, C.; Burel, C.; Dragacci, S.; Favrot, M.-C.; Fremy, J.-M.; Massimi, C.; Pringent, P.; Debongnie, P.;Pussemier, L.; Boudra, H. Review of mycotoxin-detoxifying agents used as feed additives: Mode of action,efficacy and feed/food safety. EFSA Support. Publ. 2009, 6, 22E. [CrossRef]
40. Gromadzka, K.; Waskiewicz, A.; Chelkowski, J.; Golinski, P. Zearalenone and its metabolites: Occurrence,detection, toxicity and guidelines. World Mycotoxin J. 2008, 1, 209–220. [CrossRef]
41. Zhao, Z.; Liu, N.; Yang, L.; Wang, J.; Song, S.; Nie, D.; Yang, X.; Hou, J.; Wu, A. Cross-linked chitosanpolymers as generic adsorbents for simultaneous adsorption of multiple mycotoxins. Food Control 2015, 57,362–369. [CrossRef]
42. Faucet-Marquis, V.; Joannis-Cassan, C.; Hadjeba-Medjdoub, K.; Ballet, N.; Pfohl-Leszkowicz, A. Developmentof an in vitro method for the prediction of mycotoxin binding on yeast-based products: Case of aflatoxin B 1,zearalenone and ochratoxin A. Appl. Microbiol. Biotechnol. 2014, 98, 7583–7596. [CrossRef]
43. Soleimany, F.; Jinap, S.; Abas, F.J.F.C. Determination of mycotoxins in cereals by liquid chromatographytandem mass spectrometry. Food Chem. 2012, 130, 1055–1060. [CrossRef]
44. Bornet, A.; Teissedre, P. Chitosan, chitin-glucan and chitin effects on minerals (iron, lead, cadmium) andorganic (ochratoxin A) contaminants in wines. Eur. Food Res. Technol. 2008, 226, 681–689. [CrossRef]
45. Khajarern, J.; Khajarern, S.; Moon, T.; Lee, J. Effects of dietary supplementation of fermented chitin-chitosan(fermkit) on toxicity of mycotoxin in ducks. Asian-Australas. J. Anim. Sci. 2003, 16, 706–713. [CrossRef]
46. Solís-Cruz, B.; Hernández-Patlán, D.; Beyssac, E.; Latorre, J.; Hernandez-Velasco, X.; Merino-Guzman, R.;Tellez, G.; López-Arellano, R. Evaluation of chitosan and cellulosic polymers as binding adsorbent materials toprevent aflatoxin B1, fumonisin B1, ochratoxin, trichothecene, deoxynivalenol, and zearalenone mycotoxicosesthrough an in vitro gastrointestinal model for poultry. Polymers 2017, 9, 529. [CrossRef] [PubMed]
© 2020 by the authors. Licensee MDPI, Basel, Switzerland. This article is an open accessarticle distributed under the terms and conditions of the Creative Commons Attribution(CC BY) license (http://creativecommons.org/licenses/by/4.0/).
104
toxins
Article
Effect of Ozone and Electron Beam Irradiation onDegradation of Zearalenone and Ochratoxin A
Kai Yang 1, Ke Li 1, Lihong Pan 1, Xiaohu Luo 1,2,3,4,*, Jiali Xing 5, Jing Wang 2, Li Wang 1, Ren
Wang 1, Yuheng Zhai 1 and Zhengxing Chen 1,*
1 National Engineering Laboratory for Cereal Fermentation Technology, Jiangnan University,Wuxi 214122, China; [email protected] (K.Y.); [email protected] (K.L.);[email protected] (L.P.); [email protected] (L.W.); [email protected] (R.W.);[email protected] (Y.Z.)
2 Beijing Advanced Innovation Center for Food Nutrition and Human Health, Beijing Technology andBusiness University (BTBU), Beijing 100048, China; [email protected]
3 College of Food and Pharmaceutical Science, Ningbo University, Ningbo 315000, China4 Research Institute of Gang Yagou Healthy Food and Biotechnology, Ningbo 315205, China5 Ningbo Institute for Food Control, Ningbo 315048, China; [email protected]* Correspondence: [email protected] (X.L.); [email protected] (Z.C.)
Received: 16 January 2020; Accepted: 21 February 2020; Published: 24 February 2020
Abstract: Zearalenone (ZEN) and ochratoxin A (OTA) are key concerns of the food industry becauseof their toxicity and pollution scope. This study investigated the effects of ozone and electron beamirradiation (EBI) on the degradation of ZEN and OTA. Results demonstrated that 2 mL of 50 μg/mLZEN was completely degraded after 10 s of treatment by 2.0 mg/L ozone. The degradation rate of1 μg/mL ZEN by 16 kGy EBI was 92.76%. Methanol was superior to acetonitrile in terms of degradingZEN when the irradiation dose was higher than 6 kGy. The degradation rate of 2 mL of 5 μg/mLOTA by 50 mg/L ozone at 180 s was 34%, and that of 1 μg/mL OTA by 16 kGy EBI exceeded 90%.Moreover, OTA degraded more rapidly in acetonitrile. Ozone performed better in the degradation ofZEN, whereas EBI was better for OTA. The conclusions provide theoretical and practical bases for thedegradation of different fungal toxins.
Keywords: ozone; electron beam irradiation; degradation; zearalenone; ochratoxin A
Key Contribution: (1) ZEN and OTA in methanol and acetonitrile can be efficiently degraded byelectron beam irradiation (EBI). (2) ZEN in standard solution can be efficiently degraded by ozone;OTA required a higher ozone concentration and longer treatment time than ZEN. (3). EBI inducesreactions involving acetonitrile and between acetonitrile and ZEN and OTA.
1. Introduction
Crop pollution by fungal toxins is a global issue that causes massive annual economic losses.Large territorial areas of China are located in temperate and subtropical zones, offering favorableclimatic conditions for the growth and reproduction of toxic fungi [1]. Zearalenone (ZEN) of Fusarium [2]and ochratoxin A (OTA) of Aspergillus and Penicillium [3] exhibited the most extensive distribution andstrongest toxicity among the more than 400 toxic fungi discovered thus far [4]. Numerous studies havereported on the reproduction, genetic, and immune toxicities of ZEN, which causes nausea, vomiting,and diarrhea in humans and animals [5]. Animal toxicological experiments and clinical studies havedemonstrated the strong nephrotoxicity, immunotoxicity, and carcinogenicity of OTA [6,7].
Ozone, as a strong oxidant, can attack the double bond in organic compounds through moleculesand free radicals in a liquid system [8–10]. In addition, ozone exhibits acceptable permeability and can
Toxins 2020, 12, 138; doi:10.3390/toxins12020138 www.mdpi.com/journal/toxins105
Toxins 2020, 12, 138
automatically decompose into oxygen without generating toxic residues [11]. Hence, ozonation is afungal toxin degradation technology with promising potential, and has been the focus of numerousstudies in recent decades. Xu et al. discussed the reduction of ZEN in corn flour by ozone treatment,and four ozonation products were identified by a method involving the use of ultra-performanceliquid chromatography-tandem mass spectrometry [12]. Inan et al. degraded aflatoxin B1 (AFB1) insliced and ground pimiento by 33 and 66 mg/L ozone and obtained degradation rates of 80% and93%, respectively [13]. Zorlugenc et al. treated AFB1 in dry figs by ozone gas and ozonated water for180 min, and the degradation rates of AFB1 were 95.21% and 88.62%, respectively [14]. These studiesproved the strong degradation capability of ozonated gas and ozone water for fungal toxins.
Electron beam irradiation (EBI) is the process of irradiating products by using the electron beamgenerated by an electron accelerator. This technology is characterized by high energy utilization,simple operation, and safe use. EBI is a safe and effective green-processing technology. Researchershave explored the application of EBI in agricultural products and food storage, crop breeding, radiationsterilization, radiation pest control, and other emerging fields such as radiation chemical and radiationmaterial engineering [15,16]. The degradation of fungal toxins in foods based on EBI has recently beendiscussed. Stepanik et al. investigated the degradation of deoxynivalenol (DON) in three productionintermediates in distillers dried grain and solubles by using a dose of EBI treatment [17]. Wang et al.discussed the degradation of AFB1 by EBI and found that 8.6 kGy of EBI was adequate to completelydegrade 5 ng/g AFB1 [18]. The mechanism of action was similar to that of γ-ray [19]. Water moleculeswere activated and ionized after EBI, generating hydroxyl radicals and hydration molecules. Hydroxylradicals further destroy the molecular structure of the toxin.
Few studies on the degradation of ZEN and OTA by ozone and EBI are available presently,although numerous studies have focused on the degradation of AFB1 [20]. The effects of ozone and EBIon the degradation of ZEN and OTA cannot be easily understood due to the different structures of ZENand OTA from AFB1, thereby limiting the applications of ozone and EBI in ZEN- and OTA-contaminatedfoods. The influences of ozone concentration, sample concentration, treatment time, and radiationdose in acetonitrile and methanol systems on the degradation rates of ZEN and OTA were discussedon the basis of previous studies on DON [21] and AFB1 [22] degradation by ozone and EBI. The presentstudy provides theoretical and practical bases for OTA and ZEN degradation in food by ozone and EBIin the future.
2. Results
2.1. Standard Curves of Zearalenone (ZEN) and Ochratoxin A (OTA)
The linear correlation between the peak area and concentration (0.5–5.0 and 0.1–1.0 μg/mL) wasclarified on the basis of the standard curves of ZEN and OTA (Figure 1). The regression equations ofthe ZEN and OTA standard curves are marked in Figure 1. R2 represents the square of the correlationcoefficient, and the determination coefficient R2 is a relative index of goodness of fit between theregression line and the observed value of the sample, reflecting the proportion of the fluctuations of thedependent variable that can be explained by the independent variable. The closer R2 is to 1, the betterthe goodness of fit. R2 of the regression equations in the ZEN and OTA standard curves were 0.9999and 0.9998, respectively, indicating a high degree of linear regression.
2.2. Degradation Rates of ZEN and OTA by Ozone
The degradation rates of 2 mL of 50 μg/mL ZEN standard working solution (a) and 2 mL of5 μg/mL OTA standard working solution (b) by ozone under different treatment time periods areshown in Figure 2. The degradation rate of ZEN at 1 s was higher than 50%. The degradation ofZEN slowed down with the increase in treatment time. No ZEN was detected in the solution at 10 s.The degradation curve of OTA from 0–180 s was a reverse S-shaped curve. The degradation rate of
106
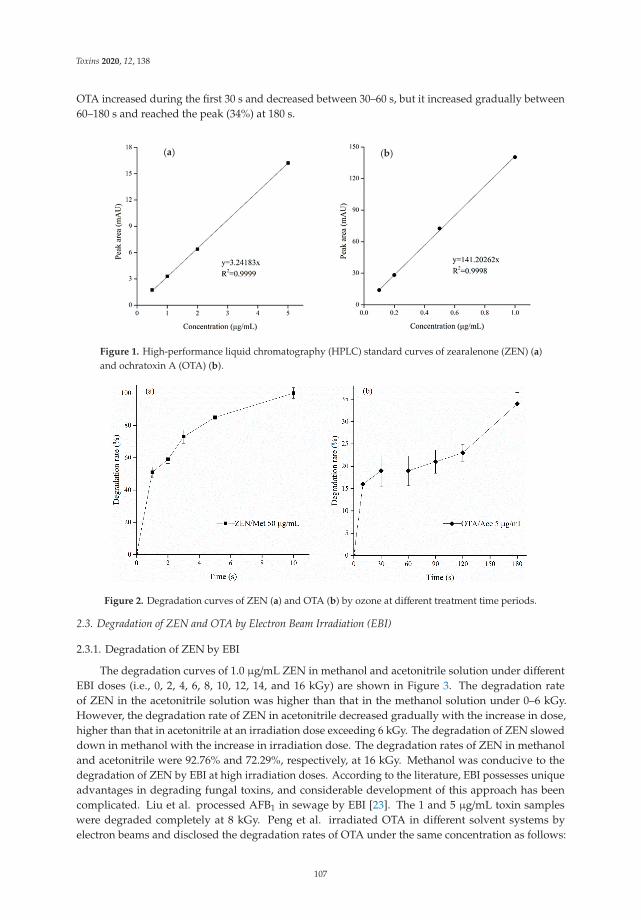
Toxins 2020, 12, 138
OTA increased during the first 30 s and decreased between 30–60 s, but it increased gradually between60–180 s and reached the peak (34%) at 180 s.
(a) (b)
Figure 1. High-performance liquid chromatography (HPLC) standard curves of zearalenone (ZEN) (a)and ochratoxin A (OTA) (b).
Figure 2. Degradation curves of ZEN (a) and OTA (b) by ozone at different treatment time periods.
2.3. Degradation of ZEN and OTA by Electron Beam Irradiation (EBI)
2.3.1. Degradation of ZEN by EBI
The degradation curves of 1.0 μg/mL ZEN in methanol and acetonitrile solution under differentEBI doses (i.e., 0, 2, 4, 6, 8, 10, 12, 14, and 16 kGy) are shown in Figure 3. The degradation rateof ZEN in the acetonitrile solution was higher than that in the methanol solution under 0–6 kGy.However, the degradation rate of ZEN in acetonitrile decreased gradually with the increase in dose,higher than that in acetonitrile at an irradiation dose exceeding 6 kGy. The degradation of ZEN sloweddown in methanol with the increase in irradiation dose. The degradation rates of ZEN in methanoland acetonitrile were 92.76% and 72.29%, respectively, at 16 kGy. Methanol was conducive to thedegradation of ZEN by EBI at high irradiation doses. According to the literature, EBI possesses uniqueadvantages in degrading fungal toxins, and considerable development of this approach has beencomplicated. Liu et al. processed AFB1 in sewage by EBI [23]. The 1 and 5 μg/mL toxin sampleswere degraded completely at 8 kGy. Peng et al. irradiated OTA in different solvent systems byelectron beams and disclosed the degradation rates of OTA under the same concentration as follows:
107
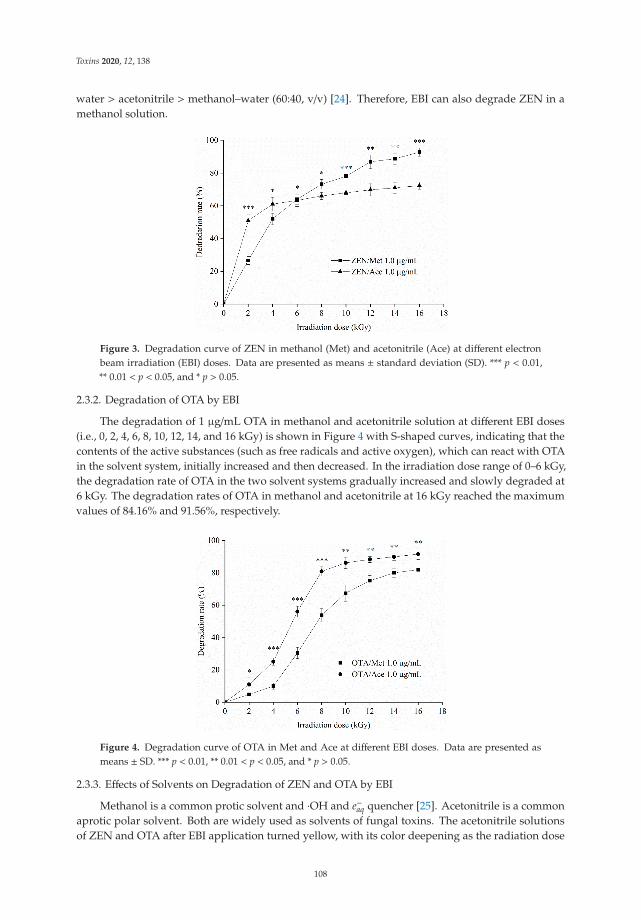
Toxins 2020, 12, 138
water > acetonitrile > methanol–water (60:40, v/v) [24]. Therefore, EBI can also degrade ZEN in amethanol solution.
Figure 3. Degradation curve of ZEN in methanol (Met) and acetonitrile (Ace) at different electronbeam irradiation (EBI) doses. Data are presented as means ± standard deviation (SD). *** p < 0.01,** 0.01 < p < 0.05, and * p > 0.05.
2.3.2. Degradation of OTA by EBI
The degradation of 1 μg/mL OTA in methanol and acetonitrile solution at different EBI doses(i.e., 0, 2, 4, 6, 8, 10, 12, 14, and 16 kGy) is shown in Figure 4 with S-shaped curves, indicating that thecontents of the active substances (such as free radicals and active oxygen), which can react with OTAin the solvent system, initially increased and then decreased. In the irradiation dose range of 0–6 kGy,the degradation rate of OTA in the two solvent systems gradually increased and slowly degraded at6 kGy. The degradation rates of OTA in methanol and acetonitrile at 16 kGy reached the maximumvalues of 84.16% and 91.56%, respectively.
Figure 4. Degradation curve of OTA in Met and Ace at different EBI doses. Data are presented asmeans ± SD. *** p < 0.01, ** 0.01 < p < 0.05, and * p > 0.05.
2.3.3. Effects of Solvents on Degradation of ZEN and OTA by EBI
Methanol is a common protic solvent and ·OH and e−aq quencher [25]. Acetonitrile is a commonaprotic polar solvent. Both are widely used as solvents of fungal toxins. The acetonitrile solutionsof ZEN and OTA after EBI application turned yellow, with its color deepening as the radiation dose
108
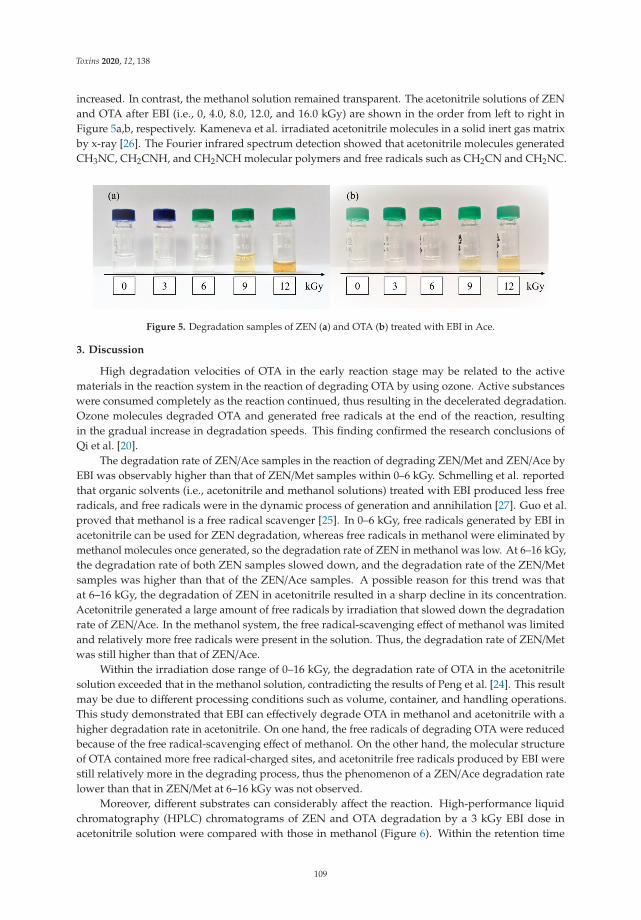
Toxins 2020, 12, 138
increased. In contrast, the methanol solution remained transparent. The acetonitrile solutions of ZENand OTA after EBI (i.e., 0, 4.0, 8.0, 12.0, and 16.0 kGy) are shown in the order from left to right inFigure 5a,b, respectively. Kameneva et al. irradiated acetonitrile molecules in a solid inert gas matrixby x-ray [26]. The Fourier infrared spectrum detection showed that acetonitrile molecules generatedCH3NC, CH2CNH, and CH2NCH molecular polymers and free radicals such as CH2CN and CH2NC.
Figure 5. Degradation samples of ZEN (a) and OTA (b) treated with EBI in Ace.
3. Discussion
High degradation velocities of OTA in the early reaction stage may be related to the activematerials in the reaction system in the reaction of degrading OTA by using ozone. Active substanceswere consumed completely as the reaction continued, thus resulting in the decelerated degradation.Ozone molecules degraded OTA and generated free radicals at the end of the reaction, resultingin the gradual increase in degradation speeds. This finding confirmed the research conclusions ofQi et al. [20].
The degradation rate of ZEN/Ace samples in the reaction of degrading ZEN/Met and ZEN/Ace byEBI was observably higher than that of ZEN/Met samples within 0–6 kGy. Schmelling et al. reportedthat organic solvents (i.e., acetonitrile and methanol solutions) treated with EBI produced less freeradicals, and free radicals were in the dynamic process of generation and annihilation [27]. Guo et al.proved that methanol is a free radical scavenger [25]. In 0–6 kGy, free radicals generated by EBI inacetonitrile can be used for ZEN degradation, whereas free radicals in methanol were eliminated bymethanol molecules once generated, so the degradation rate of ZEN in methanol was low. At 6–16 kGy,the degradation rate of both ZEN samples slowed down, and the degradation rate of the ZEN/Metsamples was higher than that of the ZEN/Ace samples. A possible reason for this trend was thatat 6–16 kGy, the degradation of ZEN in acetonitrile resulted in a sharp decline in its concentration.Acetonitrile generated a large amount of free radicals by irradiation that slowed down the degradationrate of ZEN/Ace. In the methanol system, the free radical-scavenging effect of methanol was limitedand relatively more free radicals were present in the solution. Thus, the degradation rate of ZEN/Metwas still higher than that of ZEN/Ace.
Within the irradiation dose range of 0–16 kGy, the degradation rate of OTA in the acetonitrilesolution exceeded that in the methanol solution, contradicting the results of Peng et al. [24]. This resultmay be due to different processing conditions such as volume, container, and handling operations.This study demonstrated that EBI can effectively degrade OTA in methanol and acetonitrile with ahigher degradation rate in acetonitrile. On one hand, the free radicals of degrading OTA were reducedbecause of the free radical-scavenging effect of methanol. On the other hand, the molecular structureof OTA contained more free radical-charged sites, and acetonitrile free radicals produced by EBI werestill relatively more in the degrading process, thus the phenomenon of a ZEN/Ace degradation ratelower than that in ZEN/Met at 6–16 kGy was not observed.
Moreover, different substrates can considerably affect the reaction. High-performance liquidchromatography (HPLC) chromatograms of ZEN and OTA degradation by a 3 kGy EBI dose inacetonitrile solution were compared with those in methanol (Figure 6). Within the retention time
109
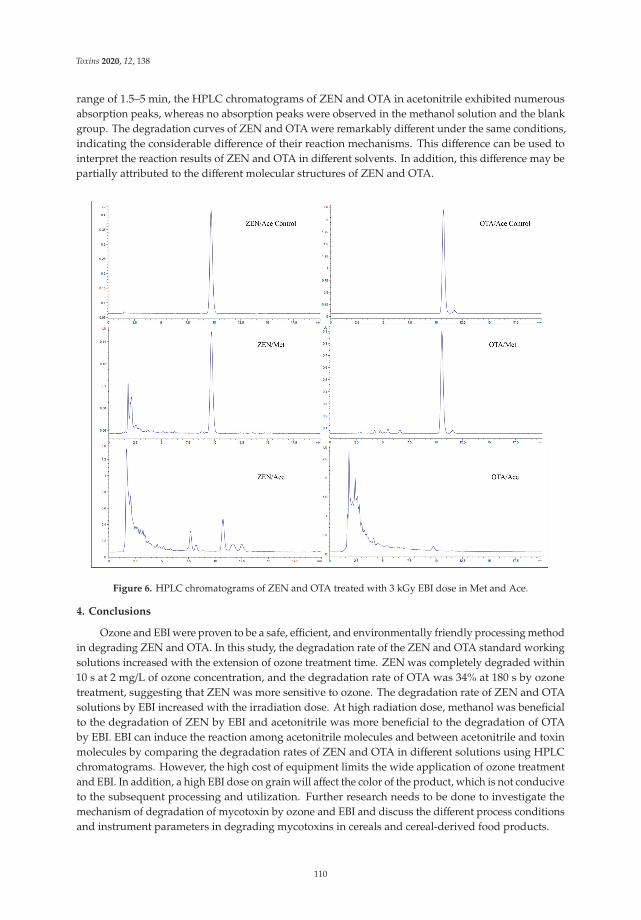
Toxins 2020, 12, 138
range of 1.5–5 min, the HPLC chromatograms of ZEN and OTA in acetonitrile exhibited numerousabsorption peaks, whereas no absorption peaks were observed in the methanol solution and the blankgroup. The degradation curves of ZEN and OTA were remarkably different under the same conditions,indicating the considerable difference of their reaction mechanisms. This difference can be used tointerpret the reaction results of ZEN and OTA in different solvents. In addition, this difference may bepartially attributed to the different molecular structures of ZEN and OTA.
Figure 6. HPLC chromatograms of ZEN and OTA treated with 3 kGy EBI dose in Met and Ace.
4. Conclusions
Ozone and EBI were proven to be a safe, efficient, and environmentally friendly processing methodin degrading ZEN and OTA. In this study, the degradation rate of the ZEN and OTA standard workingsolutions increased with the extension of ozone treatment time. ZEN was completely degraded within10 s at 2 mg/L of ozone concentration, and the degradation rate of OTA was 34% at 180 s by ozonetreatment, suggesting that ZEN was more sensitive to ozone. The degradation rate of ZEN and OTAsolutions by EBI increased with the irradiation dose. At high radiation dose, methanol was beneficialto the degradation of ZEN by EBI and acetonitrile was more beneficial to the degradation of OTAby EBI. EBI can induce the reaction among acetonitrile molecules and between acetonitrile and toxinmolecules by comparing the degradation rates of ZEN and OTA in different solutions using HPLCchromatograms. However, the high cost of equipment limits the wide application of ozone treatmentand EBI. In addition, a high EBI dose on grain will affect the color of the product, which is not conduciveto the subsequent processing and utilization. Further research needs to be done to investigate themechanism of degradation of mycotoxin by ozone and EBI and discuss the different process conditionsand instrument parameters in degrading mycotoxins in cereals and cereal-derived food products.
110
Toxins 2020, 12, 138
5. Materials and Methods
5.1. Materials and Instruments
5.1.1. Materials and Reagent
Standard ZEN and OTA products (purity ≥ 99.8%) and acetic acid (HPLC grade) were obtainedfrom J&K Scientific Ltd. (Shanghai, China). HPLC-grade methanol (Met) and acetonitrile (Ace) werepurchased from Fisher Scientific Company (Waltham, MA, USA). Milli-Q quality water (resistance≥ 18.2 MΩ/cm) was prepared by a Millipore-QSP ultrapure water instrument (Millipore, Bedford,MA, USA). Nitrogen (purity ≥ 99.8%) and oxygen (purity ≥ 99.8%) were obtained from Wuxi XinnanChemical Gas Co., Ltd., Wuxi, China. The other analytical pure reagents were purchased from ChinaPharmaceutical Chemical Reagent Co., Ltd., Shanghai, China.
5.1.2. Major Apparatus
HPLC (HPLC 1260) with a fluorescence detector and ZORBAX SB-C18 column was purchasedfrom Agilent Technologies (Palo Alto, CA, USA). The AB5.0 electron beam accelerator was obtainedfrom Wuxi EL PONT Radiation Technology Co., Ltd. (Wuxi, China) and the CFG-3-20 g-type ozonegenerator was purchased from Qingdao Guolin Industrial Co., Ltd. (Qingdao, China). An Ideal 2000Ozone concentration analysis recorder was obtained from Zibo ADEL Measurement Control Co., Ltd.(Zibo, China) and the MD200-1 pressure-blowing instrument was purchased from Hangzhou AllshengInstrument Co., Ltd. (Hangzhou, China).
5.2. Experimental Methods
5.2.1. Preparation of Standard Stock and Working Solutions of ZEN and OTA
ZEN was dissolved in a methanol solution, and OTA was dissolved in an acetonitrile solutionto prepare 100 and 10 μg/mL standard stock solutions, respectively. The solutions were stored at−20 ◦C. A certain amount of ZEN standard stock solution was collected and dried using nitrogen.Then, methanol and acetonitrile were added for secondary dissolution to prepare 1.0 μg/mL ZEN/Metand ZEN/Ace standard working solutions, respectively. The solutions were stored at 4 ◦C for EBI.A certain amount of ZEN standard stock solution and methanol was used to prepare 50 μg/mL ofstandard working solution and stored at 4 ◦C for subsequent ozone treatment. A certain amount ofOTA standard stock solution was obtained and dried by nitrogen. Then, methanol and acetonitrilewere added for secondary dissolution to prepare 1.0 μg/mL OTA/Met and OTA/Ace standard workingsolutions, respectively. The solutions were stored at 4 ◦C for EBI. A portion of OTA standard stocksolution and acetonitrile was used to prepare a 5 μg/mL working solution and stored at 4 ◦C forsubsequent ozone treatment.
5.2.2. Measurement of ZEN and OTA Contents
An Agilent 1260 HPLC with a G1321B fluorescence detector was employed. The chromatographiccolumn was a ZORBAX SB-C18 column (4.6 mm × 150 mm). The filling diameter and columntemperature were 5 μm and 35 ◦C, respectively. The injection volume was 20 μL. The flow phase ofZEN was methanol/water (60/40, v/v) with the flow rate set at 1.0 mL/min. The detection wavelengthwas 274 and 440 nm for the excitation and emission wavelengths, respectively. The flow phase of OTAwas water/acetonitrile/acetic acid (56/43/1, v/v/v), and the flow rate was 0.9 mL/min. The detectionwavelength consisted of 333 and 477 nm for the excitation and emission wavelengths, respectively.
5.2.3. Drawing of Standard ZEN and OTA Curves
Several ZEN and OTA standard stock solutions were selected. ZEN (i.e., 0.5, 1.0, 2.0, and 5.0μg/mL)and OTA standard working solutions (i.e., 0.1, 0.2, 0.5, and 1.0 μg/mL) were prepared by the flow phase.
111
Toxins 2020, 12, 138
The relation curves between the absorption peak area in the liquid chromatograph and concentrationof solutions were drawn and the standard curves of ZEN and OTA were drawn according to theserelation curves.
5.2.4. Degradation of ZEN and OTA by Ozone
Ozone was generated by a high-pressure discharger from an ozone generator connected with anexternal oxygen source. Ozone concentration was adjusted by controlling the current of the ozonegenerator, and changes in ozone concentration were monitored online by ozone concentration detectors.The excess ozone was eliminated by the decomposition of the ozone destroyer.
A total of 2 mL ZEN (50 μg/mL) and OTA (5 μg/mL) working solutions were dissolved in a piece of10 mL polyethylene centrifuge tube, which was supplied with ozone. The ozone treatment conditionsfor ZEN were as follows: concentration = 2.0 mg/L, flow rate = 1.0 L/min, and treatment time = 0, 1, 2,3, 5, and 10 s. The ozone treatment conditions for OTA were as follows: concentration = 50.0 mg/L,flow rate = 1.0 L/min, and treatment time = 0, 10, 30, 60, 90, 120, and 180 s. After the ozone treatment,nitrogen was supplied for 3 min, and then the reaction was terminated. Subsequently, 1 mL flow phasewas used for secondary dissolution.
5.2.5. Degradation of ZEN and OTA by EBIs
A total of 2 mL ZEN and 2 mL OTA working solutions were placed in a 5 mL polyethylenecentrifuge tube. Irradiation doses were 0, 2, 4, 6, 8, 10, 12, 14, and 16 kGy. The accelerated electronenergy was 5 MeV, and the electron beam current was 20 mA with a 1000 mm scan width. The doserate was 2 kGy/s. The samples were dried by nitrogen after irradiation, and a 1 mL flow phase wasused for secondary dissolution.
5.2.6. Data Processing
Sample processing and detection were repeated at least three times. One-way analysis of variancewas performed by the Statistical Package for the Social Sciences version 17.0. p < 0.05 was consideredto be statistically significant. p >0.05 was not statistically significant.
Author Contributions: Conceptualization, K.Y. and K.L.; Data curation, K.Y. and L.P.; Formal analysis, K.L.;Funding acquisition, K.Y.; Investigation, L.P. and X.L.; Methodology, K.Y. and L.P.; Project administration, X.L.;Resources, K.Y. and X.L.; Software, K.L., J.X., Y.Z. and Z.C.; Supervision, J.X. and L.W.; Validation, K.L. and J.W.;Visualization, L.W.; Writing—original draft, K.Y.; Writing—review & editing, K.Y., R.W. and Z.C. All authors haveread and agreed to the published version of the manuscript.
Funding: This research was financially supported by the National Key Research and Development Program ofChina (2017YFC1600904), the Jiangsu Agriculture Science and Technology Innovation Fund CX(17)1003, the ChinaAgriculture Research System (CARS-02-32), the Open Foundation of Beijing Advanced Innovation Center forFood Nutrition and Human Health (20182014), the National Natural Science Foundation of China (31771898),and the National Top Youth for Grain Industry (LQ2018302).
Conflicts of Interest: The authors declare no conflict of interest.
References
1. Abramson, D.; Richter, W.; Rintelen, J.; Sinha, R.N.; Schuster, M. Ochratoxin-A Production in BavarianCereal-Grains Stored at 15-Percent and 19-Percent Moisture-Content. Arch. Environ. Contam. Toxicol. 1992,23, 259–265. [CrossRef] [PubMed]
2. Bennett, J.W.; Klich, M. Mycotoxins. Clin. Microbiol. Rev. 2003, 16, 497–516. [CrossRef] [PubMed]3. Janati, S.S.F.; Beheshti, H.R.; Asadi, M.; Mihanparast, S.; Feizy, J. Preliminary Survey of Aflatoxins and
Ochratoxin A in Dried Fruits from Iran. Bull. Environ. Contam. Toxicol. 2012, 88, 391–395. [CrossRef][PubMed]
4. Hussein, H.S.; Brasel, J.M. Toxicity, metabolism, and impact of mycotoxins on humans and animals. Toxicology2001, 167, 101–134. [CrossRef]
112
Toxins 2020, 12, 138
5. World Health Organization; International Agency for Research on Cancer. Some Naturally Occurring Substances:Food Items and Constituents, Heterocyclic Aromatic Amines and Mycotoxins; World Health Organization: Geneva,Switzerland, 1993.
6. Castegnaro, M.; Canadas, D.; Vrabcheva, T.; Petkova-Bocharova, T.; Chernozemsky, I.N.; Pfohl-Leszkowicz, A.Balkan endemic nephropathy: Role of ochratoxins A through biomarkers. Mol. Nutr. Food Res. 2006, 50,519–529. [CrossRef] [PubMed]
7. Heller, M.; Rosner, H.; Burkert, B.; Moller, U.; Hinsching, A.; Rohrmann, B.; Thierbach, S.; Kohler, H. In vitrostudies into the influence of ochratoxin A on the production of tumor necrosis factor alpha by the humanmonocytic cell line THP-1. Dtsch. Tierarztl. Wochenschr. 2002, 109, 200–205.
8. Hoigné, J.; Bader, H.J.W.R. Rate constants of reactions of ozone with organic and inorganic compounds inwater—I: Non-dissociating organic compounds. Water Res. 1983, 17, 173–183. [CrossRef]
9. Kleiser, G.; Frimmel, F.H. Removal of precursors for disinfection by-products (DBPs)—Differences betweenozone- and OH-radical-induced oxidation. Sci. Total Environ. 2000, 256, 1–9. [CrossRef]
10. Staehelin, J.; Hoigne, J. Decomposition of ozone in water in the presence of organic solutes acting as promotersand inhibitors of radical chain reactions. Environ. Sci. Technol. 1985, 19, 1206–1213. [CrossRef]
11. Luo, X.; Wang, R.; Wang, L.; Li, Y.; Zheng, R.; Sun, X.; Wang, Y.; Chen, Z.; Tao, G. Analyses by UPLCQ-TOF MS of products of aflatoxin B-1 after ozone treatment. Food Addit. Contam. Part A 2014, 31, 105–110.[CrossRef]
12. Xu, Y.; Wang, Y.F.; Ji, J.; Wu, H.; Pi, F.W.; Zhang, Y.Z.; Sun, X.L. Chemical and toxicological alterations ofzearalenone under ozone treatment. Food Addit. Contam. Part A 2019, 36, 163–174. [CrossRef] [PubMed]
13. Inan, F.; Pala, M.; Doymaz, I. Use of ozone in detoxification of aflatoxin B-1 in red pepper. J. Stored Product.Res. 2007, 43, 425–429. [CrossRef]
14. Zorlugenc, B.; Zorlugenc, F.K.; Oztekin, S.; Evliya, I.B. The influence of gaseous ozone and ozonated wateron microbial flora and degradation of aflatoxin B-1 in dried figs. Food Chem. Toxicol. 2008, 46, 3593–3597.[CrossRef] [PubMed]
15. Manaila, E.; Stelescu, M.D.; Craciun, G.; Ighigeanu, D. Wood Sawdust/Natural Rubber EcocompositesCross-Linked by Electron Beam Irradiation. Materials 2016, 9, 503. [CrossRef] [PubMed]
16. Stelescu, M.; Manaila, E.; Craciun, G.; Ighigeanu, D. Electron beam processing ofethylene-propylene-terpolymer-based rubber mixtures. Int. Sch. Sci. Res. Innov. 2018, 12, 258–262.
17. Stepanik, T.; Kost, D.; Nowicki, T.; Gabay, D. Effects of electron beam irradiation on deoxynivalenol levels indistillers dried grain and solubles and in production intermediates. Food Addit. Contam. 2007, 24, 1001–1006.[CrossRef] [PubMed]
18. Wang, R.Q.; Liu, R.J.; Chang, M.; Jin, Q.Z.; Huang, J.H.; Liu, Y.F.; Wang, X.G. Ultra-performance LiquidChromatography Quadrupole Time-of-Flight MS for Identification of Electron Beam from AcceleratorDegradation Products of Aflatoxin B-1. Appl. Biochem. Biotechnol. 2015, 175, 1548–1556. [CrossRef]
19. Getoff, N. Radiation-induced degradation of water pollutants—State of the art. Radiat. Phys. Chem. 1996, 47,581–593. [CrossRef]
20. Qi, L.J.; Li, Y.L.; Luo, X.H.; Wang, R.; Zheng, R.H.; Wang, L.; Li, Y.F.; Yang, D.; Fang, W.M.; Chen, Z.X.Detoxification of zearalenone and ochratoxin A by ozone and quality evaluation of ozonised corn. Food Addit.Contam. Part A 2016, 33, 1700–1710. [CrossRef]
21. Wang, L.; Luo, Y.P.; Luo, X.H.; Wang, R.; Li, Y.F.; Li, Y.N.; Shao, H.L.; Chen, Z.X. Effect of deoxynivalenoldetoxification by ozone treatment in wheat grains. Food Control 2016, 66, 137–144. [CrossRef]
22. Luo, X.H.; Qi, L.J.; Liu, Y.T.; Wang, R.; Yang, D.; Li, K.; Wang, L.; Li, Y.N.; Zhang, Y.W.; Chen, Z.X. Effects ofElectron Beam Irradiation on Zearalenone and Ochratoxin A in Naturally Contaminated Corn and CornQuality Parameters. Toxins 2017, 9, 84. [CrossRef] [PubMed]
23. Liu, R.; Wang, R.; Lu, J.; Chang, M.; Jin, Q.; Du, Z.; Wang, S.; Li, Q.; Wang, X. Degradation of AFB(1) inaqueous medium by electron beam irradiation: Kinetics, pathway and toxicology. Food Control 2016, 66,151–157. [CrossRef]
24. Peng, C.H.; Ding, Y.; An, F.P.; Wang, L.; Li, S.Y.; Nie, Y.; Zhou, L.Y.; Li, Y.R.; Wang, C.G.; Li, S.R. Degradationof ochratoxin A in aqueous solutions by electron beam irradiation. J. Radioanal. Nucl. Chem. 2015, 306, 39–46.[CrossRef]
25. Guo, Z.B.; Zhou, F.; Zhao, Y.F.; Zhang, C.Z.; Liu, F.L.; Bao, C.X.; Lin, M.Y. Gamma irradiation-inducedsulfadiazine degradation and its removal mechanisms. Chem. Eng. J. 2012, 191, 256–262. [CrossRef]
113

Toxins 2020, 12, 138
26. Kameneva, S.V.; Volosatova, A.D.; Feldman, V.I. Radiation-induced transformations of isolated CH3CNmolecules in noble gas matrices. Radiat. Phys. Chem. 2017, 141, 363–368. [CrossRef]
27. Schmelling, D.; Poster, D.; Chaychian, M.; Neta, P.; McLaughlin, W.; Silverman, J.; Al-Sheikhly, M. Applicationsof ionizing radiation to the remediation of materials contaminated with heavy metals and polychlorinatedbiphenyls. Radiat. Phys. Chem. 1998, 52, 371–377. [CrossRef]
© 2020 by the authors. Licensee MDPI, Basel, Switzerland. This article is an open accessarticle distributed under the terms and conditions of the Creative Commons Attribution(CC BY) license (http://creativecommons.org/licenses/by/4.0/).
114
toxins
Article
Acetamiprid Affects Destruxins Production but ItsAccumulation in Metarhizium sp. Spores IncreasesInfection Ability of Fungi
Monika Nowak 1, Przemysław Bernat 1, Julia Mrozinska 2 and Sylwia Rózalska 1,*
1 Department of Industrial Microbiology and Biotechnology, Faculty of Biology and Environmental Protection,University of Łódz, 90–237 Łódz, Poland; [email protected] (M.N.);[email protected] (P.B.)
2 Scientific Students Group “SKN Bio-Mik”, Faculty of Biology and Environmental Protection, University ofŁódz, 90–237 Łódz, Poland; [email protected]
* Correspondence: [email protected]
Received: 10 August 2020; Accepted: 5 September 2020; Published: 11 September 2020
Abstract: Metarhizium sp. are entomopathogenic fungi that inhabit the soil environment. Together,they act as natural pest control factors. In the natural environment, they come into contact withvarious anthropogenic pollutants, and sometimes, they are used together and interchangeably withchemical insecticides (e.g., neonicotinoids) for pest control. In most cases, the compatibility ofentomopathogens with insecticides has been determined; however, the influence of these compoundson the metabolism of entomopathogenic fungi has not yet been studied. Secondary metabolites arevery important factors that influence the fitness of the producers, playing important roles in theability of these pathogens to successfully parasitize insects. In this study, for the first time, we focuson whether the insecticide present in the fungal growth environment affects secondary metabolism infungi. The research revealed that acetamiprid at concentrations from 5 to 50 mg L−1 did not inhibitthe growth of all tested Metarhizium sp.; however, it reduced the level of 19 produced destruxins indirect proportion to the dosage used. Furthermore, it was shown that acetamiprid accumulates notonly in plant or animal tissues, but also in fungal cells. Despite the negative impact of acetamiprid onsecondary metabolism, it was proofed to accumulate in Metarhizium spores, which appeared to havea stronger infectious potential against mealworm Tenebrio molitor, in comparison to the insecticide orthe biological agent alone.
Keywords: entomopathogens; mycoinsecticides; secondary metabolites; insect pathogenesis;acetamiprid accumulation
Key Contribution: Acetamiprid represses destruxins production by Metarhizium sp.; Spores ofM. brunneum with accumulated acetamiprid have increased infectivity against T. molitor.
1. Introduction
Synthetic insecticides are important pesticides for both agricultural and domestic pest control.Among them, neonicotinoids (e.g., acetamiprid, imidacloprid, thiacloprid) are the most extensively usedworldwide because of their high effectiveness in controlling crop and domestic pests [1]. They accountfor more than 25% of the global insecticide market and are now being considered as a replacement formany existing conventional insecticide classes [2]. Neonicotinoids’ popularity is largely due to theirphysicochemical properties, high effectiveness, low resistance, and the fact that they are less harmfulto mammals compared to other insecticides. For example, to protect fruit plants against pests, up to3 g per 100 m2 of a popular pest control product (e.g., Mospilan 20 SP) is used with acetamiprid as the
Toxins 2020, 12, 587; doi:10.3390/toxins12090587 www.mdpi.com/journal/toxins115
Toxins 2020, 12, 587
active substance are used and, as a consequence, acetamiprid penetrates the soil and bioaccumulates.According to data from the European Food Safety Authority (EFSA), 14C-acetamiprid was identified asthe major constituent of the radioactive residues in all plant parts (the study included eggplants, apples,carrots and cabbage) in an amount of 30–90% within 14–90 days after the last application [3]. The abilityof neonicotinoids to accumulate in plants is known to increase the probability of environmentalcontamination and exposure to nontarget organisms [3–5]. In addition, despite the lack of recognitionof acetamiprid as a compound persisting in soil, its degradation in environmental conditions has beenfound to last up to 43 days [3].
Among all methods of insect control, biological methods deserve special attention. Metarhizium sp.,the common insect pathogens in wildlife, are very efficient bioinsecticides usually applied in practice [6].Their effectiveness against insects depends mainly on their infective potential, i.e., the ability to produceextracellular lytic enzymes and secondary metabolites [7,8]. While the extracellular enzymes are wellstudied, equally important secondary metabolites, which play critical roles in the ability of Metarhiziumto successfully parasitize their hosts and ultimately contribute to the success or failure of these fungi asbiological control agents, are quite often neglected [9]. Entomopathogenic fungi produce a variety ofbioactive metabolites including >40 cyclic hexadepsipeptides destruxins (dtxs) [8]. It is suggested thatin attacked insects, dtxs induce paralysis and muscle contraction via muscle depolarization by thedirect opening of Ca2+ channels in the membrane [10,11]. Besides their insecticidal activity, dtxs havealso potential as pharmaceuticals showing antiviral, antitumor, cytotoxic, immunosuppressant orantiproliferative effects [12,13]. However, due to the endophytic properties of Metarhizium sp.,the presence of dtxs can be found in, e.g., potatoes [14], maize and strawberries [15], causing dtxs toenter the food chain and pose a threat to human health.
The aim of this work was to determine the influence of acetamiprid on the growth and thesecondary metabolism of Metarhizium, which is considered as a significant factor during the pestinfection process. Furthermore, we checked whether acetamiprid could be accumulated by Metarhizium,how it affected the production of dtxs, and whether it affected the ability of fungi to infect insects.This study could help to understand the potential risks of a harmful influence of acetamiprid onsoil-inhabiting fungi and their infectious potential, which plays an important role in maintaining theecological balance.
2. Results
2.1. Fungal Biomass Yield of Metarhizium sp. in the Presence of Acetamiprid
Among the tested strains, M. anisopliae and M. robertsii IM2358 were the best growing species,while M. brunneum and M. robertsii ARSEF727 grew at a similar medium rate (biomass yield about6 g L−1). The slowest growing species was M. globosum. It turned out that acetamiprid did not inhibitgrowth in any of the tested strains, even at the highest concentration of 50 mg L−1 (p > 0.05) (Figure 1).Literature data also provides information that acetamiprid has no harmful effect on conidia germinationand production or vegetative growth in M. anisopliae—strain E9 (ESALQ/USP) [16]. The lack of toxiceffect was also confirmed in the presented study.
2.2. Quantitative Analyses of the Content of Acetamiprid in Metarhizium Fungal Cultures
In this study, the fungal ability to eliminate acetamiprid added to cultures at concentrations of5, 25 and 50 mg L−1 was verified (Figure S1). None of the tested Metarhizium sp. showed the highlyeffective ability to remove acetamiprid from the Czapek Dox culture medium after seven days ofincubation. At the concentration of 5 mg L−1, a slight elimination capacity was demonstrated for M.brunneum and M. robertsii IM6519 (the average removal rate reached 29 and 24%, respectively). In asituation where five times more acetamiprid was added to the fungal culture, a loss was observed inthe samples of all tested strains. M. anisopliae, M. globosum and M. brunneum removed respectively 31,25 and 24% of acetamiprid from the culture medium. In the case of the other species, the substrate
116
Toxins 2020, 12, 587
elimination was below 20%. In the fungal cultures, where the insecticide concentration was 50 mg L−1
there was no loss of more than 20% of the insecticide for any species. However, studies of the contentof acetamiprid separately in the mycelium and culture medium showed that it was accumulated in thefungal cells.
Figure 1. Influence of acetamiprid at concentrations of 5, 25 and 50 mg L−1 on fungal biomass yield ofMetarhizium sp. One-way ANOVA was used for investigations of statistical significance. All differencesare statistically insignificant (p > 0.05).
This insecticide has proved the ability to accumulate, inter alia, in the tissues of plants where,through translocation, it can even move from the roots to the shoots [17,18]. It was found that dueto its good solubility in water, acetamiprid has a strong toxic effect on aquatic organisms whereit bioaccumulates by sorption mechanisms characteristic for compounds with high polarity [19,20].Although acetamiprid accumulation ability has been described for several different species, in this paper,we present for the first time that entomopathogens, which are often used interchangeably or alternativelywith various insecticides in agriculture, can also accumulate this compound, without metabolizingit inside the cells (during seven days of incubation). Herein, the amount of acetamiprid on themycelium dry weight (mg g−1) was directly proportional to the increasing concentration (p < 0.05)(Figure 2). This trend was similar for each tested species while M. brunneum exhibited the highestaccumulation potential. The rest of the strains showed statistically significant differences in theamounts of acetamiprid accumulated in the cells at the three concentrations used. At the concentrationof 25 mg L−1 in M. anisopliae the highest amount of the accumulated insecticide (0.69 mg per g ofdry weight) was observed (p < 0.05), but it is worth noting that this species had been previouslyfound to have high biomass yield (Figure 1). M. robertsii IM6519, M. robertsii IM2358 and M. globosumaccumulated in the cells’ comparable amounts of acetamiprid (approximately 0.36–0.45 mg per gof dry weight, p > 0.05). By comparison, 0.12 mg per g of dry weight was found in M. brunneum(p < 0.05). The situation changed for the acetamiprid concentration of 50 mg L−1 in the fungal cultureand the amount of the toxic substrate accumulated in the mycelium leveled out (Figure 2). The largestquantity was detected for M. globosum (1.05 mg per g of dry weight), which was different from the other
117
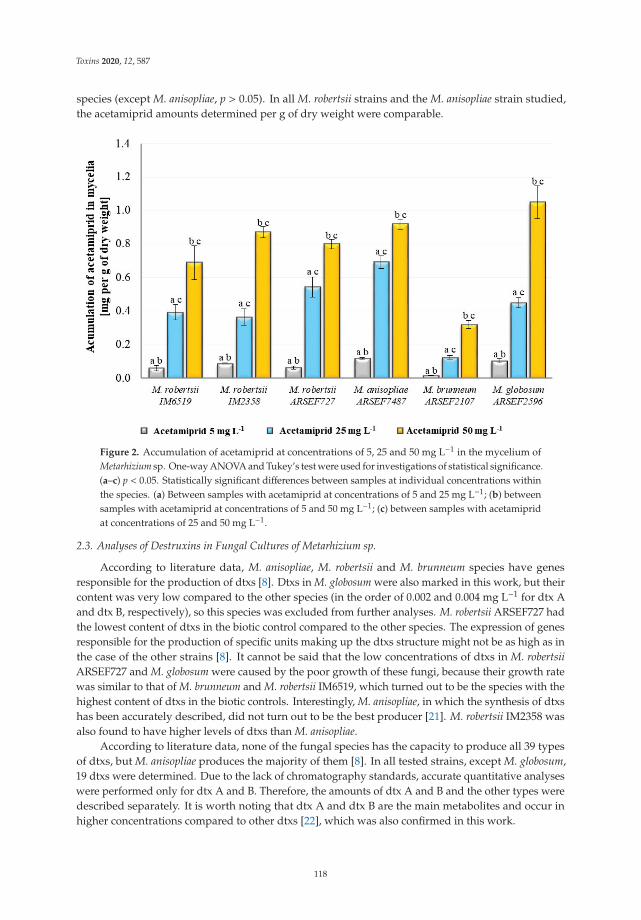
Toxins 2020, 12, 587
species (except M. anisopliae, p > 0.05). In all M. robertsii strains and the M. anisopliae strain studied,the acetamiprid amounts determined per g of dry weight were comparable.
Figure 2. Accumulation of acetamiprid at concentrations of 5, 25 and 50 mg L−1 in the mycelium ofMetarhizium sp. One-way ANOVA and Tukey’s test were used for investigations of statistical significance.(a–c) p < 0.05. Statistically significant differences between samples at individual concentrations withinthe species. (a) Between samples with acetamiprid at concentrations of 5 and 25 mg L−1; (b) betweensamples with acetamiprid at concentrations of 5 and 50 mg L−1; (c) between samples with acetamipridat concentrations of 25 and 50 mg L−1.
2.3. Analyses of Destruxins in Fungal Cultures of Metarhizium sp.
According to literature data, M. anisopliae, M. robertsii and M. brunneum species have genesresponsible for the production of dtxs [8]. Dtxs in M. globosum were also marked in this work, but theircontent was very low compared to the other species (in the order of 0.002 and 0.004 mg L−1 for dtx Aand dtx B, respectively), so this species was excluded from further analyses. M. robertsii ARSEF727 hadthe lowest content of dtxs in the biotic control compared to the other species. The expression of genesresponsible for the production of specific units making up the dtxs structure might not be as high as inthe case of the other strains [8]. It cannot be said that the low concentrations of dtxs in M. robertsiiARSEF727 and M. globosum were caused by the poor growth of these fungi, because their growth ratewas similar to that of M. brunneum and M. robertsii IM6519, which turned out to be the species with thehighest content of dtxs in the biotic controls. Interestingly, M. anisopliae, in which the synthesis of dtxshas been accurately described, did not turn out to be the best producer [21]. M. robertsii IM2358 wasalso found to have higher levels of dtxs than M. anisopliae.
According to literature data, none of the fungal species has the capacity to produce all 39 typesof dtxs, but M. anisopliae produces the majority of them [8]. In all tested strains, except M. globosum,19 dtxs were determined. Due to the lack of chromatography standards, accurate quantitative analyseswere performed only for dtx A and B. Therefore, the amounts of dtx A and B and the other types weredescribed separately. It is worth noting that dtx A and dtx B are the main metabolites and occur inhigher concentrations compared to other dtxs [22], which was also confirmed in this work.
118
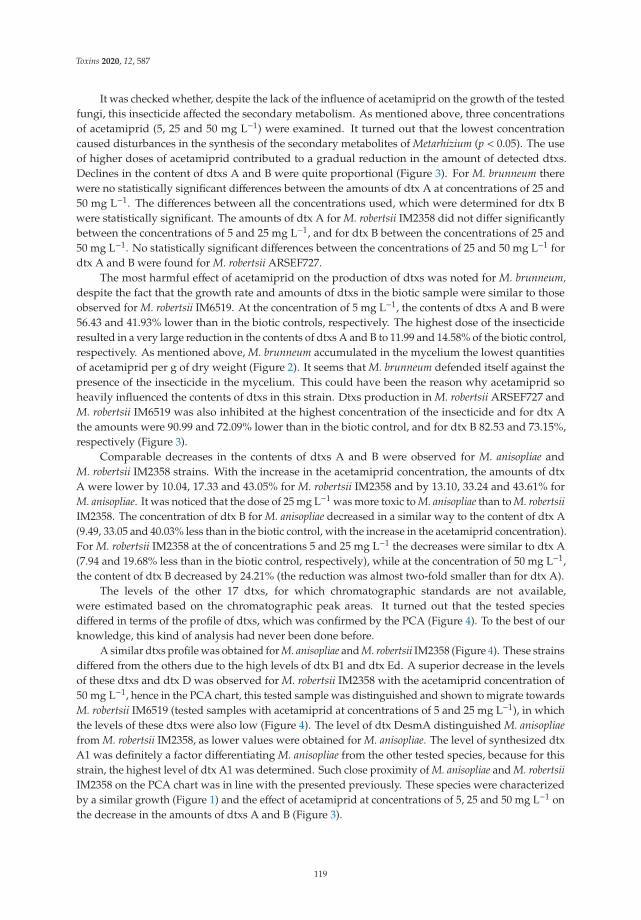
Toxins 2020, 12, 587
It was checked whether, despite the lack of the influence of acetamiprid on the growth of the testedfungi, this insecticide affected the secondary metabolism. As mentioned above, three concentrationsof acetamiprid (5, 25 and 50 mg L−1) were examined. It turned out that the lowest concentrationcaused disturbances in the synthesis of the secondary metabolites of Metarhizium (p < 0.05). The useof higher doses of acetamiprid contributed to a gradual reduction in the amount of detected dtxs.Declines in the content of dtxs A and B were quite proportional (Figure 3). For M. brunneum therewere no statistically significant differences between the amounts of dtx A at concentrations of 25 and50 mg L−1. The differences between all the concentrations used, which were determined for dtx Bwere statistically significant. The amounts of dtx A for M. robertsii IM2358 did not differ significantlybetween the concentrations of 5 and 25 mg L−1, and for dtx B between the concentrations of 25 and50 mg L−1. No statistically significant differences between the concentrations of 25 and 50 mg L−1 fordtx A and B were found for M. robertsii ARSEF727.
The most harmful effect of acetamiprid on the production of dtxs was noted for M. brunneum,despite the fact that the growth rate and amounts of dtxs in the biotic sample were similar to thoseobserved for M. robertsii IM6519. At the concentration of 5 mg L−1, the contents of dtxs A and B were56.43 and 41.93% lower than in the biotic controls, respectively. The highest dose of the insecticideresulted in a very large reduction in the contents of dtxs A and B to 11.99 and 14.58% of the biotic control,respectively. As mentioned above, M. brunneum accumulated in the mycelium the lowest quantitiesof acetamiprid per g of dry weight (Figure 2). It seems that M. brunneum defended itself against thepresence of the insecticide in the mycelium. This could have been the reason why acetamiprid soheavily influenced the contents of dtxs in this strain. Dtxs production in M. robertsii ARSEF727 andM. robertsii IM6519 was also inhibited at the highest concentration of the insecticide and for dtx Athe amounts were 90.99 and 72.09% lower than in the biotic control, and for dtx B 82.53 and 73.15%,respectively (Figure 3).
Comparable decreases in the contents of dtxs A and B were observed for M. anisopliae andM. robertsii IM2358 strains. With the increase in the acetamiprid concentration, the amounts of dtxA were lower by 10.04, 17.33 and 43.05% for M. robertsii IM2358 and by 13.10, 33.24 and 43.61% forM. anisopliae. It was noticed that the dose of 25 mg L−1 was more toxic to M. anisopliae than to M. robertsiiIM2358. The concentration of dtx B for M. anisopliae decreased in a similar way to the content of dtx A(9.49, 33.05 and 40.03% less than in the biotic control, with the increase in the acetamiprid concentration).For M. robertsii IM2358 at the of concentrations 5 and 25 mg L−1 the decreases were similar to dtx A(7.94 and 19.68% less than in the biotic control, respectively), while at the concentration of 50 mg L−1,the content of dtx B decreased by 24.21% (the reduction was almost two-fold smaller than for dtx A).
The levels of the other 17 dtxs, for which chromatographic standards are not available,were estimated based on the chromatographic peak areas. It turned out that the tested speciesdiffered in terms of the profile of dtxs, which was confirmed by the PCA (Figure 4). To the best of ourknowledge, this kind of analysis had never been done before.
A similar dtxs profile was obtained for M. anisopliae and M. robertsii IM2358 (Figure 4). These strainsdiffered from the others due to the high levels of dtx B1 and dtx Ed. A superior decrease in the levelsof these dtxs and dtx D was observed for M. robertsii IM2358 with the acetamiprid concentration of50 mg L−1, hence in the PCA chart, this tested sample was distinguished and shown to migrate towardsM. robertsii IM6519 (tested samples with acetamiprid at concentrations of 5 and 25 mg L−1), in whichthe levels of these dtxs were also low (Figure 4). The level of dtx DesmA distinguished M. anisopliaefrom M. robertsii IM2358, as lower values were obtained for M. anisopliae. The level of synthesized dtxA1 was definitely a factor differentiating M. anisopliae from the other tested species, because for thisstrain, the highest level of dtx A1 was determined. Such close proximity of M. anisopliae and M. robertsiiIM2358 on the PCA chart was in line with the presented previously. These species were characterizedby a similar growth (Figure 1) and the effect of acetamiprid at concentrations of 5, 25 and 50 mg L−1 onthe decrease in the amounts of dtxs A and B (Figure 3).
119
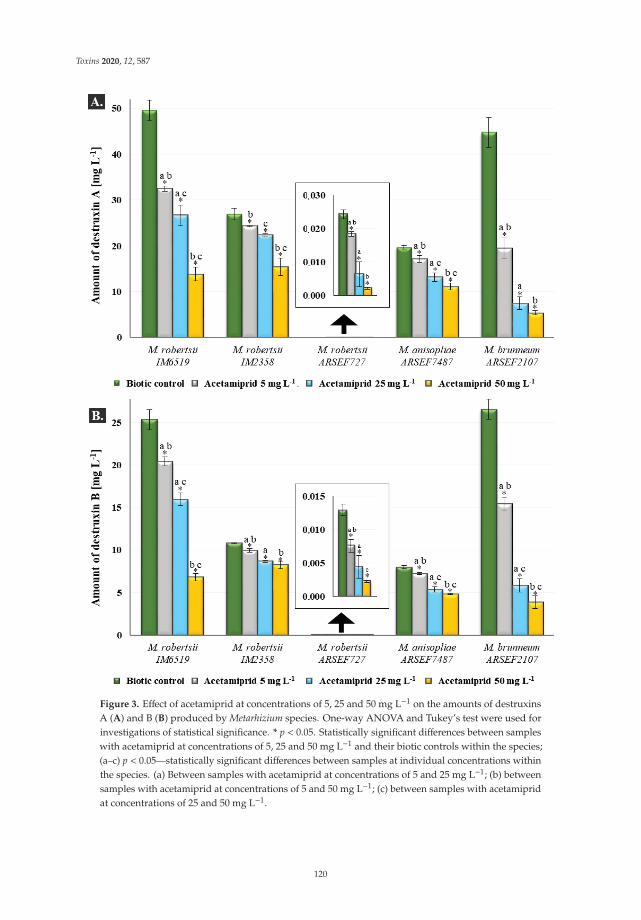
Toxins 2020, 12, 587
Figure 3. Effect of acetamiprid at concentrations of 5, 25 and 50 mg L−1 on the amounts of destruxinsA (A) and B (B) produced by Metarhizium species. One-way ANOVA and Tukey’s test were used forinvestigations of statistical significance. * p < 0.05. Statistically significant differences between sampleswith acetamiprid at concentrations of 5, 25 and 50 mg L−1 and their biotic controls within the species;(a–c) p < 0.05—statistically significant differences between samples at individual concentrations withinthe species. (a) Between samples with acetamiprid at concentrations of 5 and 25 mg L−1; (b) betweensamples with acetamiprid at concentrations of 5 and 50 mg L−1; (c) between samples with acetamipridat concentrations of 25 and 50 mg L−1.
120
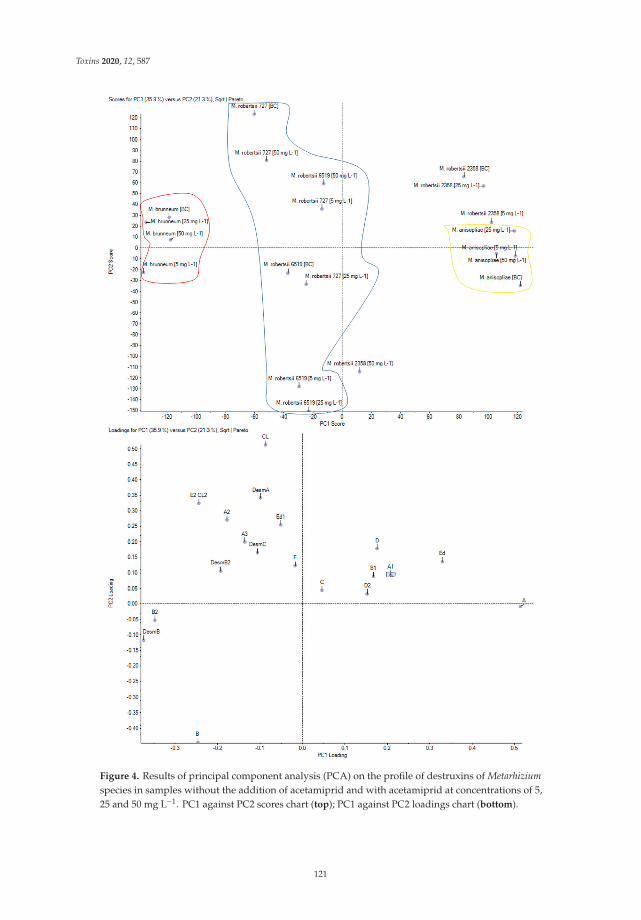
Toxins 2020, 12, 587
Figure 4. Results of principal component analysis (PCA) on the profile of destruxins of Metarhiziumspecies in samples without the addition of acetamiprid and with acetamiprid at concentrations of 5,25 and 50 mg L−1. PC1 against PC2 scores chart (top); PC1 against PC2 loadings chart (bottom).
121
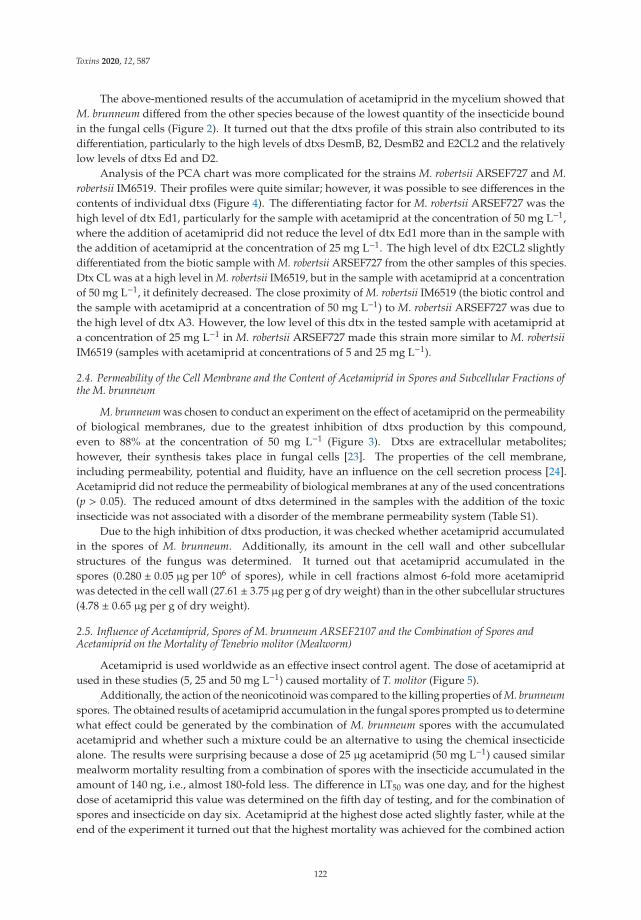
Toxins 2020, 12, 587
The above-mentioned results of the accumulation of acetamiprid in the mycelium showed thatM. brunneum differed from the other species because of the lowest quantity of the insecticide boundin the fungal cells (Figure 2). It turned out that the dtxs profile of this strain also contributed to itsdifferentiation, particularly to the high levels of dtxs DesmB, B2, DesmB2 and E2CL2 and the relativelylow levels of dtxs Ed and D2.
Analysis of the PCA chart was more complicated for the strains M. robertsii ARSEF727 and M.robertsii IM6519. Their profiles were quite similar; however, it was possible to see differences in thecontents of individual dtxs (Figure 4). The differentiating factor for M. robertsii ARSEF727 was thehigh level of dtx Ed1, particularly for the sample with acetamiprid at the concentration of 50 mg L−1,where the addition of acetamiprid did not reduce the level of dtx Ed1 more than in the sample withthe addition of acetamiprid at the concentration of 25 mg L−1. The high level of dtx E2CL2 slightlydifferentiated from the biotic sample with M. robertsii ARSEF727 from the other samples of this species.Dtx CL was at a high level in M. robertsii IM6519, but in the sample with acetamiprid at a concentrationof 50 mg L−1, it definitely decreased. The close proximity of M. robertsii IM6519 (the biotic control andthe sample with acetamiprid at a concentration of 50 mg L−1) to M. robertsii ARSEF727 was due tothe high level of dtx A3. However, the low level of this dtx in the tested sample with acetamiprid ata concentration of 25 mg L−1 in M. robertsii ARSEF727 made this strain more similar to M. robertsiiIM6519 (samples with acetamiprid at concentrations of 5 and 25 mg L−1).
2.4. Permeability of the Cell Membrane and the Content of Acetamiprid in Spores and Subcellular Fractions ofthe M. brunneum
M. brunneum was chosen to conduct an experiment on the effect of acetamiprid on the permeabilityof biological membranes, due to the greatest inhibition of dtxs production by this compound,even to 88% at the concentration of 50 mg L−1 (Figure 3). Dtxs are extracellular metabolites;however, their synthesis takes place in fungal cells [23]. The properties of the cell membrane,including permeability, potential and fluidity, have an influence on the cell secretion process [24].Acetamiprid did not reduce the permeability of biological membranes at any of the used concentrations(p > 0.05). The reduced amount of dtxs determined in the samples with the addition of the toxicinsecticide was not associated with a disorder of the membrane permeability system (Table S1).
Due to the high inhibition of dtxs production, it was checked whether acetamiprid accumulatedin the spores of M. brunneum. Additionally, its amount in the cell wall and other subcellularstructures of the fungus was determined. It turned out that acetamiprid accumulated in thespores (0.280 ± 0.05 μg per 106 of spores), while in cell fractions almost 6-fold more acetamipridwas detected in the cell wall (27.61 ± 3.75 μg per g of dry weight) than in the other subcellular structures(4.78 ± 0.65 μg per g of dry weight).
2.5. Influence of Acetamiprid, Spores of M. brunneum ARSEF2107 and the Combination of Spores andAcetamiprid on the Mortality of Tenebrio molitor (Mealworm)
Acetamiprid is used worldwide as an effective insect control agent. The dose of acetamiprid atused in these studies (5, 25 and 50 mg L−1) caused mortality of T. molitor (Figure 5).
Additionally, the action of the neonicotinoid was compared to the killing properties of M. brunneumspores. The obtained results of acetamiprid accumulation in the fungal spores prompted us to determinewhat effect could be generated by the combination of M. brunneum spores with the accumulatedacetamiprid and whether such a mixture could be an alternative to using the chemical insecticidealone. The results were surprising because a dose of 25 μg acetamiprid (50 mg L−1) caused similarmealworm mortality resulting from a combination of spores with the insecticide accumulated in theamount of 140 ng, i.e., almost 180-fold less. The difference in LT50 was one day, and for the highestdose of acetamiprid this value was determined on the fifth day of testing, and for the combination ofspores and insecticide on day six. Acetamiprid at the highest dose acted slightly faster, while at theend of the experiment it turned out that the highest mortality was achieved for the combined action
122
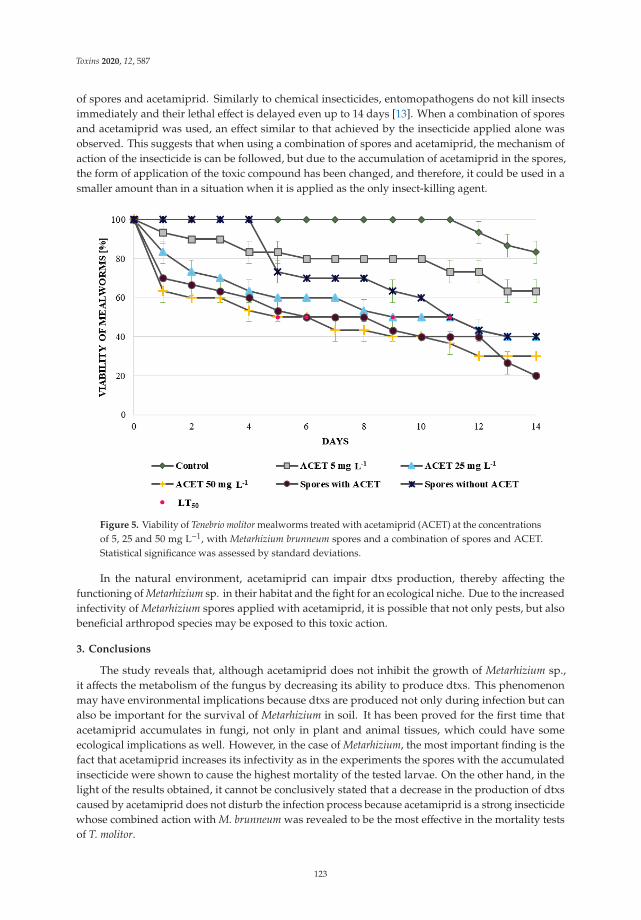
Toxins 2020, 12, 587
of spores and acetamiprid. Similarly to chemical insecticides, entomopathogens do not kill insectsimmediately and their lethal effect is delayed even up to 14 days [13]. When a combination of sporesand acetamiprid was used, an effect similar to that achieved by the insecticide applied alone wasobserved. This suggests that when using a combination of spores and acetamiprid, the mechanism ofaction of the insecticide is can be followed, but due to the accumulation of acetamiprid in the spores,the form of application of the toxic compound has been changed, and therefore, it could be used in asmaller amount than in a situation when it is applied as the only insect-killing agent.
Figure 5. Viability of Tenebrio molitor mealworms treated with acetamiprid (ACET) at the concentrationsof 5, 25 and 50 mg L−1, with Metarhizium brunneum spores and a combination of spores and ACET.Statistical significance was assessed by standard deviations.
In the natural environment, acetamiprid can impair dtxs production, thereby affecting thefunctioning of Metarhizium sp. in their habitat and the fight for an ecological niche. Due to the increasedinfectivity of Metarhizium spores applied with acetamiprid, it is possible that not only pests, but alsobeneficial arthropod species may be exposed to this toxic action.
3. Conclusions
The study reveals that, although acetamiprid does not inhibit the growth of Metarhizium sp.,it affects the metabolism of the fungus by decreasing its ability to produce dtxs. This phenomenonmay have environmental implications because dtxs are produced not only during infection but canalso be important for the survival of Metarhizium in soil. It has been proved for the first time thatacetamiprid accumulates in fungi, not only in plant and animal tissues, which could have someecological implications as well. However, in the case of Metarhizium, the most important finding is thefact that acetamiprid increases its infectivity as in the experiments the spores with the accumulatedinsecticide were shown to cause the highest mortality of the tested larvae. On the other hand, in thelight of the results obtained, it cannot be conclusively stated that a decrease in the production of dtxscaused by acetamiprid does not disturb the infection process because acetamiprid is a strong insecticidewhose combined action with M. brunneum was revealed to be the most effective in the mortality testsof T. molitor.
123
Toxins 2020, 12, 587
4. Materials and Methods
4.1. Chemicals and Reagents
All reagents and solvents were of analytical or liquid chromatography-mass spectrometry(LC–MS) grade and were purchased from Sigma-Aldrich (Steinheim, Germany) unless otherwise stated.Destruxin A (dtx A) from M. anisopliae and destruxin B (dtx B; Cayman Chemical, Ann Arbor, MI, USA)were used as chromatography standards. LC–MS grade water (Merck, Darmstadt, Germany) wasused for chromatography. Fungi were cultivated on Czapek Dox broth (BD-Difco, Le Pont-de-Claix,France). Acetamiprid (99% purity) was added to the fungal cultures and was also used as achromatography standard.
4.2. Microorganisms and Cultivation Conditions
Six fungal strains of the genus Metarhizium (M. robertsii IM6519, M. robertsii IM2358, M. robertsiiARSEF727, M. anisopliae ARSEF7487, M. brunneum ARSEF2107, M. globosum ARSEF2596) from thestrains collection of the ARSEF (The Agricultural Research Service Collection of EntomopathogenicFungal Cultures) and the Department of Industrial Microbiology and Biotechnology, Universityof Lodz (Poland), were used during the investigations. All strains were maintained on ZT agarslants(glucose (4 g L−1); Difco yeast extract (4 g L−1); agar (25 g L−1); and malt extract (6 ◦Blg), up to1 L; pH 7.0) as described previously [25–27]. Cultures for tests with Metarhizium spore suspensionadjusted to 1 × 10⁶ spores mL−1 were prepared on Czapek Dox liquid medium (total volume 40 mLin 100 mL Erlenmeyer flasks; BD-Difco, Le Pont-de-Claix, France). Acetamiprid stock dissolved inacetonitrile at the concentration of 50 mg mL−1 was added to fungal cultures to a final concentrationof 5, 25 and 50 mg L−1. Additionally, abiotic controls (without fungal biomass) and biotic controls(without acetamiprid) were prepared. All samples were incubated on a rotary shaker (120 rpm) at28 ◦C for 7 days.
4.3. Destruxins Extraction by a Modified QuEChERS Method
After the incubation, the fungal cultures were filtrated through Whatman filter paper Number 1(Sigma-Aldrich, Steinheim, Germany) to separate the culture media from the mycelia. The mycelia(for biomass estimation) were harvested and dried at 105 ◦C until a constant weight was obtained.The culture media were centrifuged for 5 min at 10,000 rpm, and subsequently, 20 mL was transferredto each 50 mL Falcon tube with 10 mL acetonitrile. After vigorous vortexing for 1 min, 3000 rpm,QuEChERS salts (4 g MgSO4; 1 g NaCl; 1 g C6H5 Na3O7·2H2O; 0.5 g C6H6Na2O7·1.5 H2O) were addedand the tubes were again vortexed for 1 min. Afterwards, the tubes were centrifuged for 5 min at8000 rpm. Eight milliliters of the upper layer was transferred to each 15 mL Falcon tube and evaporatedto dryness under reduced pressure at 40 ◦C. After evaporation, the samples were dissolved in 5 mLLC–MS grade water (Merck, Darmstadt, Germany) and 4 mL of the extracts were cleaned on the SolidPhase Extraction Column with octadecyl sorbent C18. Subsequently, 5 mL of acetonitrile was added torinse the metabolites bound on the sorbent, and next, 4 mL of the extract was transferred to each 15 mLFalcon tube and again evaporated to dryness as described above. After evaporation, the samples weredissolved in 2.5 mL of LC–MS grade water and 1 mL was subjected to LC–MS/MS.
4.4. Acetamiprid Extraction by a Modified QuEChERS Method
The mycelia were separated from Czapek Dox medium by filtration through Whatman filterpaper Number 1 (Sigma-Aldrich, Steinheim, Germany). Then, 20 mL of deionized water and 10 mLof acetonitrile were added to each mycelium sample and ultrasonic extraction was done (2 min,Am 36%, pulse for 10 s). Then, 10 mL of acetonitrile was added to the culture medium in the volume20 mL, and ultrasonic extraction was performed as mentioned above. The subsequent procedure wasthe same for both types of samples. The samples were transferred to each 50 mL Falcon tube andextracted with a Ball Mill (Retch MM400, Idar-Oberstein, Germany) for 5 min and at 25/s frequency.
124
Toxins 2020, 12, 587
After homogenization, QuEChERS salts were added and the tubes were vortexed 3000 rpm for 1 min.Subsequently, the extracts were centrifuged for 5 min at 5000 rpm. Then, 1 mL of the top layer wascollected for the LC–MS/MS analysis.
4.5. Acetamiprid Extraction from M. brunneum Spores and Subcellular Fractions
To determine the acetamiprid concentration in spores, 7-day-old fungal cultures were filteredthrough the nylon net. The filtrates were centrifuged for 10 min at 10,000 rpm, and after supernatantremoval, 20 mL of deionized water was added to the spores’ pellet. The number of spores were countedin the Thoma cell counting chamber. Then, 10 mL of acetonitrile was added and the QuEChERSprocedure was done as described above.
For acetamiprid presence in cell fractions, fungal cultures were centrifuged (10 min at 10,000 rpm),and after supernatant removal, the precipitate was washed twice with 20 mL of deionized water [28].Then, the mycelium was suspended in 20 mL of deionized water and ultrasonic extraction wasperformed (2 min, Am 36%, pulse for 10 s). Mycelia disintegration was controlled by cell oscopicobservations. After mycelia disruption, the samples were centrifuged for 10 min at 1200 rpm.The supernatant was separated from the precipitate with the cell wall fraction, then it was transferredinto Eppendorf tubes and centrifuged for 20 min at 20,000 rpm at 4 ◦C. Obtained precipitates weresuspended in 20 mL of deionized water, then 10 mL of acetonitrile was added and the QuEChERSextraction procedure was performed as described above. The cell wall fraction precipitate was washedtwice in 20 mL of deionized water by centrifugation for 10 min at 1200 rpm. Then, it was suspended in20 mL of deionized water, 10 mL of acetonitrile was added and the extraction procedure was followedas described above.
4.6. LC–MS/MS Quantitative and Qualitative Analyses of Destruxins
Quantitative and qualitative analyses of dtxs were carried out by using LC–MS/MS (LC Agilent1200 coupled with a tandem mass spectrometer, AB Sciex QTRAP 4500, Framingham, MA, USA).The separation was performed with a Kinetex C18 column maintained at 40 ◦C. Water with 5 mMammonium formate (AF, Solvent A) and methanol with 5 mM ammonium formate (Wolvent B) wereused as mobile phases at a flow rate of 0.5 mL min−1. The injection volume was 5 μL. The eluentgradient was conducted as follows: hold 90% A from 0 to 0.25 min, linear increase from 90% A to 90% Bto 2 min, hold 90% B from 2 to 4 min, reverse to the initial conditions from 4 to 4.1 min, and maintainedfor column equilibration to 6.0 min.
The detection of dtxs was conducted using MS/MS with an electrospray ion source (ESI) in thepositive ionization scheduled multiple reaction monitoring (sMRM) scan mode. The MRM detectionwindow was set to 25 s. The optimized ESI parameters were as follows: CUR: 25; IS: 5000 V; TEMP:500 ◦C; GS1: 50; GS2:50. MRM parameters of 19 dtxs are presented in Table S2 [29]. Dtxs were detectedin the culture medium of each of the tested strains. The quantitative analyses of dtx A and dtx B werecarried out using standard curves in the linearity range 2.5–100 ng mL−1 (r = 0.9997 and r = 0.9999,respectively). The levels of the other dtxs were determined based on chromatographic peak areas andcompared between samples using principal component analysis (PCA).
4.7. LC–MS/MS Quantitative Analyses of Acetamiprid
Quantitative analyses of acetamiprid were carried out using LC–MS/MS (LC Agilent 1200 coupledwith a tandem mass spectrometer, AB Sciex QTRAP 3200). The separation was performed with aKinetex C18 column maintained at 40 ◦C. Water with 5 mM AF (solvent A) and acetonitrile with 5 mMAF and 0.1% formic acid (FA, Solvent B) were used as mobile phases at a flow rate of 0.5 mL min−1.The injection volume was 10 μL. The eluent gradient was conducted as follows: hold 90% A from 0 to0.25 min, linear increase from 90% A to 90% B to 0.5 min, hold 90% B from 0.5 to 4 min, reverse toinitial conditions from 4 to 4.1 min, and maintained for column equilibration to 6.0 min.
125

Toxins 2020, 12, 587
The detection of acetamiprid was conducted using MS/MS with ESI in the positive ionizationMRM scan mode (223.2/126.1 m/z; 223.2/73.0 m/z). The optimized ESI parameters were as follows: CUR:25; IS: 5500 V; TEMP: 500 ◦C; GS1: 50; GS2:60. The quantitation curve of acetamiprid was accomplishedin the quadratic regression in the range 25–1000 ng mL−1 and r = 0.9999.
4.8. Permeability of the Cell Membranes
The intention was to check whether acetamiprid simply interferes with the transport of dtxs fromthe fungal cell to the culture medium, or its action is connected with another mechanism. The procedurewas performed according to the method described by Siewiera et al., 2015 [30] with some modifications.Briefly, 1 mL each of the control samples and the tested samples with acetamiprid concentrations of 5,25 and 50 mg L−1 was transferred into Eppendorf tubes and then centrifuged for 10 min at 12,000 rpm.The supernatant was removed and 1 mL of Phosphate Buffered Saline (PBS) and 2 μL of propidiumiodide (stock solution 0.1 mg mL−1) were added to the precipitate and the mixture was vortexed for30 s at 3000 rpm. After incubation in the dark for 5 min, the supernatant was removed. The myceliumwas washed twice in PBS by centrifugation in the conditions described previously. Finally, the sampleswere suspended in 1 mL of PBS and propidium iodide fluorescence was measured at λex = 540 andλem = 630 (FLUOstar Omega, BMG LABTECH, Ortenberg, Germany). The final results were presentedas fluorescence intensity per mg of dry weight.
4.9. Mortality Test of Larvae of Tenebrio molitor (Mealworm)
Three concentrations of acetamiprid (5, 25 and 50 mg L−1) and Metarhizium sp. spores(1 × 10⁶ spores mL−1) with and without accumulated acetamiprid were tested. Control sampleswithout any stressful factors were also done. The effects of the individual variants were checked using10 mealworms, kept in the dark in plastic boxes with holes in the lid, and the bottom was lined withtissue paper. Before starting the experiment, the larvae were fed with oat flakes, which eliminates thedeath of starvation. Insect vitality was assessed daily for 14 days.
4.10. Data Analysis
Fungal biomass estimation and quantitative analyses of acetamiprid were conducted in fourrepetitions, analyses of dtxs in six repetitions. Measurements of propidium iodide fluorescence werecarried out in four repetitions. The mortality test of larvae of T. molitor was conducted in triplicates.Variabilities of samples were given as standard deviations (±SD). The one-way analysis of variance(ANOVA) and the posthoc Tukey test were used for investigations of statistical significance, using theconcentrations of acetamiprid as a factor on transformed data. Scores at p < 0.05 were classified assignificant. Statistica 13.1 (StatSoft, Tulsa, OK, USA) was used to analyze the data. The qualitative dataof dtxs were submitted to PCA in orthogonal rotation and normalization using total area sums andPareto scaling (Marker View Software 1.2.1., AB Sciex, Framingham, MA, USA).
5. Patents
Patent application No. P.434091 in the Patent Office of the Republic of Poland.
Supplementary Materials: The following are available online at http://www.mdpi.com/2072-6651/12/9/587/s1,Figure S1: Elimination of acetamiprid at the concentrations of 5 (A), 25 (B) and 50 mg L−1 (C) after 7 days ofincubation by Metarhizium sp. considering the residual content in the culture medium and mycelium; Table S1:Effect of acetamiprid on the permeability of the Metarhizium brunneum ARSEF2107 fungal cell wall; Table S2:Multiple Reaction Monitoring (MRM) parameters for determining 19 types of destruxins.
Author Contributions: M.N.: Conceptualization, Investigation, Methodology, Writing—review and editing; J.M.:Investigation; P.B.: Methodology; S.R.: Investigation, Methodology, Funding acquisition, Writing—review andediting. All authors have read and agreed to the published version of the manuscript.
Funding: This work was supported by the National Science Center in Krakow (Poland), grant numberUMO-2016/23/B/NZ9/00840.
126
Toxins 2020, 12, 587
Conflicts of Interest: The authors declare no conflict of interest.
References
1. Han, W.; Tian, Y.; Shen, X. Human exposure to neonicotinoid insecticides and the evaluation of their potentialtoxicity: An overview. Chemosphere 2018, 192, 59–65. [CrossRef]
2. Bass, C.; Denholm, I.; Williamson, M.S.; Nauen, R. The global status of insect resistance to neonicotinoidinsecticides. Pestic. Biochem. Physiol. 2015, 121, 78–87. [CrossRef] [PubMed]
3. EFSA (European Food Safety Authority). Conclusion on the peer review of the pesticide risk assessment ofthe active substance acetamiprid. EFSA J. 2016, 14, 26. [CrossRef]
4. Xiong, J.; Wang, Z.; Ma, X.; Li, H.; You, J. Occurrence and risk of neonicotinoid insecticides in surfacewater in a rapidly developing region: Application of polar organic chemical integrative samplers.Sci. Total Environ. 2019. [CrossRef] [PubMed]
5. Ihara, M. Neonicotinoids: Molecular mechanisms of action, insights into resistance and impact on pollinators.Curr. Opin. Insect Sci. 2018, 30, 86–92. [CrossRef] [PubMed]
6. Lovett, B.; St. Leger, R.J. Genetically engineering better fungal biopesticides. Pest Manag. Sci. 2018, 74,781–789. [CrossRef]
7. Mondal, S.; Baksi, S.; Koris, A.; Vatai, G. Journey of enzymes in entomopathogenic fungi. Pac. Sci. Rev. ANat. Sci. Eng. 2016. [CrossRef]
8. Wang, B.; Kang, Q.; Lu, Y.; Bai, L.; Wang, C. Unveiling the biosynthetic puzzle of destruxins in Metarhiziumspecies. Proc. Natl. Acad. Sci. USA 2012, 109, 1287–1292. [CrossRef]
9. Donzelli, B.G.G.; Krasnoff, S.B. Molecular Genetics of Secondary Chemistry in Metarhizium Fungi. Adv. Genet.2016. [CrossRef]
10. Pedras, M.S.C.; Irina Zaharia, L.I.; Ward, D.E. The destruxins: Synthesis, biosynthesis, biotransformation,and biological activity. Phytochemistry 2002, 59, 579–596. [CrossRef]
11. Wang, X.; Gong, X.; Li, P.; Lai, D.; Zhou, L.; Wang, X.; Gong, X.; Li, P.; Lai, D.; Zhou, L. Structural diversityand biological activities of cyclic depsipeptides from fungi. Molecules 2018, 23, 169. [CrossRef] [PubMed]
12. Liu, B.L.; Tzeng, Y.M. Development and applications of destruxins: A review. Biotechnol. Adv. 2012, 30,1242–1254. [CrossRef] [PubMed]
13. Litwin, A.; Nowak, M.; Rózalska, S. Entomopathogenic fungi: Unconventional applications. Rev. Environ.Sci. Biotechnol. 2020, 19, 23–42. [CrossRef]
14. Ríos-Moreno, A.; Garrido-Jurado, I.; Resquín-Romero, G.; Arroyo-Manzanares, N.; Arce, L.;Quesada-Moraga, E. Destruxin A production by Metarhizium brunneum strains during transient endophyticcolonisation of Solanum tuberosum. Biocontrol Sci. Technol. 2016, 26, 1574–1585. [CrossRef]
15. Taibon, J.; Sturm, S.; Seger, C.; Strasser, H.; Stuppner, H. Quantitative assessment of destruxins fromstrawberry and maize in the lower parts per billion range: Combination of a QuEChERS-based extractionprotocol with a fast and selective UHPLC-QTOF-MS assay. J. Agric. Food Chem. 2015, 63, 5707–5713.[CrossRef]
16. Neves, P.M.O.J.; Hirose, E.; Tchujo, P.T.; Moino, J.R.A. Compatibility of entomopathogenic fungi withneonicotinoid insecticides. Neotrop. Entomol. 2001, 30, 263–268. [CrossRef]
17. Li, Y.; Long, L.; Yan, H.; Ge, J.; Cheng, J.; Ren, L.; Yu, X. Comparison of uptake, translocation and accumulationof several neonicotinoids in komatsuna (Brassica rapa var. perviridis) from contaminated soils. Chemosphere2018, 200, 603–611. [CrossRef] [PubMed]
18. De Laet, C.; Matringe, T.; Petit, E.; Grison, C. Eichhornia crassipes: A Powerful Bio-indicator for WaterPollution by Emerging Pollutants. Sci. Rep. 2019, 9, 7326. [CrossRef]
19. Barbieri, M.V.; Postigo, C.; Guillem-Argiles, N.; Monllor-Alcaraz, L.S.; Simionato, J.I.; Stella, E.; Barceló, D.;López de Alda, M. Analysis of 52 pesticides in fresh fish muscle by QuEChERS extraction followed byLC-MS/MS determination. Sci. Total Environ. 2019, 653, 958–967. [CrossRef]
20. Bartlett, A.J.; Hedges, A.M.; Intini, K.D.; Brown, L.R.; Maisonneuve, F.J.; Robinson, S.A.; Gillis, P.L.;de Solla, S.R. Acute and chronic toxicity of neonicotinoid and butenolide insecticides to the freshwateramphipod, Hyalella azteca. Ecotoxicol. Environ. Saf. 2019, 175, 215–223. [CrossRef]
127
Toxins 2020, 12, 587
21. Dong, T.; Zhang, B.; Weng, Q.; Hu, Q. The production relationship of destruxins and blastospores ofMetarhizium anisopliae with virulence against Plutella xylostella. J. Integr. Agric. 2016, 15, 1313–1320.[CrossRef]
22. Ríos-Moreno, A.; Carpio, A.; Garrido-Jurado, I.; Arroyo-Manzanares, N.; Lozano-Tovar, M.D.; Arce, L.;Gámiz-Gracia, L.; García-Campaña, A.M.; Quesada-Moraga, E. Production of destruxins by Metarhiziumstrains under different stress conditions and their detection by using UHPLC-MS/MS. Biocontrol Sci. Technol.2016, 26, 1298–1311. [CrossRef]
23. Ravindran, K.; Akutse, S.; Sivaramakrishnan, S.; Wang, L. Determination and characterization of destruxinproduction in Metarhizium anisopliae Tk6 and formulations for Aedes aegypti mosquitoes control at thefield level. Toxicon 2016. [CrossRef] [PubMed]
24. Bernat, P.; Nykiel-Szymanska, J.; Stolarek, P.; Słaba, M.; Szewczyk, R.; Ró, S. 2,4-dichlorophenoxyaceticacid-induced oxidative stress: Metabolome and membrane modifications in Umbelopsis isabellina, a herbicidedegrader. PLoS ONE 2018, 13, e0199677. [CrossRef]
25. Rózalska, S.; Pawłowska, J.; Wrzosek, M.; Tkaczuk, C.; Długonski, J. Utilization of 4-n-nonylphenol byMetarhizium sp. isolates. Acta Biochim. Pol. 2013, 60, 677–682. [CrossRef]
26. Rózalska, S.; Glinska, S.; Długonski, J. Metarhizium robertsii morphological flexibility during nonylphenolremoval. Int. Biodeterior. Biodegrad. 2014, 95, 285–293. [CrossRef]
27. Nowak, M.; Sobon, A.; Litwin, A.; Rózalska, S. 4-n-nonylphenol degradation by the genus Metarhizium withcytochrome P450 involvement. Chemosphere 2019, 220, 324–334. [CrossRef]
28. Słaba, M.; Szewczyk, R.; Bernat, P.; Długonski, J. Simultaneous toxic action of zinc and alachlor resulted inenhancement of zinc uptake by the filamentous fungus Paecilomyces marquandii. Sci. Total Environ. 2009,407, 4127–4133. [CrossRef]
29. Arroyo-Manzanares, N.; Diana Di Mavungu, J.; Garrido-Jurado, I.; Arce, L.; Vanhaecke, L.;Quesada-Moraga, E.; De Saeger, S. Analytical strategy for determination of known and unknown destruxinsusing hybrid quadrupole-Orbitrap high-resolution mass spectrometry. Anal. Bioanal. Chem. 2017, 409,3347–3357. [CrossRef]
30. Siewiera, P.; Bernat, P.; Rózalska, S.; Długonski, J. Estradiol improves tributyltin degradation by thefilamentous fungus Metarhizium robertsii. Int. Biodeterior. Biodegrad. 2015, 104, 258–263. [CrossRef]
© 2020 by the authors. Licensee MDPI, Basel, Switzerland. This article is an open accessarticle distributed under the terms and conditions of the Creative Commons Attribution(CC BY) license (http://creativecommons.org/licenses/by/4.0/).
128
toxins
Article
Interactions of Destruxin A with Silkworms’ ArgininetRNA Synthetase and Lamin-C Proteins
Jingjing Wang, Qunfang Weng, Fei Yin and Qiongbo Hu *
Key Laboratory of Bio-Pesticide Innovation and Application of Guangdong Province; College of Agriculture,South China Agricultural University, Guangzhou 510642, China; [email protected] (J.W.);[email protected] (Q.W.); [email protected] (F.Y.)* Correspondence: [email protected]
Received: 30 December 2019; Accepted: 21 February 2020; Published: 22 February 2020
Abstract: Destruxin A (DA), a cyclodepsipeptidic mycotoxin produced by entomopathogenicfungus Metarhizium anisopliae, has good insecticidal activity and potential to be a new pesticide.However, the mechanism of action is still obscure. Our previous experiments showed that DAwas involved in regulation of transcription and protein synthesis and suggested that silkworms’arginine tRNA synthetase (BmArgRS), Lamin-C Proteins (BmLamin-C) and ATP-dependent RNAhelicase PRP1 (BmPRP1) were candidates of DA-binding proteins. In this study, we employedbio-layer interferometry (BLI), circular dichroism (CD), cellular thermal shift assay (CETSA), andother technologies to verify the interaction of DA with above three proteins in vitro and in vivo. Theresults of BLI indicated that BmArgRS and BmLamin-C were binding-protein of DA with KD value5.53 × 10−5 and 8.64 × 10⁻⁵ M, but not BmPRP1. These interactions were also verified by CD andCETSA tests. In addition, docking model and mutants assay in vitro showed that BmArgRS interactswith DA at the pocket including Lys228, His231, Asp434 and Gln437 in its enzyme active catalysisregion, while BmLamin-C binds to DA at His524 and Lys528 in the tail domain. This study mightprovide new insight and evidence in illustrating molecular mechanism of DA in breaking insect.
Keywords: Destruxins; Bombyx mori; BmArgRS; BmLamin-C; RNA helicase; binding protein
Key Contribution: BmArgRS and BmLamin-C are binding protein of Destruxin A in silkworm Bm12cells. BmArgRS interacts with DA in its enzyme active catalysis region at Lys228, His231, Asp434 andGln437. BmLamin-C binds to DA in its lamin tail domain at His524 and Lys528.
1. Introduction
Destruxin A (DA, Figure 1A) isolated from entomopathogenic fungus Metarhizium anisopliaeis a cyclodepsipeptidic mycotoxin with insecticidal, antifeedant, and anti-immunity effects on hostinsects [1,2]. It is also reported that DA is a key pathogenic factor of M. anisopliae against insects [3]. DAis considered as a new potential pesticide to contract researchers interesting. For this, it is necessary toelucidate the targets of DA acting on insects. In the past decade, several studies indicated that DAchanges the morphology of hemocytes and brings on equilibrium chaos of intra- and extra- cellularhydrogen and calcium ion in Bombyx mori [4,5], and regulates immune related gene expression [6,7].Recently, a few DA binding-proteins in silkworm were found [8–10]. However, these results are notenough to explain the mechanisms of DA against insects.
Toxins 2020, 12, 137; doi:10.3390/toxins12020137 www.mdpi.com/journal/toxins129
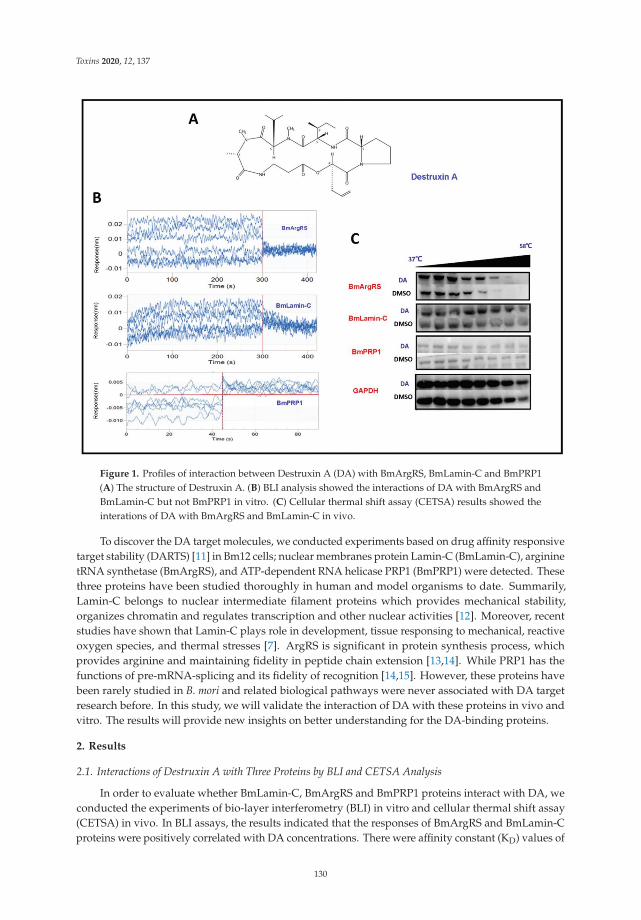
Toxins 2020, 12, 137
Figure 1. Profiles of interaction between Destruxin A (DA) with BmArgRS, BmLamin-C and BmPRP1(A) The structure of Destruxin A. (B) BLI analysis showed the interactions of DA with BmArgRS andBmLamin-C but not BmPRP1 in vitro. (C) Cellular thermal shift assay (CETSA) results showed theinterations of DA with BmArgRS and BmLamin-C in vivo.
To discover the DA target molecules, we conducted experiments based on drug affinity responsivetarget stability (DARTS) [11] in Bm12 cells; nuclear membranes protein Lamin-C (BmLamin-C), argininetRNA synthetase (BmArgRS), and ATP-dependent RNA helicase PRP1 (BmPRP1) were detected. Thesethree proteins have been studied thoroughly in human and model organisms to date. Summarily,Lamin-C belongs to nuclear intermediate filament proteins which provides mechanical stability,organizes chromatin and regulates transcription and other nuclear activities [12]. Moreover, recentstudies have shown that Lamin-C plays role in development, tissue responsing to mechanical, reactiveoxygen species, and thermal stresses [7]. ArgRS is significant in protein synthesis process, whichprovides arginine and maintaining fidelity in peptide chain extension [13,14]. While PRP1 has thefunctions of pre-mRNA-splicing and its fidelity of recognition [14,15]. However, these proteins havebeen rarely studied in B. mori and related biological pathways were never associated with DA targetresearch before. In this study, we will validate the interaction of DA with these proteins in vivo andvitro. The results will provide new insights on better understanding for the DA-binding proteins.
2. Results
2.1. Interactions of Destruxin A with Three Proteins by BLI and CETSA Analysis
In order to evaluate whether BmLamin-C, BmArgRS and BmPRP1 proteins interact with DA, weconducted the experiments of bio-layer interferometry (BLI) in vitro and cellular thermal shift assay(CETSA) in vivo. In BLI assays, the results indicated that the responses of BmArgRS and BmLamin-Cproteins were positively correlated with DA concentrations. There were affinity constant (KD) values of
130
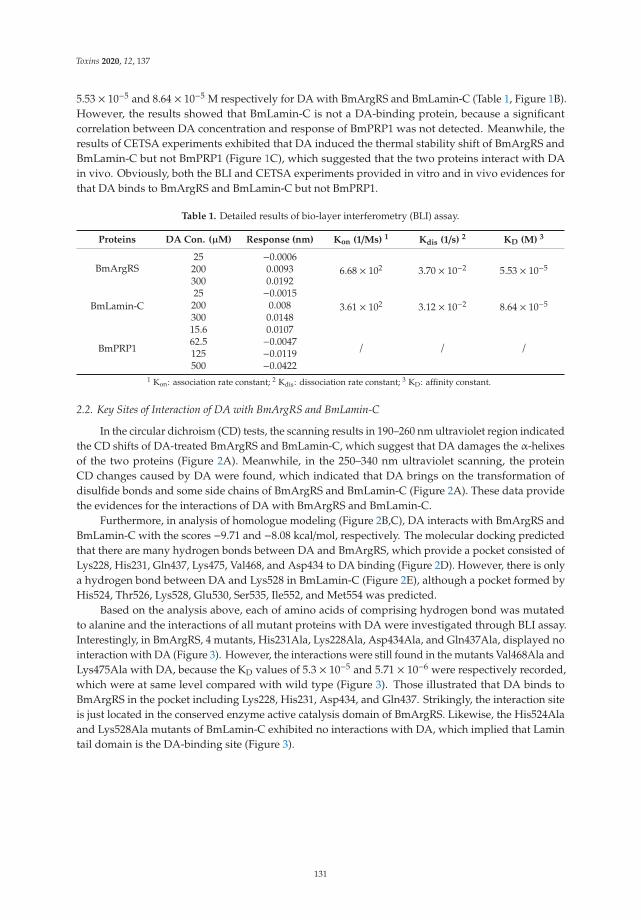
Toxins 2020, 12, 137
5.53 × 10⁻⁵ and 8.64 × 10⁻⁵ M respectively for DA with BmArgRS and BmLamin-C (Table 1, Figure 1B).However, the results showed that BmLamin-C is not a DA-binding protein, because a significantcorrelation between DA concentration and response of BmPRP1 was not detected. Meanwhile, theresults of CETSA experiments exhibited that DA induced the thermal stability shift of BmArgRS andBmLamin-C but not BmPRP1 (Figure 1C), which suggested that the two proteins interact with DAin vivo. Obviously, both the BLI and CETSA experiments provided in vitro and in vivo evidences forthat DA binds to BmArgRS and BmLamin-C but not BmPRP1.
Table 1. Detailed results of bio-layer interferometry (BLI) assay.
Proteins DA Con. (μM) Response (nm) Kon (1/Ms) 1 Kdis (1/s) 2 KD (M) 3
BmArgRS25 −0.0006
6.68 × 10² 3.70 × 10⁻² 5.53 × 10−5200 0.0093300 0.0192
BmLamin-C25 −0.0015
3.61 × 10² 3.12 × 10⁻² 8.64 × 10−5200 0.008300 0.0148
BmPRP1
15.6 0.0107
/ / /62.5 −0.0047125 −0.0119500 −0.0422
1 Kon: association rate constant; 2 Kdis: dissociation rate constant; 3 KD: affinity constant.
2.2. Key Sites of Interaction of DA with BmArgRS and BmLamin-C
In the circular dichroism (CD) tests, the scanning results in 190–260 nm ultraviolet region indicatedthe CD shifts of DA-treated BmArgRS and BmLamin-C, which suggest that DA damages the α-helixesof the two proteins (Figure 2A). Meanwhile, in the 250–340 nm ultraviolet scanning, the proteinCD changes caused by DA were found, which indicated that DA brings on the transformation ofdisulfide bonds and some side chains of BmArgRS and BmLamin-C (Figure 2A). These data providethe evidences for the interactions of DA with BmArgRS and BmLamin-C.
Furthermore, in analysis of homologue modeling (Figure 2B,C), DA interacts with BmArgRS andBmLamin-C with the scores −9.71 and −8.08 kcal/mol, respectively. The molecular docking predictedthat there are many hydrogen bonds between DA and BmArgRS, which provide a pocket consisted ofLys228, His231, Gln437, Lys475, Val468, and Asp434 to DA binding (Figure 2D). However, there is onlya hydrogen bond between DA and Lys528 in BmLamin-C (Figure 2E), although a pocket formed byHis524, Thr526, Lys528, Glu530, Ser535, Ile552, and Met554 was predicted.
Based on the analysis above, each of amino acids of comprising hydrogen bond was mutatedto alanine and the interactions of all mutant proteins with DA were investigated through BLI assay.Interestingly, in BmArgRS, 4 mutants, His231Ala, Lys228Ala, Asp434Ala, and Gln437Ala, displayed nointeraction with DA (Figure 3). However, the interactions were still found in the mutants Val468Ala andLys475Ala with DA, because the KD values of 5.3 × 10⁻⁵ and 5.71 × 10⁻⁶ were respectively recorded,which were at same level compared with wild type (Figure 3). Those illustrated that DA binds toBmArgRS in the pocket including Lys228, His231, Asp434, and Gln437. Strikingly, the interaction siteis just located in the conserved enzyme active catalysis domain of BmArgRS. Likewise, the His524Alaand Lys528Ala mutants of BmLamin-C exhibited no interactions with DA, which implied that Lamintail domain is the DA-binding site (Figure 3).
131
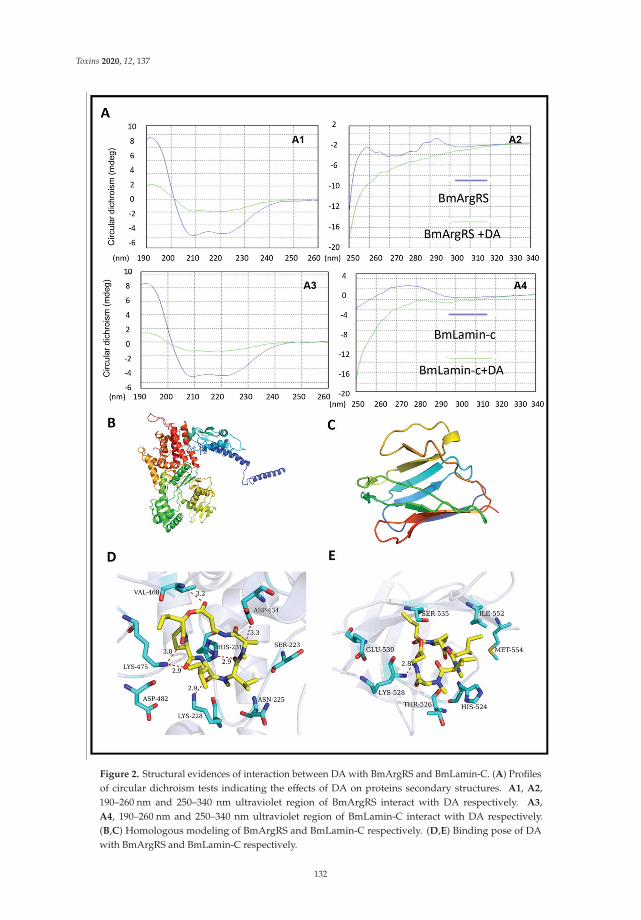
Toxins 2020, 12, 137
Figure 2. Structural evidences of interaction between DA with BmArgRS and BmLamin-C. (A) Profilesof circular dichroism tests indicating the effects of DA on proteins secondary structures. A1, A2,190–260 nm and 250–340 nm ultraviolet region of BmArgRS interact with DA respectively. A3,A4, 190–260 nm and 250–340 nm ultraviolet region of BmLamin-C interact with DA respectively.(B,C) Homologous modeling of BmArgRS and BmLamin-C respectively. (D,E) Binding pose of DAwith BmArgRS and BmLamin-C respectively.
132
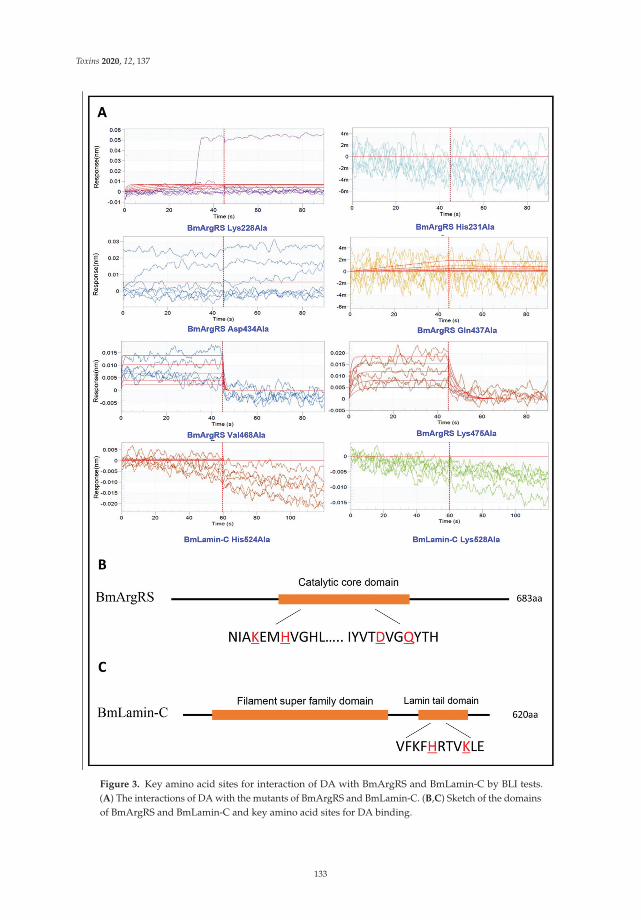
Toxins 2020, 12, 137
Figure 3. Key amino acid sites for interaction of DA with BmArgRS and BmLamin-C by BLI tests.(A) The interactions of DA with the mutants of BmArgRS and BmLamin-C. (B,C) Sketch of the domainsof BmArgRS and BmLamin-C and key amino acid sites for DA binding.
133
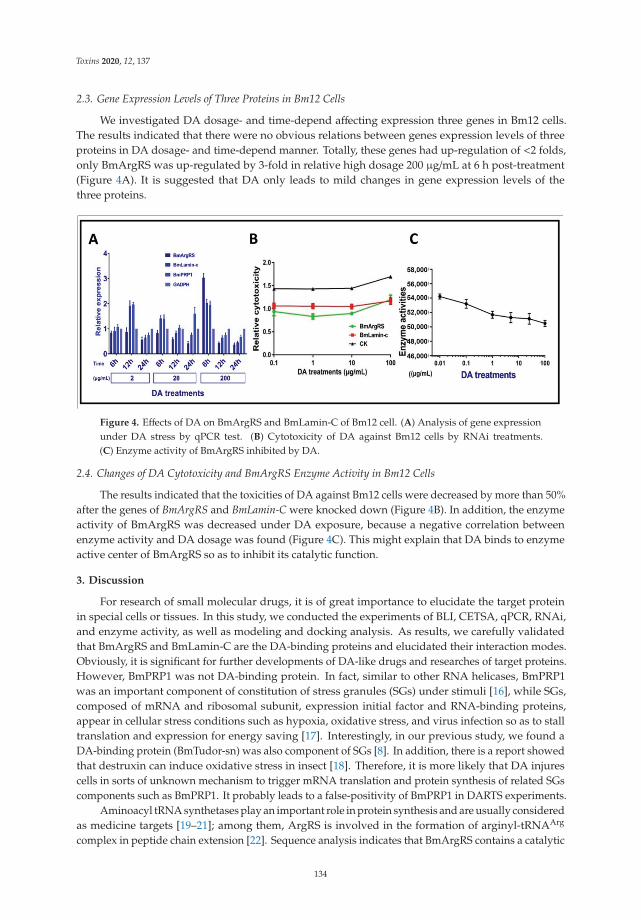
Toxins 2020, 12, 137
2.3. Gene Expression Levels of Three Proteins in Bm12 Cells
We investigated DA dosage- and time-depend affecting expression three genes in Bm12 cells.The results indicated that there were no obvious relations between genes expression levels of threeproteins in DA dosage- and time-depend manner. Totally, these genes had up-regulation of <2 folds,only BmArgRS was up-regulated by 3-fold in relative high dosage 200 μg/mL at 6 h post-treatment(Figure 4A). It is suggested that DA only leads to mild changes in gene expression levels of thethree proteins.
Figure 4. Effects of DA on BmArgRS and BmLamin-C of Bm12 cell. (A) Analysis of gene expressionunder DA stress by qPCR test. (B) Cytotoxicity of DA against Bm12 cells by RNAi treatments.(C) Enzyme activity of BmArgRS inhibited by DA.
2.4. Changes of DA Cytotoxicity and BmArgRS Enzyme Activity in Bm12 Cells
The results indicated that the toxicities of DA against Bm12 cells were decreased by more than 50%after the genes of BmArgRS and BmLamin-C were knocked down (Figure 4B). In addition, the enzymeactivity of BmArgRS was decreased under DA exposure, because a negative correlation betweenenzyme activity and DA dosage was found (Figure 4C). This might explain that DA binds to enzymeactive center of BmArgRS so as to inhibit its catalytic function.
3. Discussion
For research of small molecular drugs, it is of great importance to elucidate the target proteinin special cells or tissues. In this study, we conducted the experiments of BLI, CETSA, qPCR, RNAi,and enzyme activity, as well as modeling and docking analysis. As results, we carefully validatedthat BmArgRS and BmLamin-C are the DA-binding proteins and elucidated their interaction modes.Obviously, it is significant for further developments of DA-like drugs and researches of target proteins.However, BmPRP1 was not DA-binding protein. In fact, similar to other RNA helicases, BmPRP1was an important component of constitution of stress granules (SGs) under stimuli [16], while SGs,composed of mRNA and ribosomal subunit, expression initial factor and RNA-binding proteins,appear in cellular stress conditions such as hypoxia, oxidative stress, and virus infection so as to stalltranslation and expression for energy saving [17]. Interestingly, in our previous study, we found aDA-binding protein (BmTudor-sn) was also component of SGs [8]. In addition, there is a report showedthat destruxin can induce oxidative stress in insect [18]. Therefore, it is more likely that DA injurescells in sorts of unknown mechanism to trigger mRNA translation and protein synthesis of related SGscomponents such as BmPRP1. It probably leads to a false-positivity of BmPRP1 in DARTS experiments.
Aminoacyl tRNA synthetases play an important role in protein synthesis and are usually consideredas medicine targets [19–21]; among them, ArgRS is involved in the formation of arginyl-tRNAArg
complex in peptide chain extension [22]. Sequence analysis indicates that BmArgRS contains a catalytic
134
Toxins 2020, 12, 137
core domain of arginyl-tRNA synthetases in the region of 216–481. Interestingly, in this study, weproved that DA binds to a pocket of BmArgRS in the conserved active catalysis sites. It might bespeculated that DA suppresses the synthesis of some proteins containing arginine, especially thearginine rich basic proteins (histone), subsequently causes and leads to cells chaos in insects. Ourresearch results give some clues to development of ArgRS inhibitors. Although DA interacts withBmArgRS at lower level as 10−5 M, more other chemicals with higher bioactivity can be found on thebasis of the quantitative structure-activity relationship (QSAR) of molecules and BmArgRS.
Lamins-C has many functions which usually acts as intermediate filament proteins providingstability and strength to cells, as supporting (scaffolding) components of the nuclear enveloperegulating the movement of molecules into and out of the nucleus, and as a role in regulating theactivity (expression) of certain genes [12]. Previously, researchers found out that DA showed no affinityto nucleus, but was abundant in cytosol [23]. As above indicated, nonpolar DA might access intonucleus at inner membrane to bind BmLamin-C but does not result in mechanical stress. In cytoplasm,lamins mainly function as response to eliminate heat shock and oxidative stress [7]. Interestingly, DAinduced heat shock proteins upregulation and oxidative stress in cells. It is suggested that DA binds toBmLamin-C leading to maintain unsuitable environment in cells which constant to previous study thatDA acts as immunosuppressor [2]. Intriguingly, C-terminal lamin tail domain is highly conserved andcontains immunoglobulin fold. However, researches of Lamin-C were insufficient in B. mori, so it ishard to in-depth study in function with DA and make an assumption. But it provides new evidencesand insight to further study owing to several nuclear related candidate proteins we have.
Reviewed in previous research on molecular mechanism of DA, the widely accepted hypothesis isthat DA acts as immunosuppressor to inhibit innate immune system when M. anisopliae infected host.However, traditional molecular mechanism of DA target sites such as hemocyte and hemolymph areobscure. Here, we can speculate that DA stresses and leads to cell in uncomfortable environment and themeantime DA binds to those stress induced proteins to repress host defense as an immunosuppressor.Because we previously found that DA bond to heat shock protein [10], stress granule proteinBmTudor-sn [8] and immunophilin peptidyl-prolylcis-transisomerase (BmPPI) [9], and interactedwith BmArgRS to inhibit protein synthesis and bond to stress support protein BmLamin-C as well inthis study.
In conclusion, we investigated the interaction between DA and three candidate proteins, and foundthat BmArgRS and BmLamin-C are DA-binding proteins but not BmPRP1. In addition, structurally,DA interacts with BmArgRS at Lys228, His231, Gln437 and Lys475 in catalysis active domain and withBmLamin-C at Lys528 and His524 in lamin tail domain. The above findings would offer new insightand evidence to DA target protein discovery.
4. Materials and Methods
4.1. Cell Culture and Destruxin A
The Bombyx mori Bm12 cell line was donated by our colleague Cao Yang (College of AnimalScience, South China Agricultural University) and cultured in Grace’s culture medium (Hyclone,Pittsburgh, MA, USA) and 10% fetal bovine serum (Gibco, Waltham, MA, USA). Cells were cultured at27 ◦C and maintained at over a period of 2–4 days.
Destruxin A (DA) was isolated and purified from the Metarhizium anisopliae var. anisopliaestrain MaQ10 in our laboratory [24]. Stock solution is 10,000 μg/mL in dimethyl sulfoxide (DMSO,Sigma-Aldrich, Darmstadt, Germany).
4.2. Bio-Layer Interferometry (BLI)
All proteins were prepared by expression in E. coli, and were tagged with His-tag and purified bynickel affinity chromatography. Protein accession number of BmArgRS, BmLamin-C, and BmPRP1 areXP_004931696.1, XP_004930078.1, and XP_004926349.1, respectively.
135
Toxins 2020, 12, 137
BLI analysis was performed on a ForteBio OctetQK System (K2, Pall Fortebio Corp, Menlo Park,CA, USA) [25]. Generally, the protein samples were coupled with a biosensor for immobilization.Dilutions of DA were used for treatment. PBST buffer (0.05% Tween20, 5% DMSO) was used forthe running and dilution buffers. The working procedure was baseline for 60 s, association for 60 s,and dissociation for 60 s. Finally, the raw data were processed with Data Analysis Software (9.0, PallForteBio Corp, Menlo Park, CA, USA).
4.3. Cellular Thermal Shift Assay (CETSA)
The Bm12 cell line was used to conduct the CETSA experiments [26]. Firstly, Bm12 cells weretreated with 100 μg/mL DA and divided into 8–10 aliquots. After heated at 37–58 ◦C at 3 min, cellswere lysed by a freeze-thawcycle. After centrifugated, the supernatants of the lysed cells were used forthe western blot analysis.
4.4. RNAi and Toxicity Assessment RNAi
SiRNAs were prepared by synthesis in vitro. The sequence of BmLamin-C siRNA:5′-GCUGAUACCCGUAAGACUUTT-3′ and 5′-AAGUCUUACGGGUAUCAGCTT-3′. The sequenceof BmArgRS: 5′-GCGAUCAAGAAGGAAGCUATT-3′ and 5′-UAGCUUCCUUCUUGAUCGCTT-3′.SiRNA and FuGENE (Promega, Beijing, China) transfection reagent were each diluted in serum-freemedium and then mixed. The mixture was added to Bm12 cells and DA treatments. Toxicity assessmentwas performed by LDH-Glo™ Cytotoxicity Assay (Promega, Beijing, China) and detected in Synergy™H1 (BioTek, Winooski, VT, USA).
4.5. Survey of Gene Expression
Expression of target gene was measured by RT-qPCR. Primer of BmLamin-C:5′-CTTCACCACGGCTCTGCTCAAC-3′ and 5′- TGCGGCAATTCTCTTCACCTTCG-3′.Primer of BmArgRS: 5′-GAGGTTAGAAGAGCGAACCACCAG-3′ and5′-CGCCGCTGAAGATTCGGTCTC-3′. Primer of BmPRP1: 5′-GGTGCTGTGATGGCGGAGTTC-3′and 5′-GCATGGCAGTGATGGAGAGGATC-3′. The qPCR reactive program was subjected to 39 cyclesat 95 ◦C for 10 s, 60 ◦C for 10 s, 72 ◦C for 30 s, then 95 ◦C for 10 s, and 65–95 ◦C for 5 s. The experimentwas repeated three times. The silkworm GAPDH (glyceraldehyde-3-phosphate dehydrogenase) genewas taken as the reference gene. The qPCR data were analyzed by using the 2−ΔΔCt method. Themeans and DMRT (Duncan multiple range test) were evaluated by employing SPSS software (IBM,Armonk, NY, USA).
4.6. Homology Modeling and Molecular Docking
The target sequence of BmArgRS and BmLamin-C were acquired from Uniprot, with the Uniprot IDH9JHD3 and H9J2B5. Template crystal structures of RARS and LAMC were identified through BLAST anddownloaded from RCSB Protein Data Bank (PDB ID were 4R3Z1 and 6GHD2). Homology modeling anddocking were conducted in MOE v2014.09014 (Chemical Computing Group, Montreal, Canada).
4.7. Circular Dichroism Spectrum
Circular dichroism (CD) experiments were conducted by Chirascan Plus V100 (Leatherhead,Surrey, United Kingdom) provided by Applied Photophysics Ltd. Analysis processing in 1.0 nmband width. Measurement range include 190~260 nm (far-UV region scan) and 250–340 nm (near-UVregion scan). The test was repeated three times. All raw scanning data were processed in Pro-DataViewer (Applied Photophysics, Leatherhead, Surrey, United Kingdom) with subtract baseline andsmoothing analysis.
136
Toxins 2020, 12, 137
Author Contributions: Conceived the experiments and revised the manuscript, Q.H.; Performed the experiments,analyzed the data, and wrote the paper, J.W.; Analyzed the data, Q.W. and F.Y. All authors have read and agreedto the published version of the manuscript.
Funding: This research is supported by National Natural Science Foundation of China (U1901205).
Conflicts of Interest: The authors declare no conflict of interest.
References
1. Pedras, M.S.C.; Zaharia, L.I.; Ward, D.E. The destruxins: Synthesis, biosynthesis, biotransformation, andbiological activity. Phytochemistry 2002, 59, 579–596. [CrossRef]
2. Liu, B.; Tzeng, Y. Development and applications of destruxins: A review. Biotechnol. Adv. 2012, 30, 1242–1254.[CrossRef] [PubMed]
3. Wang, B.; Kang, Q.; Lu, Y.; Bai, L.; Wang, C. Unveiling the biosynthetic puzzle of destruxins in Metarhiziumspecies. Proc. Nat. Acad. Sci. USA 2012, 109, 1287–1292. [CrossRef] [PubMed]
4. Fan, J.Q.; Chen, X.R.; Hu, Q.-B. Effects of Destruxin A on Hemocytes Morphology of Bombyx mori. J. Integr.Agric. 2013, 12, 1042–1048. [CrossRef]
5. Chen, X.; Hu, Q.; Yu, X.; Ren, S. Effects of destruxins on free calcium and hydrogen ions in insect hemocytes.Insect Sci. 2014, 21, 31–38. [CrossRef] [PubMed]
6. Hu, W.; He, G.; Wang, J.; Hu, Q. The Effects of Destruxin A on Relish and Rel Gene Regulation to theSuspected Immune-Related Genes of Silkworm. Molecules 2016, 22, 41. [CrossRef]
7. Zuela, N.; Bar, D.Z.; Gruenbaum, Y. Lamins in development, tissue maintenance and stress. EMBO Rep. 2012,13, 1070–1078. [CrossRef]
8. Wang, J.; Hu, W.; Hu, Q. BmTudor-sn Is a Binding Protein of Destruxin A in Silkworm Bm12 Cells. Toxins2019, 11, 67. [CrossRef]
9. Wang, J.; Wen, Q.; Hu, Q. Effects of Destruxin A on Silkworm’s Immunophilins. Toxins 2019, 11, 349.[CrossRef]
10. Zhang, H.; Hu, W.; Xiao, M.; Ou, S.; Hu, Q. Destruxin A induces and binds HSPs in Bombyx mori Bm12 cells.J. Agric. Food Chem. 2017, 65, 9849–9853. [CrossRef]
11. Lomenick, B.; Hao, R.; Jonai, N.; Chin, R.M.; Aghajan, M.; Warburton, S.; Wang, J.; Wu, R.P.; Gomez, F.;Loo, J.A. Target identification using drug affinity responsive target stability (DARTS). Proc. Natl. Acad. Sci.USA 2009, 106, 21984–21989. [CrossRef] [PubMed]
12. Al-Saaidi, R.; Peter, B. Do lamin A and lamin C have unique roles? Chromosoma 2015, 124, 1–12. [CrossRef][PubMed]
13. Bence, A.K.; Crooks, P.A. The mechanism of L-canavanine cytotoxicity: Arginyl tRNA synthetase as a noveltarget for anticancer drug discovery. J. Enzym. Inhib. Med. Chem. 2003, 18, 383. [CrossRef] [PubMed]
14. Sloan, K.E.; Bohnsack, M.T. Unravelling the Mechanisms of RNA Helicase Regulation. Trends Biochem. Sci.2018, 43, 237–250. [CrossRef] [PubMed]
15. Jankowsky, E. RNA helicases at work: Binding and rearranging. Trends Biochem. Sci. 2011, 36, 19–29.[CrossRef] [PubMed]
16. Xu, F. RNA Helicases and Stress Granules. Chin. J. Biochem. Mol. Biol. 2014, 30, 630–635.17. Ivanov, P.; Kedersha, N.; Anderson, P. Stress Granules and Processing Bodies in Translational Control. Cold
Spring Harb. Perspect. Biol. 2018, 11, a032813. [CrossRef]18. Sree, K.S.; Padmaja, V. Destruxin from Metarhizium anisopliae induces oxidative stress effecting larval
mortality of the polyphagous pest Spodoptera litura. J. Appl. Entomol. 2010, 132, 68–78. [CrossRef]19. Chhibber-Goel, J.; Joshi, S.; Sharma, A. Aminoacyl tRNA synthetases as potential drug targets of the Panthera
pathogen Babesia. Parasit Vectors 2019, 12, 482. [CrossRef]20. Kim, E.Y.; Lee, J.G.; Lee, J.M.; Kim, A.; Yoo, H.C.; Kim, K.; Lee, M.; Lee, C.; P., N.; Han, G.; et al. Therapeutic
effects of the novel Leucyl-tRNA synthetase inhibitor BC-LI-0186 in non-small cell lung cancer. Ther. Adv.Med Oncol. 2019, 11. [CrossRef]
21. Buckner, F.S.; Ranade, R.M.; Gillespie, J.R.; Shibata, S.; Hulverson, M.A.; Zhang, Z.; Huang, W.; Choi, R.;Ochida, A.; Akao, Y.; et al. Optimization of Methionyl tRNA-Synthetase Inhibitors for Treatment ofCryptosporidium Infection. Antimicrob. Agents Chemother. 2019, 63. [CrossRef]
137
Toxins 2020, 12, 137
22. Won, L.S.; Byeong Hoon, C.; Gyu, P.S.; Sunghoon, K. Aminoacyl-tRNA synthetase complexes: Beyondtranslation. J. Cell Sci. 2004, 117, 3725–3734.
23. Vey, A.; Dumas, C. Mechanism of action of insecticidal mycotoxins of the group of destruxins. Toxicon 1996,34, 1096. [CrossRef]
24. Hu, Q.B.; Ren, S.X.; Wu, J.H.; Chang, J.M.; Musa, P.D. Investigation of destruxin A and B from 80 Metarhiziumstrains in China, and the optimization of cultural conditions for the strain MaQ10. Toxicon 2006, 48, 491–498.[CrossRef] [PubMed]
25. Abdiche, Y.; Dan, M.; Pinkerton, A.; Pons, J. Determining kinetics and affinities of protein interactions usinga parallel real-time label-free biosensor, the Octet. Anal. Biochem. 2008, 377, 209–217. [CrossRef] [PubMed]
26. Martinez Molina, D.; Jafari, R.; Ignatushchenko, M.; Seki, T.; Larsson, E.A.; Dan, C.; Sreekumar, L.; Cao, Y.;Nordlund, P. Monitoring drug target engagement in cells and tissues using the cellular thermal shift assay.Science 2013, 341, 84–87. [CrossRef] [PubMed]
© 2020 by the authors. Licensee MDPI, Basel, Switzerland. This article is an open accessarticle distributed under the terms and conditions of the Creative Commons Attribution(CC BY) license (http://creativecommons.org/licenses/by/4.0/).
138
toxins
Review
Recent Advances on Macrocyclic Trichothecenes,Their Bioactivities and Biosynthetic Pathway
Muzi Zhu, Youfei Cen, Wei Ye, Saini Li and Weimin Zhang *
Guangdong Provincial Key Laboratory of Microbial Culture Collection and Application,State Key Laboratory of Applied Microbiology Southern China, Guangdong Institute of Microbiology,Guangdong Academy of Sciences, Guangzhou 510070, China; [email protected] (M.Z.);[email protected] (Y.C.); [email protected] (W.Y.); [email protected] (S.L.)* Correspondence: [email protected]; Tel.: +86-20-8768-8309
Received: 23 May 2020; Accepted: 19 June 2020; Published: 23 June 2020
Abstract: Macrocyclic trichothecenes are an important group of trichothecenes bearing a large ring.Despite the fact that many of trichothecenes are of concern in agriculture, food contamination, healthcare and building protection, the macrocyclic ones are becoming the research hotspot because oftheir diversity in structure and biologic activity. Several researchers have declared that macrocyclictrichothecenes have great potential to be developed as antitumor agents, due to the plenty of theircompounds and bioactivities. In this review we summarize the newly discovered macrocyclictrichothecenes and their bioactivities over the last decade, as well as identifications of genes tri17 andtri18 involved in the trichothecene biosynthesis and putative biosynthetic pathway. According tothe search results in database and phylogenetic trees generated in the review, the species of thegenera Podostroma and Monosporascus would probably be great sources for producing macrocyclictrichothecenes. Moreover, we propose that the macrocyclic trichothecene roridin E could be formedvia acylation or esterification of the long side chain linked with C-4 to the hydroxyl group at C-15,and vice versa. More assays and evidences are needed to support this hypothesis, which wouldpromote the verification of the proposed pathway.
Keywords: macrocyclic trichothecenes; bioactivities; putative biosynthetic pathway; macrocycle formation
Key Contribution: A new supposed biosynthetic pathway of macrocyclic trichothecene was proposed.
1. Introduction
Trichothecenes are a family of sesquiterpenoid mycotoxins produced by multiple genera of fungi,including plant and insect pathogens, and they are of great concern because they are toxic to animalsand humans and frequently detected in cereal crops, especially in wheat, barley, maize and oats [1–4].In the European Union, 57% of the collected food samples have been contaminated with deoxynivalenol(DON) [5], and a high proportion of UK oats were believed to contain high concentrations of thetrichothecenes T-2 and HT-2 according to a survey of commercial crops [6]. These toxins consist ofover 200 structurally distinct molecules, all of which are characterized by a three-ring molecule knownas 12,13-epoxytrichothec-9-ene (EPT; Figure 1) [7,8]. One obvious structural variation can dividetrichothecenes into two groups: the simple trichothecenes and the macrocyclic ones (also called TypeD trichothecenes, Figure 1) [9,10]. The macrocyclic trichothecenes possess an additional ring at C-4and C-15 of EPT, formed by esterification of the hydroxyls at relevant positions with a 12- or 14-carbonchain. On the contrary, the simple trichothecenes in the other group do not have a macrolide ring.
Toxins 2020, 12, 417; doi:10.3390/toxins12060417 www.mdpi.com/journal/toxins139
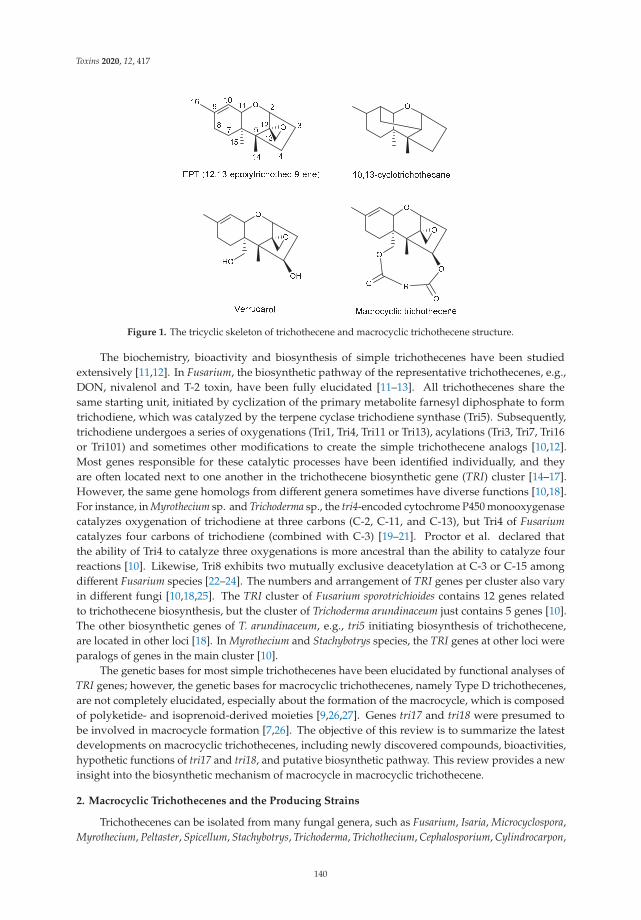
Toxins 2020, 12, 417
Figure 1. The tricyclic skeleton of trichothecene and macrocyclic trichothecene structure.
The biochemistry, bioactivity and biosynthesis of simple trichothecenes have been studiedextensively [11,12]. In Fusarium, the biosynthetic pathway of the representative trichothecenes, e.g.,DON, nivalenol and T-2 toxin, have been fully elucidated [11–13]. All trichothecenes share thesame starting unit, initiated by cyclization of the primary metabolite farnesyl diphosphate to formtrichodiene, which was catalyzed by the terpene cyclase trichodiene synthase (Tri5). Subsequently,trichodiene undergoes a series of oxygenations (Tri1, Tri4, Tri11 or Tri13), acylations (Tri3, Tri7, Tri16or Tri101) and sometimes other modifications to create the simple trichothecene analogs [10,12].Most genes responsible for these catalytic processes have been identified individually, and theyare often located next to one another in the trichothecene biosynthetic gene (TRI) cluster [14–17].However, the same gene homologs from different genera sometimes have diverse functions [10,18].For instance, in Myrothecium sp. and Trichoderma sp., the tri4-encoded cytochrome P450 monooxygenasecatalyzes oxygenation of trichodiene at three carbons (C-2, C-11, and C-13), but Tri4 of Fusariumcatalyzes four carbons of trichodiene (combined with C-3) [19–21]. Proctor et al. declared thatthe ability of Tri4 to catalyze three oxygenations is more ancestral than the ability to catalyze fourreactions [10]. Likewise, Tri8 exhibits two mutually exclusive deacetylation at C-3 or C-15 amongdifferent Fusarium species [22–24]. The numbers and arrangement of TRI genes per cluster also varyin different fungi [10,18,25]. The TRI cluster of Fusarium sporotrichioides contains 12 genes relatedto trichothecene biosynthesis, but the cluster of Trichoderma arundinaceum just contains 5 genes [10].The other biosynthetic genes of T. arundinaceum, e.g., tri5 initiating biosynthesis of trichothecene,are located in other loci [18]. In Myrothecium and Stachybotrys species, the TRI genes at other loci wereparalogs of genes in the main cluster [10].
The genetic bases for most simple trichothecenes have been elucidated by functional analyses ofTRI genes; however, the genetic bases for macrocyclic trichothecenes, namely Type D trichothecenes,are not completely elucidated, especially about the formation of the macrocycle, which is composedof polyketide- and isoprenoid-derived moieties [9,26,27]. Genes tri17 and tri18 were presumed tobe involved in macrocycle formation [7,26]. The objective of this review is to summarize the latestdevelopments on macrocyclic trichothecenes, including newly discovered compounds, bioactivities,hypothetic functions of tri17 and tri18, and putative biosynthetic pathway. This review provides a newinsight into the biosynthetic mechanism of macrocycle in macrocyclic trichothecene.
2. Macrocyclic Trichothecenes and the Producing Strains
Trichothecenes can be isolated from many fungal genera, such as Fusarium, Isaria, Microcyclospora,Myrothecium, Peltaster, Spicellum, Stachybotrys, Trichoderma, Trichothecium, Cephalosporium, Cylindrocarpon,
140
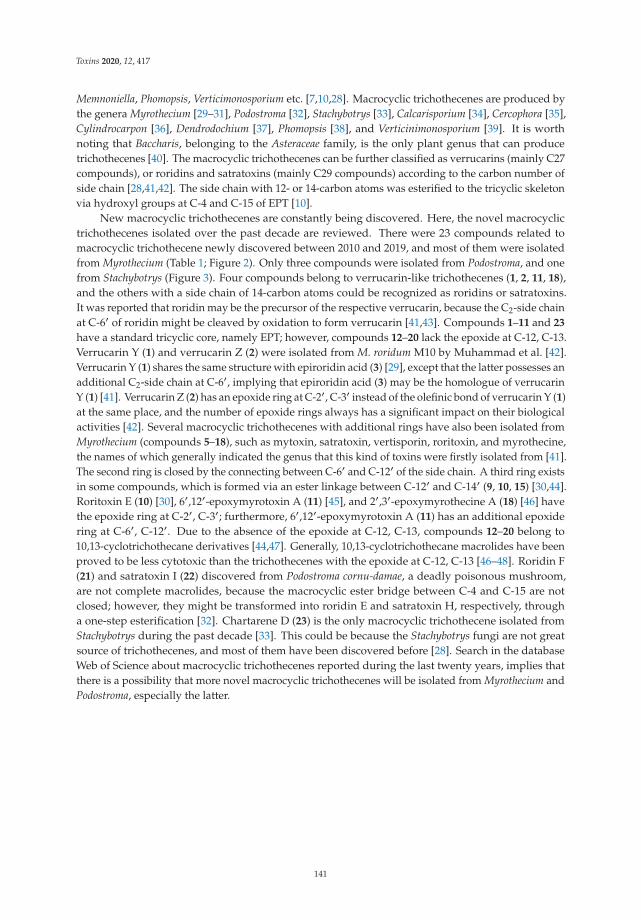
Toxins 2020, 12, 417
Memnoniella, Phomopsis, Verticimonosporium etc. [7,10,28]. Macrocyclic trichothecenes are produced bythe genera Myrothecium [29–31], Podostroma [32], Stachybotrys [33], Calcarisporium [34], Cercophora [35],Cylindrocarpon [36], Dendrodochium [37], Phomopsis [38], and Verticinimonosporium [39]. It is worthnoting that Baccharis, belonging to the Asteraceae family, is the only plant genus that can producetrichothecenes [40]. The macrocyclic trichothecenes can be further classified as verrucarins (mainly C27compounds), or roridins and satratoxins (mainly C29 compounds) according to the carbon number ofside chain [28,41,42]. The side chain with 12- or 14-carbon atoms was esterified to the tricyclic skeletonvia hydroxyl groups at C-4 and C-15 of EPT [10].
New macrocyclic trichothecenes are constantly being discovered. Here, the novel macrocyclictrichothecenes isolated over the past decade are reviewed. There were 23 compounds related tomacrocyclic trichothecene newly discovered between 2010 and 2019, and most of them were isolatedfrom Myrothecium (Table 1; Figure 2). Only three compounds were isolated from Podostroma, and onefrom Stachybotrys (Figure 3). Four compounds belong to verrucarin-like trichothecenes (1, 2, 11, 18),and the others with a side chain of 14-carbon atoms could be recognized as roridins or satratoxins.It was reported that roridin may be the precursor of the respective verrucarin, because the C2-side chainat C-6′ of roridin might be cleaved by oxidation to form verrucarin [41,43]. Compounds 1–11 and 23
have a standard tricyclic core, namely EPT; however, compounds 12–20 lack the epoxide at C-12, C-13.Verrucarin Y (1) and verrucarin Z (2) were isolated from M. roridum M10 by Muhammad et al. [42].Verrucarin Y (1) shares the same structure with epiroridin acid (3) [29], except that the latter possesses anadditional C2-side chain at C-6′, implying that epiroridin acid (3) may be the homologue of verrucarinY (1) [41]. Verrucarin Z (2) has an epoxide ring at C-2′, C-3′ instead of the olefinic bond of verrucarin Y (1)at the same place, and the number of epoxide rings always has a significant impact on their biologicalactivities [42]. Several macrocyclic trichothecenes with additional rings have also been isolated fromMyrothecium (compounds 5–18), such as mytoxin, satratoxin, vertisporin, roritoxin, and myrothecine,the names of which generally indicated the genus that this kind of toxins were firstly isolated from [41].The second ring is closed by the connecting between C-6′ and C-12′ of the side chain. A third ring existsin some compounds, which is formed via an ester linkage between C-12′ and C-14′ (9, 10, 15) [30,44].Roritoxin E (10) [30], 6′,12′-epoxymyrotoxin A (11) [45], and 2′,3′-epoxymyrothecine A (18) [46] havethe epoxide ring at C-2′, C-3′; furthermore, 6′,12′-epoxymyrotoxin A (11) has an additional epoxidering at C-6′, C-12′. Due to the absence of the epoxide at C-12, C-13, compounds 12–20 belong to10,13-cyclotrichothecane derivatives [44,47]. Generally, 10,13-cyclotrichothecane macrolides have beenproved to be less cytotoxic than the trichothecenes with the epoxide at C-12, C-13 [46–48]. Roridin F(21) and satratoxin I (22) discovered from Podostroma cornu-damae, a deadly poisonous mushroom,are not complete macrolides, because the macrocyclic ester bridge between C-4 and C-15 are notclosed; however, they might be transformed into roridin E and satratoxin H, respectively, througha one-step esterification [32]. Chartarene D (23) is the only macrocyclic trichothecene isolated fromStachybotrys during the past decade [33]. This could be because the Stachybotrys fungi are not greatsource of trichothecenes, and most of them have been discovered before [28]. Search in the databaseWeb of Science about macrocyclic trichothecenes reported during the last twenty years, implies thatthere is a possibility that more novel macrocyclic trichothecenes will be isolated from Myrothecium andPodostroma, especially the latter.
141
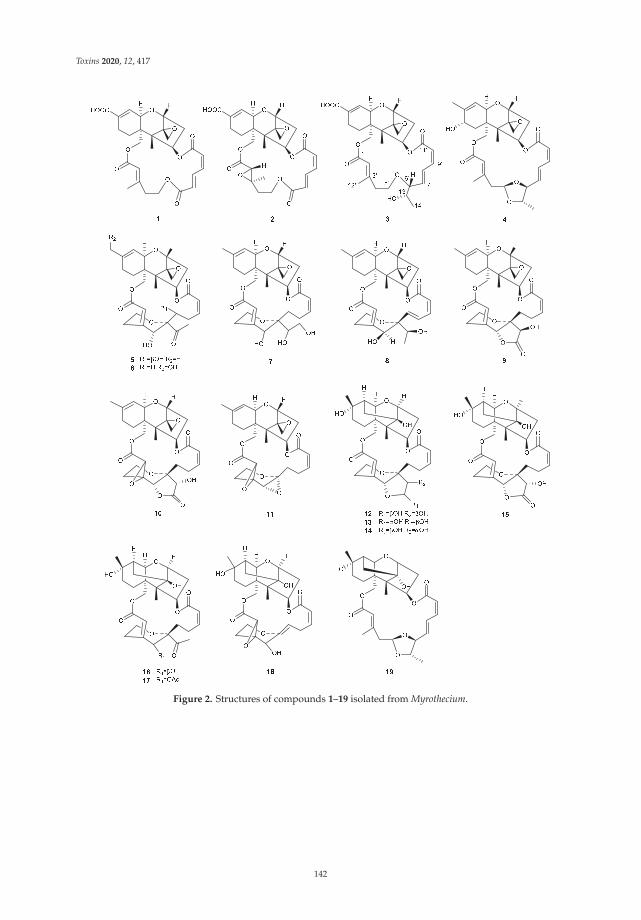
Toxins 2020, 12, 417
Figure 2. Structures of compounds 1–19 isolated from Myrothecium.
142
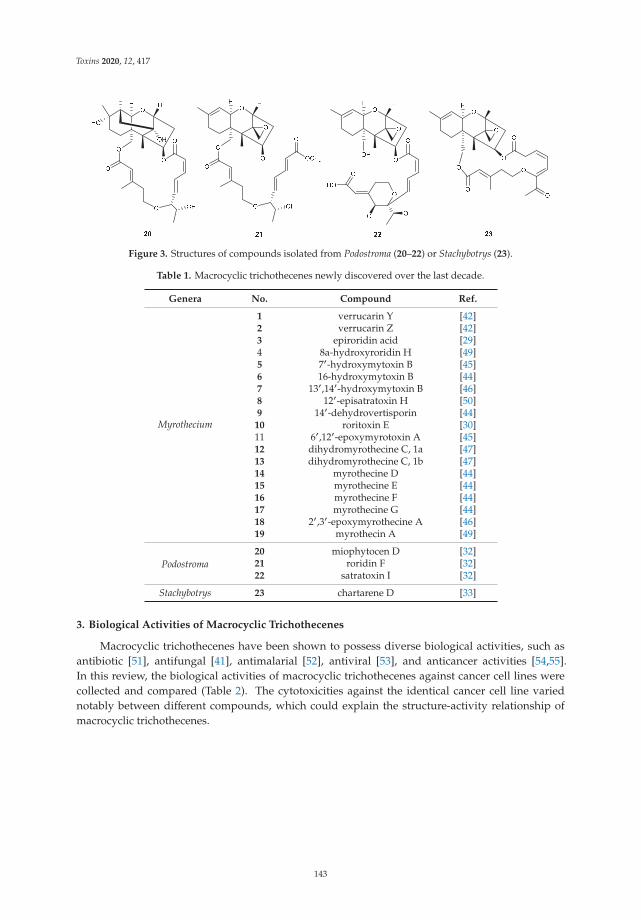
Toxins 2020, 12, 417
Figure 3. Structures of compounds isolated from Podostroma (20–22) or Stachybotrys (23).
Table 1. Macrocyclic trichothecenes newly discovered over the last decade.
Genera No. Compound Ref.
Myrothecium
1 verrucarin Y [42]2 verrucarin Z [42]3 epiroridin acid [29]4 8a-hydroxyroridin H [49]5 7′-hydroxymytoxin B [45]6 16-hydroxymytoxin B [44]7 13′,14′-hydroxymytoxin B [46]8 12′-episatratoxin H [50]9 14′-dehydrovertisporin [44]10 roritoxin E [30]11 6′,12′-epoxymyrotoxin A [45]12 dihydromyrothecine C, 1a [47]13 dihydromyrothecine C, 1b [47]14 myrothecine D [44]15 myrothecine E [44]16 myrothecine F [44]17 myrothecine G [44]18 2′,3′-epoxymyrothecine A [46]19 myrothecin A [49]
Podostroma20 miophytocen D [32]21 roridin F [32]22 satratoxin I [32]
Stachybotrys 23 chartarene D [33]
3. Biological Activities of Macrocyclic Trichothecenes
Macrocyclic trichothecenes have been shown to possess diverse biological activities, such asantibiotic [51], antifungal [41], antimalarial [52], antiviral [53], and anticancer activities [54,55].In this review, the biological activities of macrocyclic trichothecenes against cancer cell lines werecollected and compared (Table 2). The cytotoxicities against the identical cancer cell line variednotably between different compounds, which could explain the structure-activity relationship ofmacrocyclic trichothecenes.
143
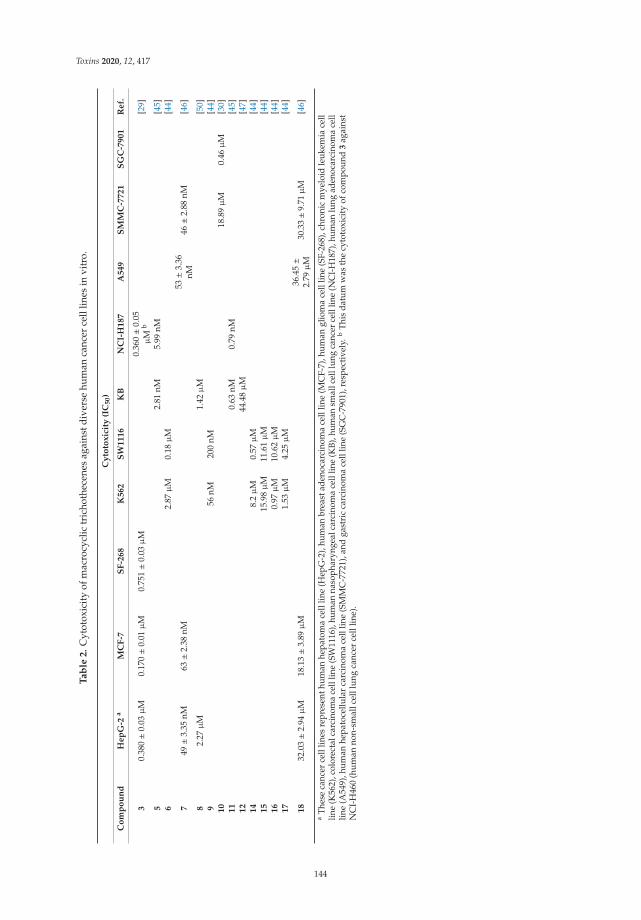
Toxins 2020, 12, 417
Ta
ble
2.
Cyt
otox
icit
yof
mac
rocy
clic
tric
hoth
ecen
esag
ains
tdiv
erse
hum
anca
ncer
cell
lines
invi
tro.
Cy
toto
xic
ity
(IC
50)
Co
mp
ou
nd
Hep
G-2
aM
CF
-7S
F-2
68
K562
SW
1116
KB
NC
I-H
187
A549
SM
MC
-7721
SG
C-7
901
Ref.
30.
380±0
.03μ
M0.
170±0
.01μ
M0.
751±0
.03μ
M0.
360±0
.05
μM
b[2
9]
52.
81nM
5.99
nM[4
5]6
2.87
μM
0.18
μM
[44]
749±3
.35
nM63±2
.38
nM53±3
.36
nM46±2
.88
nM[4
6]
82.
27μ
M1.
42μ
M[5
0]9
56nM
200
nM[4
4]10
18.8
9μ
M0.
46μ
M[3
0]11
0.63
nM0.
79nM
[45]
12
44.4
8μ
M[4
7]14
8.2μ
M0.
57μ
M[4
4]15
15.9
8μ
M11
.61μ
M[4
4]16
0.97
μM
10.6
2μ
M[4
4]17
1.53
μM
4.25
μM
[44]
18
32.0
3±2
.94μ
M18
.13±3
.89μ
M36
.45±
2.79
μM
30.3
3±9
.71μ
M[4
6]
aTh
ese
canc
erce
lllin
esre
pres
enth
uman
hepa
tom
ace
lllin
e(H
epG
-2),
hum
anbr
east
aden
ocar
cino
ma
cell
line
(MC
F-7)
,hum
angl
iom
ace
lllin
e(S
F-26
8),c
hron
icm
yelo
idle
ukem
iace
lllin
e(K
562)
,col
orec
talc
arci
nom
ace
lllin
e(S
W11
16),
hum
anna
soph
aryn
geal
carc
inom
ace
lllin
e(K
B),h
uman
smal
lcel
llun
gca
ncer
cell
line
(NC
I-H
187)
,hum
anlu
ngad
enoc
arci
nom
ace
lllin
e(A
549)
,hum
anhe
pato
cellu
lar
carc
inom
ace
lllin
e(S
MM
C-7
721)
,and
gast
ric
carc
inom
ace
lllin
e(S
GC
-790
1),r
espe
ctiv
ely.
bTh
isda
tum
was
the
cyto
toxi
city
ofco
mpo
und
3ag
ains
tN
CI-
H46
0(h
uman
non-
smal
lcel
llun
gca
ncer
cell
line)
.
144
Toxins 2020, 12, 417
Firstly, the existences of a double bond at C-9, C-10 and an epoxide at C-12, C-13 are the mostimportant structural features, which contributes to the significant differences in biological activity(Table 2) [1,45,46,56]. The compounds lacking this epoxide and a double bond at C-9, such as compounds12–20, are not likely to show cytotoxicity with a nanomolar level. Secondly, an increase of the additionalepoxide groups on the macrolide ring remarkably promote toxicity [1,57]. The 6′,12′-epoxymyrotoxinA (11), bearing an epoxide ring at C-6′, C-12′, showed quite strong cytotoxicity towards the KBand NCI-H187 cancer cell lines [45]. The substituent groups of other sites also affect the bioactivity.The carboxylation at C-16 could significantly reduce the cytotoxicity of epiroridin acid (3) compared toepiroridin [29]. The 12′-O-acetyl group in myrothecine G (17) enhanced bioactivity [44]. However,the hydroxylation of C-12′ decreased roridin E toxicity more than 1000-fold [58]. On the contrary,it has been reported that roridin H 8α-hydroxylation increased cytotoxicities towards MCF-7, Helacells KB3.1, and skin cancer cells A431, but the acetylation of this hydroxy group or no oxidationat C-8 decreased activity towards all the mentioned cell lines [41]. Compounds 6, 9, 14–17 wereevaluated for their in vitro cytotoxicities against K562 and SW1116, and the relatively large differencesin IC50 values suggested that the slight changes of the substituent group have obvious effects on thebiological selectivity of macrocyclic trichothecenes against cancer cell lines [44]. There have beensome studies suggesting that the breakage of the macrocyclic ring could dramatically decrease thecytotoxicity [45,54], and it was supported by the fact that roridin F (21) and satratoxin I (22) withoutmacrocyclic ring were almost inactive against cancer cell lines (data not included in Table 2) [32].All these data indicated that even small alterations in the molecular structure can lead to a substantialchange in biological activity or selectivity against cancer cell lines [41,59]. It should be noted thatconsiderable research have pointed out that the macrocyclic trichothecenes have more potential thanthe other types of trichothecenes to become antitumor agents [41,60]. Therefore, more attention shouldbe paid to exploration of the structure-activity relationships in the future.
There are some macrocyclic trichothecenes displaying other biological activities, such as antifungaland antimalarial activities. Verrucarin Z (2) showed a similar activity against Mucor miehei at aconcentration of 50 μg/disk when compared with the positive drug nystatin [42]. The 8a-hydroxyroridinH (4) and myrothecin A (19) exhibited bioactivities against plant pathogenic fungi Rhizoctonia solaniand Fusarium oxysporum [49]. Manami et al. suggested that the C-12-epoxide of trichothecene wasessential for the antifungal activity against Cochliobolus miyabeanus [61]. Besides the cytotoxicity againstthe KB and NCI-H187 cell lines, 7′-hydroxymytoxin B (5) and 6′,12′-epoxymyrotoxin A (11) exhibitedstrong antimalarial activity against Plasmodium falciparum with 86.1% (1.84 nM) and 98.85% (2 nM)parasite inhibition, respectively [45].
4. Biosynthetic Pathway
Despite considerable published research on macrocyclic trichothecene, the biosynthetic pathwayof Type D trichothecene remains obscure, especially on how the macrocycle is formed and linked to EPT.To date it has been well known that this mechanism is associated with genes tri17 and tri18, but how theyfunction is still being studied (Figure 4). According to previously reported BLAST analyses and functionprediction [10,62], tri17 is regarded as a polyketide synthase gene, and tri18 as an acyltransferase gene.Based on the existence of tri17 and tri18 in the Stachybotrys TRI cluster, Semeiks et al. speculatedthat the polyketide portion catalyzed by Tri17 protein participate in the biosynthesis of macrocyclictrichothecene in Stachybotrys [26]. Through gene deletion and complementation analyses, gene tri17 inTrichoderma arundinaceum IBT 40,837 (Ta37) was confirmed to be essential for synthesis of the polyketideside chain of harzianum A (Figure 4). Furthermore, the complementation of M. roridum tri17 intoTa37 could recover harzianum A production, demonstrating that tri17 from different species played asimilar role in biosynthesis of the polyketide-derived substituents of macrocyclic trichothecene [10].Polyketide synthase is generally a delicate and complicate enzyme, containing several functionallydiverse domains, including acyl carrier protein (ACP), acyl transferase (AT), ketosynthase (KS),ketoreductase (KR), dehydratase (DH), and enoylreductase (ER), all of which conjointly and sequentially
145
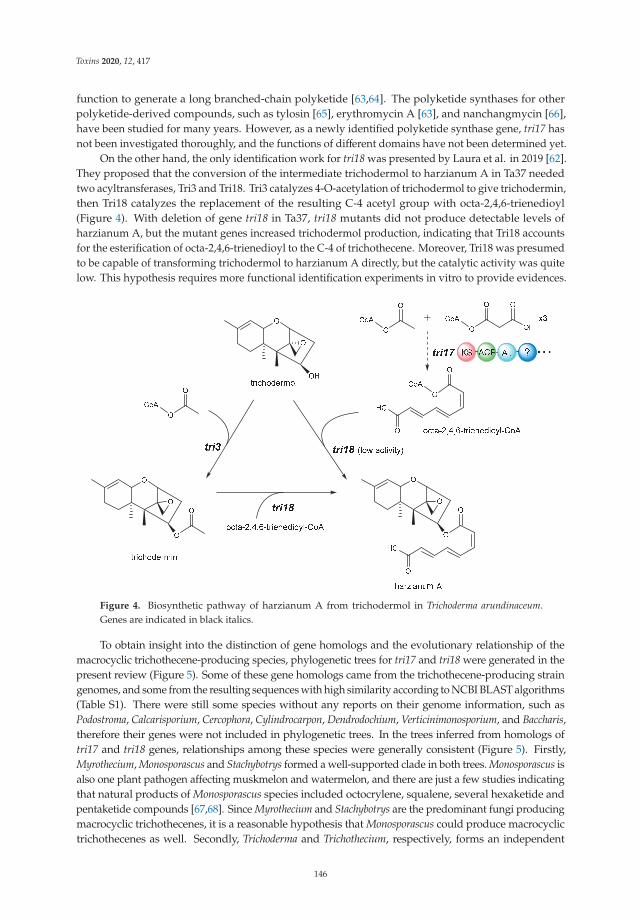
Toxins 2020, 12, 417
function to generate a long branched-chain polyketide [63,64]. The polyketide synthases for otherpolyketide-derived compounds, such as tylosin [65], erythromycin A [63], and nanchangmycin [66],have been studied for many years. However, as a newly identified polyketide synthase gene, tri17 hasnot been investigated thoroughly, and the functions of different domains have not been determined yet.
On the other hand, the only identification work for tri18 was presented by Laura et al. in 2019 [62].They proposed that the conversion of the intermediate trichodermol to harzianum A in Ta37 neededtwo acyltransferases, Tri3 and Tri18. Tri3 catalyzes 4-O-acetylation of trichodermol to give trichodermin,then Tri18 catalyzes the replacement of the resulting C-4 acetyl group with octa-2,4,6-trienedioyl(Figure 4). With deletion of gene tri18 in Ta37, tri18 mutants did not produce detectable levels ofharzianum A, but the mutant genes increased trichodermol production, indicating that Tri18 accountsfor the esterification of octa-2,4,6-trienedioyl to the C-4 of trichothecene. Moreover, Tri18 was presumedto be capable of transforming trichodermol to harzianum A directly, but the catalytic activity was quitelow. This hypothesis requires more functional identification experiments in vitro to provide evidences.
Figure 4. Biosynthetic pathway of harzianum A from trichodermol in Trichoderma arundinaceum.Genes are indicated in black italics.
To obtain insight into the distinction of gene homologs and the evolutionary relationship of themacrocyclic trichothecene-producing species, phylogenetic trees for tri17 and tri18 were generated in thepresent review (Figure 5). Some of these gene homologs came from the trichothecene-producing straingenomes, and some from the resulting sequences with high similarity according to NCBI BLAST algorithms(Table S1). There were still some species without any reports on their genome information, such asPodostroma, Calcarisporium, Cercophora, Cylindrocarpon, Dendrodochium, Verticinimonosporium, and Baccharis,therefore their genes were not included in phylogenetic trees. In the trees inferred from homologs oftri17 and tri18 genes, relationships among these species were generally consistent (Figure 5). Firstly,Myrothecium, Monosporascus and Stachybotrys formed a well-supported clade in both trees. Monosporascus isalso one plant pathogen affecting muskmelon and watermelon, and there are just a few studies indicatingthat natural products of Monosporascus species included octocrylene, squalene, several hexaketide andpentaketide compounds [67,68]. Since Myrothecium and Stachybotrys are the predominant fungi producingmacrocyclic trichothecenes, it is a reasonable hypothesis that Monosporascus could produce macrocyclictrichothecenes as well. Secondly, Trichoderma and Trichothecium, respectively, forms an independent
146
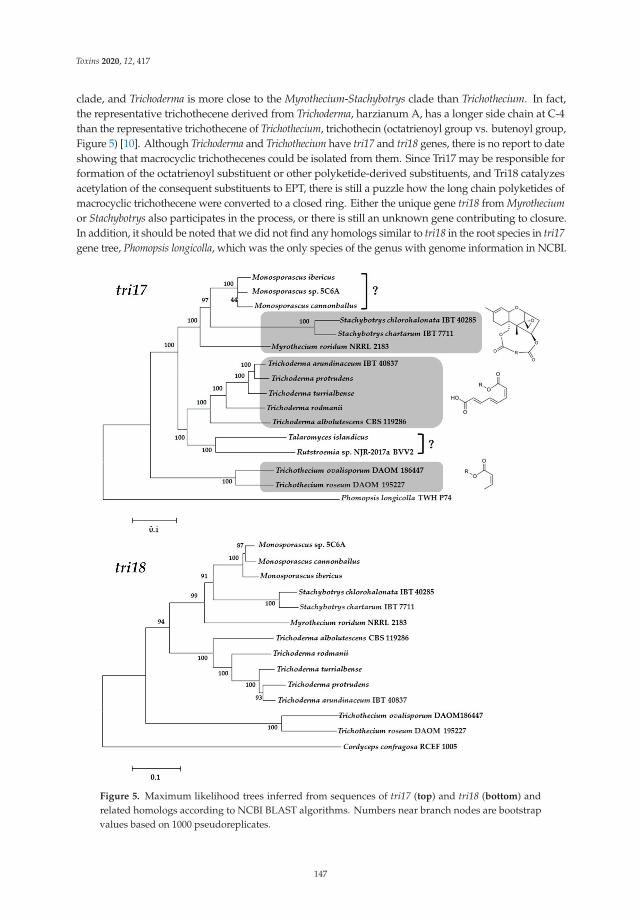
Toxins 2020, 12, 417
clade, and Trichoderma is more close to the Myrothecium-Stachybotrys clade than Trichothecium. In fact,the representative trichothecene derived from Trichoderma, harzianum A, has a longer side chain at C-4than the representative trichothecene of Trichothecium, trichothecin (octatrienoyl group vs. butenoyl group,Figure 5) [10]. Although Trichoderma and Trichothecium have tri17 and tri18 genes, there is no report to dateshowing that macrocyclic trichothecenes could be isolated from them. Since Tri17 may be responsible forformation of the octatrienoyl substituent or other polyketide-derived substituents, and Tri18 catalyzesacetylation of the consequent substituents to EPT, there is still a puzzle how the long chain polyketides ofmacrocyclic trichothecene were converted to a closed ring. Either the unique gene tri18 from Myrotheciumor Stachybotrys also participates in the process, or there is still an unknown gene contributing to closure.In addition, it should be noted that we did not find any homologs similar to tri18 in the root species in tri17gene tree, Phomopsis longicolla, which was the only species of the genus with genome information in NCBI.
Figure 5. Maximum likelihood trees inferred from sequences of tri17 (top) and tri18 (bottom) andrelated homologs according to NCBI BLAST algorithms. Numbers near branch nodes are bootstrapvalues based on 1000 pseudoreplicates.
147
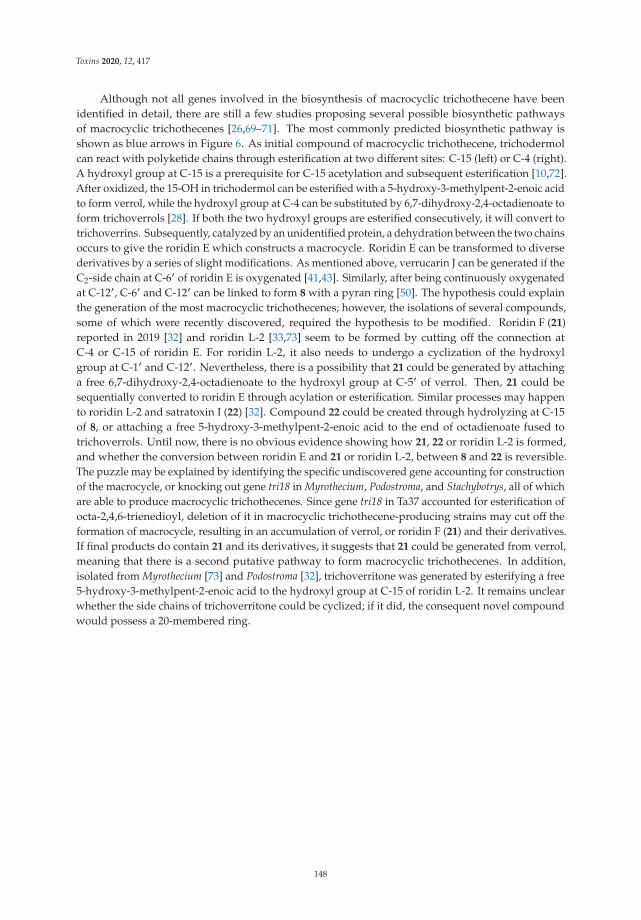
Toxins 2020, 12, 417
Although not all genes involved in the biosynthesis of macrocyclic trichothecene have beenidentified in detail, there are still a few studies proposing several possible biosynthetic pathwaysof macrocyclic trichothecenes [26,69–71]. The most commonly predicted biosynthetic pathway isshown as blue arrows in Figure 6. As initial compound of macrocyclic trichothecene, trichodermolcan react with polyketide chains through esterification at two different sites: C-15 (left) or C-4 (right).A hydroxyl group at C-15 is a prerequisite for C-15 acetylation and subsequent esterification [10,72].After oxidized, the 15-OH in trichodermol can be esterified with a 5-hydroxy-3-methylpent-2-enoic acidto form verrol, while the hydroxyl group at C-4 can be substituted by 6,7-dihydroxy-2,4-octadienoate toform trichoverrols [28]. If both the two hydroxyl groups are esterified consecutively, it will convert totrichoverrins. Subsequently, catalyzed by an unidentified protein, a dehydration between the two chainsoccurs to give the roridin E which constructs a macrocycle. Roridin E can be transformed to diversederivatives by a series of slight modifications. As mentioned above, verrucarin J can be generated if theC2-side chain at C-6′ of roridin E is oxygenated [41,43]. Similarly, after being continuously oxygenatedat C-12′, C-6′ and C-12′ can be linked to form 8 with a pyran ring [50]. The hypothesis could explainthe generation of the most macrocyclic trichothecenes; however, the isolations of several compounds,some of which were recently discovered, required the hypothesis to be modified. Roridin F (21)reported in 2019 [32] and roridin L-2 [33,73] seem to be formed by cutting off the connection atC-4 or C-15 of roridin E. For roridin L-2, it also needs to undergo a cyclization of the hydroxylgroup at C-1′ and C-12′. Nevertheless, there is a possibility that 21 could be generated by attachinga free 6,7-dihydroxy-2,4-octadienoate to the hydroxyl group at C-5′ of verrol. Then, 21 could besequentially converted to roridin E through acylation or esterification. Similar processes may happento roridin L-2 and satratoxin I (22) [32]. Compound 22 could be created through hydrolyzing at C-15of 8, or attaching a free 5-hydroxy-3-methylpent-2-enoic acid to the end of octadienoate fused totrichoverrols. Until now, there is no obvious evidence showing how 21, 22 or roridin L-2 is formed,and whether the conversion between roridin E and 21 or roridin L-2, between 8 and 22 is reversible.The puzzle may be explained by identifying the specific undiscovered gene accounting for constructionof the macrocycle, or knocking out gene tri18 in Myrothecium, Podostroma, and Stachybotrys, all of whichare able to produce macrocyclic trichothecenes. Since gene tri18 in Ta37 accounted for esterification ofocta-2,4,6-trienedioyl, deletion of it in macrocyclic trichothecene-producing strains may cut off theformation of macrocycle, resulting in an accumulation of verrol, or roridin F (21) and their derivatives.If final products do contain 21 and its derivatives, it suggests that 21 could be generated from verrol,meaning that there is a second putative pathway to form macrocyclic trichothecenes. In addition,isolated from Myrothecium [73] and Podostroma [32], trichoverritone was generated by esterifying a free5-hydroxy-3-methylpent-2-enoic acid to the hydroxyl group at C-15 of roridin L-2. It remains unclearwhether the side chains of trichoverritone could be cyclized; if it did, the consequent novel compoundwould possess a 20-membered ring.
148
Toxins 2020, 12, 417
Figure 6. Plausible biogenetic pathway of macrocyclic trichothecenes. Blue arrows indicate the mostpredicted pathway; interrogation marks indicate that the process between two compounds still remainsuncovered; gray ball represents a predicted unknown compound with a very large ring.
5. Conclusions and Outlook
Trichothecenes have been studied for more than 40 years. Initially, trichothecenes were wellknown and studied as the important contamination sources of grains [2,74], building materials [75,76],
149
Toxins 2020, 12, 417
and air-handling systems [7]. However, because of a large number of identification of new macrocyclictrichothecenes and their diverse bioactivities, they have drawn much attention from chemists andpharmacists as research hotspots [41,77,78]. We have summarized the macrocyclic trichothecenesreported during the last ten years and their biological activities. Although there are many speciescapable of macrocyclic trichothecene production, the newly discovered compounds were isolated fromMyrothecium, Podostroma and Stachybotrys. Meanwhile, summary review in bioactivity studies revealedthat the small changes between structurally similar compounds isolated from different species canresult in a considerable alteration on bioactivity and/or selectivity against cancer cell lines [41,59],which again confirmed the great potential of macrocyclic trichothecenes as antitumor drugs. We alsooverviewed the recent advances in the identification of genes involved in the formation of macrocycleand plausible biosynthetic pathways. Knowledge obtained from functional analyses of tri17 andtri18 genes in Trichoderma has contributed significantly to insights into the evolutionary history ofmacrocyclic trichothecene biosynthesis. In terms of phylogenetic trees generated in the review andthe presence of the highly similar genes tri17 and tri18 in Monosporascus, it was suggested that thesespecies would probably be a source of macrocyclic trichothecenes. Furthermore, based on severalnewly isolated intermediates, we propose that there is a second biosynthetic pathway of macrocyclictrichothecene. An identification assay of the genes responsible for constructing the macrocycle inmacrocyclic trichothecene-producing strains (maybe tri18 or other unidentified gene), will be critical tomore precisely clarify the biosynthesis mechanism of potential anticancer compounds.
Supplementary Materials: The following are available online at http://www.mdpi.com/2072-6651/12/6/417/s1,Table S1: Information on fungal strains and genome sequences examined in the current study.
Author Contributions: Conceptualization, M.Z. and W.Z.; software and figure preparation, Y.C.; data collection,S.L.; writing—original draft preparation, M.Z.; writing—review and editing, W.Y. and W.Z. All authors have readand agreed to the published version of the manuscript.
Funding: This research was funded by the National Natural Science Foundation of China (grant 31800063),the National Natural Science Foundation of Guangdong Province (2019A1515011702, 2019A1515011829), GDAS’Project of Science and Technology Development (2020GDASYL-20200104012), Guangdong Provincial SpecialFund for Marine Economic Development Project (Yue Natural Resources Contract No. [2020]042).
Conflicts of Interest: The authors declare no conflicts of interest.
References
1. Wu, Q.H.; Dohnal, V.; Kuca, K.; Yuan, Z.H. Trichothecenes: Structure-toxic activity relationships.Curr. Drug Metab. 2013, 14, 641–660. [CrossRef] [PubMed]
2. McMullen, M.; Jones, R.; Gallenberg, D. Scab of wheat and barley: A re-emerging disease of devastatingimpact. Plant Dis. 1997, 81, 1340–1348. [CrossRef] [PubMed]
3. Eriksen, G.S.; Pettersson, H. Toxicological evaluation of trichothecenes in animal feed. Anim. Feed Sci. Technol.2004, 114, 205–239. [CrossRef]
4. Pascari, X.; Maul, R.; Kemmlein, S.; Marin, S.; Sanchis, V. The fate of several trichothecenes and zearalenoneduring roasting and enzymatic treatment of cereal flour applied in cereal-based infant food production.Food Control 2020, 114. [CrossRef]
5. Habrowska-Gorczynska, D.E.; Kowalska, K.; Urbanek, K.A.; Dominska, K.; Sakowicz, A.;Piastowska-Ciesielska, A.W. Deoxynivalenol modulates the viability, ROS production and apoptosis in prostatecancer cells. Toxins 2019, 11, 265. [CrossRef]
6. Opoku, N.; Back, M.A.; Edwards, S.G. Susceptibility of cereal species to Fusarium langsethiae under identicalfield conditions. Eur. J. Plant Pathol. 2018, 150, 869–879. [CrossRef]
7. McCormick, S.P.; Stanley, A.M.; Stover, N.A.; Alexander, N.J. Trichothecenes: From simple to complexmycotoxins. Toxins 2011, 3, 802–814. [CrossRef]
8. Grove, J.F. The trichothecenes and their biosynthesis. Cheminform 2007, 38, 63–130. [CrossRef]9. Tamm, C.; Breitenstein, W. The Biosynthesis of Mycotoxins: A Study of Secondary Metabolism; Academic Press:
New York, NY, USA, 1980; pp. 69–104.
150
Toxins 2020, 12, 417
10. Proctor, R.H.; McCormick, S.P.; Kim, H.S.; Cardoza, R.E.; Stanley, A.M.; Lindo, L.; Kelly, A.; Brown, D.W.;Lee, T.; Vaughan, M.M.; et al. Evolution of structural diversity of trichothecenes, a family of toxins producedby plant pathogenic and entomopathogenic fungi. PLoS Path. 2018, 14, e1006946. [CrossRef]
11. Kimura, M.; Tokai, T.; Takahashi-Ando, N.; Ohsato, S.; Fujimura, M. Molecular and genetic studies ofFusarium trichothecene biosynthesis: Pathways, genes, and evolution. Biosci. Biotechnol. Biochem. 2007, 71,2105–2123. [CrossRef]
12. Alexander, N.J.; Proctor, R.H.; McCormick, S.P. Genes, gene clusters, and biosynthesis of trichothecenes andfumonisins in Fusarium. Toxin Rev. 2009, 28, 198–215. [CrossRef]
13. Brown, D.W.; Dyer, R.B.; McCormick, S.P.; Kendra, D.F.; Plattner, R.D. Functional demarcation of theFusarium core trichothecene gene cluster. Fungal Genet. Biol. 2004, 41, 454–462. [CrossRef] [PubMed]
14. Garvey, G.S.; McCormick, S.P.; Alexander, N.J.; Rayment, I. Structural and functional characterization of TRI3trichothecene 15-O-acetyltransferase from Fusarium sporotrichioides. Protein Sci. 2009, 18, 747–761. [CrossRef][PubMed]
15. Hohn, T.M.; Krishna, R.; Proctor, R.H. Characterization of a transcriptional activator controlling trichothecenetoxin biosynthesis. Fungal Genet. Biol. 1999, 26, 224–235. [CrossRef] [PubMed]
16. Malmierca, M.G.; Cardoza, R.E.; Alexander, N.J.; McCormick, S.P.; Collado, I.G.; Hermosa, R.; Monte, E.;Gutierrez, S. Relevance of trichothecenes in fungal physiology: Disruption of tri5 in Trichoderma arundinaceum.Fungal Genet. Biol. 2013, 53, 22–33. [CrossRef] [PubMed]
17. Garvey, G.S.; McCormick, S.P.; Rayment, I. Structural and functional characterization of the TRI101trichothecene 3-O-acetyltransferase from Fusarium sporotrichioides and Fusarium graminearum—Kineticinsights to combating fusarium head blight. J. Biol. Chem. 2008, 283, 1660–1669. [CrossRef] [PubMed]
18. Cardoza, R.E.; Malmierca, M.G.; Hermosa, M.R.; Alexander, N.J.; McCormick, S.P.; Proctor, R.H.;Tijerino, A.M.; Rumbero, A.; Monte, E.; Gutierrez, S. Identification of loci and functional characterization oftrichothecene biosynthesis genes in filamentous fungi of the genus Trichoderma. Appl. Environ. Microbiol.2011, 77, 4867–4877. [CrossRef]
19. McCormick, S.P.; Alexander, N.J.; Proctor, R.H. Fusarium Tri4 encodes a multifunctional oxygenase requiredfor trichothecene biosynthesis. Can. J. Microbiol. 2006, 52, 636–642. [CrossRef]
20. McCormick, S.P.; Alexander, N.J. Myrothecium roridum Tri4 encodes a multifunctional oxygenase required forthree oxygenation steps. Can. J. Microbiol. 2007, 53, 572–579. [CrossRef]
21. Tokai, T.; Koshino, H.; Takahashi-Ando, N.; Sato, M.; Fujimura, M.; Kimura, M. Fusarium Tri4 encodes a keymultifunctional cytochrome P450 monooxygenase for four consecutive oxygenation steps in trichothecenebiosynthesis. Biochem. Biophys. Res. Commun. 2007, 353, 412–417. [CrossRef]
22. Lee, T.; Han, Y.K.; Kim, K.H.; Yun, S.H.; Lee, Y.W. Tri13 and Tri7 determine deoxynivalenol- andnivalenol-producing chemotypes of Gibberella zeae. Appl. Environ. Microbiol. 2002, 68, 2148–2154. [CrossRef][PubMed]
23. Brown, D.W.; McCormick, S.P.; Alexander, N.J.; Proctor, R.H.; Desjardins, A.E. Inactivation of a cytochromeP450 is a determinant of trichothecene diversity in Fusarium species. Fungal Genet. Biol. 2002, 36, 224–233.[CrossRef]
24. Alexander, N.J.; McCormick, S.P.; Waalwijk, C.; van der Lee, T.; Proctor, R.H. The genetic basis for 3-ADONand 15-ADON trichothecene chemotypes in Fusarium. Fungal Genet. Biol. 2011, 48, 485–495. [CrossRef]
25. Villafana, R.T.; Ramdass, A.C.; Rampersad, S.N. Selection of Fusarium trichothecene toxin genes for moleculardetection depends on TRI gene cluster organization and gene function. Toxins 2019, 11, 36. [CrossRef][PubMed]
26. Semeiks, J.; Borek, D.; Otwinowski, Z.; Grishin, N.V. Comparative genome sequencing revealschemotype-specific gene clusters in the toxigenic black mold Stachybotrys. BMC Genom. 2014, 15. [CrossRef][PubMed]
27. Corley, D.G.; Millerwideman, M.; Durley, R.C. Isolation and Structure of Harzianum A: A New Trichothecenefrom Trichoderma harzianum. J. Nat. Prod. 1994, 57, 422–425. [CrossRef]
28. Wang, A.R.; Xu, Y.B.; Gao, Y.X.; Huang, Q.; Luo, X.; An, H.M.; Dong, J.Y. Chemical and bioactive diversitiesof the genera Stachybotrys and Memnoniella secondary metabolites. Phytochem. Rev. 2015, 14, 623–655.[CrossRef]
151
Toxins 2020, 12, 417
29. Liu, H.X.; Liu, W.Z.; Chen, Y.C.; Sun, Z.H.; Tan, Y.Z.; Li, H.H.; Zhang, W.M. Cytotoxic trichothecenemacrolides from the endophyte fungus Myrothecium roridum. J. Asian Nat. Prod. Res. 2016, 18, 684–689.[CrossRef]
30. Shen, L.; Wang, J.A.S.; Shen, H.J.; Song, Y.C.; Tan, R.X. A new cytotoxic trichothecene macrolide from theendophyte Myrothecium roridum. Planta Med. 2010, 76, 1004–1006. [CrossRef]
31. Zhao, L.; Liu, L.; Wang, N.; Wang, S.J.; Hu, J.C.; Gao, J.M. Potent Toxic Macrocyclic Trichothecenes fromthe Marine-Derived Fungus Myrothecium verrucaria Hmp-F73. Nat. Prod. Commun. 2011, 6, 1915–1916.[CrossRef]
32. Lee, S.R.; Seok, S.; Ryoo, R.; Choi, S.U.; Kim, K.H. Macrocyclic trichothecene mycotoxins from a deadlypoisonous mushroom, Podostroma cornu-damae. J. Nat. Prod. 2019, 82, 122–128. [CrossRef] [PubMed]
33. Li, Y.; Liu, D.; Cheng, Z.B.; Proksch, P.; Lin, W.H. Cytotoxic trichothecene-type sesquiterpenes from thesponge-derived fungus Stachybotrys chartarum with tyrosine kinase inhibition. RSC Adv. 2017, 7, 7259–7267.[CrossRef]
34. Yu, N.J.; Guo, S.X.; Lu, H.Y. Cytotoxic macrocyclic trichothecenes from the mycelia of Calcarisporium arbusculaPreuss. J. Asian Nat. Prod. Res. 2002, 4, 179–183. [CrossRef] [PubMed]
35. Whyte, A.C.; Gloer, J.B.; Scott, J.A.; Malloch, D. Cercophorins A–C: Novel antifungal and cytotoxic metabolitesfrom the coprophilous fungus Cercophora areolata. J. Nat. Prod. 1996, 59, 765–769. [CrossRef] [PubMed]
36. Matsumoto, M.; Minato, H.; Tori, K.; Ueyama, M. Structures of Isororidin E, Epoxyisororidin E, and Epoxy Hand Diepoxyroridin H, New Metabolites Isolated from Cylindrocarpon Species Determined by C-13 and H-1NMR Spectroscopy. Revision of C-2′:C-3′ Double-Bond Configuration of Roridin Group. Tetrahedron Lett.1977, 18, 4093–4096. [CrossRef]
37. Panozish, K.P.; Borovkov, A.V. Roridin a from Dendrodochium toxicum. Khimiya Prir. Soedin. 1974, 10, 404–405.38. Samples, D.; Hill, D.W.; Bridges, C.H.; Camp, B.J. Isolation of a mycotoxin (roridin A) from Phomopsis spp.
Vet. Hum. Toxicol. 1984, 26, 21–23.39. Minato, H.; Katayama, T.; Tori, K. Vertisporin, a New Antibiotic from Verticimonosporium diffractum.
Tetrahedron Lett. 1975, 16, 2579–2582. [CrossRef]40. Kupchan, S.M.; Jarvis, B.B.; Dailey, R.J., Jr.; Bright, W.; Bryan, R.F.; Shizuri, Y. Baccharin, a novel potent
antileukemic trichothecene triepoxide from Baccharis megapotamica. J. Am. Chem. Soc. 1976, 98, 7092–7093.[CrossRef]
41. De Carvalho, M.P.; Weich, H.; Abraham, W.R. Macrocyclic trichothecenes as antifungal and anticancercompounds. Curr. Med. Chem. 2016, 23, 23–35. [CrossRef]
42. Mondol, M.A.; Surovy, M.Z.; Islam, M.T.; Schuffler, A.; Laatsch, H. Macrocyclic trichothecenesfrom Myrothecium roridum strain M10 with motility inhibitory and zoosporicidal activities againstPhytophthora nicotianae. J. Agric. Food Chem. 2015, 63, 8777–8786. [CrossRef] [PubMed]
43. Jarvis, B.B.; Stahly, G.P.; Pavanasasivam, G.; Midiwo, J.O.; Geoghegan, R.F. Isolation and characterization ofthe trichoverroids and new roridins and verrucarins. J. Org. Chem. 1981, 47, 1117–1124. [CrossRef]
44. Shen, L.; Ai, C.Z.; Song, Y.C.; Wang, F.W.; Jiao, R.H.; Zhang, A.H.; Man, H.Z.; Tan, R.X. Cytotoxic trichothecenemacrolides produced by the endophytic Myrothecium roridum. J. Nat. Prod. 2019, 82, 1503–1509. [CrossRef][PubMed]
45. Lakornwong, W.; Kanokmedhakul, K.; Soytong, K.; Unartngam, A.; Tontapha, S.; Amornkitbamrung, V.;Kanokmedhakul, S. Types A and D trichothecene mycotoxins from the fungus Myrothecium roridum.Planta Med. 2019, 85, 774–780. [CrossRef]
46. Lin, T.; Wang, G.H.; Zhou, Y.Q.; Zeng, D.Q.; Liu, X.X.; Ding, R.; Jiang, X.; Zhu, D.; Shan, W.J.; Chen, H.F.Structure elucidation and biological activity of two new trichothecenes from an endophyte, Myrothecium roridum.J. Agric. Food Chem. 2014, 62, 5993–6000. [CrossRef]
47. Shen, L.; Zhu, L.; Tan, Q.W.; Wan, D.; Xie, J.; Peng, J.N. New cytotoxic trichothecene macrolide epimers fromendophytic Myrothecium roridum IFB-E012. J. Antibiot. 2016, 69, 652–655. [CrossRef]
48. Shen, L.; Jiao, R.H.; Ye, Y.H.; Wang, X.T.; Xu, C.; Song, Y.C.; Zhu, H.L.; Tan, R.X. Absolute configuration ofnew cytotoxic and other bioactive trichothecene macrolides. Chemistry 2006, 12, 5596–5602. [CrossRef]
49. Zhang, S.Y.; Li, Z.L.; Guan, L.P.; Wu, X.; Pan, H.Q.; Bai, J.; Hua, H.M. Structure determination of two newtrichothecenes from a halotolerant fungus Myrothecium sp. GS-17 by NMR spectroscopy. Magn. Reson. Chem.2012, 50, 632–636. [CrossRef]
152
Toxins 2020, 12, 417
50. Piao, M.Z.; Shen, L.; Wang, F.W. A new trichothecene from Myrothecium roridum QDFE005, a symbioticfungus isolated from Mactra chinensis. J. Asian Nat. Prod. Res. 2013, 15, 1284–1289. [CrossRef] [PubMed]
51. Matsumoto, M.; Minato, H.; Uotani, N.; Matsumoto, K.; Kondo, E. New antibiotics from Cylindrocarpon sp.J. Antibiot. 1977, 30, 681–682. [CrossRef] [PubMed]
52. Zhang, H.J.; Tamez, P.A.; Aydogmus, Z.; Tan, G.T.; Saikawa, Y.; Hashimoto, K.; Nakata, M.; Hung, N.V.;Xuan le, T.; Cuong, N.M.; et al. Antimalarial agents from plants. III. Trichothecenes from Ficus fistulosa andRhaphidophora decursiva. Planta Med. 2002, 68, 1088–1091. [CrossRef] [PubMed]
53. Garcia, C.C.; Rosso, M.L.; Bertoni, M.D.; Maier, M.S.; Damonte, E.B. Evaluation of the antiviral activity againstJunin virus of macrocyclic trichothecenes produced by the hypocrealean epibiont of Baccharis coridifolia.Planta Med. 2002, 68, 209–212. [CrossRef] [PubMed]
54. Amagata, T.; Rath, C.; Rigot, J.F.; Tarlov, N.; Tenney, K.; Valeriote, F.A.; Crews, P. Structures andcytotoxic properties of trichoverroids and their macrolide analogues produced by saltwater culture ofMyrothecium verrucaria. J. Med. Chem. 2003, 46, 4342–4350. [CrossRef] [PubMed]
55. Jayasooriya, R.G.P.T.; Moon, D.O.; Park, S.R.; Choi, Y.H.; Asami, Y.; Kim, M.O.; Jang, J.H.; Kim, B.Y.; Ahn, J.S.;Kim, G.Y. Combined treatment with verrucarin A and tumor necrosis factor-alpha sensitizes apoptosisby overexpression of nuclear factor-kappaB-mediated Fas. Environ. Toxicol. Pharmacol. 2013, 36, 303–310.[CrossRef]
56. Brase, S.; Encinas, A.; Keck, J.; Nising, C.F. Chemistry and Biology of Mycotoxins and Related FungalMetabolites. Chem. Rev. 2009, 109, 3903–3990. [CrossRef]
57. Steinmetz, W.E.; Rodarte, C.B.; Lin, A. 3D QSAR study of the toxicity of trichothecene mycotoxins. Eur. J.Med. Chem. 2009, 44, 4485–4489. [CrossRef]
58. Oda, T.; Xu, J.; Ukai, K.; Nakazawa, T.; Namikoshi, M. 12′-Hydroxyl group remarkably reduces Roridin Ecytotoxicity. Mycoscience 2010, 51, 317–320. [CrossRef]
59. Wu, Q.H.; Wang, X.; Nepovimova, E.; Miron, A.; Liu, Q.Y.; Wang, Y.; Su, D.X.; Yang, H.L.; Li, L.; Kuca, K.Trichothecenes: Immunomodulatory effects, mechanisms, and anti-cancer potential. Arch. Toxicol. 2017, 91,3737–3785. [CrossRef]
60. Smitka, T.A.; Bunge, R.H.; Bloem, R.J.; French, J.C. Two new trichothecenes, PD 113,325 and PD 113,326.J. Antibiot. 1984, 37, 823–828. [CrossRef]
61. Matsumoto, M.; Nishiyama, M.; Maeda, H.; Tonouchi, A.; Konno, K.; Hashimoto, M. Structure-activityrelationships of trichothecenes against COLO201 cells and Cochliobolus miyabeanus: The role of 12-epoxideand macrocyclic moieties. Bioorg. Med. Chem. Lett. 2019, 29, 982–985. [CrossRef]
62. Lindo, L.; McCormick, S.P.; Cardoza, R.E.; Busman, M.; Alexander, N.J.; Proctor, R.H.; Gutierrez, S.Requirement of two acyltransferases for 4-O-acylation during biosynthesis of harzianum A, an antifungaltrichothecene produced by Trichoderma arundinaceum. J. Agric. Food Chem. 2019, 67, 723–734. [CrossRef][PubMed]
63. Weissman, K.J. Genetic engineering of modular PKSs: From combinatorial biosynthesis to synthetic biology.Nat. Prod. Rep. 2016, 33, 203–230. [CrossRef] [PubMed]
64. Xie, X.Q.; Garg, A.; Khosla, C.; Cane, D.E. Mechanism and stereochemistry of polyketide chain elongation andmethyl group epimerization in polyether biosynthesis. J. Am. Chem. Soc. 2017, 139, 3283–3292. [CrossRef][PubMed]
65. Valenzano, C.R.; Lawson, R.J.; Chen, A.Y.; Khosla, C.; Cane, D.E. The biochemical basis for stereochemicalcontrol in polyketide biosynthesis. J. Am. Chem. Soc. 2009, 131, 18501–18511. [CrossRef]
66. Liu, T.G.; Lin, X.; Zhou, X.F.; Deng, Z.X.; Cane, D.E. Mechanism of thioesterase-catalyzed chain release in thebiosynthesis of the polyether antibiotic nanchangmycin. Chem. Biol. 2008, 15, 449–458. [CrossRef]
67. Al-Rawahi, A.Y.; Al-Mahmooli, I.H.; Al-Sadi, A.M.; Al-Sabahi, J.N.; Velazhahan, R. Toxin production bymelon root rot fungus, Monosporascus cannonballus. Australas. Plant Path. 2018, 47, 543–546. [CrossRef]
68. Wheeler, M.H.; Bruton, B.D.; Puckhaber, L.S.; Zhang, J.X.; Stipanovic, R.D. Identification of1,8-dihydroxynaphthalene melanin in Monosporascus cannonballus and the analysis of hexaketide andpentaketide compounds produced by wild-type and pigmented isolates of the fungus. J. Agric. Food Chem.2004, 52, 4113–4120. [CrossRef]
69. Trapp, S.C.; Hohn, T.M.; McCormick, S.; Jarvis, B.B. Characterization of the gene cluster for biosynthesis ofmacrocyclic trichothecenes in Myrothecium roridum. Mol. Gen. Genet. 1998, 257, 421–432. [CrossRef]
153
Toxins 2020, 12, 417
70. Degenkolb, T.; Dieckmann, R.; Nielsen, K.F.; Grafenhan, T.; Theis, C.; Zafari, D.; Chaverri, P.; Ismaiel, A.;Bruckner, H.; von Dohren, H.; et al. The Trichoderma brevicompactum clade: A separate lineage with newspecies, new peptaibiotics, and mycotoxins. Mycol. Prog. 2008, 7, 177–219. [CrossRef]
71. Liu, L.; Tang, M.X.; Sang, X.N.; Chen, S.F.; Lu, X.J.; Wang, Y.B.; Si, Y.Y.; Wang, H.F.; Chen, G.; Pei, Y.H.Three new tetralol analogs from soil-derived fungus Myrothecium verrucaria with anti-inflammatory activity.J. Asian Nat. Prod. Res. 2018, 21, 33–42. [CrossRef]
72. Tokai, T.; Takahashi-Ando, N.; Izawa, M.; Kamakura, T.; Yoshida, M.; Fujimura, M.; Kimura, M.4-O-acetylation and 3-O-acetylation of trichothecenes by trichothecene 15-O-acetyltransferase encodedby Fusarium Tri3. Biosci. Biotechnol. Biochem. 2008, 72, 2485–2489. [CrossRef] [PubMed]
73. Jarvis, B.B.; Vrudhula, V.M.; Pavanasasivam, G. Trichoverritone and 16-hydroxyroridin L-2, new trichothecenesfrom Myrothecium roridum. Tetrahedron Lett. 1983, 24, 3539–3542. [CrossRef]
74. Desjardins, A.E. Fusarium Mycotoxins: Chemistry, Genetics and Biology; APS Press: St. Paul, MN, USA, 2006;pp. 1–260.
75. Pestka, J.J.; Forsell, J.H. Inhibition of Human-Lymphocyte Transformation by the Macrocyclic TrichothecenesRoridin A and Verrucarin A. Toxicol. Lett. 1988, 41, 215–222. [CrossRef]
76. Dosen, I.; Andersen, B.; Phippen, C.B.W.; Clausen, G.; Nielsen, K.F. Stachybotrys mycotoxins: From cultureextracts to dust samples. Anal. Bioanal. Chem. 2016, 408, 5513–5526. [CrossRef]
77. Jarvis, B.B.; Mazzola, E.P. Macrocyclic and Other Novel Trichothecenes—Their Structure, Synthesis,and Biological Significance. Acc. Chem. Res. 1982, 15, 388–395. [CrossRef]
78. Sy-Cordero, A.A.; Graf, T.N.; Wani, M.C.; Kroll, D.J.; Pearce, C.J.; Oberlies, N.H. Dereplication of macrocyclictrichothecenes from extracts of filamentous fungi through UV and NMR profiles. J. Antibiot. 2010, 63,539–544. [CrossRef]
© 2020 by the authors. Licensee MDPI, Basel, Switzerland. This article is an open accessarticle distributed under the terms and conditions of the Creative Commons Attribution(CC BY) license (http://creativecommons.org/licenses/by/4.0/).
154

MDPISt. Alban-Anlage 66
4052 BaselSwitzerland
Tel. +41 61 683 77 34Fax +41 61 302 89 18
www.mdpi.com
Toxins Editorial OfficeE-mail: [email protected]
www.mdpi.com/journal/toxins


MDPI
St. Alban-Anlage 66
4052 Basel
Switzerland
Tel: +41 61 683 77 34
Fax: +41 61 302 89 18
www.mdpi.com ISBN 978-3-0365-1415-4


