Embed Size (px)
Citation preview
applied sciences
Article
Citizens’ Perception of Smart Cities: A Case Study
Athanasios Georgiadis, Panayiotis Christodoulou and Zinon Zinonos *
�����������������
Citation: Georgiadis, A.;
Christodoulou, P.; Zinonos, Z.
Citizens’ Perception of Smart Cities:
A Case Study. Appl. Sci. 2021, 11,
2517. https://doi.org/10.3390/
app11062517
Academic Editors: Stavros Souravlas,
Stefanos Katsavounis and Sofia
Anastasiadou
Received: 17 February 2021
Accepted: 9 March 2021
Published: 11 March 2021
Publisher’s Note: MDPI stays neutral
with regard to jurisdictional claims in
published maps and institutional affil-
iations.
Copyright: © 2021 by the authors.
Licensee MDPI, Basel, Switzerland.
This article is an open access article
distributed under the terms and
conditions of the Creative Commons
Attribution (CC BY) license (https://
creativecommons.org/licenses/by/
4.0/).
Intelligent Systems Laboratory, Department of Computer Science, Neapolis University Pafos, 8042 Pafos, Cyprus;[email protected] (A.G.); [email protected] (P.C.)* Correspondence: [email protected]
Abstract: The 21st century is considered to be “The Century of Cities”. By the end of this century, over80% of the global population is expected to be living in urban areas. To become smart, a city shoulddevelop an approach of services that will focus mainly on citizens to be the primary beneficiaries ofthe services offered by a Smart City. In this work, we present through a survey of 545 participants,the citizens’ perception about the smart city concept and reveal the Greek and Cypriot citizens’ levelof knowledge regards to a Smart City’s actions, applications, and elements. The final results of thisstudy revealed several interesting outcomes. Firstly, this study showed that Cypriot citizens seem toknow better what a “Smart City” is compared to Greek citizens, secondly, the study revealed that alarge number of participants do not believe that any efforts have been made in their city in order tobecome “smart” and finally, regards to the most important challenges for the development of a smartcity, the survey disclose that the cooperation of the private and public sector is the biggest challengethat needs to be tackled so as citizens can move towards a “smarter” future.
Keywords: smart cities; citizen perception; smart cities impact
1. Introduction
At the beginning of the 21st century, cities are presented as the primary source forsome of the biggest concerns and challenges that the world has ever faced. Rapid urban-ization (which leads to overpopulation), diminished resources, and continuous climatechanges are some of these challenges. Gradually, this leads to many other global challengesand concerns, such as energy over-consumption, climate changes, resource constraints,and air pollution. To cope with the aforementioned challenges, the concept of sustainableurban development emerged through the “Smart City” concept to define urban planningsignificantly [1]. The “Smart City” concept constitutes the precursor of sustainable de-velopment and it targets improving life in cities by using innovative and state-of-the-arttechnologies. To become smart, a city should develop an approach of services that aremainly focused on citizens who are the primary beneficiaries of the things and services aSmart City can offer.
The “Smart City” concept is defined as a concept that can tackle environmental, eco-nomic, and social challenges that modern cities are facing and will continue to face in thefuture [1]. By focusing only on using Information and Communication Technology sys-tems, a smart city can get more closely related to people and communities [2]. Nowadaysthere may not have been yet a clear and globally accepted definition for the smart city,but, despite this fact, cities are embracing the notion of achieving smartness to achievesustainable development and economic growth and, also, to improve their citizens’ qualityof life. In a simplified way, we can define a “smart city” as a city that uses advanced tech-nologies in order to achieve the goals it has set. These goals may be financial development,education, eradication of poverty, social equality, enhanced citizens’ security, tourism,cultural education, intercultural physique, environment, and fast citizen service in publicservices and can vary, depending on the city’s geographical location, the socio-economic
Appl. Sci. 2021, 11, 2517. https://doi.org/10.3390/app11062517 https://www.mdpi.com/journal/applsci
Appl. Sci. 2021, 11, 2517 2 of 20
conditions, the resources that the city can allocate and the perceptions of the respectivelocal authorities.
Smart cities projects are related to many domains of applications, such as communica-tion, culture, energy, environment/climate, health, tourism, and transport. “Smart cities”are closely related to “smart buildings” and “smart devices”, but neither cities, buildings,nor devices are smart by themselves. Nowadays while there is a plethora of applicationsthat can be utilized and support the concept of Smart cities [3–6] the whole concept relieson the city administration’s smartness, politicians, and citizens to utilize technology in“smart” ways [7].
With new communication channels and interaction, citizens have acquired the oppor-tunity to play a more active role in the city. The significant increase in citizens’ democratiza-tion and production capability has turned them into key factors for the innovation processand development of a city [8]. To succeed in the development of smart cities, citizensshould be involved as an integral part of the process as they are both users and decision-makers and can also be reliable sources of data and information [9]. Citizens’ participation,ideas, and perspectives are critical factors for smart city development. The bigger theparticipation and the involvement in their (smart) city’s decision making, the better theunderstanding of the benefits and the positive impact that the smart city provides them.
In this work, we aim to present the citizens’ perception of the smart city concept,and reveal the level of knowledge of Greek and Cypriot citizens regards to a Smart City’sactions, application and elements. In addition, we target to illustrate to what extend theGreek and Cypriot citizens have realized the importance, the positive impact and thebenefits that a “smart project” can offer in their lives.
2. Literature Review
In this section, various surveys and studies that present the effects and benefits aswell as the impact of smart cities on the citizens’ lives and how citizens participate informing a smart city, are analyzed. The information and communication technology(ICT) applications form an essential factor for the development of sustainable smart cities,thus their adoption has become a significant model for municipal cooperation betweengovernment and corporations.
In [10] the authors outline a study where several Taiwanese citizens are being surveyed.The purpose of this study was to emphasize the fact that smart city services providetheir citizens with an improved living environment which increases the quality of life.Furthermore, the study aimed to point out how important it is for the citizens’ whentheir ideas and perspectives are taken into account during the planning of the smart city’sservices. The results of the study highlighted the citizens’ willingness to accept the ICT-based smart city services especially when their design is based on innovative processesthat offer personal privacy and high quality of services. The city engagement factor didnot seem to have played a major role in influencing the participants’ usage of the smartcity services in [10]. However, Belanche’s et al. in [11] presented that city attachment(engagement) affects both citizens’ attitudes toward urban services and citizens’ usage ofthem. The major difference between the aforementioned investigation and the one in [10]is that the findings of the latter were based on data that were collected by the citizens of aEuropean city: the city of Zaragoza in Spain. Final outcomes revealed how citizens’ cityattachment levels and other personal factors contribute to urban services usage.
As mentioned in [12], the more the citizens use the urban services, the better theservice’s performance, the life’s quality, and the greater the satisfaction with urban man-agement become. It is confirmed that the use of public transportation (which is an urbanservice) leads to the production of substantial savings for the citizens [13] and, also, to ad-ditional benefits for the environment, as it reduces air pollution, traffic injuries, and CO2emissions [14]. The survey’s framework resulted from a number of hypotheses relevant tothe influence that the city attachment has on attitudes toward urban services and the use ofthem as well as on the city attachment’s dependence on citizens’ demographic features.
Appl. Sci. 2021, 11, 2517 3 of 20
The data were gathered from various groups of citizens in Zaragoza (different for eachgroup) through a questionnaire that included questions about attitudes towards urbanservices, city attachment and the personal necessity to use the services. Although theresults indicated that city engagement affects the attitudes toward urban services posi-tively, the effect of city attachment on the use of these services is not of high significance.Moreover, city attachment was positively affected by the age factor in a positive way andnegatively affected by the educational level of the participants. In contrast, urban serviceusage was positively affected as well by highly educated people and it was not affected bythe age or gender of participants.
Generally, the citizens’ role in smart cities is significant and their participation in thedevelopment of smart city initiatives seems crucial. In [15], the authors analyze the conceptof co-production, which can be considered as a boosted type of participation of citizens,with their involvement in the creation and development of public services and policies.Co-production is based on the redistribution of power between citizens and government.“Smart” citizens constitute a fundamental dimension of smart cities thus, no smart city canbe formed without smart citizens. Every smart city initiative impacts the citizens’ way oflife and this can lead to a failure in case the citizens do not accept to adapt their lifestylesaccordingly or to collaborate by adopting “smart” behaviors. The collaboration between theservice designers and creators and the service users (citizens) is a critical condition so thatthe desired results can be accomplished in smart city initiatives [16]. This collaboration isone of the critical attributes of the co-production of public services. From this aspect, whencitizens act like co-producers, they get the chance to participate in smart city initiativesactively and to make the city that they live in “smarter”.
Since in some cases the citizens do not get the chance to evaluate the improvementsthat take place in their city, the authors in [17] introduce a procedure/model to enhancethe citizens’ participation in their smart city’s development plan. To become smart, a cityshould develop an approach of services that will mainly focus on citizens so that theycould be the primary beneficiaries of the new urban project. In other words, according tothe citizens’ satisfaction, the city can proceed with the development, which will be focusedon its residents. In [17], the authors use Boyd Cohen’s model (Smart Cities Wheel) as ametric model, which consists of six Key Performance Indicators (KPIs), based on Kanomethodology, to determine the level of satisfaction that is generated from the citizens.Through the Kano model, the attributes that provide levels of satisfaction are determinedand classified. Generally, the model classifies a service’s (or product) characteristics basedon the degree of interaction relations of customer satisfaction.
The research in [7] shows how smart cities are likely to be developed in India, consid-ering the perspectives of both citizens and city officials (such as governments). It is alsoindicated in this study how the size of a city can influence the priorities of both citizens andauthorities. Since the urban population in India increases year by year, the developmentof smart cities becomes mandatory. The Indian perspective regarding smart cities wasextracted by a citizen survey, which provided how citizens imagine a smart city. In addition,additional smart city vision statements, which provide insights into how the city officialsconsider a smart city and the most important things for them were analyzed. The citizensurvey obtained information about citizens’ perspectives on various areas of priority forsmart city development and the analysis of the citizens’ data revealed the citizens’ priorityareas, where the size of the cities played a major role in the results. Overall, in terms ofimportance for the citizens, Smart Living was ranked as the most selected domain (51%),while Smart Mobility ranked second (30%). According to the authors, these results makesense, considering that India faces many deficits in these two domains. The results alsorevealed that the city officials prioritize Smart Living, followed by Environment and Econ-omy and that the population plays a major role in the influences and the priorities of thecitizens. In other words, the population may be a determinant factor for the concept of asmart city in India.

Appl. Sci. 2021, 11, 2517 4 of 20
As the authors in [18] mention, the citizens can have their roles in smart cities throughtheir participation and interaction in a smart city concept. Citizens’ participation consists asignificant part of the smart city’s development and can be either political or non-political.By taking the above statement into consideration, the authors in [18] present the citizens’political participation, through which the citizens influence political decisions, and the non-political (general) citizen participation, through which citizens aid in finding solutions forthe city’s problems. The aforementioned study is mostly related to Norwegian smart citiesand municipalities and describes the concept of participation as a democracy manifestation.Authors emphasize the fact that citizens can share their knowledge, expertise, and time toimprove smart city service. The authors present their model to define the requirementsneeded for the citizens’ electronic participation in a smart city.
Another study that is worth mentioning in this study is the one presented by theauthors in [9]. The work in [9] analyses the assessment and perception of universitystudents on the smart city concept based on their involvement with the city they currentlylive. The main findings reveal the most significant goal of urban planning which is the goodquality of life. According to the results, the mean score was below the intermediate valueof 3 in the five-point Likert scale in all six factors that affect smart cities. More specifically,Smart living (2.76) and Smart mobility (2.66) had the highest mean scores, whereas Smartgovernance (2.43) had the lowest. This means that the respondents’ assessment wasinadequate and that they generally shared a negative perception of the city regards to allsix dimensions.
The discussion about citizens’ participation in smart cities, which is followed by arelevant survey in [19] seems to be of high interest. Through this survey, which was sharedbetween various smart city experts from different cities across the globe, the authors’ goalwas to evaluate the citizens’ participation in smart cities through the eyes of the smartcity experts and to identify new ways for increasing civic participation. The results of thepreviously mentioned survey revealed how citizens are affected by the various factors of asmart city.
3. Smart City
According to [20], the 21st century is characterized as “the century of cities”. Thisseems fair enough, as, by 2030, about 60% of the world’s population will be living in urbanareas and big cities; this percentage will exceed 80% at the end of the century [21]. Vanoloin [22] says that, nowadays, the concept of a smart city is viewed as a vision to determinethe sustainable and ideal city form in the 21st century. In other words, a smart city is agreen, socially inclusive city characterized by efficiency and technological advances. Theshort-term goal of the cities globally is the continuous development in essential sectors suchas the economy, health and education. Their long-term goal is the satisfaction of the peopleliving in them. The innovative solutions that are offered by already-existing smart citiesconstitute a crucial factor for achieving these goals. However, many cities are not able tofully implement these innovations due to significant (mainly economic) difficulties. For thisreason, the large urban centers are considered to be the most appropriate starting pointsfor development so that the application spreading can be smoother and more efficient at alater stage.
In general, smart cities constitute a promising idea for an ideal future of globalurbanization and the confrontation of its drawbacks. Smart cities constitute the idealmodel that can lead to urban development. A smart city corresponds to an integrated,forward-looking vision, useful for defining a method for city development, as seen throughthe prism of digital technologies and knowledge ecosystems. Moreover, the adaption ofthis vision to the local needs, priorities and constraints of a city is of high importance.Even today, no city can consider itself totally “smart”. On the contrary, since societies andtechnologies change frequently, the smart city has to reassess itself and try new ways ofthinking about technology and its engagement for the common good.

Appl. Sci. 2021, 11, 2517 5 of 20
3.1. Sustainable Urban Development
Sustainability is a new development model that emerged from various concerns ofthe late twentieth and early twenty-first century [23]. These concerns were mostly envi-ronmental, social and economic. Molnar et al. in [24] state that the concept of sustainabledevelopment is contested; thus, there is no clear and specific definition of sustainabilitythat is globally accepted. The “sustainable development” notion was defined through the1987 Brundtland Commission as the “development that meets the needs of the presentwithout compromising the ability of future generations to meet their own needs” [25].In the next years, sustainable development became an exciting object for study for scientificpurposes and policy-making, along with international organizations’ related programs,reports, and conferences [26].
The cities’ role in sustainable development is reflected in the Sustainable DevelopmentGoals (SGDs) of the United Nations Department of Economic and Social Affairs (DESAU. N.) 2030 Agenda for Sustainable Development. This role is to “make cities and humansettlements inclusive, safe, resilient, and sustainable” [27]. Most of the cities consumemassive energy amounts globally. The main domains of this consumption are relatedto waste management, public lighting, heating and cooling of buildings, infrastructurein building and maintenance, public service precaution in transport and many more. Itis a fact that modern cities cause the most massive environmental pollution and energyconsumption. It becomes clear that, in case humanity stays inactive against this situation,the consequences will be harmful, especially in areas of water management, accessibilityand urban air pollution [23]. Therefore, the concept of sustainable urban developmentemerged and significantly defined urban planning and development starting in the early1990s [28]. According to [29], any city or ecosystem is supposed to be sustainable “if itsconditions of production do not destroy over time the conditions of its reproduction”.In addition, Castells in [29] stated that, essentially, sustainable development is a type ofsolidarity between the older and the future generations. This solidarity is based on thefact that the older generations consume carefully and pollute the least they can get sothat the future generations could have the opportunity to live under the same or evenbetter-living conditions. The desirable state is the one where cities will consume the leastpossible resources, will become more livable, will offer a better quality of life to theircitizens, and will minimize the impact that humans have on the environment [28].
The vast array of technical and environmental requirements that appear both on thebuilding and the neighborhood scale shows how mostly sustainable urban developmenthas penetrated in urban growth. Requirement systems such as LEED for NeighborhoodDevelopment, CASBEE for Urban Development, EarthCraft Communities and BREEAMCommunities are some of the sustainable urban development assessment frameworks [23].The authors in [23] state that some of the essential characteristics of a sustainable commu-nity at the moment are the adequacy, quality, and resource efficiency of urban infrastructure.Essentially, cities are places that offer the ground for new ideas and new solutions. Thus,many sustainable urban development frameworks reference the role of ICTs and humanparticipation in progressing sustainability goals in cities. The great potential of the smartcity approach is already thoroughly investigated by the United Nations through their studyon “Big Data and the 2030 Agenda for Sustainable Development” [23].
3.2. Smart City Dimensions
In Giffinger et al. [30], the authors discovered the four primary components of a smartcity, which are education, participation, industry and technical infrastructure. Subsequently,after a more extensive analysis of the aforementioned components along with a smartcity project that was run by the Centre of Regional Science at the Vienna University ofTechnology the following six main dimensions/pillars of a smart city were identified: smarteconomy, smart people, smart governance, smart living, smart environment and smartmobility [31]. A summary of the six main dimensions is presented in Figure 1.

Appl. Sci. 2021, 11, 2517 6 of 20
Figure 1. Smart city pillars and applications.
The inclusion of “quality of life” as an additional dimension of a smart city would beparticularly interesting. However, a significant number of scholars and researchers arguethat “quality of life” should not be included in the dimension list as a separate smart citypillar, as all the actions that are taken in the other six pillars have a common goal whichis to improve the quality of life [32]. Each one of the six dimensions is linked to severalindividual factors. The dimensions constitute a smart city model, which was developedas a ranking tool, to evaluate mid-sized European smart cities in the corresponding fieldsof governance, mobility, people, economy, living and environment. [33]. Furthermore,Colldahl et al. in [33] state that the six-dimension model allows the examination of acity’s current state and can identify the areas that need further development to reach theappropriate level of being “smart”. The main focus of the six-dimensional model is tosolve the various problems that appear in actual cities and to prevent any possible issuesthat may appear, such as population-related, mobility, environmental or energy-savingproblems. Each smart application should contribute to at least one of the six dimensions,without negatively affecting any of the other ones. For example, an application thatcontributes to economic prosperity but causes a massive environmental problem can neverbe considered a smart application [34]. six components of the smart city also synchronizewith the “hard” and “soft” domains, thus, they cover all forms of application of the smartcity concept [1].
4. Survey Methodology and Analysis
The main purpose of this work is to examine the perception that the Greek andCypriot citizens have regards to the Smart City concept, and to present their opinions andbeliefs about the current level of “smartness” that appears in the city they are currentlylive. The level of “smartness” is based on how much developed is each one of the sixprincipal pillars of smart cities. Currently, most of the Greek cities have not yet delvedinto the smart city concept and the development of most of the six Smart City pillars isstill in an early stage. In other words, Greece, as a country, is still not totally orientedand adapted towards the implementation of smart-city methods and elements in its cities.For the aforementioned reason, we decided, through this quantitative research, to examinethe standpoints of the Greek and Cypriot citizens regarding the implementation of smart
Appl. Sci. 2021, 11, 2517 7 of 20
city elements into Greek and Cypriot cities. By doing this, some conclusions could bedrawn regards to the impact that a smart city has on its citizens at present or in the future.Conclusions also emerged about the intentions of the citizens who are not at all familiarwith the smart city concept, as of their interest and willingness to understand the term andthe impact in their lives.
4.1. Research Questions
Based on the current literature review on smart cities and the purpose of this study,various research questions have been identified and used for further analysis. These ques-tions lead to conclusions that reveal the Greek and Cypriot citizens’ point of view on thesmart city objectives, elements, and applications. The same applies to a small sample ofGreek citizens who live in other European countries and have also participated in this sur-vey. Conclusions were eventuated through multiple comparisons and statistical analyses.In addition, in this study a questionnaire was designed based on the identified researchquestions so that data could be gathered and analyzed to provide thorough answers to theresearch questions. The research questions correspond to two main categories: the firstcategory includes the participants that have either a small or broad knowledge of the smartcity concept and its contributions while the second category includes the participants thatare not familiar with the term at all. The research questions that correspond to the firstcategory are shown below:
1. How many of the citizens who participated in the survey have heard about the “smartcity” term? How is the result formed when age, gender and city factors are takeninto account?
2. How many of the participants have a decent (or probably better) knowledge of whata smart city is? How is the result formed when age, gender and city factors are takeninto account?
3. How many of the participants believe that actions have been made in their city so thatit can be transformed into a smart city in a holistic way? How is the result formedwhen the city factor is taken into account?
4. According to the participants, Which challenges are considered as the most importantfor the development of a smart city? How do these results form when the city factoris taken into account?
The research questions that correspond to the second category of participants (the“non-familiar with the smart city term” ones) are listed below:
1. Does the “Education level” factor play a significant role in how the number of non-familiar participants is formed?
2. Are the non-familiar participants interested in acquiring further information about thesmart city concept in the future? How is their opinion affected by their age and city?
4.2. Questionnaire Composure
For the conduction of this quantitative research, we have opted for a questionnaire asa tool for collecting data. The data were collected from the 3rd until the 17th of December,in 2020.
Participants before filling in the questionnaire were introduced to the objectives andthe purpose of it. The Greek language was used in the questionnaire as the questionnairewas referring only to Greek-speaking people who live in Greece and Cyprus and also toa small number of Greeks who live in other European countries. Specifically, the ques-tionnaire was filled in by a total of 545 adult respondents from which 415 live in Greece,and 108 in Cyprus. From the Greece respondents, 74 are citizens of Athens, 181 are living inThessaloniki and 160 of them live in other Greek cities. As of Cyprus, 79 of the respondentslive in Paphos, whereas 29 live in other Cypriot cities. Lastly, 22 of the participants areGreeks who live in other European countries.
Appl. Sci. 2021, 11, 2517 8 of 20
4.3. Analysis
Internal consistency refers to the general agreement between multiple Likert-scaleitems that make-up a composite score of a survey measurement of a given construct. Thisagreement is generally measured by the correlation between items. In order to assessthe internal consistency of the questionnaire, the coefficient alpha (Cronbach’s alpha)was calculated for the number of questions that were formed under the Likert scale.The software program that was used for this calculation was the Statistical Package for theSocial Sciences (SPSS).
A generally accepted rule is that an alpha coefficient of 0.6–0.7 indicates an acceptablelevel of reliability whereas a value equal or greater then 0.8 indicates a very good level [35].For the specific research attempt, the value of Cronbach’s alpha was calculated as 0.935.This fact indicates that, when it comes to the amount of Likert variables, our questionnairehas a very high internal consistency. As a result, the credibility of the present researchattempt is certified. The number of “Items” (79 in total) indicates the number of ordinalvariables that are included in the questionnaire. The Cronbach’s alpha has also beencalculated for the ordinal variables (items) of each of the Likert questions that appear in theresearch, separately. Each calculation’s result appears in the “Survey Analysis” subchapter,under the statistical analysis of each one of the questions that belong to this specific type.
The Kaiser–Meyer–Olkin (KMO) test as well as Bartlett’s test of Sphericity havealso been executed for the number of questions that were formed under the Likert scale.The KMO test is used in research to determine the sampling adequacy of data that willbe used for factor analysis [36]. Bartlett’s test of sphericity checks if there is a redundancybetween variables that can be summarized with some factors [37]. According to theresults, the KMO value (0.854) is considered as meritorious [38], while Bartlett’s test value(Sig. = 0.000) is lower than 0.05. Therefore, the sampling is adequate and the data aresuitable for Factor Analysis. All variables are suitable for Factor Analysis, considering thefact that their “Extraction” values are >0.5. More specifically, the extraction values fluctuatefrom 0.5 to 0.846, as SPSS’s results indicate.
The demographic feature questions formed the questionnaire’s first section. Whenit comes to the first question (“Gender”), a relative balance seems to appear betweenthe number of men and the number of women that participated in the survey. Morespecifically, 49% (267 in total) of the participants were women, whereas 51% (278 in total).The second question was about the participants’ age. As already mentioned earlier, onlyadults participated in this survey. Out of the total respondents, 37.2% (203 in total) werefrom 18 to 30 years old; 50.03% (274 in total) were from 31 to 40 years old; 9.4% (51 in total)were from 41 to 50 years old; 2.4% (13 in total) were from 51 to 60 years old and, lastly,a small percentage of 0.7% (4 in total) were older than 60 years old. As a result, a total of87.5% of the citizens that have taken part in the survey were from 18 to 40 years old.
Most of the participants (57.1%, which corresponds to 311 citizens in total) belongto the “Higher Education” category, whereas a quite high percentage of 28.3% of thetotal participants (154 in total) hold a Master’s degree, 9% of all the participants have alower educational level (primary and secondary education) than the others, 4.2% of theparticipants are holders of doctoral diploma, while 1.5% of them have declared “Other” asan answer. In general, based on the results, 91% of the participants appear to be highlyeducated, whereas a total of 9% appear to have a lower educational level.
Regards to the participants’ occupation, most of the participants (47.7%) work asprivate employees, while 19.6% of them are freelancers and 15% of them are civil employees.The college students constitute 8.4% of the participants, and the rest 9.2%, are unemployedor retired citizens. The participants that have taken part in this survey are citizens of a totalof 61 cities all over Greece, Cyprus and other European countries. In order to analyze thedata in a more composed way, we decided to classify the cities into six big categories:
1. Citizens of Thessaloniki.2. Citizens of Athens.3. Citizens who live in other cities within Greece (Rest of Greece).

Appl. Sci. 2021, 11, 2517 9 of 20
4. Citizens of Paphos.5. Citizens who live in other cities within Cyprus (Rest of Cyprus), such as Larnaca,
Limassol, Nicosia.6. Greek citizens who live in other European cities, such as London, Liverpool, Manch-
ester Stuttgart, Frankfurt, Copenhagen, Madrid, Bucuresti, Groningen etc.
Specifically, 33.2% of the participants live in Thessaloniki (181 in total number) and13.4% of them live in Athens (73 in total), while there is a total number of 160 Greekcitizens (29.5% in percentage number) who live in other 41 Greek cities than Athens andThessaloniki. As of Cyprus, 14.5% of the participants live in Paphos, while 5.3% live inother Cypriot cities. The 4% of the participants are Greeks who live in other Europeancities. Table 1 summarizes the results.
Table 1. Characteristics of participants.
Classification Options Values
Male 278 (51%)Gender Female 267 (49%)
Sum 545
18–30 203 (37.2%)31–40 274 (50.03%)
Age 41–50 51 (9.4%)51–60 13 (2.4%)
Over 60 4 (0.7%)
Primary Education 6 (1.1%)Secondary Education 43 (7.9%)
Education Higher Education 311 (57.1%)Master’s Degree 154 (28.3%)
Doctoral Diploma 23 (4.2%)Other 8 (1.5%)
Civil Employee 82 (15%)Private Employee 260 (47.7%)
Self-Employed/Freelancer 107 (19.6%)Occupation College Student 46 (8.4%)
Retired 4 (0.6%)Unemployed 37 (6.8%)
Other 9 (1.8%)
Thessaloniki 181 (33.2%)Athens 73 (13.4%)Paphos 79 (14.5%)
City Rest of Greece 160 (29.5%)Rest of Cyprus 29 (5.3%)
Other European Countries 22 (4%)
The five first questions (as shown in Table 1) constituted the questionnaire’s firstsection and were common questions for all participants. The subsequent question was:“Have you ever heard the term “Smart City” before?” and was purpose was to separatethe correspondents who were familiar with the smart city term from those who were not.The results showed that 58.5% of the participants answered “Yes”. This means that 319of the participants stated that they had at least heard the smart city term or had a decentknowledge about it.
Then the 319 participants, were asked to express their opinion by answering thefollowing question: “To what extent do you believe that the following options correlatewith the smart city concept?”. Since that question was created by the five-point Likertscale, each of its items constituted an ordinal variable in SPSS software. As a result,the Cronbach’s alpha value was calculated for the amount of the ordinal variables of thisquestion so that the internal consistency of these items could be checked. We notice that
Appl. Sci. 2021, 11, 2517 10 of 20
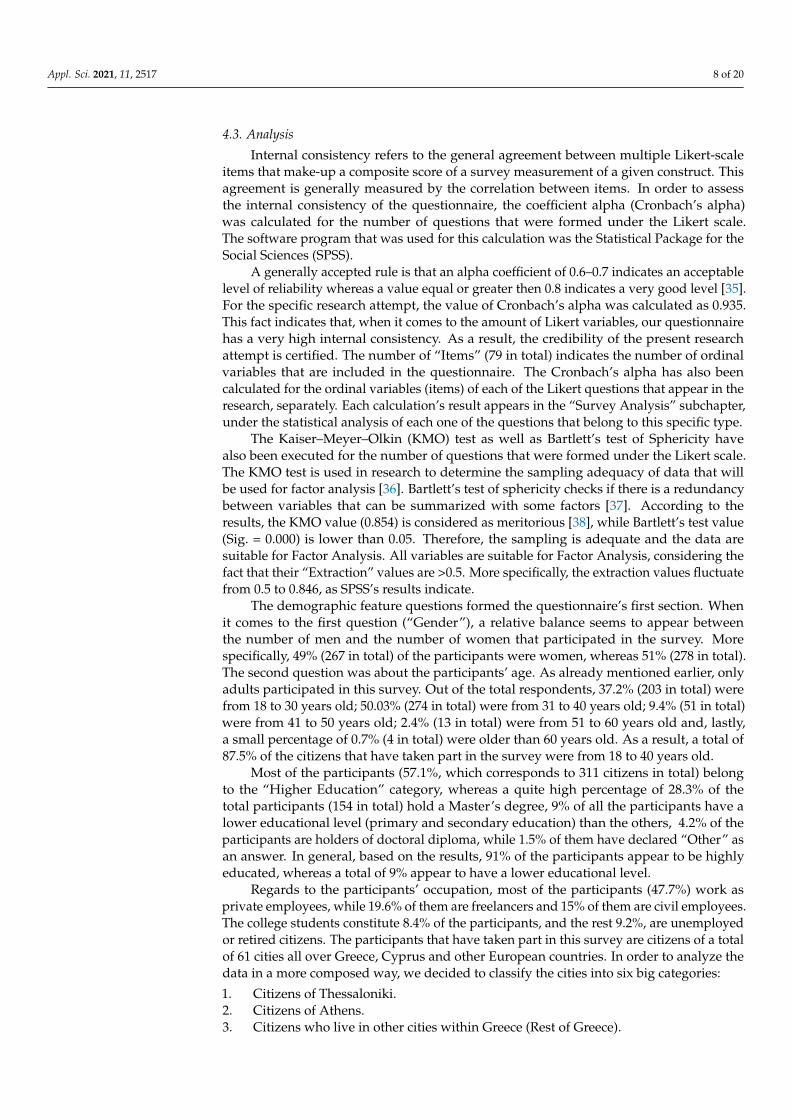
the value of Cronbach’s alpha is 0.606, which indicates an acceptable level of reliability.A number of options/items were presented to the participants. They were offered tochoose among the following responses for each option: “Not important at all”, “Lessimportant”, “Moderately important”, “Quite important” and “Very important”. Generally,the participants acknowledged the fact that all options given are of high importance forthe development of a smart city project; thus, “Not important” and “Less important”options gathered an insignificant percentage amount. The results also showed that thetwo options that gathered the highest percentages of “Very important” responses werethe “Efficient use of energy” option (74.9% of the participants opted for “Very important”)and the “Sustainable development” (63.3% of the participants opted for “Very important”).The results are shown in Figure 2.
Figure 2. Importance of sectors.
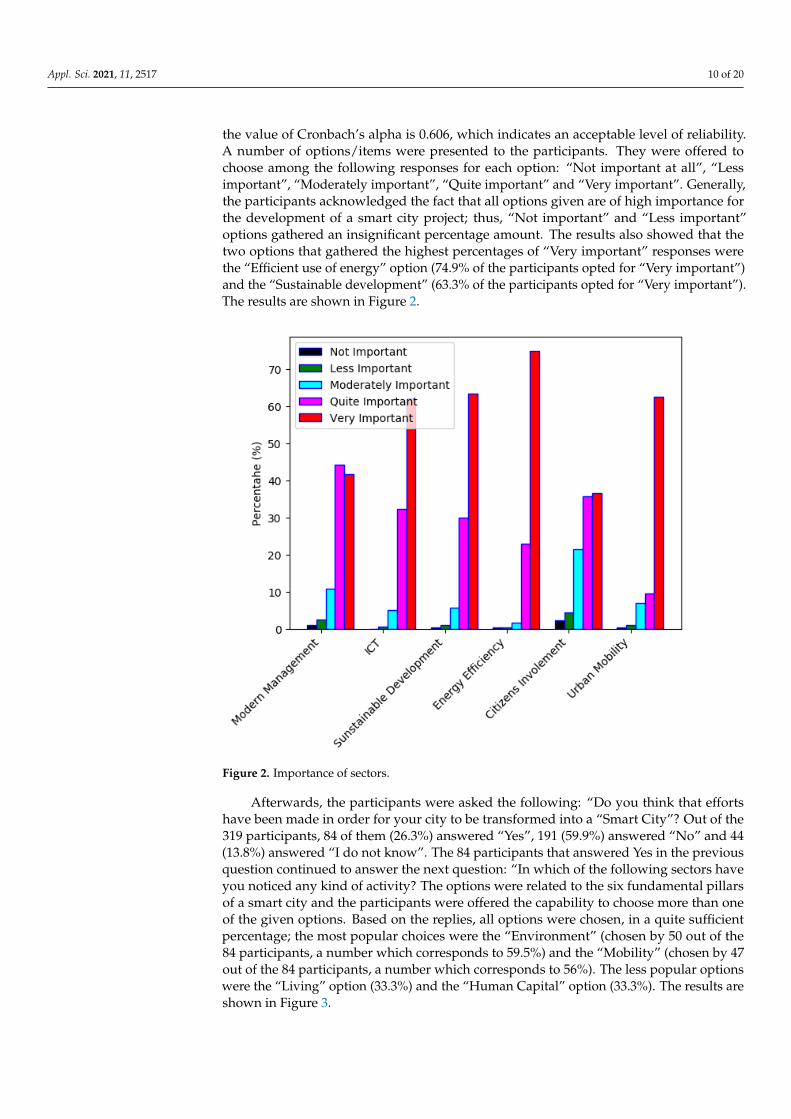
Afterwards, the participants were asked the following: “Do you think that effortshave been made in order for your city to be transformed into a “Smart City”? Out of the319 participants, 84 of them (26.3%) answered “Yes”, 191 (59.9%) answered “No” and 44(13.8%) answered “I do not know”. The 84 participants that answered Yes in the previousquestion continued to answer the next question: “In which of the following sectors haveyou noticed any kind of activity? The options were related to the six fundamental pillarsof a smart city and the participants were offered the capability to choose more than oneof the given options. Based on the replies, all options were chosen, in a quite sufficientpercentage; the most popular choices were the “Environment” (chosen by 50 out of the84 participants, a number which corresponds to 59.5%) and the “Mobility” (chosen by 47out of the 84 participants, a number which corresponds to 56%). The less popular optionswere the “Living” option (33.3%) and the “Human Capital” option (33.3%). The results areshown in Figure 3.
Appl. Sci. 2021, 11, 2517 11 of 20
Figure 3. Efforts to transform your city to a smart city.
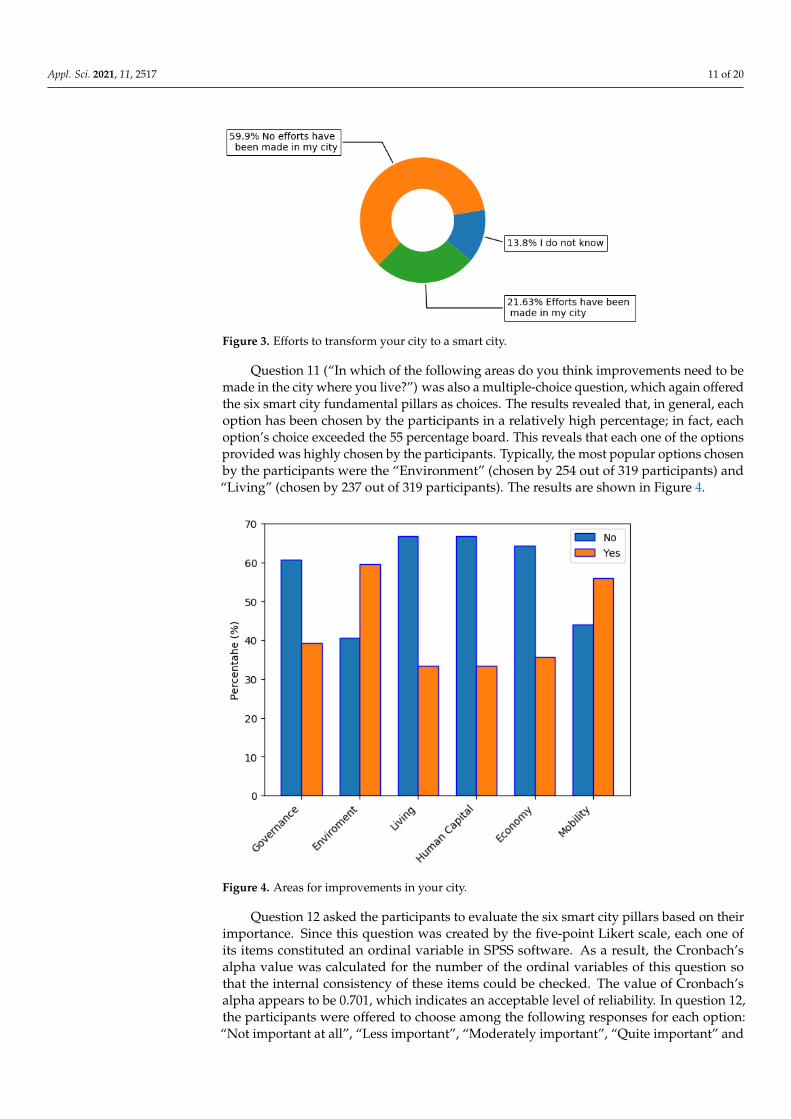
Question 11 (“In which of the following areas do you think improvements need to bemade in the city where you live?”) was also a multiple-choice question, which again offeredthe six smart city fundamental pillars as choices. The results revealed that, in general, eachoption has been chosen by the participants in a relatively high percentage; in fact, eachoption’s choice exceeded the 55 percentage board. This reveals that each one of the optionsprovided was highly chosen by the participants. Typically, the most popular options chosenby the participants were the “Environment” (chosen by 254 out of 319 participants) and“Living” (chosen by 237 out of 319 participants). The results are shown in Figure 4.
Figure 4. Areas for improvements in your city.
Question 12 asked the participants to evaluate the six smart city pillars based on theirimportance. Since this question was created by the five-point Likert scale, each one ofits items constituted an ordinal variable in SPSS software. As a result, the Cronbach’salpha value was calculated for the number of the ordinal variables of this question sothat the internal consistency of these items could be checked. The value of Cronbach’salpha appears to be 0.701, which indicates an acceptable level of reliability. In question 12,the participants were offered to choose among the following responses for each option:“Not important at all”, “Less important”, “Moderately important”, “Quite important” and
Appl. Sci. 2021, 11, 2517 12 of 20
“Very important”. The results revealed once again that the participants are generally awareof each one of the pillars’ high importance. This is shown by the fact that the “Quiteimportant” and “Very important” choices (combined) exceeded the 75% percentage boardfor each of the six pillars provided, whereas “Not important” and “Less important” choicescould not even exceed the 5% percentage board for each of them. Tables 2 shows the results.
Table 2. Importance of smart city pillars.
Smart Smart Smart Smart Smart SmartGovernance Enviroment Living Mobility People Economy
NotImportant 0.3% 0.0% 0.0% 0.0% 0.3% 0.0%
LessImportant 4.1% 0.3% 0.3% 0.9% 2.2% 0.9%
Moderately 19.4% 1.6% 2.5% 4.1% 8.2% 8.2%Important
QuiteImportant 41.7% 26.3% 19.4% 25.4% 34.8% 37.3%
VeryImportant 34.5% 71.8% 77.7% 69.6% 54.5% 53.6%
4.3.1. Research Questions Analysis—First Category
In this subsection, the analysis of the research questions that are mentioned inSection 4.1 is presented. In addition, statistical tests are applied to check if there is any kindof dependency between the categorical variables that are related to each research question.
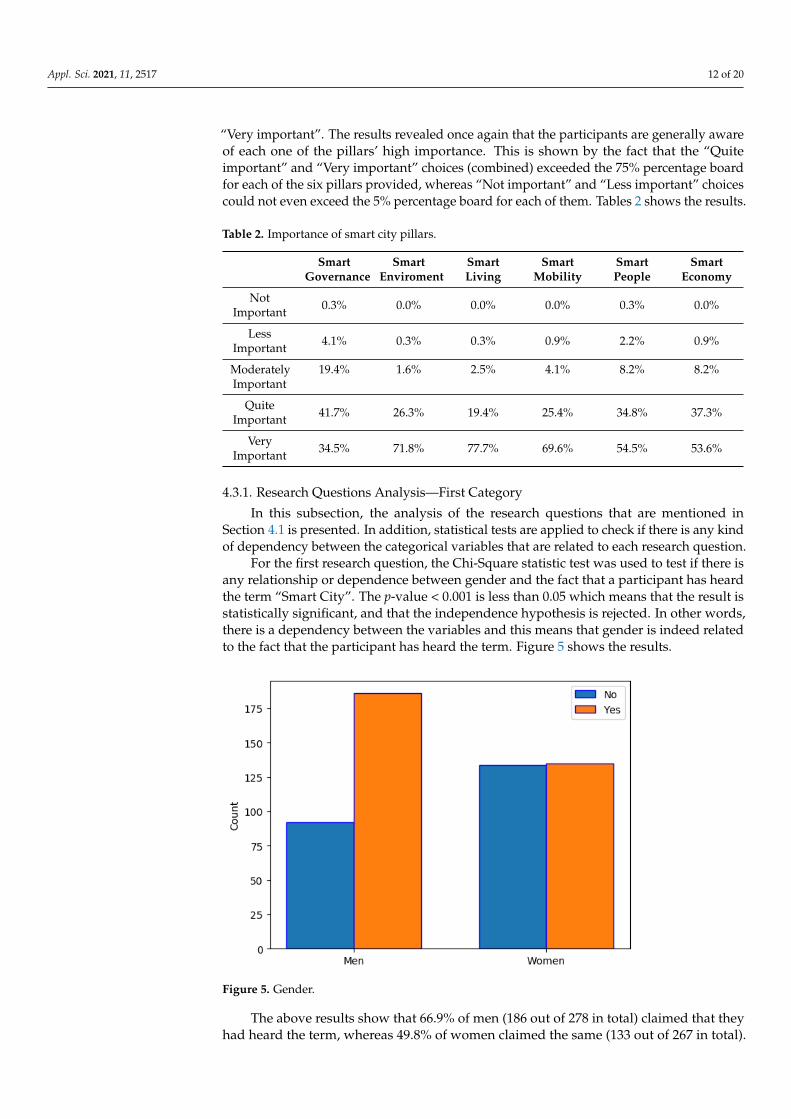
For the first research question, the Chi-Square statistic test was used to test if there isany relationship or dependence between gender and the fact that a participant has heardthe term “Smart City”. The p-value < 0.001 is less than 0.05 which means that the result isstatistically significant, and that the independence hypothesis is rejected. In other words,there is a dependency between the variables and this means that gender is indeed relatedto the fact that the participant has heard the term. Figure 5 shows the results.
Figure 5. Gender.
The above results show that 66.9% of men (186 out of 278 in total) claimed that theyhad heard the term, whereas 49.8% of women claimed the same (133 out of 267 in total).
Appl. Sci. 2021, 11, 2517 13 of 20
This indicates that, based on the research, men are more familiar with the term “Smart City”than women.
Furthermore, in order to investigate the relationship of dependence between age andthe fact that a participant has heard the term “Smart City” we used the Chi-Square statistictest for these variables. The p-value is 0.066 > 0.05. This means that the independencehypothesis cannot be rejected. In other words, the variables are not likely to be associated,thus age is not a significant factor for a person that has heard the term before.
Finally, we run the Chi-square’s test to investigate if a city is a determinant factor forthe fact that a participant has heard the term. The p-value is 0.012 < 0.05 which meansthat the result is statistically significant, and that the independence hypothesis is rejected.In other words, there is a dependency between the variables and this means that city isindeed related to the fact that the participant has heard the term.
In the second research question, we wanted to investigate if age, gender and cityare determinant factors for a better knowledge of what a smart city is. From the 319participants that have heard the smart city term, 262 of them have a decent or even broaderknowledge about it, whereas the rest of them (57 participants) have not, and have justheard the term.
For the three factors, we run the Chi-square’s test and the results are summarized be-low:
• Gender: The p-value is 0.121 and bigger than 0.05, thus, the independence hypothesiscannot be rejected. In other words, the variables are not likely to be associated, thusgender is not a significant factor for a person that has a decent or broader knowledgeof the term.
• Age: In this case, we check the Fisher–Freeman–Halton Exact Test value. This valueis taken into consideration, instead of the p-value when over 20% of the cells haveexpected counts less than 5, in order to test if there is any relationship or dependencebetween the variables [39]. If this value is >0.05, then there is no kind of dependencebetween the variables that were examined. Otherwise, the variables are associatedwith each other. In our case, the Fisher–Freeman–Halton value is 0.511 > 0.05, thus,the independence hypothesis cannot be rejected. In other words, the variables arenot likely to be associated, thus age is not a significant factor for a person that has adecent or broader knowledge of the term.
• City: The p-value is 0.057 > 0.05 which means that the independence hypothesiscannot be rejected. In other words, the variables are not likely to be associated, thusthe city is not a significant factor for a person that knows what “smart city” means.
The next hypothesis’ question is the following: Is the city factor related to the factthat a participant’s belief is that actions have been made to their city, so that it can betransformed into a smart city? In this case, we check the Fisher–Freeman–Halton value.However, when using the Exact Method, the results for Fisher–Freeman–Halton test cannotbe obtained (“Cannot be computed because there is insufficient memory”). Therefore,the Chi-Square tests have been calculated again, by using the Monte Carlo method. Thismethod is used when we cannot obtain the results using the Exact Method [40]. The MonteCarlo estimation of 0.000 for the Fisher–Freeman–Halton p-value is based on 10.000 randomsamples from the reference set, using a specific starting seed [40]. According to the MonteCarlo method, there is an estimation of 99% that the p-value is within the confidenceinterval (Lower Bound, Upper Bound). Fisher–Freeman–Halton p-value is 0.000 < 0.05as the Significance column indicates. This means that the result is statistically significant,and that the independence hypothesis is rejected. In other words, there is a dependencybetween the variables which means that city is indeed related to the belief of a participantthat actions have been made to their city, so that it can be transformed into a “smart” one.
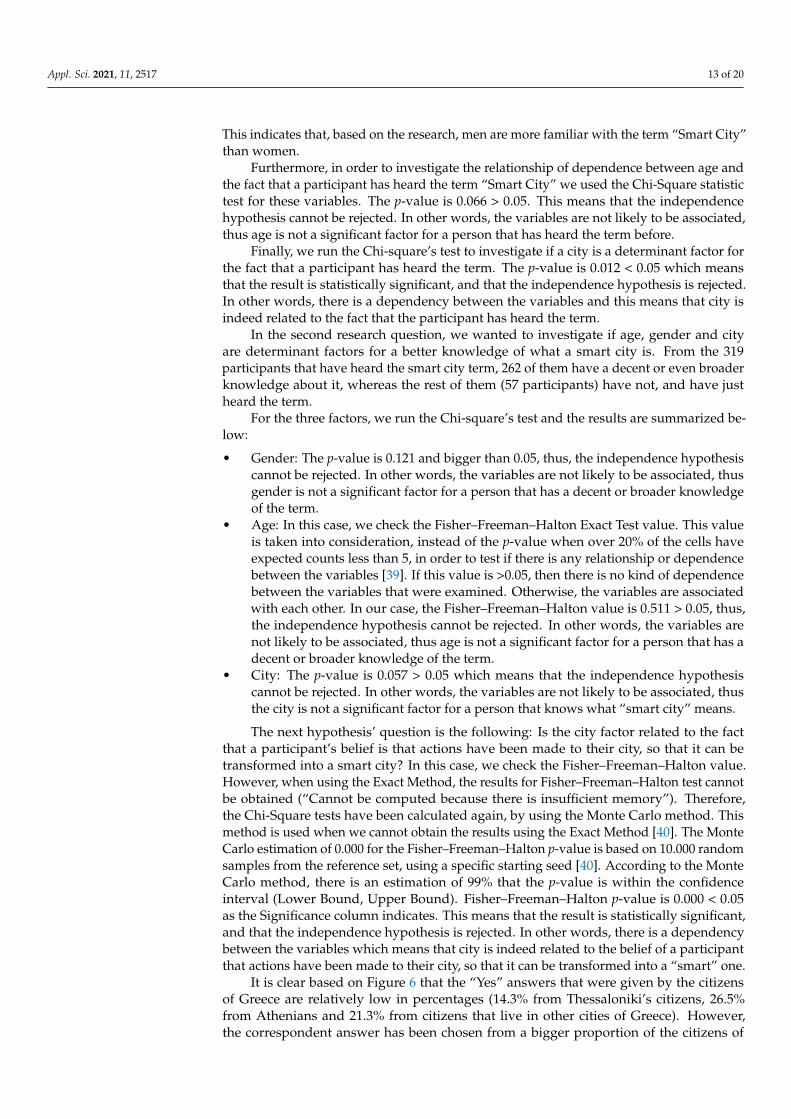
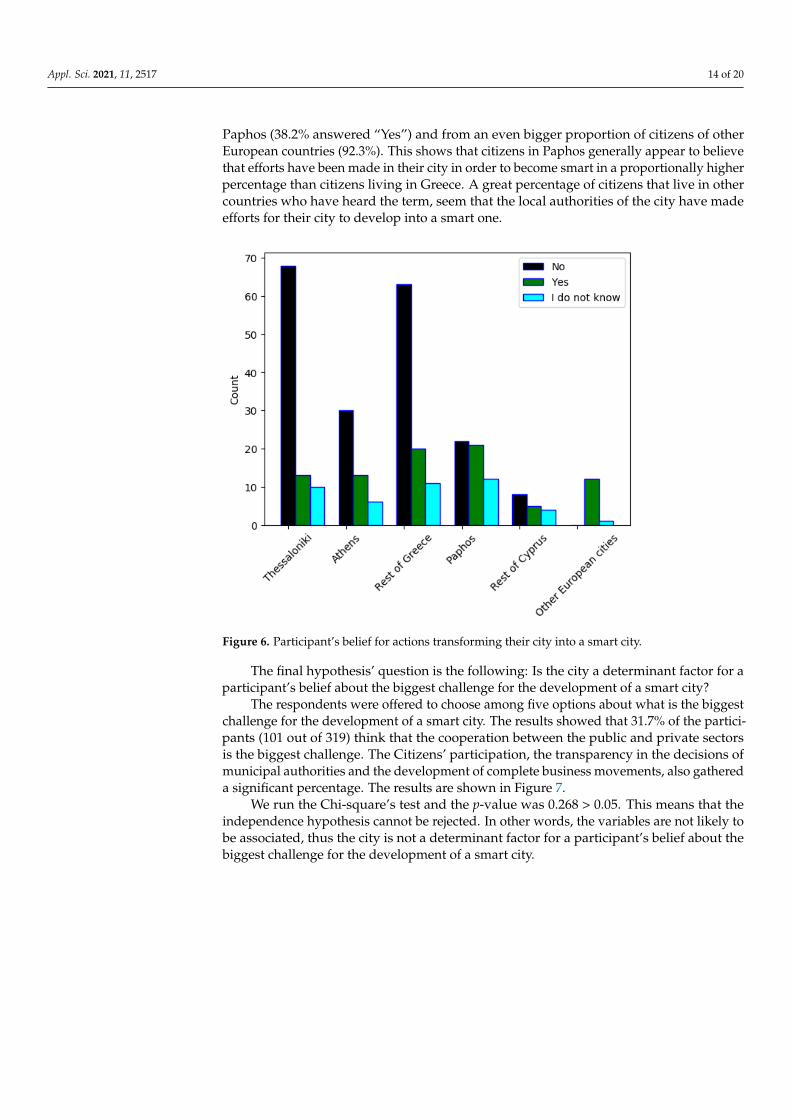
It is clear based on Figure 6 that the “Yes” answers that were given by the citizensof Greece are relatively low in percentages (14.3% from Thessaloniki’s citizens, 26.5%from Athenians and 21.3% from citizens that live in other cities of Greece). However,the correspondent answer has been chosen from a bigger proportion of the citizens of
Appl. Sci. 2021, 11, 2517 14 of 20
Paphos (38.2% answered “Yes”) and from an even bigger proportion of citizens of otherEuropean countries (92.3%). This shows that citizens in Paphos generally appear to believethat efforts have been made in their city in order to become smart in a proportionally higherpercentage than citizens living in Greece. A great percentage of citizens that live in othercountries who have heard the term, seem that the local authorities of the city have madeefforts for their city to develop into a smart one.
Figure 6. Participant’s belief for actions transforming their city into a smart city.
The final hypothesis’ question is the following: Is the city a determinant factor for aparticipant’s belief about the biggest challenge for the development of a smart city?
The respondents were offered to choose among five options about what is the biggestchallenge for the development of a smart city. The results showed that 31.7% of the partici-pants (101 out of 319) think that the cooperation between the public and private sectorsis the biggest challenge. The Citizens’ participation, the transparency in the decisions ofmunicipal authorities and the development of complete business movements, also gathereda significant percentage. The results are shown in Figure 7.
We run the Chi-square’s test and the p-value was 0.268 > 0.05. This means that theindependence hypothesis cannot be rejected. In other words, the variables are not likely tobe associated, thus the city is not a determinant factor for a participant’s belief about thebiggest challenge for the development of a smart city.

Appl. Sci. 2021, 11, 2517 15 of 20
Figure 7. Challenges based on participant’s belief.
4.3.2. Research Questions Analysis—Second Category
In this section, we present the responses from participants that declared themselves asnon-familiar with the smart city term. An amount of 226 (41.5% of the total participants)were declared as non-familiar with the smart city term.
At the beginning, the participants were asked if they are willing to learn more thingsabout the smart city concept in the future so that they can understand the term better.A vast amount of them (89.8%) answered “Yes”.
Then the participants were asked about whether the local authorities in their cityhave taken initiatives to inform them about the Smart City concept or not. The resultshave shown that over half of the respondents claimed that they don’t think that this kindof initiative has been taken in their city, by answering “No” (50.4%). The 43.4% of theparticipants showed unawareness on the subject while only 6.2% (which corresponds toonly 14 out of 226 respondents) answered “Yes”.
Subsequently, the “non-familiar” participants were asked whether they would bewilling to participate in the decision-making for the development of their city via a digitalplatform or not. The vast majority of them (71.2%) answered “Yes”, while 27.4% did notappear to be sure. Only 1.4% showed no interest in taking part in decisions for projectsrelated to their city.
Afterwards, to investigate if the education level factor determines the way that thenumber of non-familiar participants is formed we run the Chi-square test and we no-ticed that 33.3% of the cells have expected count less than 5. In this case, we check the“Fisher-Freeman-Halton” p-value. Since it is lower than 0.05 (p-value < 0.001), the result isstatistically significant, and the independence hypothesis is rejected. In other words, thereis a dependency between the variables and this means that education is indeed related tothe fact that a participant is or is not familiar with the term.
Based on Figure 8, it is clearly concluded that most of those who have a lower educa-tional level (secondary education and below) tend to be non-familiar with the smart cityterm, whereas most of those who have a high educational level (“Higher education” andabove) tend to be more familiar with it, by even just having heard of it.
The next hypothesis’ question is the following: Is age a determinant factor regardingthe participants’ interest for further learning about “Smart Cities” in the future?

Appl. Sci. 2021, 11, 2517 16 of 20
Figure 8. Education level for non-familiar citizens
We notice that 40% of the cells have an expected count less than 5. In this case, wecheck the “Fisher-Freeman-Halton”-value. Since 0.562 > 0.05, the independence hypothesiscannot be rejected. In other words, the variables are not likely to be associated, thus ageis not a determinant factor regarding the participants’ interest for further learning about“Smart Cities” in the future.
The final hypothesis’ question is: Is the city a determinant factor regarding the partici-pants’ interest for further learning about “Smart Cities” in the future?
We notice that 33.3% of the cells have an expected count of less than 5. In this case,we check the “Fisher-Freeman-Halton” p-value. Since 0.779 > 0.05, the independencehypothesis cannot be rejected. In other words, the variables are not likely to be associated,thus the city is not a determinant factor regarding the participants’ interest for furtherlearning about “Smart Cities” in the future. To sum up, the results have shown that mostof the participants are interested in learning new things reagrds to the smart city conceptin the future, regardless of their age and the city in which they live.
5. Discussion
Most of the respondents had a high educational level, meaning that most of them areUniversity graduates. Although the Greek respondents appeared to live in places all overEurope, most of them who filled in the questionnaire live in Greece and Cyprus (90.7%in total, combined). Only a total of 22 Greek citizens were inhabitants of other Europeancountries. Thus, for a major part of the review, we considered the number of Greek citizensthat live in foreign countries insignificant. Generally, we focused on four city categories:Thessaloniki, Athens, the Rest of Greece, and Paphos.
Regarding the “Smart City” term, 319 out of 545 participants (58.5%) stated that theyhave already heard it. The 48.1% (262 out of the total 545) of the Greek participants statedthat not only have they heard the “Smart City” term before, but they also have a decent (orbroader) knowledge of what “Smart City” stands for. This is quite encouraging, especiallyfor the citizens of Greece, where there is not a “pure” Smart City till today. The conclusionsthat accrued from the above results show that most of the people who have heard theterm are men; thus, gender is a contributory factor for those who have heard the term.
Appl. Sci. 2021, 11, 2517 17 of 20
Overall, the Cypriot citizens in Paphos seem to know better what a “Smart City” is thanthe citizens of Thessaloniki, the Athenians, and those who live in other cities in Greece.When isolating the participants that live in Greece, the Athenians seem to have a broaderknowledge of the term than citizens of Thessaloniki and those who live in other cities ofGreece, proportionately. This happened because Athens is the capital of Greece and itscitizens probably have better information from the local authorities about the Smart Cityconcept. It is also worth mentioning that, according to the survey analysis and results, mostof those who have a lower educational level (secondary education and below) tend to benon-familiar with the smart city term, whereas most of those who have a high educationallevel (“Higher education” and above) tend to be more familiar with it, by even just havingheard of it.
Consequently, the survey’s results revealed that most of the participants consider“Efficient use of energy” and “Sustainable development” as the factors that correlate themost with the smart city concept.
Generally, a large number of participants indicated that they do not believe that anyefforts have been made in their city in order to become smart. Of those who indeed believethat there has been some action, most of them stated that they had noticed actions inenvironment and mobility categories. Another conclusion that emerged from the analysisis that citizens in Paphos generally appear to believe that efforts have been made in theircity in order to become smart in a proportionally higher percentage than citizens livingin Greece. This can be explained by the initiatives taken by the municipality of Paphosrecently to offer smart city applications to its citizens.
About the most important challenges for the development of a smart city, the surveyrevealed that the cooperation of the private and public sectors is the biggest of them,according to the participants. The city factor does not appear to be determinant forthis result. For the participants that do not appear to be familiar with the smart cityterm, a number of conclusions also accrue. The fact that almost 90% of the non-familiarparticipants claimed that they are interested in acquiring further information about SmartCities in the future is very promising. The age and city factors do not appear to bedeterminant for this result.
Another interesting conclusion is that none of the “non-familiar with the smart cityterm” citizens of both Thessaloniki and Athens thinks that initiatives have been taken fortheir information about the “smart city” concept. A very small number of the citizensthat live in other cities in Greece, as well as in Paphos, believes the opposite. In general,negativity and ignorance prevail for all the city categories regarding the initiatives that thelocal authorities have taken for informing the citizens about smart cities.
The purpose of the smart city is not the technological upgrade of the services butthe commitment to improving the living conditions of the citizens. It is a citizens-centricvision with implications that include quality of life, way of life, sustainable development,and citizens’ smooth coexistence. A “smart city” should consider the needs and problemsof its residents, businesses, and the various organizations that operate in it. Technology isthe means to achieve economic and social goals.
It is obvious that each of the six pillars contributes specially and substantially to thedevelopment of a universally smart city. Every city that envisions becoming smart mustchoose the pillars of development that will invest in having the citizens’ real needs as theirmain priority. Regardless of the pillars or applications chosen to be implemented, it isessential to have already implemented some preconditions that will enhance the efforts totransform a city into a “smart city”. These conditions include investment in technologicalinfrastructure and the constant interaction with the citizens and the city’s businesses.
An essential role in the effort to develop “smart cities” plays the technological infras-tructure. Smart cities without universal connectivity do not exist. Connectivity is basedon three main actors: infrastructure providers, service providers, and local authoritiesthat will define the operating framework. Institutions must work together to ensure thecity’s telecommunications coverage. Device-human communication is the key to turning a
Appl. Sci. 2021, 11, 2517 18 of 20
conventional city into a smart one. Undoubtedly, the cities of the future are interconnectedwith Wi-Fi and 5G technologies. Soon, people’s confidence in these technologies becomes agiven, and the benefits of digital urban transformation are more than visible. The properinfrastructure allows devices to interact efficiently. At the same time, a key element ofsmart cities’ infrastructure is the centers for the collection and storage of the data generatedby the interconnected devices. Big data is now a gold that enhances the quality of servicesthat the city can offer. Proper utilization of this data can provide elements of the utmostimportance for the development of the city.
A city can only be improved when there is perfect harmony between a city’s localauthorities and its citizens. Active citizen participation is a vital part of developing asmart city. City authorities must adopt new methods that inspire and encourage the activeinvolvement of citizens. Citizen engagement is essential, and improving their engagementby providing incentives is a huge challenge for local authorities. There are many reasonswhy citizens may be reluctant to participate in a city’s public actions. Reluctance is oftenassociated with dissatisfaction with people representing local authorities or a lack ofconfidence in their commitments. With a vision of the smart city, local authorities shouldimplement new innovative ideas to enhance citizen involvement and overcome barriersthat limit their active participation in the community. Local authorities and city citizensshould work closely together to solve local problems. Furthermore, direct communicationbetween citizens and officials seems to be of utmost importance.
Our research shows that the citizens of the two countries, although they do not havedaily experience with the activities and applications of a smart city, showed a great interestin how a smart city could improve their quality of life. Based on this, we intend in our nextresearch to examine, in more detail, how citizen engagement can be increased and alsostudy various areas in which citizens have shown great interest, such as smart living.
6. Conclusions
The purpose of this paper was mainly to examine the perception that the Greek andCypriot citizens have, regarding the Smart City concept, as well as to reveal their beliefsabout the current level of “smartness” that appears in the city they live in. Since Greekcities have not delved into the smart city concept and applications at an advanced andholistic level, we decided to examine the standpoints of Greek and Cypriot citizens inregards to the implementation of smart city elements into Greek and Cypriot cities throughquantitative research. Since the questionnaire that was used for this research as a tool forcollecting data was provided in an e-version, we are aware of the limitation that accrues:only citizens with internet access were able to participate. Another limitation comes fromthe fact that the choice of the participants was totally random; since we addressed to anaudience that has generally a small experience regarding the Smart City concept and wedid not focus on experts to fill in the questionnaire. We proceeded by this way in orderto get the opinion and perception of random Greek and Cypriot adult citizens about thesubject. It is worth mentioning here that 87.5% of the participants who opted for fillingthe questionnaire were from 18 to 40 years old. This result reveals that younger people areprobably more interested in indulging in the Smart City concept. The smart city conceptis becoming a mega-trend and appears to emerge globally. The development of smartcities seems to have become mandatory, as it allows cities all over the world to copewith the challenges that are derived from increasing urbanization and population growth.The smart city concept already holds the potential to address aspects of the sustainabilitychallenge by promoting citizen participation, developing innovative and smart solutionsfor sustainability, and adopting a transparent governance system.
Author Contributions: Conceptualization, A.G. and Z.Z.; methodology, A.G.; validation, A.G.and Z.Z.; formal analysis, A.G.; investigation, A.G.; writing—original draft preparation, A.G.;writing—review and editing, Z.Z. and P.C.; visualization, Z.Z.; supervision, Z.Z. and A.G. All authorshave read and agreed to the published version of the manuscript.
Appl. Sci. 2021, 11, 2517 19 of 20
Funding: This research received no external funding.
Institutional Review Board Statement: The study was conducted according to the guidelines of theDeclaration of Helsinki, and approved by the Institutional Review Board of Neapolis UniversityPafos (12/11/2020).
Informed Consent Statement: Informed consent was obtained from all subjects involved in the study.
Data Availability Statement: The data presented in this study are available on request from thecorresponding author.
Conflicts of Interest: The authors declare no conflict of interest.
References1. Venkatachalam, S. Re-Thinking the Role of Citizens in Evaluating Quality of Life in the Smart City. Master’s Thesis, Delft
University of Technology, Delft, The Netherland, 2020.2. Albino, V.; Berardi, U.; Dangelico, R.M. Smart cities: Definitions, dimensions, performance, and initiatives. J. Urban Technol. 2015,
22, 3–21. [CrossRef]3. Zinonos, Z.; Christodoulou, P.; Andreou, A.; Chatzichristofis, S. Parkchain: An iot parking service based on blockchain. In
Proceedings of the 2019 15th International Conference on Distributed Computing in Sensor Systems (DCOSS), Santorini, Greece,31 May 2019; pp. 687–693.
4. Christodoulou, P.; Christodoulou, K.; Andreou, A. A decentralized application for logistics: Using blockchain in real-worldapplications. Cyprus Rev. 2018, 30, 181–193.
5. Christodoulou, K.; Christodoulou, P.; Zinonos, Z.; Carayannis, E.G.; Chatzichristofis, S.A. Health information exchange withblockchain amid COVID-19-like pandemics. In Proceedings of the IEEE 2020 16th International Conference on DistributedComputing in Sensor Systems (DCOSS), Marina del Rey, CA, USA, 25–27 May 2020; pp. 412–417.
6. Anastasiou, A.; Christodoulou, P.; Christodoulou, K.; Vassiliou, V.; Zinonos, Z. Iot device firmware update over lora: Theblockchain solution. In Proceedings of the IEEE 2020 16th International Conference on Distributed Computing in Sensor Systems(DCOSS), Marina del Rey, CA, USA, 25–27 May 2020; pp. 404–411.
7. Berntzen, L.; Johannessen, M.R. The role of citizens in “smart cities”. In Proceedings of the Management International Conference,Pula, Croatia, 1–4 June 2016.
8. Capdevila, I.; Zarlenga, M.I. Smart city or smart citizens? The Barcelona case. J. Strategy Manag. 2015, 8, 266–282. [CrossRef]9. Tadili, J.; Fasly, H. Citizen participation in smart cities: A survey. In Proceedings of the 4th International Conference on Smart
City Applications, Casablanca, Morocco, 2–4 October 2019; pp. 1–6.10. Yeh, H. The effects of successful ICT-based smart city services: From citizens’ perspectives. Gov. Inf. Q. 2017, 34, 556–565.
[CrossRef]11. Belanche, D.; Casaló, L.V.; Orús, C. City attachment and use of urban services: Benefits for smart cities. Cities 2016, 50, 75–81.
[CrossRef]12. Zenker, S.; Rütter, N. Is satisfaction the key? The role of citizen satisfaction, place attachment and place brand attitude on positive
citizenship behavior. Cities 2014, 38, 11–17. [CrossRef]13. Mattingly, K.; Morrissey, J. Housing and transport expenditure: Socio-spatial indicators of affordability in Auckland. Cities 2014,
38, 69–83. [CrossRef]14. Tiwari, R.; Cervero, R.; Schipper, L. Driving CO2 reduction by integrating transport and urban design strategies. Cities 2011,
28, 394–405. [CrossRef]15. Castelnovo, W. Co-production makes cities smarter: Citizens’ participation in smart city initiatives. In Co-Production in the Public
Sector; Springer: Cham, Switzerland, 2016; pp. 97–117.16. Bovaird, T.; Loeffler, E. From engagement to co-production: The contribution of users and communities to outcomes and public
value. Volunt. Int. J. Volunt. Nonprofit Organ. 2012, 23, 1119–1138. [CrossRef]17. Gupta, K.; Hall, R.P. The Indian perspective of smart cities. In Proceedings of the IEEE 2017 Smart City Symposium Prague
(SCSP), Prague, Czech Republic, 25–26 May 2017; pp. 1–6.18. Berntzen, L.; Karamagioli, E. Regulatory measures to support eDemocracy. In Proceedings of the IEEE 2010 Fourth International
Conference on Digital Society, Saint Maarten, Netherlands Antilles, 10–16 February 2010; pp. 311–316.19. Hollands, R.G. Will the real smart city please stand up? Intelligent, progressive or entrepreneurial? City 2008, 12, 303–320.
[CrossRef]20. Carrillo, F.J.; Yigitcanlar, T.; García, B.; Lönnqvist, A. Knowledge and the City: Concepts, Applications and Trends of Knowledge-Based
Urban Development; Routledge: Oxfordshire, UK, 2014.21. Hardoy, J.E.; Mitlin, D.; Satterthwaite, D. Environmental Problems in an Urbanizing World: Finding Solutions in Cities in Africa, Asia
and Latin America; Routledge: Oxfordshire, UK, 2013.22. Vanolo, A. Smartmentality: The smart city as disciplinary strategy. Urban Stud. 2014, 51, 883–898. [CrossRef]23. Angelidou, M.; Psaltoglou, A.; Komninos, N.; Kakderi, C.; Tsarchopoulos, P.; Panori, A. Enhancing sustainable urban development
through smart city applications. J. Sci. Technol. Policy Manag. 2018, 9, 146–169. [CrossRef]
Appl. Sci. 2021, 11, 2517 20 of 20
24. Molnar, D.; Morgan, A. Defining Sustainability, Sustainable Development and Sustainable Communities: A Working Paper forthe Sustainable Toronto Project. Sustainability 2001, 829.
25. Brundtland, G.H. What is sustainable development. In Our Common Future; Oxford University Press: Oxford, UK, 1987,pp. 8–15.
26. Atkinson, A. Cities after oil—1: ‘Sustainable development’and energy futures. City 2007, 11, 201–213. [CrossRef]27. Desa, U. Transforming Our World: The 2030 Agenda for Sustainable Development; United Nations: Geneva, Switzerland, 2016.28. Bibri, S.E.; Krogstie, J. Smart sustainable cities of the future: An extensive interdisciplinary literature review. Sustain. Cities Soc.
2017, 31, 183–212. [CrossRef]29. Castells, M. Urban sustainability in the information age. City 2000, 4, 118–122. [CrossRef]30. Giffinger, R.; Fertner, C.; Kramar, H.; Meijers, E. City-Ranking of European Medium-Sized Cities; Vienna University of Technology:
Vienna, Austria, 2007; pp. 1–12.31. Giffinger, R.; Gudrun, H. Smart cities ranking: An effective instrument for the positioning of the cities? ACE Arch. City Environ.
2010, 4, 7–26.32. Shapiro, J.M. Smart cities: Quality of life, productivity, and the growth effects of human capital. Rev. Econ. Stat. 2006, 88, 324–335.
[CrossRef]33. Colldahl, C.; Frey, S.; Kelemen, J.E. Smart Cities: Strategic Sustainable Development for an Urban World. Master Thesis, School
of Engineering Blekinge Institute of Technology, Karlskrona, Sweden, 2013.34. Zubizarreta, I.; Seravalli, A.; Arrizabalaga, S. Smart city concept: What it is and what it should be. J. Urban Plan. Dev. 2016,
142, 04015005. [CrossRef]35. Ursachi, G.; Horodnic, I.A.; Zait, A. How reliable are measurement scales? External factors with indirect influence on reliability
estimators. Procedia Econ. Financ. 2015, 20, 679–686. [CrossRef]36. How-to Guide for IBM® SPSS® Statistics Software. Available online: https://methods.sagepub.com/dataset/howtoguide/kmo-
nilt-2012 (accessed on 21 November 2020).37. Bartlett’s Test: Definition and Examples. Available online: https://www.statisticshowto.com/bartletts-test/ (accessed on 8
November 2020).38. Kaiser-Meyer-Olkin (KMO) Test for Sampling Adequacy. Available online: https://www.statisticshowto.com/kaiser-meyer-
olkin/ (accessed on 15 November 2020).39. How to Use SPSS-Fisher’s Exact Test. Available online: https://www.youtube.com/watch?v=LynasIsG0xI&feature=youtu.be
(accessed on 13 November 2020).40. Mehta, C.R.; Patel, N.R. IBM SPSS Exact Tests; IBM Corporation: Armonk, NY, USA, 2011.


