Embed Size (px)
Citation preview
metals
Article
Theoretical Study of Particle Dissolution duringHomogenization in Cu–Fe–P Alloy
Spyros Papaefthymiou 1,* ID , Marianthi Bouzouni 1,2 and Evangelos Gavalas 1,2 ID
1 Laboratory of Physical Metallurgy, Division of Metallurgy and Materials, School of Mining & MetallurgicalEngineering, National Technical University of Athens, 9, Her. Polytechniou str., Zografos,15780 Athens, Greece; [email protected] (M.B.); [email protected] (E.G.)
2 Department of Physical Metallurgy and Forming, Hellenic Research Centre for Metals S.A.—ELKEME S.A.,56th km Athens-Lamia Nat. Road, 32011 Oinofyta, Greece
* Correspondence: [email protected]; Tel.: +30-210-772-4710
Received: 18 May 2018; Accepted: 12 June 2018; Published: 14 June 2018�����������������
Abstract: The effect of temperature, soaking time and particle size on the dissolution of particles(Fe3P and Fe) during homogenization was simulated employing Thermocalc® and DICTRA software.The initial precipitate size was determined through metallographic evaluation on industrial as-castCu–Fe–P alloy. The particle sizes vary from submicron (<1 µm) up to 10 µm before the heattreatment. As homogenization temperature rises, the dissolution rate increases as well, but only ontemperatures above 1273 K (1000 ◦C) is the rate capable of completely dissolving particles effectively.At temperatures above 1273 K (1000 ◦C), precipitates with sizes below 5 µm dissolve completely intothe Cu matrix, while larger particles only slightly decrease their size. Particles at enriched copper areasremain undissolved and slightly increase their size which is attributed to micro segregation and thelocal change of equilibrium conditions. The simulation results are in agreement with homogenizationtrials at lab scale.
Keywords: Cu–Fe–P; dissolution; diffusion; homogenization; heat treatment; Fe3P; Fe particles;solid solution
1. Introduction
The increased requirements for economic copper (Cu) tubes being able to withstand higherpressures while working in extreme service environments and maintain their conductivityhave led to research around a number of Cu-based alloys with higher mechanical properties.The endeavor to increase the mechanical properties of solid solution hardened alloys is limited bytheir insufficient relaxation resistance at slightly increased temperatures and decreasing electricaland thermal conductivity when heavily alloyed. To overcome this, the focus has turned toprecipitation-hardened alloys [1,2]. Recently, copper–iron–phosphorus (Cu–Fe–P) alloys have beena successful medium-strength and high-conductivity alternative that provide superior properties overother widely used materials for copper tubes, such as deoxidized-high-phosphorus (DHP) copper [3].
The industrial application and the effects of thermomechanical processing on the microstructureand second-phase particles have been studied in [4–6]. The improvement of the mechanical propertiesin Cu–Fe–P alloys is attributed to precipitation hardening via fine dispersion of particles (α-Fe, γ-Fe,Fe3P) in the Cu matrix and the materials’ resistance to softening due to recrystallization [2,4,5,7,8].
In Cu–Fe–P alloys, small-sized particles (submicron scale), found at the grain boundaries,are desirable in the microstructure as they control recrystallization and pin grain boundaries anddislocations via the Zener drag mechanism [4,5,9], thereby limiting grain growth. Coarse particlesshould be avoided as they do not pin dislocations and grain boundaries during recrystallization which
Metals 2018, 8, 455; doi:10.3390/met8060455 www.mdpi.com/journal/metals

Metals 2018, 8, 455 2 of 12
results in reduced mechanical properties and material sensitivity at high temperatures. Homogeneousdistribution of fine particles is of great importance and is achieved via appropriate precipitationheat treatment, which consists of homogenization, quenching and aging. During homogenization,the temperature must be high enough to induce the dissolution of particles. This procedure is followedby quenching in which the cooling rate must prevent any diffusion and precipitation, and ensure thatthe copper (Cu) matrix is supersaturated with phosphorous (P) and iron (Fe) atoms. Finally, duringthe aging treatment the required driving force is provided for the supersaturated matrix to reachequilibrium. So, fine particles begin to form homogeneously. The size of phosphides depends on thetemperature and time for aging and not on the final cooling rate [10].
Since the properties of Cu–Fe–P alloys are greatly influenced by microalloying, each productionstep has to be carefully designed to achieve the required final properties. Many researchershave applied various methods to optimize mechanical and material (i.e., thermal conductivity,microstructure, etc.) properties. Extensive investigation has been held on the influence of variousalloying elements (e.g., Ni, Si, Mg, Mn) and their concentration on the Cu matrix [6,11–15].Lu et al. [11] showed that traces of boron B and cerium Ce could increase the recrystallizationtemperature, succeeding more complete aging and, thus, obtaining the strengthening effect viawork and precipitation hardening. Brovc et al. [12] and Yamamoto et al. [13,14] indicated the highpotential of Cu–Fe–Ni–P alloy, illustrating the good conductivity and mechanical properties at elevatedtemperatures, as an alternative economic alloy, in order to avoid the addition of toxic (i.e., Cd, Be) orprecious metals (e.g., Ag) used until now as alloying elements in the industry. The addition of Mg, Si,Pb and Mn further improve the mechanical properties of the alloy without compromising conductivitywhen carefully used [6,15].
Since the results of annealing at the final stages of copper tube production, where recrystallizationand aging takes place, have as a prerequisite an efficient homogenization at the beginning of theproduction process, the dissolution of Fe and Fe3P particles during homogenization is of greatimportance. Particle dissolution theory initially introduced by Whelan [16], describes the soluteflux in conjunction with the particle size and concentrations. The diffusional growth and dissolutionhas been studied extensively in terms of interface movement and diffusion of solute atoms in ironsystems [17–19]. However, little work has been done on non-ferrous alloys.
Although both the alloying and the ageing treatment have been thoroughly studied,the homogenization step has not been adequately investigated. Several homogenization strategies havebeen implemented industrially and many researchers have analyzed the effect of temperature and timeon homogenization annealing, using only material characterization techniques but without explainingthe criteria of the optimal homogenization and specifying the optimal conditions for a successfulhomogenization [4,7,11,12]. Parameters are difficult to be determined and are very important forindustrial production, where time and sizes impose limitations.
For this purpose, homogenization experiments were simulated with the aid of Thermocalc® andDICTRA software at various temperatures and soaking times in order to understand the influence of theprocess conditions and the local chemical composition on the Fe-rich particle dissolution. The resultshave been compared to experimental data in order to determine the homogenization behavior ofCu–Fe–P alloy.
2. Material and Modelling
The chemical composition of an industrially produced billet with a diameter of 600 mm isshown in Table 1, which complies with BS EN 12449:2012 standard [20]. The Thermocalc® (Version2018a, Thermo-Calc Software AB, Solna, Sweden) calculation of the alloy’s phase diagram, utilizingthe CALculation of PHAse Diagrams—CALPHAD method, has been deployed in order to predictthe phases formed in crucial temperature areas and determine the temperature window for thehomogenization process. Through metallographic evaluation, the different sizes of precipitates weremeasured and used as input data for the simulation. For the simulation of homogenization, three phases
Metals 2018, 8, 455 3 of 12
were considered: Fe, Fe3P and Cu matrix. The system was limited to Cu–Fe–P–Zn. The alloy’ssolidification was simulated in DICTRA (Version 2018a, Thermo-Calc Software AB, Solna, Sweden)with a cooling rate 10 K/s in order to predict the chemical composition of the Cu matrix (Table 2).
Table 1. Alloy’s composition.
Fe (%) P (%) Zn (%) Cu (%)
2.3 0.025 0.12 97.555
Table 2. Composition of Cu matrix in alloying element-depleted regions.
Fe (%) P (%) Zn (%)
1.8 0.01 0.1291
The activation enthalpies were set at 250,000 J/mol and 210,000 J/mol respectively determined byThermocalc. Similar values for the activation enthalpy can be found elsewhere [21].
The effect of segregation upon homogenization was taken into account in this study as itgreatly affects the homogenization result. Thus, additional simulations were carried out for particlesdissolving in an alloying element-enriched Cu matrix whose chemical composition is shown in Table 3.The chemical composition was defined by Thermocalc® considering that the segregated zones obtainthe chemical composition of the Cu matrix at the beginning of the solidification, as given in Table 3.
Table 3. Composition of Cu matrix in alloying element-enriched regions.
Fe (%) P (%) Zn (%)
3.8 0.025 0.15
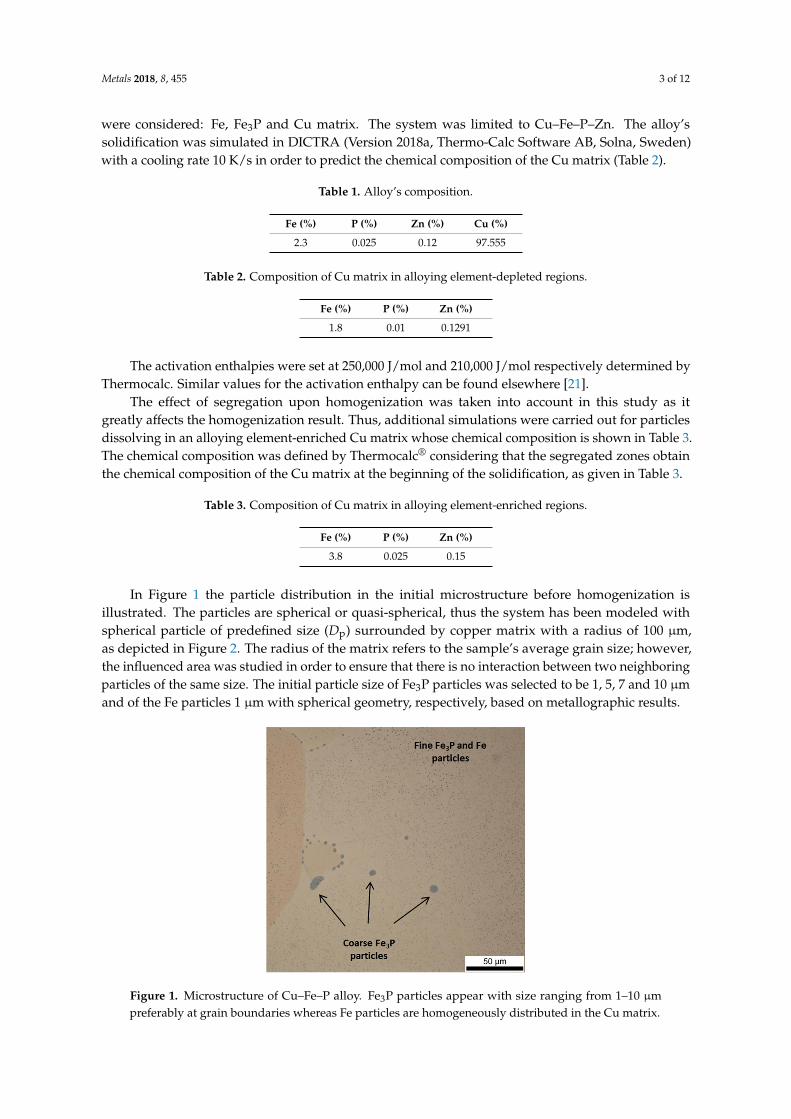
In Figure 1 the particle distribution in the initial microstructure before homogenization isillustrated. The particles are spherical or quasi-spherical, thus the system has been modeled withspherical particle of predefined size (Dp) surrounded by copper matrix with a radius of 100 µm,as depicted in Figure 2. The radius of the matrix refers to the sample’s average grain size; however,the influenced area was studied in order to ensure that there is no interaction between two neighboringparticles of the same size. The initial particle size of Fe3P particles was selected to be 1, 5, 7 and 10 µmand of the Fe particles 1 µm with spherical geometry, respectively, based on metallographic results.
Metals 2018, 8, x FOR PEER REVIEW 3 of 12
solidification was simulated in DICTRA (Version 2018a, Thermo-Calc Software AB, Solna, Sweden) with a cooling rate 10 K/s in order to predict the chemical composition of the Cu matrix (Table 2).
Table 1. Alloy’s composition.
Fe (%) P (%) Zn (%) Cu (%) 2.3 0.025 0.12 97.555
Table 2. Composition of Cu matrix in alloying element-depleted regions.
Fe (%) P (%) Zn (%) 1.8 0.01 0.1291
The activation enthalpies were set at 250,000 J/mol and 210,000 J/mol respectively determined by Thermocalc. Similar values for the activation enthalpy can be found elsewhere [21].
The effect of segregation upon homogenization was taken into account in this study as it greatly affects the homogenization result. Thus, additional simulations were carried out for particles dissolving in an alloying element-enriched Cu matrix whose chemical composition is shown in Table 3. The chemical composition was defined by Thermocalc® considering that the segregated zones obtain the chemical composition of the Cu matrix at the beginning of the solidification, as given in Table 3.
Table 3. Composition of Cu matrix in alloying element-enriched regions.
Fe (%) P (%) Zn (%) 3.8 0.025 0.15
In Figure 1 the particle distribution in the initial microstructure before homogenization is illustrated. The particles are spherical or quasi-spherical, thus the system has been modeled with spherical particle of predefined size (Dp) surrounded by copper matrix with a radius of 100 μm, as depicted in Figure 2. The radius of the matrix refers to the sample’s average grain size; however, the influenced area was studied in order to ensure that there is no interaction between two neighboring particles of the same size. The initial particle size of Fe3P particles was selected to be 1, 5, 7 and 10 μm and of the Fe particles 1 μm with spherical geometry, respectively, based on metallographic results.
Figure 1. Microstructure of Cu–Fe–P alloy. Fe3P particles appear with size ranging from 1–10 μm preferably at grain boundaries whereas Fe particles are homogeneously distributed in the Cu matrix. Figure 1. Microstructure of Cu–Fe–P alloy. Fe3P particles appear with size ranging from 1–10 µm
preferably at grain boundaries whereas Fe particles are homogeneously distributed in the Cu matrix.

Metals 2018, 8, 455 4 of 12Metals 2018, 8, x FOR PEER REVIEW 4 of 12
Figure 2. Schematic representation of the system used for DICTRA calculations. The DP obtains values 1 μm, 5 μm, 7 μm, 10 μm.
Two sets of simulations for each individual particle were held at the following temperatures: 1073 K (800 °C), 1173 (900 °C) and 1273 K (1000 °C). In the first set, particle dissolution took place in the alloying element-depleted Cu matrix (Table 2), and in the second set dissolution simulations took place in the alloying element-enriched Cu matrix (Table 3). The temperature of 1073 K (800 °C) was defined as the lowest temperature that the billet can be extruded in an industrial extrusion press. The maximum soaking time selected for the homogenization simulations was 10 h. The heating rate used to reach the homogenization temperature was 1 K/s. An estimate of the mobility expression [21] of Fe and P for the Fe3P and Fe particle was made,
−=RTQ
RTMM
o
exp (1)
in which M° is the frequency factor, Q the activation enthalpy, R is the constant for gas and T is the temperature. Calculations were performed using DICTRA software and the databases TCCU1 and MOBCU1 assuming that local equilibrium exists at interfaces [22].
3. Modelling Results
3.1. Phase Diagram
The calculated isopleth sections of phase diagrams of the Cu–Fe–P alloy in thermodynamic equilibrium are illustrated in Figures 3 and 4. The diagrams show that the phases that exist at equilibrium are liquid, Cu (matrix), γ-Fe, α-Fe and Fe3P while the red lines denote the examined alloy’s chemical composition also indicated in Table 1. Fe3P and α-Fe precipitates form in temperatures below 973–1230 K (700–957 °C) depending on the local chemical composition. The influence of the Fe and P on the phase diagram has been studied as well in order to understand the influence of local chemical composition variation. By increasing Fe concentration, the Fe3P dissolution threshold temperature slightly decreases by ~30 K in the range from 2.1% Fe to 2.6% Fe, as shown in Figure 3. However, P plays a more important role as depicted in Figure 4. By increasing P concentration from 0.015% P to 0.05% P, the Fe3P dissolution temperature increases from 843 K (570 °C) to 1033 K (760 °C). The liquid temperature is not influenced by chemical composition variation of Fe and P.
Figure 2. Schematic representation of the system used for DICTRA calculations. The DP obtains values1 µm, 5 µm, 7 µm, 10 µm.
Two sets of simulations for each individual particle were held at the following temperatures:1073 K (800 ◦C), 1173 (900 ◦C) and 1273 K (1000 ◦C). In the first set, particle dissolution took placein the alloying element-depleted Cu matrix (Table 2), and in the second set dissolution simulationstook place in the alloying element-enriched Cu matrix (Table 3). The temperature of 1073 K (800 ◦C)was defined as the lowest temperature that the billet can be extruded in an industrial extrusion press.The maximum soaking time selected for the homogenization simulations was 10 h. The heating rateused to reach the homogenization temperature was 1 K/s. An estimate of the mobility expression [21]of Fe and P for the Fe3P and Fe particle was made,
M =Mo
RTexp
(−QRT
)(1)
in which M◦ is the frequency factor, Q the activation enthalpy, R is the constant for gas and T is thetemperature. Calculations were performed using DICTRA software and the databases TCCU1 andMOBCU1 assuming that local equilibrium exists at interfaces [22].
3. Modelling Results
3.1. Phase Diagram
The calculated isopleth sections of phase diagrams of the Cu–Fe–P alloy in thermodynamicequilibrium are illustrated in Figures 3 and 4. The diagrams show that the phases that exist atequilibrium are liquid, Cu (matrix), γ-Fe, α-Fe and Fe3P while the red lines denote the examinedalloy’s chemical composition also indicated in Table 1. Fe3P and α-Fe precipitates form in temperaturesbelow 973–1230 K (700–957 ◦C) depending on the local chemical composition. The influence of theFe and P on the phase diagram has been studied as well in order to understand the influence oflocal chemical composition variation. By increasing Fe concentration, the Fe3P dissolution thresholdtemperature slightly decreases by ~30 K in the range from 2.1% Fe to 2.6% Fe, as shown in Figure 3.However, P plays a more important role as depicted in Figure 4. By increasing P concentration from0.015% P to 0.05% P, the Fe3P dissolution temperature increases from 843 K (570 ◦C) to 1033 K (760 ◦C).The liquid temperature is not influenced by chemical composition variation of Fe and P.

Metals 2018, 8, 455 5 of 12Metals 2018, 8, x FOR PEER REVIEW 5 of 12
Figure 3. Isopleth section of CuFe2P alloy phase diagram—Fe dependency. The red lines show the temperatures at which α-Fe and Fe3P particles are formed depending on Fe content.
Figure 4. Isopleth section of CuFe2P alloy phase diagram—P dependency. The red lines show the temperatures at which α-Fe and Fe3P particles are formed depending on P content.
3.2. Dissolution Calculations
In Figures 5–7 the particle size evolution during homogenization, in both alloying element depleted and enriched regions, is illustrated for various initial particle diameters and different soaking temperatures.
At 1073 K (800 °C) the graphs remain almost parallel to the abscissa axis at the depleted matrix simulations. According to the phase diagrams (Figures 3 and 4), although it is thermodynamically feasible to perform homogenization at the temperature of 1073 K (800 °C), since it is higher than the dissolution threshold temperature, practically there is no phosphide size alteration for the given time. The low temperature limits the diffusion rate which in turn deteriorates the particle dissolution (Figure 5).
Figure 3. Isopleth section of CuFe2P alloy phase diagram—Fe dependency. The red lines show thetemperatures at which α-Fe and Fe3P particles are formed depending on Fe content.
Metals 2018, 8, x FOR PEER REVIEW 5 of 12
Figure 3. Isopleth section of CuFe2P alloy phase diagram—Fe dependency. The red lines show the temperatures at which α-Fe and Fe3P particles are formed depending on Fe content.
Figure 4. Isopleth section of CuFe2P alloy phase diagram—P dependency. The red lines show the temperatures at which α-Fe and Fe3P particles are formed depending on P content.
3.2. Dissolution Calculations
In Figures 5–7 the particle size evolution during homogenization, in both alloying element depleted and enriched regions, is illustrated for various initial particle diameters and different soaking temperatures.
At 1073 K (800 °C) the graphs remain almost parallel to the abscissa axis at the depleted matrix simulations. According to the phase diagrams (Figures 3 and 4), although it is thermodynamically feasible to perform homogenization at the temperature of 1073 K (800 °C), since it is higher than the dissolution threshold temperature, practically there is no phosphide size alteration for the given time. The low temperature limits the diffusion rate which in turn deteriorates the particle dissolution (Figure 5).
Figure 4. Isopleth section of CuFe2P alloy phase diagram—P dependency. The red lines show thetemperatures at which α-Fe and Fe3P particles are formed depending on P content.
3.2. Dissolution Calculations
In Figures 5–7 the particle size evolution during homogenization, in both alloying elementdepleted and enriched regions, is illustrated for various initial particle diameters and differentsoaking temperatures.
At 1073 K (800 ◦C) the graphs remain almost parallel to the abscissa axis at the depleted matrixsimulations. According to the phase diagrams (Figures 3 and 4), although it is thermodynamicallyfeasible to perform homogenization at the temperature of 1073 K (800 ◦C), since it is higher thanthe dissolution threshold temperature, practically there is no phosphide size alteration for the giventime. The low temperature limits the diffusion rate which in turn deteriorates the particle dissolution(Figure 5).
Metals 2018, 8, 455 6 of 12
Metals 2018, 8, x FOR PEER REVIEW 6 of 12
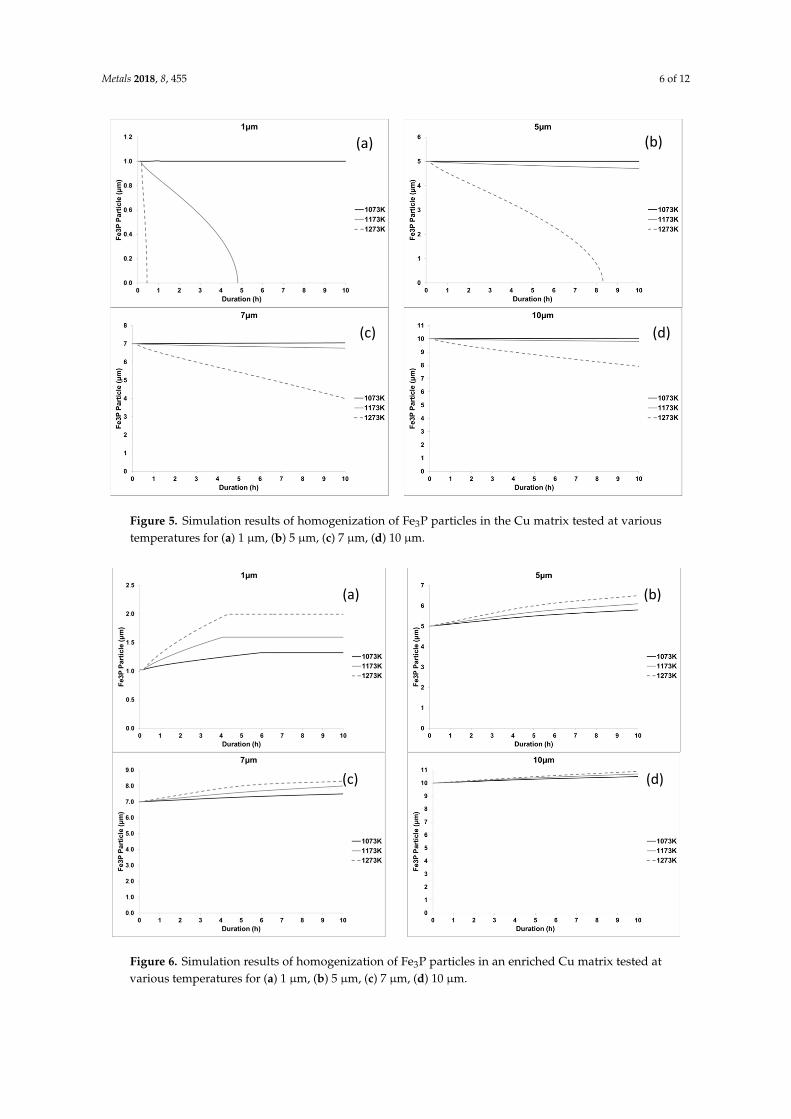
Figure 5. Simulation results of homogenization of Fe3P particles in the Cu matrix tested at various temperatures for (a) 1 μm, (b) 5 μm, (c) 7 μm, (d) 10 μm.
Figure 6. Simulation results of homogenization of Fe3P particles in an enriched Cu matrix tested at various temperatures for (a) 1 μm, (b) 5 μm, (c) 7 μm, (d) 10 μm.
(a) (b)
(c) (d)
(a) (b)
(c) (d)
Figure 5. Simulation results of homogenization of Fe3P particles in the Cu matrix tested at varioustemperatures for (a) 1 µm, (b) 5 µm, (c) 7 µm, (d) 10 µm.
Metals 2018, 8, x FOR PEER REVIEW 6 of 12
Figure 5. Simulation results of homogenization of Fe3P particles in the Cu matrix tested at various temperatures for (a) 1 μm, (b) 5 μm, (c) 7 μm, (d) 10 μm.
Figure 6. Simulation results of homogenization of Fe3P particles in an enriched Cu matrix tested at various temperatures for (a) 1 μm, (b) 5 μm, (c) 7 μm, (d) 10 μm.
(a) (b)
(c) (d)
(a) (b)
(c) (d)
Figure 6. Simulation results of homogenization of Fe3P particles in an enriched Cu matrix tested atvarious temperatures for (a) 1 µm, (b) 5 µm, (c) 7 µm, (d) 10 µm.
Metals 2018, 8, 455 7 of 12
Metals 2018, 8, x FOR PEER REVIEW 7 of 12
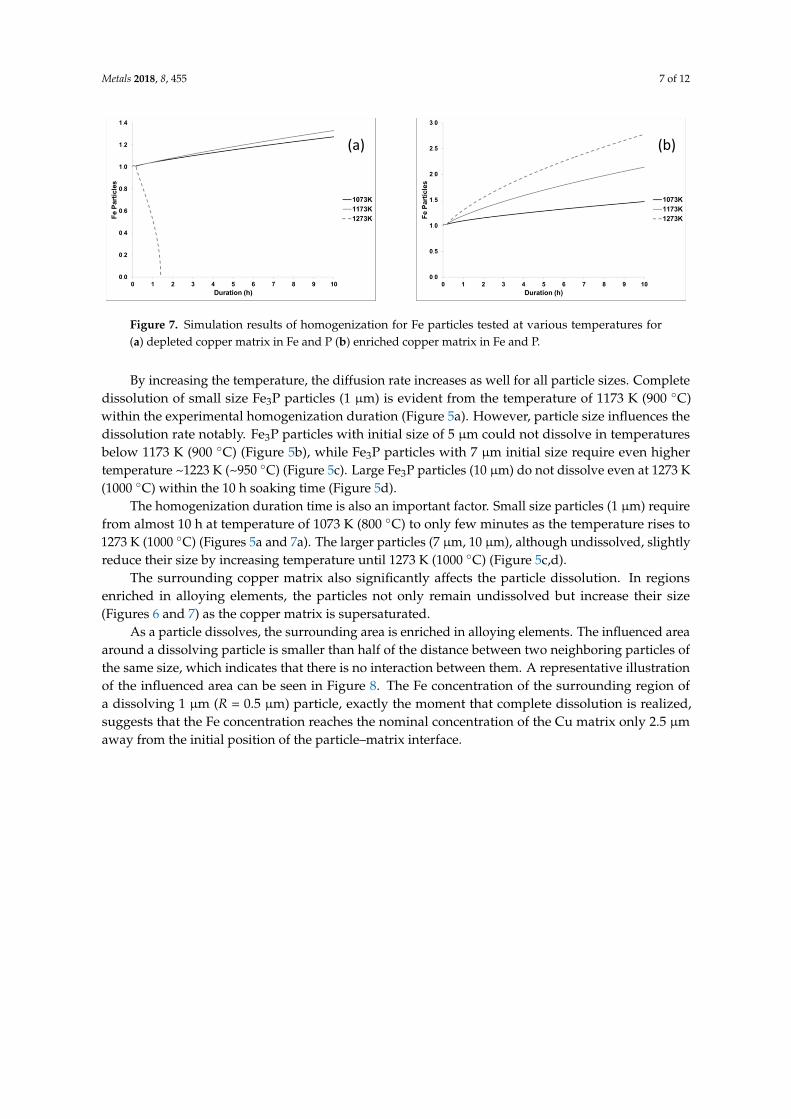
Figure 7. Simulation results of homogenization for Fe particles tested at various temperatures for (a) depleted copper matrix in Fe and P (b) enriched copper matrix in Fe and P.
By increasing the temperature, the diffusion rate increases as well for all particle sizes. Complete dissolution of small size Fe3P particles (1 μm) is evident from the temperature of 1173 K (900 °C) within the experimental homogenization duration (Figure 5a). However, particle size influences the dissolution rate notably. Fe3P particles with initial size of 5 μm could not dissolve in temperatures below 1173 K (900 °C) (Figure 5b), while Fe3P particles with 7 μm initial size require even higher temperature ~1223 K (~950 °C) (Figure 5c). Large Fe3P particles (10 μm) do not dissolve even at 1273 K (1000 °C) within the 10 h soaking time (Figure 5d).
The homogenization duration time is also an important factor. Small size particles (1 μm) require from almost 10 h at temperature of 1073 K (800 °C) to only few minutes as the temperature rises to 1273 K (1000 °C) (Figures 5a and 7a). The larger particles (7 μm, 10 μm), although undissolved, slightly reduce their size by increasing temperature until 1273 K (1000 °C) (Figure 5c,d).
The surrounding copper matrix also significantly affects the particle dissolution. In regions enriched in alloying elements, the particles not only remain undissolved but increase their size (Figures 6 and 7) as the copper matrix is supersaturated.
As a particle dissolves, the surrounding area is enriched in alloying elements. The influenced area around a dissolving particle is smaller than half of the distance between two neighboring particles of the same size, which indicates that there is no interaction between them. A representative illustration of the influenced area can be seen in Figure 8. The Fe concentration of the surrounding region of a dissolving 1 μm (R = 0.5 μm) particle, exactly the moment that complete dissolution is realized, suggests that the Fe concentration reaches the nominal concentration of the Cu matrix only 2.5 μm away from the initial position of the particle–matrix interface.
(a) (b)
Figure 7. Simulation results of homogenization for Fe particles tested at various temperatures for(a) depleted copper matrix in Fe and P (b) enriched copper matrix in Fe and P.
By increasing the temperature, the diffusion rate increases as well for all particle sizes. Completedissolution of small size Fe3P particles (1 µm) is evident from the temperature of 1173 K (900 ◦C)within the experimental homogenization duration (Figure 5a). However, particle size influences thedissolution rate notably. Fe3P particles with initial size of 5 µm could not dissolve in temperaturesbelow 1173 K (900 ◦C) (Figure 5b), while Fe3P particles with 7 µm initial size require even highertemperature ~1223 K (~950 ◦C) (Figure 5c). Large Fe3P particles (10 µm) do not dissolve even at 1273 K(1000 ◦C) within the 10 h soaking time (Figure 5d).
The homogenization duration time is also an important factor. Small size particles (1 µm) requirefrom almost 10 h at temperature of 1073 K (800 ◦C) to only few minutes as the temperature rises to1273 K (1000 ◦C) (Figures 5a and 7a). The larger particles (7 µm, 10 µm), although undissolved, slightlyreduce their size by increasing temperature until 1273 K (1000 ◦C) (Figure 5c,d).
The surrounding copper matrix also significantly affects the particle dissolution. In regionsenriched in alloying elements, the particles not only remain undissolved but increase their size(Figures 6 and 7) as the copper matrix is supersaturated.
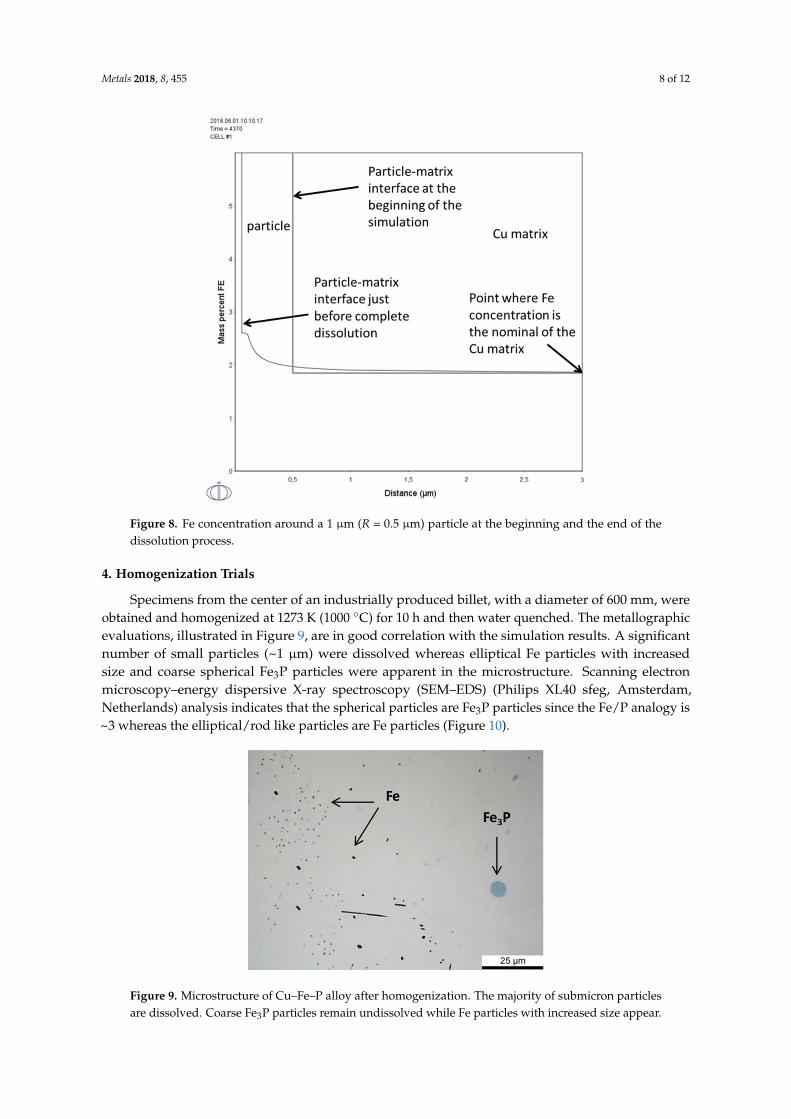
As a particle dissolves, the surrounding area is enriched in alloying elements. The influenced areaaround a dissolving particle is smaller than half of the distance between two neighboring particles ofthe same size, which indicates that there is no interaction between them. A representative illustrationof the influenced area can be seen in Figure 8. The Fe concentration of the surrounding region ofa dissolving 1 µm (R = 0.5 µm) particle, exactly the moment that complete dissolution is realized,suggests that the Fe concentration reaches the nominal concentration of the Cu matrix only 2.5 µmaway from the initial position of the particle–matrix interface.
Metals 2018, 8, 455 8 of 12Metals 2018, 8, x FOR PEER REVIEW 8 of 12
Figure 8. Fe concentration around a 1 μm (R = 0.5 μm) particle at the beginning and the end of the dissolution process.
4. Homogenization Trials
Specimens from the center of an industrially produced billet, with a diameter of 600 mm, were obtained and homogenized at 1273 K (1000 °C) for 10 h and then water quenched. The metallographic evaluations, illustrated in Figure 9, are in good correlation with the simulation results. A significant number of small particles (~1 μm) were dissolved whereas elliptical Fe particles with increased size and coarse spherical Fe3P particles were apparent in the microstructure. Scanning electron microscopy–energy dispersive X-ray spectroscopy (SEM–EDS) (Philips XL40 sfeg, Amsterdam, Netherlands) analysis indicates that the spherical particles are Fe3P particles since the Fe/P analogy is ~3 whereas the elliptical/rod like particles are Fe particles (Figure 10).
Figure 9. Microstructure of Cu–Fe–P alloy after homogenization. The majority of submicron particles are dissolved. Coarse Fe3P particles remain undissolved while Fe particles with increased size appear.
Figure 8. Fe concentration around a 1 µm (R = 0.5 µm) particle at the beginning and the end of thedissolution process.
4. Homogenization Trials
Specimens from the center of an industrially produced billet, with a diameter of 600 mm, wereobtained and homogenized at 1273 K (1000 ◦C) for 10 h and then water quenched. The metallographicevaluations, illustrated in Figure 9, are in good correlation with the simulation results. A significantnumber of small particles (~1 µm) were dissolved whereas elliptical Fe particles with increasedsize and coarse spherical Fe3P particles were apparent in the microstructure. Scanning electronmicroscopy–energy dispersive X-ray spectroscopy (SEM–EDS) (Philips XL40 sfeg, Amsterdam,Netherlands) analysis indicates that the spherical particles are Fe3P particles since the Fe/P analogy is~3 whereas the elliptical/rod like particles are Fe particles (Figure 10).
Metals 2018, 8, x FOR PEER REVIEW 8 of 12
Figure 8. Fe concentration around a 1 μm (R = 0.5 μm) particle at the beginning and the end of the dissolution process.
4. Homogenization Trials
Specimens from the center of an industrially produced billet, with a diameter of 600 mm, were obtained and homogenized at 1273 K (1000 °C) for 10 h and then water quenched. The metallographic evaluations, illustrated in Figure 9, are in good correlation with the simulation results. A significant number of small particles (~1 μm) were dissolved whereas elliptical Fe particles with increased size and coarse spherical Fe3P particles were apparent in the microstructure. Scanning electron microscopy–energy dispersive X-ray spectroscopy (SEM–EDS) (Philips XL40 sfeg, Amsterdam, Netherlands) analysis indicates that the spherical particles are Fe3P particles since the Fe/P analogy is ~3 whereas the elliptical/rod like particles are Fe particles (Figure 10).
Figure 9. Microstructure of Cu–Fe–P alloy after homogenization. The majority of submicron particles are dissolved. Coarse Fe3P particles remain undissolved while Fe particles with increased size appear. Figure 9. Microstructure of Cu–Fe–P alloy after homogenization. The majority of submicron particlesare dissolved. Coarse Fe3P particles remain undissolved while Fe particles with increased size appear.
Metals 2018, 8, 455 9 of 12
Metals 2018, 8, x FOR PEER REVIEW 9 of 12
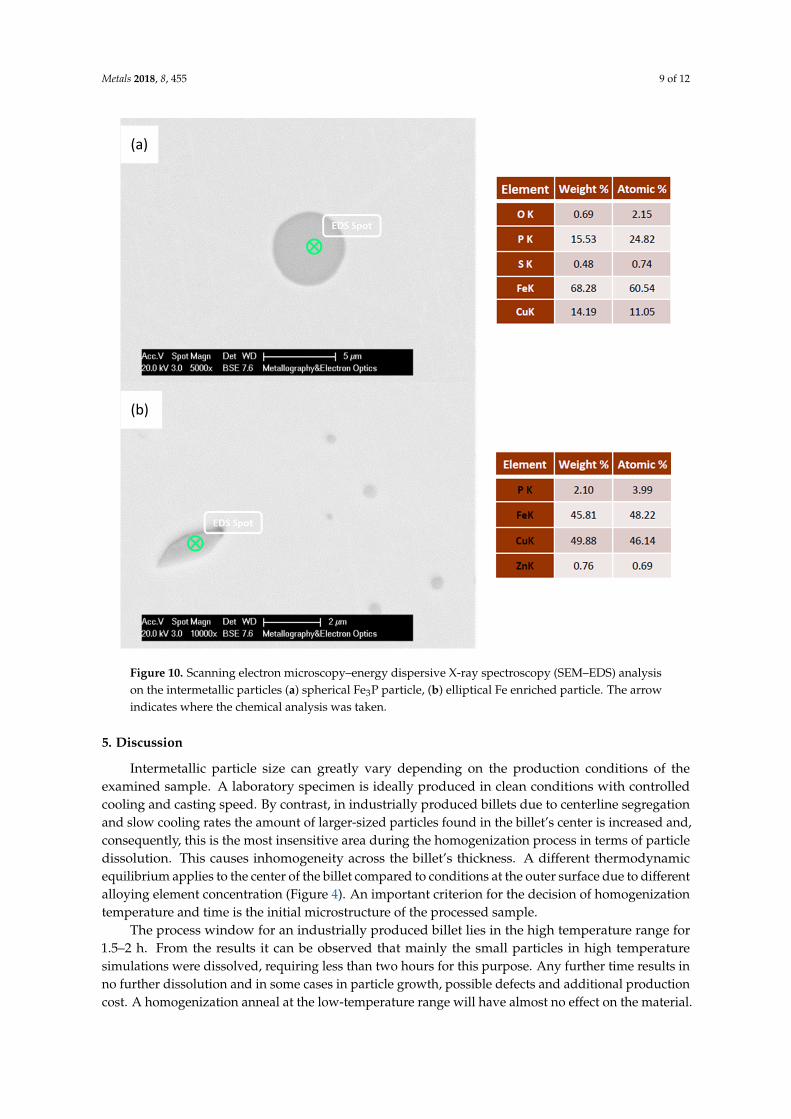
Figure 10. Scanning electron microscopy–energy dispersive X-ray spectroscopy (SEM–EDS) analysis on the intermetallic particles (a) spherical Fe3P particle, (b) elliptical Fe enriched particle. The arrow indicates where the chemical analysis was taken.
5. Discussion
Intermetallic particle size can greatly vary depending on the production conditions of the examined sample. A laboratory specimen is ideally produced in clean conditions with controlled cooling and casting speed. By contrast, in industrially produced billets due to centerline segregation and slow cooling rates the amount of larger-sized particles found in the billet’s center is increased and, consequently, this is the most insensitive area during the homogenization process in terms of particle dissolution. This causes inhomogeneity across the billet’s thickness. A different thermodynamic equilibrium applies to the center of the billet compared to conditions at the outer surface due to different alloying element concentration (Figure 4). An important criterion for the decision of homogenization temperature and time is the initial microstructure of the processed sample.
The process window for an industrially produced billet lies in the high temperature range for 1.5–2 h. From the results it can be observed that mainly the small particles in high temperature simulations were dissolved, requiring less than two hours for this purpose. Any further time results in no further dissolution and in some cases in particle growth, possible defects and additional production cost. A homogenization anneal at the low-temperature range will have almost no effect on the material.
(a)
(b)
Figure 10. Scanning electron microscopy–energy dispersive X-ray spectroscopy (SEM–EDS) analysison the intermetallic particles (a) spherical Fe3P particle, (b) elliptical Fe enriched particle. The arrowindicates where the chemical analysis was taken.
5. Discussion
Intermetallic particle size can greatly vary depending on the production conditions of theexamined sample. A laboratory specimen is ideally produced in clean conditions with controlledcooling and casting speed. By contrast, in industrially produced billets due to centerline segregationand slow cooling rates the amount of larger-sized particles found in the billet’s center is increased and,consequently, this is the most insensitive area during the homogenization process in terms of particledissolution. This causes inhomogeneity across the billet’s thickness. A different thermodynamicequilibrium applies to the center of the billet compared to conditions at the outer surface due to differentalloying element concentration (Figure 4). An important criterion for the decision of homogenizationtemperature and time is the initial microstructure of the processed sample.
The process window for an industrially produced billet lies in the high temperature range for1.5–2 h. From the results it can be observed that mainly the small particles in high temperaturesimulations were dissolved, requiring less than two hours for this purpose. Any further time results inno further dissolution and in some cases in particle growth, possible defects and additional productioncost. A homogenization anneal at the low-temperature range will have almost no effect on the material.

Metals 2018, 8, 455 10 of 12
The duration of homogenization can vary from a few minutes to many hours even for small-sizedparticles (1–5 µm) at temperatures in which Fe3P particles should have been dissolved (~800 ◦C)according to the phase diagram. Since the Cu matrix is not in equilibrium but filled with alloyingelements in solid solution, the diffusion rate decreases, restricting the particle dissolution.
Although small particles were successfully dissolved, large particles were still found in themicrostructure after the homogenization, as expected after the simulation. However, it is obviousthat there are regions with increased large particle concentration. As can be seen from the phasediagrams (Figures 3 and 4), in the case of P, increased local concentration, due to excessive segregation,dramatically increases the dissolution temperature and stabilizes the phosphide particles makingthe dissolution even more difficult. Moreover, copper regions enriched in alloying elements aresupersaturated and it is difficult for Fe to diffuse and, therefore, it remains in solid solution in the Cumatrix. Figure 11 shows the concentration profile of Fe at the Fe particle/Cu matrix interface. Cβ isthe Fe concentration in the Fe particle as expected by equilibrium, whereas Cα is the Fe concentrationin Cu matrix at equilibrium. Co is the Fe content of the supersaturated Cu matrix. When Cα < Co,it means that the Fe content has to reach the Cα composition in the Cu matrix, thus, there is a flux of Featoms from the matrix towards the Fe particle and diffusional growth can be achieved. When Cα > Co,this indicates that the Fe content in the Cu matrix should reach Cα composition. In order to achievethis, Fe atoms diffuse from the Fe particle towards Cu matrix and the dissolution of Fe particles can beachieved. The different solubility of particles and Cu matrix is attributed to the chemical compositionand crystal structure. Fe3P and Fe particles were considered to have a BCC (body centered cubic)structure whereas the Cu matrix has an FCC (face centered cubic) structure. The flux of solute atomstowards the interface is described by an error function introduced by Whelan [16]. The diffusionaldistance that the atoms have to move ∆x can be calculated from, the overall concentration of mass isgiven by Equation (2) for isothermal transformation [23]:
(Cβ − Co
)x =
12(Co − Ca)∆x (2)
where C stands for concentration and x for particle size.
Metals 2018, 8, x FOR PEER REVIEW 10 of 12
The duration of homogenization can vary from a few minutes to many hours even for small-sized particles (1–5 μm) at temperatures in which Fe3P particles should have been dissolved (~800 °C) according to the phase diagram. Since the Cu matrix is not in equilibrium but filled with alloying elements in solid solution, the diffusion rate decreases, restricting the particle dissolution.
Although small particles were successfully dissolved, large particles were still found in the microstructure after the homogenization, as expected after the simulation. However, it is obvious that there are regions with increased large particle concentration. As can be seen from the phase diagrams (Figures 3 and 4), in the case of P, increased local concentration, due to excessive segregation, dramatically increases the dissolution temperature and stabilizes the phosphide particles making the dissolution even more difficult. Moreover, copper regions enriched in alloying elements are supersaturated and it is difficult for Fe to diffuse and, therefore, it remains in solid solution in the Cu matrix. Figure 11 shows the concentration profile of Fe at the Fe particle/Cu matrix interface. Cβ is the Fe concentration in the Fe particle as expected by equilibrium, whereas Cα is the Fe concentration in Cu matrix at equilibrium. Co is the Fe content of the supersaturated Cu matrix. When Cα < Co, it means that the Fe content has to reach the Cα composition in the Cu matrix, thus, there is a flux of Fe atoms from the matrix towards the Fe particle and diffusional growth can be achieved. When Cα > Co, this indicates that the Fe content in the Cu matrix should reach Cα composition. In order to achieve this, Fe atoms diffuse from the Fe particle towards Cu matrix and the dissolution of Fe particles can be achieved. The different solubility of particles and Cu matrix is attributed to the chemical composition and crystal structure. Fe3P and Fe particles were considered to have a BCC (body centered cubic) structure whereas the Cu matrix has an FCC (face centered cubic) structure. The flux of solute atoms towards the interface is described by an error function introduced by Whelan [16]. The diffusional distance that the atoms have to move Δx can be calculated from, the overall concentration of mass is given by Equation (2) for isothermal transformation [23]: 12 ∆ (2)
where C stands for concentration and x for particle size
Figure 11. Plot of Fe profiles versus Cu matrix (a) growth of Fe particles, (b) dissolution of Fe particles. The diagrams are concentrated on the interface thus is 90 wt. %.
It can be observed that in alloying element-enriched regions, particles had even increased their size. The increase of particle size can also be explained from the Ostwald ripening theory where large particles are more energetically stable than smaller particles. Atoms of the small particles diffuse and attach to the large particles resulting in large particles growing in size and small particles shrinking [24].
Figure 11. Plot of Fe profiles versus Cu matrix (a) growth of Fe particles, (b) dissolution of Fe particles.The diagrams are concentrated on the interface thus Cβ is 90 wt. %.
It can be observed that in alloying element-enriched regions, particles had even increased theirsize. The increase of particle size can also be explained from the Ostwald ripening theory where largeparticles are more energetically stable than smaller particles. Atoms of the small particles diffuse andattach to the large particles resulting in large particles growing in size and small particles shrinking [24].

Metals 2018, 8, 455 11 of 12
6. Conclusions
Particle dissolution has been investigated during the homogenization process in a Cu–Fe–Palloy via Thermocalc® and DICTRA software. The phase diagrams indicate that the iron masspercentage does not influence the dissolution temperature. However, higher phosphorus concentrationstabilizes the Fe3P loop and increases the dissolution temperature. According to the simulation results,the particle dissolution depends on four critical parameters influencing each other: (a) the size ofphosphides; (b) soaking time; (c) the temperature of homogenization; and (d) the local chemicalcomposition of the base metal. In alloying element-depleted regions dissolution was realized inapproximately 1 h for the small particles of 1 µm in the temperature of 1273 K (1000 ◦C). Larger particlesare more difficult, requiring longer, or are even impossible to dissolve. Chemical heterogeneity due tosegregation caused local phenomena of a higher element concentration in the base metal, resulting inparticles either remaining undissolved or in many cases increasing in size due to the Ostwald ripeningphenomena. Metallographic evaluation showed that the experiments are consistent with the simulation.Microsegregation is evident in the initial microstructure situated mainly in grain boundaries andinterdendritic regions. The homogenization heat treatment created in the microstructure patches ofprecipitation-free regions and other regions with a small number of enlarged particles due to a differentlocal chemical equilibrium.
For the optimal homogenization of the specific material, a high temperature of 1273 K (1000 ◦C) isrequired. Homogenization time of 1.5–2 h will result in the dissolution of the small particles withoutaffecting the larger ones. Longer soaking time will result in no further dissolution.
Author Contributions: Conceptualization, S.P.; Methodology, S.P., E.G. and M.B.; Validation, E.G., M.B. andS.P.; Writing–Original Draft Preparation, M.B.; Writing–Review and Editing, S.P. & E.G.; Supervision, S.P.;Project Administration, E.G.
Funding: This research received no external funding.
Acknowledgments: The authors express their gratitude to the Hellenic Research Centre for Metals—ELKEMES.A., the R&D company VIOHALCO S.A., for their overall support to this research. The authors sincerely thankAthanasios Vazdirvanidis and Alexandros Antonopoulos for carrying out SEM and OM.
Conflicts of Interest: The authors declare no conflict of interest.
References
1. Pawlek, F.; Reichel, K. Der Einfluss von Beimengungen auf die elektrische Leitfähigkeit von Kupfer. Z. Met.1956, 47, 347–356.
2. Zauter, R.; Kudashov, D.V. Precipitation hardened high copper alloys for connector pins made of wire.In Proceedings of the 23rd International Conference on Electrical Contacts ICEC2006/Sendai, Sendai, Japan,6–9 June 2006.
3. Pantazopoulos, G.; Toulfatzis, A.; Zormalia, S.; Vazdirvanidis, A.; Skarmoutsos, D. Preliminary evaluation ofthe thermally affected metallurgical condition of extruded and drawn CuFe2P tubes. J. Mater. Eng. Perform.2012, 21, 2188–2194. [CrossRef]
4. Dong, Q.-Y.; Shen, L.-N.; Wang, M.-P.; Jia, Y.-L.; Li, Z.; Cao, F.; Chen, C. Microstructure and properties ofCu−2.3Fe−0.03P alloy during thermomechanical treatments. Trans. Nonferrous Metals Soc. China 2015, 25,1551–1558. [CrossRef]
5. Cao, H.; Min, J.Y.; Wu, S.D.; Xian, A.P.; Shang, J.K. Re-precipitation of coherent γ-Fe particles followingannealing of equal channel angular pressed Cu–Fe alloy. Mater. Sci. Eng. A 2006, 431, 86–91. [CrossRef]
6. Taro, K.; Motohisa, M.; Kenjyu, M.; Mitsuhiro, O.; Ryoichi, O.; Akinori, T. Corrosion resistant copper alloytube and fin-tube heat exchanger. European Patent 0626459A1, 27 May 1994.
7. Kim, H.G.; Han, S.Z.; Euh, K.; Lim, S.H. Effects of C addition and thermo-mechanical treatments onmicrostructures and properties of Cu–Fe–P alloys. Mater. Sci. Eng. A 2011, 530, 652–658. [CrossRef]
8. Ammannati, N. Method for the production of alloy pipes for heat exchangers using precipitation hardeningthrough underwater extrusion. EP 2027947B1 European Patent Specification, 6 April 2011.

Metals 2018, 8, 455 12 of 12
9. Smith, S.C. Grains, phases, and interfaces: An interpretation of microstructure. Metall. Mater. Trans. B 1948,175, 15–51.
10. Callister, W.D., Jr.; David, G.R. Materials Science and Engineering, 9th ed.; Wiley: Hoboken, NJ, USA, 2014.11. Lu, D.P.; Wang, J.; Zeng, W.J.; Liu, Y.; Lu, L.; Sun, B.D. Study on high-strength and high-conductivity Cu–Fe–P
alloys. Mater. Sci. Eng. A 2006, 421, 254–259. [CrossRef]12. Brovc, G.; Drazic, G.; Karpe, B.; Djordjevic, I.; Lojen, G.; Kosec, B.; Bizjak, M. Synthesis and characterization
of hardened Cu-Fe-Ni-P alloy. Metalurgija 2015, 54, 51–54.13. Yanamoto, Y.; Sasaki, G.; Yamakawa, K.; Ota, M. Tokio: Hitachi Cable Review; No. 19; The Technical Journal of
Hitachi Cable: Tokyo, Japan, 2000.14. Yamamoto, Y.; Takano, H.; Ohta, M.; Tong, C.; Kunishige, A. Tokio: Hitachi Cable Review; No. 26; The Technical
Journal of Hitachi Cable: Tokyo, Japan, 2007.15. Ohashi, Y.; Fujino, T.; Taki, Y.; Nishijima, T. Aged Copper Alloy with Iron and Phosphorous. U.S. Patent
5,071,494, 10 December 1991.16. Whelan, M.J. On the kinetics of precipitate dissolution. Metal Sci. J. 2013. [CrossRef]17. Voice, W.E.; Faulkner, R.G. Computer simulated dissolution of carbide precipitates in alloys. Metal Sci. 1984,
18, 411–418. [CrossRef]18. Liu, Z.K.; Höglund, L.; Jönsson, B.; Ågren, J. An experimental and theoretical study of cementite dissolution
in an Fe-Cr-C alloy. Metall. Trans. A 1991, 22. [CrossRef]19. Liu, Z.K.; Agren, J. Morphology of cementite decomposition in an Fe-Cr-C alloy. Metall. Trans. A 1991, 22,
1753–1759. [CrossRef]20. Davis, J.R. Copper and copper alloys—Seamless, round tubes for general purposes. In BSI Standards Limited
2012: The British Standards Institution; ASM International: Geauga County, OH, USA, 2012.21. Butrymowicz, D.B.; Manning, J.R. Michael R. Diffusion in copper and copper alloys. Part III. Diffusion in
systems involving elements of the groups IA, IIA, IIIB, IVB, VB, VIB, and VIIB. J. Phys. Chem. Ref. Data 1975.[CrossRef]
22. Borgenstam, A.; Engstrom, A.; Hoglund, L.; Agren, J. Dictra, a tool for simulation of diffusionaltransformations in alloys. J. Phase Equilib. 2000, 21, 269–280. [CrossRef]
23. Bhadeshia, H.K.D.H. Course MP6, Kinetics and Microstructure Modelling. Available online: https://www.phase-trans.msm.cam.ac.uk/mphil/MP6-15.pdf (accessed on 13 June 2018).
24. Tada, T.; Seo, T.; Higashimine, K.; Monzen, R. Ostwald ripening of rod-shaped α-Fe particles in a Cu matrix.Mater. Lett. 2004, 58, 2007–2011.
© 2018 by the authors. Licensee MDPI, Basel, Switzerland. This article is an open accessarticle distributed under the terms and conditions of the Creative Commons Attribution(CC BY) license (http://creativecommons.org/licenses/by/4.0/).


