Embed Size (px)
Citation preview

MOSAIC
Investment Company with Variable Capital,Luxembourg
Audited annual report as at December 31, 2009
R.C.S. Luxembourg B 107 223


MosaicSociété d’Investissement à Capital Variable, Luxembourg
Audited annual report as at December 31, 2009
1

2
Mosaic
Audited annual report as at December 31, 2009
No subscriptions can be received on the basis of this report. Subscriptions are only valid if made on the basis of the current prospectus accompanied by the latest annual report and the most recent semi-annual report, if published thereafter.

3
Mosaic
TABLE OF CONTENTS
ORGANISATION OF THE SICAV 4
GENERAL INFORMATION 6
MANAGEMENT REPORT 7
INDEPENDENT AUDITOR’S REPORT 10
FINANCIAL STATEMENTS
STATEMENT OF NET ASSETS 12
STATEMENT OF OPERATIONS AND CHANGES IN NET ASSETS 13
NUMBER OF SHARES OUTSTANDING AND NET ASSET VALUE PER SHARE 14
STATEMENT OF INVESTMENTS AND OTHER NET ASSETS 15
GEOGRAPHICAL AND INDUSTRIAL CLASSIFICATION OF INVESTMENTS 19
NOTES TO THE FINANCIAL STATEMENTS 20

4
Mosaic
ORGANISATION OF THE SICAV (continued)
Registered Office 1, boulevard Royal, L-2449 Luxembourg
Board of Directors
Chairman Mr Marc PICTET, CEO, Pictet & Cie (Europe) S.A., Luxembourg and member of theExecutive Committee of Pictet Funds (Europe) S.A.
Directors Mrs Michèle BERGER, Executive Vice-President, Pictet Funds (Europe) S.A.,Luxembourg
Mr Nicolas CAMPICHE, Executive Vice-President, Pictet & Cie, Geneva
Mr Claude DEMOLE, Partner, Pictet & Cie, Geneva (until March 31, 2009)
Mr Pierre ETIENNE, Senior Vice-President, Pictet & Cie (Europe) S.A., Luxembourg
Mr Yves MARTIGNIER, Senior Vice-President, Pictet & Cie, Geneva (untilDecember 1, 2009)
Mr Bertrand DEMOLE, Senior Vice-President, Pictet & Cie, Geneva (from April 21, 2009)
Mr Francesco ILARDI, Senior Vice-President, Pictet & Cie, Geneva (from April 21, 2009)
Management Company
Pictet Funds (Europe) S.A., 3, boulevard Royal, L-2449 Luxembourg
Management Company’s Board of Directors
Chairman Mr Pierre ETIENNE, Senior Vice-President, Pictet & Cie (Europe) S.A., Luxembourg
Members Mr Rolf BANZ, Executive Vice-President, Pictet Asset Management S.A., Geneva
Mr Frédéric FASEL, Senior Vice-President, Pictet & Cie (Europe) S.A., Luxembourg
Mr Yves MARTIGNIER, Senior Vice-President, Pictet & Cie, Geneva (untilDecember 1, 2009)
Mr Marc PICTET, CEO, Pictet & Cie (Europe) S.A., Luxembourg and member of theExecutive Committee of Pictet Funds (Europe) S.A.
Mr Laurent RAMSEY, CEO, Pictet Funds S.A., Geneva
Mr Christoph SCHWEIZER, Senior Vice-President, Pictet Funds S.A., Geneva
Conducting Officers of the Management Company
Mrs Michèle BERGER, Executive Vice-President, Pictet Funds (Europe) S.A.,Luxembourg
Mr Laurent RAMSEY, CEO, Pictet Funds S.A., Geneva

5
Mosaic
ORGANISATION OF THE SICAV (continued)
Custodian Bank Pictet & Cie (Europe) S.A., 1, boulevard Royal, L-2449 Luxembourg
Administrative, Domiciliary, Registrar and Transfer Agent
Pictet & Cie (Europe) S.A., 1, boulevard Royal, L-2449 Luxembourg
Investment Manager Pictet & Cie, Genève, 60, route des Acacias, CH-1211 Geneva 73
Investment Adviser Pictet Bank & Trust Limited, Bayside Executive Park, Building No. 1, West Bay Street andBlack Road P.O. Box, 4837, Nassau, Bahamas
Auditor Deloitte S.A., 560, rue de Neudorf, L-2220 Luxembourg
Legal Advisors Elvinger, Hoss & Prussen, 2, Place Winston Churchill, L-1340 Luxembourg

6
Mosaic
GENERAL INFORMATION
The SICAV will publish an audited annual report within four months after the end of thebusiness year and an unaudited semi-annual report within two months after the end ofthe period to which it refers.
All these reports are made available to the shareholders free of charge at the registeredoffice of the SICAV.
Any other financial information to be published concerning the SICAV, including themonthly issue, redemption and conversion price of the shares, is available to the publicat the registered office of the SICAV.
The net asset value per share, the issue price and the redemption price are available, inLuxembourg, at the registered office of the SICAV, the Custodian and any Paying Agent.
Any amendments to the articles of incorporation will be published in the Mémorial of theGrand-Duchy of Luxembourg.
A detailed schedule of changes in the investments for the reporting year is available freeof charge upon request at the registered office of the SICAV.

7
Mosaic
MANAGEMENT REPORT (continued)
Market Review
The CS Broad index returned +18.6% for the year, while the MSCI World NR returned+30.0%.
The hedge fund industry entered 2009 wounded from a very difficult 2008. The yearbegan with a highly uncertain environment and risk aversion still at historic highs. Theilliquidity problems of 2008 that resulted from the Lehman failure coupled with theMadoff scandal drove many investors away from hedge funds. The resulting highredemptions pushed a number of funds into gating redemptions and side pocketing lessliquid investments in order to face the high level of outflows. The latter peaked in March2009.
In terms of strategies, those which had suffered the most following 2008's events, turnedout to be the winners in 2009 as markets normalised, reversing the extreme moves thatfollowed the financial crisis. With the benefit of hindsight, one should look at 2008 and2009 together in terms of performance, while we believe that 2010 will be more of a pivotyear for our managers and the market as a whole.
Activity of the SICAV
Mosaic finished the year up 11.2% for the P class denominated in USD
First quarter
Despite a challenging first quarter across financial markets, Mosaic Trading finished inpositive territory, at +0.1%. The bulk of the performance came in January with a 1.3%return. The fund was then down in February (0.3%) and down in March (0.9%).
Despite 2009 starting as another difficult year, with the S&P trading below 700 points, allstrategies finished in positive territory apart from Event Driven. Skilfully managing thefront-end of the curve, as well as the "normalisation" in currency markets, both GlobalMacro and Emerging Market managers generated strong numbers. Lastly, after being adrag on performance during the second half of 2008, our credit allocation benefited fromthe strength in credit markets, spanning from distressed bonds to investment-gradeones. Interestingly, managers have expressed a wide range of macro views, since the tugof war between inflation or deflation as a final ending is still open. Nevertheless, due tothe current general uncertainty and volatility, many managers have been more tacticaland short-term oriented.
In terms of tactical allocation, Global Macro and Long/Short equity remained our majorbets.
Second quarter
The fund performed well in the second quarter, with a +2.4% return. May proved to bethe best month, with a +3.2% return, while April and June dragged a little bit theperformance.

8
Mosaic
MANAGEMENT REPORT (continued)
The strong reversal witnessed on both equity and credit markets continued unchangedin the second quarter. At the same time, the dollar continued to weaken, particularlyagainst emerging market currencies. But the main event of the quarter proved to be thesharp move in forward short-term rates. Following a stronger than expected non-farmpayroll in the United States announced in June, Global Macro funds were caught off-guard by the upward move in short-term rates. Indeed, managers were mainlypositioned for the "o rate policy" to last longer.
Consequently, Global Macro managers incurred losses at the end of the quarter butcontributed positively for the whole quarter. In this environment, the contributionpattern observed in first quarter remained unchanged. All strategies finished in positiveterritory apart from CTA. Event Driven, Distressed and Relative Value benefited from therebound in credit markets. At the end of the quarter, managers were more consensuallypositioned than at the end of the first quarter, with trades like long gold, short USDversus commodity currencies, or long equity indices.
Third quarter
Mosaic continued to capture the continued strength of financial markets and posted a5.7% return. All months were positive, with performances of 1.7%, 1.8%, and 2.1%, forJuly, August, and September respectively.
Even though some managers were at first sceptical about the continuation of trendsstarted in March/April, most of them came to embrace them in the third quarter.Consequently, portfolio positioning tended to converge during the quarter on what canbe described as "popular trades". For example, Global Macro and Emerging Marketmanagers recorded profits on being long sovereign credit, short the dollar, long front-end of the dollar yield curve, or simply long equity indices. Nevertheless, convictionlevels are not very high since many of them are worried about tail risks. Mostimportantly, the biggest focus remains the potential consequences of the end ofquantitative easing. In terms of strategy, all of them finished in positive territory apartfrom Volatility Arbitrage. Losses were generally limited and in line with historicalvolatility. Of note is the fact that credit managers, who did poorly in 2008 and wereamong the worst contributors, continued to rebound and contributed significantly to theperformance in the third quarter just behind the Global Macro contribution.
At the portfolio level we have continued to increase slightly our exposure to EmergingMarkets and remained overweight Global Macro and Long/Short equity.
Fourth quarter
Despite a slightly negative number for October, at -0.4%, the fund posted positiveperformances for both November and December, with 1.1% and 1.9% respectively. Thefund finished the year up 11.2% for the P class denominated in USD.

9
Mosaic
MANAGEMENT REPORT (continued)
It seemed at first that markets would continue their upward moves and that "populartrades" would perform once again. Unfortunately, the combination of further indicationsthat the Fed would tighten sooner than expected with stronger than expected USemployment data triggered a sharp reversal. The main impacts proved to be on thedollar and on forward-rate markets. Interestingly, discretionary Global Macro managersproved their tactical ability by limiting losses or even gaining from such sudden moves.On the negative side, CTA with a core trend following strategy suffered the most, since ittakes longer for their models to adapt to new trends. Despite volatility rising again, it didnot move up enough for Volatility Arbitrage managers to post positive performance inthe fourth quarter. Long/Short Equity, despite a difficult October month, did finish thequarter in positive territory. Credit managers continued to contribute to the overallportfolio performance, be it in the Distressed and Relative Value buckets.
The favoured strategies for 2010 remain the dynamic and liquid strategies, mainly GlobalMacro and Long-short Equity funds. Event-driven was increased as explained earlier on,and is now Neutral vis-à-vis our long-term allocation, together with Emerging Marketand Fixed Income strategies. Finally, Volatility arbitrage and Relative Value remain themost underweight allocations in the portfolio.
April 2010
The Investment Manager

10
INDEPENDENT AUDITOR’S REPORT (continued)
To the Shareholders ofMosaic(Investment Company with Variable Capital)1, boulevard Royal, L-2449 Luxembourg
Following our appointment by the annual General Meeting of the Shareholders held onApril 21, 2009, we have audited the accompanying financial statements of Mosaic, whichcomprise the statement of net assets and the statement of investments and other netassets as at December 31, 2009 and the statement of operations and changes in net assetsfor the year then ended, and a summary of significant accounting policies and otherexplanatory notes to the financial statements.
Board of Directors’ responsibility for the financial statements
The Board of Directors of the SICAV is responsible for the preparation and fairpresentation of these financial statements in accordance with the Luxembourg legal andregulatory requirements relating to the preparation of the financial statements. Thisresponsibility includes: designing, implementing and maintaining internal controlrelevant to the preparation and fair presentation of financial statements that are freefrom material misstatement, whether due to fraud or error; selecting and applyingappropriate accounting policies; and making accounting estimates that are reasonable inthe circumstances.
Auditor’s responsibility
Our responsibility is to express an opinion on these financial statements based on ouraudit. We conducted our audit in accordance with International Standards on Auditingas adopted by the Institut des Réviseurs d’Entreprises. Those standards require that wecomply with ethical requirements and plan and perform the audit to obtain reasonableassurance whether the financial statements are free from material misstatement.
An audit involves performing procedures to obtain audit evidence about the amountsand disclosures in the financial statements. The procedures selected depend on theauditor’s judgement, including the assessment of the risks of material misstatement ofthe financial statements, whether due to fraud or error. In making those riskassessments, the auditor considers internal control relevant to the entity’s preparationand fair presentation of the financial statements in order to design audit procedures thatare appropriate in the circumstances, but not for the purpose of expressing an opinionon the effectiveness of the entity’s internal control.
An audit also includes evaluating the appropriateness of accounting policies used andthe reasonableness of accounting estimates made by the Board of Directors of theSICAV, as well as evaluating the overall presentation of the financial statements. Webelieve that the audit evidence we have obtained is sufficient and appropriate to providea basis for our audit opinion.

Deloitte.
INDEPENDENT AUDITOR'S REPORT (continuedl
Opinion
In our opinion. lhe financial statements give a true and fair view of the financial positionof Mosaic;: as of December 31, 2009, and of the results of ils operations and changes in itsnet assets for the year then ended in accordance with the Luxembourg legal andregulatory requirements relating 10 tile preparation oflhc financial statements.
O!her mallcr
Supplementary information Included in the annual report has been reviewed in lhecontext afour mandate but has not been subject to specific audit procedures carried outin accordance with the standards described above. Consequently. we express no opinionon such infonnation. However, we have no observation to make concerning suchinformation in the context of the financial statements taken as a whole.
Deloiue S.A.Reviseur d'Entreprises
k i;
~/\rtncr
Luxembourg. April 15. 2010560, rue de NcudorfL-2220 Luxcmbourg
11

12
Mosaic
STATEMENT OF NET ASSETS AS AT DECEMBER 31, 2009
The accompanying notes form an integral part of these financial statements.
USD
ASSETS
Investments in securities at acquisition cost 799,000,271.05
Net unrealised gain on investments 107,062,731.76
Investments in securities at market value (note 2) 906,063,002.81
LIABILITIES
Management fee and service fee payable (note 3) 2,621,461.70
Bank overdraft 88,494,043.43
"Taxe d’abonnement" payable (note 5) 74,276.74
Other fees payable (note 4) 254,119.07
Unrealised loss on forward foreign exchange contracts (note 8) 5,732,142.29
97,176,043.23
TOTAL NET ASSETS AS AT DECEMBER 31, 2009 808,886,959.58
TOTAL NET ASSETS AS AT DECEMBER 31, 2008 778,737,504.04
TOTAL NET ASSETS AS AT DECEMBER 31, 2007 844,488,046.38

13
Mosaic
STATEMENT OF OPERATIONS AND CHANGES IN NET ASSETS FOR THE YEAR ENDED DECEMBER 31, 2009
The accompanying notes form an integral part of these financial statements.
USD
NET ASSETS AT THE BEGINNING OF THE YEAR 778,737,504.04
INCOME
Dividends, net of taxes 847,203.51
Bank interest, net 84,904.79
932,108.30
EXPENSES
Interest on loans 98,472.28
Management and service fees (note 3) 9,852,812.22
Custodian fee and bank interest 372,056.56
Other expenses 413,971.17
"Taxe d’abonnement" (note 5) 291,820.13
11,029,132.36
NET INVESTMENT LOSS -10,097,024.06
Net realised gain on sales of investments 61,167,518.24
Net realised gain on forward foreign exchange contracts 27,867,363.25
Net realised loss on foreign exchange -1,855,340.69
NET REALISED GAIN 77,082,516.74
Change in net unrealised appreciation/(depreciation) :
- investments 17,580,206.90
- forward foreign exchange contracts -28,579,428.80
INCREASE IN NET ASSETS AS A RESULT OF OPERATIONS 66,083,294.84
Proceeds from subscriptions of shares 263,840,477.48
Cost of shares redeemed -314,974,387.49
Revaluation difference* 15,200,070.71
NET ASSETS AT THE END OF THE YEAR 808,886,959.58
* The difference results from the fluctuations in the conversion rates into USD of the net assets of the share classes expressed in other currencies than the USDbetween January 1, 2009 to December 31, 2009.

14
Mosaic
NUMBER OF SHARES OUTSTANDING AND NET ASSET VALUE PER SHARE
The accompanying notes form an integral part of these financial statements.
Type of shares Currency Number of sharesoutstanding
Net asset valueper share
Net asset valueper share
Net asset valueper share
31.12.2009 31.12.2009 31.12.2008 31.12.2007
P USD 1,762,943.77 154.74 139.16 164.64
I USD 368,797.80 156.67 140.48 165.72
R USD 16,790.77 150.74 136.22 162.00
Z USD 77,279.51 104.18 92.28 107.49
HP-EUR EUR 635,990.36 121.04 109.56 129.93
HI-EUR EUR 704,670.78 122.55 110.62 130.81
HR-EUR EUR 56,472.17 117.88 107.25 127.84
HZ-EUR EUR 2,332.44 76.42 68.12 79.54
HP-CHF CHF 833,241.78 171.48 156.64 188.98
HI-CHF CHF 223,972.15 173.61 158.11 190.22
HR-CHF CHF 57,868.30 167.02 153.32 185.92
HZ-CHF CHF 245,258.49 122.65 110.31 131.03
HP-GBP GBP 100.00 93.46 84.15 -
HI-GBP GBP 100.00 93.88 84.28 -
HR-GBP GBP 231.80 92.76 83.93 -
HZ-GBP GBP 100.00 95.67 84.82 -
OP-CHF (note 1) CHF 47,433.99 102.51 - -
OP-EUR (note 1) EUR 30,474.86 103.00 - -

15
Mosaic
STATEMENT OF INVESTMENTS AND OTHER NET ASSETS AS AT DECEMBER 31, 2009 (EXPRESSED IN USD)
The accompanying notes form an integral part of these financial statements.
Description Quantity Market value (note 2) % of net assets
UNITS OF INVESTMENT FUNDS
BAHAMAS
AVESTA FUND ’F’ S. IX 6,000.00 6,445,015.74 0.80
AVESTA FUND ’F’ S. XI 5,000.00 5,423,980.05 0.67
AVESTA FUND ’F’ S. XII 6,000.00 6,306,591.36 0.78
AVESTA FUND ’F’ S. XIII 3,000.00 3,100,950.00 0.38
AVESTA FUND ’F’ S. XV 9,000.00 9,262,620.00 1.15
MOORE GLOBAL FIXED INCOME FUND 857.52 8,759,331.99 1.08
MOORE GLOBAL INV. ’A’ (USD) 1,020.21 43,777,215.59 5.41
83,075,704.73 10.27
BERMUDA
LYNX (BERMUDA) ’D’ S. OCT 09 6,500.00 6,402,949.74 0.79
MAPLERIDGE ’B’ B.3 60,000.00 5,751,600.00 0.71
MAPLERIDGE FUND ’B1’ 22,075.38 4,906,915.47 0.61
PERELLA WE-XE ’A1’ S. -P0608- 10,000.00 11,486,883.20 1.42
PERELLA WE-XE ’A1’ S. -P0408- 7,958.83 10,178,237.75 1.26
PERELLA WE-XE ’A1’ S. -P0508- 11,730.00 14,506,077.99 1.79
53,232,664.15 6.58
BRITISH VIRGIN ISLANDS
ATTICUS EUROPEAN ’A’ S. 10. 08. P1 11,729.02 4,786,124.61 0.59
CAXTON GLOBAL INV. PREF ’E’ SI 12/08 (2) 3,075.00 112,114.50 0.01
CAXTON GLOBAL INV. PREF N-VTG (2) 52,577.41 35,894,072.05 4.44
CAXTON GLOBAL INV. PREF ’SI’ (2) 5,970.00 237,869.10 0.03
DISCUS FEEDER ’B’ USD STD. LEVER. 12,374.18 14,186,010.99 1.75
KING STREET CAPITAL ’A’ S. 1 (HOT) 25,919.61 12,051,323.13 1.49
KING STREET CAPITAL ’A’ S. 2 NHI 13,000.00 6,018,090.00 0.74
KING STREET CAPITAL ’S’ S. 1 (1) 46.01 4,310.73 0.00
KING STREET CAPITAL ’S’ S. 2 (1) 13.50 892.54 0.00
KING STREET CAPITAL ’S’ S. 5 (1) 42.81 2,650.93 0.00
KING STREET CAPITAL ’S’ S. 9 (1) 70.50 7,964.93 0.00
KING STREET CAPITAL ’S’ S. 13 REST. (1) 379.27 29,642.38 0.00
KING STREET CAPITAL ’S’ S. 14 (A S1) (1) 1,248.12 124,391.06 0.02
RECAP INTERNATIONAL ’A’ S. 1 7.92 251,754.56 0.03
SHEPHERD INVESTMENTS INT. S. S. SA 01 38.49 56,771.60 0.01
SHEPHERD INVESTMENTS INT. S. S. SA 02 (1) 1,034.68 1,194,510.30 0.15
SHEPHERD INVESTMENTS INT. S. S. SA 03 (1) 2,417.38 832,720.00 0.10
SHEPHERD INVESTMENTS INT. S. S. SA 06 (1) 181.54 268,486.56 0.03
SHEPHERD INVESTMENTS INT. S. S. SA 07 (1) 139.80 231.82 0.00
SHEPHERD INVESTMENTS INT. S. S. SA 09 (1) 604.89 912,374.08 0.11
SHEPHERD INVESTMENTS INT. S. S. SA 10 (1) 20.41 71.80 0.00
SHEPHERD INVESTMENTS INT. S. S. SA 12 (1) 148,963.48 10,141.43 0.00
SHEPHERD INVESTMENTS INT. S. S. SA 15 (1) 65.87 136,227.21 0.02
SHEPHERD INVESTMENTS INT. S. S. SA 16 (1) 37.92 11,000.33 0.00
SHEPHERD INVESTMENTS INT. S. SA 17 (1) 52.30 42.87 0.00
SHEPHERD INVESTMENTS INT. S. SA 18 (1) 85.24 184,148.43 0.02
SHEPHERD INVESTMENTS INT. SIH (1) 271.20 278,485.49 0.03
SHEPHERD INVESTMENTS INT. S. SA 19 (1) 96.41 33,835.54 0.00
SHEPHERD INVESTMENTS S. S. SA 14 (1) 85.64 137,656.63 0.02
(1) Side Pocket(2) Funds in liquidation

16
Mosaic
STATEMENT OF INVESTMENTS AND OTHER NET ASSETS AS AT DECEMBER 31, 2009 (EXPRESSED IN USD)
The accompanying notes form an integral part of these financial statements.
SHEPHERDS SELECT ASSET SPV (1) 2,048.72 2,211,054.44 0.27
WINTON FUTURES ’B’ USD S. 06/09 80,000.00 8,087,200.00 1.00
WINTON FUTURES ’B’ USD S. 09/09 60,000.00 6,184,800.00 0.76
94,246,970.04 11.62
CAYMAN ISLANDS
AB2 ’RED. PTG’ 259,587.11 5,364,030.19 0.66
AM INVESTMENT V A S. 1 1,038.00 11,048,002.22 1.37
AM INVESTMENT V FUND C - AS. 1/09 100.00 867,254.36 0.11
ARGONAUT GLOBAL MACRO ’A’ S. 1 NI 135,302.66 20,487,136.99 2.53
ARGONAUT GLOBAL MACRO ’A’ S. 1 NI (Securities to receive) (2) 5,000,000.00 5,000,000.00 0.62
BLENHEIM GLOBAL MARKETS ’A’ S. 1 1,202.31 14,659,705.71 1.81
BLENHEIM GLOBAL MARKETS ’A’ S. 1 (Securities to receive) (2) 8,000,000.00 8,000,000.00 0.99
BLENHEIM GLOBAL MARKETS ’A’ S. 8 08/08 PFD 3,012.63 3,511,521.53 0.43
BLUECREST CAPITAL ’F’ (USD) 84,437.13 20,268,288.80 2.51
BLUECREST CAPITAL ’F’ (USD) (Securities to receive) (2) 7,000,000.00 7,000,000.00 0.87
BLUECREST CAPITAL ’F’ (USD) EQUAL. 08/09 586,382.68 586,382.68 0.07
BLUETREND FUND ’B’ (USD) 62,253.59 15,638,706.04 1.93
BREVAN HOWARD B (USD) (Securities to receive) (2) 10,000,000.00 10,000,000.00 1.24
BREVAN HOWARD E. M. S ’B’ USD N-REST 104,398.84 13,889,221.91 1.72
BREVAN HOWARD E. M. S ’B’ USD N-REST EQUAL 769,533.06 769,533.06 0.10
BREVAN HOWARD FUND ’A’ EUR 15,900.00 5,760,378.64 0.71
BREVAN HOWARD FUND ’A’ USD 72,047.77 18,544,375.52 2.29
CANYON VALUE REALIZATION ’A’ LIQ. 3,910.55 6,048,887.59 0.75
CANYON VALUE REALIZATION A DI (A) 1,880.35 2,208,466.24 0.27
CANYON VALUE REALIZATION FUND ’A’ 0.00 0.20 0.00
CANYON VALUE REALIZATION FUND ’A’ (Securities to receive) (2) 305.22 1,278,226.92 0.16
CHILDREN’S INV. ’A1’ S. 04/08 56,000.00 3,887,520.00 0.48
CHILDREN’S INV. ’A1’ S. A2004 47,044.32 12,006,179.63 1.48
COATUE OFFSHORE ’A’ TR. C4 S. 01/10 100,000.00 10,000,000.00 1.24
DBGM OFF. (USD) SPV 152 MASPV 070901 (1) 4.18 5,421.14 0.00
DIAMONDBACK LU1/9A SUB1 S1 7/05 (1) 2,802.49 1,456,509.67 0.18
DIAMONDBACK OFFSHORE A1 S1 07/05 13,054.74 22,124,309.29 2.74
DIAMONDBACK OFFSHORE C SUB. 1 S1 11/08 8,252.50 10,416,523.91 1.29
DISCOVERY GLOBAL OPPORTUNITY ’A’ 44,446.43 23,923,068.07 2.96
DRAWBRIDGE GLOBAL MACRO ’K1’ S 3 02/07 (1) 40.62 29,811.80 0.00
DRAWBRIDGE GLOBAL MACRO ’K1’ S SP4 7/07 (1) 53.80 44,067.26 0.01
DRAWBRIDGE GLOBAL MACRO ’K1’ S SP5 9/07 (1) 30.29 29,229.82 0.00
DRAWBRIDGE GLOBAL MACRO ’K1’ S SP6 1107 (1) 32.35 22,392.88 0.00
DRAWBRIDGE GLOBAL MACRO ’K1’ SP10 08/08 (1) 5.56 3,533.91 0.00
DRAWBRIDGE GLOBAL MACRO ’K1’ SP11 09/08 (1) 5.47 1,906.71 0.00
DRAWBRIDGE GLOBAL MACRO ’K1’ SP12 09/08 (1) 339.18 169,975.64 0.02
DRAWBRIDGE GLOBAL MACRO ’K1’ SP7 02/08 (1) 21.22 27,509.94 0.00
DRAWBRIDGE GLOBAL MACRO ’K1’ SP9 05/08 (1) 19.59 16,337.74 0.00
DRAWBRIDGE GLOBAL MACRO ’R’ 2,195.63 3,141,493.13 0.39
FORTRESS MACRO FUND ’A’ (Securities to receive) (2) 10,000,000.00 10,000,000.00 1.24
FORTRESS MACRO FUND ’A’ USD 10,000.00 10,116,229.20 1.25
FORTRESS MACRO OFFSH. LP ’A’ 17,344,935.19 18,337,065.48 2.27
GLENVIEW CAPITAL PARTNERS ’CC’ S. 20 19,705.00 19,524,712.85 2.41
GRUSS GLOBAL INV. ’A’ INIT. UNREST. 0.01 9.42 0.00
(1) Side Pocket(2) "Securities to receive" or "Securities to deliver" are corresponding to investments for which the number of shares subscribed / redeemed are not yet confirmed by
the administrator of the underlying fund.
Description Quantity Market value (note 2) % of net assets

17
Mosaic
STATEMENT OF INVESTMENTS AND OTHER NET ASSETS AS AT DECEMBER 31, 2009 (EXPRESSED IN USD)
The accompanying notes form an integral part of these financial statements.
HARBINGER ’L’ HOLDINGS S. 2 (1) 178.01 625,044.89 0.08
HARBINGER CAPITAL PARTNERS ’A’ S. 1 21,000.00 9,208,000.68 1.14
HARBINGER CAPITAL PARTNERS ’I’ PE S. 1 (1) 3,048.56 2,720,785.72 0.34
HARBINGER CLASS L HOLDINGS S. 3 (1) 162.64 488,839.78 0.06
HARBINGER CLASS L HOLDINGS S. 6 (1) 112.19 244,791.06 0.03
HARBINGER CLASS PE HOLDINGS S. 2 (1) 2,216.64 2,125,022.06 0.26
HARBINGER CLASS PE HOLDINGS S. 6 (1) 1,175.62 1,086,841.64 0.13
HORSEMAN GLOBAL FD ’B’ USD 75,603.87 13,811,314.72 1.71
JABCAP MULTI STRAT. EQUAL 11/07 14,457.99 14,457.99 0.00
JABCAP MULTI STRATEGY ’D’ S. 1 240,439.99 30,713,804.75 3.80
LONDON DIVERSIFIED ’B’ 129.75 512,100.92 0.06
LONDON DIVERSIFIED ’B’ DESIGN. SHS (1) 14.84 87,204.00 0.01
LONDON DIVERSIFIED ’D’ 521.08 2,038,642.13 0.25
LONDON DIVERSIFIED ’D’ DESIGNED (1) 183.24 1,067,319.86 0.13
LONDON DIVERSIFIED ’D’ S. 10/08 DESI. SHS (1) 261.19 1,520,082.67 0.19
LONDON DIVERSIFIED D S. 10/08 2,168.68 8,478,005.59 1.05
M. KINGDON OFFSHORE ’A’ S. 1 229,576.69 28,388,144.88 3.51
M. KINGDON OFFSHORE ’A’ S. 1 (Securities to receive) (3) 7,000,000.00 7,000,000.00 0.87
M. KINGDON OFFSHORE ’A’ S. 17 17,165.03 2,098,444.14 0.26
MAPLE LEAF OFFSHORE ’C’ S. 05/04 0.00 0.69 0.00
OWL CREEK OVERSEAS ’C’ S1 07/07 (1) 1,750.22 1,480,016.96 0.18
OWL CREEK OVERSEAS ’S’ S. 8 09/05 UNR. 15,987.00 28,275,383.77 3.50
OWL CREEK OVERSEAS ’S’ S. 9 0807 UNR. 156.99 193,078.66 0.02
OWL CREEK OVERSEAS ’S’ S12 11/09 UNRES 1,200.00 1,255,094.86 0.16
OWL CREEK OVERSEAS ’S1’ UNRES (Securities to receive) (3) 10,000,000.00 10,000,000.00 1.24
OWL CREEK OVERSEAS CS. S3 BS 03/09 (1) 94.10 98,955.67 0.01
OWL CREEK OVERSEAS CS. S3 BT 03/09 (1) 892.68 938,692.69 0.12
PANTERA GLOBAL MACRO ’A’ S. 39 01/09 (2) 6.25 6,379.91 0.00
PHARO MACRO ’A’ S. 11 11/09 2,198.76 4,739,731.02 0.59
PHARO MACRO FUND ’A’ S. 8 08/09 2,605.42 5,596,519.71 0.69
PHARO MACRO FUND ’B’ S. 4 06/09 1,350.00 2,941,041.85 0.36
PHARO MACRO FUND S. 8 08/08 1,025.00 2,204,824.66 0.27
PHARO MACRO S. 05 05/08 6,604.85 14,214,666.77 1.76
RUBICON GLOBAL FUND M S. 05/09 60,000.00 6,477,424.20 0.80
RUBICON GLOBAL FUND M S. M-0609 50,000.00 5,299,836.50 0.66
RUBICON GLOBAL FUND S. M0709 30,000.00 3,427,056.90 0.42
TACONIC OPPORTUNITY OFFSH. ’A’ S. 2 NON REST 25,000.00 26,097,812.25 3.23
TACONIC OPPORTUNITY OFFSH. A S9-NR 15,000.00 15,431,194.50 1.91
TOURADJI GBL RES. A SUB. 4 S10/07 387.19 497,521.11 0.06
TOURADJI GL. RES. HOLD. A S. 01/09 2,160.99 2,098,249.76 0.26
VICIS CAPITAL FUND ’A’ S. 111 (2) 11,497.99 11,484,177.66 1.42
WCG OFFSHORE ’A’ (USD) S. 16 ELIGIBLE 10,000.00 10,000,000.00 1.24
WCG OFFSHORE FD. ’A’ (USD) S. 12 ELIGIBLE 1,880.00 1,945,662.87 0.24
WHITEBEAM EM. MKT B USD 02/06 EQUAL 18,890.88 0.00 0.00
WOODBINE CAPITAL ’A’ S. 10/09 UNR. 7,000.00 6,907,470.64 0.85
WOODBINE CAPITAL FD’A’ 07/09 UNR. 5,000.00 5,056,790.35 0.63
595,110,357.53 73.60
(1) Side Pocket(2) Funds in liquidation(3) "Securities to receive" or "Securities to deliver" are corresponding to investments for which the number of shares subscribed / redeemed are not yet confirmed by
the administrator of the underlying fund.
Description Quantity Market value (note 2) % of net assets

18
Mosaic
STATEMENT OF INVESTMENTS AND OTHER NET ASSETS AS AT DECEMBER 31, 2009 (EXPRESSED IN USD)
The accompanying notes form an integral part of these financial statements.
GUERNSEY
BOUSSARD & GAVAUDAN HOLDINGS 637,238.00 9,005,611.79 1.11
9,005,611.79 1.11
LUXEMBOURG
TRANSTREND-OMNITREND PLUS 2,253.91 5,355,648.23 0.66
5,355,648.23 0.66
SWITZERLAND
PICTET (CH) - MONEY MARKET (USD) ’Z’ 66,650.56 66,036,046.34 8.17
66,036,046.34 8.17
TOTAL INVESTMENTS 906,063,002.81 112.01
BANK OVERDRAFT -88,494,043.43 -10.94
OTHER NET LIABILITIES -8,681,999.80 -1.07
TOTAL NET ASSETS 808,886,959.58 100.00
Description Quantity Market value (note 2) % of net assets

19
Mosaic
GEOGRAPHICAL AND INDUSTRIAL CLASSIFICATION OF INVESTMENTS AS AT DECEMBER 31, 2009
The accompanying notes form an integral part of these financial statements.
Geographical classification Industrial classification(in % of net assets)
Cayman Islands 73.60
British Virgin Islands 11.62
Bahamas 10.27
Switzerland 8.17
Bermuda 6.58
Guernsey 1.11
Luxembourg 0.66
112.01
(in % of net assets)
Units of investment funds 112.01
112.01

20
Mosaic
NOTES TO THE FINANCIAL STATEMENTS (continued) AS AT DECEMBER 31, 2009
NOTE 1 GENERAL
The SICAV has the status of an undertaking for collective investment and the particularform of an "Investment Company with Variable Capital" (SICAV). The SICAV qualifiesunder the Part II of the Luxembourg Law of December 20, 2002 as amended regardingundertakings for collective investment. The articles of incorporation of the SICAV (the"Articles") were published in the Mémorial of April 22, 2005.
The SICAV is registered with the register of commerce and companies of Luxembourgunder number B 107 223.
The shares issued by the SICAV are in registered form. They are freely transferable andentitled to participate equally in the profits and liquidation proceeds attributable to theSICAV. The shares, which are of no par value and which must be fully paid upon issue,carry no preferential or pre-emptive rights and each share is entitled to one vote at allmeetings of shareholders.
The SICAV offers the following classes of shares:
• I Shares are suitable for institutional investors;• P shares and R shares, through their broad range of features, each meet different
commercial practices in the countries in which the SICAV is marketed, and theirflexibility enables them to be adapted where necessary in line with developments intheir target markets. It should be noted that in some countries, part of themanagement fee may be passed on to the intermediaries in marketing the shares ofthe SICAV;
• Z Shares are reserved for institutional investors who have concluded a specificremuneration agreement with Pictet & Cie, Geneva or any other entity of the PictetGroup;
• HI, HP, HR and HZ Shares ("Hedged Shares") seek to hedge for their correspondingshares most of the exchange rate risk of the USD against the Swiss Franc, the GBPand the Euro respectively;
• OI, OP, OR and OZ shares ("Overlay shares") seek to hedge for their correspondingshares part of the exchange-rate risk of the USD against the Swiss franc and the Eurorespectively, by using partially an active hedging technique.
The Overlay shares have been created following a resolution of the Board of Directorsdated August 17, 2009. At the date of the present report, only the OP shares have beenlaunched.
The reference currency is the :
US Dollar (USD) for I, P, R and Z Shares;Swiss Franc (CHF) for HI-CHF, HP-CHF, HR-CHF, HZ-CHF, OI-CHF, OP-CHF, OR-CHFand OZ-CHF shares;Euro (EUR) for the HI-EUR, HP-EUR, HR-EUR, HZ-EUR, OI-EUR, OP-EUR, OR-EUR andOZ-EUR shares;Sterling Pound (GBP) for the HI-GBP, HP-GBP, HR-GBP and HZ-GBP Shares.

21
Mosaic
NOTES TO THE FINANCIAL STATEMENTS (continued) AS AT DECEMBER 31, 2009
I, P, R and Z Shares are subject to a minimum initial subscription amount as follows:
The Hedged shares and Overlay shares are subject to the same minimum initialsubscription amount as their corresponding shares as described above.
NOTE 2 SUMMARY OF SIGNIFICANT ACCOUNTING POLICIES
a) General
The financial statements are presented in accordance with the legal reportingrequirements applicable in Luxembourg.
b) Presentation of financial statements
The reference currency of the SICAV is the USD.
The accounting year of the SICAV terminates on December 31 of each year.
c) Valuation of investment securities
Securities held by the SICAV (including shares or units in closed-end UCI) which arequoted or dealt in on a stock exchange are valued at their latest available publicised stockexchange closing price and where appropriate the bid market price on the stockexchange which is normally the principal market for such security. Securities dealt in onany other organised market are valued in a manner as near as possible to that for quotedsecurities.
The valuation of a security denominated in a currency other than the reference currencyof the SICAV is determined in the national currency and converted into the referencecurrency at the foreign exchange rate in effect as of the relevant Valuation Day.
The valuation of securities not quoted or dealt in on a stock exchange or anotherorganised market and of securities which are so quoted or dealt in but in respect ofwhich no price quotation is available or the price quoted is not representative of thesecurities’ fair market value, are determined prudently and in good faith on the basis oftheir reasonably foreseeable sale prices. All other assets are valued at their respectivefair values as determined in good faith by the Board of Directors in accordance withgenerally accepted valuation principles and procedures.
I Shares USD 1,000,000P Shares USD 10,000R Shares USD 10,000Z Shares USD 10,000

22
Mosaic
NOTES TO THE FINANCIAL STATEMENTS (continued) AS AT DECEMBER 31, 2009
In determining the value of the assets of the SICAV, shares or units in open-endedunderlying Funds are valued at the actual net asset value for such shares or units as ofthe relevant Valuation Day, or if no such actual net asset value is available they are valuedat the estimated net asset value as of such Valuation Day, or if no such estimated netasset value is available they are valued at the last available actual or estimated net assetvalue which is calculated prior to such Valuation Day whichever is the closer to suchValuation Day. If events have occurred which may have resulted in a material change inthe net asset value of such shares or units since the date on which such actual orestimated net asset value was calculated, the value of such shares or units may beadjusted in order to reflect, in the reasonable opinion of the Directors, such change, butthe Directors will not be required to revise or recalculate the Net Asset Value on the basisof which subscriptions, redemptions or conversions may have been previously accepted.
Money market instruments and cash will be valued at face value. Interest is accrued andrecorded separately and included in the appropriate asset account.
In respect of shares or units held by the SICAV, for which issues and redemptions arerestricted and a secondary market trading is effected between dealers who, as mainmarket makers, offer prices in response to market conditions, the Directors may decideto value such shares or units in line with the realisation prices so established.
Further details are given in the Prospectus of the SICAV.
d) Formation expenses
Formation expenses are amortised over a maximum period of five years.
e) Conversion of foreign currencies
Cash at banks, other net assets as well as the market value of the investment portfolio incurrencies other than the currency of the SICAV are converted into the base currency ofthe SICAV at the exchange rates prevailing at the end of the year.
Income and expenses in currencies other than the currency of the SICAV are convertedinto the currency of the SICAV at the exchange rate applicable on the payment date.
Resulting foreign exchange gains and losses are included in the statement of operations.
f) Net realised gain/loss on sales of investments
Realised gains or losses on the sales of investments are calculated on the basis of theaverage cost of the investments sold.
g) Cost of investment securities
The cost of investment securities in currencies other than USD is translated into USD atthe exchange rate applicable at purchase date.

23
Mosaic
NOTES TO THE FINANCIAL STATEMENTS (continued) AS AT DECEMBER 31, 2009
h) Income
Dividends are recorded at ex-date. Interest is recorded on an accrual basis.
i) Valuation of forward foreign exchange contracts
The unrealised gains or losses resulting from outstanding forward foreign exchangecontracts are determined on the valuation day on the basis of forward foreign exchangeprices applicable on this date and are included in the statement of net assets.
NOTE 3 MANAGEMENT FEE AND SERVICE FEE
An annual management fee and service fee calculated on the average net asset values ofthe classes, will be paid quarterly to the Management Company in payment for theservices provided by it to the SICAV. These fees will also enable the ManagementCompany to remunerate the Investment Manager, Investment Adviser, Pictet & Cie(Europe) S.A. for the functions of transfer agent, domiciliary and administrative agentand distributors, if applicable.
Such fees cannot exceed the amounts specified below:
* Maximum percentage per year of the average net assets attributable to this type ofshares during the relevant quarter.
NOTE 4 OTHER FEES
As at December 31, 2009, the other fees payable include mainly administration, custodianand audit fees.
Type of shares Fees (max %) *Management Service
I 1.50% 0.15%P 2.00% 0.15%R 2.50% 0.15%Z 0.00% 0.15%HI-CHF 1.50% 0.20%HP-CHF 2.00% 0.20%HR-CHF 2.50% 0.20%HZ-CHF 0.00% 0.20%HI-EUR 1.50% 0.20%HP-EUR 2.00% 0.20%HR-EUR 2.50% 0.20%HZ-EUR 0.00% 0.20%HI-GBP 1.50% 0.20%HP-GBP 2.00% 0.20%HR-GBP 2.50% 0.20%HZ-GBP 0.00% 0.20%OI-CHF 1.75% 0.20%OP-CHF 2.00% 0.20%OR-CHF 2.50% 0.20%OZ-CHF 0.00% 0.20%OI-EUR 1.75% 0.20%OP-EUR 2.00% 0.20%OR-EUR 2.50% 0.20%OZ-EUR 0.00% 0.20%

24
Mosaic
NOTES TO THE FINANCIAL STATEMENTS (continued) AS AT DECEMBER 31, 2009
NOTE 5 TAXATION
Under current law and practice the SICAV is not liable to any Luxembourg income tax,nor are dividends, if any, paid by the SICAV liable to any Luxembourg withholding tax.However, the SICAV is normally liable in Luxembourg to a tax of 0.05% per annum of itsnet assets. Such tax rate is reduced to a rate of 0.01% in respect of the net assetsattributable to such classes of shares which are reserved for institutional investors withinthe meaning of, and as provided for in, article 129 of the Law of December 20, 2002 asamended.
Such tax being payable quarterly and calculated on the Net Asset Value of the relevantclass at the end of the relevant quarter. For the portion of the assets of the SICAVinvested in other UCIs which are established in Luxembourg, no such tax is payable asprovided for in, article 129 of the Law of December 20, 2002 as amended.
NOTE 6 SUBSCRIPTIONS AND REDEMPTIONS
a) Subscriptions
Shares in each class are issued at the relevant Net Asset Value (the “Subscription Price”),as determined as of each “Valuation Day”, being the last calendar day of each month. Thenet asset value is made public as soon as practicable after the relevant Valuation Day.
A Subscription Charge of up to 3.5% of the relevant Subscription Price may be added tothe Subscription Price to compensate financial intermediaries and other persons whoassist in the placement of shares.
b) Redemptions
The Shares are redeemable at their relevant Net Asset Value (the "Redemption Price")each calculated as of the Valuation Day of the months of March, June, September andDecember. The Board of Directors may determine additional Redemption ValuationDays for which all shareholders in identical situations will be treated equally.
A Redemption Charge of up to 3% of the relevant Redemption Price may be levied on theRedemption Price to compensate financial intermediaries and other persons who assistin the placement of shares.
NOTE 7 EXCHANGE RATES AS AT DECEMBER 31, 2009
The following exchange rates were used for the conversion of the SICAV’s net assets intoUSD as at December 31, 2009:
1 USD = 0.696987 EUR1 USD = 1.033750 CHF1 USD = 0.619253 GBP
25
Mosaic
NOTES TO THE FINANCIAL STATEMENTS (continued) AS AT DECEMBER 31, 2009
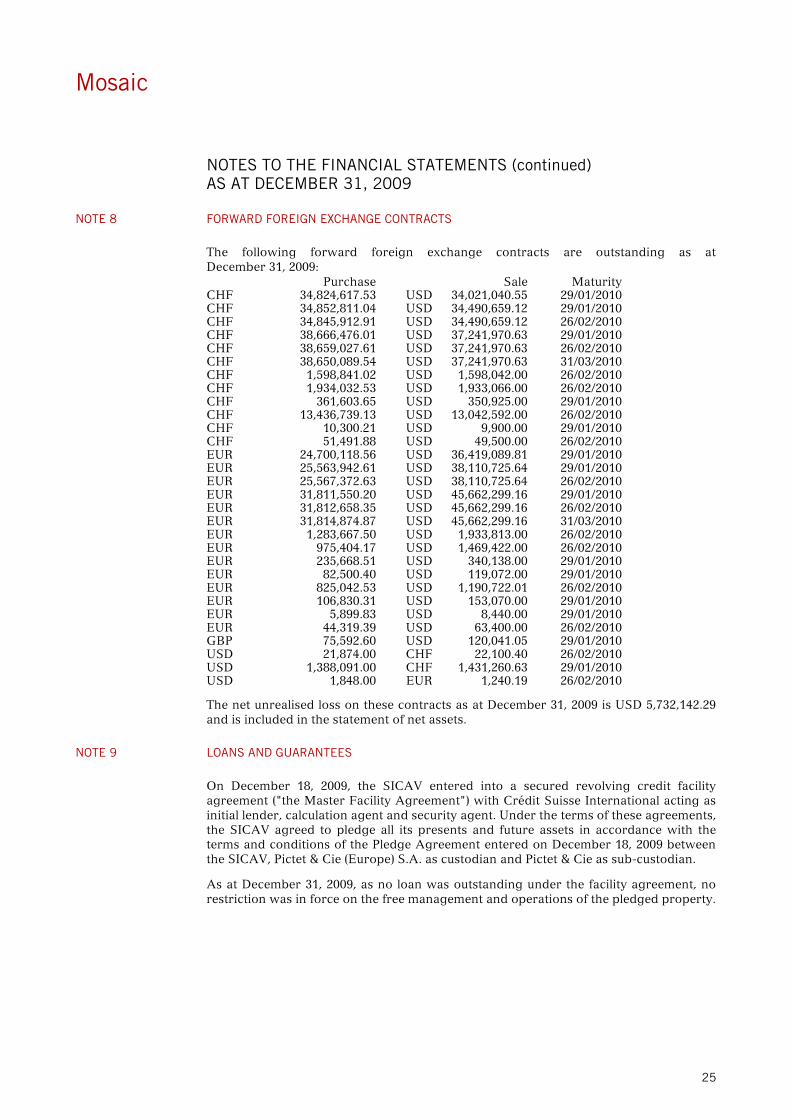
NOTE 8 FORWARD FOREIGN EXCHANGE CONTRACTS
The following forward foreign exchange contracts are outstanding as atDecember 31, 2009:
The net unrealised loss on these contracts as at December 31, 2009 is USD 5,732,142.29and is included in the statement of net assets.
NOTE 9 LOANS AND GUARANTEES
On December 18, 2009, the SICAV entered into a secured revolving credit facilityagreement ("the Master Facility Agreement") with Crédit Suisse International acting asinitial lender, calculation agent and security agent. Under the terms of these agreements,the SICAV agreed to pledge all its presents and future assets in accordance with theterms and conditions of the Pledge Agreement entered on December 18, 2009 betweenthe SICAV, Pictet & Cie (Europe) S.A. as custodian and Pictet & Cie as sub-custodian.
As at December 31, 2009, as no loan was outstanding under the facility agreement, norestriction was in force on the free management and operations of the pledged property.
Purchase Sale MaturityCHF 34,824,617.53 USD 34,021,040.55 29/01/2010CHF 34,852,811.04 USD 34,490,659.12 29/01/2010CHF 34,845,912.91 USD 34,490,659.12 26/02/2010CHF 38,666,476.01 USD 37,241,970.63 29/01/2010CHF 38,659,027.61 USD 37,241,970.63 26/02/2010CHF 38,650,089.54 USD 37,241,970.63 31/03/2010CHF 1,598,841.02 USD 1,598,042.00 26/02/2010CHF 1,934,032.53 USD 1,933,066.00 26/02/2010CHF 361,603.65 USD 350,925.00 29/01/2010CHF 13,436,739.13 USD 13,042,592.00 26/02/2010CHF 10,300.21 USD 9,900.00 29/01/2010CHF 51,491.88 USD 49,500.00 26/02/2010EUR 24,700,118.56 USD 36,419,089.81 29/01/2010EUR 25,563,942.61 USD 38,110,725.64 29/01/2010EUR 25,567,372.63 USD 38,110,725.64 26/02/2010EUR 31,811,550.20 USD 45,662,299.16 29/01/2010EUR 31,812,658.35 USD 45,662,299.16 26/02/2010EUR 31,814,874.87 USD 45,662,299.16 31/03/2010EUR 1,283,667.50 USD 1,933,813.00 26/02/2010EUR 975,404.17 USD 1,469,422.00 26/02/2010EUR 235,668.51 USD 340,138.00 29/01/2010EUR 82,500.40 USD 119,072.00 29/01/2010EUR 825,042.53 USD 1,190,722.01 26/02/2010EUR 106,830.31 USD 153,070.00 29/01/2010EUR 5,899.83 USD 8,440.00 29/01/2010EUR 44,319.39 USD 63,400.00 26/02/2010GBP 75,592.60 USD 120,041.05 29/01/2010USD 21,874.00 CHF 22,100.40 26/02/2010USD 1,388,091.00 CHF 1,431,260.63 29/01/2010USD 1,848.00 EUR 1,240.19 26/02/2010


