Embed Size (px)
Citation preview
ab
Annual Report 2016/2017
Investment Company under Luxembourg Law (SICAV)
R.C.S. Luxembourg N° B 129 748
Audited annual report as of 31 July 2017
Multi Manager Access IIMulti Manager Access II – Emerging Markets DebtMulti Manager Access II – European Multi CreditMulti Manager Access II – FlexibleMulti Manager Access II – Global Fixed Income Enhanced StrategiesMulti Manager Access II – High YieldMulti Manager Access II – US Multi Credit

1
Audited annual report as of 31 July 2017
Table of contents Page ISIN
Management and Administration 2Features of the Company 4Report of the Portfolio Managers 6Audit report 7
Multi Manager Access II 10Multi Manager Access II – Emerging Markets Debt 12 BI LU0985399996 BI (CHF hedged) LU0985400083 BI (EUR hedged) LU0985400166 BI (SGD hedged) LU0985400323 I-UKdist LU0985400596 I-UKdist (CHF hedged) LU0985400679 I-UKdist (EUR hedged) LU0985400752 I-UKdist (GBP hedged) LU0985400919Multi Manager Access II – European Multi Credit 31 BI LU0313363508 BI (CHF hedged) LU0313363680 BI (USD hedged) LU0313363763 I-UKdist LU1005257800 I-UKdist (CHF hedged) LU1363543296 I-UKdist (GBP hedged) LU1344274698Multi Manager Access II – Flexible 49 BI LU0392610902Multi Manager Access II – Global Fixed Income Enhanced Strategies 55 BI LU0313364142 BI (CHF hedged) LU0313364571 BI (USD hedged) LU0313364811Multi Manager Access II – High Yield 58 BI LU1344275315 BI (CHF hedged) LU1344275075 BI (EUR hedged) LU1344275158 BI (SGD hedged) LU1344275745 I-UKdist LU1344275406 I-UKdist (CHF hedged) LU1363543452 I-UKdist (EUR hedged) LU1344275232 I-UKdist (GBP hedged) LU1344275661Multi Manager Access II – US Multi Credit 81 BI LU0313364738 BI (CHF hedged) LU0313364498 BI (EUR hedged) LU0313363920 I-UKdist LU1344274938 I-UKdist (CHF hedged) LU1363543379 I-UKdist (EUR hedged) LU1344274771 I-UKdist (GBP hedged) LU1003004865
Notes to the Financial Statements 103Unaudited Information 109
Sales restrictions
Shares of this Company may not be offered, sold ordistributed within the United States of America.
Sale in Germany
Shares of the subfund Multi Manager Access II – Flexible may not be publicly distributed to investors in Germany.
2
Multi Manager Access IIAnnual Report as of 31 July 2017
Management and Administration
Registered Office
33A, avenue J.F. KennedyL-1855 LuxembourgR.C.S. Luxembourg N° B 129 748
Board of Directors
Andreas Aebersold, Chairman (Member until 13 September 2016)Executive Director, UBS Switzerland AG, Switzerland
André Müller-Wegner, Member (Chairman until 13 September 2016)Managing Director, UBS AG, Basel and Zurich
Madhu RamachandranExecutive DirectorUBS Europe SE, Luxembourg Branch, Luxembourg
Christian Schön, MemberExecutive DirectorUBS Europe SE, Luxembourg Branch, Luxembourg
Jeremy Stenham, MemberChartered Accountant, Independent DirectorLondon, United Kingdom
Management Company
UBS Third Party Management Company S.A. (until 30 July 2017)33A, avenue J.F. KennedyL-1855 LuxembourgR.C.S. Luxembourg N° B 135 728
UBS Fund Management (Luxembourg) S.A. (since 31 July 2017)33A, avenue J.F. KennedyL-1855 LuxembourgR.C.S. Luxembourg N° B 154 210
Eligible Portfolio Managers
AllianceBernstein L.P.New York, USA
Ashmore Investment Management LimitedLondon, United Kingdom
AXA Investment Managers ParisParis, France
AXA Investment Managers, IncDelaware USA
Bluebay Asset Management LLPLondon, United Kingdom
BNY Mellon Investment Management EMEA Limited London, United Kingdom (who may delegate investment management duties to Standish Mellon Asset Management Company LLC (Boston, United States) and Insight Investment Management (Global) Limited (London, United Kingdom))
Brandywine Global Investment Management, LLCPhiladelphia, USA
Candriam FranceParis, France
Capital Four Management Fondsmaeglerselskab A/S Copenhagen, Denmark
DCI, LLC, Delaware, USA
Deutsche Asset Management International GmbHFrankfurt, Germany
Eaton Vance ManagementBoston, USA
ECM Asset Management LimitedLondon, United Kingdom
Goldman Sachs Asset Management InternationalLondon, United Kingdom
Guggenheim Partners Investment Management, LLCNew York, USA
HSBC Global Asset Management (France)Paris, France
JPMorgan Asset Management (UK) Limited London, United Kingdom
Neuberger Berman Europe LimitedLondon, United Kingdom
Nordea Investment Management AB, DenmarkBranch of Nordea Investment Management ABCopenhagen, Denmark
Oaktree Capital Management L.P. Delaware, USA
Payden & RygelLos Angeles, USA
3
Multi Manager Access IIAnnual Report as of 31 July 2017
PGIM, Inc.Newark, USA
TCW Investment Management Company Los Angeles, USA
UBS Switzerland AG (its branches or its affiliated companies, successors or assigns)Zurich, Switzerland(which may delegate this function worldwide within the UBS Group)
Not all of the eligible Portfolio Managers need to be ap-pointed at all times. The Portfolio Managers appointed as well as the period of the appointment and the assets under management of each Portfolio Manager are avail-able free of charge to the shareholders upon request.
Depositary and Paying agent
UBS Europe SE, Luxembourg Branch33A, avenue J.F. KennedyL-1855 Luxembourg
Administrative Agent
UBS Fund Services (Luxembourg) S.A.33A, avenue J.F. KennedyL-1855 Luxembourg
Auditor of the Company
PricewaterhouseCoopers, Société coopérative2, rue Gerhard Mercator, B.P. 1443L-1014 Luxembourg
Sale in Germany
Paying and information agentUBS Europe SE, Bockenheimer Landstr. 2-4D-60306 Frankfurt am Main
The sales prospectus, the KIID, the articles of association of the Company, the annual and semi-annual reports as well as the portfolio movements of the Company mentioned in this publication are availa-ble free of charge from UBS Europe SE, Bockenheimer Landstr. 2-4, D-60306 Frankfurt am Main.
For the subfund Multi Manager Access II – Flexible no notification has been filed to the Bundesanstalt für Finanzdienstleistungsaufsicht and therefore shares of this subfund may not be publicly distributed in Germany.
The sales prospectus, the articles of association of the Company, the annual and semi-annual reports as well as the portfolio movements of the Company mentioned in this publication are available free of charge at the sales agencies and at the registered office of the Company.
4
Multi Manager Access IIAnnual Report as of 31 July 2017
Features of the Company
Multi Manager Access II (hereinafter called the “Company”) offers investors a range of different subfunds (“umbrella construction”) which invest in accordance with the investment policies described in the sales prospectus. The sales prospectus, which contains specific details on each subfund, will be updated on the inception of each new subfund.
Multi Manager Access II was incorporated as UBS Multi Manager Access II on 10 July 2007 as an open‐end investment fund in the legal form of a “Société d’Investissement à Capital Variable” (SICAV) in accor-dance with Part II of the Luxembourg law relating to undertakings for collective investment of 20 December 2002. The Company is entered under no. B 129 748 in the Luxembourg Commercial Register (Registre de Commerce et des Sociétés). When the Company was established, its initial capital amounted to EUR 31 000 and was represented by 310 fully paid‐up shares with no face value.
The Articles of Incorporation were published in the Luxembourg Official Gazette, on 29 August 2007. Each amendment to the Articles of Incorporation shall be published in the Luxembourg Official Gazette, in a Luxembourg daily newspaper and, if necessary, in the official publications specified for the respective countries in which shares of the Company are sold. Such amend-ments become legally binding in respect of all sharehold-ers subsequent to their approval by the general meeting of shareholders. The Company was converted from a UCI subject to Part II of the Law of 2010 to a UCI subject to Part I of the Law of 2010 with effect as of 3 February 2016. The Company is authorised under Part I of the Law of 2010, as amended.
The Board of Directors of the Company is empowered to establish new subfunds and/or to liquidate existing ones at any time or to establish various share classes with specific characteristics within these subfunds. The current sales prospectus shall be updated following the establishing of a new subfund or new share class.
As at 31 July 2017, the following subfunds are active:
Multi Manager Access II Currency of account
– Emerging Markets Debt USD
– European Multi Credit EUR
– Flexible USD
– High Yield USD
– US Multi Credit USD
The Company can issue several share classes for each of the subfunds. Unless otherwise specified in the subfund specific section (“Special Investment Policy of the subfunds”) of the sales prospectus, the shares may only be held by UBS on its own account or in the context of discretionary asset management mandates concluded with UBS or by any other investor as may be determined by the Board of Directors in its sole discretion.
Currently, the following share classes may be offered:B = Class “B” shares will accumulate their incomeA = Class “A” shares will distribute their incomeI = Class “I” shares are reserved for institutional
investors R = Class “R” shares are reserved for retail clients.
Unless the Company decides otherwise, the initial issue price of these shares amounts to 100 CAD, 100 CHF, 100 EUR, 100 GBP, 10,000 JPY, 100 SGD, 100 USD. Their smallest tradable unit is 0.001.
Additional characteristics:
Currency Hedged Share Classes
Share classes may be denominated in the following currencies which may differ from the currency of account of the subfund: CAD, CHF, EUR, GBP, JPY, SGD, USD. In such cases, the share class will have the word “hedged” in its name.
Hedging
For share classes with “hedged” in their name (“Currency Hedged Share Classes”), and denominat-ed in a currency other than the subfund’s currency of account, foreign exchange transactions and currency forwards are conducted in order to hedge the net asset value of the subfund, calculated in the currency of account, against the net asset values of the share classes denominated in other currencies. Provision is made for the amount of the hedging to be in principle between 95% and 105% of the total net assets of the share class in foreign currency. Changes in the marketvalue of the portfolio, as well as in subscriptions and redemptions of share classes in foreign currencies, can result in the hedg-ing temporarily surpassing the aforementioned range. The Currency Manager (“UBS Switzerland AG”) will take all the necessary steps to bring the hedging back within the aforementioned limits. The hedging described has no effect on possible currency risks resulting from investments denominated in a currency other than the subfund’s currency of account.
5
Multi Manager Access IIAnnual Report as of 31 July 2017
“UKdist”
The aforementioned share classes can be issued as those with “UKdist” in their name. In these cases, the Company intends to distribute a sum which corresponds to 100% of the reportable income within the meaning of the UK reporting fund rules when the share classes are subject to the reporting fund rules. The Company does not in-tend to make available taxable values in other countries for this share class, as these share classes are intended for investors whose investment in the share class is liable to tax in the UK.
The sum of the subfunds’ net assets forms the total net assets of the Company, which at any time correspond to the share capital of the Company and consist of fully paid in and non-par-value shares (the “shares”).
The Company is a single legal entity. However, each subfund corresponds to a distinct part of the assets and liabilities of the Company.
For the purpose of the relations as between the share-holders, each subfund is deemed to be a separate entity, separate from the others. The assets of a subfund are exclusively available to satisfy the requests of that subfund and the right of creditors whose claims have arisen in connection with that subfund.
The Company is unlimited with regard to duration and total assets.
The financial year of the Company ends on 31 July.
The ordinary general meeting takes place annually on 31 January at 12 p.m. at the registered office of the Company. If such a day does not fall on a business day in Luxembourg, the ordinary general meeting must take place on the next following working day.
At general meetings, the shareholder has the right to one vote per whole share held, irrespective of the difference in value of shares in the respective subfunds. Shares of a particular subfund or class carry the right of one vote per whole share held when voting at meetings affecting this subfund or class.
The shares of the subfunds of Multi Manager Access II are not listed on the Luxembourg Stock Exchange, except for the shares of the subfund Multi Manager Access II – Flexible.
The issue and redemption of shares of Multi Manager Access II are subject to the regulations prevailing in the concerned country.
Only the information contained in the sales prospectus and in any of the documents referred to therein shall be deemed to be valid.
The annual and semi-annual reports are available free of charge to shareholders at the registered office of the Company and the Depositary.
No subscription may be accepted on the basis of the financial reports. Subscriptions are accepted only on the basis of the current prospectus accompanied by the latest annual report and the latest semi-annual report if available.
The figures stated in this report are historical and not necessarily indicative of future performance.
6
Multi Manager Access IIAnnual Report as of 31 July 2017
Report of the Portfolio Managers
The financial market performance in the second half of 2016 was characterized by a global equity markets sell-off that was cushioned by supportive central banks, slightly better corporate earnings and increasing oil prices, by the end of the year. Short-term volatility was increased by the unexpected decision of the UK to leave the European Union as well as the election victory of Donald Trump as the next US president.
In this environment, Eurozone and Swiss equities expe-rienced a weaker performance than US equities. How-ever, the strongest equity market in 2016, in absolute terms, were Emerging Markets. Despite several political surprises, active equity managers have mostly managed the circumstances well and performed in line with their peer groups. The contribution of non-hedged equity exposures were particularly affected by the strong depreciation of the British pound in the aftermath of the UK referendum.
The second semester performance of credit instru-ments has been strong overall as credit spreads mostly tightened. The oil prices were the main driver for credit spreads, especially for US high yield bonds. In a still very low interest rate environment, hedge funds performed rather flat, but provided a stabilizing contribution.
Turning to 2017: The first seven months of the year were characterized by very unsteady financial markets that continued to be influenced by geopolitical events and responding central banks. The headlines that influenced markets most were the coverages of President Trump, the situation and ongoing negotiation tasks about the British exit as well as the rejection of anti-European politicians in the Netherlands and France. The orienta-tion of the major central banks – the Federal Reserve and the European Central Bank – diverged: While the US Fed lifted its policy rate for the second time, its European counterpart is still continuing its easing attempts.
The ambient macroeconomic environment was strong and shaped by benign economic data. In particular, posi-tive reportings on inflation and consumer confidence led to a growth-friendly environment that fed the investors’ risk-appetite. These good reportings about revenues and margins, earnings and investment drove equity markets and lifted the major indices to record highs.
Exposure to fixed income helped to diversify risk and delivered a solid positive return, especially the exposure to high yield bonds and emerging market debt which profited from a more optimistic economic outlook. High grade bonds were affected by the moderately accelerat-ing inflation tendencies and consequential rate hiking intentions.
7
Multi Manager Access IIAnnual Report as of 31 July 2017
Audit report
To the Shareholders of
Multi Manager Access II
Our opinion
In our opinion, the accompanying financial statements give a true and fair view of the financial position of Multi Manager Access II and of each of its subfunds (the “Fund”) as at 31 July 2017, and of the results of their operations and changes in their net assets for the year then ended in accordance with Luxembourg legal and regulatory requirements relating to the preparation and presentation of the financial statements.
What we have audited
The Fund’s financial statements comprise:• the statement of net assets as at 31 July 2017;• the statement of investments in securities and other
net assets as at 31 July 2017;• the statement of operations and the statement of
changes in net assets for the year then ended; and• the notes to the financial statements, which include a
summary of significant accounting policies.
Basis for opinion
We conducted our audit in accordance with the Law of 23 July 2016 on the audit profession (Law of 23 July 2016) and with International Standards on Auditing (ISAs) as adopted for Luxembourg by the “Commission de Surveillance du Secteur Financier” (CSSF). Our responsibilities under those Law and stan-dards are further described in the “Responsibilities of the “Réviseur d’entreprises agréé” for the audit of the financial statements” section of our report.
We believe that the audit evidence we have obtained is sufficient and appropriate to provide a basis for our opinion.
We are independent of the Fund in accordance with the International Ethics Standards Board for Accountants’ Code of Ethics for Professional Accountants (IESBA Code) as adopted for Luxembourg by the CSSF together with the ethical requirements that are relevant to our audit of the financial statements. We have fulfilled our other ethical responsibilities under those ethical requirements.
Other information
The Board of Directors of the Fund is responsible for the other information. The other information comprises the information included in the annual report but does not include the financial statements and our audit report thereon.
Our opinion on the financial statements does not cover the other information and we do not express any form of assurance conclusion thereon.
In connection with our audit of the financial statements, our responsibility is to read the other information identi-fied above and, in doing so, consider whether the other information is materially inconsistent with the financial statements or our knowledge obtained in the audit, or otherwise appears to be materially misstated. If, based on the work we have performed, we conclude that there is a material misstatement of this other information, we are required to report that fact. We have nothing to report in this regard.
PricewaterhouseCoopers, Société coopérative, 2 rue Gerhard Mercator, B.P. 1443, L-1014 LuxembourgT: +352 494848 1, F: +352 494848 2900, www.pwc.lu
Cabinet de révision agréé. Expert-comptable (autorisation gouvernementale n°10028256)R.C.S. Luxembourg B 65 477 - TVA LU25482518
8
Multi Manager Access IIAnnual Report as of 31 July 2017
Responsibilities of the Board of Directors of the Fund and those charged with governance for the financial statements
The Board of Directors of the Fund is responsible for the preparation and fair presentation of the financial statements in accordance with Luxembourg legal and regulatory requirements relating to the preparation and presentation of the financial statements, and for such internal control as the Board of Directors of the Fund determines is necessary to enable the preparation of financial statements that are free from material misstate-ment, whether due to fraud or error.
In preparing the financial statements, the Board of Directors of the Fund is responsible for assessing the Fund’s ability to continue as a going concern, disclos-ing, as applicable, matters related to going concern and using the going concern basis of accounting unless the Board of Directors of the Fund either intends to liquidate the Fund or to cease operations, or has no realistic alter-native but to do so.
Those charged with governance are responsible for overseeing the Fund’s financial reporting process.
Responsibilities of the “Réviseur d’entreprises agréé” for the audit of the financial statements
The objectives of our audit are to obtain reasonable assurance about whether the financial statements as a whole are free from material misstatement, whether due to fraud or error, and to issue an audit report that includes our opinion. Reasonable assurance is a high level of assurance, but is not a guarantee that an audit conducted in accordance with the Law of 23 July 2016 and with ISAs as adopted for Luxembourg by the CSSF will always detect a material misstatement when it exists. Misstatements can arise from fraud or error and are con-sidered material if, individually or in the aggregate, they could reasonably be expected to influence the economic decisions of users taken on the basis of these financial statements.
As part of an audit in accordance with the Law of 23 July 2016 and with ISAs as adopted for Luxembourg by the CSSF, we exercise professional judgment and maintain professional scepticism throughout the audit.
We also:• identify and assess the risks of material misstatement
of the financial statements, whether due to fraud or error, design and perform audit procedures responsive to those risks, and obtain audit evidence that is sufficient and appropriate to provide a basis for our opinion. The risk of not detecting a material misstatement resulting from fraud is higher than for one resulting from error, as fraud may involve collusion, forgery, intentional omissions, misrepresentations, or the override of internal control;
• obtain an understanding of internal control relevant to the audit in order to design audit procedures that are appropriate in the circumstances, but not for the purpose of expressing an opinion on the effectiveness of the Fund’s internal control;
• evaluate the appropriateness of accounting policies used and the reasonableness of accounting estimates and related disclosures made by the Board of Directors of the Fund;
• conclude on the appropriateness of the Board of Directors of the Fund’s use of the going concern basis of accounting and, based on the audit evidence obtained, whether a material uncertainty exists related to events or conditions that may cast significant doubt on the Fund’s ability to continue as a going concern. If we conclude that a material uncertainty exists, we are required to draw attention in our audit report to the related disclosures in the financial statements or, if such disclosures are inadequate, to modify our opinion. Our conclusions are based on the audit evidence obtained up to the date of our audit report. However, future events or conditions may cause the Fund to cease to continue as a going concern;
• evaluate the overall presentation, structure and content of the financial statements, including the disclosures, and whether the financial statements represent the underlying transactions and events in a manner that achieves fair presentation.
pwc
We communicate with those charged with governanceregarding, among other matters, the planned scope andtiming of the audit and significant audit findings, includ-ing any significant deficiencies in internal control that weidentify during our audit.
Luxembourg, 28 November 2017
PricewaterhouseCoopers, Société coopérativeRepresented by
Valerie Piastrelli
Multi Manager Access IIAnnual Report as of 31 July 2017
10 The notes are an integral part of the fi nancial statements.
Multi Manager Access IIAnnual Report as of 31 July 2017
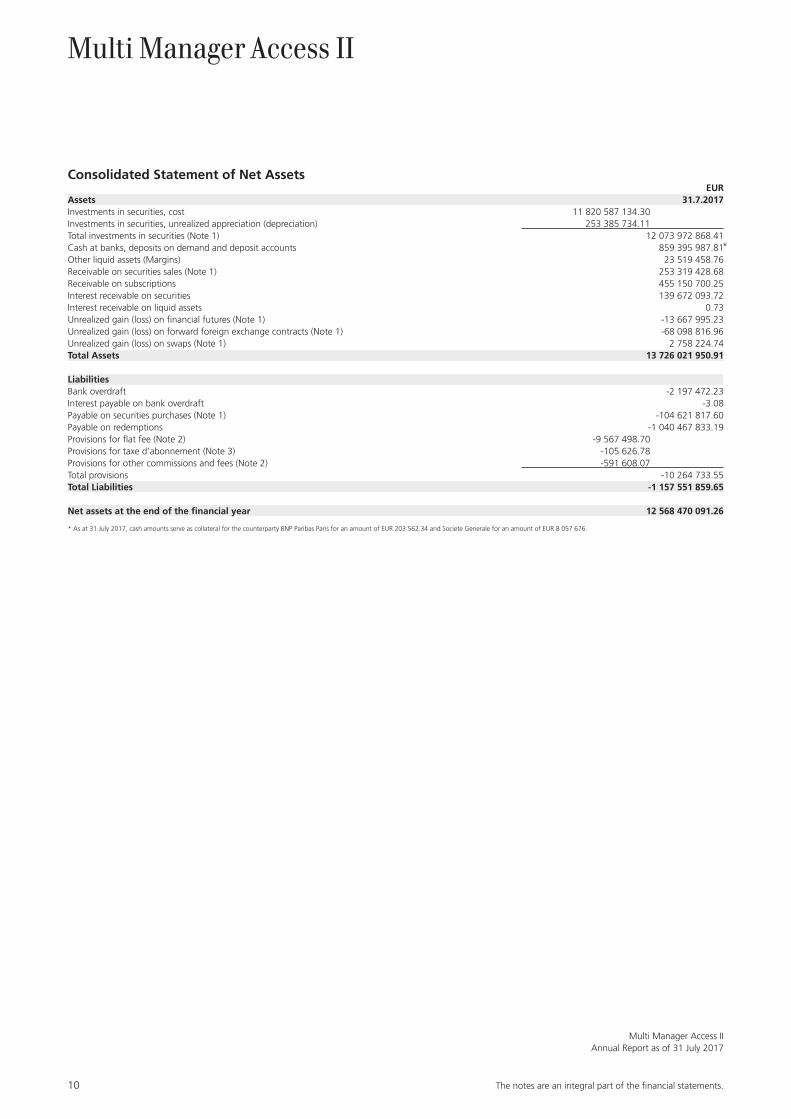
Consolidated Statement of Net Assets EURAssets 31.7.2017Investments in securities, cost 11 820 587 134.30Investments in securities, unrealized appreciation (depreciation) 253 385 734.11Total investments in securities (Note 1) 12 073 972 868.41Cash at banks, deposits on demand and deposit accounts 859 395 987.81Other liquid assets (Margins) 23 519 458.76Receivable on securities sales (Note 1) 253 319 428.68Receivable on subscriptions 455 150 700.25Interest receivable on securities 139 672 093.72Interest receivable on liquid assets 0.73Unrealized gain (loss) on financial futures (Note 1) -13 667 995.23Unrealized gain (loss) on forward foreign exchange contracts (Note 1) -68 098 816.96Unrealized gain (loss) on swaps (Note 1) 2 758 224.74Total Assets 13 726 021 950.91
LiabilitiesBank overdraft -2 197 472.23Interest payable on bank overdraft -3.08Payable on securities purchases (Note 1) -104 621 817.60Payable on redemptions -1 040 467 833.19Provisions for flat fee (Note 2) -9 567 498.70Provisions for taxe d’abonnement (Note 3) -105 626.78Provisions for other commissions and fees (Note 2) -591 608.07Total provisions -10 264 733.55Total Liabilities -1 157 551 859.65
Net assets at the end of the financial year 12 568 470 091.26
* As at 31 July 2017, cash amounts serve as collateral for the counterparty BNP Paribas Paris for an amount of EUR 203 562.34 and Societe Generale for an amount of EUR 8 057 676.
*
Multi Manager Access II
The notes are an integral part of the fi nancial statements. 11
Multi Manager Access IIAnnual Report as of 31 July 2017
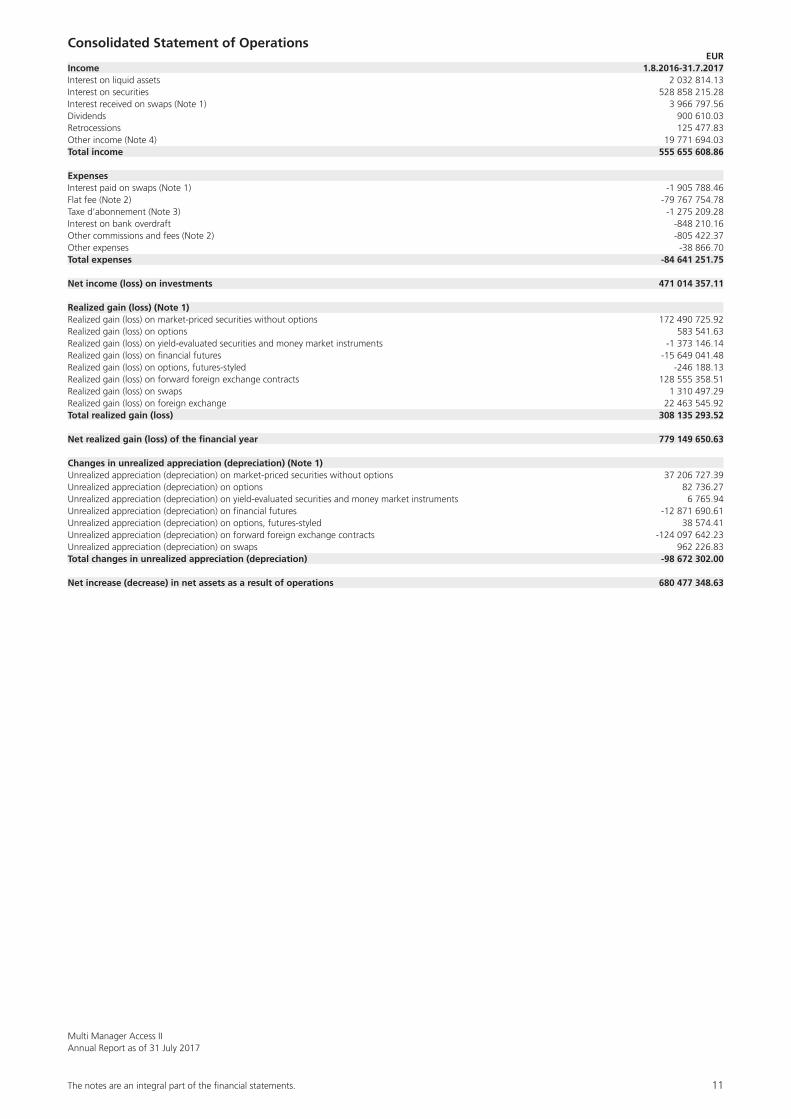
Consolidated Statement of Operations EURIncome 1.8.2016-31.7.2017Interest on liquid assets 2 032 814.13Interest on securities 528 858 215.28Interest received on swaps (Note 1) 3 966 797.56Dividends 900 610.03Retrocessions 125 477.83Other income (Note 4) 19 771 694.03Total income 555 655 608.86
ExpensesInterest paid on swaps (Note 1) -1 905 788.46Flat fee (Note 2) -79 767 754.78Taxe d’abonnement (Note 3) -1 275 209.28Interest on bank overdraft -848 210.16Other commissions and fees (Note 2) -805 422.37Other expenses -38 866.70Total expenses -84 641 251.75
Net income (loss) on investments 471 014 357.11
Realized gain (loss) (Note 1)Realized gain (loss) on market-priced securities without options 172 490 725.92Realized gain (loss) on options 583 541.63Realized gain (loss) on yield-evaluated securities and money market instruments -1 373 146.14Realized gain (loss) on financial futures -15 649 041.48Realized gain (loss) on options, futures-styled -246 188.13Realized gain (loss) on forward foreign exchange contracts 128 555 358.51Realized gain (loss) on swaps 1 310 497.29Realized gain (loss) on foreign exchange 22 463 545.92Total realized gain (loss) 308 135 293.52
Net realized gain (loss) of the financial year 779 149 650.63
Changes in unrealized appreciation (depreciation) (Note 1)Unrealized appreciation (depreciation) on market-priced securities without options 37 206 727.39Unrealized appreciation (depreciation) on options 82 736.27Unrealized appreciation (depreciation) on yield-evaluated securities and money market instruments 6 765.94Unrealized appreciation (depreciation) on financial futures -12 871 690.61Unrealized appreciation (depreciation) on options, futures-styled 38 574.41Unrealized appreciation (depreciation) on forward foreign exchange contracts -124 097 642.23Unrealized appreciation (depreciation) on swaps 962 226.83Total changes in unrealized appreciation (depreciation) -98 672 302.00
Net increase (decrease) in net assets as a result of operations 680 477 348.63
12 The notes are an integral part of the fi nancial statements.
Multi Manager Access II – Emerging Markets DebtAnnual Report as of 31 July 2017
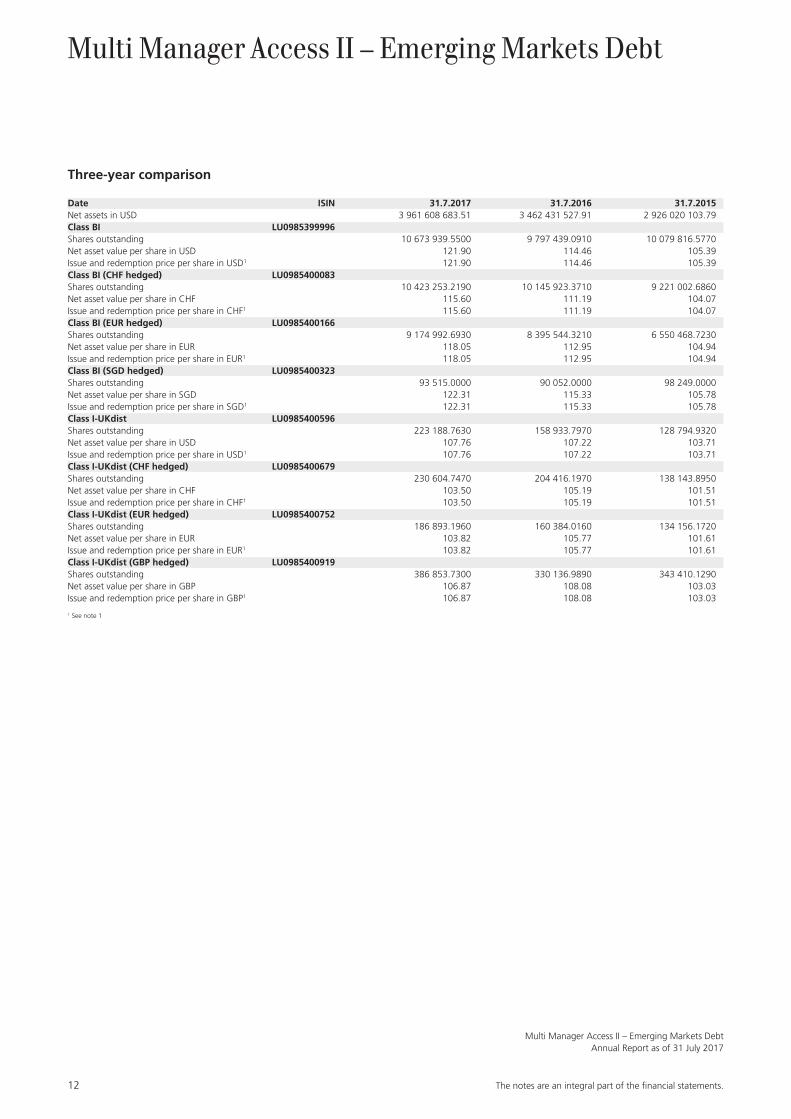
Multi Manager Access II – Emerging Markets Debt
Three-year comparison
Date ISIN 31.7.2017 31.7.2016 31.7.2015Net assets in USD 3 961 608 683.51 3 462 431 527.91 2 926 020 103.79Class BI LU0985399996Shares outstanding 10 673 939.5500 9 797 439.0910 10 079 816.5770Net asset value per share in USD 121.90 114.46 105.39Issue and redemption price per share in USD1 121.90 114.46 105.39Class BI (CHF hedged) LU0985400083Shares outstanding 10 423 253.2190 10 145 923.3710 9 221 002.6860Net asset value per share in CHF 115.60 111.19 104.07Issue and redemption price per share in CHF1 115.60 111.19 104.07Class BI (EUR hedged) LU0985400166Shares outstanding 9 174 992.6930 8 395 544.3210 6 550 468.7230Net asset value per share in EUR 118.05 112.95 104.94Issue and redemption price per share in EUR1 118.05 112.95 104.94Class BI (SGD hedged) LU0985400323Shares outstanding 93 515.0000 90 052.0000 98 249.0000Net asset value per share in SGD 122.31 115.33 105.78Issue and redemption price per share in SGD1 122.31 115.33 105.78Class I-UKdist LU0985400596Shares outstanding 223 188.7630 158 933.7970 128 794.9320Net asset value per share in USD 107.76 107.22 103.71Issue and redemption price per share in USD1 107.76 107.22 103.71Class I-UKdist (CHF hedged) LU0985400679Shares outstanding 230 604.7470 204 416.1970 138 143.8950Net asset value per share in CHF 103.50 105.19 101.51Issue and redemption price per share in CHF1 103.50 105.19 101.51Class I-UKdist (EUR hedged) LU0985400752Shares outstanding 186 893.1960 160 384.0160 134 156.1720Net asset value per share in EUR 103.82 105.77 101.61Issue and redemption price per share in EUR1 103.82 105.77 101.61Class I-UKdist (GBP hedged) LU0985400919Shares outstanding 386 853.7300 330 136.9890 343 410.1290Net asset value per share in GBP 106.87 108.08 103.03Issue and redemption price per share in GBP1 106.87 108.08 103.03
1 See note 1
The notes are an integral part of the fi nancial statements. 13
Multi Manager Access II – Emerging Markets DebtAnnual Report as of 31 July 2017
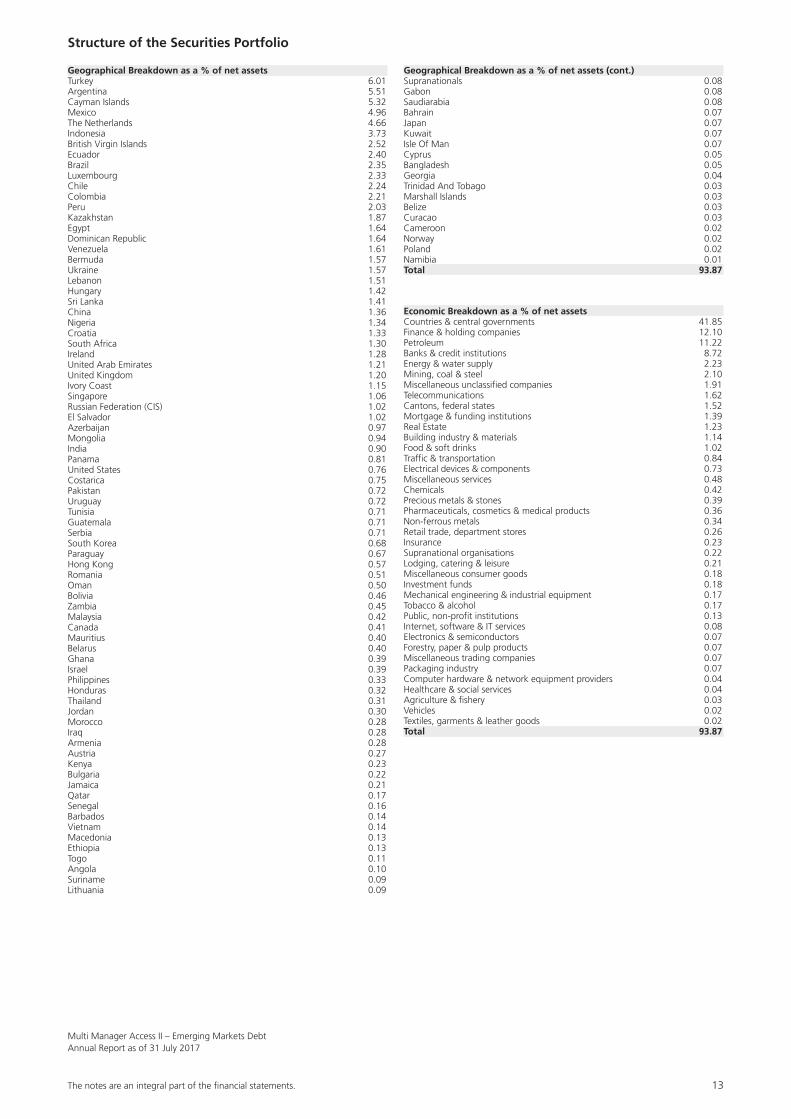
Structure of the Securities Portfolio
Geographical Breakdown as a % of net assetsTurkey 6.01Argentina 5.51Cayman Islands 5.32Mexico 4.96The Netherlands 4.66Indonesia 3.73British Virgin Islands 2.52Ecuador 2.40Brazil 2.35Luxembourg 2.33Chile 2.24Colombia 2.21Peru 2.03Kazakhstan 1.87Egypt 1.64Dominican Republic 1.64Venezuela 1.61Bermuda 1.57Ukraine 1.57Lebanon 1.51Hungary 1.42Sri Lanka 1.41China 1.36Nigeria 1.34Croatia 1.33South Africa 1.30Ireland 1.28United Arab Emirates 1.21United Kingdom 1.20Ivory Coast 1.15Singapore 1.06Russian Federation (CIS) 1.02El Salvador 1.02Azerbaijan 0.97Mongolia 0.94India 0.90Panama 0.81United States 0.76Costarica 0.75Pakistan 0.72Uruguay 0.72Tunisia 0.71Guatemala 0.71Serbia 0.71South Korea 0.68Paraguay 0.67Hong Kong 0.57Romania 0.51Oman 0.50Bolivia 0.46Zambia 0.45Malaysia 0.42Canada 0.41Mauritius 0.40Belarus 0.40Ghana 0.39Israel 0.39Philippines 0.33Honduras 0.32Thailand 0.31Jordan 0.30Morocco 0.28Iraq 0.28Armenia 0.28Austria 0.27Kenya 0.23Bulgaria 0.22Jamaica 0.21Qatar 0.17Senegal 0.16Barbados 0.14Vietnam 0.14Macedonia 0.13Ethiopia 0.13Togo 0.11Angola 0.10Suriname 0.09Lithuania 0.09
Geographical Breakdown as a % of net assets (cont.)Supranationals 0.08Gabon 0.08Saudiarabia 0.08Bahrain 0.07Japan 0.07Kuwait 0.07Isle Of Man 0.07Cyprus 0.05Bangladesh 0.05Georgia 0.04Trinidad And Tobago 0.03Marshall Islands 0.03Belize 0.03Curacao 0.03Cameroon 0.02Norway 0.02Poland 0.02Namibia 0.01Total 93.87
Economic Breakdown as a % of net assetsCountries & central governments 41.85Finance & holding companies 12.10Petroleum 11.22Banks & credit institutions 8.72Energy & water supply 2.23Mining, coal & steel 2.10Miscellaneous unclassified companies 1.91Telecommunications 1.62Cantons, federal states 1.52Mortgage & funding institutions 1.39Real Estate 1.23Building industry & materials 1.14Food & soft drinks 1.02Traffic & transportation 0.84Electrical devices & components 0.73Miscellaneous services 0.48Chemicals 0.42Precious metals & stones 0.39Pharmaceuticals, cosmetics & medical products 0.36Non-ferrous metals 0.34Retail trade, department stores 0.26Insurance 0.23Supranational organisations 0.22Lodging, catering & leisure 0.21Miscellaneous consumer goods 0.18Investment funds 0.18Mechanical engineering & industrial equipment 0.17Tobacco & alcohol 0.17Public, non-profit institutions 0.13Internet, software & IT services 0.08Electronics & semiconductors 0.07Forestry, paper & pulp products 0.07Miscellaneous trading companies 0.07Packaging industry 0.07Computer hardware & network equipment providers 0.04Healthcare & social services 0.04Agriculture & fishery 0.03Vehicles 0.02Textiles, garments & leather goods 0.02Total 93.87
14 The notes are an integral part of the fi nancial statements.
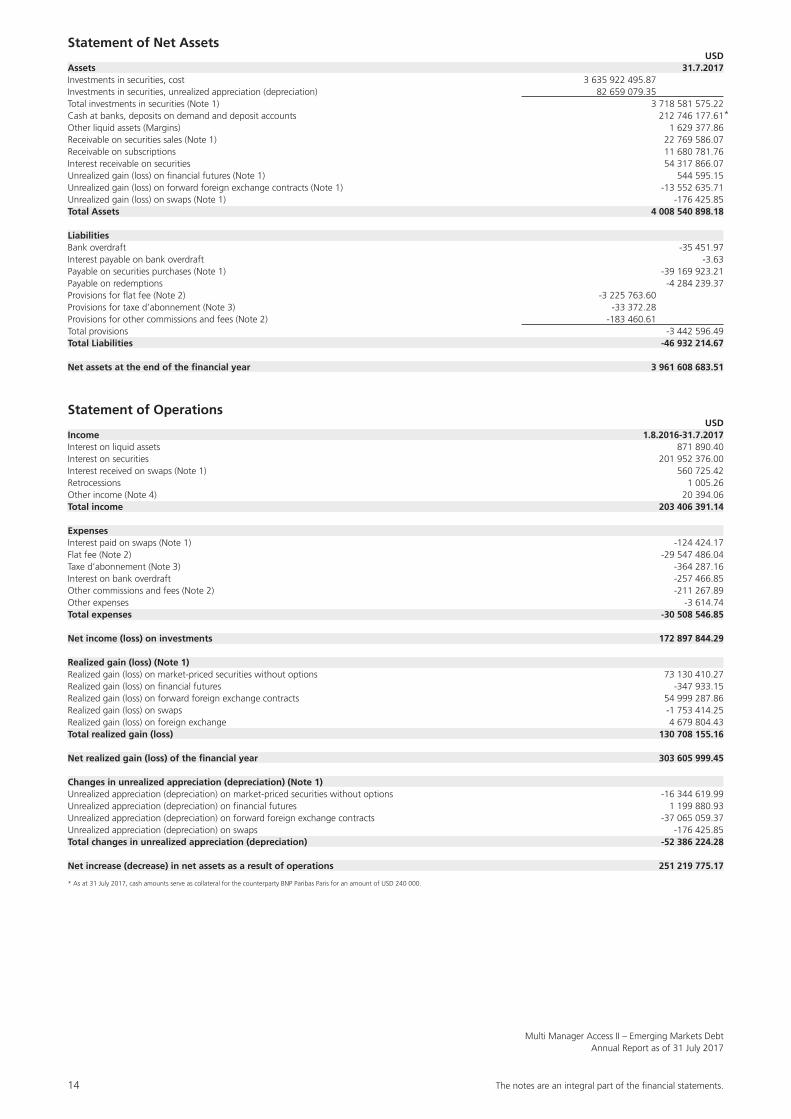
Multi Manager Access II – Emerging Markets DebtAnnual Report as of 31 July 2017
Statement of Net Assets USDAssets 31.7.2017Investments in securities, cost 3 635 922 495.87Investments in securities, unrealized appreciation (depreciation) 82 659 079.35Total investments in securities (Note 1) 3 718 581 575.22Cash at banks, deposits on demand and deposit accounts 212 746 177.61Other liquid assets (Margins) 1 629 377.86Receivable on securities sales (Note 1) 22 769 586.07Receivable on subscriptions 11 680 781.76Interest receivable on securities 54 317 866.07Unrealized gain (loss) on financial futures (Note 1) 544 595.15Unrealized gain (loss) on forward foreign exchange contracts (Note 1) -13 552 635.71Unrealized gain (loss) on swaps (Note 1) -176 425.85Total Assets 4 008 540 898.18
LiabilitiesBank overdraft -35 451.97Interest payable on bank overdraft -3.63Payable on securities purchases (Note 1) -39 169 923.21Payable on redemptions -4 284 239.37Provisions for flat fee (Note 2) -3 225 763.60Provisions for taxe d’abonnement (Note 3) -33 372.28Provisions for other commissions and fees (Note 2) -183 460.61Total provisions -3 442 596.49Total Liabilities -46 932 214.67
Net assets at the end of the financial year 3 961 608 683.51
Statement of Operations USDIncome 1.8.2016-31.7.2017Interest on liquid assets 871 890.40Interest on securities 201 952 376.00Interest received on swaps (Note 1) 560 725.42Retrocessions 1 005.26Other income (Note 4) 20 394.06Total income 203 406 391.14
ExpensesInterest paid on swaps (Note 1) -124 424.17Flat fee (Note 2) -29 547 486.04Taxe d’abonnement (Note 3) -364 287.16Interest on bank overdraft -257 466.85Other commissions and fees (Note 2) -211 267.89Other expenses -3 614.74Total expenses -30 508 546.85
Net income (loss) on investments 172 897 844.29
Realized gain (loss) (Note 1)Realized gain (loss) on market-priced securities without options 73 130 410.27Realized gain (loss) on financial futures -347 933.15Realized gain (loss) on forward foreign exchange contracts 54 999 287.86Realized gain (loss) on swaps -1 753 414.25Realized gain (loss) on foreign exchange 4 679 804.43Total realized gain (loss) 130 708 155.16
Net realized gain (loss) of the financial year 303 605 999.45
Changes in unrealized appreciation (depreciation) (Note 1)Unrealized appreciation (depreciation) on market-priced securities without options -16 344 619.99Unrealized appreciation (depreciation) on financial futures 1 199 880.93Unrealized appreciation (depreciation) on forward foreign exchange contracts -37 065 059.37Unrealized appreciation (depreciation) on swaps -176 425.85Total changes in unrealized appreciation (depreciation) -52 386 224.28
Net increase (decrease) in net assets as a result of operations 251 219 775.17
* As at 31 July 2017, cash amounts serve as collateral for the counterparty BNP Paribas Paris for an amount of USD 240 000.
*

The notes are an integral part of the fi nancial statements. 15
Multi Manager Access II – Emerging Markets DebtAnnual Report as of 31 July 2017
Statement of Changes in Net Assets USD 1.8.2016-31.7.2017Net assets at the beginning of the financial year 3 462 431 527.91Subscriptions 1 148 297 523.96Redemptions -894 198 348.31Total net subscriptions (redemptions) 254 099 175.65Dividend paid -6 141 795.22Net income (loss) on investments 172 897 844.29Total realized gain (loss) 130 708 155.16Total changes in unrealized appreciation (depreciation) -52 386 224.28Net increase (decrease) in net assets as a result of operations 251 219 775.17Net assets at the end of the financial year 3 961 608 683.51
Changes in the Number of Shares outstanding
1.8.2016-31.7.2017Class BINumber of shares outstanding at the beginning of the financial year 9 797 439.0910Number of shares issued 4 417 355.2440Number of shares redeemed -3 540 854.7850Number of shares outstanding at the end of the financial year 10 673 939.5500Class BI (CHF hedged)Number of shares outstanding at the beginning of the financial year 10 145 923.3710Number of shares issued 2 128 521.2320Number of shares redeemed -1 851 191.3840Number of shares outstanding at the end of the financial year 10 423 253.2190Class BI (EUR hedged)Number of shares outstanding at the beginning of the financial year 8 395 544.3210Number of shares issued 2 729 395.4240Number of shares redeemed -1 949 947.0520Number of shares outstanding at the end of the financial year 9 174 992.6930Class BI (SGD hedged)Number of shares outstanding at the beginning of the financial year 90 052.0000Number of shares issued 32 135.0000Number of shares redeemed -28 672.0000Number of shares outstanding at the end of the financial year 93 515.0000Class I-UKdistNumber of shares outstanding at the beginning of the financial year 158 933.7970Number of shares issued 123 173.9750Number of shares redeemed -58 919.0090Number of shares outstanding at the end of the financial year 223 188.7630Class I-UKdist (CHF hedged)Number of shares outstanding at the beginning of the financial year 204 416.1970Number of shares issued 47 762.0880Number of shares redeemed -21 573.5380Number of shares outstanding at the end of the financial year 230 604.7470Class I-UKdist (EUR hedged)Number of shares outstanding at the beginning of the financial year 160 384.0160Number of shares issued 80 742.0840Number of shares redeemed -54 232.9040Number of shares outstanding at the end of the financial year 186 893.1960Class I-UKdist (GBP hedged)Number of shares outstanding at the beginning of the financial year 330 136.9890Number of shares issued 116 886.3160Number of shares redeemed -60 169.5750Number of shares outstanding at the end of the financial year 386 853.7300
Annual Distribution
Multi Manager Access II − Emerging Markets Debt Ex-Date Pay-Date Currency Amount per shareI-UKdist 30.8.2016 2.9.2016 USD 5.29I-UKdist (CHF hedged) 30.8.2016 2.9.2016 CHF 5.10I-UKdist (EUR hedged) 30.8.2016 2.9.2016 EUR 5.16I-UKdist (GBP hedged) 30.8.2016 2.9.2016 GBP 5.86
Interim distribution
Multi Manager Access II − Emerging Markets Debt Ex-Date Pay-Date Currency Amount per shareI-UKdist 16.12.2016 21.12.2016 USD 0.81I-UKdist (CHF hedged) 16.12.2016 21.12.2016 CHF 0.59I-UKdist (EUR hedged) 16.12.2016 21.12.2016 EUR 1.31I-UKdist (GBP hedged) 16.12.2016 21.12.2016 GBP 1.05
16 The notes are an integral part of the fi nancial statements.
Multi Manager Access II – Emerging Markets DebtAnnual Report as of 31 July 2017
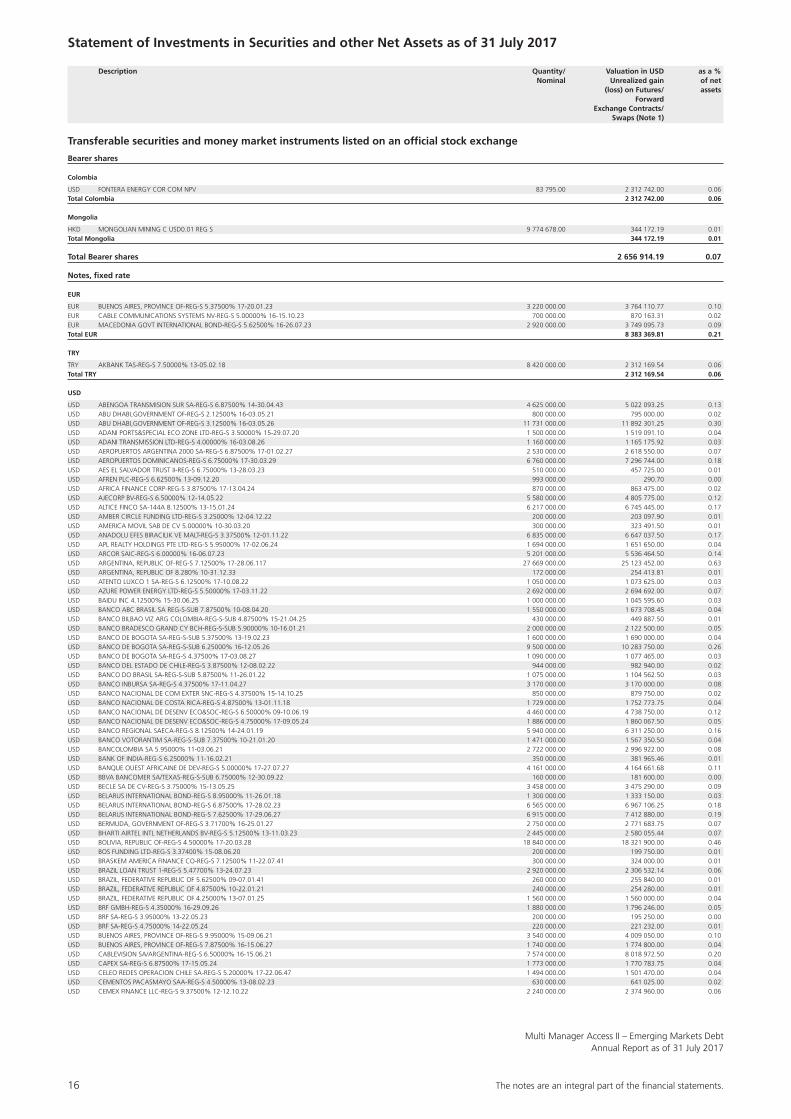
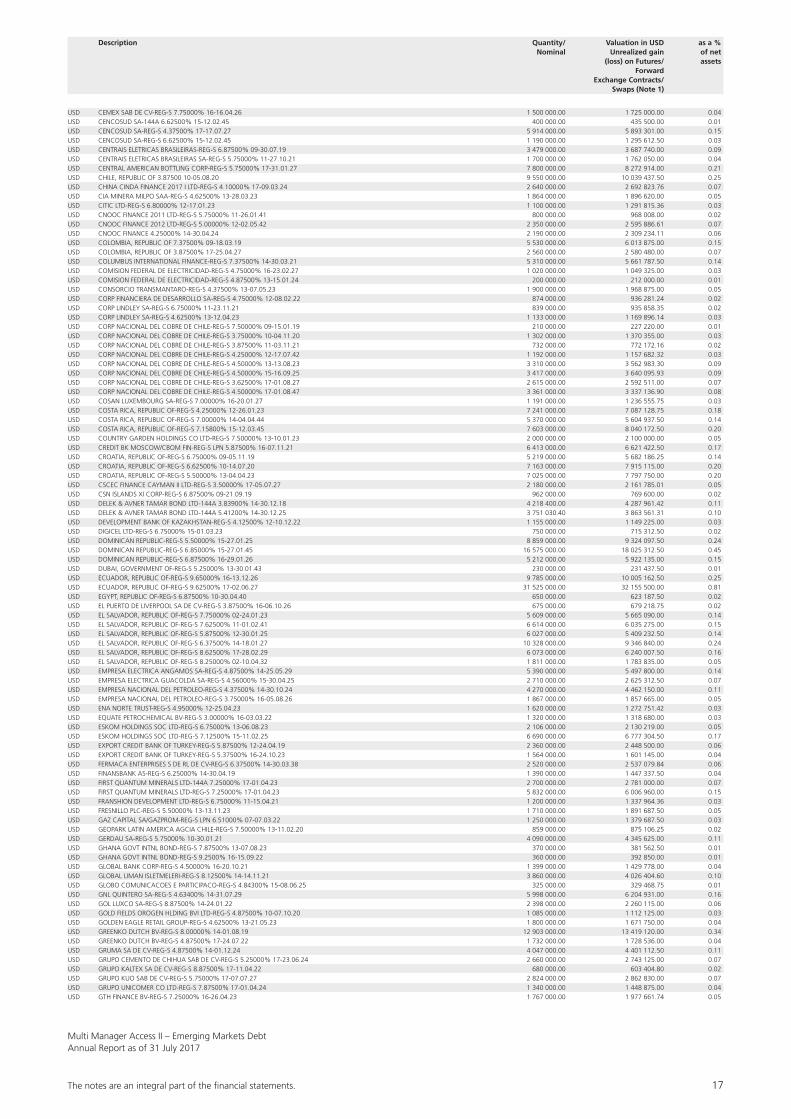
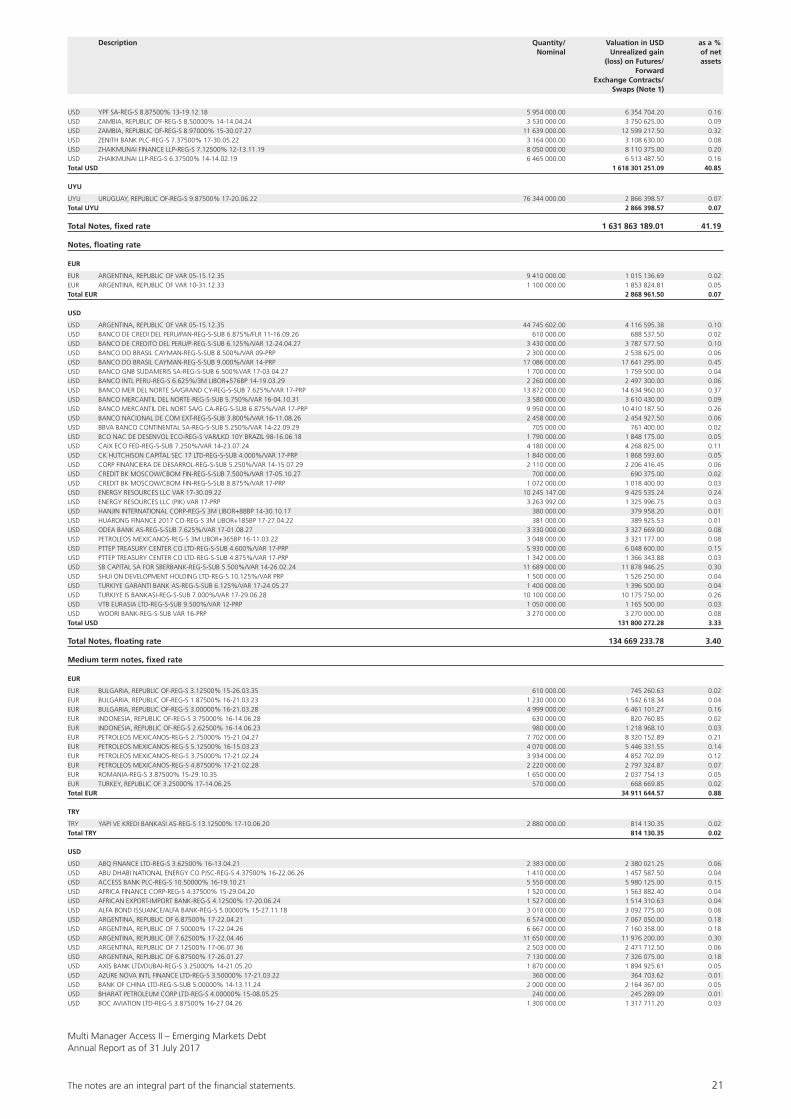
Statement of Investments in Securities and other Net Assets as of 31 July 2017
Description Quantity/ Valuation in USD as a % Nominal Unrealized gain of net (loss) on Futures/ assets Forward Exchange Contracts/ Swaps (Note 1)
Transferable securities and money market instruments listed on an official stock exchange
Bearer shares
Colombia
USD FONTERA ENERGY COR COM NPV 83 795.00 2 312 742.00 0.06Total Colombia 2 312 742.00 0.06
Mongolia
HKD MONGOLIAN MINING C USD0.01 REG S 9 774 678.00 344 172.19 0.01Total Mongolia 344 172.19 0.01
Total Bearer shares 2 656 914.19 0.07
Notes, fixed rate
EUR
EUR BUENOS AIRES, PROVINCE OF-REG-S 5.37500% 17-20.01.23 3 220 000.00 3 764 110.77 0.10EUR CABLE COMMUNICATIONS SYSTEMS NV-REG-S 5.00000% 16-15.10.23 700 000.00 870 163.31 0.02EUR MACEDONIA GOVT INTERNATIONAL BOND-REG-S 5.62500% 16-26.07.23 2 920 000.00 3 749 095.73 0.09Total EUR 8 383 369.81 0.21
TRY
TRY AKBANK TAS-REG-S 7.50000% 13-05.02.18 8 420 000.00 2 312 169.54 0.06Total TRY 2 312 169.54 0.06
USD
USD ABENGOA TRANSMISION SUR SA-REG-S 6.87500% 14-30.04.43 4 625 000.00 5 022 093.25 0.13USD ABU DHABI,GOVERNMENT OF-REG-S 2.12500% 16-03.05.21 800 000.00 795 000.00 0.02USD ABU DHABI,GOVERNMENT OF-REG-S 3.12500% 16-03.05.26 11 731 000.00 11 892 301.25 0.30USD ADANI PORTS&SPECIAL ECO ZONE LTD-REG-S 3.50000% 15-29.07.20 1 500 000.00 1 519 091.10 0.04USD ADANI TRANSMISSION LTD-REG-S 4.00000% 16-03.08.26 1 160 000.00 1 165 175.92 0.03USD AEROPUERTOS ARGENTINA 2000 SA-REG-S 6.87500% 17-01.02.27 2 530 000.00 2 618 550.00 0.07USD AEROPUERTOS DOMINICANOS-REG-S 6.75000% 17-30.03.29 6 760 000.00 7 296 744.00 0.18USD AES EL SALVADOR TRUST II-REG-S 6.75000% 13-28.03.23 510 000.00 457 725.00 0.01USD AFREN PLC-REG-S 6.62500% 13-09.12.20 993 000.00 290.70 0.00USD AFRICA FINANCE CORP-REG-S 3.87500% 17-13.04.24 870 000.00 863 475.00 0.02USD AJECORP BV-REG-S 6.50000% 12-14.05.22 5 580 000.00 4 805 775.00 0.12USD ALTICE FINCO SA-144A 8.12500% 13-15.01.24 6 217 000.00 6 745 445.00 0.17USD AMBER CIRCLE FUNDING LTD-REG-S 3.25000% 12-04.12.22 200 000.00 203 097.90 0.01USD AMERICA MOVIL SAB DE CV 5.00000% 10-30.03.20 300 000.00 323 491.50 0.01USD ANADOLU EFES BIRACILIK VE MALT-REG-S 3.37500% 12-01.11.22 6 835 000.00 6 647 037.50 0.17USD APL REALTY HOLDINGS PTE LTD-REG-S 5.95000% 17-02.06.24 1 694 000.00 1 651 650.00 0.04USD ARCOR SAIC-REG-S 6.00000% 16-06.07.23 5 201 000.00 5 536 464.50 0.14USD ARGENTINA, REPUBLIC OF-REG-S 7.12500% 17-28.06.117 27 669 000.00 25 123 452.00 0.63USD ARGENTINA, REPUBLIC OF 8.280% 10-31.12.33 172 000.00 254 413.81 0.01USD ATENTO LUXCO 1 SA-REG-S 6.12500% 17-10.08.22 1 050 000.00 1 073 625.00 0.03USD AZURE POWER ENERGY LTD-REG-S 5.50000% 17-03.11.22 2 692 000.00 2 694 692.00 0.07USD BAIDU INC 4.12500% 15-30.06.25 1 000 000.00 1 045 595.60 0.03USD BANCO ABC BRASIL SA REG-S-SUB 7.87500% 10-08.04.20 1 550 000.00 1 673 708.45 0.04USD BANCO BILBAO VIZ ARG COLOMBIA-REG-S-SUB 4.87500% 15-21.04.25 430 000.00 449 887.50 0.01USD BANCO BRADESCO GRAND CY BCH-REG-S-SUB 5.90000% 10-16.01.21 2 000 000.00 2 122 500.00 0.05USD BANCO DE BOGOTA SA-REG-S-SUB 5.37500% 13-19.02.23 1 600 000.00 1 690 000.00 0.04USD BANCO DE BOGOTA SA-REG-S-SUB 6.25000% 16-12.05.26 9 500 000.00 10 283 750.00 0.26USD BANCO DE BOGOTA SA-REG-S 4.37500% 17-03.08.27 1 090 000.00 1 077 465.00 0.03USD BANCO DEL ESTADO DE CHILE-REG-S 3.87500% 12-08.02.22 944 000.00 982 940.00 0.02USD BANCO DO BRASIL SA-REG-S-SUB 5.87500% 11-26.01.22 1 075 000.00 1 104 562.50 0.03USD BANCO INBURSA SA-REG-S 4.37500% 17-11.04.27 3 170 000.00 3 170 000.00 0.08USD BANCO NACIONAL DE COM EXTER SNC-REG-S 4.37500% 15-14.10.25 850 000.00 879 750.00 0.02USD BANCO NACIONAL DE COSTA RICA-REG-S 4.87500% 13-01.11.18 1 729 000.00 1 752 773.75 0.04USD BANCO NACIONAL DE DESENV ECO&SOC-REG-S 6.50000% 09-10.06.19 4 460 000.00 4 738 750.00 0.12USD BANCO NACIONAL DE DESENV ECO&SOC-REG-S 4.75000% 17-09.05.24 1 886 000.00 1 860 067.50 0.05USD BANCO REGIONAL SAECA-REG-S 8.12500% 14-24.01.19 5 940 000.00 6 311 250.00 0.16USD BANCO VOTORANTIM SA-REG-S-SUB 7.37500% 10-21.01.20 1 471 000.00 1 567 350.50 0.04USD BANCOLOMBIA SA 5.95000% 11-03.06.21 2 722 000.00 2 996 922.00 0.08USD BANK OF INDIA-REG-S 6.25000% 11-16.02.21 350 000.00 381 965.46 0.01USD BANQUE OUEST AFRICAINE DE DEV-REG-S 5.00000% 17-27.07.27 4 161 000.00 4 164 661.68 0.11USD BBVA BANCOMER SA/TEXAS-REG-S-SUB 6.75000% 12-30.09.22 160 000.00 181 600.00 0.00USD BECLE SA DE CV-REG-S 3.75000% 15-13.05.25 3 458 000.00 3 475 290.00 0.09USD BELARUS INTERNATIONAL BOND-REG-S 8.95000% 11-26.01.18 1 300 000.00 1 333 150.00 0.03USD BELARUS INTERNATIONAL BOND-REG-S 6.87500% 17-28.02.23 6 565 000.00 6 967 106.25 0.18USD BELARUS INTERNATIONAL BOND-REG-S 7.62500% 17-29.06.27 6 915 000.00 7 412 880.00 0.19USD BERMUDA, GOVERNMENT OF-REG-S 3.71700% 16-25.01.27 2 750 000.00 2 771 683.75 0.07USD BHARTI AIRTEL INTL NETHERLANDS BV-REG-S 5.12500% 13-11.03.23 2 445 000.00 2 580 055.44 0.07USD BOLIVIA, REPUBLIC OF-REG-S 4.50000% 17-20.03.28 18 840 000.00 18 321 900.00 0.46USD BOS FUNDING LTD-REG-S 3.37400% 15-08.06.20 200 000.00 199 750.00 0.01USD BRASKEM AMERICA FINANCE CO-REG-S 7.12500% 11-22.07.41 300 000.00 324 000.00 0.01USD BRAZIL LOAN TRUST 1-REG-S 5.47700% 13-24.07.23 2 920 000.00 2 306 532.14 0.06USD BRAZIL, FEDERATIVE REPUBLIC OF 5.62500% 09-07.01.41 260 000.00 255 840.00 0.01USD BRAZIL, FEDERATIVE REPUBLIC OF 4.87500% 10-22.01.21 240 000.00 254 280.00 0.01USD BRAZIL, FEDERATIVE REPUBLIC OF 4.25000% 13-07.01.25 1 560 000.00 1 560 000.00 0.04USD BRF GMBH-REG-S 4.35000% 16-29.09.26 1 880 000.00 1 796 246.00 0.05USD BRF SA-REG-S 3.95000% 13-22.05.23 200 000.00 195 250.00 0.00USD BRF SA-REG-S 4.75000% 14-22.05.24 220 000.00 221 232.00 0.01USD BUENOS AIRES, PROVINCE OF-REG-S 9.95000% 15-09.06.21 3 540 000.00 4 009 050.00 0.10USD BUENOS AIRES, PROVINCE OF-REG-S 7.87500% 16-15.06.27 1 740 000.00 1 774 800.00 0.04USD CABLEVISION SA/ARGENTINA-REG-S 6.50000% 16-15.06.21 7 574 000.00 8 018 972.50 0.20USD CAPEX SA-REG-S 6.87500% 17-15.05.24 1 773 000.00 1 770 783.75 0.04USD CELEO REDES OPERACION CHILE SA-REG-S 5.20000% 17-22.06.47 1 494 000.00 1 501 470.00 0.04USD CEMENTOS PACASMAYO SAA-REG-S 4.50000% 13-08.02.23 630 000.00 641 025.00 0.02USD CEMEX FINANCE LLC-REG-S 9.37500% 12-12.10.22 2 240 000.00 2 374 960.00 0.06
The notes are an integral part of the fi nancial statements. 17
Multi Manager Access II – Emerging Markets DebtAnnual Report as of 31 July 2017
USD CEMEX SAB DE CV-REG-S 7.75000% 16-16.04.26 1 500 000.00 1 725 000.00 0.04USD CENCOSUD SA-144A 6.62500% 15-12.02.45 400 000.00 435 500.00 0.01USD CENCOSUD SA-REG-S 4.37500% 17-17.07.27 5 914 000.00 5 893 301.00 0.15USD CENCOSUD SA-REG-S 6.62500% 15-12.02.45 1 190 000.00 1 295 612.50 0.03USD CENTRAIS ELETRICAS BRASILEIRAS-REG-S 6.87500% 09-30.07.19 3 479 000.00 3 687 740.00 0.09USD CENTRAIS ELETRICAS BRASILEIRAS SA-REG-S 5.75000% 11-27.10.21 1 700 000.00 1 762 050.00 0.04USD CENTRAL AMERICAN BOTTLING CORP-REG-S 5.75000% 17-31.01.27 7 800 000.00 8 272 914.00 0.21USD CHILE, REPUBLIC OF 3.87500 10-05.08.20 9 550 000.00 10 039 437.50 0.25USD CHINA CINDA FINANCE 2017 I LTD-REG-S 4.10000% 17-09.03.24 2 640 000.00 2 692 823.76 0.07USD CIA MINERA MILPO SAA-REG-S 4.62500% 13-28.03.23 1 864 000.00 1 896 620.00 0.05USD CITIC LTD-REG-S 6.80000% 12-17.01.23 1 100 000.00 1 291 815.36 0.03USD CNOOC FINANCE 2011 LTD-REG-S 5.75000% 11-26.01.41 800 000.00 968 008.00 0.02USD CNOOC FINANCE 2012 LTD-REG-S 5.00000% 12-02.05.42 2 350 000.00 2 595 886.61 0.07USD CNOOC FINANCE 4.25000% 14-30.04.24 2 190 000.00 2 309 234.11 0.06USD COLOMBIA, REPUBLIC OF 7.37500% 09-18.03.19 5 530 000.00 6 013 875.00 0.15USD COLOMBIA, REPUBLIC OF 3.87500% 17-25.04.27 2 560 000.00 2 580 480.00 0.07USD COLUMBUS INTERNATIONAL FINANCE-REG-S 7.37500% 14-30.03.21 5 310 000.00 5 661 787.50 0.14USD COMISION FEDERAL DE ELECTRICIDAD-REG-S 4.75000% 16-23.02.27 1 020 000.00 1 049 325.00 0.03USD COMISION FEDERAL DE ELECTRICIDAD-REG-S 4.87500% 13-15.01.24 200 000.00 212 000.00 0.01USD CONSORCIO TRANSMANTARO-REG-S 4.37500% 13-07.05.23 1 900 000.00 1 968 875.00 0.05USD CORP FINANCIERA DE DESARROLLO SA-REG-S 4.75000% 12-08.02.22 874 000.00 936 281.24 0.02USD CORP LINDLEY SA-REG-S 6.75000% 11-23.11.21 839 000.00 935 858.35 0.02USD CORP LINDLEY SA-REG-S 4.62500% 13-12.04.23 1 133 000.00 1 169 896.14 0.03USD CORP NACIONAL DEL COBRE DE CHILE-REG-S 7.50000% 09-15.01.19 210 000.00 227 220.00 0.01USD CORP NACIONAL DEL COBRE DE CHILE-REG-S 3.75000% 10-04.11.20 1 302 000.00 1 370 355.00 0.03USD CORP NACIONAL DEL COBRE DE CHILE-REG-S 3.87500% 11-03.11.21 732 000.00 772 172.16 0.02USD CORP NACIONAL DEL COBRE DE CHILE-REG-S 4.25000% 12-17.07.42 1 192 000.00 1 157 682.32 0.03USD CORP NACIONAL DEL COBRE DE CHILE-REG-S 4.50000% 13-13.08.23 3 310 000.00 3 562 983.30 0.09USD CORP NACIONAL DEL COBRE DE CHILE-REG-S 4.50000% 15-16.09.25 3 417 000.00 3 640 095.93 0.09USD CORP NACIONAL DEL COBRE DE CHILE-REG-S 3.62500% 17-01.08.27 2 615 000.00 2 592 511.00 0.07USD CORP NACIONAL DEL COBRE DE CHILE-REG-S 4.50000% 17-01.08.47 3 361 000.00 3 337 136.90 0.08USD COSAN LUXEMBOURG SA-REG-S 7.00000% 16-20.01.27 1 191 000.00 1 236 555.75 0.03USD COSTA RICA, REPUBLIC OF-REG-S 4.25000% 12-26.01.23 7 241 000.00 7 087 128.75 0.18USD COSTA RICA, REPUBLIC OF-REG-S 7.00000% 14-04.04.44 5 370 000.00 5 604 937.50 0.14USD COSTA RICA, REPUBLIC OF-REG-S 7.15800% 15-12.03.45 7 603 000.00 8 040 172.50 0.20USD COUNTRY GARDEN HOLDINGS CO LTD-REG-S 7.50000% 13-10.01.23 2 000 000.00 2 100 000.00 0.05USD CREDIT BK MOSCOW/CBOM FIN-REG-S LPN 5.87500% 16-07.11.21 6 413 000.00 6 621 422.50 0.17USD CROATIA, REPUBLIC OF-REG-S 6.75000% 09-05.11.19 5 219 000.00 5 682 186.25 0.14USD CROATIA, REPUBLIC OF-REG-S 6.62500% 10-14.07.20 7 163 000.00 7 915 115.00 0.20USD CROATIA, REPUBLIC OF-REG-S 5.50000% 13-04.04.23 7 025 000.00 7 797 750.00 0.20USD CSCEC FINANCE CAYMAN II LTD-REG-S 3.50000% 17-05.07.27 2 180 000.00 2 161 785.01 0.05USD CSN ISLANDS XI CORP-REG-S 6.87500% 09-21.09.19 962 000.00 769 600.00 0.02USD DELEK & AVNER TAMAR BOND LTD-144A 3.83900% 14-30.12.18 4 218 400.00 4 287 961.42 0.11USD DELEK & AVNER TAMAR BOND LTD-144A 5.41200% 14-30.12.25 3 751 030.40 3 863 561.31 0.10USD DEVELOPMENT BANK OF KAZAKHSTAN-REG-S 4.12500% 12-10.12.22 1 155 000.00 1 149 225.00 0.03USD DIGICEL LTD-REG-S 6.75000% 15-01.03.23 750 000.00 715 312.50 0.02USD DOMINICAN REPUBLIC-REG-S 5.50000% 15-27.01.25 8 859 000.00 9 324 097.50 0.24USD DOMINICAN REPUBLIC-REG-S 6.85000% 15-27.01.45 16 575 000.00 18 025 312.50 0.45USD DOMINICAN REPUBLIC-REG-S 6.87500% 16-29.01.26 5 212 000.00 5 922 135.00 0.15USD DUBAI, GOVERNMENT OF-REG-S 5.25000% 13-30.01.43 230 000.00 231 437.50 0.01USD ECUADOR, REPUBLIC OF-REG-S 9.65000% 16-13.12.26 9 785 000.00 10 005 162.50 0.25USD ECUADOR, REPUBLIC OF-REG-S 9.62500% 17-02.06.27 31 525 000.00 32 155 500.00 0.81USD EGYPT, REPUBLIC OF-REG-S 6.87500% 10-30.04.40 650 000.00 623 187.50 0.02USD EL PUERTO DE LIVERPOOL SA DE CV-REG-S 3.87500% 16-06.10.26 675 000.00 679 218.75 0.02USD EL SALVADOR, REPUBLIC OF-REG-S 7.75000% 02-24.01.23 5 609 000.00 5 665 090.00 0.14USD EL SALVADOR, REPUBLIC OF-REG-S 7.62500% 11-01.02.41 6 614 000.00 6 035 275.00 0.15USD EL SALVADOR, REPUBLIC OF-REG-S 5.87500% 12-30.01.25 6 027 000.00 5 409 232.50 0.14USD EL SALVADOR, REPUBLIC OF-REG-S 6.37500% 14-18.01.27 10 328 000.00 9 346 840.00 0.24USD EL SALVADOR, REPUBLIC OF-REG-S 8.62500% 17-28.02.29 6 073 000.00 6 240 007.50 0.16USD EL SALVADOR, REPUBLIC OF-REG-S 8.25000% 02-10.04.32 1 811 000.00 1 783 835.00 0.05USD EMPRESA ELECTRICA ANGAMOS SA-REG-S 4.87500% 14-25.05.29 5 390 000.00 5 497 800.00 0.14USD EMPRESA ELECTRICA GUACOLDA SA-REG-S 4.56000% 15-30.04.25 2 710 000.00 2 625 312.50 0.07USD EMPRESA NACIONAL DEL PETROLEO-REG-S 4.37500% 14-30.10.24 4 270 000.00 4 462 150.00 0.11USD EMPRESA NACIONAL DEL PETROLEO-REG-S 3.75000% 16-05.08.26 1 867 000.00 1 857 665.00 0.05USD ENA NORTE TRUST-REG-S 4.95000% 12-25.04.23 1 620 000.00 1 272 751.42 0.03USD EQUATE PETROCHEMICAL BV-REG-S 3.00000% 16-03.03.22 1 320 000.00 1 318 680.00 0.03USD ESKOM HOLDINGS SOC LTD-REG-S 6.75000% 13-06.08.23 2 106 000.00 2 130 219.00 0.05USD ESKOM HOLDINGS SOC LTD-REG-S 7.12500% 15-11.02.25 6 690 000.00 6 777 304.50 0.17USD EXPORT CREDIT BANK OF TURKEY-REG-S 5.87500% 12-24.04.19 2 360 000.00 2 448 500.00 0.06USD EXPORT CREDIT BANK OF TURKEY-REG-S 5.37500% 16-24.10.23 1 564 000.00 1 601 145.00 0.04USD FERMACA ENTERPRISES S DE RL DE CV-REG-S 6.37500% 14-30.03.38 2 520 000.00 2 537 079.84 0.06USD FINANSBANK AS-REG-S 6.25000% 14-30.04.19 1 390 000.00 1 447 337.50 0.04USD FIRST QUANTUM MINERALS LTD-144A 7.25000% 17-01.04.23 2 700 000.00 2 781 000.00 0.07USD FIRST QUANTUM MINERALS LTD-REG-S 7.25000% 17-01.04.23 5 832 000.00 6 006 960.00 0.15USD FRANSHION DEVELOPMENT LTD-REG-S 6.75000% 11-15.04.21 1 200 000.00 1 337 964.36 0.03USD FRESNILLO PLC-REG-S 5.50000% 13-13.11.23 1 710 000.00 1 891 687.50 0.05USD GAZ CAPITAL SA/GAZPROM-REG-S LPN 6.51000% 07-07.03.22 1 250 000.00 1 379 687.50 0.03USD GEOPARK LATIN AMERICA AGCIA CHILE-REG-S 7.50000% 13-11.02.20 859 000.00 875 106.25 0.02USD GERDAU SA-REG-S 5.75000% 10-30.01.21 4 090 000.00 4 345 625.00 0.11USD GHANA GOVT INTNL BOND-REG-S 7.87500% 13-07.08.23 370 000.00 381 562.50 0.01USD GHANA GOVT INTNL BOND-REG-S 9.2500% 16-15.09.22 360 000.00 392 850.00 0.01USD GLOBAL BANK CORP-REG-S 4.50000% 16-20.10.21 1 399 000.00 1 429 778.00 0.04USD GLOBAL LIMAN ISLETMELERI-REG-S 8.12500% 14-14.11.21 3 860 000.00 4 026 404.60 0.10USD GLOBO COMUNICACOES E PARTICIPACO-REG-S 4.84300% 15-08.06.25 325 000.00 329 468.75 0.01USD GNL QUINTERO SA-REG-S 4.63400% 14-31.07.29 5 998 000.00 6 204 931.00 0.16USD GOL LUXCO SA-REG-S 8.87500% 14-24.01.22 2 398 000.00 2 260 115.00 0.06USD GOLD FIELDS OROGEN HLDING BVI LTD-REG-S 4.87500% 10-07.10.20 1 085 000.00 1 112 125.00 0.03USD GOLDEN EAGLE RETAIL GROUP-REG-S 4.62500% 13-21.05.23 1 800 000.00 1 671 750.00 0.04USD GREENKO DUTCH BV-REG-S 8.00000% 14-01.08.19 12 903 000.00 13 419 120.00 0.34USD GREENKO DUTCH BV-REG-S 4.87500% 17-24.07.22 1 732 000.00 1 728 536.00 0.04USD GRUMA SA DE CV-REG-S 4.87500% 14-01.12.24 4 047 000.00 4 401 112.50 0.11USD GRUPO CEMENTO DE CHIHUA SAB DE CV-REG-S 5.25000% 17-23.06.24 2 660 000.00 2 743 125.00 0.07USD GRUPO KALTEX SA DE CV-REG-S 8.87500% 17-11.04.22 680 000.00 603 404.80 0.02USD GRUPO KUO SAB DE CV-REG-S 5.75000% 17-07.07.27 2 824 000.00 2 862 830.00 0.07USD GRUPO UNICOMER CO LTD-REG-S 7.87500% 17-01.04.24 1 340 000.00 1 448 875.00 0.04USD GTH FINANCE BV-REG-S 7.25000% 16-26.04.23 1 767 000.00 1 977 661.74 0.05
Description Quantity/ Valuation in USD as a % Nominal Unrealized gain of net (loss) on Futures/ assets Forward Exchange Contracts/ Swaps (Note 1)
18 The notes are an integral part of the fi nancial statements.
Multi Manager Access II – Emerging Markets DebtAnnual Report as of 31 July 2017
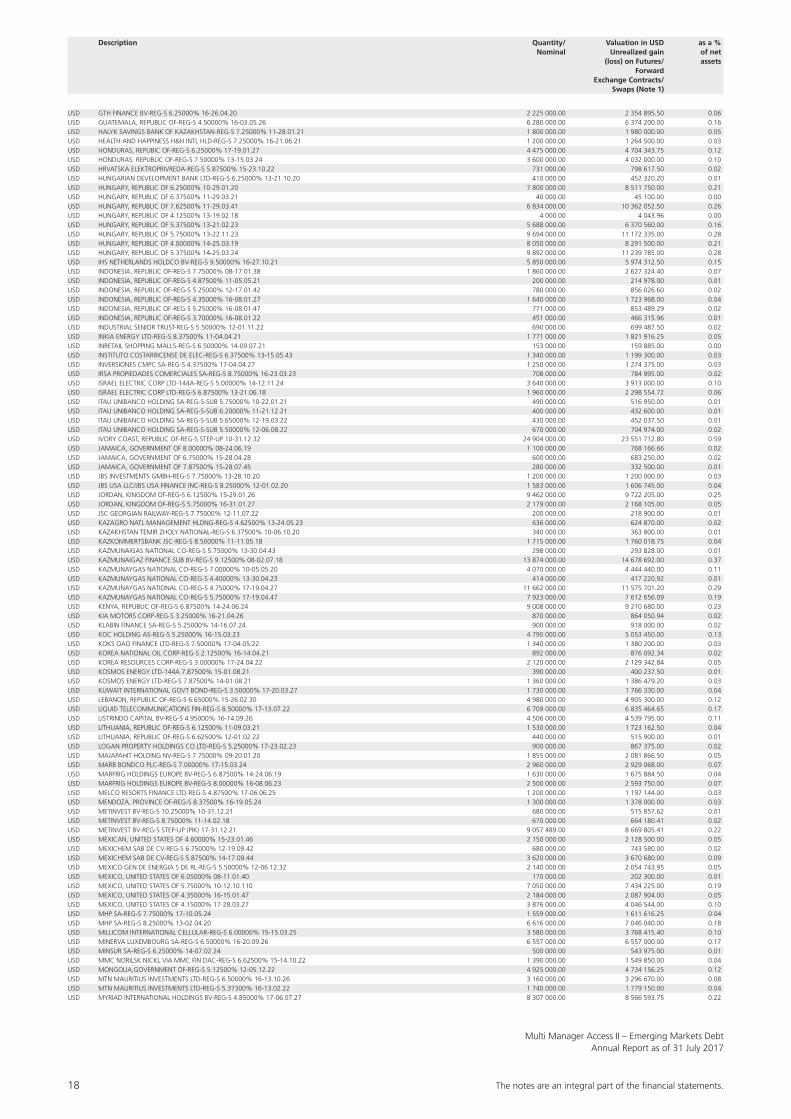
USD GTH FINANCE BV-REG-S 6.25000% 16-26.04.20 2 225 000.00 2 354 895.50 0.06USD GUATEMALA, REPUBLIC OF-REG-S 4.50000% 16-03.05.26 6 280 000.00 6 374 200.00 0.16USD HALYK SAVINGS BANK OF KAZAKHSTAN-REG-S 7.25000% 11-28.01.21 1 800 000.00 1 980 000.00 0.05USD HEALTH AND HAPPINESS H&H INTL HLD-REG-S 7.25000% 16-21.06.21 1 200 000.00 1 264 500.00 0.03USD HONDURAS, REPUBIC OF-REG-S 6.25000% 17-19.01.27 4 475 000.00 4 704 343.75 0.12USD HONDURAS. REPUBLIC OF-REG-S 7.50000% 13-15.03.24 3 600 000.00 4 032 000.00 0.10USD HRVATSKA ELEKTROPRIVREDA-REG-S 5.87500% 15-23.10.22 731 000.00 798 617.50 0.02USD HUNGARIAN DEVELOPMENT BANK LTD-REG-S 6.25000% 13-21.10.20 410 000.00 452 320.20 0.01USD HUNGARY, REPUBLIC OF 6.25000% 10-29.01.20 7 800 000.00 8 511 750.00 0.21USD HUNGARY, REPUBLIC OF 6.37500% 11-29.03.21 40 000.00 45 100.00 0.00USD HUNGARY, REPUBLIC OF 7.62500% 11-29.03.41 6 834 000.00 10 362 052.50 0.26USD HUNGARY, REPUBLIC OF 4.12500% 13-19.02.18 4 000.00 4 043.96 0.00USD HUNGARY, REPUBLIC OF 5.37500% 13-21.02.23 5 688 000.00 6 370 560.00 0.16USD HUNGARY, REPUBLIC OF 5.75000% 13-22.11.23 9 694 000.00 11 172 335.00 0.28USD HUNGARY, REPUBLIC OF 4.00000% 14-25.03.19 8 050 000.00 8 291 500.00 0.21USD HUNGARY, REPUBLIC OF 5.37500% 14-25.03.24 9 892 000.00 11 239 785.00 0.28USD IHS NETHERLANDS HOLDCO BV-REG-S 9.50000% 16-27.10.21 5 850 000.00 5 974 312.50 0.15USD INDONESIA, REPUBLIC OF-REG-S 7.75000% 08-17.01.38 1 860 000.00 2 627 324.40 0.07USD INDONESIA, REPUBLIC OF-REG-S 4.87500% 11-05.05.21 200 000.00 214 978.00 0.01USD INDONESIA, REPUBLIC OF-REG-S 5.25000% 12-17.01.42 780 000.00 856 026.60 0.02USD INDONESIA, REPUBLIC OF-REG-S 4.35000% 16-08.01.27 1 640 000.00 1 723 968.00 0.04USD INDONESIA, REPUBLIC OF-REG-S 5.25000% 16-08.01.47 771 000.00 853 489.29 0.02USD INDONESIA, REPUBLIC OF-REG-S 3.70000% 16-08.01.22 451 000.00 466 315.96 0.01USD INDUSTRIAL SENIOR TRUST-REG-S 5.50000% 12-01.11.22 690 000.00 699 487.50 0.02USD INKIA ENERGY LTD-REG-S 8.37500% 11-04.04.21 1 771 000.00 1 821 916.25 0.05USD INRETAIL SHOPPING MALLS-REG-S 6.50000% 14-09.07.21 153 000.00 159 885.00 0.00USD INSTITUTO COSTARRICENSE DE ELEC-REG-S 6.37500% 13-15.05.43 1 340 000.00 1 199 300.00 0.03USD INVERSIONES CMPC SA-REG-S 4.37500% 17-04.04.27 1 250 000.00 1 274 375.00 0.03USD IRSA PROPIEDADES COMERCIALES SA-REG-S 8.75000% 16-23.03.23 708 000.00 784 995.00 0.02USD ISRAEL ELECTRIC CORP LTD-144A-REG-S 5.00000% 14-12.11.24 3 640 000.00 3 913 000.00 0.10USD ISRAEL ELECTRIC CORP LTD-REG-S 6.87500% 13-21.06.18 1 960 000.00 2 298 554.72 0.06USD ITAU UNIBANCO HOLDING SA-REG-S-SUB 5.75000% 10-22.01.21 490 000.00 516 950.00 0.01USD ITAU UNIBANCO HOLDING SA-REG-S-SUB 6.20000% 11-21.12.21 400 000.00 432 600.00 0.01USD ITAU UNIBANCO HOLDING SA-REG-S-SUB 5.65000% 12-19.03.22 430 000.00 452 037.50 0.01USD ITAU UNIBANCO HOLDING SA-REG-S-SUB 5.50000% 12-06.08.22 670 000.00 704 974.00 0.02USD IVORY COAST, REPUBLIC OF-REG-S STEP-UP 10-31.12.32 24 904 000.00 23 551 712.80 0.59USD JAMAICA, GOVERNMENT OF 8.00000% 08-24.06.19 1 100 000.00 768 166.66 0.02USD JAMAICA, GOVERNMENT OF 6.75000% 15-28.04.28 600 000.00 683 250.00 0.02USD JAMAICA, GOVERNMENT OF 7.87500% 15-28.07.45 280 000.00 332 500.00 0.01USD JBS INVESTMENTS GMBH-REG-S 7.75000% 13-28.10.20 1 200 000.00 1 200 000.00 0.03USD JBS USA LLC/JBS USA FINANCE INC-REG-S 8.25000% 12-01.02.20 1 583 000.00 1 606 745.00 0.04USD JORDAN, KINGDOM OF-REG-S 6.12500% 15-29.01.26 9 462 000.00 9 722 205.00 0.25USD JORDAN, KINGDOM OF-REG-S 5.75000% 16-31.01.27 2 179 000.00 2 168 105.00 0.05USD JSC GEORGIAN RAILWAY-REG-S 7.75000% 12-11.07.22 200 000.00 218 900.00 0.01USD KAZAGRO NATL MANAGEMENT HLDNG-REG-S 4.62500% 13-24.05.23 636 000.00 624 870.00 0.02USD KAZAKHSTAN TEMIR ZHOLY NATIONAL-REG-S 6.37500% 10-06.10.20 340 000.00 363 800.00 0.01USD KAZKOMMERTSBANK JSC-REG-S 8.50000% 11-11.05.18 1 715 000.00 1 760 018.75 0.04USD KAZMUNAIGAS NATIONAL CO-REG-S 5.75000% 13-30.04.43 298 000.00 293 828.00 0.01USD KAZMUNAIGAZ FINANCE SUB BV-REG-S 9.12500% 08-02.07.18 13 874 000.00 14 678 692.00 0.37USD KAZMUNAYGAS NATIONAL CO-REG-S 7.00000% 10-05.05.20 4 070 000.00 4 444 440.00 0.11USD KAZMUNAYGAS NATIONAL CO-REG-S 4.40000% 13-30.04.23 414 000.00 417 220.92 0.01USD KAZMUNAYGAS NATIONAL CO-REG-S 4.75000% 17-19.04.27 11 662 000.00 11 575 701.20 0.29USD KAZMUNAYGAS NATIONAL CO-REG-S 5.75000% 17-19.04.47 7 923 000.00 7 612 656.09 0.19USD KENYA, REPUBLIC OF-REG-S 6.87500% 14-24.06.24 9 008 000.00 9 210 680.00 0.23USD KIA MOTORS CORP-REG-S 3.25000% 16-21.04.26 870 000.00 864 050.94 0.02USD KLABIN FINANCE SA-REG-S 5.25000% 14-16.07.24 900 000.00 918 000.00 0.02USD KOC HOLDING AS-REG-S 5.25000% 16-15.03.23 4 790 000.00 5 053 450.00 0.13USD KOKS OAO FINANCE LTD-REG-S 7.50000% 17-04.05.22 1 340 000.00 1 380 200.00 0.03USD KOREA NATIONAL OIL CORP-REG-S 2.12500% 16-14.04.21 892 000.00 876 092.34 0.02USD KOREA RESOURCES CORP-REG-S 3.00000% 17-24.04.22 2 120 000.00 2 129 342.84 0.05USD KOSMOS ENERGY LTD-144A 7.87500% 15-01.08.21 390 000.00 400 237.50 0.01USD KOSMOS ENERGY LTD-REG-S 7.87500% 14-01.08.21 1 360 000.00 1 386 479.20 0.03USD KUWAIT INTERNATIONAL GOVT BOND-REG-S 3.50000% 17-20.03.27 1 730 000.00 1 766 330.00 0.04USD LEBANON, REPUBLIC OF-REG-S 6.65000% 15-26.02.30 4 980 000.00 4 905 300.00 0.12USD LIQUID TELECOMMUNICATIONS FIN-REG-S 8.50000% 17-13.07.22 6 709 000.00 6 835 464.65 0.17USD LISTRINDO CAPITAL BV-REG-S 4.95000% 16-14.09.26 4 506 000.00 4 539 795.00 0.11USD LITHUANIA, REPUBLIC OF-REG-S 6.12500% 11-09.03.21 1 530 000.00 1 723 162.50 0.04USD LITHUANIA, REPUBLIC OF-REG-S 6.62500% 12-01.02.22 440 000.00 515 900.00 0.01USD LOGAN PROPERTY HOLDINGS CO LTD-REG-S 5.25000% 17-23.02.23 900 000.00 867 375.00 0.02USD MAJAPAHIT HOLDING NV-REG-S 7.75000% 09-20.01.20 1 855 000.00 2 081 866.50 0.05USD MARB BONDCO PLC-REG-S 7.00000% 17-15.03.24 2 960 000.00 2 929 068.00 0.07USD MARFRIG HOLDINGS EUROPE BV-REG-S 6.87500% 14-24.06.19 1 630 000.00 1 675 884.50 0.04USD MARFRIG HOLDINGS EUROPE BV-REG-S 8.00000% 16-08.06.23 2 500 000.00 2 593 750.00 0.07USD MELCO RESORTS FINANCE LTD-REG-S 4.87500% 17-06.06.25 1 200 000.00 1 197 144.00 0.03USD MENDOZA, PROVINCE OF-REG-S 8.37500% 16-19.05.24 1 300 000.00 1 378 000.00 0.03USD METINVEST BV-REG-S 10.25000% 10-31.12.21 680 000.00 515 857.62 0.01USD METINVEST BV-REG-S 8.75000% 11-14.02.18 670 000.00 664 180.41 0.02USD METINVEST BV-REG-S STEP-UP (PIK) 17-31.12.21 9 057 489.00 8 669 805.41 0.22USD MEXICAN, UNITED STATES OF 4.60000% 15-23.01.46 2 150 000.00 2 128 500.00 0.05USD MEXICHEM SAB DE CV-REG-S 6.75000% 12-19.09.42 680 000.00 743 580.00 0.02USD MEXICHEM SAB DE CV-REG-S 5.87500% 14-17.09.44 3 620 000.00 3 670 680.00 0.09USD MEXICO GEN DE ENERGIA S DE RL-REG-S 5.50000% 12-06.12.32 2 140 000.00 2 054 743.95 0.05USD MEXICO, UNITED STATES OF 6.05000% 08-11.01.40 170 000.00 202 300.00 0.01USD MEXICO, UNITED STATES OF 5.75000% 10-12.10.110 7 050 000.00 7 434 225.00 0.19USD MEXICO, UNITED STATES OF 4.35000% 16-15.01.47 2 184 000.00 2 087 904.00 0.05USD MEXICO, UNITED STATES OF 4.15000% 17-28.03.27 3 876 000.00 4 046 544.00 0.10USD MHP SA-REG-S 7.75000% 17-10.05.24 1 559 000.00 1 611 616.25 0.04USD MHP SA-REG-S 8.25000% 13-02.04.20 6 616 000.00 7 046 040.00 0.18USD MILLICOM INTERNATIONAL CELLULAR-REG-S 6.00000% 15-15.03.25 3 580 000.00 3 768 415.40 0.10USD MINERVA LUXEMBOURG SA-REG-S 6.50000% 16-20.09.26 6 557 000.00 6 557 000.00 0.17USD MINSUR SA-REG-S 6.25000% 14-07.02.24 500 000.00 543 975.00 0.01USD MMC NORILSK NICKL VIA MMC FIN DAC-REG-S 6.62500% 15-14.10.22 1 390 000.00 1 549 850.00 0.04USD MONGOLIA,GOVERNMENT OF-REG-S 5.12500% 12-05.12.22 4 925 000.00 4 734 156.25 0.12USD MTN MAURITIUS INVESTMENTS LTD-REG-S 6.50000% 16-13.10.26 3 160 000.00 3 296 670.00 0.08USD MTN MAURITIUS INVESTMENTS LTD-REG-S 5.37300% 16-13.02.22 1 740 000.00 1 779 150.00 0.04USD MYRIAD INTERNATIONAL HOLDINGS BV-REG-S 4.85000% 17-06.07.27 8 307 000.00 8 566 593.75 0.22
Description Quantity/ Valuation in USD as a % Nominal Unrealized gain of net (loss) on Futures/ assets Forward Exchange Contracts/ Swaps (Note 1)
The notes are an integral part of the fi nancial statements. 19
Multi Manager Access II – Emerging Markets DebtAnnual Report as of 31 July 2017
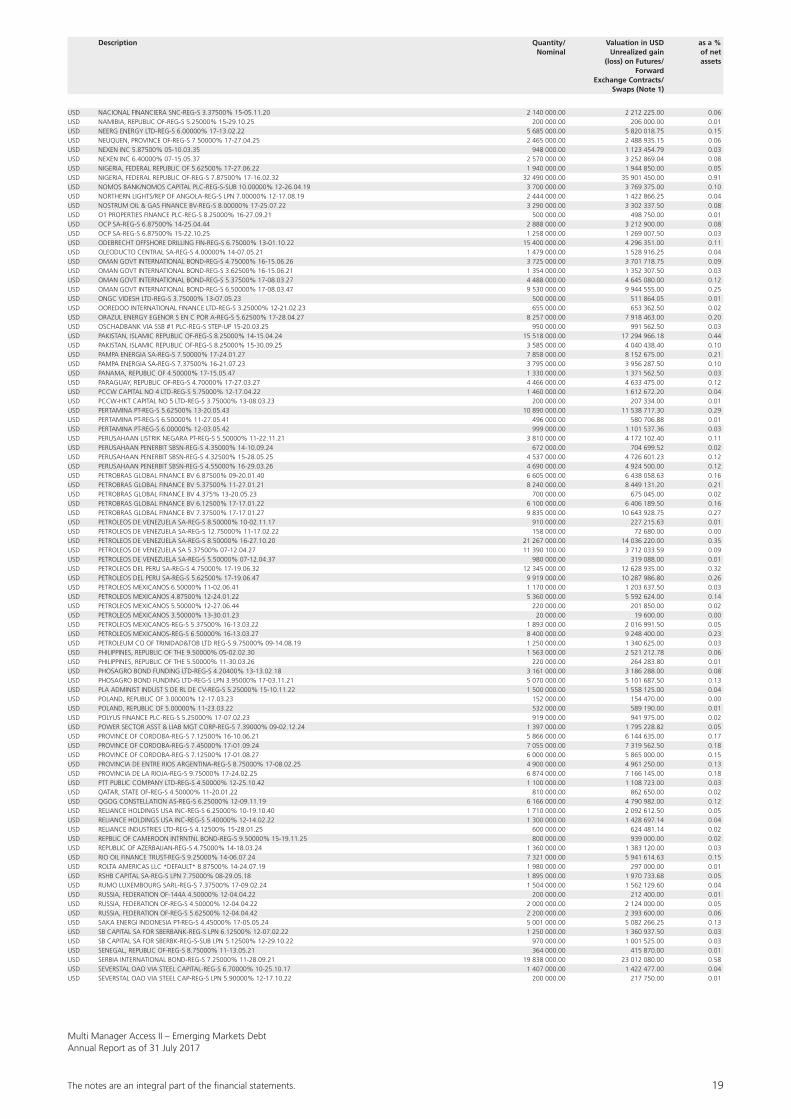
USD NACIONAL FINANCIERA SNC-REG-S 3.37500% 15-05.11.20 2 140 000.00 2 212 225.00 0.06USD NAMIBIA, REPUBLIC OF-REG-S 5.25000% 15-29.10.25 200 000.00 206 000.00 0.01USD NEERG ENERGY LTD-REG-S 6.00000% 17-13.02.22 5 685 000.00 5 820 018.75 0.15USD NEUQUEN, PROVINCE OF-REG-S 7.50000% 17-27.04.25 2 465 000.00 2 488 935.15 0.06USD NEXEN INC 5.87500% 05-10.03.35 948 000.00 1 123 454.79 0.03USD NEXEN INC 6.40000% 07-15.05.37 2 570 000.00 3 252 869.04 0.08USD NIGERIA, FEDERAL REPUBLIC OF 5.62500% 17-27.06.22 1 940 000.00 1 944 850.00 0.05USD NIGERIA, FEDERAL REPUBLIC OF-REG-S 7.87500% 17-16.02.32 32 490 000.00 35 901 450.00 0.91USD NOMOS BANK/NOMOS CAPITAL PLC-REG-S-SUB 10.00000% 12-26.04.19 3 700 000.00 3 769 375.00 0.10USD NORTHERN LIGHTS/REP OF ANGOLA-REG-S LPN 7.00000% 12-17.08.19 2 444 000.00 1 422 866.25 0.04USD NOSTRUM OIL & GAS FINANCE BV-REG-S 8.00000% 17-25.07.22 3 290 000.00 3 302 337.50 0.08USD O1 PROPERTIES FINANCE PLC-REG-S 8.25000% 16-27.09.21 500 000.00 498 750.00 0.01USD OCP SA-REG-S 6.87500% 14-25.04.44 2 888 000.00 3 212 900.00 0.08USD OCP SA-REG-S 6.87500% 15-22.10.25 1 258 000.00 1 269 007.50 0.03USD ODEBRECHT OFFSHORE DRILLING FIN-REG-S 6.75000% 13-01.10.22 15 400 000.00 4 296 351.00 0.11USD OLEODUCTO CENTRAL SA-REG-S 4.00000% 14-07.05.21 1 479 000.00 1 528 916.25 0.04USD OMAN GOVT INTERNATIONAL BOND-REG-S 4.75000% 16-15.06.26 3 725 000.00 3 701 718.75 0.09USD OMAN GOVT INTERNATIONAL BOND-REG-S 3.62500% 16-15.06.21 1 354 000.00 1 352 307.50 0.03USD OMAN GOVT INTERNATIONAL BOND-REG-S 5.37500% 17-08.03.27 4 488 000.00 4 645 080.00 0.12USD OMAN GOVT INTERNATIONAL BOND-REG-S 6.50000% 17-08.03.47 9 530 000.00 9 944 555.00 0.25USD ONGC VIDESH LTD-REG-S 3.75000% 13-07.05.23 500 000.00 511 864.05 0.01USD OOREDOO INTERNATIONAL FINANCE LTD-REG-S 3.25000% 12-21.02.23 655 000.00 653 362.50 0.02USD ORAZUL ENERGY EGENOR S EN C POR A-REG-S 5.62500% 17-28.04.27 8 257 000.00 7 918 463.00 0.20USD OSCHADBANK VIA SSB #1 PLC-REG-S STEP-UP 15-20.03.25 950 000.00 991 562.50 0.03USD PAKISTAN, ISLAMIC REPUBLIC OF-REG-S 8.25000% 14-15.04.24 15 518 000.00 17 294 966.18 0.44USD PAKISTAN, ISLAMIC REPUBLIC OF-REG-S 8.25000% 15-30.09.25 3 585 000.00 4 040 438.40 0.10USD PAMPA ENERGIA SA-REG-S 7.50000% 17-24.01.27 7 858 000.00 8 152 675.00 0.21USD PAMPA ENERGIA SA-REG-S 7.37500% 16-21.07.23 3 795 000.00 3 956 287.50 0.10USD PANAMA, REPUBLIC OF 4.50000% 17-15.05.47 1 330 000.00 1 371 562.50 0.03USD PARAGUAY, REPUBLIC OF-REG-S 4.70000% 17-27.03.27 4 466 000.00 4 633 475.00 0.12USD PCCW CAPITAL NO 4 LTD-REG-S 5.75000% 12-17.04.22 1 460 000.00 1 612 672.20 0.04USD PCCW-HKT CAPITAL NO 5 LTD-REG-S 3.75000% 13-08.03.23 200 000.00 207 334.00 0.01USD PERTAMINA PT-REG-S 5.62500% 13-20.05.43 10 890 000.00 11 538 717.30 0.29USD PERTAMINA PT-REG-S 6.50000% 11-27.05.41 496 000.00 580 706.88 0.01USD PERTAMINA PT-REG-S 6.00000% 12-03.05.42 999 000.00 1 101 537.36 0.03USD PERUSAHAAN LISTRIK NEGARA PT-REG-S 5.50000% 11-22.11.21 3 810 000.00 4 172 102.40 0.11USD PERUSAHAAN PENERBIT SBSN-REG-S 4.35000% 14-10.09.24 672 000.00 704 699.52 0.02USD PERUSAHAAN PENERBIT SBSN-REG-S 4.32500% 15-28.05.25 4 537 000.00 4 726 601.23 0.12USD PERUSAHAAN PENERBIT SBSN-REG-S 4.55000% 16-29.03.26 4 690 000.00 4 924 500.00 0.12USD PETROBRAS GLOBAL FINANCE BV 6.87500% 09-20.01.40 6 605 000.00 6 438 058.63 0.16USD PETROBRAS GLOBAL FINANCE BV 5.37500% 11-27.01.21 8 240 000.00 8 449 131.20 0.21USD PETROBRAS GLOBAL FINANCE BV 4.375% 13-20.05.23 700 000.00 675 045.00 0.02USD PETROBRAS GLOBAL FINANCE BV 6.12500% 17-17.01.22 6 100 000.00 6 406 189.50 0.16USD PETROBRAS GLOBAL FINANCE BV 7.37500% 17-17.01.27 9 835 000.00 10 643 928.75 0.27USD PETROLEOS DE VENEZUELA SA-REG-S 8.50000% 10-02.11.17 910 000.00 227 215.63 0.01USD PETROLEOS DE VENEZUELA SA-REG-S 12.75000% 11-17.02.22 158 000.00 72 680.00 0.00USD PETROLEOS DE VENEZUELA SA-REG-S 8.50000% 16-27.10.20 21 267 000.00 14 036 220.00 0.35USD PETROLEOS DE VENEZUELA SA 5.37500% 07-12.04.27 11 390 100.00 3 712 033.59 0.09USD PETROLEOS DE VENEZUELA SA-REG-S 5.50000% 07-12.04.37 980 000.00 319 088.00 0.01USD PETROLEOS DEL PERU SA-REG-S 4.75000% 17-19.06.32 12 345 000.00 12 628 935.00 0.32USD PETROLEOS DEL PERU SA-REG-S 5.62500% 17-19.06.47 9 919 000.00 10 287 986.80 0.26USD PETROLEOS MEXICANOS 6.50000% 11-02.06.41 1 170 000.00 1 203 637.50 0.03USD PETROLEOS MEXICANOS 4.87500% 12-24.01.22 5 360 000.00 5 592 624.00 0.14USD PETROLEOS MEXICANOS 5.50000% 12-27.06.44 220 000.00 201 850.00 0.02USD PETROLEOS MEXICANOS 3.50000% 13-30.01.23 20 000.00 19 600.00 0.00USD PETROLEOS MEXICANOS-REG-S 5.37500% 16-13.03.22 1 893 000.00 2 016 991.50 0.05USD PETROLEOS MEXICANOS-REG-S 6.50000% 16-13.03.27 8 400 000.00 9 248 400.00 0.23USD PETROLEUM CO OF TRINIDAD&TOB LTD REG-S 9.75000% 09-14.08.19 1 250 000.00 1 340 625.00 0.03USD PHILIPPINES, REPUBLIC OF THE 9.50000% 05-02.02.30 1 563 000.00 2 521 212.78 0.06USD PHILIPPINES, REPUBLIC OF THE 5.50000% 11-30.03.26 220 000.00 264 283.80 0.01USD PHOSAGRO BOND FUNDING LTD-REG-S 4.20400% 13-13.02.18 3 161 000.00 3 186 288.00 0.08USD PHOSAGRO BOND FUNDING LTD-REG-S LPN 3.95000% 17-03.11.21 5 070 000.00 5 101 687.50 0.13USD PLA ADMINIST INDUST S DE RL DE CV-REG-S 5.25000% 15-10.11.22 1 500 000.00 1 558 125.00 0.04USD POLAND, REPUBLIC OF 3.00000% 12-17.03.23 152 000.00 154 470.00 0.00USD POLAND, REPUBLIC OF 5.00000% 11-23.03.22 532 000.00 589 190.00 0.01USD POLYUS FINANCE PLC-REG-S 5.25000% 17-07.02.23 919 000.00 941 975.00 0.02USD POWER SECTOR ASST & LIAB MGT CORP-REG-S 7.39000% 09-02.12.24 1 397 000.00 1 795 228.82 0.05USD PROVINCE OF CORDOBA-REG-S 7.12500% 16-10.06.21 5 866 000.00 6 144 635.00 0.17USD PROVINCE OF CORDOBA-REG-S 7.45000% 17-01.09.24 7 055 000.00 7 319 562.50 0.18USD PROVINCE OF CORDOBA-REG-S 7.12500% 17-01.08.27 6 000 000.00 5 865 000.00 0.15USD PROVINCIA DE ENTRE RIOS ARGENTINA-REG-S 8.75000% 17-08.02.25 4 900 000.00 4 961 250.00 0.13USD PROVINCIA DE LA RIOJA-REG-S 9.75000% 17-24.02.25 6 874 000.00 7 166 145.00 0.18USD PTT PUBLIC COMPANY LTD-REG-S 4.50000% 12-25.10.42 1 100 000.00 1 108 723.00 0.03USD QATAR, STATE OF-REG-S 4.50000% 11-20.01.22 810 000.00 862 650.00 0.02USD QGOG CONSTELLATION AS-REG-S 6.25000% 12-09.11.19 6 166 000.00 4 790 982.00 0.12USD RELIANCE HOLDINGS USA INC-REG-S 6.25000% 10-19.10.40 1 710 000.00 2 092 612.50 0.05USD RELIANCE HOLDINGS USA INC-REG-S 5.40000% 12-14.02.22 1 300 000.00 1 428 697.14 0.04USD RELIANCE INDUSTRIES LTD-REG-S 4.12500% 15-28.01.25 600 000.00 624 481.14 0.02USD REPBLIC OF CAMEROON INTRNTNL BOND-REG-S 9.50000% 15-19.11.25 800 000.00 939 000.00 0.02USD REPUBLIC OF AZERBAIJAN-REG-S 4.75000% 14-18.03.24 1 360 000.00 1 383 120.00 0.03USD RIO OIL FINANCE TRUST-REG-S 9.25000% 14-06.07.24 7 321 000.00 5 941 614.63 0.15USD ROLTA AMERICAS LLC *DEFAULT* 8.87500% 14-24.07.19 1 980 000.00 297 000.00 0.01USD RSHB CAPITAL SA-REG-S LPN 7.75000% 08-29.05.18 1 895 000.00 1 970 733.68 0.05USD RUMO LUXEMBOURG SARL-REG-S 7.37500% 17-09.02.24 1 504 000.00 1 562 129.60 0.04USD RUSSIA, FEDERATION OF-144A 4.50000% 12-04.04.22 200 000.00 212 400.00 0.01USD RUSSIA, FEDERATION OF-REG-S 4.50000% 12-04.04.22 2 000 000.00 2 124 000.00 0.05USD RUSSIA, FEDERATION OF-REG-S 5.62500% 12-04.04.42 2 200 000.00 2 393 600.00 0.06USD SAKA ENERGI INDONESIA PT-REG-S 4.45000% 17-05.05.24 5 001 000.00 5 082 266.25 0.13USD SB CAPITAL SA FOR SBERBANK-REG-S LPN 6.12500% 12-07.02.22 1 250 000.00 1 360 937.50 0.03USD SB CAPITAL SA FOR SBERBK-REG-S-SUB LPN 5.12500% 12-29.10.22 970 000.00 1 001 525.00 0.03USD SENEGAL, REPUBLIC OF-REG-S 8.75000% 11-13.05.21 364 000.00 415 870.00 0.01USD SERBIA INTERNATIONAL BOND-REG-S 7.25000% 11-28.09.21 19 838 000.00 23 012 080.00 0.58USD SEVERSTAL OAO VIA STEEL CAPITAL-REG-S 6.70000% 10-25.10.17 1 407 000.00 1 422 477.00 0.04USD SEVERSTAL OAO VIA STEEL CAP-REG-S LPN 5.90000% 12-17.10.22 200 000.00 217 750.00 0.01
Description Quantity/ Valuation in USD as a % Nominal Unrealized gain of net (loss) on Futures/ assets Forward Exchange Contracts/ Swaps (Note 1)
20 The notes are an integral part of the fi nancial statements.
Multi Manager Access II – Emerging Markets DebtAnnual Report as of 31 July 2017
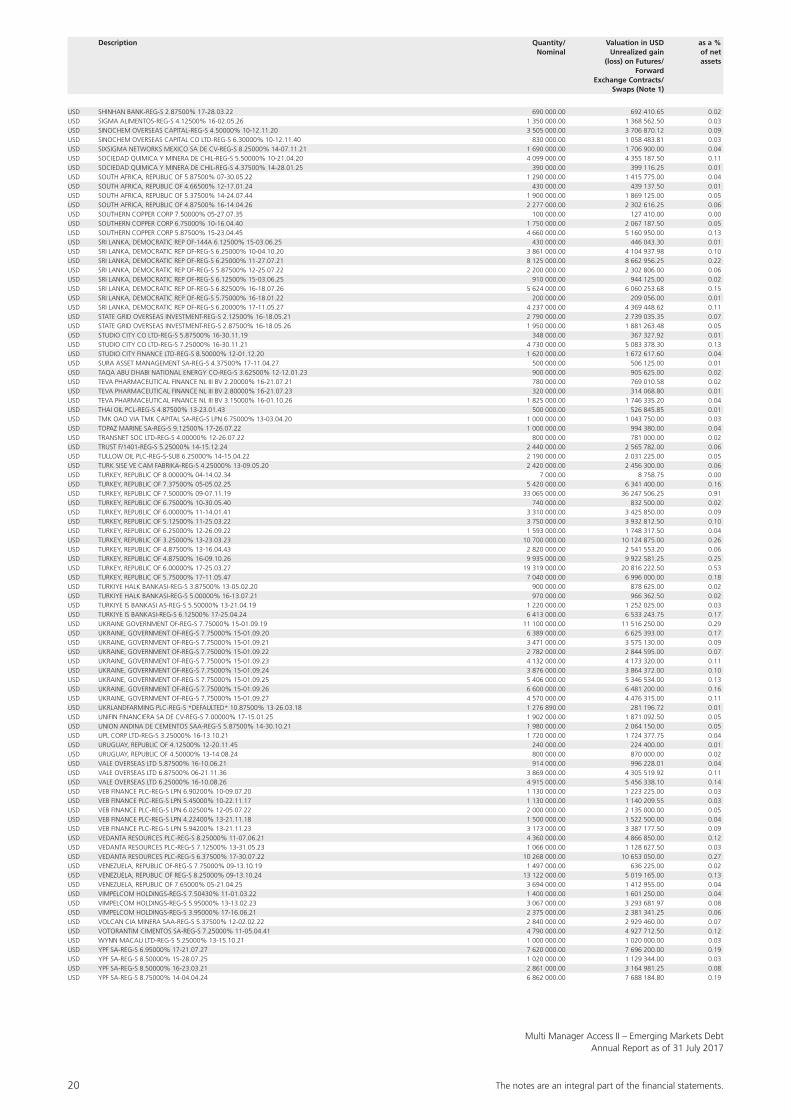
USD SHINHAN BANK-REG-S 2.87500% 17-28.03.22 690 000.00 692 410.65 0.02USD SIGMA ALIMENTOS-REG-S 4.12500% 16-02.05.26 1 350 000.00 1 368 562.50 0.03USD SINOCHEM OVERSEAS CAPITAL-REG-S 4.50000% 10-12.11.20 3 505 000.00 3 706 870.12 0.09USD SINOCHEM OVERSEAS CAPITAL CO LTD-REG-S 6.30000% 10-12.11.40 830 000.00 1 058 483.81 0.03USD SIXSIGMA NETWORKS MEXICO SA DE CV-REG-S 8.25000% 14-07.11.21 1 690 000.00 1 706 900.00 0.04USD SOCIEDAD QUIMICA Y MINERA DE CHIL-REG-S 5.50000% 10-21.04.20 4 099 000.00 4 355 187.50 0.11USD SOCIEDAD QUIMICA Y MINERA DE CHIL-REG-S 4.37500% 14-28.01.25 390 000.00 399 116.25 0.01USD SOUTH AFRICA, REPUBLIC OF 5.87500% 07-30.05.22 1 290 000.00 1 415 775.00 0.04USD SOUTH AFRICA, REPUBLIC OF 4.66500% 12-17.01.24 430 000.00 439 137.50 0.01USD SOUTH AFRICA, REPUBLIC OF 5.37500% 14-24.07.44 1 900 000.00 1 869 125.00 0.05USD SOUTH AFRICA, REPUBLIC OF 4.87500% 16-14.04.26 2 277 000.00 2 302 616.25 0.06USD SOUTHERN COPPER CORP 7.50000% 05-27.07.35 100 000.00 127 410.00 0.00USD SOUTHERN COPPER CORP 6.75000% 10-16.04.40 1 750 000.00 2 067 187.50 0.05USD SOUTHERN COPPER CORP 5.87500% 15-23.04.45 4 660 000.00 5 160 950.00 0.13USD SRI LANKA, DEMOCRATIC REP OF-144A 6.12500% 15-03.06.25 430 000.00 446 043.30 0.01USD SRI LANKA, DEMOCRATIC REP OF-REG-S 6.25000% 10-04.10.20 3 861 000.00 4 104 937.98 0.10USD SRI LANKA, DEMOCRATIC REP OF-REG-S 6.25000% 11-27.07.21 8 125 000.00 8 662 956.25 0.22USD SRI LANKA, DEMOCRATIC REP OF-REG-S 5.87500% 12-25.07.22 2 200 000.00 2 302 806.00 0.06USD SRI LANKA, DEMOCRATIC REP OF-REG-S 6.12500% 15-03.06.25 910 000.00 944 125.00 0.02USD SRI LANKA, DEMOCRATIC REP OF-REG-S 6.82500% 16-18.07.26 5 624 000.00 6 060 253.68 0.15USD SRI LANKA, DEMOCRATIC REP OF-REG-S 5.75000% 16-18.01.22 200 000.00 209 056.00 0.01USD SRI LANKA, DEMOCRATIC REP OF-REG-S 6.20000% 17-11.05.27 4 237 000.00 4 369 448.62 0.11USD STATE GRID OVERSEAS INVESTMENT-REG-S 2.12500% 16-18.05.21 2 790 000.00 2 739 035.35 0.07USD STATE GRID OVERSEAS INVESTMENT-REG-S 2.87500% 16-18.05.26 1 950 000.00 1 881 263.48 0.05USD STUDIO CITY CO LTD-REG-S 5.87500% 16-30.11.19 348 000.00 367 327.92 0.01USD STUDIO CITY CO LTD-REG-S 7.25000% 16-30.11.21 4 730 000.00 5 083 378.30 0.13USD STUDIO CITY FINANCE LTD-REG-S 8.50000% 12-01.12.20 1 620 000.00 1 672 617.60 0.04USD SURA ASSET MANAGEMENT SA-REG-S 4.37500% 17-11.04.27 500 000.00 506 125.00 0.01USD TAQA ABU DHABI NATIONAL ENERGY CO-REG-S 3.62500% 12-12.01.23 900 000.00 905 625.00 0.02USD TEVA PHARMACEUTICAL FINANCE NL III BV 2.20000% 16-21.07.21 780 000.00 769 010.58 0.02USD TEVA PHARMACEUTICAL FINANCE NL III BV 2.80000% 16-21.07.23 320 000.00 314 068.80 0.01USD TEVA PHARMACEUTICAL FINANCE NL III BV 3.15000% 16-01.10.26 1 825 000.00 1 746 335.20 0.04USD THAI OIL PCL-REG-S 4.87500% 13-23.01.43 500 000.00 526 845.85 0.01USD TMK OAO VIA TMK CAPITAL SA-REG-S LPN 6.75000% 13-03.04.20 1 000 000.00 1 043 750.00 0.03USD TOPAZ MARINE SA-REG-S 9.12500% 17-26.07.22 1 000 000.00 994 380.00 0.04USD TRANSNET SOC LTD-REG-S 4.00000% 12-26.07.22 800 000.00 781 000.00 0.02USD TRUST F/1401-REG-S 5.25000% 14-15.12.24 2 440 000.00 2 565 782.00 0.06USD TULLOW OIL PLC-REG-S-SUB 6.25000% 14-15.04.22 2 190 000.00 2 031 225.00 0.05USD TURK SISE VE CAM FABRIKA-REG-S 4.25000% 13-09.05.20 2 420 000.00 2 456 300.00 0.06USD TURKEY, REPUBLIC OF 8.00000% 04-14.02.34 7 000.00 8 758.75 0.00USD TURKEY, REPUBLIC OF 7.37500% 05-05.02.25 5 420 000.00 6 341 400.00 0.16USD TURKEY, REPUBLIC OF 7.50000% 09-07.11.19 33 065 000.00 36 247 506.25 0.91USD TURKEY, REPUBLIC OF 6.75000% 10-30.05.40 740 000.00 832 500.00 0.02USD TURKEY, REPUBLIC OF 6.00000% 11-14.01.41 3 310 000.00 3 425 850.00 0.09USD TURKEY, REPUBLIC OF 5.12500% 11-25.03.22 3 750 000.00 3 932 812.50 0.10USD TURKEY, REPUBLIC OF 6.25000% 12-26.09.22 1 593 000.00 1 748 317.50 0.04USD TURKEY, REPUBLIC OF 3.25000% 13-23.03.23 10 700 000.00 10 124 875.00 0.26USD TURKEY, REPUBLIC OF 4.87500% 13-16.04.43 2 820 000.00 2 541 553.20 0.06USD TURKEY, REPUBLIC OF 4.87500% 16-09.10.26 9 935 000.00 9 922 581.25 0.25USD TURKEY, REPUBLIC OF 6.00000% 17-25.03.27 19 319 000.00 20 816 222.50 0.53USD TURKEY, REPUBLIC OF 5.75000% 17-11.05.47 7 040 000.00 6 996 000.00 0.18USD TURKIYE HALK BANKASI-REG-S 3.87500% 13-05.02.20 900 000.00 878 625.00 0.02USD TURKIYE HALK BANKASI-REG-S 5.00000% 16-13.07.21 970 000.00 966 362.50 0.02USD TURKIYE IS BANKASI AS-REG-S 5.50000% 13-21.04.19 1 220 000.00 1 252 025.00 0.03USD TURKIYE IS BANKASI-REG-S 6.12500% 17-25.04.24 6 413 000.00 6 533 243.75 0.17USD UKRAINE GOVERNMENT OF-REG-S 7.75000% 15-01.09.19 11 100 000.00 11 516 250.00 0.29USD UKRAINE, GOVERNMENT OF-REG-S 7.75000% 15-01.09.20 6 389 000.00 6 625 393.00 0.17USD UKRAINE, GOVERNMENT OF-REG-S 7.75000% 15-01.09.21 3 471 000.00 3 575 130.00 0.09USD UKRAINE, GOVERNMENT OF-REG-S 7.75000% 15-01.09.22 2 782 000.00 2 844 595.00 0.07USD UKRAINE, GOVERNMENT OF-REG-S 7.75000% 15-01.09.23 4 132 000.00 4 173 320.00 0.11USD UKRAINE, GOVERNMENT OF-REG-S 7.75000% 15-01.09.24 3 876 000.00 3 864 372.00 0.10USD UKRAINE, GOVERNMENT OF-REG-S 7.75000% 15-01.09.25 5 406 000.00 5 346 534.00 0.13USD UKRAINE, GOVERNMENT OF-REG-S 7.75000% 15-01.09.26 6 600 000.00 6 481 200.00 0.16USD UKRAINE, GOVERNMENT OF-REG-S 7.75000% 15-01.09.27 4 570 000.00 4 476 315.00 0.11USD UKRLANDFARMING PLC-REG-S *DEFAULTED* 10.87500% 13-26.03.18 1 276 890.00 281 196.72 0.01USD UNIFIN FINANCIERA SA DE CV-REG-S 7.00000% 17-15.01.25 1 902 000.00 1 871 092.50 0.05USD UNION ANDINA DE CEMENTOS SAA-REG-S 5.87500% 14-30.10.21 1 980 000.00 2 064 150.00 0.05USD UPL CORP LTD-REG-S 3.25000% 16-13.10.21 1 720 000.00 1 724 377.75 0.04USD URUGUAY, REPUBLIC OF 4.12500% 12-20.11.45 240 000.00 224 400.00 0.01USD URUGUAY, REPUBLIC OF 4.50000% 13-14.08.24 800 000.00 870 000.00 0.02USD VALE OVERSEAS LTD 5.87500% 16-10.06.21 914 000.00 996 228.01 0.04USD VALE OVERSEAS LTD 6.87500% 06-21.11.36 3 869 000.00 4 305 519.92 0.11USD VALE OVERSEAS LTD 6.25000% 16-10.08.26 4 915 000.00 5 456 338.10 0.14USD VEB FINANCE PLC-REG-S LPN 6.90200% 10-09.07.20 1 130 000.00 1 223 225.00 0.03USD VEB FINANCE PLC-REG-S LPN 5.45000% 10-22.11.17 1 130 000.00 1 140 209.55 0.03USD VEB FINANCE PLC-REG-S LPN 6.02500% 12-05.07.22 2 000 000.00 2 135 000.00 0.05USD VEB FINANCE PLC-REG-S LPN 4.22400% 13-21.11.18 1 500 000.00 1 522 500.00 0.04USD VEB FINANCE PLC-REG-S LPN 5.94200% 13-21.11.23 3 173 000.00 3 387 177.50 0.09USD VEDANTA RESOURCES PLC-REG-S 8.25000% 11-07.06.21 4 360 000.00 4 866 850.00 0.12USD VEDANTA RESOURCES PLC-REG-S 7.12500% 13-31.05.23 1 066 000.00 1 128 627.50 0.03USD VEDANTA RESOURCES PLC-REG-S 6.37500% 17-30.07.22 10 268 000.00 10 653 050.00 0.27USD VENEZUELA, REPUBLIC OF-REG-S 7.75000% 09-13.10.19 1 497 000.00 636 225.00 0.02USD VENEZUELA, REPUBLIC OF REG-S 8.25000% 09-13.10.24 13 122 000.00 5 019 165.00 0.13USD VENEZUELA, REPUBLIC OF 7.65000% 05-21.04.25 3 694 000.00 1 412 955.00 0.04USD VIMPELCOM HOLDINGS-REG-S 7.50430% 11-01.03.22 1 400 000.00 1 601 250.00 0.04USD VIMPELCOM HOLDINGS-REG-S 5.95000% 13-13.02.23 3 067 000.00 3 293 681.97 0.08USD VIMPELCOM HOLDINGS-REG-S 3.95000% 17-16.06.21 2 375 000.00 2 381 341.25 0.06USD VOLCAN CIA MINERA SAA-REG-S 5.37500% 12-02.02.22 2 840 000.00 2 929 460.00 0.07USD VOTORANTIM CIMENTOS SA-REG-S 7.25000% 11-05.04.41 4 790 000.00 4 927 712.50 0.12USD WYNN MACAU LTD-REG-S 5.25000% 13-15.10.21 1 000 000.00 1 020 000.00 0.03USD YPF SA-REG-S 6.95000% 17-21.07.27 7 620 000.00 7 696 200.00 0.19USD YPF SA-REG-S 8.50000% 15-28.07.25 1 020 000.00 1 129 344.00 0.03USD YPF SA-REG-S 8.50000% 16-23.03.21 2 861 000.00 3 164 981.25 0.08USD YPF SA-REG-S 8.75000% 14-04.04.24 6 862 000.00 7 688 184.80 0.19
Description Quantity/ Valuation in USD as a % Nominal Unrealized gain of net (loss) on Futures/ assets Forward Exchange Contracts/ Swaps (Note 1)
The notes are an integral part of the fi nancial statements. 21
Multi Manager Access II – Emerging Markets DebtAnnual Report as of 31 July 2017
USD YPF SA-REG-S 8.87500% 13-19.12.18 5 954 000.00 6 354 704.20 0.16USD ZAMBIA, REPUBLIC OF-REG-S 8.50000% 14-14.04.24 3 530 000.00 3 750 625.00 0.09USD ZAMBIA, REPUBLIC OF-REG-S 8.97000% 15-30.07.27 11 639 000.00 12 599 217.50 0.32USD ZENITH BANK PLC-REG-S 7.37500% 17-30.05.22 3 164 000.00 3 108 630.00 0.08USD ZHAIKMUNAI FINANCE LLP-REG-S 7.12500% 12-13.11.19 8 050 000.00 8 110 375.00 0.20USD ZHAIKMUNAI LLP-REG-S 6.37500% 14-14.02.19 6 465 000.00 6 513 487.50 0.16Total USD 1 618 301 251.09 40.85
UYU
UYU URUGUAY, REPUBLIC OF-REG-S 9.87500% 17-20.06.22 76 344 000.00 2 866 398.57 0.07Total UYU 2 866 398.57 0.07
Total Notes, fixed rate 1 631 863 189.01 41.19
Notes, floating rate
EUR
EUR ARGENTINA, REPUBLIC OF VAR 05-15.12.35 9 410 000.00 1 015 136.69 0.02EUR ARGENTINA, REPUBLIC OF VAR 10-31.12.33 1 100 000.00 1 853 824.81 0.05Total EUR 2 868 961.50 0.07
USD
USD ARGENTINA, REPUBLIC OF VAR 05-15.12.35 44 745 602.00 4 116 595.38 0.10USD BANCO DE CREDI DEL PERU/PAN-REG-S-SUB 6.875%/FLR 11-16.09.26 610 000.00 688 537.50 0.02USD BANCO DE CREDITO DEL PERU/P-REG-S-SUB 6.125%/VAR 12-24.04.27 3 430 000.00 3 787 577.50 0.10USD BANCO DO BRASIL CAYMAN-REG-S-SUB 8.500%/VAR 09-PRP 2 300 000.00 2 538 625.00 0.06USD BANCO DO BRASIL CAYMAN-REG-S-SUB 9.000%/VAR 14-PRP 17 086 000.00 17 641 295.00 0.45USD BANCO GNB SUDAMERIS SA-REG-S-SUB 6.500%VAR 17-03.04.27 1 700 000.00 1 759 500.00 0.04USD BANCO INTL PERU-REG-S 6.625%/3M LIBOR+576BP 14-19.03.29 2 260 000.00 2 497 300.00 0.06USD BANCO MER DEL NORTE SA/GRAND CY-REG-S-SUB 7.625%/VAR 17-PRP 13 872 000.00 14 634 960.00 0.37USD BANCO MERCANTIL DEL NORTE-REG-S-SUB 5.750%/VAR 16-04.10.31 3 580 000.00 3 610 430.00 0.09USD BANCO MERCANTIL DEL NORT SA/G CA-REG-S-SUB 6.875%/VAR 17-PRP 9 950 000.00 10 410 187.50 0.26USD BANCO NACIONAL DE COM EXT-REG-S-SUB 3.800%/VAR 16-11.08.26 2 458 000.00 2 454 927.50 0.06USD BBVA BANCO CONTINENTAL SA-REG-S-SUB 5.250%/VAR 14-22.09.29 705 000.00 761 400.00 0.02USD BCO NAC DE DESENVOL ECO-REG-S VAR/LKD 10Y BRAZIL 98-16.06.18 1 790 000.00 1 848 175.00 0.05USD CAIX ECO FED-REG-S-SUB 7.250%/VAR 14-23.07.24 4 180 000.00 4 268 825.00 0.11USD CK HUTCHISON CAPITAL SEC 17 LTD-REG-S-SUB 4.000%/VAR 17-PRP 1 840 000.00 1 868 593.60 0.05USD CORP FINANCIERA DE DESARROL-REG-S-SUB 5.250%/VAR 14-15.07.29 2 110 000.00 2 206 416.45 0.06USD CREDIT BK MOSCOW/CBOM FIN-REG-S-SUB 7.500%/VAR 17-05.10.27 700 000.00 690 375.00 0.02USD CREDIT BK MOSCOW/CBOM FIN-REG-S-SUB 8.875%/VAR 17-PRP 1 072 000.00 1 018 400.00 0.03USD ENERGY RESOURCES LLC VAR 17-30.09.22 10 245 147.00 9 425 535.24 0.24USD ENERGY RESOURCES LLC (PIK) VAR 17-PRP 3 263 992.00 1 325 996.75 0.03USD HANJIN INTERNATIONAL CORP-REG-S 3M LIBOR+88BP 14-30.10.17 380 000.00 379 958.20 0.01USD HUARONG FINANCE 2017 CO-REG-S 3M LIBOR+185BP 17-27.04.22 381 000.00 389 925.53 0.01USD ODEA BANK AS-REG-S-SUB 7.625%/VAR 17-01.08.27 3 330 000.00 3 327 669.00 0.08USD PETROLEOS MEXICANOS-REG-S 3M LIBOR+365BP 16-11.03.22 3 048 000.00 3 321 177.00 0.08USD PTTEP TREASURY CENTER CO LTD-REG-S-SUB 4.600%/VAR 17-PRP 5 930 000.00 6 048 600.00 0.15USD PTTEP TREASURY CENTER CO LTD-REG-S-SUB 4.875%/VAR 17-PRP 1 342 000.00 1 366 343.88 0.03USD SB CAPITAL SA FOR SBERBANK-REG-S-SUB 5.500%/VAR 14-26.02.24 11 689 000.00 11 878 946.25 0.30USD SHUI ON DEVELOPMENT HOLDING LTD-REG-S 10.125%/VAR PRP 1 500 000.00 1 526 250.00 0.04USD TURKIYE GARANTI BANK AS-REG-S-SUB 6.125%/VAR 17-24.05.27 1 400 000.00 1 396 500.00 0.04USD TURKIYE IS BANKASI-REG-S-SUB 7.000%/VAR 17-29.06.28 10 100 000.00 10 175 750.00 0.26USD VTB EURASIA LTD-REG-S-SUB 9.500%/VAR 12-PRP 1 050 000.00 1 165 500.00 0.03USD WOORI BANK-REG-S-SUB VAR 16-PRP 3 270 000.00 3 270 000.00 0.08Total USD 131 800 272.28 3.33
Total Notes, floating rate 134 669 233.78 3.40
Medium term notes, fixed rate
EUR
EUR BULGARIA, REPUBLIC OF-REG-S 3.12500% 15-26.03.35 610 000.00 745 260.63 0.02EUR BULGARIA, REPUBLIC OF-REG-S 1.87500% 16-21.03.23 1 230 000.00 1 542 618.34 0.04EUR BULGARIA, REPUBLIC OF-REG-S 3.00000% 16-21.03.28 4 999 000.00 6 461 101.27 0.16EUR INDONESIA, REPUBLIC OF-REG-S 3.75000% 16-14.06.28 630 000.00 820 760.85 0.02EUR INDONESIA, REPUBLIC OF-REG-S 2.62500% 16-14.06.23 980 000.00 1 218 968.10 0.03EUR PETROLEOS MEXICANOS-REG-S 2.75000% 15-21.04.27 7 702 000.00 8 320 152.89 0.21EUR PETROLEOS MEXICANOS-REG-S 5.12500% 16-15.03.23 4 070 000.00 5 446 331.55 0.14EUR PETROLEOS MEXICANOS-REG-S 3.75000% 17-21.02.24 3 934 000.00 4 852 702.09 0.12EUR PETROLEOS MEXICANOS-REG-S 4.87500% 17-21.02.28 2 220 000.00 2 797 324.87 0.07EUR ROMANIA-REG-S 3.87500% 15-29.10.35 1 650 000.00 2 037 754.13 0.05EUR TURKEY, REPUBLIC OF 3.25000% 17-14.06.25 570 000.00 668 669.85 0.02Total EUR 34 911 644.57 0.88
TRY
TRY YAPI VE KREDI BANKASI AS-REG-S 13.12500% 17-10.06.20 2 880 000.00 814 130.35 0.02Total TRY 814 130.35 0.02
USD
USD ABQ FINANCE LTD-REG-S 3.62500% 16-13.04.21 2 383 000.00 2 380 021.25 0.06USD ABU DHABI NATIONAL ENERGY CO PJSC-REG-S 4.37500% 16-22.06.26 1 410 000.00 1 457 587.50 0.04USD ACCESS BANK PLC-REG-S 10.50000% 16-19.10.21 5 550 000.00 5 980 125.00 0.15USD AFRICA FINANCE CORP-REG-S 4.37500% 15-29.04.20 1 520 000.00 1 563 882.40 0.04USD AFRICAN EXPORT-IMPORT BANK-REG-S 4.12500% 17-20.06.24 1 527 000.00 1 514 310.63 0.04USD ALFA BOND ISSUANCE/ALFA BANK-REG-S 5.00000% 15-27.11.18 3 010 000.00 3 092 775.00 0.08USD ARGENTINA, REPUBLIC OF 6.87500% 17-22.04.21 6 574 000.00 7 067 050.00 0.18USD ARGENTINA, REPUBLIC OF 7.50000% 17-22.04.26 6 667 000.00 7 160 358.00 0.18USD ARGENTINA, REPUBLIC OF 7.62500% 17-22.04.46 11 650 000.00 11 976 200.00 0.30USD ARGENTINA, REPUBLIC OF 7.12500% 17-06.07.36 2 503 000.00 2 471 712.50 0.06USD ARGENTINA, REPUBLIC OF 6.87500% 17-26.01.27 7 130 000.00 7 326 075.00 0.18USD AXIS BANK LTD/DUBAI-REG-S 3.25000% 14-21.05.20 1 870 000.00 1 894 925.61 0.05USD AZURE NOVA INTL FINANCE LTD-REG-S 3.50000% 17-21.03.22 360 000.00 364 703.62 0.01USD BANK OF CHINA LTD-REG-S-SUB 5.00000% 14-13.11.24 2 000 000.00 2 164 367.00 0.05USD BHARAT PETROLEUM CORP LTD-REG-S 4.00000% 15-08.05.25 240 000.00 245 289.09 0.01USD BOC AVIATION LTD-REG-S 3.87500% 16-27.04.26 1 300 000.00 1 317 711.20 0.03
Description Quantity/ Valuation in USD as a % Nominal Unrealized gain of net (loss) on Futures/ assets Forward Exchange Contracts/ Swaps (Note 1)
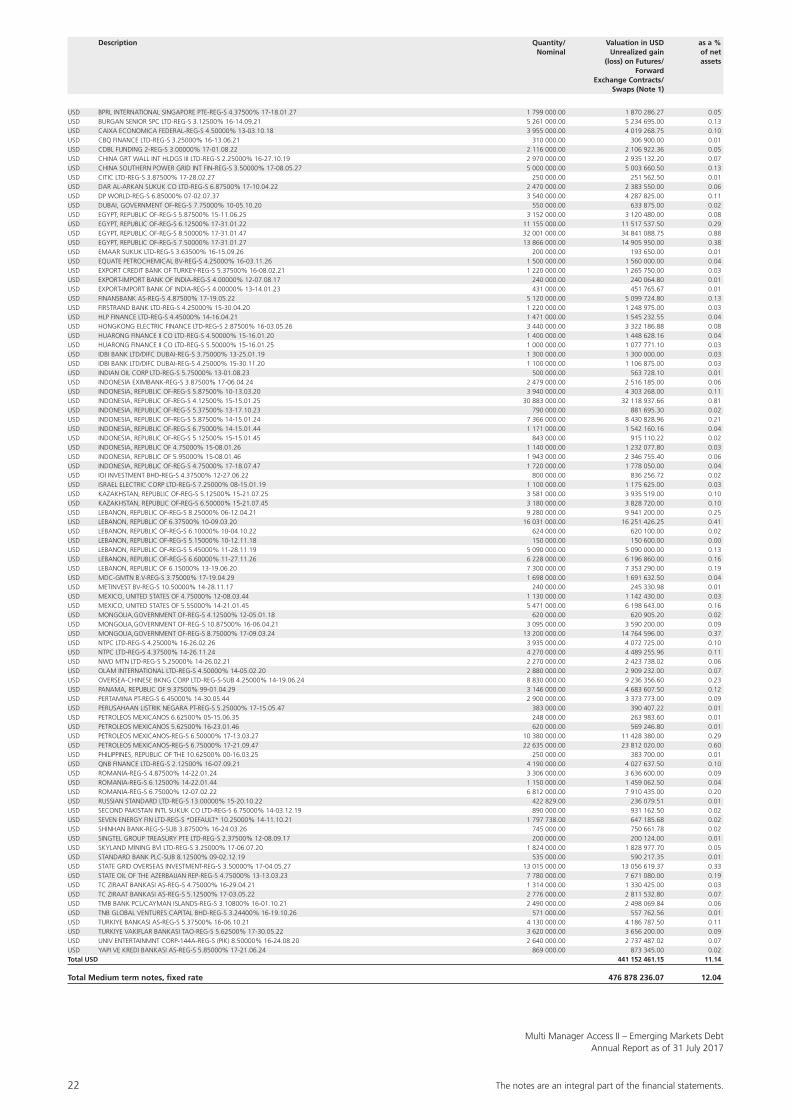
22 The notes are an integral part of the fi nancial statements.
Multi Manager Access II – Emerging Markets DebtAnnual Report as of 31 July 2017
USD BPRL INTERNATIONAL SINGAPORE PTE-REG-S 4.37500% 17-18.01.27 1 799 000.00 1 870 286.27 0.05USD BURGAN SENIOR SPC LTD-REG-S 3.12500% 16-14.09.21 5 261 000.00 5 234 695.00 0.13USD CAIXA ECONOMICA FEDERAL-REG-S 4.50000% 13-03.10.18 3 955 000.00 4 019 268.75 0.10USD CBQ FINANCE LTD-REG-S 3.25000% 16-13.06.21 310 000.00 306 900.00 0.01USD CDBL FUNDING 2-REG-S 3.00000% 17-01.08.22 2 116 000.00 2 106 922.36 0.05USD CHINA GRT WALL INT HLDGS III LTD-REG-S 2.25000% 16-27.10.19 2 970 000.00 2 935 132.20 0.07USD CHINA SOUTHERN POWER GRID INT FIN-REG-S 3.50000% 17-08.05.27 5 000 000.00 5 003 660.50 0.13USD CITIC LTD-REG-S 3.87500% 17-28.02.27 250 000.00 251 562.50 0.01USD DAR AL-ARKAN SUKUK CO LTD-REG-S 6.87500% 17-10.04.22 2 470 000.00 2 383 550.00 0.06USD DP WORLD-REG-S 6.85000% 07-02.07.37 3 540 000.00 4 287 825.00 0.11USD DUBAI, GOVERNMENT OF-REG-S 7.75000% 10-05.10.20 550 000.00 633 875.00 0.02USD EGYPT, REPUBLIC OF-REG-S 5.87500% 15-11.06.25 3 152 000.00 3 120 480.00 0.08USD EGYPT, REPUBLIC OF-REG-S 6.12500% 17-31.01.22 11 155 000.00 11 517 537.50 0.29USD EGYPT, REPUBLIC OF-REG-S 8.50000% 17-31.01.47 32 001 000.00 34 841 088.75 0.88USD EGYPT, REPUBLIC OF-REG-S 7.50000% 17-31.01.27 13 866 000.00 14 905 950.00 0.38USD EMAAR SUKUK LTD-REG-S 3.63500% 16-15.09.26 200 000.00 193 650.00 0.01USD EQUATE PETROCHEMICAL BV-REG-S 4.25000% 16-03.11.26 1 500 000.00 1 560 000.00 0.04USD EXPORT CREDIT BANK OF TURKEY-REG-S 5.37500% 16-08.02.21 1 220 000.00 1 265 750.00 0.03USD EXPORT-IMPORT BANK OF INDIA-REG-S 4.00000% 12-07.08.17 240 000.00 240 064.80 0.01USD EXPORT-IMPORT BANK OF INDIA-REG-S 4.00000% 13-14.01.23 431 000.00 451 765.67 0.01USD FINANSBANK AS-REG-S 4.87500% 17-19.05.22 5 120 000.00 5 099 724.80 0.13USD FIRSTRAND BANK LTD-REG-S 4.25000% 15-30.04.20 1 220 000.00 1 248 975.00 0.03USD HLP FINANCE LTD-REG-S 4.45000% 14-16.04.21 1 471 000.00 1 545 232.55 0.04USD HONGKONG ELECTRIC FINANCE LTD-REG-S 2.87500% 16-03.05.26 3 440 000.00 3 322 186.88 0.08USD HUARONG FINANCE II CO LTD-REG-S 4.50000% 15-16.01.20 1 400 000.00 1 448 628.16 0.04USD HUARONG FINANCE II CO LTD-REG-S 5.50000% 15-16.01.25 1 000 000.00 1 077 771.10 0.03USD IDBI BANK LTD/DIFC DUBAI-REG-S 3.75000% 13-25.01.19 1 300 000.00 1 300 000.00 0.03USD IDBI BANK LTD/DIFC DUBAI-REG-S 4.25000% 15-30.11.20 1 100 000.00 1 106 875.00 0.03USD INDIAN OIL CORP LTD-REG-S 5.75000% 13-01.08.23 500 000.00 563 728.10 0.01USD INDONESIA EXIMBANK-REG-S 3.87500% 17-06.04.24 2 479 000.00 2 516 185.00 0.06USD INDONESIA, REPUBLIC OF-REG-S 5.87500% 10-13.03.20 3 940 000.00 4 303 268.00 0.11USD INDONESIA, REPUBLIC OF-REG-S 4.12500% 15-15.01.25 30 883 000.00 32 118 937.66 0.81USD INDONESIA, REPUBLIC OF-REG-S 5.37500% 13-17.10.23 790 000.00 881 695.30 0.02USD INDONESIA, REPUBLIC OF-REG-S 5.87500% 14-15.01.24 7 366 000.00 8 430 828.96 0.21USD INDONESIA, REPUBLIC OF-REG-S 6.75000% 14-15.01.44 1 171 000.00 1 542 160.16 0.04USD INDONESIA, REPUBLIC OF-REG-S 5.12500% 15-15.01.45 843 000.00 915 110.22 0.02USD INDONESIA, REPUBLIC OF 4.75000% 15-08.01.26 1 140 000.00 1 232 077.80 0.03USD INDONESIA, REPUBLIC OF 5.95000% 15-08.01.46 1 943 000.00 2 346 755.40 0.06USD INDONESIA, REPUBLIC OF-REG-S 4.75000% 17-18.07.47 1 720 000.00 1 778 050.00 0.04USD IOI INVESTMENT BHD-REG-S 4.37500% 12-27.06.22 800 000.00 836 256.72 0.02USD ISRAEL ELECTRIC CORP LTD-REG-S 7.25000% 08-15.01.19 1 100 000.00 1 175 625.00 0.03USD KAZAKHSTAN, REPUBLIC OF-REG-S 5.12500% 15-21.07.25 3 581 000.00 3 935 519.00 0.10USD KAZAKHSTAN, REPUBLIC OF-REG-S 6.50000% 15-21.07.45 3 180 000.00 3 828 720.00 0.10USD LEBANON, REPUBLIC OF-REG-S 8.25000% 06-12.04.21 9 280 000.00 9 941 200.00 0.25USD LEBANON, REPUBLIC OF 6.37500% 10-09.03.20 16 031 000.00 16 251 426.25 0.41USD LEBANON, REPUBLIC OF-REG-S 6.10000% 10-04.10.22 624 000.00 620 100.00 0.02USD LEBANON, REPUBLIC OF-REG-S 5.15000% 10-12.11.18 150 000.00 150 600.00 0.00USD LEBANON, REPUBLIC OF-REG-S 5.45000% 11-28.11.19 5 090 000.00 5 090 000.00 0.13USD LEBANON, REPUBLIC OF-REG-S 6.60000% 11-27.11.26 6 228 000.00 6 196 860.00 0.16USD LEBANON, REPUBLIC OF 6.15000% 13-19.06.20 7 300 000.00 7 353 290.00 0.19USD MDC-GMTN B.V-REG-S 3.75000% 17-19.04.29 1 698 000.00 1 691 632.50 0.04USD METINVEST BV-REG-S 10.50000% 14-28.11.17 240 000.00 245 330.98 0.01USD MEXICO, UNITED STATES OF 4.75000% 12-08.03.44 1 130 000.00 1 142 430.00 0.03USD MEXICO, UNITED STATES OF 5.55000% 14-21.01.45 5 471 000.00 6 198 643.00 0.16USD MONGOLIA,GOVERNMENT OF-REG-S 4.12500% 12-05.01.18 620 000.00 620 905.20 0.02USD MONGOLIA,GOVERNMENT OF-REG-S 10.87500% 16-06.04.21 3 095 000.00 3 590 200.00 0.09USD MONGOLIA,GOVERNMENT OF-REG-S 8.75000% 17-09.03.24 13 200 000.00 14 764 596.00 0.37USD NTPC LTD-REG-S 4.25000% 16-26.02.26 3 935 000.00 4 072 725.00 0.10USD NTPC LTD-REG-S 4.37500% 14-26.11.24 4 270 000.00 4 489 255.96 0.11USD NWD MTN LTD-REG-S 5.25000% 14-26.02.21 2 270 000.00 2 423 738.02 0.06USD OLAM INTERNATIONAL LTD-REG-S 4.50000% 14-05.02.20 2 880 000.00 2 909 232.00 0.07USD OVERSEA-CHINESE BKNG CORP LTD-REG-S-SUB 4.25000% 14-19.06.24 8 830 000.00 9 236 356.60 0.23USD PANAMA, REPUBLIC OF 9.37500% 99-01.04.29 3 146 000.00 4 683 607.50 0.12USD PERTAMINA PT-REG-S 6.45000% 14-30.05.44 2 900 000.00 3 373 773.00 0.09USD PERUSAHAAN LISTRIK NEGARA PT-REG-S 5.25000% 17-15.05.47 383 000.00 390 407.22 0.01USD PETROLEOS MEXICANOS 6.62500% 05-15.06.35 248 000.00 263 983.60 0.01USD PETROLEOS MEXICANOS 5.62500% 16-23.01.46 620 000.00 569 246.80 0.01USD PETROLEOS MEXICANOS-REG-S 6.50000% 17-13.03.27 10 380 000.00 11 428 380.00 0.29USD PETROLEOS MEXICANOS-REG-S 6.75000% 17-21.09.47 22 635 000.00 23 812 020.00 0.60USD PHILIPPINES, REPUBLIC OF THE 10.62500% 00-16.03.25 250 000.00 383 700.00 0.01USD QNB FINANCE LTD-REG-S 2.12500% 16-07.09.21 4 190 000.00 4 027 637.50 0.10USD ROMANIA-REG-S 4.87500% 14-22.01.24 3 306 000.00 3 636 600.00 0.09USD ROMANIA-REG-S 6.12500% 14-22.01.44 1 150 000.00 1 459 062.50 0.04USD ROMANIA-REG-S 6.75000% 12-07.02.22 6 812 000.00 7 910 435.00 0.20USD RUSSIAN STANDARD LTD-REG-S 13.00000% 15-20.10.22 422 829.00 236 079.51 0.01USD SECOND PAKISTAN INTL SUKUK CO LTD-REG-S 6.75000% 14-03.12.19 890 000.00 931 162.50 0.02USD SEVEN ENERGY FIN LTD-REG-S *DEFAULT* 10.25000% 14-11.10.21 1 797 738.00 647 185.68 0.02USD SHINHAN BANK-REG-S-SUB 3.87500% 16-24.03.26 745 000.00 750 661.78 0.02USD SINGTEL GROUP TREASURY PTE LTD-REG-S 2.37500% 12-08.09.17 200 000.00 200 124.00 0.01USD SKYLAND MINING BVI LTD-REG-S 3.25000% 17-06.07.20 1 824 000.00 1 828 977.70 0.05USD STANDARD BANK PLC-SUB 8.12500% 09-02.12.19 535 000.00 590 217.35 0.01USD STATE GRID OVERSEAS INVESTMENT-REG-S 3.50000% 17-04.05.27 13 015 000.00 13 056 619.37 0.33USD STATE OIL OF THE AZERBAIJAN REP-REG-S 4.75000% 13-13.03.23 7 780 000.00 7 671 080.00 0.19USD TC ZIRAAT BANKASI AS-REG-S 4.75000% 16-29.04.21 1 314 000.00 1 330 425.00 0.03USD TC ZIRAAT BANKASI AS-REG-S 5.12500% 17-03.05.22 2 776 000.00 2 811 532.80 0.07USD TMB BANK PCL/CAYMAN ISLANDS-REG-S 3.10800% 16-01.10.21 2 490 000.00 2 498 069.84 0.06USD TNB GLOBAL VENTURES CAPITAL BHD-REG-S 3.24400% 16-19.10.26 571 000.00 557 762.56 0.01USD TURKIYE BANKASI AS-REG-S 5.37500% 16-06.10.21 4 130 000.00 4 186 787.50 0.11USD TURKIYE VAKIFLAR BANKASI TAO-REG-S 5.62500% 17-30.05.22 3 620 000.00 3 656 200.00 0.09USD UNIV ENTERTAINMNT CORP-144A-REG-S (PIK) 8.50000% 16-24.08.20 2 640 000.00 2 737 487.02 0.07USD YAPI VE KREDI BANKASI AS-REG-S 5.85000% 17-21.06.24 869 000.00 873 345.00 0.02Total USD 441 152 461.15 11.14
Total Medium term notes, fixed rate 476 878 236.07 12.04
Description Quantity/ Valuation in USD as a % Nominal Unrealized gain of net (loss) on Futures/ assets Forward Exchange Contracts/ Swaps (Note 1)
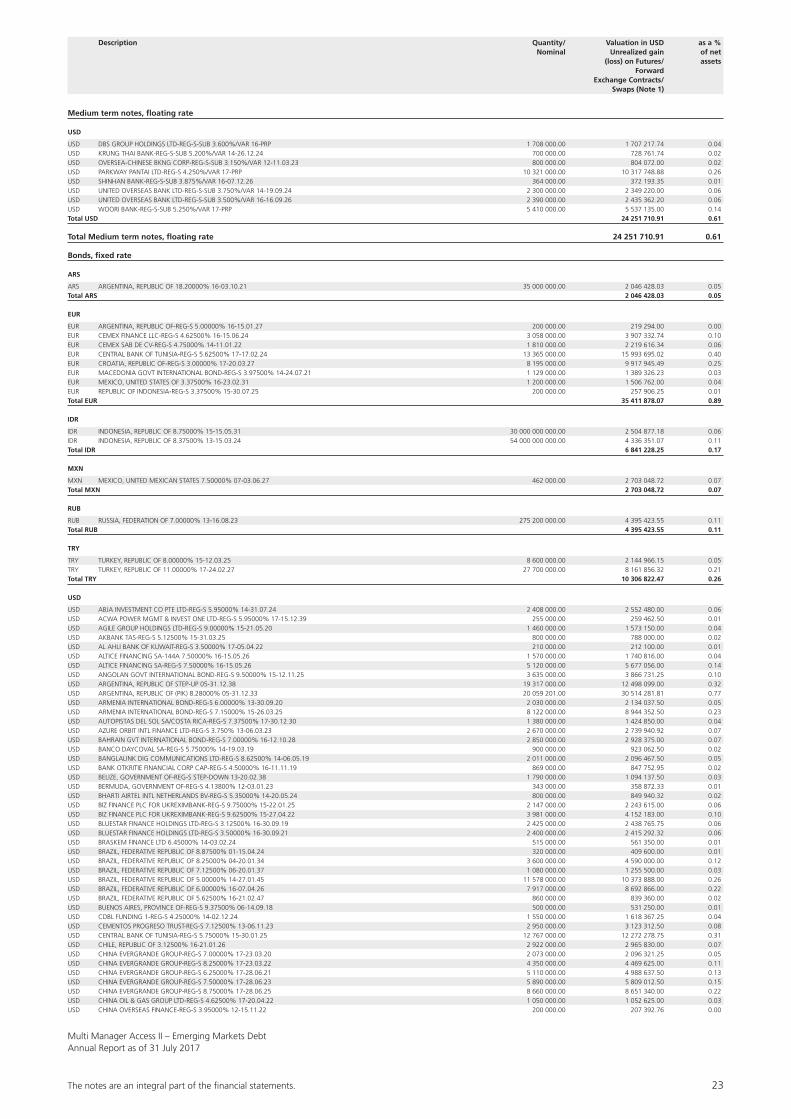
The notes are an integral part of the fi nancial statements. 23
Multi Manager Access II – Emerging Markets DebtAnnual Report as of 31 July 2017
Medium term notes, floating rate
USD
USD DBS GROUP HOLDINGS LTD-REG-S-SUB 3.600%/VAR 16-PRP 1 708 000.00 1 707 217.74 0.04USD KRUNG THAI BANK-REG-S-SUB 5.200%/VAR 14-26.12.24 700 000.00 728 761.74 0.02USD OVERSEA-CHINESE BKNG CORP-REG-S-SUB 3.150%/VAR 12-11.03.23 800 000.00 804 072.00 0.02USD PARKWAY PANTAI LTD-REG-S 4.250%/VAR 17-PRP 10 321 000.00 10 317 748.88 0.26USD SHINHAN BANK-REG-S-SUB 3.875%/VAR 16-07.12.26 364 000.00 372 193.35 0.01USD UNITED OVERSEAS BANK LTD-REG-S-SUB 3.750%/VAR 14-19.09.24 2 300 000.00 2 349 220.00 0.06USD UNITED OVERSEAS BANK LTD-REG-S-SUB 3.500%/VAR 16-16.09.26 2 390 000.00 2 435 362.20 0.06USD WOORI BANK-REG-S-SUB 5.250%/VAR 17-PRP 5 410 000.00 5 537 135.00 0.14Total USD 24 251 710.91 0.61
Total Medium term notes, floating rate 24 251 710.91 0.61
Bonds, fixed rate
ARS
ARS ARGENTINA, REPUBLIC OF 18.20000% 16-03.10.21 35 000 000.00 2 046 428.03 0.05Total ARS 2 046 428.03 0.05
EUR
EUR ARGENTINA, REPUBLIC OF-REG-S 5.00000% 16-15.01.27 200 000.00 219 294.00 0.00EUR CEMEX FINANCE LLC-REG-S 4.62500% 16-15.06.24 3 058 000.00 3 907 332.74 0.10EUR CEMEX SAB DE CV-REG-S 4.75000% 14-11.01.22 1 810 000.00 2 219 616.34 0.06EUR CENTRAL BANK OF TUNISIA-REG-S 5.62500% 17-17.02.24 13 365 000.00 15 993 695.02 0.40EUR CROATIA, REPUBLIC OF-REG-S 3.00000% 17-20.03.27 8 195 000.00 9 917 945.49 0.25EUR MACEDONIA GOVT INTERNATIONAL BOND-REG-S 3.97500% 14-24.07.21 1 129 000.00 1 389 326.23 0.03EUR MEXICO, UNITED STATES OF 3.37500% 16-23.02.31 1 200 000.00 1 506 762.00 0.04EUR REPUBLIC OF INDONESIA-REG-S 3.37500% 15-30.07.25 200 000.00 257 906.25 0.01Total EUR 35 411 878.07 0.89
IDR
IDR INDONESIA, REPUBLIC OF 8.75000% 15-15.05.31 30 000 000 000.00 2 504 877.18 0.06IDR INDONESIA, REPUBLIC OF 8.37500% 13-15.03.24 54 000 000 000.00 4 336 351.07 0.11Total IDR 6 841 228.25 0.17
MXN
MXN MEXICO, UNITED MEXICAN STATES 7.50000% 07-03.06.27 462 000.00 2 703 048.72 0.07Total MXN 2 703 048.72 0.07
RUB
RUB RUSSIA, FEDERATION OF 7.00000% 13-16.08.23 275 200 000.00 4 395 423.55 0.11Total RUB 4 395 423.55 0.11
TRY
TRY TURKEY, REPUBLIC OF 8.00000% 15-12.03.25 8 600 000.00 2 144 966.15 0.05TRY TURKEY, REPUBLIC OF 11.00000% 17-24.02.27 27 700 000.00 8 161 856.32 0.21Total TRY 10 306 822.47 0.26
USD
USD ABJA INVESTMENT CO PTE LTD-REG-S 5.95000% 14-31.07.24 2 408 000.00 2 552 480.00 0.06USD ACWA POWER MGMT & INVEST ONE LTD-REG-S 5.95000% 17-15.12.39 255 000.00 259 462.50 0.01USD AGILE GROUP HOLDINGS LTD-REG-S 9.00000% 15-21.05.20 1 460 000.00 1 573 150.00 0.04USD AKBANK TAS-REG-S 5.12500% 15-31.03.25 800 000.00 788 000.00 0.02USD AL AHLI BANK OF KUWAIT-REG-S 3.50000% 17-05.04.22 210 000.00 212 100.00 0.01USD ALTICE FINANCING SA-144A 7.50000% 16-15.05.26 1 570 000.00 1 740 816.00 0.04USD ALTICE FINANCING SA-REG-S 7.50000% 16-15.05.26 5 120 000.00 5 677 056.00 0.14USD ANGOLAN GOVT INTERNATIONAL BOND-REG-S 9.50000% 15-12.11.25 3 635 000.00 3 866 731.25 0.10USD ARGENTINA, REPUBLIC OF STEP-UP 05-31.12.38 19 317 000.00 12 498 099.00 0.32USD ARGENTINA, REPUBLIC OF (PIK) 8.28000% 05-31.12.33 20 059 201.00 30 514 281.81 0.77USD ARMENIA INTERNATIONAL BOND-REG-S 6.00000% 13-30.09.20 2 030 000.00 2 134 037.50 0.05USD ARMENIA INTERNATIONAL BOND-REG-S 7.15000% 15-26.03.25 8 122 000.00 8 944 352.50 0.23USD AUTOPISTAS DEL SOL SA/COSTA RICA-REG-S 7.37500% 17-30.12.30 1 380 000.00 1 424 850.00 0.04USD AZURE ORBIT INTL FINANCE LTD-REG-S 3.750% 13-06.03.23 2 670 000.00 2 739 940.92 0.07USD BAHRAIN GVT INTERNATIONAL BOND-REG-S 7.00000% 16-12.10.28 2 850 000.00 2 928 375.00 0.07USD BANCO DAYCOVAL SA-REG-S 5.75000% 14-19.03.19 900 000.00 923 062.50 0.02USD BANGLALINK DIG COMMUNICATIONS LTD-REG-S 8.62500% 14-06.05.19 2 011 000.00 2 096 467.50 0.05USD BANK OTKRITIE FINANCIAL CORP CAP-REG-S 4.50000% 16-11.11.19 869 000.00 847 752.95 0.02USD BELIZE, GOVERNMENT OF-REG-S STEP-DOWN 13-20.02.38 1 790 000.00 1 094 137.50 0.03USD BERMUDA, GOVERNMENT OF-REG-S 4.13800% 12-03.01.23 343 000.00 358 872.33 0.01USD BHARTI AIRTEL INTL NETHERLANDS BV-REG-S 5.35000% 14-20.05.24 800 000.00 849 940.32 0.02USD BIZ FINANCE PLC FOR UKREXIMBANK-REG-S 9.75000% 15-22.01.25 2 147 000.00 2 243 615.00 0.06USD BIZ FINANCE PLC FOR UKREXIMBANK-REG-S 9.62500% 15-27.04.22 3 981 000.00 4 152 183.00 0.10USD BLUESTAR FINANCE HOLDINGS LTD-REG-S 3.12500% 16-30.09.19 2 425 000.00 2 438 765.75 0.06USD BLUESTAR FINANCE HOLDINGS LTD-REG-S 3.50000% 16-30.09.21 2 400 000.00 2 415 292.32 0.06USD BRASKEM FINANCE LTD 6.45000% 14-03.02.24 515 000.00 561 350.00 0.01USD BRAZIL, FEDERATIVE REPUBLIC OF 8.87500% 01-15.04.24 320 000.00 409 600.00 0.01USD BRAZIL, FEDERATIVE REPUBLIC OF 8.25000% 04-20.01.34 3 600 000.00 4 590 000.00 0.12USD BRAZIL, FEDERATIVE REPUBLIC OF 7.12500% 06-20.01.37 1 080 000.00 1 255 500.00 0.03USD BRAZIL, FEDERATIVE REPUBLIC OF 5.00000% 14-27.01.45 11 578 000.00 10 373 888.00 0.26USD BRAZIL, FEDERATIVE REPUBLIC OF 6.00000% 16-07.04.26 7 917 000.00 8 692 866.00 0.22USD BRAZIL, FEDERATIVE REPUBLIC OF 5.62500% 16-21.02.47 860 000.00 839 360.00 0.02USD BUENOS AIRES, PROVINCE OF-REG-S 9.37500% 06-14.09.18 500 000.00 531 250.00 0.01USD CDBL FUNDING 1-REG-S 4.25000% 14-02.12.24 1 550 000.00 1 618 367.25 0.04USD CEMENTOS PROGRESO TRUST-REG-S 7.12500% 13-06.11.23 2 950 000.00 3 123 312.50 0.08USD CENTRAL BANK OF TUNISIA-REG-S 5.75000% 15-30.01.25 12 767 000.00 12 272 278.75 0.31USD CHILE, REPUBLIC OF 3.12500% 16-21.01.26 2 922 000.00 2 965 830.00 0.07USD CHINA EVERGRANDE GROUP-REG-S 7.00000% 17-23.03.20 2 073 000.00 2 096 321.25 0.05USD CHINA EVERGRANDE GROUP-REG-S 8.25000% 17-23.03.22 4 350 000.00 4 469 625.00 0.11USD CHINA EVERGRANDE GROUP-REG-S 6.25000% 17-28.06.21 5 110 000.00 4 988 637.50 0.13USD CHINA EVERGRANDE GROUP-REG-S 7.50000% 17-28.06.23 5 890 000.00 5 809 012.50 0.15USD CHINA EVERGRANDE GROUP-REG-S 8.75000% 17-28.06.25 8 660 000.00 8 651 340.00 0.22USD CHINA OIL & GAS GROUP LTD-REG-S 4.62500% 17-20.04.22 1 050 000.00 1 052 625.00 0.03USD CHINA OVERSEAS FINANCE-REG-S 3.95000% 12-15.11.22 200 000.00 207 392.76 0.00
Description Quantity/ Valuation in USD as a % Nominal Unrealized gain of net (loss) on Futures/ assets Forward Exchange Contracts/ Swaps (Note 1)
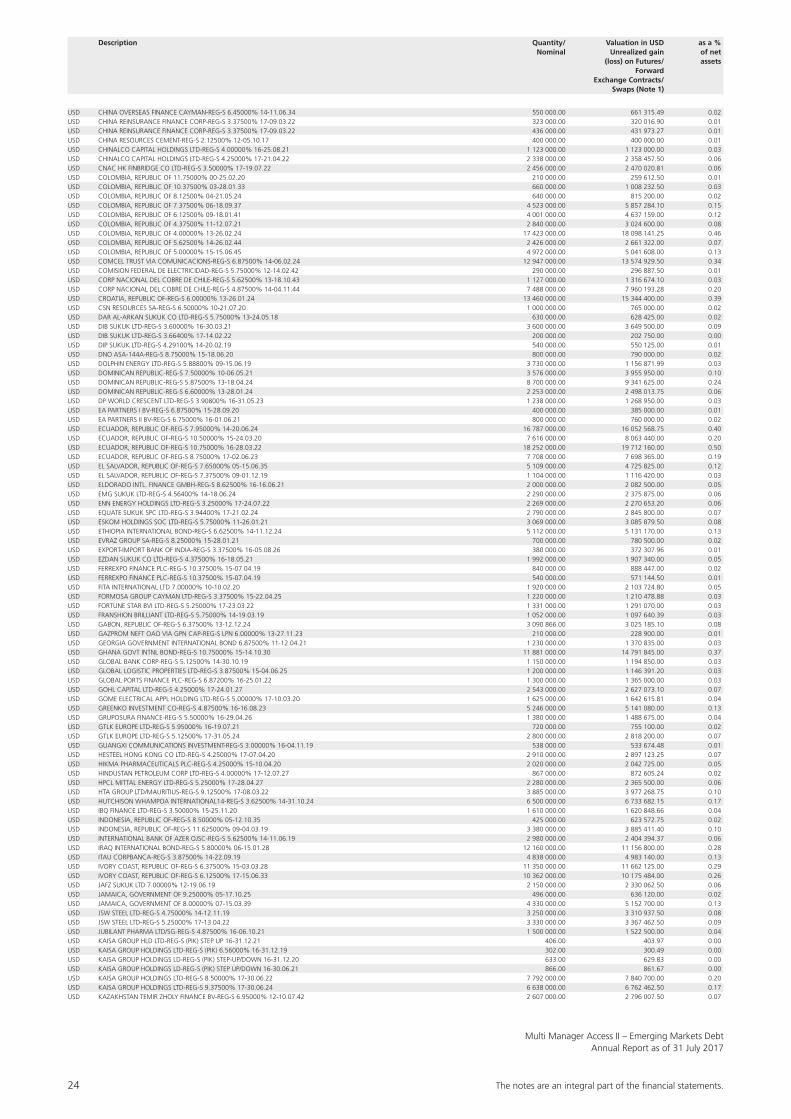
24 The notes are an integral part of the fi nancial statements.
Multi Manager Access II – Emerging Markets DebtAnnual Report as of 31 July 2017
USD CHINA OVERSEAS FINANCE CAYMAN-REG-S 6.45000% 14-11.06.34 550 000.00 661 315.49 0.02USD CHINA REINSURANCE FINANCE CORP-REG-S 3.37500% 17-09.03.22 323 000.00 320 016.90 0.01USD CHINA REINSURANCE FINANCE CORP-REG-S 3.37500% 17-09.03.22 436 000.00 431 973.27 0.01USD CHINA RESOURCES CEMENT-REG-S 2.12500% 12-05.10.17 400 000.00 400 000.00 0.01USD CHINALCO CAPITAL HOLDINGS LTD-REG-S 4.00000% 16-25.08.21 1 123 000.00 1 123 000.00 0.03USD CHINALCO CAPITAL HOLDINGS LTD-REG-S 4.25000% 17-21.04.22 2 338 000.00 2 358 457.50 0.06USD CNAC HK FINBRIDGE CO LTD-REG-S 3.50000% 17-19.07.22 2 456 000.00 2 470 020.81 0.06USD COLOMBIA, REPUBLIC OF 11.75000% 00-25.02.20 210 000.00 259 612.50 0.01USD COLOMBIA, REPUBLIC OF 10.37500% 03-28.01.33 660 000.00 1 008 232.50 0.03USD COLOMBIA, REPUBLIC OF 8.12500% 04-21.05.24 640 000.00 815 200.00 0.02USD COLOMBIA, REPUBLIC OF 7.37500% 06-18.09.37 4 523 000.00 5 857 284.10 0.15USD COLOMBIA, REPUBLIC OF 6.12500% 09-18.01.41 4 001 000.00 4 637 159.00 0.12USD COLOMBIA, REPUBLIC OF 4.37500% 11-12.07.21 2 840 000.00 3 024 600.00 0.08USD COLOMBIA, REPUBLIC OF 4.00000% 13-26.02.24 17 423 000.00 18 098 141.25 0.46USD COLOMBIA, REPUBLIC OF 5.62500% 14-26.02.44 2 426 000.00 2 661 322.00 0.07USD COLOMBIA, REPUBLIC OF 5.00000% 15-15.06.45 4 972 000.00 5 041 608.00 0.13USD COMCEL TRUST VIA COMUNICACIONS-REG-S 6.87500% 14-06.02.24 12 947 000.00 13 574 929.50 0.34USD COMISION FEDERAL DE ELECTRICIDAD-REG-S 5.75000% 12-14.02.42 290 000.00 296 887.50 0.01USD CORP NACIONAL DEL COBRE DE CHILE-REG-S 5.62500% 13-18.10.43 1 127 000.00 1 316 674.10 0.03USD CORP NACIONAL DEL COBRE DE CHILE-REG-S 4.87500% 14-04.11.44 7 488 000.00 7 960 193.28 0.20USD CROATIA, REPUBLIC OF-REG-S 6.00000% 13-26.01.24 13 460 000.00 15 344 400.00 0.39USD CSN RESOURCES SA-REG-S 6.50000% 10-21.07.20 1 000 000.00 765 000.00 0.02USD DAR AL-ARKAN SUKUK CO LTD-REG-S 5.75000% 13-24.05.18 630 000.00 628 425.00 0.02USD DIB SUKUK LTD-REG-S 3.60000% 16-30.03.21 3 600 000.00 3 649 500.00 0.09USD DIB SUKUK LTD-REG-S 3.66400% 17-14.02.22 200 000.00 202 750.00 0.00USD DIP SUKUK LTD-REG-S 4.29100% 14-20.02.19 540 000.00 550 125.00 0.01USD DNO ASA-144A-REG-S 8.75000% 15-18.06.20 800 000.00 790 000.00 0.02USD DOLPHIN ENERGY LTD-REG-S 5.88800% 09-15.06.19 3 730 000.00 1 156 871.99 0.03USD DOMINICAN REPUBLIC-REG-S 7.50000% 10-06.05.21 3 576 000.00 3 955 950.00 0.10USD DOMINICAN REPUBLIC-REG-S 5.87500% 13-18.04.24 8 700 000.00 9 341 625.00 0.24USD DOMINICAN REPUBLIC-REG-S 6.60000% 13-28.01.24 2 253 000.00 2 498 013.75 0.06USD DP WORLD CRESCENT LTD-REG-S 3.90800% 16-31.05.23 1 238 000.00 1 268 950.00 0.03USD EA PARTNERS I BV-REG-S 6.87500% 15-28.09.20 400 000.00 385 000.00 0.01USD EA PARTNERS II BV-REG-S 6.75000% 16-01.06.21 800 000.00 760 000.00 0.02USD ECUADOR, REPUBLIC OF-REG-S 7.95000% 14-20.06.24 16 787 000.00 16 052 568.75 0.40USD ECUADOR, REPUBLIC OF-REG-S 10.50000% 15-24.03.20 7 616 000.00 8 063 440.00 0.20USD ECUADOR, REPUBLIC OF-REG-S 10.75000% 16-28.03.22 18 252 000.00 19 712 160.00 0.50USD ECUADOR, REPUBLIC OF-REG-S 8.75000% 17-02.06.23 7 708 000.00 7 698 365.00 0.19USD EL SALVADOR, REPUBLIC OF-REG-S 7.65000% 05-15.06.35 5 109 000.00 4 725 825.00 0.12USD EL SALVADOR, REPUBLIC OF-REG-S 7.37500% 09-01.12.19 1 104 000.00 1 116 420.00 0.03USD ELDORADO INTL. FINANCE GMBH-REG-S 8.62500% 16-16.06.21 2 000 000.00 2 082 500.00 0.05USD EMG SUKUK LTD-REG-S 4.56400% 14-18.06.24 2 290 000.00 2 375 875.00 0.06USD ENN ENERGY HOLDINGS LTD-REG-S 3.25000% 17-24.07.22 2 269 000.00 2 270 653.20 0.06USD EQUATE SUKUK SPC LTD-REG-S 3.94400% 17-21.02.24 2 790 000.00 2 845 800.00 0.07USD ESKOM HOLDINGS SOC LTD-REG-S 5.75000% 11-26.01.21 3 069 000.00 3 085 879.50 0.08USD ETHIOPIA INTERNATIONAL BOND-REG-S 6.62500% 14-11.12.24 5 112 000.00 5 131 170.00 0.13USD EVRAZ GROUP SA-REG-S 8.25000% 15-28.01.21 700 000.00 780 500.00 0.02USD EXPORT-IMPORT BANK OF INDIA-REG-S 3.37500% 16-05.08.26 380 000.00 372 307.96 0.01USD EZDAN SUKUK CO LTD-REG-S 4.37500% 16-18.05.21 1 992 000.00 1 907 340.00 0.05USD FERREXPO FINANCE PLC-REG-S 10.37500% 15-07.04.19 840 000.00 888 447.00 0.02USD FERREXPO FINANCE PLC-REG-S 10.37500% 15-07.04.19 540 000.00 571 144.50 0.01USD FITA INTERNATIONAL LTD 7.00000% 10-10.02.20 1 920 000.00 2 103 724.80 0.05USD FORMOSA GROUP CAYMAN LTD-REG-S 3.37500% 15-22.04.25 1 220 000.00 1 210 478.88 0.03USD FORTUNE STAR BVI LTD-REG-S 5.25000% 17-23.03.22 1 331 000.00 1 291 070.00 0.03USD FRANSHION BRILLIANT LTD-REG-S 5.75000% 14-19.03.19 1 052 000.00 1 097 640.39 0.03USD GABON, REPUBLIC OF-REG-S 6.37500% 13-12.12.24 3 090 866.00 3 025 185.10 0.08USD GAZPROM NEFT OAO VIA GPN CAP-REG-S LPN 6.00000% 13-27.11.23 210 000.00 228 900.00 0.01USD GEORGIA GOVERNMENT INTERNATIONAL BOND 6.87500% 11-12.04.21 1 230 000.00 1 370 835.00 0.03USD GHANA GOVT INTNL BOND-REG-S 10.75000% 15-14.10.30 11 881 000.00 14 791 845.00 0.37USD GLOBAL BANK CORP-REG-S 5.12500% 14-30.10.19 1 150 000.00 1 194 850.00 0.03USD GLOBAL LOGISTIC PROPERTIES LTD-REG-S 3.87500% 15-04.06.25 1 200 000.00 1 146 391.20 0.03USD GLOBAL PORTS FINANCE PLC-REG-S 6.87200% 16-25.01.22 1 300 000.00 1 365 000.00 0.03USD GOHL CAPITAL LTD-REG-S 4.25000% 17-24.01.27 2 543 000.00 2 627 073.10 0.07USD GOME ELECTRICAL APPL HOLDING LTD-REG-S 5.00000% 17-10.03.20 1 625 000.00 1 642 615.81 0.04USD GREENKO INVESTMENT CO-REG-S 4.87500% 16-16.08.23 5 246 000.00 5 141 080.00 0.13USD GRUPOSURA FINANCE-REG-S 5.50000% 16-29.04.26 1 380 000.00 1 488 675.00 0.04USD GTLK EUROPE LTD-REG-S 5.95000% 16-19.07.21 720 000.00 755 100.00 0.02USD GTLK EUROPE LTD-REG-S 5.12500% 17-31.05.24 2 800 000.00 2 818 200.00 0.07USD GUANGXI COMMUNICATIONS INVESTMENT-REG-S 3.00000% 16-04.11.19 538 000.00 533 674.48 0.01USD HESTEEL HONG KONG CO LTD-REG-S 4.25000% 17-07.04.20 2 910 000.00 2 897 123.25 0.07USD HIKMA PHARMACEUTICALS PLC-REG-S 4.25000% 15-10.04.20 2 020 000.00 2 042 725.00 0.05USD HINDUSTAN PETROLEUM CORP LTD-REG-S 4.00000% 17-12.07.27 867 000.00 872 605.24 0.02USD HPCL MITTAL ENERGY LTD-REG-S 5.25000% 17-28.04.27 2 280 000.00 2 365 500.00 0.06USD HTA GROUP LTD/MAURITIUS-REG-S 9.12500% 17-08.03.22 3 885 000.00 3 977 268.75 0.10USD HUTCHISON WHAMPOA INTERNATIONAL14-REG-S 3.62500% 14-31.10.24 6 500 000.00 6 733 682.15 0.17USD IBQ FINANCE LTD-REG-S 3.50000% 15-25.11.20 1 610 000.00 1 620 848.66 0.04USD INDONESIA, REPUBLIC OF-REG-S 8.50000% 05-12.10.35 425 000.00 623 572.75 0.02USD INDONESIA, REPUBLIC OF-REG-S 11.625000% 09-04.03.19 3 380 000.00 3 885 411.40 0.10USD INTERNATIONAL BANK OF AZER OJSC-REG-S 5.62500% 14-11.06.19 2 980 000.00 2 404 394.37 0.06USD IRAQ INTERNATIONAL BOND-REG-S 5.80000% 06-15.01.28 12 160 000.00 11 156 800.00 0.28USD ITAU CORPBANCA-REG-S 3.87500% 14-22.09.19 4 838 000.00 4 983 140.00 0.13USD IVORY COAST, REPUBLIC OF-REG-S 6.37500% 15-03.03.28 11 350 000.00 11 662 125.00 0.29USD IVORY COAST, REPUBLIC OF-REG-S 6.12500% 17-15.06.33 10 362 000.00 10 175 484.00 0.26USD JAFZ SUKUK LTD 7.00000% 12-19.06.19 2 150 000.00 2 330 062.50 0.06USD JAMAICA, GOVERNMENT OF 9.25000% 05-17.10.25 496 000.00 636 120.00 0.02USD JAMAICA, GOVERNMENT OF 8.00000% 07-15.03.39 4 330 000.00 5 152 700.00 0.13USD JSW STEEL LTD-REG-S 4.75000% 14-12.11.19 3 250 000.00 3 310 937.50 0.08USD JSW STEEL LTD-REG-S 5.25000% 17-13.04.22 3 330 000.00 3 367 462.50 0.09USD JUBILANT PHARMA LTD/SG-REG-S 4.87500% 16-06.10.21 1 500 000.00 1 522 500.00 0.04USD KAISA GROUP HLD LTD-REG-S (PIK) STEP UP 16-31.12.21 406.00 403.97 0.00USD KAISA GROUP HOLDINGS LTD-REG-S (PIK) 6.56000% 16-31.12.19 302.00 300.49 0.00USD KAISA GROUP HOLDINGS LD-REG-S (PIK) STEP-UP/DOWN 16-31.12.20 633.00 629.83 0.00USD KAISA GROUP HOLDINGS LD-REG-S (PIK) STEP UP/DOWN 16-30.06.21 866.00 861.67 0.00USD KAISA GROUP HOLDINGS LTD-REG-S 8.50000% 17-30.06.22 7 792 000.00 7 840 700.00 0.20USD KAISA GROUP HOLDINGS LTD-REG-S 9.37500% 17-30.06.24 6 638 000.00 6 762 462.50 0.17USD KAZAKHSTAN TEMIR ZHOLY FINANCE BV-REG-S 6.95000% 12-10.07.42 2 607 000.00 2 796 007.50 0.07
Description Quantity/ Valuation in USD as a % Nominal Unrealized gain of net (loss) on Futures/ assets Forward Exchange Contracts/ Swaps (Note 1)
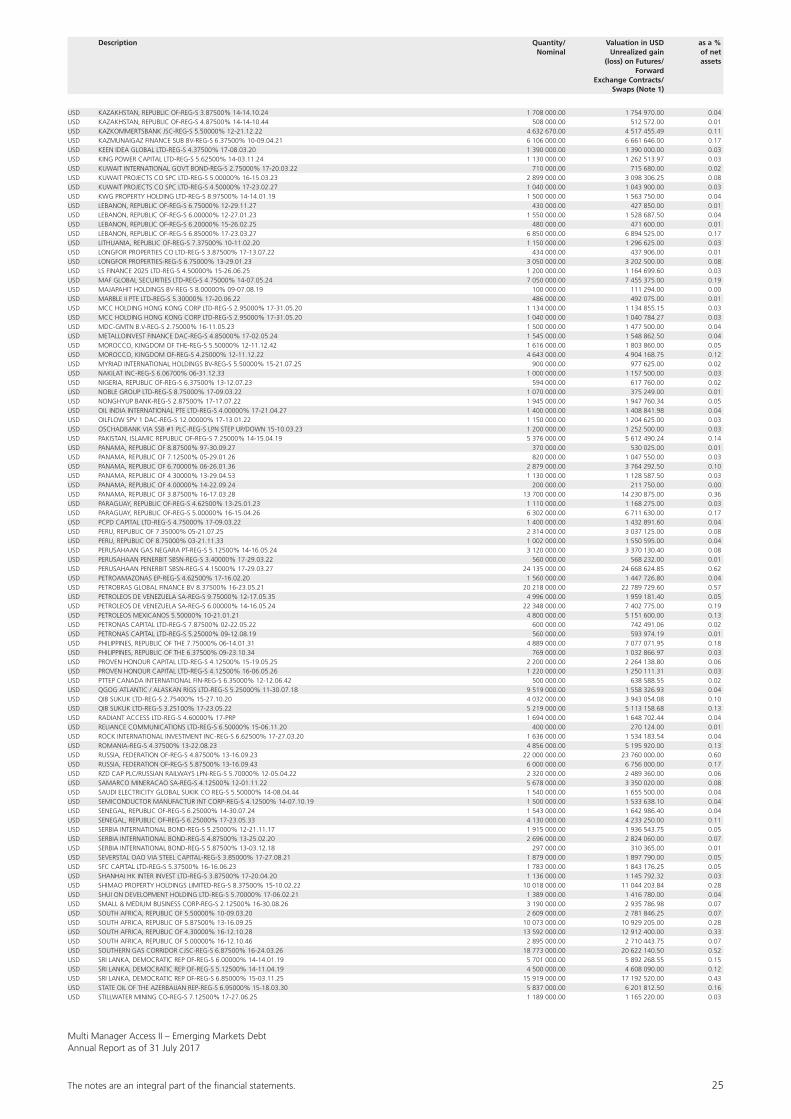
The notes are an integral part of the fi nancial statements. 25
Multi Manager Access II – Emerging Markets DebtAnnual Report as of 31 July 2017
USD KAZAKHSTAN, REPUBLIC OF-REG-S 3.87500% 14-14.10.24 1 708 000.00 1 754 970.00 0.04USD KAZAKHSTAN, REPUBLIC OF-REG-S 4.87500% 14-14-10.44 508 000.00 512 572.00 0.01USD KAZKOMMERTSBANK JSC-REG-S 5.50000% 12-21.12.22 4 632 670.00 4 517 455.49 0.11USD KAZMUNAIGAZ FINANCE SUB BV-REG-S 6.37500% 10-09.04.21 6 106 000.00 6 661 646.00 0.17USD KEEN IDEA GLOBAL LTD-REG-S 4.37500% 17-08.03.20 1 390 000.00 1 390 000.00 0.03USD KING POWER CAPITAL LTD-REG-S 5.62500% 14-03.11.24 1 130 000.00 1 262 513.97 0.03USD KUWAIT INTERNATIONAL GOVT BOND-REG-S 2.75000% 17-20.03.22 710 000.00 715 680.00 0.02USD KUWAIT PROJECTS CO SPC LTD-REG-S 5.00000% 16-15.03.23 2 899 000.00 3 098 306.25 0.08USD KUWAIT PROJECTS CO SPC LTD-REG-S 4.50000% 17-23.02.27 1 040 000.00 1 043 900.00 0.03USD KWG PROPERTY HOLDING LTD-REG-S 8.97500% 14-14.01.19 1 500 000.00 1 563 750.00 0.04USD LEBANON, REPUBLIC OF-REG-S 6.75000% 12-29.11.27 430 000.00 427 850.00 0.01USD LEBANON, REPUBLIC OF-REG-S 6.00000% 12-27.01.23 1 550 000.00 1 528 687.50 0.04USD LEBANON, REPUBLIC OF-REG-S 6.20000% 15-26.02.25 480 000.00 471 600.00 0.01USD LEBANON, REPUBLIC OF-REG-S 6.85000% 17-23.03.27 6 850 000.00 6 894 525.00 0.17USD LITHUANIA, REPUBLIC OF-REG-S 7.37500% 10-11.02.20 1 150 000.00 1 296 625.00 0.03USD LONGFOR PROPERTIES CO LTD-REG-S 3.87500% 17-13.07.22 434 000.00 437 906.00 0.01USD LONGFOR PROPERTIES-REG-S 6.75000% 13-29.01.23 3 050 000.00 3 202 500.00 0.08USD LS FINANCE 2025 LTD-REG-S 4.50000% 15-26.06.25 1 200 000.00 1 164 699.60 0.03USD MAF GLOBAL SECURITIES LTD-REG-S 4.75000% 14-07.05.24 7 050 000.00 7 455 375.00 0.19USD MAJAPAHIT HOLDINGS BV-REG-S 8.00000% 09-07.08.19 100 000.00 111 294.00 0.00USD MARBLE II PTE LTD-REG-S 5.30000% 17-20.06.22 486 000.00 492 075.00 0.01USD MCC HOLDING HONG KONG CORP LTD-REG-S 2.95000% 17-31.05.20 1 134 000.00 1 134 855.15 0.03USD MCC HOLDING HONG KONG CORP LTD-REG-S 2.95000% 17-31.05.20 1 040 000.00 1 040 784.27 0.03USD MDC-GMTN B.V-REG-S 2.75000% 16-11.05.23 1 500 000.00 1 477 500.00 0.04USD METALLOINVEST FINANCE DAC-REG-S 4.85000% 17-02.05.24 1 545 000.00 1 548 862.50 0.04USD MOROCCO, KINGDOM OF THE-REG-S 5.50000% 12-11.12.42 1 616 000.00 1 803 860.00 0.05USD MOROCCO, KINGDOM OF-REG-S 4.25000% 12-11.12.22 4 643 000.00 4 904 168.75 0.12USD MYRIAD INTERNATIONAL HOLDINGS BV-REG-S 5.50000% 15-21.07.25 900 000.00 977 625.00 0.02USD NAKILAT INC-REG-S 6.06700% 06-31.12.33 1 000 000.00 1 157 500.00 0.03USD NIGERIA, REPUBLIC OF-REG-S 6.37500% 13-12.07.23 594 000.00 617 760.00 0.02USD NOBLE GROUP LTD-REG-S 8.75000% 17-09.03.22 1 070 000.00 375 249.00 0.01USD NONGHYUP BANK-REG-S 2.87500% 17-17.07.22 1 945 000.00 1 947 760.34 0.05USD OIL INDIA INTERNATIONAL PTE LTD-REG-S 4.00000% 17-21.04.27 1 400 000.00 1 408 841.98 0.04USD OILFLOW SPV 1 DAC-REG-S 12.00000% 17-13.01.22 1 150 000.00 1 204 625.00 0.03USD OSCHADBANK VIA SSB #1 PLC-REG-S LPN STEP UP/DOWN 15-10.03.23 1 200 000.00 1 252 500.00 0.03USD PAKISTAN, ISLAMIC REPUBLIC OF-REG-S 7.25000% 14-15.04.19 5 376 000.00 5 612 490.24 0.14USD PANAMA, REPUBLIC OF 8.87500% 97-30.09.27 370 000.00 530 025.00 0.01USD PANAMA, REPUBLIC OF 7.12500% 05-29.01.26 820 000.00 1 047 550.00 0.03USD PANAMA, REPUBLIC OF 6.70000% 06-26.01.36 2 879 000.00 3 764 292.50 0.10USD PANAMA, REPUBLIC OF 4.30000% 13-29.04.53 1 130 000.00 1 128 587.50 0.03USD PANAMA, REPUBLIC OF 4.00000% 14-22.09.24 200 000.00 211 750.00 0.00USD PANAMA, REPUBLIC OF 3.87500% 16-17.03.28 13 700 000.00 14 230 875.00 0.36USD PARAGUAY, REPUBLIC OF-REG-S 4.62500% 13-25.01.23 1 110 000.00 1 168 275.00 0.03USD PARAGUAY, REPUBLIC OF-REG-S 5.00000% 16-15.04.26 6 302 000.00 6 711 630.00 0.17USD PCPD CAPITAL LTD-REG-S 4.75000% 17-09.03.22 1 400 000.00 1 432 891.60 0.04USD PERU, REPUBLIC OF 7.35000% 05-21.07.25 2 314 000.00 3 037 125.00 0.08USD PERU, REPUBLIC OF 8.75000% 03-21.11.33 1 002 000.00 1 550 595.00 0.04USD PERUSAHAAN GAS NEGARA PT-REG-S 5.12500% 14-16.05.24 3 120 000.00 3 370 130.40 0.08USD PERUSAHAAN PENERBIT SBSN-REG-S 3.40000% 17-29.03.22 560 000.00 568 232.00 0.01USD PERUSAHAAN PENERBIT SBSN-REG-S 4.15000% 17-29.03.27 24 135 000.00 24 668 624.85 0.62USD PETROAMAZONAS EP-REG-S 4.62500% 17-16.02.20 1 560 000.00 1 447 726.80 0.04USD PETROBRAS GLOBAL FINANCE BV 8.37500% 16-23.05.21 20 218 000.00 22 789 729.60 0.57USD PETROLEOS DE VENEZUELA SA-REG-S 9.75000% 12-17.05.35 4 996 000.00 1 959 181.40 0.05USD PETROLEOS DE VENEZUELA SA-REG-S 6.00000% 14-16.05.24 22 348 000.00 7 402 775.00 0.19USD PETROLEOS MEXICANOS 5.50000% 10-21.01.21 4 800 000.00 5 151 600.00 0.13USD PETRONAS CAPITAL LTD-REG-S 7.87500% 02-22.05.22 600 000.00 742 491.06 0.02USD PETRONAS CAPITAL LTD-REG-S 5.25000% 09-12.08.19 560 000.00 593 974.19 0.01USD PHILIPPINES, REPUBLIC OF THE 7.75000% 06-14.01.31 4 889 000.00 7 077 071.95 0.18USD PHILIPPINES, REPUBLIC OF THE 6.37500% 09-23.10.34 769 000.00 1 032 866.97 0.03USD PROVEN HONOUR CAPITAL LTD-REG-S 4.12500% 15-19.05.25 2 200 000.00 2 264 138.80 0.06USD PROVEN HONOUR CAPITAL LTD-REG-S 4.12500% 16-06.05.26 1 220 000.00 1 250 111.31 0.03USD PTTEP CANADA INTERNATIONAL FIN-REG-S 6.35000% 12-12.06.42 500 000.00 638 588.55 0.02USD QGOG ATLANTIC / ALASKAN RIGS LTD-REG-S 5.25000% 11-30.07.18 9 519 000.00 1 558 326.93 0.04USD QIB SUKUK LTD-REG-S 2.75400% 15-27.10.20 4 032 000.00 3 943 054.08 0.10USD QIB SUKUK LTD-REG-S 3.25100% 17-23.05.22 5 219 000.00 5 113 158.68 0.13USD RADIANT ACCESS LTD-REG-S 4.60000% 17-PRP 1 694 000.00 1 648 702.44 0.04USD RELIANCE COMMUNICATIONS LTD-REG-S 6.50000% 15-06.11.20 400 000.00 270 124.00 0.01USD ROCK INTERNATIONAL INVESTMENT INC-REG-S 6.62500% 17-27.03.20 1 636 000.00 1 534 183.54 0.04USD ROMANIA-REG-S 4.37500% 13-22.08.23 4 856 000.00 5 195 920.00 0.13USD RUSSIA, FEDERATION OF-REG-S 4.87500% 13-16.09.23 22 000 000.00 23 760 000.00 0.60USD RUSSIA, FEDERATION OF-REG-S 5.87500% 13-16.09.43 6 000 000.00 6 756 000.00 0.17USD RZD CAP PLC/RUSSIAN RAILWAYS LPN-REG-S 5.70000% 12-05.04.22 2 320 000.00 2 489 360.00 0.06USD SAMARCO MINERACAO SA-REG-S 4.12500% 12-01.11.22 5 678 000.00 3 350 020.00 0.08USD SAUDI ELECTRICITY GLOBAL SUKIK CO REG-S 5.50000% 14-08.04.44 1 540 000.00 1 655 500.00 0.04USD SEMICONDUCTOR MANUFACTUR INT CORP-REG-S 4.12500% 14-07.10.19 1 500 000.00 1 533 638.10 0.04USD SENEGAL, REPUBLIC OF-REG-S 6.25000% 14-30.07.24 1 543 000.00 1 642 986.40 0.04USD SENEGAL, REPUBLIC OF-REG-S 6.25000% 17-23.05.33 4 130 000.00 4 233 250.00 0.11USD SERBIA INTERNATIONAL BOND-REG-S 5.25000% 12-21.11.17 1 915 000.00 1 936 543.75 0.05USD SERBIA INTERNATIONAL BOND-REG-S 4.87500% 13-25.02.20 2 696 000.00 2 824 060.00 0.07USD SERBIA INTERNATIONAL BOND-REG-S 5.87500% 13-03.12.18 297 000.00 310 365.00 0.01USD SEVERSTAL OAO VIA STEEL CAPITAL-REG-S 3.85000% 17-27.08.21 1 879 000.00 1 897 790.00 0.05USD SFC CAPITAL LTD-REG-S 5.37500% 16-16.06.23 1 783 000.00 1 843 176.25 0.05USD SHANHAI HK INTER INVEST LTD-REG-S 3.87500% 17-20.04.20 1 136 000.00 1 145 792.32 0.03USD SHIMAO PROPERTY HOLDINGS LIMITED-REG-S 8.37500% 15-10.02.22 10 018 000.00 11 044 203.84 0.28USD SHUI ON DEVELOPMENT HOLDING LTD-REG-S 5.70000% 17-06.02.21 1 389 000.00 1 416 780.00 0.04USD SMALL & MEDIUM BUSINESS CORP-REG-S 2.12500% 16-30.08.26 3 190 000.00 2 935 786.98 0.07USD SOUTH AFRICA, REPUBLIC OF 5.50000% 10-09.03.20 2 609 000.00 2 781 846.25 0.07USD SOUTH AFRICA, REPUBLIC OF 5.87500% 13-16.09.25 10 073 000.00 10 929 205.00 0.28USD SOUTH AFRICA, REPUBLIC OF 4.30000% 16-12.10.28 13 592 000.00 12 912 400.00 0.33USD SOUTH AFRICA, REPUBLIC OF 5.00000% 16-12.10.46 2 895 000.00 2 710 443.75 0.07USD SOUTHERN GAS CORRIDOR CJSC-REG-S 6.87500% 16-24.03.26 18 773 000.00 20 622 140.50 0.52USD SRI LANKA, DEMOCRATIC REP OF-REG-S 6.00000% 14-14.01.19 5 701 000.00 5 892 268.55 0.15USD SRI LANKA, DEMOCRATIC REP OF-REG-S 5.12500% 14-11.04.19 4 500 000.00 4 608 090.00 0.12USD SRI LANKA, DEMOCRATIC REP OF-REG-S 6.85000% 15-03.11.25 15 919 000.00 17 192 520.00 0.43USD STATE OIL OF THE AZERBAIJAN REP-REG-S 6.95000% 15-18.03.30 5 837 000.00 6 201 812.50 0.16USD STILLWATER MINING CO-REG-S 7.12500% 17-27.06.25 1 189 000.00 1 165 220.00 0.03
Description Quantity/ Valuation in USD as a % Nominal Unrealized gain of net (loss) on Futures/ assets Forward Exchange Contracts/ Swaps (Note 1)
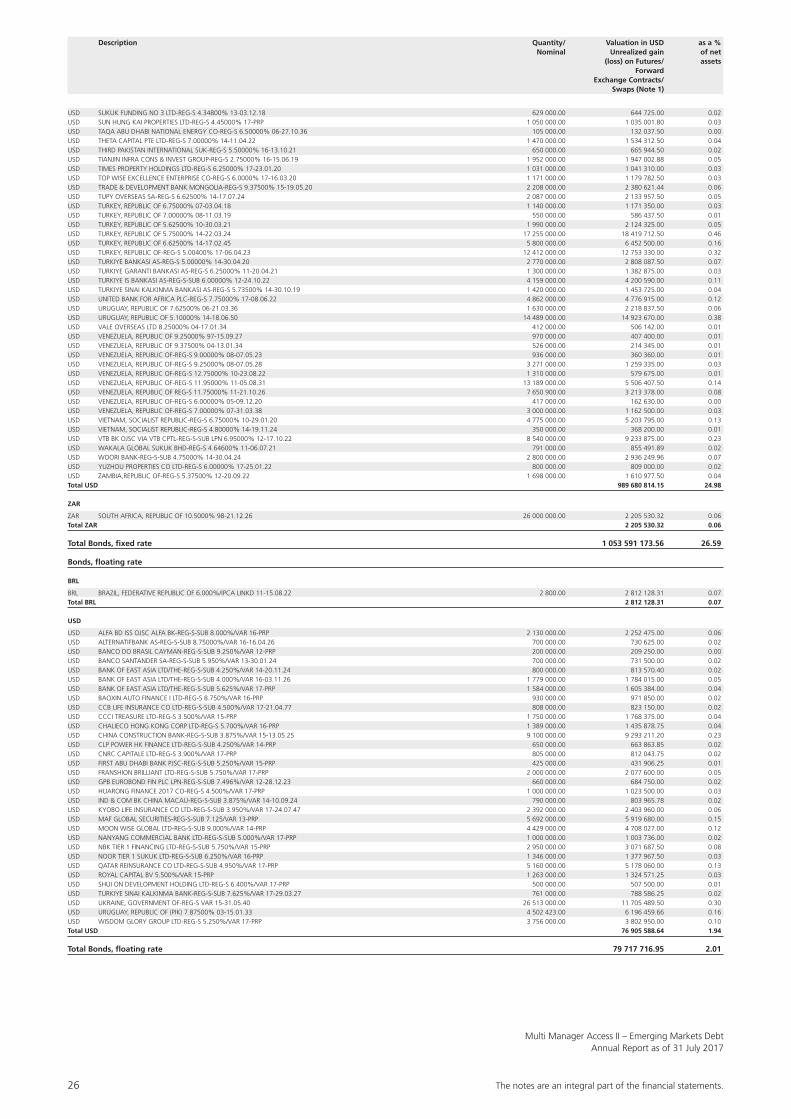
26 The notes are an integral part of the fi nancial statements.
Multi Manager Access II – Emerging Markets DebtAnnual Report as of 31 July 2017
USD SUKUK FUNDING NO 3 LTD-REG-S 4.34800% 13-03.12.18 629 000.00 644 725.00 0.02USD SUN HUNG KAI PROPERTIES LTD-REG-S 4.45000% 17-PRP 1 050 000.00 1 035 001.80 0.03USD TAQA ABU DHABI NATIONAL ENERGY CO-REG-S 6.50000% 06-27.10.36 105 000.00 132 037.50 0.00USD THETA CAPITAL PTE LTD-REG-S 7.00000% 14-11.04.22 1 470 000.00 1 534 312.50 0.04USD THIRD PAKISTAN INTERNATIONAL SUK-REG-S 5.50000% 16-13.10.21 650 000.00 665 944.50 0.02USD TIANJIN INFRA CONS & INVEST GROUP-REG-S 2.75000% 16-15.06.19 1 952 000.00 1 947 002.88 0.05USD TIMES PROPERTY HOLDINGS LTD-REG-S 6.25000% 17-23.01.20 1 031 000.00 1 041 310.00 0.03USD TOP WISE EXCELLENCE ENTERPRISE CO-REG-S 6.0000% 17-16.03.20 1 171 000.00 1 179 782.50 0.03USD TRADE & DEVELOPMENT BANK MONGOLIA-REG-S 9.37500% 15-19.05.20 2 208 000.00 2 380 621.44 0.06USD TUPY OVERSEAS SA-REG-S 6.62500% 14-17.07.24 2 087 000.00 2 133 957.50 0.05USD TURKEY, REPUBLIC OF 6.75000% 07-03.04.18 1 140 000.00 1 171 350.00 0.03USD TURKEY, REPUBLIC OF 7.00000% 08-11.03.19 550 000.00 586 437.50 0.01USD TURKEY, REPUBLIC OF 5.62500% 10-30.03.21 1 990 000.00 2 124 325.00 0.05USD TURKEY, REPUBLIC OF 5.75000% 14-22.03.24 17 255 000.00 18 419 712.50 0.46USD TURKEY, REPUBLIC OF 6.62500% 14-17.02.45 5 800 000.00 6 452 500.00 0.16USD TURKEY, REPUBLIC OF-REG-S 5.00400% 17-06.04.23 12 412 000.00 12 753 330.00 0.32USD TURKIYE BANKASI AS-REG-S 5.00000% 14-30.04.20 2 770 000.00 2 808 087.50 0.07USD TURKIYE GARANTI BANKASI AS-REG-S 6.25000% 11-20.04.21 1 300 000.00 1 382 875.00 0.03USD TURKIYE IS BANKASI AS-REG-S-SUB 6.00000% 12-24.10.22 4 159 000.00 4 200 590.00 0.11USD TURKIYE SINAI KALKINMA BANKASI AS-REG-S 5.73500% 14-30.10.19 1 420 000.00 1 453 725.00 0.04USD UNITED BANK FOR AFRICA PLC-REG-S 7.75000% 17-08.06.22 4 862 000.00 4 776 915.00 0.12USD URUGUAY, REPUBLIC OF 7.62500% 06-21.03.36 1 630 000.00 2 218 837.50 0.06USD URUGUAY, REPUBLIC OF 5.10000% 14-18.06.50 14 489 000.00 14 923 670.00 0.38USD VALE OVERSEAS LTD 8.25000% 04-17.01.34 412 000.00 506 142.00 0.01USD VENEZUELA, REPUBLIC OF 9.25000% 97-15.09.27 970 000.00 407 400.00 0.01USD VENEZUELA, REPUBLIC OF 9.37500% 04-13.01.34 526 000.00 214 345.00 0.01USD VENEZUELA, REPUBLIC OF-REG-S 9.00000% 08-07.05.23 936 000.00 360 360.00 0.01USD VENEZUELA, REPUBLIC OF-REG-S 9.25000% 08-07.05.28 3 271 000.00 1 259 335.00 0.03USD VENEZUELA, REPUBLIC OF-REG-S 12.75000% 10-23.08.22 1 310 000.00 579 675.00 0.01USD VENEZUELA, REPUBLIC OF-REG-S 11.95000% 11-05.08.31 13 189 000.00 5 506 407.50 0.14USD VENEZUELA, REPUBLIC OF REG-S 11.75000% 11-21.10.26 7 650 900.00 3 213 378.00 0.08USD VENEZUELA, REPUBLIC OF-REG-S 6.00000% 05-09.12.20 417 000.00 162 630.00 0.00USD VENEZUELA, REPUBLIC OF-REG-S 7.00000% 07-31.03.38 3 000 000.00 1 162 500.00 0.03USD VIETNAM, SOCIALIST REPUBLIC-REG-S 6.75000% 10-29.01.20 4 775 000.00 5 203 795.00 0.13USD VIETNAM, SOCIALIST REPUBLIC-REG-S 4.80000% 14-19.11.24 350 000.00 368 200.00 0.01USD VTB BK OJSC VIA VTB CPTL-REG-S-SUB LPN 6.95000% 12-17.10.22 8 540 000.00 9 233 875.00 0.23USD WAKALA GLOBAL SUKUK BHD-REG-S 4.64600% 11-06.07.21 791 000.00 855 491.89 0.02USD WOORI BANK-REG-S-SUB 4.75000% 14-30.04.24 2 800 000.00 2 936 249.96 0.07USD YUZHOU PROPERTIES CO LTD-REG-S 6.00000% 17-25.01.22 800 000.00 809 000.00 0.02USD ZAMBIA,REPUBLIC OF-REG-S 5.37500% 12-20.09.22 1 698 000.00 1 610 977.50 0.04Total USD 989 680 814.15 24.98
ZAR
ZAR SOUTH AFRICA, REPUBLIC OF 10.5000% 98-21.12.26 26 000 000.00 2 205 530.32 0.06Total ZAR 2 205 530.32 0.06
Total Bonds, fixed rate 1 053 591 173.56 26.59
Bonds, floating rate
BRL
BRL BRAZIL, FEDERATIVE REPUBLIC OF 6.000%/IPCA LINKD 11-15.08.22 2 800.00 2 812 128.31 0.07Total BRL 2 812 128.31 0.07
USD
USD ALFA BD ISS OJSC ALFA BK-REG-S-SUB 8.000%/VAR 16-PRP 2 130 000.00 2 252 475.00 0.06USD ALTERNATIFBANK AS-REG-S-SUB 8.75000%/VAR 16-16.04.26 700 000.00 730 625.00 0.02USD BANCO DO BRASIL CAYMAN-REG-S-SUB 9.250%/VAR 12-PRP 200 000.00 209 250.00 0.00USD BANCO SANTANDER SA-REG-S-SUB 5.950%/VAR 13-30.01.24 700 000.00 731 500.00 0.02USD BANK OF EAST ASIA LTD/THE-REG-S-SUB 4.250%/VAR 14-20.11.24 800 000.00 813 570.40 0.02USD BANK OF EAST ASIA LTD/THE-REG-S-SUB 4.000%/VAR 16-03.11.26 1 779 000.00 1 784 015.00 0.05USD BANK OF EAST ASIA LTD/THE-REG-S-SUB 5.625%/VAR 17-PRP 1 584 000.00 1 605 384.00 0.04USD BAOXIN AUTO FINANCE I LTD-REG-S 8.750%/VAR 16-PRP 930 000.00 971 850.00 0.02USD CCB LIFE INSURANCE CO LTD-REG-S-SUB 4.500%/VAR 17-21.04.77 808 000.00 823 150.00 0.02USD CCCI TREASURE LTD-REG-S 3.500%/VAR 15-PRP 1 750 000.00 1 768 375.00 0.04USD CHALIECO HONG KONG CORP LTD-REG-S 5.700%/VAR 16-PRP 1 389 000.00 1 435 878.75 0.04USD CHINA CONSTRUCTION BANK-REG-S-SUB 3.875%/VAR 15-13.05.25 9 100 000.00 9 293 211.20 0.23USD CLP POWER HK FINANCE LTD-REG-S-SUB 4.250%/VAR 14-PRP 650 000.00 663 863.85 0.02USD CNRC CAPITALE LTD-REG-S 3.900%/VAR 17-PRP 805 000.00 812 043.75 0.02USD FIRST ABU DHABI BANK PJSC-REG-S-SUB 5.250%/VAR 15-PRP 425 000.00 431 906.25 0.01USD FRANSHION BRILLIANT LTD-REG-S-SUB 5.750%/VAR 17-PRP 2 000 000.00 2 077 600.00 0.05USD GPB EUROBOND FIN PLC LPN-REG-S-SUB 7.496%/VAR 12-28.12.23 660 000.00 684 750.00 0.02USD HUARONG FINANCE 2017 CO-REG-S 4.500%/VAR 17-PRP 1 000 000.00 1 023 500.00 0.03USD IND & COM BK CHINA MACAU-REG-S-SUB 3.875%/VAR 14-10.09.24 790 000.00 803 965.78 0.02USD KYOBO LIFE INSURANCE CO LTD-REG-S-SUB 3.950%/VAR 17-24.07.47 2 392 000.00 2 403 960.00 0.06USD MAF GLOBAL SECURITIES-REG-S-SUB 7.125/VAR 13-PRP 5 692 000.00 5 919 680.00 0.15USD MOON WISE GLOBAL LTD-REG-S-SUB 9.000%/VAR 14-PRP 4 429 000.00 4 708 027.00 0.12USD NANYANG COMMERCIAL BANK LTD-REG-S-SUB 5.000%/VAR 17-PRP 1 000 000.00 1 003 736.00 0.02USD NBK TIER 1 FINANCING LTD-REG-S-SUB 5.750%/VAR 15-PRP 2 950 000.00 3 071 687.50 0.08USD NOOR TIER 1 SUKUK LTD-REG-S-SUB 6.250%/VAR 16-PRP 1 346 000.00 1 377 967.50 0.03USD QATAR REINSURANCE CO LTD-REG-S-SUB 4.950%/VAR 17-PRP 5 160 000.00 5 178 060.00 0.13USD ROYAL CAPITAL BV 5.500%/VAR 15-PRP 1 263 000.00 1 324 571.25 0.03USD SHUI ON DEVELOPMENT HOLDING LTD-REG-S 6.400%/VAR 17-PRP 500 000.00 507 500.00 0.01USD TURKIYE SINAI KALKINMA BANK-REG-S-SUB 7.625%/VAR 17-29.03.27 761 000.00 788 586.25 0.02USD UKRAINE, GOVERNMENT OF-REG-S VAR 15-31.05.40 26 513 000.00 11 705 489.50 0.30USD URUGUAY, REPUBLIC OF (PIK) 7.87500% 03-15.01.33 4 502 423.00 6 196 459.66 0.16USD WISDOM GLORY GROUP LTD-REG-S 5.250%/VAR 17-PRP 3 756 000.00 3 802 950.00 0.10Total USD 76 905 588.64 1.94
Total Bonds, floating rate 79 717 716.95 2.01
Description Quantity/ Valuation in USD as a % Nominal Unrealized gain of net (loss) on Futures/ assets Forward Exchange Contracts/ Swaps (Note 1)
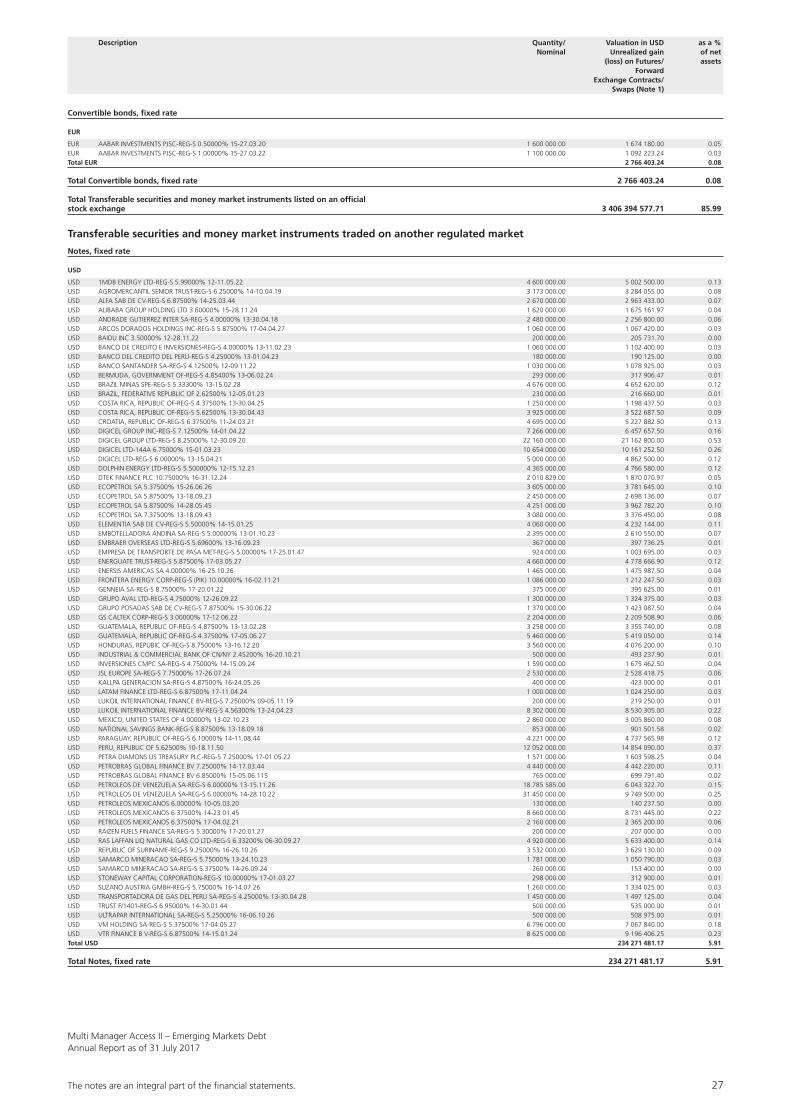
The notes are an integral part of the fi nancial statements. 27
Multi Manager Access II – Emerging Markets DebtAnnual Report as of 31 July 2017
Convertible bonds, fixed rate
EUR
EUR AABAR INVESTMENTS PJSC-REG-S 0.50000% 15-27.03.20 1 600 000.00 1 674 180.00 0.05EUR AABAR INVESTMENTS PJSC-REG-S 1.00000% 15-27.03.22 1 100 000.00 1 092 223.24 0.03Total EUR 2 766 403.24 0.08
Total Convertible bonds, fixed rate 2 766 403.24 0.08
Total Transferable securities and money market instruments listed on an official stock exchange 3 406 394 577.71 85.99
Transferable securities and money market instruments traded on another regulated market
Notes, fixed rate
USD
USD 1MDB ENERGY LTD-REG-S 5.99000% 12-11.05.22 4 600 000.00 5 002 500.00 0.13USD AGROMERCANTIL SENIOR TRUST-REG-S 6.25000% 14-10.04.19 3 173 000.00 3 284 055.00 0.08USD ALFA SAB DE CV-REG-S 6.87500% 14-25.03.44 2 670 000.00 2 963 433.00 0.07USD ALIBABA GROUP HOLDING LTD 3.60000% 15-28.11.24 1 620 000.00 1 675 161.97 0.04USD ANDRADE GUTIERREZ INTER SA-REG-S 4.00000% 13-30.04.18 2 480 000.00 2 256 800.00 0.06USD ARCOS DORADOS HOLDINGS INC-REG-S 5.87500% 17-04.04.27 1 060 000.00 1 067 420.00 0.03USD BAIDU INC 3.50000% 12-28.11.22 200 000.00 205 731.70 0.00USD BANCO DE CREDITO E INVERSIONES-REG-S 4.00000% 13-11.02.23 1 060 000.00 1 102 400.00 0.03USD BANCO DEL CREDITO DEL PERU-REG-S 4.25000% 13-01.04.23 180 000.00 190 125.00 0.00USD BANCO SANTANDER SA-REG-S 4.12500% 12-09.11.22 1 030 000.00 1 078 925.00 0.03USD BERMUDA, GOVERNMENT OF-REG-S 4.85400% 13-06.02.24 293 000.00 317 906.47 0.01USD BRAZIL MINAS SPE-REG-S 5.33300% 13-15.02.28 4 676 000.00 4 652 620.00 0.12USD BRAZIL, FEDERATIVE REPUBLIC OF 2.62500% 12-05.01.23 230 000.00 216 660.00 0.01USD COSTA RICA, REPUBLIC OF-REG-S 4.37500% 13-30.04.25 1 250 000.00 1 198 437.50 0.03USD COSTA RICA, REPUBLIC OF-REG-S 5.62500% 13-30.04.43 3 925 000.00 3 522 687.50 0.09USD CROATIA, REPUBLIC OF-REG-S 6.37500% 11-24.03.21 4 695 000.00 5 227 882.50 0.13USD DIGICEL GROUP INC-REG-S 7.12500% 14-01.04.22 7 266 000.00 6 457 657.50 0.16USD DIGICEL GROUP LTD-REG-S 8.25000% 12-30.09.20 22 160 000.00 21 162 800.00 0.53USD DIGICEL LTD-144A 6.75000% 15-01.03.23 10 654 000.00 10 161 252.50 0.26USD DIGICEL LTD-REG-S 6.00000% 13-15.04.21 5 000 000.00 4 862 500.00 0.12USD DOLPHIN ENERGY LTD-REG-S 5.500000% 12-15.12.21 4 365 000.00 4 766 580.00 0.12USD DTEK FINANCE PLC 10.75000% 16-31.12.24 2 010 829.00 1 870 070.97 0.05USD ECOPETROL SA 5.37500% 15-26.06.26 3 605 000.00 3 781 645.00 0.10USD ECOPETROL SA 5.87500% 13-18.09.23 2 450 000.00 2 698 136.00 0.07USD ECOPETROL SA 5.87500% 14-28.05.45 4 251 000.00 3 962 782.20 0.10USD ECOPETROL SA 7.37500% 13-18.09.43 3 080 000.00 3 376 450.00 0.08USD ELEMENTIA SAB DE CV-REG-S 5.50000% 14-15.01.25 4 060 000.00 4 232 144.00 0.11USD EMBOTELLADORA ANDINA SA-REG-S 5.00000% 13-01.10.23 2 395 000.00 2 610 550.00 0.07USD EMBRAER OVERSEAS LTD-REG-S 5.69600% 13-16.09.23 367 000.00 397 736.25 0.01USD EMPRESA DE TRANSPORTE DE PASA MET-REG-S 5.00000% 17-25.01.47 924 000.00 1 003 695.00 0.03USD ENERGUATE TRUST-REG-S 5.87500% 17-03.05.27 4 660 000.00 4 778 666.90 0.12USD ENERSIS AMERICAS SA 4.00000% 16-25.10.26 1 465 000.00 1 475 987.50 0.04USD FRONTERA ENERGY CORP-REG-S (PIK) 10.00000% 16-02.11.21 1 086 000.00 1 212 247.50 0.03USD GENNEIA SA-REG-S 8.75000% 17-20.01.22 375 000.00 395 625.00 0.01USD GRUPO AVAL LTD-REG-S 4.75000% 12-26.09.22 1 300 000.00 1 324 375.00 0.03USD GRUPO POSADAS SAB DE CV-REG-S 7.87500% 15-30.06.22 1 370 000.00 1 423 087.50 0.04USD GS CALTEX CORP-REG-S 3.00000% 17-12.06.22 2 204 000.00 2 209 508.90 0.06USD GUATEMALA, REPUBLIC OF-REG-S 4.87500% 13-13.02.28 3 258 000.00 3 355 740.00 0.08USD GUATEMALA, REPUBLIC OF-REG-S 4.37500% 17-05.06.27 5 460 000.00 5 419 050.00 0.14USD HONDURAS, REPUBIC OF-REG-S 8.75000% 13-16.12.20 3 560 000.00 4 076 200.00 0.10USD INDUSTRIAL & COMMERCIAL BANK OF CN/NY 2.45200% 16-20.10.21 500 000.00 493 237.90 0.01USD INVERSIONES CMPC SA-REG-S 4.75000% 14-15.09.24 1 590 000.00 1 675 462.50 0.04USD JSL EUROPE SA-REG-S 7.75000% 17-26.07.24 2 530 000.00 2 528 418.75 0.06USD KALLPA GENERACION SA-REG-S 4.87500% 16-24.05.26 400 000.00 423 000.00 0.01USD LATAM FINANCE LTD-REG-S 6.87500% 17-11.04.24 1 000 000.00 1 024 250.00 0.03USD LUKOIL INTERNATIONAL FINANCE BV-REG-S 7.25000% 09-05.11.19 200 000.00 219 250.00 0.01USD LUKOIL INTERNATIONAL FINANCE BV-REG-S 4.56300% 13-24.04.23 8 302 000.00 8 530 305.00 0.22USD MEXICO, UNITED STATES OF 4.00000% 13-02.10.23 2 860 000.00 3 005 860.00 0.08USD NATIONAL SAVINGS BANK-REG-S 8.87500% 13-18.09.18 853 000.00 901 501.58 0.02USD PARAGUAY, REPUBLIC OF-REG-S 6.10000% 14-11.08.44 4 221 000.00 4 737 565.98 0.12USD PERU, REPUBLIC OF 5.62500% 10-18.11.50 12 052 000.00 14 854 090.00 0.37USD PETRA DIAMONS US TREASURY PLC-REG-S 7.25000% 17-01.05.22 1 571 000.00 1 603 598.25 0.04USD PETROBRAS GLOBAL FINANCE BV 7.25000% 14-17.03.44 4 440 000.00 4 442 220.00 0.11USD PETROBRAS GLOBAL FINANCE BV 6.85000% 15-05.06.115 765 000.00 699 791.40 0.02USD PETROLEOS DE VENEZUELA SA-REG-S 6.00000% 13-15.11.26 18 785 585.00 6 043 322.70 0.15USD PETROLEOS DE VENEZUELA SA-REG-S 6.00000% 14-28.10.22 31 450 000.00 9 749 500.00 0.25USD PETROLEOS MEXICANOS 6.00000% 10-05.03.20 130 000.00 140 237.50 0.00USD PETROLEOS MEXICANOS 6.37500% 14-23.01.45 8 660 000.00 8 731 445.00 0.22USD PETROLEOS MEXICANOS 6.37500% 17-04.02.21 2 160 000.00 2 365 200.00 0.06USD RAIZEN FUELS FINANCE SA-REG-S 5.30000% 17-20.01.27 200 000.00 207 000.00 0.00USD RAS LAFFAN LIQ NATURAL GAS CO LTD-REG-S 6.33200% 06-30.09.27 4 920 000.00 5 633 400.00 0.14USD REPUBLIC OF SURINAME-REG-S 9.25000% 16-26.10.26 3 532 000.00 3 629 130.00 0.09USD SAMARCO MINERACAO SA-REG-S 5.75000% 13-24.10.23 1 781 000.00 1 050 790.00 0.03USD SAMARCO MINERACAO SA-REG-S 5.37500% 14-26.09.24 260 000.00 153 400.00 0.00USD STONEWAY CAPITAL CORPORATION-REG-S 10.00000% 17-01.03.27 298 000.00 312 900.00 0.01USD SUZANO AUSTRIA GMBH-REG-S 5.75000% 16-14.07.26 1 260 000.00 1 334 025.00 0.03USD TRANSPORTADORA DE GAS DEL PERU SA-REG-S 4.25000% 13-30.04.28 1 450 000.00 1 497 125.00 0.04USD TRUST F/1401-REG-S 6.95000% 14-30.01.44 500 000.00 535 000.00 0.01USD ULTRAPAR INTERNATIONAL SA-REG-S 5.25000% 16-06.10.26 500 000.00 508 975.00 0.01USD VM HOLDING SA-REG-S 5.37500% 17-04.05.27 6 796 000.00 7 067 840.00 0.18USD VTR FINANCE B V-REG-S 6.87500% 14-15.01.24 8 625 000.00 9 196 406.25 0.23Total USD 234 271 481.17 5.91
Total Notes, fixed rate 234 271 481.17 5.91
Description Quantity/ Valuation in USD as a % Nominal Unrealized gain of net (loss) on Futures/ assets Forward Exchange Contracts/ Swaps (Note 1)
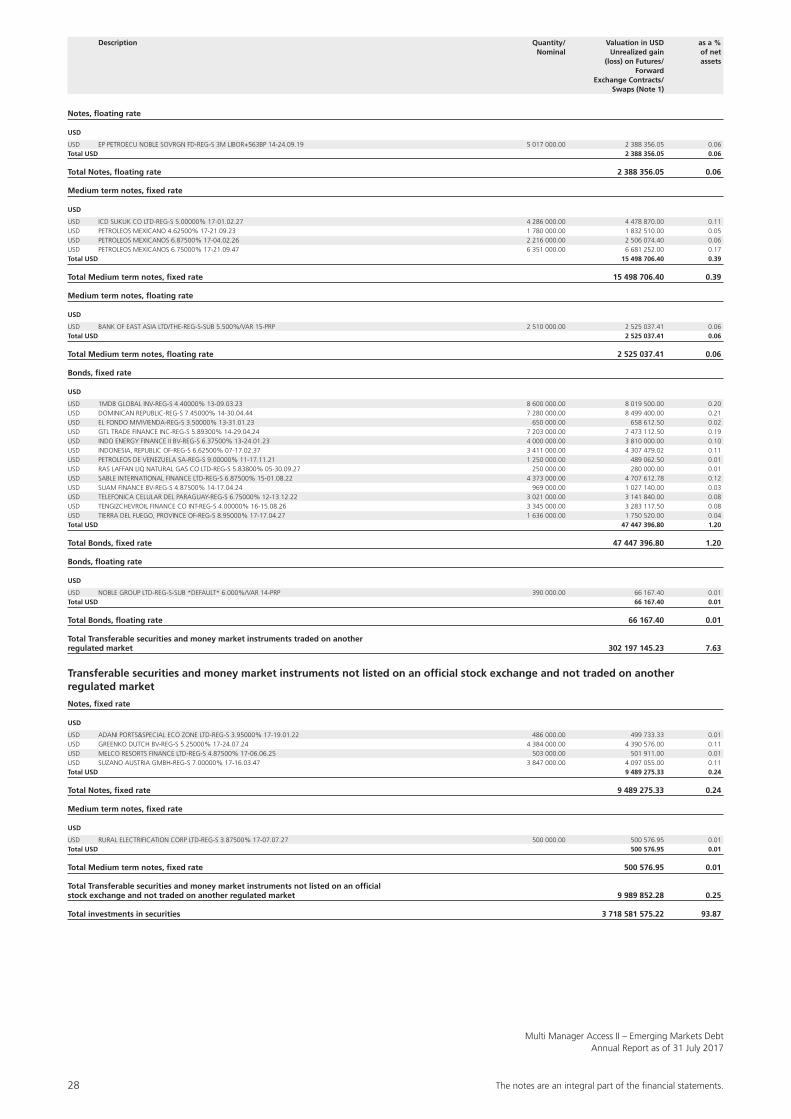
28 The notes are an integral part of the fi nancial statements.
Multi Manager Access II – Emerging Markets DebtAnnual Report as of 31 July 2017
Notes, floating rate
USD
USD EP PETROECU NOBLE SOVRGN FD-REG-S 3M LIBOR+563BP 14-24.09.19 5 017 000.00 2 388 356.05 0.06Total USD 2 388 356.05 0.06
Total Notes, floating rate 2 388 356.05 0.06
Medium term notes, fixed rate
USD
USD ICD SUKUK CO LTD-REG-S 5.00000% 17-01.02.27 4 286 000.00 4 478 870.00 0.11USD PETROLEOS MEXICANO 4.62500% 17-21.09.23 1 780 000.00 1 832 510.00 0.05USD PETROLEOS MEXICANOS 6.87500% 17-04.02.26 2 216 000.00 2 506 074.40 0.06USD PETROLEOS MEXICANOS 6.75000% 17-21.09.47 6 351 000.00 6 681 252.00 0.17Total USD 15 498 706.40 0.39
Total Medium term notes, fixed rate 15 498 706.40 0.39
Medium term notes, floating rate
USD
USD BANK OF EAST ASIA LTD/THE-REG-S-SUB 5.500%/VAR 15-PRP 2 510 000.00 2 525 037.41 0.06Total USD 2 525 037.41 0.06
Total Medium term notes, floating rate 2 525 037.41 0.06
Bonds, fixed rate
USD
USD 1MDB GLOBAL INV-REG-S 4.40000% 13-09.03.23 8 600 000.00 8 019 500.00 0.20USD DOMINICAN REPUBLIC-REG-S 7.45000% 14-30.04.44 7 280 000.00 8 499 400.00 0.21USD EL FONDO MIVIVIENDA-REG-S 3.50000% 13-31.01.23 650 000.00 658 612.50 0.02USD GTL TRADE FINANCE INC-REG-S 5.89300% 14-29.04.24 7 203 000.00 7 473 112.50 0.19USD INDO ENERGY FINANCE II BV-REG-S 6.37500% 13-24.01.23 4 000 000.00 3 810 000.00 0.10USD INDONESIA, REPUBLIC OF-REG-S 6.62500% 07-17.02.37 3 411 000.00 4 307 479.02 0.11USD PETROLEOS DE VENEZUELA SA-REG-S 9.00000% 11-17.11.21 1 250 000.00 489 062.50 0.01USD RAS LAFFAN LIQ NATURAL GAS CO LTD-REG-S 5.83800% 05-30.09.27 250 000.00 280 000.00 0.01USD SABLE INTERNATIONAL FINANCE LTD-REG-S 6.87500% 15-01.08.22 4 373 000.00 4 707 612.78 0.12USD SUAM FINANCE BV-REG-S 4.87500% 14-17.04.24 969 000.00 1 027 140.00 0.03USD TELEFONICA CELULAR DEL PARAGUAY-REG-S 6.75000% 12-13.12.22 3 021 000.00 3 141 840.00 0.08USD TENGIZCHEVROIL FINANCE CO INT-REG-S 4.00000% 16-15.08.26 3 345 000.00 3 283 117.50 0.08USD TIERRA DEL FUEGO, PROVINCE OF-REG-S 8.95000% 17-17.04.27 1 636 000.00 1 750 520.00 0.04Total USD 47 447 396.80 1.20
Total Bonds, fixed rate 47 447 396.80 1.20
Bonds, floating rate
USD
USD NOBLE GROUP LTD-REG-S-SUB *DEFAULT* 6.000%/VAR 14-PRP 390 000.00 66 167.40 0.01Total USD 66 167.40 0.01
Total Bonds, floating rate 66 167.40 0.01
Total Transferable securities and money market instruments traded on another regulated market 302 197 145.23 7.63
Transferable securities and money market instruments not listed on an official stock exchange and not traded on another regulated market
Notes, fixed rate
USD
USD ADANI PORTS&SPECIAL ECO ZONE LTD-REG-S 3.95000% 17-19.01.22 486 000.00 499 733.33 0.01USD GREENKO DUTCH BV-REG-S 5.25000% 17-24.07.24 4 384 000.00 4 390 576.00 0.11USD MELCO RESORTS FINANCE LTD-REG-S 4.87500% 17-06.06.25 503 000.00 501 911.00 0.01USD SUZANO AUSTRIA GMBH-REG-S 7.00000% 17-16.03.47 3 847 000.00 4 097 055.00 0.11Total USD 9 489 275.33 0.24
Total Notes, fixed rate 9 489 275.33 0.24
Medium term notes, fixed rate
USD
USD RURAL ELECTRIFICATION CORP LTD-REG-S 3.87500% 17-07.07.27 500 000.00 500 576.95 0.01Total USD 500 576.95 0.01
Total Medium term notes, fixed rate 500 576.95 0.01
Total Transferable securities and money market instruments not listed on an official stock exchange and not traded on another regulated market 9 989 852.28 0.25
Total investments in securities 3 718 581 575.22 93.87
Description Quantity/ Valuation in USD as a % Nominal Unrealized gain of net (loss) on Futures/ assets Forward Exchange Contracts/ Swaps (Note 1)
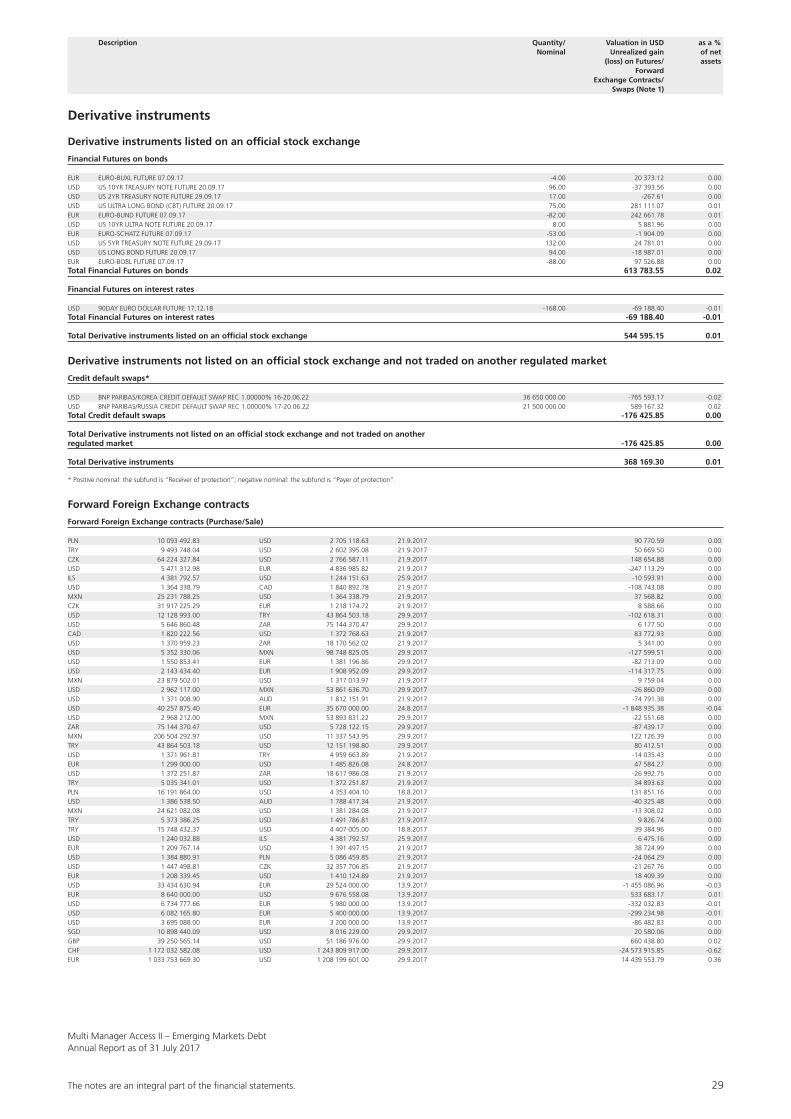
The notes are an integral part of the fi nancial statements. 29
Multi Manager Access II – Emerging Markets DebtAnnual Report as of 31 July 2017
Derivative instruments
Derivative instruments listed on an official stock exchange
Financial Futures on bonds
EUR EURO-BUXL FUTURE 07.09.17 -4.00 20 373.12 0.00USD US 10YR TREASURY NOTE FUTURE 20.09.17 96.00 -37 393.56 0.00USD US 2YR TREASURY NOTE FUTURE 29.09.17 17.00 -267.61 0.00USD US ULTRA LONG BOND (CBT) FUTURE 20.09.17 75.00 281 111.07 0.01EUR EURO-BUND FUTURE 07.09.17 -82.00 242 661.78 0.01USD US 10YR ULTRA NOTE FUTURE 20.09.17 8.00 5 881.96 0.00EUR EURO-SCHATZ FUTURE 07.09.17 -53.00 -1 904.09 0.00USD US 5YR TREASURY NOTE FUTURE 29.09.17 132.00 24 781.01 0.00USD US LONG BOND FUTURE 20.09.17 94.00 -18 987.01 0.00EUR EURO-BOBL FUTURE 07.09.17 -88.00 97 526.88 0.00Total Financial Futures on bonds 613 783.55 0.02
Financial Futures on interest rates
USD 90DAY EURO DOLLAR FUTURE 17.12.18 -168.00 -69 188.40 -0.01Total Financial Futures on interest rates -69 188.40 -0.01
Total Derivative instruments listed on an official stock exchange 544 595.15 0.01
Derivative instruments not listed on an official stock exchange and not traded on another regulated market
Credit default swaps*
USD BNP PARIBAS/KOREA CREDIT DEFAULT SWAP REC 1.00000% 16-20.06.22 36 650 000.00 -765 593.17 -0.02USD BNP PARIBAS/RUSSIA CREDIT DEFAULT SWAP REC 1.00000% 17-20.06.22 21 500 000.00 589 167.32 0.02Total Credit default swaps -176 425.85 0.00
Total Derivative instruments not listed on an official stock exchange and not traded on another regulated market -176 425.85 0.00
Total Derivative instruments 368 169.30 0.01
* Positive nominal: the subfund is “Receiver of protection”; negative nominal: the subfund is “Payer of protection”.
Forward Foreign Exchange contracts
Forward Foreign Exchange contracts (Purchase/Sale)
PLN 10 093 492.83 USD 2 705 118.63 21.9.2017 90 770.59 0.00TRY 9 493 748.04 USD 2 602 395.08 21.9.2017 50 669.50 0.00CZK 64 224 327.84 USD 2 766 587.11 21.9.2017 148 654.88 0.00USD 5 471 312.98 EUR 4 836 985.82 21.9.2017 -247 113.29 0.00ILS 4 381 792.57 USD 1 244 151.63 25.9.2017 -10 593.91 0.00USD 1 364 338.79 CAD 1 840 892.78 21.9.2017 -108 743.08 0.00MXN 25 231 788.25 USD 1 364 338.79 21.9.2017 37 568.82 0.00CZK 31 917 225.29 EUR 1 218 174.72 21.9.2017 8 588.66 0.00USD 12 128 993.00 TRY 43 864 503.18 29.9.2017 -102 618.31 0.00USD 5 646 860.48 ZAR 75 144 370.47 29.9.2017 6 177.50 0.00CAD 1 820 222.56 USD 1 372 768.63 21.9.2017 83 772.93 0.00USD 1 370 959.23 ZAR 18 170 562.02 21.9.2017 5 341.00 0.00USD 5 352 330.06 MXN 98 748 825.05 29.9.2017 -127 599.51 0.00USD 1 550 853.41 EUR 1 381 196.86 29.9.2017 -82 713.09 0.00USD 2 143 434.40 EUR 1 908 952.09 29.9.2017 -114 317.75 0.00MXN 23 879 502.01 USD 1 317 013.97 21.9.2017 9 759.04 0.00USD 2 962 117.00 MXN 53 861 636.70 29.9.2017 -26 860.09 0.00USD 1 371 008.90 AUD 1 812 151.91 21.9.2017 -74 791.38 0.00USD 40 257 875.40 EUR 35 670 000.00 24.8.2017 -1 848 935.38 -0.04USD 2 968 212.00 MXN 53 893 831.22 29.9.2017 -22 551.68 0.00ZAR 75 144 370.47 USD 5 728 122.15 29.9.2017 -87 439.17 0.00MXN 206 504 292.97 USD 11 337 543.95 29.9.2017 122 126.39 0.00TRY 43 864 503.18 USD 12 151 198.80 29.9.2017 80 412.51 0.00USD 1 371 961.81 TRY 4 959 663.89 21.9.2017 -14 035.43 0.00EUR 1 299 000.00 USD 1 485 826.08 24.8.2017 47 584.27 0.00USD 1 372 251.87 ZAR 18 617 986.08 21.9.2017 -26 992.75 0.00TRY 5 035 341.01 USD 1 372 251.87 21.9.2017 34 893.63 0.00PLN 16 191 864.00 USD 4 353 404.10 18.8.2017 131 851.16 0.00USD 1 386 538.50 AUD 1 788 417.34 21.9.2017 -40 325.48 0.00MXN 24 621 082.08 USD 1 381 284.08 21.9.2017 -13 308.02 0.00TRY 5 373 386.25 USD 1 491 786.81 21.9.2017 9 826.74 0.00TRY 15 748 432.37 USD 4 407 005.00 18.8.2017 39 384.96 0.00USD 1 240 032.88 ILS 4 381 792.57 25.9.2017 6 475.16 0.00EUR 1 209 767.14 USD 1 391 497.15 21.9.2017 38 724.99 0.00USD 1 384 880.91 PLN 5 086 459.85 21.9.2017 -24 064.29 0.00USD 1 447 498.81 CZK 32 357 706.85 21.9.2017 -21 267.76 0.00EUR 1 208 339.45 USD 1 410 124.89 21.9.2017 18 409.39 0.00USD 33 434 630.94 EUR 29 524 000.00 13.9.2017 -1 455 086.96 -0.03EUR 8 640 000.00 USD 9 676 558.08 13.9.2017 533 683.17 0.01USD 6 734 777.66 EUR 5 980 000.00 13.9.2017 -332 032.83 -0.01USD 6 082 165.80 EUR 5 400 000.00 13.9.2017 -299 234.98 -0.01USD 3 695 088.00 EUR 3 200 000.00 13.9.2017 -86 482.83 0.00SGD 10 898 440.09 USD 8 016 229.00 29.9.2017 20 580.06 0.00GBP 39 250 565.14 USD 51 186 976.00 29.9.2017 660 438.80 0.02CHF 1 172 032 582.08 USD 1 243 809 917.00 29.9.2017 -24 573 915.85 -0.62EUR 1 033 753 669.30 USD 1 208 199 601.00 29.9.2017 14 439 553.79 0.36
Description Quantity/ Valuation in USD as a % Nominal Unrealized gain of net (loss) on Futures/ assets Forward Exchange Contracts/ Swaps (Note 1)
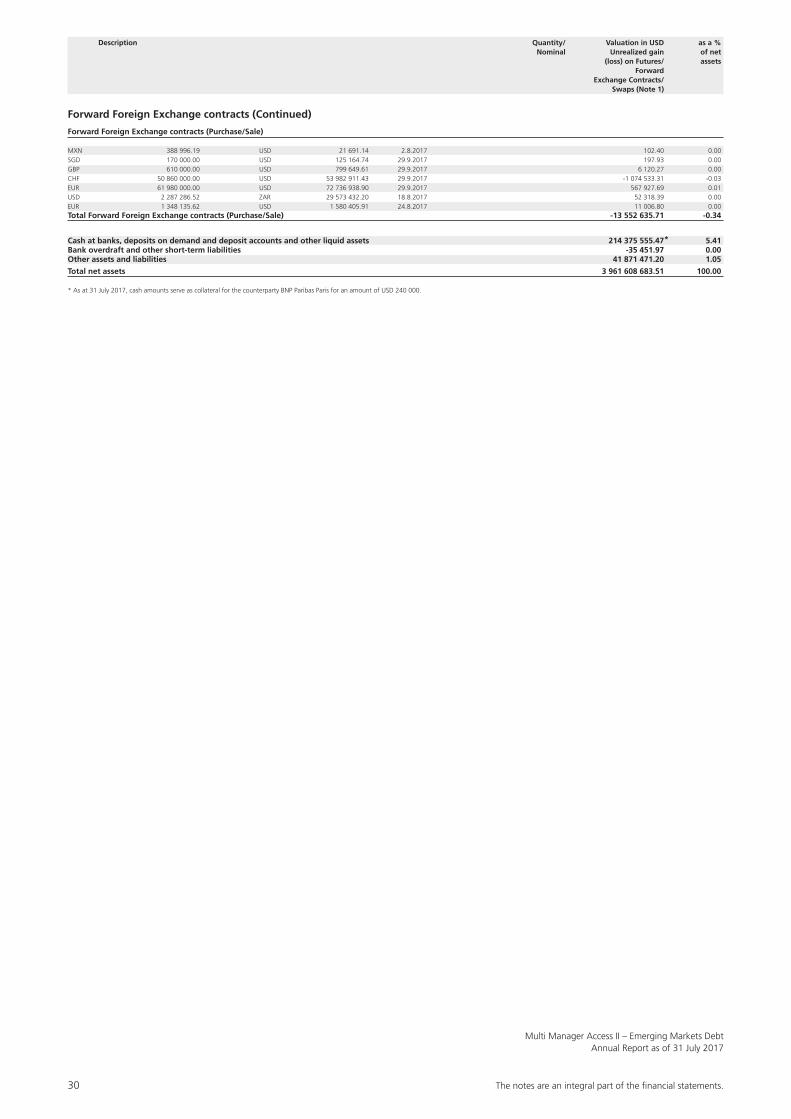
30 The notes are an integral part of the fi nancial statements.
Multi Manager Access II – Emerging Markets DebtAnnual Report as of 31 July 2017
Forward Foreign Exchange contracts (Continued)
Forward Foreign Exchange contracts (Purchase/Sale)
MXN 388 996.19 USD 21 691.14 2.8.2017 102.40 0.00SGD 170 000.00 USD 125 164.74 29.9.2017 197.93 0.00GBP 610 000.00 USD 799 649.61 29.9.2017 6 120.27 0.00CHF 50 860 000.00 USD 53 982 911.43 29.9.2017 -1 074 533.31 -0.03EUR 61 980 000.00 USD 72 736 938.90 29.9.2017 567 927.69 0.01USD 2 287 286.52 ZAR 29 573 432.20 18.8.2017 52 318.39 0.00EUR 1 348 135.62 USD 1 580 405.91 24.8.2017 11 006.80 0.00Total Forward Foreign Exchange contracts (Purchase/Sale) -13 552 635.71 -0.34
Cash at banks, deposits on demand and deposit accounts and other liquid assets 214 375 555.47 5.41Bank overdraft and other short-term liabilities -35 451.97 0.00Other assets and liabilities 41 871 471.20 1.05
Total net assets 3 961 608 683.51 100.00
* As at 31 July 2017, cash amounts serve as collateral for the counterparty BNP Paribas Paris for an amount of USD 240 000.
*
Description Quantity/ Valuation in USD as a % Nominal Unrealized gain of net (loss) on Futures/ assets Forward Exchange Contracts/ Swaps (Note 1)
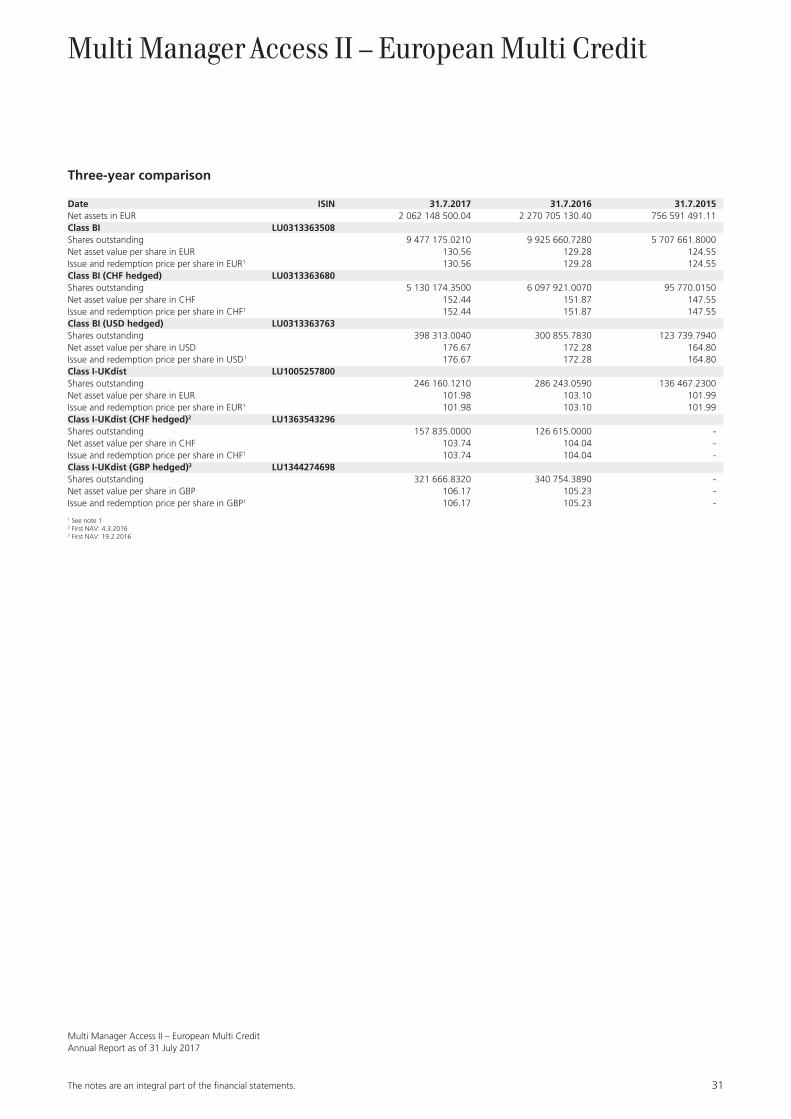
The notes are an integral part of the fi nancial statements. 31
Multi Manager Access II – European Multi CreditAnnual Report as of 31 July 2017
Multi Manager Access II – European Multi Credit
Three-year comparison
Date ISIN 31.7.2017 31.7.2016 31.7.2015Net assets in EUR 2 062 148 500.04 2 270 705 130.40 756 591 491.11Class BI LU0313363508Shares outstanding 9 477 175.0210 9 925 660.7280 5 707 661.8000Net asset value per share in EUR 130.56 129.28 124.55Issue and redemption price per share in EUR1 130.56 129.28 124.55Class BI (CHF hedged) LU0313363680Shares outstanding 5 130 174.3500 6 097 921.0070 95 770.0150Net asset value per share in CHF 152.44 151.87 147.55Issue and redemption price per share in CHF1 152.44 151.87 147.55Class BI (USD hedged) LU0313363763Shares outstanding 398 313.0040 300 855.7830 123 739.7940Net asset value per share in USD 176.67 172.28 164.80Issue and redemption price per share in USD1 176.67 172.28 164.80Class I-UKdist LU1005257800Shares outstanding 246 160.1210 286 243.0590 136 467.2300Net asset value per share in EUR 101.98 103.10 101.99Issue and redemption price per share in EUR1 101.98 103.10 101.99Class I-UKdist (CHF hedged)2 LU1363543296Shares outstanding 157 835.0000 126 615.0000 -Net asset value per share in CHF 103.74 104.04 -Issue and redemption price per share in CHF1 103.74 104.04 -Class I-UKdist (GBP hedged)3 LU1344274698Shares outstanding 321 666.8320 340 754.3890 -Net asset value per share in GBP 106.17 105.23 -Issue and redemption price per share in GBP1 106.17 105.23 -
1 See note 12 First NAV: 4.3.20163 First NAV: 19.2.2016
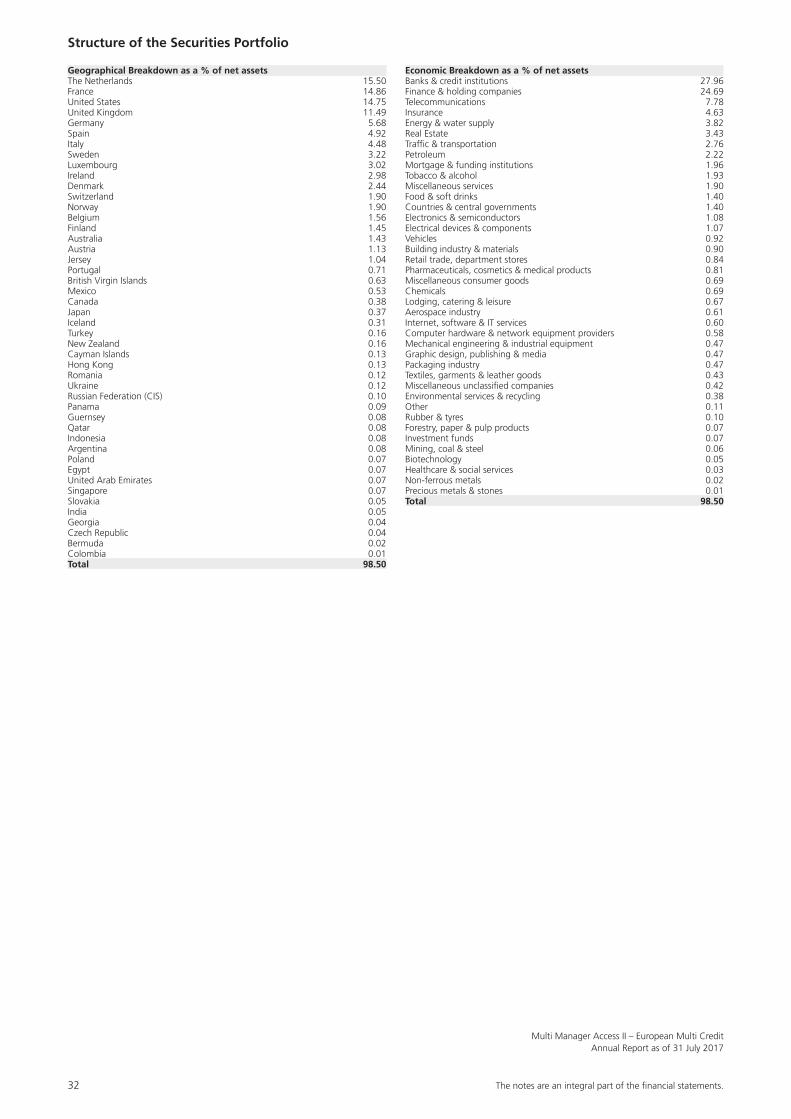
32 The notes are an integral part of the fi nancial statements.
Multi Manager Access II – European Multi CreditAnnual Report as of 31 July 2017
Structure of the Securities Portfolio
Geographical Breakdown as a % of net assetsThe Netherlands 15.50France 14.86United States 14.75United Kingdom 11.49Germany 5.68Spain 4.92Italy 4.48Sweden 3.22Luxembourg 3.02Ireland 2.98Denmark 2.44Switzerland 1.90Norway 1.90Belgium 1.56Finland 1.45Australia 1.43Austria 1.13Jersey 1.04Portugal 0.71British Virgin Islands 0.63Mexico 0.53Canada 0.38Japan 0.37Iceland 0.31Turkey 0.16New Zealand 0.16Cayman Islands 0.13Hong Kong 0.13Romania 0.12Ukraine 0.12Russian Federation (CIS) 0.10Panama 0.09Guernsey 0.08Qatar 0.08Indonesia 0.08Argentina 0.08Poland 0.07Egypt 0.07United Arab Emirates 0.07Singapore 0.07Slovakia 0.05India 0.05Georgia 0.04Czech Republic 0.04Bermuda 0.02Colombia 0.01Total 98.50
Economic Breakdown as a % of net assetsBanks & credit institutions 27.96Finance & holding companies 24.69Telecommunications 7.78Insurance 4.63Energy & water supply 3.82Real Estate 3.43Traffic & transportation 2.76Petroleum 2.22Mortgage & funding institutions 1.96Tobacco & alcohol 1.93Miscellaneous services 1.90Food & soft drinks 1.40Countries & central governments 1.40Electronics & semiconductors 1.08Electrical devices & components 1.07Vehicles 0.92Building industry & materials 0.90Retail trade, department stores 0.84Pharmaceuticals, cosmetics & medical products 0.81Miscellaneous consumer goods 0.69Chemicals 0.69Lodging, catering & leisure 0.67Aerospace industry 0.61Internet, software & IT services 0.60Computer hardware & network equipment providers 0.58Mechanical engineering & industrial equipment 0.47Graphic design, publishing & media 0.47Packaging industry 0.47Textiles, garments & leather goods 0.43Miscellaneous unclassified companies 0.42Environmental services & recycling 0.38Other 0.11Rubber & tyres 0.10Forestry, paper & pulp products 0.07Investment funds 0.07Mining, coal & steel 0.06Biotechnology 0.05Healthcare & social services 0.03Non-ferrous metals 0.02Precious metals & stones 0.01Total 98.50
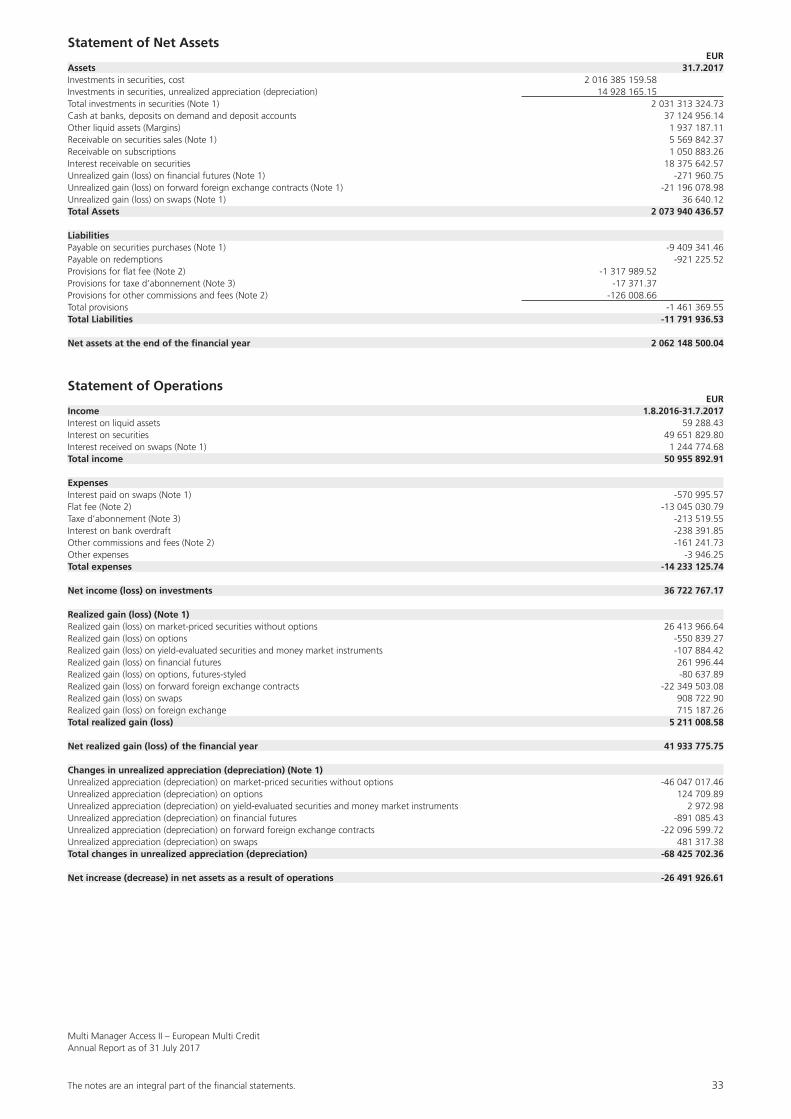
The notes are an integral part of the fi nancial statements. 33
Multi Manager Access II – European Multi CreditAnnual Report as of 31 July 2017
Statement of Net Assets EURAssets 31.7.2017Investments in securities, cost 2 016 385 159.58Investments in securities, unrealized appreciation (depreciation) 14 928 165.15Total investments in securities (Note 1) 2 031 313 324.73Cash at banks, deposits on demand and deposit accounts 37 124 956.14Other liquid assets (Margins) 1 937 187.11Receivable on securities sales (Note 1) 5 569 842.37Receivable on subscriptions 1 050 883.26Interest receivable on securities 18 375 642.57Unrealized gain (loss) on financial futures (Note 1) -271 960.75Unrealized gain (loss) on forward foreign exchange contracts (Note 1) -21 196 078.98Unrealized gain (loss) on swaps (Note 1) 36 640.12Total Assets 2 073 940 436.57
LiabilitiesPayable on securities purchases (Note 1) -9 409 341.46Payable on redemptions -921 225.52Provisions for flat fee (Note 2) -1 317 989.52Provisions for taxe d’abonnement (Note 3) -17 371.37Provisions for other commissions and fees (Note 2) -126 008.66Total provisions -1 461 369.55Total Liabilities -11 791 936.53
Net assets at the end of the financial year 2 062 148 500.04
Statement of Operations EURIncome 1.8.2016-31.7.2017Interest on liquid assets 59 288.43Interest on securities 49 651 829.80Interest received on swaps (Note 1) 1 244 774.68Total income 50 955 892.91
ExpensesInterest paid on swaps (Note 1) -570 995.57Flat fee (Note 2) -13 045 030.79Taxe d’abonnement (Note 3) -213 519.55Interest on bank overdraft -238 391.85Other commissions and fees (Note 2) -161 241.73Other expenses -3 946.25Total expenses -14 233 125.74
Net income (loss) on investments 36 722 767.17
Realized gain (loss) (Note 1)Realized gain (loss) on market-priced securities without options 26 413 966.64Realized gain (loss) on options -550 839.27Realized gain (loss) on yield-evaluated securities and money market instruments -107 884.42Realized gain (loss) on financial futures 261 996.44Realized gain (loss) on options, futures-styled -80 637.89Realized gain (loss) on forward foreign exchange contracts -22 349 503.08Realized gain (loss) on swaps 908 722.90Realized gain (loss) on foreign exchange 715 187.26Total realized gain (loss) 5 211 008.58
Net realized gain (loss) of the financial year 41 933 775.75
Changes in unrealized appreciation (depreciation) (Note 1)Unrealized appreciation (depreciation) on market-priced securities without options -46 047 017.46Unrealized appreciation (depreciation) on options 124 709.89Unrealized appreciation (depreciation) on yield-evaluated securities and money market instruments 2 972.98Unrealized appreciation (depreciation) on financial futures -891 085.43Unrealized appreciation (depreciation) on forward foreign exchange contracts -22 096 599.72Unrealized appreciation (depreciation) on swaps 481 317.38Total changes in unrealized appreciation (depreciation) -68 425 702.36
Net increase (decrease) in net assets as a result of operations -26 491 926.61
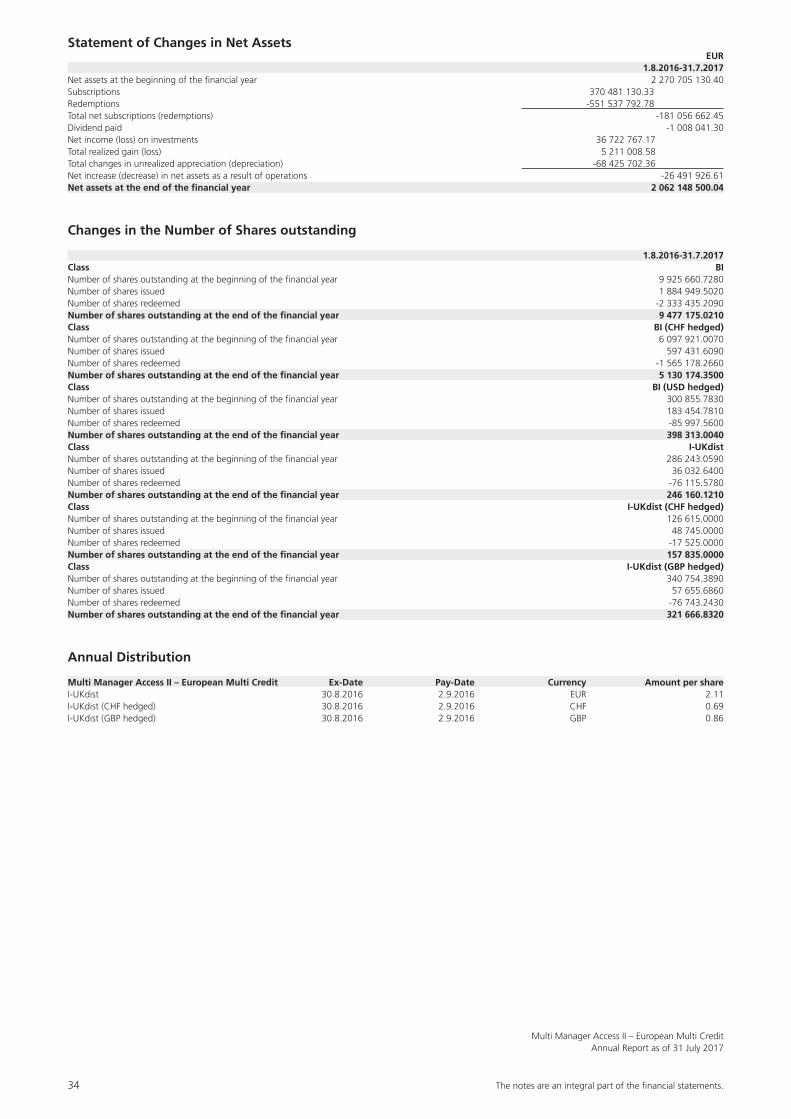
34 The notes are an integral part of the fi nancial statements.
Multi Manager Access II – European Multi CreditAnnual Report as of 31 July 2017
Statement of Changes in Net Assets EUR 1.8.2016-31.7.2017Net assets at the beginning of the financial year 2 270 705 130.40Subscriptions 370 481 130.33Redemptions -551 537 792.78Total net subscriptions (redemptions) -181 056 662.45Dividend paid -1 008 041.30Net income (loss) on investments 36 722 767.17Total realized gain (loss) 5 211 008.58Total changes in unrealized appreciation (depreciation) -68 425 702.36Net increase (decrease) in net assets as a result of operations -26 491 926.61Net assets at the end of the financial year 2 062 148 500.04
Changes in the Number of Shares outstanding
1.8.2016-31.7.2017Class BINumber of shares outstanding at the beginning of the financial year 9 925 660.7280Number of shares issued 1 884 949.5020Number of shares redeemed -2 333 435.2090Number of shares outstanding at the end of the financial year 9 477 175.0210Class BI (CHF hedged)Number of shares outstanding at the beginning of the financial year 6 097 921.0070Number of shares issued 597 431.6090Number of shares redeemed -1 565 178.2660Number of shares outstanding at the end of the financial year 5 130 174.3500Class BI (USD hedged)Number of shares outstanding at the beginning of the financial year 300 855.7830Number of shares issued 183 454.7810Number of shares redeemed -85 997.5600Number of shares outstanding at the end of the financial year 398 313.0040Class I-UKdistNumber of shares outstanding at the beginning of the financial year 286 243.0590Number of shares issued 36 032.6400Number of shares redeemed -76 115.5780Number of shares outstanding at the end of the financial year 246 160.1210Class I-UKdist (CHF hedged)Number of shares outstanding at the beginning of the financial year 126 615.0000Number of shares issued 48 745.0000Number of shares redeemed -17 525.0000Number of shares outstanding at the end of the financial year 157 835.0000Class I-UKdist (GBP hedged)Number of shares outstanding at the beginning of the financial year 340 754.3890Number of shares issued 57 655.6860Number of shares redeemed -76 743.2430Number of shares outstanding at the end of the financial year 321 666.8320
Annual Distribution
Multi Manager Access II – European Multi Credit Ex-Date Pay-Date Currency Amount per shareI-UKdist 30.8.2016 2.9.2016 EUR 2.11I-UKdist (CHF hedged) 30.8.2016 2.9.2016 CHF 0.69I-UKdist (GBP hedged) 30.8.2016 2.9.2016 GBP 0.86
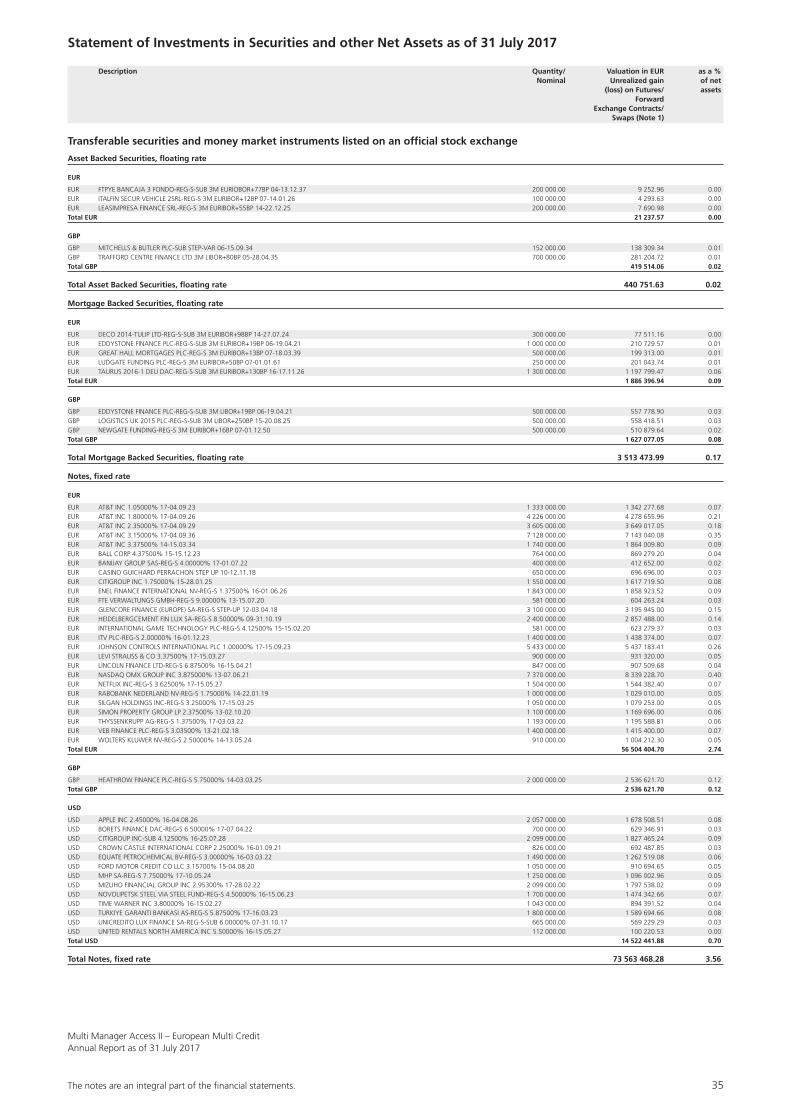
The notes are an integral part of the fi nancial statements. 35
Multi Manager Access II – European Multi CreditAnnual Report as of 31 July 2017
Statement of Investments in Securities and other Net Assets as of 31 July 2017
Description Quantity/ Valuation in EUR as a % Nominal Unrealized gain of net (loss) on Futures/ assets Forward Exchange Contracts/ Swaps (Note 1)
Transferable securities and money market instruments listed on an official stock exchange
Asset Backed Securities, floating rate
EUR
EUR FTPYE BANCAJA 3 FONDO-REG-S-SUB 3M EURIOBOR+77BP 04-13.12.37 200 000.00 9 252.96 0.00EUR ITALFIN SECUR VEHICLE 2SRL-REG-S 3M EURIBOR+12BP 07-14.01.26 100 000.00 4 293.63 0.00EUR LEASIMPRESA FINANCE SRL-REG-S 3M EURIBOR+55BP 14-22.12.25 200 000.00 7 690.98 0.00Total EUR 21 237.57 0.00
GBP
GBP MITCHELLS & BUTLER PLC-SUB STEP-VAR 06-15.09.34 152 000.00 138 309.34 0.01GBP TRAFFORD CENTRE FINANCE LTD 3M LIBOR+80BP 05-28.04.35 700 000.00 281 204.72 0.01Total GBP 419 514.06 0.02
Total Asset Backed Securities, floating rate 440 751.63 0.02
Mortgage Backed Securities, floating rate
EUR
EUR DECO 2014-TULIP LTD-REG-S-SUB 3M EURIBOR+98BP 14-27.07.24 300 000.00 77 511.16 0.00EUR EDDYSTONE FINANCE PLC-REG-S-SUB 3M EURIBOR+19BP 06-19.04.21 1 000 000.00 210 729.57 0.01EUR GREAT HALL MORTGAGES PLC-REG-S 3M EURIBOR+13BP 07-18.03.39 500 000.00 199 313.00 0.01EUR LUDGATE FUNDING PLC-REG-S 3M EURIBOR+50BP 07-01.01.61 250 000.00 201 043.74 0.01EUR TAURUS 2016-1 DEU DAC-REG-S-SUB 3M EURIBOR+130BP 16-17.11.26 1 300 000.00 1 197 799.47 0.06Total EUR 1 886 396.94 0.09
GBP
GBP EDDYSTONE FINANCE PLC-REG-S-SUB 3M LIBOR+19BP 06-19.04.21 500 000.00 557 778.90 0.03GBP LOGISTICS UK 2015 PLC-REG-S-SUB 3M LIBOR+250BP 15-20.08.25 500 000.00 558 418.51 0.03GBP NEWGATE FUNDING-REG-S 3M EURIBOR+16BP 07-01.12.50 500 000.00 510 879.64 0.02Total GBP 1 627 077.05 0.08
Total Mortgage Backed Securities, floating rate 3 513 473.99 0.17
Notes, fixed rate
EUR
EUR AT&T INC 1.05000% 17-04.09.23 1 333 000.00 1 342 277.68 0.07EUR AT&T INC 1.80000% 17-04.09.26 4 226 000.00 4 278 655.96 0.21EUR AT&T INC 2.35000% 17-04.09.29 3 605 000.00 3 649 017.05 0.18EUR AT&T INC 3.15000% 17-04.09.36 7 128 000.00 7 143 040.08 0.35EUR AT&T INC 3.37500% 14-15.03.34 1 740 000.00 1 864 009.80 0.09EUR BALL CORP 4.37500% 15-15.12.23 764 000.00 869 279.20 0.04EUR BANIJAY GROUP SAS-REG-S 4.00000% 17-01.07.22 400 000.00 412 652.00 0.02EUR CASINO GUICHARD PERRACHON STEP UP 10-12.11.18 650 000.00 696 696.00 0.03EUR CITIGROUP INC 1.75000% 15-28.01.25 1 550 000.00 1 617 719.50 0.08EUR ENEL FINANCE INTERNATIONAL NV-REG-S 1.37500% 16-01.06.26 1 843 000.00 1 858 923.52 0.09EUR FTE VERWALTUNGS GMBH-REG-S 9.00000% 13-15.07.20 581 000.00 604 263.24 0.03EUR GLENCORE FINANCE (EUROPE) SA-REG-S STEP-UP 12-03.04.18 3 100 000.00 3 195 945.00 0.15EUR HEIDELBERGCEMENT FIN LUX SA-REG-S 8.50000% 09-31.10.19 2 400 000.00 2 857 488.00 0.14EUR INTERNATIONAL GAME TECHNOLOGY PLC-REG-S 4.12500% 15-15.02.20 581 000.00 623 279.37 0.03EUR ITV PLC-REG-S 2.00000% 16-01.12.23 1 400 000.00 1 438 374.00 0.07EUR JOHNSON CONTROLS INTERNATIONAL PLC 1.00000% 17-15.09.23 5 433 000.00 5 437 183.41 0.26EUR LEVI STRAUSS & CO 3.37500% 17-15.03.27 900 000.00 931 320.00 0.05EUR LINCOLN FINANCE LTD-REG-S 6.87500% 16-15.04.21 847 000.00 907 509.68 0.04EUR NASDAQ OMX GROUP INC 3.875000% 13-07.06.21 7 370 000.00 8 339 228.70 0.40EUR NETFLIX INC-REG-S 3.62500% 17-15.05.27 1 504 000.00 1 544 382.40 0.07EUR RABOBANK NEDERLAND NV-REG-S 1.75000% 14-22.01.19 1 000 000.00 1 029 010.00 0.05EUR SILGAN HOLDINGS INC-REG-S 3.25000% 17-15.03.25 1 050 000.00 1 079 253.00 0.05EUR SIMON PROPERTY GROUP LP 2.37500% 13-02.10.20 1 100 000.00 1 169 696.00 0.06EUR THYSSENKRUPP AG-REG-S 1.37500% 17-03.03.22 1 193 000.00 1 195 588.81 0.06EUR VEB FINANCE PLC-REG-S 3.03500% 13-21.02.18 1 400 000.00 1 415 400.00 0.07EUR WOLTERS KLUWER NV-REG-S 2.50000% 14-13.05.24 910 000.00 1 004 212.30 0.05Total EUR 56 504 404.70 2.74
GBP
GBP HEATHROW FINANCE PLC-REG-S 5.75000% 14-03.03.25 2 000 000.00 2 536 621.70 0.12Total GBP 2 536 621.70 0.12
USD
USD APPLE INC 2.45000% 16-04.08.26 2 057 000.00 1 678 508.51 0.08USD BORETS FINANCE DAC-REG-S 6.50000% 17-07.04.22 700 000.00 629 346.91 0.03USD CITIGROUP INC-SUB 4.12500% 16-25.07.28 2 099 000.00 1 827 465.24 0.09USD CROWN CASTLE INTERNATIONAL CORP 2.25000% 16-01.09.21 826 000.00 692 487.85 0.03USD EQUATE PETROCHEMICAL BV-REG-S 3.00000% 16-03.03.22 1 490 000.00 1 262 519.08 0.06USD FORD MOTOR CREDIT CO LLC 3.15700% 15-04.08.20 1 050 000.00 910 694.65 0.05USD MHP SA-REG-S 7.75000% 17-10.05.24 1 250 000.00 1 096 002.96 0.05USD MIZUHO FINANCIAL GROUP INC 2.95300% 17-28.02.22 2 099 000.00 1 797 538.02 0.09USD NOVOLIPETSK STEEL VIA STEEL FUND-REG-S 4.50000% 16-15.06.23 1 700 000.00 1 474 342.66 0.07USD TIME WARNER INC 3.80000% 16-15.02.27 1 043 000.00 894 391.52 0.04USD TURKIYE GARANTI BANKASI AS-REG-S 5.87500% 17-16.03.23 1 800 000.00 1 589 694.66 0.08USD UNICREDITO LUX FINANCE SA-REG-S-SUB 6.00000% 07-31.10.17 665 000.00 569 229.29 0.03USD UNITED RENTALS NORTH AMERICA INC 5.50000% 16-15.05.27 112 000.00 100 220.53 0.00Total USD 14 522 441.88 0.70
Total Notes, fixed rate 73 563 468.28 3.56
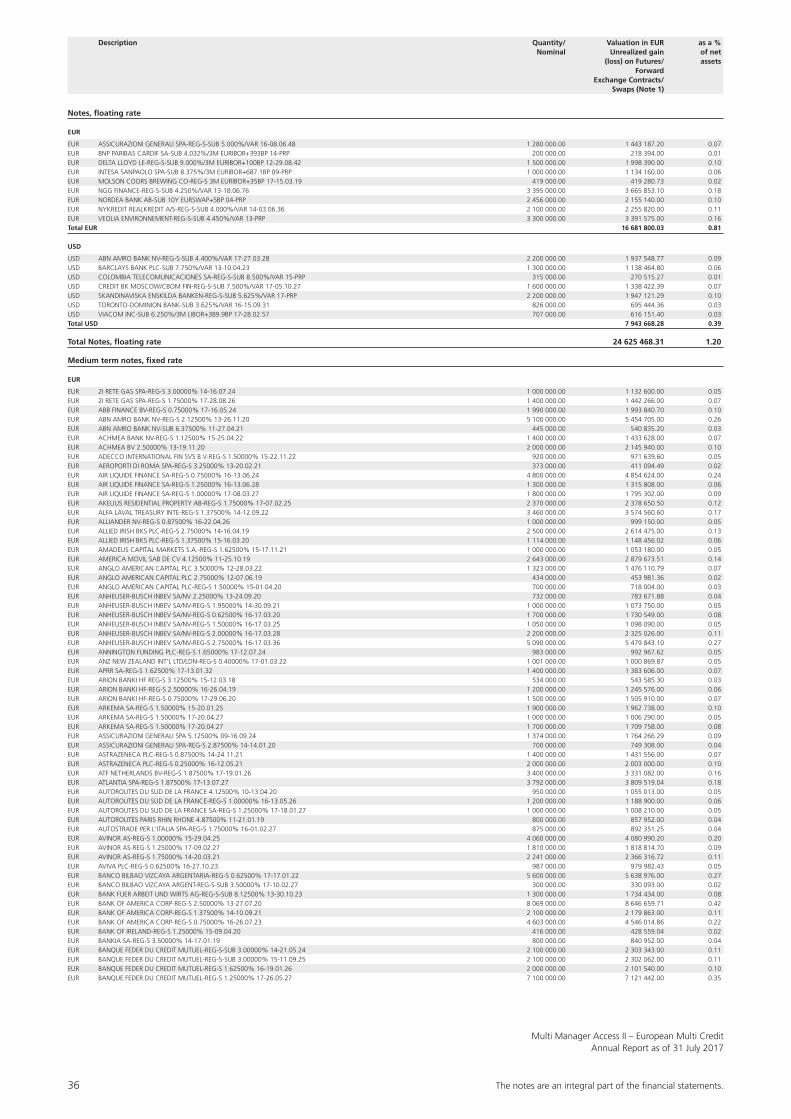
36 The notes are an integral part of the fi nancial statements.
Multi Manager Access II – European Multi CreditAnnual Report as of 31 July 2017
Notes, floating rate
EUR
EUR ASSICURAZIONI GENERALI SPA-REG-S-SUB 5.000%/VAR 16-08.06.48 1 280 000.00 1 443 187.20 0.07EUR BNP PARIBAS CARDIF SA-SUB 4.032%/3M EURIBOR+393BP 14-PRP 200 000.00 218 394.00 0.01EUR DELTA LLOYD LE-REG-S-SUB 9.000%/3M EURIBOR+100BP 12-29.08.42 1 500 000.00 1 998 390.00 0.10EUR INTESA SANPAOLO SPA-SUB 8.375%/3M EURIBOR+687.1BP 09-PRP 1 000 000.00 1 134 160.00 0.06EUR MOLSON COORS BREWING CO-REG-S 3M EURIBOR+35BP 17-15.03.19 419 000.00 419 280.73 0.02EUR NGG FINANCE-REG-S-SUB 4.250%/VAR 13-18.06.76 3 395 000.00 3 665 853.10 0.18EUR NORDEA BANK AB-SUB 10Y EURSWAP+5BP 04-PRP 2 456 000.00 2 155 140.00 0.10EUR NYKREDIT REALKREDIT A/S-REG-S-SUB 4.000%/VAR 14-03.06.36 2 100 000.00 2 255 820.00 0.11EUR VEOLIA ENVIRONNEMENT-REG-S-SUB 4.450%/VAR 13-PRP 3 300 000.00 3 391 575.00 0.16Total EUR 16 681 800.03 0.81
USD
USD ABN AMRO BANK NV-REG-S-SUB 4.400%/VAR 17-27.03.28 2 200 000.00 1 937 548.77 0.09USD BARCLAYS BANK PLC-SUB 7.750%/VAR 13-10.04.23 1 300 000.00 1 138 464.80 0.06USD COLOMBIA TELECOMUNICACIONES SA-REG-S-SUB 8.500%/VAR 15-PRP 315 000.00 270 515.27 0.01USD CREDIT BK MOSCOW/CBOM FIN-REG-S-SUB 7.500%/VAR 17-05.10.27 1 600 000.00 1 338 422.39 0.07USD SKANDINAVISKA ENSKILDA BANKEN-REG-S-SUB 5.625%/VAR 17-PRP 2 200 000.00 1 947 121.29 0.10USD TORONTO-DOMINION BANK-SUB 3.625%/VAR 16-15.09.31 826 000.00 695 444.36 0.03USD VIACOM INC-SUB 6.250%/3M LIBOR+389.9BP 17-28.02.57 707 000.00 616 151.40 0.03Total USD 7 943 668.28 0.39
Total Notes, floating rate 24 625 468.31 1.20
Medium term notes, fixed rate
EUR
EUR 2I RETE GAS SPA-REG-S 3.00000% 14-16.07.24 1 000 000.00 1 132 600.00 0.05EUR 2I RETE GAS SPA-REG-S 1.75000% 17-28.08.26 1 400 000.00 1 442 266.00 0.07EUR ABB FINANCE BV-REG-S 0.75000% 17-16.05.24 1 990 000.00 1 993 840.70 0.10EUR ABN AMRO BANK NV-REG-S 2.12500% 13-26.11.20 5 100 000.00 5 454 705.00 0.26EUR ABN AMRO BANK NV-SUB 6.37500% 11-27.04.21 445 000.00 540 835.20 0.03EUR ACHMEA BANK NV-REG-S 1.12500% 15-25.04.22 1 400 000.00 1 433 628.00 0.07EUR ACHMEA BV 2.50000% 13-19.11.20 2 000 000.00 2 145 940.00 0.10EUR ADECCO INTERNATIONAL FIN SVS B.V-REG-S 1.50000% 15-22.11.22 920 000.00 971 639.60 0.05EUR AEROPORTI DI ROMA SPA-REG-S 3.25000% 13-20.02.21 373 000.00 411 094.49 0.02EUR AIR LIQUIDE FINANCE SA-REG-S 0.75000% 16-13.06.24 4 800 000.00 4 854 624.00 0.24EUR AIR LIQUIDE FINANCE SA-REG-S 1.25000% 16-13.06.28 1 300 000.00 1 315 808.00 0.06EUR AIR LIQUIDE FINANCE SA-REG-S 1.00000% 17-08.03.27 1 800 000.00 1 795 302.00 0.09EUR AKELIUS RESIDENTIAL PROPERTY AB-REG-S 1.75000% 17-07.02.25 2 370 000.00 2 378 650.50 0.12EUR ALFA LAVAL TREASURY INTE-REG-S 1.37500% 14-12.09.22 3 460 000.00 3 574 560.60 0.17EUR ALLIANDER NV-REG-S 0.87500% 16-22.04.26 1 000 000.00 999 150.00 0.05EUR ALLIED IRISH BKS PLC-REG-S 2.75000% 14-16.04.19 2 500 000.00 2 614 475.00 0.13EUR ALLIED IRISH BKS PLC-REG-S 1.37500% 15-16.03.20 1 114 000.00 1 148 456.02 0.06EUR AMADEUS CAPITAL MARKETS S.A.-REG-S 1.62500% 15-17.11.21 1 000 000.00 1 053 180.00 0.05EUR AMERICA MOVIL SAB DE CV 4.12500% 11-25.10.19 2 643 000.00 2 879 673.51 0.14EUR ANGLO AMERICAN CAPITAL PLC 3.50000% 12-28.03.22 1 323 000.00 1 476 110.79 0.07EUR ANGLO AMERICAN CAPITAL PLC 2.75000% 12-07.06.19 434 000.00 453 981.36 0.02EUR ANGLO AMERICAN CAPITAL PLC-REG-S 1.50000% 15-01.04.20 700 000.00 718 004.00 0.03EUR ANHEUSER-BUSCH INBEV SA/NV 2.25000% 13-24.09.20 732 000.00 783 671.88 0.04EUR ANHEUSER-BUSCH INBEV SA/NV-REG-S 1.95000% 14-30.09.21 1 000 000.00 1 073 750.00 0.05EUR ANHEUSER-BUSCH INBEV SA/NV-REG-S 0.62500% 16-17.03.20 1 700 000.00 1 730 549.00 0.08EUR ANHEUSER-BUSCH INBEV SA/NV-REG-S 1.50000% 16-17.03.25 1 050 000.00 1 098 090.00 0.05EUR ANHEUSER-BUSCH INBEV SA/NV-REG-S 2.00000% 16-17.03.28 2 200 000.00 2 325 026.00 0.11EUR ANHEUSER-BUSCH INBEV SA/NV-REG-S 2.75000% 16-17.03.36 5 090 000.00 5 479 843.10 0.27EUR ANNINGTON FUNDING PLC-REG-S 1.65000% 17-12.07.24 983 000.00 992 967.62 0.05EUR ANZ NEW ZEALAND INT’L LTD/LDN-REG-S 0.40000% 17-01.03.22 1 001 000.00 1 000 869.87 0.05EUR APRR SA-REG-S 1.62500% 17-13.01.32 1 400 000.00 1 383 606.00 0.07EUR ARION BANKI HF REG-S 3.12500% 15-12.03.18 534 000.00 543 585.30 0.03EUR ARION BANKI HF-REG-S 2.50000% 16-26.04.19 1 200 000.00 1 245 576.00 0.06EUR ARION BANKI HF-REG-S 0.75000% 17-29.06.20 1 500 000.00 1 505 910.00 0.07EUR ARKEMA SA-REG-S 1.50000% 15-20.01.25 1 900 000.00 1 962 738.00 0.10EUR ARKEMA SA-REG-S 1.50000% 17-20.04.27 1 000 000.00 1 006 290.00 0.05EUR ARKEMA SA-REG-S 1.50000% 17-20.04.27 1 700 000.00 1 709 758.00 0.08EUR ASSICURAZIONI GENERALI SPA 5.12500% 09-16.09.24 1 374 000.00 1 764 266.29 0.09EUR ASSICURAZIONI GENERALI SPA-REG-S 2.87500% 14-14.01.20 700 000.00 749 308.00 0.04EUR ASTRAZENECA PLC-REG-S 0.87500% 14-24.11.21 1 400 000.00 1 431 556.00 0.07EUR ASTRAZENECA PLC-REG-S 0.25000% 16-12.05.21 2 000 000.00 2 003 000.00 0.10EUR ATF NETHERLANDS BV-REG-S 1.87500% 17-19.01.26 3 400 000.00 3 331 082.00 0.16EUR ATLANTIA SPA-REG-S 1.87500% 17-13.07.27 3 792 000.00 3 809 519.04 0.18EUR AUTOROUTES DU SUD DE LA FRANCE 4.12500% 10-13.04.20 950 000.00 1 055 013.00 0.05EUR AUTOROUTES DU SUD DE LA FRANCE-REG-S 1.00000% 16-13.05.26 1 200 000.00 1 188 900.00 0.06EUR AUTOROUTES DU SUD DE LA FRANCE SA-REG-S 1.25000% 17-18.01.27 1 000 000.00 1 008 210.00 0.05EUR AUTOROUTES PARIS RHIN RHONE 4.87500% 11-21.01.19 800 000.00 857 952.00 0.04EUR AUTOSTRADE PER L’ITALIA SPA-REG-S 1.75000% 16-01.02.27 875 000.00 892 351.25 0.04EUR AVINOR AS-REG-S 1.00000% 15-29.04.25 4 060 000.00 4 080 990.20 0.20EUR AVINOR AS-REG-S 1.25000% 17-09.02.27 1 810 000.00 1 818 814.70 0.09EUR AVINOR AS-REG-S 1.75000% 14-20.03.21 2 241 000.00 2 366 316.72 0.11EUR AVIVA PLC-REG-S 0.62500% 16-27.10.23 987 000.00 979 982.43 0.05EUR BANCO BILBAO VIZCAYA ARGENTARIA-REG-S 0.62500% 17-17.01.22 5 600 000.00 5 638 976.00 0.27EUR BANCO BILBAO VIZCAYA ARGENT-REG-S-SUB 3.50000% 17-10.02.27 300 000.00 330 093.00 0.02EUR BANK FUER ARBEIT UND WIRTS AG-REG-S-SUB 8.12500% 13-30.10.23 1 300 000.00 1 734 434.00 0.08EUR BANK OF AMERICA CORP-REG-S 2.50000% 13-27.07.20 8 069 000.00 8 646 659.71 0.42EUR BANK OF AMERICA CORP-REG-S 1.37500% 14-10.09.21 2 100 000.00 2 179 863.00 0.11EUR BANK OF AMERICA CORP-REG-S 0.75000% 16-26.07.23 4 603 000.00 4 546 014.86 0.22EUR BANK OF IRELAND-REG-S 1.25000% 15-09.04.20 416 000.00 428 559.04 0.02EUR BANKIA SA-REG-S 3.50000% 14-17.01.19 800 000.00 840 952.00 0.04EUR BANQUE FEDER DU CREDIT MUTUEL-REG-S-SUB 3.00000% 14-21.05.24 2 100 000.00 2 303 343.00 0.11EUR BANQUE FEDER DU CREDIT MUTUEL-REG-S-SUB 3.00000% 15-11.09.25 2 100 000.00 2 302 062.00 0.11EUR BANQUE FEDER DU CREDIT MUTUEL-REG-S 1.62500% 16-19.01.26 2 000 000.00 2 101 540.00 0.10EUR BANQUE FEDER DU CREDIT MUTUEL-REG-S 1.25000% 17-26.05.27 7 100 000.00 7 121 442.00 0.35
Description Quantity/ Valuation in EUR as a % Nominal Unrealized gain of net (loss) on Futures/ assets Forward Exchange Contracts/ Swaps (Note 1)

The notes are an integral part of the fi nancial statements. 37
Multi Manager Access II – European Multi CreditAnnual Report as of 31 July 2017
EUR BANQUE FEDERATIVE DU CREDIT MUTUEL 4.12500% 10-20.07.20 700 000.00 786 695.00 0.04EUR BANQUE FEDERATIVE DU CREDIT MUTUEL 2.62500% 13-24.02.21 2 100 000.00 2 287 530.00 0.11EUR BARCLAYS PLC-REG-S 1.87500% 16-08.12.23 2 206 000.00 2 312 130.66 0.11EUR BAT INTERNATIONAL FINANCE PLC-REG-S 2.75000% 13-25.03.25 908 000.00 992 907.08 0.05EUR BAT INTERNATIONAL FINANCE PLC-REG-S 3.12500% 14-06.03.29 3 060 000.00 3 381 361.20 0.16EUR BAT INTERNATIONAL FINANCE PLC-REG-S 0.87500% 15-13.10.23 1 000 000.00 982 630.00 0.05EUR BAT INTERNATIONAL FINANCE PLC-REG-S 1.25000% 15-13.03.27 3 195 000.00 3 044 707.20 0.15EUR BAYER CAPITAL CORP BV-REG-S 1.25000% 14-13.11.23 500 000.00 525 390.00 0.03EUR BERTELSMANN SE & CO KGAA-REG-S 1.12500% 16-27.04.26 300 000.00 300 789.00 0.01EUR BERTELSMANN SE & CO KGAA-REG-S 0.25000% 17-26.05.21 1 400 000.00 1 403 010.00 0.07EUR BHP BILLITON FINANCE LTD 2.25000% 12-25.09.20 2 100 000.00 2 238 117.00 0.11EUR BMW FINANCE NV-REG-S 0.50000% 15-21.01.20 4 450 000.00 4 502 821.50 0.22EUR BMW FINANCE NV-REG-S 0.12500% 17-03.07.20 3 964 000.00 3 970 818.08 0.19EUR BMW US CAPITAL LLC-REG-S 1.12500% 15-18.09.21 1 349 000.00 1 394 299.42 0.07EUR BNP PARIBAS 2.50000% 12-23.08.19 1 500 000.00 1 582 380.00 0.08EUR BNP PARIBAS 2.87500% 13-26.09.23 2 000 000.00 2 277 400.00 0.11EUR BNP PARIBAS SA-REG-S 1.50000% 17-17.11.25 3 577 000.00 3 619 065.52 0.18EUR BNP PARIBAS-REG-S 0.50000% 16-01.06.22 679 000.00 685 355.44 0.03EUR BNP PARIBAS-REG-S 1.12500% 16-15.01.23 1 900 000.00 1 970 110.00 0.10EUR BNP PARIBAS-REG-S 1.50000% 16-25.05.28 182 000.00 187 723.90 0.01EUR BNP PARIBAS-REG-S 1.12500% 17-10.10.23 2 550 000.00 2 589 295.50 0.13EUR BNP PARIBAS-REG-S-SUB 2.37500% 15-17.02.25 945 000.00 993 667.50 0.05EUR BP CAPITAL MARKETS PLC 2.97200% 14-27.02.26 700 000.00 802 858.00 0.04EUR BP CAPITAL MARKETS PLC-REG-S 1.526% 14-26.09.22 1 000 000.00 1 056 770.00 0.05EUR BP CAPITAL MARKETS PLC-REG-S 1.10900% 15-16.02.23 1 302 000.00 1 341 164.16 0.07EUR BP CAPITAL MARKETS PLC-REG-S 1.95300% 16-03.03.25 6 060 000.00 6 477 412.80 0.31EUR BP CAPITAL MARKETS PLC-REG-S 0.83000% 16-19.09.24 1 504 000.00 1 496 765.76 0.07EUR BP CAPITAL MARKETS PLC-REG-S 1.11700% 16-25.01.24 2 313 000.00 2 364 603.03 0.11EUR BP CAPITAL MARKETS PLC-REG-S 1.07700% 17-26.06.25 900 000.00 901 503.00 0.04EUR BPCE SA 0.37500% 16-05.10.23 5 500 000.00 5 422 615.00 0.26EUR BPCE SA 0.62500% 16-20.04.20 1 000 000.00 1 018 150.00 0.05EUR BPCE SA 1.00000% 16-05.10.28 1 400 000.00 1 350 580.00 0.07EUR BPCE SA-REG-S 1.12500% 17-18.01.23 3 400 000.00 3 464 532.00 0.17EUR BPCE SA-REG-S-SUB 2.87500% 16-22.04.26 900 000.00 974 394.00 0.05EUR BRISA CONCESSAO RODOVIARIA SA-REG-S 2.00000% 16-22.03.23 2 700 000.00 2 843 397.00 0.14EUR BRITISH TELECOMMUNICATIONS PLC-REG-S 1.75000% 16-10.03.26 7 390 000.00 7 598 619.70 0.37EUR BRITISH TELECOMMUNICATIONS PLC-REG-S 0.62500% 16-10.03.21 3 400 000.00 3 435 938.00 0.17EUR BRITISH TELECOMMUNICATIONS PLC-REG-S 1.12500% 16-10.03.23 5 052 000.00 5 171 782.92 0.25EUR BRITISH TELECOMMUNICATIONS PLC-REG-S 1.50000% 17-23.06.27 3 108 000.00 3 080 307.72 0.15EUR CAIXABANK SA 1.12500% 17-17.05.24 6 700 000.00 6 740 267.00 0.33EUR CARLSBERG BREWERIES AS-REG-S 2.50000% 14-28.05.24 610 000.00 671 951.60 0.03EUR CARREFOUR SA 1.75000% 14-15.07.22 1 050 000.00 1 117 389.00 0.05EUR CARREFOUR SA 4.00000% 10-09.04.20 1 800 000.00 1 992 384.00 0.10EUR CASINO GUICHARD PERRACHON SA-REG-S STEP UP 12-06.08.19 2 500 000.00 2 710 675.00 0.13EUR CASINO GUICHARD PERRACHON SA-REG-S STEP-UP 14-07.03.24 2 000 000.00 2 240 440.00 0.11EUR CELLNEX TELECOM SA-REG-S 2.87500% 17-18.04.25 1 100 000.00 1 147 531.00 0.06EUR CELLNEX TELECOM SAU-REG-S 3.12500% 15-27.07.22 1 300 000.00 1 422 213.00 0.07EUR CELLNEX TELECOM SAU-REG-S 2.37500% 16-16.01.24 2 000 000.00 2 059 360.00 0.10EUR CHORUS LTD-REG-S 1.12500% 16-18.10.23 3 218 000.00 3 219 834.26 0.16EUR CIE DE SAINT-GOBAIN SA 4.00000% 10-08.10.18 1 397 000.00 1 463 902.33 0.07EUR CIE DE SAINT-GOBAIN SA 4.50000% 11-30.09.19 1 000 000.00 1 098 500.00 0.05EUR CIE DE SAINT-GOBAIN SA-REG-S 1.37500% 17-14.06.27 2 500 000.00 2 489 625.00 0.12EUR CITIGROUP INC-REG-S 2.37500% 14-22.05.24 980 000.00 1 069 826.80 0.05EUR CITIGROUP INC-REG-S 1.37500% 14-27.10.21 2 500 000.00 2 603 350.00 0.13EUR CITIGROUP INC-REG-S 0.75000% 16-26.10.23 7 037 000.00 6 957 481.90 0.34EUR CLOVERIE PLC FOR ZURICH INS CO-REG-S 1.75000% 14-16.09.24 399 000.00 424 013.31 0.02EUR COCA-COLA HBC FINANCE BV 2.37500% 13-18.06.20 754 000.00 800 046.78 0.04EUR COMMERZBANK AG 0.50000% 16-13.09.23 2 643 000.00 2 581 999.56 0.13EUR COMMERZBANK AG 0.62500% 15-14.03.19 2 800 000.00 2 832 116.00 0.14EUR COMMERZBANK AG-REG-S-SUB 4.00000% 16-23.03.26 810 000.00 888 723.90 0.04EUR COMMERZBANK AG-SUB 7.75000% 11-16.03.21 1 400 000.00 1 722 210.00 0.08EUR COMPAGNIE DE FINANCEMENT FONCIER-REG-S 0.25000% 16-16.03.22 2 700 000.00 2 715 012.00 0.13EUR COMPAGNIE DE FINANCEMENT FONCIER-REG-S 0.20000% 17-16.09.22 3 200 000.00 3 192 480.00 0.15EUR COMPASS GROUP INTERNATIONAL BV-REG-S 0.62500% 17-03.07.24 1 900 000.00 1 872 127.00 0.09EUR CREDIT AGRICOLE SA 3.87500% 12-13.02.19 900 000.00 956 268.00 0.05EUR CREDIT AGRICOLE SA LONDON 2.37500% 14-20.05.24 3 000 000.00 3 330 330.00 0.16EUR CREDIT AGRICOLE SA LONDON 1.25000% 16-14.04.26 5 100 000.00 5 182 824.00 0.25EUR CREDIT AGRICOLE SA LONDON-REG-S 0.75000% 16-01.12.22 1 400 000.00 1 423 702.00 0.07EUR CREDIT AGRICOLE SA LONDON-REG-S 1.87500% 16-20.12.26 3 000 000.00 3 102 870.00 0.15EUR CREDIT AGRICOLE SA LONDON-REG-S 1.00000% 17-16.09.24 3 900 000.00 3 968 367.00 0.19EUR CREDIT AGRICOLE SA LONDON 1.37500% 17-03.05.27 4 400 000.00 4 462 084.00 0.22EUR CREDIT SUISSE GRP FDNG GUERNSEY-REG-S 1.25000% 15-14.04.22 1 710 000.00 1 755 417.60 0.09EUR CREDIT SUISSE LONDON BRANCH 4.75000% 09-05.08.19 1 200 000.00 1 316 777.52 0.06EUR CREDIT SUISSE LONDON BRANCH-REG-S 1.00000% 16-07.06.23 6 500 000.00 6 629 740.00 0.32EUR CRH FINANCE BV 5.00000% 12-25.01.19 1 300 000.00 1 397 981.00 0.07EUR CRH FINANCE GERMANY GMBH-REG-S 1.75000% 14-16.07.21 3 150 000.00 3 325 738.50 0.16EUR CRH FINLAND SERVICES PLC 2.75000% 13-15.10.20 2 507 000.00 2 703 774.43 0.13EUR CRITERIA CAIXA SAU-REG-S 1.50000% 17-10.05.23 2 000 000.00 1 999 900.00 0.10EUR DAIMLER AG-REG-S 0.50000%16-09.09.19 2 500 000.00 2 526 125.00 0.12EUR DAIMLER AG-REG-S 2.12500% 17-03.07.37 2 050 000.00 1 957 237.50 0.09EUR DAIMLER AG-REG-S- 2.00000% 13-25.06.21 1 036 000.00 1 105 598.48 0.05EUR DANFOSS A/S-REG-S 1.37500% 14-23.02.22 8 932 000.00 9 232 115.20 0.44EUR DANONE SA-REG-S 0.42400% 16-03.11.22 1 700 000.00 1 701 105.00 0.08EUR DANSKE BANK AS-REG-S 0.50000% 16-06.05.21 2 296 000.00 2 325 503.60 0.11EUR DANSKE BANK AS-REG-S 0.75000% 16-02.06.23 3 522 000.00 3 561 939.48 0.17EUR DEUTSCHE BAHN FINANCE BV 2.75000% 14-19.03.29 1 237 000.00 1 441 674.02 0.07EUR DEUTSCHE BAHN FINANCE BV-REG-S 1.62500% 15-06.11.30 2 660 000.00 2 738 948.80 0.13EUR DEUTSCHE BAHN FINANCE BV-REG-S 0.87500% 16-11.07.31 750 000.00 690 345.00 0.03EUR DEUTSCHE BANK AG 1.00000% 16-18.03.19 5 300 000.00 5 383 316.00 0.26EUR DEUTSCHE BANK AG 1.25000% 14-08.09.21 1 000 000.00 1 026 370.00 0.05EUR DEUTSCHE BANK AG 1.50000% 17-20.01.22 1 800 000.00 1 859 958.00 0.09EUR DEUTSCHE BANK AG-REG-S 1.12500% 15-17.03.25 1 500 000.00 1 495 035.00 0.07EUR DEUTSCHE BANK AG-SUB 4.50000% 16-19.05.26 3 300 000.00 3 694 086.00 0.18EUR DEUTSCHE BANK-REG-S 2.37500% 13-11.01.23 800 000.00 870 536.00 0.04EUR DEUTSCHE PFANDBRIEFBANK AG 1.12500% 16-27.04.20 1 798 000.00 1 837 556.00 0.09EUR DEUTSCHE TELEKOM INTL FINANCE-REG-S 2.12500% 13-18.01.21 1 049 000.00 1 120 195.63 0.05
Description Quantity/ Valuation in EUR as a % Nominal Unrealized gain of net (loss) on Futures/ assets Forward Exchange Contracts/ Swaps (Note 1)
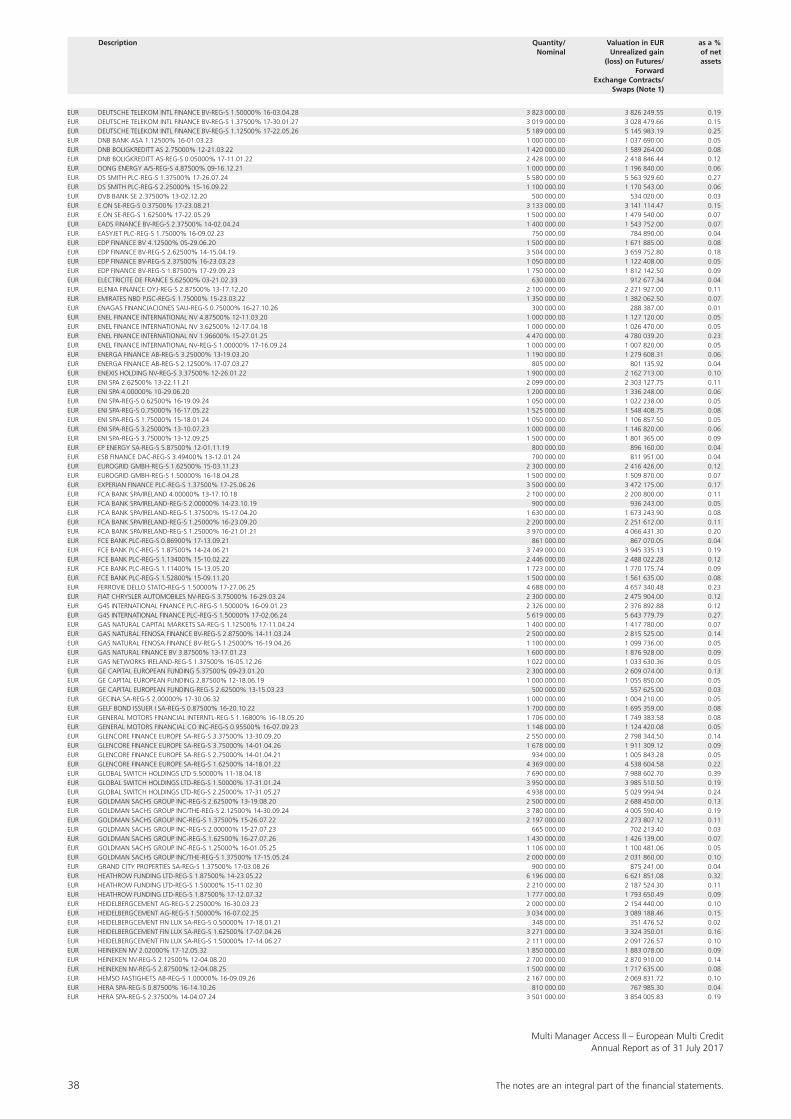
38 The notes are an integral part of the fi nancial statements.
Multi Manager Access II – European Multi CreditAnnual Report as of 31 July 2017
EUR DEUTSCHE TELEKOM INTL FINANCE BV-REG-S 1.50000% 16-03.04.28 3 823 000.00 3 826 249.55 0.19EUR DEUTSCHE TELEKOM INTL FINANCE BV-REG-S 1.37500% 17-30.01.27 3 019 000.00 3 028 479.66 0.15EUR DEUTSCHE TELEKOM INTL FINANCE BV-REG-S 1.12500% 17-22.05.26 5 189 000.00 5 145 983.19 0.25EUR DNB BANK ASA 1.12500% 16-01.03.23 1 000 000.00 1 037 690.00 0.05EUR DNB BOLIGKREDITT AS 2.75000% 12-21.03.22 1 420 000.00 1 589 264.00 0.08EUR DNB BOLIGKREDITT AS-REG-S 0.05000% 17-11.01.22 2 428 000.00 2 418 846.44 0.12EUR DONG ENERGY A/S-REG-S 4.87500% 09-16.12.21 1 000 000.00 1 196 840.00 0.06EUR DS SMITH PLC-REG-S 1.37500% 17-26.07.24 5 580 000.00 5 563 929.60 0.27EUR DS SMITH PLC-REG-S 2.25000% 15-16.09.22 1 100 000.00 1 170 543.00 0.06EUR DVB BANK SE 2.37500% 13-02.12.20 500 000.00 534 020.00 0.03EUR E.ON SE-REG-S 0.37500% 17-23.08.21 3 133 000.00 3 141 114.47 0.15EUR E.ON SE-REG-S 1.62500% 17-22.05.29 1 500 000.00 1 479 540.00 0.07EUR EADS FINANCE BV-REG-S 2.37500% 14-02.04.24 1 400 000.00 1 543 752.00 0.07EUR EASYJET PLC-REG-S 1.75000% 16-09.02.23 750 000.00 784 890.00 0.04EUR EDP FINANCE BV 4.12500% 05-29.06.20 1 500 000.00 1 671 885.00 0.08EUR EDP FINANCE BV-REG-S 2.62500% 14-15.04.19 3 504 000.00 3 659 752.80 0.18EUR EDP FINANCE BV-REG-S 2.37500% 16-23.03.23 1 050 000.00 1 122 408.00 0.05EUR EDP FINANCE BV-REG-S 1.87500% 17-29.09.23 1 750 000.00 1 812 142.50 0.09EUR ELECTRICITE DE FRANCE 5.62500% 03-21.02.33 630 000.00 912 677.34 0.04EUR ELENIA FINANCE OYJ-REG-S 2.87500% 13-17.12.20 2 100 000.00 2 271 927.00 0.11EUR EMIRATES NBD PJSC-REG-S 1.75000% 15-23.03.22 1 350 000.00 1 382 062.50 0.07EUR ENAGAS FINANCIACIONES SAU-REG-S 0.75000% 16-27.10.26 300 000.00 288 387.00 0.01EUR ENEL FINANCE INTERNATIONAL NV 4.87500% 12-11.03.20 1 000 000.00 1 127 120.00 0.05EUR ENEL FINANCE INTERNATIONAL NV 3.62500% 12-17.04.18 1 000 000.00 1 026 470.00 0.05EUR ENEL FINANCE INTERNATIONAL NV 1.96600% 15-27.01.25 4 470 000.00 4 780 039.20 0.23EUR ENEL FINANCE INTERNATIONAL NV-REG-S 1.00000% 17-16.09.24 1 000 000.00 1 007 820.00 0.05EUR ENERGA FINANCE AB-REG-S 3.25000% 13-19.03.20 1 190 000.00 1 279 608.31 0.06EUR ENERGA FINANCE AB-REG-S 2.12500% 17-07.03.27 805 000.00 801 135.92 0.04EUR ENEXIS HOLDING NV-REG-S 3.37500% 12-26.01.22 1 900 000.00 2 162 713.00 0.10EUR ENI SPA 2.62500% 13-22.11.21 2 099 000.00 2 303 127.75 0.11EUR ENI SPA 4.00000% 10-29.06.20 1 200 000.00 1 336 248.00 0.06EUR ENI SPA-REG-S 0.62500% 16-19.09.24 1 050 000.00 1 022 238.00 0.05EUR ENI SPA-REG-S 0.75000% 16-17.05.22 1 525 000.00 1 548 408.75 0.08EUR ENI SPA-REG-S 1.75000% 15-18.01.24 1 050 000.00 1 106 857.50 0.05EUR ENI SPA-REG-S 3.25000% 13-10.07.23 1 000 000.00 1 146 820.00 0.06EUR ENI SPA-REG-S 3.75000% 13-12.09.25 1 500 000.00 1 801 365.00 0.09EUR EP ENERGY SA-REG-S 5.87500% 12-01.11.19 800 000.00 896 160.00 0.04EUR ESB FINANCE DAC-REG-S 3.49400% 13-12.01.24 700 000.00 811 951.00 0.04EUR EUROGRID GMBH-REG-S 1.62500% 15-03.11.23 2 300 000.00 2 416 426.00 0.12EUR EUROGRID GMBH-REG-S 1.50000% 16-18.04.28 1 500 000.00 1 509 870.00 0.07EUR EXPERIAN FINANCE PLC-REG-S 1.37500% 17-25.06.26 3 500 000.00 3 472 175.00 0.17EUR FCA BANK SPA/IRELAND 4.00000% 13-17.10.18 2 100 000.00 2 200 800.00 0.11EUR FCA BANK SPA/IRELAND-REG-S 2.00000% 14-23.10.19 900 000.00 936 243.00 0.05EUR FCA BANK SPA/IRELAND-REG-S 1.37500% 15-17.04.20 1 630 000.00 1 673 243.90 0.08EUR FCA BANK SPA/IRELAND-REG-S 1.25000% 16-23.09.20 2 200 000.00 2 251 612.00 0.11EUR FCA BANK SPA/IRELAND-REG-S 1.25000% 16-21.01.21 3 970 000.00 4 066 431.30 0.20EUR FCE BANK PLC-REG-S 0.86900% 17-13.09.21 861 000.00 867 070.05 0.04EUR FCE BANK PLC-REG-S 1.87500% 14-24.06.21 3 749 000.00 3 945 335.13 0.19EUR FCE BANK PLC-REG-S 1.13400% 15-10.02.22 2 446 000.00 2 488 022.28 0.12EUR FCE BANK PLC-REG-S 1.11400% 15-13.05.20 1 723 000.00 1 770 175.74 0.09EUR FCE BANK PLC-REG-S 1.52800% 15-09.11.20 1 500 000.00 1 561 635.00 0.08EUR FERROVIE DELLO STATO-REG-S 1.50000% 17-27.06.25 4 688 000.00 4 657 340.48 0.23EUR FIAT CHRYSLER AUTOMOBILES NV-REG-S 3.75000% 16-29.03.24 2 300 000.00 2 475 904.00 0.12EUR G4S INTERNATIONAL FINANCE PLC-REG-S 1.50000% 16-09.01.23 2 326 000.00 2 376 892.88 0.12EUR G4S INTERNATIONAL FINANCE PLC-REG-S 1.50000% 17-02.06.24 5 619 000.00 5 643 779.79 0.27EUR GAS NATURAL CAPITAL MARKETS SA-REG-S 1.12500% 17-11.04.24 1 400 000.00 1 417 780.00 0.07EUR GAS NATURAL FENOSA FINANCE BV-REG-S 2.87500% 14-11.03.24 2 500 000.00 2 815 525.00 0.14EUR GAS NATURAL FENOSA FINANCE BV-REG-S 1.25000% 16-19.04.26 1 100 000.00 1 099 736.00 0.05EUR GAS NATURAL FINANCE BV 3.87500% 13-17.01.23 1 600 000.00 1 876 928.00 0.09EUR GAS NETWORKS IRELAND-REG-S 1.37500% 16-05.12.26 1 022 000.00 1 033 630.36 0.05EUR GE CAPITAL EUROPEAN FUNDING 5.37500% 09-23.01.20 2 300 000.00 2 609 074.00 0.13EUR GE CAPITAL EUROPEAN FUNDING 2.87500% 12-18.06.19 1 000 000.00 1 055 850.00 0.05EUR GE CAPITAL EUROPEAN FUNDING-REG-S 2.62500% 13-15.03.23 500 000.00 557 625.00 0.03EUR GECINA SA-REG-S 2.00000% 17-30.06.32 1 000 000.00 1 004 210.00 0.05EUR GELF BOND ISSUER I SA-REG-S 0.87500% 16-20.10.22 1 700 000.00 1 695 359.00 0.08EUR GENERAL MOTORS FINANCIAL INTERNTL-REG-S 1.16800% 16-18.05.20 1 706 000.00 1 749 383.58 0.08EUR GENERAL MOTORS FINANCIAL CO INC-REG-S 0.95500% 16-07.09.23 1 148 000.00 1 124 420.08 0.05EUR GLENCORE FINANCE EUROPE SA-REG-S 3.37500% 13-30.09.20 2 550 000.00 2 798 344.50 0.14EUR GLENCORE FINANCE EUROPE SA-REG-S 3.75000% 14-01.04.26 1 678 000.00 1 911 309.12 0.09EUR GLENCORE FINANCE EUROPE SA-REG-S 2.75000% 14-01.04.21 934 000.00 1 005 843.28 0.05EUR GLENCORE FINANCE EUROPE SA-REG-S 1.62500% 14-18.01.22 4 369 000.00 4 538 604.58 0.22EUR GLOBAL SWITCH HOLDINGS LTD 5.50000% 11-18.04.18 7 690 000.00 7 988 602.70 0.39EUR GLOBAL SWITCH HOLDINGS LTD-REG-S 1.50000% 17-31.01.24 3 950 000.00 3 985 510.50 0.19EUR GLOBAL SWITCH HOLDINGS LTD-REG-S 2.25000% 17-31.05.27 4 938 000.00 5 029 994.94 0.24EUR GOLDMAN SACHS GROUP INC-REG-S 2.62500% 13-19.08.20 2 500 000.00 2 688 450.00 0.13EUR GOLDMAN SACHS GROUP INC/THE-REG-S 2.12500% 14-30.09.24 3 780 000.00 4 005 590.40 0.19EUR GOLDMAN SACHS GROUP INC-REG-S 1.37500% 15-26.07.22 2 197 000.00 2 273 807.12 0.11EUR GOLDMAN SACHS GROUP INC-REG-S 2.00000% 15-27.07.23 665 000.00 702 213.40 0.03EUR GOLDMAN SACHS GROUP INC-REG-S 1.62500% 16-27.07.26 1 430 000.00 1 426 139.00 0.07EUR GOLDMAN SACHS GROUP INC-REG-S 1.25000% 16-01.05.25 1 106 000.00 1 100 481.06 0.05EUR GOLDMAN SACHS GROUP INC/THE-REG-S 1.37500% 17-15.05.24 2 000 000.00 2 031 860.00 0.10EUR GRAND CITY PROPERTIES SA-REG-S 1.37500% 17-03.08.26 900 000.00 875 241.00 0.04EUR HEATHROW FUNDING LTD-REG-S 1.87500% 14-23.05.22 6 196 000.00 6 621 851.08 0.32EUR HEATHROW FUNDING LTD-REG-S 1.50000% 15-11.02.30 2 210 000.00 2 187 524.30 0.11EUR HEATHROW FUNDING LTD-REG-S 1.87500% 17-12.07.32 1 777 000.00 1 793 650.49 0.09EUR HEIDELBERGCEMENT AG-REG-S 2.25000% 16-30.03.23 2 000 000.00 2 154 440.00 0.10EUR HEIDELBERGCEMENT AG-REG-S 1.50000% 16-07.02.25 3 034 000.00 3 089 188.46 0.15EUR HEIDELBERGCEMENT FIN LUX SA-REG-S 0.50000% 17-18.01.21 348 000.00 351 476.52 0.02EUR HEIDELBERGCEMENT FIN LUX SA-REG-S 1.62500% 17-07.04.26 3 271 000.00 3 324 350.01 0.16EUR HEIDELBERGCEMENT FIN LUX SA-REG-S 1.50000% 17-14.06.27 2 111 000.00 2 091 726.57 0.10EUR HEINEKEN NV 2.02000% 17-12.05.32 1 850 000.00 1 883 078.00 0.09EUR HEINEKEN NV-REG-S 2.12500% 12-04.08.20 2 700 000.00 2 870 910.00 0.14EUR HEINEKEN NV-REG-S 2.87500% 12-04.08.25 1 500 000.00 1 717 635.00 0.08EUR HEMSO FASTIGHETS AB-REG-S 1.00000% 16-09.09.26 2 167 000.00 2 069 831.72 0.10EUR HERA SPA-REG-S 0.87500% 16-14.10.26 810 000.00 767 985.30 0.04EUR HERA SPA-REG-S 2.37500% 14-04.07.24 3 501 000.00 3 854 005.83 0.19
Description Quantity/ Valuation in EUR as a % Nominal Unrealized gain of net (loss) on Futures/ assets Forward Exchange Contracts/ Swaps (Note 1)
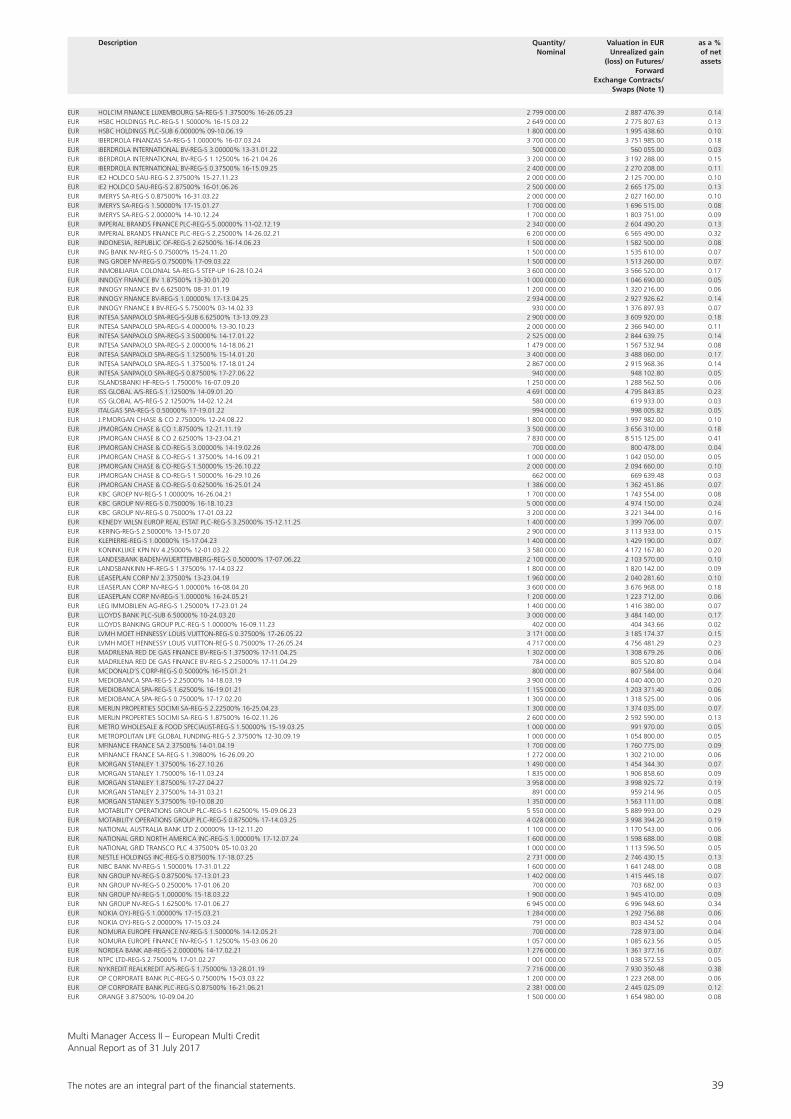
The notes are an integral part of the fi nancial statements. 39
Multi Manager Access II – European Multi CreditAnnual Report as of 31 July 2017
EUR HOLCIM FINANCE LUXEMBOURG SA-REG-S 1.37500% 16-26.05.23 2 799 000.00 2 887 476.39 0.14EUR HSBC HOLDINGS PLC-REG-S 1.50000% 16-15.03.22 2 649 000.00 2 775 807.63 0.13EUR HSBC HOLDINGS PLC-SUB 6.00000% 09-10.06.19 1 800 000.00 1 995 438.60 0.10EUR IBERDROLA FINANZAS SA-REG-S 1.00000% 16-07.03.24 3 700 000.00 3 751 985.00 0.18EUR IBERDROLA INTERNATIONAL BV-REG-S 3.00000% 13-31.01.22 500 000.00 560 055.00 0.03EUR IBERDROLA INTERNATIONAL BV-REG-S 1.12500% 16-21.04.26 3 200 000.00 3 192 288.00 0.15EUR IBERDROLA INTERNATIONAL BV-REG-S 0.37500% 16-15.09.25 2 400 000.00 2 270 208.00 0.11EUR IE2 HOLDCO SAU-REG-S 2.37500% 15-27.11.23 2 000 000.00 2 125 700.00 0.10EUR IE2 HOLDCO SAU-REG-S 2.87500% 16-01.06.26 2 500 000.00 2 665 175.00 0.13EUR IMERYS SA-REG-S 0.87500% 16-31.03.22 2 000 000.00 2 027 160.00 0.10EUR IMERYS SA-REG-S 1.50000% 17-15.01.27 1 700 000.00 1 696 515.00 0.08EUR IMERYS SA-REG-S 2.00000% 14-10.12.24 1 700 000.00 1 803 751.00 0.09EUR IMPERIAL BRANDS FINANCE PLC-REG-S 5.00000% 11-02.12.19 2 340 000.00 2 604 490.20 0.13EUR IMPERIAL BRANDS FINANCE PLC-REG-S 2.25000% 14-26.02.21 6 200 000.00 6 565 490.00 0.32EUR INDONESIA, REPUBLIC OF-REG-S 2.62500% 16-14.06.23 1 500 000.00 1 582 500.00 0.08EUR ING BANK NV-REG-S 0.75000% 15-24.11.20 1 500 000.00 1 535 610.00 0.07EUR ING GROEP NV-REG-S 0.75000% 17-09.03.22 1 500 000.00 1 513 260.00 0.07EUR INMOBILIARIA COLONIAL SA-REG-S STEP-UP 16-28.10.24 3 600 000.00 3 566 520.00 0.17EUR INNOGY FINANCE BV 1.87500% 13-30.01.20 1 000 000.00 1 046 690.00 0.05EUR INNOGY FINANCE BV 6.62500% 08-31.01.19 1 200 000.00 1 320 216.00 0.06EUR INNOGY FINANCE BV-REG-S 1.00000% 17-13.04.25 2 934 000.00 2 927 926.62 0.14EUR INNOGY FINANCE II BV-REG-S 5.75000% 03-14.02.33 930 000.00 1 376 897.93 0.07EUR INTESA SANPAOLO SPA-REG-S-SUB 6.62500% 13-13.09.23 2 900 000.00 3 609 920.00 0.18EUR INTESA SANPAOLO SPA-REG-S 4.00000% 13-30.10.23 2 000 000.00 2 366 940.00 0.11EUR INTESA SANPAOLO SPA-REG-S 3.50000% 14-17.01.22 2 525 000.00 2 844 639.75 0.14EUR INTESA SANPAOLO SPA-REG-S 2.00000% 14-18.06.21 1 479 000.00 1 567 532.94 0.08EUR INTESA SANPAOLO SPA-REG-S 1.12500% 15-14.01.20 3 400 000.00 3 488 060.00 0.17EUR INTESA SANPAOLO SPA-REG-S 1.37500% 17-18.01.24 2 867 000.00 2 915 968.36 0.14EUR INTESA SANPAOLO SPA-REG-S 0.87500% 17-27.06.22 940 000.00 948 102.80 0.05EUR ISLANDSBANKI HF-REG-S 1.75000% 16-07.09.20 1 250 000.00 1 288 562.50 0.06EUR ISS GLOBAL A/S-REG-S 1.12500% 14-09.01.20 4 691 000.00 4 795 843.85 0.23EUR ISS GLOBAL A/S-REG-S 2.12500% 14-02.12.24 580 000.00 619 933.00 0.03EUR ITALGAS SPA-REG-S 0.50000% 17-19.01.22 994 000.00 998 005.82 0.05EUR J.P.MORGAN CHASE & CO 2.75000% 12-24.08.22 1 800 000.00 1 997 982.00 0.10EUR JPMORGAN CHASE & CO 1.87500% 12-21.11.19 3 500 000.00 3 656 310.00 0.18EUR JPMORGAN CHASE & CO 2.62500% 13-23.04.21 7 830 000.00 8 515 125.00 0.41EUR JPMORGAN CHASE & CO-REG-S 3.00000% 14-19.02.26 700 000.00 800 478.00 0.04EUR JPMORGAN CHASE & CO-REG-S 1.37500% 14-16.09.21 1 000 000.00 1 042 050.00 0.05EUR JPMORGAN CHASE & CO-REG-S 1.50000% 15-26.10.22 2 000 000.00 2 094 660.00 0.10EUR JPMORGAN CHASE & CO-REG-S 1.50000% 16-29.10.26 662 000.00 669 639.48 0.03EUR JPMORGAN CHASE & CO-REG-S 0.62500% 16-25.01.24 1 386 000.00 1 362 451.86 0.07EUR KBC GROEP NV-REG-S 1.00000% 16-26.04.21 1 700 000.00 1 743 554.00 0.08EUR KBC GROUP NV-REG-S 0.75000% 16-18.10.23 5 000 000.00 4 974 150.00 0.24EUR KBC GROUP NV-REG-S 0.75000% 17-01.03.22 3 200 000.00 3 221 344.00 0.16EUR KENEDY WILSN EUROP REAL ESTAT PLC-REG-S 3.25000% 15-12.11.25 1 400 000.00 1 399 706.00 0.07EUR KERING-REG-S 2.50000% 13-15.07.20 2 900 000.00 3 113 933.00 0.15EUR KLEPIERRE-REG-S 1.00000% 15-17.04.23 1 400 000.00 1 429 190.00 0.07EUR KONINKLIJKE KPN NV 4.25000% 12-01.03.22 3 580 000.00 4 172 167.80 0.20EUR LANDESBANK BADEN-WUERTTEMBERG-REG-S 0.50000% 17-07.06.22 2 100 000.00 2 103 570.00 0.10EUR LANDSBANKINN HF-REG-S 1.37500% 17-14.03.22 1 800 000.00 1 820 142.00 0.09EUR LEASEPLAN CORP NV 2.37500% 13-23.04.19 1 960 000.00 2 040 281.60 0.10EUR LEASEPLAN CORP NV-REG-S 1.00000% 16-08.04.20 3 600 000.00 3 676 968.00 0.18EUR LEASEPLAN CORP NV-REG-S 1.00000% 16-24.05.21 1 200 000.00 1 223 712.00 0.06EUR LEG IMMOBILIEN AG-REG-S 1.25000% 17-23.01.24 1 400 000.00 1 416 380.00 0.07EUR LLOYDS BANK PLC-SUB 6.50000% 10-24.03.20 3 000 000.00 3 484 140.00 0.17EUR LLOYDS BANKING GROUP PLC-REG-S 1.00000% 16-09.11.23 402 000.00 404 343.66 0.02EUR LVMH MOET HENNESSY LOUIS VUITTON-REG-S 0.37500% 17-26.05.22 3 171 000.00 3 185 174.37 0.15EUR LVMH MOET HENNESSY LOUIS VUITTON-REG-S 0.75000% 17-26.05.24 4 717 000.00 4 756 481.29 0.23EUR MADRILENA RED DE GAS FINANCE BV-REG-S 1.37500% 17-11.04.25 1 302 000.00 1 308 679.26 0.06EUR MADRILENA RED DE GAS FINANCE BV-REG-S 2.25000% 17-11.04.29 784 000.00 805 520.80 0.04EUR MCDONALD’S CORP-REG-S 0.50000% 16-15.01.21 800 000.00 807 584.00 0.04EUR MEDIOBANCA SPA-REG-S 2.25000% 14-18.03.19 3 900 000.00 4 040 400.00 0.20EUR MEDIOBANCA SPA-REG-S 1.62500% 16-19.01.21 1 155 000.00 1 203 371.40 0.06EUR MEDIOBANCA SPA-REG-S 0.75000% 17-17.02.20 1 300 000.00 1 318 525.00 0.06EUR MERLIN PROPERTIES SOCIMI SA-REG-S 2.22500% 16-25.04.23 1 300 000.00 1 374 035.00 0.07EUR MERLIN PROPERTIES SOCIMI SA-REG-S 1.87500% 16-02.11.26 2 600 000.00 2 592 590.00 0.13EUR METRO WHOLESALE & FOOD SPECIALIST-REG-S 1.50000% 15-19.03.25 1 000 000.00 991 970.00 0.05EUR METROPOLITAN LIFE GLOBAL FUNDING-REG-S 2.37500% 12-30.09.19 1 000 000.00 1 054 800.00 0.05EUR MFINANCE FRANCE SA 2.37500% 14-01.04.19 1 700 000.00 1 760 775.00 0.09EUR MFINANCE FRANCE SA-REG-S 1.39800% 16-26.09.20 1 272 000.00 1 302 210.00 0.06EUR MORGAN STANLEY 1.37500% 16-27.10.26 1 490 000.00 1 454 344.30 0.07EUR MORGAN STANLEY 1.75000% 16-11.03.24 1 835 000.00 1 906 858.60 0.09EUR MORGAN STANLEY 1.87500% 17-27.04.27 3 958 000.00 3 998 925.72 0.19EUR MORGAN STANLEY 2.37500% 14-31.03.21 891 000.00 959 214.96 0.05EUR MORGAN STANLEY 5.37500% 10-10.08.20 1 350 000.00 1 563 111.00 0.08EUR MOTABILITY OPERATIONS GROUP PLC-REG-S 1.62500% 15-09.06.23 5 550 000.00 5 889 993.00 0.29EUR MOTABILITY OPERATIONS GROUP PLC-REG-S 0.87500% 17-14.03.25 4 028 000.00 3 998 394.20 0.19EUR NATIONAL AUSTRALIA BANK LTD 2.00000% 13-12.11.20 1 100 000.00 1 170 543.00 0.06EUR NATIONAL GRID NORTH AMERICA INC-REG-S 1.00000% 17-12.07.24 1 600 000.00 1 598 688.00 0.08EUR NATIONAL GRID TRANSCO PLC 4.37500% 05-10.03.20 1 000 000.00 1 113 596.50 0.05EUR NESTLE HOLDINGS INC-REG-S 0.87500% 17-18.07.25 2 731 000.00 2 746 430.15 0.13EUR NIBC BANK NV-REG-S 1.50000% 17-31.01.22 1 600 000.00 1 641 248.00 0.08EUR NN GROUP NV-REG-S 0.87500% 17-13.01.23 1 402 000.00 1 415 445.18 0.07EUR NN GROUP NV-REG-S 0.25000% 17-01.06.20 700 000.00 703 682.00 0.03EUR NN GROUP NV-REG-S 1.00000% 15-18.03.22 1 900 000.00 1 945 410.00 0.09EUR NN GROUP NV-REG-S 1.62500% 17-01.06.27 6 945 000.00 6 996 948.60 0.34EUR NOKIA OYJ-REG-S 1.00000% 17-15.03.21 1 284 000.00 1 292 756.88 0.06EUR NOKIA OYJ-REG-S 2.00000% 17-15.03.24 791 000.00 803 434.52 0.04EUR NOMURA EUROPE FINANCE NV-REG-S 1.50000% 14-12.05.21 700 000.00 728 973.00 0.04EUR NOMURA EUROPE FINANCE NV-REG-S 1.12500% 15-03.06.20 1 057 000.00 1 085 623.56 0.05EUR NORDEA BANK AB-REG-S 2.00000% 14-17.02.21 1 276 000.00 1 361 377.16 0.07EUR NTPC LTD-REG-S 2.75000% 17-01.02.27 1 001 000.00 1 038 572.53 0.05EUR NYKREDIT REALKREDIT A/S-REG-S 1.75000% 13-28.01.19 7 716 000.00 7 930 350.48 0.38EUR OP CORPORATE BANK PLC-REG-S 0.75000% 15-03.03.22 1 200 000.00 1 223 268.00 0.06EUR OP CORPORATE BANK PLC-REG-S 0.87500% 16-21.06.21 2 381 000.00 2 445 025.09 0.12EUR ORANGE 3.87500% 10-09.04.20 1 500 000.00 1 654 980.00 0.08
Description Quantity/ Valuation in EUR as a % Nominal Unrealized gain of net (loss) on Futures/ assets Forward Exchange Contracts/ Swaps (Note 1)
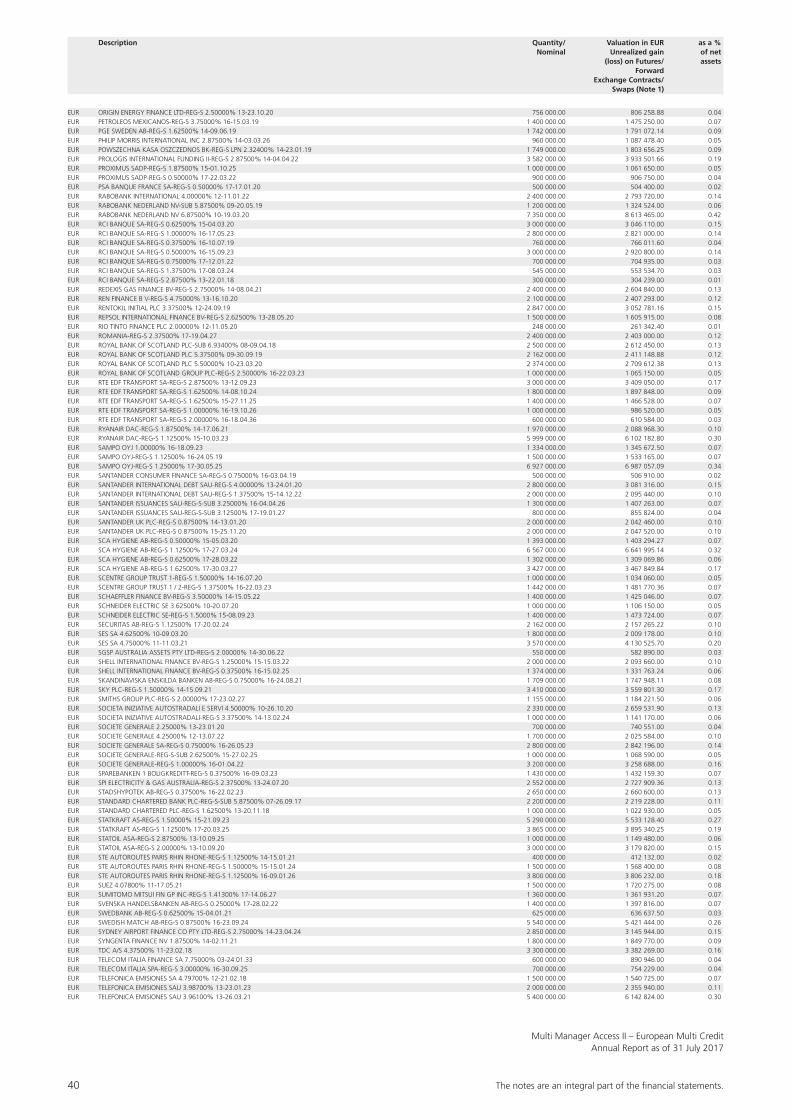
40 The notes are an integral part of the fi nancial statements.
Multi Manager Access II – European Multi CreditAnnual Report as of 31 July 2017
EUR ORIGIN ENERGY FINANCE LTD-REG-S 2.50000% 13-23.10.20 756 000.00 806 258.88 0.04EUR PETROLEOS MEXICANOS-REG-S 3.75000% 16-15.03.19 1 400 000.00 1 475 250.00 0.07EUR PGE SWEDEN AB-REG-S 1.62500% 14-09.06.19 1 742 000.00 1 791 072.14 0.09EUR PHILIP MORRIS INTERNATIONAL INC 2.87500% 14-03.03.26 960 000.00 1 087 478.40 0.05EUR POWSZECHNA KASA OSZCZEDNOS BK-REG-S LPN 2.32400% 14-23.01.19 1 749 000.00 1 803 656.25 0.09EUR PROLOGIS INTERNATIONAL FUNDING II-REG-S 2.87500% 14-04.04.22 3 582 000.00 3 933 501.66 0.19EUR PROXIMUS SADP-REG-S 1.87500% 15-01.10.25 1 000 000.00 1 061 650.00 0.05EUR PROXIMUS SADP-REG-S 0.50000% 17-22.03.22 900 000.00 906 750.00 0.04EUR PSA BANQUE FRANCE SA-REG-S 0.50000% 17-17.01.20 500 000.00 504 400.00 0.02EUR RABOBANK INTERNATIONAL 4.00000% 12-11.01.22 2 400 000.00 2 793 720.00 0.14EUR RABOBANK NEDERLAND NV-SUB 5.87500% 09-20.05.19 1 200 000.00 1 324 524.00 0.06EUR RABOBANK NEDERLAND NV 6.87500% 10-19.03.20 7 350 000.00 8 613 465.00 0.42EUR RCI BANQUE SA-REG-S 0.62500% 15-04.03.20 3 000 000.00 3 046 110.00 0.15EUR RCI BANQUE SA-REG-S 1.00000% 16-17.05.23 2 800 000.00 2 821 000.00 0.14EUR RCI BANQUE SA-REG-S 0.37500% 16-10.07.19 760 000.00 766 011.60 0.04EUR RCI BANQUE SA-REG-S 0.50000% 16-15.09.23 3 000 000.00 2 920 800.00 0.14EUR RCI BANQUE SA-REG-S 0.75000% 17-12.01.22 700 000.00 704 935.00 0.03EUR RCI BANQUE SA-REG-S 1.37500% 17-08.03.24 545 000.00 553 534.70 0.03EUR RCI BANQUE SA-REG-S 2.87500% 13-22.01.18 300 000.00 304 239.00 0.01EUR REDEXIS GAS FINANCE BV-REG-S 2.75000% 14-08.04.21 2 400 000.00 2 604 840.00 0.13EUR REN FINANCE B V-REG-S 4.75000% 13-16.10.20 2 100 000.00 2 407 293.00 0.12EUR RENTOKIL INITIAL PLC 3.37500% 12-24.09.19 2 847 000.00 3 052 781.16 0.15EUR REPSOL INTERNATIONAL FINANCE BV-REG-S 2.62500% 13-28.05.20 1 500 000.00 1 605 915.00 0.08EUR RIO TINTO FINANCE PLC 2.00000% 12-11.05.20 248 000.00 261 342.40 0.01EUR ROMANIA-REG-S 2.37500% 17-19.04.27 2 400 000.00 2 403 000.00 0.12EUR ROYAL BANK OF SCOTLAND PLC-SUB 6.93400% 08-09.04.18 2 500 000.00 2 612 450.00 0.13EUR ROYAL BANK OF SCOTLAND PLC 5.37500% 09-30.09.19 2 162 000.00 2 411 148.88 0.12EUR ROYAL BANK OF SCOTLAND PLC 5.50000% 10-23.03.20 2 374 000.00 2 709 612.38 0.13EUR ROYAL BANK OF SCOTLAND GROUP PLC-REG-S 2.50000% 16-22.03.23 1 000 000.00 1 065 150.00 0.05EUR RTE EDF TRANSPORT SA-REG-S 2.87500% 13-12.09.23 3 000 000.00 3 409 050.00 0.17EUR RTE EDF TRANSPORT SA-REG-S 1.62500% 14-08.10.24 1 800 000.00 1 897 848.00 0.09EUR RTE EDF TRANSPORT SA-REG-S 1.62500% 15-27.11.25 1 400 000.00 1 466 528.00 0.07EUR RTE EDF TRANSPORT SA-REG-S 1.00000% 16-19.10.26 1 000 000.00 986 520.00 0.05EUR RTE EDF TRANSPORT SA-REG-S 2.00000% 16-18.04.36 600 000.00 610 584.00 0.03EUR RYANAIR DAC-REG-S 1.87500% 14-17.06.21 1 970 000.00 2 088 968.30 0.10EUR RYANAIR DAC-REG-S 1.12500% 15-10.03.23 5 999 000.00 6 102 182.80 0.30EUR SAMPO OYJ 1.00000% 16-18.09.23 1 334 000.00 1 345 672.50 0.07EUR SAMPO OYJ-REG-S 1.12500% 16-24.05.19 1 500 000.00 1 533 165.00 0.07EUR SAMPO OYJ-REG-S 1.25000% 17-30.05.25 6 927 000.00 6 987 057.09 0.34EUR SANTANDER CONSUMER FINANCE SA-REG-S 0.75000% 16-03.04.19 500 000.00 506 910.00 0.02EUR SANTANDER INTERNATIONAL DEBT SAU-REG-S 4.00000% 13-24.01.20 2 800 000.00 3 081 316.00 0.15EUR SANTANDER INTERNATIONAL DEBT SAU-REG-S 1.37500% 15-14.12.22 2 000 000.00 2 095 440.00 0.10EUR SANTANDER ISSUANCES SAU-REG-S-SUB 3.25000% 16-04.04.26 1 300 000.00 1 407 263.00 0.07EUR SANTANDER ISSUANCES SAU-REG-S-SUB 3.12500% 17-19.01.27 800 000.00 855 824.00 0.04EUR SANTANDER UK PLC-REG-S 0.87500% 14-13.01.20 2 000 000.00 2 042 460.00 0.10EUR SANTANDER UK PLC-REG-S 0.87500% 15-25.11.20 2 000 000.00 2 047 520.00 0.10EUR SCA HYGIENE AB-REG-S 0.50000% 15-05.03.20 1 393 000.00 1 403 294.27 0.07EUR SCA HYGIENE AB-REG-S 1.12500% 17-27.03.24 6 567 000.00 6 641 995.14 0.32EUR SCA HYGIENE AB-REG-S 0.62500% 17-28.03.22 1 302 000.00 1 309 069.86 0.06EUR SCA HYGIENE AB-REG-S 1.62500% 17-30.03.27 3 427 000.00 3 467 849.84 0.17EUR SCENTRE GROUP TRUST 1-REG-S 1.50000% 14-16.07.20 1 000 000.00 1 034 060.00 0.05EUR SCENTRE GROUP TRUST 1 / 2-REG-S 1.37500% 16-22.03.23 1 442 000.00 1 481 770.36 0.07EUR SCHAEFFLER FINANCE BV-REG-S 3.50000% 14-15.05.22 1 400 000.00 1 425 046.00 0.07EUR SCHNEIDER ELECTRIC SE 3.62500% 10-20.07.20 1 000 000.00 1 106 150.00 0.05EUR SCHNEIDER ELECTRIC SE-REG-S 1.5000% 15-08.09.23 1 400 000.00 1 473 724.00 0.07EUR SECURITAS AB-REG-S 1.12500% 17-20.02.24 2 162 000.00 2 157 265.22 0.10EUR SES SA 4.62500% 10-09.03.20 1 800 000.00 2 009 178.00 0.10EUR SES SA 4.75000% 11-11.03.21 3 570 000.00 4 130 525.70 0.20EUR SGSP AUSTRALIA ASSETS PTY LTD-REG-S 2.00000% 14-30.06.22 550 000.00 582 890.00 0.03EUR SHELL INTERNATIONAL FINANCE BV-REG-S 1.25000% 15-15.03.22 2 000 000.00 2 093 660.00 0.10EUR SHELL INTERNATIONAL FINANCE BV-REG-S 0.37500% 16-15.02.25 1 374 000.00 1 331 763.24 0.06EUR SKANDINAVISKA ENSKILDA BANKEN AB-REG-S 0.75000% 16-24.08.21 1 709 000.00 1 747 948.11 0.08EUR SKY PLC-REG-S 1.50000% 14-15.09.21 3 410 000.00 3 559 801.30 0.17EUR SMITHS GROUP PLC-REG-S 2.00000% 17-23.02.27 1 155 000.00 1 184 221.50 0.06EUR SOCIETA INIZIATIVE AUTOSTRADALI E SERVI 4.50000% 10-26.10.20 2 330 000.00 2 659 531.90 0.13EUR SOCIETA INIZIATIVE AUTOSTRADALI-REG-S 3.37500% 14-13.02.24 1 000 000.00 1 141 170.00 0.06EUR SOCIETE GENERALE 2.25000% 13-23.01.20 700 000.00 740 551.00 0.04EUR SOCIETE GENERALE 4.25000% 12-13.07.22 1 700 000.00 2 025 584.00 0.10EUR SOCIETE GENERALE SA-REG-S 0.75000% 16-26.05.23 2 800 000.00 2 842 196.00 0.14EUR SOCIETE GENERALE-REG-S-SUB 2.62500% 15-27.02.25 1 000 000.00 1 068 590.00 0.05EUR SOCIETE GENERALE-REG-S 1.00000% 16-01.04.22 3 200 000.00 3 258 688.00 0.16EUR SPAREBANKEN 1 BOLIGKREDITT-REG-S 0.37500% 16-09.03.23 1 430 000.00 1 432 159.30 0.07EUR SPI ELECTRICITY & GAS AUSTRALIA-REG-S 2.37500% 13-24.07.20 2 552 000.00 2 727 909.36 0.13EUR STADSHYPOTEK AB-REG-S 0.37500% 16-22.02.23 2 650 000.00 2 660 600.00 0.13EUR STANDARD CHARTERED BANK PLC-REG-S-SUB 5.87500% 07-26.09.17 2 200 000.00 2 219 228.00 0.11EUR STANDARD CHARTERED PLC-REG-S 1.62500% 13-20.11.18 1 000 000.00 1 022 930.00 0.05EUR STATKRAFT AS-REG-S 1.50000% 15-21.09.23 5 290 000.00 5 533 128.40 0.27EUR STATKRAFT AS-REG-S 1.12500% 17-20.03.25 3 865 000.00 3 895 340.25 0.19EUR STATOIL ASA-REG-S 2.87500% 13-10.09.25 1 000 000.00 1 149 480.00 0.06EUR STATOIL ASA-REG-S 2.00000% 13-10.09.20 3 000 000.00 3 179 820.00 0.15EUR STE AUTOROUTES PARIS RHIN RHONE-REG-S 1.12500% 14-15.01.21 400 000.00 412 132.00 0.02EUR STE AUTOROUTES PARIS RHIN RHONE-REG-S 1.50000% 15-15.01.24 1 500 000.00 1 568 400.00 0.08EUR STE AUTOROUTES PARIS RHIN RHONE-REG-S 1.12500% 16-09.01.26 3 800 000.00 3 806 232.00 0.18EUR SUEZ 4.07800% 11-17.05.21 1 500 000.00 1 720 275.00 0.08EUR SUMITOMO MITSUI FIN GP INC-REG-S 1.41300% 17-14.06.27 1 360 000.00 1 361 931.20 0.07EUR SVENSKA HANDELSBANKEN AB-REG-S 0.25000% 17-28.02.22 1 400 000.00 1 397 816.00 0.07EUR SWEDBANK AB-REG-S 0.62500% 15-04.01.21 625 000.00 636 637.50 0.03EUR SWEDISH MATCH AB-REG-S 0.87500% 16-23.09.24 5 540 000.00 5 421 444.00 0.26EUR SYDNEY AIRPORT FINANCE CO PTY LTD-REG-S 2.75000% 14-23.04.24 2 850 000.00 3 145 944.00 0.15EUR SYNGENTA FINANCE NV 1.87500% 14-02.11.21 1 800 000.00 1 849 770.00 0.09EUR TDC A/S 4.37500% 11-23.02.18 3 300 000.00 3 382 269.00 0.16EUR TELECOM ITALIA FINANCE SA 7.75000% 03-24.01.33 600 000.00 890 946.00 0.04EUR TELECOM ITALIA SPA-REG-S 3.00000% 16-30.09.25 700 000.00 754 229.00 0.04EUR TELEFONICA EMISIONES SA 4.79700% 12-21.02.18 1 500 000.00 1 540 725.00 0.07EUR TELEFONICA EMISIONES SAU 3.98700% 13-23.01.23 2 000 000.00 2 355 940.00 0.11EUR TELEFONICA EMISIONES SAU 3.96100% 13-26.03.21 5 400 000.00 6 142 824.00 0.30
Description Quantity/ Valuation in EUR as a % Nominal Unrealized gain of net (loss) on Futures/ assets Forward Exchange Contracts/ Swaps (Note 1)
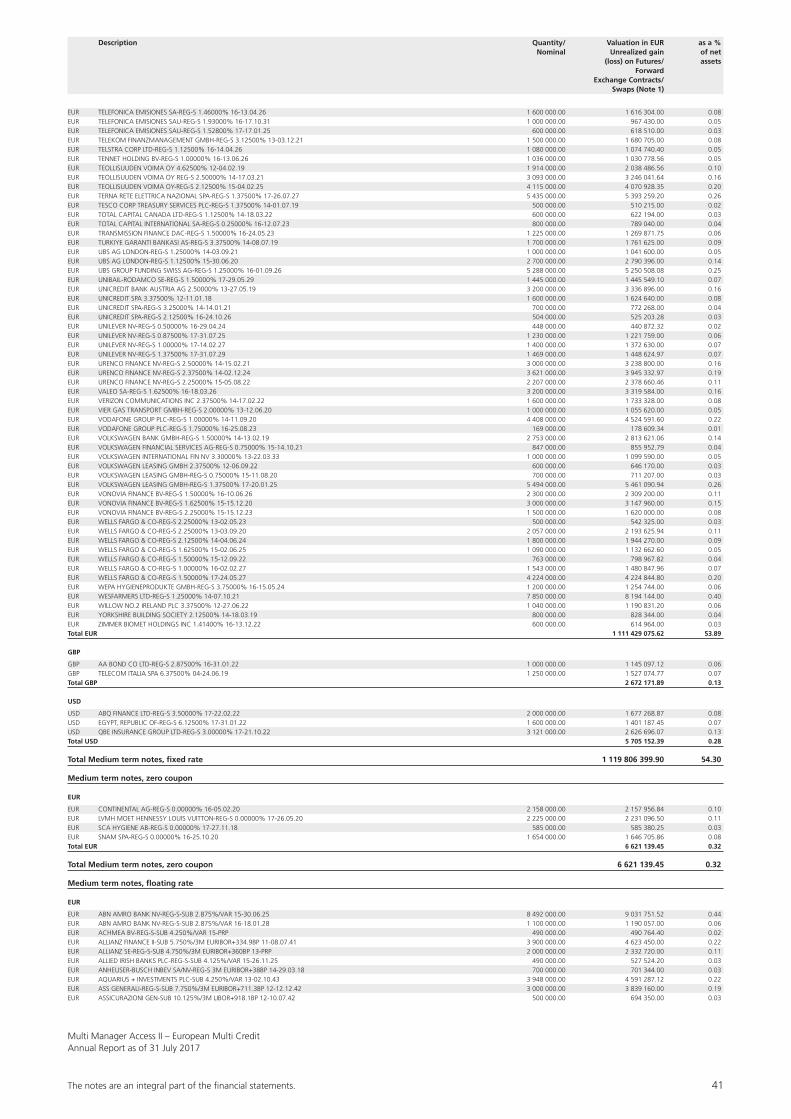
The notes are an integral part of the fi nancial statements. 41
Multi Manager Access II – European Multi CreditAnnual Report as of 31 July 2017
EUR TELEFONICA EMISIONES SA-REG-S 1.46000% 16-13.04.26 1 600 000.00 1 616 304.00 0.08EUR TELEFONICA EMISIONES SAU-REG-S 1.93000% 16-17.10.31 1 000 000.00 967 430.00 0.05EUR TELEFONICA EMISIONES SAU-REG-S 1.52800% 17-17.01.25 600 000.00 618 510.00 0.03EUR TELEKOM FINANZMANAGEMENT GMBH-REG-S 3.12500% 13-03.12.21 1 500 000.00 1 680 705.00 0.08EUR TELSTRA CORP LTD-REG-S 1.12500% 16-14.04.26 1 080 000.00 1 074 740.40 0.05EUR TENNET HOLDING BV-REG-S 1.00000% 16-13.06.26 1 036 000.00 1 030 778.56 0.05EUR TEOLLISUUDEN VOIMA OY 4.62500% 12-04.02.19 1 914 000.00 2 038 486.56 0.10EUR TEOLLISUUDEN VOIMA OY REG-S 2.50000% 14-17.03.21 3 093 000.00 3 246 041.64 0.16EUR TEOLLISUUDEN VOIMA OY-REG-S 2.12500% 15-04.02.25 4 115 000.00 4 070 928.35 0.20EUR TERNA RETE ELETTRICA NAZIONAL SPA-REG-S 1.37500% 17-26.07.27 5 435 000.00 5 393 259.20 0.26EUR TESCO CORP TREASURY SERVICES PLC-REG-S 1.37500% 14-01.07.19 500 000.00 510 215.00 0.02EUR TOTAL CAPITAL CANADA LTD-REG-S 1.12500% 14-18.03.22 600 000.00 622 194.00 0.03EUR TOTAL CAPITAL INTERNATIONAL SA-REG-S 0.25000% 16-12.07.23 800 000.00 789 040.00 0.04EUR TRANSMISSION FINANCE DAC-REG-S 1.50000% 16-24.05.23 1 225 000.00 1 269 871.75 0.06EUR TURKIYE GARANTI BANKASI AS-REG-S 3.37500% 14-08.07.19 1 700 000.00 1 761 625.00 0.09EUR UBS AG LONDON-REG-S 1.25000% 14-03.09.21 1 000 000.00 1 041 600.00 0.05EUR UBS AG LONDON-REG-S 1.12500% 15-30.06.20 2 700 000.00 2 790 396.00 0.14EUR UBS GROUP FUNDING SWISS AG-REG-S 1.25000% 16-01.09.26 5 288 000.00 5 250 508.08 0.25EUR UNIBAIL-RODAMCO SE-REG-S 1.50000% 17-29.05.29 1 445 000.00 1 445 549.10 0.07EUR UNICREDIT BANK AUSTRIA AG 2.50000% 13-27.05.19 3 200 000.00 3 336 896.00 0.16EUR UNICREDIT SPA 3.37500% 12-11.01.18 1 600 000.00 1 624 640.00 0.08EUR UNICREDIT SPA-REG-S 3.25000% 14-14.01.21 700 000.00 772 268.00 0.04EUR UNICREDIT SPA-REG-S 2.12500% 16-24.10.26 504 000.00 525 203.28 0.03EUR UNILEVER NV-REG-S 0.50000% 16-29.04.24 448 000.00 440 872.32 0.02EUR UNILEVER NV-REG-S 0.87500% 17-31.07.25 1 230 000.00 1 221 759.00 0.06EUR UNILEVER NV-REG-S 1.00000% 17-14.02.27 1 400 000.00 1 372 630.00 0.07EUR UNILEVER NV-REG-S 1.37500% 17-31.07.29 1 469 000.00 1 448 624.97 0.07EUR URENCO FINANCE NV-REG-S 2.50000% 14-15.02.21 3 000 000.00 3 238 800.00 0.16EUR URENCO FINANCE NV-REG-S 2.37500% 14-02.12.24 3 621 000.00 3 945 332.97 0.19EUR URENCO FINANCE NV-REG-S 2.25000% 15-05.08.22 2 207 000.00 2 378 660.46 0.11EUR VALEO SA-REG-S 1.62500% 16-18.03.26 3 200 000.00 3 319 584.00 0.16EUR VERIZON COMMUNICATIONS INC 2.37500% 14-17.02.22 1 600 000.00 1 733 328.00 0.08EUR VIER GAS TRANSPORT GMBH-REG-S 2.00000% 13-12.06.20 1 000 000.00 1 055 620.00 0.05EUR VODAFONE GROUP PLC-REG-S 1.00000% 14-11.09.20 4 408 000.00 4 524 591.60 0.22EUR VODAFONE GROUP PLC-REG-S 1.75000% 16-25.08.23 169 000.00 178 609.34 0.01EUR VOLKSWAGEN BANK GMBH-REG-S 1.50000% 14-13.02.19 2 753 000.00 2 813 621.06 0.14EUR VOLKSWAGEN FINANCIAL SERVICES AG-REG-S 0.75000% 15-14.10.21 847 000.00 855 952.79 0.04EUR VOLKSWAGEN INTERNATIONAL FIN NV 3.30000% 13-22.03.33 1 000 000.00 1 099 590.00 0.05EUR VOLKSWAGEN LEASING GMBH 2.37500% 12-06.09.22 600 000.00 646 170.00 0.03EUR VOLKSWAGEN LEASING GMBH-REG-S 0.75000% 15-11.08.20 700 000.00 711 207.00 0.03EUR VOLKSWAGEN LEASING GMBH-REG-S 1.37500% 17-20.01.25 5 494 000.00 5 461 090.94 0.26EUR VONOVIA FINANCE BV-REG-S 1.50000% 16-10.06.26 2 300 000.00 2 309 200.00 0.11EUR VONOVIA FINANCE BV-REG-S 1.62500% 15-15.12.20 3 000 000.00 3 147 960.00 0.15EUR VONOVIA FINANCE BV-REG-S 2.25000% 15-15.12.23 1 500 000.00 1 620 000.00 0.08EUR WELLS FARGO & CO-REG-S 2.25000% 13-02.05.23 500 000.00 542 325.00 0.03EUR WELLS FARGO & CO-REG-S 2.25000% 13-03.09.20 2 057 000.00 2 193 625.94 0.11EUR WELLS FARGO & CO-REG-S 2.12500% 14-04.06.24 1 800 000.00 1 944 270.00 0.09EUR WELLS FARGO & CO-REG-S 1.62500% 15-02.06.25 1 090 000.00 1 132 662.60 0.05EUR WELLS FARGO & CO-REG-S 1.50000% 15-12.09.22 763 000.00 798 967.82 0.04EUR WELLS FARGO & CO-REG-S 1.00000% 16-02.02.27 1 543 000.00 1 480 847.96 0.07EUR WELLS FARGO & CO-REG-S 1.50000% 17-24.05.27 4 224 000.00 4 224 844.80 0.20EUR WEPA HYGIENEPRODUKTE GMBH-REG-S 3.75000% 16-15.05.24 1 200 000.00 1 254 744.00 0.06EUR WESFARMERS LTD-REG-S 1.25000% 14-07.10.21 7 850 000.00 8 194 144.00 0.40EUR WILLOW NO.2 IRELAND PLC 3.37500% 12-27.06.22 1 040 000.00 1 190 831.20 0.06EUR YORKSHIRE BUILDING SOCIETY 2.12500% 14-18.03.19 800 000.00 828 344.00 0.04EUR ZIMMER BIOMET HOLDINGS INC 1.41400% 16-13.12.22 600 000.00 614 964.00 0.03Total EUR 1 111 429 075.62 53.89
GBP
GBP AA BOND CO LTD-REG-S 2.87500% 16-31.01.22 1 000 000.00 1 145 097.12 0.06GBP TELECOM ITALIA SPA 6.37500% 04-24.06.19 1 250 000.00 1 527 074.77 0.07Total GBP 2 672 171.89 0.13
USD
USD ABQ FINANCE LTD-REG-S 3.50000% 17-22.02.22 2 000 000.00 1 677 268.87 0.08USD EGYPT, REPUBLIC OF-REG-S 6.12500% 17-31.01.22 1 600 000.00 1 401 187.45 0.07USD QBE INSURANCE GROUP LTD-REG-S 3.00000% 17-21.10.22 3 121 000.00 2 626 696.07 0.13Total USD 5 705 152.39 0.28
Total Medium term notes, fixed rate 1 119 806 399.90 54.30
Medium term notes, zero coupon
EUR
EUR CONTINENTAL AG-REG-S 0.00000% 16-05.02.20 2 158 000.00 2 157 956.84 0.10EUR LVMH MOET HENNESSY LOUIS VUITTON-REG-S 0.00000% 17-26.05.20 2 225 000.00 2 231 096.50 0.11EUR SCA HYGIENE AB-REG-S 0.00000% 17-27.11.18 585 000.00 585 380.25 0.03EUR SNAM SPA-REG-S 0.00000% 16-25.10.20 1 654 000.00 1 646 705.86 0.08Total EUR 6 621 139.45 0.32
Total Medium term notes, zero coupon 6 621 139.45 0.32
Medium term notes, floating rate
EUR
EUR ABN AMRO BANK NV-REG-S-SUB 2.875%/VAR 15-30.06.25 8 492 000.00 9 031 751.52 0.44EUR ABN AMRO BANK NV-REG-S-SUB 2.875%/VAR 16-18.01.28 1 100 000.00 1 190 057.00 0.06EUR ACHMEA BV-REG-S-SUB 4.250%/VAR 15-PRP 490 000.00 490 764.40 0.02EUR ALLIANZ FINANCE II-SUB 5.750%/3M EURIBOR+334.9BP 11-08.07.41 3 900 000.00 4 623 450.00 0.22EUR ALLIANZ SE-REG-S-SUB 4.750%/3M EURIBOR+360BP 13-PRP 2 000 000.00 2 332 720.00 0.11EUR ALLIED IRISH BANKS PLC-REG-S-SUB 4.125%/VAR 15-26.11.25 490 000.00 527 524.20 0.03EUR ANHEUSER-BUSCH INBEV SA/NV-REG-S 3M EURIBOR+38BP 14-29.03.18 700 000.00 701 344.00 0.03EUR AQUARIUS + INVESTMENTS PLC-SUB 4.250%/VAR 13-02.10.43 3 948 000.00 4 591 287.12 0.22EUR ASS GENERALI-REG-S-SUB 7.750%/3M EURIBOR+711.3BP 12-12.12.42 3 000 000.00 3 839 160.00 0.19EUR ASSICURAZIONI GEN-SUB 10.125%/3M LIBOR+918.1BP 12-10.07.42 500 000.00 694 350.00 0.03
Description Quantity/ Valuation in EUR as a % Nominal Unrealized gain of net (loss) on Futures/ assets Forward Exchange Contracts/ Swaps (Note 1)
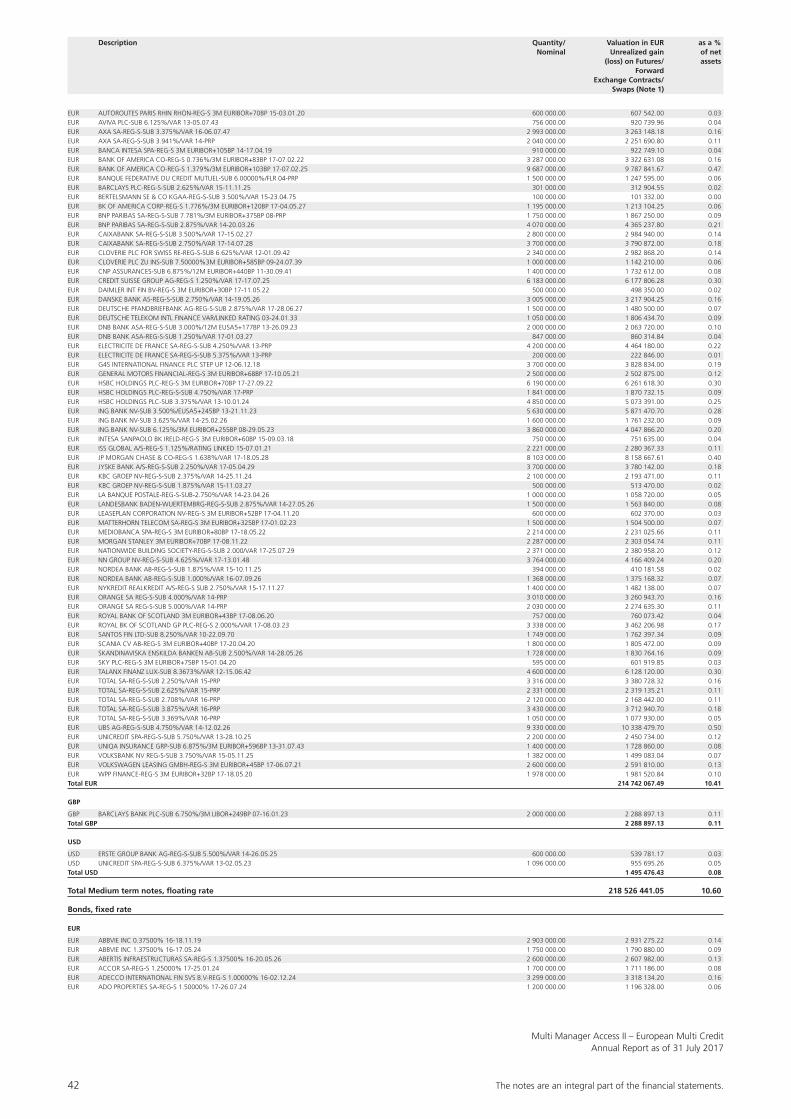
42 The notes are an integral part of the fi nancial statements.
Multi Manager Access II – European Multi CreditAnnual Report as of 31 July 2017
EUR AUTOROUTES PARIS RHIN RHON-REG-S 3M EURIBOR+70BP 15-03.01.20 600 000.00 607 542.00 0.03EUR AVIVA PLC-SUB 6.125%/VAR 13-05.07.43 756 000.00 920 739.96 0.04EUR AXA SA-REG-S-SUB 3.375%/VAR 16-06.07.47 2 993 000.00 3 263 148.18 0.16EUR AXA SA-REG-S-SUB 3.941%/VAR 14-PRP 2 040 000.00 2 251 690.80 0.11EUR BANCA INTESA SPA-REG-S 3M EURIBOR+105BP 14-17.04.19 910 000.00 922 749.10 0.04EUR BANK OF AMERICA CO-REG-S 0.736%/3M EURIBOR+83BP 17-07.02.22 3 287 000.00 3 322 631.08 0.16EUR BANK OF AMERICA CO-REG-S 1.379%/3M EURIBOR+103BP 17-07.02.25 9 687 000.00 9 787 841.67 0.47EUR BANQUE FEDERATIVE DU CREDIT MUTUEL-SUB 6.00000%/FLR 04-PRP 1 500 000.00 1 247 595.00 0.06EUR BARCLAYS PLC-REG-S-SUB 2.625%/VAR 15-11.11.25 301 000.00 312 904.55 0.02EUR BERTELSMANN SE & CO KGAA-REG-S-SUB 3.500%/VAR 15-23.04.75 100 000.00 101 332.00 0.00EUR BK OF AMERICA CORP-REG-S 1.776%/3M EURIBOR+120BP 17-04.05.27 1 195 000.00 1 213 104.25 0.06EUR BNP PARIBAS SA-REG-S-SUB 7.781%/3M EURIBOR+375BP 08-PRP 1 750 000.00 1 867 250.00 0.09EUR BNP PARIBAS SA-REG-S-SUB 2.875%/VAR 14-20.03.26 4 070 000.00 4 365 237.80 0.21EUR CAIXABANK SA-REG-S-SUB 3.500%/VAR 17-15.02.27 2 800 000.00 2 984 940.00 0.14EUR CAIXABANK SA-REG-S-SUB 2.750%/VAR 17-14.07.28 3 700 000.00 3 790 872.00 0.18EUR CLOVERIE PLC FOR SWISS RE-REG-S-SUB 6.625%/VAR 12-01.09.42 2 340 000.00 2 982 868.20 0.14EUR CLOVERIE PLC ZU INS-SUB 7.50000%3M EURIBOR+585BP 09-24.07.39 1 000 000.00 1 142 210.00 0.06EUR CNP ASSURANCES-SUB 6.875%/12M EURIBOR+440BP 11-30.09.41 1 400 000.00 1 732 612.00 0.08EUR CREDIT SUISSE GROUP AG-REG-S 1.250%/VAR 17-17.07.25 6 183 000.00 6 177 806.28 0.30EUR DAIMLER INT FIN BV-REG-S 3M EURIBOR+30BP 17-11.05.22 500 000.00 498 350.00 0.02EUR DANSKE BANK AS-REG-S-SUB 2.750%/VAR 14-19.05.26 3 005 000.00 3 217 904.25 0.16EUR DEUTSCHE PFANDBRIEFBANK AG-REG-S-SUB 2.875%/VAR 17-28.06.27 1 500 000.00 1 480 500.00 0.07EUR DEUTSCHE TELEKOM INTL FINANCE VAR/LINKED RATING 03-24.01.33 1 050 000.00 1 806 434.70 0.09EUR DNB BANK ASA-REG-S-SUB 3.000%/12M EUSA5+177BP 13-26.09.23 2 000 000.00 2 063 720.00 0.10EUR DNB BANK ASA-REG-S-SUB 1.250%/VAR 17-01.03.27 847 000.00 860 314.84 0.04EUR ELECTRICITE DE FRANCE SA-REG-S-SUB 4.250%/VAR 13-PRP 4 200 000.00 4 464 180.00 0.22EUR ELECTRICITE DE FRANCE SA-REG-S-SUB 5.375%/VAR 13-PRP 200 000.00 222 846.00 0.01EUR G4S INTERNATIONAL FINANCE PLC STEP UP 12-06.12.18 3 700 000.00 3 828 834.00 0.19EUR GENERAL MOTORS FINANCIAL-REG-S 3M EURIBOR+68BP 17-10.05.21 2 500 000.00 2 502 875.00 0.12EUR HSBC HOLDINGS PLC-REG-S 3M EURIBOR+70BP 17-27.09.22 6 190 000.00 6 261 618.30 0.30EUR HSBC HOLDINGS PLC-REG-S-SUB 4.750%/VAR 17-PRP 1 841 000.00 1 870 732.15 0.09EUR HSBC HOLDINGS PLC-SUB 3.375%/VAR 13-10.01.24 4 850 000.00 5 073 391.00 0.25EUR ING BANK NV-SUB 3.500%/EUSA5+245BP 13-21.11.23 5 630 000.00 5 871 470.70 0.28EUR ING BANK NV-SUB 3.625%/VAR 14-25.02.26 1 600 000.00 1 761 232.00 0.09EUR ING BANK NV-SUB 6.125%/3M EURIBOR+255BP 08-29.05.23 3 860 000.00 4 047 866.20 0.20EUR INTESA SANPAOLO BK IRELD-REG-S 3M EURIBOR+60BP 15-09.03.18 750 000.00 751 635.00 0.04EUR ISS GLOBAL A/S-REG-S 1.125%/RATING LINKED 15-07.01.21 2 221 000.00 2 280 367.33 0.11EUR JP MORGAN CHASE & CO-REG-S 1.638%/VAR 17-18.05.28 8 103 000.00 8 158 667.61 0.40EUR JYSKE BANK A/S-REG-S-SUB 2.250%/VAR 17-05.04.29 3 700 000.00 3 780 142.00 0.18EUR KBC GROEP NV-REG-S-SUB 2.375%/VAR 14-25.11.24 2 100 000.00 2 193 471.00 0.11EUR KBC GROEP NV-REG-S-SUB 1.875%/VAR 15-11.03.27 500 000.00 513 470.00 0.02EUR LA BANQUE POSTALE-REG-S-SUB-2.750%/VAR 14-23.04.26 1 000 000.00 1 058 720.00 0.05EUR LANDESBANK BADEN-WUERTEMBRG-REG-S-SUB 2.875%/VAR 14-27.05.26 1 500 000.00 1 563 840.00 0.08EUR LEASEPLAN CORPORATION NV-REG-S 3M EURIBOR+52BP 17-04.11.20 600 000.00 602 370.00 0.03EUR MATTERHORN TELECOM SA-REG-S 3M EURIBOR+325BP 17-01.02.23 1 500 000.00 1 504 500.00 0.07EUR MEDIOBANCA SPA-REG-S 3M EURIBOR+80BP 17-18.05.22 2 214 000.00 2 231 025.66 0.11EUR MORGAN STANLEY 3M EURIBOR+70BP 17-08.11.22 2 287 000.00 2 303 054.74 0.11EUR NATIONWIDE BUILDING SOCIETY-REG-S-SUB 2.000/VAR 17-25.07.29 2 371 000.00 2 380 958.20 0.12EUR NN GROUP NV-REG-S-SUB 4.625%/VAR 17-13.01.48 3 764 000.00 4 166 409.24 0.20EUR NORDEA BANK AB-REG-S-SUB 1.875%/VAR 15-10.11.25 394 000.00 410 181.58 0.02EUR NORDEA BANK AB-REG-S-SUB 1.000%/VAR 16-07.09.26 1 368 000.00 1 375 168.32 0.07EUR NYKREDIT REALKREDIT A/S-REG-S SUB 2.750%/VAR 15-17.11.27 1 400 000.00 1 482 138.00 0.07EUR ORANGE SA REG-S-SUB 4.000%/VAR 14-PRP 3 010 000.00 3 260 943.70 0.16EUR ORANGE SA REG-S-SUB 5.000%/VAR 14-PRP 2 030 000.00 2 274 635.30 0.11EUR ROYAL BANK OF SCOTLAND 3M EURIBOR+43BP 17-08.06.20 757 000.00 760 073.42 0.04EUR ROYAL BK OF SCOTLAND GP PLC-REG-S 2.000%/VAR 17-08.03.23 3 338 000.00 3 462 206.98 0.17EUR SANTOS FIN LTD-SUB 8.250%/VAR 10-22.09.70 1 749 000.00 1 762 397.34 0.09EUR SCANIA CV AB-REG-S 3M EURIBOR+40BP 17-20.04.20 1 800 000.00 1 805 472.00 0.09EUR SKANDINAVISKA ENSKILDA BANKEN AB-SUB 2.500%/VAR 14-28.05.26 1 728 000.00 1 830 764.16 0.09EUR SKY PLC-REG-S 3M EURIBOR+75BP 15-01.04.20 595 000.00 601 919.85 0.03EUR TALANX FINANZ LUX-SUB 8.3673%/VAR 12-15.06.42 4 600 000.00 6 128 120.00 0.30EUR TOTAL SA-REG-S-SUB 2.250%/VAR 15-PRP 3 316 000.00 3 380 728.32 0.16EUR TOTAL SA-REG-S-SUB 2.625%/VAR 15-PRP 2 331 000.00 2 319 135.21 0.11EUR TOTAL SA-REG-S-SUB 2.708%/VAR 16-PRP 2 120 000.00 2 168 442.00 0.11EUR TOTAL SA-REG-S-SUB 3.875%/VAR 16-PRP 3 430 000.00 3 712 940.70 0.18EUR TOTAL SA-REG-S-SUB 3.369%/VAR 16-PRP 1 050 000.00 1 077 930.00 0.05EUR UBS AG-REG-S-SUB 4.750%/VAR 14-12.02.26 9 330 000.00 10 338 479.70 0.50EUR UNICREDIT SPA-REG-S-SUB 5.750%/VAR 13-28.10.25 2 200 000.00 2 450 734.00 0.12EUR UNIQA INSURANCE GRP-SUB 6.875%/3M EURIBOR+596BP 13-31.07.43 1 400 000.00 1 728 860.00 0.08EUR VOLKSBANK NV REG-S-SUB 3.750%/VAR 15-05.11.25 1 382 000.00 1 499 083.04 0.07EUR VOLKSWAGEN LEASING GMBH-REG-S 3M EURIBOR+45BP 17-06.07.21 2 600 000.00 2 591 810.00 0.13EUR WPP FINANCE-REG-S 3M EURIBOR+32BP 17-18.05.20 1 978 000.00 1 981 520.84 0.10Total EUR 214 742 067.49 10.41
GBP
GBP BARCLAYS BANK PLC-SUB 6.750%/3M LIBOR+249BP 07-16.01.23 2 000 000.00 2 288 897.13 0.11Total GBP 2 288 897.13 0.11
USD
USD ERSTE GROUP BANK AG-REG-S-SUB 5.500%/VAR 14-26.05.25 600 000.00 539 781.17 0.03USD UNICREDIT SPA-REG-S-SUB 6.375%/VAR 13-02.05.23 1 096 000.00 955 695.26 0.05Total USD 1 495 476.43 0.08
Total Medium term notes, floating rate 218 526 441.05 10.60
Bonds, fixed rate
EUR
EUR ABBVIE INC 0.37500% 16-18.11.19 2 903 000.00 2 931 275.22 0.14EUR ABBVIE INC 1.37500% 16-17.05.24 1 750 000.00 1 790 880.00 0.09EUR ABERTIS INFRAESTRUCTURAS SA-REG-S 1.37500% 16-20.05.26 2 600 000.00 2 607 982.00 0.13EUR ACCOR SA-REG-S 1.25000% 17-25.01.24 1 700 000.00 1 711 186.00 0.08EUR ADECCO INTERNATIONAL FIN SVS B.V-REG-S 1.00000% 16-02.12.24 3 299 000.00 3 318 134.20 0.16EUR ADO PROPERTIES SA-REG-S 1.50000% 17-26.07.24 1 200 000.00 1 196 328.00 0.06
Description Quantity/ Valuation in EUR as a % Nominal Unrealized gain of net (loss) on Futures/ assets Forward Exchange Contracts/ Swaps (Note 1)
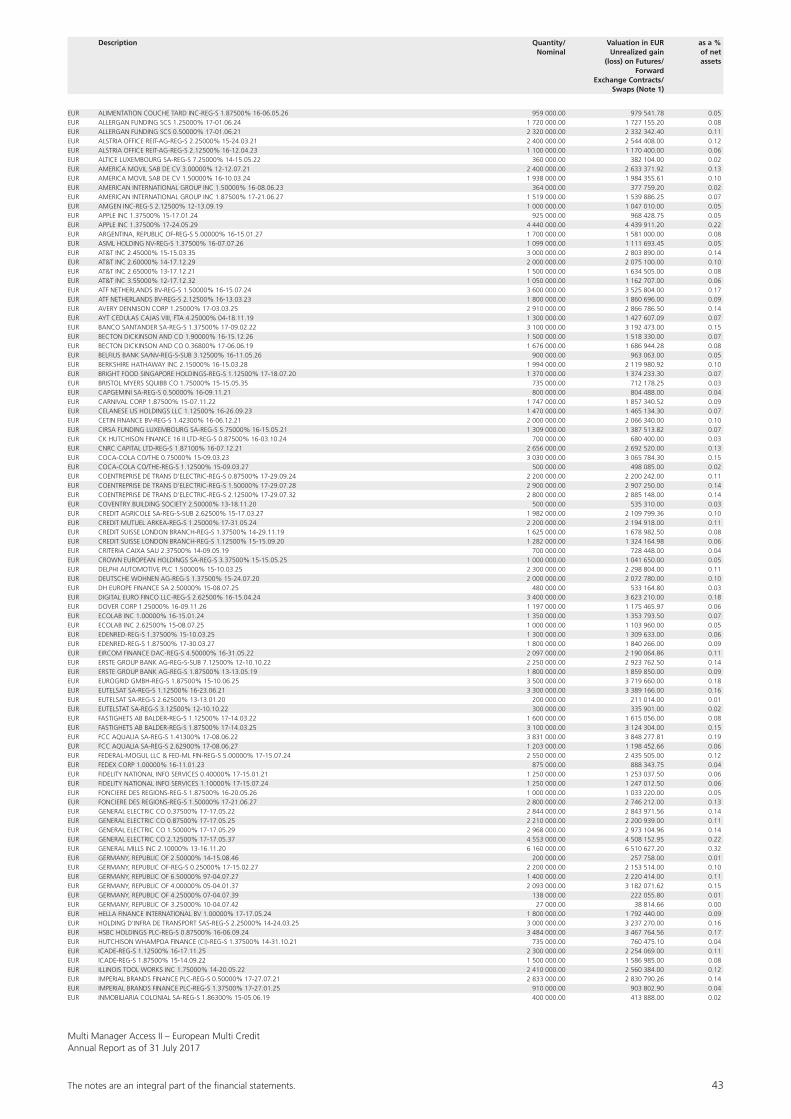
The notes are an integral part of the fi nancial statements. 43
Multi Manager Access II – European Multi CreditAnnual Report as of 31 July 2017
EUR ALIMENTATION COUCHE TARD INC-REG-S 1.87500% 16-06.05.26 959 000.00 979 541.78 0.05EUR ALLERGAN FUNDING SCS 1.25000% 17-01.06.24 1 720 000.00 1 727 155.20 0.08EUR ALLERGAN FUNDING SCS 0.50000% 17-01.06.21 2 320 000.00 2 332 342.40 0.11EUR ALSTRIA OFFICE REIT-AG-REG-S 2.25000% 15-24.03.21 2 400 000.00 2 544 408.00 0.12EUR ALSTRIA OFFICE REIT-AG-REG-S 2.12500% 16-12.04.23 1 100 000.00 1 170 400.00 0.06EUR ALTICE LUXEMBOURG SA-REG-S 7.25000% 14-15.05.22 360 000.00 382 104.00 0.02EUR AMERICA MOVIL SAB DE CV 3.00000% 12-12.07.21 2 400 000.00 2 633 371.92 0.13EUR AMERICA MOVIL SAB DE CV 1.50000% 16-10.03.24 1 938 000.00 1 984 355.61 0.10EUR AMERICAN INTERNATIONAL GROUP INC 1.50000% 16-08.06.23 364 000.00 377 759.20 0.02EUR AMERICAN INTERNATIONAL GROUP INC 1.87500% 17-21.06.27 1 519 000.00 1 539 886.25 0.07EUR AMGEN INC-REG-S 2.12500% 12-13.09.19 1 000 000.00 1 047 010.00 0.05EUR APPLE INC 1.37500% 15-17.01.24 925 000.00 968 428.75 0.05EUR APPLE INC 1.37500% 17-24.05.29 4 440 000.00 4 439 911.20 0.22EUR ARGENTINA, REPUBLIC OF-REG-S 5.00000% 16-15.01.27 1 700 000.00 1 581 000.00 0.08EUR ASML HOLDING NV-REG-S 1.37500% 16-07.07.26 1 099 000.00 1 111 693.45 0.05EUR AT&T INC 2.45000% 15-15.03.35 3 000 000.00 2 803 890.00 0.14EUR AT&T INC 2.60000% 14-17.12.29 2 000 000.00 2 075 100.00 0.10EUR AT&T INC 2.65000% 13-17.12.21 1 500 000.00 1 634 505.00 0.08EUR AT&T INC 3.55000% 12-17.12.32 1 050 000.00 1 162 707.00 0.06EUR ATF NETHERLANDS BV-REG-S 1.50000% 16-15.07.24 3 600 000.00 3 525 804.00 0.17EUR ATF NETHERLANDS BV-REG-S 2.12500% 16-13.03.23 1 800 000.00 1 860 696.00 0.09EUR AVERY DENNISON CORP 1.25000% 17-03.03.25 2 910 000.00 2 866 786.50 0.14EUR AYT CEDULAS CAJAS VIII, FTA 4.25000% 04-18.11.19 1 300 000.00 1 427 607.09 0.07EUR BANCO SANTANDER SA-REG-S 1.37500% 17-09.02.22 3 100 000.00 3 192 473.00 0.15EUR BECTON DICKINSON AND CO 1.90000% 16-15.12.26 1 500 000.00 1 518 330.00 0.07EUR BECTON DICKINSON AND CO 0.36800% 17-06.06.19 1 676 000.00 1 686 944.28 0.08EUR BELFIUS BANK SA/NV-REG-S-SUB 3.12500% 16-11.05.26 900 000.00 963 063.00 0.05EUR BERKSHIRE HATHAWAY INC 2.15000% 16-15.03.28 1 994 000.00 2 119 980.92 0.10EUR BRIGHT FOOD SINGAPORE HOLDINGS-REG-S 1.12500% 17-18.07.20 1 370 000.00 1 374 233.30 0.07EUR BRISTOL MYERS SQUIBB CO 1.75000% 15-15.05.35 735 000.00 712 178.25 0.03EUR CAPGEMINI SA-REG-S 0.50000% 16-09.11.21 800 000.00 804 488.00 0.04EUR CARNIVAL CORP 1.87500% 15-07.11.22 1 747 000.00 1 857 340.52 0.09EUR CELANESE US HOLDINGS LLC 1.12500% 16-26.09.23 1 470 000.00 1 465 134.30 0.07EUR CETIN FINANCE BV-REG-S 1.42300% 16-06.12.21 2 000 000.00 2 066 340.00 0.10EUR CIRSA FUNDING LUXEMBOURG SA-REG-S 5.75000% 16-15.05.21 1 309 000.00 1 387 513.82 0.07EUR CK HUTCHISON FINANCE 16 II LTD-REG-S 0.87500% 16-03.10.24 700 000.00 680 400.00 0.03EUR CNRC CAPITAL LTD-REG-S 1.87100% 16-07.12.21 2 656 000.00 2 692 520.00 0.13EUR COCA-COLA CO/THE 0.75000% 15-09.03.23 3 030 000.00 3 065 784.30 0.15EUR COCA-COLA CO/THE-REG-S 1.12500% 15-09.03.27 500 000.00 498 085.00 0.02EUR COENTREPRISE DE TRANS D’ELECTRIC-REG-S 0.87500% 17-29.09.24 2 200 000.00 2 200 242.00 0.11EUR COENTREPRISE DE TRANS D’ELECTRIC-REG-S 1.50000% 17-29.07.28 2 900 000.00 2 907 250.00 0.14EUR COENTREPRISE DE TRANS D’ELECTRIC-REG-S 2.12500% 17-29.07.32 2 800 000.00 2 885 148.00 0.14EUR COVENTRY BUILDING SOCIETY 2.50000% 13-18.11.20 500 000.00 535 310.00 0.03EUR CREDIT AGRICOLE SA-REG-S-SUB 2.62500% 15-17.03.27 1 982 000.00 2 109 799.36 0.10EUR CREDIT MUTUEL ARKEA-REG-S 1.25000% 17-31.05.24 2 200 000.00 2 194 918.00 0.11EUR CREDIT SUISSE LONDON BRANCH-REG-S 1.37500% 14-29.11.19 1 625 000.00 1 678 982.50 0.08EUR CREDIT SUISSE LONDON BRANCH-REG-S 1.12500% 15-15.09.20 1 282 000.00 1 324 164.98 0.06EUR CRITERIA CAIXA SAU 2.37500% 14-09.05.19 700 000.00 728 448.00 0.04EUR CROWN EUROPEAN HOLDINGS SA-REG-S 3.37500% 15-15.05.25 1 000 000.00 1 041 650.00 0.05EUR DELPHI AUTOMOTIVE PLC 1.50000% 15-10.03.25 2 300 000.00 2 298 804.00 0.11EUR DEUTSCHE WOHNEN AG-REG-S 1.37500% 15-24.07.20 2 000 000.00 2 072 780.00 0.10EUR DH EUROPE FINANCE SA 2.50000% 15-08.07.25 480 000.00 533 164.80 0.03EUR DIGITAL EURO FINCO LLC-REG-S 2.62500% 16-15.04.24 3 400 000.00 3 623 210.00 0.18EUR DOVER CORP 1.25000% 16-09.11.26 1 197 000.00 1 175 465.97 0.06EUR ECOLAB INC 1.00000% 16-15.01.24 1 350 000.00 1 353 793.50 0.07EUR ECOLAB INC 2.62500% 15-08.07.25 1 000 000.00 1 103 960.00 0.05EUR EDENRED-REG-S 1.37500% 15-10.03.25 1 300 000.00 1 309 633.00 0.06EUR EDENRED-REG-S 1.87500% 17-30.03.27 1 800 000.00 1 840 266.00 0.09EUR EIRCOM FINANCE DAC-REG-S 4.50000% 16-31.05.22 2 097 000.00 2 190 064.86 0.11EUR ERSTE GROUP BANK AG-REG-S-SUB 7.12500% 12-10.10.22 2 250 000.00 2 923 762.50 0.14EUR ERSTE GROUP BANK AG-REG-S 1.87500% 13-13.05.19 1 800 000.00 1 859 850.00 0.09EUR EUROGRID GMBH-REG-S 1.87500% 15-10.06.25 3 500 000.00 3 719 660.00 0.18EUR EUTELSAT SA-REG-S 1.12500% 16-23.06.21 3 300 000.00 3 389 166.00 0.16EUR EUTELSAT SA-REG-S 2.62500% 13-13.01.20 200 000.00 211 014.00 0.01EUR EUTELSTAT SA-REG-S 3.12500% 12-10.10.22 300 000.00 335 901.00 0.02EUR FASTIGHETS AB BALDER-REG-S 1.12500% 17-14.03.22 1 600 000.00 1 615 056.00 0.08EUR FASTIGHETS AB BALDER-REG-S 1.87500% 17-14.03.25 3 100 000.00 3 124 304.00 0.15EUR FCC AQUALIA SA-REG-S 1.41300% 17-08.06.22 3 831 000.00 3 848 277.81 0.19EUR FCC AQUALIA SA-REG-S 2.62900% 17-08.06.27 1 203 000.00 1 198 452.66 0.06EUR FEDERAL-MOGUL LLC & FED-ML FIN-REG-S 5.00000% 17-15.07.24 2 550 000.00 2 435 505.00 0.12EUR FEDEX CORP 1.00000% 16-11.01.23 875 000.00 888 343.75 0.04EUR FIDELITY NATIONAL INFO SERVICES 0.40000% 17-15.01.21 1 250 000.00 1 253 037.50 0.06EUR FIDELITY NATIONAL INFO SERVICES 1.10000% 17-15.07.24 1 250 000.00 1 247 012.50 0.06EUR FONCIERE DES REGIONS-REG-S 1.87500% 16-20.05.26 1 000 000.00 1 033 220.00 0.05EUR FONCIERE DES REGIONS-REG-S 1.50000% 17-21.06.27 2 800 000.00 2 746 212.00 0.13EUR GENERAL ELECTRIC CO 0.37500% 17-17.05.22 2 844 000.00 2 843 971.56 0.14EUR GENERAL ELECTRIC CO 0.87500% 17-17.05.25 2 210 000.00 2 200 939.00 0.11EUR GENERAL ELECTRIC CO 1.50000% 17-17.05.29 2 968 000.00 2 973 104.96 0.14EUR GENERAL ELECTRIC CO 2.12500% 17-17.05.37 4 553 000.00 4 508 152.95 0.22EUR GENERAL MILLS INC 2.10000% 13-16.11.20 6 160 000.00 6 510 627.20 0.32EUR GERMANY, REPUBLIC OF 2.50000% 14-15.08.46 200 000.00 257 758.00 0.01EUR GERMANY, REPUBLIC OF-REG-S 0.25000% 17-15.02.27 2 200 000.00 2 153 514.00 0.10EUR GERMANY, REPUBLIC OF 6.50000% 97-04.07.27 1 400 000.00 2 220 414.00 0.11EUR GERMANY, REPUBLIC OF 4.00000% 05-04.01.37 2 093 000.00 3 182 071.62 0.15EUR GERMANY, REPUBLIC OF 4.25000% 07-04.07.39 138 000.00 222 055.80 0.01EUR GERMANY, REPUBLIC OF 3.25000% 10-04.07.42 27 000.00 38 814.66 0.00EUR HELLA FINANCE INTERNATIONAL BV 1.00000% 17-17.05.24 1 800 000.00 1 792 440.00 0.09EUR HOLDING D’INFRA DE TRANSPORT SAS-REG-S 2.25000% 14-24.03.25 3 000 000.00 3 237 270.00 0.16EUR HSBC HOLDINGS PLC-REG-S 0.87500% 16-06.09.24 3 484 000.00 3 467 764.56 0.17EUR HUTCHISON WHAMPOA FINANCE (CI)-REG-S 1.37500% 14-31.10.21 735 000.00 760 475.10 0.04EUR ICADE-REG-S 1.12500% 16-17.11.25 2 300 000.00 2 254 069.00 0.11EUR ICADE-REG-S 1.87500% 15-14.09.22 1 500 000.00 1 586 985.00 0.08EUR ILLINOIS TOOL WORKS INC 1.75000% 14-20.05.22 2 410 000.00 2 560 384.00 0.12EUR IMPERIAL BRANDS FINANCE PLC-REG-S 0.50000% 17-27.07.21 2 833 000.00 2 830 790.26 0.14EUR IMPERIAL BRANDS FINANCE PLC-REG-S 1.37500% 17-27.01.25 910 000.00 903 802.90 0.04EUR INMOBILIARIA COLONIAL SA-REG-S 1.86300% 15-05.06.19 400 000.00 413 888.00 0.02
Description Quantity/ Valuation in EUR as a % Nominal Unrealized gain of net (loss) on Futures/ assets Forward Exchange Contracts/ Swaps (Note 1)
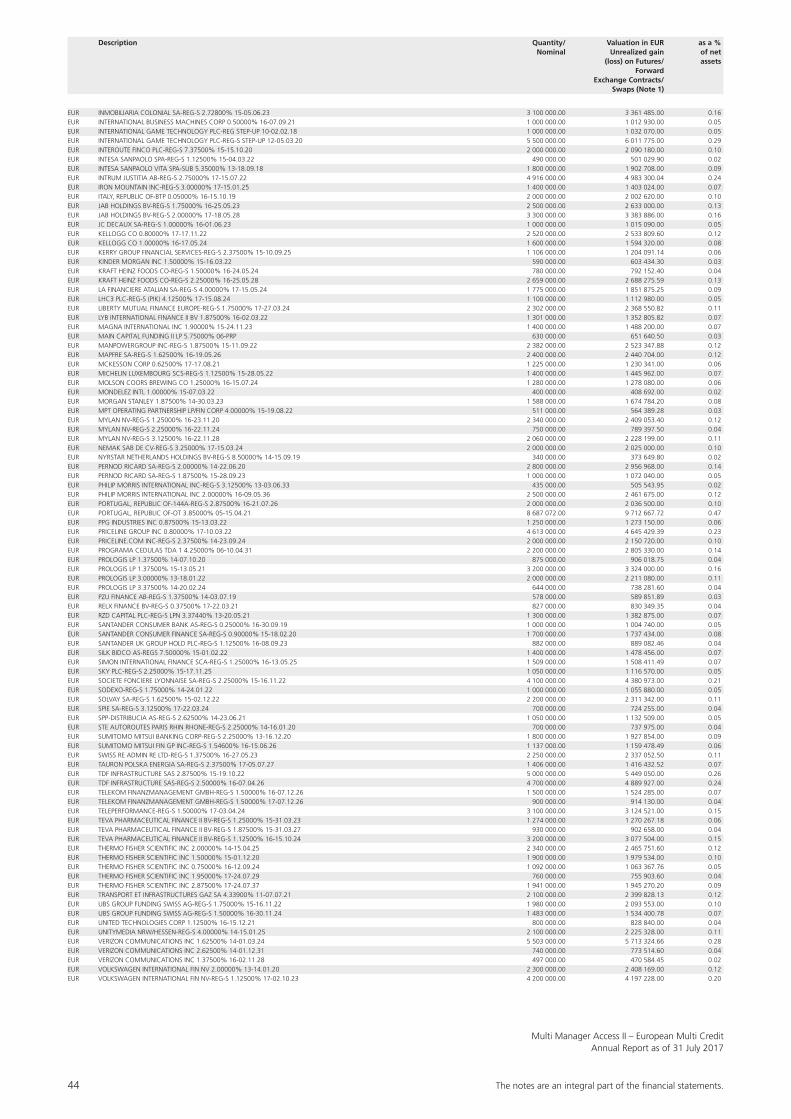
44 The notes are an integral part of the fi nancial statements.
Multi Manager Access II – European Multi CreditAnnual Report as of 31 July 2017
EUR INMOBILIARIA COLONIAL SA-REG-S 2.72800% 15-05.06.23 3 100 000.00 3 361 485.00 0.16EUR INTERNATIONAL BUSINESS MACHINES CORP 0.50000% 16-07.09.21 1 000 000.00 1 012 930.00 0.05EUR INTERNATIONAL GAME TECHNOLOGY PLC-REG STEP-UP 10-02.02.18 1 000 000.00 1 032 070.00 0.05EUR INTERNATIONAL GAME TECHNOLOGY PLC-REG-S STEP-UP 12-05.03.20 5 500 000.00 6 011 775.00 0.29EUR INTEROUTE FINCO PLC-REG-S 7.37500% 15-15.10.20 2 000 000.00 2 090 180.00 0.10EUR INTESA SANPAOLO SPA-REG-S 1.12500% 15-04.03.22 490 000.00 501 029.90 0.02EUR INTESA SANPAOLO VITA SPA-SUB 5.35000% 13-18.09.18 1 800 000.00 1 902 708.00 0.09EUR INTRUM JUSTITIA AB-REG-S 2.75000% 17-15.07.22 4 916 000.00 4 983 300.04 0.24EUR IRON MOUNTAIN INC-REG-S 3.00000% 17-15.01.25 1 400 000.00 1 403 024.00 0.07EUR ITALY, REPUBLIC OF-BTP 0.05000% 16-15.10.19 2 000 000.00 2 002 620.00 0.10EUR JAB HOLDINGS BV-REG-S 1.75000% 16-25.05.23 2 500 000.00 2 633 000.00 0.13EUR JAB HOLDINGS BV-REG-S 2.00000% 17-18.05.28 3 300 000.00 3 383 886.00 0.16EUR JC DECAUX SA-REG-S 1.00000% 16-01.06.23 1 000 000.00 1 015 090.00 0.05EUR KELLOGG CO 0.80000% 17-17.11.22 2 520 000.00 2 533 809.60 0.12EUR KELLOGG CO 1.00000% 16-17.05.24 1 600 000.00 1 594 320.00 0.08EUR KERRY GROUP FINANCIAL SERVICES-REG-S 2.37500% 15-10.09.25 1 106 000.00 1 204 091.14 0.06EUR KINDER MORGAN INC 1.50000% 15-16.03.22 590 000.00 603 434.30 0.03EUR KRAFT HEINZ FOODS CO-REG-S 1.50000% 16-24.05.24 780 000.00 792 152.40 0.04EUR KRAFT HEINZ FOODS CO-REG-S 2.25000% 16-25.05.28 2 659 000.00 2 688 275.59 0.13EUR LA FINANCIERE ATALIAN SA-REG-S 4.00000% 17-15.05.24 1 775 000.00 1 851 875.25 0.09EUR LHC3 PLC-REG-S (PIK) 4.12500% 17-15.08.24 1 100 000.00 1 112 980.00 0.05EUR LIBERTY MUTUAL FINANCE EUROPE-REG-S 1.75000% 17-27.03.24 2 302 000.00 2 368 550.82 0.11EUR LYB INTERNATIONAL FINANCE II BV 1.87500% 16-02.03.22 1 301 000.00 1 352 805.82 0.07EUR MAGNA INTERNATIONAL INC 1.90000% 15-24.11.23 1 400 000.00 1 488 200.00 0.07EUR MAIN CAPITAL FUNDING II LP 5.75000% 06-PRP 630 000.00 651 640.50 0.03EUR MANPOWERGROUP INC-REG-S 1.87500% 15-11.09.22 2 382 000.00 2 523 347.88 0.12EUR MAPFRE SA-REG-S 1.62500% 16-19.05.26 2 400 000.00 2 440 704.00 0.12EUR MCKESSON CORP 0.62500% 17-17.08.21 1 225 000.00 1 230 341.00 0.06EUR MICHELIN LUXEMBOURG SCS-REG-S 1.12500% 15-28.05.22 1 400 000.00 1 445 962.00 0.07EUR MOLSON COORS BREWING CO 1.25000% 16-15.07.24 1 280 000.00 1 278 080.00 0.06EUR MONDELEZ INTL 1.00000% 15-07.03.22 400 000.00 408 692.00 0.02EUR MORGAN STANLEY 1.87500% 14-30.03.23 1 588 000.00 1 674 784.20 0.08EUR MPT OPERATING PARTNERSHIP LP/FIN CORP 4.00000% 15-19.08.22 511 000.00 564 389.28 0.03EUR MYLAN NV-REG-S 1.25000% 16-23.11.20 2 340 000.00 2 409 053.40 0.12EUR MYLAN NV-REG-S 2.25000% 16-22.11.24 750 000.00 789 397.50 0.04EUR MYLAN NV-REG-S 3.12500% 16-22.11.28 2 060 000.00 2 228 199.00 0.11EUR NEMAK SAB DE CV-REG-S 3.25000% 17-15.03.24 2 000 000.00 2 025 000.00 0.10EUR NYRSTAR NETHERLANDS HOLDINGS BV-REG-S 8.50000% 14-15.09.19 340 000.00 373 649.80 0.02EUR PERNOD RICARD SA-REG-S 2.00000% 14-22.06.20 2 800 000.00 2 956 968.00 0.14EUR PERNOD RICARD SA-REG-S 1.87500% 15-28.09.23 1 000 000.00 1 072 040.00 0.05EUR PHILIP MORRIS INTERNATIONAL INC-REG-S 3.12500% 13-03.06.33 435 000.00 505 543.95 0.02EUR PHILIP MORRIS INTERNATIONAL INC 2.00000% 16-09.05.36 2 500 000.00 2 461 675.00 0.12EUR PORTUGAL, REPUBLIC OF-144A-REG-S 2.87500% 16-21.07.26 2 000 000.00 2 036 500.00 0.10EUR PORTUGAL, REPUBLIC OF-OT 3.85000% 05-15.04.21 8 687 072.00 9 712 667.72 0.47EUR PPG INDUSTRIES INC 0.87500% 15-13.03.22 1 250 000.00 1 273 150.00 0.06EUR PRICELINE GROUP INC 0.80000% 17-10.03.22 4 613 000.00 4 645 429.39 0.23EUR PRICELINE.COM INC-REG-S 2.37500% 14-23.09.24 2 000 000.00 2 150 720.00 0.10EUR PROGRAMA CEDULAS TDA 1 4.25000% 06-10.04.31 2 200 000.00 2 805 330.00 0.14EUR PROLOGIS LP 1.37500% 14-07.10.20 875 000.00 906 018.75 0.04EUR PROLOGIS LP 1.37500% 15-13.05.21 3 200 000.00 3 324 000.00 0.16EUR PROLOGIS LP 3.00000% 13-18.01.22 2 000 000.00 2 211 080.00 0.11EUR PROLOGIS LP 3.37500% 14-20.02.24 644 000.00 738 281.60 0.04EUR PZU FINANCE AB-REG-S 1.37500% 14-03.07.19 578 000.00 589 851.89 0.03EUR RELX FINANCE BV-REG-S 0.37500% 17-22.03.21 827 000.00 830 349.35 0.04EUR RZD CAPITAL PLC-REG-S LPN 3.37440% 13-20.05.21 1 300 000.00 1 382 875.00 0.07EUR SANTANDER CONSUMER BANK AS-REG-S 0.25000% 16-30.09.19 1 000 000.00 1 004 740.00 0.05EUR SANTANDER CONSUMER FINANCE SA-REG-S 0.90000% 15-18.02.20 1 700 000.00 1 737 434.00 0.08EUR SANTANDER UK GROUP HOLD PLC-REG-S 1.12500% 16-08.09.23 882 000.00 889 082.46 0.04EUR SILK BIDCO AS-REGS 7.50000% 15-01.02.22 1 400 000.00 1 478 456.00 0.07EUR SIMON INTERNATIONAL FINANCE SCA-REG-S 1.25000% 16-13.05.25 1 509 000.00 1 508 411.49 0.07EUR SKY PLC-REG-S 2.25000% 15-17.11.25 1 050 000.00 1 116 570.00 0.05EUR SOCIETE FONCIERE LYONNAISE SA-REG-S 2.25000% 15-16.11.22 4 100 000.00 4 380 973.00 0.21EUR SODEXO-REG-S 1.75000% 14-24.01.22 1 000 000.00 1 055 880.00 0.05EUR SOLVAY SA-REG-S 1.62500% 15-02.12.22 2 200 000.00 2 311 342.00 0.11EUR SPIE SA-REG-S 3.12500% 17-22.03.24 700 000.00 724 255.00 0.04EUR SPP-DISTRIBUCIA AS-REG-S 2.62500% 14-23.06.21 1 050 000.00 1 132 509.00 0.05EUR STE AUTOROUTES PARIS RHIN RHONE-REG-S 2.25000% 14-16.01.20 700 000.00 737 975.00 0.04EUR SUMITOMO MITSUI BANKING CORP-REG-S 2.25000% 13-16.12.20 1 800 000.00 1 927 854.00 0.09EUR SUMITOMO MITSUI FIN GP INC-REG-S 1.54600% 16-15.06.26 1 137 000.00 1 159 478.49 0.06EUR SWISS RE ADMIN RE LTD-REG-S 1.37500% 16-27.05.23 2 250 000.00 2 337 052.50 0.11EUR TAURON POLSKA ENERGIA SA-REG-S 2.37500% 17-05.07.27 1 406 000.00 1 416 432.52 0.07EUR TDF INFRASTRUCTURE SAS 2.87500% 15-19.10.22 5 000 000.00 5 449 050.00 0.26EUR TDF INFRASTRUCTURE SAS-REG-S 2.50000% 16-07.04.26 4 700 000.00 4 889 927.00 0.24EUR TELEKOM FINANZMANAGEMENT GMBH-REG-S 1.50000% 16-07.12.26 1 500 000.00 1 524 285.00 0.07EUR TELEKOM FINANZMANAGEMENT GMBH-REG-S 1.50000% 17-07.12.26 900 000.00 914 130.00 0.04EUR TELEPERFORMANCE-REG-S 1.50000% 17-03.04.24 3 100 000.00 3 124 521.00 0.15EUR TEVA PHARMACEUTICAL FINANCE II BV-REG-S 1.25000% 15-31.03.23 1 274 000.00 1 270 267.18 0.06EUR TEVA PHARMACEUTICAL FINANCE II BV-REG-S 1.87500% 15-31.03.27 930 000.00 902 658.00 0.04EUR TEVA PHARMACEUTICAL FINANCE II BV-REG-S 1.12500% 16-15.10.24 3 200 000.00 3 077 504.00 0.15EUR THERMO FISHER SCIENTIFIC INC 2.00000% 14-15.04.25 2 340 000.00 2 465 751.60 0.12EUR THERMO FISHER SCIENTIFIC INC 1.50000% 15-01.12.20 1 900 000.00 1 979 534.00 0.10EUR THERMO FISHER SCIENTIFIC INC 0.75000% 16-12.09.24 1 092 000.00 1 063 367.76 0.05EUR THERMO FISHER SCIENTIFIC INC 1.95000% 17-24.07.29 760 000.00 755 903.60 0.04EUR THERMO FISHER SCIENTIFIC INC 2.87500% 17-24.07.37 1 941 000.00 1 945 270.20 0.09EUR TRANSPORT ET INFRASTRUCTURES GAZ SA 4.33900% 11-07.07.21 2 100 000.00 2 399 828.13 0.12EUR UBS GROUP FUNDING SWISS AG-REG-S 1.75000% 15-16.11.22 1 980 000.00 2 093 553.00 0.10EUR UBS GROUP FUNDING SWISS AG-REG-S 1.50000% 16-30.11.24 1 483 000.00 1 534 400.78 0.07EUR UNITED TECHNOLOGIES CORP 1.12500% 16-15.12.21 800 000.00 828 840.00 0.04EUR UNITYMEDIA NRW/HESSEN-REG-S 4.00000% 14-15.01.25 2 100 000.00 2 225 328.00 0.11EUR VERIZON COMMUNICATIONS INC 1.62500% 14-01.03.24 5 503 000.00 5 713 324.66 0.28EUR VERIZON COMMUNICATIONS INC 2.62500% 14-01.12.31 740 000.00 773 514.60 0.04EUR VERIZON COMMUNICATIONS INC 1.37500% 16-02.11.28 497 000.00 470 584.45 0.02EUR VOLKSWAGEN INTERNATIONAL FIN NV 2.00000% 13-14.01.20 2 300 000.00 2 408 169.00 0.12EUR VOLKSWAGEN INTERNATIONAL FIN NV-REG-S 1.12500% 17-02.10.23 4 200 000.00 4 197 228.00 0.20
Description Quantity/ Valuation in EUR as a % Nominal Unrealized gain of net (loss) on Futures/ assets Forward Exchange Contracts/ Swaps (Note 1)
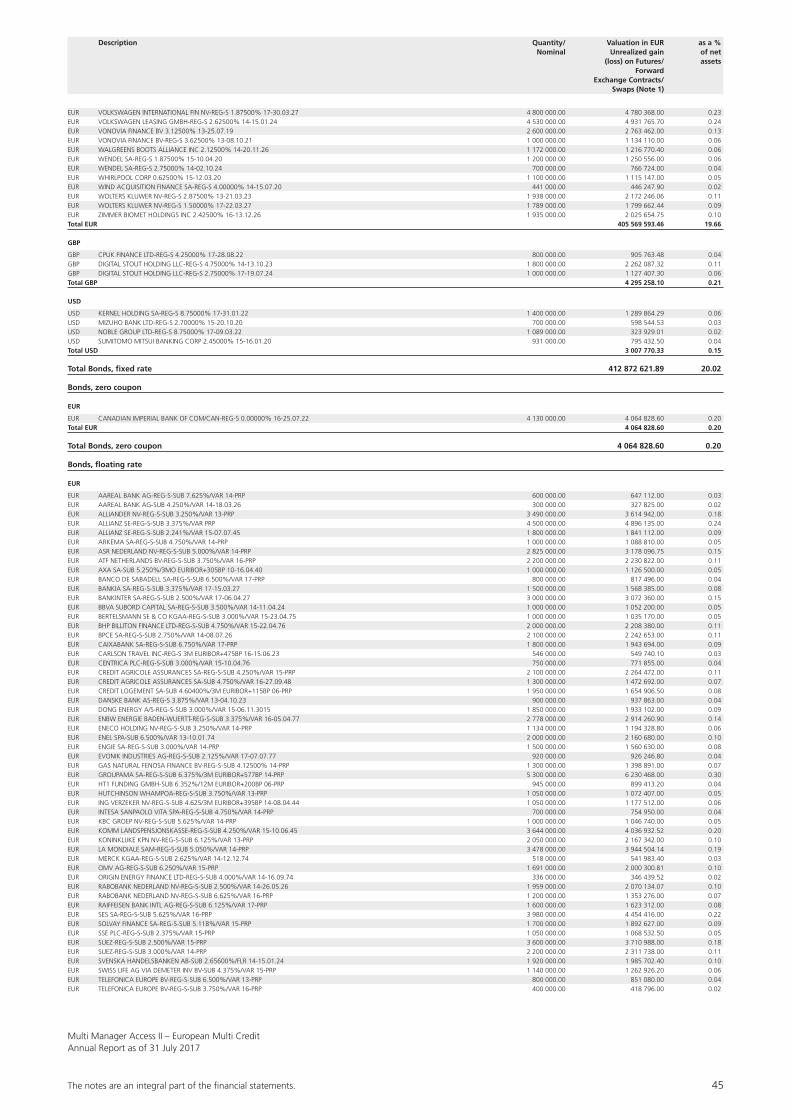
The notes are an integral part of the fi nancial statements. 45
Multi Manager Access II – European Multi CreditAnnual Report as of 31 July 2017
EUR VOLKSWAGEN INTERNATIONAL FIN NV-REG-S 1.87500% 17-30.03.27 4 800 000.00 4 780 368.00 0.23EUR VOLKSWAGEN LEASING GMBH-REG-S 2.62500% 14-15.01.24 4 530 000.00 4 931 765.70 0.24EUR VONOVIA FINANCE BV 3.12500% 13-25.07.19 2 600 000.00 2 763 462.00 0.13EUR VONOVIA FINANCE BV-REG-S 3.62500% 13-08.10.21 1 000 000.00 1 134 110.00 0.06EUR WALGREENS BOOTS ALLIANCE INC 2.12500% 14-20.11.26 1 172 000.00 1 216 770.40 0.06EUR WENDEL SA-REG-S 1.87500% 15-10.04.20 1 200 000.00 1 250 556.00 0.06EUR WENDEL SA-REG-S 2.75000% 14-02.10.24 700 000.00 766 724.00 0.04EUR WHIRLPOOL CORP 0.62500% 15-12.03.20 1 100 000.00 1 115 147.00 0.05EUR WIND ACQUISITION FINANCE SA-REG-S 4.00000% 14-15.07.20 441 000.00 446 247.90 0.02EUR WOLTERS KLUWER NV-REG-S 2.87500% 13-21.03.23 1 938 000.00 2 172 246.06 0.11EUR WOLTERS KLUWER NV-REG-S 1.50000% 17-22.03.27 1 789 000.00 1 799 662.44 0.09EUR ZIMMER BIOMET HOLDINGS INC 2.42500% 16-13.12.26 1 935 000.00 2 025 654.75 0.10Total EUR 405 569 593.46 19.66
GBP
GBP CPUK FINANCE LTD-REG-S 4.25000% 17-28.08.22 800 000.00 905 763.48 0.04GBP DIGITAL STOUT HOLDING LLC-REG-S 4.75000% 14-13.10.23 1 800 000.00 2 262 087.32 0.11GBP DIGITAL STOUT HOLDING LLC-REG-S 2.75000% 17-19.07.24 1 000 000.00 1 127 407.30 0.06Total GBP 4 295 258.10 0.21
USD
USD KERNEL HOLDING SA-REG-S 8.75000% 17-31.01.22 1 400 000.00 1 289 864.29 0.06USD MIZUHO BANK LTD-REG-S 2.70000% 15-20.10.20 700 000.00 598 544.53 0.03USD NOBLE GROUP LTD-REG-S 8.75000% 17-09.03.22 1 089 000.00 323 929.01 0.02USD SUMITOMO MITSUI BANKING CORP 2.45000% 15-16.01.20 931 000.00 795 432.50 0.04Total USD 3 007 770.33 0.15
Total Bonds, fixed rate 412 872 621.89 20.02
Bonds, zero coupon
EUR
EUR CANADIAN IMPERIAL BANK OF COM/CAN-REG-S 0.00000% 16-25.07.22 4 130 000.00 4 064 828.60 0.20Total EUR 4 064 828.60 0.20
Total Bonds, zero coupon 4 064 828.60 0.20
Bonds, floating rate
EUR
EUR AAREAL BANK AG-REG-S-SUB 7.625%/VAR 14-PRP 600 000.00 647 112.00 0.03EUR AAREAL BANK AG-SUB 4.250%/VAR 14-18.03.26 300 000.00 327 825.00 0.02EUR ALLIANDER NV-REG-S-SUB 3.250%/VAR 13-PRP 3 490 000.00 3 614 942.00 0.18EUR ALLIANZ SE-REG-S-SUB 3.375%/VAR PRP 4 500 000.00 4 896 135.00 0.24EUR ALLIANZ SE-REG-S-SUB 2.241%/VAR 15-07.07.45 1 800 000.00 1 841 112.00 0.09EUR ARKEMA SA-REG-S-SUB 4.750%/VAR 14-PRP 1 000 000.00 1 088 810.00 0.05EUR ASR NEDERLAND NV-REG-S-SUB 5.000%/VAR 14-PRP 2 825 000.00 3 178 096.75 0.15EUR ATF NETHERLANDS BV-REG-S-SUB 3.750%/VAR 16-PRP 2 200 000.00 2 230 822.00 0.11EUR AXA SA-SUB 5.250%/3MO EURIBOR+305BP 10-16.04.40 1 000 000.00 1 126 500.00 0.05EUR BANCO DE SABADELL SA-REG-S-SUB 6.500%/VAR 17-PRP 800 000.00 817 496.00 0.04EUR BANKIA SA-REG-S-SUB 3.375%/VAR 17-15.03.27 1 500 000.00 1 568 385.00 0.08EUR BANKINTER SA-REG-S-SUB 2.500%/VAR 17-06.04.27 3 000 000.00 3 072 360.00 0.15EUR BBVA SUBORD CAPITAL SA-REG-S-SUB 3.500%/VAR 14-11.04.24 1 000 000.00 1 052 200.00 0.05EUR BERTELSMANN SE & CO KGAA-REG-S-SUB 3.000%/VAR 15-23.04.75 1 000 000.00 1 035 170.00 0.05EUR BHP BILLITON FINANCE LTD-REG-S-SUB 4.750%/VAR 15-22.04.76 2 000 000.00 2 208 380.00 0.11EUR BPCE SA-REG-S-SUB 2.750%/VAR 14-08.07.26 2 100 000.00 2 242 653.00 0.11EUR CAIXABANK SA-REG-S-SUB 6.750%/VAR 17-PRP 1 800 000.00 1 943 694.00 0.09EUR CARLSON TRAVEL INC-REG-S 3M EURIBOR+475BP 16-15.06.23 546 000.00 549 740.10 0.03EUR CENTRICA PLC-REG-S-SUB 3.000%/VAR 15-10.04.76 750 000.00 771 855.00 0.04EUR CREDIT AGRICOLE ASSURANCES SA-REG-S-SUB 4.250%/VAR 15-PRP 2 100 000.00 2 264 472.00 0.11EUR CREDIT AGRICOLE ASSURANCES SA-SUB 4.750%/VAR 16-27.09.48 1 300 000.00 1 472 692.00 0.07EUR CREDIT LOGEMENT SA-SUB 4.60400%/3M EURIBOR+115BP 06-PRP 1 950 000.00 1 654 906.50 0.08EUR DANSKE BANK AS-REG-S 3.875%/VAR 13-04.10.23 900 000.00 937 863.00 0.04EUR DONG ENERGY A/S-REG-S-SUB 3.000%/VAR 15-06.11.3015 1 850 000.00 1 933 102.00 0.09EUR ENBW ENERGIE BADEN-WUERTT-REG-S-SUB 3.375%/VAR 16-05.04.77 2 778 000.00 2 914 260.90 0.14EUR ENECO HOLDING NV-REG-S-SUB 3.250%/VAR 14-PRP 1 134 000.00 1 194 328.80 0.06EUR ENEL SPA-SUB 6.500%/VAR 13-10.01.74 2 000 000.00 2 160 680.00 0.10EUR ENGIE SA-REG-S-SUB 3.000%/VAR 14-PRP 1 500 000.00 1 560 630.00 0.08EUR EVONIK INDUSTRIES AG-REG-S-SUB 2.125%/VAR 17-07.07.77 920 000.00 926 246.80 0.04EUR GAS NATURAL FENOSA FINANCE BV-REG-S-SUB 4.12500% 14-PRP 1 300 000.00 1 398 891.00 0.07EUR GROUPAMA SA-REG-S-SUB 6.375%/3M EURIBOR+577BP 14-PRP 5 300 000.00 6 230 468.00 0.30EUR HT1 FUNDING GMBH-SUB 6.352%/12M EURIBOR+200BP 06-PRP 945 000.00 899 413.20 0.04EUR HUTCHINSON WHAMPOA-REG-S-SUB 3.750%/VAR 13-PRP 1 050 000.00 1 072 407.00 0.05EUR ING VERZEKER NV-REG-S-SUB 4.625/3M EURIBOR+395BP 14-08.04.44 1 050 000.00 1 177 512.00 0.06EUR INTESA SANPAOLO VITA SPA-REG-S-SUB 4.750%/VAR 14-PRP 700 000.00 754 950.00 0.04EUR KBC GROEP NV-REG-S-SUB 5.625%/VAR 14-PRP 1 000 000.00 1 046 740.00 0.05EUR KOMM LANDSPENSJONSKASSE-REG-S-SUB 4.250%/VAR 15-10.06.45 3 644 000.00 4 036 932.52 0.20EUR KONINKLIJKE KPN NV-REG-S-SUB 6.125%/VAR 13-PRP 2 050 000.00 2 167 342.00 0.10EUR LA MONDIALE SAM-REG-S-SUB 5.050%/VAR 14-PRP 3 478 000.00 3 944 504.14 0.19EUR MERCK KGAA-REG-S-SUB 2.625%/VAR 14-12.12.74 518 000.00 541 983.40 0.03EUR OMV AG-REG-S-SUB 6.250%/VAR 15-PRP 1 691 000.00 2 000 300.81 0.10EUR ORIGIN ENERGY FINANCE LTD-REG-S-SUB 4.000%/VAR 14-16.09.74 336 000.00 346 439.52 0.02EUR RABOBANK NEDERLAND NV-REG-S-SUB 2.500%/VAR 14-26.05.26 1 959 000.00 2 070 134.07 0.10EUR RABOBANK NEDERLAND NV-REG-S-SUB 6.625%/VAR 16-PRP 1 200 000.00 1 353 276.00 0.07EUR RAIFFEISEN BANK INTL AG-REG-S-SUB 6.125%/VAR 17-PRP 1 600 000.00 1 623 312.00 0.08EUR SES SA-REG-S-SUB 5.625%/VAR 16-PRP 3 980 000.00 4 454 416.00 0.22EUR SOLVAY FINANCE SA-REG-S-SUB 5.118%/VAR 15-PRP 1 700 000.00 1 892 627.00 0.09EUR SSE PLC-REG-S-SUB 2.375%/VAR 15-PRP 1 050 000.00 1 068 532.50 0.05EUR SUEZ-REG-S-SUB 2.500%/VAR 15-PRP 3 600 000.00 3 710 988.00 0.18EUR SUEZ-REG-S-SUB 3.000%/VAR 14-PRP 2 200 000.00 2 311 738.00 0.11EUR SVENSKA HANDELSBANKEN AB-SUB 2.65600%/FLR 14-15.01.24 1 920 000.00 1 985 702.40 0.10EUR SWISS LIFE AG VIA DEMETER INV BV-SUB 4.375%/VAR 15-PRP 1 140 000.00 1 262 926.20 0.06EUR TELEFONICA EUROPE BV-REG-S-SUB 6.500%/VAR 13-PRP 800 000.00 851 080.00 0.04EUR TELEFONICA EUROPE BV-REG-S-SUB 3.750%/VAR 16-PRP 400 000.00 418 796.00 0.02
Description Quantity/ Valuation in EUR as a % Nominal Unrealized gain of net (loss) on Futures/ assets Forward Exchange Contracts/ Swaps (Note 1)
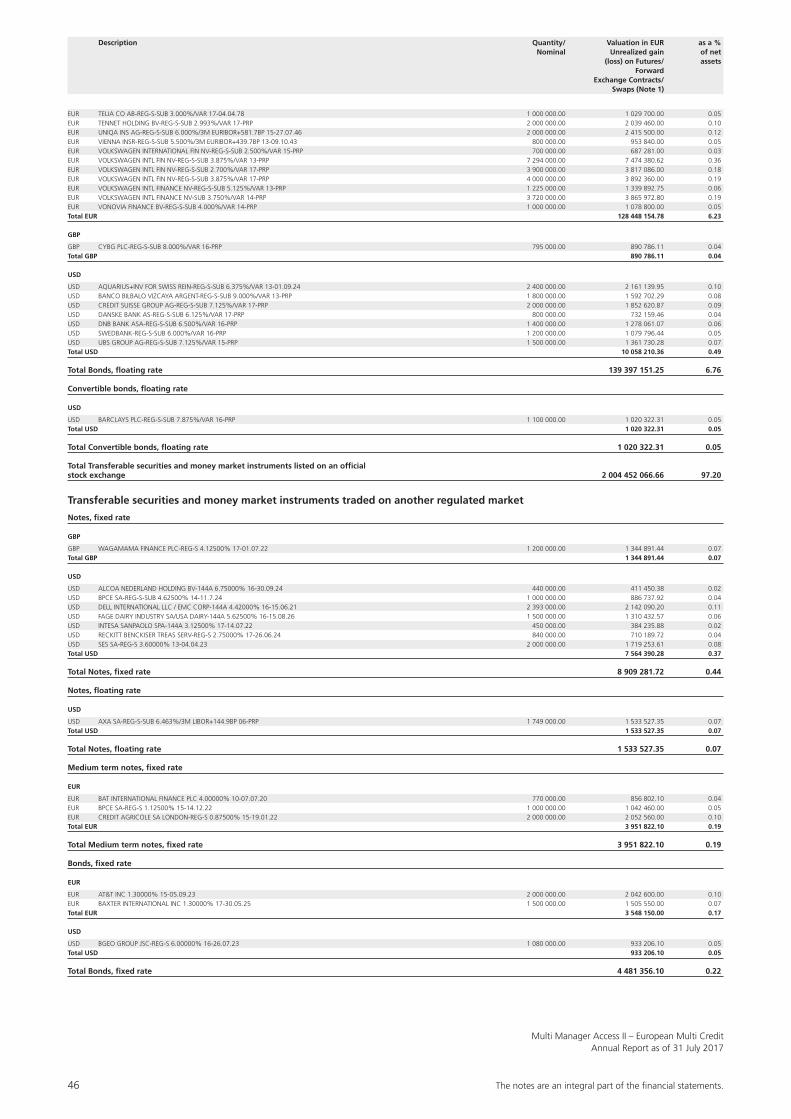
46 The notes are an integral part of the fi nancial statements.
Multi Manager Access II – European Multi CreditAnnual Report as of 31 July 2017
EUR TELIA CO AB-REG-S-SUB 3.000%/VAR 17-04.04.78 1 000 000.00 1 029 700.00 0.05EUR TENNET HOLDING BV-REG-S-SUB 2.993%/VAR 17-PRP 2 000 000.00 2 039 460.00 0.10EUR UNIQA INS AG-REG-S-SUB 6.000%/3M EURIBOR+581.7BP 15-27.07.46 2 000 000.00 2 415 500.00 0.12EUR VIENNA INSR-REG-S-SUB 5.500%/3M EURIBOR+439.7BP 13-09.10.43 800 000.00 953 840.00 0.05EUR VOLKSWAGEN INTERNATIONAL FIN NV-REG-S-SUB 2.500%/VAR 15-PRP 700 000.00 687 281.00 0.03EUR VOLKSWAGEN INTL FIN NV-REG-S-SUB 3.875%/VAR 13-PRP 7 294 000.00 7 474 380.62 0.36EUR VOLKSWAGEN INTL FIN NV-REG-S-SUB 2.700%/VAR 17-PRP 3 900 000.00 3 817 086.00 0.18EUR VOLKSWAGEN INTL FIN NV-REG-S-SUB 3.875%/VAR 17-PRP 4 000 000.00 3 892 360.00 0.19EUR VOLKSWAGEN INTL FINANCE NV-REG-S-SUB 5.125%/VAR 13-PRP 1 225 000.00 1 339 892.75 0.06EUR VOLKSWAGEN INTL FINANCE NV-SUB 3.750%/VAR 14-PRP 3 720 000.00 3 865 972.80 0.19EUR VONOVIA FINANCE BV-REG-S-SUB 4.000%/VAR 14-PRP 1 000 000.00 1 078 800.00 0.05Total EUR 128 448 154.78 6.23
GBP
GBP CYBG PLC-REG-S-SUB 8.000%/VAR 16-PRP 795 000.00 890 786.11 0.04Total GBP 890 786.11 0.04
USD
USD AQUARIUS+INV FOR SWISS REIN-REG-S-SUB 6.375%/VAR 13-01.09.24 2 400 000.00 2 161 139.95 0.10USD BANCO BILBALO VIZCAYA ARGENT-REG-S-SUB 9.000%/VAR 13-PRP 1 800 000.00 1 592 702.29 0.08USD CREDIT SUISSE GROUP AG-REG-S-SUB 7.125%/VAR 17-PRP 2 000 000.00 1 852 620.87 0.09USD DANSKE BANK AS-REG-S-SUB 6.125%/VAR 17-PRP 800 000.00 732 159.46 0.04USD DNB BANK ASA-REG-S-SUB 6.500%/VAR 16-PRP 1 400 000.00 1 278 061.07 0.06USD SWEDBANK-REG-S-SUB 6.000%/VAR 16-PRP 1 200 000.00 1 079 796.44 0.05USD UBS GROUP AG-REG-S-SUB 7.125%/VAR 15-PRP 1 500 000.00 1 361 730.28 0.07Total USD 10 058 210.36 0.49
Total Bonds, floating rate 139 397 151.25 6.76
Convertible bonds, floating rate
USD
USD BARCLAYS PLC-REG-S-SUB 7.875%/VAR 16-PRP 1 100 000.00 1 020 322.31 0.05Total USD 1 020 322.31 0.05
Total Convertible bonds, floating rate 1 020 322.31 0.05
Total Transferable securities and money market instruments listed on an official stock exchange 2 004 452 066.66 97.20
Transferable securities and money market instruments traded on another regulated market
Notes, fixed rate
GBP
GBP WAGAMAMA FINANCE PLC-REG-S 4.12500% 17-01.07.22 1 200 000.00 1 344 891.44 0.07Total GBP 1 344 891.44 0.07
USD
USD ALCOA NEDERLAND HOLDING BV-144A 6.75000% 16-30.09.24 440 000.00 411 450.38 0.02USD BPCE SA-REG-S-SUB 4.62500% 14-11.7.24 1 000 000.00 886 737.92 0.04USD DELL INTERNATIONAL LLC / EMC CORP-144A 4.42000% 16-15.06.21 2 393 000.00 2 142 090.20 0.11USD FAGE DAIRY INDUSTRY SA/USA DAIRY-144A 5.62500% 16-15.08.26 1 500 000.00 1 310 432.57 0.06USD INTESA SANPAOLO SPA-144A 3.12500% 17-14.07.22 450 000.00 384 235.88 0.02USD RECKITT BENCKISER TREAS SERV-REG-S 2.75000% 17-26.06.24 840 000.00 710 189.72 0.04USD SES SA-REG-S 3.60000% 13-04.04.23 2 000 000.00 1 719 253.61 0.08Total USD 7 564 390.28 0.37
Total Notes, fixed rate 8 909 281.72 0.44
Notes, floating rate
USD
USD AXA SA-REG-S-SUB 6.463%/3M LIBOR+144.9BP 06-PRP 1 749 000.00 1 533 527.35 0.07Total USD 1 533 527.35 0.07
Total Notes, floating rate 1 533 527.35 0.07
Medium term notes, fixed rate
EUR
EUR BAT INTERNATIONAL FINANCE PLC 4.00000% 10-07.07.20 770 000.00 856 802.10 0.04EUR BPCE SA-REG-S 1.12500% 15-14.12.22 1 000 000.00 1 042 460.00 0.05EUR CREDIT AGRICOLE SA LONDON-REG-S 0.87500% 15-19.01.22 2 000 000.00 2 052 560.00 0.10Total EUR 3 951 822.10 0.19
Total Medium term notes, fixed rate 3 951 822.10 0.19
Bonds, fixed rate
EUR
EUR AT&T INC 1.30000% 15-05.09.23 2 000 000.00 2 042 600.00 0.10EUR BAXTER INTERNATIONAL INC 1.30000% 17-30.05.25 1 500 000.00 1 505 550.00 0.07Total EUR 3 548 150.00 0.17
USD
USD BGEO GROUP JSC-REG-S 6.00000% 16-26.07.23 1 080 000.00 933 206.10 0.05Total USD 933 206.10 0.05
Total Bonds, fixed rate 4 481 356.10 0.22
Description Quantity/ Valuation in EUR as a % Nominal Unrealized gain of net (loss) on Futures/ assets Forward Exchange Contracts/ Swaps (Note 1)
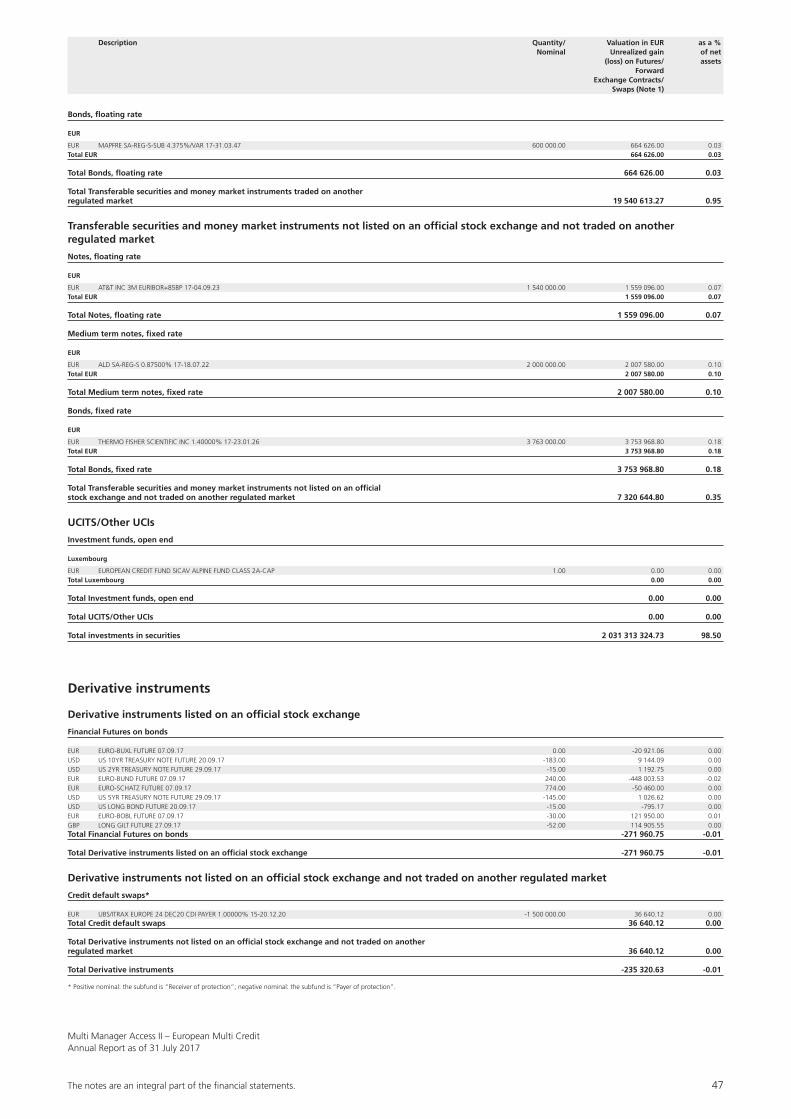
The notes are an integral part of the fi nancial statements. 47
Multi Manager Access II – European Multi CreditAnnual Report as of 31 July 2017
Bonds, floating rate
EUR
EUR MAPFRE SA-REG-S-SUB 4.375%/VAR 17-31.03.47 600 000.00 664 626.00 0.03Total EUR 664 626.00 0.03
Total Bonds, floating rate 664 626.00 0.03
Total Transferable securities and money market instruments traded on another regulated market 19 540 613.27 0.95
Transferable securities and money market instruments not listed on an official stock exchange and not traded on another regulated market
Notes, floating rate
EUR
EUR AT&T INC 3M EURIBOR+85BP 17-04.09.23 1 540 000.00 1 559 096.00 0.07Total EUR 1 559 096.00 0.07
Total Notes, floating rate 1 559 096.00 0.07
Medium term notes, fixed rate
EUR
EUR ALD SA-REG-S 0.87500% 17-18.07.22 2 000 000.00 2 007 580.00 0.10Total EUR 2 007 580.00 0.10
Total Medium term notes, fixed rate 2 007 580.00 0.10
Bonds, fixed rate
EUR
EUR THERMO FISHER SCIENTIFIC INC 1.40000% 17-23.01.26 3 763 000.00 3 753 968.80 0.18Total EUR 3 753 968.80 0.18
Total Bonds, fixed rate 3 753 968.80 0.18
Total Transferable securities and money market instruments not listed on an official stock exchange and not traded on another regulated market 7 320 644.80 0.35
UCITS/Other UCIs
Investment funds, open end
Luxembourg
EUR EUROPEAN CREDIT FUND SICAV ALPINE FUND CLASS 2A-CAP 1.00 0.00 0.00Total Luxembourg 0.00 0.00
Total Investment funds, open end 0.00 0.00
Total UCITS/Other UCIs 0.00 0.00
Total investments in securities 2 031 313 324.73 98.50
Derivative instruments
Derivative instruments listed on an official stock exchange
Financial Futures on bonds
EUR EURO-BUXL FUTURE 07.09.17 0.00 -20 921.06 0.00USD US 10YR TREASURY NOTE FUTURE 20.09.17 -183.00 9 144.09 0.00USD US 2YR TREASURY NOTE FUTURE 29.09.17 -15.00 1 192.75 0.00EUR EURO-BUND FUTURE 07.09.17 240.00 -448 003.53 -0.02EUR EURO-SCHATZ FUTURE 07.09.17 774.00 -50 460.00 0.00USD US 5YR TREASURY NOTE FUTURE 29.09.17 -145.00 1 026.62 0.00USD US LONG BOND FUTURE 20.09.17 -15.00 -795.17 0.00EUR EURO-BOBL FUTURE 07.09.17 -30.00 121 950.00 0.01GBP LONG GILT FUTURE 27.09.17 -52.00 114 905.55 0.00Total Financial Futures on bonds -271 960.75 -0.01
Total Derivative instruments listed on an official stock exchange -271 960.75 -0.01
Derivative instruments not listed on an official stock exchange and not traded on another regulated market
Credit default swaps*
EUR UBS/ITRAX EUROPE 24 DEC20 CDI PAYER 1.00000% 15-20.12.20 -1 500 000.00 36 640.12 0.00Total Credit default swaps 36 640.12 0.00
Total Derivative instruments not listed on an official stock exchange and not traded on another regulated market 36 640.12 0.00
Total Derivative instruments -235 320.63 -0.01
* Positive nominal: the subfund is “Receiver of protection”; negative nominal: the subfund is “Payer of protection”.
Description Quantity/ Valuation in EUR as a % Nominal Unrealized gain of net (loss) on Futures/ assets Forward Exchange Contracts/ Swaps (Note 1)
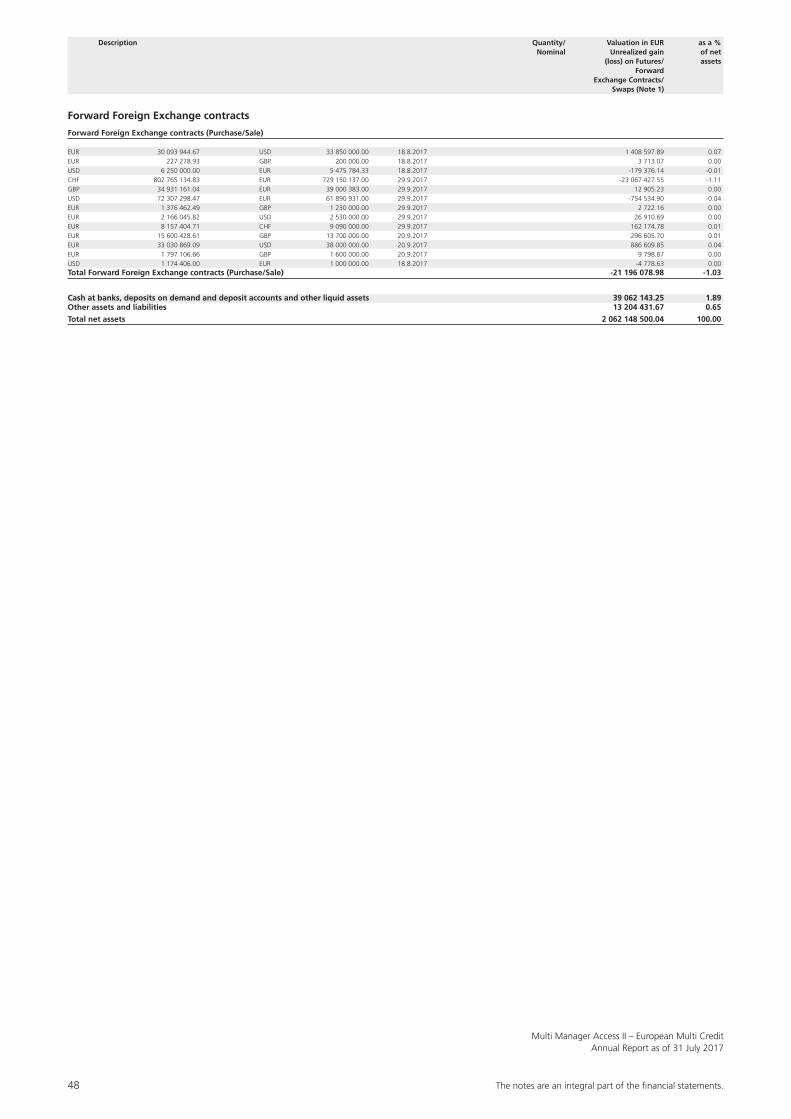
48 The notes are an integral part of the fi nancial statements.
Multi Manager Access II – European Multi CreditAnnual Report as of 31 July 2017
Forward Foreign Exchange contracts
Forward Foreign Exchange contracts (Purchase/Sale)
EUR 30 093 944.67 USD 33 850 000.00 18.8.2017 1 408 597.89 0.07EUR 227 278.93 GBP 200 000.00 18.8.2017 3 713.07 0.00USD 6 250 000.00 EUR 5 475 784.33 18.8.2017 -179 376.14 -0.01CHF 802 765 134.83 EUR 729 150 137.00 29.9.2017 -23 067 427.55 -1.11GBP 34 931 161.04 EUR 39 000 383.00 29.9.2017 12 905.23 0.00USD 72 307 298.47 EUR 61 890 931.00 29.9.2017 -754 534.90 -0.04EUR 1 376 462.49 GBP 1 230 000.00 29.9.2017 2 722.16 0.00EUR 2 166 045.82 USD 2 530 000.00 29.9.2017 26 910.69 0.00EUR 8 157 404.71 CHF 9 090 000.00 29.9.2017 162 174.78 0.01EUR 15 600 428.61 GBP 13 700 000.00 20.9.2017 296 605.70 0.01EUR 33 030 869.09 USD 38 000 000.00 20.9.2017 886 609.85 0.04EUR 1 797 106.66 GBP 1 600 000.00 20.9.2017 9 798.87 0.00USD 1 174 406.00 EUR 1 000 000.00 18.8.2017 -4 778.63 0.00Total Forward Foreign Exchange contracts (Purchase/Sale) -21 196 078.98 -1.03
Cash at banks, deposits on demand and deposit accounts and other liquid assets 39 062 143.25 1.89Other assets and liabilities 13 204 431.67 0.65
Total net assets 2 062 148 500.04 100.00
Description Quantity/ Valuation in EUR as a % Nominal Unrealized gain of net (loss) on Futures/ assets Forward Exchange Contracts/ Swaps (Note 1)
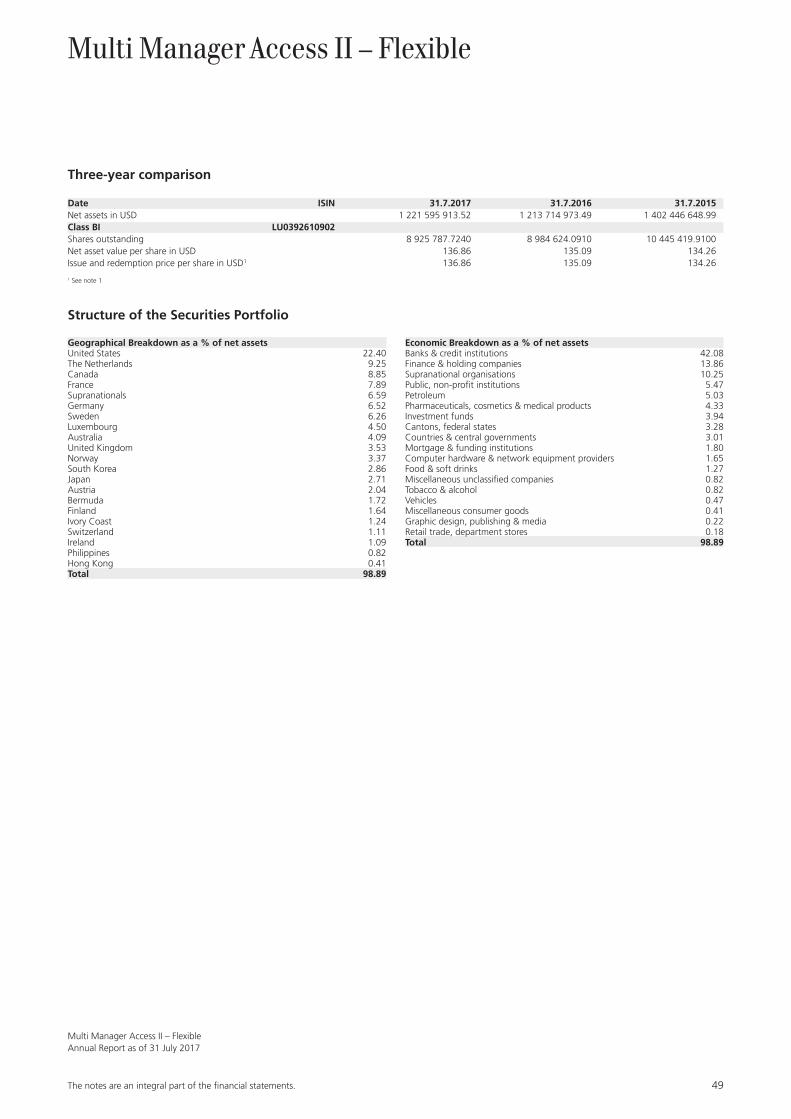
The notes are an integral part of the fi nancial statements. 49
Multi Manager Access II – FlexibleAnnual Report as of 31 July 2017
Multi Manager Access II – Flexible
Three-year comparison
Date ISIN 31.7.2017 31.7.2016 31.7.2015Net assets in USD 1 221 595 913.52 1 213 714 973.49 1 402 446 648.99Class BI LU0392610902Shares outstanding 8 925 787.7240 8 984 624.0910 10 445 419.9100Net asset value per share in USD 136.86 135.09 134.26Issue and redemption price per share in USD1 136.86 135.09 134.26
1 See note 1
Structure of the Securities Portfolio
Geographical Breakdown as a % of net assetsUnited States 22.40The Netherlands 9.25Canada 8.85France 7.89Supranationals 6.59Germany 6.52Sweden 6.26Luxembourg 4.50Australia 4.09United Kingdom 3.53Norway 3.37South Korea 2.86Japan 2.71Austria 2.04Bermuda 1.72Finland 1.64Ivory Coast 1.24Switzerland 1.11Ireland 1.09Philippines 0.82Hong Kong 0.41Total 98.89
Economic Breakdown as a % of net assetsBanks & credit institutions 42.08Finance & holding companies 13.86Supranational organisations 10.25Public, non-profit institutions 5.47Petroleum 5.03Pharmaceuticals, cosmetics & medical products 4.33Investment funds 3.94Cantons, federal states 3.28Countries & central governments 3.01Mortgage & funding institutions 1.80Computer hardware & network equipment providers 1.65Food & soft drinks 1.27Miscellaneous unclassified companies 0.82Tobacco & alcohol 0.82Vehicles 0.47Miscellaneous consumer goods 0.41Graphic design, publishing & media 0.22Retail trade, department stores 0.18Total 98.89
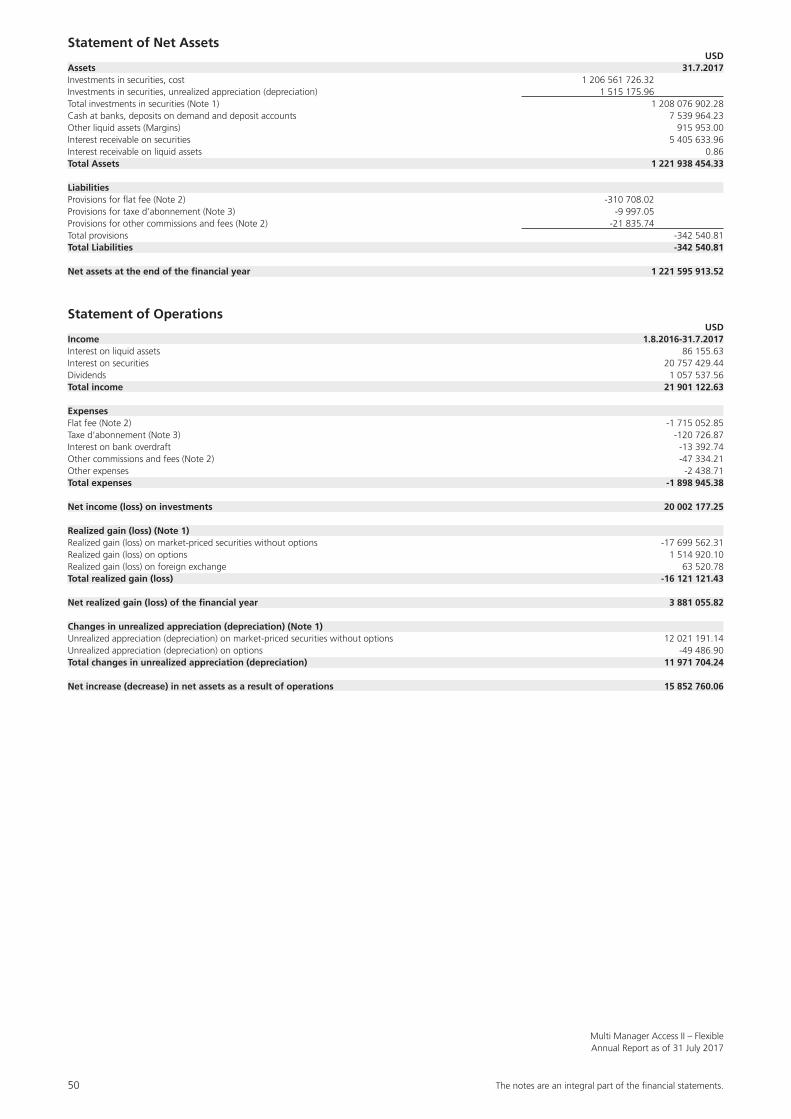
50 The notes are an integral part of the fi nancial statements.
Multi Manager Access II – FlexibleAnnual Report as of 31 July 2017
Statement of Net Assets USDAssets 31.7.2017Investments in securities, cost 1 206 561 726.32Investments in securities, unrealized appreciation (depreciation) 1 515 175.96Total investments in securities (Note 1) 1 208 076 902.28Cash at banks, deposits on demand and deposit accounts 7 539 964.23Other liquid assets (Margins) 915 953.00Interest receivable on securities 5 405 633.96Interest receivable on liquid assets 0.86Total Assets 1 221 938 454.33
LiabilitiesProvisions for flat fee (Note 2) -310 708.02Provisions for taxe d’abonnement (Note 3) -9 997.05Provisions for other commissions and fees (Note 2) -21 835.74Total provisions -342 540.81Total Liabilities -342 540.81
Net assets at the end of the financial year 1 221 595 913.52
Statement of Operations USDIncome 1.8.2016-31.7.2017Interest on liquid assets 86 155.63Interest on securities 20 757 429.44Dividends 1 057 537.56Total income 21 901 122.63
ExpensesFlat fee (Note 2) -1 715 052.85Taxe d’abonnement (Note 3) -120 726.87Interest on bank overdraft -13 392.74Other commissions and fees (Note 2) -47 334.21Other expenses -2 438.71Total expenses -1 898 945.38
Net income (loss) on investments 20 002 177.25
Realized gain (loss) (Note 1)Realized gain (loss) on market-priced securities without options -17 699 562.31Realized gain (loss) on options 1 514 920.10Realized gain (loss) on foreign exchange 63 520.78Total realized gain (loss) -16 121 121.43
Net realized gain (loss) of the financial year 3 881 055.82
Changes in unrealized appreciation (depreciation) (Note 1)Unrealized appreciation (depreciation) on market-priced securities without options 12 021 191.14Unrealized appreciation (depreciation) on options -49 486.90Total changes in unrealized appreciation (depreciation) 11 971 704.24
Net increase (decrease) in net assets as a result of operations 15 852 760.06
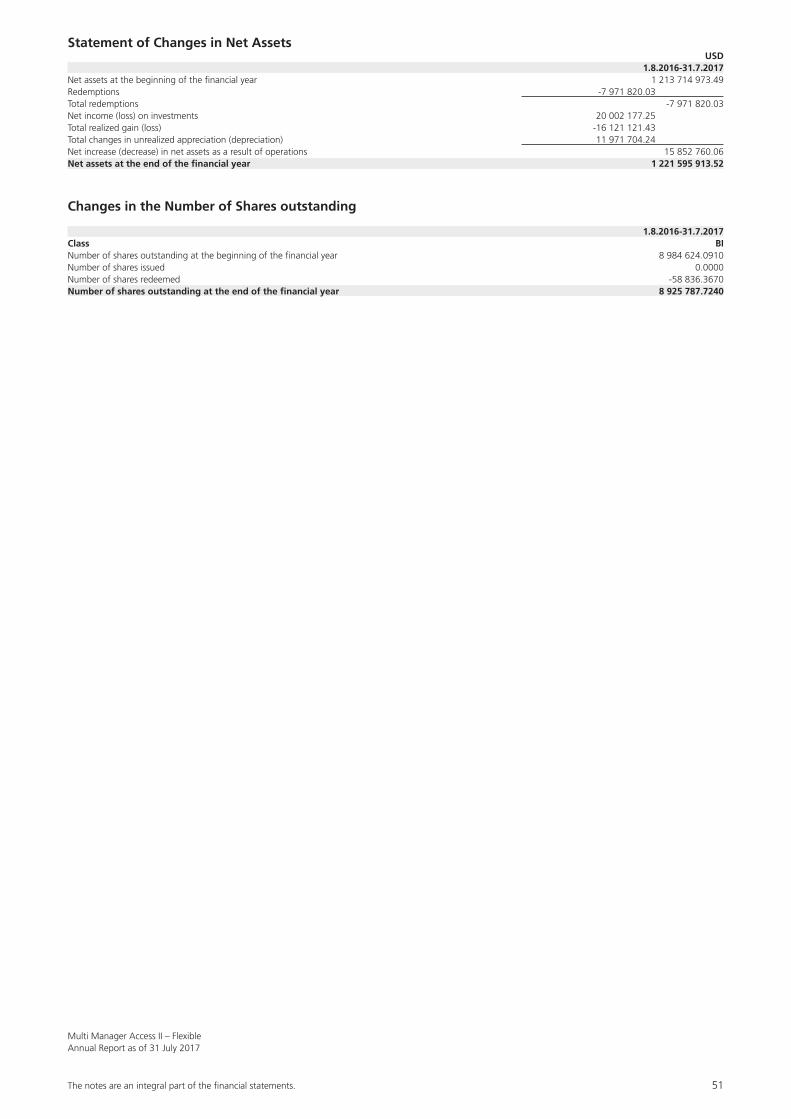
The notes are an integral part of the fi nancial statements. 51
Multi Manager Access II – FlexibleAnnual Report as of 31 July 2017
Statement of Changes in Net Assets USD 1.8.2016-31.7.2017Net assets at the beginning of the financial year 1 213 714 973.49Redemptions -7 971 820.03Total redemptions -7 971 820.03Net income (loss) on investments 20 002 177.25Total realized gain (loss) -16 121 121.43Total changes in unrealized appreciation (depreciation) 11 971 704.24Net increase (decrease) in net assets as a result of operations 15 852 760.06Net assets at the end of the financial year 1 221 595 913.52
Changes in the Number of Shares outstanding
1.8.2016-31.7.2017Class BINumber of shares outstanding at the beginning of the financial year 8 984 624.0910Number of shares issued 0.0000Number of shares redeemed -58 836.3670Number of shares outstanding at the end of the financial year 8 925 787.7240
52 The notes are an integral part of the fi nancial statements.
Multi Manager Access II – FlexibleAnnual Report as of 31 July 2017
Statement of Investments in Securities and other Net Assets as of 31 July 2017
Description Quantity/ Valuation in USD as a % Nominal Unrealized gain of net (loss) on Futures/ assets Forward Exchange Contracts/ Swaps (Note 1)
Transferable securities and money market instruments listed on an official stock exchange
Bearer shares
Hong Kong
USD SEASPAN CORP COM STK USD0.01 754 894.00 5 057 789.80 0.41Total Hong Kong 5 057 789.80 0.41
United States
USD ALPHABET INC CAP STK USD0.001 CL C 5.00 4 652.50 0.00USD COMCAST CORP COM CLS’A’ USD0.01 66 000.00 2 669 700.00 0.22USD JOHNSON & JOHNSON COM USD1 24 000.00 3 185 280.00 0.26USD MONDELEZ INTL INC COM USD0.01 80 000.00 3 521 600.00 0.29USD TJX COS INC COM USD1 31 000.00 2 179 610.00 0.18Total United States 11 560 842.50 0.95
Total Bearer shares 16 618 632.30 1.36
Certificates on indices
Switzerland
USD UBS AG LONDON/MSCI DAILY TR GROSS USA INDEX 15-PRP 137 500.00 13 578 125.00 1.11Total Switzerland 13 578 125.00 1.11
Total Certificates on indices 13 578 125.00 1.11
Notes, fixed rate
USD
USD ABN AMRO BANK NV-REG-S 2.50000% 13-30.10.18 10 000 000.00 10 081 900.00 0.83USD AFRICAN DEVELOPMENT BANK 1.37500% 15-17.12.18 5 000 000.00 4 992 635.00 0.41USD ANHEUSER-BUSCH INBEV FINANCE INC 1.25000% 13-17.01.18 5 000 000.00 4 993 215.00 0.41USD BANK NEDERLANDSE GEMEENTEN NV-REG-S 1.25000% 15-29.10.2018 20 000 000.00 19 925 800.00 1.63USD BANK OF NOVA SCOTIA 1.95000% 16-15.01.19 10 000 000.00 10 035 440.00 0.82USD CATERPILLAR FINANCIAL SERVICES CORP 1.80000% 15-13.11.18 5 000 000.00 5 011 400.00 0.41USD CHEVRON CORP 1.36500% 15-02.03.18 5 150 000.00 5 148 645.55 0.42USD CHEVRON CORP 1.56100% 16-16.05.19 7 000 000.00 6 998 740.00 0.57USD CHEVRON CORP 1.79000% 15-16.11.18 10 000 000.00 10 041 290.00 0.82USD CREDIT AGRICOLE SA LONDON-REG-S 2.12500% 13-17.04.18 1 000 000.00 1 003 133.00 0.08USD DAIMLER FINANCE NORTH AMERICA LLC-REG-S 1.65000% 15-18.05.18 3 250 000.00 3 249 574.25 0.27USD DAIMLER FINANCE NORTH AMERICA LLC-REG-S 2.00000% 15-03.08.18 2 500 000.00 2 507 897.50 0.21USD INTER-AMERICAN DEVELOPMENT BANK 2.37500% 10-15.08.17 10 000 000.00 10 004 470.00 0.82USD INTL BK FOR RECONSTR & DEVT WORLD BANK 0.87500% 16-19.07.18 14 500 000.00 14 431 415.00 1.18USD KOREA DEVELOPMENT BANK 3.50000% 12-22.08.17 15 000 000.00 15 013 050.00 1.23USD KREDITANSTALT FUER WIEDERAUFBAU 1.00000% 16-15.07.19 6 670 000.00 6 602 813.09 0.54USD LLOYDS BANK PLC 2.00000% 15-17.08.18 10 000 000.00 10 017 890.00 0.82USD MUNICIPALITY FINANCE PLC-REG-S 1.75000% 14-21.05.19 20 000 000.00 20 050 200.00 1.64USD OESTERREICHISCHE KONTROLLBANK AG 1.12500% 16-26.04.19 10 000 000.00 9 923 590.00 0.81USD PFIZER INC 1.20000% 16-01.06.18 5 000 000.00 4 989 880.00 0.41USD PFIZER INC 1.70000% 16-15.12.19 13 000 000.00 13 023 309.00 1.07USD PHILIP MORRIS INTERNATIONAL INC 1.25000% 15-11.08.17 10 000 000.00 9 999 470.00 0.82USD PROCTER & GAMBLE CO 1.90000% 14-01.11.19 5 000 000.00 5 032 475.00 0.41USD RABOBANK NEDERLAND NV-REG-S 4.75000% 10-15.01.20 13 375 000.00 14 264 384.00 1.17USD SHELL INTERNATIONAL FINANCE BV 2.00000% 13-15.11.18 8 300 000.00 8 346 355.50 0.68USD SIEMENS FINANCIERINGSMAATSCH NV-REG-S 1.30000% 16-13.09.19 14 950 000.00 14 816 272.25 1.21USD SVENSKA HANDELSBANKEN AB 1.62500% 13-21.03.18 16 659 000.00 16 668 828.81 1.36USD TOTAL CAPITAL INTERNATIONAL SA 2.10000% 14-19.06.19 15 000 000.00 15 126 630.00 1.24Total USD 272 300 702.95 22.29
Total Notes, fixed rate 272 300 702.95 22.29
Notes, floating rate
USD
USD APPLE INC 3M LIBOR+25BP 13-03.05.18 10 000 000.00 10 022 270.00 0.82USD APPLE INC 3M LIBOR+82BP 16-22.02.19 10 000 000.00 10 120 980.00 0.83USD ASIAN DEVELOPMENT BANK 3M LIBOR+0BP 14-25.06.19 500 000.00 499 759.50 0.04USD EXXON MOBIL CORP 3M LIBOR+15BP 14-15.03.19 3 000 000.00 3 005 337.00 0.25USD EXXON MOBIL CORP 3M LIBOR+5BP 15-01.03.18 5 000 000.00 5 000 500.00 0.41USD JPMORGAN CHASE & CO 3M LIBOR+63BP 14-28.01.19 20 000 000.00 20 122 600.00 1.65USD PFIZER INC 3M LIBOR+30BP 13-15.06.18 6 000 000.00 6 014 520.00 0.49USD SIEMENS FINANCIERINGSMAATSCH-REG-S 3M LIBOR+28BP 15-25.05.18 2 750 000.00 2 755 186.50 0.22Total USD 57 541 153.00 4.71
Total Notes, floating rate 57 541 153.00 4.71
Medium term notes, fixed rate
USD
USD AGENCE FRANCAISE DE DEVELOPPEMENT-REG-S 1.37500% 16-02.08.19 20 000 000.00 19 821 000.00 1.62USD ASIAN DEVELOPMENT BANK 1.87500% 14-12.04.19 10 000 000.00 10 064 880.00 0.82USD CAISSE D’AMORTIS DE LA DETTE SOC-REG-S 1.37500% 13-29.01.18 15 000 000.00 14 968 500.00 1.23USD CAISSE DES DEPOTS ET CONSIGNATION-REG-S 1.25000% 15-04.06.18 10 000 000.00 9 966 000.00 0.82USD CAISSE DES DEPOTS ET CONSIGNATION-REG-S 1.50000% 15-13.11.18 15 000 000.00 14 966 550.00 1.22USD COMMONWEALTH BANK OF AUSTRALIA-REG-S 1.37500% 16-06.09.18 10 000 000.00 9 960 100.00 0.82USD DEVELOPMENT BANK OF JAPAN-REG-S 1.87500% 13-03.10.18 2 000 000.00 2 001 280.00 0.16USD EUROPEAN INVESTMNT BANK-REG-S 2.12500% 12-15.03.19 20 000 000.00 20 146 400.00 1.65USD JAPAN FINANCE ORG FOR MUNI-REG-S 2.12500% 14-06.03.19 10 000 000.00 10 001 800.00 0.82USD KOMMUNINVEST I SVERIGE AB-REG-S 1.12500% 15-09.10.18 25 000 000.00 24 897 500.00 2.04USD MACQUARIE BANK LTD-REG-S 1.60000% 14-27.10.17 4 906 000.00 4 906 196.24 0.40USD NRW BANK-REG-S 1.25000% 16-29.07.19 14 000 000.00 13 876 800.00 1.14

The notes are an integral part of the fi nancial statements. 53
Multi Manager Access II – FlexibleAnnual Report as of 31 July 2017
USD SANTANDER UK PLC 2.00000% 15-24.08.18 20 000 000.00 20 046 300.00 1.64USD SWEDEN, KINGDOM OF-REG-S 1.00000% 13-27.02.18 20 000 000.00 19 966 400.00 1.63USD TORONTO-DOMINION BANK 1.40000% 13-30.04.18 20 000 000.00 19 990 960.00 1.64USD TOYOTA MOTOR CREDIT CORP 2.00000% 13-24.10.18 10 000 000.00 10 074 050.00 0.82Total USD 225 654 716.24 18.47
Total Medium term notes, fixed rate 225 654 716.24 18.47
Medium term notes, floating rate
USD
USD EXPORT DEVELOPMENT CANADA-REG-S 3M LIBOR+5BP 16-17.01.18 20 000 000.00 20 005 000.00 1.64USD FMS WERTMANAGEMENT-REG-S 3M LIBOR+30BP 16-11.02.19 7 000 000.00 7 029 890.00 0.58USD ING BANK NV-REG-S 3M LIBOR+113BP 16-22.03.19 7 500 000.00 7 590 195.00 0.62USD INTERNATIONAL FINANCE CORP 3M LIBOR+6BP 15-09.01.19 15 000 000.00 15 011 610.00 1.23USD KOMMUNALBANKEN AS-REG-S 3M LIBOR+18BP 13-20.02.18 5 000 000.00 5 003 150.00 0.41USD MORGAN STANLEY 3M LIBOR+128BP 13-25.04.18 5 500 000.00 5 543 972.50 0.45USD NEDEDERLANDSE FINANCIE-MAAT-REG-S 3M LIBOR+32BP 16-18.04.19 400 000.00 401 748.00 0.03USD NRW BANK-REG-S 3M LIBOR+11BP 15-22.01.19 2 000 000.00 2 002 300.00 0.16USD QUEBEC, PROVINCE OF 3M LIBOR+23BP 15-04.09.18 5 000 000.00 5 010 205.00 0.41USD QUEBEC, PROVINCE OF 3M LIBOR+28BP 16-21.07.19 20 000 000.00 20 082 440.00 1.65Total USD 87 680 510.50 7.18
Total Medium term notes, floating rate 87 680 510.50 7.18
Bonds, fixed rate
USD
USD AFRICAN DEVELOPMENT BANK 1.87500% 17-16.03.20 15 000 000.00 15 085 200.00 1.24USD BANK OF NOVA SCOTIA 1.85000% 15-14.04.20 8 000 000.00 7 965 760.00 0.65USD BP CAPITAL MARKETS PLC 1.37500% 12-06.11.17 13 000 000.00 12 996 789.00 1.06USD COUNCIL OF EUROPE DEVELOPMENT BANK 1.75000% 14-14.11.19 15 000 000.00 15 053 640.00 1.23USD EXPORT DEVELOPMENT CANADA 1.62500% 14-03.12.19 10 000 000.00 10 014 770.00 0.82USD FMS WERTMANAGEMENT 1.00000% 12-21.11.17 20 000 000.00 19 984 140.00 1.64USD INTER-AMERICAN DEVELOPMENT BANK 3.87500% 10-14.02.20 10 000 000.00 10 544 790.00 0.86USD INTL BK FOR RECONSTR & DEVT WORLD BANK 1.25000% 16-26.07.19 10 000 000.00 9 951 000.00 0.82USD JAPAN BANK FOR INTL COOPERATION 2.25000% 17-24.02.20 21 000 000.00 21 127 890.00 1.73USD JOHNSON & JOHNSON 1.87500% 14-05.12.19 5 000 000.00 5 033 615.00 0.41USD KEB HANA BANK-REG-S 1.75000% 16-18.10.19 10 000 000.00 9 843 696.00 0.81USD KOMMUNALBANKEN AS-REG-S 1.12500% 13-23.05.18 17 000 000.00 16 959 370.00 1.39USD KREDITANSTALT FUER WIEDERAUFBAU 1.75000% 14-15.10.19 20 000 000.00 20 076 160.00 1.64USD KREDITANSTALT FUER WIEDERAUFBAU 0.87500% 14-15.12.17 5 000 000.00 4 993 495.00 0.41USD LANDWIRTSCHAFTLICHE RENTENBANK 1.87500% 11-17.09.18 5 000 000.00 5 026 490.00 0.41USD MERCK SHARP & DOHME CORP 5.00000% 09-30.06.19 10 000 000.00 10 635 890.00 0.87USD NEDERLANDSE WATERSCHAPSBANK NV-REG-S 1.62500% 15-04.03.20 15 000 000.00 14 937 150.00 1.22USD OESTERREICHISCHE KONTROLLBANK AG 1.75000% 17-24.01.20 15 000 000.00 15 033 330.00 1.23USD ONTARIO, PROVINCE OF 1.62500% 16-18.01.19 15 000 000.00 15 009 030.00 1.23USD STATOIL ASA 2.25000% 14-08.11.19 14 000 000.00 14 139 286.00 1.16USD WESTPAC BANKING CORP-REG-S 1.85000% 13-26.11.18 10 000 000.00 10 027 700.00 0.82Total USD 264 439 191.00 21.65
Total Bonds, fixed rate 264 439 191.00 21.65
Treasury notes, floating rate
USD
USD AMERICA, UNITED STATES OF 0.625%/CPI LINKED 11-15.07.21 2 300 000.00 2 567 518.61 0.21USD AMERICA, UNITED STATES OF 0.125%/CPI LINKED 12-15.01.22 1 700 000.00 1 842 692.90 0.15USD AMERICA, UNITED STATES OF 0.125%/CPI INDEX 14-15.07.24 1 600 000.00 1 629 260.33 0.13Total USD 6 039 471.84 0.49
Total Treasury notes, floating rate 6 039 471.84 0.49
Total Transferable securities and money market instruments listed on an official stock exchange 943 852 502.83 77.26
Transferable securities and money market instruments traded on another regulated market
Notes, fixed rate
USD
USD COCA-COLA CO/THE 1.15000% 13-01.04.18 12 000 000.00 11 984 688.00 0.98USD COMMONWEALTH BANK OF AUSTRALIA 1.90000% 12-18.09.17 12 000 000.00 12 006 240.00 0.98USD ING BANK NV-REG-S 1.65000% 16-15.08.19 12 000 000.00 11 911 224.00 0.97USD SCHLUMBERGER HOLDINGS CORP-REG-S 2.35000% 15-21.12.18 12 000 000.00 12 081 312.00 0.99USD SHELL INTERNATIONAL FINANCE BV 1.12500% 12-21.08.17 3 000 000.00 2 999 637.00 0.25USD SHELL INTERNATIONAL FINANCE BV 1.62500% 15-10.11.18 5 000 000.00 5 002 900.00 0.41USD STATOIL ASA 3.12500% 10-17.08.17 5 000 000.00 5 003 075.00 0.41USD TOTAL CAPITAL SA 2.12500% 13-10.08.18 500 000.00 503 410.00 0.04Total USD 61 492 486.00 5.03
Total Notes, fixed rate 61 492 486.00 5.03
Notes, floating rate
USD
USD AUSTRALIA & NEW ZEALAND BKG GRP/NY 3M LIBOR+56BP 13-15.05.18 9 933 000.00 9 971 917.50 0.82USD CITIBANK NA 3M LIBOR+50BP 17-12.06.20 10 000 000.00 10 047 870.00 0.82USD MERCK & CO INC 3M LIBOR+36BP 13-18.05.18 10 000 000.00 10 027 600.00 0.82USD WELLS FARGO BANK NA 3M LIBOR+60BP 16-24.05.19 20 000 000.00 20 151 420.00 1.65USD WESTPAC BANKING CORP 3M LIBOR+74BP 13-30.07.18 10 000 000.00 10 056 800.00 0.82Total USD 60 255 607.50 4.93
Total Notes, floating rate 60 255 607.50 4.93
Description Quantity/ Valuation in USD as a % Nominal Unrealized gain of net (loss) on Futures/ assets Forward Exchange Contracts/ Swaps (Note 1)
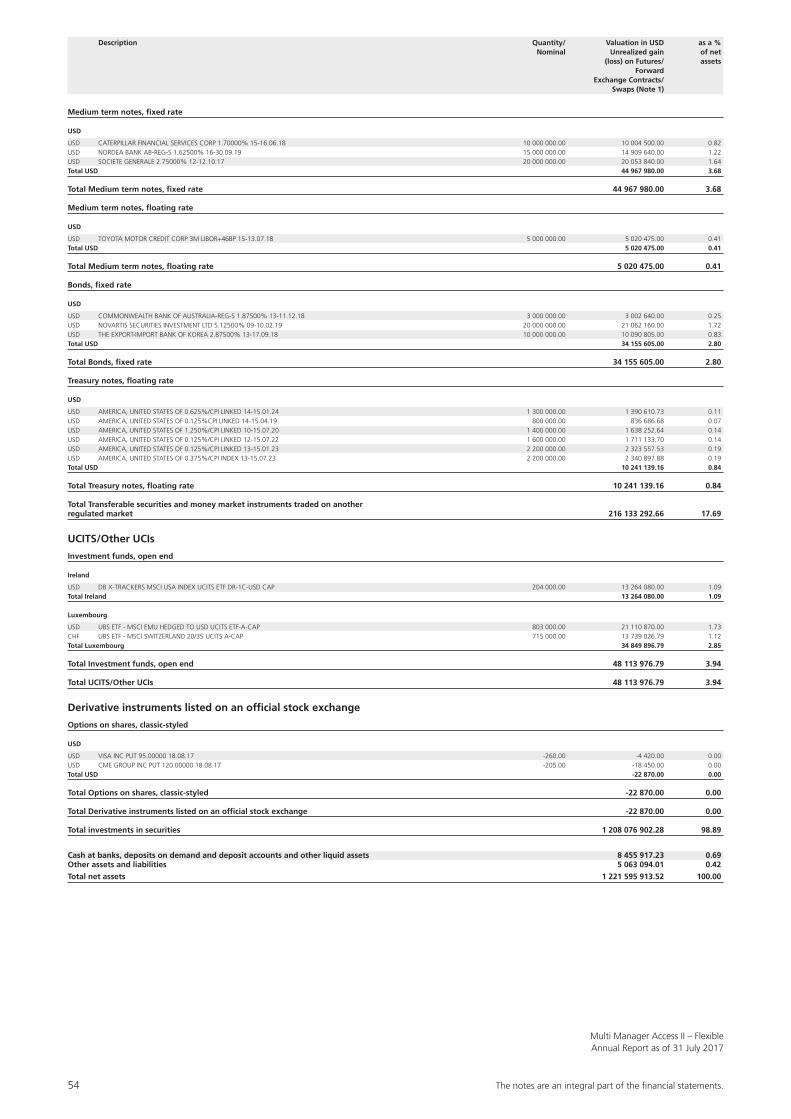
54 The notes are an integral part of the fi nancial statements.
Multi Manager Access II – FlexibleAnnual Report as of 31 July 2017
Description Quantity/ Valuation in USD as a % Nominal Unrealized gain of net (loss) on Futures/ assets Forward Exchange Contracts/ Swaps (Note 1)
Medium term notes, fixed rate
USD
USD CATERPILLAR FINANCIAL SERVICES CORP 1.70000% 15-16.06.18 10 000 000.00 10 004 500.00 0.82USD NORDEA BANK AB-REG-S 1.62500% 16-30.09.19 15 000 000.00 14 909 640.00 1.22USD SOCIETE GENERALE 2.75000% 12-12.10.17 20 000 000.00 20 053 840.00 1.64Total USD 44 967 980.00 3.68
Total Medium term notes, fixed rate 44 967 980.00 3.68
Medium term notes, floating rate
USD
USD TOYOTA MOTOR CREDIT CORP 3M LIBOR+46BP 15-13.07.18 5 000 000.00 5 020 475.00 0.41Total USD 5 020 475.00 0.41
Total Medium term notes, floating rate 5 020 475.00 0.41
Bonds, fixed rate
USD
USD COMMONWEALTH BANK OF AUSTRALIA-REG-S 1.87500% 13-11.12.18 3 000 000.00 3 002 640.00 0.25USD NOVARTIS SECURITIES INVESTMENT LTD 5.12500% 09-10.02.19 20 000 000.00 21 062 160.00 1.72USD THE EXPORT-IMPORT BANK OF KOREA 2.87500% 13-17.09.18 10 000 000.00 10 090 805.00 0.83Total USD 34 155 605.00 2.80
Total Bonds, fixed rate 34 155 605.00 2.80
Treasury notes, floating rate
USD
USD AMERICA, UNITED STATES OF 0.625%/CPI LINKED 14-15.01.24 1 300 000.00 1 390 610.73 0.11USD AMERICA, UNITED STATES OF 0.125%CPI LINKED 14-15.04.19 800 000.00 836 686.68 0.07USD AMERICA, UNITED STATES OF 1.250%/CPI LINKED 10-15.07.20 1 400 000.00 1 638 252.64 0.14USD AMERICA, UNITED STATES OF 0.125%/CPI LINKED 12-15.07.22 1 600 000.00 1 711 133.70 0.14USD AMERICA, UNITED STATES OF 0.125%/CPI LINKED 13-15.01.23 2 200 000.00 2 323 557.53 0.19USD AMERICA, UNITED STATES OF 0.375%/CPI INDEX 13-15.07.23 2 200 000.00 2 340 897.88 0.19Total USD 10 241 139.16 0.84
Total Treasury notes, floating rate 10 241 139.16 0.84
Total Transferable securities and money market instruments traded on another regulated market 216 133 292.66 17.69
UCITS/Other UCIs
Investment funds, open end
Ireland
USD DB X-TRACKERS MSCI USA INDEX UCITS ETF DR-1C-USD CAP 204 000.00 13 264 080.00 1.09Total Ireland 13 264 080.00 1.09
Luxembourg
USD UBS ETF - MSCI EMU HEDGED TO USD UCITS ETF-A-CAP 803 000.00 21 110 870.00 1.73CHF UBS ETF - MSCI SWITZERLAND 20/35 UCITS A-CAP 715 000.00 13 739 026.79 1.12Total Luxembourg 34 849 896.79 2.85
Total Investment funds, open end 48 113 976.79 3.94
Total UCITS/Other UCIs 48 113 976.79 3.94
Derivative instruments listed on an official stock exchange
Options on shares, classic-styled
USD
USD VISA INC PUT 95.00000 18.08.17 -260.00 -4 420.00 0.00USD CME GROUP INC PUT 120.00000 18.08.17 -205.00 -18 450.00 0.00Total USD -22 870.00 0.00
Total Options on shares, classic-styled -22 870.00 0.00
Total Derivative instruments listed on an official stock exchange -22 870.00 0.00
Total investments in securities 1 208 076 902.28 98.89
Cash at banks, deposits on demand and deposit accounts and other liquid assets 8 455 917.23 0.69Other assets and liabilities 5 063 094.01 0.42
Total net assets 1 221 595 913.52 100.00
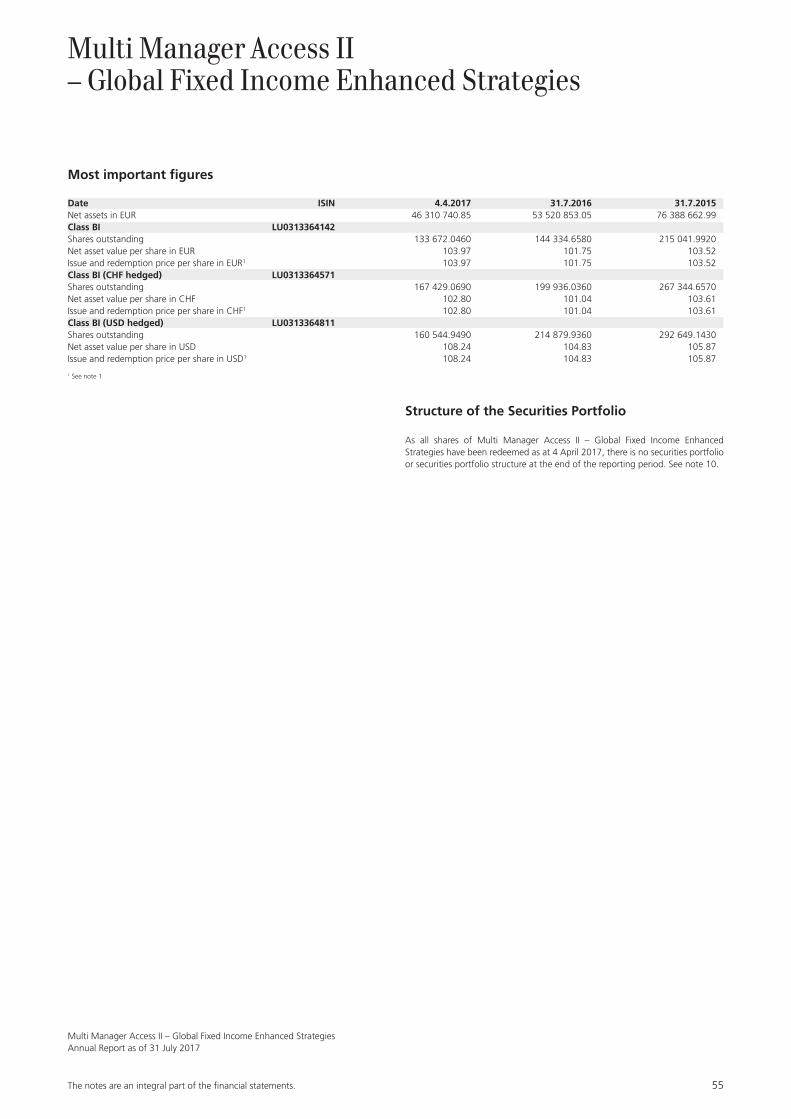
The notes are an integral part of the fi nancial statements. 55
Multi Manager Access II – Global Fixed Income Enhanced StrategiesAnnual Report as of 31 July 2017
Most important figures
Date ISIN 4.4.2017 31.7.2016 31.7.2015Net assets in EUR 46 310 740.85 53 520 853.05 76 388 662.99Class BI LU0313364142Shares outstanding 133 672.0460 144 334.6580 215 041.9920Net asset value per share in EUR 103.97 101.75 103.52Issue and redemption price per share in EUR1 103.97 101.75 103.52Class BI (CHF hedged) LU0313364571Shares outstanding 167 429.0690 199 936.0360 267 344.6570Net asset value per share in CHF 102.80 101.04 103.61Issue and redemption price per share in CHF1 102.80 101.04 103.61Class BI (USD hedged) LU0313364811Shares outstanding 160 544.9490 214 879.9360 292 649.1430Net asset value per share in USD 108.24 104.83 105.87Issue and redemption price per share in USD1 108.24 104.83 105.87
1 See note 1
Structure of the Securities Portfolio
As all shares of Multi Manager Access II – Global Fixed Income Enhanced Strategies have been redeemed as at 4 April 2017, there is no securities portfolio or securities portfolio structure at the end of the reporting period. See note 10.
Multi Manager Access II – Global Fixed Income Enhanced Strategies
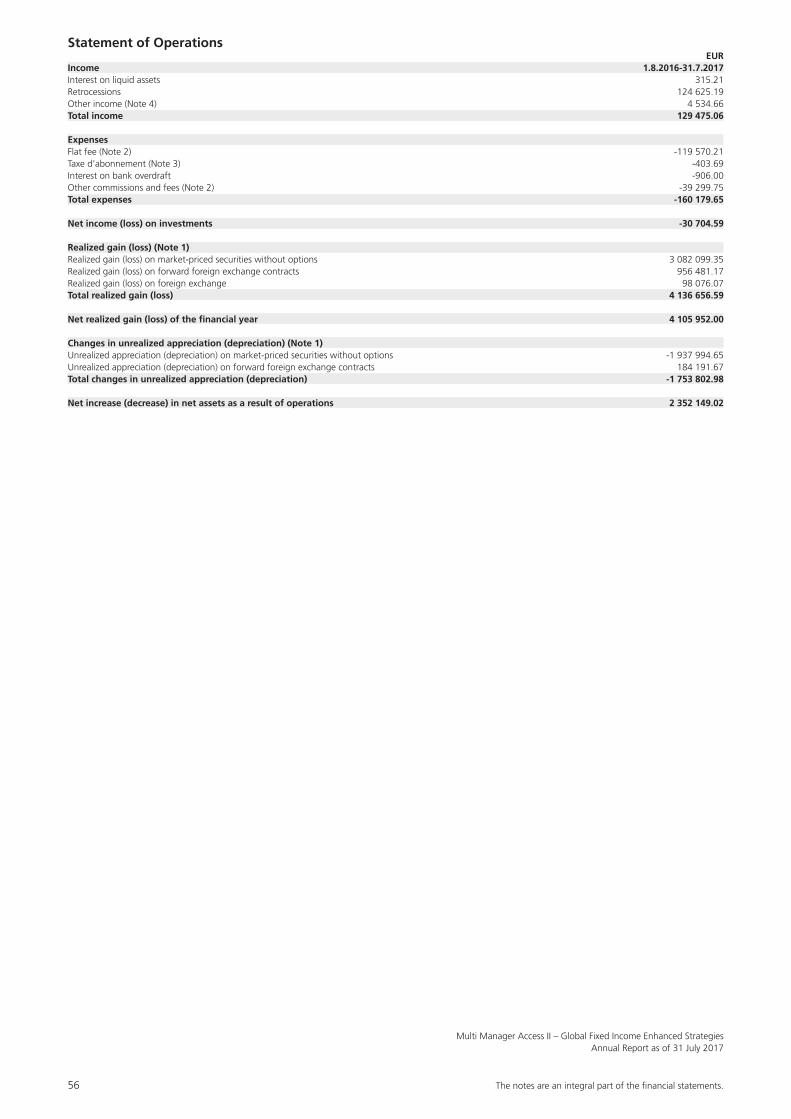
56 The notes are an integral part of the fi nancial statements.
Multi Manager Access II – Global Fixed Income Enhanced StrategiesAnnual Report as of 31 July 2017
Statement of Operations EURIncome 1.8.2016-31.7.2017Interest on liquid assets 315.21Retrocessions 124 625.19Other income (Note 4) 4 534.66Total income 129 475.06
ExpensesFlat fee (Note 2) -119 570.21Taxe d’abonnement (Note 3) -403.69Interest on bank overdraft -906.00Other commissions and fees (Note 2) -39 299.75Total expenses -160 179.65
Net income (loss) on investments -30 704.59
Realized gain (loss) (Note 1)Realized gain (loss) on market-priced securities without options 3 082 099.35Realized gain (loss) on forward foreign exchange contracts 956 481.17Realized gain (loss) on foreign exchange 98 076.07Total realized gain (loss) 4 136 656.59
Net realized gain (loss) of the financial year 4 105 952.00
Changes in unrealized appreciation (depreciation) (Note 1)Unrealized appreciation (depreciation) on market-priced securities without options -1 937 994.65Unrealized appreciation (depreciation) on forward foreign exchange contracts 184 191.67Total changes in unrealized appreciation (depreciation) -1 753 802.98
Net increase (decrease) in net assets as a result of operations 2 352 149.02
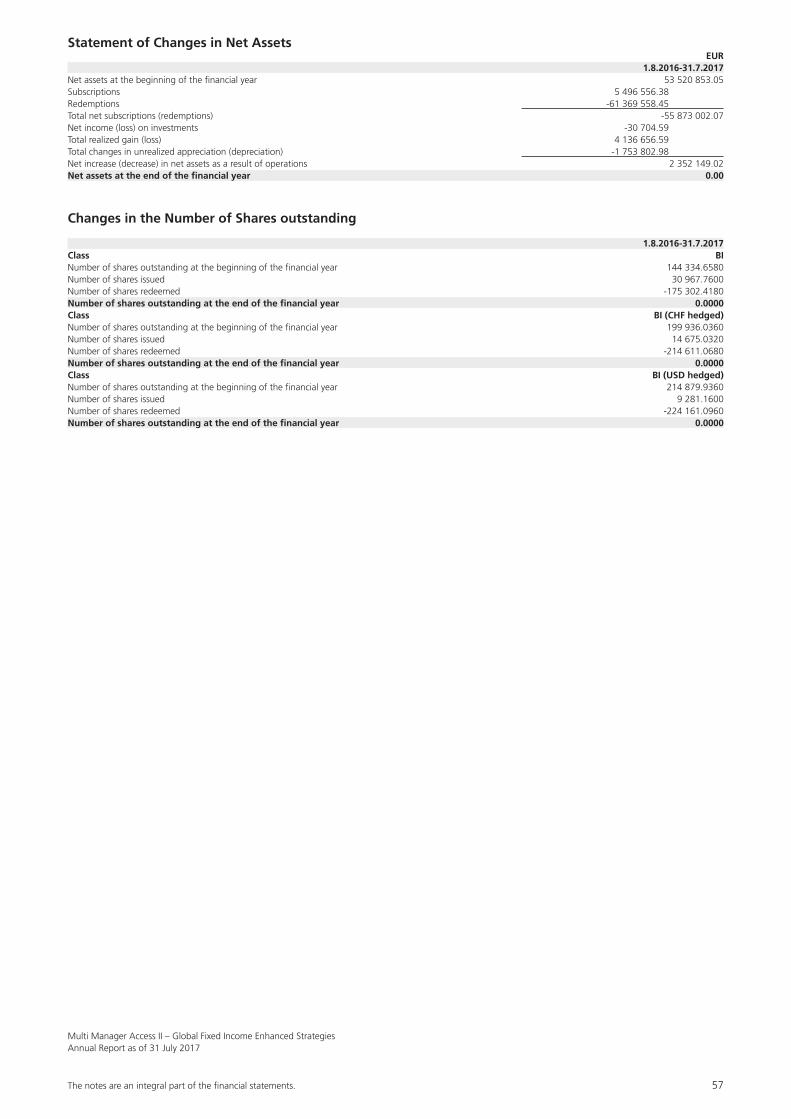
The notes are an integral part of the fi nancial statements. 57
Multi Manager Access II – Global Fixed Income Enhanced StrategiesAnnual Report as of 31 July 2017
Statement of Changes in Net Assets EUR 1.8.2016-31.7.2017Net assets at the beginning of the financial year 53 520 853.05Subscriptions 5 496 556.38Redemptions -61 369 558.45Total net subscriptions (redemptions) -55 873 002.07Net income (loss) on investments -30 704.59Total realized gain (loss) 4 136 656.59Total changes in unrealized appreciation (depreciation) -1 753 802.98Net increase (decrease) in net assets as a result of operations 2 352 149.02Net assets at the end of the financial year 0.00
Changes in the Number of Shares outstanding
1.8.2016-31.7.2017Class BINumber of shares outstanding at the beginning of the financial year 144 334.6580Number of shares issued 30 967.7600Number of shares redeemed -175 302.4180Number of shares outstanding at the end of the financial year 0.0000Class BI (CHF hedged)Number of shares outstanding at the beginning of the financial year 199 936.0360Number of shares issued 14 675.0320Number of shares redeemed -214 611.0680Number of shares outstanding at the end of the financial year 0.0000Class BI (USD hedged)Number of shares outstanding at the beginning of the financial year 214 879.9360Number of shares issued 9 281.1600Number of shares redeemed -224 161.0960Number of shares outstanding at the end of the financial year 0.0000
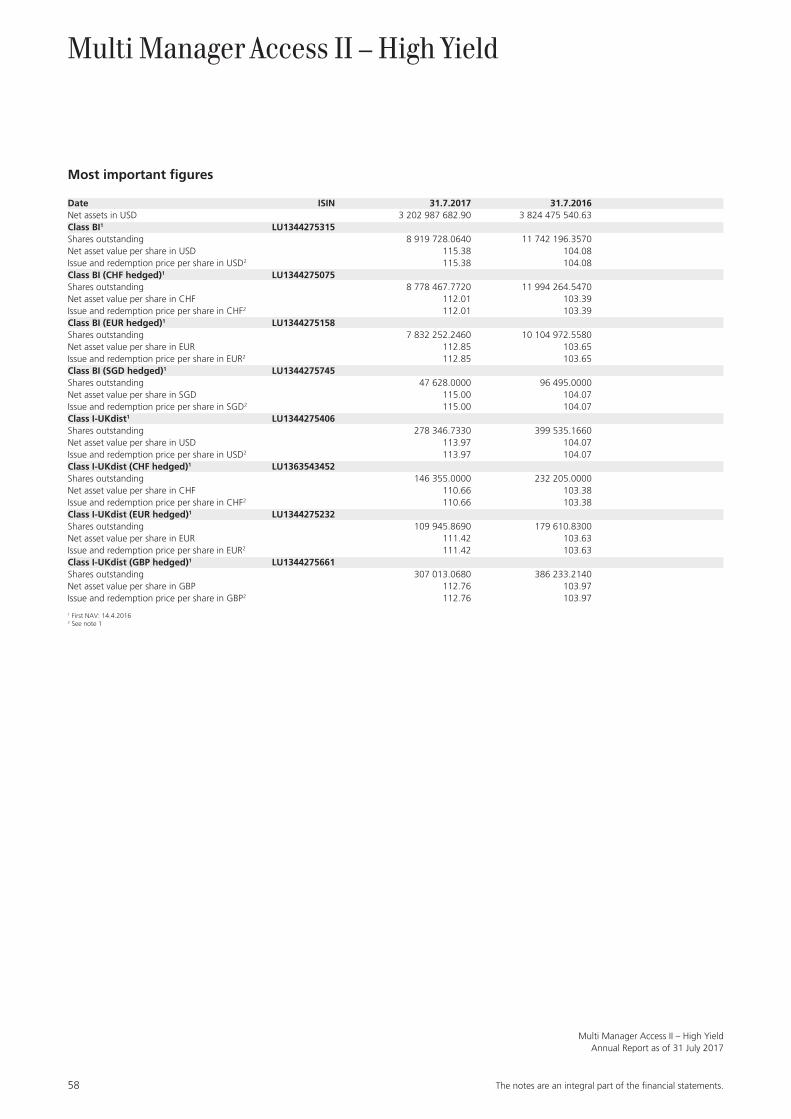
58 The notes are an integral part of the fi nancial statements.
Multi Manager Access II – High YieldAnnual Report as of 31 July 2017
Multi Manager Access II – High Yield
Most important figures
Date ISIN 31.7.2017 31.7.2016Net assets in USD 3 202 987 682.90 3 824 475 540.63Class BI1 LU1344275315Shares outstanding 8 919 728.0640 11 742 196.3570Net asset value per share in USD 115.38 104.08Issue and redemption price per share in USD2 115.38 104.08Class BI (CHF hedged)1 LU1344275075Shares outstanding 8 778 467.7720 11 994 264.5470Net asset value per share in CHF 112.01 103.39Issue and redemption price per share in CHF2 112.01 103.39Class BI (EUR hedged)1 LU1344275158Shares outstanding 7 832 252.2460 10 104 972.5580Net asset value per share in EUR 112.85 103.65Issue and redemption price per share in EUR2 112.85 103.65Class BI (SGD hedged)1 LU1344275745Shares outstanding 47 628.0000 96 495.0000Net asset value per share in SGD 115.00 104.07Issue and redemption price per share in SGD2 115.00 104.07Class I-UKdist1 LU1344275406Shares outstanding 278 346.7330 399 535.1660Net asset value per share in USD 113.97 104.07Issue and redemption price per share in USD2 113.97 104.07Class I-UKdist (CHF hedged)1 LU1363543452Shares outstanding 146 355.0000 232 205.0000Net asset value per share in CHF 110.66 103.38Issue and redemption price per share in CHF2 110.66 103.38Class I-UKdist (EUR hedged)1 LU1344275232Shares outstanding 109 945.8690 179 610.8300Net asset value per share in EUR 111.42 103.63Issue and redemption price per share in EUR2 111.42 103.63Class I-UKdist (GBP hedged)1 LU1344275661Shares outstanding 307 013.0680 386 233.2140Net asset value per share in GBP 112.76 103.97Issue and redemption price per share in GBP2 112.76 103.97
1 First NAV: 14.4.20162 See note 1
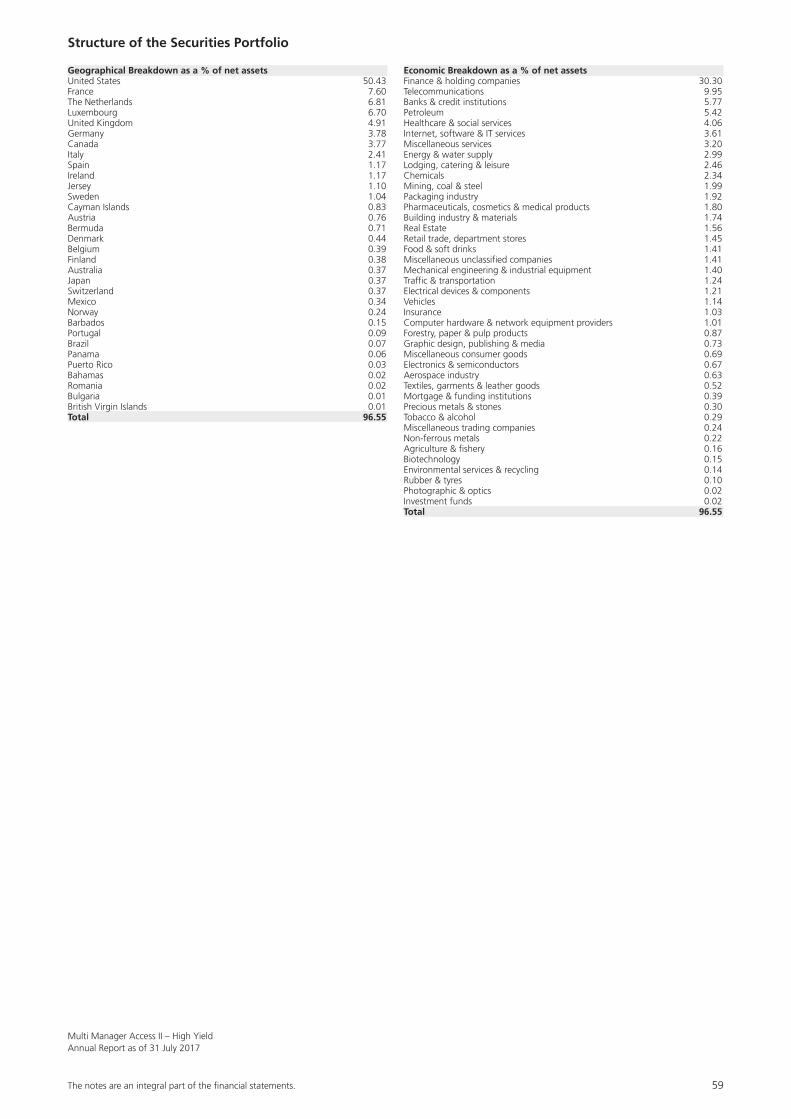
The notes are an integral part of the fi nancial statements. 59
Multi Manager Access II – High YieldAnnual Report as of 31 July 2017
Structure of the Securities Portfolio
Geographical Breakdown as a % of net assetsUnited States 50.43France 7.60The Netherlands 6.81Luxembourg 6.70United Kingdom 4.91Germany 3.78Canada 3.77Italy 2.41Spain 1.17Ireland 1.17Jersey 1.10Sweden 1.04Cayman Islands 0.83Austria 0.76Bermuda 0.71Denmark 0.44Belgium 0.39Finland 0.38Australia 0.37Japan 0.37Switzerland 0.37Mexico 0.34Norway 0.24Barbados 0.15Portugal 0.09Brazil 0.07Panama 0.06Puerto Rico 0.03Bahamas 0.02Romania 0.02Bulgaria 0.01British Virgin Islands 0.01Total 96.55
Economic Breakdown as a % of net assetsFinance & holding companies 30.30Telecommunications 9.95Banks & credit institutions 5.77Petroleum 5.42Healthcare & social services 4.06Internet, software & IT services 3.61Miscellaneous services 3.20Energy & water supply 2.99Lodging, catering & leisure 2.46Chemicals 2.34Mining, coal & steel 1.99Packaging industry 1.92Pharmaceuticals, cosmetics & medical products 1.80Building industry & materials 1.74Real Estate 1.56Retail trade, department stores 1.45Food & soft drinks 1.41Miscellaneous unclassified companies 1.41Mechanical engineering & industrial equipment 1.40Traffic & transportation 1.24Electrical devices & components 1.21Vehicles 1.14Insurance 1.03Computer hardware & network equipment providers 1.01Forestry, paper & pulp products 0.87Graphic design, publishing & media 0.73Miscellaneous consumer goods 0.69Electronics & semiconductors 0.67Aerospace industry 0.63Textiles, garments & leather goods 0.52Mortgage & funding institutions 0.39Precious metals & stones 0.30Tobacco & alcohol 0.29Miscellaneous trading companies 0.24Non-ferrous metals 0.22Agriculture & fishery 0.16Biotechnology 0.15Environmental services & recycling 0.14Rubber & tyres 0.10Photographic & optics 0.02Investment funds 0.02Total 96.55
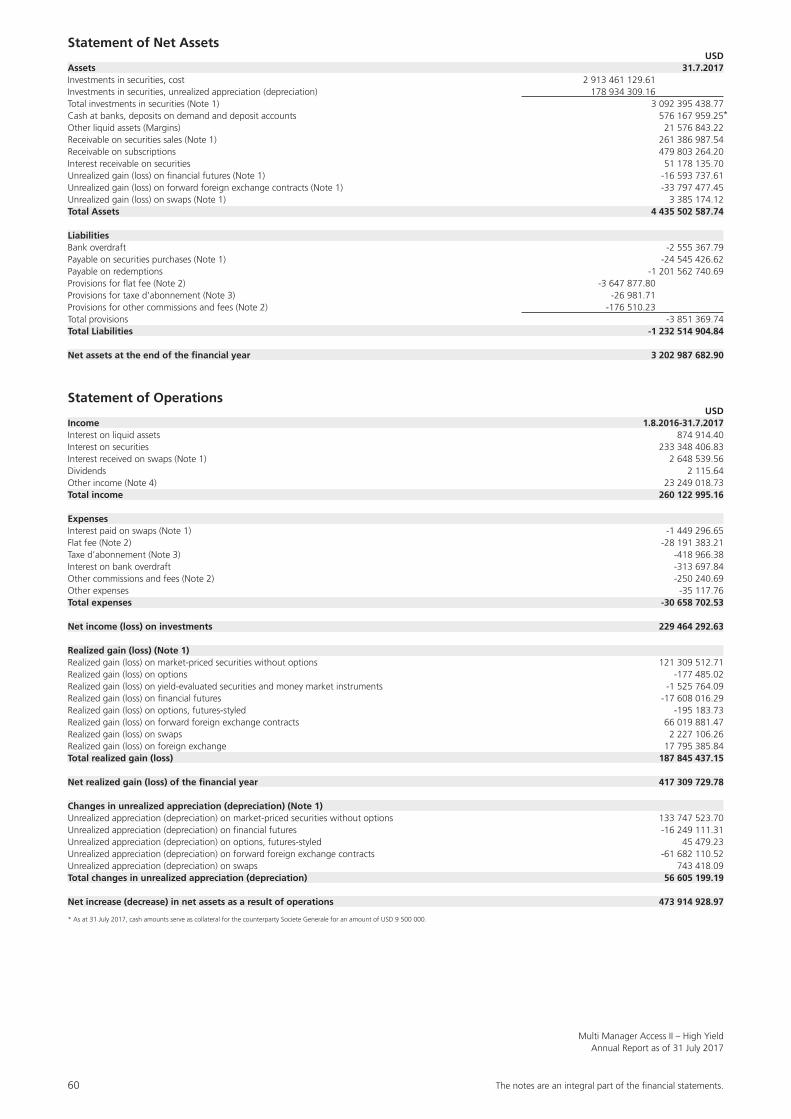
60 The notes are an integral part of the fi nancial statements.
Multi Manager Access II – High YieldAnnual Report as of 31 July 2017
Statement of Net Assets USDAssets 31.7.2017Investments in securities, cost 2 913 461 129.61Investments in securities, unrealized appreciation (depreciation) 178 934 309.16Total investments in securities (Note 1) 3 092 395 438.77Cash at banks, deposits on demand and deposit accounts 576 167 959.25Other liquid assets (Margins) 21 576 843.22Receivable on securities sales (Note 1) 261 386 987.54Receivable on subscriptions 479 803 264.20Interest receivable on securities 51 178 135.70Unrealized gain (loss) on financial futures (Note 1) -16 593 737.61Unrealized gain (loss) on forward foreign exchange contracts (Note 1) -33 797 477.45Unrealized gain (loss) on swaps (Note 1) 3 385 174.12Total Assets 4 435 502 587.74
LiabilitiesBank overdraft -2 555 367.79Payable on securities purchases (Note 1) -24 545 426.62Payable on redemptions -1 201 562 740.69Provisions for flat fee (Note 2) -3 647 877.80Provisions for taxe d’abonnement (Note 3) -26 981.71Provisions for other commissions and fees (Note 2) -176 510.23Total provisions -3 851 369.74Total Liabilities -1 232 514 904.84
Net assets at the end of the financial year 3 202 987 682.90
Statement of Operations USDIncome 1.8.2016-31.7.2017Interest on liquid assets 874 914.40Interest on securities 233 348 406.83Interest received on swaps (Note 1) 2 648 539.56Dividends 2 115.64Other income (Note 4) 23 249 018.73Total income 260 122 995.16
ExpensesInterest paid on swaps (Note 1) -1 449 296.65Flat fee (Note 2) -28 191 383.21Taxe d’abonnement (Note 3) -418 966.38Interest on bank overdraft -313 697.84Other commissions and fees (Note 2) -250 240.69Other expenses -35 117.76Total expenses -30 658 702.53
Net income (loss) on investments 229 464 292.63
Realized gain (loss) (Note 1)Realized gain (loss) on market-priced securities without options 121 309 512.71Realized gain (loss) on options -177 485.02Realized gain (loss) on yield-evaluated securities and money market instruments -1 525 764.09Realized gain (loss) on financial futures -17 608 016.29Realized gain (loss) on options, futures-styled -195 183.73Realized gain (loss) on forward foreign exchange contracts 66 019 881.47Realized gain (loss) on swaps 2 227 106.26Realized gain (loss) on foreign exchange 17 795 385.84Total realized gain (loss) 187 845 437.15
Net realized gain (loss) of the financial year 417 309 729.78
Changes in unrealized appreciation (depreciation) (Note 1)Unrealized appreciation (depreciation) on market-priced securities without options 133 747 523.70Unrealized appreciation (depreciation) on financial futures -16 249 111.31Unrealized appreciation (depreciation) on options, futures-styled 45 479.23Unrealized appreciation (depreciation) on forward foreign exchange contracts -61 682 110.52Unrealized appreciation (depreciation) on swaps 743 418.09Total changes in unrealized appreciation (depreciation) 56 605 199.19
Net increase (decrease) in net assets as a result of operations 473 914 928.97
* As at 31 July 2017, cash amounts serve as collateral for the counterparty Societe Generale for an amount of USD 9 500 000.
*
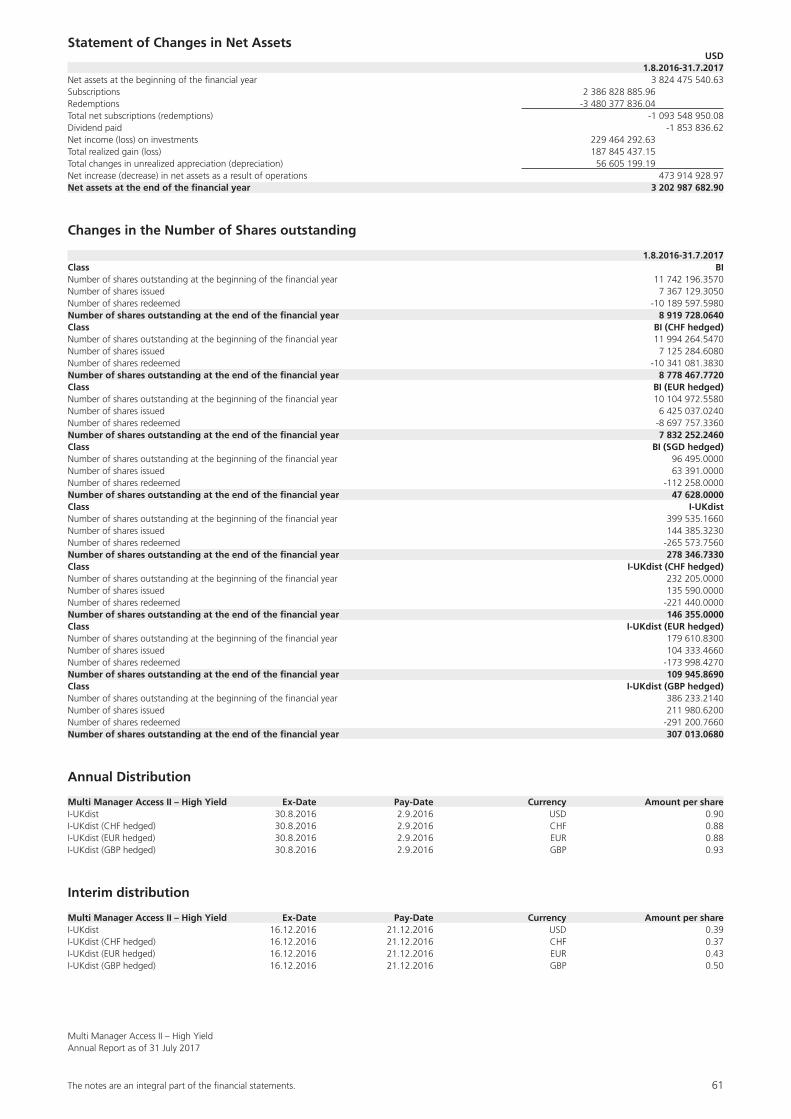
The notes are an integral part of the fi nancial statements. 61
Multi Manager Access II – High YieldAnnual Report as of 31 July 2017
Statement of Changes in Net Assets USD 1.8.2016-31.7.2017Net assets at the beginning of the financial year 3 824 475 540.63Subscriptions 2 386 828 885.96Redemptions -3 480 377 836.04Total net subscriptions (redemptions) -1 093 548 950.08Dividend paid -1 853 836.62Net income (loss) on investments 229 464 292.63Total realized gain (loss) 187 845 437.15Total changes in unrealized appreciation (depreciation) 56 605 199.19Net increase (decrease) in net assets as a result of operations 473 914 928.97Net assets at the end of the financial year 3 202 987 682.90
Changes in the Number of Shares outstanding
1.8.2016-31.7.2017Class BINumber of shares outstanding at the beginning of the financial year 11 742 196.3570Number of shares issued 7 367 129.3050Number of shares redeemed -10 189 597.5980Number of shares outstanding at the end of the financial year 8 919 728.0640Class BI (CHF hedged)Number of shares outstanding at the beginning of the financial year 11 994 264.5470Number of shares issued 7 125 284.6080Number of shares redeemed -10 341 081.3830Number of shares outstanding at the end of the financial year 8 778 467.7720Class BI (EUR hedged)Number of shares outstanding at the beginning of the financial year 10 104 972.5580Number of shares issued 6 425 037.0240Number of shares redeemed -8 697 757.3360Number of shares outstanding at the end of the financial year 7 832 252.2460Class BI (SGD hedged)Number of shares outstanding at the beginning of the financial year 96 495.0000Number of shares issued 63 391.0000Number of shares redeemed -112 258.0000Number of shares outstanding at the end of the financial year 47 628.0000Class I-UKdistNumber of shares outstanding at the beginning of the financial year 399 535.1660Number of shares issued 144 385.3230Number of shares redeemed -265 573.7560Number of shares outstanding at the end of the financial year 278 346.7330Class I-UKdist (CHF hedged)Number of shares outstanding at the beginning of the financial year 232 205.0000Number of shares issued 135 590.0000Number of shares redeemed -221 440.0000Number of shares outstanding at the end of the financial year 146 355.0000Class I-UKdist (EUR hedged)Number of shares outstanding at the beginning of the financial year 179 610.8300Number of shares issued 104 333.4660Number of shares redeemed -173 998.4270Number of shares outstanding at the end of the financial year 109 945.8690Class I-UKdist (GBP hedged)Number of shares outstanding at the beginning of the financial year 386 233.2140Number of shares issued 211 980.6200Number of shares redeemed -291 200.7660Number of shares outstanding at the end of the financial year 307 013.0680
Annual Distribution
Multi Manager Access II – High Yield Ex-Date Pay-Date Currency Amount per shareI-UKdist 30.8.2016 2.9.2016 USD 0.90I-UKdist (CHF hedged) 30.8.2016 2.9.2016 CHF 0.88I-UKdist (EUR hedged) 30.8.2016 2.9.2016 EUR 0.88I-UKdist (GBP hedged) 30.8.2016 2.9.2016 GBP 0.93
Interim distribution
Multi Manager Access II – High Yield Ex-Date Pay-Date Currency Amount per shareI-UKdist 16.12.2016 21.12.2016 USD 0.39I-UKdist (CHF hedged) 16.12.2016 21.12.2016 CHF 0.37I-UKdist (EUR hedged) 16.12.2016 21.12.2016 EUR 0.43I-UKdist (GBP hedged) 16.12.2016 21.12.2016 GBP 0.50
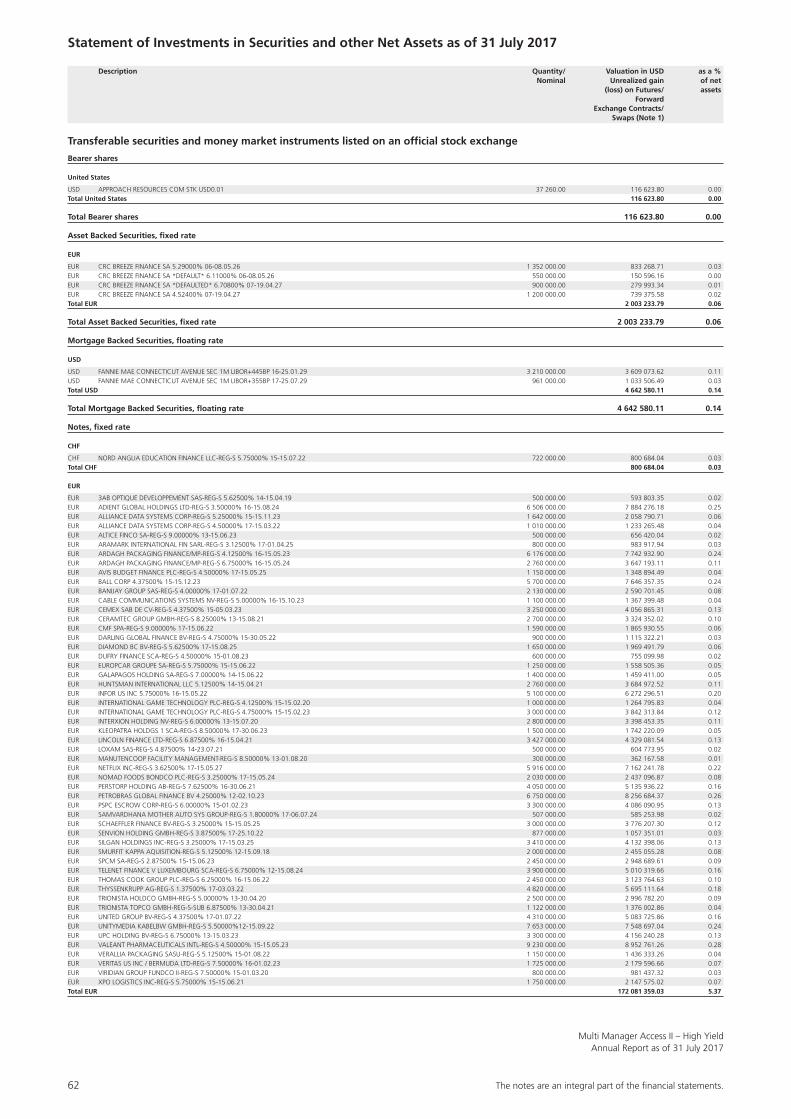
62 The notes are an integral part of the fi nancial statements.
Multi Manager Access II – High YieldAnnual Report as of 31 July 2017
Statement of Investments in Securities and other Net Assets as of 31 July 2017
Description Quantity/ Valuation in USD as a % Nominal Unrealized gain of net (loss) on Futures/ assets Forward Exchange Contracts/ Swaps (Note 1)
Transferable securities and money market instruments listed on an official stock exchange
Bearer shares
United States
USD APPROACH RESOURCES COM STK USD0.01 37 260.00 116 623.80 0.00Total United States 116 623.80 0.00
Total Bearer shares 116 623.80 0.00
Asset Backed Securities, fixed rate
EUR
EUR CRC BREEZE FINANCE SA 5.29000% 06-08.05.26 1 352 000.00 833 268.71 0.03EUR CRC BREEZE FINANCE SA *DEFAULT* 6.11000% 06-08.05.26 550 000.00 150 596.16 0.00EUR CRC BREEZE FINANCE SA *DEFAULTED* 6.70800% 07-19.04.27 900 000.00 279 993.34 0.01EUR CRC BREEZE FINANCE SA 4.52400% 07-19.04.27 1 200 000.00 739 375.58 0.02Total EUR 2 003 233.79 0.06
Total Asset Backed Securities, fixed rate 2 003 233.79 0.06
Mortgage Backed Securities, floating rate
USD
USD FANNIE MAE CONNECTICUT AVENUE SEC 1M LIBOR+445BP 16-25.01.29 3 210 000.00 3 609 073.62 0.11USD FANNIE MAE CONNECTICUT AVENUE SEC 1M LIBOR+355BP 17-25.07.29 961 000.00 1 033 506.49 0.03Total USD 4 642 580.11 0.14
Total Mortgage Backed Securities, floating rate 4 642 580.11 0.14
Notes, fixed rate
CHF
CHF NORD ANGLIA EDUCATION FINANCE LLC-REG-S 5.75000% 15-15.07.22 722 000.00 800 684.04 0.03Total CHF 800 684.04 0.03
EUR
EUR 3AB OPTIQUE DEVELOPPEMENT SAS-REG-S 5.62500% 14-15.04.19 500 000.00 593 803.35 0.02EUR ADIENT GLOBAL HOLDINGS LTD-REG-S 3.50000% 16-15.08.24 6 506 000.00 7 884 276.18 0.25EUR ALLIANCE DATA SYSTEMS CORP-REG-S 5.25000% 15-15.11.23 1 642 000.00 2 058 790.71 0.06EUR ALLIANCE DATA SYSTEMS CORP-REG-S 4.50000% 17-15.03.22 1 010 000.00 1 233 265.48 0.04EUR ALTICE FINCO SA-REG-S 9.00000% 13-15.06.23 500 000.00 656 420.04 0.02EUR ARAMARK INTERNATIONAL FIN SARL-REG-S 3.12500% 17-01.04.25 800 000.00 983 917.94 0.03EUR ARDAGH PACKAGING FINANCE/MP-REG-S 4.12500% 16-15.05.23 6 176 000.00 7 742 932.90 0.24EUR ARDAGH PACKAGING FINANCE/MP-REG-S 6.75000% 16-15.05.24 2 760 000.00 3 647 193.11 0.11EUR AVIS BUDGET FINANCE PLC-REG-S 4.50000% 17-15.05.25 1 150 000.00 1 348 894.49 0.04EUR BALL CORP 4.37500% 15-15.12.23 5 700 000.00 7 646 357.35 0.24EUR BANIJAY GROUP SAS-REG-S 4.00000% 17-01.07.22 2 130 000.00 2 590 701.45 0.08EUR CABLE COMMUNICATIONS SYSTEMS NV-REG-S 5.00000% 16-15.10.23 1 100 000.00 1 367 399.48 0.04EUR CEMEX SAB DE CV-REG-S 4.37500% 15-05.03.23 3 250 000.00 4 056 865.31 0.13EUR CERAMTEC GROUP GMBH-REG-S 8.25000% 13-15.08.21 2 700 000.00 3 324 352.02 0.10EUR CMF SPA-REG-S 9.00000% 17-15.06.22 1 590 000.00 1 865 930.55 0.06EUR DARLING GLOBAL FINANCE BV-REG-S 4.75000% 15-30.05.22 900 000.00 1 115 322.21 0.03EUR DIAMOND BC BV-REG-S 5.62500% 17-15.08.25 1 650 000.00 1 969 491.79 0.06EUR DUFRY FINANCE SCA-REG-S 4.50000% 15-01.08.23 600 000.00 755 099.98 0.02EUR EUROPCAR GROUPE SA-REG-S 5.75000% 15-15.06.22 1 250 000.00 1 558 505.36 0.05EUR GALAPAGOS HOLDING SA-REG-S 7.00000% 14-15.06.22 1 400 000.00 1 459 411.00 0.05EUR HUNTSMAN INTERNATIONAL LLC 5.12500% 14-15.04.21 2 760 000.00 3 684 972.52 0.11EUR INFOR US INC 5.75000% 16-15.05.22 5 100 000.00 6 272 296.51 0.20EUR INTERNATIONAL GAME TECHNOLOGY PLC-REG-S 4.12500% 15-15.02.20 1 000 000.00 1 264 795.83 0.04EUR INTERNATIONAL GAME TECHNOLOGY PLC-REG-S 4.75000% 15-15.02.23 3 000 000.00 3 842 313.84 0.12EUR INTERXION HOLDING NV-REG-S 6.00000% 13-15.07.20 2 800 000.00 3 398 453.35 0.11EUR KLEOPATRA HOLDGS 1 SCA-REG-S 8.50000% 17-30.06.23 1 500 000.00 1 742 220.09 0.05EUR LINCOLN FINANCE LTD-REG-S 6.87500% 16-15.04.21 3 427 000.00 4 329 081.54 0.13EUR LOXAM SAS-REG-S 4.87500% 14-23.07.21 500 000.00 604 773.95 0.02EUR MANUTENCOOP FACILITY MANAGEMENT-REG-S 8.50000% 13-01.08.20 300 000.00 362 167.58 0.01EUR NETFLIX INC-REG-S 3.62500% 17-15.05.27 5 916 000.00 7 162 241.78 0.22EUR NOMAD FOODS BONDCO PLC-REG-S 3.25000% 17-15.05.24 2 030 000.00 2 437 096.87 0.08EUR PERSTORP HOLDING AB-REG-S 7.62500% 16-30.06.21 4 050 000.00 5 135 936.22 0.16EUR PETROBRAS GLOBAL FINANCE BV 4.25000% 12-02.10.23 6 750 000.00 8 256 684.37 0.26EUR PSPC ESCROW CORP-REG-S 6.00000% 15-01.02.23 3 300 000.00 4 086 090.95 0.13EUR SAMVARDHANA MOTHER AUTO SYS GROUP-REG-S 1.80000% 17-06.07.24 507 000.00 585 253.98 0.02EUR SCHAEFFLER FINANCE BV-REG-S 3.25000% 15-15.05.25 3 000 000.00 3 776 207.30 0.12EUR SENVION HOLDING GMBH-REG-S 3.87500% 17-25.10.22 877 000.00 1 057 351.01 0.03EUR SILGAN HOLDINGS INC-REG-S 3.25000% 17-15.03.25 3 410 000.00 4 132 398.06 0.13EUR SMURFIT KAPPA AQUISITION-REG-S 5.12500% 12-15.09.18 2 000 000.00 2 455 055.28 0.08EUR SPCM SA-REG-S 2.87500% 15-15.06.23 2 450 000.00 2 948 689.61 0.09EUR TELENET FINANCE V LUXEMBOURG SCA-REG-S 6.75000% 12-15.08.24 3 900 000.00 5 010 319.66 0.16EUR THOMAS COOK GROUP PLC-REG-S 6.25000% 16-15.06.22 2 450 000.00 3 123 764.63 0.10EUR THYSSENKRUPP AG-REG-S 1.37500% 17-03.03.22 4 820 000.00 5 695 111.64 0.18EUR TRIONISTA HOLDCO GMBH-REG-S 5.00000% 13-30.04.20 2 500 000.00 2 996 782.20 0.09EUR TRIONISTA TOPCO GMBH-REG-S-SUB 6.87500% 13-30.04.21 1 122 000.00 1 376 002.86 0.04EUR UNITED GROUP BV-REG-S 4.37500% 17-01.07.22 4 310 000.00 5 083 725.86 0.16EUR UNITYMEDIA KABELBW GMBH-REG-S 5.50000%12-15.09.22 7 653 000.00 7 548 697.04 0.24EUR UPC HOLDING BV-REG-S 6.75000% 13-15.03.23 3 300 000.00 4 156 240.28 0.13EUR VALEANT PHARMACEUTICALS INTL-REG-S 4.50000% 15-15.05.23 9 230 000.00 8 952 761.26 0.28EUR VERALLIA PACKAGING SASU-REG-S 5.12500% 15-01.08.22 1 150 000.00 1 436 333.26 0.04EUR VERITAS US INC / BERMUDA LTD-REG-S 7.50000% 16-01.02.23 1 725 000.00 2 179 596.66 0.07EUR VIRIDIAN GROUP FUNDCO II-REG-S 7.50000% 15-01.03.20 800 000.00 981 437.32 0.03EUR XPO LOGISTICS INC-REG-S 5.75000% 15-15.06.21 1 750 000.00 2 147 575.02 0.07Total EUR 172 081 359.03 5.37
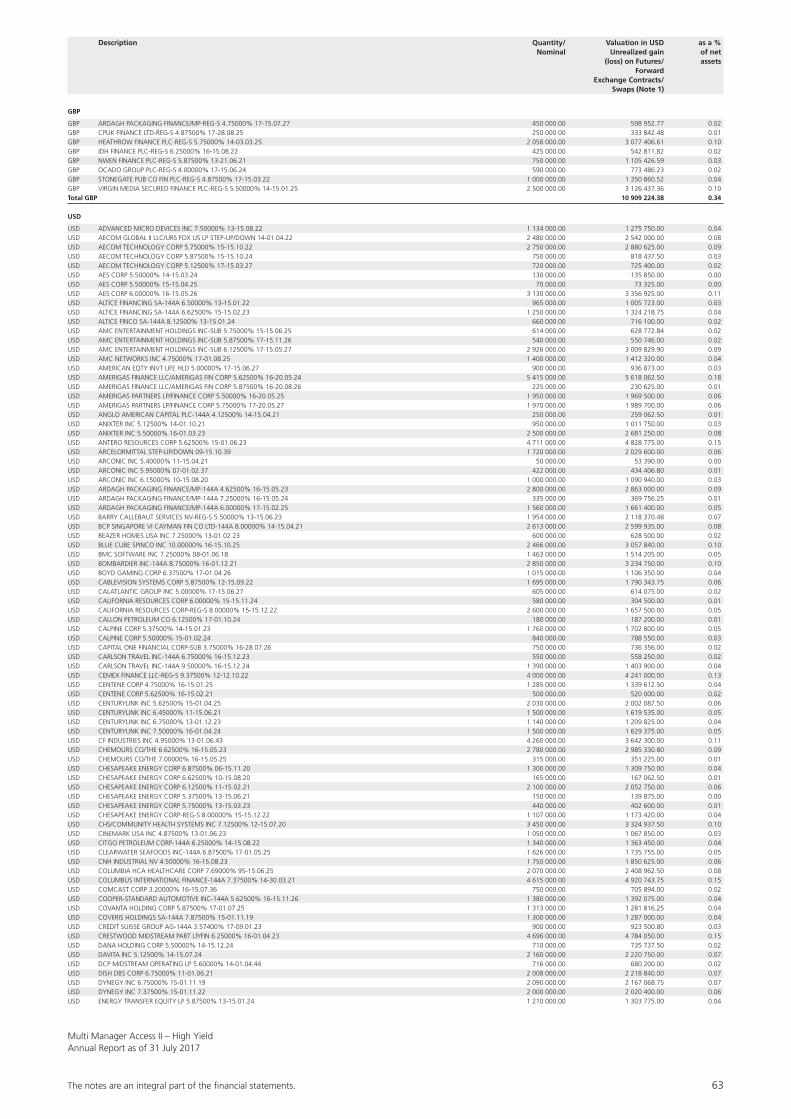
The notes are an integral part of the fi nancial statements. 63
Multi Manager Access II – High YieldAnnual Report as of 31 July 2017
GBP
GBP ARDAGH PACKAGING FINANCE/MP-REG-S 4.75000% 17-15.07.27 450 000.00 598 952.77 0.02GBP CPUK FINANCE LTD-REG-S 4.87500% 17-28.08.25 250 000.00 333 842.48 0.01GBP HEATHROW FINANCE PLC-REG-S 5.75000% 14-03.03.25 2 058 000.00 3 077 406.61 0.10GBP IDH FINANCE PLC-REG-S 6.25000% 16-15.08.22 425 000.00 542 811.82 0.02GBP NWEN FINANCE PLC-REG-S 5.87500% 13-21.06.21 750 000.00 1 105 426.59 0.03GBP OCADO GROUP PLC-REG-S 4.00000% 17-15.06.24 590 000.00 773 486.23 0.02GBP STONEGATE PUB CO FIN PLC-REG-S 4.87500% 17-15.03.22 1 000 000.00 1 350 860.52 0.04GBP VIRGIN MEDIA SECURED FINANCE PLC-REG-S 5.50000% 14-15.01.25 2 500 000.00 3 126 437.36 0.10Total GBP 10 909 224.38 0.34
USD
USD ADVANCED MICRO DEVICES INC 7.50000% 13-15.08.22 1 134 000.00 1 275 750.00 0.04USD AECOM GLOBAL II LLC/URS FOX US LP STEP-UP/DOWN 14-01.04.22 2 480 000.00 2 542 000.00 0.08USD AECOM TECHNOLOGY CORP 5.75000% 15-15.10.22 2 750 000.00 2 880 625.00 0.09USD AECOM TECHNOLOGY CORP 5.87500% 15-15.10.24 750 000.00 818 437.50 0.03USD AECOM TECHNOLOGY CORP 5.12500% 17-15.03.27 720 000.00 725 400.00 0.02USD AES CORP 5.50000% 14-15.03.24 130 000.00 135 850.00 0.00USD AES CORP 5.50000% 15-15.04.25 70 000.00 73 325.00 0.00USD AES CORP 6.00000% 16-15.05.26 3 130 000.00 3 356 925.00 0.11USD ALTICE FINANCING SA-144A 6.50000% 13-15.01.22 965 000.00 1 005 723.00 0.03USD ALTICE FINANCING SA-144A 6.62500% 15-15.02.23 1 250 000.00 1 324 218.75 0.04USD ALTICE FINCO SA-144A 8.12500% 13-15.01.24 660 000.00 716 100.00 0.02USD AMC ENTERTAINMENT HOLDINGS INC-SUB 5.75000% 15-15.06.25 614 000.00 628 772.84 0.02USD AMC ENTERTAINMENT HOLDINGS INC-SUB 5.87500% 17-15.11.26 540 000.00 550 746.00 0.02USD AMC ENTERTAINMENT HOLDINGS INC-SUB 6.12500% 17-15.05.27 2 926 000.00 3 009 829.90 0.09USD AMC NETWORKS INC 4.75000% 17-01.08.25 1 400 000.00 1 412 320.00 0.04USD AMERICAN EQTY INVT LIFE HLD 5.00000% 17-15.06.27 900 000.00 936 873.00 0.03USD AMERIGAS FINANCE LLC/AMERIGAS FIN CORP 5.62500% 16-20.05.24 5 415 000.00 5 618 062.50 0.18USD AMERIGAS FINANCE LLC/AMERIGAS FIN CORP 5.87500% 16-20.08.26 225 000.00 230 625.00 0.01USD AMERIGAS PARTNERS LP/FINANCE CORP 5.50000% 16-20.05.25 1 950 000.00 1 969 500.00 0.06USD AMERIGAS PARTNERS LP/FINANCE CORP 5.75000% 17-20.05.27 1 970 000.00 1 989 700.00 0.06USD ANGLO AMERICAN CAPITAL PLC-144A 4.12500% 14-15.04.21 250 000.00 259 062.50 0.01USD ANIXTER INC 5.12500% 14-01.10.21 950 000.00 1 011 750.00 0.03USD ANIXTER INC 5.50000% 16-01.03.23 2 500 000.00 2 681 250.00 0.08USD ANTERO RESOURCES CORP 5.62500% 15-01.06.23 4 711 000.00 4 828 775.00 0.15USD ARCELORMITTAL STEP-UP/DOWN 09-15.10.39 1 720 000.00 2 029 600.00 0.06USD ARCONIC INC 5.40000% 11-15.04.21 50 000.00 53 390.00 0.00USD ARCONIC INC 5.95000% 07-01.02.37 422 000.00 434 406.80 0.01USD ARCONIC INC 6.15000% 10-15.08.20 1 000 000.00 1 090 940.00 0.03USD ARDAGH PACKAGING FINANCE/MP-144A 4.62500% 16-15.05.23 2 800 000.00 2 863 000.00 0.09USD ARDAGH PACKAGING FINANCE/MP-144A 7.25000% 16-15.05.24 335 000.00 369 756.25 0.01USD ARDAGH PACKAGING FINANCE/MP-144A 6.00000% 17-15.02.25 1 560 000.00 1 661 400.00 0.05USD BARRY CALLEBAUT SERVICES NV-REG-S 5.50000% 13-15.06.23 1 954 000.00 2 118 370.48 0.07USD BCP SINGAPORE VI CAYMAN FIN CO LTD-144A 8.00000% 14-15.04.21 2 613 000.00 2 599 935.00 0.08USD BEAZER HOMES USA INC 7.25000% 13-01.02.23 600 000.00 628 500.00 0.02USD BLUE CUBE SPINCO INC 10.00000% 16-15.10.25 2 466 000.00 3 057 840.00 0.10USD BMC SOFTWARE INC 7.25000% 08-01.06.18 1 463 000.00 1 514 205.00 0.05USD BOMBARDIER INC-144A 8.75000% 16-01.12.21 2 850 000.00 3 234 750.00 0.10USD BOYD GAMING CORP 6.37500% 17-01.04.26 1 015 000.00 1 106 350.00 0.04USD CABLEVISION SYSTEMS CORP 5.87500% 12-15.09.22 1 695 000.00 1 790 343.75 0.06USD CALATLANTIC GROUP INC 5.00000% 17-15.06.27 605 000.00 614 075.00 0.02USD CALIFORNIA RESOURCES CORP 6.00000% 15-15.11.24 580 000.00 304 500.00 0.01USD CALIFORNIA RESOURCES CORP-REG-S 8.00000% 15-15.12.22 2 600 000.00 1 657 500.00 0.05USD CALLON PETROLEUM CO 6.12500% 17-01.10.24 180 000.00 187 200.00 0.01USD CALPINE CORP 5.37500% 14-15.01.23 1 760 000.00 1 702 800.00 0.05USD CALPINE CORP 5.50000% 15-01.02.24 840 000.00 788 550.00 0.03USD CAPITAL ONE FINANCIAL CORP-SUB 3.75000% 16-28.07.26 750 000.00 736 356.00 0.02USD CARLSON TRAVEL INC-144A 6.75000% 16-15.12.23 550 000.00 558 250.00 0.02USD CARLSON TRAVEL INC-144A 9.50000% 16-15.12.24 1 390 000.00 1 403 900.00 0.04USD CEMEX FINANCE LLC-REG-S 9.37500% 12-12.10.22 4 000 000.00 4 241 000.00 0.13USD CENTENE CORP 4.75000% 16-15.01.25 1 285 000.00 1 339 612.50 0.04USD CENTENE CORP 5.62500% 16-15.02.21 500 000.00 520 000.00 0.02USD CENTURYLINK INC 5.62500% 15-01.04.25 2 030 000.00 2 002 087.50 0.06USD CENTURYLINK INC 6.45000% 11-15.06.21 1 500 000.00 1 619 535.00 0.05USD CENTURYLINK INC 6.75000% 13-01.12.23 1 140 000.00 1 209 825.00 0.04USD CENTURYLINK INC 7.50000% 16-01.04.24 1 500 000.00 1 629 375.00 0.05USD CF INDUSTRIES INC 4.95000% 13-01.06.43 4 260 000.00 3 642 300.00 0.11USD CHEMOURS CO/THE 6.62500% 16-15.05.23 2 780 000.00 2 985 330.80 0.09USD CHEMOURS CO/THE 7.00000% 16-15.05.25 315 000.00 351 225.00 0.01USD CHESAPEAKE ENERGY CORP 6.87500% 06-15.11.20 1 300 000.00 1 309 750.00 0.04USD CHESAPEAKE ENERGY CORP 6.62500% 10-15.08.20 165 000.00 167 062.50 0.01USD CHESAPEAKE ENERGY CORP 6.12500% 11-15.02.21 2 100 000.00 2 052 750.00 0.06USD CHESAPEAKE ENERGY CORP 5.37500% 13-15.06.21 150 000.00 139 875.00 0.00USD CHESAPEAKE ENERGY CORP 5.75000% 13-15.03.23 440 000.00 402 600.00 0.01USD CHESAPEAKE ENERGY CORP-REG-S 8.00000% 15-15.12.22 1 107 000.00 1 173 420.00 0.04USD CHS/COMMUNITY HEALTH SYSTEMS INC 7.12500% 12-15.07.20 3 450 000.00 3 324 937.50 0.10USD CINEMARK USA INC 4.87500% 13-01.06.23 1 050 000.00 1 067 850.00 0.03USD CITGO PETROLEUM CORP-144A 6.25000% 14-15.08.22 1 340 000.00 1 363 450.00 0.04USD CLEARWATER SEAFOODS INC-144A 6.87500% 17-01.05.25 1 626 000.00 1 735 755.00 0.05USD CNH INDUSTRIAL NV 4.50000% 16-15.08.23 1 750 000.00 1 850 625.00 0.06USD COLUMBIA HCA HEALTHCARE CORP 7.69000% 95-15.06.25 2 070 000.00 2 408 962.50 0.08USD COLUMBUS INTERNATIONAL FINANCE-144A 7.37500% 14-30.03.21 4 615 000.00 4 920 743.75 0.15USD COMCAST CORP 3.20000% 16-15.07.36 750 000.00 705 894.00 0.02USD COOPER-STANDARD AUTOMOTIVE INC-144A 5.62500% 16-15.11.26 1 380 000.00 1 392 075.00 0.04USD COVANTA HOLDING CORP 5.87500% 17-01.07.25 1 313 000.00 1 281 816.25 0.04USD COVERIS HOLDINGS SA-144A 7.87500% 15-01.11.19 1 300 000.00 1 287 000.00 0.04USD CREDIT SUISSE GROUP AG-144A 3.57400% 17-09.01.23 900 000.00 923 500.80 0.03USD CRESTWOOD MIDSTREAM PART LP/FIN 6.25000% 16-01.04.23 4 696 000.00 4 784 050.00 0.15USD DANA HOLDING CORP 5.50000% 14-15.12.24 710 000.00 735 737.50 0.02USD DAVITA INC 5.12500% 14-15.07.24 2 160 000.00 2 220 750.00 0.07USD DCP MIDSTREAM OPERATING LP 5.60000% 14-01.04.44 716 000.00 680 200.00 0.02USD DISH DBS CORP 6.75000% 11-01.06.21 2 008 000.00 2 218 840.00 0.07USD DYNEGY INC 6.75000% 15-01.11.19 2 090 000.00 2 167 068.75 0.07USD DYNEGY INC 7.37500% 15-01.11.22 2 000 000.00 2 020 400.00 0.06USD ENERGY TRANSFER EQUITY LP 5.87500% 13-15.01.24 1 210 000.00 1 303 775.00 0.04
Description Quantity/ Valuation in USD as a % Nominal Unrealized gain of net (loss) on Futures/ assets Forward Exchange Contracts/ Swaps (Note 1)
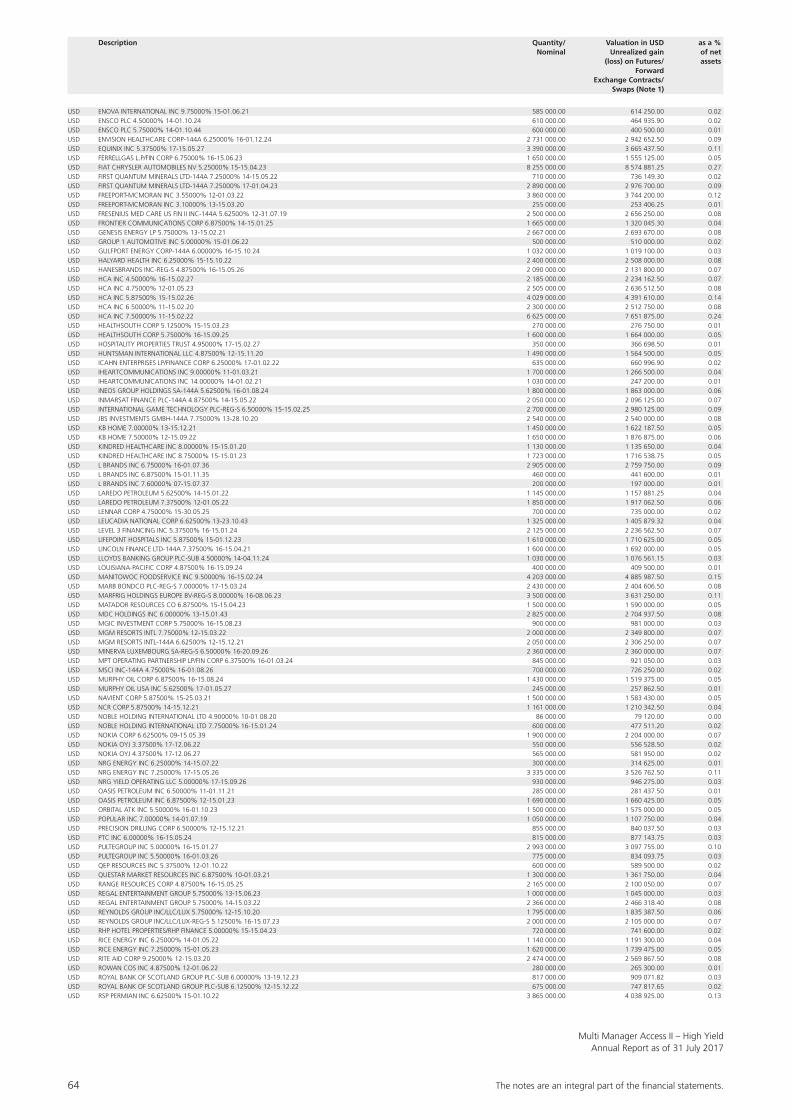
64 The notes are an integral part of the fi nancial statements.
Multi Manager Access II – High YieldAnnual Report as of 31 July 2017
Description Quantity/ Valuation in USD as a % Nominal Unrealized gain of net (loss) on Futures/ assets Forward Exchange Contracts/ Swaps (Note 1)
USD ENOVA INTERNATIONAL INC 9.75000% 15-01.06.21 585 000.00 614 250.00 0.02USD ENSCO PLC 4.50000% 14-01.10.24 610 000.00 464 935.90 0.02USD ENSCO PLC 5.75000% 14-01.10.44 600 000.00 400 500.00 0.01USD ENVISION HEALTHCARE CORP-144A 6.25000% 16-01.12.24 2 731 000.00 2 942 652.50 0.09USD EQUINIX INC 5.37500% 17-15.05.27 3 390 000.00 3 665 437.50 0.11USD FERRELLGAS L.P/FIN CORP 6.75000% 16-15.06.23 1 650 000.00 1 555 125.00 0.05USD FIAT CHRYSLER AUTOMOBILES NV 5.25000% 15-15.04.23 8 255 000.00 8 574 881.25 0.27USD FIRST QUANTUM MINERALS LTD-144A 7.25000% 14-15.05.22 710 000.00 736 149.30 0.02USD FIRST QUANTUM MINERALS LTD-144A 7.25000% 17-01.04.23 2 890 000.00 2 976 700.00 0.09USD FREEPORT-MCMORAN INC 3.55000% 12-01.03.22 3 860 000.00 3 744 200.00 0.12USD FREEPORT-MCMORAN INC 3.10000% 13-15.03.20 255 000.00 253 406.25 0.01USD FRESENIUS MED CARE US FIN II INC-144A 5.62500% 12-31.07.19 2 500 000.00 2 656 250.00 0.08USD FRONTIER COMMUNICATIONS CORP 6.87500% 14-15.01.25 1 665 000.00 1 320 045.30 0.04USD GENESIS ENERGY LP 5.75000% 13-15.02.21 2 667 000.00 2 693 670.00 0.08USD GROUP 1 AUTOMOTIVE INC 5.00000% 15-01.06.22 500 000.00 510 000.00 0.02USD GULFPORT ENERGY CORP-144A 6.00000% 16-15.10.24 1 032 000.00 1 019 100.00 0.03USD HALYARD HEALTH INC 6.25000% 15-15.10.22 2 400 000.00 2 508 000.00 0.08USD HANESBRANDS INC-REG-S 4.87500% 16-15.05.26 2 090 000.00 2 131 800.00 0.07USD HCA INC 4.50000% 16-15.02.27 2 185 000.00 2 234 162.50 0.07USD HCA INC 4.75000% 12-01.05.23 2 505 000.00 2 636 512.50 0.08USD HCA INC 5.87500% 15-15.02.26 4 029 000.00 4 391 610.00 0.14USD HCA INC 6.50000% 11-15.02.20 2 300 000.00 2 512 750.00 0.08USD HCA INC 7.50000% 11-15.02.22 6 625 000.00 7 651 875.00 0.24USD HEALTHSOUTH CORP 5.12500% 15-15.03.23 270 000.00 276 750.00 0.01USD HEALTHSOUTH CORP 5.75000% 16-15.09.25 1 600 000.00 1 664 000.00 0.05USD HOSPITALITY PROPERTIES TRUST 4.95000% 17-15.02.27 350 000.00 366 698.50 0.01USD HUNTSMAN INTERNATIONAL LLC 4.87500% 12-15.11.20 1 490 000.00 1 564 500.00 0.05USD ICAHN ENTERPRISES LP/FINANCE CORP 6.25000% 17-01.02.22 635 000.00 660 996.90 0.02USD IHEARTCOMMUNICATIONS INC 9.00000% 11-01.03.21 1 700 000.00 1 266 500.00 0.04USD IHEARTCOMMUNICATIONS INC 14.00000% 14-01.02.21 1 030 000.00 247 200.00 0.01USD INEOS GROUP HOLDINGS SA-144A 5.62500% 16-01.08.24 1 800 000.00 1 863 000.00 0.06USD INMARSAT FINANCE PLC-144A 4.87500% 14-15.05.22 2 050 000.00 2 096 125.00 0.07USD INTERNATIONAL GAME TECHNOLOGY PLC-REG-S 6.50000% 15-15.02.25 2 700 000.00 2 980 125.00 0.09USD JBS INVESTMENTS GMBH-144A 7.75000% 13-28.10.20 2 540 000.00 2 540 000.00 0.08USD KB HOME 7.00000% 13-15.12.21 1 450 000.00 1 622 187.50 0.05USD KB HOME 7.50000% 12-15.09.22 1 650 000.00 1 876 875.00 0.06USD KINDRED HEALTHCARE INC 8.00000% 15-15.01.20 1 130 000.00 1 135 650.00 0.04USD KINDRED HEALTHCARE INC 8.75000% 15-15.01.23 1 723 000.00 1 716 538.75 0.05USD L BRANDS INC 6.75000% 16-01.07.36 2 905 000.00 2 759 750.00 0.09USD L BRANDS INC 6.87500% 15-01.11.35 460 000.00 441 600.00 0.01USD L BRANDS INC 7.60000% 07-15.07.37 200 000.00 197 000.00 0.01USD LAREDO PETROLEUM 5.62500% 14-15.01.22 1 145 000.00 1 157 881.25 0.04USD LAREDO PETROLEUM 7.37500% 12-01.05.22 1 850 000.00 1 917 062.50 0.06USD LENNAR CORP 4.75000% 15-30.05.25 700 000.00 735 000.00 0.02USD LEUCADIA NATIONAL CORP 6.62500% 13-23.10.43 1 325 000.00 1 405 879.32 0.04USD LEVEL 3 FINANCING INC 5.37500% 16-15.01.24 2 125 000.00 2 236 562.50 0.07USD LIFEPOINT HOSPITALS INC 5.87500% 15-01.12.23 1 610 000.00 1 710 625.00 0.05USD LINCOLN FINANCE LTD-144A 7.37500% 16-15.04.21 1 600 000.00 1 692 000.00 0.05USD LLOYDS BANKING GROUP PLC-SUB 4.50000% 14-04.11.24 1 030 000.00 1 076 561.15 0.03USD LOUISIANA-PACIFIC CORP 4.87500% 16-15.09.24 400 000.00 409 500.00 0.01USD MANITOWOC FOODSERVICE INC 9.50000% 16-15.02.24 4 203 000.00 4 885 987.50 0.15USD MARB BONDCO PLC-REG-S 7.00000% 17-15.03.24 2 430 000.00 2 404 606.50 0.08USD MARFRIG HOLDINGS EUROPE BV-REG-S 8.00000% 16-08.06.23 3 500 000.00 3 631 250.00 0.11USD MATADOR RESOURCES CO 6.87500% 15-15.04.23 1 500 000.00 1 590 000.00 0.05USD MDC HOLDINGS INC 6.00000% 13-15.01.43 2 825 000.00 2 704 937.50 0.08USD MGIC INVESTMENT CORP 5.75000% 16-15.08.23 900 000.00 981 000.00 0.03USD MGM RESORTS INTL 7.75000% 12-15.03.22 2 000 000.00 2 349 800.00 0.07USD MGM RESORTS INTL-144A 6.62500% 12-15.12.21 2 050 000.00 2 306 250.00 0.07USD MINERVA LUXEMBOURG SA-REG-S 6.50000% 16-20.09.26 2 360 000.00 2 360 000.00 0.07USD MPT OPERATING PARTNERSHIP LP/FIN CORP 6.37500% 16-01.03.24 845 000.00 921 050.00 0.03USD MSCI INC-144A 4.75000% 16-01.08.26 700 000.00 726 250.00 0.02USD MURPHY OIL CORP 6.87500% 16-15.08.24 1 430 000.00 1 519 375.00 0.05USD MURPHY OIL USA INC 5.62500% 17-01.05.27 245 000.00 257 862.50 0.01USD NAVIENT CORP 5.87500% 15-25.03.21 1 500 000.00 1 583 430.00 0.05USD NCR CORP 5.87500% 14-15.12.21 1 161 000.00 1 210 342.50 0.04USD NOBLE HOLDING INTERNATIONAL LTD 4.90000% 10-01.08.20 86 000.00 79 120.00 0.00USD NOBLE HOLDING INTERNATIONAL LTD 7.75000% 16-15.01.24 600 000.00 477 511.20 0.02USD NOKIA CORP 6.62500% 09-15.05.39 1 900 000.00 2 204 000.00 0.07USD NOKIA OYJ 3.37500% 17-12.06.22 550 000.00 556 528.50 0.02USD NOKIA OYJ 4.37500% 17-12.06.27 565 000.00 581 950.00 0.02USD NRG ENERGY INC 6.25000% 14-15.07.22 300 000.00 314 625.00 0.01USD NRG ENERGY INC 7.25000% 17-15.05.26 3 335 000.00 3 526 762.50 0.11USD NRG YIELD OPERATING LLC 5.00000% 17-15.09.26 930 000.00 946 275.00 0.03USD OASIS PETROLEUM INC 6.50000% 11-01.11.21 285 000.00 281 437.50 0.01USD OASIS PETROLEUM INC 6.87500% 12-15.01.23 1 690 000.00 1 660 425.00 0.05USD ORBITAL ATK INC 5.50000% 16-01.10.23 1 500 000.00 1 575 000.00 0.05USD POPULAR INC 7.00000% 14-01.07.19 1 050 000.00 1 107 750.00 0.04USD PRECISION DRILLING CORP 6.50000% 12-15.12.21 855 000.00 840 037.50 0.03USD PTC INC 6.00000% 16-15.05.24 815 000.00 877 143.75 0.03USD PULTEGROUP INC 5.00000% 16-15.01.27 2 993 000.00 3 097 755.00 0.10USD PULTEGROUP INC 5.50000% 16-01.03.26 775 000.00 834 093.75 0.03USD QEP RESOURCES INC 5.37500% 12-01.10.22 600 000.00 589 500.00 0.02USD QUESTAR MARKET RESOURCES INC 6.87500% 10-01.03.21 1 300 000.00 1 361 750.00 0.04USD RANGE RESOURCES CORP 4.87500% 16-15.05.25 2 165 000.00 2 100 050.00 0.07USD REGAL ENTERTAINMENT GROUP 5.75000% 13-15.06.23 1 000 000.00 1 045 000.00 0.03USD REGAL ENTERTAINMENT GROUP 5.75000% 14-15.03.22 2 366 000.00 2 466 318.40 0.08USD REYNOLDS GROUP INC/LLC/LUX 5.75000% 12-15.10.20 1 795 000.00 1 835 387.50 0.06USD REYNOLDS GROUP INC/LLC/LUX-REG-S 5.12500% 16-15.07.23 2 000 000.00 2 105 000.00 0.07USD RHP HOTEL PROPERTIES/RHP FINANCE 5.00000% 15-15.04.23 720 000.00 741 600.00 0.02USD RICE ENERGY INC 6.25000% 14-01.05.22 1 140 000.00 1 191 300.00 0.04USD RICE ENERGY INC 7.25000% 15-01.05.23 1 620 000.00 1 739 475.00 0.05USD RITE AID CORP 9.25000% 12-15.03.20 2 474 000.00 2 569 867.50 0.08USD ROWAN COS INC 4.87500% 12-01.06.22 280 000.00 265 300.00 0.01USD ROYAL BANK OF SCOTLAND GROUP PLC-SUB 6.00000% 13-19.12.23 817 000.00 909 071.82 0.03USD ROYAL BANK OF SCOTLAND GROUP PLC-SUB 6.12500% 12-15.12.22 675 000.00 747 817.65 0.02USD RSP PERMIAN INC 6.62500% 15-01.10.22 3 865 000.00 4 038 925.00 0.13
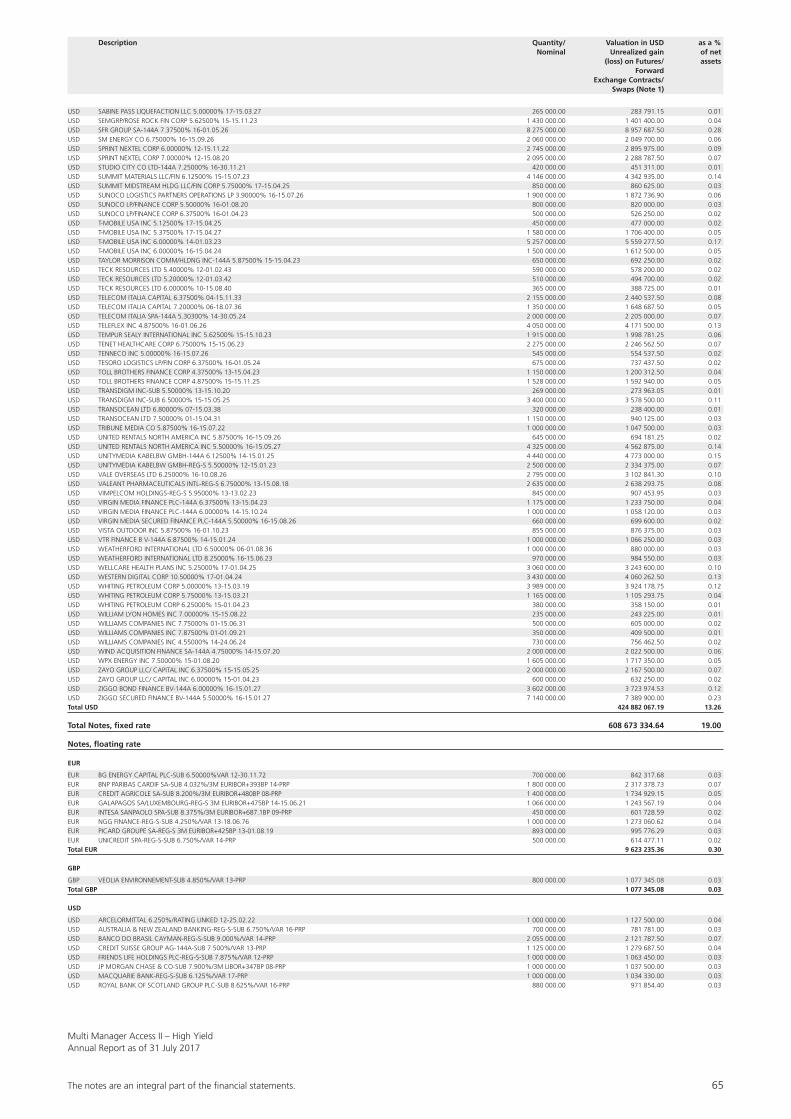
The notes are an integral part of the fi nancial statements. 65
Multi Manager Access II – High YieldAnnual Report as of 31 July 2017
USD SABINE PASS LIQUEFACTION LLC 5.00000% 17-15.03.27 265 000.00 283 791.15 0.01USD SEMGRP/ROSE ROCK FIN CORP 5.62500% 15-15.11.23 1 430 000.00 1 401 400.00 0.04USD SFR GROUP SA-144A 7.37500% 16-01.05.26 8 275 000.00 8 957 687.50 0.28USD SM ENERGY CO 6.75000% 16-15.09.26 2 060 000.00 2 049 700.00 0.06USD SPRINT NEXTEL CORP 6.00000% 12-15.11.22 2 745 000.00 2 895 975.00 0.09USD SPRINT NEXTEL CORP 7.00000% 12-15.08.20 2 095 000.00 2 288 787.50 0.07USD STUDIO CITY CO LTD-144A 7.25000% 16-30.11.21 420 000.00 451 311.00 0.01USD SUMMIT MATERIALS LLC/FIN 6.12500% 15-15.07.23 4 146 000.00 4 342 935.00 0.14USD SUMMIT MIDSTREAM HLDG LLC/FIN CORP 5.75000% 17-15.04.25 850 000.00 860 625.00 0.03USD SUNOCO LOGISTICS PARTNERS OPERATIONS LP 3.90000% 16-15.07.26 1 900 000.00 1 872 736.90 0.06USD SUNOCO LP/FINANCE CORP 5.50000% 16-01.08.20 800 000.00 820 000.00 0.03USD SUNOCO LP/FINANCE CORP 6.37500% 16-01.04.23 500 000.00 526 250.00 0.02USD T-MOBILE USA INC 5.12500% 17-15.04.25 450 000.00 477 000.00 0.02USD T-MOBILE USA INC 5.37500% 17-15.04.27 1 580 000.00 1 706 400.00 0.05USD T-MOBILE USA INC 6.00000% 14-01.03.23 5 257 000.00 5 559 277.50 0.17USD T-MOBILE USA INC 6.00000% 16-15.04.24 1 500 000.00 1 612 500.00 0.05USD TAYLOR MORRISON COMM/HLDNG INC-144A 5.87500% 15-15.04.23 650 000.00 692 250.00 0.02USD TECK RESOURCES LTD 5.40000% 12-01.02.43 590 000.00 578 200.00 0.02USD TECK RESOURCES LTD 5.20000% 12-01.03.42 510 000.00 494 700.00 0.02USD TECK RESOURCES LTD 6.00000% 10-15.08.40 365 000.00 388 725.00 0.01USD TELECOM ITALIA CAPITAL 6.37500% 04-15.11.33 2 155 000.00 2 440 537.50 0.08USD TELECOM ITALIA CAPITAL 7.20000% 06-18.07.36 1 350 000.00 1 648 687.50 0.05USD TELECOM ITALIA SPA-144A 5.30300% 14-30.05.24 2 000 000.00 2 205 000.00 0.07USD TELEFLEX INC 4.87500% 16-01.06.26 4 050 000.00 4 171 500.00 0.13USD TEMPUR SEALY INTERNATIONAL INC 5.62500% 15-15.10.23 1 915 000.00 1 998 781.25 0.06USD TENET HEALTHCARE CORP 6.75000% 15-15.06.23 2 275 000.00 2 246 562.50 0.07USD TENNECO INC 5.00000% 16-15.07.26 545 000.00 554 537.50 0.02USD TESORO LOGISTICS LP/FIN CORP 6.37500% 16-01.05.24 675 000.00 737 437.50 0.02USD TOLL BROTHERS FINANCE CORP 4.37500% 13-15.04.23 1 150 000.00 1 200 312.50 0.04USD TOLL BROTHERS FINANCE CORP 4.87500% 15-15.11.25 1 528 000.00 1 592 940.00 0.05USD TRANSDIGM INC-SUB 5.50000% 13-15.10.20 269 000.00 273 963.05 0.01USD TRANSDIGM INC-SUB 6.50000% 15-15.05.25 3 400 000.00 3 578 500.00 0.11USD TRANSOCEAN LTD 6.80000% 07-15.03.38 320 000.00 238 400.00 0.01USD TRANSOCEAN LTD 7.50000% 01-15.04.31 1 150 000.00 940 125.00 0.03USD TRIBUNE MEDIA CO 5.87500% 16-15.07.22 1 000 000.00 1 047 500.00 0.03USD UNITED RENTALS NORTH AMERICA INC 5.87500% 16-15.09.26 645 000.00 694 181.25 0.02USD UNITED RENTALS NORTH AMERICA INC 5.50000% 16-15.05.27 4 325 000.00 4 562 875.00 0.14USD UNITYMEDIA KABELBW GMBH-144A 6.12500% 14-15.01.25 4 440 000.00 4 773 000.00 0.15USD UNITYMEDIA KABELBW GMBH-REG-S 5.50000% 12-15.01.23 2 500 000.00 2 334 375.00 0.07USD VALE OVERSEAS LTD 6.25000% 16-10.08.26 2 795 000.00 3 102 841.30 0.10USD VALEANT PHARMACEUTICALS INTL-REG-S 6.75000% 13-15.08.18 2 635 000.00 2 638 293.75 0.08USD VIMPELCOM HOLDINGS-REG-S 5.95000% 13-13.02.23 845 000.00 907 453.95 0.03USD VIRGIN MEDIA FINANCE PLC-144A 6.37500% 13-15.04.23 1 175 000.00 1 233 750.00 0.04USD VIRGIN MEDIA FINANCE PLC-144A 6.00000% 14-15.10.24 1 000 000.00 1 058 120.00 0.03USD VIRGIN MEDIA SECURED FINANCE PLC-144A 5.50000% 16-15.08.26 660 000.00 699 600.00 0.02USD VISTA OUTDOOR INC 5.87500% 16-01.10.23 855 000.00 876 375.00 0.03USD VTR FINANCE B V-144A 6.87500% 14-15.01.24 1 000 000.00 1 066 250.00 0.03USD WEATHERFORD INTERNATIONAL LTD 6.50000% 06-01.08.36 1 000 000.00 880 000.00 0.03USD WEATHERFORD INTERNATIONAL LTD 8.25000% 16-15.06.23 970 000.00 984 550.00 0.03USD WELLCARE HEALTH PLANS INC 5.25000% 17-01.04.25 3 060 000.00 3 243 600.00 0.10USD WESTERN DIGITAL CORP 10.50000% 17-01.04.24 3 430 000.00 4 060 262.50 0.13USD WHITING PETROLEUM CORP 5.00000% 13-15.03.19 3 989 000.00 3 924 178.75 0.12USD WHITING PETROLEUM CORP 5.75000% 13-15.03.21 1 165 000.00 1 105 293.75 0.04USD WHITING PETROLEUM CORP 6.25000% 15-01.04.23 380 000.00 358 150.00 0.01USD WILLIAM LYON HOMES INC 7.00000% 15-15.08.22 235 000.00 243 225.00 0.01USD WILLIAMS COMPANIES INC 7.75000% 01-15.06.31 500 000.00 605 000.00 0.02USD WILLIAMS COMPANIES INC 7.87500% 01-01.09.21 350 000.00 409 500.00 0.01USD WILLIAMS COMPANIES INC 4.55000% 14-24.06.24 730 000.00 756 462.50 0.02USD WIND ACQUISITION FINANCE SA-144A 4.75000% 14-15.07.20 2 000 000.00 2 022 500.00 0.06USD WPX ENERGY INC 7.50000% 15-01.08.20 1 605 000.00 1 717 350.00 0.05USD ZAYO GROUP LLC/ CAPITAL INC 6.37500% 15-15.05.25 2 000 000.00 2 167 500.00 0.07USD ZAYO GROUP LLC/ CAPITAL INC 6.00000% 15-01.04.23 600 000.00 632 250.00 0.02USD ZIGGO BOND FINANCE BV-144A 6.00000% 16-15.01.27 3 602 000.00 3 723 974.53 0.12USD ZIGGO SECURED FINANCE BV-144A 5.50000% 16-15.01.27 7 140 000.00 7 389 900.00 0.23Total USD 424 882 067.19 13.26
Total Notes, fixed rate 608 673 334.64 19.00
Notes, floating rate
EUR
EUR BG ENERGY CAPITAL PLC-SUB 6.50000%VAR 12-30.11.72 700 000.00 842 317.68 0.03EUR BNP PARIBAS CARDIF SA-SUB 4.032%/3M EURIBOR+393BP 14-PRP 1 800 000.00 2 317 378.73 0.07EUR CREDIT AGRICOLE SA-SUB 8.200%/3M EURIBOR+480BP 08-PRP 1 400 000.00 1 734 929.15 0.05EUR GALAPAGOS SA/LUXEMBOURG-REG-S 3M EURIBOR+475BP 14-15.06.21 1 066 000.00 1 243 567.19 0.04EUR INTESA SANPAOLO SPA-SUB 8.375%/3M EURIBOR+687.1BP 09-PRP 450 000.00 601 728.59 0.02EUR NGG FINANCE-REG-S-SUB 4.250%/VAR 13-18.06.76 1 000 000.00 1 273 060.62 0.04EUR PICARD GROUPE SA-REG-S 3M EURIBOR+425BP 13-01.08.19 893 000.00 995 776.29 0.03EUR UNICREDIT SPA-REG-S-SUB 6.750%/VAR 14-PRP 500 000.00 614 477.11 0.02Total EUR 9 623 235.36 0.30
GBP
GBP VEOLIA ENVIRONNEMENT-SUB 4.850%/VAR 13-PRP 800 000.00 1 077 345.08 0.03Total GBP 1 077 345.08 0.03
USD
USD ARCELORMITTAL 6.250%/RATING LINKED 12-25.02.22 1 000 000.00 1 127 500.00 0.04USD AUSTRALIA & NEW ZEALAND BANKING-REG-S-SUB 6.750%/VAR 16-PRP 700 000.00 781 781.00 0.03USD BANCO DO BRASIL CAYMAN-REG-S-SUB 9.000%/VAR 14-PRP 2 055 000.00 2 121 787.50 0.07USD CREDIT SUISSE GROUP AG-144A-SUB 7.500%/VAR 13-PRP 1 125 000.00 1 279 687.50 0.04USD FRIENDS LIFE HOLDINGS PLC-REG-S-SUB 7.875%/VAR 12-PRP 1 000 000.00 1 063 450.00 0.03USD JP MORGAN CHASE & CO-SUB 7.900%/3M LIBOR+347BP 08-PRP 1 000 000.00 1 037 500.00 0.03USD MACQUARIE BANK-REG-S-SUB 6.125%/VAR 17-PRP 1 000 000.00 1 034 330.00 0.03USD ROYAL BANK OF SCOTLAND GROUP PLC-SUB 8.625%/VAR 16-PRP 880 000.00 971 854.40 0.03
Description Quantity/ Valuation in USD as a % Nominal Unrealized gain of net (loss) on Futures/ assets Forward Exchange Contracts/ Swaps (Note 1)
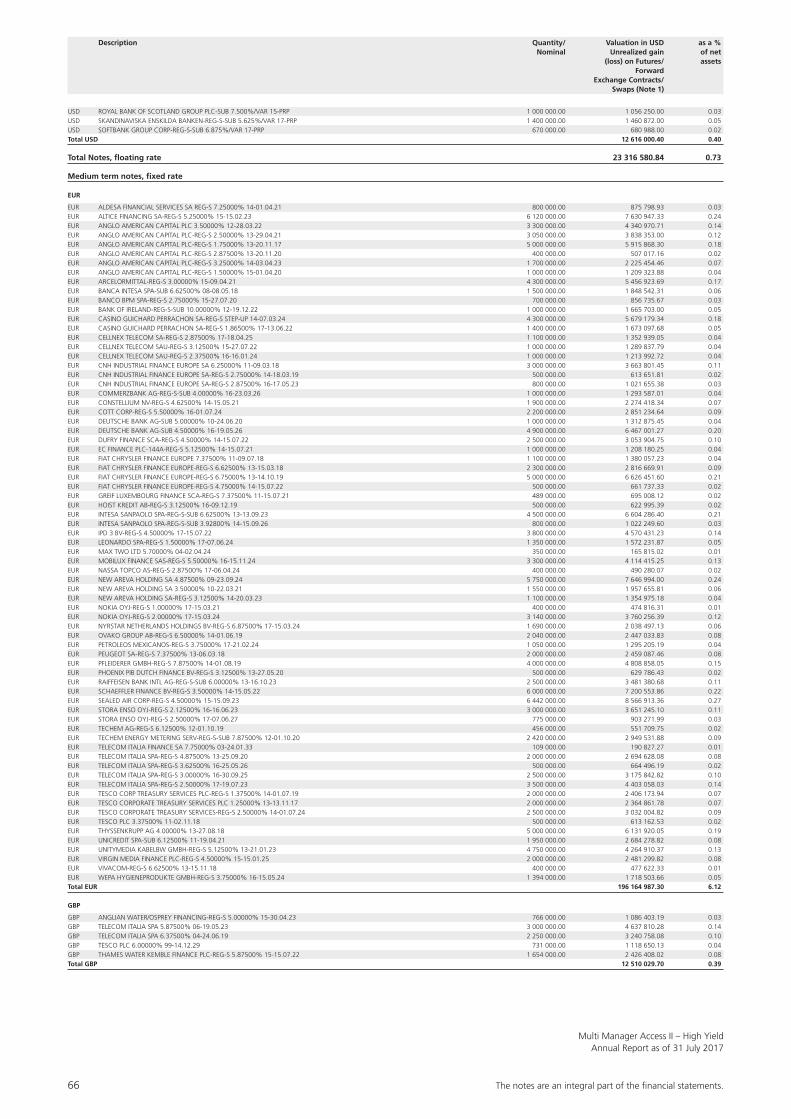
66 The notes are an integral part of the fi nancial statements.
Multi Manager Access II – High YieldAnnual Report as of 31 July 2017
Description Quantity/ Valuation in USD as a % Nominal Unrealized gain of net (loss) on Futures/ assets Forward Exchange Contracts/ Swaps (Note 1)
USD ROYAL BANK OF SCOTLAND GROUP PLC-SUB 7.500%/VAR 15-PRP 1 000 000.00 1 056 250.00 0.03USD SKANDINAVISKA ENSKILDA BANKEN-REG-S-SUB 5.625%/VAR 17-PRP 1 400 000.00 1 460 872.00 0.05USD SOFTBANK GROUP CORP-REG-S-SUB 6.875%/VAR 17-PRP 670 000.00 680 988.00 0.02Total USD 12 616 000.40 0.40
Total Notes, floating rate 23 316 580.84 0.73
Medium term notes, fixed rate
EUR
EUR ALDESA FINANCIAL SERVICES SA REG-S 7.25000% 14-01.04.21 800 000.00 875 798.93 0.03EUR ALTICE FINANCING SA-REG-S 5.25000% 15-15.02.23 6 120 000.00 7 630 947.33 0.24EUR ANGLO AMERICAN CAPITAL PLC 3.50000% 12-28.03.22 3 300 000.00 4 340 970.71 0.14EUR ANGLO AMERICAN CAPITAL PLC-REG-S 2.50000% 13-29.04.21 3 050 000.00 3 838 353.00 0.12EUR ANGLO AMERICAN CAPITAL PLC-REG-S 1.75000% 13-20.11.17 5 000 000.00 5 915 868.30 0.18EUR ANGLO AMERICAN CAPITAL PLC-REG-S 2.87500% 13-20.11.20 400 000.00 507 017.16 0.02EUR ANGLO AMERICAN CAPITAL PLC-REG-S 3.25000% 14-03.04.23 1 700 000.00 2 225 454.46 0.07EUR ANGLO AMERICAN CAPITAL PLC-REG-S 1.50000% 15-01.04.20 1 000 000.00 1 209 323.88 0.04EUR ARCELORMITTAL-REG-S 3.00000% 15-09.04.21 4 300 000.00 5 456 923.69 0.17EUR BANCA INTESA SPA-SUB 6.62500% 08-08.05.18 1 500 000.00 1 848 542.31 0.06EUR BANCO BPM SPA-REG-S 2.75000% 15-27.07.20 700 000.00 856 735.67 0.03EUR BANK OF IRELAND-REG-S-SUB 10.00000% 12-19.12.22 1 000 000.00 1 665 703.00 0.05EUR CASINO GUICHARD PERRACHON SA-REG-S STEP-UP 14-07.03.24 4 300 000.00 5 679 179.34 0.18EUR CASINO GUICHARD PERRACHON SA-REG-S 1.86500% 17-13.06.22 1 400 000.00 1 673 097.68 0.05EUR CELLNEX TELECOM SA-REG-S 2.87500% 17-18.04.25 1 100 000.00 1 352 939.05 0.04EUR CELLNEX TELECOM SAU-REG-S 3.12500% 15-27.07.22 1 000 000.00 1 289 837.79 0.04EUR CELLNEX TELECOM SAU-REG-S 2.37500% 16-16.01.24 1 000 000.00 1 213 992.72 0.04EUR CNH INDUSTRIAL FINANCE EUROPE SA 6.25000% 11-09.03.18 3 000 000.00 3 663 801.45 0.11EUR CNH INDUSTRIAL FINANCE EUROPE SA-REG-S 2.75000% 14-18.03.19 500 000.00 613 651.81 0.02EUR CNH INDUSTRIAL FINANCE EUROPE SA-REG-S 2.87500% 16-17.05.23 800 000.00 1 021 655.38 0.03EUR COMMERZBANK AG-REG-S-SUB 4.00000% 16-23.03.26 1 000 000.00 1 293 587.01 0.04EUR CONSTELLIUM NV-REG-S 4.62500% 14-15.05.21 1 900 000.00 2 274 418.34 0.07EUR COTT CORP-REG-S 5.50000% 16-01.07.24 2 200 000.00 2 851 234.64 0.09EUR DEUTSCHE BANK AG-SUB 5.00000% 10-24.06.20 1 000 000.00 1 312 875.45 0.04EUR DEUTSCHE BANK AG-SUB 4.50000% 16-19.05.26 4 900 000.00 6 467 001.27 0.20EUR DUFRY FINANCE SCA-REG-S 4.50000% 14-15.07.22 2 500 000.00 3 053 904.75 0.10EUR EC FINANCE PLC-144A-REG-S 5.12500% 14-15.07.21 1 000 000.00 1 208 180.25 0.04EUR FIAT CHRYSLER FINANCE EUROPE 7.37500% 11-09.07.18 1 100 000.00 1 380 057.23 0.04EUR FIAT CHRYSLER FINANCE EUROPE-REG-S 6.62500% 13-15.03.18 2 300 000.00 2 816 669.91 0.09EUR FIAT CHRYSLER FINANCE EUROPE-REG-S 6.75000% 13-14.10.19 5 000 000.00 6 626 451.60 0.21EUR FIAT CHRYSLER FINANCE EUROPE-REG-S 4.75000% 14-15.07.22 500 000.00 661 737.33 0.02EUR GREIF LUXEMBOURG FINANCE SCA-REG-S 7.37500% 11-15.07.21 489 000.00 695 008.12 0.02EUR HOIST KREDIT AB-REG-S 3.12500% 16-09.12.19 500 000.00 622 995.39 0.02EUR INTESA SANPAOLO SPA-REG-S-SUB 6.62500% 13-13.09.23 4 500 000.00 6 604 286.40 0.21EUR INTESA SANPAOLO SPA-REG-S-SUB 3.92800% 14-15.09.26 800 000.00 1 022 249.60 0.03EUR IPD 3 BV-REG-S 4.50000% 17-15.07.22 3 800 000.00 4 570 431.23 0.14EUR LEONARDO SPA-REG-S 1.50000% 17-07.06.24 1 350 000.00 1 572 231.87 0.05EUR MAX TWO LTD 5.70000% 04-02.04.24 350 000.00 165 815.02 0.01EUR MOBILUX FINANCE SAS-REG-S 5.50000% 16-15.11.24 3 300 000.00 4 114 415.25 0.13EUR NASSA TOPCO AS-REG-S 2.87500% 17-06.04.24 400 000.00 490 280.07 0.02EUR NEW AREVA HOLDING SA 4.87500% 09-23.09.24 5 750 000.00 7 646 994.00 0.24EUR NEW AREVA HOLDING SA 3.50000% 10-22.03.21 1 550 000.00 1 957 655.81 0.06EUR NEW AREVA HOLDING SA-REG-S 3.12500% 14-20.03.23 1 100 000.00 1 354 975.18 0.04EUR NOKIA OYJ-REG-S 1.00000% 17-15.03.21 400 000.00 474 816.31 0.01EUR NOKIA OYJ-REG-S 2.00000% 17-15.03.24 3 140 000.00 3 760 256.39 0.12EUR NYRSTAR NETHERLANDS HOLDINGS BV-REG-S 6.87500% 17-15.03.24 1 690 000.00 2 038 497.13 0.06EUR OVAKO GROUP AB-REG-S 6.50000% 14-01.06.19 2 040 000.00 2 447 033.83 0.08EUR PETROLEOS MEXICANOS-REG-S 3.75000% 17-21.02.24 1 050 000.00 1 295 205.19 0.04EUR PEUGEOT SA-REG-S 7.37500% 13-06.03.18 2 000 000.00 2 459 087.46 0.08EUR PFLEIDERER GMBH-REG-S 7.87500% 14-01.08.19 4 000 000.00 4 808 858.05 0.15EUR PHOENIX PIB DUTCH FINANCE BV-REG-S 3.12500% 13-27.05.20 500 000.00 629 786.43 0.02EUR RAIFFEISEN BANK INTL AG-REG-S-SUB 6.00000% 13-16.10.23 2 500 000.00 3 481 380.68 0.11EUR SCHAEFFLER FINANCE BV-REG-S 3.50000% 14-15.05.22 6 000 000.00 7 200 553.86 0.22EUR SEALED AIR CORP-REG-S 4.50000% 15-15.09.23 6 442 000.00 8 566 913.36 0.27EUR STORA ENSO OYJ-REG-S 2.12500% 16-16.06.23 3 000 000.00 3 651 245.10 0.11EUR STORA ENSO OYJ-REG-S 2.50000% 17-07.06.27 775 000.00 903 271.99 0.03EUR TECHEM AG-REG-S 6.12500% 12-01.10.19 456 000.00 551 709.75 0.02EUR TECHEM ENERGY METERING SERV-REG-S-SUB 7.87500% 12-01.10.20 2 420 000.00 2 949 531.88 0.09EUR TELECOM ITALIA FINANCE SA 7.75000% 03-24.01.33 109 000.00 190 827.27 0.01EUR TELECOM ITALIA SPA-REG-S 4.87500% 13-25.09.20 2 000 000.00 2 694 628.08 0.08EUR TELECOM ITALIA SPA-REG-S 3.62500% 16-25.05.26 500 000.00 664 496.19 0.02EUR TELECOM ITALIA SPA-REG-S 3.00000% 16-30.09.25 2 500 000.00 3 175 842.82 0.10EUR TELECOM ITALIA SPA-REG-S 2.50000% 17-19.07.23 3 500 000.00 4 403 058.03 0.14EUR TESCO CORP TREASURY SERVICES PLC-REG-S 1.37500% 14-01.07.19 2 000 000.00 2 406 173.94 0.07EUR TESCO CORPORATE TREASURY SERVICES PLC 1.25000% 13-13.11.17 2 000 000.00 2 364 861.78 0.07EUR TESCO CORPORATE TREASURY SERVICES-REG-S 2.50000% 14-01.07.24 2 500 000.00 3 032 004.82 0.09EUR TESCO PLC 3.37500% 11-02.11.18 500 000.00 613 162.53 0.02EUR THYSSENKRUPP AG 4.00000% 13-27.08.18 5 000 000.00 6 131 920.05 0.19EUR UNICREDIT SPA-SUB 6.12500% 11-19.04.21 1 950 000.00 2 684 278.82 0.08EUR UNITYMEDIA KABELBW GMBH-REG-S 5.12500% 13-21.01.23 4 750 000.00 4 264 910.37 0.13EUR VIRGIN MEDIA FINANCE PLC-REG-S 4.50000% 15-15.01.25 2 000 000.00 2 481 299.82 0.08EUR VIVACOM-REG-S 6.62500% 13-15.11.18 400 000.00 477 622.33 0.01EUR WEPA HYGIENEPRODUKTE GMBH-REG-S 3.75000% 16-15.05.24 1 394 000.00 1 718 503.66 0.05Total EUR 196 164 987.30 6.12
GBP
GBP ANGLIAN WATER/OSPREY FINANCING-REG-S 5.00000% 15-30.04.23 766 000.00 1 086 403.19 0.03GBP TELECOM ITALIA SPA 5.87500% 06-19.05.23 3 000 000.00 4 637 810.28 0.14GBP TELECOM ITALIA SPA 6.37500% 04-24.06.19 2 250 000.00 3 240 758.08 0.10GBP TESCO PLC 6.00000% 99-14.12.29 731 000.00 1 118 650.13 0.04GBP THAMES WATER KEMBLE FINANCE PLC-REG-S 5.87500% 15-15.07.22 1 654 000.00 2 426 408.02 0.08Total GBP 12 510 029.70 0.39
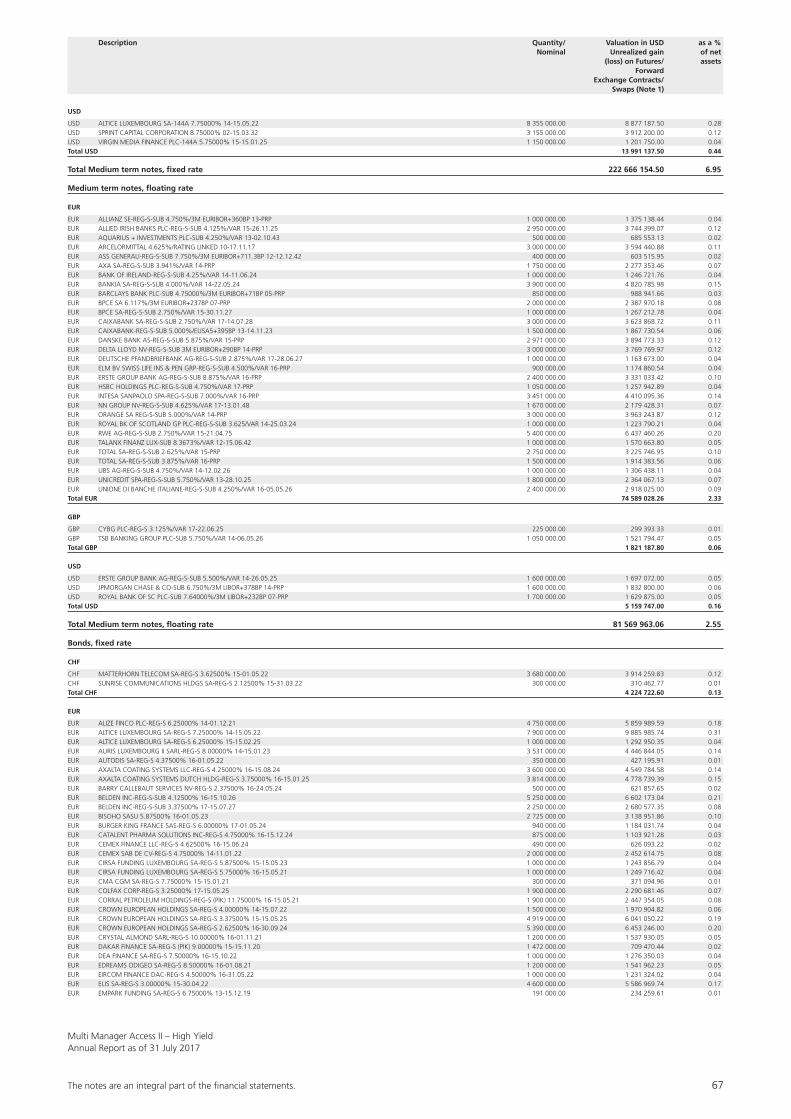
The notes are an integral part of the fi nancial statements. 67
Multi Manager Access II – High YieldAnnual Report as of 31 July 2017
USD
USD ALTICE LUXEMBOURG SA-144A 7.75000% 14-15.05.22 8 355 000.00 8 877 187.50 0.28USD SPRINT CAPITAL CORPORATION 8.75000% 02-15.03.32 3 155 000.00 3 912 200.00 0.12USD VIRGIN MEDIA FINANCE PLC-144A 5.75000% 15-15.01.25 1 150 000.00 1 201 750.00 0.04Total USD 13 991 137.50 0.44
Total Medium term notes, fixed rate 222 666 154.50 6.95
Medium term notes, floating rate
EUR
EUR ALLIANZ SE-REG-S-SUB 4.750%/3M EURIBOR+360BP 13-PRP 1 000 000.00 1 375 138.44 0.04EUR ALLIED IRISH BANKS PLC-REG-S-SUB 4.125%/VAR 15-26.11.25 2 950 000.00 3 744 399.07 0.12EUR AQUARIUS + INVESTMENTS PLC-SUB 4.250%/VAR 13-02.10.43 500 000.00 685 553.13 0.02EUR ARCELORMITTAL 4.625%/RATING LINKED 10-17.11.17 3 000 000.00 3 594 440.88 0.11EUR ASS GENERALI-REG-S-SUB 7.750%/3M EURIBOR+711.3BP 12-12.12.42 400 000.00 603 515.95 0.02EUR AXA SA-REG-S-SUB 3.941%/VAR 14-PRP 1 750 000.00 2 277 353.46 0.07EUR BANK OF IRELAND-REG-S-SUB 4.25%/VAR 14-11.06.24 1 000 000.00 1 246 721.76 0.04EUR BANKIA SA-REG-S-SUB 4.000%/VAR 14-22.05.24 3 900 000.00 4 820 785.98 0.15EUR BARCLAYS BANK PLC-SUB 4.75000%/3M EURIBOR+71BP 05-PRP 850 000.00 988 941.66 0.03EUR BPCE SA 6.117%/3M EURIBOR+237BP 07-PRP 2 000 000.00 2 387 970.18 0.08EUR BPCE SA-REG-S-SUB 2.750%/VAR 15-30.11.27 1 000 000.00 1 267 212.78 0.04EUR CAIXABANK SA-REG-S-SUB 2.750%/VAR 17-14.07.28 3 000 000.00 3 623 868.72 0.11EUR CAIXABANK-REG-S-SUB 5.000%/EUSA5+395BP 13-14.11.23 1 500 000.00 1 867 730.54 0.06EUR DANSKE BANK AS-REG-S-SUB 5.875%/VAR 15-PRP 2 971 000.00 3 894 773.33 0.12EUR DELTA LLOYD NV-REG-S-SUB 3M EURIBOR+290BP 14-PRP 3 000 000.00 3 769 769.97 0.12EUR DEUTSCHE PFANDBRIEFBANK AG-REG-S-SUB 2.875%/VAR 17-28.06.27 1 000 000.00 1 163 673.00 0.04EUR ELM BV SWISS LIFE INS & PEN GRP-REG-S-SUB 4.500%/VAR 16-PRP 900 000.00 1 174 860.54 0.04EUR ERSTE GROUP BANK AG-REG-S-SUB 8.875%/VAR 16-PRP 2 400 000.00 3 331 033.42 0.10EUR HSBC HOLDINGS PLC-REG-S-SUB 4.750%/VAR 17-PRP 1 050 000.00 1 257 942.89 0.04EUR INTESA SANPAOLO SPA-REG-S-SUB 7.000%/VAR 16-PRP 3 451 000.00 4 410 095.36 0.14EUR NN GROUP NV-REG-S-SUB 4.625%/VAR 17-13.01.48 1 670 000.00 2 179 428.31 0.07EUR ORANGE SA REG-S-SUB 5.000%/VAR 14-PRP 3 000 000.00 3 963 243.87 0.12EUR ROYAL BK OF SCOTLAND GP PLC-REG-S-SUB 3.625/VAR 14-25.03.24 1 000 000.00 1 223 790.21 0.04EUR RWE AG-REG-S-SUB 2.750%/VAR 15-21.04.75 5 400 000.00 6 437 460.26 0.20EUR TALANX FINANZ LUX-SUB 8.3673%/VAR 12-15.06.42 1 000 000.00 1 570 663.80 0.05EUR TOTAL SA-REG-S-SUB 2.625%/VAR 15-PRP 2 750 000.00 3 225 746.95 0.10EUR TOTAL SA-REG-S-SUB 3.875%/VAR 16-PRP 1 500 000.00 1 914 383.56 0.06EUR UBS AG-REG-S-SUB 4.750%/VAR 14-12.02.26 1 000 000.00 1 306 438.11 0.04EUR UNICREDIT SPA-REG-S-SUB 5.750%/VAR 13-28.10.25 1 800 000.00 2 364 067.13 0.07EUR UNIONE DI BANCHE ITALIANE-REG-S-SUB 4.250%/VAR 16-05.05.26 2 400 000.00 2 918 025.00 0.09Total EUR 74 589 028.26 2.33
GBP
GBP CYBG PLC-REG-S 3.125%/VAR 17-22.06.25 225 000.00 299 393.33 0.01GBP TSB BANKING GROUP PLC-SUB 5.750%/VAR 14-06.05.26 1 050 000.00 1 521 794.47 0.05Total GBP 1 821 187.80 0.06
USD
USD ERSTE GROUP BANK AG-REG-S-SUB 5.500%/VAR 14-26.05.25 1 600 000.00 1 697 072.00 0.05USD JPMORGAN CHASE & CO-SUB 6.750%/3M LIBOR+378BP 14-PRP 1 600 000.00 1 832 800.00 0.06USD ROYAL BANK OF SC PLC-SUB 7.64000%/3M LIBOR+232BP 07-PRP 1 700 000.00 1 629 875.00 0.05Total USD 5 159 747.00 0.16
Total Medium term notes, floating rate 81 569 963.06 2.55
Bonds, fixed rate
CHF
CHF MATTERHORN TELECOM SA-REG-S 3.62500% 15-01.05.22 3 680 000.00 3 914 259.83 0.12CHF SUNRISE COMMUNICATIONS HLDGS SA-REG-S 2.12500% 15-31.03.22 300 000.00 310 462.77 0.01Total CHF 4 224 722.60 0.13
EUR
EUR ALIZE FINCO PLC-REG-S 6.25000% 14-01.12.21 4 750 000.00 5 859 989.59 0.18EUR ALTICE LUXEMBOURG SA-REG-S 7.25000% 14-15.05.22 7 900 000.00 9 885 985.74 0.31EUR ALTICE LUXEMBOURG SA-REG-S 6.25000% 15-15.02.25 1 000 000.00 1 292 950.35 0.04EUR AURIS LUXEMBOURG II SARL-REG-S 8.00000% 14-15.01.23 3 531 000.00 4 446 844.05 0.14EUR AUTODIS SA-REG-S 4.37500% 16-01.05.22 350 000.00 427 195.91 0.01EUR AXALTA COATING SYSTEMS LLC-REG-S 4.25000% 16-15.08.24 3 600 000.00 4 549 784.58 0.14EUR AXALTA COATING SYSTEMS DUTCH HLDG-REG-S 3.75000% 16-15.01.25 3 814 000.00 4 778 739.39 0.15EUR BARRY CALLEBAUT SERVICES NV-REG-S 2.37500% 16-24.05.24 500 000.00 621 857.65 0.02EUR BELDEN INC-REG-S-SUB 4.12500% 16-15.10.26 5 250 000.00 6 602 173.04 0.21EUR BELDEN INC-REG-S-SUB 3.37500% 17-15.07.27 2 250 000.00 2 680 577.35 0.08EUR BISOHO SASU 5.87500% 16-01.05.23 2 725 000.00 3 138 951.86 0.10EUR BURGER KING FRANCE SAS-REG-S 6.00000% 17-01.05.24 940 000.00 1 184 031.74 0.04EUR CATALENT PHARMA SOLUTIONS INC-REG-S 4.75000% 16-15.12.24 875 000.00 1 103 921.28 0.03EUR CEMEX FINANCE LLC-REG-S 4.62500% 16-15.06.24 490 000.00 626 093.22 0.02EUR CEMEX SAB DE CV-REG-S 4.75000% 14-11.01.22 2 000 000.00 2 452 614.75 0.08EUR CIRSA FUNDING LUXEMBOURG SA-REG-S 5.87500% 15-15.05.23 1 000 000.00 1 243 856.79 0.04EUR CIRSA FUNDING LUXEMBOURG SA-REG-S 5.75000% 16-15.05.21 1 000 000.00 1 249 716.42 0.04EUR CMA CGM SA-REG-S 7.75000% 15-15.01.21 300 000.00 371 094.96 0.01EUR COLFAX CORP-REG-S 3.25000% 17-15.05.25 1 900 000.00 2 290 681.46 0.07EUR CORRAL PETROLEUM HOLDINGS-REG-S (PIK) 11.75000% 16-15.05.21 1 900 000.00 2 447 354.05 0.08EUR CROWN EUROPEAN HOLDINGS SA-REG-S 4.00000% 14-15.07.22 1 500 000.00 1 970 904.82 0.06EUR CROWN EUROPEAN HOLDINGS SA-REG-S 3.37500% 15-15.05.25 4 919 000.00 6 041 050.22 0.19EUR CROWN EUROPEAN HOLDINGS SA-REG-S 2.62500% 16-30.09.24 5 390 000.00 6 453 246.00 0.20EUR CRYSTAL ALMOND SARL-REG-S 10.00000% 16-01.11.21 1 200 000.00 1 537 930.05 0.05EUR DAKAR FINANCE SA-REG-S (PIK) 9.00000% 15-15.11.20 1 472 000.00 709 470.44 0.02EUR DEA FINANCE SA-REG-S 7.50000% 16-15.10.22 1 000 000.00 1 276 350.03 0.04EUR EDREAMS ODIGEO SA-REG-S 8.50000% 16-01.08.21 1 200 000.00 1 541 962.23 0.05EUR EIRCOM FINANCE DAC-REG-S 4.50000% 16-31.05.22 1 000 000.00 1 231 324.02 0.04EUR ELIS SA-REG-S 3.00000% 15-30.04.22 4 600 000.00 5 586 969.74 0.17EUR EMPARK FUNDING SA-REG-S 6.75000% 13-15.12.19 191 000.00 234 259.61 0.01
Description Quantity/ Valuation in USD as a % Nominal Unrealized gain of net (loss) on Futures/ assets Forward Exchange Contracts/ Swaps (Note 1)
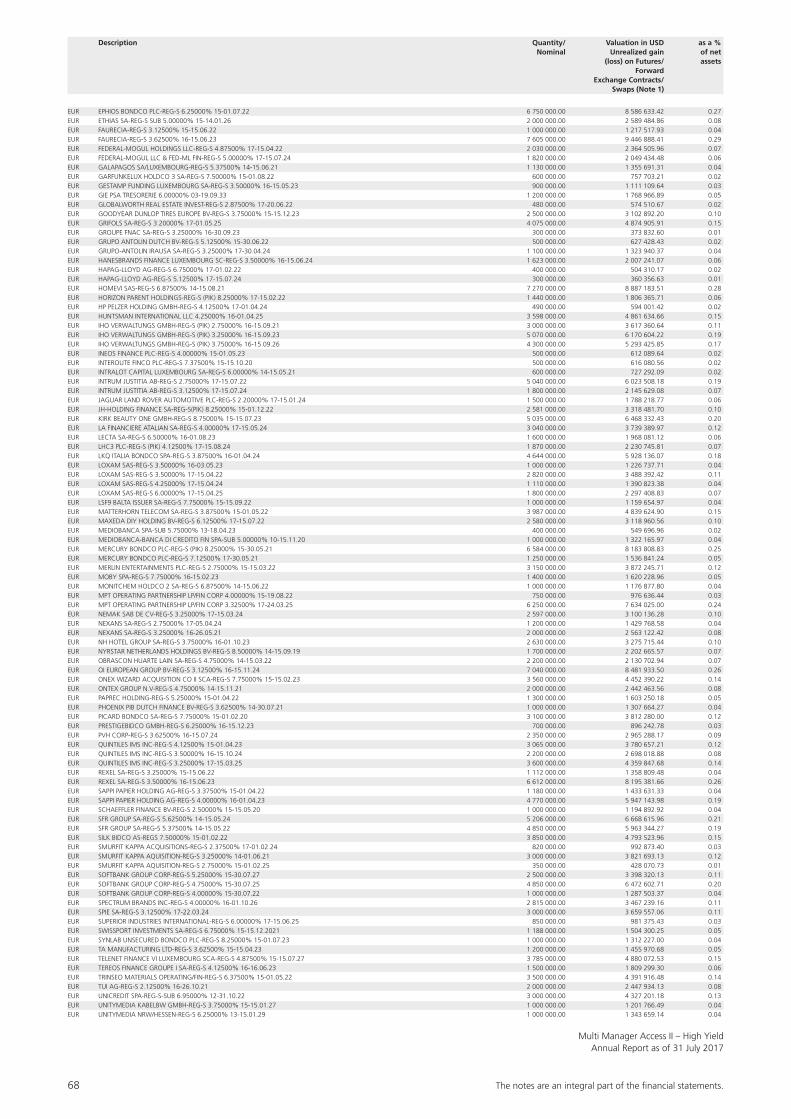
68 The notes are an integral part of the fi nancial statements.
Multi Manager Access II – High YieldAnnual Report as of 31 July 2017
Description Quantity/ Valuation in USD as a % Nominal Unrealized gain of net (loss) on Futures/ assets Forward Exchange Contracts/ Swaps (Note 1)
EUR EPHIOS BONDCO PLC-REG-S 6.25000% 15-01.07.22 6 750 000.00 8 586 633.42 0.27EUR ETHIAS SA-REG-S SUB 5.00000% 15-14.01.26 2 000 000.00 2 589 484.86 0.08EUR FAURECIA-REG-S 3.12500% 15-15.06.22 1 000 000.00 1 217 517.93 0.04EUR FAURECIA-REG-S 3.62500% 16-15.06.23 7 605 000.00 9 446 888.41 0.29EUR FEDERAL-MOGUL HOLDINGS LLC-REG-S 4.87500% 17-15.04.22 2 030 000.00 2 364 505.96 0.07EUR FEDERAL-MOGUL LLC & FED-ML FIN-REG-S 5.00000% 17-15.07.24 1 820 000.00 2 049 434.48 0.06EUR GALAPAGOS SA/LUXEMBOURG-REG-S 5.37500% 14-15.06.21 1 130 000.00 1 355 691.31 0.04EUR GARFUNKELUX HOLDCO 3 SA-REG-S 7.50000% 15-01.08.22 600 000.00 757 703.21 0.02EUR GESTAMP FUNDING LUXEMBOURG SA-REG-S 3.50000% 16-15.05.23 900 000.00 1 111 109.64 0.03EUR GIE PSA TRESORERIE 6.00000% 03-19.09.33 1 200 000.00 1 768 966.89 0.05EUR GLOBALWORTH REAL ESTATE INVEST-REG-S 2.87500% 17-20.06.22 480 000.00 574 510.67 0.02EUR GOODYEAR DUNLOP TIRES EUROPE BV-REG-S 3.75000% 15-15.12.23 2 500 000.00 3 102 892.20 0.10EUR GRIFOLS SA-REG-S 3.20000% 17-01.05.25 4 075 000.00 4 874 905.91 0.15EUR GROUPE FNAC SA-REG-S 3.25000% 16-30.09.23 300 000.00 373 832.60 0.01EUR GRUPO ANTOLIN DUTCH BV-REG-S 5.12500% 15-30.06.22 500 000.00 627 428.43 0.02EUR GRUPO-ANTOLIN IRAUSA SA-REG-S 3.25000% 17-30.04.24 1 100 000.00 1 323 940.37 0.04EUR HANESBRANDS FINANCE LUXEMBOURG SC-REG-S 3.50000% 16-15.06.24 1 623 000.00 2 007 241.07 0.06EUR HAPAG-LLOYD AG-REG-S 6.75000% 17-01.02.22 400 000.00 504 310.17 0.02EUR HAPAG-LLOYD AG-REG-S 5.12500% 17-15.07.24 300 000.00 360 356.63 0.01EUR HOMEVI SAS-REG-S 6.87500% 14-15.08.21 7 270 000.00 8 887 183.51 0.28EUR HORIZON PARENT HOLDINGS-REG-S (PIK) 8.25000% 17-15.02.22 1 440 000.00 1 806 365.71 0.06EUR HP PELZER HOLDING GMBH-REG-S 4.12500% 17-01.04.24 490 000.00 594 001.42 0.02EUR HUNTSMAN INTERNATIONAL LLC 4.25000% 16-01.04.25 3 598 000.00 4 861 634.66 0.15EUR IHO VERWALTUNGS GMBH-REG-S (PIK) 2.75000% 16-15.09.21 3 000 000.00 3 617 360.64 0.11EUR IHO VERWALTUNGS GMBH-REG-S (PIK) 3.25000% 16-15.09.23 5 070 000.00 6 170 604.22 0.19EUR IHO VERWALTUNGS GMBH-REG-S (PIK) 3.75000% 16-15.09.26 4 300 000.00 5 293 425.85 0.17EUR INEOS FINANCE PLC-REG-S 4.00000% 15-01.05.23 500 000.00 612 089.64 0.02EUR INTEROUTE FINCO PLC-REG-S 7.37500% 15-15.10.20 500 000.00 616 080.56 0.02EUR INTRALOT CAPITAL LUXEMBOURG SA-REG-S 6.00000% 14-15.05.21 600 000.00 727 292.09 0.02EUR INTRUM JUSTITIA AB-REG-S 2.75000% 17-15.07.22 5 040 000.00 6 023 508.18 0.19EUR INTRUM JUSTITIA AB-REG-S 3.12500% 17-15.07.24 1 800 000.00 2 145 629.08 0.07EUR JAGUAR LAND ROVER AUTOMOTIVE PLC-REG-S 2.20000% 17-15.01.24 1 500 000.00 1 788 218.77 0.06EUR JH-HOLDING FINANCE SA-REG-S(PIK) 8.25000% 15-01.12.22 2 581 000.00 3 318 481.70 0.10EUR KIRK BEAUTY ONE GMBH-REG-S 8.75000% 15-15.07.23 5 035 000.00 6 468 332.43 0.20EUR LA FINANCIERE ATALIAN SA-REG-S 4.00000% 17-15.05.24 3 040 000.00 3 739 389.97 0.12EUR LECTA SA-REG-S 6.50000% 16-01.08.23 1 600 000.00 1 968 081.12 0.06EUR LHC3 PLC-REG-S (PIK) 4.12500% 17-15.08.24 1 870 000.00 2 230 745.81 0.07EUR LKQ ITALIA BONDCO SPA-REG-S 3.87500% 16-01.04.24 4 644 000.00 5 928 136.07 0.18EUR LOXAM SAS-REG-S 3.50000% 16-03.05.23 1 000 000.00 1 226 737.71 0.04EUR LOXAM SAS-REG-S 3.50000% 17-15.04.22 2 820 000.00 3 488 392.42 0.11EUR LOXAM SAS-REG-S 4.25000% 17-15.04.24 1 110 000.00 1 390 823.38 0.04EUR LOXAM SAS-REG-S 6.00000% 17-15.04.25 1 800 000.00 2 297 408.83 0.07EUR LSF9 BALTA ISSUER SA-REG-S 7.75000% 15-15.09.22 1 000 000.00 1 159 654.97 0.04EUR MATTERHORN TELECOM SA-REG-S 3.87500% 15-01.05.22 3 987 000.00 4 839 624.90 0.15EUR MAXEDA DIY HOLDING BV-REG-S 6.12500% 17-15.07.22 2 580 000.00 3 118 960.56 0.10EUR MEDIOBANCA SPA-SUB 5.75000% 13-18.04.23 400 000.00 549 696.96 0.02EUR MEDIOBANCA-BANCA DI CREDITO FIN SPA-SUB 5.00000% 10-15.11.20 1 000 000.00 1 322 165.97 0.04EUR MERCURY BONDCO PLC-REG-S (PIK) 8.25000% 15-30.05.21 6 584 000.00 8 183 808.83 0.25EUR MERCURY BONDCO PLC-REG-S 7.12500% 17-30.05.21 1 250 000.00 1 536 841.24 0.05EUR MERLIN ENTERTAINMENTS PLC-REG-S 2.75000% 15-15.03.22 3 150 000.00 3 872 245.71 0.12EUR MOBY SPA-REG-S 7.75000% 16-15.02.23 1 400 000.00 1 620 228.96 0.05EUR MONITCHEM HOLDCO 2 SA-REG-S 6.87500% 14-15.06.22 1 000 000.00 1 176 877.80 0.04EUR MPT OPERATING PARTNERSHIP LP/FIN CORP 4.00000% 15-19.08.22 750 000.00 976 636.44 0.03EUR MPT OPERATING PARTNERSHIP LP/FIN CORP 3.32500% 17-24.03.25 6 250 000.00 7 634 025.00 0.24EUR NEMAK SAB DE CV-REG-S 3.25000% 17-15.03.24 2 597 000.00 3 100 136.28 0.10EUR NEXANS SA-REG-S 2.75000% 17-05.04.24 1 200 000.00 1 429 768.58 0.04EUR NEXANS SA-REG-S 3.25000% 16-26.05.21 2 000 000.00 2 563 122.42 0.08EUR NH HOTEL GROUP SA-REG-S 3.75000% 16-01.10.23 2 630 000.00 3 275 715.44 0.10EUR NYRSTAR NETHERLANDS HOLDINGS BV-REG-S 8.50000% 14-15.09.19 1 700 000.00 2 202 665.57 0.07EUR OBRASCON HUARTE LAIN SA-REG-S 4.75000% 14-15.03.22 2 200 000.00 2 130 702.94 0.07EUR OI EUROPEAN GROUP BV-REG-S 3.12500% 16-15.11.24 7 040 000.00 8 481 933.50 0.26EUR ONEX WIZARD ACQUISITION CO II SCA-REG-S 7.75000% 15-15.02.23 3 560 000.00 4 452 390.22 0.14EUR ONTEX GROUP N.V-REG-S 4.75000% 14-15.11.21 2 000 000.00 2 442 463.56 0.08EUR PAPREC HOLDING-REG-S 5.25000% 15-01.04.22 1 300 000.00 1 603 250.18 0.05EUR PHOENIX PIB DUTCH FINANCE BV-REG-S 3.62500% 14-30.07.21 1 000 000.00 1 307 664.27 0.04EUR PICARD BONDCO SA-REG-S 7.75000% 15-01.02.20 3 100 000.00 3 812 280.00 0.12EUR PRESTIGEBIDCO GMBH-REG-S 6.25000% 16-15.12.23 700 000.00 896 242.78 0.03EUR PVH CORP-REG-S 3.62500% 16-15.07.24 2 350 000.00 2 965 288.17 0.09EUR QUINTILES IMS INC-REG-S 4.12500% 15-01.04.23 3 065 000.00 3 780 657.21 0.12EUR QUINTILES IMS INC-REG-S 3.50000% 16-15.10.24 2 200 000.00 2 698 018.88 0.08EUR QUINTILES IMS INC-REG-S 3.25000% 17-15.03.25 3 600 000.00 4 359 847.68 0.14EUR REXEL SA-REG-S 3.25000% 15-15.06.22 1 112 000.00 1 358 809.48 0.04EUR REXEL SA-REG-S 3.50000% 16-15.06.23 6 612 000.00 8 195 381.66 0.26EUR SAPPI PAPIER HOLDING AG-REG-S 3.37500% 15-01.04.22 1 180 000.00 1 433 631.33 0.04EUR SAPPI PAPIER HOLDING AG-REG-S 4.00000% 16-01.04.23 4 770 000.00 5 947 143.98 0.19EUR SCHAEFFLER FINANCE BV-REG-S 2.50000% 15-15.05.20 1 000 000.00 1 194 892.92 0.04EUR SFR GROUP SA-REG-S 5.62500% 14-15.05.24 5 206 000.00 6 668 615.96 0.21EUR SFR GROUP SA-REG-S 5.37500% 14-15.05.22 4 850 000.00 5 963 344.27 0.19EUR SILK BIDCO AS-REGS 7.50000% 15-01.02.22 3 850 000.00 4 793 523.96 0.15EUR SMURFIT KAPPA ACQUISITIONS-REG-S 2.37500% 17-01.02.24 820 000.00 992 873.40 0.03EUR SMURFIT KAPPA AQUISITION-REG-S 3.25000% 14-01.06.21 3 000 000.00 3 821 693.13 0.12EUR SMURFIT KAPPA AQUISITION-REG-S 2.75000% 15-01.02.25 350 000.00 428 070.73 0.01EUR SOFTBANK GROUP CORP-REG-S 5.25000% 15-30.07.27 2 500 000.00 3 398 320.13 0.11EUR SOFTBANK GROUP CORP-REG-S 4.75000% 15-30.07.25 4 850 000.00 6 472 602.71 0.20EUR SOFTBANK GROUP CORP-REG-S 4.00000% 15-30.07.22 1 000 000.00 1 287 503.37 0.04EUR SPECTRUM BRANDS INC-REG-S 4.00000% 16-01.10.26 2 815 000.00 3 467 239.16 0.11EUR SPIE SA-REG-S 3.12500% 17-22.03.24 3 000 000.00 3 659 557.06 0.11EUR SUPERIOR INDUSTRIES INTERNATIONAL-REG-S 6.00000% 17-15.06.25 850 000.00 981 375.43 0.03EUR SWISSPORT INVESTMENTS SA-REG-S 6.75000% 15-15.12.2021 1 188 000.00 1 504 300.25 0.05EUR SYNLAB UNSECURED BONDCO PLC-REG-S 8.25000% 15-01.07.23 1 000 000.00 1 312 227.00 0.04EUR TA MANUFACTURING LTD-REG-S 3.62500% 15-15.04.23 1 200 000.00 1 455 970.68 0.05EUR TELENET FINANCE VI LUXEMBOURG SCA-REG-S 4.87500% 15-15.07.27 3 785 000.00 4 880 072.53 0.15EUR TEREOS FINANCE GROUPE I SA-REG-S 4.12500% 16-16.06.23 1 500 000.00 1 809 299.30 0.06EUR TRINSEO MATERIALS OPERATING/FIN-REG-S 6.37500% 15-01.05.22 3 500 000.00 4 391 916.48 0.14EUR TUI AG-REG-S 2.12500% 16-26.10.21 2 000 000.00 2 447 934.13 0.08EUR UNICREDIT SPA-REG-S-SUB 6.95000% 12-31.10.22 3 000 000.00 4 327 201.18 0.13EUR UNITYMEDIA KABELBW GMBH-REG-S 3.75000% 15-15.01.27 1 000 000.00 1 201 766.49 0.04EUR UNITYMEDIA NRW/HESSEN-REG-S 6.25000% 13-15.01.29 1 000 000.00 1 343 659.14 0.04
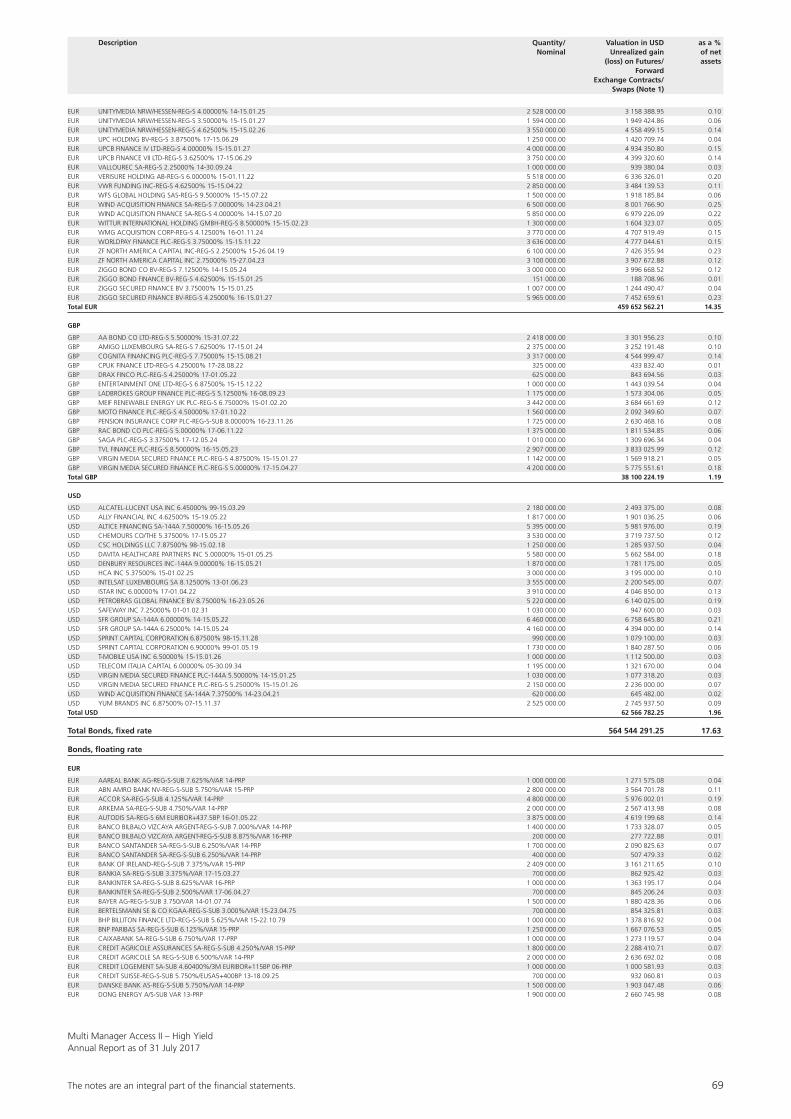
The notes are an integral part of the fi nancial statements. 69
Multi Manager Access II – High YieldAnnual Report as of 31 July 2017
EUR UNITYMEDIA NRW/HESSEN-REG-S 4.00000% 14-15.01.25 2 528 000.00 3 158 388.95 0.10EUR UNITYMEDIA NRW/HESSEN-REG-S 3.50000% 15-15.01.27 1 594 000.00 1 949 424.86 0.06EUR UNITYMEDIA NRW/HESSEN-REG-S 4.62500% 15-15.02.26 3 550 000.00 4 558 499.15 0.14EUR UPC HOLDING BV-REG-S 3.87500% 17-15.06.29 1 250 000.00 1 420 709.74 0.04EUR UPCB FINANCE IV LTD-REG-S 4.00000% 15-15.01.27 4 000 000.00 4 934 350.80 0.15EUR UPCB FINANCE VII LTD-REG-S 3.62500% 17-15.06.29 3 750 000.00 4 399 320.60 0.14EUR VALLOUREC SA-REG-S 2.25000% 14-30.09.24 1 000 000.00 939 380.04 0.03EUR VERISURE HOLDING AB-REG-S 6.00000% 15-01.11.22 5 518 000.00 6 336 326.01 0.20EUR VWR FUNDING INC-REG-S 4.62500% 15-15.04.22 2 850 000.00 3 484 139.53 0.11EUR WFS GLOBAL HOLDING SAS-REG-S 9.50000% 15-15.07.22 1 500 000.00 1 918 185.84 0.06EUR WIND ACQUISITION FINANCE SA-REG-S 7.00000% 14-23.04.21 6 500 000.00 8 001 766.90 0.25EUR WIND ACQUISITION FINANCE SA-REG-S 4.00000% 14-15.07.20 5 850 000.00 6 979 226.09 0.22EUR WITTUR INTERNATIONAL HOLDING GMBH-REG-S 8.50000% 15-15.02.23 1 300 000.00 1 604 323.07 0.05EUR WMG ACQUISITION CORP-REG-S 4.12500% 16-01.11.24 3 770 000.00 4 707 919.49 0.15EUR WORLDPAY FINANCE PLC-REG-S 3.75000% 15-15.11.22 3 636 000.00 4 777 044.61 0.15EUR ZF NORTH AMERICA CAPITAL INC-REG-S 2.25000% 15-26.04.19 6 100 000.00 7 426 355.94 0.23EUR ZF NORTH AMERICA CAPITAL INC 2.75000% 15-27.04.23 3 100 000.00 3 907 672.88 0.12EUR ZIGGO BOND CO BV-REG-S 7.12500% 14-15.05.24 3 000 000.00 3 996 668.52 0.12EUR ZIGGO BOND FINANCE BV-REG-S 4.62500% 15-15.01.25 151 000.00 188 708.96 0.01EUR ZIGGO SECURED FINANCE BV 3.75000% 15-15.01.25 1 007 000.00 1 244 490.47 0.04EUR ZIGGO SECURED FINANCE BV-REG-S 4.25000% 16-15.01.27 5 965 000.00 7 452 659.61 0.23Total EUR 459 652 562.21 14.35
GBP
GBP AA BOND CO LTD-REG-S 5.50000% 15-31.07.22 2 418 000.00 3 301 956.23 0.10GBP AMIGO LUXEMBOURG SA-REG-S 7.62500% 17-15.01.24 2 375 000.00 3 252 191.48 0.10GBP COGNITA FINANCING PLC-REG-S 7.75000% 15-15.08.21 3 317 000.00 4 544 999.47 0.14GBP CPUK FINANCE LTD-REG-S 4.25000% 17-28.08.22 325 000.00 433 832.40 0.01GBP DRAX FINCO PLC-REG-S 4.25000% 17-01.05.22 625 000.00 843 694.56 0.03GBP ENTERTAINMENT ONE LTD-REG-S 6.87500% 15-15.12.22 1 000 000.00 1 443 039.54 0.04GBP LADBROKES GROUP FINANCE PLC-REG-S 5.12500% 16-08.09.23 1 175 000.00 1 573 304.06 0.05GBP MEIF RENEWABLE ENERGY UK PLC-REG-S 6.75000% 15-01.02.20 3 442 000.00 3 684 661.69 0.12GBP MOTO FINANCE PLC-REG-S 4.50000% 17-01.10.22 1 560 000.00 2 092 349.60 0.07GBP PENSION INSURANCE CORP PLC-REG-S-SUB 8.00000% 16-23.11.26 1 725 000.00 2 630 468.16 0.08GBP RAC BOND CO PLC-REG-S 5.00000% 17-06.11.22 1 375 000.00 1 811 534.85 0.06GBP SAGA PLC-REG-S 3.37500% 17-12.05.24 1 010 000.00 1 309 696.34 0.04GBP TVL FINANCE PLC-REG-S 8.50000% 16-15.05.23 2 907 000.00 3 833 025.99 0.12GBP VIRGIN MEDIA SECURED FINANCE PLC-REG-S 4.87500% 15-15.01.27 1 142 000.00 1 569 918.21 0.05GBP VIRGIN MEDIA SECURED FINANCE PLC-REG-S 5.00000% 17-15.04.27 4 200 000.00 5 775 551.61 0.18Total GBP 38 100 224.19 1.19
USD
USD ALCATEL-LUCENT USA INC 6.45000% 99-15.03.29 2 180 000.00 2 493 375.00 0.08USD ALLY FINANCIAL INC 4.62500% 15-19.05.22 1 817 000.00 1 901 036.25 0.06USD ALTICE FINANCING SA-144A 7.50000% 16-15.05.26 5 395 000.00 5 981 976.00 0.19USD CHEMOURS CO/THE 5.37500% 17-15.05.27 3 530 000.00 3 719 737.50 0.12USD CSC HOLDINGS LLC 7.87500% 98-15.02.18 1 250 000.00 1 285 937.50 0.04USD DAVITA HEALTHCARE PARTNERS INC 5.00000% 15-01.05.25 5 580 000.00 5 662 584.00 0.18USD DENBURY RESOURCES INC-144A 9.00000% 16-15.05.21 1 870 000.00 1 781 175.00 0.05USD HCA INC 5.37500% 15-01.02.25 3 000 000.00 3 195 000.00 0.10USD INTELSAT LUXEMBOURG SA 8.12500% 13-01.06.23 3 555 000.00 2 200 545.00 0.07USD ISTAR INC 6.00000% 17-01.04.22 3 910 000.00 4 046 850.00 0.13USD PETROBRAS GLOBAL FINANCE BV 8.75000% 16-23.05.26 5 220 000.00 6 140 025.00 0.19USD SAFEWAY INC 7.25000% 01-01.02.31 1 030 000.00 947 600.00 0.03USD SFR GROUP SA-144A 6.00000% 14-15.05.22 6 460 000.00 6 758 645.80 0.21USD SFR GROUP SA-144A 6.25000% 14-15.05.24 4 160 000.00 4 394 000.00 0.14USD SPRINT CAPITAL CORPORATION 6.87500% 98-15.11.28 990 000.00 1 079 100.00 0.03USD SPRINT CAPITAL CORPORATION 6.90000% 99-01.05.19 1 730 000.00 1 840 287.50 0.06USD T-MOBILE USA INC 6.50000% 15-15.01.26 1 000 000.00 1 112 500.00 0.03USD TELECOM ITALIA CAPITAL 6.00000% 05-30.09.34 1 195 000.00 1 321 670.00 0.04USD VIRGIN MEDIA SECURED FINANCE PLC-144A 5.50000% 14-15.01.25 1 030 000.00 1 077 318.20 0.03USD VIRGIN MEDIA SECURED FINANCE PLC-REG-S 5.25000% 15-15.01.26 2 150 000.00 2 236 000.00 0.07USD WIND ACQUISITION FINANCE SA-144A 7.37500% 14-23.04.21 620 000.00 645 482.00 0.02USD YUM BRANDS INC 6.87500% 07-15.11.37 2 525 000.00 2 745 937.50 0.09Total USD 62 566 782.25 1.96
Total Bonds, fixed rate 564 544 291.25 17.63
Bonds, floating rate
EUR
EUR AAREAL BANK AG-REG-S-SUB 7.625%/VAR 14-PRP 1 000 000.00 1 271 575.08 0.04EUR ABN AMRO BANK NV-REG-S-SUB 5.750%/VAR 15-PRP 2 800 000.00 3 564 701.78 0.11EUR ACCOR SA-REG-S-SUB 4.125%/VAR 14-PRP 4 800 000.00 5 976 002.01 0.19EUR ARKEMA SA-REG-S-SUB 4.750%/VAR 14-PRP 2 000 000.00 2 567 413.98 0.08EUR AUTODIS SA-REG-S 6M EURIBOR+437.5BP 16-01.05.22 3 875 000.00 4 619 199.68 0.14EUR BANCO BILBALO VIZCAYA ARGENT-REG-S-SUB 7.000%/VAR 14-PRP 1 400 000.00 1 733 328.07 0.05EUR BANCO BILBALO VIZCAYA ARGENT-REG-S-SUB 8.875%/VAR 16-PRP 200 000.00 277 722.88 0.01EUR BANCO SANTANDER SA-REG-S-SUB 6.250%/VAR 14-PRP 1 700 000.00 2 090 825.63 0.07EUR BANCO SANTANDER SA-REG-S-SUB 6.250%/VAR 14-PRP 400 000.00 507 479.33 0.02EUR BANK OF IRELAND-REG-S-SUB 7.375%/VAR 15-PRP 2 409 000.00 3 161 211.65 0.10EUR BANKIA SA-REG-S-SUB 3.375%/VAR 17-15.03.27 700 000.00 862 925.42 0.03EUR BANKINTER SA-REG-S-SUB 8.625%/VAR 16-PRP 1 000 000.00 1 363 195.17 0.04EUR BANKINTER SA-REG-S-SUB 2.500%/VAR 17-06.04.27 700 000.00 845 206.24 0.03EUR BAYER AG-REG-S-SUB 3.750/VAR 14-01.07.74 1 500 000.00 1 880 428.36 0.06EUR BERTELSMANN SE & CO KGAA-REG-S-SUB 3.000%/VAR 15-23.04.75 700 000.00 854 325.81 0.03EUR BHP BILLITON FINANCE LTD-REG-S-SUB 5.625%/VAR 15-22.10.79 1 000 000.00 1 378 816.92 0.04EUR BNP PARIBAS SA-REG-S-SUB 6.125%/VAR 15-PRP 1 250 000.00 1 667 076.53 0.05EUR CAIXABANK SA-REG-S-SUB 6.750%/VAR 17-PRP 1 000 000.00 1 273 119.57 0.04EUR CREDIT AGRICOLE ASSURANCES SA-REG-S-SUB 4.250%/VAR 15-PRP 1 800 000.00 2 288 410.71 0.07EUR CREDIT AGRICOLE SA REG-S-SUB 6.500%/VAR 14-PRP 2 000 000.00 2 636 692.02 0.08EUR CREDIT LOGEMENT SA-SUB 4.60400%/3M EURIBOR+115BP 06-PRP 1 000 000.00 1 000 581.93 0.03EUR CREDIT SUISSE-REG-S-SUB 5.750%/EUSA5+400BP 13-18.09.25 700 000.00 932 060.81 0.03EUR DANSKE BANK AS-REG-S-SUB 5.750%/VAR 14-PRP 1 500 000.00 1 903 047.48 0.06EUR DONG ENERGY A/S-SUB VAR 13-PRP 1 900 000.00 2 660 745.98 0.08
Description Quantity/ Valuation in USD as a % Nominal Unrealized gain of net (loss) on Futures/ assets Forward Exchange Contracts/ Swaps (Note 1)
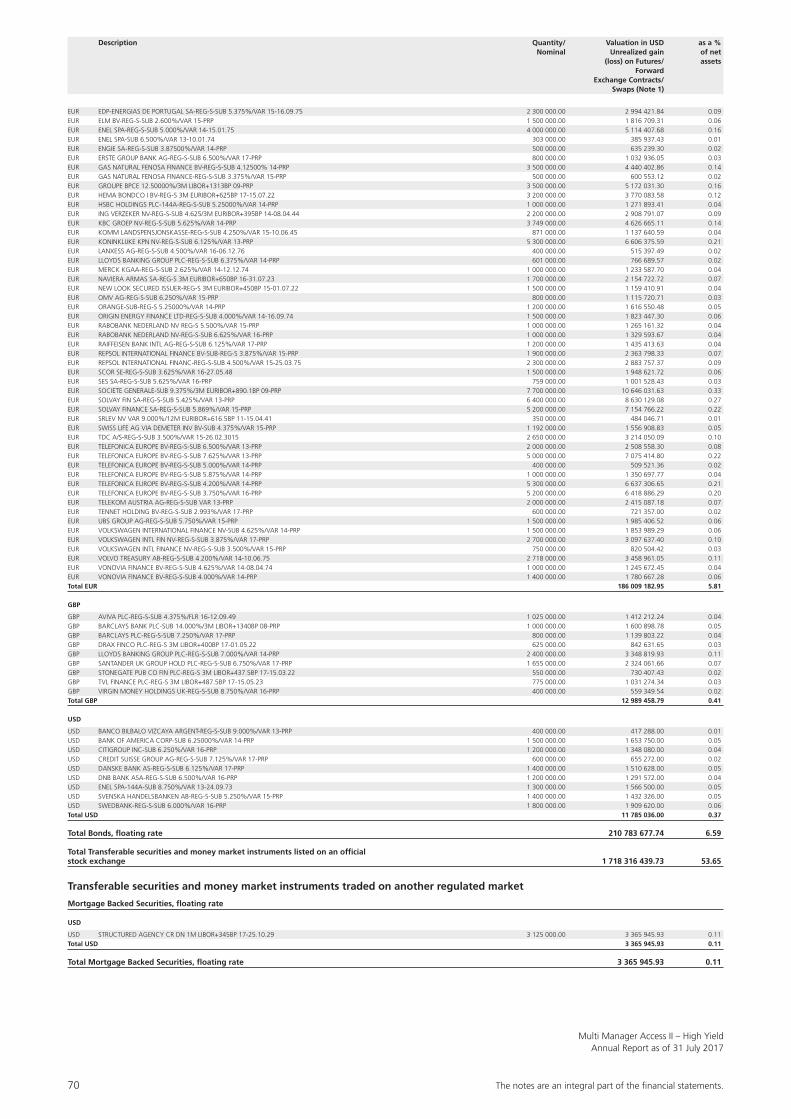
70 The notes are an integral part of the fi nancial statements.
Multi Manager Access II – High YieldAnnual Report as of 31 July 2017
Description Quantity/ Valuation in USD as a % Nominal Unrealized gain of net (loss) on Futures/ assets Forward Exchange Contracts/ Swaps (Note 1)
EUR EDP-ENERGIAS DE PORTUGAL SA-REG-S-SUB 5.375%/VAR 15-16.09.75 2 300 000.00 2 994 421.84 0.09EUR ELM BV-REG-S-SUB 2.600%/VAR 15-PRP 1 500 000.00 1 816 709.31 0.06EUR ENEL SPA-REG-S-SUB 5.000%/VAR 14-15.01.75 4 000 000.00 5 114 407.68 0.16EUR ENEL SPA-SUB 6.500%/VAR 13-10.01.74 303 000.00 385 937.43 0.01EUR ENGIE SA-REG-S-SUB 3.87500%/VAR 14-PRP 500 000.00 635 239.30 0.02EUR ERSTE GROUP BANK AG-REG-S-SUB 6.500%/VAR 17-PRP 800 000.00 1 032 936.05 0.03EUR GAS NATURAL FENOSA FINANCE BV-REG-S-SUB 4.12500% 14-PRP 3 500 000.00 4 440 402.86 0.14EUR GAS NATURAL FENOSA FINANCE-REG-S-SUB 3.375%/VAR 15-PRP 500 000.00 600 553.12 0.02EUR GROUPE BPCE 12.50000%/3M LIBOR+1313BP 09-PRP 3 500 000.00 5 172 031.30 0.16EUR HEMA BONDCO I BV-REG-S 3M EURIBOR+625BP 17-15.07.22 3 200 000.00 3 770 083.58 0.12EUR HSBC HOLDINGS PLC-144A-REG-S-SUB 5.25000%/VAR 14-PRP 1 000 000.00 1 271 893.41 0.04EUR ING VERZEKER NV-REG-S-SUB 4.625/3M EURIBOR+395BP 14-08.04.44 2 200 000.00 2 908 791.07 0.09EUR KBC GROEP NV-REG-S-SUB 5.625%/VAR 14-PRP 3 749 000.00 4 626 665.11 0.14EUR KOMM LANDSPENSJONSKASSE-REG-S-SUB 4.250%/VAR 15-10.06.45 871 000.00 1 137 640.59 0.04EUR KONINKLIJKE KPN NV-REG-S-SUB 6.125%/VAR 13-PRP 5 300 000.00 6 606 375.59 0.21EUR LANXESS AG-REG-S-SUB 4.500%/VAR 16-06.12.76 400 000.00 515 397.49 0.02EUR LLOYDS BANKING GROUP PLC-REG-S-SUB 6.375%/VAR 14-PRP 601 000.00 766 689.57 0.02EUR MERCK KGAA-REG-S-SUB 2.625%/VAR 14-12.12.74 1 000 000.00 1 233 587.70 0.04EUR NAVIERA ARMAS SA-REG-S 3M EURIBOR+650BP 16-31.07.23 1 700 000.00 2 154 722.72 0.07EUR NEW LOOK SECURED ISSUER-REG-S 3M EURIBOR+450BP 15-01.07.22 1 500 000.00 1 159 410.91 0.04EUR OMV AG-REG-S-SUB 6.250%/VAR 15-PRP 800 000.00 1 115 720.71 0.03EUR ORANGE-SUB-REG-S 5.25000%/VAR 14-PRP 1 200 000.00 1 616 550.48 0.05EUR ORIGIN ENERGY FINANCE LTD-REG-S-SUB 4.000%/VAR 14-16.09.74 1 500 000.00 1 823 447.30 0.06EUR RABOBANK NEDERLAND NV REG-S 5.500%/VAR 15-PRP 1 000 000.00 1 265 161.32 0.04EUR RABOBANK NEDERLAND NV-REG-S-SUB 6.625%/VAR 16-PRP 1 000 000.00 1 329 593.67 0.04EUR RAIFFEISEN BANK INTL AG-REG-S-SUB 6.125%/VAR 17-PRP 1 200 000.00 1 435 413.63 0.04EUR REPSOL INTERNATIONAL FINANCE BV-SUB-REG-S 3.875%/VAR 15-PRP 1 900 000.00 2 363 798.33 0.07EUR REPSOL INTERNATIONAL FINANC-REG-S-SUB 4.500%/VAR 15-25.03.75 2 300 000.00 2 883 757.37 0.09EUR SCOR SE-REG-S-SUB 3.625%/VAR 16-27.05.48 1 500 000.00 1 948 621.72 0.06EUR SES SA-REG-S-SUB 5.625%/VAR 16-PRP 759 000.00 1 001 528.43 0.03EUR SOCIETE GENERALE-SUB 9.375%/3M EURIBOR+890.1BP 09-PRP 7 700 000.00 10 646 031.63 0.33EUR SOLVAY FIN SA-REG-S-SUB 5.425%/VAR 13-PRP 6 400 000.00 8 630 129.08 0.27EUR SOLVAY FINANCE SA-REG-S-SUB 5.869%/VAR 15-PRP 5 200 000.00 7 154 766.22 0.22EUR SRLEV NV VAR 9.000%/12M EURIBOR+616.5BP 11-15.04.41 350 000.00 484 046.71 0.01EUR SWISS LIFE AG VIA DEMETER INV BV-SUB 4.375%/VAR 15-PRP 1 192 000.00 1 556 908.83 0.05EUR TDC A/S-REG-S-SUB 3.500%/VAR 15-26.02.3015 2 650 000.00 3 214 050.09 0.10EUR TELEFONICA EUROPE BV-REG-S-SUB 6.500%/VAR 13-PRP 2 000 000.00 2 508 558.30 0.08EUR TELEFONICA EUROPE BV-REG-S-SUB 7.625%/VAR 13-PRP 5 000 000.00 7 075 414.80 0.22EUR TELEFONICA EUROPE BV-REG-S-SUB 5.000%/VAR 14-PRP 400 000.00 509 521.36 0.02EUR TELEFONICA EUROPE BV-REG-S-SUB 5.875%/VAR 14-PRP 1 000 000.00 1 350 697.77 0.04EUR TELEFONICA EUROPE BV-REG-S-SUB 4.200%/VAR 14-PRP 5 300 000.00 6 637 306.65 0.21EUR TELEFONICA EUROPE BV-REG-S-SUB 3.750%/VAR 16-PRP 5 200 000.00 6 418 886.29 0.20EUR TELEKOM AUSTRIA AG-REG-S-SUB VAR 13-PRP 2 000 000.00 2 415 087.18 0.07EUR TENNET HOLDING BV-REG-S-SUB 2.993%/VAR 17-PRP 600 000.00 721 357.00 0.02EUR UBS GROUP AG-REG-S-SUB 5.750%/VAR 15-PRP 1 500 000.00 1 985 406.52 0.06EUR VOLKSWAGEN INTERNATIONAL FINANCE NV-SUB 4.625%/VAR 14-PRP 1 500 000.00 1 853 989.29 0.06EUR VOLKSWAGEN INTL FIN NV-REG-S-SUB 3.875%/VAR 17-PRP 2 700 000.00 3 097 637.40 0.10EUR VOLKSWAGEN INTL FINANCE NV-REG-S-SUB 3.500%/VAR 15-PRP 750 000.00 820 504.42 0.03EUR VOLVO TREASURY AB-REG-S-SUB 4.200%/VAR 14-10.06.75 2 718 000.00 3 458 961.05 0.11EUR VONOVIA FINANCE BV-REG-S-SUB 4.625%/VAR 14-08.04.74 1 000 000.00 1 245 672.45 0.04EUR VONOVIA FINANCE BV-REG-S-SUB 4.000%/VAR 14-PRP 1 400 000.00 1 780 667.28 0.06Total EUR 186 009 182.95 5.81
GBP
GBP AVIVA PLC-REG-S-SUB 4.375%/FLR 16-12.09.49 1 025 000.00 1 412 212.24 0.04GBP BARCLAYS BANK PLC-SUB 14.000%/3M LIBOR+1340BP 08-PRP 1 000 000.00 1 600 898.78 0.05GBP BARCLAYS PLC-REG-S-SUB 7.250%/VAR 17-PRP 800 000.00 1 139 803.22 0.04GBP DRAX FINCO PLC-REG-S 3M LIBOR+400BP 17-01.05.22 625 000.00 842 631.65 0.03GBP LLOYDS BANKING GROUP PLC-REG-S-SUB 7.000%/VAR 14-PRP 2 400 000.00 3 348 819.93 0.11GBP SANTANDER UK GROUP HOLD PLC-REG-S-SUB 6.750%/VAR 17-PRP 1 655 000.00 2 324 061.66 0.07GBP STONEGATE PUB CO FIN PLC-REG-S 3M LIBOR+437.5BP 17-15.03.22 550 000.00 730 407.43 0.02GBP TVL FINANCE PLC-REG-S 3M LIBOR+487.5BP 17-15.05.23 775 000.00 1 031 274.34 0.03GBP VIRGIN MONEY HOLDINGS UK-REG-S-SUB 8.750%/VAR 16-PRP 400 000.00 559 349.54 0.02Total GBP 12 989 458.79 0.41
USD
USD BANCO BILBALO VIZCAYA ARGENT-REG-S-SUB 9.000%/VAR 13-PRP 400 000.00 417 288.00 0.01USD BANK OF AMERICA CORP-SUB 6.25000%/VAR 14-PRP 1 500 000.00 1 653 750.00 0.05USD CITIGROUP INC-SUB 6.250%/VAR 16-PRP 1 200 000.00 1 348 080.00 0.04USD CREDIT SUISSE GROUP AG-REG-S-SUB 7.125%/VAR 17-PRP 600 000.00 655 272.00 0.02USD DANSKE BANK AS-REG-S-SUB 6.125%/VAR 17-PRP 1 400 000.00 1 510 628.00 0.05USD DNB BANK ASA-REG-S-SUB 6.500%/VAR 16-PRP 1 200 000.00 1 291 572.00 0.04USD ENEL SPA-144A-SUB 8.750%/VAR 13-24.09.73 1 300 000.00 1 566 500.00 0.05USD SVENSKA HANDELSBANKEN AB-REG-S-SUB 5.250%/VAR 15-PRP 1 400 000.00 1 432 326.00 0.05USD SWEDBANK-REG-S-SUB 6.000%/VAR 16-PRP 1 800 000.00 1 909 620.00 0.06Total USD 11 785 036.00 0.37
Total Bonds, floating rate 210 783 677.74 6.59
Total Transferable securities and money market instruments listed on an official stock exchange 1 718 316 439.73 53.65
Transferable securities and money market instruments traded on another regulated market
Mortgage Backed Securities, floating rate
USD
USD STRUCTURED AGENCY CR DN 1M LIBOR+345BP 17-25.10.29 3 125 000.00 3 365 945.93 0.11Total USD 3 365 945.93 0.11
Total Mortgage Backed Securities, floating rate 3 365 945.93 0.11
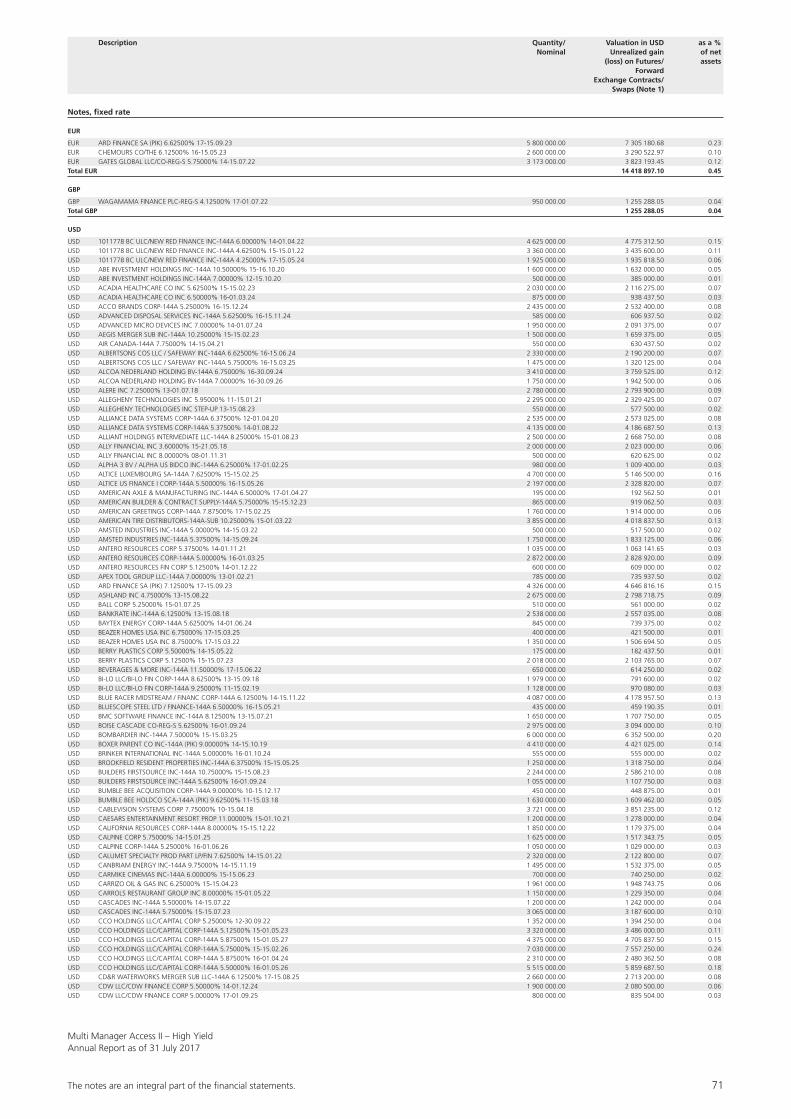
The notes are an integral part of the fi nancial statements. 71
Multi Manager Access II – High YieldAnnual Report as of 31 July 2017
Notes, fixed rate
EUR
EUR ARD FINANCE SA (PIK) 6.62500% 17-15.09.23 5 800 000.00 7 305 180.68 0.23EUR CHEMOURS CO/THE 6.12500% 16-15.05.23 2 600 000.00 3 290 522.97 0.10EUR GATES GLOBAL LLC/CO-REG-S 5.75000% 14-15.07.22 3 173 000.00 3 823 193.45 0.12Total EUR 14 418 897.10 0.45
GBP
GBP WAGAMAMA FINANCE PLC-REG-S 4.12500% 17-01.07.22 950 000.00 1 255 288.05 0.04Total GBP 1 255 288.05 0.04
USD
USD 1011778 BC ULC/NEW RED FINANCE INC-144A 6.00000% 14-01.04.22 4 625 000.00 4 775 312.50 0.15USD 1011778 BC ULC/NEW RED FINANCE INC-144A 4.62500% 15-15.01.22 3 360 000.00 3 435 600.00 0.11USD 1011778 BC ULC/NEW RED FINANCE INC-144A 4.25000% 17-15.05.24 1 925 000.00 1 935 818.50 0.06USD ABE INVESTMENT HOLDINGS INC-144A 10.50000% 15-16.10.20 1 600 000.00 1 632 000.00 0.05USD ABE INVESTMENT HOLDINGS INC-144A 7.00000% 12-15.10.20 500 000.00 385 000.00 0.01USD ACADIA HEALTHCARE CO INC 5.62500% 15-15.02.23 2 030 000.00 2 116 275.00 0.07USD ACADIA HEALTHCARE CO INC 6.50000% 16-01.03.24 875 000.00 938 437.50 0.03USD ACCO BRANDS CORP-144A 5.25000% 16-15.12.24 2 435 000.00 2 532 400.00 0.08USD ADVANCED DISPOSAL SERVICES INC-144A 5.62500% 16-15.11.24 585 000.00 606 937.50 0.02USD ADVANCED MICRO DEVICES INC 7.00000% 14-01.07.24 1 950 000.00 2 091 375.00 0.07USD AEGIS MERGER SUB INC-144A 10.25000% 15-15.02.23 1 500 000.00 1 659 375.00 0.05USD AIR CANADA-144A 7.75000% 14-15.04.21 550 000.00 630 437.50 0.02USD ALBERTSONS COS LLC / SAFEWAY INC-144A 6.62500% 16-15.06.24 2 330 000.00 2 190 200.00 0.07USD ALBERTSONS COS LLC / SAFEWAY INC-144A 5.75000% 16-15.03.25 1 475 000.00 1 320 125.00 0.04USD ALCOA NEDERLAND HOLDING BV-144A 6.75000% 16-30.09.24 3 410 000.00 3 759 525.00 0.12USD ALCOA NEDERLAND HOLDING BV-144A 7.00000% 16-30.09.26 1 750 000.00 1 942 500.00 0.06USD ALERE INC 7.25000% 13-01.07.18 2 780 000.00 2 793 900.00 0.09USD ALLEGHENY TECHNOLOGIES INC 5.95000% 11-15.01.21 2 295 000.00 2 329 425.00 0.07USD ALLEGHENY TECHNOLOGIES INC STEP-UP 13-15.08.23 550 000.00 577 500.00 0.02USD ALLIANCE DATA SYSTEMS CORP-144A 6.37500% 12-01.04.20 2 535 000.00 2 573 025.00 0.08USD ALLIANCE DATA SYSTEMS CORP-144A 5.37500% 14-01.08.22 4 135 000.00 4 186 687.50 0.13USD ALLIANT HOLDINGS INTERMEDIATE LLC-144A 8.25000% 15-01.08.23 2 500 000.00 2 668 750.00 0.08USD ALLY FINANCIAL INC 3.60000% 15-21.05.18 2 000 000.00 2 023 000.00 0.06USD ALLY FINANCIAL INC 8.00000% 08-01.11.31 500 000.00 620 625.00 0.02USD ALPHA 3 BV / ALPHA US BIDCO INC-144A 6.25000% 17-01.02.25 980 000.00 1 009 400.00 0.03USD ALTICE LUXEMBOURG SA-144A 7.62500% 15-15.02.25 4 700 000.00 5 146 500.00 0.16USD ALTICE US FINANCE I CORP-144A 5.50000% 16-15.05.26 2 197 000.00 2 328 820.00 0.07USD AMERICAN AXLE & MANUFACTURING INC-144A 6.50000% 17-01.04.27 195 000.00 192 562.50 0.01USD AMERICAN BUILDER & CONTRACT SUPPLY-144A 5.75000% 15-15.12.23 865 000.00 919 062.50 0.03USD AMERICAN GREETINGS CORP-144A 7.87500% 17-15.02.25 1 760 000.00 1 914 000.00 0.06USD AMERICAN TIRE DISTRIBUTORS-144A-SUB 10.25000% 15-01.03.22 3 855 000.00 4 018 837.50 0.13USD AMSTED INDUSTRIES INC-144A 5.00000% 14-15.03.22 500 000.00 517 500.00 0.02USD AMSTED INDUSTRIES INC-144A 5.37500% 14-15.09.24 1 750 000.00 1 833 125.00 0.06USD ANTERO RESOURCES CORP 5.37500% 14-01.11.21 1 035 000.00 1 063 141.65 0.03USD ANTERO RESOURCES CORP-144A 5.00000% 16-01.03.25 2 872 000.00 2 828 920.00 0.09USD ANTERO RESOURCES FIN CORP 5.12500% 14-01.12.22 600 000.00 609 000.00 0.02USD APEX TOOL GROUP LLC-144A 7.00000% 13-01.02.21 785 000.00 735 937.50 0.02USD ARD FINANCE SA (PIK) 7.12500% 17-15.09.23 4 326 000.00 4 646 816.16 0.15USD ASHLAND INC 4.75000% 13-15.08.22 2 675 000.00 2 798 718.75 0.09USD BALL CORP 5.25000% 15-01.07.25 510 000.00 561 000.00 0.02USD BANKRATE INC-144A 6.12500% 13-15.08.18 2 538 000.00 2 557 035.00 0.08USD BAYTEX ENERGY CORP-144A 5.62500% 14-01.06.24 845 000.00 739 375.00 0.02USD BEAZER HOMES USA INC 6.75000% 17-15.03.25 400 000.00 421 500.00 0.01USD BEAZER HOMES USA INC 8.75000% 17-15.03.22 1 350 000.00 1 506 694.50 0.05USD BERRY PLASTICS CORP 5.50000% 14-15.05.22 175 000.00 182 437.50 0.01USD BERRY PLASTICS CORP 5.12500% 15-15.07.23 2 018 000.00 2 103 765.00 0.07USD BEVERAGES & MORE INC-144A 11.50000% 17-15.06.22 650 000.00 614 250.00 0.02USD BI-LO LLC/BI-LO FIN CORP-144A 8.62500% 13-15.09.18 1 979 000.00 791 600.00 0.02USD BI-LO LLC/BI-LO FIN CORP-144A 9.25000% 11-15.02.19 1 128 000.00 970 080.00 0.03USD BLUE RACER MIDSTREAM / FINANC CORP-144A 6.12500% 14-15.11.22 4 087 000.00 4 178 957.50 0.13USD BLUESCOPE STEEL LTD / FINANCE-144A 6.50000% 16-15.05.21 435 000.00 459 190.35 0.01USD BMC SOFTWARE FINANCE INC-144A 8.12500% 13-15.07.21 1 650 000.00 1 707 750.00 0.05USD BOISE CASCADE CO-REG-S 5.62500% 16-01.09.24 2 975 000.00 3 094 000.00 0.10USD BOMBARDIER INC-144A 7.50000% 15-15.03.25 6 000 000.00 6 352 500.00 0.20USD BOXER PARENT CO INC-144A (PIK) 9.00000% 14-15.10.19 4 410 000.00 4 421 025.00 0.14USD BRINKER INTERNATIONAL INC-144A 5.00000% 16-01.10.24 555 000.00 555 000.00 0.02USD BROOKFIELD RESIDENT PROPERTIES INC-144A 6.37500% 15-15.05.25 1 250 000.00 1 318 750.00 0.04USD BUILDERS FIRSTSOURCE INC-144A 10.75000% 15-15.08.23 2 244 000.00 2 586 210.00 0.08USD BUILDERS FIRSTSOURCE INC-144A 5.62500% 16-01.09.24 1 055 000.00 1 107 750.00 0.03USD BUMBLE BEE ACQUISITION CORP-144A 9.00000% 10-15.12.17 450 000.00 448 875.00 0.01USD BUMBLE BEE HOLDCO SCA-144A (PIK) 9.62500% 11-15.03.18 1 630 000.00 1 609 462.00 0.05USD CABLEVISION SYSTEMS CORP 7.75000% 10-15.04.18 3 721 000.00 3 851 235.00 0.12USD CAESARS ENTERTAINMENT RESORT PROP 11.00000% 15-01.10.21 1 200 000.00 1 278 000.00 0.04USD CALIFORNIA RESOURCES CORP-144A 8.00000% 15-15.12.22 1 850 000.00 1 179 375.00 0.04USD CALPINE CORP 5.75000% 14-15.01.25 1 625 000.00 1 517 343.75 0.05USD CALPINE CORP-144A 5.25000% 16-01.06.26 1 050 000.00 1 029 000.00 0.03USD CALUMET SPECIALTY PROD PART LP/FIN 7.62500% 14-15.01.22 2 320 000.00 2 122 800.00 0.07USD CANBRIAM ENERGY INC-144A 9.75000% 14-15.11.19 1 495 000.00 1 532 375.00 0.05USD CARMIKE CINEMAS INC-144A 6.00000% 15-15.06.23 700 000.00 740 250.00 0.02USD CARRIZO OIL & GAS INC 6.25000% 15-15.04.23 1 961 000.00 1 948 743.75 0.06USD CARROLS RESTAURANT GROUP INC 8.00000% 15-01.05.22 1 150 000.00 1 229 350.00 0.04USD CASCADES INC-144A 5.50000% 14-15.07.22 1 200 000.00 1 242 000.00 0.04USD CASCADES INC-144A 5.75000% 15-15.07.23 3 065 000.00 3 187 600.00 0.10USD CCO HOLDINGS LLC/CAPITAL CORP 5.25000% 12-30.09.22 1 352 000.00 1 394 250.00 0.04USD CCO HOLDINGS LLC/CAPITAL CORP-144A 5.12500% 15-01.05.23 3 320 000.00 3 486 000.00 0.11USD CCO HOLDINGS LLC/CAPITAL CORP-144A 5.87500% 15-01.05.27 4 375 000.00 4 705 837.50 0.15USD CCO HOLDINGS LLC/CAPITAL CORP-144A 5.75000% 15-15.02.26 7 030 000.00 7 557 250.00 0.24USD CCO HOLDINGS LLC/CAPITAL CORP-144A 5.87500% 16-01.04.24 2 310 000.00 2 480 362.50 0.08USD CCO HOLDINGS LLC/CAPITAL CORP-144A 5.50000% 16-01.05.26 5 515 000.00 5 859 687.50 0.18USD CD&R WATERWORKS MERGER SUB LLC-144A 6.12500% 17-15.08.25 2 660 000.00 2 713 200.00 0.08USD CDW LLC/CDW FINANCE CORP 5.50000% 14-01.12.24 1 900 000.00 2 080 500.00 0.06USD CDW LLC/CDW FINANCE CORP 5.00000% 17-01.09.25 800 000.00 835 504.00 0.03
Description Quantity/ Valuation in USD as a % Nominal Unrealized gain of net (loss) on Futures/ assets Forward Exchange Contracts/ Swaps (Note 1)
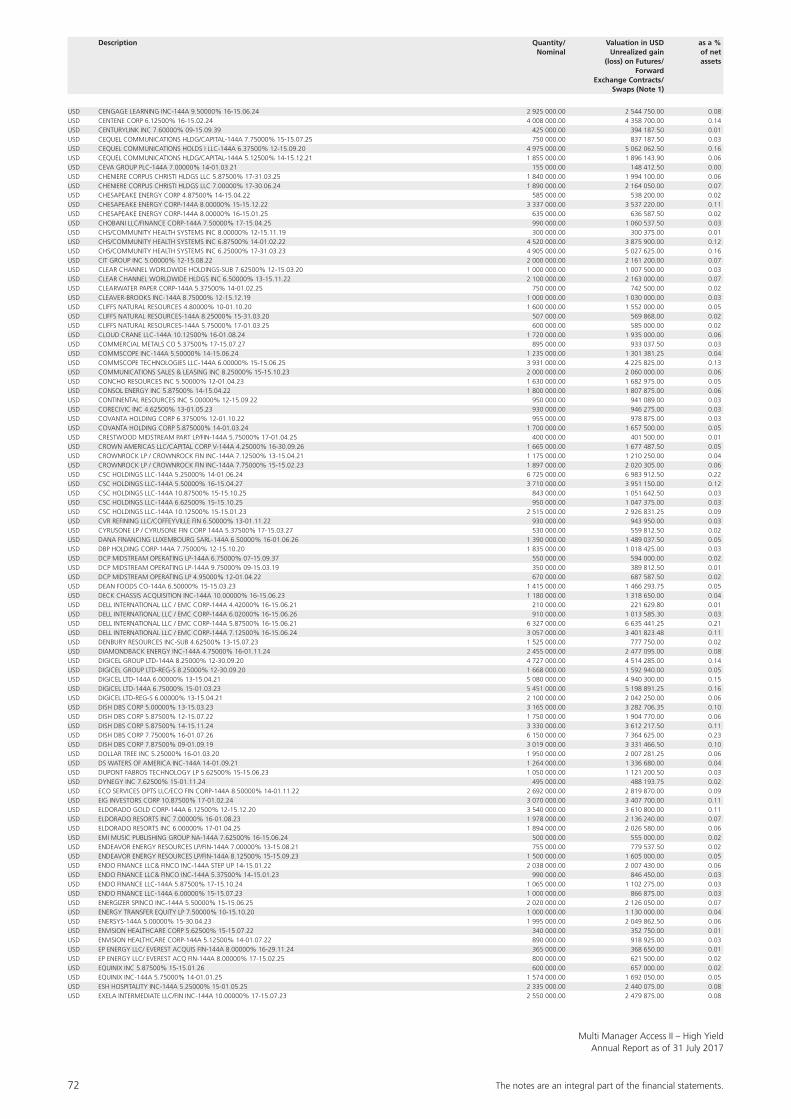
72 The notes are an integral part of the fi nancial statements.
Multi Manager Access II – High YieldAnnual Report as of 31 July 2017
Description Quantity/ Valuation in USD as a % Nominal Unrealized gain of net (loss) on Futures/ assets Forward Exchange Contracts/ Swaps (Note 1)
USD CENGAGE LEARNING INC-144A 9.50000% 16-15.06.24 2 925 000.00 2 544 750.00 0.08USD CENTENE CORP 6.12500% 16-15.02.24 4 008 000.00 4 358 700.00 0.14USD CENTURYLINK INC 7.60000% 09-15.09.39 425 000.00 394 187.50 0.01USD CEQUEL COMMUNICATIONS HLDG/CAPITAL-144A 7.75000% 15-15.07.25 750 000.00 837 187.50 0.03USD CEQUEL COMMUNICATIONS HOLDS I LLC-144A 6.37500% 12-15.09.20 4 975 000.00 5 062 062.50 0.16USD CEQUEL COMMUNICATIONS HLDG/CAPITAL-144A 5.12500% 14-15.12.21 1 855 000.00 1 896 143.90 0.06USD CEVA GROUP PLC-144A 7.00000% 14-01.03.21 155 000.00 148 412.50 0.00USD CHENIERE CORPUS CHRISTI HLDGS LLC 5.87500% 17-31.03.25 1 840 000.00 1 994 100.00 0.06USD CHENIERE CORPUS CHRISTI HLDGS LLC 7.00000% 17-30.06.24 1 890 000.00 2 164 050.00 0.07USD CHESAPEAKE ENERGY CORP 4.87500% 14-15.04.22 585 000.00 538 200.00 0.02USD CHESAPEAKE ENERGY CORP-144A 8.00000% 15-15.12.22 3 337 000.00 3 537 220.00 0.11USD CHESAPEAKE ENERGY CORP-144A 8.00000% 16-15.01.25 635 000.00 636 587.50 0.02USD CHOBANI LLC/FINANCE CORP-144A 7.50000% 17-15.04.25 990 000.00 1 060 537.50 0.03USD CHS/COMMUNITY HEALTH SYSTEMS INC 8.00000% 12-15.11.19 300 000.00 300 375.00 0.01USD CHS/COMMUNITY HEALTH SYSTEMS INC 6.87500% 14-01.02.22 4 520 000.00 3 875 900.00 0.12USD CHS/COMMUNITY HEALTH SYSTEMS INC 6.25000% 17-31.03.23 4 905 000.00 5 027 625.00 0.16USD CIT GROUP INC 5.00000% 12-15.08.22 2 000 000.00 2 161 200.00 0.07USD CLEAR CHANNEL WORLDWIDE HOLDINGS-SUB 7.62500% 12-15.03.20 1 000 000.00 1 007 500.00 0.03USD CLEAR CHANNEL WORLDWIDE HLDGS INC 6.50000% 13-15.11.22 2 100 000.00 2 163 000.00 0.07USD CLEARWATER PAPER CORP-144A 5.37500% 14-01.02.25 750 000.00 742 500.00 0.02USD CLEAVER-BROOKS INC-144A 8.75000% 12-15.12.19 1 000 000.00 1 030 000.00 0.03USD CLIFFS NATURAL RESOURCES 4.80000% 10-01.10.20 1 600 000.00 1 552 000.00 0.05USD CLIFFS NATURAL RESOURCES-144A 8.25000% 15-31.03.20 507 000.00 569 868.00 0.02USD CLIFFS NATURAL RESOURCES-144A 5.75000% 17-01.03.25 600 000.00 585 000.00 0.02USD CLOUD CRANE LLC-144A 10.12500% 16-01.08.24 1 720 000.00 1 935 000.00 0.06USD COMMERCIAL METALS CO 5.37500% 17-15.07.27 895 000.00 933 037.50 0.03USD COMMSCOPE INC-144A 5.50000% 14-15.06.24 1 235 000.00 1 301 381.25 0.04USD COMMSCOPE TECHNOLOGIES LLC-144A 6.00000% 15-15.06.25 3 931 000.00 4 225 825.00 0.13USD COMMUNICATIONS SALES & LEASING INC 8.25000% 15-15.10.23 2 000 000.00 2 060 000.00 0.06USD CONCHO RESOURCES INC 5.50000% 12-01.04.23 1 630 000.00 1 682 975.00 0.05USD CONSOL ENERGY INC 5.87500% 14-15.04.22 1 800 000.00 1 807 875.00 0.06USD CONTINENTAL RESOURCES INC 5.00000% 12-15.09.22 950 000.00 941 089.00 0.03USD CORECIVIC INC 4.62500% 13-01.05.23 930 000.00 946 275.00 0.03USD COVANTA HOLDING CORP 6.37500% 12-01.10.22 955 000.00 978 875.00 0.03USD COVANTA HOLDING CORP 5.875000% 14-01.03.24 1 700 000.00 1 657 500.00 0.05USD CRESTWOOD MIDSTREAM PART LP/FIN-144A 5.75000% 17-01.04.25 400 000.00 401 500.00 0.01USD CROWN AMERICAS LLC/CAPITAL CORP V-144A 4.25000% 16-30.09.26 1 665 000.00 1 677 487.50 0.05USD CROWNROCK LP / CROWNROCK FIN INC-144A 7.12500% 13-15.04.21 1 175 000.00 1 210 250.00 0.04USD CROWNROCK LP / CROWNROCK FIN INC-144A 7.75000% 15-15.02.23 1 897 000.00 2 020 305.00 0.06USD CSC HOLDINGS LLC-144A 5.25000% 14-01.06.24 6 725 000.00 6 983 912.50 0.22USD CSC HOLDINGS LLC-144A 5.50000% 16-15.04.27 3 710 000.00 3 951 150.00 0.12USD CSC HOLDINGS LLC-144A 10.87500% 15-15.10.25 843 000.00 1 051 642.50 0.03USD CSC HOLDINGS LLC-144A 6.62500% 15-15.10.25 950 000.00 1 047 375.00 0.03USD CSC HOLDINGS LLC-144A 10.12500% 15-15.01.23 2 515 000.00 2 926 831.25 0.09USD CVR REFINING LLC/COFFEYVILLE FIN 6.50000% 13-01.11.22 930 000.00 943 950.00 0.03USD CYRUSONE LP / CYRUSONE FIN CORP 144A 5.37500% 17-15.03.27 530 000.00 559 812.50 0.02USD DANA FINANCING LUXEMBOURG SARL-144A 6.50000% 16-01.06.26 1 390 000.00 1 489 037.50 0.05USD DBP HOLDING CORP-144A 7.75000% 12-15.10.20 1 835 000.00 1 018 425.00 0.03USD DCP MIDSTREAM OPERATING LP-144A 6.75000% 07-15.09.37 550 000.00 594 000.00 0.02USD DCP MIDSTREAM OPERATING LP-144A 9.75000% 09-15.03.19 350 000.00 389 812.50 0.01USD DCP MIDSTREAM OPERATING LP 4.95000% 12-01.04.22 670 000.00 687 587.50 0.02USD DEAN FOODS CO-144A 6.50000% 15-15.03.23 1 415 000.00 1 466 293.75 0.05USD DECK CHASSIS ACQUISITION INC-144A 10.00000% 16-15.06.23 1 180 000.00 1 318 650.00 0.04USD DELL INTERNATIONAL LLC / EMC CORP-144A 4.42000% 16-15.06.21 210 000.00 221 629.80 0.01USD DELL INTERNATIONAL LLC / EMC CORP-144A 6.02000% 16-15.06.26 910 000.00 1 013 585.30 0.03USD DELL INTERNATIONAL LLC / EMC CORP-144A 5.87500% 16-15.06.21 6 327 000.00 6 635 441.25 0.21USD DELL INTERNATIONAL LLC / EMC CORP-144A 7.12500% 16-15.06.24 3 057 000.00 3 401 823.48 0.11USD DENBURY RESOURCES INC-SUB 4.62500% 13-15.07.23 1 525 000.00 777 750.00 0.02USD DIAMONDBACK ENERGY INC-144A 4.75000% 16-01.11.24 2 455 000.00 2 477 095.00 0.08USD DIGICEL GROUP LTD-144A 8.25000% 12-30.09.20 4 727 000.00 4 514 285.00 0.14USD DIGICEL GROUP LTD-REG-S 8.25000% 12-30.09.20 1 668 000.00 1 592 940.00 0.05USD DIGICEL LTD-144A 6.00000% 13-15.04.21 5 080 000.00 4 940 300.00 0.15USD DIGICEL LTD-144A 6.75000% 15-01.03.23 5 451 000.00 5 198 891.25 0.16USD DIGICEL LTD-REG-S 6.00000% 13-15.04.21 2 100 000.00 2 042 250.00 0.06USD DISH DBS CORP 5.00000% 13-15.03.23 3 165 000.00 3 282 706.35 0.10USD DISH DBS CORP 5.87500% 12-15.07.22 1 750 000.00 1 904 770.00 0.06USD DISH DBS CORP 5.87500% 14-15.11.24 3 330 000.00 3 612 217.50 0.11USD DISH DBS CORP 7.75000% 16-01.07.26 6 150 000.00 7 364 625.00 0.23USD DISH DBS CORP 7.87500% 09-01.09.19 3 019 000.00 3 331 466.50 0.10USD DOLLAR TREE INC 5.25000% 16-01.03.20 1 950 000.00 2 007 281.25 0.06USD DS WATERS OF AMERICA INC-144A 14-01.09.21 1 264 000.00 1 336 680.00 0.04USD DUPONT FABROS TECHNOLOGY LP 5.62500% 15-15.06.23 1 050 000.00 1 121 200.50 0.03USD DYNEGY INC 7.62500% 15-01.11.24 495 000.00 488 193.75 0.02USD ECO SERVICES OPTS LLC/ECO FIN CORP-144A 8.50000% 14-01.11.22 2 692 000.00 2 819 870.00 0.09USD EIG INVESTORS CORP 10.87500% 17-01.02.24 3 070 000.00 3 407 700.00 0.11USD ELDORADO GOLD CORP-144A 6.12500% 12-15.12.20 3 540 000.00 3 610 800.00 0.11USD ELDORADO RESORTS INC 7.00000% 16-01.08.23 1 978 000.00 2 136 240.00 0.07USD ELDORADO RESORTS INC 6.00000% 17-01.04.25 1 894 000.00 2 026 580.00 0.06USD EMI MUSIC PUBLISHING GROUP NA-144A 7.62500% 16-15.06.24 500 000.00 555 000.00 0.02USD ENDEAVOR ENERGY RESOURCES LP/FIN-144A 7.00000% 13-15.08.21 755 000.00 779 537.50 0.02USD ENDEAVOR ENERGY RESOURCES LP/FIN-144A 8.12500% 15-15.09.23 1 500 000.00 1 605 000.00 0.05USD ENDO FINANCE LLC& FINCO INC-144A STEP UP 14-15.01.22 2 038 000.00 2 007 430.00 0.06USD ENDO FINANCE LLC& FINCO INC-144A 5.37500% 14-15.01.23 990 000.00 846 450.00 0.03USD ENDO FINANCE LLC-144A 5.87500% 17-15.10.24 1 065 000.00 1 102 275.00 0.03USD ENDO FINANCE LLC-144A 6.00000% 15-15.07.23 1 000 000.00 866 875.00 0.03USD ENERGIZER SPINCO INC-144A 5.50000% 15-15.06.25 2 020 000.00 2 126 050.00 0.07USD ENERGY TRANSFER EQUITY LP 7.50000% 10-15.10.20 1 000 000.00 1 130 000.00 0.04USD ENERSYS-144A 5.00000% 15-30.04.23 1 995 000.00 2 049 862.50 0.06USD ENVISION HEALTHCARE CORP 5.62500% 15-15.07.22 340 000.00 352 750.00 0.01USD ENVISION HEALTHCARE CORP-144A 5.12500% 14-01.07.22 890 000.00 918 925.00 0.03USD EP ENERGY LLC/ EVEREST ACQUIS FIN-144A 8.00000% 16-29.11.24 365 000.00 368 650.00 0.01USD EP ENERGY LLC/ EVEREST ACQ FIN-144A 8.00000% 17-15.02.25 800 000.00 621 500.00 0.02USD EQUINIX INC 5.87500% 15-15.01.26 600 000.00 657 000.00 0.02USD EQUINIX INC-144A 5.75000% 14-01.01.25 1 574 000.00 1 692 050.00 0.05USD ESH HOSPITALITY INC-144A 5.25000% 15-01.05.25 2 335 000.00 2 440 075.00 0.08USD EXELA INTERMEDIATE LLC/FIN INC-144A 10.00000% 17-15.07.23 2 550 000.00 2 479 875.00 0.08
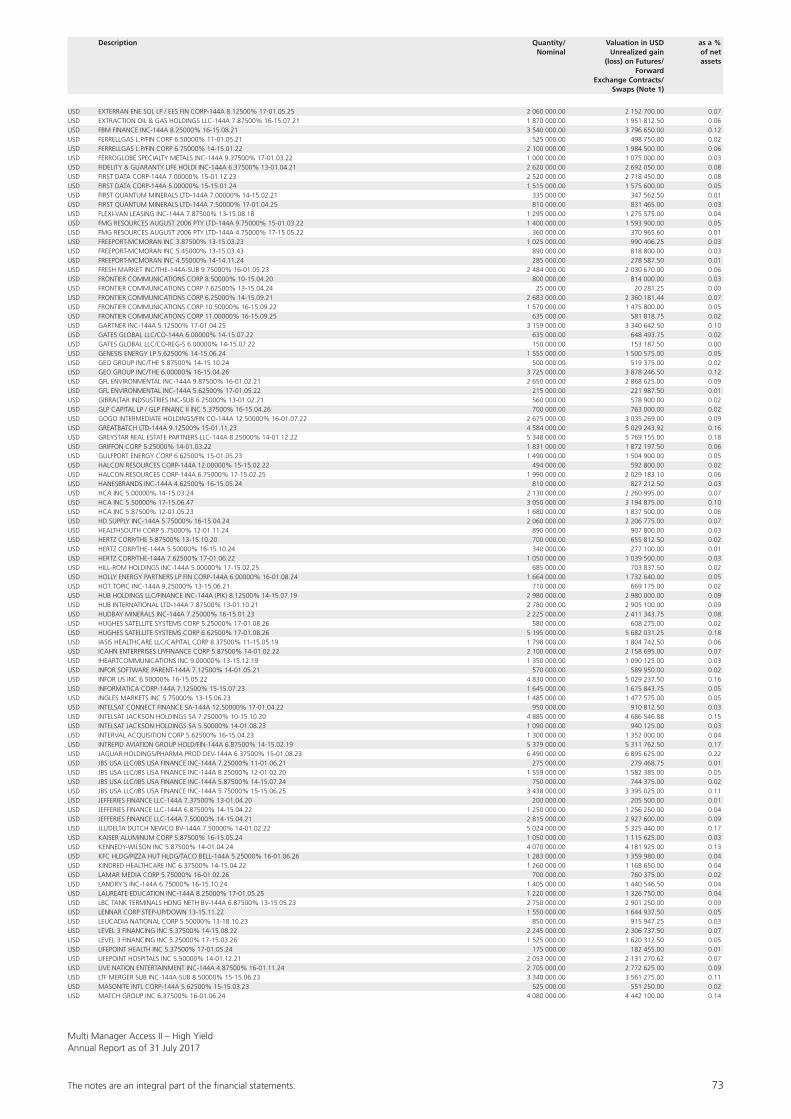
The notes are an integral part of the fi nancial statements. 73
Multi Manager Access II – High YieldAnnual Report as of 31 July 2017
USD EXTERRAN ENE SOL LP / EES FIN CORP-144A 8.12500% 17-01.05.25 2 060 000.00 2 152 700.00 0.07USD EXTRACTION OIL & GAS HOLDINGS LLC-144A 7.87500% 16-15.07.21 1 870 000.00 1 951 812.50 0.06USD FBM FINANCE INC-144A 8.25000% 16-15.08.21 3 540 000.00 3 796 650.00 0.12USD FERRELLGAS L.P/FIN CORP 6.50000% 11-01.05.21 525 000.00 498 750.00 0.02USD FERRELLGAS L.P/FIN CORP 6.75000% 14-15.01.22 2 100 000.00 1 984 500.00 0.06USD FERROGLOBE SPECIALTY METALS INC-144A 9.37500% 17-01.03.22 1 000 000.00 1 075 000.00 0.03USD FIDELITY & GUARANTY LIFE HOLDI INC-144A 6.37500% 13-01.04.21 2 620 000.00 2 692 050.00 0.08USD FIRST DATA CORP-144A 7.00000% 15-01.12.23 2 520 000.00 2 718 450.00 0.08USD FIRST DATA CORP-144A 5.00000% 15-15.01.24 1 515 000.00 1 575 600.00 0.05USD FIRST QUANTUM MINERALS LTD-144A 7.00000% 14-15.02.21 335 000.00 347 562.50 0.01USD FIRST QUANTUM MINERALS LTD-144A 7.50000% 17-01.04.25 810 000.00 831 465.00 0.03USD FLEXI-VAN LEASING INC-144A 7.87500% 13-15.08.18 1 295 000.00 1 275 575.00 0.04USD FMG RESOURCES AUGUST 2006 PTY LTD-144A 9.75000% 15-01.03.22 1 400 000.00 1 593 900.00 0.05USD FMG RESOURCES AUGUST 2006 PTY LTD-144A 4.75000% 17-15.05.22 360 000.00 370 965.60 0.01USD FREEPORT-MCMORAN INC 3.87500% 13-15.03.23 1 025 000.00 990 406.25 0.03USD FREEPORT-MCMORAN INC 5.45000% 13-15.03.43 890 000.00 818 800.00 0.03USD FREEPORT-MCMORAN INC 4.55000% 14-14.11.24 285 000.00 278 587.50 0.01USD FRESH MARKET INC/THE-144A-SUB 9.75000% 16-01.05.23 2 484 000.00 2 030 670.00 0.06USD FRONTIER COMMUNICATIONS CORP 8.50000% 10-15.04.20 800 000.00 814 000.00 0.03USD FRONTIER COMMUNICATIONS CORP 7.62500% 13-15.04.24 25 000.00 20 281.25 0.00USD FRONTIER COMMUNICATIONS CORP 6.25000% 14-15.09.21 2 683 000.00 2 360 181.44 0.07USD FRONTIER COMMUNICATIONS CORP 10.50000% 16-15.09.22 1 570 000.00 1 475 800.00 0.05USD FRONTIER COMMUNICATIONS CORP 11.00000% 16-15.09.25 635 000.00 581 818.75 0.02USD GARTNER INC-144A 5.12500% 17-01.04.25 3 159 000.00 3 340 642.50 0.10USD GATES GLOBAL LLC/CO-144A 6.00000% 14-15.07.22 635 000.00 648 493.75 0.02USD GATES GLOBAL LLC/CO-REG-S 6.00000% 14-15.07.22 150 000.00 153 187.50 0.00USD GENESIS ENERGY LP 5.62500% 14-15.06.24 1 555 000.00 1 500 575.00 0.05USD GEO GROUP INC/THE 5.87500% 14-15.10.24 500 000.00 519 375.00 0.02USD GEO GROUP INC/THE 6.00000% 16-15.04.26 3 725 000.00 3 878 246.50 0.12USD GFL ENVIRONMENTAL INC-144A 9.87500% 16-01.02.21 2 650 000.00 2 868 625.00 0.09USD GFL ENVIRONMENTAL INC-144A 5.62500% 17-01.05.22 215 000.00 221 987.50 0.01USD GIBRALTAR INDSUSTRIES INC-SUB 6.25000% 13-01.02.21 560 000.00 578 900.00 0.02USD GLP CAPITAL LP / GLP FINANC II INC 5.37500% 16-15.04.26 700 000.00 763 000.00 0.02USD GOGO INTERMEDIATE HOLDINGS/FIN CO-144A 12.50000% 16-01.07.22 2 675 000.00 3 035 269.00 0.09USD GREATBATCH LTD-144A 9.12500% 15-01.11.23 4 584 000.00 5 029 243.92 0.16USD GREYSTAR REAL ESTATE PARTNERS LLC-144A 8.25000% 14-01.12.22 5 348 000.00 5 769 155.00 0.18USD GRIFFON CORP 5.25000% 14-01.03.22 1 831 000.00 1 872 197.50 0.06USD GULFPORT ENERGY CORP 6.62500% 15-01.05.23 1 490 000.00 1 504 900.00 0.05USD HALCON RESOURCES CORP-144A 12.00000% 15-15.02.22 494 000.00 592 800.00 0.02USD HALCON RESOURCES CORP-144A 6.75000% 17-15.02.25 1 990 000.00 2 029 183.10 0.06USD HANESBRANDS INC-144A 4.62500% 16-15.05.24 810 000.00 827 212.50 0.03USD HCA INC 5.00000% 14-15.03.24 2 130 000.00 2 260 995.00 0.07USD HCA INC 5.50000% 17-15.06.47 3 050 000.00 3 194 875.00 0.10USD HCA INC 5.87500% 12-01.05.23 1 680 000.00 1 837 500.00 0.06USD HD SUPPLY INC-144A 5.75000% 16-15.04.24 2 060 000.00 2 206 775.00 0.07USD HEALTHSOUTH CORP 5.75000% 12-01.11.24 890 000.00 907 800.00 0.03USD HERTZ CORP/THE 5.87500% 13-15.10.20 700 000.00 655 812.50 0.02USD HERTZ CORP/THE-144A 5.50000% 16-15.10.24 340 000.00 277 100.00 0.01USD HERTZ CORP/THE-144A 7.62500% 17-01.06.22 1 050 000.00 1 039 500.00 0.03USD HILL-ROM HOLDINGS INC-144A 5.00000% 17-15.02.25 685 000.00 703 837.50 0.02USD HOLLY ENERGY PARTNERS LP FIN CORP-144A 6.00000% 16-01.08.24 1 664 000.00 1 732 640.00 0.05USD HOT TOPIC INC-144A 9.25000% 13-15.06.21 710 000.00 669 175.00 0.02USD HUB HOLDINGS LLC/FINANCE INC-144A (PIK) 8.12500% 14-15.07.19 2 980 000.00 2 980 000.00 0.09USD HUB INTERNATIONAL LTD-144A 7.87500% 13-01.10.21 2 780 000.00 2 905 100.00 0.09USD HUDBAY MINERALS INC-144A 7.25000% 16-15.01.23 2 225 000.00 2 411 343.75 0.08USD HUGHES SATELLITE SYSTEMS CORP 5.25000% 17-01.08.26 580 000.00 608 275.00 0.02USD HUGHES SATELLITE SYSTEMS CORP 6.62500% 17-01.08.26 5 195 000.00 5 682 031.25 0.18USD IASIS HEALTHCARE LLC/CAPITAL CORP 8.37500% 11-15.05.19 1 798 000.00 1 804 742.50 0.06USD ICAHN ENTERPRISES LP/FINANCE CORP 5.87500% 14-01.02.22 2 100 000.00 2 158 695.00 0.07USD IHEARTCOMMUNICATIONS INC 9.00000% 13-15.12.19 1 350 000.00 1 090 125.00 0.03USD INFOR SOFTWARE PARENT-144A 7.12500% 14-01.05.21 570 000.00 589 950.00 0.02USD INFOR US INC 6.50000% 16-15.05.22 4 830 000.00 5 029 237.50 0.16USD INFORMATICA CORP-144A 7.12500% 15-15.07.23 1 645 000.00 1 675 843.75 0.05USD INGLES MARKETS INC 5.75000% 13-15.06.23 1 485 000.00 1 477 575.00 0.05USD INTELSAT CONNECT FINANCE SA-144A 12.50000% 17-01.04.22 950 000.00 910 812.50 0.03USD INTELSAT JACKSON HOLDINGS SA 7.25000% 10-15.10.20 4 885 000.00 4 686 546.88 0.15USD INTELSAT JACKSON HOLDINGS SA 5.50000% 14-01.08.23 1 090 000.00 940 125.00 0.03USD INTERVAL ACQUISITION CORP 5.62500% 16-15.04.23 1 300 000.00 1 352 000.00 0.04USD INTREPID AVIATION GROUP HOLD/FIN-144A 6.87500% 14-15.02.19 5 379 000.00 5 311 762.50 0.17USD JAGUAR HOLDINGS/PHARMA PROD DEV-144A 6.37500% 15-01.08.23 6 490 000.00 6 895 625.00 0.22USD JBS USA LLC/JBS USA FINANCE INC-144A 7.25000% 11-01.06.21 275 000.00 279 468.75 0.01USD JBS USA LLC/JBS USA FINANCE INC-144A 8.25000% 12-01.02.20 1 559 000.00 1 582 385.00 0.05USD JBS USA LLC/JBS USA FINANCE INC-144A 5.87500% 14-15.07.24 750 000.00 744 375.00 0.02USD JBS USA LLC/JBS USA FINANCE INC-144A 5.75000% 15-15.06.25 3 438 000.00 3 395 025.00 0.11USD JEFFERIES FINANCE LLC-144A 7.37500% 13-01.04.20 200 000.00 205 500.00 0.01USD JEFFERIES FINANCE LLC-144A 6.87500% 14-15.04.22 1 250 000.00 1 256 250.00 0.04USD JEFFERIES FINANCE LLC-144A 7.50000% 14-15.04.21 2 815 000.00 2 927 600.00 0.09USD JLL/DELTA DUTCH NEWCO BV-144A 7.50000% 14-01.02.22 5 024 000.00 5 325 440.00 0.17USD KAISER ALUMINUM CORP 5.87500% 16-15.05.24 1 050 000.00 1 115 625.00 0.03USD KENNEDY-WILSON INC 5.87500% 14-01.04.24 4 070 000.00 4 181 925.00 0.13USD KFC HLDG/PIZZA HUT HLDG/TACO BELL-144A 5.25000% 16-01.06.26 1 283 000.00 1 359 980.00 0.04USD KINDRED HEALTHCARE INC 6.37500% 14-15.04.22 1 260 000.00 1 168 650.00 0.04USD LAMAR MEDIA CORP 5.75000% 16-01.02.26 700 000.00 760 375.00 0.02USD LANDRY’S INC-144A 6.75000% 16-15.10.24 1 405 000.00 1 440 546.50 0.04USD LAUREATE EDUCATION INC-144A 8.25000% 17-01.05.25 1 220 000.00 1 326 750.00 0.04USD LBC TANK TERMINALS HDNG NETH BV-144A 6.87500% 13-15.05.23 2 750 000.00 2 901 250.00 0.09USD LENNAR CORP STEP-UP/DOWN 13-15.11.22 1 550 000.00 1 644 937.50 0.05USD LEUCADIA NATIONAL CORP 5.50000% 13-18.10.23 850 000.00 915 947.25 0.03USD LEVEL 3 FINANCING INC 5.37500% 14-15.08.22 2 245 000.00 2 306 737.50 0.07USD LEVEL 3 FINANCING INC 5.25000% 17-15.03.26 1 525 000.00 1 620 312.50 0.05USD LIFEPOINT HEALTH INC 5.37500% 17-01.05.24 175 000.00 182 455.00 0.01USD LIFEPOINT HOSPITALS INC 5.50000% 14-01.12.21 2 053 000.00 2 131 270.62 0.07USD LIVE NATION ENTERTAINMENT INC-144A 4.87500% 16-01.11.24 2 705 000.00 2 772 625.00 0.09USD LTF MERGER SUB INC-144A-SUB 8.50000% 15-15.06.23 3 340 000.00 3 561 275.00 0.11USD MASONITE INTL CORP-144A 5.62500% 15-15.03.23 525 000.00 551 250.00 0.02USD MATCH GROUP INC 6.37500% 16-01.06.24 4 080 000.00 4 442 100.00 0.14
Description Quantity/ Valuation in USD as a % Nominal Unrealized gain of net (loss) on Futures/ assets Forward Exchange Contracts/ Swaps (Note 1)
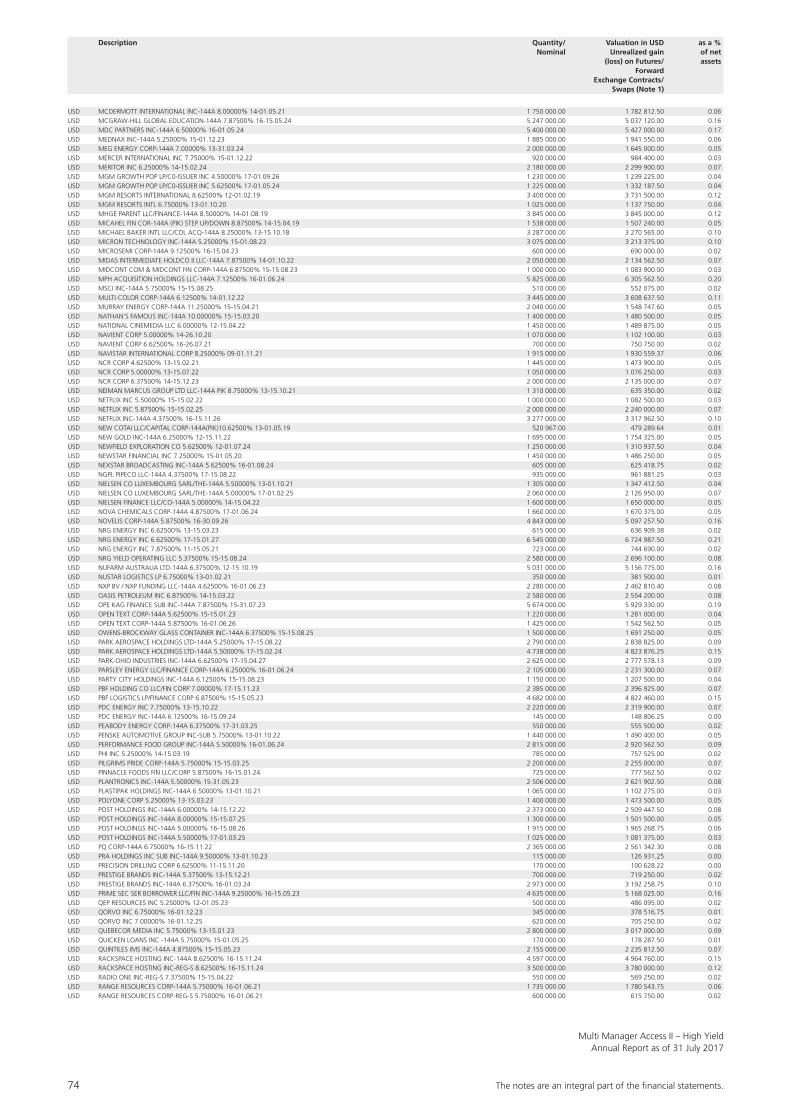
74 The notes are an integral part of the fi nancial statements.
Multi Manager Access II – High YieldAnnual Report as of 31 July 2017
Description Quantity/ Valuation in USD as a % Nominal Unrealized gain of net (loss) on Futures/ assets Forward Exchange Contracts/ Swaps (Note 1)
USD MCDERMOTT INTERNATIONAL INC-144A 8.00000% 14-01.05.21 1 750 000.00 1 782 812.50 0.06USD MCGRAW-HILL GLOBAL EDUCATION-144A 7.87500% 16-15.05.24 5 247 000.00 5 037 120.00 0.16USD MDC PARTNERS INC-144A 6.50000% 16-01.05.24 5 400 000.00 5 427 000.00 0.17USD MEDNAX INC-144A 5.25000% 15-01.12.23 1 885 000.00 1 941 550.00 0.06USD MEG ENERGY CORP-144A 7.00000% 13-31.03.24 2 000 000.00 1 645 000.00 0.05USD MERCER INTERNATIONAL INC 7.75000% 15-01.12.22 920 000.00 984 400.00 0.03USD MERITOR INC 6.25000% 14-15.02.24 2 180 000.00 2 299 900.00 0.07USD MGM GROWTH POP LP/C0-ISSUER INC 4.50000% 17-01.09.26 1 230 000.00 1 239 225.00 0.04USD MGM GROWTH POP LP/C0-ISSUER INC 5.62500% 17-01.05.24 1 225 000.00 1 332 187.50 0.04USD MGM RESORTS INTERNATIONAL 8.62500% 12-01.02.19 3 400 000.00 3 731 500.00 0.12USD MGM RESORTS INTL 6.75000% 13-01.10.20 1 025 000.00 1 137 750.00 0.04USD MHGE PARENT LLC/FINANCE-144A 8.50000% 14-01.08.19 3 845 000.00 3 845 000.00 0.12USD MICAHEL FIN COR-144A (PIK) STEP UP/DOWN 8.87500% 14-15.04.19 1 538 000.00 1 507 240.00 0.05USD MICHAEL BAKER INTL LLC/CDL ACQ-144A 8.25000% 13-15.10.18 3 287 000.00 3 270 565.00 0.10USD MICRON TECHNOLOGY INC-144A 5.25000% 15-01.08.23 3 075 000.00 3 213 375.00 0.10USD MICROSEMI CORP-144A 9.12500% 16-15.04.23 600 000.00 690 000.00 0.02USD MIDAS INTERMEDIATE HOLDCO II LLC-144A 7.87500% 14-01.10.22 2 050 000.00 2 134 562.50 0.07USD MIDCONT COM & MIDCONT FIN CORP-144A 6.87500% 15-15.08.23 1 000 000.00 1 083 900.00 0.03USD MPH ACQUISITION HOLDINGS LLC-144A 7.12500% 16-01.06.24 5 825 000.00 6 305 562.50 0.20USD MSCI INC-144A 5.75000% 15-15.08.25 510 000.00 552 075.00 0.02USD MULTI-COLOR CORP-144A 6.12500% 14-01.12.22 3 445 000.00 3 608 637.50 0.11USD MURRAY ENERGY CORP-144A 11.25000% 15-15.04.21 2 040 000.00 1 548 747.60 0.05USD NATHAN’S FAMOUS INC-144A 10.00000% 15-15.03.20 1 400 000.00 1 480 500.00 0.05USD NATIONAL CINEMEDIA LLC 6.00000% 12-15.04.22 1 450 000.00 1 489 875.00 0.05USD NAVIENT CORP 5.00000% 14-26.10.20 1 070 000.00 1 102 100.00 0.03USD NAVIENT CORP 6.62500% 16-26.07.21 700 000.00 750 750.00 0.02USD NAVISTAR INTERNATIONAL CORP 8.25000% 09-01.11.21 1 915 000.00 1 930 559.37 0.06USD NCR CORP 4.62500% 13-15.02.21 1 445 000.00 1 473 900.00 0.05USD NCR CORP 5.00000% 13-15.07.22 1 050 000.00 1 076 250.00 0.03USD NCR CORP 6.37500% 14-15.12.23 2 000 000.00 2 135 000.00 0.07USD NEIMAN MARCUS GROUP LTD LLC-144A PIK 8.75000% 13-15.10.21 1 310 000.00 635 350.00 0.02USD NETFLIX INC 5.50000% 15-15.02.22 1 000 000.00 1 082 500.00 0.03USD NETFLIX INC 5.87500% 15-15.02.25 2 000 000.00 2 240 000.00 0.07USD NETFLIX INC-144A 4.37500% 16-15.11.26 3 277 000.00 3 317 962.50 0.10USD NEW COTAI LLC/CAPITAL CORP-144A(PIK)10.62500% 13-01.05.19 520 967.00 479 289.64 0.01USD NEW GOLD INC-144A 6.25000% 12-15.11.22 1 695 000.00 1 754 325.00 0.05USD NEWFIELD EXPLORATION CO 5.62500% 12-01.07.24 1 250 000.00 1 310 937.50 0.04USD NEWSTAR FINANCIAL INC 7.25000% 15-01.05.20 1 450 000.00 1 486 250.00 0.05USD NEXSTAR BROADCASTING INC-144A 5.62500% 16-01.08.24 605 000.00 625 418.75 0.02USD NGPL PIPECO LLC-144A 4.37500% 17-15.08.22 935 000.00 961 881.25 0.03USD NIELSEN CO LUXEMBOURG SARL/THE-144A 5.50000% 13-01.10.21 1 305 000.00 1 347 412.50 0.04USD NIELSEN CO LUXEMBOURG SARL/THE-144A 5.00000% 17-01.02.25 2 060 000.00 2 126 950.00 0.07USD NIELSEN FINANCE LLC/CO-144A 5.00000% 14-15.04.22 1 600 000.00 1 650 000.00 0.05USD NOVA CHEMICALS CORP-144A 4.87500% 17-01.06.24 1 660 000.00 1 670 375.00 0.05USD NOVELIS CORP-144A 5.87500% 16-30.09.26 4 843 000.00 5 097 257.50 0.16USD NRG ENERGY INC 6.62500% 13-15.03.23 615 000.00 636 909.38 0.02USD NRG ENERGY INC 6.62500% 17-15.01.27 6 545 000.00 6 724 987.50 0.21USD NRG ENERGY INC 7.87500% 11-15.05.21 723 000.00 744 690.00 0.02USD NRG YIELD OPERATING LLC 5.37500% 15-15.08.24 2 580 000.00 2 696 100.00 0.08USD NUFARM AUSTRALIA LTD-144A 6.37500% 12-15.10.19 5 031 000.00 5 156 775.00 0.16USD NUSTAR LOGISTICS LP 6.75000% 13-01.02.21 350 000.00 381 500.00 0.01USD NXP BV / NXP FUNDING LLC-144A 4.62500% 16-01.06.23 2 280 000.00 2 462 810.40 0.08USD OASIS PETROLEUM INC 6.87500% 14-15.03.22 2 580 000.00 2 554 200.00 0.08USD OPE KAG FINANCE SUB INC-144A 7.87500% 15-31.07.23 5 674 000.00 5 929 330.00 0.19USD OPEN TEXT CORP-144A 5.62500% 15-15.01.23 1 220 000.00 1 281 000.00 0.04USD OPEN TEXT CORP-144A 5.87500% 16-01.06.26 1 425 000.00 1 542 562.50 0.05USD OWENS-BROCKWAY GLASS CONTAINER INC-144A 6.37500% 15-15.08.25 1 500 000.00 1 691 250.00 0.05USD PARK AEROSPACE HOLDINGS LTD-144A 5.25000% 17-15.08.22 2 790 000.00 2 838 825.00 0.09USD PARK AEROSPACE HOLDINGS LTD-144A 5.50000% 17-15.02.24 4 738 000.00 4 823 876.25 0.15USD PARK-OHIO INDUSTRIES INC-144A 6.62500% 17-15.04.27 2 625 000.00 2 777 578.13 0.09USD PARSLEY ENERGY LLC/FINANCE CORP-144A 6.25000% 16-01.06.24 2 105 000.00 2 231 300.00 0.07USD PARTY CITY HOLDINGS INC-144A 6.12500% 15-15.08.23 1 150 000.00 1 207 500.00 0.04USD PBF HOLDING CO LLC/FIN CORP 7.00000% 17-15.11.23 2 385 000.00 2 396 925.00 0.07USD PBF LOGISTICS LP/FINANCE CORP 6.87500% 15-15.05.23 4 682 000.00 4 822 460.00 0.15USD PDC ENERGY INC 7.75000% 13-15.10.22 2 220 000.00 2 319 900.00 0.07USD PDC ENERGY INC-144A 6.12500% 16-15.09.24 145 000.00 148 806.25 0.00USD PEABODY ENERGY CORP-144A 6.37500% 17-31.03.25 550 000.00 555 500.00 0.02USD PENSKE AUTOMOTIVE GROUP INC-SUB 5.75000% 13-01.10.22 1 440 000.00 1 490 400.00 0.05USD PERFORMANCE FOOD GROUP INC-144A 5.50000% 16-01.06.24 2 815 000.00 2 920 562.50 0.09USD PHI INC 5.25000% 14-15.03.19 785 000.00 757 525.00 0.02USD PILGRIMS PRIDE CORP-144A 5.75000% 15-15.03.25 2 200 000.00 2 255 000.00 0.07USD PINNACLE FOODS FIN LLC/CORP 5.87500% 16-15.01.24 725 000.00 777 562.50 0.02USD PLANTRONICS INC-144A 5.50000% 15-31.05.23 2 506 000.00 2 621 902.50 0.08USD PLASTIPAK HOLDINGS INC-144A 6.50000% 13-01.10.21 1 065 000.00 1 102 275.00 0.03USD POLYONE CORP 5.25000% 13-15.03.23 1 400 000.00 1 473 500.00 0.05USD POST HOLDINGS INC-144A 6.00000% 14-15.12.22 2 373 000.00 2 509 447.50 0.08USD POST HOLDINGS INC-144A 8.00000% 15-15.07.25 1 300 000.00 1 501 500.00 0.05USD POST HOLDINGS INC-144A 5.00000% 16-15.08.26 1 915 000.00 1 965 268.75 0.06USD POST HOLDINGS INC-144A 5.50000% 17-01.03.25 1 025 000.00 1 081 375.00 0.03USD PQ CORP-144A 6.75000% 16-15.11.22 2 365 000.00 2 561 342.30 0.08USD PRA HOLDINGS INC SUB INC-144A 9.50000% 13-01.10.23 115 000.00 126 931.25 0.00USD PRECISION DRILLING CORP 6.62500% 11-15.11.20 170 000.00 100 628.22 0.00USD PRESTIGE BRANDS INC-144A 5.37500% 13-15.12.21 700 000.00 719 250.00 0.02USD PRESTIGE BRANDS INC-144A 6.37500% 16-01.03.24 2 973 000.00 3 192 258.75 0.10USD PRIME SEC SER BORROWER LLC/FIN INC-144A 9.25000% 16-15.05.23 4 635 000.00 5 168 025.00 0.16USD QEP RESOURCES INC 5.25000% 12-01.05.23 500 000.00 486 095.00 0.02USD QORVO INC 6.75000% 16-01.12.23 345 000.00 378 516.75 0.01USD QORVO INC 7.00000% 16-01.12.25 620 000.00 705 250.00 0.02USD QUEBECOR MEDIA INC 5.75000% 13-15.01.23 2 800 000.00 3 017 000.00 0.09USD QUICKEN LOANS INC -144A 5.75000% 15-01.05.25 170 000.00 178 287.50 0.01USD QUINTILES IMS INC-144A 4.87500% 15-15.05.23 2 155 000.00 2 235 812.50 0.07USD RACKSPACE HOSTING INC-144A 8.62500% 16-15.11.24 4 597 000.00 4 964 760.00 0.15USD RACKSPACE HOSTING INC-REG-S 8.62500% 16-15.11.24 3 500 000.00 3 780 000.00 0.12USD RADIO ONE INC-REG-S 7.37500% 15-15.04.22 550 000.00 569 250.00 0.02USD RANGE RESOURCES CORP-144A 5.75000% 16-01.06.21 1 735 000.00 1 780 543.75 0.06USD RANGE RESOURCES CORP-REG-S 5.75000% 16-01.06.21 600 000.00 615 750.00 0.02
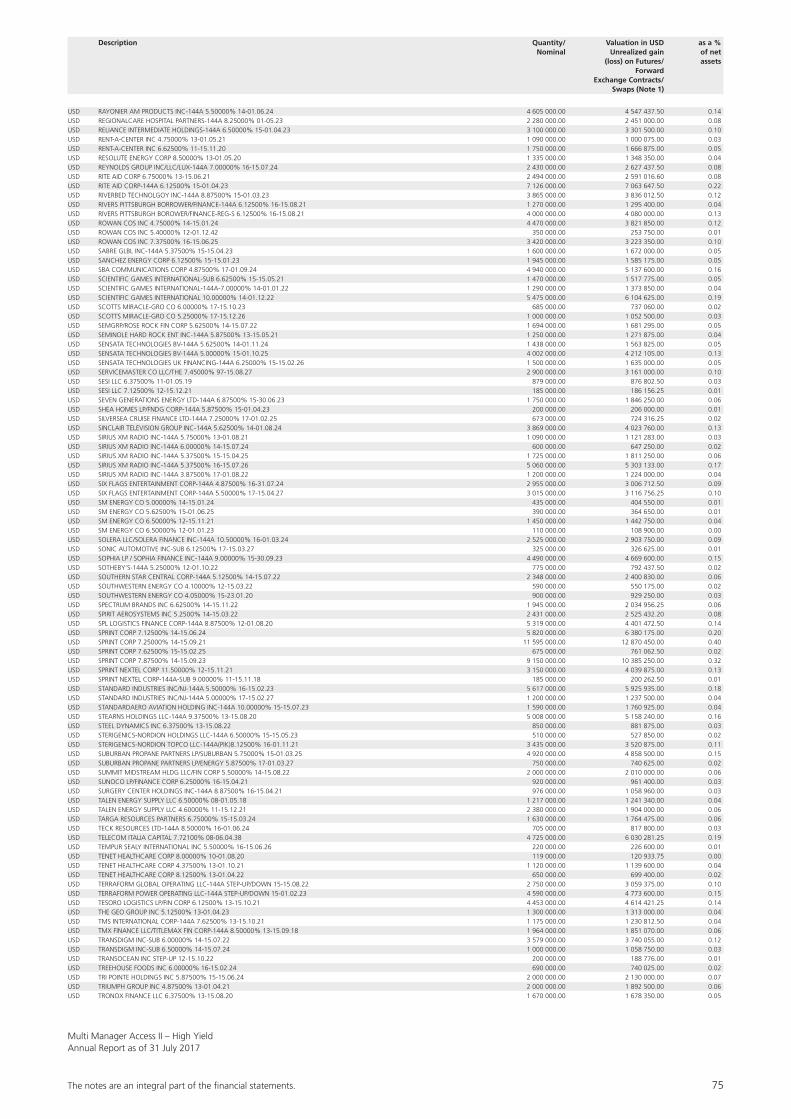
The notes are an integral part of the fi nancial statements. 75
Multi Manager Access II – High YieldAnnual Report as of 31 July 2017
USD RAYONIER AM PRODUCTS INC-144A 5.50000% 14-01.06.24 4 605 000.00 4 547 437.50 0.14USD REGIONALCARE HOSPITAL PARTNERS-144A 8.25000% 01-05.23 2 280 000.00 2 451 000.00 0.08USD RELIANCE INTERMEDIATE HOLDINGS-144A 6.50000% 15-01.04.23 3 100 000.00 3 301 500.00 0.10USD RENT-A-CENTER INC 4.75000% 13-01.05.21 1 090 000.00 1 000 075.00 0.03USD RENT-A-CENTER INC 6.62500% 11-15.11.20 1 750 000.00 1 666 875.00 0.05USD RESOLUTE ENERGY CORP 8.50000% 13-01.05.20 1 335 000.00 1 348 350.00 0.04USD REYNOLDS GROUP INC/LLC/LUX-144A 7.00000% 16-15.07.24 2 430 000.00 2 627 437.50 0.08USD RITE AID CORP 6.75000% 13-15.06.21 2 494 000.00 2 591 016.60 0.08USD RITE AID CORP-144A 6.12500% 15-01.04.23 7 126 000.00 7 063 647.50 0.22USD RIVERBED TECHNOLGOY INC-144A 8.87500% 15-01.03.23 3 865 000.00 3 836 012.50 0.12USD RIVERS PITTSBURGH BORROWER/FINANCE-144A 6.12500% 16-15.08.21 1 270 000.00 1 295 400.00 0.04USD RIVERS PITTSBURGH BOROWER/FINANCE-REG-S 6.12500% 16-15.08.21 4 000 000.00 4 080 000.00 0.13USD ROWAN COS INC 4.75000% 14-15.01.24 4 470 000.00 3 821 850.00 0.12USD ROWAN COS INC 5.40000% 12-01.12.42 350 000.00 253 750.00 0.01USD ROWAN COS INC 7.37500% 16-15.06.25 3 420 000.00 3 223 350.00 0.10USD SABRE GLBL INC-144A 5.37500% 15-15.04.23 1 600 000.00 1 672 000.00 0.05USD SANCHEZ ENERGY CORP 6.12500% 15-15.01.23 1 945 000.00 1 585 175.00 0.05USD SBA COMMUNICATIONS CORP 4.87500% 17-01.09.24 4 940 000.00 5 137 600.00 0.16USD SCIENTIFIC GAMES INTERNATIONAL-SUB 6.62500% 15-15.05.21 1 470 000.00 1 517 775.00 0.05USD SCIENTIFIC GAMES INTERNATIONAL-144A-7.00000% 14-01.01.22 1 290 000.00 1 373 850.00 0.04USD SCIENTIFIC GAMES INTERNATIONAL 10.00000% 14-01.12.22 5 475 000.00 6 104 625.00 0.19USD SCOTTS MIRACLE-GRO CO 6.00000% 17-15.10.23 685 000.00 737 060.00 0.02USD SCOTTS MIRACLE-GRO CO 5.25000% 17-15.12.26 1 000 000.00 1 052 500.00 0.03USD SEMGRP/ROSE ROCK FIN CORP 5.62500% 14-15.07.22 1 694 000.00 1 681 295.00 0.05USD SEMINOLE HARD ROCK ENT INC-144A 5.87500% 13-15.05.21 1 250 000.00 1 271 875.00 0.04USD SENSATA TECHNOLOGIES BV-144A 5.62500% 14-01.11.24 1 438 000.00 1 563 825.00 0.05USD SENSATA TECHNOLOGIES BV-144A 5.00000% 15-01.10.25 4 002 000.00 4 212 105.00 0.13USD SENSATA TECHNOLOGIES UK FINANCING-144A 6.25000% 15-15.02.26 1 500 000.00 1 635 000.00 0.05USD SERVICEMASTER CO LLC/THE 7.45000% 97-15.08.27 2 900 000.00 3 161 000.00 0.10USD SESI LLC 6.37500% 11-01.05.19 879 000.00 876 802.50 0.03USD SESI LLC 7.12500% 12-15.12.21 185 000.00 186 156.25 0.01USD SEVEN GENERATIONS ENERGY LTD-144A 6.87500% 15-30.06.23 1 750 000.00 1 846 250.00 0.06USD SHEA HOMES LP/FNDG CORP-144A 5.87500% 15-01.04.23 200 000.00 206 000.00 0.01USD SILVERSEA CRUISE FINANCE LTD-144A 7.25000% 17-01.02.25 673 000.00 724 316.25 0.02USD SINCLAIR TELEVISION GROUP INC-144A 5.62500% 14-01.08.24 3 869 000.00 4 023 760.00 0.13USD SIRIUS XM RADIO INC-144A 5.75000% 13-01.08.21 1 090 000.00 1 121 283.00 0.03USD SIRIUS XM RADIO INC-144A 6.00000% 14-15.07.24 600 000.00 647 250.00 0.02USD SIRIUS XM RADIO INC-144A 5.37500% 15-15.04.25 1 725 000.00 1 811 250.00 0.06USD SIRIUS XM RADIO INC-144A 5.37500% 16-15.07.26 5 060 000.00 5 303 133.00 0.17USD SIRIUS XM RADIO INC-144A 3.87500% 17-01.08.22 1 200 000.00 1 224 000.00 0.04USD SIX FLAGS ENTERTAINMENT CORP-144A 4.87500% 16-31.07.24 2 955 000.00 3 006 712.50 0.09USD SIX FLAGS ENTERTAINMENT CORP-144A 5.50000% 17-15.04.27 3 015 000.00 3 116 756.25 0.10USD SM ENERGY CO 5.00000% 14-15.01.24 435 000.00 404 550.00 0.01USD SM ENERGY CO 5.62500% 15-01.06.25 390 000.00 364 650.00 0.01USD SM ENERGY CO 6.50000% 12-15.11.21 1 450 000.00 1 442 750.00 0.04USD SM ENERGY CO 6.50000% 12-01.01.23 110 000.00 108 900.00 0.00USD SOLERA LLC/SOLERA FINANCE INC-144A 10.50000% 16-01.03.24 2 525 000.00 2 903 750.00 0.09USD SONIC AUTOMOTIVE INC-SUB 6.12500% 17-15.03.27 325 000.00 326 625.00 0.01USD SOPHIA LP / SOPHIA FINANCE INC-144A 9.00000% 15-30.09.23 4 490 000.00 4 669 600.00 0.15USD SOTHEBY’S-144A 5.25000% 12-01.10.22 775 000.00 792 437.50 0.02USD SOUTHERN STAR CENTRAL CORP-144A 5.12500% 14-15.07.22 2 348 000.00 2 400 830.00 0.06USD SOUTHWESTERN ENERGY CO 4.10000% 12-15.03.22 590 000.00 550 175.00 0.02USD SOUTHWESTERN ENERGY CO 4.05000% 15-23.01.20 900 000.00 929 250.00 0.03USD SPECTRUM BRANDS INC 6.62500% 14-15.11.22 1 945 000.00 2 034 956.25 0.06USD SPIRIT AEROSYSTEMS INC 5.2500% 14-15.03.22 2 431 000.00 2 525 432.20 0.08USD SPL LOGISTICS FINANCE CORP-144A 8.87500% 12-01.08.20 5 319 000.00 4 401 472.50 0.14USD SPRINT CORP 7.12500% 14-15.06.24 5 820 000.00 6 380 175.00 0.20USD SPRINT CORP 7.25000% 14-15.09.21 11 595 000.00 12 870 450.00 0.40USD SPRINT CORP 7.62500% 15-15.02.25 675 000.00 761 062.50 0.02USD SPRINT CORP 7.87500% 14-15.09.23 9 150 000.00 10 385 250.00 0.32USD SPRINT NEXTEL CORP 11.50000% 12-15.11.21 3 150 000.00 4 039 875.00 0.13USD SPRINT NEXTEL CORP-144A-SUB 9.00000% 11-15.11.18 185 000.00 200 262.50 0.01USD STANDARD INDUSTRIES INC/NJ-144A 5.50000% 16-15.02.23 5 617 000.00 5 925 935.00 0.18USD STANDARD INDUSTRIES INC/NJ-144A 5.00000% 17-15.02.27 1 200 000.00 1 237 500.00 0.04USD STANDARDAERO AVIATION HOLDING INC-144A 10.00000% 15-15.07.23 1 590 000.00 1 760 925.00 0.04USD STEARNS HOLDINGS LLC-144A 9.37500% 13-15.08.20 5 008 000.00 5 158 240.00 0.16USD STEEL DYNAMICS INC 6.37500% 13-15.08.22 850 000.00 881 875.00 0.03USD STERIGENICS-NORDION HOLDINGS LLC-144A 6.50000% 15-15.05.23 510 000.00 527 850.00 0.02USD STERIGENICS-NORDION TOPCO LLC-144A(PIK)8.12500% 16-01.11.21 3 435 000.00 3 520 875.00 0.11USD SUBURBAN PROPANE PARTNERS LP/SUBURBAN 5.75000% 15-01.03.25 4 920 000.00 4 858 500.00 0.15USD SUBURBAN PROPANE PARTNERS LP/ENERGY 5.87500% 17-01.03.27 750 000.00 740 625.00 0.02USD SUMMIT MIDSTREAM HLDG LLC/FIN CORP 5.50000% 14-15.08.22 2 000 000.00 2 010 000.00 0.06USD SUNOCO LP/FINANCE CORP 6.25000% 16-15.04.21 920 000.00 961 400.00 0.03USD SURGERY CENTER HOLDINGS INC-144A 8.87500% 16-15.04.21 976 000.00 1 058 960.00 0.03USD TALEN ENERGY SUPPLY LLC 6.50000% 08-01.05.18 1 217 000.00 1 241 340.00 0.04USD TALEN ENERGY SUPPLY LLC 4.60000% 11-15.12.21 2 380 000.00 1 904 000.00 0.06USD TARGA RESOURCES PARTNERS 6.75000% 15-15.03.24 1 630 000.00 1 764 475.00 0.06USD TECK RESOURCES LTD-144A 8.50000% 16-01.06.24 705 000.00 817 800.00 0.03USD TELECOM ITALIA CAPITAL 7.72100% 08-06.04.38 4 725 000.00 6 030 281.25 0.19USD TEMPUR SEALY INTERNATIONAL INC 5.50000% 16-15.06.26 220 000.00 226 600.00 0.01USD TENET HEALTHCARE CORP 8.00000% 10-01.08.20 119 000.00 120 933.75 0.00USD TENET HEALTHCARE CORP 4.37500% 13-01.10.21 1 120 000.00 1 139 600.00 0.04USD TENET HEALTHCARE CORP 8.12500% 13-01.04.22 650 000.00 699 400.00 0.02USD TERRAFORM GLOBAL OPERATING LLC-144A STEP-UP/DOWN 15-15.08.22 2 750 000.00 3 059 375.00 0.10USD TERRAFORM POWER OPERATING LLC-144A STEP-UP/DOWN 15-01.02.23 4 590 000.00 4 773 600.00 0.15USD TESORO LOGISTICS LP/FIN CORP 6.12500% 13-15.10.21 4 453 000.00 4 614 421.25 0.14USD THE GEO GROUP INC 5.12500% 13-01.04.23 1 300 000.00 1 313 000.00 0.04USD TMS INTERNATIONAL CORP-144A 7.62500% 13-15.10.21 1 175 000.00 1 230 812.50 0.04USD TMX FINANCE LLC/TITLEMAX FIN CORP-144A 8.50000% 13-15.09.18 1 964 000.00 1 851 070.00 0.06USD TRANSDIGM INC-SUB 6.00000% 14-15.07.22 3 579 000.00 3 740 055.00 0.12USD TRANSDIGM INC-SUB 6.50000% 14-15.07.24 1 000 000.00 1 058 750.00 0.03USD TRANSOCEAN INC STEP-UP 12-15.10.22 200 000.00 188 776.00 0.01USD TREEHOUSE FOODS INC 6.00000% 16-15.02.24 690 000.00 740 025.00 0.02USD TRI POINTE HOLDINGS INC 5.87500% 15-15.06.24 2 000 000.00 2 130 000.00 0.07USD TRIUMPH GROUP INC 4.87500% 13-01.04.21 2 000 000.00 1 892 500.00 0.06USD TRONOX FINANCE LLC 6.37500% 13-15.08.20 1 670 000.00 1 678 350.00 0.05
Description Quantity/ Valuation in USD as a % Nominal Unrealized gain of net (loss) on Futures/ assets Forward Exchange Contracts/ Swaps (Note 1)
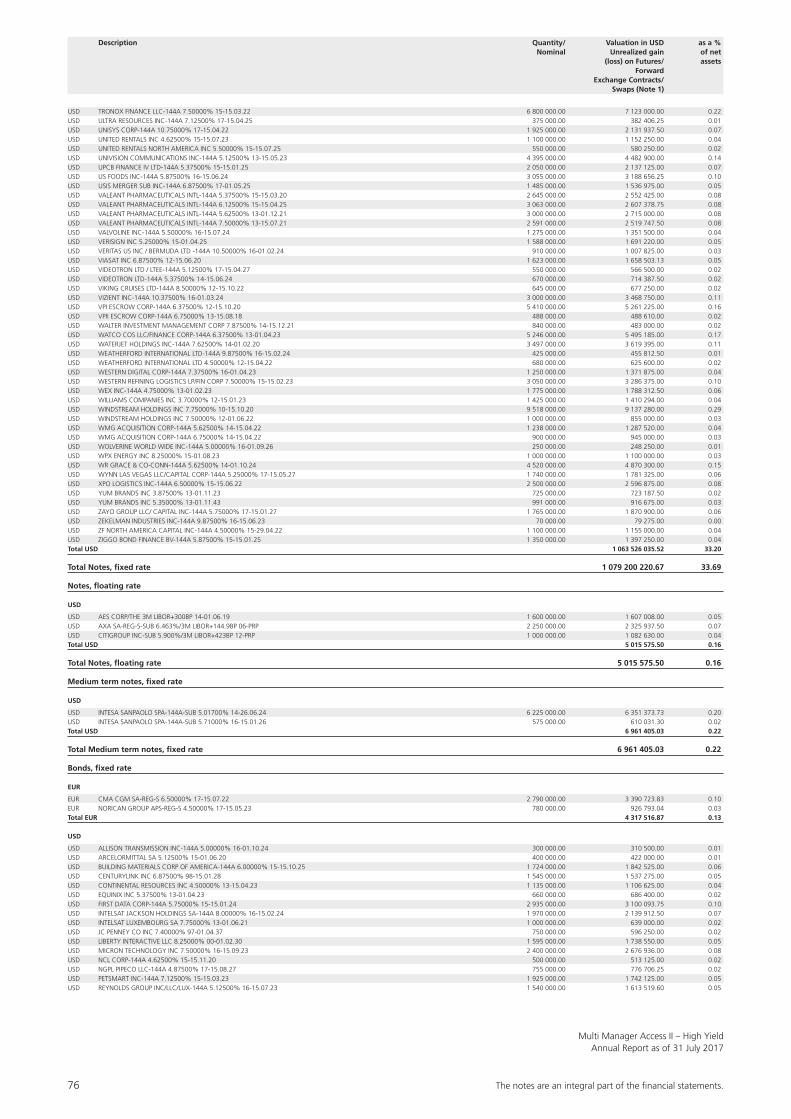
76 The notes are an integral part of the fi nancial statements.
Multi Manager Access II – High YieldAnnual Report as of 31 July 2017
Description Quantity/ Valuation in USD as a % Nominal Unrealized gain of net (loss) on Futures/ assets Forward Exchange Contracts/ Swaps (Note 1)
USD TRONOX FINANCE LLC-144A 7.50000% 15-15.03.22 6 800 000.00 7 123 000.00 0.22USD ULTRA RESOURCES INC-144A 7.12500% 17-15.04.25 375 000.00 382 406.25 0.01USD UNISYS CORP-144A 10.75000% 17-15.04.22 1 925 000.00 2 131 937.50 0.07USD UNITED RENTALS INC 4.62500% 15-15.07.23 1 100 000.00 1 152 250.00 0.04USD UNITED RENTALS NORTH AMERICA INC 5.50000% 15-15.07.25 550 000.00 580 250.00 0.02USD UNIVISION COMMUNICATIONS INC-144A 5.12500% 13-15.05.23 4 395 000.00 4 482 900.00 0.14USD UPCB FINANCE IV LTD-144A 5.37500% 15-15.01.25 2 050 000.00 2 137 125.00 0.07USD US FOODS INC-144A 5.87500% 16-15.06.24 3 055 000.00 3 188 656.25 0.10USD USIS MERGER SUB INC-144A 6.87500% 17-01.05.25 1 485 000.00 1 536 975.00 0.05USD VALEANT PHARMACEUTICALS INTL-144A 5.37500% 15-15.03.20 2 645 000.00 2 552 425.00 0.08USD VALEANT PHARMACEUTICALS INTL-144A 6.12500% 15-15.04.25 3 063 000.00 2 607 378.75 0.08USD VALEANT PHARMACEUTICALS INTL-144A 5.62500% 13-01.12.21 3 000 000.00 2 715 000.00 0.08USD VALEANT PHARMACEUTICALS INTL-144A 7.50000% 13-15.07.21 2 591 000.00 2 519 747.50 0.08USD VALVOLINE INC-144A 5.50000% 16-15.07.24 1 275 000.00 1 351 500.00 0.04USD VERISIGN INC 5.25000% 15-01.04.25 1 588 000.00 1 691 220.00 0.05USD VERITAS US INC / BERMUDA LTD -144A 10.50000% 16-01.02.24 910 000.00 1 007 825.00 0.03USD VIASAT INC 6.87500% 12-15.06.20 1 623 000.00 1 658 503.13 0.05USD VIDEOTRON LTD / LTEE-144A 5.12500% 17-15.04.27 550 000.00 566 500.00 0.02USD VIDEOTRON LTD-144A 5.37500% 14-15.06.24 670 000.00 714 387.50 0.02USD VIKING CRUISES LTD-144A 8.50000% 12-15.10.22 645 000.00 677 250.00 0.02USD VIZIENT INC-144A 10.37500% 16-01.03.24 3 000 000.00 3 468 750.00 0.11USD VPI ESCROW CORP-144A 6.37500% 12-15.10.20 5 410 000.00 5 261 225.00 0.16USD VPII ESCROW CORP-144A 6.75000% 13-15.08.18 488 000.00 488 610.00 0.02USD WALTER INVESTMENT MANAGEMENT CORP 7.87500% 14-15.12.21 840 000.00 483 000.00 0.02USD WATCO COS LLC/FINANCE CORP-144A 6.37500% 13-01.04.23 5 246 000.00 5 495 185.00 0.17USD WATERJET HOLDINGS INC-144A 7.62500% 14-01.02.20 3 497 000.00 3 619 395.00 0.11USD WEATHERFORD INTERNATIONAL LTD-144A 9.87500% 16-15.02.24 425 000.00 455 812.50 0.01USD WEATHERFORD INTERNATIONAL LTD 4.50000% 12-15.04.22 680 000.00 625 600.00 0.02USD WESTERN DIGITAL CORP-144A 7.37500% 16-01.04.23 1 250 000.00 1 371 875.00 0.04USD WESTERN REFINING LOGISTICS LP/FIN CORP 7.50000% 15-15.02.23 3 050 000.00 3 286 375.00 0.10USD WEX INC-144A 4.75000% 13-01.02.23 1 775 000.00 1 788 312.50 0.06USD WILLIAMS COMPANIES INC 3.70000% 12-15.01.23 1 425 000.00 1 410 294.00 0.04USD WINDSTREAM HOLDINGS INC 7.75000% 10-15.10.20 9 518 000.00 9 137 280.00 0.29USD WINDSTREAM HOLDINGS INC 7.50000% 12-01.06.22 1 000 000.00 855 000.00 0.03USD WMG ACQUISITION CORP-144A 5.62500% 14-15.04.22 1 238 000.00 1 287 520.00 0.04USD WMG ACQUISITION CORP-144A 6.75000% 14-15.04.22 900 000.00 945 000.00 0.03USD WOLVERINE WORLD WIDE INC-144A 5.00000% 16-01.09.26 250 000.00 248 250.00 0.01USD WPX ENERGY INC 8.25000% 15-01.08.23 1 000 000.00 1 100 000.00 0.03USD WR GRACE & CO-CONN-144A 5.62500% 14-01.10.24 4 520 000.00 4 870 300.00 0.15USD WYNN LAS VEGAS LLC/CAPITAL CORP-144A 5.25000% 17-15.05.27 1 740 000.00 1 781 325.00 0.06USD XPO LOGISTICS INC-144A 6.50000% 15-15.06.22 2 500 000.00 2 596 875.00 0.08USD YUM BRANDS INC 3.87500% 13-01.11.23 725 000.00 723 187.50 0.02USD YUM BRANDS INC 5.35000% 13-01.11.43 991 000.00 916 675.00 0.03USD ZAYO GROUP LLC/ CAPITAL INC-144A 5.75000% 17-15.01.27 1 765 000.00 1 870 900.00 0.06USD ZEKELMAN INDUSTRIES INC-144A 9.87500% 16-15.06.23 70 000.00 79 275.00 0.00USD ZF NORTH AMERICA CAPITAL INC-144A 4.50000% 15-29.04.22 1 100 000.00 1 155 000.00 0.04USD ZIGGO BOND FINANCE BV-144A 5.87500% 15-15.01.25 1 350 000.00 1 397 250.00 0.04Total USD 1 063 526 035.52 33.20
Total Notes, fixed rate 1 079 200 220.67 33.69
Notes, floating rate
USD
USD AES CORP/THE 3M LIBOR+300BP 14-01.06.19 1 600 000.00 1 607 008.00 0.05USD AXA SA-REG-S-SUB 6.463%/3M LIBOR+144.9BP 06-PRP 2 250 000.00 2 325 937.50 0.07USD CITIGROUP INC-SUB 5.900%/3M LIBOR+423BP 12-PRP 1 000 000.00 1 082 630.00 0.04Total USD 5 015 575.50 0.16
Total Notes, floating rate 5 015 575.50 0.16
Medium term notes, fixed rate
USD
USD INTESA SANPAOLO SPA-144A-SUB 5.01700% 14-26.06.24 6 225 000.00 6 351 373.73 0.20USD INTESA SANPAOLO SPA-144A-SUB 5.71000% 16-15.01.26 575 000.00 610 031.30 0.02Total USD 6 961 405.03 0.22
Total Medium term notes, fixed rate 6 961 405.03 0.22
Bonds, fixed rate
EUR
EUR CMA CGM SA-REG-S 6.50000% 17-15.07.22 2 790 000.00 3 390 723.83 0.10EUR NORICAN GROUP APS-REG-S 4.50000% 17-15.05.23 780 000.00 926 793.04 0.03Total EUR 4 317 516.87 0.13
USD
USD ALLISON TRANSMISSION INC-144A 5.00000% 16-01.10.24 300 000.00 310 500.00 0.01USD ARCELORMITTAL SA 5.12500% 15-01.06.20 400 000.00 422 000.00 0.01USD BUILDING MATERIALS CORP OF AMERICA-144A 6.00000% 15-15.10.25 1 724 000.00 1 842 525.00 0.06USD CENTURYLINK INC 6.87500% 98-15.01.28 1 545 000.00 1 537 275.00 0.05USD CONTINENTAL RESOURCES INC 4.50000% 13-15.04.23 1 135 000.00 1 106 625.00 0.04USD EQUINIX INC 5.37500% 13-01.04.23 660 000.00 686 400.00 0.02USD FIRST DATA CORP-144A 5.75000% 15-15.01.24 2 935 000.00 3 100 093.75 0.10USD INTELSAT JACKSON HOLDINGS SA-144A 8.00000% 16-15.02.24 1 970 000.00 2 139 912.50 0.07USD INTELSAT LUXEMBOURG SA 7.75000% 13-01.06.21 1 000 000.00 639 000.00 0.02USD JC PENNEY CO INC 7.40000% 97-01.04.37 750 000.00 596 250.00 0.02USD LIBERTY INTERACTIVE LLC 8.25000% 00-01.02.30 1 595 000.00 1 738 550.00 0.05USD MICRON TECHNOLOGY INC 7.50000% 16-15.09.23 2 400 000.00 2 676 936.00 0.08USD NCL CORP-144A 4.62500% 15-15.11.20 500 000.00 513 125.00 0.02USD NGPL PIPECO LLC-144A 4.87500% 17-15.08.27 755 000.00 776 706.25 0.02USD PETSMART INC-144A 7.12500% 15-15.03.23 1 925 000.00 1 742 125.00 0.05USD REYNOLDS GROUP INC/LLC/LUX-144A 5.12500% 16-15.07.23 1 540 000.00 1 613 519.60 0.05
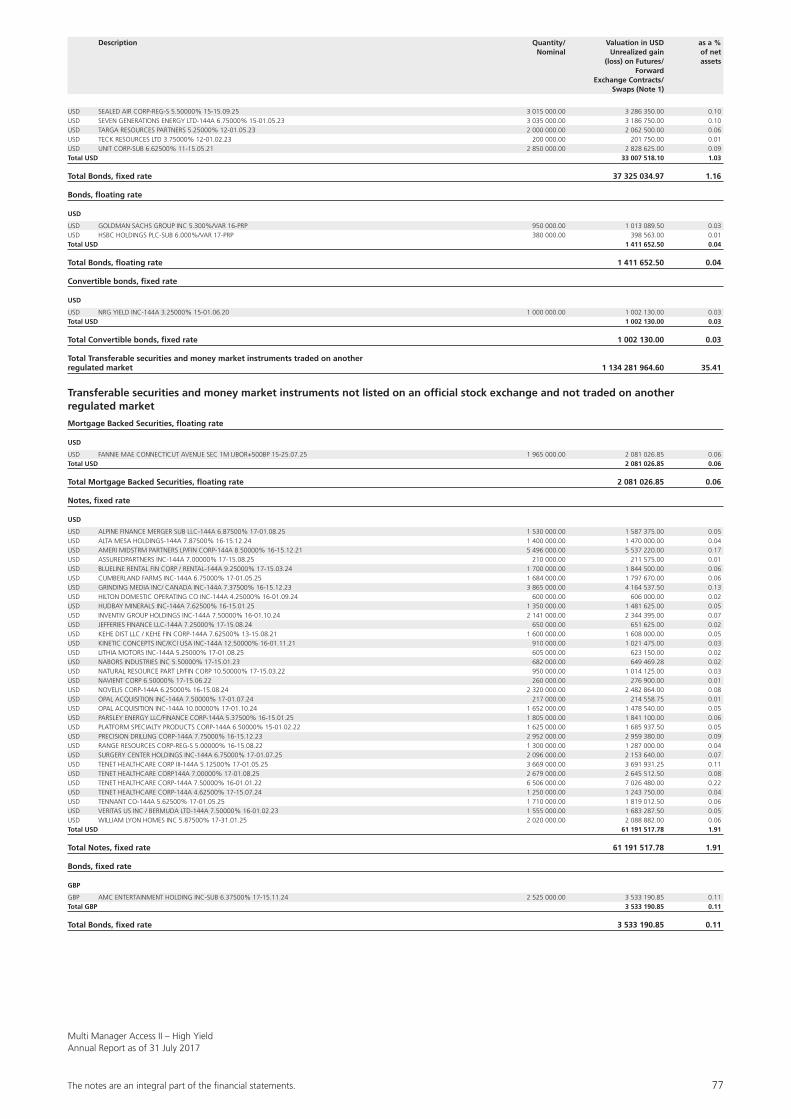
The notes are an integral part of the fi nancial statements. 77
Multi Manager Access II – High YieldAnnual Report as of 31 July 2017
USD SEALED AIR CORP-REG-S 5.50000% 15-15.09.25 3 015 000.00 3 286 350.00 0.10USD SEVEN GENERATIONS ENERGY LTD-144A 6.75000% 15-01.05.23 3 035 000.00 3 186 750.00 0.10USD TARGA RESOURCES PARTNERS 5.25000% 12-01.05.23 2 000 000.00 2 062 500.00 0.06USD TECK RESOURCES LTD 3.75000% 12-01.02.23 200 000.00 201 750.00 0.01USD UNIT CORP-SUB 6.62500% 11-15.05.21 2 850 000.00 2 828 625.00 0.09Total USD 33 007 518.10 1.03
Total Bonds, fixed rate 37 325 034.97 1.16
Bonds, floating rate
USD
USD GOLDMAN SACHS GROUP INC 5.300%/VAR 16-PRP 950 000.00 1 013 089.50 0.03USD HSBC HOLDINGS PLC-SUB 6.000%/VAR 17-PRP 380 000.00 398 563.00 0.01Total USD 1 411 652.50 0.04
Total Bonds, floating rate 1 411 652.50 0.04
Convertible bonds, fixed rate
USD
USD NRG YIELD INC-144A 3.25000% 15-01.06.20 1 000 000.00 1 002 130.00 0.03Total USD 1 002 130.00 0.03
Total Convertible bonds, fixed rate 1 002 130.00 0.03
Total Transferable securities and money market instruments traded on another regulated market 1 134 281 964.60 35.41
Transferable securities and money market instruments not listed on an official stock exchange and not traded on another regulated market
Mortgage Backed Securities, floating rate
USD
USD FANNIE MAE CONNECTICUT AVENUE SEC 1M LIBOR+500BP 15-25.07.25 1 965 000.00 2 081 026.85 0.06Total USD 2 081 026.85 0.06
Total Mortgage Backed Securities, floating rate 2 081 026.85 0.06
Notes, fixed rate
USD
USD ALPINE FINANCE MERGER SUB LLC-144A 6.87500% 17-01.08.25 1 530 000.00 1 587 375.00 0.05USD ALTA MESA HOLDINGS-144A 7.87500% 16-15.12.24 1 400 000.00 1 470 000.00 0.04USD AMERI MIDSTRM PARTNERS LP/FIN CORP-144A 8.50000% 16-15.12.21 5 496 000.00 5 537 220.00 0.17USD ASSUREDPARTNERS INC-144A 7.00000% 17-15.08.25 210 000.00 211 575.00 0.01USD BLUELINE RENTAL FIN CORP / RENTAL-144A 9.25000% 17-15.03.24 1 700 000.00 1 844 500.00 0.06USD CUMBERLAND FARMS INC-144A 6.75000% 17-01.05.25 1 684 000.00 1 797 670.00 0.06USD GRINDING MEDIA INC/ CANADA INC-144A 7.37500% 16-15.12.23 3 865 000.00 4 164 537.50 0.13USD HILTON DOMESTIC OPERATING CO INC-144A 4.25000% 16-01.09.24 600 000.00 606 000.00 0.02USD HUDBAY MINERALS INC-144A 7.62500% 16-15.01.25 1 350 000.00 1 481 625.00 0.05USD INVENTIV GROUP HOLDINGS INC-144A 7.50000% 16-01.10.24 2 141 000.00 2 344 395.00 0.07USD JEFFERIES FINANCE LLC-144A 7.25000% 17-15.08.24 650 000.00 651 625.00 0.02USD KEHE DIST LLC / KEHE FIN CORP-144A 7.62500% 13-15.08.21 1 600 000.00 1 608 000.00 0.05USD KINETIC CONCEPTS INC/KCI USA INC-144A 12.50000% 16-01.11.21 910 000.00 1 021 475.00 0.03USD LITHIA MOTORS INC-144A 5.25000% 17-01.08.25 605 000.00 623 150.00 0.02USD NABORS INDUSTRIES INC 5.50000% 17-15.01.23 682 000.00 649 469.28 0.02USD NATURAL RESOURCE PART LP/FIN CORP 10.50000% 17-15.03.22 950 000.00 1 014 125.00 0.03USD NAVIENT CORP 6.50000% 17-15.06.22 260 000.00 276 900.00 0.01USD NOVELIS CORP-144A 6.25000% 16-15.08.24 2 320 000.00 2 482 864.00 0.08USD OPAL ACQUISITION INC-144A 7.50000% 17-01.07.24 217 000.00 214 558.75 0.01USD OPAL ACQUISITION INC-144A 10.00000% 17-01.10.24 1 652 000.00 1 478 540.00 0.05USD PARSLEY ENERGY LLC/FINANCE CORP-144A 5.37500% 16-15.01.25 1 805 000.00 1 841 100.00 0.06USD PLATFORM SPECIALTY PRODUCTS CORP-144A 6.50000% 15-01.02.22 1 625 000.00 1 685 937.50 0.05USD PRECISION DRILLING CORP-144A 7.75000% 16-15.12.23 2 952 000.00 2 959 380.00 0.09USD RANGE RESOURCES CORP-REG-S 5.00000% 16-15.08.22 1 300 000.00 1 287 000.00 0.04USD SURGERY CENTER HOLDINGS INC-144A 6.75000% 17-01.07.25 2 096 000.00 2 153 640.00 0.07USD TENET HEALTHCARE CORP III-144A 5.12500% 17-01.05.25 3 669 000.00 3 691 931.25 0.11USD TENET HEALTHCARE CORP144A 7.00000% 17-01.08.25 2 679 000.00 2 645 512.50 0.08USD TENET HEALTHCARE CORP-144A 7.50000% 16-01.01.22 6 506 000.00 7 026 480.00 0.22USD TENET HEALTHCARE CORP-144A 4.62500% 17-15.07.24 1 250 000.00 1 243 750.00 0.04USD TENNANT CO-144A 5.62500% 17-01.05.25 1 710 000.00 1 819 012.50 0.06USD VERITAS US INC / BERMUDA LTD-144A 7.50000% 16-01.02.23 1 555 000.00 1 683 287.50 0.05USD WILLIAM LYON HOMES INC 5.87500% 17-31.01.25 2 020 000.00 2 088 882.00 0.06Total USD 61 191 517.78 1.91
Total Notes, fixed rate 61 191 517.78 1.91
Bonds, fixed rate
GBP
GBP AMC ENTERTAINMENT HOLDING INC-SUB 6.37500% 17-15.11.24 2 525 000.00 3 533 190.85 0.11Total GBP 3 533 190.85 0.11
Total Bonds, fixed rate 3 533 190.85 0.11
Description Quantity/ Valuation in USD as a % Nominal Unrealized gain of net (loss) on Futures/ assets Forward Exchange Contracts/ Swaps (Note 1)
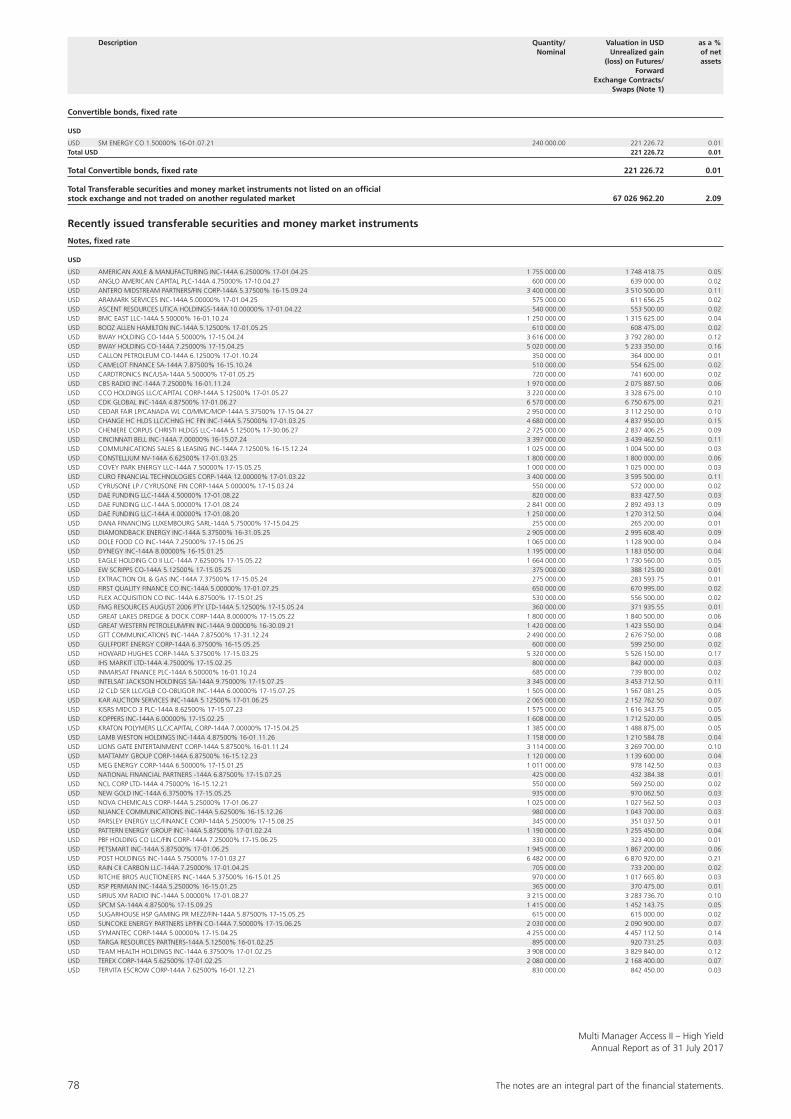
78 The notes are an integral part of the fi nancial statements.
Multi Manager Access II – High YieldAnnual Report as of 31 July 2017
Description Quantity/ Valuation in USD as a % Nominal Unrealized gain of net (loss) on Futures/ assets Forward Exchange Contracts/ Swaps (Note 1)
Convertible bonds, fixed rate
USD
USD SM ENERGY CO 1.50000% 16-01.07.21 240 000.00 221 226.72 0.01Total USD 221 226.72 0.01
Total Convertible bonds, fixed rate 221 226.72 0.01
Total Transferable securities and money market instruments not listed on an official stock exchange and not traded on another regulated market 67 026 962.20 2.09
Recently issued transferable securities and money market instruments
Notes, fixed rate
USD
USD AMERICAN AXLE & MANUFACTURING INC-144A 6.25000% 17-01.04.25 1 755 000.00 1 748 418.75 0.05USD ANGLO AMERICAN CAPITAL PLC-144A 4.75000% 17-10.04.27 600 000.00 639 000.00 0.02USD ANTERO MIDSTREAM PARTNERS/FIN CORP-144A 5.37500% 16-15.09.24 3 400 000.00 3 510 500.00 0.11USD ARAMARK SERVICES INC-144A 5.00000% 17-01.04.25 575 000.00 611 656.25 0.02USD ASCENT RESOURCES UTICA HOLDINGS-144A 10.00000% 17-01.04.22 540 000.00 553 500.00 0.02USD BMC EAST LLC-144A 5.50000% 16-01.10.24 1 250 000.00 1 315 625.00 0.04USD BOOZ ALLEN HAMILTON INC-144A 5.12500% 17-01.05.25 610 000.00 608 475.00 0.02USD BWAY HOLDING CO-144A 5.50000% 17-15.04.24 3 616 000.00 3 792 280.00 0.12USD BWAY HOLDING CO-144A 7.25000% 17-15.04.25 5 020 000.00 5 233 350.00 0.16USD CALLON PETROLEUM CO-144A 6.12500% 17-01.10.24 350 000.00 364 000.00 0.01USD CAMELOT FINANCE SA-144A 7.87500% 16-15.10.24 510 000.00 554 625.00 0.02USD CARDTRONICS INC/USA-144A 5.50000% 17-01.05.25 720 000.00 741 600.00 0.02USD CBS RADIO INC-144A 7.25000% 16-01.11.24 1 970 000.00 2 075 887.50 0.06USD CCO HOLDINGS LLC/CAPITAL CORP-144A 5.12500% 17-01.05.27 3 220 000.00 3 328 675.00 0.10USD CDK GLOBAL INC-144A 4.87500% 17-01.06.27 6 570 000.00 6 750 675.00 0.21USD CEDAR FAIR LP/CANADA WL CO/MMC/MOP-144A 5.37500% 17-15.04.27 2 950 000.00 3 112 250.00 0.10USD CHANGE HC HLDS LLC/CHNG HC FIN INC-144A 5.75000% 17-01.03.25 4 680 000.00 4 837 950.00 0.15USD CHENIERE CORPUS CHRISTI HLDGS LLC-144A 5.12500% 17-30.06.27 2 725 000.00 2 837 406.25 0.09USD CINCINNATI BELL INC-144A 7.00000% 16-15.07.24 3 397 000.00 3 439 462.50 0.11USD COMMUNICATIONS SALES & LEASING INC-144A 7.12500% 16-15.12.24 1 025 000.00 1 004 500.00 0.03USD CONSTELLIUM NV-144A 6.62500% 17-01.03.25 1 800 000.00 1 800 000.00 0.06USD COVEY PARK ENERGY LLC-144A 7.50000% 17-15.05.25 1 000 000.00 1 025 000.00 0.03USD CURO FINANCIAL TECHNOLOGIES CORP-144A 12.00000% 17-01.03.22 3 400 000.00 3 595 500.00 0.11USD CYRUSONE LP / CYRUSONE FIN CORP-144A 5.00000% 17-15.03.24 550 000.00 572 000.00 0.02USD DAE FUNDING LLC-144A 4.50000% 17-01.08.22 820 000.00 833 427.50 0.03USD DAE FUNDING LLC-144A 5.00000% 17-01.08.24 2 841 000.00 2 892 493.13 0.09USD DAE FUNDING LLC-144A 4.00000% 17-01.08.20 1 250 000.00 1 270 312.50 0.04USD DANA FINANCING LUXEMBOURG SARL-144A 5.75000% 17-15.04.25 255 000.00 265 200.00 0.01USD DIAMONDBACK ENERGY INC-144A 5.37500% 16-31.05.25 2 905 000.00 2 995 608.40 0.09USD DOLE FOOD CO INC-144A 7.25000% 17-15.06.25 1 065 000.00 1 128 900.00 0.04USD DYNEGY INC-144A 8.00000% 16-15.01.25 1 195 000.00 1 183 050.00 0.04USD EAGLE HOLDING CO II LLC-144A 7.62500% 17-15.05.22 1 664 000.00 1 730 560.00 0.05USD EW SCRIPPS CO-144A 5.12500% 17-15.05.25 375 000.00 388 125.00 0.01USD EXTRACTION OIL & GAS INC-144A 7.37500% 17-15.05.24 275 000.00 283 593.75 0.01USD FIRST QUALITY FINANCE CO INC-144A 5.00000% 17-01.07.25 650 000.00 670 995.00 0.02USD FLEX ACQUISITION CO INC-144A 6.87500% 17-15.01.25 530 000.00 556 500.00 0.02USD FMG RESOURCES AUGUST 2006 PTY LTD-144A 5.12500% 17-15.05.24 360 000.00 371 935.55 0.01USD GREAT LAKES DREDGE & DOCK CORP-144A 8.00000% 17-15.05.22 1 800 000.00 1 840 500.00 0.06USD GREAT WESTERN PETROLEUM/FIN INC-144A 9.00000% 16-30.09.21 1 420 000.00 1 423 550.00 0.04USD GTT COMMUNICATIONS INC-144A 7.87500% 17-31.12.24 2 490 000.00 2 676 750.00 0.08USD GULFPORT ENERGY CORP-144A 6.37500% 16-15.05.25 600 000.00 599 250.00 0.02USD HOWARD HUGHES CORP-144A 5.37500% 17-15.03.25 5 320 000.00 5 526 150.00 0.17USD IHS MARKIT LTD-144A 4.75000% 17-15.02.25 800 000.00 842 000.00 0.03USD INMARSAT FINANCE PLC-144A 6.50000% 16-01.10.24 685 000.00 739 800.00 0.02USD INTELSAT JACKSON HOLDINGS SA-144A 9.75000% 17-15.07.25 3 345 000.00 3 453 712.50 0.11USD J2 CLD SER LLC/GLB CO-OBLIGOR INC-144A 6.00000% 17-15.07.25 1 505 000.00 1 567 081.25 0.05USD KAR AUCTION SERVICES INC-144A 5.12500% 17-01.06.25 2 065 000.00 2 152 762.50 0.07USD KISRS MIDCO 3 PLC-144A 8.62500% 17-15.07.23 1 575 000.00 1 616 343.75 0.05USD KOPPERS INC-144A 6.00000% 17-15.02.25 1 608 000.00 1 712 520.00 0.05USD KRATON POLYMERS LLC/CAPITAL CORP-144A 7.00000% 17-15.04.25 1 385 000.00 1 488 875.00 0.05USD LAMB WESTON HOLDINGS INC-144A 4.87500% 16-01.11.26 1 158 000.00 1 210 584.78 0.04USD LIONS GATE ENTERTAINMENT CORP-144A 5.87500% 16-01.11.24 3 114 000.00 3 269 700.00 0.10USD MATTAMY GROUP CORP-144A 6.87500% 16-15.12.23 1 120 000.00 1 139 600.00 0.04USD MEG ENERGY CORP-144A 6.50000% 17-15.01.25 1 011 000.00 978 142.50 0.03USD NATIONAL FINANCIAL PARTNERS -144A 6.87500% 17-15.07.25 425 000.00 432 384.38 0.01USD NCL CORP LTD-144A 4.75000% 16-15.12.21 550 000.00 569 250.00 0.02USD NEW GOLD INC-144A 6.37500% 17-15.05.25 935 000.00 970 062.50 0.03USD NOVA CHEMICALS CORP-144A 5.25000% 17-01.06.27 1 025 000.00 1 027 562.50 0.03USD NUANCE COMMUNICATIONS INC-144A 5.62500% 16-15.12.26 980 000.00 1 043 700.00 0.03USD PARSLEY ENERGY LLC/FINANCE CORP-144A 5.25000% 17-15.08.25 345 000.00 351 037.50 0.01USD PATTERN ENERGY GROUP INC-144A 5.87500% 17-01.02.24 1 190 000.00 1 255 450.00 0.04USD PBF HOLDING CO LLC/FIN CORP-144A 7.25000% 17-15.06.25 330 000.00 323 400.00 0.01USD PETSMART INC-144A 5.87500% 17-01.06.25 1 945 000.00 1 867 200.00 0.06USD POST HOLDINGS INC-144A 5.75000% 17-01.03.27 6 482 000.00 6 870 920.00 0.21USD RAIN CII CARBON LLC-144A 7.25000% 17-01.04.25 705 000.00 733 200.00 0.02USD RITCHIE BROS AUCTIONEERS INC-144A 5.37500% 16-15.01.25 970 000.00 1 017 665.80 0.03USD RSP PERMIAN INC-144A 5.25000% 16-15.01.25 365 000.00 370 475.00 0.01USD SIRIUS XM RADIO INC-144A 5.00000% 17-01.08.27 3 215 000.00 3 283 736.70 0.10USD SPCM SA-144A 4.87500% 17-15.09.25 1 415 000.00 1 452 143.75 0.05USD SUGARHOUSE HSP GAMING PR MEZZ/FIN-144A 5.87500% 17-15.05.25 615 000.00 615 000.00 0.02USD SUNCOKE ENERGY PARTNERS LP/FIN CO-144A 7.50000% 17-15.06.25 2 030 000.00 2 090 900.00 0.07USD SYMANTEC CORP-144A 5.00000% 17-15.04.25 4 255 000.00 4 457 112.50 0.14USD TARGA RESOURCES PARTNERS-144A 5.12500% 16-01.02.25 895 000.00 920 731.25 0.03USD TEAM HEALTH HOLDINGS INC-144A 6.37500% 17-01.02.25 3 908 000.00 3 829 840.00 0.12USD TEREX CORP-144A 5.62500% 17-01.02.25 2 080 000.00 2 168 400.00 0.07USD TERVITA ESCROW CORP-144A 7.62500% 16-01.12.21 830 000.00 842 450.00 0.03
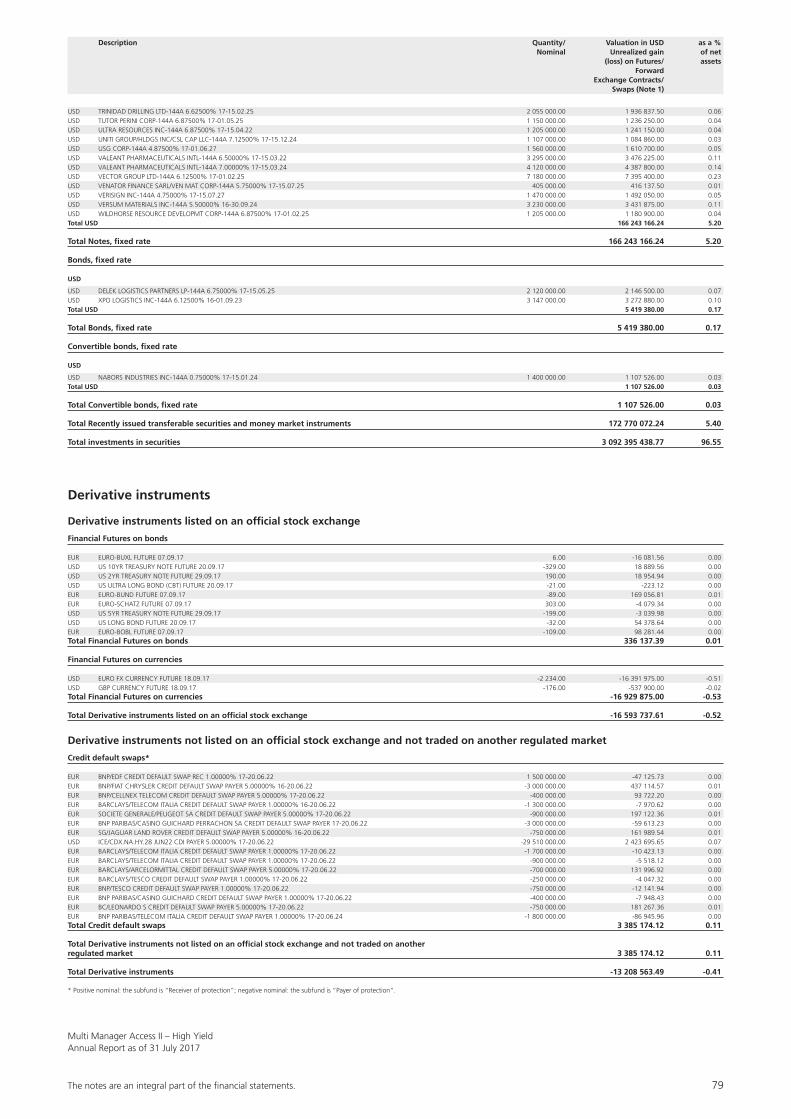
The notes are an integral part of the fi nancial statements. 79
Multi Manager Access II – High YieldAnnual Report as of 31 July 2017
USD TRINIDAD DRILLING LTD-144A 6.62500% 17-15.02.25 2 055 000.00 1 936 837.50 0.06USD TUTOR PERINI CORP-144A 6.87500% 17-01.05.25 1 150 000.00 1 236 250.00 0.04USD ULTRA RESOURCES INC-144A 6.87500% 17-15.04.22 1 205 000.00 1 241 150.00 0.04USD UNITI GROUP/HLDGS INC/CSL CAP LLC-144A 7.12500% 17-15.12.24 1 107 000.00 1 084 860.00 0.03USD USG CORP-144A 4.87500% 17-01.06.27 1 560 000.00 1 610 700.00 0.05USD VALEANT PHARMACEUTICALS INTL-144A 6.50000% 17-15.03.22 3 295 000.00 3 476 225.00 0.11USD VALEANT PHARMACEUTICALS INTL-144A 7.00000% 17-15.03.24 4 120 000.00 4 387 800.00 0.14USD VECTOR GROUP LTD-144A 6.12500% 17-01.02.25 7 180 000.00 7 395 400.00 0.23USD VENATOR FINANCE SARL/VEN MAT CORP-144A 5.75000% 17-15.07.25 405 000.00 416 137.50 0.01USD VERISIGN INC-144A 4.75000% 17-15.07.27 1 470 000.00 1 492 050.00 0.05USD VERSUM MATERIALS INC-144A 5.50000% 16-30.09.24 3 230 000.00 3 431 875.00 0.11USD WILDHORSE RESOURCE DEVELOPMT CORP-144A 6.87500% 17-01.02.25 1 205 000.00 1 180 900.00 0.04Total USD 166 243 166.24 5.20
Total Notes, fixed rate 166 243 166.24 5.20
Bonds, fixed rate
USD
USD DELEK LOGISTICS PARTNERS LP-144A 6.75000% 17-15.05.25 2 120 000.00 2 146 500.00 0.07USD XPO LOGISTICS INC-144A 6.12500% 16-01.09.23 3 147 000.00 3 272 880.00 0.10Total USD 5 419 380.00 0.17
Total Bonds, fixed rate 5 419 380.00 0.17
Convertible bonds, fixed rate
USD
USD NABORS INDUSTRIES INC-144A 0.75000% 17-15.01.24 1 400 000.00 1 107 526.00 0.03Total USD 1 107 526.00 0.03
Total Convertible bonds, fixed rate 1 107 526.00 0.03
Total Recently issued transferable securities and money market instruments 172 770 072.24 5.40
Total investments in securities 3 092 395 438.77 96.55
Derivative instruments
Derivative instruments listed on an official stock exchange
Financial Futures on bonds
EUR EURO-BUXL FUTURE 07.09.17 6.00 -16 081.56 0.00USD US 10YR TREASURY NOTE FUTURE 20.09.17 -329.00 18 889.56 0.00USD US 2YR TREASURY NOTE FUTURE 29.09.17 190.00 18 954.94 0.00USD US ULTRA LONG BOND (CBT) FUTURE 20.09.17 -21.00 -223.12 0.00EUR EURO-BUND FUTURE 07.09.17 -89.00 169 056.81 0.01EUR EURO-SCHATZ FUTURE 07.09.17 303.00 -4 079.34 0.00USD US 5YR TREASURY NOTE FUTURE 29.09.17 -199.00 -3 039.98 0.00USD US LONG BOND FUTURE 20.09.17 -32.00 54 378.64 0.00EUR EURO-BOBL FUTURE 07.09.17 -109.00 98 281.44 0.00Total Financial Futures on bonds 336 137.39 0.01
Financial Futures on currencies
USD EURO FX CURRENCY FUTURE 18.09.17 -2 234.00 -16 391 975.00 -0.51USD GBP CURRENCY FUTURE 18.09.17 -176.00 -537 900.00 -0.02Total Financial Futures on currencies -16 929 875.00 -0.53
Total Derivative instruments listed on an official stock exchange -16 593 737.61 -0.52
Derivative instruments not listed on an official stock exchange and not traded on another regulated market
Credit default swaps*
EUR BNP/EDF CREDIT DEFAULT SWAP REC 1.00000% 17-20.06.22 1 500 000.00 -47 125.73 0.00EUR BNP/FIAT CHRYSLER CREDIT DEFAULT SWAP PAYER 5.00000% 16-20.06.22 -3 000 000.00 437 114.57 0.01EUR BNP/CELLNEX TELECOM CREDIT DEFAULT SWAP PAYER 5.00000% 17-20.06.22 -400 000.00 93 722.20 0.00EUR BARCLAYS/TELECOM ITALIA CREDIT DEFAULT SWAP PAYER 1.00000% 16-20.06.22 -1 300 000.00 -7 970.62 0.00EUR SOCIETE GENERALE/PEUGEOT SA CREDIT DEFAULT SWAP PAYER 5.00000% 17-20.06.22 -900 000.00 197 122.36 0.01EUR BNP PARIBAS/CASINO GUICHARD PERRACHON SA CREDIT DEFAULT SWAP PAYER 17-20.06.22 -3 000 000.00 -59 613.23 0.00EUR SG/JAGUAR LAND ROVER CREDIT DEFAULT SWAP PAYER 5.00000% 16-20.06.22 -750 000.00 161 989.54 0.01USD ICE/CDX.NA.HY.28 JUN22 CDI PAYER 5.00000% 17-20.06.22 -29 510 000.00 2 423 695.65 0.07EUR BARCLAYS/TELECOM ITALIA CREDIT DEFAULT SWAP PAYER 1.00000% 17-20.06.22 -1 700 000.00 -10 423.13 0.00EUR BARCLAYS/TELECOM ITALIA CREDIT DEFAULT SWAP PAYER 1.00000% 17-20.06.22 -900 000.00 -5 518.12 0.00EUR BARCLAYS/ARCELORMITTAL CREDIT DEFAULT SWAP PAYER 5.00000% 17-20.06.22 -700 000.00 131 996.92 0.00EUR BARCLAYS/TESCO CREDIT DEFAULT SWAP PAYER 1.00000% 17-20.06.22 -250 000.00 -4 047.32 0.00EUR BNP/TESCO CREDIT DEFAULT SWAP PAYER 1.00000% 17-20.06.22 -750 000.00 -12 141.94 0.00EUR BNP PARIBAS/CASINO GUICHARD CREDIT DEFAULT SWAP PAYER 1.00000% 17-20.06.22 -400 000.00 -7 948.43 0.00EUR BC/LEONARDO S CREDIT DEFAULT SWAP PAYER 5.00000% 17-20.06.22 -750 000.00 181 267.36 0.01EUR BNP PARIBAS/TELECOM ITALIA CREDIT DEFAULT SWAP PAYER 1.00000% 17-20.06.24 -1 800 000.00 -86 945.96 0.00Total Credit default swaps 3 385 174.12 0.11
Total Derivative instruments not listed on an official stock exchange and not traded on another regulated market 3 385 174.12 0.11
Total Derivative instruments -13 208 563.49 -0.41
Description Quantity/ Valuation in USD as a % Nominal Unrealized gain of net (loss) on Futures/ assets Forward Exchange Contracts/ Swaps (Note 1)
* Positive nominal: the subfund is “Receiver of protection”; negative nominal: the subfund is “Payer of protection”.
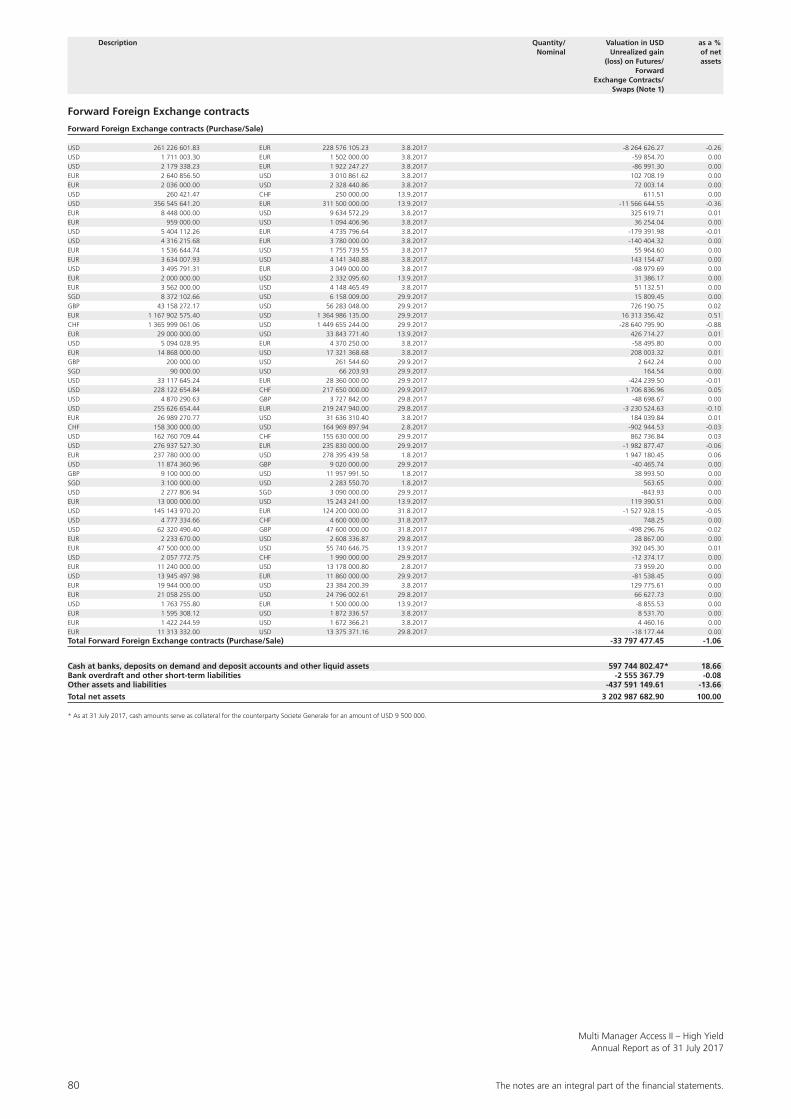
80 The notes are an integral part of the fi nancial statements.
Multi Manager Access II – High YieldAnnual Report as of 31 July 2017
Forward Foreign Exchange contracts
Forward Foreign Exchange contracts (Purchase/Sale)
USD 261 226 601.83 EUR 228 576 105.23 3.8.2017 -8 264 626.27 -0.26USD 1 711 003.30 EUR 1 502 000.00 3.8.2017 -59 854.70 0.00USD 2 179 338.23 EUR 1 922 247.27 3.8.2017 -86 991.30 0.00EUR 2 640 856.50 USD 3 010 861.62 3.8.2017 102 708.19 0.00EUR 2 036 000.00 USD 2 328 440.86 3.8.2017 72 003.14 0.00USD 260 421.47 CHF 250 000.00 13.9.2017 611.51 0.00USD 356 545 641.20 EUR 311 500 000.00 13.9.2017 -11 566 644.55 -0.36EUR 8 448 000.00 USD 9 634 572.29 3.8.2017 325 619.71 0.01EUR 959 000.00 USD 1 094 406.96 3.8.2017 36 254.04 0.00USD 5 404 112.26 EUR 4 735 796.64 3.8.2017 -179 391.98 -0.01USD 4 316 215.68 EUR 3 780 000.00 3.8.2017 -140 404.32 0.00EUR 1 536 644.74 USD 1 755 739.55 3.8.2017 55 964.60 0.00EUR 3 634 007.93 USD 4 141 340.88 3.8.2017 143 154.47 0.00USD 3 495 791.31 EUR 3 049 000.00 3.8.2017 -98 979.69 0.00EUR 2 000 000.00 USD 2 332 095.60 13.9.2017 31 386.17 0.00EUR 3 562 000.00 USD 4 148 465.49 3.8.2017 51 132.51 0.00SGD 8 372 102.66 USD 6 158 009.00 29.9.2017 15 809.45 0.00GBP 43 158 272.17 USD 56 283 048.00 29.9.2017 726 190.75 0.02EUR 1 167 902 575.40 USD 1 364 986 135.00 29.9.2017 16 313 356.42 0.51CHF 1 365 999 061.06 USD 1 449 655 244.00 29.9.2017 -28 640 795.90 -0.88EUR 29 000 000.00 USD 33 843 771.40 13.9.2017 426 714.27 0.01USD 5 094 028.95 EUR 4 370 250.00 3.8.2017 -58 495.80 0.00EUR 14 868 000.00 USD 17 321 368.68 3.8.2017 208 003.32 0.01GBP 200 000.00 USD 261 544.60 29.9.2017 2 642.24 0.00SGD 90 000.00 USD 66 203.93 29.9.2017 164.54 0.00USD 33 117 645.24 EUR 28 360 000.00 29.9.2017 -424 239.50 -0.01USD 228 122 654.84 CHF 217 650 000.00 29.9.2017 1 706 836.96 0.05USD 4 870 290.63 GBP 3 727 842.00 29.8.2017 -48 698.67 0.00USD 255 626 654.44 EUR 219 247 940.00 29.8.2017 -3 230 524.63 -0.10EUR 26 989 270.77 USD 31 636 310.40 3.8.2017 184 039.84 0.01CHF 158 300 000.00 USD 164 969 897.94 2.8.2017 -902 944.53 -0.03USD 162 760 709.44 CHF 155 630 000.00 29.9.2017 862 736.84 0.03USD 276 937 527.30 EUR 235 830 000.00 29.9.2017 -1 982 877.47 -0.06EUR 237 780 000.00 USD 278 395 439.58 1.8.2017 1 947 180.45 0.06USD 11 874 360.96 GBP 9 020 000.00 29.9.2017 -40 465.74 0.00GBP 9 100 000.00 USD 11 957 991.50 1.8.2017 38 993.50 0.00SGD 3 100 000.00 USD 2 283 550.70 1.8.2017 563.65 0.00USD 2 277 806.94 SGD 3 090 000.00 29.9.2017 -843.93 0.00EUR 13 000 000.00 USD 15 243 241.00 13.9.2017 119 390.51 0.00USD 145 143 970.20 EUR 124 200 000.00 31.8.2017 -1 527 928.15 -0.05USD 4 777 334.66 CHF 4 600 000.00 31.8.2017 748.25 0.00USD 62 320 490.40 GBP 47 600 000.00 31.8.2017 -498 296.76 -0.02EUR 2 233 670.00 USD 2 608 336.87 29.8.2017 28 867.00 0.00EUR 47 500 000.00 USD 55 740 646.75 13.9.2017 392 045.30 0.01USD 2 057 772.75 CHF 1 990 000.00 29.9.2017 -12 374.17 0.00EUR 11 240 000.00 USD 13 178 000.80 2.8.2017 73 959.20 0.00USD 13 945 497.98 EUR 11 860 000.00 29.9.2017 -81 538.45 0.00EUR 19 944 000.00 USD 23 384 200.39 3.8.2017 129 775.61 0.00EUR 21 058 255.00 USD 24 796 002.61 29.8.2017 66 627.73 0.00USD 1 763 755.80 EUR 1 500 000.00 13.9.2017 -8 855.53 0.00EUR 1 595 308.12 USD 1 872 336.57 3.8.2017 8 531.70 0.00EUR 1 422 244.59 USD 1 672 366.21 3.8.2017 4 460.16 0.00EUR 11 313 332.00 USD 13 375 371.16 29.8.2017 -18 177.44 0.00Total Forward Foreign Exchange contracts (Purchase/Sale) -33 797 477.45 -1.06
Cash at banks, deposits on demand and deposit accounts and other liquid assets 597 744 802.47 18.66Bank overdraft and other short-term liabilities -2 555 367.79 -0.08Other assets and liabilities -437 591 149.61 -13.66
Total net assets 3 202 987 682.90 100.00
* As at 31 July 2017, cash amounts serve as collateral for the counterparty Societe Generale for an amount of USD 9 500 000.
*
Description Quantity/ Valuation in USD as a % Nominal Unrealized gain of net (loss) on Futures/ assets Forward Exchange Contracts/ Swaps (Note 1)
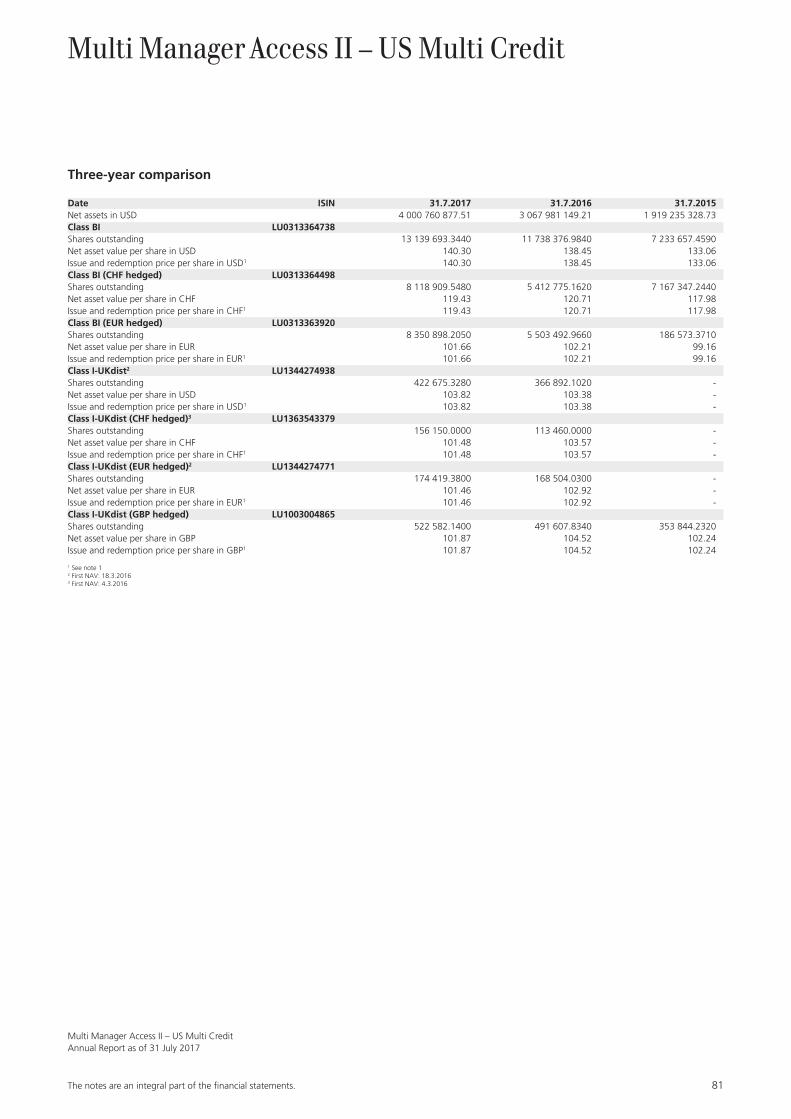
The notes are an integral part of the fi nancial statements. 81
Multi Manager Access II – US Multi CreditAnnual Report as of 31 July 2017
Multi Manager Access II – US Multi Credit
Three-year comparison
Date ISIN 31.7.2017 31.7.2016 31.7.2015Net assets in USD 4 000 760 877.51 3 067 981 149.21 1 919 235 328.73Class BI LU0313364738Shares outstanding 13 139 693.3440 11 738 376.9840 7 233 657.4590Net asset value per share in USD 140.30 138.45 133.06Issue and redemption price per share in USD1 140.30 138.45 133.06Class BI (CHF hedged) LU0313364498Shares outstanding 8 118 909.5480 5 412 775.1620 7 167 347.2440Net asset value per share in CHF 119.43 120.71 117.98Issue and redemption price per share in CHF1 119.43 120.71 117.98Class BI (EUR hedged) LU0313363920Shares outstanding 8 350 898.2050 5 503 492.9660 186 573.3710Net asset value per share in EUR 101.66 102.21 99.16Issue and redemption price per share in EUR1 101.66 102.21 99.16Class I-UKdist2 LU1344274938Shares outstanding 422 675.3280 366 892.1020 -Net asset value per share in USD 103.82 103.38 -Issue and redemption price per share in USD1 103.82 103.38 -Class I-UKdist (CHF hedged)3 LU1363543379Shares outstanding 156 150.0000 113 460.0000 -Net asset value per share in CHF 101.48 103.57 -Issue and redemption price per share in CHF1 101.48 103.57 -Class I-UKdist (EUR hedged)2 LU1344274771Shares outstanding 174 419.3800 168 504.0300 -Net asset value per share in EUR 101.46 102.92 -Issue and redemption price per share in EUR1 101.46 102.92 -Class I-UKdist (GBP hedged) LU1003004865Shares outstanding 522 582.1400 491 607.8340 353 844.2320Net asset value per share in GBP 101.87 104.52 102.24Issue and redemption price per share in GBP1 101.87 104.52 102.24
1 See note 12 First NAV: 18.3.20163 First NAV: 4.3.2016
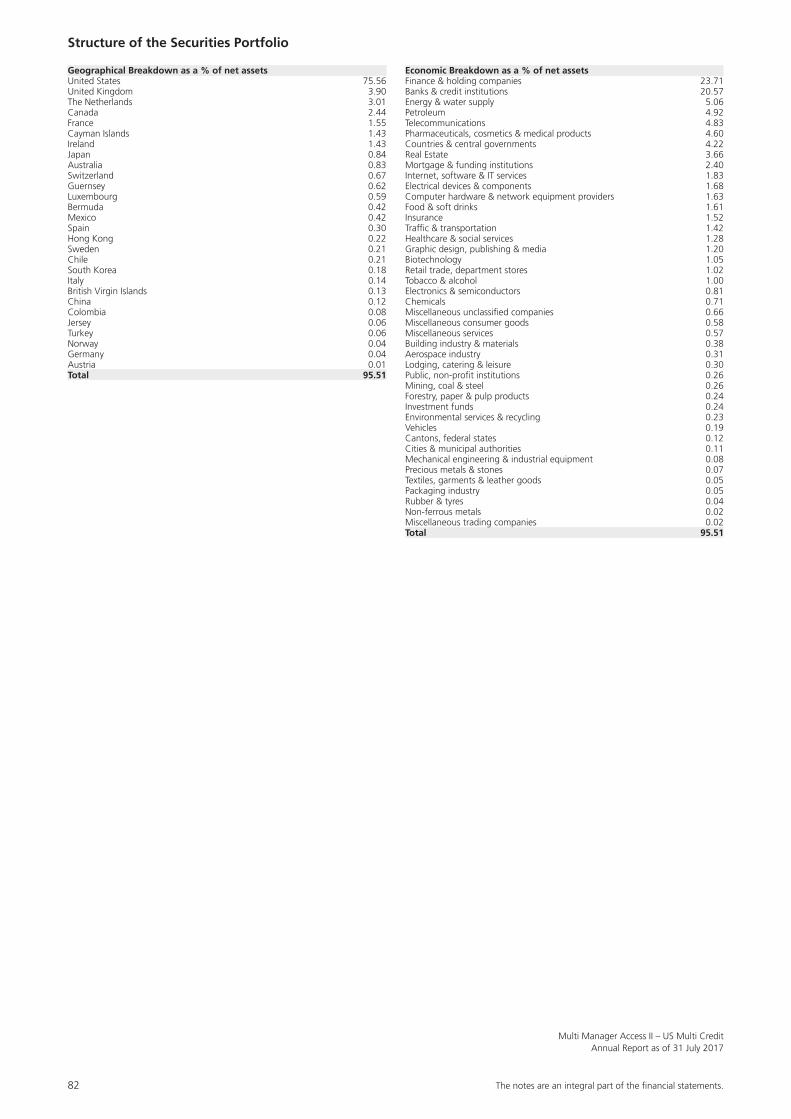
82 The notes are an integral part of the fi nancial statements.
Multi Manager Access II – US Multi CreditAnnual Report as of 31 July 2017
Structure of the Securities Portfolio
Geographical Breakdown as a % of net assetsUnited States 75.56United Kingdom 3.90The Netherlands 3.01Canada 2.44France 1.55Cayman Islands 1.43Ireland 1.43Japan 0.84Australia 0.83Switzerland 0.67Guernsey 0.62Luxembourg 0.59Bermuda 0.42Mexico 0.42Spain 0.30Hong Kong 0.22Sweden 0.21Chile 0.21South Korea 0.18Italy 0.14British Virgin Islands 0.13China 0.12Colombia 0.08Jersey 0.06Turkey 0.06Norway 0.04Germany 0.04Austria 0.01Total 95.51
Economic Breakdown as a % of net assetsFinance & holding companies 23.71Banks & credit institutions 20.57Energy & water supply 5.06Petroleum 4.92Telecommunications 4.83Pharmaceuticals, cosmetics & medical products 4.60Countries & central governments 4.22Real Estate 3.66Mortgage & funding institutions 2.40Internet, software & IT services 1.83Electrical devices & components 1.68Computer hardware & network equipment providers 1.63Food & soft drinks 1.61Insurance 1.52Traffic & transportation 1.42Healthcare & social services 1.28Graphic design, publishing & media 1.20Biotechnology 1.05Retail trade, department stores 1.02Tobacco & alcohol 1.00Electronics & semiconductors 0.81Chemicals 0.71Miscellaneous unclassified companies 0.66Miscellaneous consumer goods 0.58Miscellaneous services 0.57Building industry & materials 0.38Aerospace industry 0.31Lodging, catering & leisure 0.30Public, non-profit institutions 0.26Mining, coal & steel 0.26Forestry, paper & pulp products 0.24Investment funds 0.24Environmental services & recycling 0.23Vehicles 0.19Cantons, federal states 0.12Cities & municipal authorities 0.11Mechanical engineering & industrial equipment 0.08Precious metals & stones 0.07Textiles, garments & leather goods 0.05Packaging industry 0.05Rubber & tyres 0.04Non-ferrous metals 0.02Miscellaneous trading companies 0.02Total 95.51
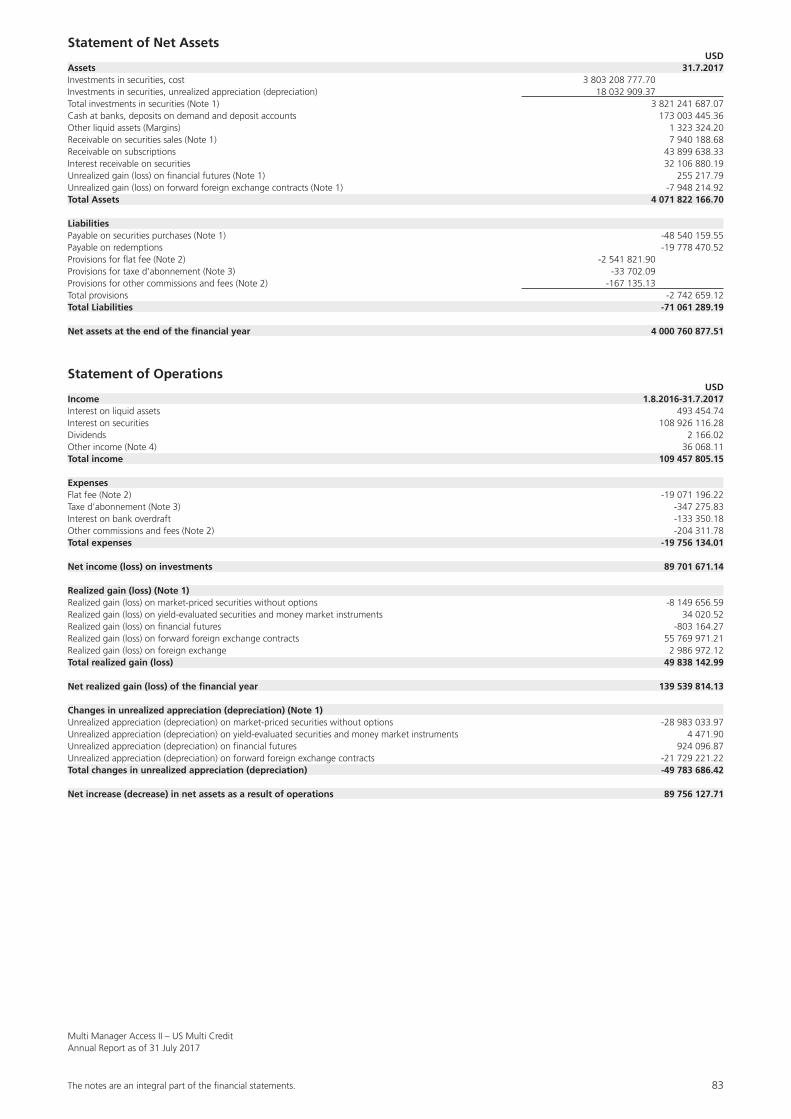
The notes are an integral part of the fi nancial statements. 83
Multi Manager Access II – US Multi CreditAnnual Report as of 31 July 2017
Statement of Net Assets USDAssets 31.7.2017Investments in securities, cost 3 803 208 777.70Investments in securities, unrealized appreciation (depreciation) 18 032 909.37Total investments in securities (Note 1) 3 821 241 687.07Cash at banks, deposits on demand and deposit accounts 173 003 445.36Other liquid assets (Margins) 1 323 324.20Receivable on securities sales (Note 1) 7 940 188.68Receivable on subscriptions 43 899 638.33Interest receivable on securities 32 106 880.19Unrealized gain (loss) on financial futures (Note 1) 255 217.79Unrealized gain (loss) on forward foreign exchange contracts (Note 1) -7 948 214.92Total Assets 4 071 822 166.70
LiabilitiesPayable on securities purchases (Note 1) -48 540 159.55Payable on redemptions -19 778 470.52Provisions for flat fee (Note 2) -2 541 821.90Provisions for taxe d’abonnement (Note 3) -33 702.09Provisions for other commissions and fees (Note 2) -167 135.13Total provisions -2 742 659.12Total Liabilities -71 061 289.19
Net assets at the end of the financial year 4 000 760 877.51
Statement of Operations USDIncome 1.8.2016-31.7.2017Interest on liquid assets 493 454.74Interest on securities 108 926 116.28Dividends 2 166.02Other income (Note 4) 36 068.11Total income 109 457 805.15
ExpensesFlat fee (Note 2) -19 071 196.22Taxe d’abonnement (Note 3) -347 275.83Interest on bank overdraft -133 350.18Other commissions and fees (Note 2) -204 311.78Total expenses -19 756 134.01
Net income (loss) on investments 89 701 671.14
Realized gain (loss) (Note 1)Realized gain (loss) on market-priced securities without options -8 149 656.59Realized gain (loss) on yield-evaluated securities and money market instruments 34 020.52Realized gain (loss) on financial futures -803 164.27Realized gain (loss) on forward foreign exchange contracts 55 769 971.21Realized gain (loss) on foreign exchange 2 986 972.12Total realized gain (loss) 49 838 142.99
Net realized gain (loss) of the financial year 139 539 814.13
Changes in unrealized appreciation (depreciation) (Note 1)Unrealized appreciation (depreciation) on market-priced securities without options -28 983 033.97Unrealized appreciation (depreciation) on yield-evaluated securities and money market instruments 4 471.90Unrealized appreciation (depreciation) on financial futures 924 096.87Unrealized appreciation (depreciation) on forward foreign exchange contracts -21 729 221.22Total changes in unrealized appreciation (depreciation) -49 783 686.42
Net increase (decrease) in net assets as a result of operations 89 756 127.71
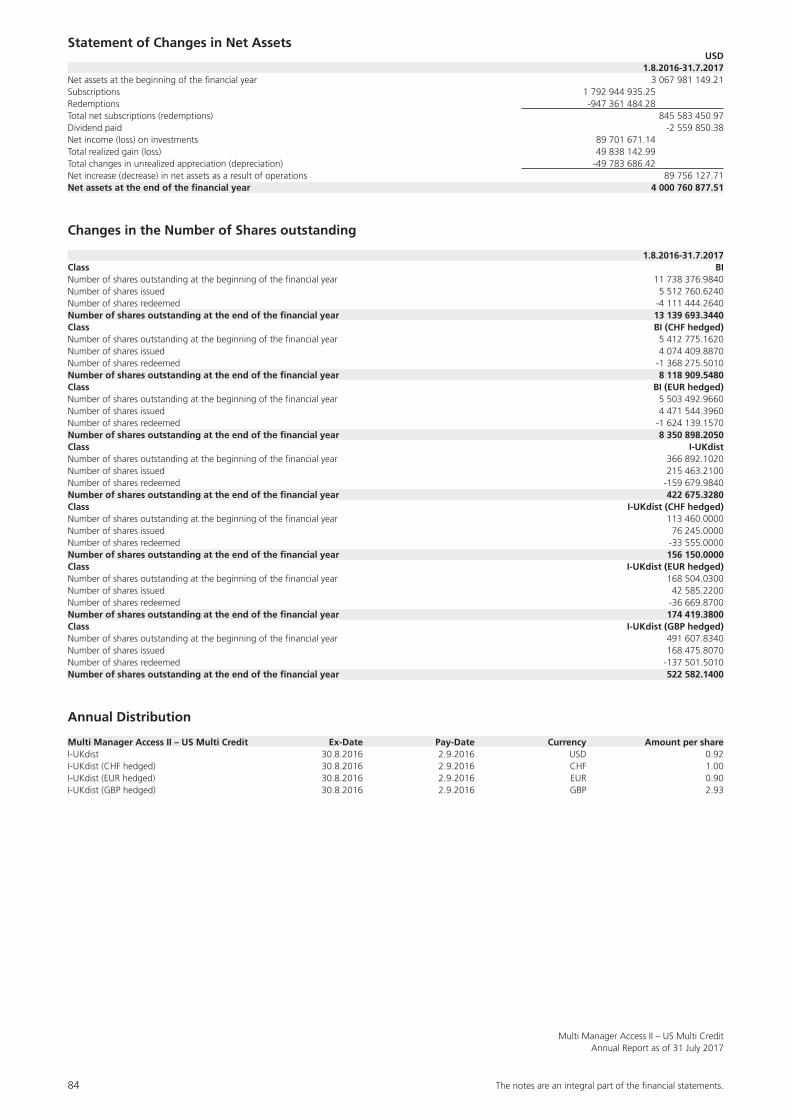
84 The notes are an integral part of the fi nancial statements.
Multi Manager Access II – US Multi CreditAnnual Report as of 31 July 2017
Statement of Changes in Net Assets USD 1.8.2016-31.7.2017Net assets at the beginning of the financial year 3 067 981 149.21Subscriptions 1 792 944 935.25Redemptions -947 361 484.28Total net subscriptions (redemptions) 845 583 450.97Dividend paid -2 559 850.38Net income (loss) on investments 89 701 671.14Total realized gain (loss) 49 838 142.99Total changes in unrealized appreciation (depreciation) -49 783 686.42Net increase (decrease) in net assets as a result of operations 89 756 127.71Net assets at the end of the financial year 4 000 760 877.51
Changes in the Number of Shares outstanding
1.8.2016-31.7.2017Class BINumber of shares outstanding at the beginning of the financial year 11 738 376.9840Number of shares issued 5 512 760.6240Number of shares redeemed -4 111 444.2640Number of shares outstanding at the end of the financial year 13 139 693.3440Class BI (CHF hedged)Number of shares outstanding at the beginning of the financial year 5 412 775.1620Number of shares issued 4 074 409.8870Number of shares redeemed -1 368 275.5010Number of shares outstanding at the end of the financial year 8 118 909.5480Class BI (EUR hedged)Number of shares outstanding at the beginning of the financial year 5 503 492.9660Number of shares issued 4 471 544.3960Number of shares redeemed -1 624 139.1570Number of shares outstanding at the end of the financial year 8 350 898.2050Class I-UKdistNumber of shares outstanding at the beginning of the financial year 366 892.1020Number of shares issued 215 463.2100Number of shares redeemed -159 679.9840Number of shares outstanding at the end of the financial year 422 675.3280Class I-UKdist (CHF hedged)Number of shares outstanding at the beginning of the financial year 113 460.0000Number of shares issued 76 245.0000Number of shares redeemed -33 555.0000Number of shares outstanding at the end of the financial year 156 150.0000Class I-UKdist (EUR hedged)Number of shares outstanding at the beginning of the financial year 168 504.0300Number of shares issued 42 585.2200Number of shares redeemed -36 669.8700Number of shares outstanding at the end of the financial year 174 419.3800Class I-UKdist (GBP hedged)Number of shares outstanding at the beginning of the financial year 491 607.8340Number of shares issued 168 475.8070Number of shares redeemed -137 501.5010Number of shares outstanding at the end of the financial year 522 582.1400
Annual Distribution
Multi Manager Access II – US Multi Credit Ex-Date Pay-Date Currency Amount per shareI-UKdist 30.8.2016 2.9.2016 USD 0.92I-UKdist (CHF hedged) 30.8.2016 2.9.2016 CHF 1.00I-UKdist (EUR hedged) 30.8.2016 2.9.2016 EUR 0.90I-UKdist (GBP hedged) 30.8.2016 2.9.2016 GBP 2.93
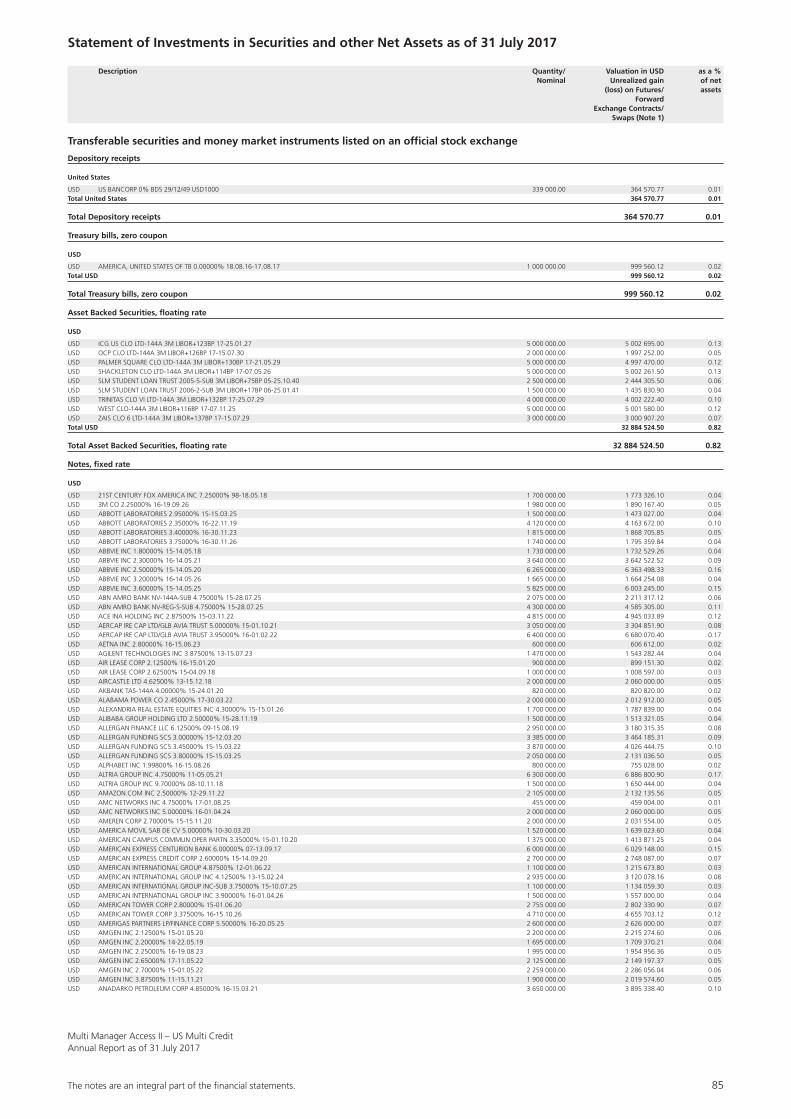
The notes are an integral part of the fi nancial statements. 85
Multi Manager Access II – US Multi CreditAnnual Report as of 31 July 2017
Statement of Investments in Securities and other Net Assets as of 31 July 2017
Description Quantity/ Valuation in USD as a % Nominal Unrealized gain of net (loss) on Futures/ assets Forward Exchange Contracts/ Swaps (Note 1)
Transferable securities and money market instruments listed on an official stock exchange
Depository receipts
United States
USD US BANCORP 0% BDS 29/12/49 USD1000 339 000.00 364 570.77 0.01Total United States 364 570.77 0.01
Total Depository receipts 364 570.77 0.01
Treasury bills, zero coupon
USD
USD AMERICA, UNITED STATES OF TB 0.00000% 18.08.16-17.08.17 1 000 000.00 999 560.12 0.02Total USD 999 560.12 0.02
Total Treasury bills, zero coupon 999 560.12 0.02
Asset Backed Securities, floating rate
USD
USD ICG US CLO LTD-144A 3M LIBOR+123BP 17-25.01.27 5 000 000.00 5 002 695.00 0.13USD OCP CLO LTD-144A 3M LIBOR+126BP 17-15.07.30 2 000 000.00 1 997 252.00 0.05USD PALMER SQUARE CLO LTD-144A 3M LIBOR+130BP 17-21.05.29 5 000 000.00 4 997 470.00 0.12USD SHACKLETON CLO LTD-144A 3M LIBOR+114BP 17-07.05.26 5 000 000.00 5 002 261.50 0.13USD SLM STUDENT LOAN TRUST 2005-5-SUB 3M LIBOR+75BP 05-25.10.40 2 500 000.00 2 444 305.50 0.06USD SLM STUDENT LOAN TRUST 2006-2-SUB 3M LIBOR+17BP 06-25.01.41 1 500 000.00 1 435 830.90 0.04USD TRINITAS CLO VI LTD-144A 3M LIBOR+132BP 17-25.07.29 4 000 000.00 4 002 222.40 0.10USD WEST CLO-144A 3M LIBOR+116BP 17-07.11.25 5 000 000.00 5 001 580.00 0.12USD ZAIS CLO 6 LTD-144A 3M LIBOR+137BP 17-15.07.29 3 000 000.00 3 000 907.20 0.07Total USD 32 884 524.50 0.82
Total Asset Backed Securities, floating rate 32 884 524.50 0.82
Notes, fixed rate
USD
USD 21ST CENTURY FOX AMERICA INC 7.25000% 98-18.05.18 1 700 000.00 1 773 326.10 0.04USD 3M CO 2.25000% 16-19.09.26 1 980 000.00 1 890 167.40 0.05USD ABBOTT LABORATORIES 2.95000% 15-15.03.25 1 500 000.00 1 473 027.00 0.04USD ABBOTT LABORATORIES 2.35000% 16-22.11.19 4 120 000.00 4 163 672.00 0.10USD ABBOTT LABORATORIES 3.40000% 16-30.11.23 1 815 000.00 1 868 705.85 0.05USD ABBOTT LABORATORIES 3.75000% 16-30.11.26 1 740 000.00 1 795 359.84 0.04USD ABBVIE INC 1.80000% 15-14.05.18 1 730 000.00 1 732 529.26 0.04USD ABBVIE INC 2.30000% 16-14.05.21 3 640 000.00 3 642 522.52 0.09USD ABBVIE INC 2.50000% 15-14.05.20 6 265 000.00 6 363 498.33 0.16USD ABBVIE INC 3.20000% 16-14.05.26 1 665 000.00 1 664 254.08 0.04USD ABBVIE INC 3.60000% 15-14.05.25 5 825 000.00 6 003 245.00 0.15USD ABN AMRO BANK NV-144A-SUB 4.75000% 15-28.07.25 2 075 000.00 2 211 317.12 0.06USD ABN AMRO BANK NV-REG-S-SUB 4.75000% 15-28.07.25 4 300 000.00 4 585 305.00 0.11USD ACE INA HOLDING INC 2.87500% 15-03.11.22 4 815 000.00 4 945 033.89 0.12USD AERCAP IRE CAP LTD/GLB AVIA TRUST 5.00000% 15-01.10.21 3 050 000.00 3 304 851.90 0.08USD AERCAP IRE CAP LTD/GLB AVIA TRUST 3.95000% 16-01.02.22 6 400 000.00 6 680 070.40 0.17USD AETNA INC 2.80000% 16-15.06.23 600 000.00 606 612.00 0.02USD AGILENT TECHNOLOGIES INC 3.87500% 13-15.07.23 1 470 000.00 1 543 282.44 0.04USD AIR LEASE CORP 2.12500% 16-15.01.20 900 000.00 899 151.30 0.02USD AIR LEASE CORP 2.62500% 15-04.09.18 1 000 000.00 1 008 597.00 0.03USD AIRCASTLE LTD 4.62500% 13-15.12.18 2 000 000.00 2 060 000.00 0.05USD AKBANK TAS-144A 4.00000% 15-24.01.20 820 000.00 820 820.00 0.02USD ALABAMA POWER CO 2.45000% 17-30.03.22 2 000 000.00 2 012 912.00 0.05USD ALEXANDRIA REAL ESTATE EQUITIES INC 4.30000% 15-15.01.26 1 700 000.00 1 787 839.00 0.04USD ALIBABA GROUP HOLDING LTD 2.50000% 15-28.11.19 1 500 000.00 1 513 321.05 0.04USD ALLERGAN FINANCE LLC 6.12500% 09-15.08.19 2 950 000.00 3 180 315.35 0.08USD ALLERGAN FUNDING SCS 3.00000% 15-12.03.20 3 385 000.00 3 464 185.31 0.09USD ALLERGAN FUNDING SCS 3.45000% 15-15.03.22 3 870 000.00 4 026 444.75 0.10USD ALLERGAN FUNDING SCS 3.80000% 15-15.03.25 2 050 000.00 2 131 036.50 0.05USD ALPHABET INC 1.99800% 16-15.08.26 800 000.00 755 028.00 0.02USD ALTRIA GROUP INC 4.75000% 11-05.05.21 6 300 000.00 6 886 800.90 0.17USD ALTRIA GROUP INC 9.70000% 08-10.11.18 1 500 000.00 1 650 444.00 0.04USD AMAZON.COM INC 2.50000% 12-29.11.22 2 105 000.00 2 132 135.56 0.05USD AMC NETWORKS INC 4.75000% 17-01.08.25 455 000.00 459 004.00 0.01USD AMC NETWORKS INC 5.00000% 16-01.04.24 2 000 000.00 2 060 000.00 0.05USD AMEREN CORP 2.70000% 15-15.11.20 2 000 000.00 2 031 554.00 0.05USD AMERICA MOVIL SAB DE CV 5.00000% 10-30.03.20 1 520 000.00 1 639 023.60 0.04USD AMERICAN CAMPUS COMMUN OPER PARTN 3.35000% 15-01.10.20 1 375 000.00 1 413 871.25 0.04USD AMERICAN EXPRESS CENTURION BANK 6.00000% 07-13.09.17 6 000 000.00 6 029 148.00 0.15USD AMERICAN EXPRESS CREDIT CORP 2.60000% 15-14.09.20 2 700 000.00 2 748 087.00 0.07USD AMERICAN INTERNATIONAL GROUP 4.87500% 12-01.06.22 1 100 000.00 1 215 673.80 0.03USD AMERICAN INTERNATIONAL GROUP INC 4.12500% 13-15.02.24 2 935 000.00 3 120 078.16 0.08USD AMERICAN INTERNATIONAL GROUP INC-SUB 3.75000% 15-10.07.25 1 100 000.00 1 134 059.30 0.03USD AMERICAN INTERNATIONAL GROUP INC 3.90000% 16-01.04.26 1 500 000.00 1 557 000.00 0.04USD AMERICAN TOWER CORP 2.80000% 15-01.06.20 2 755 000.00 2 802 330.90 0.07USD AMERICAN TOWER CORP 3.37500% 16-15.10.26 4 710 000.00 4 655 703.12 0.12USD AMERIGAS PARTNERS LP/FINANCE CORP 5.50000% 16-20.05.25 2 600 000.00 2 626 000.00 0.07USD AMGEN INC 2.12500% 15-01.05.20 2 200 000.00 2 215 274.60 0.06USD AMGEN INC 2.20000% 14-22.05.19 1 695 000.00 1 709 370.21 0.04USD AMGEN INC 2.25000% 16-19.08.23 1 995 000.00 1 954 956.36 0.05USD AMGEN INC 2.65000% 17-11.05.22 2 125 000.00 2 149 197.37 0.05USD AMGEN INC 2.70000% 15-01.05.22 2 259 000.00 2 286 056.04 0.06USD AMGEN INC 3.87500% 11-15.11.21 1 900 000.00 2 019 574.60 0.05USD ANADARKO PETROLEUM CORP 4.85000% 16-15.03.21 3 650 000.00 3 895 338.40 0.10
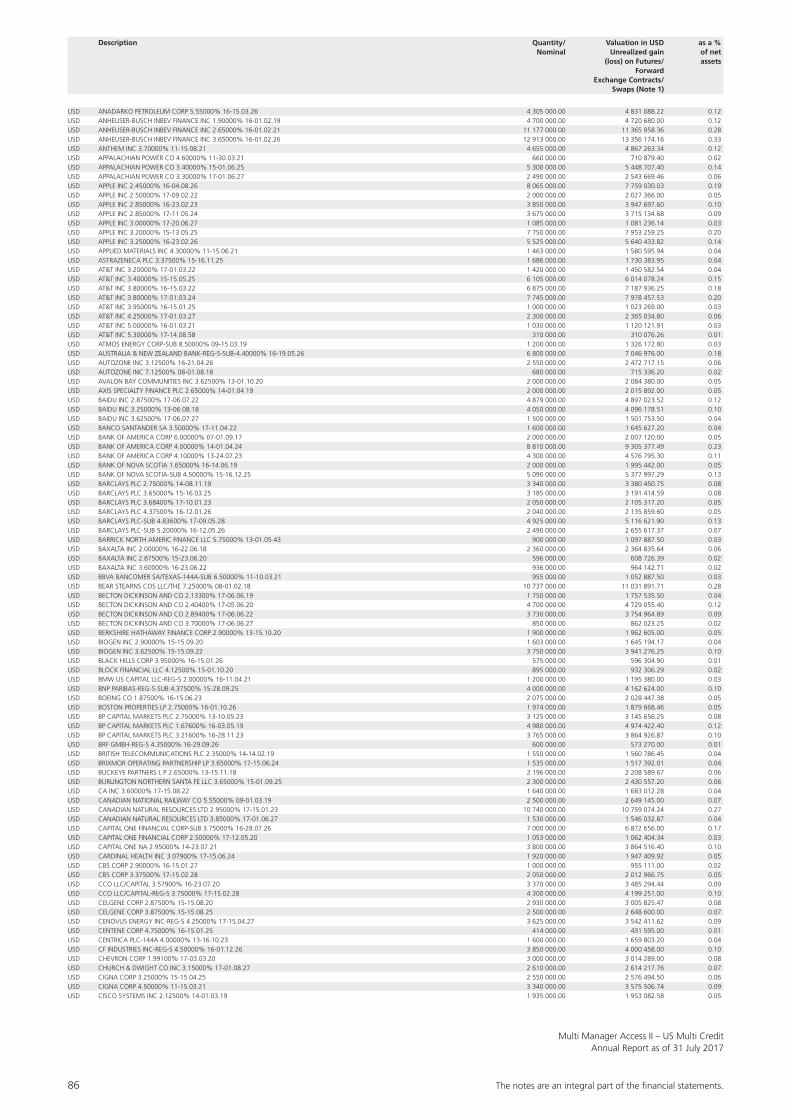
86 The notes are an integral part of the fi nancial statements.
Multi Manager Access II – US Multi CreditAnnual Report as of 31 July 2017
Description Quantity/ Valuation in USD as a % Nominal Unrealized gain of net (loss) on Futures/ assets Forward Exchange Contracts/ Swaps (Note 1)
USD ANADARKO PETROLEUM CORP 5.55000% 16-15.03.26 4 305 000.00 4 831 088.22 0.12USD ANHEUSER-BUSCH INBEV FINANCE INC 1.90000% 16-01.02.19 4 700 000.00 4 720 680.00 0.12USD ANHEUSER-BUSCH INBEV FINANCE INC 2.65000% 16-01.02.21 11 177 000.00 11 365 958.36 0.28USD ANHEUSER-BUSCH INBEV FINANCE INC 3.65000% 16-01.02.26 12 913 000.00 13 356 174.16 0.33USD ANTHEM INC 3.70000% 11-15.08.21 4 655 000.00 4 867 263.34 0.12USD APPALACHIAN POWER CO 4.60000% 11-30.03.21 660 000.00 710 879.40 0.02USD APPALACHIAN POWER CO 3.40000% 15-01.06.25 5 300 000.00 5 448 707.40 0.14USD APPALACHIAN POWER CO 3.30000% 17-01.06.27 2 490 000.00 2 543 669.46 0.06USD APPLE INC 2.45000% 16-04.08.26 8 065 000.00 7 759 030.03 0.19USD APPLE INC 2.50000% 17-09.02.22 2 000 000.00 2 027 366.00 0.05USD APPLE INC 2.85000% 16-23.02.23 3 850 000.00 3 947 697.60 0.10USD APPLE INC 2.85000% 17-11.05.24 3 675 000.00 3 715 134.68 0.09USD APPLE INC 3.00000% 17-20.06.27 1 085 000.00 1 081 236.14 0.03USD APPLE INC 3.20000% 15-13.05.25 7 750 000.00 7 953 259.25 0.20USD APPLE INC 3.25000% 16-23.02.26 5 525 000.00 5 640 433.82 0.14USD APPLIED MATERIALS INC 4.30000% 11-15.06.21 1 463 000.00 1 580 595.94 0.04USD ASTRAZENECA PLC 3.37500% 15-16.11.25 1 686 000.00 1 730 383.95 0.04USD AT&T INC 3.20000% 17-01.03.22 1 420 000.00 1 450 582.54 0.04USD AT&T INC 3.40000% 15-15.05.25 6 105 000.00 6 014 078.24 0.15USD AT&T INC 3.80000% 16-15.03.22 6 875 000.00 7 187 936.25 0.18USD AT&T INC 3.80000% 17-01.03.24 7 745 000.00 7 978 457.53 0.20USD AT&T INC 3.95000% 16-15.01.25 1 000 000.00 1 023 269.00 0.03USD AT&T INC 4.25000% 17-01.03.27 2 300 000.00 2 365 034.80 0.06USD AT&T INC 5.00000% 16-01.03.21 1 030 000.00 1 120 121.91 0.03USD AT&T INC 5.30000% 17-14.08.58 310 000.00 310 076.26 0.01USD ATMOS ENERGY CORP-SUB 8.50000% 09-15.03.19 1 200 000.00 1 326 172.80 0.03USD AUSTRALIA & NEW ZEALAND BANK-REG-S-SUB-4.40000% 16-19.05.26 6 800 000.00 7 046 976.00 0.18USD AUTOZONE INC 3.12500% 16-21.04.26 2 550 000.00 2 472 717.15 0.06USD AUTOZONE INC 7.12500% 08-01.08.18 680 000.00 715 336.20 0.02USD AVALON BAY COMMUNITIES INC 3.62500% 13-01.10.20 2 000 000.00 2 084 380.00 0.05USD AXIS SPECIALTY FINANCE PLC 2.65000% 14-01.04.19 2 000 000.00 2 015 892.00 0.05USD BAIDU INC 2.87500% 17-06.07.22 4 879 000.00 4 897 023.52 0.12USD BAIDU INC 3.25000% 13-06.08.18 4 050 000.00 4 096 178.51 0.10USD BAIDU INC 3.62500% 17-06.07.27 1 500 000.00 1 501 753.50 0.04USD BANCO SANTANDER SA 3.50000% 17-11.04.22 1 600 000.00 1 645 627.20 0.04USD BANK OF AMERICA CORP 6.00000% 07-01.09.17 2 000 000.00 2 007 120.00 0.05USD BANK OF AMERICA CORP 4.00000% 14-01.04.24 8 810 000.00 9 305 377.49 0.23USD BANK OF AMERICA CORP 4.10000% 13-24.07.23 4 300 000.00 4 576 795.30 0.11USD BANK OF NOVA SCOTIA 1.65000% 16-14.06.19 2 000 000.00 1 995 442.00 0.05USD BANK OF NOVA SCOTIA-SUB 4.50000% 15-16.12.25 5 090 000.00 5 377 997.29 0.13USD BARCLAYS PLC 2.75000% 14-08.11.19 3 340 000.00 3 380 450.75 0.08USD BARCLAYS PLC 3.65000% 15-16.03.25 3 185 000.00 3 191 414.59 0.08USD BARCLAYS PLC 3.68400% 17-10.01.23 2 050 000.00 2 105 317.20 0.05USD BARCLAYS PLC 4.37500% 16-12.01.26 2 040 000.00 2 135 859.60 0.05USD BARCLAYS PLC-SUB 4.83600% 17-09.05.28 4 925 000.00 5 116 621.90 0.13USD BARCLAYS PLC-SUB 5.20000% 16-12.05.26 2 490 000.00 2 655 617.37 0.07USD BARRICK NORTH AMERIC FINANCE LLC 5.75000% 13-01.05.43 900 000.00 1 097 887.50 0.03USD BAXALTA INC 2.00000% 16-22.06.18 2 360 000.00 2 364 835.64 0.06USD BAXALTA INC 2.87500% 15-23.06.20 596 000.00 608 726.39 0.02USD BAXALTA INC 3.60000% 16-23.06.22 936 000.00 964 142.71 0.02USD BBVA BANCOMER SA/TEXAS-144A-SUB 6.50000% 11-10.03.21 955 000.00 1 052 887.50 0.03USD BEAR STEARNS COS LLC/THE 7.25000% 08-01.02.18 10 737 000.00 11 031 891.71 0.28USD BECTON DICKINSON AND CO 2.13300% 17-06.06.19 1 750 000.00 1 757 535.50 0.04USD BECTON DICKINSON AND CO 2.40400% 17-05.06.20 4 700 000.00 4 729 055.40 0.12USD BECTON DICKINSON AND CO 2.89400% 17-06.06.22 3 730 000.00 3 754 964.89 0.09USD BECTON DICKINSON AND CO 3.70000% 17-06.06.27 850 000.00 862 023.25 0.02USD BERKSHIRE HATHAWAY FINANCE CORP 2.90000% 13-15.10.20 1 900 000.00 1 962 605.00 0.05USD BIOGEN INC 2.90000% 15-15.09.20 1 603 000.00 1 645 194.17 0.04USD BIOGEN INC 3.62500% 15-15.09.22 3 750 000.00 3 941 276.25 0.10USD BLACK HILLS CORP 3.95000% 16-15.01.26 575 000.00 596 304.90 0.01USD BLOCK FINANCIAL LLC 4.12500% 15-01.10.20 895 000.00 932 306.29 0.02USD BMW US CAPITAL LLC-REG-S 2.00000% 16-11.04.21 1 200 000.00 1 195 380.00 0.03USD BNP PARIBAS-REG-S-SUB 4.37500% 15-28.09.25 4 000 000.00 4 162 624.00 0.10USD BOEING CO 1.87500% 16-15.06.23 2 075 000.00 2 028 447.38 0.05USD BOSTON PROPERTIES LP 2.75000% 16-01.10.26 1 974 000.00 1 879 668.46 0.05USD BP CAPITAL MARKETS PLC 2.75000% 13-10.05.23 3 125 000.00 3 145 656.25 0.08USD BP CAPITAL MARKETS PLC 1.67600% 16-03.05.19 4 980 000.00 4 974 422.40 0.12USD BP CAPITAL MARKETS PLC 3.21600% 16-28.11.23 3 765 000.00 3 864 926.87 0.10USD BRF GMBH-REG-S 4.35000% 16-29.09.26 600 000.00 573 270.00 0.01USD BRITISH TELECOMMUNICATIONS PLC 2.35000% 14-14.02.19 1 550 000.00 1 560 786.45 0.04USD BRIXMOR OPERATING PARTNERSHIP LP 3.65000% 17-15.06.24 1 535 000.00 1 517 392.01 0.04USD BUCKEYE PARTNERS L P 2.65000% 13-15.11.18 2 196 000.00 2 208 589.67 0.06USD BURLINGTON NORTHERN SANTA FE LLC 3.65000% 15-01.09.25 2 300 000.00 2 430 557.20 0.06USD CA INC 3.60000% 17-15.08.22 1 640 000.00 1 683 012.28 0.04USD CANADIAN NATIONAL RAILWAY CO 5.55000% 09-01.03.19 2 500 000.00 2 649 145.00 0.07USD CANADIAN NATURAL RESOURCES LTD 2.95000% 17-15.01.23 10 740 000.00 10 759 074.24 0.27USD CANADIAN NATURAL RESOURCES LTD 3.85000% 17-01.06.27 1 530 000.00 1 546 032.87 0.04USD CAPITAL ONE FINANCIAL CORP-SUB 3.75000% 16-28.07.26 7 000 000.00 6 872 656.00 0.17USD CAPITAL ONE FINANCIAL CORP 2.50000% 17-12.05.20 1 053 000.00 1 062 404.34 0.03USD CAPITAL ONE NA 2.95000% 14-23.07.21 3 800 000.00 3 864 516.40 0.10USD CARDINAL HEALTH INC 3.07900% 17-15.06.24 1 920 000.00 1 947 409.92 0.05USD CBS CORP 2.90000% 16-15.01.27 1 000 000.00 955 111.00 0.02USD CBS CORP 3.37500% 17-15.02.28 2 050 000.00 2 012 966.75 0.05USD CCO LLC/CAPITAL 3.57900% 16-23.07.20 3 370 000.00 3 485 294.44 0.09USD CCO LLC/CAPITAL-REG-S 3.75000% 17-15.02.28 4 300 000.00 4 199 251.00 0.10USD CELGENE CORP 2.87500% 15-15.08.20 2 930 000.00 3 005 825.47 0.08USD CELGENE CORP 3.87500% 15-15.08.25 2 500 000.00 2 648 600.00 0.07USD CENOVUS ENERGY INC-REG-S 4.25000% 17-15.04.27 3 625 000.00 3 542 411.62 0.09USD CENTENE CORP 4.75000% 16-15.01.25 414 000.00 431 595.00 0.01USD CENTRICA PLC-144A 4.00000% 13-16.10.23 1 600 000.00 1 659 803.20 0.04USD CF INDUSTRIES INC-REG-S 4.50000% 16-01.12.26 3 850 000.00 4 000 458.00 0.10USD CHEVRON CORP 1.99100% 17-03.03.20 3 000 000.00 3 014 289.00 0.08USD CHURCH & DWIGHT CO INC 3.15000% 17-01.08.27 2 610 000.00 2 614 217.76 0.07USD CIGNA CORP 3.25000% 15-15.04.25 2 550 000.00 2 576 494.50 0.06USD CIGNA CORP 4.50000% 11-15.03.21 3 340 000.00 3 575 506.74 0.09USD CISCO SYSTEMS INC 2.12500% 14-01.03.19 1 935 000.00 1 953 082.58 0.05
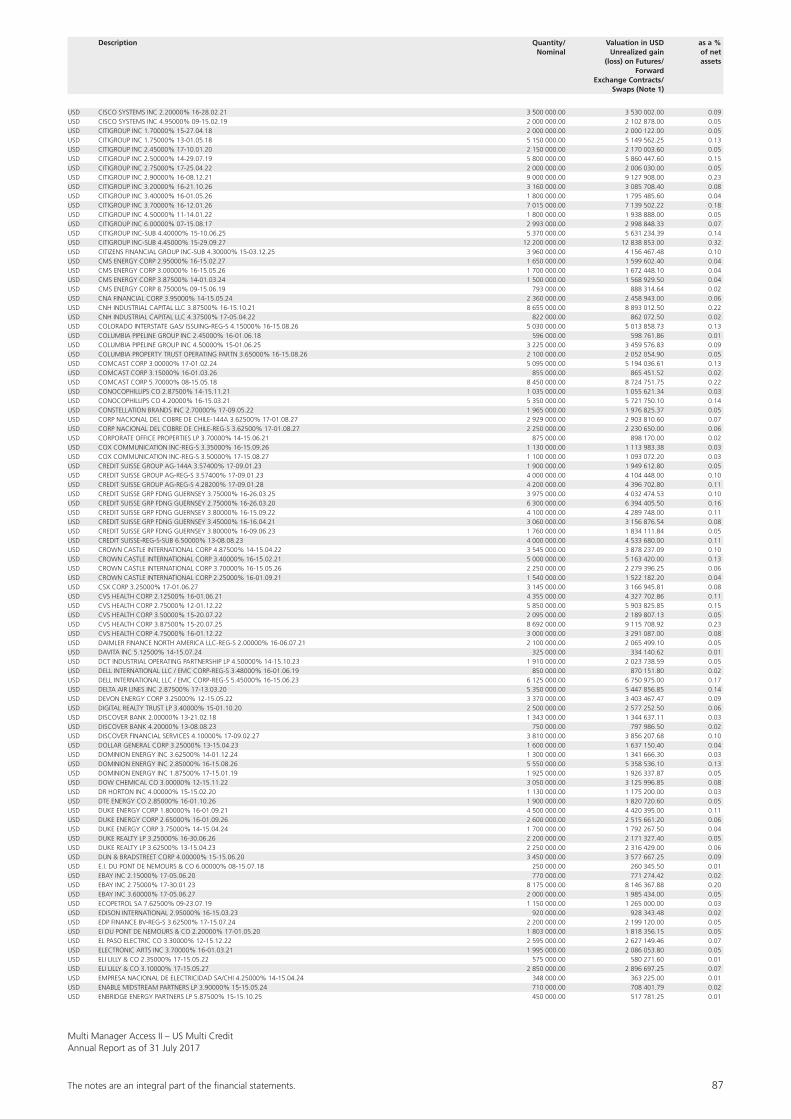
The notes are an integral part of the fi nancial statements. 87
Multi Manager Access II – US Multi CreditAnnual Report as of 31 July 2017
Description Quantity/ Valuation in USD as a % Nominal Unrealized gain of net (loss) on Futures/ assets Forward Exchange Contracts/ Swaps (Note 1)
USD CISCO SYSTEMS INC 2.20000% 16-28.02.21 3 500 000.00 3 530 002.00 0.09USD CISCO SYSTEMS INC 4.95000% 09-15.02.19 2 000 000.00 2 102 878.00 0.05USD CITIGROUP INC 1.70000% 15-27.04.18 2 000 000.00 2 000 122.00 0.05USD CITIGROUP INC 1.75000% 13-01.05.18 5 150 000.00 5 149 562.25 0.13USD CITIGROUP INC 2.45000% 17-10.01.20 2 150 000.00 2 170 003.60 0.05USD CITIGROUP INC 2.50000% 14-29.07.19 5 800 000.00 5 860 447.60 0.15USD CITIGROUP INC 2.75000% 17-25.04.22 2 000 000.00 2 006 030.00 0.05USD CITIGROUP INC 2.90000% 16-08.12.21 9 000 000.00 9 127 908.00 0.23USD CITIGROUP INC 3.20000% 16-21.10.26 3 160 000.00 3 085 708.40 0.08USD CITIGROUP INC 3.40000% 16-01.05.26 1 800 000.00 1 795 485.60 0.04USD CITIGROUP INC 3.70000% 16-12.01.26 7 015 000.00 7 139 502.22 0.18USD CITIGROUP INC 4.50000% 11-14.01.22 1 800 000.00 1 938 888.00 0.05USD CITIGROUP INC 6.00000% 07-15.08.17 2 993 000.00 2 998 848.33 0.07USD CITIGROUP INC-SUB 4.40000% 15-10.06.25 5 370 000.00 5 631 234.39 0.14USD CITIGROUP INC-SUB 4.45000% 15-29.09.27 12 200 000.00 12 838 853.00 0.32USD CITIZENS FINANCIAL GROUP INC-SUB 4.30000% 15-03.12.25 3 960 000.00 4 156 467.48 0.10USD CMS ENERGY CORP 2.95000% 16-15.02.27 1 650 000.00 1 599 602.40 0.04USD CMS ENERGY CORP 3.00000% 16-15.05.26 1 700 000.00 1 672 448.10 0.04USD CMS ENERGY CORP 3.87500% 14-01.03.24 1 500 000.00 1 568 929.50 0.04USD CMS ENERGY CORP 8.75000% 09-15.06.19 793 000.00 888 314.64 0.02USD CNA FINANCIAL CORP 3.95000% 14-15.05.24 2 360 000.00 2 458 943.00 0.06USD CNH INDUSTRIAL CAPITAL LLC 3.87500% 16-15.10.21 8 655 000.00 8 893 012.50 0.22USD CNH INDUSTRIAL CAPITAL LLC 4.37500% 17-05.04.22 822 000.00 862 072.50 0.02USD COLORADO INTERSTATE GAS/ ISSUING-REG-S 4.15000% 16-15.08.26 5 030 000.00 5 013 858.73 0.13USD COLUMBIA PIPELINE GROUP INC 2.45000% 16-01.06.18 596 000.00 598 761.86 0.01USD COLUMBIA PIPELINE GROUP INC 4.50000% 15-01.06.25 3 225 000.00 3 459 576.83 0.09USD COLUMBIA PROPERTY TRUST OPERATING PARTN 3.65000% 16-15.08.26 2 100 000.00 2 052 054.90 0.05USD COMCAST CORP 3.00000% 17-01.02.24 5 095 000.00 5 194 036.61 0.13USD COMCAST CORP 3.15000% 16-01.03.26 855 000.00 865 451.52 0.02USD COMCAST CORP 5.70000% 08-15.05.18 8 450 000.00 8 724 751.75 0.22USD CONOCOPHILLIPS CO 2.87500% 14-15.11.21 1 035 000.00 1 055 621.34 0.03USD CONOCOPHILLIPS CO 4.20000% 16-15.03.21 5 350 000.00 5 721 750.10 0.14USD CONSTELLATION BRANDS INC 2.70000% 17-09.05.22 1 965 000.00 1 976 825.37 0.05USD CORP NACIONAL DEL COBRE DE CHILE-144A 3.62500% 17-01.08.27 2 929 000.00 2 903 810.60 0.07USD CORP NACIONAL DEL COBRE DE CHILE-REG-S 3.62500% 17-01.08.27 2 250 000.00 2 230 650.00 0.06USD CORPORATE OFFICE PROPERTIES LP 3.70000% 14-15.06.21 875 000.00 898 170.00 0.02USD COX COMMUNICATION INC-REG-S 3.35000% 16-15.09.26 1 130 000.00 1 113 983.38 0.03USD COX COMMUNICATION INC-REG-S 3.50000% 17-15.08.27 1 100 000.00 1 093 072.20 0.03USD CREDIT SUISSE GROUP AG-144A 3.57400% 17-09.01.23 1 900 000.00 1 949 612.80 0.05USD CREDIT SUISSE GROUP AG-REG-S 3.57400% 17-09.01.23 4 000 000.00 4 104 448.00 0.10USD CREDIT SUISSE GROUP AG-REG-S 4.28200% 17-09.01.28 4 200 000.00 4 396 702.80 0.11USD CREDIT SUISSE GRP FDNG GUERNSEY 3.75000% 16-26.03.25 3 975 000.00 4 032 474.53 0.10USD CREDIT SUISSE GRP FDNG GUERNSEY 2.75000% 16-26.03.20 6 300 000.00 6 394 405.50 0.16USD CREDIT SUISSE GRP FDNG GUERNSEY 3.80000% 16-15.09.22 4 100 000.00 4 289 748.00 0.11USD CREDIT SUISSE GRP FDNG GUERNSEY 3.45000% 16-16.04.21 3 060 000.00 3 156 876.54 0.08USD CREDIT SUISSE GRP FDNG GUERNSEY 3.80000% 16-09.06.23 1 760 000.00 1 834 111.84 0.05USD CREDIT SUISSE-REG-S-SUB 6.50000% 13-08.08.23 4 000 000.00 4 533 680.00 0.11USD CROWN CASTLE INTERNATIONAL CORP 4.87500% 14-15.04.22 3 545 000.00 3 878 237.09 0.10USD CROWN CASTLE INTERNATIONAL CORP 3.40000% 16-15.02.21 5 000 000.00 5 163 420.00 0.13USD CROWN CASTLE INTERNATIONAL CORP 3.70000% 16-15.05.26 2 250 000.00 2 279 396.25 0.06USD CROWN CASTLE INTERNATIONAL CORP 2.25000% 16-01.09.21 1 540 000.00 1 522 182.20 0.04USD CSX CORP 3.25000% 17-01.06.27 3 145 000.00 3 166 945.81 0.08USD CVS HEALTH CORP 2.12500% 16-01.06.21 4 355 000.00 4 327 702.86 0.11USD CVS HEALTH CORP 2.75000% 12-01.12.22 5 850 000.00 5 903 825.85 0.15USD CVS HEALTH CORP 3.50000% 15-20.07.22 2 095 000.00 2 189 807.13 0.05USD CVS HEALTH CORP 3.87500% 15-20.07.25 8 692 000.00 9 115 708.92 0.23USD CVS HEALTH CORP 4.75000% 16-01.12.22 3 000 000.00 3 291 087.00 0.08USD DAIMLER FINANCE NORTH AMERICA LLC-REG-S 2.00000% 16-06.07.21 2 100 000.00 2 065 499.10 0.05USD DAVITA INC 5.12500% 14-15.07.24 325 000.00 334 140.62 0.01USD DCT INDUSTRIAL OPERATING PARTNERSHIP LP 4.50000% 14-15.10.23 1 910 000.00 2 023 738.59 0.05USD DELL INTERNATIONAL LLC / EMC CORP-REG-S 3.48000% 16-01.06.19 850 000.00 870 151.80 0.02USD DELL INTERNATIONAL LLC / EMC CORP-REG-S 5.45000% 16-15.06.23 6 125 000.00 6 750 975.00 0.17USD DELTA AIR LINES INC 2.87500% 17-13.03.20 5 350 000.00 5 447 856.85 0.14USD DEVON ENERGY CORP 3.25000% 12-15.05.22 3 370 000.00 3 403 467.47 0.09USD DIGITAL REALTY TRUST LP 3.40000% 15-01.10.20 2 500 000.00 2 577 252.50 0.06USD DISCOVER BANK 2.00000% 13-21.02.18 1 343 000.00 1 344 637.11 0.03USD DISCOVER BANK 4.20000% 13-08.08.23 750 000.00 797 986.50 0.02USD DISCOVER FINANCIAL SERVICES 4.10000% 17-09.02.27 3 810 000.00 3 856 207.68 0.10USD DOLLAR GENERAL CORP 3.25000% 13-15.04.23 1 600 000.00 1 637 150.40 0.04USD DOMINION ENERGY INC 3.62500% 14-01.12.24 1 300 000.00 1 341 666.30 0.03USD DOMINION ENERGY INC 2.85000% 16-15.08.26 5 550 000.00 5 358 536.10 0.13USD DOMINION ENERGY INC 1.87500% 17-15.01.19 1 925 000.00 1 926 337.87 0.05USD DOW CHEMICAL CO 3.00000% 12-15.11.22 3 050 000.00 3 125 996.85 0.08USD DR HORTON INC 4.00000% 15-15.02.20 1 130 000.00 1 175 200.00 0.03USD DTE ENERGY CO 2.85000% 16-01.10.26 1 900 000.00 1 820 720.60 0.05USD DUKE ENERGY CORP 1.80000% 16-01.09.21 4 500 000.00 4 420 395.00 0.11USD DUKE ENERGY CORP 2.65000% 16-01.09.26 2 600 000.00 2 515 661.20 0.06USD DUKE ENERGY CORP 3.75000% 14-15.04.24 1 700 000.00 1 792 267.50 0.04USD DUKE REALTY LP 3.25000% 16-30.06.26 2 200 000.00 2 171 327.40 0.05USD DUKE REALTY LP 3.62500% 13-15.04.23 2 250 000.00 2 316 429.00 0.06USD DUN & BRADSTREET CORP 4.00000% 15-15.06.20 3 450 000.00 3 577 667.25 0.09USD E.I. DU PONT DE NEMOURS & CO 6.00000% 08-15.07.18 250 000.00 260 345.50 0.01USD EBAY INC 2.15000% 17-05.06.20 770 000.00 771 274.42 0.02USD EBAY INC 2.75000% 17-30.01.23 8 175 000.00 8 146 367.88 0.20USD EBAY INC 3.60000% 17-05.06.27 2 000 000.00 1 985 434.00 0.05USD ECOPETROL SA 7.62500% 09-23.07.19 1 150 000.00 1 265 000.00 0.03USD EDISON INTERNATIONAL 2.95000% 16-15.03.23 920 000.00 928 343.48 0.02USD EDP FINANCE BV-REG-S 3.62500% 17-15.07.24 2 200 000.00 2 199 120.00 0.05USD EI DU PONT DE NEMOURS & CO 2.20000% 17-01.05.20 1 803 000.00 1 818 356.15 0.05USD EL PASO ELECTRIC CO 3.30000% 12-15.12.22 2 595 000.00 2 627 149.46 0.07USD ELECTRONIC ARTS INC 3.70000% 16-01.03.21 1 995 000.00 2 086 053.80 0.05USD ELI LILLY & CO 2.35000% 17-15.05.22 575 000.00 580 271.60 0.01USD ELI LILLY & CO 3.10000% 17-15.05.27 2 850 000.00 2 896 697.25 0.07USD EMPRESA NACIONAL DE ELECTRICIDAD SA/CHI 4.25000% 14-15.04.24 348 000.00 363 225.00 0.01USD ENABLE MIDSTREAM PARTNERS LP 3.90000% 15-15.05.24 710 000.00 708 401.79 0.02USD ENBRIDGE ENERGY PARTNERS LP 5.87500% 15-15.10.25 450 000.00 517 781.25 0.01
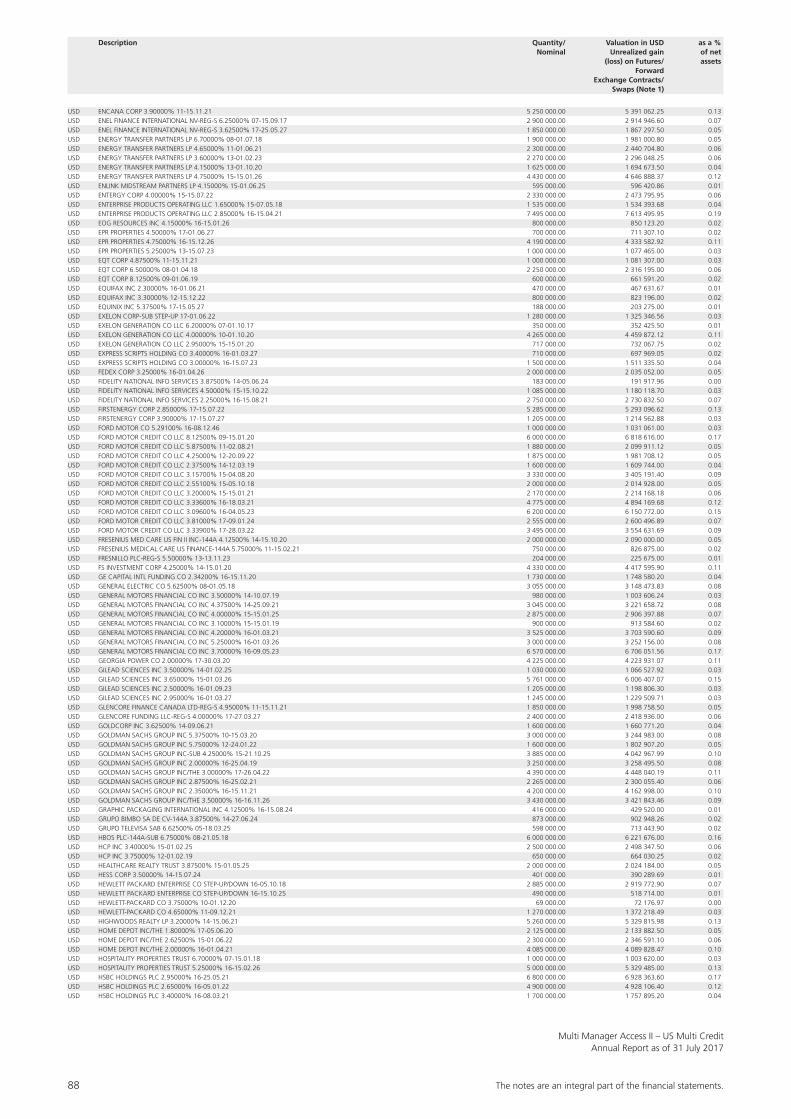
88 The notes are an integral part of the fi nancial statements.
Multi Manager Access II – US Multi CreditAnnual Report as of 31 July 2017
Description Quantity/ Valuation in USD as a % Nominal Unrealized gain of net (loss) on Futures/ assets Forward Exchange Contracts/ Swaps (Note 1)
USD ENCANA CORP 3.90000% 11-15.11.21 5 250 000.00 5 391 062.25 0.13USD ENEL FINANCE INTERNATIONAL NV-REG-S 6.25000% 07-15.09.17 2 900 000.00 2 914 946.60 0.07USD ENEL FINANCE INTERNATIONAL NV-REG-S 3.62500% 17-25.05.27 1 850 000.00 1 867 297.50 0.05USD ENERGY TRANSFER PARTNERS LP 6.70000% 08-01.07.18 1 900 000.00 1 981 000.80 0.05USD ENERGY TRANSFER PARTNERS LP 4.65000% 11-01.06.21 2 300 000.00 2 440 704.80 0.06USD ENERGY TRANSFER PARTNERS LP 3.60000% 13-01.02.23 2 270 000.00 2 296 048.25 0.06USD ENERGY TRANSFER PARTNERS LP 4.15000% 13-01.10.20 1 625 000.00 1 694 673.50 0.04USD ENERGY TRANSFER PARTNERS LP 4.75000% 15-15.01.26 4 430 000.00 4 646 888.37 0.12USD ENLINK MIDSTREAM PARTNERS LP 4.15000% 15-01.06.25 595 000.00 596 420.86 0.01USD ENTERGY CORP 4.00000% 15-15.07.22 2 330 000.00 2 473 795.95 0.06USD ENTERPRISE PRODUCTS OPERATING LLC 1.65000% 15-07.05.18 1 535 000.00 1 534 393.68 0.04USD ENTERPRISE PRODUCTS OPERATING LLC 2.85000% 16-15.04.21 7 495 000.00 7 613 495.95 0.19USD EOG RESOURCES INC 4.15000% 16-15.01.26 800 000.00 850 123.20 0.02USD EPR PROPERTIES 4.50000% 17-01.06.27 700 000.00 711 307.10 0.02USD EPR PROPERTIES 4.75000% 16-15.12.26 4 190 000.00 4 333 582.92 0.11USD EPR PROPERTIES 5.25000% 13-15.07.23 1 000 000.00 1 077 465.00 0.03USD EQT CORP 4.87500% 11-15.11.21 1 000 000.00 1 081 307.00 0.03USD EQT CORP 6.50000% 08-01.04.18 2 250 000.00 2 316 195.00 0.06USD EQT CORP 8.12500% 09-01.06.19 600 000.00 661 591.20 0.02USD EQUIFAX INC 2.30000% 16-01.06.21 470 000.00 467 631.67 0.01USD EQUIFAX INC 3.30000% 12-15.12.22 800 000.00 823 196.00 0.02USD EQUINIX INC 5.37500% 17-15.05.27 188 000.00 203 275.00 0.01USD EXELON CORP-SUB STEP-UP 17-01.06.22 1 280 000.00 1 325 346.56 0.03USD EXELON GENERATION CO LLC 6.20000% 07-01.10.17 350 000.00 352 425.50 0.01USD EXELON GENERATION CO LLC 4.00000% 10-01.10.20 4 265 000.00 4 459 872.12 0.11USD EXELON GENERATION CO LLC 2.95000% 15-15.01.20 717 000.00 732 067.75 0.02USD EXPRESS SCRIPTS HOLDING CO 3.40000% 16-01.03.27 710 000.00 697 969.05 0.02USD EXPRESS SCRIPTS HOLDING CO 3.00000% 16-15.07.23 1 500 000.00 1 511 335.50 0.04USD FEDEX CORP 3.25000% 16-01.04.26 2 000 000.00 2 035 052.00 0.05USD FIDELITY NATIONAL INFO SERVICES 3.87500% 14-05.06.24 183 000.00 191 917.96 0.00USD FIDELITY NATIONAL INFO SERVICES 4.50000% 15-15.10.22 1 085 000.00 1 180 118.70 0.03USD FIDELITY NATIONAL INFO SERVICES 2.25000% 16-15.08.21 2 750 000.00 2 730 832.50 0.07USD FIRSTENERGY CORP 2.85000% 17-15.07.22 5 285 000.00 5 293 096.62 0.13USD FIRSTENERGY CORP 3.90000% 17-15.07.27 1 205 000.00 1 214 562.88 0.03USD FORD MOTOR CO 5.29100% 16-08.12.46 1 000 000.00 1 031 061.00 0.03USD FORD MOTOR CREDIT CO LLC 8.12500% 09-15.01.20 6 000 000.00 6 818 616.00 0.17USD FORD MOTOR CREDIT CO LLC 5.87500% 11-02.08.21 1 880 000.00 2 099 911.12 0.05USD FORD MOTOR CREDIT CO LLC 4.25000% 12-20.09.22 1 875 000.00 1 981 708.12 0.05USD FORD MOTOR CREDIT CO LLC 2.37500% 14-12.03.19 1 600 000.00 1 609 744.00 0.04USD FORD MOTOR CREDIT CO LLC 3.15700% 15-04.08.20 3 330 000.00 3 405 191.40 0.09USD FORD MOTOR CREDIT CO LLC 2.55100% 15-05.10.18 2 000 000.00 2 014 928.00 0.05USD FORD MOTOR CREDIT CO LLC 3.20000% 15-15.01.21 2 170 000.00 2 214 168.18 0.06USD FORD MOTOR CREDIT CO LLC 3.33600% 16-18.03.21 4 775 000.00 4 894 169.68 0.12USD FORD MOTOR CREDIT CO LLC 3.09600% 16-04.05.23 6 200 000.00 6 150 772.00 0.15USD FORD MOTOR CREDIT CO LLC 3.81000% 17-09.01.24 2 555 000.00 2 600 496.89 0.07USD FORD MOTOR CREDIT CO LLC 3.33900% 17-28.03.22 3 495 000.00 3 554 631.69 0.09USD FRESENIUS MED CARE US FIN II INC-144A 4.12500% 14-15.10.20 2 000 000.00 2 090 000.00 0.05USD FRESENIUS MEDICAL CARE US FINANCE-144A 5.75000% 11-15.02.21 750 000.00 826 875.00 0.02USD FRESNILLO PLC-REG-S 5.50000% 13-13.11.23 204 000.00 225 675.00 0.01USD FS INVESTMENT CORP 4.25000% 14-15.01.20 4 330 000.00 4 417 595.90 0.11USD GE CAPITAL INTL FUNDING CO 2.34200% 16-15.11.20 1 730 000.00 1 748 580.20 0.04USD GENERAL ELECTRIC CO 5.62500% 08-01.05.18 3 055 000.00 3 148 473.83 0.08USD GENERAL MOTORS FINANCIAL CO INC 3.50000% 14-10.07.19 980 000.00 1 003 606.24 0.03USD GENERAL MOTORS FINANCIAL CO INC 4.37500% 14-25.09.21 3 045 000.00 3 221 658.72 0.08USD GENERAL MOTORS FINANCIAL CO INC 4.00000% 15-15.01.25 2 875 000.00 2 906 397.88 0.07USD GENERAL MOTORS FINANCIAL CO INC 3.10000% 15-15.01.19 900 000.00 913 584.60 0.02USD GENERAL MOTORS FINANCIAL CO INC 4.20000% 16-01.03.21 3 525 000.00 3 703 590.60 0.09USD GENERAL MOTORS FINANCIAL CO INC 5.25000% 16-01.03.26 3 000 000.00 3 252 156.00 0.08USD GENERAL MOTORS FINANCIAL CO INC 3.70000% 16-09.05.23 6 570 000.00 6 706 051.56 0.17USD GEORGIA POWER CO 2.00000% 17-30.03.20 4 225 000.00 4 223 931.07 0.11USD GILEAD SCIENCES INC 3.50000% 14-01.02.25 1 030 000.00 1 066 527.92 0.03USD GILEAD SCIENCES INC 3.65000% 15-01.03.26 5 761 000.00 6 006 407.07 0.15USD GILEAD SCIENCES INC 2.50000% 16-01.09.23 1 205 000.00 1 198 806.30 0.03USD GILEAD SCIENCES INC 2.95000% 16-01.03.27 1 245 000.00 1 229 509.71 0.03USD GLENCORE FINANCE CANADA LTD-REG-S 4.95000% 11-15.11.21 1 850 000.00 1 998 758.50 0.05USD GLENCORE FUNDING LLC-REG-S 4.00000% 17-27.03.27 2 400 000.00 2 418 936.00 0.06USD GOLDCORP INC 3.62500% 14-09.06.21 1 600 000.00 1 660 771.20 0.04USD GOLDMAN SACHS GROUP INC 5.37500% 10-15.03.20 3 000 000.00 3 244 983.00 0.08USD GOLDMAN SACHS GROUP INC 5.75000% 12-24.01.22 1 600 000.00 1 802 907.20 0.05USD GOLDMAN SACHS GROUP INC-SUB 4.25000% 15-21.10.25 3 885 000.00 4 042 967.99 0.10USD GOLDMAN SACHS GROUP INC 2.00000% 16-25.04.19 3 250 000.00 3 258 495.50 0.08USD GOLDMAN SACHS GROUP INC/THE 3.00000% 17-26.04.22 4 390 000.00 4 448 040.19 0.11USD GOLDMAN SACHS GROUP INC 2.87500% 16-25.02.21 2 265 000.00 2 300 055.40 0.06USD GOLDMAN SACHS GROUP INC 2.35000% 16-15.11.21 4 200 000.00 4 162 998.00 0.10USD GOLDMAN SACHS GROUP INC/THE 3.50000% 16-16.11.26 3 430 000.00 3 421 843.46 0.09USD GRAPHIC PACKAGING INTERNATIONAL INC 4.12500% 16-15.08.24 416 000.00 429 520.00 0.01USD GRUPO BIMBO SA DE CV-144A 3.87500% 14-27.06.24 873 000.00 902 948.26 0.02USD GRUPO TELEVISA SAB 6.62500% 05-18.03.25 598 000.00 713 443.90 0.02USD HBOS PLC-144A-SUB 6.75000% 08-21.05.18 6 000 000.00 6 221 676.00 0.16USD HCP INC 3.40000% 15-01.02.25 2 500 000.00 2 498 347.50 0.06USD HCP INC 3.75000% 12-01.02.19 650 000.00 664 030.25 0.02USD HEALTHCARE REALTY TRUST 3.87500% 15-01.05.25 2 000 000.00 2 024 184.00 0.05USD HESS CORP 3.50000% 14-15.07.24 401 000.00 390 289.69 0.01USD HEWLETT PACKARD ENTERPRISE CO STEP-UP/DOWN 16-05.10.18 2 885 000.00 2 919 772.90 0.07USD HEWLETT PACKARD ENTERPRISE CO STEP-UP/DOWN 16-15.10.25 490 000.00 518 714.00 0.01USD HEWLETT-PACKARD CO 3.75000% 10-01.12.20 69 000.00 72 176.97 0.00USD HEWLETT-PACKARD CO 4.65000% 11-09.12.21 1 270 000.00 1 372 218.49 0.03USD HIGHWOODS REALTY LP 3.20000% 14-15.06.21 5 260 000.00 5 329 815.98 0.13USD HOME DEPOT INC/THE 1.80000% 17-05.06.20 2 125 000.00 2 133 882.50 0.05USD HOME DEPOT INC/THE 2.62500% 15-01.06.22 2 300 000.00 2 346 591.10 0.06USD HOME DEPOT INC/THE 2.00000% 16-01.04.21 4 085 000.00 4 089 828.47 0.10USD HOSPITALITY PROPERTIES TRUST 6.70000% 07-15.01.18 1 000 000.00 1 003 620.00 0.03USD HOSPITALITY PROPERTIES TRUST 5.25000% 16-15.02.26 5 000 000.00 5 329 485.00 0.13USD HSBC HOLDINGS PLC 2.95000% 16-25.05.21 6 800 000.00 6 928 363.60 0.17USD HSBC HOLDINGS PLC 2.65000% 16-05.01.22 4 900 000.00 4 928 106.40 0.12USD HSBC HOLDINGS PLC 3.40000% 16-08.03.21 1 700 000.00 1 757 895.20 0.04
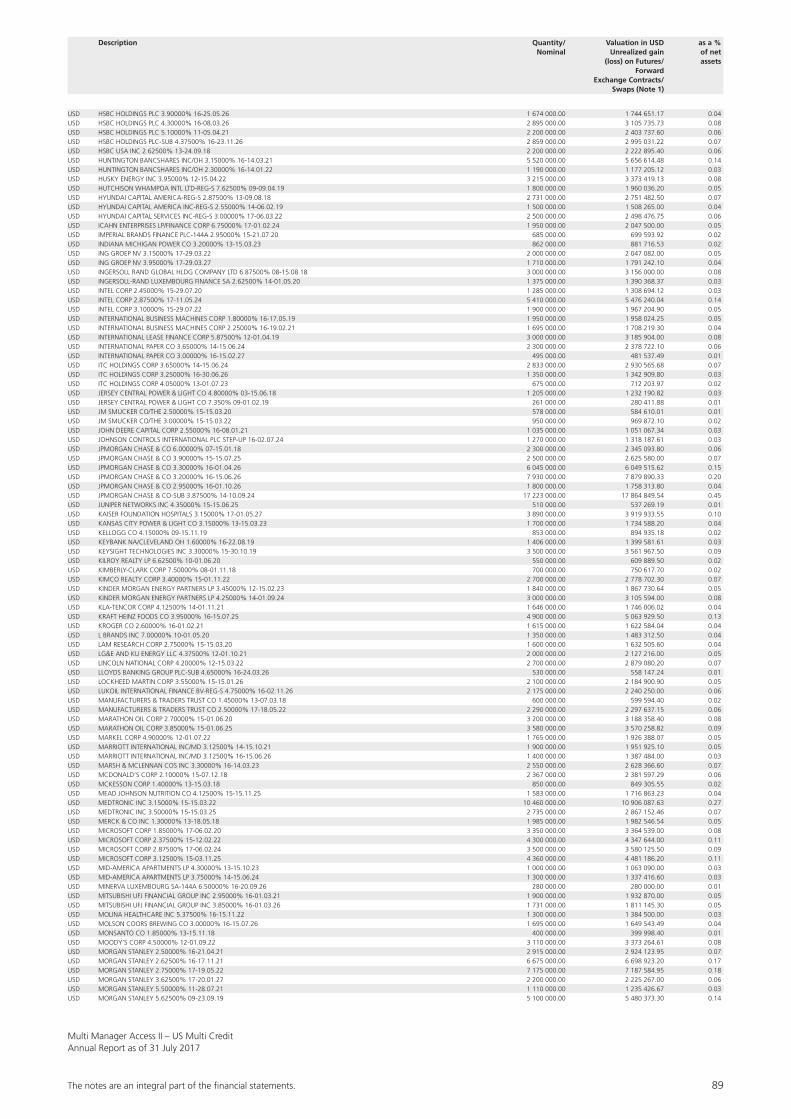
The notes are an integral part of the fi nancial statements. 89
Multi Manager Access II – US Multi CreditAnnual Report as of 31 July 2017
Description Quantity/ Valuation in USD as a % Nominal Unrealized gain of net (loss) on Futures/ assets Forward Exchange Contracts/ Swaps (Note 1)
USD HSBC HOLDINGS PLC 3.90000% 16-25.05.26 1 674 000.00 1 744 651.17 0.04USD HSBC HOLDINGS PLC 4.30000% 16-08.03.26 2 895 000.00 3 105 735.73 0.08USD HSBC HOLDINGS PLC 5.10000% 11-05.04.21 2 200 000.00 2 403 737.60 0.06USD HSBC HOLDINGS PLC-SUB 4.37500% 16-23.11.26 2 859 000.00 2 995 031.22 0.07USD HSBC USA INC 2.62500% 13-24.09.18 2 200 000.00 2 222 895.40 0.06USD HUNTINGTON BANCSHARES INC/OH 3.15000% 16-14.03.21 5 520 000.00 5 656 614.48 0.14USD HUNTINGTON BANCSHARES INC/OH 2.30000% 16-14.01.22 1 190 000.00 1 177 205.12 0.03USD HUSKY ENERGY INC 3.95000% 12-15.04.22 3 215 000.00 3 373 419.13 0.08USD HUTCHISON WHAMPOA INTL LTD-REG-S 7.62500% 09-09.04.19 1 800 000.00 1 960 036.20 0.05USD HYUNDAI CAPITAL AMERICA-REG-S 2.87500% 13-09.08.18 2 731 000.00 2 751 482.50 0.07USD HYUNDAI CAPITAL AMERICA INC-REG-S 2.55000% 14-06.02.19 1 500 000.00 1 508 265.00 0.04USD HYUNDAI CAPITAL SERVICES INC-REG-S 3.00000% 17-06.03.22 2 500 000.00 2 498 476.75 0.06USD ICAHN ENTERPRISES LP/FINANCE CORP 6.75000% 17-01.02.24 1 950 000.00 2 047 500.00 0.05USD IMPERIAL BRANDS FINANCE PLC-144A 2.95000% 15-21.07.20 685 000.00 699 593.92 0.02USD INDIANA MICHIGAN POWER CO 3.20000% 13-15.03.23 862 000.00 881 716.53 0.02USD ING GROEP NV 3.15000% 17-29.03.22 2 000 000.00 2 047 082.00 0.05USD ING GROEP NV 3.95000% 17-29.03.27 1 710 000.00 1 791 242.10 0.04USD INGERSOLL RAND GLOBAL HLDG COMPANY LTD 6.87500% 08-15.08.18 3 000 000.00 3 156 000.00 0.08USD INGERSOLL-RAND LUXEMBOURG FINANCE SA 2.62500% 14-01.05.20 1 375 000.00 1 390 368.37 0.03USD INTEL CORP 2.45000% 15-29.07.20 1 285 000.00 1 308 694.12 0.03USD INTEL CORP 2.87500% 17-11.05.24 5 410 000.00 5 476 240.04 0.14USD INTEL CORP 3.10000% 15-29.07.22 1 900 000.00 1 967 204.90 0.05USD INTERNATIONAL BUSINESS MACHINES CORP 1.80000% 16-17.05.19 1 950 000.00 1 958 024.25 0.05USD INTERNATIONAL BUSINESS MACHINES CORP 2.25000% 16-19.02.21 1 695 000.00 1 708 219.30 0.04USD INTERNATIONAL LEASE FINANCE CORP 5.87500% 12-01.04.19 3 000 000.00 3 185 904.00 0.08USD INTERNATIONAL PAPER CO 3.65000% 14-15.06.24 2 300 000.00 2 378 722.10 0.06USD INTERNATIONAL PAPER CO 3.00000% 16-15.02.27 495 000.00 481 537.49 0.01USD ITC HOLDINGS CORP 3.65000% 14-15.06.24 2 833 000.00 2 930 565.68 0.07USD ITC HOLDINGS CORP 3.25000% 16-30.06.26 1 350 000.00 1 342 909.80 0.03USD ITC HOLDINGS CORP 4.05000% 13-01.07.23 675 000.00 712 203.97 0.02USD JERSEY CENTRAL POWER & LIGHT CO 4.80000% 03-15.06.18 1 205 000.00 1 232 190.82 0.03USD JERSEY CENTRAL POWER & LIGHT CO 7.350% 09-01.02.19 261 000.00 280 411.88 0.01USD JM SMUCKER CO/THE 2.50000% 15-15.03.20 578 000.00 584 610.01 0.01USD JM SMUCKER CO/THE 3.00000% 15-15.03.22 950 000.00 969 872.10 0.02USD JOHN DEERE CAPITAL CORP 2.55000% 16-08.01.21 1 035 000.00 1 051 067.34 0.03USD JOHNSON CONTROLS INTERNATIONAL PLC STEP-UP 16-02.07.24 1 270 000.00 1 318 187.61 0.03USD JPMORGAN CHASE & CO 6.00000% 07-15.01.18 2 300 000.00 2 345 093.80 0.06USD JPMORGAN CHASE & CO 3.90000% 15-15.07.25 2 500 000.00 2 625 580.00 0.07USD JPMORGAN CHASE & CO 3.30000% 16-01.04.26 6 045 000.00 6 049 515.62 0.15USD JPMORGAN CHASE & CO 3.20000% 16-15.06.26 7 930 000.00 7 879 890.33 0.20USD JPMORGAN CHASE & CO 2.95000% 16-01.10.26 1 800 000.00 1 758 313.80 0.04USD JPMORGAN CHASE & CO-SUB 3.87500% 14-10.09.24 17 223 000.00 17 864 849.54 0.45USD JUNIPER NETWORKS INC 4.35000% 15-15.06.25 510 000.00 537 269.19 0.01USD KAISER FOUNDATION HOSPITALS 3.15000% 17-01.05.27 3 890 000.00 3 919 933.55 0.10USD KANSAS CITY POWER & LIGHT CO 3.15000% 13-15.03.23 1 700 000.00 1 734 588.20 0.04USD KELLOGG CO 4.15000% 09-15.11.19 853 000.00 894 935.18 0.02USD KEYBANK NA/CLEVELAND OH 1.60000% 16-22.08.19 1 406 000.00 1 399 581.61 0.03USD KEYSIGHT TECHNOLOGIES INC 3.30000% 15-30.10.19 3 500 000.00 3 561 967.50 0.09USD KILROY REALTY LP 6.62500% 10-01.06.20 550 000.00 609 889.50 0.02USD KIMBERLY-CLARK CORP 7.50000% 08-01.11.18 700 000.00 750 617.70 0.02USD KIMCO REALTY CORP 3.40000% 15-01.11.22 2 700 000.00 2 778 702.30 0.07USD KINDER MORGAN ENERGY PARTNERS LP 3.45000% 12-15.02.23 1 840 000.00 1 867 730.64 0.05USD KINDER MORGAN ENERGY PARTNERS LP 4.25000% 14-01.09.24 3 000 000.00 3 105 594.00 0.08USD KLA-TENCOR CORP 4.12500% 14-01.11.21 1 646 000.00 1 746 006.02 0.04USD KRAFT HEINZ FOODS CO 3.95000% 16-15.07.25 4 900 000.00 5 063 929.50 0.13USD KROGER CO 2.60000% 16-01.02.21 1 615 000.00 1 622 584.04 0.04USD L BRANDS INC 7.00000% 10-01.05.20 1 350 000.00 1 483 312.50 0.04USD LAM RESEARCH CORP 2.75000% 15-15.03.20 1 600 000.00 1 632 505.60 0.04USD LG&E AND KU ENERGY LLC 4.37500% 12-01.10.21 2 000 000.00 2 127 216.00 0.05USD LINCOLN NATIONAL CORP 4.20000% 12-15.03.22 2 700 000.00 2 879 080.20 0.07USD LLOYDS BANKING GROUP PLC-SUB 4.65000% 16-24.03.26 530 000.00 558 147.24 0.01USD LOCKHEED MARTIN CORP 3.55000% 15-15.01.26 2 100 000.00 2 184 900.90 0.05USD LUKOIL INTERNATIONAL FINANCE BV-REG-S 4.75000% 16-02.11.26 2 175 000.00 2 240 250.00 0.06USD MANUFACTURERS & TRADERS TRUST CO 1.45000% 13-07.03.18 600 000.00 599 594.40 0.02USD MANUFACTURERS & TRADERS TRUST CO 2.50000% 17-18.05.22 2 290 000.00 2 297 637.15 0.06USD MARATHON OIL CORP 2.70000% 15-01.06.20 3 200 000.00 3 188 358.40 0.08USD MARATHON OIL CORP 3.85000% 15-01.06.25 3 580 000.00 3 570 258.82 0.09USD MARKEL CORP 4.90000% 12-01.07.22 1 765 000.00 1 926 388.07 0.05USD MARRIOTT INTERNATIONAL INC/MD 3.12500% 14-15.10.21 1 900 000.00 1 951 925.10 0.05USD MARRIOTT INTERNATIONAL INC/MD 3.12500% 16-15.06.26 1 400 000.00 1 387 484.00 0.03USD MARSH & MCLENNAN COS INC 3.30000% 16-14.03.23 2 550 000.00 2 628 366.60 0.07USD MCDONALD’S CORP 2.10000% 15-07.12.18 2 367 000.00 2 381 597.29 0.06USD MCKESSON CORP 1.40000% 13-15.03.18 850 000.00 849 305.55 0.02USD MEAD JOHNSON NUTRITION CO 4.12500% 15-15.11.25 1 583 000.00 1 716 863.23 0.04USD MEDTRONIC INC 3.15000% 15-15.03.22 10 460 000.00 10 906 087.63 0.27USD MEDTRONIC INC 3.50000% 15-15.03.25 2 735 000.00 2 867 152.46 0.07USD MERCK & CO INC 1.30000% 13-18.05.18 1 985 000.00 1 982 546.54 0.05USD MICROSOFT CORP 1.85000% 17-06.02.20 3 350 000.00 3 364 539.00 0.08USD MICROSOFT CORP 2.37500% 15-12.02.22 4 300 000.00 4 347 644.00 0.11USD MICROSOFT CORP 2.87500% 17-06.02.24 3 500 000.00 3 580 125.50 0.09USD MICROSOFT CORP 3.12500% 15-03.11.25 4 360 000.00 4 481 186.20 0.11USD MID-AMERICA APARTMENTS LP 4.30000% 13-15.10.23 1 000 000.00 1 063 090.00 0.03USD MID-AMERICA APARTMENTS LP 3.75000% 14-15.06.24 1 300 000.00 1 337 416.60 0.03USD MINERVA LUXEMBOURG SA-144A 6.50000% 16-20.09.26 280 000.00 280 000.00 0.01USD MITSUBISHI UFJ FINANCIAL GROUP INC 2.95000% 16-01.03.21 1 900 000.00 1 932 870.00 0.05USD MITSUBISHI UFJ FINANCIAL GROUP INC 3.85000% 16-01.03.26 1 731 000.00 1 811 145.30 0.05USD MOLINA HEALTHCARE INC 5.37500% 16-15.11.22 1 300 000.00 1 384 500.00 0.03USD MOLSON COORS BREWING CO 3.00000% 16-15.07.26 1 695 000.00 1 649 543.49 0.04USD MONSANTO CO 1.85000% 13-15.11.18 400 000.00 399 998.40 0.01USD MOODY’S CORP 4.50000% 12-01.09.22 3 110 000.00 3 373 264.61 0.08USD MORGAN STANLEY 2.50000% 16-21.04.21 2 915 000.00 2 924 123.95 0.07USD MORGAN STANLEY 2.62500% 16-17.11.21 6 675 000.00 6 698 923.20 0.17USD MORGAN STANLEY 2.75000% 17-19.05.22 7 175 000.00 7 187 584.95 0.18USD MORGAN STANLEY 3.62500% 17-20.01.27 2 200 000.00 2 225 267.00 0.06USD MORGAN STANLEY 5.50000% 11-28.07.21 1 110 000.00 1 235 426.67 0.03USD MORGAN STANLEY 5.62500% 09-23.09.19 5 100 000.00 5 480 373.30 0.14
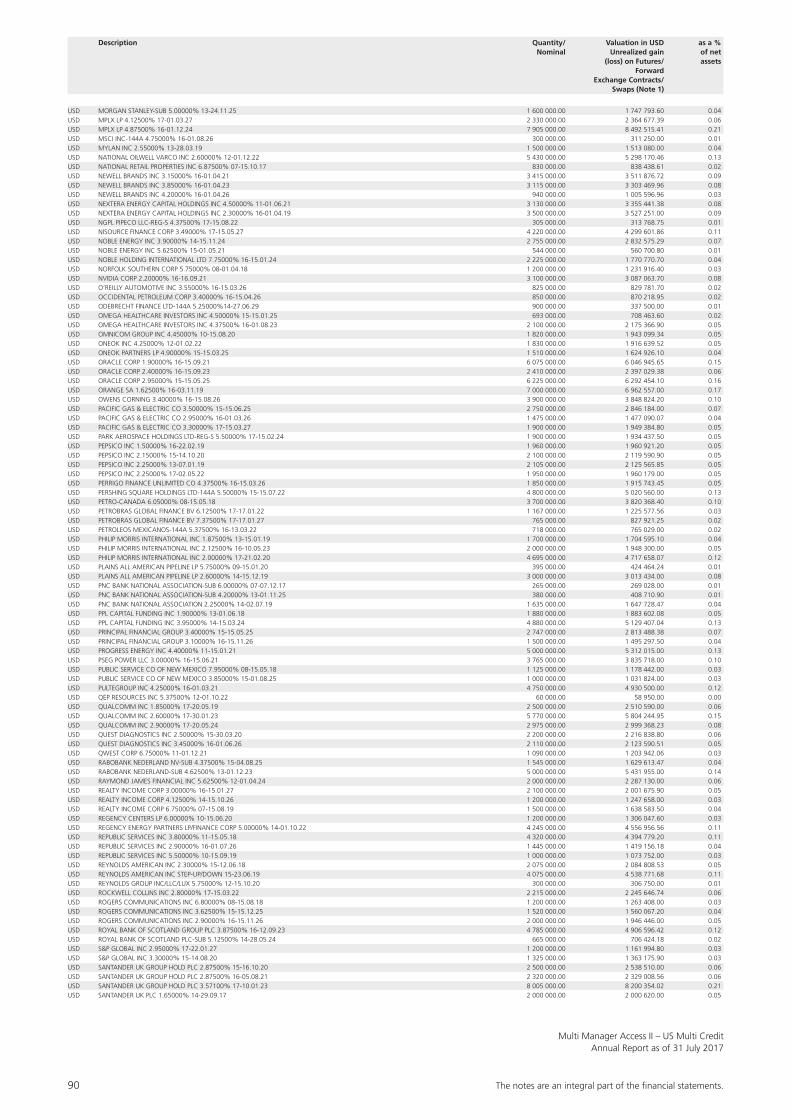
90 The notes are an integral part of the fi nancial statements.
Multi Manager Access II – US Multi CreditAnnual Report as of 31 July 2017
Description Quantity/ Valuation in USD as a % Nominal Unrealized gain of net (loss) on Futures/ assets Forward Exchange Contracts/ Swaps (Note 1)
USD MORGAN STANLEY-SUB 5.00000% 13-24.11.25 1 600 000.00 1 747 793.60 0.04USD MPLX LP 4.12500% 17-01.03.27 2 330 000.00 2 364 677.39 0.06USD MPLX LP 4.87500% 16-01.12.24 7 905 000.00 8 492 515.41 0.21USD MSCI INC-144A 4.75000% 16-01.08.26 300 000.00 311 250.00 0.01USD MYLAN INC 2.55000% 13-28.03.19 1 500 000.00 1 513 080.00 0.04USD NATIONAL OILWELL VARCO INC 2.60000% 12-01.12.22 5 430 000.00 5 298 170.46 0.13USD NATIONAL RETAIL PROPERTIES INC 6.87500% 07-15.10.17 830 000.00 838 438.61 0.02USD NEWELL BRANDS INC 3.15000% 16-01.04.21 3 415 000.00 3 511 876.72 0.09USD NEWELL BRANDS INC 3.85000% 16-01.04.23 3 115 000.00 3 303 469.96 0.08USD NEWELL BRANDS INC 4.20000% 16-01.04.26 940 000.00 1 005 596.96 0.03USD NEXTERA ENERGY CAPITAL HOLDINGS INC 4.50000% 11-01.06.21 3 130 000.00 3 355 441.38 0.08USD NEXTERA ENERGY CAPITAL HOLDINGS INC 2.30000% 16-01.04.19 3 500 000.00 3 527 251.00 0.09USD NGPL PIPECO LLC-REG-S 4.37500% 17-15.08.22 305 000.00 313 768.75 0.01USD NISOURCE FINANCE CORP 3.49000% 17-15.05.27 4 220 000.00 4 299 601.86 0.11USD NOBLE ENERGY INC 3.90000% 14-15.11.24 2 755 000.00 2 832 575.29 0.07USD NOBLE ENERGY INC 5.62500% 15-01.05.21 544 000.00 560 700.80 0.01USD NOBLE HOLDING INTERNATIONAL LTD 7.75000% 16-15.01.24 2 225 000.00 1 770 770.70 0.04USD NORFOLK SOUTHERN CORP 5.75000% 08-01.04.18 1 200 000.00 1 231 916.40 0.03USD NVIDIA CORP 2.20000% 16-16.09.21 3 100 000.00 3 087 063.70 0.08USD O’REILLY AUTOMOTIVE INC 3.55000% 16-15.03.26 825 000.00 829 781.70 0.02USD OCCIDENTAL PETROLEUM CORP 3.40000% 16-15.04.26 850 000.00 870 218.95 0.02USD ODEBRECHT FINANCE LTD-144A 5.25000%14-27.06.29 900 000.00 337 500.00 0.01USD OMEGA HEALTHCARE INVESTORS INC 4.50000% 15-15.01.25 693 000.00 708 463.60 0.02USD OMEGA HEALTHCARE INVESTORS INC 4.37500% 16-01.08.23 2 100 000.00 2 175 366.90 0.05USD OMNICOM GROUP INC 4.45000% 10-15.08.20 1 820 000.00 1 943 099.34 0.05USD ONEOK INC 4.25000% 12-01.02.22 1 830 000.00 1 916 639.52 0.05USD ONEOK PARTNERS LP 4.90000% 15-15.03.25 1 510 000.00 1 624 926.10 0.04USD ORACLE CORP 1.90000% 16-15.09.21 6 075 000.00 6 046 945.65 0.15USD ORACLE CORP 2.40000% 16-15.09.23 2 410 000.00 2 397 029.38 0.06USD ORACLE CORP 2.95000% 15-15.05.25 6 225 000.00 6 292 454.10 0.16USD ORANGE SA 1.62500% 16-03.11.19 7 000 000.00 6 962 557.00 0.17USD OWENS CORNING 3.40000% 16-15.08.26 3 900 000.00 3 848 824.20 0.10USD PACIFIC GAS & ELECTRIC CO 3.50000% 15-15.06.25 2 750 000.00 2 846 184.00 0.07USD PACIFIC GAS & ELECTRIC CO 2.95000% 16-01.03.26 1 475 000.00 1 477 090.07 0.04USD PACIFIC GAS & ELECTRIC CO 3.30000% 17-15.03.27 1 900 000.00 1 949 384.80 0.05USD PARK AEROSPACE HOLDINGS LTD-REG-S 5.50000% 17-15.02.24 1 900 000.00 1 934 437.50 0.05USD PEPSICO INC 1.50000% 16-22.02.19 1 960 000.00 1 960 921.20 0.05USD PEPSICO INC 2.15000% 15-14.10.20 2 100 000.00 2 119 590.90 0.05USD PEPSICO INC 2.25000% 13-07.01.19 2 105 000.00 2 125 565.85 0.05USD PEPSICO INC 2.25000% 17-02.05.22 1 950 000.00 1 960 179.00 0.05USD PERRIGO FINANCE UNLIMITED CO 4.37500% 16-15.03.26 1 850 000.00 1 915 743.45 0.05USD PERSHING SQUARE HOLDINGS LTD-144A 5.50000% 15-15.07.22 4 800 000.00 5 020 560.00 0.13USD PETRO-CANADA 6.05000% 08-15.05.18 3 700 000.00 3 820 368.40 0.10USD PETROBRAS GLOBAL FINANCE BV 6.12500% 17-17.01.22 1 167 000.00 1 225 577.56 0.03USD PETROBRAS GLOBAL FINANCE BV 7.37500% 17-17.01.27 765 000.00 827 921.25 0.02USD PETROLEOS MEXICANOS-144A 5.37500% 16-13.03.22 718 000.00 765 029.00 0.02USD PHILIP MORRIS INTERNATIONAL INC 1.87500% 13-15.01.19 1 700 000.00 1 704 595.10 0.04USD PHILIP MORRIS INTERNATIONAL INC 2.12500% 16-10.05.23 2 000 000.00 1 948 300.00 0.05USD PHILIP MORRIS INTERNATIONAL INC 2.00000% 17-21.02.20 4 695 000.00 4 717 658.07 0.12USD PLAINS ALL AMERICAN PIPELINE LP 5.75000% 09-15.01.20 395 000.00 424 464.24 0.01USD PLAINS ALL AMERICAN PIPELINE LP 2.60000% 14-15.12.19 3 000 000.00 3 013 434.00 0.08USD PNC BANK NATIONAL ASSOCIATION-SUB 6.00000% 07-07.12.17 265 000.00 269 028.00 0.01USD PNC BANK NATIONAL ASSOCIATION-SUB 4.20000% 13-01.11.25 380 000.00 408 710.90 0.01USD PNC BANK NATIONAL ASSOCIATION 2.25000% 14-02.07.19 1 635 000.00 1 647 728.47 0.04USD PPL CAPITAL FUNDING INC 1.90000% 13-01.06.18 1 880 000.00 1 883 602.08 0.05USD PPL CAPITAL FUNDING INC 3.95000% 14-15.03.24 4 880 000.00 5 129 407.04 0.13USD PRINCIPAL FINANCIAL GROUP 3.40000% 15-15.05.25 2 747 000.00 2 813 488.38 0.07USD PRINCIPAL FINANCIAL GROUP 3.10000% 16-15.11.26 1 500 000.00 1 495 297.50 0.04USD PROGRESS ENERGY INC 4.40000% 11-15.01.21 5 000 000.00 5 312 015.00 0.13USD PSEG POWER LLC 3.00000% 16-15.06.21 3 765 000.00 3 835 718.00 0.10USD PUBLIC SERVICE CO OF NEW MEXICO 7.95000% 08-15.05.18 1 125 000.00 1 178 442.00 0.03USD PUBLIC SERVICE CO OF NEW MEXICO 3.85000% 15-01.08.25 1 000 000.00 1 031 824.00 0.03USD PULTEGROUP INC 4.25000% 16-01.03.21 4 750 000.00 4 930 500.00 0.12USD QEP RESOURCES INC 5.37500% 12-01.10.22 60 000.00 58 950.00 0.00USD QUALCOMM INC 1.85000% 17-20.05.19 2 500 000.00 2 510 590.00 0.06USD QUALCOMM INC 2.60000% 17-30.01.23 5 770 000.00 5 804 244.95 0.15USD QUALCOMM INC 2.90000% 17-20.05.24 2 975 000.00 2 999 368.23 0.08USD QUEST DIAGNOSTICS INC 2.50000% 15-30.03.20 2 200 000.00 2 216 838.80 0.06USD QUEST DIAGNOSTICS INC 3.45000% 16-01.06.26 2 110 000.00 2 123 590.51 0.05USD QWEST CORP 6.75000% 11-01.12.21 1 090 000.00 1 203 942.06 0.03USD RABOBANK NEDERLAND NV-SUB 4.37500% 15-04.08.25 1 545 000.00 1 629 613.47 0.04USD RABOBANK NEDERLAND-SUB 4.62500% 13-01.12.23 5 000 000.00 5 431 955.00 0.14USD RAYMOND JAMES FINANCIAL INC 5.62500% 12-01.04.24 2 000 000.00 2 287 130.00 0.06USD REALTY INCOME CORP 3.00000% 16-15.01.27 2 100 000.00 2 001 675.90 0.05USD REALTY INCOME CORP 4.12500% 14-15.10.26 1 200 000.00 1 247 658.00 0.03USD REALTY INCOME CORP 6.75000% 07-15.08.19 1 500 000.00 1 638 583.50 0.04USD REGENCY CENTERS LP 6.00000% 10-15.06.20 1 200 000.00 1 306 047.60 0.03USD REGENCY ENERGY PARTNERS LP/FINANCE CORP 5.00000% 14-01.10.22 4 245 000.00 4 556 956.56 0.11USD REPUBLIC SERVICES INC 3.80000% 11-15.05.18 4 320 000.00 4 394 779.20 0.11USD REPUBLIC SERVICES INC 2.90000% 16-01.07.26 1 445 000.00 1 419 156.18 0.04USD REPUBLIC SERVICES INC 5.50000% 10-15.09.19 1 000 000.00 1 073 752.00 0.03USD REYNOLDS AMERICAN INC 2.30000% 15-12.06.18 2 075 000.00 2 084 808.53 0.05USD REYNOLDS AMERICAN INC STEP-UP/DOWN 15-23.06.19 4 075 000.00 4 538 771.68 0.11USD REYNOLDS GROUP INC/LLC/LUX 5.75000% 12-15.10.20 300 000.00 306 750.00 0.01USD ROCKWELL COLLINS INC 2.80000% 17-15.03.22 2 215 000.00 2 245 646.74 0.06USD ROGERS COMMUNICATIONS INC 6.80000% 08-15.08.18 1 200 000.00 1 263 408.00 0.03USD ROGERS COMMUNICATIONS INC 3.62500% 15-15.12.25 1 520 000.00 1 560 067.20 0.04USD ROGERS COMMUNICATIONS INC 2.90000% 16-15.11.26 2 000 000.00 1 946 446.00 0.05USD ROYAL BANK OF SCOTLAND GROUP PLC 3.87500% 16-12.09.23 4 785 000.00 4 906 596.42 0.12USD ROYAL BANK OF SCOTLAND PLC-SUB 5.12500% 14-28.05.24 665 000.00 706 424.18 0.02USD S&P GLOBAL INC 2.95000% 17-22.01.27 1 200 000.00 1 161 994.80 0.03USD S&P GLOBAL INC 3.30000% 15-14.08.20 1 325 000.00 1 363 175.90 0.03USD SANTANDER UK GROUP HOLD PLC 2.87500% 15-16.10.20 2 500 000.00 2 538 510.00 0.06USD SANTANDER UK GROUP HOLD PLC 2.87500% 16-05.08.21 2 320 000.00 2 329 008.56 0.06USD SANTANDER UK GROUP HOLD PLC 3.57100% 17-10.01.23 8 005 000.00 8 200 354.02 0.21USD SANTANDER UK PLC 1.65000% 14-29.09.17 2 000 000.00 2 000 620.00 0.05
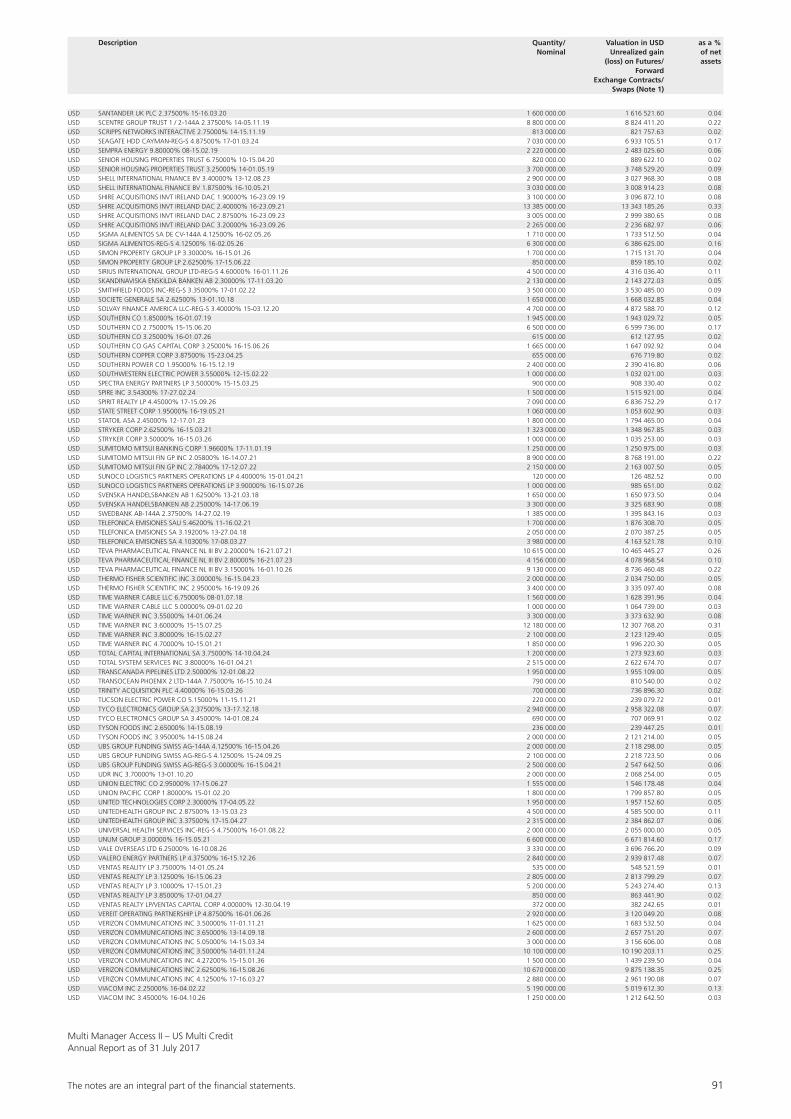
The notes are an integral part of the fi nancial statements. 91
Multi Manager Access II – US Multi CreditAnnual Report as of 31 July 2017
Description Quantity/ Valuation in USD as a % Nominal Unrealized gain of net (loss) on Futures/ assets Forward Exchange Contracts/ Swaps (Note 1)
USD SANTANDER UK PLC 2.37500% 15-16.03.20 1 600 000.00 1 616 521.60 0.04USD SCENTRE GROUP TRUST 1 / 2-144A 2.37500% 14-05.11.19 8 800 000.00 8 824 411.20 0.22USD SCRIPPS NETWORKS INTERACTIVE 2.75000% 14-15.11.19 813 000.00 821 757.63 0.02USD SEAGATE HDD CAYMAN-REG-S 4.87500% 17-01.03.24 7 030 000.00 6 933 105.51 0.17USD SEMPRA ENERGY 9.80000% 08-15.02.19 2 220 000.00 2 483 025.60 0.06USD SENIOR HOUSING PROPERTIES TRUST 6.75000% 10-15.04.20 820 000.00 889 622.10 0.02USD SENIOR HOUSING PROPERTIES TRUST 3.25000% 14-01.05.19 3 700 000.00 3 748 529.20 0.09USD SHELL INTERNATIONAL FINANCE BV 3.40000% 13-12.08.23 2 900 000.00 3 027 968.30 0.08USD SHELL INTERNATIONAL FINANCE BV 1.87500% 16-10.05.21 3 030 000.00 3 008 914.23 0.08USD SHIRE ACQUISITIONS INVT IRELAND DAC 1.90000% 16-23.09.19 3 100 000.00 3 096 872.10 0.08USD SHIRE ACQUISITIONS INVT IRELAND DAC 2.40000% 16-23.09.21 13 385 000.00 13 343 185.26 0.33USD SHIRE ACQUISITIONS INVT IRELAND DAC 2.87500% 16-23.09.23 3 005 000.00 2 999 380.65 0.08USD SHIRE ACQUISITIONS INVT IRELAND DAC 3.20000% 16-23.09.26 2 265 000.00 2 236 682.97 0.06USD SIGMA ALIMENTOS SA DE CV-144A 4.12500% 16-02.05.26 1 710 000.00 1 733 512.50 0.04USD SIGMA ALIMENTOS-REG-S 4.12500% 16-02.05.26 6 300 000.00 6 386 625.00 0.16USD SIMON PROPERTY GROUP LP 3.30000% 16-15.01.26 1 700 000.00 1 715 131.70 0.04USD SIMON PROPERTY GROUP LP 2.62500% 17-15.06.22 850 000.00 859 185.10 0.02USD SIRIUS INTERNATIONAL GROUP LTD-REG-S 4.60000% 16-01.11.26 4 500 000.00 4 316 036.40 0.11USD SKANDINAVISKA ENSKILDA BANKEN AB 2.30000% 17-11.03.20 2 130 000.00 2 143 272.03 0.05USD SMITHFIELD FOODS INC-REG-S 3.35000% 17-01.02.22 3 500 000.00 3 530 485.00 0.09USD SOCIETE GENERALE SA 2.62500% 13-01.10.18 1 650 000.00 1 668 032.85 0.04USD SOLVAY FINANCE AMERICA LLC-REG-S 3.40000% 15-03.12.20 4 700 000.00 4 872 588.70 0.12USD SOUTHERN CO 1.85000% 16-01.07.19 1 945 000.00 1 943 029.72 0.05USD SOUTHERN CO 2.75000% 15-15.06.20 6 500 000.00 6 599 736.00 0.17USD SOUTHERN CO 3.25000% 16-01.07.26 615 000.00 612 127.95 0.02USD SOUTHERN CO GAS CAPITAL CORP 3.25000% 16-15.06.26 1 665 000.00 1 647 092.92 0.04USD SOUTHERN COPPER CORP 3.87500% 15-23.04.25 655 000.00 676 719.80 0.02USD SOUTHERN POWER CO 1.95000% 16-15.12.19 2 400 000.00 2 390 416.80 0.06USD SOUTHWESTERN ELECTRIC POWER 3.55000% 12-15.02.22 1 000 000.00 1 032 021.00 0.03USD SPECTRA ENERGY PARTNERS LP 3.50000% 15-15.03.25 900 000.00 908 330.40 0.02USD SPIRE INC 3.54300% 17-27.02.24 1 500 000.00 1 515 921.00 0.04USD SPIRIT REALTY LP 4.45000% 17-15.09.26 7 090 000.00 6 836 752.29 0.17USD STATE STREET CORP 1.95000% 16-19.05.21 1 060 000.00 1 053 602.90 0.03USD STATOIL ASA 2.45000% 12-17.01.23 1 800 000.00 1 794 465.00 0.04USD STRYKER CORP 2.62500% 16-15.03.21 1 323 000.00 1 348 967.85 0.03USD STRYKER CORP 3.50000% 16-15.03.26 1 000 000.00 1 035 253.00 0.03USD SUMITOMO MITSUI BANKING CORP 1.96600% 17-11.01.19 1 250 000.00 1 250 975.00 0.03USD SUMITOMO MITSUI FIN GP INC 2.05800% 16-14.07.21 8 900 000.00 8 768 191.00 0.22USD SUMITOMO MITSUI FIN GP INC 2.78400% 17-12.07.22 2 150 000.00 2 163 007.50 0.05USD SUNOCO LOGISTICS PARTNERS OPERATIONS LP 4.40000% 15-01.04.21 120 000.00 126 482.52 0.00USD SUNOCO LOGISTICS PARTNERS OPERATIONS LP 3.90000% 16-15.07.26 1 000 000.00 985 651.00 0.02USD SVENSKA HANDELSBANKEN AB 1.62500% 13-21.03.18 1 650 000.00 1 650 973.50 0.04USD SVENSKA HANDELSBANKEN AB 2.25000% 14-17.06.19 3 300 000.00 3 325 683.90 0.08USD SWEDBANK AB-144A 2.37500% 14-27.02.19 1 385 000.00 1 395 843.16 0.03USD TELEFONICA EMISIONES SAU 5.46200% 11-16.02.21 1 700 000.00 1 876 308.70 0.05USD TELEFONICA EMISIONES SA 3.19200% 13-27.04.18 2 050 000.00 2 070 387.25 0.05USD TELEFONICA EMISIONES SA 4.10300% 17-08.03.27 3 980 000.00 4 163 521.78 0.10USD TEVA PHARMACEUTICAL FINANCE NL III BV 2.20000% 16-21.07.21 10 615 000.00 10 465 445.27 0.26USD TEVA PHARMACEUTICAL FINANCE NL III BV 2.80000% 16-21.07.23 4 156 000.00 4 078 968.54 0.10USD TEVA PHARMACEUTICAL FINANCE NL III BV 3.15000% 16-01.10.26 9 130 000.00 8 736 460.48 0.22USD THERMO FISHER SCIENTIFIC INC 3.00000% 16-15.04.23 2 000 000.00 2 034 750.00 0.05USD THERMO FISHER SCIENTIFIC INC 2.95000% 16-19.09.26 3 400 000.00 3 335 097.40 0.08USD TIME WARNER CABLE LLC 6.75000% 08-01.07.18 1 560 000.00 1 628 391.96 0.04USD TIME WARNER CABLE LLC 5.00000% 09-01.02.20 1 000 000.00 1 064 739.00 0.03USD TIME WARNER INC 3.55000% 14-01.06.24 3 300 000.00 3 373 632.90 0.08USD TIME WARNER INC 3.60000% 15-15.07.25 12 180 000.00 12 307 768.20 0.31USD TIME WARNER INC 3.80000% 16-15.02.27 2 100 000.00 2 123 129.40 0.05USD TIME WARNER INC 4.70000% 10-15.01.21 1 850 000.00 1 996 220.30 0.05USD TOTAL CAPITAL INTERNATIONAL SA 3.75000% 14-10.04.24 1 200 000.00 1 273 923.60 0.03USD TOTAL SYSTEM SERVICES INC 3.80000% 16-01.04.21 2 515 000.00 2 622 674.70 0.07USD TRANSCANADA PIPELINES LTD 2.50000% 12-01.08.22 1 950 000.00 1 955 109.00 0.05USD TRANSOCEAN PHOENIX 2 LTD-144A 7.75000% 16-15.10.24 790 000.00 810 540.00 0.02USD TRINITY ACQUISITION PLC 4.40000% 16-15.03.26 700 000.00 736 896.30 0.02USD TUCSON ELECTRIC POWER CO 5.15000% 11-15.11.21 220 000.00 239 079.72 0.01USD TYCO ELECTRONICS GROUP SA 2.37500% 13-17.12.18 2 940 000.00 2 958 322.08 0.07USD TYCO ELECTRONICS GROUP SA 3.45000% 14-01.08.24 690 000.00 707 069.91 0.02USD TYSON FOODS INC 2.65000% 14-15.08.19 236 000.00 239 447.25 0.01USD TYSON FOODS INC 3.95000% 14-15.08.24 2 000 000.00 2 121 214.00 0.05USD UBS GROUP FUNDING SWISS AG-144A 4.12500% 16-15.04.26 2 000 000.00 2 118 298.00 0.05USD UBS GROUP FUNDING SWISS AG-REG-S 4.12500% 15-24.09.25 2 100 000.00 2 218 723.50 0.06USD UBS GROUP FUNDING SWISS AG-REG-S 3.00000% 16-15.04.21 2 500 000.00 2 547 642.50 0.06USD UDR INC 3.70000% 13-01.10.20 2 000 000.00 2 068 254.00 0.05USD UNION ELECTRIC CO 2.95000% 17-15.06.27 1 555 000.00 1 546 178.48 0.04USD UNION PACIFIC CORP 1.80000% 15-01.02.20 1 800 000.00 1 799 857.80 0.05USD UNITED TECHNOLOGIES CORP 2.30000% 17-04.05.22 1 950 000.00 1 957 152.60 0.05USD UNITEDHEALTH GROUP INC 2.87500% 13-15.03.23 4 500 000.00 4 585 500.00 0.11USD UNITEDHEALTH GROUP INC 3.37500% 17-15.04.27 2 315 000.00 2 384 862.07 0.06USD UNIVERSAL HEALTH SERVICES INC-REG-S 4.75000% 16-01.08.22 2 000 000.00 2 055 000.00 0.05USD UNUM GROUP 3.00000% 16-15.05.21 6 600 000.00 6 671 814.60 0.17USD VALE OVERSEAS LTD 6.25000% 16-10.08.26 3 330 000.00 3 696 766.20 0.09USD VALERO ENERGY PARTNERS LP 4.37500% 16-15.12.26 2 840 000.00 2 939 817.48 0.07USD VENTAS REALITY LP 3.75000% 14-01.05.24 535 000.00 548 521.59 0.01USD VENTAS REALTY LP 3.12500% 16-15.06.23 2 805 000.00 2 813 799.29 0.07USD VENTAS REALTY LP 3.10000% 17-15.01.23 5 200 000.00 5 243 274.40 0.13USD VENTAS REALTY LP 3.85000% 17-01.04.27 850 000.00 863 441.90 0.02USD VENTAS REALTY LP/VENTAS CAPITAL CORP 4.00000% 12-30.04.19 372 000.00 382 242.65 0.01USD VEREIT OPERATING PARTNERSHIP LP 4.87500% 16-01.06.26 2 920 000.00 3 120 049.20 0.08USD VERIZON COMMUNICATIONS INC 3.50000% 11-01.11.21 1 625 000.00 1 683 532.50 0.04USD VERIZON COMMUNICATIONS INC 3.65000% 13-14.09.18 2 600 000.00 2 657 751.20 0.07USD VERIZON COMMUNICATIONS INC 5.05000% 14-15.03.34 3 000 000.00 3 156 606.00 0.08USD VERIZON COMMUNICATIONS INC 3.50000% 14-01.11.24 10 100 000.00 10 190 203.11 0.25USD VERIZON COMMUNICATIONS INC 4.27200% 15-15.01.36 1 500 000.00 1 439 239.50 0.04USD VERIZON COMMUNICATIONS INC 2.62500% 16-15.08.26 10 670 000.00 9 875 138.35 0.25USD VERIZON COMMUNICATIONS INC 4.12500% 17-16.03.27 2 880 000.00 2 961 190.08 0.07USD VIACOM INC 2.25000% 16-04.02.22 5 190 000.00 5 019 612.30 0.13USD VIACOM INC 3.45000% 16-04.10.26 1 250 000.00 1 212 642.50 0.03
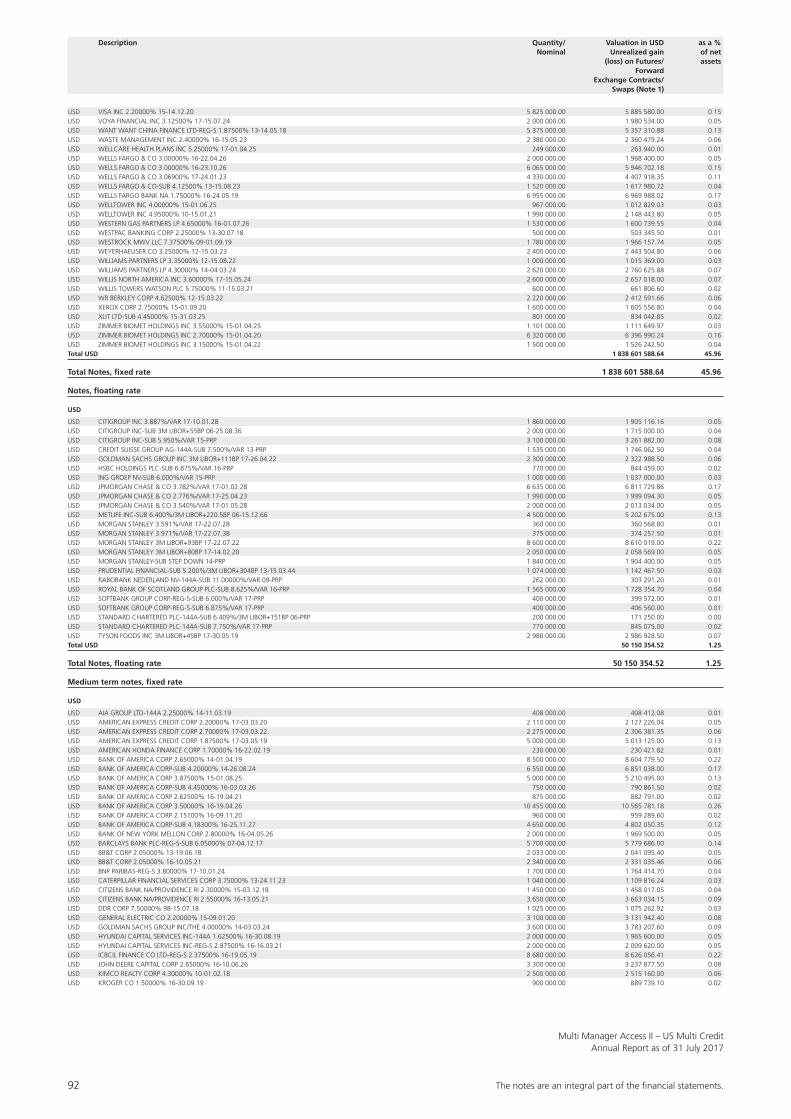
92 The notes are an integral part of the fi nancial statements.
Multi Manager Access II – US Multi CreditAnnual Report as of 31 July 2017
Description Quantity/ Valuation in USD as a % Nominal Unrealized gain of net (loss) on Futures/ assets Forward Exchange Contracts/ Swaps (Note 1)
USD VISA INC 2.20000% 15-14.12.20 5 825 000.00 5 885 580.00 0.15USD VOYA FINANCIAL INC 3.12500% 17-15.07.24 2 000 000.00 1 980 534.00 0.05USD WANT WANT CHINA FINANCE LTD-REG-S 1.87500% 13-14.05.18 5 375 000.00 5 357 310.88 0.13USD WASTE MANAGEMENT INC 2.40000% 16-15.05.23 2 380 000.00 2 360 479.24 0.06USD WELLCARE HEALTH PLANS INC 5.25000% 17-01.04.25 249 000.00 263 940.00 0.01USD WELLS FARGO & CO 3.00000% 16-22.04.26 2 000 000.00 1 968 400.00 0.05USD WELLS FARGO & CO 3.00000% 16-23.10.26 6 065 000.00 5 946 702.18 0.15USD WELLS FARGO & CO 3.06900% 17-24.01.23 4 330 000.00 4 407 918.35 0.11USD WELLS FARGO & CO-SUB 4.12500% 13-15.08.23 1 520 000.00 1 617 980.72 0.04USD WELLS FARGO BANK NA 1.75000% 16-24.05.19 6 955 000.00 6 969 988.02 0.17USD WELLTOWER INC 4.00000% 15-01.06.25 967 000.00 1 012 829.03 0.03USD WELLTOWER INC 4.95000% 10-15.01.21 1 990 000.00 2 148 443.80 0.05USD WESTERN GAS PARTNERS LP 4.65000% 16-01.07.26 1 530 000.00 1 600 739.55 0.04USD WESTPAC BANKING CORP 2.25000% 13-30.07.18 500 000.00 503 345.50 0.01USD WESTROCK MWV LLC 7.37500% 09-01.09.19 1 780 000.00 1 966 157.74 0.05USD WEYERHAEUSER CO 3.25000% 12-15.03.23 2 400 000.00 2 443 504.80 0.06USD WILLIAMS PARTNERS LP 3.35000% 12-15.08.22 1 000 000.00 1 015 369.00 0.03USD WILLIAMS PARTNERS LP 4.30000% 14-04.03.24 2 620 000.00 2 760 625.88 0.07USD WILLIS NORTH AMERICA INC 3.60000% 17-15.05.24 2 600 000.00 2 657 018.00 0.07USD WILLIS TOWERS WATSON PLC 5.75000% 11-15.03.21 600 000.00 661 806.60 0.02USD WR BERKLEY CORP 4.62500% 12-15.03.22 2 220 000.00 2 412 591.66 0.06USD XEROX CORP 2.75000% 15-01.09.20 1 600 000.00 1 605 556.80 0.04USD XLIT LTD-SUB 4.45000% 15-31.03.25 801 000.00 834 042.85 0.02USD ZIMMER BIOMET HOLDINGS INC 3.55000% 15-01.04.25 1 101 000.00 1 111 649.97 0.03USD ZIMMER BIOMET HOLDINGS INC 2.70000% 15-01.04.20 6 320 000.00 6 396 990.24 0.16USD ZIMMER BIOMET HOLDINGS INC 3.15000% 15-01.04.22 1 500 000.00 1 526 242.50 0.04Total USD 1 838 601 588.64 45.96
Total Notes, fixed rate 1 838 601 588.64 45.96
Notes, floating rate
USD
USD CITIGROUP INC 3.887%/VAR 17-10.01.28 1 860 000.00 1 905 116.16 0.05USD CITIGROUP INC-SUB 3M LIBOR+55BP 06-25.08.36 2 000 000.00 1 715 000.00 0.04USD CITIGROUP INC-SUB 5.950%/VAR 15-PRP 3 100 000.00 3 261 882.00 0.08USD CREDIT SUISSE GROUP AG-144A-SUB 7.500%/VAR 13-PRP 1 535 000.00 1 746 062.50 0.04USD GOLDMAN SACHS GROUP INC 3M LIBOR+111BP 17-26.04.22 2 300 000.00 2 322 988.50 0.06USD HSBC HOLDINGS PLC-SUB 6.875%/VAR 16-PRP 770 000.00 844 459.00 0.02USD ING GROEP NV-SUB 6.000%/VAR 15-PRP 1 000 000.00 1 037 000.00 0.03USD JPMORGAN CHASE & CO 3.782%/VAR 17-01.02.28 6 635 000.00 6 811 729.86 0.17USD JPMORGAN CHASE & CO 2.776%/VAR 17-25.04.23 1 990 000.00 1 999 094.30 0.05USD JPMORGAN CHASE & CO 3.540%/VAR 17-01.05.28 2 000 000.00 2 013 034.00 0.05USD METLIFE INC-SUB 6.400%/3M LIBOR+220.5BP 06-15.12.66 4 500 000.00 5 202 675.00 0.13USD MORGAN STANLEY 3.591%/VAR 17-22.07.28 360 000.00 360 568.80 0.01USD MORGAN STANLEY 3.971%/VAR 17-22.07.38 375 000.00 374 257.50 0.01USD MORGAN STANLEY 3M LIBOR+93BP 17-22.07.22 8 600 000.00 8 610 019.00 0.22USD MORGAN STANLEY 3M LIBOR+80BP 17-14.02.20 2 050 000.00 2 058 569.00 0.05USD MORGAN STANLEY-SUB STEP DOWN 14-PRP 1 840 000.00 1 904 400.00 0.05USD PRUDENTIAL FINANCIAL-SUB 5.200%/3M LIBOR+304BP 13-15.03.44 1 074 000.00 1 142 467.50 0.03USD RABOBANK NEDERLAND NV-144A-SUB 11.00000%/VAR 09-PRP 262 000.00 303 291.20 0.01USD ROYAL BANK OF SCOTLAND GROUP PLC-SUB 8.625%/VAR 16-PRP 1 565 000.00 1 728 354.70 0.04USD SOFTBANK GROUP CORP-REG-S-SUB 6.000%/VAR 17-PRP 400 000.00 399 572.00 0.01USD SOFTBANK GROUP CORP-REG-S-SUB 6.875%/VAR 17-PRP 400 000.00 406 560.00 0.01USD STANDARD CHARTERED PLC-144A-SUB 6.409%/3M LIBOR+151BP 06-PRP 200 000.00 171 250.00 0.00USD STANDARD CHARTERED PLC-144A-SUB 7.750%/VAR 17-PRP 770 000.00 845 075.00 0.02USD TYSON FOODS INC 3M LIBOR+45BP 17-30.05.19 2 980 000.00 2 986 928.50 0.07Total USD 50 150 354.52 1.25
Total Notes, floating rate 50 150 354.52 1.25
Medium term notes, fixed rate
USD
USD AIA GROUP LTD-144A 2.25000% 14-11.03.19 408 000.00 408 412.08 0.01USD AMERICAN EXPRESS CREDIT CORP 2.20000% 17-03.03.20 2 110 000.00 2 127 226.04 0.05USD AMERICAN EXPRESS CREDIT CORP 2.70000% 17-03.03.22 2 275 000.00 2 306 381.35 0.06USD AMERICAN EXPRESS CREDIT CORP 1.87500% 17-03.05.19 5 000 000.00 5 013 125.00 0.13USD AMERICAN HONDA FINANCE CORP 1.70000% 16-22.02.19 230 000.00 230 421.82 0.01USD BANK OF AMERICA CORP 2.65000% 14-01.04.19 8 500 000.00 8 604 779.50 0.22USD BANK OF AMERICA CORP-SUB 4.20000% 14-26.08.24 6 550 000.00 6 851 038.00 0.17USD BANK OF AMERICA CORP 3.87500% 15-01.08.25 5 000 000.00 5 210 495.00 0.13USD BANK OF AMERICA CORP-SUB 4.45000% 16-03.03.26 750 000.00 790 861.50 0.02USD BANK OF AMERICA CORP 2.62500% 16-19.04.21 875 000.00 882 791.00 0.02USD BANK OF AMERICA CORP 3.50000% 16-19.04.26 10 455 000.00 10 565 781.18 0.26USD BANK OF AMERICA CORP 2.15100% 16-09.11.20 960 000.00 959 289.60 0.02USD BANK OF AMERICA CORP-SUB 4.18300% 16-25.11.27 4 650 000.00 4 802 050.35 0.12USD BANK OF NEW YORK MELLON CORP 2.80000% 16-04.05.26 2 000 000.00 1 969 500.00 0.05USD BARCLAYS BANK PLC-REG-S-SUB 6.05000% 07-04.12.17 5 700 000.00 5 779 686.00 0.14USD BB&T CORP 2.05000% 13-19.06.18 2 033 000.00 2 041 095.40 0.05USD BB&T CORP 2.05000% 16-10.05.21 2 340 000.00 2 331 035.46 0.06USD BNP PARIBAS-REG-S 3.80000% 17-10.01.24 1 700 000.00 1 764 414.70 0.04USD CATERPILLAR FINANCIAL SERVICES CORP 3.75000% 13-24.11.23 1 040 000.00 1 109 816.24 0.03USD CITIZENS BANK NA/PROVIDENCE RI 2.30000% 15-03.12.18 1 450 000.00 1 458 017.05 0.04USD CITIZENS BANK NA/PROVIDENCE RI 2.55000% 16-13.05.21 3 650 000.00 3 663 034.15 0.09USD DDR CORP 7.50000% 98-15.07.18 1 025 000.00 1 075 262.92 0.03USD GENERAL ELECTRIC CO 2.20000% 15-09.01.20 3 100 000.00 3 131 942.40 0.08USD GOLDMAN SACHS GROUP INC/THE 4.00000% 14-03.03.24 3 600 000.00 3 783 207.60 0.09USD HYUNDAI CAPITAL SERVICES INC-144A 1.62500% 16-30.08.19 2 000 000.00 1 965 600.00 0.05USD HYUNDAI CAPITAL SERVICES INC-REG-S 2.87500% 16-16.03.21 2 000 000.00 2 009 620.00 0.05USD ICBCIL FINANCE CO LTD-REG-S 2.37500% 16-19.05.19 8 680 000.00 8 626 056.41 0.22USD JOHN DEERE CAPITAL CORP 2.65000% 16-10.06.26 3 300 000.00 3 237 877.50 0.08USD KIMCO REALTY CORP 4.30000% 10-01.02.18 2 500 000.00 2 515 160.00 0.06USD KROGER CO 1.50000% 16-30.09.19 900 000.00 889 739.10 0.02
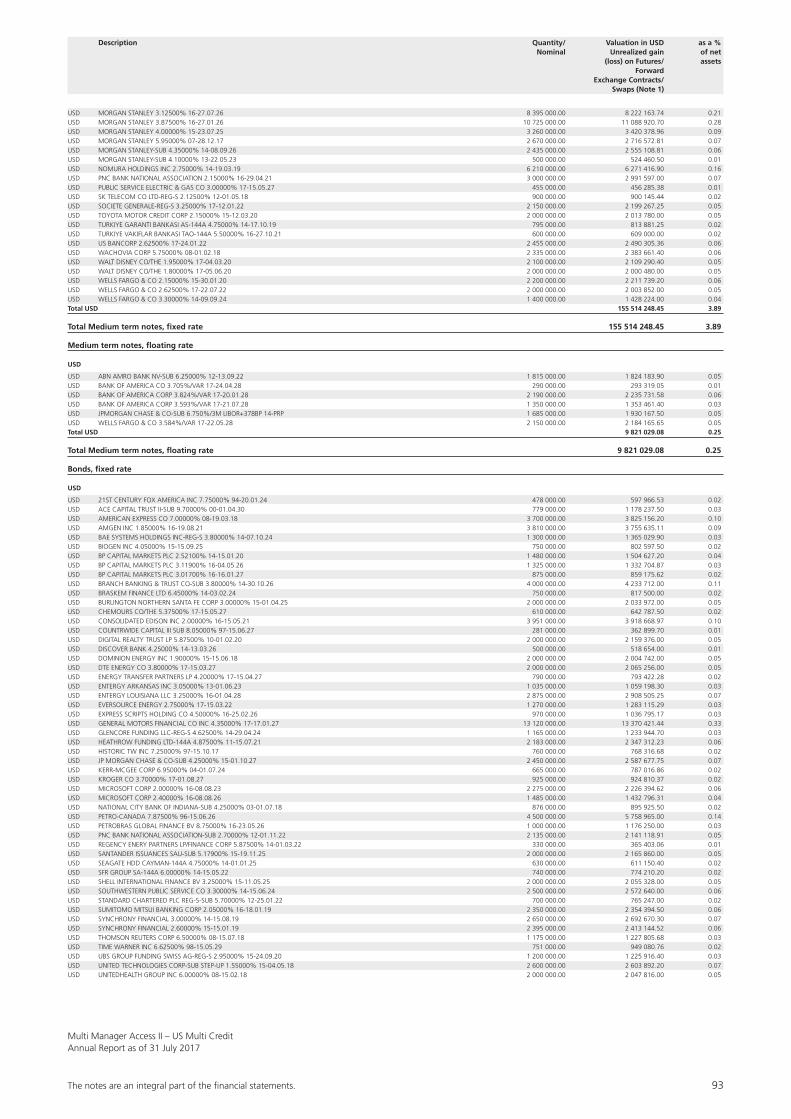
The notes are an integral part of the fi nancial statements. 93
Multi Manager Access II – US Multi CreditAnnual Report as of 31 July 2017
Description Quantity/ Valuation in USD as a % Nominal Unrealized gain of net (loss) on Futures/ assets Forward Exchange Contracts/ Swaps (Note 1)
USD MORGAN STANLEY 3.12500% 16-27.07.26 8 395 000.00 8 222 163.74 0.21USD MORGAN STANLEY 3.87500% 16-27.01.26 10 725 000.00 11 088 920.70 0.28USD MORGAN STANLEY 4.00000% 15-23.07.25 3 260 000.00 3 420 378.96 0.09USD MORGAN STANLEY 5.95000% 07-28.12.17 2 670 000.00 2 716 572.81 0.07USD MORGAN STANLEY-SUB 4.35000% 14-08.09.26 2 435 000.00 2 555 108.81 0.06USD MORGAN STANLEY-SUB 4.10000% 13-22.05.23 500 000.00 524 460.50 0.01USD NOMURA HOLDINGS INC 2.75000% 14-19.03.19 6 210 000.00 6 271 416.90 0.16USD PNC BANK NATIONAL ASSOCIATION 2.15000% 16-29.04.21 3 000 000.00 2 991 597.00 0.07USD PUBLIC SERVICE ELECTRIC & GAS CO 3.00000% 17-15.05.27 455 000.00 456 285.38 0.01USD SK TELECOM CO LTD-REG-S 2.12500% 12-01.05.18 900 000.00 900 145.44 0.02USD SOCIETE GENERALE-REG-S 3.25000% 17-12.01.22 2 150 000.00 2 199 267.25 0.05USD TOYOTA MOTOR CREDIT CORP 2.15000% 15-12.03.20 2 000 000.00 2 013 780.00 0.05USD TURKIYE GARANTI BANKASI AS-144A 4.75000% 14-17.10.19 795 000.00 813 881.25 0.02USD TURKIYE VAKIFLAR BANKASI TAO-144A 5.50000% 16-27.10.21 600 000.00 609 000.00 0.02USD US BANCORP 2.62500% 17-24.01.22 2 455 000.00 2 490 305.36 0.06USD WACHOVIA CORP 5.75000% 08-01.02.18 2 335 000.00 2 383 661.40 0.06USD WALT DISNEY CO/THE 1.95000% 17-04.03.20 2 100 000.00 2 109 290.40 0.05USD WALT DISNEY CO/THE 1.80000% 17-05.06.20 2 000 000.00 2 000 480.00 0.05USD WELLS FARGO & CO 2.15000% 15-30.01.20 2 200 000.00 2 211 739.20 0.06USD WELLS FARGO & CO 2.62500% 17-22.07.22 2 000 000.00 2 003 852.00 0.05USD WELLS FARGO & CO 3.30000% 14-09.09.24 1 400 000.00 1 428 224.00 0.04Total USD 155 514 248.45 3.89
Total Medium term notes, fixed rate 155 514 248.45 3.89
Medium term notes, floating rate
USD
USD ABN AMRO BANK NV-SUB 6.25000% 12-13.09.22 1 815 000.00 1 824 183.90 0.05USD BANK OF AMERICA CO 3.705%/VAR 17-24.04.28 290 000.00 293 319.05 0.01USD BANK OF AMERICA CORP 3.824%/VAR 17-20.01.28 2 190 000.00 2 235 731.58 0.06USD BANK OF AMERICA CORP 3.593%/VAR 17-21.07.28 1 350 000.00 1 353 461.40 0.03USD JPMORGAN CHASE & CO-SUB 6.750%/3M LIBOR+378BP 14-PRP 1 685 000.00 1 930 167.50 0.05USD WELLS FARGO & CO 3.584%/VAR 17-22.05.28 2 150 000.00 2 184 165.65 0.05Total USD 9 821 029.08 0.25
Total Medium term notes, floating rate 9 821 029.08 0.25
Bonds, fixed rate
USD
USD 21ST CENTURY FOX AMERICA INC 7.75000% 94-20.01.24 478 000.00 597 966.53 0.02USD ACE CAPITAL TRUST II-SUB 9.70000% 00-01.04.30 779 000.00 1 178 237.50 0.03USD AMERICAN EXPRESS CO 7.00000% 08-19.03.18 3 700 000.00 3 825 156.20 0.10USD AMGEN INC 1.85000% 16-19.08.21 3 810 000.00 3 755 635.11 0.09USD BAE SYSTEMS HOLDINGS INC-REG-S 3.80000% 14-07.10.24 1 300 000.00 1 365 029.90 0.03USD BIOGEN INC 4.05000% 15-15.09.25 750 000.00 802 597.50 0.02USD BP CAPITAL MARKETS PLC 2.52100% 14-15.01.20 1 480 000.00 1 504 627.20 0.04USD BP CAPITAL MARKETS PLC 3.11900% 16-04.05.26 1 325 000.00 1 332 704.87 0.03USD BP CAPITAL MARKETS PLC 3.01700% 16-16.01.27 875 000.00 859 175.62 0.02USD BRANCH BANKING & TRUST CO-SUB 3.80000% 14-30.10.26 4 000 000.00 4 233 712.00 0.11USD BRASKEM FINANCE LTD 6.45000% 14-03.02.24 750 000.00 817 500.00 0.02USD BURLINGTON NORTHERN SANTA FE CORP 3.00000% 15-01.04.25 2 000 000.00 2 033 972.00 0.05USD CHEMOURS CO/THE 5.37500% 17-15.05.27 610 000.00 642 787.50 0.02USD CONSOLIDATED EDISON INC 2.00000% 16-15.05.21 3 951 000.00 3 918 668.97 0.10USD COUNTRWIDE CAPITAL III SUB 8.05000% 97-15.06.27 281 000.00 362 899.70 0.01USD DIGITAL REALTY TRUST LP 5.87500% 10-01.02.20 2 000 000.00 2 159 376.00 0.05USD DISCOVER BANK 4.25000% 14-13.03.26 500 000.00 518 654.00 0.01USD DOMINION ENERGY INC 1.90000% 15-15.06.18 2 000 000.00 2 004 742.00 0.05USD DTE ENERGY CO 3.80000% 17-15.03.27 2 000 000.00 2 065 256.00 0.05USD ENERGY TRANSFER PARTNERS LP 4.20000% 17-15.04.27 790 000.00 793 422.28 0.02USD ENTERGY ARKANSAS INC 3.05000% 13-01.06.23 1 035 000.00 1 059 198.30 0.03USD ENTERGY LOUISIANA LLC 3.25000% 16-01.04.28 2 875 000.00 2 908 505.25 0.07USD EVERSOURCE ENERGY 2.75000% 17-15.03.22 1 270 000.00 1 283 115.29 0.03USD EXPRESS SCRIPTS HOLDING CO 4.50000% 16-25.02.26 970 000.00 1 036 795.17 0.03USD GENERAL MOTORS FINANCIAL CO INC 4.35000% 17-17.01.27 13 120 000.00 13 370 421.44 0.33USD GLENCORE FUNDING LLC-REG-S 4.62500% 14-29.04.24 1 165 000.00 1 233 944.70 0.03USD HEATHROW FUNDING LTD-144A 4.87500% 11-15.07.21 2 183 000.00 2 347 312.23 0.06USD HISTORIC TW INC 7.25000% 97-15.10.17 760 000.00 768 316.68 0.02USD JP MORGAN CHASE & CO-SUB 4.25000% 15-01.10.27 2 450 000.00 2 587 677.75 0.07USD KERR-MCGEE CORP 6.95000% 04-01.07.24 665 000.00 787 016.86 0.02USD KROGER CO 3.70000% 17-01.08.27 925 000.00 924 810.37 0.02USD MICROSOFT CORP 2.00000% 16-08.08.23 2 275 000.00 2 226 394.62 0.06USD MICROSOFT CORP 2.40000% 16-08.08.26 1 485 000.00 1 432 796.31 0.04USD NATIONAL CITY BANK OF INDIANA-SUB 4.25000% 03-01.07.18 876 000.00 895 925.50 0.02USD PETRO-CANADA 7.87500% 96-15.06.26 4 500 000.00 5 758 965.00 0.14USD PETROBRAS GLOBAL FINANCE BV 8.75000% 16-23.05.26 1 000 000.00 1 176 250.00 0.03USD PNC BANK NATIONAL ASSOCIATION-SUB 2.70000% 12-01.11.22 2 135 000.00 2 141 118.91 0.05USD REGENCY ENERY PARTNERS LP/FINANCE CORP 5.87500% 14-01.03.22 330 000.00 365 403.06 0.01USD SANTANDER ISSUANCES SAU-SUB 5.17900% 15-19.11.25 2 000 000.00 2 165 860.00 0.05USD SEAGATE HDD CAYMAN-144A 4.75000% 14-01.01.25 630 000.00 611 150.40 0.02USD SFR GROUP SA-144A 6.00000% 14-15.05.22 740 000.00 774 210.20 0.02USD SHELL INTERNATIONAL FINANCE BV 3.25000% 15-11.05.25 2 000 000.00 2 055 328.00 0.05USD SOUTHWESTERN PUBLIC SERVICE CO 3.30000% 14-15.06.24 2 500 000.00 2 572 640.00 0.06USD STANDARD CHARTERED PLC REG-S-SUB 5.70000% 12-25.01.22 700 000.00 765 247.00 0.02USD SUMITOMO MITSUI BANKING CORP 2.05000% 16-18.01.19 2 350 000.00 2 354 394.50 0.06USD SYNCHRONY FINANCIAL 3.00000% 14-15.08.19 2 650 000.00 2 692 670.30 0.07USD SYNCHRONY FINANCIAL 2.60000% 15-15.01.19 2 395 000.00 2 413 144.52 0.06USD THOMSON REUTERS CORP 6.50000% 08-15.07.18 1 175 000.00 1 227 805.68 0.03USD TIME WARNER INC 6.62500% 98-15.05.29 751 000.00 949 080.76 0.02USD UBS GROUP FUNDING SWISS AG-REG-S 2.95000% 15-24.09.20 1 200 000.00 1 225 916.40 0.03USD UNITED TECHNOLOGIES CORP-SUB STEP-UP 1.55000% 15-04.05.18 2 600 000.00 2 603 892.20 0.07USD UNITEDHEALTH GROUP INC 6.00000% 08-15.02.18 2 000 000.00 2 047 816.00 0.05
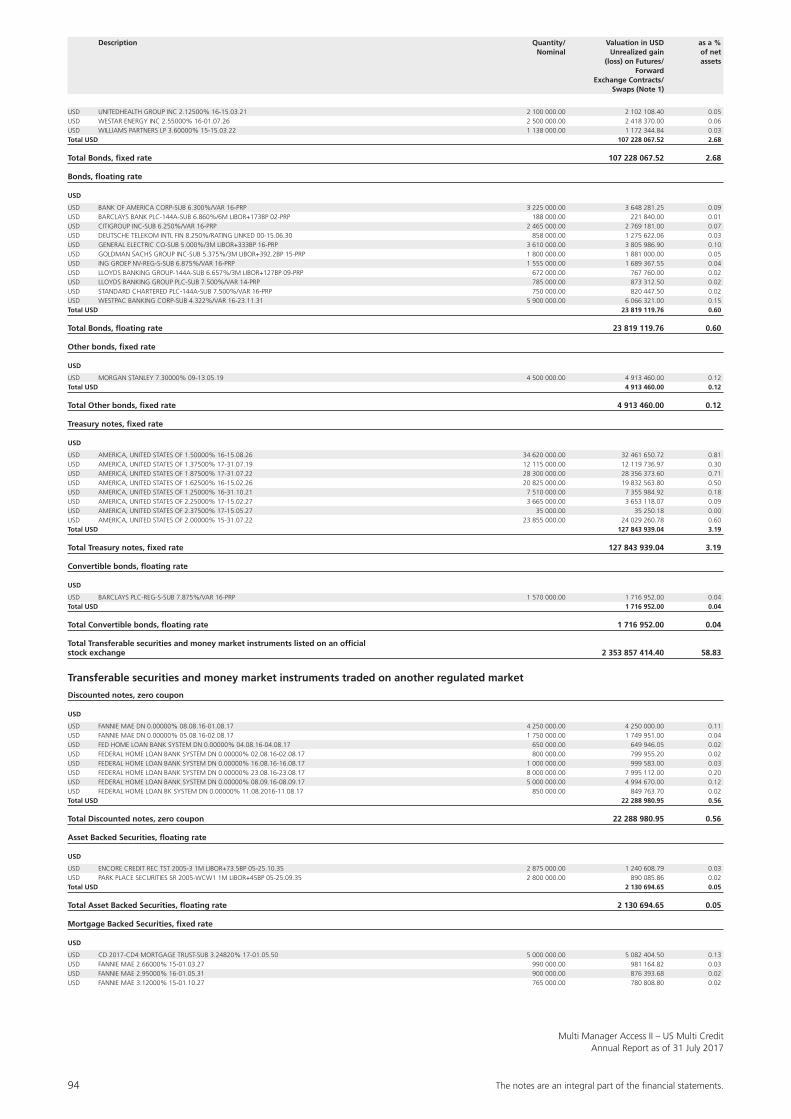
94 The notes are an integral part of the fi nancial statements.
Multi Manager Access II – US Multi CreditAnnual Report as of 31 July 2017
Description Quantity/ Valuation in USD as a % Nominal Unrealized gain of net (loss) on Futures/ assets Forward Exchange Contracts/ Swaps (Note 1)
USD UNITEDHEALTH GROUP INC 2.12500% 16-15.03.21 2 100 000.00 2 102 108.40 0.05USD WESTAR ENERGY INC 2.55000% 16-01.07.26 2 500 000.00 2 418 370.00 0.06USD WILLIAMS PARTNERS LP 3.60000% 15-15.03.22 1 138 000.00 1 172 344.84 0.03Total USD 107 228 067.52 2.68
Total Bonds, fixed rate 107 228 067.52 2.68
Bonds, floating rate
USD
USD BANK OF AMERICA CORP-SUB 6.300%/VAR 16-PRP 3 225 000.00 3 648 281.25 0.09USD BARCLAYS BANK PLC-144A-SUB 6.860%/6M LIBOR+173BP 02-PRP 188 000.00 221 840.00 0.01USD CITIGROUP INC-SUB 6.250%/VAR 16-PRP 2 465 000.00 2 769 181.00 0.07USD DEUTSCHE TELEKOM INTL FIN 8.250%/RATING LINKED 00-15.06.30 858 000.00 1 275 622.06 0.03USD GENERAL ELECTRIC CO-SUB 5.000%/3M LIBOR+333BP 16-PRP 3 610 000.00 3 805 986.90 0.10USD GOLDMAN SACHS GROUP INC-SUB 5.375%/3M LIBOR+392.2BP 15-PRP 1 800 000.00 1 881 000.00 0.05USD ING GROEP NV-REG-S-SUB 6.875%/VAR 16-PRP 1 555 000.00 1 689 367.55 0.04USD LLOYDS BANKING GROUP-144A-SUB 6.657%/3M LIBOR+127BP 09-PRP 672 000.00 767 760.00 0.02USD LLOYDS BANKING GROUP PLC-SUB 7.500%/VAR 14-PRP 785 000.00 873 312.50 0.02USD STANDARD CHARTERED PLC-144A-SUB 7.500%/VAR 16-PRP 750 000.00 820 447.50 0.02USD WESTPAC BANKING CORP-SUB 4.322%/VAR 16-23.11.31 5 900 000.00 6 066 321.00 0.15Total USD 23 819 119.76 0.60
Total Bonds, floating rate 23 819 119.76 0.60
Other bonds, fixed rate
USD
USD MORGAN STANLEY 7.30000% 09-13.05.19 4 500 000.00 4 913 460.00 0.12Total USD 4 913 460.00 0.12
Total Other bonds, fixed rate 4 913 460.00 0.12
Treasury notes, fixed rate
USD
USD AMERICA, UNITED STATES OF 1.50000% 16-15.08.26 34 620 000.00 32 461 650.72 0.81USD AMERICA, UNITED STATES OF 1.37500% 17-31.07.19 12 115 000.00 12 119 736.97 0.30USD AMERICA, UNITED STATES OF 1.87500% 17-31.07.22 28 300 000.00 28 356 373.60 0.71USD AMERICA, UNITED STATES OF 1.62500% 16-15.02.26 20 825 000.00 19 832 563.80 0.50USD AMERICA, UNITED STATES OF 1.25000% 16-31.10.21 7 510 000.00 7 355 984.92 0.18USD AMERICA, UNITED STATES OF 2.25000% 17-15.02.27 3 665 000.00 3 653 118.07 0.09USD AMERICA, UNITED STATES OF 2.37500% 17-15.05.27 35 000.00 35 250.18 0.00USD AMERICA, UNITED STATES OF 2.00000% 15-31.07.22 23 855 000.00 24 029 260.78 0.60Total USD 127 843 939.04 3.19
Total Treasury notes, fixed rate 127 843 939.04 3.19
Convertible bonds, floating rate
USD
USD BARCLAYS PLC-REG-S-SUB 7.875%/VAR 16-PRP 1 570 000.00 1 716 952.00 0.04Total USD 1 716 952.00 0.04
Total Convertible bonds, floating rate 1 716 952.00 0.04
Total Transferable securities and money market instruments listed on an official stock exchange 2 353 857 414.40 58.83
Transferable securities and money market instruments traded on another regulated market
Discounted notes, zero coupon
USD
USD FANNIE MAE DN 0.00000% 08.08.16-01.08.17 4 250 000.00 4 250 000.00 0.11USD FANNIE MAE DN 0.00000% 05.08.16-02.08.17 1 750 000.00 1 749 951.00 0.04USD FED HOME LOAN BANK SYSTEM DN 0.00000% 04.08.16-04.08.17 650 000.00 649 946.05 0.02USD FEDERAL HOME LOAN BANK SYSTEM DN 0.00000% 02.08.16-02.08.17 800 000.00 799 955.20 0.02USD FEDERAL HOME LOAN BANK SYSTEM DN 0.00000% 16.08.16-16.08.17 1 000 000.00 999 583.00 0.03USD FEDERAL HOME LOAN BANK SYSTEM DN 0.00000% 23.08.16-23.08.17 8 000 000.00 7 995 112.00 0.20USD FEDERAL HOME LOAN BANK SYSTEM DN 0.00000% 08.09.16-08.09.17 5 000 000.00 4 994 670.00 0.12USD FEDERAL HOME LOAN BK SYSTEM DN 0.00000% 11.08.2016-11.08.17 850 000.00 849 763.70 0.02Total USD 22 288 980.95 0.56
Total Discounted notes, zero coupon 22 288 980.95 0.56
Asset Backed Securities, floating rate
USD
USD ENCORE CREDIT REC TST 2005-3 1M LIBOR+73.5BP 05-25.10.35 2 875 000.00 1 240 608.79 0.03USD PARK PLACE SECURITIES SR 2005-WCW1 1M LIBOR+45BP 05-25.09.35 2 800 000.00 890 085.86 0.02Total USD 2 130 694.65 0.05
Total Asset Backed Securities, floating rate 2 130 694.65 0.05
Mortgage Backed Securities, fixed rate
USD
USD CD 2017-CD4 MORTGAGE TRUST-SUB 3.24820% 17-01.05.50 5 000 000.00 5 082 404.50 0.13USD FANNIE MAE 2.66000% 15-01.03.27 990 000.00 981 164.82 0.03USD FANNIE MAE 2.95000% 16-01.05.31 900 000.00 876 393.68 0.02USD FANNIE MAE 3.12000% 15-01.10.27 765 000.00 780 808.80 0.02
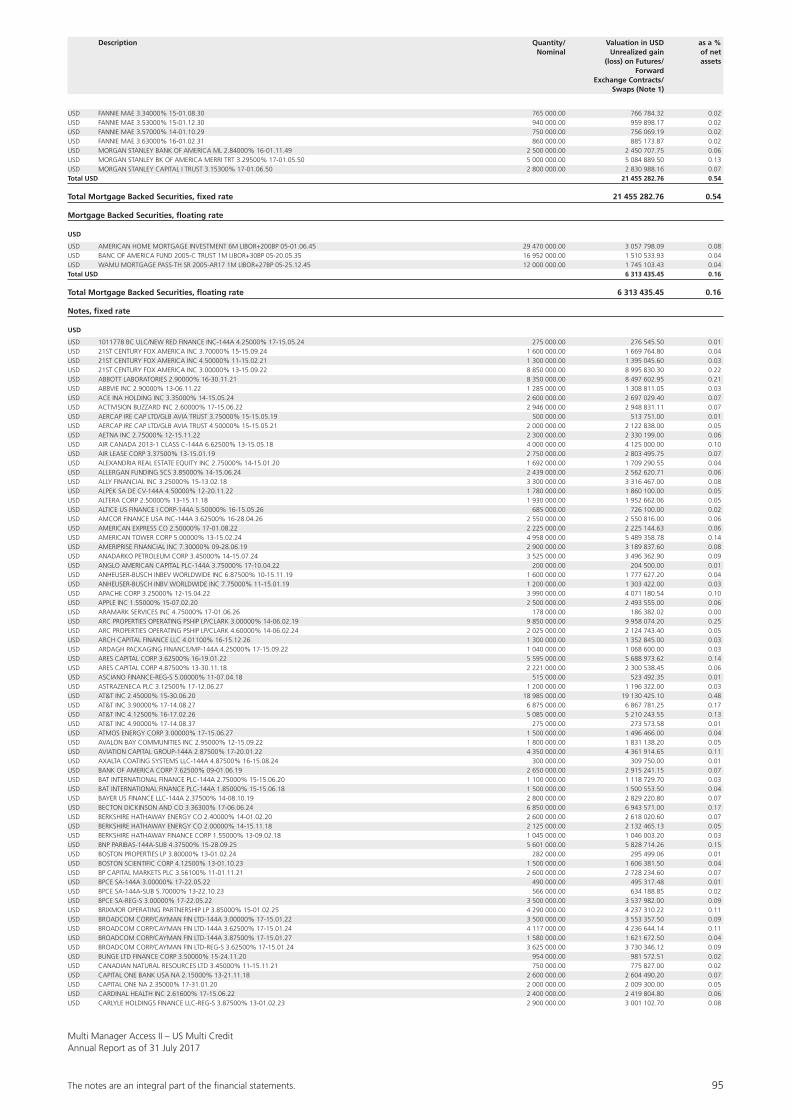
The notes are an integral part of the fi nancial statements. 95
Multi Manager Access II – US Multi CreditAnnual Report as of 31 July 2017
Description Quantity/ Valuation in USD as a % Nominal Unrealized gain of net (loss) on Futures/ assets Forward Exchange Contracts/ Swaps (Note 1)
USD FANNIE MAE 3.34000% 15-01.08.30 765 000.00 766 784.32 0.02USD FANNIE MAE 3.53000% 15-01.12.30 940 000.00 959 898.17 0.02USD FANNIE MAE 3.57000% 14-01.10.29 750 000.00 756 069.19 0.02USD FANNIE MAE 3.63000% 16-01.02.31 860 000.00 885 173.87 0.02USD MORGAN STANLEY BANK OF AMERICA ML 2.84000% 16-01.11.49 2 500 000.00 2 450 707.75 0.06USD MORGAN STANLEY BK OF AMERICA MERRI TRT 3.29500% 17-01.05.50 5 000 000.00 5 084 889.50 0.13USD MORGAN STANLEY CAPITAL I TRUST 3.15300% 17-01.06.50 2 800 000.00 2 830 988.16 0.07Total USD 21 455 282.76 0.54
Total Mortgage Backed Securities, fixed rate 21 455 282.76 0.54
Mortgage Backed Securities, floating rate
USD
USD AMERICAN HOME MORTGAGE INVESTMENT 6M LIBOR+200BP 05-01.06.45 29 470 000.00 3 057 798.09 0.08USD BANC OF AMERICA FUND 2005-C TRUST 1M LIBOR+30BP 05-20.05.35 16 952 000.00 1 510 533.93 0.04USD WAMU MORTGAGE PASS-TH SR 2005-AR17 1M LIBOR+27BP 05-25.12.45 12 000 000.00 1 745 103.43 0.04Total USD 6 313 435.45 0.16
Total Mortgage Backed Securities, floating rate 6 313 435.45 0.16
Notes, fixed rate
USD
USD 1011778 BC ULC/NEW RED FINANCE INC-144A 4.25000% 17-15.05.24 275 000.00 276 545.50 0.01USD 21ST CENTURY FOX AMERICA INC 3.70000% 15-15.09.24 1 600 000.00 1 669 764.80 0.04USD 21ST CENTURY FOX AMERICA INC 4.50000% 11-15.02.21 1 300 000.00 1 395 045.60 0.03USD 21ST CENTURY FOX AMERICA INC 3.00000% 13-15.09.22 8 850 000.00 8 995 830.30 0.22USD ABBOTT LABORATORIES 2.90000% 16-30.11.21 8 350 000.00 8 497 602.95 0.21USD ABBVIE INC 2.90000% 13-06.11.22 1 285 000.00 1 308 811.05 0.03USD ACE INA HOLDING INC 3.35000% 14-15.05.24 2 600 000.00 2 697 029.40 0.07USD ACTIVISION BLIZZARD INC 2.60000% 17-15.06.22 2 946 000.00 2 948 831.11 0.07USD AERCAP IRE CAP LTD/GLB AVIA TRUST 3.75000% 15-15.05.19 500 000.00 513 751.00 0.01USD AERCAP IRE CAP LTD/GLB AVIA TRUST 4.50000% 15-15.05.21 2 000 000.00 2 122 838.00 0.05USD AETNA INC 2.75000% 12-15.11.22 2 300 000.00 2 330 199.00 0.06USD AIR CANADA 2013-1 CLASS C-144A 6.62500% 13-15.05.18 4 000 000.00 4 125 000.00 0.10USD AIR LEASE CORP 3.37500% 13-15.01.19 2 750 000.00 2 803 495.75 0.07USD ALEXANDRIA REAL ESTATE EQUITY INC 2.75000% 14-15.01.20 1 692 000.00 1 709 290.55 0.04USD ALLERGAN FUNDING SCS 3.85000% 14-15.06.24 2 439 000.00 2 562 620.71 0.06USD ALLY FINANCIAL INC 3.25000% 15-13.02.18 3 300 000.00 3 316 467.00 0.08USD ALPEK SA DE CV-144A 4.50000% 12-20.11.22 1 780 000.00 1 860 100.00 0.05USD ALTERA CORP 2.50000% 13-15.11.18 1 930 000.00 1 952 662.06 0.05USD ALTICE US FINANCE I CORP-144A 5.50000% 16-15.05.26 685 000.00 726 100.00 0.02USD AMCOR FINANCE USA INC-144A 3.62500% 16-28.04.26 2 550 000.00 2 550 816.00 0.06USD AMERICAN EXPRESS CO 2.50000% 17-01.08.22 2 225 000.00 2 225 144.63 0.06USD AMERICAN TOWER CORP 5.00000% 13-15.02.24 4 958 000.00 5 489 358.78 0.14USD AMERIPRISE FINANCIAL INC 7.30000% 09-28.06.19 2 900 000.00 3 189 837.60 0.08USD ANADARKO PETROLEUM CORP 3.45000% 14-15.07.24 3 525 000.00 3 496 362.90 0.09USD ANGLO AMERICAN CAPITAL PLC-144A 3.75000% 17-10.04.22 200 000.00 204 500.00 0.01USD ANHEUSER-BUSCH INBEV WORLDWIDE INC 6.87500% 10-15.11.19 1 600 000.00 1 777 627.20 0.04USD ANHEUSER-BUSCH INBV WORLDWIDE INC 7.75000% 11-15.01.19 1 200 000.00 1 303 422.00 0.03USD APACHE CORP 3.25000% 12-15.04.22 3 990 000.00 4 071 180.54 0.10USD APPLE INC 1.55000% 15-07.02.20 2 500 000.00 2 493 555.00 0.06USD ARAMARK SERVICES INC 4.75000% 17-01.06.26 178 000.00 186 382.02 0.00USD ARC PROPERTIES OPERATING PSHIP LP/CLARK 3.00000% 14-06.02.19 9 850 000.00 9 958 074.20 0.25USD ARC PROPERTIES OPERATING PSHIP LP/CLARK 4.60000% 14-06.02.24 2 025 000.00 2 124 743.40 0.05USD ARCH CAPITAL FINANCE LLC 4.01100% 16-15.12.26 1 300 000.00 1 352 845.00 0.03USD ARDAGH PACKAGING FINANCE/MP-144A 4.25000% 17-15.09.22 1 040 000.00 1 068 600.00 0.03USD ARES CAPITAL CORP 3.62500% 16-19.01.22 5 595 000.00 5 688 973.62 0.14USD ARES CAPITAL CORP 4.87500% 13-30.11.18 2 221 000.00 2 300 538.45 0.06USD ASCIANO FINANCE-REG-S 5.00000% 11-07.04.18 515 000.00 523 492.35 0.01USD ASTRAZENECA PLC 3.12500% 17-12.06.27 1 200 000.00 1 196 322.00 0.03USD AT&T INC 2.45000% 15-30.06.20 18 985 000.00 19 130 425.10 0.48USD AT&T INC 3.90000% 17-14.08.27 6 875 000.00 6 867 781.25 0.17USD AT&T INC 4.12500% 16-17.02.26 5 085 000.00 5 210 243.55 0.13USD AT&T INC 4.90000% 17-14.08.37 275 000.00 273 573.58 0.01USD ATMOS ENERGY CORP 3.00000% 17-15.06.27 1 500 000.00 1 496 466.00 0.04USD AVALON BAY COMMUNITIES INC 2.95000% 12-15.09.22 1 800 000.00 1 831 138.20 0.05USD AVIATION CAPITAL GROUP-144A 2.87500% 17-20.01.22 4 350 000.00 4 361 914.65 0.11USD AXALTA COATING SYSTEMS LLC-144A 4.87500% 16-15.08.24 300 000.00 309 750.00 0.01USD BANK OF AMERICA CORP 7.62500% 09-01.06.19 2 650 000.00 2 915 241.15 0.07USD BAT INTERNATIONAL FINANCE PLC-144A 2.75000% 15-15.06.20 1 100 000.00 1 118 729.70 0.03USD BAT INTERNATIONAL FINANCE PLC-144A 1.85000% 15-15.06.18 1 500 000.00 1 500 553.50 0.04USD BAYER US FINANCE LLC-144A 2.37500% 14-08.10.19 2 800 000.00 2 829 220.80 0.07USD BECTON DICKINSON AND CO 3.36300% 17-06.06.24 6 850 000.00 6 943 571.00 0.17USD BERKSHIRE HATHAWAY ENERGY CO 2.40000% 14-01.02.20 2 600 000.00 2 618 020.60 0.07USD BERKSHIRE HATHAWAY ENERGY CO 2.00000% 14-15.11.18 2 125 000.00 2 132 465.13 0.05USD BERKSHIRE HATHAWAY FINANCE CORP 1.55000% 13-09.02.18 1 045 000.00 1 046 003.20 0.03USD BNP PARIBAS-144A-SUB 4.37500% 15-28.09.25 5 601 000.00 5 828 714.26 0.15USD BOSTON PROPERTIES LP 3.80000% 13-01.02.24 282 000.00 295 499.06 0.01USD BOSTON SCIENTIFIC CORP 4.12500% 13-01.10.23 1 500 000.00 1 606 381.50 0.04USD BP CAPITAL MARKETS PLC 3.56100% 11-01.11.21 2 600 000.00 2 728 234.60 0.07USD BPCE SA-144A 3.00000% 17-22.05.22 490 000.00 495 317.48 0.01USD BPCE SA-144A-SUB 5.70000% 13-22.10.23 566 000.00 634 188.85 0.02USD BPCE SA-REG-S 3.00000% 17-22.05.22 3 500 000.00 3 537 982.00 0.09USD BRIXMOR OPERATING PARTNERSHIP LP 3.85000% 15-01.02.25 4 290 000.00 4 237 310.22 0.11USD BROADCOM CORP/CAYMAN FIN LTD-144A 3.00000% 17-15.01.22 3 500 000.00 3 553 357.50 0.09USD BROADCOM CORP/CAYMAN FIN LTD-144A 3.62500% 17-15.01.24 4 117 000.00 4 236 644.14 0.11USD BROADCOM CORP/CAYMAN FIN LTD-144A 3.87500% 17-15.01.27 1 580 000.00 1 621 672.50 0.04USD BROADCOM CORP/CAYMAN FIN LTD-REG-S 3.62500% 17-15.01.24 3 625 000.00 3 730 346.12 0.09USD BUNGE LTD FINANCE CORP 3.50000% 15-24.11.20 954 000.00 981 572.51 0.02USD CANADIAN NATURAL RESOURCES LTD 3.45000% 11-15.11.21 750 000.00 775 827.00 0.02USD CAPITAL ONE BANK USA NA 2.15000% 13-21.11.18 2 600 000.00 2 604 490.20 0.07USD CAPITAL ONE NA 2.35000% 17-31.01.20 2 000 000.00 2 009 300.00 0.05USD CARDINAL HEALTH INC 2.61600% 17-15.06.22 2 400 000.00 2 419 804.80 0.06USD CARLYLE HOLDINGS FINANCE LLC-REG-S 3.87500% 13-01.02.23 2 900 000.00 3 001 102.70 0.08
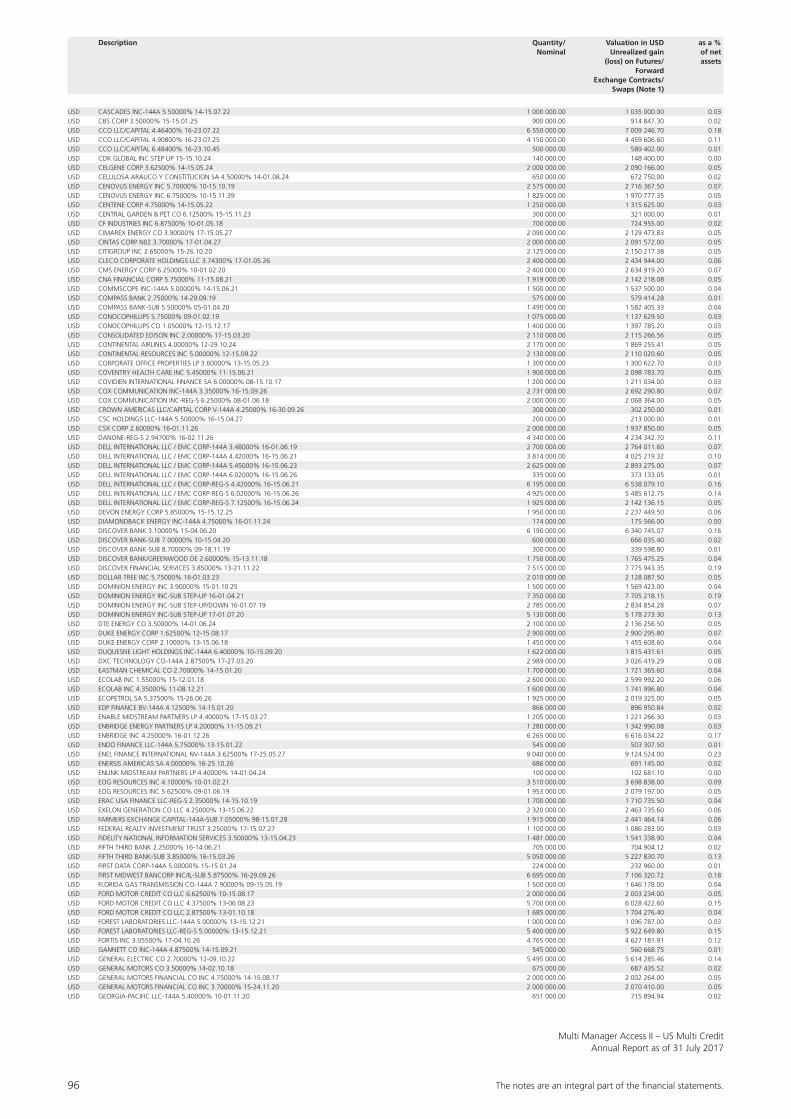
96 The notes are an integral part of the fi nancial statements.
Multi Manager Access II – US Multi CreditAnnual Report as of 31 July 2017
Description Quantity/ Valuation in USD as a % Nominal Unrealized gain of net (loss) on Futures/ assets Forward Exchange Contracts/ Swaps (Note 1)
USD CASCADES INC-144A 5.50000% 14-15.07.22 1 000 000.00 1 035 000.00 0.03USD CBS CORP 3.50000% 15-15.01.25 900 000.00 914 847.30 0.02USD CCO LLC/CAPITAL 4.46400% 16-23.07.22 6 550 000.00 7 009 246.70 0.18USD CCO LLC/CAPITAL 4.90800% 16-23.07.25 4 150 000.00 4 459 606.60 0.11USD CCO LLC/CAPITAL 6.48400% 16-23.10.45 500 000.00 589 402.00 0.01USD CDK GLOBAL INC STEP UP 15-15.10.24 140 000.00 148 400.00 0.00USD CELGENE CORP 3.62500% 14-15.05.24 2 000 000.00 2 090 166.00 0.05USD CELULOSA ARAUCO Y CONSTITUCION SA 4.50000% 14-01.08.24 650 000.00 672 750.00 0.02USD CENOVUS ENERGY INC 5.70000% 10-15.10.19 2 575 000.00 2 716 367.50 0.07USD CENOVUS ENERGY INC 6.75000% 10-15.11.39 1 825 000.00 1 970 777.35 0.05USD CENTENE CORP 4.75000% 14-15.05.22 1 250 000.00 1 315 625.00 0.03USD CENTRAL GARDEN & PET CO 6.12500% 15-15.11.23 300 000.00 321 000.00 0.01USD CF INDUSTRIES INC 6.87500% 10-01.05.18 700 000.00 724 955.00 0.02USD CIMAREX ENERGY CO 3.90000% 17-15.05.27 2 090 000.00 2 129 473.83 0.05USD CINTAS CORP N02 3.70000% 17-01.04.27 2 000 000.00 2 091 572.00 0.05USD CITIGROUP INC 2.65000% 15-26.10.20 2 125 000.00 2 150 217.38 0.05USD CLECO CORPORATE HOLDINGS LLC 3.74300% 17-01.05.26 2 400 000.00 2 434 944.00 0.06USD CMS ENERGY CORP 6.25000% 10-01.02.20 2 400 000.00 2 634 919.20 0.07USD CNA FINANCIAL CORP 5.75000% 11-15.08.21 1 919 000.00 2 142 218.08 0.05USD COMMSCOPE INC-144A 5.00000% 14-15.06.21 1 500 000.00 1 537 500.00 0.04USD COMPASS BANK 2.75000% 14-29.09.19 575 000.00 579 414.28 0.01USD COMPASS BANK-SUB 5.50000% 05-01.04.20 1 490 000.00 1 582 405.33 0.04USD CONOCOPHILLIPS 5.75000% 09-01.02.19 1 075 000.00 1 137 629.50 0.03USD CONOCOPHILLIPS CO 1.05000% 12-15.12.17 1 400 000.00 1 397 785.20 0.03USD CONSOLIDATED EDISON INC 2.00000% 17-15.03.20 2 110 000.00 2 115 266.56 0.05USD CONTINENTAL AIRLINES 4.00000% 12-29.10.24 2 170 000.00 1 869 255.41 0.05USD CONTINENTAL RESOURCES INC 5.00000% 12-15.09.22 2 130 000.00 2 110 020.60 0.05USD CORPORATE OFFICE PROPERTIES LP 3.60000% 13-15.05.23 1 300 000.00 1 300 622.70 0.03USD COVENTRY HEALTH CARE INC 5.45000% 11-15.06.21 1 900 000.00 2 098 783.70 0.05USD COVIDIEN INTERNATIONAL FINANCE SA 6.00000% 08-15.10.17 1 200 000.00 1 211 034.00 0.03USD COX COMMUNICATION INC-144A 3.35000% 16-15.09.26 2 731 000.00 2 692 290.80 0.07USD COX COMMUNICATION INC-REG-S 6.25000% 08-01.06.18 2 000 000.00 2 068 364.00 0.05USD CROWN AMERICAS LLC/CAPITAL CORP V-144A 4.25000% 16-30.09.26 300 000.00 302 250.00 0.01USD CSC HOLDINGS LLC-144A 5.50000% 16-15.04.27 200 000.00 213 000.00 0.01USD CSX CORP 2.60000% 16-01.11.26 2 000 000.00 1 937 850.00 0.05USD DANONE-REG-S 2.94700% 16-02.11.26 4 340 000.00 4 234 342.70 0.11USD DELL INTERNATIONAL LLC / EMC CORP-144A 3.48000% 16-01.06.19 2 700 000.00 2 764 011.60 0.07USD DELL INTERNATIONAL LLC / EMC CORP-144A 4.42000% 16-15.06.21 3 814 000.00 4 025 219.32 0.10USD DELL INTERNATIONAL LLC / EMC CORP-144A 5.45000% 16-15.06.23 2 625 000.00 2 893 275.00 0.07USD DELL INTERNATIONAL LLC / EMC CORP-144A 6.02000% 16-15.06.26 335 000.00 373 133.05 0.01USD DELL INTERNATIONAL LLC / EMC CORP-REG-S 4.42000% 16-15.06.21 6 195 000.00 6 538 079.10 0.16USD DELL INTERNATIONAL LLC / EMC CORP-REG-S 6.02000% 16-15.06.26 4 925 000.00 5 485 612.75 0.14USD DELL INTERNATIONAL LLC / EMC CORP-REG-S 7.12500% 16-15.06.24 1 925 000.00 2 142 136.15 0.05USD DEVON ENERGY CORP 5.85000% 15-15.12.25 1 950 000.00 2 237 449.50 0.06USD DIAMONDBACK ENERGY INC-144A 4.75000% 16-01.11.24 174 000.00 175 566.00 0.00USD DISCOVER BANK 3.10000% 15-04.06.20 6 190 000.00 6 340 745.07 0.16USD DISCOVER BANK-SUB 7.00000% 10-15.04.20 600 000.00 666 035.40 0.02USD DISCOVER BANK-SUB 8.70000% 09-18.11.19 300 000.00 339 598.80 0.01USD DISCOVER BANK/GREENWOOD DE 2.60000% 15-13.11.18 1 750 000.00 1 765 475.25 0.04USD DISCOVER FINANCIAL SERVICES 3.85000% 13-21.11.22 7 515 000.00 7 775 943.35 0.19USD DOLLAR TREE INC 5.75000% 16-01.03.23 2 010 000.00 2 128 087.50 0.05USD DOMINION ENERGY INC 3.90000% 15-01.10.25 1 500 000.00 1 569 423.00 0.04USD DOMINION ENERGY INC-SUB STEP-UP 16-01.04.21 7 350 000.00 7 705 218.15 0.19USD DOMINION ENERGY INC-SUB STEP-UP/DOWN 16-01.07.19 2 785 000.00 2 834 854.28 0.07USD DOMINION ENERGY INC-SUB STEP-UP 17-01.07.20 5 130 000.00 5 178 273.30 0.13USD DTE ENERGY CO 3.50000% 14-01.06.24 2 100 000.00 2 136 256.50 0.05USD DUKE ENERGY CORP 1.62500% 12-15.08.17 2 900 000.00 2 900 295.80 0.07USD DUKE ENERGY CORP 2.10000% 13-15.06.18 1 450 000.00 1 455 608.60 0.04USD DUQUESNE LIGHT HOLDINGS INC-144A 6.40000% 10-15.09.20 1 622 000.00 1 815 431.61 0.05USD DXC TECHNOLOGY CO-144A 2.87500% 17-27.03.20 2 989 000.00 3 026 419.29 0.08USD EASTMAN CHEMICAL CO 2.70000% 14-15.01.20 1 700 000.00 1 721 365.60 0.04USD ECOLAB INC 1.55000% 15-12.01.18 2 600 000.00 2 599 992.20 0.06USD ECOLAB INC 4.35000% 11-08.12.21 1 600 000.00 1 741 996.80 0.04USD ECOPETROL SA 5.37500% 15-26.06.26 1 925 000.00 2 019 325.00 0.05USD EDP FINANCE BV-144A 4.12500% 14-15.01.20 866 000.00 896 950.84 0.02USD ENABLE MIDSTREAM PARTNERS LP 4.40000% 17-15.03.27 1 205 000.00 1 221 266.30 0.03USD ENBRIDGE ENERGY PARTNERS LP 4.20000% 11-15.09.21 1 280 000.00 1 342 990.08 0.03USD ENBRIDGE INC 4.25000% 16-01.12.26 6 265 000.00 6 616 034.22 0.17USD ENDO FINANCE LLC-144A 5.75000% 13-15.01.22 545 000.00 503 307.50 0.01USD ENEL FINANCE INTERNATIONAL NV-144A 3.62500% 17-25.05.27 9 040 000.00 9 124 524.00 0.23USD ENERSIS AMERICAS SA 4.00000% 16-25.10.26 686 000.00 691 145.00 0.02USD ENLINK MIDSTREAM PARTNERS LP 4.40000% 14-01.04.24 100 000.00 102 681.10 0.00USD EOG RESOURCES INC 4.10000% 10-01.02.21 3 510 000.00 3 698 838.00 0.09USD EOG RESOURCES INC 5.62500% 09-01.06.19 1 953 000.00 2 079 197.00 0.05USD ERAC USA FINANCE LLC-REG-S 2.35000% 14-15.10.19 1 700 000.00 1 710 735.50 0.04USD EXELON GENERATION CO LLC 4.25000% 13-15.06.22 2 320 000.00 2 463 735.60 0.06USD FARMERS EXCHANGE CAPITAL-144A-SUB 7.05000% 98-15.07.28 1 915 000.00 2 441 464.14 0.06USD FEDERAL REALTY INVESTMENT TRUST 3.25000% 17-15.07.27 1 100 000.00 1 086 283.00 0.03USD FIDELITY NATIONAL INFORMATION SERVICES 3.50000% 13-15.04.23 1 481 000.00 1 541 338.90 0.04USD FIFTH THIRD BANK 2.25000% 16-14.06.21 705 000.00 704 904.12 0.02USD FIFTH THIRD BANK-SUB 3.85000% 16-15.03.26 5 050 000.00 5 227 830.70 0.13USD FIRST DATA CORP-144A 5.00000% 15-15.01.24 224 000.00 232 960.00 0.01USD FIRST MIDWEST BANCORP INC/IL-SUB 5.87500% 16-29.09.26 6 695 000.00 7 106 320.72 0.18USD FLORIDA GAS TRANSMISSION CO-144A 7.90000% 09-15.05.19 1 500 000.00 1 646 178.00 0.04USD FORD MOTOR CREDIT CO LLC 6.62500% 10-15.08.17 2 000 000.00 2 003 234.00 0.05USD FORD MOTOR CREDIT CO LLC 4.37500% 13-06.08.23 5 700 000.00 6 028 422.60 0.15USD FORD MOTOR CREDIT CO LLC 2.87500% 13-01.10.18 1 685 000.00 1 704 276.40 0.04USD FOREST LABORATORIES LLC-144A 5.00000% 13-15.12.21 1 000 000.00 1 096 787.00 0.03USD FOREST LABORATORIES LLC-REG-S 5.00000% 13-15.12.21 5 400 000.00 5 922 649.80 0.15USD FORTIS INC 3.05500% 17-04.10.26 4 765 000.00 4 627 181.91 0.12USD GANNETT CO INC-144A 4.87500% 14-15.09.21 545 000.00 560 668.75 0.01USD GENERAL ELECTRIC CO 2.70000% 12-09.10.22 5 495 000.00 5 614 285.46 0.14USD GENERAL MOTORS CO 3.50000% 14-02.10.18 675 000.00 687 435.52 0.02USD GENERAL MOTORS FINANCIAL CO INC 4.75000% 14-15.08.17 2 000 000.00 2 002 264.00 0.05USD GENERAL MOTORS FINANCIAL CO INC 3.70000% 15-24.11.20 2 000 000.00 2 070 410.00 0.05USD GEORGIA-PACIFIC LLC-144A 5.40000% 10-01.11.20 651 000.00 715 894.94 0.02
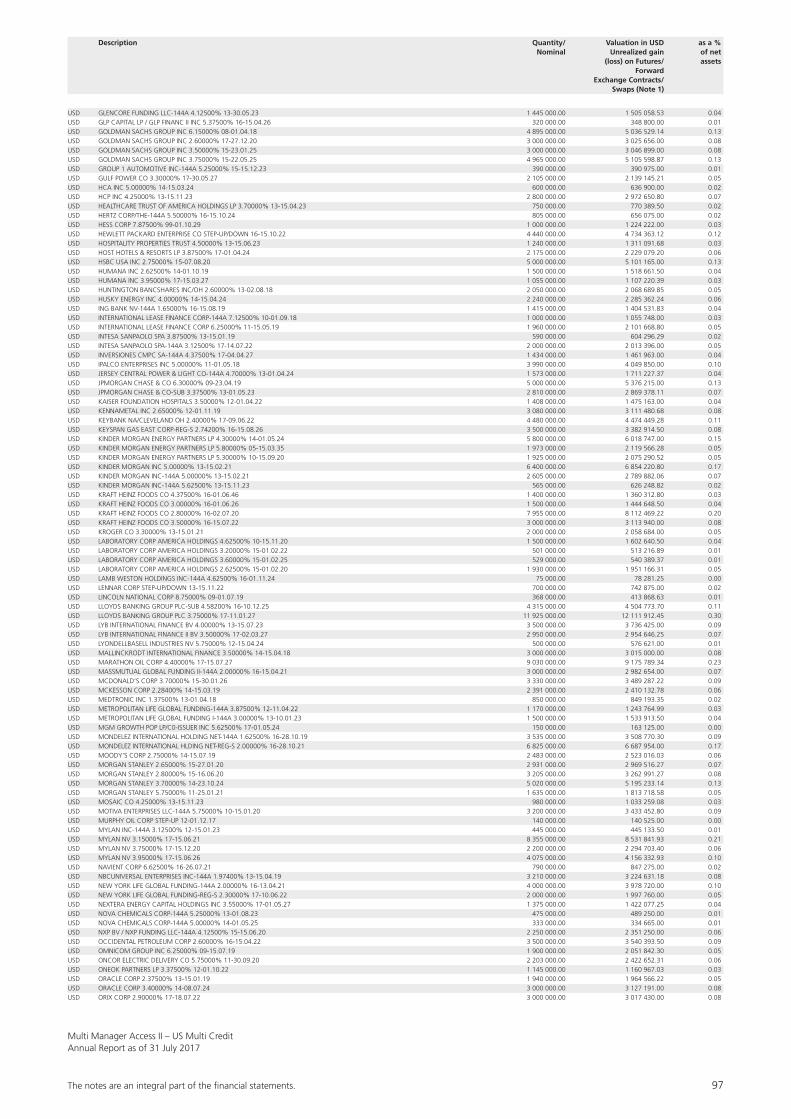
The notes are an integral part of the fi nancial statements. 97
Multi Manager Access II – US Multi CreditAnnual Report as of 31 July 2017
Description Quantity/ Valuation in USD as a % Nominal Unrealized gain of net (loss) on Futures/ assets Forward Exchange Contracts/ Swaps (Note 1)
USD GLENCORE FUNDING LLC-144A 4.12500% 13-30.05.23 1 445 000.00 1 505 058.53 0.04USD GLP CAPITAL LP / GLP FINANC II INC 5.37500% 16-15.04.26 320 000.00 348 800.00 0.01USD GOLDMAN SACHS GROUP INC 6.15000% 08-01.04.18 4 895 000.00 5 036 529.14 0.13USD GOLDMAN SACHS GROUP INC 2.60000% 17-27.12.20 3 000 000.00 3 025 656.00 0.08USD GOLDMAN SACHS GROUP INC 3.50000% 15-23.01.25 3 000 000.00 3 046 899.00 0.08USD GOLDMAN SACHS GROUP INC 3.75000% 15-22.05.25 4 965 000.00 5 105 598.87 0.13USD GROUP 1 AUTOMOTIVE INC-144A 5.25000% 15-15.12.23 390 000.00 390 975.00 0.01USD GULF POWER CO 3.30000% 17-30.05.27 2 105 000.00 2 139 145.21 0.05USD HCA INC 5.00000% 14-15.03.24 600 000.00 636 900.00 0.02USD HCP INC 4.25000% 13-15.11.23 2 800 000.00 2 972 650.80 0.07USD HEALTHCARE TRUST OF AMERICA HOLDINGS LP 3.70000% 13-15.04.23 750 000.00 770 389.50 0.02USD HERTZ CORP/THE-144A 5.50000% 16-15.10.24 805 000.00 656 075.00 0.02USD HESS CORP 7.87500% 99-01.10.29 1 000 000.00 1 224 222.00 0.03USD HEWLETT PACKARD ENTERPRISE CO STEP-UP/DOWN 16-15.10.22 4 440 000.00 4 734 363.12 0.12USD HOSPITALITY PROPERTIES TRUST 4.50000% 13-15.06.23 1 240 000.00 1 311 091.68 0.03USD HOST HOTELS & RESORTS LP 3.87500% 17-01.04.24 2 175 000.00 2 229 079.20 0.06USD HSBC USA INC 2.75000% 15-07.08.20 5 000 000.00 5 101 165.00 0.13USD HUMANA INC 2.62500% 14-01.10.19 1 500 000.00 1 518 661.50 0.04USD HUMANA INC 3.95000% 17-15.03.27 1 055 000.00 1 107 220.39 0.03USD HUNTINGTON BANCSHARES INC/OH 2.60000% 13-02.08.18 2 050 000.00 2 068 689.85 0.05USD HUSKY ENERGY INC 4.00000% 14-15.04.24 2 240 000.00 2 285 362.24 0.06USD ING BANK NV-144A 1.65000% 16-15.08.19 1 415 000.00 1 404 531.83 0.04USD INTERNATIONAL LEASE FINANCE CORP-144A 7.12500% 10-01.09.18 1 000 000.00 1 055 748.00 0.03USD INTERNATIONAL LEASE FINANCE CORP 6.25000% 11-15.05.19 1 960 000.00 2 101 668.80 0.05USD INTESA SANPAOLO SPA 3.87500% 13-15.01.19 590 000.00 604 296.29 0.02USD INTESA SANPAOLO SPA-144A 3.12500% 17-14.07.22 2 000 000.00 2 013 396.00 0.05USD INVERSIONES CMPC SA-144A 4.37500% 17-04.04.27 1 434 000.00 1 461 963.00 0.04USD IPALCO ENTERPRISES INC 5.00000% 11-01.05.18 3 990 000.00 4 049 850.00 0.10USD JERSEY CENTRAL POWER & LIGHT CO-144A 4.70000% 13-01.04.24 1 573 000.00 1 711 227.37 0.04USD JPMORGAN CHASE & CO 6.30000% 09-23.04.19 5 000 000.00 5 376 215.00 0.13USD JPMORGAN CHASE & CO-SUB 3.37500% 13-01.05.23 2 810 000.00 2 869 378.11 0.07USD KAISER FOUNDATION HOSPITALS 3.50000% 12-01.04.22 1 408 000.00 1 475 163.00 0.04USD KENNAMETAL INC 2.65000% 12-01.11.19 3 080 000.00 3 111 480.68 0.08USD KEYBANK NA/CLEVELAND OH 2.40000% 17-09.06.22 4 480 000.00 4 474 449.28 0.11USD KEYSPAN GAS EAST CORP-REG-S 2.74200% 16-15.08.26 3 500 000.00 3 382 914.50 0.08USD KINDER MORGAN ENERGY PARTNERS LP 4.30000% 14-01.05.24 5 800 000.00 6 018 747.00 0.15USD KINDER MORGAN ENERGY PARTNERS LP 5.80000% 05-15.03.35 1 973 000.00 2 119 566.28 0.05USD KINDER MORGAN ENERGY PARTNERS LP 5.30000% 10-15.09.20 1 925 000.00 2 075 290.52 0.05USD KINDER MORGAN INC 5.00000% 13-15.02.21 6 400 000.00 6 854 220.80 0.17USD KINDER MORGAN INC-144A 5.00000% 13-15.02.21 2 605 000.00 2 789 882.06 0.07USD KINDER MORGAN INC-144A 5.62500% 13-15.11.23 565 000.00 626 248.82 0.02USD KRAFT HEINZ FOODS CO 4.37500% 16-01.06.46 1 400 000.00 1 360 312.80 0.03USD KRAFT HEINZ FOODS CO 3.00000% 16-01.06.26 1 500 000.00 1 444 648.50 0.04USD KRAFT HEINZ FOODS CO 2.80000% 16-02.07.20 7 955 000.00 8 112 469.22 0.20USD KRAFT HEINZ FOODS CO 3.50000% 16-15.07.22 3 000 000.00 3 113 940.00 0.08USD KROGER CO 3.30000% 13-15.01.21 2 000 000.00 2 058 684.00 0.05USD LABORATORY CORP AMERICA HOLDINGS 4.62500% 10-15.11.20 1 500 000.00 1 602 640.50 0.04USD LABORATORY CORP AMERICA HOLDINGS 3.20000% 15-01.02.22 501 000.00 513 216.89 0.01USD LABORATORY CORP AMERICA HOLDINGS 3.60000% 15-01.02.25 529 000.00 540 389.37 0.01USD LABORATORY CORP AMERICA HOLDINGS 2.62500% 15-01.02.20 1 930 000.00 1 951 166.31 0.05USD LAMB WESTON HOLDINGS INC-144A 4.62500% 16-01.11.24 75 000.00 78 281.25 0.00USD LENNAR CORP STEP-UP/DOWN 13-15.11.22 700 000.00 742 875.00 0.02USD LINCOLN NATIONAL CORP 8.75000% 09-01.07.19 368 000.00 413 868.63 0.01USD LLOYDS BANKING GROUP PLC-SUB 4.58200% 16-10.12.25 4 315 000.00 4 504 773.70 0.11USD LLOYDS BANKING GROUP PLC 3.75000% 17-11.01.27 11 925 000.00 12 111 912.45 0.30USD LYB INTERNATIONAL FINANCE BV 4.00000% 13-15.07.23 3 500 000.00 3 736 425.00 0.09USD LYB INTERNATIONAL FINANCE II BV 3.50000% 17-02.03.27 2 950 000.00 2 954 646.25 0.07USD LYONDELLBASELL INDUSTRIES NV 5.75000% 12-15.04.24 500 000.00 576 621.00 0.01USD MALLINCKRODT INTERNATIONAL FINANCE 3.50000% 14-15.04.18 3 000 000.00 3 015 000.00 0.08USD MARATHON OIL CORP 4.40000% 17-15.07.27 9 030 000.00 9 175 789.34 0.23USD MASSMUTUAL GLOBAL FUNDING II-144A 2.00000% 16-15.04.21 3 000 000.00 2 982 654.00 0.07USD MCDONALD’S CORP 3.70000% 15-30.01.26 3 330 000.00 3 489 287.22 0.09USD MCKESSON CORP 2.28400% 14-15.03.19 2 391 000.00 2 410 132.78 0.06USD MEDTRONIC INC 1.37500% 13-01.04.18 850 000.00 849 193.35 0.02USD METROPOLITAN LIFE GLOBAL FUNDING-144A 3.87500% 12-11.04.22 1 170 000.00 1 243 764.99 0.03USD METROPOLITAN LIFE GLOBAL FUNDING I-144A 3.00000% 13-10.01.23 1 500 000.00 1 533 913.50 0.04USD MGM GROWTH POP LP/C0-ISSUER INC 5.62500% 17-01.05.24 150 000.00 163 125.00 0.00USD MONDELEZ INTERNATIONAL HOLDING NET-144A 1.62500% 16-28.10.19 3 535 000.00 3 508 770.30 0.09USD MONDELEZ INTERNATIONAL HLDING NET-REG-S 2.00000% 16-28.10.21 6 825 000.00 6 687 954.00 0.17USD MOODY’S CORP 2.75000% 14-15.07.19 2 483 000.00 2 523 016.03 0.06USD MORGAN STANLEY 2.65000% 15-27.01.20 2 931 000.00 2 969 516.27 0.07USD MORGAN STANLEY 2.80000% 15-16.06.20 3 205 000.00 3 262 991.27 0.08USD MORGAN STANLEY 3.70000% 14-23.10.24 5 020 000.00 5 195 233.14 0.13USD MORGAN STANLEY 5.75000% 11-25.01.21 1 635 000.00 1 813 718.58 0.05USD MOSAIC CO 4.25000% 13-15.11.23 980 000.00 1 033 259.08 0.03USD MOTIVA ENTERPRISES LLC-144A 5.75000% 10-15.01.20 3 200 000.00 3 433 452.80 0.09USD MURPHY OIL CORP STEP-UP 12-01.12.17 140 000.00 140 525.00 0.00USD MYLAN INC-144A 3.12500% 12-15.01.23 445 000.00 445 133.50 0.01USD MYLAN NV 3.15000% 17-15.06.21 8 355 000.00 8 531 841.93 0.21USD MYLAN NV 3.75000% 17-15.12.20 2 200 000.00 2 294 703.40 0.06USD MYLAN NV 3.95000% 17-15.06.26 4 075 000.00 4 156 332.93 0.10USD NAVIENT CORP 6.62500% 16-26.07.21 790 000.00 847 275.00 0.02USD NBCUNIVERSAL ENTERPRISES INC-144A 1.97400% 13-15.04.19 3 210 000.00 3 224 631.18 0.08USD NEW YORK LIFE GLOBAL FUNDING-144A 2.00000% 16-13.04.21 4 000 000.00 3 978 720.00 0.10USD NEW YORK LIFE GLOBAL FUNDING-REG-S 2.30000% 17-10.06.22 2 000 000.00 1 997 760.00 0.05USD NEXTERA ENERGY CAPITAL HOLDINGS INC 3.55000% 17-01.05.27 1 375 000.00 1 422 077.25 0.04USD NOVA CHEMICALS CORP-144A 5.25000% 13-01.08.23 475 000.00 489 250.00 0.01USD NOVA CHEMICALS CORP-144A 5.00000% 14-01.05.25 333 000.00 334 665.00 0.01USD NXP BV / NXP FUNDING LLC-144A 4.12500% 15-15.06.20 2 250 000.00 2 351 250.00 0.06USD OCCIDENTAL PETROLEUM CORP 2.60000% 16-15.04.22 3 500 000.00 3 540 393.50 0.09USD OMNICOM GROUP INC 6.25000% 09-15.07.19 1 900 000.00 2 051 842.30 0.05USD ONCOR ELECTRIC DELIVERY CO 5.75000% 11-30.09.20 2 203 000.00 2 422 652.31 0.06USD ONEOK PARTNERS LP 3.37500% 12-01.10.22 1 145 000.00 1 160 967.03 0.03USD ORACLE CORP 2.37500% 13-15.01.19 1 940 000.00 1 964 566.22 0.05USD ORACLE CORP 3.40000% 14-08.07.24 3 000 000.00 3 127 191.00 0.08USD ORIX CORP 2.90000% 17-18.07.22 3 000 000.00 3 017 430.00 0.08
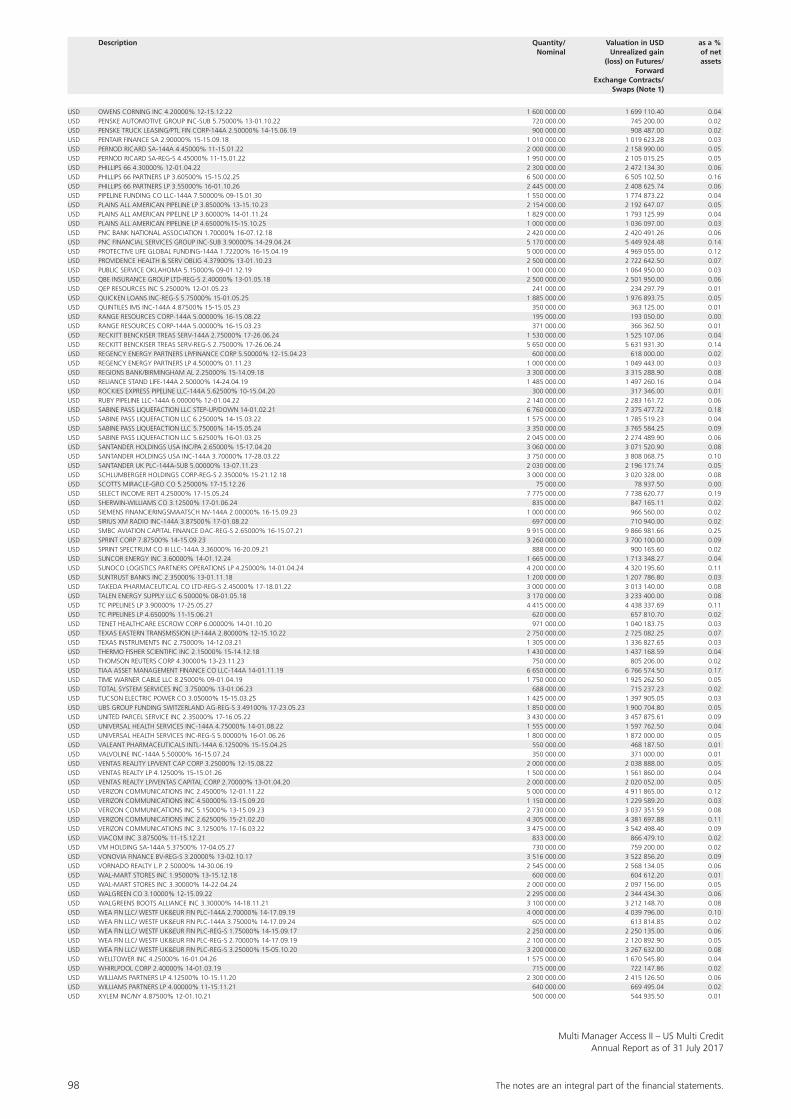
98 The notes are an integral part of the fi nancial statements.
Multi Manager Access II – US Multi CreditAnnual Report as of 31 July 2017
Description Quantity/ Valuation in USD as a % Nominal Unrealized gain of net (loss) on Futures/ assets Forward Exchange Contracts/ Swaps (Note 1)
USD OWENS CORNING INC 4.20000% 12-15.12.22 1 600 000.00 1 699 110.40 0.04USD PENSKE AUTOMOTIVE GROUP INC-SUB 5.75000% 13-01.10.22 720 000.00 745 200.00 0.02USD PENSKE TRUCK LEASING/PTL FIN CORP-144A 2.50000% 14-15.06.19 900 000.00 908 487.00 0.02USD PENTAIR FINANCE SA 2.90000% 15-15.09.18 1 010 000.00 1 019 623.28 0.03USD PERNOD RICARD SA-144A 4.45000% 11-15.01.22 2 000 000.00 2 158 990.00 0.05USD PERNOD RICARD SA-REG-S 4.45000% 11-15.01.22 1 950 000.00 2 105 015.25 0.05USD PHILLIPS 66 4.30000% 12-01.04.22 2 300 000.00 2 472 134.30 0.06USD PHILLIPS 66 PARTNERS LP 3.60500% 15-15.02.25 6 500 000.00 6 505 102.50 0.16USD PHILLIPS 66 PARTNERS LP 3.55000% 16-01.10.26 2 445 000.00 2 408 625.74 0.06USD PIPELINE FUNDING CO LLC-144A 7.50000% 09-15.01.30 1 550 000.00 1 774 873.22 0.04USD PLAINS ALL AMERICAN PIPELINE LP 3.85000% 13-15.10.23 2 154 000.00 2 192 647.07 0.05USD PLAINS ALL AMERICAN PIPELINE LP 3.60000% 14-01.11.24 1 829 000.00 1 793 125.99 0.04USD PLAINS ALL AMERICAN PIPELINE LP 4.65000%15-15.10.25 1 000 000.00 1 036 097.00 0.03USD PNC BANK NATIONAL ASSOCIATION 1.70000% 16-07.12.18 2 420 000.00 2 420 491.26 0.06USD PNC FINANCIAL SERVICES GROUP INC-SUB 3.90000% 14-29.04.24 5 170 000.00 5 449 924.48 0.14USD PROTECTIVE LIFE GLOBAL FUNDING-144A 1.72200% 16-15.04.19 5 000 000.00 4 969 055.00 0.12USD PROVIDENCE HEALTH & SERV OBLIG 4.37900% 13-01.10.23 2 500 000.00 2 722 642.50 0.07USD PUBLIC SERVICE OKLAHOMA 5.15000% 09-01.12.19 1 000 000.00 1 064 950.00 0.03USD QBE INSURANCE GROUP LTD-REG-S 2.40000% 13-01.05.18 2 500 000.00 2 501 950.00 0.06USD QEP RESOURCES INC 5.25000% 12-01.05.23 241 000.00 234 297.79 0.01USD QUICKEN LOANS INC-REG-S 5.75000% 15-01.05.25 1 885 000.00 1 976 893.75 0.05USD QUINTILES IMS INC-144A 4.87500% 15-15.05.23 350 000.00 363 125.00 0.01USD RANGE RESOURCES CORP-144A 5.00000% 16-15.08.22 195 000.00 193 050.00 0.00USD RANGE RESOURCES CORP-144A 5.00000% 16-15.03.23 371 000.00 366 362.50 0.01USD RECKITT BENCKISER TREAS SERV-144A 2.75000% 17-26.06.24 1 530 000.00 1 525 107.06 0.04USD RECKITT BENCKISER TREAS SERV-REG-S 2.75000% 17-26.06.24 5 650 000.00 5 631 931.30 0.14USD REGENCY ENERGY PARTNERS LP/FINANCE CORP 5.50000% 12-15.04.23 600 000.00 618 000.00 0.02USD REGENCY ENERGY PARTNERS LP 4.50000% 01.11.23 1 000 000.00 1 049 443.00 0.03USD REGIONS BANK/BIRMINGHAM AL 2.25000% 15-14.09.18 3 300 000.00 3 315 288.90 0.08USD RELIANCE STAND LIFE-144A 2.50000% 14-24.04.19 1 485 000.00 1 497 260.16 0.04USD ROCKIES EXPRESS PIPELINE LLC-144A 5.62500% 10-15.04.20 300 000.00 317 346.00 0.01USD RUBY PIPELINE LLC-144A 6.00000% 12-01.04.22 2 140 000.00 2 283 161.72 0.06USD SABINE PASS LIQUEFACTION LLC STEP-UP/DOWN 14-01.02.21 6 760 000.00 7 375 477.72 0.18USD SABINE PASS LIQUEFACTION LLC 6.25000% 14-15.03.22 1 575 000.00 1 785 519.23 0.04USD SABINE PASS LIQUEFACTION LLC 5.75000% 14-15.05.24 3 350 000.00 3 765 584.25 0.09USD SABINE PASS LIQUEFACTION LLC 5.62500% 16-01.03.25 2 045 000.00 2 274 489.90 0.06USD SANTANDER HOLDINGS USA INC/PA 2.65000% 15-17.04.20 3 060 000.00 3 071 520.90 0.08USD SANTANDER HOLDINGS USA INC-144A 3.70000% 17-28.03.22 3 750 000.00 3 808 068.75 0.10USD SANTANDER UK PLC-144A-SUB 5.00000% 13-07.11.23 2 030 000.00 2 196 171.74 0.05USD SCHLUMBERGER HOLDINGS CORP-REG-S 2.35000% 15-21.12.18 3 000 000.00 3 020 328.00 0.08USD SCOTTS MIRACLE-GRO CO 5.25000% 17-15.12.26 75 000.00 78 937.50 0.00USD SELECT INCOME REIT 4.25000% 17-15.05.24 7 775 000.00 7 738 620.77 0.19USD SHERWIN-WILLIAMS CO 3.12500% 17-01.06.24 835 000.00 847 165.11 0.02USD SIEMENS FINANCIERINGSMAATSCH NV-144A 2.00000% 16-15.09.23 1 000 000.00 966 560.00 0.02USD SIRIUS XM RADIO INC-144A 3.87500% 17-01.08.22 697 000.00 710 940.00 0.02USD SMBC AVIATION CAPITAL FINANCE DAC-REG-S 2.65000% 16-15.07.21 9 915 000.00 9 866 981.66 0.25USD SPRINT CORP 7.87500% 14-15.09.23 3 260 000.00 3 700 100.00 0.09USD SPRINT SPECTRUM CO III LLC-144A 3.36000% 16-20.09.21 888 000.00 900 165.60 0.02USD SUNCOR ENERGY INC 3.60000% 14-01.12.24 1 665 000.00 1 713 348.27 0.04USD SUNOCO LOGISTICS PARTNERS OPERATIONS LP 4.25000% 14-01.04.24 4 200 000.00 4 320 195.60 0.11USD SUNTRUST BANKS INC 2.35000% 13-01.11.18 1 200 000.00 1 207 786.80 0.03USD TAKEDA PHARMACEUTICAL CO LTD-REG-S 2.45000% 17-18.01.22 3 000 000.00 3 013 140.00 0.08USD TALEN ENERGY SUPPLY LLC 6.50000% 08-01.05.18 3 170 000.00 3 233 400.00 0.08USD TC PIPELINES LP 3.90000% 17-25.05.27 4 415 000.00 4 438 337.69 0.11USD TC PIPELINES LP 4.65000% 11-15.06.21 620 000.00 657 810.70 0.02USD TENET HEALTHCARE ESCROW CORP 6.00000% 14-01.10.20 971 000.00 1 040 183.75 0.03USD TEXAS EASTERN TRANSMISSION LP-144A 2.80000% 12-15.10.22 2 750 000.00 2 725 082.25 0.07USD TEXAS INSTRUMENTS INC 2.75000% 14-12.03.21 1 305 000.00 1 336 827.65 0.03USD THERMO FISHER SCIENTIFIC INC 2.15000% 15-14.12.18 1 430 000.00 1 437 168.59 0.04USD THOMSON REUTERS CORP 4.30000% 13-23.11.23 750 000.00 805 206.00 0.02USD TIAA ASSET MANAGEMENT FINANCE CO LLC-144A 14-01.11.19 6 650 000.00 6 766 574.50 0.17USD TIME WARNER CABLE LLC 8.25000% 09-01.04.19 1 750 000.00 1 925 262.50 0.05USD TOTAL SYSTEM SERVICES INC 3.75000% 13-01.06.23 688 000.00 715 237.23 0.02USD TUCSON ELECTRIC POWER CO 3.05000% 15-15.03.25 1 425 000.00 1 397 905.05 0.03USD UBS GROUP FUNDING SWITZERLAND AG-REG-S 3.49100% 17-23.05.23 1 850 000.00 1 900 704.80 0.05USD UNITED PARCEL SERVICE INC 2.35000% 17-16.05.22 3 430 000.00 3 457 875.61 0.09USD UNIVERSAL HEALTH SERVICES INC-144A 4.75000% 14-01.08.22 1 555 000.00 1 597 762.50 0.04USD UNIVERSAL HEALTH SERVICES INC-REG-S 5.00000% 16-01.06.26 1 800 000.00 1 872 000.00 0.05USD VALEANT PHARMACEUTICALS INTL-144A 6.12500% 15-15.04.25 550 000.00 468 187.50 0.01USD VALVOLINE INC-144A 5.50000% 16-15.07.24 350 000.00 371 000.00 0.01USD VENTAS REALITY LP/VENT CAP CORP 3.25000% 12-15.08.22 2 000 000.00 2 038 888.00 0.05USD VENTAS REALTY LP 4.12500% 15-15.01.26 1 500 000.00 1 561 860.00 0.04USD VENTAS REALTY LP/VENTAS CAPITAL CORP 2.70000% 13-01.04.20 2 000 000.00 2 020 052.00 0.05USD VERIZON COMMUNICATIONS INC 2.45000% 12-01.11.22 5 000 000.00 4 911 865.00 0.12USD VERIZON COMMUNICATIONS INC 4.50000% 13-15.09.20 1 150 000.00 1 229 589.20 0.03USD VERIZON COMMUNICATIONS INC 5.15000% 13-15.09.23 2 730 000.00 3 037 351.59 0.08USD VERIZON COMMUNICATIONS INC 2.62500% 15-21.02.20 4 305 000.00 4 381 697.88 0.11USD VERIZON COMMUNICATIONS INC 3.12500% 17-16.03.22 3 475 000.00 3 542 498.40 0.09USD VIACOM INC 3.87500% 11-15.12.21 833 000.00 866 479.10 0.02USD VM HOLDING SA-144A 5.37500% 17-04.05.27 730 000.00 759 200.00 0.02USD VONOVIA FINANCE BV-REG-S 3.20000% 13-02.10.17 3 516 000.00 3 522 856.20 0.09USD VORNADO REALTY L.P. 2.50000% 14-30.06.19 2 545 000.00 2 568 134.05 0.06USD WAL-MART STORES INC 1.95000% 13-15.12.18 600 000.00 604 612.20 0.01USD WAL-MART STORES INC 3.30000% 14-22.04.24 2 000 000.00 2 097 156.00 0.05USD WALGREEN CO 3.10000% 12-15.09.22 2 295 000.00 2 344 434.30 0.06USD WALGREENS BOOTS ALLIANCE INC 3.30000% 14-18.11.21 3 100 000.00 3 212 148.70 0.08USD WEA FIN LLC/ WESTF UK&EUR FIN PLC-144A 2.70000% 14-17.09.19 4 000 000.00 4 039 796.00 0.10USD WEA FIN LLC/ WESTF UK&EUR FIN PLC-144A 3.75000% 14-17.09.24 605 000.00 613 814.85 0.02USD WEA FIN LLC/ WESTF UK&EUR FIN PLC-REG-S 1.75000% 14-15.09.17 2 250 000.00 2 250 135.00 0.06USD WEA FIN LLC/ WESTF UK&EUR FIN PLC-REG-S 2.70000% 14-17.09.19 2 100 000.00 2 120 892.90 0.05USD WEA FIN LLC/ WESTF UK&EUR FIN PLC-REG-S 3.25000% 15-05.10.20 3 200 000.00 3 267 632.00 0.08USD WELLTOWER INC 4.25000% 16-01.04.26 1 575 000.00 1 670 545.80 0.04USD WHIRLPOOL CORP 2.40000% 14-01.03.19 715 000.00 722 147.86 0.02USD WILLIAMS PARTNERS LP 4.12500% 10-15.11.20 2 300 000.00 2 415 126.50 0.06USD WILLIAMS PARTNERS LP 4.00000% 11-15.11.21 640 000.00 669 495.04 0.02USD XYLEM INC/NY 4.87500% 12-01.10.21 500 000.00 544 935.50 0.01
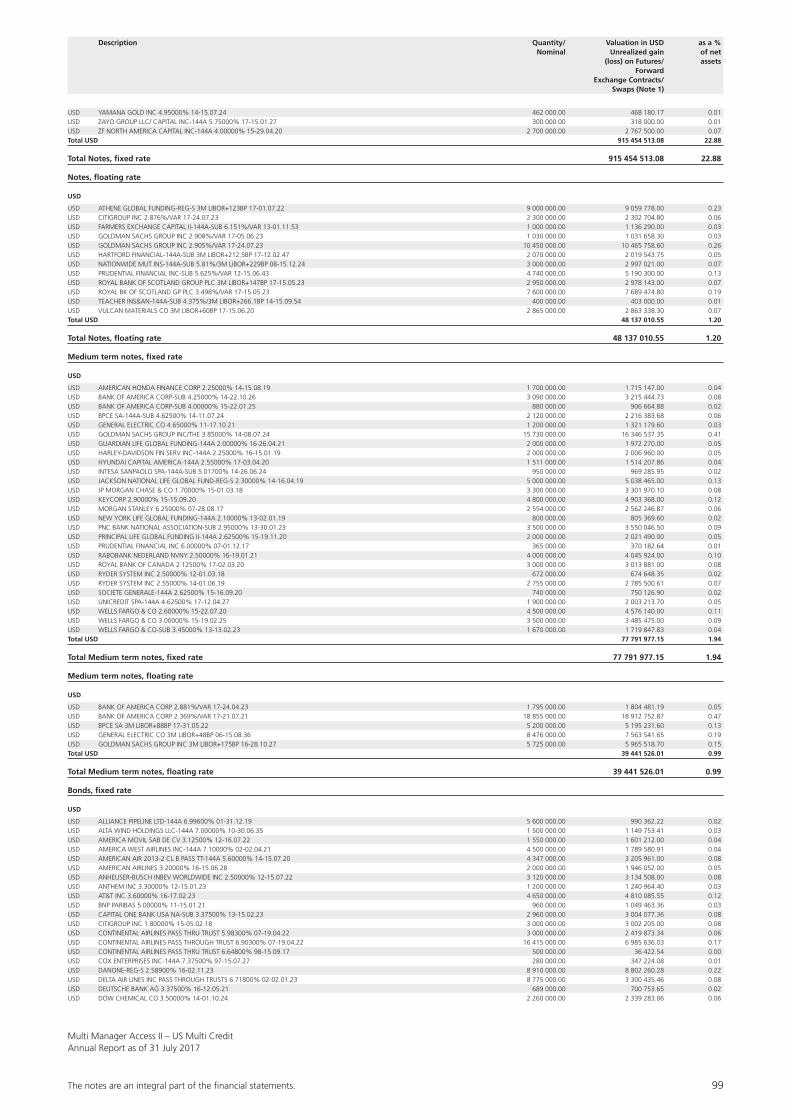
The notes are an integral part of the fi nancial statements. 99
Multi Manager Access II – US Multi CreditAnnual Report as of 31 July 2017
USD YAMANA GOLD INC 4.95000% 14-15.07.24 462 000.00 468 180.17 0.01USD ZAYO GROUP LLC/ CAPITAL INC-144A 5.75000% 17-15.01.27 300 000.00 318 000.00 0.01USD ZF NORTH AMERICA CAPITAL INC-144A 4.00000% 15-29.04.20 2 700 000.00 2 767 500.00 0.07Total USD 915 454 513.08 22.88
Total Notes, fixed rate 915 454 513.08 22.88
Notes, floating rate
USD
USD ATHENE GLOBAL FUNDING-REG-S 3M LIBOR+123BP 17-01.07.22 9 000 000.00 9 059 778.00 0.23USD CITIGROUP INC 2.876%/VAR 17-24.07.23 2 300 000.00 2 302 704.80 0.06USD FARMERS EXCHANGE CAPITAL II-144A-SUB 6.151%/VAR 13-01.11.53 1 000 000.00 1 136 290.00 0.03USD GOLDMAN SACHS GROUP INC 2.908%/VAR 17-05.06.23 1 030 000.00 1 031 658.30 0.03USD GOLDMAN SACHS GROUP INC 2.905%/VAR 17-24.07.23 10 450 000.00 10 465 758.60 0.26USD HARTFORD FINANCIAL-144A-SUB 3M LIBOR+212.5BP 17-12.02.47 2 070 000.00 2 019 543.75 0.05USD NATIONWIDE MUT INS-144A-SUB 5.81%/3M LIBOR+229BP 08-15.12.24 3 000 000.00 2 997 021.00 0.07USD PRUDENTIAL FINANCIAL INC-SUB 5.625%/VAR 12-15.06.43 4 740 000.00 5 190 300.00 0.13USD ROYAL BANK OF SCOTLAND GROUP PLC 3M LIBOR+147BP 17-15.05.23 2 950 000.00 2 978 143.00 0.07USD ROYAL BK OF SCOTLAND GP PLC 3.498%/VAR 17-15.05.23 7 600 000.00 7 689 474.80 0.19USD TEACHER INS&AN-144A-SUB 4.375%/3M LIBOR+266.1BP 14-15.09.54 400 000.00 403 000.00 0.01USD VULCAN MATERIALS CO 3M LIBOR+60BP 17-15.06.20 2 865 000.00 2 863 338.30 0.07Total USD 48 137 010.55 1.20
Total Notes, floating rate 48 137 010.55 1.20
Medium term notes, fixed rate
USD
USD AMERICAN HONDA FINANCE CORP 2.25000% 14-15.08.19 1 700 000.00 1 715 147.00 0.04USD BANK OF AMERICA CORP-SUB 4.25000% 14-22.10.26 3 090 000.00 3 215 444.73 0.08USD BANK OF AMERICA CORP-SUB 4.00000% 15-22.01.25 880 000.00 906 664.88 0.02USD BPCE SA-144A-SUB 4.62500% 14-11.07.24 2 120 000.00 2 216 383.68 0.06USD GENERAL ELECTRIC CO 4.65000% 11-17.10.21 1 200 000.00 1 321 179.60 0.03USD GOLDMAN SACHS GROUP INC/THE 3.85000% 14-08.07.24 15 730 000.00 16 346 537.35 0.41USD GUARDIAN LIFE GLOBAL FUNDING-144A 2.00000% 16-26.04.21 2 000 000.00 1 972 270.00 0.05USD HARLEY-DAVIDSON FIN.SERV INC-144A 2.25000% 16-15.01.19 2 000 000.00 2 006 960.00 0.05USD HYUNDAI CAPITAL AMERICA-144A 2.55000% 17-03.04.20 1 511 000.00 1 514 207.86 0.04USD INTESA SANPAOLO SPA-144A-SUB 5.01700% 14-26.06.24 950 000.00 969 285.95 0.02USD JACKSON NATIONAL LIFE GLOBAL FUND-REG-S 2.30000% 14-16.04.19 5 000 000.00 5 038 465.00 0.13USD JP MORGAN CHASE & CO 1.70000% 15-01.03.18 3 300 000.00 3 301 970.10 0.08USD KEYCORP 2.90000% 15-15.09.20 4 800 000.00 4 903 368.00 0.12USD MORGAN STANLEY 6.25000% 07-28.08.17 2 554 000.00 2 562 246.87 0.06USD NEW YORK LIFE GLOBAL FUNDING-144A 2.10000% 13-02.01.19 800 000.00 805 369.60 0.02USD PNC BANK NATIONAL ASSOCIATION-SUB 2.95000% 13-30.01.23 3 500 000.00 3 550 046.50 0.09USD PRINCIPAL LIFE GLOBAL FUNDING II-144A 2.62500% 15-19.11.20 2 000 000.00 2 021 490.00 0.05USD PRUDENTIAL FINANCIAL INC 6.00000% 07-01.12.17 365 000.00 370 182.64 0.01USD RABOBANK NEDERLAND NVNY 2.50000% 16-19.01.21 4 000 000.00 4 045 924.00 0.10USD ROYAL BANK OF CANADA 2.12500% 17-02.03.20 3 000 000.00 3 013 881.00 0.08USD RYDER SYSTEM INC 2.50000% 12-01.03.18 672 000.00 674 648.35 0.02USD RYDER SYSTEM INC 2.55000% 14-01.06.19 2 755 000.00 2 785 500.61 0.07USD SOCIETE GENERALE-144A 2.62500% 15-16.09.20 740 000.00 750 126.90 0.02USD UNICREDIT SPA-144A 4.62500% 17-12.04.27 1 900 000.00 2 003 213.70 0.05USD WELLS FARGO & CO 2.60000% 15-22.07.20 4 500 000.00 4 576 140.00 0.11USD WELLS FARGO & CO 3.00000% 15-19.02.25 3 500 000.00 3 485 475.00 0.09USD WELLS FARGO & CO-SUB 3.45000% 13-13.02.23 1 670 000.00 1 719 847.83 0.04Total USD 77 791 977.15 1.94
Total Medium term notes, fixed rate 77 791 977.15 1.94
Medium term notes, floating rate
USD
USD BANK OF AMERICA CORP 2.881%/VAR 17-24.04.23 1 795 000.00 1 804 481.19 0.05USD BANK OF AMERICA CORP 2.369%/VAR 17-21.07.21 18 855 000.00 18 912 752.87 0.47USD BPCE SA 3M LIBOR+88BP 17-31.05.22 5 200 000.00 5 195 231.60 0.13USD GENERAL ELECTRIC CO 3M LIBOR+48BP 06-15.08.36 8 476 000.00 7 563 541.65 0.19USD GOLDMAN SACHS GROUP INC 3M LIBOR+175BP 16-28.10.27 5 725 000.00 5 965 518.70 0.15Total USD 39 441 526.01 0.99
Total Medium term notes, floating rate 39 441 526.01 0.99
Bonds, fixed rate
USD
USD ALLIANCE PIPELINE LTD-144A 6.99600% 01-31.12.19 5 600 000.00 990 362.22 0.02USD ALTA WIND HOLDINGS LLC-144A 7.00000% 10-30.06.35 1 500 000.00 1 149 753.41 0.03USD AMERICA MOVIL SAB DE CV 3.12500% 12-16.07.22 1 550 000.00 1 601 212.00 0.04USD AMERICA WEST AIRLINES INC-144A 7.10000% 02-02.04.21 4 500 000.00 1 789 580.91 0.04USD AMERICAN AIR 2013-2 CL B PASS TT-144A 5.60000% 14-15.07.20 4 347 000.00 3 205 961.00 0.08USD AMERICAN AIRLINES 3.20000% 16-15.06.28 2 000 000.00 1 946 052.00 0.05USD ANHEUSER-BUSCH INBEV WORLDWIDE INC 2.50000% 12-15.07.22 3 120 000.00 3 134 508.00 0.08USD ANTHEM INC 3.30000% 12-15.01.23 1 200 000.00 1 240 964.40 0.03USD AT&T INC 3.60000% 16-17.02.23 4 650 000.00 4 810 085.55 0.12USD BNP PARIBAS 5.00000% 11-15.01.21 960 000.00 1 049 463.36 0.03USD CAPITAL ONE BANK USA NA-SUB 3.37500% 13-15.02.23 2 960 000.00 3 004 077.36 0.08USD CITIGROUP INC 1.80000% 15-05.02.18 3 000 000.00 3 002 205.00 0.08USD CONTINENTAL AIRLINES PASS THRU TRUST 5.98300% 07-19.04.22 3 000 000.00 2 419 873.34 0.06USD CONTINENTAL AIRLINES PASS THROUGH TRUST 6.90300% 07-19.04.22 16 415 000.00 6 985 636.03 0.17USD CONTINENTAL AIRLINES PASS THRU TRUST 6.64800% 98-15.09.17 500 000.00 36 422.54 0.00USD COX ENTERPRISES INC-144A 7.37500% 97-15.07.27 280 000.00 347 224.08 0.01USD DANONE-REG-S 2.58900% 16-02.11.23 8 910 000.00 8 802 260.28 0.22USD DELTA AIR LINES INC PASS THROUGH TRUSTS 6.71800% 02-02.01.23 8 775 000.00 3 300 435.46 0.08USD DEUTSCHE BANK AG 3.37500% 16-12.05.21 689 000.00 700 753.65 0.02USD DOW CHEMICAL CO 3.50000% 14-01.10.24 2 260 000.00 2 339 283.06 0.06
Description Quantity/ Valuation in USD as a % Nominal Unrealized gain of net (loss) on Futures/ assets Forward Exchange Contracts/ Swaps (Note 1)
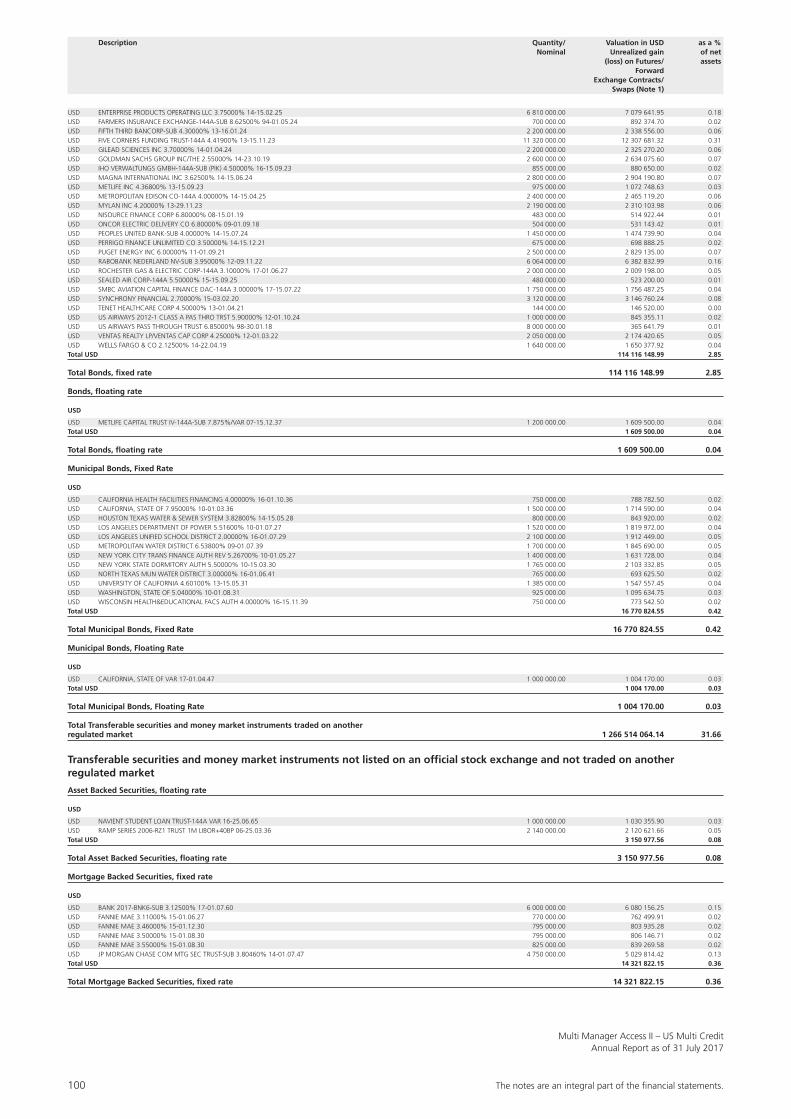
100 The notes are an integral part of the fi nancial statements.
Multi Manager Access II – US Multi CreditAnnual Report as of 31 July 2017
USD ENTERPRISE PRODUCTS OPERATING LLC 3.75000% 14-15.02.25 6 810 000.00 7 079 641.95 0.18USD FARMERS INSURANCE EXCHANGE-144A-SUB 8.62500% 94-01.05.24 700 000.00 892 374.70 0.02USD FIFTH THIRD BANCORP-SUB 4.30000% 13-16.01.24 2 200 000.00 2 338 556.00 0.06USD FIVE CORNERS FUNDING TRUST-144A 4.41900% 13-15.11.23 11 320 000.00 12 307 681.32 0.31USD GILEAD SCIENCES INC 3.70000% 14-01.04.24 2 200 000.00 2 325 270.20 0.06USD GOLDMAN SACHS GROUP INC/THE 2.55000% 14-23.10.19 2 600 000.00 2 634 075.60 0.07USD IHO VERWALTUNGS GMBH-144A-SUB (PIK) 4.50000% 16-15.09.23 855 000.00 880 650.00 0.02USD MAGNA INTERNATIONAL INC 3.62500% 14-15.06.24 2 800 000.00 2 904 190.80 0.07USD METLIFE INC 4.36800% 13-15.09.23 975 000.00 1 072 748.63 0.03USD METROPOLITAN EDISON CO-144A 4.00000% 14-15.04.25 2 400 000.00 2 465 119.20 0.06USD MYLAN INC 4.20000% 13-29.11.23 2 190 000.00 2 310 103.98 0.06USD NISOURCE FINANCE CORP 6.80000% 08-15.01.19 483 000.00 514 922.44 0.01USD ONCOR ELECTRIC DELIVERY CO 6.80000% 09-01.09.18 504 000.00 531 143.42 0.01USD PEOPLES UNITED BANK-SUB 4.00000% 14-15.07.24 1 450 000.00 1 474 739.90 0.04USD PERRIGO FINANCE UNLIMITED CO 3.50000% 14-15.12.21 675 000.00 698 888.25 0.02USD PUGET ENERGY INC 6.00000% 11-01.09.21 2 500 000.00 2 829 135.00 0.07USD RABOBANK NEDERLAND NV-SUB 3.95000% 12-09.11.22 6 064 000.00 6 382 832.99 0.16USD ROCHESTER GAS & ELECTRIC CORP-144A 3.10000% 17-01.06.27 2 000 000.00 2 009 198.00 0.05USD SEALED AIR CORP-144A 5.50000% 15-15.09.25 480 000.00 523 200.00 0.01USD SMBC AVIATION CAPITAL FINANCE DAC-144A 3.00000% 17-15.07.22 1 750 000.00 1 756 487.25 0.04USD SYNCHRONY FINANCIAL 2.70000% 15-03.02.20 3 120 000.00 3 146 760.24 0.08USD TENET HEALTHCARE CORP 4.50000% 13-01.04.21 144 000.00 146 520.00 0.00USD US AIRWAYS 2012-1 CLASS A PAS THRO TRST 5.90000% 12-01.10.24 1 000 000.00 845 355.11 0.02USD US AIRWAYS PASS THROUGH TRUST 6.85000% 98-30.01.18 8 000 000.00 365 641.79 0.01USD VENTAS REALTY LP/VENTAS CAP CORP 4.25000% 12-01.03.22 2 050 000.00 2 174 420.65 0.05USD WELLS FARGO & CO 2.12500% 14-22.04.19 1 640 000.00 1 650 377.92 0.04Total USD 114 116 148.99 2.85
Total Bonds, fixed rate 114 116 148.99 2.85
Bonds, floating rate
USD
USD METLIFE CAPITAL TRUST IV-144A-SUB 7.875%/VAR 07-15.12.37 1 200 000.00 1 609 500.00 0.04Total USD 1 609 500.00 0.04
Total Bonds, floating rate 1 609 500.00 0.04
Municipal Bonds, Fixed Rate
USD
USD CALIFORNIA HEALTH FACILITIES FINANCING 4.00000% 16-01.10.36 750 000.00 788 782.50 0.02USD CALIFORNIA, STATE OF 7.95000% 10-01.03.36 1 500 000.00 1 714 590.00 0.04USD HOUSTON TEXAS WATER & SEWER SYSTEM 3.82800% 14-15.05.28 800 000.00 843 920.00 0.02USD LOS ANGELES DEPARTMENT OF POWER 5.51600% 10-01.07.27 1 520 000.00 1 819 972.00 0.04USD LOS ANGELES UNIFIED SCHOOL DISTRICT 2.00000% 16-01.07.29 2 100 000.00 1 912 449.00 0.05USD METROPOLITAN WATER DISTRICT 6.53800% 09-01.07.39 1 700 000.00 1 845 690.00 0.05USD NEW YORK CITY TRANS FINANCE AUTH REV 5.26700% 10-01.05.27 1 400 000.00 1 631 728.00 0.04USD NEW YORK STATE DORMITORY AUTH 5.50000% 10-15.03.30 1 765 000.00 2 103 332.85 0.05USD NORTH TEXAS MUN WATER DISTRICT 3.00000% 16-01.06.41 765 000.00 693 625.50 0.02USD UNIVERSITY OF CALIFORNIA 4.60100% 13-15.05.31 1 385 000.00 1 547 557.45 0.04USD WASHINGTON, STATE OF 5.04000% 10-01.08.31 925 000.00 1 095 634.75 0.03USD WISCONSIN HEALTH&EDUCATIONAL FACS AUTH 4.00000% 16-15.11.39 750 000.00 773 542.50 0.02Total USD 16 770 824.55 0.42
Total Municipal Bonds, Fixed Rate 16 770 824.55 0.42
Municipal Bonds, Floating Rate
USD
USD CALIFORNIA, STATE OF VAR 17-01.04.47 1 000 000.00 1 004 170.00 0.03Total USD 1 004 170.00 0.03
Total Municipal Bonds, Floating Rate 1 004 170.00 0.03
Total Transferable securities and money market instruments traded on another regulated market 1 266 514 064.14 31.66
Transferable securities and money market instruments not listed on an official stock exchange and not traded on another regulated market
Asset Backed Securities, floating rate
USD
USD NAVIENT STUDENT LOAN TRUST-144A VAR 16-25.06.65 1 000 000.00 1 030 355.90 0.03USD RAMP SERIES 2006-RZ1 TRUST 1M LIBOR+40BP 06-25.03.36 2 140 000.00 2 120 621.66 0.05Total USD 3 150 977.56 0.08
Total Asset Backed Securities, floating rate 3 150 977.56 0.08
Mortgage Backed Securities, fixed rate
USD
USD BANK 2017-BNK6-SUB 3.12500% 17-01.07.60 6 000 000.00 6 080 156.25 0.15USD FANNIE MAE 3.11000% 15-01.06.27 770 000.00 762 499.91 0.02USD FANNIE MAE 3.46000% 15-01.12.30 795 000.00 803 935.28 0.02USD FANNIE MAE 3.50000% 15-01.08.30 795 000.00 806 146.71 0.02USD FANNIE MAE 3.55000% 15-01.08.30 825 000.00 839 269.58 0.02USD JP MORGAN CHASE COM MTG SEC TRUST-SUB 3.80460% 14-01.07.47 4 750 000.00 5 029 814.42 0.13Total USD 14 321 822.15 0.36
Total Mortgage Backed Securities, fixed rate 14 321 822.15 0.36
Description Quantity/ Valuation in USD as a % Nominal Unrealized gain of net (loss) on Futures/ assets Forward Exchange Contracts/ Swaps (Note 1)
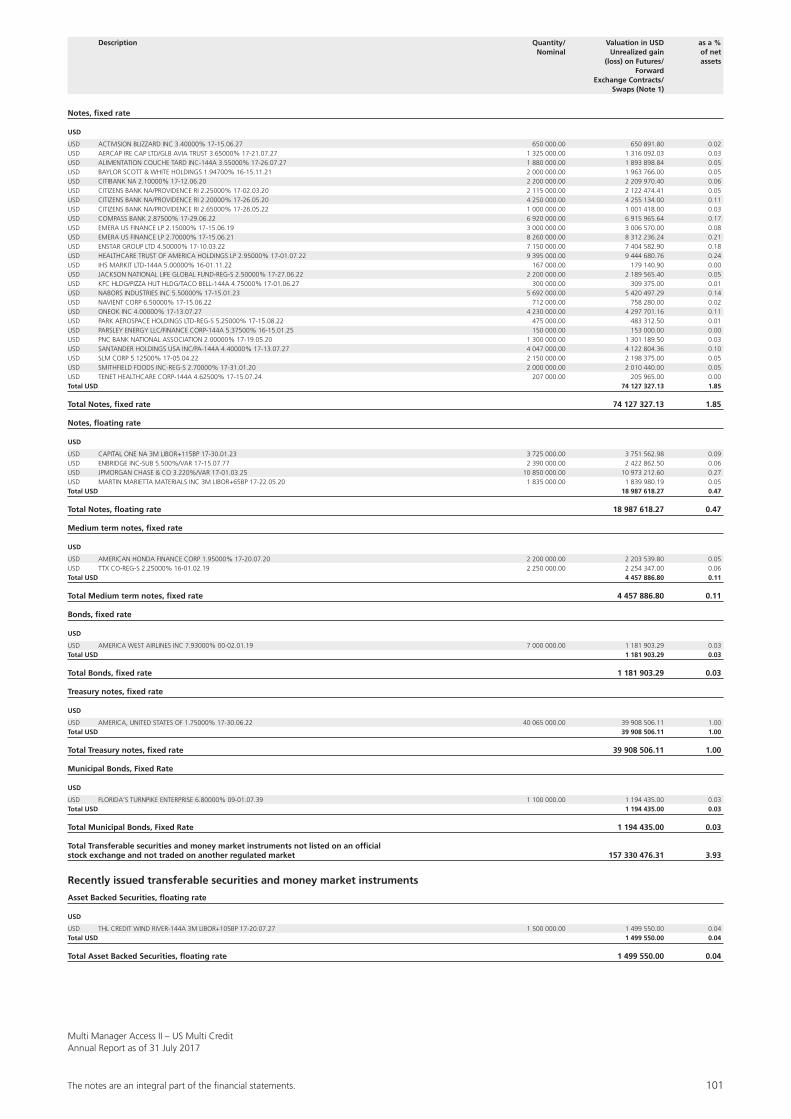
The notes are an integral part of the fi nancial statements. 101
Multi Manager Access II – US Multi CreditAnnual Report as of 31 July 2017
Notes, fixed rate
USD
USD ACTIVISION BLIZZARD INC 3.40000% 17-15.06.27 650 000.00 650 891.80 0.02USD AERCAP IRE CAP LTD/GLB AVIA TRUST 3.65000% 17-21.07.27 1 325 000.00 1 316 092.03 0.03USD ALIMENTATION COUCHE TARD INC-144A 3.55000% 17-26.07.27 1 880 000.00 1 893 898.84 0.05USD BAYLOR SCOTT & WHITE HOLDINGS 1.94700% 16-15.11.21 2 000 000.00 1 963 766.00 0.05USD CITIBANK NA 2.10000% 17-12.06.20 2 200 000.00 2 209 970.40 0.06USD CITIZENS BANK NA/PROVIDENCE RI 2.25000% 17-02.03.20 2 115 000.00 2 122 474.41 0.05USD CITIZENS BANK NA/PROVIDENCE RI 2.20000% 17-26.05.20 4 250 000.00 4 255 134.00 0.11USD CITIZENS BANK NA/PROVIDENCE RI 2.65000% 17-26.05.22 1 000 000.00 1 001 418.00 0.03USD COMPASS BANK 2.87500% 17-29.06.22 6 920 000.00 6 915 965.64 0.17USD EMERA US FINANCE LP 2.15000% 17-15.06.19 3 000 000.00 3 006 570.00 0.08USD EMERA US FINANCE LP 2.70000% 17-15.06.21 8 260 000.00 8 312 236.24 0.21USD ENSTAR GROUP LTD 4.50000% 17-10.03.22 7 150 000.00 7 404 582.90 0.18USD HEALTHCARE TRUST OF AMERICA HOLDINGS LP 2.95000% 17-01.07.22 9 395 000.00 9 444 680.76 0.24USD IHS MARKIT LTD-144A 5.00000% 16-01.11.22 167 000.00 179 140.90 0.00USD JACKSON NATIONAL LIFE GLOBAL FUND-REG-S 2.50000% 17-27.06.22 2 200 000.00 2 189 565.40 0.05USD KFC HLDG/PIZZA HUT HLDG/TACO BELL-144A 4.75000% 17-01.06.27 300 000.00 309 375.00 0.01USD NABORS INDUSTRIES INC 5.50000% 17-15.01.23 5 692 000.00 5 420 497.29 0.14USD NAVIENT CORP 6.50000% 17-15.06.22 712 000.00 758 280.00 0.02USD ONEOK INC 4.00000% 17-13.07.27 4 230 000.00 4 297 701.16 0.11USD PARK AEROSPACE HOLDINGS LTD-REG-S 5.25000% 17-15.08.22 475 000.00 483 312.50 0.01USD PARSLEY ENERGY LLC/FINANCE CORP-144A 5.37500% 16-15.01.25 150 000.00 153 000.00 0.00USD PNC BANK NATIONAL ASSOCIATION 2.00000% 17-19.05.20 1 300 000.00 1 301 189.50 0.03USD SANTANDER HOLDINGS USA INC/PA-144A 4.40000% 17-13.07.27 4 047 000.00 4 122 804.36 0.10USD SLM CORP 5.12500% 17-05.04.22 2 150 000.00 2 198 375.00 0.05USD SMITHFIELD FOODS INC-REG-S 2.70000% 17-31.01.20 2 000 000.00 2 010 440.00 0.05USD TENET HEALTHCARE CORP-144A 4.62500% 17-15.07.24 207 000.00 205 965.00 0.00Total USD 74 127 327.13 1.85
Total Notes, fixed rate 74 127 327.13 1.85
Notes, floating rate
USD
USD CAPITAL ONE NA 3M LIBOR+115BP 17-30.01.23 3 725 000.00 3 751 562.98 0.09USD ENBRIDGE INC-SUB 5.500%/VAR 17-15.07.77 2 390 000.00 2 422 862.50 0.06USD JPMORGAN CHASE & CO 3.220%/VAR 17-01.03.25 10 850 000.00 10 973 212.60 0.27USD MARTIN MARIETTA MATERIALS INC 3M LIBOR+65BP 17-22.05.20 1 835 000.00 1 839 980.19 0.05Total USD 18 987 618.27 0.47
Total Notes, floating rate 18 987 618.27 0.47
Medium term notes, fixed rate
USD
USD AMERICAN HONDA FINANCE CORP 1.95000% 17-20.07.20 2 200 000.00 2 203 539.80 0.05USD TTX CO-REG-S 2.25000% 16-01.02.19 2 250 000.00 2 254 347.00 0.06Total USD 4 457 886.80 0.11
Total Medium term notes, fixed rate 4 457 886.80 0.11
Bonds, fixed rate
USD
USD AMERICA WEST AIRLINES INC 7.93000% 00-02.01.19 7 000 000.00 1 181 903.29 0.03Total USD 1 181 903.29 0.03
Total Bonds, fixed rate 1 181 903.29 0.03
Treasury notes, fixed rate
USD
USD AMERICA, UNITED STATES OF 1.75000% 17-30.06.22 40 065 000.00 39 908 506.11 1.00Total USD 39 908 506.11 1.00
Total Treasury notes, fixed rate 39 908 506.11 1.00
Municipal Bonds, Fixed Rate
USD
USD FLORIDA’S TURNPIKE ENTERPRISE 6.80000% 09-01.07.39 1 100 000.00 1 194 435.00 0.03Total USD 1 194 435.00 0.03
Total Municipal Bonds, Fixed Rate 1 194 435.00 0.03
Total Transferable securities and money market instruments not listed on an official stock exchange and not traded on another regulated market 157 330 476.31 3.93
Recently issued transferable securities and money market instruments
Asset Backed Securities, floating rate
USD
USD THL CREDIT WIND RIVER-144A 3M LIBOR+105BP 17-20.07.27 1 500 000.00 1 499 550.00 0.04Total USD 1 499 550.00 0.04
Total Asset Backed Securities, floating rate 1 499 550.00 0.04
Description Quantity/ Valuation in USD as a % Nominal Unrealized gain of net (loss) on Futures/ assets Forward Exchange Contracts/ Swaps (Note 1)
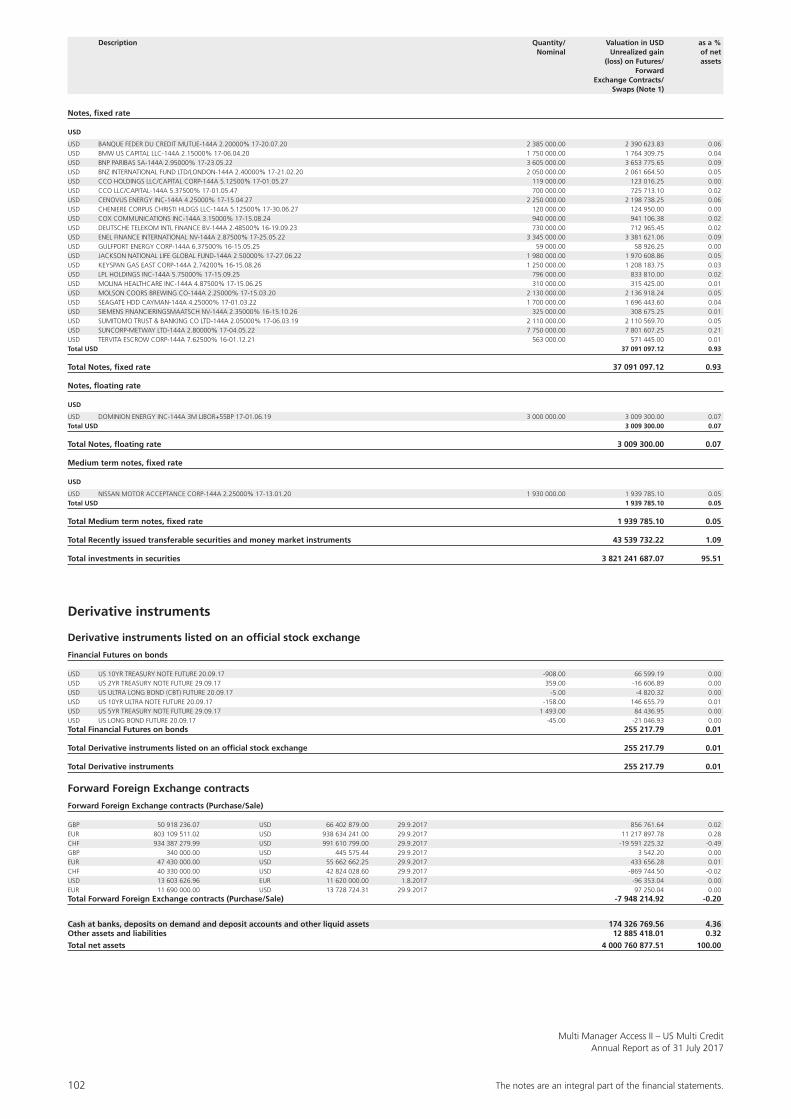
102 The notes are an integral part of the fi nancial statements.
Multi Manager Access II – US Multi CreditAnnual Report as of 31 July 2017
Notes, fixed rate
USD
USD BANQUE FEDER DU CREDIT MUTUE-144A 2.20000% 17-20.07.20 2 385 000.00 2 390 623.83 0.06USD BMW US CAPITAL LLC-144A 2.15000% 17-06.04.20 1 750 000.00 1 764 309.75 0.04USD BNP PARIBAS SA-144A 2.95000% 17-23.05.22 3 605 000.00 3 653 775.65 0.09USD BNZ INTERNATIONAL FUND LTD/LONDON-144A 2.40000% 17-21.02.20 2 050 000.00 2 061 664.50 0.05USD CCO HOLDINGS LLC/CAPITAL CORP-144A 5.12500% 17-01.05.27 119 000.00 123 016.25 0.00USD CCO LLC/CAPITAL-144A 5.37500% 17-01.05.47 700 000.00 725 713.10 0.02USD CENOVUS ENERGY INC-144A 4.25000% 17-15.04.27 2 250 000.00 2 198 738.25 0.06USD CHENIERE CORPUS CHRISTI HLDGS LLC-144A 5.12500% 17-30.06.27 120 000.00 124 950.00 0.00USD COX COMMUNICATIONS INC-144A 3.15000% 17-15.08.24 940 000.00 941 106.38 0.02USD DEUTSCHE TELEKOM INTL FINANCE BV-144A 2.48500% 16-19.09.23 730 000.00 712 965.45 0.02USD ENEL FINANCE INTERNATIONAL NV-144A 2.87500% 17-25.05.22 3 345 000.00 3 381 621.06 0.09USD GULFPORT ENERGY CORP-144A 6.37500% 16-15.05.25 59 000.00 58 926.25 0.00USD JACKSON NATIONAL LIFE GLOBAL FUND-144A 2.50000% 17-27.06.22 1 980 000.00 1 970 608.86 0.05USD KEYSPAN GAS EAST CORP-144A 2.74200% 16-15.08.26 1 250 000.00 1 208 183.75 0.03USD LPL HOLDINGS INC-144A 5.75000% 17-15.09.25 796 000.00 833 810.00 0.02USD MOLINA HEALTHCARE INC-144A 4.87500% 17-15.06.25 310 000.00 315 425.00 0.01USD MOLSON COORS BREWING CO-144A 2.25000% 17-15.03.20 2 130 000.00 2 136 918.24 0.05USD SEAGATE HDD CAYMAN-144A 4.25000% 17-01.03.22 1 700 000.00 1 696 443.60 0.04USD SIEMENS FINANCIERINGSMAATSCH NV-144A 2.35000% 16-15.10.26 325 000.00 308 675.25 0.01USD SUMITOMO TRUST & BANKING CO LTD-144A 2.05000% 17-06.03.19 2 110 000.00 2 110 569.70 0.05USD SUNCORP-METWAY LTD-144A 2.80000% 17-04.05.22 7 750 000.00 7 801 607.25 0.21USD TERVITA ESCROW CORP-144A 7.62500% 16-01.12.21 563 000.00 571 445.00 0.01Total USD 37 091 097.12 0.93
Total Notes, fixed rate 37 091 097.12 0.93
Notes, floating rate
USD
USD DOMINION ENERGY INC-144A 3M LIBOR+55BP 17-01.06.19 3 000 000.00 3 009 300.00 0.07Total USD 3 009 300.00 0.07
Total Notes, floating rate 3 009 300.00 0.07
Medium term notes, fixed rate
USD
USD NISSAN MOTOR ACCEPTANCE CORP-144A 2.25000% 17-13.01.20 1 930 000.00 1 939 785.10 0.05Total USD 1 939 785.10 0.05
Total Medium term notes, fixed rate 1 939 785.10 0.05
Total Recently issued transferable securities and money market instruments 43 539 732.22 1.09
Total investments in securities 3 821 241 687.07 95.51
Derivative instruments
Derivative instruments listed on an official stock exchange
Financial Futures on bonds
USD US 10YR TREASURY NOTE FUTURE 20.09.17 -908.00 66 599.19 0.00USD US 2YR TREASURY NOTE FUTURE 29.09.17 359.00 -16 606.89 0.00USD US ULTRA LONG BOND (CBT) FUTURE 20.09.17 -5.00 -4 820.32 0.00USD US 10YR ULTRA NOTE FUTURE 20.09.17 -158.00 146 655.79 0.01USD US 5YR TREASURY NOTE FUTURE 29.09.17 1 493.00 84 436.95 0.00USD US LONG BOND FUTURE 20.09.17 -45.00 -21 046.93 0.00Total Financial Futures on bonds 255 217.79 0.01
Total Derivative instruments listed on an official stock exchange 255 217.79 0.01
Total Derivative instruments 255 217.79 0.01
Forward Foreign Exchange contracts
Forward Foreign Exchange contracts (Purchase/Sale)
GBP 50 918 236.07 USD 66 402 879.00 29.9.2017 856 761.64 0.02EUR 803 109 511.02 USD 938 634 241.00 29.9.2017 11 217 897.78 0.28CHF 934 387 279.99 USD 991 610 799.00 29.9.2017 -19 591 225.32 -0.49GBP 340 000.00 USD 445 575.44 29.9.2017 3 542.20 0.00EUR 47 430 000.00 USD 55 662 662.25 29.9.2017 433 656.28 0.01CHF 40 330 000.00 USD 42 824 028.60 29.9.2017 -869 744.50 -0.02USD 13 603 626.96 EUR 11 620 000.00 1.8.2017 -96 353.04 0.00EUR 11 690 000.00 USD 13 728 724.31 29.9.2017 97 250.04 0.00Total Forward Foreign Exchange contracts (Purchase/Sale) -7 948 214.92 -0.20
Cash at banks, deposits on demand and deposit accounts and other liquid assets 174 326 769.56 4.36Other assets and liabilities 12 885 418.01 0.32
Total net assets 4 000 760 877.51 100.00
Description Quantity/ Valuation in USD as a % Nominal Unrealized gain of net (loss) on Futures/ assets Forward Exchange Contracts/ Swaps (Note 1)
The notes are an integral part of the fi nancial statements. 103
Multi Manager Access IIAnnual Report as of 31 July 2017
Note 1 – Summary of significant accounting Policies
The financial statements have been prepared in accor-dance with the generally accepted accounting principles for investment fund in Luxembourg. The significant accounting policies are summarised as follows:
a) Calculation of the Net Asset ValueThe net asset value per share of any share class is expressed in the reference currency of the share class concerned and calculated on every business day (the “Valuation Day”). The net asset value per share is calculated by dividing the overall total net assets of the subfund attributable to each share class by the number of shares issued in the particular share class of the subfund.
In this context, “business day” refers to the normal bank business days (i.e. each day on which banks are open during normal business hours) in Luxembourg, with the exception of individual, non-statutory rest days as well as days on which exchanges in the main countries in which a subfund invests are closed or 50% or more subfund investments cannot be adequately valued.
The percentage of the net asset value which is attribut-able to each respective share class of a subfund is deter-mined by the ratio of the shares issued in each share class to the total number of shares issued in the subfund, and will change each time shares are issued or redeemed.
If the total subscriptions or redemptions affecting all the share classes of a subfund on a single Dealing Day result in a net capital inflow or outflow, the net asset value of the share classes of the subfund on the relevant Dealing Day may be adjusted (Single Swing Pricing, “SSP”). The maxi-mum adjustment amounts to 1% of the net asset value. Estimated transaction costs and tax charges that may be incurred by the subfund as well as the estimated bid/offer spread of the assets in which the Company invests may be taken into account. The adjustment leads to an increase in net asset value in case of net capital inflow in the affected subfund. It results in a reduction of net asset value in case of net capital outflow in the affected subfund.
b) Valuation principles – Securities, derivatives and other investments listed on a stock exchange are valued at the last known market price. If the same security, derivative or other investment is quoted on several stock exchanges, the last available quotation on the stock exchange that represents the major market for this investment will
apply. In the case of securities, derivatives and other investments little traded on a stock exchange and for which a secondary market among securities traders exists with pricing in line with the market, the Company may value these securities, derivatives and other investments based on these prices.
Securities, derivatives and other investments that are not listed on a stock exchange, but which are traded on another regulated market which is recognised, open to the public and operates in a due and orderly fashion, are valued at the last available price on this market.
– Securities, derivatives and other investments that are not listed on a stock exchange or traded on another regulated market, and for which no appropriate price can be obtained, will be valued by the Company according to other principles chosen by it in good faith on the basis of the likely sales prices.
– The valuation of derivatives, which are not listed on a stock exchange (OTC derivatives), takes place by refer-ence to independent pricing sources. In case only one independent pricing source of a derivative is available, the plausibility of the valuation price obtained will be verified by means of methods of calculation recog-nised by the Company, based on the market value of the underlying instrument from which the derivative is derived.
– Shares of other UCITS and/or other UCIs will be valued at their last net asset value.
– For money market instruments, the valuation price will be gradually adjusted to the redemption price, based on the net acquisition price and retaining the ensu-ing yield. In the event of a significant change in mar-ket conditions, the basis for the valuation of different investments will be brought into line with the new market yields.
For subfunds that predominantly invest in money mar-ket instruments, securities with a residual maturity of less than 12 months are valued in accordance with the guidelines for money market instruments.
– Securities and other investments that are denominated in a currency other than the currency of account of the relevant subfund and which are not hedged by means of currency transactions are valued at the middle currency rate (midway between the bid and offer rate) obtained from external price providers.
– Time deposits and fiduciary investments are valued at their nominal value plus accumulated interest.
– The value of swap transactions is calculated by an external service provider and a second independent valuation is made available by another external service provider. The calculation is based on the net present value of all cash flows, both inflows and outflows.
Notes to the Financial Statements
104 The notes are an integral part of the fi nancial statements.
Multi Manager Access IIAnnual Report as of 31 July 2017
In some specific cases, internal calculations based on models and market data available from Bloomberg and/or broker statement valuations may be used. The valuation methods depend on the respective security and are determined pursuant to the UBS Valuation Policy.
– For subfunds that predominantly invest in money market instruments, interest income earned by subfunds up to and including the second valuation date following the valuation date concerned is included in the valuation of the assets of the subfunds concerned. The Net Asset Value per share on a given valuation date therefore includes projected interest earnings as at two valuation days hence.
In circumstances where the interests of the Company or its shareholders so justify (avoidance of market tim-ing practices, for example), the Directors may take any appropriate measures, such as applying a fair value pricing methodology to adjust the value of the Company’s assets.
The Company is authorized to apply other generally rec-ognized and auditable valuation criteria chosen in good faith in order to achieve an appropriate valuation of the Net Asset Value if, due to extraordinary circumstances, a valuation in accordance with the above-mentioned regu-lations proves to be unfeasible or inaccurate.
In the case of extraordinary circumstances, additional valuations, which will affect the prices of the shares to be subsequently issued or redeemed, may be carried out within one Valuation Day.
c) Valuation of forward foreign exchange contractsThe unrealized gain (loss) of outstanding forward foreign exchange contracts is valued on the basis of the forward exchange rates prevailing at valuation date.
d) Valuation of financial futures contractsFinancial futures contracts are valued based on the lat-est available published price applicable on the valuation date. Realized gains and losses and the changes in unre-alized gains and losses are recorded in the statement of operations. The realized gains and losses are calculated in accordance with the FIFO method, i.e. the first con-tracts acquired are regarded as the first to be sold.
e) Net realized gains (losses) on sales of securitiesThe realized gains or losses on the sales of securities are calculated on the basis of the average cost of the securities sold.
f) Valuation on options Outstanding options traded on a regulated market are valued on the settlement price or the last avail ablemarket price of the instruments. OTC options are marked to market based upon daily prices obtained from Bloomberg option pricer functionality and checked against third party pricing agents.
The realized gains or losses on options and the change in unrealized appreciation or depreciation on options are disclosed in the statement of operations and in the statement of changes in net assets respectively under the positions realized gains (losses) on options and Unrealized appreciation (depreciation) on options.
g) Conversion of foreign currenciesBank accounts, other net assets and the valuation of the investments in securities held denominated in currencies other than the reference currency of the different subfunds are converted at the mid closing spot rates on the valuation date. Income and expenses denominated in currencies other than the currency of the different subfunds are converted at the mid closing spot rates at payment date. Gain or loss on foreign exchange is included in the statement of operations.
The cost of securities denominated in currencies other than the reference currency of the different subfunds is converted at the mid closing spot rate on the day of acquisition.
h) Accounting of securities’ portfolio transactionsThe securities’ portfolio transactions are accounted for the bank business day following the transaction day.
i) Consolidated financial statementsThe consolidated financial statements are expressed in EUR. The various items of the consolidated statement of net assets and the consolidated statement of operations at 31 July 2017 of the investment Company are equal to the sum of the corresponding items in the financial statements of each subfund converted into EUR.
The following exchange rate was used for the conversion of the consolidated financial statements as of 31 July 2017:
Exchange rate
EUR 1 = USD 1.179000
For the liquidated or merged subfunds, the exchange rate used for the conversion of the consolidated financial statements is the one as at liquidation or merger date.
j) Receivable on securities sales,Payable on securities purchasesThe account ”Receivable on securities sales” can also include receivables from foreign currency transactions. The account ”Payable on securities purchases” can also include payables from foreign currency transactions.
k) Income recognitionDividends, net of withholding taxes, are recognized as income on the date upon which the relevant securities are first listed as “ex-dividend”. Interest income is accrued on a daily basis.
The notes are an integral part of the fi nancial statements. 105
Multi Manager Access IIAnnual Report as of 31 July 2017
l) SwapsThe Company may enter into interest rate swap contracts, forward rate agreements on interest rates swaptions and credit default swaps, if they are executed with first-class financial institutions that specialize in transactions of this kind.
Changes in unrealized profits and losses are reflected in the statement of operations under the changes in “Unrealized appreciation (depreciation) on swaps”.
Gains or losses on swaps incurred when closed-out or matured are recorded as “Realized gain (loss) on swaps” in the statement of operations.
Note 2 – Flat fee
The Company and, more specifically, its different classes of shares, will bear a monthly flat fee calculated on the average net assets attributable to this share class and payable monthly (the “Flat Fee”) as listed below:
Multi Manager Access II Maximum Flat fee– Emerging Markets Debt 1.25% p.a.
– European Multi Credit 0.85% p.a.
– Flexible 0.35% p.a.
– Global Fixed Income Enhanced Strategies 0.40% p.a.
– High Yield 1.25% p.a.
– US Multi Credit 0.85% p.a.
In accordance with the table above, the Flat Fee covers the following fees, costs and expenses of the Company, each subfund and class:1. fees, costs and expenses of the Depositary;2. fees, costs and expenses of the Administrative Agent;3. fees, costs and expenses of the Management Company;4. fees, costs and expenses of the Advisor and the Currency
Manager;5. fees, costs and expenses of the Portfolio Managers
and any delegate(s) of the Portfolio Managers and the Transition Advisor;
6. fees, costs and expenses in relation to distribution activities relating to the shares of the Company (including the costs and fees incurred in maintaining registration of the Company in foreign countries with competent authorities).
Operation and administration expenses of the Company
In addition to the fees, costs and expenses covered by the Flat Fee, the Company bears all expenses which are oper-ational and administrative expenses, which will include but not be limited to:− all taxes which may be due on the assets and the
income of the Company (including the applicable subscription tax);
− any custody charges of banks and financial institu-tions to whom custody of assets of the Company is entrusted;
− usual banking fees due on transactions involving securities or other assets (including derivatives) held in the portfolio of the Company (such fees to be included in the acquisition price and to be deducted from the selling price);
− the fees, expenses and all reasonable out-of-pocket expenses properly incurred by the Company;
− legal fees and expenses incurred by the Company, the Management Company or the Portfolio Managers while acting in the interests of the shareholders (including, for the avoidance of doubt, any legal fees and expenses relating to any re-structuring of the Company or any of its subfund(s));
− the cost of accounting, bookkeeping and calculating the net asset value;
− the costs of preparing, in such languages as are neces-sary for the benefit of the shareholders (including the beneficial holders of the Shares), and distributing (but not printing) annual and semi-annual reports and such other reports or documents as may be required under applicable laws or regulations;
− the cost of preparing notices to the shareholders and all costs of transactions (broker’s normal commission, fees, taxes, etc.) connected with administration of the Company’s assets;
− charges and costs of approvals and supervision of the Company in Luxembourg and abroad;
− costs and expenses of printing of the Articles of Incor-poration, prospectus and annual and semi-annual reports and of preparing and/or filing and printing the Articles of Incorporation and all other documents concerning the Company (in such languages as are necessary), including registration statements, prospec-tuses and explanatory memoranda with all authorities (including local securities dealers’ associations) having jurisdiction over the Company or the offering of shares of the Company;
− costs and expenses related to the publications of the net asset value and the publication of notices to investors;
− fees and expenses charged in connection with listing the Company’s shares on any stock exchange or regu-lated market;
− fees and other costs for the payment of dividends to shareholders;
− audit fees, costs and expenses (including the fees and expenses of the Auditor);
− fees and expenses in relation to KIID production, translation and filing to regulators.
The Company may accrue in its accounts administra-tive and other expenses of a regular or recurring nature based on an estimated amount rate ably for yearly or other periods.
All costs which can be allocated accurately to individual subfunds and/or individual share classes will be charged to these subfunds and classes. Costs pertaining to several or all subfunds or classes will be charged to the subfunds or classes concerned in proportion to their relative net asset values or on such other basis reasonably deter-mined by the Company or the Management Company.
106 The notes are an integral part of the fi nancial statements.
Multi Manager Access IIAnnual Report as of 31 July 2017
The costs involved in launching new subfunds will be written off over a period of up to five years in the respec-tive subfunds only.
Note 3 – Taxe d’abonnement
The Company is subject to the Grand Duchy of Luxembourg’s “taxe d’abonnement”, which is payable at the end of every quarter. This tax is calculated on the total net assets of each class at the end of every quarter. The tax is levied at a rate of 0.05% of the total net assets. The rate is reduced to 0.01% in respect of classes reserved to institutional investors.
The value of the assets represented by shares held in other Luxembourg undertakings for collective invest-ment that already pay a “taxe d’abonnement” will be exempted from any “taxe d’abonnement”.
Note 4 – Other income
Other income mainly consist of income resulting from Single Swing Pricing.
Note 5 – Distribution
The general meeting of shareholders of the respective subfunds or classes of shares shall decide, at the proposal of the Board of Directors and after closing the annual accounts per subfund, whether and to what extent distri-butions are to be paid out by each subfund or share class, provided that such subfund or share class gives right to distribution payments. The payment of distributions must not result in the net assets of the Company fall-ing below the minimum amount of assets prescribed by law. If a distribution is made, payment will be effected no later than four months after the end of the financial year.
The Board of Directors is authorised to pay interim dividends and to suspend the payment of distributions.
Note 6 – Commitments on Financial Futures, Swaps and Options
Commitments on Financial Futures, Swaps and Options per subfund and respective currency as of 31 July 2017 can be summarised as follows:
a) Financial Futures
Multi Manager Access II Financial Futures Financial Futures on bonds on bonds (bought) (sold)
– Emerging Markets Debt 86 909 343.82 USD 64 879 435.98 USD
– European Multi Credit 161 430 080.00 EUR 85 878 727.71 EUR
– High Yield 82 945 699.97 USD 107 901 792.90 USD
– US Multi Credit 344 828 180.49 USD 234 117 343.82 USD
Multi Manager Access II Financial Futures Financial Futures on interest rates on interest rates (bought) (sold)
– Emerging Markets Debt - USD 41 271 300.00 USD
Multi Manager Access II Financial Futures Financial Futures on currencies on currencies (bought) (sold)
– High Yield - USD 345 743 162.50 USD
b) Swaps
Multi Manager Access II Credit default swaps Credit default swaps (bought) (sold)
– Emerging Markets Debt 58 260 199.46 USD - USD
– European Multi Credit - EUR 1 534 931.79 EUR
– High Yield 1 813 611.61 USD 52 496 626.17 USD
c) Options
Multi Manager Access II Options on shares classic-styled
– Flexible 975 338.20 USD
Note 7 – Total Expense Ratio (TER)
This ratio was calculated in accordance with the Swiss Funds & Asset Management Association (SFAMA) “Guidelines on the calculation and disclosure of the TER” in the current version and expresses the sum of all costs and commissions charged on an ongoing basis to the net assets (operating expenses) taken retrospectively as a percentage of the net assets.
TER for the last 12 months:
Multi Manager Access II Total Expense Ratio (TER)
– Emerging Markets Debt BI 0.83%
– Emerging Markets Debt BI (CHF hedged) 0.86%
– Emerging Markets Debt BI (EUR hedged) 0.86%
– Emerging Markets Debt BI (SGD hedged) 0.92%
– Emerging Markets Debt I-UKdist 0.87%
– Emerging Markets Debt I-UKdist (CHF hedged) 0.89%
– Emerging Markets Debt I-UKdist (EUR hedged) 0.90%
– Emerging Markets Debt I-UKdist (GBP hedged) 0.88%
– European Multi Credit BI 0.61%
– European Multi Credit BI (CHF hedged) 0.64%
– European Multi Credit BI (USD hedged) 0.65%
– European Multi Credit I-UKdist 0.63%
– European Multi Credit I-UKdist (CHF hedged) 0.65%
– European Multi Credit I-UKdist (GBP hedged) 0.63%
– Flexible BI 0.16%
– High Yield BI 0.68%
– High Yield BI (CHF hedged) 0.71%
– High Yield BI (EUR hedged) 0.71%
– High Yield BI (SGD hedged) 0.72%
– High Yield I-UKdist 0.68%
– High Yield I-UKdist (CHF hedged) 0.72%
– High Yield I-UKdist (EUR hedged) 0.73%
– High Yield I-UKdist (GBP hedged) 0.71%
– US Multi Credit BI 0.58%
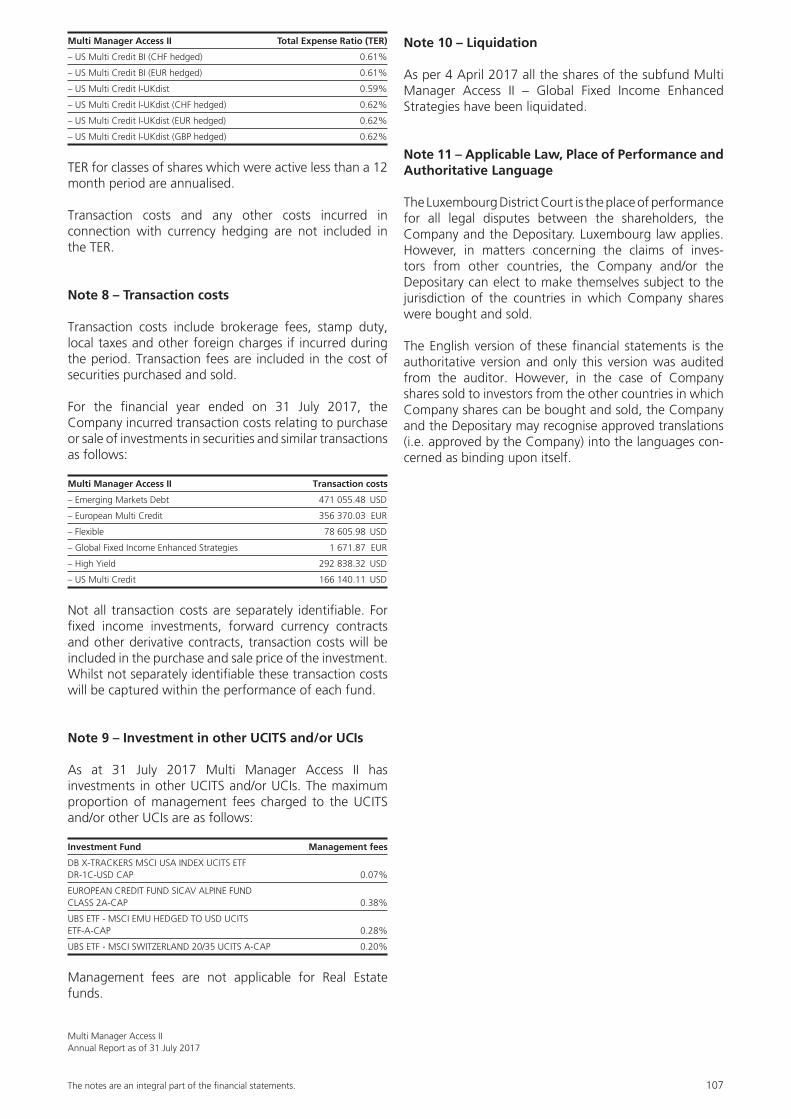
The notes are an integral part of the fi nancial statements. 107
Multi Manager Access IIAnnual Report as of 31 July 2017
Multi Manager Access II Total Expense Ratio (TER)
– US Multi Credit BI (CHF hedged) 0.61%
– US Multi Credit BI (EUR hedged) 0.61%
– US Multi Credit I-UKdist 0.59%
– US Multi Credit I-UKdist (CHF hedged) 0.62%
– US Multi Credit I-UKdist (EUR hedged) 0.62%
– US Multi Credit I-UKdist (GBP hedged) 0.62%
TER for classes of shares which were active less than a 12 month period are annualised.
Transaction costs and any other costs incurred in connection with currency hedging are not included in the TER.
Note 8 – Transaction costs
Transaction costs include brokerage fees, stamp duty, local taxes and other foreign charges if incurred during the period. Transaction fees are included in the cost of securities purchased and sold.
For the financial year ended on 31 July 2017, the Company incurred transaction costs relating to purchase or sale of investments in securities and similar transactions as follows:
Multi Manager Access II Transaction costs
– Emerging Markets Debt 471 055.48 USD
– European Multi Credit 356 370.03 EUR
– Flexible 78 605.98 USD
– Global Fixed Income Enhanced Strategies 1 671.87 EUR
– High Yield 292 838.32 USD
– US Multi Credit 166 140.11 USD
Not all transaction costs are separately identifiable. For fixed income investments, forward currency contracts and other derivative contracts, transaction costs will be included in the purchase and sale price of the investment. Whilst not separately identifiable these transaction costs will be captured within the performance of each fund.
Note 9 – Investment in other UCITS and/or UCIs
As at 31 July 2017 Multi Manager Access II has investments in other UCITS and/or UCIs. The maximum proportion of management fees charged to the UCITS and/or other UCIs are as follows:
Investment Fund Management fees
DB X-TRACKERS MSCI USA INDEX UCITS ETF DR-1C-USD CAP 0.07%
EUROPEAN CREDIT FUND SICAV ALPINE FUND CLASS 2A-CAP 0.38%
UBS ETF - MSCI EMU HEDGED TO USD UCITS ETF-A-CAP 0.28%
UBS ETF - MSCI SWITZERLAND 20/35 UCITS A-CAP 0.20%
Management fees are not applicable for Real Estate funds.
Note 10 – Liquidation
As per 4 April 2017 all the shares of the subfund Multi Manager Access II – Global Fixed Income Enhanced Strategies have been liquidated.
Note 11 – Applicable Law, Place of Performance and Authoritative Language
The Luxembourg District Court is the place of performance for all legal disputes between the shareholders, the Company and the Depositary. Luxembourg law applies. However, in matters concerning the claims of inves-tors from other countries, the Company and/or the Depositary can elect to make themselves subject to the jurisdiction of the countries in which Company shares were bought and sold.
The English version of these financial statements is the authoritative version and only this version was audited from the auditor. However, in the case of Company shares sold to investors from the other countries in which Company shares can be bought and sold, the Company and the Depositary may recognise approved translations (i.e. approved by the Company) into the languages con-cerned as binding upon itself.
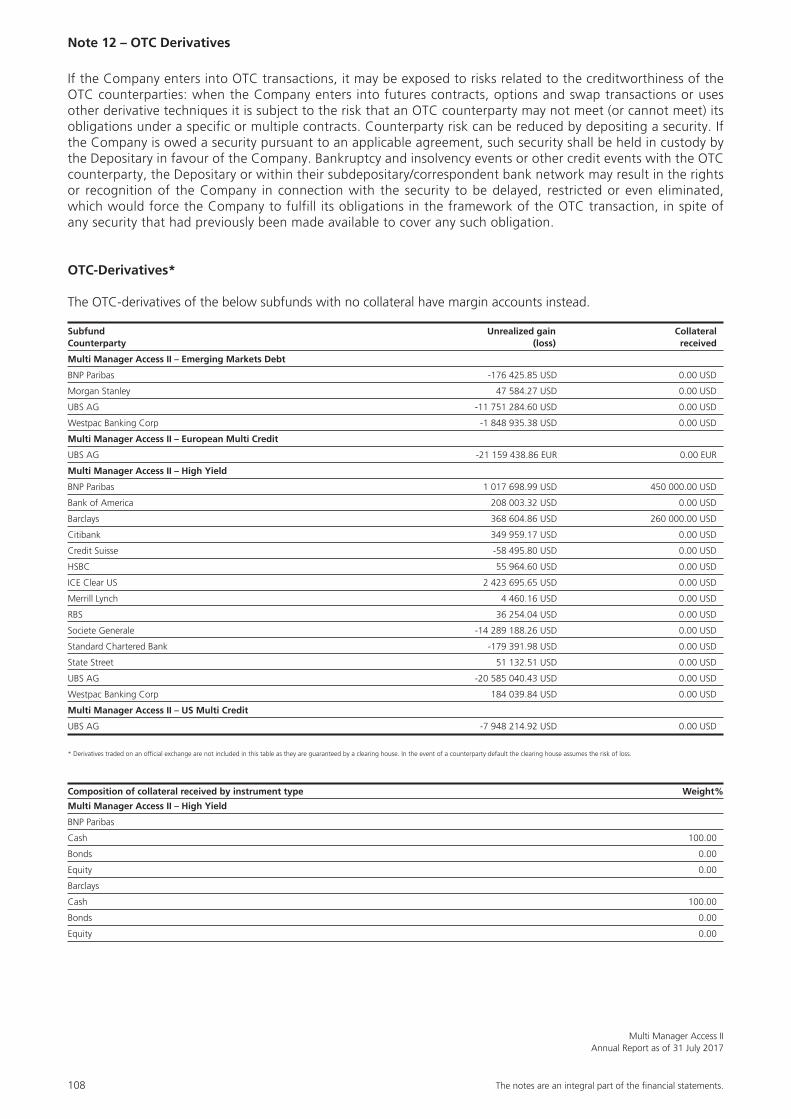
108 The notes are an integral part of the fi nancial statements.
Multi Manager Access IIAnnual Report as of 31 July 2017
Note 12 – OTC Derivatives
If the Company enters into OTC transactions, it may be exposed to risks related to the creditworthiness of the OTC counterparties: when the Company enters into futures contracts, options and swap transactions or uses other derivative techniques it is subject to the risk that an OTC counterparty may not meet (or cannot meet) its obligations under a specific or multiple contracts. Counterparty risk can be reduced by depositing a security. If the Company is owed a security pursuant to an applicable agreement, such security shall be held in custody by the Depositary in favour of the Company. Bankruptcy and insolvency events or other credit events with the OTC counterparty, the Depositary or within their subdepositary/correspondent bank network may result in the rights or recognition of the Company in connection with the security to be delayed, restricted or even eliminated, which would force the Company to fulfill its obligations in the framework of the OTC transaction, in spite of any security that had previously been made available to cover any such obligation.
OTC-Derivatives*
The OTC-derivatives of the below subfunds with no collateral have margin accounts instead.
Subfund Unrealized gain CollateralCounterparty (loss) received
Multi Manager Access II – Emerging Markets Debt
BNP Paribas -176 425.85 USD 0.00 USD
Morgan Stanley 47 584.27 USD 0.00 USD
UBS AG -11 751 284.60 USD 0.00 USD
Westpac Banking Corp -1 848 935.38 USD 0.00 USD
Multi Manager Access II – European Multi Credit
UBS AG -21 159 438.86 EUR 0.00 EUR
Multi Manager Access II – High Yield
BNP Paribas 1 017 698.99 USD 450 000.00 USD
Bank of America 208 003.32 USD 0.00 USD
Barclays 368 604.86 USD 260 000.00 USD
Citibank 349 959.17 USD 0.00 USD
Credit Suisse -58 495.80 USD 0.00 USD
HSBC 55 964.60 USD 0.00 USD
ICE Clear US 2 423 695.65 USD 0.00 USD
Merrill Lynch 4 460.16 USD 0.00 USD
RBS 36 254.04 USD 0.00 USD
Societe Generale -14 289 188.26 USD 0.00 USD
Standard Chartered Bank -179 391.98 USD 0.00 USD
State Street 51 132.51 USD 0.00 USD
UBS AG -20 585 040.43 USD 0.00 USD
Westpac Banking Corp 184 039.84 USD 0.00 USD
Multi Manager Access II – US Multi Credit
UBS AG -7 948 214.92 USD 0.00 USD
* Derivatives traded on an official exchange are not included in this table as they are guaranteed by a clearing house. In the event of a counterparty default the clearing house assumes the risk of loss.
Composition of collateral received by instrument type Weight%
Multi Manager Access II – High Yield
BNP Paribas
Cash 100.00
Bonds 0.00
Equity 0.00
Barclays
Cash 100.00
Bonds 0.00
Equity 0.00
109
Multi Manager Access IIAnnual Report as of 31 July 2017
Unaudited Information
1) Global Exposure
Risk managementRisk management in accordance with the commitment approach and the value-at-risk approach is applied pur-suant to the applicable laws and regulatory provisions.
LeverageLeverage is defined pursuant to the applicable ESMA directives as the total of the notional values of the deri-vatives used by the respective subfund. According to this definition, leverage may result in artificially increased leverage amounts, as some derivatives that can be used for hedging purposes may be included in the calcula-tion. Consequently, this information does not necessarily reflect the precise actual leverage risk that the investor is exposed to.
Multi Manager Access II Global risk calculation method
– Emerging Markets Debt Commitment approach
– European Multi Credit Commitment approach
– Flexible Commitment approach
– High Yield Commitment approach
– US Multi Credit Commitment approach
2) Remuneration Policy and quantitative disclosure
The Board of Directors of UBS Third Party Management Company S.A. has adopted a remuneration policy (the “Policy”) on 17 March 2016, whose objectives are on one hand; to ensure that the remuneration frame-work is in line with the applicable laws and regulations, and more specifically with provisions defined under (i) the Articles 111bis and 111ter of the Luxembourg Law of 17 December 2010 on Undertakings for Collec-tive Investment in Transferable Securities as amended from time to time (the UCITS Law) transposing the UCITS Directive 2014/91/EU (the UCITS V Directive), (ii) the Alternative Investment Fund Managers (AIFM) Directive 2011/61/ EU, transposed into the Luxembourg AIFM Law dated from 12 July 2013, as amended from time to time, (iii) the ESMA’s guidelines on sound remunera-tion policies under the UCITS Directive - ESMA/2016/575
published on 14 October 2016 and ESMA’s guidelines on sound remuneration policies under the AIFMD - ESMA/2016/579 published on 14 October 2016 amend-ing the ESMA’s guidelines on sound remuneration policies under the UCITS Directive and AIFMD published on 31 March 2016 - ESMA/2016/411 (the ESMA Guide-lines) and (iv) the CSSF Circular 10/437 on Guidelines concerning the remuneration policies in the financial sector issued on 1 February 2010; and on the other hand, to comply with the UBS AG Remuneration policy framework. The Policy is meant not to encourage exces-sive risk taking, to contain measures to avoid conflicts of interest, to be consistent with, and promote, sound and effective risk management and to be consistent with the UBS Group business strategy, objectives and values.
Further information in relation to UBS AG Remuneration Policy is available in the UBS Group AG Annual Report 2016 and in the compensation report 2016. More details about the remuneration policy of the Management Company, which describes, but not limited to, how remuneration and benefits are determined, are available at http://www.ubs.com/third-party-man-co-policies.
Application of the requirements and remuneration disclosure
In accordance with the Article 151 of the UCITS Law, the Management Company is required to disclose at least annually certain information concerning its remunera-tion policy and the practices for its identified staff.
The Management Company complies with the aforemen-tioned regulatory provisions in a way and to the extent that is appropriate to its size, internal organization and the nature, scope and complexity of its activities.
As at the end of the Company’s financial year on 31 July 2017, the Management Company has not com-pleted its first annual performance period in which it has to comply with the UCITS Law remuneration rules.
As a consequence, the aggregate amount of remu-neration broken down by categories of employees or other members of staff as well as the other informa-tion required to be disclosed by the UCITS Law in the annual report of the Company is not yet available and will be disclosed once a full performance year has been completed.
110
Multi Manager Access IIAnnual Report as of 31 July 2017
Unaudited Information
3) Transparency of securities financing transactions and their reuse
No securities financing transactions or total return swaps within the meaning of Regulation (EU) 2015/2365 of the European Parliament and of the Council of 25 November 2015 on transparency of securities financing transactions and of reuse and amending Regulation (EU) No 648/2012 (“SFTR”) were used in the investment fund’s financial year. As a result, no disclosures within the meaning of Article 13 of said Regulation need to be made to investors in the annual report.

ab
© U
BS 2
017.
The
key
sym
bol a
nd U
BS a
re a
mon
g th
e re
gist
ered
and
unr
egis
tere
d tr
adem
arks
of
UBS
. All
right
s re
serv
ed.


