Embed Size (px)
Citation preview
FRANKLIN TEMPLETON INVESTMENT FUNDSSOCIEŁ TEŁ D’INVESTISSEMENT AØ CAPITAL VARIABLE
UNAUDITEDSEMI-ANNUAL REPORT
DECEMBER 31, 2008
FRANKLIN TEMPLETON INVESTMENT FUNDSsocie¤ te¤ d’investissement a' capital variable
UNAUDITED SEMI-ANNUAL REPORTFOR THE SIX MONTHS ENDED DECEMBER 31, 2008
This report shall not constitute an offer or a solicitation of an offer to buy shares of Franklin Templeton InvestmentFunds (the ‘‘Company’’). Subscriptions are to be made on the basis of the current simplified prospectus accompanied bythe current full prospectus and its addendum, a copy of the latest available audited report and, if published thereafter,the latest unaudited semi- annual report.

General Information 3Report of the Investment Managers 5Fund Performance 6Statement of Net Assets 8Statistical Information 19Statement of Operations and Changes in Net Assets 32Notes to the Financial Statements 44Franklin Asian Flex Cap Fund 74Franklin Biotechnology Discovery Fund 76Franklin Euroland Core Fund 77Franklin European Growth Fund 80Franklin European Small-Mid Cap Growth Fund 81Franklin Global Growth Fund 82Franklin Global Real Estate (Euro) Fund 84Franklin Global Real Estate (USD) Fund 86Franklin Global Small-Mid Cap Growth Fund 88Franklin High Yield Fund 90Franklin High Yield (Euro) Fund 92Franklin Income Fund 94Franklin India Fund 97Franklin MENA Fund 99Franklin Natural Resources Fund 101Franklin Strategic Income Fund 103Franklin Technology Fund 109Franklin U.S. Equity Fund 111Franklin U.S. Focus Fund 114Franklin U.S. Government Fund 116Franklin U.S. Growth Fund 117Franklin U.S. Opportunities Fund 120Franklin U.S. Small-Mid Cap Growth Fund 123Franklin U.S. Total Return Fund 126Franklin U.S. Ultra Short Bond Fund 130Franklin World Perspectives Fund 132Franklin Mutual Beacon Fund 138Franklin Mutual Euroland Fund 144Franklin Mutual European Fund 146Franklin Mutual Global Discovery Fund 149Franklin Templeton Global Equity Strategies Fund 153Franklin Templeton Global Fundamental Strategies Fund 160Franklin Templeton Global Growth and Value Fund 167Franklin Templeton Japan Fund 171Templeton Asian Bond Fund 175Templeton Asian Growth Fund 176Templeton Asian Smaller Companies Fund 178Templeton BRIC Fund 180Templeton China Fund 183Templeton Eastern Europe Fund 186Templeton Emerging Markets Fund 188Templeton Emerging Markets Bond Fund 192Templeton Emerging Markets Smaller Companies Fund 194Templeton Euro Liquid Reserve Fund 198Templeton Euroland Fund 199Templeton Euroland Bond Fund 201Templeton European Fund 202Templeton European Total Return Fund 205Templeton Frontier Markets Fund 206Templeton Global Fund 208Templeton Global (Euro) Fund 211Templeton Global Balanced Fund 214Templeton Global Bond Fund 218Templeton Global Bond (Euro) Fund 220Templeton Global Equity Income Fund 222Templeton Global High Yield Fund 224Templeton Global Income Fund 226Templeton Global Smaller Companies Fund 231Templeton Global Total Return Fund 234Templeton Growth (Euro) Fund 239Templeton Korea Fund 242Templeton Latin America Fund 244Templeton Thailand Fund 246Templeton U.S. Dollar Liquid Reserve Fund 248Templeton U.S. Value Fund 249Franklin Templeton Investments Office Directory 251
FRANKL IN TEMPLETON INVESTMENT FUNDS
Contents
Unaudited Semi-Annual Report www.franklintempleton.lu2
BOARD OF DIRECTORSChairmanThe Honorable Nicholas F. BradyChairman and Chief Executive OfficerCHOPTANK PARTNERS, INC.16 North Washington StreetEaston, MD 21601, U.S.A.
DirectorsGregory E. JohnsonPresident and Chief Executive OfficerFRANKLIN RESOURCES, INC.One Franklin ParkwaySan Mateo, CA 94403-1906, U.S.A.
Dr J. B. Mark MobiusDirector EmeritusTEMPLETON ASSET MANAGEMENT LIMITED7 Temasek Boulevard, # 38-03 Suntec Tower OneSingapore 038987
Mark G. HoloweskoPresidentHOLOWESKO PARTNERS LTDShipston HouseBox N-7776, West Bay Street, Lyford Cay,Nassau, Bahamas
Gregory E. McGowanExecutive Vice President and General CounselTEMPLETON WORLDWIDE, INC.500 East Broward Boulevard, Suite 2100Fort Lauderdale, FL 33394, U.S.A.
Duke of Abercorn KGChairmanCALOR TEORANTABarons CourtOmagh BT78 4EZ, Northern Ireland, U.K.
Vijay C. AdvaniExecutive Vice President-Global Advisory ServicesFRANKLIN RESOURCES, INC.One Franklin ParkwaySan Mateo, CA 94403-1906, U.S.A.
Richard H. FrankChief Executive OfficerDARBY OVERSEAS INVESTMENTS LIMITED1133 Connecticut Avenue, NW, Suite 400Washington DC 20036, U.S.A.
David E. SmartDirector and Chief Executive OfficerFRANKLIN TEMPLETON INVESTMENT MANAGEMENT LIMITEDThe Adelphi Building, 1-11 John Adam StreetLondon WC2N 6HT, England, U.K.
The Honourable Trevor G. TrefgarneChairmanGARRO SECURITIES LIMITED30 Kimbell GardensLondon SW6 6QQ, U.K.
James J. K. HungPresident and Chief Executive OfficerASIA SECURITIES GLOBAL LIMITEDRoom 63, 21st floor, New World Tower 118 Queen’s Road, CentralHong Kong
Geoffrey Ainsworth LanglandsManaging PartnerLANGLANDS CONSULTORIA LtdaAvenida das Americas 500Bloco 6, Sala 227 (Downtown)Rio de Janeiro ^ RJ CEP 22640-100, Brazil
CONDUCTING OFFICERS:William Lockwood26, boulevard Royal, L-2449 LuxembourgGrand-Duchy of Luxembourg
Denise Voss26, boulevard Royal, L-2449 LuxembourgGrand-Duchy of Luxembourg
REGISTERED OFFICE:26, boulevard Royal, L-2449 LuxembourgGrand-Duchy of Luxembourg
PRINCIPAL DISTRIBUTOR:TEMPLETON GLOBAL ADVISORS LIMITEDP.O. Box N-7759, Lyford Cay, Nassau, Bahamas
INVESTMENT MANAGERS:As to: Franklin Euroland Core Fund;
Franklin High Yield (Euro) Fund*;Franklin World Perspectives Fund�;Franklin Mutual Beacon Fund`;Franklin Mutual Global Discovery Fund`;Templeton Euroland Bond Fund;Templeton Euroland Fund;Templeton Euro Liquid Reserve Fund;Templeton European Fund;Templeton European Total Return Fund*;Templeton Global (Euro) Fund;Templeton Global Balanced Fund*;Templeton Global Equity Income Fund;Templeton Global Fund; andTempleton U.S. Value Fund.
FRANKLIN TEMPLETON INVESTMENT MANAGEMENT LIMITED5 Morrison StreetEdinburgh EH3 8BH, ScotlandU.K.
* Franklin Templeton Investment Management Limited has beenappointed as Co-Investment Manager of these Funds, together withFranklin Advisers, Inc.
� Franklin Templeton Investment Management Limited has been selectedand appointed by the lead Investment Manager Franklin Advisers, Inc. asCo-Investment Manager of this Fund together with (i) Franklin TempletonInvestments Corp., (ii) Franklin Templeton Investments Japan Limited,(iii) Franklin Templeton Investimentos (Brasil) Ltda. and (iv) FranklinTempleton Investment Trust Management Co. Limited.
` Franklin Templeton Investment Management Limited has beenappointed as Co-Investment Manager for these Funds, together withFranklin Mutual Advisers, LLC.
As to: Franklin Templeton Global Equity Strategies Fund*;Templeton Asian Growth Fund;Templeton Asian Smaller Companies Fund;Templeton BRIC Fund;Templeton China Fund;Templeton Eastern Europe Fund;Templeton Emerging Markets Fund;Templeton Emerging Markets Smaller Companies Fund;Templeton Frontier Markets Fund;Templeton Global Income Fund�;Templeton Korea Fund;Templeton Latin America Fund; andTempleton Thailand Fund.
TEMPLETON ASSET MANAGEMENT LTD7 Temasek Boulevard# 38-03 Suntec Tower OneSingapore 038987
* Templeton Asset Management Limited has been appointed asCo-Investment Manager of this Fund, together with (i) Franklin Advisers,Inc., (ii) Franklin Mutual Advisers, LLC and (iii) Templeton GlobalAdvisors Limited.
� Templeton Asset Management Limited has been appointed asCo-Investment Manager of this Fund, together with Franklin Advisers,Inc.
As to: Franklin Asian Flex Cap Fund;Franklin Biotechnology Discovery Fund;Franklin High Yield Fund;Franklin High Yield (Euro) Fund*;Franklin Income Fund;Franklin India Fund;Franklin MENA Fund;Franklin Natural Resources Fund;Franklin Strategic Income Fund;Franklin Technology Fund;Franklin Templeton Global Equity Strategies Fund�;Franklin Templeton Global Fundamental Strategies Fund`;Franklin World Perspectives Fund�;Franklin U.S. Equity Fund;Franklin U.S. Focus Fund;Franklin U.S. Government Fund;Franklin U.S. Growth Fund;Franklin U.S. Opportunities Fund;Franklin U.S. Ultra Short Bond Fund;Franklin U.S. Small-Mid Cap Growth Fund;
socie¤te¤ d’investissement a' capital variable26, boulevard Royal, L-2449 Luxembourg, Grand-Duchy of Luxembourg
(Registered with the registre de commerce et des socie¤te¤s, Luxembourg, under number B 35 177)
FRANKL IN TEMPLETON INVESTMENT FUNDS
General Information (as at December 31, 2008)
www.franklintempleton.lu Unaudited Semi-Annual Report 3
Franklin U.S. Total Return Fund;Franklin Templeton Global Growth and Value Fund;Templeton Asian Bond Fund;Templeton Emerging Markets Bond Fund;Templeton European Total Return Fund*;Templeton Global Balanced Fund*;Templeton Global Bond Fund;Templeton Global Bond (Euro) Fund;Templeton Global High Yield Fund;Templeton Global Income Fund‰;Templeton Global Total Return Fund; andTempleton U.S. Dollar Liquid Reserve Fund.
FRANKLIN ADVISERS, INC.One Franklin ParkwaySan Mateo, CA 94403-1906, U.S.A.
* Franklin Advisers, Inc. has been appointed as Co-Investment Managerof these Funds, together with Franklin Templeton InvestmentManagement Limited.
� Franklin Advisers, Inc. has been appointed as Co-Investment Managerof this Fund, together with (i) Franklin Mutual Advisers, LLC,(ii) Templeton Asset Management Limited, and (iii) Templeton GlobalAdvisors Limited.
` Franklin Advisers, Inc. has been appointed as Co-Investment Managerof this Fund, together with (i) Franklin Mutual Advisers, LLC and(ii) Templeton Global Advisors Limited.
� Franklin Advisers, Inc. has been appointed as lead Investment Managerof this Fund and has selected and appointed as Co-Investment Managers(i) Franklin Templeton Investments Corp., (ii) Franklin TempletonInvestments Japan Limited, (iii) Franklin Templeton Investimentos (Brasil)Ltda., (iv) Franklin Templeton Investment Management Limited and(v) Franklin Templeton Investment Trust Management Co. Limited.
‰ Franklin Advisers, Inc. has been appointed as Co-Investment Managerof this Fund, together with Templeton Asset Management Limited.
As to: Franklin European Growth Fund;Franklin European Small-Mid Cap Growth Fund;Franklin Global Growth Fund;Franklin Global Real Estate (Euro) Fund;Franklin Global Real Estate (USD) Fund; andFranklin Global Small-Mid Cap Growth Fund.
FRANKLIN TEMPLETON INSTITUTIONAL LLC600 Fifth Avenue,New York, NY 10020, U.S.A.
As to: Templeton Growth (Euro) Fund;Franklin Templeton Global Equity Strategies Fund*; andFranklin Templeton Global Fundamental Strategies Fund�.
TEMPLETON GLOBAL ADVISORS LIMITEDP.O. Box N-7759Lyford Cay, Nassau, Bahamas
* Templeton Global Advisors Limited has been appointed asCo-Investment Manager of this Fund, together with (i) Franklin MutualAdvisers, LLC, (ii) Templeton Asset Management Limited and(iii) Franklin Advisers, Inc.
� Templeton Global Advisors Limited has been appointed asCo-Investment Manager of this Fund, together with (i) Franklin MutualAdvisers, LLC and (ii) Franklin Advisers, Inc.
As to: Franklin World Perspectives Fund*;Templeton Global Smaller Companies Fund.
FRANKLIN TEMPLETON INVESTMENTS CORP.1, Adelaide Street East, Suite 2101,Toronto Ontario M5C 3B8, Canada
* Franklin Templeton Investments Corp. has been selected and appointedby the lead Investment Manager Franklin Advisers, Inc. as Co-InvestmentManager of this Fund together with (i) Franklin Templeton InvestmentsJapan Limited, (ii) Franklin Templeton Investimentos (Brasil) Ltda.,(iii) Franklin Templeton Investment Management Limited and(iv) Franklin Templeton Investment Trust Management Co. Limited.
As to: Franklin Mutual Beacon Fund*;Franklin Mutual Euroland Fund;Franklin Mutual European Fund;Franklin Mutual Global Discovery Fund*;Franklin Templeton Global Equity Strategies Fund�; andFranklin Templeton Global Fundamental Strategies Fund`.
FRANKLIN MUTUAL ADVISERS, LLC101 John F. Kennedy ParkwayShort Hills, NJ 07078-2789, U.S.A.
* Franklin Mutual Advisers, LLC has been appointed as Co-InvestmentManager for these Funds, together with Franklin Templeton InvestmentManagement Limited.
� Franklin Mutual Advisers, LLC has been appointed as Co-InvestmentManager of this Fund, together with (i) Franklin Advisers, Inc.,(ii) Templeton Asset Management Limited and (iii) Templeton GlobalAdvisors Limited.
` Franklin Mutual Advisers, LLC has been appointed as Co-InvestmentManager of this Fund, together with (i) Franklin Advisers, Inc. and(ii) Templeton Global Advisors Limited.
As to: Franklin World Perspectives Fund*;Franklin Templeton Japan Fund.
FRANKLIN TEMPLETON INVESTMENTS JAPAN LIMITEDKanematsu Building, 6th Floor14-1, Kyobashi 2 ^ chomeChuo-Ku, Tokyo, Japan
* Franklin Templeton Investments Japan Limited has been selected andappointed by the lead Investment Manager Franklin Advisers, Inc. as Co-Investment Manager of this Fund together with (i) Franklin TempletonInvestments Corp., (ii) Franklin Templeton Investimentos (Brasil) Ltda.,(iii) Franklin Templeton Investment Management Limited and(iv) Franklin Templeton Investment Trust Management Co. Limited.
As to: Franklin World Perspectives Fund*.
FRANKLIN TEMPLETON INVESTIMENTOS (Brasil) Ltda.Avenue Brigadeiro Faria Lima 3311, 5o andar,Sa‹o Paulo 04538-133, Brazil
* Franklin Templeton Investimentos (Brasil) Ltda. has been selected andappointed by the lead Investment Manager Franklin Advisers, Inc. asCo-Investment Manager of this Fund together with (i) Franklin TempletonInvestments Corp., (ii) Franklin Templeton Investments Japan Limited,(iii) Franklin Templeton Investment Management Limited and(iv) Franklin Templeton Investment Trust Management Co. Limited.
As to: Franklin World Perspectives Fund*.
FRANKLIN TEMPLETON INVESTMENT TRUST MANAGEMENTCO. LIMITED12 Youido-dong, Youngdungpo-gu,Seoul, Korea
* Franklin Templeton Investment Trust Management Co. Limited hasbeen selected and appointed by the lead Investment Manager FranklinAdvisers, Inc. as Co-Investment Manager of this Fund together with(i) Franklin Templeton Investments Corp., (ii) Franklin TempletonInvestments Japan Limited, (iii) Franklin Templeton Investimentos (Brasil)Ltda. and (iv) Franklin Templeton Investment Management Limited.
CUSTODIAN, LISTING AGENT AND PRINCIPAL PAYING AGENT:J.P. MORGAN BANK LUXEMBOURG S.A.European Bank and Business Centre6 Route de Tre'ves, L-2633 SenningerbergGrand-Duchy of Luxembourg
REGISTRAR AND TRANSFER, CORPORATE,DOMICILIARY AND ADMINISTRATIVE AGENT:FRANKLIN TEMPLETON INTERNATIONAL SERVICES S.A.26, boulevard Royal, L-2449 LuxembourgGrand-Duchy of Luxembourg
AUDITORS:PRICEWATERHOUSECOOPERS S.a' r.l.400, route d’Esch, B.P. 1443, L-1014 LuxembourgGrand-Duchy of Luxembourg
LEGAL ADVISERS:ELVINGER, HOSS & PRUSSEN2, place Winston Churchill, B.P. 425, L-2014 LuxembourgGrand-Duchy of Luxembourg
FRANKL IN TEMPLETON INVESTMENT FUNDS
General Information (as at December 31, 2008)
Unaudited Semi-Annual Report www.franklintempleton.lu4
Market conditions have been extremely difficult over the past six months. The performance of most asset classes was adverselyaffected by unprecedented problems in the financials sector that initially became visible in mid-2007.
Through much of the period under review, banks exposed to the rapid decline in property markets in the U.S. and parts ofEurope faced mounting losses and increasing funding problems. The crisis in the financials sector reached a climax in mid-September with the collapse of Lehman Brothers, which led other investment banks such as Merrill Lynch to seek mergers withstronger, deposit-taking banks or capital injections from a variety of sources. A number of financial institutions on both sidesof the Atlantic had to be saved through state intervention, leading to large-scale nationalization and a wave of forced mergers.
Tightening credit conditions forced consumers and companies alike to deleverage, leading to falling demand and provokingrecession across the developed world. Countries such as Hungary and Ukraine faced severe difficulties as investor risk aversionincreased, while Iceland faced a sharp contraction in its economy following the overexpansion of the country’s main banks andan equally sharp depreciation in the value of its currency.
For equity investors, style and geographic diversification proved to be less relevant than in the past, with markets in Europe,the U.S. and Japan all falling pretty uniformly (allowing for currency variations). Although large-cap stocks showed some slightoutperformance toward the end of the period under review, large-cap and small-cap stocks alike produced negative returns.Nor was there much difference in the returns produced by ‘growth’-style investing versus ‘value’-style peers.
The price of oil and other commodities peaked in July, but subsequently declined in the face of a slump in demand, leading toincreased risk of deflation in the developed world. Important commodity producers such as Russia and Brazil initially resistedthe severe downturn in the western world and in countries reliant on food and energy imports. However, as the half-year drewto a close, commodity-reliant countries like Russia were feeling the full effect of diminished world growth prospects.
Despite repeated intervention by public authorities, the banks’ difficulty in sourcing funding on the interbank market in turnhad a negative impact on the availability of credit to the wider economy around the developed world. On the credit markets,better-quality credits, which had previously fared relatively well, were seriously hurt by the fallout from Lehman’s collapse inSeptember. Spreads in the corporate bond market widened considerably, whether for investment-grade or non-investment-gradebonds.
Given the sharp rise in risk aversion seen in the six months under review, it is not surprising that long-dated government bondssignificantly outperformed equities. By December, the liquidity and credit problems affecting most other asset classes hadpushed U.S. Treasury yields to multi-decade lows.
Low yields in the U.S. put an end to a revival in the dollar’s value against the euro as the period wore on, while the UKsterling fell heavily against both the euro and the dollar because investors grew steadily more alarmed by the UK’s dependenceon the financial sector and high household indebtedness. The best-performing currency has been the Japanese yen, with risingrisk aversion prompting a progressive unwinding of carry trades between low-yielding currencies (such as the yen) and onespromising higher yields. Alas, the yen’s rise has driven Japan’s export-driven economy even deeper into recession.
As we moved into the second half of the financial year, economic data continued to be dire. Home prices in developedcountries still have not stabilized, consumer and corporate confidence is low, and question marks remain over the future ofsome high-profile names in sectors such as financial services and the auto industry.
In November, the International Monetary Fund (IMF) forecast that global growth would slow to 2.2% in 2009, down fromabout 3.7% in 2008. The U.S. economy, the IMF predicts, will contract by 0.7% and the eurozone by 0.5%. Forecasts byother parties have been even more somber, with the European central bank predicting that the eurozone economy may contractby up to one percentage point in 2009.
Toward the end of the reporting period, there were some signs that the panic of recent months was starting to abate. Stockvolatility indexes were off their October peaks, and interbank markets felt some relief.
The first six months of 2009 are expected to be especially difficult, and financial markets will likely have to withstand a largeincrease in corporate default rates. However, repeated fiscal and monetary stimuli may help stabilize the situation during thecourse of the year. Should official stimulus be seen to work, the attractiveness of high-grade corporate bonds may become moreevident, at least in the near and intermediate term.
Despite deleveraging and continued economic difficulties, improvement in the credit markets may spark renewed interest inequities, which are already trading at low book values on a historical basis and pricing in steep declines in profits. But in sucha scenario, the recent bull market in long-dated government bonds may well be brought into question, especially in light oflarge increases in bond issuance in the industrialized world.
Although conditions on financial markets may be challenging, investors should remember that Franklin Templeton Investmentshas navigated through periods of high market volatility in the past, such as that following the stock market crash of 1987.Throughout, we have remained committed to our long-term perspective and investment philosophy. We view recent volatility asa long-term opportunity. Although conditions remain challenging, our experience gives us ample reason to be optimistic aboutmarket stabilization and recovery.
THE INVESTMENT MANAGERSJanuary, 2009
The information in this report represents historical data and is not an indication of future results.
FRANKL IN TEMPLETON INVESTMENT FUNDS
Report of the Investment Managers
www.franklintempleton.lu Unaudited Semi-Annual Report 5
Launch Base 6 1 3 5 10 SinceDate Currency Months Year Years Years Years Launch
% % % % % %
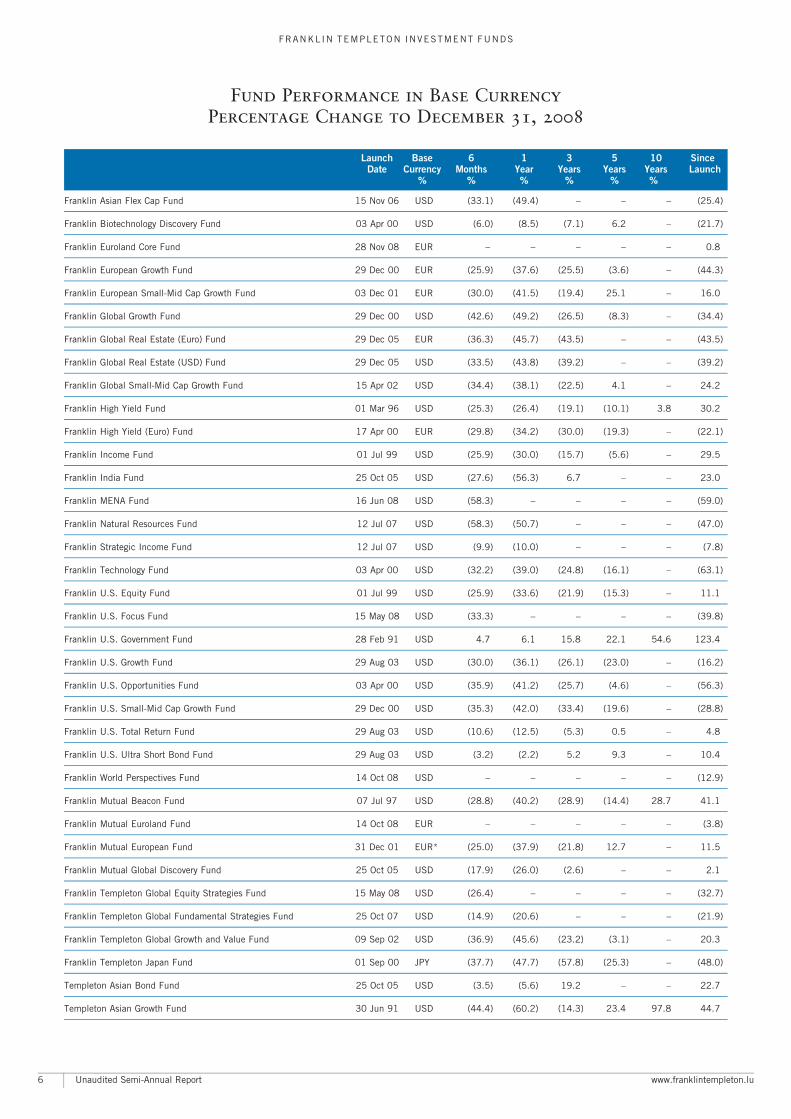
Franklin Asian Flex Cap Fund 15 Nov 06 USD (33.1) (49.4) ^ ^ ^ (25.4)
Franklin Biotechnology Discovery Fund 03 Apr 00 USD (6.0) (8.5) (7.1) 6.2 ^ (21.7)
Franklin Euroland Core Fund 28 Nov 08 EUR ^ ^ ^ ^ ^ 0.8
Franklin European Growth Fund 29 Dec 00 EUR (25.9) (37.6) (25.5) (3.6) ^ (44.3)
Franklin European Small-Mid Cap Growth Fund 03 Dec 01 EUR (30.0) (41.5) (19.4) 25.1 ^ 16.0
Franklin Global Growth Fund 29 Dec 00 USD (42.6) (49.2) (26.5) (8.3) ^ (34.4)
Franklin Global Real Estate (Euro) Fund 29 Dec 05 EUR (36.3) (45.7) (43.5) ^ ^ (43.5)
Franklin Global Real Estate (USD) Fund 29 Dec 05 USD (33.5) (43.8) (39.2) ^ ^ (39.2)
Franklin Global Small-Mid Cap Growth Fund 15 Apr 02 USD (34.4) (38.1) (22.5) 4.1 ^ 24.2
Franklin High Yield Fund 01 Mar 96 USD (25.3) (26.4) (19.1) (10.1) 3.8 30.2
Franklin High Yield (Euro) Fund 17 Apr 00 EUR (29.8) (34.2) (30.0) (19.3) ^ (22.1)
Franklin Income Fund 01 Jul 99 USD (25.9) (30.0) (15.7) (5.6) ^ 29.5
Franklin India Fund 25 Oct 05 USD (27.6) (56.3) 6.7 ^ ^ 23.0
Franklin MENA Fund 16 Jun 08 USD (58.3) ^ ^ ^ ^ (59.0)
Franklin Natural Resources Fund 12 Jul 07 USD (58.3) (50.7) ^ ^ ^ (47.0)
Franklin Strategic Income Fund 12 Jul 07 USD (9.9) (10.0) ^ ^ ^ (7.8)
Franklin Technology Fund 03 Apr 00 USD (32.2) (39.0) (24.8) (16.1) ^ (63.1)
Franklin U.S. Equity Fund 01 Jul 99 USD (25.9) (33.6) (21.9) (15.3) ^ 11.1
Franklin U.S. Focus Fund 15 May 08 USD (33.3) ^ ^ ^ ^ (39.8)
Franklin U.S. Government Fund 28 Feb 91 USD 4.7 6.1 15.8 22.1 54.6 123.4
Franklin U.S. Growth Fund 29 Aug 03 USD (30.0) (36.1) (26.1) (23.0) ^ (16.2)
Franklin U.S. Opportunities Fund 03 Apr 00 USD (35.9) (41.2) (25.7) (4.6) ^ (56.3)
Franklin U.S. Small-Mid Cap Growth Fund 29 Dec 00 USD (35.3) (42.0) (33.4) (19.6) ^ (28.8)
Franklin U.S. Total Return Fund 29 Aug 03 USD (10.6) (12.5) (5.3) 0.5 ^ 4.8
Franklin U.S. Ultra Short Bond Fund 29 Aug 03 USD (3.2) (2.2) 5.2 9.3 ^ 10.4
Franklin World Perspectives Fund 14 Oct 08 USD ^ ^ ^ ^ ^ (12.9)
Franklin Mutual Beacon Fund 07 Jul 97 USD (28.8) (40.2) (28.9) (14.4) 28.7 41.1
Franklin Mutual Euroland Fund 14 Oct 08 EUR ^ ^ ^ ^ ^ (3.8)
Franklin Mutual European Fund 31 Dec 01 EUR* (25.0) (37.9) (21.8) 12.7 ^ 11.5
Franklin Mutual Global Discovery Fund 25 Oct 05 USD (17.9) (26.0) (2.6) ^ ^ 2.1
Franklin Templeton Global Equity Strategies Fund 15 May 08 USD (26.4) ^ ^ ^ ^ (32.7)
Franklin Templeton Global Fundamental Strategies Fund 25 Oct 07 USD (14.9) (20.6) ^ ^ ^ (21.9)
Franklin Templeton Global Growth and Value Fund 09 Sep 02 USD (36.9) (45.6) (23.2) (3.1) ^ 20.3
Franklin Templeton Japan Fund 01 Sep 00 JPY (37.7) (47.7) (57.8) (25.3) ^ (48.0)
Templeton Asian Bond Fund 25 Oct 05 USD (3.5) (5.6) 19.2 ^ ^ 22.7
Templeton Asian Growth Fund 30 Jun 91 USD (44.4) (60.2) (14.3) 23.4 97.8 44.7
FRANKL IN TEMPLETON INVESTMENT FUNDS
Fund Performance in Base Currency
Percentage Change to December 31, 2008
Unaudited Semi-Annual Report www.franklintempleton.lu6
Launch Base 6 1 3 5 10 SinceDate Currency Months Year Years Years Years Launch
% % % % % %
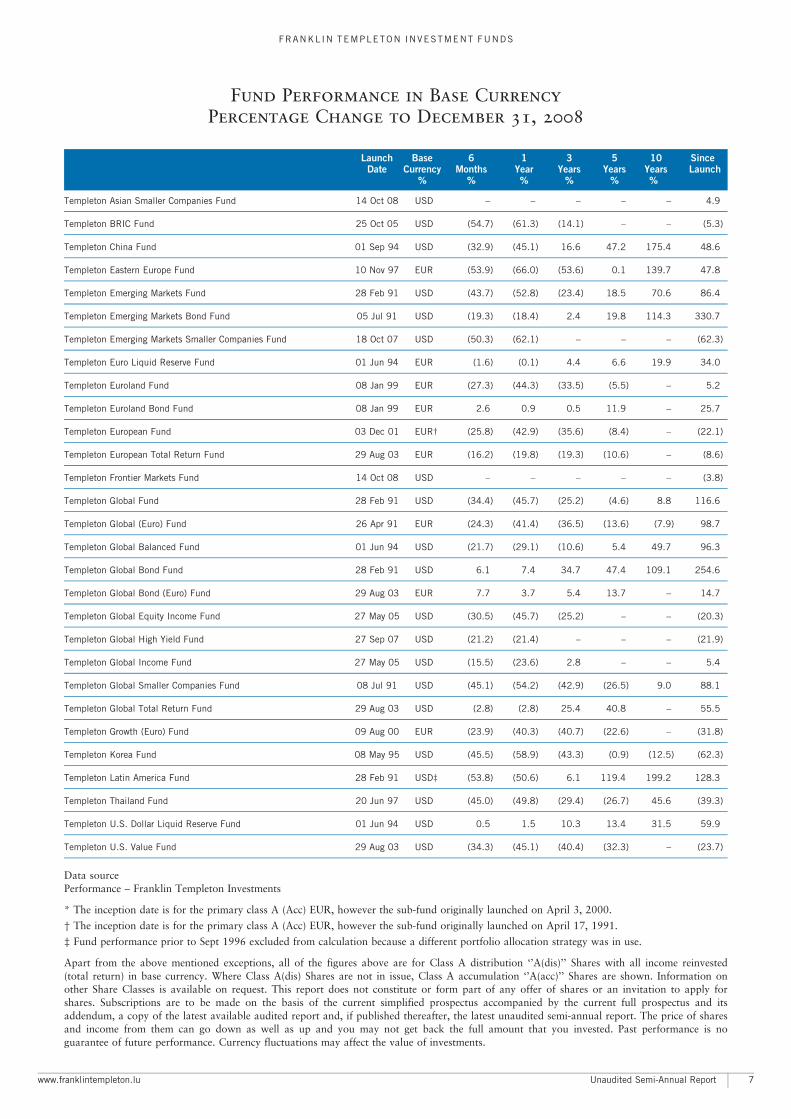
Templeton Asian Smaller Companies Fund 14 Oct 08 USD ^ ^ ^ ^ ^ 4.9
Templeton BRIC Fund 25 Oct 05 USD (54.7) (61.3) (14.1) ^ ^ (5.3)
Templeton China Fund 01 Sep 94 USD (32.9) (45.1) 16.6 47.2 175.4 48.6
Templeton Eastern Europe Fund 10 Nov 97 EUR (53.9) (66.0) (53.6) 0.1 139.7 47.8
Templeton Emerging Markets Fund 28 Feb 91 USD (43.7) (52.8) (23.4) 18.5 70.6 86.4
Templeton Emerging Markets Bond Fund 05 Jul 91 USD (19.3) (18.4) 2.4 19.8 114.3 330.7
Templeton Emerging Markets Smaller Companies Fund 18 Oct 07 USD (50.3) (62.1) ^ ^ ^ (62.3)
Templeton Euro Liquid Reserve Fund 01 Jun 94 EUR (1.6) (0.1) 4.4 6.6 19.9 34.0
Templeton Euroland Fund 08 Jan 99 EUR (27.3) (44.3) (33.5) (5.5) ^ 5.2
Templeton Euroland Bond Fund 08 Jan 99 EUR 2.6 0.9 0.5 11.9 ^ 25.7
Templeton European Fund 03 Dec 01 EUR� (25.8) (42.9) (35.6) (8.4) ^ (22.1)
Templeton European Total Return Fund 29 Aug 03 EUR (16.2) (19.8) (19.3) (10.6) ^ (8.6)
Templeton Frontier Markets Fund 14 Oct 08 USD ^ ^ ^ ^ ^ (3.8)
Templeton Global Fund 28 Feb 91 USD (34.4) (45.7) (25.2) (4.6) 8.8 116.6
Templeton Global (Euro) Fund 26 Apr 91 EUR (24.3) (41.4) (36.5) (13.6) (7.9) 98.7
Templeton Global Balanced Fund 01 Jun 94 USD (21.7) (29.1) (10.6) 5.4 49.7 96.3
Templeton Global Bond Fund 28 Feb 91 USD 6.1 7.4 34.7 47.4 109.1 254.6
Templeton Global Bond (Euro) Fund 29 Aug 03 EUR 7.7 3.7 5.4 13.7 ^ 14.7
Templeton Global Equity Income Fund 27 May 05 USD (30.5) (45.7) (25.2) ^ ^ (20.3)
Templeton Global High Yield Fund 27 Sep 07 USD (21.2) (21.4) ^ ^ ^ (21.9)
Templeton Global Income Fund 27 May 05 USD (15.5) (23.6) 2.8 ^ ^ 5.4
Templeton Global Smaller Companies Fund 08 Jul 91 USD (45.1) (54.2) (42.9) (26.5) 9.0 88.1
Templeton Global Total Return Fund 29 Aug 03 USD (2.8) (2.8) 25.4 40.8 ^ 55.5
Templeton Growth (Euro) Fund 09 Aug 00 EUR (23.9) (40.3) (40.7) (22.6) ^ (31.8)
Templeton Korea Fund 08 May 95 USD (45.5) (58.9) (43.3) (0.9) (12.5) (62.3)
Templeton Latin America Fund 28 Feb 91 USD` (53.8) (50.6) 6.1 119.4 199.2 128.3
Templeton Thailand Fund 20 Jun 97 USD (45.0) (49.8) (29.4) (26.7) 45.6 (39.3)
Templeton U.S. Dollar Liquid Reserve Fund 01 Jun 94 USD 0.5 1.5 10.3 13.4 31.5 59.9
Templeton U.S. Value Fund 29 Aug 03 USD (34.3) (45.1) (40.4) (32.3) ^ (23.7)
Data sourcePerformance ^ Franklin Templeton Investments
* The inception date is for the primary class A (Acc) EUR, however the sub-fund originally launched on April 3, 2000.
� The inception date is for the primary class A (Acc) EUR, however the sub-fund originally launched on April 17, 1991.
` Fund performance prior to Sept 1996 excluded from calculation because a different portfolio allocation strategy was in use.
Apart from the above mentioned exceptions, all of the figures above are for Class A distribution ‘’A(dis)’’ Shares with all income reinvested(total return) in base currency. Where Class A(dis) Shares are not in issue, Class A accumulation ‘’A(acc)’’ Shares are shown. Information onother Share Classes is available on request. This report does not constitute or form part of any offer of shares or an invitation to apply forshares. Subscriptions are to be made on the basis of the current simplified prospectus accompanied by the current full prospectus and itsaddendum, a copy of the latest available audited report and, if published thereafter, the latest unaudited semi-annual report. The price of sharesand income from them can go down as well as up and you may not get back the full amount that you invested. Past performance is noguarantee of future performance. Currency fluctuations may affect the value of investments.
FRANKL IN TEMPLETON INVESTMENT FUNDS
Fund Performance in Base Currency
Percentage Change to December 31, 2008
www.franklintempleton.lu Unaudited Semi-Annual Report 7
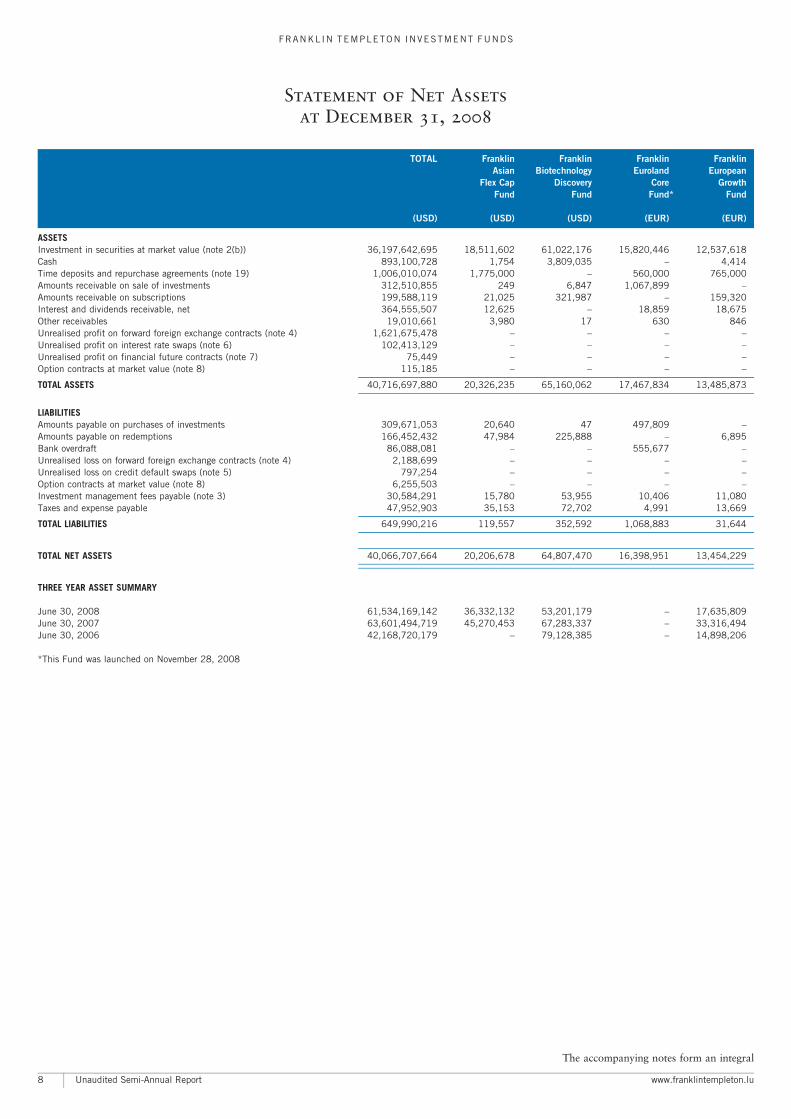
TOTAL Franklin Franklin Franklin Franklin
Asian Biotechnology Euroland European
Flex Cap Discovery Core Growth
Fund Fund Fund* Fund
(USD) (USD) (USD) (EUR) (EUR)
ASSETSInvestment in securities at market value (note 2(b)) 36,197,642,695 18,511,602 61,022,176 15,820,446 12,537,618Cash 893,100,728 1,754 3,809,035 ^ 4,414Time deposits and repurchase agreements (note 19) 1,006,010,074 1,775,000 ^ 560,000 765,000Amounts receivable on sale of investments 312,510,855 249 6,847 1,067,899 ^Amounts receivable on subscriptions 199,588,119 21,025 321,987 ^ 159,320Interest and dividends receivable, net 364,555,507 12,625 ^ 18,859 18,675Other receivables 19,010,661 3,980 17 630 846Unrealised profit on forward foreign exchange contracts (note 4) 1,621,675,478 ^ ^ ^ ^Unrealised profit on interest rate swaps (note 6) 102,413,129 ^ ^ ^ ^Unrealised profit on financial future contracts (note 7) 75,449 ^ ^ ^ ^Option contracts at market value (note 8) 115,185 ^ ^ ^ ^
TOTAL ASSETS 40,716,697,880 20,326,235 65,160,062 17,467,834 13,485,873
LIABILITIESAmounts payable on purchases of investments 309,671,053 20,640 47 497,809 ^Amounts payable on redemptions 166,452,432 47,984 225,888 ^ 6,895Bank overdraft 86,088,081 ^ ^ 555,677 ^Unrealised loss on forward foreign exchange contracts (note 4) 2,188,699 ^ ^ ^ ^Unrealised loss on credit default swaps (note 5) 797,254 ^ ^ ^ ^Option contracts at market value (note 8) 6,255,503 ^ ^ ^ ^Investment management fees payable (note 3) 30,584,291 15,780 53,955 10,406 11,080Taxes and expense payable 47,952,903 35,153 72,702 4,991 13,669
TOTAL LIABILITIES 649,990,216 119,557 352,592 1,068,883 31,644
TOTAL NET ASSETS 40,066,707,664 20,206,678 64,807,470 16,398,951 13,454,229
THREE YEAR ASSET SUMMARY(USD) (USD) (USD) (EUR) (EUR)
June 30, 2008 61,534,169,142 36,332,132 53,201,179 ^ 17,635,809June 30, 2007 63,601,494,719 45,270,453 67,283,337 ^ 33,316,494June 30, 2006 42,168,720,179 ^ 79,128,385 ^ 14,898,206
*This Fund was launched on November 28, 2008
The accompanying notes form an integral
FRANKL IN TEMPLETON INVESTMENT FUNDS
Statement of Net Assets
at December 31, 2008
Unaudited Semi-Annual Report www.franklintempleton.lu8
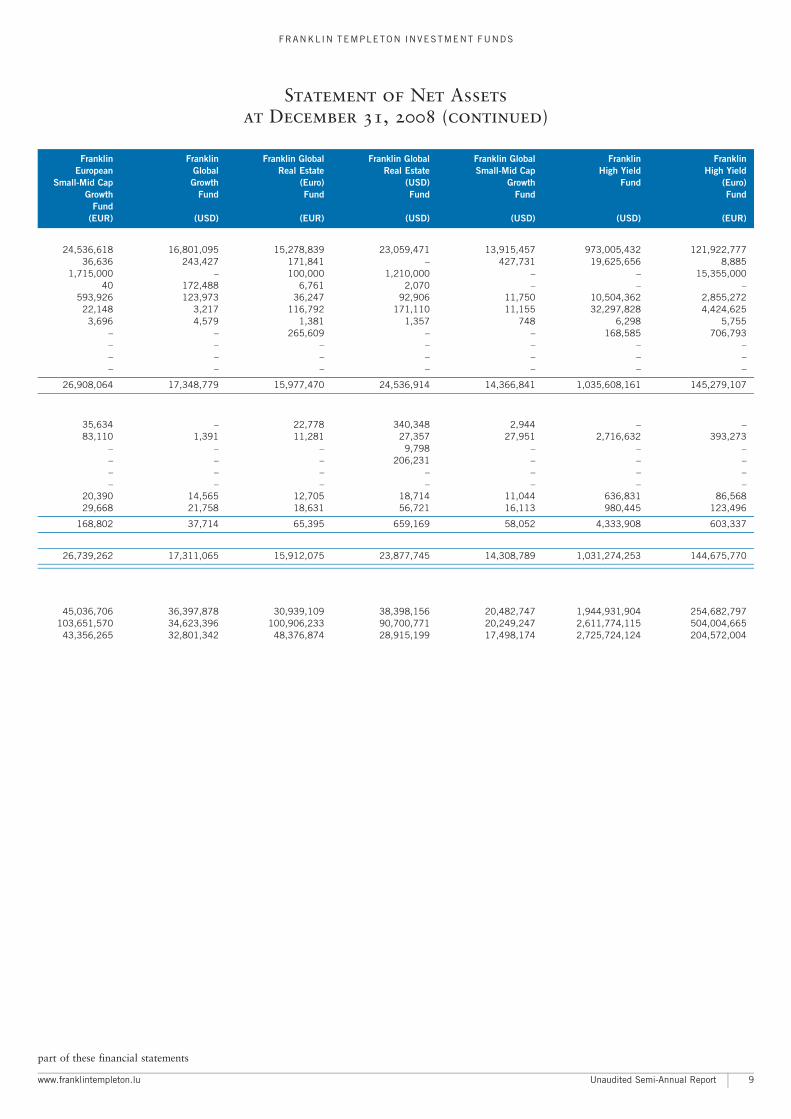
Franklin Franklin Franklin Global Franklin Global Franklin Global Franklin Franklin
European Global Real Estate Real Estate Small-Mid Cap High Yield High Yield
Small-Mid Cap Growth (Euro) (USD) Growth Fund (Euro)
Growth Fund Fund Fund Fund Fund
Fund
(EUR) (USD) (EUR) (USD) (USD) (USD) (EUR)
24,536,618 16,801,095 15,278,839 23,059,471 13,915,457 973,005,432 121,922,77736,636 243,427 171,841 ^ 427,731 19,625,656 8,885
1,715,000 ^ 100,000 1,210,000 ^ ^ 15,355,00040 172,488 6,761 2,070 ^ ^ ^
593,926 123,973 36,247 92,906 11,750 10,504,362 2,855,27222,148 3,217 116,792 171,110 11,155 32,297,828 4,424,6253,696 4,579 1,381 1,357 748 6,298 5,755
^ ^ 265,609 ^ ^ 168,585 706,793^ ^ ^ ^ ^ ^ ^^ ^ ^ ^ ^ ^ ^^ ^ ^ ^ ^ ^ ^
26,908,064 17,348,779 15,977,470 24,536,914 14,366,841 1,035,608,161 145,279,107
35,634 ^ 22,778 340,348 2,944 ^ ^83,110 1,391 11,281 27,357 27,951 2,716,632 393,273
^ ^ ^ 9,798 ^ ^ ^^ ^ ^ 206,231 ^ ^ ^^ ^ ^ ^ ^ ^ ^^ ^ ^ ^ ^ ^ ^
20,390 14,565 12,705 18,714 11,044 636,831 86,56829,668 21,758 18,631 56,721 16,113 980,445 123,496
168,802 37,714 65,395 659,169 58,052 4,333,908 603,337
26,739,262 17,311,065 15,912,075 23,877,745 14,308,789 1,031,274,253 144,675,770
(EUR) (USD) (EUR) (USD) (USD) (USD) (EUR)
45,036,706 36,397,878 30,939,109 38,398,156 20,482,747 1,944,931,904 254,682,797103,651,570 34,623,396 100,906,233 90,700,771 20,249,247 2,611,774,115 504,004,66543,356,265 32,801,342 48,376,874 28,915,199 17,498,174 2,725,724,124 204,572,004
part of these financial statements
www.franklintempleton.lu Unaudited Semi-Annual Report
FRANKL IN TEMPLETON INVESTMENT FUNDS
Statement of Net Assets
at December 31, 2008 (continued)
9
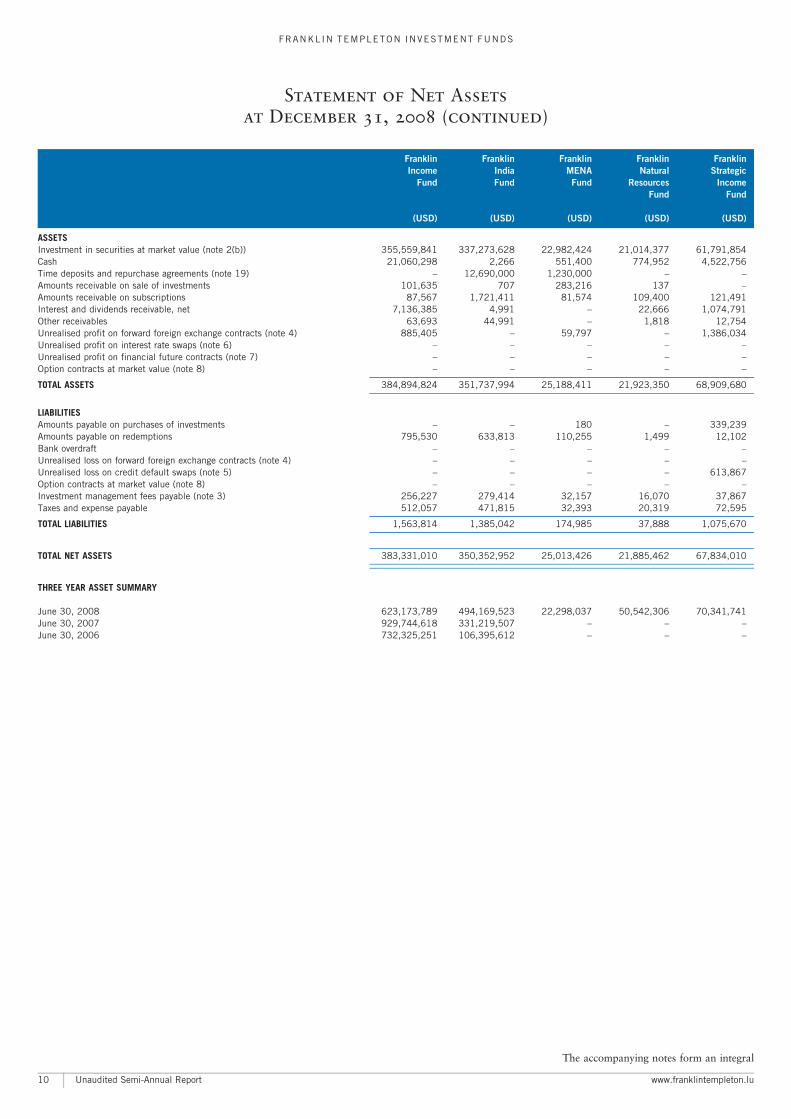
Franklin Franklin Franklin Franklin Franklin
Income India MENA Natural Strategic
Fund Fund Fund Resources Income
Fund Fund
(USD) (USD) (USD) (USD) (USD)
ASSETSInvestment in securities at market value (note 2(b)) 355,559,841 337,273,628 22,982,424 21,014,377 61,791,854Cash 21,060,298 2,266 551,400 774,952 4,522,756Time deposits and repurchase agreements (note 19) ^ 12,690,000 1,230,000 ^ ^Amounts receivable on sale of investments 101,635 707 283,216 137 ^Amounts receivable on subscriptions 87,567 1,721,411 81,574 109,400 121,491Interest and dividends receivable, net 7,136,385 4,991 ^ 22,666 1,074,791Other receivables 63,693 44,991 ^ 1,818 12,754Unrealised profit on forward foreign exchange contracts (note 4) 885,405 ^ 59,797 ^ 1,386,034Unrealised profit on interest rate swaps (note 6) ^ ^ ^ ^ ^Unrealised profit on financial future contracts (note 7) ^ ^ ^ ^ ^Option contracts at market value (note 8) ^ ^ ^ ^ ^
TOTAL ASSETS 384,894,824 351,737,994 25,188,411 21,923,350 68,909,680
LIABILITIESAmounts payable on purchases of investments ^ ^ 180 ^ 339,239Amounts payable on redemptions 795,530 633,813 110,255 1,499 12,102Bank overdraft ^ ^ ^ ^ ^Unrealised loss on forward foreign exchange contracts (note 4) ^ ^ ^ ^ ^Unrealised loss on credit default swaps (note 5) ^ ^ ^ ^ 613,867Option contracts at market value (note 8) ^ ^ ^ ^ ^Investment management fees payable (note 3) 256,227 279,414 32,157 16,070 37,867Taxes and expense payable 512,057 471,815 32,393 20,319 72,595
TOTAL LIABILITIES 1,563,814 1,385,042 174,985 37,888 1,075,670
TOTAL NET ASSETS 383,331,010 350,352,952 25,013,426 21,885,462 67,834,010
THREE YEAR ASSET SUMMARY(USD) (USD) (USD) (USD) (USD)
June 30, 2008 623,173,789 494,169,523 22,298,037 50,542,306 70,341,741June 30, 2007 929,744,618 331,219,507 ^ ^ ^June 30, 2006 732,325,251 106,395,612 ^ ^ ^
The accompanying notes form an integral
Unaudited Semi-Annual Report www.franklintempleton.lu
FRANKL IN TEMPLETON INVESTMENT FUNDS
Statement of Net Assets
at December 31, 2008 (continued)
10
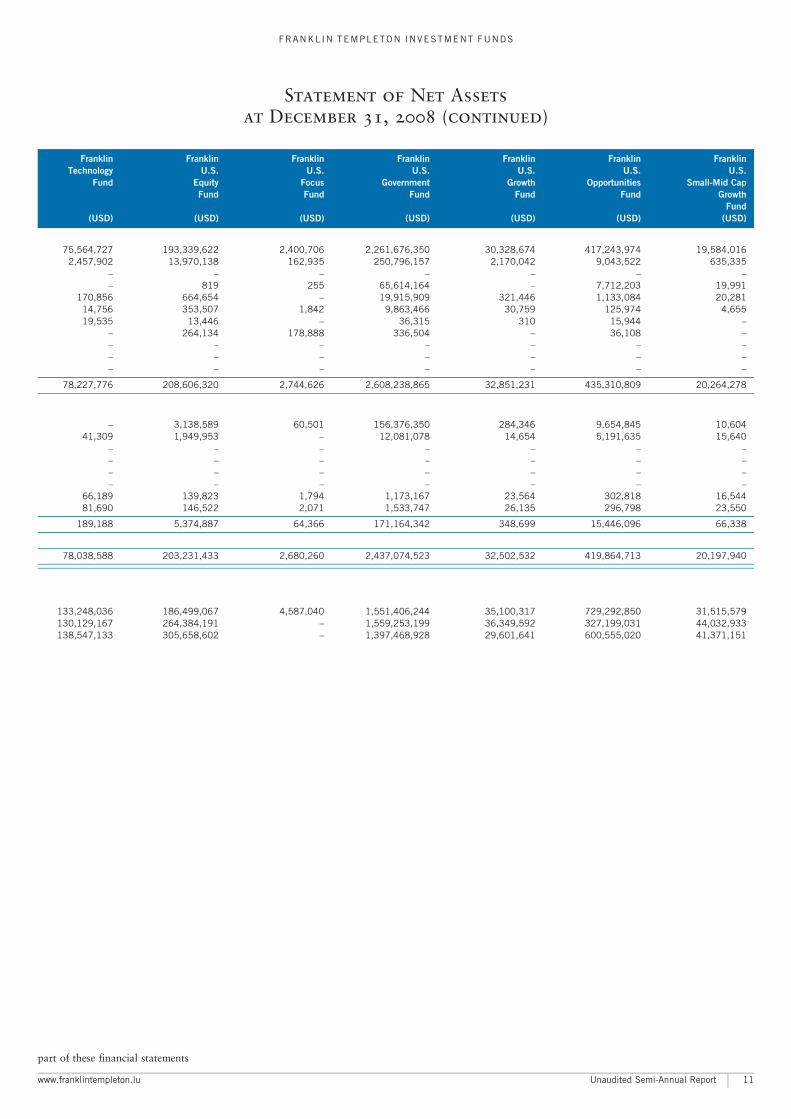
Franklin Franklin Franklin Franklin Franklin Franklin Franklin
Technology U.S. U.S. U.S. U.S. U.S. U.S.
Fund Equity Focus Government Growth Opportunities Small-Mid Cap
Fund Fund Fund Fund Fund Growth
Fund
(USD) (USD) (USD) (USD) (USD) (USD) (USD)
75,564,727 193,339,622 2,400,706 2,261,676,350 30,328,674 417,243,974 19,584,0162,457,902 13,970,138 162,935 250,796,157 2,170,042 9,043,522 635,335
^ ^ ^ ^ ^ ^ ^^ 819 255 65,614,164 ^ 7,712,203 19,991
170,856 664,654 ^ 19,915,909 321,446 1,133,084 20,28114,756 353,507 1,842 9,863,466 30,759 125,974 4,65519,535 13,446 ^ 36,315 310 15,944 ^
^ 264,134 178,888 336,504 ^ 36,108 ^^ ^ ^ ^ ^ ^ ^^ ^ ^ ^ ^ ^ ^^ ^ ^ ^ ^ ^ ^
78,227,776 208,606,320 2,744,626 2,608,238,865 32,851,231 435,310,809 20,264,278
^ 3,138,589 60,501 156,376,350 284,346 9,654,845 10,60441,309 1,949,953 ^ 12,081,078 14,654 5,191,635 15,640
^ ^ ^ ^ ^ ^ ^^ ^ ^ ^ ^ ^ ^^ ^ ^ ^ ^ ^ ^^ ^ ^ ^ ^ ^ ^
66,189 139,823 1,794 1,173,167 23,564 302,818 16,54481,690 146,522 2,071 1,533,747 26,135 296,798 23,550
189,188 5,374,887 64,366 171,164,342 348,699 15,446,096 66,338
78,038,588 203,231,433 2,680,260 2,437,074,523 32,502,532 419,864,713 20,197,940
(USD) (USD) (USD) (USD) (USD) (USD) (USD)
133,248,036 186,499,067 4,587,040 1,551,406,244 35,100,317 729,292,850 31,515,579130,129,167 264,384,191 ^ 1,559,253,199 36,349,592 327,199,031 44,032,933138,547,133 305,658,602 ^ 1,397,468,928 29,601,641 600,555,020 41,371,151
part of these financial statements
www.franklintempleton.lu Unaudited Semi-Annual Report
FRANKL IN TEMPLETON INVESTMENT FUNDS
Statement of Net Assets
at December 31, 2008 (continued)
11
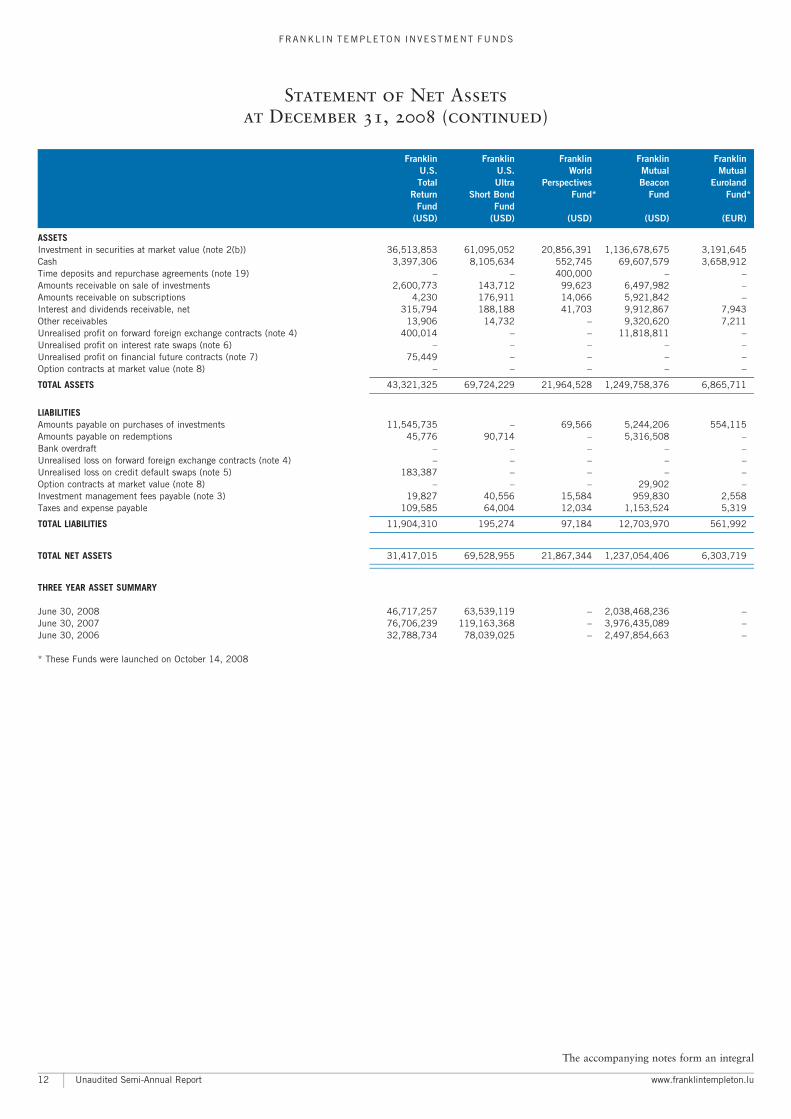
Franklin Franklin Franklin Franklin Franklin
U.S. U.S. World Mutual Mutual
Total Ultra Perspectives Beacon Euroland
Return Short Bond Fund* Fund Fund*
Fund Fund
(USD) (USD) (USD) (USD) (EUR)
ASSETSInvestment in securities at market value (note 2(b)) 36,513,853 61,095,052 20,856,391 1,136,678,675 3,191,645Cash 3,397,306 8,105,634 552,745 69,607,579 3,658,912Time deposits and repurchase agreements (note 19) ^ ^ 400,000 ^ ^Amounts receivable on sale of investments 2,600,773 143,712 99,623 6,497,982 ^Amounts receivable on subscriptions 4,230 176,911 14,066 5,921,842 ^Interest and dividends receivable, net 315,794 188,188 41,703 9,912,867 7,943Other receivables 13,906 14,732 ^ 9,320,620 7,211Unrealised profit on forward foreign exchange contracts (note 4) 400,014 ^ ^ 11,818,811 ^Unrealised profit on interest rate swaps (note 6) ^ ^ ^ ^ ^Unrealised profit on financial future contracts (note 7) 75,449 ^ ^ ^ ^Option contracts at market value (note 8) ^ ^ ^ ^ ^
TOTAL ASSETS 43,321,325 69,724,229 21,964,528 1,249,758,376 6,865,711
LIABILITIESAmounts payable on purchases of investments 11,545,735 ^ 69,566 5,244,206 554,115Amounts payable on redemptions 45,776 90,714 ^ 5,316,508 ^Bank overdraft ^ ^ ^ ^ ^Unrealised loss on forward foreign exchange contracts (note 4) ^ ^ ^ ^ ^Unrealised loss on credit default swaps (note 5) 183,387 ^ ^ ^ ^Option contracts at market value (note 8) ^ ^ ^ 29,902 ^Investment management fees payable (note 3) 19,827 40,556 15,584 959,830 2,558Taxes and expense payable 109,585 64,004 12,034 1,153,524 5,319
TOTAL LIABILITIES 11,904,310 195,274 97,184 12,703,970 561,992
TOTAL NET ASSETS 31,417,015 69,528,955 21,867,344 1,237,054,406 6,303,719
THREE YEAR ASSET SUMMARY(USD) (USD) (USD) (USD) (EUR)
June 30, 2008 46,717,257 63,539,119 ^ 2,038,468,236 ^June 30, 2007 76,706,239 119,163,368 ^ 3,976,435,089 ^June 30, 2006 32,788,734 78,039,025 ^ 2,497,854,663 ^
* These Funds were launched on October 14, 2008
The accompanying notes form an integral
Unaudited Semi-Annual Report www.franklintempleton.lu
FRANKL IN TEMPLETON INVESTMENT FUNDS
Statement of Net Assets
at December 31, 2008 (continued)
12
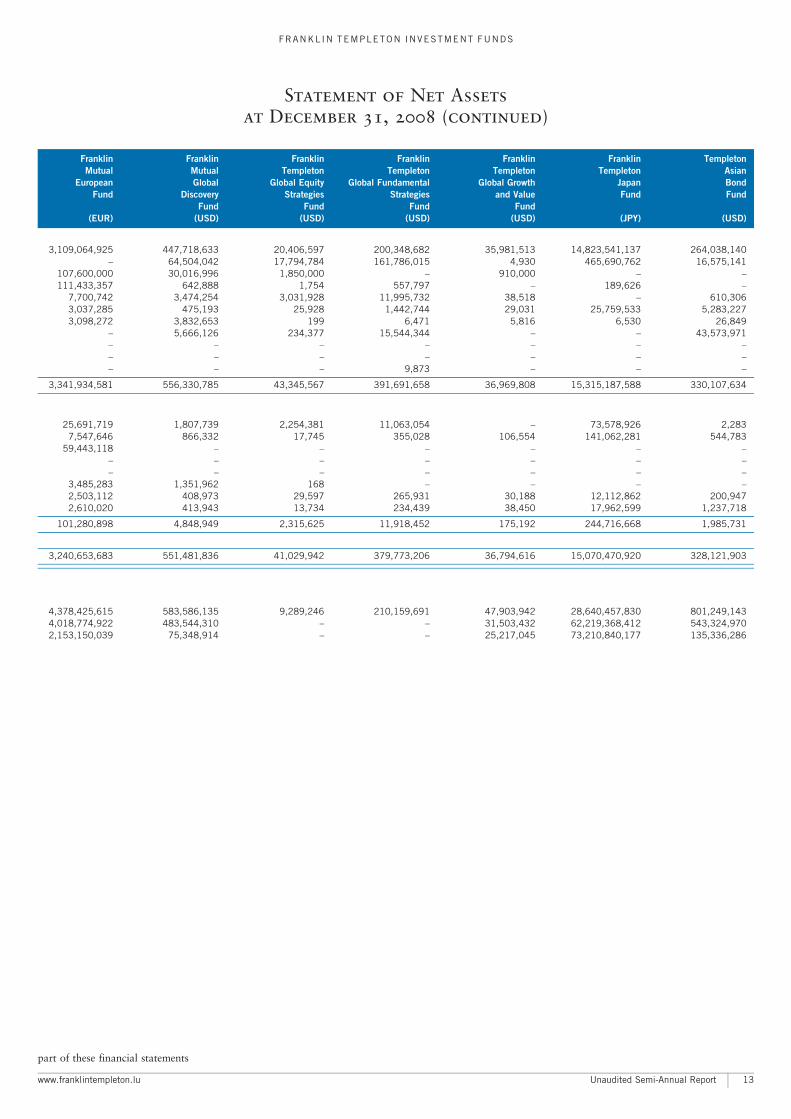
Franklin Franklin Franklin Franklin Franklin Franklin Templeton
Mutual Mutual Templeton Templeton Templeton Templeton Asian
European Global Global Equity Global Fundamental Global Growth Japan Bond
Fund Discovery Strategies Strategies and Value Fund Fund
Fund Fund Fund Fund
(EUR) (USD) (USD) (USD) (USD) (JPY) (USD)
3,109,064,925 447,718,633 20,406,597 200,348,682 35,981,513 14,823,541,137 264,038,140^ 64,504,042 17,794,784 161,786,015 4,930 465,690,762 16,575,141
107,600,000 30,016,996 1,850,000 ^ 910,000 ^ ^111,433,357 642,888 1,754 557,797 ^ 189,626 ^
7,700,742 3,474,254 3,031,928 11,995,732 38,518 ^ 610,3063,037,285 475,193 25,928 1,442,744 29,031 25,759,533 5,283,2273,098,272 3,832,653 199 6,471 5,816 6,530 26,849
^ 5,666,126 234,377 15,544,344 ^ ^ 43,573,971^ ^ ^ ^ ^ ^ ^^ ^ ^ ^ ^ ^ ^^ ^ ^ 9,873 ^ ^ ^
3,341,934,581 556,330,785 43,345,567 391,691,658 36,969,808 15,315,187,588 330,107,634
25,691,719 1,807,739 2,254,381 11,063,054 ^ 73,578,926 2,2837,547,646 866,332 17,745 355,028 106,554 141,062,281 544,783
59,443,118 ^ ^ ^ ^ ^ ^^ ^ ^ ^ ^ ^ ^^ ^ ^ ^ ^ ^ ^
3,485,283 1,351,962 168 ^ ^ ^ ^2,503,112 408,973 29,597 265,931 30,188 12,112,862 200,9472,610,020 413,943 13,734 234,439 38,450 17,962,599 1,237,718
101,280,898 4,848,949 2,315,625 11,918,452 175,192 244,716,668 1,985,731
3,240,653,683 551,481,836 41,029,942 379,773,206 36,794,616 15,070,470,920 328,121,903
(EUR) (USD) (USD) (USD) (USD) (JPY) (USD)
4,378,425,615 583,586,135 9,289,246 210,159,691 47,903,942 28,640,457,830 801,249,1434,018,774,922 483,544,310 ^ ^ 31,503,432 62,219,368,412 543,324,9702,153,150,039 75,348,914 ^ ^ 25,217,045 73,210,840,177 135,336,286
part of these financial statements
www.franklintempleton.lu Unaudited Semi-Annual Report
FRANKL IN TEMPLETON INVESTMENT FUNDS
Statement of Net Assets
at December 31, 2008 (continued)
13
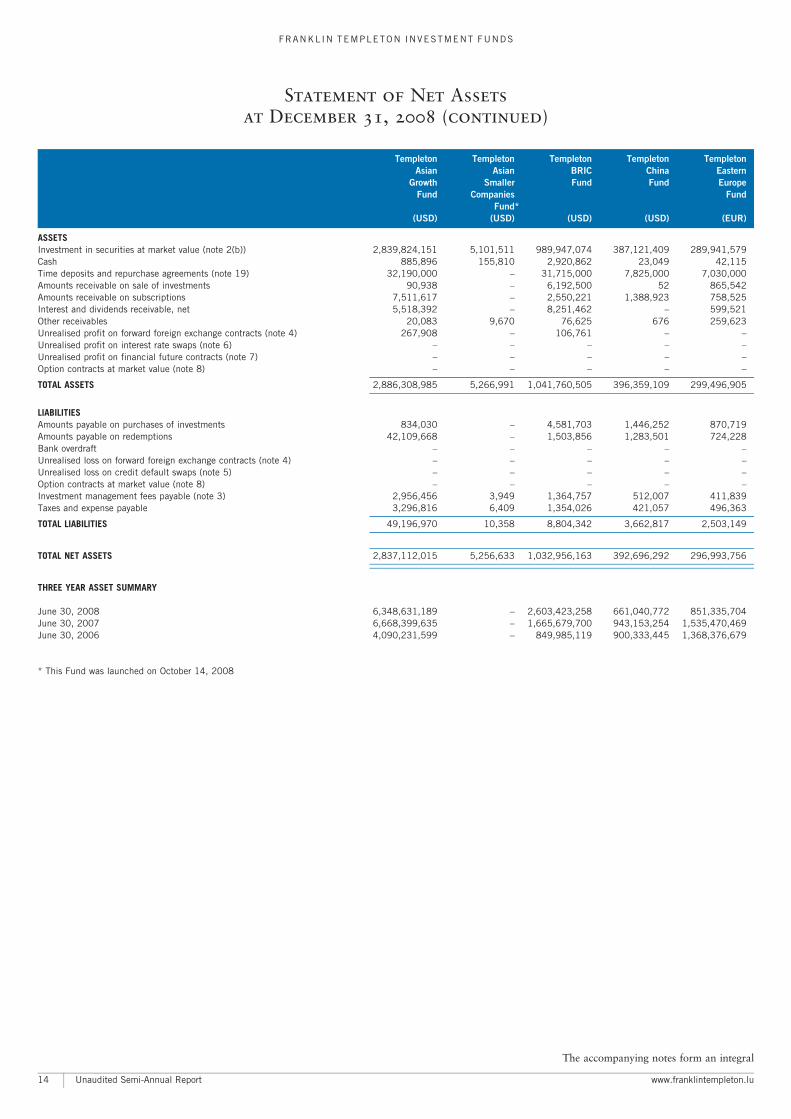
Templeton Templeton Templeton Templeton Templeton
Asian Asian BRIC China Eastern
Growth Smaller Fund Fund Europe
Fund Companies Fund
Fund*
(USD) (USD) (USD) (USD) (EUR)
ASSETSInvestment in securities at market value (note 2(b)) 2,839,824,151 5,101,511 989,947,074 387,121,409 289,941,579Cash 885,896 155,810 2,920,862 23,049 42,115Time deposits and repurchase agreements (note 19) 32,190,000 ^ 31,715,000 7,825,000 7,030,000Amounts receivable on sale of investments 90,938 ^ 6,192,500 52 865,542Amounts receivable on subscriptions 7,511,617 ^ 2,550,221 1,388,923 758,525Interest and dividends receivable, net 5,518,392 ^ 8,251,462 ^ 599,521Other receivables 20,083 9,670 76,625 676 259,623Unrealised profit on forward foreign exchange contracts (note 4) 267,908 ^ 106,761 ^ ^Unrealised profit on interest rate swaps (note 6) ^ ^ ^ ^ ^Unrealised profit on financial future contracts (note 7) ^ ^ ^ ^ ^Option contracts at market value (note 8) ^ ^ ^ ^ ^
TOTAL ASSETS 2,886,308,985 5,266,991 1,041,760,505 396,359,109 299,496,905
LIABILITIESAmounts payable on purchases of investments 834,030 ^ 4,581,703 1,446,252 870,719Amounts payable on redemptions 42,109,668 ^ 1,503,856 1,283,501 724,228Bank overdraft ^ ^ ^ ^ ^Unrealised loss on forward foreign exchange contracts (note 4) ^ ^ ^ ^ ^Unrealised loss on credit default swaps (note 5) ^ ^ ^ ^ ^Option contracts at market value (note 8) ^ ^ ^ ^ ^Investment management fees payable (note 3) 2,956,456 3,949 1,364,757 512,007 411,839Taxes and expense payable 3,296,816 6,409 1,354,026 421,057 496,363
TOTAL LIABILITIES 49,196,970 10,358 8,804,342 3,662,817 2,503,149
TOTAL NET ASSETS 2,837,112,015 5,256,633 1,032,956,163 392,696,292 296,993,756
THREE YEAR ASSET SUMMARY(USD) (USD) (USD) (USD) (EUR)
June 30, 2008 6,348,631,189 ^ 2,603,423,258 661,040,772 851,335,704June 30, 2007 6,668,399,635 ^ 1,665,679,700 943,153,254 1,535,470,469June 30, 2006 4,090,231,599 ^ 849,985,119 900,333,445 1,368,376,679
* This Fund was launched on October 14, 2008
The accompanying notes form an integral
Unaudited Semi-Annual Report www.franklintempleton.lu
FRANKL IN TEMPLETON INVESTMENT FUNDS
Statement of Net Assets
at December 31, 2008 (continued)
14
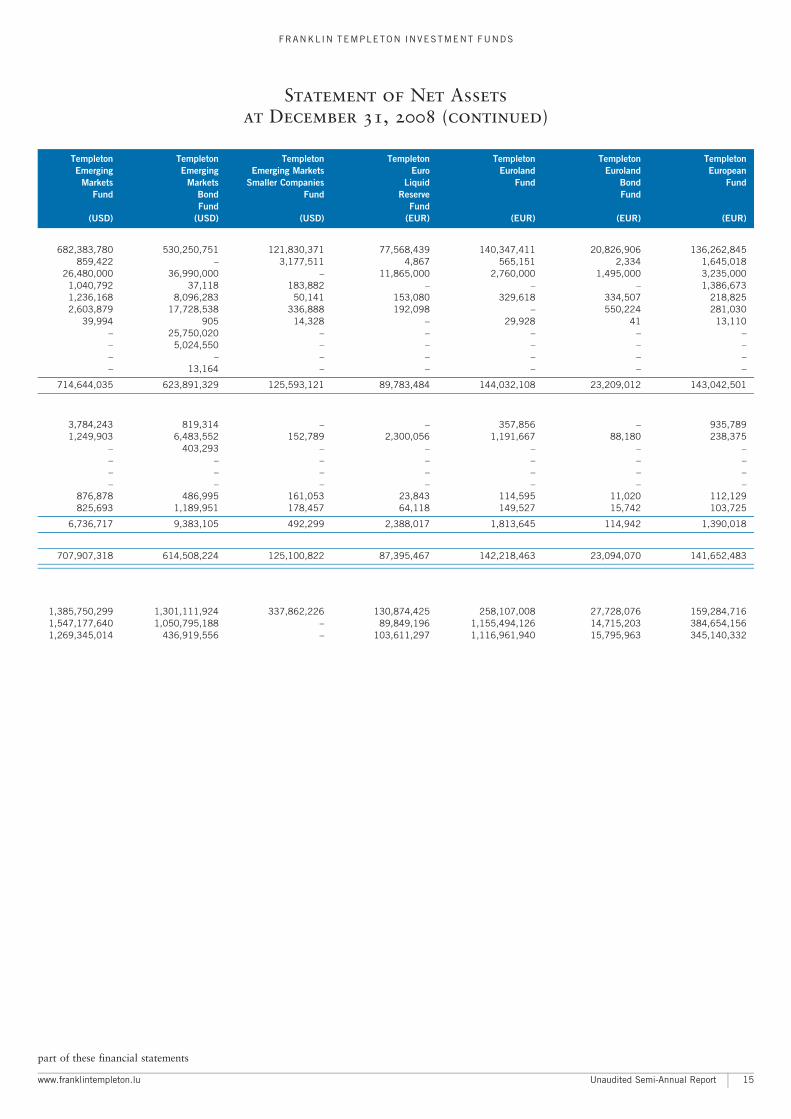
Templeton Templeton Templeton Templeton Templeton Templeton Templeton
Emerging Emerging Emerging Markets Euro Euroland Euroland European
Markets Markets Smaller Companies Liquid Fund Bond Fund
Fund Bond Fund Reserve Fund
Fund Fund
(USD) (USD) (USD) (EUR) (EUR) (EUR) (EUR)
682,383,780 530,250,751 121,830,371 77,568,439 140,347,411 20,826,906 136,262,845859,422 ^ 3,177,511 4,867 565,151 2,334 1,645,018
26,480,000 36,990,000 ^ 11,865,000 2,760,000 1,495,000 3,235,0001,040,792 37,118 183,882 ^ ^ ^ 1,386,6731,236,168 8,096,283 50,141 153,080 329,618 334,507 218,8252,603,879 17,728,538 336,888 192,098 ^ 550,224 281,030
39,994 905 14,328 ^ 29,928 41 13,110^ 25,750,020 ^ ^ ^ ^ ^^ 5,024,550 ^ ^ ^ ^ ^^ ^ ^ ^ ^ ^ ^^ 13,164 ^ ^ ^ ^ ^
714,644,035 623,891,329 125,593,121 89,783,484 144,032,108 23,209,012 143,042,501
3,784,243 819,314 ^ ^ 357,856 ^ 935,7891,249,903 6,483,552 152,789 2,300,056 1,191,667 88,180 238,375
^ 403,293 ^ ^ ^ ^ ^^ ^ ^ ^ ^ ^ ^^ ^ ^ ^ ^ ^ ^^ ^ ^ ^ ^ ^ ^
876,878 486,995 161,053 23,843 114,595 11,020 112,129825,693 1,189,951 178,457 64,118 149,527 15,742 103,725
6,736,717 9,383,105 492,299 2,388,017 1,813,645 114,942 1,390,018
707,907,318 614,508,224 125,100,822 87,395,467 142,218,463 23,094,070 141,652,483
(USD) (USD) (USD) (EUR) (EUR) (EUR) (EUR)
1,385,750,299 1,301,111,924 337,862,226 130,874,425 258,107,008 27,728,076 159,284,7161,547,177,640 1,050,795,188 ^ 89,849,196 1,155,494,126 14,715,203 384,654,1561,269,345,014 436,919,556 ^ 103,611,297 1,116,961,940 15,795,963 345,140,332
part of these financial statements
www.franklintempleton.lu Unaudited Semi-Annual Report
FRANKL IN TEMPLETON INVESTMENT FUNDS
Statement of Net Assets
at December 31, 2008 (continued)
15
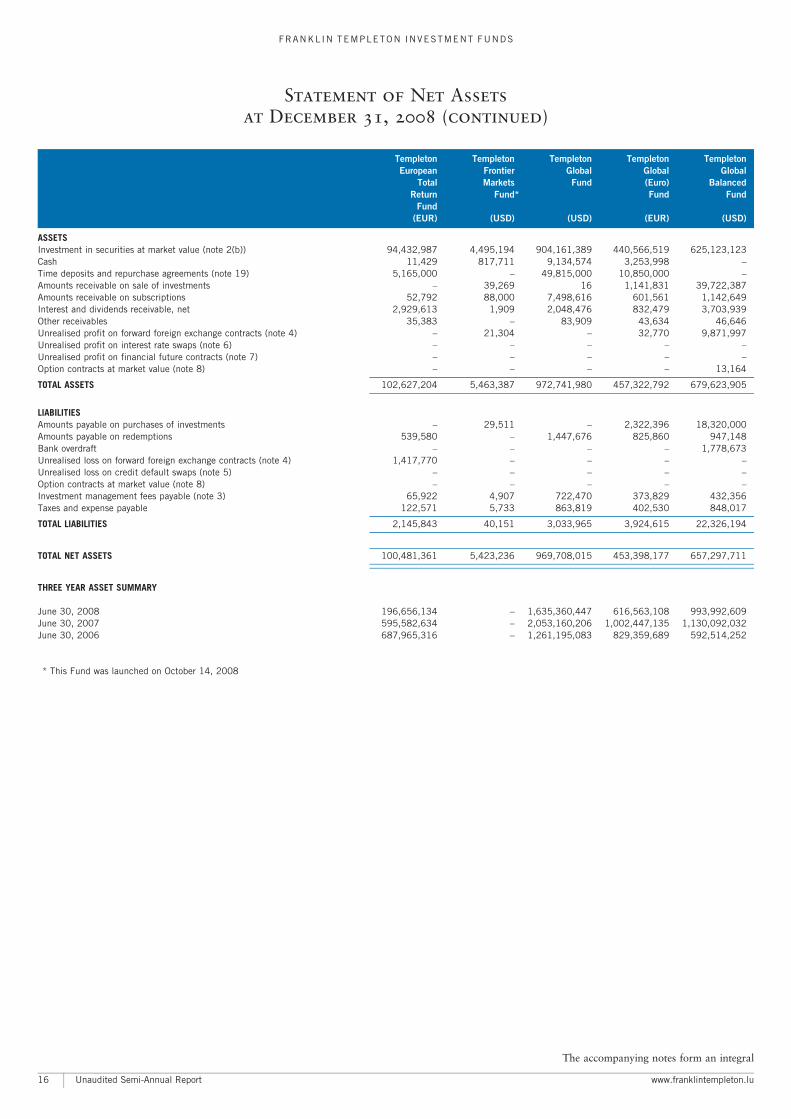
Templeton Templeton Templeton Templeton Templeton
European Frontier Global Global Global
Total Markets Fund (Euro) Balanced
Return Fund* Fund Fund
Fund
(EUR) (USD) (USD) (EUR) (USD)
ASSETSInvestment in securities at market value (note 2(b)) 94,432,987 4,495,194 904,161,389 440,566,519 625,123,123Cash 11,429 817,711 9,134,574 3,253,998 ^Time deposits and repurchase agreements (note 19) 5,165,000 ^ 49,815,000 10,850,000 ^Amounts receivable on sale of investments ^ 39,269 16 1,141,831 39,722,387Amounts receivable on subscriptions 52,792 88,000 7,498,616 601,561 1,142,649Interest and dividends receivable, net 2,929,613 1,909 2,048,476 832,479 3,703,939Other receivables 35,383 ^ 83,909 43,634 46,646Unrealised profit on forward foreign exchange contracts (note 4) ^ 21,304 ^ 32,770 9,871,997Unrealised profit on interest rate swaps (note 6) ^ ^ ^ ^ ^Unrealised profit on financial future contracts (note 7) ^ ^ ^ ^ ^Option contracts at market value (note 8) ^ ^ ^ ^ 13,164
TOTAL ASSETS 102,627,204 5,463,387 972,741,980 457,322,792 679,623,905
LIABILITIESAmounts payable on purchases of investments ^ 29,511 ^ 2,322,396 18,320,000Amounts payable on redemptions 539,580 ^ 1,447,676 825,860 947,148Bank overdraft ^ ^ ^ ^ 1,778,673Unrealised loss on forward foreign exchange contracts (note 4) 1,417,770 ^ ^ ^ ^Unrealised loss on credit default swaps (note 5) ^ ^ ^ ^ ^Option contracts at market value (note 8) ^ ^ ^ ^ ^Investment management fees payable (note 3) 65,922 4,907 722,470 373,829 432,356Taxes and expense payable 122,571 5,733 863,819 402,530 848,017
TOTAL LIABILITIES 2,145,843 40,151 3,033,965 3,924,615 22,326,194
TOTAL NET ASSETS 100,481,361 5,423,236 969,708,015 453,398,177 657,297,711
THREE YEAR ASSET SUMMARY(EUR) (USD) (USD) (EUR) (USD)
June 30, 2008 196,656,134 ^ 1,635,360,447 616,563,108 993,992,609June 30, 2007 595,582,634 ^ 2,053,160,206 1,002,447,135 1,130,092,032June 30, 2006 687,965,316 ^ 1,261,195,083 829,359,689 592,514,252
* This Fund was launched on October 14, 2008
The accompanying notes form an integral
Unaudited Semi-Annual Report www.franklintempleton.lu
FRANKL IN TEMPLETON INVESTMENT FUNDS
Statement of Net Assets
at December 31, 2008 (continued)
16
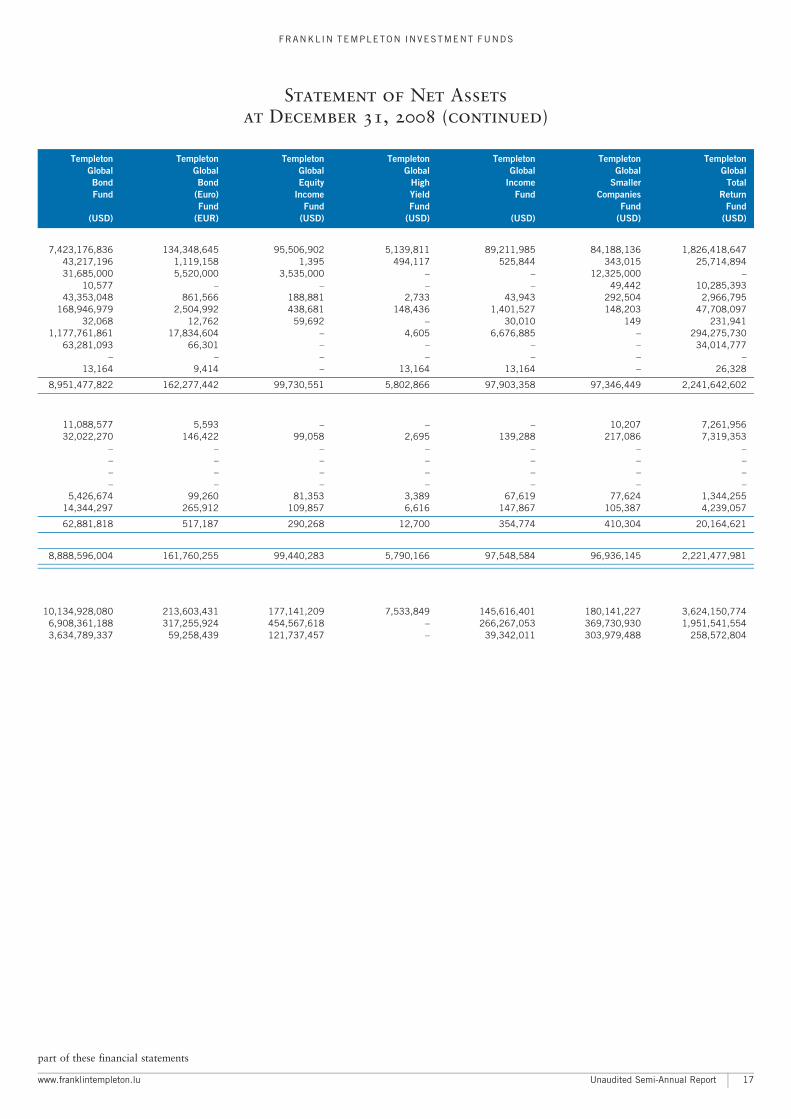
Templeton Templeton Templeton Templeton Templeton Templeton Templeton
Global Global Global Global Global Global Global
Bond Bond Equity High Income Smaller Total
Fund (Euro) Income Yield Fund Companies Return
Fund Fund Fund Fund Fund
(USD) (EUR) (USD) (USD) (USD) (USD) (USD)
7,423,176,836 134,348,645 95,506,902 5,139,811 89,211,985 84,188,136 1,826,418,64743,217,196 1,119,158 1,395 494,117 525,844 343,015 25,714,89431,685,000 5,520,000 3,535,000 ^ ^ 12,325,000 ^
10,577 ^ ^ ^ ^ 49,442 10,285,39343,353,048 861,566 188,881 2,733 43,943 292,504 2,966,795
168,946,979 2,504,992 438,681 148,436 1,401,527 148,203 47,708,09732,068 12,762 59,692 ^ 30,010 149 231,941
1,177,761,861 17,834,604 ^ 4,605 6,676,885 ^ 294,275,73063,281,093 66,301 ^ ^ ^ ^ 34,014,777
^ ^ ^ ^ ^ ^ ^13,164 9,414 ^ 13,164 13,164 ^ 26,328
8,951,477,822 162,277,442 99,730,551 5,802,866 97,903,358 97,346,449 2,241,642,602
11,088,577 5,593 ^ ^ ^ 10,207 7,261,95632,022,270 146,422 99,058 2,695 139,288 217,086 7,319,353
^ ^ ^ ^ ^ ^ ^^ ^ ^ ^ ^ ^ ^^ ^ ^ ^ ^ ^ ^^ ^ ^ ^ ^ ^ ^
5,426,674 99,260 81,353 3,389 67,619 77,624 1,344,25514,344,297 265,912 109,857 6,616 147,867 105,387 4,239,057
62,881,818 517,187 290,268 12,700 354,774 410,304 20,164,621
8,888,596,004 161,760,255 99,440,283 5,790,166 97,548,584 96,936,145 2,221,477,981
(USD) (EUR) (USD) (USD) (USD) (USD) (USD)
10,134,928,080 213,603,431 177,141,209 7,533,849 145,616,401 180,141,227 3,624,150,7746,908,361,188 317,255,924 454,567,618 ^ 266,267,053 369,730,930 1,951,541,5543,634,789,337 59,258,439 121,737,457 ^ 39,342,011 303,979,488 258,572,804
part of these financial statements
www.franklintempleton.lu Unaudited Semi-Annual Report
FRANKL IN TEMPLETON INVESTMENT FUNDS
Statement of Net Assets
at December 31, 2008 (continued)
17
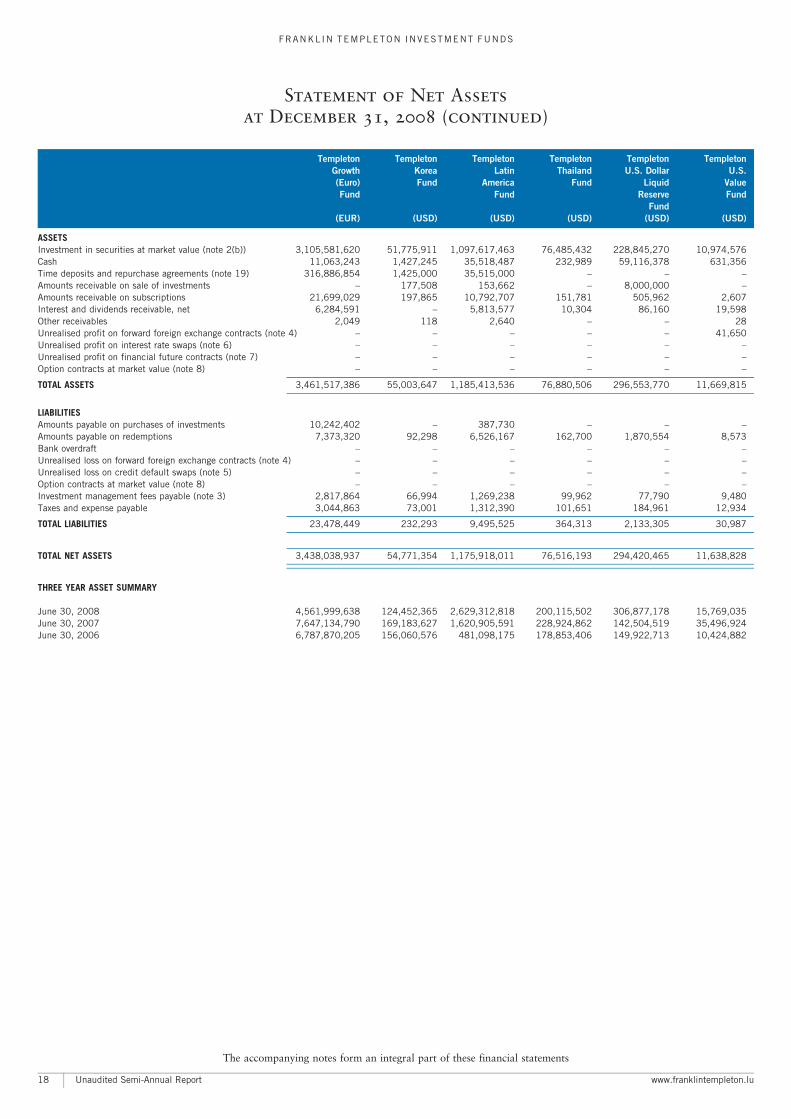
Templeton Templeton Templeton Templeton Templeton Templeton
Growth Korea Latin Thailand U.S. Dollar U.S.
(Euro) Fund America Fund Liquid Value
Fund Fund Reserve Fund
Fund
(EUR) (USD) (USD) (USD) (USD) (USD)
ASSETSInvestment in securities at market value (note 2(b)) 3,105,581,620 51,775,911 1,097,617,463 76,485,432 228,845,270 10,974,576Cash 11,063,243 1,427,245 35,518,487 232,989 59,116,378 631,356Time deposits and repurchase agreements (note 19) 316,886,854 1,425,000 35,515,000 ^ ^ ^Amounts receivable on sale of investments ^ 177,508 153,662 ^ 8,000,000 ^Amounts receivable on subscriptions 21,699,029 197,865 10,792,707 151,781 505,962 2,607Interest and dividends receivable, net 6,284,591 ^ 5,813,577 10,304 86,160 19,598Other receivables 2,049 118 2,640 ^ ^ 28Unrealised profit on forward foreign exchange contracts (note 4) ^ ^ ^ ^ ^ 41,650Unrealised profit on interest rate swaps (note 6) ^ ^ ^ ^ ^ ^Unrealised profit on financial future contracts (note 7) ^ ^ ^ ^ ^ ^Option contracts at market value (note 8) ^ ^ ^ ^ ^ ^
TOTAL ASSETS 3,461,517,386 55,003,647 1,185,413,536 76,880,506 296,553,770 11,669,815
LIABILITIESAmounts payable on purchases of investments 10,242,402 ^ 387,730 ^ ^ ^Amounts payable on redemptions 7,373,320 92,298 6,526,167 162,700 1,870,554 8,573Bank overdraft ^ ^ ^ ^ ^ ^Unrealised loss on forward foreign exchange contracts (note 4) ^ ^ ^ ^ ^ ^Unrealised loss on credit default swaps (note 5) ^ ^ ^ ^ ^ ^Option contracts at market value (note 8) ^ ^ ^ ^ ^ ^Investment management fees payable (note 3) 2,817,864 66,994 1,269,238 99,962 77,790 9,480Taxes and expense payable 3,044,863 73,001 1,312,390 101,651 184,961 12,934
TOTAL LIABILITIES 23,478,449 232,293 9,495,525 364,313 2,133,305 30,987
TOTAL NET ASSETS 3,438,038,937 54,771,354 1,175,918,011 76,516,193 294,420,465 11,638,828
THREE YEAR ASSET SUMMARY(EUR) (USD) (USD) (USD) (USD) (USD)
June 30, 2008 4,561,999,638 124,452,365 2,629,312,818 200,115,502 306,877,178 15,769,035June 30, 2007 7,647,134,790 169,183,627 1,620,905,591 228,924,862 142,504,519 35,496,924June 30, 2006 6,787,870,205 156,060,576 481,098,175 178,853,406 149,922,713 10,424,882
The accompanying notes form an integral part of these financial statements
Unaudited Semi-Annual Report www.franklintempleton.lu
FRANKL IN TEMPLETON INVESTMENT FUNDS
Statement of Net Assets
at December 31, 2008 (continued)
18

Total Shares
Expense Ratio Outstanding Net Asset Value per Share
December 31, December 31, December 31, June 30, June 30,
2008 2008 2008 2008 2007
(see Note 17)
Franklin Asian Flex Cap Fund ^ USDFranklin Asian Flex Cap ^ A (Acc) 2.00% 713,619.012 7.46 11.15 12.72Franklin Asian Flex Cap ^ A (Acc) ^ SGD 1.95% 1,604.851 4.76 6.76Franklin Asian Flex Cap ^ A (Ydis) 2.00% 285,695.066 7.45 11.13 12.73Franklin Asian Flex Cap ^ A (Ydis) ^ GBP 2.00% 106,066.517 5.10 5.59 6.33Franklin Asian Flex Cap ^ B (Acc) 3.25% 1,103,384.003 7.26 10.92 12.62Franklin Asian Flex Cap ^ C (Acc) 2.60% 3,639.791 7.34 11.00 12.67Franklin Asian Flex Cap ^ I (Acc) 1.00% 250,438.765 7.65 11.37 12.80Franklin Asian Flex Cap ^ I (Ydis) 1.00% 99,700.000 7.50 11.26 12.80Franklin Asian Flex Cap ^ N (Acc) 2.75% 170,931.675 7.33 11.00 12.66
Franklin Biotechnology Discovery Fund ^ USDFranklin Biotechnology Discovery ^ A (Acc) 2.11% 6,025,915.958 7.83 8.33 8.96Franklin Biotechnology Discovery ^ A (Acc) ^ SGD 2.12% 1,797,107.586 8.17 8.26Franklin Biotechnology Discovery ^ B (Acc) 3.45% 458,184.588 7.02 7.53 8.19Franklin Biotechnology Discovery ^ C (Acc) 2.68% 109,765.381 9.77 10.44 11.28Franklin Biotechnology Discovery ^ I (Acc) 0.97% 25,421.859 10.88 11.53 12.26Franklin Biotechnology Discovery ^ N (Acc) 2.89% 390,330.334 7.27 7.77 8.42
Franklin Euroland Core Fund ^ EUR *Franklin Euroland Core ^ A (Acc) 1.76% 168,662.110 10.08Franklin Euroland Core ^ A (Acc) ^ USD 1.74% 177,416.582 11.10Franklin Euroland Core ^ I (Acc) 0.89% 638,569.604 10.09Franklin Euroland Core ^ I (Acc) ^ USD 0.89% 811,047.233 11.11Franklin Euroland Core ^ N (Acc) 2.44% 39,910.600 10.08
Franklin European Growth Fund ^ EURFranklin European Growth ^ A (Acc) 2.00% 1,746,159.248 5.57 7.52 9.66Franklin European Growth ^ I (Acc) 1.00% 147,757.421 10.27 13.80 17.58Franklin European Growth ^ N (Acc) 2.75% 424,412.956 5.23 7.09 9.18
Franklin European Small-Mid Cap Growth Fund ^ EURFranklin European Small-Mid Cap Growth ^ A (Acc) 2.07% 1,650,755.598 11.60 16.58 21.94Franklin European Small-Mid Cap Growth ^ A (Acc) ^ USD 2.06% 46,865.049 16.23 26.12 29.69Franklin European Small-Mid Cap Growth ^ B (Acc) ^ USD 3.37% 36,720.791 16.48 26.71 30.75Franklin European Small-Mid Cap Growth ^ I (Acc) 0.99% 191,874.904 12.98 18.45 24.17Franklin European Small-Mid Cap Growth ^ I (Acc) ^ USD 1.00% 6,554.583 18.14 29.04 32.71Franklin European Small-Mid Cap Growth ^ N (Acc) 2.80% 354,441.423 11.39 16.35 21.80
Franklin Global Growth Fund ^ USDFranklin Global Growth ^ A (Acc) 1.97% 2,367,233.351 6.56 11.42 12.16Franklin Global Growth ^ I (Acc) 0.99% 500.000 5.40 9.53Franklin Global Growth ^ N (Acc) 2.71% 287,313.940 6.17 10.78 11.57
Franklin Global Real Estate (Euro) Fund ^ EURFranklin Global Real Estate (Euro) ^ A (Acc) 1.94% 1,921,094.186 5.65 8.87 11.99Franklin Global Real Estate (Euro) ^ A (Ydis) 1.94% 75,482.798 7.87 12.61 17.25Franklin Global Real Estate (Euro) ^ I (Acc) 0.99% 422,548.418 5.80 9.07 12.14Franklin Global Real Estate (Euro) ^ I (Ydis) 1.00% 3,565.031 5.51 8.89 12.14Franklin Global Real Estate (Euro) ^ N (Acc) 2.69% 362,735.272 5.52 8.71 11.85
Franklin Global Real Estate (USD) Fund ^ USDFranklin Global Real Estate (USD) ^ A (Acc) 1.93% 2,351,308.753 6.08 9.15 12.43Franklin Global Real Estate (USD) ^ A (Qdis) 1.93% 445,081.815 5.78 8.79 12.18Franklin Global Real Estate (USD) ^ A (Qdis) ^ SGD 1.91% 1,219.919 4.92 7.10Franklin Global Real Estate (USD) ^ B (Qdis) 3.22% 144,763.013 5.76 8.75 12.11Franklin Global Real Estate (USD) ^ C (Qdis) 2.51% 421,662.176 5.78 8.77 12.16Franklin Global Real Estate (USD) ^ I (Acc) 1.00% 275,977.487 6.25 9.35 12.61Franklin Global Real Estate (USD) ^ I (Qdis) 0.99% 204,073.625 5.79 8.81 12.21Franklin Global Real Estate (USD) ^ N (Acc) 2.67% 137,972.929 5.94 8.97 12.29Franklin Global Real Estate (USD) ^ N (Qdis) 2.68% 1,870.791 5.79 8.79 12.14
www.franklintempleton.lu Unaudited Semi-Annual Report
FRANKL IN TEMPLETON INVESTMENT FUNDS
Statistical Information
All classes in base currency unless otherwise stated
19
Total Shares
Expense Ratio Outstanding Net Asset Value per Share
December 31, December 31, December 31, June 30, June 30,
2008 2008 2008 2008 2007
(see Note 17)
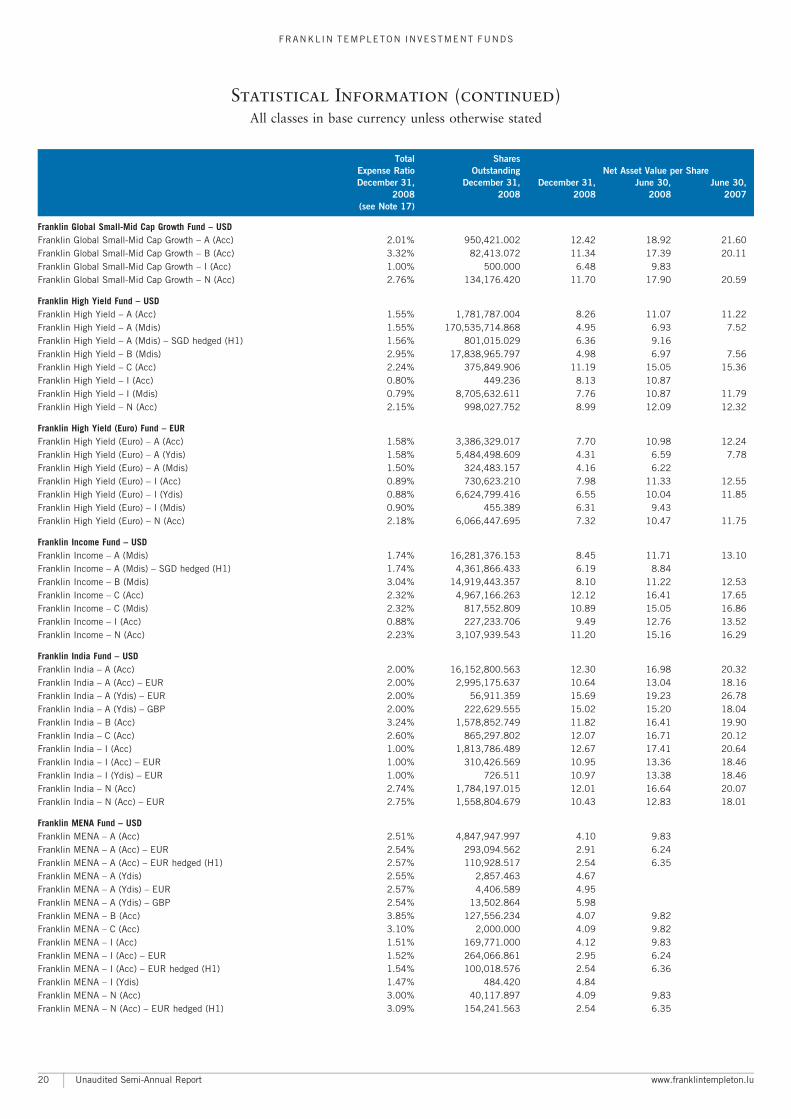
Franklin Global Small-Mid Cap Growth Fund ^ USDFranklin Global Small-Mid Cap Growth ^ A (Acc) 2.01% 950,421.002 12.42 18.92 21.60Franklin Global Small-Mid Cap Growth ^ B (Acc) 3.32% 82,413.072 11.34 17.39 20.11Franklin Global Small-Mid Cap Growth ^ I (Acc) 1.00% 500.000 6.48 9.83Franklin Global Small-Mid Cap Growth ^ N (Acc) 2.76% 134,176.420 11.70 17.90 20.59
Franklin High Yield Fund ^ USDFranklin High Yield ^ A (Acc) 1.55% 1,781,787.004 8.26 11.07 11.22Franklin High Yield ^ A (Mdis) 1.55% 170,535,714.868 4.95 6.93 7.52Franklin High Yield ^ A (Mdis) ^ SGD hedged (H1) 1.56% 801,015.029 6.36 9.16Franklin High Yield ^ B (Mdis) 2.95% 17,838,965.797 4.98 6.97 7.56Franklin High Yield ^ C (Acc) 2.24% 375,849.906 11.19 15.05 15.36Franklin High Yield ^ I (Acc) 0.80% 449.236 8.13 10.87Franklin High Yield ^ I (Mdis) 0.79% 8,705,632.611 7.76 10.87 11.79Franklin High Yield ^ N (Acc) 2.15% 998,027.752 8.99 12.09 12.32
Franklin High Yield (Euro) Fund ^ EURFranklin High Yield (Euro) ^ A (Acc) 1.58% 3,386,329.017 7.70 10.98 12.24Franklin High Yield (Euro) ^ A (Ydis) 1.58% 5,484,498.609 4.31 6.59 7.78Franklin High Yield (Euro) ^ A (Mdis) 1.50% 324,483.157 4.16 6.22Franklin High Yield (Euro) ^ I (Acc) 0.89% 730,623.210 7.98 11.33 12.55Franklin High Yield (Euro) ^ I (Ydis) 0.88% 6,624,799.416 6.55 10.04 11.85Franklin High Yield (Euro) ^ I (Mdis) 0.90% 455.389 6.31 9.43Franklin High Yield (Euro) ^ N (Acc) 2.18% 6,066,447.695 7.32 10.47 11.75
Franklin Income Fund ^ USDFranklin Income ^ A (Mdis) 1.74% 16,281,376.153 8.45 11.71 13.10Franklin Income ^ A (Mdis) ^ SGD hedged (H1) 1.74% 4,361,866.433 6.19 8.84Franklin Income ^ B (Mdis) 3.04% 14,919,443.357 8.10 11.22 12.53Franklin Income ^ C (Acc) 2.32% 4,967,166.263 12.12 16.41 17.65Franklin Income ^ C (Mdis) 2.32% 817,552.809 10.89 15.05 16.86Franklin Income ^ I (Acc) 0.88% 227,233.706 9.49 12.76 13.52Franklin Income ^ N (Acc) 2.23% 3,107,939.543 11.20 15.16 16.29
Franklin India Fund ^ USDFranklin India ^ A (Acc) 2.00% 16,152,800.563 12.30 16.98 20.32Franklin India ^ A (Acc) ^ EUR 2.00% 2,995,175.637 10.64 13.04 18.16Franklin India ^ A (Ydis) ^ EUR 2.00% 56,911.359 15.69 19.23 26.78Franklin India ^ A (Ydis) ^ GBP 2.00% 222,629.555 15.02 15.20 18.04Franklin India ^ B (Acc) 3.24% 1,578,852.749 11.82 16.41 19.90Franklin India ^ C (Acc) 2.60% 865,297.802 12.07 16.71 20.12Franklin India ^ I (Acc) 1.00% 1,813,786.489 12.67 17.41 20.64Franklin India ^ I (Acc) ^ EUR 1.00% 310,426.569 10.95 13.36 18.46Franklin India ^ I (Ydis) ^ EUR 1.00% 726.511 10.97 13.38 18.46Franklin India ^ N (Acc) 2.74% 1,784,197.015 12.01 16.64 20.07Franklin India ^ N (Acc) ^ EUR 2.75% 1,558,804.679 10.43 12.83 18.01
Franklin MENA Fund ^ USDFranklin MENA ^ A (Acc) 2.51% 4,847,947.997 4.10 9.83Franklin MENA ^ A (Acc) ^ EUR 2.54% 293,094.562 2.91 6.24Franklin MENA ^ A (Acc) ^ EUR hedged (H1) 2.57% 110,928.517 2.54 6.35Franklin MENA ^ A (Ydis) 2.55% 2,857.463 4.67Franklin MENA ^ A (Ydis) ^ EUR 2.57% 4,406.589 4.95Franklin MENA ^ A (Ydis) ^ GBP 2.54% 13,502.864 5.98Franklin MENA ^ B (Acc) 3.85% 127,556.234 4.07 9.82Franklin MENA ^ C (Acc) 3.10% 2,000.000 4.09 9.82Franklin MENA ^ I (Acc) 1.51% 169,771.000 4.12 9.83Franklin MENA ^ I (Acc) ^ EUR 1.52% 264,066.861 2.95 6.24Franklin MENA ^ I (Acc) ^ EUR hedged (H1) 1.54% 100,018.576 2.54 6.36Franklin MENA ^ I (Ydis) 1.47% 484.420 4.84Franklin MENA ^ N (Acc) 3.00% 40,117.897 4.09 9.83Franklin MENA ^ N (Acc) ^ EUR hedged (H1) 3.09% 154,241.563 2.54 6.35
Unaudited Semi-Annual Report www.franklintempleton.lu
FRANKL IN TEMPLETON INVESTMENT FUNDS
Statistical Information (continued)
All classes in base currency unless otherwise stated
20
Total Shares
Expense Ratio Outstanding Net Asset Value per Share
December 31, December 31, December 31, June 30, June 30,
2008 2008 2008 2008 2007
(see Note 17)
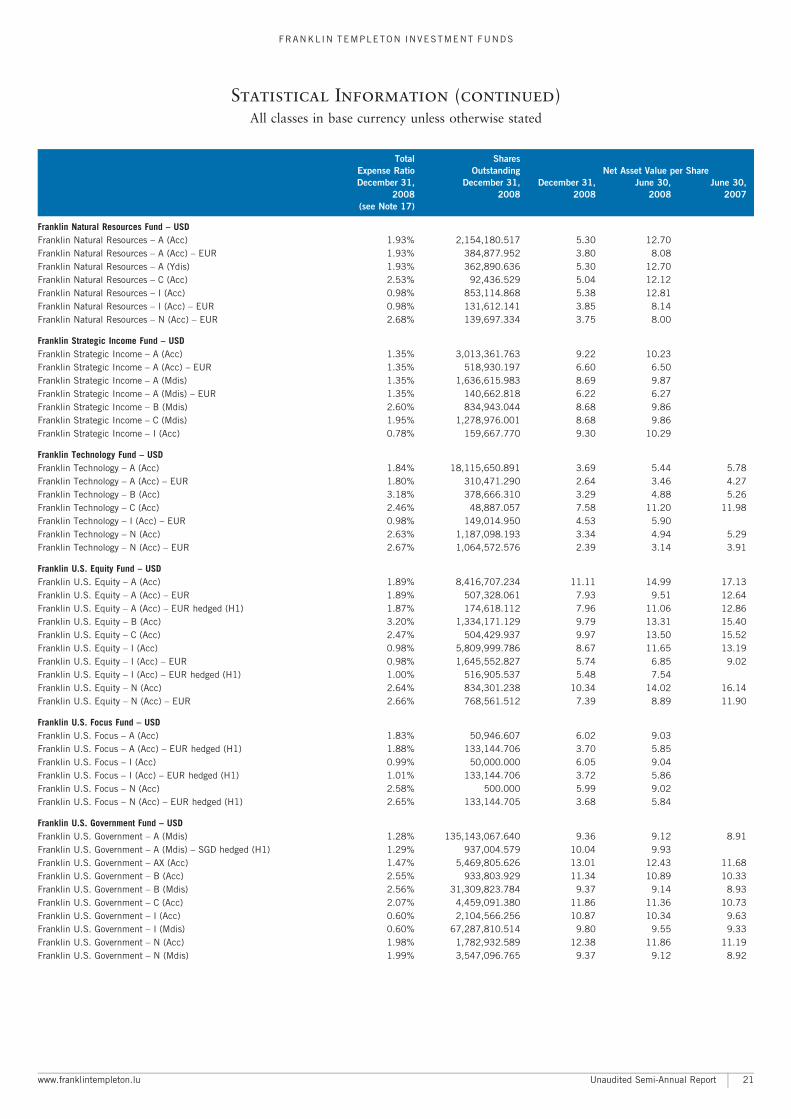
Franklin Natural Resources Fund ^ USDFranklin Natural Resources ^ A (Acc) 1.93% 2,154,180.517 5.30 12.70Franklin Natural Resources ^ A (Acc) ^ EUR 1.93% 384,877.952 3.80 8.08Franklin Natural Resources ^ A (Ydis) 1.93% 362,890.636 5.30 12.70Franklin Natural Resources ^ C (Acc) 2.53% 92,436.529 5.04 12.12Franklin Natural Resources ^ I (Acc) 0.98% 853,114.868 5.38 12.81Franklin Natural Resources ^ I (Acc) ^ EUR 0.98% 131,612.141 3.85 8.14Franklin Natural Resources ^ N (Acc) ^ EUR 2.68% 139,697.334 3.75 8.00
Franklin Strategic Income Fund ^ USDFranklin Strategic Income ^ A (Acc) 1.35% 3,013,361.763 9.22 10.23Franklin Strategic Income ^ A (Acc) ^ EUR 1.35% 518,930.197 6.60 6.50Franklin Strategic Income ^ A (Mdis) 1.35% 1,636,615.983 8.69 9.87Franklin Strategic Income ^ A (Mdis) ^ EUR 1.35% 140,662.818 6.22 6.27Franklin Strategic Income ^ B (Mdis) 2.60% 834,943.044 8.68 9.86Franklin Strategic Income ^ C (Mdis) 1.95% 1,278,976.001 8.68 9.86Franklin Strategic Income ^ I (Acc) 0.78% 159,667.770 9.30 10.29
Franklin Technology Fund ^ USDFranklin Technology ^ A (Acc) 1.84% 18,115,650.891 3.69 5.44 5.78Franklin Technology ^ A (Acc) ^ EUR 1.80% 310,471.290 2.64 3.46 4.27Franklin Technology ^ B (Acc) 3.18% 378,666.310 3.29 4.88 5.26Franklin Technology ^ C (Acc) 2.46% 48,887.057 7.58 11.20 11.98Franklin Technology ^ I (Acc) ^ EUR 0.98% 149,014.950 4.53 5.90Franklin Technology ^ N (Acc) 2.63% 1,187,098.193 3.34 4.94 5.29Franklin Technology ^ N (Acc) ^ EUR 2.67% 1,064,572.576 2.39 3.14 3.91
Franklin U.S. Equity Fund ^ USDFranklin U.S. Equity ^ A (Acc) 1.89% 8,416,707.234 11.11 14.99 17.13Franklin U.S. Equity ^ A (Acc) ^ EUR 1.89% 507,328.061 7.93 9.51 12.64Franklin U.S. Equity ^ A (Acc) ^ EUR hedged (H1) 1.87% 174,618.112 7.96 11.06 12.86Franklin U.S. Equity ^ B (Acc) 3.20% 1,334,171.129 9.79 13.31 15.40Franklin U.S. Equity ^ C (Acc) 2.47% 504,429.937 9.97 13.50 15.52Franklin U.S. Equity ^ I (Acc) 0.98% 5,809,999.786 8.67 11.65 13.19Franklin U.S. Equity ^ I (Acc) ^ EUR 0.98% 1,645,552.827 5.74 6.85 9.02Franklin U.S. Equity ^ I (Acc) ^ EUR hedged (H1) 1.00% 516,905.537 5.48 7.54Franklin U.S. Equity ^ N (Acc) 2.64% 834,301.238 10.34 14.02 16.14Franklin U.S. Equity ^ N (Acc) ^ EUR 2.66% 768,561.512 7.39 8.89 11.90
Franklin U.S. Focus Fund ^ USDFranklin U.S. Focus ^ A (Acc) 1.83% 50,946.607 6.02 9.03Franklin U.S. Focus ^ A (Acc) ^ EUR hedged (H1) 1.88% 133,144.706 3.70 5.85Franklin U.S. Focus ^ I (Acc) 0.99% 50,000.000 6.05 9.04Franklin U.S. Focus ^ I (Acc) ^ EUR hedged (H1) 1.01% 133,144.706 3.72 5.86Franklin U.S. Focus ^ N (Acc) 2.58% 500.000 5.99 9.02Franklin U.S. Focus ^ N (Acc) ^ EUR hedged (H1) 2.65% 133,144.705 3.68 5.84
Franklin U.S. Government Fund ^ USDFranklin U.S. Government ^ A (Mdis) 1.28% 135,143,067.640 9.36 9.12 8.91Franklin U.S. Government ^ A (Mdis) ^ SGD hedged (H1) 1.29% 937,004.579 10.04 9.93Franklin U.S. Government ^ AX (Acc) 1.47% 5,469,805.626 13.01 12.43 11.68Franklin U.S. Government ^ B (Acc) 2.55% 933,803.929 11.34 10.89 10.33Franklin U.S. Government ^ B (Mdis) 2.56% 31,309,823.784 9.37 9.14 8.93Franklin U.S. Government ^ C (Acc) 2.07% 4,459,091.380 11.86 11.36 10.73Franklin U.S. Government ^ I (Acc) 0.60% 2,104,566.256 10.87 10.34 9.63Franklin U.S. Government ^ I (Mdis) 0.60% 67,287,810.514 9.80 9.55 9.33Franklin U.S. Government ^ N (Acc) 1.98% 1,782,932.589 12.38 11.86 11.19Franklin U.S. Government ^ N (Mdis) 1.99% 3,547,096.765 9.37 9.12 8.92
www.franklintempleton.lu Unaudited Semi-Annual Report
FRANKL IN TEMPLETON INVESTMENT FUNDS
Statistical Information (continued)
All classes in base currency unless otherwise stated
21
Total Shares
Expense Ratio Outstanding Net Asset Value per Share
December 31, December 31, December 31, June 30, June 30,
2008 2008 2008 2008 2007
(see Note 17)
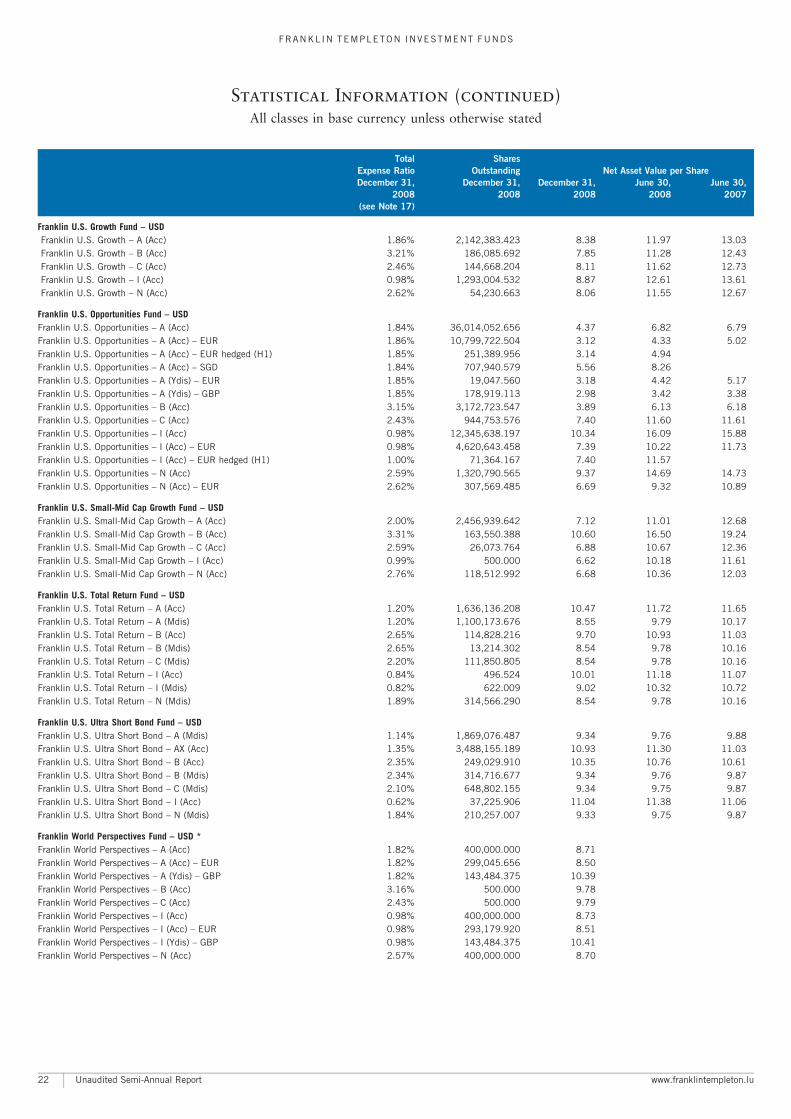
Franklin U.S. Growth Fund ^ USDFranklin U.S. Growth ^ A (Acc) 1.86% 2,142,383.423 8.38 11.97 13.03Franklin U.S. Growth ^ B (Acc) 3.21% 186,085.692 7.85 11.28 12.43Franklin U.S. Growth ^ C (Acc) 2.46% 144,668.204 8.11 11.62 12.73Franklin U.S. Growth ^ I (Acc) 0.98% 1,293,004.532 8.87 12.61 13.61Franklin U.S. Growth ^ N (Acc) 2.62% 54,230.663 8.06 11.55 12.67
Franklin U.S. Opportunities Fund ^ USDFranklin U.S. Opportunities ^ A (Acc) 1.84% 36,014,052.656 4.37 6.82 6.79Franklin U.S. Opportunities ^ A (Acc) ^ EUR 1.86% 10,799,722.504 3.12 4.33 5.02Franklin U.S. Opportunities ^ A (Acc) ^ EUR hedged (H1) 1.85% 251,389.956 3.14 4.94Franklin U.S. Opportunities ^ A (Acc) ^ SGD 1.84% 707,940.579 5.56 8.26Franklin U.S. Opportunities ^ A (Ydis) ^ EUR 1.85% 19,047.560 3.18 4.42 5.17Franklin U.S. Opportunities ^ A (Ydis) ^ GBP 1.85% 178,919.113 2.98 3.42 3.38Franklin U.S. Opportunities ^ B (Acc) 3.15% 3,172,723.547 3.89 6.13 6.18Franklin U.S. Opportunities ^ C (Acc) 2.43% 944,753.576 7.40 11.60 11.61Franklin U.S. Opportunities ^ I (Acc) 0.98% 12,345,638.197 10.34 16.09 15.88Franklin U.S. Opportunities ^ I (Acc) ^ EUR 0.98% 4,620,643.458 7.39 10.22 11.73Franklin U.S. Opportunities ^ I (Acc) ^ EUR hedged (H1) 1.00% 71,364.167 7.40 11.57Franklin U.S. Opportunities ^ N (Acc) 2.59% 1,320,790.565 9.37 14.69 14.73Franklin U.S. Opportunities ^ N (Acc) ^ EUR 2.62% 307,569.485 6.69 9.32 10.89
Franklin U.S. Small-Mid Cap Growth Fund ^ USDFranklin U.S. Small-Mid Cap Growth ^ A (Acc) 2.00% 2,456,939.642 7.12 11.01 12.68Franklin U.S. Small-Mid Cap Growth ^ B (Acc) 3.31% 163,550.388 10.60 16.50 19.24Franklin U.S. Small-Mid Cap Growth ^ C (Acc) 2.59% 26,073.764 6.88 10.67 12.36Franklin U.S. Small-Mid Cap Growth ^ I (Acc) 0.99% 500.000 6.62 10.18 11.61Franklin U.S. Small-Mid Cap Growth ^ N (Acc) 2.76% 118,512.992 6.68 10.36 12.03
Franklin U.S. Total Return Fund ^ USDFranklin U.S. Total Return ^ A (Acc) 1.20% 1,636,136.208 10.47 11.72 11.65Franklin U.S. Total Return ^ A (Mdis) 1.20% 1,100,173.676 8.55 9.79 10.17Franklin U.S. Total Return ^ B (Acc) 2.65% 114,828.216 9.70 10.93 11.03Franklin U.S. Total Return ^ B (Mdis) 2.65% 13,214.302 8.54 9.78 10.16Franklin U.S. Total Return ^ C (Mdis) 2.20% 111,850.805 8.54 9.78 10.16Franklin U.S. Total Return ^ I (Acc) 0.84% 496.524 10.01 11.18 11.07Franklin U.S. Total Return ^ I (Mdis) 0.82% 622.009 9.02 10.32 10.72Franklin U.S. Total Return ^ N (Mdis) 1.89% 314,566.290 8.54 9.78 10.16
Franklin U.S. Ultra Short Bond Fund ^ USDFranklin U.S. Ultra Short Bond ^ A (Mdis) 1.14% 1,869,076.487 9.34 9.76 9.88Franklin U.S. Ultra Short Bond ^ AX (Acc) 1.35% 3,488,155.189 10.93 11.30 11.03Franklin U.S. Ultra Short Bond ^ B (Acc) 2.35% 249,029.910 10.35 10.76 10.61Franklin U.S. Ultra Short Bond ^ B (Mdis) 2.34% 314,716.677 9.34 9.76 9.87Franklin U.S. Ultra Short Bond ^ C (Mdis) 2.10% 648,802.155 9.34 9.75 9.87Franklin U.S. Ultra Short Bond ^ I (Acc) 0.62% 37,225.906 11.04 11.38 11.06Franklin U.S. Ultra Short Bond ^ N (Mdis) 1.84% 210,257.007 9.33 9.75 9.87
Franklin World Perspectives Fund ^ USD *Franklin World Perspectives ^ A (Acc) 1.82% 400,000.000 8.71Franklin World Perspectives ^ A (Acc) ^ EUR 1.82% 299,045.656 8.50Franklin World Perspectives ^ A (Ydis) ^ GBP 1.82% 143,484.375 10.39Franklin World Perspectives ^ B (Acc) 3.16% 500.000 9.78Franklin World Perspectives ^ C (Acc) 2.43% 500.000 9.79Franklin World Perspectives ^ I (Acc) 0.98% 400,000.000 8.73Franklin World Perspectives ^ I (Acc) ^ EUR 0.98% 293,179.920 8.51Franklin World Perspectives ^ I (Ydis) ^ GBP 0.98% 143,484.375 10.41Franklin World Perspectives ^ N (Acc) 2.57% 400,000.000 8.70
Unaudited Semi-Annual Report www.franklintempleton.lu
FRANKL IN TEMPLETON INVESTMENT FUNDS
Statistical Information (continued)
All classes in base currency unless otherwise stated
22
Total Shares
Expense Ratio Outstanding Net Asset Value per Share
December 31, December 31, December 31, June 30, June 30,
2008 2008 2008 2008 2007
(see Note 17)
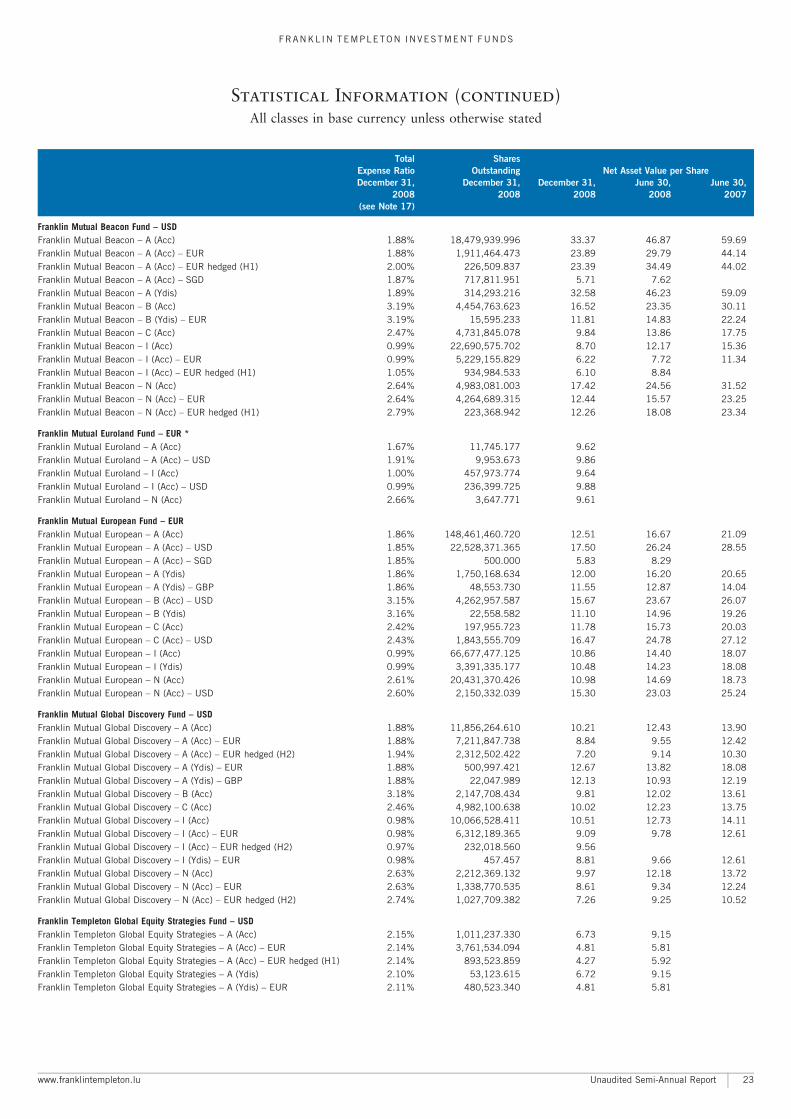
Franklin Mutual Beacon Fund ^ USDFranklin Mutual Beacon ^ A (Acc) 1.88% 18,479,939.996 33.37 46.87 59.69Franklin Mutual Beacon ^ A (Acc) ^ EUR 1.88% 1,911,464.473 23.89 29.79 44.14Franklin Mutual Beacon ^ A (Acc) ^ EUR hedged (H1) 2.00% 226,509.837 23.39 34.49 44.02Franklin Mutual Beacon ^ A (Acc) ^ SGD 1.87% 717,811.951 5.71 7.62Franklin Mutual Beacon ^ A (Ydis) 1.89% 314,293.216 32.58 46.23 59.09Franklin Mutual Beacon ^ B (Acc) 3.19% 4,454,763.623 16.52 23.35 30.11Franklin Mutual Beacon ^ B (Ydis) ^ EUR 3.19% 15,595.233 11.81 14.83 22.24Franklin Mutual Beacon ^ C (Acc) 2.47% 4,731,845.078 9.84 13.86 17.75Franklin Mutual Beacon ^ I (Acc) 0.99% 22,690,575.702 8.70 12.17 15.36Franklin Mutual Beacon ^ I (Acc) ^ EUR 0.99% 5,229,155.829 6.22 7.72 11.34Franklin Mutual Beacon ^ I (Acc) ^ EUR hedged (H1) 1.05% 934,984.533 6.10 8.84Franklin Mutual Beacon ^ N (Acc) 2.64% 4,983,081.003 17.42 24.56 31.52Franklin Mutual Beacon ^ N (Acc) ^ EUR 2.64% 4,264,689.315 12.44 15.57 23.25Franklin Mutual Beacon ^ N (Acc) ^ EUR hedged (H1) 2.79% 223,368.942 12.26 18.08 23.34
Franklin Mutual Euroland Fund ^ EUR *Franklin Mutual Euroland ^ A (Acc) 1.67% 11,745.177 9.62Franklin Mutual Euroland ^ A (Acc) ^ USD 1.91% 9,953.673 9.86Franklin Mutual Euroland ^ I (Acc) 1.00% 457,973.774 9.64Franklin Mutual Euroland ^ I (Acc) ^ USD 0.99% 236,399.725 9.88Franklin Mutual Euroland ^ N (Acc) 2.66% 3,647.771 9.61
Franklin Mutual European Fund ^ EURFranklin Mutual European ^ A (Acc) 1.86% 148,461,460.720 12.51 16.67 21.09Franklin Mutual European ^ A (Acc) ^ USD 1.85% 22,528,371.365 17.50 26.24 28.55Franklin Mutual European ^ A (Acc) ^ SGD 1.85% 500.000 5.83 8.29Franklin Mutual European ^ A (Ydis) 1.86% 1,750,168.634 12.00 16.20 20.65Franklin Mutual European ^ A (Ydis) ^ GBP 1.86% 48,553.730 11.55 12.87 14.04Franklin Mutual European ^ B (Acc) ^ USD 3.15% 4,262,957.587 15.67 23.67 26.07Franklin Mutual European ^ B (Ydis) 3.16% 22,558.582 11.10 14.96 19.26Franklin Mutual European ^ C (Acc) 2.42% 197,955.723 11.78 15.73 20.03Franklin Mutual European ^ C (Acc) ^ USD 2.43% 1,843,555.709 16.47 24.78 27.12Franklin Mutual European ^ I (Acc) 0.99% 66,677,477.125 10.86 14.40 18.07Franklin Mutual European ^ I (Ydis) 0.99% 3,391,335.177 10.48 14.23 18.08Franklin Mutual European ^ N (Acc) 2.61% 20,431,370.426 10.98 14.69 18.73Franklin Mutual European ^ N (Acc) ^ USD 2.60% 2,150,332.039 15.30 23.03 25.24
Franklin Mutual Global Discovery Fund ^ USDFranklin Mutual Global Discovery ^ A (Acc) 1.88% 11,856,264.610 10.21 12.43 13.90Franklin Mutual Global Discovery ^ A (Acc) ^ EUR 1.88% 7,211,847.738 8.84 9.55 12.42Franklin Mutual Global Discovery ^ A (Acc) ^ EUR hedged (H2) 1.94% 2,312,502.422 7.20 9.14 10.30Franklin Mutual Global Discovery ^ A (Ydis) ^ EUR 1.88% 500,997.421 12.67 13.82 18.08Franklin Mutual Global Discovery ^ A (Ydis) ^ GBP 1.88% 22,047.989 12.13 10.93 12.19Franklin Mutual Global Discovery ^ B (Acc) 3.18% 2,147,708.434 9.81 12.02 13.61Franklin Mutual Global Discovery ^ C (Acc) 2.46% 4,982,100.638 10.02 12.23 13.75Franklin Mutual Global Discovery ^ I (Acc) 0.98% 10,066,528.411 10.51 12.73 14.11Franklin Mutual Global Discovery ^ I (Acc) ^ EUR 0.98% 6,312,189.365 9.09 9.78 12.61Franklin Mutual Global Discovery ^ I (Acc) ^ EUR hedged (H2) 0.97% 232,018.560 9.56Franklin Mutual Global Discovery ^ I (Ydis) ^ EUR 0.98% 457.457 8.81 9.66 12.61Franklin Mutual Global Discovery ^ N (Acc) 2.63% 2,212,369.132 9.97 12.18 13.72Franklin Mutual Global Discovery ^ N (Acc) ^ EUR 2.63% 1,338,770.535 8.61 9.34 12.24Franklin Mutual Global Discovery ^ N (Acc) ^ EUR hedged (H2) 2.74% 1,027,709.382 7.26 9.25 10.52
Franklin Templeton Global Equity Strategies Fund ^ USDFranklin Templeton Global Equity Strategies ^ A (Acc) 2.15% 1,011,237.330 6.73 9.15Franklin Templeton Global Equity Strategies ^ A (Acc) ^ EUR 2.14% 3,761,534.094 4.81 5.81Franklin Templeton Global Equity Strategies ^ A (Acc) ^ EUR hedged (H1) 2.14% 893,523.859 4.27 5.92Franklin Templeton Global Equity Strategies ^ A (Ydis) 2.10% 53,123.615 6.72 9.15Franklin Templeton Global Equity Strategies ^ A (Ydis) ^ EUR 2.11% 480,523.340 4.81 5.81
www.franklintempleton.lu Unaudited Semi-Annual Report
FRANKL IN TEMPLETON INVESTMENT FUNDS
Statistical Information (continued)
All classes in base currency unless otherwise stated
23
Total Shares
Expense Ratio Outstanding Net Asset Value per Share
December 31, December 31, December 31, June 30, June 30,
2008 2008 2008 2008 2007
(see Note 17)
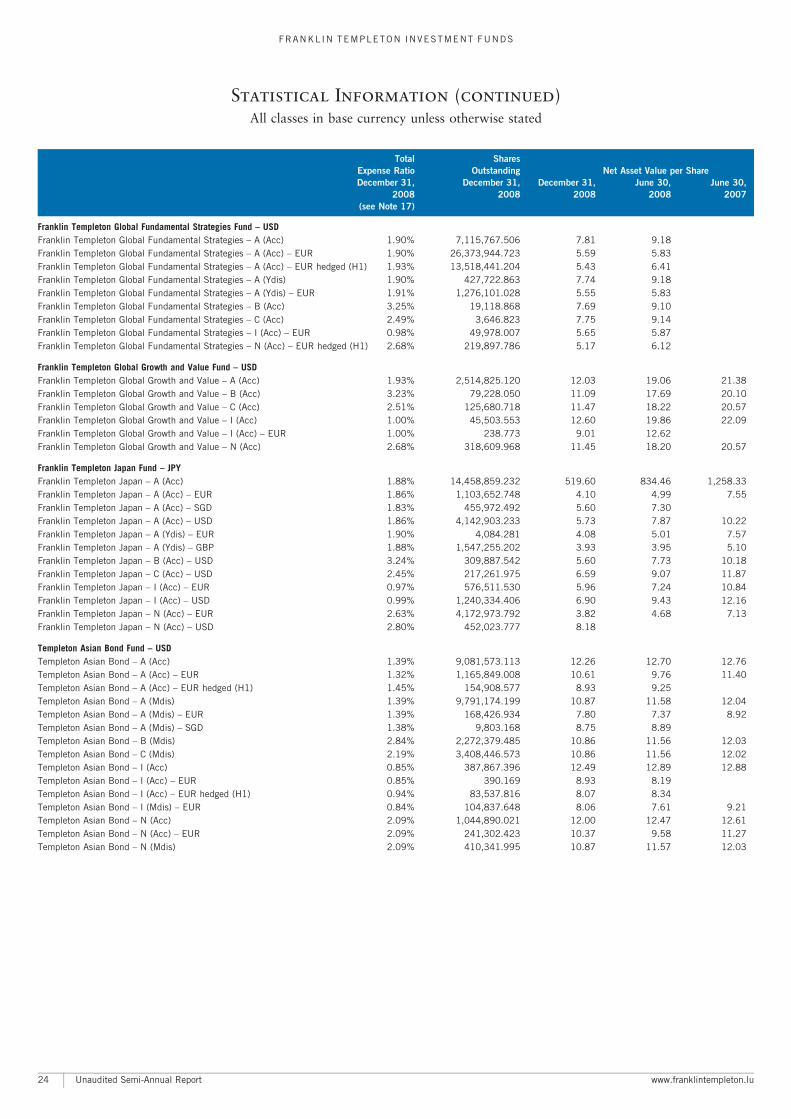
Franklin Templeton Global Fundamental Strategies Fund ^ USDFranklin Templeton Global Fundamental Strategies ^ A (Acc) 1.90% 7,115,767.506 7.81 9.18Franklin Templeton Global Fundamental Strategies ^ A (Acc) ^ EUR 1.90% 26,373,944.723 5.59 5.83Franklin Templeton Global Fundamental Strategies ^ A (Acc) ^ EUR hedged (H1) 1.93% 13,518,441.204 5.43 6.41Franklin Templeton Global Fundamental Strategies ^ A (Ydis) 1.90% 427,722.863 7.74 9.18Franklin Templeton Global Fundamental Strategies ^ A (Ydis) ^ EUR 1.91% 1,276,101.028 5.55 5.83Franklin Templeton Global Fundamental Strategies ^ B (Acc) 3.25% 19,118.868 7.69 9.10Franklin Templeton Global Fundamental Strategies ^ C (Acc) 2.49% 3,646.823 7.75 9.14Franklin Templeton Global Fundamental Strategies ^ I (Acc) ^ EUR 0.98% 49,978.007 5.65 5.87Franklin Templeton Global Fundamental Strategies ^ N (Acc) ^ EUR hedged (H1) 2.68% 219,897.786 5.17 6.12
Franklin Templeton Global Growth and Value Fund ^ USDFranklin Templeton Global Growth and Value ^ A (Acc) 1.93% 2,514,825.120 12.03 19.06 21.38Franklin Templeton Global Growth and Value ^ B (Acc) 3.23% 79,228.050 11.09 17.69 20.10Franklin Templeton Global Growth and Value ^ C (Acc) 2.51% 125,680.718 11.47 18.22 20.57Franklin Templeton Global Growth and Value ^ I (Acc) 1.00% 45,503.553 12.60 19.86 22.09Franklin Templeton Global Growth and Value ^ I (Acc) ^ EUR 1.00% 238.773 9.01 12.62Franklin Templeton Global Growth and Value ^ N (Acc) 2.68% 318,609.968 11.45 18.20 20.57
Franklin Templeton Japan Fund ^ JPYFranklin Templeton Japan ^ A (Acc) 1.88% 14,458,859.232 519.60 834.46 1,258.33Franklin Templeton Japan ^ A (Acc) ^ EUR 1.86% 1,103,652.748 4.10 4.99 7.55Franklin Templeton Japan ^ A (Acc) ^ SGD 1.83% 455,972.492 5.60 7.30Franklin Templeton Japan ^ A (Acc) ^ USD 1.86% 4,142,903.233 5.73 7.87 10.22Franklin Templeton Japan ^ A (Ydis) ^ EUR 1.90% 4,084.281 4.08 5.01 7.57Franklin Templeton Japan ^ A (Ydis) ^ GBP 1.88% 1,547,255.202 3.93 3.95 5.10Franklin Templeton Japan ^ B (Acc) ^ USD 3.24% 309,887.542 5.60 7.73 10.18Franklin Templeton Japan ^ C (Acc) ^ USD 2.45% 217,261.975 6.59 9.07 11.87Franklin Templeton Japan ^ I (Acc) ^ EUR 0.97% 576,511.530 5.96 7.24 10.84Franklin Templeton Japan ^ I (Acc) ^ USD 0.99% 1,240,334.406 6.90 9.43 12.16Franklin Templeton Japan ^ N (Acc) ^ EUR 2.63% 4,172,973.792 3.82 4.68 7.13Franklin Templeton Japan ^ N (Acc) ^ USD 2.80% 452,023.777 8.18
Templeton Asian Bond Fund ^ USDTempleton Asian Bond ^ A (Acc) 1.39% 9,081,573.113 12.26 12.70 12.76Templeton Asian Bond ^ A (Acc) ^ EUR 1.32% 1,165,849.008 10.61 9.76 11.40Templeton Asian Bond ^ A (Acc) ^ EUR hedged (H1) 1.45% 154,908.577 8.93 9.25Templeton Asian Bond ^ A (Mdis) 1.39% 9,791,174.199 10.87 11.58 12.04Templeton Asian Bond ^ A (Mdis) ^ EUR 1.39% 168,426.934 7.80 7.37 8.92Templeton Asian Bond ^ A (Mdis) ^ SGD 1.38% 9,803.168 8.75 8.89Templeton Asian Bond ^ B (Mdis) 2.84% 2,272,379.485 10.86 11.56 12.03Templeton Asian Bond ^ C (Mdis) 2.19% 3,408,446.573 10.86 11.56 12.02Templeton Asian Bond ^ I (Acc) 0.85% 387,867.396 12.49 12.89 12.88Templeton Asian Bond ^ I (Acc) ^ EUR 0.85% 390.169 8.93 8.19Templeton Asian Bond ^ I (Acc) ^ EUR hedged (H1) 0.94% 83,537.816 8.07 8.34Templeton Asian Bond ^ I (Mdis) ^ EUR 0.84% 104,837.648 8.06 7.61 9.21Templeton Asian Bond ^ N (Acc) 2.09% 1,044,890.021 12.00 12.47 12.61Templeton Asian Bond ^ N (Acc) ^ EUR 2.09% 241,302.423 10.37 9.58 11.27Templeton Asian Bond ^ N (Mdis) 2.09% 410,341.995 10.87 11.57 12.03
Unaudited Semi-Annual Report www.franklintempleton.lu
FRANKL IN TEMPLETON INVESTMENT FUNDS
Statistical Information (continued)
All classes in base currency unless otherwise stated
24
Total Shares
Expense Ratio Outstanding Net Asset Value per Share
December 31, December 31, December 31, June 30, June 30,
2008 2008 2008 2008 2007
(see Note 17)
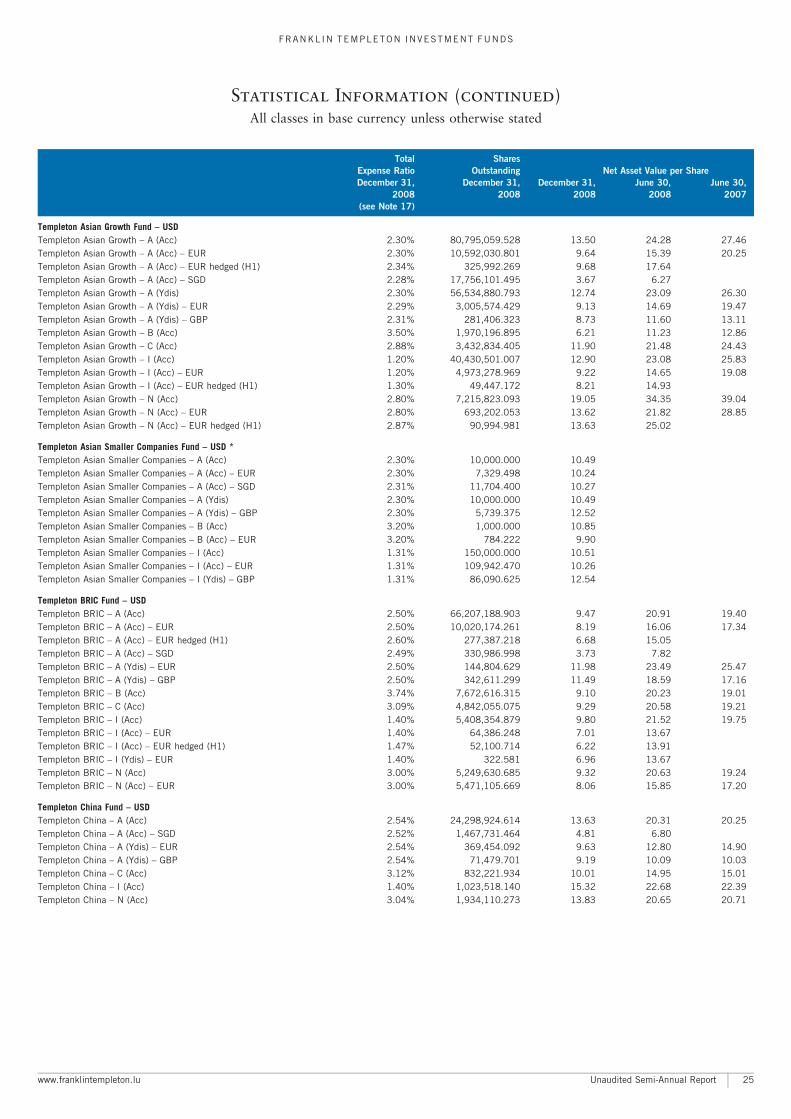
Templeton Asian Growth Fund ^ USDTempleton Asian Growth ^ A (Acc) 2.30% 80,795,059.528 13.50 24.28 27.46Templeton Asian Growth ^ A (Acc) ^ EUR 2.30% 10,592,030.801 9.64 15.39 20.25Templeton Asian Growth ^ A (Acc) ^ EUR hedged (H1) 2.34% 325,992.269 9.68 17.64Templeton Asian Growth ^ A (Acc) ^ SGD 2.28% 17,756,101.495 3.67 6.27Templeton Asian Growth ^ A (Ydis) 2.30% 56,534,880.793 12.74 23.09 26.30Templeton Asian Growth ^ A (Ydis) ^ EUR 2.29% 3,005,574.429 9.13 14.69 19.47Templeton Asian Growth ^ A (Ydis) ^ GBP 2.31% 281,406.323 8.73 11.60 13.11Templeton Asian Growth ^ B (Acc) 3.50% 1,970,196.895 6.21 11.23 12.86Templeton Asian Growth ^ C (Acc) 2.88% 3,432,834.405 11.90 21.48 24.43Templeton Asian Growth ^ I (Acc) 1.20% 40,430,501.007 12.90 23.08 25.83Templeton Asian Growth ^ I (Acc) ^ EUR 1.20% 4,973,278.969 9.22 14.65 19.08Templeton Asian Growth ^ I (Acc) ^ EUR hedged (H1) 1.30% 49,447.172 8.21 14.93Templeton Asian Growth ^ N (Acc) 2.80% 7,215,823.093 19.05 34.35 39.04Templeton Asian Growth ^ N (Acc) ^ EUR 2.80% 693,202.053 13.62 21.82 28.85Templeton Asian Growth ^ N (Acc) ^ EUR hedged (H1) 2.87% 90,994.981 13.63 25.02
Templeton Asian Smaller Companies Fund ^ USD *Templeton Asian Smaller Companies ^ A (Acc) 2.30% 10,000.000 10.49Templeton Asian Smaller Companies ^ A (Acc) ^ EUR 2.30% 7,329.498 10.24Templeton Asian Smaller Companies ^ A (Acc) ^ SGD 2.31% 11,704.400 10.27Templeton Asian Smaller Companies ^ A (Ydis) 2.30% 10,000.000 10.49Templeton Asian Smaller Companies ^ A (Ydis) ^ GBP 2.30% 5,739.375 12.52Templeton Asian Smaller Companies ^ B (Acc) 3.20% 1,000.000 10.85Templeton Asian Smaller Companies ^ B (Acc) ^ EUR 3.20% 784.222 9.90Templeton Asian Smaller Companies ^ I (Acc) 1.31% 150,000.000 10.51Templeton Asian Smaller Companies ^ I (Acc) ^ EUR 1.31% 109,942.470 10.26Templeton Asian Smaller Companies ^ I (Ydis) ^ GBP 1.31% 86,090.625 12.54
Templeton BRIC Fund ^ USDTempleton BRIC ^ A (Acc) 2.50% 66,207,188.903 9.47 20.91 19.40Templeton BRIC ^ A (Acc) ^ EUR 2.50% 10,020,174.261 8.19 16.06 17.34Templeton BRIC ^ A (Acc) ^ EUR hedged (H1) 2.60% 277,387.218 6.68 15.05Templeton BRIC ^ A (Acc) ^ SGD 2.49% 330,986.998 3.73 7.82Templeton BRIC ^ A (Ydis) ^ EUR 2.50% 144,804.629 11.98 23.49 25.47Templeton BRIC ^ A (Ydis) ^ GBP 2.50% 342,611.299 11.49 18.59 17.16Templeton BRIC ^ B (Acc) 3.74% 7,672,616.315 9.10 20.23 19.01Templeton BRIC ^ C (Acc) 3.09% 4,842,055.075 9.29 20.58 19.21Templeton BRIC ^ I (Acc) 1.40% 5,408,354.879 9.80 21.52 19.75Templeton BRIC ^ I (Acc) ^ EUR 1.40% 64,386.248 7.01 13.67Templeton BRIC ^ I (Acc) ^ EUR hedged (H1) 1.47% 52,100.714 6.22 13.91Templeton BRIC ^ I (Ydis) ^ EUR 1.40% 322.581 6.96 13.67Templeton BRIC ^ N (Acc) 3.00% 5,249,630.685 9.32 20.63 19.24Templeton BRIC ^ N (Acc) ^ EUR 3.00% 5,471,105.669 8.06 15.85 17.20
Templeton China Fund ^ USDTempleton China ^ A (Acc) 2.54% 24,298,924.614 13.63 20.31 20.25Templeton China ^ A (Acc) ^ SGD 2.52% 1,467,731.464 4.81 6.80Templeton China ^ A (Ydis) ^ EUR 2.54% 369,454.092 9.63 12.80 14.90Templeton China ^ A (Ydis) ^ GBP 2.54% 71,479.701 9.19 10.09 10.03Templeton China ^ C (Acc) 3.12% 832,221.934 10.01 14.95 15.01Templeton China ^ I (Acc) 1.40% 1,023,518.140 15.32 22.68 22.39Templeton China ^ N (Acc) 3.04% 1,934,110.273 13.83 20.65 20.71
www.franklintempleton.lu Unaudited Semi-Annual Report
FRANKL IN TEMPLETON INVESTMENT FUNDS
Statistical Information (continued)
All classes in base currency unless otherwise stated
25
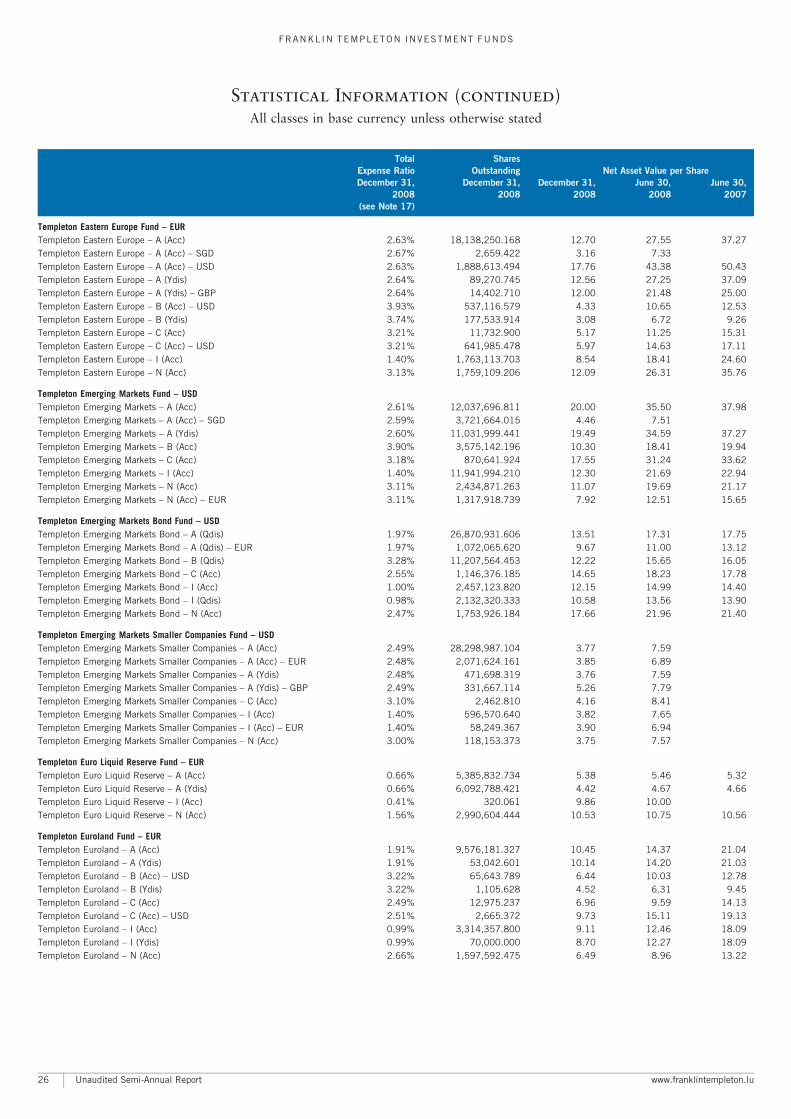
Total Shares
Expense Ratio Outstanding Net Asset Value per Share
December 31, December 31, December 31, June 30, June 30,
2008 2008 2008 2008 2007
(see Note 17)
Templeton Eastern Europe Fund ^ EURTempleton Eastern Europe ^ A (Acc) 2.63% 18,138,250.168 12.70 27.55 37.27Templeton Eastern Europe ^ A (Acc) ^ SGD 2.67% 2,659.422 3.16 7.33Templeton Eastern Europe ^ A (Acc) ^ USD 2.63% 1,888,613.494 17.76 43.38 50.43Templeton Eastern Europe ^ A (Ydis) 2.64% 89,270.745 12.56 27.25 37.09Templeton Eastern Europe ^ A (Ydis) ^ GBP 2.64% 14,402.710 12.00 21.48 25.00Templeton Eastern Europe ^ B (Acc) ^ USD 3.93% 537,116.579 4.33 10.65 12.53Templeton Eastern Europe ^ B (Ydis) 3.74% 177,533.914 3.08 6.72 9.26Templeton Eastern Europe ^ C (Acc) 3.21% 11,732.900 5.17 11.25 15.31Templeton Eastern Europe ^ C (Acc) ^ USD 3.21% 641,985.478 5.97 14.63 17.11Templeton Eastern Europe ^ I (Acc) 1.40% 1,763,113.703 8.54 18.41 24.60Templeton Eastern Europe ^ N (Acc) 3.13% 1,759,109.206 12.09 26.31 35.76
Templeton Emerging Markets Fund ^ USDTempleton Emerging Markets ^ A (Acc) 2.61% 12,037,696.811 20.00 35.50 37.98Templeton Emerging Markets ^ A (Acc) ^ SGD 2.59% 3,721,664.015 4.46 7.51Templeton Emerging Markets ^ A (Ydis) 2.60% 11,031,999.441 19.49 34.59 37.27Templeton Emerging Markets ^ B (Acc) 3.90% 3,575,142.196 10.30 18.41 19.94Templeton Emerging Markets ^ C (Acc) 3.18% 870,641.924 17.55 31.24 33.62Templeton Emerging Markets ^ I (Acc) 1.40% 11,941,994.210 12.30 21.69 22.94Templeton Emerging Markets ^ N (Acc) 3.11% 2,434,871.263 11.07 19.69 21.17Templeton Emerging Markets ^ N (Acc) ^ EUR 3.11% 1,317,918.739 7.92 12.51 15.65
Templeton Emerging Markets Bond Fund ^ USDTempleton Emerging Markets Bond ^ A (Qdis) 1.97% 26,870,931.606 13.51 17.31 17.75Templeton Emerging Markets Bond ^ A (Qdis) ^ EUR 1.97% 1,072,065.620 9.67 11.00 13.12Templeton Emerging Markets Bond ^ B (Qdis) 3.28% 11,207,564.453 12.22 15.65 16.05Templeton Emerging Markets Bond ^ C (Acc) 2.55% 1,146,376.185 14.65 18.23 17.78Templeton Emerging Markets Bond ^ I (Acc) 1.00% 2,457,123.820 12.15 14.99 14.40Templeton Emerging Markets Bond ^ I (Qdis) 0.98% 2,132,320.333 10.58 13.56 13.90Templeton Emerging Markets Bond ^ N (Acc) 2.47% 1,753,926.184 17.66 21.96 21.40
Templeton Emerging Markets Smaller Companies Fund ^ USDTempleton Emerging Markets Smaller Companies ^ A (Acc) 2.49% 28,298,987.104 3.77 7.59Templeton Emerging Markets Smaller Companies ^ A (Acc) ^ EUR 2.48% 2,071,624.161 3.85 6.89Templeton Emerging Markets Smaller Companies ^ A (Ydis) 2.48% 471,698.319 3.76 7.59Templeton Emerging Markets Smaller Companies ^ A (Ydis) ^ GBP 2.49% 331,667.114 5.26 7.79Templeton Emerging Markets Smaller Companies ^ C (Acc) 3.10% 2,462.810 4.16 8.41Templeton Emerging Markets Smaller Companies ^ I (Acc) 1.40% 596,570.640 3.82 7.65Templeton Emerging Markets Smaller Companies ^ I (Acc) ^ EUR 1.40% 58,249.367 3.90 6.94Templeton Emerging Markets Smaller Companies ^ N (Acc) 3.00% 118,153.373 3.75 7.57
Templeton Euro Liquid Reserve Fund ^ EURTempleton Euro Liquid Reserve ^ A (Acc) 0.66% 5,385,832.734 5.38 5.46 5.32Templeton Euro Liquid Reserve ^ A (Ydis) 0.66% 6,092,788.421 4.42 4.67 4.66Templeton Euro Liquid Reserve ^ I (Acc) 0.41% 320.061 9.86 10.00Templeton Euro Liquid Reserve ^ N (Acc) 1.56% 2,990,604.444 10.53 10.75 10.56
Templeton Euroland Fund ^ EURTempleton Euroland ^ A (Acc) 1.91% 9,576,181.327 10.45 14.37 21.04Templeton Euroland ^ A (Ydis) 1.91% 53,042.601 10.14 14.20 21.03Templeton Euroland ^ B (Acc) ^ USD 3.22% 65,643.789 6.44 10.03 12.78Templeton Euroland ^ B (Ydis) 3.22% 1,105.628 4.52 6.31 9.45Templeton Euroland ^ C (Acc) 2.49% 12,975.237 6.96 9.59 14.13Templeton Euroland ^ C (Acc) ^ USD 2.51% 2,665.372 9.73 15.11 19.13Templeton Euroland ^ I (Acc) 0.99% 3,314,357.800 9.11 12.46 18.09Templeton Euroland ^ I (Ydis) 0.99% 70,000.000 8.70 12.27 18.09Templeton Euroland ^ N (Acc) 2.66% 1,597,592.475 6.49 8.96 13.22
Unaudited Semi-Annual Report www.franklintempleton.lu
FRANKL IN TEMPLETON INVESTMENT FUNDS
Statistical Information (continued)
All classes in base currency unless otherwise stated
26
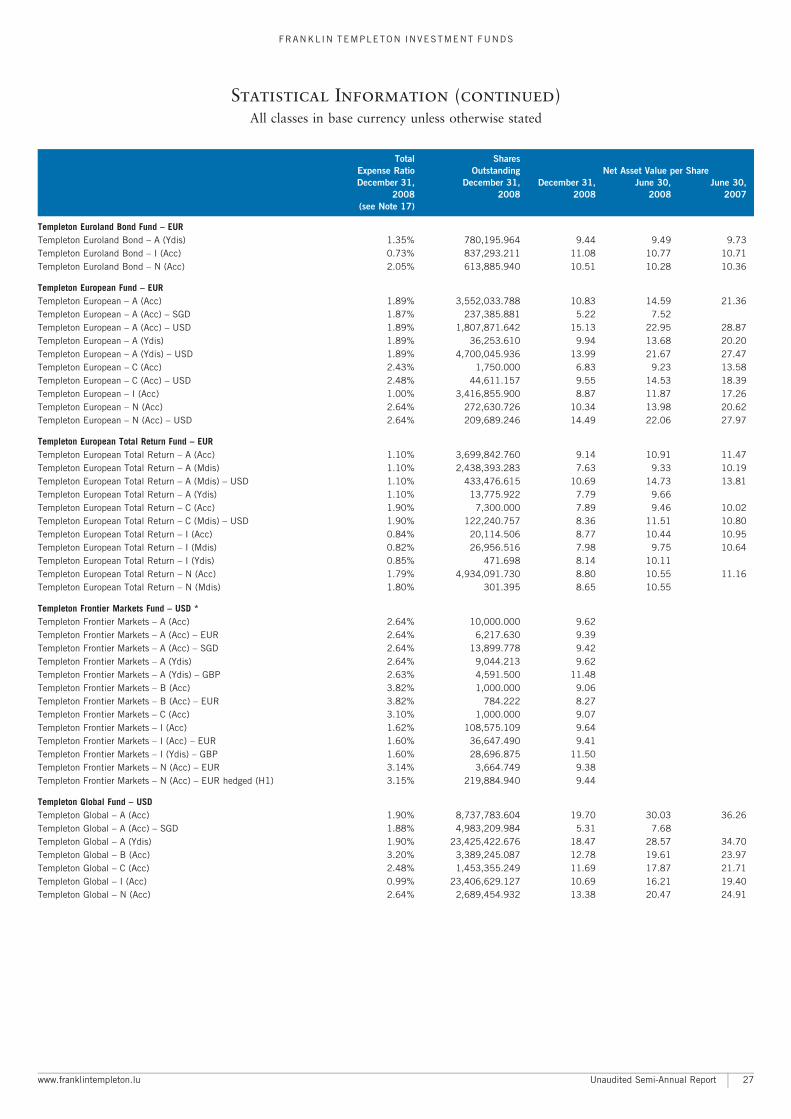
Total Shares
Expense Ratio Outstanding Net Asset Value per Share
December 31, December 31, December 31, June 30, June 30,
2008 2008 2008 2008 2007
(see Note 17)
Templeton Euroland Bond Fund ^ EURTempleton Euroland Bond ^ A (Ydis) 1.35% 780,195.964 9.44 9.49 9.73Templeton Euroland Bond ^ I (Acc) 0.73% 837,293.211 11.08 10.77 10.71Templeton Euroland Bond ^ N (Acc) 2.05% 613,885.940 10.51 10.28 10.36
Templeton European Fund ^ EURTempleton European ^ A (Acc) 1.89% 3,552,033.788 10.83 14.59 21.36Templeton European ^ A (Acc) ^ SGD 1.87% 237,385.881 5.22 7.52Templeton European ^ A (Acc) ^ USD 1.89% 1,807,871.642 15.13 22.95 28.87Templeton European ^ A (Ydis) 1.89% 36,253.610 9.94 13.68 20.20Templeton European ^ A (Ydis) ^ USD 1.89% 4,700,045.936 13.99 21.67 27.47Templeton European ^ C (Acc) 2.43% 1,750.000 6.83 9.23 13.58Templeton European ^ C (Acc) ^ USD 2.48% 44,611.157 9.55 14.53 18.39Templeton European ^ I (Acc) 1.00% 3,416,855.900 8.87 11.87 17.26Templeton European ^ N (Acc) 2.64% 272,630.726 10.34 13.98 20.62Templeton European ^ N (Acc) ^ USD 2.64% 209,689.246 14.49 22.06 27.97
Templeton European Total Return Fund ^ EURTempleton European Total Return ^ A (Acc) 1.10% 3,699,842.760 9.14 10.91 11.47Templeton European Total Return ^ A (Mdis) 1.10% 2,438,393.283 7.63 9.33 10.19Templeton European Total Return ^ A (Mdis) ^ USD 1.10% 433,476.615 10.69 14.73 13.81Templeton European Total Return ^ A (Ydis) 1.10% 13,775.922 7.79 9.66Templeton European Total Return ^ C (Acc) 1.90% 7,300.000 7.89 9.46 10.02Templeton European Total Return ^ C (Mdis) ^ USD 1.90% 122,240.757 8.36 11.51 10.80Templeton European Total Return ^ I (Acc) 0.84% 20,114.506 8.77 10.44 10.95Templeton European Total Return ^ I (Mdis) 0.82% 26,956.516 7.98 9.75 10.64Templeton European Total Return ^ I (Ydis) 0.85% 471.698 8.14 10.11Templeton European Total Return ^ N (Acc) 1.79% 4,934,091.730 8.80 10.55 11.16Templeton European Total Return ^ N (Mdis) 1.80% 301.395 8.65 10.55
Templeton Frontier Markets Fund ^ USD *Templeton Frontier Markets ^ A (Acc) 2.64% 10,000.000 9.62Templeton Frontier Markets ^ A (Acc) ^ EUR 2.64% 6,217.630 9.39Templeton Frontier Markets ^ A (Acc) ^ SGD 2.64% 13,899.778 9.42Templeton Frontier Markets ^ A (Ydis) 2.64% 9,044.213 9.62Templeton Frontier Markets ^ A (Ydis) ^ GBP 2.63% 4,591.500 11.48Templeton Frontier Markets ^ B (Acc) 3.82% 1,000.000 9.06Templeton Frontier Markets ^ B (Acc) ^ EUR 3.82% 784.222 8.27Templeton Frontier Markets ^ C (Acc) 3.10% 1,000.000 9.07Templeton Frontier Markets ^ I (Acc) 1.62% 108,575.109 9.64Templeton Frontier Markets ^ I (Acc) ^ EUR 1.60% 36,647.490 9.41Templeton Frontier Markets ^ I (Ydis) ^ GBP 1.60% 28,696.875 11.50Templeton Frontier Markets ^ N (Acc) ^ EUR 3.14% 3,664.749 9.38Templeton Frontier Markets ^ N (Acc) ^ EUR hedged (H1) 3.15% 219,884.940 9.44
Templeton Global Fund ^ USDTempleton Global ^ A (Acc) 1.90% 8,737,783.604 19.70 30.03 36.26Templeton Global ^ A (Acc) ^ SGD 1.88% 4,983,209.984 5.31 7.68Templeton Global ^ A (Ydis) 1.90% 23,425,422.676 18.47 28.57 34.70Templeton Global ^ B (Acc) 3.20% 3,389,245.087 12.78 19.61 23.97Templeton Global ^ C (Acc) 2.48% 1,453,355.249 11.69 17.87 21.71Templeton Global ^ I (Acc) 0.99% 23,406,629.127 10.69 16.21 19.40Templeton Global ^ N (Acc) 2.64% 2,689,454.932 13.38 20.47 24.91
www.franklintempleton.lu Unaudited Semi-Annual Report
FRANKL IN TEMPLETON INVESTMENT FUNDS
Statistical Information (continued)
All classes in base currency unless otherwise stated
27

Total Shares
Expense Ratio Outstanding Net Asset Value per Share
December 31, December 31, December 31, June 30, June 30,
2008 2008 2008 2008 2007
(see Note 17)
Templeton Global (Euro) Fund ^ EURTempleton Global (Euro) ^ A (Acc) 1.91% 3,368,546.508 9.31 12.30 17.48Templeton Global (Euro) ^ A (Ydis) 1.91% 43,975,782.099 8.81 11.82 16.91Templeton Global (Euro) ^ B (Acc) ^ USD 3.25% 749.252 6.43 9.64 11.92Templeton Global (Euro) ^ I (Acc) 0.97% 2,183,709.353 8.53 11.22 15.80Templeton Global (Euro) ^ I (Acc) ^ hedged (H2) 0.97% 1,517,646.937 9.05 12.06 15.85Templeton Global (Euro) ^ N (Acc) 2.66% 304,707.334 8.08 10.71 15.34
Templeton Global Balanced Fund ^ USDTempleton Global Balanced ^ A (Acc) 1.77% 5,478,224.012 16.86 21.55 23.79Templeton Global Balanced ^ A (Acc) ^ EUR 1.75% 732,073.915 12.06 13.69 17.58Templeton Global Balanced ^ A (Acc) ^ EUR hedged (H1) 1.75% 65,904.699 12.15 15.61Templeton Global Balanced ^ A (Acc) ^ SGD 1.72% 28,904,570.618 6.87 8.33Templeton Global Balanced ^ A (Qdis) 1.75% 15,785,298.514 15.03 19.48 21.87Templeton Global Balanced ^ B (Acc) 3.06% 10,338,752.882 11.65 14.98 16.75Templeton Global Balanced ^ C (Qdis) 2.33% 4,005,906.108 8.84 11.45 12.86Templeton Global Balanced ^ I (Acc) 0.90% 415,767.407 8.86 11.27 12.35Templeton Global Balanced ^ I (Acc) ^ EUR hedged (H1) 0.92% 86,034.621 5.71 7.29Templeton Global Balanced ^ N (Acc) ^ EUR 2.25% 1,154,845.227 8.81 10.02 12.94Templeton Global Balanced ^ N (Acc) ^ EUR hedged (H1) 2.25% 136,507.000 6.53 8.39
Templeton Global Bond Fund ^ USDTempleton Global Bond ^ A (Acc) 1.45% 44,530,082.101 18.96 17.88 16.77Templeton Global Bond ^ A (Acc) ^ EUR 1.45% 26,156,080.632 13.56 11.35 12.40Templeton Global Bond ^ A (Acc) ^ EUR hedged (H1) 1.45% 17,172,160.987 13.94 13.04 12.39Templeton Global Bond ^ A (Mdis) 1.45% 195,932,125.821 16.30 15.68 15.25Templeton Global Bond ^ A (Mdis) ^ EUR 1.45% 22,326,027.541 11.67 9.97 11.29Templeton Global Bond ^ A (Mdis) ^ GBP 1.46% 3,368,484.111 11.18 7.88 7.61Templeton Global Bond ^ A (Mdis) ^ GBP hedged (H1) 1.45% 407,903.369 8.34 7.85Templeton Global Bond ^ A (Mdis) ^ SGD 1.35% 5,619,161.184 10.10 9.23Templeton Global Bond ^ A (Mdis) ^ EUR hedged (H1) 1.45% 286,948.470 10.68 10.13Templeton Global Bond ^ A (Mdis) ^ SGD hedged (H1) 1.49% 1,377,572.568 10.27 9.97Templeton Global Bond ^ A (Ydis) ^ EUR 1.35% 330,369.300 11.86 10.30Templeton Global Bond ^ AX (Acc) 1.65% 32,456,516.705 14.51 13.69 12.87Templeton Global Bond ^ B (Mdis) 2.96% 50,149,688.317 17.07 16.42 15.98Templeton Global Bond ^ C (Mdis) 2.23% 46,593,733.517 12.51 12.03 11.71Templeton Global Bond ^ I (Acc) 0.85% 28,447,032.336 15.18 14.27 13.31Templeton Global Bond ^ I (Acc) ^ EUR 0.85% 10,684,062.831 10.78 9.00 9.76Templeton Global Bond ^ I (Acc) ^ EUR hedged (H1) 0.94% 1,879,411.387 11.13 10.29Templeton Global Bond ^ I (Mdis) ^ EUR 0.85% 3,394,181.413 9.78 8.35 9.45Templeton Global Bond ^ I (Ydis) ^ EUR 0.85% 1,187,596.517 9.98 8.68Templeton Global Bond ^ N (Acc) 2.15% 21,632,997.112 19.36 18.31 17.30Templeton Global Bond ^ N (Acc) ^ EUR 2.15% 222,923.123 13.84 11.63 12.78Templeton Global Bond ^ N (Acc) ^ EUR hedged (H1) 2.15% 25,972,007.676 14.23 13.38 12.78Templeton Global Bond ^ N (Mdis) ^ EUR hedged (H1) 2.15% 54,615.788 12.51 11.84
Templeton Global Bond (Euro) Fund ^ EURTempleton Global Bond (Euro) ^ A (Acc) 1.35% 5,237,620.723 11.48 10.65 11.19Templeton Global Bond (Euro) ^ A (Ydis) 1.34% 2,490,254.096 9.55 9.37 10.25Templeton Global Bond (Euro) ^ B (Acc) ^ USD 3.02% 9,868.085 11.11 11.70 10.72Templeton Global Bond (Euro) ^ I (Acc) 0.85% 1,038,424.003 11.33 10.48 10.96Templeton Global Bond (Euro) ^ N (Acc) 2.05% 5,965,232.791 11.06 10.30 10.90
Unaudited Semi-Annual Report www.franklintempleton.lu
FRANKL IN TEMPLETON INVESTMENT FUNDS
Statistical Information (continued)
All classes in base currency unless otherwise stated
28
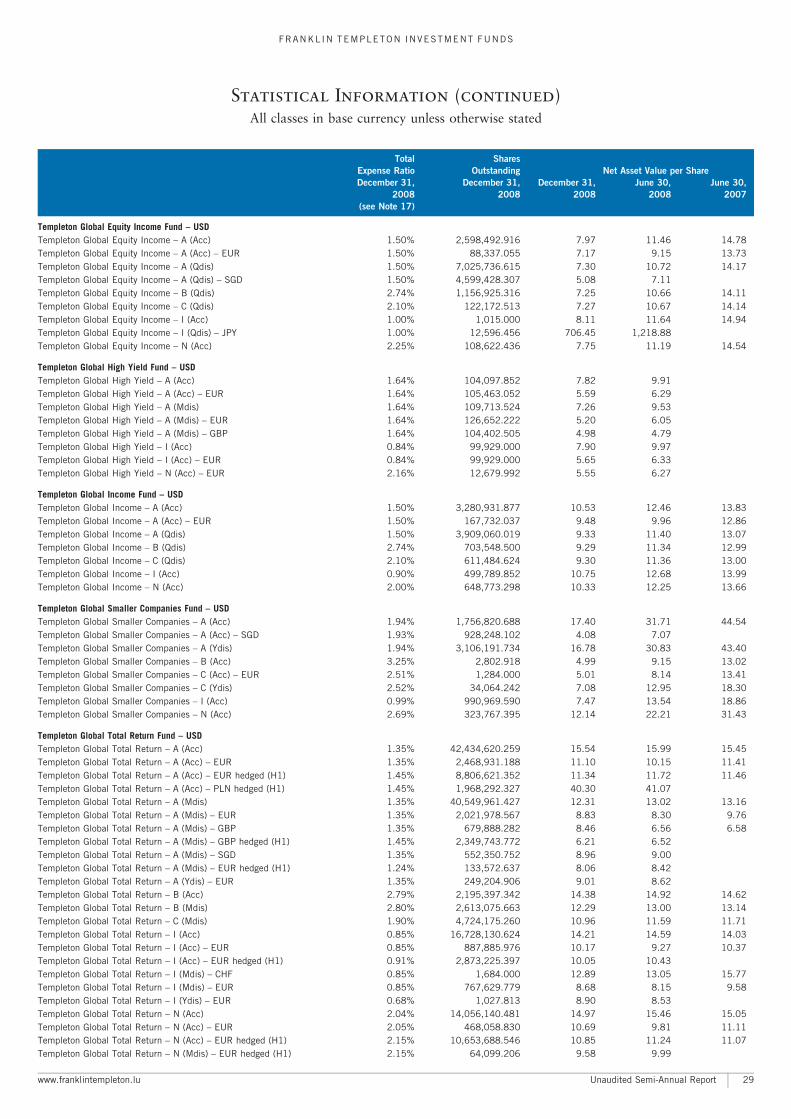
Total Shares
Expense Ratio Outstanding Net Asset Value per Share
December 31, December 31, December 31, June 30, June 30,
2008 2008 2008 2008 2007
(see Note 17)
Templeton Global Equity Income Fund ^ USDTempleton Global Equity Income ^ A (Acc) 1.50% 2,598,492.916 7.97 11.46 14.78Templeton Global Equity Income ^ A (Acc) ^ EUR 1.50% 88,337.055 7.17 9.15 13.73Templeton Global Equity Income ^ A (Qdis) 1.50% 7,025,736.615 7.30 10.72 14.17Templeton Global Equity Income ^ A (Qdis) ^ SGD 1.50% 4,599,428.307 5.08 7.11Templeton Global Equity Income ^ B (Qdis) 2.74% 1,156,925.316 7.25 10.66 14.11Templeton Global Equity Income ^ C (Qdis) 2.10% 122,172.513 7.27 10.67 14.14Templeton Global Equity Income ^ I (Acc) 1.00% 1,015.000 8.11 11.64 14.94Templeton Global Equity Income ^ I (Qdis) ^ JPY 1.00% 12,596.456 706.45 1,218.88Templeton Global Equity Income ^ N (Acc) 2.25% 108,622.436 7.75 11.19 14.54
Templeton Global High Yield Fund ^ USDTempleton Global High Yield ^ A (Acc) 1.64% 104,097.852 7.82 9.91Templeton Global High Yield ^ A (Acc) ^ EUR 1.64% 105,463.052 5.59 6.29Templeton Global High Yield ^ A (Mdis) 1.64% 109,713.524 7.26 9.53Templeton Global High Yield ^ A (Mdis) ^ EUR 1.64% 126,652.222 5.20 6.05Templeton Global High Yield ^ A (Mdis) ^ GBP 1.64% 104,402.505 4.98 4.79Templeton Global High Yield ^ I (Acc) 0.84% 99,929.000 7.90 9.97Templeton Global High Yield ^ I (Acc) ^ EUR 0.84% 99,929.000 5.65 6.33Templeton Global High Yield ^ N (Acc) ^ EUR 2.16% 12,679.992 5.55 6.27
Templeton Global Income Fund ^ USDTempleton Global Income ^ A (Acc) 1.50% 3,280,931.877 10.53 12.46 13.83Templeton Global Income ^ A (Acc) ^ EUR 1.50% 167,732.037 9.48 9.96 12.86Templeton Global Income ^ A (Qdis) 1.50% 3,909,060.019 9.33 11.40 13.07Templeton Global Income ^ B (Qdis) 2.74% 703,548.500 9.29 11.34 12.99Templeton Global Income ^ C (Qdis) 2.10% 611,484.624 9.30 11.36 13.00Templeton Global Income ^ I (Acc) 0.90% 499,789.852 10.75 12.68 13.99Templeton Global Income ^ N (Acc) 2.00% 648,773.298 10.33 12.25 13.66
Templeton Global Smaller Companies Fund ^ USDTempleton Global Smaller Companies ^ A (Acc) 1.94% 1,756,820.688 17.40 31.71 44.54Templeton Global Smaller Companies ^ A (Acc) ^ SGD 1.93% 928,248.102 4.08 7.07Templeton Global Smaller Companies ^ A (Ydis) 1.94% 3,106,191.734 16.78 30.83 43.40Templeton Global Smaller Companies ^ B (Acc) 3.25% 2,802.918 4.99 9.15 13.02Templeton Global Smaller Companies ^ C (Acc) ^ EUR 2.51% 1,284.000 5.01 8.14 13.41Templeton Global Smaller Companies ^ C (Ydis) 2.52% 34,064.242 7.08 12.95 18.30Templeton Global Smaller Companies ^ I (Acc) 0.99% 990,969.590 7.47 13.54 18.86Templeton Global Smaller Companies ^ N (Acc) 2.69% 323,767.395 12.14 22.21 31.43
Templeton Global Total Return Fund ^ USDTempleton Global Total Return ^ A (Acc) 1.35% 42,434,620.259 15.54 15.99 15.45Templeton Global Total Return ^ A (Acc) ^ EUR 1.35% 2,468,931.188 11.10 10.15 11.41Templeton Global Total Return ^ A (Acc) ^ EUR hedged (H1) 1.45% 8,806,621.352 11.34 11.72 11.46Templeton Global Total Return ^ A (Acc) ^ PLN hedged (H1) 1.45% 1,968,292.327 40.30 41.07Templeton Global Total Return ^ A (Mdis) 1.35% 40,549,961.427 12.31 13.02 13.16Templeton Global Total Return ^ A (Mdis) ^ EUR 1.35% 2,021,978.567 8.83 8.30 9.76Templeton Global Total Return ^ A (Mdis) ^ GBP 1.35% 679,888.282 8.46 6.56 6.58Templeton Global Total Return ^ A (Mdis) ^ GBP hedged (H1) 1.45% 2,349,743.772 6.21 6.52Templeton Global Total Return ^ A (Mdis) ^ SGD 1.35% 552,350.752 8.96 9.00Templeton Global Total Return ^ A (Mdis) ^ EUR hedged (H1) 1.24% 133,572.637 8.06 8.42Templeton Global Total Return ^ A (Ydis) ^ EUR 1.35% 249,204.906 9.01 8.62Templeton Global Total Return ^ B (Acc) 2.79% 2,195,397.342 14.38 14.92 14.62Templeton Global Total Return ^ B (Mdis) 2.80% 2,613,075.663 12.29 13.00 13.14Templeton Global Total Return ^ C (Mdis) 1.90% 4,724,175.260 10.96 11.59 11.71Templeton Global Total Return ^ I (Acc) 0.85% 16,728,130.624 14.21 14.59 14.03Templeton Global Total Return ^ I (Acc) ^ EUR 0.85% 887,885.976 10.17 9.27 10.37Templeton Global Total Return ^ I (Acc) ^ EUR hedged (H1) 0.91% 2,873,225.397 10.05 10.43Templeton Global Total Return ^ I (Mdis) ^ CHF 0.85% 1,684.000 12.89 13.05 15.77Templeton Global Total Return ^ I (Mdis) ^ EUR 0.85% 767,629.779 8.68 8.15 9.58Templeton Global Total Return ^ I (Ydis) ^ EUR 0.68% 1,027.813 8.90 8.53Templeton Global Total Return ^ N (Acc) 2.04% 14,056,140.481 14.97 15.46 15.05Templeton Global Total Return ^ N (Acc) ^ EUR 2.05% 468,058.830 10.69 9.81 11.11Templeton Global Total Return ^ N (Acc) ^ EUR hedged (H1) 2.15% 10,653,688.546 10.85 11.24 11.07Templeton Global Total Return ^ N (Mdis) ^ EUR hedged (H1) 2.15% 64,099.206 9.58 9.99
www.franklintempleton.lu Unaudited Semi-Annual Report
FRANKL IN TEMPLETON INVESTMENT FUNDS
Statistical Information (continued)
All classes in base currency unless otherwise stated
29
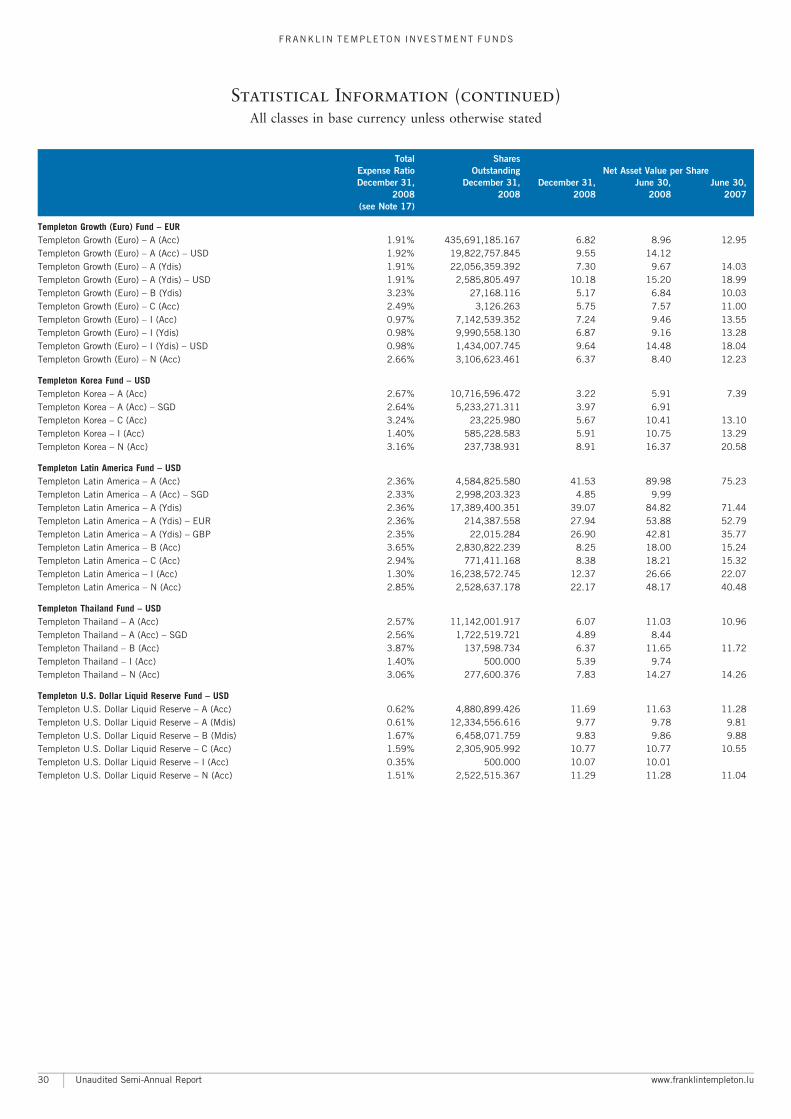
Total Shares
Expense Ratio Outstanding Net Asset Value per Share
December 31, December 31, December 31, June 30, June 30,
2008 2008 2008 2008 2007
(see Note 17)
Templeton Growth (Euro) Fund ^ EURTempleton Growth (Euro) ^ A (Acc) 1.91% 435,691,185.167 6.82 8.96 12.95Templeton Growth (Euro) ^ A (Acc) ^ USD 1.92% 19,822,757.845 9.55 14.12Templeton Growth (Euro) ^ A (Ydis) 1.91% 22,056,359.392 7.30 9.67 14.03Templeton Growth (Euro) ^ A (Ydis) ^ USD 1.91% 2,585,805.497 10.18 15.20 18.99Templeton Growth (Euro) ^ B (Ydis) 3.23% 27,168.116 5.17 6.84 10.03Templeton Growth (Euro) ^ C (Acc) 2.49% 3,126.263 5.75 7.57 11.00Templeton Growth (Euro) ^ I (Acc) 0.97% 7,142,539.352 7.24 9.46 13.55Templeton Growth (Euro) ^ I (Ydis) 0.98% 9,990,558.130 6.87 9.16 13.28Templeton Growth (Euro) ^ I (Ydis) ^ USD 0.98% 1,434,007.745 9.64 14.48 18.04Templeton Growth (Euro) ^ N (Acc) 2.66% 3,106,623.461 6.37 8.40 12.23
Templeton Korea Fund ^ USDTempleton Korea ^ A (Acc) 2.67% 10,716,596.472 3.22 5.91 7.39Templeton Korea ^ A (Acc) ^ SGD 2.64% 5,233,271.311 3.97 6.91Templeton Korea ^ C (Acc) 3.24% 23,225.980 5.67 10.41 13.10Templeton Korea ^ I (Acc) 1.40% 585,228.583 5.91 10.75 13.29Templeton Korea ^ N (Acc) 3.16% 237,738.931 8.91 16.37 20.58
Templeton Latin America Fund ^ USDTempleton Latin America ^ A (Acc) 2.36% 4,584,825.580 41.53 89.98 75.23Templeton Latin America ^ A (Acc) ^ SGD 2.33% 2,998,203.323 4.85 9.99Templeton Latin America ^ A (Ydis) 2.36% 17,389,400.351 39.07 84.82 71.44Templeton Latin America ^ A (Ydis) ^ EUR 2.36% 214,387.558 27.94 53.88 52.79Templeton Latin America ^ A (Ydis) ^ GBP 2.35% 22,015.284 26.90 42.81 35.77Templeton Latin America ^ B (Acc) 3.65% 2,830,822.239 8.25 18.00 15.24Templeton Latin America ^ C (Acc) 2.94% 771,411.168 8.38 18.21 15.32Templeton Latin America ^ I (Acc) 1.30% 16,238,572.745 12.37 26.66 22.07Templeton Latin America ^ N (Acc) 2.85% 2,528,637.178 22.17 48.17 40.48
Templeton Thailand Fund ^ USDTempleton Thailand ^ A (Acc) 2.57% 11,142,001.917 6.07 11.03 10.96Templeton Thailand ^ A (Acc) ^ SGD 2.56% 1,722,519.721 4.89 8.44Templeton Thailand ^ B (Acc) 3.87% 137,598.734 6.37 11.65 11.72Templeton Thailand ^ I (Acc) 1.40% 500.000 5.39 9.74Templeton Thailand ^ N (Acc) 3.06% 277,600.376 7.83 14.27 14.26
Templeton U.S. Dollar Liquid Reserve Fund ^ USDTempleton U.S. Dollar Liquid Reserve ^ A (Acc) 0.62% 4,880,899.426 11.69 11.63 11.28Templeton U.S. Dollar Liquid Reserve ^ A (Mdis) 0.61% 12,334,556.616 9.77 9.78 9.81Templeton U.S. Dollar Liquid Reserve ^ B (Mdis) 1.67% 6,458,071.759 9.83 9.86 9.88Templeton U.S. Dollar Liquid Reserve ^ C (Acc) 1.59% 2,305,905.992 10.77 10.77 10.55Templeton U.S. Dollar Liquid Reserve ^ I (Acc) 0.35% 500.000 10.07 10.01Templeton U.S. Dollar Liquid Reserve ^ N (Acc) 1.51% 2,522,515.367 11.29 11.28 11.04
Unaudited Semi-Annual Report www.franklintempleton.lu
FRANKL IN TEMPLETON INVESTMENT FUNDS
Statistical Information (continued)
All classes in base currency unless otherwise stated
30
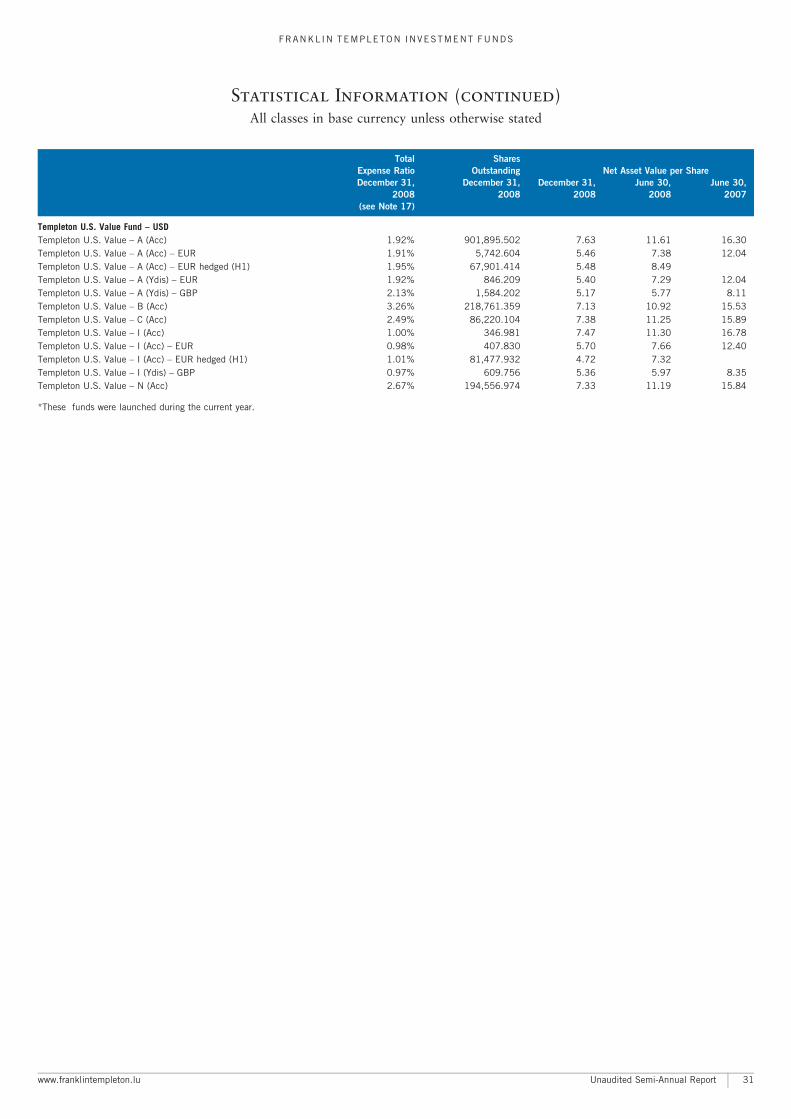
Total Shares
Expense Ratio Outstanding Net Asset Value per Share
December 31, December 31, December 31, June 30, June 30,
2008 2008 2008 2008 2007
(see Note 17)
Templeton U.S. Value Fund ^ USDTempleton U.S. Value ^ A (Acc) 1.92% 901,895.502 7.63 11.61 16.30Templeton U.S. Value ^ A (Acc) ^ EUR 1.91% 5,742.604 5.46 7.38 12.04Templeton U.S. Value ^ A (Acc) ^ EUR hedged (H1) 1.95% 67,901.414 5.48 8.49Templeton U.S. Value ^ A (Ydis) ^ EUR 1.92% 846.209 5.40 7.29 12.04Templeton U.S. Value ^ A (Ydis) ^ GBP 2.13% 1,584.202 5.17 5.77 8.11Templeton U.S. Value ^ B (Acc) 3.26% 218,761.359 7.13 10.92 15.53Templeton U.S. Value ^ C (Acc) 2.49% 86,220.104 7.38 11.25 15.89Templeton U.S. Value ^ I (Acc) 1.00% 346.981 7.47 11.30 16.78Templeton U.S. Value ^ I (Acc) ^ EUR 0.98% 407.830 5.70 7.66 12.40Templeton U.S. Value ^ I (Acc) ^ EUR hedged (H1) 1.01% 81,477.932 4.72 7.32Templeton U.S. Value ^ I (Ydis) ^ GBP 0.97% 609.756 5.36 5.97 8.35Templeton U.S. Value ^ N (Acc) 2.67% 194,556.974 7.33 11.19 15.84
*These funds were launched during the current year.
www.franklintempleton.lu Unaudited Semi-Annual Report
FRANKL IN TEMPLETON INVESTMENT FUNDS
Statistical Information (continued)
All classes in base currency unless otherwise stated
31
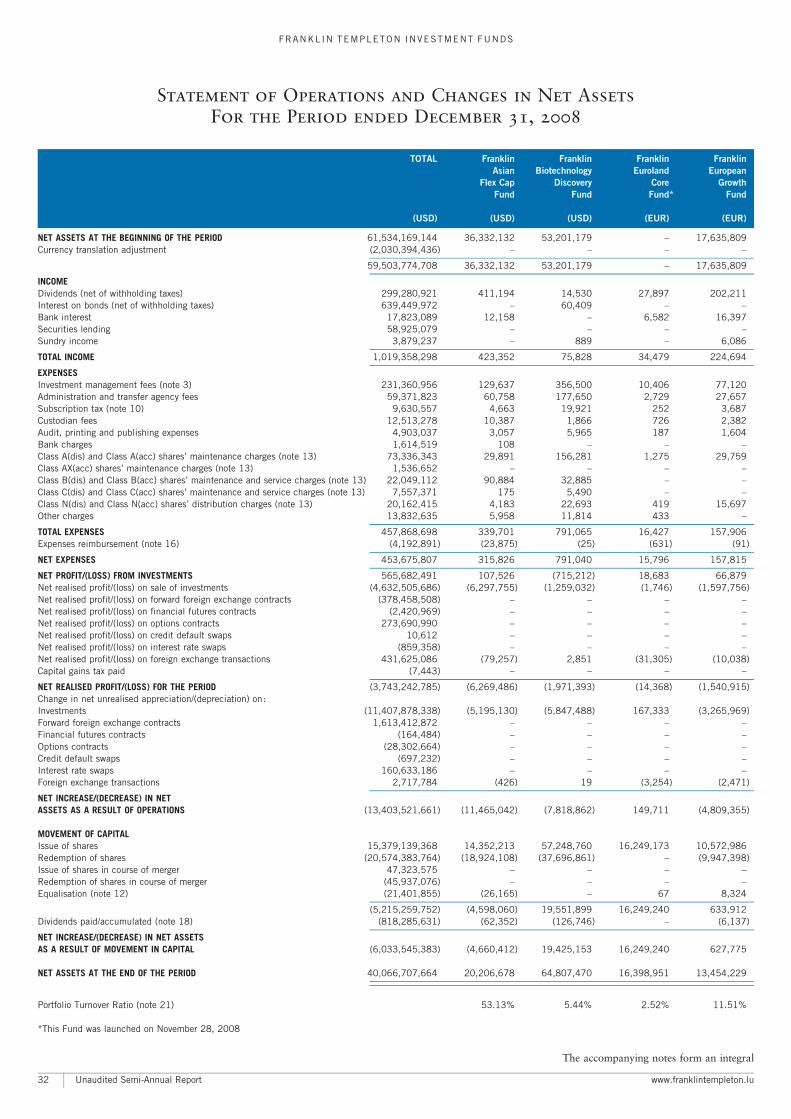
TOTAL Franklin Franklin Franklin Franklin
Asian Biotechnology Euroland European
Flex Cap Discovery Core Growth
Fund Fund Fund* Fund
(USD) (USD) (USD) (EUR) (EUR)
NET ASSETS AT THE BEGINNING OF THE PERIOD 61,534,169,144 36,332,132 53,201,179 ^ 17,635,809Currency translation adjustment (2,030,394,436) ^ ^ ^ ^
59,503,774,708 36,332,132 53,201,179 ^ 17,635,809
INCOMEDividends (net of withholding taxes) 299,280,921 411,194 14,530 27,897 202,211Interest on bonds (net of withholding taxes) 639,449,972 ^ 60,409 ^ ^Bank interest 17,823,089 12,158 ^ 6,582 16,397Securities lending 58,925,079 ^ ^ ^ ^Sundry income 3,879,237 ^ 889 ^ 6,086
TOTAL INCOME 1,019,358,298 423,352 75,828 34,479 224,694
EXPENSESInvestment management fees (note 3) 231,360,956 129,637 356,500 10,406 77,120Administration and transfer agency fees 59,371,823 60,758 177,650 2,729 27,657Subscription tax (note 10) 9,630,557 4,663 19,921 252 3,687Custodian fees 12,513,278 10,387 1,866 726 2,382Audit, printing and publishing expenses 4,903,037 3,057 5,965 187 1,604Bank charges 1,614,519 108 ^ ^ ^Class A(dis) and Class A(acc) shares’ maintenance charges (note 13) 73,336,343 29,891 156,281 1,275 29,759Class AX(acc) shares’ maintenance charges (note 13) 1,536,652 ^ ^ ^ ^Class B(dis) and Class B(acc) shares’ maintenance and service charges (note 13) 22,049,112 90,884 32,885 ^ ^Class C(dis) and Class C(acc) shares’ maintenance and service charges (note 13) 7,557,371 175 5,490 ^ ^Class N(dis) and Class N(acc) shares’ distribution charges (note 13) 20,162,415 4,183 22,693 419 15,697Other charges 13,832,635 5,958 11,814 433 ^
TOTAL EXPENSES 457,868,698 339,701 791,065 16,427 157,906Expenses reimbursement (note 16) (4,192,891) (23,875) (25) (631) (91)
NET EXPENSES 453,675,807 315,826 791,040 15,796 157,815
NET PROFIT/(LOSS) FROM INVESTMENTS 565,682,491 107,526 (715,212) 18,683 66,879Net realised profit/(loss) on sale of investments (4,632,505,686) (6,297,755) (1,259,032) (1,746) (1,597,756)Net realised profit/(loss) on forward foreign exchange contracts (378,458,508) ^ ^ ^ ^Net realised profit/(loss) on financial futures contracts (2,420,969) ^ ^ ^ ^Net realised profit/(loss) on options contracts 273,690,990 ^ ^ ^ ^Net realised profit/(loss) on credit default swaps 10,612 ^ ^ ^ ^Net realised profit/(loss) on interest rate swaps (859,358) ^ ^ ^ ^Net realised profit/(loss) on foreign exchange transactions 431,625,086 (79,257) 2,851 (31,305) (10,038)Capital gains tax paid (7,443) ^ ^ ^ ^
NET REALISED PROFIT/(LOSS) FOR THE PERIOD (3,743,242,785) (6,269,486) (1,971,393) (14,368) (1,540,915)Change in net unrealised appreciation/(depreciation) on:Investments (11,407,878,338) (5,195,130) (5,847,488) 167,333 (3,265,969)Forward foreign exchange contracts 1,613,412,872 ^ ^ ^ ^Financial futures contracts (164,484) ^ ^ ^ ^Options contracts (28,302,664) ^ ^ ^ ^Credit default swaps (697,232) ^ ^ ^ ^Interest rate swaps 160,633,186 ^ ^ ^ ^Foreign exchange transactions 2,717,784 (426) 19 (3,254) (2,471)
NET INCREASE/(DECREASE) IN NETASSETS AS A RESULT OF OPERATIONS (13,403,521,661) (11,465,042) (7,818,862) 149,711 (4,809,355)
MOVEMENT OF CAPITALIssue of shares 15,379,139,368 14,352,213 57,248,760 16,249,173 10,572,986Redemption of shares (20,574,383,764) (18,924,108) (37,696,861) ^ (9,947,398)Issue of shares in course of merger 47,323,575 ^ ^ ^ ^Redemption of shares in course of merger (45,937,076) ^ ^ ^ ^Equalisation (note 12) (21,401,855) (26,165) ^ 67 8,324
(5,215,259,752) (4,598,060) 19,551,899 16,249,240 633,912Dividends paid/accumulated (note 18) (818,285,631) (62,352) (126,746) ^ (6,137)
NET INCREASE/(DECREASE) IN NET ASSETSAS A RESULT OF MOVEMENT IN CAPITAL (6,033,545,383) (4,660,412) 19,425,153 16,249,240 627,775
NET ASSETS AT THE END OF THE PERIOD 40,066,707,664 20,206,678 64,807,470 16,398,951 13,454,229
Portfolio Turnover Ratio (note 21) 53.13% 5.44% 2.52% 11.51%
*This Fund was launched on November 28, 2008
The accompanying notes form an integral
Unaudited Semi-Annual Report www.franklintempleton.lu
FRANKL IN TEMPLETON INVESTMENT FUNDS
Statement of Operations and Changes in Net Assets
For the Period ended December 31, 2008
32
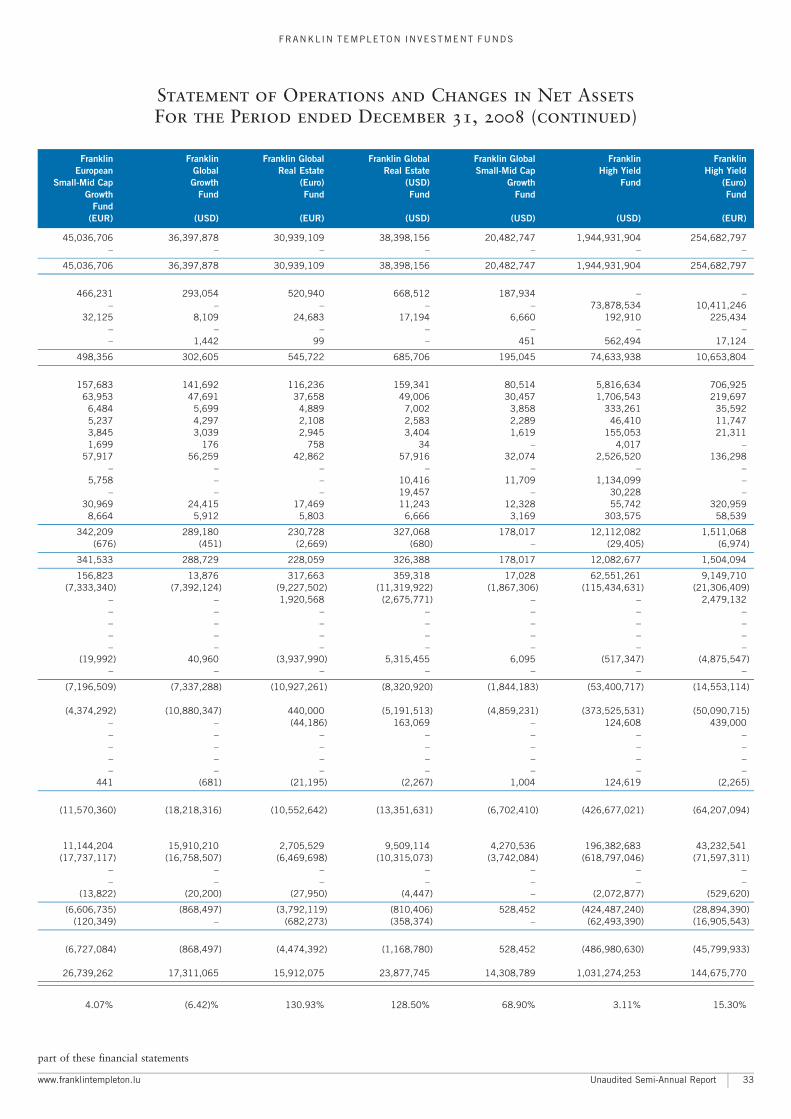
Franklin Franklin Franklin Global Franklin Global Franklin Global Franklin Franklin
European Global Real Estate Real Estate Small-Mid Cap High Yield High Yield
Small-Mid Cap Growth (Euro) (USD) Growth Fund (Euro)
Growth Fund Fund Fund Fund Fund
Fund
(EUR) (USD) (EUR) (USD) (USD) (USD) (EUR)
45,036,706 36,397,878 30,939,109 38,398,156 20,482,747 1,944,931,904 254,682,797^ ^ ^ ^ ^ ^ ^
45,036,706 36,397,878 30,939,109 38,398,156 20,482,747 1,944,931,904 254,682,797
466,231 293,054 520,940 668,512 187,934 ^ ^^ ^ ^ ^ ^ 73,878,534 10,411,246
32,125 8,109 24,683 17,194 6,660 192,910 225,434^ ^ ^ ^ ^ ^ ^^ 1,442 99 ^ 451 562,494 17,124
498,356 302,605 545,722 685,706 195,045 74,633,938 10,653,804
157,683 141,692 116,236 159,341 80,514 5,816,634 706,92563,953 47,691 37,658 49,006 30,457 1,706,543 219,6976,484 5,699 4,889 7,002 3,858 333,261 35,5925,237 4,297 2,108 2,583 2,289 46,410 11,7473,845 3,039 2,945 3,404 1,619 155,053 21,3111,699 176 758 34 ^ 4,017 ^
57,917 56,259 42,862 57,916 32,074 2,526,520 136,298^ ^ ^ ^ ^ ^ ^
5,758 ^ ^ 10,416 11,709 1,134,099 ^^ ^ ^ 19,457 ^ 30,228 ^
30,969 24,415 17,469 11,243 12,328 55,742 320,9598,664 5,912 5,803 6,666 3,169 303,575 58,539
342,209 289,180 230,728 327,068 178,017 12,112,082 1,511,068(676) (451) (2,669) (680) ^ (29,405) (6,974)
341,533 288,729 228,059 326,388 178,017 12,082,677 1,504,094
156,823 13,876 317,663 359,318 17,028 62,551,261 9,149,710(7,333,340) (7,392,124) (9,227,502) (11,319,922) (1,867,306) (115,434,631) (21,306,409)
^ ^ 1,920,568 (2,675,771) ^ ^ 2,479,132^ ^ ^ ^ ^ ^ ^^ ^ ^ ^ ^ ^ ^^ ^ ^ ^ ^ ^ ^^ ^ ^ ^ ^ ^ ^
(19,992) 40,960 (3,937,990) 5,315,455 6,095 (517,347) (4,875,547)^ ^ ^ ^ ^ ^ ^
(7,196,509) (7,337,288) (10,927,261) (8,320,920) (1,844,183) (53,400,717) (14,553,114)
(4,374,292) (10,880,347) 440,000 (5,191,513) (4,859,231) (373,525,531) (50,090,715)^ ^ (44,186) 163,069 ^ 124,608 439,000^ ^ ^ ^ ^ ^ ^^ ^ ^ ^ ^ ^ ^^ ^ ^ ^ ^ ^ ^^ ^ ^ ^ ^ ^ ^
441 (681) (21,195) (2,267) 1,004 124,619 (2,265)
(11,570,360) (18,218,316) (10,552,642) (13,351,631) (6,702,410) (426,677,021) (64,207,094)
11,144,204 15,910,210 2,705,529 9,509,114 4,270,536 196,382,683 43,232,541(17,737,117) (16,758,507) (6,469,698) (10,315,073) (3,742,084) (618,797,046) (71,597,311)
^ ^ ^ ^ ^ ^ ^^ ^ ^ ^ ^ ^ ^
(13,822) (20,200) (27,950) (4,447) ^ (2,072,877) (529,620)
(6,606,735) (868,497) (3,792,119) (810,406) 528,452 (424,487,240) (28,894,390)(120,349) ^ (682,273) (358,374) ^ (62,493,390) (16,905,543)
(6,727,084) (868,497) (4,474,392) (1,168,780) 528,452 (486,980,630) (45,799,933)
26,739,262 17,311,065 15,912,075 23,877,745 14,308,789 1,031,274,253 144,675,770
4.07% (6.42)% 130.93% 128.50% 68.90% 3.11% 15.30%
part of these financial statements
www.franklintempleton.lu Unaudited Semi-Annual Report
FRANKL IN TEMPLETON INVESTMENT FUNDS
Statement of Operations and Changes in Net Assets
For the Period ended December 31, 2008 (continued)
33
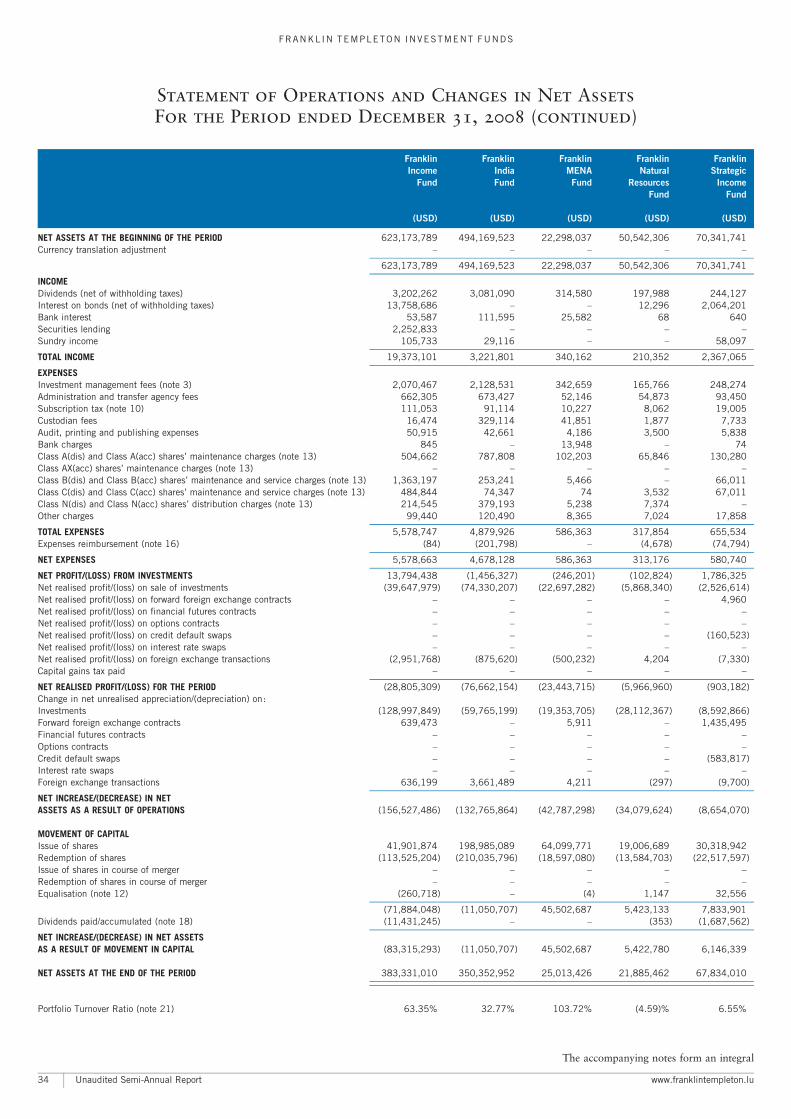
Franklin Franklin Franklin Franklin Franklin
Income India MENA Natural Strategic
Fund Fund Fund Resources Income
Fund Fund
(USD) (USD) (USD) (USD) (USD)
NET ASSETS AT THE BEGINNING OF THE PERIOD 623,173,789 494,169,523 22,298,037 50,542,306 70,341,741Currency translation adjustment ^ ^ ^ ^ ^
623,173,789 494,169,523 22,298,037 50,542,306 70,341,741
INCOMEDividends (net of withholding taxes) 3,202,262 3,081,090 314,580 197,988 244,127Interest on bonds (net of withholding taxes) 13,758,686 ^ ^ 12,296 2,064,201Bank interest 53,587 111,595 25,582 68 640Securities lending 2,252,833 ^ ^ ^ ^Sundry income 105,733 29,116 ^ ^ 58,097
TOTAL INCOME 19,373,101 3,221,801 340,162 210,352 2,367,065
EXPENSESInvestment management fees (note 3) 2,070,467 2,128,531 342,659 165,766 248,274Administration and transfer agency fees 662,305 673,427 52,146 54,873 93,450Subscription tax (note 10) 111,053 91,114 10,227 8,062 19,005Custodian fees 16,474 329,114 41,851 1,877 7,733Audit, printing and publishing expenses 50,915 42,661 4,186 3,500 5,838Bank charges 845 ^ 13,948 ^ 74Class A(dis) and Class A(acc) shares’ maintenance charges (note 13) 504,662 787,808 102,203 65,846 130,280Class AX(acc) shares’ maintenance charges (note 13) ^ ^ ^ ^ ^Class B(dis) and Class B(acc) shares’ maintenance and service charges (note 13) 1,363,197 253,241 5,466 ^ 66,011Class C(dis) and Class C(acc) shares’ maintenance and service charges (note 13) 484,844 74,347 74 3,532 67,011Class N(dis) and Class N(acc) shares’ distribution charges (note 13) 214,545 379,193 5,238 7,374 ^Other charges 99,440 120,490 8,365 7,024 17,858
TOTAL EXPENSES 5,578,747 4,879,926 586,363 317,854 655,534Expenses reimbursement (note 16) (84) (201,798) ^ (4,678) (74,794)
NET EXPENSES 5,578,663 4,678,128 586,363 313,176 580,740
NET PROFIT/(LOSS) FROM INVESTMENTS 13,794,438 (1,456,327) (246,201) (102,824) 1,786,325Net realised profit/(loss) on sale of investments (39,647,979) (74,330,207) (22,697,282) (5,868,340) (2,526,614)Net realised profit/(loss) on forward foreign exchange contracts ^ ^ ^ ^ 4,960Net realised profit/(loss) on financial futures contracts ^ ^ ^ ^ ^Net realised profit/(loss) on options contracts ^ ^ ^ ^ ^Net realised profit/(loss) on credit default swaps ^ ^ ^ ^ (160,523)Net realised profit/(loss) on interest rate swaps ^ ^ ^ ^ ^Net realised profit/(loss) on foreign exchange transactions (2,951,768) (875,620) (500,232) 4,204 (7,330)Capital gains tax paid ^ ^ ^ ^ ^
NET REALISED PROFIT/(LOSS) FOR THE PERIOD (28,805,309) (76,662,154) (23,443,715) (5,966,960) (903,182)Change in net unrealised appreciation/(depreciation) on:Investments (128,997,849) (59,765,199) (19,353,705) (28,112,367) (8,592,866)Forward foreign exchange contracts 639,473 ^ 5,911 ^ 1,435,495Financial futures contracts ^ ^ ^ ^ ^Options contracts ^ ^ ^ ^ ^Credit default swaps ^ ^ ^ ^ (583,817)Interest rate swaps ^ ^ ^ ^ ^Foreign exchange transactions 636,199 3,661,489 4,211 (297) (9,700)
NET INCREASE/(DECREASE) IN NETASSETS AS A RESULT OF OPERATIONS (156,527,486) (132,765,864) (42,787,298) (34,079,624) (8,654,070)
MOVEMENT OF CAPITALIssue of shares 41,901,874 198,985,089 64,099,771 19,006,689 30,318,942Redemption of shares (113,525,204) (210,035,796) (18,597,080) (13,584,703) (22,517,597)Issue of shares in course of merger ^ ^ ^ ^ ^Redemption of shares in course of merger ^ ^ ^ ^ ^Equalisation (note 12) (260,718) ^ (4) 1,147 32,556
(71,884,048) (11,050,707) 45,502,687 5,423,133 7,833,901Dividends paid/accumulated (note 18) (11,431,245) ^ ^ (353) (1,687,562)
NET INCREASE/(DECREASE) IN NET ASSETSAS A RESULT OF MOVEMENT IN CAPITAL (83,315,293) (11,050,707) 45,502,687 5,422,780 6,146,339
NET ASSETS AT THE END OF THE PERIOD 383,331,010 350,352,952 25,013,426 21,885,462 67,834,010
Portfolio Turnover Ratio (note 21) 63.35% 32.77% 103.72% (4.59)% 6.55%
The accompanying notes form an integral
Unaudited Semi-Annual Report www.franklintempleton.lu
FRANKL IN TEMPLETON INVESTMENT FUNDS
Statement of Operations and Changes in Net Assets
For the Period ended December 31, 2008 (continued)
34
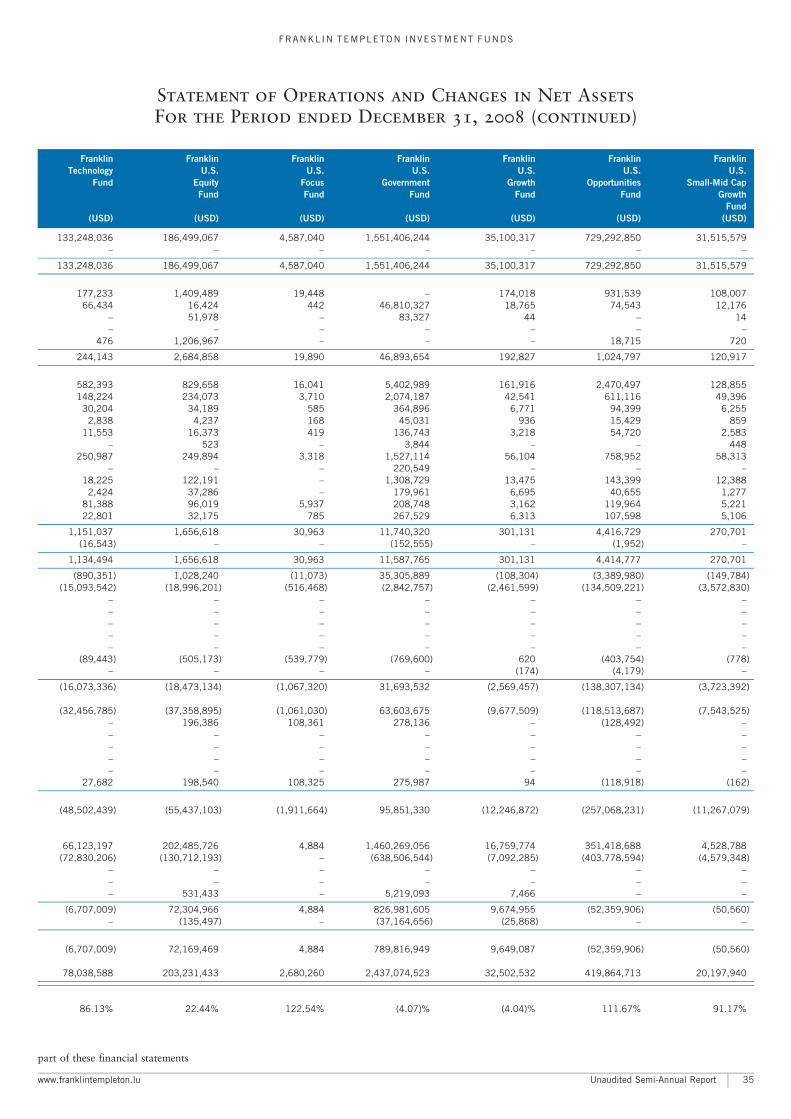
Franklin Franklin Franklin Franklin Franklin Franklin Franklin
Technology U.S. U.S. U.S. U.S. U.S. U.S.
Fund Equity Focus Government Growth Opportunities Small-Mid Cap
Fund Fund Fund Fund Fund Growth
Fund
(USD) (USD) (USD) (USD) (USD) (USD) (USD)
133,248,036 186,499,067 4,587,040 1,551,406,244 35,100,317 729,292,850 31,515,579^ ^ ^ ^ ^ ^ ^
133,248,036 186,499,067 4,587,040 1,551,406,244 35,100,317 729,292,850 31,515,579
177,233 1,409,489 19,448 ^ 174,018 931,539 108,00766,434 16,424 442 46,810,327 18,765 74,543 12,176
^ 51,978 ^ 83,327 44 ^ 14^ ^ ^ ^ ^ ^ ^
476 1,206,967 ^ ^ ^ 18,715 720
244,143 2,684,858 19,890 46,893,654 192,827 1,024,797 120,917
582,393 829,658 16,041 5,402,989 161,916 2,470,497 128,855148,224 234,073 3,710 2,074,187 42,541 611,116 49,396
30,204 34,189 585 364,896 6,771 94,399 6,2552,838 4,237 168 45,031 936 15,429 859
11,553 16,373 419 136,743 3,218 54,720 2,583^ 523 ^ 3,844 ^ ^ 448
250,987 249,894 3,318 1,527,114 56,104 758,952 58,313^ ^ ^ 220,549 ^ ^ ^
18,225 122,191 ^ 1,308,729 13,475 143,399 12,3882,424 37,286 ^ 179,961 6,695 40,655 1,277
81,388 96,019 5,937 208,748 3,162 119,964 5,22122,801 32,175 785 267,529 6,313 107,598 5,106
1,151,037 1,656,618 30,963 11,740,320 301,131 4,416,729 270,701(16,543) ^ ^ (152,555) ^ (1,952) ^
1,134,494 1,656,618 30,963 11,587,765 301,131 4,414,777 270,701
(890,351) 1,028,240 (11,073) 35,305,889 (108,304) (3,389,980) (149,784)(15,093,542) (18,996,201) (516,468) (2,842,757) (2,461,599) (134,509,221) (3,572,830)
^ ^ ^ ^ ^ ^ ^^ ^ ^ ^ ^ ^ ^^ ^ ^ ^ ^ ^ ^^ ^ ^ ^ ^ ^ ^^ ^ ^ ^ ^ ^ ^
(89,443) (505,173) (539,779) (769,600) 620 (403,754) (778)^ ^ ^ ^ (174) (4,179) ^
(16,073,336) (18,473,134) (1,067,320) 31,693,532 (2,569,457) (138,307,134) (3,723,392)
(32,456,785) (37,358,895) (1,061,030) 63,603,675 (9,677,509) (118,513,687) (7,543,525)^ 196,386 108,361 278,136 ^ (128,492) ^^ ^ ^ ^ ^ ^ ^^ ^ ^ ^ ^ ^ ^^ ^ ^ ^ ^ ^ ^^ ^ ^ ^ ^ ^ ^
27,682 198,540 108,325 275,987 94 (118,918) (162)
(48,502,439) (55,437,103) (1,911,664) 95,851,330 (12,246,872) (257,068,231) (11,267,079)
66,123,197 202,485,726 4,884 1,460,269,056 16,759,774 351,418,688 4,528,788(72,830,206) (130,712,193) ^ (638,506,544) (7,092,285) (403,778,594) (4,579,348)
^ ^ ^ ^ ^ ^ ^^ ^ ^ ^ ^ ^ ^^ 531,433 ^ 5,219,093 7,466 ^ ^
(6,707,009) 72,304,966 4,884 826,981,605 9,674,955 (52,359,906) (50,560)^ (135,497) ^ (37,164,656) (25,868) ^ ^
(6,707,009) 72,169,469 4,884 789,816,949 9,649,087 (52,359,906) (50,560)
78,038,588 203,231,433 2,680,260 2,437,074,523 32,502,532 419,864,713 20,197,940
86.13% 22.44% 122.54% (4.07)% (4.04)% 111.67% 91.17%
part of these financial statements
www.franklintempleton.lu Unaudited Semi-Annual Report
FRANKL IN TEMPLETON INVESTMENT FUNDS
Statement of Operations and Changes in Net Assets
For the Period ended December 31, 2008 (continued)
35
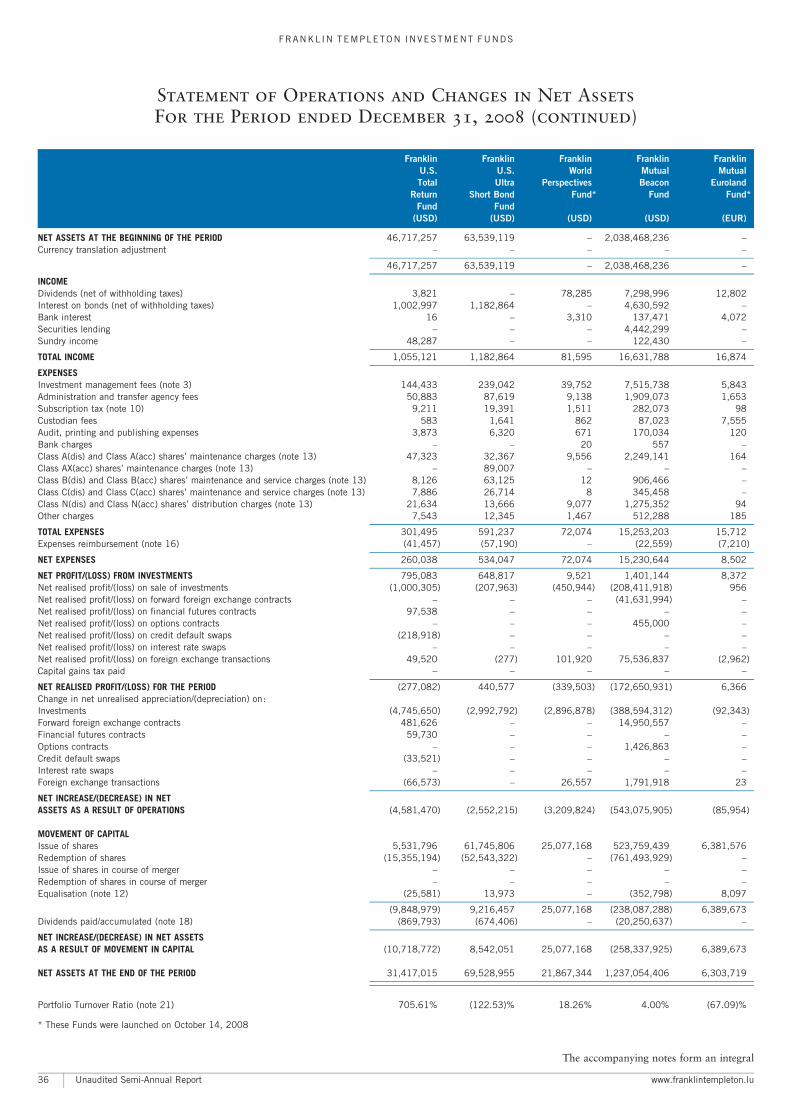
Franklin Franklin Franklin Franklin Franklin
U.S. U.S. World Mutual Mutual
Total Ultra Perspectives Beacon Euroland
Return Short Bond Fund* Fund Fund*
Fund Fund
(USD) (USD) (USD) (USD) (EUR)
NET ASSETS AT THE BEGINNING OF THE PERIOD 46,717,257 63,539,119 ^ 2,038,468,236 ^Currency translation adjustment ^ ^ ^ ^ ^
46,717,257 63,539,119 ^ 2,038,468,236 ^
INCOMEDividends (net of withholding taxes) 3,821 ^ 78,285 7,298,996 12,802Interest on bonds (net of withholding taxes) 1,002,997 1,182,864 ^ 4,630,592 ^Bank interest 16 ^ 3,310 137,471 4,072Securities lending ^ ^ ^ 4,442,299 ^Sundry income 48,287 ^ ^ 122,430 ^
TOTAL INCOME 1,055,121 1,182,864 81,595 16,631,788 16,874
EXPENSESInvestment management fees (note 3) 144,433 239,042 39,752 7,515,738 5,843Administration and transfer agency fees 50,883 87,619 9,138 1,909,073 1,653Subscription tax (note 10) 9,211 19,391 1,511 282,073 98Custodian fees 583 1,641 862 87,023 7,555Audit, printing and publishing expenses 3,873 6,320 671 170,034 120Bank charges ^ ^ 20 557 ^Class A(dis) and Class A(acc) shares’ maintenance charges (note 13) 47,323 32,367 9,556 2,249,141 164Class AX(acc) shares’ maintenance charges (note 13) ^ 89,007 ^ ^ ^Class B(dis) and Class B(acc) shares’ maintenance and service charges (note 13) 8,126 63,125 12 906,466 ^Class C(dis) and Class C(acc) shares’ maintenance and service charges (note 13) 7,886 26,714 8 345,458 ^Class N(dis) and Class N(acc) shares’ distribution charges (note 13) 21,634 13,666 9,077 1,275,352 94Other charges 7,543 12,345 1,467 512,288 185
TOTAL EXPENSES 301,495 591,237 72,074 15,253,203 15,712Expenses reimbursement (note 16) (41,457) (57,190) ^ (22,559) (7,210)
NET EXPENSES 260,038 534,047 72,074 15,230,644 8,502
NET PROFIT/(LOSS) FROM INVESTMENTS 795,083 648,817 9,521 1,401,144 8,372Net realised profit/(loss) on sale of investments (1,000,305) (207,963) (450,944) (208,411,918) 956Net realised profit/(loss) on forward foreign exchange contracts ^ ^ ^ (41,631,994) ^Net realised profit/(loss) on financial futures contracts 97,538 ^ ^ ^ ^Net realised profit/(loss) on options contracts ^ ^ ^ 455,000 ^Net realised profit/(loss) on credit default swaps (218,918) ^ ^ ^ ^Net realised profit/(loss) on interest rate swaps ^ ^ ^ ^ ^Net realised profit/(loss) on foreign exchange transactions 49,520 (277) 101,920 75,536,837 (2,962)Capital gains tax paid ^ ^ ^ ^ ^
NET REALISED PROFIT/(LOSS) FOR THE PERIOD (277,082) 440,577 (339,503) (172,650,931) 6,366Change in net unrealised appreciation/(depreciation) on:Investments (4,745,650) (2,992,792) (2,896,878) (388,594,312) (92,343)Forward foreign exchange contracts 481,626 ^ ^ 14,950,557 ^Financial futures contracts 59,730 ^ ^ ^ ^Options contracts ^ ^ ^ 1,426,863 ^Credit default swaps (33,521) ^ ^ ^ ^Interest rate swaps ^ ^ ^ ^ ^Foreign exchange transactions (66,573) ^ 26,557 1,791,918 23
NET INCREASE/(DECREASE) IN NETASSETS AS A RESULT OF OPERATIONS (4,581,470) (2,552,215) (3,209,824) (543,075,905) (85,954)
MOVEMENT OF CAPITALIssue of shares 5,531,796 61,745,806 25,077,168 523,759,439 6,381,576Redemption of shares (15,355,194) (52,543,322) ^ (761,493,929) ^Issue of shares in course of merger ^ ^ ^ ^ ^Redemption of shares in course of merger ^ ^ ^ ^ ^Equalisation (note 12) (25,581) 13,973 ^ (352,798) 8,097
(9,848,979) 9,216,457 25,077,168 (238,087,288) 6,389,673Dividends paid/accumulated (note 18) (869,793) (674,406) ^ (20,250,637) ^
NET INCREASE/(DECREASE) IN NET ASSETSAS A RESULT OF MOVEMENT IN CAPITAL (10,718,772) 8,542,051 25,077,168 (258,337,925) 6,389,673
NET ASSETS AT THE END OF THE PERIOD 31,417,015 69,528,955 21,867,344 1,237,054,406 6,303,719
Portfolio Turnover Ratio (note 21) 705.61% (122.53)% 18.26% 4.00% (67.09)%
* These Funds were launched on October 14, 2008
The accompanying notes form an integral
Unaudited Semi-Annual Report www.franklintempleton.lu
FRANKL IN TEMPLETON INVESTMENT FUNDS
Statement of Operations and Changes in Net Assets
For the Period ended December 31, 2008 (continued)
36
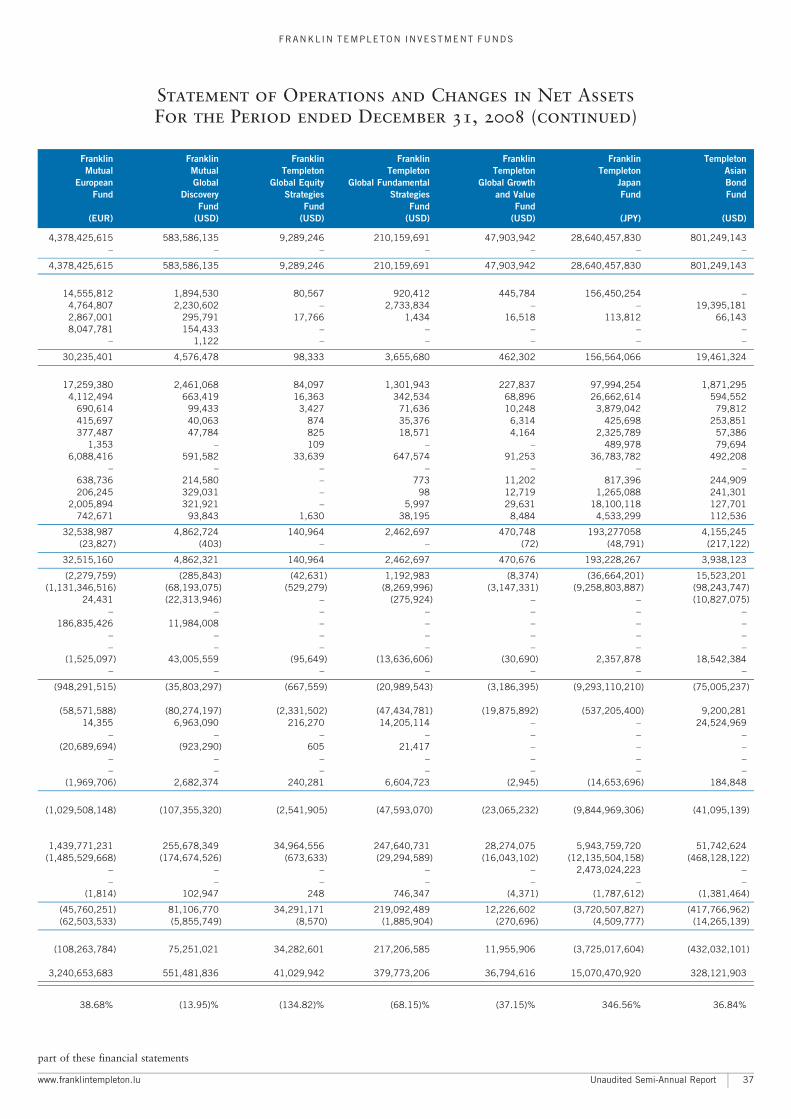
Franklin Franklin Franklin Franklin Franklin Franklin Templeton
Mutual Mutual Templeton Templeton Templeton Templeton Asian
European Global Global Equity Global Fundamental Global Growth Japan Bond
Fund Discovery Strategies Strategies and Value Fund Fund
Fund Fund Fund Fund
(EUR) (USD) (USD) (USD) (USD) (JPY) (USD)
4,378,425,615 583,586,135 9,289,246 210,159,691 47,903,942 28,640,457,830 801,249,143^ ^ ^ ^ ^ ^ ^
4,378,425,615 583,586,135 9,289,246 210,159,691 47,903,942 28,640,457,830 801,249,143
14,555,812 1,894,530 80,567 920,412 445,784 156,450,254 ^4,764,807 2,230,602 ^ 2,733,834 ^ ^ 19,395,1812,867,001 295,791 17,766 1,434 16,518 113,812 66,1438,047,781 154,433 ^ ^ ^ ^ ^
^ 1,122 ^ ^ ^ ^ ^
30,235,401 4,576,478 98,333 3,655,680 462,302 156,564,066 19,461,324
17,259,380 2,461,068 84,097 1,301,943 227,837 97,994,254 1,871,2954,112,494 663,419 16,363 342,534 68,896 26,662,614 594,552
690,614 99,433 3,427 71,636 10,248 3,879,042 79,812415,697 40,063 874 35,376 6,314 425,698 253,851377,487 47,784 825 18,571 4,164 2,325,789 57,386
1,353 ^ 109 ^ ^ 489,978 79,6946,088,416 591,582 33,639 647,574 91,253 36,783,782 492,208
^ ^ ^ ^ ^ ^ ^638,736 214,580 ^ 773 11,202 817,396 244,909206,245 329,031 ^ 98 12,719 1,265,088 241,301
2,005,894 321,921 ^ 5,997 29,631 18,100,118 127,701742,671 93,843 1,630 38,195 8,484 4,533,299 112,536
32,538,987 4,862,724 140,964 2,462,697 470,748 193,277058 4,155,245(23,827) (403) ^ ^ (72) (48,791) (217,122)
32,515,160 4,862,321 140,964 2,462,697 470,676 193,228,267 3,938,123
(2,279,759) (285,843) (42,631) 1,192,983 (8,374) (36,664,201) 15,523,201(1,131,346,516) (68,193,075) (529,279) (8,269,996) (3,147,331) (9,258,803,887) (98,243,747)
24,431 (22,313,946) ^ (275,924) ^ ^ (10,827,075)^ ^ ^ ^ ^ ^ ^
186,835,426 11,984,008 ^ ^ ^ ^ ^^ ^ ^ ^ ^ ^ ^^ ^ ^ ^ ^ ^ ^
(1,525,097) 43,005,559 (95,649) (13,636,606) (30,690) 2,357,878 18,542,384^ ^ ^ ^ ^ ^ ^
(948,291,515) (35,803,297) (667,559) (20,989,543) (3,186,395) (9,293,110,210) (75,005,237)
(58,571,588) (80,274,197) (2,331,502) (47,434,781) (19,875,892) (537,205,400) 9,200,28114,355 6,963,090 216,270 14,205,114 ^ ^ 24,524,969
^ ^ ^ ^ ^ ^ ^(20,689,694) (923,290) 605 21,417 ^ ^ ^
^ ^ ^ ^ ^ ^ ^^ ^ ^ ^ ^ ^ ^
(1,969,706) 2,682,374 240,281 6,604,723 (2,945) (14,653,696) 184,848
(1,029,508,148) (107,355,320) (2,541,905) (47,593,070) (23,065,232) (9,844,969,306) (41,095,139)
1,439,771,231 255,678,349 34,964,556 247,640,731 28,274,075 5,943,759,720 51,742,624(1,485,529,668) (174,674,526) (673,633) (29,294,589) (16,043,102) (12,135,504,158) (468,128,122)
^ ^ ^ ^ ^ 2,473,024,223 ^^ ^ ^ ^ ^ ^ ^
(1,814) 102,947 248 746,347 (4,371) (1,787,612) (1,381,464)
(45,760,251) 81,106,770 34,291,171 219,092,489 12,226,602 (3,720,507,827) (417,766,962)(62,503,533) (5,855,749) (8,570) (1,885,904) (270,696) (4,509,777) (14,265,139)
(108,263,784) 75,251,021 34,282,601 217,206,585 11,955,906 (3,725,017,604) (432,032,101)
3,240,653,683 551,481,836 41,029,942 379,773,206 36,794,616 15,070,470,920 328,121,903
38.68% (13.95)% (134.82)% (68.15)% (37.15)% 346.56% 36.84%
part of these financial statements
www.franklintempleton.lu Unaudited Semi-Annual Report
FRANKL IN TEMPLETON INVESTMENT FUNDS
Statement of Operations and Changes in Net Assets
For the Period ended December 31, 2008 (continued)
37
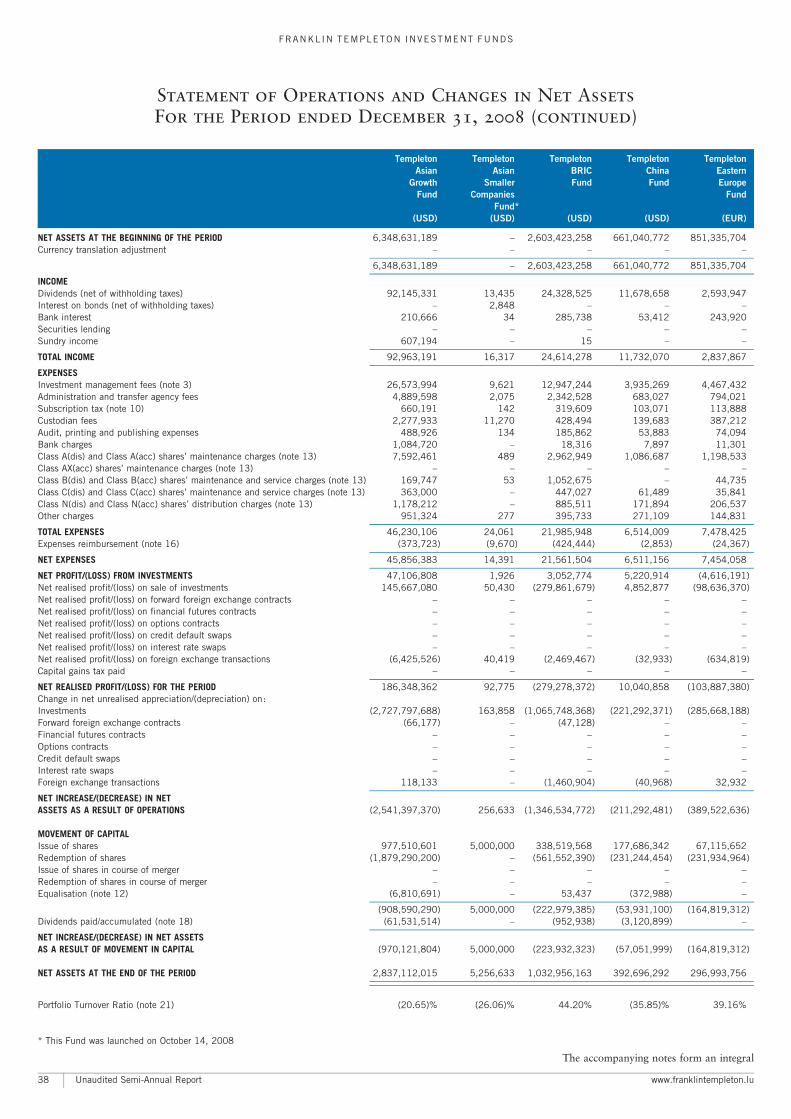
Templeton Templeton Templeton Templeton Templeton
Asian Asian BRIC China Eastern
Growth Smaller Fund Fund Europe
Fund Companies Fund
Fund*
(USD) (USD) (USD) (USD) (EUR)
NET ASSETS AT THE BEGINNING OF THE PERIOD 6,348,631,189 ^ 2,603,423,258 661,040,772 851,335,704Currency translation adjustment ^ ^ ^ ^ ^
6,348,631,189 ^ 2,603,423,258 661,040,772 851,335,704
INCOMEDividends (net of withholding taxes) 92,145,331 13,435 24,328,525 11,678,658 2,593,947Interest on bonds (net of withholding taxes) ^ 2,848 ^ ^ ^Bank interest 210,666 34 285,738 53,412 243,920Securities lending ^ ^ ^ ^ ^Sundry income 607,194 ^ 15 ^ ^
TOTAL INCOME 92,963,191 16,317 24,614,278 11,732,070 2,837,867
EXPENSESInvestment management fees (note 3) 26,573,994 9,621 12,947,244 3,935,269 4,467,432Administration and transfer agency fees 4,889,598 2,075 2,342,528 683,027 794,021Subscription tax (note 10) 660,191 142 319,609 103,071 113,888Custodian fees 2,277,933 11,270 428,494 139,683 387,212Audit, printing and publishing expenses 488,926 134 185,862 53,883 74,094Bank charges 1,084,720 ^ 18,316 7,897 11,301Class A(dis) and Class A(acc) shares’ maintenance charges (note 13) 7,592,461 489 2,962,949 1,086,687 1,198,533Class AX(acc) shares’ maintenance charges (note 13) ^ ^ ^ ^ ^Class B(dis) and Class B(acc) shares’ maintenance and service charges (note 13) 169,747 53 1,052,675 ^ 44,735Class C(dis) and Class C(acc) shares’ maintenance and service charges (note 13) 363,000 ^ 447,027 61,489 35,841Class N(dis) and Class N(acc) shares’ distribution charges (note 13) 1,178,212 ^ 885,511 171,894 206,537Other charges 951,324 277 395,733 271,109 144,831
TOTAL EXPENSES 46,230,106 24,061 21,985,948 6,514,009 7,478,425Expenses reimbursement (note 16) (373,723) (9,670) (424,444) (2,853) (24,367)
NET EXPENSES 45,856,383 14,391 21,561,504 6,511,156 7,454,058
NET PROFIT/(LOSS) FROM INVESTMENTS 47,106,808 1,926 3,052,774 5,220,914 (4,616,191)Net realised profit/(loss) on sale of investments 145,667,080 50,430 (279,861,679) 4,852,877 (98,636,370)Net realised profit/(loss) on forward foreign exchange contracts ^ ^ ^ ^ ^Net realised profit/(loss) on financial futures contracts ^ ^ ^ ^ ^Net realised profit/(loss) on options contracts ^ ^ ^ ^ ^Net realised profit/(loss) on credit default swaps ^ ^ ^ ^ ^Net realised profit/(loss) on interest rate swaps ^ ^ ^ ^ ^Net realised profit/(loss) on foreign exchange transactions (6,425,526) 40,419 (2,469,467) (32,933) (634,819)Capital gains tax paid ^ ^ ^ ^ ^
NET REALISED PROFIT/(LOSS) FOR THE PERIOD 186,348,362 92,775 (279,278,372) 10,040,858 (103,887,380)Change in net unrealised appreciation/(depreciation) on:Investments (2,727,797,688) 163,858 (1,065,748,368) (221,292,371) (285,668,188)Forward foreign exchange contracts (66,177) ^ (47,128) ^ ^Financial futures contracts ^ ^ ^ ^ ^Options contracts ^ ^ ^ ^ ^Credit default swaps ^ ^ ^ ^ ^Interest rate swaps ^ ^ ^ ^ ^Foreign exchange transactions 118,133 ^ (1,460,904) (40,968) 32,932
NET INCREASE/(DECREASE) IN NETASSETS AS A RESULT OF OPERATIONS (2,541,397,370) 256,633 (1,346,534,772) (211,292,481) (389,522,636)
MOVEMENT OF CAPITALIssue of shares 977,510,601 5,000,000 338,519,568 177,686,342 67,115,652Redemption of shares (1,879,290,200) ^ (561,552,390) (231,244,454) (231,934,964)Issue of shares in course of merger ^ ^ ^ ^ ^Redemption of shares in course of merger ^ ^ ^ ^ ^Equalisation (note 12) (6,810,691) ^ 53,437 (372,988) ^
(908,590,290) 5,000,000 (222,979,385) (53,931,100) (164,819,312)Dividends paid/accumulated (note 18) (61,531,514) ^ (952,938) (3,120,899) ^
NET INCREASE/(DECREASE) IN NET ASSETSAS A RESULT OF MOVEMENT IN CAPITAL (970,121,804) 5,000,000 (223,932,323) (57,051,999) (164,819,312)
NET ASSETS AT THE END OF THE PERIOD 2,837,112,015 5,256,633 1,032,956,163 392,696,292 296,993,756
Portfolio Turnover Ratio (note 21) (20.65)% (26.06)% 44.20% (35.85)% 39.16%
* This Fund was launched on October 14, 2008
The accompanying notes form an integral
Unaudited Semi-Annual Report www.franklintempleton.lu
FRANKL IN TEMPLETON INVESTMENT FUNDS
Statement of Operations and Changes in Net Assets
For the Period ended December 31, 2008 (continued)
38
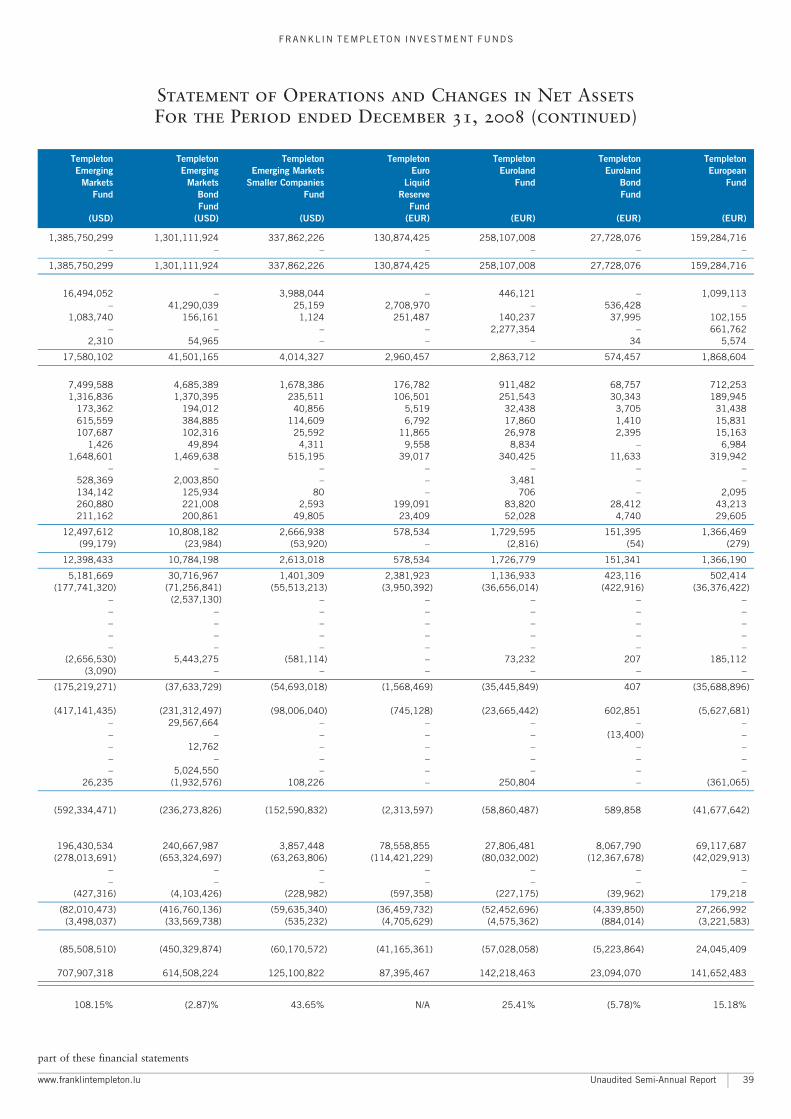
Templeton Templeton Templeton Templeton Templeton Templeton Templeton
Emerging Emerging Emerging Markets Euro Euroland Euroland European
Markets Markets Smaller Companies Liquid Fund Bond Fund
Fund Bond Fund Reserve Fund
Fund Fund
(USD) (USD) (USD) (EUR) (EUR) (EUR) (EUR)
1,385,750,299 1,301,111,924 337,862,226 130,874,425 258,107,008 27,728,076 159,284,716^ ^ ^ ^ ^ ^ ^
1,385,750,299 1,301,111,924 337,862,226 130,874,425 258,107,008 27,728,076 159,284,716
16,494,052 ^ 3,988,044 ^ 446,121 ^ 1,099,113^ 41,290,039 25,159 2,708,970 ^ 536,428 ^
1,083,740 156,161 1,124 251,487 140,237 37,995 102,155^ ^ ^ ^ 2,277,354 ^ 661,762
2,310 54,965 ^ ^ ^ 34 5,574
17,580,102 41,501,165 4,014,327 2,960,457 2,863,712 574,457 1,868,604
7,499,588 4,685,389 1,678,386 176,782 911,482 68,757 712,2531,316,836 1,370,395 235,511 106,501 251,543 30,343 189,945
173,362 194,012 40,856 5,519 32,438 3,705 31,438615,559 384,885 114,609 6,792 17,860 1,410 15,831107,687 102,316 25,592 11,865 26,978 2,395 15,163
1,426 49,894 4,311 9,558 8,834 ^ 6,9841,648,601 1,469,638 515,195 39,017 340,425 11,633 319,942
^ ^ ^ ^ ^ ^ ^528,369 2,003,850 ^ ^ 3,481 ^ ^134,142 125,934 80 ^ 706 ^ 2,095260,880 221,008 2,593 199,091 83,820 28,412 43,213211,162 200,861 49,805 23,409 52,028 4,740 29,605
12,497,612 10,808,182 2,666,938 578,534 1,729,595 151,395 1,366,469(99,179) (23,984) (53,920) ^ (2,816) (54) (279)
12,398,433 10,784,198 2,613,018 578,534 1,726,779 151,341 1,366,190
5,181,669 30,716,967 1,401,309 2,381,923 1,136,933 423,116 502,414(177,741,320) (71,256,841) (55,513,213) (3,950,392) (36,656,014) (422,916) (36,376,422)
^ (2,537,130) ^ ^ ^ ^ ^^ ^ ^ ^ ^ ^ ^^ ^ ^ ^ ^ ^ ^^ ^ ^ ^ ^ ^ ^^ ^ ^ ^ ^ ^ ^
(2,656,530) 5,443,275 (581,114) ^ 73,232 207 185,112(3,090) ^ ^ ^ ^ ^ ^
(175,219,271) (37,633,729) (54,693,018) (1,568,469) (35,445,849) 407 (35,688,896)
(417,141,435) (231,312,497) (98,006,040) (745,128) (23,665,442) 602,851 (5,627,681)^ 29,567,664 ^ ^ ^ ^ ^^ ^ ^ ^ ^ (13,400) ^^ 12,762 ^ ^ ^ ^ ^^ ^ ^ ^ ^ ^ ^^ 5,024,550 ^ ^ ^ ^ ^
26,235 (1,932,576) 108,226 ^ 250,804 ^ (361,065)
(592,334,471) (236,273,826) (152,590,832) (2,313,597) (58,860,487) 589,858 (41,677,642)
196,430,534 240,667,987 3,857,448 78,558,855 27,806,481 8,067,790 69,117,687(278,013,691) (653,324,697) (63,263,806) (114,421,229) (80,032,002) (12,367,678) (42,029,913)
^ ^ ^ ^ ^ ^ ^^ ^ ^ ^ ^ ^ ^
(427,316) (4,103,426) (228,982) (597,358) (227,175) (39,962) 179,218
(82,010,473) (416,760,136) (59,635,340) (36,459,732) (52,452,696) (4,339,850) 27,266,992(3,498,037) (33,569,738) (535,232) (4,705,629) (4,575,362) (884,014) (3,221,583)
(85,508,510) (450,329,874) (60,170,572) (41,165,361) (57,028,058) (5,223,864) 24,045,409
707,907,318 614,508,224 125,100,822 87,395,467 142,218,463 23,094,070 141,652,483
108.15% (2.87)% 43.65% N/A 25.41% (5.78)% 15.18%
part of these financial statements
www.franklintempleton.lu Unaudited Semi-Annual Report
FRANKL IN TEMPLETON INVESTMENT FUNDS
Statement of Operations and Changes in Net Assets
For the Period ended December 31, 2008 (continued)
39
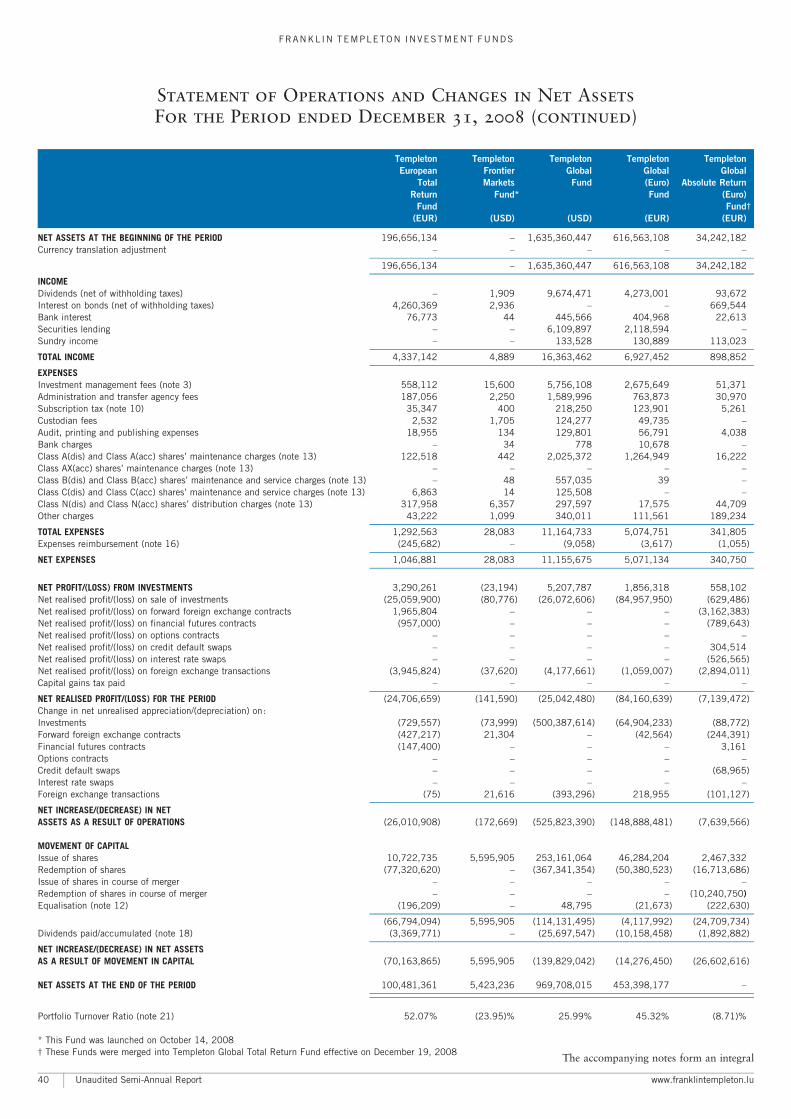
Templeton Templeton Templeton Templeton Templeton
European Frontier Global Global Global
Total Markets Fund (Euro) Absolute Return
Return Fund* Fund (Euro)
Fund Fund�
(EUR) (USD) (USD) (EUR) (EUR)
NET ASSETS AT THE BEGINNING OF THE PERIOD 196,656,134 ^ 1,635,360,447 616,563,108 34,242,182Currency translation adjustment ^ ^ ^ ^ ^
196,656,134 ^ 1,635,360,447 616,563,108 34,242,182
INCOMEDividends (net of withholding taxes) ^ 1,909 9,674,471 4,273,001 93,672Interest on bonds (net of withholding taxes) 4,260,369 2,936 ^ ^ 669,544Bank interest 76,773 44 445,566 404,968 22,613Securities lending ^ ^ 6,109,897 2,118,594 ^Sundry income ^ ^ 133,528 130,889 113,023
TOTAL INCOME 4,337,142 4,889 16,363,462 6,927,452 898,852
EXPENSESInvestment management fees (note 3) 558,112 15,600 5,756,108 2,675,649 51,371Administration and transfer agency fees 187,056 2,250 1,589,996 763,873 30,970Subscription tax (note 10) 35,347 400 218,250 123,901 5,261Custodian fees 2,532 1,705 124,277 49,735 ^Audit, printing and publishing expenses 18,955 134 129,801 56,791 4,038Bank charges ^ 34 778 10,678 ^Class A(dis) and Class A(acc) shares’ maintenance charges (note 13) 122,518 442 2,025,372 1,264,949 16,222Class AX(acc) shares’ maintenance charges (note 13) ^ ^ ^ ^ ^Class B(dis) and Class B(acc) shares’ maintenance and service charges (note 13) ^ 48 557,035 39 ^Class C(dis) and Class C(acc) shares’ maintenance and service charges (note 13) 6,863 14 125,508 ^ ^Class N(dis) and Class N(acc) shares’ distribution charges (note 13) 317,958 6,357 297,597 17,575 44,709Other charges 43,222 1,099 340,011 111,561 189,234
TOTAL EXPENSES 1,292,563 28,083 11,164,733 5,074,751 341,805Expenses reimbursement (note 16) (245,682) ^ (9,058) (3,617) (1,055)
NET EXPENSES 1,046,881 28,083 11,155,675 5,071,134 340,750
NET PROFIT/(LOSS) FROM INVESTMENTS 3,290,261 (23,194) 5,207,787 1,856,318 558,102Net realised profit/(loss) on sale of investments (25,059,900) (80,776) (26,072,606) (84,957,950) (629,486)Net realised profit/(loss) on forward foreign exchange contracts 1,965,804 ^ ^ ^ (3,162,383)Net realised profit/(loss) on financial futures contracts (957,000) ^ ^ ^ (789,643)Net realised profit/(loss) on options contracts ^ ^ ^ ^ ^Net realised profit/(loss) on credit default swaps ^ ^ ^ ^ 304,514Net realised profit/(loss) on interest rate swaps ^ ^ ^ ^ (526,565)Net realised profit/(loss) on foreign exchange transactions (3,945,824) (37,620) (4,177,661) (1,059,007) (2,894,011)Capital gains tax paid ^ ^ ^ ^ ^
NET REALISED PROFIT/(LOSS) FOR THE PERIOD (24,706,659) (141,590) (25,042,480) (84,160,639) (7,139,472)Change in net unrealised appreciation/(depreciation) on:Investments (729,557) (73,999) (500,387,614) (64,904,233) (88,772)Forward foreign exchange contracts (427,217) 21,304 ^ (42,564) (244,391)Financial futures contracts (147,400) ^ ^ ^ 3,161Options contracts ^ ^ ^ ^ ^Credit default swaps ^ ^ ^ ^ (68,965)Interest rate swaps ^ ^ ^ ^ ^Foreign exchange transactions (75) 21,616 (393,296) 218,955 (101,127)
NET INCREASE/(DECREASE) IN NETASSETS AS A RESULT OF OPERATIONS (26,010,908) (172,669) (525,823,390) (148,888,481) (7,639,566)
MOVEMENT OF CAPITALIssue of shares 10,722,735 5,595,905 253,161,064 46,284,204 2,467,332Redemption of shares (77,320,620) ^ (367,341,354) (50,380,523) (16,713,686)Issue of shares in course of merger ^ ^ ^ ^ ^Redemption of shares in course of merger ^ ^ ^ ^ (10,240,750)Equalisation (note 12) (196,209) ^ 48,795 (21,673) (222,630)
(66,794,094) 5,595,905 (114,131,495) (4,117,992) (24,709,734)Dividends paid/accumulated (note 18) (3,369,771) ^ (25,697,547) (10,158,458) (1,892,882)
NET INCREASE/(DECREASE) IN NET ASSETSAS A RESULT OF MOVEMENT IN CAPITAL (70,163,865) 5,595,905 (139,829,042) (14,276,450) (26,602,616)
NET ASSETS AT THE END OF THE PERIOD 100,481,361 5,423,236 969,708,015 453,398,177 ^
Portfolio Turnover Ratio (note 21) 52.07% (23.95)% 25.99% 45.32% (8.71)%
* This Fund was launched on October 14, 2008� These Funds were merged into Templeton Global Total Return Fund effective on December 19, 2008
The accompanying notes form an integral
Unaudited Semi-Annual Report www.franklintempleton.lu
FRANKL IN TEMPLETON INVESTMENT FUNDS
Statement of Operations and Changes in Net Assets
For the Period ended December 31, 2008 (continued)
40
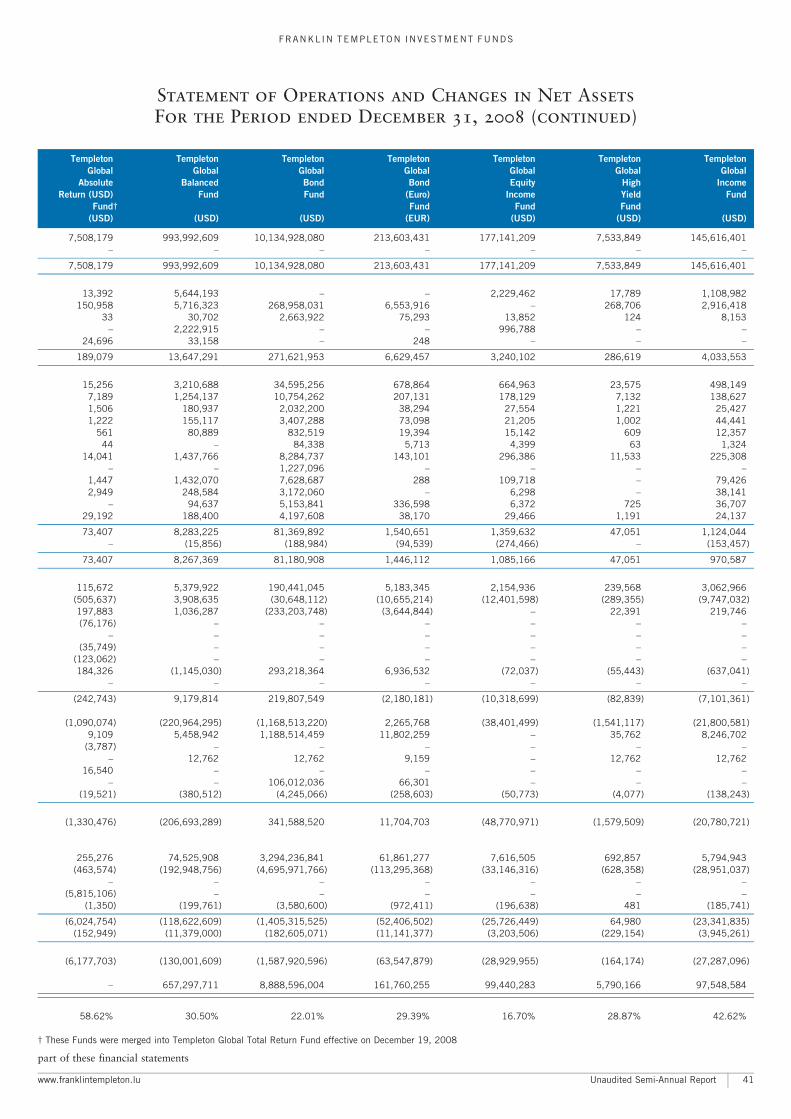
Templeton Templeton Templeton Templeton Templeton Templeton Templeton
Global Global Global Global Global Global Global
Absolute Balanced Bond Bond Equity High Income
Return (USD) Fund Fund (Euro) Income Yield Fund
Fund� Fund Fund Fund
(USD) (USD) (USD) (EUR) (USD) (USD) (USD)
7,508,179 993,992,609 10,134,928,080 213,603,431 177,141,209 7,533,849 145,616,401^ ^ ^ ^ ^ ^ ^
7,508,179 993,992,609 10,134,928,080 213,603,431 177,141,209 7,533,849 145,616,401
13,392 5,644,193 ^ ^ 2,229,462 17,789 1,108,982150,958 5,716,323 268,958,031 6,553,916 ^ 268,706 2,916,418
33 30,702 2,663,922 75,293 13,852 124 8,153^ 2,222,915 ^ ^ 996,788 ^ ^
24,696 33,158 ^ 248 ^ ^ ^
189,079 13,647,291 271,621,953 6,629,457 3,240,102 286,619 4,033,553
15,256 3,210,688 34,595,256 678,864 664,963 23,575 498,1497,189 1,254,137 10,754,262 207,131 178,129 7,132 138,6271,506 180,937 2,032,200 38,294 27,554 1,221 25,4271,222 155,117 3,407,288 73,098 21,205 1,002 44,441
561 80,889 832,519 19,394 15,142 609 12,35744 ^ 84,338 5,713 4,399 63 1,324
14,041 1,437,766 8,284,737 143,101 296,386 11,533 225,308^ ^ 1,227,096 ^ ^ ^ ^
1,447 1,432,070 7,628,687 288 109,718 ^ 79,4262,949 248,584 3,172,060 ^ 6,298 ^ 38,141
^ 94,637 5,153,841 336,598 6,372 725 36,70729,192 188,400 4,197,608 38,170 29,466 1,191 24,137
73,407 8,283,225 81,369,892 1,540,651 1,359,632 47,051 1,124,044^ (15,856) (188,984) (94,539) (274,466) ^ (153,457)
73,407 8,267,369 81,180,908 1,446,112 1,085,166 47,051 970,587
115,672 5,379,922 190,441,045 5,183,345 2,154,936 239,568 3,062,966(505,637) 3,908,635 (30,648,112) (10,655,214) (12,401,598) (289,355) (9,747,032)197,883 1,036,287 (233,203,748) (3,644,844) ^ 22,391 219,746(76,176) ^ ^ ^ ^ ^ ^
^ ^ ^ ^ ^ ^ ^(35,749) ^ ^ ^ ^ ^ ^
(123,062) ^ ^ ^ ^ ^ ^184,326 (1,145,030) 293,218,364 6,936,532 (72,037) (55,443) (637,041)
^ ^ ^ ^ ^ ^ ^
(242,743) 9,179,814 219,807,549 (2,180,181) (10,318,699) (82,839) (7,101,361)
(1,090,074) (220,964,295) (1,168,513,220) 2,265,768 (38,401,499) (1,541,117) (21,800,581)9,109 5,458,942 1,188,514,459 11,802,259 ^ 35,762 8,246,702
(3,787) ^ ^ ^ ^ ^ ^^ 12,762 12,762 9,159 ^ 12,762 12,762
16,540 ^ ^ ^ ^ ^ ^^ ^ 106,012,036 66,301 ^ ^ ^
(19,521) (380,512) (4,245,066) (258,603) (50,773) (4,077) (138,243)
(1,330,476) (206,693,289) 341,588,520 11,704,703 (48,770,971) (1,579,509) (20,780,721)
255,276 74,525,908 3,294,236,841 61,861,277 7,616,505 692,857 5,794,943(463,574) (192,948,756) (4,695,971,766) (113,295,368) (33,146,316) (628,358) (28,951,037)
^ ^ ^ ^ ^ ^ ^(5,815,106) ^ ^ ^ ^ ^ ^
(1,350) (199,761) (3,580,600) (972,411) (196,638) 481 (185,741)
(6,024,754) (118,622,609) (1,405,315,525) (52,406,502) (25,726,449) 64,980 (23,341,835)(152,949) (11,379,000) (182,605,071) (11,141,377) (3,203,506) (229,154) (3,945,261)
(6,177,703) (130,001,609) (1,587,920,596) (63,547,879) (28,929,955) (164,174) (27,287,096)
^ 657,297,711 8,888,596,004 161,760,255 99,440,283 5,790,166 97,548,584
58.62% 30.50% 22.01% 29.39% 16.70% 28.87% 42.62%
� These Funds were merged into Templeton Global Total Return Fund effective on December 19, 2008
part of these financial statements
www.franklintempleton.lu Unaudited Semi-Annual Report
FRANKL IN TEMPLETON INVESTMENT FUNDS
Statement of Operations and Changes in Net Assets
For the Period ended December 31, 2008 (continued)
41
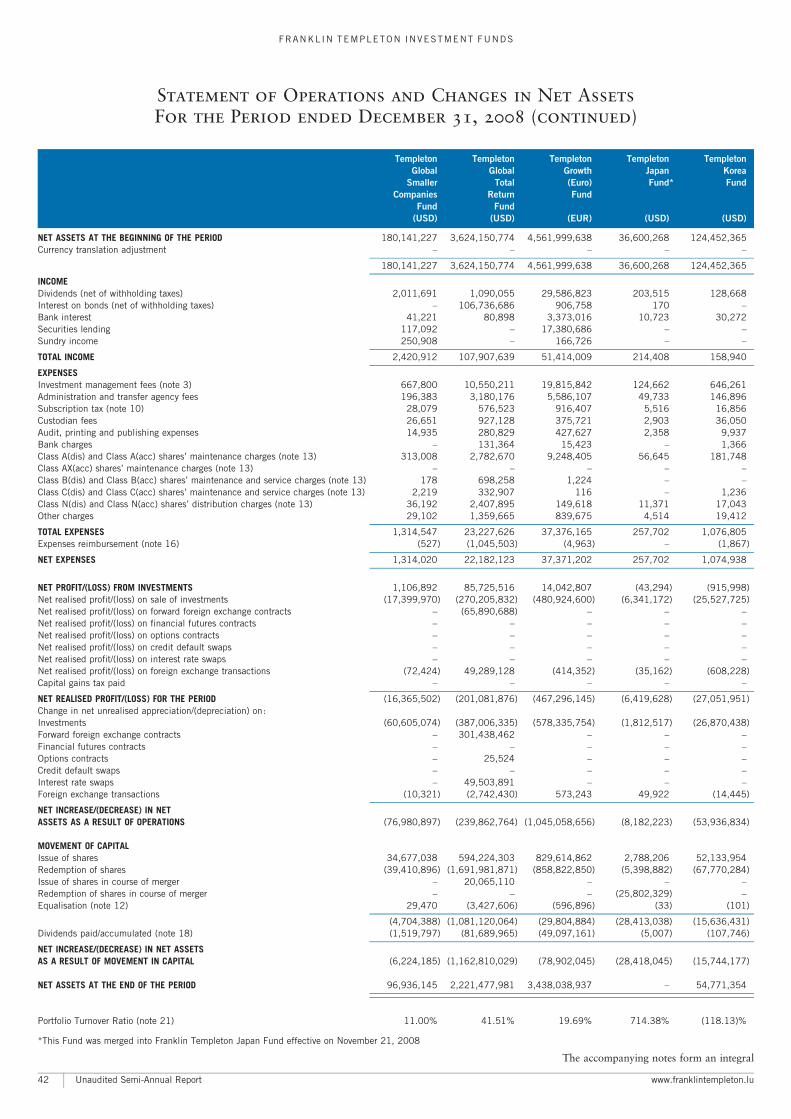
Templeton Templeton Templeton Templeton Templeton
Global Global Growth Japan Korea
Smaller Total (Euro) Fund* Fund
Companies Return Fund
Fund Fund
(USD) (USD) (EUR) (USD) (USD)
NET ASSETS AT THE BEGINNING OF THE PERIOD 180,141,227 3,624,150,774 4,561,999,638 36,600,268 124,452,365Currency translation adjustment ^ ^ ^ ^ ^
180,141,227 3,624,150,774 4,561,999,638 36,600,268 124,452,365
INCOMEDividends (net of withholding taxes) 2,011,691 1,090,055 29,586,823 203,515 128,668Interest on bonds (net of withholding taxes) ^ 106,736,686 906,758 170 ^Bank interest 41,221 80,898 3,373,016 10,723 30,272Securities lending 117,092 ^ 17,380,686 ^ ^Sundry income 250,908 ^ 166,726 ^ ^
TOTAL INCOME 2,420,912 107,907,639 51,414,009 214,408 158,940
EXPENSESInvestment management fees (note 3) 667,800 10,550,211 19,815,842 124,662 646,261Administration and transfer agency fees 196,383 3,180,176 5,586,107 49,733 146,896Subscription tax (note 10) 28,079 576,523 916,407 5,516 16,856Custodian fees 26,651 927,128 375,721 2,903 36,050Audit, printing and publishing expenses 14,935 280,829 427,627 2,358 9,937Bank charges ^ 131,364 15,423 ^ 1,366Class A(dis) and Class A(acc) shares’ maintenance charges (note 13) 313,008 2,782,670 9,248,405 56,645 181,748Class AX(acc) shares’ maintenance charges (note 13) ^ ^ ^ ^ ^Class B(dis) and Class B(acc) shares’ maintenance and service charges (note 13) 178 698,258 1,224 ^ ^Class C(dis) and Class C(acc) shares’ maintenance and service charges (note 13) 2,219 332,907 116 ^ 1,236Class N(dis) and Class N(acc) shares’ distribution charges (note 13) 36,192 2,407,895 149,618 11,371 17,043Other charges 29,102 1,359,665 839,675 4,514 19,412
TOTAL EXPENSES 1,314,547 23,227,626 37,376,165 257,702 1,076,805Expenses reimbursement (note 16) (527) (1,045,503) (4,963) ^ (1,867)
NET EXPENSES 1,314,020 22,182,123 37,371,202 257,702 1,074,938
NET PROFIT/(LOSS) FROM INVESTMENTS 1,106,892 85,725,516 14,042,807 (43,294) (915,998)Net realised profit/(loss) on sale of investments (17,399,970) (270,205,832) (480,924,600) (6,341,172) (25,527,725)Net realised profit/(loss) on forward foreign exchange contracts ^ (65,890,688) ^ ^ ^Net realised profit/(loss) on financial futures contracts ^ ^ ^ ^ ^Net realised profit/(loss) on options contracts ^ ^ ^ ^ ^Net realised profit/(loss) on credit default swaps ^ ^ ^ ^ ^Net realised profit/(loss) on interest rate swaps ^ ^ ^ ^ ^Net realised profit/(loss) on foreign exchange transactions (72,424) 49,289,128 (414,352) (35,162) (608,228)Capital gains tax paid ^ ^ ^ ^ ^
NET REALISED PROFIT/(LOSS) FOR THE PERIOD (16,365,502) (201,081,876) (467,296,145) (6,419,628) (27,051,951)Change in net unrealised appreciation/(depreciation) on:Investments (60,605,074) (387,006,335) (578,335,754) (1,812,517) (26,870,438)Forward foreign exchange contracts ^ 301,438,462 ^ ^ ^Financial futures contracts ^ ^ ^ ^ ^Options contracts ^ 25,524 ^ ^ ^Credit default swaps ^ ^ ^ ^ ^Interest rate swaps ^ 49,503,891 ^ ^ ^Foreign exchange transactions (10,321) (2,742,430) 573,243 49,922 (14,445)
NET INCREASE/(DECREASE) IN NETASSETS AS A RESULT OF OPERATIONS (76,980,897) (239,862,764) (1,045,058,656) (8,182,223) (53,936,834)
MOVEMENT OF CAPITALIssue of shares 34,677,038 594,224,303 829,614,862 2,788,206 52,133,954Redemption of shares (39,410,896) (1,691,981,871) (858,822,850) (5,398,882) (67,770,284)Issue of shares in course of merger ^ 20,065,110 ^ ^ ^Redemption of shares in course of merger ^ ^ ^ (25,802,329) ^Equalisation (note 12) 29,470 (3,427,606) (596,896) (33) (101)
(4,704,388) (1,081,120,064) (29,804,884) (28,413,038) (15,636,431)Dividends paid/accumulated (note 18) (1,519,797) (81,689,965) (49,097,161) (5,007) (107,746)
NET INCREASE/(DECREASE) IN NET ASSETSAS A RESULT OF MOVEMENT IN CAPITAL (6,224,185) (1,162,810,029) (78,902,045) (28,418,045) (15,744,177)
NET ASSETS AT THE END OF THE PERIOD 96,936,145 2,221,477,981 3,438,038,937 ^ 54,771,354
Portfolio Turnover Ratio (note 21) 11.00% 41.51% 19.69% 714.38% (118.13)%
*This Fund was merged into Franklin Templeton Japan Fund effective on November 21, 2008
The accompanying notes form an integral
Unaudited Semi-Annual Report www.franklintempleton.lu
FRANKL IN TEMPLETON INVESTMENT FUNDS
Statement of Operations and Changes in Net Assets
For the Period ended December 31, 2008 (continued)
42

Templeton Templeton Templeton Templeton
Latin Thailand U.S. Dollar U.S.
America Fund Liquid Value
Fund Reserve Fund
Fund
(USD) (USD) (USD) (USD)
2,629,312,818 200,115,502 306,877,178 15,769,035^ ^ ^ ^
2,629,312,818 200,115,502 306,877,178 15,769,035
26,688,555 2,467,778 ^ 132,165^ ^ 2,341,729 6,188
544,414 5,507 ^ ^^ ^ ^ ^^ ^ ^ 540
27,232,969 2,473,285 2,341,729 138,893
11,777,072 984,072 475,937 80,3342,148,585 176,308 232,757 24,158
347,756 22,677 16,793 3,499837,252 50,644 14,236 504187,690 14,589 25,753 1,516
2,118 11,096 135 ^3,406,356 290,977 98,420 26,800
^ ^ ^ ^437,820 20,273 305,354 8,801
63,793 ^ 144,216 4,975535,882 21,828 205,018 8,822368,058 28,513 52,093 3,046
20,112,382 1,620,977 1,570,712 162,455(82,658) ^ ^ (45)
20,029,724 1,620,977 1,570,712 162,410
7,203,245 852,308 771,017 (23,517)(99,726,926) (15,501,057) ^ (5,621,159)
^ ^ ^ ^^ ^ ^ ^^ ^ ^ ^^ ^ ^ ^^ ^ ^ ^
(1,800,860) (108,437) ^ (266,463)^ ^ ^ ^
(94,324,541) (14,757,186) 771,017 (5,911,139)
(1,312,470,771) (63,744,271) 156,625 (2,488,997)^ ^ ^ (7,413)^ ^ ^ ^^ ^ ^ ^^ ^ ^ ^^ ^ ^ ^
(74,172) 943 ^ (7,456)
(1,406,869,484) (78,500,514) 927,642 (8,415,005)
913,370,683 25,455,168 282,141,491 19,592,186(953,085,082) (68,535,100) (294,186,725) (15,293,953)
^ ^ ^ ^^ ^ ^ ^
348,846 (279,483) (602) (7,436)
(39,365,553) (43,359,415) (12,045,836) 4,290,797(7,159,770) (1,739,380) (1,338,519) (5,999)
(46,525,323) (45,098,795) (13,384,355) 4,284,798
1,175,918,011 76,516,193 294,420,465 11,638,828
(8.04)% (56.15)% N/A (46.76)%
part of these financial statements
www.franklintempleton.lu Unaudited Semi-Annual Report
FRANKL IN TEMPLETON INVESTMENT FUNDS
Statement of Operations and Changes in Net Assets
For the Period ended December 31, 2008 (continued)
43
Note 1 ç The CompanyFranklin Templeton Investment Funds (‘‘FTIF’’ or the ‘‘Company’’) is a collective investment undertaking pursuant to Part 1 of the Luxembourglaw of December 20, 2002 relating to collective investment undertakings, as amended, and qualifies as a socie¤te¤ d’investissement a' capitalvariable. The Company was incorporated in Luxembourg on November 6, 1990, for an undetermined period. At the date of this report, itoffers shares in 65 sub-funds of the Company (the ‘‘Funds’’). The Board of Directors of the Company may authorise the creation of additionalFunds in the future with different investment objectives.
The Company aims to provide investors with a choice of funds investing in a wide range of eligible assets on a worldwide basis and featuring adiverse array of investment objectives, including capital growth and income. The overall objective of the Company is to seek to minimiseinvestment exposure through diversification and to provide Shareholders with the benefit of a portfolio managed by Franklin TempletonInvestments, according to its successful time-tested investment selection methods.
The following share classes were launched effective on August 14, 2008:
> Franklin MENA Fund Class A (Ydis) GBP, Class A (Ydis) EUR and Class A (Ydis)
The following share class was launched effective on August 25, 2008:
> Franklin Templeton Japan Fund Class N (Acc) USD
The following share class was launched effective on August 29, 2008:
> Franklin MENA Fund Class I (Ydis)
The following Funds were launched effective on October 14, 2008:
> Franklin World Perspectives Fund
> Templeton Asian Smaller Companies Fund
> Franklin Mutual Euroland Fund
> Templeton Frontier Markets Fund
The following share class was launched effective on November 5, 2008:
> Franklin Mutual Global Discovery Fund Class I (Acc) EUR-H2
The following share classes were launched effective on November 7, 2008:
> Franklin World Perspectives Fund Class B (Acc) and Class C (Acc)
> Templeton Asian Smaller Companies Fund Class B (Acc) and Class B (Acc) EUR
> Templeton Frontier Markets Fund Class B (Acc), Class C (Acc) and Class B (Acc) EUR
The following Fund was merged into Franklin Templeton Japan Fund effective on November 21, 2008:
> Templeton Japan Fund
The following Fund was launched effective on November 28, 2008:
> Franklin Euroland Core Fund
The following share class was closed effective on December 18, 2008:
> Templeton European Total Return Fund Class A (Mdis) GBP
The following share class was closed effective on December 19, 2008:
> Franklin Global Real Estate (Euro) Fund Class A (Ydis) GBP
The following Funds were merged into Templeton Global Total Return Fund effective on December 19, 2008:
> Templeton Global Absolute Return (Euro) Fund
> Templeton Global Absolute Return (USD) Fund
The following Funds had their name changed effective on November 5, 2008:
> Franklin Mutual Global Discovery Fund Class N (Acc) EUR-H1 became Franklin Mutual Global Discovery Fund Class N (Acc) EUR-H2
> Franklin Mutual Global Discovery Fund Class A (Acc) EUR-H1 became Franklin Mutual Global Discovery Fund Class A (Acc) EUR-H2
For a full list of Funds and share classes offered as at December 31, 2008 please refer to note 13.
Note 2 ç Significant accounting policies(a) General
The financial statements are prepared in accordance with the regulations of the Grand-Duchy of Luxembourg relating to investment funds.
(b) Investment in securities
Securities which are listed on a stock exchange or traded on any other organised market are valued at the last available price on such exchangeor market which is normally the principal market for each security, and those securities dealt in on an over-the-counter market are valued in amanner as near as possible to that for quoted securities.
Securities not listed on any stock exchange nor traded on any organised market are valued at the last available price, or if such price is notrepresentative of their fair value, they are valued prudently and in good faith on the basis of their reasonably foreseeable sales prices.
The Fund has procedures to determine the fair value of individual securities and other assets for which market prices are not readily availableor which may not be reliably priced. In such circumstances, the price of such investment shall be adjusted in accordance with the proceduresadopted, as determined by or under the direction of the Board of Directors.
During the accounting period under review, gains and losses on investment securities sold were computed on the average cost basis for allFunds with the exception of the Franklin High Yield Fund, the Franklin Income Fund and the Franklin U.S. Government Fund which werecomputed on the first-in, first-out basis.
FRANKL IN TEMPLETON INVESTMENT FUNDS
Notes to the Financial Statements
at December 31, 2008
Unaudited Semi-Annual Report www.franklintempleton.lu44
Note 2 ç Significant accounting policies (continued)(b) Investment in securities (continued)
During the accounting period under review, discounts and premiums were amortised to income over the period to maturity, or date sold, ifearlier.
For mortgage-backed and other similar holdings with scheduled debt paydowns, the Funds record estimates, based in its historical experience,for anticipated paydowns. Such estimates are recorded as a reduction or increase to the related holdings as disclosed on the Schedule ofInvestments and are included in the related unrealised appreciation/depreciation on investments shown in the ‘‘Statement of Operations andChanges in Net Assets’’.
(c) Foreign exchange transactions
Transactions expressed in currencies other than each Fund’s currency are translated into each Fund’s currency at the exchange rates applicableon the transaction dates.
Assets and liabilities designated in currencies other than each Fund’s currency are translated into each Fund’s currency at the appropriateexchange rates ruling at the period-end. Gains and losses on foreign exchange transactions are recognised in the ‘‘Statement of Operations andChanges in Net Assets’’ in determining the results for the accounting period.
(d) Forward foreign exchange contracts
Forward foreign exchange contracts are valued at the forward rate applicable at the ‘‘Statement of Net Assets’’ date for the remaining period,until maturity. Gains or losses resulting from forward exchange contracts are recognised in the ‘‘Statement of Operations and Changes in NetAssets’’.
(e) Income
Dividends are credited to income on their ex-dividend date.
Interest income is accrued on a daily basis.
(f) Formation expenses
Formation expenses associated with the launch of new Funds are expensed as incurred.
(g) Futures contracts
The Company may enter into financial futures contracts to gain exposure to market changes. A financial futures contract is an agreementbetween two parties to buy or sell a security for a set price on a future date. Required initial margin deposits of cash or securities aremaintained by a broker in a segregated account. Subsequent payments, known as variation margin, are made or received by the Companydepending on the fluctuations in the value of the underlying securities. Such variation margin is accounted for as unrealised gains or losses untilthe contract is closed, at which time the gains or losses are reclassified to realised gains or losses. Realised and unrealised gains and losses areincluded in the ‘‘Statement of Operations and Changes in Net Assets’’.
(h) Option contracts
Options are contracts entitling the holder to purchase or sell a specified number of shares or units of a particular security at a specified price atany time until the contract-stated expiration date. Options purchased are recorded as investments; options written (sold) are recorded asliabilities. When the exercise of an option results in a cash settlement, the difference between the premium (original option value) and thesettlement proceeds is accounted for as a realised gain or loss. When securities are acquired or delivered upon exercise of an option, theacquisition cost or sale proceeds are adjusted by the amount of the premium. When an option is closed, the difference between the premiumand the cost to close the position is accounted for as a realised gain or loss. When an option expires, the premium is accounted for as a realisedgain or loss for options written or as a realised loss for options purchased. The risks include price movements in the underlying securities, thepossibility there may be an illiquid options market, or the inability of the counterparties to fulfill their obligations under the contract.
(i) Interest Rate Swaps
Interest Rate Swap contracts are used to hedge the risk of changes in interest rates and are agreements between two parties to exchange cashflows based on a notional principal amount. The net interest received or paid on interest rate swap agreements is accrued daily as interestincome/expense. Interest rate swaps are marked to market daily based upon quotations from the market makers and the change, if any, isrecorded as an unrealized gain or loss in the Statement of Operations. When the swap contract is terminated early, the fund records a realizedgain or loss equal to the difference between the current net present value and the executed net present value. Any outstanding interest accrualwill be recorded as either a net receivable or net payable.
The risks of interest rate swaps include changes in market conditions and the possible inability of the counterparty to fulfill its obligationsunder the agreement.
FRANKL IN TEMPLETON INVESTMENT FUNDS
Notes to the Financial Statements
at December 31, 2008 (continued)
www.franklintempleton.lu Unaudited Semi-Annual Report 45
Note 2 ç Significant accounting policies (continued)(j) Credit Default Swaps
A Credit Default Swap is a credit derivative transaction in which two parties enter into an agreement, whereby one party pays the other a fixedperiodic payment for the specified life of the agreement. The other party makes no payments unless a credit event, relating to a predeterminedreference asset, occurs. If such an event occurs, the party will then make a payment to the first party, and the swap will terminate. The value ofthe underlying securities shall be taken into account for the calculation of the investment and borrowing powers applicable to individual users.
Credit default swaps are marked to market daily based upon quotations from the market makers and the change in value, if any, is recorded asan unrealized gain or loss in the Statement of Operations. Any payment received or paid to initiate a contract is recorded as a liability or assetin the Statement of Assets and Liabilities. When the swap contract is terminated early, the Fund records a realized gain or loss for anypayments received or paid.
The risks of credit default swaps include unfavorable changes in interest rates, an illiquid secondary market and the possible inability of thecounterparty to fulfill its obligations under the agreement, which may be in excess of the amount reflected in the Statement of Assets andLiabilities.
(k) Mortgage Dollar Rolls
In a mortgage dollar roll, a Fund sells mortgage-backed securities for delivery in the current month and simultaneously contracts to repurchasesubstantially similar (name, type, coupon, and maturity) securities on a specified future date. During the period between the sale andrepurchase, the Fund foregoes principal and interest paid on the mortgage-backed securities. The Fund is compensated by the difference betweenthe current sales price and the lower forward price for the future purchase, as well as by the interest earned on the cash proceeds of the initialsale.
The difference between the current sales price and the lower forward price is treated as realized gain.
(l) Securities Lending
The Company may lend selected sub-funds’ portfolio securities to specialised banks, credit institutions and other financial institutions of highstanding, or through recognised clearing institutions such as Clearstream or Euroclear. The lending of securities will be made for periods notexceeding 30 calendar days provided, however, that this limit is not applicable where the Company has the right to terminate the lendingcontract at any time and obtain restitution of the securities lent. Loans will be secured continuously by collateral which must at least equal thevalue of the global valuation of the securities lent. Lending transactions may not be carried out on more than 50% of the aggregate marketvalue of the securities of each sub-fund’s portfolio except where the Company has the right to terminate the lending contract at any time andobtain restitution of the securities lent. The dividends earned on the collateral are included in the ‘‘Statement of Operations and Changes in NetAssets’’. Any transaction expenses in connection with the loans are charged to the concerned Fund.
Unaudited Semi-Annual Report www.franklintempleton.lu
FRANKL IN TEMPLETON INVESTMENT FUNDS
Notes to the Financial Statements
at December 31, 2008 (continued)
46
Note 3 ç Investment management feesThe Investment Managers, as noted on pages 3 and 4, receive from the Company a monthly fee equivalent to a certain percentage per annum(as detailed below) of each Fund’s average daily net assets during the year. The following percentages apply in respect of the different Funds asat December 31, 2008.
All classes exceptClass I Class I
Franklin Asian Flex Cap Fund 1.00% 0.70%Franklin Biotechnology Discovery Fund 1.00% 0.70%Franklin Euroland Core Fund 1.00% 0.70%Franklin European Growth Fund 1.00% 0.70%Franklin European Small-Mid Cap Growth Fund 1.00% 0.70%Franklin Global Growth Fund 1.00% 0.70%Franklin Global Real Estate (Euro) Fund 1.00% 0.70%Franklin Global Real Estate (USD) Fund 1.00% 0.70%Franklin Global Small-Mid Cap Growth Fund 1.00% 0.70%Franklin High Yield Fund 0.80% 0.60%Franklin High Yield (Euro) Fund 0.80% 0.60%Franklin Income Fund 0.85% 0.60%Franklin India Fund 1.00% 0.70%Franklin MENA Fund 1.50% 1.05%Franklin Natural Resources Fund 1.00% 0.70%Franklin Strategic Income Fund 0.75% 0.55%Franklin Technology Fund 1.00% 0.70%Franklin U.S. Equity Fund 1.00% 0.70%Franklin U.S. Focus Fund 1.00% 0.70%Franklin U.S. Government Fund 0.65% 0.40%Franklin U.S. Growth Fund 1.00% 0.70%Franklin U.S. Opportunities Fund 1.00% 0.70%Franklin U.S. Small-Mid Cap Growth Fund 1.00% 0.70%Franklin U.S. Total Return Fund 0.75% 0.55%Franklin U.S. Ultra Short Bond Fund 0.65% 0.40%Franklin World Perspectives Fund 1.00% 0.70%Franklin Mutual Beacon Fund 1.00% 0.70%Franklin Mutual Euroland Fund 1.00% 0.70%Franklin Mutual European Fund 1.00% 0.70%Franklin Mutual Global Discovery Fund 1.00% 0.70%Franklin Templeton Global Equity Strategies Fund 1.25%Franklin Templeton Global Fundamental Strategies Fund 1.00% 0.70%Franklin Templeton Global Growth and Value Fund 1.00% 0.70%Franklin Templeton Japan Fund 1.00% 0.70%Templeton Asian Bond Fund 0.75% 0.55%Templeton Asian Growth Fund 1.35% 0.90%Templeton Asian Smaller Companies Fund 1.35% 0.90%Templeton BRIC Fund 1.60% 1.10%Templeton China Fund 1.60% 1.10%Templeton Eastern Europe Fund 1.60% 1.10%Templeton Emerging Markets Fund 1.60% 1.10%Templeton Emerging Markets Bond Fund 1.00% 0.70%Templeton Emerging Markets Smaller Companies Fund 1.60% 1.10%Templeton Euro Liquid Reserve Fund 0.30% 0.20%Templeton Euroland Fund 1.00% 0.70%Templeton Euroland Bond Fund 0.65% 0.45%Templeton European Fund 1.00% 0.70%Templeton European Total Return Fund 0.75% 0.55%Templeton Frontier Markets Fund 1.60% 1.10%Templeton Global Fund 1.00% 0.70%Templeton Global (Euro) Fund 1.00% 0.70%Templeton Global Absolute Return (Euro) Fund* 0.50% 0.35%Templeton Global Absolute Return (USD) Fund* 0.50%Templeton Global Balanced Fund 0.80%` 0.60%Templeton Global Bond Fund 0.75% 0.55%Templeton Global Bond (Euro) Fund 0.75% 0.55%Templeton Global Equity Income Fund 1.00% 0.70%Templeton Global High Yield Fund 0.85% 0.60%Templeton Global Income Fund 0.85% 0.60%Templeton Global Smaller Companies Fund 1.00% 0.70%Templeton Global Total Return Fund 0.75% 0.55%Templeton Growth (Euro) Fund 1.00% 0.70%Templeton Japan Fund� 1.00%Templeton Korea Fund 1.60% 1.10%Templeton Latin America Fund 1.40% 1.00%Templeton Thailand Fund 1.60% 1.10%Templeton U.S. Dollar Liquid Reserve Fund 0.30% 0.20%Templeton U.S. Value Fund 1.00% 0.70%
*These Funds were merged into Templeton Global Total Return Fund effective on December 19, 2008
�This Fund was merged into Franklin Templeton Japan Fund effective on November 21, 2008
`Except A (Acc) ^ EUR hedged (H1) and N (Acc) ^ EUR hedged (H1): 0.75%
In addition, investment management fees are charged on the underlying target funds as detailed in note 22.
www.franklintempleton.lu Unaudited Semi-Annual Report
FRANKL IN TEMPLETON INVESTMENT FUNDS
Notes to the Financial Statements
at December 31, 2008 (continued)
47
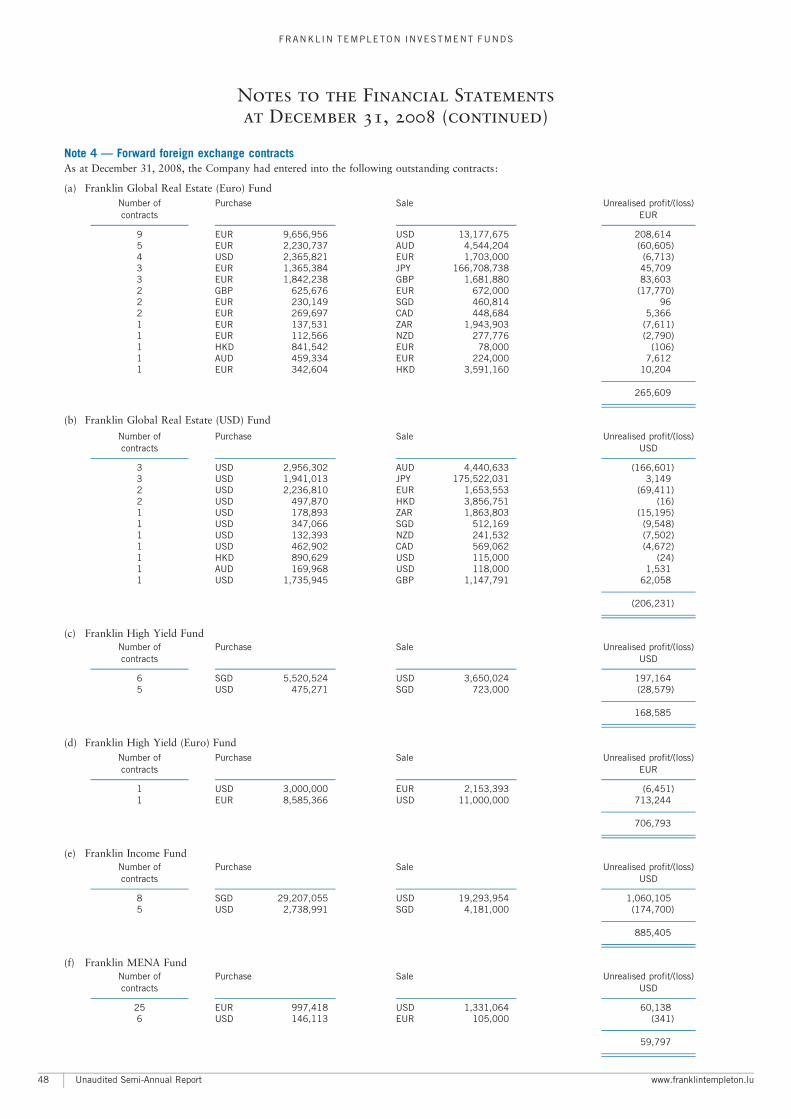
Note 4 ç Forward foreign exchange contractsAs at December 31, 2008, the Company had entered into the following outstanding contracts:
(a) Franklin Global Real Estate (Euro) FundNumber of Purchase Sale Unrealised profit/(loss)contracts EURAA A A
9 EUR 9,656,956 USD 13,177,675 208,6145 EUR 2,230,737 AUD 4,544,204 (60,605)4 USD 2,365,821 EUR 1,703,000 (6,713)3 EUR 1,365,384 JPY 166,708,738 45,7093 EUR 1,842,238 GBP 1,681,880 83,6032 GBP 625,676 EUR 672,000 (17,770)2 EUR 230,149 SGD 460,814 962 EUR 269,697 CAD 448,684 5,3661 EUR 137,531 ZAR 1,943,903 (7,611)1 EUR 112,566 NZD 277,776 (2,790)1 HKD 841,542 EUR 78,000 (106)1 AUD 459,334 EUR 224,000 7,6121 EUR 342,604 HKD 3,591,160 10,204
A
265,609A
A
(b) Franklin Global Real Estate (USD) Fund
Number of Purchase Sale Unrealised profit/(loss)contracts USDAA A A
3 USD 2,956,302 AUD 4,440,633 (166,601)3 USD 1,941,013 JPY 175,522,031 3,1492 USD 2,236,810 EUR 1,653,553 (69,411)2 USD 497,870 HKD 3,856,751 (16)1 USD 178,893 ZAR 1,863,803 (15,195)1 USD 347,066 SGD 512,169 (9,548)1 USD 132,393 NZD 241,532 (7,502)1 USD 462,902 CAD 569,062 (4,672)1 HKD 890,629 USD 115,000 (24)1 AUD 169,968 USD 118,000 1,5311 USD 1,735,945 GBP 1,147,791 62,058
A
(206,231)A
A
(c) Franklin High Yield FundNumber of Purchase Sale Unrealised profit/(loss)contracts USDAA A A
6 SGD 5,520,524 USD 3,650,024 197,1645 USD 475,271 SGD 723,000 (28,579)
A
168,585A
A
(d) Franklin High Yield (Euro) FundNumber of Purchase Sale Unrealised profit/(loss)contracts EURAA A A
1 USD 3,000,000 EUR 2,153,393 (6,451)1 EUR 8,585,366 USD 11,000,000 713,244
A
706,793A
A
(e) Franklin Income FundNumber of Purchase Sale Unrealised profit/(loss)contracts USDAA A A
8 SGD 29,207,055 USD 19,293,954 1,060,1055 USD 2,738,991 SGD 4,181,000 (174,700)
A
885,405A
A
(f) Franklin MENA FundNumber of Purchase Sale Unrealised profit/(loss)contracts USDAA A A
25 EUR 997,418 USD 1,331,064 60,1386 USD 146,113 EUR 105,000 (341)
A
59,797A
A
Unaudited Semi-Annual Report www.franklintempleton.lu
FRANKL IN TEMPLETON INVESTMENT FUNDS
Notes to the Financial Statements
at December 31, 2008 (continued)
48
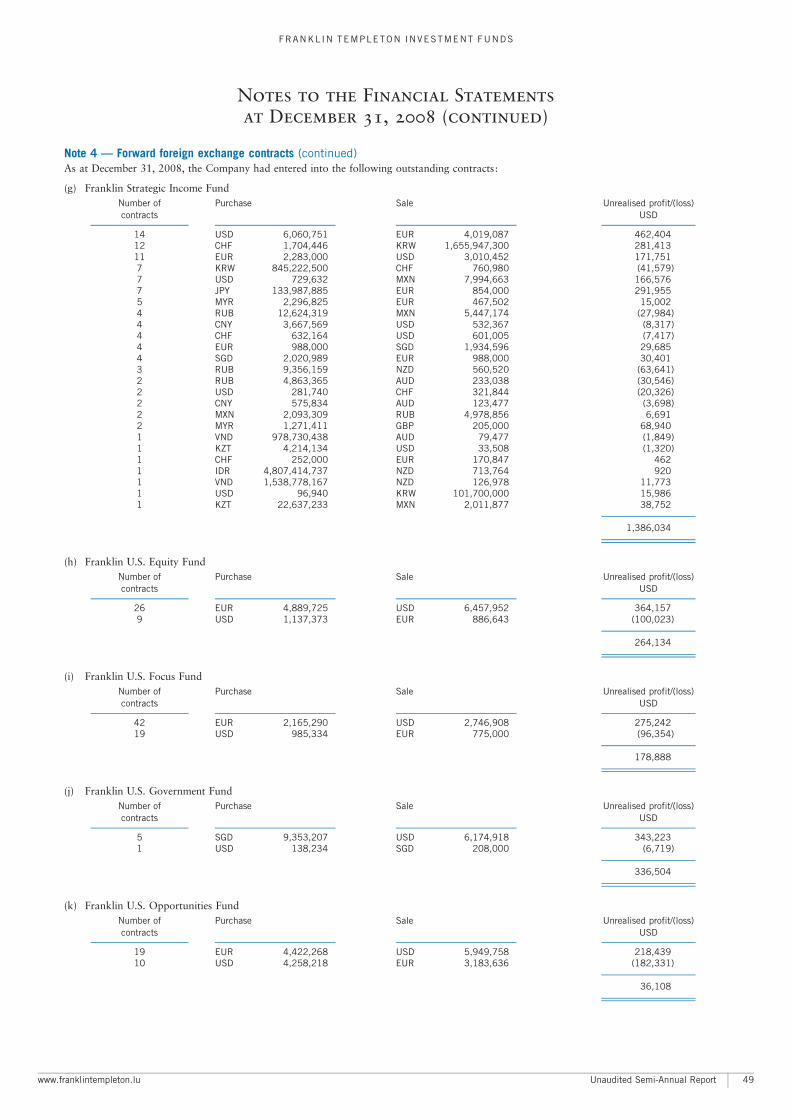
Note 4 ç Forward foreign exchange contracts (continued)As at December 31, 2008, the Company had entered into the following outstanding contracts:
(g) Franklin Strategic Income FundNumber of Purchase Sale Unrealised profit/(loss)contracts USDAA A A
14 USD 6,060,751 EUR 4,019,087 462,40412 CHF 1,704,446 KRW 1,655,947,300 281,41311 EUR 2,283,000 USD 3,010,452 171,7517 KRW 845,222,500 CHF 760,980 (41,579)7 USD 729,632 MXN 7,994,663 166,5767 JPY 133,987,885 EUR 854,000 291,9555 MYR 2,296,825 EUR 467,502 15,0024 RUB 12,624,319 MXN 5,447,174 (27,984)4 CNY 3,667,569 USD 532,367 (8,317)4 CHF 632,164 USD 601,005 (7,417)4 EUR 988,000 SGD 1,934,596 29,6854 SGD 2,020,989 EUR 988,000 30,4013 RUB 9,356,159 NZD 560,520 (63,641)2 RUB 4,863,365 AUD 233,038 (30,546)2 USD 281,740 CHF 321,844 (20,326)2 CNY 575,834 AUD 123,477 (3,698)2 MXN 2,093,309 RUB 4,978,856 6,6912 MYR 1,271,411 GBP 205,000 68,9401 VND 978,730,438 AUD 79,477 (1,849)1 KZT 4,214,134 USD 33,508 (1,320)1 CHF 252,000 EUR 170,847 4621 IDR 4,807,414,737 NZD 713,764 9201 VND 1,538,778,167 NZD 126,978 11,7731 USD 96,940 KRW 101,700,000 15,9861 KZT 22,637,233 MXN 2,011,877 38,752
A
1,386,034A
A
(h) Franklin U.S. Equity FundNumber of Purchase Sale Unrealised profit/(loss)contracts USDAA A A
26 EUR 4,889,725 USD 6,457,952 364,1579 USD 1,137,373 EUR 886,643 (100,023)
A
264,134A
A
(i) Franklin U.S. Focus FundNumber of Purchase Sale Unrealised profit/(loss)contracts USDAA A A
42 EUR 2,165,290 USD 2,746,908 275,24219 USD 985,334 EUR 775,000 (96,354)
A
178,888A
A
(j) Franklin U.S. Government FundNumber of Purchase Sale Unrealised profit/(loss)contracts USDAA A A
5 SGD 9,353,207 USD 6,174,918 343,2231 USD 138,234 SGD 208,000 (6,719)
A
336,504A
A
(k) Franklin U.S. Opportunities FundNumber of Purchase Sale Unrealised profit/(loss)contracts USDAA A A
19 EUR 4,422,268 USD 5,949,758 218,43910 USD 4,258,218 EUR 3,183,636 (182,331)
A
36,108A
A
www.franklintempleton.lu Unaudited Semi-Annual Report
FRANKL IN TEMPLETON INVESTMENT FUNDS
Notes to the Financial Statements
at December 31, 2008 (continued)
49
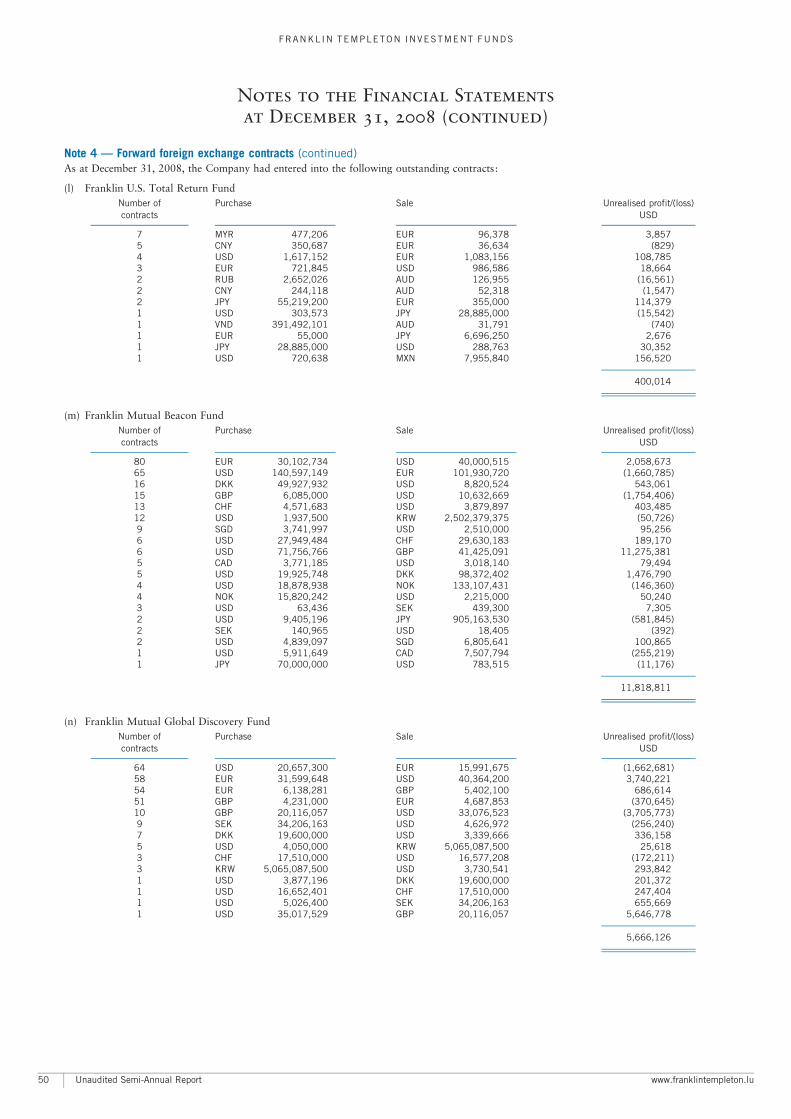
Note 4 ç Forward foreign exchange contracts (continued)As at December 31, 2008, the Company had entered into the following outstanding contracts:
(l) Franklin U.S. Total Return FundNumber of Purchase Sale Unrealised profit/(loss)contracts USDAA A A
7 MYR 477,206 EUR 96,378 3,8575 CNY 350,687 EUR 36,634 (829)4 USD 1,617,152 EUR 1,083,156 108,7853 EUR 721,845 USD 986,586 18,6642 RUB 2,652,026 AUD 126,955 (16,561)2 CNY 244,118 AUD 52,318 (1,547)2 JPY 55,219,200 EUR 355,000 114,3791 USD 303,573 JPY 28,885,000 (15,542)1 VND 391,492,101 AUD 31,791 (740)1 EUR 55,000 JPY 6,696,250 2,6761 JPY 28,885,000 USD 288,763 30,3521 USD 720,638 MXN 7,955,840 156,520
A
400,014A
A
(m) Franklin Mutual Beacon FundNumber of Purchase Sale Unrealised profit/(loss)contracts USDAA A A
80 EUR 30,102,734 USD 40,000,515 2,058,67365 USD 140,597,149 EUR 101,930,720 (1,660,785)16 DKK 49,927,932 USD 8,820,524 543,06115 GBP 6,085,000 USD 10,632,669 (1,754,406)13 CHF 4,571,683 USD 3,879,897 403,48512 USD 1,937,500 KRW 2,502,379,375 (50,726)9 SGD 3,741,997 USD 2,510,000 95,2566 USD 27,949,484 CHF 29,630,183 189,1706 USD 71,756,766 GBP 41,425,091 11,275,3815 CAD 3,771,185 USD 3,018,140 79,4945 USD 19,925,748 DKK 98,372,402 1,476,7904 USD 18,878,938 NOK 133,107,431 (146,360)4 NOK 15,820,242 USD 2,215,000 50,2403 USD 63,436 SEK 439,300 7,3052 USD 9,405,196 JPY 905,163,530 (581,845)2 SEK 140,965 USD 18,405 (392)2 USD 4,839,097 SGD 6,805,641 100,8651 USD 5,911,649 CAD 7,507,794 (255,219)1 JPY 70,000,000 USD 783,515 (11,176)
A
11,818,811A
A
(n) Franklin Mutual Global Discovery FundNumber of Purchase Sale Unrealised profit/(loss)contracts USDAA A A
64 USD 20,657,300 EUR 15,991,675 (1,662,681)58 EUR 31,599,648 USD 40,364,200 3,740,22154 EUR 6,138,281 GBP 5,402,100 686,61451 GBP 4,231,000 EUR 4,687,853 (370,645)10 GBP 20,116,057 USD 33,076,523 (3,705,773)9 SEK 34,206,163 USD 4,626,972 (256,240)7 DKK 19,600,000 USD 3,339,666 336,1585 USD 4,050,000 KRW 5,065,087,500 25,6183 CHF 17,510,000 USD 16,577,208 (172,211)3 KRW 5,065,087,500 USD 3,730,541 293,8421 USD 3,877,196 DKK 19,600,000 201,3721 USD 16,652,401 CHF 17,510,000 247,4041 USD 5,026,400 SEK 34,206,163 655,6691 USD 35,017,529 GBP 20,116,057 5,646,778
A
5,666,126A
A
Unaudited Semi-Annual Report www.franklintempleton.lu
FRANKL IN TEMPLETON INVESTMENT FUNDS
Notes to the Financial Statements
at December 31, 2008 (continued)
50
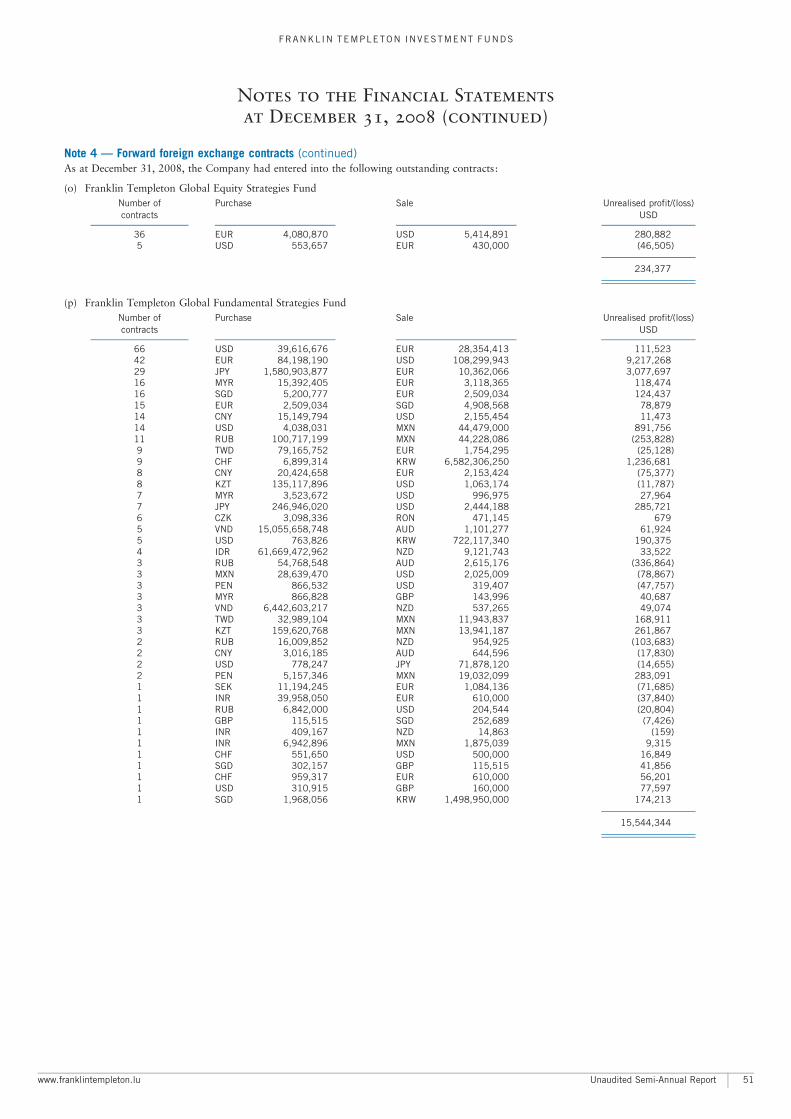
Note 4 ç Forward foreign exchange contracts (continued)As at December 31, 2008, the Company had entered into the following outstanding contracts:
(o) Franklin Templeton Global Equity Strategies FundNumber of Purchase Sale Unrealised profit/(loss)contracts USDAA A A
36 EUR 4,080,870 USD 5,414,891 280,8825 USD 553,657 EUR 430,000 (46,505)
A
234,377A
A
(p) Franklin Templeton Global Fundamental Strategies FundNumber of Purchase Sale Unrealised profit/(loss)contracts USDAA A A
66 USD 39,616,676 EUR 28,354,413 111,52342 EUR 84,198,190 USD 108,299,943 9,217,26829 JPY 1,580,903,877 EUR 10,362,066 3,077,69716 MYR 15,392,405 EUR 3,118,365 118,47416 SGD 5,200,777 EUR 2,509,034 124,43715 EUR 2,509,034 SGD 4,908,568 78,87914 CNY 15,149,794 USD 2,155,454 11,47314 USD 4,038,031 MXN 44,479,000 891,75611 RUB 100,717,199 MXN 44,228,086 (253,828)9 TWD 79,165,752 EUR 1,754,295 (25,128)9 CHF 6,899,314 KRW 6,582,306,250 1,236,6818 CNY 20,424,658 EUR 2,153,424 (75,377)8 KZT 135,117,896 USD 1,063,174 (11,787)7 MYR 3,523,672 USD 996,975 27,9647 JPY 246,946,020 USD 2,444,188 285,7216 CZK 3,098,336 RON 471,145 6795 VND 15,055,658,748 AUD 1,101,277 61,9245 USD 763,826 KRW 722,117,340 190,3754 IDR 61,669,472,962 NZD 9,121,743 33,5223 RUB 54,768,548 AUD 2,615,176 (336,864)3 MXN 28,639,470 USD 2,025,009 (78,867)3 PEN 866,532 USD 319,407 (47,757)3 MYR 866,828 GBP 143,996 40,6873 VND 6,442,603,217 NZD 537,265 49,0743 TWD 32,989,104 MXN 11,943,837 168,9113 KZT 159,620,768 MXN 13,941,187 261,8672 RUB 16,009,852 NZD 954,925 (103,683)2 CNY 3,016,185 AUD 644,596 (17,830)2 USD 778,247 JPY 71,878,120 (14,655)2 PEN 5,157,346 MXN 19,032,099 283,0911 SEK 11,194,245 EUR 1,084,136 (71,685)1 INR 39,958,050 EUR 610,000 (37,840)1 RUB 6,842,000 USD 204,544 (20,804)1 GBP 115,515 SGD 252,689 (7,426)1 INR 409,167 NZD 14,863 (159)1 INR 6,942,896 MXN 1,875,039 9,3151 CHF 551,650 USD 500,000 16,8491 SGD 302,157 GBP 115,515 41,8561 CHF 959,317 EUR 610,000 56,2011 USD 310,915 GBP 160,000 77,5971 SGD 1,968,056 KRW 1,498,950,000 174,213
A
15,544,344A
A
www.franklintempleton.lu Unaudited Semi-Annual Report
FRANKL IN TEMPLETON INVESTMENT FUNDS
Notes to the Financial Statements
at December 31, 2008 (continued)
51
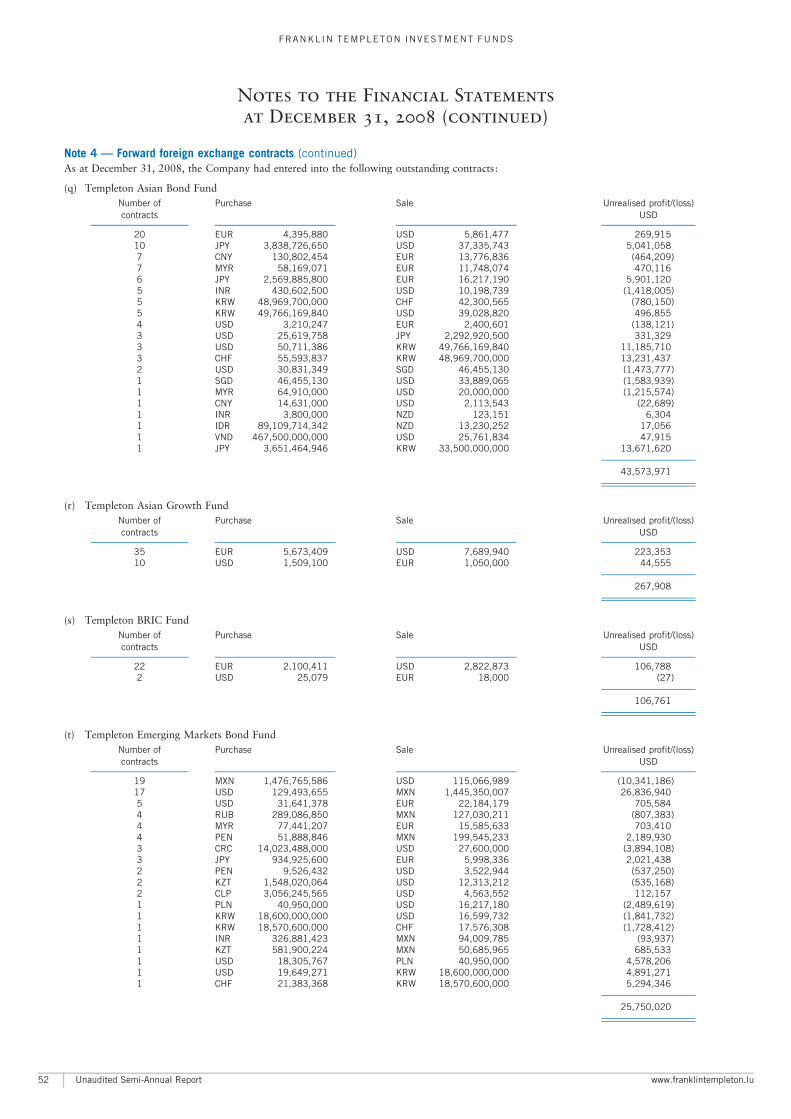
Note 4 ç Forward foreign exchange contracts (continued)As at December 31, 2008, the Company had entered into the following outstanding contracts:
(q) Templeton Asian Bond FundNumber of Purchase Sale Unrealised profit/(loss)contracts USDAA A A
20 EUR 4,395,880 USD 5,861,477 269,91510 JPY 3,838,726,650 USD 37,335,743 5,041,0587 CNY 130,802,454 EUR 13,776,836 (464,209)7 MYR 58,169,071 EUR 11,748,074 470,1166 JPY 2,569,885,800 EUR 16,217,190 5,901,1205 INR 430,602,500 USD 10,198,739 (1,418,005)5 KRW 48,969,700,000 CHF 42,300,565 (780,150)5 KRW 49,766,169,840 USD 39,028,820 496,8554 USD 3,210,247 EUR 2,400,601 (138,121)3 USD 25,619,758 JPY 2,292,920,500 331,3293 USD 50,711,386 KRW 49,766,169,840 11,185,7103 CHF 55,593,837 KRW 48,969,700,000 13,231,4372 USD 30,831,349 SGD 46,455,130 (1,473,777)1 SGD 46,455,130 USD 33,889,065 (1,583,939)1 MYR 64,910,000 USD 20,000,000 (1,215,574)1 CNY 14,631,000 USD 2,113,543 (22,689)1 INR 3,800,000 NZD 123,151 6,3041 IDR 89,109,714,342 NZD 13,230,252 17,0561 VND 467,500,000,000 USD 25,761,834 47,9151 JPY 3,651,464,946 KRW 33,500,000,000 13,671,620
A
43,573,971A
A
(r) Templeton Asian Growth FundNumber of Purchase Sale Unrealised profit/(loss)contracts USDAA A A
35 EUR 5,673,409 USD 7,689,940 223,35310 USD 1,509,100 EUR 1,050,000 44,555
A
267,908A
A
(s) Templeton BRIC FundNumber of Purchase Sale Unrealised profit/(loss)contracts USDAA A A
22 EUR 2,100,411 USD 2,822,873 106,7882 USD 25,079 EUR 18,000 (27)
A
106,761A
A
(t) Templeton Emerging Markets Bond FundNumber of Purchase Sale Unrealised profit/(loss)contracts USDAA A A
19 MXN 1,476,765,586 USD 115,066,989 (10,341,186)17 USD 129,493,655 MXN 1,445,350,007 26,836,9405 USD 31,641,378 EUR 22,184,179 705,5844 RUB 289,086,850 MXN 127,030,211 (807,383)4 MYR 77,441,207 EUR 15,585,633 703,4104 PEN 51,888,846 MXN 199,545,233 2,189,9303 CRC 14,023,488,000 USD 27,600,000 (3,894,108)3 JPY 934,925,600 EUR 5,998,336 2,021,4382 PEN 9,526,432 USD 3,522,944 (537,250)2 KZT 1,548,020,064 USD 12,313,212 (535,168)2 CLP 3,056,245,565 USD 4,563,552 112,1571 PLN 40,950,000 USD 16,217,180 (2,489,619)1 KRW 18,600,000,000 USD 16,599,732 (1,841,732)1 KRW 18,570,600,000 CHF 17,576,308 (1,728,412)1 INR 326,881,423 MXN 94,009,785 (93,937)1 KZT 581,900,224 MXN 50,685,965 685,5331 USD 18,305,767 PLN 40,950,000 4,578,2061 USD 19,649,271 KRW 18,600,000,000 4,891,2711 CHF 21,383,368 KRW 18,570,600,000 5,294,346
A
25,750,020A
A
Unaudited Semi-Annual Report www.franklintempleton.lu
FRANKL IN TEMPLETON INVESTMENT FUNDS
Notes to the Financial Statements
at December 31, 2008 (continued)
52
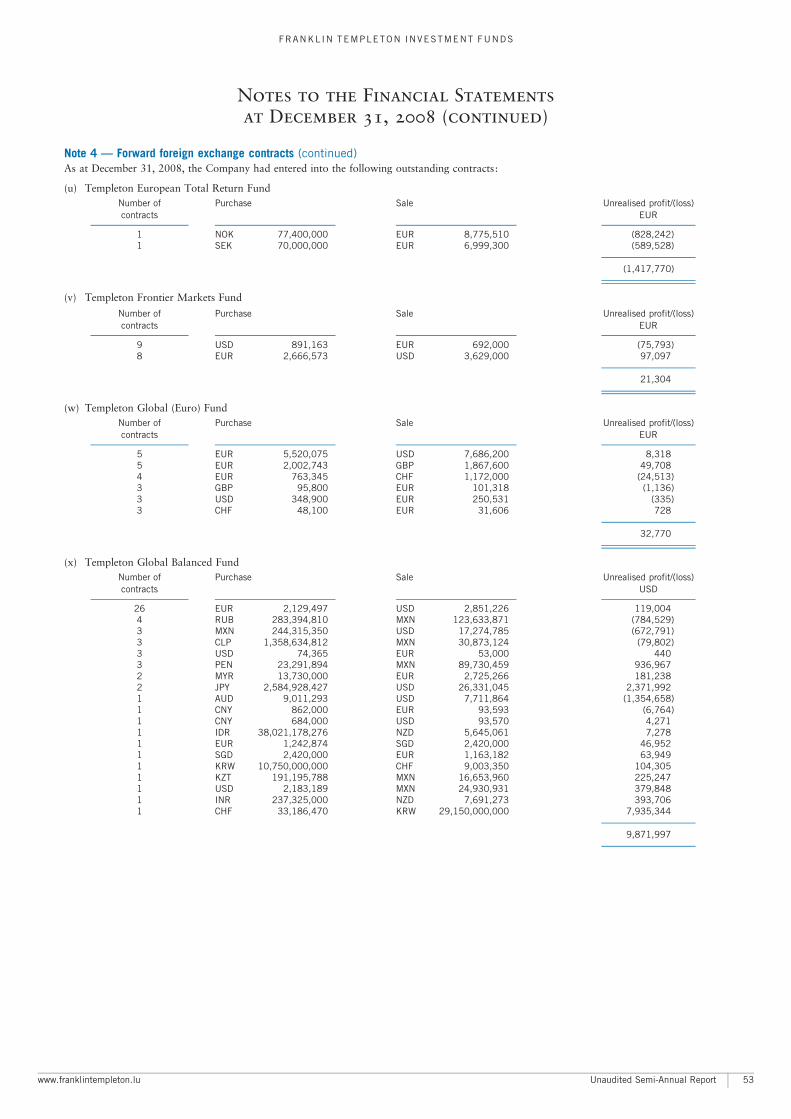
Note 4 ç Forward foreign exchange contracts (continued)As at December 31, 2008, the Company had entered into the following outstanding contracts:
(u) Templeton European Total Return FundNumber of Purchase Sale Unrealised profit/(loss)contracts EURAA A A
1 NOK 77,400,000 EUR 8,775,510 (828,242)1 SEK 70,000,000 EUR 6,999,300 (589,528)
A
(1,417,770)A
A
(v) Templeton Frontier Markets Fund
Number of Purchase Sale Unrealised profit/(loss)contracts EURAA A A
9 USD 891,163 EUR 692,000 (75,793)8 EUR 2,666,573 USD 3,629,000 97,097
A
21,304A
A
(w) Templeton Global (Euro) FundNumber of Purchase Sale Unrealised profit/(loss)contracts EURAA A A
5 EUR 5,520,075 USD 7,686,200 8,3185 EUR 2,002,743 GBP 1,867,600 49,7084 EUR 763,345 CHF 1,172,000 (24,513)3 GBP 95,800 EUR 101,318 (1,136)3 USD 348,900 EUR 250,531 (335)3 CHF 48,100 EUR 31,606 728
A
32,770A
A
(x) Templeton Global Balanced FundNumber of Purchase Sale Unrealised profit/(loss)contracts USDAA A A
26 EUR 2,129,497 USD 2,851,226 119,0044 RUB 283,394,810 MXN 123,633,871 (784,529)3 MXN 244,315,350 USD 17,274,785 (672,791)3 CLP 1,358,634,812 MXN 30,873,124 (79,802)3 USD 74,365 EUR 53,000 4403 PEN 23,291,894 MXN 89,730,459 936,9672 MYR 13,730,000 EUR 2,725,266 181,2382 JPY 2,584,928,427 USD 26,331,045 2,371,9921 AUD 9,011,293 USD 7,711,864 (1,354,658)1 CNY 862,000 EUR 93,593 (6,764)1 CNY 684,000 USD 93,570 4,2711 IDR 38,021,178,276 NZD 5,645,061 7,2781 EUR 1,242,874 SGD 2,420,000 46,9521 SGD 2,420,000 EUR 1,163,182 63,9491 KRW 10,750,000,000 CHF 9,003,350 104,3051 KZT 191,195,788 MXN 16,653,960 225,2471 USD 2,183,189 MXN 24,930,931 379,8481 INR 237,325,000 NZD 7,691,273 393,7061 CHF 33,186,470 KRW 29,150,000,000 7,935,344
A
9,871,997A
www.franklintempleton.lu Unaudited Semi-Annual Report
FRANKL IN TEMPLETON INVESTMENT FUNDS
Notes to the Financial Statements
at December 31, 2008 (continued)
53
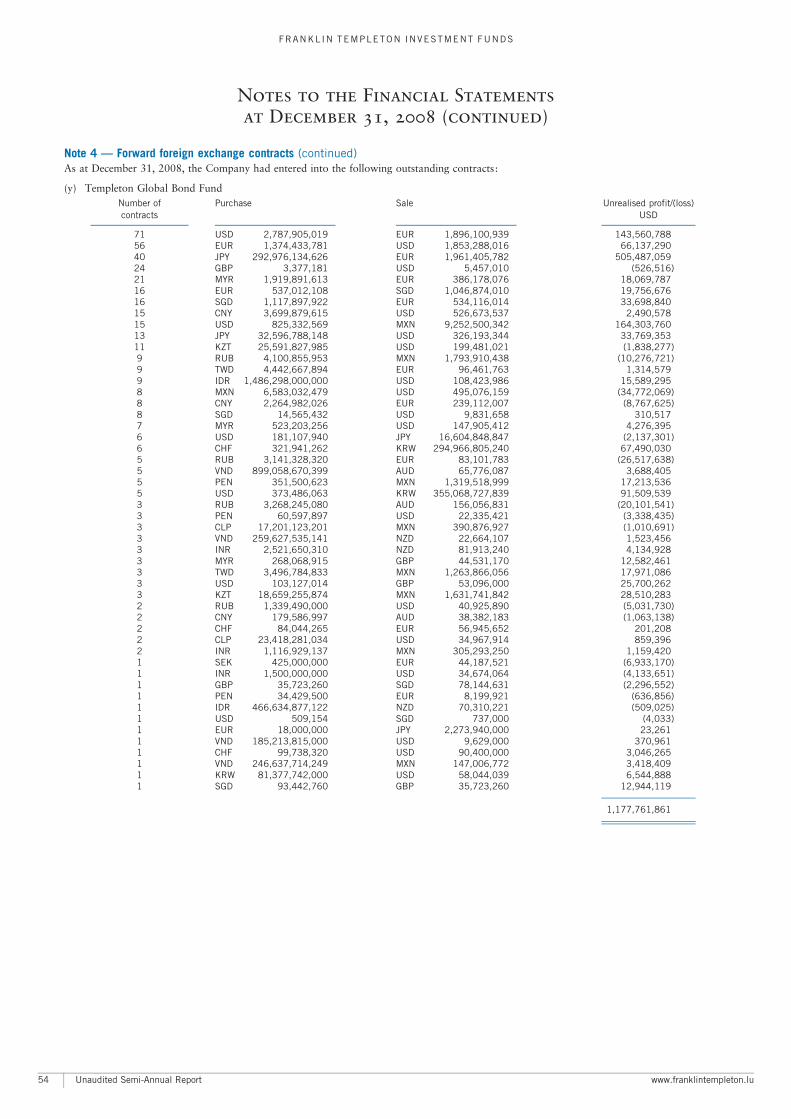
Note 4 ç Forward foreign exchange contracts (continued)As at December 31, 2008, the Company had entered into the following outstanding contracts:
(y) Templeton Global Bond FundNumber of Purchase Sale Unrealised profit/(loss)contracts USDAA A A
71 USD 2,787,905,019 EUR 1,896,100,939 143,560,78856 EUR 1,374,433,781 USD 1,853,288,016 66,137,29040 JPY 292,976,134,626 EUR 1,961,405,782 505,487,05924 GBP 3,377,181 USD 5,457,010 (526,516)21 MYR 1,919,891,613 EUR 386,178,076 18,069,78716 EUR 537,012,108 SGD 1,046,874,010 19,756,67616 SGD 1,117,897,922 EUR 534,116,014 33,698,84015 CNY 3,699,879,615 USD 526,673,537 2,490,57815 USD 825,332,569 MXN 9,252,500,342 164,303,76013 JPY 32,596,788,148 USD 326,193,344 33,769,35311 KZT 25,591,827,985 USD 199,481,021 (1,838,277)9 RUB 4,100,855,953 MXN 1,793,910,438 (10,276,721)9 TWD 4,442,667,894 EUR 96,461,763 1,314,5799 IDR 1,486,298,000,000 USD 108,423,986 15,589,2958 MXN 6,583,032,479 USD 495,076,159 (34,772,069)8 CNY 2,264,982,026 EUR 239,112,007 (8,767,625)8 SGD 14,565,432 USD 9,831,658 310,5177 MYR 523,203,256 USD 147,905,412 4,276,3956 USD 181,107,940 JPY 16,604,848,847 (2,137,301)6 CHF 321,941,262 KRW 294,966,805,240 67,490,0305 RUB 3,141,328,320 EUR 83,101,783 (26,517,638)5 VND 899,058,670,399 AUD 65,776,087 3,688,4055 PEN 351,500,623 MXN 1,319,518,999 17,213,5365 USD 373,486,063 KRW 355,068,727,839 91,509,5393 RUB 3,268,245,080 AUD 156,056,831 (20,101,541)3 PEN 60,597,897 USD 22,335,421 (3,338,435)3 CLP 17,201,123,201 MXN 390,876,927 (1,010,691)3 VND 259,627,535,141 NZD 22,664,107 1,523,4563 INR 2,521,650,310 NZD 81,913,240 4,134,9283 MYR 268,068,915 GBP 44,531,170 12,582,4613 TWD 3,496,784,833 MXN 1,263,866,056 17,971,0863 USD 103,127,014 GBP 53,096,000 25,700,2623 KZT 18,659,255,874 MXN 1,631,741,842 28,510,2832 RUB 1,339,490,000 USD 40,925,890 (5,031,730)2 CNY 179,586,997 AUD 38,382,183 (1,063,138)2 CHF 84,044,265 EUR 56,945,652 201,2082 CLP 23,418,281,034 USD 34,967,914 859,3962 INR 1,116,929,137 MXN 305,293,250 1,159,4201 SEK 425,000,000 EUR 44,187,521 (6,933,170)1 INR 1,500,000,000 USD 34,674,064 (4,133,651)1 GBP 35,723,260 SGD 78,144,631 (2,296,552)1 PEN 34,429,500 EUR 8,199,921 (636,856)1 IDR 466,634,877,122 NZD 70,310,221 (509,025)1 USD 509,154 SGD 737,000 (4,033)1 EUR 18,000,000 JPY 2,273,940,000 23,2611 VND 185,213,815,000 USD 9,629,000 370,9611 CHF 99,738,320 USD 90,400,000 3,046,2651 VND 246,637,714,249 MXN 147,006,772 3,418,4091 KRW 81,377,742,000 USD 58,044,039 6,544,8881 SGD 93,442,760 GBP 35,723,260 12,944,119
A
1,177,761,861A
A
Unaudited Semi-Annual Report www.franklintempleton.lu
FRANKL IN TEMPLETON INVESTMENT FUNDS
Notes to the Financial Statements
at December 31, 2008 (continued)
54
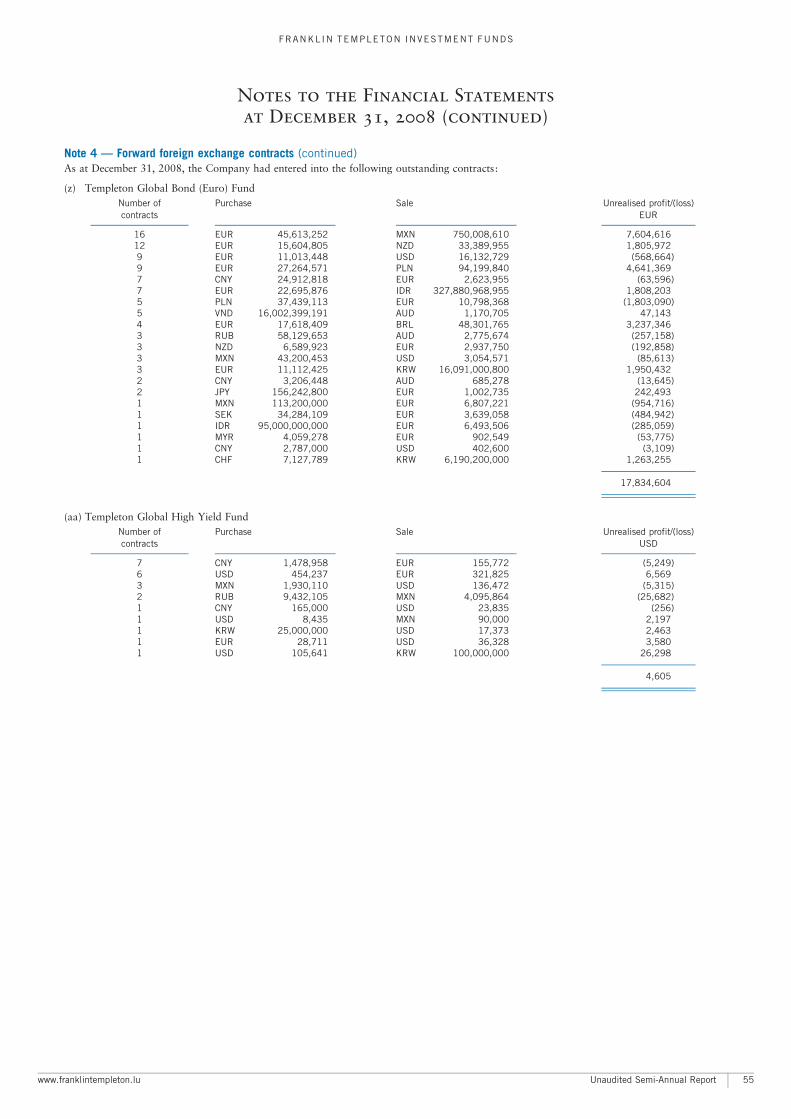
Note 4 ç Forward foreign exchange contracts (continued)As at December 31, 2008, the Company had entered into the following outstanding contracts:
(z) Templeton Global Bond (Euro) FundNumber of Purchase Sale Unrealised profit/(loss)contracts EURAA A A
16 EUR 45,613,252 MXN 750,008,610 7,604,61612 EUR 15,604,805 NZD 33,389,955 1,805,9729 EUR 11,013,448 USD 16,132,729 (568,664)9 EUR 27,264,571 PLN 94,199,840 4,641,3697 CNY 24,912,818 EUR 2,623,955 (63,596)7 EUR 22,695,876 IDR 327,880,968,955 1,808,2035 PLN 37,439,113 EUR 10,798,368 (1,803,090)5 VND 16,002,399,191 AUD 1,170,705 47,1434 EUR 17,618,409 BRL 48,301,765 3,237,3463 RUB 58,129,653 AUD 2,775,674 (257,158)3 NZD 6,589,923 EUR 2,937,750 (192,858)3 MXN 43,200,453 USD 3,054,571 (85,613)3 EUR 11,112,425 KRW 16,091,000,800 1,950,4322 CNY 3,206,448 AUD 685,278 (13,645)2 JPY 156,242,800 EUR 1,002,735 242,4931 MXN 113,200,000 EUR 6,807,221 (954,716)1 SEK 34,284,109 EUR 3,639,058 (484,942)1 IDR 95,000,000,000 EUR 6,493,506 (285,059)1 MYR 4,059,278 EUR 902,549 (53,775)1 CNY 2,787,000 USD 402,600 (3,109)1 CHF 7,127,789 KRW 6,190,200,000 1,263,255
A
17,834,604A
A
(aa) Templeton Global High Yield FundNumber of Purchase Sale Unrealised profit/(loss)contracts USDAA A A
7 CNY 1,478,958 EUR 155,772 (5,249)6 USD 454,237 EUR 321,825 6,5693 MXN 1,930,110 USD 136,472 (5,315)2 RUB 9,432,105 MXN 4,095,864 (25,682)1 CNY 165,000 USD 23,835 (256)1 USD 8,435 MXN 90,000 2,1971 KRW 25,000,000 USD 17,373 2,4631 EUR 28,711 USD 36,328 3,5801 USD 105,641 KRW 100,000,000 26,298
A
4,605A
A
www.franklintempleton.lu Unaudited Semi-Annual Report
FRANKL IN TEMPLETON INVESTMENT FUNDS
Notes to the Financial Statements
at December 31, 2008 (continued)
55
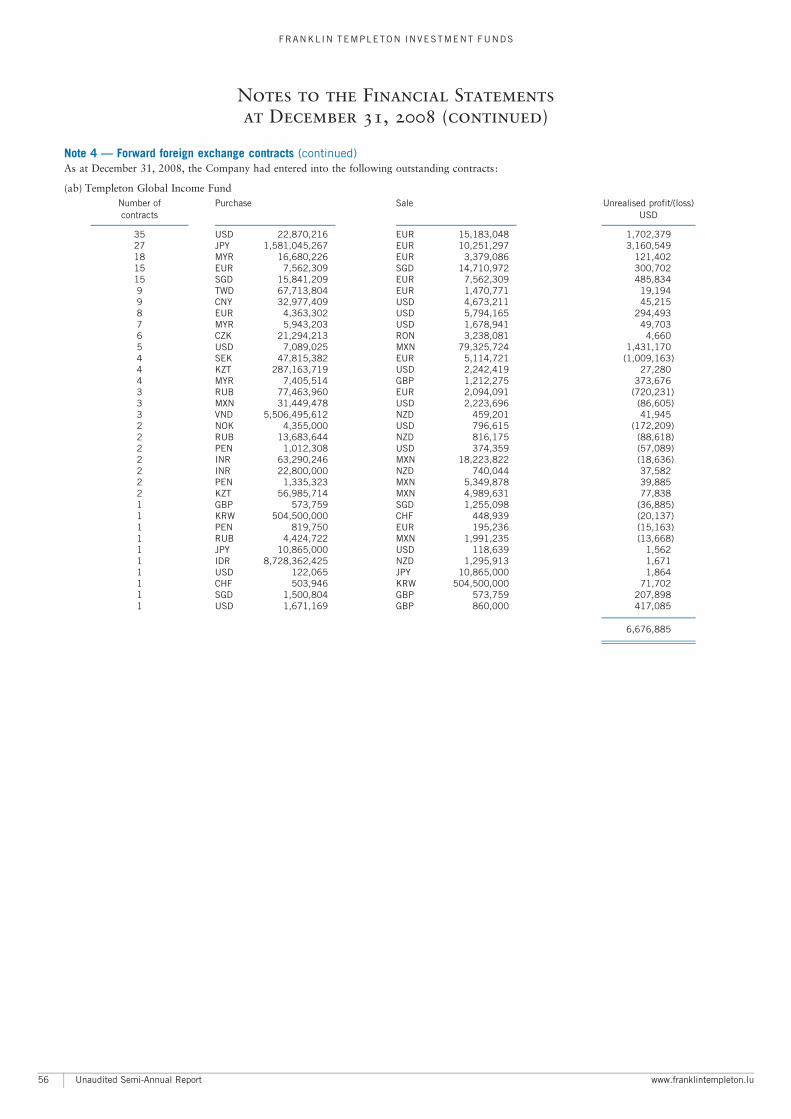
Note 4 ç Forward foreign exchange contracts (continued)As at December 31, 2008, the Company had entered into the following outstanding contracts:
(ab) Templeton Global Income FundNumber of Purchase Sale Unrealised profit/(loss)contracts USDAA A A
35 USD 22,870,216 EUR 15,183,048 1,702,37927 JPY 1,581,045,267 EUR 10,251,297 3,160,54918 MYR 16,680,226 EUR 3,379,086 121,40215 EUR 7,562,309 SGD 14,710,972 300,70215 SGD 15,841,209 EUR 7,562,309 485,8349 TWD 67,713,804 EUR 1,470,771 19,1949 CNY 32,977,409 USD 4,673,211 45,2158 EUR 4,363,302 USD 5,794,165 294,4937 MYR 5,943,203 USD 1,678,941 49,7036 CZK 21,294,213 RON 3,238,081 4,6605 USD 7,089,025 MXN 79,325,724 1,431,1704 SEK 47,815,382 EUR 5,114,721 (1,009,163)4 KZT 287,163,719 USD 2,242,419 27,2804 MYR 7,405,514 GBP 1,212,275 373,6763 RUB 77,463,960 EUR 2,094,091 (720,231)3 MXN 31,449,478 USD 2,223,696 (86,605)3 VND 5,506,495,612 NZD 459,201 41,9452 NOK 4,355,000 USD 796,615 (172,209)2 RUB 13,683,644 NZD 816,175 (88,618)2 PEN 1,012,308 USD 374,359 (57,089)2 INR 63,290,246 MXN 18,223,822 (18,636)2 INR 22,800,000 NZD 740,044 37,5822 PEN 1,335,323 MXN 5,349,878 39,8852 KZT 56,985,714 MXN 4,989,631 77,8381 GBP 573,759 SGD 1,255,098 (36,885)1 KRW 504,500,000 CHF 448,939 (20,137)1 PEN 819,750 EUR 195,236 (15,163)1 RUB 4,424,722 MXN 1,991,235 (13,668)1 JPY 10,865,000 USD 118,639 1,5621 IDR 8,728,362,425 NZD 1,295,913 1,6711 USD 122,065 JPY 10,865,000 1,8641 CHF 503,946 KRW 504,500,000 71,7021 SGD 1,500,804 GBP 573,759 207,8981 USD 1,671,169 GBP 860,000 417,085
A
6,676,885A
A
Unaudited Semi-Annual Report www.franklintempleton.lu
FRANKL IN TEMPLETON INVESTMENT FUNDS
Notes to the Financial Statements
at December 31, 2008 (continued)
56
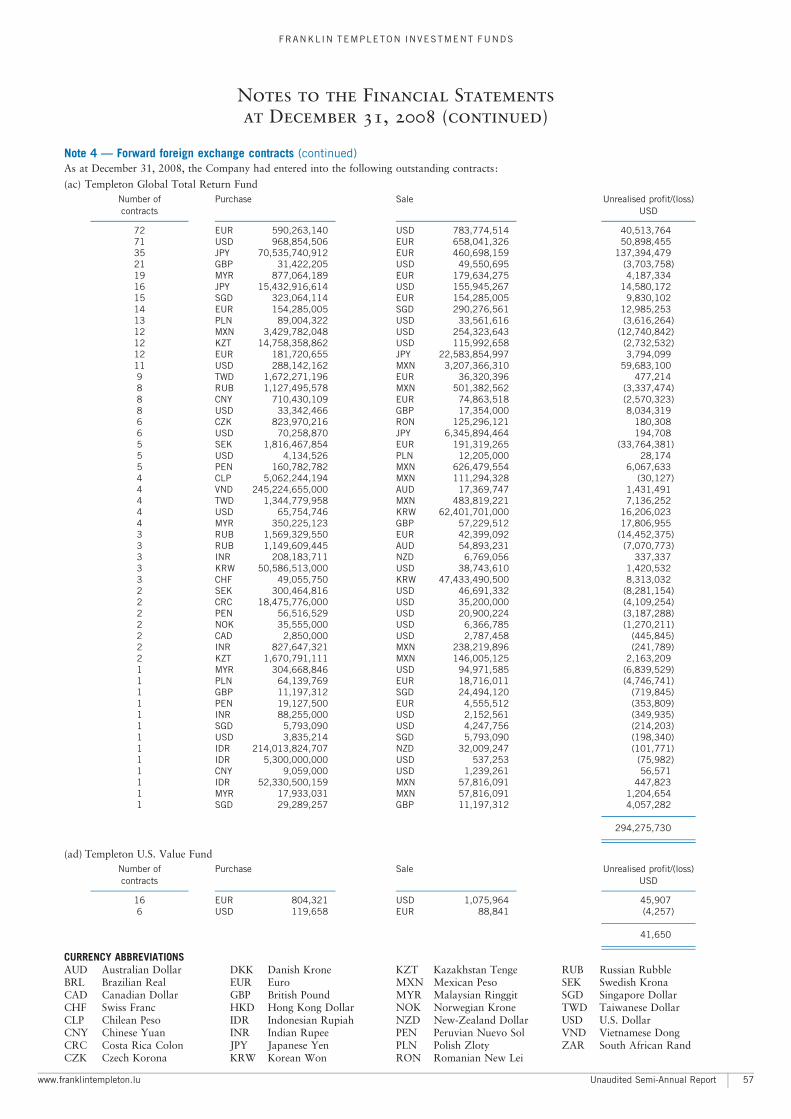
Note 4 ç Forward foreign exchange contracts (continued)As at December 31, 2008, the Company had entered into the following outstanding contracts:
(ac) Templeton Global Total Return FundNumber of Purchase Sale Unrealised profit/(loss)contracts USDAA A A
72 EUR 590,263,140 USD 783,774,514 40,513,76471 USD 968,854,506 EUR 658,041,326 50,898,45535 JPY 70,535,740,912 EUR 460,698,159 137,394,47921 GBP 31,422,205 USD 49,550,695 (3,703,758)19 MYR 877,064,189 EUR 179,634,275 4,187,33416 JPY 15,432,916,614 USD 155,945,267 14,580,17215 SGD 323,064,114 EUR 154,285,005 9,830,10214 EUR 154,285,005 SGD 290,276,561 12,985,25313 PLN 89,004,322 USD 33,561,616 (3,616,264)12 MXN 3,429,782,048 USD 254,323,643 (12,740,842)12 KZT 14,758,358,862 USD 115,992,658 (2,732,532)12 EUR 181,720,655 JPY 22,583,854,997 3,794,09911 USD 288,142,162 MXN 3,207,366,310 59,683,1009 TWD 1,672,271,196 EUR 36,320,396 477,2148 RUB 1,127,495,578 MXN 501,382,562 (3,337,474)8 CNY 710,430,109 EUR 74,863,518 (2,570,323)8 USD 33,342,466 GBP 17,354,000 8,034,3196 CZK 823,970,216 RON 125,296,121 180,3086 USD 70,258,870 JPY 6,345,894,464 194,7085 SEK 1,816,467,854 EUR 191,319,265 (33,764,381)5 USD 4,134,526 PLN 12,205,000 28,1745 PEN 160,782,782 MXN 626,479,554 6,067,6334 CLP 5,062,244,194 MXN 111,294,328 (30,127)4 VND 245,224,655,000 AUD 17,369,747 1,431,4914 TWD 1,344,779,958 MXN 483,819,221 7,136,2524 USD 65,754,746 KRW 62,401,701,000 16,206,0234 MYR 350,225,123 GBP 57,229,512 17,806,9553 RUB 1,569,329,550 EUR 42,399,092 (14,452,375)3 RUB 1,149,609,445 AUD 54,893,231 (7,070,773)3 INR 208,183,711 NZD 6,769,056 337,3373 KRW 50,586,513,000 USD 38,743,610 1,420,5323 CHF 49,055,750 KRW 47,433,490,500 8,313,0322 SEK 300,464,816 USD 46,691,332 (8,281,154)2 CRC 18,475,776,000 USD 35,200,000 (4,109,254)2 PEN 56,516,529 USD 20,900,224 (3,187,288)2 NOK 35,555,000 USD 6,366,785 (1,270,211)2 CAD 2,850,000 USD 2,787,458 (445,845)2 INR 827,647,321 MXN 238,219,896 (241,789)2 KZT 1,670,791,111 MXN 146,005,125 2,163,2091 MYR 304,668,846 USD 94,971,585 (6,839,529)1 PLN 64,139,769 EUR 18,716,011 (4,746,741)1 GBP 11,197,312 SGD 24,494,120 (719,845)1 PEN 19,127,500 EUR 4,555,512 (353,809)1 INR 88,255,000 USD 2,152,561 (349,935)1 SGD 5,793,090 USD 4,247,756 (214,203)1 USD 3,835,214 SGD 5,793,090 (198,340)1 IDR 214,013,824,707 NZD 32,009,247 (101,771)1 IDR 5,300,000,000 USD 537,253 (75,982)1 CNY 9,059,000 USD 1,239,261 56,5711 IDR 52,330,500,159 MXN 57,816,091 447,8231 MYR 17,933,031 MXN 57,816,091 1,204,6541 SGD 29,289,257 GBP 11,197,312 4,057,282
A
294,275,730A
A
(ad) Templeton U.S. Value FundNumber of Purchase Sale Unrealised profit/(loss)contracts USDAA A A
16 EUR 804,321 USD 1,075,964 45,9076 USD 119,658 EUR 88,841 (4,257)
A
41,650A
A
CURRENCY ABBREVIATIONSAUD Australian DollarBRL Brazilian RealCAD Canadian DollarCHF Swiss FrancCLP Chilean PesoCNY Chinese YuanCRC Costa Rica ColonCZK Czech Korona
DKK Danish KroneEUR EuroGBP British PoundHKD Hong Kong DollarIDR Indonesian RupiahINR Indian RupeeJPY Japanese YenKRW Korean Won
KZT Kazakhstan TengeMXN Mexican PesoMYR Malaysian RinggitNOK Norwegian KroneNZD New-Zealand DollarPEN Peruvian Nuevo SolPLN Polish ZlotyRON Romanian New Lei
RUB Russian RubbleSEK Swedish KronaSGD Singapore DollarTWD Taiwanese DollarUSD U.S. DollarVND Vietnamese DongZAR South African Rand
www.franklintempleton.lu Unaudited Semi-Annual Report
FRANKL IN TEMPLETON INVESTMENT FUNDS
Notes to the Financial Statements
at December 31, 2008 (continued)
57
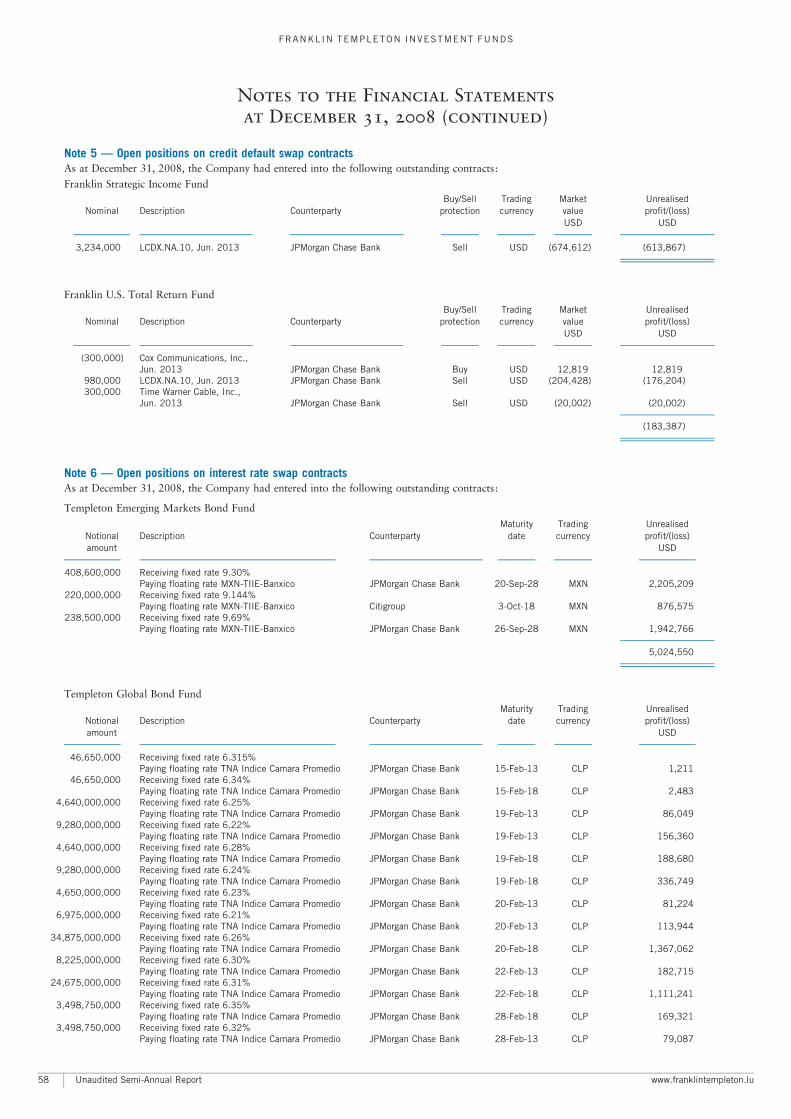
Note 5 ç Open positions on credit default swap contractsAs at December 31, 2008, the Company had entered into the following outstanding contracts:
Franklin Strategic Income FundBuy/Sell Trading Market Unrealised
Nominal Description Counterparty protection currency value profit/(loss)USD USD
AA A A A A A
3,234,000 LCDX.NA.10, Jun. 2013 JPMorgan Chase Bank Sell USD (674,612) (613,867)A
A
Franklin U.S. Total Return FundBuy/Sell Trading Market Unrealised
Nominal Description Counterparty protection currency value profit/(loss)USD USD
AA A A A A A
(300,000) Cox Communications, Inc.,Jun. 2013 JPMorgan Chase Bank Buy USD 12,819 12,819
980,000 LCDX.NA.10, Jun. 2013 JPMorgan Chase Bank Sell USD (204,428) (176,204)300,000 Time Warner Cable, Inc.,
Jun. 2013 JPMorgan Chase Bank Sell USD (20,002) (20,002)A
(183,387)A
A
Note 6 ç Open positions on interest rate swap contractsAs at December 31, 2008, the Company had entered into the following outstanding contracts:
Templeton Emerging Markets Bond Fund
Maturity Trading UnrealisedNotional Description Counterparty date currency profit/(loss)amount USDAAAA A A
408,600,000 Receiving fixed rate 9.30%Paying floating rate MXN-TIIE-Banxico JPMorgan Chase Bank 20-Sep-28 MXN 2,205,209
220,000,000 Receiving fixed rate 9.144%Paying floating rate MXN-TIIE-Banxico Citigroup 3-Oct-18 MXN 876,575
238,500,000 Receiving fixed rate 9.69%Paying floating rate MXN-TIIE-Banxico JPMorgan Chase Bank 26-Sep-28 MXN 1,942,766
A
5,024,550A
A
Templeton Global Bond FundMaturity Trading Unrealised
Notional Description Counterparty date currency profit/(loss)amount USDAAAA A A
46,650,000 Receiving fixed rate 6.315%Paying floating rate TNA Indice Camara Promedio JPMorgan Chase Bank 15-Feb-13 CLP 1,211
46,650,000 Receiving fixed rate 6.34%Paying floating rate TNA Indice Camara Promedio JPMorgan Chase Bank 15-Feb-18 CLP 2,483
4,640,000,000 Receiving fixed rate 6.25%Paying floating rate TNA Indice Camara Promedio JPMorgan Chase Bank 19-Feb-13 CLP 86,049
9,280,000,000 Receiving fixed rate 6.22%Paying floating rate TNA Indice Camara Promedio JPMorgan Chase Bank 19-Feb-13 CLP 156,360
4,640,000,000 Receiving fixed rate 6.28%Paying floating rate TNA Indice Camara Promedio JPMorgan Chase Bank 19-Feb-18 CLP 188,680
9,280,000,000 Receiving fixed rate 6.24%Paying floating rate TNA Indice Camara Promedio JPMorgan Chase Bank 19-Feb-18 CLP 336,749
4,650,000,000 Receiving fixed rate 6.23%Paying floating rate TNA Indice Camara Promedio JPMorgan Chase Bank 20-Feb-13 CLP 81,224
6,975,000,000 Receiving fixed rate 6.21%Paying floating rate TNA Indice Camara Promedio JPMorgan Chase Bank 20-Feb-13 CLP 113,944
34,875,000,000 Receiving fixed rate 6.26%Paying floating rate TNA Indice Camara Promedio JPMorgan Chase Bank 20-Feb-18 CLP 1,367,062
8,225,000,000 Receiving fixed rate 6.30%Paying floating rate TNA Indice Camara Promedio JPMorgan Chase Bank 22-Feb-13 CLP 182,715
24,675,000,000 Receiving fixed rate 6.31%Paying floating rate TNA Indice Camara Promedio JPMorgan Chase Bank 22-Feb-18 CLP 1,111,241
3,498,750,000 Receiving fixed rate 6.35%Paying floating rate TNA Indice Camara Promedio JPMorgan Chase Bank 28-Feb-18 CLP 169,321
3,498,750,000 Receiving fixed rate 6.32%Paying floating rate TNA Indice Camara Promedio JPMorgan Chase Bank 28-Feb-13 CLP 79,087
Unaudited Semi-Annual Report www.franklintempleton.lu
FRANKL IN TEMPLETON INVESTMENT FUNDS
Notes to the Financial Statements
at December 31, 2008 (continued)
58
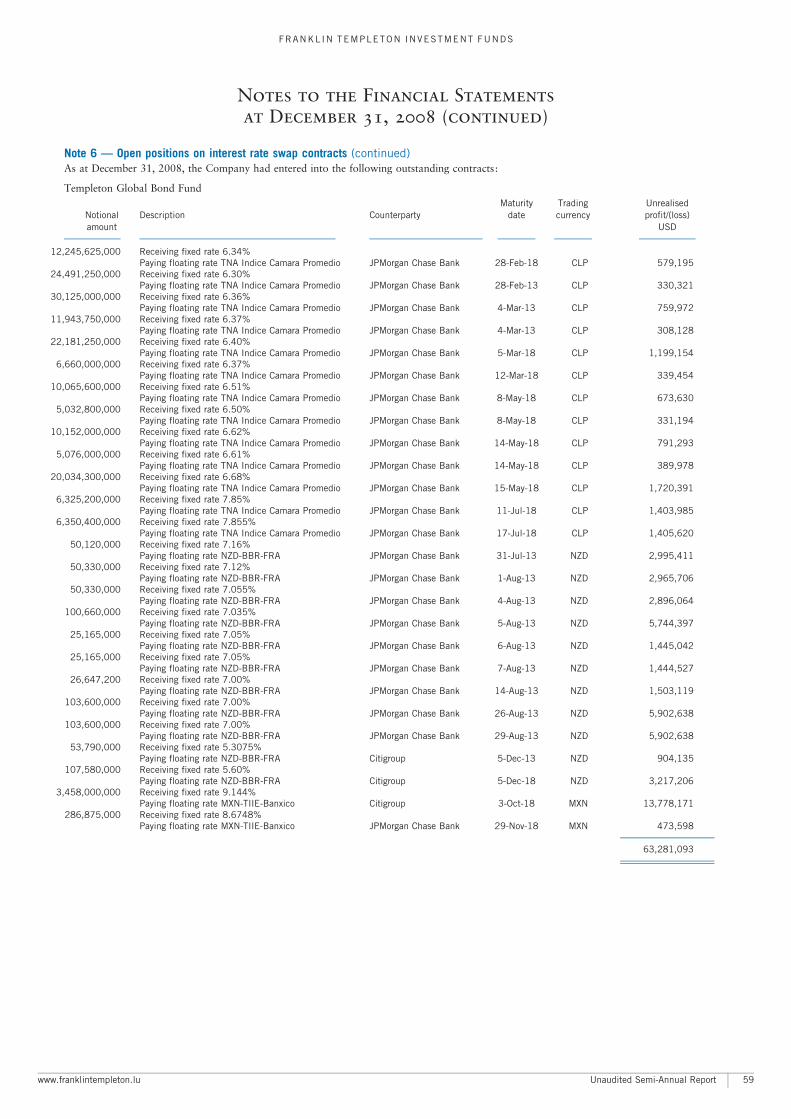
Note 6 ç Open positions on interest rate swap contracts (continued)As at December 31, 2008, the Company had entered into the following outstanding contracts:
Templeton Global Bond FundMaturity Trading Unrealised
Notional Description Counterparty date currency profit/(loss)amount USDAAAA A A
12,245,625,000 Receiving fixed rate 6.34%Paying floating rate TNA Indice Camara Promedio JPMorgan Chase Bank 28-Feb-18 CLP 579,195
24,491,250,000 Receiving fixed rate 6.30%Paying floating rate TNA Indice Camara Promedio JPMorgan Chase Bank 28-Feb-13 CLP 330,321
30,125,000,000 Receiving fixed rate 6.36%Paying floating rate TNA Indice Camara Promedio JPMorgan Chase Bank 4-Mar-13 CLP 759,972
11,943,750,000 Receiving fixed rate 6.37%Paying floating rate TNA Indice Camara Promedio JPMorgan Chase Bank 4-Mar-13 CLP 308,128
22,181,250,000 Receiving fixed rate 6.40%Paying floating rate TNA Indice Camara Promedio JPMorgan Chase Bank 5-Mar-18 CLP 1,199,154
6,660,000,000 Receiving fixed rate 6.37%Paying floating rate TNA Indice Camara Promedio JPMorgan Chase Bank 12-Mar-18 CLP 339,454
10,065,600,000 Receiving fixed rate 6.51%Paying floating rate TNA Indice Camara Promedio JPMorgan Chase Bank 8-May-18 CLP 673,630
5,032,800,000 Receiving fixed rate 6.50%Paying floating rate TNA Indice Camara Promedio JPMorgan Chase Bank 8-May-18 CLP 331,194
10,152,000,000 Receiving fixed rate 6.62%Paying floating rate TNA Indice Camara Promedio JPMorgan Chase Bank 14-May-18 CLP 791,293
5,076,000,000 Receiving fixed rate 6.61%Paying floating rate TNA Indice Camara Promedio JPMorgan Chase Bank 14-May-18 CLP 389,978
20,034,300,000 Receiving fixed rate 6.68%Paying floating rate TNA Indice Camara Promedio JPMorgan Chase Bank 15-May-18 CLP 1,720,391
6,325,200,000 Receiving fixed rate 7.85%Paying floating rate TNA Indice Camara Promedio JPMorgan Chase Bank 11-Jul-18 CLP 1,403,985
6,350,400,000 Receiving fixed rate 7.855%Paying floating rate TNA Indice Camara Promedio JPMorgan Chase Bank 17-Jul-18 CLP 1,405,620
50,120,000 Receiving fixed rate 7.16%Paying floating rate NZD-BBR-FRA JPMorgan Chase Bank 31-Jul-13 NZD 2,995,411
50,330,000 Receiving fixed rate 7.12%Paying floating rate NZD-BBR-FRA JPMorgan Chase Bank 1-Aug-13 NZD 2,965,706
50,330,000 Receiving fixed rate 7.055%Paying floating rate NZD-BBR-FRA JPMorgan Chase Bank 4-Aug-13 NZD 2,896,064
100,660,000 Receiving fixed rate 7.035%Paying floating rate NZD-BBR-FRA JPMorgan Chase Bank 5-Aug-13 NZD 5,744,397
25,165,000 Receiving fixed rate 7.05%Paying floating rate NZD-BBR-FRA JPMorgan Chase Bank 6-Aug-13 NZD 1,445,042
25,165,000 Receiving fixed rate 7.05%Paying floating rate NZD-BBR-FRA JPMorgan Chase Bank 7-Aug-13 NZD 1,444,527
26,647,200 Receiving fixed rate 7.00%Paying floating rate NZD-BBR-FRA JPMorgan Chase Bank 14-Aug-13 NZD 1,503,119
103,600,000 Receiving fixed rate 7.00%Paying floating rate NZD-BBR-FRA JPMorgan Chase Bank 26-Aug-13 NZD 5,902,638
103,600,000 Receiving fixed rate 7.00%Paying floating rate NZD-BBR-FRA JPMorgan Chase Bank 29-Aug-13 NZD 5,902,638
53,790,000 Receiving fixed rate 5.3075%Paying floating rate NZD-BBR-FRA Citigroup 5-Dec-13 NZD 904,135
107,580,000 Receiving fixed rate 5.60%Paying floating rate NZD-BBR-FRA Citigroup 5-Dec-18 NZD 3,217,206
3,458,000,000 Receiving fixed rate 9.144%Paying floating rate MXN-TIIE-Banxico Citigroup 3-Oct-18 MXN 13,778,171
286,875,000 Receiving fixed rate 8.6748%Paying floating rate MXN-TIIE-Banxico JPMorgan Chase Bank 29-Nov-18 MXN 473,598
A
63,281,093A
A
www.franklintempleton.lu Unaudited Semi-Annual Report
FRANKL IN TEMPLETON INVESTMENT FUNDS
Notes to the Financial Statements
at December 31, 2008 (continued)
59
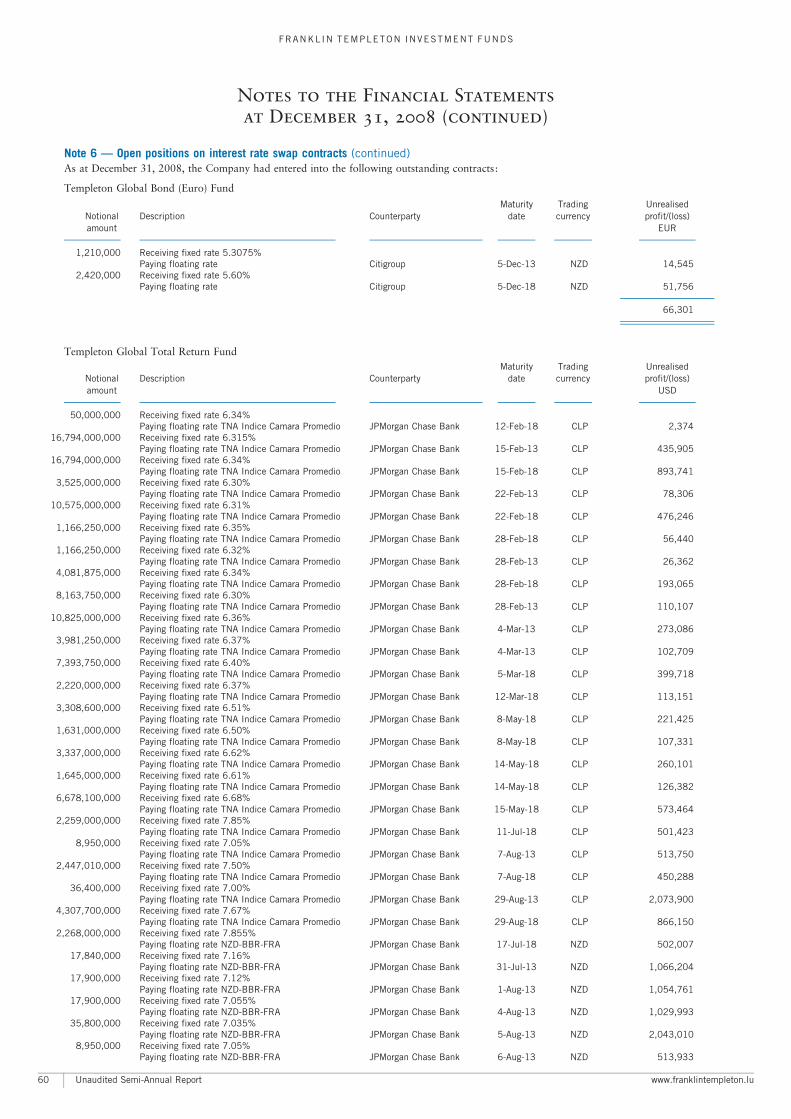
Note 6 ç Open positions on interest rate swap contracts (continued)As at December 31, 2008, the Company had entered into the following outstanding contracts:
Templeton Global Bond (Euro) Fund
Maturity Trading UnrealisedNotional Description Counterparty date currency profit/(loss)amount EURAAAA A A
1,210,000 Receiving fixed rate 5.3075%Paying floating rate Citigroup 5-Dec-13 NZD 14,545
2,420,000 Receiving fixed rate 5.60%Paying floating rate Citigroup 5-Dec-18 NZD 51,756
A
66,301A
A
Templeton Global Total Return FundMaturity Trading Unrealised
Notional Description Counterparty date currency profit/(loss)amount USDAAAA A A
50,000,000 Receiving fixed rate 6.34%Paying floating rate TNA Indice Camara Promedio JPMorgan Chase Bank 12-Feb-18 CLP 2,374
16,794,000,000 Receiving fixed rate 6.315%Paying floating rate TNA Indice Camara Promedio JPMorgan Chase Bank 15-Feb-13 CLP 435,905
16,794,000,000 Receiving fixed rate 6.34%Paying floating rate TNA Indice Camara Promedio JPMorgan Chase Bank 15-Feb-18 CLP 893,741
3,525,000,000 Receiving fixed rate 6.30%Paying floating rate TNA Indice Camara Promedio JPMorgan Chase Bank 22-Feb-13 CLP 78,306
10,575,000,000 Receiving fixed rate 6.31%Paying floating rate TNA Indice Camara Promedio JPMorgan Chase Bank 22-Feb-18 CLP 476,246
1,166,250,000 Receiving fixed rate 6.35%Paying floating rate TNA Indice Camara Promedio JPMorgan Chase Bank 28-Feb-18 CLP 56,440
1,166,250,000 Receiving fixed rate 6.32%Paying floating rate TNA Indice Camara Promedio JPMorgan Chase Bank 28-Feb-13 CLP 26,362
4,081,875,000 Receiving fixed rate 6.34%Paying floating rate TNA Indice Camara Promedio JPMorgan Chase Bank 28-Feb-18 CLP 193,065
8,163,750,000 Receiving fixed rate 6.30%Paying floating rate TNA Indice Camara Promedio JPMorgan Chase Bank 28-Feb-13 CLP 110,107
10,825,000,000 Receiving fixed rate 6.36%Paying floating rate TNA Indice Camara Promedio JPMorgan Chase Bank 4-Mar-13 CLP 273,086
3,981,250,000 Receiving fixed rate 6.37%Paying floating rate TNA Indice Camara Promedio JPMorgan Chase Bank 4-Mar-13 CLP 102,709
7,393,750,000 Receiving fixed rate 6.40%Paying floating rate TNA Indice Camara Promedio JPMorgan Chase Bank 5-Mar-18 CLP 399,718
2,220,000,000 Receiving fixed rate 6.37%Paying floating rate TNA Indice Camara Promedio JPMorgan Chase Bank 12-Mar-18 CLP 113,151
3,308,600,000 Receiving fixed rate 6.51%Paying floating rate TNA Indice Camara Promedio JPMorgan Chase Bank 8-May-18 CLP 221,425
1,631,000,000 Receiving fixed rate 6.50%Paying floating rate TNA Indice Camara Promedio JPMorgan Chase Bank 8-May-18 CLP 107,331
3,337,000,000 Receiving fixed rate 6.62%Paying floating rate TNA Indice Camara Promedio JPMorgan Chase Bank 14-May-18 CLP 260,101
1,645,000,000 Receiving fixed rate 6.61%Paying floating rate TNA Indice Camara Promedio JPMorgan Chase Bank 14-May-18 CLP 126,382
6,678,100,000 Receiving fixed rate 6.68%Paying floating rate TNA Indice Camara Promedio JPMorgan Chase Bank 15-May-18 CLP 573,464
2,259,000,000 Receiving fixed rate 7.85%Paying floating rate TNA Indice Camara Promedio JPMorgan Chase Bank 11-Jul-18 CLP 501,423
8,950,000 Receiving fixed rate 7.05%Paying floating rate TNA Indice Camara Promedio JPMorgan Chase Bank 7-Aug-13 CLP 513,750
2,447,010,000 Receiving fixed rate 7.50%Paying floating rate TNA Indice Camara Promedio JPMorgan Chase Bank 7-Aug-18 CLP 450,288
36,400,000 Receiving fixed rate 7.00%Paying floating rate TNA Indice Camara Promedio JPMorgan Chase Bank 29-Aug-13 CLP 2,073,900
4,307,700,000 Receiving fixed rate 7.67%Paying floating rate TNA Indice Camara Promedio JPMorgan Chase Bank 29-Aug-18 CLP 866,150
2,268,000,000 Receiving fixed rate 7.855%Paying floating rate NZD-BBR-FRA JPMorgan Chase Bank 17-Jul-18 NZD 502,007
17,840,000 Receiving fixed rate 7.16%Paying floating rate NZD-BBR-FRA JPMorgan Chase Bank 31-Jul-13 NZD 1,066,204
17,900,000 Receiving fixed rate 7.12%Paying floating rate NZD-BBR-FRA JPMorgan Chase Bank 1-Aug-13 NZD 1,054,761
17,900,000 Receiving fixed rate 7.055%Paying floating rate NZD-BBR-FRA JPMorgan Chase Bank 4-Aug-13 NZD 1,029,993
35,800,000 Receiving fixed rate 7.035%Paying floating rate NZD-BBR-FRA JPMorgan Chase Bank 5-Aug-13 NZD 2,043,010
8,950,000 Receiving fixed rate 7.05%Paying floating rate NZD-BBR-FRA JPMorgan Chase Bank 6-Aug-13 NZD 513,933
Unaudited Semi-Annual Report www.franklintempleton.lu
FRANKL IN TEMPLETON INVESTMENT FUNDS
Notes to the Financial Statements
at December 31, 2008 (continued)
60
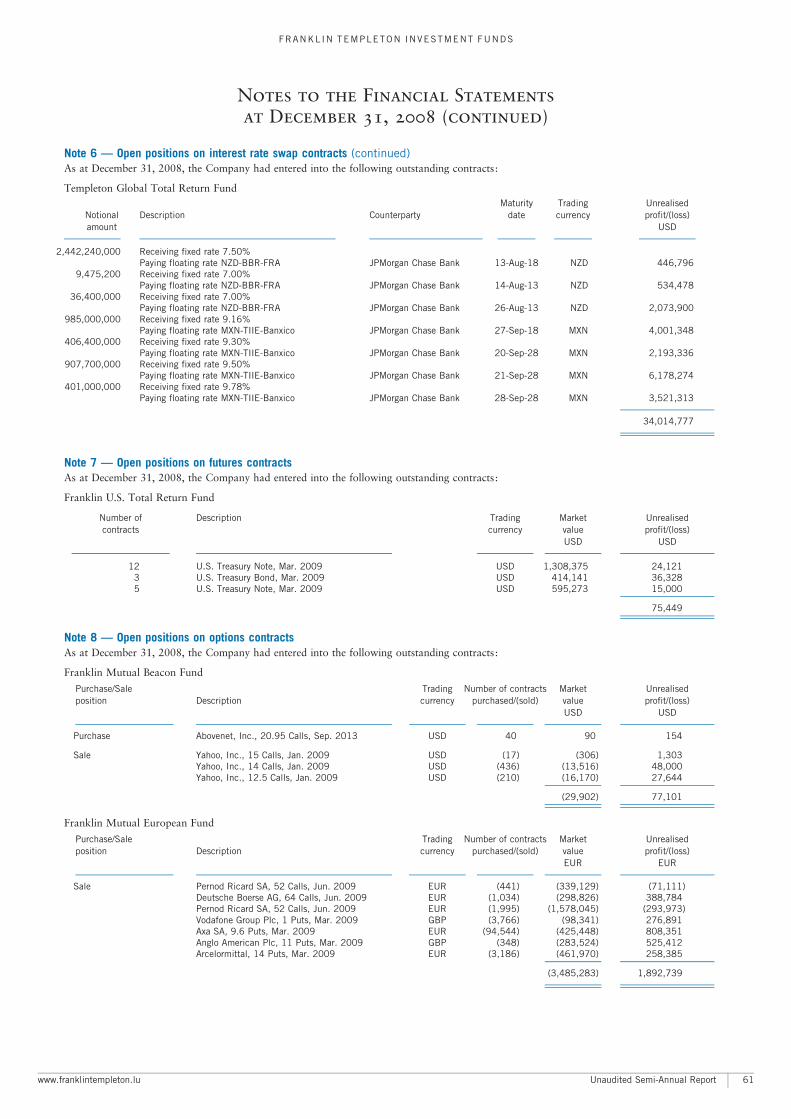
Note 6 ç Open positions on interest rate swap contracts (continued)As at December 31, 2008, the Company had entered into the following outstanding contracts:
Templeton Global Total Return FundMaturity Trading Unrealised
Notional Description Counterparty date currency profit/(loss)amount USDAAAA A A
2,442,240,000 Receiving fixed rate 7.50%Paying floating rate NZD-BBR-FRA JPMorgan Chase Bank 13-Aug-18 NZD 446,796
9,475,200 Receiving fixed rate 7.00%Paying floating rate NZD-BBR-FRA JPMorgan Chase Bank 14-Aug-13 NZD 534,478
36,400,000 Receiving fixed rate 7.00%Paying floating rate NZD-BBR-FRA JPMorgan Chase Bank 26-Aug-13 NZD 2,073,900
985,000,000 Receiving fixed rate 9.16%Paying floating rate MXN-TIIE-Banxico JPMorgan Chase Bank 27-Sep-18 MXN 4,001,348
406,400,000 Receiving fixed rate 9.30%Paying floating rate MXN-TIIE-Banxico JPMorgan Chase Bank 20-Sep-28 MXN 2,193,336
907,700,000 Receiving fixed rate 9.50%Paying floating rate MXN-TIIE-Banxico JPMorgan Chase Bank 21-Sep-28 MXN 6,178,274
401,000,000 Receiving fixed rate 9.78%Paying floating rate MXN-TIIE-Banxico JPMorgan Chase Bank 28-Sep-28 MXN 3,521,313
A
34,014,777A
A
Note 7 ç Open positions on futures contractsAs at December 31, 2008, the Company had entered into the following outstanding contracts:
Franklin U.S. Total Return Fund
Number of Description Trading Market Unrealisedcontracts currency value profit/(loss)
USD USDAA AAA
12 U.S. Treasury Note, Mar. 2009 USD 1,308,375 24,1213 U.S. Treasury Bond, Mar. 2009 USD 414,141 36,3285 U.S. Treasury Note, Mar. 2009 USD 595,273 15,000
A
75,449A
A
Note 8 ç Open positions on options contractsAs at December 31, 2008, the Company had entered into the following outstanding contracts:
Franklin Mutual Beacon Fund
Purchase/Sale Trading Number of contracts Market Unrealisedposition Description currency purchased/(sold) value profit/(loss)
USD USDAAAAAA
Purchase Abovenet, Inc., 20.95 Calls, Sep. 2013 USD 40 90 154
Sale Yahoo, Inc., 15 Calls, Jan. 2009 USD (17) (306) 1,303Yahoo, Inc., 14 Calls, Jan. 2009 USD (436) (13,516) 48,000Yahoo, Inc., 12.5 Calls, Jan. 2009 USD (210) (16,170) 27,644
AA
(29,902) 77,101AA
AA
Franklin Mutual European Fund
Purchase/Sale Trading Number of contracts Market Unrealisedposition Description currency purchased/(sold) value profit/(loss)
EUR EURAAAAAA
Sale Pernod Ricard SA, 52 Calls, Jun. 2009 EUR (441) (339,129) (71,111)Deutsche Boerse AG, 64 Calls, Jun. 2009 EUR (1,034) (298,826) 388,784Pernod Ricard SA, 52 Calls, Jun. 2009 EUR (1,995) (1,578,045) (293,973)Vodafone Group Plc, 1 Puts, Mar. 2009 GBP (3,766) (98,341) 276,891Axa SA, 9.6 Puts, Mar. 2009 EUR (94,544) (425,448) 808,351Anglo American Plc, 11 Puts, Mar. 2009 GBP (348) (283,524) 525,412Arcelormittal, 14 Puts, Mar. 2009 EUR (3,186) (461,970) 258,385
AA
(3,485,283) 1,892,739AA
AA
www.franklintempleton.lu Unaudited Semi-Annual Report
FRANKL IN TEMPLETON INVESTMENT FUNDS
Notes to the Financial Statements
at December 31, 2008 (continued)
61
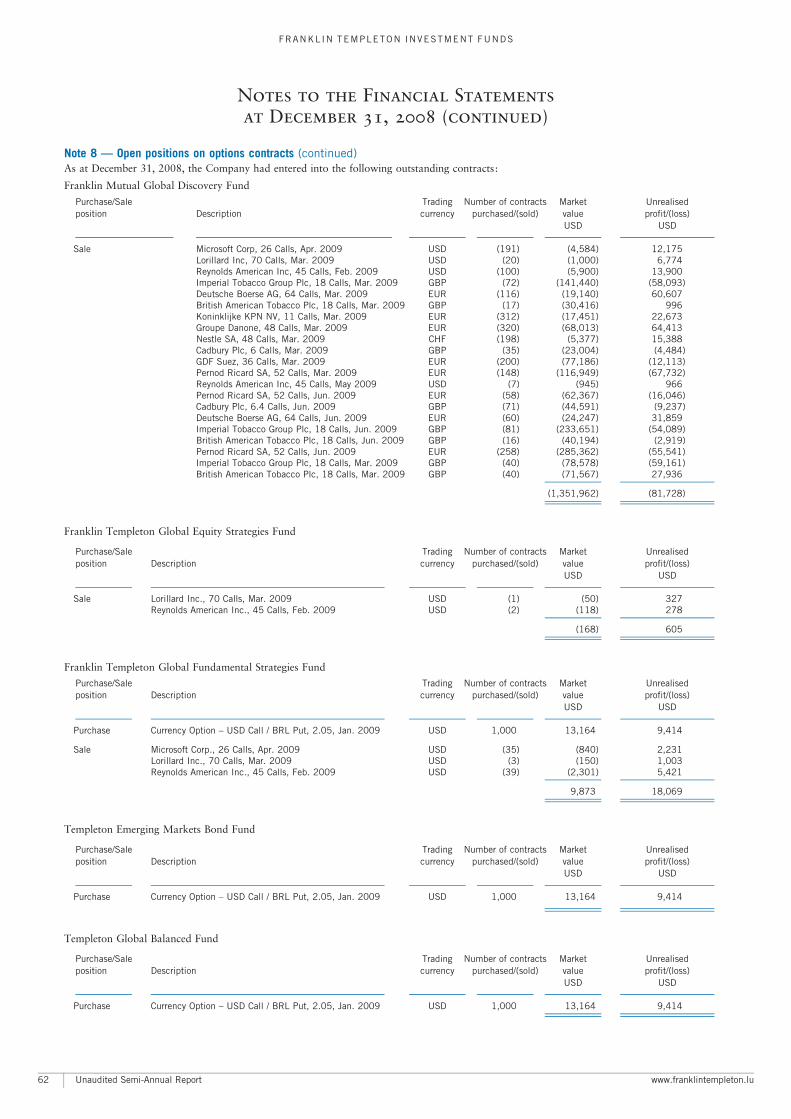
Note 8 ç Open positions on options contracts (continued)As at December 31, 2008, the Company had entered into the following outstanding contracts:
Franklin Mutual Global Discovery Fund
Purchase/Sale Trading Number of contracts Market Unrealisedposition Description currency purchased/(sold) value profit/(loss)
USD USDAAAAAA
Sale Microsoft Corp, 26 Calls, Apr. 2009 USD (191) (4,584) 12,175Lorillard Inc, 70 Calls, Mar. 2009 USD (20) (1,000) 6,774Reynolds American Inc, 45 Calls, Feb. 2009 USD (100) (5,900) 13,900Imperial Tobacco Group Plc, 18 Calls, Mar. 2009 GBP (72) (141,440) (58,093)Deutsche Boerse AG, 64 Calls, Mar. 2009 EUR (116) (19,140) 60,607British American Tobacco Plc, 18 Calls, Mar. 2009 GBP (17) (30,416) 996Koninklijke KPN NV, 11 Calls, Mar. 2009 EUR (312) (17,451) 22,673Groupe Danone, 48 Calls, Mar. 2009 EUR (320) (68,013) 64,413Nestle SA, 48 Calls, Mar. 2009 CHF (198) (5,377) 15,388Cadbury Plc, 6 Calls, Mar. 2009 GBP (35) (23,004) (4,484)GDF Suez, 36 Calls, Mar. 2009 EUR (200) (77,186) (12,113)Pernod Ricard SA, 52 Calls, Mar. 2009 EUR (148) (116,949) (67,732)Reynolds American Inc, 45 Calls, May 2009 USD (7) (945) 966Pernod Ricard SA, 52 Calls, Jun. 2009 EUR (58) (62,367) (16,046)Cadbury Plc, 6.4 Calls, Jun. 2009 GBP (71) (44,591) (9,237)Deutsche Boerse AG, 64 Calls, Jun. 2009 EUR (60) (24,247) 31,859Imperial Tobacco Group Plc, 18 Calls, Jun. 2009 GBP (81) (233,651) (54,089)British American Tobacco Plc, 18 Calls, Jun. 2009 GBP (16) (40,194) (2,919)Pernod Ricard SA, 52 Calls, Jun. 2009 EUR (258) (285,362) (55,541)Imperial Tobacco Group Plc, 18 Calls, Mar. 2009 GBP (40) (78,578) (59,161)British American Tobacco Plc, 18 Calls, Mar. 2009 GBP (40) (71,567) 27,936
AA
(1,351,962) (81,728)AA
AA
Franklin Templeton Global Equity Strategies Fund
Purchase/Sale Trading Number of contracts Market Unrealisedposition Description currency purchased/(sold) value profit/(loss)
USD USDAAAAAA
Sale Lorillard Inc., 70 Calls, Mar. 2009 USD (1) (50) 327Reynolds American Inc., 45 Calls, Feb. 2009 USD (2) (118) 278
AA
(168) 605AA
AA
Franklin Templeton Global Fundamental Strategies Fund
Purchase/Sale Trading Number of contracts Market Unrealisedposition Description currency purchased/(sold) value profit/(loss)
USD USDAAAAAA
Purchase Currency Option ^ USD Call / BRL Put, 2.05, Jan. 2009 USD 1,000 13,164 9,414
Sale Microsoft Corp., 26 Calls, Apr. 2009 USD (35) (840) 2,231Lorillard Inc., 70 Calls, Mar. 2009 USD (3) (150) 1,003Reynolds American Inc., 45 Calls, Feb. 2009 USD (39) (2,301) 5,421
AA
9,873 18,069AA
AA
Templeton Emerging Markets Bond Fund
Purchase/Sale Trading Number of contracts Market Unrealisedposition Description currency purchased/(sold) value profit/(loss)
USD USDAAAAAA
Purchase Currency Option ^ USD Call / BRL Put, 2.05, Jan. 2009 USD 1,000 13,164 9,414AA
AA
Templeton Global Balanced Fund
Purchase/Sale Trading Number of contracts Market Unrealisedposition Description currency purchased/(sold) value profit/(loss)
USD USDAAAAAA
Purchase Currency Option ^ USD Call / BRL Put, 2.05, Jan. 2009 USD 1,000 13,164 9,414AA
AA
Unaudited Semi-Annual Report www.franklintempleton.lu
FRANKL IN TEMPLETON INVESTMENT FUNDS
Notes to the Financial Statements
at December 31, 2008 (continued)
62
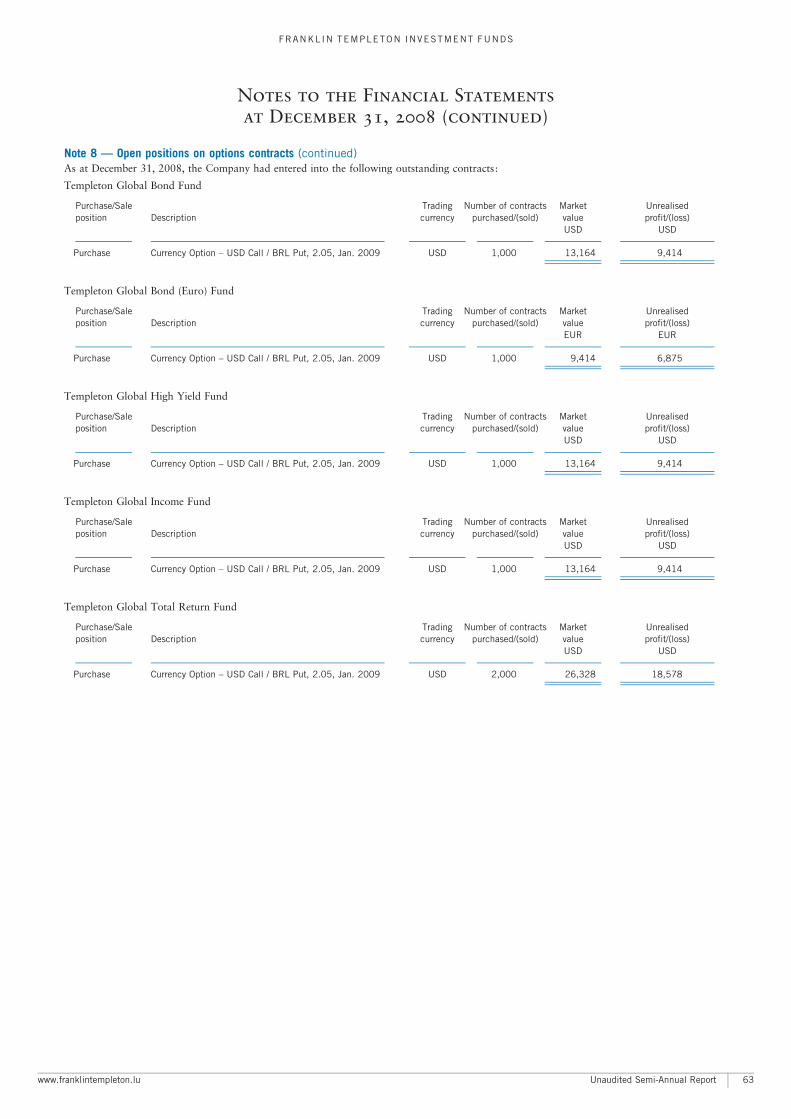
Note 8 ç Open positions on options contracts (continued)As at December 31, 2008, the Company had entered into the following outstanding contracts:
Templeton Global Bond Fund
Purchase/Sale Trading Number of contracts Market Unrealisedposition Description currency purchased/(sold) value profit/(loss)
USD USDAAAAAA
Purchase Currency Option ^ USD Call / BRL Put, 2.05, Jan. 2009 USD 1,000 13,164 9,414AA
AA
Templeton Global Bond (Euro) Fund
Purchase/Sale Trading Number of contracts Market Unrealisedposition Description currency purchased/(sold) value profit/(loss)
EUR EURAAAAAA
Purchase Currency Option ^ USD Call / BRL Put, 2.05, Jan. 2009 USD 1,000 9,414 6,875AA
AA
Templeton Global High Yield Fund
Purchase/Sale Trading Number of contracts Market Unrealisedposition Description currency purchased/(sold) value profit/(loss)
USD USDAAAAAA
Purchase Currency Option ^ USD Call / BRL Put, 2.05, Jan. 2009 USD 1,000 13,164 9,414AA
AA
Templeton Global Income Fund
Purchase/Sale Trading Number of contracts Market Unrealisedposition Description currency purchased/(sold) value profit/(loss)
USD USDAAAAAA
Purchase Currency Option ^ USD Call / BRL Put, 2.05, Jan. 2009 USD 1,000 13,164 9,414AA
AA
Templeton Global Total Return Fund
Purchase/Sale Trading Number of contracts Market Unrealisedposition Description currency purchased/(sold) value profit/(loss)
USD USDAAAAAA
Purchase Currency Option ^ USD Call / BRL Put, 2.05, Jan. 2009 USD 2,000 26,328 18,578AA
AA
www.franklintempleton.lu Unaudited Semi-Annual Report
FRANKL IN TEMPLETON INVESTMENT FUNDS
Notes to the Financial Statements
at December 31, 2008 (continued)
63
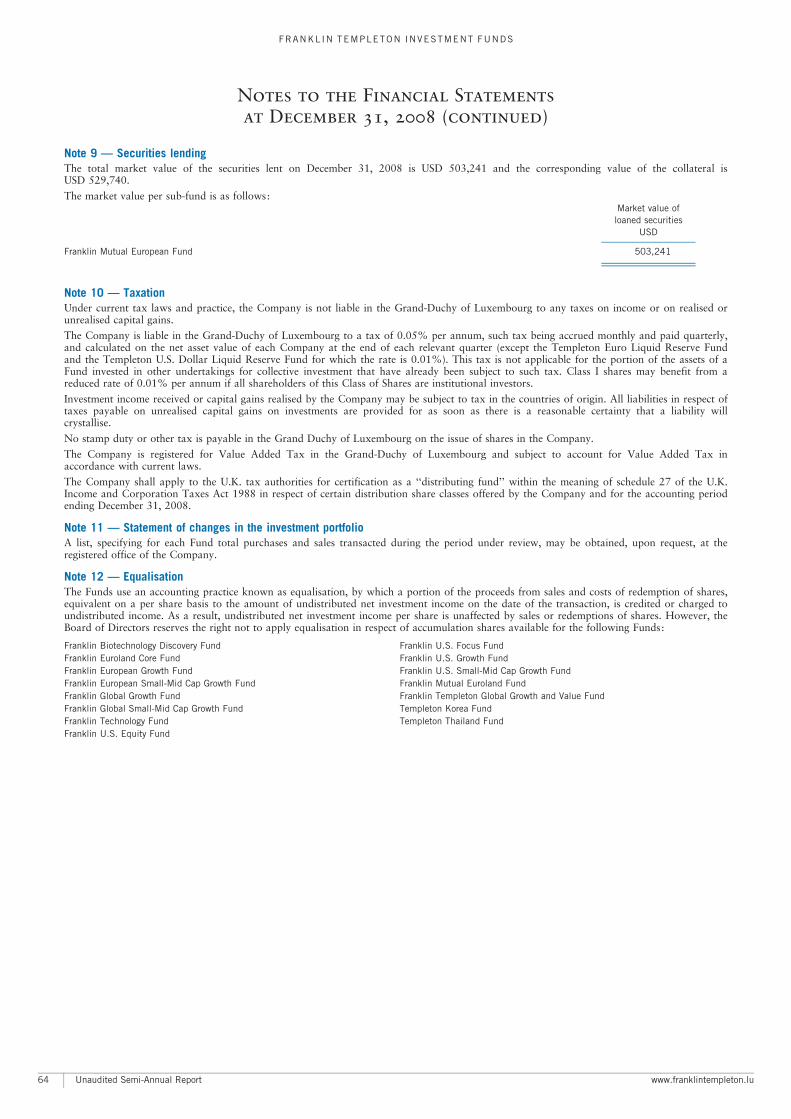
Note 9 ç Securities lendingThe total market value of the securities lent on December 31, 2008 is USD 503,241 and the corresponding value of the collateral isUSD 529,740.
The market value per sub-fund is as follows:Market value ofloaned securities
USDA
Franklin Mutual European Fund 503,241A
A
Note 10 ç TaxationUnder current tax laws and practice, the Company is not liable in the Grand-Duchy of Luxembourg to any taxes on income or on realised orunrealised capital gains.
The Company is liable in the Grand-Duchy of Luxembourg to a tax of 0.05% per annum, such tax being accrued monthly and paid quarterly,and calculated on the net asset value of each Company at the end of each relevant quarter (except the Templeton Euro Liquid Reserve Fundand the Templeton U.S. Dollar Liquid Reserve Fund for which the rate is 0.01%). This tax is not applicable for the portion of the assets of aFund invested in other undertakings for collective investment that have already been subject to such tax. Class I shares may benefit from areduced rate of 0.01% per annum if all shareholders of this Class of Shares are institutional investors.
Investment income received or capital gains realised by the Company may be subject to tax in the countries of origin. All liabilities in respect oftaxes payable on unrealised capital gains on investments are provided for as soon as there is a reasonable certainty that a liability willcrystallise.
No stamp duty or other tax is payable in the Grand Duchy of Luxembourg on the issue of shares in the Company.
The Company is registered for Value Added Tax in the Grand-Duchy of Luxembourg and subject to account for Value Added Tax inaccordance with current laws.
The Company shall apply to the U.K. tax authorities for certification as a ‘‘distributing fund’’ within the meaning of schedule 27 of the U.K.Income and Corporation Taxes Act 1988 in respect of certain distribution share classes offered by the Company and for the accounting periodending December 31, 2008.
Note 11 ç Statement of changes in the investment portfolioA list, specifying for each Fund total purchases and sales transacted during the period under review, may be obtained, upon request, at theregistered office of the Company.
Note 12 ç EqualisationThe Funds use an accounting practice known as equalisation, by which a portion of the proceeds from sales and costs of redemption of shares,equivalent on a per share basis to the amount of undistributed net investment income on the date of the transaction, is credited or charged toundistributed income. As a result, undistributed net investment income per share is unaffected by sales or redemptions of shares. However, theBoard of Directors reserves the right not to apply equalisation in respect of accumulation shares available for the following Funds:
Franklin Biotechnology Discovery Fund Franklin U.S. Focus FundFranklin Euroland Core Fund Franklin U.S. Growth FundFranklin European Growth Fund Franklin U.S. Small-Mid Cap Growth FundFranklin European Small-Mid Cap Growth Fund Franklin Mutual Euroland FundFranklin Global Growth Fund Franklin Templeton Global Growth and Value FundFranklin Global Small-Mid Cap Growth Fund Templeton Korea FundFranklin Technology Fund Templeton Thailand FundFranklin U.S. Equity Fund
Unaudited Semi-Annual Report www.franklintempleton.lu
FRANKL IN TEMPLETON INVESTMENT FUNDS
Notes to the Financial Statements
at December 31, 2008 (continued)
64
Note 13 ç Classes of shares: A(acc), A(dis), AX(acc), B(acc), B(dis), C(acc), C(dis), I(acc), I(dis), N(acc), N(dis), alternativecurrency class and alternative currency hedged class of sharesClass A(acc) Shares: No distribution of dividends will be made in respect of Class A(acc) shares but the net income attributable will be reflectedin the increased value of the shares. All other terms and conditions are the same as those which apply for Class A(dis) shares.
Class A(dis) Shares: are offered at the applicable net asset value, plus an initial sales charge of up to 6.50% of the total amount invested. Inaddition, a maintenance charge of up to 0.50% per annum of the applicable average net asset value is deducted and paid to the PrincipalDistributor. This charge is accrued daily and is deducted and paid monthly to the Principal Distributor. A contingent deferred sales charge of1% applies to certain redemptions on qualified investments of USD 1 million or more within 18 months after repurchase.
Class AX(acc) Shares: are offered at the applicable net asset value, plus an initial sales charge of up to 6.50% of the total amount invested. Inaddition, a maintenance charge of up to 0.50% per annum of the applicable average net asset value is deducted and paid to the PrincipalDistributor. This charge is accrued daily and is deducted and paid monthly to the Principal Distributor. No distribution of dividends will bemade in respect of Class AX(acc) shares but the net income attributable will be reflected in the increased value of the shares. A contingentdeferred sales charge of 1% applies to certain redemptions on qualified investments of USD 1 million or more within 18 months afterrepurchase.
Class B(acc) Shares: No distribution of dividends will be made in respect of Class B(acc) shares but the net income attributable will be reflectedin the increased value of the shares. All other terms and conditions are the same as those which apply for Class B(dis) shares.
Class B(dis) Shares: are not subject to an initial sales charge but are subject to a contingent deferred sales charge if an investor redeems shareswithin four years of purchase. In addition, a maintenance charge of up to 0.75% per annum of the applicable average net asset value and aservicing charge of up to 1.06% per annum of the applicable average net asset value are applied. These charges are accrued daily and arededucted and paid monthly to the Principal Distributor and/or other parties. Shares purchased from February 1, 2004 forward shall beautomatically converted into Class A shares of the same fund seven years after their purchase as more fully disclosed in the Prospectus. Sharespurchased by January 31, 2004 will be automatically converted into the same fund’s Class A shares on January 31, 2011.
Class C(acc) Shares: No distribution of dividends will be made but the net income attributable will be reflected in the increased value of theshares. All other terms and conditions are the same as the those which apply for Class C(dis) Shares.
Class C(dis) Shares: are not subject to an initial sales charge but are subject to a contingent deferred sales charge of 1.00% if an investorredeems shares within one year of purchase. In addition, a maintenance and service charge of up to 1.08% per annum of the applicable averagenet asset value is deducted. This charge is accrued daily and is deducted and paid monthly to the Principal Distributor and/or other party.
Class I(acc) Shares: No distribution of dividends will be made but the net income attributable will be reflected in the increased value of theshares. All other terms and conditions are the same as those which apply for Class I(dis) shares.
Class I(dis) Shares: are offered to institutional investors as more fully described in the current Prospectus and addendums of the Company.Purchases of Class I(dis) shares are not subject to an initial sales charge, nor a contingent deferred sales charge or any maintenance, distributionor servicing charges. Class I(dis) shares benefit from a reduced Investment Management fee (note 3).
Class N(acc) Shares: No distribution of dividends will be made but the net income attributable will be reflected in the increased value of theshares. All other terms and conditions are the same as these which apply for Class N(dis) shares.
Class N(dis) Shares: are subject to an initial sales charge of up to 3% of the total amount invested. In addition, a distribution charge of up to1.25% per annum of the applicable average net asset value is accrued daily and is deducted and paid monthly to the Principal Distributor.Class N(dis) shares may be offered in certain limited circumstances as more fully described in the current prospectus and addendum of theCompany.
www.franklintempleton.lu Unaudited Semi-Annual Report
FRANKL IN TEMPLETON INVESTMENT FUNDS
Notes to the Financial Statements
at December 31, 2008 (continued)
65
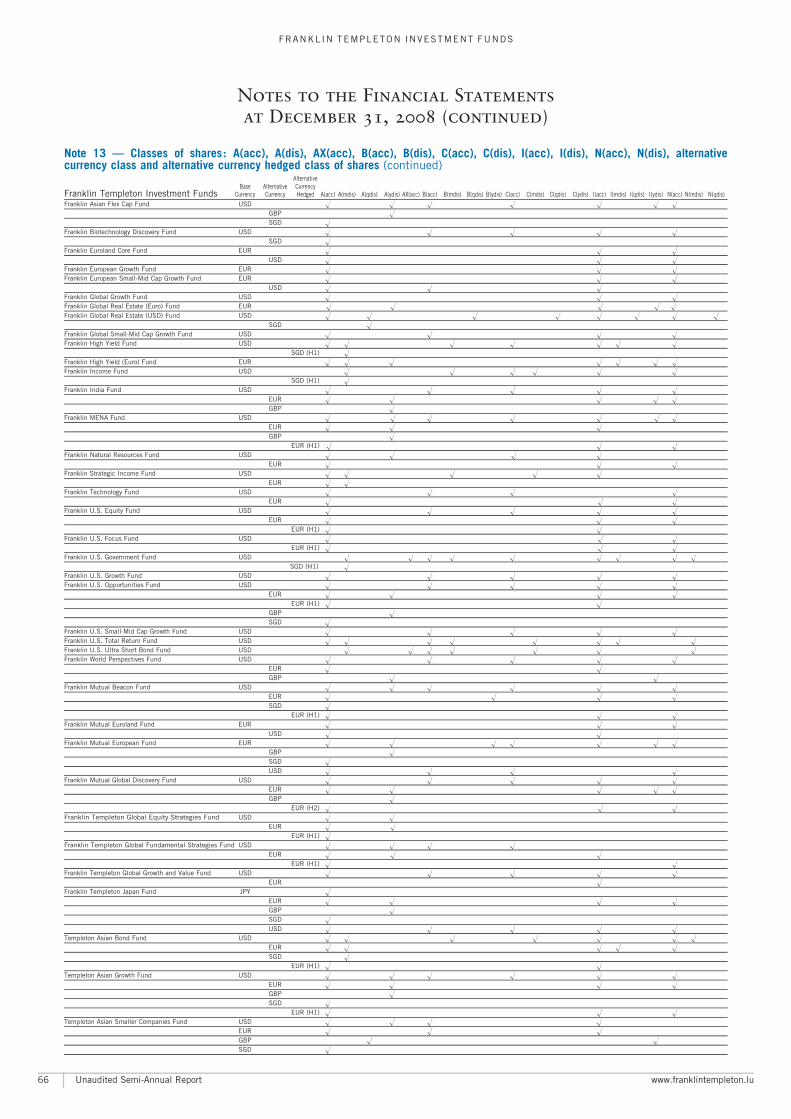
Note 13 ç Classes of shares: A(acc), A(dis), AX(acc), B(acc), B(dis), C(acc), C(dis), I(acc), I(dis), N(acc), N(dis), alternativecurrency class and alternative currency hedged class of shares (continued)
AlternativeBase Alternative Currency
Franklin Templeton Investment Funds Currency Currency Hedged A(acc) A(mdis) A(qdis) A(ydis) AX(acc) B(acc) B(mdis) B(qdis) B(ydis) C(acc) C(mdis) C(qdis) C(ydis) I(acc) I(mdis) I(qdis) I(ydis) N(acc) N(mdis) N(qdis)Franklin Asian Flex Cap Fund USD H H H H H H H
GBP HSGD H
Franklin Biotechnology Discovery Fund USD H H H H HSGD H
Franklin Euroland Core Fund EUR H H HUSD H H H
Franklin European Growth Fund EUR H H HFranklin European Small-Mid Cap Growth Fund EUR H H H
USD H H HFranklin Global Growth Fund USD H H HFranklin Global Real Estate (Euro) Fund EUR H H H H HFranklin Global Real Estate (USD) Fund USD H H H H H H H H
SGD HFranklin Global Small-Mid Cap Growth Fund USD H H H HFranklin High Yield Fund USD H H H H H H H
SGD (H1) HFranklin High Yield (Euro) Fund EUR H H H H H H HFranklin Income Fund USD H H H H H H
SGD (H1) HFranklin India Fund USD H H H H H
EUR H H H H HGBP H
Franklin MENA Fund USD H H H H H H HEUR H H HGBP H
EUR (H1) H H HFranklin Natural Resources Fund USD H H H H
EUR H H HFranklin Strategic Income Fund USD H H H H H
EUR H HFranklin Technology Fund USD H H H H
EUR H H HFranklin U.S. Equity Fund USD H H H H H
EUR H H HEUR (H1) H H
Franklin U.S. Focus Fund USD H H HEUR (H1) H H H
Franklin U.S. Government Fund USD H H H H H H H H HSGD (H1) H
Franklin U.S. Growth Fund USD H H H H HFranklin U.S. Opportunities Fund USD H H H H H
EUR H H H HEUR (H1) H H
GBP HSGD H
Franklin U.S. Small-Mid Cap Growth Fund USD H H H H HFranklin U.S. Total Return Fund USD H H H H H H H HFranklin U.S. Ultra Short Bond Fund USD H H H H H H HFranklin World Perspectives Fund USD H H H H H
EUR H HGBP H H
Franklin Mutual Beacon Fund USD H H H H H HEUR H H H HSGD H
EUR (H1) H H HFranklin Mutual Euroland Fund EUR H H H
USD H HFranklin Mutual European Fund EUR H H H H H H H
GBP HSGD HUSD H H H H
Franklin Mutual Global Discovery Fund USD H H H H HEUR H H H H HGBP H
EUR (H2) H H HFranklin Templeton Global Equity Strategies Fund USD H H
EUR H HEUR (H1) H
Franklin Templeton Global Fundamental Strategies Fund USD H H H HEUR H H H
EUR (H1) H HFranklin Templeton Global Growth and Value Fund USD H H H H H
EUR HFranklin Templeton Japan Fund JPY H
EUR H H H HGBP HSGD HUSD H H H H H
Templeton Asian Bond Fund USD H H H H H H HEUR H H H H HSGD H
EUR (H1) H HTempleton Asian Growth Fund USD H H H H H H
EUR H H H HGBP HSGD H
EUR (H1) H H HTempleton Asian Smaller Companies Fund USD H H H H
EUR H H HGBP H HSGD H
Unaudited Semi-Annual Report www.franklintempleton.lu
FRANKL IN TEMPLETON INVESTMENT FUNDS
Notes to the Financial Statements
at December 31, 2008 (continued)
66
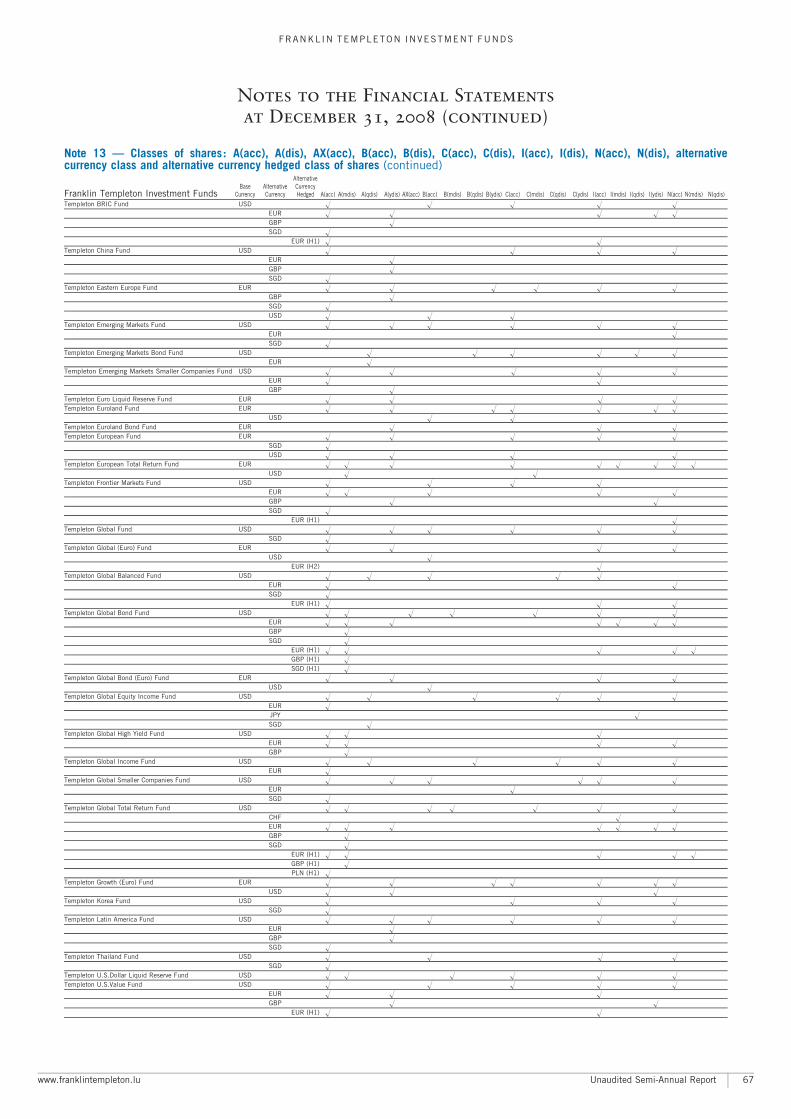
Note 13 ç Classes of shares: A(acc), A(dis), AX(acc), B(acc), B(dis), C(acc), C(dis), I(acc), I(dis), N(acc), N(dis), alternativecurrency class and alternative currency hedged class of shares (continued)
AlternativeBase Alternative Currency
Franklin Templeton Investment Funds Currency Currency Hedged A(acc) A(mdis) A(qdis) A(ydis) AX(acc) B(acc) B(mdis) B(qdis) B(ydis) C(acc) C(mdis) C(qdis) C(ydis) I(acc) I(mdis) I(qdis) I(ydis) N(acc) N(mdis) N(qdis)Templeton BRIC Fund USD H H H H H
EUR H H H H HGBP HSGD H
EUR (H1) H HTempleton China Fund USD H H H H
EUR HGBP HSGD H
Templeton Eastern Europe Fund EUR H H H H H HGBP HSGD HUSD H H H
Templeton Emerging Markets Fund USD H H H H H HEUR HSGD H
Templeton Emerging Markets Bond Fund USD H H H H H HEUR H
Templeton Emerging Markets Smaller Companies Fund USD H H H H HEUR H HGBP H
Templeton Euro Liquid Reserve Fund EUR H H H HTempleton Euroland Fund EUR H H H H H H H
USD H HTempleton Euroland Bond Fund EUR H H HTempleton European Fund EUR H H H H H
SGD HUSD H H H H
Templeton European Total Return Fund EUR H H H H H H H H HUSD H H
Templeton Frontier Markets Fund USD H H H HEUR H H H H HGBP H HSGD H
EUR (H1) HTempleton Global Fund USD H H H H H H
SGD HTempleton Global (Euro) Fund EUR H H H H
USD HEUR (H2) H
Templeton Global Balanced Fund USD H H H H HEUR H HSGD H
EUR (H1) H H HTempleton Global Bond Fund USD H H H H H H H
EUR H H H H H H HGBP HSGD H
EUR (H1) H H H H HGBP (H1) HSGD (H1) H
Templeton Global Bond (Euro) Fund EUR H H H HUSD H
Templeton Global Equity Income Fund USD H H H H H HEUR HJPY HSGD H
Templeton Global High Yield Fund USD H H HEUR H H H HGBP H
Templeton Global Income Fund USD H H H H H HEUR H
Templeton Global Smaller Companies Fund USD H H H H H HEUR HSGD H
Templeton Global Total Return Fund USD H H H H H H HCHF HEUR H H H H H H HGBP HSGD H
EUR (H1) H H H H HGBP (H1) HPLN (H1) H
Templeton Growth (Euro) Fund EUR H H H H H H HUSD H H H
Templeton Korea Fund USD H H H HSGD H
Templeton Latin America Fund USD H H H H H HEUR HGBP HSGD H
Templeton Thailand Fund USD H H H HSGD H
Templeton U.S.Dollar Liquid Reserve Fund USD H H H H H HTempleton U.S.Value Fund USD H H H H H
EUR H H HGBP H H
EUR (H1) H H
www.franklintempleton.lu Unaudited Semi-Annual Report
FRANKL IN TEMPLETON INVESTMENT FUNDS
Notes to the Financial Statements
at December 31, 2008 (continued)
67
Note 14 ç Soft commissionConsistent with obtaining best execution, brokerage commissions on portfolio transactions for the Company may be directed by the InvestmentManagers to broker-dealers in recognition of research services furnished by them as well as for services rendered in the execution of orders bysuch broker-dealers.
The receipt of investment research and information and related services permits the Investment Managers to supplement their own research andanalysis and makes available to them the views and information of individuals and research staffs of other firms.
Such services do not include travel, accommodation, entertainment, general administrative goods or services, general office equipment orpremises, membership fees, employee salaries or direct money payment, which are paid by the Investment Managers.
Note 15 ç Connected party transactionsCertain directors of the Company are or may also be officers and/or directors of one or more of the various Investment Managers of the Funds,among others Franklin Advisers, Inc., Franklin Mutual Advisers L.L.C., Franklin Templeton Alternative Strategies, Inc., Franklin TempletonInvestment Management Limited, Franklin Templeton Investments Corp., Franklin Templeton Investments Japan Limited, Templeton AssetManagement Limited and Templeton Global Advisors Limited and the Registrar and Transfer, Corporate, Domiciliary and AdministrativeAgent, Franklin Templeton International Services S.A., and the Commission Payer, Lightning Finance Limited/SG Constellation One Inc. Alltransactions with connected parties were entered into in the ordinary course of business and under normal commercial terms.
The investment management fees that are paid by the Company to the Investment Managers are detailed in note 3 to the financial statements.
There are no connected brokers in Franklin Templeton Investments, and no transactions were entered into with connected brokers during theperiod ended December 31, 2008.
The Company paid the following fees to Franklin Templeton International Services S.A. as the Registrar and Transfer, Corporate, Domiciliaryand Administrative Agent for the period ended December 31, 2008:
> Administration and Transfer Agency Fees USD 59,480,671> Servicing charge USD 104,738
The Company paid the following fees to Templeton Global Advisors Limited as the Principal Distributor of the Funds for the period endedDecember 31, 2008:
> Maintenance and Distribution charge USD 116,665,074
The Company paid the following fees to Lightning Finance Limited/SG Constellation One, Inc. as the Commission Payer to the Funds for theperiod ended December 31, 2008:
> Servicing charge USD 17,464,375
Note 16 ç Expenses reimbursementFor the period ended December 31, 2008, the following expenses will be reimbursed in the first instance by the Administrative Agent ‘‘FranklinTempleton International Services S.A.’’ and in the event that the expense exceeds the Administration fee, they will be reimbursed by the Fund’sInvestment Manager as detailed on pages 3 and 4.
Fund Currency AmountFranklin Asian Flex Cap Fund USD 23,875Franklin Global Real Estate (Euro) Fund EUR 2,669Franklin Global Real Estate (USD) Fund USD 680Franklin High Yield (Euro) Fund EUR 6,974Franklin India Fund USD 201,798Franklin Natural Resources Fund USD 4,678Franklin Strategic Income Fund USD 74,794Franklin Technology Fund USD 16,543Franklin U.S. Total Return Fund USD 41,457Franklin U.S. Ultra Short Bond Fund USD 57,190Franklin Mutual Beacon Fund USD 22,559Franklin Mutual Euroland Fund EUR 7,210Franklin Mutual Global Discovery Fund USD 403Franklin Templeton Japan Fund JPY 48,791Templeton Asian Bond Fund USD 217,122Templeton Asian Growth Fund USD 373,723Templeton Asian Smaller Companies Fund USD 9,670Templeton BRIC Fund USD 424,444Templeton Eastern Europe Fund EUR 24,367Templeton Emerging Markets Smaller Companies
Fund USD 53,920Templeton European Total Return Fund EUR 245,682Templeton Global Fund USD 9,058Templeton Global Absolute Return (Euro) Fund EUR 1,055Templeton Global Balanced Fund USD 15,856Templeton Global Bond Fund USD 188,984Templeton Global Bond (Euro) Fund EUR 94,539Templeton Global Equity Income Fund USD 274,466Templeton Global Income Fund USD 153,457Templeton Global Total Return Fund USD 1,045,503Templeton Growth (Euro) Fund EUR 4,963
Fund* Class Currency AmountFranklin Biotechnology Discovery Fund I(acc) USD 25Franklin Euroland Core Fund I(acc) EUR 631Franklin European Growth Fund I(acc) EUR 91Franklin European Small-Mid Cap Growth Fund I(acc) EUR 676Franklin Global Growth Fund I(acc) USD 451Franklin High Yield Fund I(dis) USD 29,405Franklin Income Fund I(acc) USD 84Franklin U.S. Government Fund I(acc) USD 5,884Franklin U.S. Government Fund I(dis) USD 146,671Franklin U.S. Opportunities Fund I(acc) USD 1,952Franklin Mutual European Fund I(acc) EUR 22,641Franklin Mutual European Fund I(dis) EUR 1,186Franklin Templeton Global Growth and Value Fund I(acc) USD 72Templeton China Fund I(acc) USD 2,853Templeton Emerging Markets Fund I(acc) USD 99,179Templeton Emerging Markets Bond Fund I(acc) USD 18,524Templeton Emerging Markets Bond Fund I(dis) USD 5,460Templeton Euroland Fund I(acc) EUR 2,760Templeton Euroland Fund I(dis) EUR 56Templeton Euroland Bond Fund I(acc) EUR 54Templeton European Fund I(acc) EUR 279Templeton Global (Euro) Fund I(acc) EUR 3,617Templeton Global Smaller Companies Fund I(acc) USD 527Templeton Korea Fund I(acc) USD 1,867Templeton Latin America Fund I(acc) USD 82,658Templeton U.S. Value Fund I(acc) USD 45
*The reimbursement applies only to the class disclosed.
Note 17 ç Total expense ratioThe Total Expense Ratio (‘‘TER’’), expressed as a percentage, represents how the total expenses of the Funds relate to the average net assets ofthe Funds for the period ended December 31, 2008. The total expenses comprise the investment management fees, the administration andtransfer agency fees, the custodian fees and other expenses as summarised in the Statement of Operations and Changes in Net Assets.
Unaudited Semi-Annual Report www.franklintempleton.lu
FRANKL IN TEMPLETON INVESTMENT FUNDS
Notes to the Financial Statements
at December 31, 2008 (continued)
68
Note 18 ç Annual and interim dividends distributed for the period ended December 31, 2008Accumulated dividends have not been paid out and are reflected as an increase in the Issue of shares in the Statement of Operations andChanges in Net Assets.
A A A A A A A A A A A(mdis) (qdis) (mdis) (qdis) (ydis) (mdis) (qdis) (ydis) (mdis) (qdis) (mdis)
USD USD EUR EUR EUR GBP GBP GBP SGD SGD EURHdg(H1)
Franklin Global Real Estate (Euro) FundDec-08 ^ ^ ^ ^ ^ ^ ^ 0.082 ^ ^ ^
Franklin Global Real Estate (USD) FundJul-08 ^ 0.049 ^ ^ ^ ^ ^ ^ ^ 0.040 ^Oct-08 ^ 0.036 ^ ^ ^ ^ ^ ^ ^ 0.031 ^
Franklin High Yield FundJul-08 0.042 ^ ^ ^ ^ ^ ^ ^ ^ ^ ^Aug-08 0.042 ^ ^ ^ ^ ^ ^ ^ ^ ^ ^Sep-08 0.043 ^ ^ ^ ^ ^ ^ ^ ^ ^ ^Oct-08 0.040 ^ ^ ^ ^ ^ ^ ^ ^ ^ ^Nov-08 0.044 ^ ^ ^ ^ ^ ^ ^ ^ ^ ^Dec-08 0.045 ^ ^ ^ ^ ^ ^ ^ ^ ^ ^
Franklin High Yield (Euro) FundJul-08 ^ ^ 0.039 ^ ^ ^ ^ ^ ^ ^ ^Aug-08 ^ ^ 0.040 ^ ^ ^ ^ ^ ^ ^ ^Sep-08 ^ ^ 0.042 ^ ^ ^ ^ ^ ^ ^ ^Oct-08 ^ ^ 0.042 ^ ^ ^ ^ ^ ^ ^ ^Nov-08 ^ ^ 0.046 ^ ^ ^ ^ ^ ^ ^ ^Dec-08 ^ ^ 0.043 ^ ^ ^ ^ ^ ^ ^ ^
Franklin Income FundJul-08 0.031 ^ ^ ^ ^ ^ ^ ^ ^ ^ ^Aug-08 0.040 ^ ^ ^ ^ ^ ^ ^ ^ ^ ^Sep-08 0.040 ^ ^ ^ ^ ^ ^ ^ ^ ^ ^Oct-08 0.043 ^ ^ ^ ^ ^ ^ ^ ^ ^ ^Nov-08 0.050 ^ ^ ^ ^ ^ ^ ^ ^ ^ ^Dec-08 0.050 ^ ^ ^ ^ ^ ^ ^ ^ ^ ^
Franklin Strategic Income FundJul-08 0.033 ^ 0.021 ^ ^ ^ ^ ^ ^ ^ ^Aug-08 0.036 ^ 0.023 ^ ^ ^ ^ ^ ^ ^ ^Sep-08 0.038 ^ 0.027 ^ ^ ^ ^ ^ ^ ^ ^Oct-08 0.040 ^ 0.028 ^ ^ ^ ^ ^ ^ ^ ^Nov-08 0.033 ^ 0.028 ^ ^ ^ ^ ^ ^ ^ ^Dec-08 0.039 ^ 0.030 ^ ^ ^ ^ ^ ^ ^ ^
Franklin U.S. Government FundJul-08 0.031 ^ ^ ^ ^ ^ ^ ^ ^ ^ ^Aug-08 0.031 ^ ^ ^ ^ ^ ^ ^ ^ ^ ^Sep-08 0.031 ^ ^ ^ ^ ^ ^ ^ ^ ^ ^Oct-08 0.031 ^ ^ ^ ^ ^ ^ ^ ^ ^ ^Nov-08 0.031 ^ ^ ^ ^ ^ ^ ^ ^ ^ ^Dec-08 0.031 ^ ^ ^ ^ ^ ^ ^ ^ ^ ^
Franklin U.S. Total Return FundJul-08 0.046 ^ ^ ^ ^ ^ ^ ^ ^ ^ ^Aug-08 0.029 ^ ^ ^ ^ ^ ^ ^ ^ ^ ^Sep-08 0.035 ^ ^ ^ ^ ^ ^ ^ ^ ^ ^Oct-08 0.031 ^ ^ ^ ^ ^ ^ ^ ^ ^ ^Nov-08 0.032 ^ ^ ^ ^ ^ ^ ^ ^ ^ ^Dec-08 0.036 ^ ^ ^ ^ ^ ^ ^ ^ ^ ^
Franklin U.S. Ultra Short Bond FundJul-08 0.018 ^ ^ ^ ^ ^ ^ ^ ^ ^ ^Aug-08 0.017 ^ ^ ^ ^ ^ ^ ^ ^ ^ ^Sep-08 0.017 ^ ^ ^ ^ ^ ^ ^ ^ ^ ^Oct-08 0.016 ^ ^ ^ ^ ^ ^ ^ ^ ^ ^Nov-08 0.013 ^ ^ ^ ^ ^ ^ ^ ^ ^ ^Dec-08 0.024 ^ ^ ^ ^ ^ ^ ^ ^ ^ ^
Templeton Asian Bond FundJul-08 0.039 ^ 0.024 ^ ^ ^ ^ ^ 0.030 ^ ^Aug-08 0.053 ^ 0.034 ^ ^ ^ ^ ^ 0.041 ^ ^Sep-08 0.053 ^ 0.037 ^ ^ ^ ^ ^ 0.044 ^ ^Oct-08 0.050 ^ 0.036 ^ ^ ^ ^ ^ 0.040 ^ ^Nov-08 0.055 ^ 0.045 ^ ^ ^ ^ ^ 0.049 ^ ^Dec-08 0.048 ^ 0.037 ^ ^ ^ ^ ^ 0.039 ^ ^
www.franklintempleton.lu Unaudited Semi-Annual Report
FRANKL IN TEMPLETON INVESTMENT FUNDS
Notes to the Financial Statements
at December 31, 2008 (continued)
69
Note 18 ç Annual and interim dividends distributed for the period ended December 31, 2008 (continued)Accumulated dividends have not been paid out and are reflected as an increase in the Issue of shares in the Statement of Operations andChanges in Net Assets.
A A B B C C I I I I I I N N N N(mdis) (mdis) (mdis) (qdis) (mdis) (qdis) (mdis) (qdis) (mdis) (mdis) (ydis) (qdis) (mdis) (qdis) (mdis) (mdis)
GBP SGD USD USD USD USD USD USD CHF EUR EUR JPY USD USD EUR EURHdg Hdg Hdg(H1) (H1) (H1)
^ ^ ^ ^ ^ ^ ^ ^ ^ ^ ^ ^ ^ ^ ^ ^
^ ^ ^ 0.019 ^ 0.034 ^ 0.071 ^ ^ ^ ^ ^ 0.030 ^ ^^ ^ ^ 0.007 ^ 0.023 ^ 0.056 ^ ^ ^ ^ ^ 0.019 ^ ^
^ 0.055 0.033 ^ ^ ^ 0.071 ^ ^ ^ ^ ^ ^ ^ ^ ^^ 0.056 0.035 ^ ^ ^ 0.073 ^ ^ ^ ^ ^ ^ ^ ^ ^^ 0.060 0.035 ^ ^ ^ 0.075 ^ ^ ^ ^ ^ ^ ^ ^ ^^ 0.054 0.033 ^ ^ ^ 0.069 ^ ^ ^ ^ ^ ^ ^ ^ ^^ 0.062 0.037 ^ ^ ^ 0.074 ^ ^ ^ ^ ^ ^ ^ ^ ^^ 0.062 0.040 ^ ^ ^ 0.076 ^ ^ ^ ^ ^ ^ ^ ^ ^
^ ^ ^ ^ ^ ^ ^ ^ ^ 0.048 ^ ^ ^ ^ ^ ^^ ^ ^ ^ ^ ^ ^ ^ ^ 0.066 ^ ^ ^ ^ ^ ^^ ^ ^ ^ ^ ^ ^ ^ ^ 0.068 ^ ^ ^ ^ ^ ^^ ^ ^ ^ ^ ^ ^ ^ ^ 0.068 ^ ^ ^ ^ ^ ^^ ^ ^ ^ ^ ^ ^ ^ ^ 0.072 ^ ^ ^ ^ ^ ^^ ^ ^ ^ ^ ^ ^ ^ ^ 0.068 ^ ^ ^ ^ ^ ^
^ 0.034 0.022 ^ 0.032 ^ ^ ^ ^ ^ ^ ^ ^ ^ ^ ^^ 0.029 0.030 ^ 0.040 ^ ^ ^ ^ ^ ^ ^ ^ ^ ^ ^^ 0.030 0.030 ^ 0.040 ^ ^ ^ ^ ^ ^ ^ ^ ^ ^ ^^ 0.037 0.027 ^ 0.044 ^ ^ ^ ^ ^ ^ ^ ^ ^ ^ ^^ 0.030 0.035 ^ 0.050 ^ ^ ^ ^ ^ ^ ^ ^ ^ ^ ^^ 0.030 0.035 ^ 0.050 ^ ^ ^ ^ ^ ^ ^ ^ ^ ^ ^
^ ^ 0.023 ^ 0.028 ^ ^ ^ ^ ^ ^ ^ ^ ^ ^ ^^ ^ 0.026 ^ 0.032 ^ ^ ^ ^ ^ ^ ^ ^ ^ ^ ^^ ^ 0.027 ^ 0.033 ^ ^ ^ ^ ^ ^ ^ ^ ^ ^ ^^ ^ 0.030 ^ 0.035 ^ ^ ^ ^ ^ ^ ^ ^ ^ ^ ^^ ^ 0.024 ^ 0.029 ^ ^ ^ ^ ^ ^ ^ ^ ^ ^ ^^ ^ 0.030 ^ 0.034 ^ ^ ^ ^ ^ ^ ^ ^ ^ ^ ^
^ 0.090 0.023 ^ ^ ^ 0.039 ^ ^ ^ ^ ^ 0.025 ^ ^ ^^ 0.071 0.023 ^ ^ ^ 0.039 ^ ^ ^ ^ ^ 0.025 ^ ^ ^^ 0.037 0.023 ^ ^ ^ 0.039 ^ ^ ^ ^ ^ 0.025 ^ ^ ^^ 0.034 0.023 ^ ^ ^ 0.039 ^ ^ ^ ^ ^ 0.025 ^ ^ ^^ 0.020 0.023 ^ ^ ^ 0.039 ^ ^ ^ ^ ^ 0.025 ^ ^ ^^ 0.020 0.023 ^ ^ ^ 0.039 ^ ^ ^ ^ ^ 0.025 ^ ^ ^
^ ^ 0.034 ^ 0.037 ^ 0.053 ^ ^ ^ ^ ^ 0.040 ^ ^ ^^ ^ 0.017 ^ 0.021 ^ 0.034 ^ ^ ^ ^ ^ 0.023 ^ ^ ^^ ^ 0.024 ^ 0.027 ^ 0.036 ^ ^ ^ ^ ^ 0.030 ^ ^ ^^ ^ 0.018 ^ 0.023 ^ 0.035 ^ ^ ^ ^ ^ 0.025 ^ ^ ^^ ^ 0.021 ^ 0.024 ^ 0.035 ^ ^ ^ ^ ^ 0.027 ^ ^ ^^ ^ 0.026 ^ 0.030 ^ 0.041 ^ ^ ^ ^ ^ 0.031 ^ ^ ^
^ ^ 0.009 ^ 0.010 ^ ^ ^ ^ ^ ^ ^ 0.012 ^ ^ ^^ ^ 0.007 ^ 0.010 ^ ^ ^ ^ ^ ^ ^ 0.012 ^ ^ ^^ ^ 0.007 ^ 0.009 ^ ^ ^ ^ ^ ^ ^ 0.011 ^ ^ ^^ ^ 0.007 ^ 0.009 ^ ^ ^ ^ ^ ^ ^ 0.011 ^ ^ ^^ ^ 0.003 ^ 0.005 ^ ^ ^ ^ ^ ^ ^ 0.006 ^ ^ ^^ ^ 0.015 ^ 0.017 ^ ^ ^ ^ ^ ^ ^ 0.019 ^ ^ ^
^ ^ 0.025 ^ 0.032 ^ ^ ^ ^ 0.029 ^ ^ 0.033 ^ ^ ^^ ^ 0.038 ^ 0.044 ^ ^ ^ ^ 0.038 ^ ^ 0.045 ^ ^ ^^ ^ 0.039 ^ 0.046 ^ ^ ^ ^ 0.042 ^ ^ 0.047 ^ ^ ^^ ^ 0.036 ^ 0.042 ^ ^ ^ ^ 0.041 ^ ^ 0.043 ^ ^ ^^ ^ 0.043 ^ 0.048 ^ ^ ^ ^ 0.050 ^ ^ 0.049 ^ ^ ^^ ^ 0.036 ^ 0.041 ^ ^ ^ ^ 0.043 ^ ^ 0.042 ^ ^ ^
Unaudited Semi-Annual Report www.franklintempleton.lu
FRANKL IN TEMPLETON INVESTMENT FUNDS
Notes to the Financial Statements
at December 31, 2008 (continued)
70
Note 18 ç Annual and interim dividends distributed for the period ended December 31, 2008 (continued)Accumulated dividends have not been paid out and are reflected as an increase in the Issue of shares in the Statement of Operations andChanges in Net Assets.
A A A A A A A A A A A(mdis) (qdis) (mdis) (qdis) (ydis) (mdis) (qdis) (ydis) (mdis) (qdis) (mdis)
USD USD EUR EUR EUR GBP GBP GBP SGD SGD EURHdg(H1)
Templeton China FundDec-08 ^ ^ ^ ^ 0.008 ^ ^ 0.011 ^ ^ ^
Templeton Emerging Markets Bond FundJul-08 ^ 0.246 ^ 0.156 ^ ^ ^ ^ ^ ^ ^Oct-08 ^ 0.273 ^ 0.190 ^ ^ ^ ^ ^ ^ ^
Templeton European Total Return FundJul-08 0.057 ^ 0.034 ^ ^ 0.028 ^ ^ ^ ^ ^Aug-08 0.055 ^ 0.036 ^ ^ 0.028 ^ ^ ^ ^ ^Sep-08 0.051 ^ 0.035 ^ ^ 0.029 ^ ^ ^ ^ ^Oct-08 0.045 ^ 0.032 ^ ^ 0.026 ^ ^ ^ ^ ^Nov-08 0.043 ^ 0.035 ^ ^ 0.026 ^ ^ ^ ^ ^Dec-08 0.041 ^ 0.034 ^ ^ 0.034 ^ ^ ^ ^ ^
Templeton Global Absolute Return (Euro) Fund*Dec-08 ^ ^ ^ ^ 0.197 ^ ^ ^ ^ ^ ^
Templeton Global Absolute Return (USD) Fund*Jul-08 ^ 0.077 ^ ^ ^ ^ 0.039 ^ ^ ^ ^Oct-08 ^ 0.076 ^ ^ ^ ^ 0.043 ^ ^ ^ ^Dec-08 ^ 0.050 ^ ^ ^ ^ 0.035 ^ ^ ^ ^
Templeton Global Balanced FundJul-08 ^ 0.183 ^ ^ ^ ^ ^ ^ ^ ^ ^Oct-08 ^ 0.077 ^ ^ ^ ^ ^ ^ ^ ^ ^
Templeton Global Bond FundJul-08 0.049 ^ 0.030 ^ ^ 0.025 ^ ^ 0.029 ^ 0.017Aug-08 0.067 ^ 0.044 ^ ^ 0.033 ^ ^ 0.040 ^ 0.043Sep-08 0.061 ^ 0.042 ^ ^ 0.034 ^ ^ 0.040 ^ 0.042Oct-08 0.049 ^ 0.035 ^ ^ 0.029 ^ ^ 0.031 ^ 0.034Nov-08 0.043 ^ 0.036 ^ ^ 0.027 ^ ^ 0.029 ^ 0.033Dec-08 0.046 ^ 0.036 ^ ^ 0.032 ^ ^ 0.032 ^ 0.031
Templeton Global Equity Income FundJul-08 ^ 0.059 ^ ^ ^ ^ ^ ^ ^ 0.064 ^Oct-08 ^ 0.120 ^ ^ ^ ^ ^ ^ ^ 0.098 ^
Templeton Global High Yield FundJul-08 0.046 ^ 0.029 ^ ^ 0.024 ^ ^ ^ ^ ^Aug-08 0.050 ^ 0.031 ^ ^ 0.025 ^ ^ ^ ^ ^Sep-08 0.047 ^ 0.033 ^ ^ 0.026 ^ ^ ^ ^ ^Oct-08 0.055 ^ 0.039 ^ ^ 0.032 ^ ^ ^ ^ ^Nov-08 0.054 ^ 0.045 ^ ^ 0.033 ^ ^ ^ ^ ^Dec-08 0.030 ^ 0.023 ^ ^ 0.021 ^ ^ ^ ^ ^
Templeton Global Income FundJul-08 ^ 0.185 ^ ^ ^ ^ ^ ^ ^ ^ ^Oct-08 ^ 0.149 ^ ^ ^ ^ ^ ^ ^ ^ ^
Templeton Global Total Return FundJul-08 0.051 ^ 0.032 ^ ^ 0.026 ^ ^ 0.035 ^ 0.018Aug-08 0.070 ^ 0.045 ^ ^ 0.035 ^ ^ 0.049 ^ 0.044Sep-08 0.065 ^ 0.046 ^ ^ 0.037 ^ ^ 0.048 ^ 0.044Oct-08 0.055 ^ 0.039 ^ ^ 0.032 ^ ^ 0.040 ^ 0.037Nov-08 0.049 ^ 0.040 ^ ^ 0.030 ^ ^ 0.038 ^ 0.036Dec-08 0.056 ^ 0.045 ^ ^ 0.039 ^ ^ 0.044 ^ 0.040
Templeton U.S. Dollar Liquid Reserve FundJul-08 0.013 ^ ^ ^ ^ ^ ^ ^ ^ ^ ^Aug-08 0.013 ^ ^ ^ ^ ^ ^ ^ ^ ^ ^Sep-08 0.012 ^ ^ ^ ^ ^ ^ ^ ^ ^ ^Oct-08 0.012 ^ ^ ^ ^ ^ ^ ^ ^ ^ ^Nov-08 0.005 ^ ^ ^ ^ ^ ^ ^ ^ ^ ^Dec-08 0.001 ^ ^ ^ ^ ^ ^ ^ ^ ^ ^
* These Funds were merged into Templeton Global Total Return Fund effective on December 19, 2008
www.franklintempleton.lu Unaudited Semi-Annual Report
FRANKL IN TEMPLETON INVESTMENT FUNDS
Notes to the Financial Statements
at December 31, 2008 (continued)
71
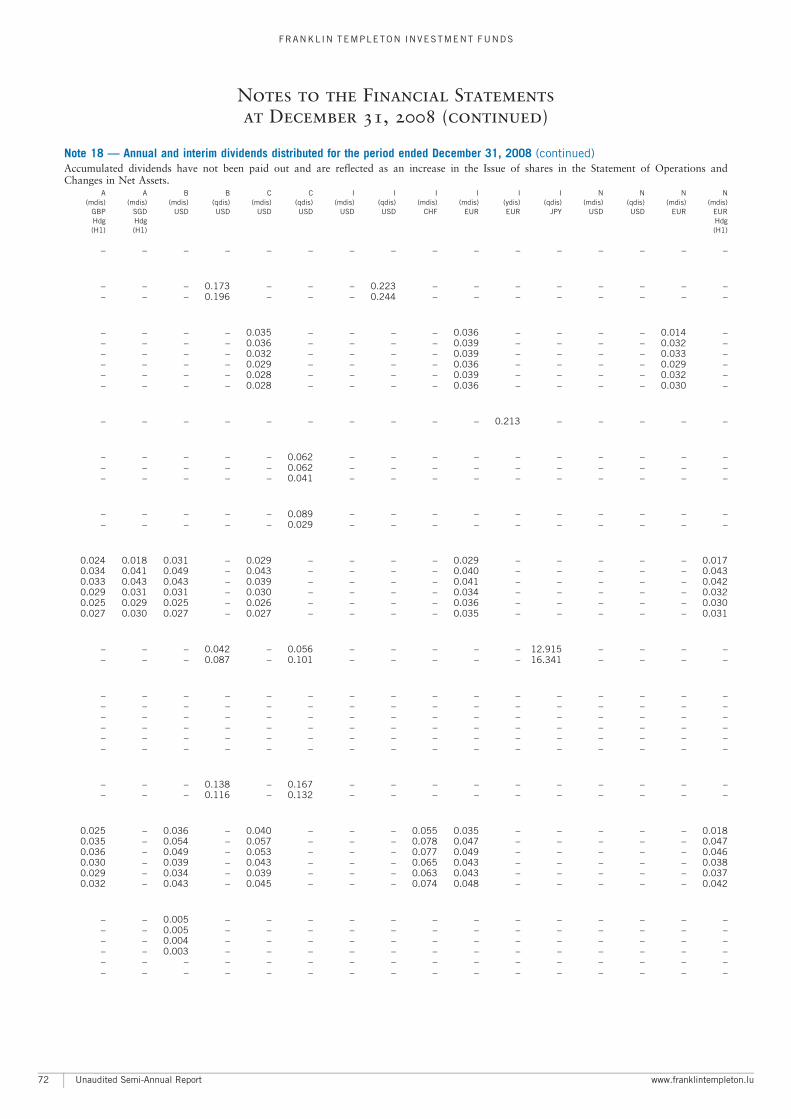
Note 18 ç Annual and interim dividends distributed for the period ended December 31, 2008 (continued)Accumulated dividends have not been paid out and are reflected as an increase in the Issue of shares in the Statement of Operations andChanges in Net Assets.
A A B B C C I I I I I I N N N N(mdis) (mdis) (mdis) (qdis) (mdis) (qdis) (mdis) (qdis) (mdis) (mdis) (ydis) (qdis) (mdis) (qdis) (mdis) (mdis)
GBP SGD USD USD USD USD USD USD CHF EUR EUR JPY USD USD EUR EURHdg Hdg Hdg(H1) (H1) (H1)
^ ^ ^ ^ ^ ^ ^ ^ ^ ^ ^ ^ ^ ^ ^ ^
^ ^ ^ 0.173 ^ ^ ^ 0.223 ^ ^ ^ ^ ^ ^ ^ ^^ ^ ^ 0.196 ^ ^ ^ 0.244 ^ ^ ^ ^ ^ ^ ^ ^
^ ^ ^ ^ 0.035 ^ ^ ^ ^ 0.036 ^ ^ ^ ^ 0.014 ^^ ^ ^ ^ 0.036 ^ ^ ^ ^ 0.039 ^ ^ ^ ^ 0.032 ^^ ^ ^ ^ 0.032 ^ ^ ^ ^ 0.039 ^ ^ ^ ^ 0.033 ^^ ^ ^ ^ 0.029 ^ ^ ^ ^ 0.036 ^ ^ ^ ^ 0.029 ^^ ^ ^ ^ 0.028 ^ ^ ^ ^ 0.039 ^ ^ ^ ^ 0.032 ^^ ^ ^ ^ 0.028 ^ ^ ^ ^ 0.036 ^ ^ ^ ^ 0.030 ^
^ ^ ^ ^ ^ ^ ^ ^ ^ ^ 0.213 ^ ^ ^ ^ ^
^ ^ ^ ^ ^ 0.062 ^ ^ ^ ^ ^ ^ ^ ^ ^ ^^ ^ ^ ^ ^ 0.062 ^ ^ ^ ^ ^ ^ ^ ^ ^ ^^ ^ ^ ^ ^ 0.041 ^ ^ ^ ^ ^ ^ ^ ^ ^ ^
^ ^ ^ ^ ^ 0.089 ^ ^ ^ ^ ^ ^ ^ ^ ^ ^^ ^ ^ ^ ^ 0.029 ^ ^ ^ ^ ^ ^ ^ ^ ^ ^
0.024 0.018 0.031 ^ 0.029 ^ ^ ^ ^ 0.029 ^ ^ ^ ^ ^ 0.0170.034 0.041 0.049 ^ 0.043 ^ ^ ^ ^ 0.040 ^ ^ ^ ^ ^ 0.0430.033 0.043 0.043 ^ 0.039 ^ ^ ^ ^ 0.041 ^ ^ ^ ^ ^ 0.0420.029 0.031 0.031 ^ 0.030 ^ ^ ^ ^ 0.034 ^ ^ ^ ^ ^ 0.0320.025 0.029 0.025 ^ 0.026 ^ ^ ^ ^ 0.036 ^ ^ ^ ^ ^ 0.0300.027 0.030 0.027 ^ 0.027 ^ ^ ^ ^ 0.035 ^ ^ ^ ^ ^ 0.031
^ ^ ^ 0.042 ^ 0.056 ^ ^ ^ ^ ^ 12.915 ^ ^ ^ ^^ ^ ^ 0.087 ^ 0.101 ^ ^ ^ ^ ^ 16.341 ^ ^ ^ ^
^ ^ ^ ^ ^ ^ ^ ^ ^ ^ ^ ^ ^ ^ ^ ^^ ^ ^ ^ ^ ^ ^ ^ ^ ^ ^ ^ ^ ^ ^ ^^ ^ ^ ^ ^ ^ ^ ^ ^ ^ ^ ^ ^ ^ ^ ^^ ^ ^ ^ ^ ^ ^ ^ ^ ^ ^ ^ ^ ^ ^ ^^ ^ ^ ^ ^ ^ ^ ^ ^ ^ ^ ^ ^ ^ ^ ^^ ^ ^ ^ ^ ^ ^ ^ ^ ^ ^ ^ ^ ^ ^ ^
^ ^ ^ 0.138 ^ 0.167 ^ ^ ^ ^ ^ ^ ^ ^ ^ ^^ ^ ^ 0.116 ^ 0.132 ^ ^ ^ ^ ^ ^ ^ ^ ^ ^
0.025 ^ 0.036 ^ 0.040 ^ ^ ^ 0.055 0.035 ^ ^ ^ ^ ^ 0.0180.035 ^ 0.054 ^ 0.057 ^ ^ ^ 0.078 0.047 ^ ^ ^ ^ ^ 0.0470.036 ^ 0.049 ^ 0.053 ^ ^ ^ 0.077 0.049 ^ ^ ^ ^ ^ 0.0460.030 ^ 0.039 ^ 0.043 ^ ^ ^ 0.065 0.043 ^ ^ ^ ^ ^ 0.0380.029 ^ 0.034 ^ 0.039 ^ ^ ^ 0.063 0.043 ^ ^ ^ ^ ^ 0.0370.032 ^ 0.043 ^ 0.045 ^ ^ ^ 0.074 0.048 ^ ^ ^ ^ ^ 0.042
^ ^ 0.005 ^ ^ ^ ^ ^ ^ ^ ^ ^ ^ ^ ^ ^^ ^ 0.005 ^ ^ ^ ^ ^ ^ ^ ^ ^ ^ ^ ^ ^^ ^ 0.004 ^ ^ ^ ^ ^ ^ ^ ^ ^ ^ ^ ^ ^^ ^ 0.003 ^ ^ ^ ^ ^ ^ ^ ^ ^ ^ ^ ^ ^^ ^ ^ ^ ^ ^ ^ ^ ^ ^ ^ ^ ^ ^ ^ ^^ ^ ^ ^ ^ ^ ^ ^ ^ ^ ^ ^ ^ ^ ^ ^
Unaudited Semi-Annual Report www.franklintempleton.lu
FRANKL IN TEMPLETON INVESTMENT FUNDS
Notes to the Financial Statements
at December 31, 2008 (continued)
72
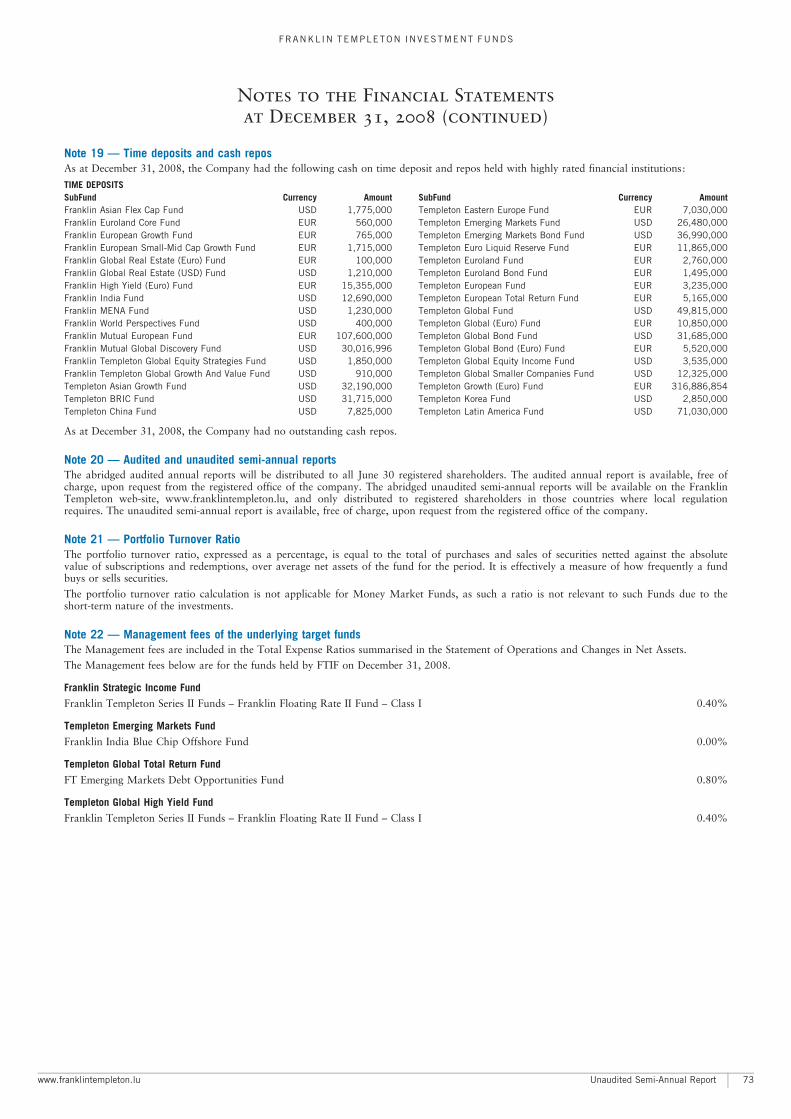
Note 19 ç Time deposits and cash reposAs at December 31, 2008, the Company had the following cash on time deposit and repos held with highly rated financial institutions:
TIME DEPOSITSSubFund Currency Amount SubFund Currency AmountFranklin Asian Flex Cap Fund USD 1,775,000 Templeton Eastern Europe Fund EUR 7,030,000Franklin Euroland Core Fund EUR 560,000 Templeton Emerging Markets Fund USD 26,480,000Franklin European Growth Fund EUR 765,000 Templeton Emerging Markets Bond Fund USD 36,990,000Franklin European Small-Mid Cap Growth Fund EUR 1,715,000 Templeton Euro Liquid Reserve Fund EUR 11,865,000Franklin Global Real Estate (Euro) Fund EUR 100,000 Templeton Euroland Fund EUR 2,760,000Franklin Global Real Estate (USD) Fund USD 1,210,000 Templeton Euroland Bond Fund EUR 1,495,000Franklin High Yield (Euro) Fund EUR 15,355,000 Templeton European Fund EUR 3,235,000Franklin India Fund USD 12,690,000 Templeton European Total Return Fund EUR 5,165,000Franklin MENA Fund USD 1,230,000 Templeton Global Fund USD 49,815,000Franklin World Perspectives Fund USD 400,000 Templeton Global (Euro) Fund EUR 10,850,000Franklin Mutual European Fund EUR 107,600,000 Templeton Global Bond Fund USD 31,685,000Franklin Mutual Global Discovery Fund USD 30,016,996 Templeton Global Bond (Euro) Fund EUR 5,520,000Franklin Templeton Global Equity Strategies Fund USD 1,850,000 Templeton Global Equity Income Fund USD 3,535,000Franklin Templeton Global Growth And Value Fund USD 910,000 Templeton Global Smaller Companies Fund USD 12,325,000Templeton Asian Growth Fund USD 32,190,000 Templeton Growth (Euro) Fund EUR 316,886,854Templeton BRIC Fund USD 31,715,000 Templeton Korea Fund USD 2,850,000Templeton China Fund USD 7,825,000 Templeton Latin America Fund USD 71,030,000
As at December 31, 2008, the Company had no outstanding cash repos.
Note 20 ç Audited and unaudited semi-annual reportsThe abridged audited annual reports will be distributed to all June 30 registered shareholders. The audited annual report is available, free ofcharge, upon request from the registered office of the company. The abridged unaudited semi-annual reports will be available on the FranklinTempleton web-site, www.franklintempleton.lu, and only distributed to registered shareholders in those countries where local regulationrequires. The unaudited semi-annual report is available, free of charge, upon request from the registered office of the company.
Note 21 ç Portfolio Turnover RatioThe portfolio turnover ratio, expressed as a percentage, is equal to the total of purchases and sales of securities netted against the absolutevalue of subscriptions and redemptions, over average net assets of the fund for the period. It is effectively a measure of how frequently a fundbuys or sells securities.
The portfolio turnover ratio calculation is not applicable for Money Market Funds, as such a ratio is not relevant to such Funds due to theshort-term nature of the investments.
Note 22 ç Management fees of the underlying target fundsThe Management fees are included in the Total Expense Ratios summarised in the Statement of Operations and Changes in Net Assets.
The Management fees below are for the funds held by FTIF on December 31, 2008.
Franklin Strategic Income FundFranklin Templeton Series II Funds ^ Franklin Floating Rate II Fund ^ Class I 0.40%
Templeton Emerging Markets FundFranklin India Blue Chip Offshore Fund 0.00%
Templeton Global Total Return FundFT Emerging Markets Debt Opportunities Fund 0.80%
Templeton Global High Yield FundFranklin Templeton Series II Funds ^ Franklin Floating Rate II Fund ^ Class I 0.40%
www.franklintempleton.lu Unaudited Semi-Annual Report
FRANKL IN TEMPLETON INVESTMENT FUNDS
Notes to the Financial Statements
at December 31, 2008 (continued)
73
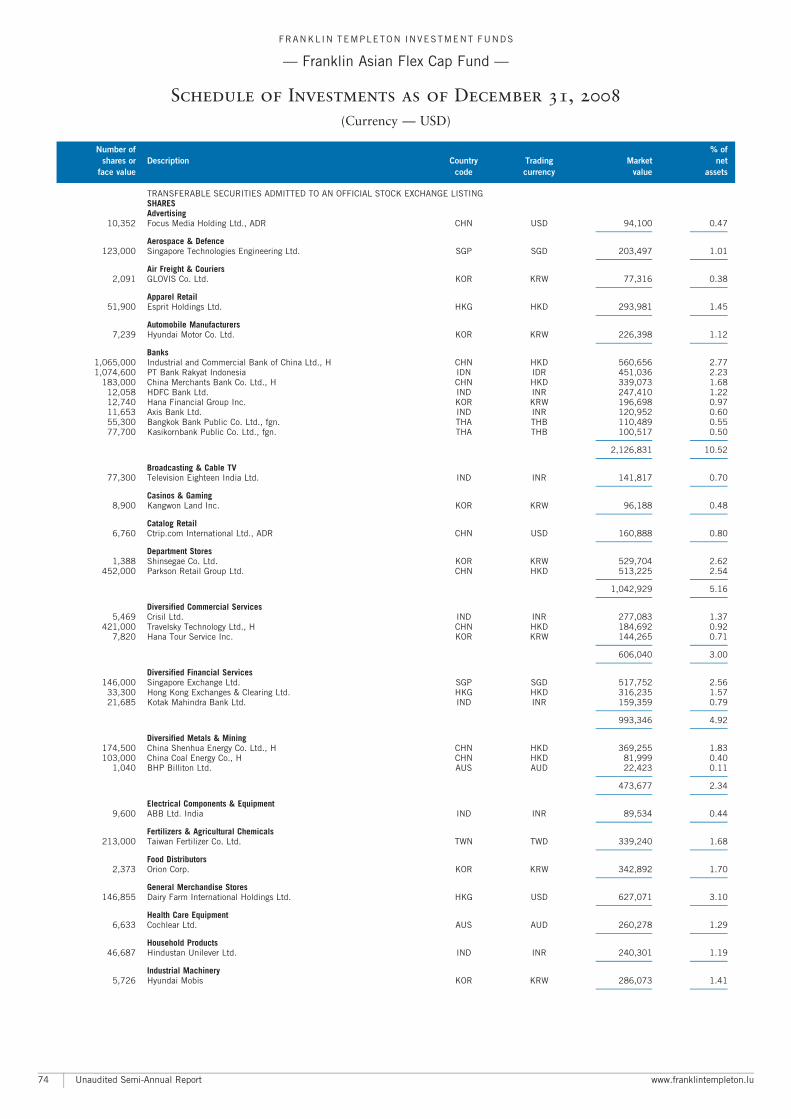
TRANSFERABLE SECURITIES ADMITTED TO AN OFFICIAL STOCK EXCHANGE LISTINGSHARESAdvertising
10,352 Focus Media Holding Ltd., ADR CHN USD 94,100 0.47A A
Aerospace & Defence123,000 Singapore Technologies Engineering Ltd. SGP SGD 203,497 1.01
A A
Air Freight & Couriers2,091 GLOVIS Co. Ltd. KOR KRW 77,316 0.38
A A
Apparel Retail51,900 Esprit Holdings Ltd. HKG HKD 293,981 1.45
A A
Automobile Manufacturers7,239 Hyundai Motor Co. Ltd. KOR KRW 226,398 1.12
A A
Banks1,065,000 Industrial and Commercial Bank of China Ltd., H CHN HKD 560,656 2.771,074,600 PT Bank Rakyat Indonesia IDN IDR 451,036 2.23
183,000 China Merchants Bank Co. Ltd., H CHN HKD 339,073 1.6812,058 HDFC Bank Ltd. IND INR 247,410 1.2212,740 Hana Financial Group Inc. KOR KRW 196,698 0.9711,653 Axis Bank Ltd. IND INR 120,952 0.6055,300 Bangkok Bank Public Co. Ltd., fgn. THA THB 110,489 0.5577,700 Kasikornbank Public Co. Ltd., fgn. THA THB 100,517 0.50
A A
2,126,831 10.52A A
Broadcasting & Cable TV77,300 Television Eighteen India Ltd. IND INR 141,817 0.70
A A
Casinos & Gaming8,900 Kangwon Land Inc. KOR KRW 96,188 0.48
A A
Catalog Retail6,760 Ctrip.com International Ltd., ADR CHN USD 160,888 0.80
A A
Department Stores1,388 Shinsegae Co. Ltd. KOR KRW 529,704 2.62
452,000 Parkson Retail Group Ltd. CHN HKD 513,225 2.54A A
1,042,929 5.16A A
Diversified Commercial Services5,469 Crisil Ltd. IND INR 277,083 1.37
421,000 Travelsky Technology Ltd., H CHN HKD 184,692 0.927,820 Hana Tour Service Inc. KOR KRW 144,265 0.71
A A
606,040 3.00A A
Diversified Financial Services146,000 Singapore Exchange Ltd. SGP SGD 517,752 2.56
33,300 Hong Kong Exchanges & Clearing Ltd. HKG HKD 316,235 1.5721,685 Kotak Mahindra Bank Ltd. IND INR 159,359 0.79
A A
993,346 4.92A A
Diversified Metals & Mining174,500 China Shenhua Energy Co. Ltd., H CHN HKD 369,255 1.83103,000 China Coal Energy Co., H CHN HKD 81,999 0.40
1,040 BHP Billiton Ltd. AUS AUD 22,423 0.11A A
473,677 2.34A A
Electrical Components & Equipment9,600 ABB Ltd. India IND INR 89,534 0.44
A A
Fertilizers & Agricultural Chemicals213,000 Taiwan Fertilizer Co. Ltd. TWN TWD 339,240 1.68
A A
Food Distributors2,373 Orion Corp. KOR KRW 342,892 1.70
A A
General Merchandise Stores146,855 Dairy Farm International Holdings Ltd. HKG USD 627,071 3.10
A A
Health Care Equipment6,633 Cochlear Ltd. AUS AUD 260,278 1.29
A A
Household Products46,687 Hindustan Unilever Ltd. IND INR 240,301 1.19
A A
Industrial Machinery5,726 Hyundai Mobis KOR KRW 286,073 1.41
A A
FRANKL IN TEMPLETON INVESTMENT FUNDS
ç Franklin Asian Flex Cap Fund ç
Schedule of Investments as of December 31, 2008
(Currency ç USD)
Number of % of
shares or Description Country Trading Market net
face value code currency value assets
Unaudited Semi-Annual Report www.franklintempleton.lu74
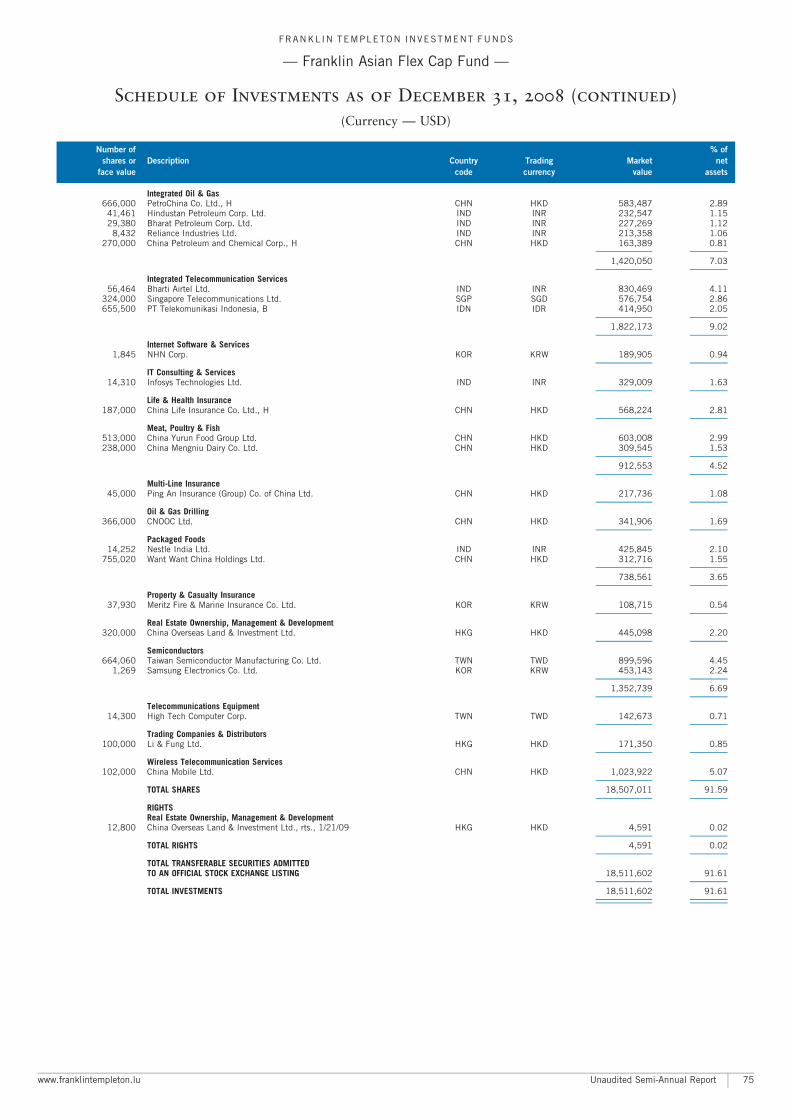
Integrated Oil & Gas666,000 PetroChina Co. Ltd., H CHN HKD 583,487 2.89
41,461 Hindustan Petroleum Corp. Ltd. IND INR 232,547 1.1529,380 Bharat Petroleum Corp. Ltd. IND INR 227,269 1.12
8,432 Reliance Industries Ltd. IND INR 213,358 1.06270,000 China Petroleum and Chemical Corp., H CHN HKD 163,389 0.81
A A
1,420,050 7.03A A
Integrated Telecommunication Services56,464 Bharti Airtel Ltd. IND INR 830,469 4.11
324,000 Singapore Telecommunications Ltd. SGP SGD 576,754 2.86655,500 PT Telekomunikasi Indonesia, B IDN IDR 414,950 2.05
A A
1,822,173 9.02A A
Internet Software & Services1,845 NHN Corp. KOR KRW 189,905 0.94
A A
IT Consulting & Services14,310 Infosys Technologies Ltd. IND INR 329,009 1.63
A A
Life & Health Insurance187,000 China Life Insurance Co. Ltd., H CHN HKD 568,224 2.81
A A
Meat, Poultry & Fish513,000 China Yurun Food Group Ltd. CHN HKD 603,008 2.99238,000 China Mengniu Dairy Co. Ltd. CHN HKD 309,545 1.53
A A
912,553 4.52A A
Multi-Line Insurance45,000 Ping An Insurance (Group) Co. of China Ltd. CHN HKD 217,736 1.08
A A
Oil & Gas Drilling366,000 CNOOC Ltd. CHN HKD 341,906 1.69
A A
Packaged Foods14,252 Nestle India Ltd. IND INR 425,845 2.10
755,020 Want Want China Holdings Ltd. CHN HKD 312,716 1.55A A
738,561 3.65A A
Property & Casualty Insurance37,930 Meritz Fire & Marine Insurance Co. Ltd. KOR KRW 108,715 0.54
A A
Real Estate Ownership, Management & Development320,000 China Overseas Land & Investment Ltd. HKG HKD 445,098 2.20
A A
Semiconductors664,060 Taiwan Semiconductor Manufacturing Co. Ltd. TWN TWD 899,596 4.45
1,269 Samsung Electronics Co. Ltd. KOR KRW 453,143 2.24A A
1,352,739 6.69A A
Telecommunications Equipment14,300 High Tech Computer Corp. TWN TWD 142,673 0.71
A A
Trading Companies & Distributors100,000 Li & Fung Ltd. HKG HKD 171,350 0.85
A A
Wireless Telecommunication Services102,000 China Mobile Ltd. CHN HKD 1,023,922 5.07
A A
TOTAL SHARES 18,507,011 91.59A A
RIGHTSReal Estate Ownership, Management & Development
12,800 China Overseas Land & Investment Ltd., rts., 1/21/09 HKG HKD 4,591 0.02A A
TOTAL RIGHTS 4,591 0.02A A
TOTAL TRANSFERABLE SECURITIES ADMITTEDTO AN OFFICIAL STOCK EXCHANGE LISTING 18,511,602 91.61
A A
TOTAL INVESTMENTS 18,511,602 91.61A A
A A
FRANKL IN TEMPLETON INVESTMENT FUNDS
ç Franklin Asian Flex Cap Fund ç
Schedule of Investments as of December 31, 2008 (continued)
(Currency ç USD)
Number of % of
shares or Description Country Trading Market net
face value code currency value assets
www.franklintempleton.lu Unaudited Semi-Annual Report 75
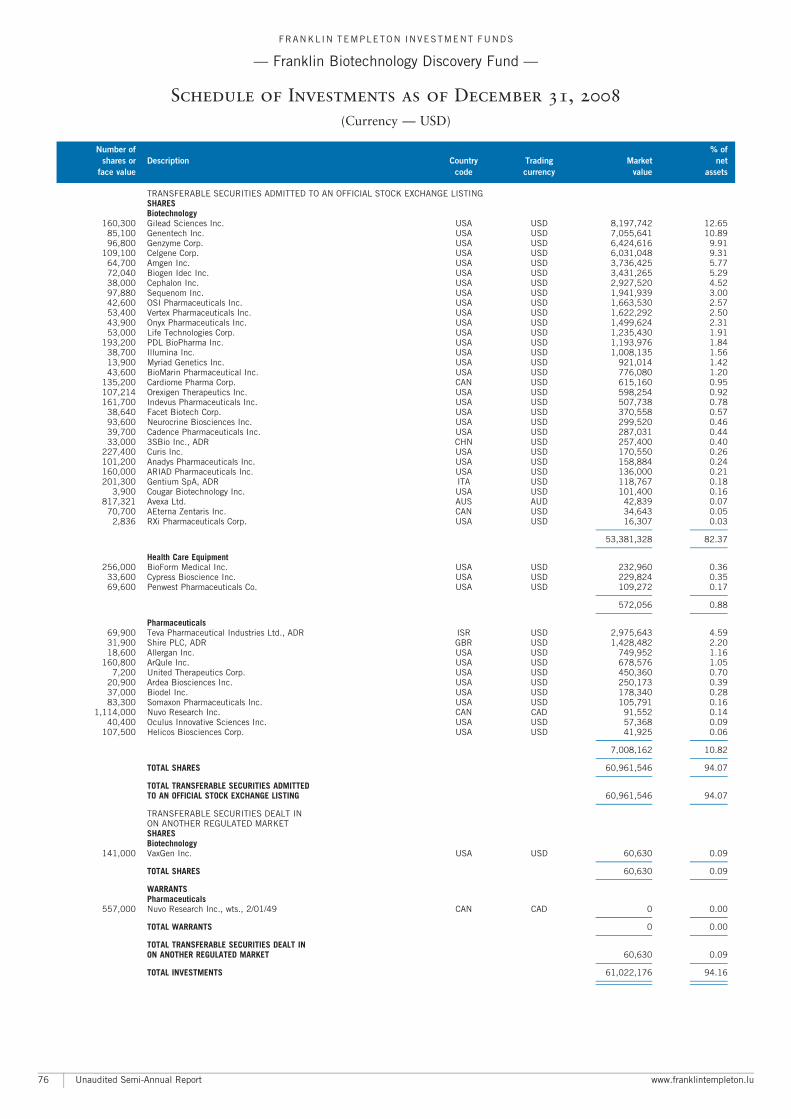
TRANSFERABLE SECURITIES ADMITTED TO AN OFFICIAL STOCK EXCHANGE LISTINGSHARESBiotechnology
160,300 Gilead Sciences Inc. USA USD 8,197,742 12.6585,100 Genentech Inc. USA USD 7,055,641 10.8996,800 Genzyme Corp. USA USD 6,424,616 9.91
109,100 Celgene Corp. USA USD 6,031,048 9.3164,700 Amgen Inc. USA USD 3,736,425 5.7772,040 Biogen Idec Inc. USA USD 3,431,265 5.2938,000 Cephalon Inc. USA USD 2,927,520 4.5297,880 Sequenom Inc. USA USD 1,941,939 3.0042,600 OSI Pharmaceuticals Inc. USA USD 1,663,530 2.5753,400 Vertex Pharmaceuticals Inc. USA USD 1,622,292 2.5043,900 Onyx Pharmaceuticals Inc. USA USD 1,499,624 2.3153,000 Life Technologies Corp. USA USD 1,235,430 1.91
193,200 PDL BioPharma Inc. USA USD 1,193,976 1.8438,700 Illumina Inc. USA USD 1,008,135 1.5613,900 Myriad Genetics Inc. USA USD 921,014 1.4243,600 BioMarin Pharmaceutical Inc. USA USD 776,080 1.20
135,200 Cardiome Pharma Corp. CAN USD 615,160 0.95107,214 Orexigen Therapeutics Inc. USA USD 598,254 0.92161,700 Indevus Pharmaceuticals Inc. USA USD 507,738 0.78
38,640 Facet Biotech Corp. USA USD 370,558 0.5793,600 Neurocrine Biosciences Inc. USA USD 299,520 0.4639,700 Cadence Pharmaceuticals Inc. USA USD 287,031 0.4433,000 3SBio Inc., ADR CHN USD 257,400 0.40
227,400 Curis Inc. USA USD 170,550 0.26101,200 Anadys Pharmaceuticals Inc. USA USD 158,884 0.24160,000 ARIAD Pharmaceuticals Inc. USA USD 136,000 0.21201,300 Gentium SpA, ADR ITA USD 118,767 0.18
3,900 Cougar Biotechnology Inc. USA USD 101,400 0.16817,321 Avexa Ltd. AUS AUD 42,839 0.07
70,700 AEterna Zentaris Inc. CAN USD 34,643 0.052,836 RXi Pharmaceuticals Corp. USA USD 16,307 0.03
A A
53,381,328 82.37A A
Health Care Equipment256,000 BioForm Medical Inc. USA USD 232,960 0.36
33,600 Cypress Bioscience Inc. USA USD 229,824 0.3569,600 Penwest Pharmaceuticals Co. USA USD 109,272 0.17
A A
572,056 0.88A A
Pharmaceuticals69,900 Teva Pharmaceutical Industries Ltd., ADR ISR USD 2,975,643 4.5931,900 Shire PLC, ADR GBR USD 1,428,482 2.2018,600 Allergan Inc. USA USD 749,952 1.16
160,800 ArQule Inc. USA USD 678,576 1.057,200 United Therapeutics Corp. USA USD 450,360 0.70
20,900 Ardea Biosciences Inc. USA USD 250,173 0.3937,000 Biodel Inc. USA USD 178,340 0.2883,300 Somaxon Pharmaceuticals Inc. USA USD 105,791 0.16
1,114,000 Nuvo Research Inc. CAN CAD 91,552 0.1440,400 Oculus Innovative Sciences Inc. USA USD 57,368 0.09
107,500 Helicos Biosciences Corp. USA USD 41,925 0.06A A
7,008,162 10.82A A
TOTAL SHARES 60,961,546 94.07A A
TOTAL TRANSFERABLE SECURITIES ADMITTEDTO AN OFFICIAL STOCK EXCHANGE LISTING 60,961,546 94.07
A A
TRANSFERABLE SECURITIES DEALT INON ANOTHER REGULATED MARKETSHARESBiotechnology
141,000 VaxGen Inc. USA USD 60,630 0.09A A
TOTAL SHARES 60,630 0.09A A
WARRANTSPharmaceuticals
557,000 Nuvo Research Inc., wts., 2/01/49 CAN CAD 0 0.00A A
TOTAL WARRANTS 0 0.00A A
TOTAL TRANSFERABLE SECURITIES DEALT INON ANOTHER REGULATED MARKET 60,630 0.09
A A
TOTAL INVESTMENTS 61,022,176 94.16A A
A A
FRANKL IN TEMPLETON INVESTMENT FUNDS
ç Franklin Biotechnology Discovery Fund ç
Schedule of Investments as of December 31, 2008
(Currency ç USD)
Number of % of
shares or Description Country Trading Market net
face value code currency value assets
Unaudited Semi-Annual Report www.franklintempleton.lu76
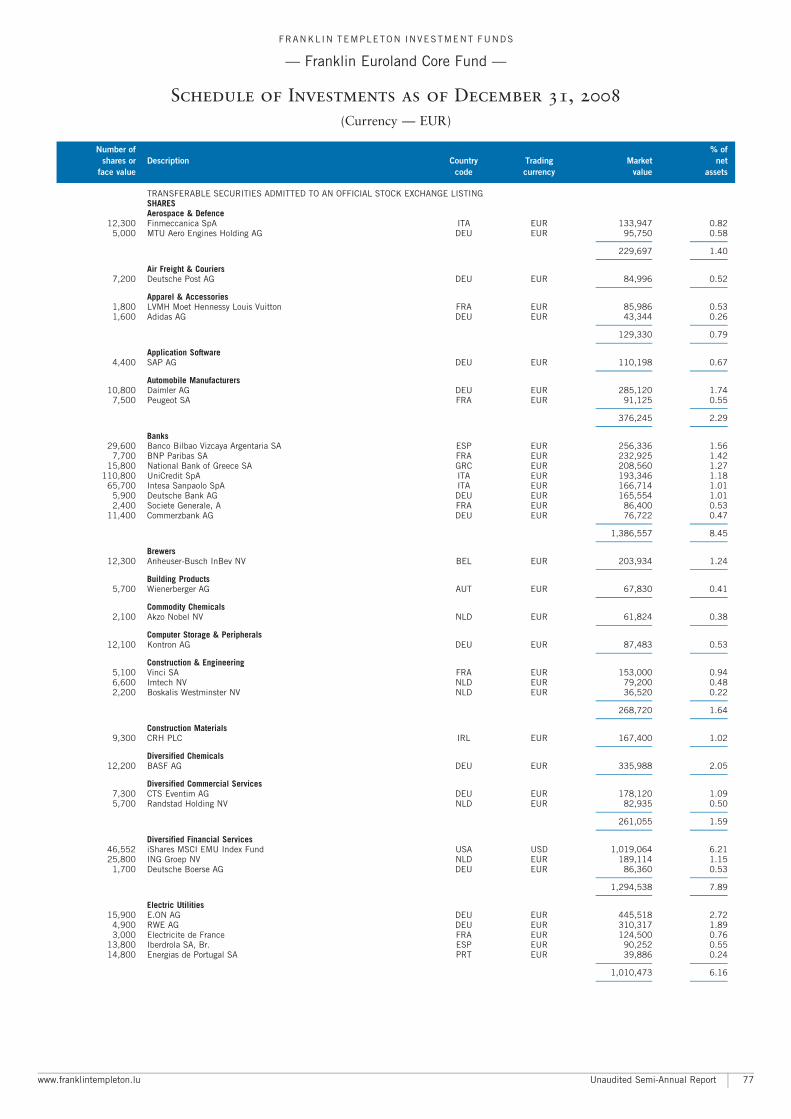
TRANSFERABLE SECURITIES ADMITTED TO AN OFFICIAL STOCK EXCHANGE LISTINGSHARESAerospace & Defence
12,300 Finmeccanica SpA ITA EUR 133,947 0.825,000 MTU Aero Engines Holding AG DEU EUR 95,750 0.58
A A
229,697 1.40A A
Air Freight & Couriers7,200 Deutsche Post AG DEU EUR 84,996 0.52
A A
Apparel & Accessories1,800 LVMH Moet Hennessy Louis Vuitton FRA EUR 85,986 0.531,600 Adidas AG DEU EUR 43,344 0.26
A A
129,330 0.79A A
Application Software4,400 SAP AG DEU EUR 110,198 0.67
A A
Automobile Manufacturers10,800 Daimler AG DEU EUR 285,120 1.74
7,500 Peugeot SA FRA EUR 91,125 0.55A A
376,245 2.29A A
Banks29,600 Banco Bilbao Vizcaya Argentaria SA ESP EUR 256,336 1.56
7,700 BNP Paribas SA FRA EUR 232,925 1.4215,800 National Bank of Greece SA GRC EUR 208,560 1.27
110,800 UniCredit SpA ITA EUR 193,346 1.1865,700 Intesa Sanpaolo SpA ITA EUR 166,714 1.01
5,900 Deutsche Bank AG DEU EUR 165,554 1.012,400 Societe Generale, A FRA EUR 86,400 0.53
11,400 Commerzbank AG DEU EUR 76,722 0.47A A
1,386,557 8.45A A
Brewers12,300 Anheuser-Busch InBev NV BEL EUR 203,934 1.24
A A
Building Products5,700 Wienerberger AG AUT EUR 67,830 0.41
A A
Commodity Chemicals2,100 Akzo Nobel NV NLD EUR 61,824 0.38
A A
Computer Storage & Peripherals12,100 Kontron AG DEU EUR 87,483 0.53
A A
Construction & Engineering5,100 Vinci SA FRA EUR 153,000 0.946,600 Imtech NV NLD EUR 79,200 0.482,200 Boskalis Westminster NV NLD EUR 36,520 0.22
A A
268,720 1.64A A
Construction Materials9,300 CRH PLC IRL EUR 167,400 1.02
A A
Diversified Chemicals12,200 BASF AG DEU EUR 335,988 2.05
A A
Diversified Commercial Services7,300 CTS Eventim AG DEU EUR 178,120 1.095,700 Randstad Holding NV NLD EUR 82,935 0.50
A A
261,055 1.59A A
Diversified Financial Services46,552 iShares MSCI EMU Index Fund USA USD 1,019,064 6.2125,800 ING Groep NV NLD EUR 189,114 1.15
1,700 Deutsche Boerse AG DEU EUR 86,360 0.53A A
1,294,538 7.89A A
Electric Utilities15,900 E.ON AG DEU EUR 445,518 2.72
4,900 RWE AG DEU EUR 310,317 1.893,000 Electricite de France FRA EUR 124,500 0.76
13,800 Iberdrola SA, Br. ESP EUR 90,252 0.5514,800 Energias de Portugal SA PRT EUR 39,886 0.24
A A
1,010,473 6.16A A
FRANKL IN TEMPLETON INVESTMENT FUNDS
ç Franklin Euroland Core Fund ç
Schedule of Investments as of December 31, 2008
(Currency ç EUR)
Number of % of
shares or Description Country Trading Market net
face value code currency value assets
www.franklintempleton.lu Unaudited Semi-Annual Report 77
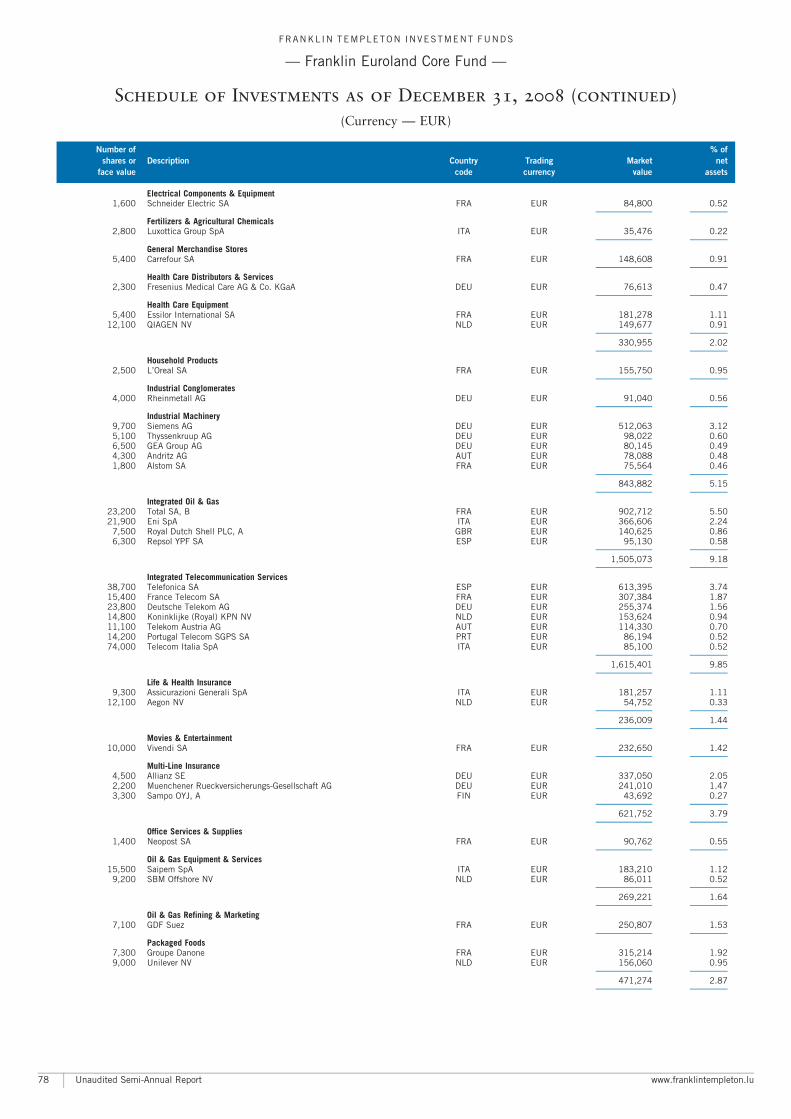
Electrical Components & Equipment1,600 Schneider Electric SA FRA EUR 84,800 0.52
A A
Fertilizers & Agricultural Chemicals2,800 Luxottica Group SpA ITA EUR 35,476 0.22
A A
General Merchandise Stores5,400 Carrefour SA FRA EUR 148,608 0.91
A A
Health Care Distributors & Services2,300 Fresenius Medical Care AG & Co. KGaA DEU EUR 76,613 0.47
A A
Health Care Equipment5,400 Essilor International SA FRA EUR 181,278 1.11
12,100 QIAGEN NV NLD EUR 149,677 0.91A A
330,955 2.02A A
Household Products2,500 L’Oreal SA FRA EUR 155,750 0.95
A A
Industrial Conglomerates4,000 Rheinmetall AG DEU EUR 91,040 0.56
A A
Industrial Machinery9,700 Siemens AG DEU EUR 512,063 3.125,100 Thyssenkruup AG DEU EUR 98,022 0.606,500 GEA Group AG DEU EUR 80,145 0.494,300 Andritz AG AUT EUR 78,088 0.481,800 Alstom SA FRA EUR 75,564 0.46
A A
843,882 5.15A A
Integrated Oil & Gas23,200 Total SA, B FRA EUR 902,712 5.5021,900 Eni SpA ITA EUR 366,606 2.24
7,500 Royal Dutch Shell PLC, A GBR EUR 140,625 0.866,300 Repsol YPF SA ESP EUR 95,130 0.58
A A
1,505,073 9.18A A
Integrated Telecommunication Services38,700 Telefonica SA ESP EUR 613,395 3.7415,400 France Telecom SA FRA EUR 307,384 1.8723,800 Deutsche Telekom AG DEU EUR 255,374 1.5614,800 Koninklijke (Royal) KPN NV NLD EUR 153,624 0.9411,100 Telekom Austria AG AUT EUR 114,330 0.7014,200 Portugal Telecom SGPS SA PRT EUR 86,194 0.5274,000 Telecom Italia SpA ITA EUR 85,100 0.52
A A
1,615,401 9.85A A
Life & Health Insurance9,300 Assicurazioni Generali SpA ITA EUR 181,257 1.11
12,100 Aegon NV NLD EUR 54,752 0.33A A
236,009 1.44A A
Movies & Entertainment10,000 Vivendi SA FRA EUR 232,650 1.42
A A
Multi-Line Insurance4,500 Allianz SE DEU EUR 337,050 2.052,200 Muenchener Rueckversicherungs-Gesellschaft AG DEU EUR 241,010 1.473,300 Sampo OYJ, A FIN EUR 43,692 0.27
A A
621,752 3.79A A
Office Services & Supplies1,400 Neopost SA FRA EUR 90,762 0.55
A A
Oil & Gas Equipment & Services15,500 Saipem SpA ITA EUR 183,210 1.12
9,200 SBM Offshore NV NLD EUR 86,011 0.52A A
269,221 1.64A A
Oil & Gas Refining & Marketing7,100 GDF Suez FRA EUR 250,807 1.53
A A
Packaged Foods7,300 Groupe Danone FRA EUR 315,214 1.929,000 Unilever NV NLD EUR 156,060 0.95
A A
471,274 2.87A A
FRANKL IN TEMPLETON INVESTMENT FUNDS
ç Franklin Euroland Core Fund ç
Schedule of Investments as of December 31, 2008 (continued)
(Currency ç EUR)
Number of % of
shares or Description Country Trading Market net
face value code currency value assets
Unaudited Semi-Annual Report www.franklintempleton.lu78
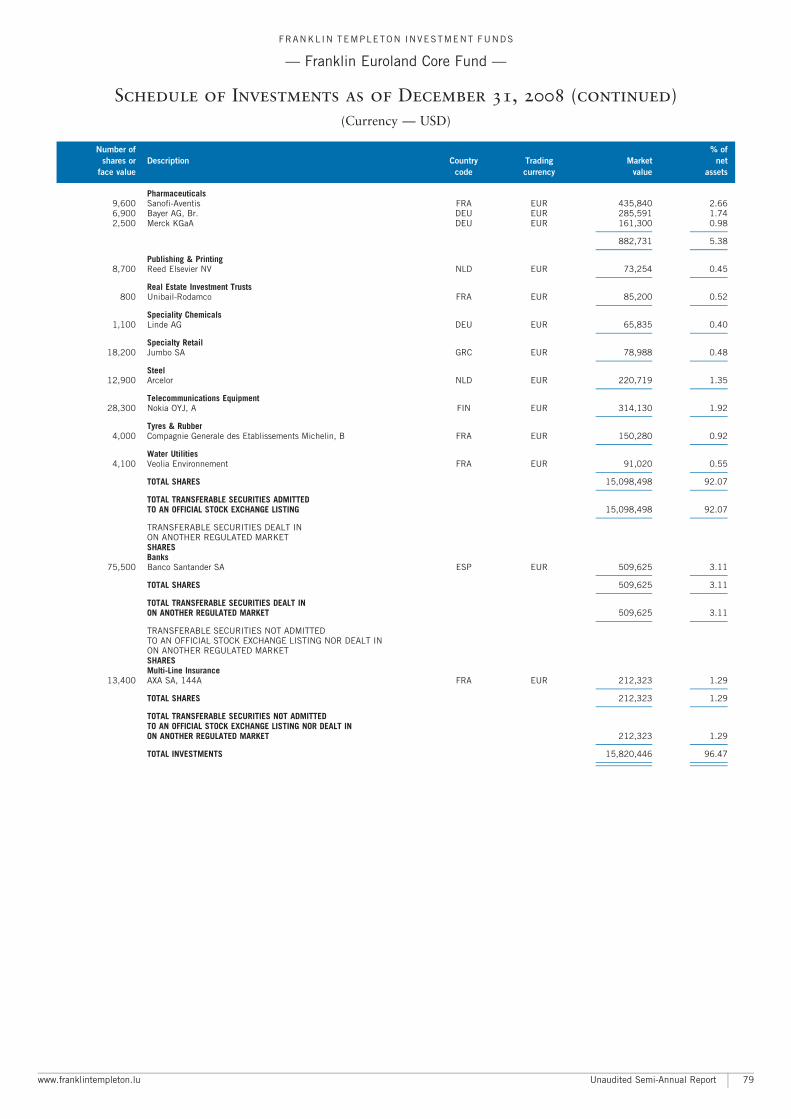
Pharmaceuticals9,600 Sanofi-Aventis FRA EUR 435,840 2.666,900 Bayer AG, Br. DEU EUR 285,591 1.742,500 Merck KGaA DEU EUR 161,300 0.98
A A
882,731 5.38A A
Publishing & Printing8,700 Reed Elsevier NV NLD EUR 73,254 0.45
A A
Real Estate Investment Trusts800 Unibail-Rodamco FRA EUR 85,200 0.52
A A
Speciality Chemicals1,100 Linde AG DEU EUR 65,835 0.40
A A
Specialty Retail18,200 Jumbo SA GRC EUR 78,988 0.48
A A
Steel12,900 Arcelor NLD EUR 220,719 1.35
A A
Telecommunications Equipment28,300 Nokia OYJ, A FIN EUR 314,130 1.92
A A
Tyres & Rubber4,000 Compagnie Generale des Etablissements Michelin, B FRA EUR 150,280 0.92
A A
Water Utilities4,100 Veolia Environnement FRA EUR 91,020 0.55
A A
TOTAL SHARES 15,098,498 92.07A A
TOTAL TRANSFERABLE SECURITIES ADMITTEDTO AN OFFICIAL STOCK EXCHANGE LISTING 15,098,498 92.07
A A
TRANSFERABLE SECURITIES DEALT INON ANOTHER REGULATED MARKETSHARESBanks
75,500 Banco Santander SA ESP EUR 509,625 3.11A A
TOTAL SHARES 509,625 3.11A A
TOTAL TRANSFERABLE SECURITIES DEALT INON ANOTHER REGULATED MARKET 509,625 3.11
A A
TRANSFERABLE SECURITIES NOT ADMITTEDTO AN OFFICIAL STOCK EXCHANGE LISTING NOR DEALT INON ANOTHER REGULATED MARKETSHARESMulti-Line Insurance
13,400 AXA SA, 144A FRA EUR 212,323 1.29A A
TOTAL SHARES 212,323 1.29A A
TOTAL TRANSFERABLE SECURITIES NOT ADMITTEDTO AN OFFICIAL STOCK EXCHANGE LISTING NOR DEALT INON ANOTHER REGULATED MARKET 212,323 1.29
A A
TOTAL INVESTMENTS 15,820,446 96.47A A
A A
FRANKL IN TEMPLETON INVESTMENT FUNDS
ç Franklin Euroland Core Fund ç
Schedule of Investments as of December 31, 2008 (continued)
(Currency ç USD)
Number of % of
shares or Description Country Trading Market net
face value code currency value assets
www.franklintempleton.lu Unaudited Semi-Annual Report 79
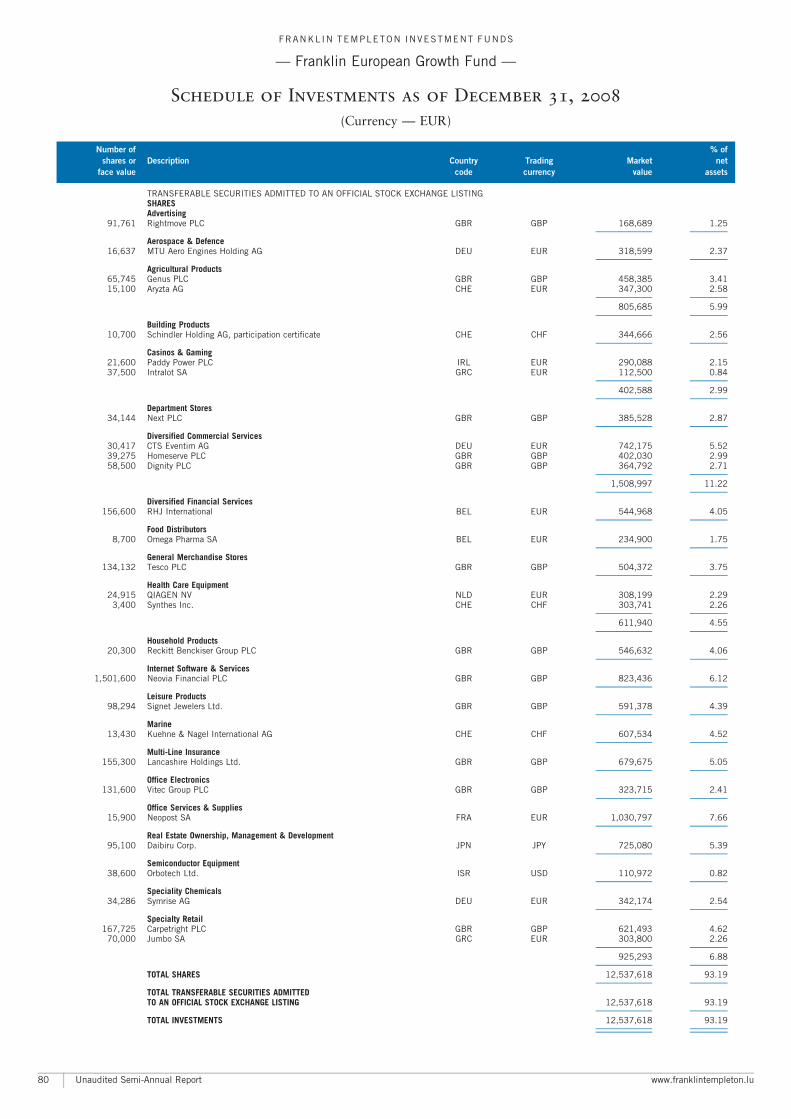
TRANSFERABLE SECURITIES ADMITTED TO AN OFFICIAL STOCK EXCHANGE LISTINGSHARESAdvertising
91,761 Rightmove PLC GBR GBP 168,689 1.25A A
Aerospace & Defence16,637 MTU Aero Engines Holding AG DEU EUR 318,599 2.37
A A
Agricultural Products65,745 Genus PLC GBR GBP 458,385 3.4115,100 Aryzta AG CHE EUR 347,300 2.58
A A
805,685 5.99A A
Building Products10,700 Schindler Holding AG, participation certificate CHE CHF 344,666 2.56
A A
Casinos & Gaming21,600 Paddy Power PLC IRL EUR 290,088 2.1537,500 Intralot SA GRC EUR 112,500 0.84
A A
402,588 2.99A A
Department Stores34,144 Next PLC GBR GBP 385,528 2.87
A A
Diversified Commercial Services30,417 CTS Eventim AG DEU EUR 742,175 5.5239,275 Homeserve PLC GBR GBP 402,030 2.9958,500 Dignity PLC GBR GBP 364,792 2.71
A A
1,508,997 11.22A A
Diversified Financial Services156,600 RHJ International BEL EUR 544,968 4.05
A A
Food Distributors8,700 Omega Pharma SA BEL EUR 234,900 1.75
A A
General Merchandise Stores134,132 Tesco PLC GBR GBP 504,372 3.75
A A
Health Care Equipment24,915 QIAGEN NV NLD EUR 308,199 2.29
3,400 Synthes Inc. CHE CHF 303,741 2.26A A
611,940 4.55A A
Household Products20,300 Reckitt Benckiser Group PLC GBR GBP 546,632 4.06
A A
Internet Software & Services1,501,600 Neovia Financial PLC GBR GBP 823,436 6.12
A A
Leisure Products98,294 Signet Jewelers Ltd. GBR GBP 591,378 4.39
A A
Marine13,430 Kuehne & Nagel International AG CHE CHF 607,534 4.52
A A
Multi-Line Insurance155,300 Lancashire Holdings Ltd. GBR GBP 679,675 5.05
A A
Office Electronics131,600 Vitec Group PLC GBR GBP 323,715 2.41
A A
Office Services & Supplies15,900 Neopost SA FRA EUR 1,030,797 7.66
A A
Real Estate Ownership, Management & Development95,100 Daibiru Corp. JPN JPY 725,080 5.39
A A
Semiconductor Equipment38,600 Orbotech Ltd. ISR USD 110,972 0.82
A A
Speciality Chemicals34,286 Symrise AG DEU EUR 342,174 2.54
A A
Specialty Retail167,725 Carpetright PLC GBR GBP 621,493 4.62
70,000 Jumbo SA GRC EUR 303,800 2.26A A
925,293 6.88A A
TOTAL SHARES 12,537,618 93.19A A
TOTAL TRANSFERABLE SECURITIES ADMITTEDTO AN OFFICIAL STOCK EXCHANGE LISTING 12,537,618 93.19
A A
TOTAL INVESTMENTS 12,537,618 93.19A A
A A
FRANKL IN TEMPLETON INVESTMENT FUNDS
ç Franklin European Growth Fund ç
Schedule of Investments as of December 31, 2008
(Currency ç EUR)
Number of % of
shares or Description Country Trading Market net
face value code currency value assets
Unaudited Semi-Annual Report www.franklintempleton.lu80
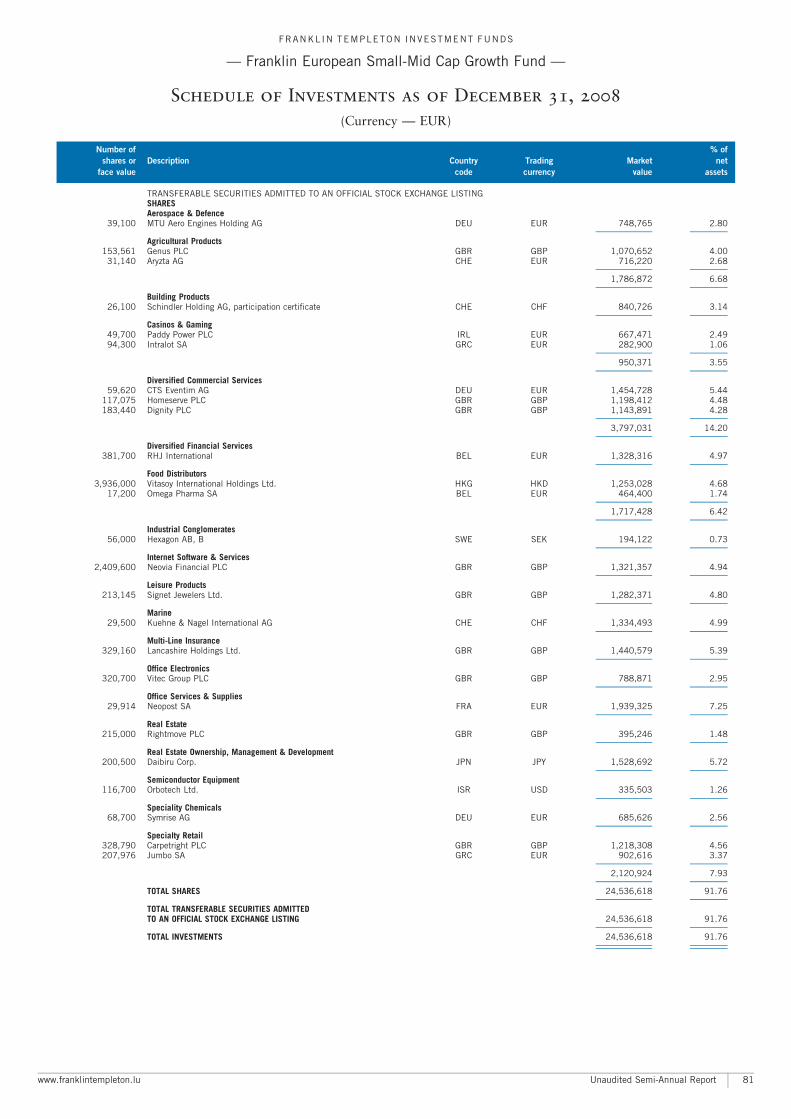
TRANSFERABLE SECURITIES ADMITTED TO AN OFFICIAL STOCK EXCHANGE LISTINGSHARESAerospace & Defence
39,100 MTU Aero Engines Holding AG DEU EUR 748,765 2.80A A
Agricultural Products153,561 Genus PLC GBR GBP 1,070,652 4.00
31,140 Aryzta AG CHE EUR 716,220 2.68A A
1,786,872 6.68A A
Building Products26,100 Schindler Holding AG, participation certificate CHE CHF 840,726 3.14
A A
Casinos & Gaming49,700 Paddy Power PLC IRL EUR 667,471 2.4994,300 Intralot SA GRC EUR 282,900 1.06
A A
950,371 3.55A A
Diversified Commercial Services59,620 CTS Eventim AG DEU EUR 1,454,728 5.44
117,075 Homeserve PLC GBR GBP 1,198,412 4.48183,440 Dignity PLC GBR GBP 1,143,891 4.28
A A
3,797,031 14.20A A
Diversified Financial Services381,700 RHJ International BEL EUR 1,328,316 4.97
A A
Food Distributors3,936,000 Vitasoy International Holdings Ltd. HKG HKD 1,253,028 4.68
17,200 Omega Pharma SA BEL EUR 464,400 1.74A A
1,717,428 6.42A A
Industrial Conglomerates56,000 Hexagon AB, B SWE SEK 194,122 0.73
A A
Internet Software & Services2,409,600 Neovia Financial PLC GBR GBP 1,321,357 4.94
A A
Leisure Products213,145 Signet Jewelers Ltd. GBR GBP 1,282,371 4.80
A A
Marine29,500 Kuehne & Nagel International AG CHE CHF 1,334,493 4.99
A A
Multi-Line Insurance329,160 Lancashire Holdings Ltd. GBR GBP 1,440,579 5.39
A A
Office Electronics320,700 Vitec Group PLC GBR GBP 788,871 2.95
A A
Office Services & Supplies29,914 Neopost SA FRA EUR 1,939,325 7.25
A A
Real Estate215,000 Rightmove PLC GBR GBP 395,246 1.48
A A
Real Estate Ownership, Management & Development200,500 Daibiru Corp. JPN JPY 1,528,692 5.72
A A
Semiconductor Equipment116,700 Orbotech Ltd. ISR USD 335,503 1.26
A A
Speciality Chemicals68,700 Symrise AG DEU EUR 685,626 2.56
A A
Specialty Retail328,790 Carpetright PLC GBR GBP 1,218,308 4.56207,976 Jumbo SA GRC EUR 902,616 3.37
A A
2,120,924 7.93A A
TOTAL SHARES 24,536,618 91.76A A
TOTAL TRANSFERABLE SECURITIES ADMITTEDTO AN OFFICIAL STOCK EXCHANGE LISTING 24,536,618 91.76
A A
TOTAL INVESTMENTS 24,536,618 91.76A A
A A
FRANKL IN TEMPLETON INVESTMENT FUNDS
ç Franklin European Small-Mid Cap Growth Fund ç
Schedule of Investments as of December 31, 2008
(Currency ç EUR)
Number of % of
shares or Description Country Trading Market net
face value code currency value assets
www.franklintempleton.lu Unaudited Semi-Annual Report 81
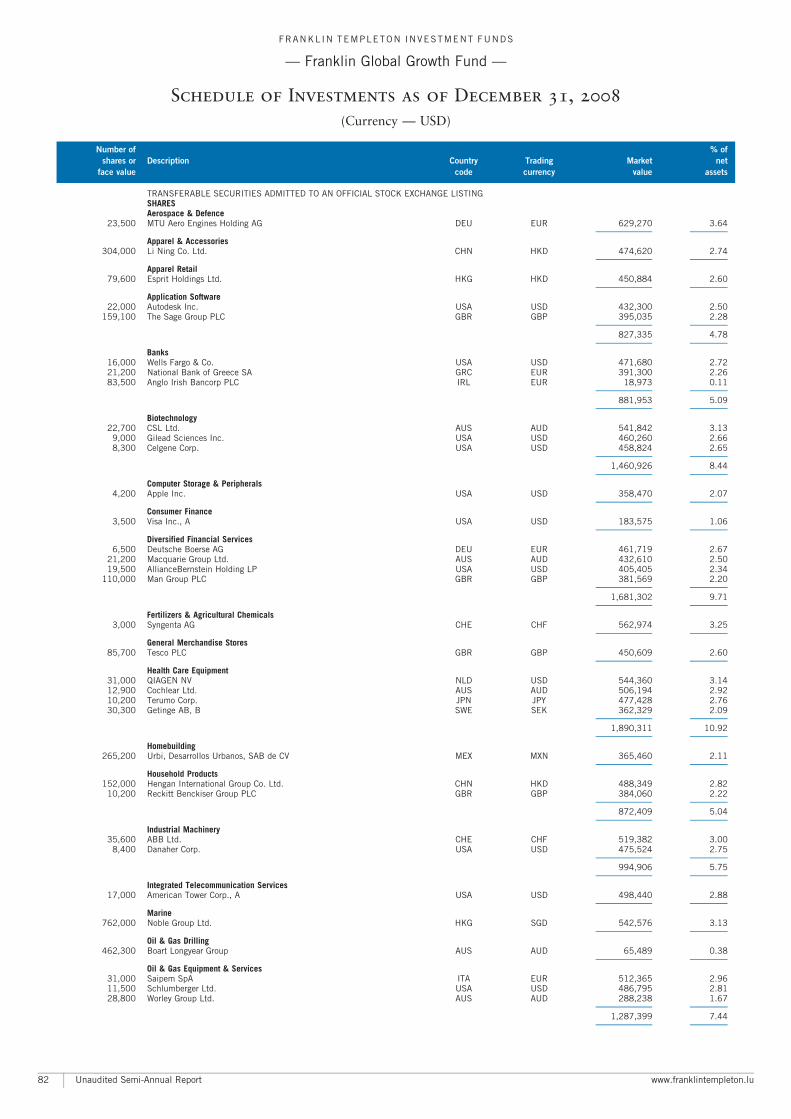
TRANSFERABLE SECURITIES ADMITTED TO AN OFFICIAL STOCK EXCHANGE LISTINGSHARESAerospace & Defence
23,500 MTU Aero Engines Holding AG DEU EUR 629,270 3.64A A
Apparel & Accessories304,000 Li Ning Co. Ltd. CHN HKD 474,620 2.74
A A
Apparel Retail79,600 Esprit Holdings Ltd. HKG HKD 450,884 2.60
A A
Application Software22,000 Autodesk Inc. USA USD 432,300 2.50
159,100 The Sage Group PLC GBR GBP 395,035 2.28A A
827,335 4.78A A
Banks16,000 Wells Fargo & Co. USA USD 471,680 2.7221,200 National Bank of Greece SA GRC EUR 391,300 2.2683,500 Anglo Irish Bancorp PLC IRL EUR 18,973 0.11
A A
881,953 5.09A A
Biotechnology22,700 CSL Ltd. AUS AUD 541,842 3.13
9,000 Gilead Sciences Inc. USA USD 460,260 2.668,300 Celgene Corp. USA USD 458,824 2.65
A A
1,460,926 8.44A A
Computer Storage & Peripherals4,200 Apple Inc. USA USD 358,470 2.07
A A
Consumer Finance3,500 Visa Inc., A USA USD 183,575 1.06
A A
Diversified Financial Services6,500 Deutsche Boerse AG DEU EUR 461,719 2.67
21,200 Macquarie Group Ltd. AUS AUD 432,610 2.5019,500 AllianceBernstein Holding LP USA USD 405,405 2.34
110,000 Man Group PLC GBR GBP 381,569 2.20A A
1,681,302 9.71A A
Fertilizers & Agricultural Chemicals3,000 Syngenta AG CHE CHF 562,974 3.25
A A
General Merchandise Stores85,700 Tesco PLC GBR GBP 450,609 2.60
A A
Health Care Equipment31,000 QIAGEN NV NLD USD 544,360 3.1412,900 Cochlear Ltd. AUS AUD 506,194 2.9210,200 Terumo Corp. JPN JPY 477,428 2.7630,300 Getinge AB, B SWE SEK 362,329 2.09
A A
1,890,311 10.92A A
Homebuilding265,200 Urbi, Desarrollos Urbanos, SAB de CV MEX MXN 365,460 2.11
A A
Household Products152,000 Hengan International Group Co. Ltd. CHN HKD 488,349 2.82
10,200 Reckitt Benckiser Group PLC GBR GBP 384,060 2.22A A
872,409 5.04A A
Industrial Machinery35,600 ABB Ltd. CHE CHF 519,382 3.00
8,400 Danaher Corp. USA USD 475,524 2.75A A
994,906 5.75A A
Integrated Telecommunication Services17,000 American Tower Corp., A USA USD 498,440 2.88
A A
Marine762,000 Noble Group Ltd. HKG SGD 542,576 3.13
A A
Oil & Gas Drilling462,300 Boart Longyear Group AUS AUD 65,489 0.38
A A
Oil & Gas Equipment & Services31,000 Saipem SpA ITA EUR 512,365 2.9611,500 Schlumberger Ltd. USA USD 486,795 2.8128,800 Worley Group Ltd. AUS AUD 288,238 1.67
A A
1,287,399 7.44A A
FRANKL IN TEMPLETON INVESTMENT FUNDS
ç Franklin Global Growth Fund ç
Schedule of Investments as of December 31, 2008
(Currency ç USD)
Number of % of
shares or Description Country Trading Market net
face value code currency value assets
Unaudited Semi-Annual Report www.franklintempleton.lu82
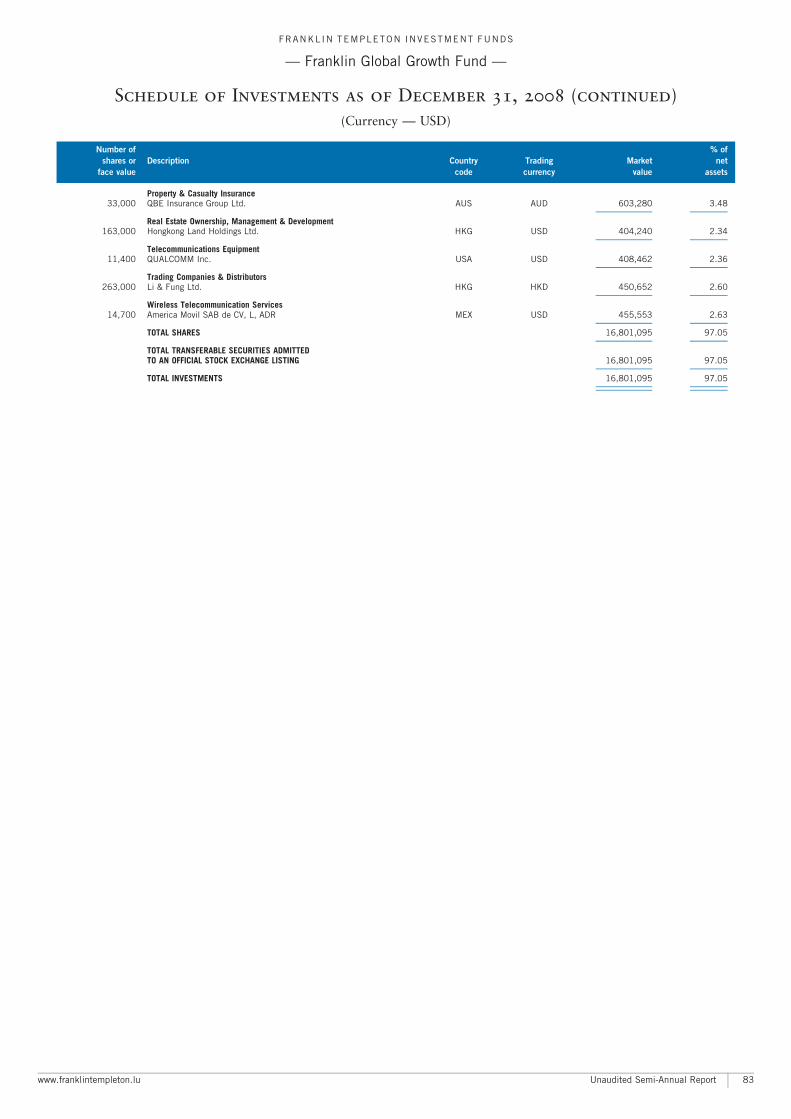
Property & Casualty Insurance33,000 QBE Insurance Group Ltd. AUS AUD 603,280 3.48
A A
Real Estate Ownership, Management & Development163,000 Hongkong Land Holdings Ltd. HKG USD 404,240 2.34
A A
Telecommunications Equipment11,400 QUALCOMM Inc. USA USD 408,462 2.36
A A
Trading Companies & Distributors263,000 Li & Fung Ltd. HKG HKD 450,652 2.60
A A
Wireless Telecommunication Services14,700 America Movil SAB de CV, L, ADR MEX USD 455,553 2.63
A A
TOTAL SHARES 16,801,095 97.05A A
TOTAL TRANSFERABLE SECURITIES ADMITTEDTO AN OFFICIAL STOCK EXCHANGE LISTING 16,801,095 97.05
A A
TOTAL INVESTMENTS 16,801,095 97.05A A
A A
FRANKL IN TEMPLETON INVESTMENT FUNDS
ç Franklin Global Growth Fund ç
Schedule of Investments as of December 31, 2008 (continued)
(Currency ç USD)
Number of % of
shares or Description Country Trading Market net
face value code currency value assets
www.franklintempleton.lu Unaudited Semi-Annual Report 83
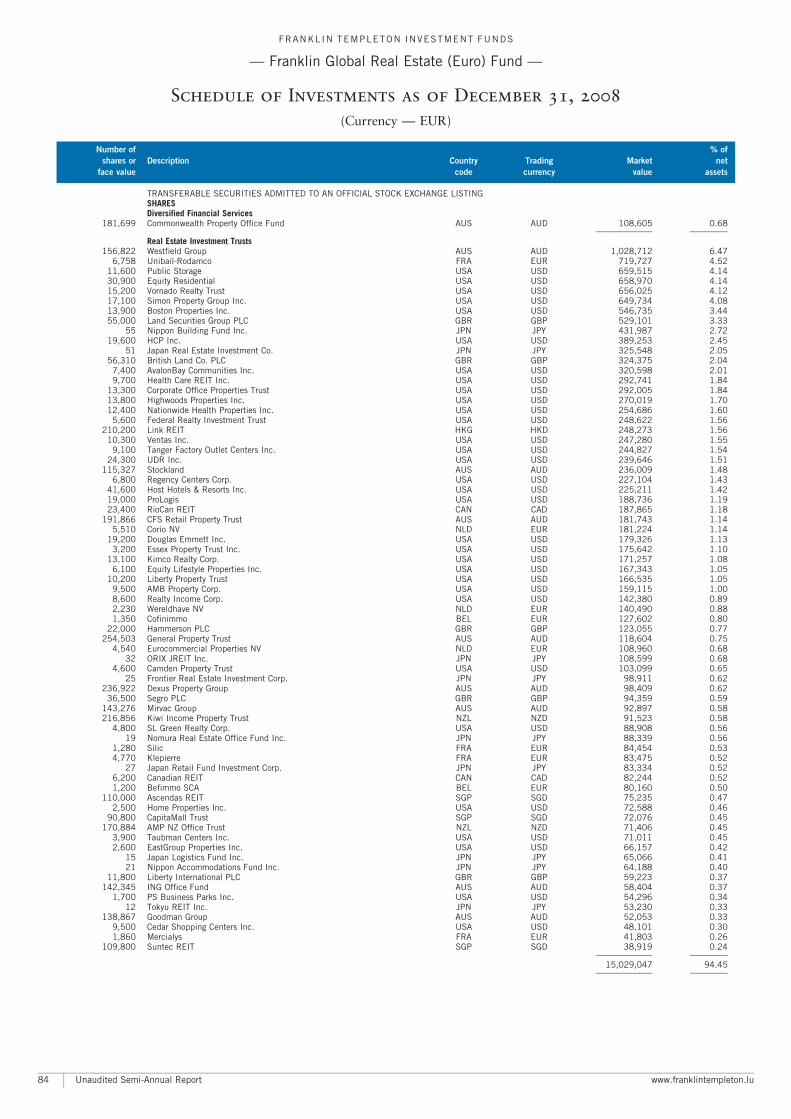
TRANSFERABLE SECURITIES ADMITTED TO AN OFFICIAL STOCK EXCHANGE LISTINGSHARESDiversified Financial Services
181,699 Commonwealth Property Office Fund AUS AUD 108,605 0.68A A
Real Estate Investment Trusts156,822 Westfield Group AUS AUD 1,028,712 6.47
6,758 Unibail-Rodamco FRA EUR 719,727 4.5211,600 Public Storage USA USD 659,515 4.1430,900 Equity Residential USA USD 658,970 4.1415,200 Vornado Realty Trust USA USD 656,025 4.1217,100 Simon Property Group Inc. USA USD 649,734 4.0813,900 Boston Properties Inc. USA USD 546,735 3.4455,000 Land Securities Group PLC GBR GBP 529,101 3.33
55 Nippon Building Fund Inc. JPN JPY 431,987 2.7219,600 HCP Inc. USA USD 389,253 2.45
51 Japan Real Estate Investment Co. JPN JPY 325,548 2.0556,310 British Land Co. PLC GBR GBP 324,375 2.04
7,400 AvalonBay Communities Inc. USA USD 320,598 2.019,700 Health Care REIT Inc. USA USD 292,741 1.84
13,300 Corporate Office Properties Trust USA USD 292,005 1.8413,800 Highwoods Properties Inc. USA USD 270,019 1.7012,400 Nationwide Health Properties Inc. USA USD 254,686 1.60
5,600 Federal Realty Investment Trust USA USD 248,622 1.56210,200 Link REIT HKG HKD 248,273 1.56
10,300 Ventas Inc. USA USD 247,280 1.559,100 Tanger Factory Outlet Centers Inc. USA USD 244,827 1.54
24,300 UDR Inc. USA USD 239,646 1.51115,327 Stockland AUS AUD 236,009 1.48
6,800 Regency Centers Corp. USA USD 227,104 1.4341,600 Host Hotels & Resorts Inc. USA USD 225,211 1.4219,000 ProLogis USA USD 188,736 1.1923,400 RioCan REIT CAN CAD 187,865 1.18
191,866 CFS Retail Property Trust AUS AUD 181,743 1.145,510 Corio NV NLD EUR 181,224 1.14
19,200 Douglas Emmett Inc. USA USD 179,326 1.133,200 Essex Property Trust Inc. USA USD 175,642 1.10
13,100 Kimco Realty Corp. USA USD 171,257 1.086,100 Equity Lifestyle Properties Inc. USA USD 167,343 1.05
10,200 Liberty Property Trust USA USD 166,535 1.059,500 AMB Property Corp. USA USD 159,115 1.008,600 Realty Income Corp. USA USD 142,380 0.892,230 Wereldhave NV NLD EUR 140,490 0.881,350 Cofinimmo BEL EUR 127,602 0.80
22,000 Hammerson PLC GBR GBP 123,055 0.77254,503 General Property Trust AUS AUD 118,604 0.75
4,540 Eurocommercial Properties NV NLD EUR 108,960 0.6832 ORIX JREIT Inc. JPN JPY 108,599 0.68
4,600 Camden Property Trust USA USD 103,099 0.6525 Frontier Real Estate Investment Corp. JPN JPY 98,911 0.62
236,922 Dexus Property Group AUS AUD 98,409 0.6236,500 Segro PLC GBR GBP 94,359 0.59
143,276 Mirvac Group AUS AUD 92,897 0.58216,856 Kiwi Income Property Trust NZL NZD 91,523 0.58
4,800 SL Green Realty Corp. USA USD 88,908 0.5619 Nomura Real Estate Office Fund Inc. JPN JPY 88,339 0.56
1,280 Silic FRA EUR 84,454 0.534,770 Klepierre FRA EUR 83,475 0.52
27 Japan Retail Fund Investment Corp. JPN JPY 83,334 0.526,200 Canadian REIT CAN CAD 82,244 0.521,200 Befimmo SCA BEL EUR 80,160 0.50
110,000 Ascendas REIT SGP SGD 75,235 0.472,500 Home Properties Inc. USA USD 72,588 0.46
90,800 CapitaMall Trust SGP SGD 72,076 0.45170,884 AMP NZ Office Trust NZL NZD 71,406 0.45
3,900 Taubman Centers Inc. USA USD 71,011 0.452,600 EastGroup Properties Inc. USA USD 66,157 0.42
15 Japan Logistics Fund Inc. JPN JPY 65,066 0.4121 Nippon Accommodations Fund Inc. JPN JPY 64,188 0.40
11,800 Liberty International PLC GBR GBP 59,223 0.37142,345 ING Office Fund AUS AUD 58,404 0.37
1,700 PS Business Parks Inc. USA USD 54,296 0.3412 Tokyu REIT Inc. JPN JPY 53,230 0.33
138,867 Goodman Group AUS AUD 52,053 0.339,500 Cedar Shopping Centers Inc. USA USD 48,101 0.301,860 Mercialys FRA EUR 41,803 0.26
109,800 Suntec REIT SGP SGD 38,919 0.24A A
15,029,047 94.45A A
FRANKL IN TEMPLETON INVESTMENT FUNDS
ç Franklin Global Real Estate (Euro) Fund ç
Schedule of Investments as of December 31, 2008
(Currency ç EUR)
Number of % of
shares or Description Country Trading Market net
face value code currency value assets
Unaudited Semi-Annual Report www.franklintempleton.lu84
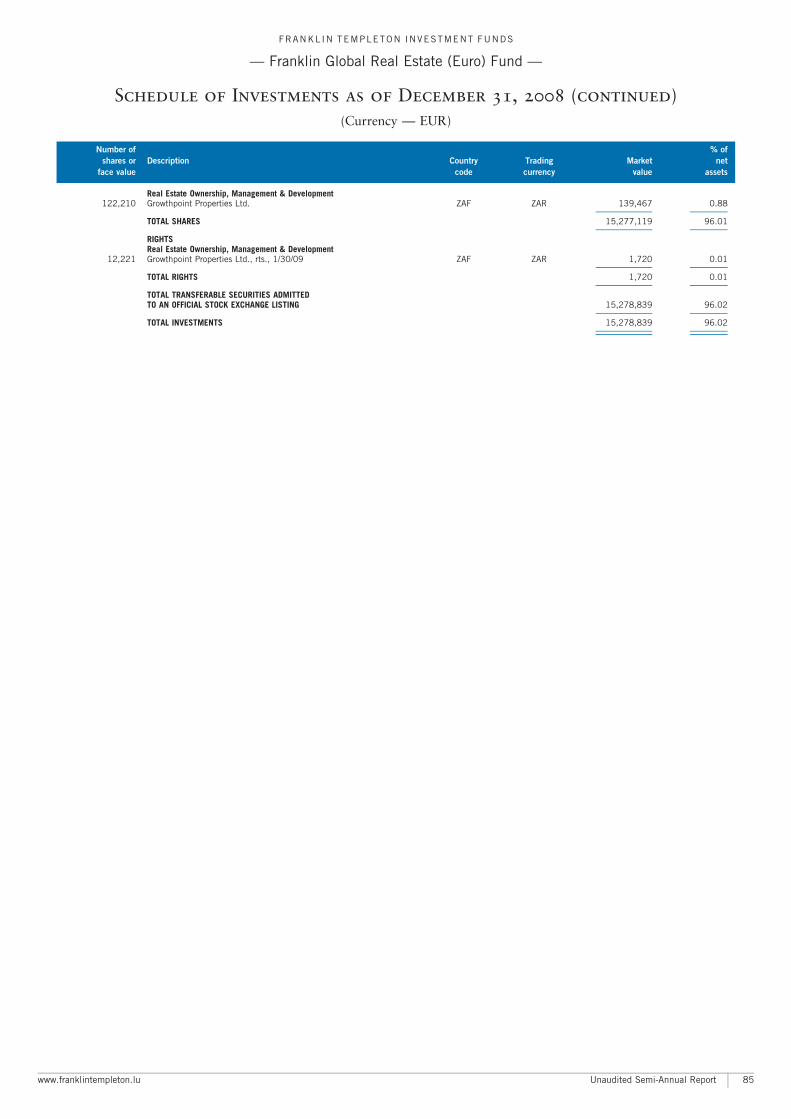
Real Estate Ownership, Management & Development122,210 Growthpoint Properties Ltd. ZAF ZAR 139,467 0.88
A A
TOTAL SHARES 15,277,119 96.01A A
RIGHTSReal Estate Ownership, Management & Development
12,221 Growthpoint Properties Ltd., rts., 1/30/09 ZAF ZAR 1,720 0.01A A
TOTAL RIGHTS 1,720 0.01A A
TOTAL TRANSFERABLE SECURITIES ADMITTEDTO AN OFFICIAL STOCK EXCHANGE LISTING 15,278,839 96.02
A A
TOTAL INVESTMENTS 15,278,839 96.02A A
A A
FRANKL IN TEMPLETON INVESTMENT FUNDS
ç Franklin Global Real Estate (Euro) Fund ç
Schedule of Investments as of December 31, 2008 (continued)
(Currency ç EUR)
Number of % of
shares or Description Country Trading Market net
face value code currency value assets
www.franklintempleton.lu Unaudited Semi-Annual Report 85
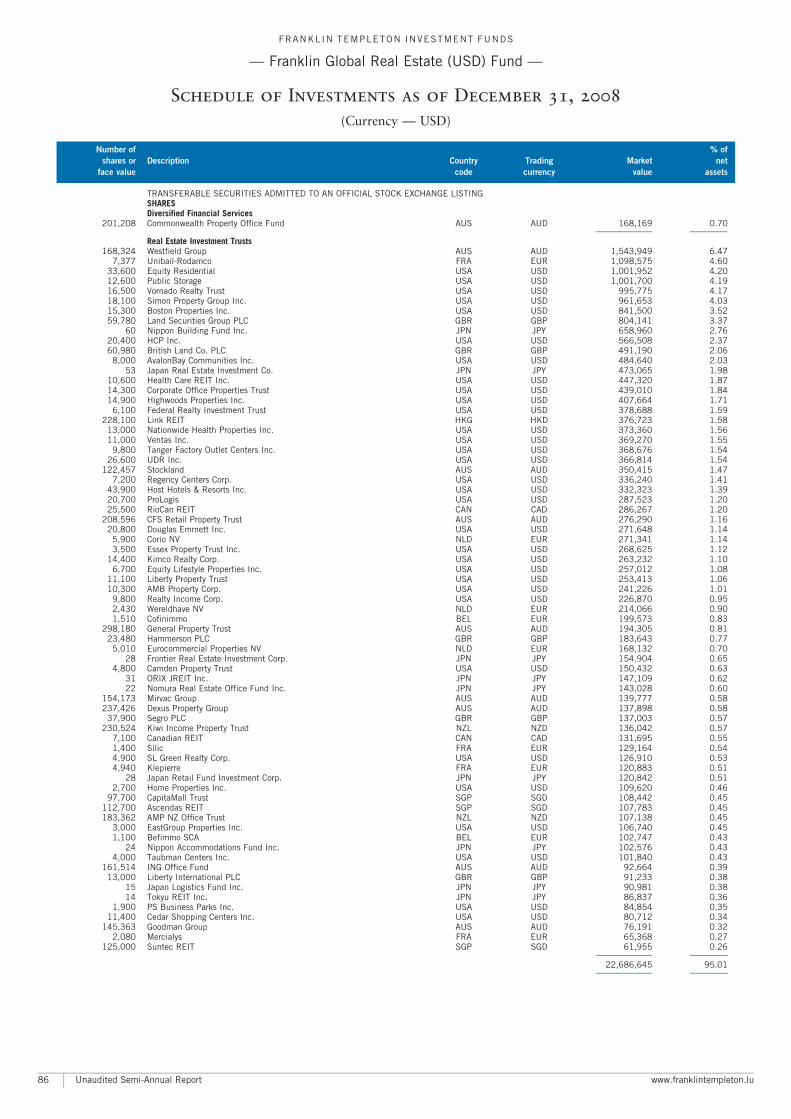
TRANSFERABLE SECURITIES ADMITTED TO AN OFFICIAL STOCK EXCHANGE LISTINGSHARESDiversified Financial Services
201,208 Commonwealth Property Office Fund AUS AUD 168,169 0.70A A
Real Estate Investment Trusts168,324 Westfield Group AUS AUD 1,543,949 6.47
7,377 Unibail-Rodamco FRA EUR 1,098,575 4.6033,600 Equity Residential USA USD 1,001,952 4.2012,600 Public Storage USA USD 1,001,700 4.1916,500 Vornado Realty Trust USA USD 995,775 4.1718,100 Simon Property Group Inc. USA USD 961,653 4.0315,300 Boston Properties Inc. USA USD 841,500 3.5259,780 Land Securities Group PLC GBR GBP 804,141 3.37
60 Nippon Building Fund Inc. JPN JPY 658,960 2.7620,400 HCP Inc. USA USD 566,508 2.3760,980 British Land Co. PLC GBR GBP 491,190 2.06
8,000 AvalonBay Communities Inc. USA USD 484,640 2.0353 Japan Real Estate Investment Co. JPN JPY 473,065 1.98
10,600 Health Care REIT Inc. USA USD 447,320 1.8714,300 Corporate Office Properties Trust USA USD 439,010 1.8414,900 Highwoods Properties Inc. USA USD 407,664 1.71
6,100 Federal Realty Investment Trust USA USD 378,688 1.59228,100 Link REIT HKG HKD 376,723 1.58
13,000 Nationwide Health Properties Inc. USA USD 373,360 1.5611,000 Ventas Inc. USA USD 369,270 1.55
9,800 Tanger Factory Outlet Centers Inc. USA USD 368,676 1.5426,600 UDR Inc. USA USD 366,814 1.54
122,457 Stockland AUS AUD 350,415 1.477,200 Regency Centers Corp. USA USD 336,240 1.41
43,900 Host Hotels & Resorts Inc. USA USD 332,323 1.3920,700 ProLogis USA USD 287,523 1.2025,500 RioCan REIT CAN CAD 286,267 1.20
208,596 CFS Retail Property Trust AUS AUD 276,290 1.1620,800 Douglas Emmett Inc. USA USD 271,648 1.14
5,900 Corio NV NLD EUR 271,341 1.143,500 Essex Property Trust Inc. USA USD 268,625 1.12
14,400 Kimco Realty Corp. USA USD 263,232 1.106,700 Equity Lifestyle Properties Inc. USA USD 257,012 1.08
11,100 Liberty Property Trust USA USD 253,413 1.0610,300 AMB Property Corp. USA USD 241,226 1.01
9,800 Realty Income Corp. USA USD 226,870 0.952,430 Wereldhave NV NLD EUR 214,066 0.901,510 Cofinimmo BEL EUR 199,573 0.83
298,180 General Property Trust AUS AUD 194,305 0.8123,480 Hammerson PLC GBR GBP 183,643 0.77
5,010 Eurocommercial Properties NV NLD EUR 168,132 0.7028 Frontier Real Estate Investment Corp. JPN JPY 154,904 0.65
4,800 Camden Property Trust USA USD 150,432 0.6331 ORIX JREIT Inc. JPN JPY 147,109 0.6222 Nomura Real Estate Office Fund Inc. JPN JPY 143,028 0.60
154,173 Mirvac Group AUS AUD 139,777 0.58237,426 Dexus Property Group AUS AUD 137,898 0.58
37,900 Segro PLC GBR GBP 137,003 0.57230,524 Kiwi Income Property Trust NZL NZD 136,042 0.57
7,100 Canadian REIT CAN CAD 131,695 0.551,400 Silic FRA EUR 129,164 0.544,900 SL Green Realty Corp. USA USD 126,910 0.534,940 Klepierre FRA EUR 120,883 0.51
28 Japan Retail Fund Investment Corp. JPN JPY 120,842 0.512,700 Home Properties Inc. USA USD 109,620 0.46
97,700 CapitaMall Trust SGP SGD 108,442 0.45112,700 Ascendas REIT SGP SGD 107,783 0.45183,362 AMP NZ Office Trust NZL NZD 107,138 0.45
3,000 EastGroup Properties Inc. USA USD 106,740 0.451,100 Befimmo SCA BEL EUR 102,747 0.43
24 Nippon Accommodations Fund Inc. JPN JPY 102,576 0.434,000 Taubman Centers Inc. USA USD 101,840 0.43
161,514 ING Office Fund AUS AUD 92,664 0.3913,000 Liberty International PLC GBR GBP 91,233 0.38
15 Japan Logistics Fund Inc. JPN JPY 90,981 0.3814 Tokyu REIT Inc. JPN JPY 86,837 0.36
1,900 PS Business Parks Inc. USA USD 84,854 0.3511,400 Cedar Shopping Centers Inc. USA USD 80,712 0.34
145,363 Goodman Group AUS AUD 76,191 0.322,080 Mercialys FRA EUR 65,368 0.27
125,000 Suntec REIT SGP SGD 61,955 0.26A A
22,686,645 95.01A A
FRANKL IN TEMPLETON INVESTMENT FUNDS
ç Franklin Global Real Estate (USD) Fund ç
Schedule of Investments as of December 31, 2008
(Currency ç USD)
Number of % of
shares or Description Country Trading Market net
face value code currency value assets
Unaudited Semi-Annual Report www.franklintempleton.lu86

Real Estate Ownership, Management & Development126,749 Growthpoint Properties Ltd. ZAF ZAR 202,259 0.85
A A
TOTAL SHARES 23,057,073 96.56A A
RIGHTSReal Estate Ownership, Management & Development
12,187 Growthpoint Properties Ltd., rts., 1/30/09 ZAF ZAR 2,398 0.01A A
TOTAL RIGHTS 2,398 0.01A A
TOTAL TRANSFERABLE SECURITIES ADMITTEDTO AN OFFICIAL STOCK EXCHANGE LISTING 23,059,471 96.57
A A
TOTAL INVESTMENTS 23,059,471 96.57A A
A A
FRANKL IN TEMPLETON INVESTMENT FUNDS
ç Franklin Global Real Estate (USD) Fund ç
Schedule of Investments as of December 31, 2008 (continued)
(Currency ç USD)
Number of % of
shares or Description Country Trading Market net
face value code currency value assets
www.franklintempleton.lu Unaudited Semi-Annual Report 87
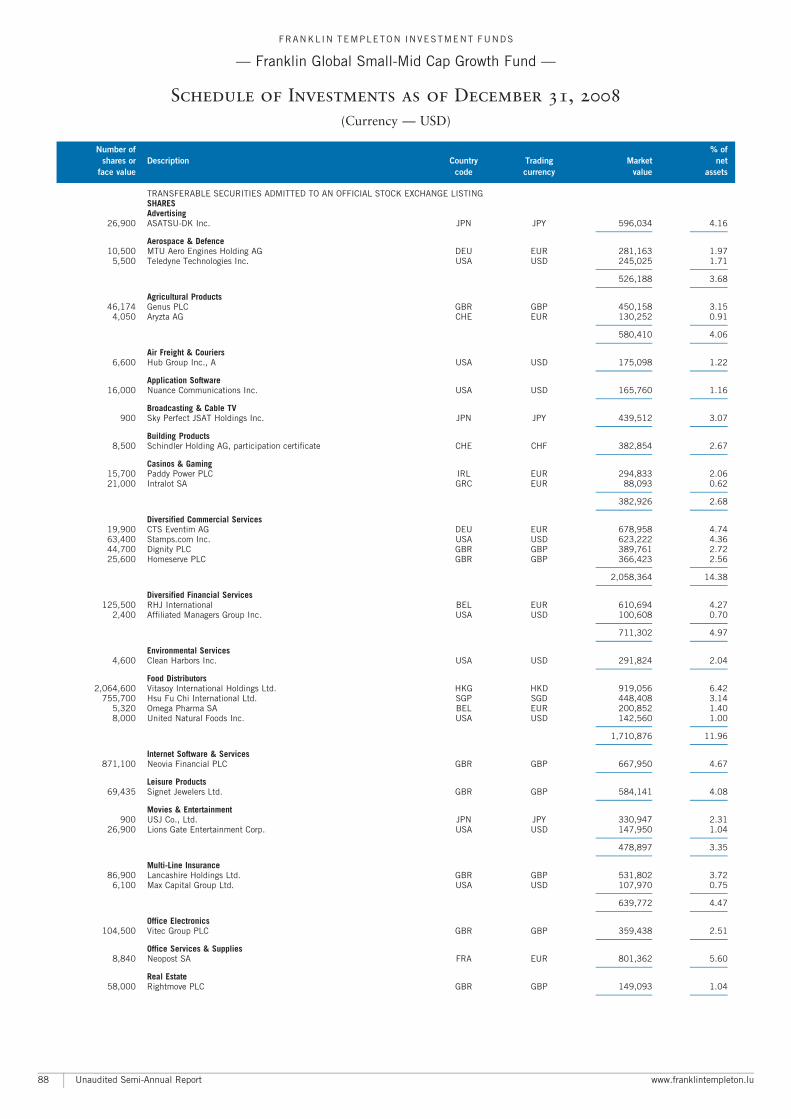
TRANSFERABLE SECURITIES ADMITTED TO AN OFFICIAL STOCK EXCHANGE LISTINGSHARESAdvertising
26,900 ASATSU-DK Inc. JPN JPY 596,034 4.16A A
Aerospace & Defence10,500 MTU Aero Engines Holding AG DEU EUR 281,163 1.97
5,500 Teledyne Technologies Inc. USA USD 245,025 1.71A A
526,188 3.68A A
Agricultural Products46,174 Genus PLC GBR GBP 450,158 3.15
4,050 Aryzta AG CHE EUR 130,252 0.91A A
580,410 4.06A A
Air Freight & Couriers6,600 Hub Group Inc., A USA USD 175,098 1.22
A A
Application Software16,000 Nuance Communications Inc. USA USD 165,760 1.16
A A
Broadcasting & Cable TV900 Sky Perfect JSAT Holdings Inc. JPN JPY 439,512 3.07
A A
Building Products8,500 Schindler Holding AG, participation certificate CHE CHF 382,854 2.67
A A
Casinos & Gaming15,700 Paddy Power PLC IRL EUR 294,833 2.0621,000 Intralot SA GRC EUR 88,093 0.62
A A
382,926 2.68A A
Diversified Commercial Services19,900 CTS Eventim AG DEU EUR 678,958 4.7463,400 Stamps.com Inc. USA USD 623,222 4.3644,700 Dignity PLC GBR GBP 389,761 2.7225,600 Homeserve PLC GBR GBP 366,423 2.56
A A
2,058,364 14.38A A
Diversified Financial Services125,500 RHJ International BEL EUR 610,694 4.27
2,400 Affiliated Managers Group Inc. USA USD 100,608 0.70A A
711,302 4.97A A
Environmental Services4,600 Clean Harbors Inc. USA USD 291,824 2.04
A A
Food Distributors2,064,600 Vitasoy International Holdings Ltd. HKG HKD 919,056 6.42
755,700 Hsu Fu Chi International Ltd. SGP SGD 448,408 3.145,320 Omega Pharma SA BEL EUR 200,852 1.408,000 United Natural Foods Inc. USA USD 142,560 1.00
A A
1,710,876 11.96A A
Internet Software & Services871,100 Neovia Financial PLC GBR GBP 667,950 4.67
A A
Leisure Products69,435 Signet Jewelers Ltd. GBR GBP 584,141 4.08
A A
Movies & Entertainment900 USJ Co., Ltd. JPN JPY 330,947 2.31
26,900 Lions Gate Entertainment Corp. USA USD 147,950 1.04A A
478,897 3.35A A
Multi-Line Insurance86,900 Lancashire Holdings Ltd. GBR GBP 531,802 3.72
6,100 Max Capital Group Ltd. USA USD 107,970 0.75A A
639,772 4.47A A
Office Electronics104,500 Vitec Group PLC GBR GBP 359,438 2.51
A A
Office Services & Supplies8,840 Neopost SA FRA EUR 801,362 5.60
A A
Real Estate58,000 Rightmove PLC GBR GBP 149,093 1.04
A A
FRANKL IN TEMPLETON INVESTMENT FUNDS
ç Franklin Global Small-Mid Cap Growth Fund ç
Schedule of Investments as of December 31, 2008
(Currency ç USD)
Number of % of
shares or Description Country Trading Market net
face value code currency value assets
Unaudited Semi-Annual Report www.franklintempleton.lu88
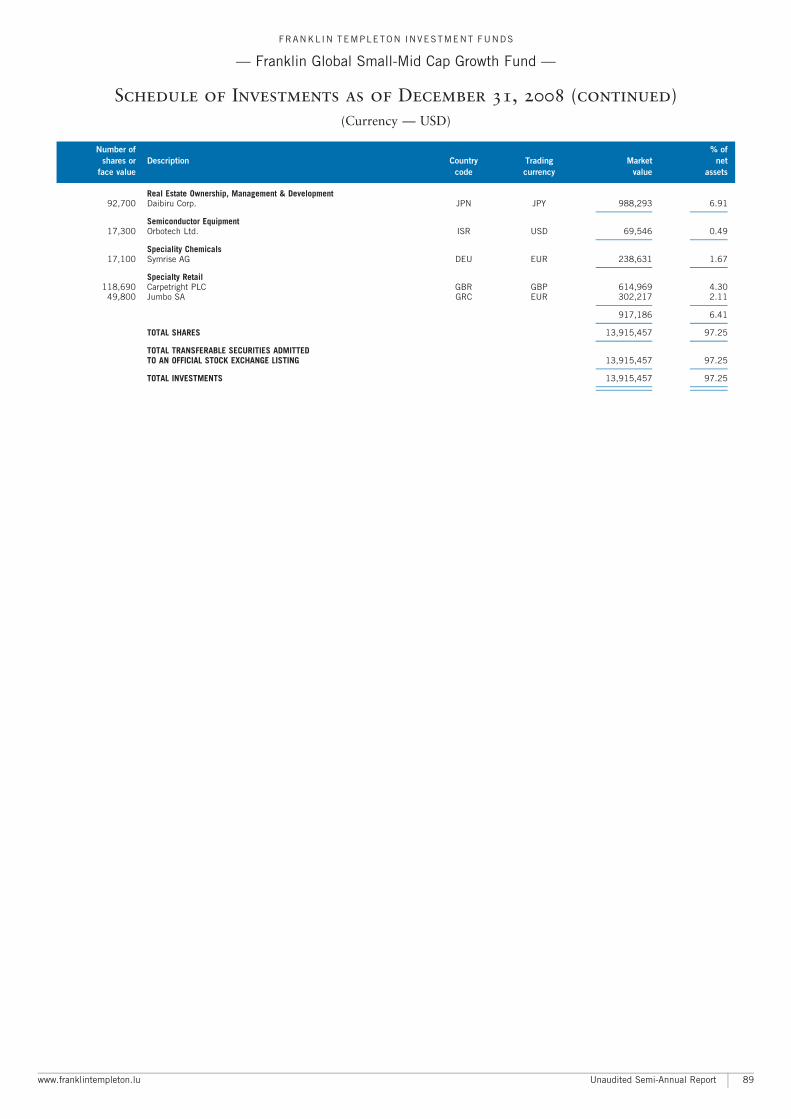
Real Estate Ownership, Management & Development92,700 Daibiru Corp. JPN JPY 988,293 6.91
A A
Semiconductor Equipment17,300 Orbotech Ltd. ISR USD 69,546 0.49
A A
Speciality Chemicals17,100 Symrise AG DEU EUR 238,631 1.67
A A
Specialty Retail118,690 Carpetright PLC GBR GBP 614,969 4.30
49,800 Jumbo SA GRC EUR 302,217 2.11A A
917,186 6.41A A
TOTAL SHARES 13,915,457 97.25A A
TOTAL TRANSFERABLE SECURITIES ADMITTEDTO AN OFFICIAL STOCK EXCHANGE LISTING 13,915,457 97.25
A A
TOTAL INVESTMENTS 13,915,457 97.25A A
A A
FRANKL IN TEMPLETON INVESTMENT FUNDS
ç Franklin Global Small-Mid Cap Growth Fund ç
Schedule of Investments as of December 31, 2008 (continued)
(Currency ç USD)
Number of % of
shares or Description Country Trading Market net
face value code currency value assets
www.franklintempleton.lu Unaudited Semi-Annual Report 89
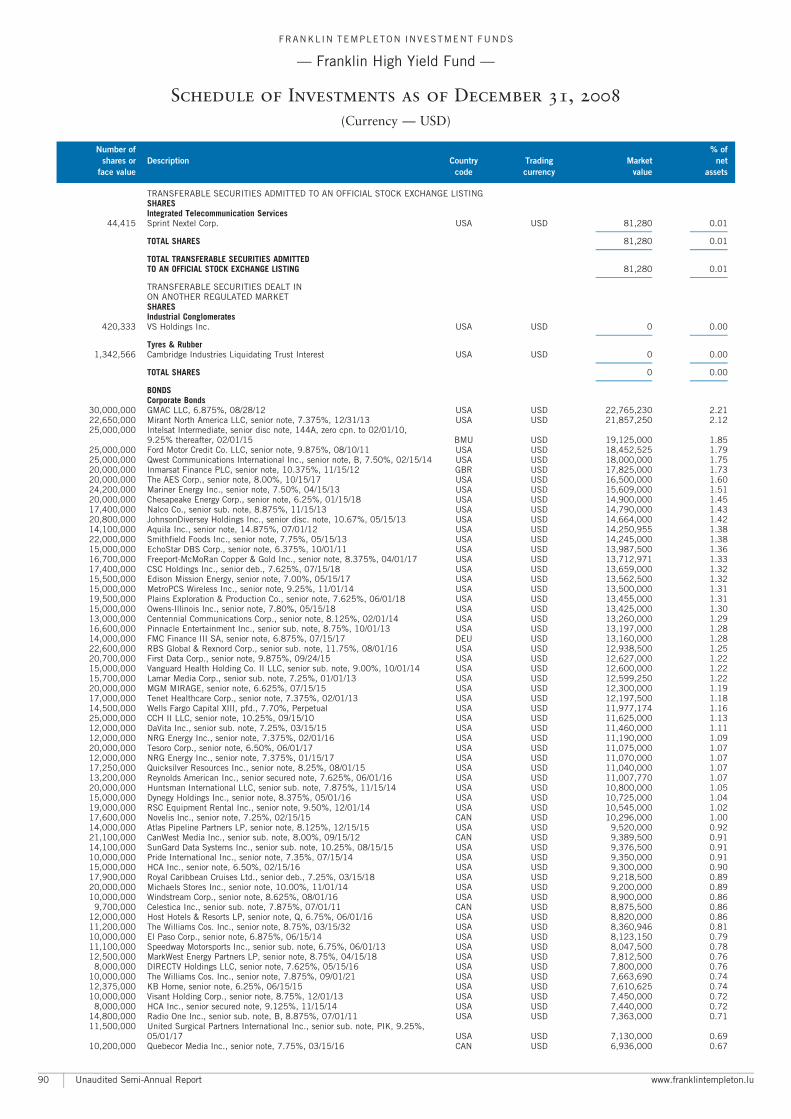
TRANSFERABLE SECURITIES ADMITTED TO AN OFFICIAL STOCK EXCHANGE LISTINGSHARESIntegrated Telecommunication Services
44,415 Sprint Nextel Corp. USA USD 81,280 0.01A A
TOTAL SHARES 81,280 0.01A A
TOTAL TRANSFERABLE SECURITIES ADMITTEDTO AN OFFICIAL STOCK EXCHANGE LISTING 81,280 0.01
A A
TRANSFERABLE SECURITIES DEALT INON ANOTHER REGULATED MARKETSHARESIndustrial Conglomerates
420,333 VS Holdings Inc. USA USD 0 0.00A A
Tyres & Rubber1,342,566 Cambridge Industries Liquidating Trust Interest USA USD 0 0.00
A A
TOTAL SHARES 0 0.00A A
BONDSCorporate Bonds
30,000,000 GMAC LLC, 6.875%, 08/28/12 USA USD 22,765,230 2.2122,650,000 Mirant North America LLC, senior note, 7.375%, 12/31/13 USA USD 21,857,250 2.1225,000,000 Intelsat Intermediate, senior disc note, 144A, zero cpn. to 02/01/10,
9.25% thereafter, 02/01/15 BMU USD 19,125,000 1.8525,000,000 Ford Motor Credit Co. LLC, senior note, 9.875%, 08/10/11 USA USD 18,452,525 1.7925,000,000 Qwest Communications International Inc., senior note, B, 7.50%, 02/15/14 USA USD 18,000,000 1.7520,000,000 Inmarsat Finance PLC, senior note, 10.375%, 11/15/12 GBR USD 17,825,000 1.7320,000,000 The AES Corp., senior note, 8.00%, 10/15/17 USA USD 16,500,000 1.6024,200,000 Mariner Energy Inc., senior note, 7.50%, 04/15/13 USA USD 15,609,000 1.5120,000,000 Chesapeake Energy Corp., senior note, 6.25%, 01/15/18 USA USD 14,900,000 1.4517,400,000 Nalco Co., senior sub. note, 8.875%, 11/15/13 USA USD 14,790,000 1.4320,800,000 JohnsonDiversey Holdings Inc., senior disc. note, 10.67%, 05/15/13 USA USD 14,664,000 1.4214,100,000 Aquila Inc., senior note, 14.875%, 07/01/12 USA USD 14,250,955 1.3822,000,000 Smithfield Foods Inc., senior note, 7.75%, 05/15/13 USA USD 14,245,000 1.3815,000,000 EchoStar DBS Corp., senior note, 6.375%, 10/01/11 USA USD 13,987,500 1.3616,700,000 Freeport-McMoRan Copper & Gold Inc., senior note, 8.375%, 04/01/17 USA USD 13,712,971 1.3317,400,000 CSC Holdings Inc., senior deb., 7.625%, 07/15/18 USA USD 13,659,000 1.3215,500,000 Edison Mission Energy, senior note, 7.00%, 05/15/17 USA USD 13,562,500 1.3215,000,000 MetroPCS Wireless Inc., senior note, 9.25%, 11/01/14 USA USD 13,500,000 1.3119,500,000 Plains Exploration & Production Co., senior note, 7.625%, 06/01/18 USA USD 13,455,000 1.3115,000,000 Owens-Illinois Inc., senior note, 7.80%, 05/15/18 USA USD 13,425,000 1.3013,000,000 Centennial Communications Corp., senior note, 8.125%, 02/01/14 USA USD 13,260,000 1.2916,600,000 Pinnacle Entertainment Inc., senior sub. note, 8.75%, 10/01/13 USA USD 13,197,000 1.2814,000,000 FMC Finance III SA, senior note, 6.875%, 07/15/17 DEU USD 13,160,000 1.2822,600,000 RBS Global & Rexnord Corp., senior sub. note, 11.75%, 08/01/16 USA USD 12,938,500 1.2520,700,000 First Data Corp., senior note, 9.875%, 09/24/15 USA USD 12,627,000 1.2215,000,000 Vanguard Health Holding Co. II LLC, senior sub. note, 9.00%, 10/01/14 USA USD 12,600,000 1.2215,700,000 Lamar Media Corp., senior sub. note, 7.25%, 01/01/13 USA USD 12,599,250 1.2220,000,000 MGM MIRAGE, senior note, 6.625%, 07/15/15 USA USD 12,300,000 1.1917,000,000 Tenet Healthcare Corp., senior note, 7.375%, 02/01/13 USA USD 12,197,500 1.1814,500,000 Wells Fargo Capital XIII, pfd., 7.70%, Perpetual USA USD 11,977,174 1.1625,000,000 CCH II LLC, senior note, 10.25%, 09/15/10 USA USD 11,625,000 1.1312,000,000 DaVita Inc., senior sub. note, 7.25%, 03/15/15 USA USD 11,460,000 1.1112,000,000 NRG Energy Inc., senior note, 7.375%, 02/01/16 USA USD 11,190,000 1.0920,000,000 Tesoro Corp., senior note, 6.50%, 06/01/17 USA USD 11,075,000 1.0712,000,000 NRG Energy Inc., senior note, 7.375%, 01/15/17 USA USD 11,070,000 1.0717,250,000 Quicksilver Resources Inc., senior note, 8.25%, 08/01/15 USA USD 11,040,000 1.0713,200,000 Reynolds American Inc., senior secured note, 7.625%, 06/01/16 USA USD 11,007,770 1.0720,000,000 Huntsman International LLC, senior sub. note, 7.875%, 11/15/14 USA USD 10,800,000 1.0515,000,000 Dynegy Holdings Inc., senior note, 8.375%, 05/01/16 USA USD 10,725,000 1.0419,000,000 RSC Equipment Rental Inc., senior note, 9.50%, 12/01/14 USA USD 10,545,000 1.0217,600,000 Novelis Inc., senior note, 7.25%, 02/15/15 CAN USD 10,296,000 1.0014,000,000 Atlas Pipeline Partners LP, senior note, 8.125%, 12/15/15 USA USD 9,520,000 0.9221,100,000 CanWest Media Inc., senior sub. note, 8.00%, 09/15/12 CAN USD 9,389,500 0.9114,100,000 SunGard Data Systems Inc., senior sub. note, 10.25%, 08/15/15 USA USD 9,376,500 0.9110,000,000 Pride International Inc., senior note, 7.35%, 07/15/14 USA USD 9,350,000 0.9115,000,000 HCA Inc., senior note, 6.50%, 02/15/16 USA USD 9,300,000 0.9017,900,000 Royal Caribbean Cruises Ltd., senior deb., 7.25%, 03/15/18 USA USD 9,218,500 0.8920,000,000 Michaels Stores Inc., senior note, 10.00%, 11/01/14 USA USD 9,200,000 0.8910,000,000 Windstream Corp., senior note, 8.625%, 08/01/16 USA USD 8,900,000 0.86
9,700,000 Celestica Inc., senior sub. note, 7.875%, 07/01/11 CAN USD 8,875,500 0.8612,000,000 Host Hotels & Resorts LP, senior note, Q, 6.75%, 06/01/16 USA USD 8,820,000 0.8611,200,000 The Williams Cos. Inc., senior note, 8.75%, 03/15/32 USA USD 8,360,946 0.8110,000,000 El Paso Corp., senior note, 6.875%, 06/15/14 USA USD 8,123,150 0.7911,100,000 Speedway Motorsports Inc., senior sub. note, 6.75%, 06/01/13 USA USD 8,047,500 0.7812,500,000 MarkWest Energy Partners LP, senior note, 8.75%, 04/15/18 USA USD 7,812,500 0.76
8,000,000 DIRECTV Holdings LLC, senior note, 7.625%, 05/15/16 USA USD 7,800,000 0.7610,000,000 The Williams Cos. Inc., senior note, 7.875%, 09/01/21 USA USD 7,663,690 0.7412,375,000 KB Home, senior note, 6.25%, 06/15/15 USA USD 7,610,625 0.7410,000,000 Visant Holding Corp., senior note, 8.75%, 12/01/13 USA USD 7,450,000 0.72
8,000,000 HCA Inc., senior secured note, 9.125%, 11/15/14 USA USD 7,440,000 0.7214,800,000 Radio One Inc., senior sub. note, B, 8.875%, 07/01/11 USA USD 7,363,000 0.7111,500,000 United Surgical Partners International Inc., senior sub. note, PIK, 9.25%,
05/01/17 USA USD 7,130,000 0.6910,200,000 Quebecor Media Inc., senior note, 7.75%, 03/15/16 CAN USD 6,936,000 0.67
FRANKL IN TEMPLETON INVESTMENT FUNDS
ç Franklin High Yield Fund ç
Schedule of Investments as of December 31, 2008
(Currency ç USD)
Number of % of
shares or Description Country Trading Market net
face value code currency value assets
Unaudited Semi-Annual Report www.franklintempleton.lu90
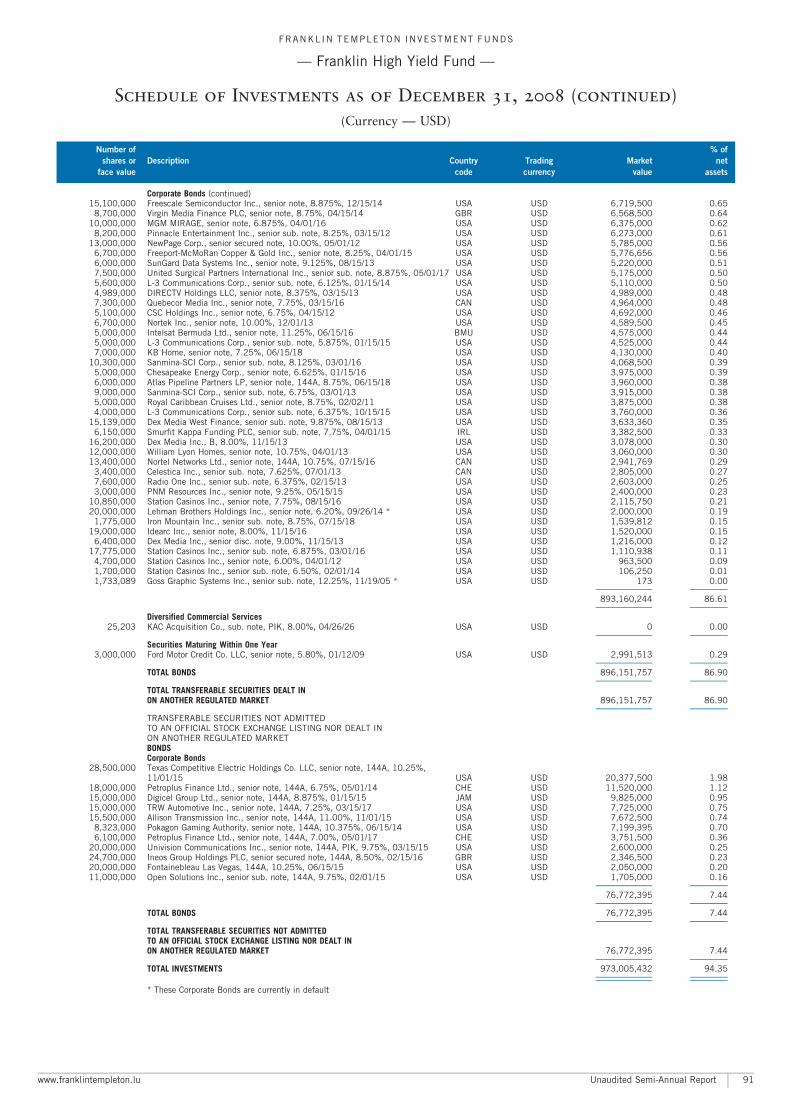
Corporate Bonds (continued)15,100,000 Freescale Semiconductor Inc., senior note, 8.875%, 12/15/14 USA USD 6,719,500 0.65
8,700,000 Virgin Media Finance PLC, senior note, 8.75%, 04/15/14 GBR USD 6,568,500 0.6410,000,000 MGM MIRAGE, senior note, 6.875%, 04/01/16 USA USD 6,375,000 0.62
8,200,000 Pinnacle Entertainment Inc., senior sub. note, 8.25%, 03/15/12 USA USD 6,273,000 0.6113,000,000 NewPage Corp., senior secured note, 10.00%, 05/01/12 USA USD 5,785,000 0.56
6,700,000 Freeport-McMoRan Copper & Gold Inc., senior note, 8.25%, 04/01/15 USA USD 5,776,656 0.566,000,000 SunGard Data Systems Inc., senior note, 9.125%, 08/15/13 USA USD 5,220,000 0.517,500,000 United Surgical Partners International Inc., senior sub. note, 8.875%, 05/01/17 USA USD 5,175,000 0.505,600,000 L-3 Communications Corp., senior sub. note, 6.125%, 01/15/14 USA USD 5,110,000 0.504,989,000 DIRECTV Holdings LLC, senior note, 8.375%, 03/15/13 USA USD 4,989,000 0.487,300,000 Quebecor Media Inc., senior note, 7.75%, 03/15/16 CAN USD 4,964,000 0.485,100,000 CSC Holdings Inc., senior note, 6.75%, 04/15/12 USA USD 4,692,000 0.466,700,000 Nortek Inc., senior note, 10.00%, 12/01/13 USA USD 4,589,500 0.455,000,000 Intelsat Bermuda Ltd., senior note, 11.25%, 06/15/16 BMU USD 4,575,000 0.445,000,000 L-3 Communications Corp., senior sub. note, 5.875%, 01/15/15 USA USD 4,525,000 0.447,000,000 KB Home, senior note, 7.25%, 06/15/18 USA USD 4,130,000 0.40
10,300,000 Sanmina-SCI Corp., senior sub. note, 8.125%, 03/01/16 USA USD 4,068,500 0.395,000,000 Chesapeake Energy Corp., senior note, 6.625%, 01/15/16 USA USD 3,975,000 0.396,000,000 Atlas Pipeline Partners LP, senior note, 144A, 8.75%, 06/15/18 USA USD 3,960,000 0.389,000,000 Sanmina-SCI Corp., senior sub. note, 6.75%, 03/01/13 USA USD 3,915,000 0.385,000,000 Royal Caribbean Cruises Ltd., senior note, 8.75%, 02/02/11 USA USD 3,875,000 0.384,000,000 L-3 Communications Corp., senior sub. note, 6.375%, 10/15/15 USA USD 3,760,000 0.36
15,139,000 Dex Media West Finance, senior sub. note, 9.875%, 08/15/13 USA USD 3,633,360 0.356,150,000 Smurfit Kappa Funding PLC, senior sub. note, 7.75%, 04/01/15 IRL USD 3,382,500 0.33
16,200,000 Dex Media Inc., B, 8.00%, 11/15/13 USA USD 3,078,000 0.3012,000,000 William Lyon Homes, senior note, 10.75%, 04/01/13 USA USD 3,060,000 0.3013,400,000 Nortel Networks Ltd., senior note, 144A, 10.75%, 07/15/16 CAN USD 2,941,769 0.29
3,400,000 Celestica Inc., senior sub. note, 7.625%, 07/01/13 CAN USD 2,805,000 0.277,600,000 Radio One Inc., senior sub. note, 6.375%, 02/15/13 USA USD 2,603,000 0.253,000,000 PNM Resources Inc., senior note, 9.25%, 05/15/15 USA USD 2,400,000 0.23
10,850,000 Station Casinos Inc., senior note, 7.75%, 08/15/16 USA USD 2,115,750 0.2120,000,000 Lehman Brothers Holdings Inc., senior note, 6.20%, 09/26/14 * USA USD 2,000,000 0.19
1,775,000 Iron Mountain Inc., senior sub. note, 8.75%, 07/15/18 USA USD 1,539,812 0.1519,000,000 Idearc Inc., senior note, 8.00%, 11/15/16 USA USD 1,520,000 0.15
6,400,000 Dex Media Inc., senior disc. note, 9.00%, 11/15/13 USA USD 1,216,000 0.1217,775,000 Station Casinos Inc., senior sub. note, 6.875%, 03/01/16 USA USD 1,110,938 0.11
4,700,000 Station Casinos Inc., senior note, 6.00%, 04/01/12 USA USD 963,500 0.091,700,000 Station Casinos Inc., senior sub. note, 6.50%, 02/01/14 USA USD 106,250 0.011,733,089 Goss Graphic Systems Inc., senior sub. note, 12.25%, 11/19/05 * USA USD 173 0.00
A A
893,160,244 86.61A A
Diversified Commercial Services25,203 KAC Acquisition Co., sub. note, PIK, 8.00%, 04/26/26 USA USD 0 0.00
A A
Securities Maturing Within One Year3,000,000 Ford Motor Credit Co. LLC, senior note, 5.80%, 01/12/09 USA USD 2,991,513 0.29
A A
TOTAL BONDS 896,151,757 86.90A A
TOTAL TRANSFERABLE SECURITIES DEALT INON ANOTHER REGULATED MARKET 896,151,757 86.90
A A
TRANSFERABLE SECURITIES NOT ADMITTEDTO AN OFFICIAL STOCK EXCHANGE LISTING NOR DEALT INON ANOTHER REGULATED MARKETBONDSCorporate Bonds
28,500,000 Texas Competitive Electric Holdings Co. LLC, senior note, 144A, 10.25%,11/01/15 USA USD 20,377,500 1.98
18,000,000 Petroplus Finance Ltd., senior note, 144A, 6.75%, 05/01/14 CHE USD 11,520,000 1.1215,000,000 Digicel Group Ltd., senior note, 144A, 8.875%, 01/15/15 JAM USD 9,825,000 0.9515,000,000 TRW Automotive Inc., senior note, 144A, 7.25%, 03/15/17 USA USD 7,725,000 0.7515,500,000 Allison Transmission Inc., senior note, 144A, 11.00%, 11/01/15 USA USD 7,672,500 0.74
8,323,000 Pokagon Gaming Authority, senior note, 144A, 10.375%, 06/15/14 USA USD 7,199,395 0.706,100,000 Petroplus Finance Ltd., senior note, 144A, 7.00%, 05/01/17 CHE USD 3,751,500 0.36
20,000,000 Univision Communications Inc., senior note, 144A, PIK, 9.75%, 03/15/15 USA USD 2,600,000 0.2524,700,000 Ineos Group Holdings PLC, senior secured note, 144A, 8.50%, 02/15/16 GBR USD 2,346,500 0.2320,000,000 Fontainebleau Las Vegas, 144A, 10.25%, 06/15/15 USA USD 2,050,000 0.2011,000,000 Open Solutions Inc., senior sub. note, 144A, 9.75%, 02/01/15 USA USD 1,705,000 0.16
A A
76,772,395 7.44A A
TOTAL BONDS 76,772,395 7.44A A
TOTAL TRANSFERABLE SECURITIES NOT ADMITTEDTO AN OFFICIAL STOCK EXCHANGE LISTING NOR DEALT INON ANOTHER REGULATED MARKET 76,772,395 7.44
A A
TOTAL INVESTMENTS 973,005,432 94.35A A
A A
* These Corporate Bonds are currently in default
FRANKL IN TEMPLETON INVESTMENT FUNDS
ç Franklin High Yield Fund ç
Schedule of Investments as of December 31, 2008 (continued)
(Currency ç USD)
Number of % of
shares or Description Country Trading Market net
face value code currency value assets
www.franklintempleton.lu Unaudited Semi-Annual Report 91
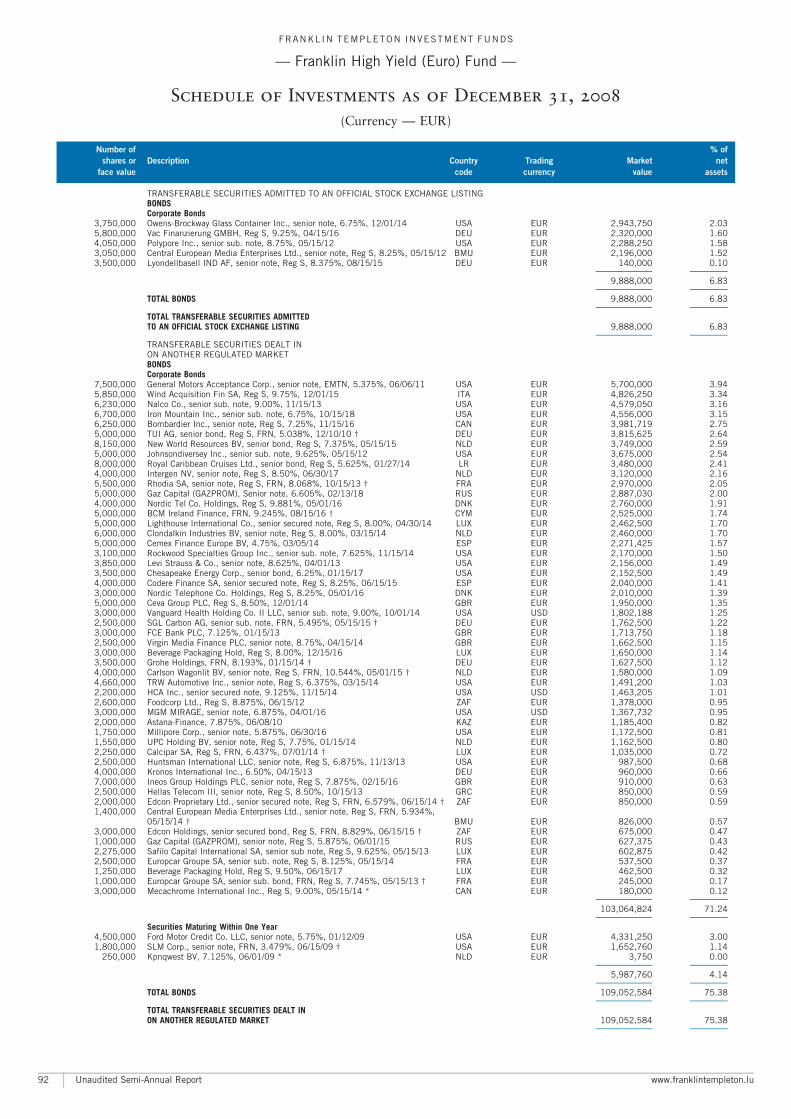
TRANSFERABLE SECURITIES ADMITTED TO AN OFFICIAL STOCK EXCHANGE LISTINGBONDSCorporate Bonds
3,750,000 Owens-Brockway Glass Container Inc., senior note, 6.75%, 12/01/14 USA EUR 2,943,750 2.035,800,000 Vac Finanzierung GMBH, Reg S, 9.25%, 04/15/16 DEU EUR 2,320,000 1.604,050,000 Polypore Inc., senior sub. note, 8.75%, 05/15/12 USA EUR 2,288,250 1.583,050,000 Central European Media Enterprises Ltd., senior note, Reg S, 8.25%, 05/15/12 BMU EUR 2,196,000 1.523,500,000 Lyondellbasell IND AF, senior note, Reg S, 8.375%, 08/15/15 DEU EUR 140,000 0.10
A A
9,888,000 6.83A A
TOTAL BONDS 9,888,000 6.83A A
TOTAL TRANSFERABLE SECURITIES ADMITTEDTO AN OFFICIAL STOCK EXCHANGE LISTING 9,888,000 6.83
A A
TRANSFERABLE SECURITIES DEALT INON ANOTHER REGULATED MARKETBONDSCorporate Bonds
7,500,000 General Motors Acceptance Corp., senior note, EMTN, 5.375%, 06/06/11 USA EUR 5,700,000 3.945,850,000 Wind Acquisition Fin SA, Reg S, 9.75%, 12/01/15 ITA EUR 4,826,250 3.346,230,000 Nalco Co., senior sub. note, 9.00%, 11/15/13 USA EUR 4,579,050 3.166,700,000 Iron Mountain Inc., senior sub. note, 6.75%, 10/15/18 USA EUR 4,556,000 3.156,250,000 Bombardier Inc., senior note, Reg S, 7.25%, 11/15/16 CAN EUR 3,981,719 2.755,000,000 TUI AG, senior bond, Reg S, FRN, 5.038%, 12/10/10 � DEU EUR 3,815,625 2.648,150,000 New World Resources BV, senior bond, Reg S, 7.375%, 05/15/15 NLD EUR 3,749,000 2.595,000,000 Johnsondiversey Inc., senior sub. note, 9.625%, 05/15/12 USA EUR 3,675,000 2.548,000,000 Royal Caribbean Cruises Ltd., senior bond, Reg S, 5.625%, 01/27/14 LR EUR 3,480,000 2.414,000,000 Intergen NV, senior note, Reg S, 8.50%, 06/30/17 NLD EUR 3,120,000 2.165,500,000 Rhodia SA, senior note, Reg S, FRN, 8.068%, 10/15/13 � FRA EUR 2,970,000 2.055,000,000 Gaz Capital (GAZPROM), Senior note, 6.605%, 02/13/18 RUS EUR 2,887,030 2.004,000,000 Nordic Tel Co. Holdings, Reg S, 9.881%, 05/01/16 DNK EUR 2,760,000 1.915,000,000 BCM Ireland Finance, FRN, 9.245%, 08/15/16 � CYM EUR 2,525,000 1.745,000,000 Lighthouse International Co., senior secured note, Reg S, 8.00%, 04/30/14 LUX EUR 2,462,500 1.706,000,000 Clondalkin Industries BV, senior note, Reg S, 8.00%, 03/15/14 NLD EUR 2,460,000 1.705,000,000 Cemex Finance Europe BV, 4.75%, 03/05/14 ESP EUR 2,271,425 1.573,100,000 Rockwood Specialties Group Inc., senior sub. note, 7.625%, 11/15/14 USA EUR 2,170,000 1.503,850,000 Levi Strauss & Co., senior note, 8.625%, 04/01/13 USA EUR 2,156,000 1.493,500,000 Chesapeake Energy Corp., senior bond, 6.25%, 01/15/17 USA EUR 2,152,500 1.494,000,000 Codere Finance SA, senior secured note, Reg S, 8.25%, 06/15/15 ESP EUR 2,040,000 1.413,000,000 Nordic Telephone Co. Holdings, Reg S, 8.25%, 05/01/16 DNK EUR 2,010,000 1.395,000,000 Ceva Group PLC, Reg S, 8.50%, 12/01/14 GBR EUR 1,950,000 1.353,000,000 Vanguard Health Holding Co. II LLC, senior sub. note, 9.00%, 10/01/14 USA USD 1,802,188 1.252,500,000 SGL Carbon AG, senior sub. note, FRN, 5.495%, 05/15/15 � DEU EUR 1,762,500 1.223,000,000 FCE Bank PLC, 7.125%, 01/15/13 GBR EUR 1,713,750 1.182,500,000 Virgin Media Finance PLC, senior note, 8.75%, 04/15/14 GBR EUR 1,662,500 1.153,000,000 Beverage Packaging Hold, Reg S, 8.00%, 12/15/16 LUX EUR 1,650,000 1.143,500,000 Grohe Holdings, FRN, 8.193%, 01/15/14 � DEU EUR 1,627,500 1.124,000,000 Carlson Wagonlit BV, senior note, Reg S, FRN, 10.544%, 05/01/15 � NLD EUR 1,580,000 1.094,660,000 TRW Automotive Inc., senior note, Reg S, 6.375%, 03/15/14 USA EUR 1,491,200 1.032,200,000 HCA Inc., senior secured note, 9.125%, 11/15/14 USA USD 1,463,205 1.012,600,000 Foodcorp Ltd., Reg S, 8.875%, 06/15/12 ZAF EUR 1,378,000 0.953,000,000 MGM MIRAGE, senior note, 6.875%, 04/01/16 USA USD 1,367,732 0.952,000,000 Astana-Finance, 7.875%, 06/08/10 KAZ EUR 1,185,400 0.821,750,000 Millipore Corp., senior note, 5.875%, 06/30/16 USA EUR 1,172,500 0.811,550,000 UPC Holding BV, senior note, Reg S, 7.75%, 01/15/14 NLD EUR 1,162,500 0.802,250,000 Calcipar SA, Reg S, FRN, 6.437%, 07/01/14 � LUX EUR 1,035,000 0.722,500,000 Huntsman International LLC, senior note, Reg S, 6.875%, 11/13/13 USA EUR 987,500 0.684,000,000 Kronos International Inc., 6.50%, 04/15/13 DEU EUR 960,000 0.667,000,000 Ineos Group Holdings PLC, senior note, Reg S, 7.875%, 02/15/16 GBR EUR 910,000 0.632,500,000 Hellas Telecom III, senior note, Reg S, 8.50%, 10/15/13 GRC EUR 850,000 0.592,000,000 Edcon Proprietary Ltd., senior secured note, Reg S, FRN, 6.579%, 06/15/14 � ZAF EUR 850,000 0.591,400,000 Central European Media Enterprises Ltd., senior note, Reg S, FRN, 5.934%,
05/15/14 � BMU EUR 826,000 0.573,000,000 Edcon Holdings, senior secured bond, Reg S, FRN, 8.829%, 06/15/15 � ZAF EUR 675,000 0.471,000,000 Gaz Capital (GAZPROM), senior note, Reg S, 5.875%, 06/01/15 RUS EUR 627,375 0.432,275,000 Safilo Capital International SA, senior sub note, Reg S, 9.625%, 05/15/13 LUX EUR 602,875 0.422,500,000 Europcar Groupe SA, senior sub. note, Reg S, 8.125%, 05/15/14 FRA EUR 537,500 0.371,250,000 Beverage Packaging Hold, Reg S, 9.50%, 06/15/17 LUX EUR 462,500 0.321,000,000 Europcar Groupe SA, senior sub. bond, FRN, Reg S, 7.745%, 05/15/13 � FRA EUR 245,000 0.173,000,000 Mecachrome International Inc., Reg S, 9.00%, 05/15/14 * CAN EUR 180,000 0.12
A A
103,064,824 71.24A A
Securities Maturing Within One Year4,500,000 Ford Motor Credit Co. LLC, senior note, 5.75%, 01/12/09 USA EUR 4,331,250 3.001,800,000 SLM Corp., senior note, FRN, 3.479%, 06/15/09 � USA EUR 1,652,760 1.14
250,000 Kpnqwest BV, 7.125%, 06/01/09 * NLD EUR 3,750 0.00A A
5,987,760 4.14A A
TOTAL BONDS 109,052,584 75.38A A
TOTAL TRANSFERABLE SECURITIES DEALT INON ANOTHER REGULATED MARKET 109,052,584 75.38
A A
FRANKL IN TEMPLETON INVESTMENT FUNDS
ç Franklin High Yield (Euro) Fund ç
Schedule of Investments as of December 31, 2008
(Currency ç EUR)
Number of % of
shares or Description Country Trading Market net
face value code currency value assets
Unaudited Semi-Annual Report www.franklintempleton.lu92
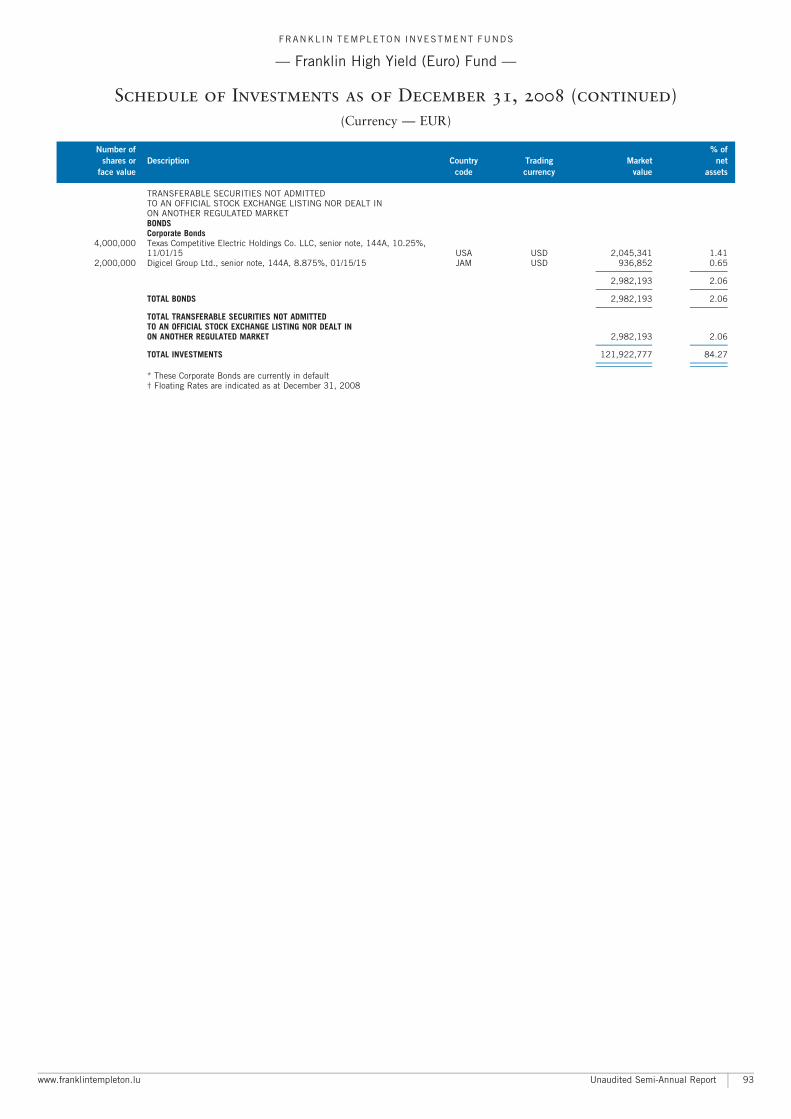
TRANSFERABLE SECURITIES NOT ADMITTEDTO AN OFFICIAL STOCK EXCHANGE LISTING NOR DEALT INON ANOTHER REGULATED MARKETBONDSCorporate Bonds
4,000,000 Texas Competitive Electric Holdings Co. LLC, senior note, 144A, 10.25%,11/01/15 USA USD 2,045,341 1.41
2,000,000 Digicel Group Ltd., senior note, 144A, 8.875%, 01/15/15 JAM USD 936,852 0.65A A
2,982,193 2.06A A
TOTAL BONDS 2,982,193 2.06A A
TOTAL TRANSFERABLE SECURITIES NOT ADMITTEDTO AN OFFICIAL STOCK EXCHANGE LISTING NOR DEALT INON ANOTHER REGULATED MARKET 2,982,193 2.06
A A
TOTAL INVESTMENTS 121,922,777 84.27A A
A A
* These Corporate Bonds are currently in default� Floating Rates are indicated as at December 31, 2008
FRANKL IN TEMPLETON INVESTMENT FUNDS
ç Franklin High Yield (Euro) Fund ç
Schedule of Investments as of December 31, 2008 (continued)
(Currency ç EUR)
Number of % of
shares or Description Country Trading Market net
face value code currency value assets
www.franklintempleton.lu Unaudited Semi-Annual Report 93
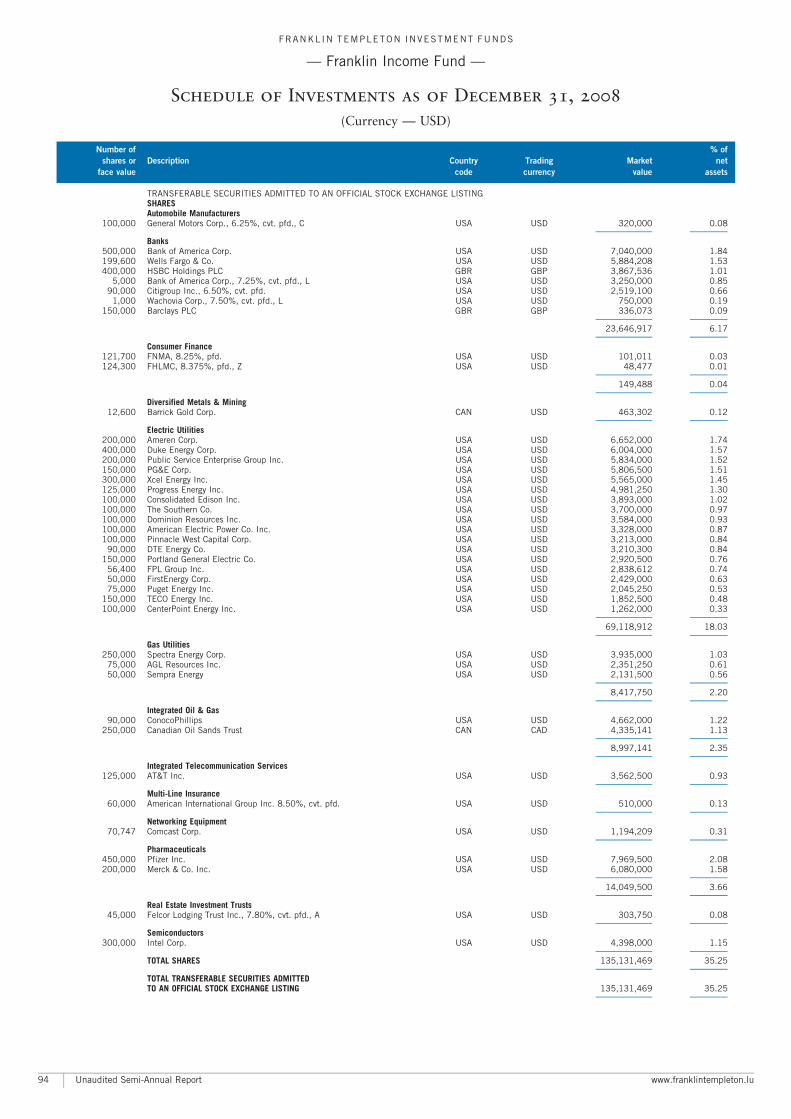
TRANSFERABLE SECURITIES ADMITTED TO AN OFFICIAL STOCK EXCHANGE LISTINGSHARESAutomobile Manufacturers
100,000 General Motors Corp., 6.25%, cvt. pfd., C USA USD 320,000 0.08A A
Banks500,000 Bank of America Corp. USA USD 7,040,000 1.84199,600 Wells Fargo & Co. USA USD 5,884,208 1.53400,000 HSBC Holdings PLC GBR GBP 3,867,536 1.01
5,000 Bank of America Corp., 7.25%, cvt. pfd., L USA USD 3,250,000 0.8590,000 Citigroup Inc., 6.50%, cvt. pfd. USA USD 2,519,100 0.66
1,000 Wachovia Corp., 7.50%, cvt. pfd., L USA USD 750,000 0.19150,000 Barclays PLC GBR GBP 336,073 0.09
A A
23,646,917 6.17A A
Consumer Finance121,700 FNMA, 8.25%, pfd. USA USD 101,011 0.03124,300 FHLMC, 8.375%, pfd., Z USA USD 48,477 0.01
A A
149,488 0.04A A
Diversified Metals & Mining12,600 Barrick Gold Corp. CAN USD 463,302 0.12
A A
Electric Utilities200,000 Ameren Corp. USA USD 6,652,000 1.74400,000 Duke Energy Corp. USA USD 6,004,000 1.57200,000 Public Service Enterprise Group Inc. USA USD 5,834,000 1.52150,000 PG&E Corp. USA USD 5,806,500 1.51300,000 Xcel Energy Inc. USA USD 5,565,000 1.45125,000 Progress Energy Inc. USA USD 4,981,250 1.30100,000 Consolidated Edison Inc. USA USD 3,893,000 1.02100,000 The Southern Co. USA USD 3,700,000 0.97100,000 Dominion Resources Inc. USA USD 3,584,000 0.93100,000 American Electric Power Co. Inc. USA USD 3,328,000 0.87100,000 Pinnacle West Capital Corp. USA USD 3,213,000 0.84
90,000 DTE Energy Co. USA USD 3,210,300 0.84150,000 Portland General Electric Co. USA USD 2,920,500 0.76
56,400 FPL Group Inc. USA USD 2,838,612 0.7450,000 FirstEnergy Corp. USA USD 2,429,000 0.6375,000 Puget Energy Inc. USA USD 2,045,250 0.53
150,000 TECO Energy Inc. USA USD 1,852,500 0.48100,000 CenterPoint Energy Inc. USA USD 1,262,000 0.33
A A
69,118,912 18.03A A
Gas Utilities250,000 Spectra Energy Corp. USA USD 3,935,000 1.03
75,000 AGL Resources Inc. USA USD 2,351,250 0.6150,000 Sempra Energy USA USD 2,131,500 0.56
A A
8,417,750 2.20A A
Integrated Oil & Gas90,000 ConocoPhillips USA USD 4,662,000 1.22
250,000 Canadian Oil Sands Trust CAN CAD 4,335,141 1.13A A
8,997,141 2.35A A
Integrated Telecommunication Services125,000 AT&T Inc. USA USD 3,562,500 0.93
A A
Multi-Line Insurance60,000 American International Group Inc. 8.50%, cvt. pfd. USA USD 510,000 0.13
A A
Networking Equipment70,747 Comcast Corp. USA USD 1,194,209 0.31
A A
Pharmaceuticals450,000 Pfizer Inc. USA USD 7,969,500 2.08200,000 Merck & Co. Inc. USA USD 6,080,000 1.58
A A
14,049,500 3.66A A
Real Estate Investment Trusts45,000 Felcor Lodging Trust Inc., 7.80%, cvt. pfd., A USA USD 303,750 0.08
A A
Semiconductors300,000 Intel Corp. USA USD 4,398,000 1.15
A A
TOTAL SHARES 135,131,469 35.25A A
TOTAL TRANSFERABLE SECURITIES ADMITTEDTO AN OFFICIAL STOCK EXCHANGE LISTING 135,131,469 35.25
A A
FRANKL IN TEMPLETON INVESTMENT FUNDS
ç Franklin Income Fund ç
Schedule of Investments as of December 31, 2008
(Currency ç USD)
Number of % of
shares or Description Country Trading Market net
face value code currency value assets
Unaudited Semi-Annual Report www.franklintempleton.lu94
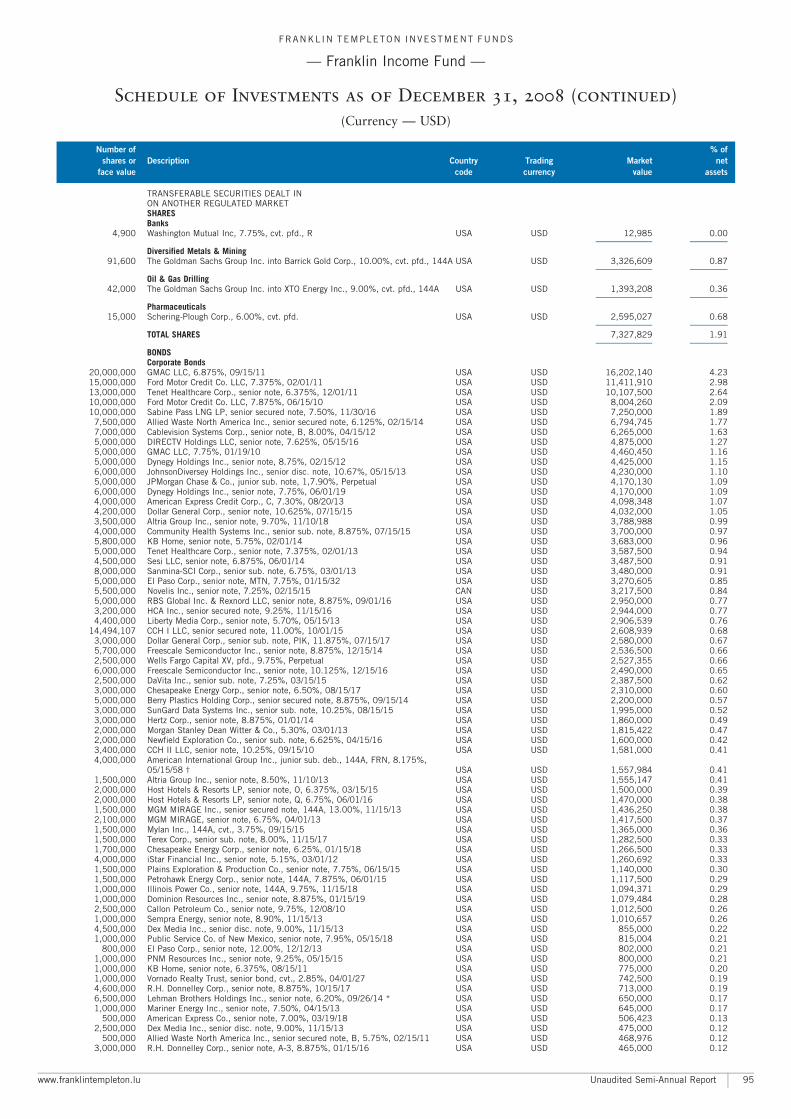
TRANSFERABLE SECURITIES DEALT INON ANOTHER REGULATED MARKETSHARESBanks
4,900 Washington Mutual Inc, 7.75%, cvt. pfd., R USA USD 12,985 0.00A A
Diversified Metals & Mining91,600 The Goldman Sachs Group Inc. into Barrick Gold Corp., 10.00%, cvt. pfd., 144A USA USD 3,326,609 0.87
A A
Oil & Gas Drilling42,000 The Goldman Sachs Group Inc. into XTO Energy Inc., 9.00%, cvt. pfd., 144A USA USD 1,393,208 0.36
A A
Pharmaceuticals15,000 Schering-Plough Corp., 6.00%, cvt. pfd. USA USD 2,595,027 0.68
A A
TOTAL SHARES 7,327,829 1.91A A
BONDSCorporate Bonds
20,000,000 GMAC LLC, 6.875%, 09/15/11 USA USD 16,202,140 4.2315,000,000 Ford Motor Credit Co. LLC, 7.375%, 02/01/11 USA USD 11,411,910 2.9813,000,000 Tenet Healthcare Corp., senior note, 6.375%, 12/01/11 USA USD 10,107,500 2.6410,000,000 Ford Motor Credit Co. LLC, 7.875%, 06/15/10 USA USD 8,004,260 2.0910,000,000 Sabine Pass LNG LP, senior secured note, 7.50%, 11/30/16 USA USD 7,250,000 1.89
7,500,000 Allied Waste North America Inc., senior secured note, 6.125%, 02/15/14 USA USD 6,794,745 1.777,000,000 Cablevision Systems Corp., senior note, B, 8.00%, 04/15/12 USA USD 6,265,000 1.635,000,000 DIRECTV Holdings LLC, senior note, 7.625%, 05/15/16 USA USD 4,875,000 1.275,000,000 GMAC LLC, 7.75%, 01/19/10 USA USD 4,460,450 1.165,000,000 Dynegy Holdings Inc., senior note, 8.75%, 02/15/12 USA USD 4,425,000 1.156,000,000 JohnsonDiversey Holdings Inc., senior disc. note, 10.67%, 05/15/13 USA USD 4,230,000 1.105,000,000 JPMorgan Chase & Co., junior sub. note, 1,7.90%, Perpetual USA USD 4,170,130 1.096,000,000 Dynegy Holdings Inc., senior note, 7.75%, 06/01/19 USA USD 4,170,000 1.094,000,000 American Express Credit Corp., C, 7.30%, 08/20/13 USA USD 4,098,348 1.074,200,000 Dollar General Corp., senior note, 10.625%, 07/15/15 USA USD 4,032,000 1.053,500,000 Altria Group Inc., senior note, 9.70%, 11/10/18 USA USD 3,788,988 0.994,000,000 Community Health Systems Inc., senior sub. note, 8.875%, 07/15/15 USA USD 3,700,000 0.975,800,000 KB Home, senior note, 5.75%, 02/01/14 USA USD 3,683,000 0.965,000,000 Tenet Healthcare Corp., senior note, 7.375%, 02/01/13 USA USD 3,587,500 0.944,500,000 Sesi LLC, senior note, 6.875%, 06/01/14 USA USD 3,487,500 0.918,000,000 Sanmina-SCI Corp., senior sub. note, 6.75%, 03/01/13 USA USD 3,480,000 0.915,000,000 El Paso Corp., senior note, MTN, 7.75%, 01/15/32 USA USD 3,270,605 0.855,500,000 Novelis Inc., senior note, 7.25%, 02/15/15 CAN USD 3,217,500 0.845,000,000 RBS Global Inc. & Rexnord LLC, senior note, 8.875%, 09/01/16 USA USD 2,950,000 0.773,200,000 HCA Inc., senior secured note, 9.25%, 11/15/16 USA USD 2,944,000 0.774,400,000 Liberty Media Corp., senior note, 5.70%, 05/15/13 USA USD 2,906,539 0.76
14,494,107 CCH I LLC, senior secured note, 11.00%, 10/01/15 USA USD 2,608,939 0.683,000,000 Dollar General Corp., senior sub. note, PIK, 11.875%, 07/15/17 USA USD 2,580,000 0.675,700,000 Freescale Semiconductor Inc., senior note, 8.875%, 12/15/14 USA USD 2,536,500 0.662,500,000 Wells Fargo Capital XV, pfd., 9.75%, Perpetual USA USD 2,527,355 0.666,000,000 Freescale Semiconductor Inc., senior note, 10.125%, 12/15/16 USA USD 2,490,000 0.652,500,000 DaVita Inc., senior sub. note, 7.25%, 03/15/15 USA USD 2,387,500 0.623,000,000 Chesapeake Energy Corp., senior note, 6.50%, 08/15/17 USA USD 2,310,000 0.605,000,000 Berry Plastics Holding Corp., senior secured note, 8.875%, 09/15/14 USA USD 2,200,000 0.573,000,000 SunGard Data Systems Inc., senior sub. note, 10.25%, 08/15/15 USA USD 1,995,000 0.523,000,000 Hertz Corp., senior note, 8.875%, 01/01/14 USA USD 1,860,000 0.492,000,000 Morgan Stanley Dean Witter & Co., 5.30%, 03/01/13 USA USD 1,815,422 0.472,000,000 Newfield Exploration Co., senior sub. note, 6.625%, 04/15/16 USA USD 1,600,000 0.423,400,000 CCH II LLC, senior note, 10.25%, 09/15/10 USA USD 1,581,000 0.414,000,000 American International Group Inc., junior sub. deb., 144A, FRN, 8.175%,
05/15/58 � USA USD 1,557,984 0.411,500,000 Altria Group Inc., senior note, 8.50%, 11/10/13 USA USD 1,555,147 0.412,000,000 Host Hotels & Resorts LP, senior note, O, 6.375%, 03/15/15 USA USD 1,500,000 0.392,000,000 Host Hotels & Resorts LP, senior note, Q, 6.75%, 06/01/16 USA USD 1,470,000 0.381,500,000 MGM MIRAGE Inc., senior secured note, 144A, 13.00%, 11/15/13 USA USD 1,436,250 0.382,100,000 MGM MIRAGE, senior note, 6.75%, 04/01/13 USA USD 1,417,500 0.371,500,000 Mylan Inc., 144A, cvt., 3.75%, 09/15/15 USA USD 1,365,000 0.361,500,000 Terex Corp., senior sub. note, 8.00%, 11/15/17 USA USD 1,282,500 0.331,700,000 Chesapeake Energy Corp., senior note, 6.25%, 01/15/18 USA USD 1,266,500 0.334,000,000 iStar Financial Inc., senior note, 5.15%, 03/01/12 USA USD 1,260,692 0.331,500,000 Plains Exploration & Production Co., senior note, 7.75%, 06/15/15 USA USD 1,140,000 0.301,500,000 Petrohawk Energy Corp., senior note, 144A, 7.875%, 06/01/15 USA USD 1,117,500 0.291,000,000 Illinois Power Co., senior note, 144A, 9.75%, 11/15/18 USA USD 1,094,371 0.291,000,000 Dominion Resources Inc., senior note, 8.875%, 01/15/19 USA USD 1,079,484 0.282,500,000 Callon Petroleum Co., senior note, 9.75%, 12/08/10 USA USD 1,012,500 0.261,000,000 Sempra Energy, senior note, 8.90%, 11/15/13 USA USD 1,010,657 0.264,500,000 Dex Media Inc., senior disc. note, 9.00%, 11/15/13 USA USD 855,000 0.221,000,000 Public Service Co. of New Mexico, senior note, 7.95%, 05/15/18 USA USD 815,004 0.21
800,000 El Paso Corp., senior note, 12.00%, 12/12/13 USA USD 802,000 0.211,000,000 PNM Resources Inc., senior note, 9.25%, 05/15/15 USA USD 800,000 0.211,000,000 KB Home, senior note, 6.375%, 08/15/11 USA USD 775,000 0.201,000,000 Vornado Realty Trust, senior bond, cvt., 2.85%, 04/01/27 USA USD 742,500 0.194,600,000 R.H. Donnelley Corp., senior note, 8.875%, 10/15/17 USA USD 713,000 0.196,500,000 Lehman Brothers Holdings Inc., senior note, 6.20%, 09/26/14 * USA USD 650,000 0.171,000,000 Mariner Energy Inc., senior note, 7.50%, 04/15/13 USA USD 645,000 0.17
500,000 American Express Co., senior note, 7.00%, 03/19/18 USA USD 506,423 0.132,500,000 Dex Media Inc., senior disc. note, 9.00%, 11/15/13 USA USD 475,000 0.12
500,000 Allied Waste North America Inc., senior secured note, B, 5.75%, 02/15/11 USA USD 468,976 0.123,000,000 R.H. Donnelley Corp., senior note, A-3, 8.875%, 01/15/16 USA USD 465,000 0.12
FRANKL IN TEMPLETON INVESTMENT FUNDS
ç Franklin Income Fund ç
Schedule of Investments as of December 31, 2008 (continued)
(Currency ç USD)
Number of % of
shares or Description Country Trading Market net
face value code currency value assets
www.franklintempleton.lu Unaudited Semi-Annual Report 95
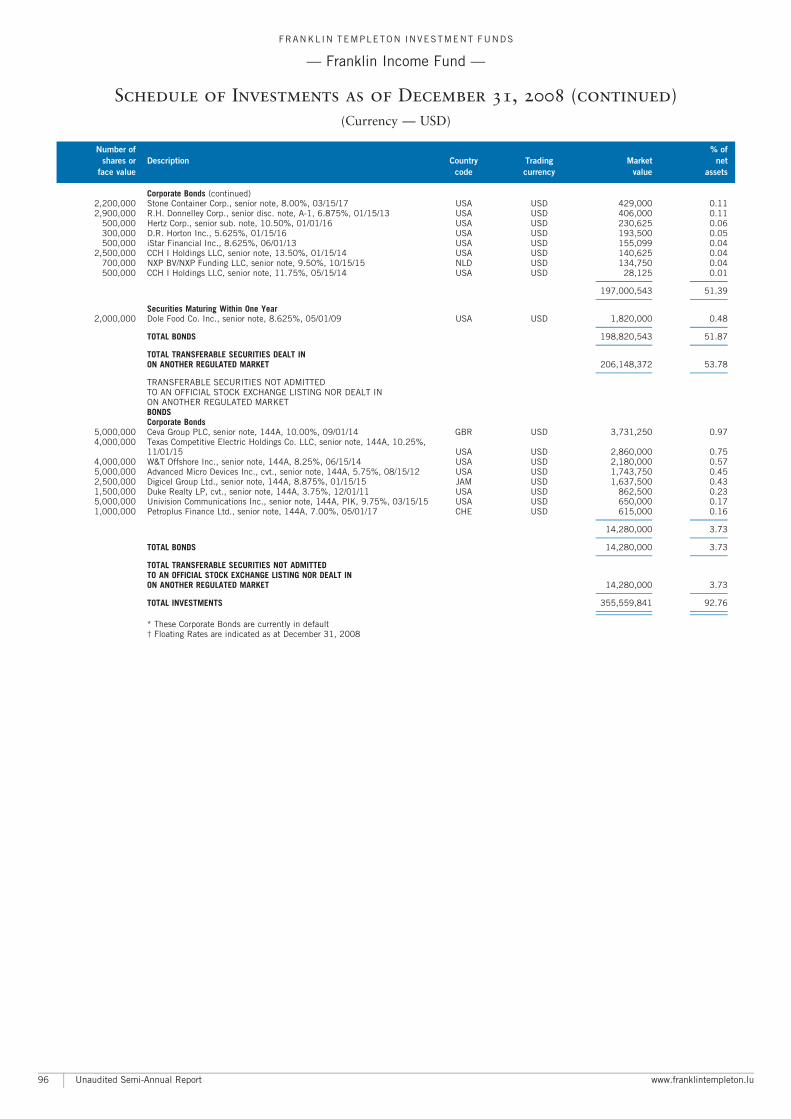
Corporate Bonds (continued)2,200,000 Stone Container Corp., senior note, 8.00%, 03/15/17 USA USD 429,000 0.112,900,000 R.H. Donnelley Corp., senior disc. note, A-1, 6.875%, 01/15/13 USA USD 406,000 0.11
500,000 Hertz Corp., senior sub. note, 10.50%, 01/01/16 USA USD 230,625 0.06300,000 D.R. Horton Inc., 5.625%, 01/15/16 USA USD 193,500 0.05500,000 iStar Financial Inc., 8.625%, 06/01/13 USA USD 155,099 0.04
2,500,000 CCH I Holdings LLC, senior note, 13.50%, 01/15/14 USA USD 140,625 0.04700,000 NXP BV/NXP Funding LLC, senior note, 9.50%, 10/15/15 NLD USD 134,750 0.04500,000 CCH I Holdings LLC, senior note, 11.75%, 05/15/14 USA USD 28,125 0.01
A A
197,000,543 51.39A A
Securities Maturing Within One Year2,000,000 Dole Food Co. Inc., senior note, 8.625%, 05/01/09 USA USD 1,820,000 0.48
A A
TOTAL BONDS 198,820,543 51.87A A
TOTAL TRANSFERABLE SECURITIES DEALT INON ANOTHER REGULATED MARKET 206,148,372 53.78
A A
TRANSFERABLE SECURITIES NOT ADMITTEDTO AN OFFICIAL STOCK EXCHANGE LISTING NOR DEALT INON ANOTHER REGULATED MARKETBONDSCorporate Bonds
5,000,000 Ceva Group PLC, senior note, 144A, 10.00%, 09/01/14 GBR USD 3,731,250 0.974,000,000 Texas Competitive Electric Holdings Co. LLC, senior note, 144A, 10.25%,
11/01/15 USA USD 2,860,000 0.754,000,000 W&T Offshore Inc., senior note, 144A, 8.25%, 06/15/14 USA USD 2,180,000 0.575,000,000 Advanced Micro Devices Inc., cvt., senior note, 144A, 5.75%, 08/15/12 USA USD 1,743,750 0.452,500,000 Digicel Group Ltd., senior note, 144A, 8.875%, 01/15/15 JAM USD 1,637,500 0.431,500,000 Duke Realty LP, cvt., senior note, 144A, 3.75%, 12/01/11 USA USD 862,500 0.235,000,000 Univision Communications Inc., senior note, 144A, PIK, 9.75%, 03/15/15 USA USD 650,000 0.171,000,000 Petroplus Finance Ltd., senior note, 144A, 7.00%, 05/01/17 CHE USD 615,000 0.16
A A
14,280,000 3.73A A
TOTAL BONDS 14,280,000 3.73A A
TOTAL TRANSFERABLE SECURITIES NOT ADMITTEDTO AN OFFICIAL STOCK EXCHANGE LISTING NOR DEALT INON ANOTHER REGULATED MARKET 14,280,000 3.73
A A
TOTAL INVESTMENTS 355,559,841 92.76A A
A A
* These Corporate Bonds are currently in default� Floating Rates are indicated as at December 31, 2008
FRANKL IN TEMPLETON INVESTMENT FUNDS
ç Franklin Income Fund ç
Schedule of Investments as of December 31, 2008 (continued)
(Currency ç USD)
Number of % of
shares or Description Country Trading Market net
face value code currency value assets
Unaudited Semi-Annual Report www.franklintempleton.lu96
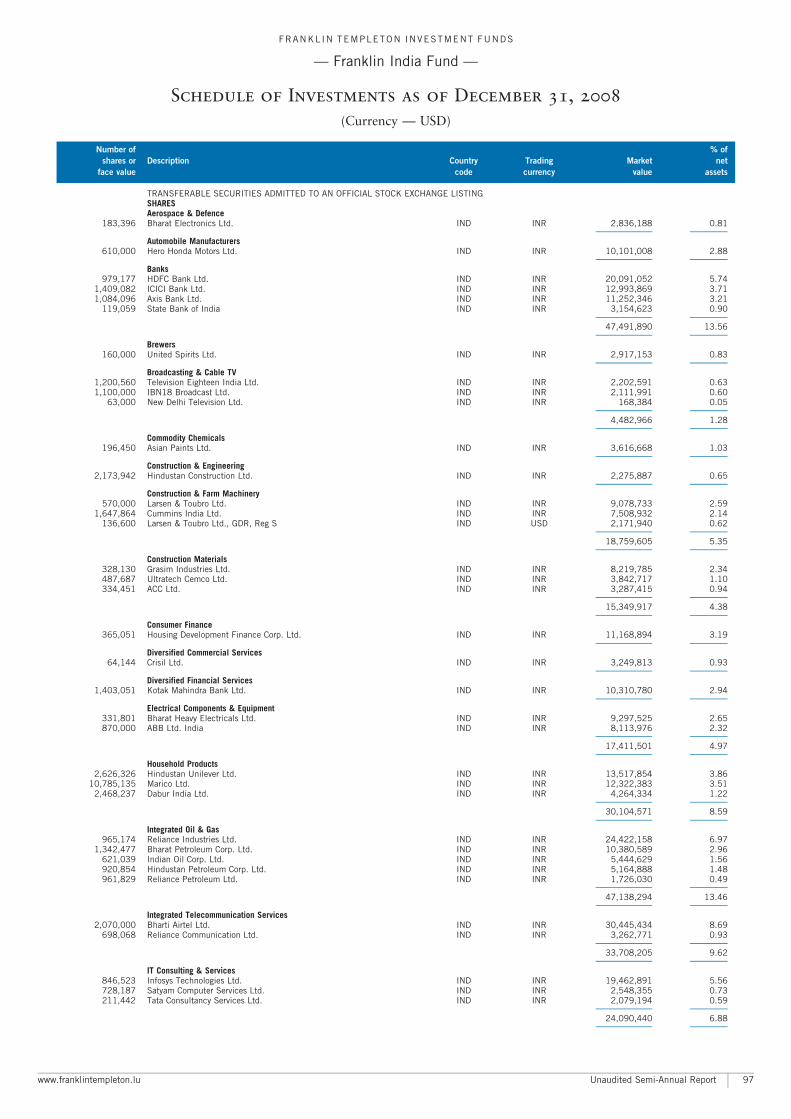
TRANSFERABLE SECURITIES ADMITTED TO AN OFFICIAL STOCK EXCHANGE LISTINGSHARESAerospace & Defence
183,396 Bharat Electronics Ltd. IND INR 2,836,188 0.81A A
Automobile Manufacturers610,000 Hero Honda Motors Ltd. IND INR 10,101,008 2.88
A A
Banks979,177 HDFC Bank Ltd. IND INR 20,091,052 5.74
1,409,082 ICICI Bank Ltd. IND INR 12,993,869 3.711,084,096 Axis Bank Ltd. IND INR 11,252,346 3.21
119,059 State Bank of India IND INR 3,154,623 0.90A A
47,491,890 13.56A A
Brewers160,000 United Spirits Ltd. IND INR 2,917,153 0.83
A A
Broadcasting & Cable TV1,200,560 Television Eighteen India Ltd. IND INR 2,202,591 0.631,100,000 IBN18 Broadcast Ltd. IND INR 2,111,991 0.60
63,000 New Delhi Television Ltd. IND INR 168,384 0.05A A
4,482,966 1.28A A
Commodity Chemicals196,450 Asian Paints Ltd. IND INR 3,616,668 1.03
A A
Construction & Engineering2,173,942 Hindustan Construction Ltd. IND INR 2,275,887 0.65
A A
Construction & Farm Machinery570,000 Larsen & Toubro Ltd. IND INR 9,078,733 2.59
1,647,864 Cummins India Ltd. IND INR 7,508,932 2.14136,600 Larsen & Toubro Ltd., GDR, Reg S IND USD 2,171,940 0.62
A A
18,759,605 5.35A A
Construction Materials328,130 Grasim Industries Ltd. IND INR 8,219,785 2.34487,687 Ultratech Cemco Ltd. IND INR 3,842,717 1.10334,451 ACC Ltd. IND INR 3,287,415 0.94
A A
15,349,917 4.38A A
Consumer Finance365,051 Housing Development Finance Corp. Ltd. IND INR 11,168,894 3.19
A A
Diversified Commercial Services64,144 Crisil Ltd. IND INR 3,249,813 0.93
A A
Diversified Financial Services1,403,051 Kotak Mahindra Bank Ltd. IND INR 10,310,780 2.94
A A
Electrical Components & Equipment331,801 Bharat Heavy Electricals Ltd. IND INR 9,297,525 2.65870,000 ABB Ltd. India IND INR 8,113,976 2.32
A A
17,411,501 4.97A A
Household Products2,626,326 Hindustan Unilever Ltd. IND INR 13,517,854 3.86
10,785,135 Marico Ltd. IND INR 12,322,383 3.512,468,237 Dabur India Ltd. IND INR 4,264,334 1.22
A A
30,104,571 8.59A A
Integrated Oil & Gas965,174 Reliance Industries Ltd. IND INR 24,422,158 6.97
1,342,477 Bharat Petroleum Corp. Ltd. IND INR 10,380,589 2.96621,039 Indian Oil Corp. Ltd. IND INR 5,444,629 1.56920,854 Hindustan Petroleum Corp. Ltd. IND INR 5,164,888 1.48961,829 Reliance Petroleum Ltd. IND INR 1,726,030 0.49
A A
47,138,294 13.46A A
Integrated Telecommunication Services2,070,000 Bharti Airtel Ltd. IND INR 30,445,434 8.69
698,068 Reliance Communication Ltd. IND INR 3,262,771 0.93A A
33,708,205 9.62A A
IT Consulting & Services846,523 Infosys Technologies Ltd. IND INR 19,462,891 5.56728,187 Satyam Computer Services Ltd. IND INR 2,548,355 0.73211,442 Tata Consultancy Services Ltd. IND INR 2,079,194 0.59
A A
24,090,440 6.88A A
FRANKL IN TEMPLETON INVESTMENT FUNDS
ç Franklin India Fund ç
Schedule of Investments as of December 31, 2008
(Currency ç USD)
Number of % of
shares or Description Country Trading Market net
face value code currency value assets
www.franklintempleton.lu Unaudited Semi-Annual Report 97
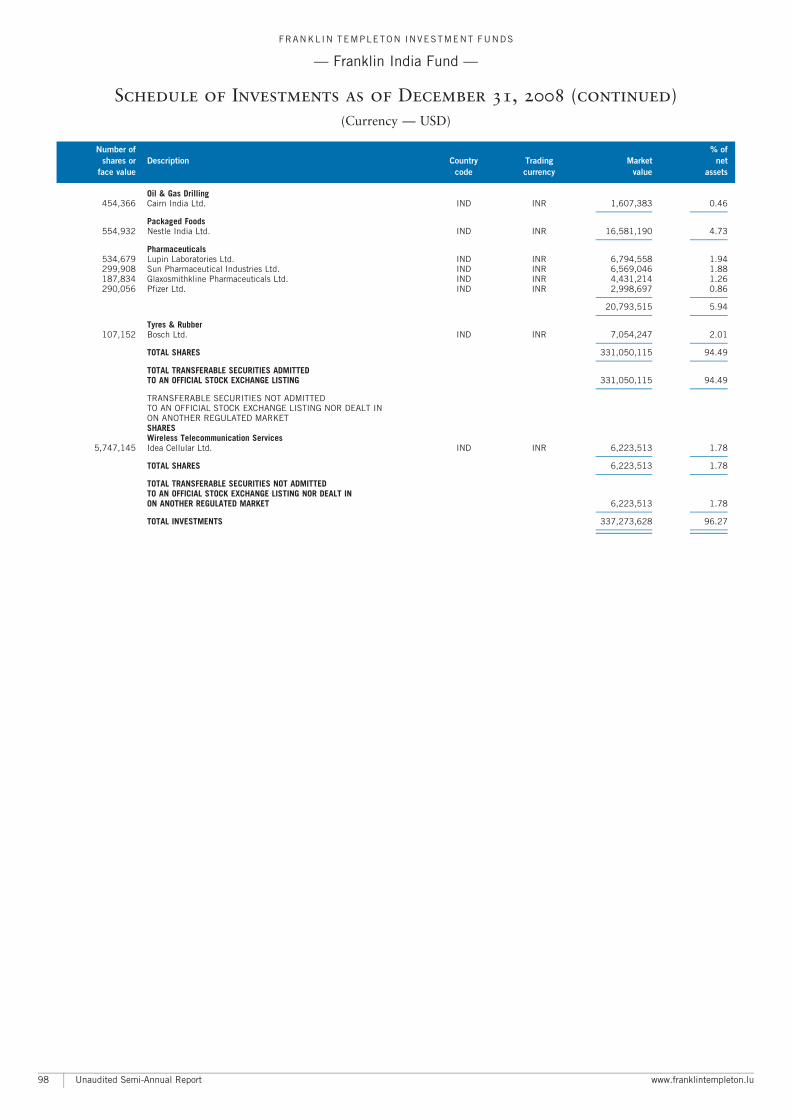
Oil & Gas Drilling454,366 Cairn India Ltd. IND INR 1,607,383 0.46
A A
Packaged Foods554,932 Nestle India Ltd. IND INR 16,581,190 4.73
A A
Pharmaceuticals534,679 Lupin Laboratories Ltd. IND INR 6,794,558 1.94299,908 Sun Pharmaceutical Industries Ltd. IND INR 6,569,046 1.88187,834 Glaxosmithkline Pharmaceuticals Ltd. IND INR 4,431,214 1.26290,056 Pfizer Ltd. IND INR 2,998,697 0.86
A A
20,793,515 5.94A A
Tyres & Rubber107,152 Bosch Ltd. IND INR 7,054,247 2.01
A A
TOTAL SHARES 331,050,115 94.49A A
TOTAL TRANSFERABLE SECURITIES ADMITTEDTO AN OFFICIAL STOCK EXCHANGE LISTING 331,050,115 94.49
A A
TRANSFERABLE SECURITIES NOT ADMITTEDTO AN OFFICIAL STOCK EXCHANGE LISTING NOR DEALT INON ANOTHER REGULATED MARKETSHARESWireless Telecommunication Services
5,747,145 Idea Cellular Ltd. IND INR 6,223,513 1.78A A
TOTAL SHARES 6,223,513 1.78A A
TOTAL TRANSFERABLE SECURITIES NOT ADMITTEDTO AN OFFICIAL STOCK EXCHANGE LISTING NOR DEALT INON ANOTHER REGULATED MARKET 6,223,513 1.78
A A
TOTAL INVESTMENTS 337,273,628 96.27A A
A A
FRANKL IN TEMPLETON INVESTMENT FUNDS
ç Franklin India Fund ç
Schedule of Investments as of December 31, 2008 (continued)
(Currency ç USD)
Number of % of
shares or Description Country Trading Market net
face value code currency value assets
Unaudited Semi-Annual Report www.franklintempleton.lu98
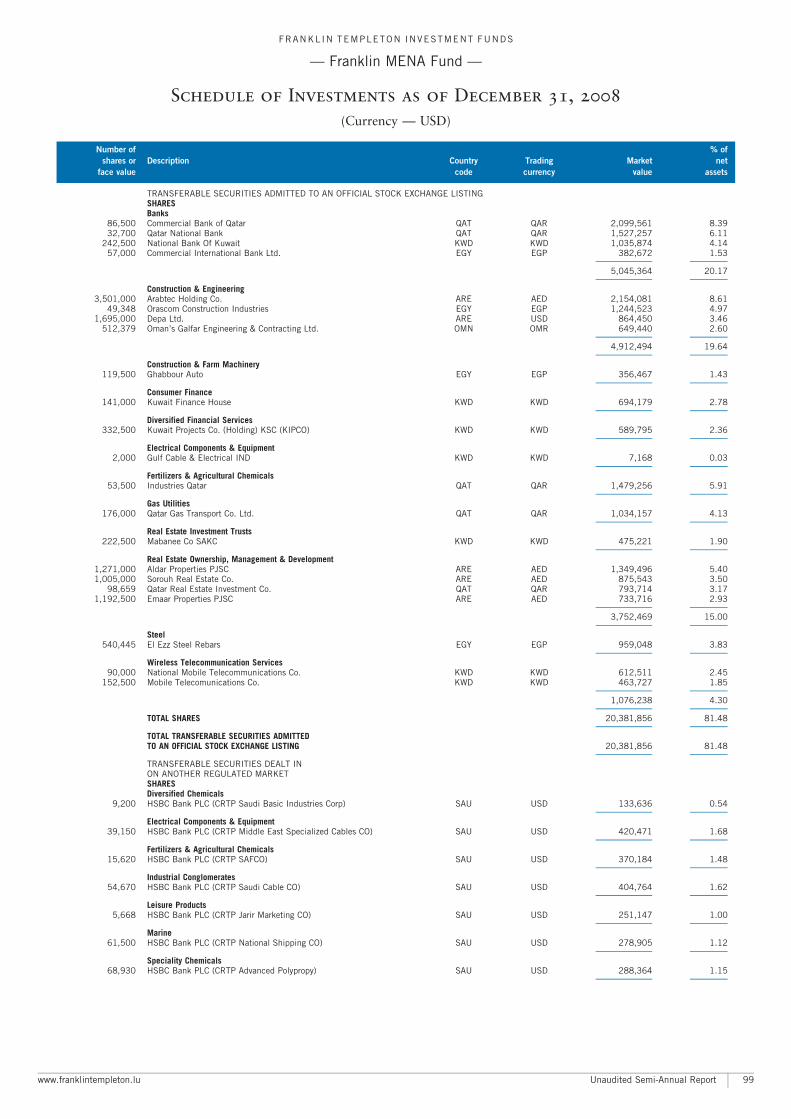
TRANSFERABLE SECURITIES ADMITTED TO AN OFFICIAL STOCK EXCHANGE LISTINGSHARESBanks
86,500 Commercial Bank of Qatar QAT QAR 2,099,561 8.3932,700 Qatar National Bank QAT QAR 1,527,257 6.11
242,500 National Bank Of Kuwait KWD KWD 1,035,874 4.1457,000 Commercial International Bank Ltd. EGY EGP 382,672 1.53
A A
5,045,364 20.17A A
Construction & Engineering3,501,000 Arabtec Holding Co. ARE AED 2,154,081 8.61
49,348 Orascom Construction Industries EGY EGP 1,244,523 4.971,695,000 Depa Ltd. ARE USD 864,450 3.46
512,379 Oman’s Galfar Engineering & Contracting Ltd. OMN OMR 649,440 2.60A A
4,912,494 19.64A A
Construction & Farm Machinery119,500 Ghabbour Auto EGY EGP 356,467 1.43
A A
Consumer Finance141,000 Kuwait Finance House KWD KWD 694,179 2.78
A A
Diversified Financial Services332,500 Kuwait Projects Co. (Holding) KSC (KIPCO) KWD KWD 589,795 2.36
A A
Electrical Components & Equipment2,000 Gulf Cable & Electrical IND KWD KWD 7,168 0.03
A A
Fertilizers & Agricultural Chemicals53,500 Industries Qatar QAT QAR 1,479,256 5.91
A A
Gas Utilities176,000 Qatar Gas Transport Co. Ltd. QAT QAR 1,034,157 4.13
A A
Real Estate Investment Trusts222,500 Mabanee Co SAKC KWD KWD 475,221 1.90
A A
Real Estate Ownership, Management & Development1,271,000 Aldar Properties PJSC ARE AED 1,349,496 5.401,005,000 Sorouh Real Estate Co. ARE AED 875,543 3.50
98,659 Qatar Real Estate Investment Co. QAT QAR 793,714 3.171,192,500 Emaar Properties PJSC ARE AED 733,716 2.93
A A
3,752,469 15.00A A
Steel540,445 El Ezz Steel Rebars EGY EGP 959,048 3.83
A A
Wireless Telecommunication Services90,000 National Mobile Telecommunications Co. KWD KWD 612,511 2.45
152,500 Mobile Telecomunications Co. KWD KWD 463,727 1.85A A
1,076,238 4.30A A
TOTAL SHARES 20,381,856 81.48A A
TOTAL TRANSFERABLE SECURITIES ADMITTEDTO AN OFFICIAL STOCK EXCHANGE LISTING 20,381,856 81.48
A A
TRANSFERABLE SECURITIES DEALT INON ANOTHER REGULATED MARKETSHARESDiversified Chemicals
9,200 HSBC Bank PLC (CRTP Saudi Basic Industries Corp) SAU USD 133,636 0.54A A
Electrical Components & Equipment39,150 HSBC Bank PLC (CRTP Middle East Specialized Cables CO) SAU USD 420,471 1.68
A A
Fertilizers & Agricultural Chemicals15,620 HSBC Bank PLC (CRTP SAFCO) SAU USD 370,184 1.48
A A
Industrial Conglomerates54,670 HSBC Bank PLC (CRTP Saudi Cable CO) SAU USD 404,764 1.62
A A
Leisure Products5,668 HSBC Bank PLC (CRTP Jarir Marketing CO) SAU USD 251,147 1.00
A A
Marine61,500 HSBC Bank PLC (CRTP National Shipping CO) SAU USD 278,905 1.12
A A
Speciality Chemicals68,930 HSBC Bank PLC (CRTP Advanced Polypropy) SAU USD 288,364 1.15
A A
FRANKL IN TEMPLETON INVESTMENT FUNDS
ç Franklin MENA Fund ç
Schedule of Investments as of December 31, 2008
(Currency ç USD)
Number of % of
shares or Description Country Trading Market net
face value code currency value assets
www.franklintempleton.lu Unaudited Semi-Annual Report 99
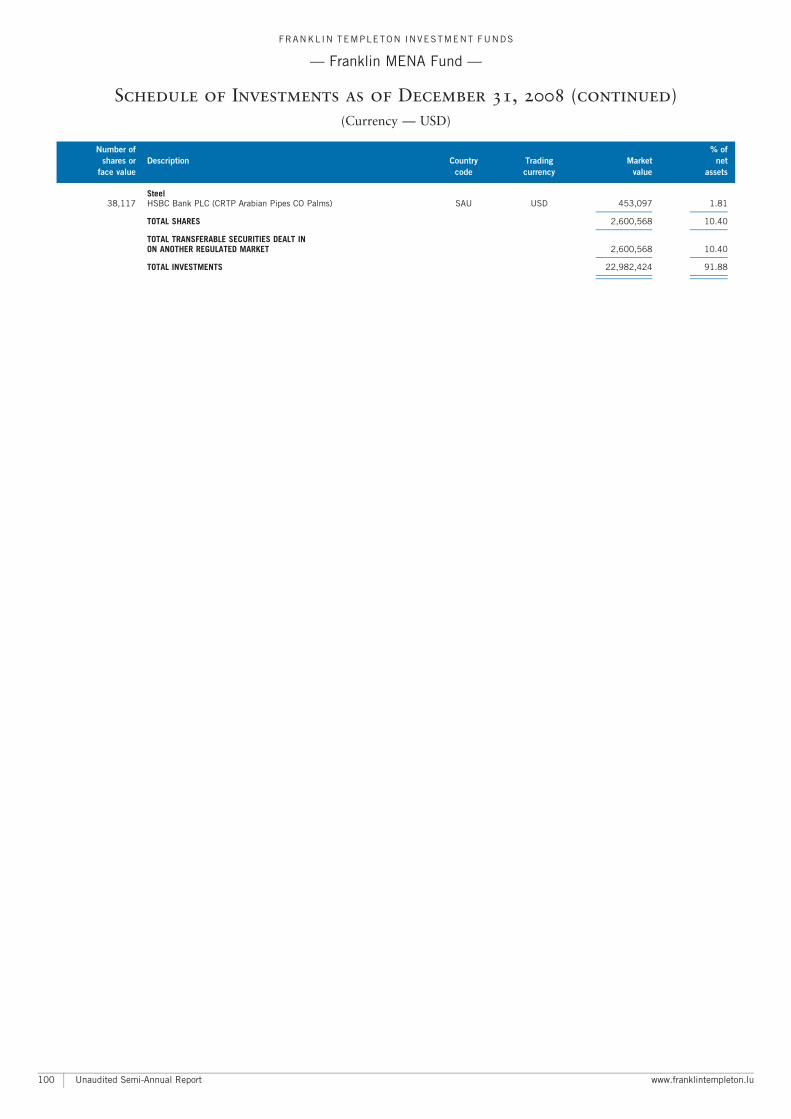
Steel38,117 HSBC Bank PLC (CRTP Arabian Pipes CO Palms) SAU USD 453,097 1.81
A A
TOTAL SHARES 2,600,568 10.40A A
TOTAL TRANSFERABLE SECURITIES DEALT INON ANOTHER REGULATED MARKET 2,600,568 10.40
A A
TOTAL INVESTMENTS 22,982,424 91.88A A
A A
FRANKL IN TEMPLETON INVESTMENT FUNDS
ç Franklin MENA Fund ç
Schedule of Investments as of December 31, 2008 (continued)
(Currency ç USD)
Number of % of
shares or Description Country Trading Market net
face value code currency value assets
Unaudited Semi-Annual Report www.franklintempleton.lu100
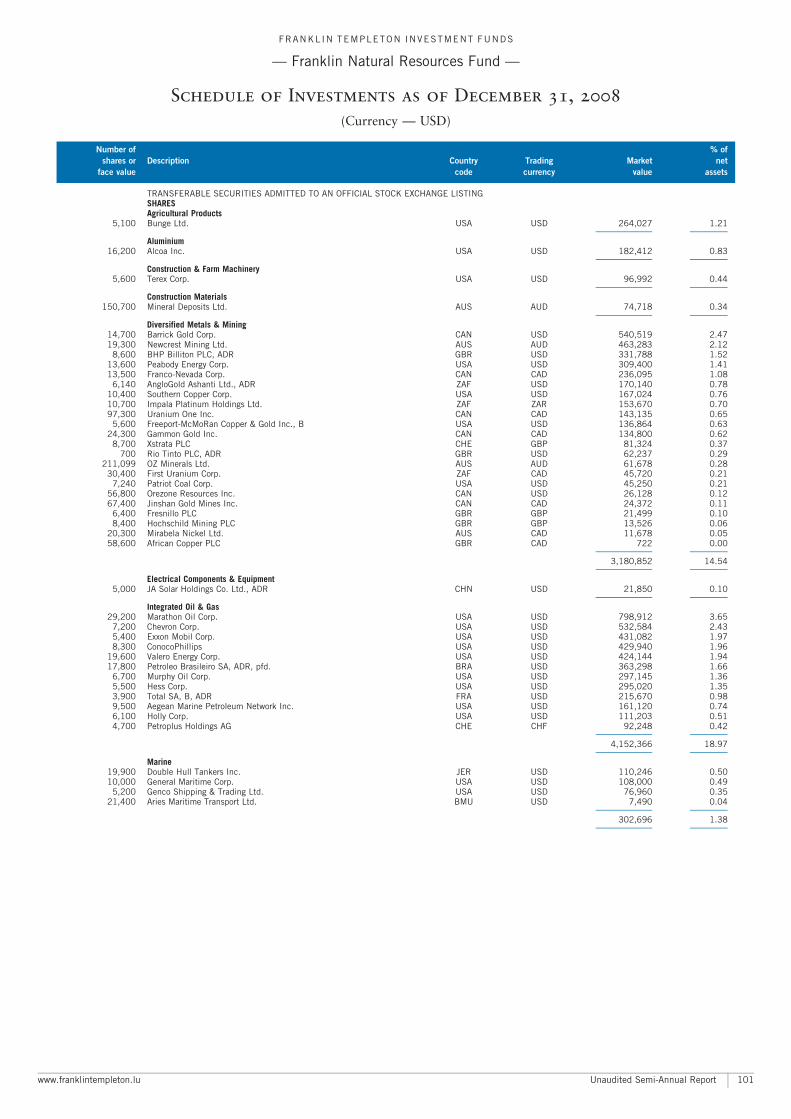
TRANSFERABLE SECURITIES ADMITTED TO AN OFFICIAL STOCK EXCHANGE LISTINGSHARESAgricultural Products
5,100 Bunge Ltd. USA USD 264,027 1.21A A
Aluminium16,200 Alcoa Inc. USA USD 182,412 0.83
A A
Construction & Farm Machinery5,600 Terex Corp. USA USD 96,992 0.44
A A
Construction Materials150,700 Mineral Deposits Ltd. AUS AUD 74,718 0.34
A A
Diversified Metals & Mining14,700 Barrick Gold Corp. CAN USD 540,519 2.4719,300 Newcrest Mining Ltd. AUS AUD 463,283 2.12
8,600 BHP Billiton PLC, ADR GBR USD 331,788 1.5213,600 Peabody Energy Corp. USA USD 309,400 1.4113,500 Franco-Nevada Corp. CAN CAD 236,095 1.08
6,140 AngloGold Ashanti Ltd., ADR ZAF USD 170,140 0.7810,400 Southern Copper Corp. USA USD 167,024 0.7610,700 Impala Platinum Holdings Ltd. ZAF ZAR 153,670 0.7097,300 Uranium One Inc. CAN CAD 143,135 0.65
5,600 Freeport-McMoRan Copper & Gold Inc., B USA USD 136,864 0.6324,300 Gammon Gold Inc. CAN CAD 134,800 0.62
8,700 Xstrata PLC CHE GBP 81,324 0.37700 Rio Tinto PLC, ADR GBR USD 62,237 0.29
211,099 OZ Minerals Ltd. AUS AUD 61,678 0.2830,400 First Uranium Corp. ZAF CAD 45,720 0.21
7,240 Patriot Coal Corp. USA USD 45,250 0.2156,800 Orezone Resources Inc. CAN USD 26,128 0.1267,400 Jinshan Gold Mines Inc. CAN CAD 24,372 0.11
6,400 Fresnillo PLC GBR GBP 21,499 0.108,400 Hochschild Mining PLC GBR GBP 13,526 0.06
20,300 Mirabela Nickel Ltd. AUS CAD 11,678 0.0558,600 African Copper PLC GBR CAD 722 0.00
A A
3,180,852 14.54A A
Electrical Components & Equipment5,000 JA Solar Holdings Co. Ltd., ADR CHN USD 21,850 0.10
A A
Integrated Oil & Gas29,200 Marathon Oil Corp. USA USD 798,912 3.65
7,200 Chevron Corp. USA USD 532,584 2.435,400 Exxon Mobil Corp. USA USD 431,082 1.978,300 ConocoPhillips USA USD 429,940 1.96
19,600 Valero Energy Corp. USA USD 424,144 1.9417,800 Petroleo Brasileiro SA, ADR, pfd. BRA USD 363,298 1.66
6,700 Murphy Oil Corp. USA USD 297,145 1.365,500 Hess Corp. USA USD 295,020 1.353,900 Total SA, B, ADR FRA USD 215,670 0.989,500 Aegean Marine Petroleum Network Inc. USA USD 161,120 0.746,100 Holly Corp. USA USD 111,203 0.514,700 Petroplus Holdings AG CHE CHF 92,248 0.42
A A
4,152,366 18.97A A
Marine19,900 Double Hull Tankers Inc. JER USD 110,246 0.5010,000 General Maritime Corp. USA USD 108,000 0.49
5,200 Genco Shipping & Trading Ltd. USA USD 76,960 0.3521,400 Aries Maritime Transport Ltd. BMU USD 7,490 0.04
A A
302,696 1.38A A
FRANKL IN TEMPLETON INVESTMENT FUNDS
ç Franklin Natural Resources Fund ç
Schedule of Investments as of December 31, 2008
(Currency ç USD)
Number of % of
shares or Description Country Trading Market net
face value code currency value assets
www.franklintempleton.lu Unaudited Semi-Annual Report 101
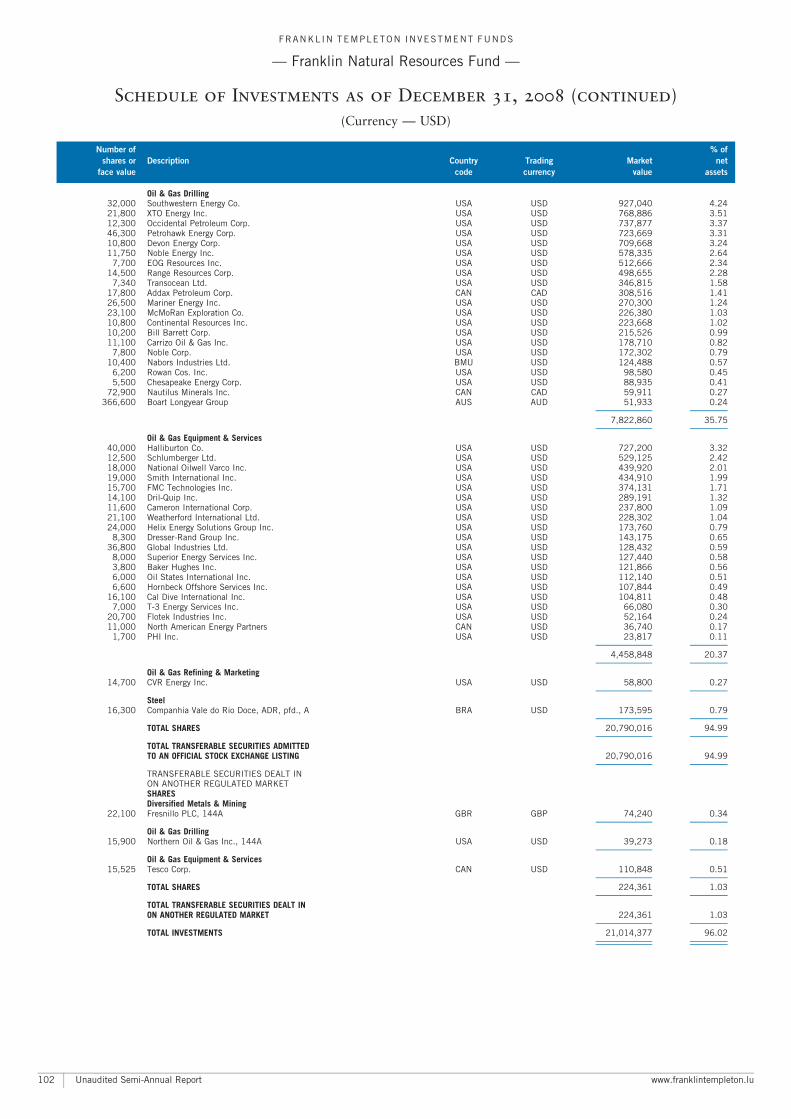
Oil & Gas Drilling32,000 Southwestern Energy Co. USA USD 927,040 4.2421,800 XTO Energy Inc. USA USD 768,886 3.5112,300 Occidental Petroleum Corp. USA USD 737,877 3.3746,300 Petrohawk Energy Corp. USA USD 723,669 3.3110,800 Devon Energy Corp. USA USD 709,668 3.2411,750 Noble Energy Inc. USA USD 578,335 2.64
7,700 EOG Resources Inc. USA USD 512,666 2.3414,500 Range Resources Corp. USA USD 498,655 2.28
7,340 Transocean Ltd. USA USD 346,815 1.5817,800 Addax Petroleum Corp. CAN CAD 308,516 1.4126,500 Mariner Energy Inc. USA USD 270,300 1.2423,100 McMoRan Exploration Co. USA USD 226,380 1.0310,800 Continental Resources Inc. USA USD 223,668 1.0210,200 Bill Barrett Corp. USA USD 215,526 0.9911,100 Carrizo Oil & Gas Inc. USA USD 178,710 0.82
7,800 Noble Corp. USA USD 172,302 0.7910,400 Nabors Industries Ltd. BMU USD 124,488 0.57
6,200 Rowan Cos. Inc. USA USD 98,580 0.455,500 Chesapeake Energy Corp. USA USD 88,935 0.41
72,900 Nautilus Minerals Inc. CAN CAD 59,911 0.27366,600 Boart Longyear Group AUS AUD 51,933 0.24
A A
7,822,860 35.75A A
Oil & Gas Equipment & Services40,000 Halliburton Co. USA USD 727,200 3.3212,500 Schlumberger Ltd. USA USD 529,125 2.4218,000 National Oilwell Varco Inc. USA USD 439,920 2.0119,000 Smith International Inc. USA USD 434,910 1.9915,700 FMC Technologies Inc. USA USD 374,131 1.7114,100 Dril-Quip Inc. USA USD 289,191 1.3211,600 Cameron International Corp. USA USD 237,800 1.0921,100 Weatherford International Ltd. USA USD 228,302 1.0424,000 Helix Energy Solutions Group Inc. USA USD 173,760 0.79
8,300 Dresser-Rand Group Inc. USA USD 143,175 0.6536,800 Global Industries Ltd. USA USD 128,432 0.59
8,000 Superior Energy Services Inc. USA USD 127,440 0.583,800 Baker Hughes Inc. USA USD 121,866 0.566,000 Oil States International Inc. USA USD 112,140 0.516,600 Hornbeck Offshore Services Inc. USA USD 107,844 0.49
16,100 Cal Dive International Inc. USA USD 104,811 0.487,000 T-3 Energy Services Inc. USA USD 66,080 0.30
20,700 Flotek Industries Inc. USA USD 52,164 0.2411,000 North American Energy Partners CAN USD 36,740 0.17
1,700 PHI Inc. USA USD 23,817 0.11A A
4,458,848 20.37A A
Oil & Gas Refining & Marketing14,700 CVR Energy Inc. USA USD 58,800 0.27
A A
Steel16,300 Companhia Vale do Rio Doce, ADR, pfd., A BRA USD 173,595 0.79
A A
TOTAL SHARES 20,790,016 94.99A A
TOTAL TRANSFERABLE SECURITIES ADMITTEDTO AN OFFICIAL STOCK EXCHANGE LISTING 20,790,016 94.99
A A
TRANSFERABLE SECURITIES DEALT INON ANOTHER REGULATED MARKETSHARESDiversified Metals & Mining
22,100 Fresnillo PLC, 144A GBR GBP 74,240 0.34A A
Oil & Gas Drilling15,900 Northern Oil & Gas Inc., 144A USA USD 39,273 0.18
A A
Oil & Gas Equipment & Services15,525 Tesco Corp. CAN USD 110,848 0.51
A A
TOTAL SHARES 224,361 1.03A A
TOTAL TRANSFERABLE SECURITIES DEALT INON ANOTHER REGULATED MARKET 224,361 1.03
A A
TOTAL INVESTMENTS 21,014,377 96.02A A
A A
FRANKL IN TEMPLETON INVESTMENT FUNDS
ç Franklin Natural Resources Fund ç
Schedule of Investments as of December 31, 2008 (continued)
(Currency ç USD)
Number of % of
shares or Description Country Trading Market net
face value code currency value assets
Unaudited Semi-Annual Report www.franklintempleton.lu102
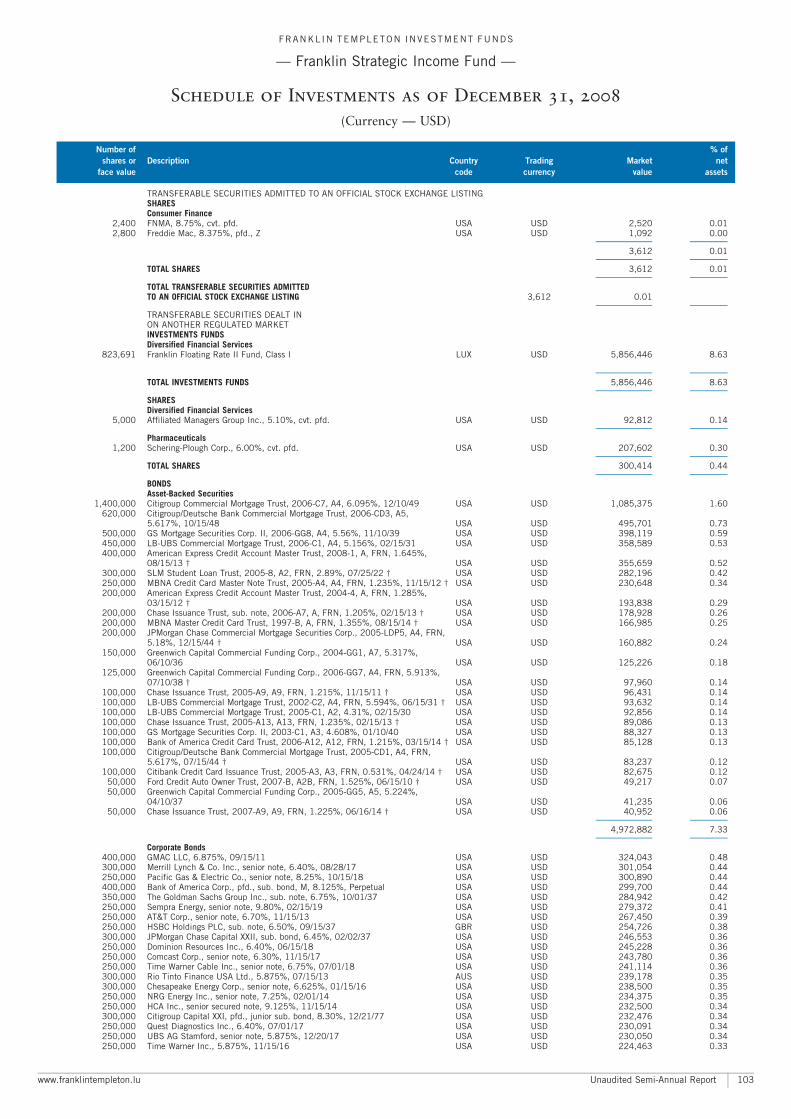
TRANSFERABLE SECURITIES ADMITTED TO AN OFFICIAL STOCK EXCHANGE LISTINGSHARESConsumer Finance
2,400 FNMA, 8.75%, cvt. pfd. USA USD 2,520 0.012,800 Freddie Mac, 8.375%, pfd., Z USA USD 1,092 0.00
A A
3,612 0.01A A
TOTAL SHARES 3,612 0.01A A
TOTAL TRANSFERABLE SECURITIES ADMITTEDTO AN OFFICIAL STOCK EXCHANGE LISTING 3,612 0.01
A A
TRANSFERABLE SECURITIES DEALT INON ANOTHER REGULATED MARKETINVESTMENTS FUNDSDiversified Financial Services
823,691 Franklin Floating Rate II Fund, Class I LUX USD 5,856,446 8.63
A A
TOTAL INVESTMENTS FUNDS 5,856,446 8.63A A
SHARESDiversified Financial Services
5,000 Affiliated Managers Group Inc., 5.10%, cvt. pfd. USA USD 92,812 0.14A A
Pharmaceuticals1,200 Schering-Plough Corp., 6.00%, cvt. pfd. USA USD 207,602 0.30
A A
TOTAL SHARES 300,414 0.44A A
BONDSAsset-Backed Securities
1,400,000 Citigroup Commercial Mortgage Trust, 2006-C7, A4, 6.095%, 12/10/49 USA USD 1,085,375 1.60620,000 Citigroup/Deutsche Bank Commercial Mortgage Trust, 2006-CD3, A5,
5.617%, 10/15/48 USA USD 495,701 0.73500,000 GS Mortgage Securities Corp. II, 2006-GG8, A4, 5.56%, 11/10/39 USA USD 398,119 0.59450,000 LB-UBS Commercial Mortgage Trust, 2006-C1, A4, 5.156%, 02/15/31 USA USD 358,589 0.53400,000 American Express Credit Account Master Trust, 2008-1, A, FRN, 1.645%,
08/15/13 � USA USD 355,659 0.52300,000 SLM Student Loan Trust, 2005-8, A2, FRN, 2.89%, 07/25/22 � USA USD 282,196 0.42250,000 MBNA Credit Card Master Note Trust, 2005-A4, A4, FRN, 1.235%, 11/15/12 � USA USD 230,648 0.34200,000 American Express Credit Account Master Trust, 2004-4, A, FRN, 1.285%,
03/15/12 � USA USD 193,838 0.29200,000 Chase Issuance Trust, sub. note, 2006-A7, A, FRN, 1.205%, 02/15/13 � USA USD 178,928 0.26200,000 MBNA Master Credit Card Trust, 1997-B, A, FRN, 1.355%, 08/15/14 � USA USD 166,985 0.25200,000 JPMorgan Chase Commercial Mortgage Securities Corp., 2005-LDP5, A4, FRN,
5.18%, 12/15/44 � USA USD 160,882 0.24150,000 Greenwich Capital Commercial Funding Corp., 2004-GG1, A7, 5.317%,
06/10/36 USA USD 125,226 0.18125,000 Greenwich Capital Commercial Funding Corp., 2006-GG7, A4, FRN, 5.913%,
07/10/38 � USA USD 97,960 0.14100,000 Chase Issuance Trust, 2005-A9, A9, FRN, 1.215%, 11/15/11 � USA USD 96,431 0.14100,000 LB-UBS Commercial Mortgage Trust, 2002-C2, A4, FRN, 5.594%, 06/15/31 � USA USD 93,632 0.14100,000 LB-UBS Commercial Mortgage Trust, 2005-C1, A2, 4.31%, 02/15/30 USA USD 92,856 0.14100,000 Chase Issuance Trust, 2005-A13, A13, FRN, 1.235%, 02/15/13 � USA USD 89,086 0.13100,000 GS Mortgage Securities Corp. II, 2003-C1, A3, 4.608%, 01/10/40 USA USD 88,327 0.13100,000 Bank of America Credit Card Trust, 2006-A12, A12, FRN, 1.215%, 03/15/14 � USA USD 85,128 0.13100,000 Citigroup/Deutsche Bank Commercial Mortgage Trust, 2005-CD1, A4, FRN,
5.617%, 07/15/44 � USA USD 83,237 0.12100,000 Citibank Credit Card Issuance Trust, 2005-A3, A3, FRN, 0.531%, 04/24/14 � USA USD 82,675 0.12
50,000 Ford Credit Auto Owner Trust, 2007-B, A2B, FRN, 1.525%, 06/15/10 � USA USD 49,217 0.0750,000 Greenwich Capital Commercial Funding Corp., 2005-GG5, A5, 5.224%,
04/10/37 USA USD 41,235 0.0650,000 Chase Issuance Trust, 2007-A9, A9, FRN, 1.225%, 06/16/14 � USA USD 40,952 0.06
A A
4,972,882 7.33A A
Corporate Bonds400,000 GMAC LLC, 6.875%, 09/15/11 USA USD 324,043 0.48300,000 Merrill Lynch & Co. Inc., senior note, 6.40%, 08/28/17 USA USD 301,054 0.44250,000 Pacific Gas & Electric Co., senior note, 8.25%, 10/15/18 USA USD 300,890 0.44400,000 Bank of America Corp., pfd., sub. bond, M, 8.125%, Perpetual USA USD 299,700 0.44350,000 The Goldman Sachs Group Inc., sub. note, 6.75%, 10/01/37 USA USD 284,942 0.42250,000 Sempra Energy, senior note, 9.80%, 02/15/19 USA USD 279,372 0.41250,000 AT&T Corp., senior note, 6.70%, 11/15/13 USA USD 267,450 0.39250,000 HSBC Holdings PLC, sub. note, 6.50%, 09/15/37 GBR USD 254,726 0.38300,000 JPMorgan Chase Capital XXII, sub. bond, 6.45%, 02/02/37 USA USD 246,553 0.36250,000 Dominion Resources Inc., 6.40%, 06/15/18 USA USD 245,228 0.36250,000 Comcast Corp., senior note, 6.30%, 11/15/17 USA USD 243,780 0.36250,000 Time Warner Cable Inc., senior note, 6.75%, 07/01/18 USA USD 241,114 0.36300,000 Rio Tinto Finance USA Ltd., 5.875%, 07/15/13 AUS USD 239,178 0.35300,000 Chesapeake Energy Corp., senior note, 6.625%, 01/15/16 USA USD 238,500 0.35250,000 NRG Energy Inc., senior note, 7.25%, 02/01/14 USA USD 234,375 0.35250,000 HCA Inc., senior secured note, 9.125%, 11/15/14 USA USD 232,500 0.34300,000 Citigroup Capital XXI, pfd., junior sub. bond, 8.30%, 12/21/77 USA USD 232,476 0.34250,000 Quest Diagnostics Inc., 6.40%, 07/01/17 USA USD 230,091 0.34250,000 UBS AG Stamford, senior note, 5.875%, 12/20/17 USA USD 230,050 0.34250,000 Time Warner Inc., 5.875%, 11/15/16 USA USD 224,463 0.33
FRANKL IN TEMPLETON INVESTMENT FUNDS
ç Franklin Strategic Income Fund ç
Schedule of Investments as of December 31, 2008
(Currency ç USD)
Number of % of
shares or Description Country Trading Market net
face value code currency value assets
www.franklintempleton.lu Unaudited Semi-Annual Report 103
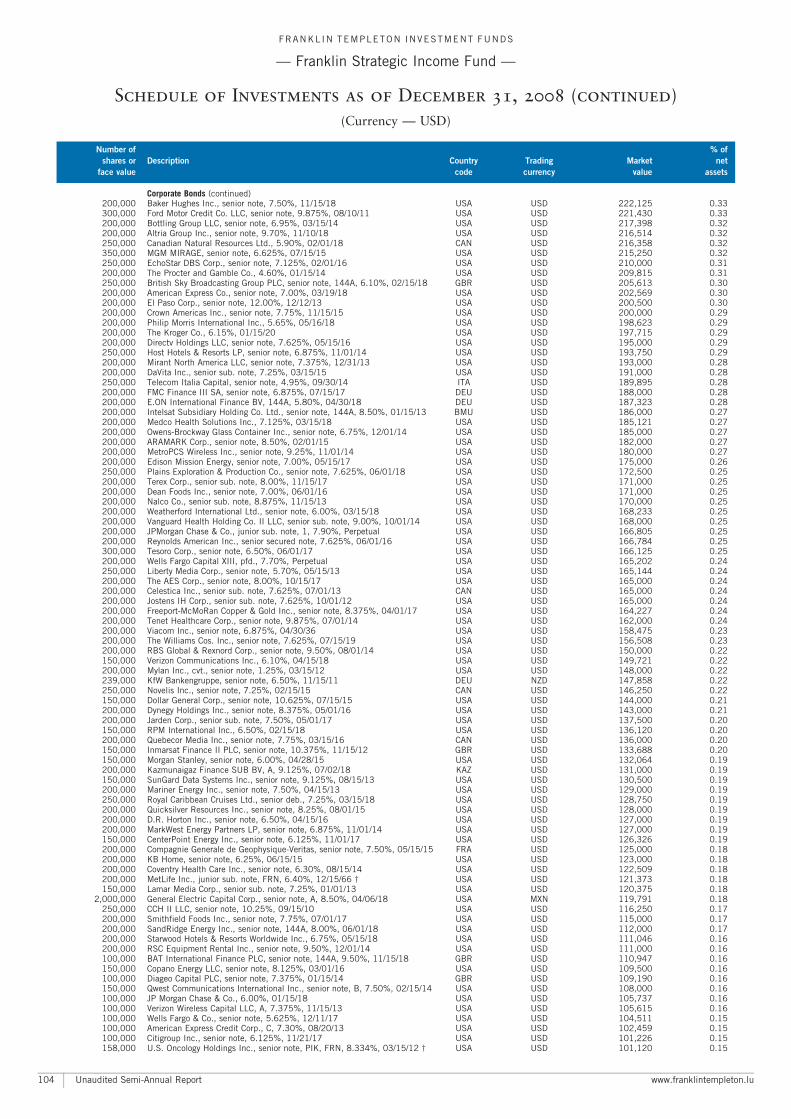
Corporate Bonds (continued)200,000 Baker Hughes Inc., senior note, 7.50%, 11/15/18 USA USD 222,125 0.33300,000 Ford Motor Credit Co. LLC, senior note, 9.875%, 08/10/11 USA USD 221,430 0.33200,000 Bottling Group LLC, senior note, 6.95%, 03/15/14 USA USD 217,398 0.32200,000 Altria Group Inc., senior note, 9.70%, 11/10/18 USA USD 216,514 0.32250,000 Canadian Natural Resources Ltd., 5.90%, 02/01/18 CAN USD 216,358 0.32350,000 MGM MIRAGE, senior note, 6.625%, 07/15/15 USA USD 215,250 0.32250,000 EchoStar DBS Corp., senior note, 7.125%, 02/01/16 USA USD 210,000 0.31200,000 The Procter and Gamble Co., 4.60%, 01/15/14 USA USD 209,815 0.31250,000 British Sky Broadcasting Group PLC, senior note, 144A, 6.10%, 02/15/18 GBR USD 205,613 0.30200,000 American Express Co., senior note, 7.00%, 03/19/18 USA USD 202,569 0.30200,000 El Paso Corp., senior note, 12.00%, 12/12/13 USA USD 200,500 0.30200,000 Crown Americas Inc., senior note, 7.75%, 11/15/15 USA USD 200,000 0.29200,000 Philip Morris International Inc., 5.65%, 05/16/18 USA USD 198,623 0.29200,000 The Kroger Co., 6.15%, 01/15/20 USA USD 197,715 0.29200,000 Directv Holdings LLC, senior note, 7.625%, 05/15/16 USA USD 195,000 0.29250,000 Host Hotels & Resorts LP, senior note, 6.875%, 11/01/14 USA USD 193,750 0.29200,000 Mirant North America LLC, senior note, 7.375%, 12/31/13 USA USD 193,000 0.28200,000 DaVita Inc., senior sub. note, 7.25%, 03/15/15 USA USD 191,000 0.28250,000 Telecom Italia Capital, senior note, 4.95%, 09/30/14 ITA USD 189,895 0.28200,000 FMC Finance III SA, senior note, 6.875%, 07/15/17 DEU USD 188,000 0.28200,000 E.ON International Finance BV, 144A, 5.80%, 04/30/18 DEU USD 187,323 0.28200,000 Intelsat Subsidiary Holding Co. Ltd., senior note, 144A, 8.50%, 01/15/13 BMU USD 186,000 0.27200,000 Medco Health Solutions Inc., 7.125%, 03/15/18 USA USD 185,121 0.27200,000 Owens-Brockway Glass Container Inc., senior note, 6.75%, 12/01/14 USA USD 185,000 0.27200,000 ARAMARK Corp., senior note, 8.50%, 02/01/15 USA USD 182,000 0.27200,000 MetroPCS Wireless Inc., senior note, 9.25%, 11/01/14 USA USD 180,000 0.27200,000 Edison Mission Energy, senior note, 7.00%, 05/15/17 USA USD 175,000 0.26250,000 Plains Exploration & Production Co., senior note, 7.625%, 06/01/18 USA USD 172,500 0.25200,000 Terex Corp., senior sub. note, 8.00%, 11/15/17 USA USD 171,000 0.25200,000 Dean Foods Inc., senior note, 7.00%, 06/01/16 USA USD 171,000 0.25200,000 Nalco Co., senior sub. note, 8.875%, 11/15/13 USA USD 170,000 0.25200,000 Weatherford International Ltd., senior note, 6.00%, 03/15/18 USA USD 168,233 0.25200,000 Vanguard Health Holding Co. II LLC, senior sub. note, 9.00%, 10/01/14 USA USD 168,000 0.25200,000 JPMorgan Chase & Co., junior sub. note, 1, 7.90%, Perpetual USA USD 166,805 0.25200,000 Reynolds American Inc., senior secured note, 7.625%, 06/01/16 USA USD 166,784 0.25300,000 Tesoro Corp., senior note, 6.50%, 06/01/17 USA USD 166,125 0.25200,000 Wells Fargo Capital XIII, pfd., 7.70%, Perpetual USA USD 165,202 0.24250,000 Liberty Media Corp., senior note, 5.70%, 05/15/13 USA USD 165,144 0.24200,000 The AES Corp., senior note, 8.00%, 10/15/17 USA USD 165,000 0.24200,000 Celestica Inc., senior sub. note, 7.625%, 07/01/13 CAN USD 165,000 0.24200,000 Jostens IH Corp., senior sub. note, 7.625%, 10/01/12 USA USD 165,000 0.24200,000 Freeport-McMoRan Copper & Gold Inc., senior note, 8.375%, 04/01/17 USA USD 164,227 0.24200,000 Tenet Healthcare Corp., senior note, 9.875%, 07/01/14 USA USD 162,000 0.24200,000 Viacom Inc., senior note, 6.875%, 04/30/36 USA USD 158,475 0.23200,000 The Williams Cos. Inc., senior note, 7.625%, 07/15/19 USA USD 156,508 0.23200,000 RBS Global & Rexnord Corp., senior note, 9.50%, 08/01/14 USA USD 150,000 0.22150,000 Verizon Communications Inc., 6.10%, 04/15/18 USA USD 149,721 0.22200,000 Mylan Inc., cvt., senior note, 1.25%, 03/15/12 USA USD 148,000 0.22239,000 KfW Bankengruppe, senior note, 6.50%, 11/15/11 DEU NZD 147,858 0.22250,000 Novelis Inc., senior note, 7.25%, 02/15/15 CAN USD 146,250 0.22150,000 Dollar General Corp., senior note, 10.625%, 07/15/15 USA USD 144,000 0.21200,000 Dynegy Holdings Inc., senior note, 8.375%, 05/01/16 USA USD 143,000 0.21200,000 Jarden Corp., senior sub. note, 7.50%, 05/01/17 USA USD 137,500 0.20150,000 RPM International Inc., 6.50%, 02/15/18 USA USD 136,120 0.20200,000 Quebecor Media Inc., senior note, 7.75%, 03/15/16 CAN USD 136,000 0.20150,000 Inmarsat Finance II PLC, senior note, 10.375%, 11/15/12 GBR USD 133,688 0.20150,000 Morgan Stanley, senior note, 6.00%, 04/28/15 USA USD 132,064 0.19200,000 Kazmunaigaz Finance SUB BV, A, 9.125%, 07/02/18 KAZ USD 131,000 0.19150,000 SunGard Data Systems Inc., senior note, 9.125%, 08/15/13 USA USD 130,500 0.19200,000 Mariner Energy Inc., senior note, 7.50%, 04/15/13 USA USD 129,000 0.19250,000 Royal Caribbean Cruises Ltd., senior deb., 7.25%, 03/15/18 USA USD 128,750 0.19200,000 Quicksilver Resources Inc., senior note, 8.25%, 08/01/15 USA USD 128,000 0.19200,000 D.R. Horton Inc., senior note, 6.50%, 04/15/16 USA USD 127,000 0.19200,000 MarkWest Energy Partners LP, senior note, 6.875%, 11/01/14 USA USD 127,000 0.19150,000 CenterPoint Energy Inc., senior note, 6.125%, 11/01/17 USA USD 126,326 0.19200,000 Compagnie Generale de Geophysique-Veritas, senior note, 7.50%, 05/15/15 FRA USD 125,000 0.18200,000 KB Home, senior note, 6.25%, 06/15/15 USA USD 123,000 0.18200,000 Coventry Health Care Inc., senior note, 6.30%, 08/15/14 USA USD 122,509 0.18200,000 MetLife Inc., junior sub. note, FRN, 6.40%, 12/15/66 � USA USD 121,373 0.18150,000 Lamar Media Corp., senior sub. note, 7.25%, 01/01/13 USA USD 120,375 0.18
2,000,000 General Electric Capital Corp., senior note, A, 8.50%, 04/06/18 USA MXN 119,791 0.18250,000 CCH II LLC, senior note, 10.25%, 09/15/10 USA USD 116,250 0.17200,000 Smithfield Foods Inc., senior note, 7.75%, 07/01/17 USA USD 115,000 0.17200,000 SandRidge Energy Inc., senior note, 144A, 8.00%, 06/01/18 USA USD 112,000 0.17200,000 Starwood Hotels & Resorts Worldwide Inc., 6.75%, 05/15/18 USA USD 111,046 0.16200,000 RSC Equipment Rental Inc., senior note, 9.50%, 12/01/14 USA USD 111,000 0.16100,000 BAT International Finance PLC, senior note, 144A, 9.50%, 11/15/18 GBR USD 110,947 0.16150,000 Copano Energy LLC, senior note, 8.125%, 03/01/16 USA USD 109,500 0.16100,000 Diageo Capital PLC, senior note, 7.375%, 01/15/14 GBR USD 109,190 0.16150,000 Qwest Communications International Inc., senior note, B, 7.50%, 02/15/14 USA USD 108,000 0.16100,000 JP Morgan Chase & Co., 6.00%, 01/15/18 USA USD 105,737 0.16100,000 Verizon Wireless Capital LLC, A, 7.375%, 11/15/13 USA USD 105,615 0.16100,000 Wells Fargo & Co., senior note, 5.625%, 12/11/17 USA USD 104,511 0.15100,000 American Express Credit Corp., C, 7.30%, 08/20/13 USA USD 102,459 0.15100,000 Citigroup Inc., senior note, 6.125%, 11/21/17 USA USD 101,226 0.15158,000 U.S. Oncology Holdings Inc., senior note, PIK, FRN, 8.334%, 03/15/12 � USA USD 101,120 0.15
FRANKL IN TEMPLETON INVESTMENT FUNDS
ç Franklin Strategic Income Fund ç
Schedule of Investments as of December 31, 2008 (continued)
(Currency ç USD)
Number of % of
shares or Description Country Trading Market net
face value code currency value assets
Unaudited Semi-Annual Report www.franklintempleton.lu104
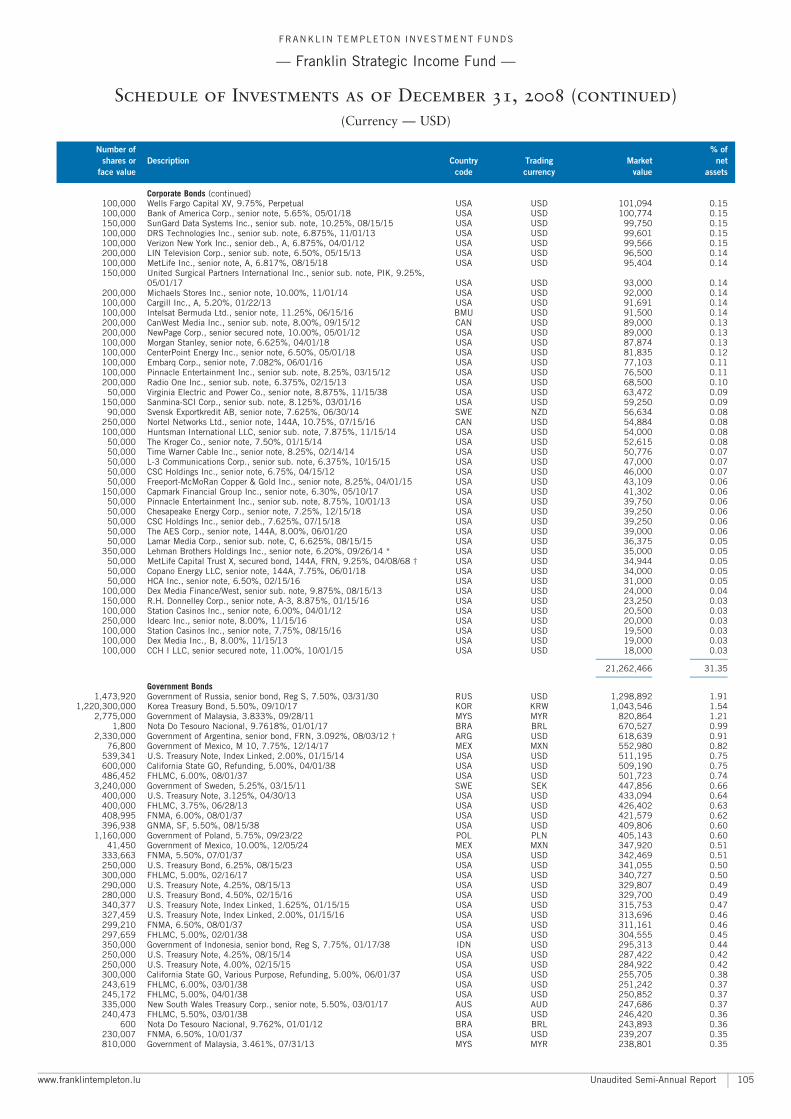
Corporate Bonds (continued)100,000 Wells Fargo Capital XV, 9.75%, Perpetual USA USD 101,094 0.15100,000 Bank of America Corp., senior note, 5.65%, 05/01/18 USA USD 100,774 0.15150,000 SunGard Data Systems Inc., senior sub. note, 10.25%, 08/15/15 USA USD 99,750 0.15100,000 DRS Technologies Inc., senior sub. note, 6.875%, 11/01/13 USA USD 99,601 0.15100,000 Verizon New York Inc., senior deb., A, 6.875%, 04/01/12 USA USD 99,566 0.15200,000 LIN Television Corp., senior sub. note, 6.50%, 05/15/13 USA USD 96,500 0.14100,000 MetLife Inc., senior note, A, 6.817%, 08/15/18 USA USD 95,404 0.14150,000 United Surgical Partners International Inc., senior sub. note, PIK, 9.25%,
05/01/17 USA USD 93,000 0.14200,000 Michaels Stores Inc., senior note, 10.00%, 11/01/14 USA USD 92,000 0.14100,000 Cargill Inc., A, 5.20%, 01/22/13 USA USD 91,691 0.14100,000 Intelsat Bermuda Ltd., senior note, 11.25%, 06/15/16 BMU USD 91,500 0.14200,000 CanWest Media Inc., senior sub. note, 8.00%, 09/15/12 CAN USD 89,000 0.13200,000 NewPage Corp., senior secured note, 10.00%, 05/01/12 USA USD 89,000 0.13100,000 Morgan Stanley, senior note, 6.625%, 04/01/18 USA USD 87,874 0.13100,000 CenterPoint Energy Inc., senior note, 6.50%, 05/01/18 USA USD 81,835 0.12100,000 Embarq Corp., senior note, 7.082%, 06/01/16 USA USD 77,103 0.11100,000 Pinnacle Entertainment Inc., senior sub. note, 8.25%, 03/15/12 USA USD 76,500 0.11200,000 Radio One Inc., senior sub. note, 6.375%, 02/15/13 USA USD 68,500 0.10
50,000 Virginia Electric and Power Co., senior note, 8.875%, 11/15/38 USA USD 63,472 0.09150,000 Sanmina-SCI Corp., senior sub. note, 8.125%, 03/01/16 USA USD 59,250 0.09
90,000 Svensk Exportkredit AB, senior note, 7.625%, 06/30/14 SWE NZD 56,634 0.08250,000 Nortel Networks Ltd., senior note, 144A, 10.75%, 07/15/16 CAN USD 54,884 0.08100,000 Huntsman International LLC, senior sub. note, 7.875%, 11/15/14 USA USD 54,000 0.08
50,000 The Kroger Co., senior note, 7.50%, 01/15/14 USA USD 52,615 0.0850,000 Time Warner Cable Inc., senior note, 8.25%, 02/14/14 USA USD 50,776 0.0750,000 L-3 Communications Corp., senior sub. note, 6.375%, 10/15/15 USA USD 47,000 0.0750,000 CSC Holdings Inc., senior note, 6.75%, 04/15/12 USA USD 46,000 0.0750,000 Freeport-McMoRan Copper & Gold Inc., senior note, 8.25%, 04/01/15 USA USD 43,109 0.06
150,000 Capmark Financial Group Inc., senior note, 6.30%, 05/10/17 USA USD 41,302 0.0650,000 Pinnacle Entertainment Inc., senior sub. note, 8.75%, 10/01/13 USA USD 39,750 0.0650,000 Chesapeake Energy Corp., senior note, 7.25%, 12/15/18 USA USD 39,250 0.0650,000 CSC Holdings Inc., senior deb., 7.625%, 07/15/18 USA USD 39,250 0.0650,000 The AES Corp., senior note, 144A, 8.00%, 06/01/20 USA USD 39,000 0.0650,000 Lamar Media Corp., senior sub. note, C, 6.625%, 08/15/15 USA USD 36,375 0.05
350,000 Lehman Brothers Holdings Inc., senior note, 6.20%, 09/26/14 * USA USD 35,000 0.0550,000 MetLife Capital Trust X, secured bond, 144A, FRN, 9.25%, 04/08/68 � USA USD 34,944 0.0550,000 Copano Energy LLC, senior note, 144A, 7.75%, 06/01/18 USA USD 34,000 0.0550,000 HCA Inc., senior note, 6.50%, 02/15/16 USA USD 31,000 0.05
100,000 Dex Media Finance/West, senior sub. note, 9.875%, 08/15/13 USA USD 24,000 0.04150,000 R.H. Donnelley Corp., senior note, A-3, 8.875%, 01/15/16 USA USD 23,250 0.03100,000 Station Casinos Inc., senior note, 6.00%, 04/01/12 USA USD 20,500 0.03250,000 Idearc Inc., senior note, 8.00%, 11/15/16 USA USD 20,000 0.03100,000 Station Casinos Inc., senior note, 7.75%, 08/15/16 USA USD 19,500 0.03100,000 Dex Media Inc., B, 8.00%, 11/15/13 USA USD 19,000 0.03100,000 CCH I LLC, senior secured note, 11.00%, 10/01/15 USA USD 18,000 0.03
A A
21,262,466 31.35A A
Government Bonds1,473,920 Government of Russia, senior bond, Reg S, 7.50%, 03/31/30 RUS USD 1,298,892 1.91
1,220,300,000 Korea Treasury Bond, 5.50%, 09/10/17 KOR KRW 1,043,546 1.542,775,000 Government of Malaysia, 3.833%, 09/28/11 MYS MYR 820,864 1.21
1,800 Nota Do Tesouro Nacional, 9.7618%, 01/01/17 BRA BRL 670,527 0.992,330,000 Government of Argentina, senior bond, FRN, 3.092%, 08/03/12 � ARG USD 618,639 0.91
76,800 Government of Mexico, M 10, 7.75%, 12/14/17 MEX MXN 552,980 0.82539,341 U.S. Treasury Note, Index Linked, 2.00%, 01/15/14 USA USD 511,195 0.75600,000 California State GO, Refunding, 5.00%, 04/01/38 USA USD 509,190 0.75486,452 FHLMC, 6.00%, 08/01/37 USA USD 501,723 0.74
3,240,000 Government of Sweden, 5.25%, 03/15/11 SWE SEK 447,856 0.66400,000 U.S. Treasury Note, 3.125%, 04/30/13 USA USD 433,094 0.64400,000 FHLMC, 3.75%, 06/28/13 USA USD 426,402 0.63408,995 FNMA, 6.00%, 08/01/37 USA USD 421,579 0.62396,938 GNMA, SF, 5.50%, 08/15/38 USA USD 409,806 0.60
1,160,000 Government of Poland, 5.75%, 09/23/22 POL PLN 405,143 0.6041,450 Government of Mexico, 10.00%, 12/05/24 MEX MXN 347,920 0.51
333,663 FNMA, 5.50%, 07/01/37 USA USD 342,469 0.51250,000 U.S. Treasury Bond, 6.25%, 08/15/23 USA USD 341,055 0.50300,000 FHLMC, 5.00%, 02/16/17 USA USD 340,727 0.50290,000 U.S. Treasury Note, 4.25%, 08/15/13 USA USD 329,807 0.49280,000 U.S. Treasury Bond, 4.50%, 02/15/16 USA USD 329,700 0.49340,377 U.S. Treasury Note, Index Linked, 1.625%, 01/15/15 USA USD 315,753 0.47327,459 U.S. Treasury Note, Index Linked, 2.00%, 01/15/16 USA USD 313,696 0.46299,210 FNMA, 6.50%, 08/01/37 USA USD 311,161 0.46297,659 FHLMC, 5.00%, 02/01/38 USA USD 304,555 0.45350,000 Government of Indonesia, senior bond, Reg S, 7.75%, 01/17/38 IDN USD 295,313 0.44250,000 U.S. Treasury Note, 4.25%, 08/15/14 USA USD 287,422 0.42250,000 U.S. Treasury Note, 4.00%, 02/15/15 USA USD 284,922 0.42300,000 California State GO, Various Purpose, Refunding, 5.00%, 06/01/37 USA USD 255,705 0.38243,619 FHLMC, 6.00%, 03/01/38 USA USD 251,242 0.37245,172 FHLMC, 5.00%, 04/01/38 USA USD 250,852 0.37335,000 New South Wales Treasury Corp., senior note, 5.50%, 03/01/17 AUS AUD 247,686 0.37240,473 FHLMC, 5.50%, 03/01/38 USA USD 246,420 0.36
600 Nota Do Tesouro Nacional, 9.762%, 01/01/12 BRA BRL 243,893 0.36230,007 FNMA, 6.50%, 10/01/37 USA USD 239,207 0.35810,000 Government of Malaysia, 3.461%, 07/31/13 MYS MYR 238,801 0.35
FRANKL IN TEMPLETON INVESTMENT FUNDS
ç Franklin Strategic Income Fund ç
Schedule of Investments as of December 31, 2008 (continued)
(Currency ç USD)
Number of % of
shares or Description Country Trading Market net
face value code currency value assets
www.franklintempleton.lu Unaudited Semi-Annual Report 105

Government Bonds (continued)221,447 FNMA, 5.00%, 04/01/38 USA USD 226,370 0.33190,000 U.S. Treasury Bond, 4.50%, 05/15/17 USA USD 223,013 0.33216,608 FNMA, 5.50%, 06/01/37 USA USD 222,325 0.33
2,319,000,000 Government of Indonesia, FR34, 12.80%, 06/15/21 IDN IDR 221,262 0.33229,865 U.S. Treasury Note, Index Linked, 2.00%, 07/15/14 USA USD 217,456 0.32200,000 FHLMC, senior note, 4.75%, 03/05/12 USA USD 217,182 0.32198,815 FNMA, 6.00%, 12/01/36 USA USD 204,944 0.30
2,636,000,000 Government of Indonesia, FR47, 10.00%, 02/15/28 IDN IDR 203,141 0.30198,693 FNMA, 5.00%, 04/01/38 USA USD 203,110 0.30198,279 FNMA, 5.00%, 05/01/38 USA USD 202,687 0.30196,708 FHLMC, 5.50%, 07/01/38 USA USD 201,573 0.30193,780 FNMA, 5.00%, 11/01/37 USA USD 198,107 0.29191,059 FNMA, 6.00%, 02/01/37 USA USD 196,938 0.29189,140 FNMA, 6.00%, 05/01/36 USA USD 194,970 0.29165,000 U.S. Treasury Note, 4.625%, 11/15/16 USA USD 194,855 0.29304,000 European Investment Bank, senior note, 1612/37, 6.50%, 09/10/14 SP NZD 192,812 0.28181,116 FNMA, 6.50%, 10/01/37 USA USD 188,350 0.28300,000 Province of Manitoba, 6.375%, 09/01/15 CAN NZD 185,824 0.27157,409 FHLMC, 5.50%, 03/01/37 USA USD 161,317 0.24130,000 U.S. Treasury Note, 4.75%, 08/15/17 USA USD 155,472 0.23107,000 U.S. Treasury Bond, 7.125%, 02/15/23 USA USD 155,267 0.23149,169 FNMA, 6.00%, 03/01/38 USA USD 153,744 0.23148,609 FNMA, 5.00%, 05/01/38 USA USD 151,912 0.22147,244 FNMA, 5.50%, 07/01/38 USA USD 151,115 0.22145,600 FNMA, 6.00%, 06/01/37 USA USD 150,080 0.22145,427 FNMA, 5.00%, 06/01/38 USA USD 148,659 0.22136,024 FHLMC, 5.50%, 03/01/23 USA USD 140,308 0.21129,094 FNMA, 6.00%, 11/01/37 USA USD 133,066 0.20128,486 FHLMC, 6.00%, 02/01/38 USA USD 132,507 0.20126,759 FHLMC, 6.50%, 04/01/38 USA USD 131,810 0.19
1,332,000,000 Government of Indonesia, FR35, 12.90%, 06/15/22 IDN IDR 128,006 0.19122,466 FNMA, 5.00%, 06/01/38 USA USD 125,189 0.18120,560 FHLMC, 5.50%, 03/01/38 USA USD 123,541 0.18
80,000 U.S. Treasury Bond, 7.25%, 08/15/22 USA USD 116,338 0.17392,000 Government of Malaysia, 3.756%, 04/28/11 MYS MYR 115,489 0.17111,533 FHLMC, 5.50%, 05/01/37 USA USD 114,309 0.17140,000 Government of Venezuela, senior bond, Reg S, 5.375%, 08/07/10 VEN USD 109,907 0.16105,534 FHLMC, 6.00%, 11/01/37 USA USD 108,847 0.16
95,000 U.S. Treasury Note, 3.625%, 05/15/13 USA USD 104,411 0.1599,622 FHLMC, 6.50%, 08/01/38 USA USD 103,591 0.15
100,000 FHLMC, 5.00%, 01/01/34 USA USD 102,203 0.1598,488 GNMA, SF, 5.50%, 06/15/38 USA USD 101,680 0.1598,801 FNMA, 5.00%, 06/01/38 USA USD 100,998 0.1598,652 FNMA, 5.00%, 04/01/38 USA USD 100,845 0.1598,207 FNMA, 5.50%, 03/01/38 USA USD 100,789 0.1597,613 FNMA, 6.00%, 06/01/38 USA USD 100,606 0.1598,026 FNMA, 5.50%, 04/01/38 USA USD 100,604 0.1598,019 FNMA, 5.50%, 07/01/38 USA USD 100,596 0.1596,532 FHLMC, 6.50%, 09/01/37 USA USD 100,388 0.1597,868 FNMA, 4.50%, 07/01/23 USA USD 100,206 0.1596,940 FNMA, 6.00%, 07/01/37 USA USD 99,923 0.1596,691 FNMA, 6.00%, 08/01/38 USA USD 99,656 0.1596,820 FNMA, 5.00%, 07/01/23 USA USD 99,541 0.1594,482 FHLMC, 6.00%, 01/01/38 USA USD 97,448 0.1493,405 FNMA, 6.50%, 11/01/35 USA USD 97,156 0.1493,307 FNMA, 6.50%, 11/01/36 USA USD 97,039 0.1492,443 FHLMC, 6.50%, 04/01/38 USA USD 96,135 0.1492,480 FNMA, 5.00%, 08/01/37 USA USD 94,545 0.1492,037 FHLMC, 5.50%, 12/01/37 USA USD 94,322 0.1490,659 FHLMC, 5.50%, 12/01/37 USA USD 92,910 0.1489,390 FHLMC, 6.00%, 12/01/37 USA USD 92,196 0.1488,708 FHLMC, 5.00%, 02/01/23 USA USD 91,201 0.13
1,000,000,000 Government of Indonesia, FR37, 12.00%, 09/15/26 IDN IDR 90,138 0.131,123,000,000 Government of Indonesia, FR42, 10.25%, 07/15/27 IDN IDR 88,604 0.13
83,892 FHLMC, 5.50%, 10/01/37 USA USD 85,975 0.1381,525 FHLMC, 5.50%, 05/01/22 USA USD 84,093 0.12
100,000 Government of South Africa, 5.875%, 05/30/22 ZAF USD 82,750 0.1285,000 Placentia-Yorba Linda USD, GO, 2008 Election, Series A, 0.00% USA USD 82,536 0.12
1,100,000,000 Government of Indonesia, FR46, 9.50%, 07/15/23 IDN IDR 82,500 0.12100,000 Government of Indonesia, Reg S, 6.875%, 01/17/18 IDN USD 81,596 0.12
73,914 FHLMC, 5.00%, 09/01/37 USA USD 75,634 0.1172,757 FHLMC, 5.00%, 03/01/38 USA USD 74,443 0.11
110,000 Government of Venezuela, 10.75%, 09/19/13 VEN USD 72,600 0.1170,000 Matanuska-Susitna Borough Lease Revenue, Goose Greek Correctional Center,
Assured Guaranty, 6.00%, 09/01/28 USA USD 71,039 0.1066,105 FHLMC, 6.00%, 11/01/37 USA USD 68,180 0.1065,377 FHLMC, 6.00%, 08/01/37 USA USD 67,429 0.1063,320 FHLMC, 6.50%, 11/01/37 USA USD 65,850 0.10
781,000,000 Government of Indonesia, FR40, 11.00%, 09/15/25 IDN IDR 65,561 0.1060,358 GNMA, SF, 5.00%, 06/15/37 USA USD 62,043 0.0975,000 Queensland Treasury Corp., 17, 6.00%, 09/14/17 AUS AUD 57,419 0.08
190,000 Government of Malaysia, 3.702%, 02/25/13 MYS MYR 56,559 0.0855,000 Matanuska-Susitna Borough Lease Revenue, Goose Greek Correctional Center,
Assured Guaranty, 5.50%, 09/01/23 USA USD 55,481 0.0865,000,000 Korea Treasury Bond, 5.25%, 03/10/27 KOR KRW 55,036 0.08
53,370 FNMA, 5.00%, 11/01/22 USA USD 54,875 0.08
FRANKL IN TEMPLETON INVESTMENT FUNDS
ç Franklin Strategic Income Fund ç
Schedule of Investments as of December 31, 2008 (continued)
(Currency ç USD)
Number of % of
shares or Description Country Trading Market net
face value code currency value assets
Unaudited Semi-Annual Report www.franklintempleton.lu106
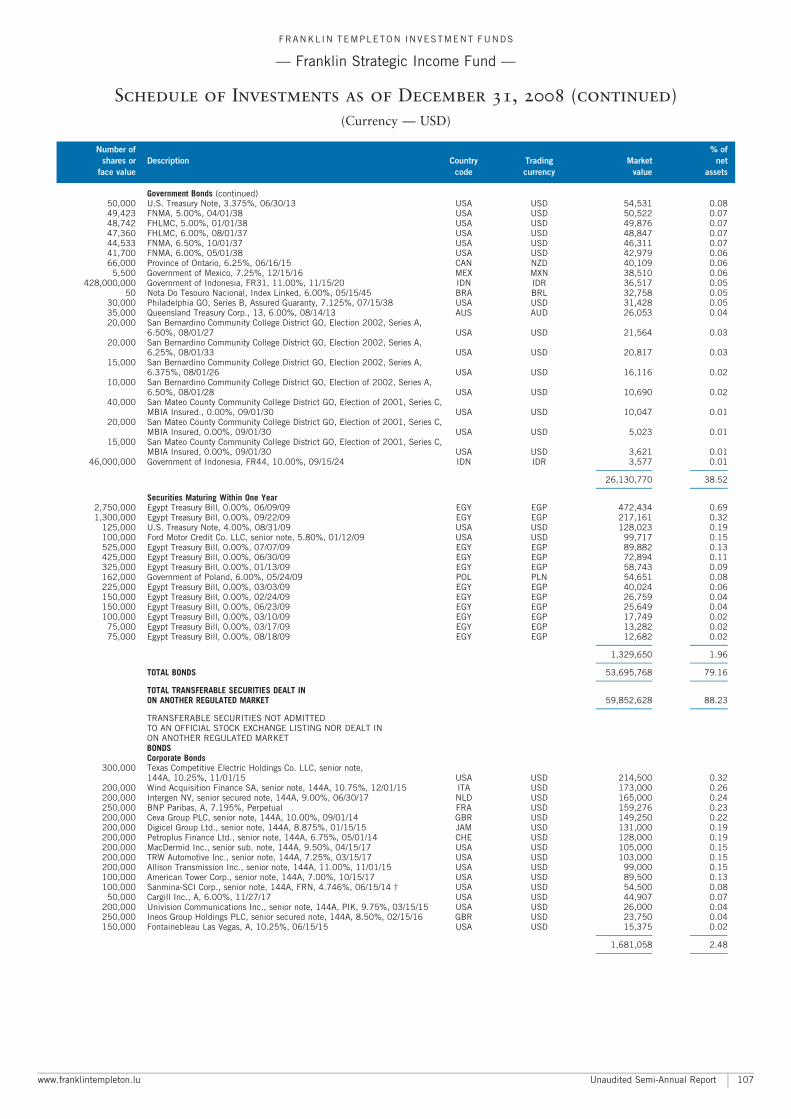
Government Bonds (continued)50,000 U.S. Treasury Note, 3.375%, 06/30/13 USA USD 54,531 0.0849,423 FNMA, 5.00%, 04/01/38 USA USD 50,522 0.0748,742 FHLMC, 5.00%, 01/01/38 USA USD 49,876 0.0747,360 FHLMC, 6.00%, 08/01/37 USA USD 48,847 0.0744,533 FNMA, 6.50%, 10/01/37 USA USD 46,311 0.0741,700 FNMA, 6.00%, 05/01/38 USA USD 42,979 0.0666,000 Province of Ontario, 6.25%, 06/16/15 CAN NZD 40,109 0.06
5,500 Government of Mexico, 7.25%, 12/15/16 MEX MXN 38,510 0.06428,000,000 Government of Indonesia, FR31, 11.00%, 11/15/20 IDN IDR 36,517 0.05
50 Nota Do Tesouro Nacional, Index Linked, 6.00%, 05/15/45 BRA BRL 32,758 0.0530,000 Philadelphia GO, Series B, Assured Guaranty, 7.125%, 07/15/38 USA USD 31,428 0.0535,000 Queensland Treasury Corp., 13, 6.00%, 08/14/13 AUS AUD 26,053 0.0420,000 San Bernardino Community College District GO, Election 2002, Series A,
6.50%, 08/01/27 USA USD 21,564 0.0320,000 San Bernardino Community College District GO, Election 2002, Series A,
6.25%, 08/01/33 USA USD 20,817 0.0315,000 San Bernardino Community College District GO, Election 2002, Series A,
6.375%, 08/01/26 USA USD 16,116 0.0210,000 San Bernardino Community College District GO, Election of 2002, Series A,
6.50%, 08/01/28 USA USD 10,690 0.0240,000 San Mateo County Community College District GO, Election of 2001, Series C,
MBIA Insured., 0.00%, 09/01/30 USA USD 10,047 0.0120,000 San Mateo County Community College District GO, Election of 2001, Series C,
MBIA Insured, 0.00%, 09/01/30 USA USD 5,023 0.0115,000 San Mateo County Community College District GO, Election of 2001, Series C,
MBIA Insured, 0.00%, 09/01/30 USA USD 3,621 0.0146,000,000 Government of Indonesia, FR44, 10.00%, 09/15/24 IDN IDR 3,577 0.01
A A
26,130,770 38.52A A
Securities Maturing Within One Year2,750,000 Egypt Treasury Bill, 0.00%, 06/09/09 EGY EGP 472,434 0.691,300,000 Egypt Treasury Bill, 0.00%, 09/22/09 EGY EGP 217,161 0.32
125,000 U.S. Treasury Note, 4.00%, 08/31/09 USA USD 128,023 0.19100,000 Ford Motor Credit Co. LLC, senior note, 5.80%, 01/12/09 USA USD 99,717 0.15525,000 Egypt Treasury Bill, 0.00%, 07/07/09 EGY EGP 89,882 0.13425,000 Egypt Treasury Bill, 0.00%, 06/30/09 EGY EGP 72,894 0.11325,000 Egypt Treasury Bill, 0.00%, 01/13/09 EGY EGP 58,743 0.09162,000 Government of Poland, 6.00%, 05/24/09 POL PLN 54,651 0.08225,000 Egypt Treasury Bill, 0.00%, 03/03/09 EGY EGP 40,024 0.06150,000 Egypt Treasury Bill, 0.00%, 02/24/09 EGY EGP 26,759 0.04150,000 Egypt Treasury Bill, 0.00%, 06/23/09 EGY EGP 25,649 0.04100,000 Egypt Treasury Bill, 0.00%, 03/10/09 EGY EGP 17,749 0.02
75,000 Egypt Treasury Bill, 0.00%, 03/17/09 EGY EGP 13,282 0.0275,000 Egypt Treasury Bill, 0.00%, 08/18/09 EGY EGP 12,682 0.02
A A
1,329,650 1.96A A
TOTAL BONDS 53,695,768 79.16A A
TOTAL TRANSFERABLE SECURITIES DEALT INON ANOTHER REGULATED MARKET 59,852,628 88.23
A A
TRANSFERABLE SECURITIES NOT ADMITTEDTO AN OFFICIAL STOCK EXCHANGE LISTING NOR DEALT INON ANOTHER REGULATED MARKETBONDSCorporate Bonds
300,000 Texas Competitive Electric Holdings Co. LLC, senior note,144A, 10.25%, 11/01/15 USA USD 214,500 0.32
200,000 Wind Acquisition Finance SA, senior note, 144A, 10.75%, 12/01/15 ITA USD 173,000 0.26200,000 Intergen NV, senior secured note, 144A, 9.00%, 06/30/17 NLD USD 165,000 0.24250,000 BNP Paribas, A, 7.195%, Perpetual FRA USD 159,276 0.23200,000 Ceva Group PLC, senior note, 144A, 10.00%, 09/01/14 GBR USD 149,250 0.22200,000 Digicel Group Ltd., senior note, 144A, 8.875%, 01/15/15 JAM USD 131,000 0.19200,000 Petroplus Finance Ltd., senior note, 144A, 6.75%, 05/01/14 CHE USD 128,000 0.19200,000 MacDermid Inc., senior sub. note, 144A, 9.50%, 04/15/17 USA USD 105,000 0.15200,000 TRW Automotive Inc., senior note, 144A, 7.25%, 03/15/17 USA USD 103,000 0.15200,000 Allison Transmission Inc., senior note, 144A, 11.00%, 11/01/15 USA USD 99,000 0.15100,000 American Tower Corp., senior note, 144A, 7.00%, 10/15/17 USA USD 89,500 0.13100,000 Sanmina-SCI Corp., senior note, 144A, FRN, 4.746%, 06/15/14 � USA USD 54,500 0.08
50,000 Cargill Inc., A, 6.00%, 11/27/17 USA USD 44,907 0.07200,000 Univision Communications Inc., senior note, 144A, PIK, 9.75%, 03/15/15 USA USD 26,000 0.04250,000 Ineos Group Holdings PLC, senior secured note, 144A, 8.50%, 02/15/16 GBR USD 23,750 0.04150,000 Fontainebleau Las Vegas, A, 10.25%, 06/15/15 USA USD 15,375 0.02
A A
1,681,058 2.48A A
FRANKL IN TEMPLETON INVESTMENT FUNDS
ç Franklin Strategic Income Fund ç
Schedule of Investments as of December 31, 2008 (continued)
(Currency ç USD)
Number of % of
shares or Description Country Trading Market net
face value code currency value assets
www.franklintempleton.lu Unaudited Semi-Annual Report 107
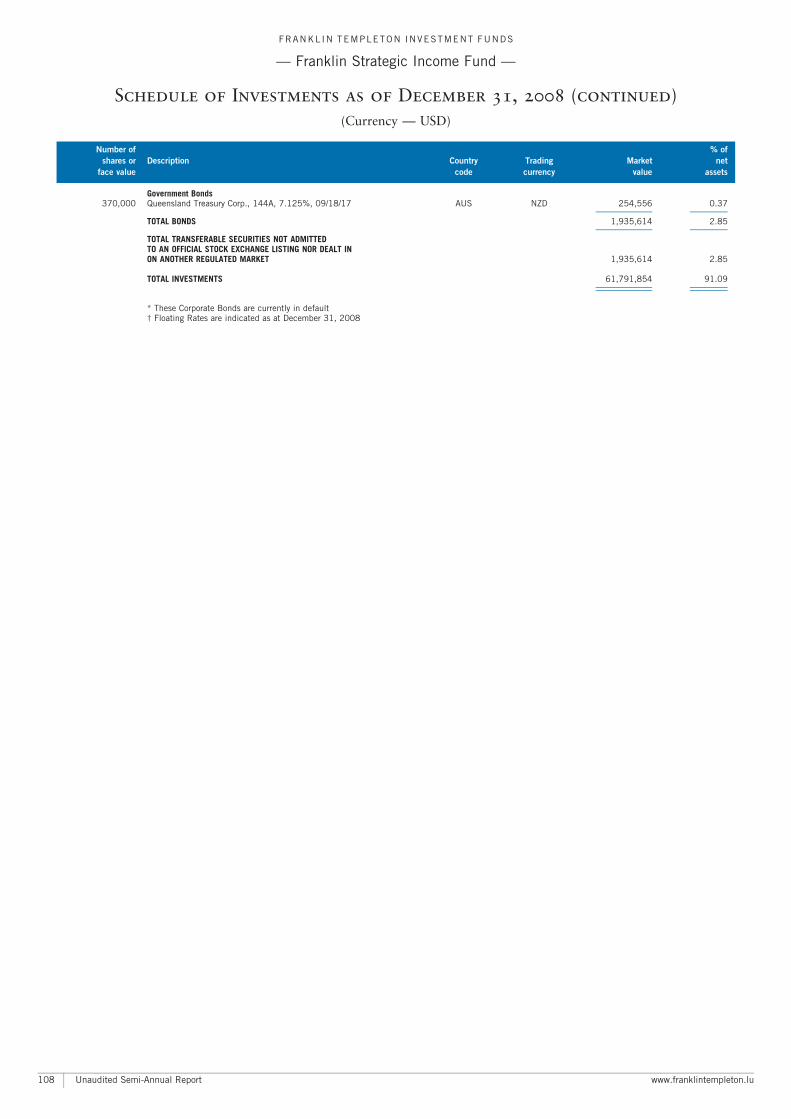
Government Bonds370,000 Queensland Treasury Corp., 144A, 7.125%, 09/18/17 AUS NZD 254,556 0.37
A A
TOTAL BONDS 1,935,614 2.85A A
TOTAL TRANSFERABLE SECURITIES NOT ADMITTEDTO AN OFFICIAL STOCK EXCHANGE LISTING NOR DEALT INON ANOTHER REGULATED MARKET 1,935,614 2.85
TOTAL INVESTMENTS 61,791,854 91.09A A
A A
* These Corporate Bonds are currently in default� Floating Rates are indicated as at December 31, 2008
FRANKL IN TEMPLETON INVESTMENT FUNDS
ç Franklin Strategic Income Fund ç
Schedule of Investments as of December 31, 2008 (continued)
(Currency ç USD)
Number of % of
shares or Description Country Trading Market net
face value code currency value assets
Unaudited Semi-Annual Report www.franklintempleton.lu108
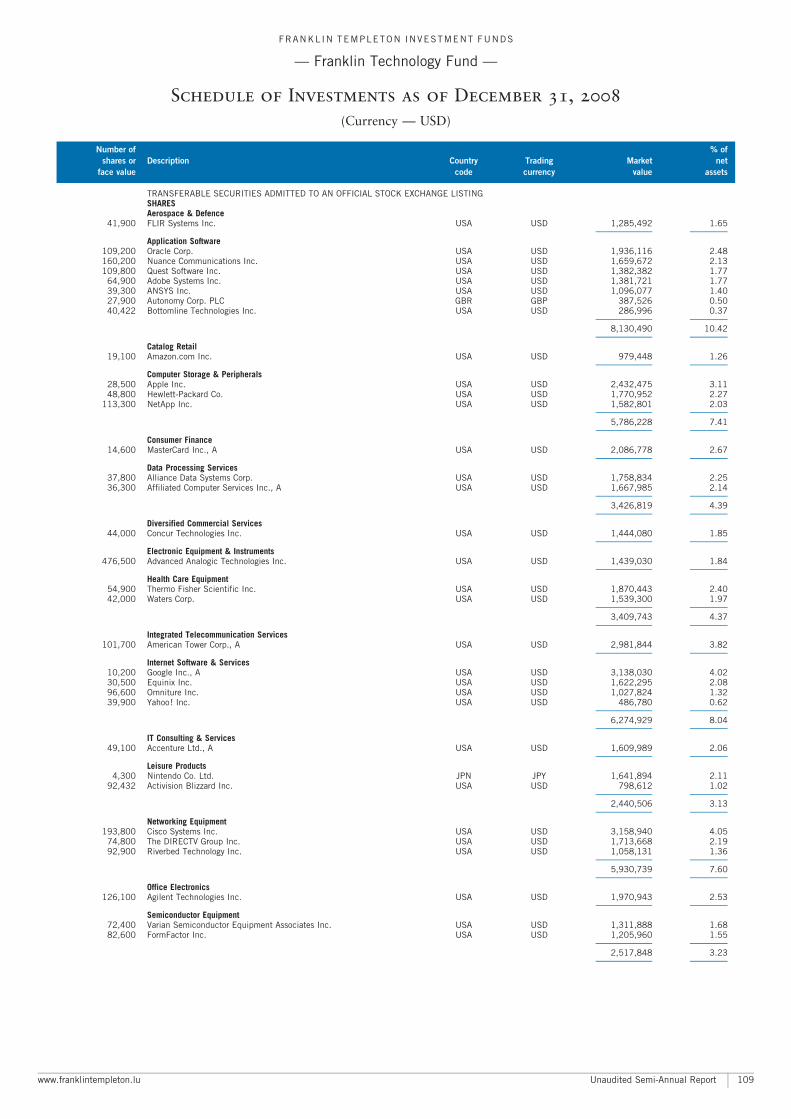
TRANSFERABLE SECURITIES ADMITTED TO AN OFFICIAL STOCK EXCHANGE LISTINGSHARESAerospace & Defence
41,900 FLIR Systems Inc. USA USD 1,285,492 1.65A A
Application Software109,200 Oracle Corp. USA USD 1,936,116 2.48160,200 Nuance Communications Inc. USA USD 1,659,672 2.13109,800 Quest Software Inc. USA USD 1,382,382 1.77
64,900 Adobe Systems Inc. USA USD 1,381,721 1.7739,300 ANSYS Inc. USA USD 1,096,077 1.4027,900 Autonomy Corp. PLC GBR GBP 387,526 0.5040,422 Bottomline Technologies Inc. USA USD 286,996 0.37
A A
8,130,490 10.42A A
Catalog Retail19,100 Amazon.com Inc. USA USD 979,448 1.26
A A
Computer Storage & Peripherals28,500 Apple Inc. USA USD 2,432,475 3.1148,800 Hewlett-Packard Co. USA USD 1,770,952 2.27
113,300 NetApp Inc. USA USD 1,582,801 2.03A A
5,786,228 7.41A A
Consumer Finance14,600 MasterCard Inc., A USA USD 2,086,778 2.67
A A
Data Processing Services37,800 Alliance Data Systems Corp. USA USD 1,758,834 2.2536,300 Affiliated Computer Services Inc., A USA USD 1,667,985 2.14
A A
3,426,819 4.39A A
Diversified Commercial Services44,000 Concur Technologies Inc. USA USD 1,444,080 1.85
A A
Electronic Equipment & Instruments476,500 Advanced Analogic Technologies Inc. USA USD 1,439,030 1.84
A A
Health Care Equipment54,900 Thermo Fisher Scientific Inc. USA USD 1,870,443 2.4042,000 Waters Corp. USA USD 1,539,300 1.97
A A
3,409,743 4.37A A
Integrated Telecommunication Services101,700 American Tower Corp., A USA USD 2,981,844 3.82
A A
Internet Software & Services10,200 Google Inc., A USA USD 3,138,030 4.0230,500 Equinix Inc. USA USD 1,622,295 2.0896,600 Omniture Inc. USA USD 1,027,824 1.3239,900 Yahoo! Inc. USA USD 486,780 0.62
A A
6,274,929 8.04A A
IT Consulting & Services49,100 Accenture Ltd., A USA USD 1,609,989 2.06
A A
Leisure Products4,300 Nintendo Co. Ltd. JPN JPY 1,641,894 2.11
92,432 Activision Blizzard Inc. USA USD 798,612 1.02A A
2,440,506 3.13A A
Networking Equipment193,800 Cisco Systems Inc. USA USD 3,158,940 4.05
74,800 The DIRECTV Group Inc. USA USD 1,713,668 2.1992,900 Riverbed Technology Inc. USA USD 1,058,131 1.36
A A
5,930,739 7.60A A
Office Electronics126,100 Agilent Technologies Inc. USA USD 1,970,943 2.53
A A
Semiconductor Equipment72,400 Varian Semiconductor Equipment Associates Inc. USA USD 1,311,888 1.6882,600 FormFactor Inc. USA USD 1,205,960 1.55
A A
2,517,848 3.23A A
FRANKL IN TEMPLETON INVESTMENT FUNDS
ç Franklin Technology Fund ç
Schedule of Investments as of December 31, 2008
(Currency ç USD)
Number of % of
shares or Description Country Trading Market net
face value code currency value assets
www.franklintempleton.lu Unaudited Semi-Annual Report 109
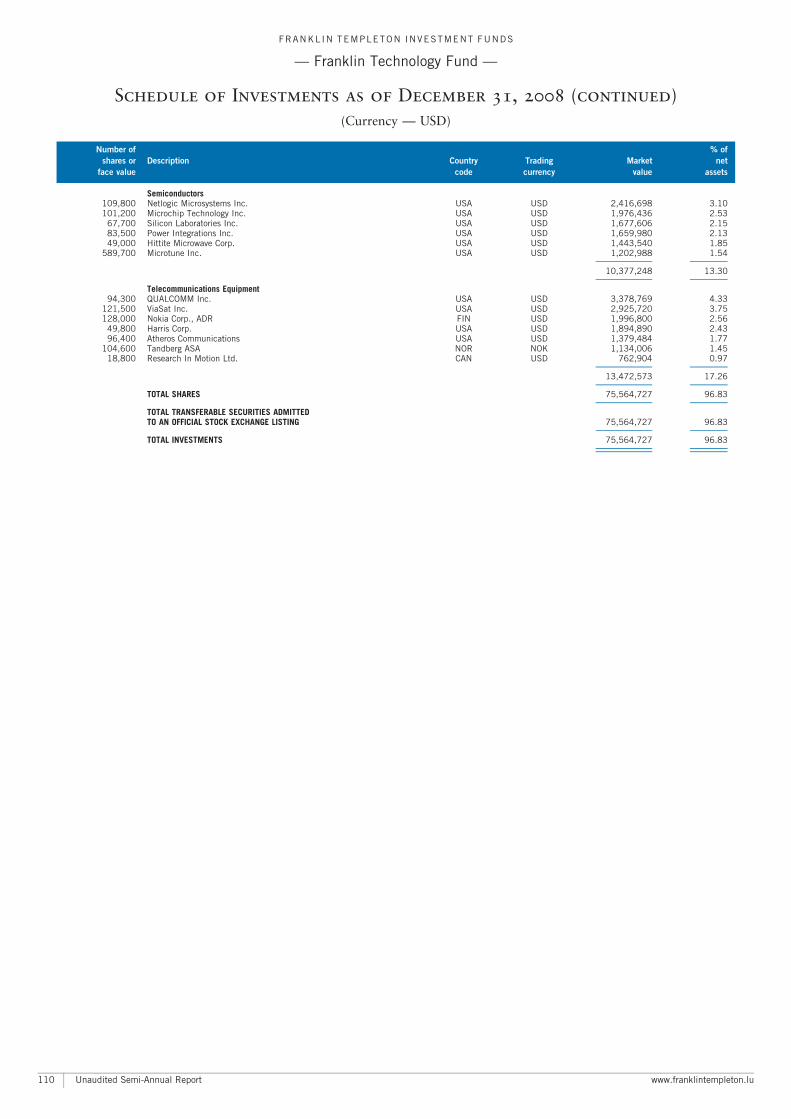
Semiconductors109,800 Netlogic Microsystems Inc. USA USD 2,416,698 3.10101,200 Microchip Technology Inc. USA USD 1,976,436 2.53
67,700 Silicon Laboratories Inc. USA USD 1,677,606 2.1583,500 Power Integrations Inc. USA USD 1,659,980 2.1349,000 Hittite Microwave Corp. USA USD 1,443,540 1.85
589,700 Microtune Inc. USA USD 1,202,988 1.54A A
10,377,248 13.30A A
Telecommunications Equipment94,300 QUALCOMM Inc. USA USD 3,378,769 4.33
121,500 ViaSat Inc. USA USD 2,925,720 3.75128,000 Nokia Corp., ADR FIN USD 1,996,800 2.56
49,800 Harris Corp. USA USD 1,894,890 2.4396,400 Atheros Communications USA USD 1,379,484 1.77
104,600 Tandberg ASA NOR NOK 1,134,006 1.4518,800 Research In Motion Ltd. CAN USD 762,904 0.97
A A
13,472,573 17.26A A
TOTAL SHARES 75,564,727 96.83A A
TOTAL TRANSFERABLE SECURITIES ADMITTEDTO AN OFFICIAL STOCK EXCHANGE LISTING 75,564,727 96.83
A A
TOTAL INVESTMENTS 75,564,727 96.83A A
A A
FRANKL IN TEMPLETON INVESTMENT FUNDS
ç Franklin Technology Fund ç
Schedule of Investments as of December 31, 2008 (continued)
(Currency ç USD)
Number of % of
shares or Description Country Trading Market net
face value code currency value assets
Unaudited Semi-Annual Report www.franklintempleton.lu110
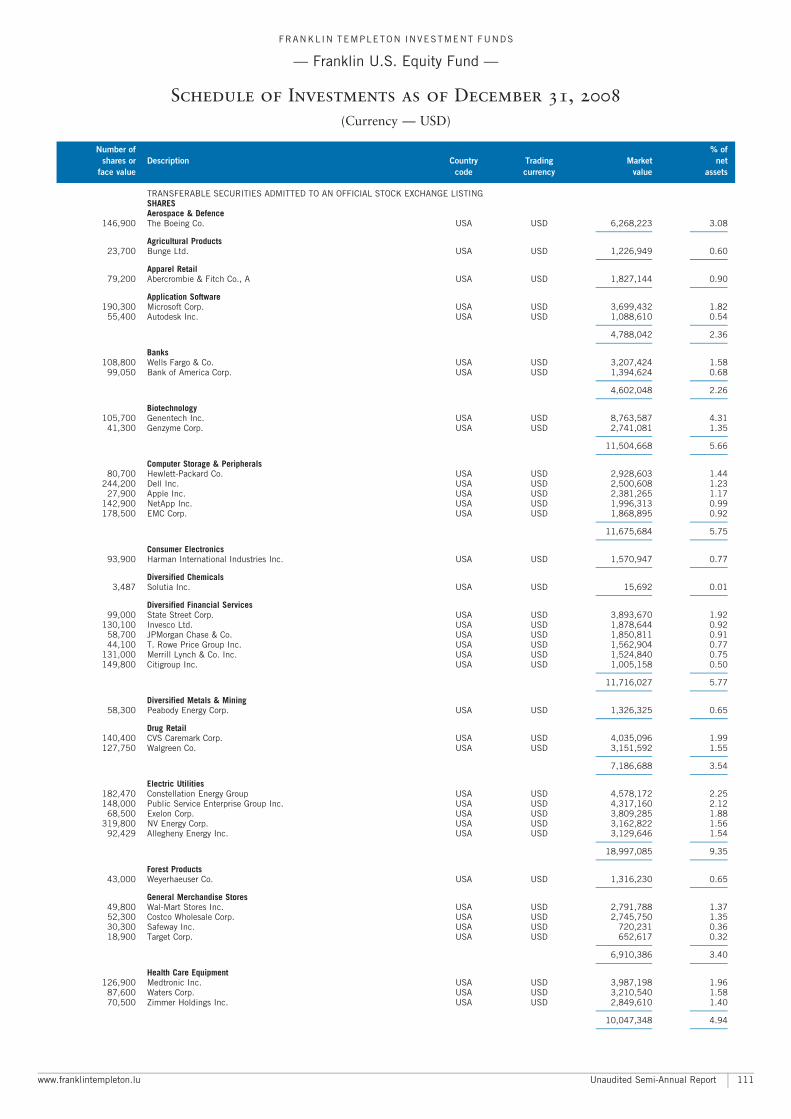
TRANSFERABLE SECURITIES ADMITTED TO AN OFFICIAL STOCK EXCHANGE LISTINGSHARESAerospace & Defence
146,900 The Boeing Co. USA USD 6,268,223 3.08A A
Agricultural Products23,700 Bunge Ltd. USA USD 1,226,949 0.60
A A
Apparel Retail79,200 Abercrombie & Fitch Co., A USA USD 1,827,144 0.90
A A
Application Software190,300 Microsoft Corp. USA USD 3,699,432 1.82
55,400 Autodesk Inc. USA USD 1,088,610 0.54A A
4,788,042 2.36A A
Banks108,800 Wells Fargo & Co. USA USD 3,207,424 1.58
99,050 Bank of America Corp. USA USD 1,394,624 0.68A A
4,602,048 2.26A A
Biotechnology105,700 Genentech Inc. USA USD 8,763,587 4.31
41,300 Genzyme Corp. USA USD 2,741,081 1.35A A
11,504,668 5.66A A
Computer Storage & Peripherals80,700 Hewlett-Packard Co. USA USD 2,928,603 1.44
244,200 Dell Inc. USA USD 2,500,608 1.2327,900 Apple Inc. USA USD 2,381,265 1.17
142,900 NetApp Inc. USA USD 1,996,313 0.99178,500 EMC Corp. USA USD 1,868,895 0.92
A A
11,675,684 5.75A A
Consumer Electronics93,900 Harman International Industries Inc. USA USD 1,570,947 0.77
A A
Diversified Chemicals3,487 Solutia Inc. USA USD 15,692 0.01
A A
Diversified Financial Services99,000 State Street Corp. USA USD 3,893,670 1.92
130,100 Invesco Ltd. USA USD 1,878,644 0.9258,700 JPMorgan Chase & Co. USA USD 1,850,811 0.9144,100 T. Rowe Price Group Inc. USA USD 1,562,904 0.77
131,000 Merrill Lynch & Co. Inc. USA USD 1,524,840 0.75149,800 Citigroup Inc. USA USD 1,005,158 0.50
A A
11,716,027 5.77A A
Diversified Metals & Mining58,300 Peabody Energy Corp. USA USD 1,326,325 0.65
A A
Drug Retail140,400 CVS Caremark Corp. USA USD 4,035,096 1.99127,750 Walgreen Co. USA USD 3,151,592 1.55
A A
7,186,688 3.54A A
Electric Utilities182,470 Constellation Energy Group USA USD 4,578,172 2.25148,000 Public Service Enterprise Group Inc. USA USD 4,317,160 2.12
68,500 Exelon Corp. USA USD 3,809,285 1.88319,800 NV Energy Corp. USA USD 3,162,822 1.56
92,429 Allegheny Energy Inc. USA USD 3,129,646 1.54A A
18,997,085 9.35A A
Forest Products43,000 Weyerhaeuser Co. USA USD 1,316,230 0.65
A A
General Merchandise Stores49,800 Wal-Mart Stores Inc. USA USD 2,791,788 1.3752,300 Costco Wholesale Corp. USA USD 2,745,750 1.3530,300 Safeway Inc. USA USD 720,231 0.3618,900 Target Corp. USA USD 652,617 0.32
A A
6,910,386 3.40A A
Health Care Equipment126,900 Medtronic Inc. USA USD 3,987,198 1.96
87,600 Waters Corp. USA USD 3,210,540 1.5870,500 Zimmer Holdings Inc. USA USD 2,849,610 1.40
A A
10,047,348 4.94A A
FRANKL IN TEMPLETON INVESTMENT FUNDS
ç Franklin U.S. Equity Fund ç
Schedule of Investments as of December 31, 2008
(Currency ç USD)
Number of % of
shares or Description Country Trading Market net
face value code currency value assets
www.franklintempleton.lu Unaudited Semi-Annual Report 111
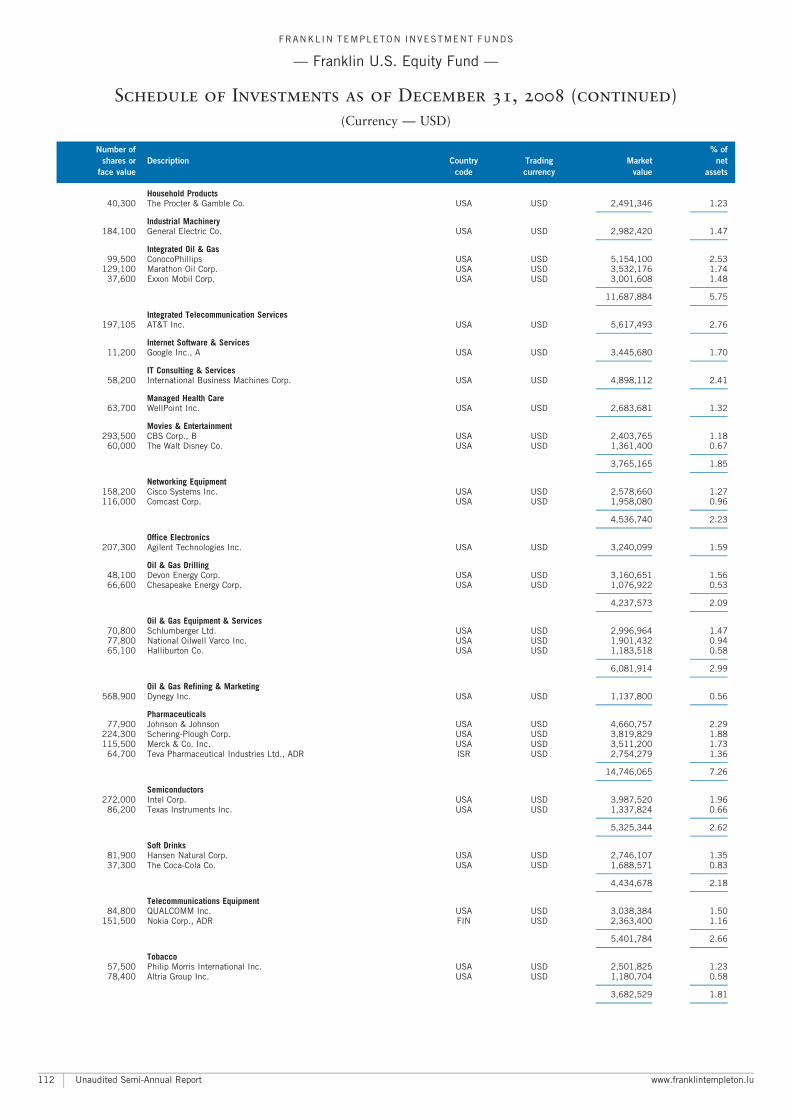
Household Products40,300 The Procter & Gamble Co. USA USD 2,491,346 1.23
A A
Industrial Machinery184,100 General Electric Co. USA USD 2,982,420 1.47
A A
Integrated Oil & Gas99,500 ConocoPhillips USA USD 5,154,100 2.53
129,100 Marathon Oil Corp. USA USD 3,532,176 1.7437,600 Exxon Mobil Corp. USA USD 3,001,608 1.48
A A
11,687,884 5.75A A
Integrated Telecommunication Services197,105 AT&T Inc. USA USD 5,617,493 2.76
A A
Internet Software & Services11,200 Google Inc., A USA USD 3,445,680 1.70
A A
IT Consulting & Services58,200 International Business Machines Corp. USA USD 4,898,112 2.41
A A
Managed Health Care63,700 WellPoint Inc. USA USD 2,683,681 1.32
A A
Movies & Entertainment293,500 CBS Corp., B USA USD 2,403,765 1.18
60,000 The Walt Disney Co. USA USD 1,361,400 0.67A A
3,765,165 1.85A A
Networking Equipment158,200 Cisco Systems Inc. USA USD 2,578,660 1.27116,000 Comcast Corp. USA USD 1,958,080 0.96
A A
4,536,740 2.23A A
Office Electronics207,300 Agilent Technologies Inc. USA USD 3,240,099 1.59
A A
Oil & Gas Drilling48,100 Devon Energy Corp. USA USD 3,160,651 1.5666,600 Chesapeake Energy Corp. USA USD 1,076,922 0.53
A A
4,237,573 2.09A A
Oil & Gas Equipment & Services70,800 Schlumberger Ltd. USA USD 2,996,964 1.4777,800 National Oilwell Varco Inc. USA USD 1,901,432 0.9465,100 Halliburton Co. USA USD 1,183,518 0.58
A A
6,081,914 2.99A A
Oil & Gas Refining & Marketing568,900 Dynegy Inc. USA USD 1,137,800 0.56
A A
Pharmaceuticals77,900 Johnson & Johnson USA USD 4,660,757 2.29
224,300 Schering-Plough Corp. USA USD 3,819,829 1.88115,500 Merck & Co. Inc. USA USD 3,511,200 1.73
64,700 Teva Pharmaceutical Industries Ltd., ADR ISR USD 2,754,279 1.36A A
14,746,065 7.26A A
Semiconductors272,000 Intel Corp. USA USD 3,987,520 1.96
86,200 Texas Instruments Inc. USA USD 1,337,824 0.66A A
5,325,344 2.62A A
Soft Drinks81,900 Hansen Natural Corp. USA USD 2,746,107 1.3537,300 The Coca-Cola Co. USA USD 1,688,571 0.83
A A
4,434,678 2.18A A
Telecommunications Equipment84,800 QUALCOMM Inc. USA USD 3,038,384 1.50
151,500 Nokia Corp., ADR FIN USD 2,363,400 1.16A A
5,401,784 2.66A A
Tobacco57,500 Philip Morris International Inc. USA USD 2,501,825 1.2378,400 Altria Group Inc. USA USD 1,180,704 0.58
A A
3,682,529 1.81A A
FRANKL IN TEMPLETON INVESTMENT FUNDS
ç Franklin U.S. Equity Fund ç
Schedule of Investments as of December 31, 2008 (continued)
(Currency ç USD)
Number of % of
shares or Description Country Trading Market net
face value code currency value assets
Unaudited Semi-Annual Report www.franklintempleton.lu112
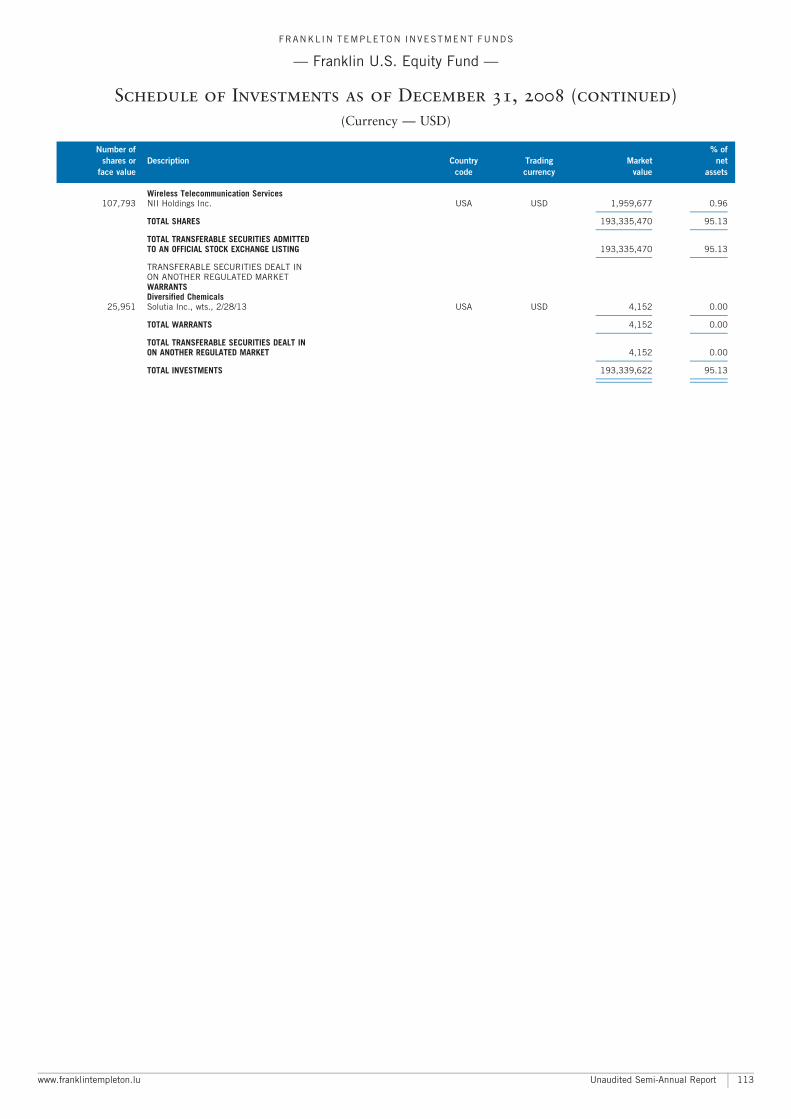
Wireless Telecommunication Services107,793 NII Holdings Inc. USA USD 1,959,677 0.96
A A
TOTAL SHARES 193,335,470 95.13A A
TOTAL TRANSFERABLE SECURITIES ADMITTEDTO AN OFFICIAL STOCK EXCHANGE LISTING 193,335,470 95.13
A A
TRANSFERABLE SECURITIES DEALT INON ANOTHER REGULATED MARKETWARRANTSDiversified Chemicals
25,951 Solutia Inc., wts., 2/28/13 USA USD 4,152 0.00A A
TOTAL WARRANTS 4,152 0.00A A
TOTAL TRANSFERABLE SECURITIES DEALT INON ANOTHER REGULATED MARKET 4,152 0.00
A A
TOTAL INVESTMENTS 193,339,622 95.13A A
A A
FRANKL IN TEMPLETON INVESTMENT FUNDS
ç Franklin U.S. Equity Fund ç
Schedule of Investments as of December 31, 2008 (continued)
(Currency ç USD)
Number of % of
shares or Description Country Trading Market net
face value code currency value assets
www.franklintempleton.lu Unaudited Semi-Annual Report 113
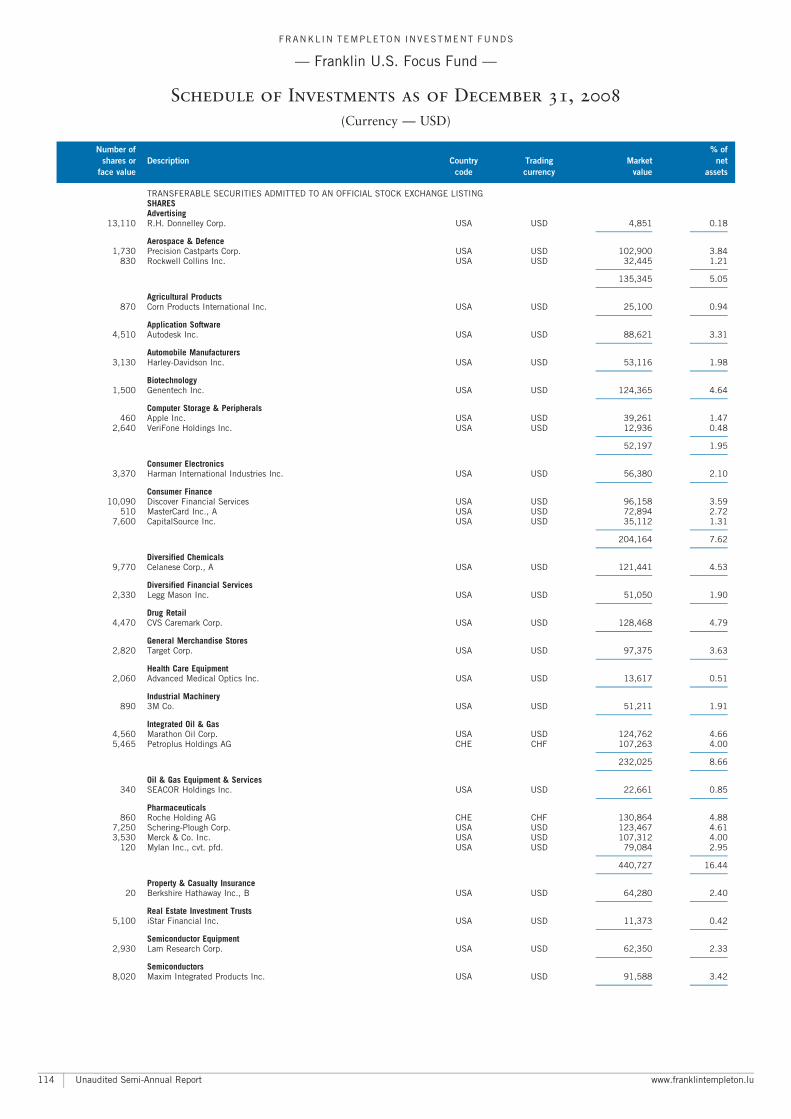
TRANSFERABLE SECURITIES ADMITTED TO AN OFFICIAL STOCK EXCHANGE LISTINGSHARESAdvertising
13,110 R.H. Donnelley Corp. USA USD 4,851 0.18A A
Aerospace & Defence1,730 Precision Castparts Corp. USA USD 102,900 3.84
830 Rockwell Collins Inc. USA USD 32,445 1.21A A
135,345 5.05A A
Agricultural Products870 Corn Products International Inc. USA USD 25,100 0.94
A A
Application Software4,510 Autodesk Inc. USA USD 88,621 3.31
A A
Automobile Manufacturers3,130 Harley-Davidson Inc. USA USD 53,116 1.98
A A
Biotechnology1,500 Genentech Inc. USA USD 124,365 4.64
A A
Computer Storage & Peripherals460 Apple Inc. USA USD 39,261 1.47
2,640 VeriFone Holdings Inc. USA USD 12,936 0.48A A
52,197 1.95A A
Consumer Electronics3,370 Harman International Industries Inc. USA USD 56,380 2.10
A A
Consumer Finance10,090 Discover Financial Services USA USD 96,158 3.59
510 MasterCard Inc., A USA USD 72,894 2.727,600 CapitalSource Inc. USA USD 35,112 1.31
A A
204,164 7.62A A
Diversified Chemicals9,770 Celanese Corp., A USA USD 121,441 4.53
A A
Diversified Financial Services2,330 Legg Mason Inc. USA USD 51,050 1.90
A A
Drug Retail4,470 CVS Caremark Corp. USA USD 128,468 4.79
A A
General Merchandise Stores2,820 Target Corp. USA USD 97,375 3.63
A A
Health Care Equipment2,060 Advanced Medical Optics Inc. USA USD 13,617 0.51
A A
Industrial Machinery890 3M Co. USA USD 51,211 1.91
A A
Integrated Oil & Gas4,560 Marathon Oil Corp. USA USD 124,762 4.665,465 Petroplus Holdings AG CHE CHF 107,263 4.00
A A
232,025 8.66A A
Oil & Gas Equipment & Services340 SEACOR Holdings Inc. USA USD 22,661 0.85
A A
Pharmaceuticals860 Roche Holding AG CHE CHF 130,864 4.88
7,250 Schering-Plough Corp. USA USD 123,467 4.613,530 Merck & Co. Inc. USA USD 107,312 4.00
120 Mylan Inc., cvt. pfd. USA USD 79,084 2.95A A
440,727 16.44A A
Property & Casualty Insurance20 Berkshire Hathaway Inc., B USA USD 64,280 2.40
A A
Real Estate Investment Trusts5,100 iStar Financial Inc. USA USD 11,373 0.42
A A
Semiconductor Equipment2,930 Lam Research Corp. USA USD 62,350 2.33
A A
Semiconductors8,020 Maxim Integrated Products Inc. USA USD 91,588 3.42
A A
FRANKL IN TEMPLETON INVESTMENT FUNDS
ç Franklin U.S. Focus Fund ç
Schedule of Investments as of December 31, 2008
(Currency ç USD)
Number of % of
shares or Description Country Trading Market net
face value code currency value assets
Unaudited Semi-Annual Report www.franklintempleton.lu114
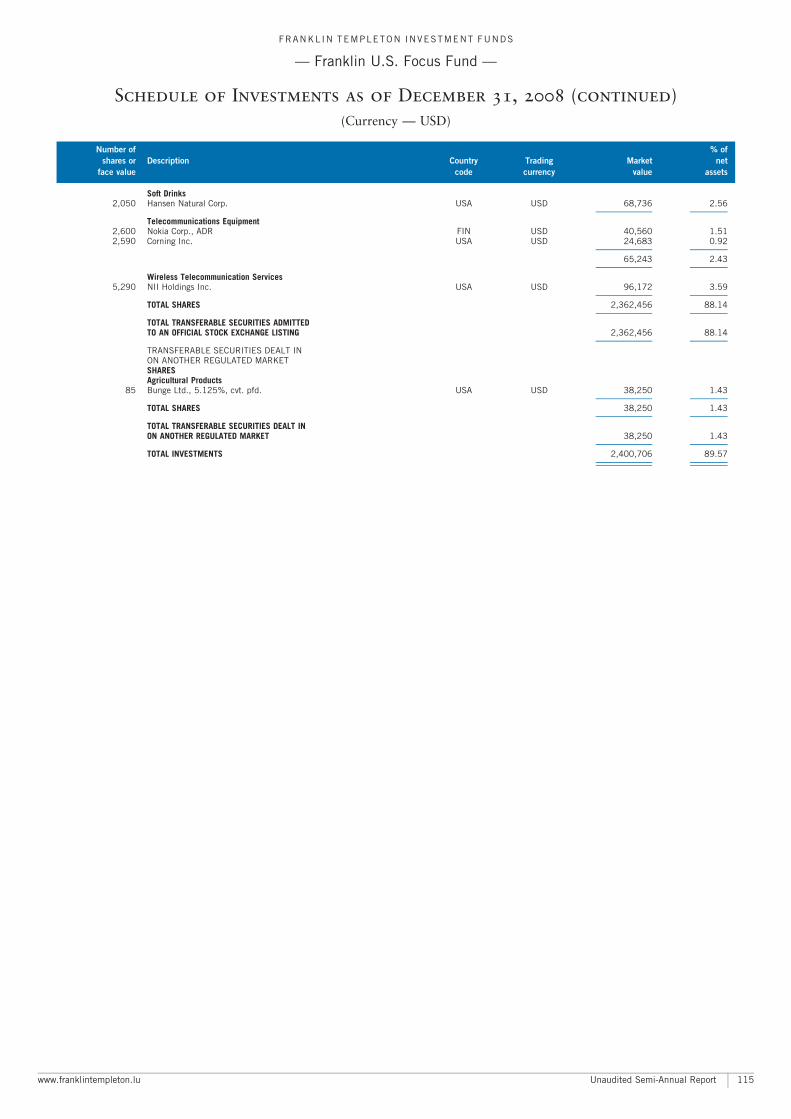
Soft Drinks2,050 Hansen Natural Corp. USA USD 68,736 2.56
A A
Telecommunications Equipment2,600 Nokia Corp., ADR FIN USD 40,560 1.512,590 Corning Inc. USA USD 24,683 0.92
A A
65,243 2.43A A
Wireless Telecommunication Services5,290 NII Holdings Inc. USA USD 96,172 3.59
A A
TOTAL SHARES 2,362,456 88.14A A
TOTAL TRANSFERABLE SECURITIES ADMITTEDTO AN OFFICIAL STOCK EXCHANGE LISTING 2,362,456 88.14
A A
TRANSFERABLE SECURITIES DEALT INON ANOTHER REGULATED MARKETSHARESAgricultural Products
85 Bunge Ltd., 5.125%, cvt. pfd. USA USD 38,250 1.43A A
TOTAL SHARES 38,250 1.43A A
TOTAL TRANSFERABLE SECURITIES DEALT INON ANOTHER REGULATED MARKET 38,250 1.43
A A
TOTAL INVESTMENTS 2,400,706 89.57A A
A A
FRANKL IN TEMPLETON INVESTMENT FUNDS
ç Franklin U.S. Focus Fund ç
Schedule of Investments as of December 31, 2008 (continued)
(Currency ç USD)
Number of % of
shares or Description Country Trading Market net
face value code currency value assets
www.franklintempleton.lu Unaudited Semi-Annual Report 115
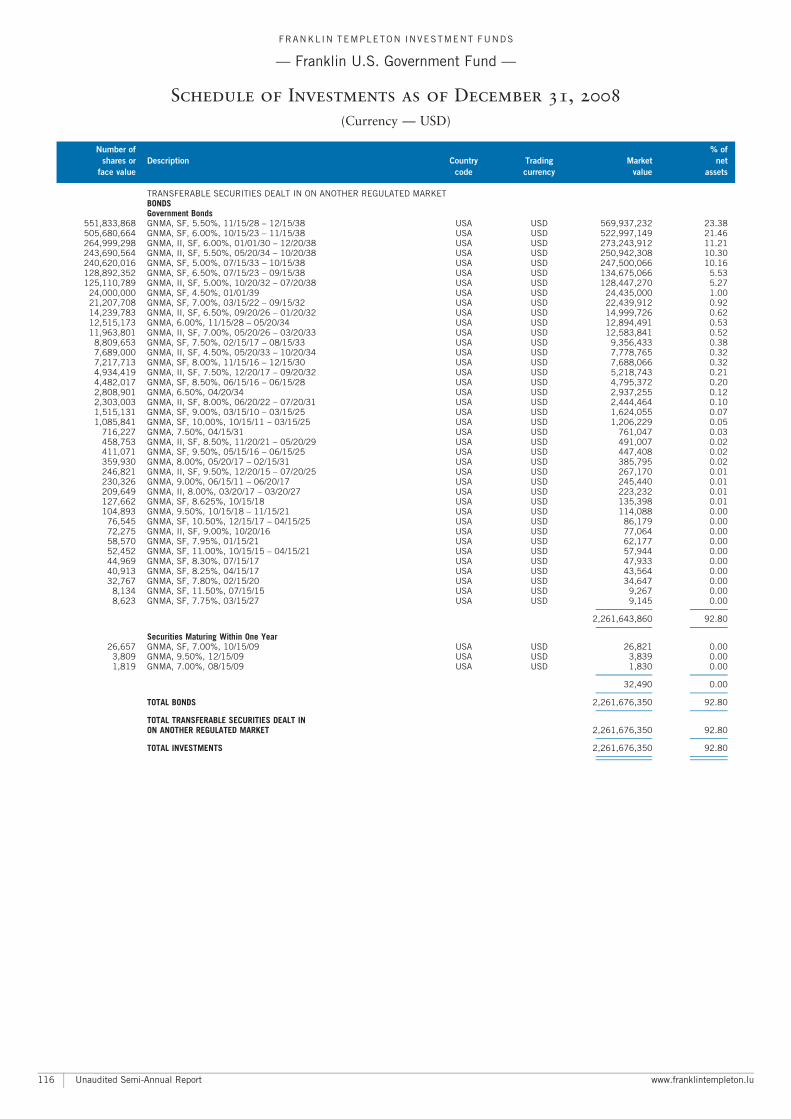
TRANSFERABLE SECURITIES DEALT IN ON ANOTHER REGULATED MARKETBONDSGovernment Bonds
551,833,868 GNMA, SF, 5.50%, 11/15/28 ^ 12/15/38 USA USD 569,937,232 23.38505,680,664 GNMA, SF, 6.00%, 10/15/23 ^ 11/15/38 USA USD 522,997,149 21.46264,999,298 GNMA, II, SF, 6.00%, 01/01/30 ^ 12/20/38 USA USD 273,243,912 11.21243,690,564 GNMA, II, SF, 5.50%, 05/20/34 ^ 10/20/38 USA USD 250,942,308 10.30240,620,016 GNMA, SF, 5.00%, 07/15/33 ^ 10/15/38 USA USD 247,500,066 10.16128,892,352 GNMA, SF, 6.50%, 07/15/23 ^ 09/15/38 USA USD 134,675,066 5.53125,110,789 GNMA, II, SF, 5.00%, 10/20/32 ^ 07/20/38 USA USD 128,447,270 5.27
24,000,000 GNMA, SF, 4.50%, 01/01/39 USA USD 24,435,000 1.0021,207,708 GNMA, SF, 7.00%, 03/15/22 ^ 09/15/32 USA USD 22,439,912 0.9214,239,783 GNMA, II, SF, 6.50%, 09/20/26 ^ 01/20/32 USA USD 14,999,726 0.6212,515,173 GNMA, 6.00%, 11/15/28 ^ 05/20/34 USA USD 12,894,491 0.5311,963,801 GNMA, II, SF, 7.00%, 05/20/26 ^ 03/20/33 USA USD 12,583,841 0.52
8,809,653 GNMA, SF, 7.50%, 02/15/17 ^ 08/15/33 USA USD 9,356,433 0.387,689,000 GNMA, II, SF, 4.50%, 05/20/33 ^ 10/20/34 USA USD 7,778,765 0.327,217,713 GNMA, SF, 8.00%, 11/15/16 ^ 12/15/30 USA USD 7,688,066 0.324,934,419 GNMA, II, SF, 7.50%, 12/20/17 ^ 09/20/32 USA USD 5,218,743 0.214,482,017 GNMA, SF, 8.50%, 06/15/16 ^ 06/15/28 USA USD 4,795,372 0.202,808,901 GNMA, 6.50%, 04/20/34 USA USD 2,937,255 0.122,303,003 GNMA, II, SF, 8.00%, 06/20/22 ^ 07/20/31 USA USD 2,444,464 0.101,515,131 GNMA, SF, 9.00%, 03/15/10 ^ 03/15/25 USA USD 1,624,055 0.071,085,841 GNMA, SF, 10.00%, 10/15/11 ^ 03/15/25 USA USD 1,206,229 0.05
716,227 GNMA, 7.50%, 04/15/31 USA USD 761,047 0.03458,753 GNMA, II, SF, 8.50%, 11/20/21 ^ 05/20/29 USA USD 491,007 0.02411,071 GNMA, SF, 9.50%, 05/15/16 ^ 06/15/25 USA USD 447,408 0.02359,930 GNMA, 8.00%, 05/20/17 ^ 02/15/31 USA USD 385,795 0.02246,821 GNMA, II, SF, 9.50%, 12/20/15 ^ 07/20/25 USA USD 267,170 0.01230,326 GNMA, 9.00%, 06/15/11 ^ 06/20/17 USA USD 245,440 0.01209,649 GNMA, II, 8.00%, 03/20/17 ^ 03/20/27 USA USD 223,232 0.01127,662 GNMA, SF, 8.625%, 10/15/18 USA USD 135,398 0.01104,893 GNMA, 9.50%, 10/15/18 ^ 11/15/21 USA USD 114,088 0.00
76,545 GNMA, SF, 10.50%, 12/15/17 ^ 04/15/25 USA USD 86,179 0.0072,275 GNMA, II, SF, 9.00%, 10/20/16 USA USD 77,064 0.0058,570 GNMA, SF, 7.95%, 01/15/21 USA USD 62,177 0.0052,452 GNMA, SF, 11.00%, 10/15/15 ^ 04/15/21 USA USD 57,944 0.0044,969 GNMA, SF, 8.30%, 07/15/17 USA USD 47,933 0.0040,913 GNMA, SF, 8.25%, 04/15/17 USA USD 43,564 0.0032,767 GNMA, SF, 7.80%, 02/15/20 USA USD 34,647 0.00
8,134 GNMA, SF, 11.50%, 07/15/15 USA USD 9,267 0.008,623 GNMA, SF, 7.75%, 03/15/27 USA USD 9,145 0.00
A A
2,261,643,860 92.80A A
Securities Maturing Within One Year26,657 GNMA, SF, 7.00%, 10/15/09 USA USD 26,821 0.00
3,809 GNMA, 9.50%, 12/15/09 USA USD 3,839 0.001,819 GNMA, 7.00%, 08/15/09 USA USD 1,830 0.00
A A
32,490 0.00A A
TOTAL BONDS 2,261,676,350 92.80A A
TOTAL TRANSFERABLE SECURITIES DEALT INON ANOTHER REGULATED MARKET 2,261,676,350 92.80
A A
TOTAL INVESTMENTS 2,261,676,350 92.80A A
A A
FRANKL IN TEMPLETON INVESTMENT FUNDS
ç Franklin U.S. Government Fund ç
Schedule of Investments as of December 31, 2008
(Currency ç USD)
Number of % of
shares or Description Country Trading Market net
face value code currency value assets
Unaudited Semi-Annual Report www.franklintempleton.lu116
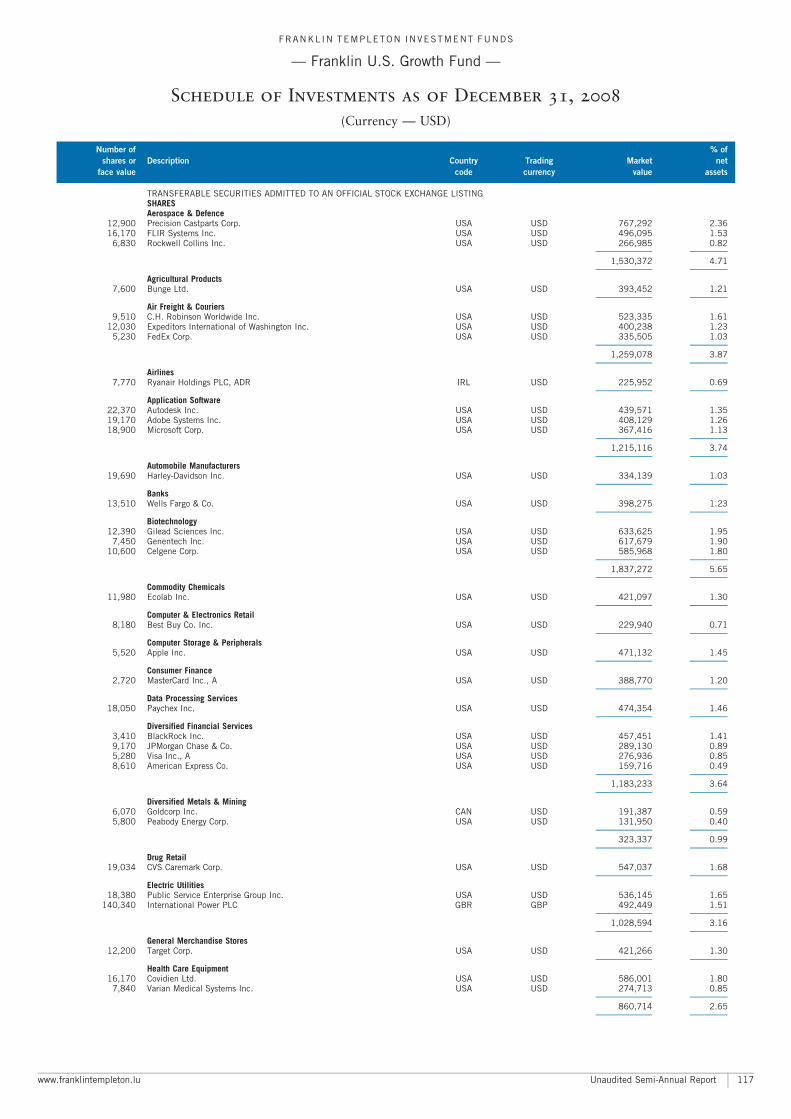
TRANSFERABLE SECURITIES ADMITTED TO AN OFFICIAL STOCK EXCHANGE LISTINGSHARESAerospace & Defence
12,900 Precision Castparts Corp. USA USD 767,292 2.3616,170 FLIR Systems Inc. USA USD 496,095 1.53
6,830 Rockwell Collins Inc. USA USD 266,985 0.82A A
1,530,372 4.71A A
Agricultural Products7,600 Bunge Ltd. USA USD 393,452 1.21
A A
Air Freight & Couriers9,510 C.H. Robinson Worldwide Inc. USA USD 523,335 1.61
12,030 Expeditors International of Washington Inc. USA USD 400,238 1.235,230 FedEx Corp. USA USD 335,505 1.03
A A
1,259,078 3.87A A
Airlines7,770 Ryanair Holdings PLC, ADR IRL USD 225,952 0.69
A A
Application Software22,370 Autodesk Inc. USA USD 439,571 1.3519,170 Adobe Systems Inc. USA USD 408,129 1.2618,900 Microsoft Corp. USA USD 367,416 1.13
A A
1,215,116 3.74A A
Automobile Manufacturers19,690 Harley-Davidson Inc. USA USD 334,139 1.03
A A
Banks13,510 Wells Fargo & Co. USA USD 398,275 1.23
A A
Biotechnology12,390 Gilead Sciences Inc. USA USD 633,625 1.95
7,450 Genentech Inc. USA USD 617,679 1.9010,600 Celgene Corp. USA USD 585,968 1.80
A A
1,837,272 5.65A A
Commodity Chemicals11,980 Ecolab Inc. USA USD 421,097 1.30
A A
Computer & Electronics Retail8,180 Best Buy Co. Inc. USA USD 229,940 0.71
A A
Computer Storage & Peripherals5,520 Apple Inc. USA USD 471,132 1.45
A A
Consumer Finance2,720 MasterCard Inc., A USA USD 388,770 1.20
A A
Data Processing Services18,050 Paychex Inc. USA USD 474,354 1.46
A A
Diversified Financial Services3,410 BlackRock Inc. USA USD 457,451 1.419,170 JPMorgan Chase & Co. USA USD 289,130 0.895,280 Visa Inc., A USA USD 276,936 0.858,610 American Express Co. USA USD 159,716 0.49
A A
1,183,233 3.64A A
Diversified Metals & Mining6,070 Goldcorp Inc. CAN USD 191,387 0.595,800 Peabody Energy Corp. USA USD 131,950 0.40
A A
323,337 0.99A A
Drug Retail19,034 CVS Caremark Corp. USA USD 547,037 1.68
A A
Electric Utilities18,380 Public Service Enterprise Group Inc. USA USD 536,145 1.65
140,340 International Power PLC GBR GBP 492,449 1.51A A
1,028,594 3.16A A
General Merchandise Stores12,200 Target Corp. USA USD 421,266 1.30
A A
Health Care Equipment16,170 Covidien Ltd. USA USD 586,001 1.80
7,840 Varian Medical Systems Inc. USA USD 274,713 0.85A A
860,714 2.65A A
FRANKL IN TEMPLETON INVESTMENT FUNDS
ç Franklin U.S. Growth Fund ç
Schedule of Investments as of December 31, 2008
(Currency ç USD)
Number of % of
shares or Description Country Trading Market net
face value code currency value assets
www.franklintempleton.lu Unaudited Semi-Annual Report 117
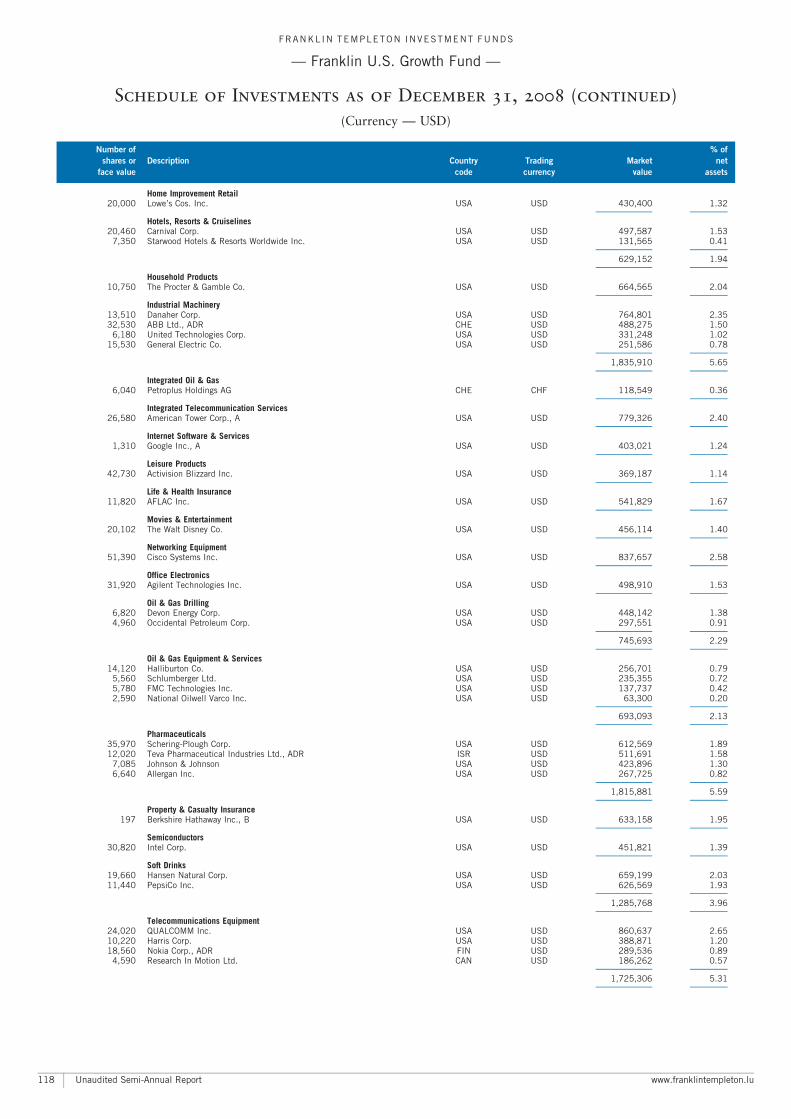
Home Improvement Retail20,000 Lowe’s Cos. Inc. USA USD 430,400 1.32
A A
Hotels, Resorts & Cruiselines20,460 Carnival Corp. USA USD 497,587 1.53
7,350 Starwood Hotels & Resorts Worldwide Inc. USA USD 131,565 0.41A A
629,152 1.94A A
Household Products10,750 The Procter & Gamble Co. USA USD 664,565 2.04
A A
Industrial Machinery13,510 Danaher Corp. USA USD 764,801 2.3532,530 ABB Ltd., ADR CHE USD 488,275 1.50
6,180 United Technologies Corp. USA USD 331,248 1.0215,530 General Electric Co. USA USD 251,586 0.78
A A
1,835,910 5.65A A
Integrated Oil & Gas6,040 Petroplus Holdings AG CHE CHF 118,549 0.36
A A
Integrated Telecommunication Services26,580 American Tower Corp., A USA USD 779,326 2.40
A A
Internet Software & Services1,310 Google Inc., A USA USD 403,021 1.24
A A
Leisure Products42,730 Activision Blizzard Inc. USA USD 369,187 1.14
A A
Life & Health Insurance11,820 AFLAC Inc. USA USD 541,829 1.67
A A
Movies & Entertainment20,102 The Walt Disney Co. USA USD 456,114 1.40
A A
Networking Equipment51,390 Cisco Systems Inc. USA USD 837,657 2.58
A A
Office Electronics31,920 Agilent Technologies Inc. USA USD 498,910 1.53
A A
Oil & Gas Drilling6,820 Devon Energy Corp. USA USD 448,142 1.384,960 Occidental Petroleum Corp. USA USD 297,551 0.91
A A
745,693 2.29A A
Oil & Gas Equipment & Services14,120 Halliburton Co. USA USD 256,701 0.79
5,560 Schlumberger Ltd. USA USD 235,355 0.725,780 FMC Technologies Inc. USA USD 137,737 0.422,590 National Oilwell Varco Inc. USA USD 63,300 0.20
A A
693,093 2.13A A
Pharmaceuticals35,970 Schering-Plough Corp. USA USD 612,569 1.8912,020 Teva Pharmaceutical Industries Ltd., ADR ISR USD 511,691 1.58
7,085 Johnson & Johnson USA USD 423,896 1.306,640 Allergan Inc. USA USD 267,725 0.82
A A
1,815,881 5.59A A
Property & Casualty Insurance197 Berkshire Hathaway Inc., B USA USD 633,158 1.95
A A
Semiconductors30,820 Intel Corp. USA USD 451,821 1.39
A A
Soft Drinks19,660 Hansen Natural Corp. USA USD 659,199 2.0311,440 PepsiCo Inc. USA USD 626,569 1.93
A A
1,285,768 3.96A A
Telecommunications Equipment24,020 QUALCOMM Inc. USA USD 860,637 2.6510,220 Harris Corp. USA USD 388,871 1.2018,560 Nokia Corp., ADR FIN USD 289,536 0.89
4,590 Research In Motion Ltd. CAN USD 186,262 0.57A A
1,725,306 5.31A A
FRANKL IN TEMPLETON INVESTMENT FUNDS
ç Franklin U.S. Growth Fund ç
Schedule of Investments as of December 31, 2008 (continued)
(Currency ç USD)
Number of % of
shares or Description Country Trading Market net
face value code currency value assets
Unaudited Semi-Annual Report www.franklintempleton.lu118
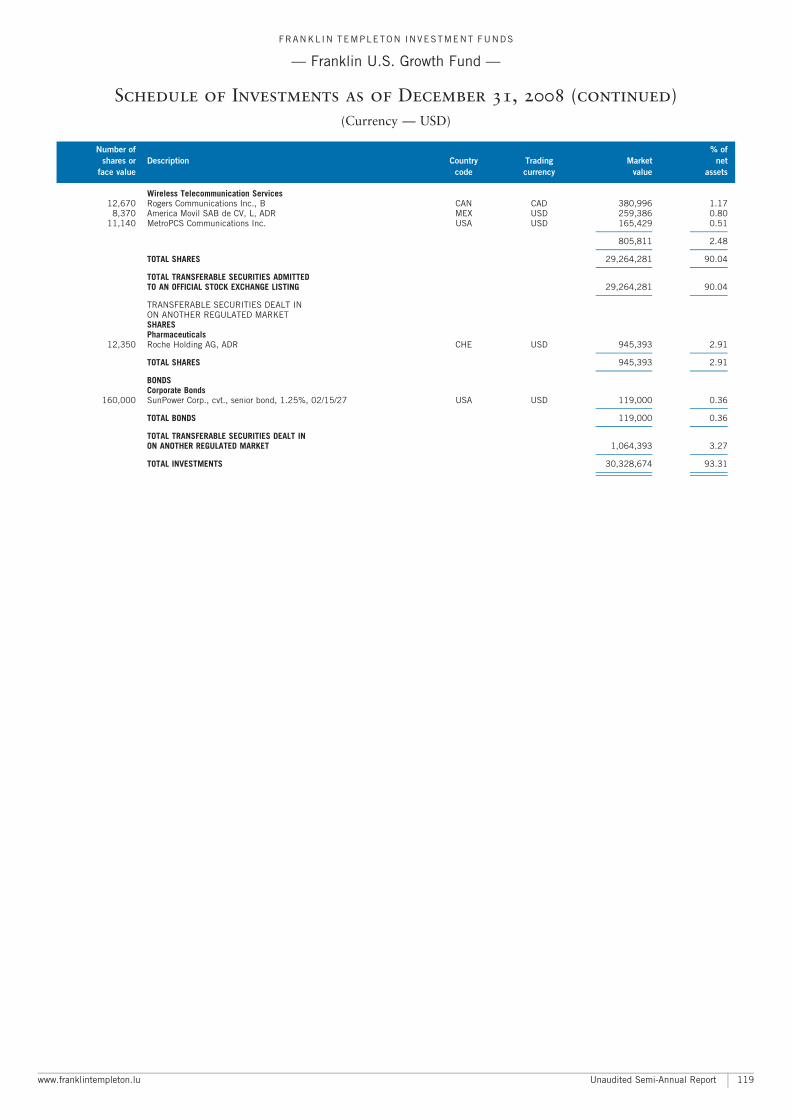
Wireless Telecommunication Services12,670 Rogers Communications Inc., B CAN CAD 380,996 1.17
8,370 America Movil SAB de CV, L, ADR MEX USD 259,386 0.8011,140 MetroPCS Communications Inc. USA USD 165,429 0.51
A A
805,811 2.48A A
TOTAL SHARES 29,264,281 90.04A A
TOTAL TRANSFERABLE SECURITIES ADMITTEDTO AN OFFICIAL STOCK EXCHANGE LISTING 29,264,281 90.04
A A
TRANSFERABLE SECURITIES DEALT INON ANOTHER REGULATED MARKETSHARESPharmaceuticals
12,350 Roche Holding AG, ADR CHE USD 945,393 2.91A A
TOTAL SHARES 945,393 2.91A A
BONDSCorporate Bonds
160,000 SunPower Corp., cvt., senior bond, 1.25%, 02/15/27 USA USD 119,000 0.36A A
TOTAL BONDS 119,000 0.36A A
TOTAL TRANSFERABLE SECURITIES DEALT INON ANOTHER REGULATED MARKET 1,064,393 3.27
A A
TOTAL INVESTMENTS 30,328,674 93.31A A
A A
FRANKL IN TEMPLETON INVESTMENT FUNDS
ç Franklin U.S. Growth Fund ç
Schedule of Investments as of December 31, 2008 (continued)
(Currency ç USD)
Number of % of
shares or Description Country Trading Market net
face value code currency value assets
www.franklintempleton.lu Unaudited Semi-Annual Report 119
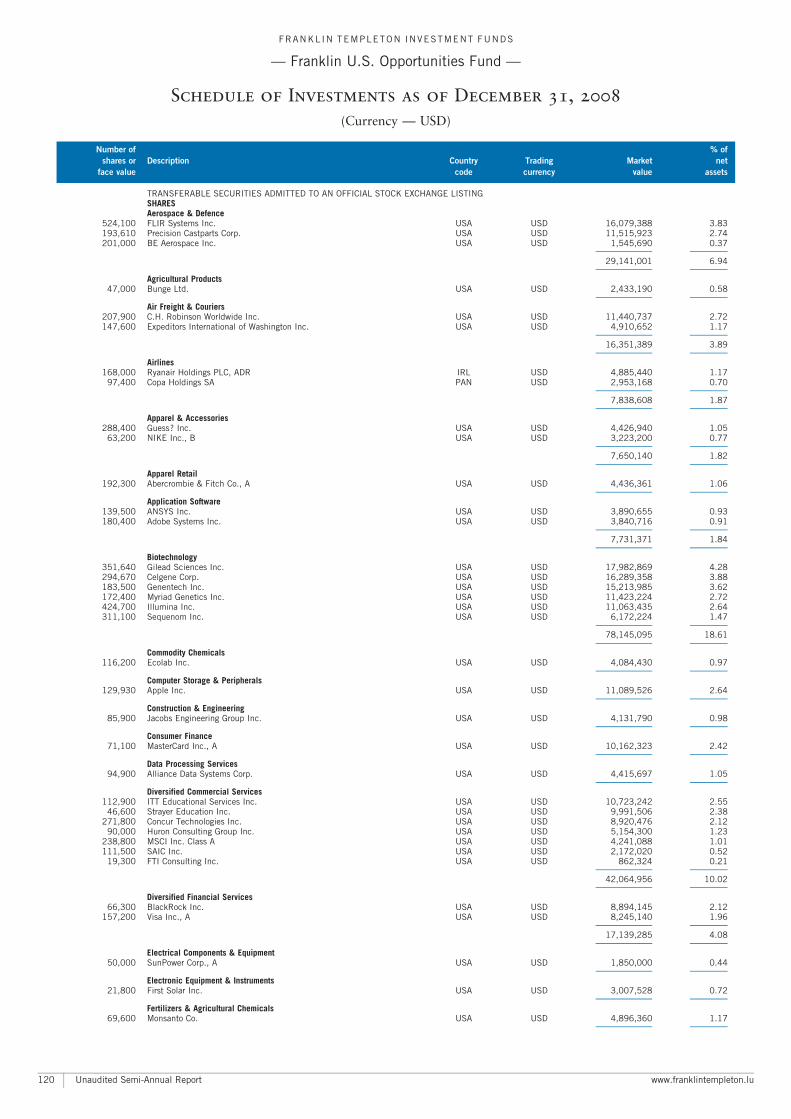
TRANSFERABLE SECURITIES ADMITTED TO AN OFFICIAL STOCK EXCHANGE LISTINGSHARESAerospace & Defence
524,100 FLIR Systems Inc. USA USD 16,079,388 3.83193,610 Precision Castparts Corp. USA USD 11,515,923 2.74201,000 BE Aerospace Inc. USA USD 1,545,690 0.37
A A
29,141,001 6.94A A
Agricultural Products47,000 Bunge Ltd. USA USD 2,433,190 0.58
A A
Air Freight & Couriers207,900 C.H. Robinson Worldwide Inc. USA USD 11,440,737 2.72147,600 Expeditors International of Washington Inc. USA USD 4,910,652 1.17
A A
16,351,389 3.89A A
Airlines168,000 Ryanair Holdings PLC, ADR IRL USD 4,885,440 1.17
97,400 Copa Holdings SA PAN USD 2,953,168 0.70A A
7,838,608 1.87A A
Apparel & Accessories288,400 Guess? Inc. USA USD 4,426,940 1.05
63,200 NIKE Inc., B USA USD 3,223,200 0.77A A
7,650,140 1.82A A
Apparel Retail192,300 Abercrombie & Fitch Co., A USA USD 4,436,361 1.06
A A
Application Software139,500 ANSYS Inc. USA USD 3,890,655 0.93180,400 Adobe Systems Inc. USA USD 3,840,716 0.91
A A
7,731,371 1.84A A
Biotechnology351,640 Gilead Sciences Inc. USA USD 17,982,869 4.28294,670 Celgene Corp. USA USD 16,289,358 3.88183,500 Genentech Inc. USA USD 15,213,985 3.62172,400 Myriad Genetics Inc. USA USD 11,423,224 2.72424,700 Illumina Inc. USA USD 11,063,435 2.64311,100 Sequenom Inc. USA USD 6,172,224 1.47
A A
78,145,095 18.61A A
Commodity Chemicals116,200 Ecolab Inc. USA USD 4,084,430 0.97
A A
Computer Storage & Peripherals129,930 Apple Inc. USA USD 11,089,526 2.64
A A
Construction & Engineering85,900 Jacobs Engineering Group Inc. USA USD 4,131,790 0.98
A A
Consumer Finance71,100 MasterCard Inc., A USA USD 10,162,323 2.42
A A
Data Processing Services94,900 Alliance Data Systems Corp. USA USD 4,415,697 1.05
A A
Diversified Commercial Services112,900 ITT Educational Services Inc. USA USD 10,723,242 2.55
46,600 Strayer Education Inc. USA USD 9,991,506 2.38271,800 Concur Technologies Inc. USA USD 8,920,476 2.12
90,000 Huron Consulting Group Inc. USA USD 5,154,300 1.23238,800 MSCI Inc. Class A USA USD 4,241,088 1.01111,500 SAIC Inc. USA USD 2,172,020 0.52
19,300 FTI Consulting Inc. USA USD 862,324 0.21A A
42,064,956 10.02A A
Diversified Financial Services66,300 BlackRock Inc. USA USD 8,894,145 2.12
157,200 Visa Inc., A USA USD 8,245,140 1.96A A
17,139,285 4.08A A
Electrical Components & Equipment50,000 SunPower Corp., A USA USD 1,850,000 0.44
A A
Electronic Equipment & Instruments21,800 First Solar Inc. USA USD 3,007,528 0.72
A A
Fertilizers & Agricultural Chemicals69,600 Monsanto Co. USA USD 4,896,360 1.17
A A
FRANKL IN TEMPLETON INVESTMENT FUNDS
ç Franklin U.S. Opportunities Fund ç
Schedule of Investments as of December 31, 2008
(Currency ç USD)
Number of % of
shares or Description Country Trading Market net
face value code currency value assets
Unaudited Semi-Annual Report www.franklintempleton.lu120
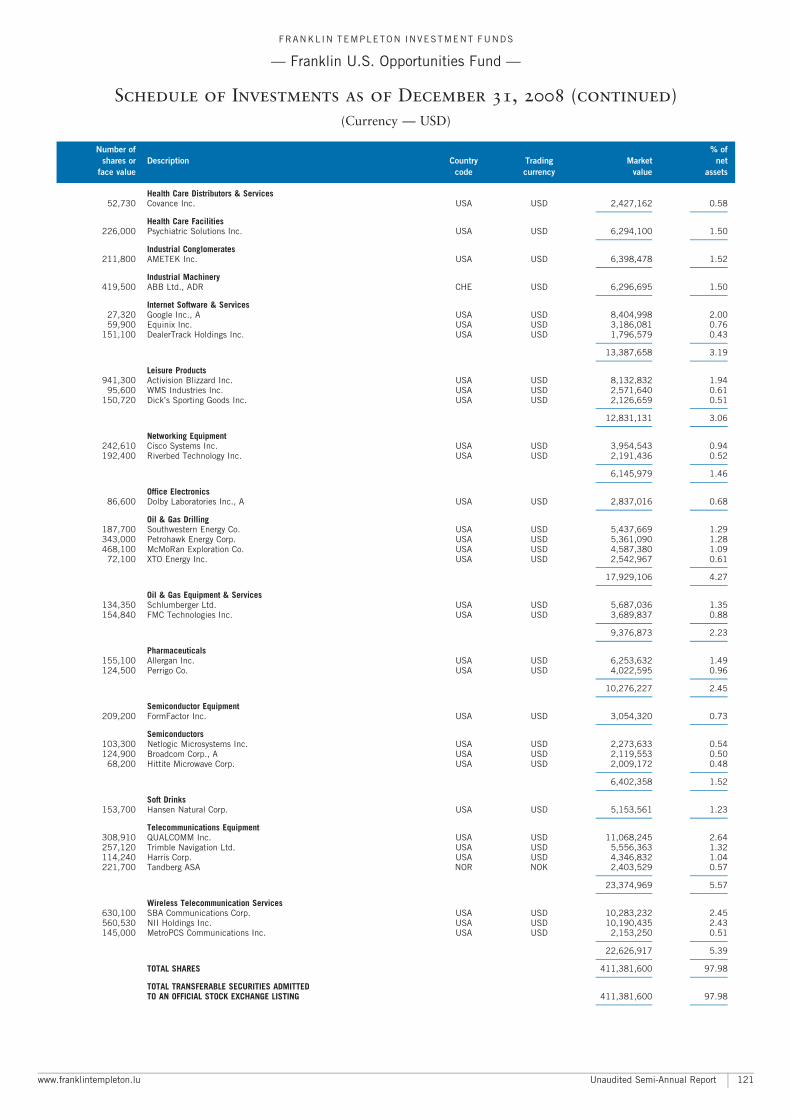
Health Care Distributors & Services52,730 Covance Inc. USA USD 2,427,162 0.58
A A
Health Care Facilities226,000 Psychiatric Solutions Inc. USA USD 6,294,100 1.50
A A
Industrial Conglomerates211,800 AMETEK Inc. USA USD 6,398,478 1.52
A A
Industrial Machinery419,500 ABB Ltd., ADR CHE USD 6,296,695 1.50
A A
Internet Software & Services27,320 Google Inc., A USA USD 8,404,998 2.0059,900 Equinix Inc. USA USD 3,186,081 0.76
151,100 DealerTrack Holdings Inc. USA USD 1,796,579 0.43A A
13,387,658 3.19A A
Leisure Products941,300 Activision Blizzard Inc. USA USD 8,132,832 1.94
95,600 WMS Industries Inc. USA USD 2,571,640 0.61150,720 Dick’s Sporting Goods Inc. USA USD 2,126,659 0.51
A A
12,831,131 3.06A A
Networking Equipment242,610 Cisco Systems Inc. USA USD 3,954,543 0.94192,400 Riverbed Technology Inc. USA USD 2,191,436 0.52
A A
6,145,979 1.46A A
Office Electronics86,600 Dolby Laboratories Inc., A USA USD 2,837,016 0.68
A A
Oil & Gas Drilling187,700 Southwestern Energy Co. USA USD 5,437,669 1.29343,000 Petrohawk Energy Corp. USA USD 5,361,090 1.28468,100 McMoRan Exploration Co. USA USD 4,587,380 1.09
72,100 XTO Energy Inc. USA USD 2,542,967 0.61A A
17,929,106 4.27A A
Oil & Gas Equipment & Services134,350 Schlumberger Ltd. USA USD 5,687,036 1.35154,840 FMC Technologies Inc. USA USD 3,689,837 0.88
A A
9,376,873 2.23A A
Pharmaceuticals155,100 Allergan Inc. USA USD 6,253,632 1.49124,500 Perrigo Co. USA USD 4,022,595 0.96
A A
10,276,227 2.45A A
Semiconductor Equipment209,200 FormFactor Inc. USA USD 3,054,320 0.73
A A
Semiconductors103,300 Netlogic Microsystems Inc. USA USD 2,273,633 0.54124,900 Broadcom Corp., A USA USD 2,119,553 0.50
68,200 Hittite Microwave Corp. USA USD 2,009,172 0.48A A
6,402,358 1.52A A
Soft Drinks153,700 Hansen Natural Corp. USA USD 5,153,561 1.23
A A
Telecommunications Equipment308,910 QUALCOMM Inc. USA USD 11,068,245 2.64257,120 Trimble Navigation Ltd. USA USD 5,556,363 1.32114,240 Harris Corp. USA USD 4,346,832 1.04221,700 Tandberg ASA NOR NOK 2,403,529 0.57
A A
23,374,969 5.57A A
Wireless Telecommunication Services630,100 SBA Communications Corp. USA USD 10,283,232 2.45560,530 NII Holdings Inc. USA USD 10,190,435 2.43145,000 MetroPCS Communications Inc. USA USD 2,153,250 0.51
A A
22,626,917 5.39A A
TOTAL SHARES 411,381,600 97.98A A
TOTAL TRANSFERABLE SECURITIES ADMITTEDTO AN OFFICIAL STOCK EXCHANGE LISTING 411,381,600 97.98
A A
FRANKL IN TEMPLETON INVESTMENT FUNDS
ç Franklin U.S. Opportunities Fund ç
Schedule of Investments as of December 31, 2008 (continued)
(Currency ç USD)
Number of % of
shares or Description Country Trading Market net
face value code currency value assets
www.franklintempleton.lu Unaudited Semi-Annual Report 121
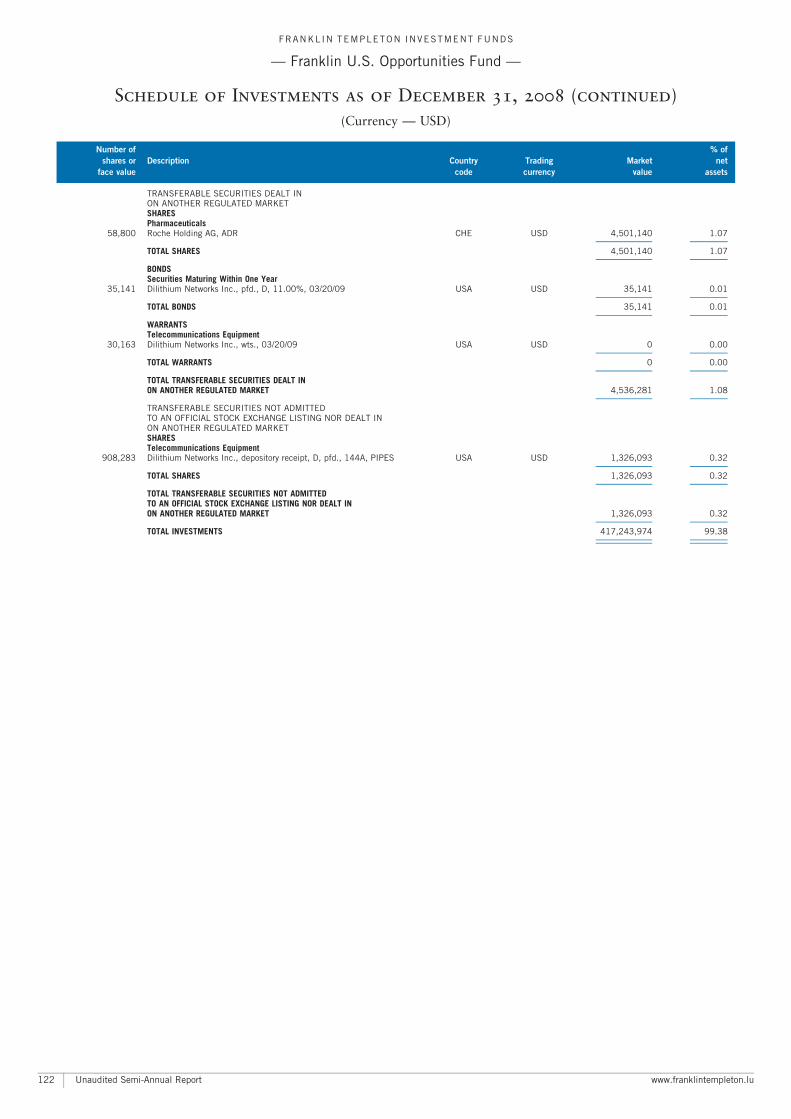
TRANSFERABLE SECURITIES DEALT INON ANOTHER REGULATED MARKETSHARESPharmaceuticals
58,800 Roche Holding AG, ADR CHE USD 4,501,140 1.07A A
TOTAL SHARES 4,501,140 1.07A A
BONDSSecurities Maturing Within One Year
35,141 Dilithium Networks Inc., pfd., D, 11.00%, 03/20/09 USA USD 35,141 0.01A A
TOTAL BONDS 35,141 0.01A A
WARRANTSTelecommunications Equipment
30,163 Dilithium Networks Inc., wts., 03/20/09 USA USD 0 0.00A A
TOTAL WARRANTS 0 0.00A A
TOTAL TRANSFERABLE SECURITIES DEALT INON ANOTHER REGULATED MARKET 4,536,281 1.08
A A
TRANSFERABLE SECURITIES NOT ADMITTEDTO AN OFFICIAL STOCK EXCHANGE LISTING NOR DEALT INON ANOTHER REGULATED MARKETSHARESTelecommunications Equipment
908,283 Dilithium Networks Inc., depository receipt, D, pfd., 144A, PIPES USA USD 1,326,093 0.32A A
TOTAL SHARES 1,326,093 0.32A A
TOTAL TRANSFERABLE SECURITIES NOT ADMITTEDTO AN OFFICIAL STOCK EXCHANGE LISTING NOR DEALT INON ANOTHER REGULATED MARKET 1,326,093 0.32
A A
TOTAL INVESTMENTS 417,243,974 99.38A A
A A
FRANKL IN TEMPLETON INVESTMENT FUNDS
ç Franklin U.S. Opportunities Fund ç
Schedule of Investments as of December 31, 2008 (continued)
(Currency ç USD)
Number of % of
shares or Description Country Trading Market net
face value code currency value assets
Unaudited Semi-Annual Report www.franklintempleton.lu122
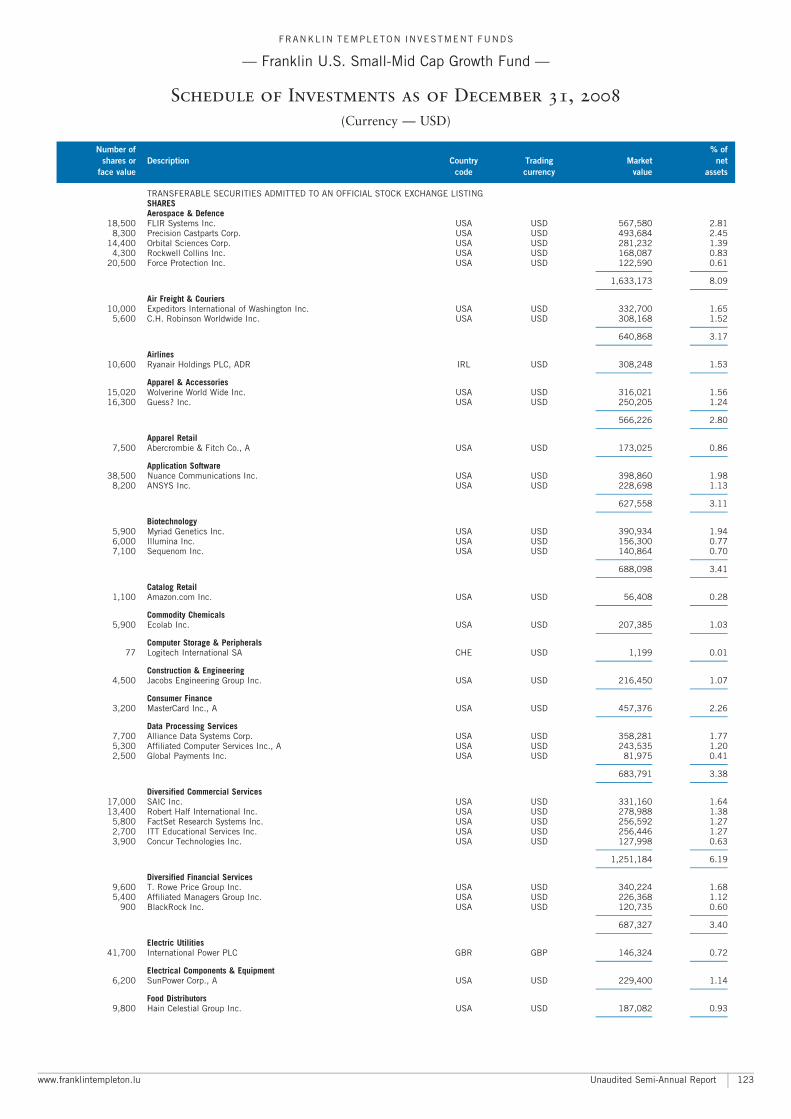
TRANSFERABLE SECURITIES ADMITTED TO AN OFFICIAL STOCK EXCHANGE LISTINGSHARESAerospace & Defence
18,500 FLIR Systems Inc. USA USD 567,580 2.818,300 Precision Castparts Corp. USA USD 493,684 2.45
14,400 Orbital Sciences Corp. USA USD 281,232 1.394,300 Rockwell Collins Inc. USA USD 168,087 0.83
20,500 Force Protection Inc. USA USD 122,590 0.61A A
1,633,173 8.09A A
Air Freight & Couriers10,000 Expeditors International of Washington Inc. USA USD 332,700 1.65
5,600 C.H. Robinson Worldwide Inc. USA USD 308,168 1.52A A
640,868 3.17A A
Airlines10,600 Ryanair Holdings PLC, ADR IRL USD 308,248 1.53
A A
Apparel & Accessories15,020 Wolverine World Wide Inc. USA USD 316,021 1.5616,300 Guess? Inc. USA USD 250,205 1.24
A A
566,226 2.80A A
Apparel Retail7,500 Abercrombie & Fitch Co., A USA USD 173,025 0.86
A A
Application Software38,500 Nuance Communications Inc. USA USD 398,860 1.98
8,200 ANSYS Inc. USA USD 228,698 1.13A A
627,558 3.11A A
Biotechnology5,900 Myriad Genetics Inc. USA USD 390,934 1.946,000 Illumina Inc. USA USD 156,300 0.777,100 Sequenom Inc. USA USD 140,864 0.70
A A
688,098 3.41A A
Catalog Retail1,100 Amazon.com Inc. USA USD 56,408 0.28
A A
Commodity Chemicals5,900 Ecolab Inc. USA USD 207,385 1.03
A A
Computer Storage & Peripherals77 Logitech International SA CHE USD 1,199 0.01
A A
Construction & Engineering4,500 Jacobs Engineering Group Inc. USA USD 216,450 1.07
A A
Consumer Finance3,200 MasterCard Inc., A USA USD 457,376 2.26
A A
Data Processing Services7,700 Alliance Data Systems Corp. USA USD 358,281 1.775,300 Affiliated Computer Services Inc., A USA USD 243,535 1.202,500 Global Payments Inc. USA USD 81,975 0.41
A A
683,791 3.38A A
Diversified Commercial Services17,000 SAIC Inc. USA USD 331,160 1.6413,400 Robert Half International Inc. USA USD 278,988 1.38
5,800 FactSet Research Systems Inc. USA USD 256,592 1.272,700 ITT Educational Services Inc. USA USD 256,446 1.273,900 Concur Technologies Inc. USA USD 127,998 0.63
A A
1,251,184 6.19A A
Diversified Financial Services9,600 T. Rowe Price Group Inc. USA USD 340,224 1.685,400 Affiliated Managers Group Inc. USA USD 226,368 1.12
900 BlackRock Inc. USA USD 120,735 0.60A A
687,327 3.40A A
Electric Utilities41,700 International Power PLC GBR GBP 146,324 0.72
A A
Electrical Components & Equipment6,200 SunPower Corp., A USA USD 229,400 1.14
A A
Food Distributors9,800 Hain Celestial Group Inc. USA USD 187,082 0.93
A A
FRANKL IN TEMPLETON INVESTMENT FUNDS
ç Franklin U.S. Small-Mid Cap Growth Fund ç
Schedule of Investments as of December 31, 2008
(Currency ç USD)
Number of % of
shares or Description Country Trading Market net
face value code currency value assets
www.franklintempleton.lu Unaudited Semi-Annual Report 123
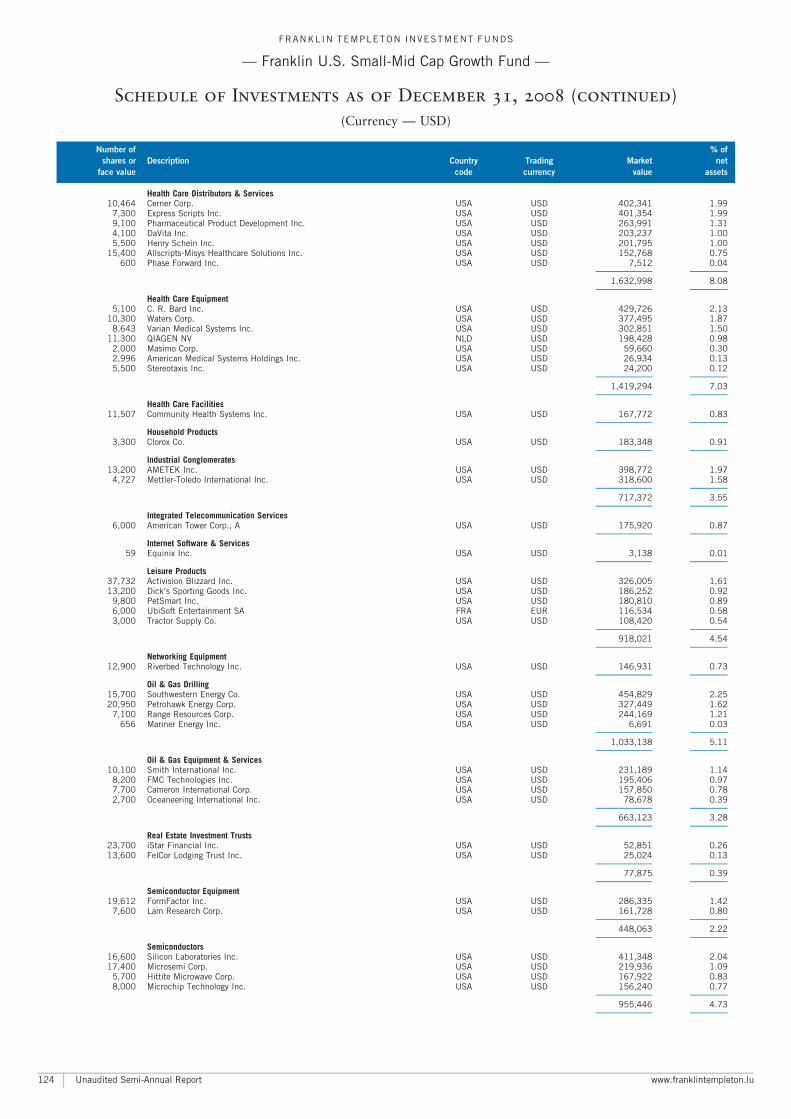
Health Care Distributors & Services10,464 Cerner Corp. USA USD 402,341 1.99
7,300 Express Scripts Inc. USA USD 401,354 1.999,100 Pharmaceutical Product Development Inc. USA USD 263,991 1.314,100 DaVita Inc. USA USD 203,237 1.005,500 Henry Schein Inc. USA USD 201,795 1.00
15,400 Allscripts-Misys Healthcare Solutions Inc. USA USD 152,768 0.75600 Phase Forward Inc. USA USD 7,512 0.04
A A
1,632,998 8.08A A
Health Care Equipment5,100 C. R. Bard Inc. USA USD 429,726 2.13
10,300 Waters Corp. USA USD 377,495 1.878,643 Varian Medical Systems Inc. USA USD 302,851 1.50
11,300 QIAGEN NV NLD USD 198,428 0.982,000 Masimo Corp. USA USD 59,660 0.302,996 American Medical Systems Holdings Inc. USA USD 26,934 0.135,500 Stereotaxis Inc. USA USD 24,200 0.12
A A
1,419,294 7.03A A
Health Care Facilities11,507 Community Health Systems Inc. USA USD 167,772 0.83
A A
Household Products3,300 Clorox Co. USA USD 183,348 0.91
A A
Industrial Conglomerates13,200 AMETEK Inc. USA USD 398,772 1.97
4,727 Mettler-Toledo International Inc. USA USD 318,600 1.58A A
717,372 3.55A A
Integrated Telecommunication Services6,000 American Tower Corp., A USA USD 175,920 0.87
A A
Internet Software & Services59 Equinix Inc. USA USD 3,138 0.01
A A
Leisure Products37,732 Activision Blizzard Inc. USA USD 326,005 1.6113,200 Dick’s Sporting Goods Inc. USA USD 186,252 0.92
9,800 PetSmart Inc. USA USD 180,810 0.896,000 UbiSoft Entertainment SA FRA EUR 116,534 0.583,000 Tractor Supply Co. USA USD 108,420 0.54
A A
918,021 4.54A A
Networking Equipment12,900 Riverbed Technology Inc. USA USD 146,931 0.73
A A
Oil & Gas Drilling15,700 Southwestern Energy Co. USA USD 454,829 2.2520,950 Petrohawk Energy Corp. USA USD 327,449 1.62
7,100 Range Resources Corp. USA USD 244,169 1.21656 Mariner Energy Inc. USA USD 6,691 0.03
A A
1,033,138 5.11A A
Oil & Gas Equipment & Services10,100 Smith International Inc. USA USD 231,189 1.14
8,200 FMC Technologies Inc. USA USD 195,406 0.977,700 Cameron International Corp. USA USD 157,850 0.782,700 Oceaneering International Inc. USA USD 78,678 0.39
A A
663,123 3.28A A
Real Estate Investment Trusts23,700 iStar Financial Inc. USA USD 52,851 0.2613,600 FelCor Lodging Trust Inc. USA USD 25,024 0.13
A A
77,875 0.39A A
Semiconductor Equipment19,612 FormFactor Inc. USA USD 286,335 1.42
7,600 Lam Research Corp. USA USD 161,728 0.80A A
448,063 2.22A A
Semiconductors16,600 Silicon Laboratories Inc. USA USD 411,348 2.0417,400 Microsemi Corp. USA USD 219,936 1.09
5,700 Hittite Microwave Corp. USA USD 167,922 0.838,000 Microchip Technology Inc. USA USD 156,240 0.77
A A
955,446 4.73A A
FRANKL IN TEMPLETON INVESTMENT FUNDS
ç Franklin U.S. Small-Mid Cap Growth Fund ç
Schedule of Investments as of December 31, 2008 (continued)
(Currency ç USD)
Number of % of
shares or Description Country Trading Market net
face value code currency value assets
Unaudited Semi-Annual Report www.franklintempleton.lu124
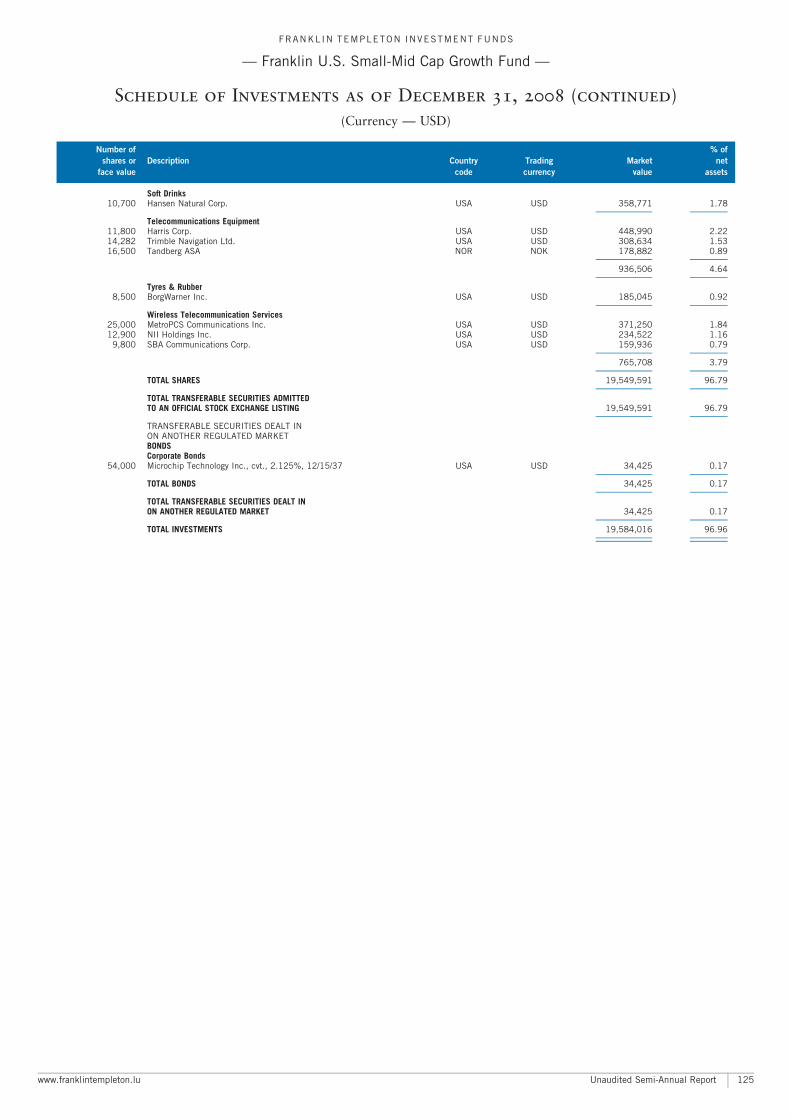
Soft Drinks10,700 Hansen Natural Corp. USA USD 358,771 1.78
A A
Telecommunications Equipment11,800 Harris Corp. USA USD 448,990 2.2214,282 Trimble Navigation Ltd. USA USD 308,634 1.5316,500 Tandberg ASA NOR NOK 178,882 0.89
A A
936,506 4.64A A
Tyres & Rubber8,500 BorgWarner Inc. USA USD 185,045 0.92
A A
Wireless Telecommunication Services25,000 MetroPCS Communications Inc. USA USD 371,250 1.8412,900 NII Holdings Inc. USA USD 234,522 1.16
9,800 SBA Communications Corp. USA USD 159,936 0.79A A
765,708 3.79A A
TOTAL SHARES 19,549,591 96.79A A
TOTAL TRANSFERABLE SECURITIES ADMITTEDTO AN OFFICIAL STOCK EXCHANGE LISTING 19,549,591 96.79
A A
TRANSFERABLE SECURITIES DEALT INON ANOTHER REGULATED MARKETBONDSCorporate Bonds
54,000 Microchip Technology Inc., cvt., 2.125%, 12/15/37 USA USD 34,425 0.17A A
TOTAL BONDS 34,425 0.17A A
TOTAL TRANSFERABLE SECURITIES DEALT INON ANOTHER REGULATED MARKET 34,425 0.17
A A
TOTAL INVESTMENTS 19,584,016 96.96A A
A A
FRANKL IN TEMPLETON INVESTMENT FUNDS
ç Franklin U.S. Small-Mid Cap Growth Fund ç
Schedule of Investments as of December 31, 2008 (continued)
(Currency ç USD)
Number of % of
shares or Description Country Trading Market net
face value code currency value assets
www.franklintempleton.lu Unaudited Semi-Annual Report 125
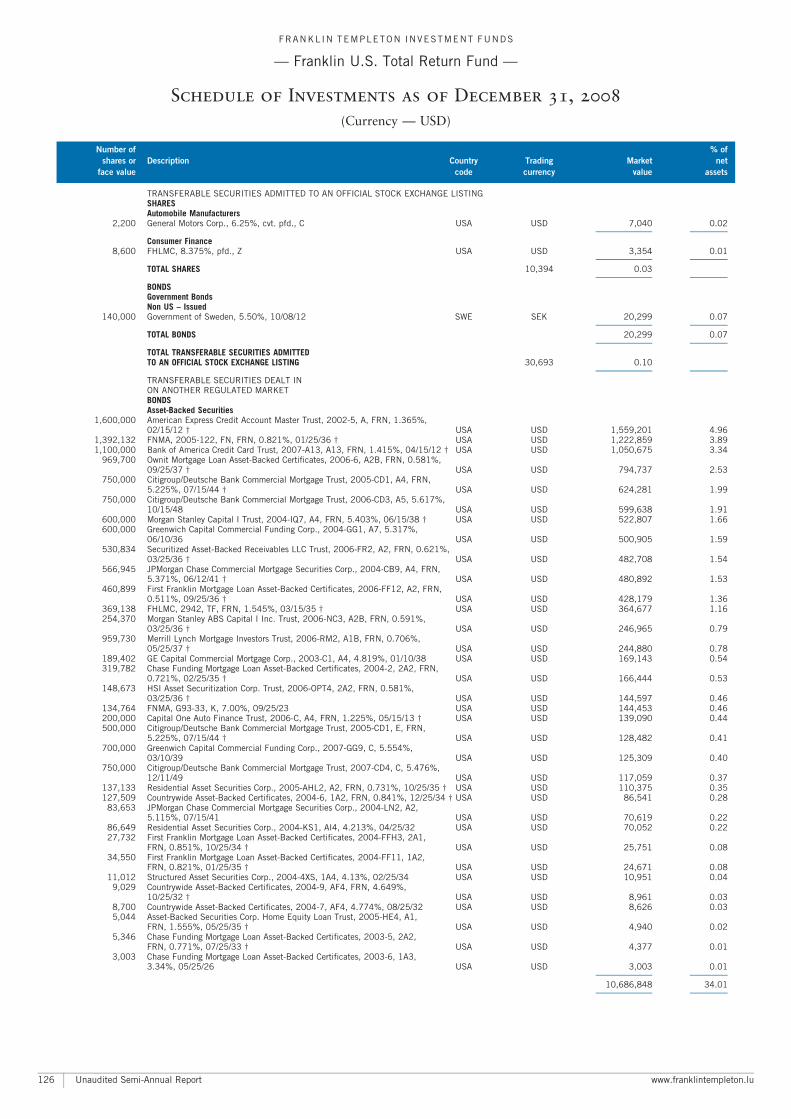
TRANSFERABLE SECURITIES ADMITTED TO AN OFFICIAL STOCK EXCHANGE LISTINGSHARESAutomobile Manufacturers
2,200 General Motors Corp., 6.25%, cvt. pfd., C USA USD 7,040 0.02A A
Consumer Finance8,600 FHLMC, 8.375%, pfd., Z USA USD 3,354 0.01
A A
TOTAL SHARES 10,394 0.03A A
BONDSGovernment BondsNon US ^ Issued
140,000 Government of Sweden, 5.50%, 10/08/12 SWE SEK 20,299 0.07A A
TOTAL BONDS 20,299 0.07A A
TOTAL TRANSFERABLE SECURITIES ADMITTEDTO AN OFFICIAL STOCK EXCHANGE LISTING 30,693 0.10
A A
TRANSFERABLE SECURITIES DEALT INON ANOTHER REGULATED MARKETBONDSAsset-Backed Securities
1,600,000 American Express Credit Account Master Trust, 2002-5, A, FRN, 1.365%,02/15/12 � USA USD 1,559,201 4.96
1,392,132 FNMA, 2005-122, FN, FRN, 0.821%, 01/25/36 � USA USD 1,222,859 3.891,100,000 Bank of America Credit Card Trust, 2007-A13, A13, FRN, 1.415%, 04/15/12 � USA USD 1,050,675 3.34
969,700 Ownit Mortgage Loan Asset-Backed Certificates, 2006-6, A2B, FRN, 0.581%,09/25/37 � USA USD 794,737 2.53
750,000 Citigroup/Deutsche Bank Commercial Mortgage Trust, 2005-CD1, A4, FRN,5.225%, 07/15/44 � USA USD 624,281 1.99
750,000 Citigroup/Deutsche Bank Commercial Mortgage Trust, 2006-CD3, A5, 5.617%,10/15/48 USA USD 599,638 1.91
600,000 Morgan Stanley Capital I Trust, 2004-IQ7, A4, FRN, 5.403%, 06/15/38 � USA USD 522,807 1.66600,000 Greenwich Capital Commercial Funding Corp., 2004-GG1, A7, 5.317%,
06/10/36 USA USD 500,905 1.59530,834 Securitized Asset-Backed Receivables LLC Trust, 2006-FR2, A2, FRN, 0.621%,
03/25/36 � USA USD 482,708 1.54566,945 JPMorgan Chase Commercial Mortgage Securities Corp., 2004-CB9, A4, FRN,
5.371%, 06/12/41 � USA USD 480,892 1.53460,899 First Franklin Mortgage Loan Asset-Backed Certificates, 2006-FF12, A2, FRN,
0.511%, 09/25/36 � USA USD 428,179 1.36369,138 FHLMC, 2942, TF, FRN, 1.545%, 03/15/35 � USA USD 364,677 1.16254,370 Morgan Stanley ABS Capital I Inc. Trust, 2006-NC3, A2B, FRN, 0.591%,
03/25/36 � USA USD 246,965 0.79959,730 Merrill Lynch Mortgage Investors Trust, 2006-RM2, A1B, FRN, 0.706%,
05/25/37 � USA USD 244,880 0.78189,402 GE Capital Commercial Mortgage Corp., 2003-C1, A4, 4.819%, 01/10/38 USA USD 169,143 0.54319,782 Chase Funding Mortgage Loan Asset-Backed Certificates, 2004-2, 2A2, FRN,
0.721%, 02/25/35 � USA USD 166,444 0.53148,673 HSI Asset Securitization Corp. Trust, 2006-OPT4, 2A2, FRN, 0.581%,
03/25/36 � USA USD 144,597 0.46134,764 FNMA, G93-33, K, 7.00%, 09/25/23 USA USD 144,453 0.46200,000 Capital One Auto Finance Trust, 2006-C, A4, FRN, 1.225%, 05/15/13 � USA USD 139,090 0.44500,000 Citigroup/Deutsche Bank Commercial Mortgage Trust, 2005-CD1, E, FRN,
5.225%, 07/15/44 � USA USD 128,482 0.41700,000 Greenwich Capital Commercial Funding Corp., 2007-GG9, C, 5.554%,
03/10/39 USA USD 125,309 0.40750,000 Citigroup/Deutsche Bank Commercial Mortgage Trust, 2007-CD4, C, 5.476%,
12/11/49 USA USD 117,059 0.37137,133 Residential Asset Securities Corp., 2005-AHL2, A2, FRN, 0.731%, 10/25/35 � USA USD 110,375 0.35127,509 Countrywide Asset-Backed Certificates, 2004-6, 1A2, FRN, 0.841%, 12/25/34 � USA USD 86,541 0.28
83,653 JPMorgan Chase Commercial Mortgage Securities Corp., 2004-LN2, A2,5.115%, 07/15/41 USA USD 70,619 0.22
86,649 Residential Asset Securities Corp., 2004-KS1, AI4, 4.213%, 04/25/32 USA USD 70,052 0.2227,732 First Franklin Mortgage Loan Asset-Backed Certificates, 2004-FFH3, 2A1,
FRN, 0.851%, 10/25/34 � USA USD 25,751 0.0834,550 First Franklin Mortgage Loan Asset-Backed Certificates, 2004-FF11, 1A2,
FRN, 0.821%, 01/25/35 � USA USD 24,671 0.0811,012 Structured Asset Securities Corp., 2004-4XS, 1A4, 4.13%, 02/25/34 USA USD 10,951 0.04
9,029 Countrywide Asset-Backed Certificates, 2004-9, AF4, FRN, 4.649%,10/25/32 � USA USD 8,961 0.03
8,700 Countrywide Asset-Backed Certificates, 2004-7, AF4, 4.774%, 08/25/32 USA USD 8,626 0.035,044 Asset-Backed Securities Corp. Home Equity Loan Trust, 2005-HE4, A1,
FRN, 1.555%, 05/25/35 � USA USD 4,940 0.025,346 Chase Funding Mortgage Loan Asset-Backed Certificates, 2003-5, 2A2,
FRN, 0.771%, 07/25/33 � USA USD 4,377 0.013,003 Chase Funding Mortgage Loan Asset-Backed Certificates, 2003-6, 1A3,
3.34%, 05/25/26 USA USD 3,003 0.01A A
10,686,848 34.01A A
FRANKL IN TEMPLETON INVESTMENT FUNDS
ç Franklin U.S. Total Return Fund ç
Schedule of Investments as of December 31, 2008
(Currency ç USD)
Number of % of
shares or Description Country Trading Market net
face value code currency value assets
Unaudited Semi-Annual Report www.franklintempleton.lu126
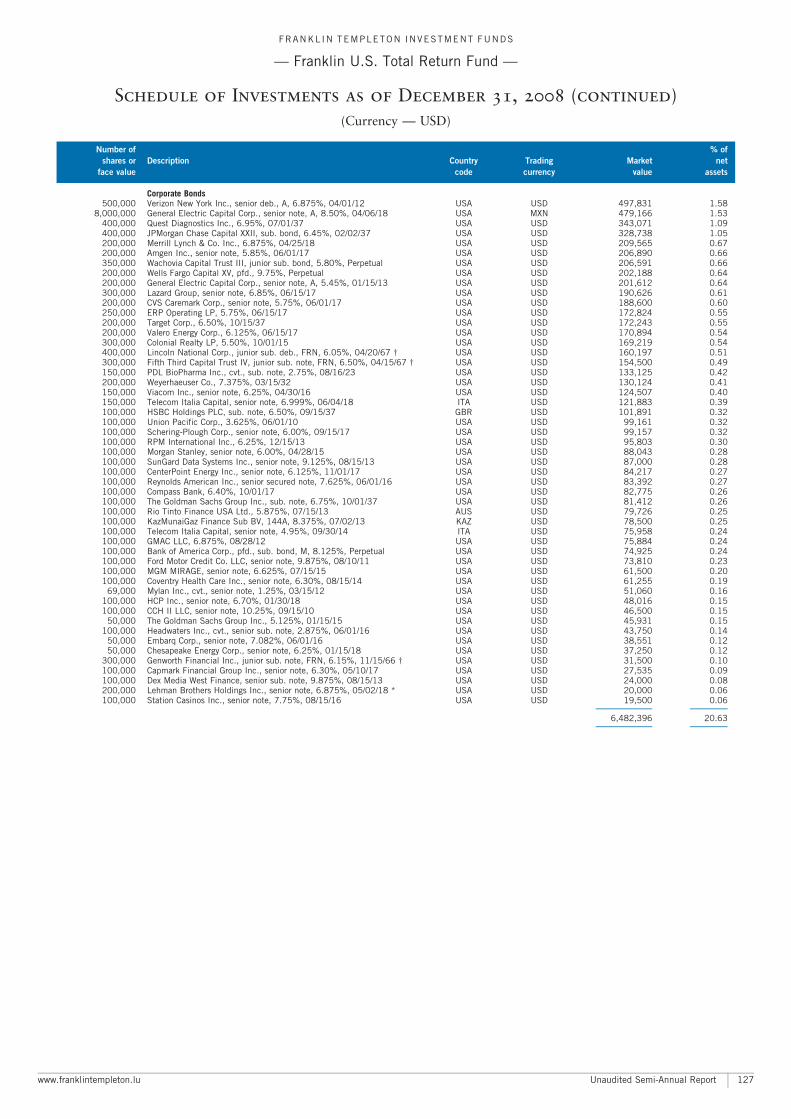
Corporate Bonds500,000 Verizon New York Inc., senior deb., A, 6.875%, 04/01/12 USA USD 497,831 1.58
8,000,000 General Electric Capital Corp., senior note, A, 8.50%, 04/06/18 USA MXN 479,166 1.53400,000 Quest Diagnostics Inc., 6.95%, 07/01/37 USA USD 343,071 1.09400,000 JPMorgan Chase Capital XXII, sub. bond, 6.45%, 02/02/37 USA USD 328,738 1.05200,000 Merrill Lynch & Co. Inc., 6.875%, 04/25/18 USA USD 209,565 0.67200,000 Amgen Inc., senior note, 5.85%, 06/01/17 USA USD 206,890 0.66350,000 Wachovia Capital Trust III, junior sub. bond, 5.80%, Perpetual USA USD 206,591 0.66200,000 Wells Fargo Capital XV, pfd., 9.75%, Perpetual USA USD 202,188 0.64200,000 General Electric Capital Corp., senior note, A, 5.45%, 01/15/13 USA USD 201,612 0.64300,000 Lazard Group, senior note, 6.85%, 06/15/17 USA USD 190,626 0.61200,000 CVS Caremark Corp., senior note, 5.75%, 06/01/17 USA USD 188,600 0.60250,000 ERP Operating LP, 5.75%, 06/15/17 USA USD 172,824 0.55200,000 Target Corp., 6.50%, 10/15/37 USA USD 172,243 0.55200,000 Valero Energy Corp., 6.125%, 06/15/17 USA USD 170,894 0.54300,000 Colonial Realty LP, 5.50%, 10/01/15 USA USD 169,219 0.54400,000 Lincoln National Corp., junior sub. deb., FRN, 6.05%, 04/20/67 � USA USD 160,197 0.51300,000 Fifth Third Capital Trust IV, junior sub. note, FRN, 6.50%, 04/15/67 � USA USD 154,500 0.49150,000 PDL BioPharma Inc., cvt., sub. note, 2.75%, 08/16/23 USA USD 133,125 0.42200,000 Weyerhaeuser Co., 7.375%, 03/15/32 USA USD 130,124 0.41150,000 Viacom Inc., senior note, 6.25%, 04/30/16 USA USD 124,507 0.40150,000 Telecom Italia Capital, senior note, 6.999%, 06/04/18 ITA USD 121,883 0.39100,000 HSBC Holdings PLC, sub. note, 6.50%, 09/15/37 GBR USD 101,891 0.32100,000 Union Pacific Corp., 3.625%, 06/01/10 USA USD 99,161 0.32100,000 Schering-Plough Corp., senior note, 6.00%, 09/15/17 USA USD 99,157 0.32100,000 RPM International Inc., 6.25%, 12/15/13 USA USD 95,803 0.30100,000 Morgan Stanley, senior note, 6.00%, 04/28/15 USA USD 88,043 0.28100,000 SunGard Data Systems Inc., senior note, 9.125%, 08/15/13 USA USD 87,000 0.28100,000 CenterPoint Energy Inc., senior note, 6.125%, 11/01/17 USA USD 84,217 0.27100,000 Reynolds American Inc., senior secured note, 7.625%, 06/01/16 USA USD 83,392 0.27100,000 Compass Bank, 6.40%, 10/01/17 USA USD 82,775 0.26100,000 The Goldman Sachs Group Inc., sub. note, 6.75%, 10/01/37 USA USD 81,412 0.26100,000 Rio Tinto Finance USA Ltd., 5.875%, 07/15/13 AUS USD 79,726 0.25100,000 KazMunaiGaz Finance Sub BV, 144A, 8.375%, 07/02/13 KAZ USD 78,500 0.25100,000 Telecom Italia Capital, senior note, 4.95%, 09/30/14 ITA USD 75,958 0.24100,000 GMAC LLC, 6.875%, 08/28/12 USA USD 75,884 0.24100,000 Bank of America Corp., pfd., sub. bond, M, 8.125%, Perpetual USA USD 74,925 0.24100,000 Ford Motor Credit Co. LLC, senior note, 9.875%, 08/10/11 USA USD 73,810 0.23100,000 MGM MIRAGE, senior note, 6.625%, 07/15/15 USA USD 61,500 0.20100,000 Coventry Health Care Inc., senior note, 6.30%, 08/15/14 USA USD 61,255 0.19
69,000 Mylan Inc., cvt., senior note, 1.25%, 03/15/12 USA USD 51,060 0.16100,000 HCP Inc., senior note, 6.70%, 01/30/18 USA USD 48,016 0.15100,000 CCH II LLC, senior note, 10.25%, 09/15/10 USA USD 46,500 0.15
50,000 The Goldman Sachs Group Inc., 5.125%, 01/15/15 USA USD 45,931 0.15100,000 Headwaters Inc., cvt., senior sub. note, 2.875%, 06/01/16 USA USD 43,750 0.14
50,000 Embarq Corp., senior note, 7.082%, 06/01/16 USA USD 38,551 0.1250,000 Chesapeake Energy Corp., senior note, 6.25%, 01/15/18 USA USD 37,250 0.12
300,000 Genworth Financial Inc., junior sub. note, FRN, 6.15%, 11/15/66 � USA USD 31,500 0.10100,000 Capmark Financial Group Inc., senior note, 6.30%, 05/10/17 USA USD 27,535 0.09100,000 Dex Media West Finance, senior sub. note, 9.875%, 08/15/13 USA USD 24,000 0.08200,000 Lehman Brothers Holdings Inc., senior note, 6.875%, 05/02/18 * USA USD 20,000 0.06100,000 Station Casinos Inc., senior note, 7.75%, 08/15/16 USA USD 19,500 0.06
A A
6,482,396 20.63A A
FRANKL IN TEMPLETON INVESTMENT FUNDS
ç Franklin U.S. Total Return Fund ç
Schedule of Investments as of December 31, 2008 (continued)
(Currency ç USD)
Number of % of
shares or Description Country Trading Market net
face value code currency value assets
www.franklintempleton.lu Unaudited Semi-Annual Report 127
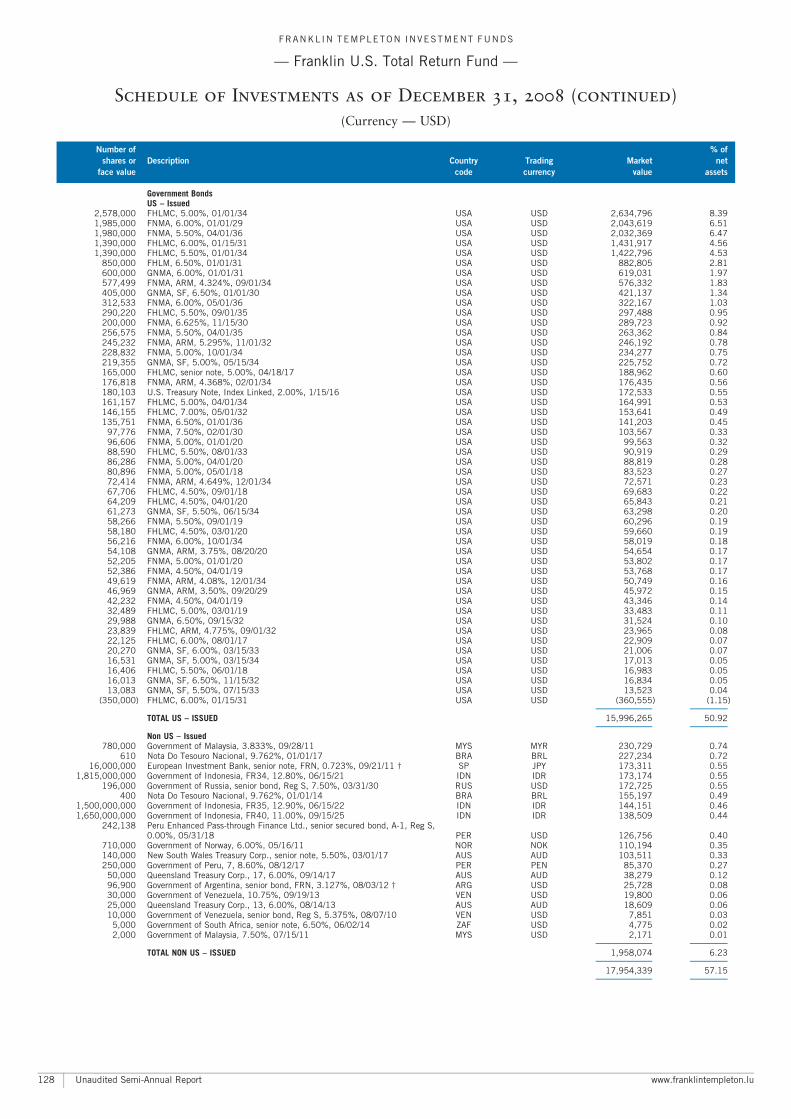
Government BondsUS ^ Issued
2,578,000 FHLMC, 5.00%, 01/01/34 USA USD 2,634,796 8.391,985,000 FNMA, 6.00%, 01/01/29 USA USD 2,043,619 6.511,980,000 FNMA, 5.50%, 04/01/36 USA USD 2,032,369 6.471,390,000 FHLMC, 6.00%, 01/15/31 USA USD 1,431,917 4.561,390,000 FHLMC, 5.50%, 01/01/34 USA USD 1,422,796 4.53
850,000 FHLM, 6.50%, 01/01/31 USA USD 882,805 2.81600,000 GNMA, 6.00%, 01/01/31 USA USD 619,031 1.97577,499 FNMA, ARM, 4.324%, 09/01/34 USA USD 576,332 1.83405,000 GNMA, SF, 6.50%, 01/01/30 USA USD 421,137 1.34312,533 FNMA, 6.00%, 05/01/36 USA USD 322,167 1.03290,220 FHLMC, 5.50%, 09/01/35 USA USD 297,488 0.95200,000 FNMA, 6.625%, 11/15/30 USA USD 289,723 0.92256,575 FNMA, 5.50%, 04/01/35 USA USD 263,362 0.84245,232 FNMA, ARM, 5.295%, 11/01/32 USA USD 246,192 0.78228,832 FNMA, 5.00%, 10/01/34 USA USD 234,277 0.75219,355 GNMA, SF, 5.00%, 05/15/34 USA USD 225,752 0.72165,000 FHLMC, senior note, 5.00%, 04/18/17 USA USD 188,962 0.60176,818 FNMA, ARM, 4.368%, 02/01/34 USA USD 176,435 0.56180,103 U.S. Treasury Note, Index Linked, 2.00%, 1/15/16 USA USD 172,533 0.55161,157 FHLMC, 5.00%, 04/01/34 USA USD 164,991 0.53146,155 FHLMC, 7.00%, 05/01/32 USA USD 153,641 0.49135,751 FNMA, 6.50%, 01/01/36 USA USD 141,203 0.45
97,776 FNMA, 7.50%, 02/01/30 USA USD 103,567 0.3396,606 FNMA, 5.00%, 01/01/20 USA USD 99,563 0.3288,590 FHLMC, 5.50%, 08/01/33 USA USD 90,919 0.2986,286 FNMA, 5.00%, 04/01/20 USA USD 88,819 0.2880,896 FNMA, 5.00%, 05/01/18 USA USD 83,523 0.2772,414 FNMA, ARM, 4.649%, 12/01/34 USA USD 72,571 0.2367,706 FHLMC, 4.50%, 09/01/18 USA USD 69,683 0.2264,209 FHLMC, 4.50%, 04/01/20 USA USD 65,843 0.2161,273 GNMA, SF, 5.50%, 06/15/34 USA USD 63,298 0.2058,266 FNMA, 5.50%, 09/01/19 USA USD 60,296 0.1958,180 FHLMC, 4.50%, 03/01/20 USA USD 59,660 0.1956,216 FNMA, 6.00%, 10/01/34 USA USD 58,019 0.1854,108 GNMA, ARM, 3.75%, 08/20/20 USA USD 54,654 0.1752,205 FNMA, 5.00%, 01/01/20 USA USD 53,802 0.1752,386 FNMA, 4.50%, 04/01/19 USA USD 53,768 0.1749,619 FNMA, ARM, 4.08%, 12/01/34 USA USD 50,749 0.1646,969 GNMA, ARM, 3.50%, 09/20/29 USA USD 45,972 0.1542,232 FNMA, 4.50%, 04/01/19 USA USD 43,346 0.1432,489 FHLMC, 5.00%, 03/01/19 USA USD 33,483 0.1129,988 GNMA, 6.50%, 09/15/32 USA USD 31,524 0.1023,839 FHLMC, ARM, 4.775%, 09/01/32 USA USD 23,965 0.0822,125 FHLMC, 6.00%, 08/01/17 USA USD 22,909 0.0720,270 GNMA, SF, 6.00%, 03/15/33 USA USD 21,006 0.0716,531 GNMA, SF, 5.00%, 03/15/34 USA USD 17,013 0.0516,406 FHLMC, 5.50%, 06/01/18 USA USD 16,983 0.0516,013 GNMA, SF, 6.50%, 11/15/32 USA USD 16,834 0.0513,083 GNMA, SF, 5.50%, 07/15/33 USA USD 13,523 0.04
(350,000) FHLMC, 6.00%, 01/15/31 USA USD (360,555) (1.15)A A
TOTAL US ^ ISSUED 15,996,265 50.92A A
Non US ^ Issued780,000 Government of Malaysia, 3.833%, 09/28/11 MYS MYR 230,729 0.74
610 Nota Do Tesouro Nacional, 9.762%, 01/01/17 BRA BRL 227,234 0.7216,000,000 European Investment Bank, senior note, FRN, 0.723%, 09/21/11 � SP JPY 173,311 0.55
1,815,000,000 Government of Indonesia, FR34, 12.80%, 06/15/21 IDN IDR 173,174 0.55196,000 Government of Russia, senior bond, Reg S, 7.50%, 03/31/30 RUS USD 172,725 0.55
400 Nota Do Tesouro Nacional, 9.762%, 01/01/14 BRA BRL 155,197 0.491,500,000,000 Government of Indonesia, FR35, 12.90%, 06/15/22 IDN IDR 144,151 0.461,650,000,000 Government of Indonesia, FR40, 11.00%, 09/15/25 IDN IDR 138,509 0.44
242,138 Peru Enhanced Pass-through Finance Ltd., senior secured bond, A-1, Reg S,0.00%, 05/31/18 PER USD 126,756 0.40
710,000 Government of Norway, 6.00%, 05/16/11 NOR NOK 110,194 0.35140,000 New South Wales Treasury Corp., senior note, 5.50%, 03/01/17 AUS AUD 103,511 0.33250,000 Government of Peru, 7, 8.60%, 08/12/17 PER PEN 85,370 0.27
50,000 Queensland Treasury Corp., 17, 6.00%, 09/14/17 AUS AUD 38,279 0.1296,900 Government of Argentina, senior bond, FRN, 3.127%, 08/03/12 � ARG USD 25,728 0.0830,000 Government of Venezuela, 10.75%, 09/19/13 VEN USD 19,800 0.0625,000 Queensland Treasury Corp., 13, 6.00%, 08/14/13 AUS AUD 18,609 0.0610,000 Government of Venezuela, senior bond, Reg S, 5.375%, 08/07/10 VEN USD 7,851 0.03
5,000 Government of South Africa, senior note, 6.50%, 06/02/14 ZAF USD 4,775 0.022,000 Government of Malaysia, 7.50%, 07/15/11 MYS USD 2,171 0.01
A A
TOTAL NON US ^ ISSUED 1,958,074 6.23A A
17,954,339 57.15A A
FRANKL IN TEMPLETON INVESTMENT FUNDS
ç Franklin U.S. Total Return Fund ç
Schedule of Investments as of December 31, 2008 (continued)
(Currency ç USD)
Number of % of
shares or Description Country Trading Market net
face value code currency value assets
Unaudited Semi-Annual Report www.franklintempleton.lu128
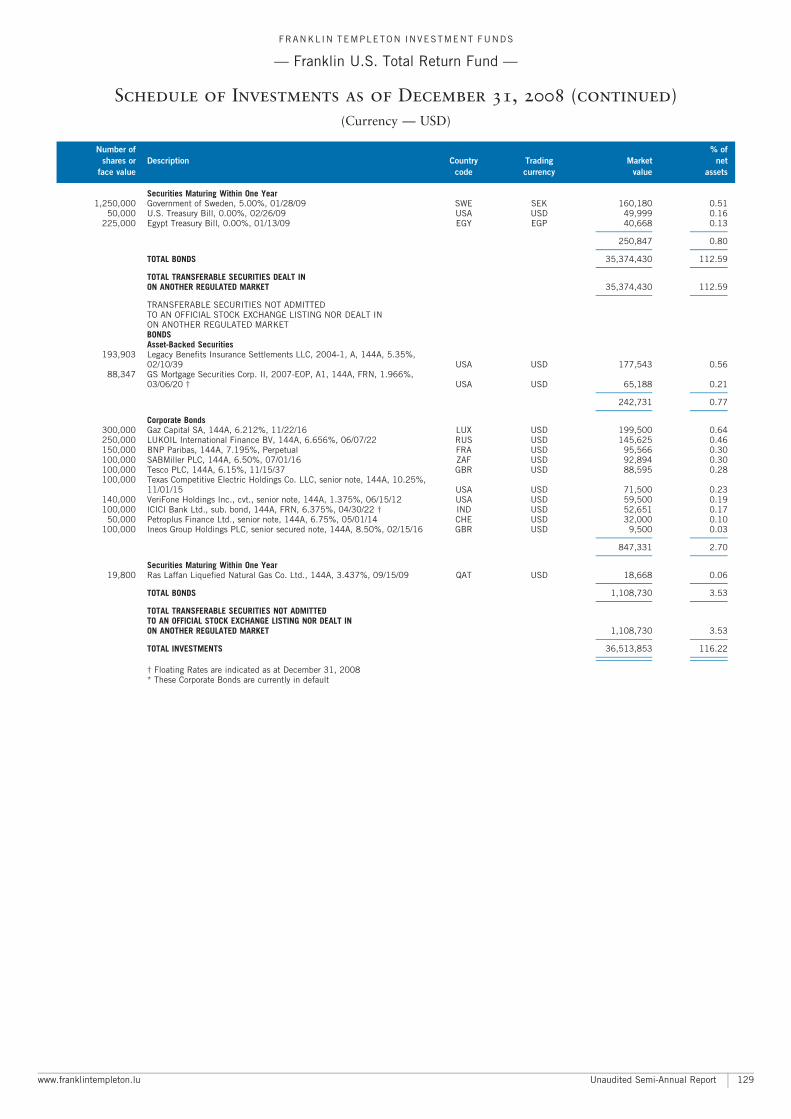
Securities Maturing Within One Year1,250,000 Government of Sweden, 5.00%, 01/28/09 SWE SEK 160,180 0.51
50,000 U.S. Treasury Bill, 0.00%, 02/26/09 USA USD 49,999 0.16225,000 Egypt Treasury Bill, 0.00%, 01/13/09 EGY EGP 40,668 0.13
A A
250,847 0.80A A
TOTAL BONDS 35,374,430 112.59A A
TOTAL TRANSFERABLE SECURITIES DEALT INON ANOTHER REGULATED MARKET 35,374,430 112.59
A A
TRANSFERABLE SECURITIES NOT ADMITTEDTO AN OFFICIAL STOCK EXCHANGE LISTING NOR DEALT INON ANOTHER REGULATED MARKETBONDSAsset-Backed Securities
193,903 Legacy Benefits Insurance Settlements LLC, 2004-1, A, 144A, 5.35%,02/10/39 USA USD 177,543 0.56
88,347 GS Mortgage Securities Corp. II, 2007-E0P, A1, 144A, FRN, 1.966%,03/06/20 � USA USD 65,188 0.21
A A
242,731 0.77A A
Corporate Bonds300,000 Gaz Capital SA, 144A, 6.212%, 11/22/16 LUX USD 199,500 0.64250,000 LUKOIL International Finance BV, 144A, 6.656%, 06/07/22 RUS USD 145,625 0.46150,000 BNP Paribas, 144A, 7.195%, Perpetual FRA USD 95,566 0.30100,000 SABMiller PLC, 144A, 6.50%, 07/01/16 ZAF USD 92,894 0.30100,000 Tesco PLC, 144A, 6.15%, 11/15/37 GBR USD 88,595 0.28100,000 Texas Competitive Electric Holdings Co. LLC, senior note, 144A, 10.25%,
11/01/15 USA USD 71,500 0.23140,000 VeriFone Holdings Inc., cvt., senior note, 144A, 1.375%, 06/15/12 USA USD 59,500 0.19100,000 ICICI Bank Ltd., sub. bond, 144A, FRN, 6.375%, 04/30/22 � IND USD 52,651 0.17
50,000 Petroplus Finance Ltd., senior note, 144A, 6.75%, 05/01/14 CHE USD 32,000 0.10100,000 Ineos Group Holdings PLC, senior secured note, 144A, 8.50%, 02/15/16 GBR USD 9,500 0.03
A A
847,331 2.70A A
Securities Maturing Within One Year19,800 Ras Laffan Liquefied Natural Gas Co. Ltd., 144A, 3.437%, 09/15/09 QAT USD 18,668 0.06
A A
TOTAL BONDS 1,108,730 3.53A A
TOTAL TRANSFERABLE SECURITIES NOT ADMITTEDTO AN OFFICIAL STOCK EXCHANGE LISTING NOR DEALT INON ANOTHER REGULATED MARKET 1,108,730 3.53
A A
TOTAL INVESTMENTS 36,513,853 116.22A A
A A
� Floating Rates are indicated as at December 31, 2008* These Corporate Bonds are currently in default
FRANKL IN TEMPLETON INVESTMENT FUNDS
ç Franklin U.S. Total Return Fund ç
Schedule of Investments as of December 31, 2008 (continued)
(Currency ç USD)
Number of % of
shares or Description Country Trading Market net
face value code currency value assets
www.franklintempleton.lu Unaudited Semi-Annual Report 129
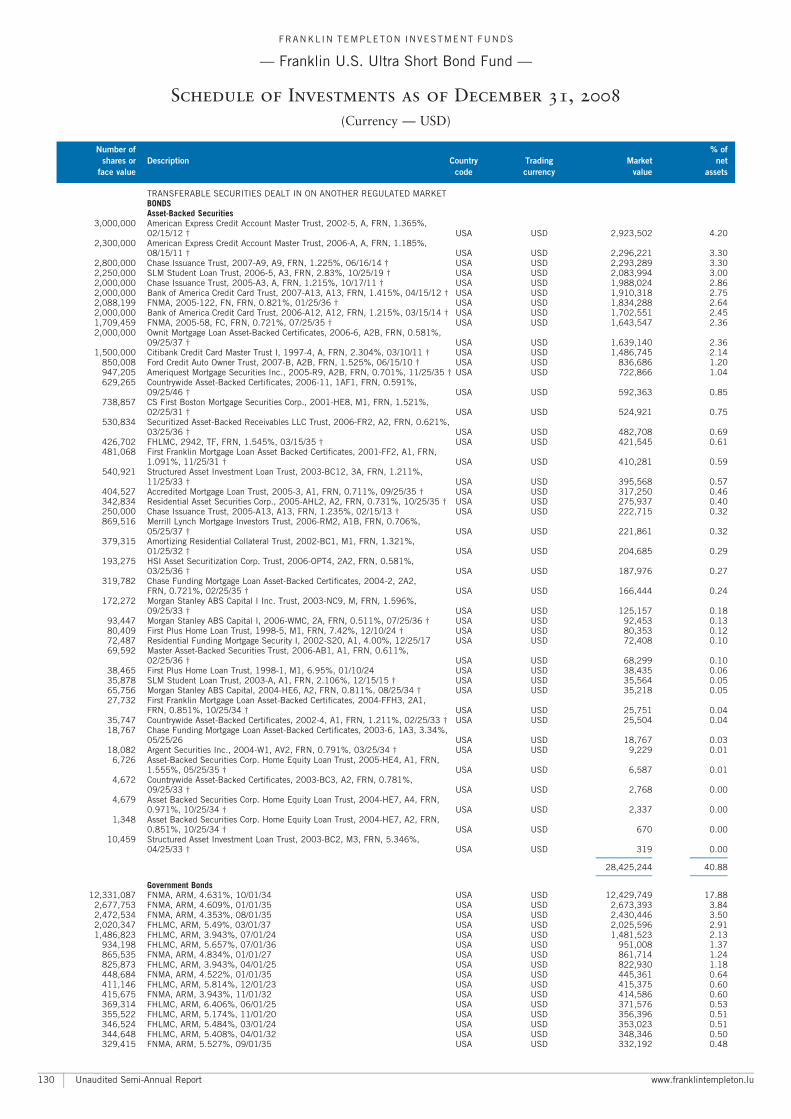
TRANSFERABLE SECURITIES DEALT IN ON ANOTHER REGULATED MARKETBONDSAsset-Backed Securities
3,000,000 American Express Credit Account Master Trust, 2002-5, A, FRN, 1.365%,02/15/12 � USA USD 2,923,502 4.20
2,300,000 American Express Credit Account Master Trust, 2006-A, A, FRN, 1.185%,08/15/11 � USA USD 2,296,221 3.30
2,800,000 Chase Issuance Trust, 2007-A9, A9, FRN, 1.225%, 06/16/14 � USA USD 2,293,289 3.302,250,000 SLM Student Loan Trust, 2006-5, A3, FRN, 2.83%, 10/25/19 � USA USD 2,083,994 3.002,000,000 Chase Issuance Trust, 2005-A3, A, FRN, 1.215%, 10/17/11 � USA USD 1,988,024 2.862,000,000 Bank of America Credit Card Trust, 2007-A13, A13, FRN, 1.415%, 04/15/12 � USA USD 1,910,318 2.752,088,199 FNMA, 2005-122, FN, FRN, 0.821%, 01/25/36 � USA USD 1,834,288 2.642,000,000 Bank of America Credit Card Trust, 2006-A12, A12, FRN, 1.215%, 03/15/14 � USA USD 1,702,551 2.451,709,459 FNMA, 2005-58, FC, FRN, 0.721%, 07/25/35 � USA USD 1,643,547 2.362,000,000 Ownit Mortgage Loan Asset-Backed Certificates, 2006-6, A2B, FRN, 0.581%,
09/25/37 � USA USD 1,639,140 2.361,500,000 Citibank Credit Card Master Trust I, 1997-4, A, FRN, 2.304%, 03/10/11 � USA USD 1,486,745 2.14
850,008 Ford Credit Auto Owner Trust, 2007-B, A2B, FRN, 1.525%, 06/15/10 � USA USD 836,686 1.20947,205 Ameriquest Mortgage Securities Inc., 2005-R9, A2B, FRN, 0.701%, 11/25/35 � USA USD 722,866 1.04629,265 Countrywide Asset-Backed Certificates, 2006-11, 1AF1, FRN, 0.591%,
09/25/46 � USA USD 592,363 0.85738,857 CS First Boston Mortgage Securities Corp., 2001-HE8, M1, FRN, 1.521%,
02/25/31 � USA USD 524,921 0.75530,834 Securitized Asset-Backed Receivables LLC Trust, 2006-FR2, A2, FRN, 0.621%,
03/25/36 � USA USD 482,708 0.69426,702 FHLMC, 2942, TF, FRN, 1.545%, 03/15/35 � USA USD 421,545 0.61481,068 First Franklin Mortgage Loan Asset Backed Certificates, 2001-FF2, A1, FRN,
1.091%, 11/25/31 � USA USD 410,281 0.59540,921 Structured Asset Investment Loan Trust, 2003-BC12, 3A, FRN, 1.211%,
11/25/33 � USA USD 395,568 0.57404,527 Accredited Mortgage Loan Trust, 2005-3, A1, FRN, 0.711%, 09/25/35 � USA USD 317,250 0.46342,834 Residential Asset Securities Corp., 2005-AHL2, A2, FRN, 0.731%, 10/25/35 � USA USD 275,937 0.40250,000 Chase Issuance Trust, 2005-A13, A13, FRN, 1.235%, 02/15/13 � USA USD 222,715 0.32869,516 Merrill Lynch Mortgage Investors Trust, 2006-RM2, A1B, FRN, 0.706%,
05/25/37 � USA USD 221,861 0.32379,315 Amortizing Residential Collateral Trust, 2002-BC1, M1, FRN, 1.321%,
01/25/32 � USA USD 204,685 0.29193,275 HSI Asset Securitization Corp. Trust, 2006-OPT4, 2A2, FRN, 0.581%,
03/25/36 � USA USD 187,976 0.27319,782 Chase Funding Mortgage Loan Asset-Backed Certificates, 2004-2, 2A2,
FRN, 0.721%, 02/25/35 � USA USD 166,444 0.24172,272 Morgan Stanley ABS Capital I Inc. Trust, 2003-NC9, M, FRN, 1.596%,
09/25/33 � USA USD 125,157 0.1893,447 Morgan Stanley ABS Capital I, 2006-WMC, 2A, FRN, 0.511%, 07/25/36 � USA USD 92,453 0.1380,409 First Plus Home Loan Trust, 1998-5, M1, FRN, 7.42%, 12/10/24 � USA USD 80,353 0.1272,487 Residential Funding Mortgage Security I, 2002-S20, A1, 4.00%, 12/25/17 USA USD 72,408 0.1069,592 Master Asset-Backed Securities Trust, 2006-AB1, A1, FRN, 0.611%,
02/25/36 � USA USD 68,299 0.1038,465 First Plus Home Loan Trust, 1998-1, M1, 6.95%, 01/10/24 USA USD 38,435 0.0635,878 SLM Student Loan Trust, 2003-A, A1, FRN, 2.106%, 12/15/15 � USA USD 35,564 0.0565,756 Morgan Stanley ABS Capital, 2004-HE6, A2, FRN, 0.811%, 08/25/34 � USA USD 35,218 0.0527,732 First Franklin Mortgage Loan Asset-Backed Certificates, 2004-FFH3, 2A1,
FRN, 0.851%, 10/25/34 � USA USD 25,751 0.0435,747 Countrywide Asset-Backed Certificates, 2002-4, A1, FRN, 1.211%, 02/25/33 � USA USD 25,504 0.0418,767 Chase Funding Mortgage Loan Asset-Backed Certificates, 2003-6, 1A3, 3.34%,
05/25/26 USA USD 18,767 0.0318,082 Argent Securities Inc., 2004-W1, AV2, FRN, 0.791%, 03/25/34 � USA USD 9,229 0.01
6,726 Asset-Backed Securities Corp. Home Equity Loan Trust, 2005-HE4, A1, FRN,1.555%, 05/25/35 � USA USD 6,587 0.01
4,672 Countrywide Asset-Backed Certificates, 2003-BC3, A2, FRN, 0.781%,09/25/33 � USA USD 2,768 0.00
4,679 Asset Backed Securities Corp. Home Equity Loan Trust, 2004-HE7, A4, FRN,0.971%, 10/25/34 � USA USD 2,337 0.00
1,348 Asset Backed Securities Corp. Home Equity Loan Trust, 2004-HE7, A2, FRN,0.851%, 10/25/34 � USA USD 670 0.00
10,459 Structured Asset Investment Loan Trust, 2003-BC2, M3, FRN, 5.346%,04/25/33 � USA USD 319 0.00
A A
28,425,244 40.88A A
Government Bonds12,331,087 FNMA, ARM, 4.631%, 10/01/34 USA USD 12,429,749 17.88
2,677,753 FNMA, ARM, 4.609%, 01/01/35 USA USD 2,673,393 3.842,472,534 FNMA, ARM, 4.353%, 08/01/35 USA USD 2,430,446 3.502,020,347 FHLMC, ARM, 5.49%, 03/01/37 USA USD 2,025,596 2.911,486,823 FHLMC, ARM, 3.943%, 07/01/24 USA USD 1,481,523 2.13
934,198 FHLMC, ARM, 5.657%, 07/01/36 USA USD 951,008 1.37865,535 FNMA, ARM, 4.834%, 01/01/27 USA USD 861,714 1.24825,873 FHLMC, ARM, 3.943%, 04/01/25 USA USD 822,930 1.18448,684 FNMA, ARM, 4.522%, 01/01/35 USA USD 445,361 0.64411,146 FHLMC, ARM, 5.814%, 12/01/23 USA USD 415,375 0.60415,675 FNMA, ARM, 3.943%, 11/01/32 USA USD 414,586 0.60369,314 FHLMC, ARM, 6.406%, 06/01/25 USA USD 371,576 0.53355,522 FHLMC, ARM, 5.174%, 11/01/20 USA USD 356,396 0.51346,524 FHLMC, ARM, 5.484%, 03/01/24 USA USD 353,023 0.51344,648 FHLMC, ARM, 5.408%, 04/01/32 USA USD 348,346 0.50329,415 FNMA, ARM, 5.527%, 09/01/35 USA USD 332,192 0.48
FRANKL IN TEMPLETON INVESTMENT FUNDS
ç Franklin U.S. Ultra Short Bond Fund ç
Schedule of Investments as of December 31, 2008
(Currency ç USD)
Number of % of
shares or Description Country Trading Market net
face value code currency value assets
Unaudited Semi-Annual Report www.franklintempleton.lu130
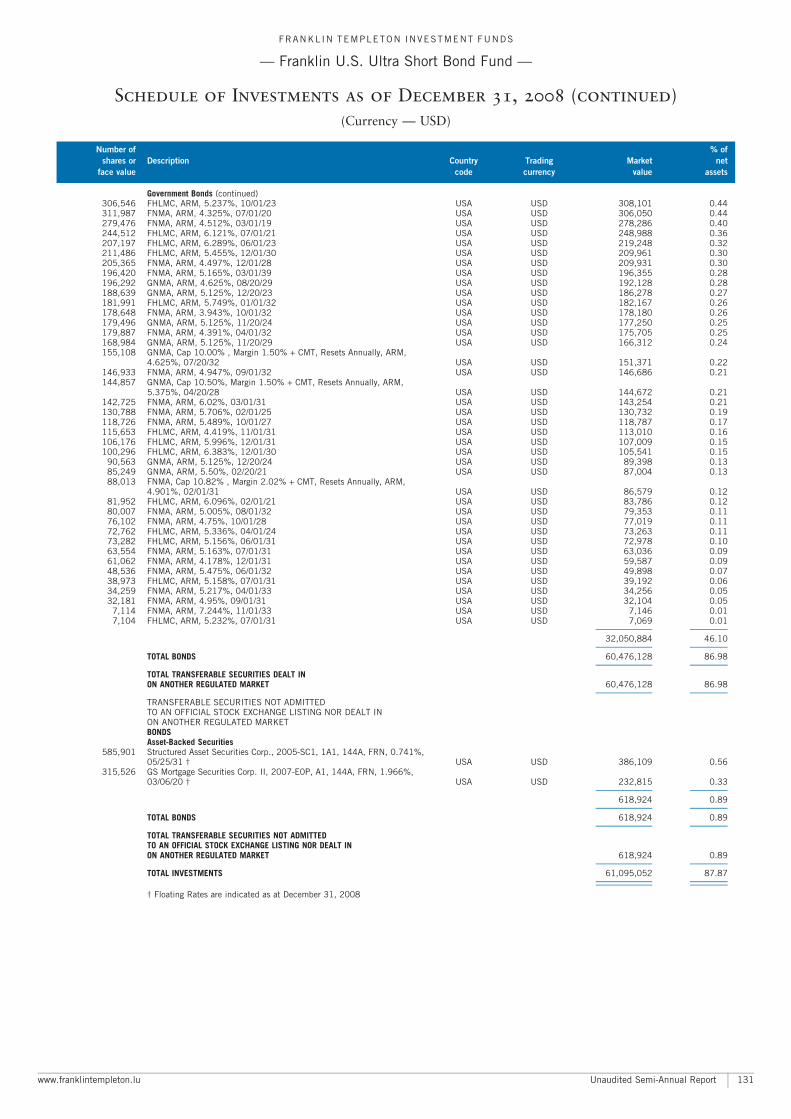
Government Bonds (continued)306,546 FHLMC, ARM, 5.237%, 10/01/23 USA USD 308,101 0.44311,987 FNMA, ARM, 4.325%, 07/01/20 USA USD 306,050 0.44279,476 FNMA, ARM, 4.512%, 03/01/19 USA USD 278,286 0.40244,512 FHLMC, ARM, 6.121%, 07/01/21 USA USD 248,988 0.36207,197 FHLMC, ARM, 6.289%, 06/01/23 USA USD 219,248 0.32211,486 FHLMC, ARM, 5.455%, 12/01/30 USA USD 209,961 0.30205,365 FNMA, ARM, 4.497%, 12/01/28 USA USD 209,931 0.30196,420 FNMA, ARM, 5.165%, 03/01/39 USA USD 196,355 0.28196,292 GNMA, ARM, 4.625%, 08/20/29 USA USD 192,128 0.28188,639 GNMA, ARM, 5.125%, 12/20/23 USA USD 186,278 0.27181,991 FHLMC, ARM, 5.749%, 01/01/32 USA USD 182,167 0.26178,648 FNMA, ARM, 3.943%, 10/01/32 USA USD 178,180 0.26179,496 GNMA, ARM, 5.125%, 11/20/24 USA USD 177,250 0.25179,887 FNMA, ARM, 4.391%, 04/01/32 USA USD 175,705 0.25168,984 GNMA, ARM, 5.125%, 11/20/29 USA USD 166,312 0.24155,108 GNMA, Cap 10.00% , Margin 1.50% + CMT, Resets Annually, ARM,
4.625%, 07/20/32 USA USD 151,371 0.22146,933 FNMA, ARM, 4.947%, 09/01/32 USA USD 146,686 0.21144,857 GNMA, Cap 10.50%, Margin 1.50% + CMT, Resets Annually, ARM,
5.375%, 04/20/28 USA USD 144,672 0.21142,725 FNMA, ARM, 6.02%, 03/01/31 USA USD 143,254 0.21130,788 FNMA, ARM, 5.706%, 02/01/25 USA USD 130,732 0.19118,726 FNMA, ARM, 5.489%, 10/01/27 USA USD 118,787 0.17115,653 FHLMC, ARM, 4.419%, 11/01/31 USA USD 113,010 0.16106,176 FHLMC, ARM, 5.996%, 12/01/31 USA USD 107,009 0.15100,296 FHLMC, ARM, 6.383%, 12/01/30 USA USD 105,541 0.15
90,563 GNMA, ARM, 5.125%, 12/20/24 USA USD 89,398 0.1385,249 GNMA, ARM, 5.50%, 02/20/21 USA USD 87,004 0.1388,013 FNMA, Cap 10.82% , Margin 2.02% + CMT, Resets Annually, ARM,
4.901%, 02/01/31 USA USD 86,579 0.1281,952 FHLMC, ARM, 6.096%, 02/01/21 USA USD 83,786 0.1280,007 FNMA, ARM, 5.005%, 08/01/32 USA USD 79,353 0.1176,102 FNMA, ARM, 4.75%, 10/01/28 USA USD 77,019 0.1172,762 FHLMC, ARM, 5.336%, 04/01/24 USA USD 73,263 0.1173,282 FHLMC, ARM, 5.156%, 06/01/31 USA USD 72,978 0.1063,554 FNMA, ARM, 5.163%, 07/01/31 USA USD 63,036 0.0961,062 FNMA, ARM, 4.178%, 12/01/31 USA USD 59,587 0.0948,536 FNMA, ARM, 5.475%, 06/01/32 USA USD 49,898 0.0738,973 FHLMC, ARM, 5.158%, 07/01/31 USA USD 39,192 0.0634,259 FNMA, ARM, 5.217%, 04/01/33 USA USD 34,256 0.0532,181 FNMA, ARM, 4.95%, 09/01/31 USA USD 32,104 0.05
7,114 FNMA, ARM, 7.244%, 11/01/33 USA USD 7,146 0.017,104 FHLMC, ARM, 5.232%, 07/01/31 USA USD 7,069 0.01
A A
32,050,884 46.10A A
TOTAL BONDS 60,476,128 86.98A A
TOTAL TRANSFERABLE SECURITIES DEALT INON ANOTHER REGULATED MARKET 60,476,128 86.98
A A
TRANSFERABLE SECURITIES NOT ADMITTEDTO AN OFFICIAL STOCK EXCHANGE LISTING NOR DEALT INON ANOTHER REGULATED MARKETBONDSAsset-Backed Securities
585,901 Structured Asset Securities Corp., 2005-SC1, 1A1, 144A, FRN, 0.741%,05/25/31 � USA USD 386,109 0.56
315,526 GS Mortgage Securities Corp. II, 2007-E0P, A1, 144A, FRN, 1.966%,03/06/20 � USA USD 232,815 0.33
A A
618,924 0.89A A
TOTAL BONDS 618,924 0.89A A
TOTAL TRANSFERABLE SECURITIES NOT ADMITTEDTO AN OFFICIAL STOCK EXCHANGE LISTING NOR DEALT INON ANOTHER REGULATED MARKET 618,924 0.89
A A
TOTAL INVESTMENTS 61,095,052 87.87A A
A A
� Floating Rates are indicated as at December 31, 2008
FRANKL IN TEMPLETON INVESTMENT FUNDS
ç Franklin U.S. Ultra Short Bond Fund ç
Schedule of Investments as of December 31, 2008 (continued)
(Currency ç USD)
Number of % of
shares or Description Country Trading Market net
face value code currency value assets
www.franklintempleton.lu Unaudited Semi-Annual Report 131
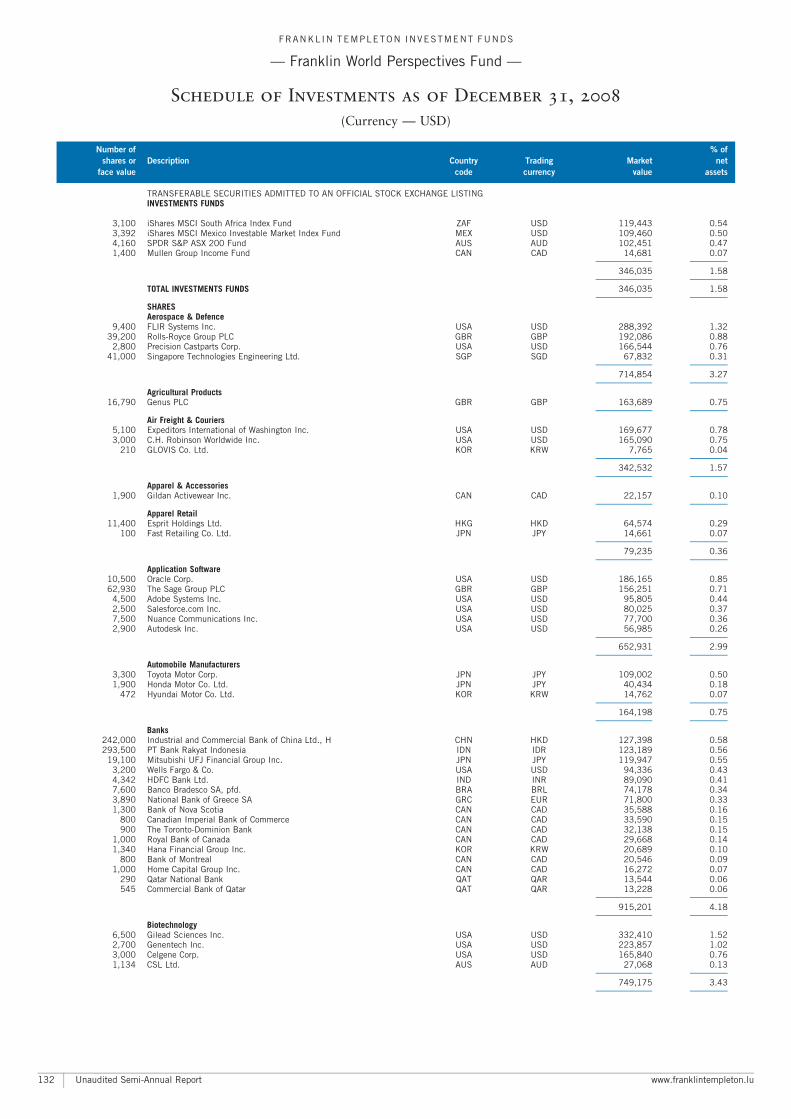
TRANSFERABLE SECURITIES ADMITTED TO AN OFFICIAL STOCK EXCHANGE LISTINGINVESTMENTS FUNDS
3,100 iShares MSCI South Africa Index Fund ZAF USD 119,443 0.543,392 iShares MSCI Mexico Investable Market Index Fund MEX USD 109,460 0.504,160 SPDR S&P ASX 200 Fund AUS AUD 102,451 0.471,400 Mullen Group Income Fund CAN CAD 14,681 0.07
A A
346,035 1.58A A
TOTAL INVESTMENTS FUNDS 346,035 1.58A A
SHARESAerospace & Defence
9,400 FLIR Systems Inc. USA USD 288,392 1.3239,200 Rolls-Royce Group PLC GBR GBP 192,086 0.88
2,800 Precision Castparts Corp. USA USD 166,544 0.7641,000 Singapore Technologies Engineering Ltd. SGP SGD 67,832 0.31
A A
714,854 3.27A A
Agricultural Products16,790 Genus PLC GBR GBP 163,689 0.75
A A
Air Freight & Couriers5,100 Expeditors International of Washington Inc. USA USD 169,677 0.783,000 C.H. Robinson Worldwide Inc. USA USD 165,090 0.75
210 GLOVIS Co. Ltd. KOR KRW 7,765 0.04A A
342,532 1.57A A
Apparel & Accessories1,900 Gildan Activewear Inc. CAN CAD 22,157 0.10
A A
Apparel Retail11,400 Esprit Holdings Ltd. HKG HKD 64,574 0.29
100 Fast Retailing Co. Ltd. JPN JPY 14,661 0.07A A
79,235 0.36A A
Application Software10,500 Oracle Corp. USA USD 186,165 0.8562,930 The Sage Group PLC GBR GBP 156,251 0.71
4,500 Adobe Systems Inc. USA USD 95,805 0.442,500 Salesforce.com Inc. USA USD 80,025 0.377,500 Nuance Communications Inc. USA USD 77,700 0.362,900 Autodesk Inc. USA USD 56,985 0.26
A A
652,931 2.99A A
Automobile Manufacturers3,300 Toyota Motor Corp. JPN JPY 109,002 0.501,900 Honda Motor Co. Ltd. JPN JPY 40,434 0.18
472 Hyundai Motor Co. Ltd. KOR KRW 14,762 0.07A A
164,198 0.75A A
Banks242,000 Industrial and Commercial Bank of China Ltd., H CHN HKD 127,398 0.58293,500 PT Bank Rakyat Indonesia IDN IDR 123,189 0.56
19,100 Mitsubishi UFJ Financial Group Inc. JPN JPY 119,947 0.553,200 Wells Fargo & Co. USA USD 94,336 0.434,342 HDFC Bank Ltd. IND INR 89,090 0.417,600 Banco Bradesco SA, pfd. BRA BRL 74,178 0.343,890 National Bank of Greece SA GRC EUR 71,800 0.331,300 Bank of Nova Scotia CAN CAD 35,588 0.16
800 Canadian Imperial Bank of Commerce CAN CAD 33,590 0.15900 The Toronto-Dominion Bank CAN CAD 32,138 0.15
1,000 Royal Bank of Canada CAN CAD 29,668 0.141,340 Hana Financial Group Inc. KOR KRW 20,689 0.10
800 Bank of Montreal CAN CAD 20,546 0.091,000 Home Capital Group Inc. CAN CAD 16,272 0.07
290 Qatar National Bank QAT QAR 13,544 0.06545 Commercial Bank of Qatar QAT QAR 13,228 0.06
A A
915,201 4.18A A
Biotechnology6,500 Gilead Sciences Inc. USA USD 332,410 1.522,700 Genentech Inc. USA USD 223,857 1.023,000 Celgene Corp. USA USD 165,840 0.761,134 CSL Ltd. AUS AUD 27,068 0.13
A A
749,175 3.43A A
FRANKL IN TEMPLETON INVESTMENT FUNDS
ç Franklin World Perspectives Fund ç
Schedule of Investments as of December 31, 2008
(Currency ç USD)
Number of % of
shares or Description Country Trading Market net
face value code currency value assets
Unaudited Semi-Annual Report www.franklintempleton.lu132
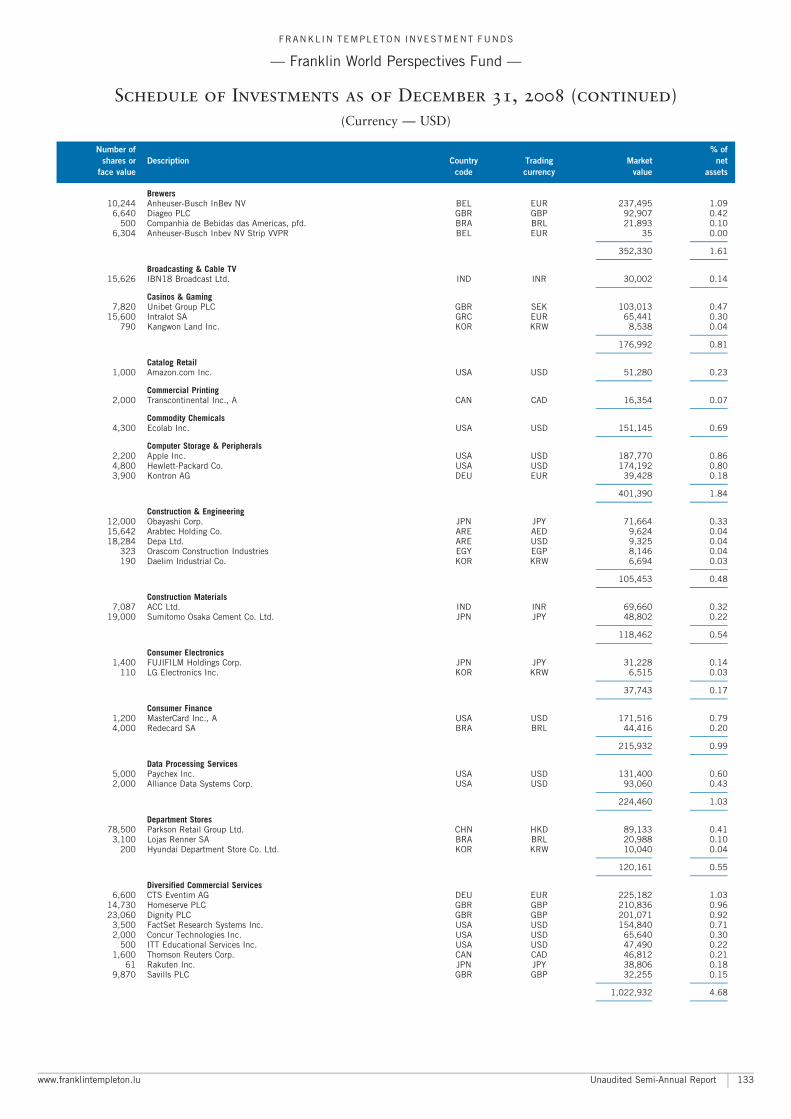
Brewers10,244 Anheuser-Busch InBev NV BEL EUR 237,495 1.09
6,640 Diageo PLC GBR GBP 92,907 0.42500 Companhia de Bebidas das Americas, pfd. BRA BRL 21,893 0.10
6,304 Anheuser-Busch Inbev NV Strip VVPR BEL EUR 35 0.00A A
352,330 1.61A A
Broadcasting & Cable TV15,626 IBN18 Broadcast Ltd. IND INR 30,002 0.14
A A
Casinos & Gaming7,820 Unibet Group PLC GBR SEK 103,013 0.47
15,600 Intralot SA GRC EUR 65,441 0.30790 Kangwon Land Inc. KOR KRW 8,538 0.04
A A
176,992 0.81A A
Catalog Retail1,000 Amazon.com Inc. USA USD 51,280 0.23
A A
Commercial Printing2,000 Transcontinental Inc., A CAN CAD 16,354 0.07
A A
Commodity Chemicals4,300 Ecolab Inc. USA USD 151,145 0.69
A A
Computer Storage & Peripherals2,200 Apple Inc. USA USD 187,770 0.864,800 Hewlett-Packard Co. USA USD 174,192 0.803,900 Kontron AG DEU EUR 39,428 0.18
A A
401,390 1.84A A
Construction & Engineering12,000 Obayashi Corp. JPN JPY 71,664 0.3315,642 Arabtec Holding Co. ARE AED 9,624 0.0418,284 Depa Ltd. ARE USD 9,325 0.04
323 Orascom Construction Industries EGY EGP 8,146 0.04190 Daelim Industrial Co. KOR KRW 6,694 0.03
A A
105,453 0.48A A
Construction Materials7,087 ACC Ltd. IND INR 69,660 0.32
19,000 Sumitomo Osaka Cement Co. Ltd. JPN JPY 48,802 0.22A A
118,462 0.54A A
Consumer Electronics1,400 FUJIFILM Holdings Corp. JPN JPY 31,228 0.14
110 LG Electronics Inc. KOR KRW 6,515 0.03A A
37,743 0.17A A
Consumer Finance1,200 MasterCard Inc., A USA USD 171,516 0.794,000 Redecard SA BRA BRL 44,416 0.20
A A
215,932 0.99A A
Data Processing Services5,000 Paychex Inc. USA USD 131,400 0.602,000 Alliance Data Systems Corp. USA USD 93,060 0.43
A A
224,460 1.03A A
Department Stores78,500 Parkson Retail Group Ltd. CHN HKD 89,133 0.41
3,100 Lojas Renner SA BRA BRL 20,988 0.10200 Hyundai Department Store Co. Ltd. KOR KRW 10,040 0.04
A A
120,161 0.55A A
Diversified Commercial Services6,600 CTS Eventim AG DEU EUR 225,182 1.03
14,730 Homeserve PLC GBR GBP 210,836 0.9623,060 Dignity PLC GBR GBP 201,071 0.92
3,500 FactSet Research Systems Inc. USA USD 154,840 0.712,000 Concur Technologies Inc. USA USD 65,640 0.30
500 ITT Educational Services Inc. USA USD 47,490 0.221,600 Thomson Reuters Corp. CAN CAD 46,812 0.21
61 Rakuten Inc. JPN JPY 38,806 0.189,870 Savills PLC GBR GBP 32,255 0.15
A A
1,022,932 4.68A A
FRANKL IN TEMPLETON INVESTMENT FUNDS
ç Franklin World Perspectives Fund ç
Schedule of Investments as of December 31, 2008 (continued)
(Currency ç USD)
Number of % of
shares or Description Country Trading Market net
face value code currency value assets
www.franklintempleton.lu Unaudited Semi-Annual Report 133

Diversified Financial Services13,200 Vanguard FTSE All-World Ex-US Index Fund SP USD 426,624 1.95
3,200 Visa Inc., A USA USD 167,840 0.773,500 T. Rowe Price Group Inc. USA USD 124,040 0.57
800 BlackRock Inc. USA USD 107,320 0.4925,000 Mizuho Financial Group Inc. JPN JPY 74,345 0.34
5,400 Hong Kong Exchanges & Clearing Ltd. HKG HKD 51,281 0.2412,000 Singapore Exchange Ltd. SGP SGD 42,555 0.20
1,600 Power Financial Corp. CAN CAD 31,427 0.141,000 IGM Financial Inc. CAN CAD 29,134 0.131,100 Sun Life Financial Inc. CAN CAD 25,710 0.121,100 TMX Group Inc. CAN CAD 22,772 0.102,900 Groupe Aeroplan Inc. CAN CAD 20,687 0.103,590 Woori Finance Holdings Co. Ltd. KOR KRW 18,049 0.08
680 Shinhan Financial Group Co. Ltd. KOR KRW 15,991 0.07900 Bonavista Energy Trust CAN CAD 12,574 0.06152 Samsung Securities Co. Ltd. KOR KRW 7,462 0.03
A A
1,177,811 5.39A A
Diversified Metals & Mining31,500 China Shenhua Energy Co. Ltd., H CHN HKD 66,656 0.30
1,689 BHP Billiton Ltd. AUS AUD 36,416 0.17A A
103,072 0.47A A
Drug Retail6,300 CVS Caremark Corp. USA USD 181,062 0.83
A A
Electric Utilities5,800 The Tokyo Electric Power Co. Inc. JPN JPY 193,454 0.893,200 Aes Tiete SA, pfd. BRA BRL 20,531 0.09
A A
213,985 0.98A A
Electrical Components & Equipment1,800 SunPower Corp., A USA USD 66,600 0.31
800 Nidec Corp. JPN JPY 31,262 0.14A A
97,862 0.45A A
Fertilizers & Agricultural Chemicals380 Industries Qatar QAT QAR 10,507 0.05
A A
Food Distributors3,870 Aryzta AG CHE CHF 123,938 0.573,180 Omega Pharma SA BEL EUR 120,058 0.558,000 Ajinomoto Co. Inc. JPN JPY 87,241 0.40
70 Orion Corp. KOR KRW 10,115 0.04A A
341,352 1.56A A
General Merchandise Stores53,020 Tesco PLC GBR GBP 278,778 1.28
3,400 Seven & I Holdings Co. Ltd. JPN JPY 116,767 0.5320,700 Dairy Farm International Holdings Ltd. HKG USD 88,389 0.41
1,900 Target Corp. USA USD 65,607 0.303,700 Alimentation Couche-Tard Inc., B CAN CAD 43,908 0.201,991 Woolworths Ltd. AUS AUD 37,611 0.17
A A
631,060 2.89A A
Health Care Distributors & Services3,000 Stericycle Inc. USA USD 156,240 0.712,300 Express Scripts Inc. USA USD 126,454 0.582,500 Covance Inc. USA USD 115,075 0.525,600 VCA Antech Inc. USA USD 111,328 0.511,000 DaVita Inc. USA USD 49,570 0.23
A A
558,667 2.55A A
Health Care Equipment3,390 Essilor International SA FRA EUR 159,130 0.731,800 C. R. Bard Inc. USA USD 151,668 0.698,310 QIAGEN NV NLD EUR 143,738 0.661,090 Synthes Inc. CHE CHF 136,160 0.621,900 Baxter International Inc. USA USD 101,821 0.472,000 Stryker Corp. USA USD 79,900 0.372,000 Waters Corp. USA USD 73,300 0.331,822 Cochlear Ltd. AUS AUD 71,495 0.331,200 Varian Medical Systems Inc. USA USD 42,048 0.19
A A
959,260 4.39A A
Homebuilding7,000 Sekisui Chemical Co. Ltd. JPN JPY 43,665 0.20
A A
FRANKL IN TEMPLETON INVESTMENT FUNDS
ç Franklin World Perspectives Fund ç
Schedule of Investments as of December 31, 2008 (continued)
(Currency ç USD)
Number of % of
shares or Description Country Trading Market net
face value code currency value assets
Unaudited Semi-Annual Report www.franklintempleton.lu134
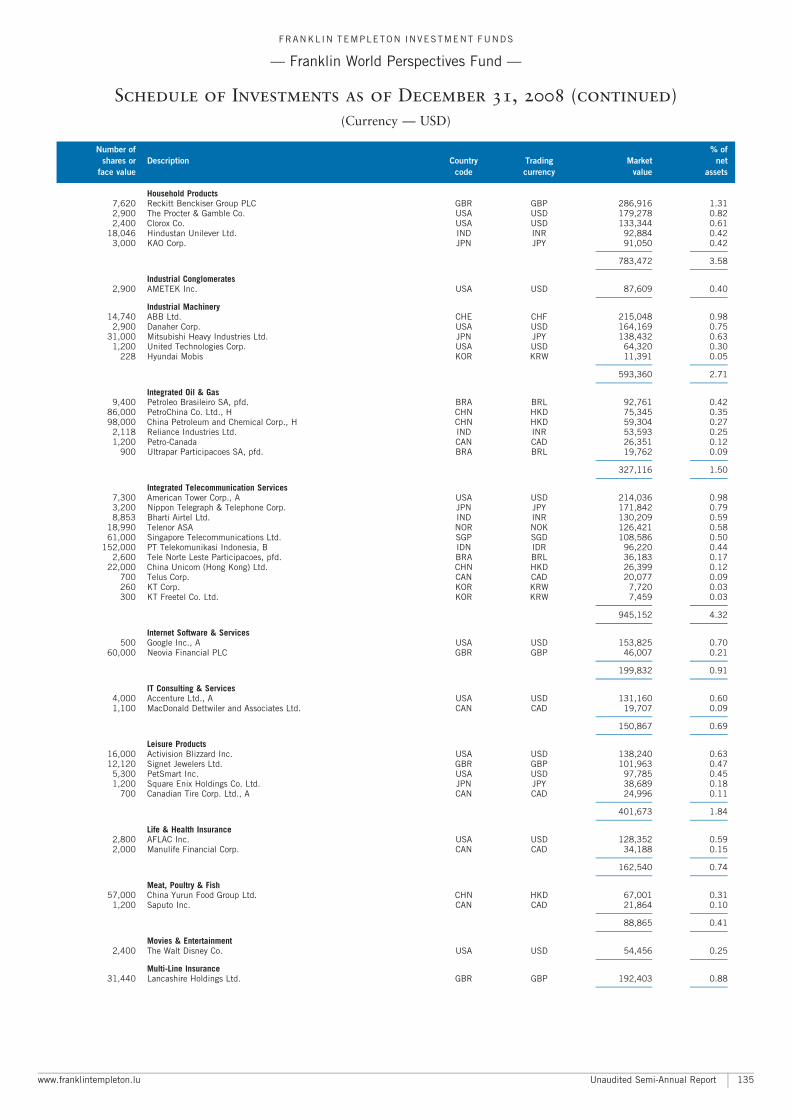
Household Products7,620 Reckitt Benckiser Group PLC GBR GBP 286,916 1.312,900 The Procter & Gamble Co. USA USD 179,278 0.822,400 Clorox Co. USA USD 133,344 0.61
18,046 Hindustan Unilever Ltd. IND INR 92,884 0.423,000 KAO Corp. JPN JPY 91,050 0.42
A A
783,472 3.58A A
Industrial Conglomerates2,900 AMETEK Inc. USA USD 87,609 0.40
A A
Industrial Machinery14,740 ABB Ltd. CHE CHF 215,048 0.98
2,900 Danaher Corp. USA USD 164,169 0.7531,000 Mitsubishi Heavy Industries Ltd. JPN JPY 138,432 0.63
1,200 United Technologies Corp. USA USD 64,320 0.30228 Hyundai Mobis KOR KRW 11,391 0.05
A A
593,360 2.71A A
Integrated Oil & Gas9,400 Petroleo Brasileiro SA, pfd. BRA BRL 92,761 0.42
86,000 PetroChina Co. Ltd., H CHN HKD 75,345 0.3598,000 China Petroleum and Chemical Corp., H CHN HKD 59,304 0.27
2,118 Reliance Industries Ltd. IND INR 53,593 0.251,200 Petro-Canada CAN CAD 26,351 0.12
900 Ultrapar Participacoes SA, pfd. BRA BRL 19,762 0.09A A
327,116 1.50A A
Integrated Telecommunication Services7,300 American Tower Corp., A USA USD 214,036 0.983,200 Nippon Telegraph & Telephone Corp. JPN JPY 171,842 0.798,853 Bharti Airtel Ltd. IND INR 130,209 0.59
18,990 Telenor ASA NOR NOK 126,421 0.5861,000 Singapore Telecommunications Ltd. SGP SGD 108,586 0.50
152,000 PT Telekomunikasi Indonesia, B IDN IDR 96,220 0.442,600 Tele Norte Leste Participacoes, pfd. BRA BRL 36,183 0.17
22,000 China Unicom (Hong Kong) Ltd. CHN HKD 26,399 0.12700 Telus Corp. CAN CAD 20,077 0.09260 KT Corp. KOR KRW 7,720 0.03300 KT Freetel Co. Ltd. KOR KRW 7,459 0.03
A A
945,152 4.32A A
Internet Software & Services500 Google Inc., A USA USD 153,825 0.70
60,000 Neovia Financial PLC GBR GBP 46,007 0.21A A
199,832 0.91A A
IT Consulting & Services4,000 Accenture Ltd., A USA USD 131,160 0.601,100 MacDonald Dettwiler and Associates Ltd. CAN CAD 19,707 0.09
A A
150,867 0.69A A
Leisure Products16,000 Activision Blizzard Inc. USA USD 138,240 0.6312,120 Signet Jewelers Ltd. GBR GBP 101,963 0.47
5,300 PetSmart Inc. USA USD 97,785 0.451,200 Square Enix Holdings Co. Ltd. JPN JPY 38,689 0.18
700 Canadian Tire Corp. Ltd., A CAN CAD 24,996 0.11A A
401,673 1.84A A
Life & Health Insurance2,800 AFLAC Inc. USA USD 128,352 0.592,000 Manulife Financial Corp. CAN CAD 34,188 0.15
A A
162,540 0.74A A
Meat, Poultry & Fish57,000 China Yurun Food Group Ltd. CHN HKD 67,001 0.31
1,200 Saputo Inc. CAN CAD 21,864 0.10A A
88,865 0.41A A
Movies & Entertainment2,400 The Walt Disney Co. USA USD 54,456 0.25
A A
Multi-Line Insurance31,440 Lancashire Holdings Ltd. GBR GBP 192,403 0.88
A A
FRANKL IN TEMPLETON INVESTMENT FUNDS
ç Franklin World Perspectives Fund ç
Schedule of Investments as of December 31, 2008 (continued)
(Currency ç USD)
Number of % of
shares or Description Country Trading Market net
face value code currency value assets
www.franklintempleton.lu Unaudited Semi-Annual Report 135
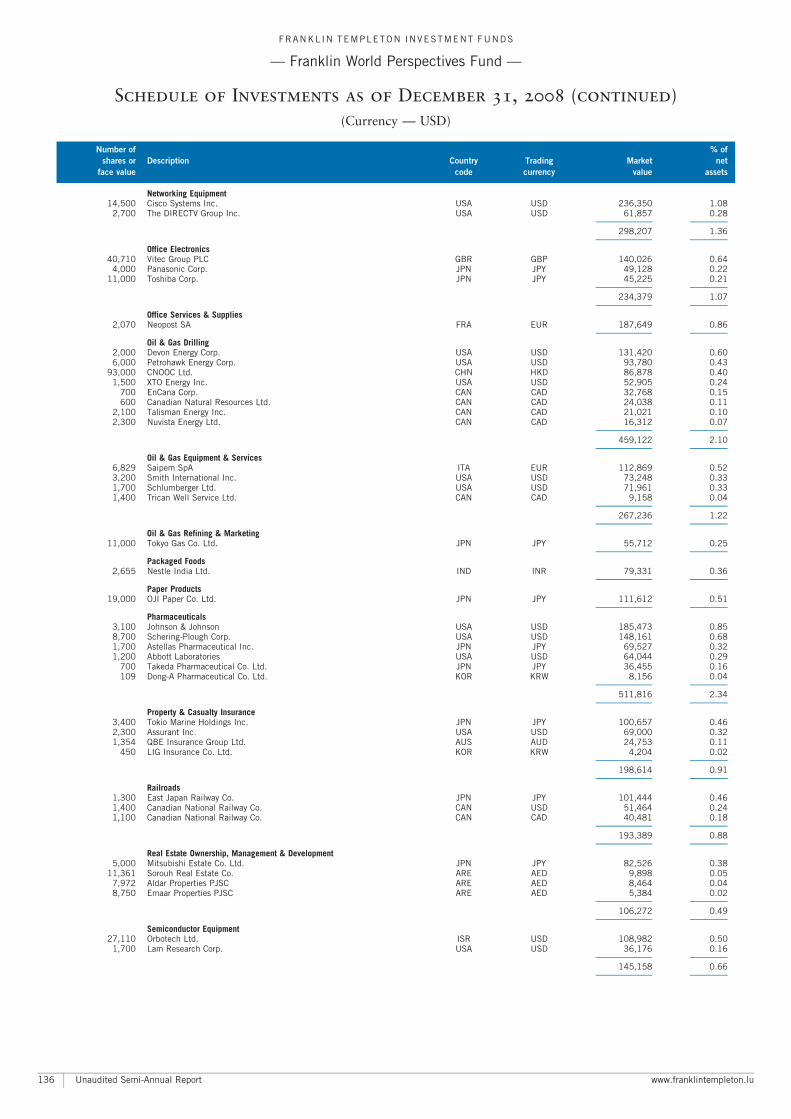
Networking Equipment14,500 Cisco Systems Inc. USA USD 236,350 1.08
2,700 The DIRECTV Group Inc. USA USD 61,857 0.28A A
298,207 1.36A A
Office Electronics40,710 Vitec Group PLC GBR GBP 140,026 0.64
4,000 Panasonic Corp. JPN JPY 49,128 0.2211,000 Toshiba Corp. JPN JPY 45,225 0.21
A A
234,379 1.07A A
Office Services & Supplies2,070 Neopost SA FRA EUR 187,649 0.86
A A
Oil & Gas Drilling2,000 Devon Energy Corp. USA USD 131,420 0.606,000 Petrohawk Energy Corp. USA USD 93,780 0.43
93,000 CNOOC Ltd. CHN HKD 86,878 0.401,500 XTO Energy Inc. USA USD 52,905 0.24
700 EnCana Corp. CAN CAD 32,768 0.15600 Canadian Natural Resources Ltd. CAN CAD 24,038 0.11
2,100 Talisman Energy Inc. CAN CAD 21,021 0.102,300 Nuvista Energy Ltd. CAN CAD 16,312 0.07
A A
459,122 2.10A A
Oil & Gas Equipment & Services6,829 Saipem SpA ITA EUR 112,869 0.523,200 Smith International Inc. USA USD 73,248 0.331,700 Schlumberger Ltd. USA USD 71,961 0.331,400 Trican Well Service Ltd. CAN CAD 9,158 0.04
A A
267,236 1.22A A
Oil & Gas Refining & Marketing11,000 Tokyo Gas Co. Ltd. JPN JPY 55,712 0.25
A A
Packaged Foods2,655 Nestle India Ltd. IND INR 79,331 0.36
A A
Paper Products19,000 OJI Paper Co. Ltd. JPN JPY 111,612 0.51
A A
Pharmaceuticals3,100 Johnson & Johnson USA USD 185,473 0.858,700 Schering-Plough Corp. USA USD 148,161 0.681,700 Astellas Pharmaceutical Inc. JPN JPY 69,527 0.321,200 Abbott Laboratories USA USD 64,044 0.29
700 Takeda Pharmaceutical Co. Ltd. JPN JPY 36,455 0.16109 Dong-A Pharmaceutical Co. Ltd. KOR KRW 8,156 0.04
A A
511,816 2.34A A
Property & Casualty Insurance3,400 Tokio Marine Holdings Inc. JPN JPY 100,657 0.462,300 Assurant Inc. USA USD 69,000 0.321,354 QBE Insurance Group Ltd. AUS AUD 24,753 0.11
450 LIG Insurance Co. Ltd. KOR KRW 4,204 0.02A A
198,614 0.91A A
Railroads1,300 East Japan Railway Co. JPN JPY 101,444 0.461,400 Canadian National Railway Co. CAN USD 51,464 0.241,100 Canadian National Railway Co. CAN CAD 40,481 0.18
A A
193,389 0.88A A
Real Estate Ownership, Management & Development5,000 Mitsubishi Estate Co. Ltd. JPN JPY 82,526 0.38
11,361 Sorouh Real Estate Co. ARE AED 9,898 0.057,972 Aldar Properties PJSC ARE AED 8,464 0.048,750 Emaar Properties PJSC ARE AED 5,384 0.02
A A
106,272 0.49A A
Semiconductor Equipment27,110 Orbotech Ltd. ISR USD 108,982 0.50
1,700 Lam Research Corp. USA USD 36,176 0.16A A
145,158 0.66A A
FRANKL IN TEMPLETON INVESTMENT FUNDS
ç Franklin World Perspectives Fund ç
Schedule of Investments as of December 31, 2008 (continued)
(Currency ç USD)
Number of % of
shares or Description Country Trading Market net
face value code currency value assets
Unaudited Semi-Annual Report www.franklintempleton.lu136

Semiconductors6,100 Microchip Technology Inc. USA USD 119,133 0.54
80,640 ARM Holdings PLC GBR GBP 101,879 0.477,600 Microsemi Corp. USA USD 96,064 0.44
11,790 Taiwan Semiconductor Manufacturing Co. Ltd., ADR TWN USD 93,141 0.43132 Samsung Electronics Co. Ltd. KOR KRW 47,135 0.21
A A
457,352 2.09A A
Soft Drinks3,100 PepsiCo Inc. USA USD 169,787 0.782,900 Hansen Natural Corp. USA USD 97,237 0.446,032 Coca-Cola Amatil Ltd. AUS AUD 39,264 0.18
A A
306,288 1.40A A
Speciality Chemicals3,400 Praxair Inc. USA USD 201,824 0.938,820 Symrise AG DEU EUR 123,083 0.56
A A
324,907 1.49A A
Specialty Retail38,620 Carpetright PLC GBR GBP 200,102 0.9127,320 Jumbo SA GRC EUR 165,795 0.76
A A
365,897 1.67A A
Steel7,200 Companhia Vale do Rio Doce BRA BRL 86,139 0.39
15,000 Nippon Steel Corp. JPN JPY 49,253 0.2365 POSCO KOR KRW 19,557 0.09
6,670 El Ezz Steel Rebars EGY EGP 11,836 0.05370 Hyundai Steel Co. KOR KRW 11,015 0.05270 Dongkuk Steel Mill Co. Ltd. KOR KRW 5,751 0.03
A A
183,551 0.84A A
Telecommunications Equipment7,300 QUALCOMM Inc. USA USD 261,559 1.205,100 Trimble Navigation Ltd. USA USD 110,211 0.501,700 Research In Motion Ltd. CAN USD 68,986 0.32
A A
440,756 2.02A A
Textiles340 Hyosung Corp. KOR KRW 10,283 0.05
A A
Trading Companies & Distributors5,500 Mitsubishi Corp. JPN JPY 77,838 0.36
A A
Tyres & Rubber3,800 Bridgestone Corp. JPN JPY 56,951 0.262,000 Johnson Controls Inc. USA USD 36,320 0.16
800 BorgWarner Inc. USA USD 17,416 0.082,420 Sungwoo Hitech Co. Ltd. KOR KRW 5,988 0.03
A A
116,675 0.53A A
Wireless Telecommunication Services10,500 China Mobile Ltd. CHN HKD 105,404 0.48
4,800 NII Holdings Inc. USA USD 87,264 0.401,600 Rogers Communications Inc., B CAN CAD 48,113 0.22
A A
240,781 1.10A A
TOTAL SHARES 20,507,081 93.78A A
TOTAL TRANSFERABLE SECURITIES ADMITTEDTO AN OFFICIAL STOCK EXCHANGE LISTING 20,853,116 95.36
A A
TRANSFERABLE SECURITIES DEALT INON ANOTHER REGULATED MARKETSHARESAerospace & Defence
2,242,240 Rolls-Royce Group PLC, C GBR GBP 3,275 0.02A A
TOTAL SHARES 3,275 0.02A A
TOTAL TRANSFERABLE SECURITIES DEALT INON ANOTHER REGULATED MARKET 3,275 0.02
A A
TOTAL INVESTMENTS 20,856,391 95.38A A
A A
FRANKL IN TEMPLETON INVESTMENT FUNDS
ç Franklin World Perspectives Fund ç
Schedule of Investments as of December 31, 2008 (continued)
(Currency ç USD)
Number of % of
shares or Description Country Trading Market net
face value code currency value assets
www.franklintempleton.lu Unaudited Semi-Annual Report 137
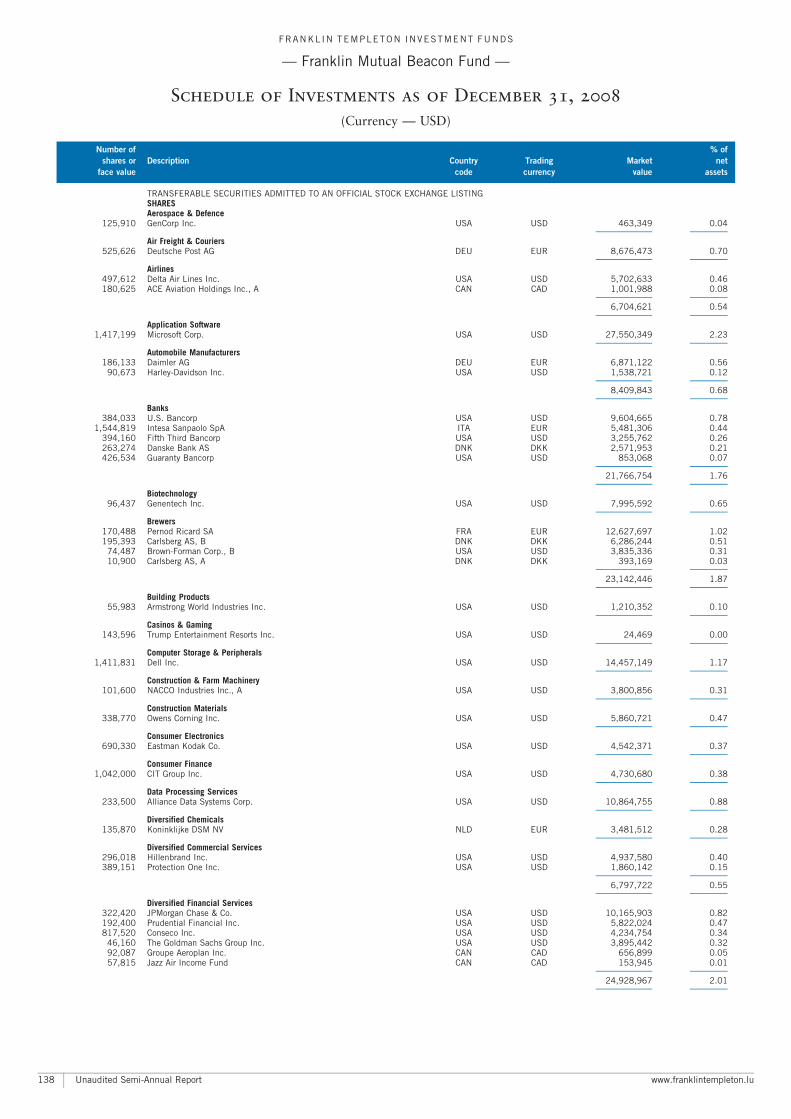
TRANSFERABLE SECURITIES ADMITTED TO AN OFFICIAL STOCK EXCHANGE LISTINGSHARESAerospace & Defence
125,910 GenCorp Inc. USA USD 463,349 0.04A A
Air Freight & Couriers525,626 Deutsche Post AG DEU EUR 8,676,473 0.70
A A
Airlines497,612 Delta Air Lines Inc. USA USD 5,702,633 0.46180,625 ACE Aviation Holdings Inc., A CAN CAD 1,001,988 0.08
A A
6,704,621 0.54A A
Application Software1,417,199 Microsoft Corp. USA USD 27,550,349 2.23
A A
Automobile Manufacturers186,133 Daimler AG DEU EUR 6,871,122 0.56
90,673 Harley-Davidson Inc. USA USD 1,538,721 0.12A A
8,409,843 0.68A A
Banks384,033 U.S. Bancorp USA USD 9,604,665 0.78
1,544,819 Intesa Sanpaolo SpA ITA EUR 5,481,306 0.44394,160 Fifth Third Bancorp USA USD 3,255,762 0.26263,274 Danske Bank AS DNK DKK 2,571,953 0.21426,534 Guaranty Bancorp USA USD 853,068 0.07
A A
21,766,754 1.76A A
Biotechnology96,437 Genentech Inc. USA USD 7,995,592 0.65
A A
Brewers170,488 Pernod Ricard SA FRA EUR 12,627,697 1.02195,393 Carlsberg AS, B DNK DKK 6,286,244 0.51
74,487 Brown-Forman Corp., B USA USD 3,835,336 0.3110,900 Carlsberg AS, A DNK DKK 393,169 0.03
A A
23,142,446 1.87A A
Building Products55,983 Armstrong World Industries Inc. USA USD 1,210,352 0.10
A A
Casinos & Gaming143,596 Trump Entertainment Resorts Inc. USA USD 24,469 0.00
A A
Computer Storage & Peripherals1,411,831 Dell Inc. USA USD 14,457,149 1.17
A A
Construction & Farm Machinery101,600 NACCO Industries Inc., A USA USD 3,800,856 0.31
A A
Construction Materials338,770 Owens Corning Inc. USA USD 5,860,721 0.47
A A
Consumer Electronics690,330 Eastman Kodak Co. USA USD 4,542,371 0.37
A A
Consumer Finance1,042,000 CIT Group Inc. USA USD 4,730,680 0.38
A A
Data Processing Services233,500 Alliance Data Systems Corp. USA USD 10,864,755 0.88
A A
Diversified Chemicals135,870 Koninklijke DSM NV NLD EUR 3,481,512 0.28
A A
Diversified Commercial Services296,018 Hillenbrand Inc. USA USD 4,937,580 0.40389,151 Protection One Inc. USA USD 1,860,142 0.15
A A
6,797,722 0.55A A
Diversified Financial Services322,420 JPMorgan Chase & Co. USA USD 10,165,903 0.82192,400 Prudential Financial Inc. USA USD 5,822,024 0.47817,520 Conseco Inc. USA USD 4,234,754 0.34
46,160 The Goldman Sachs Group Inc. USA USD 3,895,442 0.3292,087 Groupe Aeroplan Inc. CAN CAD 656,899 0.0557,815 Jazz Air Income Fund CAN CAD 153,945 0.01
A A
24,928,967 2.01A A
FRANKL IN TEMPLETON INVESTMENT FUNDS
ç Franklin Mutual Beacon Fund ç
Schedule of Investments as of December 31, 2008
(Currency ç USD)
Number of % of
shares or Description Country Trading Market net
face value code currency value assets
Unaudited Semi-Annual Report www.franklintempleton.lu138
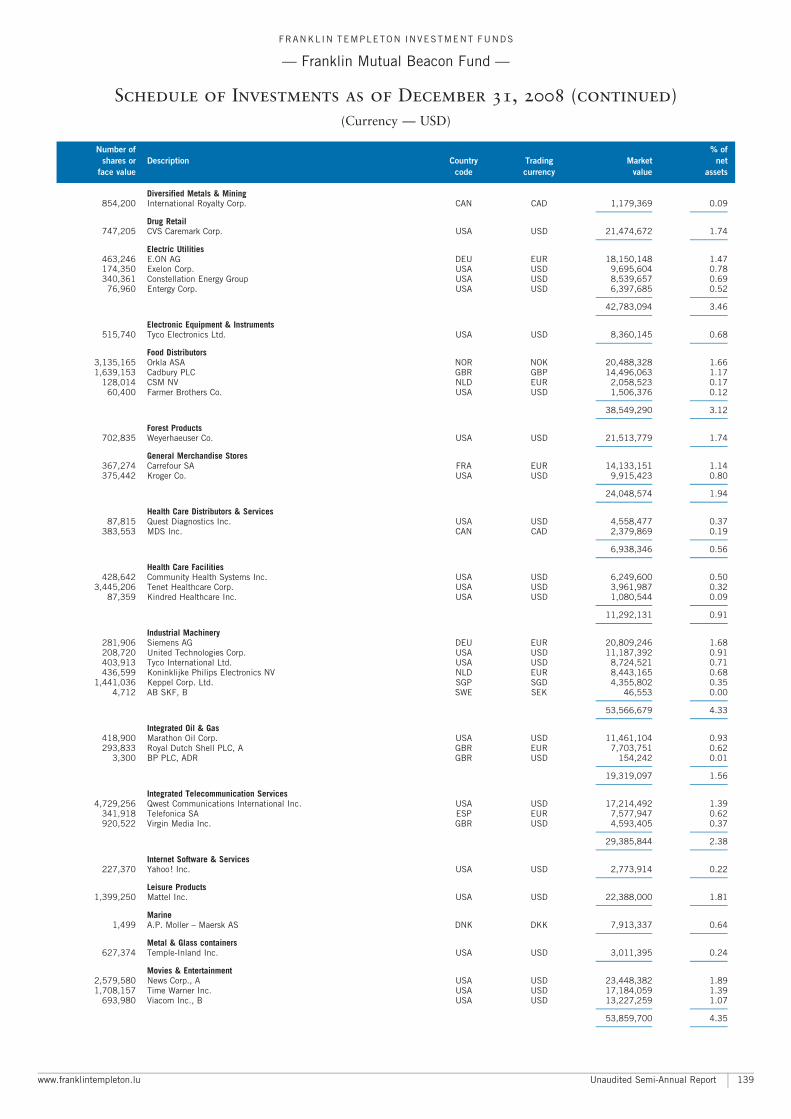
Diversified Metals & Mining854,200 International Royalty Corp. CAN CAD 1,179,369 0.09
A A
Drug Retail747,205 CVS Caremark Corp. USA USD 21,474,672 1.74
A A
Electric Utilities463,246 E.ON AG DEU EUR 18,150,148 1.47174,350 Exelon Corp. USA USD 9,695,604 0.78340,361 Constellation Energy Group USA USD 8,539,657 0.69
76,960 Entergy Corp. USA USD 6,397,685 0.52A A
42,783,094 3.46A A
Electronic Equipment & Instruments515,740 Tyco Electronics Ltd. USA USD 8,360,145 0.68
A A
Food Distributors3,135,165 Orkla ASA NOR NOK 20,488,328 1.661,639,153 Cadbury PLC GBR GBP 14,496,063 1.17
128,014 CSM NV NLD EUR 2,058,523 0.1760,400 Farmer Brothers Co. USA USD 1,506,376 0.12
A A
38,549,290 3.12A A
Forest Products702,835 Weyerhaeuser Co. USA USD 21,513,779 1.74
A A
General Merchandise Stores367,274 Carrefour SA FRA EUR 14,133,151 1.14375,442 Kroger Co. USA USD 9,915,423 0.80
A A
24,048,574 1.94A A
Health Care Distributors & Services87,815 Quest Diagnostics Inc. USA USD 4,558,477 0.37
383,553 MDS Inc. CAN CAD 2,379,869 0.19A A
6,938,346 0.56A A
Health Care Facilities428,642 Community Health Systems Inc. USA USD 6,249,600 0.50
3,445,206 Tenet Healthcare Corp. USA USD 3,961,987 0.3287,359 Kindred Healthcare Inc. USA USD 1,080,544 0.09
A A
11,292,131 0.91A A
Industrial Machinery281,906 Siemens AG DEU EUR 20,809,246 1.68208,720 United Technologies Corp. USA USD 11,187,392 0.91403,913 Tyco International Ltd. USA USD 8,724,521 0.71436,599 Koninklijke Philips Electronics NV NLD EUR 8,443,165 0.68
1,441,036 Keppel Corp. Ltd. SGP SGD 4,355,802 0.354,712 AB SKF, B SWE SEK 46,553 0.00
A A
53,566,679 4.33A A
Integrated Oil & Gas418,900 Marathon Oil Corp. USA USD 11,461,104 0.93293,833 Royal Dutch Shell PLC, A GBR EUR 7,703,751 0.62
3,300 BP PLC, ADR GBR USD 154,242 0.01A A
19,319,097 1.56A A
Integrated Telecommunication Services4,729,256 Qwest Communications International Inc. USA USD 17,214,492 1.39
341,918 Telefonica SA ESP EUR 7,577,947 0.62920,522 Virgin Media Inc. GBR USD 4,593,405 0.37
A A
29,385,844 2.38A A
Internet Software & Services227,370 Yahoo! Inc. USA USD 2,773,914 0.22
A A
Leisure Products1,399,250 Mattel Inc. USA USD 22,388,000 1.81
A A
Marine1,499 A.P. Moller ^ Maersk AS DNK DKK 7,913,337 0.64
A A
Metal & Glass containers627,374 Temple-Inland Inc. USA USD 3,011,395 0.24
A A
Movies & Entertainment2,579,580 News Corp., A USA USD 23,448,382 1.891,708,157 Time Warner Inc. USA USD 17,184,059 1.39
693,980 Viacom Inc., B USA USD 13,227,259 1.07A A
53,859,700 4.35A A
FRANKL IN TEMPLETON INVESTMENT FUNDS
ç Franklin Mutual Beacon Fund ç
Schedule of Investments as of December 31, 2008 (continued)
(Currency ç USD)
Number of % of
shares or Description Country Trading Market net
face value code currency value assets
www.franklintempleton.lu Unaudited Semi-Annual Report 139
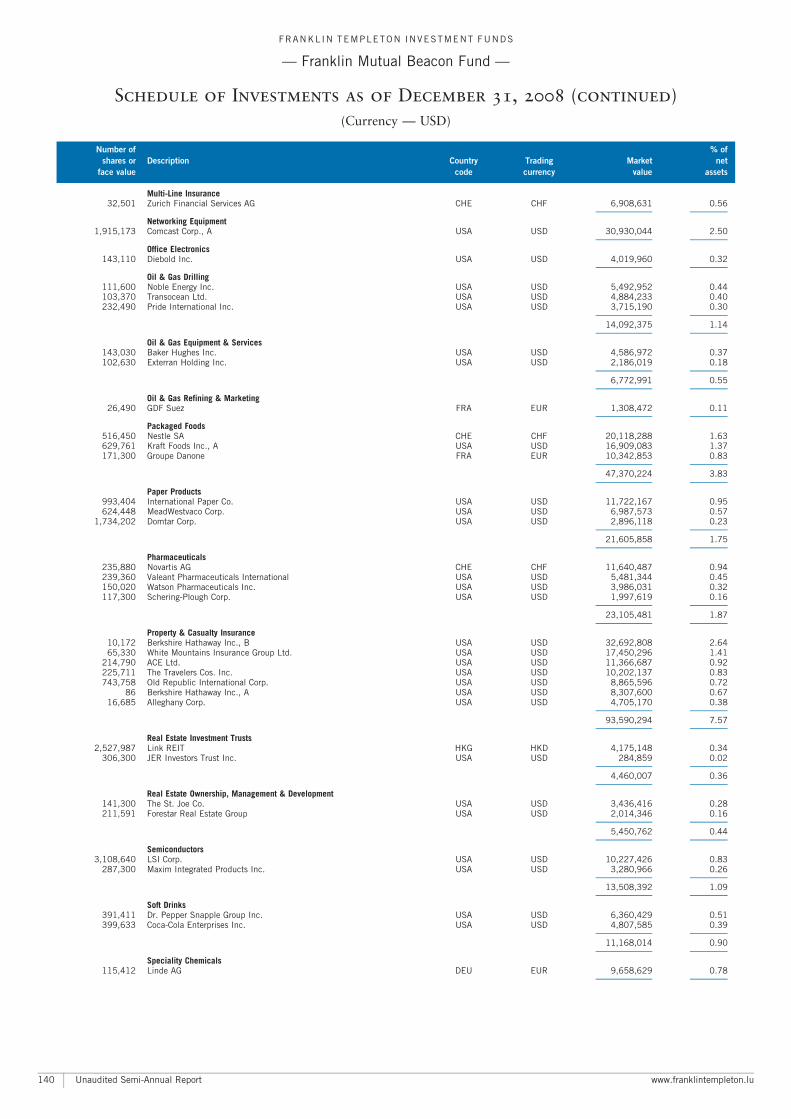
Multi-Line Insurance32,501 Zurich Financial Services AG CHE CHF 6,908,631 0.56
A A
Networking Equipment1,915,173 Comcast Corp., A USA USD 30,930,044 2.50
A A
Office Electronics143,110 Diebold Inc. USA USD 4,019,960 0.32
A A
Oil & Gas Drilling111,600 Noble Energy Inc. USA USD 5,492,952 0.44103,370 Transocean Ltd. USA USD 4,884,233 0.40232,490 Pride International Inc. USA USD 3,715,190 0.30
A A
14,092,375 1.14A A
Oil & Gas Equipment & Services143,030 Baker Hughes Inc. USA USD 4,586,972 0.37102,630 Exterran Holding Inc. USA USD 2,186,019 0.18
A A
6,772,991 0.55A A
Oil & Gas Refining & Marketing26,490 GDF Suez FRA EUR 1,308,472 0.11
A A
Packaged Foods516,450 Nestle SA CHE CHF 20,118,288 1.63629,761 Kraft Foods Inc., A USA USD 16,909,083 1.37171,300 Groupe Danone FRA EUR 10,342,853 0.83
A A
47,370,224 3.83A A
Paper Products993,404 International Paper Co. USA USD 11,722,167 0.95624,448 MeadWestvaco Corp. USA USD 6,987,573 0.57
1,734,202 Domtar Corp. USA USD 2,896,118 0.23A A
21,605,858 1.75A A
Pharmaceuticals235,880 Novartis AG CHE CHF 11,640,487 0.94239,360 Valeant Pharmaceuticals International USA USD 5,481,344 0.45150,020 Watson Pharmaceuticals Inc. USA USD 3,986,031 0.32117,300 Schering-Plough Corp. USA USD 1,997,619 0.16
A A
23,105,481 1.87A A
Property & Casualty Insurance10,172 Berkshire Hathaway Inc., B USA USD 32,692,808 2.6465,330 White Mountains Insurance Group Ltd. USA USD 17,450,296 1.41
214,790 ACE Ltd. USA USD 11,366,687 0.92225,711 The Travelers Cos. Inc. USA USD 10,202,137 0.83743,758 Old Republic International Corp. USA USD 8,865,596 0.72
86 Berkshire Hathaway Inc., A USA USD 8,307,600 0.6716,685 Alleghany Corp. USA USD 4,705,170 0.38
A A
93,590,294 7.57A A
Real Estate Investment Trusts2,527,987 Link REIT HKG HKD 4,175,148 0.34
306,300 JER Investors Trust Inc. USA USD 284,859 0.02A A
4,460,007 0.36A A
Real Estate Ownership, Management & Development141,300 The St. Joe Co. USA USD 3,436,416 0.28211,591 Forestar Real Estate Group USA USD 2,014,346 0.16
A A
5,450,762 0.44A A
Semiconductors3,108,640 LSI Corp. USA USD 10,227,426 0.83
287,300 Maxim Integrated Products Inc. USA USD 3,280,966 0.26A A
13,508,392 1.09A A
Soft Drinks391,411 Dr. Pepper Snapple Group Inc. USA USD 6,360,429 0.51399,633 Coca-Cola Enterprises Inc. USA USD 4,807,585 0.39
A A
11,168,014 0.90A A
Speciality Chemicals115,412 Linde AG DEU EUR 9,658,629 0.78
A A
FRANKL IN TEMPLETON INVESTMENT FUNDS
ç Franklin Mutual Beacon Fund ç
Schedule of Investments as of December 31, 2008 (continued)
(Currency ç USD)
Number of % of
shares or Description Country Trading Market net
face value code currency value assets
Unaudited Semi-Annual Report www.franklintempleton.lu140
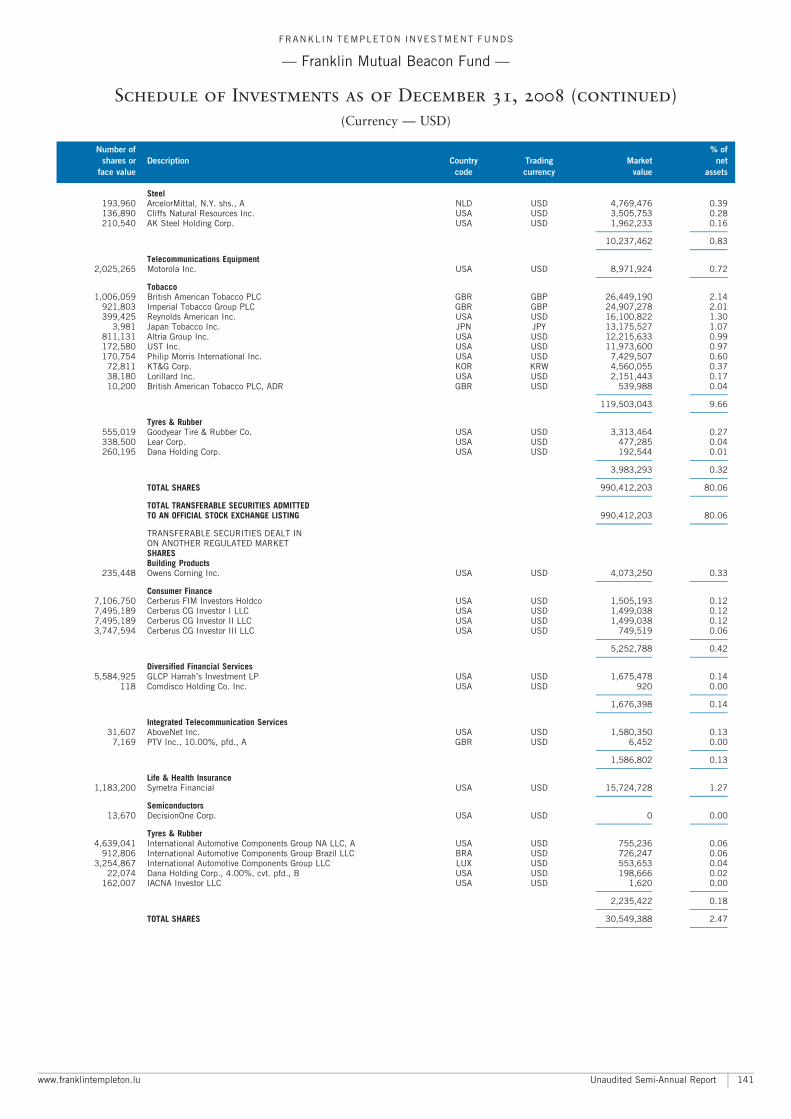
Steel193,960 ArcelorMittal, N.Y. shs., A NLD USD 4,769,476 0.39136,890 Cliffs Natural Resources Inc. USA USD 3,505,753 0.28210,540 AK Steel Holding Corp. USA USD 1,962,233 0.16
A A
10,237,462 0.83A A
Telecommunications Equipment2,025,265 Motorola Inc. USA USD 8,971,924 0.72
A A
Tobacco1,006,059 British American Tobacco PLC GBR GBP 26,449,190 2.14
921,803 Imperial Tobacco Group PLC GBR GBP 24,907,278 2.01399,425 Reynolds American Inc. USA USD 16,100,822 1.30
3,981 Japan Tobacco Inc. JPN JPY 13,175,527 1.07811,131 Altria Group Inc. USA USD 12,215,633 0.99172,580 UST Inc. USA USD 11,973,600 0.97170,754 Philip Morris International Inc. USA USD 7,429,507 0.60
72,811 KT&G Corp. KOR KRW 4,560,055 0.3738,180 Lorillard Inc. USA USD 2,151,443 0.1710,200 British American Tobacco PLC, ADR GBR USD 539,988 0.04
A A
119,503,043 9.66A A
Tyres & Rubber555,019 Goodyear Tire & Rubber Co. USA USD 3,313,464 0.27338,500 Lear Corp. USA USD 477,285 0.04260,195 Dana Holding Corp. USA USD 192,544 0.01
A A
3,983,293 0.32A A
TOTAL SHARES 990,412,203 80.06A A
TOTAL TRANSFERABLE SECURITIES ADMITTEDTO AN OFFICIAL STOCK EXCHANGE LISTING 990,412,203 80.06
A A
TRANSFERABLE SECURITIES DEALT INON ANOTHER REGULATED MARKETSHARESBuilding Products
235,448 Owens Corning Inc. USA USD 4,073,250 0.33A A
Consumer Finance7,106,750 Cerberus FIM Investors Holdco USA USD 1,505,193 0.127,495,189 Cerberus CG Investor I LLC USA USD 1,499,038 0.127,495,189 Cerberus CG Investor II LLC USA USD 1,499,038 0.123,747,594 Cerberus CG Investor III LLC USA USD 749,519 0.06
A A
5,252,788 0.42A A
Diversified Financial Services5,584,925 GLCP Harrah’s Investment LP USA USD 1,675,478 0.14
118 Comdisco Holding Co. Inc. USA USD 920 0.00A A
1,676,398 0.14A A
Integrated Telecommunication Services31,607 AboveNet Inc. USA USD 1,580,350 0.13
7,169 PTV Inc., 10.00%, pfd., A GBR USD 6,452 0.00A A
1,586,802 0.13A A
Life & Health Insurance1,183,200 Symetra Financial USA USD 15,724,728 1.27
A A
Semiconductors13,670 DecisionOne Corp. USA USD 0 0.00
A A
Tyres & Rubber4,639,041 International Automotive Components Group NA LLC, A USA USD 755,236 0.06
912,806 International Automotive Components Group Brazil LLC BRA USD 726,247 0.063,254,867 International Automotive Components Group LLC LUX USD 553,653 0.04
22,074 Dana Holding Corp., 4.00%, cvt. pfd., B USA USD 198,666 0.02162,007 IACNA Investor LLC USA USD 1,620 0.00
A A
2,235,422 0.18A A
TOTAL SHARES 30,549,388 2.47A A
FRANKL IN TEMPLETON INVESTMENT FUNDS
ç Franklin Mutual Beacon Fund ç
Schedule of Investments as of December 31, 2008 (continued)
(Currency ç USD)
Number of % of
shares or Description Country Trading Market net
face value code currency value assets
www.franklintempleton.lu Unaudited Semi-Annual Report 141
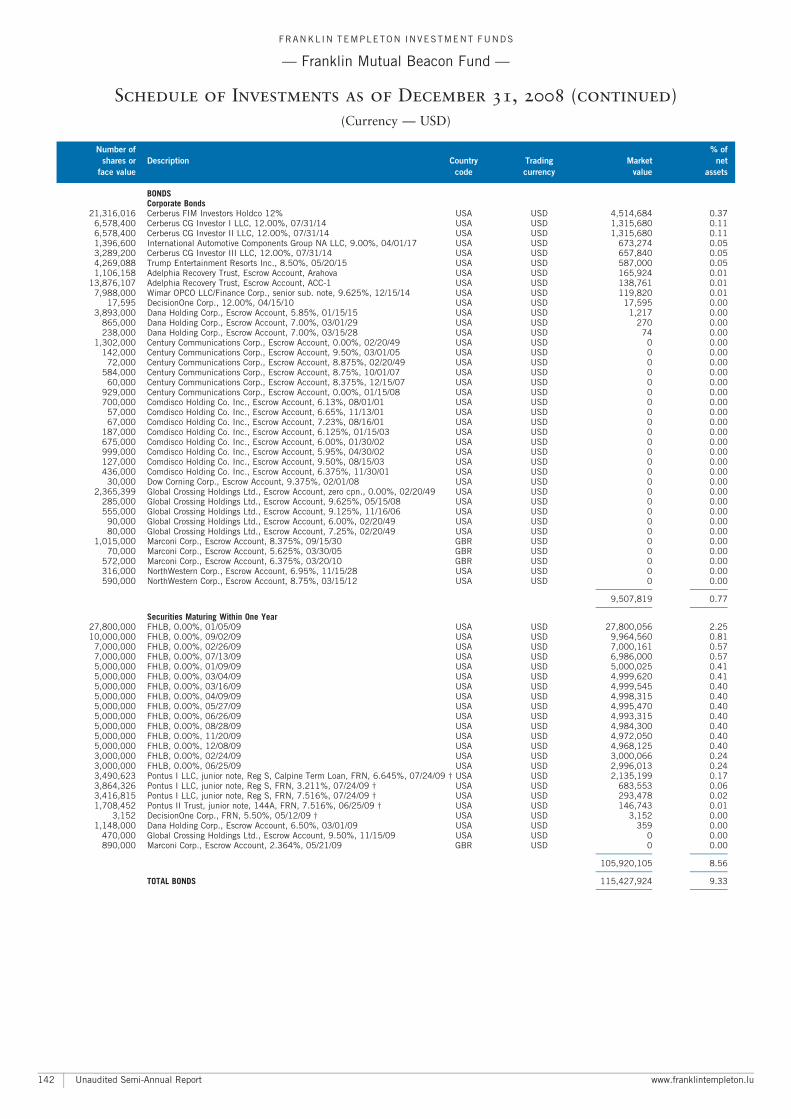
BONDSCorporate Bonds
21,316,016 Cerberus FIM Investors Holdco 12% USA USD 4,514,684 0.376,578,400 Cerberus CG Investor I LLC, 12.00%, 07/31/14 USA USD 1,315,680 0.116,578,400 Cerberus CG Investor II LLC, 12.00%, 07/31/14 USA USD 1,315,680 0.111,396,600 International Automotive Components Group NA LLC, 9.00%, 04/01/17 USA USD 673,274 0.053,289,200 Cerberus CG Investor III LLC, 12.00%, 07/31/14 USA USD 657,840 0.054,269,088 Trump Entertainment Resorts Inc., 8.50%, 05/20/15 USA USD 587,000 0.051,106,158 Adelphia Recovery Trust, Escrow Account, Arahova USA USD 165,924 0.01
13,876,107 Adelphia Recovery Trust, Escrow Account, ACC-1 USA USD 138,761 0.017,988,000 Wimar OPCO LLC/Finance Corp., senior sub. note, 9.625%, 12/15/14 USA USD 119,820 0.01
17,595 DecisionOne Corp., 12.00%, 04/15/10 USA USD 17,595 0.003,893,000 Dana Holding Corp., Escrow Account, 5.85%, 01/15/15 USA USD 1,217 0.00
865,000 Dana Holding Corp., Escrow Account, 7.00%, 03/01/29 USA USD 270 0.00238,000 Dana Holding Corp., Escrow Account, 7.00%, 03/15/28 USA USD 74 0.00
1,302,000 Century Communications Corp., Escrow Account, 0.00%, 02/20/49 USA USD 0 0.00142,000 Century Communications Corp., Escrow Account, 9.50%, 03/01/05 USA USD 0 0.00
72,000 Century Communications Corp., Escrow Account, 8.875%, 02/20/49 USA USD 0 0.00584,000 Century Communications Corp., Escrow Account, 8.75%, 10/01/07 USA USD 0 0.00
60,000 Century Communications Corp., Escrow Account, 8.375%, 12/15/07 USA USD 0 0.00929,000 Century Communications Corp., Escrow Account, 0.00%, 01/15/08 USA USD 0 0.00700,000 Comdisco Holding Co. Inc., Escrow Account, 6.13%, 08/01/01 USA USD 0 0.00
57,000 Comdisco Holding Co. Inc., Escrow Account, 6.65%, 11/13/01 USA USD 0 0.0067,000 Comdisco Holding Co. Inc., Escrow Account, 7.23%, 08/16/01 USA USD 0 0.00
187,000 Comdisco Holding Co. Inc., Escrow Account, 6.125%, 01/15/03 USA USD 0 0.00675,000 Comdisco Holding Co. Inc., Escrow Account, 6.00%, 01/30/02 USA USD 0 0.00999,000 Comdisco Holding Co. Inc., Escrow Account, 5.95%, 04/30/02 USA USD 0 0.00127,000 Comdisco Holding Co. Inc., Escrow Account, 9.50%, 08/15/03 USA USD 0 0.00436,000 Comdisco Holding Co. Inc., Escrow Account, 6.375%, 11/30/01 USA USD 0 0.00
30,000 Dow Corning Corp., Escrow Account, 9.375%, 02/01/08 USA USD 0 0.002,365,399 Global Crossing Holdings Ltd., Escrow Account, zero cpn., 0.00%, 02/20/49 USA USD 0 0.00
285,000 Global Crossing Holdings Ltd., Escrow Account, 9.625%, 05/15/08 USA USD 0 0.00555,000 Global Crossing Holdings Ltd., Escrow Account, 9.125%, 11/16/06 USA USD 0 0.00
90,000 Global Crossing Holdings Ltd., Escrow Account, 6.00%, 02/20/49 USA USD 0 0.0080,000 Global Crossing Holdings Ltd., Escrow Account, 7.25%, 02/20/49 USA USD 0 0.00
1,015,000 Marconi Corp., Escrow Account, 8.375%, 09/15/30 GBR USD 0 0.0070,000 Marconi Corp., Escrow Account, 5.625%, 03/30/05 GBR USD 0 0.00
572,000 Marconi Corp., Escrow Account, 6.375%, 03/20/10 GBR USD 0 0.00316,000 NorthWestern Corp., Escrow Account, 6.95%, 11/15/28 USA USD 0 0.00590,000 NorthWestern Corp., Escrow Account, 8.75%, 03/15/12 USA USD 0 0.00
A A
9,507,819 0.77A A
Securities Maturing Within One Year27,800,000 FHLB, 0.00%, 01/05/09 USA USD 27,800,056 2.2510,000,000 FHLB, 0.00%, 09/02/09 USA USD 9,964,560 0.81
7,000,000 FHLB, 0.00%, 02/26/09 USA USD 7,000,161 0.577,000,000 FHLB, 0.00%, 07/13/09 USA USD 6,986,000 0.575,000,000 FHLB, 0.00%, 01/09/09 USA USD 5,000,025 0.415,000,000 FHLB, 0.00%, 03/04/09 USA USD 4,999,620 0.415,000,000 FHLB, 0.00%, 03/16/09 USA USD 4,999,545 0.405,000,000 FHLB, 0.00%, 04/09/09 USA USD 4,998,315 0.405,000,000 FHLB, 0.00%, 05/27/09 USA USD 4,995,470 0.405,000,000 FHLB, 0.00%, 06/26/09 USA USD 4,993,315 0.405,000,000 FHLB, 0.00%, 08/28/09 USA USD 4,984,300 0.405,000,000 FHLB, 0.00%, 11/20/09 USA USD 4,972,050 0.405,000,000 FHLB, 0.00%, 12/08/09 USA USD 4,968,125 0.403,000,000 FHLB, 0.00%, 02/24/09 USA USD 3,000,066 0.243,000,000 FHLB, 0.00%, 06/25/09 USA USD 2,996,013 0.243,490,623 Pontus I LLC, junior note, Reg S, Calpine Term Loan, FRN, 6.645%, 07/24/09 � USA USD 2,135,199 0.173,864,326 Pontus I LLC, junior note, Reg S, FRN, 3.211%, 07/24/09 � USA USD 683,553 0.063,416,815 Pontus I LLC, junior note, Reg S, FRN, 7.516%, 07/24/09 � USA USD 293,478 0.021,708,452 Pontus II Trust, junior note, 144A, FRN, 7.516%, 06/25/09 � USA USD 146,743 0.01
3,152 DecisionOne Corp., FRN, 5.50%, 05/12/09 � USA USD 3,152 0.001,148,000 Dana Holding Corp., Escrow Account, 6.50%, 03/01/09 USA USD 359 0.00
470,000 Global Crossing Holdings Ltd., Escrow Account, 9.50%, 11/15/09 USA USD 0 0.00890,000 Marconi Corp., Escrow Account, 2.364%, 05/21/09 GBR USD 0 0.00
A A
105,920,105 8.56A A
TOTAL BONDS 115,427,924 9.33A A
FRANKL IN TEMPLETON INVESTMENT FUNDS
ç Franklin Mutual Beacon Fund ç
Schedule of Investments as of December 31, 2008 (continued)
(Currency ç USD)
Number of % of
shares or Description Country Trading Market net
face value code currency value assets
Unaudited Semi-Annual Report www.franklintempleton.lu142
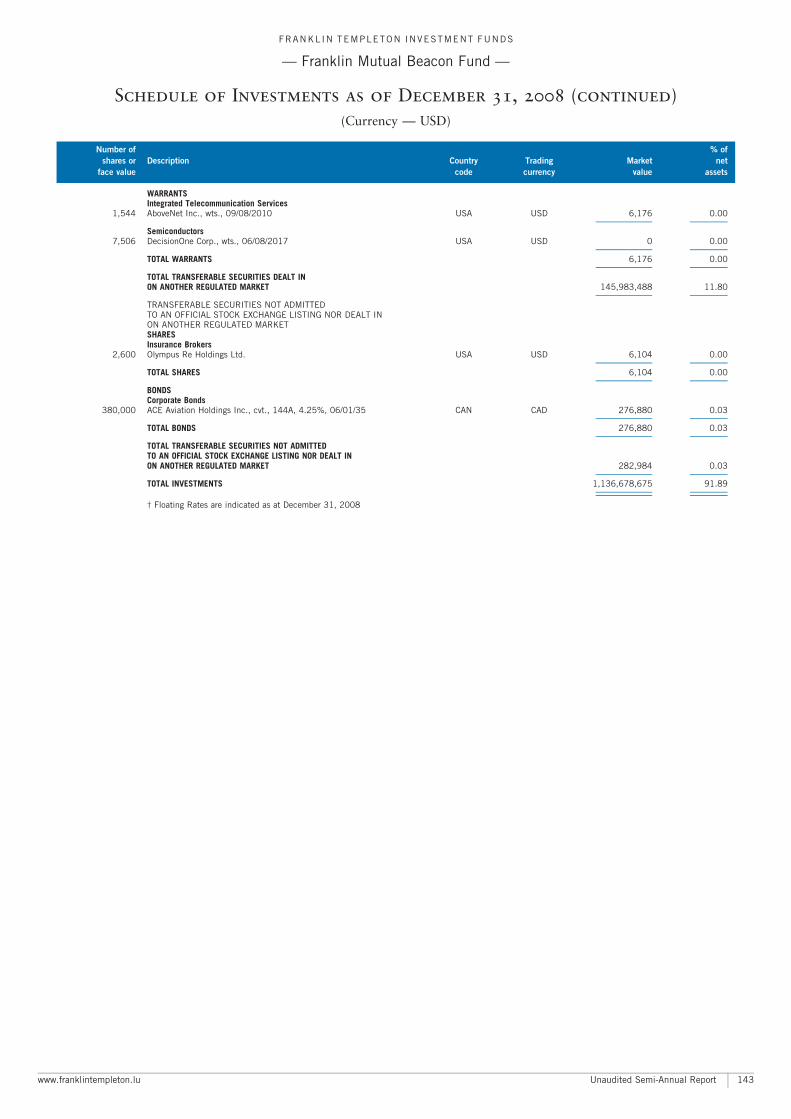
WARRANTSIntegrated Telecommunication Services
1,544 AboveNet Inc., wts., 09/08/2010 USA USD 6,176 0.00A A
Semiconductors7,506 DecisionOne Corp., wts., 06/08/2017 USA USD 0 0.00
A A
TOTAL WARRANTS 6,176 0.00A A
TOTAL TRANSFERABLE SECURITIES DEALT INON ANOTHER REGULATED MARKET 145,983,488 11.80
A A
TRANSFERABLE SECURITIES NOT ADMITTEDTO AN OFFICIAL STOCK EXCHANGE LISTING NOR DEALT INON ANOTHER REGULATED MARKETSHARESInsurance Brokers
2,600 Olympus Re Holdings Ltd. USA USD 6,104 0.00A A
TOTAL SHARES 6,104 0.00A A
BONDSCorporate Bonds
380,000 ACE Aviation Holdings Inc., cvt., 144A, 4.25%, 06/01/35 CAN CAD 276,880 0.03A A
TOTAL BONDS 276,880 0.03A A
TOTAL TRANSFERABLE SECURITIES NOT ADMITTEDTO AN OFFICIAL STOCK EXCHANGE LISTING NOR DEALT INON ANOTHER REGULATED MARKET 282,984 0.03
A A
TOTAL INVESTMENTS 1,136,678,675 91.89A A
A A
� Floating Rates are indicated as at December 31, 2008
FRANKL IN TEMPLETON INVESTMENT FUNDS
ç Franklin Mutual Beacon Fund ç
Schedule of Investments as of December 31, 2008 (continued)
(Currency ç USD)
Number of % of
shares or Description Country Trading Market net
face value code currency value assets
www.franklintempleton.lu Unaudited Semi-Annual Report 143
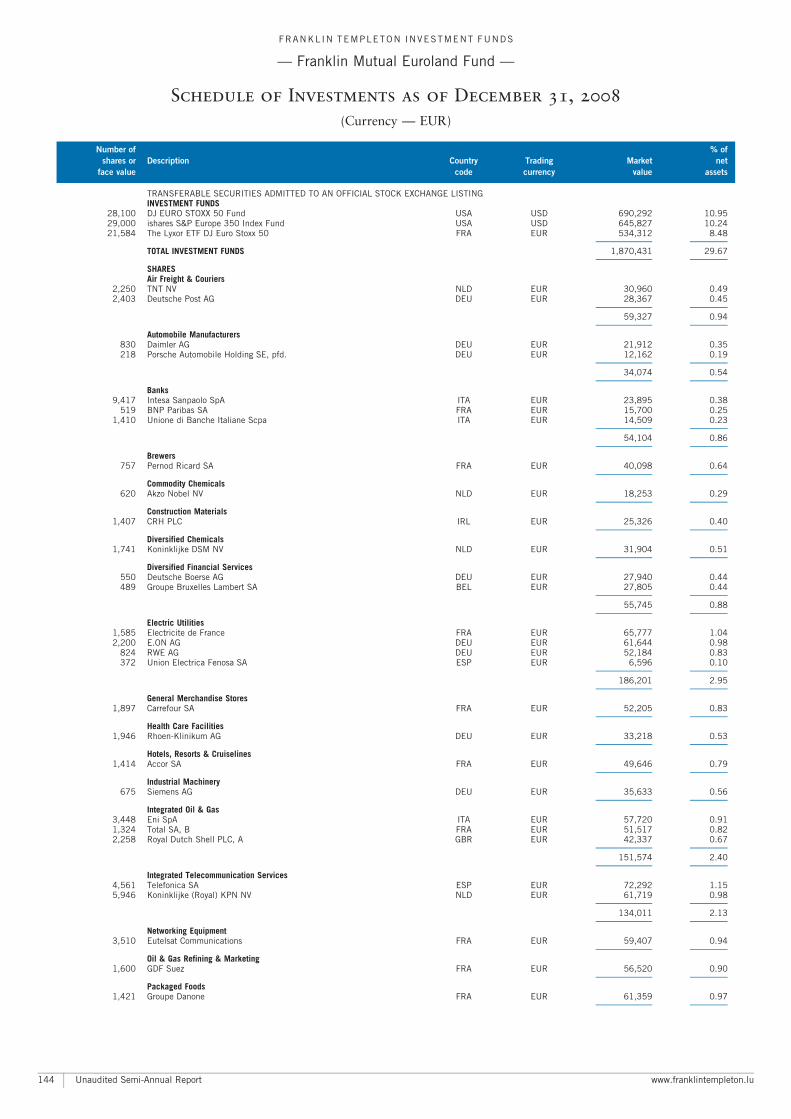
TRANSFERABLE SECURITIES ADMITTED TO AN OFFICIAL STOCK EXCHANGE LISTINGINVESTMENT FUNDS
28,100 DJ EURO STOXX 50 Fund USA USD 690,292 10.9529,000 ishares S&P Europe 350 Index Fund USA USD 645,827 10.2421,584 The Lyxor ETF DJ Euro Stoxx 50 FRA EUR 534,312 8.48
A A
TOTAL INVESTMENT FUNDS 1,870,431 29.67A A
SHARESAir Freight & Couriers
2,250 TNT NV NLD EUR 30,960 0.492,403 Deutsche Post AG DEU EUR 28,367 0.45
A A
59,327 0.94A A
Automobile Manufacturers830 Daimler AG DEU EUR 21,912 0.35218 Porsche Automobile Holding SE, pfd. DEU EUR 12,162 0.19
A A
34,074 0.54A A
Banks9,417 Intesa Sanpaolo SpA ITA EUR 23,895 0.38
519 BNP Paribas SA FRA EUR 15,700 0.251,410 Unione di Banche Italiane Scpa ITA EUR 14,509 0.23
A A
54,104 0.86A A
Brewers757 Pernod Ricard SA FRA EUR 40,098 0.64
A A
Commodity Chemicals620 Akzo Nobel NV NLD EUR 18,253 0.29
A A
Construction Materials1,407 CRH PLC IRL EUR 25,326 0.40
A A
Diversified Chemicals1,741 Koninklijke DSM NV NLD EUR 31,904 0.51
A A
Diversified Financial Services550 Deutsche Boerse AG DEU EUR 27,940 0.44489 Groupe Bruxelles Lambert SA BEL EUR 27,805 0.44
A A
55,745 0.88A A
Electric Utilities1,585 Electricite de France FRA EUR 65,777 1.042,200 E.ON AG DEU EUR 61,644 0.98
824 RWE AG DEU EUR 52,184 0.83372 Union Electrica Fenosa SA ESP EUR 6,596 0.10
A A
186,201 2.95A A
General Merchandise Stores1,897 Carrefour SA FRA EUR 52,205 0.83
A A
Health Care Facilities1,946 Rhoen-Klinikum AG DEU EUR 33,218 0.53
A A
Hotels, Resorts & Cruiselines1,414 Accor SA FRA EUR 49,646 0.79
A A
Industrial Machinery675 Siemens AG DEU EUR 35,633 0.56
A A
Integrated Oil & Gas3,448 Eni SpA ITA EUR 57,720 0.911,324 Total SA, B FRA EUR 51,517 0.822,258 Royal Dutch Shell PLC, A GBR EUR 42,337 0.67
A A
151,574 2.40A A
Integrated Telecommunication Services4,561 Telefonica SA ESP EUR 72,292 1.155,946 Koninklijke (Royal) KPN NV NLD EUR 61,719 0.98
A A
134,011 2.13A A
Networking Equipment3,510 Eutelsat Communications FRA EUR 59,407 0.94
A A
Oil & Gas Refining & Marketing1,600 GDF Suez FRA EUR 56,520 0.90
A A
Packaged Foods1,421 Groupe Danone FRA EUR 61,359 0.97
A A
FRANKL IN TEMPLETON INVESTMENT FUNDS
ç Franklin Mutual Euroland Fund ç
Schedule of Investments as of December 31, 2008
(Currency ç EUR)
Number of % of
shares or Description Country Trading Market net
face value code currency value assets
Unaudited Semi-Annual Report www.franklintempleton.lu144
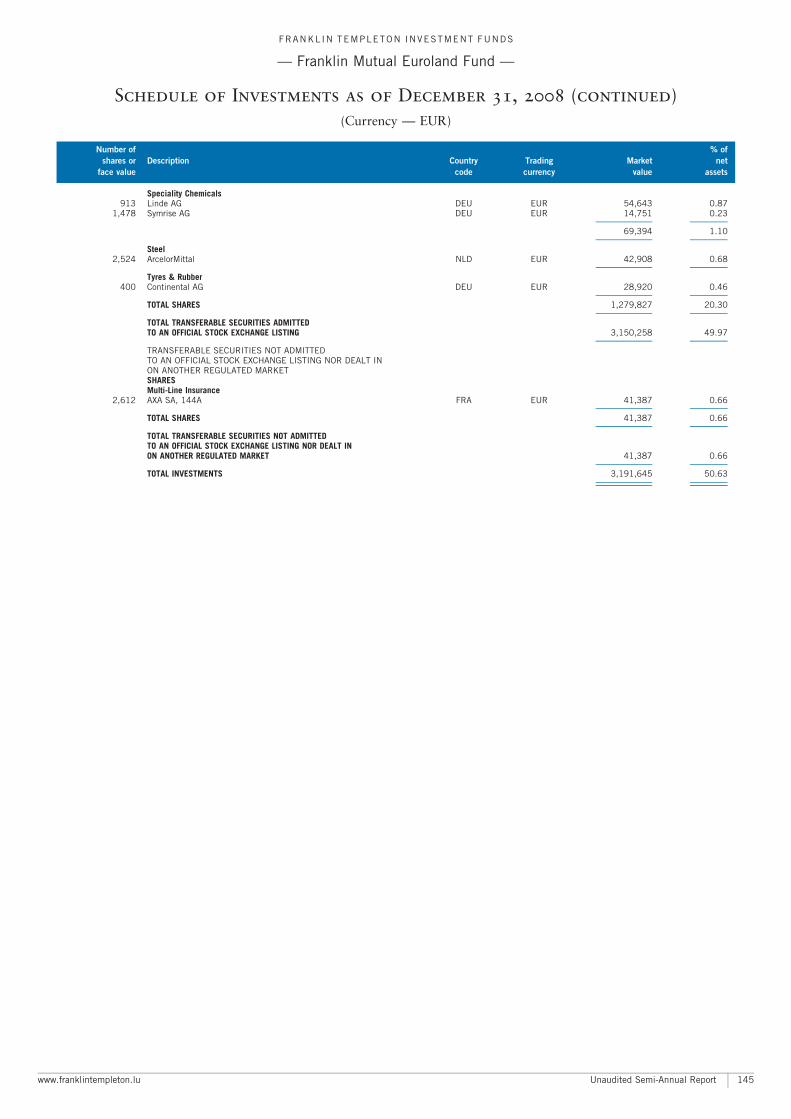
Speciality Chemicals913 Linde AG DEU EUR 54,643 0.87
1,478 Symrise AG DEU EUR 14,751 0.23A A
69,394 1.10A A
Steel2,524 ArcelorMittal NLD EUR 42,908 0.68
A A
Tyres & Rubber400 Continental AG DEU EUR 28,920 0.46
A A
TOTAL SHARES 1,279,827 20.30A A
TOTAL TRANSFERABLE SECURITIES ADMITTEDTO AN OFFICIAL STOCK EXCHANGE LISTING 3,150,258 49.97
A A
TRANSFERABLE SECURITIES NOT ADMITTEDTO AN OFFICIAL STOCK EXCHANGE LISTING NOR DEALT INON ANOTHER REGULATED MARKETSHARESMulti-Line Insurance
2,612 AXA SA, 144A FRA EUR 41,387 0.66A A
TOTAL SHARES 41,387 0.66A A
TOTAL TRANSFERABLE SECURITIES NOT ADMITTEDTO AN OFFICIAL STOCK EXCHANGE LISTING NOR DEALT INON ANOTHER REGULATED MARKET 41,387 0.66
A A
TOTAL INVESTMENTS 3,191,645 50.63A A
A A
FRANKL IN TEMPLETON INVESTMENT FUNDS
ç Franklin Mutual Euroland Fund ç
Schedule of Investments as of December 31, 2008 (continued)
(Currency ç EUR)
Number of % of
shares or Description Country Trading Market net
face value code currency value assets
www.franklintempleton.lu Unaudited Semi-Annual Report 145

TRANSFERABLE SECURITIES ADMITTED TO AN OFFICIAL STOCK EXCHANGE LISTINGSHARESAir Freight & Couriers
1,433,761 Deutsche Post AG DEU EUR 16,925,549 0.52A A
Automobile Manufacturers464,293 Porsche Automobile Holding SE, pfd. DEU EUR 25,902,907 0.80
43,476 Audi AG DEU EUR 20,238,078 0.62674,161 Daimler AG DEU EUR 17,797,850 0.55
A A
63,938,835 1.97A A
Banks9,681,557 Intesa Sanpaolo SpA ITA EUR 24,566,951 0.761,876,580 Unione di Banche Italiane Scpa ITA EUR 19,310,008 0.60
387,686 BNP Paribas SA FRA EUR 11,727,501 0.36712,770 Svenska Handelsbanken AB, A SWE SEK 8,214,259 0.25
A A
63,818,719 1.97A A
Brewers1,052,617 Pernod Ricard SA FRA EUR 55,757,122 1.721,562,430 Carlsberg AS, B DNK DKK 35,948,641 1.11
8,100 Carlsberg AS, A DNK DKK 208,948 0.01A A
91,914,711 2.84A A
Building Products1,177,060 Schindler Holding AG, participation certificate CHE CHF 37,915,145 1.17
299,580 Schindler Holding AG CHE CHF 9,439,337 0.29A A
47,354,482 1.46A A
Commodity Chemicals29,653 Sika AG CHE CHF 17,872,290 0.55
308,000 Akzo Nobel NV NLD EUR 9,067,520 0.28A A
26,939,810 0.83A A
Construction Materials1,945,014 CRH PLC IRL EUR 35,010,252 1.08
A A
Department Stores10,770 Jelmoli Holding AG CHE CHF 14,208,590 0.44
A A
Diversified Chemicals1,793,614 Koninklijke DSM NV NLD EUR 32,867,977 1.01
A A
Diversified Financial Services4,069,627 Investor AB, B SWE SEK 43,550,073 1.34
703,283 Groupe Bruxelles Lambert SA BEL EUR 39,988,671 1.23552,870 Deutsche Boerse AG DEU EUR 28,085,796 0.87622,000 Oslo Bors VPS Holding ASA NOR NOK 4,796,932 0.15
2,613,233 Ifil SpA ITA EUR 4,722,112 0.15A A
121,143,584 3.74A A
Diversified Metals & Mining2,220,866 Anglo American PLC GBR GBP 35,863,105 1.11
791,600 Anglo American PLC, ADR GBR USD 6,578,268 0.20A A
42,441,373 1.31A A
Electric Utilities2,775,620 E.ON AG DEU EUR 77,772,872 2.40
976,365 RWE AG DEU EUR 61,833,196 1.911,467,111 Electricite de France FRA EUR 60,885,107 1.88
330,951 Union Electrica Fenosa SA ESP EUR 5,867,761 0.18A A
206,358,936 6.37A A
Electrical Components & Equipment1,501,538 Zumtobel AG AUT EUR 8,378,582 0.26
A A
Environmental Services714,710 Suez Environnement SA FRA EUR 8,612,255 0.27
A A
Food Distributors6,802,462 Cadbury PLC GBR GBP 43,022,567 1.335,400,691 Orkla ASA NOR NOK 25,240,333 0.781,160,667 CSM NV NLD EUR 13,347,671 0.41
A A
81,610,571 2.52A A
General Merchandise Stores1,886,899 Carrefour SA FRA EUR 51,927,460 1.60
A A
Health Care Facilities1,483,538 Rhoen-Klinikum AG DEU EUR 25,323,994 0.78
A A
FRANKL IN TEMPLETON INVESTMENT FUNDS
ç Franklin Mutual European Fund ç
Schedule of Investments as of December 31, 2008
(Currency ç EUR)
Number of % of
shares or Description Country Trading Market net
face value code currency value assets
Unaudited Semi-Annual Report www.franklintempleton.lu146
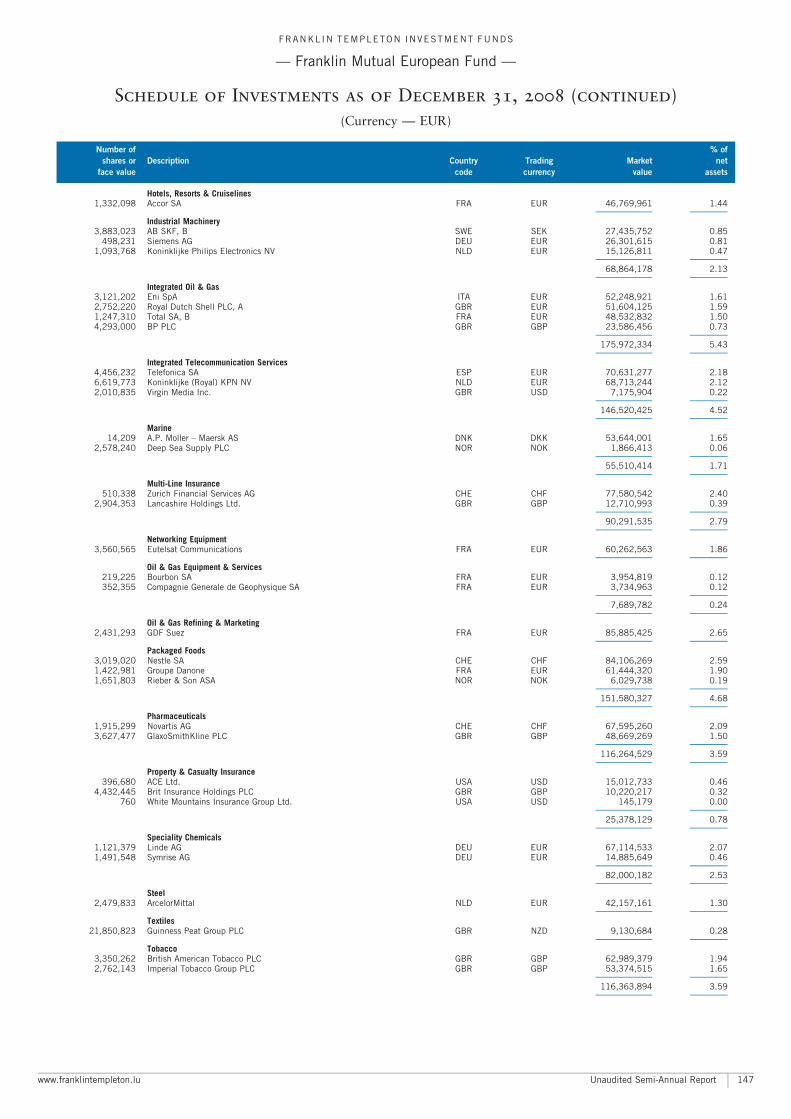
Hotels, Resorts & Cruiselines1,332,098 Accor SA FRA EUR 46,769,961 1.44
A A
Industrial Machinery3,883,023 AB SKF, B SWE SEK 27,435,752 0.85
498,231 Siemens AG DEU EUR 26,301,615 0.811,093,768 Koninklijke Philips Electronics NV NLD EUR 15,126,811 0.47
A A
68,864,178 2.13A A
Integrated Oil & Gas3,121,202 Eni SpA ITA EUR 52,248,921 1.612,752,220 Royal Dutch Shell PLC, A GBR EUR 51,604,125 1.591,247,310 Total SA, B FRA EUR 48,532,832 1.504,293,000 BP PLC GBR GBP 23,586,456 0.73
A A
175,972,334 5.43A A
Integrated Telecommunication Services4,456,232 Telefonica SA ESP EUR 70,631,277 2.186,619,773 Koninklijke (Royal) KPN NV NLD EUR 68,713,244 2.122,010,835 Virgin Media Inc. GBR USD 7,175,904 0.22
A A
146,520,425 4.52A A
Marine14,209 A.P. Moller ^ Maersk AS DNK DKK 53,644,001 1.65
2,578,240 Deep Sea Supply PLC NOR NOK 1,866,413 0.06A A
55,510,414 1.71A A
Multi-Line Insurance510,338 Zurich Financial Services AG CHE CHF 77,580,542 2.40
2,904,353 Lancashire Holdings Ltd. GBR GBP 12,710,993 0.39A A
90,291,535 2.79A A
Networking Equipment3,560,565 Eutelsat Communications FRA EUR 60,262,563 1.86
A A
Oil & Gas Equipment & Services219,225 Bourbon SA FRA EUR 3,954,819 0.12352,355 Compagnie Generale de Geophysique SA FRA EUR 3,734,963 0.12
A A
7,689,782 0.24A A
Oil & Gas Refining & Marketing2,431,293 GDF Suez FRA EUR 85,885,425 2.65
A A
Packaged Foods3,019,020 Nestle SA CHE CHF 84,106,269 2.591,422,981 Groupe Danone FRA EUR 61,444,320 1.901,651,803 Rieber & Son ASA NOR NOK 6,029,738 0.19
A A
151,580,327 4.68A A
Pharmaceuticals1,915,299 Novartis AG CHE CHF 67,595,260 2.093,627,477 GlaxoSmithKline PLC GBR GBP 48,669,269 1.50
A A
116,264,529 3.59A A
Property & Casualty Insurance396,680 ACE Ltd. USA USD 15,012,733 0.46
4,432,445 Brit Insurance Holdings PLC GBR GBP 10,220,217 0.32760 White Mountains Insurance Group Ltd. USA USD 145,179 0.00
A A
25,378,129 0.78A A
Speciality Chemicals1,121,379 Linde AG DEU EUR 67,114,533 2.071,491,548 Symrise AG DEU EUR 14,885,649 0.46
A A
82,000,182 2.53A A
Steel2,479,833 ArcelorMittal NLD EUR 42,157,161 1.30
A A
Textiles21,850,823 Guinness Peat Group PLC GBR NZD 9,130,684 0.28
A A
Tobacco3,350,262 British American Tobacco PLC GBR GBP 62,989,379 1.942,762,143 Imperial Tobacco Group PLC GBR GBP 53,374,515 1.65
A A
116,363,894 3.59A A
FRANKL IN TEMPLETON INVESTMENT FUNDS
ç Franklin Mutual European Fund ç
Schedule of Investments as of December 31, 2008 (continued)
(Currency ç EUR)
Number of % of
shares or Description Country Trading Market net
face value code currency value assets
www.franklintempleton.lu Unaudited Semi-Annual Report 147
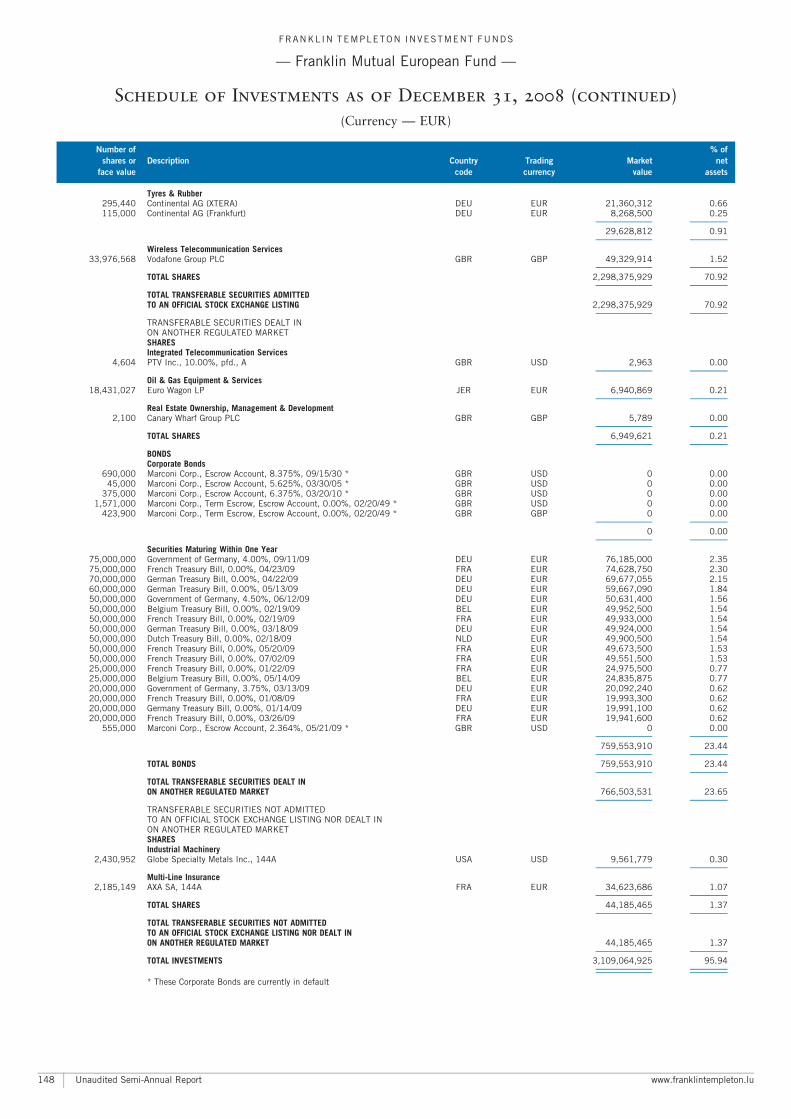
Tyres & Rubber295,440 Continental AG (XTERA) DEU EUR 21,360,312 0.66115,000 Continental AG (Frankfurt) DEU EUR 8,268,500 0.25
A A
29,628,812 0.91A A
Wireless Telecommunication Services33,976,568 Vodafone Group PLC GBR GBP 49,329,914 1.52
A A
TOTAL SHARES 2,298,375,929 70.92A A
TOTAL TRANSFERABLE SECURITIES ADMITTEDTO AN OFFICIAL STOCK EXCHANGE LISTING 2,298,375,929 70.92
A A
TRANSFERABLE SECURITIES DEALT INON ANOTHER REGULATED MARKETSHARESIntegrated Telecommunication Services
4,604 PTV Inc., 10.00%, pfd., A GBR USD 2,963 0.00A A
Oil & Gas Equipment & Services18,431,027 Euro Wagon LP JER EUR 6,940,869 0.21
A A
Real Estate Ownership, Management & Development2,100 Canary Wharf Group PLC GBR GBP 5,789 0.00
A A
TOTAL SHARES 6,949,621 0.21A A
BONDSCorporate Bonds
690,000 Marconi Corp., Escrow Account, 8.375%, 09/15/30 * GBR USD 0 0.0045,000 Marconi Corp., Escrow Account, 5.625%, 03/30/05 * GBR USD 0 0.00
375,000 Marconi Corp., Escrow Account, 6.375%, 03/20/10 * GBR USD 0 0.001,571,000 Marconi Corp., Term Escrow, Escrow Account, 0.00%, 02/20/49 * GBR USD 0 0.00
423,900 Marconi Corp., Term Escrow, Escrow Account, 0.00%, 02/20/49 * GBR GBP 0 0.00A A
0 0.00A A
Securities Maturing Within One Year75,000,000 Government of Germany, 4.00%, 09/11/09 DEU EUR 76,185,000 2.3575,000,000 French Treasury Bill, 0.00%, 04/23/09 FRA EUR 74,628,750 2.3070,000,000 German Treasury Bill, 0.00%, 04/22/09 DEU EUR 69,677,055 2.1560,000,000 German Treasury Bill, 0.00%, 05/13/09 DEU EUR 59,667,090 1.8450,000,000 Government of Germany, 4.50%, 06/12/09 DEU EUR 50,631,400 1.5650,000,000 Belgium Treasury Bill, 0.00%, 02/19/09 BEL EUR 49,952,500 1.5450,000,000 French Treasury Bill, 0.00%, 02/19/09 FRA EUR 49,933,000 1.5450,000,000 German Treasury Bill, 0.00%, 03/18/09 DEU EUR 49,924,000 1.5450,000,000 Dutch Treasury Bill, 0.00%, 02/18/09 NLD EUR 49,900,500 1.5450,000,000 French Treasury Bill, 0.00%, 05/20/09 FRA EUR 49,673,500 1.5350,000,000 French Treasury Bill, 0.00%, 07/02/09 FRA EUR 49,551,500 1.5325,000,000 French Treasury Bill, 0.00%, 01/22/09 FRA EUR 24,975,500 0.7725,000,000 Belgium Treasury Bill, 0.00%, 05/14/09 BEL EUR 24,835,875 0.7720,000,000 Government of Germany, 3.75%, 03/13/09 DEU EUR 20,092,240 0.6220,000,000 French Treasury Bill, 0.00%, 01/08/09 FRA EUR 19,993,300 0.6220,000,000 Germany Treasury Bill, 0.00%, 01/14/09 DEU EUR 19,991,100 0.6220,000,000 French Treasury Bill, 0.00%, 03/26/09 FRA EUR 19,941,600 0.62
555,000 Marconi Corp., Escrow Account, 2.364%, 05/21/09 * GBR USD 0 0.00A A
759,553,910 23.44A A
TOTAL BONDS 759,553,910 23.44A A
TOTAL TRANSFERABLE SECURITIES DEALT INON ANOTHER REGULATED MARKET 766,503,531 23.65
A A
TRANSFERABLE SECURITIES NOT ADMITTEDTO AN OFFICIAL STOCK EXCHANGE LISTING NOR DEALT INON ANOTHER REGULATED MARKETSHARESIndustrial Machinery
2,430,952 Globe Specialty Metals Inc., 144A USA USD 9,561,779 0.30A A
Multi-Line Insurance2,185,149 AXA SA, 144A FRA EUR 34,623,686 1.07
A A
TOTAL SHARES 44,185,465 1.37A A
TOTAL TRANSFERABLE SECURITIES NOT ADMITTEDTO AN OFFICIAL STOCK EXCHANGE LISTING NOR DEALT INON ANOTHER REGULATED MARKET 44,185,465 1.37
A A
TOTAL INVESTMENTS 3,109,064,925 95.94A A
A A
* These Corporate Bonds are currently in default
FRANKL IN TEMPLETON INVESTMENT FUNDS
ç Franklin Mutual European Fund ç
Schedule of Investments as of December 31, 2008 (continued)
(Currency ç EUR)
Number of % of
shares or Description Country Trading Market net
face value code currency value assets
Unaudited Semi-Annual Report www.franklintempleton.lu148
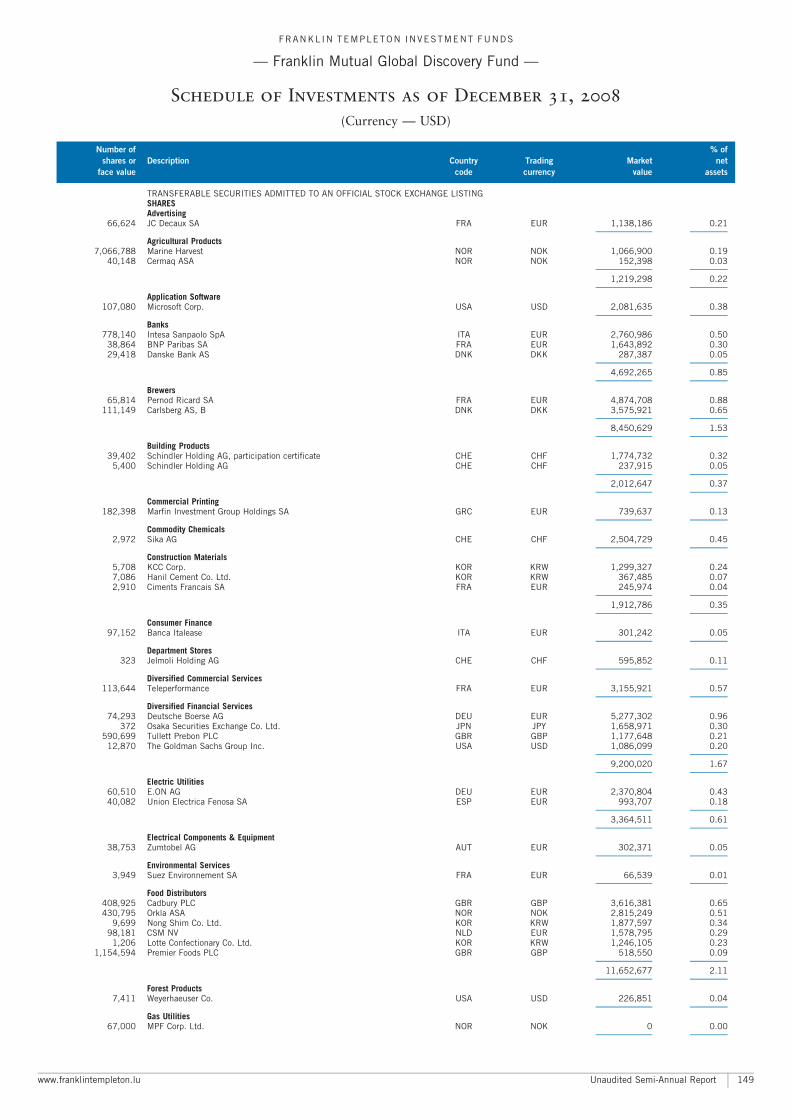
TRANSFERABLE SECURITIES ADMITTED TO AN OFFICIAL STOCK EXCHANGE LISTINGSHARESAdvertising
66,624 JC Decaux SA FRA EUR 1,138,186 0.21A A
Agricultural Products7,066,788 Marine Harvest NOR NOK 1,066,900 0.19
40,148 Cermaq ASA NOR NOK 152,398 0.03A A
1,219,298 0.22A A
Application Software107,080 Microsoft Corp. USA USD 2,081,635 0.38
A A
Banks778,140 Intesa Sanpaolo SpA ITA EUR 2,760,986 0.50
38,864 BNP Paribas SA FRA EUR 1,643,892 0.3029,418 Danske Bank AS DNK DKK 287,387 0.05
A A
4,692,265 0.85A A
Brewers65,814 Pernod Ricard SA FRA EUR 4,874,708 0.88
111,149 Carlsberg AS, B DNK DKK 3,575,921 0.65A A
8,450,629 1.53A A
Building Products39,402 Schindler Holding AG, participation certificate CHE CHF 1,774,732 0.32
5,400 Schindler Holding AG CHE CHF 237,915 0.05A A
2,012,647 0.37A A
Commercial Printing182,398 Marfin Investment Group Holdings SA GRC EUR 739,637 0.13
A A
Commodity Chemicals2,972 Sika AG CHE CHF 2,504,729 0.45
A A
Construction Materials5,708 KCC Corp. KOR KRW 1,299,327 0.247,086 Hanil Cement Co. Ltd. KOR KRW 367,485 0.072,910 Ciments Francais SA FRA EUR 245,974 0.04
A A
1,912,786 0.35A A
Consumer Finance97,152 Banca Italease ITA EUR 301,242 0.05
A A
Department Stores323 Jelmoli Holding AG CHE CHF 595,852 0.11
A A
Diversified Commercial Services113,644 Teleperformance FRA EUR 3,155,921 0.57
A A
Diversified Financial Services74,293 Deutsche Boerse AG DEU EUR 5,277,302 0.96
372 Osaka Securities Exchange Co. Ltd. JPN JPY 1,658,971 0.30590,699 Tullett Prebon PLC GBR GBP 1,177,648 0.21
12,870 The Goldman Sachs Group Inc. USA USD 1,086,099 0.20A A
9,200,020 1.67A A
Electric Utilities60,510 E.ON AG DEU EUR 2,370,804 0.4340,082 Union Electrica Fenosa SA ESP EUR 993,707 0.18
A A
3,364,511 0.61A A
Electrical Components & Equipment38,753 Zumtobel AG AUT EUR 302,371 0.05
A A
Environmental Services3,949 Suez Environnement SA FRA EUR 66,539 0.01
A A
Food Distributors408,925 Cadbury PLC GBR GBP 3,616,381 0.65430,795 Orkla ASA NOR NOK 2,815,249 0.51
9,699 Nong Shim Co. Ltd. KOR KRW 1,877,597 0.3498,181 CSM NV NLD EUR 1,578,795 0.29
1,206 Lotte Confectionary Co. Ltd. KOR KRW 1,246,105 0.231,154,594 Premier Foods PLC GBR GBP 518,550 0.09
A A
11,652,677 2.11A A
Forest Products7,411 Weyerhaeuser Co. USA USD 226,851 0.04
A A
Gas Utilities67,000 MPF Corp. Ltd. NOR NOK 0 0.00
A A
FRANKL IN TEMPLETON INVESTMENT FUNDS
ç Franklin Mutual Global Discovery Fund ç
Schedule of Investments as of December 31, 2008
(Currency ç USD)
Number of % of
shares or Description Country Trading Market net
face value code currency value assets
www.franklintempleton.lu Unaudited Semi-Annual Report 149
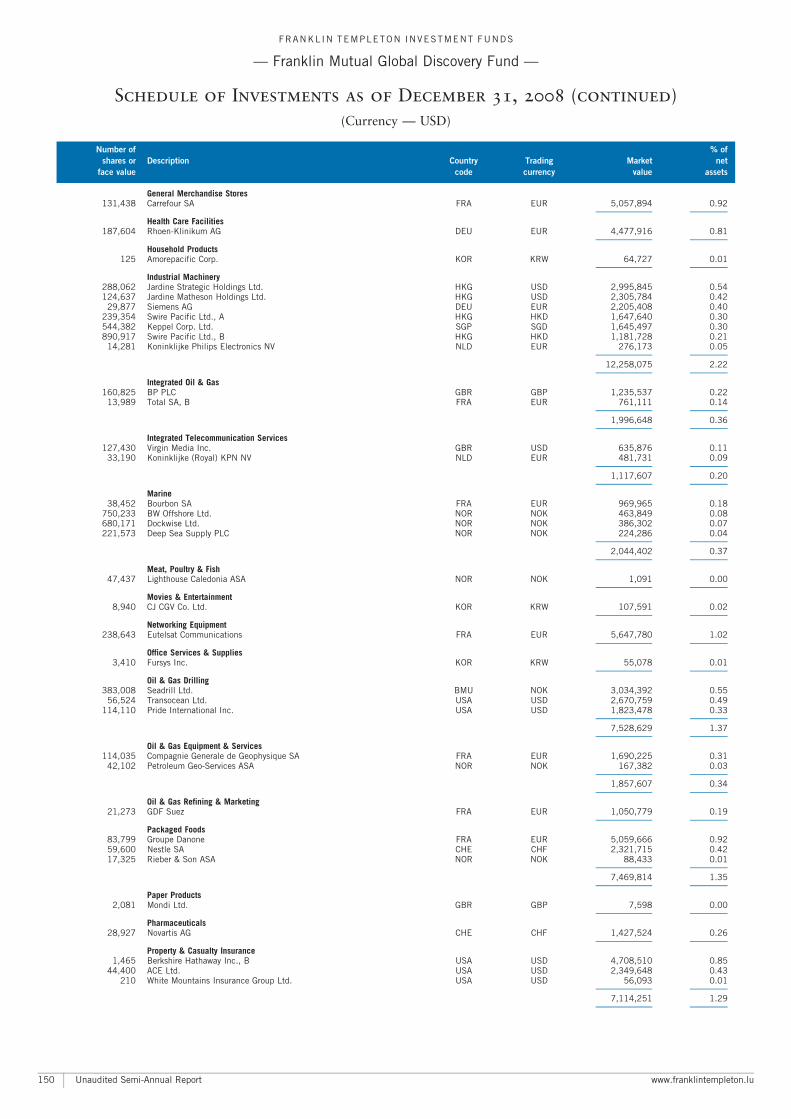
General Merchandise Stores131,438 Carrefour SA FRA EUR 5,057,894 0.92
A A
Health Care Facilities187,604 Rhoen-Klinikum AG DEU EUR 4,477,916 0.81
A A
Household Products125 Amorepacific Corp. KOR KRW 64,727 0.01
A A
Industrial Machinery288,062 Jardine Strategic Holdings Ltd. HKG USD 2,995,845 0.54124,637 Jardine Matheson Holdings Ltd. HKG USD 2,305,784 0.42
29,877 Siemens AG DEU EUR 2,205,408 0.40239,354 Swire Pacific Ltd., A HKG HKD 1,647,640 0.30544,382 Keppel Corp. Ltd. SGP SGD 1,645,497 0.30890,917 Swire Pacific Ltd., B HKG HKD 1,181,728 0.21
14,281 Koninklijke Philips Electronics NV NLD EUR 276,173 0.05A A
12,258,075 2.22A A
Integrated Oil & Gas160,825 BP PLC GBR GBP 1,235,537 0.22
13,989 Total SA, B FRA EUR 761,111 0.14A A
1,996,648 0.36A A
Integrated Telecommunication Services127,430 Virgin Media Inc. GBR USD 635,876 0.11
33,190 Koninklijke (Royal) KPN NV NLD EUR 481,731 0.09A A
1,117,607 0.20A A
Marine38,452 Bourbon SA FRA EUR 969,965 0.18
750,233 BW Offshore Ltd. NOR NOK 463,849 0.08680,171 Dockwise Ltd. NOR NOK 386,302 0.07221,573 Deep Sea Supply PLC NOR NOK 224,286 0.04
A A
2,044,402 0.37A A
Meat, Poultry & Fish47,437 Lighthouse Caledonia ASA NOR NOK 1,091 0.00
A A
Movies & Entertainment8,940 CJ CGV Co. Ltd. KOR KRW 107,591 0.02
A A
Networking Equipment238,643 Eutelsat Communications FRA EUR 5,647,780 1.02
A A
Office Services & Supplies3,410 Fursys Inc. KOR KRW 55,078 0.01
A A
Oil & Gas Drilling383,008 Seadrill Ltd. BMU NOK 3,034,392 0.55
56,524 Transocean Ltd. USA USD 2,670,759 0.49114,110 Pride International Inc. USA USD 1,823,478 0.33
A A
7,528,629 1.37A A
Oil & Gas Equipment & Services114,035 Compagnie Generale de Geophysique SA FRA EUR 1,690,225 0.31
42,102 Petroleum Geo-Services ASA NOR NOK 167,382 0.03A A
1,857,607 0.34A A
Oil & Gas Refining & Marketing21,273 GDF Suez FRA EUR 1,050,779 0.19
A A
Packaged Foods83,799 Groupe Danone FRA EUR 5,059,666 0.9259,600 Nestle SA CHE CHF 2,321,715 0.4217,325 Rieber & Son ASA NOR NOK 88,433 0.01
A A
7,469,814 1.35A A
Paper Products2,081 Mondi Ltd. GBR GBP 7,598 0.00
A A
Pharmaceuticals28,927 Novartis AG CHE CHF 1,427,524 0.26
A A
Property & Casualty Insurance1,465 Berkshire Hathaway Inc., B USA USD 4,708,510 0.85
44,400 ACE Ltd. USA USD 2,349,648 0.43210 White Mountains Insurance Group Ltd. USA USD 56,093 0.01
A A
7,114,251 1.29A A
FRANKL IN TEMPLETON INVESTMENT FUNDS
ç Franklin Mutual Global Discovery Fund ç
Schedule of Investments as of December 31, 2008 (continued)
(Currency ç USD)
Number of % of
shares or Description Country Trading Market net
face value code currency value assets
Unaudited Semi-Annual Report www.franklintempleton.lu150
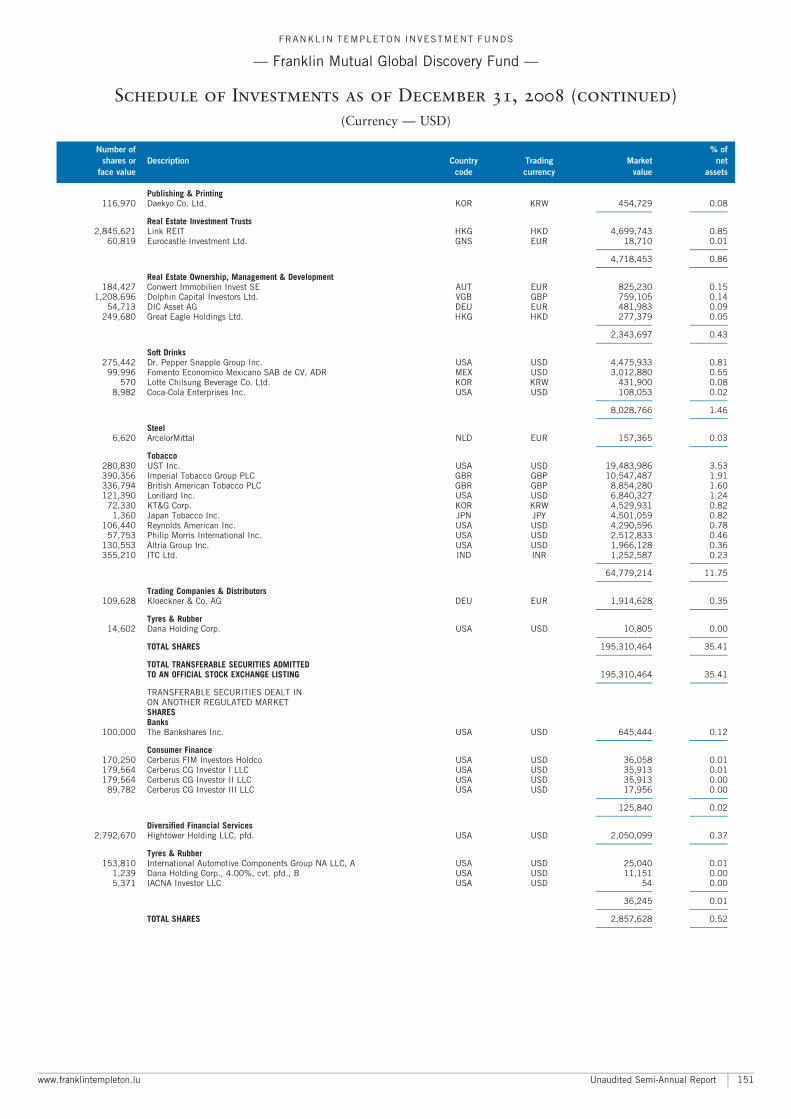
Publishing & Printing116,970 Daekyo Co. Ltd. KOR KRW 454,729 0.08
A A
Real Estate Investment Trusts2,845,621 Link REIT HKG HKD 4,699,743 0.85
60,819 Eurocastle Investment Ltd. GNS EUR 18,710 0.01A A
4,718,453 0.86A A
Real Estate Ownership, Management & Development184,427 Conwert Immobilien Invest SE AUT EUR 825,230 0.15
1,208,696 Dolphin Capital Investors Ltd. VGB GBP 759,105 0.1454,713 DIC Asset AG DEU EUR 481,983 0.09
249,680 Great Eagle Holdings Ltd. HKG HKD 277,379 0.05A A
2,343,697 0.43A A
Soft Drinks275,442 Dr. Pepper Snapple Group Inc. USA USD 4,475,933 0.81
99,996 Fomento Economico Mexicano SAB de CV, ADR MEX USD 3,012,880 0.55570 Lotte Chilsung Beverage Co. Ltd. KOR KRW 431,900 0.08
8,982 Coca-Cola Enterprises Inc. USA USD 108,053 0.02A A
8,028,766 1.46A A
Steel6,620 ArcelorMittal NLD EUR 157,365 0.03
A A
Tobacco280,830 UST Inc. USA USD 19,483,986 3.53390,356 Imperial Tobacco Group PLC GBR GBP 10,547,487 1.91336,794 British American Tobacco PLC GBR GBP 8,854,280 1.60121,390 Lorillard Inc. USA USD 6,840,327 1.24
72,330 KT&G Corp. KOR KRW 4,529,931 0.821,360 Japan Tobacco Inc. JPN JPY 4,501,059 0.82
106,440 Reynolds American Inc. USA USD 4,290,596 0.7857,753 Philip Morris International Inc. USA USD 2,512,833 0.46
130,553 Altria Group Inc. USA USD 1,966,128 0.36355,210 ITC Ltd. IND INR 1,252,587 0.23
A A
64,779,214 11.75A A
Trading Companies & Distributors109,628 Kloeckner & Co. AG DEU EUR 1,914,628 0.35
A A
Tyres & Rubber14,602 Dana Holding Corp. USA USD 10,805 0.00
A A
TOTAL SHARES 195,310,464 35.41A A
TOTAL TRANSFERABLE SECURITIES ADMITTEDTO AN OFFICIAL STOCK EXCHANGE LISTING 195,310,464 35.41
A A
TRANSFERABLE SECURITIES DEALT INON ANOTHER REGULATED MARKETSHARESBanks
100,000 The Bankshares Inc. USA USD 645,444 0.12A A
Consumer Finance170,250 Cerberus FIM Investors Holdco USA USD 36,058 0.01179,564 Cerberus CG Investor I LLC USA USD 35,913 0.01179,564 Cerberus CG Investor II LLC USA USD 35,913 0.00
89,782 Cerberus CG Investor III LLC USA USD 17,956 0.00A A
125,840 0.02A A
Diversified Financial Services2,792,670 Hightower Holding LLC, pfd. USA USD 2,050,099 0.37
A A
Tyres & Rubber153,810 International Automotive Components Group NA LLC, A USA USD 25,040 0.01
1,239 Dana Holding Corp., 4.00%, cvt. pfd., B USA USD 11,151 0.005,371 IACNA Investor LLC USA USD 54 0.00
A A
36,245 0.01A A
TOTAL SHARES 2,857,628 0.52A A
FRANKL IN TEMPLETON INVESTMENT FUNDS
ç Franklin Mutual Global Discovery Fund ç
Schedule of Investments as of December 31, 2008 (continued)
(Currency ç USD)
Number of % of
shares or Description Country Trading Market net
face value code currency value assets
www.franklintempleton.lu Unaudited Semi-Annual Report 151
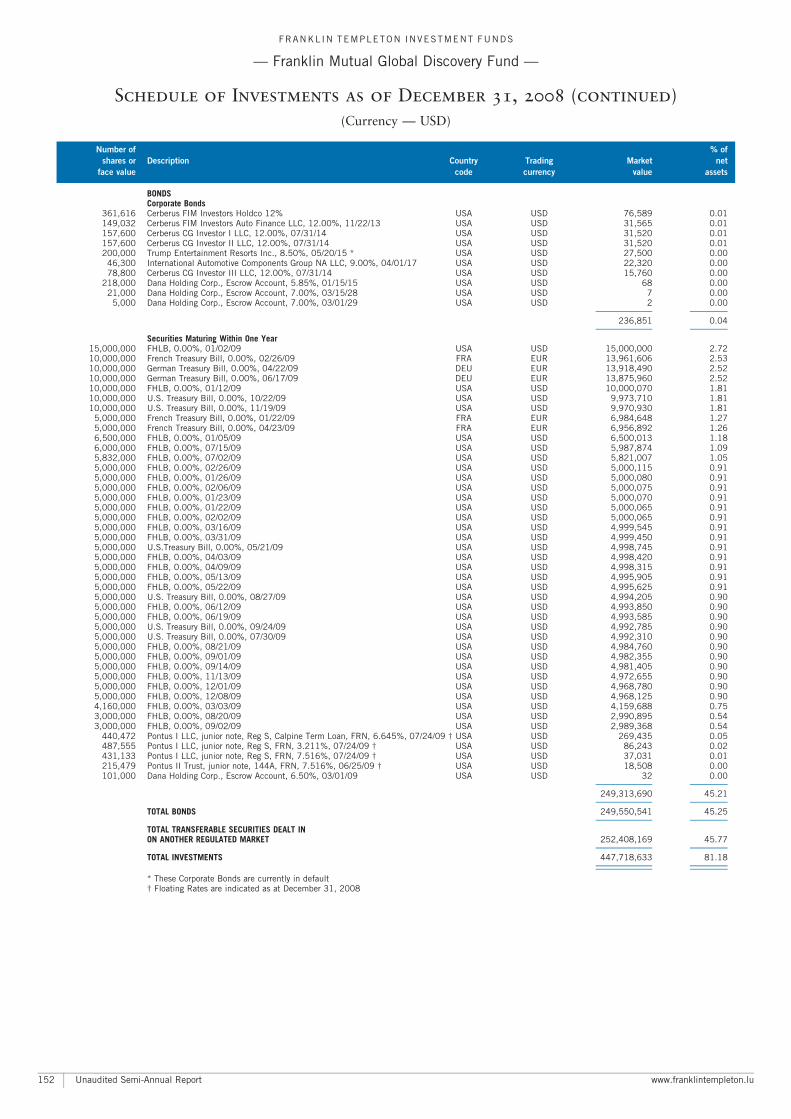
BONDSCorporate Bonds
361,616 Cerberus FIM Investors Holdco 12% USA USD 76,589 0.01149,032 Cerberus FIM Investors Auto Finance LLC, 12.00%, 11/22/13 USA USD 31,565 0.01157,600 Cerberus CG Investor I LLC, 12.00%, 07/31/14 USA USD 31,520 0.01157,600 Cerberus CG Investor II LLC, 12.00%, 07/31/14 USA USD 31,520 0.01200,000 Trump Entertainment Resorts Inc., 8.50%, 05/20/15 * USA USD 27,500 0.00
46,300 International Automotive Components Group NA LLC, 9.00%, 04/01/17 USA USD 22,320 0.0078,800 Cerberus CG Investor III LLC, 12.00%, 07/31/14 USA USD 15,760 0.00
218,000 Dana Holding Corp., Escrow Account, 5.85%, 01/15/15 USA USD 68 0.0021,000 Dana Holding Corp., Escrow Account, 7.00%, 03/15/28 USA USD 7 0.00
5,000 Dana Holding Corp., Escrow Account, 7.00%, 03/01/29 USA USD 2 0.00A A
236,851 0.04A A
Securities Maturing Within One Year15,000,000 FHLB, 0.00%, 01/02/09 USA USD 15,000,000 2.7210,000,000 French Treasury Bill, 0.00%, 02/26/09 FRA EUR 13,961,606 2.5310,000,000 German Treasury Bill, 0.00%, 04/22/09 DEU EUR 13,918,490 2.5210,000,000 German Treasury Bill, 0.00%, 06/17/09 DEU EUR 13,875,960 2.5210,000,000 FHLB, 0.00%, 01/12/09 USA USD 10,000,070 1.8110,000,000 U.S. Treasury Bill, 0.00%, 10/22/09 USA USD 9,973,710 1.8110,000,000 U.S. Treasury Bill, 0.00%, 11/19/09 USA USD 9,970,930 1.81
5,000,000 French Treasury Bill, 0.00%, 01/22/09 FRA EUR 6,984,648 1.275,000,000 French Treasury Bill, 0.00%, 04/23/09 FRA EUR 6,956,892 1.266,500,000 FHLB, 0.00%, 01/05/09 USA USD 6,500,013 1.186,000,000 FHLB, 0.00%, 07/15/09 USA USD 5,987,874 1.095,832,000 FHLB, 0.00%, 07/02/09 USA USD 5,821,007 1.055,000,000 FHLB, 0.00%, 02/26/09 USA USD 5,000,115 0.915,000,000 FHLB, 0.00%, 01/26/09 USA USD 5,000,080 0.915,000,000 FHLB, 0.00%, 02/06/09 USA USD 5,000,075 0.915,000,000 FHLB, 0.00%, 01/23/09 USA USD 5,000,070 0.915,000,000 FHLB, 0.00%, 01/22/09 USA USD 5,000,065 0.915,000,000 FHLB, 0.00%, 02/02/09 USA USD 5,000,065 0.915,000,000 FHLB, 0.00%, 03/16/09 USA USD 4,999,545 0.915,000,000 FHLB, 0.00%, 03/31/09 USA USD 4,999,450 0.915,000,000 U.S.Treasury Bill, 0.00%, 05/21/09 USA USD 4,998,745 0.915,000,000 FHLB, 0.00%, 04/03/09 USA USD 4,998,420 0.915,000,000 FHLB, 0.00%, 04/09/09 USA USD 4,998,315 0.915,000,000 FHLB, 0.00%, 05/13/09 USA USD 4,995,905 0.915,000,000 FHLB, 0.00%, 05/22/09 USA USD 4,995,625 0.915,000,000 U.S. Treasury Bill, 0.00%, 08/27/09 USA USD 4,994,205 0.905,000,000 FHLB, 0.00%, 06/12/09 USA USD 4,993,850 0.905,000,000 FHLB, 0.00%, 06/19/09 USA USD 4,993,585 0.905,000,000 U.S. Treasury Bill, 0.00%, 09/24/09 USA USD 4,992,785 0.905,000,000 U.S. Treasury Bill, 0.00%, 07/30/09 USA USD 4,992,310 0.905,000,000 FHLB, 0.00%, 08/21/09 USA USD 4,984,760 0.905,000,000 FHLB, 0.00%, 09/01/09 USA USD 4,982,355 0.905,000,000 FHLB, 0.00%, 09/14/09 USA USD 4,981,405 0.905,000,000 FHLB, 0.00%, 11/13/09 USA USD 4,972,655 0.905,000,000 FHLB, 0.00%, 12/01/09 USA USD 4,968,780 0.905,000,000 FHLB, 0.00%, 12/08/09 USA USD 4,968,125 0.904,160,000 FHLB, 0.00%, 03/03/09 USA USD 4,159,688 0.753,000,000 FHLB, 0.00%, 08/20/09 USA USD 2,990,895 0.543,000,000 FHLB, 0.00%, 09/02/09 USA USD 2,989,368 0.54
440,472 Pontus I LLC, junior note, Reg S, Calpine Term Loan, FRN, 6.645%, 07/24/09 � USA USD 269,435 0.05487,555 Pontus I LLC, junior note, Reg S, FRN, 3.211%, 07/24/09 � USA USD 86,243 0.02431,133 Pontus I LLC, junior note, Reg S, FRN, 7.516%, 07/24/09 � USA USD 37,031 0.01215,479 Pontus II Trust, junior note, 144A, FRN, 7.516%, 06/25/09 � USA USD 18,508 0.00101,000 Dana Holding Corp., Escrow Account, 6.50%, 03/01/09 USA USD 32 0.00
A A
249,313,690 45.21A A
TOTAL BONDS 249,550,541 45.25A A
TOTAL TRANSFERABLE SECURITIES DEALT INON ANOTHER REGULATED MARKET 252,408,169 45.77
A A
TOTAL INVESTMENTS 447,718,633 81.18A A
A A
* These Corporate Bonds are currently in default� Floating Rates are indicated as at December 31, 2008
FRANKL IN TEMPLETON INVESTMENT FUNDS
ç Franklin Mutual Global Discovery Fund ç
Schedule of Investments as of December 31, 2008 (continued)
(Currency ç USD)
Number of % of
shares or Description Country Trading Market net
face value code currency value assets
Unaudited Semi-Annual Report www.franklintempleton.lu152

TRANSFERABLE SECURITIES ADMITTED TO AN OFFICIAL STOCK EXCHANGE LISTINGSHARESAdvertising
5,270 Focus Media Holding Ltd., ADR CHN USD 47,904 0.12A A
Aerospace & Defence2,310 Embraer-Empresa Brasileira de Aeronautica SA, ADR BRA USD 37,445 0.096,520 BAE Systems PLC GBR GBP 35,877 0.09
A A
73,322 0.18A A
Air Freight & Couriers3,113 FedEx Corp. USA USD 199,699 0.493,530 United Parcel Service Inc., B USA USD 194,715 0.487,810 Deutsche Post AG DEU EUR 128,919 0.31
A A
523,333 1.28A A
Aluminium35,200 Hindalco Industries Ltd. IND INR 37,393 0.0910,171 Alumina Ltd. AUS AUD 10,014 0.03
A A
47,407 0.12A A
Apparel Retail1,307 Inditex ESP EUR 57,258 0.147,020 Chico’s FAS Inc. USA USD 29,344 0.07
A A
86,602 0.21A A
Application Software12,680 Microsoft Corp. USA USD 246,499 0.6013,890 Oracle Corp. USA USD 246,270 0.60
3,580 SAP AG DEU EUR 125,373 0.31A A
618,142 1.51A A
Automobile Manufacturers3,900 Toyota Motor Corp. JPN JPY 128,821 0.313,830 Bayerische Motoren Werke AG DEU EUR 117,660 0.29
59,696 KOC Holding AS TUR TRY 101,528 0.25184,000 Dongfeng Motor Corp., H CHN HKD 59,353 0.15
2,040 Harley-Davidson Inc. USA USD 34,619 0.08833 Hyundai Motor Co. Ltd. KOR KRW 26,052 0.06
A A
468,033 1.14A A
Banks4,400 Unibanco ^ Uniao de Bancos Brasileiros SA, GDR, pfd. BRA USD 284,328 0.69
425,000 Industrial and Commercial Bank of China Ltd., H CHN HKD 223,736 0.5451,909 Intesa Sanpaolo SpA ITA EUR 184,183 0.4514,900 Nedbank Group Ltd. ZAF ZAR 151,378 0.3745,000 Akbank TAS TUR TRY 139,630 0.34
3,860 The Bank of New York Mellon Corp. USA USD 109,354 0.2710,008 HSBC Holdings PLC GBR HKD 95,170 0.2312,000 DBS Group Holdings Ltd. SGP SGD 70,534 0.1728,395 UniCredit SpA ITA EUR 69,285 0.1745,400 Kasikornbank Public Co. Ltd., fgn. THA THB 58,732 0.14
3,050 ICICI Bank Ltd., ADR IND USD 58,713 0.1441,000 Siam Commercial Bank Public Co. Ltd., fgn. THA THB 57,755 0.14
4,070 Bank of America Corp. USA USD 57,306 0.145,500 Standard Bank Group Ltd. ZAF ZAR 48,564 0.123,800 Banco Bradesco SA, ADR, pfd. BRA USD 37,506 0.096,423 Union Bank of India Ltd. IND INR 21,533 0.05
468 BNP Paribas SA FRA EUR 19,796 0.053,098 Mitsubishi UFJ Financial Group Inc. JPN JPY 19,455 0.053,000 MCB Bank Ltd. PAK PKR 4,770 0.016,024 Royal Bank of Scotland Group PLC GBR GBP 4,346 0.018,500 PT Bank Central Asia Tbk IDN IDR 2,534 0.01
232 Danske Bank AS DNK DKK 2,266 0.01A A
1,720,874 4.19A A
Biotechnology4,290 Amgen Inc. USA USD 247,747 0.60
A A
Brewers3,269 Carlsberg AS, B DNK DKK 105,171 0.261,000 Companhia de Bebidas das Americas (AmBev) BRA BRL 36,634 0.09
416 Pernod Ricard SA FRA EUR 30,812 0.07170,000 Thai Beverages Co. Ltd., fgn. THA SGD 23,142 0.06
A A
195,759 0.48A A
FRANKL IN TEMPLETON INVESTMENT FUNDS
ç Franklin Templeton Global Equity Strategies Fund ç
Schedule of Investments as of December 31, 2008
(Currency ç USD)
Number of % of
shares or Description Country Trading Market net
face value code currency value assets
www.franklintempleton.lu Unaudited Semi-Annual Report 153
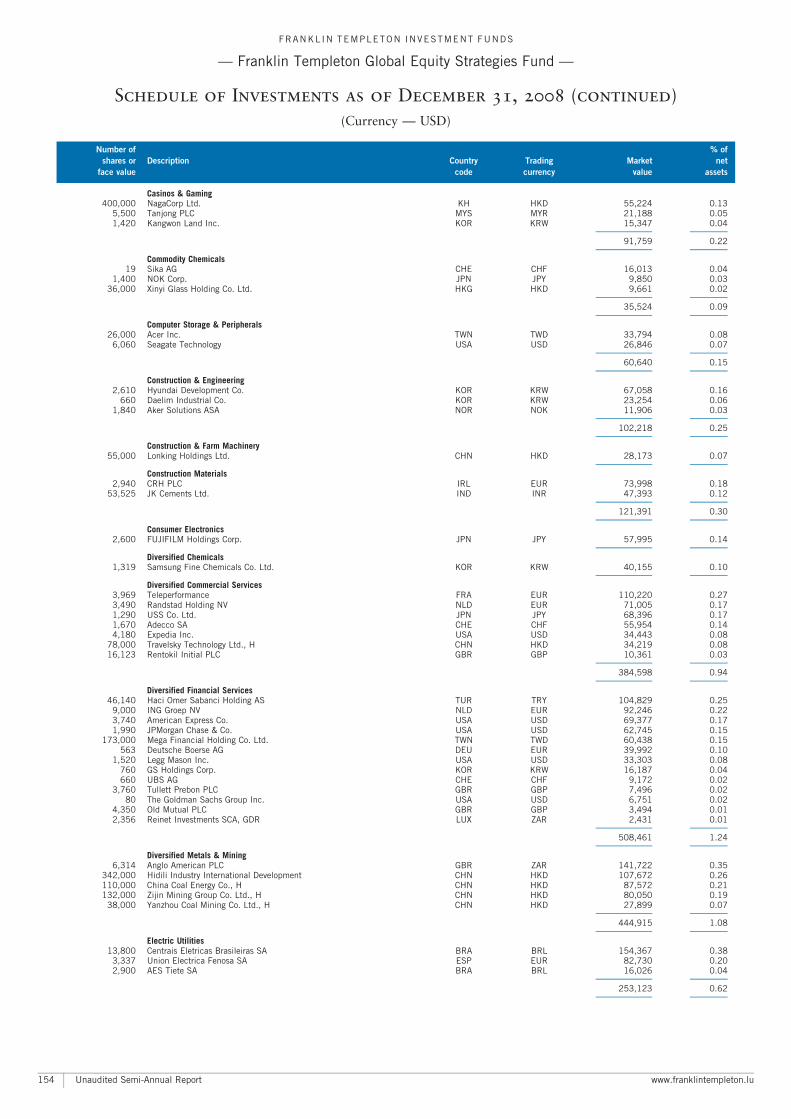
Casinos & Gaming400,000 NagaCorp Ltd. KH HKD 55,224 0.13
5,500 Tanjong PLC MYS MYR 21,188 0.051,420 Kangwon Land Inc. KOR KRW 15,347 0.04
A A
91,759 0.22A A
Commodity Chemicals19 Sika AG CHE CHF 16,013 0.04
1,400 NOK Corp. JPN JPY 9,850 0.0336,000 Xinyi Glass Holding Co. Ltd. HKG HKD 9,661 0.02
A A
35,524 0.09A A
Computer Storage & Peripherals26,000 Acer Inc. TWN TWD 33,794 0.08
6,060 Seagate Technology USA USD 26,846 0.07A A
60,640 0.15A A
Construction & Engineering2,610 Hyundai Development Co. KOR KRW 67,058 0.16
660 Daelim Industrial Co. KOR KRW 23,254 0.061,840 Aker Solutions ASA NOR NOK 11,906 0.03
A A
102,218 0.25A A
Construction & Farm Machinery55,000 Lonking Holdings Ltd. CHN HKD 28,173 0.07
A A
Construction Materials2,940 CRH PLC IRL EUR 73,998 0.18
53,525 JK Cements Ltd. IND INR 47,393 0.12A A
121,391 0.30A A
Consumer Electronics2,600 FUJIFILM Holdings Corp. JPN JPY 57,995 0.14
A A
Diversified Chemicals1,319 Samsung Fine Chemicals Co. Ltd. KOR KRW 40,155 0.10
A A
Diversified Commercial Services3,969 Teleperformance FRA EUR 110,220 0.273,490 Randstad Holding NV NLD EUR 71,005 0.171,290 USS Co. Ltd. JPN JPY 68,396 0.171,670 Adecco SA CHE CHF 55,954 0.144,180 Expedia Inc. USA USD 34,443 0.08
78,000 Travelsky Technology Ltd., H CHN HKD 34,219 0.0816,123 Rentokil Initial PLC GBR GBP 10,361 0.03
A A
384,598 0.94A A
Diversified Financial Services46,140 Haci Omer Sabanci Holding AS TUR TRY 104,829 0.25
9,000 ING Groep NV NLD EUR 92,246 0.223,740 American Express Co. USA USD 69,377 0.171,990 JPMorgan Chase & Co. USA USD 62,745 0.15
173,000 Mega Financial Holding Co. Ltd. TWN TWD 60,438 0.15563 Deutsche Boerse AG DEU EUR 39,992 0.10
1,520 Legg Mason Inc. USA USD 33,303 0.08760 GS Holdings Corp. KOR KRW 16,187 0.04660 UBS AG CHE CHF 9,172 0.02
3,760 Tullett Prebon PLC GBR GBP 7,496 0.0280 The Goldman Sachs Group Inc. USA USD 6,751 0.02
4,350 Old Mutual PLC GBR GBP 3,494 0.012,356 Reinet Investments SCA, GDR LUX ZAR 2,431 0.01
A A
508,461 1.24A A
Diversified Metals & Mining6,314 Anglo American PLC GBR ZAR 141,722 0.35
342,000 Hidili Industry International Development CHN HKD 107,672 0.26110,000 China Coal Energy Co., H CHN HKD 87,572 0.21132,000 Zijin Mining Group Co. Ltd., H CHN HKD 80,050 0.19
38,000 Yanzhou Coal Mining Co. Ltd., H CHN HKD 27,899 0.07A A
444,915 1.08A A
Electric Utilities13,800 Centrais Eletricas Brasileiras SA BRA BRL 154,367 0.38
3,337 Union Electrica Fenosa SA ESP EUR 82,730 0.202,900 AES Tiete SA BRA BRL 16,026 0.04
A A
253,123 0.62A A
FRANKL IN TEMPLETON INVESTMENT FUNDS
ç Franklin Templeton Global Equity Strategies Fund ç
Schedule of Investments as of December 31, 2008 (continued)
(Currency ç USD)
Number of % of
shares or Description Country Trading Market net
face value code currency value assets
Unaudited Semi-Annual Report www.franklintempleton.lu154
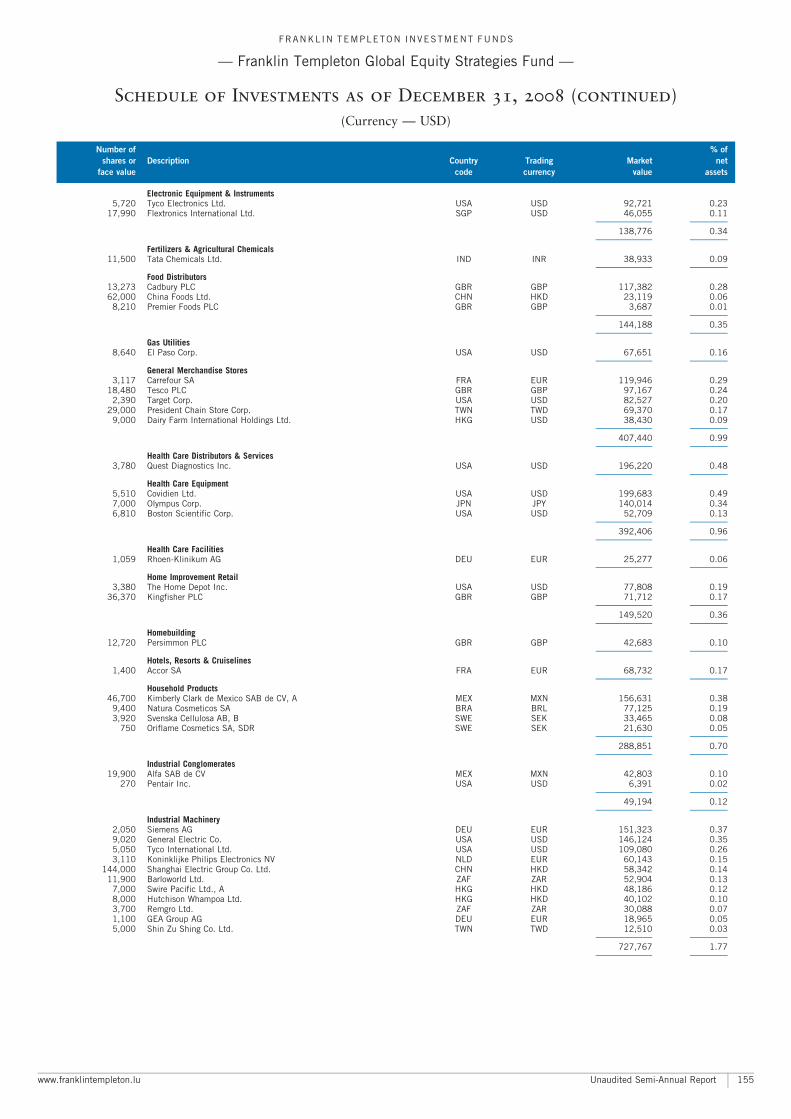
Electronic Equipment & Instruments5,720 Tyco Electronics Ltd. USA USD 92,721 0.23
17,990 Flextronics International Ltd. SGP USD 46,055 0.11A A
138,776 0.34A A
Fertilizers & Agricultural Chemicals11,500 Tata Chemicals Ltd. IND INR 38,933 0.09
A A
Food Distributors13,273 Cadbury PLC GBR GBP 117,382 0.2862,000 China Foods Ltd. CHN HKD 23,119 0.06
8,210 Premier Foods PLC GBR GBP 3,687 0.01A A
144,188 0.35A A
Gas Utilities8,640 El Paso Corp. USA USD 67,651 0.16
A A
General Merchandise Stores3,117 Carrefour SA FRA EUR 119,946 0.29
18,480 Tesco PLC GBR GBP 97,167 0.242,390 Target Corp. USA USD 82,527 0.20
29,000 President Chain Store Corp. TWN TWD 69,370 0.179,000 Dairy Farm International Holdings Ltd. HKG USD 38,430 0.09
A A
407,440 0.99A A
Health Care Distributors & Services3,780 Quest Diagnostics Inc. USA USD 196,220 0.48
A A
Health Care Equipment5,510 Covidien Ltd. USA USD 199,683 0.497,000 Olympus Corp. JPN JPY 140,014 0.346,810 Boston Scientific Corp. USA USD 52,709 0.13
A A
392,406 0.96A A
Health Care Facilities1,059 Rhoen-Klinikum AG DEU EUR 25,277 0.06
A A
Home Improvement Retail3,380 The Home Depot Inc. USA USD 77,808 0.19
36,370 Kingfisher PLC GBR GBP 71,712 0.17A A
149,520 0.36A A
Homebuilding12,720 Persimmon PLC GBR GBP 42,683 0.10
A A
Hotels, Resorts & Cruiselines1,400 Accor SA FRA EUR 68,732 0.17
A A
Household Products46,700 Kimberly Clark de Mexico SAB de CV, A MEX MXN 156,631 0.38
9,400 Natura Cosmeticos SA BRA BRL 77,125 0.193,920 Svenska Cellulosa AB, B SWE SEK 33,465 0.08
750 Oriflame Cosmetics SA, SDR SWE SEK 21,630 0.05A A
288,851 0.70A A
Industrial Conglomerates19,900 Alfa SAB de CV MEX MXN 42,803 0.10
270 Pentair Inc. USA USD 6,391 0.02A A
49,194 0.12A A
Industrial Machinery2,050 Siemens AG DEU EUR 151,323 0.379,020 General Electric Co. USA USD 146,124 0.355,050 Tyco International Ltd. USA USD 109,080 0.263,110 Koninklijke Philips Electronics NV NLD EUR 60,143 0.15
144,000 Shanghai Electric Group Co. Ltd. CHN HKD 58,342 0.1411,900 Barloworld Ltd. ZAF ZAR 52,904 0.13
7,000 Swire Pacific Ltd., A HKG HKD 48,186 0.128,000 Hutchison Whampoa Ltd. HKG HKD 40,102 0.103,700 Remgro Ltd. ZAF ZAR 30,088 0.071,100 GEA Group AG DEU EUR 18,965 0.055,000 Shin Zu Shing Co. Ltd. TWN TWD 12,510 0.03
A A
727,767 1.77A A
FRANKL IN TEMPLETON INVESTMENT FUNDS
ç Franklin Templeton Global Equity Strategies Fund ç
Schedule of Investments as of December 31, 2008 (continued)
(Currency ç USD)
Number of % of
shares or Description Country Trading Market net
face value code currency value assets
www.franklintempleton.lu Unaudited Semi-Annual Report 155
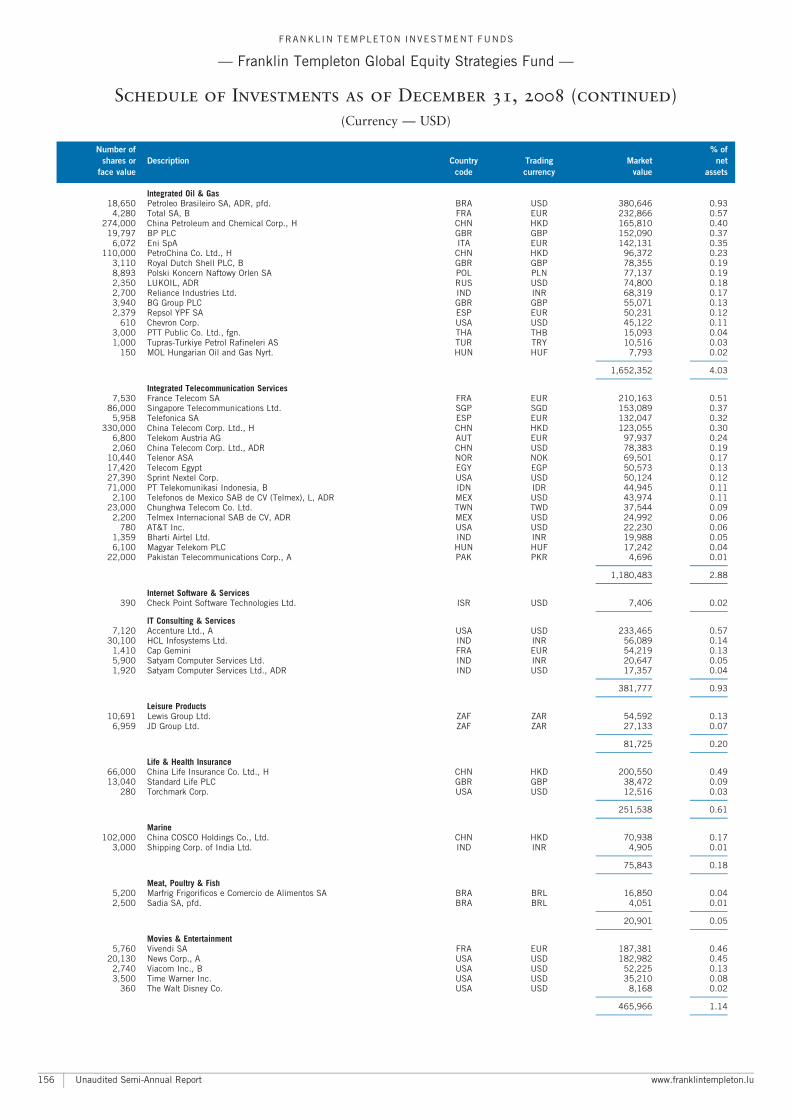
Integrated Oil & Gas18,650 Petroleo Brasileiro SA, ADR, pfd. BRA USD 380,646 0.93
4,280 Total SA, B FRA EUR 232,866 0.57274,000 China Petroleum and Chemical Corp., H CHN HKD 165,810 0.40
19,797 BP PLC GBR GBP 152,090 0.376,072 Eni SpA ITA EUR 142,131 0.35
110,000 PetroChina Co. Ltd., H CHN HKD 96,372 0.233,110 Royal Dutch Shell PLC, B GBR GBP 78,355 0.198,893 Polski Koncern Naftowy Orlen SA POL PLN 77,137 0.192,350 LUKOIL, ADR RUS USD 74,800 0.182,700 Reliance Industries Ltd. IND INR 68,319 0.173,940 BG Group PLC GBR GBP 55,071 0.132,379 Repsol YPF SA ESP EUR 50,231 0.12
610 Chevron Corp. USA USD 45,122 0.113,000 PTT Public Co. Ltd., fgn. THA THB 15,093 0.041,000 Tupras-Turkiye Petrol Rafineleri AS TUR TRY 10,516 0.03
150 MOL Hungarian Oil and Gas Nyrt. HUN HUF 7,793 0.02A A
1,652,352 4.03A A
Integrated Telecommunication Services7,530 France Telecom SA FRA EUR 210,163 0.51
86,000 Singapore Telecommunications Ltd. SGP SGD 153,089 0.375,958 Telefonica SA ESP EUR 132,047 0.32
330,000 China Telecom Corp. Ltd., H CHN HKD 123,055 0.306,800 Telekom Austria AG AUT EUR 97,937 0.242,060 China Telecom Corp. Ltd., ADR CHN USD 78,383 0.19
10,440 Telenor ASA NOR NOK 69,501 0.1717,420 Telecom Egypt EGY EGP 50,573 0.1327,390 Sprint Nextel Corp. USA USD 50,124 0.1271,000 PT Telekomunikasi Indonesia, B IDN IDR 44,945 0.11
2,100 Telefonos de Mexico SAB de CV (Telmex), L, ADR MEX USD 43,974 0.1123,000 Chunghwa Telecom Co. Ltd. TWN TWD 37,544 0.09
2,200 Telmex Internacional SAB de CV, ADR MEX USD 24,992 0.06780 AT&T Inc. USA USD 22,230 0.06
1,359 Bharti Airtel Ltd. IND INR 19,988 0.056,100 Magyar Telekom PLC HUN HUF 17,242 0.04
22,000 Pakistan Telecommunications Corp., A PAK PKR 4,696 0.01A A
1,180,483 2.88A A
Internet Software & Services390 Check Point Software Technologies Ltd. ISR USD 7,406 0.02
A A
IT Consulting & Services7,120 Accenture Ltd., A USA USD 233,465 0.57
30,100 HCL Infosystems Ltd. IND INR 56,089 0.141,410 Cap Gemini FRA EUR 54,219 0.135,900 Satyam Computer Services Ltd. IND INR 20,647 0.051,920 Satyam Computer Services Ltd., ADR IND USD 17,357 0.04
A A
381,777 0.93A A
Leisure Products10,691 Lewis Group Ltd. ZAF ZAR 54,592 0.13
6,959 JD Group Ltd. ZAF ZAR 27,133 0.07A A
81,725 0.20A A
Life & Health Insurance66,000 China Life Insurance Co. Ltd., H CHN HKD 200,550 0.4913,040 Standard Life PLC GBR GBP 38,472 0.09
280 Torchmark Corp. USA USD 12,516 0.03A A
251,538 0.61A A
Marine102,000 China COSCO Holdings Co., Ltd. CHN HKD 70,938 0.17
3,000 Shipping Corp. of India Ltd. IND INR 4,905 0.01A A
75,843 0.18A A
Meat, Poultry & Fish5,200 Marfrig Frigorificos e Comercio de Alimentos SA BRA BRL 16,850 0.042,500 Sadia SA, pfd. BRA BRL 4,051 0.01
A A
20,901 0.05A A
Movies & Entertainment5,760 Vivendi SA FRA EUR 187,381 0.46
20,130 News Corp., A USA USD 182,982 0.452,740 Viacom Inc., B USA USD 52,225 0.133,500 Time Warner Inc. USA USD 35,210 0.08
360 The Walt Disney Co. USA USD 8,168 0.02A A
465,966 1.14A A
FRANKL IN TEMPLETON INVESTMENT FUNDS
ç Franklin Templeton Global Equity Strategies Fund ç
Schedule of Investments as of December 31, 2008 (continued)
(Currency ç USD)
Number of % of
shares or Description Country Trading Market net
face value code currency value assets
Unaudited Semi-Annual Report www.franklintempleton.lu156
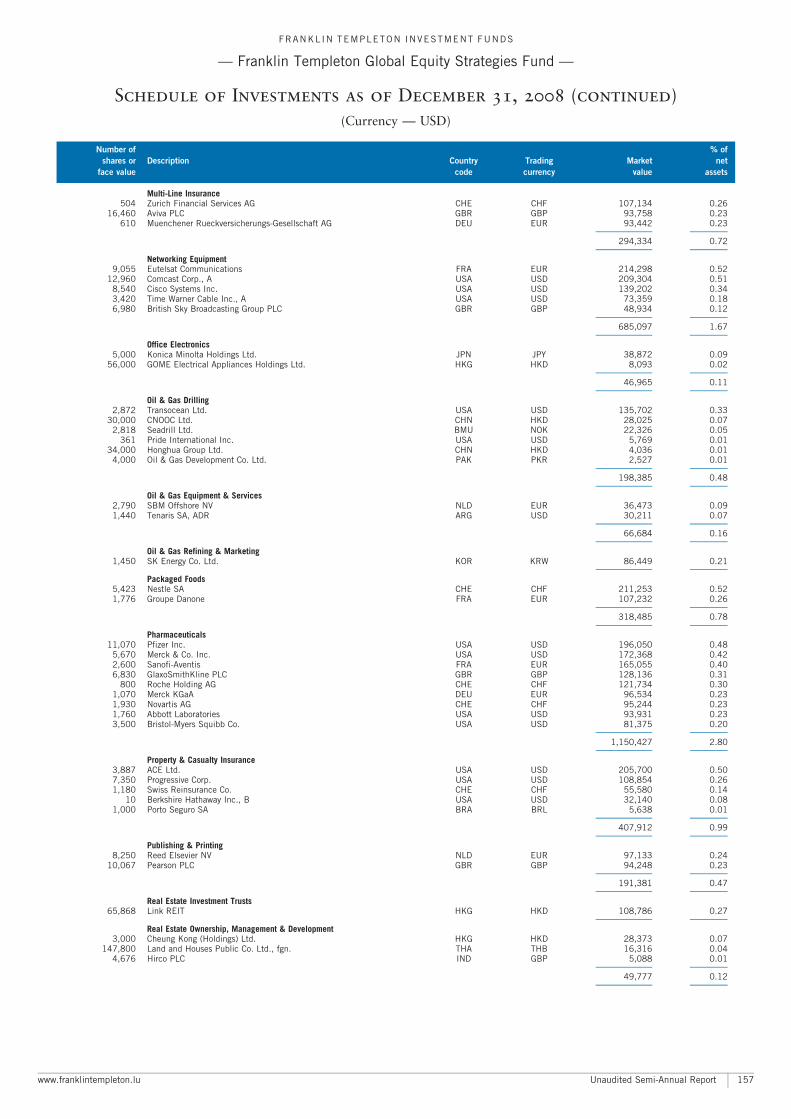
Multi-Line Insurance504 Zurich Financial Services AG CHE CHF 107,134 0.26
16,460 Aviva PLC GBR GBP 93,758 0.23610 Muenchener Rueckversicherungs-Gesellschaft AG DEU EUR 93,442 0.23
A A
294,334 0.72A A
Networking Equipment9,055 Eutelsat Communications FRA EUR 214,298 0.52
12,960 Comcast Corp., A USA USD 209,304 0.518,540 Cisco Systems Inc. USA USD 139,202 0.343,420 Time Warner Cable Inc., A USA USD 73,359 0.186,980 British Sky Broadcasting Group PLC GBR GBP 48,934 0.12
A A
685,097 1.67A A
Office Electronics5,000 Konica Minolta Holdings Ltd. JPN JPY 38,872 0.09
56,000 GOME Electrical Appliances Holdings Ltd. HKG HKD 8,093 0.02A A
46,965 0.11A A
Oil & Gas Drilling2,872 Transocean Ltd. USA USD 135,702 0.33
30,000 CNOOC Ltd. CHN HKD 28,025 0.072,818 Seadrill Ltd. BMU NOK 22,326 0.05
361 Pride International Inc. USA USD 5,769 0.0134,000 Honghua Group Ltd. CHN HKD 4,036 0.01
4,000 Oil & Gas Development Co. Ltd. PAK PKR 2,527 0.01A A
198,385 0.48A A
Oil & Gas Equipment & Services2,790 SBM Offshore NV NLD EUR 36,473 0.091,440 Tenaris SA, ADR ARG USD 30,211 0.07
A A
66,684 0.16A A
Oil & Gas Refining & Marketing1,450 SK Energy Co. Ltd. KOR KRW 86,449 0.21
A A
Packaged Foods5,423 Nestle SA CHE CHF 211,253 0.521,776 Groupe Danone FRA EUR 107,232 0.26
A A
318,485 0.78A A
Pharmaceuticals11,070 Pfizer Inc. USA USD 196,050 0.48
5,670 Merck & Co. Inc. USA USD 172,368 0.422,600 Sanofi-Aventis FRA EUR 165,055 0.406,830 GlaxoSmithKline PLC GBR GBP 128,136 0.31
800 Roche Holding AG CHE CHF 121,734 0.301,070 Merck KGaA DEU EUR 96,534 0.231,930 Novartis AG CHE CHF 95,244 0.231,760 Abbott Laboratories USA USD 93,931 0.233,500 Bristol-Myers Squibb Co. USA USD 81,375 0.20
A A
1,150,427 2.80A A
Property & Casualty Insurance3,887 ACE Ltd. USA USD 205,700 0.507,350 Progressive Corp. USA USD 108,854 0.261,180 Swiss Reinsurance Co. CHE CHF 55,580 0.14
10 Berkshire Hathaway Inc., B USA USD 32,140 0.081,000 Porto Seguro SA BRA BRL 5,638 0.01
A A
407,912 0.99A A
Publishing & Printing8,250 Reed Elsevier NV NLD EUR 97,133 0.24
10,067 Pearson PLC GBR GBP 94,248 0.23A A
191,381 0.47A A
Real Estate Investment Trusts65,868 Link REIT HKG HKD 108,786 0.27
A A
Real Estate Ownership, Management & Development3,000 Cheung Kong (Holdings) Ltd. HKG HKD 28,373 0.07
147,800 Land and Houses Public Co. Ltd., fgn. THA THB 16,316 0.044,676 Hirco PLC IND GBP 5,088 0.01
A A
49,777 0.12A A
FRANKL IN TEMPLETON INVESTMENT FUNDS
ç Franklin Templeton Global Equity Strategies Fund ç
Schedule of Investments as of December 31, 2008 (continued)
(Currency ç USD)
Number of % of
shares or Description Country Trading Market net
face value code currency value assets
www.franklintempleton.lu Unaudited Semi-Annual Report 157
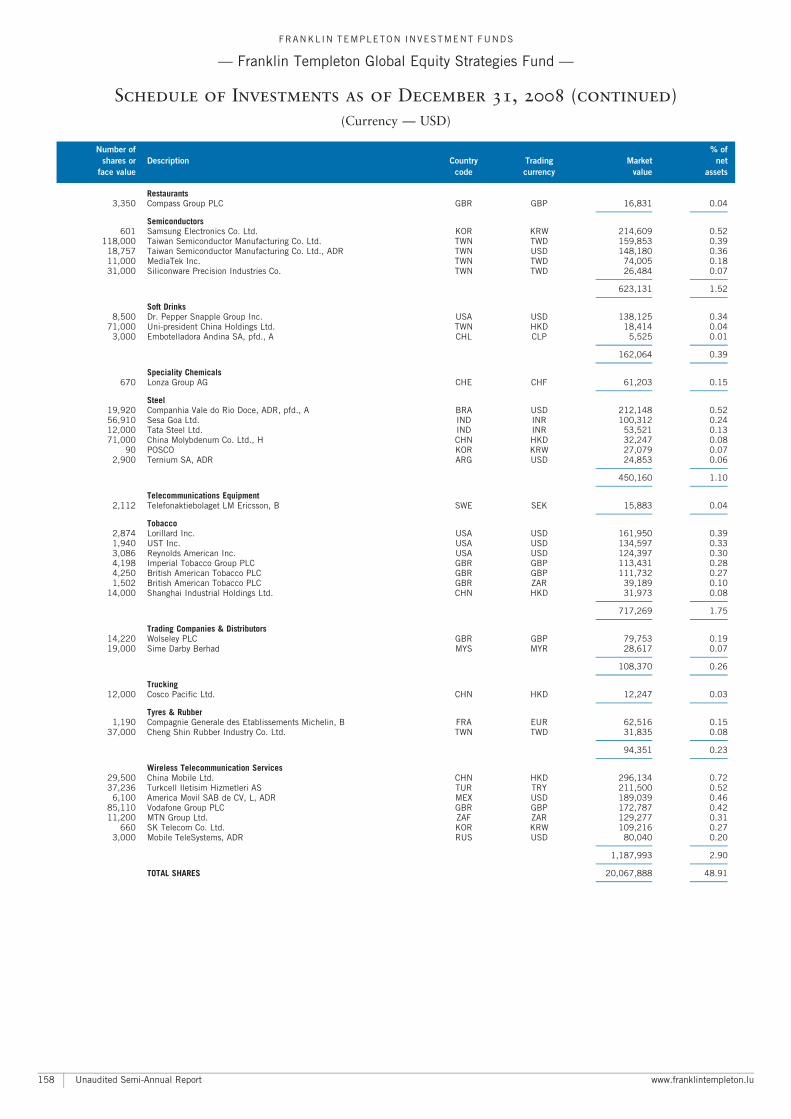
Restaurants3,350 Compass Group PLC GBR GBP 16,831 0.04
A A
Semiconductors601 Samsung Electronics Co. Ltd. KOR KRW 214,609 0.52
118,000 Taiwan Semiconductor Manufacturing Co. Ltd. TWN TWD 159,853 0.3918,757 Taiwan Semiconductor Manufacturing Co. Ltd., ADR TWN USD 148,180 0.3611,000 MediaTek Inc. TWN TWD 74,005 0.1831,000 Siliconware Precision Industries Co. TWN TWD 26,484 0.07
A A
623,131 1.52A A
Soft Drinks8,500 Dr. Pepper Snapple Group Inc. USA USD 138,125 0.34
71,000 Uni-president China Holdings Ltd. TWN HKD 18,414 0.043,000 Embotelladora Andina SA, pfd., A CHL CLP 5,525 0.01
A A
162,064 0.39A A
Speciality Chemicals670 Lonza Group AG CHE CHF 61,203 0.15
A A
Steel19,920 Companhia Vale do Rio Doce, ADR, pfd., A BRA USD 212,148 0.5256,910 Sesa Goa Ltd. IND INR 100,312 0.2412,000 Tata Steel Ltd. IND INR 53,521 0.1371,000 China Molybdenum Co. Ltd., H CHN HKD 32,247 0.08
90 POSCO KOR KRW 27,079 0.072,900 Ternium SA, ADR ARG USD 24,853 0.06
A A
450,160 1.10A A
Telecommunications Equipment2,112 Telefonaktiebolaget LM Ericsson, B SWE SEK 15,883 0.04
A A
Tobacco2,874 Lorillard Inc. USA USD 161,950 0.391,940 UST Inc. USA USD 134,597 0.333,086 Reynolds American Inc. USA USD 124,397 0.304,198 Imperial Tobacco Group PLC GBR GBP 113,431 0.284,250 British American Tobacco PLC GBR GBP 111,732 0.271,502 British American Tobacco PLC GBR ZAR 39,189 0.10
14,000 Shanghai Industrial Holdings Ltd. CHN HKD 31,973 0.08A A
717,269 1.75A A
Trading Companies & Distributors14,220 Wolseley PLC GBR GBP 79,753 0.1919,000 Sime Darby Berhad MYS MYR 28,617 0.07
A A
108,370 0.26A A
Trucking12,000 Cosco Pacific Ltd. CHN HKD 12,247 0.03
A A
Tyres & Rubber1,190 Compagnie Generale des Etablissements Michelin, B FRA EUR 62,516 0.15
37,000 Cheng Shin Rubber Industry Co. Ltd. TWN TWD 31,835 0.08A A
94,351 0.23A A
Wireless Telecommunication Services29,500 China Mobile Ltd. CHN HKD 296,134 0.7237,236 Turkcell Iletisim Hizmetleri AS TUR TRY 211,500 0.52
6,100 America Movil SAB de CV, L, ADR MEX USD 189,039 0.4685,110 Vodafone Group PLC GBR GBP 172,787 0.4211,200 MTN Group Ltd. ZAF ZAR 129,277 0.31
660 SK Telecom Co. Ltd. KOR KRW 109,216 0.273,000 Mobile TeleSystems, ADR RUS USD 80,040 0.20
A A
1,187,993 2.90A A
TOTAL SHARES 20,067,888 48.91A A
FRANKL IN TEMPLETON INVESTMENT FUNDS
ç Franklin Templeton Global Equity Strategies Fund ç
Schedule of Investments as of December 31, 2008 (continued)
(Currency ç USD)
Number of % of
shares or Description Country Trading Market net
face value code currency value assets
Unaudited Semi-Annual Report www.franklintempleton.lu158
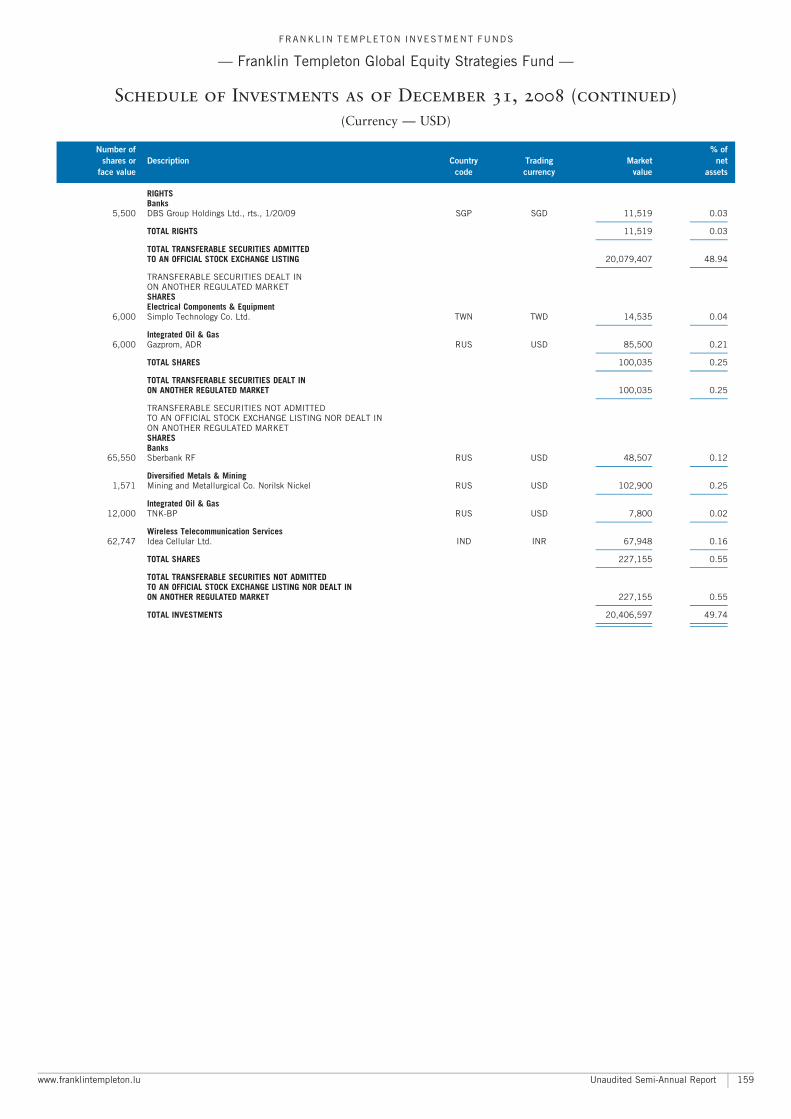
RIGHTSBanks
5,500 DBS Group Holdings Ltd., rts., 1/20/09 SGP SGD 11,519 0.03A A
TOTAL RIGHTS 11,519 0.03A A
TOTAL TRANSFERABLE SECURITIES ADMITTEDTO AN OFFICIAL STOCK EXCHANGE LISTING 20,079,407 48.94
A A
TRANSFERABLE SECURITIES DEALT INON ANOTHER REGULATED MARKETSHARESElectrical Components & Equipment
6,000 Simplo Technology Co. Ltd. TWN TWD 14,535 0.04A A
Integrated Oil & Gas6,000 Gazprom, ADR RUS USD 85,500 0.21
A A
TOTAL SHARES 100,035 0.25A A
TOTAL TRANSFERABLE SECURITIES DEALT INON ANOTHER REGULATED MARKET 100,035 0.25
A A
TRANSFERABLE SECURITIES NOT ADMITTEDTO AN OFFICIAL STOCK EXCHANGE LISTING NOR DEALT INON ANOTHER REGULATED MARKETSHARESBanks
65,550 Sberbank RF RUS USD 48,507 0.12A A
Diversified Metals & Mining1,571 Mining and Metallurgical Co. Norilsk Nickel RUS USD 102,900 0.25
A A
Integrated Oil & Gas12,000 TNK-BP RUS USD 7,800 0.02
A A
Wireless Telecommunication Services62,747 Idea Cellular Ltd. IND INR 67,948 0.16
A A
TOTAL SHARES 227,155 0.55A A
TOTAL TRANSFERABLE SECURITIES NOT ADMITTEDTO AN OFFICIAL STOCK EXCHANGE LISTING NOR DEALT INON ANOTHER REGULATED MARKET 227,155 0.55
A A
TOTAL INVESTMENTS 20,406,597 49.74A A
A A
FRANKL IN TEMPLETON INVESTMENT FUNDS
ç Franklin Templeton Global Equity Strategies Fund ç
Schedule of Investments as of December 31, 2008 (continued)
(Currency ç USD)
Number of % of
shares or Description Country Trading Market net
face value code currency value assets
www.franklintempleton.lu Unaudited Semi-Annual Report 159
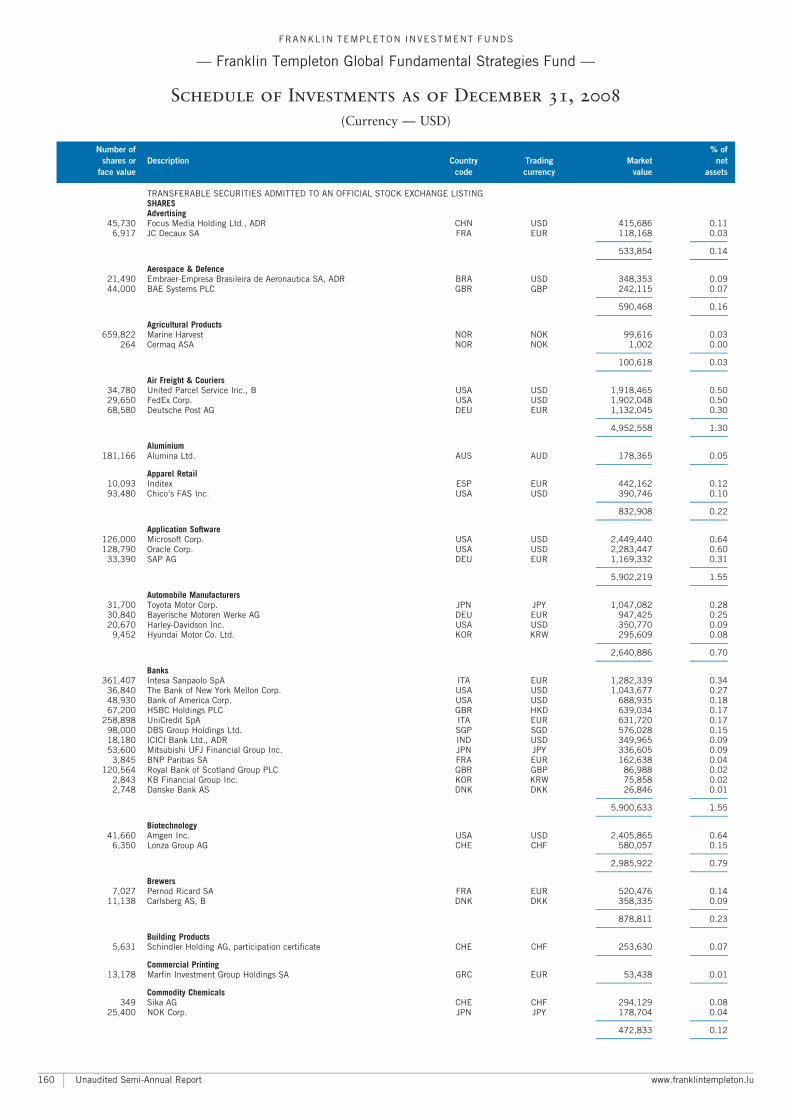
TRANSFERABLE SECURITIES ADMITTED TO AN OFFICIAL STOCK EXCHANGE LISTINGSHARESAdvertising
45,730 Focus Media Holding Ltd., ADR CHN USD 415,686 0.116,917 JC Decaux SA FRA EUR 118,168 0.03
A A
533,854 0.14A A
Aerospace & Defence21,490 Embraer-Empresa Brasileira de Aeronautica SA, ADR BRA USD 348,353 0.0944,000 BAE Systems PLC GBR GBP 242,115 0.07
A A
590,468 0.16A A
Agricultural Products659,822 Marine Harvest NOR NOK 99,616 0.03
264 Cermaq ASA NOR NOK 1,002 0.00A A
100,618 0.03A A
Air Freight & Couriers34,780 United Parcel Service Inc., B USA USD 1,918,465 0.5029,650 FedEx Corp. USA USD 1,902,048 0.5068,580 Deutsche Post AG DEU EUR 1,132,045 0.30
A A
4,952,558 1.30A A
Aluminium181,166 Alumina Ltd. AUS AUD 178,365 0.05
A A
Apparel Retail10,093 Inditex ESP EUR 442,162 0.1293,480 Chico’s FAS Inc. USA USD 390,746 0.10
A A
832,908 0.22A A
Application Software126,000 Microsoft Corp. USA USD 2,449,440 0.64128,790 Oracle Corp. USA USD 2,283,447 0.60
33,390 SAP AG DEU EUR 1,169,332 0.31A A
5,902,219 1.55A A
Automobile Manufacturers31,700 Toyota Motor Corp. JPN JPY 1,047,082 0.2830,840 Bayerische Motoren Werke AG DEU EUR 947,425 0.2520,670 Harley-Davidson Inc. USA USD 350,770 0.09
9,452 Hyundai Motor Co. Ltd. KOR KRW 295,609 0.08A A
2,640,886 0.70A A
Banks361,407 Intesa Sanpaolo SpA ITA EUR 1,282,339 0.34
36,840 The Bank of New York Mellon Corp. USA USD 1,043,677 0.2748,930 Bank of America Corp. USA USD 688,935 0.1867,200 HSBC Holdings PLC GBR HKD 639,034 0.17
258,898 UniCredit SpA ITA EUR 631,720 0.1798,000 DBS Group Holdings Ltd. SGP SGD 576,028 0.1518,180 ICICI Bank Ltd., ADR IND USD 349,965 0.0953,600 Mitsubishi UFJ Financial Group Inc. JPN JPY 336,605 0.09
3,845 BNP Paribas SA FRA EUR 162,638 0.04120,564 Royal Bank of Scotland Group PLC GBR GBP 86,988 0.02
2,843 KB Financial Group Inc. KOR KRW 75,858 0.022,748 Danske Bank AS DNK DKK 26,846 0.01
A A
5,900,633 1.55A A
Biotechnology41,660 Amgen Inc. USA USD 2,405,865 0.64
6,350 Lonza Group AG CHE CHF 580,057 0.15A A
2,985,922 0.79A A
Brewers7,027 Pernod Ricard SA FRA EUR 520,476 0.14
11,138 Carlsberg AS, B DNK DKK 358,335 0.09A A
878,811 0.23A A
Building Products5,631 Schindler Holding AG, participation certificate CHE CHF 253,630 0.07
A A
Commercial Printing13,178 Marfin Investment Group Holdings SA GRC EUR 53,438 0.01
A A
Commodity Chemicals349 Sika AG CHE CHF 294,129 0.08
25,400 NOK Corp. JPN JPY 178,704 0.04A A
472,833 0.12A A
FRANKL IN TEMPLETON INVESTMENT FUNDS
ç Franklin Templeton Global Fundamental Strategies Fund ç
Schedule of Investments as of December 31, 2008
(Currency ç USD)
Number of % of
shares or Description Country Trading Market net
face value code currency value assets
Unaudited Semi-Annual Report www.franklintempleton.lu160
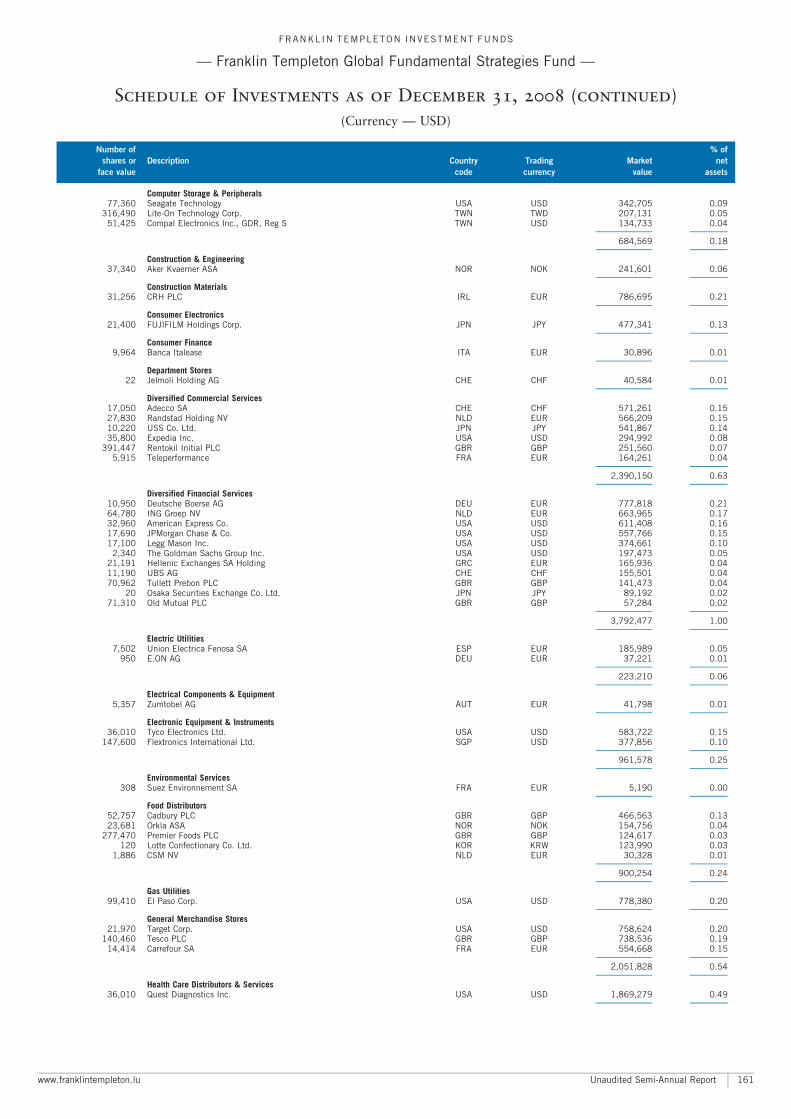
Computer Storage & Peripherals77,360 Seagate Technology USA USD 342,705 0.09
316,490 Lite-On Technology Corp. TWN TWD 207,131 0.0551,425 Compal Electronics Inc., GDR, Reg S TWN USD 134,733 0.04
A A
684,569 0.18A A
Construction & Engineering37,340 Aker Kvaerner ASA NOR NOK 241,601 0.06
A A
Construction Materials31,256 CRH PLC IRL EUR 786,695 0.21
A A
Consumer Electronics21,400 FUJIFILM Holdings Corp. JPN JPY 477,341 0.13
A A
Consumer Finance9,964 Banca Italease ITA EUR 30,896 0.01
A A
Department Stores22 Jelmoli Holding AG CHE CHF 40,584 0.01
A A
Diversified Commercial Services17,050 Adecco SA CHE CHF 571,261 0.1527,830 Randstad Holding NV NLD EUR 566,209 0.1510,220 USS Co. Ltd. JPN JPY 541,867 0.1435,800 Expedia Inc. USA USD 294,992 0.08
391,447 Rentokil Initial PLC GBR GBP 251,560 0.075,915 Teleperformance FRA EUR 164,261 0.04
A A
2,390,150 0.63A A
Diversified Financial Services10,950 Deutsche Boerse AG DEU EUR 777,818 0.2164,780 ING Groep NV NLD EUR 663,965 0.1732,960 American Express Co. USA USD 611,408 0.1617,690 JPMorgan Chase & Co. USA USD 557,766 0.1517,100 Legg Mason Inc. USA USD 374,661 0.10
2,340 The Goldman Sachs Group Inc. USA USD 197,473 0.0521,191 Hellenic Exchanges SA Holding GRC EUR 165,936 0.0411,190 UBS AG CHE CHF 155,501 0.0470,962 Tullett Prebon PLC GBR GBP 141,473 0.04
20 Osaka Securities Exchange Co. Ltd. JPN JPY 89,192 0.0271,310 Old Mutual PLC GBR GBP 57,284 0.02
A A
3,792,477 1.00A A
Electric Utilities7,502 Union Electrica Fenosa SA ESP EUR 185,989 0.05
950 E.ON AG DEU EUR 37,221 0.01A A
223,210 0.06A A
Electrical Components & Equipment5,357 Zumtobel AG AUT EUR 41,798 0.01
A A
Electronic Equipment & Instruments36,010 Tyco Electronics Ltd. USA USD 583,722 0.15
147,600 Flextronics International Ltd. SGP USD 377,856 0.10A A
961,578 0.25A A
Environmental Services308 Suez Environnement SA FRA EUR 5,190 0.00
A A
Food Distributors52,757 Cadbury PLC GBR GBP 466,563 0.1323,681 Orkla ASA NOR NOK 154,756 0.04
277,470 Premier Foods PLC GBR GBP 124,617 0.03120 Lotte Confectionary Co. Ltd. KOR KRW 123,990 0.03
1,886 CSM NV NLD EUR 30,328 0.01A A
900,254 0.24A A
Gas Utilities99,410 El Paso Corp. USA USD 778,380 0.20
A A
General Merchandise Stores21,970 Target Corp. USA USD 758,624 0.20
140,460 Tesco PLC GBR GBP 738,536 0.1914,414 Carrefour SA FRA EUR 554,668 0.15
A A
2,051,828 0.54A A
Health Care Distributors & Services36,010 Quest Diagnostics Inc. USA USD 1,869,279 0.49
A A
FRANKL IN TEMPLETON INVESTMENT FUNDS
ç Franklin Templeton Global Fundamental Strategies Fund ç
Schedule of Investments as of December 31, 2008 (continued)
(Currency ç USD)
Number of % of
shares or Description Country Trading Market net
face value code currency value assets
www.franklintempleton.lu Unaudited Semi-Annual Report 161
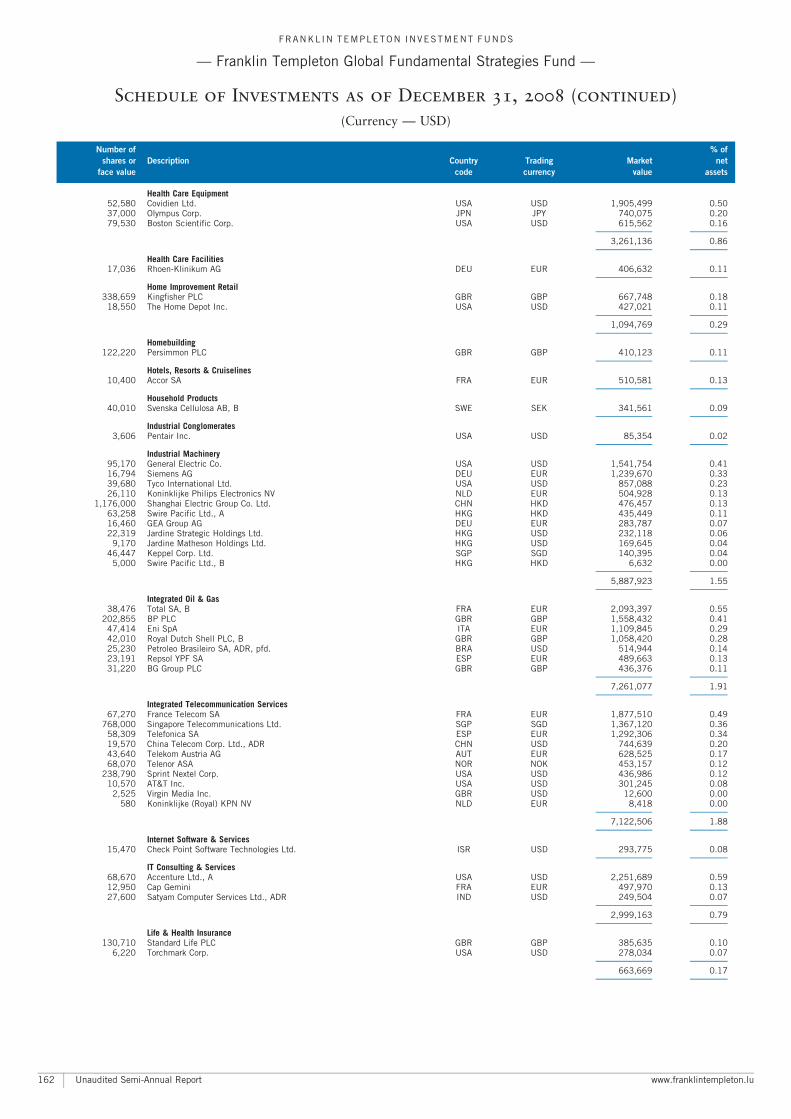
Health Care Equipment52,580 Covidien Ltd. USA USD 1,905,499 0.5037,000 Olympus Corp. JPN JPY 740,075 0.2079,530 Boston Scientific Corp. USA USD 615,562 0.16
A A
3,261,136 0.86A A
Health Care Facilities17,036 Rhoen-Klinikum AG DEU EUR 406,632 0.11
A A
Home Improvement Retail338,659 Kingfisher PLC GBR GBP 667,748 0.18
18,550 The Home Depot Inc. USA USD 427,021 0.11A A
1,094,769 0.29A A
Homebuilding122,220 Persimmon PLC GBR GBP 410,123 0.11
A A
Hotels, Resorts & Cruiselines10,400 Accor SA FRA EUR 510,581 0.13
A A
Household Products40,010 Svenska Cellulosa AB, B SWE SEK 341,561 0.09
A A
Industrial Conglomerates3,606 Pentair Inc. USA USD 85,354 0.02
A A
Industrial Machinery95,170 General Electric Co. USA USD 1,541,754 0.4116,794 Siemens AG DEU EUR 1,239,670 0.3339,680 Tyco International Ltd. USA USD 857,088 0.2326,110 Koninklijke Philips Electronics NV NLD EUR 504,928 0.13
1,176,000 Shanghai Electric Group Co. Ltd. CHN HKD 476,457 0.1363,258 Swire Pacific Ltd., A HKG HKD 435,449 0.1116,460 GEA Group AG DEU EUR 283,787 0.0722,319 Jardine Strategic Holdings Ltd. HKG USD 232,118 0.06
9,170 Jardine Matheson Holdings Ltd. HKG USD 169,645 0.0446,447 Keppel Corp. Ltd. SGP SGD 140,395 0.04
5,000 Swire Pacific Ltd., B HKG HKD 6,632 0.00A A
5,887,923 1.55A A
Integrated Oil & Gas38,476 Total SA, B FRA EUR 2,093,397 0.55
202,855 BP PLC GBR GBP 1,558,432 0.4147,414 Eni SpA ITA EUR 1,109,845 0.2942,010 Royal Dutch Shell PLC, B GBR GBP 1,058,420 0.2825,230 Petroleo Brasileiro SA, ADR, pfd. BRA USD 514,944 0.1423,191 Repsol YPF SA ESP EUR 489,663 0.1331,220 BG Group PLC GBR GBP 436,376 0.11
A A
7,261,077 1.91A A
Integrated Telecommunication Services67,270 France Telecom SA FRA EUR 1,877,510 0.49
768,000 Singapore Telecommunications Ltd. SGP SGD 1,367,120 0.3658,309 Telefonica SA ESP EUR 1,292,306 0.3419,570 China Telecom Corp. Ltd., ADR CHN USD 744,639 0.2043,640 Telekom Austria AG AUT EUR 628,525 0.1768,070 Telenor ASA NOR NOK 453,157 0.12
238,790 Sprint Nextel Corp. USA USD 436,986 0.1210,570 AT&T Inc. USA USD 301,245 0.08
2,525 Virgin Media Inc. GBR USD 12,600 0.00580 Koninklijke (Royal) KPN NV NLD EUR 8,418 0.00
A A
7,122,506 1.88A A
Internet Software & Services15,470 Check Point Software Technologies Ltd. ISR USD 293,775 0.08
A A
IT Consulting & Services68,670 Accenture Ltd., A USA USD 2,251,689 0.5912,950 Cap Gemini FRA EUR 497,970 0.1327,600 Satyam Computer Services Ltd., ADR IND USD 249,504 0.07
A A
2,999,163 0.79A A
Life & Health Insurance130,710 Standard Life PLC GBR GBP 385,635 0.10
6,220 Torchmark Corp. USA USD 278,034 0.07A A
663,669 0.17A A
FRANKL IN TEMPLETON INVESTMENT FUNDS
ç Franklin Templeton Global Fundamental Strategies Fund ç
Schedule of Investments as of December 31, 2008 (continued)
(Currency ç USD)
Number of % of
shares or Description Country Trading Market net
face value code currency value assets
Unaudited Semi-Annual Report www.franklintempleton.lu162
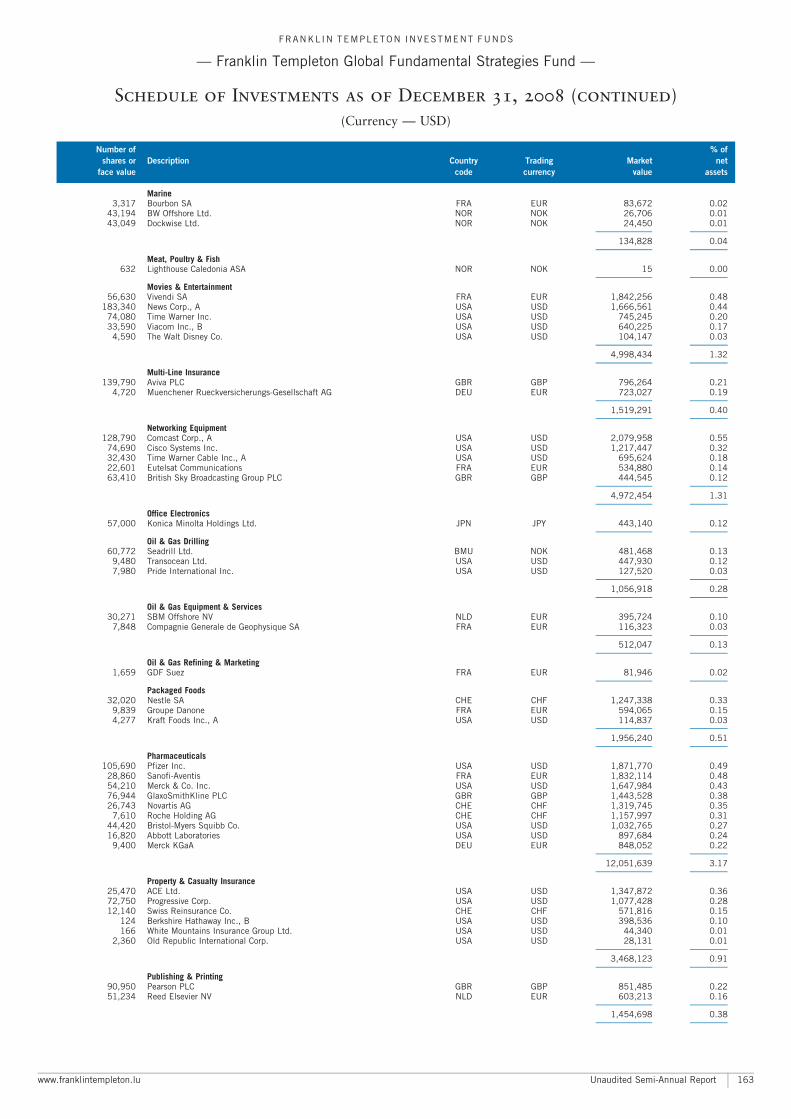
Marine3,317 Bourbon SA FRA EUR 83,672 0.02
43,194 BW Offshore Ltd. NOR NOK 26,706 0.0143,049 Dockwise Ltd. NOR NOK 24,450 0.01
A A
134,828 0.04A A
Meat, Poultry & Fish632 Lighthouse Caledonia ASA NOR NOK 15 0.00
A A
Movies & Entertainment56,630 Vivendi SA FRA EUR 1,842,256 0.48
183,340 News Corp., A USA USD 1,666,561 0.4474,080 Time Warner Inc. USA USD 745,245 0.2033,590 Viacom Inc., B USA USD 640,225 0.17
4,590 The Walt Disney Co. USA USD 104,147 0.03A A
4,998,434 1.32A A
Multi-Line Insurance139,790 Aviva PLC GBR GBP 796,264 0.21
4,720 Muenchener Rueckversicherungs-Gesellschaft AG DEU EUR 723,027 0.19A A
1,519,291 0.40A A
Networking Equipment128,790 Comcast Corp., A USA USD 2,079,958 0.55
74,690 Cisco Systems Inc. USA USD 1,217,447 0.3232,430 Time Warner Cable Inc., A USA USD 695,624 0.1822,601 Eutelsat Communications FRA EUR 534,880 0.1463,410 British Sky Broadcasting Group PLC GBR GBP 444,545 0.12
A A
4,972,454 1.31A A
Office Electronics57,000 Konica Minolta Holdings Ltd. JPN JPY 443,140 0.12
A A
Oil & Gas Drilling60,772 Seadrill Ltd. BMU NOK 481,468 0.13
9,480 Transocean Ltd. USA USD 447,930 0.127,980 Pride International Inc. USA USD 127,520 0.03
A A
1,056,918 0.28A A
Oil & Gas Equipment & Services30,271 SBM Offshore NV NLD EUR 395,724 0.10
7,848 Compagnie Generale de Geophysique SA FRA EUR 116,323 0.03A A
512,047 0.13A A
Oil & Gas Refining & Marketing1,659 GDF Suez FRA EUR 81,946 0.02
A A
Packaged Foods32,020 Nestle SA CHE CHF 1,247,338 0.33
9,839 Groupe Danone FRA EUR 594,065 0.154,277 Kraft Foods Inc., A USA USD 114,837 0.03
A A
1,956,240 0.51A A
Pharmaceuticals105,690 Pfizer Inc. USA USD 1,871,770 0.49
28,860 Sanofi-Aventis FRA EUR 1,832,114 0.4854,210 Merck & Co. Inc. USA USD 1,647,984 0.4376,944 GlaxoSmithKline PLC GBR GBP 1,443,528 0.3826,743 Novartis AG CHE CHF 1,319,745 0.35
7,610 Roche Holding AG CHE CHF 1,157,997 0.3144,420 Bristol-Myers Squibb Co. USA USD 1,032,765 0.2716,820 Abbott Laboratories USA USD 897,684 0.24
9,400 Merck KGaA DEU EUR 848,052 0.22A A
12,051,639 3.17A A
Property & Casualty Insurance25,470 ACE Ltd. USA USD 1,347,872 0.3672,750 Progressive Corp. USA USD 1,077,428 0.2812,140 Swiss Reinsurance Co. CHE CHF 571,816 0.15
124 Berkshire Hathaway Inc., B USA USD 398,536 0.10166 White Mountains Insurance Group Ltd. USA USD 44,340 0.01
2,360 Old Republic International Corp. USA USD 28,131 0.01A A
3,468,123 0.91A A
Publishing & Printing90,950 Pearson PLC GBR GBP 851,485 0.2251,234 Reed Elsevier NV NLD EUR 603,213 0.16
A A
1,454,698 0.38A A
FRANKL IN TEMPLETON INVESTMENT FUNDS
ç Franklin Templeton Global Fundamental Strategies Fund ç
Schedule of Investments as of December 31, 2008 (continued)
(Currency ç USD)
Number of % of
shares or Description Country Trading Market net
face value code currency value assets
www.franklintempleton.lu Unaudited Semi-Annual Report 163
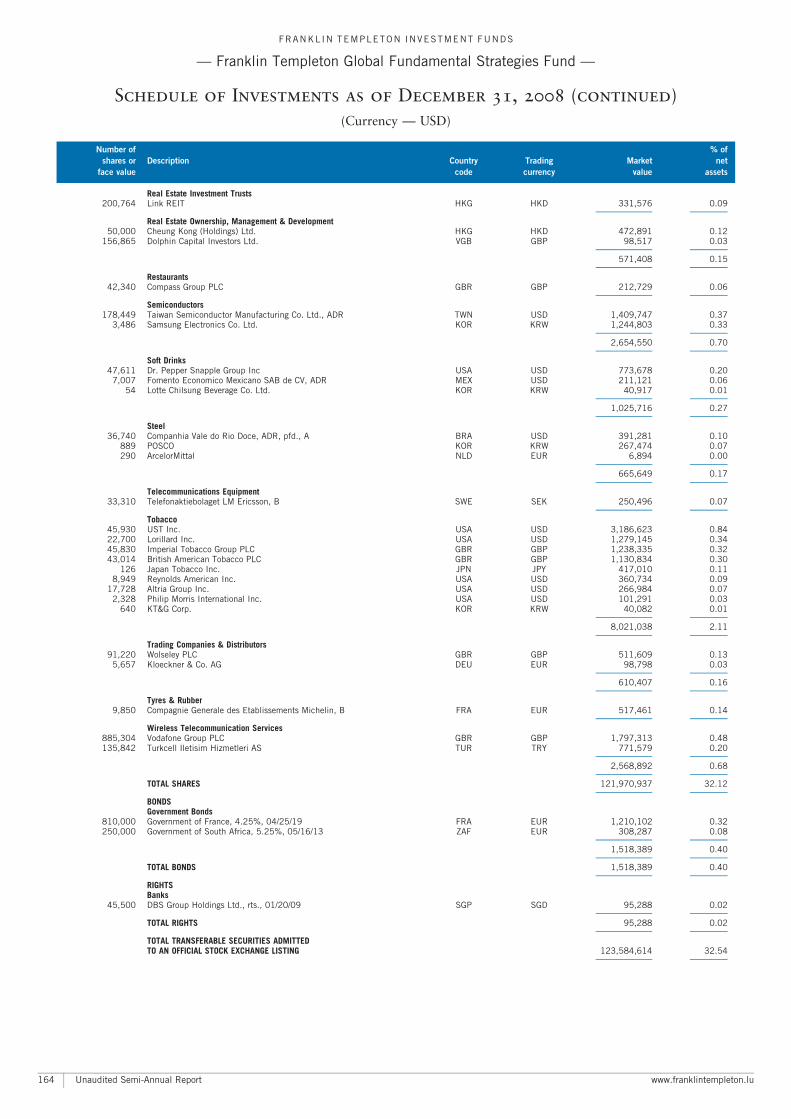
Real Estate Investment Trusts200,764 Link REIT HKG HKD 331,576 0.09
A A
Real Estate Ownership, Management & Development50,000 Cheung Kong (Holdings) Ltd. HKG HKD 472,891 0.12
156,865 Dolphin Capital Investors Ltd. VGB GBP 98,517 0.03A A
571,408 0.15A A
Restaurants42,340 Compass Group PLC GBR GBP 212,729 0.06
A A
Semiconductors178,449 Taiwan Semiconductor Manufacturing Co. Ltd., ADR TWN USD 1,409,747 0.37
3,486 Samsung Electronics Co. Ltd. KOR KRW 1,244,803 0.33A A
2,654,550 0.70A A
Soft Drinks47,611 Dr. Pepper Snapple Group Inc USA USD 773,678 0.20
7,007 Fomento Economico Mexicano SAB de CV, ADR MEX USD 211,121 0.0654 Lotte Chilsung Beverage Co. Ltd. KOR KRW 40,917 0.01
A A
1,025,716 0.27A A
Steel36,740 Companhia Vale do Rio Doce, ADR, pfd., A BRA USD 391,281 0.10
889 POSCO KOR KRW 267,474 0.07290 ArcelorMittal NLD EUR 6,894 0.00
A A
665,649 0.17A A
Telecommunications Equipment33,310 Telefonaktiebolaget LM Ericsson, B SWE SEK 250,496 0.07
A A
Tobacco45,930 UST Inc. USA USD 3,186,623 0.8422,700 Lorillard Inc. USA USD 1,279,145 0.3445,830 Imperial Tobacco Group PLC GBR GBP 1,238,335 0.3243,014 British American Tobacco PLC GBR GBP 1,130,834 0.30
126 Japan Tobacco Inc. JPN JPY 417,010 0.118,949 Reynolds American Inc. USA USD 360,734 0.09
17,728 Altria Group Inc. USA USD 266,984 0.072,328 Philip Morris International Inc. USA USD 101,291 0.03
640 KT&G Corp. KOR KRW 40,082 0.01A A
8,021,038 2.11A A
Trading Companies & Distributors91,220 Wolseley PLC GBR GBP 511,609 0.13
5,657 Kloeckner & Co. AG DEU EUR 98,798 0.03A A
610,407 0.16A A
Tyres & Rubber9,850 Compagnie Generale des Etablissements Michelin, B FRA EUR 517,461 0.14
A A
Wireless Telecommunication Services885,304 Vodafone Group PLC GBR GBP 1,797,313 0.48135,842 Turkcell Iletisim Hizmetleri AS TUR TRY 771,579 0.20
A A
2,568,892 0.68A A
TOTAL SHARES 121,970,937 32.12A A
BONDSGovernment Bonds
810,000 Government of France, 4.25%, 04/25/19 FRA EUR 1,210,102 0.32250,000 Government of South Africa, 5.25%, 05/16/13 ZAF EUR 308,287 0.08
A A
1,518,389 0.40A A
TOTAL BONDS 1,518,389 0.40A A
RIGHTSBanks
45,500 DBS Group Holdings Ltd., rts., 01/20/09 SGP SGD 95,288 0.02A A
TOTAL RIGHTS 95,288 0.02A A
TOTAL TRANSFERABLE SECURITIES ADMITTEDTO AN OFFICIAL STOCK EXCHANGE LISTING 123,584,614 32.54
A A
FRANKL IN TEMPLETON INVESTMENT FUNDS
ç Franklin Templeton Global Fundamental Strategies Fund ç
Schedule of Investments as of December 31, 2008 (continued)
(Currency ç USD)
Number of % of
shares or Description Country Trading Market net
face value code currency value assets
Unaudited Semi-Annual Report www.franklintempleton.lu164
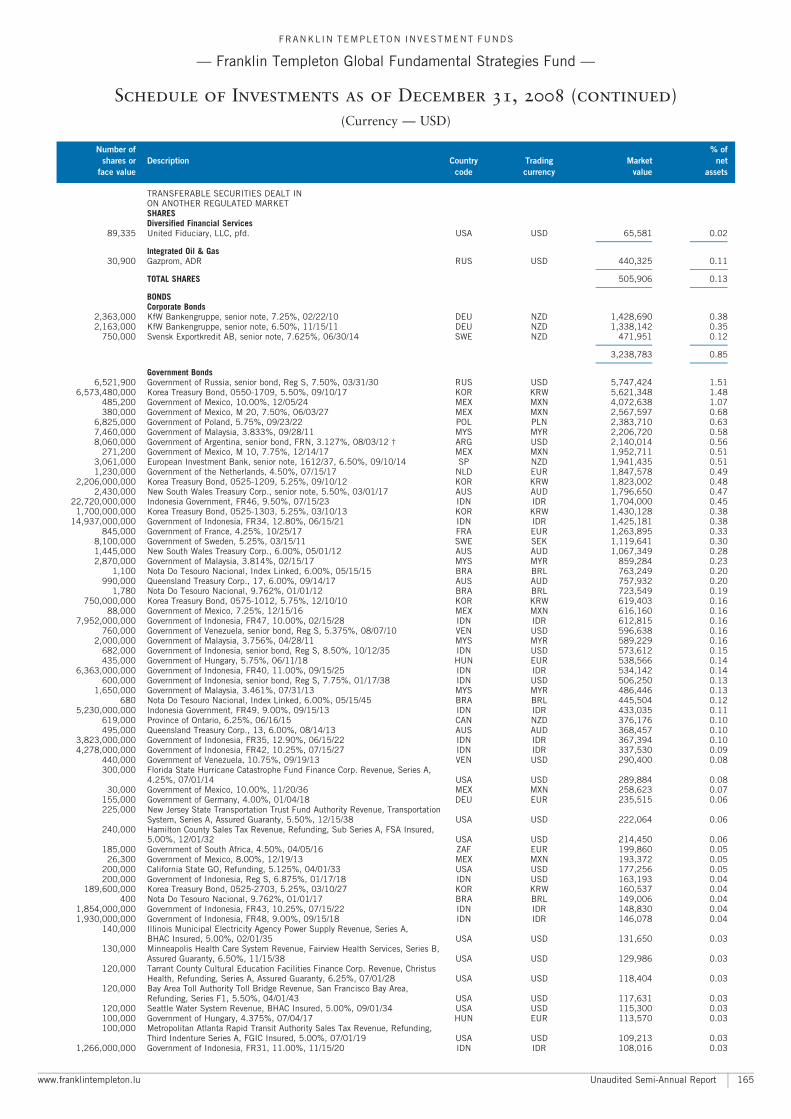
TRANSFERABLE SECURITIES DEALT INON ANOTHER REGULATED MARKETSHARESDiversified Financial Services
89,335 United Fiduciary, LLC, pfd. USA USD 65,581 0.02A A
Integrated Oil & Gas30,900 Gazprom, ADR RUS USD 440,325 0.11
A A
TOTAL SHARES 505,906 0.13A A
BONDSCorporate Bonds
2,363,000 KfW Bankengruppe, senior note, 7.25%, 02/22/10 DEU NZD 1,428,690 0.382,163,000 KfW Bankengruppe, senior note, 6.50%, 11/15/11 DEU NZD 1,338,142 0.35
750,000 Svensk Exportkredit AB, senior note, 7.625%, 06/30/14 SWE NZD 471,951 0.12A A
3,238,783 0.85A A
Government Bonds6,521,900 Government of Russia, senior bond, Reg S, 7.50%, 03/31/30 RUS USD 5,747,424 1.51
6,573,480,000 Korea Treasury Bond, 0550-1709, 5.50%, 09/10/17 KOR KRW 5,621,348 1.48485,200 Government of Mexico, 10.00%, 12/05/24 MEX MXN 4,072,638 1.07380,000 Government of Mexico, M 20, 7.50%, 06/03/27 MEX MXN 2,567,597 0.68
6,825,000 Government of Poland, 5.75%, 09/23/22 POL PLN 2,383,710 0.637,460,000 Government of Malaysia, 3.833%, 09/28/11 MYS MYR 2,206,720 0.588,060,000 Government of Argentina, senior bond, FRN, 3.127%, 08/03/12 � ARG USD 2,140,014 0.56
271,200 Government of Mexico, M 10, 7.75%, 12/14/17 MEX MXN 1,952,711 0.513,061,000 European Investment Bank, senior note, 1612/37, 6.50%, 09/10/14 SP NZD 1,941,435 0.511,230,000 Government of the Netherlands, 4.50%, 07/15/17 NLD EUR 1,847,578 0.49
2,206,000,000 Korea Treasury Bond, 0525-1209, 5.25%, 09/10/12 KOR KRW 1,823,002 0.482,430,000 New South Wales Treasury Corp., senior note, 5.50%, 03/01/17 AUS AUD 1,796,650 0.47
22,720,000,000 Indonesia Government, FR46, 9.50%, 07/15/23 IDN IDR 1,704,000 0.451,700,000,000 Korea Treasury Bond, 0525-1303, 5.25%, 03/10/13 KOR KRW 1,430,128 0.38
14,937,000,000 Government of Indonesia, FR34, 12.80%, 06/15/21 IDN IDR 1,425,181 0.38845,000 Government of France, 4.25%, 10/25/17 FRA EUR 1,263,895 0.33
8,100,000 Government of Sweden, 5.25%, 03/15/11 SWE SEK 1,119,641 0.301,445,000 New South Wales Treasury Corp., 6.00%, 05/01/12 AUS AUD 1,067,349 0.282,870,000 Government of Malaysia, 3.814%, 02/15/17 MYS MYR 859,284 0.23
1,100 Nota Do Tesouro Nacional, Index Linked, 6.00%, 05/15/15 BRA BRL 763,249 0.20990,000 Queensland Treasury Corp., 17, 6.00%, 09/14/17 AUS AUD 757,932 0.20
1,780 Nota Do Tesouro Nacional, 9.762%, 01/01/12 BRA BRL 723,549 0.19750,000,000 Korea Treasury Bond, 0575-1012, 5.75%, 12/10/10 KOR KRW 619,403 0.16
88,000 Government of Mexico, 7.25%, 12/15/16 MEX MXN 616,160 0.167,952,000,000 Government of Indonesia, FR47, 10.00%, 02/15/28 IDN IDR 612,815 0.16
760,000 Government of Venezuela, senior bond, Reg S, 5.375%, 08/07/10 VEN USD 596,638 0.162,000,000 Government of Malaysia, 3.756%, 04/28/11 MYS MYR 589,229 0.16
682,000 Government of Indonesia, senior bond, Reg S, 8.50%, 10/12/35 IDN USD 573,612 0.15435,000 Government of Hungary, 5.75%, 06/11/18 HUN EUR 538,566 0.14
6,363,000,000 Government of Indonesia, FR40, 11.00%, 09/15/25 IDN IDR 534,142 0.14600,000 Government of Indonesia, senior bond, Reg S, 7.75%, 01/17/38 IDN USD 506,250 0.13
1,650,000 Government of Malaysia, 3.461%, 07/31/13 MYS MYR 486,446 0.13680 Nota Do Tesouro Nacional, Index Linked, 6.00%, 05/15/45 BRA BRL 445,504 0.12
5,230,000,000 Indonesia Government, FR49, 9.00%, 09/15/13 IDN IDR 433,035 0.11619,000 Province of Ontario, 6.25%, 06/16/15 CAN NZD 376,176 0.10495,000 Queensland Treasury Corp., 13, 6.00%, 08/14/13 AUS AUD 368,457 0.10
3,823,000,000 Government of Indonesia, FR35, 12.90%, 06/15/22 IDN IDR 367,394 0.104,278,000,000 Government of Indonesia, FR42, 10.25%, 07/15/27 IDN IDR 337,530 0.09
440,000 Government of Venezuela, 10.75%, 09/19/13 VEN USD 290,400 0.08300,000 Florida State Hurricane Catastrophe Fund Finance Corp. Revenue, Series A,
4.25%, 07/01/14 USA USD 289,884 0.0830,000 Government of Mexico, 10.00%, 11/20/36 MEX MXN 258,623 0.07
155,000 Government of Germany, 4.00%, 01/04/18 DEU EUR 235,515 0.06225,000 New Jersey State Transportation Trust Fund Authority Revenue, Transportation
System, Series A, Assured Guaranty, 5.50%, 12/15/38 USA USD 222,064 0.06240,000 Hamilton County Sales Tax Revenue, Refunding, Sub Series A, FSA Insured,
5.00%, 12/01/32 USA USD 214,450 0.06185,000 Government of South Africa, 4.50%, 04/05/16 ZAF EUR 199,860 0.05
26,300 Government of Mexico, 8.00%, 12/19/13 MEX MXN 193,372 0.05200,000 California State GO, Refunding, 5.125%, 04/01/33 USA USD 177,256 0.05200,000 Government of Indonesia, Reg S, 6.875%, 01/17/18 IDN USD 163,193 0.04
189,600,000 Korea Treasury Bond, 0525-2703, 5.25%, 03/10/27 KOR KRW 160,537 0.04400 Nota Do Tesouro Nacional, 9.762%, 01/01/17 BRA BRL 149,006 0.04
1,854,000,000 Government of Indonesia, FR43, 10.25%, 07/15/22 IDN IDR 148,830 0.041,930,000,000 Government of Indonesia, FR48, 9.00%, 09/15/18 IDN IDR 146,078 0.04
140,000 Illinois Municipal Electricity Agency Power Supply Revenue, Series A,BHAC Insured, 5.00%, 02/01/35 USA USD 131,650 0.03
130,000 Minneapolis Health Care System Revenue, Fairview Health Services, Series B,Assured Guaranty, 6.50%, 11/15/38 USA USD 129,986 0.03
120,000 Tarrant County Cultural Education Facilities Finance Corp. Revenue, ChristusHealth, Refunding, Series A, Assured Guaranty, 6.25%, 07/01/28 USA USD 118,404 0.03
120,000 Bay Area Toll Authority Toll Bridge Revenue, San Francisco Bay Area,Refunding, Series F1, 5.50%, 04/01/43 USA USD 117,631 0.03
120,000 Seattle Water System Revenue, BHAC Insured, 5.00%, 09/01/34 USA USD 115,300 0.03100,000 Government of Hungary, 4.375%, 07/04/17 HUN EUR 113,570 0.03100,000 Metropolitan Atlanta Rapid Transit Authority Sales Tax Revenue, Refunding,
Third Indenture Series A, FGIC Insured, 5.00%, 07/01/19 USA USD 109,213 0.031,266,000,000 Government of Indonesia, FR31, 11.00%, 11/15/20 IDN IDR 108,016 0.03
FRANKL IN TEMPLETON INVESTMENT FUNDS
ç Franklin Templeton Global Fundamental Strategies Fund ç
Schedule of Investments as of December 31, 2008 (continued)
(Currency ç USD)
Number of % of
shares or Description Country Trading Market net
face value code currency value assets
www.franklintempleton.lu Unaudited Semi-Annual Report 165
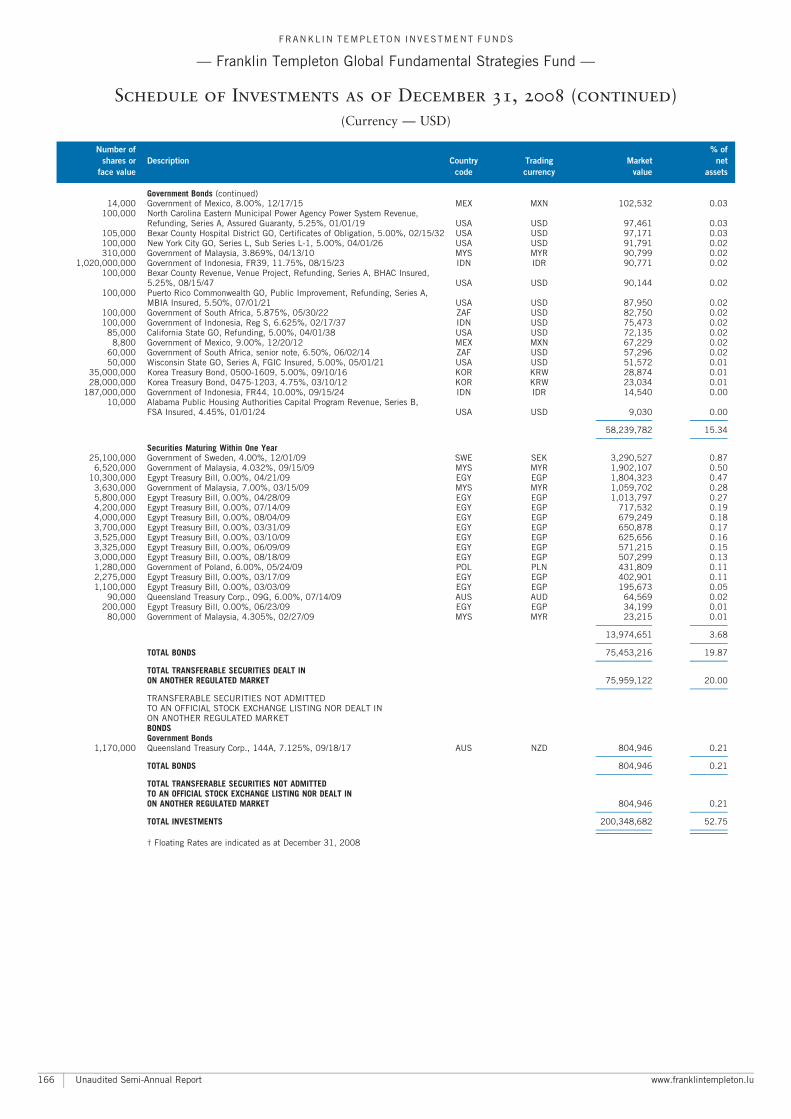
Government Bonds (continued)14,000 Government of Mexico, 8.00%, 12/17/15 MEX MXN 102,532 0.03
100,000 North Carolina Eastern Municipal Power Agency Power System Revenue,Refunding, Series A, Assured Guaranty, 5.25%, 01/01/19 USA USD 97,461 0.03
105,000 Bexar County Hospital District GO, Certificates of Obligation, 5.00%, 02/15/32 USA USD 97,171 0.03100,000 New York City GO, Series L, Sub Series L-1, 5.00%, 04/01/26 USA USD 91,791 0.02310,000 Government of Malaysia, 3.869%, 04/13/10 MYS MYR 90,799 0.02
1,020,000,000 Government of Indonesia, FR39, 11.75%, 08/15/23 IDN IDR 90,771 0.02100,000 Bexar County Revenue, Venue Project, Refunding, Series A, BHAC Insured,
5.25%, 08/15/47 USA USD 90,144 0.02100,000 Puerto Rico Commonwealth GO, Public Improvement, Refunding, Series A,
MBIA Insured, 5.50%, 07/01/21 USA USD 87,950 0.02100,000 Government of South Africa, 5.875%, 05/30/22 ZAF USD 82,750 0.02100,000 Government of Indonesia, Reg S, 6.625%, 02/17/37 IDN USD 75,473 0.02
85,000 California State GO, Refunding, 5.00%, 04/01/38 USA USD 72,135 0.028,800 Government of Mexico, 9.00%, 12/20/12 MEX MXN 67,229 0.02
60,000 Government of South Africa, senior note, 6.50%, 06/02/14 ZAF USD 57,296 0.0250,000 Wisconsin State GO, Series A, FGIC Insured, 5.00%, 05/01/21 USA USD 51,572 0.01
35,000,000 Korea Treasury Bond, 0500-1609, 5.00%, 09/10/16 KOR KRW 28,874 0.0128,000,000 Korea Treasury Bond, 0475-1203, 4.75%, 03/10/12 KOR KRW 23,034 0.01
187,000,000 Government of Indonesia, FR44, 10.00%, 09/15/24 IDN IDR 14,540 0.0010,000 Alabama Public Housing Authorities Capital Program Revenue, Series B,
FSA Insured, 4.45%, 01/01/24 USA USD 9,030 0.00A A
58,239,782 15.34A A
Securities Maturing Within One Year25,100,000 Government of Sweden, 4.00%, 12/01/09 SWE SEK 3,290,527 0.87
6,520,000 Government of Malaysia, 4.032%, 09/15/09 MYS MYR 1,902,107 0.5010,300,000 Egypt Treasury Bill, 0.00%, 04/21/09 EGY EGP 1,804,323 0.47
3,630,000 Government of Malaysia, 7.00%, 03/15/09 MYS MYR 1,059,702 0.285,800,000 Egypt Treasury Bill, 0.00%, 04/28/09 EGY EGP 1,013,797 0.274,200,000 Egypt Treasury Bill, 0.00%, 07/14/09 EGY EGP 717,532 0.194,000,000 Egypt Treasury Bill, 0.00%, 08/04/09 EGY EGP 679,249 0.183,700,000 Egypt Treasury Bill, 0.00%, 03/31/09 EGY EGP 650,878 0.173,525,000 Egypt Treasury Bill, 0.00%, 03/10/09 EGY EGP 625,656 0.163,325,000 Egypt Treasury Bill, 0.00%, 06/09/09 EGY EGP 571,215 0.153,000,000 Egypt Treasury Bill, 0.00%, 08/18/09 EGY EGP 507,299 0.131,280,000 Government of Poland, 6.00%, 05/24/09 POL PLN 431,809 0.112,275,000 Egypt Treasury Bill, 0.00%, 03/17/09 EGY EGP 402,901 0.111,100,000 Egypt Treasury Bill, 0.00%, 03/03/09 EGY EGP 195,673 0.05
90,000 Queensland Treasury Corp., 09G, 6.00%, 07/14/09 AUS AUD 64,569 0.02200,000 Egypt Treasury Bill, 0.00%, 06/23/09 EGY EGP 34,199 0.01
80,000 Government of Malaysia, 4.305%, 02/27/09 MYS MYR 23,215 0.01A A
13,974,651 3.68A A
TOTAL BONDS 75,453,216 19.87A A
TOTAL TRANSFERABLE SECURITIES DEALT INON ANOTHER REGULATED MARKET 75,959,122 20.00
A A
TRANSFERABLE SECURITIES NOT ADMITTEDTO AN OFFICIAL STOCK EXCHANGE LISTING NOR DEALT INON ANOTHER REGULATED MARKETBONDSGovernment Bonds
1,170,000 Queensland Treasury Corp., 144A, 7.125%, 09/18/17 AUS NZD 804,946 0.21A A
TOTAL BONDS 804,946 0.21A A
TOTAL TRANSFERABLE SECURITIES NOT ADMITTEDTO AN OFFICIAL STOCK EXCHANGE LISTING NOR DEALT INON ANOTHER REGULATED MARKET 804,946 0.21
A A
TOTAL INVESTMENTS 200,348,682 52.75A A
A A
� Floating Rates are indicated as at December 31, 2008
FRANKL IN TEMPLETON INVESTMENT FUNDS
ç Franklin Templeton Global Fundamental Strategies Fund ç
Schedule of Investments as of December 31, 2008 (continued)
(Currency ç USD)
Number of % of
shares or Description Country Trading Market net
face value code currency value assets
Unaudited Semi-Annual Report www.franklintempleton.lu166
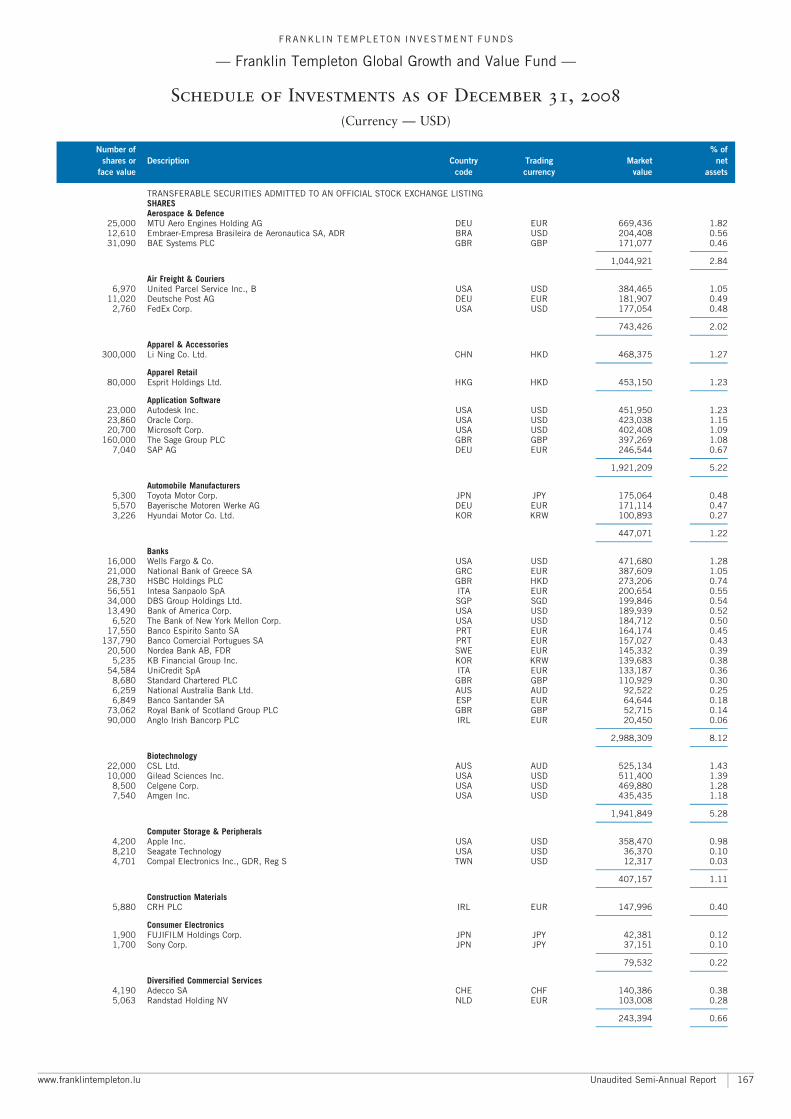
TRANSFERABLE SECURITIES ADMITTED TO AN OFFICIAL STOCK EXCHANGE LISTINGSHARESAerospace & Defence
25,000 MTU Aero Engines Holding AG DEU EUR 669,436 1.8212,610 Embraer-Empresa Brasileira de Aeronautica SA, ADR BRA USD 204,408 0.5631,090 BAE Systems PLC GBR GBP 171,077 0.46
A A
1,044,921 2.84A A
Air Freight & Couriers6,970 United Parcel Service Inc., B USA USD 384,465 1.05
11,020 Deutsche Post AG DEU EUR 181,907 0.492,760 FedEx Corp. USA USD 177,054 0.48
A A
743,426 2.02A A
Apparel & Accessories300,000 Li Ning Co. Ltd. CHN HKD 468,375 1.27
A A
Apparel Retail80,000 Esprit Holdings Ltd. HKG HKD 453,150 1.23
A A
Application Software23,000 Autodesk Inc. USA USD 451,950 1.2323,860 Oracle Corp. USA USD 423,038 1.1520,700 Microsoft Corp. USA USD 402,408 1.09
160,000 The Sage Group PLC GBR GBP 397,269 1.087,040 SAP AG DEU EUR 246,544 0.67
A A
1,921,209 5.22A A
Automobile Manufacturers5,300 Toyota Motor Corp. JPN JPY 175,064 0.485,570 Bayerische Motoren Werke AG DEU EUR 171,114 0.473,226 Hyundai Motor Co. Ltd. KOR KRW 100,893 0.27
A A
447,071 1.22A A
Banks16,000 Wells Fargo & Co. USA USD 471,680 1.2821,000 National Bank of Greece SA GRC EUR 387,609 1.0528,730 HSBC Holdings PLC GBR HKD 273,206 0.7456,551 Intesa Sanpaolo SpA ITA EUR 200,654 0.5534,000 DBS Group Holdings Ltd. SGP SGD 199,846 0.5413,490 Bank of America Corp. USA USD 189,939 0.52
6,520 The Bank of New York Mellon Corp. USA USD 184,712 0.5017,550 Banco Espirito Santo SA PRT EUR 164,174 0.45
137,790 Banco Comercial Portugues SA PRT EUR 157,027 0.4320,500 Nordea Bank AB, FDR SWE EUR 145,332 0.39
5,235 KB Financial Group Inc. KOR KRW 139,683 0.3854,584 UniCredit SpA ITA EUR 133,187 0.36
8,680 Standard Chartered PLC GBR GBP 110,929 0.306,259 National Australia Bank Ltd. AUS AUD 92,522 0.256,849 Banco Santander SA ESP EUR 64,644 0.18
73,062 Royal Bank of Scotland Group PLC GBR GBP 52,715 0.1490,000 Anglo Irish Bancorp PLC IRL EUR 20,450 0.06
A A
2,988,309 8.12A A
Biotechnology22,000 CSL Ltd. AUS AUD 525,134 1.4310,000 Gilead Sciences Inc. USA USD 511,400 1.39
8,500 Celgene Corp. USA USD 469,880 1.287,540 Amgen Inc. USA USD 435,435 1.18
A A
1,941,849 5.28A A
Computer Storage & Peripherals4,200 Apple Inc. USA USD 358,470 0.988,210 Seagate Technology USA USD 36,370 0.104,701 Compal Electronics Inc., GDR, Reg S TWN USD 12,317 0.03
A A
407,157 1.11A A
Construction Materials5,880 CRH PLC IRL EUR 147,996 0.40
A A
Consumer Electronics1,900 FUJIFILM Holdings Corp. JPN JPY 42,381 0.121,700 Sony Corp. JPN JPY 37,151 0.10
A A
79,532 0.22A A
Diversified Commercial Services4,190 Adecco SA CHE CHF 140,386 0.385,063 Randstad Holding NV NLD EUR 103,008 0.28
A A
243,394 0.66A A
FRANKL IN TEMPLETON INVESTMENT FUNDS
ç Franklin Templeton Global Growth and Value Fund ç
Schedule of Investments as of December 31, 2008
(Currency ç USD)
Number of % of
shares or Description Country Trading Market net
face value code currency value assets
www.franklintempleton.lu Unaudited Semi-Annual Report 167
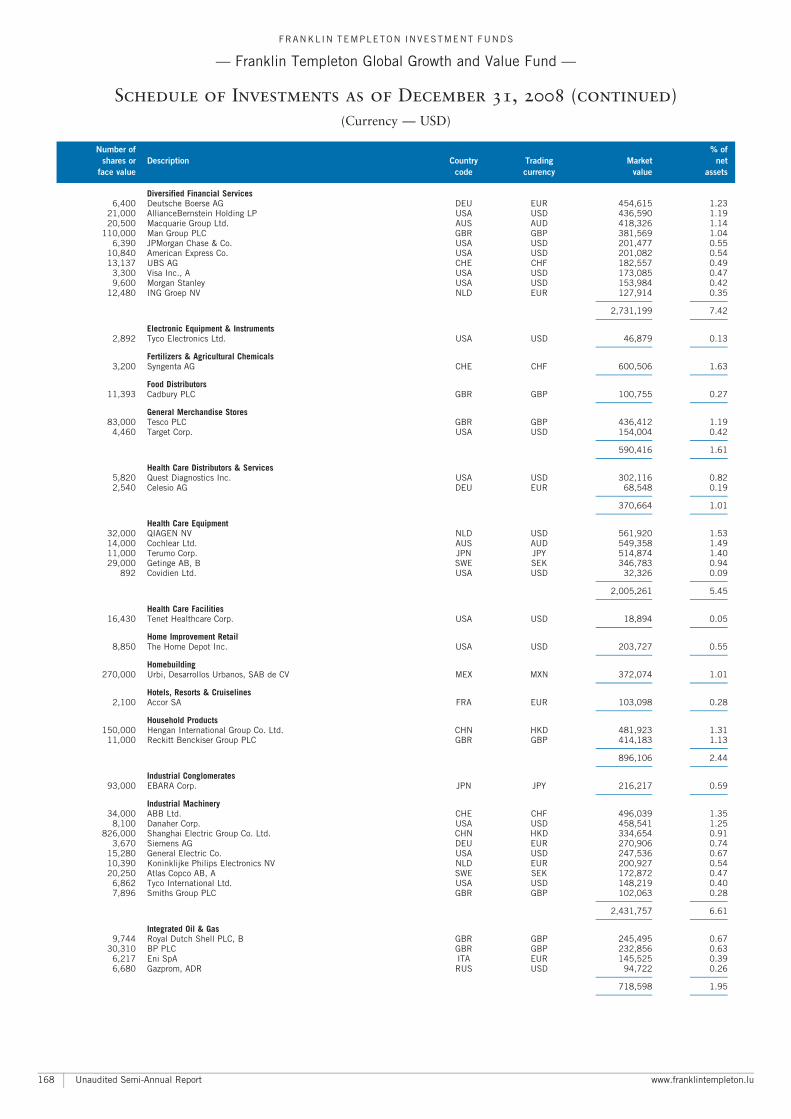
Diversified Financial Services6,400 Deutsche Boerse AG DEU EUR 454,615 1.23
21,000 AllianceBernstein Holding LP USA USD 436,590 1.1920,500 Macquarie Group Ltd. AUS AUD 418,326 1.14
110,000 Man Group PLC GBR GBP 381,569 1.046,390 JPMorgan Chase & Co. USA USD 201,477 0.55
10,840 American Express Co. USA USD 201,082 0.5413,137 UBS AG CHE CHF 182,557 0.49
3,300 Visa Inc., A USA USD 173,085 0.479,600 Morgan Stanley USA USD 153,984 0.42
12,480 ING Groep NV NLD EUR 127,914 0.35A A
2,731,199 7.42A A
Electronic Equipment & Instruments2,892 Tyco Electronics Ltd. USA USD 46,879 0.13
A A
Fertilizers & Agricultural Chemicals3,200 Syngenta AG CHE CHF 600,506 1.63
A A
Food Distributors11,393 Cadbury PLC GBR GBP 100,755 0.27
A A
General Merchandise Stores83,000 Tesco PLC GBR GBP 436,412 1.19
4,460 Target Corp. USA USD 154,004 0.42A A
590,416 1.61A A
Health Care Distributors & Services5,820 Quest Diagnostics Inc. USA USD 302,116 0.822,540 Celesio AG DEU EUR 68,548 0.19
A A
370,664 1.01A A
Health Care Equipment32,000 QIAGEN NV NLD USD 561,920 1.5314,000 Cochlear Ltd. AUS AUD 549,358 1.4911,000 Terumo Corp. JPN JPY 514,874 1.4029,000 Getinge AB, B SWE SEK 346,783 0.94
892 Covidien Ltd. USA USD 32,326 0.09A A
2,005,261 5.45A A
Health Care Facilities16,430 Tenet Healthcare Corp. USA USD 18,894 0.05
A A
Home Improvement Retail8,850 The Home Depot Inc. USA USD 203,727 0.55
A A
Homebuilding270,000 Urbi, Desarrollos Urbanos, SAB de CV MEX MXN 372,074 1.01
A A
Hotels, Resorts & Cruiselines2,100 Accor SA FRA EUR 103,098 0.28
A A
Household Products150,000 Hengan International Group Co. Ltd. CHN HKD 481,923 1.31
11,000 Reckitt Benckiser Group PLC GBR GBP 414,183 1.13A A
896,106 2.44A A
Industrial Conglomerates93,000 EBARA Corp. JPN JPY 216,217 0.59
A A
Industrial Machinery34,000 ABB Ltd. CHE CHF 496,039 1.35
8,100 Danaher Corp. USA USD 458,541 1.25826,000 Shanghai Electric Group Co. Ltd. CHN HKD 334,654 0.91
3,670 Siemens AG DEU EUR 270,906 0.7415,280 General Electric Co. USA USD 247,536 0.6710,390 Koninklijke Philips Electronics NV NLD EUR 200,927 0.5420,250 Atlas Copco AB, A SWE SEK 172,872 0.47
6,862 Tyco International Ltd. USA USD 148,219 0.407,896 Smiths Group PLC GBR GBP 102,063 0.28
A A
2,431,757 6.61A A
Integrated Oil & Gas9,744 Royal Dutch Shell PLC, B GBR GBP 245,495 0.67
30,310 BP PLC GBR GBP 232,856 0.636,217 Eni SpA ITA EUR 145,525 0.396,680 Gazprom, ADR RUS USD 94,722 0.26
A A
718,598 1.95A A
FRANKL IN TEMPLETON INVESTMENT FUNDS
ç Franklin Templeton Global Growth and Value Fund ç
Schedule of Investments as of December 31, 2008 (continued)
(Currency ç USD)
Number of % of
shares or Description Country Trading Market net
face value code currency value assets
Unaudited Semi-Annual Report www.franklintempleton.lu168
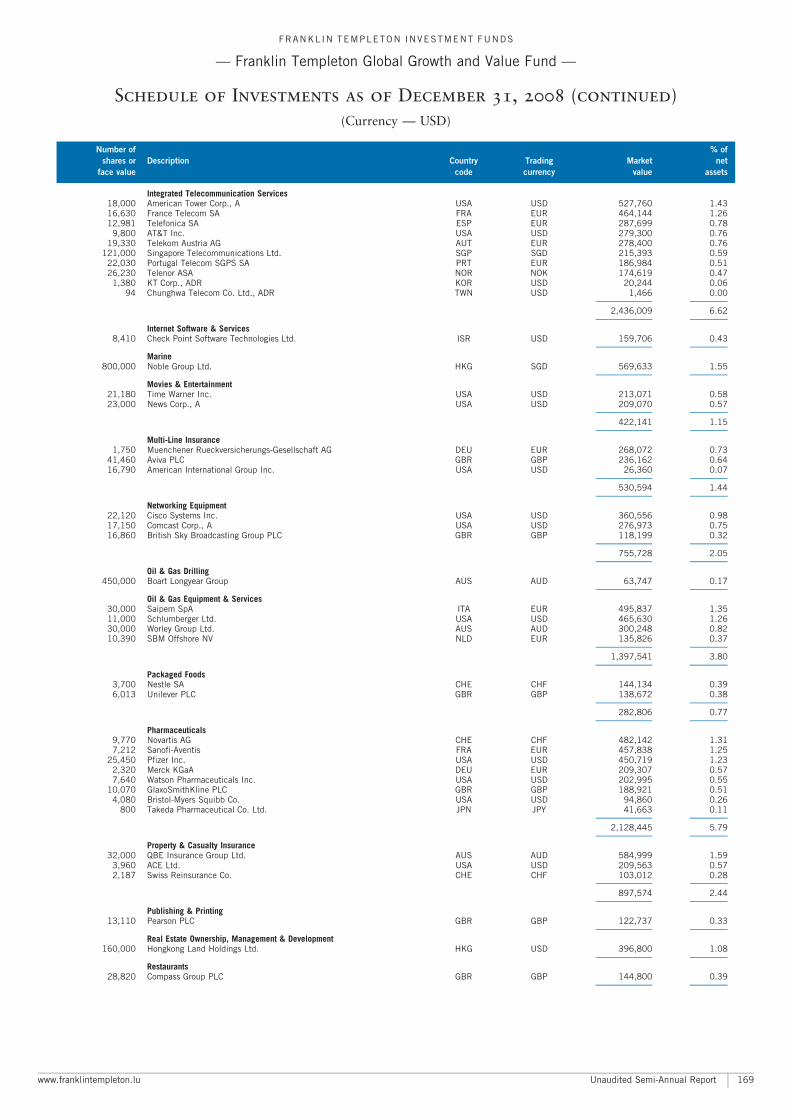
Integrated Telecommunication Services18,000 American Tower Corp., A USA USD 527,760 1.4316,630 France Telecom SA FRA EUR 464,144 1.2612,981 Telefonica SA ESP EUR 287,699 0.78
9,800 AT&T Inc. USA USD 279,300 0.7619,330 Telekom Austria AG AUT EUR 278,400 0.76
121,000 Singapore Telecommunications Ltd. SGP SGD 215,393 0.5922,030 Portugal Telecom SGPS SA PRT EUR 186,984 0.5126,230 Telenor ASA NOR NOK 174,619 0.47
1,380 KT Corp., ADR KOR USD 20,244 0.0694 Chunghwa Telecom Co. Ltd., ADR TWN USD 1,466 0.00
A A
2,436,009 6.62A A
Internet Software & Services8,410 Check Point Software Technologies Ltd. ISR USD 159,706 0.43
A A
Marine800,000 Noble Group Ltd. HKG SGD 569,633 1.55
A A
Movies & Entertainment21,180 Time Warner Inc. USA USD 213,071 0.5823,000 News Corp., A USA USD 209,070 0.57
A A
422,141 1.15A A
Multi-Line Insurance1,750 Muenchener Rueckversicherungs-Gesellschaft AG DEU EUR 268,072 0.73
41,460 Aviva PLC GBR GBP 236,162 0.6416,790 American International Group Inc. USA USD 26,360 0.07
A A
530,594 1.44A A
Networking Equipment22,120 Cisco Systems Inc. USA USD 360,556 0.9817,150 Comcast Corp., A USA USD 276,973 0.7516,860 British Sky Broadcasting Group PLC GBR GBP 118,199 0.32
A A
755,728 2.05A A
Oil & Gas Drilling450,000 Boart Longyear Group AUS AUD 63,747 0.17
A A
Oil & Gas Equipment & Services30,000 Saipem SpA ITA EUR 495,837 1.3511,000 Schlumberger Ltd. USA USD 465,630 1.2630,000 Worley Group Ltd. AUS AUD 300,248 0.8210,390 SBM Offshore NV NLD EUR 135,826 0.37
A A
1,397,541 3.80A A
Packaged Foods3,700 Nestle SA CHE CHF 144,134 0.396,013 Unilever PLC GBR GBP 138,672 0.38
A A
282,806 0.77A A
Pharmaceuticals9,770 Novartis AG CHE CHF 482,142 1.317,212 Sanofi-Aventis FRA EUR 457,838 1.25
25,450 Pfizer Inc. USA USD 450,719 1.232,320 Merck KGaA DEU EUR 209,307 0.577,640 Watson Pharmaceuticals Inc. USA USD 202,995 0.55
10,070 GlaxoSmithKline PLC GBR GBP 188,921 0.514,080 Bristol-Myers Squibb Co. USA USD 94,860 0.26
800 Takeda Pharmaceutical Co. Ltd. JPN JPY 41,663 0.11A A
2,128,445 5.79A A
Property & Casualty Insurance32,000 QBE Insurance Group Ltd. AUS AUD 584,999 1.59
3,960 ACE Ltd. USA USD 209,563 0.572,187 Swiss Reinsurance Co. CHE CHF 103,012 0.28
A A
897,574 2.44A A
Publishing & Printing13,110 Pearson PLC GBR GBP 122,737 0.33
A A
Real Estate Ownership, Management & Development160,000 Hongkong Land Holdings Ltd. HKG USD 396,800 1.08
A A
Restaurants28,820 Compass Group PLC GBR GBP 144,800 0.39
A A
FRANKL IN TEMPLETON INVESTMENT FUNDS
ç Franklin Templeton Global Growth and Value Fund ç
Schedule of Investments as of December 31, 2008 (continued)
(Currency ç USD)
Number of % of
shares or Description Country Trading Market net
face value code currency value assets
www.franklintempleton.lu Unaudited Semi-Annual Report 169
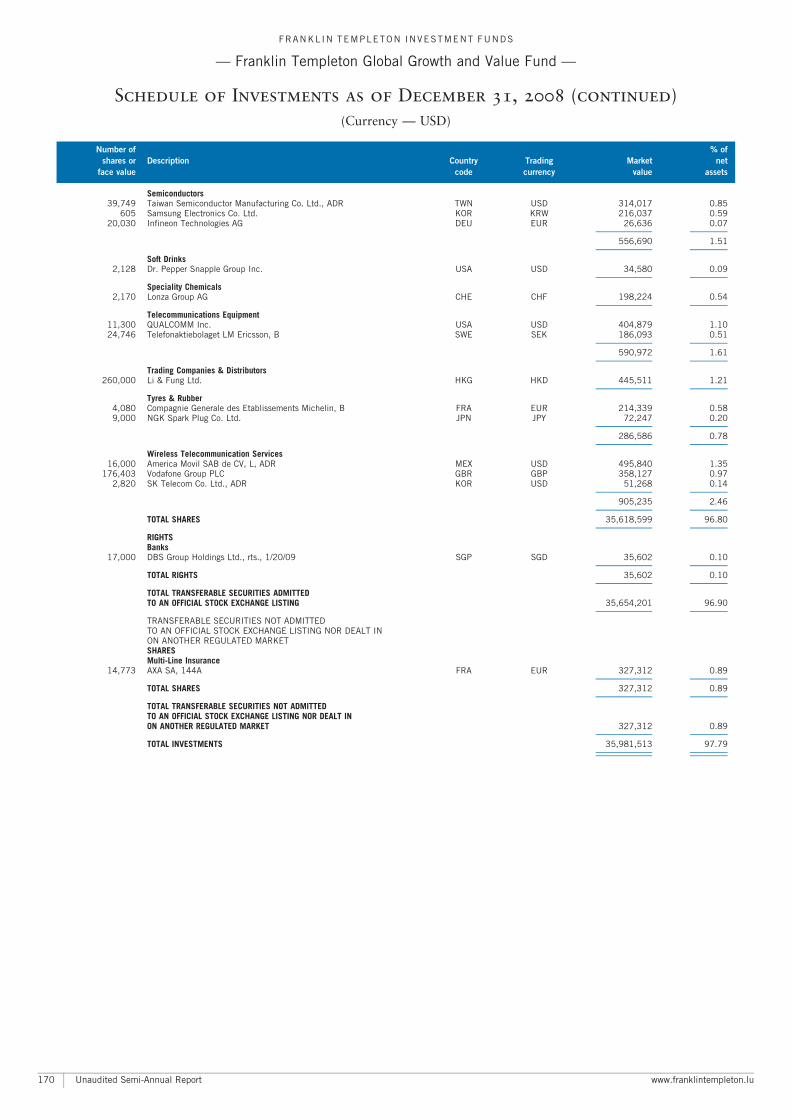
Semiconductors39,749 Taiwan Semiconductor Manufacturing Co. Ltd., ADR TWN USD 314,017 0.85
605 Samsung Electronics Co. Ltd. KOR KRW 216,037 0.5920,030 Infineon Technologies AG DEU EUR 26,636 0.07
A A
556,690 1.51A A
Soft Drinks2,128 Dr. Pepper Snapple Group Inc. USA USD 34,580 0.09
A A
Speciality Chemicals2,170 Lonza Group AG CHE CHF 198,224 0.54
A A
Telecommunications Equipment11,300 QUALCOMM Inc. USA USD 404,879 1.1024,746 Telefonaktiebolaget LM Ericsson, B SWE SEK 186,093 0.51
A A
590,972 1.61A A
Trading Companies & Distributors260,000 Li & Fung Ltd. HKG HKD 445,511 1.21
A A
Tyres & Rubber4,080 Compagnie Generale des Etablissements Michelin, B FRA EUR 214,339 0.589,000 NGK Spark Plug Co. Ltd. JPN JPY 72,247 0.20
A A
286,586 0.78A A
Wireless Telecommunication Services16,000 America Movil SAB de CV, L, ADR MEX USD 495,840 1.35
176,403 Vodafone Group PLC GBR GBP 358,127 0.972,820 SK Telecom Co. Ltd., ADR KOR USD 51,268 0.14
A A
905,235 2.46A A
TOTAL SHARES 35,618,599 96.80A A
RIGHTSBanks
17,000 DBS Group Holdings Ltd., rts., 1/20/09 SGP SGD 35,602 0.10A A
TOTAL RIGHTS 35,602 0.10A A
TOTAL TRANSFERABLE SECURITIES ADMITTEDTO AN OFFICIAL STOCK EXCHANGE LISTING 35,654,201 96.90
A A
TRANSFERABLE SECURITIES NOT ADMITTEDTO AN OFFICIAL STOCK EXCHANGE LISTING NOR DEALT INON ANOTHER REGULATED MARKETSHARESMulti-Line Insurance
14,773 AXA SA, 144A FRA EUR 327,312 0.89A A
TOTAL SHARES 327,312 0.89A A
TOTAL TRANSFERABLE SECURITIES NOT ADMITTEDTO AN OFFICIAL STOCK EXCHANGE LISTING NOR DEALT INON ANOTHER REGULATED MARKET 327,312 0.89
A A
TOTAL INVESTMENTS 35,981,513 97.79A A
A A
FRANKL IN TEMPLETON INVESTMENT FUNDS
ç Franklin Templeton Global Growth and Value Fund ç
Schedule of Investments as of December 31, 2008 (continued)
(Currency ç USD)
Number of % of
shares or Description Country Trading Market net
face value code currency value assets
Unaudited Semi-Annual Report www.franklintempleton.lu170
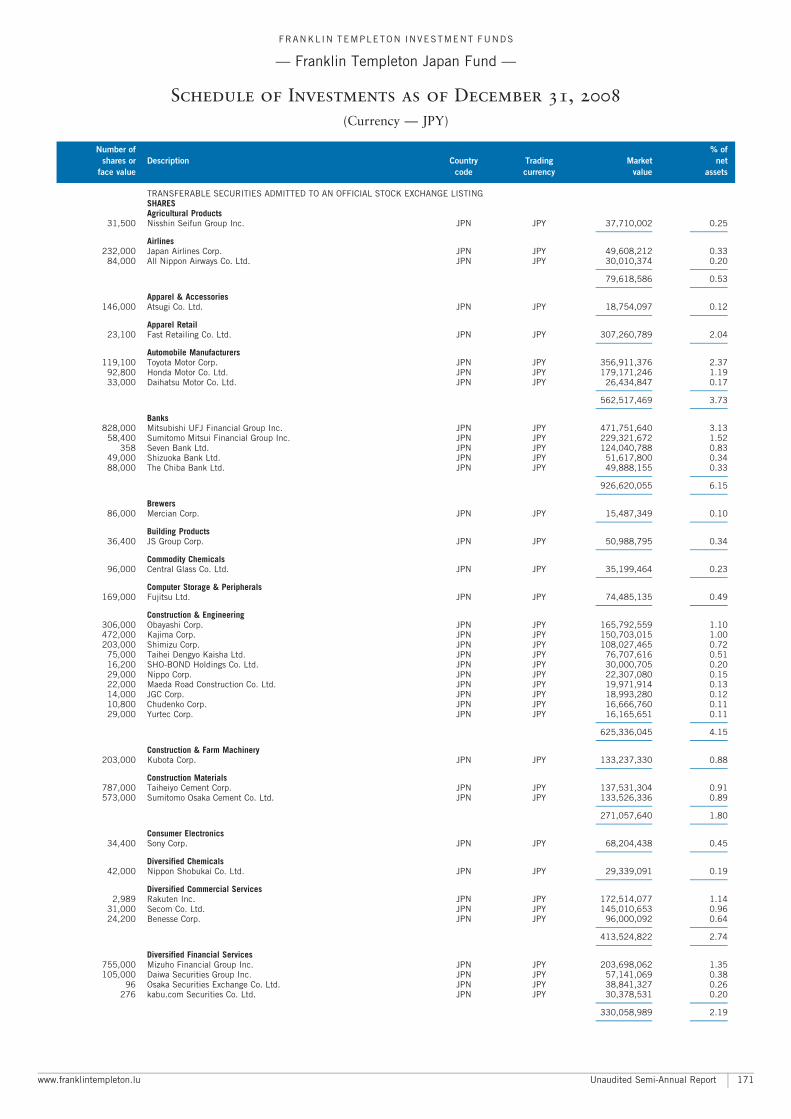
TRANSFERABLE SECURITIES ADMITTED TO AN OFFICIAL STOCK EXCHANGE LISTINGSHARESAgricultural Products
31,500 Nisshin Seifun Group Inc. JPN JPY 37,710,002 0.25A A
Airlines232,000 Japan Airlines Corp. JPN JPY 49,608,212 0.33
84,000 All Nippon Airways Co. Ltd. JPN JPY 30,010,374 0.20A A
79,618,586 0.53A A
Apparel & Accessories146,000 Atsugi Co. Ltd. JPN JPY 18,754,097 0.12
A A
Apparel Retail23,100 Fast Retailing Co. Ltd. JPN JPY 307,260,789 2.04
A A
Automobile Manufacturers119,100 Toyota Motor Corp. JPN JPY 356,911,376 2.37
92,800 Honda Motor Co. Ltd. JPN JPY 179,171,246 1.1933,000 Daihatsu Motor Co. Ltd. JPN JPY 26,434,847 0.17
A A
562,517,469 3.73A A
Banks828,000 Mitsubishi UFJ Financial Group Inc. JPN JPY 471,751,640 3.13
58,400 Sumitomo Mitsui Financial Group Inc. JPN JPY 229,321,672 1.52358 Seven Bank Ltd. JPN JPY 124,040,788 0.83
49,000 Shizuoka Bank Ltd. JPN JPY 51,617,800 0.3488,000 The Chiba Bank Ltd. JPN JPY 49,888,155 0.33
A A
926,620,055 6.15A A
Brewers86,000 Mercian Corp. JPN JPY 15,487,349 0.10
A A
Building Products36,400 JS Group Corp. JPN JPY 50,988,795 0.34
A A
Commodity Chemicals96,000 Central Glass Co. Ltd. JPN JPY 35,199,464 0.23
A A
Computer Storage & Peripherals169,000 Fujitsu Ltd. JPN JPY 74,485,135 0.49
A A
Construction & Engineering306,000 Obayashi Corp. JPN JPY 165,792,559 1.10472,000 Kajima Corp. JPN JPY 150,703,015 1.00203,000 Shimizu Corp. JPN JPY 108,027,465 0.72
75,000 Taihei Dengyo Kaisha Ltd. JPN JPY 76,707,616 0.5116,200 SHO-BOND Holdings Co. Ltd. JPN JPY 30,000,705 0.2029,000 Nippo Corp. JPN JPY 22,307,080 0.1522,000 Maeda Road Construction Co. Ltd. JPN JPY 19,971,914 0.1314,000 JGC Corp. JPN JPY 18,993,280 0.1210,800 Chudenko Corp. JPN JPY 16,666,760 0.1129,000 Yurtec Corp. JPN JPY 16,165,651 0.11
A A
625,336,045 4.15A A
Construction & Farm Machinery203,000 Kubota Corp. JPN JPY 133,237,330 0.88
A A
Construction Materials787,000 Taiheiyo Cement Corp. JPN JPY 137,531,304 0.91573,000 Sumitomo Osaka Cement Co. Ltd. JPN JPY 133,526,336 0.89
A A
271,057,640 1.80A A
Consumer Electronics34,400 Sony Corp. JPN JPY 68,204,438 0.45
A A
Diversified Chemicals42,000 Nippon Shobukai Co. Ltd. JPN JPY 29,339,091 0.19
A A
Diversified Commercial Services2,989 Rakuten Inc. JPN JPY 172,514,077 1.14
31,000 Secom Co. Ltd. JPN JPY 145,010,653 0.9624,200 Benesse Corp. JPN JPY 96,000,092 0.64
A A
413,524,822 2.74A A
Diversified Financial Services755,000 Mizuho Financial Group Inc. JPN JPY 203,698,062 1.35105,000 Daiwa Securities Group Inc. JPN JPY 57,141,069 0.38
96 Osaka Securities Exchange Co. Ltd. JPN JPY 38,841,327 0.26276 kabu.com Securities Co. Ltd. JPN JPY 30,378,531 0.20
A A
330,058,989 2.19A A
FRANKL IN TEMPLETON INVESTMENT FUNDS
ç Franklin Templeton Japan Fund ç
Schedule of Investments as of December 31, 2008
(Currency ç JPY)
Number of % of
shares or Description Country Trading Market net
face value code currency value assets
www.franklintempleton.lu Unaudited Semi-Annual Report 171
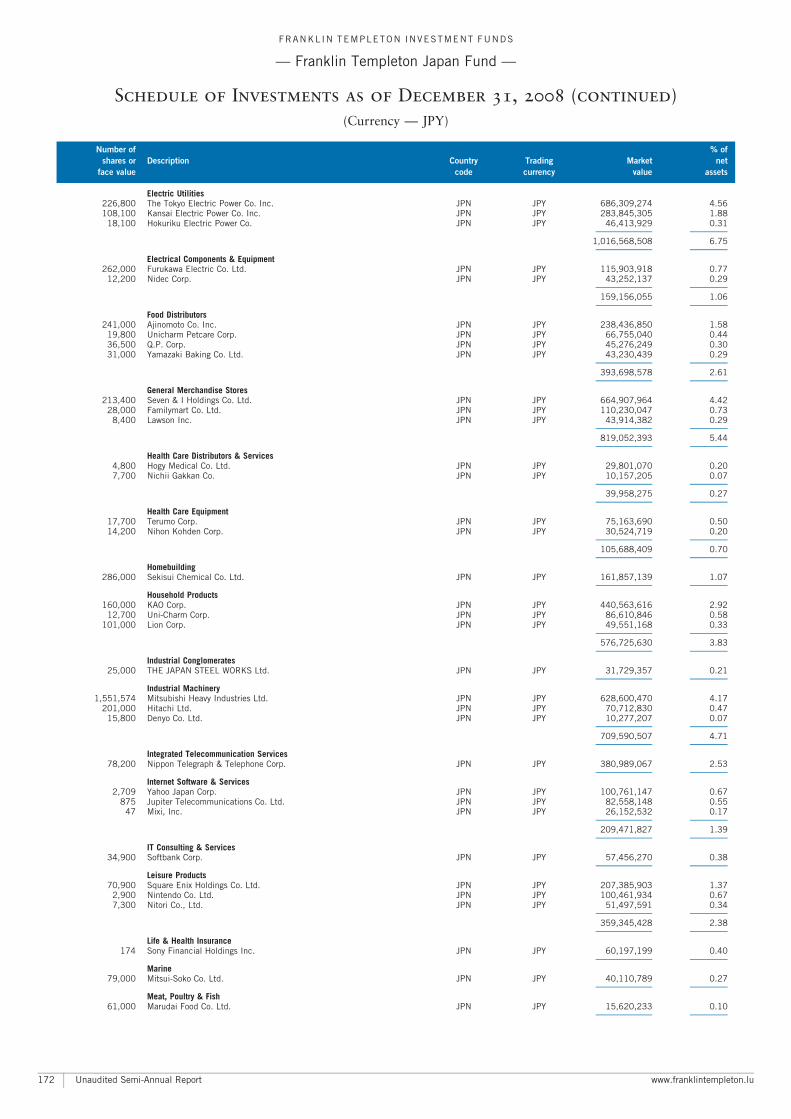
Electric Utilities226,800 The Tokyo Electric Power Co. Inc. JPN JPY 686,309,274 4.56108,100 Kansai Electric Power Co. Inc. JPN JPY 283,845,305 1.88
18,100 Hokuriku Electric Power Co. JPN JPY 46,413,929 0.31A A
1,016,568,508 6.75A A
Electrical Components & Equipment262,000 Furukawa Electric Co. Ltd. JPN JPY 115,903,918 0.77
12,200 Nidec Corp. JPN JPY 43,252,137 0.29A A
159,156,055 1.06A A
Food Distributors241,000 Ajinomoto Co. Inc. JPN JPY 238,436,850 1.58
19,800 Unicharm Petcare Corp. JPN JPY 66,755,040 0.4436,500 Q.P. Corp. JPN JPY 45,276,249 0.3031,000 Yamazaki Baking Co. Ltd. JPN JPY 43,230,439 0.29
A A
393,698,578 2.61A A
General Merchandise Stores213,400 Seven & I Holdings Co. Ltd. JPN JPY 664,907,964 4.42
28,000 Familymart Co. Ltd. JPN JPY 110,230,047 0.738,400 Lawson Inc. JPN JPY 43,914,382 0.29
A A
819,052,393 5.44A A
Health Care Distributors & Services4,800 Hogy Medical Co. Ltd. JPN JPY 29,801,070 0.207,700 Nichii Gakkan Co. JPN JPY 10,157,205 0.07
A A
39,958,275 0.27A A
Health Care Equipment17,700 Terumo Corp. JPN JPY 75,163,690 0.5014,200 Nihon Kohden Corp. JPN JPY 30,524,719 0.20
A A
105,688,409 0.70A A
Homebuilding286,000 Sekisui Chemical Co. Ltd. JPN JPY 161,857,139 1.07
A A
Household Products160,000 KAO Corp. JPN JPY 440,563,616 2.92
12,700 Uni-Charm Corp. JPN JPY 86,610,846 0.58101,000 Lion Corp. JPN JPY 49,551,168 0.33
A A
576,725,630 3.83A A
Industrial Conglomerates25,000 THE JAPAN STEEL WORKS Ltd. JPN JPY 31,729,357 0.21
A A
Industrial Machinery1,551,574 Mitsubishi Heavy Industries Ltd. JPN JPY 628,600,470 4.17
201,000 Hitachi Ltd. JPN JPY 70,712,830 0.4715,800 Denyo Co. Ltd. JPN JPY 10,277,207 0.07
A A
709,590,507 4.71A A
Integrated Telecommunication Services78,200 Nippon Telegraph & Telephone Corp. JPN JPY 380,989,067 2.53
A A
Internet Software & Services2,709 Yahoo Japan Corp. JPN JPY 100,761,147 0.67
875 Jupiter Telecommunications Co. Ltd. JPN JPY 82,558,148 0.5547 Mixi, Inc. JPN JPY 26,152,532 0.17
A A
209,471,827 1.39A A
IT Consulting & Services34,900 Softbank Corp. JPN JPY 57,456,270 0.38
A A
Leisure Products70,900 Square Enix Holdings Co. Ltd. JPN JPY 207,385,903 1.37
2,900 Nintendo Co. Ltd. JPN JPY 100,461,934 0.677,300 Nitori Co., Ltd. JPN JPY 51,497,591 0.34
A A
359,345,428 2.38A A
Life & Health Insurance174 Sony Financial Holdings Inc. JPN JPY 60,197,199 0.40
A A
Marine79,000 Mitsui-Soko Co. Ltd. JPN JPY 40,110,789 0.27
A A
Meat, Poultry & Fish61,000 Marudai Food Co. Ltd. JPN JPY 15,620,233 0.10
A A
FRANKL IN TEMPLETON INVESTMENT FUNDS
ç Franklin Templeton Japan Fund ç
Schedule of Investments as of December 31, 2008 (continued)
(Currency ç JPY)
Number of % of
shares or Description Country Trading Market net
face value code currency value assets
Unaudited Semi-Annual Report www.franklintempleton.lu172
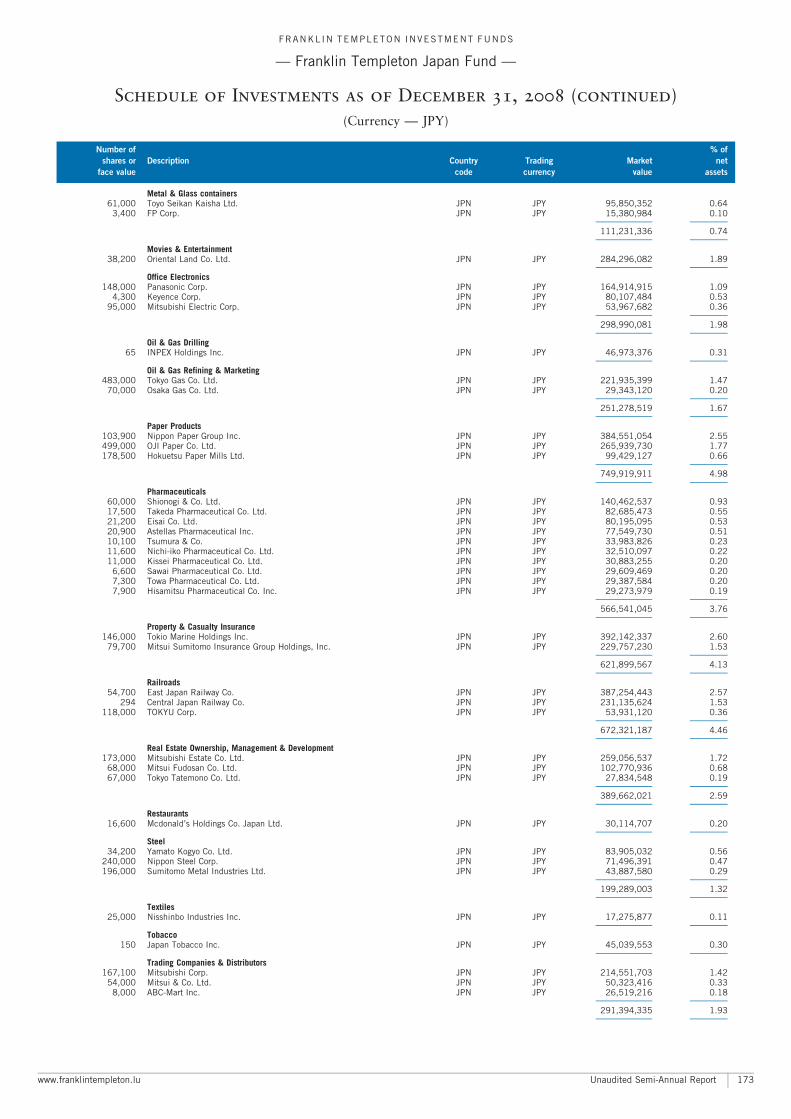
Metal & Glass containers61,000 Toyo Seikan Kaisha Ltd. JPN JPY 95,850,352 0.64
3,400 FP Corp. JPN JPY 15,380,984 0.10A A
111,231,336 0.74A A
Movies & Entertainment38,200 Oriental Land Co. Ltd. JPN JPY 284,296,082 1.89
A A
Office Electronics148,000 Panasonic Corp. JPN JPY 164,914,915 1.09
4,300 Keyence Corp. JPN JPY 80,107,484 0.5395,000 Mitsubishi Electric Corp. JPN JPY 53,967,682 0.36
A A
298,990,081 1.98A A
Oil & Gas Drilling65 INPEX Holdings Inc. JPN JPY 46,973,376 0.31
A A
Oil & Gas Refining & Marketing483,000 Tokyo Gas Co. Ltd. JPN JPY 221,935,399 1.47
70,000 Osaka Gas Co. Ltd. JPN JPY 29,343,120 0.20A A
251,278,519 1.67A A
Paper Products103,900 Nippon Paper Group Inc. JPN JPY 384,551,054 2.55499,000 OJI Paper Co. Ltd. JPN JPY 265,939,730 1.77178,500 Hokuetsu Paper Mills Ltd. JPN JPY 99,429,127 0.66
A A
749,919,911 4.98A A
Pharmaceuticals60,000 Shionogi & Co. Ltd. JPN JPY 140,462,537 0.9317,500 Takeda Pharmaceutical Co. Ltd. JPN JPY 82,685,473 0.5521,200 Eisai Co. Ltd. JPN JPY 80,195,095 0.5320,900 Astellas Pharmaceutical Inc. JPN JPY 77,549,730 0.5110,100 Tsumura & Co. JPN JPY 33,983,826 0.2311,600 Nichi-iko Pharmaceutical Co. Ltd. JPN JPY 32,510,097 0.2211,000 Kissei Pharmaceutical Co. Ltd. JPN JPY 30,883,255 0.20
6,600 Sawai Pharmaceutical Co. Ltd. JPN JPY 29,609,469 0.207,300 Towa Pharmaceutical Co. Ltd. JPN JPY 29,387,584 0.207,900 Hisamitsu Pharmaceutical Co. Inc. JPN JPY 29,273,979 0.19
A A
566,541,045 3.76A A
Property & Casualty Insurance146,000 Tokio Marine Holdings Inc. JPN JPY 392,142,337 2.60
79,700 Mitsui Sumitomo Insurance Group Holdings, Inc. JPN JPY 229,757,230 1.53A A
621,899,567 4.13A A
Railroads54,700 East Japan Railway Co. JPN JPY 387,254,443 2.57
294 Central Japan Railway Co. JPN JPY 231,135,624 1.53118,000 TOKYU Corp. JPN JPY 53,931,120 0.36
A A
672,321,187 4.46A A
Real Estate Ownership, Management & Development173,000 Mitsubishi Estate Co. Ltd. JPN JPY 259,056,537 1.72
68,000 Mitsui Fudosan Co. Ltd. JPN JPY 102,770,936 0.6867,000 Tokyo Tatemono Co. Ltd. JPN JPY 27,834,548 0.19
A A
389,662,021 2.59A A
Restaurants16,600 Mcdonald’s Holdings Co. Japan Ltd. JPN JPY 30,114,707 0.20
A A
Steel34,200 Yamato Kogyo Co. Ltd. JPN JPY 83,905,032 0.56
240,000 Nippon Steel Corp. JPN JPY 71,496,391 0.47196,000 Sumitomo Metal Industries Ltd. JPN JPY 43,887,580 0.29
A A
199,289,003 1.32A A
Textiles25,000 Nisshinbo Industries Inc. JPN JPY 17,275,877 0.11
A A
Tobacco150 Japan Tobacco Inc. JPN JPY 45,039,553 0.30
A A
Trading Companies & Distributors167,100 Mitsubishi Corp. JPN JPY 214,551,703 1.42
54,000 Mitsui & Co. Ltd. JPN JPY 50,323,416 0.338,000 ABC-Mart Inc. JPN JPY 26,519,216 0.18
A A
291,394,335 1.93A A
FRANKL IN TEMPLETON INVESTMENT FUNDS
ç Franklin Templeton Japan Fund ç
Schedule of Investments as of December 31, 2008 (continued)
(Currency ç JPY)
Number of % of
shares or Description Country Trading Market net
face value code currency value assets
www.franklintempleton.lu Unaudited Semi-Annual Report 173
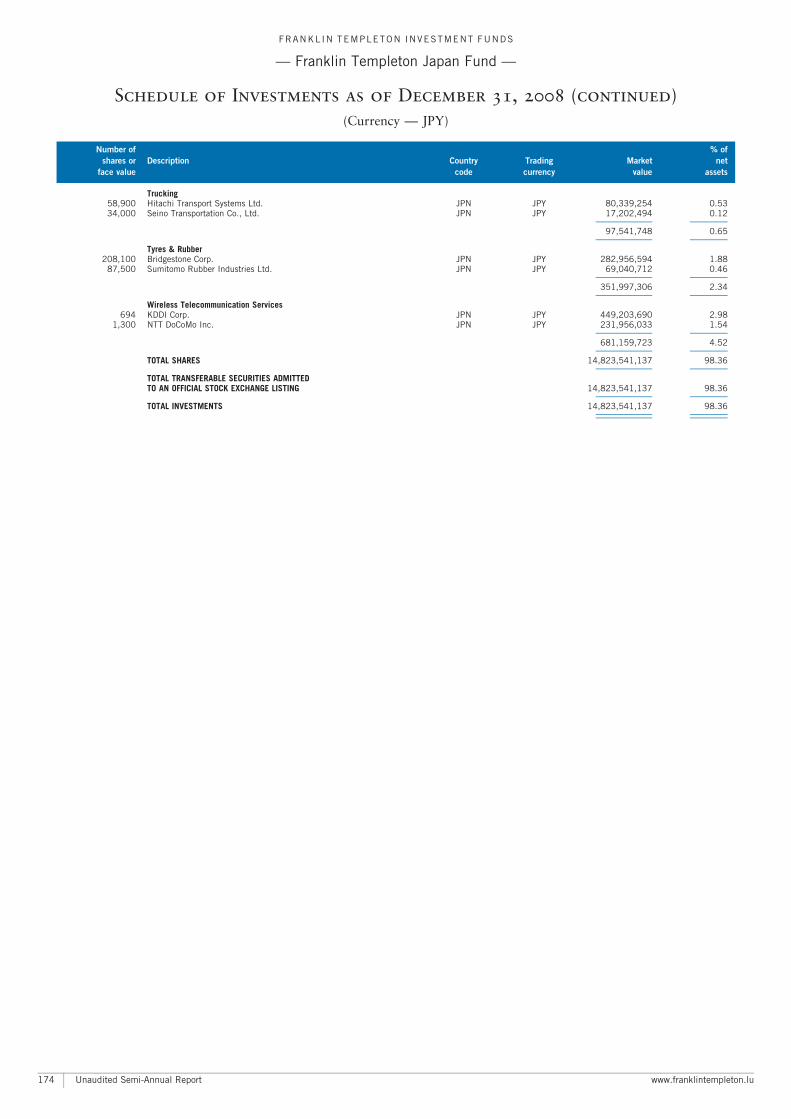
Trucking58,900 Hitachi Transport Systems Ltd. JPN JPY 80,339,254 0.5334,000 Seino Transportation Co., Ltd. JPN JPY 17,202,494 0.12
A A
97,541,748 0.65A A
Tyres & Rubber208,100 Bridgestone Corp. JPN JPY 282,956,594 1.88
87,500 Sumitomo Rubber Industries Ltd. JPN JPY 69,040,712 0.46A A
351,997,306 2.34A A
Wireless Telecommunication Services694 KDDI Corp. JPN JPY 449,203,690 2.98
1,300 NTT DoCoMo Inc. JPN JPY 231,956,033 1.54A A
681,159,723 4.52A A
TOTAL SHARES 14,823,541,137 98.36A A
TOTAL TRANSFERABLE SECURITIES ADMITTEDTO AN OFFICIAL STOCK EXCHANGE LISTING 14,823,541,137 98.36
A A
TOTAL INVESTMENTS 14,823,541,137 98.36A A
A A
FRANKL IN TEMPLETON INVESTMENT FUNDS
ç Franklin Templeton Japan Fund ç
Schedule of Investments as of December 31, 2008 (continued)
(Currency ç JPY)
Number of % of
shares or Description Country Trading Market net
face value code currency value assets
Unaudited Semi-Annual Report www.franklintempleton.lu174
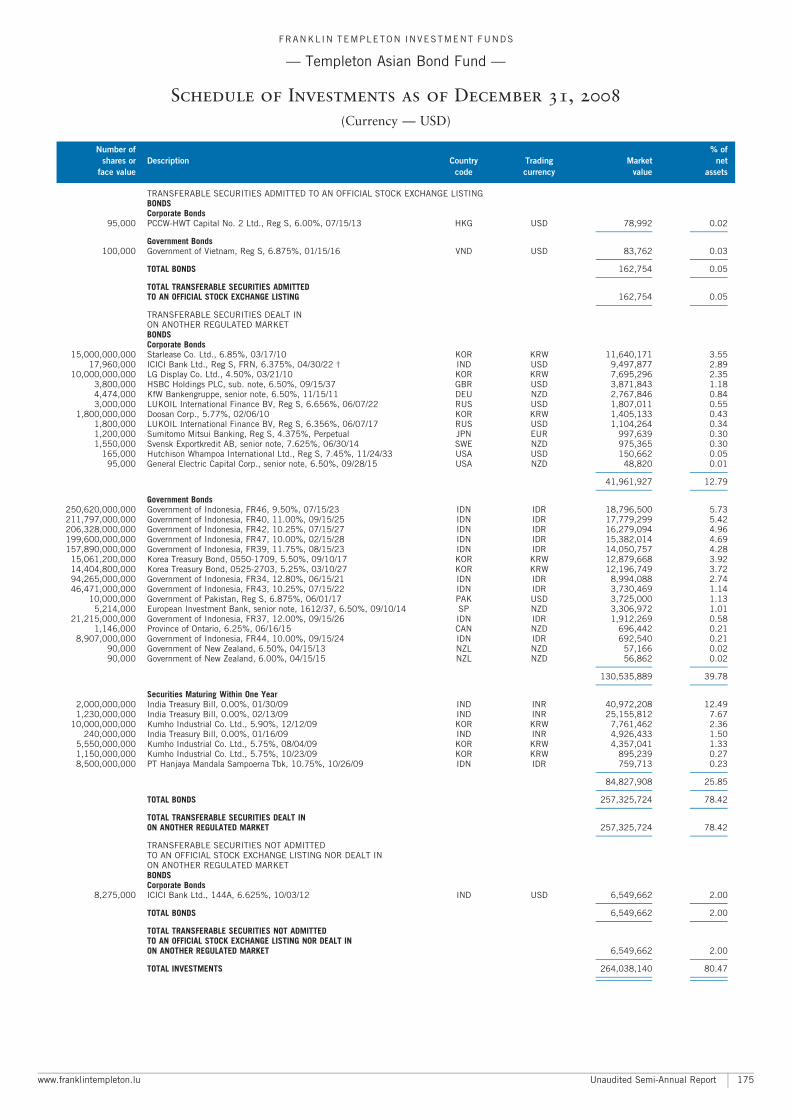
TRANSFERABLE SECURITIES ADMITTED TO AN OFFICIAL STOCK EXCHANGE LISTINGBONDSCorporate Bonds
95,000 PCCW-HWT Capital No. 2 Ltd., Reg S, 6.00%, 07/15/13 HKG USD 78,992 0.02A A
Government Bonds100,000 Government of Vietnam, Reg S, 6.875%, 01/15/16 VND USD 83,762 0.03
A A
TOTAL BONDS 162,754 0.05A A
TOTAL TRANSFERABLE SECURITIES ADMITTEDTO AN OFFICIAL STOCK EXCHANGE LISTING 162,754 0.05
A A
TRANSFERABLE SECURITIES DEALT INON ANOTHER REGULATED MARKETBONDSCorporate Bonds
15,000,000,000 Starlease Co. Ltd., 6.85%, 03/17/10 KOR KRW 11,640,171 3.5517,960,000 ICICI Bank Ltd., Reg S, FRN, 6.375%, 04/30/22 � IND USD 9,497,877 2.89
10,000,000,000 LG Display Co. Ltd., 4.50%, 03/21/10 KOR KRW 7,695,296 2.353,800,000 HSBC Holdings PLC, sub. note, 6.50%, 09/15/37 GBR USD 3,871,843 1.184,474,000 KfW Bankengruppe, senior note, 6.50%, 11/15/11 DEU NZD 2,767,846 0.843,000,000 LUKOIL International Finance BV, Reg S, 6.656%, 06/07/22 RUS USD 1,807,011 0.55
1,800,000,000 Doosan Corp., 5.77%, 02/06/10 KOR KRW 1,405,133 0.431,800,000 LUKOIL International Finance BV, Reg S, 6.356%, 06/07/17 RUS USD 1,104,264 0.341,200,000 Sumitomo Mitsui Banking, Reg S, 4.375%, Perpetual JPN EUR 997,639 0.301,550,000 Svensk Exportkredit AB, senior note, 7.625%, 06/30/14 SWE NZD 975,365 0.30
165,000 Hutchison Whampoa International Ltd., Reg S, 7.45%, 11/24/33 USA USD 150,662 0.0595,000 General Electric Capital Corp., senior note, 6.50%, 09/28/15 USA NZD 48,820 0.01
A A
41,961,927 12.79A A
Government Bonds250,620,000,000 Government of Indonesia, FR46, 9.50%, 07/15/23 IDN IDR 18,796,500 5.73211,797,000,000 Government of Indonesia, FR40, 11.00%, 09/15/25 IDN IDR 17,779,299 5.42206,328,000,000 Government of Indonesia, FR42, 10.25%, 07/15/27 IDN IDR 16,279,094 4.96199,600,000,000 Government of Indonesia, FR47, 10.00%, 02/15/28 IDN IDR 15,382,014 4.69157,890,000,000 Government of Indonesia, FR39, 11.75%, 08/15/23 IDN IDR 14,050,757 4.28
15,061,200,000 Korea Treasury Bond, 0550-1709, 5.50%, 09/10/17 KOR KRW 12,879,668 3.9214,404,800,000 Korea Treasury Bond, 0525-2703, 5.25%, 03/10/27 KOR KRW 12,196,749 3.7294,265,000,000 Government of Indonesia, FR34, 12.80%, 06/15/21 IDN IDR 8,994,088 2.7446,471,000,000 Government of Indonesia, FR43, 10.25%, 07/15/22 IDN IDR 3,730,469 1.14
10,000,000 Government of Pakistan, Reg S, 6.875%, 06/01/17 PAK USD 3,725,000 1.135,214,000 European Investment Bank, senior note, 1612/37, 6.50%, 09/10/14 SP NZD 3,306,972 1.01
21,215,000,000 Government of Indonesia, FR37, 12.00%, 09/15/26 IDN IDR 1,912,269 0.581,146,000 Province of Ontario, 6.25%, 06/16/15 CAN NZD 696,442 0.21
8,907,000,000 Government of Indonesia, FR44, 10.00%, 09/15/24 IDN IDR 692,540 0.2190,000 Government of New Zealand, 6.50%, 04/15/13 NZL NZD 57,166 0.0290,000 Government of New Zealand, 6.00%, 04/15/15 NZL NZD 56,862 0.02
A A
130,535,889 39.78A A
Securities Maturing Within One Year2,000,000,000 India Treasury Bill, 0.00%, 01/30/09 IND INR 40,972,208 12.491,230,000,000 India Treasury Bill, 0.00%, 02/13/09 IND INR 25,155,812 7.67
10,000,000,000 Kumho Industrial Co. Ltd., 5.90%, 12/12/09 KOR KRW 7,761,462 2.36240,000,000 India Treasury Bill, 0.00%, 01/16/09 IND INR 4,926,433 1.50
5,550,000,000 Kumho Industrial Co. Ltd., 5.75%, 08/04/09 KOR KRW 4,357,041 1.331,150,000,000 Kumho Industrial Co. Ltd., 5.75%, 10/23/09 KOR KRW 895,239 0.278,500,000,000 PT Hanjaya Mandala Sampoerna Tbk, 10.75%, 10/26/09 IDN IDR 759,713 0.23
A A
84,827,908 25.85A A
TOTAL BONDS 257,325,724 78.42A A
TOTAL TRANSFERABLE SECURITIES DEALT INON ANOTHER REGULATED MARKET 257,325,724 78.42
A A
TRANSFERABLE SECURITIES NOT ADMITTEDTO AN OFFICIAL STOCK EXCHANGE LISTING NOR DEALT INON ANOTHER REGULATED MARKETBONDSCorporate Bonds
8,275,000 ICICI Bank Ltd., 144A, 6.625%, 10/03/12 IND USD 6,549,662 2.00A A
TOTAL BONDS 6,549,662 2.00A A
TOTAL TRANSFERABLE SECURITIES NOT ADMITTEDTO AN OFFICIAL STOCK EXCHANGE LISTING NOR DEALT INON ANOTHER REGULATED MARKET 6,549,662 2.00
A A
TOTAL INVESTMENTS 264,038,140 80.47A A
A A
FRANKL IN TEMPLETON INVESTMENT FUNDS
ç Templeton Asian Bond Fund ç
Schedule of Investments as of December 31, 2008
(Currency ç USD)
Number of % of
shares or Description Country Trading Market net
face value code currency value assets
www.franklintempleton.lu Unaudited Semi-Annual Report 175
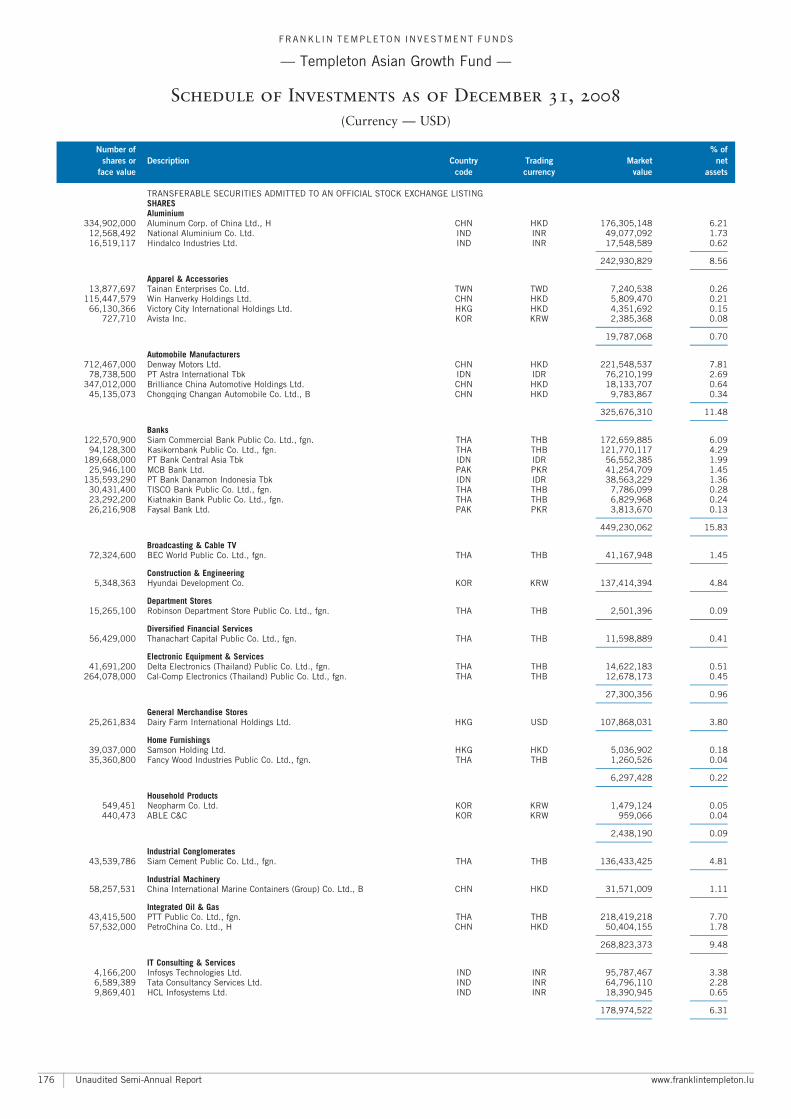
TRANSFERABLE SECURITIES ADMITTED TO AN OFFICIAL STOCK EXCHANGE LISTINGSHARESAluminium
334,902,000 Aluminum Corp. of China Ltd., H CHN HKD 176,305,148 6.2112,568,492 National Aluminium Co. Ltd. IND INR 49,077,092 1.7316,519,117 Hindalco Industries Ltd. IND INR 17,548,589 0.62
A A
242,930,829 8.56A A
Apparel & Accessories13,877,697 Tainan Enterprises Co. Ltd. TWN TWD 7,240,538 0.26
115,447,579 Win Hanverky Holdings Ltd. CHN HKD 5,809,470 0.2166,130,366 Victory City International Holdings Ltd. HKG HKD 4,351,692 0.15
727,710 Avista Inc. KOR KRW 2,385,368 0.08A A
19,787,068 0.70A A
Automobile Manufacturers712,467,000 Denway Motors Ltd. CHN HKD 221,548,537 7.81
78,738,500 PT Astra International Tbk IDN IDR 76,210,199 2.69347,012,000 Brilliance China Automotive Holdings Ltd. CHN HKD 18,133,707 0.64
45,135,073 Chongqing Changan Automobile Co. Ltd., B CHN HKD 9,783,867 0.34A A
325,676,310 11.48A A
Banks122,570,900 Siam Commercial Bank Public Co. Ltd., fgn. THA THB 172,659,885 6.09
94,128,300 Kasikornbank Public Co. Ltd., fgn. THA THB 121,770,117 4.29189,668,000 PT Bank Central Asia Tbk IDN IDR 56,552,385 1.99
25,946,100 MCB Bank Ltd. PAK PKR 41,254,709 1.45135,593,290 PT Bank Danamon Indonesia Tbk IDN IDR 38,563,229 1.36
30,431,400 TISCO Bank Public Co. Ltd., fgn. THA THB 7,786,099 0.2823,292,200 Kiatnakin Bank Public Co. Ltd., fgn. THA THB 6,829,968 0.2426,216,908 Faysal Bank Ltd. PAK PKR 3,813,670 0.13
A A
449,230,062 15.83A A
Broadcasting & Cable TV72,324,600 BEC World Public Co. Ltd., fgn. THA THB 41,167,948 1.45
A A
Construction & Engineering5,348,363 Hyundai Development Co. KOR KRW 137,414,394 4.84
A A
Department Stores15,265,100 Robinson Department Store Public Co. Ltd., fgn. THA THB 2,501,396 0.09
A A
Diversified Financial Services56,429,000 Thanachart Capital Public Co. Ltd., fgn. THA THB 11,598,889 0.41
A A
Electronic Equipment & Services41,691,200 Delta Electronics (Thailand) Public Co. Ltd., fgn. THA THB 14,622,183 0.51
264,078,000 Cal-Comp Electronics (Thailand) Public Co. Ltd., fgn. THA THB 12,678,173 0.45A A
27,300,356 0.96A A
General Merchandise Stores25,261,834 Dairy Farm International Holdings Ltd. HKG USD 107,868,031 3.80
A A
Home Furnishings39,037,000 Samson Holding Ltd. HKG HKD 5,036,902 0.1835,360,800 Fancy Wood Industries Public Co. Ltd., fgn. THA THB 1,260,526 0.04
A A
6,297,428 0.22A A
Household Products549,451 Neopharm Co. Ltd. KOR KRW 1,479,124 0.05440,473 ABLE C&C KOR KRW 959,066 0.04
A A
2,438,190 0.09A A
Industrial Conglomerates43,539,786 Siam Cement Public Co. Ltd., fgn. THA THB 136,433,425 4.81
A A
Industrial Machinery58,257,531 China International Marine Containers (Group) Co. Ltd., B CHN HKD 31,571,009 1.11
A A
Integrated Oil & Gas43,415,500 PTT Public Co. Ltd., fgn. THA THB 218,419,218 7.7057,532,000 PetroChina Co. Ltd., H CHN HKD 50,404,155 1.78
A A
268,823,373 9.48A A
IT Consulting & Services4,166,200 Infosys Technologies Ltd. IND INR 95,787,467 3.386,589,389 Tata Consultancy Services Ltd. IND INR 64,796,110 2.289,869,401 HCL Infosystems Ltd. IND INR 18,390,945 0.65
A A
178,974,522 6.31A A
FRANKL IN TEMPLETON INVESTMENT FUNDS
ç Templeton Asian Growth Fund ç
Schedule of Investments as of December 31, 2008
(Currency ç USD)
Number of % of
shares or Description Country Trading Market net
face value code currency value assets
Unaudited Semi-Annual Report www.franklintempleton.lu176
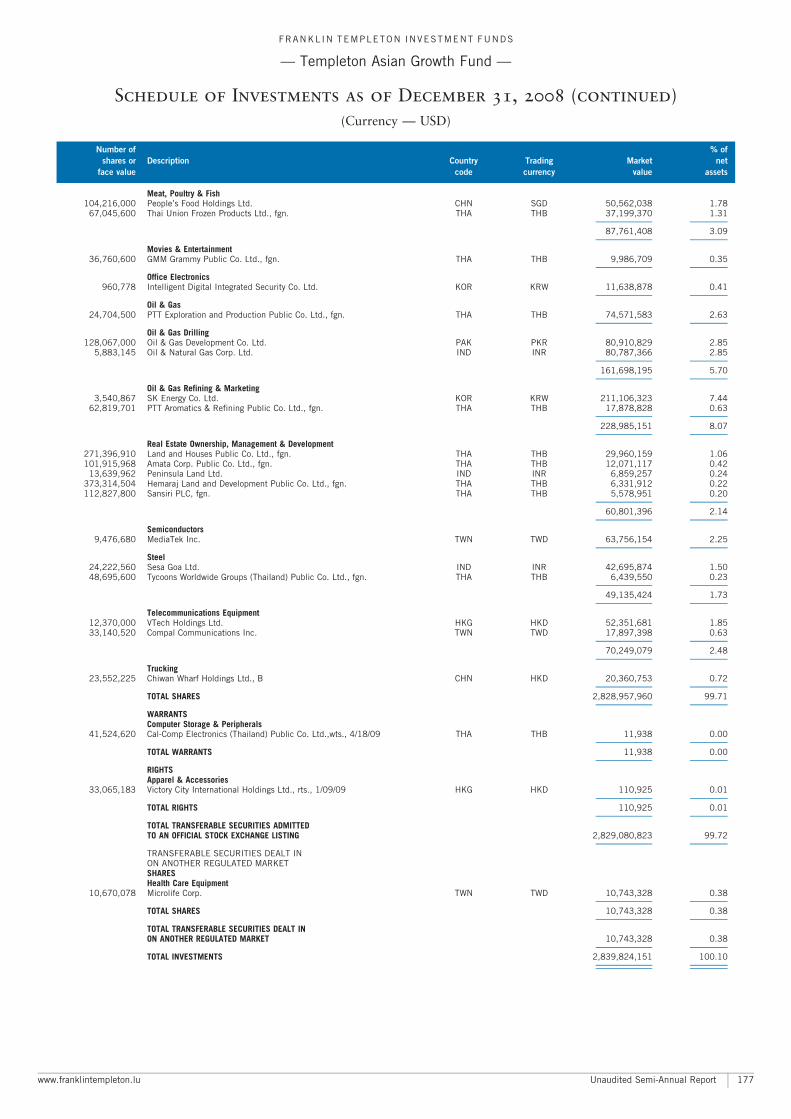
Meat, Poultry & Fish104,216,000 People’s Food Holdings Ltd. CHN SGD 50,562,038 1.78
67,045,600 Thai Union Frozen Products Ltd., fgn. THA THB 37,199,370 1.31A A
87,761,408 3.09A A
Movies & Entertainment36,760,600 GMM Grammy Public Co. Ltd., fgn. THA THB 9,986,709 0.35
A A
Office Electronics960,778 Intelligent Digital Integrated Security Co. Ltd. KOR KRW 11,638,878 0.41
A A
Oil & Gas24,704,500 PTT Exploration and Production Public Co. Ltd., fgn. THA THB 74,571,583 2.63
A A
Oil & Gas Drilling128,067,000 Oil & Gas Development Co. Ltd. PAK PKR 80,910,829 2.85
5,883,145 Oil & Natural Gas Corp. Ltd. IND INR 80,787,366 2.85A A
161,698,195 5.70A A
Oil & Gas Refining & Marketing3,540,867 SK Energy Co. Ltd. KOR KRW 211,106,323 7.44
62,819,701 PTT Aromatics & Refining Public Co. Ltd., fgn. THA THB 17,878,828 0.63A A
228,985,151 8.07A A
Real Estate Ownership, Management & Development271,396,910 Land and Houses Public Co. Ltd., fgn. THA THB 29,960,159 1.06101,915,968 Amata Corp. Public Co. Ltd., fgn. THA THB 12,071,117 0.42
13,639,962 Peninsula Land Ltd. IND INR 6,859,257 0.24373,314,504 Hemaraj Land and Development Public Co. Ltd., fgn. THA THB 6,331,912 0.22112,827,800 Sansiri PLC, fgn. THA THB 5,578,951 0.20
A A
60,801,396 2.14A A
Semiconductors9,476,680 MediaTek Inc. TWN TWD 63,756,154 2.25
A A
Steel24,222,560 Sesa Goa Ltd. IND INR 42,695,874 1.5048,695,600 Tycoons Worldwide Groups (Thailand) Public Co. Ltd., fgn. THA THB 6,439,550 0.23
A A
49,135,424 1.73A A
Telecommunications Equipment12,370,000 VTech Holdings Ltd. HKG HKD 52,351,681 1.8533,140,520 Compal Communications Inc. TWN TWD 17,897,398 0.63
A A
70,249,079 2.48A A
Trucking23,552,225 Chiwan Wharf Holdings Ltd., B CHN HKD 20,360,753 0.72
A A
TOTAL SHARES 2,828,957,960 99.71A A
WARRANTSComputer Storage & Peripherals
41,524,620 Cal-Comp Electronics (Thailand) Public Co. Ltd.,wts., 4/18/09 THA THB 11,938 0.00A A
TOTAL WARRANTS 11,938 0.00A A
RIGHTSApparel & Accessories
33,065,183 Victory City International Holdings Ltd., rts., 1/09/09 HKG HKD 110,925 0.01A A
TOTAL RIGHTS 110,925 0.01A A
TOTAL TRANSFERABLE SECURITIES ADMITTEDTO AN OFFICIAL STOCK EXCHANGE LISTING 2,829,080,823 99.72
A A
TRANSFERABLE SECURITIES DEALT INON ANOTHER REGULATED MARKETSHARESHealth Care Equipment
10,670,078 Microlife Corp. TWN TWD 10,743,328 0.38A A
TOTAL SHARES 10,743,328 0.38A A
TOTAL TRANSFERABLE SECURITIES DEALT INON ANOTHER REGULATED MARKET 10,743,328 0.38
A A
TOTAL INVESTMENTS 2,839,824,151 100.10A A
A A
FRANKL IN TEMPLETON INVESTMENT FUNDS
ç Templeton Asian Growth Fund ç
Schedule of Investments as of December 31, 2008 (continued)
(Currency ç USD)
Number of % of
shares or Description Country Trading Market net
face value code currency value assets
www.franklintempleton.lu Unaudited Semi-Annual Report 177
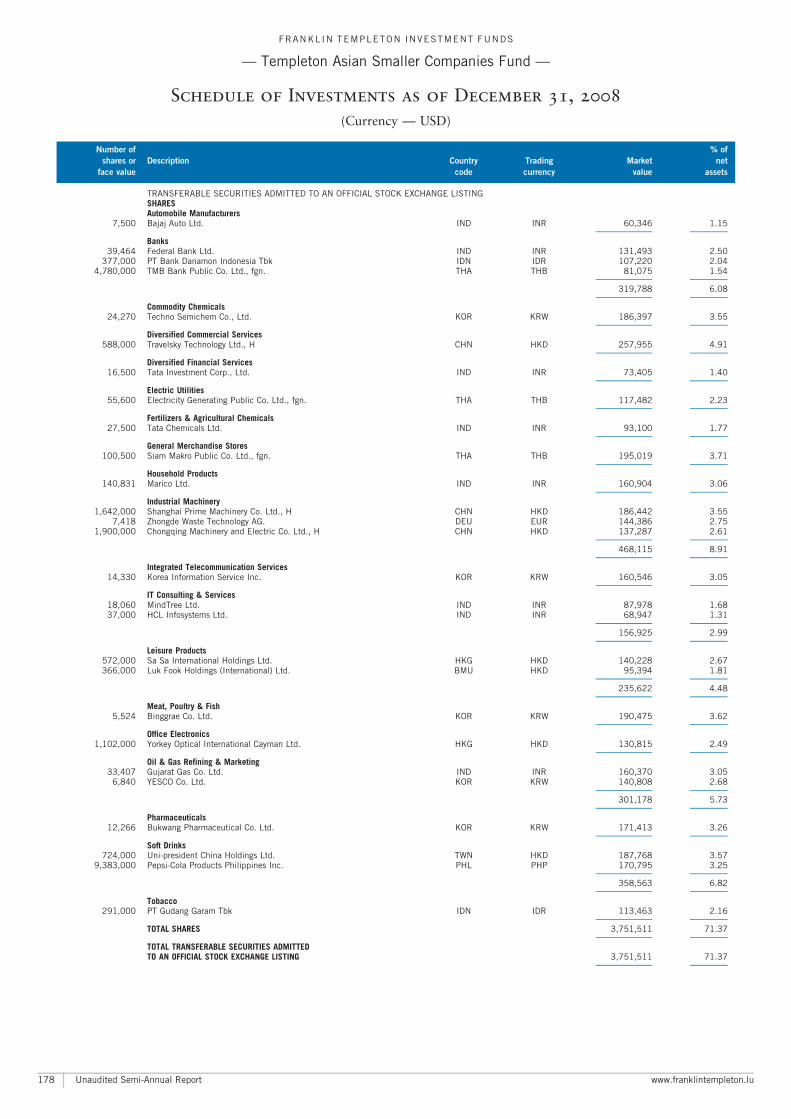
TRANSFERABLE SECURITIES ADMITTED TO AN OFFICIAL STOCK EXCHANGE LISTINGSHARESAutomobile Manufacturers
7,500 Bajaj Auto Ltd. IND INR 60,346 1.15A A
Banks39,464 Federal Bank Ltd. IND INR 131,493 2.50
377,000 PT Bank Danamon Indonesia Tbk IDN IDR 107,220 2.044,780,000 TMB Bank Public Co. Ltd., fgn. THA THB 81,075 1.54
A A
319,788 6.08A A
Commodity Chemicals24,270 Techno Semichem Co., Ltd. KOR KRW 186,397 3.55
A A
Diversified Commercial Services588,000 Travelsky Technology Ltd., H CHN HKD 257,955 4.91
A A
Diversified Financial Services16,500 Tata Investment Corp., Ltd. IND INR 73,405 1.40
A A
Electric Utilities55,600 Electricity Generating Public Co. Ltd., fgn. THA THB 117,482 2.23
A A
Fertilizers & Agricultural Chemicals27,500 Tata Chemicals Ltd. IND INR 93,100 1.77
A A
General Merchandise Stores100,500 Siam Makro Public Co. Ltd., fgn. THA THB 195,019 3.71
A A
Household Products140,831 Marico Ltd. IND INR 160,904 3.06
A A
Industrial Machinery1,642,000 Shanghai Prime Machinery Co. Ltd., H CHN HKD 186,442 3.55
7,418 Zhongde Waste Technology AG. DEU EUR 144,386 2.751,900,000 Chongqing Machinery and Electric Co. Ltd., H CHN HKD 137,287 2.61
A A
468,115 8.91A A
Integrated Telecommunication Services14,330 Korea Information Service Inc. KOR KRW 160,546 3.05
A A
IT Consulting & Services18,060 MindTree Ltd. IND INR 87,978 1.6837,000 HCL Infosystems Ltd. IND INR 68,947 1.31
A A
156,925 2.99A A
Leisure Products572,000 Sa Sa International Holdings Ltd. HKG HKD 140,228 2.67366,000 Luk Fook Holdings (International) Ltd. BMU HKD 95,394 1.81
A A
235,622 4.48A A
Meat, Poultry & Fish5,524 Binggrae Co. Ltd. KOR KRW 190,475 3.62
A A
Office Electronics1,102,000 Yorkey Optical International Cayman Ltd. HKG HKD 130,815 2.49
A A
Oil & Gas Refining & Marketing33,407 Gujarat Gas Co. Ltd. IND INR 160,370 3.05
6,840 YESCO Co. Ltd. KOR KRW 140,808 2.68A A
301,178 5.73A A
Pharmaceuticals12,266 Bukwang Pharmaceutical Co. Ltd. KOR KRW 171,413 3.26
A A
Soft Drinks724,000 Uni-president China Holdings Ltd. TWN HKD 187,768 3.57
9,383,000 Pepsi-Cola Products Philippines Inc. PHL PHP 170,795 3.25A A
358,563 6.82A A
Tobacco291,000 PT Gudang Garam Tbk IDN IDR 113,463 2.16
A A
TOTAL SHARES 3,751,511 71.37A A
TOTAL TRANSFERABLE SECURITIES ADMITTEDTO AN OFFICIAL STOCK EXCHANGE LISTING 3,751,511 71.37
A A
FRANKL IN TEMPLETON INVESTMENT FUNDS
ç Templeton Asian Smaller Companies Fund ç
Schedule of Investments as of December 31, 2008
(Currency ç USD)
Number of % of
shares or Description Country Trading Market net
face value code currency value assets
Unaudited Semi-Annual Report www.franklintempleton.lu178
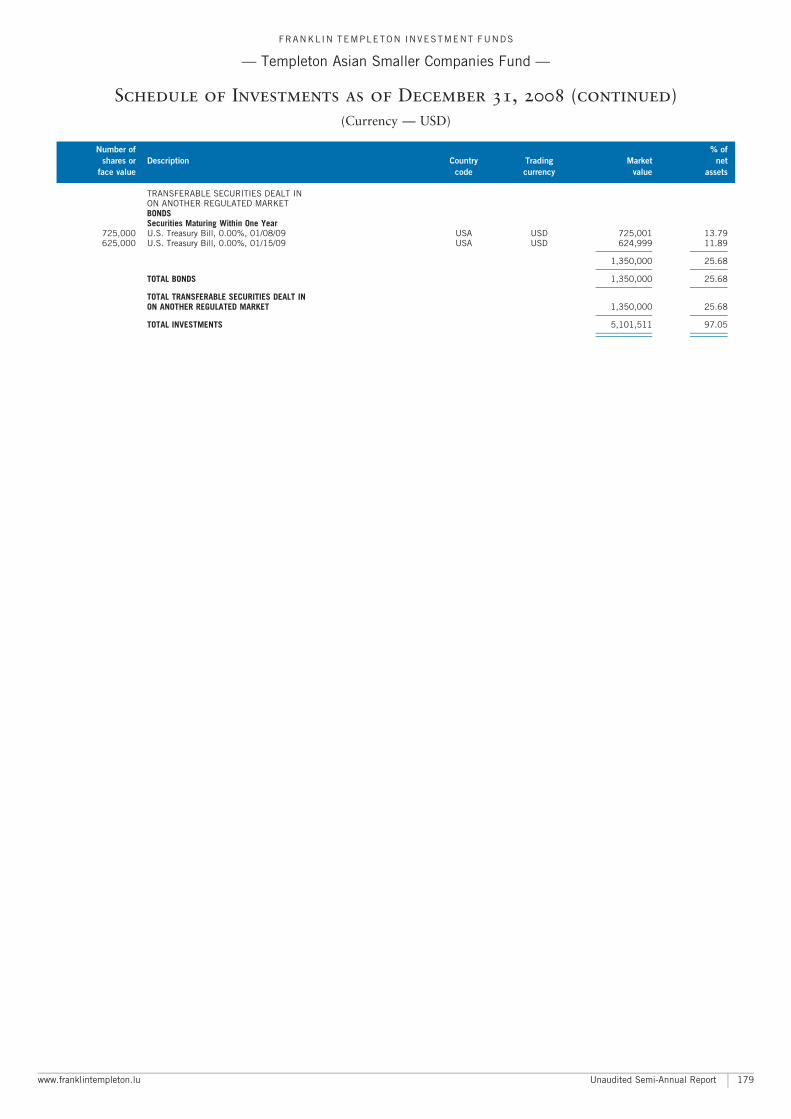
TRANSFERABLE SECURITIES DEALT INON ANOTHER REGULATED MARKETBONDSSecurities Maturing Within One Year
725,000 U.S. Treasury Bill, 0.00%, 01/08/09 USA USD 725,001 13.79625,000 U.S. Treasury Bill, 0.00%, 01/15/09 USA USD 624,999 11.89
A A
1,350,000 25.68A A
TOTAL BONDS 1,350,000 25.68A A
TOTAL TRANSFERABLE SECURITIES DEALT INON ANOTHER REGULATED MARKET 1,350,000 25.68
A A
TOTAL INVESTMENTS 5,101,511 97.05A A
A A
FRANKL IN TEMPLETON INVESTMENT FUNDS
ç Templeton Asian Smaller Companies Fund ç
Schedule of Investments as of December 31, 2008 (continued)
(Currency ç USD)
Number of % of
shares or Description Country Trading Market net
face value code currency value assets
www.franklintempleton.lu Unaudited Semi-Annual Report 179
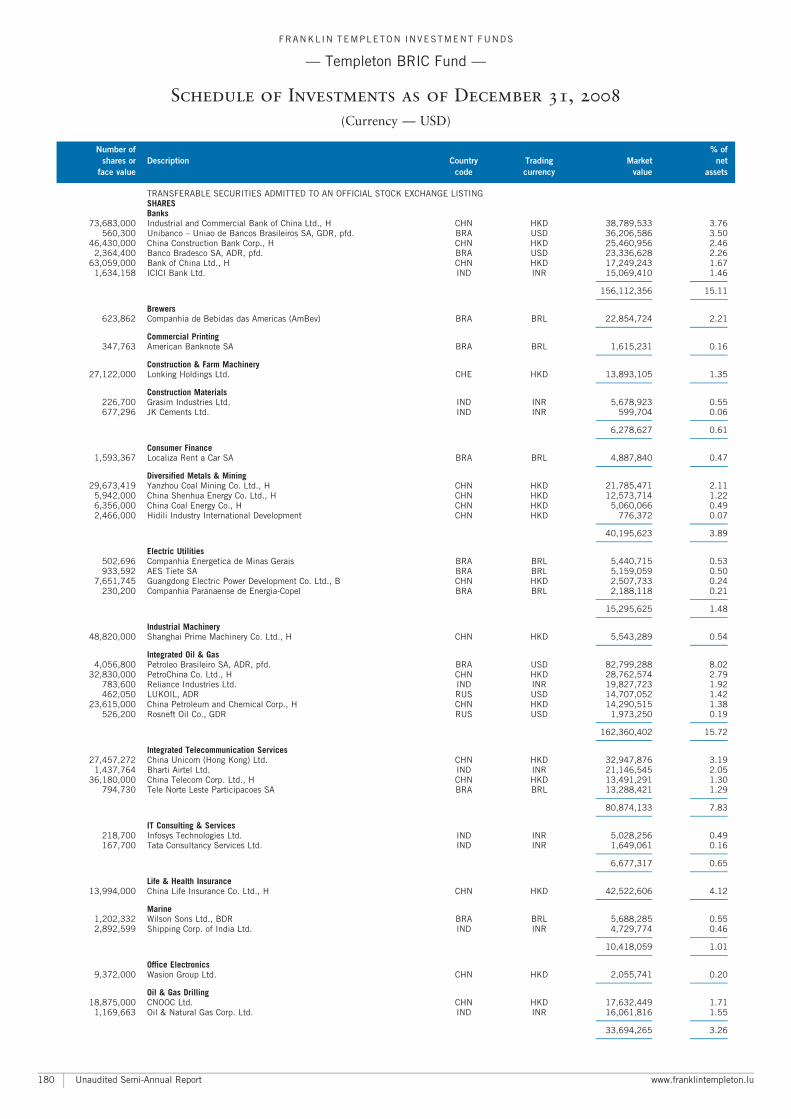
TRANSFERABLE SECURITIES ADMITTED TO AN OFFICIAL STOCK EXCHANGE LISTINGSHARESBanks
73,683,000 Industrial and Commercial Bank of China Ltd., H CHN HKD 38,789,533 3.76560,300 Unibanco ^ Uniao de Bancos Brasileiros SA, GDR, pfd. BRA USD 36,206,586 3.50
46,430,000 China Construction Bank Corp., H CHN HKD 25,460,956 2.462,364,400 Banco Bradesco SA, ADR, pfd. BRA USD 23,336,628 2.26
63,059,000 Bank of China Ltd., H CHN HKD 17,249,243 1.671,634,158 ICICI Bank Ltd. IND INR 15,069,410 1.46
A A
156,112,356 15.11A A
Brewers623,862 Companhia de Bebidas das Americas (AmBev) BRA BRL 22,854,724 2.21
A A
Commercial Printing347,763 American Banknote SA BRA BRL 1,615,231 0.16
A A
Construction & Farm Machinery27,122,000 Lonking Holdings Ltd. CHE HKD 13,893,105 1.35
A A
Construction Materials226,700 Grasim Industries Ltd. IND INR 5,678,923 0.55677,296 JK Cements Ltd. IND INR 599,704 0.06
A A
6,278,627 0.61A A
Consumer Finance1,593,367 Localiza Rent a Car SA BRA BRL 4,887,840 0.47
A A
Diversified Metals & Mining29,673,419 Yanzhou Coal Mining Co. Ltd., H CHN HKD 21,785,471 2.11
5,942,000 China Shenhua Energy Co. Ltd., H CHN HKD 12,573,714 1.226,356,000 China Coal Energy Co., H CHN HKD 5,060,066 0.492,466,000 Hidili Industry International Development CHN HKD 776,372 0.07
A A
40,195,623 3.89A A
Electric Utilities502,696 Companhia Energetica de Minas Gerais BRA BRL 5,440,715 0.53933,592 AES Tiete SA BRA BRL 5,159,059 0.50
7,651,745 Guangdong Electric Power Development Co. Ltd., B CHN HKD 2,507,733 0.24230,200 Companhia Paranaense de Energia-Copel BRA BRL 2,188,118 0.21
A A
15,295,625 1.48A A
Industrial Machinery48,820,000 Shanghai Prime Machinery Co. Ltd., H CHN HKD 5,543,289 0.54
A A
Integrated Oil & Gas4,056,800 Petroleo Brasileiro SA, ADR, pfd. BRA USD 82,799,288 8.02
32,830,000 PetroChina Co. Ltd., H CHN HKD 28,762,574 2.79783,600 Reliance Industries Ltd. IND INR 19,827,723 1.92462,050 LUKOIL, ADR RUS USD 14,707,052 1.42
23,615,000 China Petroleum and Chemical Corp., H CHN HKD 14,290,515 1.38526,200 Rosneft Oil Co., GDR RUS USD 1,973,250 0.19
A A
162,360,402 15.72A A
Integrated Telecommunication Services27,457,272 China Unicom (Hong Kong) Ltd. CHN HKD 32,947,876 3.19
1,437,764 Bharti Airtel Ltd. IND INR 21,146,545 2.0536,180,000 China Telecom Corp. Ltd., H CHN HKD 13,491,291 1.30
794,730 Tele Norte Leste Participacoes SA BRA BRL 13,288,421 1.29A A
80,874,133 7.83A A
IT Consulting & Services218,700 Infosys Technologies Ltd. IND INR 5,028,256 0.49167,700 Tata Consultancy Services Ltd. IND INR 1,649,061 0.16
A A
6,677,317 0.65A A
Life & Health Insurance13,994,000 China Life Insurance Co. Ltd., H CHN HKD 42,522,606 4.12
A A
Marine1,202,332 Wilson Sons Ltd., BDR BRA BRL 5,688,285 0.552,892,599 Shipping Corp. of India Ltd. IND INR 4,729,774 0.46
A A
10,418,059 1.01A A
Office Electronics9,372,000 Wasion Group Ltd. CHN HKD 2,055,741 0.20
A A
Oil & Gas Drilling18,875,000 CNOOC Ltd. CHN HKD 17,632,449 1.71
1,169,663 Oil & Natural Gas Corp. Ltd. IND INR 16,061,816 1.55A A
33,694,265 3.26A A
FRANKL IN TEMPLETON INVESTMENT FUNDS
ç Templeton BRIC Fund ç
Schedule of Investments as of December 31, 2008
(Currency ç USD)
Number of % of
shares or Description Country Trading Market net
face value code currency value assets
Unaudited Semi-Annual Report www.franklintempleton.lu180
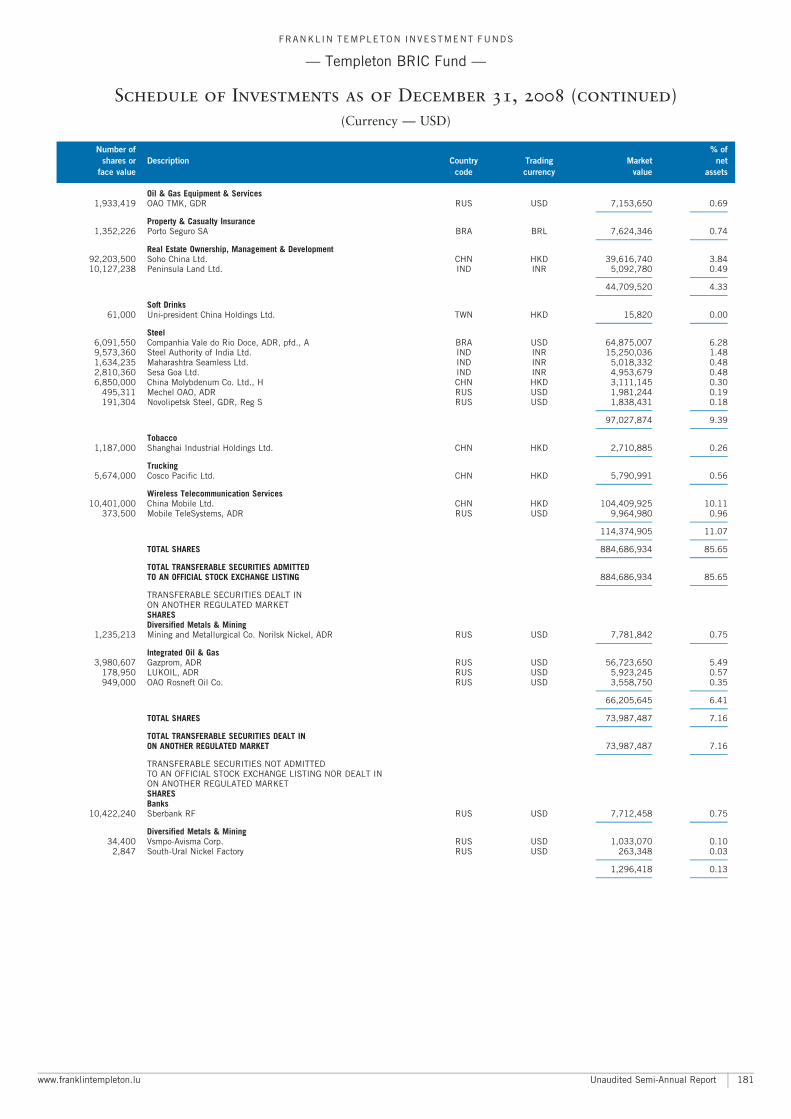
Oil & Gas Equipment & Services1,933,419 OAO TMK, GDR RUS USD 7,153,650 0.69
A A
Property & Casualty Insurance1,352,226 Porto Seguro SA BRA BRL 7,624,346 0.74
A A
Real Estate Ownership, Management & Development92,203,500 Soho China Ltd. CHN HKD 39,616,740 3.8410,127,238 Peninsula Land Ltd. IND INR 5,092,780 0.49
A A
44,709,520 4.33A A
Soft Drinks61,000 Uni-president China Holdings Ltd. TWN HKD 15,820 0.00
A A
Steel6,091,550 Companhia Vale do Rio Doce, ADR, pfd., A BRA USD 64,875,007 6.289,573,360 Steel Authority of India Ltd. IND INR 15,250,036 1.481,634,235 Maharashtra Seamless Ltd. IND INR 5,018,332 0.482,810,360 Sesa Goa Ltd. IND INR 4,953,679 0.486,850,000 China Molybdenum Co. Ltd., H CHN HKD 3,111,145 0.30
495,311 Mechel OAO, ADR RUS USD 1,981,244 0.19191,304 Novolipetsk Steel, GDR, Reg S RUS USD 1,838,431 0.18
A A
97,027,874 9.39A A
Tobacco1,187,000 Shanghai Industrial Holdings Ltd. CHN HKD 2,710,885 0.26
A A
Trucking5,674,000 Cosco Pacific Ltd. CHN HKD 5,790,991 0.56
A A
Wireless Telecommunication Services10,401,000 China Mobile Ltd. CHN HKD 104,409,925 10.11
373,500 Mobile TeleSystems, ADR RUS USD 9,964,980 0.96A A
114,374,905 11.07A A
TOTAL SHARES 884,686,934 85.65A A
TOTAL TRANSFERABLE SECURITIES ADMITTEDTO AN OFFICIAL STOCK EXCHANGE LISTING 884,686,934 85.65
A A
TRANSFERABLE SECURITIES DEALT INON ANOTHER REGULATED MARKETSHARESDiversified Metals & Mining
1,235,213 Mining and Metallurgical Co. Norilsk Nickel, ADR RUS USD 7,781,842 0.75A A
Integrated Oil & Gas3,980,607 Gazprom, ADR RUS USD 56,723,650 5.49
178,950 LUKOIL, ADR RUS USD 5,923,245 0.57949,000 OAO Rosneft Oil Co. RUS USD 3,558,750 0.35
A A
66,205,645 6.41A A
TOTAL SHARES 73,987,487 7.16A A
TOTAL TRANSFERABLE SECURITIES DEALT INON ANOTHER REGULATED MARKET 73,987,487 7.16
A A
TRANSFERABLE SECURITIES NOT ADMITTEDTO AN OFFICIAL STOCK EXCHANGE LISTING NOR DEALT INON ANOTHER REGULATED MARKETSHARESBanks
10,422,240 Sberbank RF RUS USD 7,712,458 0.75A A
Diversified Metals & Mining34,400 Vsmpo-Avisma Corp. RUS USD 1,033,070 0.10
2,847 South-Ural Nickel Factory RUS USD 263,348 0.03A A
1,296,418 0.13A A
FRANKL IN TEMPLETON INVESTMENT FUNDS
ç Templeton BRIC Fund ç
Schedule of Investments as of December 31, 2008 (continued)
(Currency ç USD)
Number of % of
shares or Description Country Trading Market net
face value code currency value assets
www.franklintempleton.lu Unaudited Semi-Annual Report 181
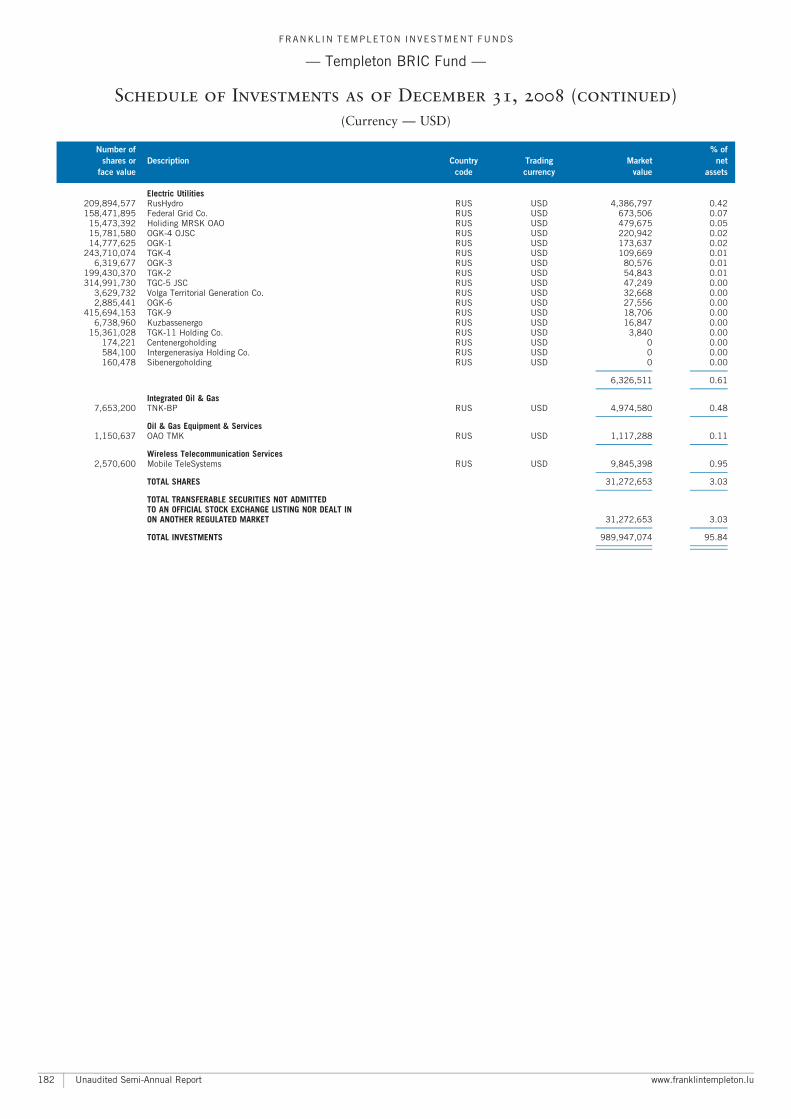
Electric Utilities209,894,577 RusHydro RUS USD 4,386,797 0.42158,471,895 Federal Grid Co. RUS USD 673,506 0.07
15,473,392 Holiding MRSK OAO RUS USD 479,675 0.0515,781,580 OGK-4 OJSC RUS USD 220,942 0.0214,777,625 OGK-1 RUS USD 173,637 0.02
243,710,074 TGK-4 RUS USD 109,669 0.016,319,677 OGK-3 RUS USD 80,576 0.01
199,430,370 TGK-2 RUS USD 54,843 0.01314,991,730 TGC-5 JSC RUS USD 47,249 0.00
3,629,732 Volga Territorial Generation Co. RUS USD 32,668 0.002,885,441 OGK-6 RUS USD 27,556 0.00
415,694,153 TGK-9 RUS USD 18,706 0.006,738,960 Kuzbassenergo RUS USD 16,847 0.00
15,361,028 TGK-11 Holding Co. RUS USD 3,840 0.00174,221 Centenergoholding RUS USD 0 0.00584,100 Intergenerasiya Holding Co. RUS USD 0 0.00160,478 Sibenergoholding RUS USD 0 0.00
A A
6,326,511 0.61A A
Integrated Oil & Gas7,653,200 TNK-BP RUS USD 4,974,580 0.48
A A
Oil & Gas Equipment & Services1,150,637 OAO TMK RUS USD 1,117,288 0.11
A A
Wireless Telecommunication Services2,570,600 Mobile TeleSystems RUS USD 9,845,398 0.95
A A
TOTAL SHARES 31,272,653 3.03A A
TOTAL TRANSFERABLE SECURITIES NOT ADMITTEDTO AN OFFICIAL STOCK EXCHANGE LISTING NOR DEALT INON ANOTHER REGULATED MARKET 31,272,653 3.03
A A
TOTAL INVESTMENTS 989,947,074 95.84A A
A A
FRANKL IN TEMPLETON INVESTMENT FUNDS
ç Templeton BRIC Fund ç
Schedule of Investments as of December 31, 2008 (continued)
(Currency ç USD)
Number of % of
shares or Description Country Trading Market net
face value code currency value assets
Unaudited Semi-Annual Report www.franklintempleton.lu182
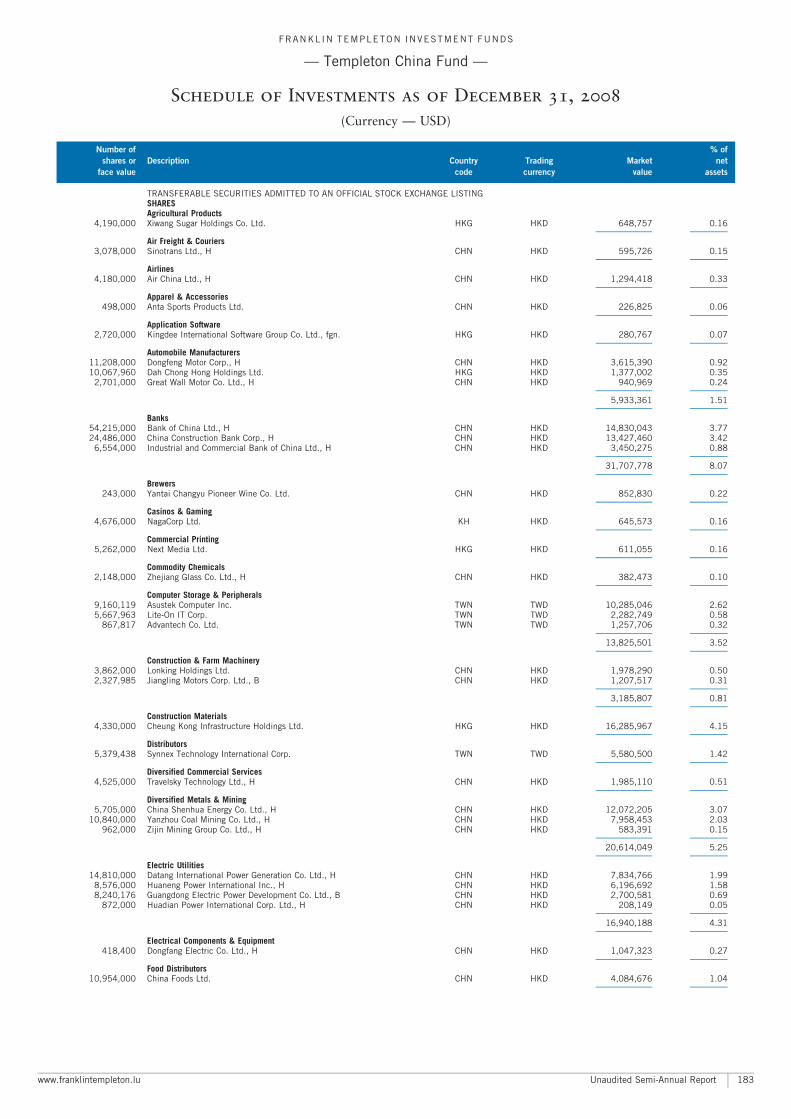
TRANSFERABLE SECURITIES ADMITTED TO AN OFFICIAL STOCK EXCHANGE LISTINGSHARESAgricultural Products
4,190,000 Xiwang Sugar Holdings Co. Ltd. HKG HKD 648,757 0.16A A
Air Freight & Couriers3,078,000 Sinotrans Ltd., H CHN HKD 595,726 0.15
A A
Airlines4,180,000 Air China Ltd., H CHN HKD 1,294,418 0.33
A A
Apparel & Accessories498,000 Anta Sports Products Ltd. CHN HKD 226,825 0.06
A A
Application Software2,720,000 Kingdee International Software Group Co. Ltd., fgn. HKG HKD 280,767 0.07
A A
Automobile Manufacturers11,208,000 Dongfeng Motor Corp., H CHN HKD 3,615,390 0.9210,067,960 Dah Chong Hong Holdings Ltd. HKG HKD 1,377,002 0.35
2,701,000 Great Wall Motor Co. Ltd., H CHN HKD 940,969 0.24A A
5,933,361 1.51A A
Banks54,215,000 Bank of China Ltd., H CHN HKD 14,830,043 3.7724,486,000 China Construction Bank Corp., H CHN HKD 13,427,460 3.42
6,554,000 Industrial and Commercial Bank of China Ltd., H CHN HKD 3,450,275 0.88A A
31,707,778 8.07A A
Brewers243,000 Yantai Changyu Pioneer Wine Co. Ltd. CHN HKD 852,830 0.22
A A
Casinos & Gaming4,676,000 NagaCorp Ltd. KH HKD 645,573 0.16
A A
Commercial Printing5,262,000 Next Media Ltd. HKG HKD 611,055 0.16
A A
Commodity Chemicals2,148,000 Zhejiang Glass Co. Ltd., H CHN HKD 382,473 0.10
A A
Computer Storage & Peripherals9,160,119 Asustek Computer Inc. TWN TWD 10,285,046 2.625,667,963 Lite-On IT Corp. TWN TWD 2,282,749 0.58
867,817 Advantech Co. Ltd. TWN TWD 1,257,706 0.32A A
13,825,501 3.52A A
Construction & Farm Machinery3,862,000 Lonking Holdings Ltd. CHN HKD 1,978,290 0.502,327,985 Jiangling Motors Corp. Ltd., B CHN HKD 1,207,517 0.31
A A
3,185,807 0.81A A
Construction Materials4,330,000 Cheung Kong Infrastructure Holdings Ltd. HKG HKD 16,285,967 4.15
A A
Distributors5,379,438 Synnex Technology International Corp. TWN TWD 5,580,500 1.42
A A
Diversified Commercial Services4,525,000 Travelsky Technology Ltd., H CHN HKD 1,985,110 0.51
A A
Diversified Metals & Mining5,705,000 China Shenhua Energy Co. Ltd., H CHN HKD 12,072,205 3.07
10,840,000 Yanzhou Coal Mining Co. Ltd., H CHN HKD 7,958,453 2.03962,000 Zijin Mining Group Co. Ltd., H CHN HKD 583,391 0.15
A A
20,614,049 5.25A A
Electric Utilities14,810,000 Datang International Power Generation Co. Ltd., H CHN HKD 7,834,766 1.99
8,576,000 Huaneng Power International Inc., H CHN HKD 6,196,692 1.588,240,176 Guangdong Electric Power Development Co. Ltd., B CHN HKD 2,700,581 0.69
872,000 Huadian Power International Corp. Ltd., H CHN HKD 208,149 0.05A A
16,940,188 4.31A A
Electrical Components & Equipment418,400 Dongfang Electric Co. Ltd., H CHN HKD 1,047,323 0.27
A A
Food Distributors10,954,000 China Foods Ltd. CHN HKD 4,084,676 1.04
A A
FRANKL IN TEMPLETON INVESTMENT FUNDS
ç Templeton China Fund ç
Schedule of Investments as of December 31, 2008
(Currency ç USD)
Number of % of
shares or Description Country Trading Market net
face value code currency value assets
www.franklintempleton.lu Unaudited Semi-Annual Report 183
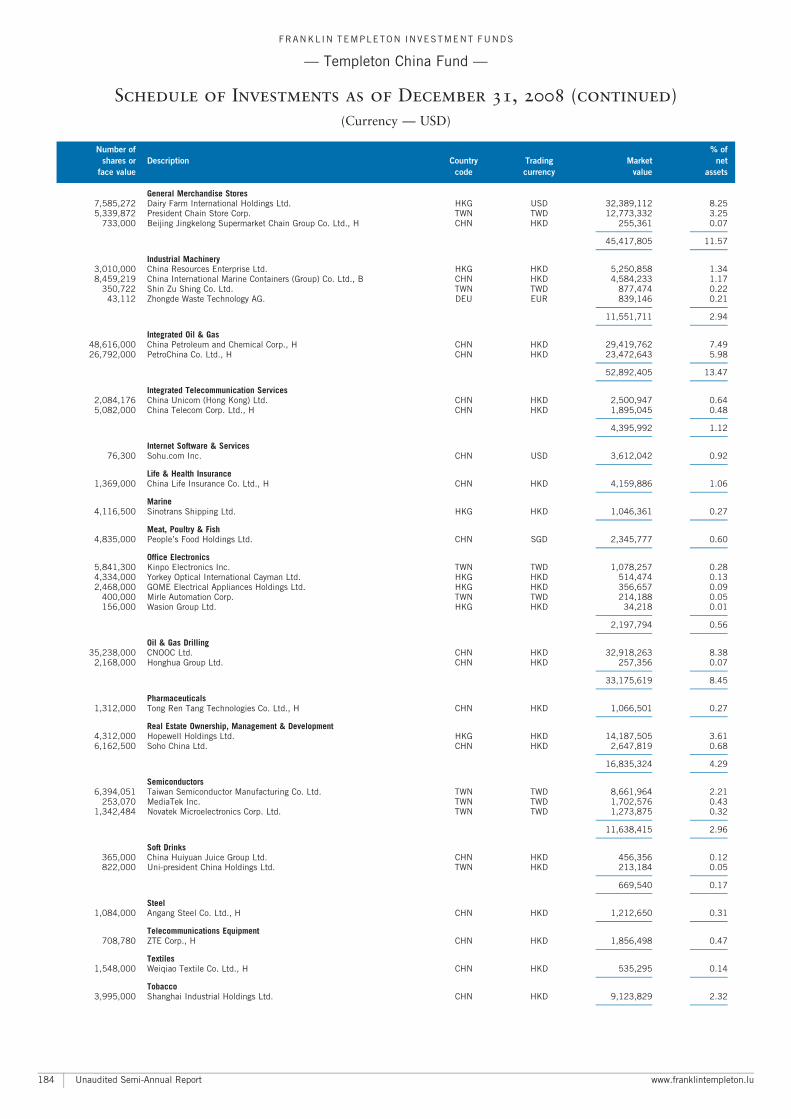
General Merchandise Stores7,585,272 Dairy Farm International Holdings Ltd. HKG USD 32,389,112 8.255,339,872 President Chain Store Corp. TWN TWD 12,773,332 3.25
733,000 Beijing Jingkelong Supermarket Chain Group Co. Ltd., H CHN HKD 255,361 0.07A A
45,417,805 11.57A A
Industrial Machinery3,010,000 China Resources Enterprise Ltd. HKG HKD 5,250,858 1.348,459,219 China International Marine Containers (Group) Co. Ltd., B CHN HKD 4,584,233 1.17
350,722 Shin Zu Shing Co. Ltd. TWN TWD 877,474 0.2243,112 Zhongde Waste Technology AG. DEU EUR 839,146 0.21
A A
11,551,711 2.94A A
Integrated Oil & Gas48,616,000 China Petroleum and Chemical Corp., H CHN HKD 29,419,762 7.4926,792,000 PetroChina Co. Ltd., H CHN HKD 23,472,643 5.98
A A
52,892,405 13.47A A
Integrated Telecommunication Services2,084,176 China Unicom (Hong Kong) Ltd. CHN HKD 2,500,947 0.645,082,000 China Telecom Corp. Ltd., H CHN HKD 1,895,045 0.48
A A
4,395,992 1.12A A
Internet Software & Services76,300 Sohu.com Inc. CHN USD 3,612,042 0.92
A A
Life & Health Insurance1,369,000 China Life Insurance Co. Ltd., H CHN HKD 4,159,886 1.06
A A
Marine4,116,500 Sinotrans Shipping Ltd. HKG HKD 1,046,361 0.27
A A
Meat, Poultry & Fish4,835,000 People’s Food Holdings Ltd. CHN SGD 2,345,777 0.60
A A
Office Electronics5,841,300 Kinpo Electronics Inc. TWN TWD 1,078,257 0.284,334,000 Yorkey Optical International Cayman Ltd. HKG HKD 514,474 0.132,468,000 GOME Electrical Appliances Holdings Ltd. HKG HKD 356,657 0.09
400,000 Mirle Automation Corp. TWN TWD 214,188 0.05156,000 Wasion Group Ltd. HKG HKD 34,218 0.01
A A
2,197,794 0.56A A
Oil & Gas Drilling35,238,000 CNOOC Ltd. CHN HKD 32,918,263 8.38
2,168,000 Honghua Group Ltd. CHN HKD 257,356 0.07A A
33,175,619 8.45A A
Pharmaceuticals1,312,000 Tong Ren Tang Technologies Co. Ltd., H CHN HKD 1,066,501 0.27
A A
Real Estate Ownership, Management & Development4,312,000 Hopewell Holdings Ltd. HKG HKD 14,187,505 3.616,162,500 Soho China Ltd. CHN HKD 2,647,819 0.68
A A
16,835,324 4.29A A
Semiconductors6,394,051 Taiwan Semiconductor Manufacturing Co. Ltd. TWN TWD 8,661,964 2.21
253,070 MediaTek Inc. TWN TWD 1,702,576 0.431,342,484 Novatek Microelectronics Corp. Ltd. TWN TWD 1,273,875 0.32
A A
11,638,415 2.96A A
Soft Drinks365,000 China Huiyuan Juice Group Ltd. CHN HKD 456,356 0.12822,000 Uni-president China Holdings Ltd. TWN HKD 213,184 0.05
A A
669,540 0.17A A
Steel1,084,000 Angang Steel Co. Ltd., H CHN HKD 1,212,650 0.31
A A
Telecommunications Equipment708,780 ZTE Corp., H CHN HKD 1,856,498 0.47
A A
Textiles1,548,000 Weiqiao Textile Co. Ltd., H CHN HKD 535,295 0.14
A A
Tobacco3,995,000 Shanghai Industrial Holdings Ltd. CHN HKD 9,123,829 2.32
A A
FRANKL IN TEMPLETON INVESTMENT FUNDS
ç Templeton China Fund ç
Schedule of Investments as of December 31, 2008 (continued)
(Currency ç USD)
Number of % of
shares or Description Country Trading Market net
face value code currency value assets
Unaudited Semi-Annual Report www.franklintempleton.lu184
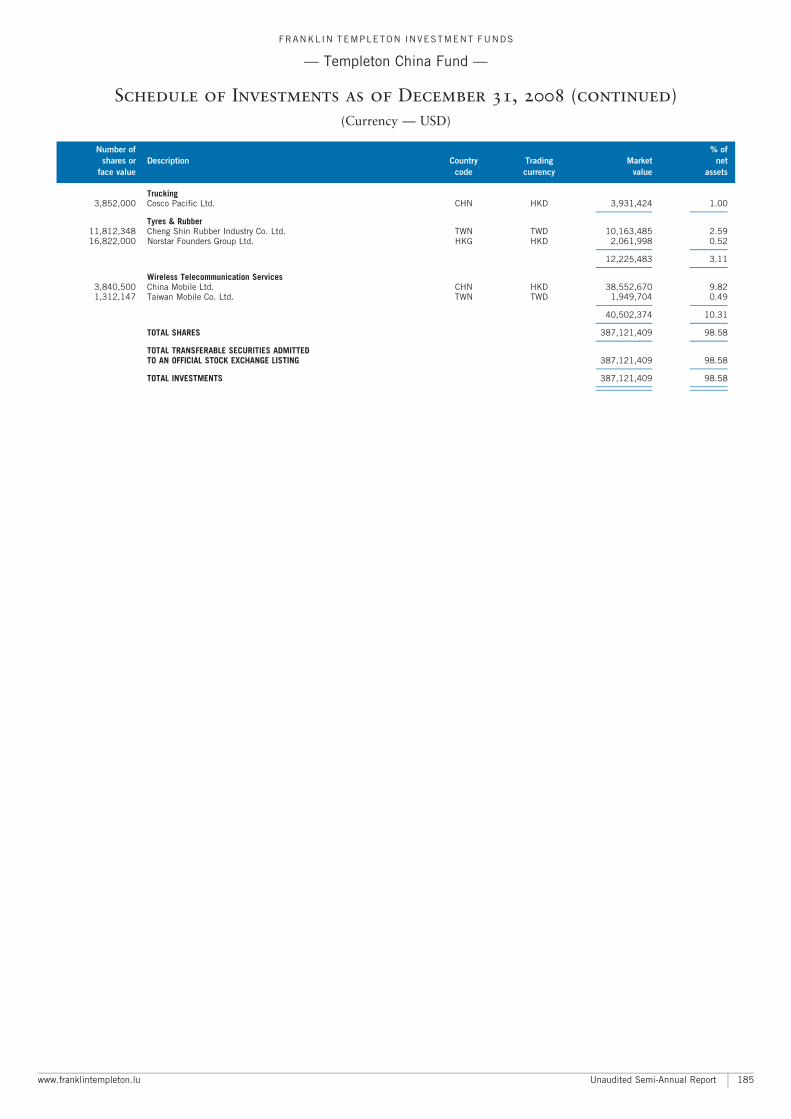
Trucking3,852,000 Cosco Pacific Ltd. CHN HKD 3,931,424 1.00
A A
Tyres & Rubber11,812,348 Cheng Shin Rubber Industry Co. Ltd. TWN TWD 10,163,485 2.5916,822,000 Norstar Founders Group Ltd. HKG HKD 2,061,998 0.52
A A
12,225,483 3.11A A
Wireless Telecommunication Services3,840,500 China Mobile Ltd. CHN HKD 38,552,670 9.821,312,147 Taiwan Mobile Co. Ltd. TWN TWD 1,949,704 0.49
A A
40,502,374 10.31A A
TOTAL SHARES 387,121,409 98.58A A
TOTAL TRANSFERABLE SECURITIES ADMITTEDTO AN OFFICIAL STOCK EXCHANGE LISTING 387,121,409 98.58
A A
TOTAL INVESTMENTS 387,121,409 98.58A A
A A
FRANKL IN TEMPLETON INVESTMENT FUNDS
ç Templeton China Fund ç
Schedule of Investments as of December 31, 2008 (continued)
(Currency ç USD)
Number of % of
shares or Description Country Trading Market net
face value code currency value assets
www.franklintempleton.lu Unaudited Semi-Annual Report 185
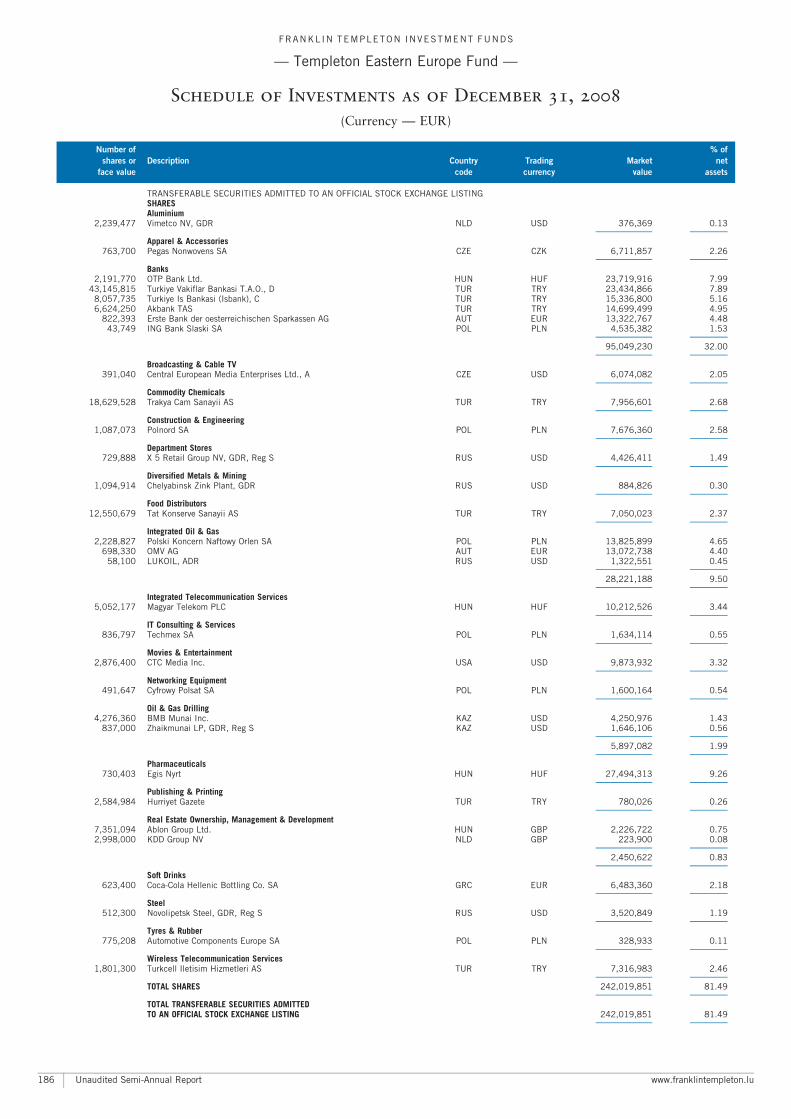
TRANSFERABLE SECURITIES ADMITTED TO AN OFFICIAL STOCK EXCHANGE LISTINGSHARESAluminium
2,239,477 Vimetco NV, GDR NLD USD 376,369 0.13A A
Apparel & Accessories763,700 Pegas Nonwovens SA CZE CZK 6,711,857 2.26
A A
Banks2,191,770 OTP Bank Ltd. HUN HUF 23,719,916 7.99
43,145,815 Turkiye Vakiflar Bankasi T.A.O., D TUR TRY 23,434,866 7.898,057,735 Turkiye Is Bankasi (Isbank), C TUR TRY 15,336,800 5.166,624,250 Akbank TAS TUR TRY 14,699,499 4.95
822,393 Erste Bank der oesterreichischen Sparkassen AG AUT EUR 13,322,767 4.4843,749 ING Bank Slaski SA POL PLN 4,535,382 1.53
A A
95,049,230 32.00A A
Broadcasting & Cable TV391,040 Central European Media Enterprises Ltd., A CZE USD 6,074,082 2.05
A A
Commodity Chemicals18,629,528 Trakya Cam Sanayii AS TUR TRY 7,956,601 2.68
A A
Construction & Engineering1,087,073 Polnord SA POL PLN 7,676,360 2.58
A A
Department Stores729,888 X 5 Retail Group NV, GDR, Reg S RUS USD 4,426,411 1.49
A A
Diversified Metals & Mining1,094,914 Chelyabinsk Zink Plant, GDR RUS USD 884,826 0.30
A A
Food Distributors12,550,679 Tat Konserve Sanayii AS TUR TRY 7,050,023 2.37
A A
Integrated Oil & Gas2,228,827 Polski Koncern Naftowy Orlen SA POL PLN 13,825,899 4.65
698,330 OMV AG AUT EUR 13,072,738 4.4058,100 LUKOIL, ADR RUS USD 1,322,551 0.45
A A
28,221,188 9.50A A
Integrated Telecommunication Services5,052,177 Magyar Telekom PLC HUN HUF 10,212,526 3.44
A A
IT Consulting & Services836,797 Techmex SA POL PLN 1,634,114 0.55
A A
Movies & Entertainment2,876,400 CTC Media Inc. USA USD 9,873,932 3.32
A A
Networking Equipment491,647 Cyfrowy Polsat SA POL PLN 1,600,164 0.54
A A
Oil & Gas Drilling4,276,360 BMB Munai Inc. KAZ USD 4,250,976 1.43
837,000 Zhaikmunai LP, GDR, Reg S KAZ USD 1,646,106 0.56A A
5,897,082 1.99A A
Pharmaceuticals730,403 Egis Nyrt HUN HUF 27,494,313 9.26
A A
Publishing & Printing2,584,984 Hurriyet Gazete TUR TRY 780,026 0.26
A A
Real Estate Ownership, Management & Development7,351,094 Ablon Group Ltd. HUN GBP 2,226,722 0.752,998,000 KDD Group NV NLD GBP 223,900 0.08
A A
2,450,622 0.83A A
Soft Drinks623,400 Coca-Cola Hellenic Bottling Co. SA GRC EUR 6,483,360 2.18
A A
Steel512,300 Novolipetsk Steel, GDR, Reg S RUS USD 3,520,849 1.19
A A
Tyres & Rubber775,208 Automotive Components Europe SA POL PLN 328,933 0.11
A A
Wireless Telecommunication Services1,801,300 Turkcell Iletisim Hizmetleri AS TUR TRY 7,316,983 2.46
A A
TOTAL SHARES 242,019,851 81.49A A
TOTAL TRANSFERABLE SECURITIES ADMITTEDTO AN OFFICIAL STOCK EXCHANGE LISTING 242,019,851 81.49
A A
FRANKL IN TEMPLETON INVESTMENT FUNDS
ç Templeton Eastern Europe Fund ç
Schedule of Investments as of December 31, 2008
(Currency ç EUR)
Number of % of
shares or Description Country Trading Market net
face value code currency value assets
Unaudited Semi-Annual Report www.franklintempleton.lu186
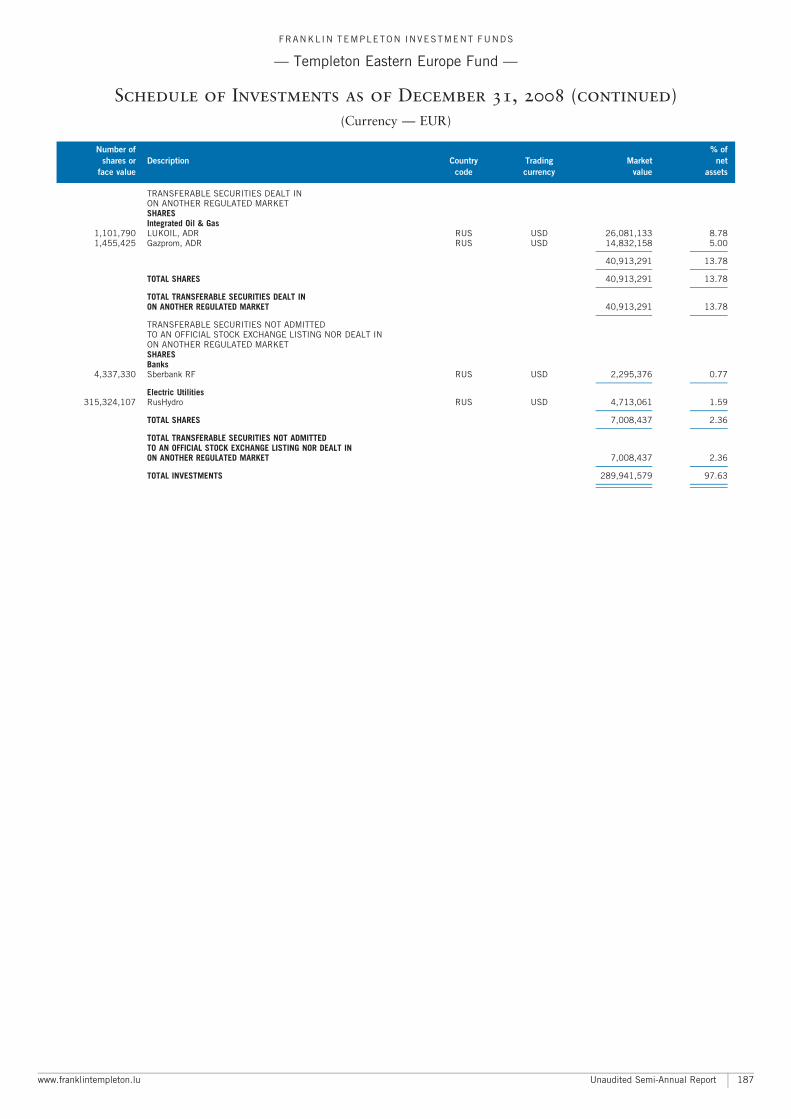
TRANSFERABLE SECURITIES DEALT INON ANOTHER REGULATED MARKETSHARESIntegrated Oil & Gas
1,101,790 LUKOIL, ADR RUS USD 26,081,133 8.781,455,425 Gazprom, ADR RUS USD 14,832,158 5.00
A A
40,913,291 13.78A A
TOTAL SHARES 40,913,291 13.78A A
TOTAL TRANSFERABLE SECURITIES DEALT INON ANOTHER REGULATED MARKET 40,913,291 13.78
A A
TRANSFERABLE SECURITIES NOT ADMITTEDTO AN OFFICIAL STOCK EXCHANGE LISTING NOR DEALT INON ANOTHER REGULATED MARKETSHARESBanks
4,337,330 Sberbank RF RUS USD 2,295,376 0.77A A
Electric Utilities315,324,107 RusHydro RUS USD 4,713,061 1.59
A A
TOTAL SHARES 7,008,437 2.36A A
TOTAL TRANSFERABLE SECURITIES NOT ADMITTEDTO AN OFFICIAL STOCK EXCHANGE LISTING NOR DEALT INON ANOTHER REGULATED MARKET 7,008,437 2.36
A A
TOTAL INVESTMENTS 289,941,579 97.63A A
A A
FRANKL IN TEMPLETON INVESTMENT FUNDS
ç Templeton Eastern Europe Fund ç
Schedule of Investments as of December 31, 2008 (continued)
(Currency ç EUR)
Number of % of
shares or Description Country Trading Market net
face value code currency value assets
www.franklintempleton.lu Unaudited Semi-Annual Report 187
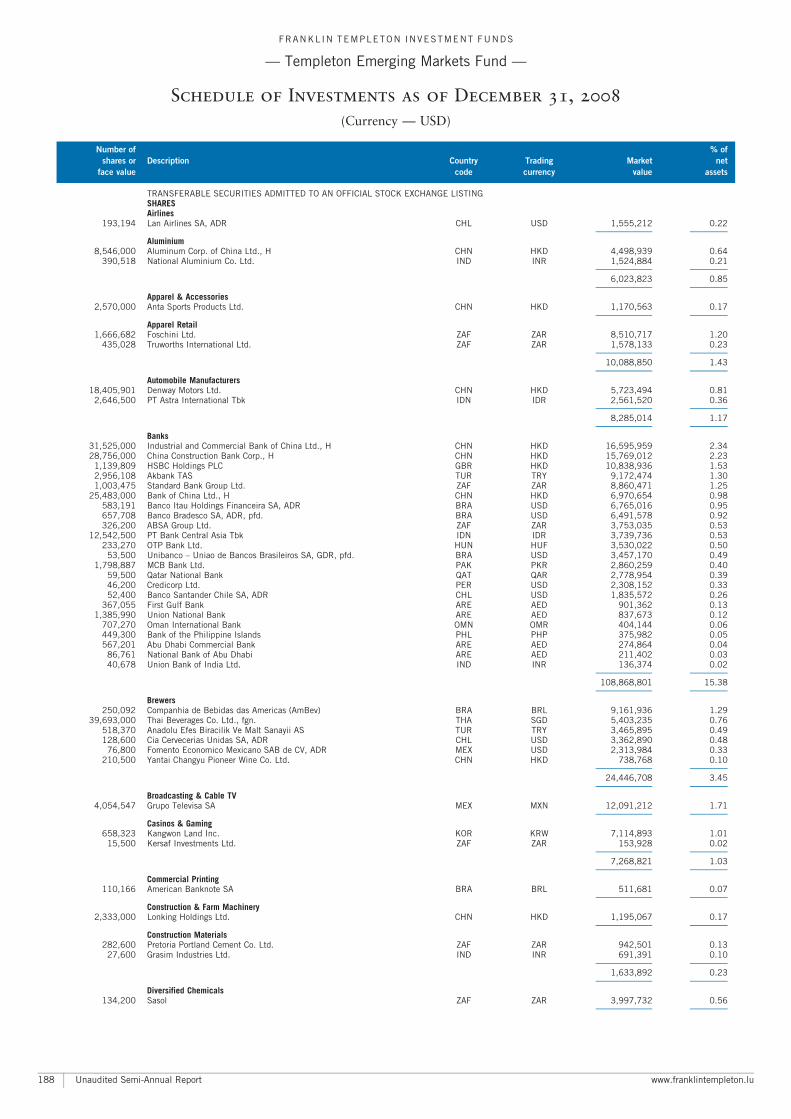
TRANSFERABLE SECURITIES ADMITTED TO AN OFFICIAL STOCK EXCHANGE LISTINGSHARESAirlines
193,194 Lan Airlines SA, ADR CHL USD 1,555,212 0.22A A
Aluminium8,546,000 Aluminum Corp. of China Ltd., H CHN HKD 4,498,939 0.64
390,518 National Aluminium Co. Ltd. IND INR 1,524,884 0.21A A
6,023,823 0.85A A
Apparel & Accessories2,570,000 Anta Sports Products Ltd. CHN HKD 1,170,563 0.17
A A
Apparel Retail1,666,682 Foschini Ltd. ZAF ZAR 8,510,717 1.20
435,028 Truworths International Ltd. ZAF ZAR 1,578,133 0.23A A
10,088,850 1.43A A
Automobile Manufacturers18,405,901 Denway Motors Ltd. CHN HKD 5,723,494 0.81
2,646,500 PT Astra International Tbk IDN IDR 2,561,520 0.36A A
8,285,014 1.17A A
Banks31,525,000 Industrial and Commercial Bank of China Ltd., H CHN HKD 16,595,959 2.3428,756,000 China Construction Bank Corp., H CHN HKD 15,769,012 2.23
1,139,809 HSBC Holdings PLC GBR HKD 10,838,936 1.532,956,108 Akbank TAS TUR TRY 9,172,474 1.301,003,475 Standard Bank Group Ltd. ZAF ZAR 8,860,471 1.25
25,483,000 Bank of China Ltd., H CHN HKD 6,970,654 0.98583,191 Banco Itau Holdings Financeira SA, ADR BRA USD 6,765,016 0.95657,708 Banco Bradesco SA, ADR, pfd. BRA USD 6,491,578 0.92326,200 ABSA Group Ltd. ZAF ZAR 3,753,035 0.53
12,542,500 PT Bank Central Asia Tbk IDN IDR 3,739,736 0.53233,270 OTP Bank Ltd. HUN HUF 3,530,022 0.50
53,500 Unibanco ^ Uniao de Bancos Brasileiros SA, GDR, pfd. BRA USD 3,457,170 0.491,798,887 MCB Bank Ltd. PAK PKR 2,860,259 0.40
59,500 Qatar National Bank QAT QAR 2,778,954 0.3946,200 Credicorp Ltd. PER USD 2,308,152 0.3352,400 Banco Santander Chile SA, ADR CHL USD 1,835,572 0.26
367,055 First Gulf Bank ARE AED 901,362 0.131,385,990 Union National Bank ARE AED 837,673 0.12
707,270 Oman International Bank OMN OMR 404,144 0.06449,300 Bank of the Philippine Islands PHL PHP 375,982 0.05567,201 Abu Dhabi Commercial Bank ARE AED 274,864 0.04
86,761 National Bank of Abu Dhabi ARE AED 211,402 0.0340,678 Union Bank of India Ltd. IND INR 136,374 0.02
A A
108,868,801 15.38A A
Brewers250,092 Companhia de Bebidas das Americas (AmBev) BRA BRL 9,161,936 1.29
39,693,000 Thai Beverages Co. Ltd., fgn. THA SGD 5,403,235 0.76518,370 Anadolu Efes Biracilik Ve Malt Sanayii AS TUR TRY 3,465,895 0.49128,600 Cia Cervecerias Unidas SA, ADR CHL USD 3,362,890 0.48
76,800 Fomento Economico Mexicano SAB de CV, ADR MEX USD 2,313,984 0.33210,500 Yantai Changyu Pioneer Wine Co. Ltd. CHN HKD 738,768 0.10
A A
24,446,708 3.45A A
Broadcasting & Cable TV4,054,547 Grupo Televisa SA MEX MXN 12,091,212 1.71
A A
Casinos & Gaming658,323 Kangwon Land Inc. KOR KRW 7,114,893 1.01
15,500 Kersaf Investments Ltd. ZAF ZAR 153,928 0.02A A
7,268,821 1.03A A
Commercial Printing110,166 American Banknote SA BRA BRL 511,681 0.07
A A
Construction & Farm Machinery2,333,000 Lonking Holdings Ltd. CHN HKD 1,195,067 0.17
A A
Construction Materials282,600 Pretoria Portland Cement Co. Ltd. ZAF ZAR 942,501 0.13
27,600 Grasim Industries Ltd. IND INR 691,391 0.10A A
1,633,892 0.23A A
Diversified Chemicals134,200 Sasol ZAF ZAR 3,997,732 0.56
A A
FRANKL IN TEMPLETON INVESTMENT FUNDS
ç Templeton Emerging Markets Fund ç
Schedule of Investments as of December 31, 2008
(Currency ç USD)
Number of % of
shares or Description Country Trading Market net
face value code currency value assets
Unaudited Semi-Annual Report www.franklintempleton.lu188
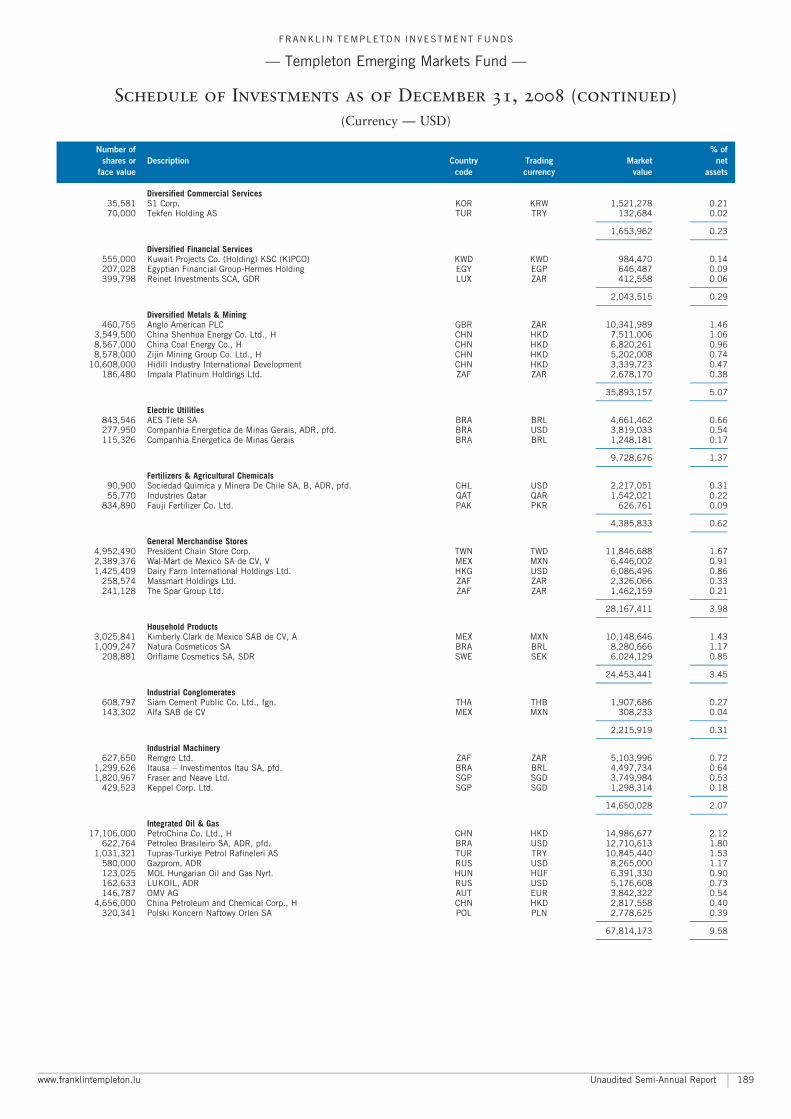
Diversified Commercial Services35,581 S1 Corp. KOR KRW 1,521,278 0.2170,000 Tekfen Holding AS TUR TRY 132,684 0.02
A A
1,653,962 0.23A A
Diversified Financial Services555,000 Kuwait Projects Co. (Holding) KSC (KIPCO) KWD KWD 984,470 0.14207,028 Egyptian Financial Group-Hermes Holding EGY EGP 646,487 0.09399,798 Reinet Investments SCA, GDR LUX ZAR 412,558 0.06
A A
2,043,515 0.29A A
Diversified Metals & Mining460,755 Anglo American PLC GBR ZAR 10,341,989 1.46
3,549,500 China Shenhua Energy Co. Ltd., H CHN HKD 7,511,006 1.068,567,000 China Coal Energy Co., H CHN HKD 6,820,261 0.968,578,000 Zijin Mining Group Co. Ltd., H CHN HKD 5,202,008 0.74
10,608,000 Hidili Industry International Development CHN HKD 3,339,723 0.47186,480 Impala Platinum Holdings Ltd. ZAF ZAR 2,678,170 0.38
A A
35,893,157 5.07A A
Electric Utilities843,546 AES Tiete SA BRA BRL 4,661,462 0.66277,950 Companhia Energetica de Minas Gerais, ADR, pfd. BRA USD 3,819,033 0.54115,326 Companhia Energetica de Minas Gerais BRA BRL 1,248,181 0.17
A A
9,728,676 1.37A A
Fertilizers & Agricultural Chemicals90,900 Sociedad Quimica y Minera De Chile SA, B, ADR, pfd. CHL USD 2,217,051 0.3155,770 Industries Qatar QAT QAR 1,542,021 0.22
834,890 Fauji Fertilizer Co. Ltd. PAK PKR 626,761 0.09A A
4,385,833 0.62A A
General Merchandise Stores4,952,490 President Chain Store Corp. TWN TWD 11,846,688 1.672,389,376 Wal-Mart de Mexico SA de CV, V MEX MXN 6,446,002 0.911,425,409 Dairy Farm International Holdings Ltd. HKG USD 6,086,496 0.86
258,574 Massmart Holdings Ltd. ZAF ZAR 2,326,066 0.33241,128 The Spar Group Ltd. ZAF ZAR 1,462,159 0.21
A A
28,167,411 3.98A A
Household Products3,025,841 Kimberly Clark de Mexico SAB de CV, A MEX MXN 10,148,646 1.431,009,247 Natura Cosmeticos SA BRA BRL 8,280,666 1.17
208,881 Oriflame Cosmetics SA, SDR SWE SEK 6,024,129 0.85A A
24,453,441 3.45A A
Industrial Conglomerates608,797 Siam Cement Public Co. Ltd., fgn. THA THB 1,907,686 0.27143,302 Alfa SAB de CV MEX MXN 308,233 0.04
A A
2,215,919 0.31A A
Industrial Machinery627,650 Remgro Ltd. ZAF ZAR 5,103,996 0.72
1,299,626 Itausa ^ Investimentos Itau SA, pfd. BRA BRL 4,497,734 0.641,820,967 Fraser and Neave Ltd. SGP SGD 3,749,984 0.53
429,523 Keppel Corp. Ltd. SGP SGD 1,298,314 0.18A A
14,650,028 2.07A A
Integrated Oil & Gas17,106,000 PetroChina Co. Ltd., H CHN HKD 14,986,677 2.12
622,764 Petroleo Brasileiro SA, ADR, pfd. BRA USD 12,710,613 1.801,031,321 Tupras-Turkiye Petrol Rafineleri AS TUR TRY 10,845,440 1.53
580,000 Gazprom, ADR RUS USD 8,265,000 1.17123,025 MOL Hungarian Oil and Gas Nyrt. HUN HUF 6,391,330 0.90162,633 LUKOIL, ADR RUS USD 5,176,608 0.73146,787 OMV AG AUT EUR 3,842,322 0.54
4,656,000 China Petroleum and Chemical Corp., H CHN HKD 2,817,558 0.40320,341 Polski Koncern Naftowy Orlen SA POL PLN 2,778,625 0.39
A A
67,814,173 9.58A A
FRANKL IN TEMPLETON INVESTMENT FUNDS
ç Templeton Emerging Markets Fund ç
Schedule of Investments as of December 31, 2008 (continued)
(Currency ç USD)
Number of % of
shares or Description Country Trading Market net
face value code currency value assets
www.franklintempleton.lu Unaudited Semi-Annual Report 189
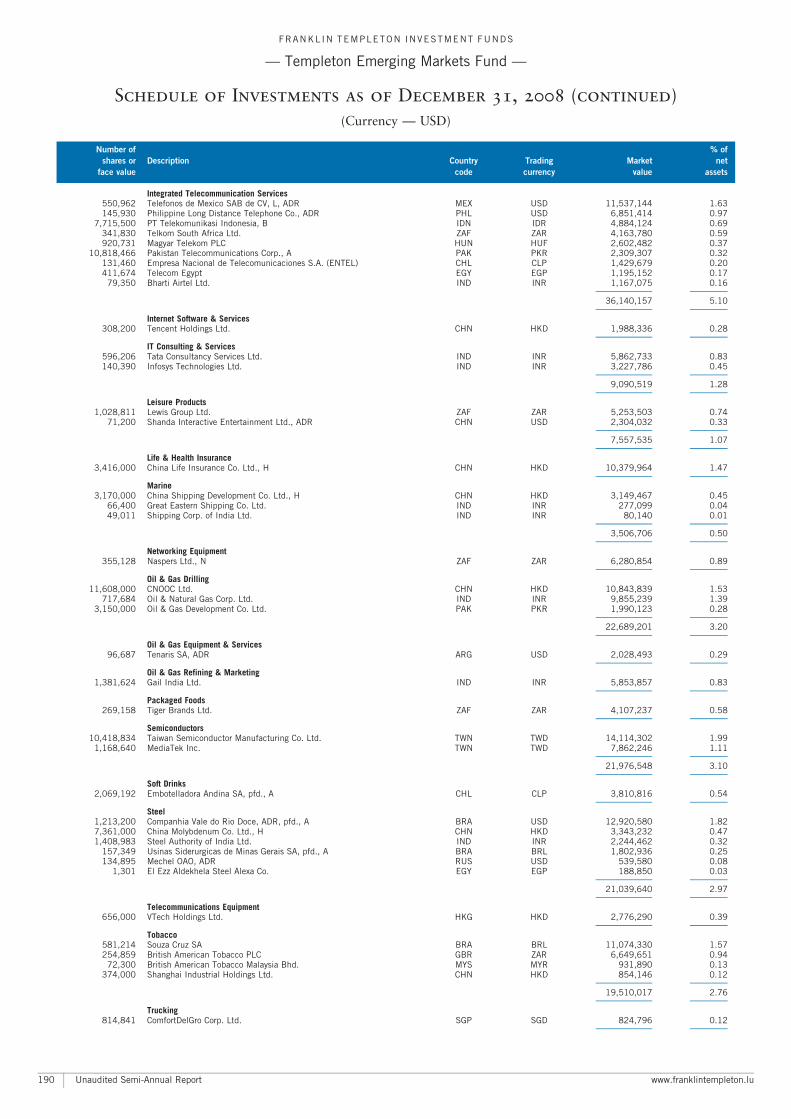
Integrated Telecommunication Services550,962 Telefonos de Mexico SAB de CV, L, ADR MEX USD 11,537,144 1.63145,930 Philippine Long Distance Telephone Co., ADR PHL USD 6,851,414 0.97
7,715,500 PT Telekomunikasi Indonesia, B IDN IDR 4,884,124 0.69341,830 Telkom South Africa Ltd. ZAF ZAR 4,163,780 0.59920,731 Magyar Telekom PLC HUN HUF 2,602,482 0.37
10,818,466 Pakistan Telecommunications Corp., A PAK PKR 2,309,307 0.32131,460 Empresa Nacional de Telecomunicaciones S.A. (ENTEL) CHL CLP 1,429,679 0.20411,674 Telecom Egypt EGY EGP 1,195,152 0.17
79,350 Bharti Airtel Ltd. IND INR 1,167,075 0.16A A
36,140,157 5.10A A
Internet Software & Services308,200 Tencent Holdings Ltd. CHN HKD 1,988,336 0.28
A A
IT Consulting & Services596,206 Tata Consultancy Services Ltd. IND INR 5,862,733 0.83140,390 Infosys Technologies Ltd. IND INR 3,227,786 0.45
A A
9,090,519 1.28A A
Leisure Products1,028,811 Lewis Group Ltd. ZAF ZAR 5,253,503 0.74
71,200 Shanda Interactive Entertainment Ltd., ADR CHN USD 2,304,032 0.33A A
7,557,535 1.07A A
Life & Health Insurance3,416,000 China Life Insurance Co. Ltd., H CHN HKD 10,379,964 1.47
A A
Marine3,170,000 China Shipping Development Co. Ltd., H CHN HKD 3,149,467 0.45
66,400 Great Eastern Shipping Co. Ltd. IND INR 277,099 0.0449,011 Shipping Corp. of India Ltd. IND INR 80,140 0.01
A A
3,506,706 0.50A A
Networking Equipment355,128 Naspers Ltd., N ZAF ZAR 6,280,854 0.89
A A
Oil & Gas Drilling11,608,000 CNOOC Ltd. CHN HKD 10,843,839 1.53
717,684 Oil & Natural Gas Corp. Ltd. IND INR 9,855,239 1.393,150,000 Oil & Gas Development Co. Ltd. PAK PKR 1,990,123 0.28
A A
22,689,201 3.20A A
Oil & Gas Equipment & Services96,687 Tenaris SA, ADR ARG USD 2,028,493 0.29
A A
Oil & Gas Refining & Marketing1,381,624 Gail India Ltd. IND INR 5,853,857 0.83
A A
Packaged Foods269,158 Tiger Brands Ltd. ZAF ZAR 4,107,237 0.58
A A
Semiconductors10,418,834 Taiwan Semiconductor Manufacturing Co. Ltd. TWN TWD 14,114,302 1.99
1,168,640 MediaTek Inc. TWN TWD 7,862,246 1.11A A
21,976,548 3.10A A
Soft Drinks2,069,192 Embotelladora Andina SA, pfd., A CHL CLP 3,810,816 0.54
A A
Steel1,213,200 Companhia Vale do Rio Doce, ADR, pfd., A BRA USD 12,920,580 1.827,361,000 China Molybdenum Co. Ltd., H CHN HKD 3,343,232 0.471,408,983 Steel Authority of India Ltd. IND INR 2,244,462 0.32
157,349 Usinas Siderurgicas de Minas Gerais SA, pfd., A BRA BRL 1,802,936 0.25134,895 Mechel OAO, ADR RUS USD 539,580 0.08
1,301 El Ezz Aldekhela Steel Alexa Co. EGY EGP 188,850 0.03A A
21,039,640 2.97A A
Telecommunications Equipment656,000 VTech Holdings Ltd. HKG HKD 2,776,290 0.39
A A
Tobacco581,214 Souza Cruz SA BRA BRL 11,074,330 1.57254,859 British American Tobacco PLC GBR ZAR 6,649,651 0.94
72,300 British American Tobacco Malaysia Bhd. MYS MYR 931,890 0.13374,000 Shanghai Industrial Holdings Ltd. CHN HKD 854,146 0.12
A A
19,510,017 2.76A A
Trucking814,841 ComfortDelGro Corp. Ltd. SGP SGD 824,796 0.12
A A
FRANKL IN TEMPLETON INVESTMENT FUNDS
ç Templeton Emerging Markets Fund ç
Schedule of Investments as of December 31, 2008 (continued)
(Currency ç USD)
Number of % of
shares or Description Country Trading Market net
face value code currency value assets
Unaudited Semi-Annual Report www.franklintempleton.lu190
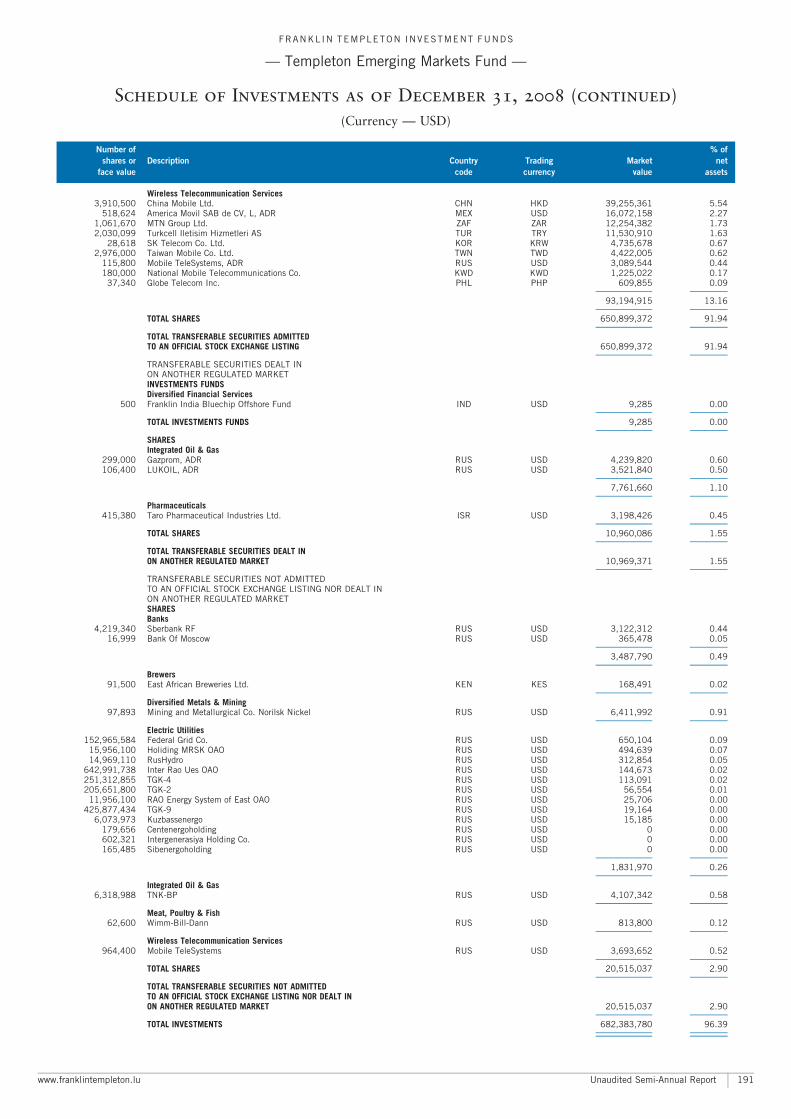
Wireless Telecommunication Services3,910,500 China Mobile Ltd. CHN HKD 39,255,361 5.54
518,624 America Movil SAB de CV, L, ADR MEX USD 16,072,158 2.271,061,670 MTN Group Ltd. ZAF ZAR 12,254,382 1.732,030,099 Turkcell Iletisim Hizmetleri AS TUR TRY 11,530,910 1.63
28,618 SK Telecom Co. Ltd. KOR KRW 4,735,678 0.672,976,000 Taiwan Mobile Co. Ltd. TWN TWD 4,422,005 0.62
115,800 Mobile TeleSystems, ADR RUS USD 3,089,544 0.44180,000 National Mobile Telecommunications Co. KWD KWD 1,225,022 0.17
37,340 Globe Telecom Inc. PHL PHP 609,855 0.09A A
93,194,915 13.16A A
TOTAL SHARES 650,899,372 91.94A A
TOTAL TRANSFERABLE SECURITIES ADMITTEDTO AN OFFICIAL STOCK EXCHANGE LISTING 650,899,372 91.94
A A
TRANSFERABLE SECURITIES DEALT INON ANOTHER REGULATED MARKETINVESTMENTS FUNDSDiversified Financial Services
500 Franklin India Bluechip Offshore Fund IND USD 9,285 0.00A A
TOTAL INVESTMENTS FUNDS 9,285 0.00A A
SHARESIntegrated Oil & Gas
299,000 Gazprom, ADR RUS USD 4,239,820 0.60106,400 LUKOIL, ADR RUS USD 3,521,840 0.50
A A
7,761,660 1.10A A
Pharmaceuticals415,380 Taro Pharmaceutical Industries Ltd. ISR USD 3,198,426 0.45
A A
TOTAL SHARES 10,960,086 1.55A A
TOTAL TRANSFERABLE SECURITIES DEALT INON ANOTHER REGULATED MARKET 10,969,371 1.55
A A
TRANSFERABLE SECURITIES NOT ADMITTEDTO AN OFFICIAL STOCK EXCHANGE LISTING NOR DEALT INON ANOTHER REGULATED MARKETSHARESBanks
4,219,340 Sberbank RF RUS USD 3,122,312 0.4416,999 Bank Of Moscow RUS USD 365,478 0.05
A A
3,487,790 0.49A A
Brewers91,500 East African Breweries Ltd. KEN KES 168,491 0.02
A A
Diversified Metals & Mining97,893 Mining and Metallurgical Co. Norilsk Nickel RUS USD 6,411,992 0.91
A A
Electric Utilities152,965,584 Federal Grid Co. RUS USD 650,104 0.09
15,956,100 Holiding MRSK OAO RUS USD 494,639 0.0714,969,110 RusHydro RUS USD 312,854 0.05
642,991,738 Inter Rao Ues OAO RUS USD 144,673 0.02251,312,855 TGK-4 RUS USD 113,091 0.02205,651,800 TGK-2 RUS USD 56,554 0.01
11,956,100 RAO Energy System of East OAO RUS USD 25,706 0.00425,877,434 TGK-9 RUS USD 19,164 0.00
6,073,973 Kuzbassenergo RUS USD 15,185 0.00179,656 Centenergoholding RUS USD 0 0.00602,321 Intergenerasiya Holding Co. RUS USD 0 0.00165,485 Sibenergoholding RUS USD 0 0.00
A A
1,831,970 0.26A A
Integrated Oil & Gas6,318,988 TNK-BP RUS USD 4,107,342 0.58
A A
Meat, Poultry & Fish62,600 Wimm-Bill-Dann RUS USD 813,800 0.12
A A
Wireless Telecommunication Services964,400 Mobile TeleSystems RUS USD 3,693,652 0.52
A A
TOTAL SHARES 20,515,037 2.90A A
TOTAL TRANSFERABLE SECURITIES NOT ADMITTEDTO AN OFFICIAL STOCK EXCHANGE LISTING NOR DEALT INON ANOTHER REGULATED MARKET 20,515,037 2.90
A A
TOTAL INVESTMENTS 682,383,780 96.39A A
A A
FRANKL IN TEMPLETON INVESTMENT FUNDS
ç Templeton Emerging Markets Fund ç
Schedule of Investments as of December 31, 2008 (continued)
(Currency ç USD)
Number of % of
shares or Description Country Trading Market net
face value code currency value assets
www.franklintempleton.lu Unaudited Semi-Annual Report 191
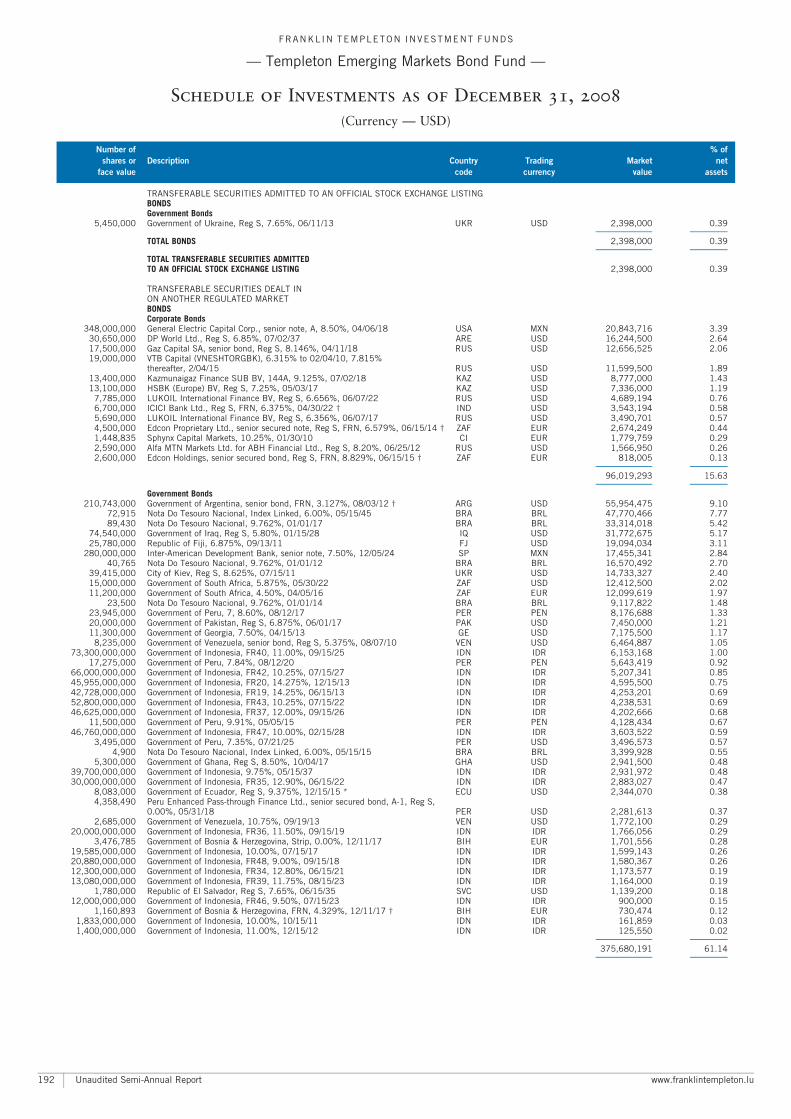
TRANSFERABLE SECURITIES ADMITTED TO AN OFFICIAL STOCK EXCHANGE LISTINGBONDSGovernment Bonds
5,450,000 Government of Ukraine, Reg S, 7.65%, 06/11/13 UKR USD 2,398,000 0.39A A
TOTAL BONDS 2,398,000 0.39A A
TOTAL TRANSFERABLE SECURITIES ADMITTEDTO AN OFFICIAL STOCK EXCHANGE LISTING 2,398,000 0.39
TRANSFERABLE SECURITIES DEALT INON ANOTHER REGULATED MARKETBONDSCorporate Bonds
348,000,000 General Electric Capital Corp., senior note, A, 8.50%, 04/06/18 USA MXN 20,843,716 3.3930,650,000 DP World Ltd., Reg S, 6.85%, 07/02/37 ARE USD 16,244,500 2.6417,500,000 Gaz Capital SA, senior bond, Reg S, 8.146%, 04/11/18 RUS USD 12,656,525 2.0619,000,000 VTB Capital (VNESHTORGBK), 6.315% to 02/04/10, 7.815%
thereafter, 2/04/15 RUS USD 11,599,500 1.8913,400,000 Kazmunaigaz Finance SUB BV, 144A, 9.125%, 07/02/18 KAZ USD 8,777,000 1.4313,100,000 HSBK (Europe) BV, Reg S, 7.25%, 05/03/17 KAZ USD 7,336,000 1.19
7,785,000 LUKOIL International Finance BV, Reg S, 6.656%, 06/07/22 RUS USD 4,689,194 0.766,700,000 ICICI Bank Ltd., Reg S, FRN, 6.375%, 04/30/22 � IND USD 3,543,194 0.585,690,000 LUKOIL International Finance BV, Reg S, 6.356%, 06/07/17 RUS USD 3,490,701 0.574,500,000 Edcon Proprietary Ltd., senior secured note, Reg S, FRN, 6.579%, 06/15/14 � ZAF EUR 2,674,249 0.441,448,835 Sphynx Capital Markets, 10.25%, 01/30/10 CI EUR 1,779,759 0.292,590,000 Alfa MTN Markets Ltd. for ABH Financial Ltd., Reg S, 8.20%, 06/25/12 RUS USD 1,566,950 0.262,600,000 Edcon Holdings, senior secured bond, Reg S, FRN, 8.829%, 06/15/15 � ZAF EUR 818,005 0.13
A A
96,019,293 15.63A A
Government Bonds210,743,000 Government of Argentina, senior bond, FRN, 3.127%, 08/03/12 � ARG USD 55,954,475 9.10
72,915 Nota Do Tesouro Nacional, Index Linked, 6.00%, 05/15/45 BRA BRL 47,770,466 7.7789,430 Nota Do Tesouro Nacional, 9.762%, 01/01/17 BRA BRL 33,314,018 5.42
74,540,000 Government of Iraq, Reg S, 5.80%, 01/15/28 IQ USD 31,772,675 5.1725,780,000 Republic of Fiji, 6.875%, 09/13/11 FJ USD 19,094,034 3.11
280,000,000 Inter-American Development Bank, senior note, 7.50%, 12/05/24 SP MXN 17,455,341 2.8440,765 Nota Do Tesouro Nacional, 9.762%, 01/01/12 BRA BRL 16,570,492 2.70
39,415,000 City of Kiev, Reg S, 8.625%, 07/15/11 UKR USD 14,733,327 2.4015,000,000 Government of South Africa, 5.875%, 05/30/22 ZAF USD 12,412,500 2.0211,200,000 Government of South Africa, 4.50%, 04/05/16 ZAF EUR 12,099,619 1.97
23,500 Nota Do Tesouro Nacional, 9.762%, 01/01/14 BRA BRL 9,117,822 1.4823,945,000 Government of Peru, 7, 8.60%, 08/12/17 PER PEN 8,176,688 1.3320,000,000 Government of Pakistan, Reg S, 6.875%, 06/01/17 PAK USD 7,450,000 1.2111,300,000 Government of Georgia, 7.50%, 04/15/13 GE USD 7,175,500 1.17
8,235,000 Government of Venezuela, senior bond, Reg S, 5.375%, 08/07/10 VEN USD 6,464,887 1.0573,300,000,000 Government of Indonesia, FR40, 11.00%, 09/15/25 IDN IDR 6,153,168 1.00
17,275,000 Government of Peru, 7.84%, 08/12/20 PER PEN 5,643,419 0.9266,000,000,000 Government of Indonesia, FR42, 10.25%, 07/15/27 IDN IDR 5,207,341 0.8545,955,000,000 Government of Indonesia, FR20, 14.275%, 12/15/13 IDN IDR 4,595,500 0.7542,728,000,000 Government of Indonesia, FR19, 14.25%, 06/15/13 IDN IDR 4,253,201 0.6952,800,000,000 Government of Indonesia, FR43, 10.25%, 07/15/22 IDN IDR 4,238,531 0.6946,625,000,000 Government of Indonesia, FR37, 12.00%, 09/15/26 IDN IDR 4,202,666 0.68
11,500,000 Government of Peru, 9.91%, 05/05/15 PER PEN 4,128,434 0.6746,760,000,000 Government of Indonesia, FR47, 10.00%, 02/15/28 IDN IDR 3,603,522 0.59
3,495,000 Government of Peru, 7.35%, 07/21/25 PER USD 3,496,573 0.574,900 Nota Do Tesouro Nacional, Index Linked, 6.00%, 05/15/15 BRA BRL 3,399,928 0.55
5,300,000 Government of Ghana, Reg S, 8.50%, 10/04/17 GHA USD 2,941,500 0.4839,700,000,000 Government of Indonesia, 9.75%, 05/15/37 IDN IDR 2,931,972 0.4830,000,000,000 Government of Indonesia, FR35, 12.90%, 06/15/22 IDN IDR 2,883,027 0.47
8,083,000 Government of Ecuador, Reg S, 9.375%, 12/15/15 * ECU USD 2,344,070 0.384,358,490 Peru Enhanced Pass-through Finance Ltd., senior secured bond, A-1, Reg S,
0.00%, 05/31/18 PER USD 2,281,613 0.372,685,000 Government of Venezuela, 10.75%, 09/19/13 VEN USD 1,772,100 0.29
20,000,000,000 Government of Indonesia, FR36, 11.50%, 09/15/19 IDN IDR 1,766,056 0.293,476,785 Government of Bosnia & Herzegovina, Strip, 0.00%, 12/11/17 BIH EUR 1,701,556 0.28
19,585,000,000 Government of Indonesia, 10.00%, 07/15/17 IDN IDR 1,599,143 0.2620,880,000,000 Government of Indonesia, FR48, 9.00%, 09/15/18 IDN IDR 1,580,367 0.2612,300,000,000 Government of Indonesia, FR34, 12.80%, 06/15/21 IDN IDR 1,173,577 0.1913,080,000,000 Government of Indonesia, FR39, 11.75%, 08/15/23 IDN IDR 1,164,000 0.19
1,780,000 Republic of El Salvador, Reg S, 7.65%, 06/15/35 SVC USD 1,139,200 0.1812,000,000,000 Government of Indonesia, FR46, 9.50%, 07/15/23 IDN IDR 900,000 0.15
1,160,893 Government of Bosnia & Herzegovina, FRN, 4.329%, 12/11/17 � BIH EUR 730,474 0.121,833,000,000 Government of Indonesia, 10.00%, 10/15/11 IDN IDR 161,859 0.031,400,000,000 Government of Indonesia, 11.00%, 12/15/12 IDN IDR 125,550 0.02
A A
375,680,191 61.14A A
FRANKL IN TEMPLETON INVESTMENT FUNDS
ç Templeton Emerging Markets Bond Fund ç
Schedule of Investments as of December 31, 2008
(Currency ç USD)
Number of % of
shares or Description Country Trading Market net
face value code currency value assets
Unaudited Semi-Annual Report www.franklintempleton.lu192
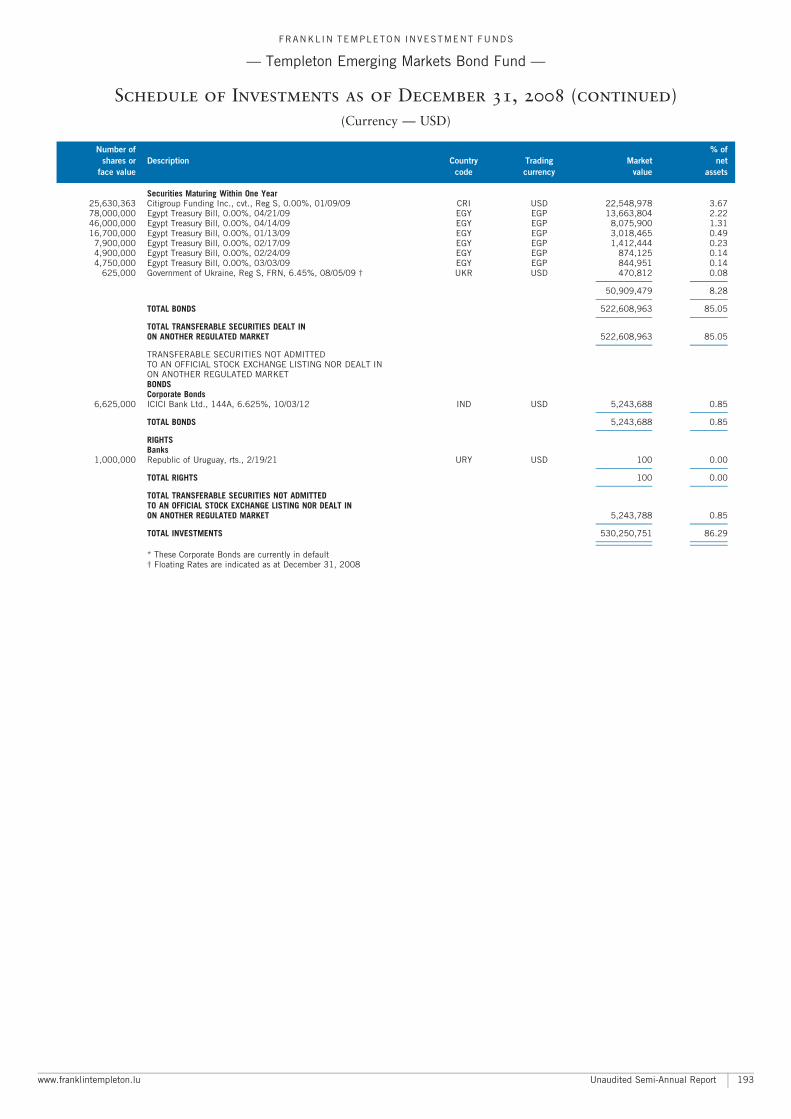
Securities Maturing Within One Year25,630,363 Citigroup Funding Inc., cvt., Reg S, 0.00%, 01/09/09 CRI USD 22,548,978 3.6778,000,000 Egypt Treasury Bill, 0.00%, 04/21/09 EGY EGP 13,663,804 2.2246,000,000 Egypt Treasury Bill, 0.00%, 04/14/09 EGY EGP 8,075,900 1.3116,700,000 Egypt Treasury Bill, 0.00%, 01/13/09 EGY EGP 3,018,465 0.49
7,900,000 Egypt Treasury Bill, 0.00%, 02/17/09 EGY EGP 1,412,444 0.234,900,000 Egypt Treasury Bill, 0.00%, 02/24/09 EGY EGP 874,125 0.144,750,000 Egypt Treasury Bill, 0.00%, 03/03/09 EGY EGP 844,951 0.14
625,000 Government of Ukraine, Reg S, FRN, 6.45%, 08/05/09 � UKR USD 470,812 0.08A A
50,909,479 8.28A A
TOTAL BONDS 522,608,963 85.05A A
TOTAL TRANSFERABLE SECURITIES DEALT INON ANOTHER REGULATED MARKET 522,608,963 85.05
A A
TRANSFERABLE SECURITIES NOT ADMITTEDTO AN OFFICIAL STOCK EXCHANGE LISTING NOR DEALT INON ANOTHER REGULATED MARKETBONDSCorporate Bonds
6,625,000 ICICI Bank Ltd., 144A, 6.625%, 10/03/12 IND USD 5,243,688 0.85A A
TOTAL BONDS 5,243,688 0.85A A
RIGHTSBanks
1,000,000 Republic of Uruguay, rts., 2/19/21 URY USD 100 0.00A A
TOTAL RIGHTS 100 0.00A A
TOTAL TRANSFERABLE SECURITIES NOT ADMITTEDTO AN OFFICIAL STOCK EXCHANGE LISTING NOR DEALT INON ANOTHER REGULATED MARKET 5,243,788 0.85
A A
TOTAL INVESTMENTS 530,250,751 86.29A A
A A
* These Corporate Bonds are currently in default� Floating Rates are indicated as at December 31, 2008
FRANKL IN TEMPLETON INVESTMENT FUNDS
ç Templeton Emerging Markets Bond Fund ç
Schedule of Investments as of December 31, 2008 (continued)
(Currency ç USD)
Number of % of
shares or Description Country Trading Market net
face value code currency value assets
www.franklintempleton.lu Unaudited Semi-Annual Report 193
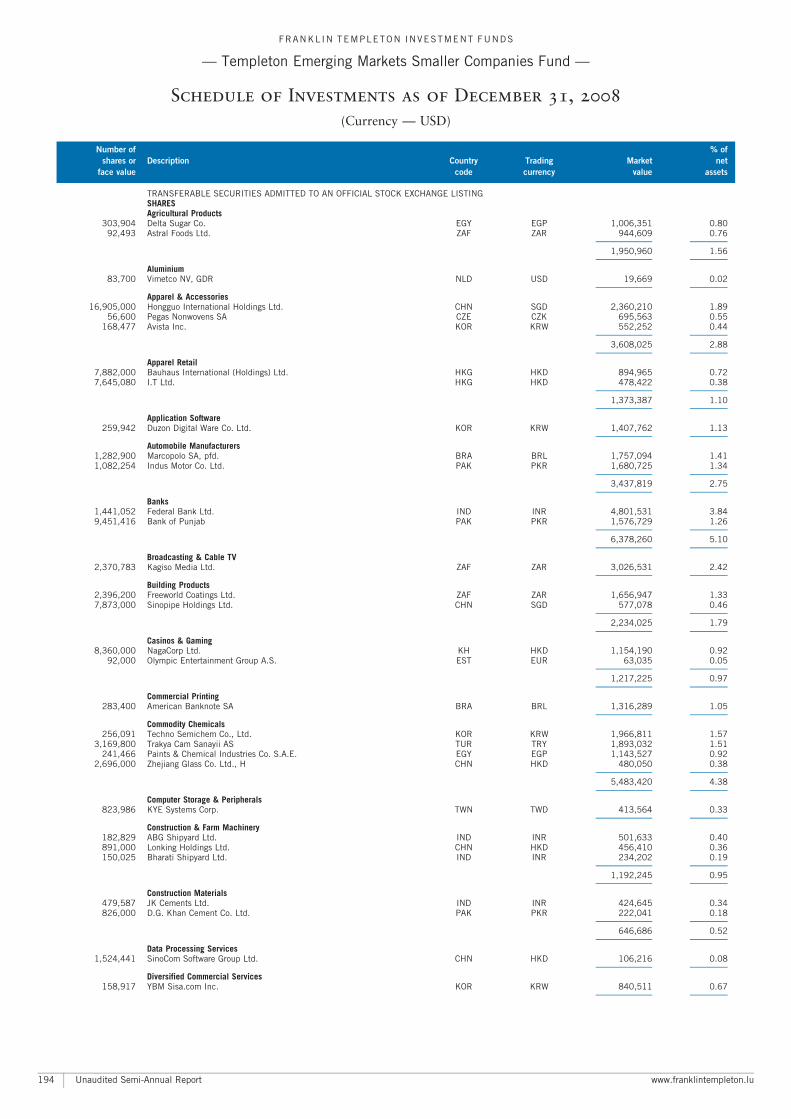
TRANSFERABLE SECURITIES ADMITTED TO AN OFFICIAL STOCK EXCHANGE LISTINGSHARESAgricultural Products
303,904 Delta Sugar Co. EGY EGP 1,006,351 0.8092,493 Astral Foods Ltd. ZAF ZAR 944,609 0.76
A A
1,950,960 1.56A A
Aluminium83,700 Vimetco NV, GDR NLD USD 19,669 0.02
A A
Apparel & Accessories16,905,000 Hongguo International Holdings Ltd. CHN SGD 2,360,210 1.89
56,600 Pegas Nonwovens SA CZE CZK 695,563 0.55168,477 Avista Inc. KOR KRW 552,252 0.44
A A
3,608,025 2.88A A
Apparel Retail7,882,000 Bauhaus International (Holdings) Ltd. HKG HKD 894,965 0.727,645,080 I.T Ltd. HKG HKD 478,422 0.38
A A
1,373,387 1.10A A
Application Software259,942 Duzon Digital Ware Co. Ltd. KOR KRW 1,407,762 1.13
A A
Automobile Manufacturers1,282,900 Marcopolo SA, pfd. BRA BRL 1,757,094 1.411,082,254 Indus Motor Co. Ltd. PAK PKR 1,680,725 1.34
A A
3,437,819 2.75A A
Banks1,441,052 Federal Bank Ltd. IND INR 4,801,531 3.849,451,416 Bank of Punjab PAK PKR 1,576,729 1.26
A A
6,378,260 5.10A A
Broadcasting & Cable TV2,370,783 Kagiso Media Ltd. ZAF ZAR 3,026,531 2.42
A A
Building Products2,396,200 Freeworld Coatings Ltd. ZAF ZAR 1,656,947 1.337,873,000 Sinopipe Holdings Ltd. CHN SGD 577,078 0.46
A A
2,234,025 1.79A A
Casinos & Gaming8,360,000 NagaCorp Ltd. KH HKD 1,154,190 0.92
92,000 Olympic Entertainment Group A.S. EST EUR 63,035 0.05A A
1,217,225 0.97A A
Commercial Printing283,400 American Banknote SA BRA BRL 1,316,289 1.05
A A
Commodity Chemicals256,091 Techno Semichem Co., Ltd. KOR KRW 1,966,811 1.57
3,169,800 Trakya Cam Sanayii AS TUR TRY 1,893,032 1.51241,466 Paints & Chemical Industries Co. S.A.E. EGY EGP 1,143,527 0.92
2,696,000 Zhejiang Glass Co. Ltd., H CHN HKD 480,050 0.38A A
5,483,420 4.38A A
Computer Storage & Peripherals823,986 KYE Systems Corp. TWN TWD 413,564 0.33
A A
Construction & Farm Machinery182,829 ABG Shipyard Ltd. IND INR 501,633 0.40891,000 Lonking Holdings Ltd. CHN HKD 456,410 0.36150,025 Bharati Shipyard Ltd. IND INR 234,202 0.19
A A
1,192,245 0.95A A
Construction Materials479,587 JK Cements Ltd. IND INR 424,645 0.34826,000 D.G. Khan Cement Co. Ltd. PAK PKR 222,041 0.18
A A
646,686 0.52A A
Data Processing Services1,524,441 SinoCom Software Group Ltd. CHN HKD 106,216 0.08
A A
Diversified Commercial Services158,917 YBM Sisa.com Inc. KOR KRW 840,511 0.67
A A
FRANKL IN TEMPLETON INVESTMENT FUNDS
ç Templeton Emerging Markets Smaller Companies Fund ç
Schedule of Investments as of December 31, 2008
(Currency ç USD)
Number of % of
shares or Description Country Trading Market net
face value code currency value assets
Unaudited Semi-Annual Report www.franklintempleton.lu194

Diversified Financial Services244,667 Tata Investment Corp., Ltd. IND INR 1,088,471 0.87331,860 IS Yatirim Menkul Degerler AS TUR TRY 180,956 0.14
A A
1,269,427 1.01A A
Diversified Metals & Mining6,384,300 Philex Mining Corp. PHL PHP 678,750 0.54
805,000 GMA Resources PLC GBR GBP 19,106 0.02A A
697,856 0.56A A
Electric Utilities4,606,900 Glow Energy Public Co. Ltd., fgn. THA THB 2,979,884 2.38
35,600 AES Barka SAOG OMN OMR 154,509 0.13A A
3,134,393 2.51A A
Electronic Equipment & Instruments398,164 Misung Polytech Co. Ltd. KOR KRW 1,547,890 1.24
A A
Electronic Equipment & Services4,473,800 Delta Electronics (Thailand) Public Co. Ltd., fgn. THA THB 1,569,078 1.264,359,100 Hana Microelectronics Public Co. Ltd., fgn. THA THB 1,253,155 1.00
A A
2,822,233 2.26A A
Fertilizers & Agricultural Chemicals652,606 E.I.D. ^ Parry (India) Ltd. IND INR 2,036,877 1.63
A A
General Merchandise Stores835,000 Beijing Jingkelong Supermarket Chain Group Co. Ltd., H CHN HKD 290,896 0.23
A A
Health Care Facilities3,361,400 Bangkok Chain Hospital PCL, fgn. THA THB 686,099 0.55
A A
Household Appliances8,140,000 Aupu Group Holding Co. Ltd. HKG HKD 504,142 0.40
A A
Household Products7,914,733 Beauty China Holdings Ltd. CHN SGD 2,348,175 1.88
115,336 Neopharm Co. Ltd. KOR KRW 310,485 0.25A A
2,658,660 2.13A A
Industrial Machinery224,446 TK Corp. KOR KRW 3,909,590 3.12
20,178,000 Shanghai Prime Machinery Co. Ltd., H CHN HKD 2,291,120 1.8344,229 Zhongde Waste Technology AG. DEU EUR 860,888 0.69
7,380,000 Chongqing Machinery and Electric Co. Ltd., H CHN HKD 533,251 0.438,750 Shin Zu Shing Co. Ltd. TWN TWD 21,892 0.02
A A
7,616,741 6.09A A
Integrated Oil & Gas728,800 Pakistan State Oil Co. Ltd. PAK PKR 1,331,689 1.06
A A
IT Consulting & Services2,184,914 HCL Infosystems Ltd. IND INR 4,071,436 3.26
41,022 Tulip Telecom Ltd. IND INR 427,010 0.34A A
4,498,446 3.60A A
Leisure Products781,137 Lewis Group Ltd. ZAF ZAR 3,988,785 3.19
2,840,000 Luk Fook Holdings (International) Ltd. BMU HKD 740,213 0.59A A
4,728,998 3.78A A
Life & Health Insurance330,597,500 PT Panin Life Tbk IDN IDR 2,517,394 2.01
A A
Managed Health Care13,696 Odontoprev SA BRA BRL 136,102 0.11
A A
Marine809,204 Great Eastern Shipping Co. Ltd. IND INR 3,376,954 2.70
3,552,600 Precious Shipping Public Co. Ltd., fgn. THA THB 1,118,326 0.89A A
4,495,280 3.59A A
Meat, Poultry & Fish68,270 Binggrae Co. Ltd. KOR KRW 2,354,045 1.88
1,171,519 Pinar Sut Mamulleri Sanayii AS TUR TRY 2,068,505 1.65A A
4,422,550 3.53A A
FRANKL IN TEMPLETON INVESTMENT FUNDS
ç Templeton Emerging Markets Smaller Companies Fund ç
Schedule of Investments as of December 31, 2008 (continued)
(Currency ç USD)
Number of % of
shares or Description Country Trading Market net
face value code currency value assets
www.franklintempleton.lu Unaudited Semi-Annual Report 195
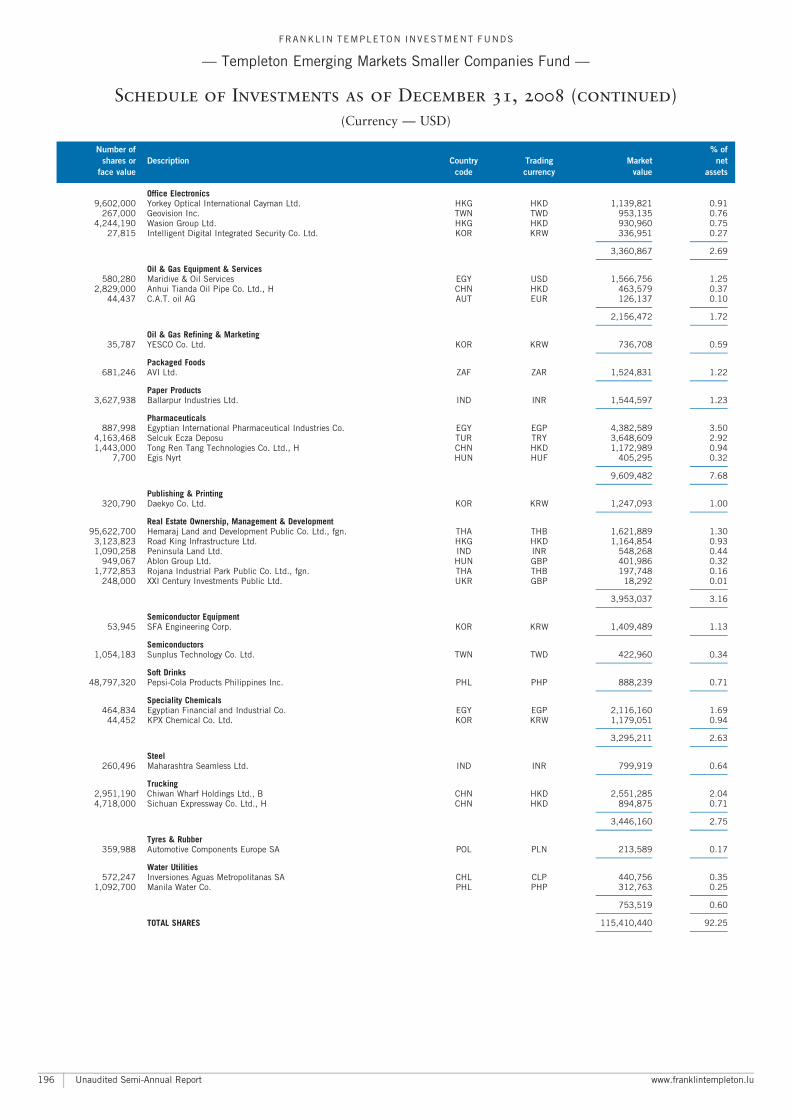
Office Electronics9,602,000 Yorkey Optical International Cayman Ltd. HKG HKD 1,139,821 0.91
267,000 Geovision Inc. TWN TWD 953,135 0.764,244,190 Wasion Group Ltd. HKG HKD 930,960 0.75
27,815 Intelligent Digital Integrated Security Co. Ltd. KOR KRW 336,951 0.27A A
3,360,867 2.69A A
Oil & Gas Equipment & Services580,280 Maridive & Oil Services EGY USD 1,566,756 1.25
2,829,000 Anhui Tianda Oil Pipe Co. Ltd., H CHN HKD 463,579 0.3744,437 C.A.T. oil AG AUT EUR 126,137 0.10
A A
2,156,472 1.72A A
Oil & Gas Refining & Marketing35,787 YESCO Co. Ltd. KOR KRW 736,708 0.59
A A
Packaged Foods681,246 AVI Ltd. ZAF ZAR 1,524,831 1.22
A A
Paper Products3,627,938 Ballarpur Industries Ltd. IND INR 1,544,597 1.23
A A
Pharmaceuticals887,998 Egyptian International Pharmaceutical Industries Co. EGY EGP 4,382,589 3.50
4,163,468 Selcuk Ecza Deposu TUR TRY 3,648,609 2.921,443,000 Tong Ren Tang Technologies Co. Ltd., H CHN HKD 1,172,989 0.94
7,700 Egis Nyrt HUN HUF 405,295 0.32A A
9,609,482 7.68A A
Publishing & Printing320,790 Daekyo Co. Ltd. KOR KRW 1,247,093 1.00
A A
Real Estate Ownership, Management & Development95,622,700 Hemaraj Land and Development Public Co. Ltd., fgn. THA THB 1,621,889 1.30
3,123,823 Road King Infrastructure Ltd. HKG HKD 1,164,854 0.931,090,258 Peninsula Land Ltd. IND INR 548,268 0.44
949,067 Ablon Group Ltd. HUN GBP 401,986 0.321,772,853 Rojana Industrial Park Public Co. Ltd., fgn. THA THB 197,748 0.16
248,000 XXI Century Investments Public Ltd. UKR GBP 18,292 0.01A A
3,953,037 3.16A A
Semiconductor Equipment53,945 SFA Engineering Corp. KOR KRW 1,409,489 1.13
A A
Semiconductors1,054,183 Sunplus Technology Co. Ltd. TWN TWD 422,960 0.34
A A
Soft Drinks48,797,320 Pepsi-Cola Products Philippines Inc. PHL PHP 888,239 0.71
A A
Speciality Chemicals464,834 Egyptian Financial and Industrial Co. EGY EGP 2,116,160 1.69
44,452 KPX Chemical Co. Ltd. KOR KRW 1,179,051 0.94A A
3,295,211 2.63A A
Steel260,496 Maharashtra Seamless Ltd. IND INR 799,919 0.64
A A
Trucking2,951,190 Chiwan Wharf Holdings Ltd., B CHN HKD 2,551,285 2.044,718,000 Sichuan Expressway Co. Ltd., H CHN HKD 894,875 0.71
A A
3,446,160 2.75A A
Tyres & Rubber359,988 Automotive Components Europe SA POL PLN 213,589 0.17
A A
Water Utilities572,247 Inversiones Aguas Metropolitanas SA CHL CLP 440,756 0.35
1,092,700 Manila Water Co. PHL PHP 312,763 0.25A A
753,519 0.60A A
TOTAL SHARES 115,410,440 92.25A A
FRANKL IN TEMPLETON INVESTMENT FUNDS
ç Templeton Emerging Markets Smaller Companies Fund ç
Schedule of Investments as of December 31, 2008 (continued)
(Currency ç USD)
Number of % of
shares or Description Country Trading Market net
face value code currency value assets
Unaudited Semi-Annual Report www.franklintempleton.lu196
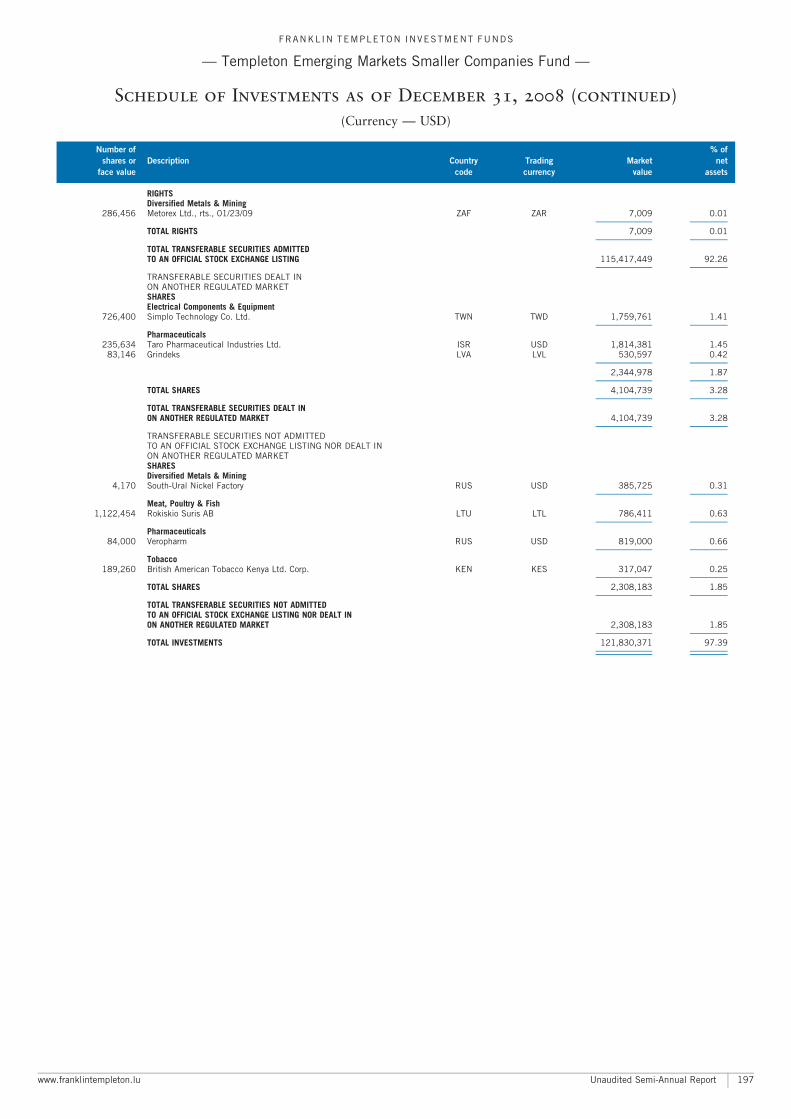
RIGHTSDiversified Metals & Mining
286,456 Metorex Ltd., rts., 01/23/09 ZAF ZAR 7,009 0.01A A
TOTAL RIGHTS 7,009 0.01A A
TOTAL TRANSFERABLE SECURITIES ADMITTEDTO AN OFFICIAL STOCK EXCHANGE LISTING 115,417,449 92.26
A A
TRANSFERABLE SECURITIES DEALT INON ANOTHER REGULATED MARKETSHARESElectrical Components & Equipment
726,400 Simplo Technology Co. Ltd. TWN TWD 1,759,761 1.41A A
Pharmaceuticals235,634 Taro Pharmaceutical Industries Ltd. ISR USD 1,814,381 1.45
83,146 Grindeks LVA LVL 530,597 0.42A A
2,344,978 1.87A A
TOTAL SHARES 4,104,739 3.28A A
TOTAL TRANSFERABLE SECURITIES DEALT INON ANOTHER REGULATED MARKET 4,104,739 3.28
A A
TRANSFERABLE SECURITIES NOT ADMITTEDTO AN OFFICIAL STOCK EXCHANGE LISTING NOR DEALT INON ANOTHER REGULATED MARKETSHARESDiversified Metals & Mining
4,170 South-Ural Nickel Factory RUS USD 385,725 0.31A A
Meat, Poultry & Fish1,122,454 Rokiskio Suris AB LTU LTL 786,411 0.63
A A
Pharmaceuticals84,000 Veropharm RUS USD 819,000 0.66
A A
Tobacco189,260 British American Tobacco Kenya Ltd. Corp. KEN KES 317,047 0.25
A A
TOTAL SHARES 2,308,183 1.85A A
TOTAL TRANSFERABLE SECURITIES NOT ADMITTEDTO AN OFFICIAL STOCK EXCHANGE LISTING NOR DEALT INON ANOTHER REGULATED MARKET 2,308,183 1.85
A A
TOTAL INVESTMENTS 121,830,371 97.39A A
A A
FRANKL IN TEMPLETON INVESTMENT FUNDS
ç Templeton Emerging Markets Smaller Companies Fund ç
Schedule of Investments as of December 31, 2008 (continued)
(Currency ç USD)
Number of % of
shares or Description Country Trading Market net
face value code currency value assets
www.franklintempleton.lu Unaudited Semi-Annual Report 197

TRANSFERABLE SECURITIES ADMITTED TO AN OFFICIAL STOCK EXCHANGE LISTINGBONDSSecurities Maturing Within One Year
1,500,000 BCP Finance Bank, senior note, FRN, 5.531%, 10/14/09 � PRT EUR 1,478,199 1.691,000,000 Unicredito Italiano Bank (Ireland) PLC, series 150, tranche 1, FRN, 3.538%,
03/10/09 � IRL EUR 998,375 1.15A A
2,476,574 2.84A A
TOTAL BONDS 2,476,574 2.84A A
TOTAL TRANSFERABLE SECURITIES ADMITTEDTO AN OFFICIAL STOCK EXCHANGE LISTING 2,476,574 2.84
A A
TRANSFERABLE SECURITIES DEALT INON ANOTHER REGULATED MARKETBONDSCorporate Bonds
5,000,000 Ulster Bank Finance PLC, senior note, FRN, 3.109%, 03/29/11 � IRL EUR 4,746,650 5.435,000,000 GE Capital Euro Funding, senior note, FRN, 3.623%, 07/01/11 � IRL EUR 4,442,505 5.084,000,000 JP Morgan Chase & Co., FRN, 4.054%, 06/01/10 � USA EUR 3,822,240 4.373,000,000 UniCredit SpA, FRN, 5.455%, 04/05/11 � ITA EUR 2,909,538 3.333,000,000 Deutsche Bank AG, senior note, FRN, 5.29%, 10/18/10 � DEU EUR 2,897,445 3.323,000,000 Bank of Scotland PLC, senior note, FRN, 3.044%, 03/29/10 � GBR EUR 2,882,419 3.303,000,000 HSBC Finance Corp., unsecured, FRN, 3.529%, 09/14/10 � USA EUR 2,668,260 3.052,000,000 BBVA Senior Finance SA, FRN, 5.05%, 01/22/10 � ESP EUR 1,973,048 2.262,000,000 Telefonica Emisones SAU, senior note, FRN, 5.271%, 01/25/10 � ESP EUR 1,940,858 2.222,000,000 Merrill Lynch SA, senior note, FRN, 3.219%, 09/29/10 � LUX EUR 1,786,625 2.041,500,000 Bat Holdings BV, FRN, 4.605%, 05/16/10 � NLD EUR 1,489,876 1.711,500,000 Telecom Italia SpA, FRN, 3.869%, 06/07/10 � ITA EUR 1,480,268 1.691,000,000 Volkswagen BK GMBH, 4.935%, 07/07/10 DEU EUR 939,479 1.081,000,000 Volkswagen Bank GMBH, senior note, FRN, 3.144%, 06/27/11 � DEU EUR 903,817 1.03
A A
34,883,028 39.91A A
Securities Maturing Within One Year5,000,000 Barclays Bank PLC, senior note, FRN, 4.353%, 02/20/09 � GBR EUR 5,007,450 5.734,000,000 Fortis Bank Luxembourg, 0.00%, 01/06/09 LUX EUR 3,998,567 4.574,000,000 Credit Agricole SA, 0.00%, 02/02/09 FRA EUR 3,990,105 4.573,000,000 Societe Generale London, 0.00%, 01/08/09 GBR EUR 2,998,496 3.433,000,000 Unilever Finance International, 0.00%, 02/17/09 NLD EUR 2,989,000 3.423,000,000 Caisse Nationale Des Caisses, 0.00%, 06/11/09 FRA EUR 2,960,072 3.392,000,000 Lloyds TSB Bank PLC, 0.00%, 03/09/09 GBR EUR 1,993,736 2.282,000,000 E.ON AG, 0.00%, 02/27/09 DEU EUR 1,991,080 2.282,000,000 Nordea Bank Finland PLC, 0.00%, 03/03/09 FIN EUR 1,989,754 2.282,000,000 Danske Bank AS, 0.00%, 03/11/09 DNK EUR 1,988,439 2.272,000,000 Nomura Europe Finance NV, FRN, 4.062%, 02/27/09 � NLD EUR 1,983,558 2.272,000,000 BNP Paribas, 0.00%, 04/22/09 FRA EUR 1,981,458 2.272,000,000 Deutsche Telekom International Finance BV, FRN, 4.326%, 11/23/09 � NLD EUR 1,954,816 2.241,500,000 DNB Norbank ASA, 0.00%, 06/01/09 NOR EUR 1,481,268 1.691,500,000 Bear Stearns Co. Inc., senior note, FRN, 5.34%, 10/20/09 � USA EUR 1,462,403 1.671,500,000 ICICI Bank Ltd. Singapore, senior unsecured note, FRN, 3.419%, 03/29/09 � SGP EUR 1,438,635 1.65
A A
40,208,837 46.01A A
TOTAL BONDS 75,091,865 85.92A A
TOTAL TRANSFERABLE SECURITIES DEALT INON ANOTHER REGULATED MARKET 75,091,865 85.92
A A
TOTAL INVESTMENTS 77,568,439 88.76A A
A A
� Floating Rates are indicated as at December 31, 2008
FRANKL IN TEMPLETON INVESTMENT FUNDS
ç Templeton Euro Liquid Reserve Fund ç
Schedule of Investments as of December 31, 2008
(Currency ç EUR)
Number of % of
shares or Description Country Trading Market net
face value code currency value assets
Unaudited Semi-Annual Report www.franklintempleton.lu198
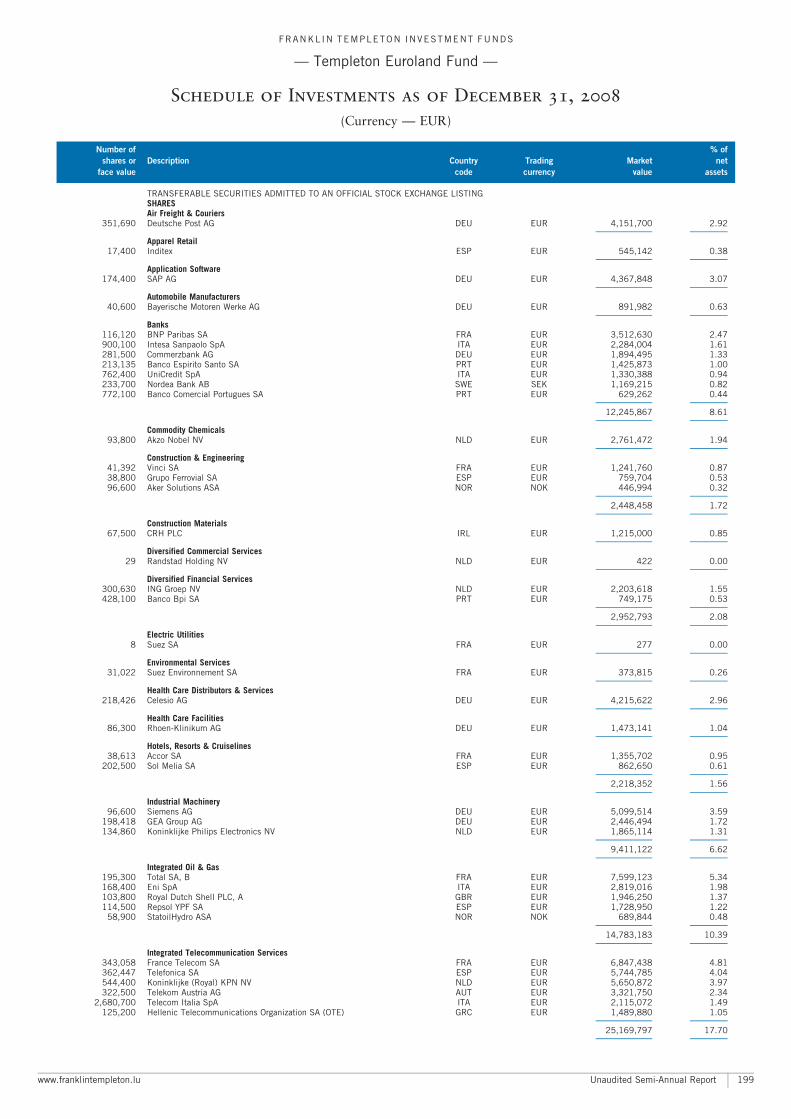
TRANSFERABLE SECURITIES ADMITTED TO AN OFFICIAL STOCK EXCHANGE LISTINGSHARESAir Freight & Couriers
351,690 Deutsche Post AG DEU EUR 4,151,700 2.92A A
Apparel Retail17,400 Inditex ESP EUR 545,142 0.38
A A
Application Software174,400 SAP AG DEU EUR 4,367,848 3.07
A A
Automobile Manufacturers40,600 Bayerische Motoren Werke AG DEU EUR 891,982 0.63
A A
Banks116,120 BNP Paribas SA FRA EUR 3,512,630 2.47900,100 Intesa Sanpaolo SpA ITA EUR 2,284,004 1.61281,500 Commerzbank AG DEU EUR 1,894,495 1.33213,135 Banco Espirito Santo SA PRT EUR 1,425,873 1.00762,400 UniCredit SpA ITA EUR 1,330,388 0.94233,700 Nordea Bank AB SWE SEK 1,169,215 0.82772,100 Banco Comercial Portugues SA PRT EUR 629,262 0.44
A A
12,245,867 8.61A A
Commodity Chemicals93,800 Akzo Nobel NV NLD EUR 2,761,472 1.94
A A
Construction & Engineering41,392 Vinci SA FRA EUR 1,241,760 0.8738,800 Grupo Ferrovial SA ESP EUR 759,704 0.5396,600 Aker Solutions ASA NOR NOK 446,994 0.32
A A
2,448,458 1.72A A
Construction Materials67,500 CRH PLC IRL EUR 1,215,000 0.85
A A
Diversified Commercial Services29 Randstad Holding NV NLD EUR 422 0.00
A A
Diversified Financial Services300,630 ING Groep NV NLD EUR 2,203,618 1.55428,100 Banco Bpi SA PRT EUR 749,175 0.53
A A
2,952,793 2.08A A
Electric Utilities8 Suez SA FRA EUR 277 0.00
A A
Environmental Services31,022 Suez Environnement SA FRA EUR 373,815 0.26
A A
Health Care Distributors & Services218,426 Celesio AG DEU EUR 4,215,622 2.96
A A
Health Care Facilities86,300 Rhoen-Klinikum AG DEU EUR 1,473,141 1.04
A A
Hotels, Resorts & Cruiselines38,613 Accor SA FRA EUR 1,355,702 0.95
202,500 Sol Melia SA ESP EUR 862,650 0.61A A
2,218,352 1.56A A
Industrial Machinery96,600 Siemens AG DEU EUR 5,099,514 3.59
198,418 GEA Group AG DEU EUR 2,446,494 1.72134,860 Koninklijke Philips Electronics NV NLD EUR 1,865,114 1.31
A A
9,411,122 6.62A A
Integrated Oil & Gas195,300 Total SA, B FRA EUR 7,599,123 5.34168,400 Eni SpA ITA EUR 2,819,016 1.98103,800 Royal Dutch Shell PLC, A GBR EUR 1,946,250 1.37114,500 Repsol YPF SA ESP EUR 1,728,950 1.22
58,900 StatoilHydro ASA NOR NOK 689,844 0.48A A
14,783,183 10.39A A
Integrated Telecommunication Services343,058 France Telecom SA FRA EUR 6,847,438 4.81362,447 Telefonica SA ESP EUR 5,744,785 4.04544,400 Koninklijke (Royal) KPN NV NLD EUR 5,650,872 3.97322,500 Telekom Austria AG AUT EUR 3,321,750 2.34
2,680,700 Telecom Italia SpA ITA EUR 2,115,072 1.49125,200 Hellenic Telecommunications Organization SA (OTE) GRC EUR 1,489,880 1.05
A A
25,169,797 17.70A A
FRANKL IN TEMPLETON INVESTMENT FUNDS
ç Templeton Euroland Fund ç
Schedule of Investments as of December 31, 2008
(Currency ç EUR)
Number of % of
shares or Description Country Trading Market net
face value code currency value assets
www.franklintempleton.lu Unaudited Semi-Annual Report 199
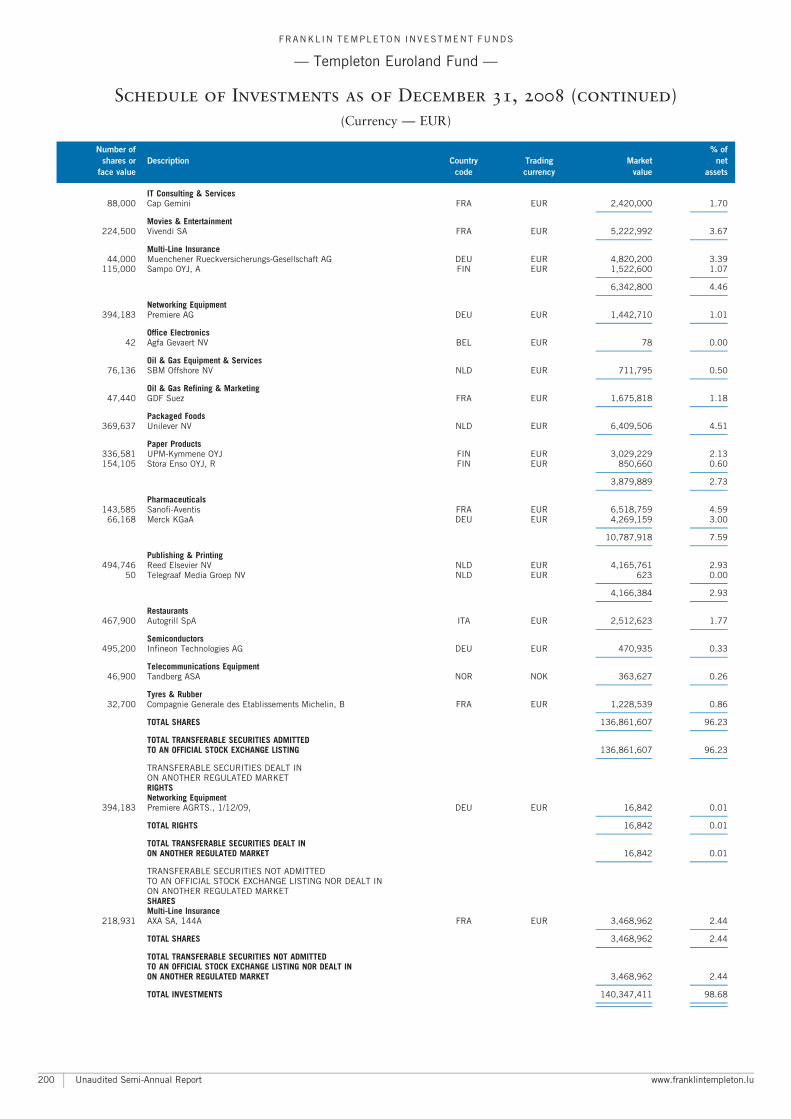
IT Consulting & Services88,000 Cap Gemini FRA EUR 2,420,000 1.70
A A
Movies & Entertainment224,500 Vivendi SA FRA EUR 5,222,992 3.67
A A
Multi-Line Insurance44,000 Muenchener Rueckversicherungs-Gesellschaft AG DEU EUR 4,820,200 3.39
115,000 Sampo OYJ, A FIN EUR 1,522,600 1.07A A
6,342,800 4.46A A
Networking Equipment394,183 Premiere AG DEU EUR 1,442,710 1.01
A A
Office Electronics42 Agfa Gevaert NV BEL EUR 78 0.00
A A
Oil & Gas Equipment & Services76,136 SBM Offshore NV NLD EUR 711,795 0.50
A A
Oil & Gas Refining & Marketing47,440 GDF Suez FRA EUR 1,675,818 1.18
A A
Packaged Foods369,637 Unilever NV NLD EUR 6,409,506 4.51
A A
Paper Products336,581 UPM-Kymmene OYJ FIN EUR 3,029,229 2.13154,105 Stora Enso OYJ, R FIN EUR 850,660 0.60
A A
3,879,889 2.73A A
Pharmaceuticals143,585 Sanofi-Aventis FRA EUR 6,518,759 4.59
66,168 Merck KGaA DEU EUR 4,269,159 3.00A A
10,787,918 7.59A A
Publishing & Printing494,746 Reed Elsevier NV NLD EUR 4,165,761 2.93
50 Telegraaf Media Groep NV NLD EUR 623 0.00A A
4,166,384 2.93A A
Restaurants467,900 Autogrill SpA ITA EUR 2,512,623 1.77
A A
Semiconductors495,200 Infineon Technologies AG DEU EUR 470,935 0.33
A A
Telecommunications Equipment46,900 Tandberg ASA NOR NOK 363,627 0.26
A A
Tyres & Rubber32,700 Compagnie Generale des Etablissements Michelin, B FRA EUR 1,228,539 0.86
A A
TOTAL SHARES 136,861,607 96.23A A
TOTAL TRANSFERABLE SECURITIES ADMITTEDTO AN OFFICIAL STOCK EXCHANGE LISTING 136,861,607 96.23
A A
TRANSFERABLE SECURITIES DEALT INON ANOTHER REGULATED MARKETRIGHTSNetworking Equipment
394,183 Premiere AGRTS., 1/12/09, DEU EUR 16,842 0.01A A
TOTAL RIGHTS 16,842 0.01A A
TOTAL TRANSFERABLE SECURITIES DEALT INON ANOTHER REGULATED MARKET 16,842 0.01
A A
TRANSFERABLE SECURITIES NOT ADMITTEDTO AN OFFICIAL STOCK EXCHANGE LISTING NOR DEALT INON ANOTHER REGULATED MARKETSHARESMulti-Line Insurance
218,931 AXA SA, 144A FRA EUR 3,468,962 2.44A A
TOTAL SHARES 3,468,962 2.44A A
TOTAL TRANSFERABLE SECURITIES NOT ADMITTEDTO AN OFFICIAL STOCK EXCHANGE LISTING NOR DEALT INON ANOTHER REGULATED MARKET 3,468,962 2.44
A A
TOTAL INVESTMENTS 140,347,411 98.68A A
A A
FRANKL IN TEMPLETON INVESTMENT FUNDS
ç Templeton Euroland Fund ç
Schedule of Investments as of December 31, 2008 (continued)
(Currency ç EUR)
Number of % of
shares or Description Country Trading Market net
face value code currency value assets
Unaudited Semi-Annual Report www.franklintempleton.lu200
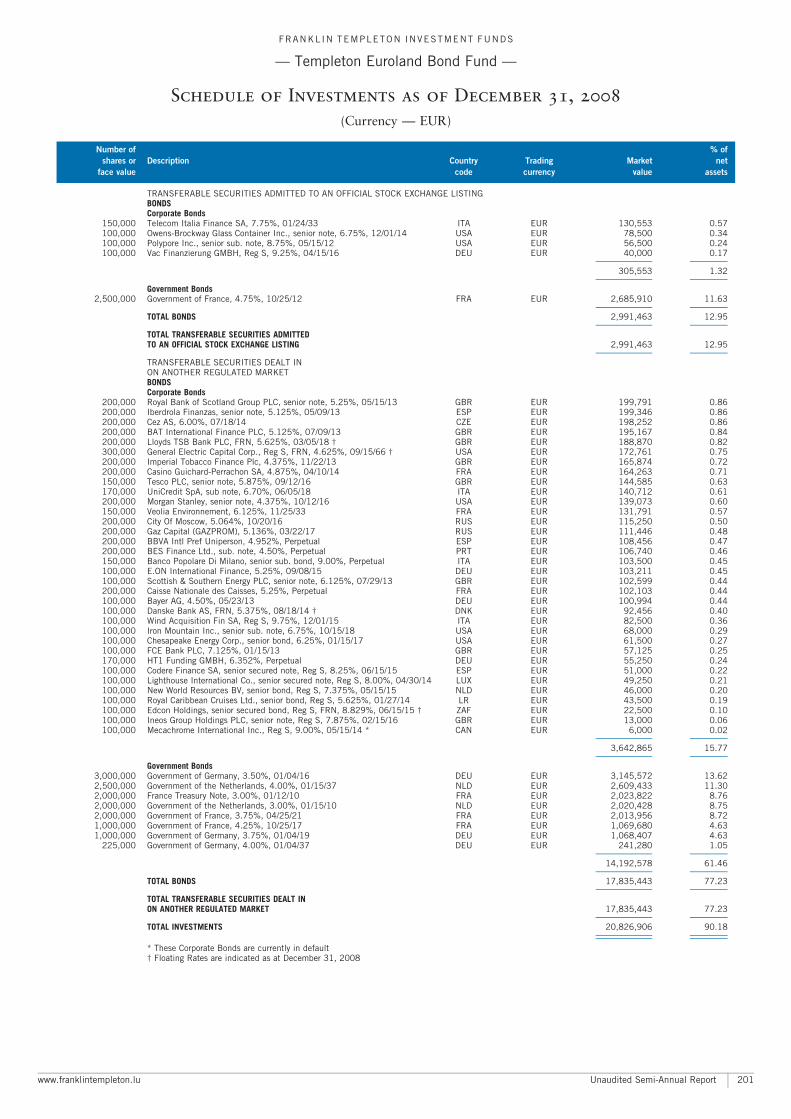
TRANSFERABLE SECURITIES ADMITTED TO AN OFFICIAL STOCK EXCHANGE LISTINGBONDSCorporate Bonds
150,000 Telecom Italia Finance SA, 7.75%, 01/24/33 ITA EUR 130,553 0.57100,000 Owens-Brockway Glass Container Inc., senior note, 6.75%, 12/01/14 USA EUR 78,500 0.34100,000 Polypore Inc., senior sub. note, 8.75%, 05/15/12 USA EUR 56,500 0.24100,000 Vac Finanzierung GMBH, Reg S, 9.25%, 04/15/16 DEU EUR 40,000 0.17
A A
305,553 1.32A A
Government Bonds2,500,000 Government of France, 4.75%, 10/25/12 FRA EUR 2,685,910 11.63
A A
TOTAL BONDS 2,991,463 12.95A A
TOTAL TRANSFERABLE SECURITIES ADMITTEDTO AN OFFICIAL STOCK EXCHANGE LISTING 2,991,463 12.95
A A
TRANSFERABLE SECURITIES DEALT INON ANOTHER REGULATED MARKETBONDSCorporate Bonds
200,000 Royal Bank of Scotland Group PLC, senior note, 5.25%, 05/15/13 GBR EUR 199,791 0.86200,000 Iberdrola Finanzas, senior note, 5.125%, 05/09/13 ESP EUR 199,346 0.86200,000 Cez AS, 6.00%, 07/18/14 CZE EUR 198,252 0.86200,000 BAT International Finance PLC, 5.125%, 07/09/13 GBR EUR 195,167 0.84200,000 Lloyds TSB Bank PLC, FRN, 5.625%, 03/05/18 � GBR EUR 188,870 0.82300,000 General Electric Capital Corp., Reg S, FRN, 4.625%, 09/15/66 � USA EUR 172,761 0.75200,000 Imperial Tobacco Finance Plc, 4.375%, 11/22/13 GBR EUR 165,874 0.72200,000 Casino Guichard-Perrachon SA, 4.875%, 04/10/14 FRA EUR 164,263 0.71150,000 Tesco PLC, senior note, 5.875%, 09/12/16 GBR EUR 144,585 0.63170,000 UniCredit SpA, sub note, 6.70%, 06/05/18 ITA EUR 140,712 0.61200,000 Morgan Stanley, senior note, 4.375%, 10/12/16 USA EUR 139,073 0.60150,000 Veolia Environnement, 6.125%, 11/25/33 FRA EUR 131,791 0.57200,000 City Of Moscow, 5.064%, 10/20/16 RUS EUR 115,250 0.50200,000 Gaz Capital (GAZPROM), 5.136%, 03/22/17 RUS EUR 111,446 0.48200,000 BBVA Intl Pref Uniperson, 4.952%, Perpetual ESP EUR 108,456 0.47200,000 BES Finance Ltd., sub. note, 4.50%, Perpetual PRT EUR 106,740 0.46150,000 Banco Popolare Di Milano, senior sub. bond, 9.00%, Perpetual ITA EUR 103,500 0.45100,000 E.ON International Finance, 5.25%, 09/08/15 DEU EUR 103,211 0.45100,000 Scottish & Southern Energy PLC, senior note, 6.125%, 07/29/13 GBR EUR 102,599 0.44200,000 Caisse Nationale des Caisses, 5.25%, Perpetual FRA EUR 102,103 0.44100,000 Bayer AG, 4.50%, 05/23/13 DEU EUR 100,994 0.44100,000 Danske Bank AS, FRN, 5.375%, 08/18/14 � DNK EUR 92,456 0.40100,000 Wind Acquisition Fin SA, Reg S, 9.75%, 12/01/15 ITA EUR 82,500 0.36100,000 Iron Mountain Inc., senior sub. note, 6.75%, 10/15/18 USA EUR 68,000 0.29100,000 Chesapeake Energy Corp., senior bond, 6.25%, 01/15/17 USA EUR 61,500 0.27100,000 FCE Bank PLC, 7.125%, 01/15/13 GBR EUR 57,125 0.25170,000 HT1 Funding GMBH, 6.352%, Perpetual DEU EUR 55,250 0.24100,000 Codere Finance SA, senior secured note, Reg S, 8.25%, 06/15/15 ESP EUR 51,000 0.22100,000 Lighthouse International Co., senior secured note, Reg S, 8.00%, 04/30/14 LUX EUR 49,250 0.21100,000 New World Resources BV, senior bond, Reg S, 7.375%, 05/15/15 NLD EUR 46,000 0.20100,000 Royal Caribbean Cruises Ltd., senior bond, Reg S, 5.625%, 01/27/14 LR EUR 43,500 0.19100,000 Edcon Holdings, senior secured bond, Reg S, FRN, 8.829%, 06/15/15 � ZAF EUR 22,500 0.10100,000 Ineos Group Holdings PLC, senior note, Reg S, 7.875%, 02/15/16 GBR EUR 13,000 0.06100,000 Mecachrome International Inc., Reg S, 9.00%, 05/15/14 * CAN EUR 6,000 0.02
A A
3,642,865 15.77A A
Government Bonds3,000,000 Government of Germany, 3.50%, 01/04/16 DEU EUR 3,145,572 13.622,500,000 Government of the Netherlands, 4.00%, 01/15/37 NLD EUR 2,609,433 11.302,000,000 France Treasury Note, 3.00%, 01/12/10 FRA EUR 2,023,822 8.762,000,000 Government of the Netherlands, 3.00%, 01/15/10 NLD EUR 2,020,428 8.752,000,000 Government of France, 3.75%, 04/25/21 FRA EUR 2,013,956 8.721,000,000 Government of France, 4.25%, 10/25/17 FRA EUR 1,069,680 4.631,000,000 Government of Germany, 3.75%, 01/04/19 DEU EUR 1,068,407 4.63
225,000 Government of Germany, 4.00%, 01/04/37 DEU EUR 241,280 1.05A A
14,192,578 61.46A A
TOTAL BONDS 17,835,443 77.23A A
TOTAL TRANSFERABLE SECURITIES DEALT INON ANOTHER REGULATED MARKET 17,835,443 77.23
A A
TOTAL INVESTMENTS 20,826,906 90.18A A
A A
* These Corporate Bonds are currently in default� Floating Rates are indicated as at December 31, 2008
FRANKL IN TEMPLETON INVESTMENT FUNDS
ç Templeton Euroland Bond Fund ç
Schedule of Investments as of December 31, 2008
(Currency ç EUR)
Number of % of
shares or Description Country Trading Market net
face value code currency value assets
www.franklintempleton.lu Unaudited Semi-Annual Report 201
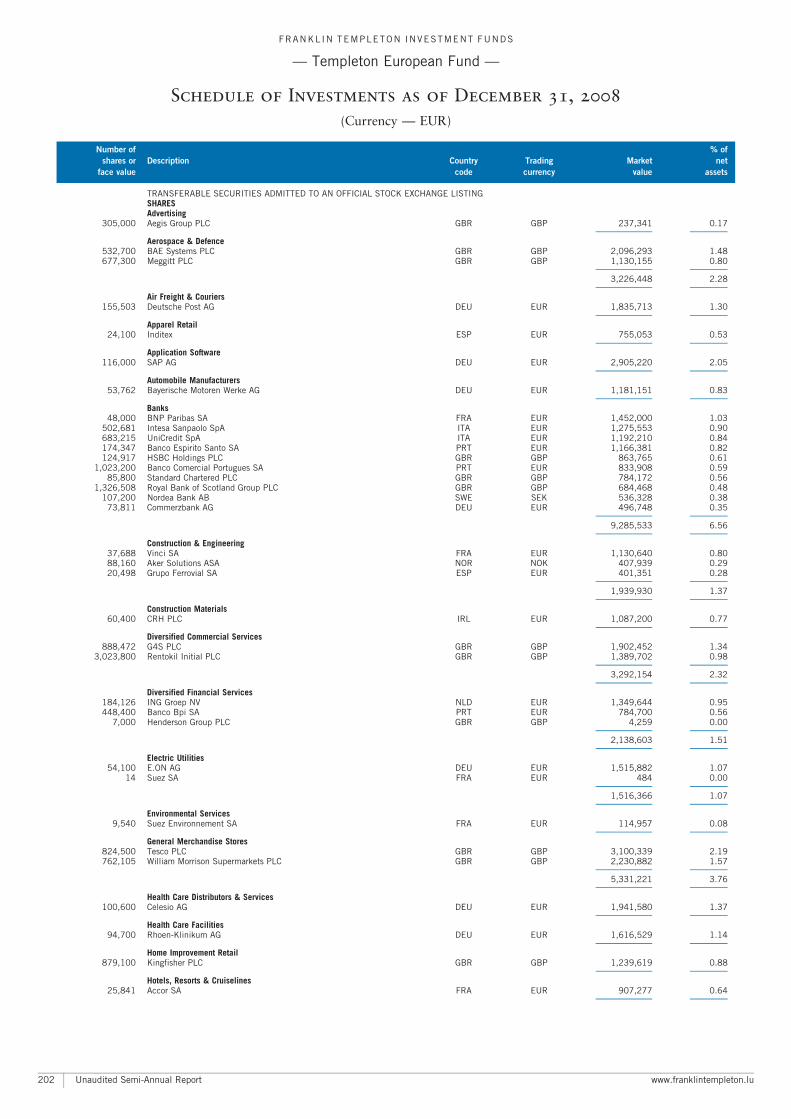
TRANSFERABLE SECURITIES ADMITTED TO AN OFFICIAL STOCK EXCHANGE LISTINGSHARESAdvertising
305,000 Aegis Group PLC GBR GBP 237,341 0.17A A
Aerospace & Defence532,700 BAE Systems PLC GBR GBP 2,096,293 1.48677,300 Meggitt PLC GBR GBP 1,130,155 0.80
A A
3,226,448 2.28A A
Air Freight & Couriers155,503 Deutsche Post AG DEU EUR 1,835,713 1.30
A A
Apparel Retail24,100 Inditex ESP EUR 755,053 0.53
A A
Application Software116,000 SAP AG DEU EUR 2,905,220 2.05
A A
Automobile Manufacturers53,762 Bayerische Motoren Werke AG DEU EUR 1,181,151 0.83
A A
Banks48,000 BNP Paribas SA FRA EUR 1,452,000 1.03
502,681 Intesa Sanpaolo SpA ITA EUR 1,275,553 0.90683,215 UniCredit SpA ITA EUR 1,192,210 0.84174,347 Banco Espirito Santo SA PRT EUR 1,166,381 0.82124,917 HSBC Holdings PLC GBR GBP 863,765 0.61
1,023,200 Banco Comercial Portugues SA PRT EUR 833,908 0.5985,800 Standard Chartered PLC GBR GBP 784,172 0.56
1,326,508 Royal Bank of Scotland Group PLC GBR GBP 684,468 0.48107,200 Nordea Bank AB SWE SEK 536,328 0.38
73,811 Commerzbank AG DEU EUR 496,748 0.35A A
9,285,533 6.56A A
Construction & Engineering37,688 Vinci SA FRA EUR 1,130,640 0.8088,160 Aker Solutions ASA NOR NOK 407,939 0.2920,498 Grupo Ferrovial SA ESP EUR 401,351 0.28
A A
1,939,930 1.37A A
Construction Materials60,400 CRH PLC IRL EUR 1,087,200 0.77
A A
Diversified Commercial Services888,472 G4S PLC GBR GBP 1,902,452 1.34
3,023,800 Rentokil Initial PLC GBR GBP 1,389,702 0.98A A
3,292,154 2.32A A
Diversified Financial Services184,126 ING Groep NV NLD EUR 1,349,644 0.95448,400 Banco Bpi SA PRT EUR 784,700 0.56
7,000 Henderson Group PLC GBR GBP 4,259 0.00A A
2,138,603 1.51A A
Electric Utilities54,100 E.ON AG DEU EUR 1,515,882 1.07
14 Suez SA FRA EUR 484 0.00A A
1,516,366 1.07A A
Environmental Services9,540 Suez Environnement SA FRA EUR 114,957 0.08
A A
General Merchandise Stores824,500 Tesco PLC GBR GBP 3,100,339 2.19762,105 William Morrison Supermarkets PLC GBR GBP 2,230,882 1.57
A A
5,331,221 3.76A A
Health Care Distributors & Services100,600 Celesio AG DEU EUR 1,941,580 1.37
A A
Health Care Facilities94,700 Rhoen-Klinikum AG DEU EUR 1,616,529 1.14
A A
Home Improvement Retail879,100 Kingfisher PLC GBR GBP 1,239,619 0.88
A A
Hotels, Resorts & Cruiselines25,841 Accor SA FRA EUR 907,277 0.64
A A
FRANKL IN TEMPLETON INVESTMENT FUNDS
ç Templeton European Fund ç
Schedule of Investments as of December 31, 2008
(Currency ç EUR)
Number of % of
shares or Description Country Trading Market net
face value code currency value assets
Unaudited Semi-Annual Report www.franklintempleton.lu202
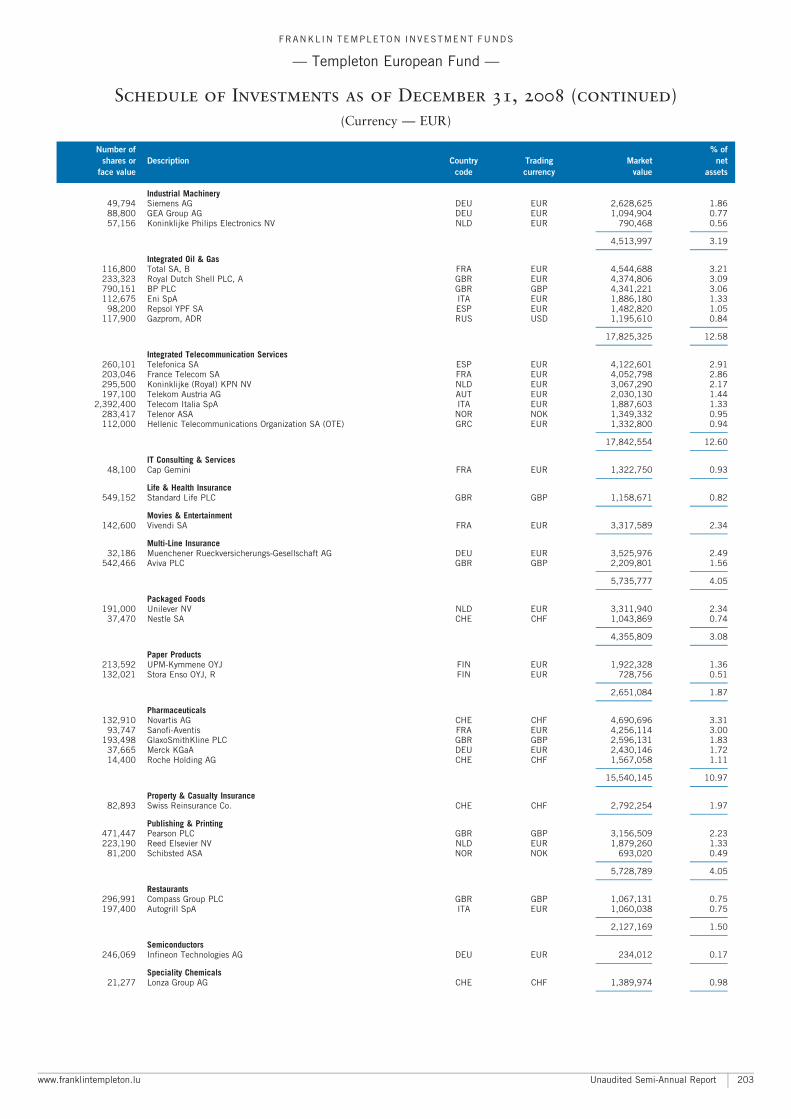
Industrial Machinery49,794 Siemens AG DEU EUR 2,628,625 1.8688,800 GEA Group AG DEU EUR 1,094,904 0.7757,156 Koninklijke Philips Electronics NV NLD EUR 790,468 0.56
A A
4,513,997 3.19A A
Integrated Oil & Gas116,800 Total SA, B FRA EUR 4,544,688 3.21233,323 Royal Dutch Shell PLC, A GBR EUR 4,374,806 3.09790,151 BP PLC GBR GBP 4,341,221 3.06112,675 Eni SpA ITA EUR 1,886,180 1.33
98,200 Repsol YPF SA ESP EUR 1,482,820 1.05117,900 Gazprom, ADR RUS USD 1,195,610 0.84
A A
17,825,325 12.58A A
Integrated Telecommunication Services260,101 Telefonica SA ESP EUR 4,122,601 2.91203,046 France Telecom SA FRA EUR 4,052,798 2.86295,500 Koninklijke (Royal) KPN NV NLD EUR 3,067,290 2.17197,100 Telekom Austria AG AUT EUR 2,030,130 1.44
2,392,400 Telecom Italia SpA ITA EUR 1,887,603 1.33283,417 Telenor ASA NOR NOK 1,349,332 0.95112,000 Hellenic Telecommunications Organization SA (OTE) GRC EUR 1,332,800 0.94
A A
17,842,554 12.60A A
IT Consulting & Services48,100 Cap Gemini FRA EUR 1,322,750 0.93
A A
Life & Health Insurance549,152 Standard Life PLC GBR GBP 1,158,671 0.82
A A
Movies & Entertainment142,600 Vivendi SA FRA EUR 3,317,589 2.34
A A
Multi-Line Insurance32,186 Muenchener Rueckversicherungs-Gesellschaft AG DEU EUR 3,525,976 2.49
542,466 Aviva PLC GBR GBP 2,209,801 1.56A A
5,735,777 4.05A A
Packaged Foods191,000 Unilever NV NLD EUR 3,311,940 2.34
37,470 Nestle SA CHE CHF 1,043,869 0.74A A
4,355,809 3.08A A
Paper Products213,592 UPM-Kymmene OYJ FIN EUR 1,922,328 1.36132,021 Stora Enso OYJ, R FIN EUR 728,756 0.51
A A
2,651,084 1.87A A
Pharmaceuticals132,910 Novartis AG CHE CHF 4,690,696 3.31
93,747 Sanofi-Aventis FRA EUR 4,256,114 3.00193,498 GlaxoSmithKline PLC GBR GBP 2,596,131 1.83
37,665 Merck KGaA DEU EUR 2,430,146 1.7214,400 Roche Holding AG CHE CHF 1,567,058 1.11
A A
15,540,145 10.97A A
Property & Casualty Insurance82,893 Swiss Reinsurance Co. CHE CHF 2,792,254 1.97
A A
Publishing & Printing471,447 Pearson PLC GBR GBP 3,156,509 2.23223,190 Reed Elsevier NV NLD EUR 1,879,260 1.33
81,200 Schibsted ASA NOR NOK 693,020 0.49A A
5,728,789 4.05A A
Restaurants296,991 Compass Group PLC GBR GBP 1,067,131 0.75197,400 Autogrill SpA ITA EUR 1,060,038 0.75
A A
2,127,169 1.50A A
Semiconductors246,069 Infineon Technologies AG DEU EUR 234,012 0.17
A A
Speciality Chemicals21,277 Lonza Group AG CHE CHF 1,389,974 0.98
A A
FRANKL IN TEMPLETON INVESTMENT FUNDS
ç Templeton European Fund ç
Schedule of Investments as of December 31, 2008 (continued)
(Currency ç EUR)
Number of % of
shares or Description Country Trading Market net
face value code currency value assets
www.franklintempleton.lu Unaudited Semi-Annual Report 203

Telecommunications Equipment45,300 Tandberg ASA NOR NOK 351,222 0.2564,704 Telefonaktiebolaget LM Ericsson, B SWE SEK 347,982 0.24
A A
699,204 0.49A A
Tyres & Rubber21,998 Compagnie Generale des Etablissements Michelin, B FRA EUR 826,465 0.58
A A
Wireless Telecommunication Services2,409,414 Vodafone Group PLC GBR GBP 3,498,181 2.47
189,971 Turkcell Iletisim Hizmetleri AS, ADR TUR USD 1,980,817 1.40A A
5,478,998 3.87A A
TOTAL SHARES 134,092,461 94.67A A
TOTAL TRANSFERABLE SECURITIES ADMITTEDTO AN OFFICIAL STOCK EXCHANGE LISTING 134,092,461 94.67
A A
TRANSFERABLE SECURITIES NOT ADMITTEDTO AN OFFICIAL STOCK EXCHANGE LISTING NOR DEALT INON ANOTHER REGULATED MARKETSHARESMulti-Line Insurance
136,976 AXA SA, 144A FRA EUR 2,170,384 1.53A A
TOTAL SHARES 2,170,384 1.53A A
TOTAL TRANSFERABLE SECURITIES NOT ADMITTEDTO AN OFFICIAL STOCK EXCHANGE LISTING NOR DEALT INON ANOTHER REGULATED MARKET 2,170,384 1.53
A A
TOTAL INVESTMENTS 136,262,845 96.20A A
A A
FRANKL IN TEMPLETON INVESTMENT FUNDS
ç Templeton European Fund ç
Schedule of Investments as of December 31, 2008 (continued)
(Currency ç EUR)
Number of % of
shares or Description Country Trading Market net
face value code currency value assets
Unaudited Semi-Annual Report www.franklintempleton.lu204
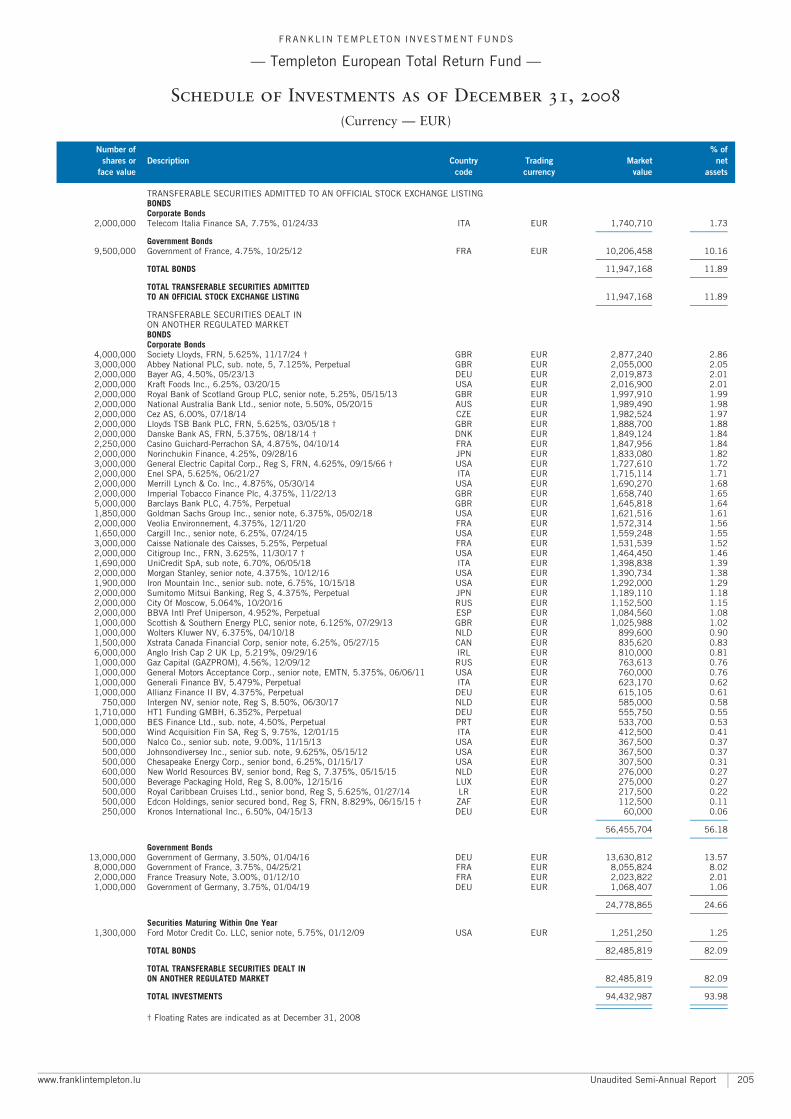
TRANSFERABLE SECURITIES ADMITTED TO AN OFFICIAL STOCK EXCHANGE LISTINGBONDSCorporate Bonds
2,000,000 Telecom Italia Finance SA, 7.75%, 01/24/33 ITA EUR 1,740,710 1.73A A
Government Bonds9,500,000 Government of France, 4.75%, 10/25/12 FRA EUR 10,206,458 10.16
A A
TOTAL BONDS 11,947,168 11.89A A
TOTAL TRANSFERABLE SECURITIES ADMITTEDTO AN OFFICIAL STOCK EXCHANGE LISTING 11,947,168 11.89
A A
TRANSFERABLE SECURITIES DEALT INON ANOTHER REGULATED MARKETBONDSCorporate Bonds
4,000,000 Society Lloyds, FRN, 5.625%, 11/17/24 � GBR EUR 2,877,240 2.863,000,000 Abbey National PLC, sub. note, 5, 7.125%, Perpetual GBR EUR 2,055,000 2.052,000,000 Bayer AG, 4.50%, 05/23/13 DEU EUR 2,019,873 2.012,000,000 Kraft Foods Inc., 6.25%, 03/20/15 USA EUR 2,016,900 2.012,000,000 Royal Bank of Scotland Group PLC, senior note, 5.25%, 05/15/13 GBR EUR 1,997,910 1.992,000,000 National Australia Bank Ltd., senior note, 5.50%, 05/20/15 AUS EUR 1,989,490 1.982,000,000 Cez AS, 6.00%, 07/18/14 CZE EUR 1,982,524 1.972,000,000 Lloyds TSB Bank PLC, FRN, 5.625%, 03/05/18 � GBR EUR 1,888,700 1.882,000,000 Danske Bank AS, FRN, 5.375%, 08/18/14 � DNK EUR 1,849,124 1.842,250,000 Casino Guichard-Perrachon SA, 4.875%, 04/10/14 FRA EUR 1,847,956 1.842,000,000 Norinchukin Finance, 4.25%, 09/28/16 JPN EUR 1,833,080 1.823,000,000 General Electric Capital Corp., Reg S, FRN, 4.625%, 09/15/66 � USA EUR 1,727,610 1.722,000,000 Enel SPA, 5.625%, 06/21/27 ITA EUR 1,715,114 1.712,000,000 Merrill Lynch & Co. Inc., 4.875%, 05/30/14 USA EUR 1,690,270 1.682,000,000 Imperial Tobacco Finance Plc, 4.375%, 11/22/13 GBR EUR 1,658,740 1.655,000,000 Barclays Bank PLC, 4.75%, Perpetual GBR EUR 1,645,818 1.641,850,000 Goldman Sachs Group Inc., senior note, 6.375%, 05/02/18 USA EUR 1,621,516 1.612,000,000 Veolia Environnement, 4.375%, 12/11/20 FRA EUR 1,572,314 1.561,650,000 Cargill Inc., senior note, 6.25%, 07/24/15 USA EUR 1,559,248 1.553,000,000 Caisse Nationale des Caisses, 5.25%, Perpetual FRA EUR 1,531,539 1.522,000,000 Citigroup Inc., FRN, 3.625%, 11/30/17 � USA EUR 1,464,450 1.461,690,000 UniCredit SpA, sub note, 6.70%, 06/05/18 ITA EUR 1,398,838 1.392,000,000 Morgan Stanley, senior note, 4.375%, 10/12/16 USA EUR 1,390,734 1.381,900,000 Iron Mountain Inc., senior sub. note, 6.75%, 10/15/18 USA EUR 1,292,000 1.292,000,000 Sumitomo Mitsui Banking, Reg S, 4.375%, Perpetual JPN EUR 1,189,110 1.182,000,000 City Of Moscow, 5.064%, 10/20/16 RUS EUR 1,152,500 1.152,000,000 BBVA Intl Pref Uniperson, 4.952%, Perpetual ESP EUR 1,084,560 1.081,000,000 Scottish & Southern Energy PLC, senior note, 6.125%, 07/29/13 GBR EUR 1,025,988 1.021,000,000 Wolters Kluwer NV, 6.375%, 04/10/18 NLD EUR 899,600 0.901,500,000 Xstrata Canada Financial Corp, senior note, 6.25%, 05/27/15 CAN EUR 835,620 0.836,000,000 Anglo Irish Cap 2 UK Lp, 5.219%, 09/29/16 IRL EUR 810,000 0.811,000,000 Gaz Capital (GAZPROM), 4.56%, 12/09/12 RUS EUR 763,613 0.761,000,000 General Motors Acceptance Corp., senior note, EMTN, 5.375%, 06/06/11 USA EUR 760,000 0.761,000,000 Generali Finance BV, 5.479%, Perpetual ITA EUR 623,170 0.621,000,000 Allianz Finance II BV, 4.375%, Perpetual DEU EUR 615,105 0.61
750,000 Intergen NV, senior note, Reg S, 8.50%, 06/30/17 NLD EUR 585,000 0.581,710,000 HT1 Funding GMBH, 6.352%, Perpetual DEU EUR 555,750 0.551,000,000 BES Finance Ltd., sub. note, 4.50%, Perpetual PRT EUR 533,700 0.53
500,000 Wind Acquisition Fin SA, Reg S, 9.75%, 12/01/15 ITA EUR 412,500 0.41500,000 Nalco Co., senior sub. note, 9.00%, 11/15/13 USA EUR 367,500 0.37500,000 Johnsondiversey Inc., senior sub. note, 9.625%, 05/15/12 USA EUR 367,500 0.37500,000 Chesapeake Energy Corp., senior bond, 6.25%, 01/15/17 USA EUR 307,500 0.31600,000 New World Resources BV, senior bond, Reg S, 7.375%, 05/15/15 NLD EUR 276,000 0.27500,000 Beverage Packaging Hold, Reg S, 8.00%, 12/15/16 LUX EUR 275,000 0.27500,000 Royal Caribbean Cruises Ltd., senior bond, Reg S, 5.625%, 01/27/14 LR EUR 217,500 0.22500,000 Edcon Holdings, senior secured bond, Reg S, FRN, 8.829%, 06/15/15 � ZAF EUR 112,500 0.11250,000 Kronos International Inc., 6.50%, 04/15/13 DEU EUR 60,000 0.06
A A
56,455,704 56.18A A
Government Bonds13,000,000 Government of Germany, 3.50%, 01/04/16 DEU EUR 13,630,812 13.57
8,000,000 Government of France, 3.75%, 04/25/21 FRA EUR 8,055,824 8.022,000,000 France Treasury Note, 3.00%, 01/12/10 FRA EUR 2,023,822 2.011,000,000 Government of Germany, 3.75%, 01/04/19 DEU EUR 1,068,407 1.06
A A
24,778,865 24.66A A
Securities Maturing Within One Year1,300,000 Ford Motor Credit Co. LLC, senior note, 5.75%, 01/12/09 USA EUR 1,251,250 1.25
A A
TOTAL BONDS 82,485,819 82.09A A
TOTAL TRANSFERABLE SECURITIES DEALT INON ANOTHER REGULATED MARKET 82,485,819 82.09
A A
TOTAL INVESTMENTS 94,432,987 93.98A A
A A
� Floating Rates are indicated as at December 31, 2008
FRANKL IN TEMPLETON INVESTMENT FUNDS
ç Templeton European Total Return Fund ç
Schedule of Investments as of December 31, 2008
(Currency ç EUR)
Number of % of
shares or Description Country Trading Market net
face value code currency value assets
www.franklintempleton.lu Unaudited Semi-Annual Report 205
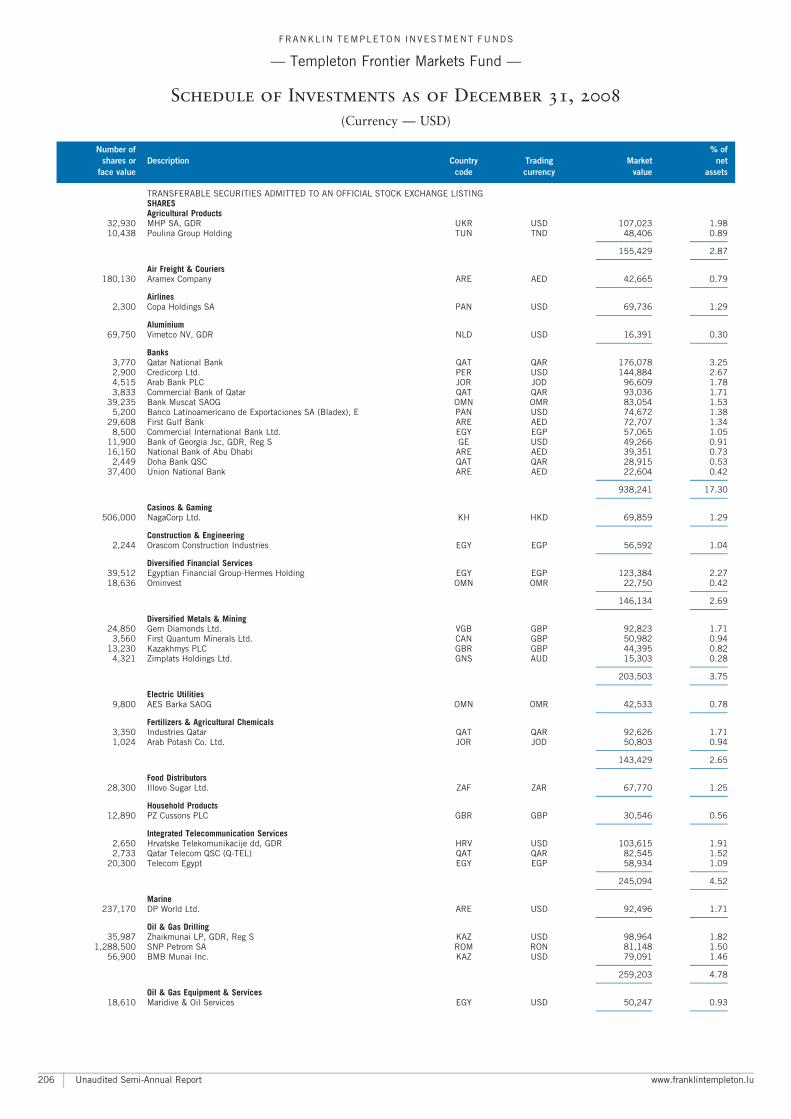
TRANSFERABLE SECURITIES ADMITTED TO AN OFFICIAL STOCK EXCHANGE LISTINGSHARESAgricultural Products
32,930 MHP SA, GDR UKR USD 107,023 1.9810,438 Poulina Group Holding TUN TND 48,406 0.89
A A
155,429 2.87A A
Air Freight & Couriers180,130 Aramex Company ARE AED 42,665 0.79
A A
Airlines2,300 Copa Holdings SA PAN USD 69,736 1.29
A A
Aluminium69,750 Vimetco NV, GDR NLD USD 16,391 0.30
A A
Banks3,770 Qatar National Bank QAT QAR 176,078 3.252,900 Credicorp Ltd. PER USD 144,884 2.674,515 Arab Bank PLC JOR JOD 96,609 1.783,833 Commercial Bank of Qatar QAT QAR 93,036 1.71
39,235 Bank Muscat SAOG OMN OMR 83,054 1.535,200 Banco Latinoamericano de Exportaciones SA (Bladex), E PAN USD 74,672 1.38
29,608 First Gulf Bank ARE AED 72,707 1.348,500 Commercial International Bank Ltd. EGY EGP 57,065 1.05
11,900 Bank of Georgia Jsc, GDR, Reg S GE USD 49,266 0.9116,150 National Bank of Abu Dhabi ARE AED 39,351 0.73
2,449 Doha Bank QSC QAT QAR 28,915 0.5337,400 Union National Bank ARE AED 22,604 0.42
A A
938,241 17.30A A
Casinos & Gaming506,000 NagaCorp Ltd. KH HKD 69,859 1.29
A A
Construction & Engineering2,244 Orascom Construction Industries EGY EGP 56,592 1.04
A A
Diversified Financial Services39,512 Egyptian Financial Group-Hermes Holding EGY EGP 123,384 2.2718,636 Ominvest OMN OMR 22,750 0.42
A A
146,134 2.69A A
Diversified Metals & Mining24,850 Gem Diamonds Ltd. VGB GBP 92,823 1.71
3,560 First Quantum Minerals Ltd. CAN GBP 50,982 0.9413,230 Kazakhmys PLC GBR GBP 44,395 0.82
4,321 Zimplats Holdings Ltd. GNS AUD 15,303 0.28A A
203,503 3.75A A
Electric Utilities9,800 AES Barka SAOG OMN OMR 42,533 0.78
A A
Fertilizers & Agricultural Chemicals3,350 Industries Qatar QAT QAR 92,626 1.711,024 Arab Potash Co. Ltd. JOR JOD 50,803 0.94
A A
143,429 2.65A A
Food Distributors28,300 Illovo Sugar Ltd. ZAF ZAR 67,770 1.25
A A
Household Products12,890 PZ Cussons PLC GBR GBP 30,546 0.56
A A
Integrated Telecommunication Services2,650 Hrvatske Telekomunikacije dd, GDR HRV USD 103,615 1.912,733 Qatar Telecom QSC (Q-TEL) QAT QAR 82,545 1.52
20,300 Telecom Egypt EGY EGP 58,934 1.09A A
245,094 4.52A A
Marine237,170 DP World Ltd. ARE USD 92,496 1.71
A A
Oil & Gas Drilling35,987 Zhaikmunai LP, GDR, Reg S KAZ USD 98,964 1.82
1,288,500 SNP Petrom SA ROM RON 81,148 1.5056,900 BMB Munai Inc. KAZ USD 79,091 1.46
A A
259,203 4.78A A
Oil & Gas Equipment & Services18,610 Maridive & Oil Services EGY USD 50,247 0.93
A A
FRANKL IN TEMPLETON INVESTMENT FUNDS
ç Templeton Frontier Markets Fund ç
Schedule of Investments as of December 31, 2008
(Currency ç USD)
Number of % of
shares or Description Country Trading Market net
face value code currency value assets
Unaudited Semi-Annual Report www.franklintempleton.lu206
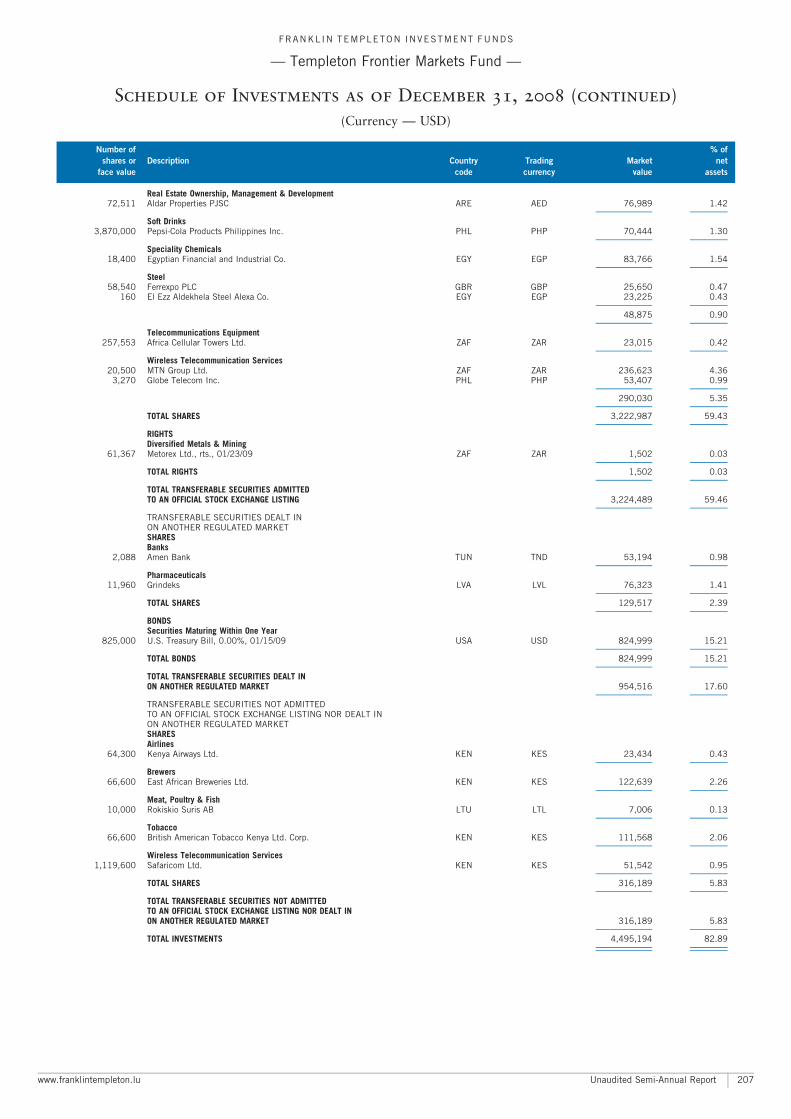
Real Estate Ownership, Management & Development72,511 Aldar Properties PJSC ARE AED 76,989 1.42
A A
Soft Drinks3,870,000 Pepsi-Cola Products Philippines Inc. PHL PHP 70,444 1.30
A A
Speciality Chemicals18,400 Egyptian Financial and Industrial Co. EGY EGP 83,766 1.54
A A
Steel58,540 Ferrexpo PLC GBR GBP 25,650 0.47
160 El Ezz Aldekhela Steel Alexa Co. EGY EGP 23,225 0.43A A
48,875 0.90A A
Telecommunications Equipment257,553 Africa Cellular Towers Ltd. ZAF ZAR 23,015 0.42
A A
Wireless Telecommunication Services20,500 MTN Group Ltd. ZAF ZAR 236,623 4.36
3,270 Globe Telecom Inc. PHL PHP 53,407 0.99A A
290,030 5.35A A
TOTAL SHARES 3,222,987 59.43A A
RIGHTSDiversified Metals & Mining
61,367 Metorex Ltd., rts., 01/23/09 ZAF ZAR 1,502 0.03A A
TOTAL RIGHTS 1,502 0.03A A
TOTAL TRANSFERABLE SECURITIES ADMITTEDTO AN OFFICIAL STOCK EXCHANGE LISTING 3,224,489 59.46
A A
TRANSFERABLE SECURITIES DEALT INON ANOTHER REGULATED MARKETSHARESBanks
2,088 Amen Bank TUN TND 53,194 0.98A A
Pharmaceuticals11,960 Grindeks LVA LVL 76,323 1.41
A A
TOTAL SHARES 129,517 2.39A A
BONDSSecurities Maturing Within One Year
825,000 U.S. Treasury Bill, 0.00%, 01/15/09 USA USD 824,999 15.21A A
TOTAL BONDS 824,999 15.21A A
TOTAL TRANSFERABLE SECURITIES DEALT INON ANOTHER REGULATED MARKET 954,516 17.60
A A
TRANSFERABLE SECURITIES NOT ADMITTEDTO AN OFFICIAL STOCK EXCHANGE LISTING NOR DEALT INON ANOTHER REGULATED MARKETSHARESAirlines
64,300 Kenya Airways Ltd. KEN KES 23,434 0.43A A
Brewers66,600 East African Breweries Ltd. KEN KES 122,639 2.26
A A
Meat, Poultry & Fish10,000 Rokiskio Suris AB LTU LTL 7,006 0.13
A A
Tobacco66,600 British American Tobacco Kenya Ltd. Corp. KEN KES 111,568 2.06
A A
Wireless Telecommunication Services1,119,600 Safaricom Ltd. KEN KES 51,542 0.95
A A
TOTAL SHARES 316,189 5.83A A
TOTAL TRANSFERABLE SECURITIES NOT ADMITTEDTO AN OFFICIAL STOCK EXCHANGE LISTING NOR DEALT INON ANOTHER REGULATED MARKET 316,189 5.83
A A
TOTAL INVESTMENTS 4,495,194 82.89A A
A A
FRANKL IN TEMPLETON INVESTMENT FUNDS
ç Templeton Frontier Markets Fund ç
Schedule of Investments as of December 31, 2008 (continued)
(Currency ç USD)
Number of % of
shares or Description Country Trading Market net
face value code currency value assets
www.franklintempleton.lu Unaudited Semi-Annual Report 207
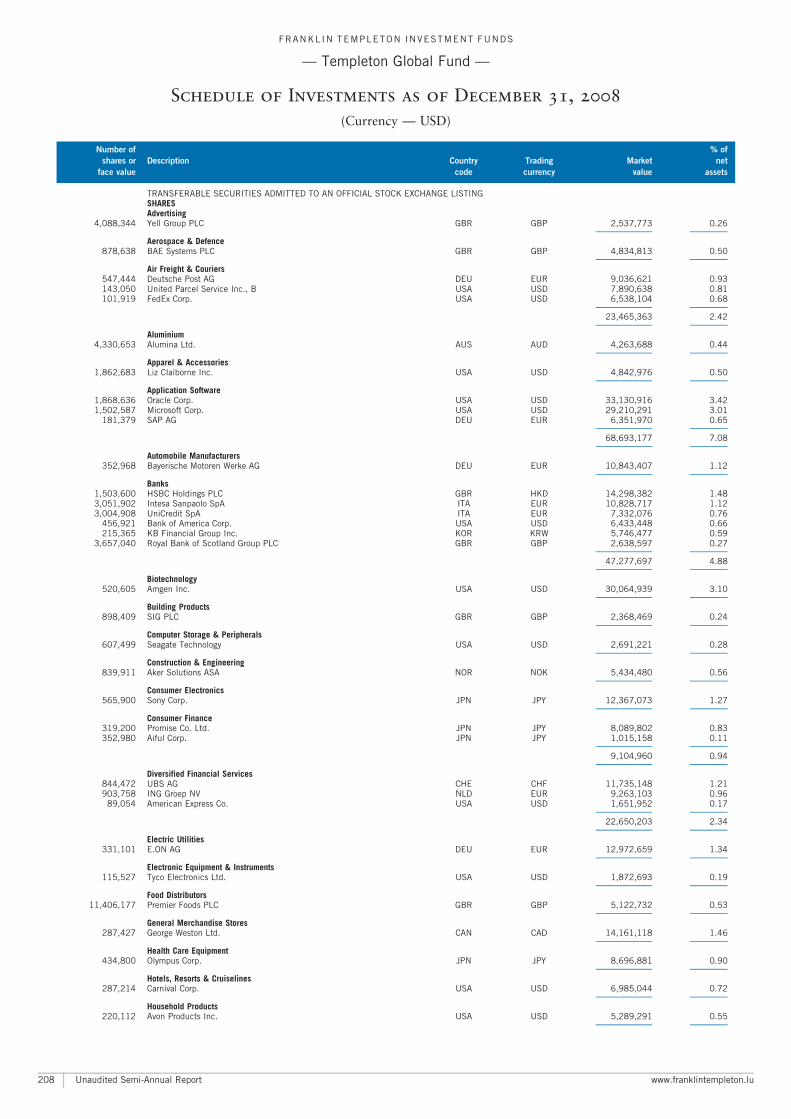
TRANSFERABLE SECURITIES ADMITTED TO AN OFFICIAL STOCK EXCHANGE LISTINGSHARESAdvertising
4,088,344 Yell Group PLC GBR GBP 2,537,773 0.26A A
Aerospace & Defence878,638 BAE Systems PLC GBR GBP 4,834,813 0.50
A A
Air Freight & Couriers547,444 Deutsche Post AG DEU EUR 9,036,621 0.93143,050 United Parcel Service Inc., B USA USD 7,890,638 0.81101,919 FedEx Corp. USA USD 6,538,104 0.68
A A
23,465,363 2.42A A
Aluminium4,330,653 Alumina Ltd. AUS AUD 4,263,688 0.44
A A
Apparel & Accessories1,862,683 Liz Claiborne Inc. USA USD 4,842,976 0.50
A A
Application Software1,868,636 Oracle Corp. USA USD 33,130,916 3.421,502,587 Microsoft Corp. USA USD 29,210,291 3.01
181,379 SAP AG DEU EUR 6,351,970 0.65A A
68,693,177 7.08A A
Automobile Manufacturers352,968 Bayerische Motoren Werke AG DEU EUR 10,843,407 1.12
A A
Banks1,503,600 HSBC Holdings PLC GBR HKD 14,298,382 1.483,051,902 Intesa Sanpaolo SpA ITA EUR 10,828,717 1.123,004,908 UniCredit SpA ITA EUR 7,332,076 0.76
456,921 Bank of America Corp. USA USD 6,433,448 0.66215,365 KB Financial Group Inc. KOR KRW 5,746,477 0.59
3,657,040 Royal Bank of Scotland Group PLC GBR GBP 2,638,597 0.27A A
47,277,697 4.88A A
Biotechnology520,605 Amgen Inc. USA USD 30,064,939 3.10
A A
Building Products898,409 SIG PLC GBR GBP 2,368,469 0.24
A A
Computer Storage & Peripherals607,499 Seagate Technology USA USD 2,691,221 0.28
A A
Construction & Engineering839,911 Aker Solutions ASA NOR NOK 5,434,480 0.56
A A
Consumer Electronics565,900 Sony Corp. JPN JPY 12,367,073 1.27
A A
Consumer Finance319,200 Promise Co. Ltd. JPN JPY 8,089,802 0.83352,980 Aiful Corp. JPN JPY 1,015,158 0.11
A A
9,104,960 0.94A A
Diversified Financial Services844,472 UBS AG CHE CHF 11,735,148 1.21903,758 ING Groep NV NLD EUR 9,263,103 0.96
89,054 American Express Co. USA USD 1,651,952 0.17A A
22,650,203 2.34A A
Electric Utilities331,101 E.ON AG DEU EUR 12,972,659 1.34
A A
Electronic Equipment & Instruments115,527 Tyco Electronics Ltd. USA USD 1,872,693 0.19
A A
Food Distributors11,406,177 Premier Foods PLC GBR GBP 5,122,732 0.53
A A
General Merchandise Stores287,427 George Weston Ltd. CAN CAD 14,161,118 1.46
A A
Health Care Equipment434,800 Olympus Corp. JPN JPY 8,696,881 0.90
A A
Hotels, Resorts & Cruiselines287,214 Carnival Corp. USA USD 6,985,044 0.72
A A
Household Products220,112 Avon Products Inc. USA USD 5,289,291 0.55
A A
FRANKL IN TEMPLETON INVESTMENT FUNDS
ç Templeton Global Fund ç
Schedule of Investments as of December 31, 2008
(Currency ç USD)
Number of % of
shares or Description Country Trading Market net
face value code currency value assets
Unaudited Semi-Annual Report www.franklintempleton.lu208
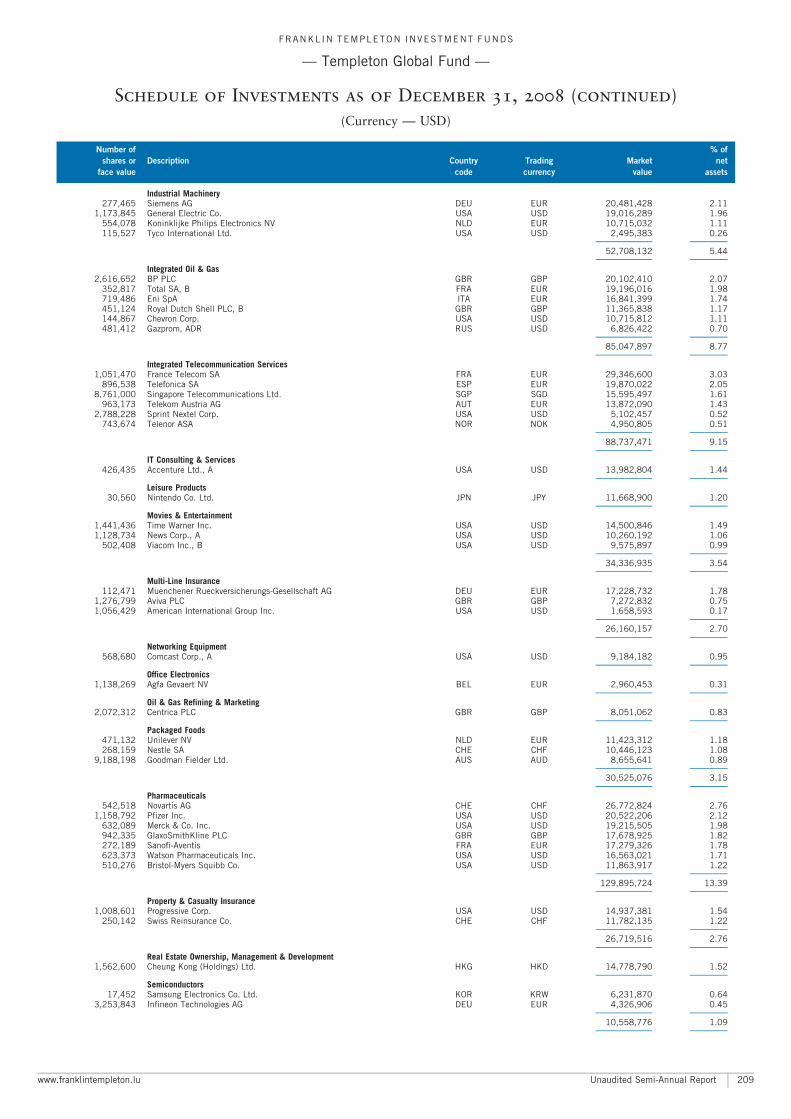
Industrial Machinery277,465 Siemens AG DEU EUR 20,481,428 2.11
1,173,845 General Electric Co. USA USD 19,016,289 1.96554,078 Koninklijke Philips Electronics NV NLD EUR 10,715,032 1.11115,527 Tyco International Ltd. USA USD 2,495,383 0.26
A A
52,708,132 5.44A A
Integrated Oil & Gas2,616,652 BP PLC GBR GBP 20,102,410 2.07
352,817 Total SA, B FRA EUR 19,196,016 1.98719,486 Eni SpA ITA EUR 16,841,399 1.74451,124 Royal Dutch Shell PLC, B GBR GBP 11,365,838 1.17144,867 Chevron Corp. USA USD 10,715,812 1.11481,412 Gazprom, ADR RUS USD 6,826,422 0.70
A A
85,047,897 8.77A A
Integrated Telecommunication Services1,051,470 France Telecom SA FRA EUR 29,346,600 3.03
896,538 Telefonica SA ESP EUR 19,870,022 2.058,761,000 Singapore Telecommunications Ltd. SGP SGD 15,595,497 1.61
963,173 Telekom Austria AG AUT EUR 13,872,090 1.432,788,228 Sprint Nextel Corp. USA USD 5,102,457 0.52
743,674 Telenor ASA NOR NOK 4,950,805 0.51A A
88,737,471 9.15A A
IT Consulting & Services426,435 Accenture Ltd., A USA USD 13,982,804 1.44
A A
Leisure Products30,560 Nintendo Co. Ltd. JPN JPY 11,668,900 1.20
A A
Movies & Entertainment1,441,436 Time Warner Inc. USA USD 14,500,846 1.491,128,734 News Corp., A USA USD 10,260,192 1.06
502,408 Viacom Inc., B USA USD 9,575,897 0.99A A
34,336,935 3.54A A
Multi-Line Insurance112,471 Muenchener Rueckversicherungs-Gesellschaft AG DEU EUR 17,228,732 1.78
1,276,799 Aviva PLC GBR GBP 7,272,832 0.751,056,429 American International Group Inc. USA USD 1,658,593 0.17
A A
26,160,157 2.70A A
Networking Equipment568,680 Comcast Corp., A USA USD 9,184,182 0.95
A A
Office Electronics1,138,269 Agfa Gevaert NV BEL EUR 2,960,453 0.31
A A
Oil & Gas Refining & Marketing2,072,312 Centrica PLC GBR GBP 8,051,062 0.83
A A
Packaged Foods471,132 Unilever NV NLD EUR 11,423,312 1.18268,159 Nestle SA CHE CHF 10,446,123 1.08
9,188,198 Goodman Fielder Ltd. AUS AUD 8,655,641 0.89A A
30,525,076 3.15A A
Pharmaceuticals542,518 Novartis AG CHE CHF 26,772,824 2.76
1,158,792 Pfizer Inc. USA USD 20,522,206 2.12632,089 Merck & Co. Inc. USA USD 19,215,505 1.98942,335 GlaxoSmithKline PLC GBR GBP 17,678,925 1.82272,189 Sanofi-Aventis FRA EUR 17,279,326 1.78623,373 Watson Pharmaceuticals Inc. USA USD 16,563,021 1.71510,276 Bristol-Myers Squibb Co. USA USD 11,863,917 1.22
A A
129,895,724 13.39A A
Property & Casualty Insurance1,008,601 Progressive Corp. USA USD 14,937,381 1.54
250,142 Swiss Reinsurance Co. CHE CHF 11,782,135 1.22A A
26,719,516 2.76A A
Real Estate Ownership, Management & Development1,562,600 Cheung Kong (Holdings) Ltd. HKG HKD 14,778,790 1.52
A A
Semiconductors17,452 Samsung Electronics Co. Ltd. KOR KRW 6,231,870 0.64
3,253,843 Infineon Technologies AG DEU EUR 4,326,906 0.45A A
10,558,776 1.09A A
FRANKL IN TEMPLETON INVESTMENT FUNDS
ç Templeton Global Fund ç
Schedule of Investments as of December 31, 2008 (continued)
(Currency ç USD)
Number of % of
shares or Description Country Trading Market net
face value code currency value assets
www.franklintempleton.lu Unaudited Semi-Annual Report 209
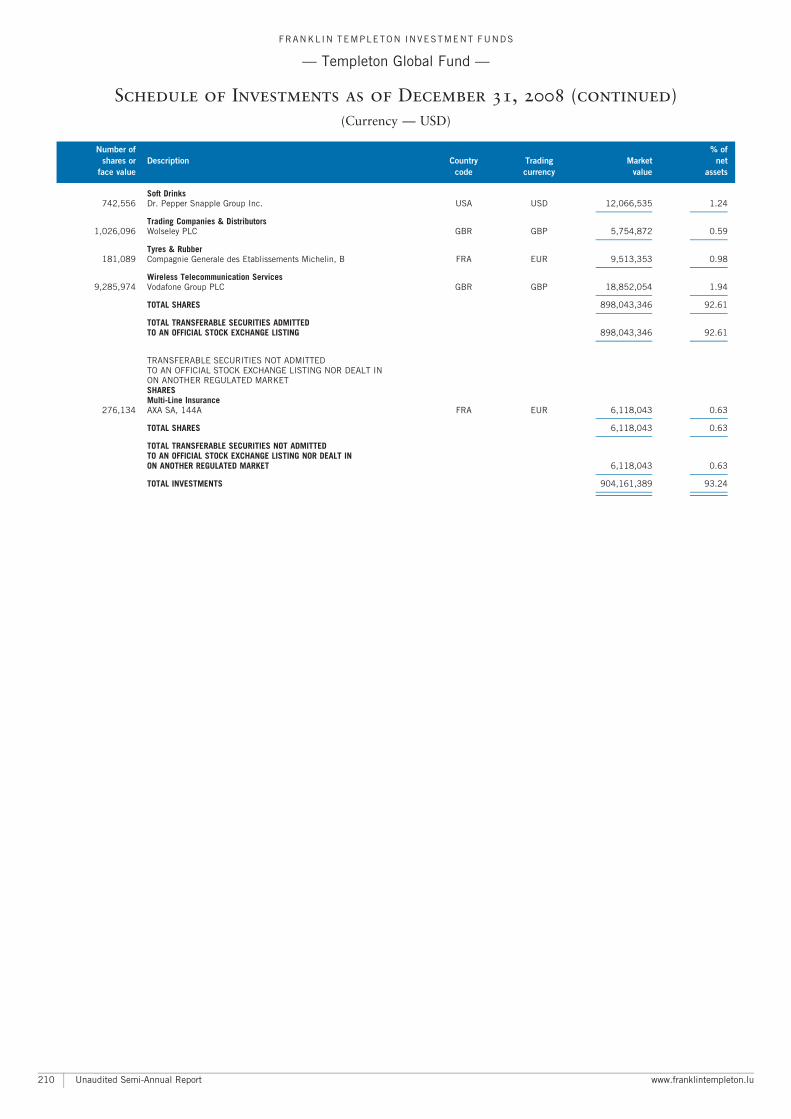
Soft Drinks742,556 Dr. Pepper Snapple Group Inc. USA USD 12,066,535 1.24
A A
Trading Companies & Distributors1,026,096 Wolseley PLC GBR GBP 5,754,872 0.59
A A
Tyres & Rubber181,089 Compagnie Generale des Etablissements Michelin, B FRA EUR 9,513,353 0.98
A A
Wireless Telecommunication Services9,285,974 Vodafone Group PLC GBR GBP 18,852,054 1.94
A A
TOTAL SHARES 898,043,346 92.61A A
TOTAL TRANSFERABLE SECURITIES ADMITTEDTO AN OFFICIAL STOCK EXCHANGE LISTING 898,043,346 92.61
A A
TRANSFERABLE SECURITIES NOT ADMITTEDTO AN OFFICIAL STOCK EXCHANGE LISTING NOR DEALT INON ANOTHER REGULATED MARKETSHARESMulti-Line Insurance
276,134 AXA SA, 144A FRA EUR 6,118,043 0.63A A
TOTAL SHARES 6,118,043 0.63A A
TOTAL TRANSFERABLE SECURITIES NOT ADMITTEDTO AN OFFICIAL STOCK EXCHANGE LISTING NOR DEALT INON ANOTHER REGULATED MARKET 6,118,043 0.63
A A
TOTAL INVESTMENTS 904,161,389 93.24A A
A A
FRANKL IN TEMPLETON INVESTMENT FUNDS
ç Templeton Global Fund ç
Schedule of Investments as of December 31, 2008 (continued)
(Currency ç USD)
Number of % of
shares or Description Country Trading Market net
face value code currency value assets
Unaudited Semi-Annual Report www.franklintempleton.lu210
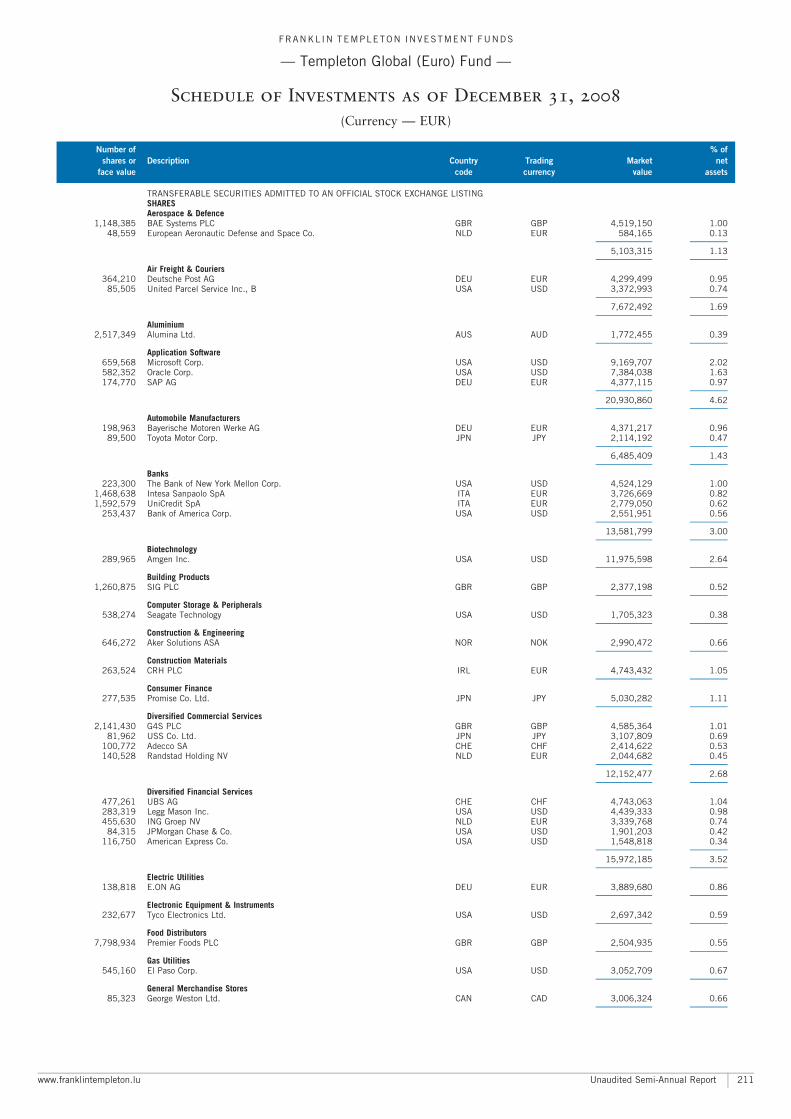
TRANSFERABLE SECURITIES ADMITTED TO AN OFFICIAL STOCK EXCHANGE LISTINGSHARESAerospace & Defence
1,148,385 BAE Systems PLC GBR GBP 4,519,150 1.0048,559 European Aeronautic Defense and Space Co. NLD EUR 584,165 0.13
A A
5,103,315 1.13A A
Air Freight & Couriers364,210 Deutsche Post AG DEU EUR 4,299,499 0.95
85,505 United Parcel Service Inc., B USA USD 3,372,993 0.74A A
7,672,492 1.69A A
Aluminium2,517,349 Alumina Ltd. AUS AUD 1,772,455 0.39
A A
Application Software659,568 Microsoft Corp. USA USD 9,169,707 2.02582,352 Oracle Corp. USA USD 7,384,038 1.63174,770 SAP AG DEU EUR 4,377,115 0.97
A A
20,930,860 4.62A A
Automobile Manufacturers198,963 Bayerische Motoren Werke AG DEU EUR 4,371,217 0.96
89,500 Toyota Motor Corp. JPN JPY 2,114,192 0.47A A
6,485,409 1.43A A
Banks223,300 The Bank of New York Mellon Corp. USA USD 4,524,129 1.00
1,468,638 Intesa Sanpaolo SpA ITA EUR 3,726,669 0.821,592,579 UniCredit SpA ITA EUR 2,779,050 0.62
253,437 Bank of America Corp. USA USD 2,551,951 0.56A A
13,581,799 3.00A A
Biotechnology289,965 Amgen Inc. USA USD 11,975,598 2.64
A A
Building Products1,260,875 SIG PLC GBR GBP 2,377,198 0.52
A A
Computer Storage & Peripherals538,274 Seagate Technology USA USD 1,705,323 0.38
A A
Construction & Engineering646,272 Aker Solutions ASA NOR NOK 2,990,472 0.66
A A
Construction Materials263,524 CRH PLC IRL EUR 4,743,432 1.05
A A
Consumer Finance277,535 Promise Co. Ltd. JPN JPY 5,030,282 1.11
A A
Diversified Commercial Services2,141,430 G4S PLC GBR GBP 4,585,364 1.01
81,962 USS Co. Ltd. JPN JPY 3,107,809 0.69100,772 Adecco SA CHE CHF 2,414,622 0.53140,528 Randstad Holding NV NLD EUR 2,044,682 0.45
A A
12,152,477 2.68A A
Diversified Financial Services477,261 UBS AG CHE CHF 4,743,063 1.04283,319 Legg Mason Inc. USA USD 4,439,333 0.98455,630 ING Groep NV NLD EUR 3,339,768 0.74
84,315 JPMorgan Chase & Co. USA USD 1,901,203 0.42116,750 American Express Co. USA USD 1,548,818 0.34
A A
15,972,185 3.52A A
Electric Utilities138,818 E.ON AG DEU EUR 3,889,680 0.86
A A
Electronic Equipment & Instruments232,677 Tyco Electronics Ltd. USA USD 2,697,342 0.59
A A
Food Distributors7,798,934 Premier Foods PLC GBR GBP 2,504,935 0.55
A A
Gas Utilities545,160 El Paso Corp. USA USD 3,052,709 0.67
A A
General Merchandise Stores85,323 George Weston Ltd. CAN CAD 3,006,324 0.66
A A
FRANKL IN TEMPLETON INVESTMENT FUNDS
ç Templeton Global (Euro) Fund ç
Schedule of Investments as of December 31, 2008
(Currency ç EUR)
Number of % of
shares or Description Country Trading Market net
face value code currency value assets
www.franklintempleton.lu Unaudited Semi-Annual Report 211
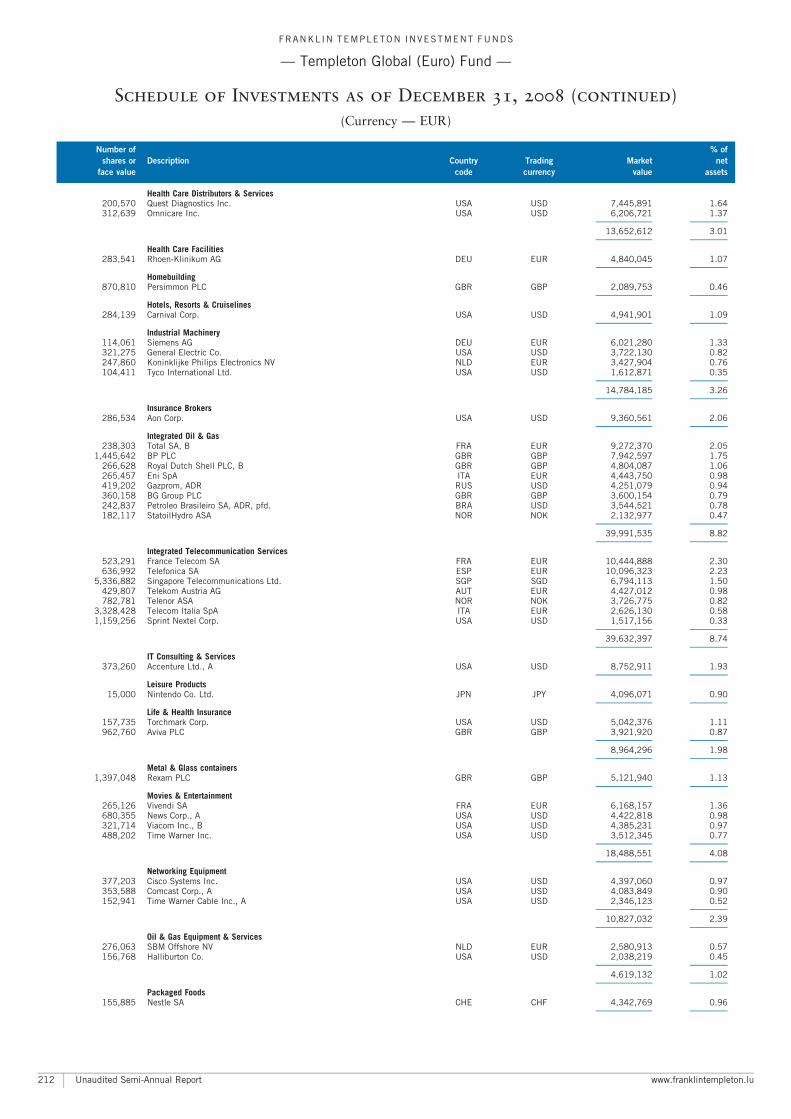
Health Care Distributors & Services200,570 Quest Diagnostics Inc. USA USD 7,445,891 1.64312,639 Omnicare Inc. USA USD 6,206,721 1.37
A A
13,652,612 3.01A A
Health Care Facilities283,541 Rhoen-Klinikum AG DEU EUR 4,840,045 1.07
A A
Homebuilding870,810 Persimmon PLC GBR GBP 2,089,753 0.46
A A
Hotels, Resorts & Cruiselines284,139 Carnival Corp. USA USD 4,941,901 1.09
A A
Industrial Machinery114,061 Siemens AG DEU EUR 6,021,280 1.33321,275 General Electric Co. USA USD 3,722,130 0.82247,860 Koninklijke Philips Electronics NV NLD EUR 3,427,904 0.76104,411 Tyco International Ltd. USA USD 1,612,871 0.35
A A
14,784,185 3.26A A
Insurance Brokers286,534 Aon Corp. USA USD 9,360,561 2.06
A A
Integrated Oil & Gas238,303 Total SA, B FRA EUR 9,272,370 2.05
1,445,642 BP PLC GBR GBP 7,942,597 1.75266,628 Royal Dutch Shell PLC, B GBR GBP 4,804,087 1.06265,457 Eni SpA ITA EUR 4,443,750 0.98419,202 Gazprom, ADR RUS USD 4,251,079 0.94360,158 BG Group PLC GBR GBP 3,600,154 0.79242,837 Petroleo Brasileiro SA, ADR, pfd. BRA USD 3,544,521 0.78182,117 StatoilHydro ASA NOR NOK 2,132,977 0.47
A A
39,991,535 8.82A A
Integrated Telecommunication Services523,291 France Telecom SA FRA EUR 10,444,888 2.30636,992 Telefonica SA ESP EUR 10,096,323 2.23
5,336,882 Singapore Telecommunications Ltd. SGP SGD 6,794,113 1.50429,807 Telekom Austria AG AUT EUR 4,427,012 0.98782,781 Telenor ASA NOR NOK 3,726,775 0.82
3,328,428 Telecom Italia SpA ITA EUR 2,626,130 0.581,159,256 Sprint Nextel Corp. USA USD 1,517,156 0.33
A A
39,632,397 8.74A A
IT Consulting & Services373,260 Accenture Ltd., A USA USD 8,752,911 1.93
A A
Leisure Products15,000 Nintendo Co. Ltd. JPN JPY 4,096,071 0.90
A A
Life & Health Insurance157,735 Torchmark Corp. USA USD 5,042,376 1.11962,760 Aviva PLC GBR GBP 3,921,920 0.87
A A
8,964,296 1.98A A
Metal & Glass containers1,397,048 Rexam PLC GBR GBP 5,121,940 1.13
A A
Movies & Entertainment265,126 Vivendi SA FRA EUR 6,168,157 1.36680,355 News Corp., A USA USD 4,422,818 0.98321,714 Viacom Inc., B USA USD 4,385,231 0.97488,202 Time Warner Inc. USA USD 3,512,345 0.77
A A
18,488,551 4.08A A
Networking Equipment377,203 Cisco Systems Inc. USA USD 4,397,060 0.97353,588 Comcast Corp., A USA USD 4,083,849 0.90152,941 Time Warner Cable Inc., A USA USD 2,346,123 0.52
A A
10,827,032 2.39A A
Oil & Gas Equipment & Services276,063 SBM Offshore NV NLD EUR 2,580,913 0.57156,768 Halliburton Co. USA USD 2,038,219 0.45
A A
4,619,132 1.02A A
Packaged Foods155,885 Nestle SA CHE CHF 4,342,769 0.96
A A
FRANKL IN TEMPLETON INVESTMENT FUNDS
ç Templeton Global (Euro) Fund ç
Schedule of Investments as of December 31, 2008 (continued)
(Currency ç EUR)
Number of % of
shares or Description Country Trading Market net
face value code currency value assets
Unaudited Semi-Annual Report www.franklintempleton.lu212
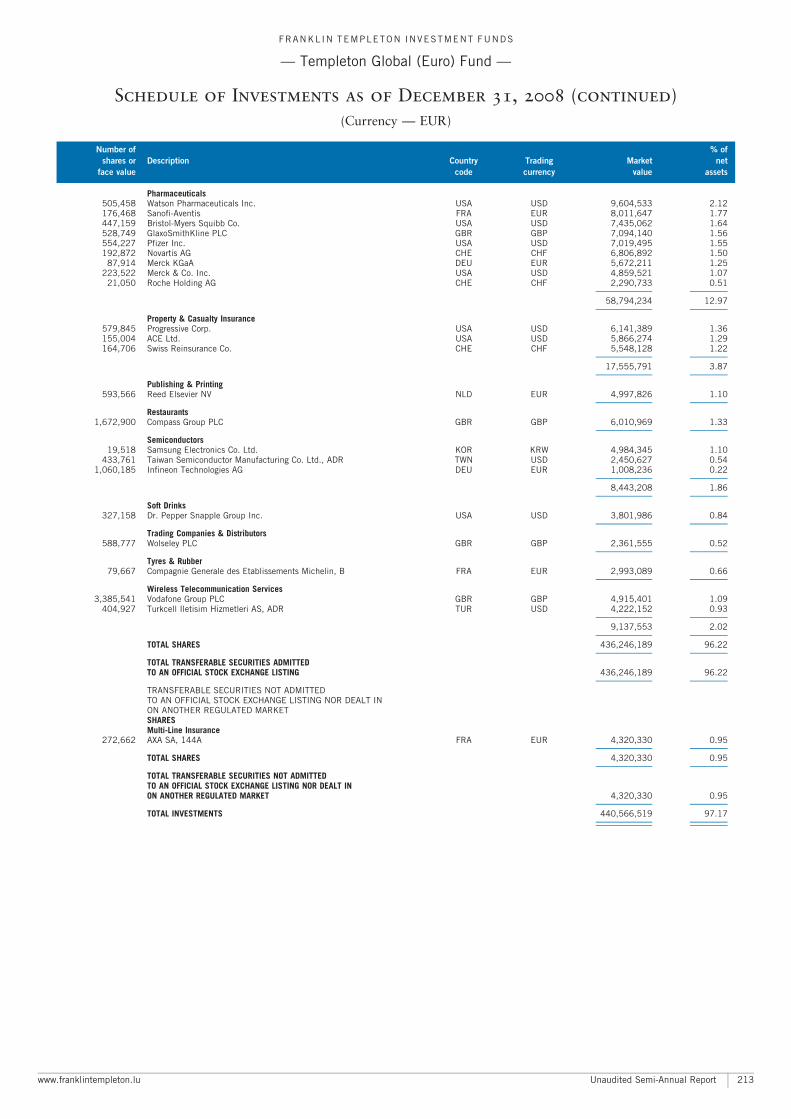
Pharmaceuticals505,458 Watson Pharmaceuticals Inc. USA USD 9,604,533 2.12176,468 Sanofi-Aventis FRA EUR 8,011,647 1.77447,159 Bristol-Myers Squibb Co. USA USD 7,435,062 1.64528,749 GlaxoSmithKline PLC GBR GBP 7,094,140 1.56554,227 Pfizer Inc. USA USD 7,019,495 1.55192,872 Novartis AG CHE CHF 6,806,892 1.50
87,914 Merck KGaA DEU EUR 5,672,211 1.25223,522 Merck & Co. Inc. USA USD 4,859,521 1.07
21,050 Roche Holding AG CHE CHF 2,290,733 0.51A A
58,794,234 12.97A A
Property & Casualty Insurance579,845 Progressive Corp. USA USD 6,141,389 1.36155,004 ACE Ltd. USA USD 5,866,274 1.29164,706 Swiss Reinsurance Co. CHE CHF 5,548,128 1.22
A A
17,555,791 3.87A A
Publishing & Printing593,566 Reed Elsevier NV NLD EUR 4,997,826 1.10
A A
Restaurants1,672,900 Compass Group PLC GBR GBP 6,010,969 1.33
A A
Semiconductors19,518 Samsung Electronics Co. Ltd. KOR KRW 4,984,345 1.10
433,761 Taiwan Semiconductor Manufacturing Co. Ltd., ADR TWN USD 2,450,627 0.541,060,185 Infineon Technologies AG DEU EUR 1,008,236 0.22
A A
8,443,208 1.86A A
Soft Drinks327,158 Dr. Pepper Snapple Group Inc. USA USD 3,801,986 0.84
A A
Trading Companies & Distributors588,777 Wolseley PLC GBR GBP 2,361,555 0.52
A A
Tyres & Rubber79,667 Compagnie Generale des Etablissements Michelin, B FRA EUR 2,993,089 0.66
A A
Wireless Telecommunication Services3,385,541 Vodafone Group PLC GBR GBP 4,915,401 1.09
404,927 Turkcell Iletisim Hizmetleri AS, ADR TUR USD 4,222,152 0.93A A
9,137,553 2.02A A
TOTAL SHARES 436,246,189 96.22A A
TOTAL TRANSFERABLE SECURITIES ADMITTEDTO AN OFFICIAL STOCK EXCHANGE LISTING 436,246,189 96.22
A A
TRANSFERABLE SECURITIES NOT ADMITTEDTO AN OFFICIAL STOCK EXCHANGE LISTING NOR DEALT INON ANOTHER REGULATED MARKETSHARESMulti-Line Insurance
272,662 AXA SA, 144A FRA EUR 4,320,330 0.95A A
TOTAL SHARES 4,320,330 0.95A A
TOTAL TRANSFERABLE SECURITIES NOT ADMITTEDTO AN OFFICIAL STOCK EXCHANGE LISTING NOR DEALT INON ANOTHER REGULATED MARKET 4,320,330 0.95
A A
TOTAL INVESTMENTS 440,566,519 97.17A A
A A
FRANKL IN TEMPLETON INVESTMENT FUNDS
ç Templeton Global (Euro) Fund ç
Schedule of Investments as of December 31, 2008 (continued)
(Currency ç EUR)
Number of % of
shares or Description Country Trading Market net
face value code currency value assets
www.franklintempleton.lu Unaudited Semi-Annual Report 213
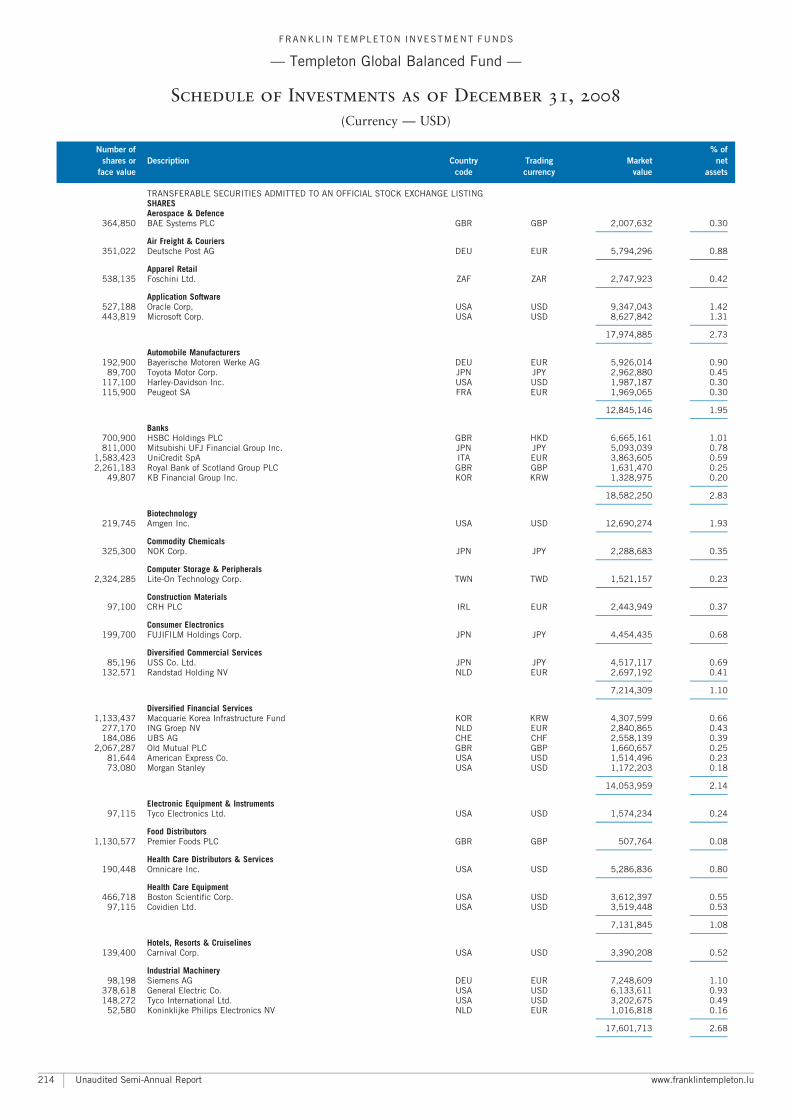
TRANSFERABLE SECURITIES ADMITTED TO AN OFFICIAL STOCK EXCHANGE LISTINGSHARESAerospace & Defence
364,850 BAE Systems PLC GBR GBP 2,007,632 0.30A A
Air Freight & Couriers351,022 Deutsche Post AG DEU EUR 5,794,296 0.88
A A
Apparel Retail538,135 Foschini Ltd. ZAF ZAR 2,747,923 0.42
A A
Application Software527,188 Oracle Corp. USA USD 9,347,043 1.42443,819 Microsoft Corp. USA USD 8,627,842 1.31
A A
17,974,885 2.73A A
Automobile Manufacturers192,900 Bayerische Motoren Werke AG DEU EUR 5,926,014 0.90
89,700 Toyota Motor Corp. JPN JPY 2,962,880 0.45117,100 Harley-Davidson Inc. USA USD 1,987,187 0.30115,900 Peugeot SA FRA EUR 1,969,065 0.30
A A
12,845,146 1.95A A
Banks700,900 HSBC Holdings PLC GBR HKD 6,665,161 1.01811,000 Mitsubishi UFJ Financial Group Inc. JPN JPY 5,093,039 0.78
1,583,423 UniCredit SpA ITA EUR 3,863,605 0.592,261,183 Royal Bank of Scotland Group PLC GBR GBP 1,631,470 0.25
49,807 KB Financial Group Inc. KOR KRW 1,328,975 0.20A A
18,582,250 2.83A A
Biotechnology219,745 Amgen Inc. USA USD 12,690,274 1.93
A A
Commodity Chemicals325,300 NOK Corp. JPN JPY 2,288,683 0.35
A A
Computer Storage & Peripherals2,324,285 Lite-On Technology Corp. TWN TWD 1,521,157 0.23
A A
Construction Materials97,100 CRH PLC IRL EUR 2,443,949 0.37
A A
Consumer Electronics199,700 FUJIFILM Holdings Corp. JPN JPY 4,454,435 0.68
A A
Diversified Commercial Services85,196 USS Co. Ltd. JPN JPY 4,517,117 0.69
132,571 Randstad Holding NV NLD EUR 2,697,192 0.41A A
7,214,309 1.10A A
Diversified Financial Services1,133,437 Macquarie Korea Infrastructure Fund KOR KRW 4,307,599 0.66
277,170 ING Groep NV NLD EUR 2,840,865 0.43184,086 UBS AG CHE CHF 2,558,139 0.39
2,067,287 Old Mutual PLC GBR GBP 1,660,657 0.2581,644 American Express Co. USA USD 1,514,496 0.2373,080 Morgan Stanley USA USD 1,172,203 0.18
A A
14,053,959 2.14A A
Electronic Equipment & Instruments97,115 Tyco Electronics Ltd. USA USD 1,574,234 0.24
A A
Food Distributors1,130,577 Premier Foods PLC GBR GBP 507,764 0.08
A A
Health Care Distributors & Services190,448 Omnicare Inc. USA USD 5,286,836 0.80
A A
Health Care Equipment466,718 Boston Scientific Corp. USA USD 3,612,397 0.55
97,115 Covidien Ltd. USA USD 3,519,448 0.53A A
7,131,845 1.08A A
Hotels, Resorts & Cruiselines139,400 Carnival Corp. USA USD 3,390,208 0.52
A A
Industrial Machinery98,198 Siemens AG DEU EUR 7,248,609 1.10
378,618 General Electric Co. USA USD 6,133,611 0.93148,272 Tyco International Ltd. USA USD 3,202,675 0.49
52,580 Koninklijke Philips Electronics NV NLD EUR 1,016,818 0.16A A
17,601,713 2.68A A
FRANKL IN TEMPLETON INVESTMENT FUNDS
ç Templeton Global Balanced Fund ç
Schedule of Investments as of December 31, 2008
(Currency ç USD)
Number of % of
shares or Description Country Trading Market net
face value code currency value assets
Unaudited Semi-Annual Report www.franklintempleton.lu214
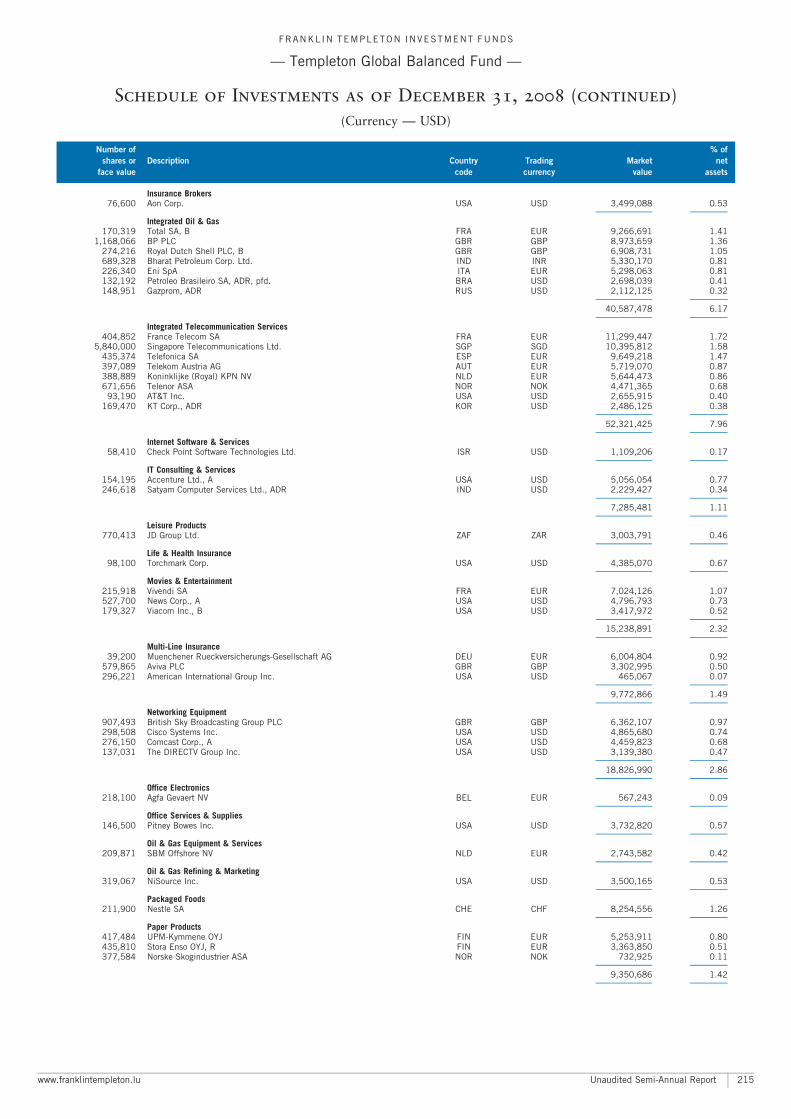
Insurance Brokers76,600 Aon Corp. USA USD 3,499,088 0.53
A A
Integrated Oil & Gas170,319 Total SA, B FRA EUR 9,266,691 1.41
1,168,066 BP PLC GBR GBP 8,973,659 1.36274,216 Royal Dutch Shell PLC, B GBR GBP 6,908,731 1.05689,328 Bharat Petroleum Corp. Ltd. IND INR 5,330,170 0.81226,340 Eni SpA ITA EUR 5,298,063 0.81132,192 Petroleo Brasileiro SA, ADR, pfd. BRA USD 2,698,039 0.41148,951 Gazprom, ADR RUS USD 2,112,125 0.32
A A
40,587,478 6.17A A
Integrated Telecommunication Services404,852 France Telecom SA FRA EUR 11,299,447 1.72
5,840,000 Singapore Telecommunications Ltd. SGP SGD 10,395,812 1.58435,374 Telefonica SA ESP EUR 9,649,218 1.47397,089 Telekom Austria AG AUT EUR 5,719,070 0.87388,889 Koninklijke (Royal) KPN NV NLD EUR 5,644,473 0.86671,656 Telenor ASA NOR NOK 4,471,365 0.68
93,190 AT&T Inc. USA USD 2,655,915 0.40169,470 KT Corp., ADR KOR USD 2,486,125 0.38
A A
52,321,425 7.96A A
Internet Software & Services58,410 Check Point Software Technologies Ltd. ISR USD 1,109,206 0.17
A A
IT Consulting & Services154,195 Accenture Ltd., A USA USD 5,056,054 0.77246,618 Satyam Computer Services Ltd., ADR IND USD 2,229,427 0.34
A A
7,285,481 1.11A A
Leisure Products770,413 JD Group Ltd. ZAF ZAR 3,003,791 0.46
A A
Life & Health Insurance98,100 Torchmark Corp. USA USD 4,385,070 0.67
A A
Movies & Entertainment215,918 Vivendi SA FRA EUR 7,024,126 1.07527,700 News Corp., A USA USD 4,796,793 0.73179,327 Viacom Inc., B USA USD 3,417,972 0.52
A A
15,238,891 2.32A A
Multi-Line Insurance39,200 Muenchener Rueckversicherungs-Gesellschaft AG DEU EUR 6,004,804 0.92
579,865 Aviva PLC GBR GBP 3,302,995 0.50296,221 American International Group Inc. USA USD 465,067 0.07
A A
9,772,866 1.49A A
Networking Equipment907,493 British Sky Broadcasting Group PLC GBR GBP 6,362,107 0.97298,508 Cisco Systems Inc. USA USD 4,865,680 0.74276,150 Comcast Corp., A USA USD 4,459,823 0.68137,031 The DIRECTV Group Inc. USA USD 3,139,380 0.47
A A
18,826,990 2.86A A
Office Electronics218,100 Agfa Gevaert NV BEL EUR 567,243 0.09
A A
Office Services & Supplies146,500 Pitney Bowes Inc. USA USD 3,732,820 0.57
A A
Oil & Gas Equipment & Services209,871 SBM Offshore NV NLD EUR 2,743,582 0.42
A A
Oil & Gas Refining & Marketing319,067 NiSource Inc. USA USD 3,500,165 0.53
A A
Packaged Foods211,900 Nestle SA CHE CHF 8,254,556 1.26
A A
Paper Products417,484 UPM-Kymmene OYJ FIN EUR 5,253,911 0.80435,810 Stora Enso OYJ, R FIN EUR 3,363,850 0.51377,584 Norske Skogindustrier ASA NOR NOK 732,925 0.11
A A
9,350,686 1.42A A
FRANKL IN TEMPLETON INVESTMENT FUNDS
ç Templeton Global Balanced Fund ç
Schedule of Investments as of December 31, 2008 (continued)
(Currency ç USD)
Number of % of
shares or Description Country Trading Market net
face value code currency value assets
www.franklintempleton.lu Unaudited Semi-Annual Report 215
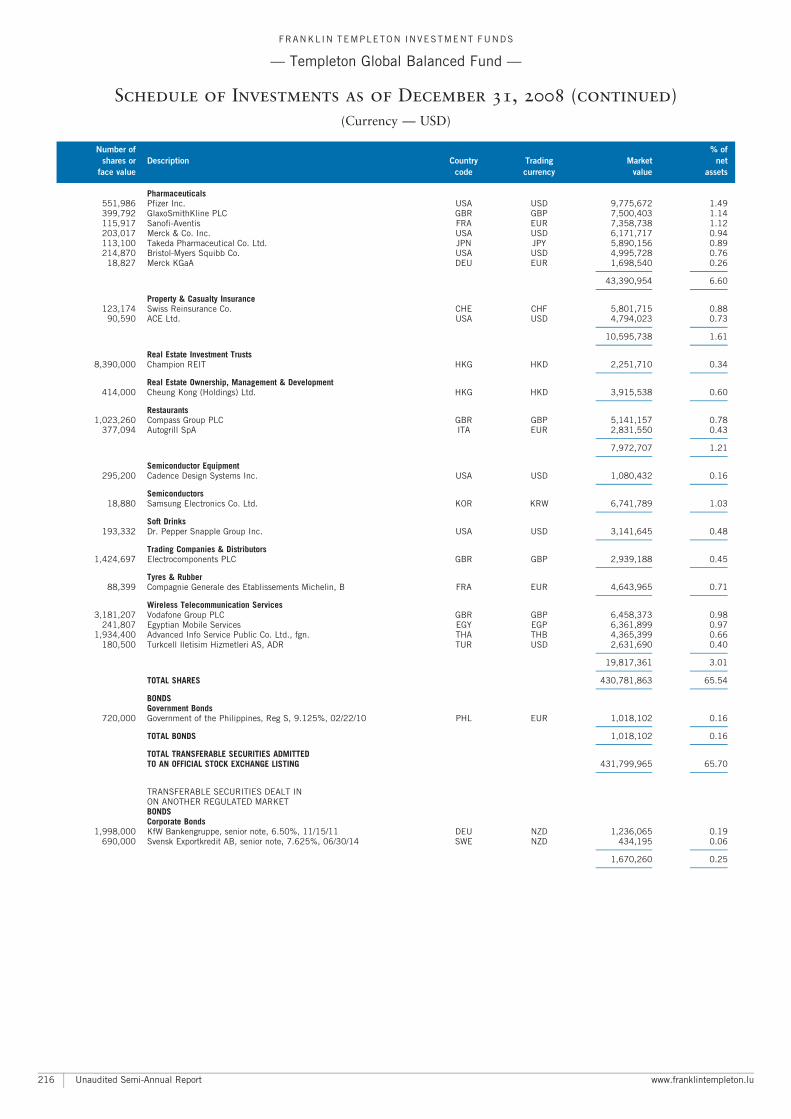
Pharmaceuticals551,986 Pfizer Inc. USA USD 9,775,672 1.49399,792 GlaxoSmithKline PLC GBR GBP 7,500,403 1.14115,917 Sanofi-Aventis FRA EUR 7,358,738 1.12203,017 Merck & Co. Inc. USA USD 6,171,717 0.94113,100 Takeda Pharmaceutical Co. Ltd. JPN JPY 5,890,156 0.89214,870 Bristol-Myers Squibb Co. USA USD 4,995,728 0.76
18,827 Merck KGaA DEU EUR 1,698,540 0.26A A
43,390,954 6.60A A
Property & Casualty Insurance123,174 Swiss Reinsurance Co. CHE CHF 5,801,715 0.88
90,590 ACE Ltd. USA USD 4,794,023 0.73A A
10,595,738 1.61A A
Real Estate Investment Trusts8,390,000 Champion REIT HKG HKD 2,251,710 0.34
A A
Real Estate Ownership, Management & Development414,000 Cheung Kong (Holdings) Ltd. HKG HKD 3,915,538 0.60
A A
Restaurants1,023,260 Compass Group PLC GBR GBP 5,141,157 0.78
377,094 Autogrill SpA ITA EUR 2,831,550 0.43A A
7,972,707 1.21A A
Semiconductor Equipment295,200 Cadence Design Systems Inc. USA USD 1,080,432 0.16
A A
Semiconductors18,880 Samsung Electronics Co. Ltd. KOR KRW 6,741,789 1.03
A A
Soft Drinks193,332 Dr. Pepper Snapple Group Inc. USA USD 3,141,645 0.48
A A
Trading Companies & Distributors1,424,697 Electrocomponents PLC GBR GBP 2,939,188 0.45
A A
Tyres & Rubber88,399 Compagnie Generale des Etablissements Michelin, B FRA EUR 4,643,965 0.71
A A
Wireless Telecommunication Services3,181,207 Vodafone Group PLC GBR GBP 6,458,373 0.98
241,807 Egyptian Mobile Services EGY EGP 6,361,899 0.971,934,400 Advanced Info Service Public Co. Ltd., fgn. THA THB 4,365,399 0.66
180,500 Turkcell Iletisim Hizmetleri AS, ADR TUR USD 2,631,690 0.40A A
19,817,361 3.01A A
TOTAL SHARES 430,781,863 65.54A A
BONDSGovernment Bonds
720,000 Government of the Philippines, Reg S, 9.125%, 02/22/10 PHL EUR 1,018,102 0.16A A
TOTAL BONDS 1,018,102 0.16A A
TOTAL TRANSFERABLE SECURITIES ADMITTEDTO AN OFFICIAL STOCK EXCHANGE LISTING 431,799,965 65.70
A A
TRANSFERABLE SECURITIES DEALT INON ANOTHER REGULATED MARKETBONDSCorporate Bonds
1,998,000 KfW Bankengruppe, senior note, 6.50%, 11/15/11 DEU NZD 1,236,065 0.19690,000 Svensk Exportkredit AB, senior note, 7.625%, 06/30/14 SWE NZD 434,195 0.06
A A
1,670,260 0.25A A
FRANKL IN TEMPLETON INVESTMENT FUNDS
ç Templeton Global Balanced Fund ç
Schedule of Investments as of December 31, 2008 (continued)
(Currency ç USD)
Number of % of
shares or Description Country Trading Market net
face value code currency value assets
Unaudited Semi-Annual Report www.franklintempleton.lu216
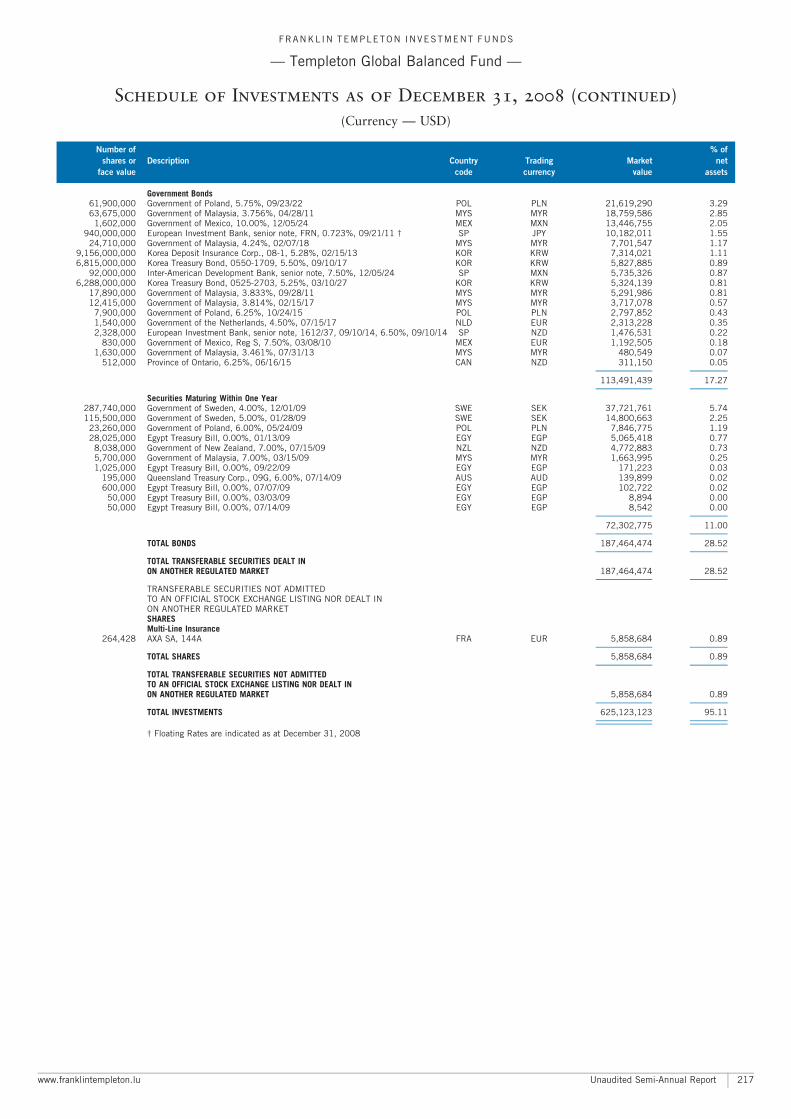
Government Bonds61,900,000 Government of Poland, 5.75%, 09/23/22 POL PLN 21,619,290 3.2963,675,000 Government of Malaysia, 3.756%, 04/28/11 MYS MYR 18,759,586 2.85
1,602,000 Government of Mexico, 10.00%, 12/05/24 MEX MXN 13,446,755 2.05940,000,000 European Investment Bank, senior note, FRN, 0.723%, 09/21/11 � SP JPY 10,182,011 1.55
24,710,000 Government of Malaysia, 4.24%, 02/07/18 MYS MYR 7,701,547 1.179,156,000,000 Korea Deposit Insurance Corp., 08-1, 5.28%, 02/15/13 KOR KRW 7,314,021 1.116,815,000,000 Korea Treasury Bond, 0550-1709, 5.50%, 09/10/17 KOR KRW 5,827,885 0.89
92,000,000 Inter-American Development Bank, senior note, 7.50%, 12/05/24 SP MXN 5,735,326 0.876,288,000,000 Korea Treasury Bond, 0525-2703, 5.25%, 03/10/27 KOR KRW 5,324,139 0.81
17,890,000 Government of Malaysia, 3.833%, 09/28/11 MYS MYR 5,291,986 0.8112,415,000 Government of Malaysia, 3.814%, 02/15/17 MYS MYR 3,717,078 0.57
7,900,000 Government of Poland, 6.25%, 10/24/15 POL PLN 2,797,852 0.431,540,000 Government of the Netherlands, 4.50%, 07/15/17 NLD EUR 2,313,228 0.352,328,000 European Investment Bank, senior note, 1612/37, 09/10/14, 6.50%, 09/10/14 SP NZD 1,476,531 0.22
830,000 Government of Mexico, Reg S, 7.50%, 03/08/10 MEX EUR 1,192,505 0.181,630,000 Government of Malaysia, 3.461%, 07/31/13 MYS MYR 480,549 0.07
512,000 Province of Ontario, 6.25%, 06/16/15 CAN NZD 311,150 0.05A A
113,491,439 17.27A A
Securities Maturing Within One Year287,740,000 Government of Sweden, 4.00%, 12/01/09 SWE SEK 37,721,761 5.74115,500,000 Government of Sweden, 5.00%, 01/28/09 SWE SEK 14,800,663 2.25
23,260,000 Government of Poland, 6.00%, 05/24/09 POL PLN 7,846,775 1.1928,025,000 Egypt Treasury Bill, 0.00%, 01/13/09 EGY EGP 5,065,418 0.77
8,038,000 Government of New Zealand, 7.00%, 07/15/09 NZL NZD 4,772,883 0.735,700,000 Government of Malaysia, 7.00%, 03/15/09 MYS MYR 1,663,995 0.251,025,000 Egypt Treasury Bill, 0.00%, 09/22/09 EGY EGP 171,223 0.03
195,000 Queensland Treasury Corp., 09G, 6.00%, 07/14/09 AUS AUD 139,899 0.02600,000 Egypt Treasury Bill, 0.00%, 07/07/09 EGY EGP 102,722 0.02
50,000 Egypt Treasury Bill, 0.00%, 03/03/09 EGY EGP 8,894 0.0050,000 Egypt Treasury Bill, 0.00%, 07/14/09 EGY EGP 8,542 0.00
A A
72,302,775 11.00A A
TOTAL BONDS 187,464,474 28.52A A
TOTAL TRANSFERABLE SECURITIES DEALT INON ANOTHER REGULATED MARKET 187,464,474 28.52
A A
TRANSFERABLE SECURITIES NOT ADMITTEDTO AN OFFICIAL STOCK EXCHANGE LISTING NOR DEALT INON ANOTHER REGULATED MARKETSHARESMulti-Line Insurance
264,428 AXA SA, 144A FRA EUR 5,858,684 0.89A A
TOTAL SHARES 5,858,684 0.89A A
TOTAL TRANSFERABLE SECURITIES NOT ADMITTEDTO AN OFFICIAL STOCK EXCHANGE LISTING NOR DEALT INON ANOTHER REGULATED MARKET 5,858,684 0.89
A A
TOTAL INVESTMENTS 625,123,123 95.11A A
A A
� Floating Rates are indicated as at December 31, 2008
FRANKL IN TEMPLETON INVESTMENT FUNDS
ç Templeton Global Balanced Fund ç
Schedule of Investments as of December 31, 2008 (continued)
(Currency ç USD)
Number of % of
shares or Description Country Trading Market net
face value code currency value assets
www.franklintempleton.lu Unaudited Semi-Annual Report 217
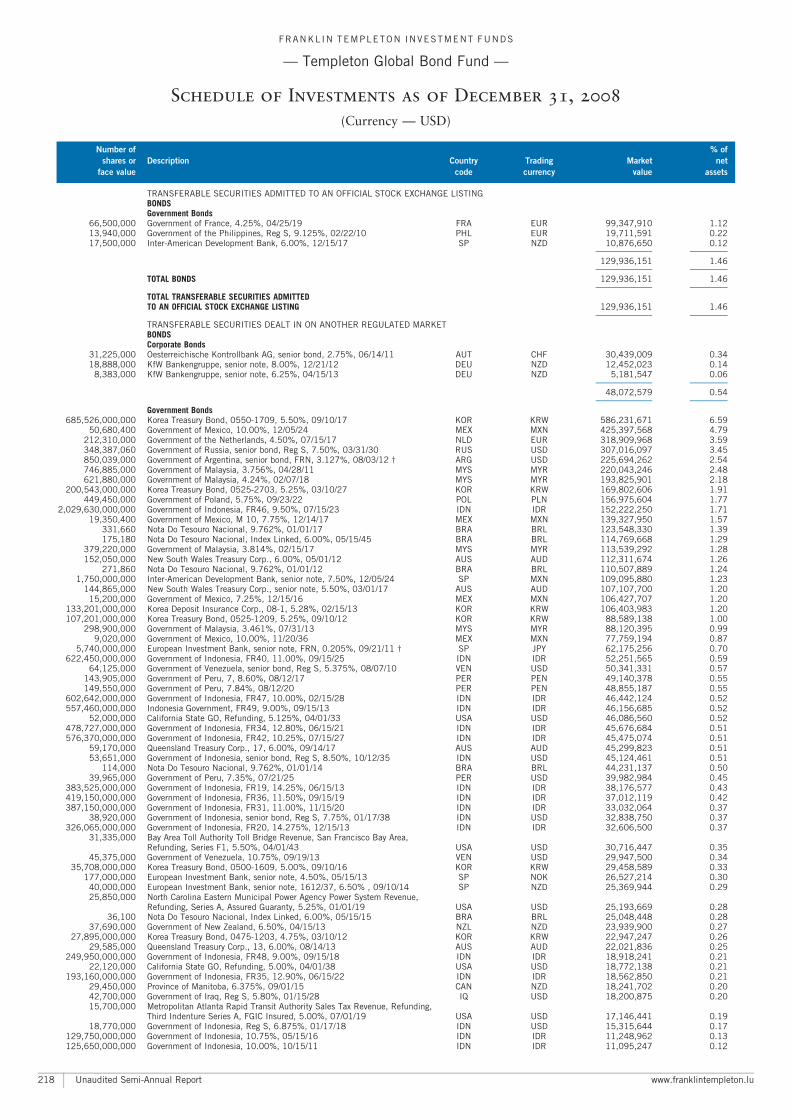
TRANSFERABLE SECURITIES ADMITTED TO AN OFFICIAL STOCK EXCHANGE LISTINGBONDSGovernment Bonds
66,500,000 Government of France, 4.25%, 04/25/19 FRA EUR 99,347,910 1.1213,940,000 Government of the Philippines, Reg S, 9.125%, 02/22/10 PHL EUR 19,711,591 0.2217,500,000 Inter-American Development Bank, 6.00%, 12/15/17 SP NZD 10,876,650 0.12
A A
129,936,151 1.46A A
TOTAL BONDS 129,936,151 1.46A A
TOTAL TRANSFERABLE SECURITIES ADMITTEDTO AN OFFICIAL STOCK EXCHANGE LISTING 129,936,151 1.46
A A
TRANSFERABLE SECURITIES DEALT IN ON ANOTHER REGULATED MARKETBONDSCorporate Bonds
31,225,000 Oesterreichische Kontrollbank AG, senior bond, 2.75%, 06/14/11 AUT CHF 30,439,009 0.3418,888,000 KfW Bankengruppe, senior note, 8.00%, 12/21/12 DEU NZD 12,452,023 0.14
8,383,000 KfW Bankengruppe, senior note, 6.25%, 04/15/13 DEU NZD 5,181,547 0.06A A
48,072,579 0.54A A
Government Bonds685,526,000,000 Korea Treasury Bond, 0550-1709, 5.50%, 09/10/17 KOR KRW 586,231,671 6.59
50,680,400 Government of Mexico, 10.00%, 12/05/24 MEX MXN 425,397,568 4.79212,310,000 Government of the Netherlands, 4.50%, 07/15/17 NLD EUR 318,909,968 3.59348,387,060 Government of Russia, senior bond, Reg S, 7.50%, 03/31/30 RUS USD 307,016,097 3.45850,039,000 Government of Argentina, senior bond, FRN, 3.127%, 08/03/12 � ARG USD 225,694,262 2.54746,885,000 Government of Malaysia, 3.756%, 04/28/11 MYS MYR 220,043,246 2.48621,880,000 Government of Malaysia, 4.24%, 02/07/18 MYS MYR 193,825,901 2.18
200,543,000,000 Korea Treasury Bond, 0525-2703, 5.25%, 03/10/27 KOR KRW 169,802,606 1.91449,450,000 Government of Poland, 5.75%, 09/23/22 POL PLN 156,975,604 1.77
2,029,630,000,000 Government of Indonesia, FR46, 9.50%, 07/15/23 IDN IDR 152,222,250 1.7119,350,400 Government of Mexico, M 10, 7.75%, 12/14/17 MEX MXN 139,327,950 1.57
331,660 Nota Do Tesouro Nacional, 9.762%, 01/01/17 BRA BRL 123,548,330 1.39175,180 Nota Do Tesouro Nacional, Index Linked, 6.00%, 05/15/45 BRA BRL 114,769,668 1.29
379,220,000 Government of Malaysia, 3.814%, 02/15/17 MYS MYR 113,539,292 1.28152,050,000 New South Wales Treasury Corp., 6.00%, 05/01/12 AUS AUD 112,311,674 1.26
271,860 Nota Do Tesouro Nacional, 9.762%, 01/01/12 BRA BRL 110,507,889 1.241,750,000,000 Inter-American Development Bank, senior note, 7.50%, 12/05/24 SP MXN 109,095,880 1.23
144,865,000 New South Wales Treasury Corp., senior note, 5.50%, 03/01/17 AUS AUD 107,107,700 1.2015,200,000 Government of Mexico, 7.25%, 12/15/16 MEX MXN 106,427,707 1.20
133,201,000,000 Korea Deposit Insurance Corp., 08-1, 5.28%, 02/15/13 KOR KRW 106,403,983 1.20107,201,000,000 Korea Treasury Bond, 0525-1209, 5.25%, 09/10/12 KOR KRW 88,589,138 1.00
298,900,000 Government of Malaysia, 3.461%, 07/31/13 MYS MYR 88,120,395 0.999,020,000 Government of Mexico, 10.00%, 11/20/36 MEX MXN 77,759,194 0.87
5,740,000,000 European Investment Bank, senior note, FRN, 0.205%, 09/21/11 � SP JPY 62,175,256 0.70622,450,000,000 Government of Indonesia, FR40, 11.00%, 09/15/25 IDN IDR 52,251,565 0.59
64,125,000 Government of Venezuela, senior bond, Reg S, 5.375%, 08/07/10 VEN USD 50,341,331 0.57143,905,000 Government of Peru, 7, 8.60%, 08/12/17 PER PEN 49,140,378 0.55149,550,000 Government of Peru, 7.84%, 08/12/20 PER PEN 48,855,187 0.55
602,642,000,000 Government of Indonesia, FR47, 10.00%, 02/15/28 IDN IDR 46,442,124 0.52557,460,000,000 Indonesia Government, FR49, 9.00%, 09/15/13 IDN IDR 46,156,685 0.52
52,000,000 California State GO, Refunding, 5.125%, 04/01/33 USA USD 46,086,560 0.52478,727,000,000 Government of Indonesia, FR34, 12.80%, 06/15/21 IDN IDR 45,676,684 0.51576,370,000,000 Government of Indonesia, FR42, 10.25%, 07/15/27 IDN IDR 45,475,074 0.51
59,170,000 Queensland Treasury Corp., 17, 6.00%, 09/14/17 AUS AUD 45,299,823 0.5153,651,000 Government of Indonesia, senior bond, Reg S, 8.50%, 10/12/35 IDN USD 45,124,461 0.51
114,000 Nota Do Tesouro Nacional, 9.762%, 01/01/14 BRA BRL 44,231,137 0.5039,965,000 Government of Peru, 7.35%, 07/21/25 PER USD 39,982,984 0.45
383,525,000,000 Government of Indonesia, FR19, 14.25%, 06/15/13 IDN IDR 38,176,577 0.43419,150,000,000 Government of Indonesia, FR36, 11.50%, 09/15/19 IDN IDR 37,012,119 0.42387,150,000,000 Government of Indonesia, FR31, 11.00%, 11/15/20 IDN IDR 33,032,064 0.37
38,920,000 Government of Indonesia, senior bond, Reg S, 7.75%, 01/17/38 IDN USD 32,838,750 0.37326,065,000,000 Government of Indonesia, FR20, 14.275%, 12/15/13 IDN IDR 32,606,500 0.37
31,335,000 Bay Area Toll Authority Toll Bridge Revenue, San Francisco Bay Area,Refunding, Series F1, 5.50%, 04/01/43 USA USD 30,716,447 0.35
45,375,000 Government of Venezuela, 10.75%, 09/19/13 VEN USD 29,947,500 0.3435,708,000,000 Korea Treasury Bond, 0500-1609, 5.00%, 09/10/16 KOR KRW 29,458,589 0.33
177,000,000 European Investment Bank, senior note, 4.50%, 05/15/13 SP NOK 26,527,214 0.3040,000,000 European Investment Bank, senior note, 1612/37, 6.50% , 09/10/14 SP NZD 25,369,944 0.2925,850,000 North Carolina Eastern Municipal Power Agency Power System Revenue,
Refunding, Series A, Assured Guaranty, 5.25%, 01/01/19 USA USD 25,193,669 0.2836,100 Nota Do Tesouro Nacional, Index Linked, 6.00%, 05/15/15 BRA BRL 25,048,448 0.28
37,690,000 Government of New Zealand, 6.50%, 04/15/13 NZL NZD 23,939,900 0.2727,895,000,000 Korea Treasury Bond, 0475-1203, 4.75%, 03/10/12 KOR KRW 22,947,247 0.26
29,585,000 Queensland Treasury Corp., 13, 6.00%, 08/14/13 AUS AUD 22,021,836 0.25249,950,000,000 Government of Indonesia, FR48, 9.00%, 09/15/18 IDN IDR 18,918,241 0.21
22,120,000 California State GO, Refunding, 5.00%, 04/01/38 USA USD 18,772,138 0.21193,160,000,000 Government of Indonesia, FR35, 12.90%, 06/15/22 IDN IDR 18,562,850 0.21
29,450,000 Province of Manitoba, 6.375%, 09/01/15 CAN NZD 18,241,702 0.2042,700,000 Government of Iraq, Reg S, 5.80%, 01/15/28 IQ USD 18,200,875 0.2015,700,000 Metropolitan Atlanta Rapid Transit Authority Sales Tax Revenue, Refunding,
Third Indenture Series A, FGIC Insured, 5.00%, 07/01/19 USA USD 17,146,441 0.1918,770,000 Government of Indonesia, Reg S, 6.875%, 01/17/18 IDN USD 15,315,644 0.17
129,750,000,000 Government of Indonesia, 10.75%, 05/15/16 IDN IDR 11,248,962 0.13125,650,000,000 Government of Indonesia, 10.00%, 10/15/11 IDN IDR 11,095,247 0.12
FRANKL IN TEMPLETON INVESTMENT FUNDS
ç Templeton Global Bond Fund ç
Schedule of Investments as of December 31, 2008
(Currency ç USD)
Number of % of
shares or Description Country Trading Market net
face value code currency value assets
Unaudited Semi-Annual Report www.franklintempleton.lu218
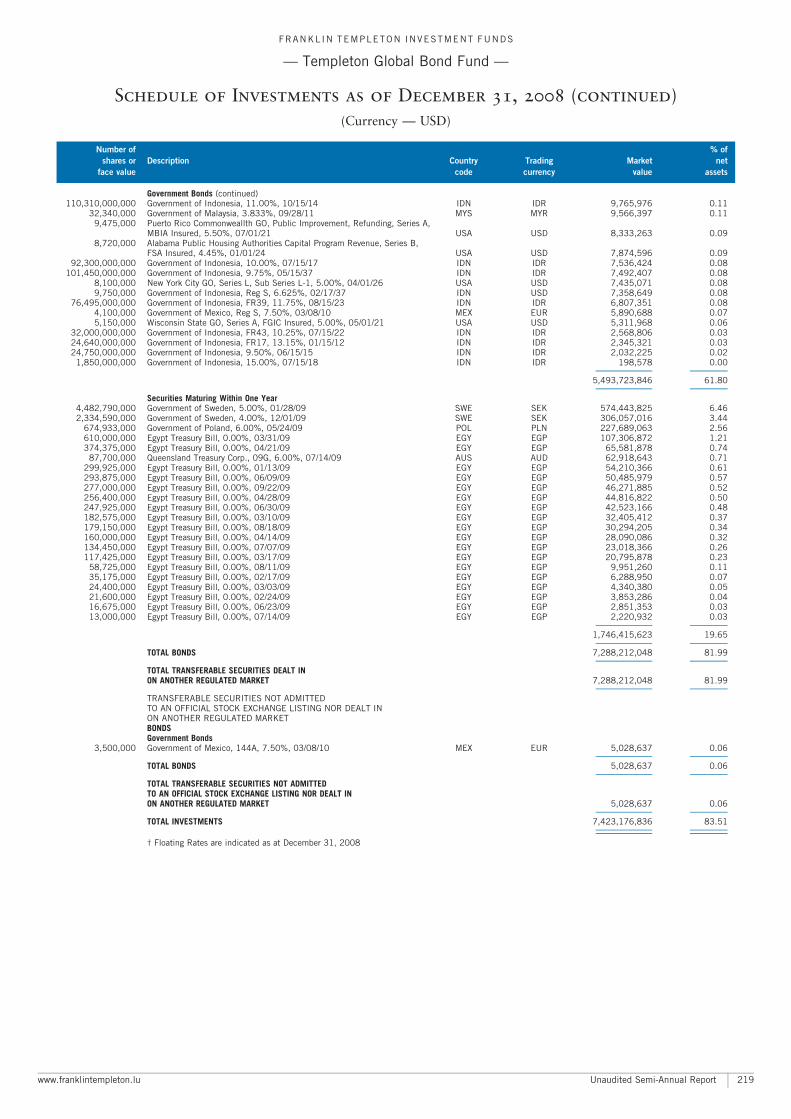
Government Bonds (continued)110,310,000,000 Government of Indonesia, 11.00%, 10/15/14 IDN IDR 9,765,976 0.11
32,340,000 Government of Malaysia, 3.833%, 09/28/11 MYS MYR 9,566,397 0.119,475,000 Puerto Rico Commonweallth GO, Public Improvement, Refunding, Series A,
MBIA Insured, 5.50%, 07/01/21 USA USD 8,333,263 0.098,720,000 Alabama Public Housing Authorities Capital Program Revenue, Series B,
FSA Insured, 4.45%, 01/01/24 USA USD 7,874,596 0.0992,300,000,000 Government of Indonesia, 10.00%, 07/15/17 IDN IDR 7,536,424 0.08
101,450,000,000 Government of Indonesia, 9.75%, 05/15/37 IDN IDR 7,492,407 0.088,100,000 New York City GO, Series L, Sub Series L-1, 5.00%, 04/01/26 USA USD 7,435,071 0.089,750,000 Government of Indonesia, Reg S, 6.625%, 02/17/37 IDN USD 7,358,649 0.08
76,495,000,000 Government of Indonesia, FR39, 11.75%, 08/15/23 IDN IDR 6,807,351 0.084,100,000 Government of Mexico, Reg S, 7.50%, 03/08/10 MEX EUR 5,890,688 0.075,150,000 Wisconsin State GO, Series A, FGIC Insured, 5.00%, 05/01/21 USA USD 5,311,968 0.06
32,000,000,000 Government of Indonesia, FR43, 10.25%, 07/15/22 IDN IDR 2,568,806 0.0324,640,000,000 Government of Indonesia, FR17, 13.15%, 01/15/12 IDN IDR 2,345,321 0.0324,750,000,000 Government of Indonesia, 9.50%, 06/15/15 IDN IDR 2,032,225 0.02
1,850,000,000 Government of Indonesia, 15.00%, 07/15/18 IDN IDR 198,578 0.00A A
5,493,723,846 61.80A A
Securities Maturing Within One Year4,482,790,000 Government of Sweden, 5.00%, 01/28/09 SWE SEK 574,443,825 6.462,334,590,000 Government of Sweden, 4.00%, 12/01/09 SWE SEK 306,057,016 3.44
674,933,000 Government of Poland, 6.00%, 05/24/09 POL PLN 227,689,063 2.56610,000,000 Egypt Treasury Bill, 0.00%, 03/31/09 EGY EGP 107,306,872 1.21374,375,000 Egypt Treasury Bill, 0.00%, 04/21/09 EGY EGP 65,581,878 0.74
87,700,000 Queensland Treasury Corp., 09G, 6.00%, 07/14/09 AUS AUD 62,918,643 0.71299,925,000 Egypt Treasury Bill, 0.00%, 01/13/09 EGY EGP 54,210,366 0.61293,875,000 Egypt Treasury Bill, 0.00%, 06/09/09 EGY EGP 50,485,979 0.57277,000,000 Egypt Treasury Bill, 0.00%, 09/22/09 EGY EGP 46,271,885 0.52256,400,000 Egypt Treasury Bill, 0.00%, 04/28/09 EGY EGP 44,816,822 0.50247,925,000 Egypt Treasury Bill, 0.00%, 06/30/09 EGY EGP 42,523,166 0.48182,575,000 Egypt Treasury Bill, 0.00%, 03/10/09 EGY EGP 32,405,412 0.37179,150,000 Egypt Treasury Bill, 0.00%, 08/18/09 EGY EGP 30,294,205 0.34160,000,000 Egypt Treasury Bill, 0.00%, 04/14/09 EGY EGP 28,090,086 0.32134,450,000 Egypt Treasury Bill, 0.00%, 07/07/09 EGY EGP 23,018,366 0.26117,425,000 Egypt Treasury Bill, 0.00%, 03/17/09 EGY EGP 20,795,878 0.23
58,725,000 Egypt Treasury Bill, 0.00%, 08/11/09 EGY EGP 9,951,260 0.1135,175,000 Egypt Treasury Bill, 0.00%, 02/17/09 EGY EGP 6,288,950 0.0724,400,000 Egypt Treasury Bill, 0.00%, 03/03/09 EGY EGP 4,340,380 0.0521,600,000 Egypt Treasury Bill, 0.00%, 02/24/09 EGY EGP 3,853,286 0.0416,675,000 Egypt Treasury Bill, 0.00%, 06/23/09 EGY EGP 2,851,353 0.0313,000,000 Egypt Treasury Bill, 0.00%, 07/14/09 EGY EGP 2,220,932 0.03
A A
1,746,415,623 19.65A A
TOTAL BONDS 7,288,212,048 81.99A A
TOTAL TRANSFERABLE SECURITIES DEALT INON ANOTHER REGULATED MARKET 7,288,212,048 81.99
A A
TRANSFERABLE SECURITIES NOT ADMITTEDTO AN OFFICIAL STOCK EXCHANGE LISTING NOR DEALT INON ANOTHER REGULATED MARKETBONDSGovernment Bonds
3,500,000 Government of Mexico, 144A, 7.50%, 03/08/10 MEX EUR 5,028,637 0.06A A
TOTAL BONDS 5,028,637 0.06A A
TOTAL TRANSFERABLE SECURITIES NOT ADMITTEDTO AN OFFICIAL STOCK EXCHANGE LISTING NOR DEALT INON ANOTHER REGULATED MARKET 5,028,637 0.06
A A
TOTAL INVESTMENTS 7,423,176,836 83.51A A
A A
� Floating Rates are indicated as at December 31, 2008
FRANKL IN TEMPLETON INVESTMENT FUNDS
ç Templeton Global Bond Fund ç
Schedule of Investments as of December 31, 2008 (continued)
(Currency ç USD)
Number of % of
shares or Description Country Trading Market net
face value code currency value assets
www.franklintempleton.lu Unaudited Semi-Annual Report 219
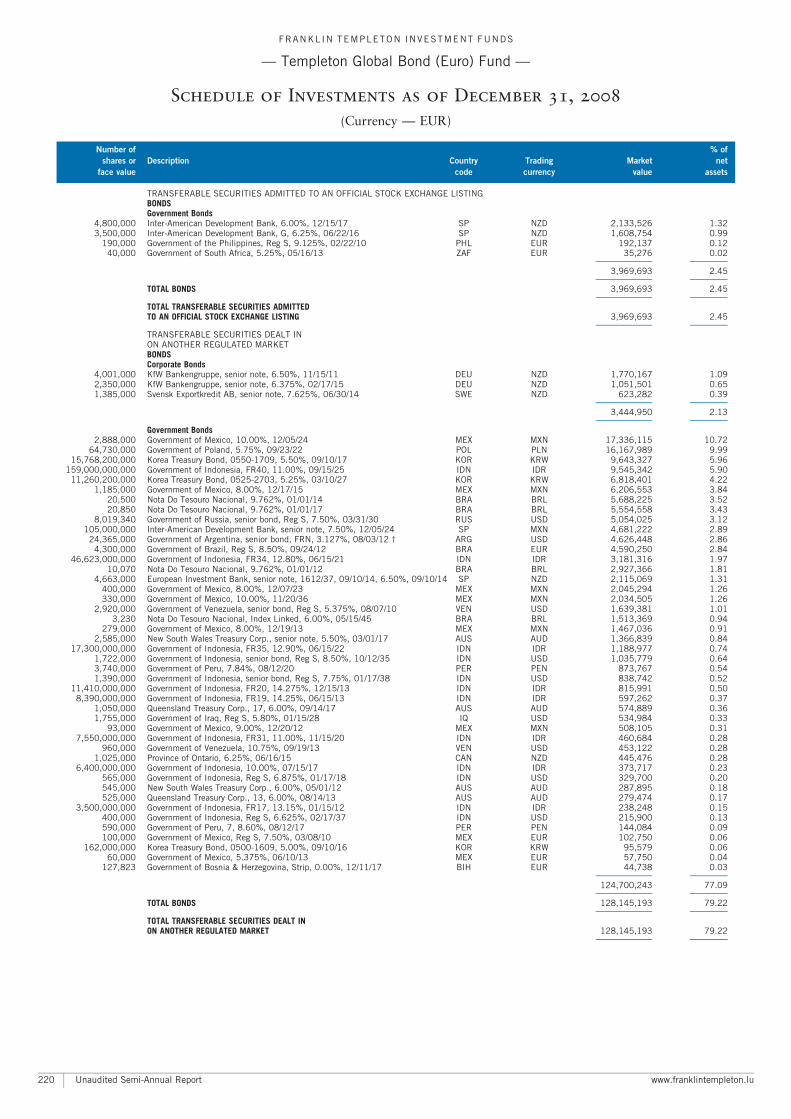
TRANSFERABLE SECURITIES ADMITTED TO AN OFFICIAL STOCK EXCHANGE LISTINGBONDSGovernment Bonds
4,800,000 Inter-American Development Bank, 6.00%, 12/15/17 SP NZD 2,133,526 1.323,500,000 Inter-American Development Bank, G, 6.25%, 06/22/16 SP NZD 1,608,754 0.99
190,000 Government of the Philippines, Reg S, 9.125%, 02/22/10 PHL EUR 192,137 0.1240,000 Government of South Africa, 5.25%, 05/16/13 ZAF EUR 35,276 0.02
A A
3,969,693 2.45A A
TOTAL BONDS 3,969,693 2.45A A
TOTAL TRANSFERABLE SECURITIES ADMITTEDTO AN OFFICIAL STOCK EXCHANGE LISTING 3,969,693 2.45
A A
TRANSFERABLE SECURITIES DEALT INON ANOTHER REGULATED MARKETBONDSCorporate Bonds
4,001,000 KfW Bankengruppe, senior note, 6.50%, 11/15/11 DEU NZD 1,770,167 1.092,350,000 KfW Bankengruppe, senior note, 6.375%, 02/17/15 DEU NZD 1,051,501 0.651,385,000 Svensk Exportkredit AB, senior note, 7.625%, 06/30/14 SWE NZD 623,282 0.39
A A
3,444,950 2.13A A
Government Bonds2,888,000 Government of Mexico, 10.00%, 12/05/24 MEX MXN 17,336,115 10.72
64,730,000 Government of Poland, 5.75%, 09/23/22 POL PLN 16,167,989 9.9915,768,200,000 Korea Treasury Bond, 0550-1709, 5.50%, 09/10/17 KOR KRW 9,643,327 5.96
159,000,000,000 Government of Indonesia, FR40, 11.00%, 09/15/25 IDN IDR 9,545,342 5.9011,260,200,000 Korea Treasury Bond, 0525-2703, 5.25%, 03/10/27 KOR KRW 6,818,401 4.22
1,185,000 Government of Mexico, 8.00%, 12/17/15 MEX MXN 6,206,553 3.8420,500 Nota Do Tesouro Nacional, 9.762%, 01/01/14 BRA BRL 5,688,225 3.5220,850 Nota Do Tesouro Nacional, 9.762%, 01/01/17 BRA BRL 5,554,558 3.43
8,019,340 Government of Russia, senior bond, Reg S, 7.50%, 03/31/30 RUS USD 5,054,025 3.12105,000,000 Inter-American Development Bank, senior note, 7.50%, 12/05/24 SP MXN 4,681,222 2.89
24,365,000 Government of Argentina, senior bond, FRN, 3.127%, 08/03/12 � ARG USD 4,626,448 2.864,300,000 Government of Brazil, Reg S, 8.50%, 09/24/12 BRA EUR 4,590,250 2.84
46,623,000,000 Government of Indonesia, FR34, 12.80%, 06/15/21 IDN IDR 3,181,316 1.9710,070 Nota Do Tesouro Nacional, 9.762%, 01/01/12 BRA BRL 2,927,366 1.81
4,663,000 European Investment Bank, senior note, 1612/37, 09/10/14, 6.50%, 09/10/14 SP NZD 2,115,069 1.31400,000 Government of Mexico, 8.00%, 12/07/23 MEX MXN 2,045,294 1.26330,000 Government of Mexico, 10.00%, 11/20/36 MEX MXN 2,034,505 1.26
2,920,000 Government of Venezuela, senior bond, Reg S, 5.375%, 08/07/10 VEN USD 1,639,381 1.013,230 Nota Do Tesouro Nacional, Index Linked, 6.00%, 05/15/45 BRA BRL 1,513,369 0.94
279,000 Government of Mexico, 8.00%, 12/19/13 MEX MXN 1,467,036 0.912,585,000 New South Wales Treasury Corp., senior note, 5.50%, 03/01/17 AUS AUD 1,366,839 0.84
17,300,000,000 Government of Indonesia, FR35, 12.90%, 06/15/22 IDN IDR 1,188,977 0.741,722,000 Government of Indonesia, senior bond, Reg S, 8.50%, 10/12/35 IDN USD 1,035,779 0.643,740,000 Government of Peru, 7.84%, 08/12/20 PER PEN 873,767 0.541,390,000 Government of Indonesia, senior bond, Reg S, 7.75%, 01/17/38 IDN USD 838,742 0.52
11,410,000,000 Government of Indonesia, FR20, 14.275%, 12/15/13 IDN IDR 815,991 0.508,390,000,000 Government of Indonesia, FR19, 14.25%, 06/15/13 IDN IDR 597,262 0.37
1,050,000 Queensland Treasury Corp., 17, 6.00%, 09/14/17 AUS AUD 574,889 0.361,755,000 Government of Iraq, Reg S, 5.80%, 01/15/28 IQ USD 534,984 0.33
93,000 Government of Mexico, 9.00%, 12/20/12 MEX MXN 508,105 0.317,550,000,000 Government of Indonesia, FR31, 11.00%, 11/15/20 IDN IDR 460,684 0.28
960,000 Government of Venezuela, 10.75%, 09/19/13 VEN USD 453,122 0.281,025,000 Province of Ontario, 6.25%, 06/16/15 CAN NZD 445,476 0.28
6,400,000,000 Government of Indonesia, 10.00%, 07/15/17 IDN IDR 373,717 0.23565,000 Government of Indonesia, Reg S, 6.875%, 01/17/18 IDN USD 329,700 0.20545,000 New South Wales Treasury Corp., 6.00%, 05/01/12 AUS AUD 287,895 0.18525,000 Queensland Treasury Corp., 13, 6.00%, 08/14/13 AUS AUD 279,474 0.17
3,500,000,000 Government of Indonesia, FR17, 13.15%, 01/15/12 IDN IDR 238,248 0.15400,000 Government of Indonesia, Reg S, 6.625%, 02/17/37 IDN USD 215,900 0.13590,000 Government of Peru, 7, 8.60%, 08/12/17 PER PEN 144,084 0.09100,000 Government of Mexico, Reg S, 7.50%, 03/08/10 MEX EUR 102,750 0.06
162,000,000 Korea Treasury Bond, 0500-1609, 5.00%, 09/10/16 KOR KRW 95,579 0.0660,000 Government of Mexico, 5.375%, 06/10/13 MEX EUR 57,750 0.04
127,823 Government of Bosnia & Herzegovina, Strip, 0.00%, 12/11/17 BIH EUR 44,738 0.03A A
124,700,243 77.09A A
TOTAL BONDS 128,145,193 79.22A A
TOTAL TRANSFERABLE SECURITIES DEALT INON ANOTHER REGULATED MARKET 128,145,193 79.22
A A
FRANKL IN TEMPLETON INVESTMENT FUNDS
ç Templeton Global Bond (Euro) Fund ç
Schedule of Investments as of December 31, 2008
(Currency ç EUR)
Number of % of
shares or Description Country Trading Market net
face value code currency value assets
Unaudited Semi-Annual Report www.franklintempleton.lu220
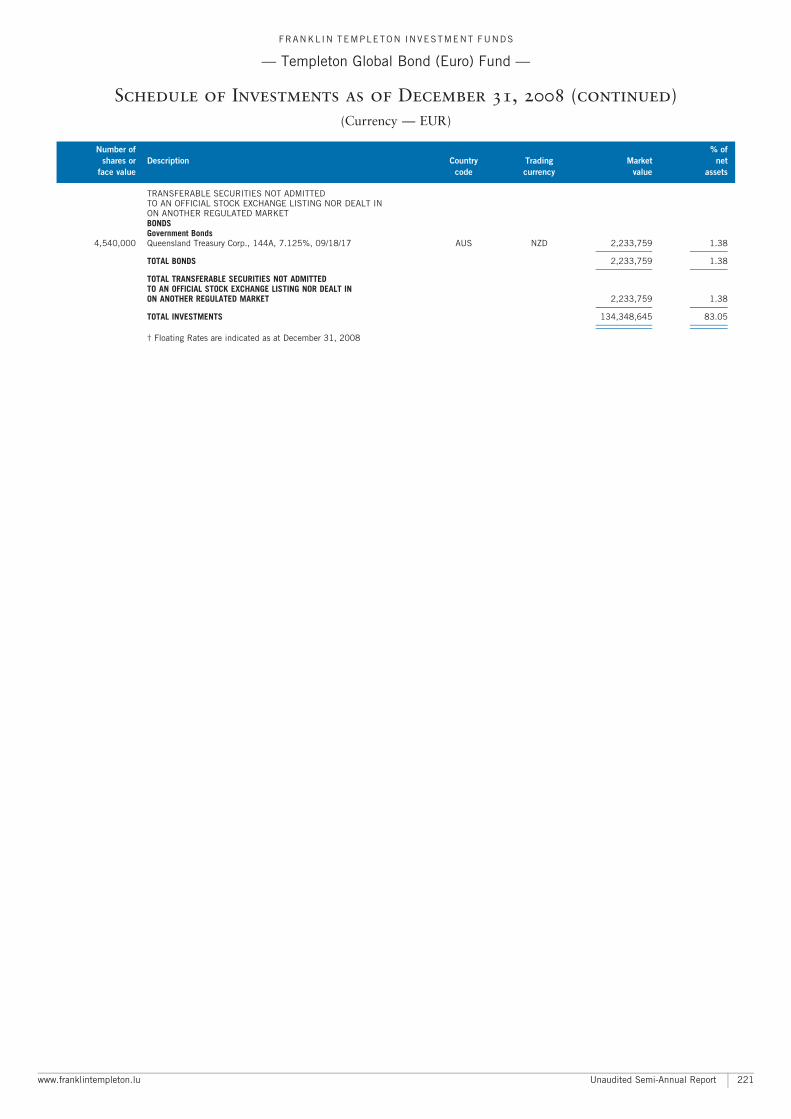
TRANSFERABLE SECURITIES NOT ADMITTEDTO AN OFFICIAL STOCK EXCHANGE LISTING NOR DEALT INON ANOTHER REGULATED MARKETBONDSGovernment Bonds
4,540,000 Queensland Treasury Corp., 144A, 7.125%, 09/18/17 AUS NZD 2,233,759 1.38A A
TOTAL BONDS 2,233,759 1.38A A
TOTAL TRANSFERABLE SECURITIES NOT ADMITTEDTO AN OFFICIAL STOCK EXCHANGE LISTING NOR DEALT INON ANOTHER REGULATED MARKET 2,233,759 1.38
A A
TOTAL INVESTMENTS 134,348,645 83.05A A
A A
� Floating Rates are indicated as at December 31, 2008
FRANKL IN TEMPLETON INVESTMENT FUNDS
ç Templeton Global Bond (Euro) Fund ç
Schedule of Investments as of December 31, 2008 (continued)
(Currency ç EUR)
Number of % of
shares or Description Country Trading Market net
face value code currency value assets
www.franklintempleton.lu Unaudited Semi-Annual Report 221
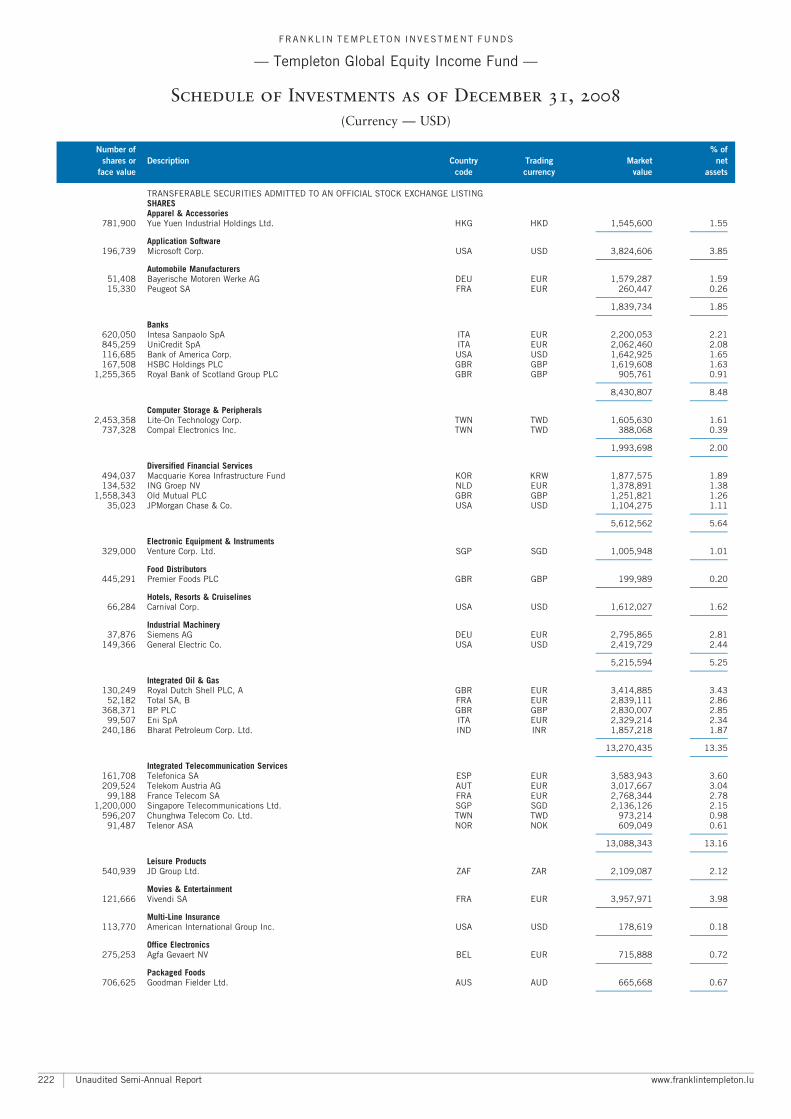
TRANSFERABLE SECURITIES ADMITTED TO AN OFFICIAL STOCK EXCHANGE LISTINGSHARESApparel & Accessories
781,900 Yue Yuen Industrial Holdings Ltd. HKG HKD 1,545,600 1.55A A
Application Software196,739 Microsoft Corp. USA USD 3,824,606 3.85
A A
Automobile Manufacturers51,408 Bayerische Motoren Werke AG DEU EUR 1,579,287 1.5915,330 Peugeot SA FRA EUR 260,447 0.26
A A
1,839,734 1.85A A
Banks620,050 Intesa Sanpaolo SpA ITA EUR 2,200,053 2.21845,259 UniCredit SpA ITA EUR 2,062,460 2.08116,685 Bank of America Corp. USA USD 1,642,925 1.65167,508 HSBC Holdings PLC GBR GBP 1,619,608 1.63
1,255,365 Royal Bank of Scotland Group PLC GBR GBP 905,761 0.91A A
8,430,807 8.48A A
Computer Storage & Peripherals2,453,358 Lite-On Technology Corp. TWN TWD 1,605,630 1.61
737,328 Compal Electronics Inc. TWN TWD 388,068 0.39A A
1,993,698 2.00A A
Diversified Financial Services494,037 Macquarie Korea Infrastructure Fund KOR KRW 1,877,575 1.89134,532 ING Groep NV NLD EUR 1,378,891 1.38
1,558,343 Old Mutual PLC GBR GBP 1,251,821 1.2635,023 JPMorgan Chase & Co. USA USD 1,104,275 1.11
A A
5,612,562 5.64A A
Electronic Equipment & Instruments329,000 Venture Corp. Ltd. SGP SGD 1,005,948 1.01
A A
Food Distributors445,291 Premier Foods PLC GBR GBP 199,989 0.20
A A
Hotels, Resorts & Cruiselines66,284 Carnival Corp. USA USD 1,612,027 1.62
A A
Industrial Machinery37,876 Siemens AG DEU EUR 2,795,865 2.81
149,366 General Electric Co. USA USD 2,419,729 2.44A A
5,215,594 5.25A A
Integrated Oil & Gas130,249 Royal Dutch Shell PLC, A GBR EUR 3,414,885 3.43
52,182 Total SA, B FRA EUR 2,839,111 2.86368,371 BP PLC GBR GBP 2,830,007 2.85
99,507 Eni SpA ITA EUR 2,329,214 2.34240,186 Bharat Petroleum Corp. Ltd. IND INR 1,857,218 1.87
A A
13,270,435 13.35A A
Integrated Telecommunication Services161,708 Telefonica SA ESP EUR 3,583,943 3.60209,524 Telekom Austria AG AUT EUR 3,017,667 3.04
99,188 France Telecom SA FRA EUR 2,768,344 2.781,200,000 Singapore Telecommunications Ltd. SGP SGD 2,136,126 2.15
596,207 Chunghwa Telecom Co. Ltd. TWN TWD 973,214 0.9891,487 Telenor ASA NOR NOK 609,049 0.61
A A
13,088,343 13.16A A
Leisure Products540,939 JD Group Ltd. ZAF ZAR 2,109,087 2.12
A A
Movies & Entertainment121,666 Vivendi SA FRA EUR 3,957,971 3.98
A A
Multi-Line Insurance113,770 American International Group Inc. USA USD 178,619 0.18
A A
Office Electronics275,253 Agfa Gevaert NV BEL EUR 715,888 0.72
A A
Packaged Foods706,625 Goodman Fielder Ltd. AUS AUD 665,668 0.67
A A
FRANKL IN TEMPLETON INVESTMENT FUNDS
ç Templeton Global Equity Income Fund ç
Schedule of Investments as of December 31, 2008
(Currency ç USD)
Number of % of
shares or Description Country Trading Market net
face value code currency value assets
Unaudited Semi-Annual Report www.franklintempleton.lu222
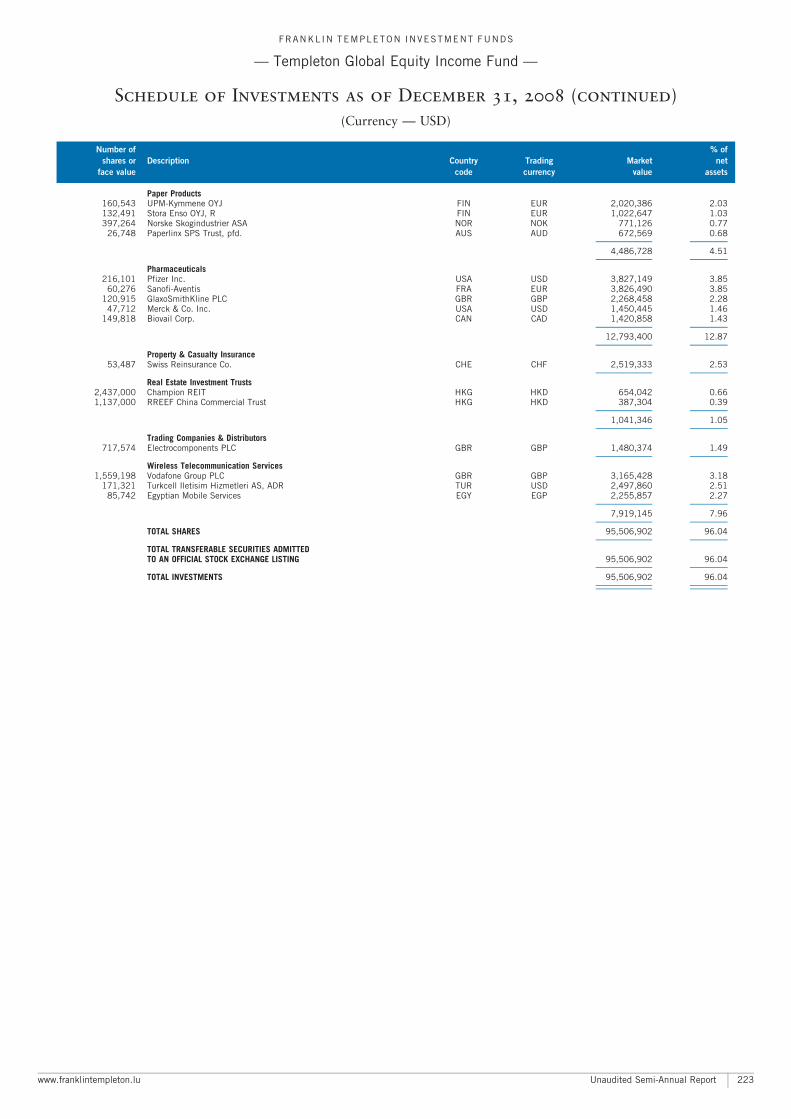
Paper Products160,543 UPM-Kymmene OYJ FIN EUR 2,020,386 2.03132,491 Stora Enso OYJ, R FIN EUR 1,022,647 1.03397,264 Norske Skogindustrier ASA NOR NOK 771,126 0.77
26,748 Paperlinx SPS Trust, pfd. AUS AUD 672,569 0.68A A
4,486,728 4.51A A
Pharmaceuticals216,101 Pfizer Inc. USA USD 3,827,149 3.85
60,276 Sanofi-Aventis FRA EUR 3,826,490 3.85120,915 GlaxoSmithKline PLC GBR GBP 2,268,458 2.28
47,712 Merck & Co. Inc. USA USD 1,450,445 1.46149,818 Biovail Corp. CAN CAD 1,420,858 1.43
A A
12,793,400 12.87A A
Property & Casualty Insurance53,487 Swiss Reinsurance Co. CHE CHF 2,519,333 2.53
A A
Real Estate Investment Trusts2,437,000 Champion REIT HKG HKD 654,042 0.661,137,000 RREEF China Commercial Trust HKG HKD 387,304 0.39
A A
1,041,346 1.05A A
Trading Companies & Distributors717,574 Electrocomponents PLC GBR GBP 1,480,374 1.49
A A
Wireless Telecommunication Services1,559,198 Vodafone Group PLC GBR GBP 3,165,428 3.18
171,321 Turkcell Iletisim Hizmetleri AS, ADR TUR USD 2,497,860 2.5185,742 Egyptian Mobile Services EGY EGP 2,255,857 2.27
A A
7,919,145 7.96A A
TOTAL SHARES 95,506,902 96.04A A
TOTAL TRANSFERABLE SECURITIES ADMITTEDTO AN OFFICIAL STOCK EXCHANGE LISTING 95,506,902 96.04
A A
TOTAL INVESTMENTS 95,506,902 96.04A A
A A
FRANKL IN TEMPLETON INVESTMENT FUNDS
ç Templeton Global Equity Income Fund ç
Schedule of Investments as of December 31, 2008 (continued)
(Currency ç USD)
Number of % of
shares or Description Country Trading Market net
face value code currency value assets
www.franklintempleton.lu Unaudited Semi-Annual Report 223
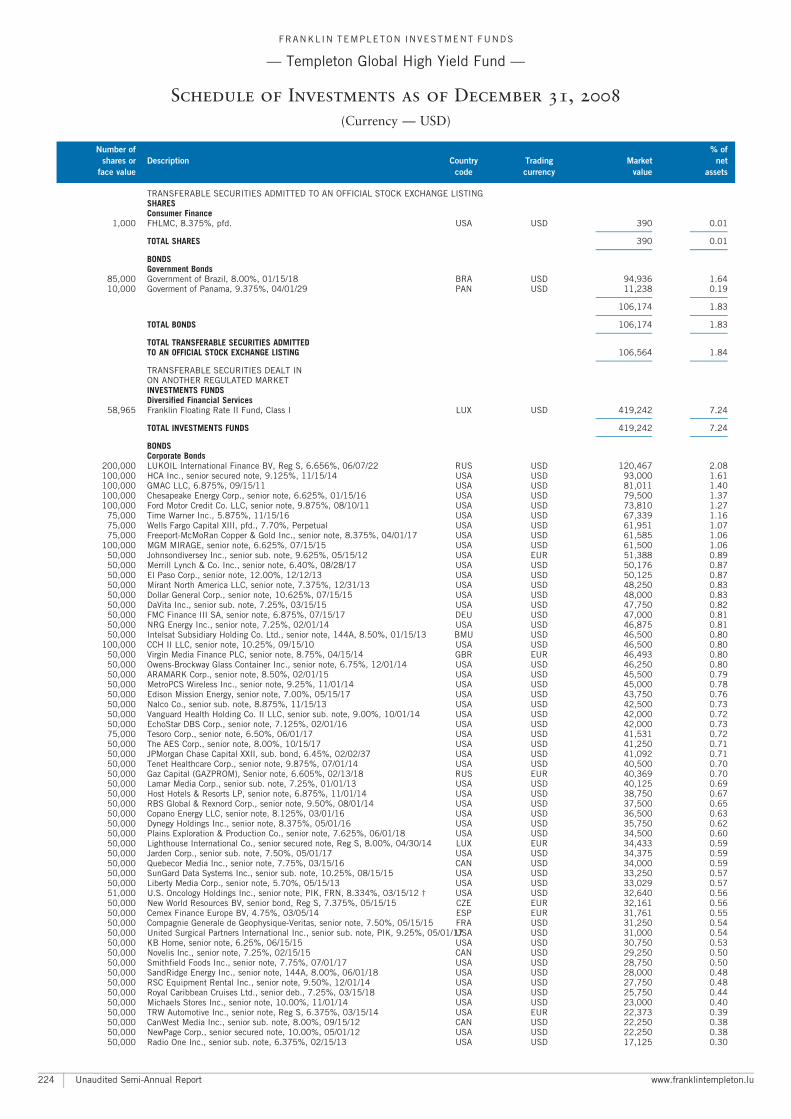
TRANSFERABLE SECURITIES ADMITTED TO AN OFFICIAL STOCK EXCHANGE LISTINGSHARESConsumer Finance
1,000 FHLMC, 8.375%, pfd. USA USD 390 0.01A A
TOTAL SHARES 390 0.01A A
BONDSGovernment Bonds
85,000 Government of Brazil, 8.00%, 01/15/18 BRA USD 94,936 1.6410,000 Goverment of Panama, 9.375%, 04/01/29 PAN USD 11,238 0.19
A A
106,174 1.83A A
TOTAL BONDS 106,174 1.83A A
TOTAL TRANSFERABLE SECURITIES ADMITTEDTO AN OFFICIAL STOCK EXCHANGE LISTING 106,564 1.84
A A
TRANSFERABLE SECURITIES DEALT INON ANOTHER REGULATED MARKETINVESTMENTS FUNDSDiversified Financial Services
58,965 Franklin Floating Rate II Fund, Class I LUX USD 419,242 7.24A A
TOTAL INVESTMENTS FUNDS 419,242 7.24A A
BONDSCorporate Bonds
200,000 LUKOIL International Finance BV, Reg S, 6.656%, 06/07/22 RUS USD 120,467 2.08100,000 HCA Inc., senior secured note, 9.125%, 11/15/14 USA USD 93,000 1.61100,000 GMAC LLC, 6.875%, 09/15/11 USA USD 81,011 1.40100,000 Chesapeake Energy Corp., senior note, 6.625%, 01/15/16 USA USD 79,500 1.37100,000 Ford Motor Credit Co. LLC, senior note, 9.875%, 08/10/11 USA USD 73,810 1.27
75,000 Time Warner Inc., 5.875%, 11/15/16 USA USD 67,339 1.1675,000 Wells Fargo Capital XIII, pfd., 7.70%, Perpetual USA USD 61,951 1.0775,000 Freeport-McMoRan Copper & Gold Inc., senior note, 8.375%, 04/01/17 USA USD 61,585 1.06
100,000 MGM MIRAGE, senior note, 6.625%, 07/15/15 USA USD 61,500 1.0650,000 Johnsondiversey Inc., senior sub. note, 9.625%, 05/15/12 USA EUR 51,388 0.8950,000 Merrill Lynch & Co. Inc., senior note, 6.40%, 08/28/17 USA USD 50,176 0.8750,000 El Paso Corp., senior note, 12.00%, 12/12/13 USA USD 50,125 0.8750,000 Mirant North America LLC, senior note, 7.375%, 12/31/13 USA USD 48,250 0.8350,000 Dollar General Corp., senior note, 10.625%, 07/15/15 USA USD 48,000 0.8350,000 DaVita Inc., senior sub. note, 7.25%, 03/15/15 USA USD 47,750 0.8250,000 FMC Finance III SA, senior note, 6.875%, 07/15/17 DEU USD 47,000 0.8150,000 NRG Energy Inc., senior note, 7.25%, 02/01/14 USA USD 46,875 0.8150,000 Intelsat Subsidiary Holding Co. Ltd., senior note, 144A, 8.50%, 01/15/13 BMU USD 46,500 0.80
100,000 CCH II LLC, senior note, 10.25%, 09/15/10 USA USD 46,500 0.8050,000 Virgin Media Finance PLC, senior note, 8.75%, 04/15/14 GBR EUR 46,493 0.8050,000 Owens-Brockway Glass Container Inc., senior note, 6.75%, 12/01/14 USA USD 46,250 0.8050,000 ARAMARK Corp., senior note, 8.50%, 02/01/15 USA USD 45,500 0.7950,000 MetroPCS Wireless Inc., senior note, 9.25%, 11/01/14 USA USD 45,000 0.7850,000 Edison Mission Energy, senior note, 7.00%, 05/15/17 USA USD 43,750 0.7650,000 Nalco Co., senior sub. note, 8.875%, 11/15/13 USA USD 42,500 0.7350,000 Vanguard Health Holding Co. II LLC, senior sub. note, 9.00%, 10/01/14 USA USD 42,000 0.7250,000 EchoStar DBS Corp., senior note, 7.125%, 02/01/16 USA USD 42,000 0.7375,000 Tesoro Corp., senior note, 6.50%, 06/01/17 USA USD 41,531 0.7250,000 The AES Corp., senior note, 8.00%, 10/15/17 USA USD 41,250 0.7150,000 JPMorgan Chase Capital XXII, sub. bond, 6.45%, 02/02/37 USA USD 41,092 0.7150,000 Tenet Healthcare Corp., senior note, 9.875%, 07/01/14 USA USD 40,500 0.7050,000 Gaz Capital (GAZPROM), Senior note, 6.605%, 02/13/18 RUS EUR 40,369 0.7050,000 Lamar Media Corp., senior sub. note, 7.25%, 01/01/13 USA USD 40,125 0.6950,000 Host Hotels & Resorts LP, senior note, 6.875%, 11/01/14 USA USD 38,750 0.6750,000 RBS Global & Rexnord Corp., senior note, 9.50%, 08/01/14 USA USD 37,500 0.6550,000 Copano Energy LLC, senior note, 8.125%, 03/01/16 USA USD 36,500 0.6350,000 Dynegy Holdings Inc., senior note, 8.375%, 05/01/16 USA USD 35,750 0.6250,000 Plains Exploration & Production Co., senior note, 7.625%, 06/01/18 USA USD 34,500 0.6050,000 Lighthouse International Co., senior secured note, Reg S, 8.00%, 04/30/14 LUX EUR 34,433 0.5950,000 Jarden Corp., senior sub. note, 7.50%, 05/01/17 USA USD 34,375 0.5950,000 Quebecor Media Inc., senior note, 7.75%, 03/15/16 CAN USD 34,000 0.5950,000 SunGard Data Systems Inc., senior sub. note, 10.25%, 08/15/15 USA USD 33,250 0.5750,000 Liberty Media Corp., senior note, 5.70%, 05/15/13 USA USD 33,029 0.5751,000 U.S. Oncology Holdings Inc., senior note, PIK, FRN, 8.334%, 03/15/12 � USA USD 32,640 0.5650,000 New World Resources BV, senior bond, Reg S, 7.375%, 05/15/15 CZE EUR 32,161 0.5650,000 Cemex Finance Europe BV, 4.75%, 03/05/14 ESP EUR 31,761 0.5550,000 Compagnie Generale de Geophysique-Veritas, senior note, 7.50%, 05/15/15 FRA USD 31,250 0.5450,000 United Surgical Partners International Inc., senior sub. note, PIK, 9.25%, 05/01/17USA USD 31,000 0.5450,000 KB Home, senior note, 6.25%, 06/15/15 USA USD 30,750 0.5350,000 Novelis Inc., senior note, 7.25%, 02/15/15 CAN USD 29,250 0.5050,000 Smithfield Foods Inc., senior note, 7.75%, 07/01/17 USA USD 28,750 0.5050,000 SandRidge Energy Inc., senior note, 144A, 8.00%, 06/01/18 USA USD 28,000 0.4850,000 RSC Equipment Rental Inc., senior note, 9.50%, 12/01/14 USA USD 27,750 0.4850,000 Royal Caribbean Cruises Ltd., senior deb., 7.25%, 03/15/18 USA USD 25,750 0.4450,000 Michaels Stores Inc., senior note, 10.00%, 11/01/14 USA USD 23,000 0.4050,000 TRW Automotive Inc., senior note, Reg S, 6.375%, 03/15/14 USA EUR 22,373 0.3950,000 CanWest Media Inc., senior sub. note, 8.00%, 09/15/12 CAN USD 22,250 0.3850,000 NewPage Corp., senior secured note, 10.00%, 05/01/12 USA USD 22,250 0.3850,000 Radio One Inc., senior sub. note, 6.375%, 02/15/13 USA USD 17,125 0.30
FRANKL IN TEMPLETON INVESTMENT FUNDS
ç Templeton Global High Yield Fund ç
Schedule of Investments as of December 31, 2008
(Currency ç USD)
Number of % of
shares or Description Country Trading Market net
face value code currency value assets
Unaudited Semi-Annual Report www.franklintempleton.lu224
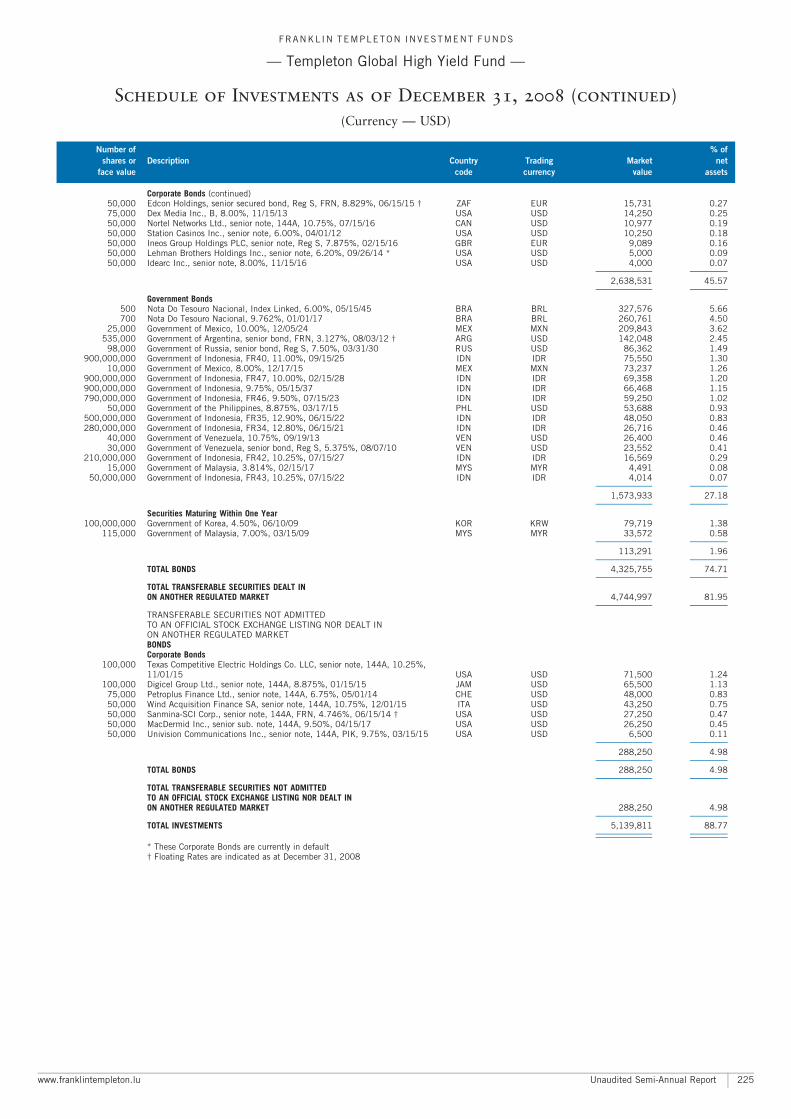
Corporate Bonds (continued)50,000 Edcon Holdings, senior secured bond, Reg S, FRN, 8.829%, 06/15/15 � ZAF EUR 15,731 0.2775,000 Dex Media Inc., B, 8.00%, 11/15/13 USA USD 14,250 0.2550,000 Nortel Networks Ltd., senior note, 144A, 10.75%, 07/15/16 CAN USD 10,977 0.1950,000 Station Casinos Inc., senior note, 6.00%, 04/01/12 USA USD 10,250 0.1850,000 Ineos Group Holdings PLC, senior note, Reg S, 7.875%, 02/15/16 GBR EUR 9,089 0.1650,000 Lehman Brothers Holdings Inc., senior note, 6.20%, 09/26/14 * USA USD 5,000 0.0950,000 Idearc Inc., senior note, 8.00%, 11/15/16 USA USD 4,000 0.07
A A
2,638,531 45.57A A
Government Bonds500 Nota Do Tesouro Nacional, Index Linked, 6.00%, 05/15/45 BRA BRL 327,576 5.66700 Nota Do Tesouro Nacional, 9.762%, 01/01/17 BRA BRL 260,761 4.50
25,000 Government of Mexico, 10.00%, 12/05/24 MEX MXN 209,843 3.62535,000 Government of Argentina, senior bond, FRN, 3.127%, 08/03/12 � ARG USD 142,048 2.45
98,000 Government of Russia, senior bond, Reg S, 7.50%, 03/31/30 RUS USD 86,362 1.49900,000,000 Government of Indonesia, FR40, 11.00%, 09/15/25 IDN IDR 75,550 1.30
10,000 Government of Mexico, 8.00%, 12/17/15 MEX MXN 73,237 1.26900,000,000 Government of Indonesia, FR47, 10.00%, 02/15/28 IDN IDR 69,358 1.20900,000,000 Government of Indonesia, 9.75%, 05/15/37 IDN IDR 66,468 1.15790,000,000 Government of Indonesia, FR46, 9.50%, 07/15/23 IDN IDR 59,250 1.02
50,000 Government of the Philippines, 8.875%, 03/17/15 PHL USD 53,688 0.93500,000,000 Government of Indonesia, FR35, 12.90%, 06/15/22 IDN IDR 48,050 0.83280,000,000 Government of Indonesia, FR34, 12.80%, 06/15/21 IDN IDR 26,716 0.46
40,000 Government of Venezuela, 10.75%, 09/19/13 VEN USD 26,400 0.4630,000 Government of Venezuela, senior bond, Reg S, 5.375%, 08/07/10 VEN USD 23,552 0.41
210,000,000 Government of Indonesia, FR42, 10.25%, 07/15/27 IDN IDR 16,569 0.2915,000 Government of Malaysia, 3.814%, 02/15/17 MYS MYR 4,491 0.08
50,000,000 Government of Indonesia, FR43, 10.25%, 07/15/22 IDN IDR 4,014 0.07A A
1,573,933 27.18A A
Securities Maturing Within One Year100,000,000 Government of Korea, 4.50%, 06/10/09 KOR KRW 79,719 1.38
115,000 Government of Malaysia, 7.00%, 03/15/09 MYS MYR 33,572 0.58A A
113,291 1.96A A
TOTAL BONDS 4,325,755 74.71A A
TOTAL TRANSFERABLE SECURITIES DEALT INON ANOTHER REGULATED MARKET 4,744,997 81.95
A A
TRANSFERABLE SECURITIES NOT ADMITTEDTO AN OFFICIAL STOCK EXCHANGE LISTING NOR DEALT INON ANOTHER REGULATED MARKETBONDSCorporate Bonds
100,000 Texas Competitive Electric Holdings Co. LLC, senior note, 144A, 10.25%,11/01/15 USA USD 71,500 1.24
100,000 Digicel Group Ltd., senior note, 144A, 8.875%, 01/15/15 JAM USD 65,500 1.1375,000 Petroplus Finance Ltd., senior note, 144A, 6.75%, 05/01/14 CHE USD 48,000 0.8350,000 Wind Acquisition Finance SA, senior note, 144A, 10.75%, 12/01/15 ITA USD 43,250 0.7550,000 Sanmina-SCI Corp., senior note, 144A, FRN, 4.746%, 06/15/14 � USA USD 27,250 0.4750,000 MacDermid Inc., senior sub. note, 144A, 9.50%, 04/15/17 USA USD 26,250 0.4550,000 Univision Communications Inc., senior note, 144A, PIK, 9.75%, 03/15/15 USA USD 6,500 0.11
A A
288,250 4.98A A
TOTAL BONDS 288,250 4.98A A
TOTAL TRANSFERABLE SECURITIES NOT ADMITTEDTO AN OFFICIAL STOCK EXCHANGE LISTING NOR DEALT INON ANOTHER REGULATED MARKET 288,250 4.98
A A
TOTAL INVESTMENTS 5,139,811 88.77A A
A A
* These Corporate Bonds are currently in default� Floating Rates are indicated as at December 31, 2008
FRANKL IN TEMPLETON INVESTMENT FUNDS
ç Templeton Global High Yield Fund ç
Schedule of Investments as of December 31, 2008 (continued)
(Currency ç USD)
Number of % of
shares or Description Country Trading Market net
face value code currency value assets
www.franklintempleton.lu Unaudited Semi-Annual Report 225
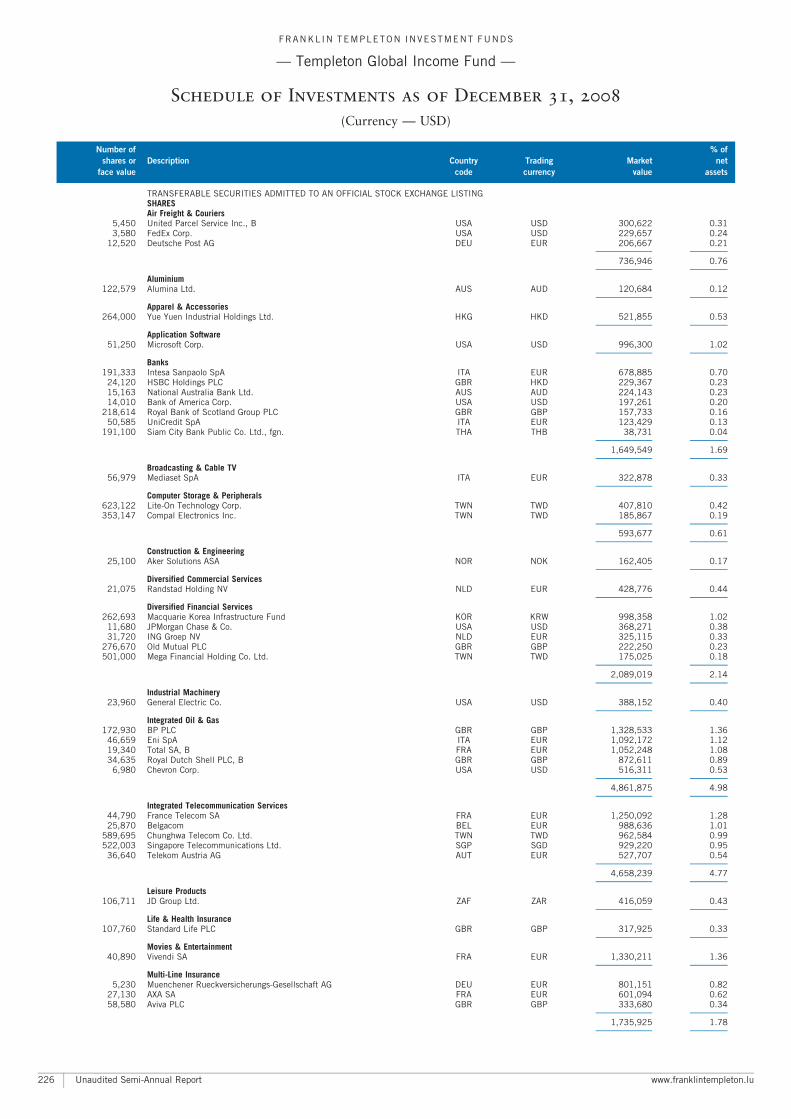
TRANSFERABLE SECURITIES ADMITTED TO AN OFFICIAL STOCK EXCHANGE LISTINGSHARESAir Freight & Couriers
5,450 United Parcel Service Inc., B USA USD 300,622 0.313,580 FedEx Corp. USA USD 229,657 0.24
12,520 Deutsche Post AG DEU EUR 206,667 0.21A A
736,946 0.76A A
Aluminium122,579 Alumina Ltd. AUS AUD 120,684 0.12
A A
Apparel & Accessories264,000 Yue Yuen Industrial Holdings Ltd. HKG HKD 521,855 0.53
A A
Application Software51,250 Microsoft Corp. USA USD 996,300 1.02
A A
Banks191,333 Intesa Sanpaolo SpA ITA EUR 678,885 0.70
24,120 HSBC Holdings PLC GBR HKD 229,367 0.2315,163 National Australia Bank Ltd. AUS AUD 224,143 0.2314,010 Bank of America Corp. USA USD 197,261 0.20
218,614 Royal Bank of Scotland Group PLC GBR GBP 157,733 0.1650,585 UniCredit SpA ITA EUR 123,429 0.13
191,100 Siam City Bank Public Co. Ltd., fgn. THA THB 38,731 0.04A A
1,649,549 1.69A A
Broadcasting & Cable TV56,979 Mediaset SpA ITA EUR 322,878 0.33
A A
Computer Storage & Peripherals623,122 Lite-On Technology Corp. TWN TWD 407,810 0.42353,147 Compal Electronics Inc. TWN TWD 185,867 0.19
A A
593,677 0.61A A
Construction & Engineering25,100 Aker Solutions ASA NOR NOK 162,405 0.17
A A
Diversified Commercial Services21,075 Randstad Holding NV NLD EUR 428,776 0.44
A A
Diversified Financial Services262,693 Macquarie Korea Infrastructure Fund KOR KRW 998,358 1.02
11,680 JPMorgan Chase & Co. USA USD 368,271 0.3831,720 ING Groep NV NLD EUR 325,115 0.33
276,670 Old Mutual PLC GBR GBP 222,250 0.23501,000 Mega Financial Holding Co. Ltd. TWN TWD 175,025 0.18
A A
2,089,019 2.14A A
Industrial Machinery23,960 General Electric Co. USA USD 388,152 0.40
A A
Integrated Oil & Gas172,930 BP PLC GBR GBP 1,328,533 1.36
46,659 Eni SpA ITA EUR 1,092,172 1.1219,340 Total SA, B FRA EUR 1,052,248 1.0834,635 Royal Dutch Shell PLC, B GBR GBP 872,611 0.89
6,980 Chevron Corp. USA USD 516,311 0.53A A
4,861,875 4.98A A
Integrated Telecommunication Services44,790 France Telecom SA FRA EUR 1,250,092 1.2825,870 Belgacom BEL EUR 988,636 1.01
589,695 Chunghwa Telecom Co. Ltd. TWN TWD 962,584 0.99522,003 Singapore Telecommunications Ltd. SGP SGD 929,220 0.95
36,640 Telekom Austria AG AUT EUR 527,707 0.54A A
4,658,239 4.77A A
Leisure Products106,711 JD Group Ltd. ZAF ZAR 416,059 0.43
A A
Life & Health Insurance107,760 Standard Life PLC GBR GBP 317,925 0.33
A A
Movies & Entertainment40,890 Vivendi SA FRA EUR 1,330,211 1.36
A A
Multi-Line Insurance5,230 Muenchener Rueckversicherungs-Gesellschaft AG DEU EUR 801,151 0.82
27,130 AXA SA FRA EUR 601,094 0.6258,580 Aviva PLC GBR GBP 333,680 0.34
A A
1,735,925 1.78A A
FRANKL IN TEMPLETON INVESTMENT FUNDS
ç Templeton Global Income Fund ç
Schedule of Investments as of December 31, 2008
(Currency ç USD)
Number of % of
shares or Description Country Trading Market net
face value code currency value assets
Unaudited Semi-Annual Report www.franklintempleton.lu226
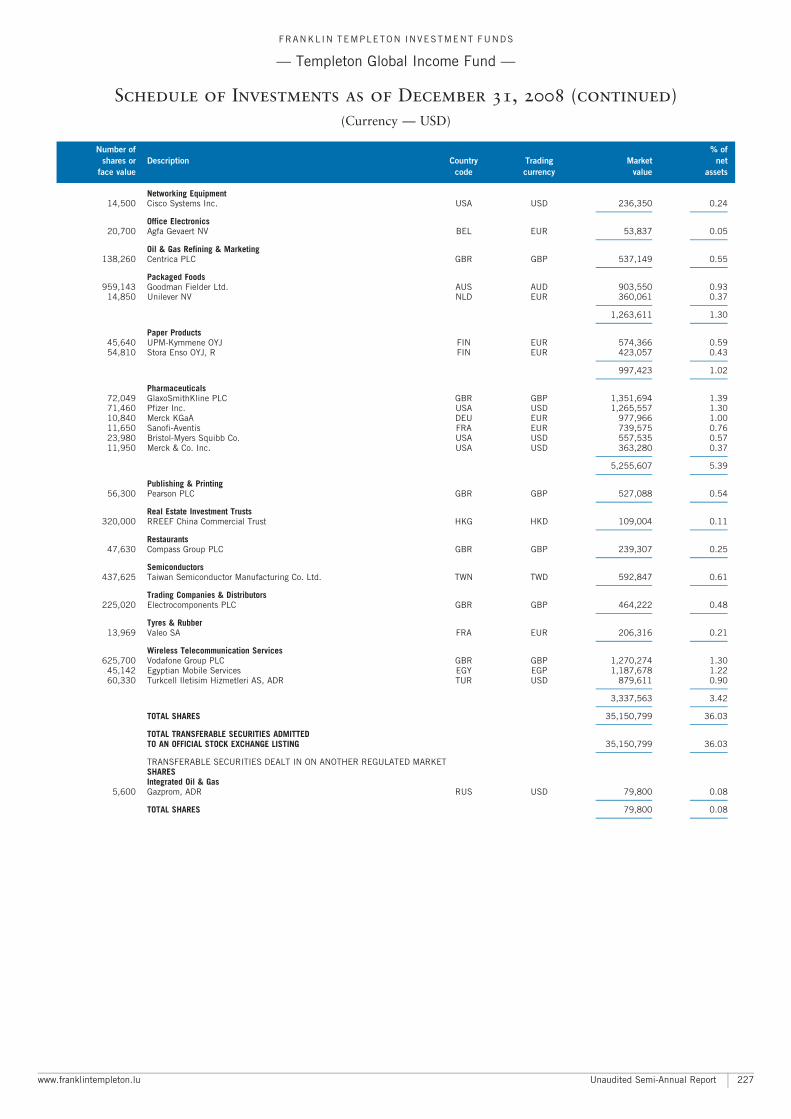
Networking Equipment14,500 Cisco Systems Inc. USA USD 236,350 0.24
A A
Office Electronics20,700 Agfa Gevaert NV BEL EUR 53,837 0.05
A A
Oil & Gas Refining & Marketing138,260 Centrica PLC GBR GBP 537,149 0.55
A A
Packaged Foods959,143 Goodman Fielder Ltd. AUS AUD 903,550 0.93
14,850 Unilever NV NLD EUR 360,061 0.37A A
1,263,611 1.30A A
Paper Products45,640 UPM-Kymmene OYJ FIN EUR 574,366 0.5954,810 Stora Enso OYJ, R FIN EUR 423,057 0.43
A A
997,423 1.02A A
Pharmaceuticals72,049 GlaxoSmithKline PLC GBR GBP 1,351,694 1.3971,460 Pfizer Inc. USA USD 1,265,557 1.3010,840 Merck KGaA DEU EUR 977,966 1.0011,650 Sanofi-Aventis FRA EUR 739,575 0.7623,980 Bristol-Myers Squibb Co. USA USD 557,535 0.5711,950 Merck & Co. Inc. USA USD 363,280 0.37
A A
5,255,607 5.39A A
Publishing & Printing56,300 Pearson PLC GBR GBP 527,088 0.54
A A
Real Estate Investment Trusts320,000 RREEF China Commercial Trust HKG HKD 109,004 0.11
A A
Restaurants47,630 Compass Group PLC GBR GBP 239,307 0.25
A A
Semiconductors437,625 Taiwan Semiconductor Manufacturing Co. Ltd. TWN TWD 592,847 0.61
A A
Trading Companies & Distributors225,020 Electrocomponents PLC GBR GBP 464,222 0.48
A A
Tyres & Rubber13,969 Valeo SA FRA EUR 206,316 0.21
A A
Wireless Telecommunication Services625,700 Vodafone Group PLC GBR GBP 1,270,274 1.30
45,142 Egyptian Mobile Services EGY EGP 1,187,678 1.2260,330 Turkcell Iletisim Hizmetleri AS, ADR TUR USD 879,611 0.90
A A
3,337,563 3.42A A
TOTAL SHARES 35,150,799 36.03A A
TOTAL TRANSFERABLE SECURITIES ADMITTEDTO AN OFFICIAL STOCK EXCHANGE LISTING 35,150,799 36.03
A A
TRANSFERABLE SECURITIES DEALT IN ON ANOTHER REGULATED MARKETSHARESIntegrated Oil & Gas
5,600 Gazprom, ADR RUS USD 79,800 0.08A A
TOTAL SHARES 79,800 0.08A A
FRANKL IN TEMPLETON INVESTMENT FUNDS
ç Templeton Global Income Fund ç
Schedule of Investments as of December 31, 2008 (continued)
(Currency ç USD)
Number of % of
shares or Description Country Trading Market net
face value code currency value assets
www.franklintempleton.lu Unaudited Semi-Annual Report 227
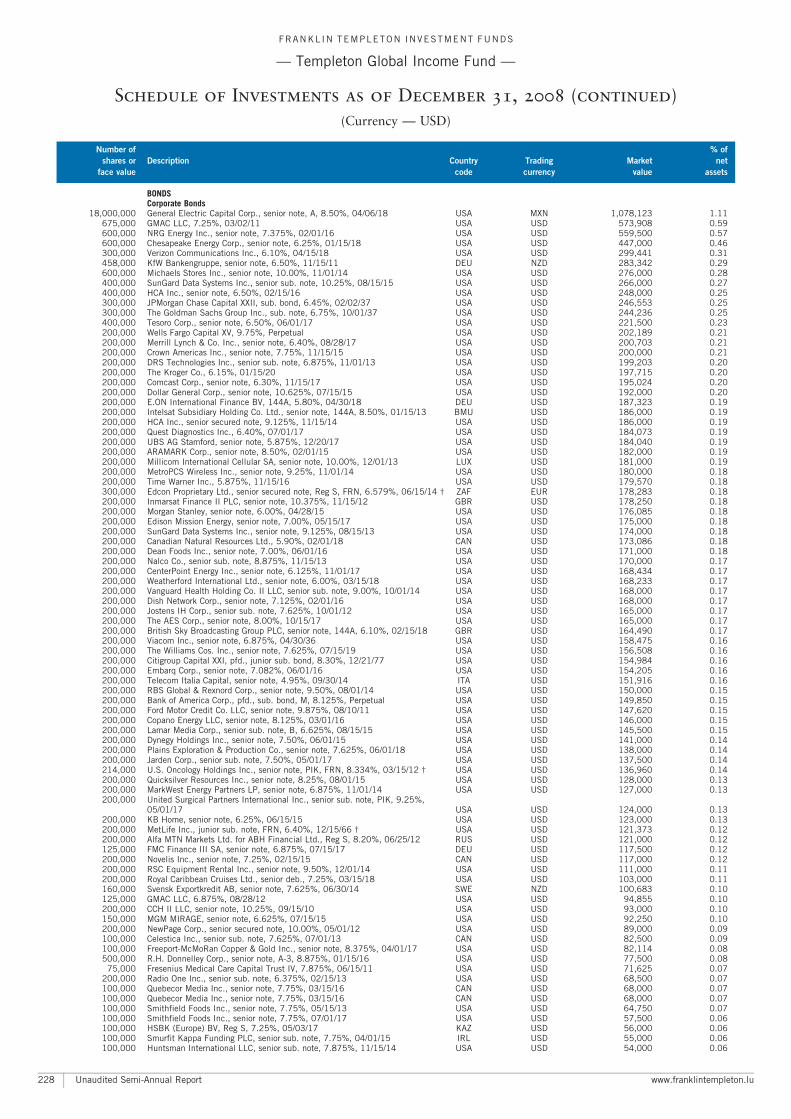
BONDSCorporate Bonds
18,000,000 General Electric Capital Corp., senior note, A, 8.50%, 04/06/18 USA MXN 1,078,123 1.11675,000 GMAC LLC, 7.25%, 03/02/11 USA USD 573,908 0.59600,000 NRG Energy Inc., senior note, 7.375%, 02/01/16 USA USD 559,500 0.57600,000 Chesapeake Energy Corp., senior note, 6.25%, 01/15/18 USA USD 447,000 0.46300,000 Verizon Communications Inc., 6.10%, 04/15/18 USA USD 299,441 0.31458,000 KfW Bankengruppe, senior note, 6.50%, 11/15/11 DEU NZD 283,342 0.29600,000 Michaels Stores Inc., senior note, 10.00%, 11/01/14 USA USD 276,000 0.28400,000 SunGard Data Systems Inc., senior sub. note, 10.25%, 08/15/15 USA USD 266,000 0.27400,000 HCA Inc., senior note, 6.50%, 02/15/16 USA USD 248,000 0.25300,000 JPMorgan Chase Capital XXII, sub. bond, 6.45%, 02/02/37 USA USD 246,553 0.25300,000 The Goldman Sachs Group Inc., sub. note, 6.75%, 10/01/37 USA USD 244,236 0.25400,000 Tesoro Corp., senior note, 6.50%, 06/01/17 USA USD 221,500 0.23200,000 Wells Fargo Capital XV, 9.75%, Perpetual USA USD 202,189 0.21200,000 Merrill Lynch & Co. Inc., senior note, 6.40%, 08/28/17 USA USD 200,703 0.21200,000 Crown Americas Inc., senior note, 7.75%, 11/15/15 USA USD 200,000 0.21200,000 DRS Technologies Inc., senior sub. note, 6.875%, 11/01/13 USA USD 199,203 0.20200,000 The Kroger Co., 6.15%, 01/15/20 USA USD 197,715 0.20200,000 Comcast Corp., senior note, 6.30%, 11/15/17 USA USD 195,024 0.20200,000 Dollar General Corp., senior note, 10.625%, 07/15/15 USA USD 192,000 0.20200,000 E.ON International Finance BV, 144A, 5.80%, 04/30/18 DEU USD 187,323 0.19200,000 Intelsat Subsidiary Holding Co. Ltd., senior note, 144A, 8.50%, 01/15/13 BMU USD 186,000 0.19200,000 HCA Inc., senior secured note, 9.125%, 11/15/14 USA USD 186,000 0.19200,000 Quest Diagnostics Inc., 6.40%, 07/01/17 USA USD 184,073 0.19200,000 UBS AG Stamford, senior note, 5.875%, 12/20/17 USA USD 184,040 0.19200,000 ARAMARK Corp., senior note, 8.50%, 02/01/15 USA USD 182,000 0.19200,000 Millicom International Cellular SA, senior note, 10.00%, 12/01/13 LUX USD 181,000 0.19200,000 MetroPCS Wireless Inc., senior note, 9.25%, 11/01/14 USA USD 180,000 0.18200,000 Time Warner Inc., 5.875%, 11/15/16 USA USD 179,570 0.18300,000 Edcon Proprietary Ltd., senior secured note, Reg S, FRN, 6.579%, 06/15/14 � ZAF EUR 178,283 0.18200,000 Inmarsat Finance II PLC, senior note, 10.375%, 11/15/12 GBR USD 178,250 0.18200,000 Morgan Stanley, senior note, 6.00%, 04/28/15 USA USD 176,085 0.18200,000 Edison Mission Energy, senior note, 7.00%, 05/15/17 USA USD 175,000 0.18200,000 SunGard Data Systems Inc., senior note, 9.125%, 08/15/13 USA USD 174,000 0.18200,000 Canadian Natural Resources Ltd., 5.90%, 02/01/18 CAN USD 173,086 0.18200,000 Dean Foods Inc., senior note, 7.00%, 06/01/16 USA USD 171,000 0.18200,000 Nalco Co., senior sub. note, 8.875%, 11/15/13 USA USD 170,000 0.17200,000 CenterPoint Energy Inc., senior note, 6.125%, 11/01/17 USA USD 168,434 0.17200,000 Weatherford International Ltd., senior note, 6.00%, 03/15/18 USA USD 168,233 0.17200,000 Vanguard Health Holding Co. II LLC, senior sub. note, 9.00%, 10/01/14 USA USD 168,000 0.17200,000 Dish Network Corp., senior note, 7.125%, 02/01/16 USA USD 168,000 0.17200,000 Jostens IH Corp., senior sub. note, 7.625%, 10/01/12 USA USD 165,000 0.17200,000 The AES Corp., senior note, 8.00%, 10/15/17 USA USD 165,000 0.17200,000 British Sky Broadcasting Group PLC, senior note, 144A, 6.10%, 02/15/18 GBR USD 164,490 0.17200,000 Viacom Inc., senior note, 6.875%, 04/30/36 USA USD 158,475 0.16200,000 The Williams Cos. Inc., senior note, 7.625%, 07/15/19 USA USD 156,508 0.16200,000 Citigroup Capital XXI, pfd., junior sub. bond, 8.30%, 12/21/77 USA USD 154,984 0.16200,000 Embarq Corp., senior note, 7.082%, 06/01/16 USA USD 154,205 0.16200,000 Telecom Italia Capital, senior note, 4.95%, 09/30/14 ITA USD 151,916 0.16200,000 RBS Global & Rexnord Corp., senior note, 9.50%, 08/01/14 USA USD 150,000 0.15200,000 Bank of America Corp., pfd., sub. bond, M, 8.125%, Perpetual USA USD 149,850 0.15200,000 Ford Motor Credit Co. LLC, senior note, 9.875%, 08/10/11 USA USD 147,620 0.15200,000 Copano Energy LLC, senior note, 8.125%, 03/01/16 USA USD 146,000 0.15200,000 Lamar Media Corp., senior sub. note, B, 6.625%, 08/15/15 USA USD 145,500 0.15200,000 Dynegy Holdings Inc., senior note, 7.50%, 06/01/15 USA USD 141,000 0.14200,000 Plains Exploration & Production Co., senior note, 7.625%, 06/01/18 USA USD 138,000 0.14200,000 Jarden Corp., senior sub. note, 7.50%, 05/01/17 USA USD 137,500 0.14214,000 U.S. Oncology Holdings Inc., senior note, PIK, FRN, 8.334%, 03/15/12 � USA USD 136,960 0.14200,000 Quicksilver Resources Inc., senior note, 8.25%, 08/01/15 USA USD 128,000 0.13200,000 MarkWest Energy Partners LP, senior note, 6.875%, 11/01/14 USA USD 127,000 0.13200,000 United Surgical Partners International Inc., senior sub. note, PIK, 9.25%,
05/01/17 USA USD 124,000 0.13200,000 KB Home, senior note, 6.25%, 06/15/15 USA USD 123,000 0.13200,000 MetLife Inc., junior sub. note, FRN, 6.40%, 12/15/66 � USA USD 121,373 0.12200,000 Alfa MTN Markets Ltd. for ABH Financial Ltd., Reg S, 8.20%, 06/25/12 RUS USD 121,000 0.12125,000 FMC Finance III SA, senior note, 6.875%, 07/15/17 DEU USD 117,500 0.12200,000 Novelis Inc., senior note, 7.25%, 02/15/15 CAN USD 117,000 0.12200,000 RSC Equipment Rental Inc., senior note, 9.50%, 12/01/14 USA USD 111,000 0.11200,000 Royal Caribbean Cruises Ltd., senior deb., 7.25%, 03/15/18 USA USD 103,000 0.11160,000 Svensk Exportkredit AB, senior note, 7.625%, 06/30/14 SWE NZD 100,683 0.10125,000 GMAC LLC, 6.875%, 08/28/12 USA USD 94,855 0.10200,000 CCH II LLC, senior note, 10.25%, 09/15/10 USA USD 93,000 0.10150,000 MGM MIRAGE, senior note, 6.625%, 07/15/15 USA USD 92,250 0.10200,000 NewPage Corp., senior secured note, 10.00%, 05/01/12 USA USD 89,000 0.09100,000 Celestica Inc., senior sub. note, 7.625%, 07/01/13 CAN USD 82,500 0.09100,000 Freeport-McMoRan Copper & Gold Inc., senior note, 8.375%, 04/01/17 USA USD 82,114 0.08500,000 R.H. Donnelley Corp., senior note, A-3, 8.875%, 01/15/16 USA USD 77,500 0.08
75,000 Fresenius Medical Care Capital Trust IV, 7.875%, 06/15/11 USA USD 71,625 0.07200,000 Radio One Inc., senior sub. note, 6.375%, 02/15/13 USA USD 68,500 0.07100,000 Quebecor Media Inc., senior note, 7.75%, 03/15/16 CAN USD 68,000 0.07100,000 Quebecor Media Inc., senior note, 7.75%, 03/15/16 CAN USD 68,000 0.07100,000 Smithfield Foods Inc., senior note, 7.75%, 05/15/13 USA USD 64,750 0.07100,000 Smithfield Foods Inc., senior note, 7.75%, 07/01/17 USA USD 57,500 0.06100,000 HSBK (Europe) BV, Reg S, 7.25%, 05/03/17 KAZ USD 56,000 0.06100,000 Smurfit Kappa Funding PLC, senior sub. note, 7.75%, 04/01/15 IRL USD 55,000 0.06100,000 Huntsman International LLC, senior sub. note, 7.875%, 11/15/14 USA USD 54,000 0.06
FRANKL IN TEMPLETON INVESTMENT FUNDS
ç Templeton Global Income Fund ç
Schedule of Investments as of December 31, 2008 (continued)
(Currency ç USD)
Number of % of
shares or Description Country Trading Market net
face value code currency value assets
Unaudited Semi-Annual Report www.franklintempleton.lu228
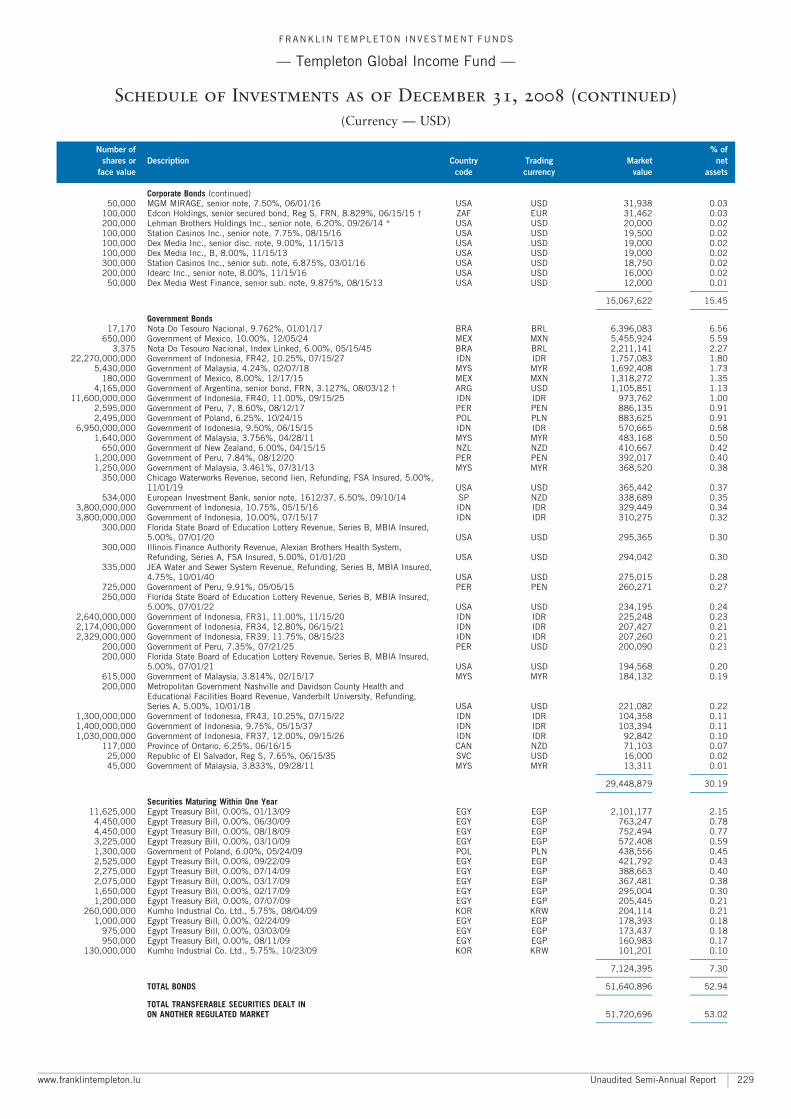
Corporate Bonds (continued)50,000 MGM MIRAGE, senior note, 7.50%, 06/01/16 USA USD 31,938 0.03
100,000 Edcon Holdings, senior secured bond, Reg S, FRN, 8.829%, 06/15/15 � ZAF EUR 31,462 0.03200,000 Lehman Brothers Holdings Inc., senior note, 6.20%, 09/26/14 * USA USD 20,000 0.02100,000 Station Casinos Inc., senior note, 7.75%, 08/15/16 USA USD 19,500 0.02100,000 Dex Media Inc., senior disc. note, 9.00%, 11/15/13 USA USD 19,000 0.02100,000 Dex Media Inc., B, 8.00%, 11/15/13 USA USD 19,000 0.02300,000 Station Casinos Inc., senior sub. note, 6.875%, 03/01/16 USA USD 18,750 0.02200,000 Idearc Inc., senior note, 8.00%, 11/15/16 USA USD 16,000 0.02
50,000 Dex Media West Finance, senior sub. note, 9.875%, 08/15/13 USA USD 12,000 0.01A A
15,067,622 15.45A A
Government Bonds17,170 Nota Do Tesouro Nacional, 9.762%, 01/01/17 BRA BRL 6,396,083 6.56
650,000 Government of Mexico, 10.00%, 12/05/24 MEX MXN 5,455,924 5.593,375 Nota Do Tesouro Nacional, Index Linked, 6.00%, 05/15/45 BRA BRL 2,211,141 2.27
22,270,000,000 Government of Indonesia, FR42, 10.25%, 07/15/27 IDN IDR 1,757,083 1.805,430,000 Government of Malaysia, 4.24%, 02/07/18 MYS MYR 1,692,408 1.73
180,000 Government of Mexico, 8.00%, 12/17/15 MEX MXN 1,318,272 1.354,165,000 Government of Argentina, senior bond, FRN, 3.127%, 08/03/12 � ARG USD 1,105,851 1.13
11,600,000,000 Government of Indonesia, FR40, 11.00%, 09/15/25 IDN IDR 973,762 1.002,595,000 Government of Peru, 7, 8.60%, 08/12/17 PER PEN 886,135 0.912,495,000 Government of Poland, 6.25%, 10/24/15 POL PLN 883,625 0.91
6,950,000,000 Government of Indonesia, 9.50%, 06/15/15 IDN IDR 570,665 0.581,640,000 Government of Malaysia, 3.756%, 04/28/11 MYS MYR 483,168 0.50
650,000 Government of New Zealand, 6.00%, 04/15/15 NZL NZD 410,667 0.421,200,000 Government of Peru, 7.84%, 08/12/20 PER PEN 392,017 0.401,250,000 Government of Malaysia, 3.461%, 07/31/13 MYS MYR 368,520 0.38
350,000 Chicago Waterworks Revenue, second lien, Refunding, FSA Insured, 5.00%,11/01/19 USA USD 365,442 0.37
534,000 European Investment Bank, senior note, 1612/37, 6.50%, 09/10/14 SP NZD 338,689 0.353,800,000,000 Government of Indonesia, 10.75%, 05/15/16 IDN IDR 329,449 0.343,800,000,000 Government of Indonesia, 10.00%, 07/15/17 IDN IDR 310,275 0.32
300,000 Florida State Board of Education Lottery Revenue, Series B, MBIA Insured,5.00%, 07/01/20 USA USD 295,365 0.30
300,000 Illinois Finance Authority Revenue, Alexian Brothers Health System,Refunding, Series A, FSA Insured, 5.00%, 01/01/20 USA USD 294,042 0.30
335,000 JEA Water and Sewer System Revenue, Refunding, Series B, MBIA Insured,4.75%, 10/01/40 USA USD 275,015 0.28
725,000 Government of Peru, 9.91%, 05/05/15 PER PEN 260,271 0.27250,000 Florida State Board of Education Lottery Revenue, Series B, MBIA Insured,
5.00%, 07/01/22 USA USD 234,195 0.242,640,000,000 Government of Indonesia, FR31, 11.00%, 11/15/20 IDN IDR 225,248 0.232,174,000,000 Government of Indonesia, FR34, 12.80%, 06/15/21 IDN IDR 207,427 0.212,329,000,000 Government of Indonesia, FR39, 11.75%, 08/15/23 IDN IDR 207,260 0.21
200,000 Government of Peru, 7.35%, 07/21/25 PER USD 200,090 0.21200,000 Florida State Board of Education Lottery Revenue, Series B, MBIA Insured,
5.00%, 07/01/21 USA USD 194,568 0.20615,000 Government of Malaysia, 3.814%, 02/15/17 MYS MYR 184,132 0.19200,000 Metropolitan Government Nashville and Davidson County Health and
Educational Facilities Board Revenue, Vanderbilt University, Refunding,Series A, 5.00%, 10/01/18 USA USD 221,082 0.22
1,300,000,000 Government of Indonesia, FR43, 10.25%, 07/15/22 IDN IDR 104,358 0.111,400,000,000 Government of Indonesia, 9.75%, 05/15/37 IDN IDR 103,394 0.111,030,000,000 Government of Indonesia, FR37, 12.00%, 09/15/26 IDN IDR 92,842 0.10
117,000 Province of Ontario, 6.25%, 06/16/15 CAN NZD 71,103 0.0725,000 Republic of El Salvador, Reg S, 7.65%, 06/15/35 SVC USD 16,000 0.0245,000 Government of Malaysia, 3.833%, 09/28/11 MYS MYR 13,311 0.01
A A
29,448,879 30.19A A
Securities Maturing Within One Year11,625,000 Egypt Treasury Bill, 0.00%, 01/13/09 EGY EGP 2,101,177 2.15
4,450,000 Egypt Treasury Bill, 0.00%, 06/30/09 EGY EGP 763,247 0.784,450,000 Egypt Treasury Bill, 0.00%, 08/18/09 EGY EGP 752,494 0.773,225,000 Egypt Treasury Bill, 0.00%, 03/10/09 EGY EGP 572,408 0.591,300,000 Government of Poland, 6.00%, 05/24/09 POL PLN 438,556 0.452,525,000 Egypt Treasury Bill, 0.00%, 09/22/09 EGY EGP 421,792 0.432,275,000 Egypt Treasury Bill, 0.00%, 07/14/09 EGY EGP 388,663 0.402,075,000 Egypt Treasury Bill, 0.00%, 03/17/09 EGY EGP 367,481 0.381,650,000 Egypt Treasury Bill, 0.00%, 02/17/09 EGY EGP 295,004 0.301,200,000 Egypt Treasury Bill, 0.00%, 07/07/09 EGY EGP 205,445 0.21
260,000,000 Kumho Industrial Co. Ltd., 5.75%, 08/04/09 KOR KRW 204,114 0.211,000,000 Egypt Treasury Bill, 0.00%, 02/24/09 EGY EGP 178,393 0.18
975,000 Egypt Treasury Bill, 0.00%, 03/03/09 EGY EGP 173,437 0.18950,000 Egypt Treasury Bill, 0.00%, 08/11/09 EGY EGP 160,983 0.17
130,000,000 Kumho Industrial Co. Ltd., 5.75%, 10/23/09 KOR KRW 101,201 0.10A A
7,124,395 7.30A A
TOTAL BONDS 51,640,896 52.94A A
TOTAL TRANSFERABLE SECURITIES DEALT INON ANOTHER REGULATED MARKET 51,720,696 53.02
A A
FRANKL IN TEMPLETON INVESTMENT FUNDS
ç Templeton Global Income Fund ç
Schedule of Investments as of December 31, 2008 (continued)
(Currency ç USD)
Number of % of
shares or Description Country Trading Market net
face value code currency value assets
www.franklintempleton.lu Unaudited Semi-Annual Report 229
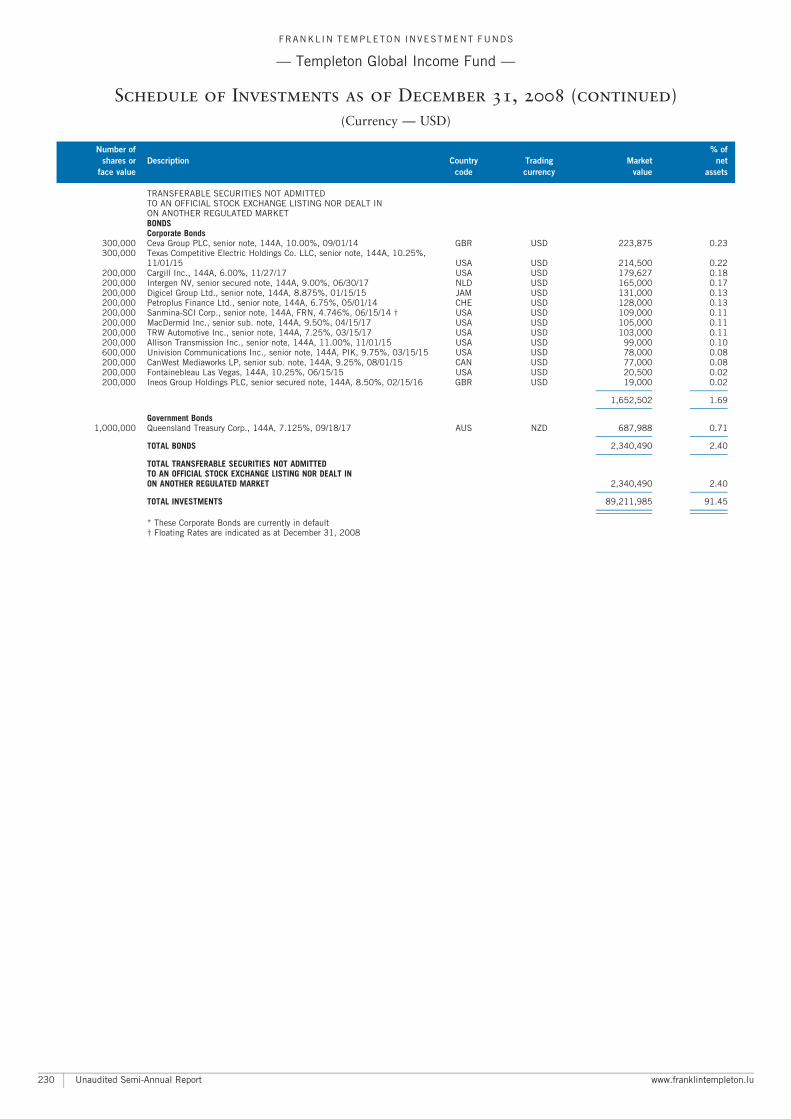
TRANSFERABLE SECURITIES NOT ADMITTEDTO AN OFFICIAL STOCK EXCHANGE LISTING NOR DEALT INON ANOTHER REGULATED MARKETBONDSCorporate Bonds
300,000 Ceva Group PLC, senior note, 144A, 10.00%, 09/01/14 GBR USD 223,875 0.23300,000 Texas Competitive Electric Holdings Co. LLC, senior note, 144A, 10.25%,
11/01/15 USA USD 214,500 0.22200,000 Cargill Inc., 144A, 6.00%, 11/27/17 USA USD 179,627 0.18200,000 Intergen NV, senior secured note, 144A, 9.00%, 06/30/17 NLD USD 165,000 0.17200,000 Digicel Group Ltd., senior note, 144A, 8.875%, 01/15/15 JAM USD 131,000 0.13200,000 Petroplus Finance Ltd., senior note, 144A, 6.75%, 05/01/14 CHE USD 128,000 0.13200,000 Sanmina-SCI Corp., senior note, 144A, FRN, 4.746%, 06/15/14 � USA USD 109,000 0.11200,000 MacDermid Inc., senior sub. note, 144A, 9.50%, 04/15/17 USA USD 105,000 0.11200,000 TRW Automotive Inc., senior note, 144A, 7.25%, 03/15/17 USA USD 103,000 0.11200,000 Allison Transmission Inc., senior note, 144A, 11.00%, 11/01/15 USA USD 99,000 0.10600,000 Univision Communications Inc., senior note, 144A, PIK, 9.75%, 03/15/15 USA USD 78,000 0.08200,000 CanWest Mediaworks LP, senior sub. note, 144A, 9.25%, 08/01/15 CAN USD 77,000 0.08200,000 Fontainebleau Las Vegas, 144A, 10.25%, 06/15/15 USA USD 20,500 0.02200,000 Ineos Group Holdings PLC, senior secured note, 144A, 8.50%, 02/15/16 GBR USD 19,000 0.02
A A
1,652,502 1.69A A
Government Bonds1,000,000 Queensland Treasury Corp., 144A, 7.125%, 09/18/17 AUS NZD 687,988 0.71
A A
TOTAL BONDS 2,340,490 2.40A A
TOTAL TRANSFERABLE SECURITIES NOT ADMITTEDTO AN OFFICIAL STOCK EXCHANGE LISTING NOR DEALT INON ANOTHER REGULATED MARKET 2,340,490 2.40
A A
TOTAL INVESTMENTS 89,211,985 91.45A A
A A
* These Corporate Bonds are currently in default� Floating Rates are indicated as at December 31, 2008
FRANKL IN TEMPLETON INVESTMENT FUNDS
ç Templeton Global Income Fund ç
Schedule of Investments as of December 31, 2008 (continued)
(Currency ç USD)
Number of % of
shares or Description Country Trading Market net
face value code currency value assets
Unaudited Semi-Annual Report www.franklintempleton.lu230
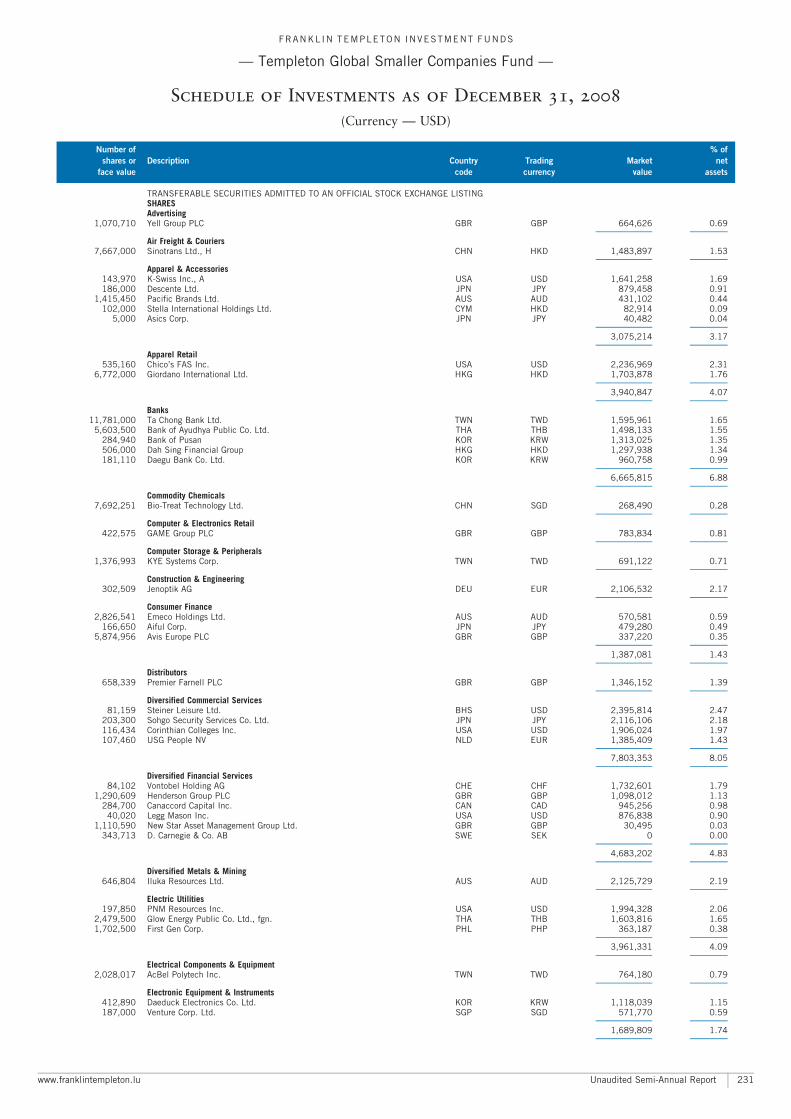
TRANSFERABLE SECURITIES ADMITTED TO AN OFFICIAL STOCK EXCHANGE LISTINGSHARESAdvertising
1,070,710 Yell Group PLC GBR GBP 664,626 0.69A A
Air Freight & Couriers7,667,000 Sinotrans Ltd., H CHN HKD 1,483,897 1.53
A A
Apparel & Accessories143,970 K-Swiss Inc., A USA USD 1,641,258 1.69186,000 Descente Ltd. JPN JPY 879,458 0.91
1,415,450 Pacific Brands Ltd. AUS AUD 431,102 0.44102,000 Stella International Holdings Ltd. CYM HKD 82,914 0.09
5,000 Asics Corp. JPN JPY 40,482 0.04A A
3,075,214 3.17A A
Apparel Retail535,160 Chico’s FAS Inc. USA USD 2,236,969 2.31
6,772,000 Giordano International Ltd. HKG HKD 1,703,878 1.76A A
3,940,847 4.07A A
Banks11,781,000 Ta Chong Bank Ltd. TWN TWD 1,595,961 1.65
5,603,500 Bank of Ayudhya Public Co. Ltd. THA THB 1,498,133 1.55284,940 Bank of Pusan KOR KRW 1,313,025 1.35506,000 Dah Sing Financial Group HKG HKD 1,297,938 1.34181,110 Daegu Bank Co. Ltd. KOR KRW 960,758 0.99
A A
6,665,815 6.88A A
Commodity Chemicals7,692,251 Bio-Treat Technology Ltd. CHN SGD 268,490 0.28
A A
Computer & Electronics Retail422,575 GAME Group PLC GBR GBP 783,834 0.81
A A
Computer Storage & Peripherals1,376,993 KYE Systems Corp. TWN TWD 691,122 0.71
A A
Construction & Engineering302,509 Jenoptik AG DEU EUR 2,106,532 2.17
A A
Consumer Finance2,826,541 Emeco Holdings Ltd. AUS AUD 570,581 0.59
166,650 Aiful Corp. JPN JPY 479,280 0.495,874,956 Avis Europe PLC GBR GBP 337,220 0.35
A A
1,387,081 1.43A A
Distributors658,339 Premier Farnell PLC GBR GBP 1,346,152 1.39
A A
Diversified Commercial Services81,159 Steiner Leisure Ltd. BHS USD 2,395,814 2.47
203,300 Sohgo Security Services Co. Ltd. JPN JPY 2,116,106 2.18116,434 Corinthian Colleges Inc. USA USD 1,906,024 1.97107,460 USG People NV NLD EUR 1,385,409 1.43
A A
7,803,353 8.05A A
Diversified Financial Services84,102 Vontobel Holding AG CHE CHF 1,732,601 1.79
1,290,609 Henderson Group PLC GBR GBP 1,098,012 1.13284,700 Canaccord Capital Inc. CAN CAD 945,256 0.98
40,020 Legg Mason Inc. USA USD 876,838 0.901,110,590 New Star Asset Management Group Ltd. GBR GBP 30,495 0.03
343,713 D. Carnegie & Co. AB SWE SEK 0 0.00A A
4,683,202 4.83A A
Diversified Metals & Mining646,804 Iluka Resources Ltd. AUS AUD 2,125,729 2.19
A A
Electric Utilities197,850 PNM Resources Inc. USA USD 1,994,328 2.06
2,479,500 Glow Energy Public Co. Ltd., fgn. THA THB 1,603,816 1.651,702,500 First Gen Corp. PHL PHP 363,187 0.38
A A
3,961,331 4.09A A
Electrical Components & Equipment2,028,017 AcBel Polytech Inc. TWN TWD 764,180 0.79
A A
Electronic Equipment & Instruments412,890 Daeduck Electronics Co. Ltd. KOR KRW 1,118,039 1.15187,000 Venture Corp. Ltd. SGP SGD 571,770 0.59
A A
1,689,809 1.74A A
FRANKL IN TEMPLETON INVESTMENT FUNDS
ç Templeton Global Smaller Companies Fund ç
Schedule of Investments as of December 31, 2008
(Currency ç USD)
Number of % of
shares or Description Country Trading Market net
face value code currency value assets
www.franklintempleton.lu Unaudited Semi-Annual Report 231
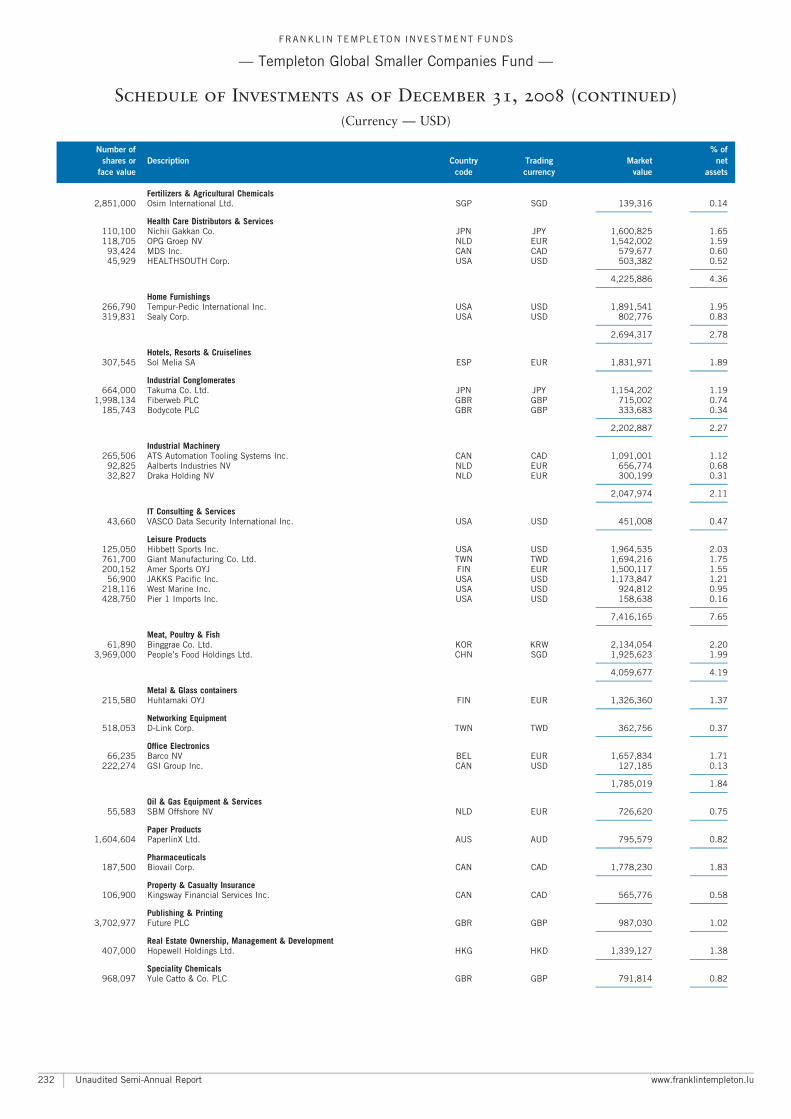
Fertilizers & Agricultural Chemicals2,851,000 Osim International Ltd. SGP SGD 139,316 0.14
A A
Health Care Distributors & Services110,100 Nichii Gakkan Co. JPN JPY 1,600,825 1.65118,705 OPG Groep NV NLD EUR 1,542,002 1.59
93,424 MDS Inc. CAN CAD 579,677 0.6045,929 HEALTHSOUTH Corp. USA USD 503,382 0.52
A A
4,225,886 4.36A A
Home Furnishings266,790 Tempur-Pedic International Inc. USA USD 1,891,541 1.95319,831 Sealy Corp. USA USD 802,776 0.83
A A
2,694,317 2.78A A
Hotels, Resorts & Cruiselines307,545 Sol Melia SA ESP EUR 1,831,971 1.89
A A
Industrial Conglomerates664,000 Takuma Co. Ltd. JPN JPY 1,154,202 1.19
1,998,134 Fiberweb PLC GBR GBP 715,002 0.74185,743 Bodycote PLC GBR GBP 333,683 0.34
A A
2,202,887 2.27A A
Industrial Machinery265,506 ATS Automation Tooling Systems Inc. CAN CAD 1,091,001 1.12
92,825 Aalberts Industries NV NLD EUR 656,774 0.6832,827 Draka Holding NV NLD EUR 300,199 0.31
A A
2,047,974 2.11A A
IT Consulting & Services43,660 VASCO Data Security International Inc. USA USD 451,008 0.47
A A
Leisure Products125,050 Hibbett Sports Inc. USA USD 1,964,535 2.03761,700 Giant Manufacturing Co. Ltd. TWN TWD 1,694,216 1.75200,152 Amer Sports OYJ FIN EUR 1,500,117 1.55
56,900 JAKKS Pacific Inc. USA USD 1,173,847 1.21218,116 West Marine Inc. USA USD 924,812 0.95428,750 Pier 1 Imports Inc. USA USD 158,638 0.16
A A
7,416,165 7.65A A
Meat, Poultry & Fish61,890 Binggrae Co. Ltd. KOR KRW 2,134,054 2.20
3,969,000 People’s Food Holdings Ltd. CHN SGD 1,925,623 1.99A A
4,059,677 4.19A A
Metal & Glass containers215,580 Huhtamaki OYJ FIN EUR 1,326,360 1.37
A A
Networking Equipment518,053 D-Link Corp. TWN TWD 362,756 0.37
A A
Office Electronics66,235 Barco NV BEL EUR 1,657,834 1.71
222,274 GSI Group Inc. CAN USD 127,185 0.13A A
1,785,019 1.84A A
Oil & Gas Equipment & Services55,583 SBM Offshore NV NLD EUR 726,620 0.75
A A
Paper Products1,604,604 PaperlinX Ltd. AUS AUD 795,579 0.82
A A
Pharmaceuticals187,500 Biovail Corp. CAN CAD 1,778,230 1.83
A A
Property & Casualty Insurance106,900 Kingsway Financial Services Inc. CAN CAD 565,776 0.58
A A
Publishing & Printing3,702,977 Future PLC GBR GBP 987,030 1.02
A A
Real Estate Ownership, Management & Development407,000 Hopewell Holdings Ltd. HKG HKD 1,339,127 1.38
A A
Speciality Chemicals968,097 Yule Catto & Co. PLC GBR GBP 791,814 0.82
A A
FRANKL IN TEMPLETON INVESTMENT FUNDS
ç Templeton Global Smaller Companies Fund ç
Schedule of Investments as of December 31, 2008 (continued)
(Currency ç USD)
Number of % of
shares or Description Country Trading Market net
face value code currency value assets
Unaudited Semi-Annual Report www.franklintempleton.lu232
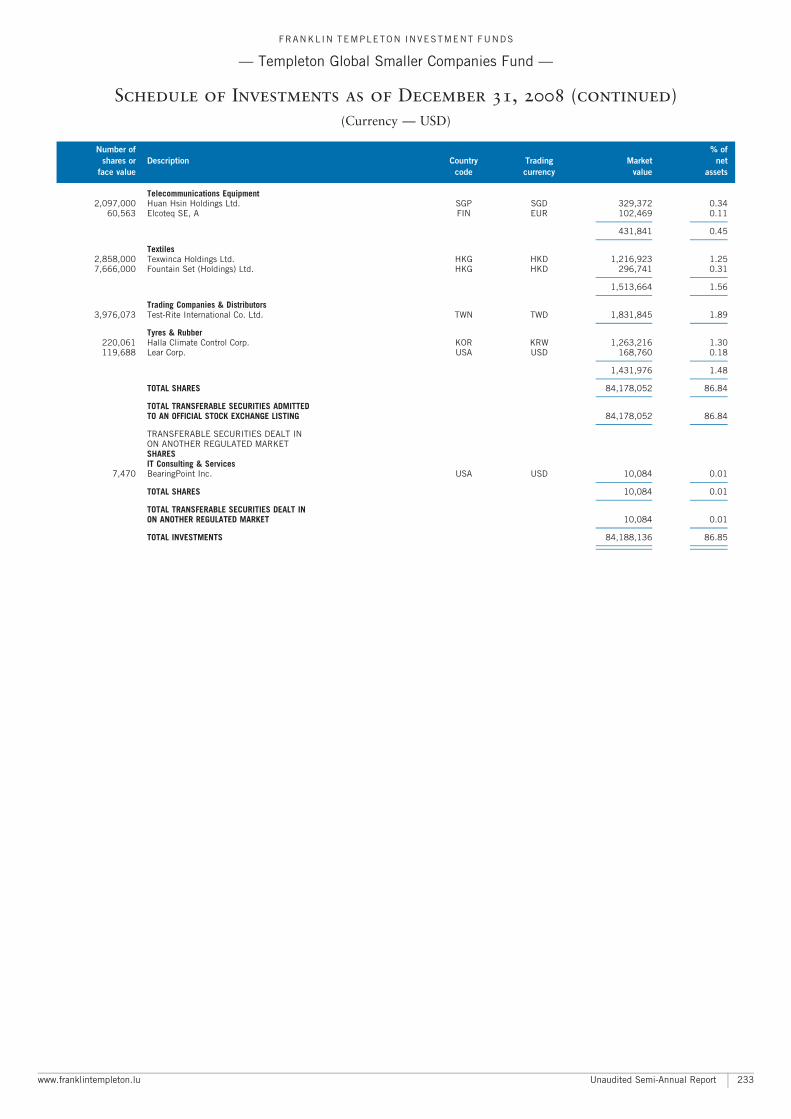
Telecommunications Equipment2,097,000 Huan Hsin Holdings Ltd. SGP SGD 329,372 0.34
60,563 Elcoteq SE, A FIN EUR 102,469 0.11A A
431,841 0.45A A
Textiles2,858,000 Texwinca Holdings Ltd. HKG HKD 1,216,923 1.257,666,000 Fountain Set (Holdings) Ltd. HKG HKD 296,741 0.31
A A
1,513,664 1.56A A
Trading Companies & Distributors3,976,073 Test-Rite International Co. Ltd. TWN TWD 1,831,845 1.89
A A
Tyres & Rubber220,061 Halla Climate Control Corp. KOR KRW 1,263,216 1.30119,688 Lear Corp. USA USD 168,760 0.18
A A
1,431,976 1.48A A
TOTAL SHARES 84,178,052 86.84A A
TOTAL TRANSFERABLE SECURITIES ADMITTEDTO AN OFFICIAL STOCK EXCHANGE LISTING 84,178,052 86.84
A A
TRANSFERABLE SECURITIES DEALT INON ANOTHER REGULATED MARKETSHARESIT Consulting & Services
7,470 BearingPoint Inc. USA USD 10,084 0.01A A
TOTAL SHARES 10,084 0.01A A
TOTAL TRANSFERABLE SECURITIES DEALT INON ANOTHER REGULATED MARKET 10,084 0.01
A A
TOTAL INVESTMENTS 84,188,136 86.85A A
A A
FRANKL IN TEMPLETON INVESTMENT FUNDS
ç Templeton Global Smaller Companies Fund ç
Schedule of Investments as of December 31, 2008 (continued)
(Currency ç USD)
Number of % of
shares or Description Country Trading Market net
face value code currency value assets
www.franklintempleton.lu Unaudited Semi-Annual Report 233
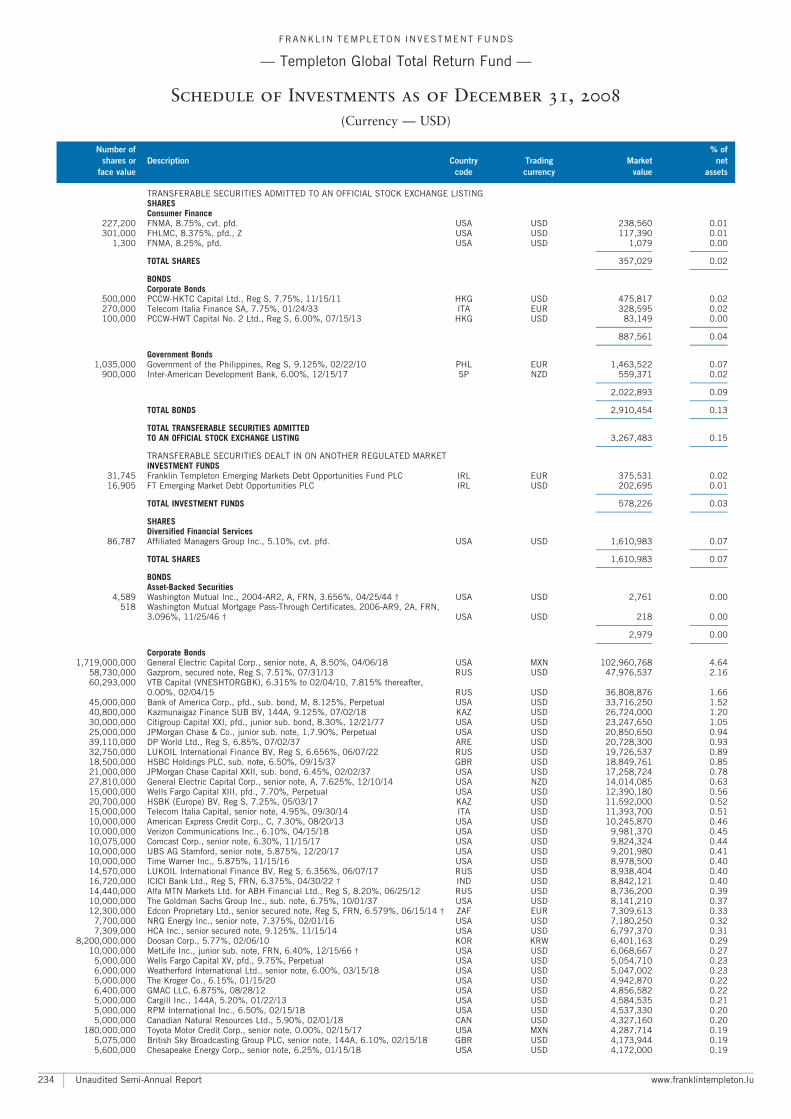
TRANSFERABLE SECURITIES ADMITTED TO AN OFFICIAL STOCK EXCHANGE LISTINGSHARESConsumer Finance
227,200 FNMA, 8.75%, cvt. pfd. USA USD 238,560 0.01301,000 FHLMC, 8.375%, pfd., Z USA USD 117,390 0.01
1,300 FNMA, 8.25%, pfd. USA USD 1,079 0.00A A
TOTAL SHARES 357,029 0.02A A
BONDSCorporate Bonds
500,000 PCCW-HKTC Capital Ltd., Reg S, 7.75%, 11/15/11 HKG USD 475,817 0.02270,000 Telecom Italia Finance SA, 7.75%, 01/24/33 ITA EUR 328,595 0.02100,000 PCCW-HWT Capital No. 2 Ltd., Reg S, 6.00%, 07/15/13 HKG USD 83,149 0.00
A A
887,561 0.04A A
Government Bonds1,035,000 Government of the Philippines, Reg S, 9.125%, 02/22/10 PHL EUR 1,463,522 0.07
900,000 Inter-American Development Bank, 6.00%, 12/15/17 SP NZD 559,371 0.02A A
2,022,893 0.09A A
TOTAL BONDS 2,910,454 0.13A A
TOTAL TRANSFERABLE SECURITIES ADMITTEDTO AN OFFICIAL STOCK EXCHANGE LISTING 3,267,483 0.15
A A
TRANSFERABLE SECURITIES DEALT IN ON ANOTHER REGULATED MARKETINVESTMENT FUNDS
31,745 Franklin Templeton Emerging Markets Debt Opportunities Fund PLC IRL EUR 375,531 0.0216,905 FT Emerging Market Debt Opportunities PLC IRL USD 202,695 0.01
A A
TOTAL INVESTMENT FUNDS 578,226 0.03A A
SHARESDiversified Financial Services
86,787 Affiliated Managers Group Inc., 5.10%, cvt. pfd. USA USD 1,610,983 0.07A A
TOTAL SHARES 1,610,983 0.07A A
BONDSAsset-Backed Securities
4,589 Washington Mutual Inc., 2004-AR2, A, FRN, 3.656%, 04/25/44 � USA USD 2,761 0.00518 Washington Mutual Mortgage Pass-Through Certificates, 2006-AR9, 2A, FRN,
3.096%, 11/25/46 � USA USD 218 0.00A A
2,979 0.00A A
Corporate Bonds1,719,000,000 General Electric Capital Corp., senior note, A, 8.50%, 04/06/18 USA MXN 102,960,768 4.64
58,730,000 Gazprom, secured note, Reg S, 7.51%, 07/31/13 RUS USD 47,976,537 2.1660,293,000 VTB Capital (VNESHTORGBK), 6.315% to 02/04/10, 7.815% thereafter,
0.00%, 02/04/15 RUS USD 36,808,876 1.6645,000,000 Bank of America Corp., pfd., sub. bond, M, 8.125%, Perpetual USA USD 33,716,250 1.5240,800,000 Kazmunaigaz Finance SUB BV, 144A, 9.125%, 07/02/18 KAZ USD 26,724,000 1.2030,000,000 Citigroup Capital XXI, pfd., junior sub. bond, 8.30%, 12/21/77 USA USD 23,247,650 1.0525,000,000 JPMorgan Chase & Co., junior sub. note, 1,7.90%, Perpetual USA USD 20,850,650 0.9439,110,000 DP World Ltd., Reg S, 6.85%, 07/02/37 ARE USD 20,728,300 0.9332,750,000 LUKOIL International Finance BV, Reg S, 6.656%, 06/07/22 RUS USD 19,726,537 0.8918,500,000 HSBC Holdings PLC, sub. note, 6.50%, 09/15/37 GBR USD 18,849,761 0.8521,000,000 JPMorgan Chase Capital XXII, sub. bond, 6.45%, 02/02/37 USA USD 17,258,724 0.7827,810,000 General Electric Capital Corp., senior note, A, 7.625%, 12/10/14 USA NZD 14,014,085 0.6315,000,000 Wells Fargo Capital XIII, pfd., 7.70%, Perpetual USA USD 12,390,180 0.5620,700,000 HSBK (Europe) BV, Reg S, 7.25%, 05/03/17 KAZ USD 11,592,000 0.5215,000,000 Telecom Italia Capital, senior note, 4.95%, 09/30/14 ITA USD 11,393,700 0.5110,000,000 American Express Credit Corp., C, 7.30%, 08/20/13 USA USD 10,245,870 0.4610,000,000 Verizon Communications Inc., 6.10%, 04/15/18 USA USD 9,981,370 0.4510,075,000 Comcast Corp., senior note, 6.30%, 11/15/17 USA USD 9,824,324 0.4410,000,000 UBS AG Stamford, senior note, 5.875%, 12/20/17 USA USD 9,201,980 0.4110,000,000 Time Warner Inc., 5.875%, 11/15/16 USA USD 8,978,500 0.4014,570,000 LUKOIL International Finance BV, Reg S, 6.356%, 06/07/17 RUS USD 8,938,404 0.4016,720,000 ICICI Bank Ltd., Reg S, FRN, 6.375%, 04/30/22 � IND USD 8,842,121 0.4014,440,000 Alfa MTN Markets Ltd. for ABH Financial Ltd., Reg S, 8.20%, 06/25/12 RUS USD 8,736,200 0.3910,000,000 The Goldman Sachs Group Inc., sub. note, 6.75%, 10/01/37 USA USD 8,141,210 0.3712,300,000 Edcon Proprietary Ltd., senior secured note, Reg S, FRN, 6.579%, 06/15/14 � ZAF EUR 7,309,613 0.33
7,700,000 NRG Energy Inc., senior note, 7.375%, 02/01/16 USA USD 7,180,250 0.327,309,000 HCA Inc., senior secured note, 9.125%, 11/15/14 USA USD 6,797,370 0.31
8,200,000,000 Doosan Corp., 5.77%, 02/06/10 KOR KRW 6,401,163 0.2910,000,000 MetLife Inc., junior sub. note, FRN, 6.40%, 12/15/66 � USA USD 6,068,667 0.27
5,000,000 Wells Fargo Capital XV, pfd., 9.75%, Perpetual USA USD 5,054,710 0.236,000,000 Weatherford International Ltd., senior note, 6.00%, 03/15/18 USA USD 5,047,002 0.235,000,000 The Kroger Co., 6.15%, 01/15/20 USA USD 4,942,870 0.226,400,000 GMAC LLC, 6.875%, 08/28/12 USA USD 4,856,582 0.225,000,000 Cargill Inc., 144A, 5.20%, 01/22/13 USA USD 4,584,535 0.215,000,000 RPM International Inc., 6.50%, 02/15/18 USA USD 4,537,330 0.205,000,000 Canadian Natural Resources Ltd., 5.90%, 02/01/18 CAN USD 4,327,160 0.20
180,000,000 Toyota Motor Credit Corp., senior note, 0.00%, 02/15/17 USA MXN 4,287,714 0.195,075,000 British Sky Broadcasting Group PLC, senior note, 144A, 6.10%, 02/15/18 GBR USD 4,173,944 0.195,600,000 Chesapeake Energy Corp., senior note, 6.25%, 01/15/18 USA USD 4,172,000 0.19
FRANKL IN TEMPLETON INVESTMENT FUNDS
ç Templeton Global Total Return Fund ç
Schedule of Investments as of December 31, 2008
(Currency ç USD)
Number of % of
shares or Description Country Trading Market net
face value code currency value assets
Unaudited Semi-Annual Report www.franklintempleton.lu234
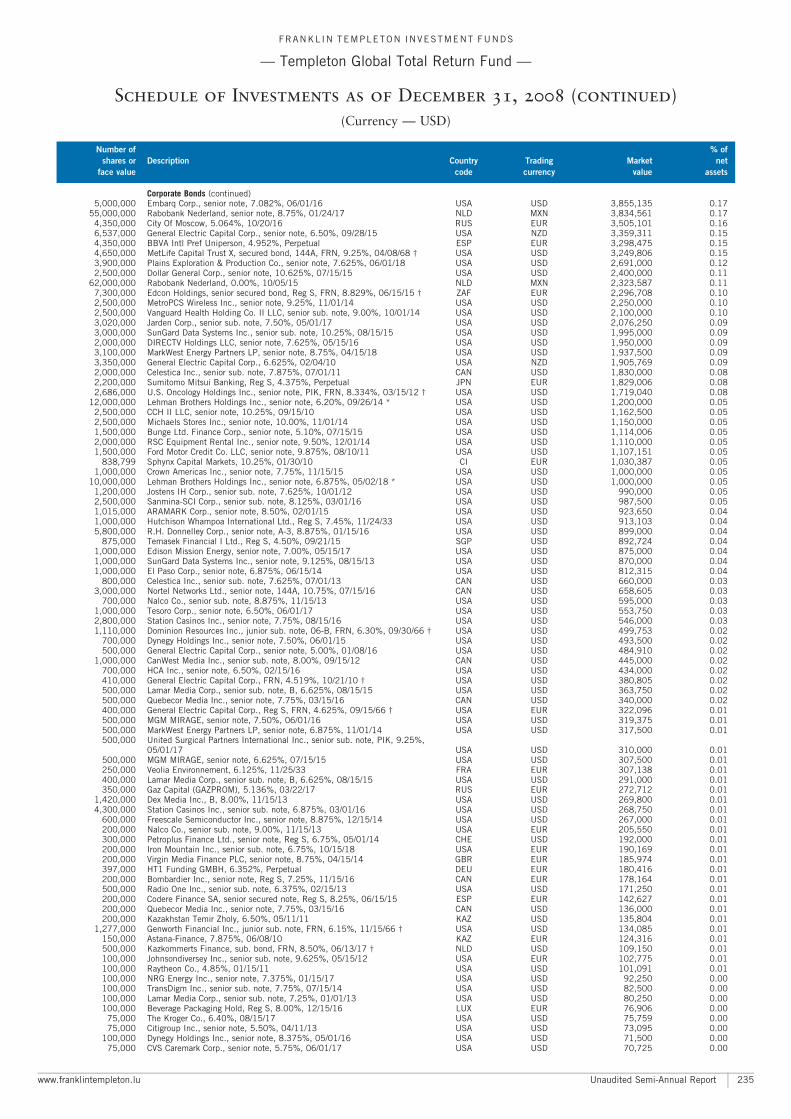
Corporate Bonds (continued)5,000,000 Embarq Corp., senior note, 7.082%, 06/01/16 USA USD 3,855,135 0.17
55,000,000 Rabobank Nederland, senior note, 8.75%, 01/24/17 NLD MXN 3,834,561 0.174,350,000 City Of Moscow, 5.064%, 10/20/16 RUS EUR 3,505,101 0.166,537,000 General Electric Capital Corp., senior note, 6.50%, 09/28/15 USA NZD 3,359,311 0.154,350,000 BBVA Intl Pref Uniperson, 4.952%, Perpetual ESP EUR 3,298,475 0.154,650,000 MetLife Capital Trust X, secured bond, 144A, FRN, 9.25%, 04/08/68 � USA USD 3,249,806 0.153,900,000 Plains Exploration & Production Co., senior note, 7.625%, 06/01/18 USA USD 2,691,000 0.122,500,000 Dollar General Corp., senior note, 10.625%, 07/15/15 USA USD 2,400,000 0.11
62,000,000 Rabobank Nederland, 0.00%, 10/05/15 NLD MXN 2,323,587 0.117,300,000 Edcon Holdings, senior secured bond, Reg S, FRN, 8.829%, 06/15/15 � ZAF EUR 2,296,708 0.102,500,000 MetroPCS Wireless Inc., senior note, 9.25%, 11/01/14 USA USD 2,250,000 0.102,500,000 Vanguard Health Holding Co. II LLC, senior sub. note, 9.00%, 10/01/14 USA USD 2,100,000 0.103,020,000 Jarden Corp., senior sub. note, 7.50%, 05/01/17 USA USD 2,076,250 0.093,000,000 SunGard Data Systems Inc., senior sub. note, 10.25%, 08/15/15 USA USD 1,995,000 0.092,000,000 DIRECTV Holdings LLC, senior note, 7.625%, 05/15/16 USA USD 1,950,000 0.093,100,000 MarkWest Energy Partners LP, senior note, 8.75%, 04/15/18 USA USD 1,937,500 0.093,350,000 General Electric Capital Corp., 6.625%, 02/04/10 USA NZD 1,905,769 0.092,000,000 Celestica Inc., senior sub. note, 7.875%, 07/01/11 CAN USD 1,830,000 0.082,200,000 Sumitomo Mitsui Banking, Reg S, 4.375%, Perpetual JPN EUR 1,829,006 0.082,686,000 U.S. Oncology Holdings Inc., senior note, PIK, FRN, 8.334%, 03/15/12 � USA USD 1,719,040 0.08
12,000,000 Lehman Brothers Holdings Inc., senior note, 6.20%, 09/26/14 * USA USD 1,200,000 0.052,500,000 CCH II LLC, senior note, 10.25%, 09/15/10 USA USD 1,162,500 0.052,500,000 Michaels Stores Inc., senior note, 10.00%, 11/01/14 USA USD 1,150,000 0.051,500,000 Bunge Ltd. Finance Corp., senior note, 5.10%, 07/15/15 USA USD 1,114,006 0.052,000,000 RSC Equipment Rental Inc., senior note, 9.50%, 12/01/14 USA USD 1,110,000 0.051,500,000 Ford Motor Credit Co. LLC, senior note, 9.875%, 08/10/11 USA USD 1,107,151 0.05
838,799 Sphynx Capital Markets, 10.25%, 01/30/10 CI EUR 1,030,387 0.051,000,000 Crown Americas Inc., senior note, 7.75%, 11/15/15 USA USD 1,000,000 0.05
10,000,000 Lehman Brothers Holdings Inc., senior note, 6.875%, 05/02/18 * USA USD 1,000,000 0.051,200,000 Jostens IH Corp., senior sub. note, 7.625%, 10/01/12 USA USD 990,000 0.052,500,000 Sanmina-SCI Corp., senior sub. note, 8.125%, 03/01/16 USA USD 987,500 0.051,015,000 ARAMARK Corp., senior note, 8.50%, 02/01/15 USA USD 923,650 0.041,000,000 Hutchison Whampoa International Ltd., Reg S, 7.45%, 11/24/33 USA USD 913,103 0.045,800,000 R.H. Donnelley Corp., senior note, A-3, 8.875%, 01/15/16 USA USD 899,000 0.04
875,000 Temasek Financial I Ltd., Reg S, 4.50%, 09/21/15 SGP USD 892,724 0.041,000,000 Edison Mission Energy, senior note, 7.00%, 05/15/17 USA USD 875,000 0.041,000,000 SunGard Data Systems Inc., senior note, 9.125%, 08/15/13 USA USD 870,000 0.041,000,000 El Paso Corp., senior note, 6.875%, 06/15/14 USA USD 812,315 0.04
800,000 Celestica Inc., senior sub. note, 7.625%, 07/01/13 CAN USD 660,000 0.033,000,000 Nortel Networks Ltd., senior note, 144A, 10.75%, 07/15/16 CAN USD 658,605 0.03
700,000 Nalco Co., senior sub. note, 8.875%, 11/15/13 USA USD 595,000 0.031,000,000 Tesoro Corp., senior note, 6.50%, 06/01/17 USA USD 553,750 0.032,800,000 Station Casinos Inc., senior note, 7.75%, 08/15/16 USA USD 546,000 0.031,110,000 Dominion Resources Inc., junior sub. note, 06-B, FRN, 6.30%, 09/30/66 � USA USD 499,753 0.02
700,000 Dynegy Holdings Inc., senior note, 7.50%, 06/01/15 USA USD 493,500 0.02500,000 General Electric Capital Corp., senior note, 5.00%, 01/08/16 USA USD 484,910 0.02
1,000,000 CanWest Media Inc., senior sub. note, 8.00%, 09/15/12 CAN USD 445,000 0.02700,000 HCA Inc., senior note, 6.50%, 02/15/16 USA USD 434,000 0.02410,000 General Electric Capital Corp., FRN, 4.519%, 10/21/10 � USA USD 380,805 0.02500,000 Lamar Media Corp., senior sub. note, B, 6.625%, 08/15/15 USA USD 363,750 0.02500,000 Quebecor Media Inc., senior note, 7.75%, 03/15/16 CAN USD 340,000 0.02400,000 General Electric Capital Corp., Reg S, FRN, 4.625%, 09/15/66 � USA EUR 322,096 0.01500,000 MGM MIRAGE, senior note, 7.50%, 06/01/16 USA USD 319,375 0.01500,000 MarkWest Energy Partners LP, senior note, 6.875%, 11/01/14 USA USD 317,500 0.01500,000 United Surgical Partners International Inc., senior sub. note, PIK, 9.25%,
05/01/17 USA USD 310,000 0.01500,000 MGM MIRAGE, senior note, 6.625%, 07/15/15 USA USD 307,500 0.01250,000 Veolia Environnement, 6.125%, 11/25/33 FRA EUR 307,138 0.01400,000 Lamar Media Corp., senior sub. note, B, 6.625%, 08/15/15 USA USD 291,000 0.01350,000 Gaz Capital (GAZPROM), 5.136%, 03/22/17 RUS EUR 272,712 0.01
1,420,000 Dex Media Inc., B, 8.00%, 11/15/13 USA USD 269,800 0.014,300,000 Station Casinos Inc., senior sub. note, 6.875%, 03/01/16 USA USD 268,750 0.01
600,000 Freescale Semiconductor Inc., senior note, 8.875%, 12/15/14 USA USD 267,000 0.01200,000 Nalco Co., senior sub. note, 9.00%, 11/15/13 USA EUR 205,550 0.01300,000 Petroplus Finance Ltd., senior note, Reg S, 6.75%, 05/01/14 CHE USD 192,000 0.01200,000 Iron Mountain Inc., senior sub. note, 6.75%, 10/15/18 USA EUR 190,169 0.01200,000 Virgin Media Finance PLC, senior note, 8.75%, 04/15/14 GBR EUR 185,974 0.01397,000 HT1 Funding GMBH, 6.352%, Perpetual DEU EUR 180,416 0.01200,000 Bombardier Inc., senior note, Reg S, 7.25%, 11/15/16 CAN EUR 178,164 0.01500,000 Radio One Inc., senior sub. note, 6.375%, 02/15/13 USA USD 171,250 0.01200,000 Codere Finance SA, senior secured note, Reg S, 8.25%, 06/15/15 ESP EUR 142,627 0.01200,000 Quebecor Media Inc., senior note, 7.75%, 03/15/16 CAN USD 136,000 0.01200,000 Kazakhstan Temir Zholy, 6.50%, 05/11/11 KAZ USD 135,804 0.01
1,277,000 Genworth Financial Inc., junior sub. note, FRN, 6.15%, 11/15/66 � USA USD 134,085 0.01150,000 Astana-Finance, 7.875%, 06/08/10 KAZ EUR 124,316 0.01500,000 Kazkommerts Finance, sub. bond, FRN, 8.50%, 06/13/17 � NLD USD 109,150 0.01100,000 Johnsondiversey Inc., senior sub. note, 9.625%, 05/15/12 USA EUR 102,775 0.01100,000 Raytheon Co., 4.85%, 01/15/11 USA USD 101,091 0.01100,000 NRG Energy Inc., senior note, 7.375%, 01/15/17 USA USD 92,250 0.00100,000 TransDigm Inc., senior sub. note, 7.75%, 07/15/14 USA USD 82,500 0.00100,000 Lamar Media Corp., senior sub. note, 7.25%, 01/01/13 USA USD 80,250 0.00100,000 Beverage Packaging Hold, Reg S, 8.00%, 12/15/16 LUX EUR 76,906 0.00
75,000 The Kroger Co., 6.40%, 08/15/17 USA USD 75,759 0.0075,000 Citigroup Inc., senior note, 5.50%, 04/11/13 USA USD 73,095 0.00
100,000 Dynegy Holdings Inc., senior note, 8.375%, 05/01/16 USA USD 71,500 0.0075,000 CVS Caremark Corp., senior note, 5.75%, 06/01/17 USA USD 70,725 0.00
FRANKL IN TEMPLETON INVESTMENT FUNDS
ç Templeton Global Total Return Fund ç
Schedule of Investments as of December 31, 2008 (continued)
(Currency ç USD)
Number of % of
shares or Description Country Trading Market net
face value code currency value assets
www.franklintempleton.lu Unaudited Semi-Annual Report 235
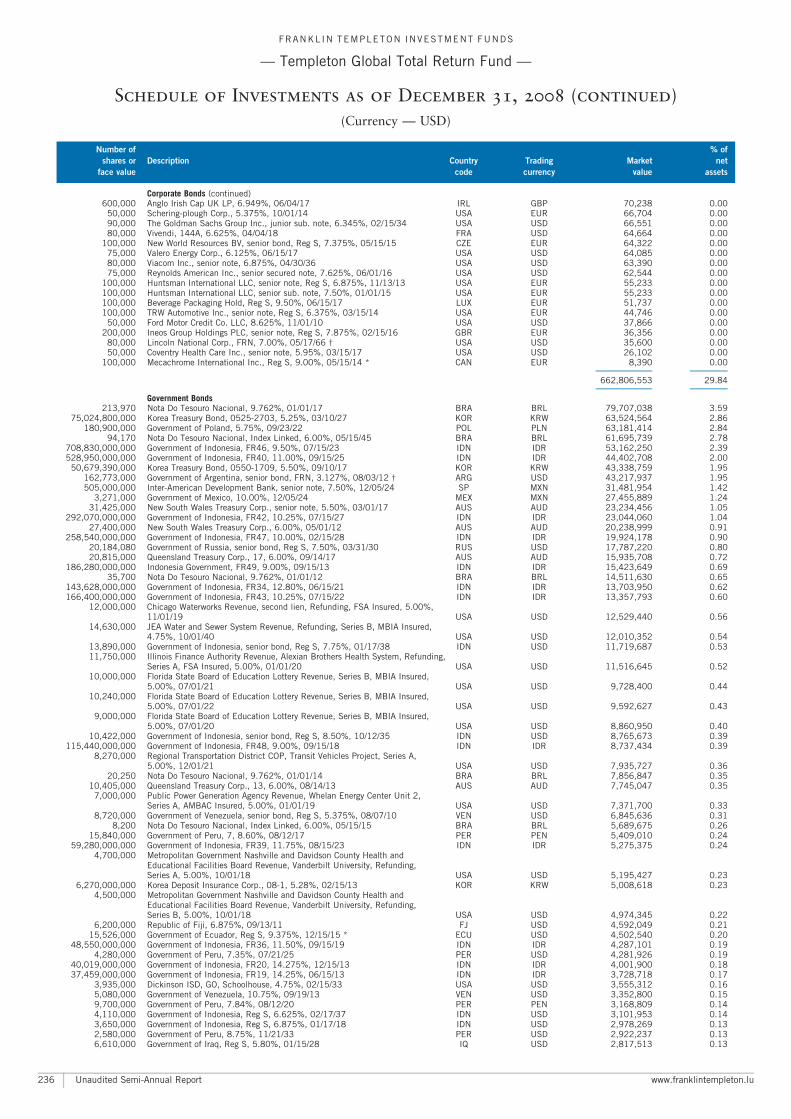
Corporate Bonds (continued)600,000 Anglo Irish Cap UK LP, 6.949%, 06/04/17 IRL GBP 70,238 0.00
50,000 Schering-plough Corp., 5.375%, 10/01/14 USA EUR 66,704 0.0090,000 The Goldman Sachs Group Inc., junior sub. note, 6.345%, 02/15/34 USA USD 66,551 0.0080,000 Vivendi, 144A, 6.625%, 04/04/18 FRA USD 64,664 0.00
100,000 New World Resources BV, senior bond, Reg S, 7.375%, 05/15/15 CZE EUR 64,322 0.0075,000 Valero Energy Corp., 6.125%, 06/15/17 USA USD 64,085 0.0080,000 Viacom Inc., senior note, 6.875%, 04/30/36 USA USD 63,390 0.0075,000 Reynolds American Inc., senior secured note, 7.625%, 06/01/16 USA USD 62,544 0.00
100,000 Huntsman International LLC, senior note, Reg S, 6.875%, 11/13/13 USA EUR 55,233 0.00100,000 Huntsman International LLC, senior sub. note, 7.50%, 01/01/15 USA EUR 55,233 0.00100,000 Beverage Packaging Hold, Reg S, 9.50%, 06/15/17 LUX EUR 51,737 0.00100,000 TRW Automotive Inc., senior note, Reg S, 6.375%, 03/15/14 USA EUR 44,746 0.00
50,000 Ford Motor Credit Co. LLC, 8.625%, 11/01/10 USA USD 37,866 0.00200,000 Ineos Group Holdings PLC, senior note, Reg S, 7.875%, 02/15/16 GBR EUR 36,356 0.00
80,000 Lincoln National Corp., FRN, 7.00%, 05/17/66 � USA USD 35,600 0.0050,000 Coventry Health Care Inc., senior note, 5.95%, 03/15/17 USA USD 26,102 0.00
100,000 Mecachrome International Inc., Reg S, 9.00%, 05/15/14 * CAN EUR 8,390 0.00A A
662,806,553 29.84A A
Government Bonds213,970 Nota Do Tesouro Nacional, 9.762%, 01/01/17 BRA BRL 79,707,038 3.59
75,024,800,000 Korea Treasury Bond, 0525-2703, 5.25%, 03/10/27 KOR KRW 63,524,564 2.86180,900,000 Government of Poland, 5.75%, 09/23/22 POL PLN 63,181,414 2.84
94,170 Nota Do Tesouro Nacional, Index Linked, 6.00%, 05/15/45 BRA BRL 61,695,739 2.78708,830,000,000 Government of Indonesia, FR46, 9.50%, 07/15/23 IDN IDR 53,162,250 2.39528,950,000,000 Government of Indonesia, FR40, 11.00%, 09/15/25 IDN IDR 44,402,708 2.00
50,679,390,000 Korea Treasury Bond, 0550-1709, 5.50%, 09/10/17 KOR KRW 43,338,759 1.95162,773,000 Government of Argentina, senior bond, FRN, 3.127%, 08/03/12 � ARG USD 43,217,937 1.95505,000,000 Inter-American Development Bank, senior note, 7.50%, 12/05/24 SP MXN 31,481,954 1.42
3,271,000 Government of Mexico, 10.00%, 12/05/24 MEX MXN 27,455,889 1.2431,425,000 New South Wales Treasury Corp., senior note, 5.50%, 03/01/17 AUS AUD 23,234,456 1.05
292,070,000,000 Government of Indonesia, FR42, 10.25%, 07/15/27 IDN IDR 23,044,060 1.0427,400,000 New South Wales Treasury Corp., 6.00%, 05/01/12 AUS AUD 20,238,999 0.91
258,540,000,000 Government of Indonesia, FR47, 10.00%, 02/15/28 IDN IDR 19,924,178 0.9020,184,080 Government of Russia, senior bond, Reg S, 7.50%, 03/31/30 RUS USD 17,787,220 0.8020,815,000 Queensland Treasury Corp., 17, 6.00%, 09/14/17 AUS AUD 15,935,708 0.72
186,280,000,000 Indonesia Government, FR49, 9.00%, 09/15/13 IDN IDR 15,423,649 0.6935,700 Nota Do Tesouro Nacional, 9.762%, 01/01/12 BRA BRL 14,511,630 0.65
143,628,000,000 Government of Indonesia, FR34, 12.80%, 06/15/21 IDN IDR 13,703,950 0.62166,400,000,000 Government of Indonesia, FR43, 10.25%, 07/15/22 IDN IDR 13,357,793 0.60
12,000,000 Chicago Waterworks Revenue, second lien, Refunding, FSA Insured, 5.00%,11/01/19 USA USD 12,529,440 0.56
14,630,000 JEA Water and Sewer System Revenue, Refunding, Series B, MBIA Insured,4.75%, 10/01/40 USA USD 12,010,352 0.54
13,890,000 Government of Indonesia, senior bond, Reg S, 7.75%, 01/17/38 IDN USD 11,719,687 0.5311,750,000 Illinois Finance Authority Revenue, Alexian Brothers Health System, Refunding,
Series A, FSA Insured, 5.00%, 01/01/20 USA USD 11,516,645 0.5210,000,000 Florida State Board of Education Lottery Revenue, Series B, MBIA Insured,
5.00%, 07/01/21 USA USD 9,728,400 0.4410,240,000 Florida State Board of Education Lottery Revenue, Series B, MBIA Insured,
5.00%, 07/01/22 USA USD 9,592,627 0.439,000,000 Florida State Board of Education Lottery Revenue, Series B, MBIA Insured,
5.00%, 07/01/20 USA USD 8,860,950 0.4010,422,000 Government of Indonesia, senior bond, Reg S, 8.50%, 10/12/35 IDN USD 8,765,673 0.39
115,440,000,000 Government of Indonesia, FR48, 9.00%, 09/15/18 IDN IDR 8,737,434 0.398,270,000 Regional Transportation District COP, Transit Vehicles Project, Series A,
5.00%, 12/01/21 USA USD 7,935,727 0.3620,250 Nota Do Tesouro Nacional, 9.762%, 01/01/14 BRA BRL 7,856,847 0.35
10,405,000 Queensland Treasury Corp., 13, 6.00%, 08/14/13 AUS AUD 7,745,047 0.357,000,000 Public Power Generation Agency Revenue, Whelan Energy Center Unit 2,
Series A, AMBAC Insured, 5.00%, 01/01/19 USA USD 7,371,700 0.338,720,000 Government of Venezuela, senior bond, Reg S, 5.375%, 08/07/10 VEN USD 6,845,636 0.31
8,200 Nota Do Tesouro Nacional, Index Linked, 6.00%, 05/15/15 BRA BRL 5,689,675 0.2615,840,000 Government of Peru, 7, 8.60%, 08/12/17 PER PEN 5,409,010 0.24
59,280,000,000 Government of Indonesia, FR39, 11.75%, 08/15/23 IDN IDR 5,275,375 0.244,700,000 Metropolitan Government Nashville and Davidson County Health and
Educational Facilities Board Revenue, Vanderbilt University, Refunding,Series A, 5.00%, 10/01/18 USA USD 5,195,427 0.23
6,270,000,000 Korea Deposit Insurance Corp., 08-1, 5.28%, 02/15/13 KOR KRW 5,008,618 0.234,500,000 Metropolitan Government Nashville and Davidson County Health and
Educational Facilities Board Revenue, Vanderbilt University, Refunding,Series B, 5.00%, 10/01/18 USA USD 4,974,345 0.22
6,200,000 Republic of Fiji, 6.875%, 09/13/11 FJ USD 4,592,049 0.2115,526,000 Government of Ecuador, Reg S, 9.375%, 12/15/15 * ECU USD 4,502,540 0.20
48,550,000,000 Government of Indonesia, FR36, 11.50%, 09/15/19 IDN IDR 4,287,101 0.194,280,000 Government of Peru, 7.35%, 07/21/25 PER USD 4,281,926 0.19
40,019,000,000 Government of Indonesia, FR20, 14.275%, 12/15/13 IDN IDR 4,001,900 0.1837,459,000,000 Government of Indonesia, FR19, 14.25%, 06/15/13 IDN IDR 3,728,718 0.17
3,935,000 Dickinson ISD, GO, Schoolhouse, 4.75%, 02/15/33 USA USD 3,555,312 0.165,080,000 Government of Venezuela, 10.75%, 09/19/13 VEN USD 3,352,800 0.159,700,000 Government of Peru, 7.84%, 08/12/20 PER PEN 3,168,809 0.144,110,000 Government of Indonesia, Reg S, 6.625%, 02/17/37 IDN USD 3,101,953 0.143,650,000 Government of Indonesia, Reg S, 6.875%, 01/17/18 IDN USD 2,978,269 0.132,580,000 Government of Peru, 8.75%, 11/21/33 PER USD 2,922,237 0.136,610,000 Government of Iraq, Reg S, 5.80%, 01/15/28 IQ USD 2,817,513 0.13
FRANKL IN TEMPLETON INVESTMENT FUNDS
ç Templeton Global Total Return Fund ç
Schedule of Investments as of December 31, 2008 (continued)
(Currency ç USD)
Number of % of
shares or Description Country Trading Market net
face value code currency value assets
Unaudited Semi-Annual Report www.franklintempleton.lu236
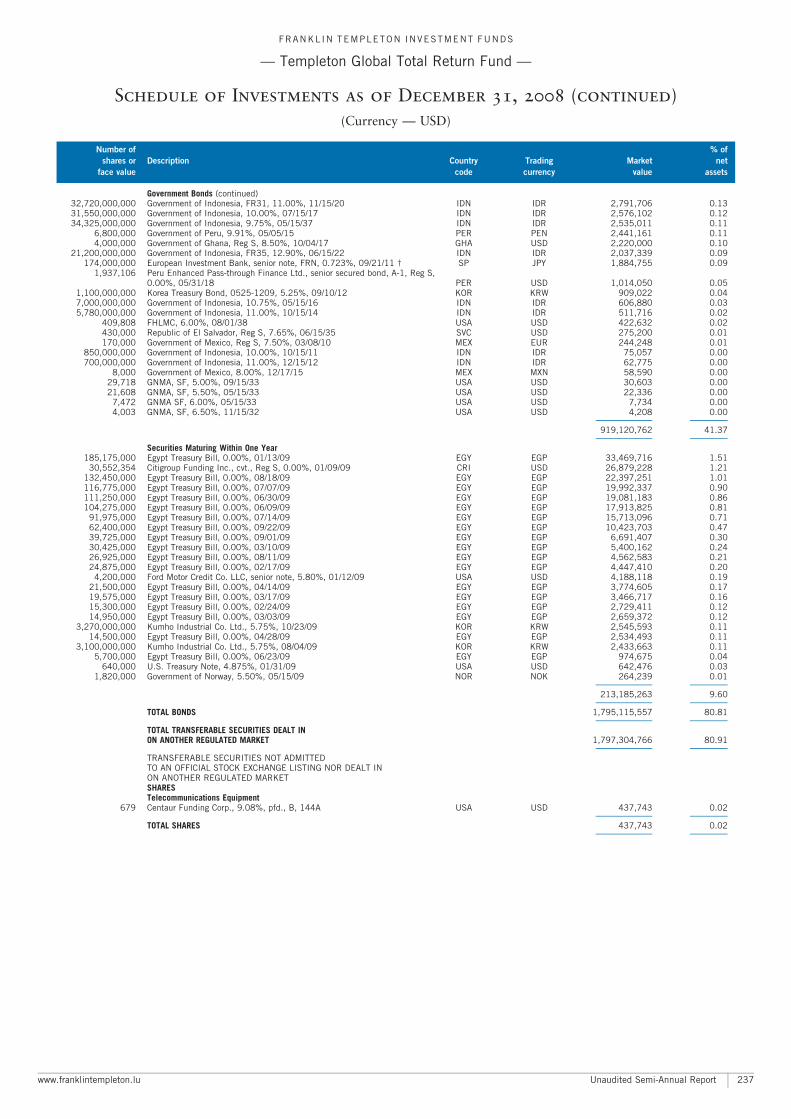
Government Bonds (continued)32,720,000,000 Government of Indonesia, FR31, 11.00%, 11/15/20 IDN IDR 2,791,706 0.1331,550,000,000 Government of Indonesia, 10.00%, 07/15/17 IDN IDR 2,576,102 0.1234,325,000,000 Government of Indonesia, 9.75%, 05/15/37 IDN IDR 2,535,011 0.11
6,800,000 Government of Peru, 9.91%, 05/05/15 PER PEN 2,441,161 0.114,000,000 Government of Ghana, Reg S, 8.50%, 10/04/17 GHA USD 2,220,000 0.10
21,200,000,000 Government of Indonesia, FR35, 12.90%, 06/15/22 IDN IDR 2,037,339 0.09174,000,000 European Investment Bank, senior note, FRN, 0.723%, 09/21/11 � SP JPY 1,884,755 0.09
1,937,106 Peru Enhanced Pass-through Finance Ltd., senior secured bond, A-1, Reg S,0.00%, 05/31/18 PER USD 1,014,050 0.05
1,100,000,000 Korea Treasury Bond, 0525-1209, 5.25%, 09/10/12 KOR KRW 909,022 0.047,000,000,000 Government of Indonesia, 10.75%, 05/15/16 IDN IDR 606,880 0.035,780,000,000 Government of Indonesia, 11.00%, 10/15/14 IDN IDR 511,716 0.02
409,808 FHLMC, 6.00%, 08/01/38 USA USD 422,632 0.02430,000 Republic of El Salvador, Reg S, 7.65%, 06/15/35 SVC USD 275,200 0.01170,000 Government of Mexico, Reg S, 7.50%, 03/08/10 MEX EUR 244,248 0.01
850,000,000 Government of Indonesia, 10.00%, 10/15/11 IDN IDR 75,057 0.00700,000,000 Government of Indonesia, 11.00%, 12/15/12 IDN IDR 62,775 0.00
8,000 Government of Mexico, 8.00%, 12/17/15 MEX MXN 58,590 0.0029,718 GNMA, SF, 5.00%, 09/15/33 USA USD 30,603 0.0021,608 GNMA, SF, 5.50%, 05/15/33 USA USD 22,336 0.00
7,472 GNMA SF, 6.00%, 05/15/33 USA USD 7,734 0.004,003 GNMA, SF, 6.50%, 11/15/32 USA USD 4,208 0.00
A A
919,120,762 41.37A A
Securities Maturing Within One Year185,175,000 Egypt Treasury Bill, 0.00%, 01/13/09 EGY EGP 33,469,716 1.51
30,552,354 Citigroup Funding Inc., cvt., Reg S, 0.00%, 01/09/09 CRI USD 26,879,228 1.21132,450,000 Egypt Treasury Bill, 0.00%, 08/18/09 EGY EGP 22,397,251 1.01116,775,000 Egypt Treasury Bill, 0.00%, 07/07/09 EGY EGP 19,992,337 0.90111,250,000 Egypt Treasury Bill, 0.00%, 06/30/09 EGY EGP 19,081,183 0.86104,275,000 Egypt Treasury Bill, 0.00%, 06/09/09 EGY EGP 17,913,825 0.81
91,975,000 Egypt Treasury Bill, 0.00%, 07/14/09 EGY EGP 15,713,096 0.7162,400,000 Egypt Treasury Bill, 0.00%, 09/22/09 EGY EGP 10,423,703 0.4739,725,000 Egypt Treasury Bill, 0.00%, 09/01/09 EGY EGP 6,691,407 0.3030,425,000 Egypt Treasury Bill, 0.00%, 03/10/09 EGY EGP 5,400,162 0.2426,925,000 Egypt Treasury Bill, 0.00%, 08/11/09 EGY EGP 4,562,583 0.2124,875,000 Egypt Treasury Bill, 0.00%, 02/17/09 EGY EGP 4,447,410 0.20
4,200,000 Ford Motor Credit Co. LLC, senior note, 5.80%, 01/12/09 USA USD 4,188,118 0.1921,500,000 Egypt Treasury Bill, 0.00%, 04/14/09 EGY EGP 3,774,605 0.1719,575,000 Egypt Treasury Bill, 0.00%, 03/17/09 EGY EGP 3,466,717 0.1615,300,000 Egypt Treasury Bill, 0.00%, 02/24/09 EGY EGP 2,729,411 0.1214,950,000 Egypt Treasury Bill, 0.00%, 03/03/09 EGY EGP 2,659,372 0.12
3,270,000,000 Kumho Industrial Co. Ltd., 5.75%, 10/23/09 KOR KRW 2,545,593 0.1114,500,000 Egypt Treasury Bill, 0.00%, 04/28/09 EGY EGP 2,534,493 0.11
3,100,000,000 Kumho Industrial Co. Ltd., 5.75%, 08/04/09 KOR KRW 2,433,663 0.115,700,000 Egypt Treasury Bill, 0.00%, 06/23/09 EGY EGP 974,675 0.04
640,000 U.S. Treasury Note, 4.875%, 01/31/09 USA USD 642,476 0.031,820,000 Government of Norway, 5.50%, 05/15/09 NOR NOK 264,239 0.01
A A
213,185,263 9.60A A
TOTAL BONDS 1,795,115,557 80.81A A
TOTAL TRANSFERABLE SECURITIES DEALT INON ANOTHER REGULATED MARKET 1,797,304,766 80.91
A A
TRANSFERABLE SECURITIES NOT ADMITTEDTO AN OFFICIAL STOCK EXCHANGE LISTING NOR DEALT INON ANOTHER REGULATED MARKETSHARESTelecommunications Equipment
679 Centaur Funding Corp., 9.08%, pfd., B, 144A USA USD 437,743 0.02A A
TOTAL SHARES 437,743 0.02A A
FRANKL IN TEMPLETON INVESTMENT FUNDS
ç Templeton Global Total Return Fund ç
Schedule of Investments as of December 31, 2008 (continued)
(Currency ç USD)
Number of % of
shares or Description Country Trading Market net
face value code currency value assets
www.franklintempleton.lu Unaudited Semi-Annual Report 237
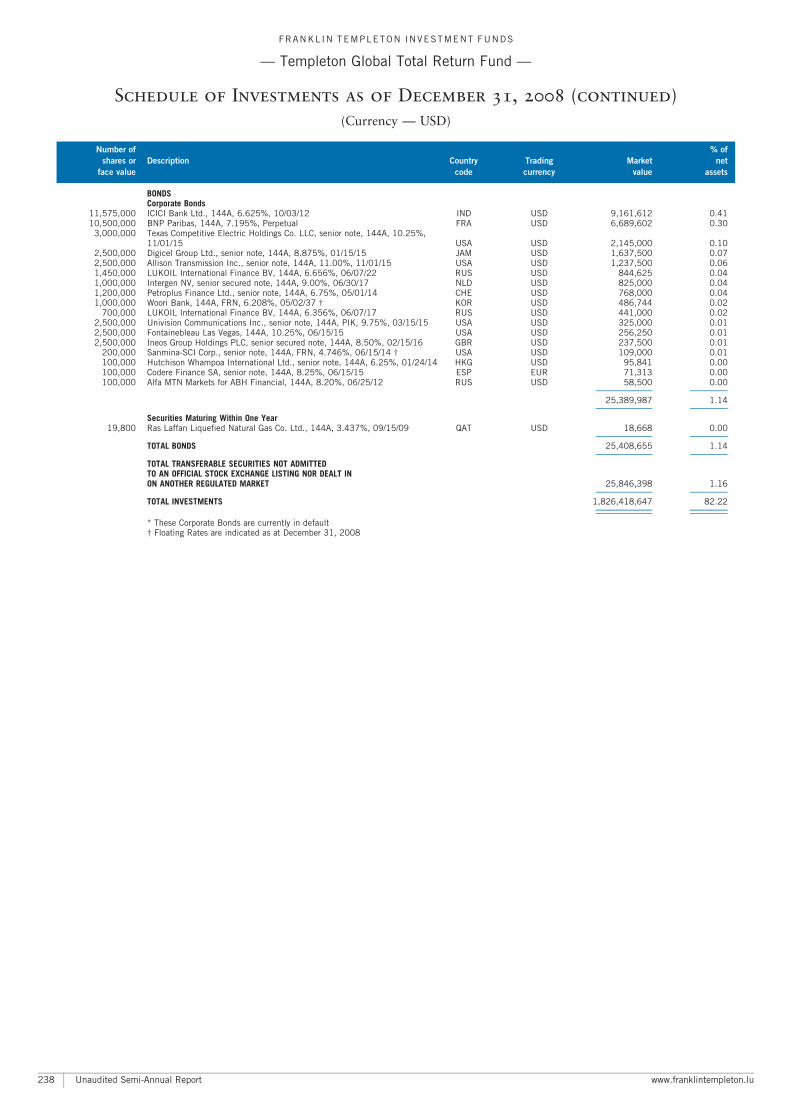
BONDSCorporate Bonds
11,575,000 ICICI Bank Ltd., 144A, 6.625%, 10/03/12 IND USD 9,161,612 0.4110,500,000 BNP Paribas, 144A, 7.195%, Perpetual FRA USD 6,689,602 0.30
3,000,000 Texas Competitive Electric Holdings Co. LLC, senior note, 144A, 10.25%,11/01/15 USA USD 2,145,000 0.10
2,500,000 Digicel Group Ltd., senior note, 144A, 8.875%, 01/15/15 JAM USD 1,637,500 0.072,500,000 Allison Transmission Inc., senior note, 144A, 11.00%, 11/01/15 USA USD 1,237,500 0.061,450,000 LUKOIL International Finance BV, 144A, 6.656%, 06/07/22 RUS USD 844,625 0.041,000,000 Intergen NV, senior secured note, 144A, 9.00%, 06/30/17 NLD USD 825,000 0.041,200,000 Petroplus Finance Ltd., senior note, 144A, 6.75%, 05/01/14 CHE USD 768,000 0.041,000,000 Woori Bank, 144A, FRN, 6.208%, 05/02/37 � KOR USD 486,744 0.02
700,000 LUKOIL International Finance BV, 144A, 6.356%, 06/07/17 RUS USD 441,000 0.022,500,000 Univision Communications Inc., senior note, 144A, PIK, 9.75%, 03/15/15 USA USD 325,000 0.012,500,000 Fontainebleau Las Vegas, 144A, 10.25%, 06/15/15 USA USD 256,250 0.012,500,000 Ineos Group Holdings PLC, senior secured note, 144A, 8.50%, 02/15/16 GBR USD 237,500 0.01
200,000 Sanmina-SCI Corp., senior note, 144A, FRN, 4.746%, 06/15/14 � USA USD 109,000 0.01100,000 Hutchison Whampoa International Ltd., senior note, 144A, 6.25%, 01/24/14 HKG USD 95,841 0.00100,000 Codere Finance SA, senior note, 144A, 8.25%, 06/15/15 ESP EUR 71,313 0.00100,000 Alfa MTN Markets for ABH Financial, 144A, 8.20%, 06/25/12 RUS USD 58,500 0.00
A A
25,389,987 1.14A A
Securities Maturing Within One Year19,800 Ras Laffan Liquefied Natural Gas Co. Ltd., 144A, 3.437%, 09/15/09 QAT USD 18,668 0.00
A A
TOTAL BONDS 25,408,655 1.14A A
TOTAL TRANSFERABLE SECURITIES NOT ADMITTEDTO AN OFFICIAL STOCK EXCHANGE LISTING NOR DEALT INON ANOTHER REGULATED MARKET 25,846,398 1.16
A A
TOTAL INVESTMENTS 1,826,418,647 82.22A A
A A
* These Corporate Bonds are currently in default� Floating Rates are indicated as at December 31, 2008
FRANKL IN TEMPLETON INVESTMENT FUNDS
ç Templeton Global Total Return Fund ç
Schedule of Investments as of December 31, 2008 (continued)
(Currency ç USD)
Number of % of
shares or Description Country Trading Market net
face value code currency value assets
Unaudited Semi-Annual Report www.franklintempleton.lu238
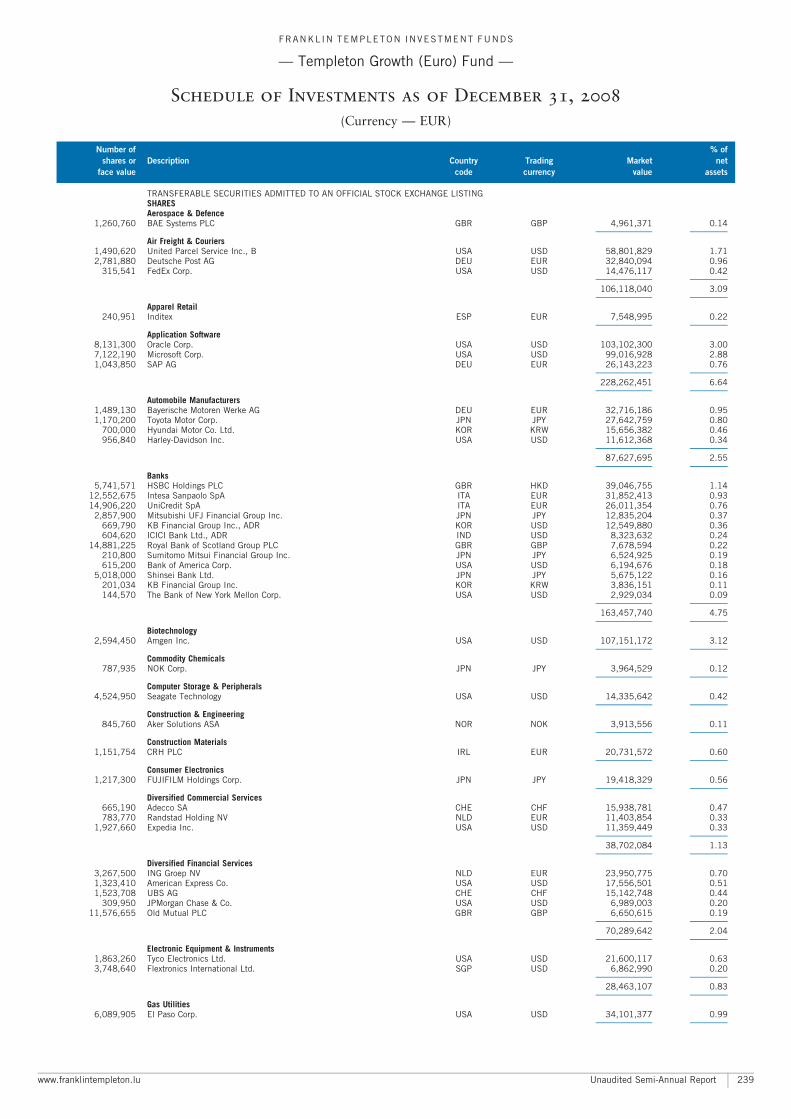
TRANSFERABLE SECURITIES ADMITTED TO AN OFFICIAL STOCK EXCHANGE LISTINGSHARESAerospace & Defence
1,260,760 BAE Systems PLC GBR GBP 4,961,371 0.14A A
Air Freight & Couriers1,490,620 United Parcel Service Inc., B USA USD 58,801,829 1.712,781,880 Deutsche Post AG DEU EUR 32,840,094 0.96
315,541 FedEx Corp. USA USD 14,476,117 0.42A A
106,118,040 3.09A A
Apparel Retail240,951 Inditex ESP EUR 7,548,995 0.22
A A
Application Software8,131,300 Oracle Corp. USA USD 103,102,300 3.007,122,190 Microsoft Corp. USA USD 99,016,928 2.881,043,850 SAP AG DEU EUR 26,143,223 0.76
A A
228,262,451 6.64A A
Automobile Manufacturers1,489,130 Bayerische Motoren Werke AG DEU EUR 32,716,186 0.951,170,200 Toyota Motor Corp. JPN JPY 27,642,759 0.80
700,000 Hyundai Motor Co. Ltd. KOR KRW 15,656,382 0.46956,840 Harley-Davidson Inc. USA USD 11,612,368 0.34
A A
87,627,695 2.55A A
Banks5,741,571 HSBC Holdings PLC GBR HKD 39,046,755 1.14
12,552,675 Intesa Sanpaolo SpA ITA EUR 31,852,413 0.9314,906,220 UniCredit SpA ITA EUR 26,011,354 0.76
2,857,900 Mitsubishi UFJ Financial Group Inc. JPN JPY 12,835,204 0.37669,790 KB Financial Group Inc., ADR KOR USD 12,549,880 0.36604,620 ICICI Bank Ltd., ADR IND USD 8,323,632 0.24
14,881,225 Royal Bank of Scotland Group PLC GBR GBP 7,678,594 0.22210,800 Sumitomo Mitsui Financial Group Inc. JPN JPY 6,524,925 0.19615,200 Bank of America Corp. USA USD 6,194,676 0.18
5,018,000 Shinsei Bank Ltd. JPN JPY 5,675,122 0.16201,034 KB Financial Group Inc. KOR KRW 3,836,151 0.11144,570 The Bank of New York Mellon Corp. USA USD 2,929,034 0.09
A A
163,457,740 4.75A A
Biotechnology2,594,450 Amgen Inc. USA USD 107,151,172 3.12
A A
Commodity Chemicals787,935 NOK Corp. JPN JPY 3,964,529 0.12
A A
Computer Storage & Peripherals4,524,950 Seagate Technology USA USD 14,335,642 0.42
A A
Construction & Engineering845,760 Aker Solutions ASA NOR NOK 3,913,556 0.11
A A
Construction Materials1,151,754 CRH PLC IRL EUR 20,731,572 0.60
A A
Consumer Electronics1,217,300 FUJIFILM Holdings Corp. JPN JPY 19,418,329 0.56
A A
Diversified Commercial Services665,190 Adecco SA CHE CHF 15,938,781 0.47783,770 Randstad Holding NV NLD EUR 11,403,854 0.33
1,927,660 Expedia Inc. USA USD 11,359,449 0.33A A
38,702,084 1.13A A
Diversified Financial Services3,267,500 ING Groep NV NLD EUR 23,950,775 0.701,323,410 American Express Co. USA USD 17,556,501 0.511,523,708 UBS AG CHE CHF 15,142,748 0.44
309,950 JPMorgan Chase & Co. USA USD 6,989,003 0.2011,576,655 Old Mutual PLC GBR GBP 6,650,615 0.19
A A
70,289,642 2.04A A
Electronic Equipment & Instruments1,863,260 Tyco Electronics Ltd. USA USD 21,600,117 0.633,748,640 Flextronics International Ltd. SGP USD 6,862,990 0.20
A A
28,463,107 0.83A A
Gas Utilities6,089,905 El Paso Corp. USA USD 34,101,377 0.99
A A
FRANKL IN TEMPLETON INVESTMENT FUNDS
ç Templeton Growth (Euro) Fund ç
Schedule of Investments as of December 31, 2008
(Currency ç EUR)
Number of % of
shares or Description Country Trading Market net
face value code currency value assets
www.franklintempleton.lu Unaudited Semi-Annual Report 239
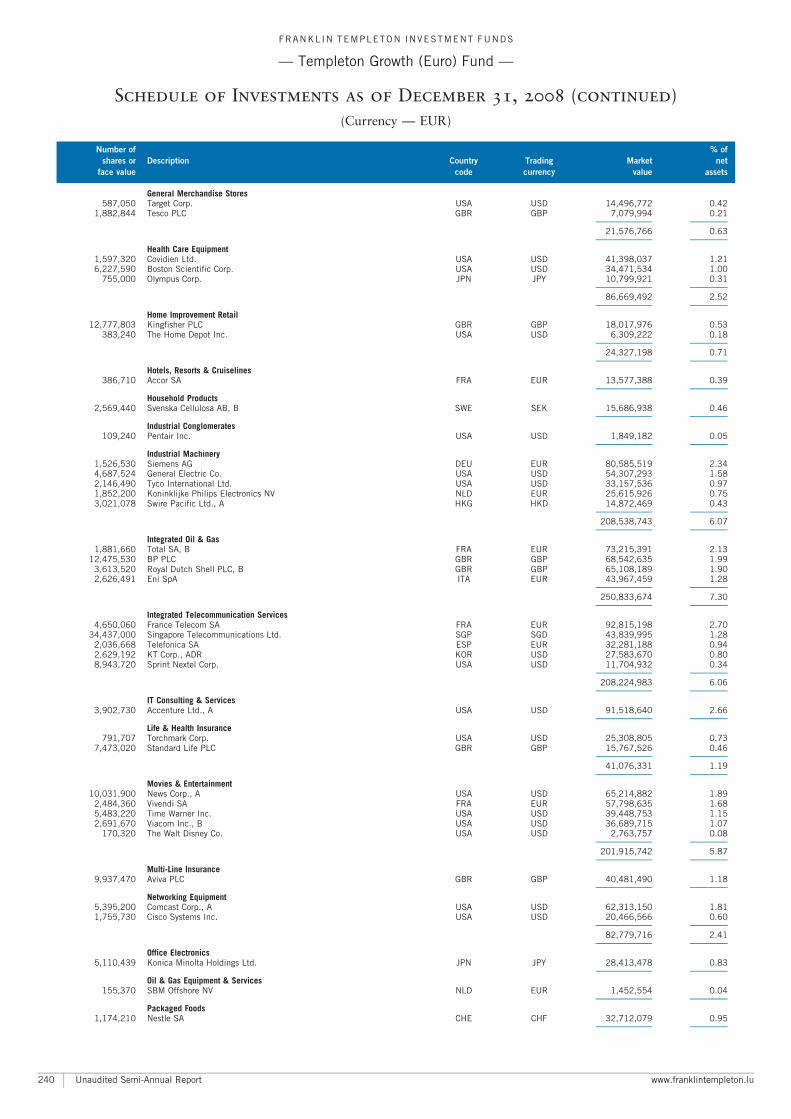
General Merchandise Stores587,050 Target Corp. USA USD 14,496,772 0.42
1,882,844 Tesco PLC GBR GBP 7,079,994 0.21A A
21,576,766 0.63A A
Health Care Equipment1,597,320 Covidien Ltd. USA USD 41,398,037 1.216,227,590 Boston Scientific Corp. USA USD 34,471,534 1.00
755,000 Olympus Corp. JPN JPY 10,799,921 0.31A A
86,669,492 2.52A A
Home Improvement Retail12,777,803 Kingfisher PLC GBR GBP 18,017,976 0.53
383,240 The Home Depot Inc. USA USD 6,309,222 0.18A A
24,327,198 0.71A A
Hotels, Resorts & Cruiselines386,710 Accor SA FRA EUR 13,577,388 0.39
A A
Household Products2,569,440 Svenska Cellulosa AB, B SWE SEK 15,686,938 0.46
A A
Industrial Conglomerates109,240 Pentair Inc. USA USD 1,849,182 0.05
A A
Industrial Machinery1,526,530 Siemens AG DEU EUR 80,585,519 2.344,687,524 General Electric Co. USA USD 54,307,293 1.582,146,490 Tyco International Ltd. USA USD 33,157,536 0.971,852,200 Koninklijke Philips Electronics NV NLD EUR 25,615,926 0.753,021,078 Swire Pacific Ltd., A HKG HKD 14,872,469 0.43
A A
208,538,743 6.07A A
Integrated Oil & Gas1,881,660 Total SA, B FRA EUR 73,215,391 2.13
12,475,530 BP PLC GBR GBP 68,542,635 1.993,613,520 Royal Dutch Shell PLC, B GBR GBP 65,108,189 1.902,626,491 Eni SpA ITA EUR 43,967,459 1.28
A A
250,833,674 7.30A A
Integrated Telecommunication Services4,650,060 France Telecom SA FRA EUR 92,815,198 2.70
34,437,000 Singapore Telecommunications Ltd. SGP SGD 43,839,995 1.282,036,668 Telefonica SA ESP EUR 32,281,188 0.942,629,192 KT Corp., ADR KOR USD 27,583,670 0.808,943,720 Sprint Nextel Corp. USA USD 11,704,932 0.34
A A
208,224,983 6.06A A
IT Consulting & Services3,902,730 Accenture Ltd., A USA USD 91,518,640 2.66
A A
Life & Health Insurance791,707 Torchmark Corp. USA USD 25,308,805 0.73
7,473,020 Standard Life PLC GBR GBP 15,767,526 0.46A A
41,076,331 1.19A A
Movies & Entertainment10,031,900 News Corp., A USA USD 65,214,882 1.89
2,484,360 Vivendi SA FRA EUR 57,798,635 1.685,483,220 Time Warner Inc. USA USD 39,448,753 1.152,691,670 Viacom Inc., B USA USD 36,689,715 1.07
170,320 The Walt Disney Co. USA USD 2,763,757 0.08A A
201,915,742 5.87A A
Multi-Line Insurance9,937,470 Aviva PLC GBR GBP 40,481,490 1.18
A A
Networking Equipment5,395,200 Comcast Corp., A USA USD 62,313,150 1.811,755,730 Cisco Systems Inc. USA USD 20,466,566 0.60
A A
82,779,716 2.41A A
Office Electronics5,110,439 Konica Minolta Holdings Ltd. JPN JPY 28,413,478 0.83
A A
Oil & Gas Equipment & Services155,370 SBM Offshore NV NLD EUR 1,452,554 0.04
A A
Packaged Foods1,174,210 Nestle SA CHE CHF 32,712,079 0.95
A A
FRANKL IN TEMPLETON INVESTMENT FUNDS
ç Templeton Growth (Euro) Fund ç
Schedule of Investments as of December 31, 2008 (continued)
(Currency ç EUR)
Number of % of
shares or Description Country Trading Market net
face value code currency value assets
Unaudited Semi-Annual Report www.franklintempleton.lu240
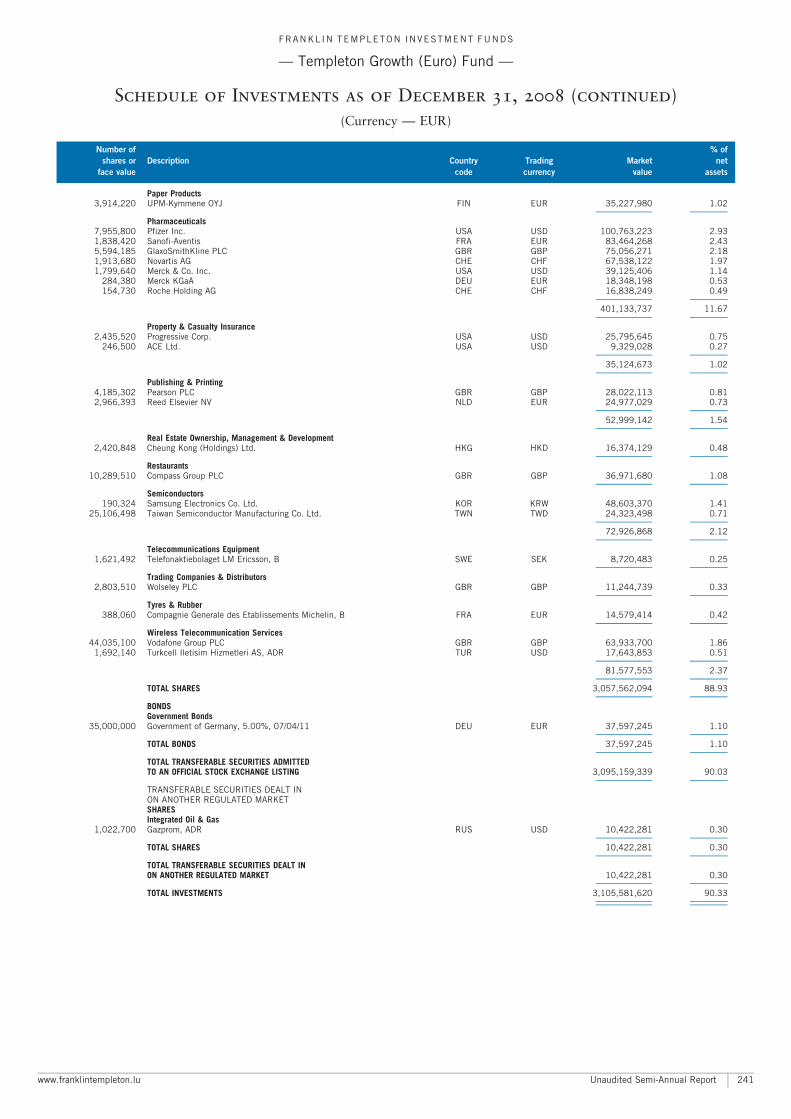
Paper Products3,914,220 UPM-Kymmene OYJ FIN EUR 35,227,980 1.02
A A
Pharmaceuticals7,955,800 Pfizer Inc. USA USD 100,763,223 2.931,838,420 Sanofi-Aventis FRA EUR 83,464,268 2.435,594,185 GlaxoSmithKline PLC GBR GBP 75,056,271 2.181,913,680 Novartis AG CHE CHF 67,538,122 1.971,799,640 Merck & Co. Inc. USA USD 39,125,406 1.14
284,380 Merck KGaA DEU EUR 18,348,198 0.53154,730 Roche Holding AG CHE CHF 16,838,249 0.49
A A
401,133,737 11.67A A
Property & Casualty Insurance2,435,520 Progressive Corp. USA USD 25,795,645 0.75
246,500 ACE Ltd. USA USD 9,329,028 0.27A A
35,124,673 1.02A A
Publishing & Printing4,185,302 Pearson PLC GBR GBP 28,022,113 0.812,966,393 Reed Elsevier NV NLD EUR 24,977,029 0.73
A A
52,999,142 1.54A A
Real Estate Ownership, Management & Development2,420,848 Cheung Kong (Holdings) Ltd. HKG HKD 16,374,129 0.48
A A
Restaurants10,289,510 Compass Group PLC GBR GBP 36,971,680 1.08
A A
Semiconductors190,324 Samsung Electronics Co. Ltd. KOR KRW 48,603,370 1.41
25,106,498 Taiwan Semiconductor Manufacturing Co. Ltd. TWN TWD 24,323,498 0.71A A
72,926,868 2.12A A
Telecommunications Equipment1,621,492 Telefonaktiebolaget LM Ericsson, B SWE SEK 8,720,483 0.25
A A
Trading Companies & Distributors2,803,510 Wolseley PLC GBR GBP 11,244,739 0.33
A A
Tyres & Rubber388,060 Compagnie Generale des Etablissements Michelin, B FRA EUR 14,579,414 0.42
A A
Wireless Telecommunication Services44,035,100 Vodafone Group PLC GBR GBP 63,933,700 1.86
1,692,140 Turkcell Iletisim Hizmetleri AS, ADR TUR USD 17,643,853 0.51A A
81,577,553 2.37A A
TOTAL SHARES 3,057,562,094 88.93A A
BONDSGovernment Bonds
35,000,000 Government of Germany, 5.00%, 07/04/11 DEU EUR 37,597,245 1.10A A
TOTAL BONDS 37,597,245 1.10A A
TOTAL TRANSFERABLE SECURITIES ADMITTEDTO AN OFFICIAL STOCK EXCHANGE LISTING 3,095,159,339 90.03
A A
TRANSFERABLE SECURITIES DEALT INON ANOTHER REGULATED MARKETSHARESIntegrated Oil & Gas
1,022,700 Gazprom, ADR RUS USD 10,422,281 0.30A A
TOTAL SHARES 10,422,281 0.30A A
TOTAL TRANSFERABLE SECURITIES DEALT INON ANOTHER REGULATED MARKET 10,422,281 0.30
A A
TOTAL INVESTMENTS 3,105,581,620 90.33A A
A A
FRANKL IN TEMPLETON INVESTMENT FUNDS
ç Templeton Growth (Euro) Fund ç
Schedule of Investments as of December 31, 2008 (continued)
(Currency ç EUR)
Number of % of
shares or Description Country Trading Market net
face value code currency value assets
www.franklintempleton.lu Unaudited Semi-Annual Report 241
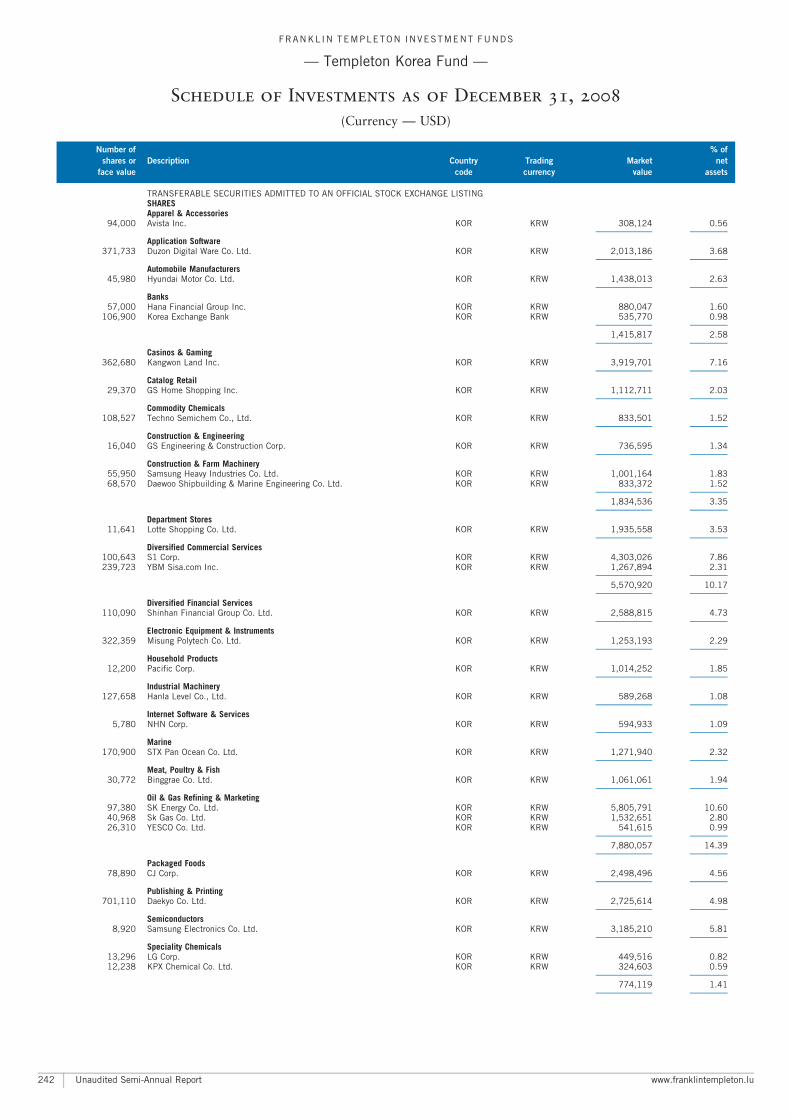
TRANSFERABLE SECURITIES ADMITTED TO AN OFFICIAL STOCK EXCHANGE LISTINGSHARESApparel & Accessories
94,000 Avista Inc. KOR KRW 308,124 0.56A A
Application Software371,733 Duzon Digital Ware Co. Ltd. KOR KRW 2,013,186 3.68
A A
Automobile Manufacturers45,980 Hyundai Motor Co. Ltd. KOR KRW 1,438,013 2.63
A A
Banks57,000 Hana Financial Group Inc. KOR KRW 880,047 1.60
106,900 Korea Exchange Bank KOR KRW 535,770 0.98A A
1,415,817 2.58A A
Casinos & Gaming362,680 Kangwon Land Inc. KOR KRW 3,919,701 7.16
A A
Catalog Retail29,370 GS Home Shopping Inc. KOR KRW 1,112,711 2.03
A A
Commodity Chemicals108,527 Techno Semichem Co., Ltd. KOR KRW 833,501 1.52
A A
Construction & Engineering16,040 GS Engineering & Construction Corp. KOR KRW 736,595 1.34
A A
Construction & Farm Machinery55,950 Samsung Heavy Industries Co. Ltd. KOR KRW 1,001,164 1.8368,570 Daewoo Shipbuilding & Marine Engineering Co. Ltd. KOR KRW 833,372 1.52
A A
1,834,536 3.35A A
Department Stores11,641 Lotte Shopping Co. Ltd. KOR KRW 1,935,558 3.53
A A
Diversified Commercial Services100,643 S1 Corp. KOR KRW 4,303,026 7.86239,723 YBM Sisa.com Inc. KOR KRW 1,267,894 2.31
A A
5,570,920 10.17A A
Diversified Financial Services110,090 Shinhan Financial Group Co. Ltd. KOR KRW 2,588,815 4.73
A A
Electronic Equipment & Instruments322,359 Misung Polytech Co. Ltd. KOR KRW 1,253,193 2.29
A A
Household Products12,200 Pacific Corp. KOR KRW 1,014,252 1.85
A A
Industrial Machinery127,658 Hanla Level Co., Ltd. KOR KRW 589,268 1.08
A A
Internet Software & Services5,780 NHN Corp. KOR KRW 594,933 1.09
A A
Marine170,900 STX Pan Ocean Co. Ltd. KOR KRW 1,271,940 2.32
A A
Meat, Poultry & Fish30,772 Binggrae Co. Ltd. KOR KRW 1,061,061 1.94
A A
Oil & Gas Refining & Marketing97,380 SK Energy Co. Ltd. KOR KRW 5,805,791 10.6040,968 Sk Gas Co. Ltd. KOR KRW 1,532,651 2.8026,310 YESCO Co. Ltd. KOR KRW 541,615 0.99
A A
7,880,057 14.39A A
Packaged Foods78,890 CJ Corp. KOR KRW 2,498,496 4.56
A A
Publishing & Printing701,110 Daekyo Co. Ltd. KOR KRW 2,725,614 4.98
A A
Semiconductors8,920 Samsung Electronics Co. Ltd. KOR KRW 3,185,210 5.81
A A
Speciality Chemicals13,296 LG Corp. KOR KRW 449,516 0.8212,238 KPX Chemical Co. Ltd. KOR KRW 324,603 0.59
A A
774,119 1.41A A
FRANKL IN TEMPLETON INVESTMENT FUNDS
ç Templeton Korea Fund ç
Schedule of Investments as of December 31, 2008
(Currency ç USD)
Number of % of
shares or Description Country Trading Market net
face value code currency value assets
Unaudited Semi-Annual Report www.franklintempleton.lu242
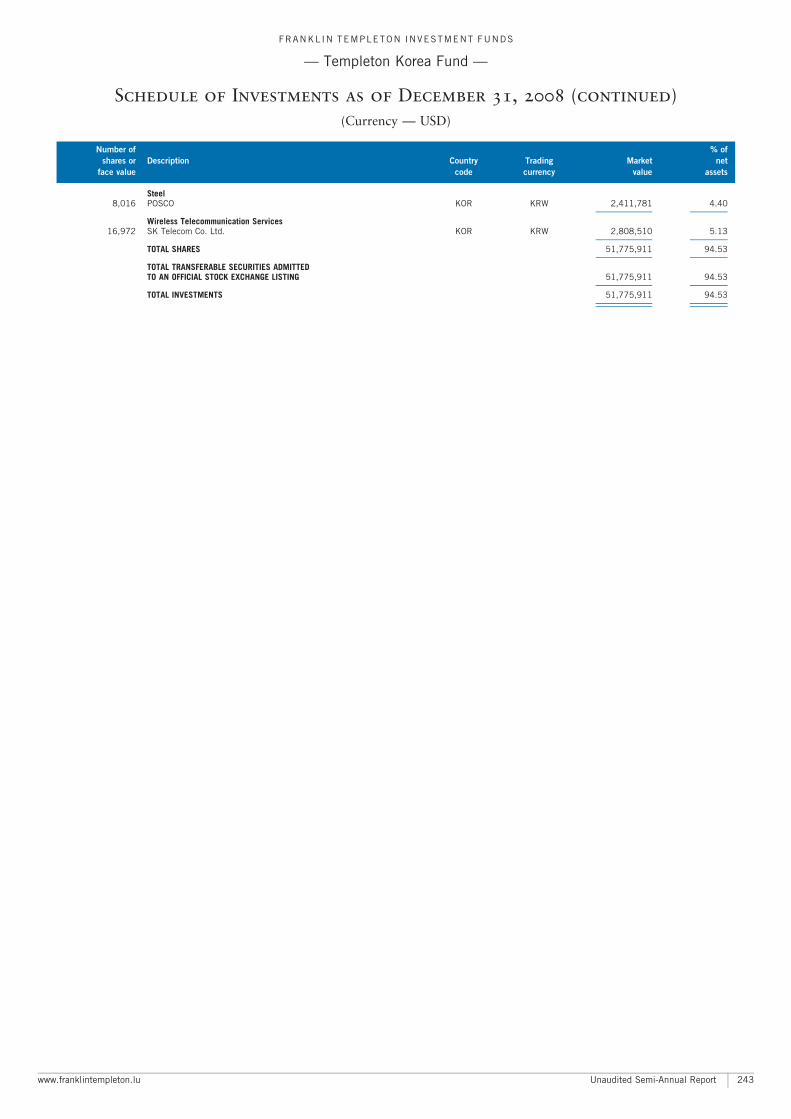
Steel8,016 POSCO KOR KRW 2,411,781 4.40
A A
Wireless Telecommunication Services16,972 SK Telecom Co. Ltd. KOR KRW 2,808,510 5.13
A A
TOTAL SHARES 51,775,911 94.53A A
TOTAL TRANSFERABLE SECURITIES ADMITTEDTO AN OFFICIAL STOCK EXCHANGE LISTING 51,775,911 94.53
A A
TOTAL INVESTMENTS 51,775,911 94.53A A
A A
FRANKL IN TEMPLETON INVESTMENT FUNDS
ç Templeton Korea Fund ç
Schedule of Investments as of December 31, 2008 (continued)
(Currency ç USD)
Number of % of
shares or Description Country Trading Market net
face value code currency value assets
www.franklintempleton.lu Unaudited Semi-Annual Report 243
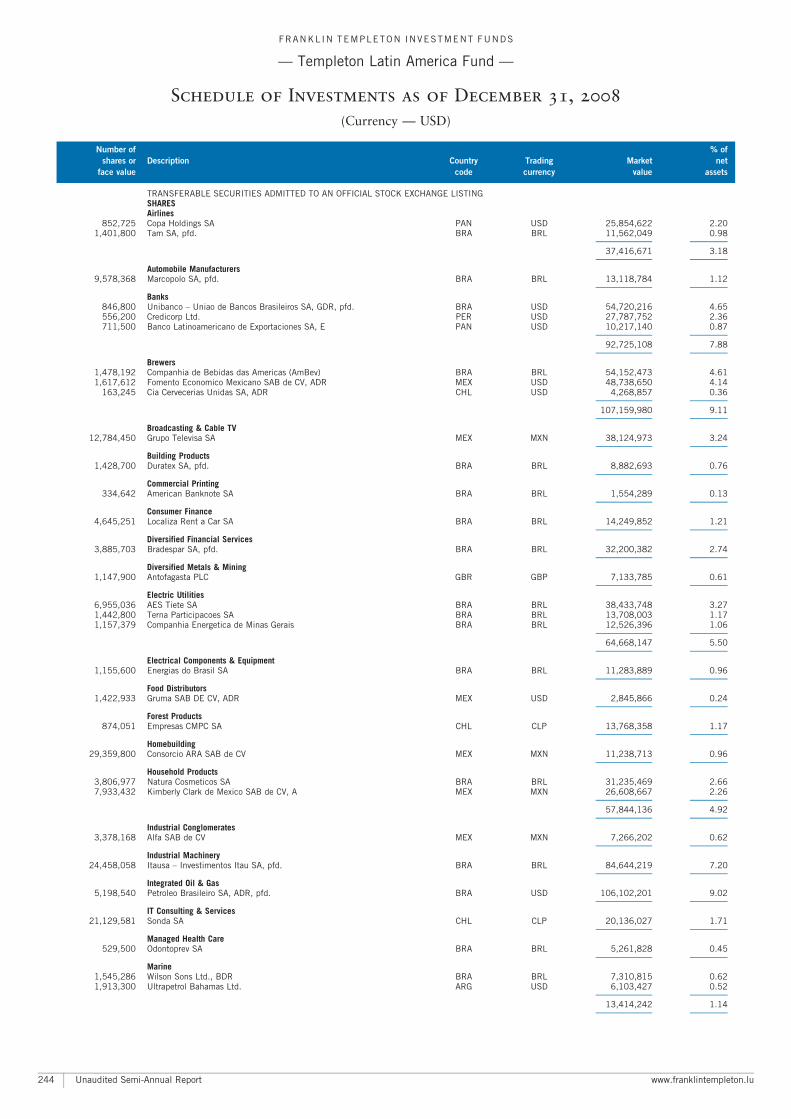
TRANSFERABLE SECURITIES ADMITTED TO AN OFFICIAL STOCK EXCHANGE LISTINGSHARESAirlines
852,725 Copa Holdings SA PAN USD 25,854,622 2.201,401,800 Tam SA, pfd. BRA BRL 11,562,049 0.98
A A
37,416,671 3.18A A
Automobile Manufacturers9,578,368 Marcopolo SA, pfd. BRA BRL 13,118,784 1.12
A A
Banks846,800 Unibanco ^ Uniao de Bancos Brasileiros SA, GDR, pfd. BRA USD 54,720,216 4.65556,200 Credicorp Ltd. PER USD 27,787,752 2.36711,500 Banco Latinoamericano de Exportaciones SA, E PAN USD 10,217,140 0.87
A A
92,725,108 7.88A A
Brewers1,478,192 Companhia de Bebidas das Americas (AmBev) BRA BRL 54,152,473 4.611,617,612 Fomento Economico Mexicano SAB de CV, ADR MEX USD 48,738,650 4.14
163,245 Cia Cervecerias Unidas SA, ADR CHL USD 4,268,857 0.36A A
107,159,980 9.11A A
Broadcasting & Cable TV12,784,450 Grupo Televisa SA MEX MXN 38,124,973 3.24
A A
Building Products1,428,700 Duratex SA, pfd. BRA BRL 8,882,693 0.76
A A
Commercial Printing334,642 American Banknote SA BRA BRL 1,554,289 0.13
A A
Consumer Finance4,645,251 Localiza Rent a Car SA BRA BRL 14,249,852 1.21
A A
Diversified Financial Services3,885,703 Bradespar SA, pfd. BRA BRL 32,200,382 2.74
A A
Diversified Metals & Mining1,147,900 Antofagasta PLC GBR GBP 7,133,785 0.61
A A
Electric Utilities6,955,036 AES Tiete SA BRA BRL 38,433,748 3.271,442,800 Terna Participacoes SA BRA BRL 13,708,003 1.171,157,379 Companhia Energetica de Minas Gerais BRA BRL 12,526,396 1.06
A A
64,668,147 5.50A A
Electrical Components & Equipment1,155,600 Energias do Brasil SA BRA BRL 11,283,889 0.96
A A
Food Distributors1,422,933 Gruma SAB DE CV, ADR MEX USD 2,845,866 0.24
A A
Forest Products874,051 Empresas CMPC SA CHL CLP 13,768,358 1.17
A A
Homebuilding29,359,800 Consorcio ARA SAB de CV MEX MXN 11,238,713 0.96
A A
Household Products3,806,977 Natura Cosmeticos SA BRA BRL 31,235,469 2.667,933,432 Kimberly Clark de Mexico SAB de CV, A MEX MXN 26,608,667 2.26
A A
57,844,136 4.92A A
Industrial Conglomerates3,378,168 Alfa SAB de CV MEX MXN 7,266,202 0.62
A A
Industrial Machinery24,458,058 Itausa ^ Investimentos Itau SA, pfd. BRA BRL 84,644,219 7.20
A A
Integrated Oil & Gas5,198,540 Petroleo Brasileiro SA, ADR, pfd. BRA USD 106,102,201 9.02
A A
IT Consulting & Services21,129,581 Sonda SA CHL CLP 20,136,027 1.71
A A
Managed Health Care529,500 Odontoprev SA BRA BRL 5,261,828 0.45
A A
Marine1,545,286 Wilson Sons Ltd., BDR BRA BRL 7,310,815 0.621,913,300 Ultrapetrol Bahamas Ltd. ARG USD 6,103,427 0.52
A A
13,414,242 1.14A A
FRANKL IN TEMPLETON INVESTMENT FUNDS
ç Templeton Latin America Fund ç
Schedule of Investments as of December 31, 2008
(Currency ç USD)
Number of % of
shares or Description Country Trading Market net
face value code currency value assets
Unaudited Semi-Annual Report www.franklintempleton.lu244
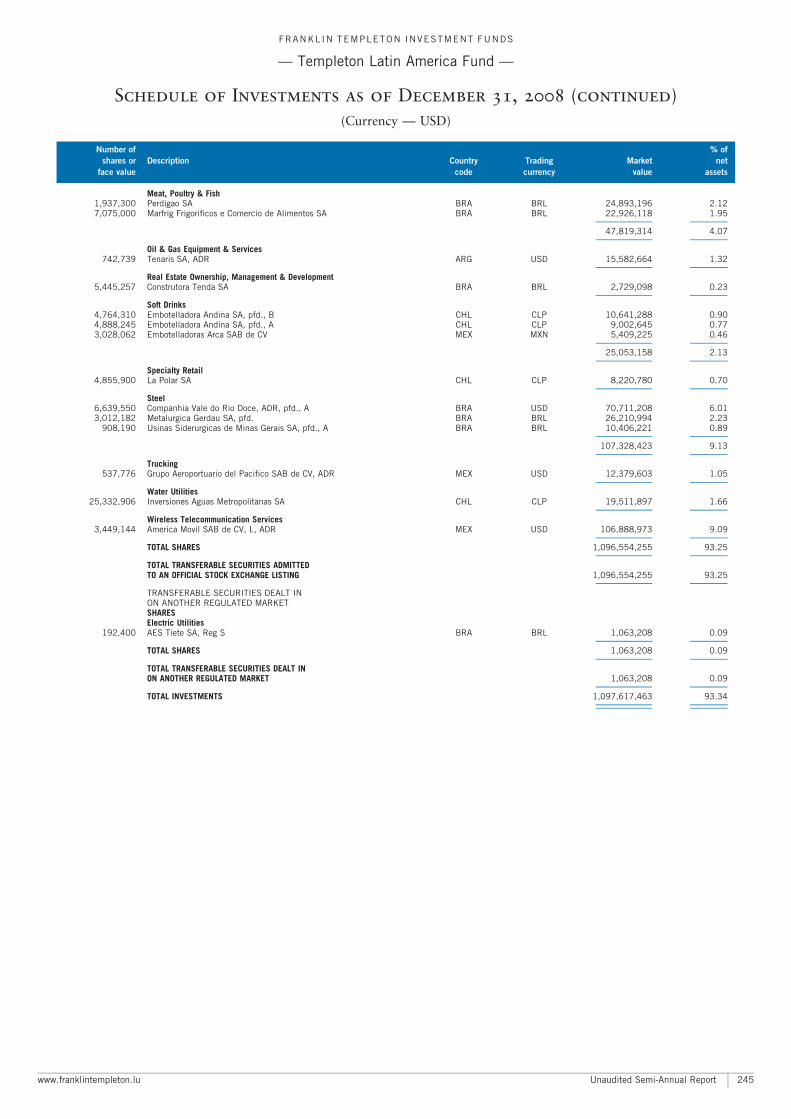
Meat, Poultry & Fish1,937,300 Perdigao SA BRA BRL 24,893,196 2.127,075,000 Marfrig Frigorificos e Comercio de Alimentos SA BRA BRL 22,926,118 1.95
A A
47,819,314 4.07A A
Oil & Gas Equipment & Services742,739 Tenaris SA, ADR ARG USD 15,582,664 1.32
A A
Real Estate Ownership, Management & Development5,445,257 Construtora Tenda SA BRA BRL 2,729,098 0.23
A A
Soft Drinks4,764,310 Embotelladora Andina SA, pfd., B CHL CLP 10,641,288 0.904,888,245 Embotelladora Andina SA, pfd., A CHL CLP 9,002,645 0.773,028,062 Embotelladoras Arca SAB de CV MEX MXN 5,409,225 0.46
A A
25,053,158 2.13A A
Specialty Retail4,855,900 La Polar SA CHL CLP 8,220,780 0.70
A A
Steel6,639,550 Companhia Vale do Rio Doce, ADR, pfd., A BRA USD 70,711,208 6.013,012,182 Metalurgica Gerdau SA, pfd. BRA BRL 26,210,994 2.23
908,190 Usinas Siderurgicas de Minas Gerais SA, pfd., A BRA BRL 10,406,221 0.89A A
107,328,423 9.13A A
Trucking537,776 Grupo Aeroportuario del Pacifico SAB de CV, ADR MEX USD 12,379,603 1.05
A A
Water Utilities25,332,906 Inversiones Aguas Metropolitanas SA CHL CLP 19,511,897 1.66
A A
Wireless Telecommunication Services3,449,144 America Movil SAB de CV, L, ADR MEX USD 106,888,973 9.09
A A
TOTAL SHARES 1,096,554,255 93.25A A
TOTAL TRANSFERABLE SECURITIES ADMITTEDTO AN OFFICIAL STOCK EXCHANGE LISTING 1,096,554,255 93.25
A A
TRANSFERABLE SECURITIES DEALT INON ANOTHER REGULATED MARKETSHARESElectric Utilities
192,400 AES Tiete SA, Reg S BRA BRL 1,063,208 0.09A A
TOTAL SHARES 1,063,208 0.09A A
TOTAL TRANSFERABLE SECURITIES DEALT INON ANOTHER REGULATED MARKET 1,063,208 0.09
A A
TOTAL INVESTMENTS 1,097,617,463 93.34A A
A A
FRANKL IN TEMPLETON INVESTMENT FUNDS
ç Templeton Latin America Fund ç
Schedule of Investments as of December 31, 2008 (continued)
(Currency ç USD)
Number of % of
shares or Description Country Trading Market net
face value code currency value assets
www.franklintempleton.lu Unaudited Semi-Annual Report 245
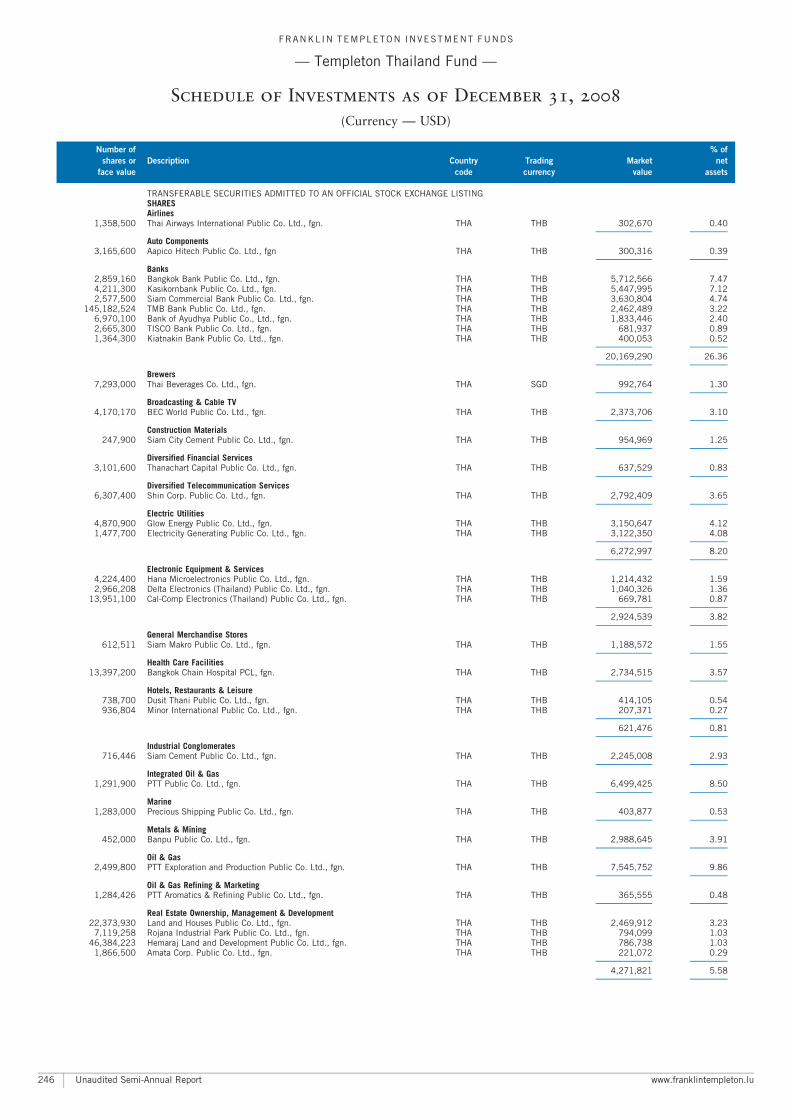
TRANSFERABLE SECURITIES ADMITTED TO AN OFFICIAL STOCK EXCHANGE LISTINGSHARESAirlines
1,358,500 Thai Airways International Public Co. Ltd., fgn. THA THB 302,670 0.40A A
Auto Components3,165,600 Aapico Hitech Public Co. Ltd., fgn THA THB 300,316 0.39
A A
Banks2,859,160 Bangkok Bank Public Co. Ltd., fgn. THA THB 5,712,566 7.474,211,300 Kasikornbank Public Co. Ltd., fgn. THA THB 5,447,995 7.122,577,500 Siam Commercial Bank Public Co. Ltd., fgn. THA THB 3,630,804 4.74
145,182,524 TMB Bank Public Co. Ltd., fgn. THA THB 2,462,489 3.226,970,100 Bank of Ayudhya Public Co., Ltd., fgn. THA THB 1,833,446 2.402,665,300 TISCO Bank Public Co. Ltd., fgn. THA THB 681,937 0.891,364,300 Kiatnakin Bank Public Co. Ltd., fgn. THA THB 400,053 0.52
A A
20,169,290 26.36A A
Brewers7,293,000 Thai Beverages Co. Ltd., fgn. THA SGD 992,764 1.30
A A
Broadcasting & Cable TV4,170,170 BEC World Public Co. Ltd., fgn. THA THB 2,373,706 3.10
A A
Construction Materials247,900 Siam City Cement Public Co. Ltd., fgn. THA THB 954,969 1.25
A A
Diversified Financial Services3,101,600 Thanachart Capital Public Co. Ltd., fgn. THA THB 637,529 0.83
A A
Diversified Telecommunication Services6,307,400 Shin Corp. Public Co. Ltd., fgn. THA THB 2,792,409 3.65
A A
Electric Utilities4,870,900 Glow Energy Public Co. Ltd., fgn. THA THB 3,150,647 4.121,477,700 Electricity Generating Public Co. Ltd., fgn. THA THB 3,122,350 4.08
A A
6,272,997 8.20A A
Electronic Equipment & Services4,224,400 Hana Microelectronics Public Co. Ltd., fgn. THA THB 1,214,432 1.592,966,208 Delta Electronics (Thailand) Public Co. Ltd., fgn. THA THB 1,040,326 1.36
13,951,100 Cal-Comp Electronics (Thailand) Public Co. Ltd., fgn. THA THB 669,781 0.87A A
2,924,539 3.82A A
General Merchandise Stores612,511 Siam Makro Public Co. Ltd., fgn. THA THB 1,188,572 1.55
A A
Health Care Facilities13,397,200 Bangkok Chain Hospital PCL, fgn. THA THB 2,734,515 3.57
A A
Hotels, Restaurants & Leisure738,700 Dusit Thani Public Co. Ltd., fgn. THA THB 414,105 0.54936,804 Minor International Public Co. Ltd., fgn. THA THB 207,371 0.27
A A
621,476 0.81A A
Industrial Conglomerates716,446 Siam Cement Public Co. Ltd., fgn. THA THB 2,245,008 2.93
A A
Integrated Oil & Gas1,291,900 PTT Public Co. Ltd., fgn. THA THB 6,499,425 8.50
A A
Marine1,283,000 Precious Shipping Public Co. Ltd., fgn. THA THB 403,877 0.53
A A
Metals & Mining452,000 Banpu Public Co. Ltd., fgn. THA THB 2,988,645 3.91
A A
Oil & Gas2,499,800 PTT Exploration and Production Public Co. Ltd., fgn. THA THB 7,545,752 9.86
A A
Oil & Gas Refining & Marketing1,284,426 PTT Aromatics & Refining Public Co. Ltd., fgn. THA THB 365,555 0.48
A A
Real Estate Ownership, Management & Development22,373,930 Land and Houses Public Co. Ltd., fgn. THA THB 2,469,912 3.23
7,119,258 Rojana Industrial Park Public Co. Ltd., fgn. THA THB 794,099 1.0346,384,223 Hemaraj Land and Development Public Co. Ltd., fgn. THA THB 786,738 1.03
1,866,500 Amata Corp. Public Co. Ltd., fgn. THA THB 221,072 0.29A A
4,271,821 5.58A A
FRANKL IN TEMPLETON INVESTMENT FUNDS
ç Templeton Thailand Fund ç
Schedule of Investments as of December 31, 2008
(Currency ç USD)
Number of % of
shares or Description Country Trading Market net
face value code currency value assets
Unaudited Semi-Annual Report www.franklintempleton.lu246
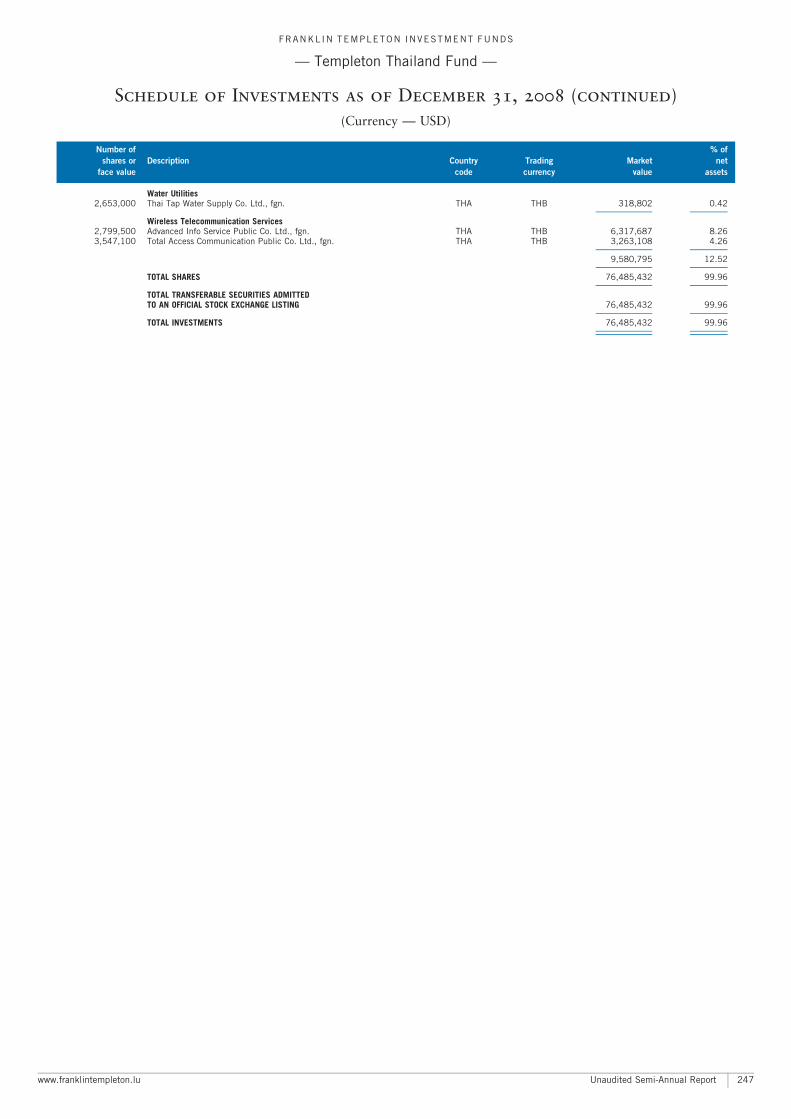
Water Utilities2,653,000 Thai Tap Water Supply Co. Ltd., fgn. THA THB 318,802 0.42
A A
Wireless Telecommunication Services2,799,500 Advanced Info Service Public Co. Ltd., fgn. THA THB 6,317,687 8.263,547,100 Total Access Communication Public Co. Ltd., fgn. THA THB 3,263,108 4.26
A A
9,580,795 12.52A A
TOTAL SHARES 76,485,432 99.96A A
TOTAL TRANSFERABLE SECURITIES ADMITTEDTO AN OFFICIAL STOCK EXCHANGE LISTING 76,485,432 99.96
A A
TOTAL INVESTMENTS 76,485,432 99.96A A
A A
FRANKL IN TEMPLETON INVESTMENT FUNDS
ç Templeton Thailand Fund ç
Schedule of Investments as of December 31, 2008 (continued)
(Currency ç USD)
Number of % of
shares or Description Country Trading Market net
face value code currency value assets
www.franklintempleton.lu Unaudited Semi-Annual Report 247
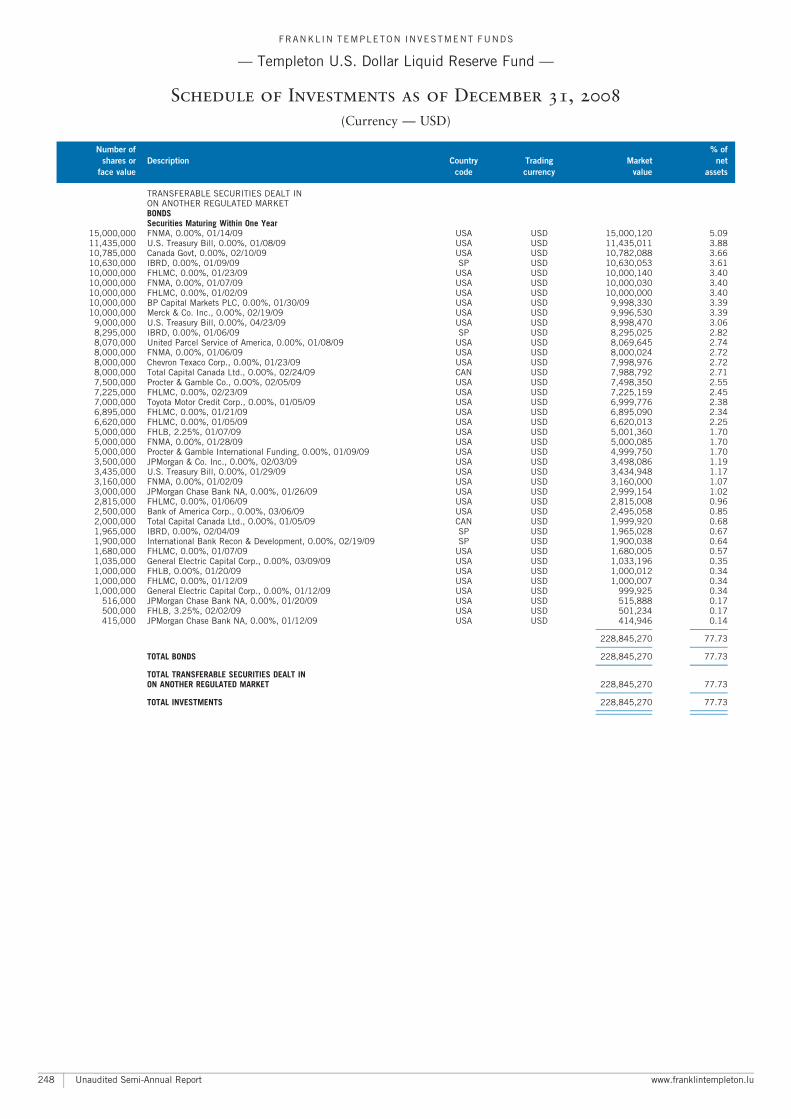
TRANSFERABLE SECURITIES DEALT INON ANOTHER REGULATED MARKETBONDSSecurities Maturing Within One Year
15,000,000 FNMA, 0.00%, 01/14/09 USA USD 15,000,120 5.0911,435,000 U.S. Treasury Bill, 0.00%, 01/08/09 USA USD 11,435,011 3.8810,785,000 Canada Govt, 0.00%, 02/10/09 USA USD 10,782,088 3.6610,630,000 IBRD, 0.00%, 01/09/09 SP USD 10,630,053 3.6110,000,000 FHLMC, 0.00%, 01/23/09 USA USD 10,000,140 3.4010,000,000 FNMA, 0.00%, 01/07/09 USA USD 10,000,030 3.4010,000,000 FHLMC, 0.00%, 01/02/09 USA USD 10,000,000 3.4010,000,000 BP Capital Markets PLC, 0.00%, 01/30/09 USA USD 9,998,330 3.3910,000,000 Merck & Co. Inc., 0.00%, 02/19/09 USA USD 9,996,530 3.39
9,000,000 U.S. Treasury Bill, 0.00%, 04/23/09 USA USD 8,998,470 3.068,295,000 IBRD, 0.00%, 01/06/09 SP USD 8,295,025 2.828,070,000 United Parcel Service of America, 0.00%, 01/08/09 USA USD 8,069,645 2.748,000,000 FNMA, 0.00%, 01/06/09 USA USD 8,000,024 2.728,000,000 Chevron Texaco Corp., 0.00%, 01/23/09 USA USD 7,998,976 2.728,000,000 Total Capital Canada Ltd., 0.00%, 02/24/09 CAN USD 7,988,792 2.717,500,000 Procter & Gamble Co., 0.00%, 02/05/09 USA USD 7,498,350 2.557,225,000 FHLMC, 0.00%, 02/23/09 USA USD 7,225,159 2.457,000,000 Toyota Motor Credit Corp., 0.00%, 01/05/09 USA USD 6,999,776 2.386,895,000 FHLMC, 0.00%, 01/21/09 USA USD 6,895,090 2.346,620,000 FHLMC, 0.00%, 01/05/09 USA USD 6,620,013 2.255,000,000 FHLB, 2.25%, 01/07/09 USA USD 5,001,360 1.705,000,000 FNMA, 0.00%, 01/28/09 USA USD 5,000,085 1.705,000,000 Procter & Gamble International Funding, 0.00%, 01/09/09 USA USD 4,999,750 1.703,500,000 JPMorgan & Co. Inc., 0.00%, 02/03/09 USA USD 3,498,086 1.193,435,000 U.S. Treasury Bill, 0.00%, 01/29/09 USA USD 3,434,948 1.173,160,000 FNMA, 0.00%, 01/02/09 USA USD 3,160,000 1.073,000,000 JPMorgan Chase Bank NA, 0.00%, 01/26/09 USA USD 2,999,154 1.022,815,000 FHLMC, 0.00%, 01/06/09 USA USD 2,815,008 0.962,500,000 Bank of America Corp., 0.00%, 03/06/09 USA USD 2,495,058 0.852,000,000 Total Capital Canada Ltd., 0.00%, 01/05/09 CAN USD 1,999,920 0.681,965,000 IBRD, 0.00%, 02/04/09 SP USD 1,965,028 0.671,900,000 International Bank Recon & Development, 0.00%, 02/19/09 SP USD 1,900,038 0.641,680,000 FHLMC, 0.00%, 01/07/09 USA USD 1,680,005 0.571,035,000 General Electric Capital Corp., 0.00%, 03/09/09 USA USD 1,033,196 0.351,000,000 FHLB, 0.00%, 01/20/09 USA USD 1,000,012 0.341,000,000 FHLMC, 0.00%, 01/12/09 USA USD 1,000,007 0.341,000,000 General Electric Capital Corp., 0.00%, 01/12/09 USA USD 999,925 0.34
516,000 JPMorgan Chase Bank NA, 0.00%, 01/20/09 USA USD 515,888 0.17500,000 FHLB, 3.25%, 02/02/09 USA USD 501,234 0.17415,000 JPMorgan Chase Bank NA, 0.00%, 01/12/09 USA USD 414,946 0.14
A A
228,845,270 77.73A A
TOTAL BONDS 228,845,270 77.73A A
TOTAL TRANSFERABLE SECURITIES DEALT INON ANOTHER REGULATED MARKET 228,845,270 77.73
A A
TOTAL INVESTMENTS 228,845,270 77.73A A
A A
FRANKL IN TEMPLETON INVESTMENT FUNDS
ç Templeton U.S. Dollar Liquid Reserve Fund ç
Schedule of Investments as of December 31, 2008
(Currency ç USD)
Number of % of
shares or Description Country Trading Market net
face value code currency value assets
Unaudited Semi-Annual Report www.franklintempleton.lu248

TRANSFERABLE SECURITIES ADMITTED TO AN OFFICIAL STOCK EXCHANGE LISTINGSHARESAir Freight & Couriers
4,780 United Parcel Service Inc., B USA USD 263,665 2.273,870 FedEx Corp. USA USD 248,260 2.13
A A
511,925 4.40A A
Apparel & Accessories67,640 Liz Claiborne Inc. USA USD 175,864 1.51
A A
Apparel Retail6,680 The Gap Inc. USA USD 89,445 0.77
A A
Application Software28,350 Microsoft Corp. USA USD 551,124 4.7427,520 Oracle Corp. USA USD 487,930 4.19
A A
1,039,054 8.93A A
Banks19,170 Bank of America Corp. USA USD 269,914 2.32
A A
Biotechnology7,100 Amgen Inc. USA USD 410,025 3.52
A A
Distributors17,940 Arrow Electronics Inc. USA USD 337,990 2.90
A A
Diversified Financial Services6,060 JPMorgan Chase & Co. USA USD 191,072 1.645,690 Morgan Stanley USA USD 91,268 0.787,110 Merrill Lynch & Co. Inc. USA USD 82,760 0.713,040 American Express Co. USA USD 56,392 0.49
A A
421,492 3.62A A
Electronic Equipment & Instruments8,152 Tyco Electronics Ltd. USA USD 132,144 1.14
A A
Gas Utilities46,540 El Paso Corp. USA USD 364,408 3.13
A A
Health Care Distributors & Services6,270 Cardinal Health Inc. USA USD 216,127 1.86
A A
Health Care Equipment41,530 Boston Scientific Corp. USA USD 321,442 2.7612,260 The Cooper Cos. Inc. USA USD 201,064 1.73
A A
522,506 4.49A A
Health Care Facilities12,410 LifePoint Hospitals Inc. USA USD 283,445 2.4371,780 Health Management Associates Inc., A USA USD 128,486 1.1057,260 Tenet Healthcare Corp. USA USD 65,849 0.57
A A
477,780 4.10A A
Household Products15,330 Avon Products Inc. USA USD 368,380 3.16
A A
Industrial Conglomerates2,990 Pentair Inc. USA USD 70,773 0.61
A A
Industrial Machinery31,870 General Electric Co. USA USD 516,294 4.44
7,832 Tyco International Ltd. USA USD 169,171 1.45A A
685,465 5.89A A
Integrated Oil & Gas6,180 Chevron Corp. USA USD 457,135 3.93
A A
Integrated Telecommunication Services81,860 Sprint Nextel Corp. USA USD 149,804 1.29
950 AT&T Inc. USA USD 27,075 0.23A A
176,879 1.52A A
Leisure Products104,180 Office Depot Inc. USA USD 310,456 2.67
35,630 Pier 1 Imports Inc. USA USD 13,183 0.11A A
323,639 2.78A A
FRANKL IN TEMPLETON INVESTMENT FUNDS
ç Templeton U.S. Value Fund ç
Schedule of Investments as of December 31, 2008
(Currency ç USD)
Number of % of
shares or Description Country Trading Market net
face value code currency value assets
www.franklintempleton.lu Unaudited Semi-Annual Report 249
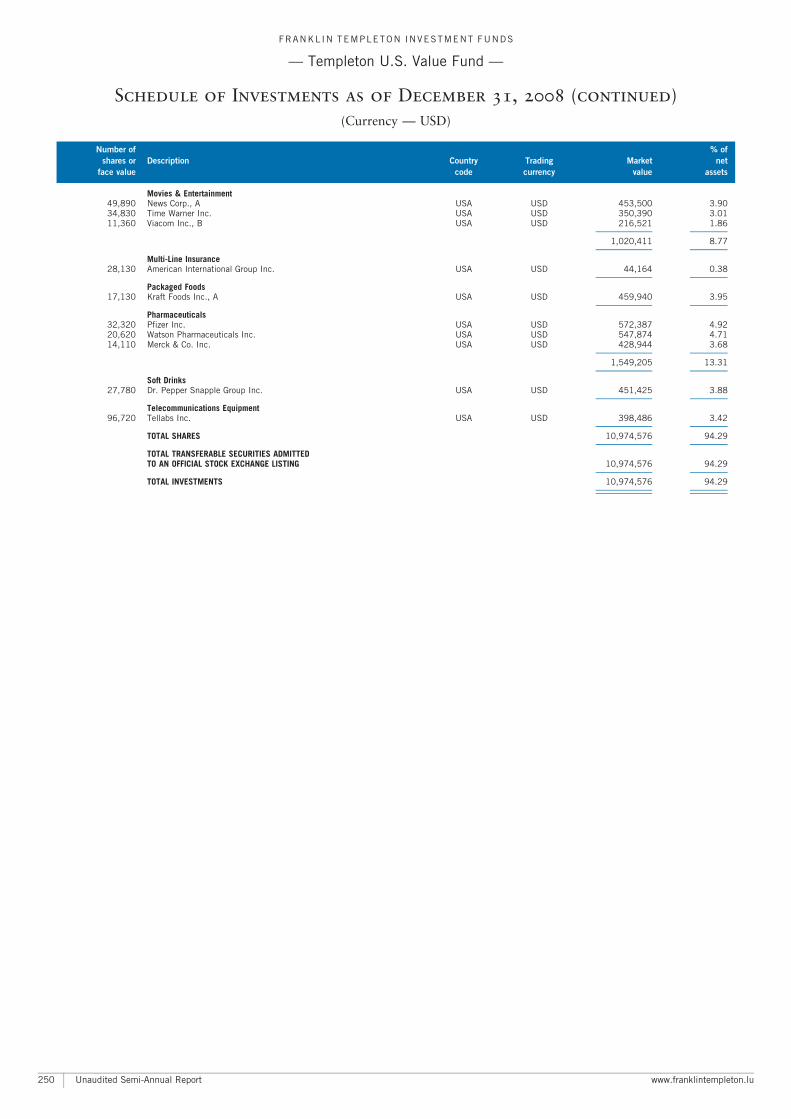
Movies & Entertainment49,890 News Corp., A USA USD 453,500 3.9034,830 Time Warner Inc. USA USD 350,390 3.0111,360 Viacom Inc., B USA USD 216,521 1.86
A A
1,020,411 8.77A A
Multi-Line Insurance28,130 American International Group Inc. USA USD 44,164 0.38
A A
Packaged Foods17,130 Kraft Foods Inc., A USA USD 459,940 3.95
A A
Pharmaceuticals32,320 Pfizer Inc. USA USD 572,387 4.9220,620 Watson Pharmaceuticals Inc. USA USD 547,874 4.7114,110 Merck & Co. Inc. USA USD 428,944 3.68
A A
1,549,205 13.31A A
Soft Drinks27,780 Dr. Pepper Snapple Group Inc. USA USD 451,425 3.88
A A
Telecommunications Equipment96,720 Tellabs Inc. USA USD 398,486 3.42
A A
TOTAL SHARES 10,974,576 94.29A A
TOTAL TRANSFERABLE SECURITIES ADMITTEDTO AN OFFICIAL STOCK EXCHANGE LISTING 10,974,576 94.29
A A
TOTAL INVESTMENTS 10,974,576 94.29A A
A A
FRANKL IN TEMPLETON INVESTMENT FUNDS
ç Templeton U.S. Value Fund ç
Schedule of Investments as of December 31, 2008 (continued)
(Currency ç USD)
Number of % of
shares or Description Country Trading Market net
face value code currency value assets
Unaudited Semi-Annual Report www.franklintempleton.lu250
Further information regarding Franklin Templeton Investment Funds is available from the following Franklin Templeton Investments offices:
EUROPEAustriaFRANKLIN TEMPLETON INVESTMENT SERVICES GMBHMainzer Landstr. 16Postfach 11 18 0360325 Frankfurt, GermanyFreefone: 08 00 29 59 11 Fax: 49 69 272 23 120www.franklintempleton.at
BelgiumFRANKLIN TEMPLETON FRANCE S.A., succursale belgeAvenue de Tervueren, 93B-1040 Brussels, BelgiumTel: 32 (0)2 743-3200 Fax: 32 (0)2 743-3228www.franklintempleton.be
FranceFRANKLIN TEMPLETON FRANCE S.A.16-18, avenue George VF-75008 Paris, FranceTel: 33 (0)1 40 73 86 00 Fax: 33 (0)1 40 73 86 10www.franklintempleton.fr
GermanyFRANKLIN TEMPLETON INVESTMENT SERVICES GMBHMainzer Landstr. 16Postfach 11 18 03D-60325 Frankfurt, GermanyTel: 49 (0) 69 272 23 0 Fax: 49 69 272 23 120Germany Freefone: 08 00 0 73 80 02Austria Freefone: 08 00 29 59 11www.franklintempleton.de
ItalyFRANKLIN TEMPLETON ITALIA S.G.R. p.AC.so Italia n.120122 Milan, ItalyTel: 39 02 854 591 Fax: 39 02 854 59222www.franklintempleton.it
LuxembourgFRANKLIN TEMPLETON INTERNATIONAL SERVICES S.A.26, boulevard Royal, L-2449 LuxembourgB.P. 169, L-2011 LuxembourgGrand-Duchy of LuxembourgTel: 352 46 66 67 1 Fax: 352 46 66 76www.franklintempleton.lu
The NetherlandsFRANKLIN TEMPLETON INVESTMENT MANAGEMENTLIMITEDWorld Trade Center AmsterdamH-Toren 16e verdiepingZuidplein 1341077 XV AmsterdamTel: 31 (0)20 575 2890 Fax: 31 (0)20 575 2892Netherlands Freefone: 0800 256 8049www.franklintempleton.nl
SpainFRANKLIN TEMPLETON INVESTMENT MANAGEMENTLIMITEDSucursal en Espan‹ aJose¤ Ortega y Gasset, 29-6� planta28006 Madrid, SpainTel: 34 91 426 3600 Fax: 34 91 577 1857www.franklintempleton.com.eswww.franklintempleton.com.pt
SwedenFRANKLIN TEMPLETON INVESTMENTSBirger Jarlsgatan 4SE-114 34 StockholmSwedenTel: 46 (0)8 545 01 230 Fax: 46 (0)8 463 1010www.franklintempleton.se
SwitzerlandFranklin Templeton Switzerland LtdBahnhofstrasse 22, P.O. BoxCH-8022 Zurich, SwitzerlandTel: 41 (0) 44 217 81 81 Fax: 41 (0) 44 217 81 82www.franklintempleton.ch
United KingdomLondonFRANKLIN TEMPLETON INVESTMENT MANAGEMENTLIMITEDThe Adelphi Building, 1-11 John Adam StreetLondon WC2N 6HT, England, U.K.Tel: 44 (0)20 7073 8500 Fax: 44 (0) 20 7073 8700U.K. Freefone: 0800 305 306www.franklintempleton.co.uk
EdinburghFRANKLIN TEMPLETON INVESTMENT MANAGEMENTLIMITED5 Morrison StreetEdinburgh EH3 8BH, Scotland, U.K.Tel: 44 (0) 131 242 4000 Fax: 44 (0) 131 242 4533U.K. Freefone: 0800 305 306www.franklintempleton.co.uk
AFRICASouth AfricaTEMPLETON ASSET MANAGEMENT LIMITEDHarrow Court 2Isle of HoughtonBoundary RoadParktown 2193, Johannesburg, South AfricaTel: 2711 645 6500 Fax: 2711 484 3311www.franklintempleton.co.za
ASIAHong KongFRANKLIN TEMPLETON INVESTMENTS(ASIA) LIMITED17/F Chater House, No. 8 Connaught Road CentralHong KongTel: 852-2877-7733 Fax: 852-2877-5401www.franklintempleton.com.hk
SingaporeTempleton Asset Management Ltd7 Temasek Boulevard#38-03 Suntec Tower 1Singapore 038987Tel: (65) 6338 7177 Fax: (65) 6332 1088www.franklintempleton.com.sg
TaiwanFRANKLIN TEMPLETON SECURITIES INVESTMENTCONSULTING (SINOAM) INC.8th Floor, #87, Sec. 4Chung Hsiao East RoadTaipei, Taiwan, R.O.C.Tel: 886-2-2781-0088 Fax: 886-2-2781-7788www.franklinsinoam.com.tw
MIDDLE EASTUnited Arab EmiratesFRANKLIN TEMPLETON INVESTMENT MANAGEMENTLIMITEDOffice No. 505, Level 5, Building No. 3,Dubai International Financial CentreP.O.Box 506613Dubai, United Arab EmiratesTel: 971 4 428 4100 Fax: 971 4 428 4140
NORTH AMERICABahamasTEMPLETON GLOBAL ADVISORS LIMITED,TEMPLETON CAPITAL ADVISORS LIMITED& TEMPLETON GLOBAL HOLDINGS LIMITEDP.O. Box N-7759, West Bay Street, Lyford CayNassau, BahamasTel: 1-242-362 4600 Fax: 1-242-362 4308
SOUTH AMERICAArgentinaTEMPLETON ASSET MANAGEMENT LTDIngeniero Butty 220, 11th Floor(C1001 AFB) Buenos Aires, ArgentinaTel: 54-11-4313-0848 Fax: 54-11-4313-0885
Please note that the websites mentioned above are directed atresidents within the country stated on these websites. (Please refer tothe website disclaimers).M
LG
Edinbu
rgh
9000
6FRANKL IN TEMPLETON INVESTMENT FUNDS
Franklin Templeton Investments Office Directory
251www.franklintempleton.lu Unaudited Semi-Annual Report
FRANKLIN TEMPLETON INTERNATIONALSERVICES S.A.26, boulevard RoyalL-2449 Luxembourg
Tel: (352) 46 66 67 1Fax: (352) 46 66 76
FTIF IR RGBP 12/08


