Embed Size (px)
Citation preview
Monthly ReportJuly 2018
Vol 70 No 7
Deutsche Bundesbank
Wilhelm-Epstein-Strasse 14
60431 Frankfurt am Main
Germany
Postal address
Postfach 10 06 02
60006 Frankfurt am Main
Germany
Tel +49 69 9566 0
Fax +49 69 9566 3077
http://www.bundesbank.de
Reproduction permitted only if source is stated.
ISSN 0418-8292 (print edition)
ISSN 1862-1325 (online edition)
The German original of this Monthly Report
went to press at 11 am on 20 July 2018.
Annual and weekly publishing schedules for
selected statistics of the Deutsche Bundes-
bank can be downloaded from our website.
The statistical data are also published on the
website.
The Monthly Report is published by the
Deutsche Bundesbank, Frankfurt am Main,
by virtue of section 18 of the Bundesbank
Act. It is available to interested parties free of
charge.
This is a translation of the original German-
language version, which is the sole authorita-
tive text.
Deutsche Bundesbank Monthly Report July 2018 2
Contents
Commentaries .......................................................................................................... 5
Economic conditions ........................................................................................................... 5
Public finances .................................................................................................................... 8
Securities markets ............................................................................................................... 11
Balance of payments ........................................................................................................... 13
The market for Federal securities: holder structure and the main drivers of yield movements ................................................................................. 15
Public sector purchase programme ..................................................................................... 17
Federal Government issuance activities and procedures ..................................................... 23
How safe haven effects impact on Bund yields – a SVAR analysis ....................................... 33
The realignment of the Chinese economy and its global implications ............................................................................................................... 39
Risks to the stability of the Chinese financial system ........................................................... 44
What conclusions for China can be drawn from other Asian countries’ convergence
processes? .......................................................................................................................... 48
The international spillover effects of a sharp economic downturn in China ........................ 53
Trends in the financing structures of German non- financial corporations as reflected in the corporate financial statements statistics ..................................................................................................................... 57
Microeconomic findings on the convergence of non-financial corporations’ equity and
bank debt ratios in the period from 2000 to 2015 .............................................................. 62
Deutsche Bundesbank Monthly Report
July 2018 3
Statistical Section.................................................................................................... 1•
Key economic data for the euro area .................................................................................. 5•
Overall monetary survey in the euro area ............................................................................ 8•
Consolidated financial statement of the Eurosystem ............................................................ 16•
Banks .................................................................................................................................. 20•
Minimum reserves ............................................................................................................... 42•
Interest rates ....................................................................................................................... 43•
Insurance corporations and pension funds .......................................................................... 48•
Capital market .................................................................................................................... 50•
Financial accounts ............................................................................................................... 54•
Public finances in Germany ................................................................................................. 58•
Economic conditions in Germany ........................................................................................ 66•
External sector .................................................................................................................... 75•
Overview of publications by the Deutsche Bundesbank .......................... 85•
Abbreviations and symbols
e Estimated
p Provisional
pe Partly estimated
r Revised
… Data available at a later date
. Data unknown, not to be published or not meaningful
0 Less than 0.5 but more than nil
– Nil
Discrepancies in the totals are due to rounding.
Deutsche Bundesbank Monthly Report July 2018 4
Commentaries
Economic conditions
Underlying trends
Overall economic output probably gained
somewhat more momentum in the second
quarter of 2018 than it had at the beginning of
the year. This is due in part to the fact that the
special factors, which were having a dampen-
ing effect in the first quarter, are now petering
out. The exceptionally virulent wave of flu,
which is likely to have had a negative impact
on economic activity in the first three months
of the year, was no longer a factor in the
second quarter. A countermovement is also ex-
pected to be seen in government consump-
tion, which showed a marked decline in the
first quarter for the first time in several years.
Industrial activity gained traction again on the
back of the recovery in export trade. Even
though it is unlikely that the high growth rates
seen last year will be achieved, the manufactur-
ing sector could be gaining greater prominence
again as a key driver of economic activity.
Owing to the ongoing excellent labour market
situation and the strong wage growth, private
consumption probably remained a cornerstone
of economic growth. Finally, activity in the
flourishing construction sector probably ex-
panded significantly, despite the existing cap-
acity constraints.
Industry
German industrial output in May 2018 grew
strongly by a seasonally adjusted 2¾% on the
month. The average for April and May was
thus slightly higher than in the first quarter of
2018 (+¼%). Manufacturers of pharmaceutical
products, in particular, reported considerable
growth in output. In line with this, consumer
goods output expanded most strongly overall
(+1½%). By contrast, manufacturers of capital
goods were only able to increase their produc-
tion volume by a marginal extent (+¼%). The
strong increase in motor vehicle production, in
particular, was the decisive factor behind the
positive overall result, while German mechan-
ical engineering firms had to cope with sharp
production cutbacks. Intermediate goods out-
put remained well below the level of the first
quarter (-½%).
After declining for four consecutive months
after the turn of the year, industrial orders rose
sharply again in May 2018 by a seasonally ad-
justed 2½% compared with the figure for April,
which had undergone a marked upward revi-
sion. However, the average inflow of new
orders in April and May was still clearly below
the level of the previous quarter (-1%). This was
due to the decline in orders from Germany
(-1¾%) and, in particular, from the euro area
(-5¼%). Demand for industrial products from
non- euro area countries grew strongly, however
(+2¾%). Excluding the rather irregular influx of
new large orders, however, the overall order in-
take contracted to a much lesser extent on the
whole (-¼%), and the gap between the inflow
of orders from the euro area and non- euro area
countries is narrowing for the most part. With
regard to the individual sectors, only manufac-
turers of capital goods were affected by the
weaker demand (-3¼%). By contrast, producers
of intermediate and consumer goods received
significantly more new orders (+2% and +1¼%,
respectively). The order situation in German in-
dustry has probably remained very favourable
on the whole. This is also indicated by the back-
log of orders, which in May 2018 significantly
exceeded the level of the first quarter.
Industrial sales rose strongly in May 2018 on
the month by a seasonally adjusted 1%, follow-
ing the path set by industrial output, albeit to a
lesser extent. The average for April and May
was thus perceptibly higher than the level re-
corded in the first quarter (+½%). With regard
to the regional distribution of sales, a strong
German econ-omy probably gained some-what more momentum in Q2 than it had at beginning of year
Strong rise in industrial output
New orders pointing upwards again
Strong growth in industrial sales and exports in May
Deutsche Bundesbank Monthly Report
July 2018 5
increase was seen in countries outside the euro
area in particular, owing mainly to the buoyant
demand for motor vehicles in these countries.
By contrast, sales of German industrial enter-
prises in the euro area went up only slightly,
whereas domestic turnover even posted a de-
cline. Broken down by sector, sales of inter-
mediate and capital goods rose significantly.
Producers of consumer goods, on the other
hand, saw a considerable drop in sales. In line
with the sharp rise in foreign industrial sales,
nominal exports also increased considerably in
May by a seasonally adjusted 1¾% on the
month. The average for April and May was also
significantly higher than the level recorded in
the first quarter of 2018 (+¾%). In price-
adjusted terms, growth was, however, signifi-
cantly lower at ¼%. Seasonally adjusted nom-
inal imports increased at a more moderate
pace in May compared with the previous
month (+¾%). Taking the average of April and
May, however, they were up significantly on
the level of the first quarter (+2¼%). The sharp
rise in energy prices was nonetheless the de-
cisive factor behind the growth. After adjust-
ment for price effects, the increase was there-
fore lower (+1%).
Construction
Construction output continued on its upward
trajectory in May 2018, rising steeply by a sea-
sonally adjusted 3% on the month. On an aver-
age of April and May, it was also up signifi-
cantly on the level of the first quarter (+2½%).
This increase was due to very strong growth in
the main construction sector (+7%), while con-
struction activity in the finishing trades fell
short of the prior- quarter level (-¾%). The con-
struction boom in Germany is therefore con-
tinuing. The order intake in the main construc-
tion sector in April – figures are available up to
then – fell sharply by 5¼% on the level of the
first quarter, which was particularly marked by
a number of large orders. That said, the equip-
ment utilisation of construction firms as well as
their range of orders were – according to the
Construction boom continuing
Economic conditions in Germany*
Seasonally adjusted
Period
Orders received (volume)
Industry; 2015 = 100Main con-struction; 2010 =100Total
of which
Domestic Foreign
2017 Q3 108.1 105.9 109.8 127.7 Q4 111.9 107.3 115.4 140.7
2018 Q1 109.5 105.0 112.9 138.4
Mar 108.6 105.6 110.9 127.7
Apr 106.9 101.0 111.3 131.0 May 109.7 105.3 113.1 …
Output; 2015 = 100
Industry
Con-structionTotal
of which
Inter-mediategoods
Capitalgoods
2017 Q3 105.7 105.9 106.0 109.2 Q4 106.7 107.3 107.0 109.3
2018 Q1 106.8 106.4 107.1 109.4
Mar 107.3 106.2 108.3 109.2
Apr 105.6 104.4 106.8 110.4 May 108.4 107.5 107.8 113.8
Foreign trade; € billion MemoitemCurrentaccountbalance in € billionExports Imports Balance
2017 Q3 320.57 258.54 62.03 67.51 Q4 329.98 265.67 64.31 68.20
2018 Q1 327.88 265.56 62.32 71.96
Mar 109.47 87.87 21.60 22.93
Apr 109.16 90.15 19.01 21.45 May 111.08 90.77 20.31 19.45
Labour market
Employ-ment
Vacan-cies1
Un-employ-ment
Un-employ-ment ratein %Number in thousands
2017 Q4 44 477 769 2 466 5.5
2018 Q1 44 672 784 2 396 5.4 Q2 … 793 2 356 5.2
Apr 44 747 788 2 369 5.3 May 44 784 793 2 357 5.2 June … 797 2 342 5.2
Prices
Importprices
Producerprices ofindustrialproducts
Con-structionprices2
Harmon-ised con-sumerprices
2010 = 100 2015 = 100
2017 Q4 102.2 105.7 118.4 102.7
2018 Q1 102.2 106.3 120.4 103.1 Q2 … 107.2 121.7 103.7
Apr 102.6 106.7 . 103.2 May 104.3 107.3 . 103.9 June … 107.5 . 104.1
* For explanatory notes, see Statistical Section, XI, and Statistical Supplement, Seasonally adjusted business statistics. 1 Excluding government-assisted forms of employment and seasonal jobs. 2 Not seasonally adjusted.
Deutsche Bundesbank
Deutsche Bundesbank Monthly Report July 2018 6
Ifo Institute – only slightly down on their peak
levels and the share of companies reporting
production hold- ups due to staffing shortages
once again reached a new record level.
Labour market
Employment continued to grow substantially in
May 2018. The particularly high growth rates
seen in the months around the turn of the year
were no longer achieved, however. There were
37,000 more persons in work in seasonally ad-
justed terms than in the previous month. Over
the last twelve months, total employment has
risen by 593,000 persons, or 1.3%. As in the
past, the continued expansion in total employ-
ment was due primarily to the strong increase
of 770,000 persons in jobs subject to social se-
curity contributions between April 2017 and
April 2018. The number of self- employed per-
sons showed a further fall, while the number of
persons working exclusively in low- paid part-
time jobs stabilised. The leading indicators of
labour demand, such as the BA- X job index of
the Federal Employment Agency (BA) and the
Ifo employment barometer, remain at a high
level. According to the indicators, however,
firms might have been somewhat more reluc-
tant to hire new staff than in recent months.
For example, the labour market barometer of
the Institute for Employment Research (IAB) for
the coming months is indicating that the high
demand for labour will stabilise.
Seasonally adjusted unemployment continued
to fall slightly in June month on month. There
were 2.34 million persons registered as un-
employed with the Federal Employment
Agency, 15,000 fewer than in May. The un-
employment rate held firm at 5.2%. On the
whole, there were 197,000 fewer persons
registered as unemployed than in the same
month last year. Total underemployment
showed a somewhat stronger decrease during
this same period, which was due to a simultan-
eous decline in the number of persons taking
part in labour market policy measures. The un-
employment component of the IAB labour
market barometer sank once again and is now
only slightly in positive territory. This suggests
that unemployment could decline to a lesser
extent in the next three months.
Prices
In June 2018, crude oil prices almost main-
tained the high level they had previously
reached despite production expansions. They
were only 2% lower than in the previous
month, but exceeded the previous year’s level
by almost two- thirds. Crude oil prices were still
fluctuating at around the US$75 mark in the
first half of July, before falling to US$72 at the
end of the reporting period. Crude oil futures
for deliveries six months ahead were being
traded without any notable discount, while de-
liveries 12 months ahead were being traded at
a discount of US$1½.
Import prices rose sharply in May in seasonally
adjusted terms, which was not due solely to
the energy component. Even excluding energy,
the depreciation of the euro was making itself
clearly felt. Producer prices, for which data are
already available for June, showed a similar
pattern, albeit in a weaker form. The annual
growth rate increased recently both in the case
of import and producer prices to around 3%.
Consumer prices (HICP) rose in June by a sea-
sonally adjusted 0.2% on the month. Energy
prices continued to rise moderately, probably
as a result of the widening of margins at re-
fineries. Food prices also went up slightly. In
the case of industrial goods excluding energy,
the price increase was somewhat stronger
again for the first time in several months. Prices
for services remained unchanged despite price
reductions in travel services. This was due in
part to a moderate increase in rents. Annual
headline HICP inflation fell from +2.2% to
+2.1% overall (CPI likewise from +2.2% to
+2.1%), and excluding energy and food from
+1.5% to +1.1%. HICP as a whole is expected
Further marked rise in employ-ment; outlook positive
Further decline in unemploy-ment
Crude oil prices still fairly high
Marked rise in import prices excluding energy
Moderate rise in consumer prices in June
Deutsche Bundesbank Monthly Report
July 2018 7
to continue to grow by 2% in the coming
months.
Public finances1
Local government finances
In the first quarter of this year, the local govern-
ment core budgets and off- budget entities
posted a deficit of €5½ billion. This represents
a fall of €½ billion on the start of last year. Rev-
enue rose considerably by 4% (€2 billion). Of
this, tax revenue increased sharply by 5½% (€1
billion), which was primarily attributable to the
8% boost in local business tax after deducting
shares accruing to other government levels. By
contrast, transfers from state government rose
at a more subdued pace overall (+2½%, or €½
billion).
At 4½% (€2½ billion), the rise in spending was
slightly more pronounced than the increase in
revenue. Spending on personnel went up by
the same rate (by €½ billion). Although the ef-
fect of the collective wage agreement’s second
adjustment stage, which came into force in
February 2017, had more or less dissipated, the
agreed upgrades to a higher pay grade and the
switchover to a new pay scheme appear to still
be making themselves felt. Moreover, there is
likely to have been a further marked increase in
staffing levels. Growth in other operating ex-
penditure remained moderate at 2½% (€½ bil-
lion). Spending on social benefits stagnated:
while spending on social assistance, in particu-
lar, went up, this was offset by the fact that
expenditure on benefits for asylum seekers fell
sharply again and spending on accommoda-
tion costs for recipients of unemployment
benefit II decreased. Following subdued devel-
opments overall last year, fixed asset formation
surged by 16% (just under €1 billion) at the
start of the year.
Personnel expenditure is set to continue rising
over 2018 as a whole. The reason for this is the
collective wage agreement of April 2018, under
which pay rates were initially raised by an aver-
age of 3.2% from March onwards. In addition,
it is possible that other operating expenditure
and social benefits will rise more sharply again
later in the year. In view of the surpluses gener-
ated in recent years, the extensive funding for
investment provided by central government
and the much lamented shortcomings of the
local transport and education infrastructure,
fixed asset formation is expected to be given a
continued boost.2 Further dynamic develop-
ments are also expected on the revenue side.
According to the May tax estimate, local gov-
ernment tax revenue (including amounts attrib-
utable to city states) is expected to increase sig-
nificantly by 5%. Transfers from state govern-
ment will probably also rise markedly. The latter
development is supported by growth in tax
revenue at the state government level as well
as by higher funds from central government to
cover accommodation costs for recipients of
unemployment benefit II. Overall, local govern-
ment budgets could therefore run a high cash
surplus, as in the previous year. The medium-
term outlook also remains extremely positive in
this regard.
The usual seasonal deficit at the start of the
year3 was covered to a large extent by the re-
serves, which many local authorities had
topped up with cash surpluses from the previ-
ous year. According to the preliminary debt
statistics, liabilities increased by only €½ billion
(to just over €142½ billion) as against year- end
Slightly higher deficit at start of year amid strong tax receipts …
… and increased fixed asset formation
Very positive outlook for year as a whole and in medium term amid significant revenue growth
Debt rose only slightly in Q1
1 The short commentaries on public finances present re-cent outturns that were not yet available when the regular quarterly reports on public finances (published in the Feb-ruary, May, August and November editions of the Monthly Report) went to press. For detailed data on budgetary de-velopments and public debt, see the statistical section of this report.2 The altogether high surplus notwithstanding, some mu-nicipalities will probably still be subject to restrictions on increasing investment due to budgetary rules. For example, local government finances in North Rhine- Westphalia are particularly strained and characterised by high cash ad-vances. While there was a clear cash surplus (€3 billion) throughout the federal state last year, capital depletion was identified in many municipalities (in the case of double- entry booking), which limits scope for investment.3 In the first quarter, local authorities initially receive only minimal funding from their shares in income tax, which is offset in the final quarter.
Deutsche Bundesbank Monthly Report July 2018 8
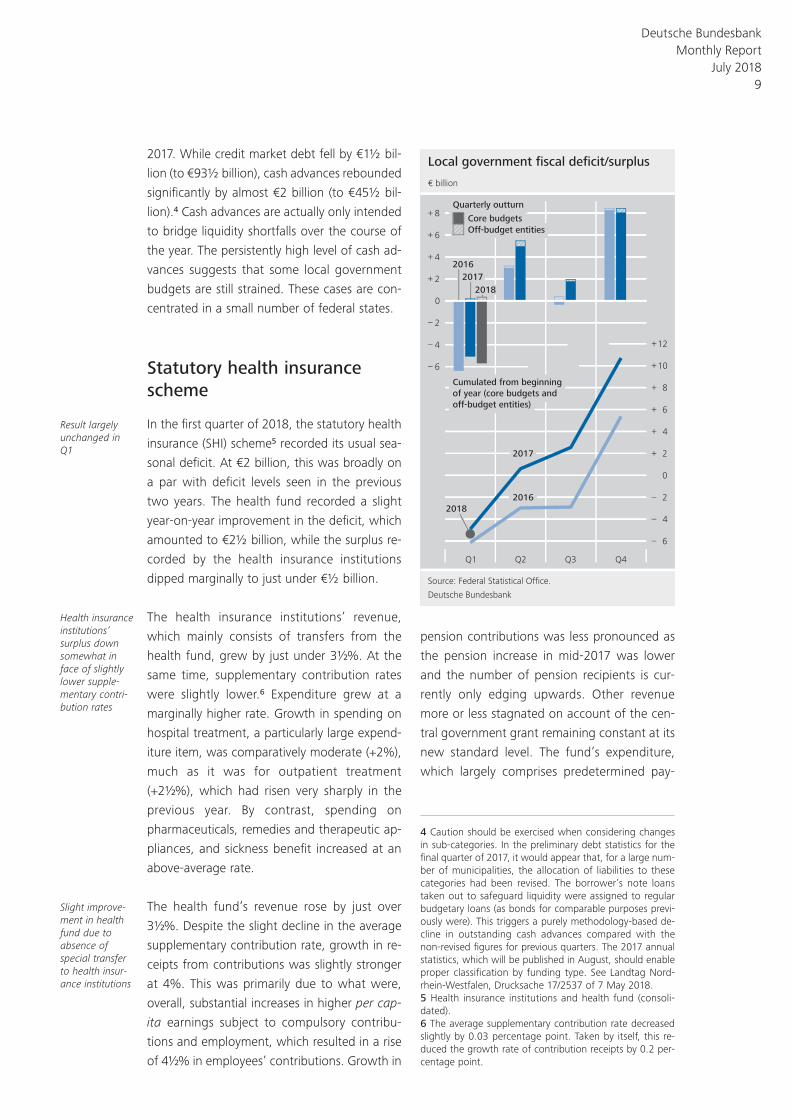
2017. While credit market debt fell by €1½ bil-
lion (to €93½ billion), cash advances rebounded
significantly by almost €2 billion (to €45½ bil-
lion).4 Cash advances are actually only intended
to bridge liquidity shortfalls over the course of
the year. The persistently high level of cash ad-
vances suggests that some local government
budgets are still strained. These cases are con-
centrated in a small number of federal states.
Statutory health insurance scheme
In the first quarter of 2018, the statutory health
insurance (SHI) scheme5 recorded its usual sea-
sonal deficit. At €2 billion, this was broadly on
a par with deficit levels seen in the previous
two years. The health fund recorded a slight
year- on- year improvement in the deficit, which
amounted to €2½ billion, while the surplus re-
corded by the health insurance institutions
dipped marginally to just under €½ billion.
The health insurance institutions’ revenue,
which mainly consists of transfers from the
health fund, grew by just under 3½%. At the
same time, supplementary contribution rates
were slightly lower.6 Expenditure grew at a
marginally higher rate. Growth in spending on
hospital treatment, a particularly large expend-
iture item, was comparatively moderate (+2%),
much as it was for outpatient treatment
(+2½%), which had risen very sharply in the
previous year. By contrast, spending on
pharmaceuticals, remedies and therapeutic ap-
pliances, and sickness benefit increased at an
above- average rate.
The health fund’s revenue rose by just over
3½%. Despite the slight decline in the average
supplementary contribution rate, growth in re-
ceipts from contributions was slightly stronger
at 4%. This was primarily due to what were,
overall, substantial increases in higher per cap-
ita earnings subject to compulsory contribu-
tions and employment, which resulted in a rise
of 4½% in employees’ contributions. Growth in
pension contributions was less pronounced as
the pension increase in mid-2017 was lower
and the number of pension recipients is cur-
rently only edging upwards. Other revenue
more or less stagnated on account of the cen-
tral government grant remaining constant at its
new standard level. The fund’s expenditure,
which largely comprises predetermined pay-
Result largely unchanged in Q1
Health insurance institutions’ s urplus down somewhat in face of slightly lower supple-mentary contri-bution rates
Slight improve-ment in health fund due to absence of special transfer to health insur-ance institutions
Local government fiscal deficit/surplus
Source: Federal Statistical Office.
Deutsche Bundesbank
Q1 Q2 Q3 Q4
Quarterly outturn
6
4
2
0
2
4
6
8
–
–
–
+
+
+
+
Cumulated from beginning
of year (core budgets and
off-budget entities)
2016
2017
2018
– 6
– 4
– 2
0
+ 2
+ 4
+ 6
+ 8
+10
+12
2017
2018
€ billion
Off-budget entities
Core budgets
2016
4 Caution should be exercised when considering changes in sub- categories. In the preliminary debt statistics for the final quarter of 2017, it would appear that, for a large num-ber of municipalities, the allocation of liabilities to these categories had been revised. The borrower’s note loans taken out to safeguard liquidity were assigned to regular budgetary loans (as bonds for comparable purposes previ-ously were). This triggers a purely methodology- based de-cline in outstanding cash advances compared with the non- revised figures for previous quarters. The 2017 annual statistics, which will be published in August, should enable proper classification by funding type. See Landtag Nord-rhein- Westfalen, Drucksache 17/ 2537 of 7 May 2018.5 Health insurance institutions and health fund (consoli-dated).6 The average supplementary contribution rate decreased slightly by 0.03 percentage point. Taken by itself, this re-duced the growth rate of contribution receipts by 0.2 per-centage point.
Deutsche Bundesbank Monthly Report
July 2018 9
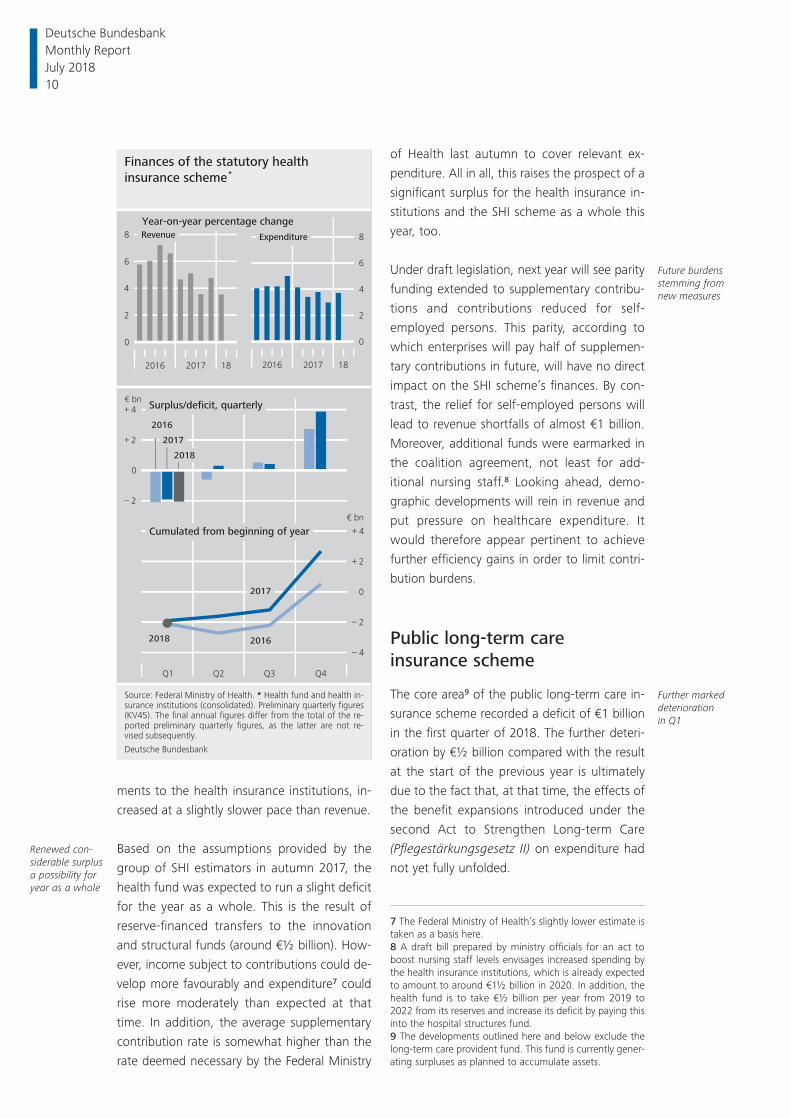
ments to the health insurance institutions, in-
creased at a slightly slower pace than revenue.
Based on the assumptions provided by the
group of SHI estimators in autumn 2017, the
health fund was expected to run a slight deficit
for the year as a whole. This is the result of
reserve- financed transfers to the innovation
and structural funds (around €½ billion). How-
ever, income subject to contributions could de-
velop more favourably and expenditure7 could
rise more moderately than expected at that
time. In addition, the average supplementary
contribution rate is somewhat higher than the
rate deemed necessary by the Federal Ministry
of Health last autumn to cover relevant ex-
penditure. All in all, this raises the prospect of a
significant surplus for the health insurance in-
stitutions and the SHI scheme as a whole this
year, too.
Under draft legislation, next year will see parity
funding extended to supplementary contribu-
tions and contributions reduced for self-
employed persons. This parity, according to
which enterprises will pay half of supplemen-
tary contributions in future, will have no direct
impact on the SHI scheme’s finances. By con-
trast, the relief for self- employed persons will
lead to revenue shortfalls of almost €1 billion.
Moreover, additional funds were earmarked in
the coalition agreement, not least for add-
itional nursing staff.8 Looking ahead, demo-
graphic developments will rein in revenue and
put pressure on healthcare expenditure. It
would therefore appear pertinent to achieve
further efficiency gains in order to limit contri-
bution burdens.
Public long- term care insurance scheme
The core area9 of the public long- term care in-
surance scheme recorded a deficit of €1 billion
in the first quarter of 2018. The further deteri-
oration by €½ billion compared with the result
at the start of the previous year is ultimately
due to the fact that, at that time, the effects of
the benefit expansions introduced under the
second Act to Strengthen Long- term Care
(Pflegestärkungsgesetz II) on expenditure had
not yet fully unfolded.
Renewed con-siderable surplus a possibility for year as a whole
Future burdens stemming from new measures
Further marked deterioration in Q1
Finances of the statutory health
insurance scheme *
Source: Federal Ministry of Health. * Health fund and health in-
surance institutions (consolidated). Preliminary quarterly figures
(KV45). The final annual figures differ from the total of the re-
ported preliminary quarterly figures, as the latter are not re-
vised subsequently.
Deutsche Bundesbank
Q1 Q2 Q3 Q4
2
0
2
4
–
+
+
– 4
– 2
0
+ 2
+ 4
Surplus/deficit, quarterly
Cumulated from beginning of year
2017
2018
2016
2017
20162018
2016 2017 18
0
2
4
6
8
2016 2017 18
0
2
4
6
8 Revenue Expenditure
€ bn
Year-on-year percentage change
€ bn
7 The Federal Ministry of Health’s slightly lower estimate is taken as a basis here.8 A draft bill prepared by ministry officials for an act to boost nursing staff levels envisages increased spending by the health insurance institutions, which is already expected to amount to around €1½ billion in 2020. In addition, the health fund is to take €½ billion per year from 2019 to 2022 from its reserves and increase its deficit by paying this into the hospital structures fund.9 The developments outlined here and below exclude the long- term care provident fund. This fund is currently gener-ating surpluses as planned to accumulate assets.
Deutsche Bundesbank Monthly Report July 2018 10
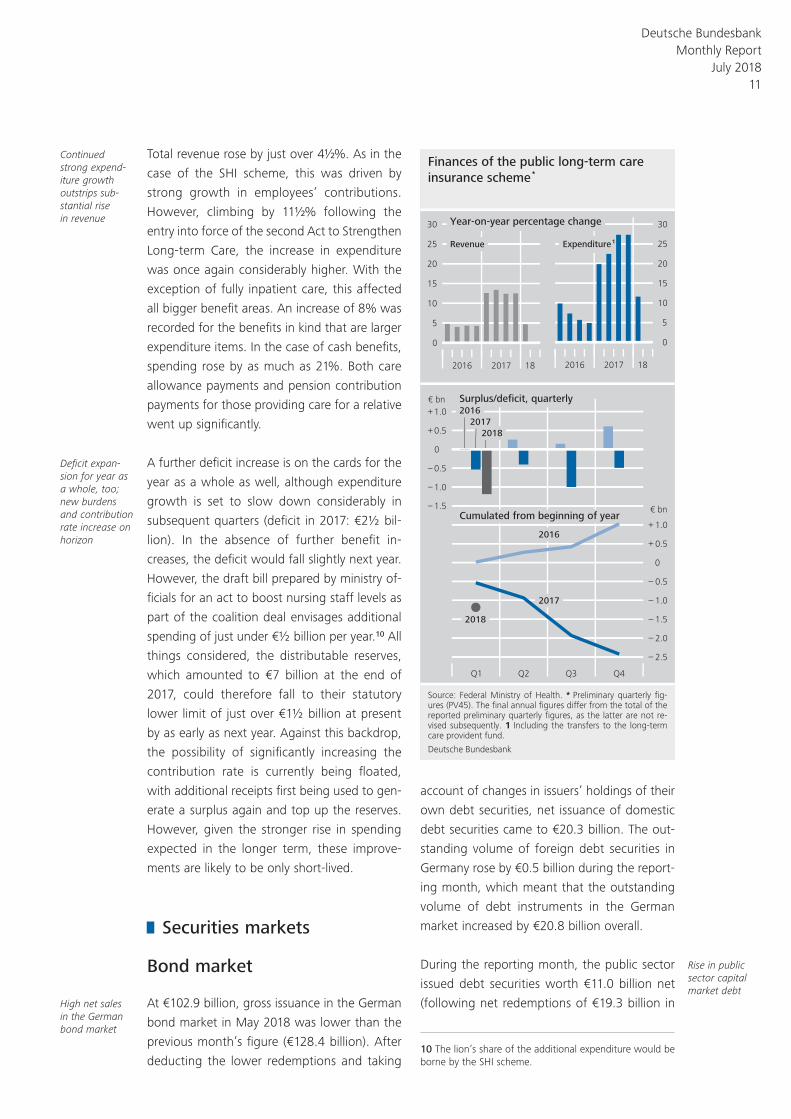
Total revenue rose by just over 4½%. As in the
case of the SHI scheme, this was driven by
strong growth in employees’ contributions.
However, climbing by 11½% following the
entry into force of the second Act to Strengthen
Long- term Care, the increase in expenditure
was once again considerably higher. With the
exception of fully inpatient care, this affected
all bigger benefit areas. An increase of 8% was
recorded for the benefits in kind that are larger
expenditure items. In the case of cash benefits,
spending rose by as much as 21%. Both care
allowance payments and pension contribution
payments for those providing care for a relative
went up significantly.
A further deficit increase is on the cards for the
year as a whole as well, although expenditure
growth is set to slow down considerably in
subsequent quarters (deficit in 2017: €2½ bil-
lion). In the absence of further benefit in-
creases, the deficit would fall slightly next year.
However, the draft bill prepared by ministry of-
ficials for an act to boost nursing staff levels as
part of the coalition deal envisages additional
spending of just under €½ billion per year.10 All
things considered, the distributable reserves,
which amounted to €7 billion at the end of
2017, could therefore fall to their statutory
lower limit of just over €1½ billion at present
by as early as next year. Against this backdrop,
the possibility of significantly increasing the
contribution rate is currently being floated,
with additional receipts first being used to gen-
erate a surplus again and top up the reserves.
However, given the stronger rise in spending
expected in the longer term, these improve-
ments are likely to be only short- lived.
Securities markets
Bond market
At €102.9 billion, gross issuance in the German
bond market in May 2018 was lower than the
previous month’s figure (€128.4 billion). After
deducting the lower redemptions and taking
account of changes in issuers’ holdings of their
own debt securities, net issuance of domestic
debt securities came to €20.3 billion. The out-
standing volume of foreign debt securities in
Germany rose by €0.5 billion during the report-
ing month, which meant that the outstanding
volume of debt instruments in the German
market increased by €20.8 billion overall.
During the reporting month, the public sector
issued debt securities worth €11.0 billion net
(following net redemptions of €19.3 billion in
Continued strong expend-iture growth outstrips sub-stantial rise in revenue
Deficit expan-sion for year as a whole, too; new burdens and contribution rate increase on horizon
High net sales in the German bond market
Rise in public sector capital market debt
Finances of the public long-term care
insurance scheme *
Source: Federal Ministry of Health. * Preliminary quarterly fig-
ures (PV45). The final annual figures differ from the total of the
reported preliminary quarterly figures, as the latter are not re-
vised subsequently. 1 Including the transfers to the long-term
care provident fund.
Deutsche Bundesbank
Q1 Q2 Q3 Q4
1.5
1.0
0.5
0
0.5
1.0
–
–
–
+
+
– 2.5
– 2.0
– 1.5
– 1.0
– 0.5
0
+ 0.5
+ 1.0
Surplus/deficit, quarterly
Cumulated from beginning of year
2017
2018
2016
2016
2018
2017
2016 2017 18
0
5
10
15
20
25
30
2016 2017 18
0
5
10
15
20
25
30
Revenue Expenditure 1
€ bn
€ bn
Year-on-year percentage change
10 The lion’s share of the additional expenditure would be borne by the SHI scheme.
Deutsche Bundesbank Monthly Report
July 2018 11
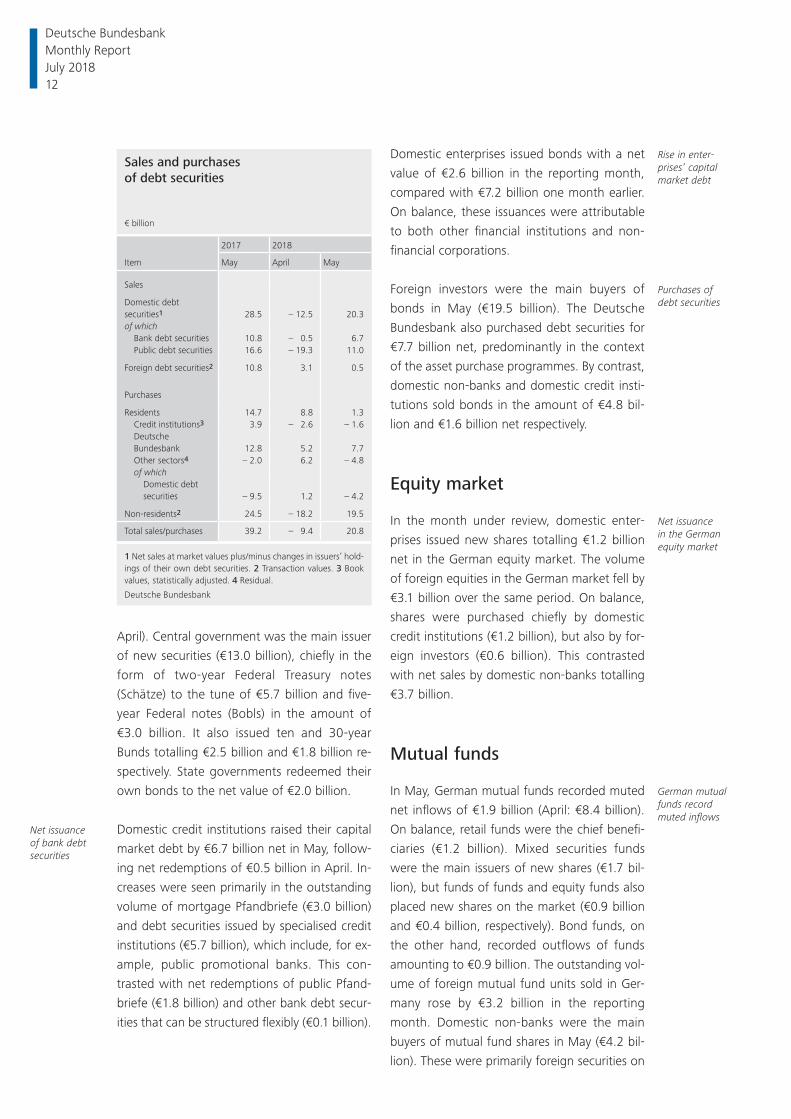
April). Central government was the main issuer
of new securities (€13.0 billion), chiefly in the
form of two- year Federal Treasury notes
(Schätze) to the tune of €5.7 billion and five-
year Federal notes (Bobls) in the amount of
€3.0 billion. It also issued ten and 30-year
Bunds totalling €2.5 billion and €1.8 billion re-
spectively. State governments redeemed their
own bonds to the net value of €2.0 billion.
Domestic credit institutions raised their capital
market debt by €6.7 billion net in May, follow-
ing net redemptions of €0.5 billion in April. In-
creases were seen primarily in the outstanding
volume of mortgage Pfandbriefe (€3.0 billion)
and debt securities issued by specialised credit
institutions (€5.7 billion), which include, for ex-
ample, public promotional banks. This con-
trasted with net redemptions of public Pfand-
briefe (€1.8 billion) and other bank debt secur-
ities that can be structured flexibly (€0.1 billion).
Domestic enterprises issued bonds with a net
value of €2.6 billion in the reporting month,
compared with €7.2 billion one month earlier.
On balance, these issuances were attributable
to both other financial institutions and non-
financial corporations.
Foreign investors were the main buyers of
bonds in May (€19.5 billion). The Deutsche
Bundesbank also purchased debt securities for
€7.7 billion net, predominantly in the context
of the asset purchase programmes. By contrast,
domestic non- banks and domestic credit insti-
tutions sold bonds in the amount of €4.8 bil-
lion and €1.6 billion net respectively.
Equity market
In the month under review, domestic enter-
prises issued new shares totalling €1.2 billion
net in the German equity market. The volume
of foreign equities in the German market fell by
€3.1 billion over the same period. On balance,
shares were purchased chiefly by domestic
credit institutions (€1.2 billion), but also by for-
eign investors (€0.6 billion). This contrasted
with net sales by domestic non- banks totalling
€3.7 billion.
Mutual funds
In May, German mutual funds recorded muted
net inflows of €1.9 billion (April: €8.4 billion).
On balance, retail funds were the chief benefi-
ciaries (€1.2 billion). Mixed securities funds
were the main issuers of new shares (€1.7 bil-
lion), but funds of funds and equity funds also
placed new shares on the market (€0.9 billion
and €0.4 billion, respectively). Bond funds, on
the other hand, recorded outflows of funds
amounting to €0.9 billion. The outstanding vol-
ume of foreign mutual fund units sold in Ger-
many rose by €3.2 billion in the reporting
month. Domestic non- banks were the main
buyers of mutual fund shares in May (€4.2 bil-
lion). These were primarily foreign securities on
Net issuance of bank debt securities
Rise in enter-prises’ capital market debt
Purchases of debt securities
Net issuance in the German equity market
German mutual funds record muted inflows
Sales and purchases of debt securities
€ billion
Item
2017 2018
May April May
Sales
Domestic debtsecurities1 28.5 – 12.5 20.3of which
Bank debt securities 10.8 – 0.5 6.7Public debt securities 16.6 – 19.3 11.0
Foreign debt securities2 10.8 3.1 0.5
Purchases
Residents 14.7 8.8 1.3Credit institutions3 3.9 – 2.6 – 1.6Deutsche Bundesbank 12.8 5.2 7.7Other sectors4 – 2.0 6.2 – 4.8of which
Domestic debtsecurities – 9.5 1.2 – 4.2
Non-residents2 24.5 – 18.2 19.5
Total sales/purchases 39.2 – 9.4 20.8
1 Net sales at market values plus/minus changes in issuers’ hold-ings of their own debt securities. 2 Transaction values. 3 Book values, statistically adjusted. 4 Re sidual.
Deutsche Bundesbank
Deutsche Bundesbank Monthly Report July 2018 12
balance. Resident credit institutions acquired
shares for €1.2 billion net, while foreign invest-
ors sold mutual fund shares for €0.3 billion net.
Balance of payments
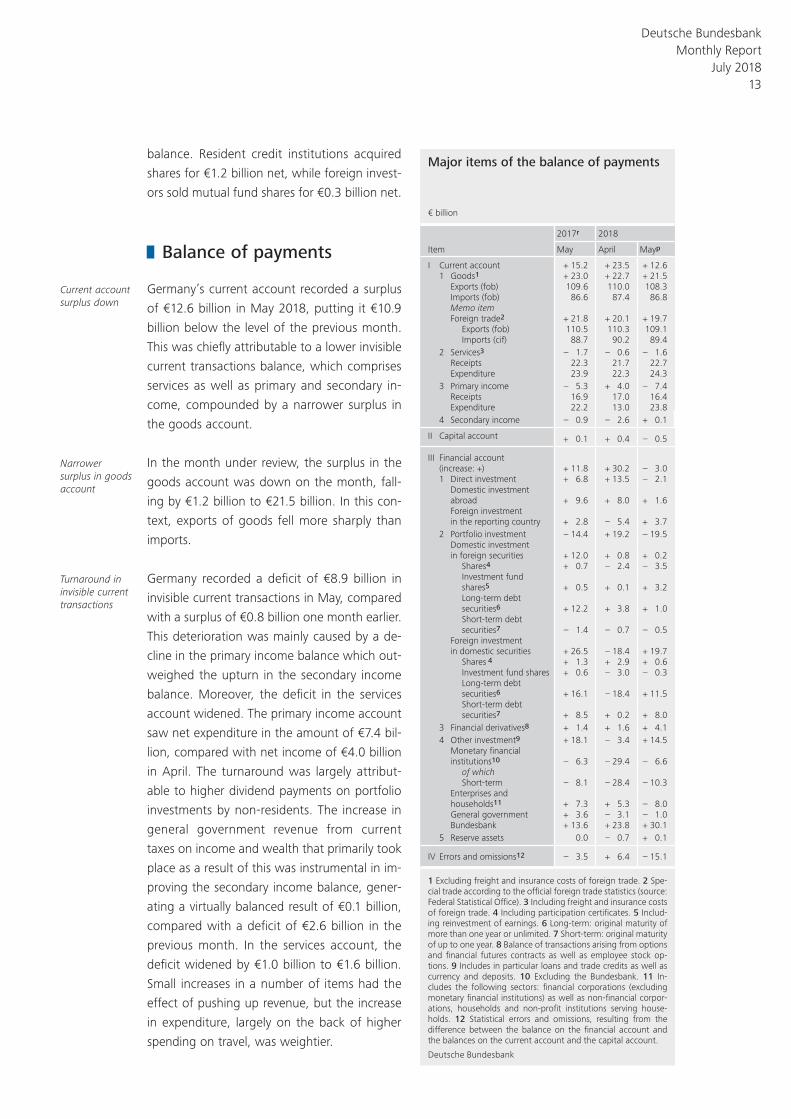
Germany’s current account recorded a surplus
of €12.6 billion in May 2018, putting it €10.9
billion below the level of the previous month.
This was chiefly attributable to a lower invisible
current transactions balance, which comprises
services as well as primary and secondary in-
come, compounded by a narrower surplus in
the goods account.
In the month under review, the surplus in the
goods account was down on the month, fall-
ing by €1.2 billion to €21.5 billion. In this con-
text, exports of goods fell more sharply than
imports.
Germany recorded a deficit of €8.9 billion in
invisible current transactions in May, compared
with a surplus of €0.8 billion one month earlier.
This deterioration was mainly caused by a de-
cline in the primary income balance which out-
weighed the upturn in the secondary income
balance. Moreover, the deficit in the services
account widened. The primary income account
saw net expenditure in the amount of €7.4 bil-
lion, compared with net income of €4.0 billion
in April. The turnaround was largely attribut-
able to higher dividend payments on portfolio
investments by non- residents. The increase in
general government revenue from current
taxes on income and wealth that primarily took
place as a result of this was instrumental in im-
proving the secondary income balance, gener-
ating a virtually balanced result of €0.1 billion,
compared with a deficit of €2.6 billion in the
previous month. In the services account, the
deficit widened by €1.0 billion to €1.6 billion.
Small increases in a number of items had the
effect of pushing up revenue, but the increase
in expenditure, largely on the back of higher
spending on travel, was weightier.
Current account surplus down
Narrower surplus in goods account
Turnaround in invisible current transactions
Major items of the balance of payments
€ billion
Item
2017r 2018
May April Mayp
I Current account + 15.2 + 23.5 + 12.6 1 Goods1 + 23.0 + 22.7 + 21.5
Exports (fob) 109.6 110.0 108.3 Imports (fob) 86.6 87.4 86.8 Memo itemForeign trade2 + 21.8 + 20.1 + 19.7
Exports (fob) 110.5 110.3 109.1 Imports (cif) 88.7 90.2 89.4
2 Services3 – 1.7 – 0.6 – 1.6 Receipts 22.3 21.7 22.7 Expenditure 23.9 22.3 24.3
3 Primary income – 5.3 + 4.0 – 7.4 Receipts 16.9 17.0 16.4 Expenditure 22.2 13.0 23.8
4 Secondary income – 0.9 – 2.6 + 0.1
II Capital account + 0.1 + 0.4 – 0.5
III Financial account (increase: +) + 11.8 + 30.2 – 3.0 1 Direct investment + 6.8 + 13.5 – 2.1
Domestic investment abroad + 9.6 + 8.0 + 1.6 Foreign investment in the reporting country + 2.8 – 5.4 + 3.7
2 Portfolio investment – 14.4 + 19.2 – 19.5 Domestic investment in foreign securities + 12.0 + 0.8 + 0.2
Shares4 + 0.7 – 2.4 – 3.5 Investment fund shares5 + 0.5 + 0.1 + 3.2 Long-term debt securities6 + 12.2 + 3.8 + 1.0 Short-term debt securities7 – 1.4 – 0.7 – 0.5
Foreign investment in domestic securities + 26.5 – 18.4 + 19.7
Shares 4 + 1.3 + 2.9 + 0.6 Investment fund shares + 0.6 – 3.0 – 0.3 Long-term debt securities6 + 16.1 – 18.4 + 11.5 Short-term debt securities7 + 8.5 + 0.2 + 8.0
3 Financial derivatives8 + 1.4 + 1.6 + 4.1 4 Other investment9 + 18.1 – 3.4 + 14.5
Monetary fi nancial institutions10 – 6.3 – 29.4 – 6.6
of which Short-term – 8.1 – 28.4 – 10.3
Enterprises and households11 + 7.3 + 5.3 – 8.0 General government + 3.6 – 3.1 – 1.0 Bundesbank + 13.6 + 23.8 + 30.1
5 Reserve assets 0.0 – 0.7 + 0.1
IV Errors and omissions12 – 3.5 + 6.4 – 15.1
1 Excluding freight and insurance costs of foreign trade. 2 Spe-cial trade according to the offi cial foreign trade statistics (source: Federal Statistical Offi ce). 3 Including freight and insurance costs of foreign trade. 4 Including participation certifi cates. 5 Includ-ing reinvestment of earnings. 6 Long- term: original maturity of more than one year or unlimited. 7 Short- term: original maturity of up to one year. 8 Balance of transactions arising from options and fi nancial futures contracts as well as employee stock op-tions. 9 Includes in particular loans and trade credits as well as currency and deposits. 10 Excluding the Bundesbank. 11 In-cludes the following sectors: fi nancial corporations (excluding monetary fi nancial institutions) as well as non- fi nancial corpor-ations, households and non- profi t institutions serving house-holds. 12 Statistical errors and omissions, resulting from the difference between the balance on the fi nancial account and the balances on the current account and the capital account.
Deutsche Bundesbank
Deutsche Bundesbank Monthly Report
July 2018 13
Against the backdrop of a spike in market un-
certainty and a slight waning in the momen-
tum of the global economy, German cross-
border portfolio investment posted net capital
imports of €19.5 billion in May, compared with
net capital exports totalling €19.2 billion in
April. This was mainly due to net purchases of
German securities in the amount of €19.7 bil-
lion by foreign investors, who acquired both
German government bonds (€6.7 billion) and
private sector bonds (€4.8 billion), with a par-
ticular appetite for bank bonds, whilst also
buying large amounts of money market paper
(€8 billion). Alongside purchasing shares to the
tune of €0.6 billion net, they disposed of mu-
tual fund shares worth €0.3 billion on balance.
Domestic investors acquired modest amounts
of foreign securities (€0.2 billion), purchasing
mutual fund shares (€3.2 billion) and debt se-
curities (€0.5 billion), while parting with shares
(€3.5 billion).
In May, direct investment likewise generated
net capital imports, in this instance amounting
to €2.1 billion, compared with net capital ex-
ports of €13.5 billion in April. Direct investment
funds flowing into Germany gave rise to capital
imports totalling €3.7 billion, with foreign com-
panies augmenting their equity stakes in Ger-
many only marginally (€0.2 billion), but capital
inflows through intra- group lending (€3.5 bil-
lion) – here executed solely in the shape of
financial credits – had a greater impact on de-
velopments. Domestic enterprises supplied
their group units abroad with a net €1.6 billion
worth of funds, doing so by bolstering their
equity capital (€4.1 billion). By contrast, the re-
demption of trade credits within the scope of
credit transactions with affiliated companies
led to a shifting of funds to Germany (€2.5 bil-
lion).
Other statistically recorded investment, which
comprises loans and trade credits (where these
do not constitute direct investment), bank de-
posits and other investments, registered net
capital exports of €14.5 billion in May, as op-
posed to net capital imports of €3.4 billion one
month previously. This result arose primarily
from outflows in the banking system (€23.5 bil-
lion), driven by the increase in the Bundes-
bank’s net claims (€30.1 billion). On the one
hand, there was a significant rise in its TARGET2
claims (€53.8 billion), but on the other hand,
there were higher deposits on the part of for-
eign counterparties at the Bundesbank (€23.6
billion). Conversely, credit institutions recorded
net capital imports (€6.6 billion), chiefly as a
result of higher short- term liabilities. Non- banks
also experienced net capital inflows (€9.0 bil-
lion), thanks to the activities of enterprises and
households (€8.0 billion) as well as to those of
general government (€1.0 billion).
The Bundesbank’s reserve assets rose slightly
– at transaction values – by €0.1 billion in May.
Inflows in portfolio investment
Direct invest-ment sees net capital imports
Outflows in other investment
Reserve assets
Deutsche Bundesbank Monthly Report July 2018 14
The market for Federal securities: holder structure and the main drivers of yield movements
German government bonds play a key role in the euro area’s spot and futures markets, and have
become a major benchmark for the price of other financial instruments in the euro area. Their
good availability and high liquidity have typically made German Federal securities an important
and attractive investment instrument for national and international investors alike. This attractive-
ness is reflected in a broad international and sectoral holder structure. From a central bank per-
spective, the market for government bonds has taken on far greater significance over the past
few years. The ECB Governing Council’s decision to purchase public sector securities (public sector
purchase programme, or PSPP) turned this segment of the bond market into a key area of engage-
ment for monetary policy. Under the PSPP, the Bundesbank purchased just under one- quarter of
the total outstanding volume of Federal securities up to the end of 2017, sharply altering the
holder structure. Holders from non- euro area countries were the main sellers of Federal securities
to the Bundesbank. Within the euro area, the securities were sold chiefly by monetary financial
institutions (MFIs), ie investors with access to the deposit facility. Against this backdrop, possible
effects of the purchase programme manifested in sectoral portfolio adjustments and the exchange
rate. Generally speaking, the purchases reduced the freely tradable volume of Federal securities
in free float; this spread to availability (scarcity premium) and market liquidity (liquidity premium).
Over the longer term, the yield on ten- year Federal bonds (Bunds) was shaped by scarcity pre-
miums, expectations regarding key interest rates, and international determinants.
Deutsche Bundesbank Monthly Report
July 2018 15
The importance of the bond market to the central bank
The market for Federal securities is an import-
ant segment of the international bond market.
Being highly liquid, German government secur-
ities play a key role in the euro area’s spot and
futures markets, and have become a major
benchmark for the price of other financial in-
struments in the euro area.1
From a central bank perspective, the bond mar-
kets and hence the market for Federal secur-
ities have grown in importance over the past
few years.2 The Eurosystem’s initial response to
the financial and sovereign debt crisis was to
start lowering the key interest rates and intro-
ducing a host of non- standard measures in
2007. As of June 2014 – with key interest rates
near 0% – the ECB then adopted unconven-
tional measures intended to further increase
the degree of monetary policy accommoda-
tion. Alongside targeted longer- term refinan-
cing operations, these included a series of asset
purchase programmes, which, when the ex-
panded asset purchase programme (APP) was
adopted, ultimately also envisaged the pur-
chase of public sector securities under a dedi-
cated programme (PSPP) from March 2015 (see
the box on pages 17 to 19). This made the
bond market an important area of engagement
for monetary policy. As monetary policy trans-
mission also flows through the bond market,
central banks consider it important to under-
stand which transmission channels are acti-
vated by the measures. Changes in the holder
structure can provide indications of this. In
addition, unwanted side effects such as the
relative scarcity of Federal securities or a pos-
sible deterioration in market liquidity, as influ-
enced by the purchases, have to be monitored.
Market developments and holder structure of Federal securities
Federal securities are an important tool for Fed-
eral Government borrowing. Their share in the
total volume outstanding in the German bond
market has risen by 10 percentage points to
just over 35% since the launch of monetary
union in 1999.3 Issuance follows a fixed calen-
dar set by Federal Republic of Germany – Fi-
nance Agency (see the box on pages 23 to 25).
It peaked in 2009 and 2010, during the finan-
cial and economic crisis. As central govern-
ment’s budgetary situation subsequently im-
proved, net issuance dropped significantly and
has hovered around the zero mark since 2014.
Since then, at just under €200 billion each year,
the Finance Agency has refinanced roughly
one- sixth of outstanding central government
debt using securities with a maturity of be-
tween six months and 30 years.
Federal securities typically have a very broad in-
vestor base. Demand for German government
bonds comes from all sectors inside and out-
side Germany. The launch of monetary union
fundamentally altered the market environment
for bonds issued by the domestic public sector.
Within the euro area, the currency- specific ad-
vantage of issuing securities in Deutsche Mark
fell away, meaning that German public sector
issuance has since competed directly with pub-
lic sector debtors of the partner countries in
the euro area. However, thanks to their high
Market for Federal securities: an important segment of the international bond market
Bond market a key transmission channel for monetary policy
Outstanding volume and issuance of Federal securities
Federal securities highly relevant to international investors
1 Futures on two- year, five- year and ten- year Federal secur-ities are the most traded contracts on Eurex Frankfurt AG. In 2017, a total of 85% of bond futures traded had Federal securities as the underlying. Italian (8%) and French (7%) securities follow far behind. For information on the import-ance of the futures market for the benchmark status of German Federal securities, see also J W Ejsing and J Sihvonen (2009), Liquidity premia in German government bonds, ECB Working Paper No 1081.2 See Deutsche Bundesbank, The macroeconomic impact of quantitative easing in the euro area, Monthly Report, June 2016, pp 29-53.3 Aside from the rise in outstanding Federal securities, an-other factor was the decrease in outstanding public Pfand-briefe and other bank debt securities. The outstanding vol-ume of bonds issued by specialised credit institutions and enterprises without a banking licence increased.
Deutsche Bundesbank Monthly Report July 2018 16
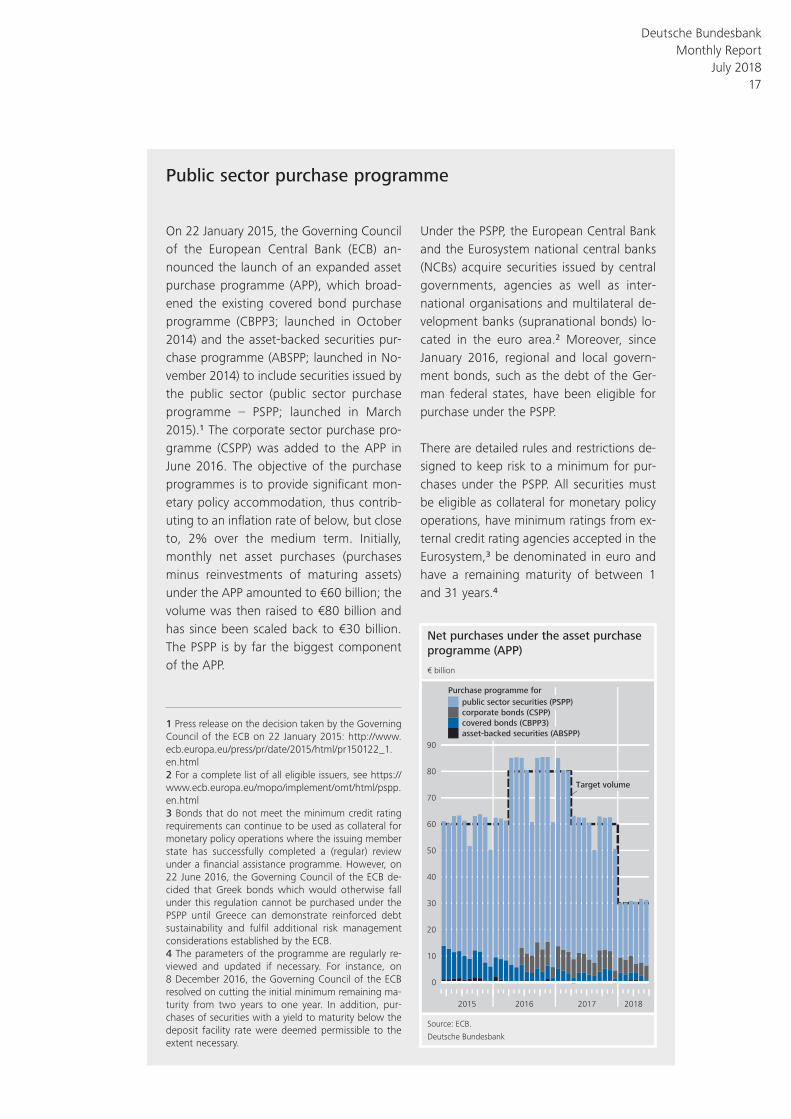
Public sector purchase programme
On 22 January 2015, the Governing Council of the European Central Bank (ECB) an-nounced the launch of an expanded asset purchase programme (APP), which broad-ened the existing covered bond purchase programme (CBPP3; launched in October 2014) and the asset- backed securities pur-chase programme (ABSPP; launched in No-vember 2014) to include securities issued by the public sector (public sector purchase programme – PSPP; launched in March 2015).1 The corporate sector purchase pro-gramme (CSPP) was added to the APP in June 2016. The objective of the purchase programmes is to provide signifi cant mon-etary policy accommodation, thus contrib-uting to an infl ation rate of below, but close to, 2% over the medium term. Initially, monthly net asset purchases (purchases minus reinvestments of maturing assets) under the APP amounted to €60 billion; the volume was then raised to €80 billion and has since been scaled back to €30 billion. The PSPP is by far the biggest component of the APP.
Under the PSPP, the European Central Bank and the Eurosystem national central banks (NCBs) acquire securities issued by central governments, agencies as well as inter-national organisations and multilateral de-velopment banks (supranational bonds) lo-cated in the euro area.2 Moreover, since January 2016, regional and local govern-ment bonds, such as the debt of the Ger-man federal states, have been eligible for purchase under the PSPP.
There are detailed rules and restrictions de-signed to keep risk to a minimum for pur-chases under the PSPP. All securities must be eligible as collateral for monetary policy operations, have minimum ratings from ex-ternal credit rating agencies accepted in the Eurosystem,3 be denominated in euro and have a remaining maturity of between 1 and 31 years.4
1 Press release on the decision taken by the Governing Council of the ECB on 22 January 2015: http://www.ecb.europa.eu/press/pr/date/2015/html/pr150122_1.en.html2 For a complete list of all eligible issuers, see https://www.ecb.europa.eu/mopo/implement/omt/html/pspp.en.html3 Bonds that do not meet the minimum credit rating requirements can continue to be used as collateral for monetary policy operations where the issuing member state has successfully completed a (regular) review under a fi nancial assistance programme. However, on 22 June 2016, the Governing Council of the ECB de-cided that Greek bonds which would otherwise fall under this regulation cannot be purchased under the PSPP until Greece can demonstrate reinforced debt sustainability and fulfi l additional risk management considerations established by the ECB.4 The parameters of the programme are regularly re-viewed and updated if necessary. For instance, on 8 December 2016, the Governing Council of the ECB resolved on cutting the initial minimum remaining ma-turity from two years to one year. In addition, pur-chases of securities with a yield to maturity below the deposit facility rate were deemed permissible to the extent necessary.
Net purchases under the asset purchase
programme (APP)
Source: ECB.
Deutsche Bundesbank
2015 2016 2017 2018
0
10
20
30
40
50
60
70
80
90
€ billion
public sector securities (PSPP)
corporate bonds (CSPP)
covered bonds (CBPP3)
asset-backed securities (ABSPP)
Target volume
Purchase programme for
Deutsche Bundesbank Monthly Report
July 2018 17
As a result of the prohibition of monetary fi nancing under Article 123 of the Treaty on the Functioning of the European Union, central banks may purchase government bonds on the secondary market only. In addition, there is a blackout period prior to and following an announced auction on the primary market before the bonds are available for purchase on the secondary market. There is an issue share limit of 33% per bond,5 subject to verifi cation on a case- by- case basis that holding such an amount would not lead to Eurosystem central banks having a blocking minority in the event of an orderly restructuring of the issuer.
One of the peculiarities of the PSPP is that the distribution of profi ts and possible losses arising from the securities purchased is governed by rules differing from those for the other programmes included in the APP. Under the PSPP, only 20% of the securities purchased are subject to joint liability at the Eurosystem level. This is broken down into purchases by the ECB (10%) and purchases of supranational bonds by the NCBs (10%). The remaining securities purchased by the NCBs are not subject to a regime of risk sharing.6
The implementation of the PSPP is based on a decentralised specialisation approach.
Each NCB purchases public sector bonds in line with its share of the ECB’s capital key7 (the Bundesbank’s current share is 25.6%), with each NCB only buying bonds from its own jurisdiction. The ECB purchases bonds from all jurisdictions.
The allocation of the purchase volumes in the PSPP is subject to a clear set of rules. There is no discretionary scope for tactical deviations to support individual govern-ment bond markets. The monthly targets are based on the shares of the individual member states’ national bonds in the total volume at the end of the programme.
However, the monthly purchase volumes of national bonds by individual member states may, at times, differ from their capital key. A number of factors at play here are of a purely temporary nature. For instance, the Eurosystem and thus the Bundesbank, too, take account of the fact that market liquid-ity can vary seasonally and that bond- specifi c offer volumes may deviate from ori-ginal expectations. In addition, all repay-ments on holdings that have already been accumulated are reinvested for a period of three months after the due date. This can also lead to temporary deviations. A con-scious decision was taken at the beginning of the PSPP to keep purchasing behaviour
5 At the start of the programme, the Governing Coun-cil of the ECB initially set the limit at 25% and subse-quently raised it to 33% with its decision of 5 Novem-ber 2015.6 At the beginning of the programme, the share of supranational bonds stood at 12% but was then cut to 10% in April 2016. The share of securities subject to joint liability remained unchanged at 20%.7 The ECB’s capital comes from the NCBs of all mem-ber states of the European Union (EU); each NCB’s share is calculated from its share in the total popula-tion and gross domestic product of the EU. As not all EU member states have adopted the euro and only the central banks of the euro area member states have to pay the full amount of their capital share, the euro area member states thus have a higher share of the ECB’s actual paid- up capital than stipulated by the cap-ital key. It is this higher modifi ed capital share per NCB that is relevant for purchases under the PSPP. For more information, see https://www.ecb.europa.eu/ecb/orga/capital/html/index.en.html
Public sector purchase programme
(PSPP)
Deutsche Bundesbank
PSPP
Nationalcentral banks
(NCBs)ECB
– National government bonds
– National agencies
– Regional and localgovernments
– Supra-nationalbonds
– Nationalgovernmentbonds
– Nationalagencies
80% 10%
10%90%
No sharing of risk / losses
Sharing of risk / losses
Deutsche Bundesbank Monthly Report July 2018 18
fl exible in this way in order to ensure the smooth implementation of the programme.
However, other factors cause more persist-ent deviations from the capital key. For ex-ample, if there is an insuffi cient quantity of existing national bonds or if these bonds do not have the minimum rating required under the PSPP, the NCB concerned makes substitute purchases of debt instruments is-sued by supranational institutions in order to fulfi l its share of purchases based on the capital key. As a result, these NCBs have a lower share of purchases of national bonds. To ensure that the stipulated total volume of national bonds remains constant at 90% and the total monthly volume does not fl uctuate, the relative share of national bonds of NCBs that do not need to conduct substitute purchases of supranational bonds automatically increases. For this reason, the share of German bonds in the entire PSPP holdings of national bonds is currently somewhat higher than Germany’s corres-ponding share in the capital key. However, this does not mean a departure from the principle that purchases generally follow the capital key. Gearing purchases to the capital key refl ects the overarching guiding principle to preserve a single monetary pol-icy.
The majority of the Bundesbank’s PSPP pur-chases on the secondary market are con-ducted in bilateral operations whereby the specifi c approach depends on the market in question. As a rule, before conducting a purchase transaction, the Bundesbank ap-proaches a large number of counterparties via the common trading platforms and asks them to submit price quotations. In the case of low- volume bonds from issuers that are not regularly active on the capital mar-ket (for instance, smaller federal states or agencies), the purchase volume is strongly infl uenced by the supply of the specifi c asset. In addition, the Bundesbank has re-cently started using (twice monthly) auc-tions to purchase less liquid securities of
government agencies as well as of regional and local governments.
As at 30 June 2018, the Eurosystem’s hold-ings of assets purchased under the PSPP had a book value of €2,068 billion, of which around €492 billion were German bonds. This means, on average, around €590 million net of German bonds were acquired each day. Holdings have continued to be built up in line with the requirements defi ned above. However, in the summer months and at the end of the year, espe-cially, the targets – as mentioned above – are reduced and reallocated to other months in order to take account of the lower market liquidity.
The Bundesbank makes a certain amount of assets that it has purchased under the PSPP available for securities lending. It thereby helps ensure that the market for German Federal bonds (Bunds) remains highly liquid. For this purpose, it uses three demand- driven lending facilities. Clearstream Bank-ing Luxembourg (CBL) offers Automated Securities Lending (ASL) to ensure that bor-rowers’ trades which would otherwise fail are settled on the settlement date, and its strategic lending facility ASLplus enables longer- term operations (maximum term of 35 days) to be concluded at a fi xed min-imum rate. In addition, the Bundesbank also lends its PSPP holdings via bilateral pro-cedures. The individual design of such pro-cedures may vary within a specifi ed risk framework but the maximum term amounts to seven days. At present, the Bundesbank provides 460 different securities from the PSPP for lending, of which 63 are Federal securities. In June 2018, on average across all Eurosystem lending facilities, around €65 billion worth of bonds were lent to market participants.
Deutsche Bundesbank Monthly Report
July 2018 19
credit quality and liquidity plus their benchmark
status, German government securities re-
mained a highly relevant and attractive invest-
ment proposition for international, non-
European investors especially. Federal securities
also continue to play a key role for the reserve
assets of foreign central banks.
The holder structure of Federal securities can
be examined in detail on the basis of the Euro-
pean Securities Holdings Statistics by Sector
(SHSS), which are collected in the Eurosystem.
The SHSS capture both the proprietary and cus-
tomer securities holdings of all reporting
account- keeping institutions in the euro area.
Data from these statistics were available up to
the end of 2017 as this article went to press.
The SHSS do not include the holdings of the
ECB or the euro area national central banks.
Combined with the Bundesbank’s holdings,
just over 95% of the total outstanding volume
of Federal securities was captured at the end of
2017 and assigned to the sector and country of
the respective holder according to the report-
ing template shown in the table on page 21. It
seems most investors from non- euro area
countries also trade German government se-
curities via their own branches or authorised
financial institutions within the euro area and
accordingly hold the securities in safe custody
at resident reporting custodians. One likely rea-
son for this is that better market liquidity is en-
sured during trading hours at the main trading
venue. The SHSS thus facilitate a detailed an-
alysis of the holder structure for German gov-
ernment securities.
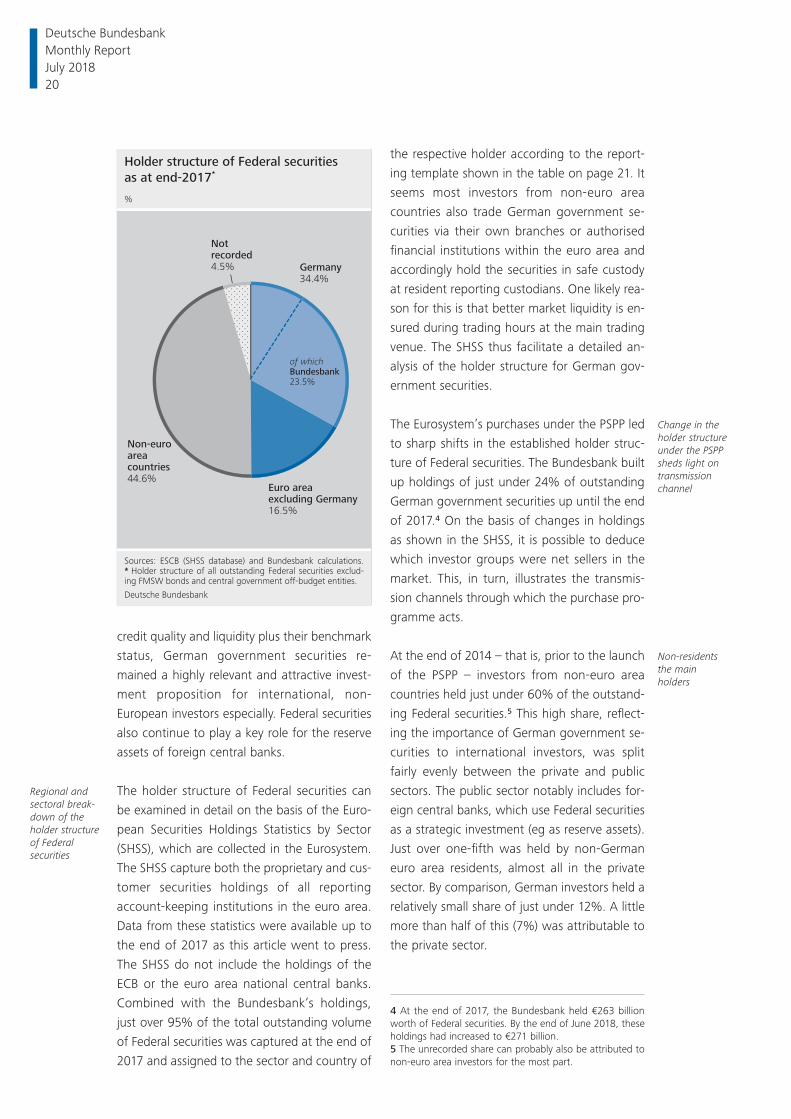
The Eurosystem’s purchases under the PSPP led
to sharp shifts in the established holder struc-
ture of Federal securities. The Bundesbank built
up holdings of just under 24% of outstanding
German government securities up until the end
of 2017.4 On the basis of changes in holdings
as shown in the SHSS, it is possible to deduce
which investor groups were net sellers in the
market. This, in turn, illustrates the transmis-
sion channels through which the purchase pro-
gramme acts.
At the end of 2014 – that is, prior to the launch
of the PSPP – investors from non- euro area
countries held just under 60% of the outstand-
ing Federal securities.5 This high share, reflect-
ing the importance of German government se-
curities to international investors, was split
fairly evenly between the private and public
sectors. The public sector notably includes for-
eign central banks, which use Federal securities
as a strategic investment (eg as reserve assets).
Just over one- fifth was held by non- German
euro area residents, almost all in the private
sector. By comparison, German investors held a
relatively small share of just under 12%. A little
more than half of this (7%) was attributable to
the private sector.
Regional and sectoral break-down of the holder structure of Federal securities
Change in the holder structure under the PSPP sheds light on transmission channel
Non- residents the main holders
Holder structure of Federal securities
as at end-2017*
Sources: ESCB (SHSS database) and Bundesbank calculations.
* Holder structure of all outstanding Federal securities exclud-
ing FMSW bonds and central government off-budget entities.
Deutsche Bundesbank
%
of whichBundesbank23.5%
Euro area excluding Germany16.5%
Non-euroarea countries44.6%
Not recorded4.5% Germany
34.4%
4 At the end of 2017, the Bundesbank held €263 billion worth of Federal securities. By the end of June 2018, these holdings had increased to €271 billion.5 The unrecorded share can probably also be attributed to non- euro area investors for the most part.
Deutsche Bundesbank Monthly Report July 2018 20
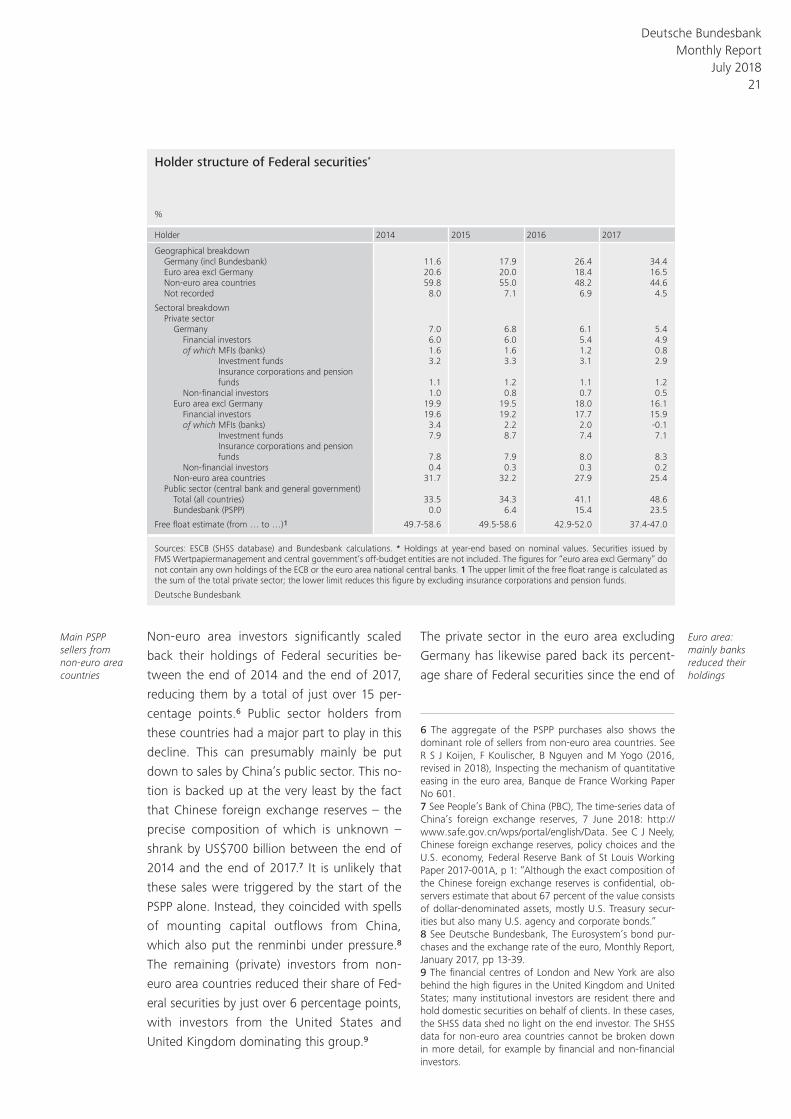
Non- euro area investors significantly scaled
back their holdings of Federal securities be-
tween the end of 2014 and the end of 2017,
reducing them by a total of just over 15 per-
centage points.6 Public sector holders from
these countries had a major part to play in this
decline. This can presumably mainly be put
down to sales by China’s public sector. This no-
tion is backed up at the very least by the fact
that Chinese foreign exchange reserves – the
precise composition of which is unknown –
shrank by US$700 billion between the end of
2014 and the end of 2017.7 It is unlikely that
these sales were triggered by the start of the
PSPP alone. Instead, they coincided with spells
of mounting capital outflows from China,
which also put the renminbi under pressure.8
The remaining (private) investors from non-
euro area countries reduced their share of Fed-
eral securities by just over 6 percentage points,
with investors from the United States and
United Kingdom dominating this group.9
The private sector in the euro area excluding
Germany has likewise pared back its percent-
age share of Federal securities since the end of
Main PSPP sellers from non-euro area countries
Euro area: mainly banks reduced their holdings
Holder structure of Federal securities*
%
Holder 2014 2015 2016 2017
Geographical breakdownGermany (incl Bundesbank) 11.6 17.9 26.4 34.4Euro area excl Germany 20.6 20.0 18.4 16.5Non- euro area countries 59.8 55.0 48.2 44.6Not recorded 8.0 7.1 6.9 4.5
Sectoral breakdownPrivate sector
Germany 7.0 6.8 6.1 5.4Financial investors 6.0 6.0 5.4 4.9of which MFIs (banks) 1.6 1.6 1.2 0.8
Investment funds 3.2 3.3 3.1 2.9Insurance corporations and pension funds 1.1 1.2 1.1 1.2
Non- fi nancial investors 1.0 0.8 0.7 0.5Euro area excl Germany 19.9 19.5 18.0 16.1
Financial investors 19.6 19.2 17.7 15.9of which MFIs (banks) 3.4 2.2 2.0 -0.1
Investment funds 7.9 8.7 7.4 7.1Insurance corporations and pension funds 7.8 7.9 8.0 8.3
Non- fi nancial investors 0.4 0.3 0.3 0.2Non- euro area countries 31.7 32.2 27.9 25.4
Public sector (central bank and general government)Total (all countries) 33.5 34.3 41.1 48.6Bundesbank (PSPP) 0.0 6.4 15.4 23.5
Free fl oat estimate (from … to …)1 49.7-58.6 49.5-58.6 42.9-52.0 37.4-47.0
Sources: ESCB (SHSS database) and Bundesbank calculations. * Holdings at year- end based on nominal values. Securities issued by FMS Wertpapiermanagement and central government’s off- budget entities are not included. The fi gures for “euro area excl Germany” do not contain any own holdings of the ECB or the euro area national central banks. 1 The upper limit of the free fl oat range is calculated as the sum of the total private sector; the lower limit reduces this fi gure by excluding insurance corporations and pension funds.
Deutsche Bundesbank
6 The aggregate of the PSPP purchases also shows the dominant role of sellers from non- euro area countries. See R S J Koijen, F Koulischer, B Nguyen and M Yogo (2016, revised in 2018), Inspecting the mechanism of quantitative easing in the euro area, Banque de France Working Paper No 601.7 See People’s Bank of China (PBC), The time- series data of China’s foreign exchange reserves, 7 June 2018: http:// www.safe.gov.cn/ wps/ portal/ english/ Data. See C J Neely, Chinese foreign exchange reserves, policy choices and the U.S. economy, Federal Reserve Bank of St Louis Working Paper 2017-001A, p 1: “Although the exact composition of the Chinese foreign exchange reserves is confidential, ob-servers estimate that about 67 percent of the value consists of dollar- denominated assets, mostly U.S. Treasury secur-ities but also many U.S. agency and corporate bonds.”8 See Deutsche Bundesbank, The Eurosystem’s bond pur-chases and the exchange rate of the euro, Monthly Report, January 2017, pp 13-39.9 The financial centres of London and New York are also behind the high figures in the United Kingdom and United States; many institutional investors are resident there and hold domestic securities on behalf of clients. In these cases, the SHSS data shed no light on the end investor. The SHSS data for non- euro area countries cannot be broken down in more detail, for example by financial and non- financial investors.
Deutsche Bundesbank Monthly Report
July 2018 21
2014, with the decrease coming to just under
4 percentage points. Within the sector, finan-
cial investors constituted the largest investor
group. Investment funds, in particular, initially
increased their shares in Federal securities in
the run- up to, and at the start of, the asset pur-
chase programme before subsequently becom-
ing net sellers from 2016 onwards and redu-
cing their shares to just over 7% at last count.
However, insurance corporations’ and pension
funds’ share in Federal securities rose to a little
more than 8%, leading them to supplant in-
vestment funds as the largest investor group
among financial investors. By contrast, banks
from the euro area excluding Germany consid-
erably reduced their comparatively small share,
even establishing a small net short position at
the end of 2017, on aggregate. A similar pic-
ture emerges for German private investors. As
is the case with the other euro area investors,
insurance corporations’ and pension funds’
share remained broadly constant, whereas do-
mestic banks scaled back their holdings over
this period.
Viewed as a global aggregate, the private sec-
tor’s behaviour was fairly homogeneous. Pri-
vate financial and non- financial investors, re-
gardless of their home region, have made simi-
lar cutbacks to their percentage shares in Fed-
eral securities since the launch in the PSPP
(between the end of 2014 and end of 2017).
Relative to the holdings at the end of 2014, the
decline in the private sector ranged from 19%
(euro area excluding Germany) through 20%
(non- euro area countries) to 23% (Germany).
When broken down by sector, the figures for
the private sector show that private financial
investors behaved very heterogeneously. There
were significant portfolio shifts. Euro area
banks, for example, reduced their percentage
shares in Federal securities almost completely
(-86%), whereas investment funds made only
slight changes (-10%). Insurance corporations
and pension funds, on the other hand, even
upped their shares (+7%).10 These varied reac-
tions can also be explained by institutional fac-
tors. Unlike the other two sectors, euro area
banks have access to the deposit facility, which
can be a cheaper and safe alternative to invest-
ing in Federal securities.11 In this sense, the
PSPP also had an impact within the euro area
via sectoral portfolio adjustments. Based on
(absolute) transaction volumes, the portfolio
effect was by far the greatest amongst invest-
ors from non- euro area countries.12 In keeping
with this, the share of absolute sales was low in
the euro area private sector, on account of the
small share of just under 27% of the outstand-
ing volume prior to the launch of the PSPP. For
the non- euro area countries, the reallocations
could also have spread to affect exchange rate
developments, in cases where bond sellers
shifted into other currencies.13
The share of freely tradable bonds (free float)
declined under the PSPP. If free float is defined
as the stock available to the private sector ex-
cept for pension funds and insurance corpor-
ations, the volume of securities in free float
came to less than 40% at the end of 2017.14
This represents a decrease of just over 10 per-
centage points during the purchase pro-
gramme, which may affect general availability
and market liquidity.
Signs that port-folio adjustment is homogeneous in regional terms, …
… but mixed within the financial private sector
Declining share of freely trad-able securities
10 For the euro area as a whole, see R S J Koijen, F Koulis-cher, B Nguyen and M Yogo (2017), Euro- area quantitative easing and portfolio rebalancing, American Economic Re-view, Vol 107, No 5, pp 621-627.11 The present analysis does not allow for a statement on how the individual sectors have adjusted their portfolios overall (portfolio rebalancing) under the influence of the PSPP.12 There is no sectoral breakdown for investors from non- euro area countries, which means that this statement only holds under the assumption that private financial investors from non- euro area countries and from the euro area reacted in similar ways.13 See Deutsche Bundesbank (2017), op cit.14 Free float normally refers to the stock that is freely avail-able for trading. It is not possible to gain a clear and com-plete picture of the investment motives of the sectors. For one thing, the banking sector is also required by regulation to hold highly liquid bonds. For another, sovereign funds tend to be more yield- focused, but are not distinguished from reserve assets in the SHSS.
Deutsche Bundesbank Monthly Report July 2018 22
Federal Government issuance activities and procedures
In Germany, the Federal Ministry of Finance
is responsible for the Federal Government’s
debt management. The primary close- to-
market and operational debt management
tasks include managing Federal Govern-
ment borrowing and liquidity, which has
been entrusted to Federal Republic of Ger-
many – Finance Agency (referred to here as
the “Finance Agency”) in Frankfurt am Main
since June 2001. The Federal Government,
represented by the Federal Ministry of
Finance , is the sole shareholder of the Fi-
nance Agency. The main task of the Finance
Agency is to provide timely, cost- effective
and low- risk debt management services for
the Federal Government, in particular
through the initial issuance of securities in
the primary market. At the same time, the
Finance Agency’s work is intended to ce-
ment and further extend the status of Ger-
many’s Federal Government as a bench-
mark issuer in the euro area.
Bundesbank the government’s fi scal agent
As the government’s fi scal agent, the Bun-
desbank performs technical debt manage-
ment duties for the Federal Government,
conducting auctions of Federal securities,
carrying out market management oper-
ations on the German stock exchanges, and
settling the Federal Government’s securities
transactions. These tasks are completed on
behalf of and for the account of the Federal
Government in coordination with the Fi-
nance Agency. It should be noted that, as
the Federal Government’s fi scal agent, the
Bundesbank provides banking services
which are strictly separate from its monet-
ary and foreign exchange policy tasks. The
Bundesbank does not grant loans when
auctioning Federal securities in the primary
market, nor does it take Federal securities
into its own portfolio. On account of its fi s-
cal agent role, the same applies to second-
ary market transactions.
Auctions: the main primary market procedure
The primary market is where securities are
issued for the fi rst time. It is where the Fed-
eral Government covers more than 90% of
its annual borrowing requirements by issu-
ing Federal securities in auctions. The Fed-
eral Government only commissions a bank
syndicate as an alternative channel for issu-
ing Federal securities for a handful of spe-
cial Federal securities, such as the two US
dollar- denominated bonds which were is-
sued in 2005 and 2009 and have since
been repaid.
Issuance planning
Market participants and investors value an
issuer’s continuity, transparency and reliabil-
ity, and this ultimately pays off for the bor-
rower in the form of favourable borrowing
conditions. Auctions of Federal securities
planned by the Federal Government over
the course of a calendar year are therefore
announced by the Finance Agency at the
end of the previous year in an annual issu-
ance calendar. The annual preview contains
precise details on the Federal securities
which will be put up for auction, such as
the auction date, the planned issuance vol-
ume and the exact maturity date. Addition-
ally, a quarterly issuance calendar is pub-
lished, which may contain deviations from
the annual preview. As an issuer, the Fed-
eral Government strives to conduct its an-
nounced issuance activities according to its
published schedules. However, these plans
Deutsche Bundesbank Monthly Report
July 2018 23
may need to be adjusted if borrowing re-
quirements, the Federal Government’s li-
quidity position, or the capital market situ-
ation as a whole change signifi cantly during
the course of the year.
Maturity profi le
The Federal Government’s commitment to
continuity and reliability means offering
Federal securities with an overall balanced
maturity profi le. First, it weighs the gener-
ally lower borrowing costs of revolving
short- term debt against the certainty that
borrowing in the long- term maturity seg-
ment can offer. Second, it takes into ac-
count the fact that offering a broad spec-
trum of maturities on a regular basis allows
investors to invest in accordance with their
respective duration goals. That way, the
Federal Government can be sure of attract-
ing a broad investor base. This is why Fed-
eral securities are put up for auction across
all maturities: six- month Treasury discount
paper (“Bubills”) in the money market seg-
ment, and in the capital market segment,
two- year Federal Treasury notes (“Schätze”),
fi ve- year Federal notes (“Bobls”) and main-
stay ten- year and thirty- year Federal bonds
(“Bunds”). Infl ation- linked Federal securities
(“Bund- Linker”) are also auctioned on a
regular basis.
Bund Issues Auction Group
Members of the Bund Issues Auction Group,
who have been approved by the Finance
Agency, are eligible to bid in Federal Gov-
ernment auctions. The group currently
comprises 36 credit institutions and invest-
ment fi rms which are established in a mem-
ber state of the European Union. To remain
in the auction group, members must sub-
scribe to at least 0.05% of the total issu-
ance allotted, weighted by maturity, in auc-
tions in any one calendar year. Member in-
stitutions which fail to subscribe to this
minimum share are required to leave the
group at the end of the year. Apart from
the minimum share requirement, members
have no additional obligations. For instance,
they are not expected to provide any mar-
ket making services in the secondary mar-
ket – ie quote bid and ask prices for Federal
securities or provide mandatory reporting
and advisory services for the issuer. On
30 June and 31 December each year, the
Finance Agency publishes a list ranking
Bund Issues Auction Group members by
their share of the weighted issuance vol-
ume allotted, without quoting percentages.
Operational implementation
Federal Government auctions take place on
the Bund Bidding System (BBS) electronic
auction platform provided by the Bundes-
bank. The Bundesbank is responsible for
technical implementation of the auction
process; in other words, it announces the
auction and the invitation to bid, monitors
bidders’ submissions on the day of the auc-
tion and publishes the auction results. The
Finance Agency and the Federal Ministry of
Finance both have direct links to the BBS,
and they make the economic decisions – ie
they determine the allotment conditions
such as allotment prices and volumes on
the day of the auction. Once the deadline
for bids has passed, it is generally the case
that the allotment decision is made and the
auction results are announced via the BBS
and fi nancial information providers within
the space of two minutes.
Auction procedure
Allotment is based on what is known as the
multiple price method, meaning that the
accepted price bids are allotted at the price
specified in the respective bid. Non-
competitive bids are fi lled at the weighted
Deutsche Bundesbank Monthly Report July 2018 24
average price of the bids accepted. Bids
above the lowest price accepted are allot-
ted in full; those below the lowest price ac-
cepted are not considered. Bids at the low-
est price accepted and non- competitive
bids can be allotted pro rata – in other
words, bids can also be fi lled here, albeit
only to a limited extent. March 2018 saw
the Federal Government use the BBS’s new
multi- ISIN auction functionality for the fi rst
time. This enables multiple Federal secur-
ities to be offered to investors in parallel as
part of a single auction.
Secondary market activities
The Finance Agency sets aside a share of
the securities issued in each auction as pro-
prietary holdings of the Federal Govern-
ment for secondary market operations. This
amount is not defi ned in advance and var-
ies from one auction to the next. On aver-
age, around 20% of the issuance volume is
set aside for this purpose. Following the
auction, these securities are gradually fed
into the market by the Finance Agency in
the context of secondary market activities.
As a result, counterparties can still purchase
Federal securities from the issuer after they
have been issued in the primary market. In
addition, the issuer might fi nd it benefi cial
to smooth its borrowing to a degree over
time. However, secondary market activities
also include secondary market operations
on the German stock exchanges, which en-
tail the Bundesbank buying and selling
listed Federal securities for the Federal Gov-
ernment’s account. These operations aim to
achieve fair prices which do not discrimin-
ate between different market participants
(nor between institutional investors and re-
tail customers) and to maintain liquid trad-
ing with low bid- ask spreads. The Bundes-
bank assists in setting a “Bundesbank refer-
ence price” on the Frankfurt Stock Exchange
for every listed Federal security on every
trading day, which provides an important
benchmark, especially for the retail busi-
ness. This institutional framework plays a
part in ensuring that Federal securities can
be traded at robust prices that are in line
with the market every trading day.
The Federal Government’s proprietary hold-
ings can also be used by the Finance Agency
to collateralise securities repurchase agree-
ments (repos) and interest rate swap trans-
actions, as well as for securities lending.
The Federal Government’s securities trans-
actions are settled via the cash and safe
custody accounts it maintains with the Bun-
desbank.
Deutsche Bundesbank Monthly Report
July 2018 25
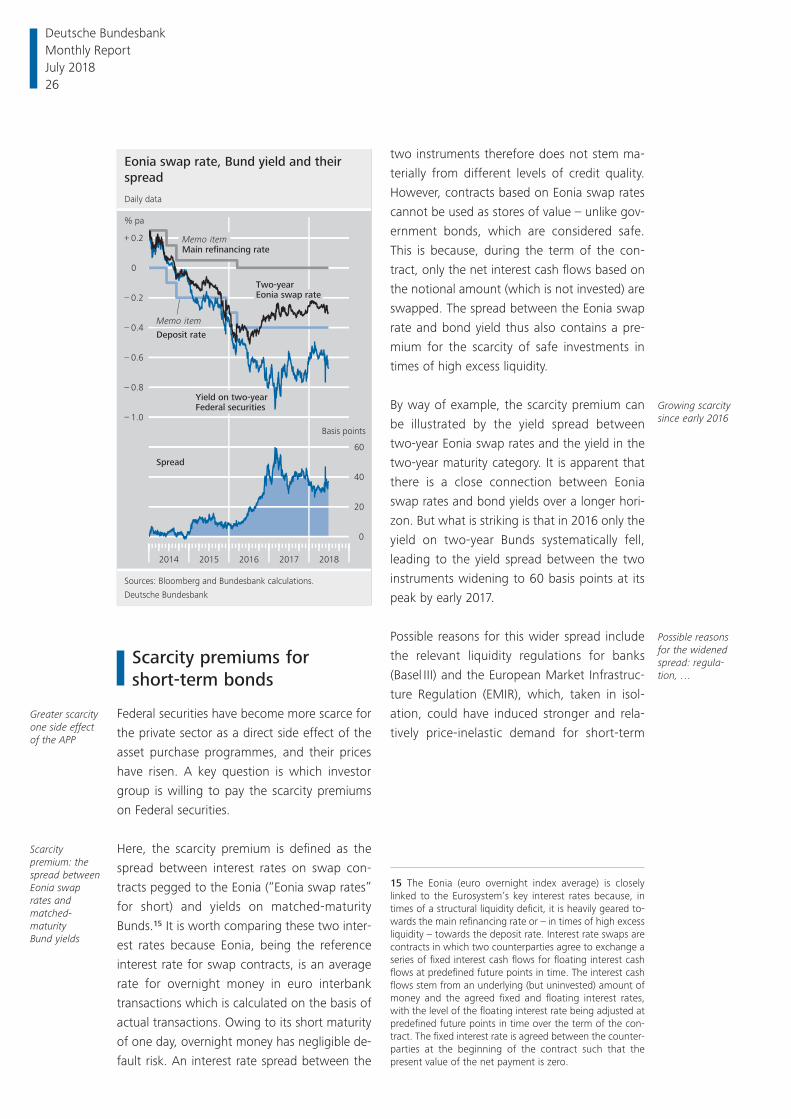
Scarcity premiums for short-term bonds
Federal securities have become more scarce for
the private sector as a direct side effect of the
asset purchase programmes, and their prices
have risen. A key question is which investor
group is willing to pay the scarcity premiums
on Federal securities.
Here, the scarcity premium is defined as the
spread between interest rates on swap con-
tracts pegged to the Eonia (“Eonia swap rates”
for short) and yields on matched- maturity
Bunds.15 It is worth comparing these two inter-
est rates because Eonia, being the reference
interest rate for swap contracts, is an average
rate for overnight money in euro interbank
transactions which is calculated on the basis of
actual transactions. Owing to its short maturity
of one day, overnight money has negligible de-
fault risk. An interest rate spread between the
two instruments therefore does not stem ma-
terially from different levels of credit quality.
However, contracts based on Eonia swap rates
cannot be used as stores of value – unlike gov-
ernment bonds, which are considered safe.
This is because, during the term of the con-
tract, only the net interest cash flows based on
the notional amount (which is not invested) are
swapped. The spread between the Eonia swap
rate and bond yield thus also contains a pre-
mium for the scarcity of safe investments in
times of high excess liquidity.
By way of example, the scarcity premium can
be illustrated by the yield spread between
two-year Eonia swap rates and the yield in the
two- year maturity category. It is apparent that
there is a close connection between Eonia
swap rates and bond yields over a longer hori-
zon. But what is striking is that in 2016 only the
yield on two- year Bunds systematically fell,
leading to the yield spread between the two
instruments widening to 60 basis points at its
peak by early 2017.
Possible reasons for this wider spread include
the relevant liquidity regulations for banks
( Basel III) and the European Market Infrastruc-
ture Regulation (EMIR), which, taken in isol-
ation, could have induced stronger and rela-
tively price- inelastic demand for short- term
Greater scarcity one side effect of the APP
Scarcity premium: the spread between Eonia swap rates and matched- maturity Bund yields
Growing scarcity since early 2016
Possible reasons for the widened spread: regula-tion, …
Eonia swap rate, Bund yield and their
spread
Sources: Bloomberg and Bundesbank calculations.
Deutsche Bundesbank
2014 2015 2016 2017 2018
0
20
40
60
Daily data
Spread
1.0
0.8
0.6
0.4
0.2
0
0.2
–
–
–
–
–
+
Two-year Eonia swap rate
Yield on two-year Federal securities
Memo itemMain refinancing rate
Basis points
Memo item
Deposit rate
% pa
15 The Eonia (euro overnight index average) is closely linked to the Eurosystem’s key interest rates because, in times of a structural liquidity deficit, it is heavily geared to-wards the main refinancing rate or – in times of high excess liquidity – towards the deposit rate. Interest rate swaps are contracts in which two counterparties agree to exchange a series of fixed interest cash flows for floating interest cash flows at predefined future points in time. The interest cash flows stem from an underlying (but uninvested) amount of money and the agreed fixed and floating interest rates, with the level of the floating interest rate being adjusted at predefined future points in time over the term of the con-tract. The fixed interest rate is agreed between the counter-parties at the beginning of the contract such that the present value of the net payment is zero.
Deutsche Bundesbank Monthly Report July 2018 26
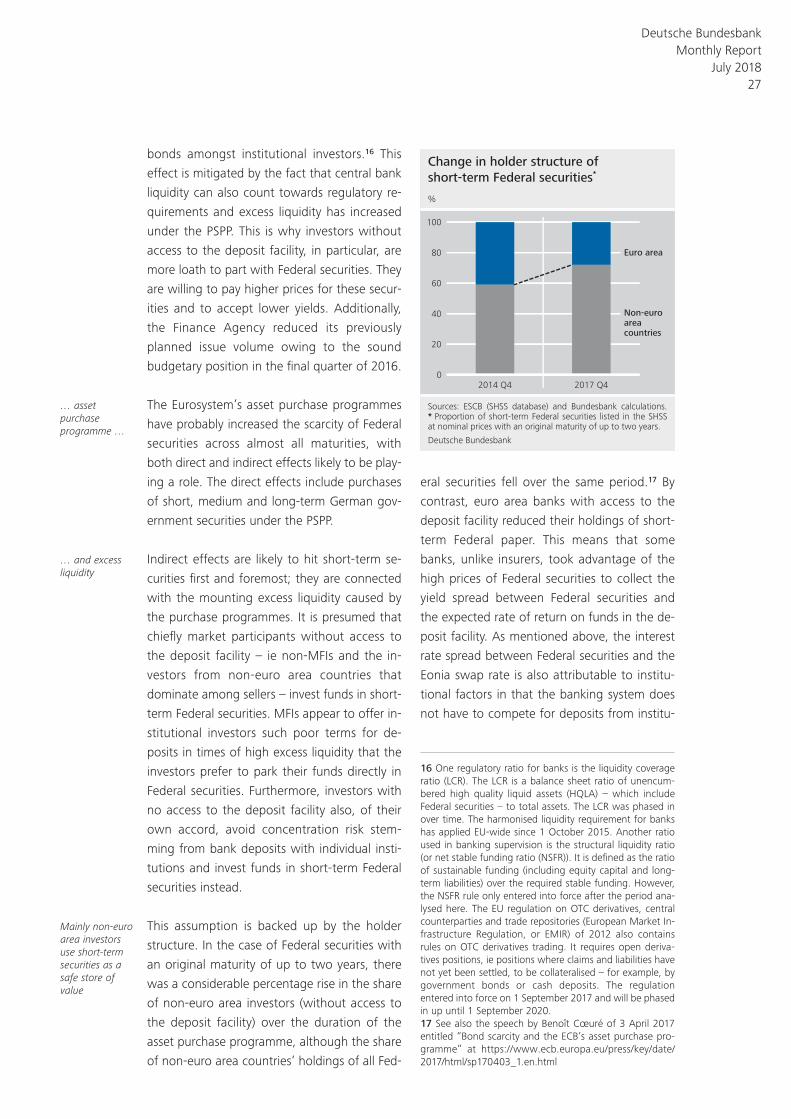
bonds amongst institutional investors.16 This
effect is mitigated by the fact that central bank
liquidity can also count towards regulatory re-
quirements and excess liquidity has increased
under the PSPP. This is why investors without
access to the deposit facility, in particular, are
more loath to part with Federal securities. They
are willing to pay higher prices for these secur-
ities and to accept lower yields. Additionally,
the Finance Agency reduced its previously
planned issue volume owing to the sound
budgetary position in the final quarter of 2016.
The Eurosystem’s asset purchase programmes
have probably increased the scarcity of Federal
securities across almost all maturities, with
both direct and indirect effects likely to be play-
ing a role. The direct effects include purchases
of short, medium and long- term German gov-
ernment securities under the PSPP.
Indirect effects are likely to hit short- term se-
curities first and foremost; they are connected
with the mounting excess liquidity caused by
the purchase programmes. It is presumed that
chiefly market participants without access to
the deposit facility – ie non- MFIs and the in-
vestors from non- euro area countries that
dominate among sellers – invest funds in short-
term Federal securities. MFIs appear to offer in-
stitutional investors such poor terms for de-
posits in times of high excess liquidity that the
investors prefer to park their funds directly in
Federal securities. Furthermore, investors with
no access to the deposit facility also, of their
own accord, avoid concentration risk stem-
ming from bank deposits with individual insti-
tutions and invest funds in short- term Federal
securities instead.
This assumption is backed up by the holder
structure. In the case of Federal securities with
an original maturity of up to two years, there
was a considerable percentage rise in the share
of non- euro area investors (without access to
the deposit facility) over the duration of the
asset purchase programme, although the share
of non- euro area countries’ holdings of all Fed-
eral securities fell over the same period.17 By
contrast, euro area banks with access to the
deposit facility reduced their holdings of short-
term Federal paper. This means that some
banks, unlike insurers, took advantage of the
high prices of Federal securities to collect the
yield spread between Federal securities and
the expected rate of return on funds in the de-
posit facility. As mentioned above, the interest
rate spread between Federal securities and the
Eonia swap rate is also attributable to institu-
tional factors in that the banking system does
not have to compete for deposits from institu-
… asset purchase programme …
… and excess liquidity
Mainly non- euro area investors use short- term securities as a safe store of value
Change in holder structure of
short-term Federal securities*
Sources: ESCB (SHSS database) and Bundesbank calculations.
* Proportion of short-term Federal securities listed in the SHSS
at nominal prices with an original maturity of up to two years.
Deutsche Bundesbank
0
20
40
60
80
100
%
2014 Q4 2017 Q4
Euro area
Non-euro area countries
16 One regulatory ratio for banks is the liquidity coverage ratio (LCR). The LCR is a balance sheet ratio of unencum-bered high quality liquid assets (HQLA) – which include Federal securities – to total assets. The LCR was phased in over time. The harmonised liquidity requirement for banks has applied EU- wide since 1 October 2015. Another ratio used in banking supervision is the structural liquidity ratio (or net stable funding ratio (NSFR)). It is defined as the ratio of sustainable funding (including equity capital and long- term liabilities) over the required stable funding. However, the NSFR rule only entered into force after the period ana-lysed here. The EU regulation on OTC derivatives, central counterparties and trade repositories (European Market In-frastructure Regulation, or EMIR) of 2012 also contains rules on OTC derivatives trading. It requires open deriva-tives positions, ie positions where claims and liabilities have not yet been settled, to be collateralised – for example, by government bonds or cash deposits. The regulation entered into force on 1 September 2017 and will be phased in up until 1 September 2020.17 See also the speech by Benoît Cœuré of 3 April 2017 entitled “Bond scarcity and the ECB’s asset purchase pro-gramme” at https:// www.ecb.europa.eu/ press/ key/ date/ 2017/ html/ sp170403_1.en.html
Deutsche Bundesbank Monthly Report
July 2018 27
tional investors when excess liquidity levels are
high, thus pressuring them, by way of un-
attractive overall conditions, into investing in
Federal securities. For the reasons given above,
the observed scarcity premium probably de-
clines in an environment of receding excess li-
quidity.
Market liquidity in the context of the purchase programmes
High market liquidity is important for the effect-
ive implementation of the PSPP. However, the
decline in Federal securities in free float reduced
the volumes available for trading and thus,
potentially , market liquidity. However, market
liquidity is a multifaceted concept, and aca-
demic researchers, market participants and pol-
icymakers have yet to reach a consensus on
how to measure it. Typically, there are three
dimensions of market liquidity: “width” (cost of
executing a trade at a given volume), “depth”
(the tradable volume at a given price) and
“resiliency ” (the half- life of random price fluctu-
ations). In view of the complexity of the con-
cept, no individual ratio covers all aspects of
market liquidity.
Federal securities trading activity has been in
decline since the 2000s, notably due to the ef-
fects of the financial and economic crisis. In the
spot market, according to Finance Agency stat-
istics, annual gross trading volumes transacted
by the members of the Bund Issues Auction
Group fell from more than €7,000 billion in
2005 to less than €5,000 billion in 2017.18
Although the outstanding bond volume rose
from 2005 onwards, 2016 saw the lowest trad-
ing volume in the spot market. The PSPP may
also have played a part in this development. In
the Eurex futures market, the volume of futures
contracts with Federal securities as the under-
lying has also been lower since the financial cri-
sis. Against this backdrop, trading in both the
spot and futures markets has also grown some-
what more fragmented. This is borne out by
the fact that trades have involved increasingly
smaller transaction volumes over time. In par-
ticular, large transactions have become more
expensive and thus less frequent.
Quantitative analyses are made more difficult
by the fact that bonds are mostly traded over-
the- counter (OTC); in other words, trading is
conducted in a decentralised manner directly
between market participants. Compared with
listed shares, bond trading is therefore more
fragmented, and scarcely any data on prices
and volumes are available that are representa-
tive of the market. In addition to traditional bi-
lateral telephone trading, more and more OTC
transactions are being conducted on electronic
trading platforms.
Individual operators of electronic trading plat-
forms use a central order book with limits
(known as a limit order book) to settle bond
purchases. Buying and selling bids with the re-
spective prices and quantities are collected in
these limit order books. Since every bid is bind-
ing, a robust picture of the market is obtained
which allows in- depth analyses. However, rela-
tively low volumes are traded on trading plat-
forms compared with OTC trading, which
means that the results need to be put into per-
spective.
A ratio known as order book illiquidity, which
can be determined on the basis of information
on the limit order book, is of interest when
analysing liquidity. This ratio contains the li-
quidity dimensions width in the numerator and
depth in the denominator. The width of the
order book corresponds to the average bid- ask
spread of the five closest buy and sell orders.
The depth of the order book, meanwhile, is de-
rived from the total volume of these five bid
and ask prices, respectively. Order book illiquid-
ity rises as bid- ask spreads widen and volumes
High liquidity important for effective imple-mentation of the PSPP
Declining trad-ing volumes and more frag-mented trading point to decrease in liquidity
Decentralised trading structure makes quantita-tive analysis difficult
Limit order book as a further source of data
Order book illiquidity con-tains the liquid-ity dimensions width and depth
18 When calculating volumes traded, trades transacted be-tween members of the Bund Issues Auction Group are counted twice for statistical purposes. Transactions in which no member of the group is involved, on the other hand, are not included in the statistics.
Deutsche Bundesbank Monthly Report July 2018 28
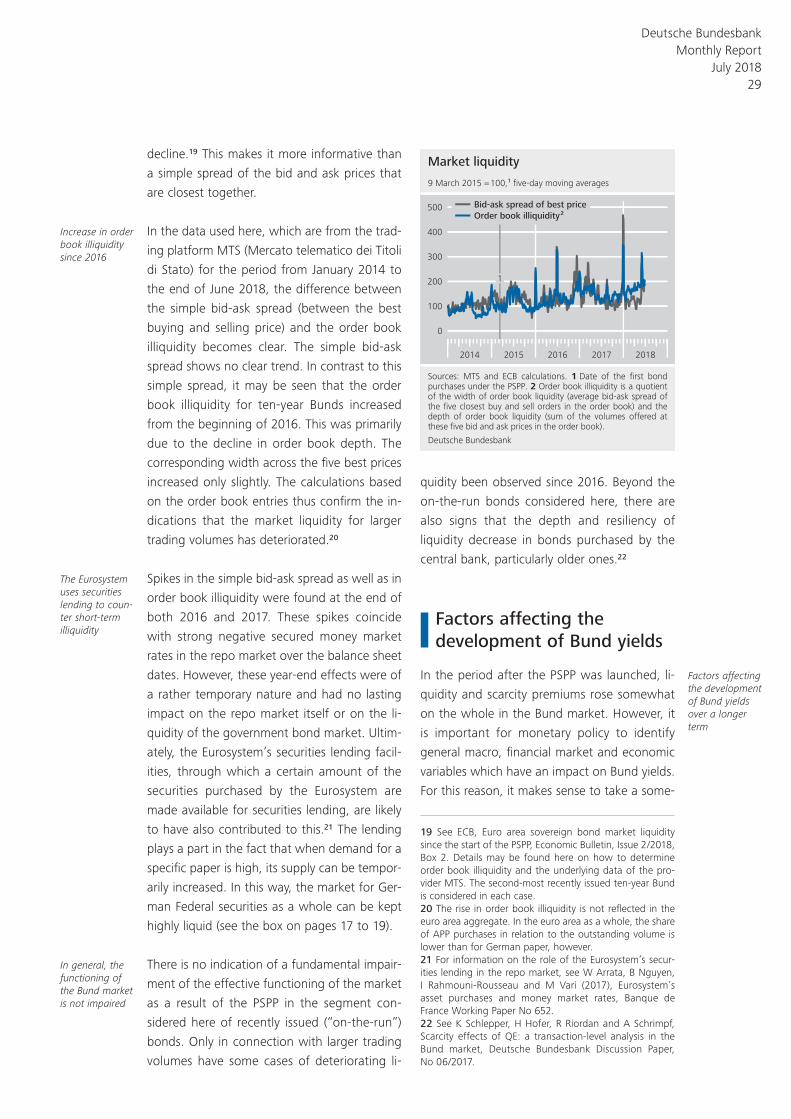
decline.19 This makes it more informative than
a simple spread of the bid and ask prices that
are closest together.
In the data used here, which are from the trad-
ing platform MTS (Mercato telematico dei Titoli
di Stato) for the period from January 2014 to
the end of June 2018, the difference between
the simple bid- ask spread (between the best
buying and selling price) and the order book
illiquidity becomes clear. The simple bid- ask
spread shows no clear trend. In contrast to this
simple spread, it may be seen that the order
book illiquidity for ten- year Bunds increased
from the beginning of 2016. This was primarily
due to the decline in order book depth. The
corresponding width across the five best prices
increased only slightly. The calculations based
on the order book entries thus confirm the in-
dications that the market liquidity for larger
trading volumes has deteriorated.20
Spikes in the simple bid- ask spread as well as in
order book illiquidity were found at the end of
both 2016 and 2017. These spikes coincide
with strong negative secured money market
rates in the repo market over the balance sheet
dates. However, these year- end effects were of
a rather temporary nature and had no lasting
impact on the repo market itself or on the li-
quidity of the government bond market. Ultim-
ately, the Eurosystem’s securities lending facil-
ities, through which a certain amount of the
securities purchased by the Eurosystem are
made available for securities lending, are likely
to have also contributed to this.21 The lending
plays a part in the fact that when demand for a
specific paper is high, its supply can be tempor-
arily increased. In this way, the market for Ger-
man Federal securities as a whole can be kept
highly liquid (see the box on pages 17 to 19).
There is no indication of a fundamental impair-
ment of the effective functioning of the market
as a result of the PSPP in the segment con-
sidered here of recently issued (“on- the- run”)
bonds. Only in connection with larger trading
volumes have some cases of deteriorating li-
quidity been observed since 2016. Beyond the
on- the- run bonds considered here, there are
also signs that the depth and resiliency of
liquidity decrease in bonds purchased by the
central bank, particularly older ones.22
Factors affecting the development of Bund yields
In the period after the PSPP was launched, li-
quidity and scarcity premiums rose somewhat
on the whole in the Bund market. However, it
is important for monetary policy to identify
general macro, financial market and economic
variables which have an impact on Bund yields.
For this reason, it makes sense to take a some-
Increase in order book illiquidity since 2016
The Eurosystem uses securities lending to coun-ter short- term illiquidity
In general, the functioning of the Bund market is not impaired
Factors affecting the development of Bund yields over a longer term
Market liquidity
Sources: MTS and ECB calculations. 1 Date of the first bond
purchases under the PSPP. 2 Order book illiquidity is a quotient
of the width of order book liquidity (average bid-ask spread of
the five closest buy and sell orders in the order book) and the
depth of order book liquidity (sum of the volumes offered at
these five bid and ask prices in the order book).
Deutsche Bundesbank
2014 2015 2016 2017 2018
9 March 2015 = 100,1 five-day moving averages
0
100
200
300
400
500Order book illiquidity 2
Bid-ask spread of best price
1
19 See ECB, Euro area sovereign bond market liquidity since the start of the PSPP, Economic Bulletin, Issue 2/ 2018, Box 2. Details may be found here on how to determine order book illiquidity and the underlying data of the pro-vider MTS. The second- most recently issued ten- year Bund is considered in each case.20 The rise in order book illiquidity is not reflected in the euro area aggregate. In the euro area as a whole, the share of APP purchases in relation to the outstanding volume is lower than for German paper, however.21 For information on the role of the Eurosystem’s secur-ities lending in the repo market, see W Arrata, B Nguyen, I Rahmouni- Rousseau and M Vari (2017), Eurosystem’s asset purchases and money market rates, Banque de France Working Paper No 652.22 See K Schlepper, H Hofer, R Riordan and A Schrimpf, Scarcity effects of QE: a transaction- level analysis in the Bund market, Deutsche Bundesbank Discussion Paper, No 06/ 2017.
Deutsche Bundesbank Monthly Report
July 2018 29
what longer view in order to examine factors
affecting the development of Bund yields be-
yond the PSPP. To this end, the previously men-
tioned special developments arising in connec-
tion with the PSPP (scarcity and liquidity pre-
mium) are also taken into consideration. In
addition, factors such as monetary policy as a
whole (interest rate movements and PSPP),
international effects and safe haven flows are
also looked at more closely.
In conjunction with global interest rates, Bund
yields fell considerably overall in the last few
years. Yields also rose strongly at times, how-
ever. Two examples of phases of strongly in-
creasing yields are the taper tantrum in the
United States in 2013, which also affected
Bund yields, and the Bund tantrum in spring
2015. The following analysis therefore also
examines the extent to which the selected de-
terminants may, during the two tantrum
phases, have given rise to special factors which
contributed to the temporary surges in yields.
The following individual factors are taken into
account:
– According to the expectations hypothesis of
the term structure, the slope of the Eonia
swap rate curve at the short end, calculated
as the two- year Eonia swap rate minus the
one- month Eonia swap rate (Slope_Eonia), is
an indicator of future changes to short- term
interest rates over the next two years and
thus also of the expected path of future key
interest rates.23 Because central banks take
economic activity and price developments
into account when setting interest rate pol-
icy, this could indirectly also reflect the eco-
nomic and inflation outlook. The slope of
the Eonia swap rate curve is expected to
have a positive impact on the (ten- year)
Bund yield (Bund_Interest).
– The interest rate relationship with the United
States is measured in terms of the yield of
ten- year US Treasuries (US_Interest). US
yields lagged by one stock exchange trading
day are used to capture a potential impact
of US yields on Bund yields in order to allow
for the time difference between the USA
and Germany. The impact of US yields is ex-
pected to be positive.
– The particularly high market liquidity of
Bunds is measured as the difference be-
tween the yield of bonds issued by public
promotional banks, such as Kreditanstalt für
Wiederaufbau (KfW), and German Bunds.
This means that, in contrast to the bid- ask
spread, it is not an absolute but a relative
measure of market liquidity. This measure
takes into account not only the particularly
high market liquidity of ten- year benchmark
bonds, but also the general, maturity-
independent liquidity advantage of Bunds.
To this end, first the yield spread between
the bonds of public promotional banks and
Bunds is calculated for every full- year matur-
ity between one and ten years.24 A principal
component analysis is then carried out to
calculate the first principal component of
the maturity- specific spreads, which then
serves as a measure of the maturity-
independent liquidity premium of Bunds
(PC_Liquidity).25 It is expected to have a
negative impact on Bund yields.
– A potential scarcity of Bunds is interpreted
as a response to excess demand which, like
the liquidity premium, drives yields below
Bund yields down consider-ably overall, but yields also up at times
Determinants of the estimation: …
… slope of the Eonia swap rate curve measures policy rates expectations, …
… the US interest rate measures the interest rate relationship, …
… the yield spread of government- guaranteed bank bonds measures the liquidity premium on Bunds, …
23 According to the expectations theory of the term struc-ture, the long- term interest rate is dependent only on the current short- term interest rate and the expected future short- term interest rates, whereas possible term premiums are disregarded. As term premiums play only a minor role in the short- term maturity spectrum, the slope of the yield curve in this segment probably mainly reflects the expected path of the short- term interest rate. This is in line, for ex-ample, with empirical evidence on US swap rates; see S Sundaresan, Z Wang and W Yang (2017), Dynamics of the expectation and risk premium in the OIS term structure, Kelley School of Business Research Paper No 17-41. See also S P Lloyd (2018), Overnight index swap market- based measures of monetary policy expectations, Bank of Eng-land Staff Working Paper No 709.24 Data are not available for six- year bonds issued by pub-lic promotional banks. The yield spreads can therefore only be calculated for the other full- year maturities.25 The first principal component explains 84% of the total variance.
Deutsche Bundesbank Monthly Report July 2018 30
the risk- free interest rate. The resulting scar-
city premiums are reflected, for example, in
the repo market26 and in the difference be-
tween Eonia swap rates and Bund yields,
which was discussed above in connection
with the holder structure. In order to quan-
tify general, maturity- independent scarcity
premiums, the difference between the re-
spective Eonia swap rates (as a measure of
the risk- free interest rate) and Bund yields is
calculated for each full- year maturity be-
tween one and ten years. As a measure of
the scarcity premium, the first principal com-
ponent of these maturity- specific Eonia
spreads is factored into the estimation (PC_
Scarcity).27 It should have a negative impact
on yields.28
– Lastly, the estimation takes into account the
possible impact on Bund yields that may re-
sult from portfolio shifts by investors follow-
ing a change in equity market uncertainty.
The VDAX volatility index, which measures
the implied volatility of the DAX calculated
from options, is used as a measure of equity
market uncertainty. The VDAX should have a
negative effect on Bund yields.
This estimation is based on daily data, whereby
all of the variables are measured in first differ-
ences in order to rule out the possibility of non-
stationarity. The observation period from the
beginning of 2012 until 23 May 2018 is se-
lected such that it covers the impact of the sov-
ereign debt crisis as well as the two tantrum
phases. In order to avoid autocorrelation in the
residuals, all estimations are supplemented by a
lagged term for the Bund yield.
The selected determinants explain 65% of the
total dispersion of Bund yields.29 All of the esti-
mated coefficients have the expected sign and
are significant at least at the 5% level (Esti-
mate 1 in the table on page 32). The results
suggest that the scarcity premiums and the
slope of the Eonia swap rate curve both have a
particularly important impact. In order to assess
the strength of the effects, it is useful to stand-
ardise the estimated coefficients such that they
reflect the impact on the dependent variable in
standard deviations. A standardisation of this
kind reveals that an increase in the scarcity pre-
miums by one standard deviation lowers the
Bund yield by 0.48 of a standard deviation. A
slightly weaker (positive) effect (0.40 of a
standard deviation) is derived for the slope of
the Eonia swap rate curve.30
The reported effect of the scarcity premiums,
which have risen considerably since the begin-
ning of 2016, implies that they dampened
yields in the last two years in particular. This
effect apparently stemmed from scarcity pre-
miums not only in the ten- year maturity seg-
ment but also at the shorter end, where the
scarcity was particularly pronounced. Possible
reasons for this are the above- mentioned
growth in demand among institutional invest-
ors in a number of maturity segments, the Eu-
rosystem’s increased holdings as well as the
rising levels of excess liquidity in the banking
system.
The strong influence also exerted by the slope
of the Eonia swap rate curve at the short end
underlines the importance of expectations re-
… Eonia swap spreads measure potential scarcity premiums, …
… and the VDAX measures equity market uncertainty
Scarcity pre-miums and slope of the Eonia swap rate curve are the key explanatory factors
Possible reasons for the scarcity of Bunds
Influence of the slope of the Eonia swap rate curve
26 In the repo market, repo rates below the deposit rate, for example, indicate scarcity premiums on the underlying Bunds. The scarcity of an individual bond is expressed, moreover, in its specialness premium. This represents the difference between the repo rate for the general collateral trade (where the collateral is only required to meet general quality standards) and the repo rate for the specific collat-eral (where a specific individual bond constitutes the collat-eral).27 The first principal component explains 89% of the total variance.28 In addition to the other full- year Bund yields, yields on ten- year Bunds are also factored into the measures used for the maturity- independent scarcity and liquidity pre-miums (the first principal components) in each case. An endogeneity problem cannot therefore be categorically ruled out. As this impact is relatively low for both meas-ures, however, the possibility of such an endogeneity prob-lem appears to be negligible.29 Including the lagged value for the Bund yield in the es-timation equation is immaterial for the coefficient of deter-mination. This is demonstrated by a further estimation without a lagged Bund yield, with robust standard errors (Newey- West method).30 As all of the variables are measured in first differences, the standard deviations also refer to the differences in the variables.
Deutsche Bundesbank Monthly Report
July 2018 31
garding the future path of key interest rates
over the next two years. This applies not only
to the monetary policy environment up until
the end of 2014, which was characterised by
falling central bank interest rates, but also to
the period thereafter, when central bank rates
were already close to zero and unconventional
measures shaped monetary policy.31
Compared with the scarcity premiums and the
monetary policy stance, US yields and liquidity
premiums constitute weaker, yet still import-
ant, determinants of Bund yields.32 The re-
ported impact of US yields illustrates the im-
portance of international capital flows and of
the transatlantic interest rate linkage. As US
yields lagged by one day are used for the esti-
mation, the reported impact also implies a
leading indicator property of US interest rates,
which are reflected in Bund yields with a time
lag.33 Compared with the other determinants,
the VDAX has a weaker impact on Bund
yields.34 However, that does not rule out the
possibility that demand for Bunds as a safe
haven is particularly strong in periods of height-
ened uncertainty (see the box on pages 33
to 37).
Effects of US yields, liquidity premiums and the VDAX
Determinants of ten-year Bund yieldso
Explanatory variable
Estimate 1 Estimate 2 Estimate 3
Coeffi cient p value Coeffi cient p value Coeffi cient p value
C 0.00* 0.05 0.00* 0.04 0.00* 0.01
Bund_Interest(–1) – 0.05* 0.00 – 0.05* 0.01 – 0.05* 0.00
US_Interest(–1) 0.19* 0.00 0.19* 0.00 0.19* 0.00US_Interest(–1) × Taper_Tantrum 0.01 0.86US_Interest(–1) × Bund_Tantrum 0.12 0.50
Slope_Eonia 0.99* 0.00 0.97* 0.00 0.95* 0.00Slope_Eonia × Taper_Tantrum 0.17 0.34Slope_Eonia × Bund_Tantrum 2.51* 0.00
PC_Scarcity – 0.02* 0.00 – 0.02* 0.00 – 0.02* 0.00PC_Scarcity × Taper_Tantrum – 0.01* 0.01PC_Scarcity × Bund_Tantrum 0.03* 0.05
PC_Liquidity – 0.01* 0.00 – 0.01* 0.00 – 0.01* 0.00PC_Liquidity × Taper_Tantrum 0.01* 0.01PC_Liquidity × Bund_Tantrum – 0.05* 0.00
VDAX – 0.31* 0.00 – 0.34* 0.00 – 0.32* 0.00VDAX × Taper_Tantrum 0.68 0.06VDAX × Bund_Tantrum – 0.84* 0.01
Adj R2 0.65 0.66 0.67
o The regression (estimated in differences) is based on daily data from 2 January 2012 to 23 May 2018. The dependent variable is the ten-year Bund yield (Bund_Interest). US_Interest is the yield on ten-year US Treasuries. Slope_Eonia is the slope of the Eonia swap rate curve at the short end (two-year Eonia swap rate minus one-month Eonia swap rate). PC_Scarcity and PC_Liquidity are each the fi rst prin-cipal component of a principal component analysis which factors in the differences between Eonia swap rates and Bund yields and the yield spreads of guaranteed bank bonds over Bunds. VDAX is the volatility index. Taper_Tantrum and Bund_Tantrum are dummy variables for the taper tantrum and Bund tantrum. * Signifi cant at the 5% level.
Deutsche Bundesbank
31 A further estimation for the subperiod from the begin-ning of 2015 indicates that the Eonia swap rate curve had a similarly strong effect even after the decision for the PSPP was adopted in January 2015.32 Measured in terms of standard deviations, they amount to 0.24 of a standard deviation for US yields and 0.23 of a standard deviation for the liquidity advantage.33 This leading indicator property does not exclude the possibility that yields on Bunds and US yields influence one another, however. See also S E Curcuru, M De Pooter and G Eckerd (2018), Measuring monetary policy spillovers be-tween U.S. and German bond yields, International Finance Discussion Papers 1226; and Deutsche Bundesbank, Inter-national linkage of interest rates and the national term structure, Monthly Report, October 2007, p 28.34 An increase by one standard deviation in the VDAX (measured in differences) lowers Bund yields (measured in differences) by 0.11 of a standard deviation.
Deutsche Bundesbank Monthly Report July 2018 32
How safe haven effects impact on Bund yields – a SVAR analysis
Times of crisis tend to depress the yields of
German Federal bonds (Bunds) as investors
often take fl ight to “safe havens” where
they can evade the heightened uncertainty.
But Bund yields are not the only variables
that adjust in response to critical situations
– other macroeconomic and fi nancial vari-
ables are also affected, and in some cases
interdependencies exist as well. Structural
vector autoregression (SVAR) models can be
used to shed light on these adjustment pro-
cesses from an econometric vantage point.
Risk- averse households respond to a sud-
den onset of heightened uncertainty1 sur-
rounding future economic developments by
reducing expenditure and building up fi nan-
cial buffers (precautionary saving effect).
Enterprises, meanwhile, are more reluctant
to make investments (eg real options effect)
or hire new employees, with the result that
they largely retain the revenue they earn.2
The ultimate outcome of these two effects
is a weakening of real economic activity
with something of a time lag. Funding con-
ditions might also tighten (fi nancial con-
straints). Unlike real economic variables,
prices and quantities in fi nancial markets
respond immediately to episodes of height-
ened uncertainty because investors instantly
step up their demand for safe yet liquid al-
ternatives. They also tend to switch be-
tween asset classes as securities generating
more volatile cash fl ows in a less certain
economic backdrop fall out of favour com-
pared with assets with steady and reliable
disbursement profi les. This response to
heightened uncertainty is known as the
fl ight to safety or quality, and also as safe
haven fl ows.
Government bonds normally account for
the bulk of safe (and liquid) securities.3 As a
result, a fl ight to safety event will typically
depress the prices of equities, say, and push
up government bond prices, thus reducing
their yields.4 To study the impact of an un-
expected fl ight to safety event on Bund
yields, it is important to account for any
interdependencies that might exist between
a given uncertainty measure, fi nancial mar-
ket variables and real economic variables.
For example, (unexpected) monetary policy
1 Strictly speaking, uncertainty denotes the inability of economic agents to determine a probability distribu-tion for uncertain future events – ie they are unable to assign specifi c probabilities to a potential set of events. This is where uncertainty differs from risk, where eco-nomic agents are aware of, or can at least estimate, a probability distribution over a set of events. See N Bloom (2014), Fluctuations in uncertainty, Journal of Economic Perspectives 28(2), pp 153-176. As discussed in Bloom (2014), the term “uncertainty” will be used in this box text more as a combination of these two con-cepts, given the empirical diffi culties involved in distin-guishing them from one another.2 See N Bloom (2009), The impact of uncertainty shocks, Econometrica 77(3), pp 626-685; and S Basu and B Bundick (2017), Uncertainty shocks in a model of effective demand, Econometrica 85(3), pp 937-958. For more on how elevated aggregate uncertainty im-pacts on enterprises’ cash holdings, see J Gao, Y Grin-stein and W Wang (2017), Cash holdings, precaution-ary motives, and systematic uncertainty, Indiana Uni-versity.3 An increase in money market instruments (such as transferable deposits) is another factor in this regard. See L Baele, G Bekaert, K Inghelbrecht and M Wei (2013), Flights to safety, NBER Working Paper No 19095.4 See R B Barsky (1989), Why don’t the prices of stocks and bonds move together?, American Economic Re-view 79(5), pp 1132-1145; or G Bekaert, E Engstrom and Y Xing (2009), Risk, uncertainty and asset prices, Journal of Financial Economics 91(1), pp 59-82. An-other term used frequently in spells of heightened fi nancial market stress is “fl ight to liquidity”. Flights to liquidity can also be observed during bouts of elevated market uncertainty, in the form of portfolio realloca-tions into highly liquid securities, which particularly in-clude government bonds. See D Vayanos (2004), Flight to quality, fl ight to liquidity, and the pricing of risk, NBER Working Paper No 10327. It is not always pos-sible to clearly distinguish fl ights to liquidity from fl ights to safety, which is why fl ights to liquidity are often included in the fl ight to safety category.
Deutsche Bundesbank Monthly Report
July 2018 33
decisions might also have a bearing on un-
certainty.5 Furthermore, there is a strong
correlation between the fi nancial risk which
fi nancial intermediaries are willing to bear,
on the one hand, and uncertainty, on the
other.6 Thus, if the uncertainty measure is
used in isolation to explain yields without
considering potential interdependencies,
one might conclude – incorrectly – that a
fl ight to safety event has occurred. The aim,
then, is to identify an unexpected increase
in uncertainty (an exogenous uncertainty
shock) as a factor driving the fl ight to safety.
Hence the use of a structural vector autore-
gression (SVAR) model, as it is known, as an
econometric methodology, which explicitly
considers interdependencies between vari-
ables and is capable of depicting the dy-
namic processes of adjustment to econom-
ically interpretable innovations (shocks).7
The uncertainty measure used in this analy-
sis is the VIX implied volatility index derived
from options on the S&P 500, a broad US
equity index.8 Other variables included in
the SVAR after the VIX are industrial pro-
duction for the euro area (in logs), the rate
of infl ation for the euro area, the Euro Stoxx
equity index (in logs), the yield of corporate
bonds,9 the short- term shadow rate,10 the
yield of ten- year Austrian government
bonds, and the yield on ten- year Bunds.
The observation period begins in January
2007, ie before the onset of the fi nancial
crisis, and ends in March 2018.11 All vari-
ables are included at a monthly frequency.12
The chosen ordering – putting macroeco-
nomic variables ahead of interest rates and
fi nancial market variables – is standard in
5 See G Bekaert, M Hoerova and M Lo Duca (2013), Risk, uncertainty and monetary policy, Journal of Mon-etary Policy 60(7), pp 771-788. The authors show that an unexpected accommodative monetary policy meas-ure (expansionary monetary policy shock) reduces un-certainty.6 Hence the need to distinguish between fi nancial shocks and uncertainty shocks. See D Caldara, C Fuentes- Albero, S Gilchrist and E Zakrajšek (2016), The macroeconomic impact of fi nancial and uncer-tainty shocks, European Economic Review 88, pp 185-207.7 The identifi cation scheme is the Cholesky decompos-ition, which assumes that shocks to a variable affect all the other variables ordered afterwards in the same period, but only have a lagged impact on variables ordered beforehand.8 Implied equity market volatility generally includes both uncertainty and risk aversion. However, since un-certainty dominates the variance in implied equity mar-ket volatility, it would appear that implied equity mar-ket volatility is a good proxy for uncertainty. See G Ba-kaert, M Hoerova and M Lo Duca (2013), op cit; and G Bekaert and M Hoerova (2014), The VIX, the vari-ance premium and stock market volatility, Journal of Econometrics 13(2), pp 181-192. It is nonetheless worth noting that the measure used here for uncer-tainty also includes risk aversion. The reason for using the US equity market here is that the US has the most signifi cant capital market worldwide. The VIX is, how-ever, highly correlated with the implied volatility for the DAX (VDAX- NEW) or the Euro Stoxx (VStoxx).9 The iBoxx non- fi nancials BBB index for bonds with a residual maturity of between seven and ten years is used.10 More information on shadow rates can be found in L Krippner (2015), Zero lower bound term structure modelling: a practitioner’s guide, New York, Palgrave Macmillan US. They are also discussed in Deutsche Bundesbank, Monetary policy indicators at the lower bound based on term structure models, Monthly Report , September 2017, pp 13-34. The time series used (last accessed on 25 May 2018) can be found at https:// www.rbnz.govt.nz/ research- and- publications/ research- programme/ additional- research/ measures- of- the- stance- of- united- states- monetary- policy/ comparison- of- international- monetary- policy-measures11 The end of the observation period is determined by data availability constraints. The shadow rate and the yields on corporate bonds, Austrian government bonds and Bunds all follow a clear downward trend during the observation period. This is derived using a Hodrick- Prescott fi lter. The SVAR therefore provides an explan-ation for deviations from this downward trend. The trend itself cannot be explained by the approach chosen. Further information on explanatory ap-proaches for the trend can be found in Deutsche Bun-desbank, The natural rate of interest, Monthly Report, October 2017, pp 27-42.12 This means that fl ight to safety events which are more protracted and therefore feed through to real economic variables can be identifi ed better. Using data at shorter intervals will tend to capture short- term fl ight to liquidity events. Monthly averages derived from daily data are used for the VIX, the equity index and yields.
Deutsche Bundesbank Monthly Report July 2018 34
the literature.13 Uncertainty is ordered fi rst
in the SVAR.14 This allows us to interpret
that uncertainty shocks generally impact
simultaneously on all the variables that fol-
low them, but that all the other shocks only
affect the uncertainty indicator with a time
lag.15 The equity market indicator is ordered
before the yields of corporate bonds. The
rationale behind this is that equity prices in-
clude more of a forward- looking compon-
ent and can thus capture expectation ef-
fects surrounding economic developments
that lie in the more distant future. Bund
yields are ordered last so that all the other
structural innovations which impact on
Bund yields can be captured in the same
period. Finally, the yield of Austrian govern-
ment bonds is included to measure the
yield spread between two government
bonds which have an identical AAA rating
and thus have the same credit quality. Any
difference that might arise can thus be ex-
pected to refl ect the benchmark status of
Bunds in addition to possible market liquid-
ity effects. The identifi cation of the uncer-
tainty shock is highly robust to changes in
the order.16
The uncertainty shocks estimated and iden-
tifi ed using the procedure outlined above
show the responses typical to a fi ght to
safety event discussed at the beginning of
13 In a Cholesky decomposition, the ordering of vari-ables has a bearing on the identifi cation of the driving structural innovations. However, the ordering used here is of secondary importance for the uncertainty shock, which is ordered fi rst, and only relates to the interpretation of the other shocks, which are not dis-cussed in any further detail here.14 The SVAR is estimated using the ordinary least squares (OLS) approach. As an alternative, it is also possible to use Bayesian techniques to estimate the SVAR. However, since the estimation results do not dif-fer substantially, the results are based on the OLS esti-mation.15 See S Basu and B Bundick (2017), op cit; or D Cal-dara, C Fuentes- Albero, S Gilchrist and E Zakrajšek (2016), op cit.16 Only if equity prices are ordered before the uncer-tainty measure does the structural shock to equity prices ultimately capture the uncertainty shock.
Impact of an increase in uncertainty on
financial market variables*
* Impulse response functions based on a vector autoregression model. Confidence intervals bootstrapped. 1 Implied option volatility of the S&P500 index for contracts with a maturity of 30 days. 2 Residual maturity of ten years. 3 Based on the iBoxx non-financials BBB index for bonds with a residual maturity of between seven and ten years.
Deutsche Bundesbank
1 2 3 4 5 6 7 8 9 10 11 12
5
0
5
10
15
–
+
+
+
Basis points
Percentage points
Basis points
Percentage points
– 15
– 10
– 5
0
+ 5
40
30
20
10
0
10
–
–
–
–
+
– 30
– 20
– 10
0
+ 10
+ 20
+ 30
+ 40
+ 50
+ 60
Months
Yield of corporate bonds 3
Bund yield 2
Euro Stoxx
VIX 1 68% confidence interval95% confidence interval
Deutsche Bundesbank Monthly Report
July 2018 35
this box text (see the chart on page 35).
Taken in isolation, an unexpected increase
in uncertainty, measured in terms of a
10-percentage- point17 increase in the VIX,
depresses equity prices by just over 8%.
Prices of risk- bearing non- fi nancial corpor-
ate bonds likewise come under pressure,
their yields climbing by as much as 30 basis
points at their peak. That is, investors lower
their valuations of assets whose (expected)
cash fl ows have become more uncertain
and “take fl ight” from these assets. As un-
certainty recedes in the months that follow,
equity prices recover and the yields of cor-
porate bonds decline again. During this
fl ight to safety, ten- year Bund yields fall ini-
tially by a little more than ten basis points.
Yields decline even further over the course
of the next half- year, depressing Bund yields
by almost 25 basis points compared to the
base level. This lagged response probably
shows that fl ights to safety identifi ed at
monthly intervals do not end abruptly. It is
also worth noting that Bund yields decline
more sharply than the yields of Austrian
government bonds with identical maturities
(see the adjacent chart). While the shape of
the responses is quite similar, the yields of
ten- year Austrian government bonds fall
less sharply – with a peak decline of just
under 20 basis points. Note also that Bund
yields take more time to recover than their
Austrian counterparts. The spread between
both yields therefore widens to a little more
than ten basis points after roughly half a
year.18 The uncertainty shock – the driver
behind fl ight to safety episodes – explains
almost 10% of the forecast error variance
of Bund yields in the fi rst month, compared
to just over 6% at most in the case of Aus-
trian government bond yields (see the adja-
cent table). At the six- month horizon, the
shock explains more than twice as much of
the forecast error variance of Bund yields
(just over 23%) compared to Austrian gov-
ernment bond yields (almost 11%). Over the
long run, almost one- quarter of the fore-
cast error variance of Bund yields can be ac-
17 This corresponds to roughly one standard deviation of the VIX in the observation period.18 There is evidence that the different responses shown by the respective yields are statistically signifi -cant.
Importance of the increase in uncertainty for fi nancial market variables (forecast error variance decomposition)*
%
Item
Yield after …
1 month 6 months 1 year 2 years
Bund yield1 9.6 22.9 22.9 22.5Austrian government bond yield1 5.9 10.6 10.2 9.9Equity prices 59.5 56.2 35.2 19.8Corporate bond yield 22.8 25.4 20.3 19.0
* Table shows the importance of the uncertainty shock for the forecast error variance as a percentage at different points in time. 1 Residual maturity of ten years.
Deutsche Bundesbank
Impact of an increase in uncertainty on
the yield of Austrian government bonds*
* Impulse response functions based on a vector autoregression model. Confidence intervals bootstrapped. 1 Residual maturity of ten years.
Deutsche Bundesbank
1 2 3 4 5 6 7 8 9 10 11 12
30
25
20
15
10
5
0
5
10
–
–
–
–
–
–
+
+
– 5
0
+ 5
+ 10
+ 15
+ 20
Months
Spread over Bunds1
Yield of Austrian government bonds1
68% confidence interval95% confidence interval
Basis points
Deutsche Bundesbank Monthly Report July 2018 36
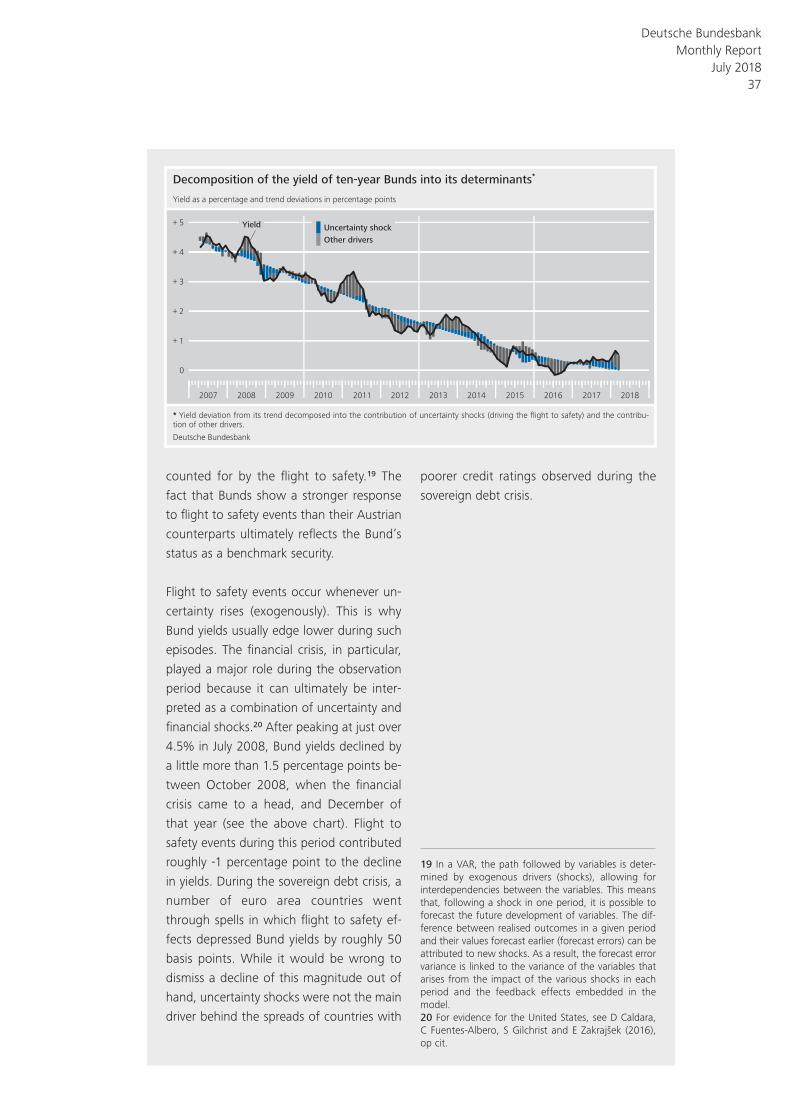
counted for by the fl ight to safety.19 The
fact that Bunds show a stronger response
to fl ight to safety events than their Austrian
counterparts ultimately refl ects the Bund’s
status as a benchmark security.
Flight to safety events occur whenever un-
certainty rises (exogenously). This is why
Bund yields usually edge lower during such
episodes. The fi nancial crisis, in particular,
played a major role during the observation
period because it can ultimately be inter-
preted as a combination of uncertainty and
fi nancial shocks.20 After peaking at just over
4.5% in July 2008, Bund yields declined by
a little more than 1.5 percentage points be-
tween October 2008, when the fi nancial
crisis came to a head, and December of
that year (see the above chart). Flight to
safety events during this period contributed
roughly -1 percentage point to the decline
in yields. During the sovereign debt crisis, a
number of euro area countries went
through spells in which fl ight to safety ef-
fects depressed Bund yields by roughly 50
basis points. While it would be wrong to
dismiss a decline of this magnitude out of
hand, uncertainty shocks were not the main
driver behind the spreads of countries with
poorer credit ratings observed during the
sovereign debt crisis.
19 In a VAR, the path followed by variables is deter-mined by exogenous drivers (shocks), allowing for interdependencies between the variables. This means that, following a shock in one period, it is possible to forecast the future development of variables. The dif-ference between realised outcomes in a given period and their values forecast earlier (forecast errors) can be attributed to new shocks. As a result, the forecast error variance is linked to the variance of the variables that arises from the impact of the various shocks in each period and the feedback effects embedded in the model.20 For evidence for the United States, see D Caldara, C Fuentes- Albero, S Gilchrist and E Zakrajšek (2016), op cit.
Decomposition of the yield of ten-year Bunds into its determinants*
* Yield deviation from its trend decomposed into the contribution of uncertainty shocks (driving the flight to safety) and the contribu-
tion of other drivers.
Deutsche Bundesbank
2007 2008 2009 2010 2011 2012 2013 2014 2015 2016 2017 2018
0
1
2
3
4
5
+
+
+
+
+
Yield as a percentage and trend deviations in percentage points
Yield
Other drivers
Uncertainty shock
Deutsche Bundesbank Monthly Report
July 2018 37
Analysis of the taper and Bund tantrums
In the following, two further estimations exam-
ine the extent to which the chosen determin-
ants had a stabilising effect on Bund yields dur-
ing what are referred to as the taper tantrum
and the Bund tantrum. To this end, the dur-
ation of both tantrums is defined in such a way
as to fully cover the two (local) periods of rising
interest rates. The time span from 3 May 2013
until 11 September 2013 is set for the taper
tantrum; the Bund tantrum is defined as lasting
from 17 April 2015 until 10 June 2015. For the
further estimations, a dummy variable is then
defined for each of the two tantrums, which
are combined with the determinants (Taper_
Tantrum, Bund_Tantrum).
For the phase of the taper tantrum, the results
indicate a significantly lower sensitivity of Bund
yields to their market liquidity and to equity
market uncertainty, as well as a heightened
sensitivity to the scarcity premiums (Estimate 2
in the table on page 32). Thus, neither the li-
quidity premiums, which actually widened dur-
ing the tantrum, nor equity market uncertainty
had a significant impact on yields overall during
this phase. Apparently, market liquidity and
events in the equity markets were insignificant
for the increase in yields at that time, while
scarcity premiums, which were somewhat
lower on balance, played an above- average
part in this respect. No changed effects are
found for the other determinants. Interestingly,
this also applies to the (at that time, sharply
rising) US yields, which continued to be re-
flected strongly in Bund yields.
The significant rise in Bund yields during the
Bund tantrum by almost one percentage point
probably largely reflects the fact that market
participants at the time felt the previous decline
in yields to be excessive and corrected it very
quickly. The estimation results provide informa-
tion on the respective contributions of the se-
lected determinants. They point to a tempor-
ary, considerably weaker (and ultimately, there-
fore, to an insignificant) impact of the scarcity
premiums and, at the same time, to signifi-
cantly stronger effects stemming from the
slope of the Eonia swap rate curve, the liquidity
premiums and the VDAX (Estimate 3). Thus, the
slope of the Eonia swap rate curve at the short
end gained just under 10 basis points during
the Bund tantrum, to which long- term Bund
yields reacted particularly sensitively. At the
same time, the liquidity advantage and equity
market uncertainty decreased somewhat. This,
coupled with the heightened sensitivity of Bund
yields to these two variables, likewise made a
significant contribution to the sharp rise in
Bund yields.
Conclusion
The analysis of possible drivers of yields of ten-
year Bunds reveals, in particular, that scarcity
premiums were among the main determinants
in explaining yield movements of late. These re-
sults therefore reflect the shifts in the holder
structure of Federal securities, which show that
the Eurosystem’s purchases under the PSPP
considerably reduced the volume of Federal se-
curities in free float. Moreover, analysis of the
holder structure suggests that the asset pur-
chase programme is also having an impact via
portfolio adjustments and the exchange rate.
In addition, the moderate decline in market li-
quidity also plays a role as a driver of yield
movements. This is consistent with a reduced
free float, the decrease in trade volumes and
the growing order book illiquidity recorded for
ten- year Bunds since the beginning of 2016.
However, this has not affected the proper func-
tioning of the bond market as a whole.
Dummy vari-ables measure taper and Bund tantrums
Liquidity pre-miums during the taper tantrum insignificant
Scarcity pre-miums and slope of the Eonia swap rate curve have par-ticularly strong impact during Bund tantrum
Deutsche Bundesbank Monthly Report July 2018 38
The realignment of the Chinese economy and its global implications
Over the past few decades, China has risen to become a global economic power, but this
catching- up process has slowed significantly in recent years. An important reason for this is that
the export- oriented growth model has reached its limits. Chinese companies used to be special-
ised in the production of labour- intensive consumer goods; the sales potential on the international
markets is now largely exhausted. In addition, wages have risen sharply as a result of a growing
shortage of labour, with the result that the cost advantages of Chinese exporters have dimin-
ished.
During the global financial and economic crisis and its aftermath, China pursued very expansion-
ary fiscal and monetary policies in order to counter the slowdown in economic growth. This led
to over- investment in various sectors and to a sharp rise in debt, particularly in the public sector
and among state- owned enterprises. This is likely to have increased the vulnerability of the Chi-
nese economy to crises.
In recent years, the Chinese government has therefore pursued moderate reforms. On the supply
side, it is aiming to boost technological convergence in order to upgrade the country’s export
range, and progress appears to have been made on this front. On the demand side, the author-
ities are working to put an end to unprofitable investments, particularly from state- owned com-
panies. At the same time, greater importance is being attached to private consumption. House-
hold demand has already grown fairly dynamically over the past few years and, against this
backdrop, services have become considerably more important in macroeconomic terms.
Due to China’s extensive trade relations and the size of the country, the ongoing transformation
of its economy is having a discernible global impact. The shift in demand from investment to con-
sumption is dampening growth in Chinese imports. In the export sector, the structural change in
China in the field of labour- intensive production is opening up opportunities for other Asian emer-
ging market economies. By contrast, the shift to higher- end products could put exporters from
advanced economies, including Germany in particular, under mounting competitive pressure.
Deutsche Bundesbank Monthly Report
July 2018 39
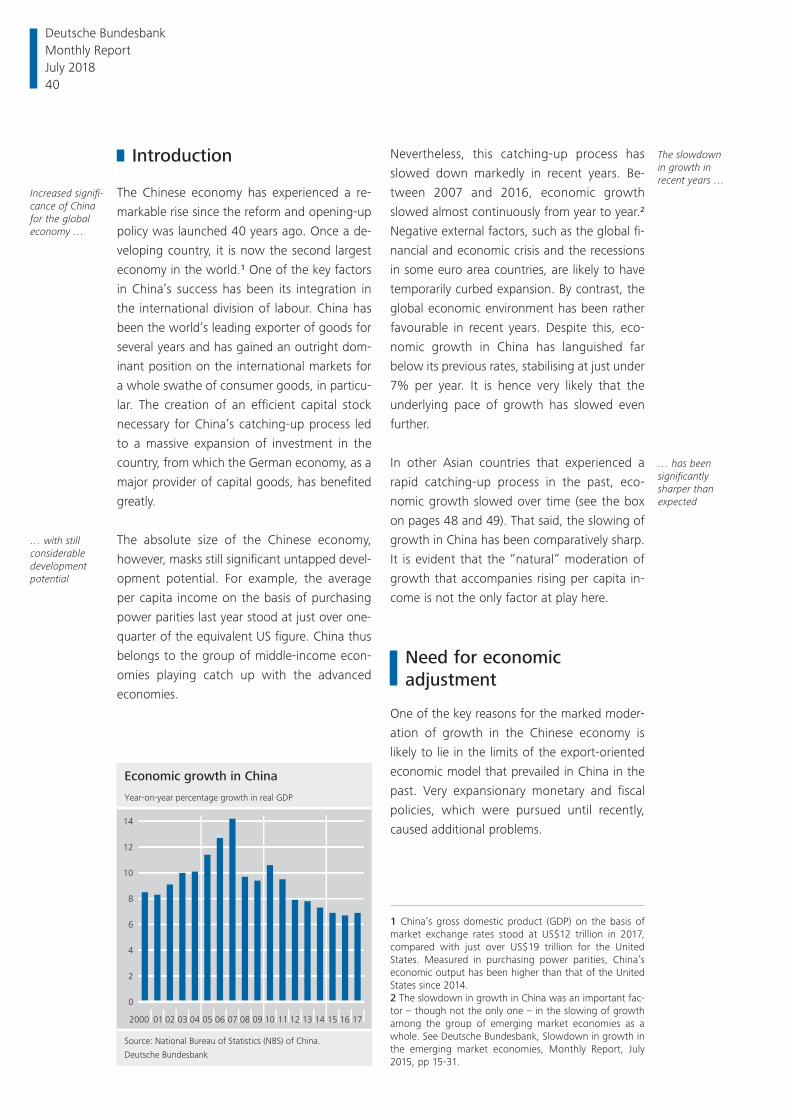
Introduction
The Chinese economy has experienced a re-
markable rise since the reform and opening- up
policy was launched 40 years ago. Once a de-
veloping country, it is now the second largest
economy in the world.1 One of the key factors
in China’s success has been its integration in
the international division of labour. China has
been the world’s leading exporter of goods for
several years and has gained an outright dom-
inant position on the international markets for
a whole swathe of consumer goods, in particu-
lar. The creation of an efficient capital stock
necessary for China’s catching- up process led
to a massive expansion of investment in the
country, from which the German economy, as a
major provider of capital goods, has benefited
greatly.
The absolute size of the Chinese economy,
however, masks still significant untapped devel-
opment potential. For example, the average
per capita income on the basis of purchasing
power parities last year stood at just over one-
quarter of the equivalent US figure. China thus
belongs to the group of middle- income econ-
omies playing catch up with the advanced
economies.
Nevertheless, this catching- up process has
slowed down markedly in recent years. Be-
tween 2007 and 2016, economic growth
slowed almost continuously from year to year.2
Negative external factors, such as the global fi-
nancial and economic crisis and the recessions
in some euro area countries, are likely to have
temporarily curbed expansion. By contrast, the
global economic environment has been rather
favourable in recent years. Despite this, eco-
nomic growth in China has languished far
below its previous rates, stabilising at just under
7% per year. It is hence very likely that the
underlying pace of growth has slowed even
further.
In other Asian countries that experienced a
rapid catching- up process in the past, eco-
nomic growth slowed over time (see the box
on pages 48 and 49). That said, the slowing of
growth in China has been comparatively sharp.
It is evident that the “natural” moderation of
growth that accompanies rising per capita in-
come is not the only factor at play here.
Need for economic adjustment
One of the key reasons for the marked moder-
ation of growth in the Chinese economy is
likely to lie in the limits of the export- oriented
economic model that prevailed in China in the
past. Very expansionary monetary and fiscal
policies, which were pursued until recently,
caused additional problems.
Increased signifi-cance of China for the global economy …
… with still considerable development potential
The slowdown in growth in recent years …
… has been significantly sharper than expected
Economic growth in China
Source: National Bureau of Statistics (NBS) of China.
Deutsche Bundesbank
0
2
4
6
8
10
12
14
Year-on-year percentage growth in real GDP
2000 01 02 03 04 05 06 07 08 09 10 11 12 13 14 15 16 17
1 China’s gross domestic product (GDP) on the basis of market exchange rates stood at US$12 trillion in 2017, compared with just over US$19 trillion for the United States. Measured in purchasing power parities, China’s economic output has been higher than that of the United States since 2014.2 The slowdown in growth in China was an important fac-tor – though not the only one – in the slowing of growth among the group of emerging market economies as a whole. See Deutsche Bundesbank, Slowdown in growth in the emerging market economies, Monthly Report, July 2015, pp 15-31.
Deutsche Bundesbank Monthly Report July 2018 40
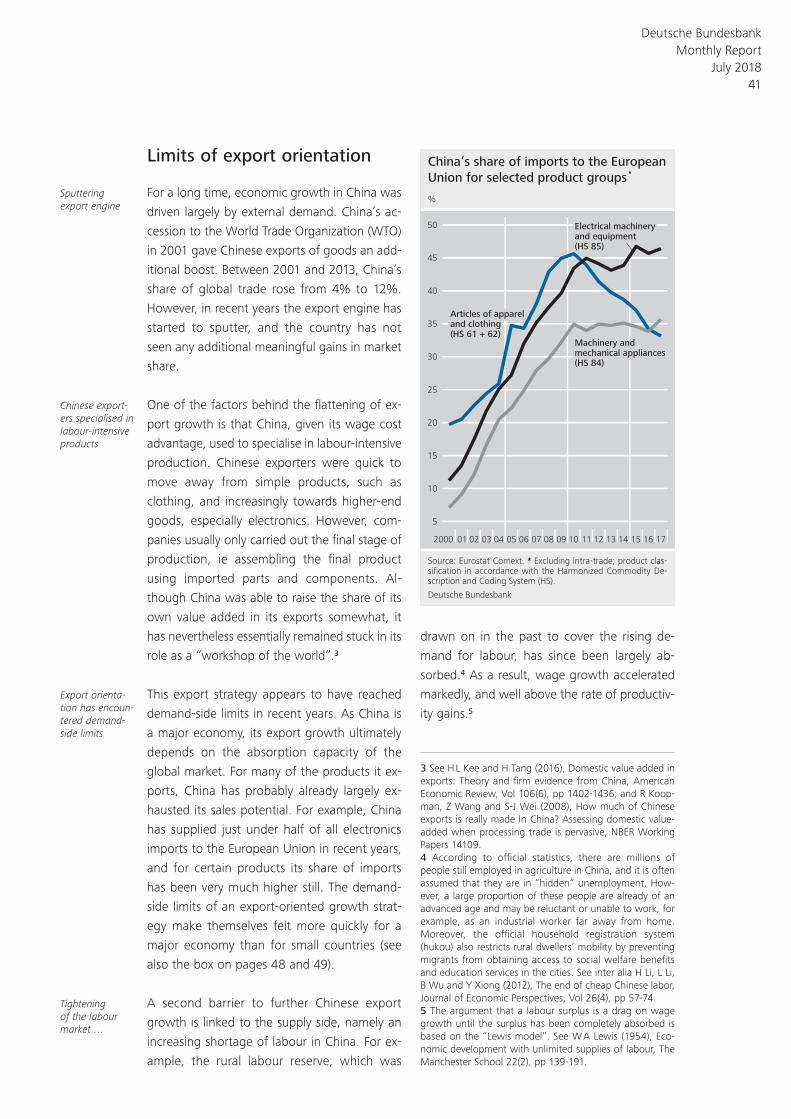
Limits of export orientation
For a long time, economic growth in China was
driven largely by external demand. China’s ac-
cession to the World Trade Organization (WTO)
in 2001 gave Chinese exports of goods an add-
itional boost. Between 2001 and 2013, China’s
share of global trade rose from 4% to 12%.
However, in recent years the export engine has
started to sputter, and the country has not
seen any additional meaningful gains in market
share.
One of the factors behind the flattening of ex-
port growth is that China, given its wage cost
advantage, used to specialise in labour- intensive
production. Chinese exporters were quick to
move away from simple products, such as
clothing, and increasingly towards higher- end
goods, especially electronics. However, com-
panies usually only carried out the final stage of
production, ie assembling the final product
using imported parts and components. Al-
though China was able to raise the share of its
own value added in its exports somewhat, it
has nevertheless essentially remained stuck in its
role as a “workshop of the world”.3
This export strategy appears to have reached
demand- side limits in recent years. As China is
a major economy, its export growth ultimately
depends on the absorption capacity of the
global market. For many of the products it ex-
ports, China has probably already largely ex-
hausted its sales potential. For example, China
has supplied just under half of all electronics
imports to the European Union in recent years,
and for certain products its share of imports
has been very much higher still. The demand-
side limits of an export- oriented growth strat-
egy make themselves felt more quickly for a
major economy than for small countries (see
also the box on pages 48 and 49).
A second barrier to further Chinese export
growth is linked to the supply side, namely an
increasing shortage of labour in China. For ex-
ample, the rural labour reserve, which was
drawn on in the past to cover the rising de-
mand for labour, has since been largely ab-
sorbed.4 As a result, wage growth accelerated
markedly, and well above the rate of productiv-
ity gains.5
Sputtering export engine
Chinese export-ers specialised in labour- intensive products
Export orienta-tion has encoun-tered demand- side limits
Tightening of the labour market …
China’s share of imports to the European
Union for selected product groups *
Source: Eurostat Comext. * Excluding intra-trade; product clas-
sification in accordance with the Harmonized Commodity De-
scription and Coding System (HS).
Deutsche Bundesbank
2000 01 02 03 04 05 06 07 08 09 10 11 12 13 14 15 16 17
5
10
15
20
25
30
35
40
45
50
%
Electrical machineryand equipment(HS 85)
Articles of appareland clothing(HS 61 + 62)
Machinery and mechanical appliances(HS 84)
3 See H L Kee and H Tang (2016), Domestic value added in exports: Theory and firm evidence from China, American Economic Review, Vol 106(6), pp 1402-1436; and R Koop-man, Z Wang and S- J Wei (2008), How much of Chinese exports is really made In China? Assessing domestic value- added when processing trade is pervasive, NBER Working Papers 14109.4 According to official statistics, there are millions of people still employed in agriculture in China, and it is often assumed that they are in “hidden” unemployment. How-ever, a large proportion of these people are already of an advanced age and may be reluctant or unable to work, for example, as an industrial worker far away from home. Moreover, the official household registration system (hukou ) also restricts rural dwellers’ mobility by preventing migrants from obtaining access to social welfare benefits and education services in the cities. See inter alia H Li, L Li, B Wu and Y Xiong (2012), The end of cheap Chinese labor, Journal of Economic Perspectives, Vol 26(4), pp 57-74.5 The argument that a labour surplus is a drag on wage growth until the surplus has been completely absorbed is based on the “Lewis model”. See W A Lewis (1954), Eco-nomic development with unlimited supplies of labour, The Manchester School 22(2), pp 139-191.
Deutsche Bundesbank Monthly Report
July 2018 41
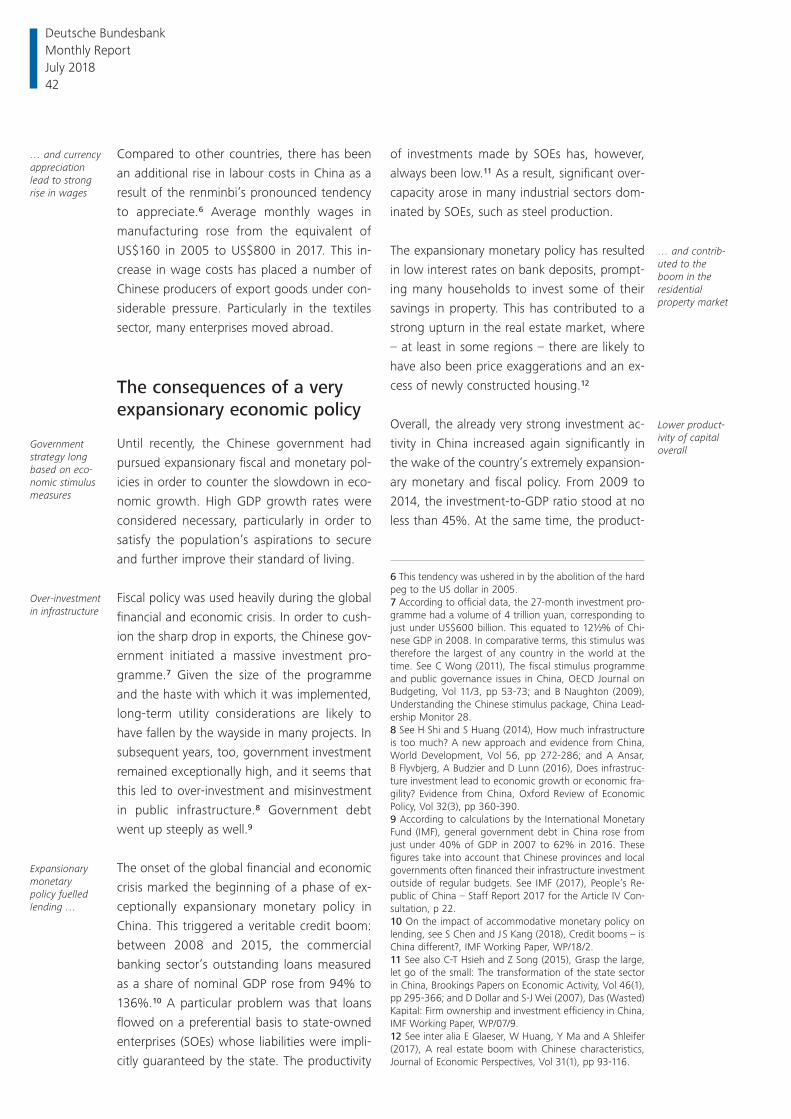
Compared to other countries, there has been
an additional rise in labour costs in China as a
result of the renminbi’s pronounced tendency
to appreciate.6 Average monthly wages in
manufacturing rose from the equivalent of
US$160 in 2005 to US$800 in 2017. This in-
crease in wage costs has placed a number of
Chinese producers of export goods under con-
siderable pressure. Particularly in the textiles
sector, many enterprises moved abroad.
The consequences of a very expansionary economic policy
Until recently, the Chinese government had
pursued expansionary fiscal and monetary pol-
icies in order to counter the slowdown in eco-
nomic growth. High GDP growth rates were
considered necessary, particularly in order to
satisfy the population’s aspirations to secure
and further improve their standard of living.
Fiscal policy was used heavily during the global
financial and economic crisis. In order to cush-
ion the sharp drop in exports, the Chinese gov-
ernment initiated a massive investment pro-
gramme.7 Given the size of the programme
and the haste with which it was implemented,
long- term utility considerations are likely to
have fallen by the wayside in many projects. In
subsequent years, too, government investment
remained exceptionally high, and it seems that
this led to over- investment and misinvestment
in public infrastructure.8 Government debt
went up steeply as well.9
The onset of the global financial and economic
crisis marked the beginning of a phase of ex-
ceptionally expansionary monetary policy in
China. This triggered a veritable credit boom:
between 2008 and 2015, the commercial
banking sector’s outstanding loans measured
as a share of nominal GDP rose from 94% to
136%.10 A particular problem was that loans
flowed on a preferential basis to state- owned
enterprises (SOEs) whose liabilities were impli-
citly guaranteed by the state. The productivity
of investments made by SOEs has, however,
always been low.11 As a result, significant over-
capacity arose in many industrial sectors dom-
inated by SOEs, such as steel production.
The expansionary monetary policy has resulted
in low interest rates on bank deposits, prompt-
ing many households to invest some of their
savings in property. This has contributed to a
strong upturn in the real estate market, where
– at least in some regions – there are likely to
have also been price exaggerations and an ex-
cess of newly constructed housing.12
Overall, the already very strong investment ac-
tivity in China increased again significantly in
the wake of the country’s extremely expansion-
ary monetary and fiscal policy. From 2009 to
2014, the investment- to- GDP ratio stood at no
less than 45%. At the same time, the product-
… and currency appreciation lead to strong rise in wages
Government strategy long based on eco-nomic stimulus measures
Over- investment in infrastructure
Expansionary monetary policy fuelled lending …
… and contrib-uted to the boom in the residential property market
Lower product-ivity of capital overall
6 This tendency was ushered in by the abolition of the hard peg to the US dollar in 2005.7 According to official data, the 27-month investment pro-gramme had a volume of 4 trillion yuan, corresponding to just under US$600 billion. This equated to 12½% of Chi-nese GDP in 2008. In comparative terms, this stimulus was therefore the largest of any country in the world at the time. See C Wong (2011), The fiscal stimulus programme and public governance issues in China, OECD Journal on Budgeting, Vol 11/ 3, pp 53-73; and B Naughton (2009), Understanding the Chinese stimulus package, China Lead-ership Monitor 28.8 See H Shi and S Huang (2014), How much infrastructure is too much? A new approach and evidence from China, World Development, Vol 56, pp 272-286; and A Ansar, B Flyvbjerg, A Budzier and D Lunn (2016), Does infrastruc-ture investment lead to economic growth or economic fra-gility? Evidence from China, Oxford Review of Economic Policy, Vol 32(3), pp 360-390.9 According to calculations by the International Monetary Fund (IMF), general government debt in China rose from just under 40% of GDP in 2007 to 62% in 2016. These figures take into account that Chinese provinces and local governments often financed their infrastructure investment outside of regular budgets. See IMF (2017), People’s Re-public of China – Staff Report 2017 for the Article IV Con-sultation, p 22.10 On the impact of accommodative monetary policy on lending, see S Chen and J S Kang (2018), Credit booms – is China different?, IMF Working Paper, WP/ 18/ 2.11 See also C- T Hsieh and Z Song (2015), Grasp the large, let go of the small: The transformation of the state sector in China, Brookings Papers on Economic Activity, Vol 46(1), pp 295-366; and D Dollar and S- J Wei (2007), Das (Wasted) Kapital: Firm ownership and investment efficiency in China, IMF Working Paper, WP/ 07/ 9.12 See inter alia E Glaeser, W Huang, Y Ma and A Shleifer (2017), A real estate boom with Chinese characteristics, Journal of Economic Perspectives, Vol 31(1), pp 93-116.
Deutsche Bundesbank Monthly Report July 2018 42
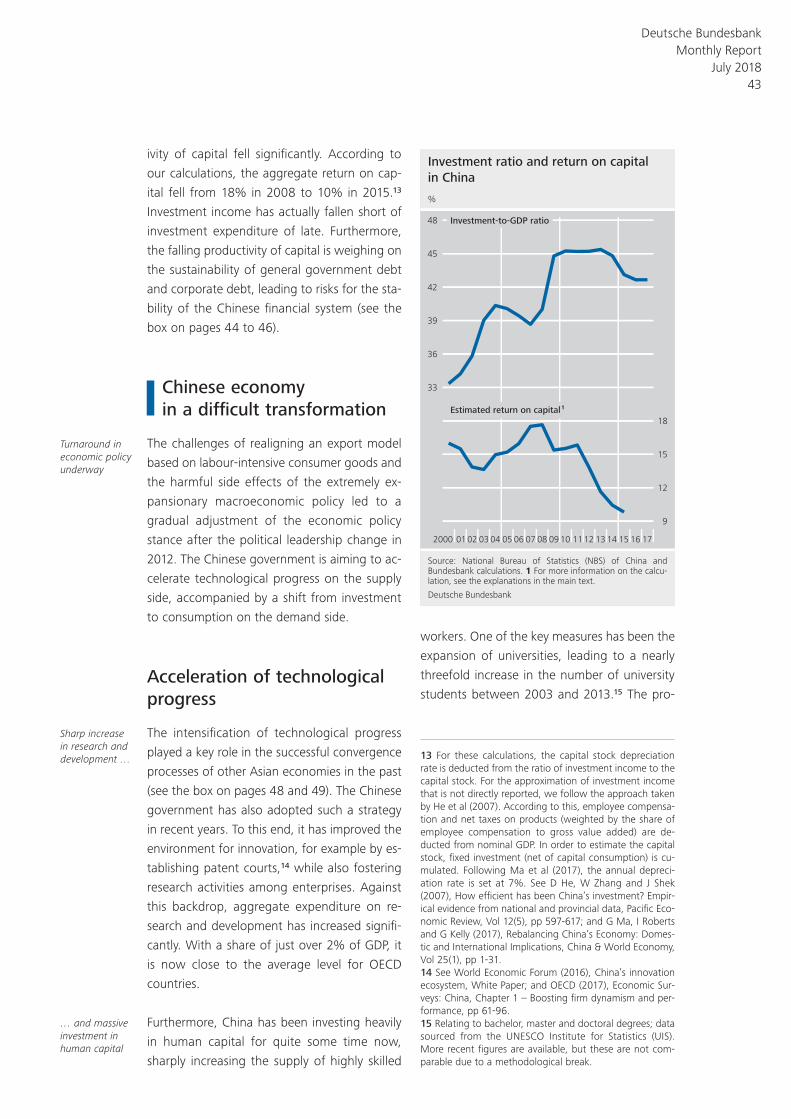
ivity of capital fell significantly. According to
our calculations, the aggregate return on cap-
ital fell from 18% in 2008 to 10% in 2015.13
Investment income has actually fallen short of
investment expenditure of late. Furthermore,
the falling productivity of capital is weighing on
the sustainability of general government debt
and corporate debt, leading to risks for the sta-
bility of the Chinese financial system (see the
box on pages 44 to 46).
Chinese economy in a difficult transformation
The challenges of realigning an export model
based on labour- intensive consumer goods and
the harmful side effects of the extremely ex-
pansionary macroeconomic policy led to a
gradual adjustment of the economic policy
stance after the political leadership change in
2012. The Chinese government is aiming to ac-
celerate technological progress on the supply
side, accompanied by a shift from investment
to consumption on the demand side.
Acceleration of technological progress
The intensification of technological progress
played a key role in the successful convergence
processes of other Asian economies in the past
(see the box on pages 48 and 49). The Chinese
government has also adopted such a strategy
in recent years. To this end, it has improved the
environment for innovation, for example by es-
tablishing patent courts,14 while also fostering
research activities among enterprises. Against
this backdrop, aggregate expenditure on re-
search and development has increased signifi-
cantly. With a share of just over 2% of GDP, it
is now close to the average level for OECD
countries.
Furthermore, China has been investing heavily
in human capital for quite some time now,
sharply increasing the supply of highly skilled
workers. One of the key measures has been the
expansion of universities, leading to a nearly
threefold increase in the number of university
students between 2003 and 2013.15 The pro-
Turnaround in economic policy underway
Sharp increase in research and development …
… and massive investment in human capital
Investment ratio and return on capital
in China
Source: National Bureau of Statistics (NBS) of China and
Bundesbank calculations. 1 For more information on the calcu-
lation, see the explanations in the main text.
Deutsche Bundesbank
2000 0102 03 04 05 06 07 08 09 10 1112 13 14 15 16 17
33
36
39
42
45
48
%
Estimated return on capital 1
Investment-to-GDP ratio
9
12
15
18
13 For these calculations, the capital stock depreciation rate is deducted from the ratio of investment income to the capital stock. For the approximation of investment income that is not directly reported, we follow the approach taken by He et al (2007). According to this, employee compensa-tion and net taxes on products (weighted by the share of employee compensation to gross value added) are de-ducted from nominal GDP. In order to estimate the capital stock, fixed investment (net of capital consumption) is cu-mulated. Following Ma et al (2017), the annual depreci-ation rate is set at 7%. See D He, W Zhang and J Shek (2007), How efficient has been China’s investment? Empir-ical evidence from national and provincial data, Pacific Eco-nomic Review, Vol 12(5), pp 597-617; and G Ma, I Roberts and G Kelly (2017), Rebalancing China’s Economy: Domes-tic and International Implications, China & World Economy, Vol 25(1), pp 1-31.14 See World Economic Forum (2016), China’s innovation ecosystem, White Paper; and OECD (2017), Economic Sur-veys: China, Chapter 1 – Boosting firm dynamism and per-formance, pp 61-96.15 Relating to bachelor, master and doctoral degrees; data sourced from the UNESCO Institute for Statistics (UIS). More recent figures are available, but these are not com-parable due to a methodological break.
Deutsche Bundesbank Monthly Report
July 2018 43
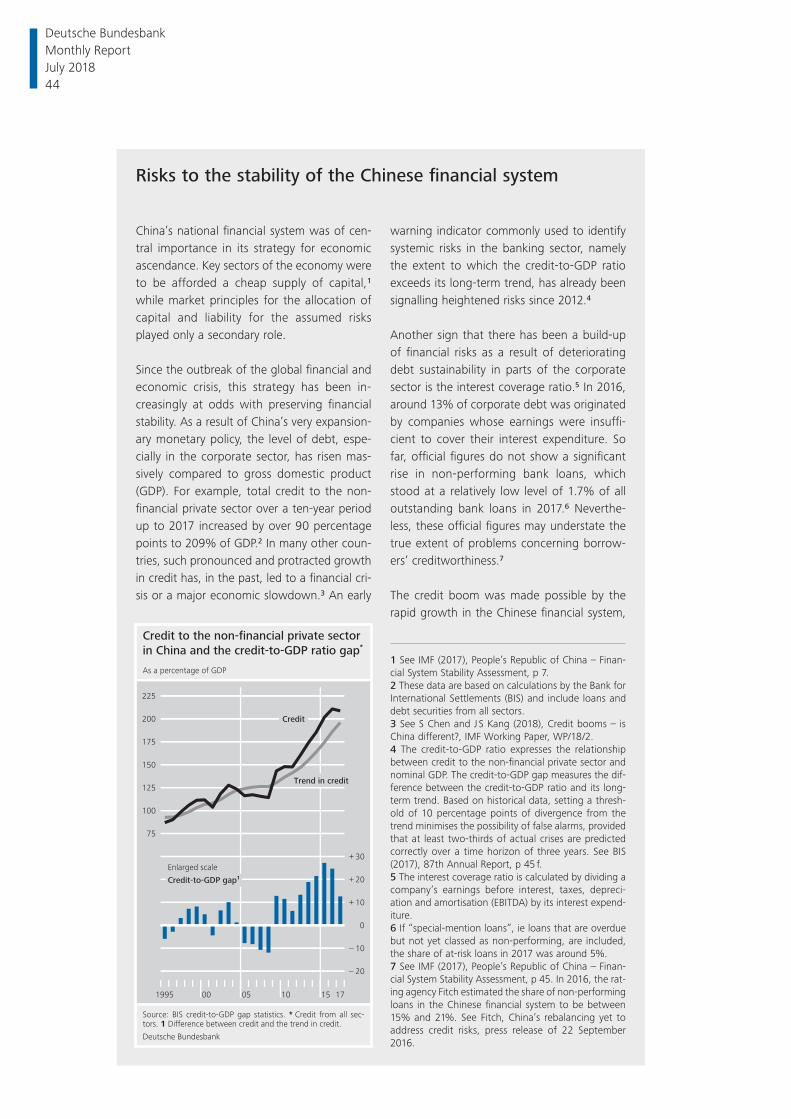
Risks to the stability of the Chinese fi nancial system
China’s national fi nancial system was of cen-tral importance in its strategy for economic ascendance. Key sectors of the economy were to be afforded a cheap supply of capital,1 while market principles for the allocation of capital and liability for the assumed risks played only a secondary role.
Since the outbreak of the global fi nancial and economic crisis, this strategy has been in-creasingly at odds with preserving fi nancial stability. As a result of China’s very expansion-ary monetary policy, the level of debt, espe-cially in the corporate sector, has risen mas-sively compared to gross domestic product (GDP). For example, total credit to the non- fi nancial private sector over a ten- year period up to 2017 increased by over 90 percentage points to 209% of GDP.2 In many other coun-tries, such pronounced and protracted growth in credit has, in the past, led to a fi nancial cri-sis or a major economic slowdown.3 An early
warning indicator commonly used to identify systemic risks in the banking sector, namely the extent to which the credit- to- GDP ratio exceeds its long- term trend, has already been signalling heightened risks since 2012.4
Another sign that there has been a build- up of fi nancial risks as a result of deteriorating debt sustainability in parts of the corporate sector is the interest coverage ratio.5 In 2016, around 13% of corporate debt was originated by companies whose earnings were insuffi -cient to cover their interest expenditure. So far, offi cial fi gures do not show a signifi cant rise in non- performing bank loans, which stood at a relatively low level of 1.7% of all outstanding bank loans in 2017.6 Neverthe-less, these offi cial fi gures may understate the true extent of problems concerning borrow-ers’ creditworthiness.7
The credit boom was made possible by the rapid growth in the Chinese fi nancial system,
1 See IMF (2017), People’s Republic of China – Finan-cial System Stability Assessment, p 7.2 These data are based on calculations by the Bank for International Settlements (BIS) and include loans and debt securities from all sectors.3 See S Chen and J S Kang (2018), Credit booms – is China different?, IMF Working Paper, WP/ 18/ 2.4 The credit- to- GDP ratio expresses the relationship between credit to the non- fi nancial private sector and nominal GDP. The credit- to- GDP gap measures the dif-ference between the credit- to- GDP ratio and its long- term trend. Based on historical data, setting a thresh-old of 10 percentage points of divergence from the trend minimises the possibility of false alarms, provided that at least two-thirds of actual crises are predicted correctly over a time horizon of three years. See BIS (2017), 87th Annual Report, p 45 f.5 The interest coverage ratio is calculated by dividing a company’s earnings before interest, taxes, depreci-ation and amortisation (EBITDA) by its interest expend-iture.6 If “special- mention loans”, ie loans that are overdue but not yet classed as non- performing, are included, the share of at- risk loans in 2017 was around 5%.7 See IMF (2017), People’s Republic of China – Finan-cial System Stability Assessment, p 45. In 2016, the rat-ing agency Fitch estimated the share of non- performing loans in the Chinese fi nancial system to be between 15% and 21%. See Fitch, China’s rebalancing yet to address credit risks, press release of 22 September 2016.
Credit to the non-financial private sector
in China and the credit-to-GDP ratio gap*
Source: BIS credit-to-GDP gap statistics. * Credit from all sec-tors. 1 Difference between credit and the trend in credit.
Deutsche Bundesbank
1995 00 05 10 15 17
75
100
125
150
175
200
225
As a percentage of GDP
– 20
– 10
0
+ 10
+ 20
+ 30
Enlarged scale
Credit-to-GDP gap1
Credit
Trend in credit
Deutsche Bundesbank Monthly Report July 2018 44
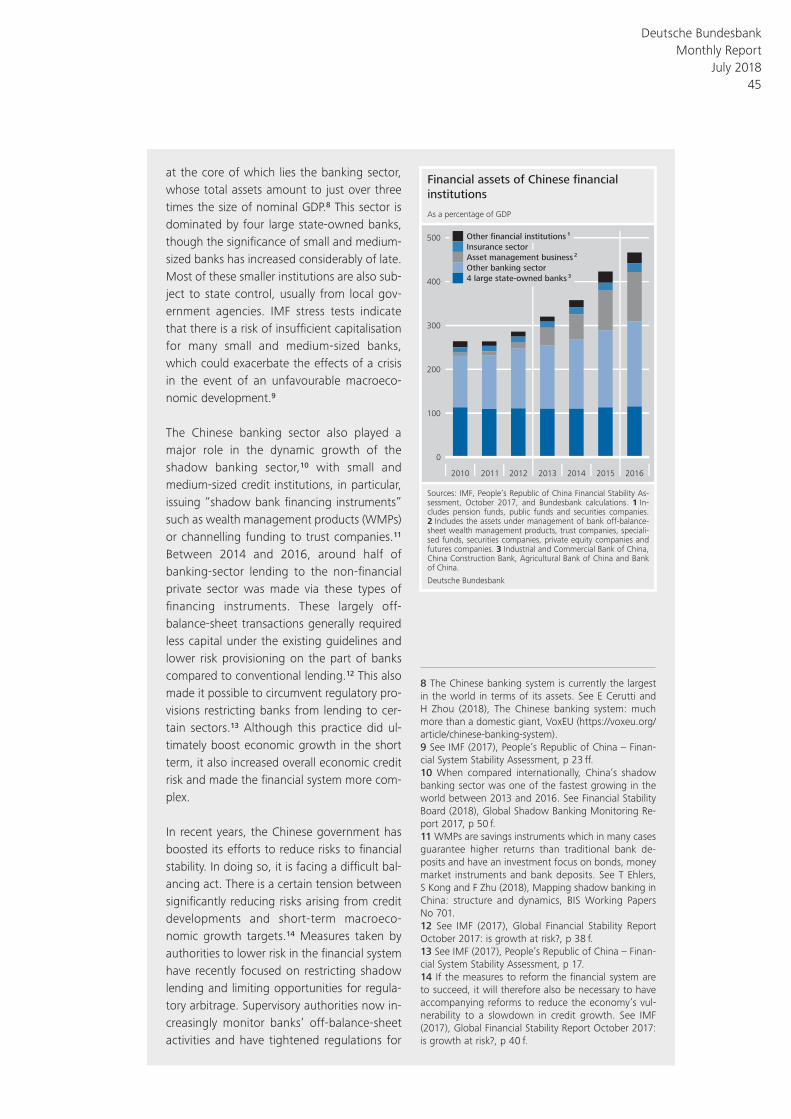
at the core of which lies the banking sector, whose total assets amount to just over three times the size of nominal GDP.8 This sector is dominated by four large state- owned banks, though the signifi cance of small and medium- sized banks has increased considerably of late. Most of these smaller institutions are also sub-ject to state control, usually from local gov-ernment agencies. IMF stress tests indicate that there is a risk of insuffi cient capitalisation for many small and medium- sized banks, which could exacerbate the effects of a crisis in the event of an unfavourable macroeco-nomic development.9
The Chinese banking sector also played a major role in the dynamic growth of the shadow banking sector,10 with small and medium- sized credit institutions, in particular, issuing “shadow bank fi nancing instruments” such as wealth management products (WMPs) or channelling funding to trust companies.11 Between 2014 and 2016, around half of banking- sector lending to the non- fi nancial private sector was made via these types of fi nancing instruments. These largely off- balance- sheet transactions generally required less capital under the existing guidelines and lower risk provisioning on the part of banks compared to conventional lending.12 This also made it possible to circumvent regulatory pro-visions restricting banks from lending to cer-tain sectors.13 Although this practice did ul-timately boost economic growth in the short term, it also increased overall economic credit risk and made the fi nancial system more com-plex.
In recent years, the Chinese government has boosted its efforts to reduce risks to fi nancial stability. In doing so, it is facing a diffi cult bal-ancing act. There is a certain tension between signifi cantly reducing risks arising from credit developments and short- term macroeco-nomic growth targets.14 Measures taken by authorities to lower risk in the fi nancial system have recently focused on restricting shadow lending and limiting opportunities for regula-tory arbitrage. Supervisory authorities now in-creasingly monitor banks’ off- balance- sheet activities and have tightened regulations for
8 The Chinese banking system is currently the largest in the world in terms of its assets. See E Cerutti and H Zhou (2018), The Chinese banking system: much more than a domestic giant, VoxEU (https://voxeu.org/article/chinese-banking-system).9 See IMF (2017), People’s Republic of China – Finan-cial System Stability Assessment, p 23 ff.10 When compared internationally, China’s shadow banking sector was one of the fastest growing in the world between 2013 and 2016. See Financial Stability Board (2018), Global Shadow Banking Monitoring Re-port 2017, p 50 f.11 WMPs are savings instruments which in many cases guarantee higher returns than traditional bank de-posits and have an investment focus on bonds, money market instruments and bank deposits. See T Ehlers, S Kong and F Zhu (2018), Mapping shadow banking in China: structure and dynamics, BIS Working Papers No 701.12 See IMF (2017), Global Financial Stability Report October 2017: is growth at risk?, p 38 f.13 See IMF (2017), People’s Republic of China – Finan-cial System Stability Assessment, p 17.14 If the measures to reform the fi nancial system are to succeed, it will therefore also be necessary to have accompanying reforms to reduce the economy’s vul-nerability to a slowdown in credit growth. See IMF (2017), Global Financial Stability Report October 2017: is growth at risk?, p 40 f.
Financial assets of Chinese financial
institutions
Sources: IMF, People’s Republic of China Financial Stability As-sessment, October 2017, and Bundesbank calculations. 1 In-cludes pension funds, public funds and securities companies. 2 Includes the assets under management of bank off-balance-sheet wealth management products, trust companies, speciali-sed funds, securities companies, private equity companies and futures companies. 3 Industrial and Commercial Bank of China, China Construction Bank, Agricultural Bank of China and Bank of China.
Deutsche Bundesbank
2010 2011 2012 2013 2014 2015 2016
0
100
200
300
400
500
As a percentage of GDP
Other financial institutions 1
Insurance sector
Asset management business 2
Other banking sector
4 large state-owned banks 3
Deutsche Bundesbank Monthly Report
July 2018 45
complex fi nancial products.15 The newly es-tablished Financial Stability and Development Committee has been set up to ensure better collaboration between the various authorities responsible for regulating and supervising the fi nancial system. To strengthen fi nancial supervision, the National People’s Congress also passed a resolution in March this year to bring its banking and insurance watchdogs under one roof.
Implicit guarantees are still a major challenge when it comes to ensuring fi nancial stability in China. For example, investors can expect to be compensated by banks or the government in the event of losses arising from a wide range of fi nancial products such as debt in-struments issued by state- owned enterprises and investment products issued by banks.16 This hampers efforts to evaluate the true risk of fi nancial assets and ultimately causes a mis-allocation of capital. Enacting policies that ex-plicitly rule out these types of guarantees could put an end to the distorted incentives that arise from them.17
A crisis in the Chinese fi nancial system could have a noticeable negative impact on other countries as China’s importance as an inter-national lender and borrower has risen signifi -cantly since the global fi nancial crisis. The cross- border claims of Chinese banks stood at just under US$1 trillion at the end of 2017.18 Emerging and developing countries in South- East Asia, Africa and Latin America in particu-lar have borrowed heavily from Chinese banks in recent years and are therefore highly de-pendent on these capital providers.19 In 2017, China’s foreign claims and liabilities totalled around US$12 trillion or 100% of its national GDP. Closer fi nancial integration increases the risk that a shock in China will spill over to the international fi nancial system.20
The German fi nancial system would probably be affected mainly by indirect spillover effects in the event of a fi nancial crisis in China.21 While the direct exposures of Germany’s banking system and insurance companies to Chinese debtors has risen in recent years and stood at €42 billion overall at the end of 2017,
these exposures account for only 1.9% and 0.7%, respectively, of each fi nancial sector’s foreign assets.22 Direct investment accounts for the lion’s share of Germany’s direct fi nan-cial exposure to China, and most recently amounted to around €80 billion. Resulting losses would initially be felt primarily in Ger-many’s non- fi nancial corporate sector, which holds over 90% of these assets.23 There would only be reason to fear credit risk to the Ger-man fi nancial system if losses arising from dir-ect investment were to have a negative im-pact on companies’ solvency.
15 See IMF (2017), People’s Republic of China – Finan-cial System Stability Assessment, p 34.16 The prevailing practice whereby banks usually fully compensate the losses that small investors suffer in capital investments such as WMPs reinforces this per-ception.17 Such an approach, however, harbours the risk of investors changing their behaviour abruptly, potentially triggering destabilising effects on the fi nancial system. Against this backdrop, the IMF recommends a series of reforms to accompany the dismantling of implicit guarantees. See IMF (2017), People’s Republic of China – Financial System Stability Assessment, p 32 and p 36.18 Source: BIS Locational banking statistics for main-land China excluding Hong Kong.19 See E Cerutti and H Zhou (2018), op cit.20 See Y Korniyenko, M Patnam, R M del Rio- Chanon and M Porter (2018), Evolution of the global fi nancial network and contagion: a new approach, IMF Work-ing Paper, WP/ 18/ 113. The international fi nancial centre of Hong Kong would probably be most directly affected by a shock to the Chinese fi nancial system, given its close fi nancial ties.21 For example, major price corrections on the Chi-nese equity market and fears of a potential economic slump in China in mid-2015 had a direct effect on global fi nancial markets. See Deutsche Bundesbank, Financial Stability Review, November 2015, p 18. Risks could also spill over to the German fi nancial system via second round effects from fi nancial hubs such as the United Kingdom, whose banking system has close dir-ect and indirect fi nancial ties with China and Germany. For more details on the United Kingdom’s fi nancial linkages with China, see Bank of England (2018), From the Middle Kingdom to the United Kingdom: spillovers from China, Quarterly Bulletin 2018 Q2.22 Data from the Bundesbank’s credit register of loans of €1.0 million or more as at 31 December 2017.23 According to international investment position as at 31 December 2017.
Deutsche Bundesbank Monthly Report July 2018 46
portion of science and engineering students is
particularly high in China.
As a result of these policy efforts in innovation
and education, China has since progressed no-
ticeably in the technological catching- up pro-
cess. For example, there has been a significant
increase in the number and the quality of Chi-
nese patent applications in the past few years.16
Furthermore, in the case of a number of tech-
nically sophisticated products, such as smart-
phones, Chinese manufacturers have become
increasingly important internationally. These
successes clearly should not belie the fact that
China still lags noticeably behind the world
leaders in many key technologies, such as semi-
conductors.
The Chinese government is aiming to transform
China into a global leader in technology over
the medium term. With this in mind, it an-
nounced its “Made in China 2025” ten- year
plan in 2015, which set out ambitious targets
for the development of ten domestic industrial
sectors, including information technologies,
electric vehicles, and industrial robots. Along-
side subsidies, the instruments of the plan also
include holdings in foreign enterprises. In a
number of partner countries – including Ger-
many – this has stoked concerns of state-
orchestrated transfers of technology to China.17
Furthermore, foreign enterprises operating in
China fear that there will be increased pressure
to surrender industrial expertise, in addition to
other discriminatory measures.18
Shift of demand from investment to consumption
The second major adjustment taking place in
the Chinese economy concerns the demand
side. For around five years – and with increased
effort in recent times – the Chinese govern-
ment has been trying to put an end to over-
investment. State- owned enterprises are a
starting point. They are being pushed to pay
more attention to putting their funds to more
productive use and limiting their debt. For indi-
vidual industrial sectors with chronic overcap-
acity, such as coal and steel, the government
even went as far as to announce investment
bans. However, in order to ensure a sustainable
solution to the problem of over- investment
among state- owned enterprises, implicit state
guarantees and other privileges will probably
also need to be abolished.19 Moreover, the au-
thorities are cracking down on speculative pur-
chases in the property market. A certain degree
of moderation in government investment in in-
frastructure can also be observed.20 Against the
backdrop of these efforts, growth in overall
economic investment has weakened consider-
ably in recent years.
Private consumption, meanwhile, has seen
constantly buoyant growth, increasing its im-
China’s techno-logical catch- up process has made significant progress of late
Guiding indus-trial policy aims to make China global leader in technology
Chinese author-ities tackling problem of over- investment
16 The increased quality can be seen in the number of pa-tent applications abroad or the number of foreign citations of patents. See S- J Wei, Z Xie and X Zhang (2017), From “Made in China” to “Innovated in China”: necessity, pro-spect, and challenges, Journal of Economic Perspectives, Vol 31(1), pp 49-70.17 The holdings of Chinese enterprises in German com-panies have risen significantly in recent years. A large por-tion of these can indeed be categorised under one of the ten key sectors covered by the “Made in China 2025” pol-icy. See Bertelsmann Stiftung (2018), Kauft China systema-tisch Schlüsseltechnologien auf? Chinesische Firmenbeteili-gungen in Deutschland im Kontext von „Made in China 2025“, GED study. For a discussion of the benefits and drawbacks of Chinese foreign direct investment in Ger-many, see Sachverständigenrat zur Begutachtung der ge-samtwirtschaftlichen Entwicklung (2016), Transformation in China birgt Risiken, Jahresgutachten 2016/ 17, chapter 12, pp 464-501.18 See European Union Chamber of Commerce in China (2017), China Manufacturing 2025: Putting industrial policy ahead of market forces, Report; as well as U.S. Chamber of Commerce (2017), Made in China 2025: Global ambitions built on local protections, Report.19 Reorganising the SOE sector was indeed one of the Chi-nese government’s main economic policy objectives in re-cent years. So far, however, increased participation of pri-vate capital donors in SOEs (known as “mixed- ownership reform”), rather than harmonising competitive conditions between SOEs and private companies, has been at the top of the reform agenda.20 Changing incentives seem to be playing a vital role in the rethink. In the past, the performance of local politicians was chiefly measured by the rate of economic growth in their respective jurisdictions, which greatly incentivised government investment. Since 2013, however, the respect-ive debt situation has also been taken into account in the performance evaluation.
Deutsche Bundesbank Monthly Report
July 2018 47
What conclusions for China can be drawn from other Asian countries’ convergence processes?
China’s per capita income, measured in pur-chasing power parities, has now reached one- quarter of that of the United States. In the coming decades, China is aiming to join the ranks of the advanced economies. This is a leap which, in past decades, only few coun-tries have accomplished. Some Asian coun-tries that have made the leap are Japan, Tai-wan and South Korea.1 Japan in the late 1950s had a similar status to that of China today, as did Taiwan in the mid-1970s and South Korea in the mid-1980s. In the course of their further ascent, all three countries saw their very rapid initial rates of economic growth diminish gradually,2 and the patterns of their growth changed.
In many respects, China’s economic conver-gence process thus far is similar to that of Japan, Taiwan and South Korea. Those econ-omies, too, followed an export- driven growth model in the past.3 Taiwan and South Korea managed to increase their exports- to- gross domestic product (GDP) ratio considerably even after having already achieved middle- income status. However, their shares of global exports were small, which meant that they did not hit absorption constraints. As a large economy, however, Japan attained an 8% share of global exports in the 1970s. For some product groups, this fi gure was much higher still. Later on, its global market share only rose slowly. Since the mid-1980s, it has actually been trending downward.4 For China, an even larger economy whose global market share has recently already hit 13%, this indicates that exports will not be able to drive the con-vergence process indefi nitely.5
What this means going forward is that Chi-nese growth will be based to an increasing extent on domestic demand. In the relatively recent past, it already grew very sharply. Up until recently, its key determinant was the boom in investment, especially in infrastruc-ture and other construction. The investment- to- GDP ratio ran up to nearly 50% in the past
few years. In Japan, Taiwan and South Korea, investment likewise rose sharply during the development process. However, in none of those countries did the aggregate investment ratio rise quite as sharply as in China.6 This ob-servation strengthens the case for believing that China may have witnessed certain exag-gerations (see the explanation in the main text beginning on page 42).
In later stages of their convergence processes, Japan, Taiwan and South Korea saw their in-vestment ratio diminish, with consumption acquiring greater macroeconomic import-ance. During that period, economic growth was increasingly being driven on the supply side by technological progress. Emerging economies can achieve this to a certain extent by adopting foreign technology. However, as they approach the technological frontier, home- grown innovation becomes more im-
1 The other two successful examples are Singapore and Hong Kong, though as city states their stories are not fully comparable with the Chinese case. In fact, there is no generally accepted defi nition of the income threshold above which a country is considered an “ad-vanced” (or “developed”) economy. Since 1989, the World Bank has published an annual classifi cation of countries into four income categories. On this basis, South Korea was fi rst classifi ed as belonging to the highest category – “high- income countries” – in 1995.2 This observation is consistent with neoclassical growth theory, according to which a country’s per capita income converges to a long- run equilibrium path. The further a country’s starting position is from the long- run equilibrium, the faster the convergence process will be.3 See inter alia P W Kuznets (1988), An east Asian model of economic development: Japan, Taiwan, and South Korea, Economic Development and Cultural Change, Vol 36, No 3, Supplement, pp 11-43.4 See K Guo and P N’Diaya (2012), Is China’s export- oriented growth sustainable?, IMF Working Paper, WP/ 09/ 172.5 See Deutsche Bundesbank, The catching- up process of major emerging market economies and its implica-tions for global trade – an analysis using the gravity model, Monthly Report, March 2016, pp 27-30.6 Housing construction investment, in particular, seems to be extremely high in China relative to other Asian countries. See Deutsche Bundesbank, The po-tential effects of a downturn in the Chinese housing market on the real economy, Monthly Report, August 2014, pp 17-19.
Deutsche Bundesbank Monthly Report July 2018 48
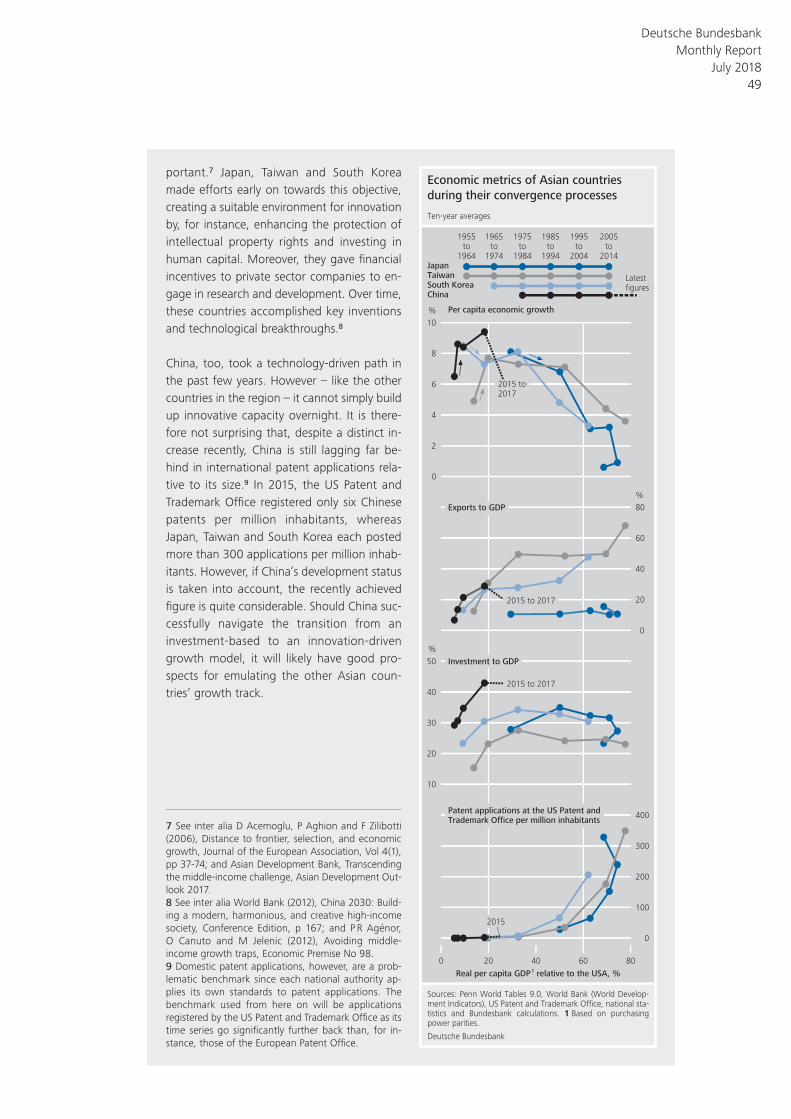
portant.7 Japan, Taiwan and South Korea made efforts early on towards this objective, creating a suitable environment for innovation by, for instance, enhancing the protection of intellectual property rights and investing in human capital. Moreover, they gave fi nancial incentives to private sector companies to en-gage in research and development. Over time, these countries accomplished key inventions and technological breakthroughs.8
China, too, took a technology- driven path in the past few years. However – like the other countries in the region – it cannot simply build up innovative capacity overnight. It is there-fore not surprising that, despite a distinct in-crease recently, China is still lagging far be-hind in international patent applications rela-tive to its size.9 In 2015, the US Patent and Trademark Offi ce registered only six Chinese patents per million inhabitants, whereas Japan, Taiwan and South Korea each posted more than 300 applications per million inhab-itants. However, if China’s development status is taken into account, the recently achieved fi gure is quite considerable. Should China suc-cessfully navigate the transition from an investment- based to an innovation- driven growth model, it will likely have good pro-spects for emulating the other Asian coun-tries’ growth track.
7 See inter alia D Acemoglu, P Aghion and F Zilibotti (2006), Distance to frontier, selection, and economic growth, Journal of the European Association, Vol 4(1), pp 37-74; and Asian Development Bank, Transcending the middle- income challenge, Asian Development Out-look 2017.8 See inter alia World Bank (2012), China 2030: Build-ing a modern, harmonious, and creative high- income society, Conference Edition, p 167; and P R Agénor, O Canuto and M Jelenic (2012), Avoiding middle- income growth traps, Economic Premise No 98.9 Domestic patent applications, however, are a prob-lematic benchmark since each national authority ap-plies its own standards to patent applications. The benchmark used from here on will be applications registered by the US Patent and Trademark Offi ce as its time series go signifi cantly further back than, for in-stance, those of the European Patent Offi ce.
Economic metrics of Asian countries
during their convergence processes
Sources: Penn World Tables 9.0, World Bank (World Develop-ment Indicators), US Patent and Trademark Office, national sta-tistics and Bundesbank calculations. 1 Based on purchasing power parities.
Deutsche Bundesbank
0 20 40 60 80
0
20
40
60
80
Ten-year averages
Exports to GDP
Real per capita GDP 1 relative to the USA, %
Latestfigures
2015
2015 to 2017
2015 to2017
2015 to 2017
2005to
2014
0
2
4
6
8
10
10
20
30
40
50
0
100
200
300
400
Per capita economic growth
Investment to GDP
Patent applications at the US Patent andTrademark Office per million inhabitants
%
%
%
JapanTaiwanSouth KoreaChina
1995to
2004
1985to
1994
1975to
1984
1955to
1964
1965to
1974
Deutsche Bundesbank Monthly Report
July 2018 49
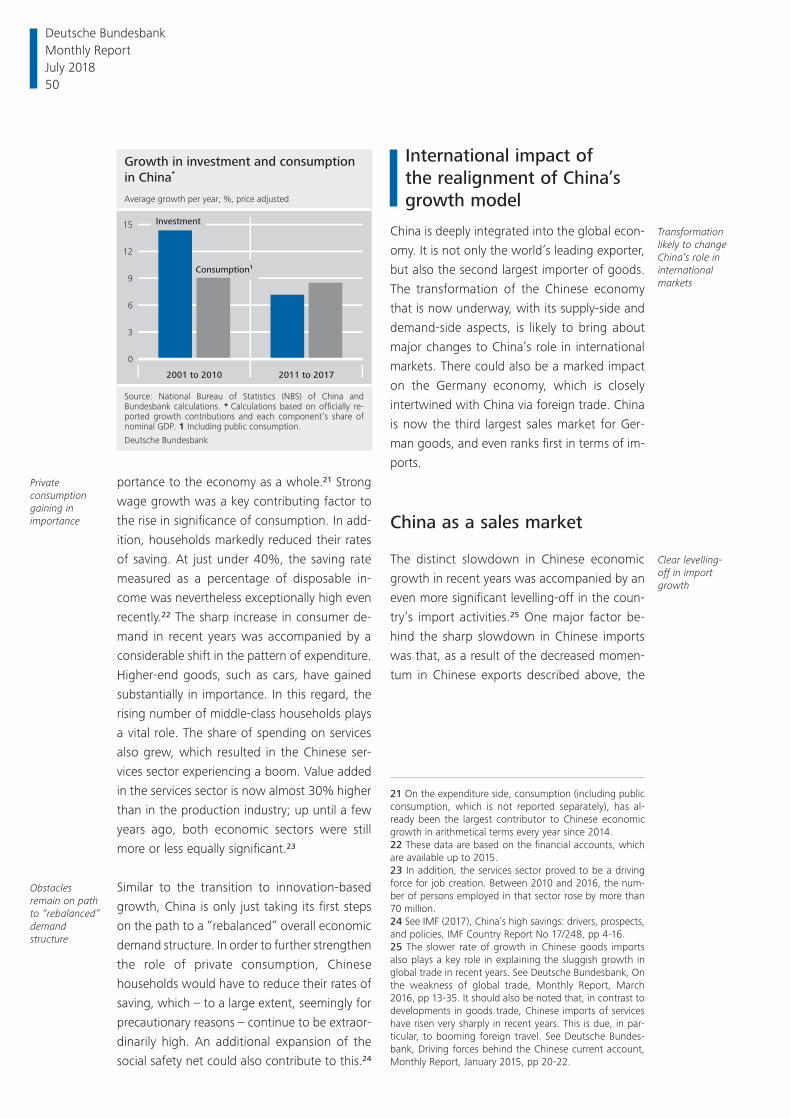
portance to the economy as a whole.21 Strong
wage growth was a key contributing factor to
the rise in significance of consumption. In add-
ition, households markedly reduced their rates
of saving. At just under 40%, the saving rate
measured as a percentage of disposable in-
come was nevertheless exceptionally high even
recently.22 The sharp increase in consumer de-
mand in recent years was accompanied by a
considerable shift in the pattern of expenditure.
Higher- end goods, such as cars, have gained
substantially in importance. In this regard, the
rising number of middle- class households plays
a vital role. The share of spending on services
also grew, which resulted in the Chinese ser-
vices sector experiencing a boom. Value added
in the services sector is now almost 30% higher
than in the production industry; up until a few
years ago, both economic sectors were still
more or less equally significant.23
Similar to the transition to innovation- based
growth, China is only just taking its first steps
on the path to a “rebalanced” overall economic
demand structure. In order to further strengthen
the role of private consumption, Chinese
households would have to reduce their rates of
saving, which – to a large extent, seemingly for
precautionary reasons – continue to be extraor-
dinarily high. An additional expansion of the
social safety net could also contribute to this.24
International impact of the realignment of China’s growth model
China is deeply integrated into the global econ-
omy. It is not only the world’s leading exporter,
but also the second largest importer of goods.
The transformation of the Chinese economy
that is now underway, with its supply- side and
demand- side aspects, is likely to bring about
major changes to China’s role in international
markets. There could also be a marked impact
on the Germany economy, which is closely
intertwined with China via foreign trade. China
is now the third largest sales market for Ger-
man goods, and even ranks first in terms of im-
ports.
China as a sales market
The distinct slowdown in Chinese economic
growth in recent years was accompanied by an
even more significant levelling- off in the coun-
try’s import activities.25 One major factor be-
hind the sharp slowdown in Chinese imports
was that, as a result of the decreased momen-
tum in Chinese exports described above, the
Private consumption gaining in importance
Obstacles remain on path to “rebalanced” demand structure
Transformation likely to change China’s role in international markets
Clear levelling- off in import growth
Growth in investment and consumption
in China*
Source: National Bureau of Statistics (NBS) of China and Bundesbank calculations. * Calculations based on officially re-ported growth contributions and each component’s share of nominal GDP. 1 Including public consumption.
Deutsche Bundesbank
0
3
6
9
12
15
Average growth per year, %, price adjusted
2001 to 2010 2011 to 2017
Investment
Consumption1
21 On the expenditure side, consumption (including public consumption, which is not reported separately), has al-ready been the largest contributor to Chinese economic growth in arithmetical terms every year since 2014.22 These data are based on the financial accounts, which are available up to 2015.23 In addition, the services sector proved to be a driving force for job creation. Between 2010 and 2016, the num-ber of persons employed in that sector rose by more than 70 million.24 See IMF (2017), China’s high savings: drivers, prospects, and policies, IMF Country Report No 17/ 248, pp 4-16.25 The slower rate of growth in Chinese goods imports also plays a key role in explaining the sluggish growth in global trade in recent years. See Deutsche Bundesbank, On the weakness of global trade, Monthly Report, March 2016, pp 13-35. It should also be noted that, in contrast to developments in goods trade, Chinese imports of services have risen very sharply in recent years. This is due, in par-ticular, to booming foreign travel. See Deutsche Bundes-bank, Driving forces behind the Chinese current account, Monthly Report, January 2015, pp 20-22.
Deutsche Bundesbank Monthly Report July 2018 50
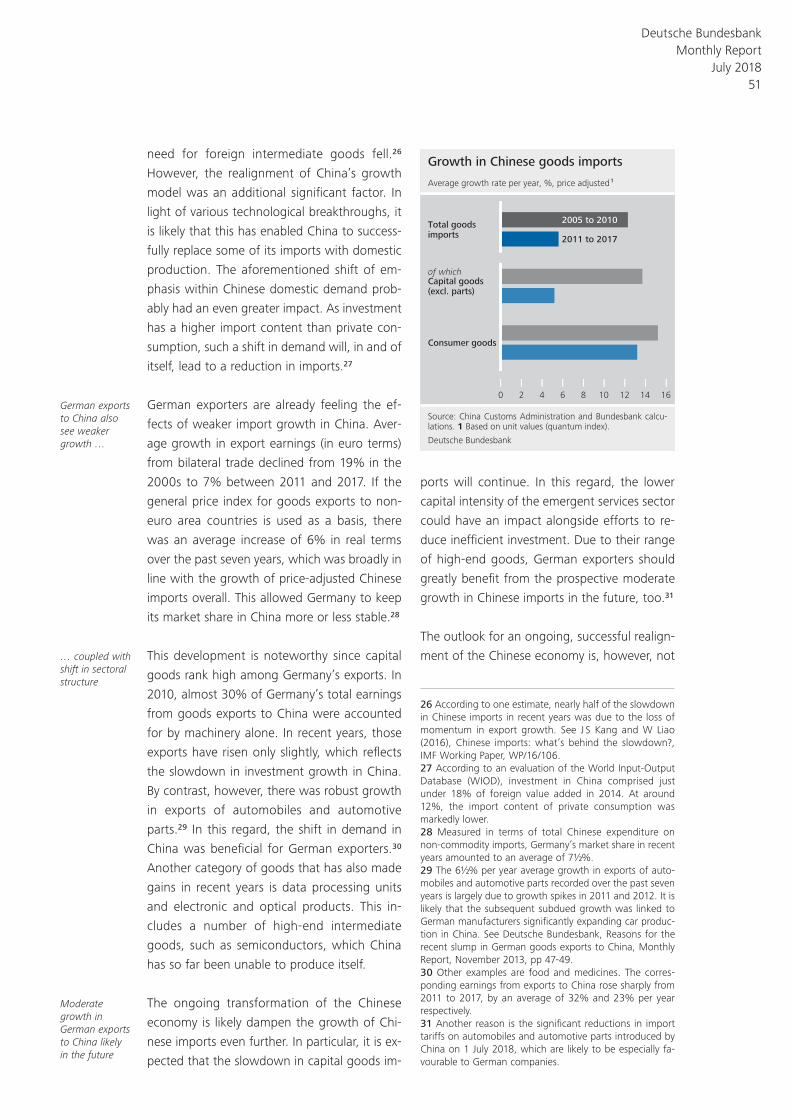
need for foreign intermediate goods fell.26
However, the realignment of China’s growth
model was an additional significant factor. In
light of various technological breakthroughs, it
is likely that this has enabled China to success-
fully replace some of its imports with domestic
production. The aforementioned shift of em-
phasis within Chinese domestic demand prob-
ably had an even greater impact. As investment
has a higher import content than private con-
sumption, such a shift in demand will, in and of
itself, lead to a reduction in imports.27
German exporters are already feeling the ef-
fects of weaker import growth in China. Aver-
age growth in export earnings (in euro terms)
from bilateral trade declined from 19% in the
2000s to 7% between 2011 and 2017. If the
general price index for goods exports to non-
euro area countries is used as a basis, there
was an average increase of 6% in real terms
over the past seven years, which was broadly in
line with the growth of price- adjusted Chinese
imports overall. This allowed Germany to keep
its market share in China more or less stable.28
This development is noteworthy since capital
goods rank high among Germany’s exports. In
2010, almost 30% of Germany’s total earnings
from goods exports to China were accounted
for by machinery alone. In recent years, those
exports have risen only slightly, which reflects
the slowdown in investment growth in China.
By contrast, however, there was robust growth
in exports of automobiles and automotive
parts.29 In this regard, the shift in demand in
China was beneficial for German exporters.30
Another category of goods that has also made
gains in recent years is data processing units
and electronic and optical products. This in-
cludes a number of high- end intermediate
goods, such as semiconductors, which China
has so far been unable to produce itself.
The ongoing transformation of the Chinese
economy is likely dampen the growth of Chi-
nese imports even further. In particular, it is ex-
pected that the slowdown in capital goods im-
ports will continue. In this regard, the lower
capital intensity of the emergent services sector
could have an impact alongside efforts to re-
duce inefficient investment. Due to their range
of high- end goods, German exporters should
greatly benefit from the prospective moderate
growth in Chinese imports in the future , too.31
The outlook for an ongoing, successful realign-
ment of the Chinese economy is, however, not
German exports to China also see weaker growth …
… coupled with shift in sectoral structure
Moderate growth in German exports to China likely in the future
Growth in Chinese goods imports
Average growth rate per year, %, price adjusted 1
0 2 4 6 8 10 12 14 16
Source: China Customs Administration and Bundesbank calcu-
lations. 1 Based on unit values (quantum index).
Deutsche Bundesbank
2005 to 2010
2011 to 2017
Total goods imports
of whichCapital goods(excl. parts)
Consumer goods
26 According to one estimate, nearly half of the slowdown in Chinese imports in recent years was due to the loss of momentum in export growth. See J S Kang and W Liao (2016), Chinese imports: what’s behind the slowdown?, IMF Working Paper, WP/ 16/ 106.27 According to an evaluation of the World Input- Output Database (WIOD), investment in China comprised just under 18% of foreign value added in 2014. At around 12%, the import content of private consumption was markedly lower.28 Measured in terms of total Chinese expenditure on non- commodity imports, Germany’s market share in recent years amounted to an average of 7½%.29 The 6½% per year average growth in exports of auto-mobiles and automotive parts recorded over the past seven years is largely due to growth spikes in 2011 and 2012. It is likely that the subsequent subdued growth was linked to German manufacturers significantly expanding car produc-tion in China. See Deutsche Bundesbank, Reasons for the recent slump in German goods exports to China, Monthly Report, November 2013, pp 47-49.30 Other examples are food and medicines. The corres-ponding earnings from exports to China rose sharply from 2011 to 2017, by an average of 32% and 23% per year respectively.31 Another reason is the significant reductions in import tariffs on automobiles and automotive parts introduced by China on 1 July 2018, which are likely to be especially fa-vourable to German companies.
Deutsche Bundesbank Monthly Report
July 2018 51
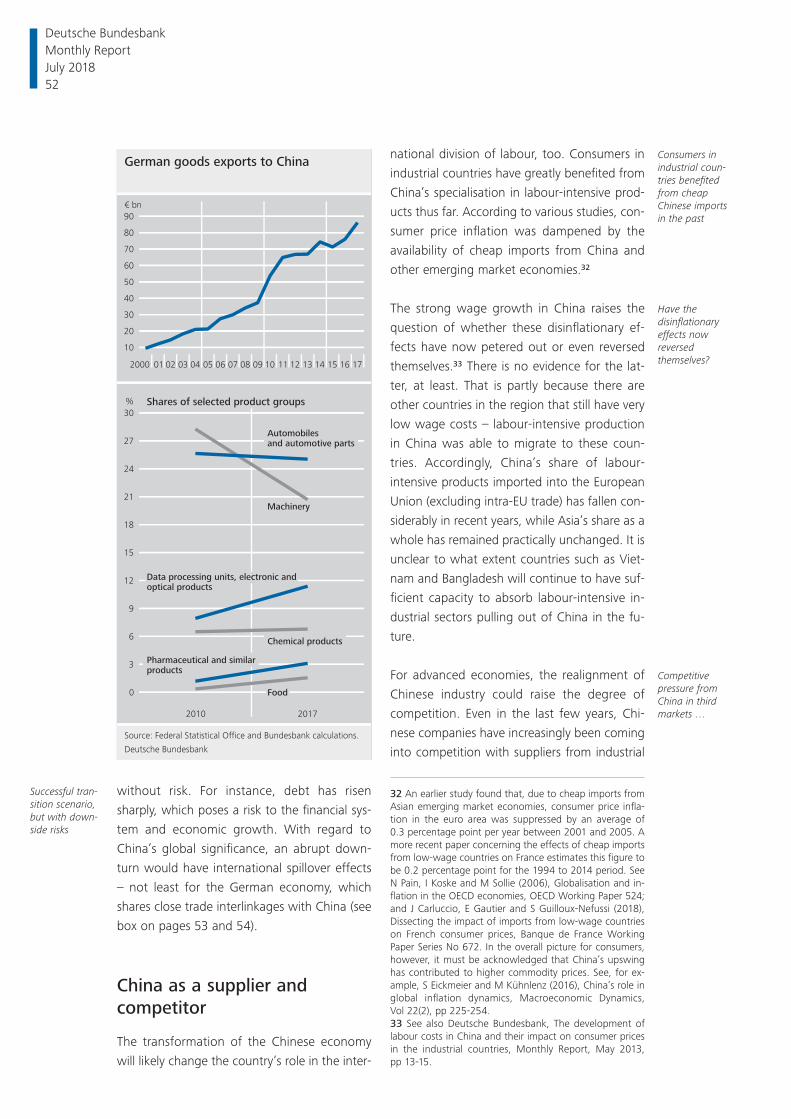
without risk. For instance, debt has risen
sharply, which poses a risk to the financial sys-
tem and economic growth. With regard to
China’s global significance, an abrupt down-
turn would have international spillover effects
– not least for the German economy, which
shares close trade interlinkages with China (see
box on pages 53 and 54).
China as a supplier and competitor
The transformation of the Chinese economy
will likely change the country’s role in the inter-
national division of labour, too. Consumers in
industrial countries have greatly benefited from
China’s specialisation in labour- intensive prod-
ucts thus far. According to various studies, con-
sumer price inflation was dampened by the
availability of cheap imports from China and
other emerging market economies.32
The strong wage growth in China raises the
question of whether these disinflationary ef-
fects have now petered out or even reversed
themselves.33 There is no evidence for the lat-
ter, at least. That is partly because there are
other countries in the region that still have very
low wage costs – labour- intensive production
in China was able to migrate to these coun-
tries. Accordingly, China’s share of labour-
intensive products imported into the European
Union (excluding intra- EU trade) has fallen con-
siderably in recent years, while Asia’s share as a
whole has remained practically unchanged. It is
unclear to what extent countries such as Viet-
nam and Bangladesh will continue to have suf-
ficient capacity to absorb labour- intensive in-
dustrial sectors pulling out of China in the fu-
ture.
For advanced economies, the realignment of
Chinese industry could raise the degree of
competition. Even in the last few years, Chi-
nese companies have increasingly been coming
into competition with suppliers from industrial
Successful tran-sition scenario, but with down-side risks
Consumers in industrial coun-tries benefited from cheap Chinese imports in the past
Have the disinflationary effects now reversed themselves?
Competitive pressure from China in third markets …
German goods exports to China
0
3
6
9
12
15
18
21
24
27
30
2010
Source: Federal Statistical Office and Bundesbank calculations.
Deutsche Bundesbank
2017
Food
Data processing units, electronic andoptical products
Automobilesand automotive parts
Machinery
Pharmaceutical and similarproducts
Chemical products
2000 01 02 03 04 05 06 07 08 09 10 11 12 13 14 15 16 17
10
20
30
40
50
60
70
80
90
Shares of selected product groups
€ bn
%
32 An earlier study found that, due to cheap imports from Asian emerging market economies, consumer price infla-tion in the euro area was suppressed by an average of 0.3 percentage point per year between 2001 and 2005. A more recent paper concerning the effects of cheap imports from low- wage countries on France estimates this figure to be 0.2 percentage point for the 1994 to 2014 period. See N Pain, I Koske and M Sollie (2006), Globalisation and in-flation in the OECD economies, OECD Working Paper 524; and J Carluccio, E Gautier and S Guilloux- Nefussi (2018), Dissecting the impact of imports from low- wage countries on French consumer prices, Banque de France Working Paper Series No 672. In the overall picture for consumers, however, it must be acknowledged that China’s upswing has contributed to higher commodity prices. See, for ex-ample, S Eickmeier and M Kühnlenz (2016), China’s role in global inflation dynamics, Macroeconomic Dynamics, Vol 22(2), pp 225-254.33 See also Deutsche Bundesbank, The development of labour costs in China and their impact on consumer prices in the industrial countries, Monthly Report, May 2013, pp 13-15.
Deutsche Bundesbank Monthly Report July 2018 52
The international spillover effects of a sharp economic downturn in China
The outlook for the Chinese economy re-mains generally upbeat, with the Inter-national Monetary Fund’s baseline scenario in the April 2018 World Economic Outlook pro-jecting that GDP growth will slow just grad-ually to 5½% in 2023. But the sharp rise in debt, particularly in the corporate sector, and opaque interlinkages in the fi nancial system entail not inconsiderable risks which cannot be ignored (see the box on pages 44 to 46).
The international spillover effects of a poten-tial sharp downturn in China triggered by a crisis in the country’s fi nancial system have al-ready been analysed in numerous studies. There are also macroeconomic model- based studies looking at the repercussions specifi c-ally for Germany and for the euro area.1 These tend to investigate the consequences of a general demand shock in China. In the past, in other countries where periods of excessive credit growth have culminated in fi nancial cri-ses, it has been investment activity which has taken a particular hit, however. Investment growth in the affected countries dropped by an average of 12 percentage points, whereas private consumption growth slowed by an average of 3 percentage points.2
The fact that investment and consumption react differently is important in terms of ex-ternal knock- on effects since, in general, in-vestment is characterised by a higher im-port intensity than private consumption – and this holds true in the case of China, too.3 As a result, a decline in investment would be channelled to foreign markets to a greater degree than the same size drop in private consumption. Studies positing sim-ply a generalised reduction in domestic de-mand in China are therefore likely to under-estimate spillover to other countries.
In the NiGEM global economic model,4 which will be used for the following simula-
tions, imports are infl uenced by a country’s aggregate demand. It therefore makes no difference whether a shock affects certain demand components to different degrees. It is only by adapting the model that differ-ences in the import content of the individ-ual expenditure components can be fac-tored in.5 The respective (country- specifi c) import intensities were estimated on the basis of data from the World Input- Output Database (WIOD).6
1 These include Deutsche Bundesbank, The inter-national ripple effects of a severe economic slowdown in China, Monthly Report, July 2015, pp 29-30 and A Dieppe, R Gilhooly, J Han, I Korhonen and D Lodge (2018), The transition of China to sustainable growth – implications for the global economy and the euro area, ECB Occasional Paper No 206.2 Based on a sample of 35 periods of excessive debt build- up in emerging markets and advanced econ-omies between 1960 and 2010, identifi ed using a country- specifi c threshold factoring in the variance of the normal credit cycle. See A Abiad, M Lee, M Pundit and A Ramayandi (2016), Moderating growth and structural change in the People’s Republic of China: implications for developing Asia and beyond, ADB Briefs No 53, and E Mendoza and M Terrones (2012), An anatomy of credit booms and their demise, NBER Working Paper 18379.3 See M Bussière, G Callegari, F Ghironi, G Sestieri and N Yamano (2013), Estimating trade elasticities: de-mand composition and the trade collapse of 2008-2009, American Economic Journal: Macroeconomics, 2013, 5(3), pp 118-151.4 NiGEM is a macroeconometric model developed by the UK- based National Institute of Economic and So-cial Research (NIESR). It includes most of the OECD countries as well as important emerging economies. International linkages are modelled through foreign trade and the interest rate- exchange rate nexus. For further information on the model structure, see https:// nimodel.niesr.ac.uk5 See M Jorra, A Esser and U Slopek (2018), The import content of expenditure components and the size of international spillovers, National Institute Economic Review, 244, pp R21-R29.6 The WIOD datasets allow intermediate inputs to be captured across national borders and individual sec-tors’ supply to be broken down by end- use categories. In this way, an import share can be determined for each expenditure component. Calculations are based on the 2016 release available at www.wiod.org. See M Timmer, E Dietzenbacher, B Los, R Stehrer and G de Vries (2015), An illustrated user guide to the World Input- Output Database: the case of global automotive production, Review of International Economics, 23(3), pp 575-605.
Deutsche Bundesbank Monthly Report
July 2018 53
For a simulation with the adjusted model, the analysis uses shocks to investment and private consumption in China correspond-ing to the above- mentioned historical val-ues for other countries with fi nancial cri-ses.7 It is assumed that, in the medium run, both variables return to the path originally laid out. In the simulation, the Chinese economy therefore experiences a substan-tial slowdown in growth. In the fi rst two years of the shock, real gross domestic product (GDP) growth contracts to an aver-age of just 2%. This means that China’s economic output undershoots the baseline by 7% in the second year. In the same period, China’s import volume falls short of
the baseline by as much as one- quarter. The relatively high sensitivity of imports to the downturn in investment is a key factor here: in a simulation using the standard version of NiGEM, imports decline by just one- fi fth.
Using the adapted model, this simulation thus yields spillover effects which – aver-aged across all trading partners – are around one- third higher. Germany’s real GDP drops markedly against the baseline, by 0.8% after two years, compared with just under 0.6% in the standard model. Both variants of the model show Germany experiencing greater output losses than other euro area countries. This is due, in particular, to the German economy’s very high degree of export exposure to China.8
It should be noted that even the adapted model could still underestimate inter-national spillover. The simulations assume a practically stable Chinese currency through-out the downturn, yet if such a situation were to see a signifi cant depreciation of the renminbi, the repercussions for China’s trading partners would probably be even greater. Likewise, the simulation does not account for a global loss of confi dence among economic agents, in particular in the fi nancial markets, triggered by a crisis in China.
7 However, there are certain circumstances applying to the Chinese economy that make it conceivable that a crisis might have milder effects than those observed in other countries. For instance, the Chinese authorities could well have at their disposal more effective means for stimulating demand than other emerging markets.8 As a percentage of nominal GDP, Germany’s goods exports to China last year amounted to 2.6%, com-pared to an average of 1% for other euro area coun-tries.
Impact of an abrupt economic downturn
in China according to NiGEM simulations *
Source: Bundesbank calculations using NiGEM (Version 4.17).
* Shocks to growth rates of Chinese investment (-12 percent-
age points) and private consumption (-3 percentage points)
persisting for two years. Rules-based monetary policy assumed.
1 Modified model takes into account differences in the import
content of the individual expenditure components.
Deutsche Bundesbank
25
20
15
10
5
0
5
10
–
–
–
–
–
+
+
Deviation from the baseline, %
Year 1 Year 4Year 3Year 2
GDP
Imports
Effects for China
Spillover effects on GDP for a selection of China’s trading partners
– 1.2 – 0.9 – 0.6 – 0.3 0 + 0.3
United States
United Kingdom
Standard model
Euro areaexcluding Germany
Germany
Japan
Modified model 1
of which
World excluding
China
Deutsche Bundesbank Monthly Report July 2018 54
countries in third markets. A simple metric can
be used to systematically capture the competi-
tive pressure exerted by China on the exporters
of individual countries. China’s global market
share of exports in 230 goods categories is cal-
culated34 and weighted by the respective cate-
gory’s share of exports of the observed indus-
trial country. In all of the industrial countries
surveyed, the degree of competition measured
using this method has risen continuously since
2004. According to the indicator, competitive
pressure on Germany from China in 2016 was
at a similar level to other industrial countries.
Competitive pressure from China could rise
over the coming years for the German econ-
omy in particular.35 This is due in part to the
fact that current Chinese industrial policy is
largely focusing on sectors in which German
companies have a strong global market pres-
ence. In the automotive sector in particular,
there could be considerably more friction be-
tween German and Chinese companies. So far,
China has only reached a global market share
of 4½% for such exports (mainly automotive
parts). As part of the “Made in China 2025”
action plan, however, the development of the
electric vehicle sector is being massively pro-
moted. The domestic market is seeing strong
growth and is already dominated by Chinese
models.36 In the medium term, large- scale ex-
ports of electric vehicles from China may also
be expected.
Conclusion
With China’s previous growth model increas-
ingly hitting its limits, the Chinese government
is aiming to create a new foundation for the
country’s economic catching- up process. On
the supply side, the transformation is being ac-
companied by improving technology in indus-
try and a growing significance of the services
sector. On the demand side, forces are shifting
from exports and investment to consumption.… could rise over coming years for Germany in particular
Realignment of growth model has begun …
Indicator for competitive pressure from China
Source: UN Comtrade and Bundesbank calculations. 1 China’s market share of global goods exports in 230 goods categories weighted
by the respective category’s share of exports of each observed industrial country.
Deutsche Bundesbank
2004
0
2
4
6
8
10
12
14
16
Weighted global market share of Chinese exports, % 1
0
2
4
6
8
10
12
14
16
Germany Other industrial countries
FR JPUSIT
2016201320102007 2016
34 The goods categories used correspond to the chapters (two- digit) of the United Nations Harmonized Commodity Description and Coding System (HS). The two most signifi-cant chapters for Chinese exports – 84 (machinery and mechanical appliances) and 85 (electrical machinery and equipment) – were broken down even further.35 German enterprises operating in China are already re-porting significantly increased competitive pressure from Chinese companies in recent times. See German Chamber of Commerce in China (2017), German Business in China – Business Confidence Survey 2017/ 18.36 Around half of the 1.2 million electric vehicles sold worldwide in 2017 were sold in China. Of those, the share of foreign models is, at 4%, extremely low. See Germany Trade and Invest, Elektromobilität VR China: Die Weichen sind gestellt, https:// www.gtai.de/ GTAI/ Navigation/ DE/ Trade/ Maerkte/ suche,t=elektromobilitaet- vr- china- die- weichen- sind- gestellt,did=1883192.html
Deutsche Bundesbank Monthly Report
July 2018 55
In order to support the structural change, the
Chinese authorities are already implementing
important reforms in a number of areas. Part-
ner countries have been critical of certain polit-
ical measures, particularly in industrial policy,
with some, such as the United States, also
using them as justification for their own trade
policy measures. Against this backdrop, further
improving the general environment for innov-
ation as well as continuing to push the Chinese
economy to open up to foreign investment
– something that has been neglected in recent
years – would be less contentious and also
probably more beneficial from a macroeco-
nomic standpoint.
For the German economy, the transformation
in China is likely to have wide- ranging implica-
tions. If a realignment of the growth model is
successful and China continues to catch up at a
rapid pace, German exporters may be pre-
sented with excellent market opportunities in
the future, too. At the same time, however, it is
expected that competitive pressure from China
will also rise. In the coming years, it is precisely
German enterprises that could feel the effects.
… but some aspects could lead to conflict
Transformation in China presents oppor-tunities and risks for German economy
Deutsche Bundesbank Monthly Report July 2018 56
Trends in the financing structures of German non- financial corporations as reflected in the corporate financial statements statistics
The funding structures of German non- financial corporations have changed discernibly since the
turn of the millennium. From a longer- term perspective, the strong increase in intra- group liabil-
ities and the declining importance of trade credits are striking, as are the trends towards conver-
gence in terms of both higher equity ratios and lower bank debt ratios. The effects are partly the
result of macroeconomic trends such as the internationalisation of the German economy and the
creation of complex value chains. On balance, the German non- financial corporations sector has
seen a considerable across- the- board improvement in its financial viability and hence its resilience
to exogenous shocks.
Based on a microdataset from the Bundesbank’s corporate financial statements statistics, the
results show that the trend among non- financial corporations towards strengthening their own
funds base continued between 2010 and 2015. The marked observable differences in the past in
the equity ratios according to sector and size category have decreased significantly. In addition,
there was a marked reduction in bank loans and trade payables during the observation period.
At the same time, particularly small and medium- sized enterprises as well as non- affiliated enter-
prises saw an expansion of liquidity reserves on the asset side of their balance sheets. This could
be interpreted as losses of flexibility in short- term funding in some segments of the corporate
sector being offset by increased holdings of cash. Intra- group financing, which has now emerged
as the second most important source of funding for non- financial corporations, continues to
make advances. In this context, the funds are often raised by group financing companies on the
international financial markets in the form of syndicated loans and securities issues.
Deutsche Bundesbank Monthly Report
July 2018 57
Changes in the underlying economic and financial conditions as a challenge for corporate financing
Since the turn of the millennium, there have
been marked changes in the underlying eco-
nomic and financial conditions for German
non- financial corporations. This has also left a
lasting mark on how enterprises make deci-
sions on the nature and structure of funding.
Besides shifts in debt financing, it has been
chiefly the strengthening of the own funds
base that has been striking. After the German
corporate sector was deemed to be undercap-
italised by international standards in the late
1990s, within a period of ten years, non-
financial enterprises had increased their equity
ratio by 5 percentage points on average to
25% in 2008.1 The associated strengthening of
financial resilience in conjunction with other
measures was a key prerequisite for German
enterprises emerging unharmed from the “en-
durance test” provided by the severe recession
in the fourth quarter of 2008 and the first
quarter of 2009, without reduced output in the
medium to long- term and protracted job
losses.
As global demand bounced back in 2010 and
2011, German enterprises returned relatively
swiftly to the decent level of profitability of the
pre- crisis period. Initially, the crisis- induced ad-
justments in the balance sheets, which focused
mainly on safeguarding liquidity, were grad-
ually reduced. Moreover, the underlying trends
in corporate funding from the pre- crisis years
have persisted into the current decade. For ex-
ample, equity capital now makes up an aver-
age of 30% of non- financial corporations’ total
assets.
Possible explanations for the ongoing strength-
ening of the equity base and the interaction
with other funding- related developments are
discussed below. This is based on empirical
analyses using granular data from the Bundes-
bank’s financial statement statistics between
2000 and 2015. Balanced samples of enter-
prises for which annual accounts are available
at the beginning and the end of each observa-
tion period are formed. This is done to ensure
that the observed changes in the balance sheet
items are due to economic effects and not to
changes in the composition of the sample.
However, in return, it has to be accepted that
representativeness is limited to a certain extent.
In a first step, there is an examination of the
hypothesis of whether the development in the
current decade towards higher equity ratios
and lower bank debt ratios can be regarded as
part of an ongoing convergence process since
at least the end of the 1990s. This implies the
notion that the extent of the adjustments de-
pends on the company- specific starting points
in terms of the two balance sheet variables.
Heterogeneity in the corporate sector may be
explicitly taken into consideration through dis-
tribution analyses and microeconometric stud-
ies.
In a second step, changes in the funding struc-
ture during the period from 2010 to 2015 are
examined in the context of the balance sheet.
In this regard, it is worth taking a look at indi-
vidual sectors or enterprises of different size
categories and legal forms. The disaggregated
analysis is also linked to the fact that the eco-
nomic upturn since 2010 has been based more
strongly on domestic forces of growth than the
expansionary phase between 2003 and 2008.
Most recently, for example, construction, trade
and some services sectors experienced a com-
paratively strong economic tailwind, which
helped make balance sheet adjustments that
had been carried out mainly by industrial enter-
prises in the more strongly export- led upswing
of the previous decade.
The funding patterns in the current decade also
reflect changes in the underlying financial con-
Increase in equity ratio since late 1990s
Return to decent earnings level after recession
Evaluations based on bal-anced sample of enterprises …
… to analyse longer- term convergence trends in equity and bank debt …
… and changes in financing structures between 2010 and 2015 …
1 See Deutsche Bundesbank, Extrapolated results from fi-nancial statements of German enterprises 1997 to 2016, Special Statistical Publication 5, December 2017.
Deutsche Bundesbank Monthly Report July 2018 58
ditions. Given exceptionally low lending rates,
the sustained trend towards reducing the share
of liabilities to credit institutions in total assets
can only be explained in the context of add-
itional key determinants such as the financial
implications of the internationalisation of the
German economy and the creation of value
chains, especially as credit supply- driven con-
straints beyond the point when the financial
crisis reached its peak are unlikely to have hurt
the greater part of the German corporate sec-
tor to a major extent.2 Specifically, the evalu-
ations indicate that the increase in intra- group
liabilities3 in the corporate balance sheets may
be attributable not only to operational pro-
cesses but also, to a large extent, to funding
operations in the international financial mar-
kets.
German enterprises’ financing behaviour from a longer- term perspective
The financing behaviour of German non-
financial corporations in terms of their balance
sheets since the turn of the millennium is es-
sentially characterised by four trends.4
– Sustained strengthening of the equity capital
base
– Substantial reduction in bank debt
– Declining funding opportunities from sup-
pliers
– Strong expansion of intra- group liabilities
The considerable growth rate of intra- group li-
abilities (and, in parallel with them, the corres-
ponding claims) is related to trend factors in
the real economy, such as the creation of value
added processes based on the division of la-
bour5 and the increasing internationalisation of
the German economy,6 as well as the deploy-
ment of group financing companies to raise
funds in the international financial markets.
The existence of trends towards convergence
in terms of a higher equity ratio and a lower
bank debt ratio suggests that the corporate
sector’s financial resilience and, hence, internal
capital adequacy has increased across the
board. Studies on the longer- term adjustment
processes, the scale of which depends on the
company- specific starting positions, are based
on a balanced sample of around 15,600 enter-
prises for which balance sheet data are avail-
able for 2000 and 2015. For this purpose, the
enterprises are grouped into deciles according
to their equity ratio or bank debt ratio in 2000.
As the chart at the top of the next page shows
using the decile- specific medians, the increase in
the equity ratio between 2000 and 2015 tended
to be all the stronger, the lower the starting
level was. Furthermore, there were striking de-
velopments at the borders of the distribution.
Thus, the median of the enterprises in the low-
est decile increased from negative territory to
16% in 2015. By contrast, the enterprises in the
highest decile slimmed down their compara-
tively generous equity base somewhat in 2000.
Convergence trends were even more pro-
nounced regarding the bank debt ratio. In the
chart at the bottom of the next page this can
be seen, for instance, by the fact that the gap
… against the backdrop of new financial conditions
Longer- term trends in enter-prises’ financing behaviour
Analysis of trends towards convergence based on bal-anced samples of enterprises …
… in terms of the equity ratio …
… and regard-ing the bank debt ratio
2 See Deutsche Bundesbank, Developments in corporate financing in the euro area since the financial and economic crisis, Monthly Report, January 2018, pp 53-71.3 Recorded on the liabilities side, these are liabilities to af-filiated enterprises as well as liabilities to other long- term investees and investors.4 The development of financing structures in the first dec-ade of the 21st century has already been the subject of earlier Bundesbank analyses. See, for example, Deutsche Bundesbank, Long- term developments in corporate finan-cing in Germany – evidence based on the financial ac-counts, Monthly Report, January 2012, pp 13-27; and Deutsche Bundesbank, Capital base of non- financial enter-prises in Germany sustainably strengthened, Monthly Re-port, December 2013, pp 44-26.5 See Deutsche Bundesbank, The German economy in the international division of labour: a look at value added flows, Monthly Report, October 2014, pp 27-42; and Deutsche Bundesbank, Structure and dynamics of manu-facturing production depth as reflected in the financial statements of German enterprises, Monthly Report, June 2016, pp 56-58.6 See Deutsche Bundesbank, The impact of the inter-nationalisation of German firms on domestic investment, Monthly Report, January 2018, pp 13-26.
Deutsche Bundesbank Monthly Report
July 2018 59
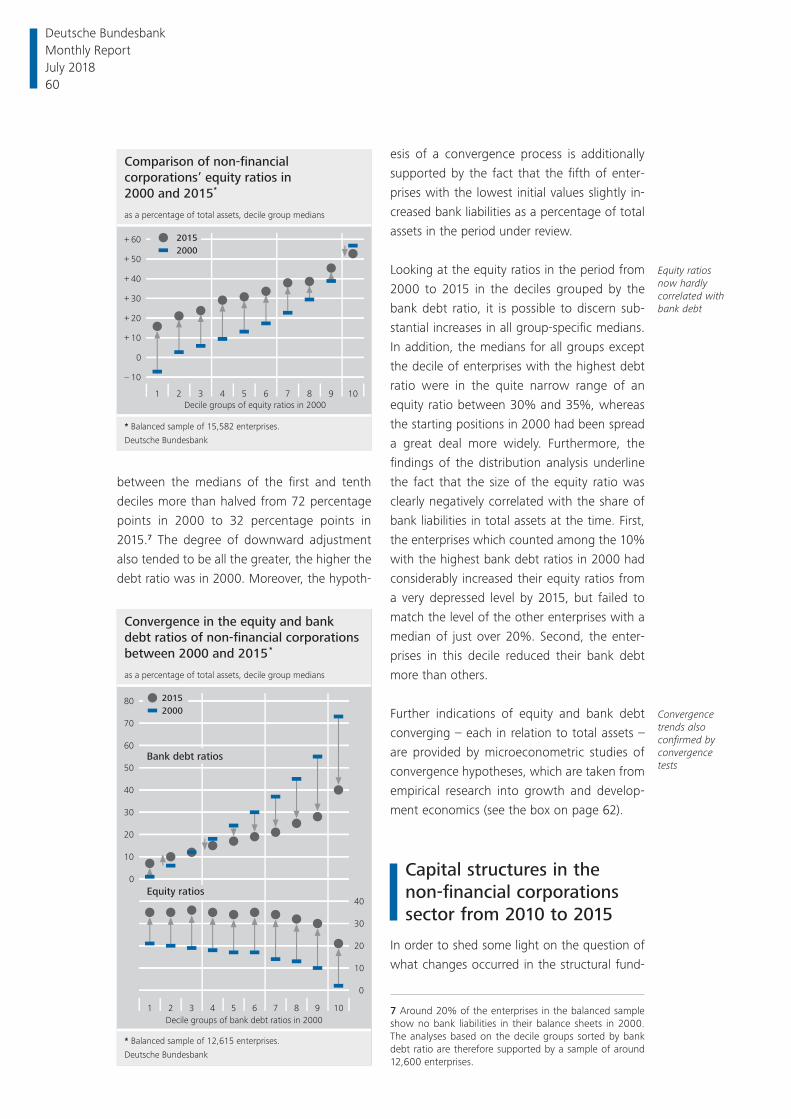
between the medians of the first and tenth
deciles more than halved from 72 percentage
points in 2000 to 32 percentage points in
2015.7 The degree of downward adjustment
also tended to be all the greater, the higher the
debt ratio was in 2000. Moreover, the hypoth-
esis of a convergence process is additionally
supported by the fact that the fifth of enter-
prises with the lowest initial values slightly in-
creased bank liabilities as a percentage of total
assets in the period under review.
Looking at the equity ratios in the period from
2000 to 2015 in the deciles grouped by the
bank debt ratio, it is possible to discern sub-
stantial increases in all group- specific medians.
In addition, the medians for all groups except
the decile of enterprises with the highest debt
ratio were in the quite narrow range of an
equity ratio between 30% and 35%, whereas
the starting positions in 2000 had been spread
a great deal more widely. Furthermore, the
findings of the distribution analysis underline
the fact that the size of the equity ratio was
clearly negatively correlated with the share of
bank liabilities in total assets at the time. First,
the enterprises which counted among the 10%
with the highest bank debt ratios in 2000 had
considerably increased their equity ratios from
a very depressed level by 2015, but failed to
match the level of the other enterprises with a
median of just over 20%. Second, the enter-
prises in this decile reduced their bank debt
more than others.
Further indications of equity and bank debt
converging – each in relation to total assets –
are provided by microeconometric studies of
convergence hypotheses, which are taken from
empirical research into growth and develop-
ment economics (see the box on page 62).
Capital structures in the non-financial corporations sector from 2010 to 2015
In order to shed some light on the question of
what changes occurred in the structural fund-
Equity ratios now hardly correlated with bank debt
Convergence trends also confirmed by convergence tests
Comparison of non-financial
corporations’ equity ratios in
2000 and 2015*
* Balanced sample of 15,582 enterprises.
Deutsche Bundesbank
10
0
10
20
30
40
50
60
–
+
+
+
+
+
+
as a percentage of total assets, decile group medians
Decile groups of equity ratios in 2000
10987654321
2000
2015
Convergence in the equity and bank
debt ratios of non-financial corporations
between 2000 and 2015 *
* Balanced sample of 12,615 enterprises.
Deutsche Bundesbank
0
10
20
30
40
50
60
70
80
as a percentage of total assets, decile group medians
Decile groups of bank debt ratios in 2000
10987654321
Equity ratios
Bank debt ratios
0
10
20
30
40
2000
2015
7 Around 20% of the enterprises in the balanced sample show no bank liabilities in their balance sheets in 2000. The analyses based on the decile groups sorted by bank debt ratio are therefore supported by a sample of around 12,600 enterprises.
Deutsche Bundesbank Monthly Report July 2018 60
ing patterns of German non- financial corpor-
ations once they had recovered from the severe
recession of the final quarter of 2008 and the
first quarter of 2009, we analyse balance sheet
data of a balanced sample of around 39,000
enterprises for which financial statement statis-
tics are available for 2010 and 2015.
The enterprises included in the study account
for more than 40% of the financial statements
used in the extrapolated data in the corporate
financial statement statistics. With regard to
overall turnover, which is recorded for all enter-
prises by the Federal Statistical Office, the com-
piled dataset for 2015 represents a share of
more than 50%. Clearly underrepresented,
above all, are small enterprises at just under
7%, compared with large enterprises at 68%.8
Owing to the high degree of correlation be-
tween the two corporate characteristics, this
also applies, albeit to a lesser extent, to the
coverage of non-affiliated enterprises (34%).
Of the aggregated economic sectors, only con-
struction has a particularly unfavourable cover-
age at just under 24%. On the whole, however,
for an empirical study based on microdata, the
analysis has a relatively comprehensive data-
base.
Equity
The results of the study clearly show that the
non- financial enterprises from the balanced
sample further increased their stocks of equity
capital in the period from 2010 to 2015. Ac-
cording to the median values, the equity ratio
rose during the observation period by more
than 5 percentage points from 24.2% to 29.4%
of total assets (see the table on page 64). By
contrast, based on the arithmetic mean,9 there
was only a minor increase from 31.9% to
32.4%. This shows that large enterprises have,
in the past few years, been significantly more
restrained in increasing their liabilities by raising
new funds, while some enterprises have even
reduced their liabilities.10
A size- category- specific analysis of movements
in equity ratios confirms this finding. In the five
years up to 2015, small enterprises increased
their equity capital based on the median from
21.7% to 28.3% of total assets, ie by more
than 6.5 percentage points. Somewhat less
marked was the increase in liable funds in the
case of medium- sized enterprises, where the
ratio went up from 26.1% to 30.6% during the
period under review. In the case of large enter-
prises, the equity ratio in the median was
boosted by no more than 2.6 percentage
points to 29.8%.
The results thus show that the earlier clear gap
between the equity ratios of small and large
enterprises in the non- financial corporations
sector in Germany has now largely disap-
peared. The group of medium- sized enter-
prises, in fact, currently stands at the top of the
non- financial corporations sector’s equity pyra-
mid.
Such a convergence of equity ratios cannot be
seen in the breakdown of enterprises by legal
form, however. The median equity capital of
corporations saw dynamic growth, rising from
28.0% to 34.2% of total assets. While the li-
able capital of non- corporations also grew over
the five- year observation period, the ratio went
up by no more than 2.1 percentage points,
meaning that – measured by the median –
non- corporations’ equity ratio in 2015, at
17.1%, was exactly half of the figure for corpor-
ations, and that remaining disparities in the en-
Study of the structural finan-cing patterns based on finan-cial statement data from 2010 and 2015, …
… which account for more than 50% of the total turnover of all enterprises
Distinct increase in median values of equity ratio between 2010 and 2015 …
… especially in the case of small enterprises, …
… as a result of which the gap in equity financing to larger enter-prises has virtually disappeared
Still major dis-parities between the equity bases of corporations and non- corporations …
8 Enterprises are grouped into size categories based on their turnover. In line with the classification recommended by the EU, small enterprises have a turnover of below €10 million, medium- sized enterprises have a turnover of be-tween €10 million and below €50 million, and large enter-prises have a turnover of €50 million and more.9 In this report, the term “arithmetic mean” always refers to the arithmetic mean weighted by total assets, which takes account of the differing sizes of enterprise; at the same time, the ratios are in relation to total assets.10 While the extrapolated results of the Bundesbank’s fi-nancial statement statistics are generally presented as weighted arithmetic means, this particular study chiefly uses (unweighted) median values. These are much less prone to outliers and are not determined by the recognis-able size effects in the cross- sections, which represents a greater robustness in statistical terms.
Deutsche Bundesbank Monthly Report
July 2018 61
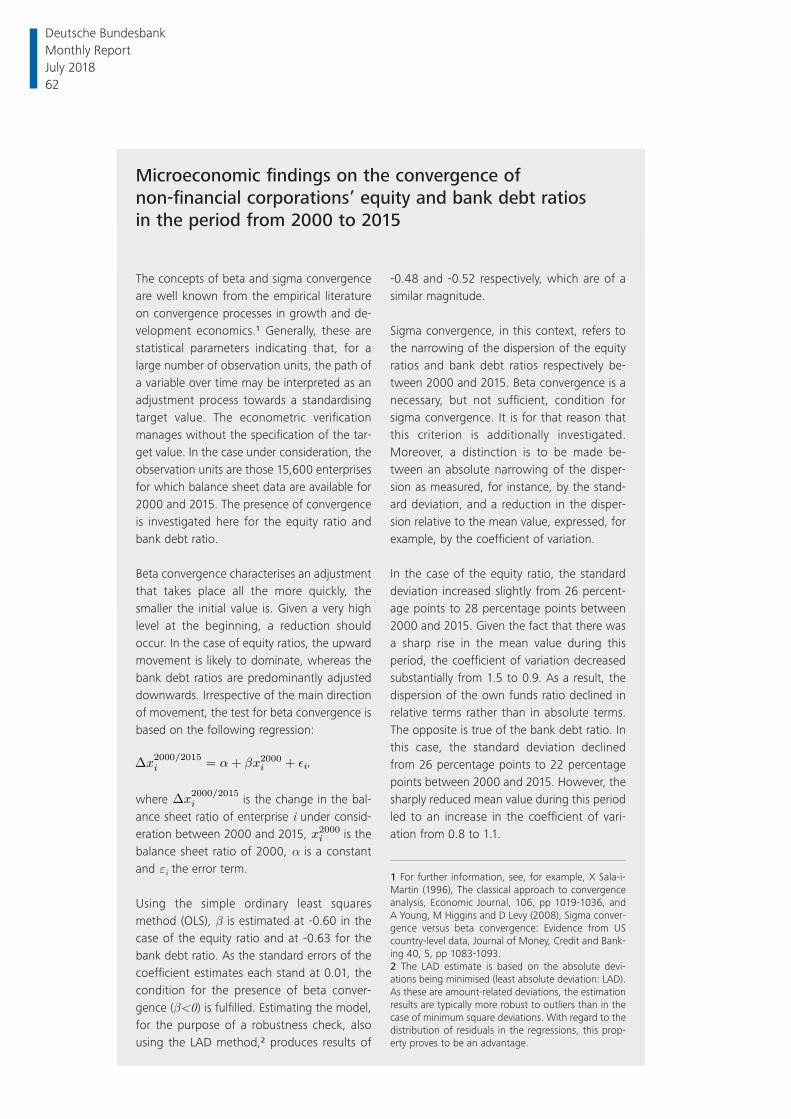
Microeconomic fi ndings on the convergence of non-fi nancial corporations’ equity and bank debt ratios in the period from 2000 to 2015
The concepts of beta and sigma convergence are well known from the empirical literature on convergence processes in growth and de-velopment economics.1 Generally, these are statistical parameters indicating that, for a large number of observation units, the path of a variable over time may be interpreted as an adjustment process towards a standardising target value. The econometric verifi cation manages without the specifi cation of the tar-get value. In the case under consideration, the observation units are those 15,600 enterprises for which balance sheet data are available for 2000 and 2015. The presence of convergence is investigated here for the equity ratio and bank debt ratio.
Beta convergence characterises an adjustment that takes place all the more quickly, the smaller the initial value is. Given a very high level at the beginning, a reduction should occur. In the case of equity ratios, the upward movement is likely to dominate, whereas the bank debt ratios are predominantly adjusted downwards. Irrespective of the main direction of movement, the test for beta convergence is based on the following regression:
x2000/2015i = ↵+ βx2000
i + ✏i,
where x2000/2015i is the change in the bal-
ance sheet ratio of enterprise i under consid-eration between 2000 and 2015, x2000
i is the balance sheet ratio of 2000, α is a constant and εi the error term.
Using the simple ordinary least squares method (OLS), β is estimated at -0.60 in the case of the equity ratio and at -0.63 for the bank debt ratio. As the standard errors of the coeffi cient estimates each stand at 0.01, the condition for the presence of beta conver-gence (β<0) is fulfi lled. Estimating the model, for the purpose of a robustness check, also using the LAD method,2 produces results of
-0.48 and -0.52 respectively, which are of a similar magnitude.
Sigma convergence, in this context, refers to the narrowing of the dispersion of the equity ratios and bank debt ratios respectively be-tween 2000 and 2015. Beta convergence is a necessary, but not suffi cient, condition for sigma convergence. It is for that reason that this criterion is additionally investigated. Moreover, a distinction is to be made be-tween an absolute narrowing of the disper-sion as measured, for instance, by the stand-ard deviation, and a reduction in the disper-sion relative to the mean value, expressed, for example, by the coeffi cient of variation.
In the case of the equity ratio, the standard deviation increased slightly from 26 percent-age points to 28 percentage points between 2000 and 2015. Given the fact that there was a sharp rise in the mean value during this period, the coeffi cient of variation decreased substantially from 1.5 to 0.9. As a result, the dispersion of the own funds ratio declined in relative terms rather than in absolute terms. The opposite is true of the bank debt ratio. In this case, the standard deviation declined from 26 percentage points to 22 percentage points between 2000 and 2015. However, the sharply reduced mean value during this period led to an increase in the coeffi cient of vari-ation from 0.8 to 1.1.
1 For further information, see, for example, X Sala- i- Martin (1996), The classical approach to convergence analysis, Economic Journal, 106, pp 1019-1036, and A Young, M Higgins and D Levy (2008), Sigma conver-gence versus beta convergence: Evidence from US country- level data, Journal of Money, Credit and Bank-ing 40, 5, pp 1083-1093.2 The LAD estimate is based on the absolute devi-ations being minimised (least absolute deviation: LAD). As these are amount- related deviations, the estimation results are typically more robust to outliers than in the case of minimum square deviations. With regard to the distribution of residuals in the regressions, this prop-erty proves to be an advantage.
Deutsche Bundesbank Monthly Report July 2018 62
terprises’ equity bases in fact became even
larger.
Differing statutory liability rules are a key factor
affecting persistent legal form- specific differ-
ences in the provision of enterprises with own
funds. Whereas only the equity capital and any
additional collateral provided can be drawn on
in the event of a corporation’s bankruptcy, in
the case of non- corporations, the company
owner’s liability is unlimited and includes all
personal assets. The equity holdings in the bal-
ance sheet therefore lose their importance as
the sole measure of the amount of liable cap-
ital as well as for the acquisition of funds.11
The results also suggest that enterprises which
are structured as group enterprises in an eco-
nomic and organisational sense normally have
a lower equity base than those that are not af-
filiated with a group, although it was possible
to derive this enterprise characteristic in the
present study only indirectly from the existing
balance sheet data.12 In groups, funds are often
obtained centrally through the parent com-
pany, a holding company or a special financing
company. In this way, the management of
intra- group financing needs is optimised and
the financial autonomy of groups vis- à- vis
banks is strengthened.13 According to the re-
sults obtained from the present study, non-
affiliated enterprises saw relatively large in-
creases in their equity ratios in the observation
period; in the median, they rose relatively
sharply from a comparatively low level of
22.7% to 30.3%. The level and dynamics of
capitalisation at affiliated enterprises, on the
other hand, were significantly lower, with the
ratio only rising from 24.8% to 28.9%.
The trend towards a further increase in equity
and a levelling of the differences in equity ratios
can also be seen if the results are broken down
by economic sector. In the manufacturing sec-
tor, the median values increased from 29.3% to
33.9%; in energy and water, the figure went up
from 28.2% to 35.8%; and there was a similar
development in wholesale and retail trade,
with a rise from 24.6% to 29.6% (with corres-
ponding increases in their mean values). Thus,
equity ratios of just over 30% on average are
now the norm in large segments of the non-
financial sector.
One exception is construction, which tradition-
ally has low equity ratios. The results show that
the liable capital situation in this sector, which
has been strained for many years, saw a further
marked improvement during the observation
period, which is evidently due to the rebound
in construction activity since 2010 and resulting
growth in profitability. Over the five years ob-
served, the increase in equity ratios was rela-
tively clear, with the median climbing from
14.0% to 18.4%. However, this means that
they are still just over one- third below the com-
parable figures of the other sectors.14 The weak
capitalisation of the construction industry is
partly related to its operational structure, as
most construction firms are owner- operated
small and medium- sized enterprises with the
legal form of non- corporations,15 and hence
they generally hold less equity capital for liabil-
ity purposes.16 Furthermore, statistically, ad-
vance payments are usually fairly high in the
… due to differ-ent liability rules
Lower equity bases in the case of group enterprises given ability to obtain funds centrally within group
Structural analysis confirms the increase in equity capital in large seg-ments of the non- financial corporate sector, …
… with equity ratios in the construction sector still just over one- third below those of other sectors
11 See Deutsche Bundesbank, Verhältniszahlen aus Jahres-abschlüssen deutscher Unternehmen von 2014 bis 2015, Special Statistical Publication 6, May 2018, p 6.12 Enterprises are classified as affiliated with a group if data are reported for at least one of the asset or liability items relating to participating interests or affiliated com-panies.13 See H Friderichs, Unternehmensanalyse im Zeichen zu-nehmender Internationalisierung der deutschen Wirtschaft, Wirtschaftsdienst, Vol 94, No 11, November 2014, pp 11ff.14 The results for the services sector buck the trend some-what, as the median values here indicate a strong increase from just 21.5% to 26.1%, while the arithmetic means even suggest a decline from 38.2% to 36.2%, with the latter very clearly reflecting particular developments in the case of large enterprises.15 In 2011, just over two- thirds of all operations in the construction sector were registered as a sole proprietor-ships. See Federal Institute for Research on Building, Urban Affairs and Spatial Development, Konsequenzen veränder-ter Finanzierungsbedingungen für die Bauwirtschaft, Bonn, 2016, p 15.16 According to the extrapolated data from the corporate financial statement statistics, non- corporations in the con-struction sector recorded an equity ratio of just under 11% in 2015, while the equity capital of corporations as a per-centage of total assets was almost twice as high.
Deutsche Bundesbank Monthly Report
July 2018 63
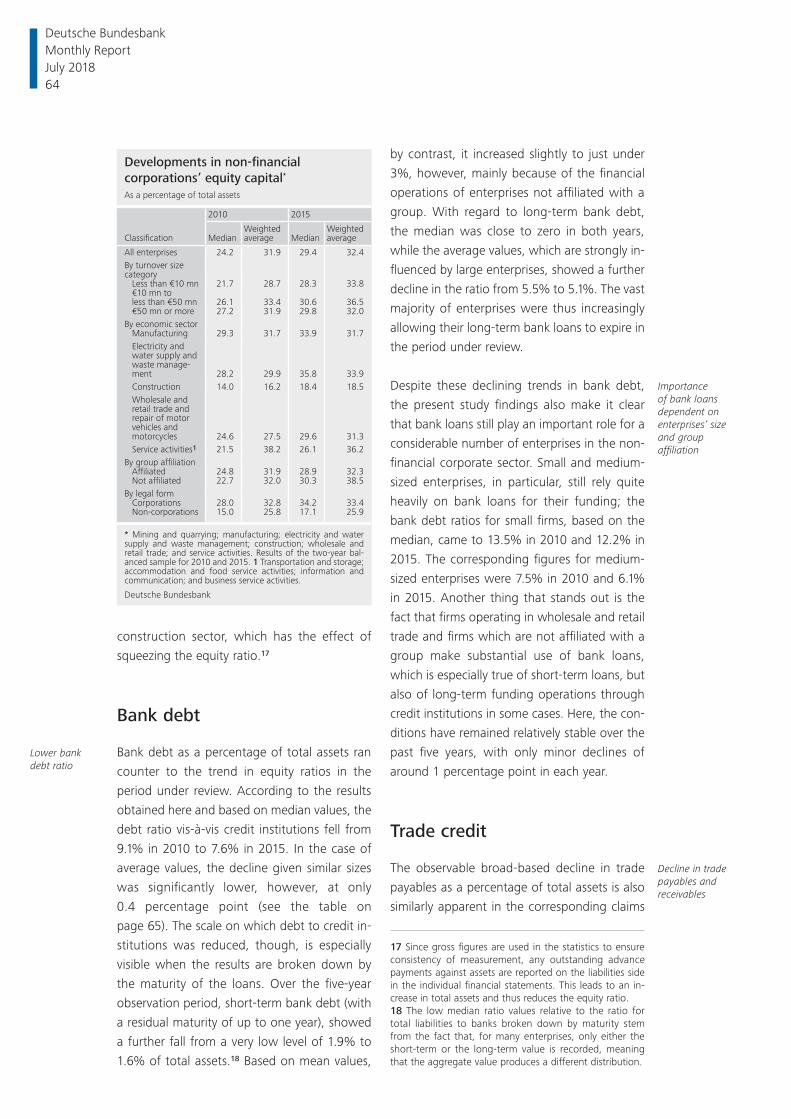
construction sector, which has the effect of
squeezing the equity ratio.17
Bank debt
Bank debt as a percentage of total assets ran
counter to the trend in equity ratios in the
period under review. According to the results
obtained here and based on median values, the
debt ratio vis- à- vis credit institutions fell from
9.1% in 2010 to 7.6% in 2015. In the case of
average values, the decline given similar sizes
was significantly lower, however, at only
0.4 percentage point (see the table on
page 65). The scale on which debt to credit in-
stitutions was reduced, though, is especially
visible when the results are broken down by
the maturity of the loans. Over the five- year
observation period, short- term bank debt (with
a residual maturity of up to one year), showed
a further fall from a very low level of 1.9% to
1.6% of total assets.18 Based on mean values,
by contrast, it increased slightly to just under
3%, however, mainly because of the financial
operations of enterprises not affiliated with a
group. With regard to long- term bank debt,
the median was close to zero in both years,
while the average values, which are strongly in-
fluenced by large enterprises, showed a further
decline in the ratio from 5.5% to 5.1%. The vast
majority of enterprises were thus increasingly
allowing their long- term bank loans to expire in
the period under review.
Despite these declining trends in bank debt,
the present study findings also make it clear
that bank loans still play an important role for a
considerable number of enterprises in the non-
financial corporate sector. Small and medium-
sized enterprises, in particular, still rely quite
heavily on bank loans for their funding; the
bank debt ratios for small firms, based on the
median, came to 13.5% in 2010 and 12.2% in
2015. The corresponding figures for medium-
sized enterprises were 7.5% in 2010 and 6.1%
in 2015. Another thing that stands out is the
fact that firms operating in wholesale and retail
trade and firms which are not affiliated with a
group make substantial use of bank loans,
which is especially true of short- term loans, but
also of long- term funding operations through
credit institutions in some cases. Here, the con-
ditions have remained relatively stable over the
past five years, with only minor declines of
around 1 percentage point in each year.
Trade credit
The observable broad- based decline in trade
payables as a percentage of total assets is also
similarly apparent in the corresponding claims
Lower bank debt ratio
Importance of bank loans dependent on enterprises’ size and group affiliation
Decline in trade payables and receivables
Developments in non-fi nancial corporations’ equity capital*As a percentage of total assets
Classifi cation
2010 2015
MedianWeighted average Median
Weighted average
All enterprises 24.2 31.9 29.4 32.4By turnover size category
Less than €10 mn 21.7 28.7 28.3 33.8€10 mn to less than €50 mn 26.1 33.4 30.6 36.5€50 mn or more 27.2 31.9 29.8 32.0
By economic sectorManufacturing 29.3 31.7 33.9 31.7Electricity and water supply and waste manage-ment 28.2 29.9 35.8 33.9Construction 14.0 16.2 18.4 18.5Wholesale and retail trade and repair of motor vehicles and motorcycles 24.6 27.5 29.6 31.3Service activities1 21.5 38.2 26.1 36.2
By group affi liationAffi liated 24.8 31.9 28.9 32.3Not affi liated 22.7 32.0 30.3 38.5
By legal formCorporations 28.0 32.8 34.2 33.4Non-corporations 15.0 25.8 17.1 25.9
* Mining and quarrying; manufacturing; electricity and water supply and waste management; construction; wholesale and retail trade; and service activities. Results of the two-year bal-anced sample for 2010 and 2015. 1 Transportation and storage; accommodation and food service activities; information and communication; and business service activities.
Deutsche Bundesbank
17 Since gross figures are used in the statistics to ensure consistency of measurement, any outstanding advance payments against assets are reported on the liabilities side in the individual financial statements. This leads to an in-crease in total assets and thus reduces the equity ratio.18 The low median ratio values relative to the ratio for total liabilities to banks broken down by maturity stem from the fact that, for many enterprises, only either the short- term or the long- term value is recorded, meaning that the aggregate value produces a different distribution.
Deutsche Bundesbank Monthly Report July 2018 64
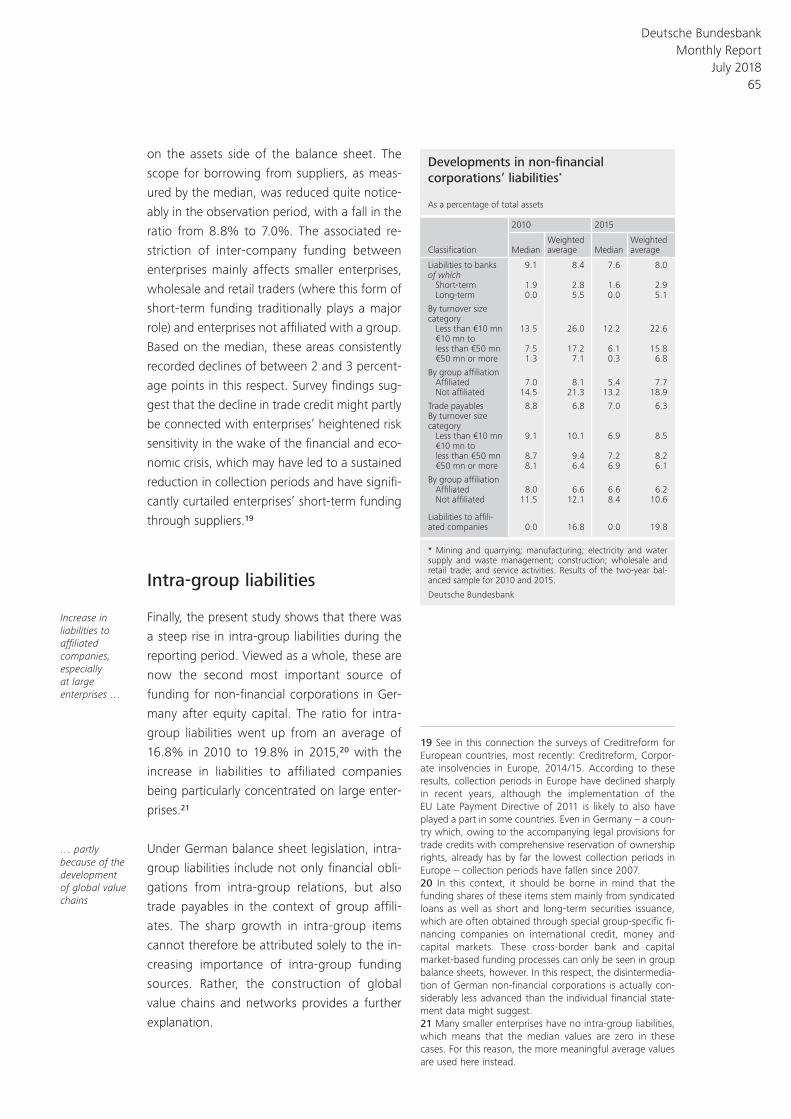
on the assets side of the balance sheet. The
scope for borrowing from suppliers, as meas-
ured by the median, was reduced quite notice-
ably in the observation period, with a fall in the
ratio from 8.8% to 7.0%. The associated re-
striction of inter- company funding between
enterprises mainly affects smaller enterprises,
wholesale and retail traders (where this form of
short- term funding traditionally plays a major
role) and enterprises not affiliated with a group.
Based on the median, these areas consistently
recorded declines of between 2 and 3 percent-
age points in this respect. Survey findings sug-
gest that the decline in trade credit might partly
be connected with enterprises’ heightened risk
sensitivity in the wake of the financial and eco-
nomic crisis, which may have led to a sustained
reduction in collection periods and have signifi-
cantly curtailed enterprises’ short- term funding
through suppliers.19
Intra- group liabilities
Finally, the present study shows that there was
a steep rise in intra- group liabilities during the
reporting period. Viewed as a whole, these are
now the second most important source of
funding for non- financial corporations in Ger-
many after equity capital. The ratio for intra-
group liabilities went up from an average of
16.8% in 2010 to 19.8% in 2015,20 with the
increase in liabilities to affiliated companies
being particularly concentrated on large enter-
prises.21
Under German balance sheet legislation, intra-
group liabilities include not only financial obli-
gations from intra- group relations, but also
trade payables in the context of group affili-
ates. The sharp growth in intra- group items
cannot therefore be attributed solely to the in-
creasing importance of intra- group funding
sources. Rather, the construction of global
value chains and networks provides a further
explanation.
Increase in liabilities to affiliated companies, especially at large enterprises …
… partly because of the development of global value chains
Developments in non-fi nancial corporations’ liabilities*
As a percentage of total assets
Classifi cation
2010 2015
MedianWeighted average Median
Weighted average
Liabilities to banks 9.1 8.4 7.6 8.0of which
Short-term 1.9 2.8 1.6 2.9Long-term 0.0 5.5 0.0 5.1
By turnover size category
Less than €10 mn 13.5 26.0 12.2 22.6€10 mn to less than €50 mn 7.5 17.2 6.1 15.8€50 mn or more 1.3 7.1 0.3 6.8
By group affi liationAffi liated 7.0 8.1 5.4 7.7Not affi liated 14.5 21.3 13.2 18.9
Trade payables 8.8 6.8 7.0 6.3By turnover size category
Less than €10 mn 9.1 10.1 6.9 8.5€10 mn to less than €50 mn 8.7 9.4 7.2 8.2€50 mn or more 8.1 6.4 6.9 6.1
By group affi liationAffi liated 8.0 6.6 6.6 6.2Not affi liated 11.5 12.1 8.4 10.6
Liabilities to affi li-ated companies 0.0 16.8 0.0 19.8
* Mining and quarrying; manufacturing; electricity and water supply and waste management; construction; wholesale and retail trade; and service activities. Results of the two-year bal-anced sample for 2010 and 2015.
Deutsche Bundesbank
19 See in this connection the surveys of Creditreform for European countries, most recently: Creditreform, Corpor-ate insolvencies in Europe, 2014/ 15. According to these results, collection periods in Europe have declined sharply in recent years, although the implementation of the EU Late Payment Directive of 2011 is likely to also have played a part in some countries. Even in Germany – a coun-try which, owing to the accompanying legal provisions for trade credits with comprehensive reservation of ownership rights, already has by far the lowest collection periods in Europe – collection periods have fallen since 2007.20 In this context, it should be borne in mind that the funding shares of these items stem mainly from syndicated loans as well as short and long- term securities issuance, which are often obtained through special group- specific fi-nancing companies on international credit, money and capital markets. These cross- border bank and capital market- based funding processes can only be seen in group balance sheets, however. In this respect, the disintermedia-tion of German non- financial corporations is actually con-siderably less advanced than the individual financial state-ment data might suggest.21 Many smaller enterprises have no intra- group liabilities, which means that the median values are zero in these cases. For this reason, the more meaningful average values are used here instead.
Deutsche Bundesbank Monthly Report
July 2018 65
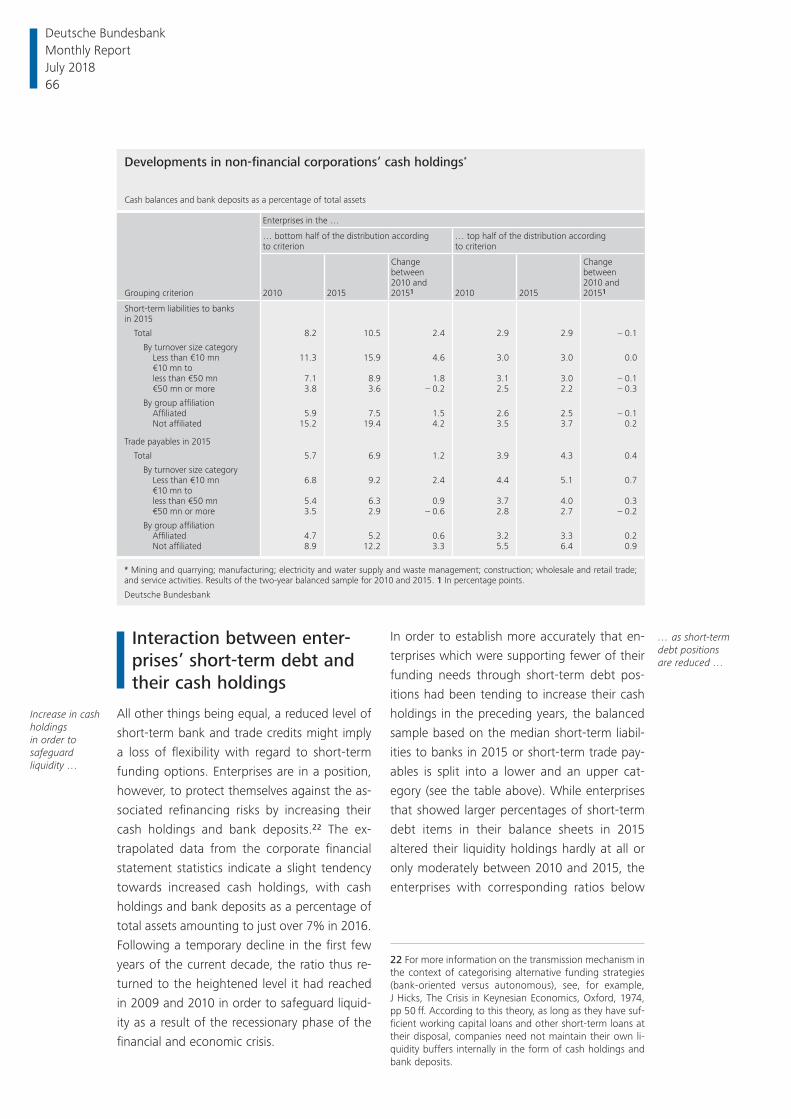
Interaction between enter-prises’ short- term debt and their cash holdings
All other things being equal, a reduced level of
short- term bank and trade credits might imply
a loss of flexibility with regard to short- term
funding options. Enterprises are in a position,
however, to protect themselves against the as-
sociated refinancing risks by increasing their
cash holdings and bank deposits.22 The ex-
trapolated data from the corporate financial
statement statistics indicate a slight tendency
towards increased cash holdings, with cash
holdings and bank deposits as a percentage of
total assets amounting to just over 7% in 2016.
Following a temporary decline in the first few
years of the current decade, the ratio thus re-
turned to the heightened level it had reached
in 2009 and 2010 in order to safeguard liquid-
ity as a result of the recessionary phase of the
financial and economic crisis.
In order to establish more accurately that en-
terprises which were supporting fewer of their
funding needs through short- term debt pos-
itions had been tending to increase their cash
holdings in the preceding years, the balanced
sample based on the median short- term liabil-
ities to banks in 2015 or short- term trade pay-
ables is split into a lower and an upper cat-
egory (see the table above). While enterprises
that showed larger percentages of short- term
debt items in their balance sheets in 2015
altered their liquidity holdings hardly at all or
only moderately between 2010 and 2015, the
enterprises with corresponding ratios below
Increase in cash holdings in order to safeguard liquidity …
… as short- term debt positions are reduced …
Developments in non-fi nancial corporations’ cash holdings*
Cash balances and bank deposits as a percentage of total assets
Grouping criterion
Enterprises in the …
… bottom half of the distribution according to criterion
… top half of the distribution according to criterion
2010 2015
Change between 2010 and 20151 2010 2015
Change between 2010 and 20151
Short-term liabilities to banks in 2015
Total 8.2 10.5 2.4 2.9 2.9 – 0.1
By turnover size categoryLess than €10 mn 11.3 15.9 4.6 3.0 3.0 0.0€10 mn to less than €50 mn 7.1 8.9 1.8 3.1 3.0 – 0.1€50 mn or more 3.8 3.6 – 0.2 2.5 2.2 – 0.3
By group affi liationAffi liated 5.9 7.5 1.5 2.6 2.5 – 0.1Not affi liated 15.2 19.4 4.2 3.5 3.7 0.2
Trade payables in 2015
Total 5.7 6.9 1.2 3.9 4.3 0.4
By turnover size categoryLess than €10 mn 6.8 9.2 2.4 4.4 5.1 0.7€10 mn to less than €50 mn 5.4 6.3 0.9 3.7 4.0 0.3€50 mn or more 3.5 2.9 – 0.6 2.8 2.7 – 0.2
By group affi liationAffi liated 4.7 5.2 0.6 3.2 3.3 0.2Not affi liated 8.9 12.2 3.3 5.5 6.4 0.9
* Mining and quarrying; manufacturing; electricity and water supply and waste management; construction; wholesale and retail trade; and service activities. Results of the two-year balanced sample for 2010 and 2015. 1 In percentage points.
Deutsche Bundesbank
22 For more information on the transmission mechanism in the context of categorising alternative funding strategies (bank- oriented versus autonomous), see, for example, J Hicks, The Crisis in Keynesian Economics, Oxford, 1974, pp 50 ff. According to this theory, as long as they have suf-ficient working capital loans and other short- term loans at their disposal, companies need not maintain their own li-quidity buffers internally in the form of cash holdings and bank deposits.
Deutsche Bundesbank Monthly Report July 2018 66
the median recorded an above- average in-
crease in their cash holdings during this period.
The link between short- term debt positions and
cash holdings is more pronounced in the case of
small and medium- sized enterprises as well as
enterprises not affiliated with a group, as they
have limited options for securing liquidity
through other channels, such as through group
affiliates, when needed. For example, small en-
terprises with lower short- term bank debt
boosted their share of cash holdings and bank
deposits from 11% in 2010 to 16% in 2015, while
medium- sized enterprises increased the size of
their balance sheet holdings of these assets from
7% to 9%. By contrast, large enterprises were
tending in this period to further scale back their
liquidity buffers as a share of total assets from
what was already a lower starting percentage of
the balance sheet. Non- group- affiliated enter-
prises with lower short- term bank debt ratios in
2015 stepped up their cash holdings and bank
deposits between 2010 and 2015 by just over
4 percentage points to almost 20% of total
assets. Even non-group-affiliated enterprises
which had smaller balance sheet holdings of
supplier liabilities showed a marked rise in their
cash ratio during this period.
Summary and conclusions
The funding patterns of non- financial enter-
prises in Germany have changed markedly in
recent years. The sustained improvement in
equity ratios, for example, continued in the
period observed here from 2010 to 2015, with
profit retention likely to have made a substan-
tial contribution in this regard. In addition,
there was a considerable reduction in the dif-
ferences in the extent to which enterprises are
equipped with liable capital depending on firm
size and economic sector. This means that the
idea of a significant equity capital gap between
small and large enterprises, to which many of
the economic problems of small and medium-
sized enterprises were regularly attributed in
the past, is now largely outdated.
On the other hand, there was a marked reduc-
tion in debt, primarily as a result of a decrease
in liabilities to banks, although funding in the
form of bank loans still plays an important role
for a large number of small and medium- sized
enterprises in Germany. The increase in cash
holdings in the balance sheets of enterprises
over the past few years can be explained in the
context of a declining share of trade credit.
Small and medium- sized enterprises as well as
enterprises not affiliated with a group, in par-
ticular, are tending to offset the decline in
funding buffers at banks and suppliers with
higher liquidity provisions of their own. Despite
the opportunity costs, this then affords them
more security and greater flexibility in decision-
making. The renewed growth in cash holdings
over the past few years therefore need not ne-
cessarily be associated with a more or less in-
voluntary reaction to a lack of sufficiently lucra-
tive investment opportunities, but could also
be interpreted as a deliberate decision to miti-
gate risk, at least in the case of enterprises
which are keeping their short- term debt pos-
itions at a comparatively low level.
What particularly stands out is the strong
growth in intra- group liabilities that has come
about as a result of the German economy’s
greater international focus and the establish-
ment of value added processes based on the
division of labour. This balance sheet item
largely reflects funding through syndicated
loans and securities issuance, which is mainly
obtained through special intra- group financing
companies on the international credit, money
and capital markets. In this respect, the actual
deleveraging taking place in Germany’s non-
financial corporate sector would appear, if any-
thing, to be overstated when looking at enter-
prises’ individual financial statements.
All things considered, the adjustments in both
the financing structures and in liquidity- holding
bring considerable advantages for non- financial
corporations’ viability in the face of exogenous
shocks and are likely to help make the German
corporate sector more resilient to crisis.
… especially in the case of small and medium- sized enterprises and non- affiliated enterprises
Convergence of equity bases at a high level
Deleveraging occasionally leads to increased cash holdings
Growing import-ance of intra- group financing companies
Altered funding patterns contrib-ute to enter-prises’ increased resilience to crisis
Deutsche Bundesbank Monthly Report
July 2018 67

Deutsche Bundesbank Monthly Report July 2018 68
Statistical Section
Deutsche Bundesbank Monthly Report
July 2018 1•
Contents
I Key economic data for the euro area
1 Monetary developments and interest rates ................................................................... 5•
2 External transactions and positions ............................................................................... 5•
3 General economic indicators ........................................................................................ 6•
II Overall monetary survey in the euro area
1 The money stock and its counterparts .......................................................................... 8•
2 Consolidated balance sheet of monetary financial institutions (MFIs) ............................ 10•
3 Banking system’s liquidity position ................................................................................ 14•
III Consolidated financial statement of the Eurosystem
1 Assets ........................................................................................................................... 16•
2 Liabilities ...................................................................................................................... 18•
IV Banks
1 Assets and liabilities of monetary financial institutions (excluding the Bundesbank)
in Germany .................................................................................................................. 20•
2 Principal assets and liabilities of banks (MFIs) in Germany, by category of banks ........... 24•
3 Assets and liabilities of banks (MFIs) in Germany vis-à-vis residents ............................... 26•
4 Assets and liabilities of banks (MFIs) in Germany vis-à-vis non-residents ........................ 28•
5 Lending by banks (MFIs) in Germany to domestic non-banks (non-MFIs) ...................... 30•
6 Lending by banks (MFIs) in Germany to domestic enterprises and households, housing
loans, sectors of economic activity ............................................................................... 32•
7 Deposits of domestic non-banks (non-MFIs) at banks (MFIs) in Germany ...................... 34•
8 Deposits of domestic households and non-profit institutions at banks (MFIs) in
Germany ...................................................................................................................... 36•
9 Deposits of domestic government at banks (MFIs) in Germany, by creditor group ......... 36•
10 Savings deposits and bank savings bonds of banks (MFIs) in Germany sold to
non-banks (non-MFIs) ................................................................................................... 38•
11 Debt securities and money market paper outstanding of banks (MFIs) in Germany ....... 38•
12 Building and loan associations (MFIs) in Germany ......................................................... 39•
13 Assets and liabilities of the foreign branches and foreign subsidiaries of
German banks (MFIs) .................................................................................................... 40•
Deutsche Bundesbank Monthly Report July 2018 2•
V Minimum reserves
1 Reserve maintenance in the euro area .......................................................................... 42•
2 Reserve maintenance in Germany ................................................................................. 42•
VI Interest rates
1 ECB interest rates ......................................................................................................... 43•
2 Base rates ..................................................................................................................... 43•
3 Eurosystem monetary policy operations allotted through tenders ................................. 43•
4 Money market rates, by month .................................................................................... 43•
5 Interest rates and volumes for outstanding amounts and new business of
German banks (MFIs) .................................................................................................... 44•
VII Insurance corporations and pension funds
1 Assets ........................................................................................................................... 48•
2 Liabilities ...................................................................................................................... 49•
VIII Capital market
1 Sales and purchases of debt securities and shares in Germany ...................................... 50•
2 Sales of debt securities issued by residents ................................................................... 51•
3 Amounts outstanding of debt securities issued by residents .......................................... 52•
4 Shares in circulation issued by residents ........................................................................ 52•
5 Yields and indices on German securities ....................................................................... 53•
6 Sales and purchases of mutual fund shares in Germany ................................................ 53•
IX Financial accounts
1 Acquisition of financial assets and external financing of non-financial corporations ...... 54•
2 Financial assets and liabilities of non-financial corporations .......................................... 55•
3 Acquisition of financial assets and external financing of households ............................. 56•
4 Financial assets and liabilities of households ................................................................. 57•
X Public finances in Germany
1 General government: deficit/surplus and debt level as defined in the Maastricht Treaty.... 58•
2 General government: revenue, expenditure and deficit/surplus as shown in the
national accounts ......................................................................................................... 58•
3 General government: budgetary development (as per government’s financial statistics) 59•
4 Central, state and local government: budgetary development ...................................... 59•
5 Central, state and local government: tax revenue ......................................................... 60•
Deutsche Bundesbank Monthly Report
July 2018 3•
6 Central and state government and European Union: tax revenue, by type .................... 60•
7 Central, state and local government: individual taxes .................................................... 61•
8 German pension insurance scheme: budgetary development and assets ....................... 61•
9 Federal Employment Agency: budgetary development .................................................. 62•
10 Statutory health insurance scheme: budgetary development......................................... 62•
11 Statutory long-term care insurance scheme: budgetary development ........................... 63•
12 Central government: borrowing in the market .............................................................. 63•
13 General government: debt by creditor .......................................................................... 63•
14 Maastricht debt by category ......................................................................................... 64•
XI Economic conditions in Germany
1 Origin and use of domestic product, distribution of national income ............................ 66•
2 Output in the production sector ................................................................................... 67•
3 Orders received by industry .......................................................................................... 68•
4 Orders received by construction ................................................................................... 69•
5 Retail trade turnover, sales of motor vehicles ................................................................ 69•
6 Labour market .............................................................................................................. 70•
7 Prices ........................................................................................................................... 71•
8 Households’ income ..................................................................................................... 72•
9 Negotiated pay rates (overall economy) ........................................................................ 72•
10 Assets, equity and liabilities of listed non-financial groups ............................................ 73•
11 Revenues and operating income of listed non-financial groups ..................................... 74•
XII External sector
1 Major items of the balance of payments of the euro area ............................................ 75•
2 Major items of the balance of payments of the Federal Republic of Germany ............... 76•
3 Foreign trade (special trade) of the Federal Republic of Germany, by country and
group of countries ........................................................................................................ 77•
4 Services and Primary income of the Federal Republic of Germany ................................. 78•
5 Secondary income of the Federal Republic of Germany ................................................ 78•
6 Capital account of the Federal Republic of Germany ..................................................... 78•
7 Financial account of the Federal Republic of Germany .................................................. 79•
8 External position of the Bundesbank ............................................................................. 80•
9 Assets and liabilities of enterprises in Germany (other than banks) vis-à-vis
non-residents ............................................................................................................... 81•
10 ECB’s euro foreign exchange reference rates of selected currencies .............................. 82•
11 Euro-area member states and irrevocable euro conversion rates in the third stage
of European Economic and Monetary Union ................................................................ 82•
12 Effective exchange rates of the euro and indicators of the German economy’s price
competitiveness ............................................................................................................ 83•
Deutsche Bundesbank Monthly Report July 2018 4•
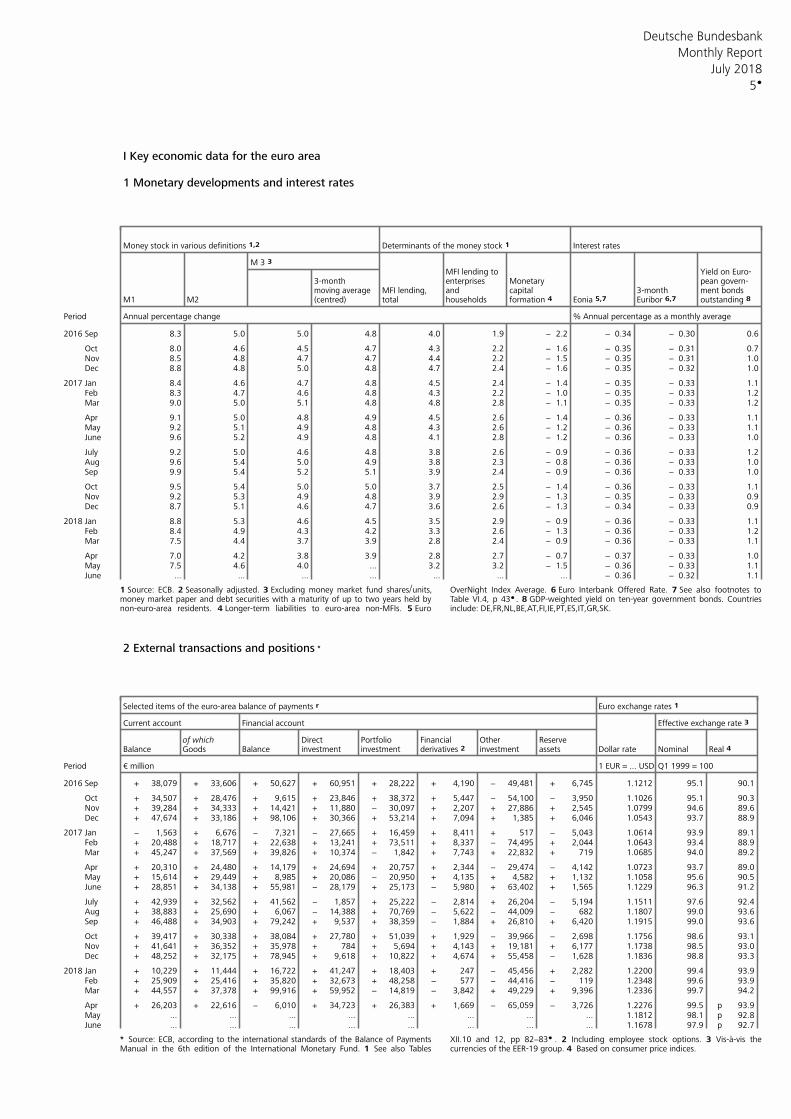
Deutsche Bundesbank
5
Monthly Report
July 2018
I Key economic data for the euro area 1 Monetary developments and interest rates
Money stock in various definitions 1,2 Determinants of the money stock 1 Interest rates
M 3 3 MFI lending to Yield on Euro-
3-month enterprises Monetary pean govern-MFI lending, and capital 3-month ment bondsmoving average
M1 M2 (centred) total households formation 4 Eonia 5,7 Euribor 6,7 outstanding 8
Period Annual percentage change % Annual percentage as a monthly average
2016 Sep 8.3 5.0 5.0 4.8 4.0 1.9 − 2.2 − 0.34 − 0.30 0.6
Oct 8.0 4.6 4.5 4.7 4.3 2.2 − 1.6 − 0.35 − 0.31 0.7 Nov 8.5 4.8 4.7 4.7 4.4 2.2 − 1.5 − 0.35 − 0.31 1.0 Dec 8.8 4.8 5.0 4.8 4.7 2.4 − 1.6 − 0.35 − 0.32 1.0
2017 Jan 8.4 4.6 4.7 4.8 4.5 2.4 − 1.4 − 0.35 − 0.33 1.1 Feb 8.3 4.7 4.6 4.8 4.3 2.2 − 1.0 − 0.35 − 0.33 1.2 Mar 9.0 5.0 5.1 4.8 4.8 2.8 − 1.1 − 0.35 − 0.33 1.2
Apr 9.1 5.0 4.8 4.9 4.5 2.6 − 1.4 − 0.36 − 0.33 1.1 May 9.2 5.1 4.9 4.8 4.3 2.6 − 1.2 − 0.36 − 0.33 1.1 June 9.6 5.2 4.9 4.8 4.1 2.8 − 1.2 − 0.36 − 0.33 1.0
July 9.2 5.0 4.6 4.8 3.8 2.6 − 0.9 − 0.36 − 0.33 1.2 Aug 9.6 5.4 5.0 4.9 3.8 2.3 − 0.8 − 0.36 − 0.33 1.0 Sep 9.9 5.4 5.2 5.1 3.9 2.4 − 0.9 − 0.36 − 0.33 1.0
Oct 9.5 5.4 5.0 5.0 3.7 2.5 − 1.4 − 0.36 − 0.33 1.1 Nov 9.2 5.3 4.9 4.8 3.9 2.9 − 1.3 − 0.35 − 0.33 0.9 Dec 8.7 5.1 4.6 4.7 3.6 2.6 − 1.3 − 0.34 − 0.33 0.9
2018 Jan 8.8 5.3 4.6 4.5 3.5 2.9 − 0.9 − 0.36 − 0.33 1.1 Feb 8.4 4.9 4.3 4.2 3.3 2.6 − 1.3 − 0.36 − 0.33 1.2 Mar 7.5 4.4 3.7 3.9 2.8 2.4 − 0.9 − 0.36 − 0.33 1.1
Apr 7.0 4.2 3.8 3.9 2.8 2.7 − 0.7 − 0.37 − 0.33 1.0 May 7.5 4.6 4.0 ... 3.2 3.2 − 1.5 − 0.36 − 0.33 1.1 June ... ... ... ... ... ... ... − 0.36 − 0.32 1.1
1 Source: ECB. 2 Seasonally adjusted. 3 Excluding money market fund shares/units, OverNight Index Average. 6 Euro Interbank Offered Rate. 7 See also footnotes tomoney market paper and debt securities with a maturity of up to two years held by Table VI.4, p 43 . 8 GDP-weighted yield on ten-year government bonds. Countriesnon-euro-area residents. 4 Longer-term liabilities to euro-area non-MFIs. 5 Euro include: DE,FR,NL,BE,AT,FI,IE,PT,ES,IT,GR,SK.
2 External transactions and positions *
Selected items of the euro-area balance of payments r Euro exchange rates 1
Current account Financial account Effective exchange rate 3
of which Direct Portfolio Financial Other ReserveBalance Goods Balance investment investment investment assets Dollar rate Nominal Real 4 derivatives 2
Period € million Q1 1999 = 1001 EUR = ... USD
2016 Sep + 38,079 + 33,606 + 50,627 + 60,951 + 28,222 + 4,190 − 49,481 + 6,745 1.1212 95.1 90.1
Oct + 34,507 + 28,476 + 9,615 + 23,846 + 38,372 + 5,447 − 54,100 − 3,950 1.1026 95.1 90.3 Nov + 39,284 + 34,333 + 14,421 + 11,880 − 30,097 + 2,207 + 27,886 + 2,545 1.0799 94.6 89.6 Dec + 47,674 + 33,186 + 98,106 + 30,366 + 53,214 + 7,094 + 1,385 + 6,046 1.0543 93.7 88.9
2017 Jan − 1,563 + 6,676 − 7,321 − 27,665 + 16,459 + 8,411 + 517 − 5,043 1.0614 93.9 89.1 Feb + 20,488 + 18,717 + 22,638 + 13,241 + 73,511 + 8,337 − 74,495 + 2,044 1.0643 93.4 88.9 Mar + 45,247 + 37,569 + 39,826 + 10,374 − 1,842 + 7,743 + 22,832 + 719 1.0685 94.0 89.2
Apr + 20,310 + 24,480 + 14,179 + 24,694 + 20,757 + 2,344 − 29,474 − 4,142 1.0723 93.7 89.0 May + 15,614 + 29,449 + 8,985 + 20,086 − 20,950 + 4,135 + 4,582 + 1,132 1.1058 95.6 90.5 June + 28,851 + 34,138 + 55,981 − 28,179 + 25,173 − 5,980 + 63,402 + 1,565 1.1229 96.3 91.2
July + 42,939 + 32,562 + 41,562 − 1,857 + 25,222 − 2,814 + 26,204 − 5,194 1.1511 97.6 92.4 Aug + 38,883 + 25,690 + 6,067 − 14,388 + 70,769 − 5,622 − 44,009 − 682 1.1807 99.0 93.6 Sep + 46,488 + 34,903 + 79,242 + 9,537 + 38,359 − 1,884 + 26,810 + 6,420 1.1915 99.0 93.6
Oct + 39,417 + 30,338 + 38,084 + 27,780 + 51,039 + 1,929 − 39,966 − 2,698 1.1756 98.6 93.1 Nov + 41,641 + 36,352 + 35,978 + 784 + 5,694 + 4,143 + 19,181 + 6,177 1.1738 98.5 93.0 Dec + 48,252 + 32,175 + 78,945 + 9,618 + 10,822 + 4,674 + 55,458 − 1,628 1.1836 98.8 93.3
2018 Jan + 10,229 + 11,444 + 16,722 + 41,247 + 18,403 + 247 − 45,456 + 2,282 1.2200 99.4 93.9 Feb + 25,909 + 25,416 + 35,820 + 32,673 + 48,258 − 577 − 44,416 − 119 1.2348 99.6 93.9 Mar + 44,557 + 37,378 + 99,916 + 59,952 − 14,819 − 3,842 + 49,229 + 9,396 1.2336 99.7 94.2
Apr + 26,203 + 22,616 − 6,010 + 34,723 + 26,383 + 1,669 − 65,059 − 3,726 1.2276 99.5 p 93.9 May ... ... ... ... ... ... ... ... 1.1812 98.1 p 92.8 June ... ... ... ... ... ... ... ... 1.1678 97.9 p 92.7
* Source: ECB, according to the international standards of the Balance of Payments XII.10 and 12, pp 82−83 . 2 Including employee stock options. 3 Vis-à-vis theManual in the 6th edition of the International Monetary Fund. 1 See also Tables currencies of the EER-19 group. 4 Based on consumer price indices.
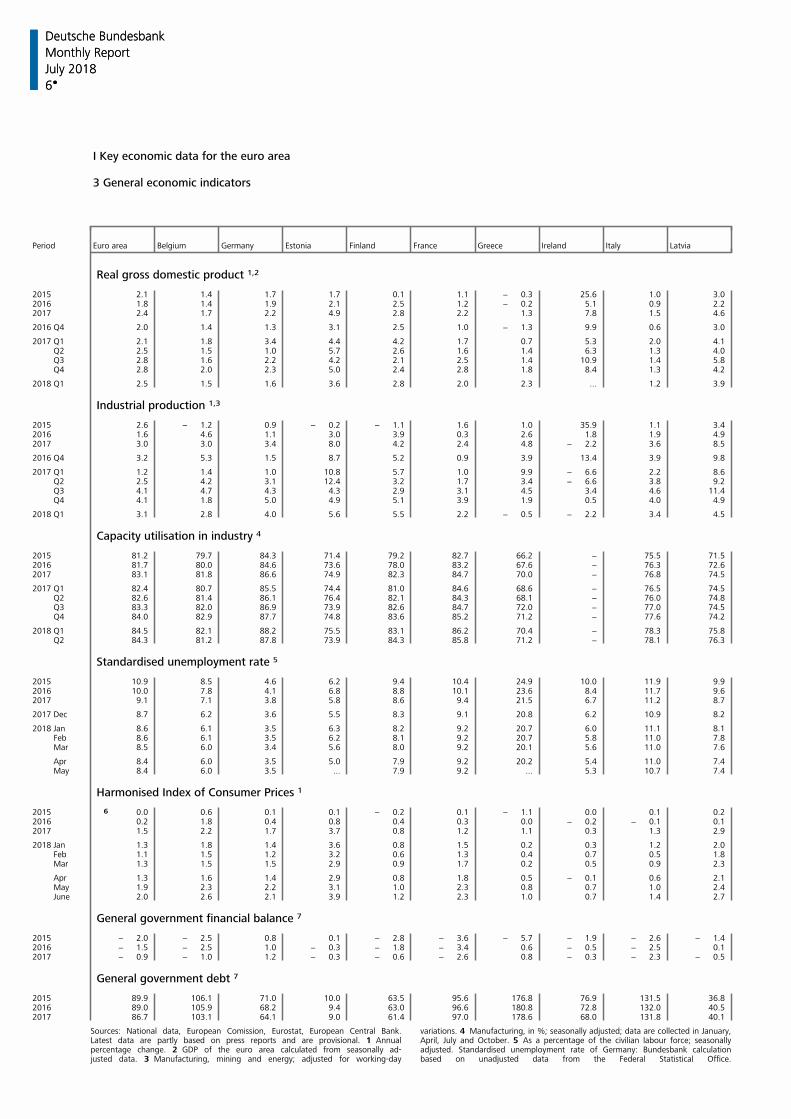
Deutsche Bundesbank
6
Monthly Report
July 2018
I Key economic data for the euro area
3 General economic indicators
Period Euro area Belgium Germany Estonia Finland France Greece Ireland Italy Latvia
Real gross domestic product 1,2
2015 2.1 1.4 1.7 1.7 0.1 1.1 − 0.3 25.6 1.0 3.02016 1.8 1.4 1.9 2.1 2.5 1.2 − 0.2 5.1 0.9 2.22017 2.4 1.7 2.2 4.9 2.8 2.2 1.3 7.8 1.5 4.6
2016 Q4 2.0 1.4 1.3 3.1 2.5 1.0 − 1.3 9.9 0.6 3.0
2017 Q1 2.1 1.8 3.4 4.4 4.2 1.7 0.7 5.3 2.0 4.1 Q2 2.5 1.5 1.0 5.7 2.6 1.6 1.4 6.3 1.3 4.0 Q3 2.8 1.6 2.2 4.2 2.1 2.5 1.4 10.9 1.4 5.8 Q4 2.8 2.0 2.3 5.0 2.4 2.8 1.8 8.4 1.3 4.2
2018 Q1 2.5 1.5 1.6 3.6 2.8 2.0 2.3 ... 1.2 3.9
Industrial production 1,3
2015 2.6 − 1.2 0.9 − 0.2 − 1.1 1.6 1.0 35.9 1.1 3.42016 1.6 4.6 1.1 3.0 3.9 0.3 2.6 1.8 1.9 4.92017 3.0 3.0 3.4 8.0 4.2 2.4 4.8 − 2.2 3.6 8.5
2016 Q4 3.2 5.3 1.5 8.7 5.2 0.9 3.9 13.4 3.9 9.8
2017 Q1 1.2 1.4 1.0 10.8 5.7 1.0 9.9 − 6.6 2.2 8.6 Q2 2.5 4.2 3.1 12.4 3.2 1.7 3.4 − 6.6 3.8 9.2 Q3 4.1 4.7 4.3 4.3 2.9 3.1 4.5 3.4 4.6 11.4 Q4 4.1 1.8 5.0 4.9 5.1 3.9 1.9 0.5 4.0 4.9
2018 Q1 3.1 2.8 4.0 5.6 5.5 2.2 − 0.5 − 2.2 3.4 4.5
Capacity utilisation in industry 4 2015 81.2 79.7 84.3 71.4 79.2 82.7 66.2 − 75.5 71.52016 81.7 80.0 84.6 73.6 78.0 83.2 67.6 − 76.3 72.62017 83.1 81.8 86.6 74.9 82.3 84.7 70.0 − 76.8 74.5
2017 Q1 82.4 80.7 85.5 74.4 81.0 84.6 68.6 − 76.5 74.5 Q2 82.6 81.4 86.1 76.4 82.1 84.3 68.1 − 76.0 74.8 Q3 83.3 82.0 86.9 73.9 82.6 84.7 72.0 − 77.0 74.5 Q4 84.0 82.9 87.7 74.8 83.6 85.2 71.2 − 77.6 74.2
2018 Q1 84.5 82.1 88.2 75.5 83.1 86.2 70.4 − 78.3 75.8 Q2 84.3 81.2 87.8 73.9 84.3 85.8 71.2 − 78.1 76.3
Standardised unemployment rate 5 2015 10.9 8.5 4.6 6.2 9.4 10.4 24.9 10.0 11.9 9.92016 10.0 7.8 4.1 6.8 8.8 10.1 23.6 8.4 11.7 9.62017 9.1 7.1 3.8 5.8 8.6 9.4 21.5 6.7 11.2 8.7
2017 Dec 8.7 6.2 3.6 5.5 8.3 9.1 20.8 6.2 10.9 8.2
2018 Jan 8.6 6.1 3.5 6.3 8.2 9.2 20.7 6.0 11.1 8.1 Feb 8.6 6.1 3.5 6.2 8.1 9.2 20.7 5.8 11.0 7.8 Mar 8.5 6.0 3.4 5.6 8.0 9.2 20.1 5.6 11.0 7.6
Apr 8.4 6.0 3.5 5.0 7.9 9.2 20.2 5.4 11.0 7.4 May 8.4 6.0 3.5 ... 7.9 9.2 ... 5.3 10.7 7.4
Deutsche Bundesbank
6
Monthly Report
July 2018
Harmonised Index of Consumer Prices 1
2015 6 0.0 0.6 0.1 0.1 − 0.2 0.1 − 1.1 0.0 0.1 0.22016 0.2 1.8 0.4 0.8 0.4 0.3 0.0 − 0.2 − 0.1 0.12017 1.5 2.2 1.7 3.7 0.8 1.2 1.1 0.3 1.3 2.9
2018 Jan 1.3 1.8 1.4 3.6 0.8 1.5 0.2 0.3 1.2 2.0 Feb 1.1 1.5 1.2 3.2 0.6 1.3 0.4 0.7 0.5 1.8 Mar 1.3 1.5 1.5 2.9 0.9 1.7 0.2 0.5 0.9 2.3
Apr 1.3 1.6 1.4 2.9 0.8 1.8 0.5 − 0.1 0.6 2.1 May 1.9 2.3 2.2 3.1 1.0 2.3 0.8 0.7 1.0 2.4 June 2.0 2.6 2.1 3.9 1.2 2.3 1.0 0.7 1.4 2.7
General government financial balance 7 2015 − 2.0 − 2.5 0.8 0.1 − 2.8 − 3.6 − 5.7 − 1.9 − 2.6 − 1.42016 − 1.5 − 2.5 1.0 − 0.3 − 1.8 − 3.4 0.6 − 0.5 − 2.5 0.12017 − 0.9 − 1.0 1.2 − 0.3 − 0.6 − 2.6 0.8 − 0.3 − 2.3 − 0.5
General government debt 7 2015 89.9 106.1 71.0 10.0 63.5 95.6 176.8 76.9 131.5 36.82016 89.0 105.9 68.2 9.4 63.0 96.6 180.8 72.8 132.0 40.52017 86.7 103.1 64.1 9.0 61.4 97.0 178.6 68.0 131.8 40.1
Sources: National data, European Comission, Eurostat, European Central Bank. variations. 4 Manufacturing, in %; seasonally adjusted; data are collected in January,Latest data are partly based on press reports and are provisional. 1 Annual April, July and October. 5 As a percentage of the civilian labour force; seasonallypercentage change. 2 GDP of the euro area calculated from seasonally ad- adjusted. Standardised unemployment rate of Germany: Bundesbank calculationjusted data. 3 Manufacturing, mining and energy; adjusted for working-day based on unadjusted data from the Federal Statistical Office.
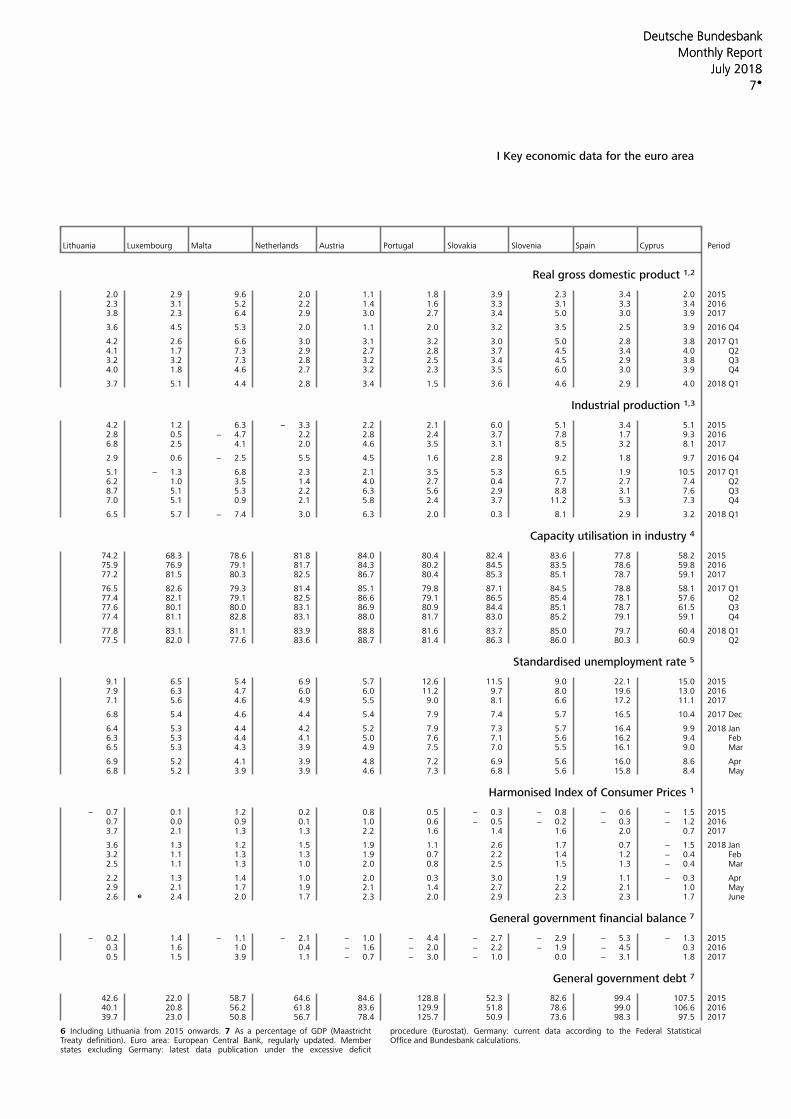
Deutsche Bundesbank
7
Monthly Report
July 2018
I Key economic data for the euro area
Lithuania Luxembourg Malta Netherlands Austria Portugal Slovakia Slovenia Spain Cyprus Period
Real gross domestic product 1,2
2.0 2.9 9.6 2.0 1.1 1.8 3.9 2.3 3.4 2.0 20152.3 3.1 5.2 2.2 1.4 1.6 3.3 3.1 3.3 3.4 20163.8 2.3 6.4 2.9 3.0 2.7 3.4 5.0 3.0 3.9 2017
3.6 4.5 5.3 2.0 1.1 2.0 3.2 3.5 2.5 3.9 2016 Q4
4.2 2.6 6.6 3.0 3.1 3.2 3.0 5.0 2.8 3.8 2017 Q14.1 1.7 7.3 2.9 2.7 2.8 3.7 4.5 3.4 4.0 Q23.2 3.2 7.3 2.8 3.2 2.5 3.4 4.5 2.9 3.8 Q34.0 1.8 4.6 2.7 3.2 2.3 3.5 6.0 3.0 3.9 Q4
3.7 5.1 4.4 2.8 3.4 1.5 3.6 4.6 2.9 4.0 2018 Q1
Industrial production 1,3
4.2 1.2 6.3 − 3.3 2.2 2.1 6.0 5.1 3.4 5.1 20152.8 0.5 − 4.7 2.2 2.8 2.4 3.7 7.8 1.7 9.3 20166.8 2.5 4.1 2.0 4.6 3.5 3.1 8.5 3.2 8.1 2017
2.9 0.6 − 2.5 5.5 4.5 1.6 2.8 9.2 1.8 9.7 2016 Q4
5.1 − 1.3 6.8 2.3 2.1 3.5 5.3 6.5 1.9 10.5 2017 Q16.2 1.0 3.5 1.4 4.0 2.7 0.4 7.7 2.7 7.4 Q28.7 5.1 5.3 2.2 6.3 5.6 2.9 8.8 3.1 7.6 Q37.0 5.1 0.9 2.1 5.8 2.4 3.7 11.2 5.3 7.3 Q4
6.5 5.7 − 7.4 3.0 6.3 2.0 0.3 8.1 2.9 3.2 2018 Q1
Capacity utilisation in industry 4
74.2 68.3 78.6 81.8 84.0 80.4 82.4 83.6 77.8 58.2 201575.9 76.9 79.1 81.7 84.3 80.2 84.5 83.5 78.6 59.8 201677.2 81.5 80.3 82.5 86.7 80.4 85.3 85.1 78.7 59.1 2017
76.5 82.6 79.3 81.4 85.1 79.8 87.1 84.5 78.8 58.1 2017 Q177.4 82.1 79.1 82.5 86.6 79.1 86.5 85.4 78.1 57.6 Q277.6 80.1 80.0 83.1 86.9 80.9 84.4 85.1 78.7 61.5 Q377.4 81.1 82.8 83.1 88.0 81.7 83.0 85.2 79.1 59.1 Q4
77.8 83.1 81.1 83.9 88.8 81.6 83.7 85.0 79.7 60.4 2018 Q177.5 82.0 77.6 83.6 88.7 81.4 86.3 86.0 80.3 60.9 Q2
Standardised unemployment rate 5
9.1 6.5 5.4 6.9 5.7 12.6 11.5 9.0 22.1 15.0 20157.9 6.3 4.7 6.0 6.0 11.2 9.7 8.0 19.6 13.0 20167.1 5.6 4.6 4.9 5.5 9.0 8.1 6.6 17.2 11.1 2017
6.8 5.4 4.6 4.4 5.4 7.9 7.4 5.7 16.5 10.4 2017 Dec
6.4 5.3 4.4 4.2 5.2 7.9 7.3 5.7 16.4 9.9 2018 Jan 6.3 5.3 4.4 4.1 5.0 7.6 7.1 5.6 16.2 9.4 Feb 6.5 5.3 4.3 3.9 4.9 7.5 7.0 5.5 16.1 9.0 Mar
6.9 5.2 4.1 3.9 4.8 7.2 6.9 5.6 16.0 8.6 Apr 6.8 5.2 3.9 3.9 4.6 7.3 6.8 5.6 15.8 8.4 May
Deutsche Bundesbank
7
Monthly Report
July 2018
Harmonised Index of Consumer Prices 1
− 0.7 0.1 1.2 0.2 0.8 0.5 − 0.3 − 0.8 − 0.6 − 1.5 20150.7 0.0 0.9 0.1 1.0 0.6 − 0.5 − 0.2 − 0.3 − 1.2 20163.7 2.1 1.3 1.3 2.2 1.6 1.4 1.6 2.0 0.7 2017
3.6 1.3 1.2 1.5 1.9 1.1 2.6 1.7 0.7 − 1.5 2018 Jan 3.2 1.1 1.3 1.3 1.9 0.7 2.2 1.4 1.2 − 0.4 Feb 2.5 1.1 1.3 1.0 2.0 0.8 2.5 1.5 1.3 − 0.4 Mar
2.2 1.3 1.4 1.0 2.0 0.3 3.0 1.9 1.1 − 0.3 Apr 2.9 2.1 1.7 1.9 2.1 1.4 2.7 2.2 2.1 1.0 May2.6 e 2.4 2.0 1.7 2.3 2.0 2.9 2.3 2.3 1.7 June
General government financial balance 7
− 0.2 1.4 − 1.1 − 2.1 − 1.0 − 4.4 − 2.7 − 2.9 − 5.3 − 1.3 20150.3 1.6 1.0 0.4 − 1.6 − 2.0 − 2.2 − 1.9 − 4.5 0.3 20160.5 1.5 3.9 1.1 − 0.7 − 3.0 − 1.0 0.0 − 3.1 1.8 2017
General government debt 7
42.6 22.0 58.7 64.6 84.6 128.8 52.3 82.6 99.4 107.5 201540.1 20.8 56.2 61.8 83.6 129.9 51.8 78.6 99.0 106.6 201639.7 23.0 50.8 56.7 78.4 125.7 50.9 73.6 98.3 97.5 2017
6 Including Lithuania from 2015 onwards. 7 As a percentage of GDP (Maastricht procedure (Eurostat). Germany: current data according to the Federal StatisticalTreaty definition). Euro area: European Central Bank, regularly updated. Member Office and Bundesbank calculations. states excluding Germany: latest data publication under the excessive deficit
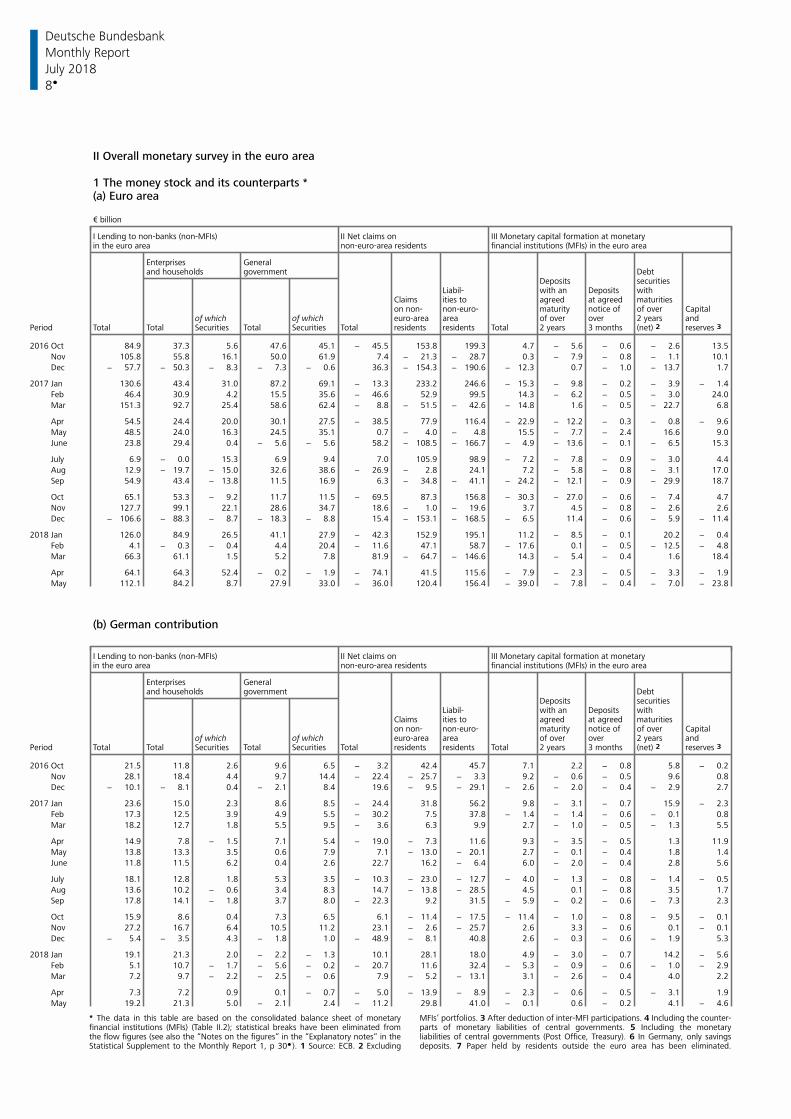
Deutsche Bundesbank
8
Monthly Report
July 2018
II Overall monetary survey in the euro area
1 The money stock and its counterparts *(a) Euro area
€ billion
I Lending to non-banks (non-MFIs) II Net claims on III Monetary capital formation at monetaryin the euro area non-euro-area residents financial institutions (MFIs) in the euro area
Enterprises Generaland households government Debt
Deposits securitiesLiabil- with an Deposits with
Claims ities to agreed at agreed maturitieson non- non-euro- maturity notice of of over Capital
of which of which euro-area area of over over 2 years andPeriod Total Total Total Total residents residents Total 2 years 3 months (net) 2 Securities Securities reserves 3
2016 Oct 84.9 37.3 5.6 47.6 45.1 − 45.5 153.8 199.3 4.7 − 5.6 − 0.6 − 2.6 13.5
Nov 105.8 55.8 16.1 50.0 61.9 7.4 − 21.3 − 28.7 0.3 − 7.9 − 0.8 − 1.1 10.1
Dec − 57.7 − 50.3 − 8.3 − 7.3 − 0.6 36.3 − 154.3 − 190.6 − 12.3 0.7 − 1.0 − 13.7 1.7
2017 Jan 130.6 43.4 31.0 87.2 69.1 − 13.3 233.2 246.6 − 15.3 − 9.8 − 0.2 − 3.9 − 1.4
Feb 46.4 30.9 4.2 15.5 35.6 − 46.6 52.9 99.5 14.3 − 6.2 − 0.5 − 3.0 24.0
Mar 151.3 92.7 25.4 58.6 62.4 − 8.8 − 51.5 − 42.6 − 14.8 1.6 − 0.5 − 22.7 6.8
Apr 54.5 24.4 20.0 30.1 27.5 − 38.5 77.9 116.4 − 22.9 − 12.2 − 0.3 − 0.8 − 9.6
May 48.5 24.0 16.3 24.5 35.1 0.7 − 4.0 − 4.8 15.5 − 7.7 − 2.4 16.6 9.0
June 23.8 29.4 0.4 − 5.6 − 5.6 58.2 − 108.5 − 166.7 − 4.9 − 13.6 − 0.1 − 6.5 15.3
July 6.9 − 0.0 15.3 6.9 9.4 7.0 105.9 98.9 − 7.2 − 7.8 − 0.9 − 3.0 4.4
Aug 12.9 − 19.7 − 15.0 32.6 38.6 − 26.9 − 2.8 24.1 7.2 − 5.8 − 0.8 − 3.1 17.0
Sep 54.9 43.4 − 13.8 11.5 16.9 6.3 − 34.8 − 41.1 − 24.2 − 12.1 − 0.9 − 29.9 18.7
Oct 65.1 53.3 − 9.2 11.7 11.5 − 69.5 87.3 156.8 − 30.3 − 27.0 − 0.6 − 7.4 4.7
Nov 127.7 99.1 22.1 28.6 34.7 18.6 − 1.0 − 19.6 3.7 4.5 − 0.8 − 2.6 2.6
Dec − 106.6 − 88.3 − 8.7 − 18.3 − 8.8 15.4 − 153.1 − 168.5 − 6.5 11.4 − 0.6 − 5.9 − 11.4
2018 Jan 126.0 84.9 26.5 41.1 27.9 − 42.3 152.9 195.1 11.2 − 8.5 − 0.1 20.2 − 0.4
Feb 4.1 − 0.3 − 0.4 4.4 20.4 − 11.6 47.1 58.7 − 17.6 0.1 − 0.5 − 12.5 − 4.8
Mar 66.3 61.1 1.5 5.2 7.8 81.9 − 64.7 − 146.6 14.3 − 5.4 − 0.4 1.6 18.4
Apr 64.1 64.3 52.4 − 0.2 − 1.9 − 74.1 41.5 115.6 − 7.9 − 2.3 − 0.5 − 3.3 − 1.9
May 112.1 84.2 8.7 27.9 33.0 − 36.0 120.4 156.4 − 39.0 − 7.8 − 0.4 − 7.0 − 23.8
(b) German contribution
I Lending to non-banks (non-MFIs) II Net claims on III Monetary capital formation at monetaryin the euro area non-euro-area residents financial institutions (MFIs) in the euro area
Enterprises Generaland households government Debt
Deposits securitiesLiabil- with an Deposits with
Claims ities to agreed at agreed maturitieson non- non-euro- maturity notice of of over Capital
of which of which euro-area area of over over 2 years andPeriod Total Total Total Total residents residents Total 2 years 3 months (net) 2 Securities Securities reserves 3
2016 Oct 21.5 11.8 2.6 9.6 6.5 − 3.2 42.4 45.7 7.1 2.2 − 0.8 5.8 − 0.2
Nov 28.1 18.4 4.4 9.7 14.4 − 22.4 − 25.7 − 3.3 9.2 − 0.6 − 0.5 9.6 0.8
Dec − 10.1 − 8.1 0.4 − 2.1 8.4 19.6 − 9.5 − 29.1 − 2.6 − 2.0 − 0.4 − 2.9 2.7
2017 Jan 23.6 15.0 2.3 8.6 8.5 − 24.4 31.8 56.2 9.8 − 3.1 − 0.7 15.9 − 2.3
Feb 17.3 12.5 3.9 4.9 5.5 − 30.2 7.5 37.8 − 1.4 − 1.4 − 0.6 − 0.1 0.8
Mar 18.2 12.7 1.8 5.5 9.5 − 3.6 6.3 9.9 2.7 − 1.0 − 0.5 − 1.3 5.5
Apr 14.9 7.8 − 1.5 7.1 5.4 − 19.0 − 7.3 11.6 9.3 − 3.5 − 0.5 1.3 11.9
May 13.8 13.3 3.5 0.6 7.9 7.1 − 13.0 − 20.1 2.7 − 0.1 − 0.4 1.8 1.4
June 11.8 11.5 6.2 0.4 2.6 22.7 16.2 − 6.4 6.0 − 2.0 − 0.4 2.8 5.6
July 18.1 12.8 1.8 5.3 3.5 − 10.3 − 23.0 − 12.7 − 4.0 − 1.3 − 0.8 − 1.4 − 0.5
Aug 13.6 10.2 − 0.6 3.4 8.3 14.7 − 13.8 − 28.5 4.5 0.1 − 0.8 3.5 1.7
Sep 17.8 14.1 − 1.8 3.7 8.0 − 22.3 9.2 31.5 − 5.9 − 0.2 − 0.6 − 7.3 2.3
Oct 15.9 8.6 0.4 7.3 6.5 6.1 − 11.4 − 17.5 − 11.4 − 1.0 − 0.8 − 9.5 − 0.1
Nov 27.2 16.7 6.4 10.5 11.2 23.1 − 2.6 − 25.7 2.6 3.3 − 0.6 0.1 − 0.1
Dec − 5.4 − 3.5 4.3 − 1.8 1.0 − 48.9 − 8.1 40.8 2.6 − 0.3 − 0.6 − 1.9 5.3
2018 Jan 19.1 21.3 2.0 − 2.2 − 1.3 10.1 28.1 18.0 4.9 − 3.0 − 0.7 14.2 − 5.6
Feb 5.1 10.7 − 1.7 − 5.6 − 0.2 − 20.7 11.6 32.4 − 5.3 − 0.9 − 0.6 − 1.0 − 2.9
Mar 7.2 9.7 − 2.2 − 2.5 − 0.6 7.9 − 5.2 − 13.1 3.1 − 2.6 − 0.4 4.0 2.2
Apr 7.3 7.2 0.9 0.1 − 0.7 − 5.0 − 13.9 − 8.9 − 2.3 − 0.6 − 0.5 − 3.1 1.9
May 19.2 21.3 5.0 − 2.1 2.4 − 11.2 29.8 41.0 − 0.1 0.6 − 0.2 4.1 − 4.6
* The data in this table are based on the consolidated balance sheet of monetary MFIs’ portfolios. 3 After deduction of inter-MFI participations. 4 Including the counter-financial institutions (MFIs) (Table II.2); statistical breaks have been eliminated from parts of monetary liabilities of central governments. 5 Including the monetarythe flow figures (see also the “Notes on the figures“ in the “Explanatory notes“ in the liabilities of central governments (Post Office, Treasury). 6 In Germany, only savingsStatistical Supplement to the Monthly Report 1, p 30 ). 1 Source: ECB. 2 Excluding deposits. 7 Paper held by residents outside the euro area has been eliminated.
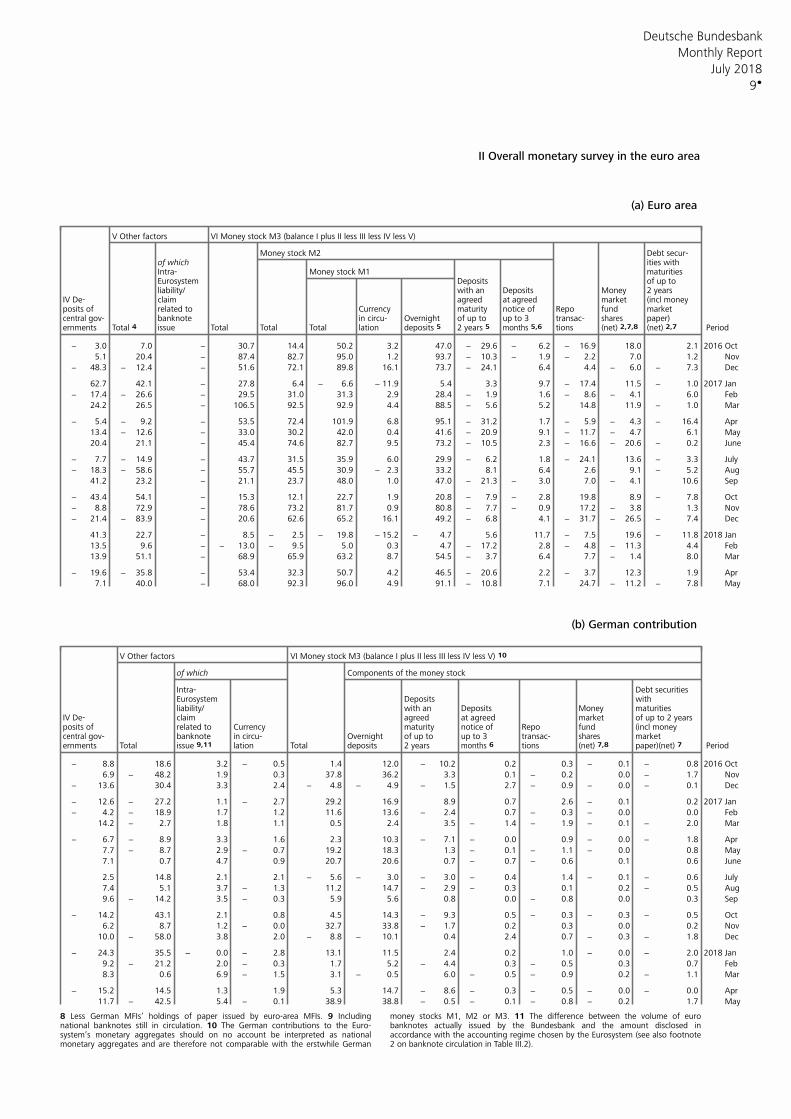
Deutsche Bundesbank
9
Monthly Report
July 2018
II Overall monetary survey in the euro area
(a) Euro area
V Other factors VI Money stock M3 (balance I plus II less III less IV less V)
Money stock M2 Debt secur-of which ities withIntra- Money stock M1 maturitiesEurosystem Deposits of up toliability/ with an Deposits Money 2 years
IV De- claim agreed at agreed market (incl moneyposits of related to Currency maturity notice of Repo fund market
banknote in circu- Overnight of up to up to 3 transac- shares paper) central gov-ernments Total 4 issue Total Total Total lation deposits 5 2 years 5 tions (net) 2,7 Period(net) 2,7,8 months 5,6
− 3.0 7.0 − 30.7 14.4 50.2 3.2 47.0 − 29.6 − 6.2 − 16.9 18.0 2.1 2016 Oct
5.1 20.4 − 87.4 82.7 95.0 1.2 93.7 − 10.3 − 1.9 − 2.2 7.0 1.2 Nov
− 48.3 − 12.4 − 51.6 72.1 89.8 16.1 73.7 − 24.1 6.4 4.4 − 6.0 − 7.3 Dec
62.7 42.1 − 27.8 6.4 − 6.6 − 11.9 5.4 3.3 9.7 − 17.4 11.5 − 1.0 2017 Jan
− 17.4 − 26.6 − 29.5 31.0 31.3 2.9 28.4 − 1.9 1.6 − 8.6 − 4.1 6.0 Feb
24.2 26.5 − 106.5 92.5 92.9 4.4 88.5 − 5.6 5.2 14.8 11.9 − 1.0 Mar
− 5.4 − 9.2 − 53.5 72.4 101.9 6.8 95.1 − 31.2 1.7 − 5.9 − 4.3 − 16.4 Apr
13.4 − 12.6 − 33.0 30.2 42.0 0.4 41.6 − 20.9 9.1 − 11.7 − 4.7 6.1 May
20.4 21.1 − 45.4 74.6 82.7 9.5 73.2 − 10.5 2.3 − 16.6 − 20.6 − 0.2 June
− 7.7 − 14.9 − 43.7 31.5 35.9 6.0 29.9 − 6.2 1.8 − 24.1 13.6 − 3.3 July
− 18.3 − 58.6 − 55.7 45.5 30.9 − 2.3 33.2 8.1 6.4 2.6 9.1 − 5.2 Aug
41.2 23.2 − 21.1 23.7 48.0 1.0 47.0 − 21.3 − 3.0 7.0 − 4.1 10.6 Sep
− 43.4 54.1 − 15.3 12.1 22.7 1.9 20.8 − 7.9 − 2.8 19.8 8.9 − 7.8 Oct
− 8.8 72.9 − 78.6 73.2 81.7 0.9 80.8 − 7.7 − 0.9 17.2 − 3.8 1.3 Nov
− 21.4 − 83.9 − 20.6 62.6 65.2 16.1 49.2 − 6.8 4.1 − 31.7 − 26.5 − 7.4 Dec
41.3 22.7 − 8.5 − 2.5 − 19.8 − 15.2 − 4.7 5.6 11.7 − 7.5 19.6 − 11.8 2018 Jan
13.5 9.6 − − 13.0 − 9.5 5.0 0.3 4.7 − 17.2 2.8 − 4.8 − 11.3 4.4 Feb
13.9 51.1 − 68.9 65.9 63.2 8.7 54.5 − 3.7 6.4 7.7 − 1.4 8.0 Mar
− 19.6 − 35.8 − 53.4 32.3 50.7 4.2 46.5 − 20.6 2.2 − 3.7 12.3 1.9 Apr
7.1 40.0 − 68.0 92.3 96.0 4.9 91.1 − 10.8 7.1 24.7 − 11.2 − 7.8 May
(b) German contribution
V Other factors VI Money stock M3 (balance I plus II less III less IV less V) 10
of which Components of the money stock
Intra- Debt securitiesEurosystem Deposits withliability/ with an Deposits Money maturities
IV De- claim agreed at agreed market of up to 2 yearsposits of related to Currency maturity notice of Repo fund (incl money
banknote in circu- Overnight of up to up to 3 transac- shares market central gov-ernments Total issue 9,11 lation Total deposits 2 years months 6 tions (net) 7,8 paper)(net) 7 Period
− 8.8 18.6 3.2 − 0.5 1.4 12.0 − 10.2 0.2 0.3 − 0.1 − 0.8 2016 Oct
6.9 − 48.2 1.9 0.3 37.8 36.2 3.3 0.1 − 0.2 0.0 − 1.7 Nov
− 13.6 30.4 3.3 2.4 − 4.8 − 4.9 − 1.5 2.7 − 0.9 − 0.0 − 0.1 Dec
− 12.6 − 27.2 1.1 − 2.7 29.2 16.9 8.9 0.7 2.6 − 0.1 0.2 2017 Jan
− 4.2 − 18.9 1.7 1.2 11.6 13.6 − 2.4 0.7 − 0.3 − 0.0 0.0 Feb
14.2 − 2.7 1.8 1.1 0.5 2.4 3.5 − 1.4 − 1.9 − 0.1 − 2.0 Mar
− 6.7 − 8.9 3.3 1.6 2.3 10.3 − 7.1 − 0.0 0.9 − 0.0 − 1.8 Apr
7.7 − 8.7 2.9 − 0.7 19.2 18.3 1.3 − 0.1 − 1.1 − 0.0 0.8 May
7.1 0.7 4.7 0.9 20.7 20.6 0.7 − 0.7 − 0.6 0.1 0.6 June
2.5 14.8 2.1 2.1 − 5.6 − 3.0 − 3.0 − 0.4 1.4 − 0.1 − 0.6 July
7.4 5.1 3.7 − 1.3 11.2 14.7 − 2.9 − 0.3 0.1 0.2 − 0.5 Aug
9.6 − 14.2 3.5 − 0.3 5.9 5.6 0.8 0.0 − 0.8 0.0 0.3 Sep
− 14.2 43.1 2.1 0.8 4.5 14.3 − 9.3 0.5 − 0.3 − 0.3 − 0.5 Oct
6.2 8.7 1.2 − 0.0 32.7 33.8 − 1.7 0.2 0.3 0.0 0.2 Nov
10.0 − 58.0 3.8 2.0 − 8.8 − 10.1 0.4 2.4 0.7 − 0.3 − 1.8 Dec
− 24.3 35.5 − 0.0 − 2.8 13.1 11.5 2.4 0.2 1.0 − 0.0 − 2.0 2018 Jan
9.2 − 21.2 2.0 − 0.3 1.7 5.2 − 4.4 0.3 − 0.5 0.3 0.7 Feb
8.3 0.6 6.9 − 1.5 3.1 − 0.5 6.0 − 0.5 − 0.9 0.2 − 1.1 Mar
− 15.2 14.5 1.3 1.9 5.3 14.7 − 8.6 − 0.3 − 0.5 − 0.0 − 0.0 Apr
11.7 − 42.5 5.4 − 0.1 38.9 38.8 − 0.5 − 0.1 − 0.8 − 0.2 1.7 May
8 Less German MFIs’ holdings of paper issued by euro-area MFIs. 9 Including money stocks M1, M2 or M3. 11 The difference between the volume of euronational banknotes still in circulation. 10 The German contributions to the Euro- banknotes actually issued by the Bundesbank and the amount disclosed insystem’s monetary aggregates should on no account be interpreted as national accordance with the accounting regime chosen by the Eurosystem (see also footnotemonetary aggregates and are therefore not comparable with the erstwhile German 2 on banknote circulation in Table III.2).
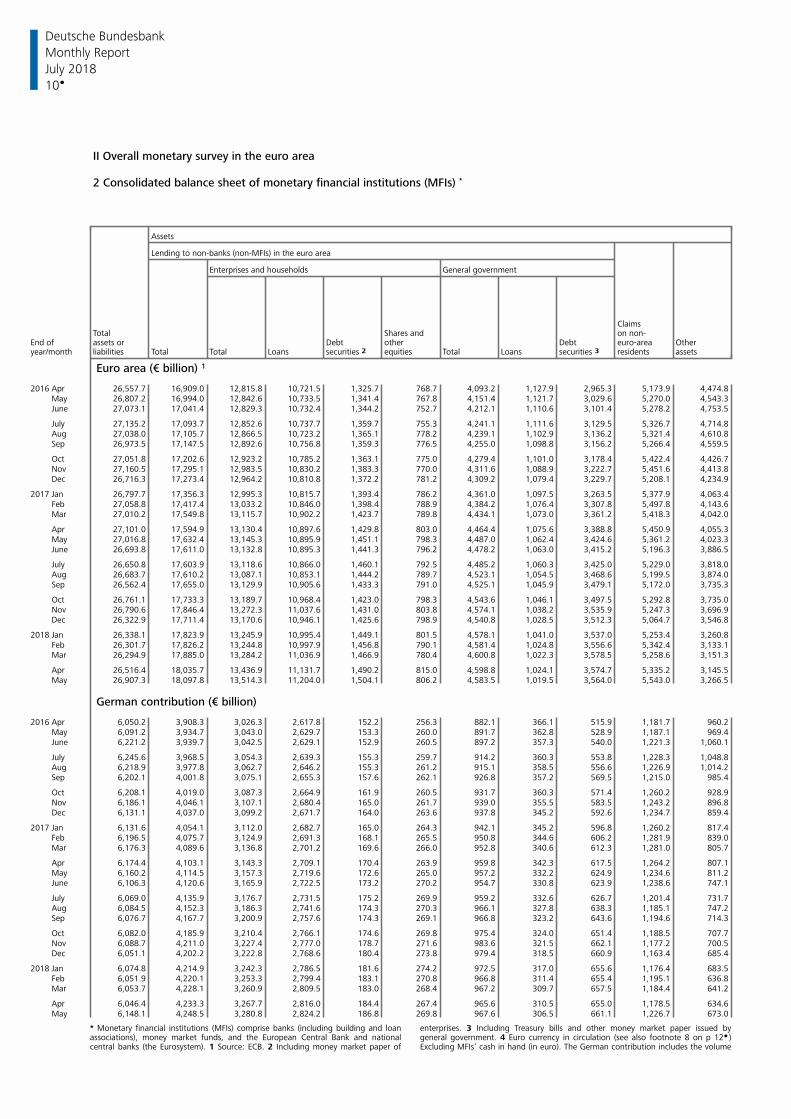
Deutsche Bundesbank
10
Monthly Report
July 2018
II Overall monetary survey in the euro area
2 Consolidated balance sheet of monetary financial institutions (MFIs) *
Assets
Lending to non-banks (non-MFIs) in the euro area
Enterprises and households General government
ClaimsTotal Shares and on non-
End of assets or Debt other Debt euro-area Otheryear/month liabilities Total Total Loans securities 2 equities Total Loans securities 3 residents assets
Euro area (€ billion) 1
2016 Apr 26,557.7 16,909.0 12,815.8 10,721.5 1,325.7 768.7 4,093.2 1,127.9 2,965.3 5,173.9 4,474.8 May 26,807.2 16,994.0 12,842.6 10,733.5 1,341.4 767.8 4,151.4 1,121.7 3,029.6 5,270.0 4,543.3 June 27,073.1 17,041.4 12,829.3 10,732.4 1,344.2 752.7 4,212.1 1,110.6 3,101.4 5,278.2 4,753.5
July 27,135.2 17,093.7 12,852.6 10,737.7 1,359.7 755.3 4,241.1 1,111.6 3,129.5 5,326.7 4,714.8 Aug 27,038.0 17,105.7 12,866.5 10,723.2 1,365.1 778.2 4,239.1 1,102.9 3,136.2 5,321.4 4,610.8 Sep 26,973.5 17,147.5 12,892.6 10,756.8 1,359.3 776.5 4,255.0 1,098.8 3,156.2 5,266.4 4,559.5
Oct 27,051.8 17,202.6 12,923.2 10,785.2 1,363.1 775.0 4,279.4 1,101.0 3,178.4 5,422.4 4,426.7 Nov 27,160.5 17,295.1 12,983.5 10,830.2 1,383.3 770.0 4,311.6 1,088.9 3,222.7 5,451.6 4,413.8 Dec 26,716.3 17,273.4 12,964.2 10,810.8 1,372.2 781.2 4,309.2 1,079.4 3,229.7 5,208.1 4,234.9
2017 Jan 26,797.7 17,356.3 12,995.3 10,815.7 1,393.4 786.2 4,361.0 1,097.5 3,263.5 5,377.9 4,063.4 Feb 27,058.8 17,417.4 13,033.2 10,846.0 1,398.4 788.9 4,384.2 1,076.4 3,307.8 5,497.8 4,143.6 Mar 27,010.2 17,549.8 13,115.7 10,902.2 1,423.7 789.8 4,434.1 1,073.0 3,361.2 5,418.3 4,042.0
Apr 27,101.0 17,594.9 13,130.4 10,897.6 1,429.8 803.0 4,464.4 1,075.6 3,388.8 5,450.9 4,055.3 May 27,016.8 17,632.4 13,145.3 10,895.9 1,451.1 798.3 4,487.0 1,062.4 3,424.6 5,361.2 4,023.3 June 26,693.8 17,611.0 13,132.8 10,895.3 1,441.3 796.2 4,478.2 1,063.0 3,415.2 5,196.3 3,886.5
July 26,650.8 17,603.9 13,118.6 10,866.0 1,460.1 792.5 4,485.2 1,060.3 3,425.0 5,229.0 3,818.0 Aug 26,683.7 17,610.2 13,087.1 10,853.1 1,444.2 789.7 4,523.1 1,054.5 3,468.6 5,199.5 3,874.0 Sep 26,562.4 17,655.0 13,129.9 10,905.6 1,433.3 791.0 4,525.1 1,045.9 3,479.1 5,172.0 3,735.3
Oct 26,761.1 17,733.3 13,189.7 10,968.4 1,423.0 798.3 4,543.6 1,046.1 3,497.5 5,292.8 3,735.0 Nov 26,790.6 17,846.4 13,272.3 11,037.6 1,431.0 803.8 4,574.1 1,038.2 3,535.9 5,247.3 3,696.9 Dec 26,322.9 17,711.4 13,170.6 10,946.1 1,425.6 798.9 4,540.8 1,028.5 3,512.3 5,064.7 3,546.8
2018 Jan 26,338.1 17,823.9 13,245.9 10,995.4 1,449.1 801.5 4,578.1 1,041.0 3,537.0 5,253.4 3,260.8 Feb 26,301.7 17,826.2 13,244.8 10,997.9 1,456.8 790.1 4,581.4 1,024.8 3,556.6 5,342.4 3,133.1 Mar 26,294.9 17,885.0 13,284.2 11,036.9 1,466.9 780.4 4,600.8 1,022.3 3,578.5 5,258.6 3,151.3
Apr 26,516.4 18,035.7 13,436.9 11,131.7 1,490.2 815.0 4,598.8 1,024.1 3,574.7 5,335.2 3,145.5 May 26,907.3 18,097.8 13,514.3 11,204.0 1,504.1 806.2 4,583.5 1,019.5 3,564.0 5,543.0 3,266.5
German contribution (€ billion)
2016 Apr 6,050.2 3,908.3 3,026.3 2,617.8 152.2 256.3 882.1 366.1 515.9 1,181.7 960.2 May 6,091.2 3,934.7 3,043.0 2,629.7 153.3 260.0 891.7 362.8 528.9 1,187.1 969.4 June 6,221.2 3,939.7 3,042.5 2,629.1 152.9 260.5 897.2 357.3 540.0 1,221.3 1,060.1
July 6,245.6 3,968.5 3,054.3 2,639.3 155.3 259.7 914.2 360.3 553.8 1,228.3 1,048.8 Aug 6,218.9 3,977.8 3,062.7 2,646.2 155.3 261.2 915.1 358.5 556.6 1,226.9 1,014.2 Sep 6,202.1 4,001.8 3,075.1 2,655.3 157.6 262.1 926.8 357.2 569.5 1,215.0 985.4
Oct 6,208.1 4,019.0 3,087.3 2,664.9 161.9 260.5 931.7 360.3 571.4 1,260.2 928.9 Nov 6,186.1 4,046.1 3,107.1 2,680.4 165.0 261.7 939.0 355.5 583.5 1,243.2 896.8 Dec 6,131.1 4,037.0 3,099.2 2,671.7 164.0 263.6 937.8 345.2 592.6 1,234.7 859.4
2017 Jan 6,131.6 4,054.1 3,112.0 2,682.7 165.0 264.3 942.1 345.2 596.8 1,260.2 817.4 Feb 6,196.5 4,075.7 3,124.9 2,691.3 168.1 265.5 950.8 344.6 606.2 1,281.9 839.0 Mar 6,176.3 4,089.6 3,136.8 2,701.2 169.6 266.0 952.8 340.6 612.3 1,281.0 805.7
Apr 6,174.4 4,103.1 3,143.3 2,709.1 170.4 263.9 959.8 342.3 617.5 1,264.2 807.1 May 6,160.2 4,114.5 3,157.3 2,719.6 172.6 265.0 957.2 332.2 624.9 1,234.6 811.2 June 6,106.3 4,120.6 3,165.9 2,722.5 173.2 270.2 954.7 330.8 623.9 1,238.6 747.1
July 6,069.0 4,135.9 3,176.7 2,731.5 175.2 269.9 959.2 332.6 626.7 1,201.4 731.7 Aug 6,084.5 4,152.3 3,186.3 2,741.6 174.3 270.3 966.1 327.8 638.3 1,185.1 747.2 Sep 6,076.7 4,167.7 3,200.9 2,757.6 174.3 269.1 966.8 323.2 643.6 1,194.6 714.3
Oct 6,082.0 4,185.9 3,210.4 2,766.1 174.6 269.8 975.4 324.0 651.4 1,188.5 707.7 Nov 6,088.7 4,211.0 3,227.4 2,777.0 178.7 271.6 983.6 321.5 662.1 1,177.2 700.5 Dec 6,051.1 4,202.2 3,222.8 2,768.6 180.4 273.8 979.4 318.5 660.9 1,163.4 685.4
2018 Jan 6,074.8 4,214.9 3,242.3 2,786.5 181.6 274.2 972.5 317.0 655.6 1,176.4 683.5 Feb 6,051.9 4,220.1 3,253.3 2,799.4 183.1 270.8 966.8 311.4 655.4 1,195.1 636.8 Mar 6,053.7 4,228.1 3,260.9 2,809.5 183.0 268.4 967.2 309.7 657.5 1,184.4 641.2
Apr 6,046.4 4,233.3 3,267.7 2,816.0 184.4 267.4 965.6 310.5 655.0 1,178.5 634.6 May 6,148.1 4,248.5 3,280.8 2,824.2 186.8 269.8 967.6 306.5 661.1 1,226.7 673.0
* Monetary financial institutions (MFIs) comprise banks (including building and loan enterprises. 3 Including Treasury bills and other money market paper issued byassociations), money market funds, and the European Central Bank and national general government. 4 Euro currency in circulation (see also footnote 8 on p 12 )central banks (the Eurosystem). 1 Source: ECB. 2 Including money market paper of Excluding MFIs‘ cash in hand (in euro). The German contribution includes the volume
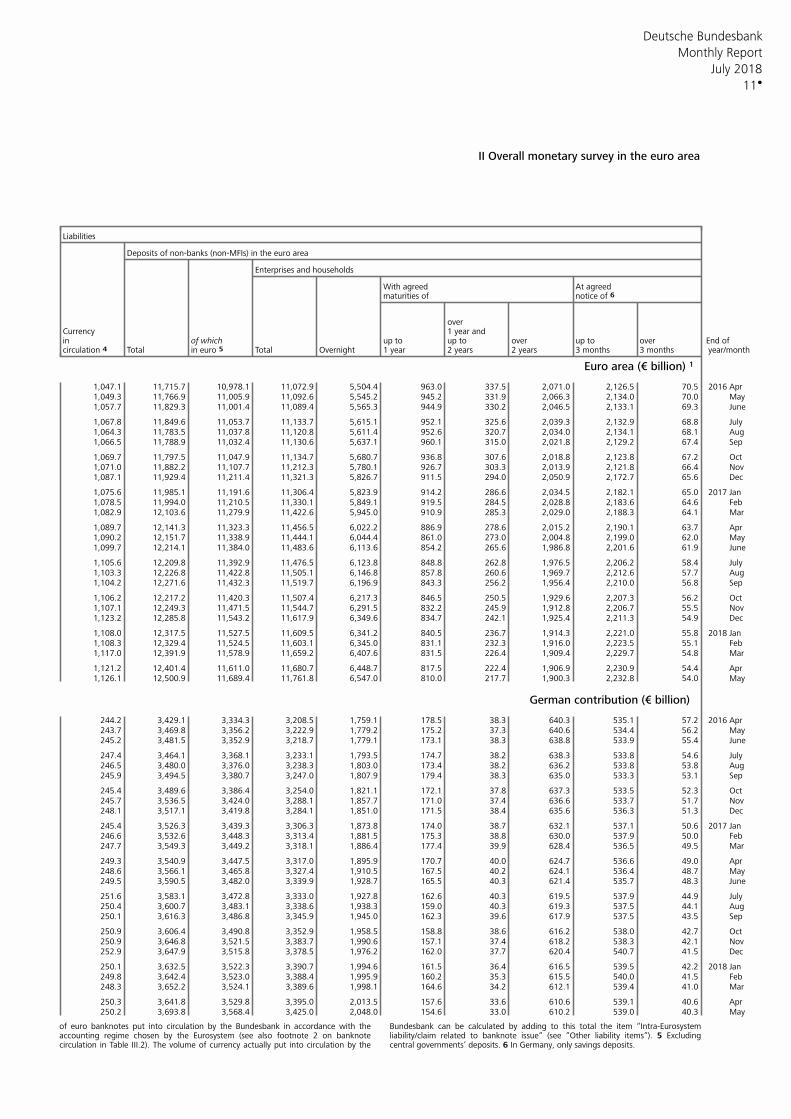
Deutsche Bundesbank
11
Monthly Report
July 2018
II Overall monetary survey in the euro area
Liabilities
Deposits of non-banks (non-MFIs) in the euro area
Enterprises and households
With agreed At agreedmaturities of notice of 6
overCurrency 1 year andin of which up to up to over up to over End of
Total in euro 5 Total Overnight 1 year 2 years 2 years 3 months 3 months year/monthcirculation 4
Euro area (€ billion) 1
1,047.1 11,715.7 10,978.1 11,072.9 5,504.4 963.0 337.5 2,071.0 2,126.5 70.5 2016 Apr 1,049.3 11,766.9 11,005.9 11,092.6 5,545.2 945.2 331.9 2,066.3 2,134.0 70.0 May1,057.7 11,829.3 11,001.4 11,089.4 5,565.3 944.9 330.2 2,046.5 2,133.1 69.3 June
1,067.8 11,849.6 11,053.7 11,133.7 5,615.1 952.1 325.6 2,039.3 2,132.9 68.8 July1,064.3 11,783.5 11,037.8 11,120.8 5,611.4 952.6 320.7 2,034.0 2,134.1 68.1 Aug 1,066.5 11,788.9 11,032.4 11,130.6 5,637.1 960.1 315.0 2,021.8 2,129.2 67.4 Sep
1,069.7 11,797.5 11,047.9 11,134.7 5,680.7 936.8 307.6 2,018.8 2,123.8 67.2 Oct 1,071.0 11,882.2 11,107.7 11,212.3 5,780.1 926.7 303.3 2,013.9 2,121.8 66.4 Nov 1,087.1 11,929.4 11,211.4 11,321.3 5,826.7 911.5 294.0 2,050.9 2,172.7 65.6 Dec
1,075.6 11,985.1 11,191.6 11,306.4 5,823.9 914.2 286.6 2,034.5 2,182.1 65.0 2017 Jan 1,078.5 11,994.0 11,210.5 11,330.1 5,849.1 919.5 284.5 2,028.8 2,183.6 64.6 Feb 1,082.9 12,103.6 11,279.9 11,422.6 5,945.0 910.9 285.3 2,029.0 2,188.3 64.1 Mar
1,089.7 12,141.3 11,323.3 11,456.5 6,022.2 886.9 278.6 2,015.2 2,190.1 63.7 Apr 1,090.2 12,151.7 11,338.9 11,444.1 6,044.4 861.0 273.0 2,004.8 2,199.0 62.0 May1,099.7 12,214.1 11,384.0 11,483.6 6,113.6 854.2 265.6 1,986.8 2,201.6 61.9 June
1,105.6 12,209.8 11,392.9 11,476.5 6,123.8 848.8 262.8 1,976.5 2,206.2 58.4 July1,103.3 12,226.8 11,422.8 11,505.1 6,146.8 857.8 260.6 1,969.7 2,212.6 57.7 Aug 1,104.2 12,271.6 11,432.3 11,519.7 6,196.9 843.3 256.2 1,956.4 2,210.0 56.8 Sep
1,106.2 12,217.2 11,420.3 11,507.4 6,217.3 846.5 250.5 1,929.6 2,207.3 56.2 Oct 1,107.1 12,249.3 11,471.5 11,544.7 6,291.5 832.2 245.9 1,912.8 2,206.7 55.5 Nov 1,123.2 12,285.8 11,543.2 11,617.9 6,349.6 834.7 242.1 1,925.4 2,211.3 54.9 Dec
1,108.0 12,317.5 11,527.5 11,609.5 6,341.2 840.5 236.7 1,914.3 2,221.0 55.8 2018 Jan 1,108.3 12,329.4 11,524.5 11,603.1 6,345.0 831.1 232.3 1,916.0 2,223.5 55.1 Feb 1,117.0 12,391.9 11,578.9 11,659.2 6,407.6 831.5 226.4 1,909.4 2,229.7 54.8 Mar
1,121.2 12,401.4 11,611.0 11,680.7 6,448.7 817.5 222.4 1,906.9 2,230.9 54.4 Apr 1,126.1 12,500.9 11,689.4 11,761.8 6,547.0 810.0 217.7 1,900.3 2,232.8 54.0 May
German contribution (€ billion)
244.2 3,429.1 3,334.3 3,208.5 1,759.1 178.5 38.3 640.3 535.1 57.2 2016 Apr 243.7 3,469.8 3,356.2 3,222.9 1,779.2 175.2 37.3 640.6 534.4 56.2 May245.2 3,481.5 3,352.9 3,218.7 1,779.1 173.1 38.3 638.8 533.9 55.4 June
247.4 3,464.1 3,368.1 3,233.1 1,793.5 174.7 38.2 638.3 533.8 54.6 July246.5 3,480.0 3,376.0 3,238.3 1,803.0 173.4 38.2 636.2 533.8 53.8 Aug 245.9 3,494.5 3,380.7 3,247.0 1,807.9 179.4 38.3 635.0 533.3 53.1 Sep
245.4 3,489.6 3,386.4 3,254.0 1,821.1 172.1 37.8 637.3 533.5 52.3 Oct 245.7 3,536.5 3,424.0 3,288.1 1,857.7 171.0 37.4 636.6 533.7 51.7 Nov 248.1 3,517.1 3,419.8 3,284.1 1,851.0 171.5 38.4 635.6 536.3 51.3 Dec
245.4 3,526.3 3,439.3 3,306.3 1,873.8 174.0 38.7 632.1 537.1 50.6 2017 Jan 246.6 3,532.6 3,448.3 3,313.4 1,881.5 175.3 38.8 630.0 537.9 50.0 Feb 247.7 3,549.3 3,449.2 3,318.1 1,886.4 177.4 39.9 628.4 536.5 49.5 Mar
249.3 3,540.9 3,447.5 3,317.0 1,895.9 170.7 40.0 624.7 536.6 49.0 Apr 248.6 3,566.1 3,465.8 3,327.4 1,910.5 167.5 40.2 624.1 536.4 48.7 May249.5 3,590.5 3,482.0 3,339.9 1,928.7 165.5 40.3 621.4 535.7 48.3 June
251.6 3,583.1 3,472.8 3,333.0 1,927.8 162.6 40.3 619.5 537.9 44.9 July250.4 3,600.7 3,483.1 3,338.6 1,938.3 159.0 40.3 619.3 537.5 44.1 Aug 250.1 3,616.3 3,486.8 3,345.9 1,945.0 162.3 39.6 617.9 537.5 43.5 Sep
250.9 3,606.4 3,490.8 3,352.9 1,958.5 158.8 38.6 616.2 538.0 42.7 Oct 250.9 3,646.8 3,521.5 3,383.7 1,990.6 157.1 37.4 618.2 538.3 42.1 Nov 252.9 3,647.9 3,515.8 3,378.5 1,976.2 162.0 37.7 620.4 540.7 41.5 Dec
250.1 3,632.5 3,522.3 3,390.7 1,994.6 161.5 36.4 616.5 539.5 42.2 2018 Jan 249.8 3,642.4 3,523.0 3,388.4 1,995.9 160.2 35.3 615.5 540.0 41.5 Feb 248.3 3,652.2 3,524.1 3,389.6 1,998.1 164.6 34.2 612.1 539.4 41.0 Mar
250.3 3,641.8 3,529.8 3,395.0 2,013.5 157.6 33.6 610.6 539.1 40.6 Apr 250.2 3,693.8 3,568.4 3,425.0 2,048.0 154.6 33.0 610.2 539.0 40.3 May
of euro banknotes put into circulation by the Bundesbank in accordance with the Bundesbank can be calculated by adding to this total the item “Intra-Eurosystemaccounting regime chosen by the Eurosystem (see also footnote 2 on banknote liability/claim related to banknote issue“ (see “Other liability items“). 5 Excludingcirculation in Table III.2). The volume of currency actually put into circulation by the central governments’ deposits. 6 In Germany, only savings deposits.
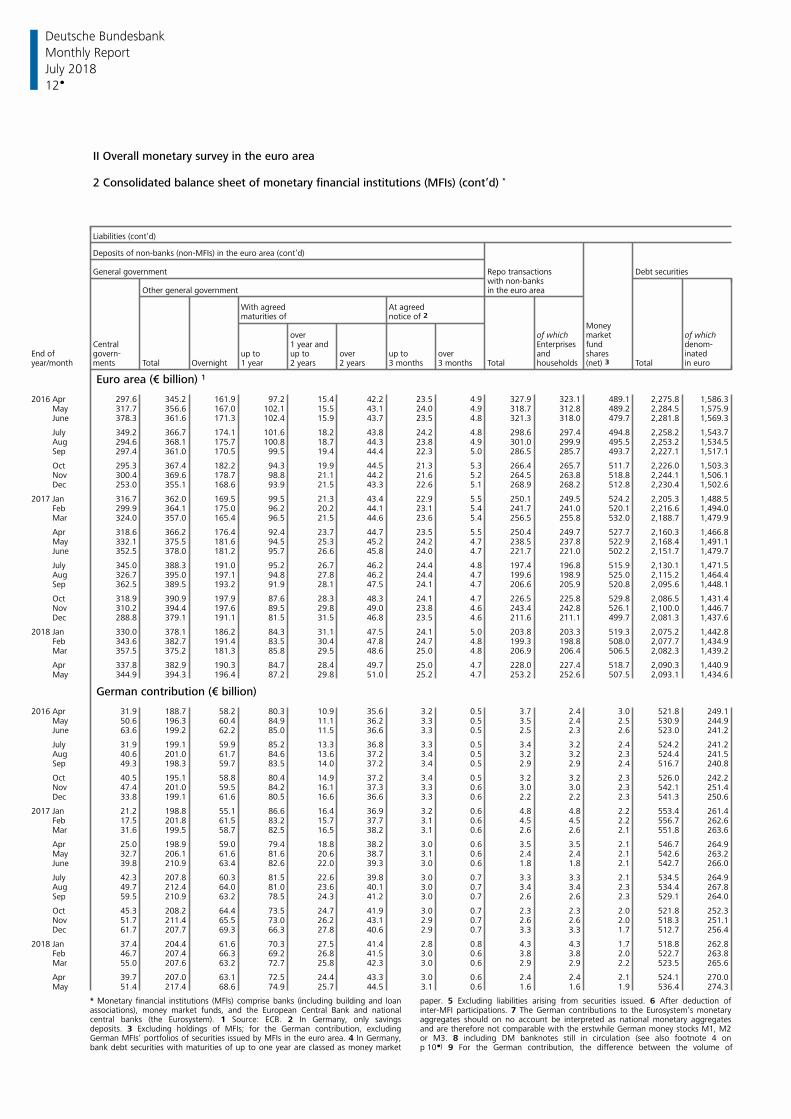
Deutsche Bundesbank
12
Monthly Report
July 2018
II Overall monetary survey in the euro area
2 Consolidated balance sheet of monetary financial institutions (MFIs) (cont’d) *
Liabilities (cont’d)
Deposits of non-banks (non-MFIs) in the euro area (cont’d)
General government Repo transactions Debt securitieswith non-banks
Other general government in the euro area
With agreed At agreedmaturities of notice of 2
Moneyover of which market of which
Central 1 year and Enterprises fund denom-End of govern- up to up to over up to over and shares inatedyear/month ments Total Overnight 1 year 2 years 2 years 3 months 3 months Total households (net) 3 Total in euro
Euro area (€ billion) 1
2016 Apr 297.6 345.2 161.9 97.2 15.4 42.2 23.5 4.9 327.9 323.1 489.1 2,275.8 1,586.3 May 317.7 356.6 167.0 102.1 15.5 43.1 24.0 4.9 318.7 312.8 489.2 2,284.5 1,575.9 June 378.3 361.6 171.3 102.4 15.9 43.7 23.5 4.8 321.3 318.0 479.7 2,281.8 1,569.3
July 349.2 366.7 174.1 101.6 18.2 43.8 24.2 4.8 298.6 297.4 494.8 2,258.2 1,543.7 Aug 294.6 368.1 175.7 100.8 18.7 44.3 23.8 4.9 301.0 299.9 495.5 2,253.2 1,534.5 Sep 297.4 361.0 170.5 99.5 19.4 44.4 22.3 5.0 286.5 285.7 493.7 2,227.1 1,517.1
Oct 295.3 367.4 182.2 94.3 19.9 44.5 21.3 5.3 266.4 265.7 511.7 2,226.0 1,503.3 Nov 300.4 369.6 178.7 98.8 21.1 44.2 21.6 5.2 264.5 263.8 518.8 2,244.1 1,506.1 Dec 253.0 355.1 168.6 93.9 21.5 43.3 22.6 5.1 268.9 268.2 512.8 2,230.4 1,502.6
2017 Jan 316.7 362.0 169.5 99.5 21.3 43.4 22.9 5.5 250.1 249.5 524.2 2,205.3 1,488.5 Feb 299.9 364.1 175.0 96.2 20.2 44.1 23.1 5.4 241.7 241.0 520.1 2,216.6 1,494.0 Mar 324.0 357.0 165.4 96.5 21.5 44.6 23.6 5.4 256.5 255.8 532.0 2,188.7 1,479.9
Apr 318.6 366.2 176.4 92.4 23.7 44.7 23.5 5.5 250.4 249.7 527.7 2,160.3 1,466.8 May 332.1 375.5 181.6 94.5 25.3 45.2 24.2 4.7 238.5 237.8 522.9 2,168.4 1,491.1 June 352.5 378.0 181.2 95.7 26.6 45.8 24.0 4.7 221.7 221.0 502.2 2,151.7 1,479.7
July 345.0 388.3 191.0 95.2 26.7 46.2 24.4 4.8 197.4 196.8 515.9 2,130.1 1,471.5 Aug 326.7 395.0 197.1 94.8 27.8 46.2 24.4 4.7 199.6 198.9 525.0 2,115.2 1,464.4 Sep 362.5 389.5 193.2 91.9 28.1 47.5 24.1 4.7 206.6 205.9 520.8 2,095.6 1,448.1
Oct 318.9 390.9 197.9 87.6 28.3 48.3 24.1 4.7 226.5 225.8 529.8 2,086.5 1,431.4 Nov 310.2 394.4 197.6 89.5 29.8 49.0 23.8 4.6 243.4 242.8 526.1 2,100.0 1,446.7 Dec 288.8 379.1 191.1 81.5 31.5 46.8 23.5 4.6 211.6 211.1 499.7 2,081.3 1,437.6
2018 Jan 330.0 378.1 186.2 84.3 31.1 47.5 24.1 5.0 203.8 203.3 519.3 2,075.2 1,442.8 Feb 343.6 382.7 191.4 83.5 30.4 47.8 24.7 4.8 199.3 198.8 508.0 2,077.7 1,434.9 Mar 357.5 375.2 181.3 85.8 29.5 48.6 25.0 4.8 206.9 206.4 506.5 2,082.3 1,439.2
Apr 337.8 382.9 190.3 84.7 28.4 49.7 25.0 4.7 228.0 227.4 518.7 2,090.3 1,440.9 May 344.9 394.3 196.4 87.2 29.8 51.0 25.2 4.7 253.2 252.6 507.5 2,093.1 1,434.6
German contribution (€ billion)
2016 Apr 31.9 188.7 58.2 80.3 10.9 35.6 3.2 0.5 3.7 2.4 3.0 521.8 249.1 May 50.6 196.3 60.4 84.9 11.1 36.2 3.3 0.5 3.5 2.4 2.5 530.9 244.9 June 63.6 199.2 62.2 85.0 11.5 36.6 3.3 0.5 2.5 2.3 2.6 523.0 241.2
July 31.9 199.1 59.9 85.2 13.3 36.8 3.3 0.5 3.4 3.2 2.4 524.2 241.2 Aug 40.6 201.0 61.7 84.6 13.6 37.2 3.4 0.5 3.2 3.2 2.3 524.4 241.5 Sep 49.3 198.3 59.7 83.5 14.0 37.2 3.4 0.5 2.9 2.9 2.4 516.7 240.8
Oct 40.5 195.1 58.8 80.4 14.9 37.2 3.4 0.5 3.2 3.2 2.3 526.0 242.2 Nov 47.4 201.0 59.5 84.2 16.1 37.3 3.3 0.6 3.0 3.0 2.3 542.1 251.4 Dec 33.8 199.1 61.6 80.5 16.6 36.6 3.3 0.6 2.2 2.2 2.3 541.3 250.6
2017 Jan 21.2 198.8 55.1 86.6 16.4 36.9 3.2 0.6 4.8 4.8 2.2 553.4 261.4 Feb 17.5 201.8 61.5 83.2 15.7 37.7 3.1 0.6 4.5 4.5 2.2 556.7 262.6 Mar 31.6 199.5 58.7 82.5 16.5 38.2 3.1 0.6 2.6 2.6 2.1 551.8 263.6
Apr 25.0 198.9 59.0 79.4 18.8 38.2 3.0 0.6 3.5 3.5 2.1 546.7 264.9 May 32.7 206.1 61.6 81.6 20.6 38.7 3.1 0.6 2.4 2.4 2.1 542.6 263.2 June 39.8 210.9 63.4 82.6 22.0 39.3 3.0 0.6 1.8 1.8 2.1 542.7 266.0
July 42.3 207.8 60.3 81.5 22.6 39.8 3.0 0.7 3.3 3.3 2.1 534.5 264.9 Aug 49.7 212.4 64.0 81.0 23.6 40.1 3.0 0.7 3.4 3.4 2.3 534.4 267.8 Sep 59.5 210.9 63.2 78.5 24.3 41.2 3.0 0.7 2.6 2.6 2.3 529.1 264.0
Oct 45.3 208.2 64.4 73.5 24.7 41.9 3.0 0.7 2.3 2.3 2.0 521.8 252.3 Nov 51.7 211.4 65.5 73.0 26.2 43.1 2.9 0.7 2.6 2.6 2.0 518.3 251.1 Dec 61.7 207.7 69.3 66.3 27.8 40.6 2.9 0.7 3.3 3.3 1.7 512.7 256.4
2018 Jan 37.4 204.4 61.6 70.3 27.5 41.4 2.8 0.8 4.3 4.3 1.7 518.8 262.8 Feb 46.7 207.4 66.3 69.2 26.8 41.5 3.0 0.6 3.8 3.8 2.0 522.7 263.8 Mar 55.0 207.6 63.2 72.7 25.8 42.3 3.0 0.6 2.9 2.9 2.2 523.5 265.6
Apr 39.7 207.0 63.1 72.5 24.4 43.3 3.0 0.6 2.4 2.4 2.1 524.1 270.0 May 51.4 217.4 68.6 74.9 25.7 44.5 3.1 0.6 1.6 1.6 1.9 536.4 274.3
* Monetary financial institutions (MFIs) comprise banks (including building and loan paper. 5 Excluding liabilities arising from securities issued. 6 After deduction ofassociations), money market funds, and the European Central Bank and national inter-MFI participations. 7 The German contributions to the Eurosystem’s monetarycentral banks (the Eurosystem). 1 Source: ECB. 2 In Germany, only savings aggregates should on no account be interpreted as national monetary aggregatesdeposits. 3 Excluding holdings of MFIs; for the German contribution, excluding and are therefore not comparable with the erstwhile German money stocks M1, M2German MFIs’ portfolios of securities issued by MFIs in the euro area. 4 In Germany, or M3. 8 including DM banknotes still in circulation (see also footnote 4 onbank debt securities with maturities of up to one year are classed as money market p 10 ) 9 For the German contribution, the difference between the volume of
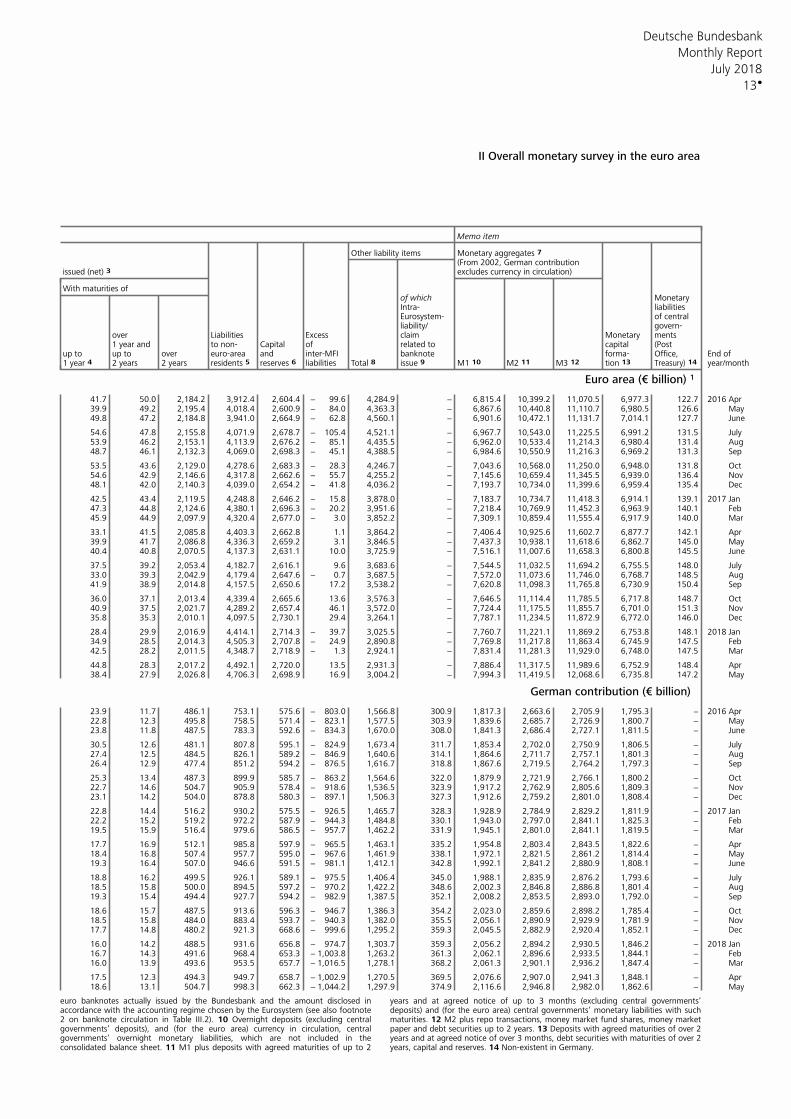
Deutsche Bundesbank
13
Monthly Report
July 2018
II Overall monetary survey in the euro area
Memo item
Other liability items Monetary aggregates 7 (From 2002, German contributionissued (net) 3 excludes currency in circulation)
With maturities ofof which MonetaryIntra- liabilitiesEurosystem- of centralliability/ govern-
over Liabilities Excess claim Monetary ments1 year and to non- Capital of related to capital (Post
up to up to over euro-area and inter-MFI banknote forma- Office, End of1 year 4 2 years 2 years residents 5 reserves 6 liabilities Total 8 issue 9 M1 10 M2 11 M3 12 tion 13 year/monthTreasury) 14
Euro area (€ billion) 1
41.7 50.0 2,184.2 3,912.4 2,604.4 − 99.6 4,284.9 − 6,815.4 10,399.2 11,070.5 6,977.3 122.7 2016 Apr 39.9 49.2 2,195.4 4,018.4 2,600.9 − 84.0 4,363.3 − 6,867.6 10,440.8 11,110.7 6,980.5 126.6 May49.8 47.2 2,184.8 3,941.0 2,664.9 − 62.8 4,560.1 − 6,901.6 10,472.1 11,131.7 7,014.1 127.7 June
54.6 47.8 2,155.8 4,071.9 2,678.7 − 105.4 4,521.1 − 6,967.7 10,543.0 11,225.5 6,991.2 131.5 July53.9 46.2 2,153.1 4,113.9 2,676.2 − 85.1 4,435.5 − 6,962.0 10,533.4 11,214.3 6,980.4 131.4 Aug 48.7 46.1 2,132.3 4,069.0 2,698.3 − 45.1 4,388.5 − 6,984.6 10,550.9 11,216.3 6,969.2 131.3 Sep
53.5 43.6 2,129.0 4,278.6 2,683.3 − 28.3 4,246.7 − 7,043.6 10,568.0 11,250.0 6,948.0 131.8 Oct 54.6 42.9 2,146.6 4,317.8 2,662.6 − 55.7 4,255.2 − 7,145.6 10,659.4 11,345.5 6,939.0 136.4 Nov 48.1 42.0 2,140.3 4,039.0 2,654.2 − 41.8 4,036.2 − 7,193.7 10,734.0 11,399.6 6,959.4 135.4 Dec
42.5 43.4 2,119.5 4,248.8 2,646.2 − 15.8 3,878.0 − 7,183.7 10,734.7 11,418.3 6,914.1 139.1 2017 Jan 47.3 44.8 2,124.6 4,380.1 2,696.3 − 20.2 3,951.6 − 7,218.4 10,769.9 11,452.3 6,963.9 140.1 Feb 45.9 44.9 2,097.9 4,320.4 2,677.0 − 3.0 3,852.2 − 7,309.1 10,859.4 11,555.4 6,917.9 140.0 Mar
33.1 41.5 2,085.8 4,403.3 2,662.8 1.1 3,864.2 − 7,406.4 10,925.6 11,602.7 6,877.7 142.1 Apr 39.9 41.7 2,086.8 4,336.3 2,659.2 3.1 3,846.5 − 7,437.3 10,938.1 11,618.6 6,862.7 145.0 May40.4 40.8 2,070.5 4,137.3 2,631.1 10.0 3,725.9 − 7,516.1 11,007.6 11,658.3 6,800.8 145.5 June
37.5 39.2 2,053.4 4,182.7 2,616.1 9.6 3,683.6 − 7,544.5 11,032.5 11,694.2 6,755.5 148.0 July33.0 39.3 2,042.9 4,179.4 2,647.6 − 0.7 3,687.5 − 7,572.0 11,073.6 11,746.0 6,768.7 148.5 Aug 41.9 38.9 2,014.8 4,157.5 2,650.6 17.2 3,538.2 − 7,620.8 11,098.3 11,765.8 6,730.9 150.4 Sep
36.0 37.1 2,013.4 4,339.4 2,665.6 13.6 3,576.3 − 7,646.5 11,114.4 11,785.5 6,717.8 148.7 Oct 40.9 37.5 2,021.7 4,289.2 2,657.4 46.1 3,572.0 − 7,724.4 11,175.5 11,855.7 6,701.0 151.3 Nov 35.8 35.3 2,010.1 4,097.5 2,730.1 29.4 3,264.1 − 7,787.1 11,234.5 11,872.9 6,772.0 146.0 Dec
28.4 29.9 2,016.9 4,414.1 2,714.3 − 39.7 3,025.5 − 7,760.7 11,221.1 11,869.2 6,753.8 148.1 2018 Jan 34.9 28.5 2,014.3 4,505.3 2,707.8 − 24.9 2,890.8 − 7,769.8 11,217.8 11,863.4 6,745.9 147.5 Feb 42.5 28.2 2,011.5 4,348.7 2,718.9 − 1.3 2,924.1 − 7,831.4 11,281.3 11,929.0 6,748.0 147.5 Mar
44.8 28.3 2,017.2 4,492.1 2,720.0 13.5 2,931.3 − 7,886.4 11,317.5 11,989.6 6,752.9 148.4 Apr 38.4 27.9 2,026.8 4,706.3 2,698.9 16.9 3,004.2 − 7,994.3 11,419.5 12,068.6 6,735.8 147.2 May
German contribution (€ billion)
23.9 11.7 486.1 753.1 575.6 − 803.0 1,566.8 300.9 1,817.3 2,663.6 2,705.9 1,795.3 − 2016 Apr 22.8 12.3 495.8 758.5 571.4 − 823.1 1,577.5 303.9 1,839.6 2,685.7 2,726.9 1,800.7 − May23.8 11.8 487.5 783.3 592.6 − 834.3 1,670.0 308.0 1,841.3 2,686.4 2,727.1 1,811.5 − June
30.5 12.6 481.1 807.8 595.1 − 824.9 1,673.4 311.7 1,853.4 2,702.0 2,750.9 1,806.5 − July27.4 12.5 484.5 826.1 589.2 − 846.9 1,640.6 314.1 1,864.6 2,711.7 2,757.1 1,801.3 − Aug 26.4 12.9 477.4 851.2 594.2 − 876.5 1,616.7 318.8 1,867.6 2,719.5 2,764.2 1,797.3 − Sep
25.3 13.4 487.3 899.9 585.7 − 863.2 1,564.6 322.0 1,879.9 2,721.9 2,766.1 1,800.2 − Oct 22.7 14.6 504.7 905.9 578.4 − 918.6 1,536.5 323.9 1,917.2 2,762.9 2,805.6 1,809.3 − Nov 23.1 14.2 504.0 878.8 580.3 − 897.1 1,506.3 327.3 1,912.6 2,759.2 2,801.0 1,808.4 − Dec
22.8 14.4 516.2 930.2 575.5 − 926.5 1,465.7 328.3 1,928.9 2,784.9 2,829.2 1,811.9 − 2017 Jan 22.2 15.2 519.2 972.2 587.9 − 944.3 1,484.8 330.1 1,943.0 2,797.0 2,841.1 1,825.3 − Feb 19.5 15.9 516.4 979.6 586.5 − 957.7 1,462.2 331.9 1,945.1 2,801.0 2,841.1 1,819.5 − Mar
17.7 16.9 512.1 985.8 597.9 − 965.5 1,463.1 335.2 1,954.8 2,803.4 2,843.5 1,822.6 − Apr 18.4 16.8 507.4 957.7 595.0 − 967.6 1,461.9 338.1 1,972.1 2,821.5 2,861.2 1,814.4 − May19.3 16.4 507.0 946.6 591.5 − 981.1 1,412.1 342.8 1,992.1 2,841.2 2,880.9 1,808.1 − June
18.8 16.2 499.5 926.1 589.1 − 975.5 1,406.4 345.0 1,988.1 2,835.9 2,876.2 1,793.6 − July18.5 15.8 500.0 894.5 597.2 − 970.2 1,422.2 348.6 2,002.3 2,846.8 2,886.8 1,801.4 − Aug 19.3 15.4 494.4 927.7 594.2 − 982.9 1,387.5 352.1 2,008.2 2,853.5 2,893.0 1,792.0 − Sep
18.6 15.7 487.5 913.6 596.3 − 946.7 1,386.3 354.2 2,023.0 2,859.6 2,898.2 1,785.4 − Oct 18.5 15.8 484.0 883.4 593.7 − 940.3 1,382.0 355.5 2,056.1 2,890.9 2,929.9 1,781.9 − Nov 17.7 14.8 480.2 921.3 668.6 − 999.6 1,295.2 359.3 2,045.5 2,882.9 2,920.4 1,852.1 − Dec
16.0 14.2 488.5 931.6 656.8 − 974.7 1,303.7 359.3 2,056.2 2,894.2 2,930.5 1,846.2 − 2018 Jan 16.7 14.3 491.6 968.4 653.3 − 1,003.8 1,263.2 361.3 2,062.1 2,896.6 2,933.5 1,844.1 − Feb 16.0 13.9 493.6 953.5 657.7 − 1,016.5 1,278.1 368.2 2,061.3 2,901.1 2,936.2 1,847.4 − Mar
17.5 12.3 494.3 949.7 658.7 − 1,002.9 1,270.5 369.5 2,076.6 2,907.0 2,941.3 1,848.1 − Apr 18.6 13.1 504.7 998.3 662.3 − 1,044.2 1,297.9 374.9 2,116.6 2,946.8 2,982.0 1,862.6 − May
euro banknotes actually issued by the Bundesbank and the amount disclosed in years and at agreed notice of up to 3 months (excluding central governments’accordance with the accounting regime chosen by the Eurosystem (see also footnote deposits) and (for the euro area) central governments’ monetary liabilities with such2 on banknote circulation in Table III.2). 10 Overnight deposits (excluding central maturities. 12 M2 plus repo transactions, money market fund shares, money marketgovernments’ deposits), and (for the euro area) currency in circulation, central paper and debt securities up to 2 years. 13 Deposits with agreed maturities of over 2governments’ overnight monetary liabilities, which are not included in the years and at agreed notice of over 3 months, debt securities with maturities of over 2consolidated balance sheet. 11 M1 plus deposits with agreed maturities of up to 2 years, capital and reserves. 14 Non-existent in Germany.
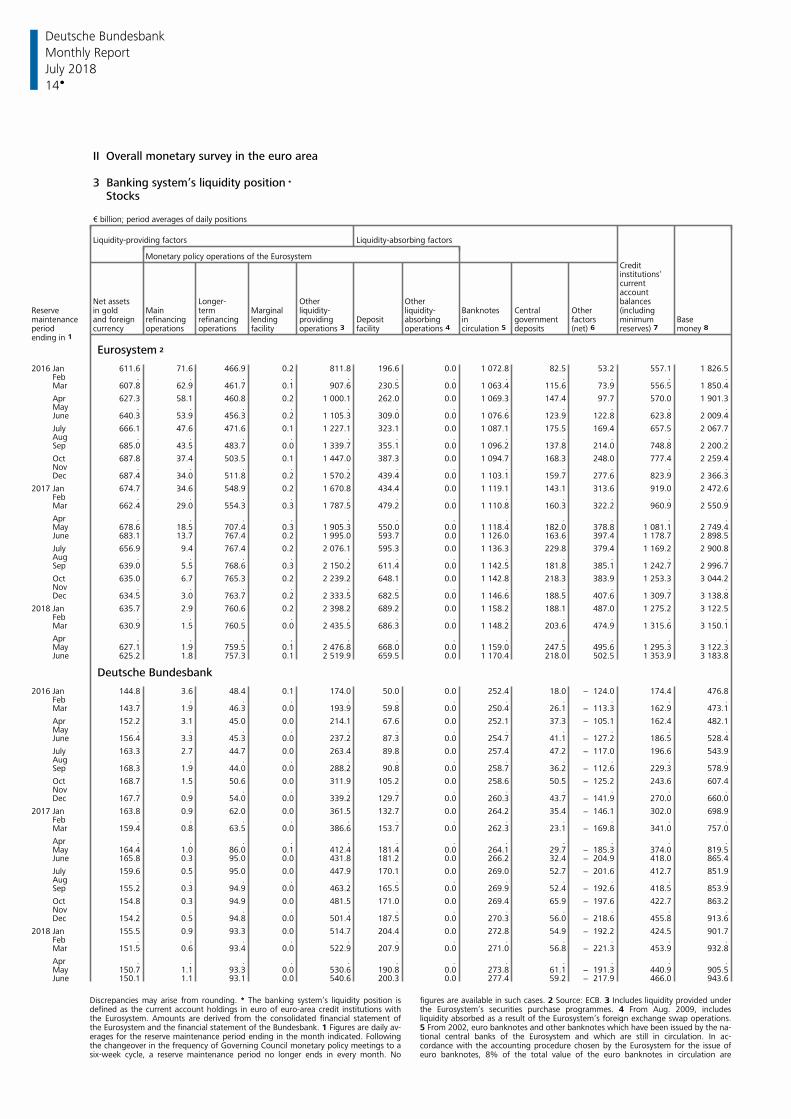
Deutsche Bundesbank
14
Monthly Report
July 2018
II Overall monetary survey in the euro area
3 Banking system’s liquidity position *
Stocks
€ billion; period averages of daily positions
Liquidity-providing factors Liquidity-absorbing factors
Monetary policy operations of the EurosystemCreditinstitutions‘currentaccount
Net assets Longer- Other Other balancesReserve in gold Main term Marginal liquidity- liquidity- Banknotes Central Other (includingmaintenance and foreign refinancing refinancing lending providing Deposit absorbing in government factors minimum Baseperiod currency operations operations facility facility deposits (net) 6 reserves) 7 money 8 operations 3 operations 4 circulation 5 ending in 1
Eurosystem 2
2016 Jan 611.6 71.6 466.9 0.2 811.8 196.6 0.0 1 072.8 82.5 53.2 557.1 1 826.5 Feb . . . . . . . . . . . . Mar 607.8 62.9 461.7 0.1 907.6 230.5 0.0 1 063.4 115.6 73.9 556.5 1 850.4
Apr 627.3 58.1 460.8 0.2 1 000.1 262.0 0.0 1 069.3 147.4 97.7 570.0 1 901.3 May . . . . . . . . . . . . June 640.3 53.9 456.3 0.2 1 105.3 309.0 0.0 1 076.6 123.9 122.8 623.8 2 009.4
July 666.1 47.6 471.6 0.1 1 227.1 323.1 0.0 1 087.1 175.5 169.4 657.5 2 067.7 Aug . . . . . . . . . . . . Sep 685.0 43.5 483.7 0.0 1 339.7 355.1 0.0 1 096.2 137.8 214.0 748.8 2 200.2
Oct 687.8 37.4 503.5 0.1 1 447.0 387.3 0.0 1 094.7 168.3 248.0 777.4 2 259.4 Nov . . . . . . . . . . . . Dec 687.4 34.0 511.8 0.2 1 570.2 439.4 0.0 1 103.1 159.7 277.6 823.9 2 366.3
2017 Jan 674.7 34.6 548.9 0.2 1 670.8 434.4 0.0 1 119.1 143.1 313.6 919.0 2 472.6 Feb . . . . . . . . . . . . Mar 662.4 29.0 554.3 0.3 1 787.5 479.2 0.0 1 110.8 160.3 322.2 960.9 2 550.9
Apr . . . . . . . . . . . . May 678.6 18.5 707.4 0.3 1 905.3 550.0 0.0 1 118.4 182.0 378.8 1 081.1 2 749.4 June 683.1 13.7 767.4 0.2 1 995.0 593.7 0.0 1 126.0 163.6 397.4 1 178.7 2 898.5
July 656.9 9.4 767.4 0.2 2 076.1 595.3 0.0 1 136.3 229.8 379.4 1 169.2 2 900.8 Aug . . . . . . . . . . . . Sep 639.0 5.5 768.6 0.3 2 150.2 611.4 0.0 1 142.5 181.8 385.1 1 242.7 2 996.7
Oct 635.0 6.7 765.3 0.2 2 239.2 648.1 0.0 1 142.8 218.3 383.9 1 253.3 3 044.2 Nov . . . . . . . . . . . . Dec 634.5 3.0 763.7 0.2 2 333.5 682.5 0.0 1 146.6 188.5 407.6 1 309.7 3 138.8
2018 Jan 635.7 2.9 760.6 0.2 2 398.2 689.2 0.0 1 158.2 188.1 487.0 1 275.2 3 122.5 Feb . . . . . . . . . . . . Mar 630.9 1.5 760.5 0.0 2 435.5 686.3 0.0 1 148.2 203.6 474.9 1 315.6 3 150.1
Apr . . . . . . . . . . . . May 627.1 1.9 759.5 0.1 2 476.8 668.0 0.0 1 159.0 247.5 495.6 1 295.3 3 122.3 June 625.2 1.8 757.3 0.1 2 519.9 659.5 0.0 1 170.4 218.0 502.5 1 353.9 3 183.8
Deutsche Bundesbank
2016 Jan 144.8 3.6 48.4 0.1 174.0 50.0 0.0 252.4 18.0 − 124.0 174.4 476.8 Feb . . . . . . . . . . . . Mar 143.7 1.9 46.3 0.0 193.9 59.8 0.0 250.4 26.1 − 113.3 162.9 473.1
Apr 152.2 3.1 45.0 0.0 214.1 67.6 0.0 252.1 37.3 − 105.1 162.4 482.1 May . . . . . . . . . . . . June 156.4 3.3 45.3 0.0 237.2 87.3 0.0 254.7 41.1 − 127.2 186.5 528.4
July 163.3 2.7 44.7 0.0 263.4 89.8 0.0 257.4 47.2 − 117.0 196.6 543.9 Aug . . . . . . . . . . . . Sep 168.3 1.9 44.0 0.0 288.2 90.8 0.0 258.7 36.2 − 112.6 229.3 578.9
Oct 168.7 1.5 50.6 0.0 311.9 105.2 0.0 258.6 50.5 − 125.2 243.6 607.4 Nov . . . . . . . . . . . . Dec 167.7 0.9 54.0 0.0 339.2 129.7 0.0 260.3 43.7 − 141.9 270.0 660.0
2017 Jan 163.8 0.9 62.0 0.0 361.5 132.7 0.0 264.2 35.4 − 146.1 302.0 698.9 Feb . . . . . . . . . . . . Mar 159.4 0.8 63.5 0.0 386.6 153.7 0.0 262.3 23.1 − 169.8 341.0 757.0
Apr . . . . . . . . . . . . May 164.4 1.0 86.0 0.1 412.4 181.4 0.0 264.1 29.7 − 185.3 374.0 819.5 June 165.8 0.3 95.0 0.0 431.8 181.2 0.0 266.2 32.4 − 204.9 418.0 865.4
July 159.6 0.5 95.0 0.0 447.9 170.1 0.0 269.0 52.7 − 201.6 412.7 851.9 Aug . . . . . . . . . . . . Sep 155.2 0.3 94.9 0.0 463.2 165.5 0.0 269.9 52.4 − 192.6 418.5 853.9
Oct 154.8 0.3 94.9 0.0 481.5 171.0 0.0 269.4 65.9 − 197.6 422.7 863.2 Nov . . . . . . . . . . . . Dec 154.2 0.5 94.8 0.0 501.4 187.5 0.0 270.3 56.0 − 218.6 455.8 913.6
2018 Jan 155.5 0.9 93.3 0.0 514.7 204.4 0.0 272.8 54.9 − 192.2 424.5 901.7 Feb . . . . . . . . . . . . Mar 151.5 0.6 93.4 0.0 522.9 207.9 0.0 271.0 56.8 − 221.3 453.9 932.8
Apr . . . . . . . . . . . . May 150.7 1.1 93.3 0.0 530.6 190.8 0.0 273.8 61.1 − 191.3 440.9 905.5 June 150.1 1.1 93.1 0.0 540.6 200.3 0.0 277.4 59.2 − 217.9 466.0 943.6
Discrepancies may arise from rounding. * The banking system’s liquidity position is figures are available in such cases. 2 Source: ECB. 3 Includes liquidity provided underdefined as the current account holdings in euro of euro-area credit institutions with the Eurosystem’s securities purchase programmes. 4 From Aug. 2009, includesthe Eurosystem. Amounts are derived from the consolidated financial statement of liquidity absorbed as a result of the Eurosystem’s foreign exchange swap operations.the Eurosystem and the financial statement of the Bundesbank. 1 Figures are daily av- 5 From 2002, euro banknotes and other banknotes which have been issued by the na-erages for the reserve maintenance period ending in the month indicated. Following tional central banks of the Eurosystem and which are still in circulation. In ac-the changeover in the frequency of Governing Council monetary policy meetings to a cordance with the accounting procedure chosen by the Eurosystem for the issue ofsix-week cycle, a reserve maintenance period no longer ends in every month. No euro banknotes, 8% of the total value of the euro banknotes in circulation are
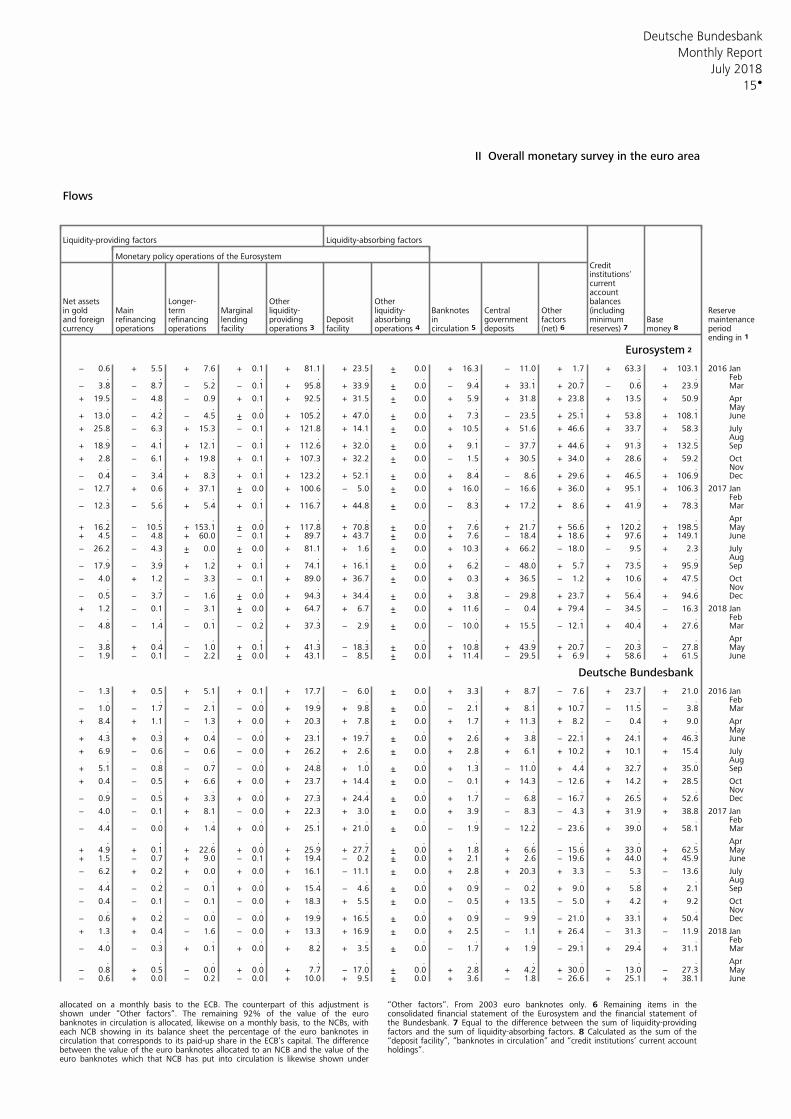
Deutsche Bundesbank
15
Monthly Report
July 2018
II Overall monetary survey in the euro area
Flows
Liquidity-providing factors Liquidity-absorbing factors
Monetary policy operations of the EurosystemCreditinstitutions‘currentaccount
Net assets Longer- Other Other balancesin gold Main term Marginal liquidity- liquidity- Banknotes Central Other (including Reserveand foreign refinancing refinancing lending providing Deposit absorbing in government factors minimum Base maintenancecurrency operations operations facility facility deposits (net) 6 reserves) 7 money 8 periodoperations 3 operations 4 circulation 5
ending in 1
Eurosystem 2
− 0.6 + 5.5 + 7.6 + 0.1 + 81.1 + 23.5 + 0.0 + 16.3 − 11.0 + 1.7 + 63.3 + 103.1 2016 Jan
. . . . . . . . . . . . Feb − 3.8 − 8.7 − 5.2 − 0.1 + 95.8 + 33.9 + 0.0 − 9.4 + 33.1 + 20.7 − 0.6 + 23.9 Mar
+ 19.5 − 4.8 − 0.9 + 0.1 + 92.5 + 31.5 + 0.0 + 5.9 + 31.8 + 23.8 + 13.5 + 50.9 Apr . . . . . . . . . . . . May
+ 13.0 − 4.2 − 4.5 + 0.0 + 105.2 + 47.0 + 0.0 + 7.3 − 23.5 + 25.1 + 53.8 + 108.1 June
+ 25.8 − 6.3 + 15.3 − 0.1 + 121.8 + 14.1 + 0.0 + 10.5 + 51.6 + 46.6 + 33.7 + 58.3 July. . . . . . . . . . . . Aug
+ 18.9 − 4.1 + 12.1 − 0.1 + 112.6 + 32.0 + 0.0 + 9.1 − 37.7 + 44.6 + 91.3 + 132.5 Sep
+ 2.8 − 6.1 + 19.8 + 0.1 + 107.3 + 32.2 + 0.0 − 1.5 + 30.5 + 34.0 + 28.6 + 59.2 Oct . . . . . . . . . . . . Nov
− 0.4 − 3.4 + 8.3 + 0.1 + 123.2 + 52.1 + 0.0 + 8.4 − 8.6 + 29.6 + 46.5 + 106.9 Dec
− 12.7 + 0.6 + 37.1 + 0.0 + 100.6 − 5.0 + 0.0 + 16.0 − 16.6 + 36.0 + 95.1 + 106.3 2017 Jan . . . . . . . . . . . . Feb
− 12.3 − 5.6 + 5.4 + 0.1 + 116.7 + 44.8 + 0.0 − 8.3 + 17.2 + 8.6 + 41.9 + 78.3 Mar
. . . . . . . . . . . . Apr + 16.2 − 10.5 + 153.1 + 0.0 + 117.8 + 70.8 + 0.0 + 7.6 + 21.7 + 56.6 + 120.2 + 198.5 May+ 4.5 − 4.8 + 60.0 − 0.1 + 89.7 + 43.7 + 0.0 + 7.6 − 18.4 + 18.6 + 97.6 + 149.1 June
− 26.2 − 4.3 + 0.0 + 0.0 + 81.1 + 1.6 + 0.0 + 10.3 + 66.2 − 18.0 − 9.5 + 2.3 July. . . . . . . . . . . . Aug
− 17.9 − 3.9 + 1.2 + 0.1 + 74.1 + 16.1 + 0.0 + 6.2 − 48.0 + 5.7 + 73.5 + 95.9 Sep
− 4.0 + 1.2 − 3.3 − 0.1 + 89.0 + 36.7 + 0.0 + 0.3 + 36.5 − 1.2 + 10.6 + 47.5 Oct . . . . . . . . . . . . Nov
− 0.5 − 3.7 − 1.6 + 0.0 + 94.3 + 34.4 + 0.0 + 3.8 − 29.8 + 23.7 + 56.4 + 94.6 Dec
+ 1.2 − 0.1 − 3.1 + 0.0 + 64.7 + 6.7 + 0.0 + 11.6 − 0.4 + 79.4 − 34.5 − 16.3 2018 Jan . . . . . . . . . . . . Feb
− 4.8 − 1.4 − 0.1 − 0.2 + 37.3 − 2.9 + 0.0 − 10.0 + 15.5 − 12.1 + 40.4 + 27.6 Mar
. . . . . . . . . . . . Apr − 3.8 + 0.4 − 1.0 + 0.1 + 41.3 − 18.3 + 0.0 + 10.8 + 43.9 + 20.7 − 20.3 − 27.8 May− 1.9 − 0.1 − 2.2 + 0.0 + 43.1 − 8.5 + 0.0 + 11.4 − 29.5 + 6.9 + 58.6 + 61.5 June
Deutsche Bundesbank
− 1.3 + 0.5 + 5.1 + 0.1 + 17.7 − 6.0 + 0.0 + 3.3 + 8.7 − 7.6 + 23.7 + 21.0 2016 Jan . . . . . . . . . . . . Feb
− 1.0 − 1.7 − 2.1 − 0.0 + 19.9 + 9.8 + 0.0 − 2.1 + 8.1 + 10.7 − 11.5 − 3.8 Mar
+ 8.4 + 1.1 − 1.3 + 0.0 + 20.3 + 7.8 + 0.0 + 1.7 + 11.3 + 8.2 − 0.4 + 9.0 Apr . . . . . . . . . . . . May
+ 4.3 + 0.3 + 0.4 − 0.0 + 23.1 + 19.7 + 0.0 + 2.6 + 3.8 − 22.1 + 24.1 + 46.3 June
+ 6.9 − 0.6 − 0.6 − 0.0 + 26.2 + 2.6 + 0.0 + 2.8 + 6.1 + 10.2 + 10.1 + 15.4 July. . . . . . . . . . . . Aug
+ 5.1 − 0.8 − 0.7 − 0.0 + 24.8 + 1.0 + 0.0 + 1.3 − 11.0 + 4.4 + 32.7 + 35.0 Sep
+ 0.4 − 0.5 + 6.6 + 0.0 + 23.7 + 14.4 + 0.0 − 0.1 + 14.3 − 12.6 + 14.2 + 28.5 Oct . . . . . . . . . . . . Nov
− 0.9 − 0.5 + 3.3 + 0.0 + 27.3 + 24.4 + 0.0 + 1.7 − 6.8 − 16.7 + 26.5 + 52.6 Dec
− 4.0 − 0.1 + 8.1 − 0.0 + 22.3 + 3.0 + 0.0 + 3.9 − 8.3 − 4.3 + 31.9 + 38.8 2017 Jan . . . . . . . . . . . . Feb
− 4.4 − 0.0 + 1.4 + 0.0 + 25.1 + 21.0 + 0.0 − 1.9 − 12.2 − 23.6 + 39.0 + 58.1 Mar
. . . . . . . . . . . . Apr + 4.9 + 0.1 + 22.6 + 0.0 + 25.9 + 27.7 + 0.0 + 1.8 + 6.6 − 15.6 + 33.0 + 62.5 May+ 1.5 − 0.7 + 9.0 − 0.1 + 19.4 − 0.2 + 0.0 + 2.1 + 2.6 − 19.6 + 44.0 + 45.9 June
− 6.2 + 0.2 + 0.0 + 0.0 + 16.1 − 11.1 + 0.0 + 2.8 + 20.3 + 3.3 − 5.3 − 13.6 July. . . . . . . . . . . . Aug
− 4.4 − 0.2 − 0.1 + 0.0 + 15.4 − 4.6 + 0.0 + 0.9 − 0.2 + 9.0 + 5.8 + 2.1 Sep
− 0.4 − 0.1 − 0.1 − 0.0 + 18.3 + 5.5 + 0.0 − 0.5 + 13.5 − 5.0 + 4.2 + 9.2 Oct . . . . . . . . . . . . Nov
− 0.6 + 0.2 − 0.0 − 0.0 + 19.9 + 16.5 + 0.0 + 0.9 − 9.9 − 21.0 + 33.1 + 50.4 Dec
+ 1.3 + 0.4 − 1.6 − 0.0 + 13.3 + 16.9 + 0.0 + 2.5 − 1.1 + 26.4 − 31.3 − 11.9 2018 Jan . . . . . . . . . . . . Feb
− 4.0 − 0.3 + 0.1 + 0.0 + 8.2 + 3.5 + 0.0 − 1.7 + 1.9 − 29.1 + 29.4 + 31.1 Mar
. . . . . . . . . . . . Apr − 0.8 + 0.5 − 0.0 + 0.0 + 7.7 − 17.0 + 0.0 + 2.8 + 4.2 + 30.0 − 13.0 − 27.3 May− 0.6 + 0.0 − 0.2 − 0.0 + 10.0 + 9.5 + 0.0 + 3.6 − 1.8 − 26.6 + 25.1 + 38.1 June
allocated on a monthly basis to the ECB. The counterpart of this adjustment is “Other factors”. From 2003 euro banknotes only. 6 Remaining items in theshown under “Other factors”. The remaining 92% of the value of the euro consolidated financial statement of the Eurosystem and the financial statement ofbanknotes in circulation is allocated, likewise on a monthly basis, to the NCBs, with the Bundesbank. 7 Equal to the difference between the sum of liquidity-providingeach NCB showing in its balance sheet the percentage of the euro banknotes in factors and the sum of liquidity-absorbing factors. 8 Calculated as the sum of thecirculation that corresponds to its paid-up share in the ECB’s capital. The difference “deposit facility”, “banknotes in circulation” and “credit institutions’ current accountbetween the value of the euro banknotes allocated to an NCB and the value of the holdings”. euro banknotes which that NCB has put into circulation is likewise shown under
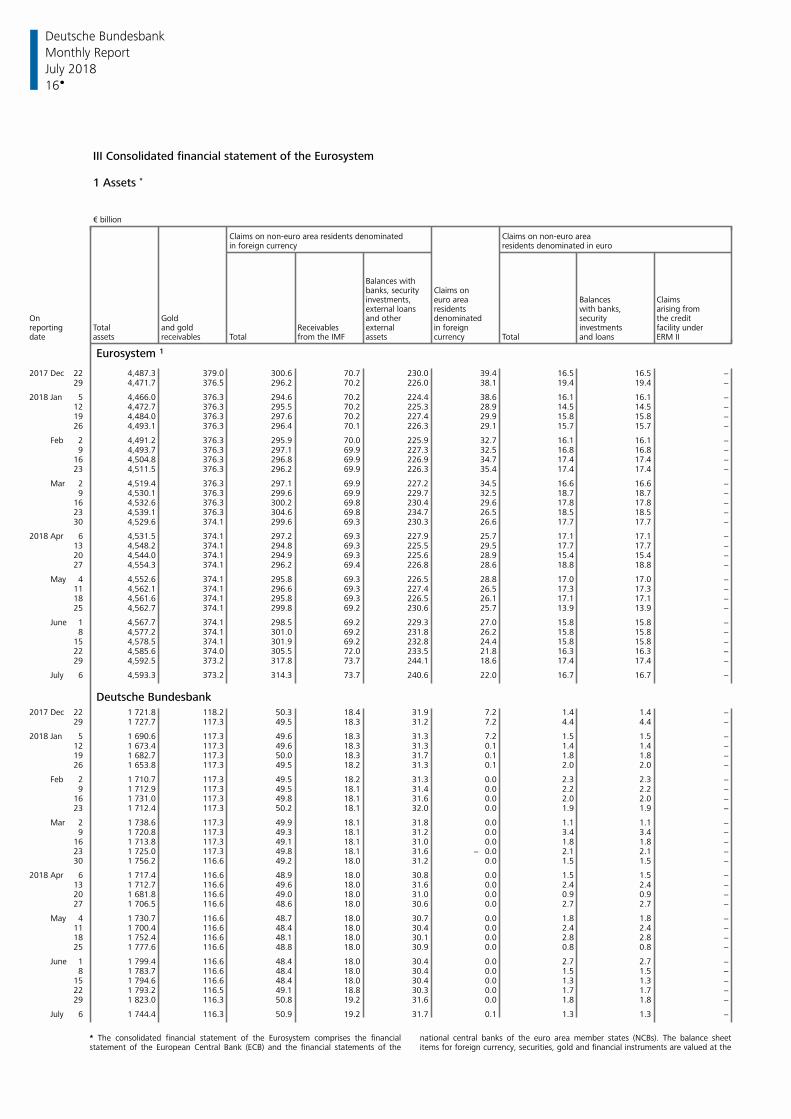
Deutsche Bundesbank
16
Monthly Report
July 2018
III Consolidated financial statement of the Eurosystem
1 Assets *
€ billion
Claims on non-euro areaClaims on non-euro area residents denominatedin foreign currency residents denominated in euro
Balances withClaims onbanks, security
investments, euro area Balances Claimsexternal loans residents with banks, arising from
On Gold and other denominated security the creditreporting Total and gold Receivables external in foreign investments facility underdate assets receivables Total from the IMF assets currency Total and loans ERM II
Eurosystem 1
2017 Dec 22 4,487.3 379.0 300.6 70.7 230.0 39.4 16.5 16.5 − 29 4,471.7 376.5 296.2 70.2 226.0 38.1 19.4 19.4 −
2018 Jan 5 4,466.0 376.3 294.6 70.2 224.4 38.6 16.1 16.1 − 12 4,472.7 376.3 295.5 70.2 225.3 28.9 14.5 14.5 − 19 4,484.0 376.3 297.6 70.2 227.4 29.9 15.8 15.8 − 26 4,493.1 376.3 296.4 70.1 226.3 29.1 15.7 15.7 −
Feb 2 4,491.2 376.3 295.9 70.0 225.9 32.7 16.1 16.1 − 9 4,493.7 376.3 297.1 69.9 227.3 32.5 16.8 16.8 − 16 4,504.8 376.3 296.8 69.9 226.9 34.7 17.4 17.4 − 23 4,511.5 376.3 296.2 69.9 226.3 35.4 17.4 17.4 −
Mar 2 4,519.4 376.3 297.1 69.9 227.2 34.5 16.6 16.6 − 9 4,530.1 376.3 299.6 69.9 229.7 32.5 18.7 18.7 − 16 4,532.6 376.3 300.2 69.8 230.4 29.6 17.8 17.8 − 23 4,539.1 376.3 304.6 69.8 234.7 26.5 18.5 18.5 − 30 4,529.6 374.1 299.6 69.3 230.3 26.6 17.7 17.7 −
2018 Apr 6 4,531.5 374.1 297.2 69.3 227.9 25.7 17.1 17.1 − 13 4,548.2 374.1 294.8 69.3 225.5 29.5 17.7 17.7 − 20 4,544.0 374.1 294.9 69.3 225.6 28.9 15.4 15.4 − 27 4,554.3 374.1 296.2 69.4 226.8 28.6 18.8 18.8 −
May 4 4,552.6 374.1 295.8 69.3 226.5 28.8 17.0 17.0 − 11 4,562.1 374.1 296.6 69.3 227.4 26.5 17.3 17.3 − 18 4,561.6 374.1 295.8 69.3 226.5 26.1 17.1 17.1 − 25 4,562.7 374.1 299.8 69.2 230.6 25.7 13.9 13.9 −
June 1 4,567.7 374.1 298.5 69.2 229.3 27.0 15.8 15.8 − 8 4,577.2 374.1 301.0 69.2 231.8 26.2 15.8 15.8 − 15 4,578.5 374.1 301.9 69.2 232.8 24.4 15.8 15.8 − 22 4,585.6 374.0 305.5 72.0 233.5 21.8 16.3 16.3 − 29 4,592.5 373.2 317.8 73.7 244.1 18.6 17.4 17.4 −
July 6 4,593.3 373.2 314.3 73.7 240.6 22.0 16.7 16.7 −
Deutsche Bundesbank2017 Dec 22 1 721.8 118.2 50.3 18.4 31.9 7.2 1.4 1.4 − 29 1 727.7 117.3 49.5 18.3 31.2 7.2 4.4 4.4 −
2018 Jan 5 1 690.6 117.3 49.6 18.3 31.3 7.2 1.5 1.5 − 12 1 673.4 117.3 49.6 18.3 31.3 0.1 1.4 1.4 − 19 1 682.7 117.3 50.0 18.3 31.7 0.1 1.8 1.8 − 26 1 653.8 117.3 49.5 18.2 31.3 0.1 2.0 2.0 −
Feb 2 1 710.7 117.3 49.5 18.2 31.3 0.0 2.3 2.3 − 9 1 712.9 117.3 49.5 18.1 31.4 0.0 2.2 2.2 − 16 1 731.0 117.3 49.8 18.1 31.6 0.0 2.0 2.0 − 23 1 712.4 117.3 50.2 18.1 32.0 0.0 1.9 1.9 −
Mar 2 1 738.6 117.3 49.9 18.1 31.8 0.0 1.1 1.1 − 9 1 720.8 117.3 49.3 18.1 31.2 0.0 3.4 3.4 − 16 1 713.8 117.3 49.1 18.1 31.0 0.0 1.8 1.8 − 23 1 725.0 117.3 49.8 18.1 31.6 − 0.0 2.1 2.1 − 30 1 756.2 116.6 49.2 18.0 31.2 0.0 1.5 1.5 −
2018 Apr 6 1 717.4 116.6 48.9 18.0 30.8 0.0 1.5 1.5 − 13 1 712.7 116.6 49.6 18.0 31.6 0.0 2.4 2.4 − 20 1 681.8 116.6 49.0 18.0 31.0 0.0 0.9 0.9 − 27 1 706.5 116.6 48.6 18.0 30.6 0.0 2.7 2.7 −
May 4 1 730.7 116.6 48.7 18.0 30.7 0.0 1.8 1.8 − 11 1 700.4 116.6 48.4 18.0 30.4 0.0 2.4 2.4 − 18 1 752.4 116.6 48.1 18.0 30.1 0.0 2.8 2.8 − 25 1 777.6 116.6 48.8 18.0 30.9 0.0 0.8 0.8 −
June 1 1 799.4 116.6 48.4 18.0 30.4 0.0 2.7 2.7 − 8 1 783.7 116.6 48.4 18.0 30.4 0.0 1.5 1.5 − 15 1 794.6 116.6 48.4 18.0 30.4 0.0 1.3 1.3 − 22 1 793.2 116.5 49.1 18.8 30.3 0.0 1.7 1.7 − 29 1 823.0 116.3 50.8 19.2 31.6 0.0 1.8 1.8 −
July 6 1 744.4 116.3 50.9 19.2 31.7 0.1 1.3 1.3 −
* The consolidated financial statement of the Eurosystem comprises the financial national central banks of the euro area member states (NCBs). The balance sheetstatement of the European Central Bank (ECB) and the financial statements of the items for foreign currency, securities, gold and financial instruments are valued at the
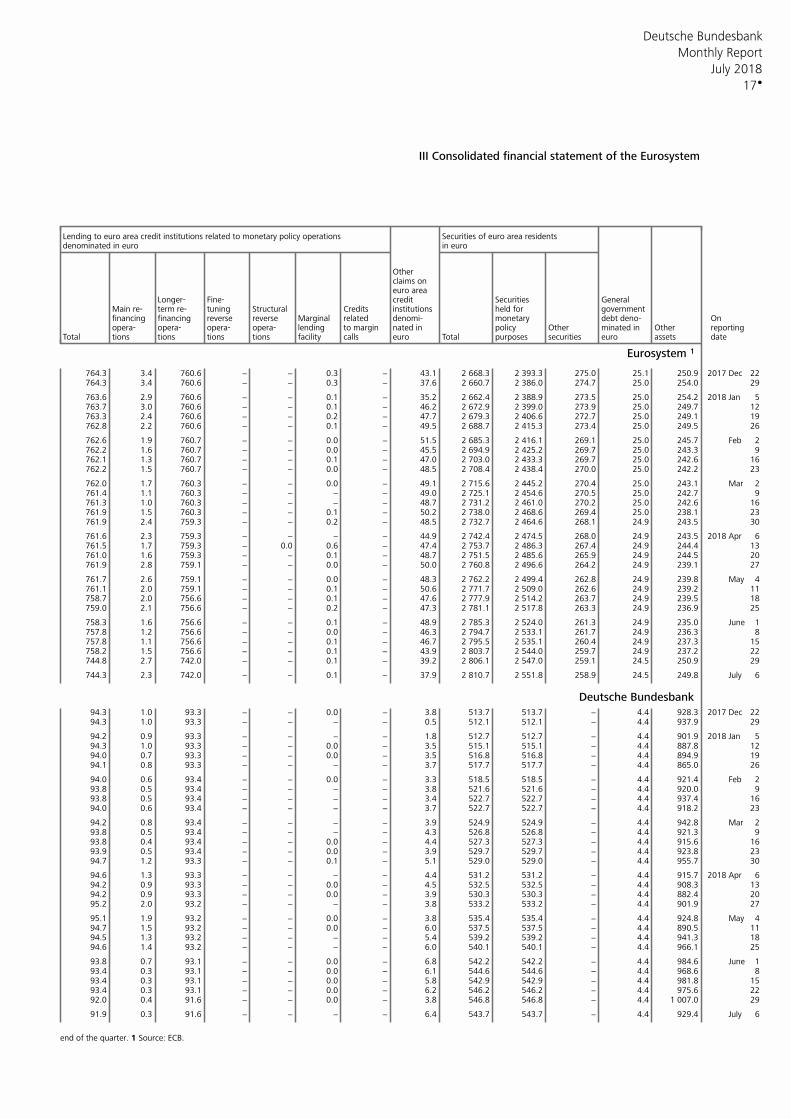
Deutsche Bundesbank
17
Monthly Report
July 2018
III Consolidated financial statement of the Eurosystem
Lending to euro area credit institutions related to monetary policy operations Securities of euro area residentsdenominated in euro in euro
Other claims on euro area
Longer- Fine- credit Securities GeneralMain re- term re- tuning Structural Credits institutions held for governmentfinancing financing reverse reverse Marginal related denomi- monetary debt deno- Onopera- opera- opera- opera- lending to margin nated in policy Other minated in Other reporting
Total tions tions tions tions facility calls euro Total purposes securities euro assets date
Eurosystem 1
764.3 3.4 760.6 − − 0.3 − 43.1 2 668.3 2 393.3 275.0 25.1 250.9 2017 Dec 22764.3 3.4 760.6 − − 0.3 − 37.6 2 660.7 2 386.0 274.7 25.0 254.0 29
763.6 2.9 760.6 − − 0.1 − 35.2 2 662.4 2 388.9 273.5 25.0 254.2 2018 Jan 5763.7 3.0 760.6 − − 0.1 − 46.2 2 672.9 2 399.0 273.9 25.0 249.7 12763.3 2.4 760.6 − − 0.2 − 47.7 2 679.3 2 406.6 272.7 25.0 249.1 19762.8 2.2 760.6 − − 0.1 − 49.5 2 688.7 2 415.3 273.4 25.0 249.5 26
762.6 1.9 760.7 − − 0.0 − 51.5 2 685.3 2 416.1 269.1 25.0 245.7 Feb 2762.2 1.6 760.7 − − 0.0 − 45.5 2 694.9 2 425.2 269.7 25.0 243.3 9762.1 1.3 760.7 − − 0.1 − 47.0 2 703.0 2 433.3 269.7 25.0 242.6 16762.2 1.5 760.7 − − 0.0 − 48.5 2 708.4 2 438.4 270.0 25.0 242.2 23
762.0 1.7 760.3 − − 0.0 − 49.1 2 715.6 2 445.2 270.4 25.0 243.1 Mar 2761.4 1.1 760.3 − − − − 49.0 2 725.1 2 454.6 270.5 25.0 242.7 9761.3 1.0 760.3 − − − − 48.7 2 731.2 2 461.0 270.2 25.0 242.6 16761.9 1.5 760.3 − − 0.1 − 50.2 2 738.0 2 468.6 269.4 25.0 238.1 23761.9 2.4 759.3 − − 0.2 − 48.5 2 732.7 2 464.6 268.1 24.9 243.5 30
761.6 2.3 759.3 − − − − 44.9 2 742.4 2 474.5 268.0 24.9 243.5 2018 Apr 6761.5 1.7 759.3 − 0.0 0.6 − 47.4 2 753.7 2 486.3 267.4 24.9 244.4 13761.0 1.6 759.3 − − 0.1 − 48.7 2 751.5 2 485.6 265.9 24.9 244.5 20761.9 2.8 759.1 − − 0.0 − 50.0 2 760.8 2 496.6 264.2 24.9 239.1 27
761.7 2.6 759.1 − − 0.0 − 48.3 2 762.2 2 499.4 262.8 24.9 239.8 May 4761.1 2.0 759.1 − − 0.1 − 50.6 2 771.7 2 509.0 262.6 24.9 239.2 11758.7 2.0 756.6 − − 0.1 − 47.6 2 777.9 2 514.2 263.7 24.9 239.5 18759.0 2.1 756.6 − − 0.2 − 47.3 2 781.1 2 517.8 263.3 24.9 236.9 25
758.3 1.6 756.6 − − 0.1 − 48.9 2 785.3 2 524.0 261.3 24.9 235.0 June 1757.8 1.2 756.6 − − 0.0 − 46.3 2 794.7 2 533.1 261.7 24.9 236.3 8757.8 1.1 756.6 − − 0.1 − 46.7 2 795.5 2 535.1 260.4 24.9 237.3 15758.2 1.5 756.6 − − 0.1 − 43.9 2 803.7 2 544.0 259.7 24.9 237.2 22744.8 2.7 742.0 − − 0.1 − 39.2 2 806.1 2 547.0 259.1 24.5 250.9 29
744.3 2.3 742.0 − − 0.1 − 37.9 2 810.7 2 551.8 258.9 24.5 249.8 July 6
Deutsche Bundesbank94.3 1.0 93.3 − − 0.0 − 3.8 513.7 513.7 − 4.4 928.3 2017 Dec 2294.3 1.0 93.3 − − − − 0.5 512.1 512.1 − 4.4 937.9 29
94.2 0.9 93.3 − − − − 1.8 512.7 512.7 − 4.4 901.9 2018 Jan 594.3 1.0 93.3 − − 0.0 − 3.5 515.1 515.1 − 4.4 887.8 1294.0 0.7 93.3 − − 0.0 − 3.5 516.8 516.8 − 4.4 894.9 1994.1 0.8 93.3 − − − − 3.7 517.7 517.7 − 4.4 865.0 26
94.0 0.6 93.4 − − 0.0 − 3.3 518.5 518.5 − 4.4 921.4 Feb 293.8 0.5 93.4 − − − − 3.8 521.6 521.6 − 4.4 920.0 993.8 0.5 93.4 − − − − 3.4 522.7 522.7 − 4.4 937.4 1694.0 0.6 93.4 − − − − 3.7 522.7 522.7 − 4.4 918.2 23
94.2 0.8 93.4 − − − − 3.9 524.9 524.9 − 4.4 942.8 Mar 293.8 0.5 93.4 − − − − 4.3 526.8 526.8 − 4.4 921.3 993.8 0.4 93.4 − − 0.0 − 4.4 527.3 527.3 − 4.4 915.6 1693.9 0.5 93.4 − − 0.0 − 3.9 529.7 529.7 − 4.4 923.8 2394.7 1.2 93.3 − − 0.1 − 5.1 529.0 529.0 − 4.4 955.7 30
94.6 1.3 93.3 − − − − 4.4 531.2 531.2 − 4.4 915.7 2018 Apr 694.2 0.9 93.3 − − 0.0 − 4.5 532.5 532.5 − 4.4 908.3 1394.2 0.9 93.3 − − 0.0 − 3.9 530.3 530.3 − 4.4 882.4 2095.2 2.0 93.2 − − − − 3.8 533.2 533.2 − 4.4 901.9 27
95.1 1.9 93.2 − − 0.0 − 3.8 535.4 535.4 − 4.4 924.8 May 494.7 1.5 93.2 − − 0.0 − 6.0 537.5 537.5 − 4.4 890.5 1194.5 1.3 93.2 − − − − 5.4 539.2 539.2 − 4.4 941.3 1894.6 1.4 93.2 − − − − 6.0 540.1 540.1 − 4.4 966.1 25
93.8 0.7 93.1 − − 0.0 − 6.8 542.2 542.2 − 4.4 984.6 June 193.4 0.3 93.1 − − 0.0 − 6.1 544.6 544.6 − 4.4 968.6 893.4 0.3 93.1 − − 0.0 − 5.8 542.9 542.9 − 4.4 981.8 1593.4 0.3 93.1 − − 0.0 − 6.2 546.2 546.2 − 4.4 975.6 2292.0 0.4 91.6 − − 0.0 − 3.8 546.8 546.8 − 4.4 1 007.0 29
91.9 0.3 91.6 − − − − 6.4 543.7 543.7 − 4.4 929.4 July 6
end of the quarter. 1 Source: ECB.
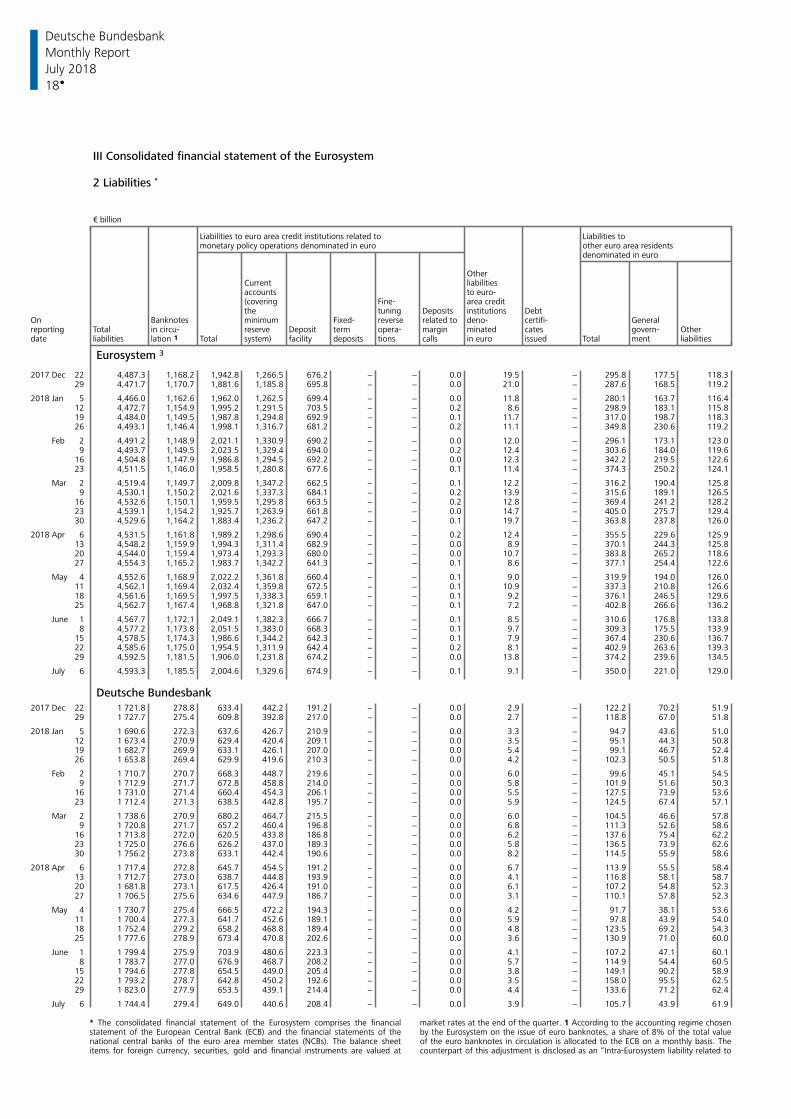
Deutsche Bundesbank
18
Monthly Report
July 2018
III Consolidated financial statement of the Eurosystem
2 Liabilities *
€ billion
Liabilities to euro area credit institutions related to Liabilities tomonetary policy operations denominated in euro other euro area residents
denominated in euro
OtherCurrent liabilitiesaccounts to euro-(covering Fine- area creditthe tuning Deposits institutions Debt
On Banknotes minimum Fixed- reverse deno- certifi- Generalrelated toreporting Total in circu- reserve Deposit term opera- margin minated cates govern- Otherdate liabilities lation 1 Total system) facility deposits tions calls in euro issued Total ment liabilities
Eurosystem 3
2017 Dec 22 4,487.3 1,168.2 1,942.8 1,266.5 676.2 − − 0.0 19.5 − 295.8 177.5 118.3 29 4,471.7 1,170.7 1,881.6 1,185.8 695.8 − − 0.0 21.0 − 287.6 168.5 119.2
2018 Jan 5 4,466.0 1,162.6 1,962.0 1,262.5 699.4 − − 0.0 11.8 − 280.1 163.7 116.4 12 4,472.7 1,154.9 1,995.2 1,291.5 703.5 − − 0.2 8.6 − 298.9 183.1 115.8 19 4,484.0 1,149.5 1,987.8 1,294.8 692.9 − − 0.1 11.7 − 317.0 198.7 118.3 26 4,493.1 1,146.4 1,998.1 1,316.7 681.2 − − 0.2 11.1 − 349.8 230.6 119.2
Feb 2 4,491.2 1,148.9 2,021.1 1,330.9 690.2 − − 0.0 12.0 − 296.1 173.1 123.0 9 4,493.7 1,149.5 2,023.5 1,329.4 694.0 − − 0.2 12.4 − 303.6 184.0 119.6 16 4,504.8 1,147.9 1,986.8 1,294.5 692.2 − − 0.0 12.3 − 342.2 219.5 122.6 23 4,511.5 1,146.0 1,958.5 1,280.8 677.6 − − 0.1 11.4 − 374.3 250.2 124.1
Mar 2 4,519.4 1,149.7 2,009.8 1,347.2 662.5 − − 0.1 12.2 − 316.2 190.4 125.8 9 4,530.1 1,150.2 2,021.6 1,337.3 684.1 − − 0.2 13.9 − 315.6 189.1 126.5 16 4,532.6 1,150.1 1,959.5 1,295.8 663.5 − − 0.2 12.8 − 369.4 241.2 128.2 23 4,539.1 1,154.2 1,925.7 1,263.9 661.8 − − 0.0 14.7 − 405.0 275.7 129.4 30 4,529.6 1,164.2 1,883.4 1,236.2 647.2 − − 0.1 19.7 − 363.8 237.8 126.0
2018 Apr 6 4,531.5 1,161.8 1,989.2 1,298.6 690.4 − − 0.2 12.4 − 355.5 229.6 125.9 13 4,548.2 1,159.9 1,994.3 1,311.4 682.9 − − 0.0 8.9 − 370.1 244.3 125.8 20 4,544.0 1,159.4 1,973.4 1,293.3 680.0 − − 0.0 10.7 − 383.8 265.2 118.6 27 4,554.3 1,165.2 1,983.7 1,342.2 641.3 − − 0.1 8.6 − 377.1 254.4 122.6
May 4 4,552.6 1,168.9 2,022.2 1,361.8 660.4 − − 0.1 9.0 − 319.9 194.0 126.0 11 4,562.1 1,169.4 2,032.4 1,359.8 672.5 − − 0.1 10.9 − 337.3 210.8 126.6 18 4,561.6 1,169.5 1,997.5 1,338.3 659.1 − − 0.1 9.2 − 376.1 246.5 129.6 25 4,562.7 1,167.4 1,968.8 1,321.8 647.0 − − 0.1 7.2 − 402.8 266.6 136.2
June 1 4,567.7 1,172.1 2,049.1 1,382.3 666.7 − − 0.1 8.5 − 310.6 176.8 133.8 8 4,577.2 1,173.8 2,051.5 1,383.0 668.3 − − 0.1 9.7 − 309.3 175.5 133.9 15 4,578.5 1,174.3 1,986.6 1,344.2 642.3 − − 0.1 7.9 − 367.4 230.6 136.7 22 4,585.6 1,175.0 1,954.5 1,311.9 642.4 − − 0.2 8.1 − 402.9 263.6 139.3 29 4,592.5 1,181.5 1,906.0 1,231.8 674.2 − − 0.0 13.8 − 374.2 239.6 134.5
July 6 4,593.3 1,185.5 2,004.6 1,329.6 674.9 − − 0.1 9.1 − 350.0 221.0 129.0
Deutsche Bundesbank2017 Dec 22 1 721.8 278.8 633.4 442.2 191.2 − − 0.0 2.9 − 122.2 70.2 51.9 29 1 727.7 275.4 609.8 392.8 217.0 − − 0.0 2.7 − 118.8 67.0 51.8
2018 Jan 5 1 690.6 272.3 637.6 426.7 210.9 − − 0.0 3.3 − 94.7 43.6 51.0 12 1 673.4 270.9 629.4 420.4 209.1 − − 0.0 3.5 − 95.1 44.3 50.8 19 1 682.7 269.9 633.1 426.1 207.0 − − 0.0 5.4 − 99.1 46.7 52.4 26 1 653.8 269.4 629.9 419.6 210.3 − − 0.0 4.2 − 102.3 50.5 51.8
Feb 2 1 710.7 270.7 668.3 448.7 219.6 − − 0.0 6.0 − 99.6 45.1 54.5 9 1 712.9 271.7 672.8 458.8 214.0 − − 0.0 5.8 − 101.9 51.6 50.3 16 1 731.0 271.4 660.4 454.3 206.1 − − 0.0 5.5 − 127.5 73.9 53.6 23 1 712.4 271.3 638.5 442.8 195.7 − − 0.0 5.9 − 124.5 67.4 57.1
Mar 2 1 738.6 270.9 680.2 464.7 215.5 − − 0.0 6.0 − 104.5 46.6 57.8 9 1 720.8 271.7 657.2 460.4 196.8 − − 0.0 6.8 − 111.3 52.6 58.6 16 1 713.8 272.0 620.5 433.8 186.8 − − 0.0 6.2 − 137.6 75.4 62.2 23 1 725.0 276.6 626.2 437.0 189.3 − − 0.0 5.8 − 136.5 73.9 62.6 30 1 756.2 273.8 633.1 442.4 190.6 − − 0.0 8.2 − 114.5 55.9 58.6
2018 Apr 6 1 717.4 272.8 645.7 454.5 191.2 − − 0.0 6.7 − 113.9 55.5 58.4 13 1 712.7 273.0 638.7 444.8 193.9 − − 0.0 4.1 − 116.8 58.1 58.7 20 1 681.8 273.1 617.5 426.4 191.0 − − 0.0 6.1 − 107.2 54.8 52.3 27 1 706.5 275.6 634.6 447.9 186.7 − − 0.0 3.1 − 110.1 57.8 52.3
May 4 1 730.7 275.4 666.5 472.2 194.3 − − 0.0 4.2 − 91.7 38.1 53.6 11 1 700.4 277.3 641.7 452.6 189.1 − − 0.0 5.9 − 97.8 43.9 54.0 18 1 752.4 279.2 658.2 468.8 189.4 − − 0.0 4.8 − 123.5 69.2 54.3 25 1 777.6 278.9 673.4 470.8 202.6 − − 0.0 3.6 − 130.9 71.0 60.0
June 1 1 799.4 275.9 703.9 480.6 223.3 − − 0.0 4.1 − 107.2 47.1 60.1 8 1 783.7 277.0 676.9 468.7 208.2 − − 0.0 5.7 − 114.9 54.4 60.5 15 1 794.6 277.8 654.5 449.0 205.4 − − 0.0 3.8 − 149.1 90.2 58.9 22 1 793.2 278.7 642.8 450.2 192.6 − − 0.0 3.5 − 158.0 95.5 62.5 29 1 823.0 277.9 653.5 439.1 214.4 − − 0.0 4.4 − 133.6 71.2 62.4
July 6 1 744.4 279.4 649.0 440.6 208.4 − − 0.0 3.9 − 105.7 43.9 61.9
* The consolidated financial statement of the Eurosystem comprises the financial market rates at the end of the quarter. 1 According to the accounting regime chosenstatement of the European Central Bank (ECB) and the financial statements of the by the Eurosystem on the issue of euro banknotes, a share of 8% of the total valuenational central banks of the euro area member states (NCBs). The balance sheet of the euro banknotes in circulation is allocated to the ECB on a monthly basis. Theitems for foreign currency, securities, gold and financial instruments are valued at counterpart of this adjustment is disclosed as an “Intra-Eurosystem liability related to
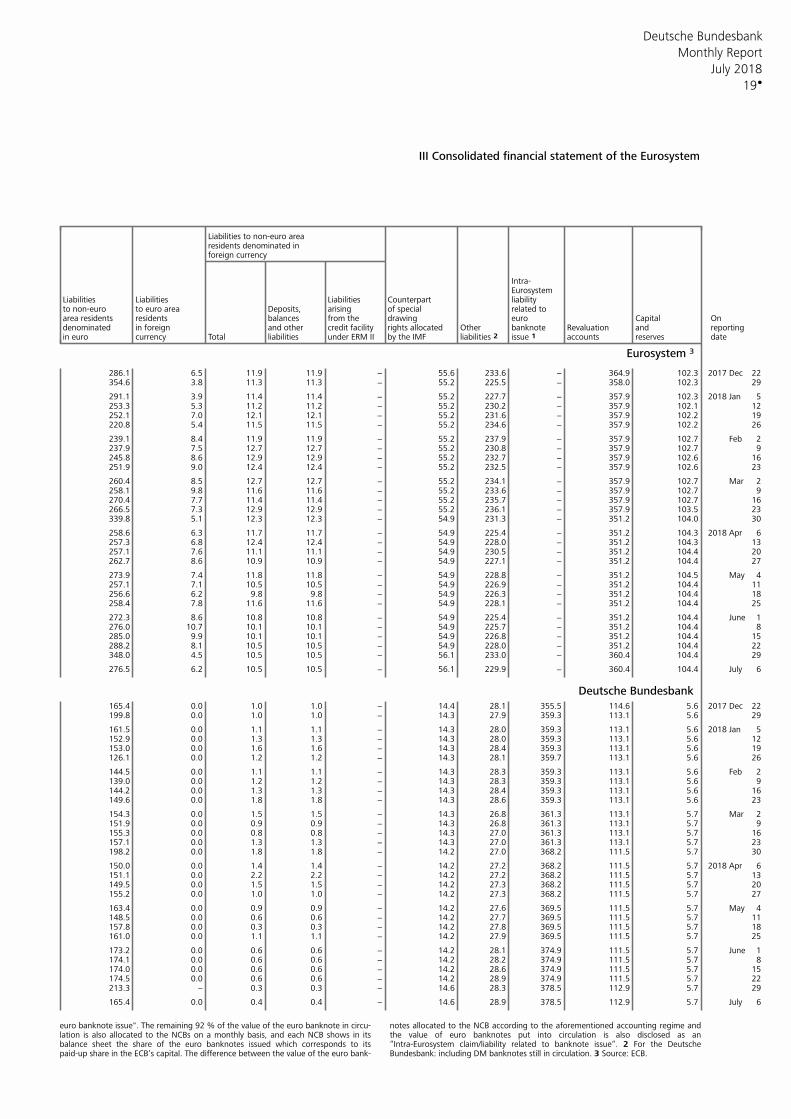
Deutsche Bundesbank
19
Monthly Report
July 2018
III Consolidated financial statement of the Eurosystem
Liabilities to non-euro arearesidents denominated inforeign currency
Intra- Eurosystem
Liabilities Liabilities Liabilities Counterpart liability to non-euro to euro area Deposits, arising of special related to area residents residents balances from the drawing euro Capital Ondenominated in foreign and other rights allocated Other banknote Revaluation and reportingcredit facilityin euro currency Total liabilities under ERM II by the IMF issue 1 accounts reserves dateliabilities 2
Eurosystem 3
286.1 6.5 11.9 11.9 − 55.6 233.6 − 364.9 102.3 2017 Dec 22354.6 3.8 11.3 11.3 − 55.2 225.5 − 358.0 102.3 29
291.1 3.9 11.4 11.4 − 55.2 227.7 − 357.9 102.3 2018 Jan 5253.3 5.3 11.2 11.2 − 55.2 230.2 − 357.9 102.1 12252.1 7.0 12.1 12.1 − 55.2 231.6 − 357.9 102.2 19220.8 5.4 11.5 11.5 − 55.2 234.6 − 357.9 102.2 26
239.1 8.4 11.9 11.9 − 55.2 237.9 − 357.9 102.7 Feb 2237.9 7.5 12.7 12.7 − 55.2 230.8 − 357.9 102.7 9245.8 8.6 12.9 12.9 − 55.2 232.7 − 357.9 102.6 16251.9 9.0 12.4 12.4 − 55.2 232.5 − 357.9 102.6 23
260.4 8.5 12.7 12.7 − 55.2 234.1 − 357.9 102.7 Mar 2258.1 9.8 11.6 11.6 − 55.2 233.6 − 357.9 102.7 9270.4 7.7 11.4 11.4 − 55.2 235.7 − 357.9 102.7 16266.5 7.3 12.9 12.9 − 55.2 236.1 − 357.9 103.5 23339.8 5.1 12.3 12.3 − 54.9 231.3 − 351.2 104.0 30
258.6 6.3 11.7 11.7 − 54.9 225.4 − 351.2 104.3 2018 Apr 6257.3 6.8 12.4 12.4 − 54.9 228.0 − 351.2 104.3 13257.1 7.6 11.1 11.1 − 54.9 230.5 − 351.2 104.4 20262.7 8.6 10.9 10.9 − 54.9 227.1 − 351.2 104.4 27
273.9 7.4 11.8 11.8 − 54.9 228.8 − 351.2 104.5 May 4257.1 7.1 10.5 10.5 − 54.9 226.9 − 351.2 104.4 11256.6 6.2 9.8 9.8 − 54.9 226.3 − 351.2 104.4 18258.4 7.8 11.6 11.6 − 54.9 228.1 − 351.2 104.4 25
272.3 8.6 10.8 10.8 − 54.9 225.4 − 351.2 104.4 June 1276.0 10.7 10.1 10.1 − 54.9 225.7 − 351.2 104.4 8285.0 9.9 10.1 10.1 − 54.9 226.8 − 351.2 104.4 15288.2 8.1 10.5 10.5 − 54.9 228.0 − 351.2 104.4 22348.0 4.5 10.5 10.5 − 56.1 233.0 − 360.4 104.4 29
276.5 6.2 10.5 10.5 − 56.1 229.9 − 360.4 104.4 July 6
Deutsche Bundesbank165.4 0.0 1.0 1.0 − 14.4 28.1 355.5 114.6 5.6 2017 Dec 22199.8 0.0 1.0 1.0 − 14.3 27.9 359.3 113.1 5.6 29
161.5 0.0 1.1 1.1 − 14.3 28.0 359.3 113.1 5.6 2018 Jan 5152.9 0.0 1.3 1.3 − 14.3 28.0 359.3 113.1 5.6 12153.0 0.0 1.6 1.6 − 14.3 28.4 359.3 113.1 5.6 19126.1 0.0 1.2 1.2 − 14.3 28.1 359.7 113.1 5.6 26
144.5 0.0 1.1 1.1 − 14.3 28.3 359.3 113.1 5.6 Feb 2139.0 0.0 1.2 1.2 − 14.3 28.3 359.3 113.1 5.6 9144.2 0.0 1.3 1.3 − 14.3 28.4 359.3 113.1 5.6 16149.6 0.0 1.8 1.8 − 14.3 28.6 359.3 113.1 5.6 23
154.3 0.0 1.5 1.5 − 14.3 26.8 361.3 113.1 5.7 Mar 2151.9 0.0 0.9 0.9 − 14.3 26.8 361.3 113.1 5.7 9155.3 0.0 0.8 0.8 − 14.3 27.0 361.3 113.1 5.7 16157.1 0.0 1.3 1.3 − 14.3 27.0 361.3 113.1 5.7 23198.2 0.0 1.8 1.8 − 14.2 27.0 368.2 111.5 5.7 30
150.0 0.0 1.4 1.4 − 14.2 27.2 368.2 111.5 5.7 2018 Apr 6151.1 0.0 2.2 2.2 − 14.2 27.2 368.2 111.5 5.7 13149.5 0.0 1.5 1.5 − 14.2 27.3 368.2 111.5 5.7 20155.2 0.0 1.0 1.0 − 14.2 27.3 368.2 111.5 5.7 27
163.4 0.0 0.9 0.9 − 14.2 27.6 369.5 111.5 5.7 May 4148.5 0.0 0.6 0.6 − 14.2 27.7 369.5 111.5 5.7 11157.8 0.0 0.3 0.3 − 14.2 27.8 369.5 111.5 5.7 18161.0 0.0 1.1 1.1 − 14.2 27.9 369.5 111.5 5.7 25
173.2 0.0 0.6 0.6 − 14.2 28.1 374.9 111.5 5.7 June 1174.1 0.0 0.6 0.6 − 14.2 28.2 374.9 111.5 5.7 8174.0 0.0 0.6 0.6 − 14.2 28.6 374.9 111.5 5.7 15174.5 0.0 0.6 0.6 − 14.2 28.9 374.9 111.5 5.7 22213.3 − 0.3 0.3 − 14.6 28.3 378.5 112.9 5.7 29
165.4 0.0 0.4 0.4 − 14.6 28.9 378.5 112.9 5.7 July 6
euro banknote issue". The remaining 92 % of the value of the euro banknote in circu- notes allocated to the NCB according to the aforementioned accounting regime andlation is also allocated to the NCBs on a monthly basis, and each NCB shows in its the value of euro banknotes put into circulation is also disclosed as anbalance sheet the share of the euro banknotes issued which corresponds to its “Intra-Eurosystem claim/liability related to banknote issue“. 2 For the Deutschepaid-up share in the ECB’s capital. The difference between the value of the euro bank- Bundesbank: including DM banknotes still in circulation. 3 Source: ECB.
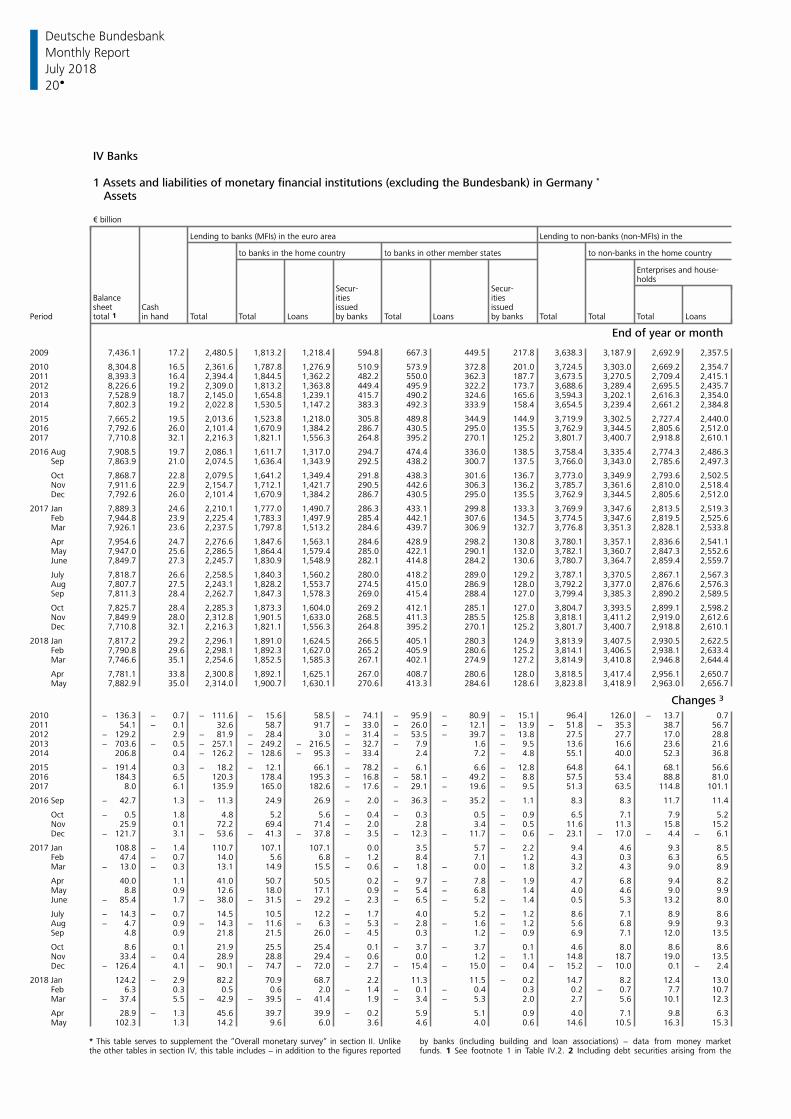
Deutsche Bundesbank
20
Monthly Report
July 2018
IV Banks
1 Assets and liabilities of monetary financial institutions (excluding the Bundesbank) in Germany *
Assets
€ billion
Lending to banks (MFIs) in the euro area Lending to non-banks (non-MFIs) in the
to banks in the home country to banks in other member states to non-banks in the home country
Enterprises and house-holds
Secur- Secur-Balance ities itiessheet Cash issued issued
Period total 1 in hand Total Total Loans by banks Total Loans by banks Total Total Total Loans
End of year or month
2009 7,436.1 17.2 2,480.5 1,813.2 1,218.4 594.8 667.3 449.5 217.8 3,638.3 3,187.9 2,692.9 2,357.5
2010 8,304.8 16.5 2,361.6 1,787.8 1,276.9 510.9 573.9 372.8 201.0 3,724.5 3,303.0 2,669.2 2,354.72011 8,393.3 16.4 2,394.4 1,844.5 1,362.2 482.2 550.0 362.3 187.7 3,673.5 3,270.5 2,709.4 2,415.12012 8,226.6 19.2 2,309.0 1,813.2 1,363.8 449.4 495.9 322.2 173.7 3,688.6 3,289.4 2,695.5 2,435.72013 7,528.9 18.7 2,145.0 1,654.8 1,239.1 415.7 490.2 324.6 165.6 3,594.3 3,202.1 2,616.3 2,354.02014 7,802.3 19.2 2,022.8 1,530.5 1,147.2 383.3 492.3 333.9 158.4 3,654.5 3,239.4 2,661.2 2,384.8
2015 7,665.2 19.5 2,013.6 1,523.8 1,218.0 305.8 489.8 344.9 144.9 3,719.9 3,302.5 2,727.4 2,440.02016 7,792.6 26.0 2,101.4 1,670.9 1,384.2 286.7 430.5 295.0 135.5 3,762.9 3,344.5 2,805.6 2,512.02017 7,710.8 32.1 2,216.3 1,821.1 1,556.3 264.8 395.2 270.1 125.2 3,801.7 3,400.7 2,918.8 2,610.1
2016 Aug 7,908.5 19.7 2,086.1 1,611.7 1,317.0 294.7 474.4 336.0 138.5 3,758.4 3,335.4 2,774.3 2,486.3 Sep 7,863.9 21.0 2,074.5 1,636.4 1,343.9 292.5 438.2 300.7 137.5 3,766.0 3,343.0 2,785.6 2,497.3
Oct 7,868.7 22.8 2,079.5 1,641.2 1,349.4 291.8 438.3 301.6 136.7 3,773.0 3,349.9 2,793.6 2,502.5 Nov 7,911.6 22.9 2,154.7 1,712.1 1,421.7 290.5 442.6 306.3 136.2 3,785.7 3,361.6 2,810.0 2,518.4 Dec 7,792.6 26.0 2,101.4 1,670.9 1,384.2 286.7 430.5 295.0 135.5 3,762.9 3,344.5 2,805.6 2,512.0
2017 Jan 7,889.3 24.6 2,210.1 1,777.0 1,490.7 286.3 433.1 299.8 133.3 3,769.9 3,347.6 2,813.5 2,519.3 Feb 7,944.8 23.9 2,225.4 1,783.3 1,497.9 285.4 442.1 307.6 134.5 3,774.5 3,347.6 2,819.5 2,525.6 Mar 7,926.1 23.6 2,237.5 1,797.8 1,513.2 284.6 439.7 306.9 132.7 3,776.8 3,351.3 2,828.1 2,533.8
Apr 7,954.6 24.7 2,276.6 1,847.6 1,563.1 284.6 428.9 298.2 130.8 3,780.1 3,357.1 2,836.6 2,541.1 May 7,947.0 25.6 2,286.5 1,864.4 1,579.4 285.0 422.1 290.1 132.0 3,782.1 3,360.7 2,847.3 2,552.6 June 7,849.7 27.3 2,245.7 1,830.9 1,548.9 282.1 414.8 284.2 130.6 3,780.7 3,364.7 2,859.4 2,559.7
July 7,818.7 26.6 2,258.5 1,840.3 1,560.2 280.0 418.2 289.0 129.2 3,787.1 3,370.5 2,867.1 2,567.3 Aug 7,807.7 27.5 2,243.1 1,828.2 1,553.7 274.5 415.0 286.9 128.0 3,792.2 3,377.0 2,876.6 2,576.3 Sep 7,811.3 28.4 2,262.7 1,847.3 1,578.3 269.0 415.4 288.4 127.0 3,799.4 3,385.3 2,890.2 2,589.5
Oct 7,825.7 28.4 2,285.3 1,873.3 1,604.0 269.2 412.1 285.1 127.0 3,804.7 3,393.5 2,899.1 2,598.2 Nov 7,849.9 28.0 2,312.8 1,901.5 1,633.0 268.5 411.3 285.5 125.8 3,818.1 3,411.2 2,919.0 2,612.6 Dec 7,710.8 32.1 2,216.3 1,821.1 1,556.3 264.8 395.2 270.1 125.2 3,801.7 3,400.7 2,918.8 2,610.1
2018 Jan 7,817.2 29.2 2,296.1 1,891.0 1,624.5 266.5 405.1 280.3 124.9 3,813.9 3,407.5 2,930.5 2,622.5 Feb 7,790.8 29.6 2,298.1 1,892.3 1,627.0 265.2 405.9 280.6 125.2 3,814.1 3,406.5 2,938.1 2,633.4 Mar 7,746.6 35.1 2,254.6 1,852.5 1,585.3 267.1 402.1 274.9 127.2 3,814.9 3,410.8 2,946.8 2,644.4
Apr 7,781.1 33.8 2,300.8 1,892.1 1,625.1 267.0 408.7 280.6 128.0 3,818.5 3,417.4 2,956.1 2,650.7 May 7,882.9 35.0 2,314.0 1,900.7 1,630.1 270.6 413.3 284.6 128.6 3,823.8 3,418.9 2,963.0 2,656.7
Changes 3
2010 − 136.3 − 0.7 − 111.6 − 15.6 58.5 − 74.1 − 95.9 − 80.9 − 15.1 96.4 126.0 − 13.7 0.72011 54.1 − 0.1 32.6 58.7 91.7 − 33.0 − 26.0 − 12.1 − 13.9 − 51.8 − 35.3 38.7 56.72012 − 129.2 2.9 − 81.9 − 28.4 3.0 − 31.4 − 53.5 − 39.7 − 13.8 27.5 27.7 17.0 28.82013 − 703.6 − 0.5 − 257.1 − 249.2 − 216.5 − 32.7 − 7.9 1.6 − 9.5 13.6 16.6 23.6 21.62014 206.8 0.4 − 126.2 − 128.6 − 95.3 − 33.4 2.4 7.2 − 4.8 55.1 40.0 52.3 36.8
2015 − 191.4 0.3 − 18.2 − 12.1 66.1 − 78.2 − 6.1 6.6 − 12.8 64.8 64.1 68.1 56.62016 184.3 6.5 120.3 178.4 195.3 − 16.8 − 58.1 − 49.2 − 8.8 57.5 53.4 88.8 81.02017 8.0 6.1 135.9 165.0 182.6 − 17.6 − 29.1 − 19.6 − 9.5 51.3 63.5 114.8 101.1
2016 Sep − 42.7 1.3 − 11.3 24.9 26.9 − 2.0 − 36.3 − 35.2 − 1.1 8.3 8.3 11.7 11.4
Oct − 0.5 1.8 4.8 5.2 5.6 − 0.4 − 0.3 0.5 − 0.9 6.5 7.1 7.9 5.2 Nov 25.9 0.1 72.2 69.4 71.4 − 2.0 2.8 3.4 − 0.5 11.6 11.3 15.8 15.2 Dec − 121.7 3.1 − 53.6 − 41.3 − 37.8 − 3.5 − 12.3 − 11.7 − 0.6 − 23.1 − 17.0 − 4.4 − 6.1
2017 Jan 108.8 − 1.4 110.7 107.1 107.1 0.0 3.5 5.7 − 2.2 9.4 4.6 9.3 8.5 Feb 47.4 − 0.7 14.0 5.6 6.8 − 1.2 8.4 7.1 1.2 4.3 0.3 6.3 6.5 Mar − 13.0 − 0.3 13.1 14.9 15.5 − 0.6 − 1.8 − 0.0 − 1.8 3.2 4.3 9.0 8.9
Apr 40.0 1.1 41.0 50.7 50.5 0.2 − 9.7 − 7.8 − 1.9 4.7 6.8 9.4 8.2 May 8.8 0.9 12.6 18.0 17.1 0.9 − 5.4 − 6.8 1.4 4.0 4.6 9.0 9.9 June − 85.4 1.7 − 38.0 − 31.5 − 29.2 − 2.3 − 6.5 − 5.2 − 1.4 0.5 5.3 13.2 8.0
July − 14.3 − 0.7 14.5 10.5 12.2 − 1.7 4.0 5.2 − 1.2 8.6 7.1 8.9 8.6 Aug − 4.7 0.9 − 14.3 − 11.6 − 6.3 − 5.3 − 2.8 − 1.6 − 1.2 5.6 6.8 9.9 9.3 Sep 4.8 0.9 21.8 21.5 26.0 − 4.5 0.3 1.2 − 0.9 6.9 7.1 12.0 13.5
Oct 8.6 0.1 21.9 25.5 25.4 0.1 − 3.7 − 3.7 0.1 4.6 8.0 8.6 8.6 Nov 33.4 − 0.4 28.9 28.8 29.4 − 0.6 0.0 1.2 − 1.1 14.8 18.7 19.0 13.5 Dec − 126.4 4.1 − 90.1 − 74.7 − 72.0 − 2.7 − 15.4 − 15.0 − 0.4 − 15.2 − 10.0 0.1 − 2.4
2018 Jan 124.2 − 2.9 82.2 70.9 68.7 2.2 11.3 11.5 − 0.2 14.7 8.2 12.4 13.0 Feb 6.3 0.3 0.5 0.6 2.0 − 1.4 − 0.1 − 0.4 0.3 0.2 − 0.7 7.7 10.7 Mar − 37.4 5.5 − 42.9 − 39.5 − 41.4 1.9 − 3.4 − 5.3 2.0 2.7 5.6 10.1 12.3
Apr 28.9 − 1.3 45.6 39.7 39.9 − 0.2 5.9 5.1 0.9 4.0 7.1 9.8 6.3 May 102.3 1.3 14.2 9.6 6.0 3.6 4.6 4.0 0.6 14.6 10.5 16.3 15.3
* This table serves to supplement the “Overall monetary survey“ in section II. Unlike by banks (including building and loan associations) − data from money marketthe other tables in section IV, this table includes − in addition to the figures reported funds. 1 See footnote 1 in Table IV.2. 2 Including debt securities arising from the
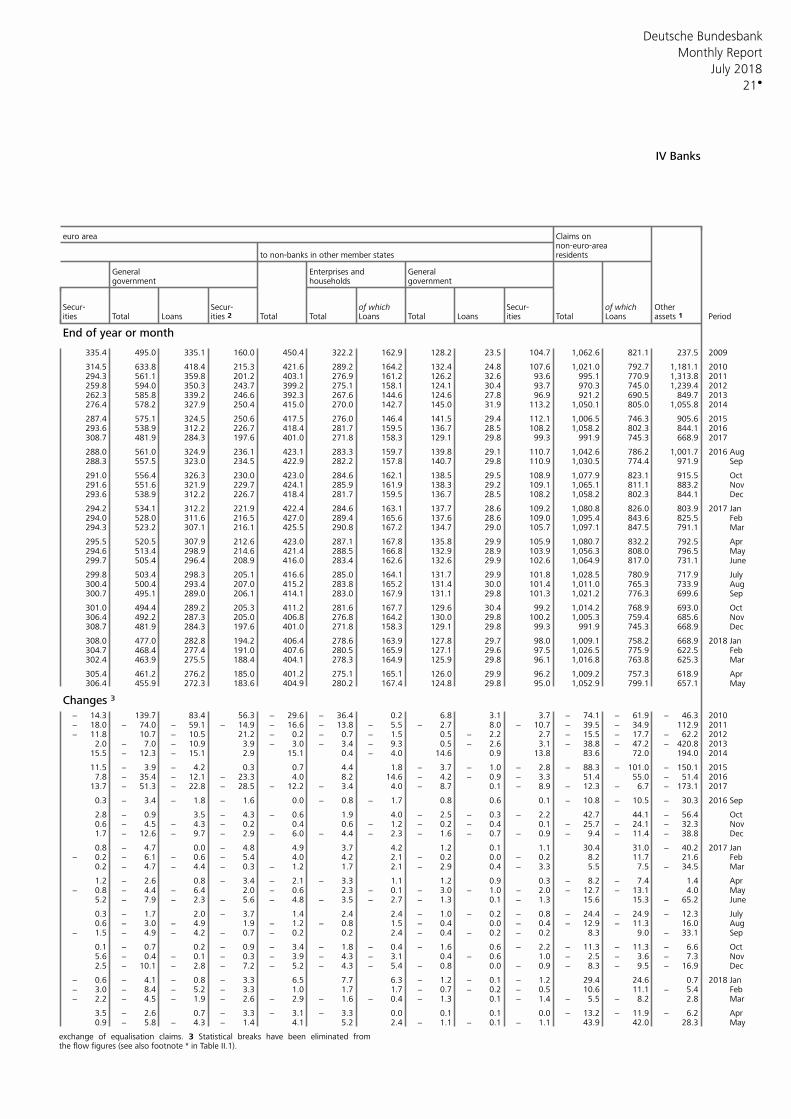
Deutsche Bundesbank
21
Monthly Report
July 2018
IV Banks
euro area Claims onnon-euro-area
to non-banks in other member states residents
General Enterprises and General government households government
Secur- Secur- of which Secur- of which Otherities Total Loans ities 2 Total Total Loans Total Loans ities Total Loans assets 1 Period
End of year or month
335.4 495.0 335.1 160.0 450.4 322.2 162.9 128.2 23.5 104.7 1,062.6 821.1 237.5 2009
314.5 633.8 418.4 215.3 421.6 289.2 164.2 132.4 24.8 107.6 1,021.0 792.7 1,181.1 2010294.3 561.1 359.8 201.2 403.1 276.9 161.2 126.2 32.6 93.6 995.1 770.9 1,313.8 2011259.8 594.0 350.3 243.7 399.2 275.1 158.1 124.1 30.4 93.7 970.3 745.0 1,239.4 2012262.3 585.8 339.2 246.6 392.3 267.6 144.6 124.6 27.8 96.9 921.2 690.5 849.7 2013276.4 578.2 327.9 250.4 415.0 270.0 142.7 145.0 31.9 113.2 1,050.1 805.0 1,055.8 2014
287.4 575.1 324.5 250.6 417.5 276.0 146.4 141.5 29.4 112.1 1,006.5 746.3 905.6 2015293.6 538.9 312.2 226.7 418.4 281.7 159.5 136.7 28.5 108.2 1,058.2 802.3 844.1 2016308.7 481.9 284.3 197.6 401.0 271.8 158.3 129.1 29.8 99.3 991.9 745.3 668.9 2017
288.0 561.0 324.9 236.1 423.1 283.3 159.7 139.8 29.1 110.7 1,042.6 786.2 1,001.7 2016 Aug 288.3 557.5 323.0 234.5 422.9 282.2 157.8 140.7 29.8 110.9 1,030.5 774.4 971.9 Sep
291.0 556.4 326.3 230.0 423.0 284.6 162.1 138.5 29.5 108.9 1,077.9 823.1 915.5 Oct 291.6 551.6 321.9 229.7 424.1 285.9 161.9 138.3 29.2 109.1 1,065.1 811.1 883.2 Nov 293.6 538.9 312.2 226.7 418.4 281.7 159.5 136.7 28.5 108.2 1,058.2 802.3 844.1 Dec
294.2 534.1 312.2 221.9 422.4 284.6 163.1 137.7 28.6 109.2 1,080.8 826.0 803.9 2017 Jan 294.0 528.0 311.6 216.5 427.0 289.4 165.6 137.6 28.6 109.0 1,095.4 843.6 825.5 Feb 294.3 523.2 307.1 216.1 425.5 290.8 167.2 134.7 29.0 105.7 1,097.1 847.5 791.1 Mar
295.5 520.5 307.9 212.6 423.0 287.1 167.8 135.8 29.9 105.9 1,080.7 832.2 792.5 Apr 294.6 513.4 298.9 214.6 421.4 288.5 166.8 132.9 28.9 103.9 1,056.3 808.0 796.5 May299.7 505.4 296.4 208.9 416.0 283.4 162.6 132.6 29.9 102.6 1,064.9 817.0 731.1 June
299.8 503.4 298.3 205.1 416.6 285.0 164.1 131.7 29.9 101.8 1,028.5 780.9 717.9 July300.4 500.4 293.4 207.0 415.2 283.8 165.2 131.4 30.0 101.4 1,011.0 765.3 733.9 Aug 300.7 495.1 289.0 206.1 414.1 283.0 167.9 131.1 29.8 101.3 1,021.2 776.3 699.6 Sep
301.0 494.4 289.2 205.3 411.2 281.6 167.7 129.6 30.4 99.2 1,014.2 768.9 693.0 Oct 306.4 492.2 287.3 205.0 406.8 276.8 164.2 130.0 29.8 100.2 1,005.3 759.4 685.6 Nov 308.7 481.9 284.3 197.6 401.0 271.8 158.3 129.1 29.8 99.3 991.9 745.3 668.9 Dec
308.0 477.0 282.8 194.2 406.4 278.6 163.9 127.8 29.7 98.0 1,009.1 758.2 668.9 2018 Jan 304.7 468.4 277.4 191.0 407.6 280.5 165.9 127.1 29.6 97.5 1,026.5 775.9 622.5 Feb 302.4 463.9 275.5 188.4 404.1 278.3 164.9 125.9 29.8 96.1 1,016.8 763.8 625.3 Mar
305.4 461.2 276.2 185.0 401.2 275.1 165.1 126.0 29.9 96.2 1,009.2 757.3 618.9 Apr 306.4 455.9 272.3 183.6 404.9 280.2 167.4 124.8 29.8 95.0 1,052.9 799.1 657.1 May
Changes 3
− 14.3 139.7 83.4 56.3 − 29.6 − 36.4 0.2 6.8 3.1 3.7 − 74.1 − 61.9 − 46.3 2010− 18.0 − 74.0 − 59.1 − 14.9 − 16.6 − 13.8 − 5.5 − 2.7 8.0 − 10.7 − 39.5 − 34.9 112.9 2011− 11.8 10.7 − 10.5 21.2 − 0.2 − 0.7 − 1.5 0.5 − 2.2 2.7 − 15.5 − 17.7 − 62.2 2012
2.0 − 7.0 − 10.9 3.9 − 3.0 − 3.4 − 9.3 0.5 − 2.6 3.1 − 38.8 − 47.2 − 420.8 201315.5 − 12.3 − 15.1 2.9 15.1 0.4 − 4.0 14.6 0.9 13.8 83.6 72.0 194.0 2014
11.5 − 3.9 − 4.2 0.3 0.7 4.4 1.8 − 3.7 − 1.0 − 2.8 − 88.3 − 101.0 − 150.1 20157.8 − 35.4 − 12.1 − 23.3 4.0 8.2 14.6 − 4.2 − 0.9 − 3.3 51.4 55.0 − 51.4 2016
13.7 − 51.3 − 22.8 − 28.5 − 12.2 − 3.4 4.0 − 8.7 0.1 − 8.9 − 12.3 − 6.7 − 173.1 2017
0.3 − 3.4 − 1.8 − 1.6 0.0 − 0.8 − 1.7 0.8 0.6 0.1 − 10.8 − 10.5 − 30.3 2016 Sep
2.8 − 0.9 3.5 − 4.3 − 0.6 1.9 4.0 − 2.5 − 0.3 − 2.2 42.7 44.1 − 56.4 Oct 0.6 − 4.5 − 4.3 − 0.2 0.4 0.6 − 1.2 − 0.2 − 0.4 0.1 − 25.7 − 24.1 − 32.3 Nov 1.7 − 12.6 − 9.7 − 2.9 − 6.0 − 4.4 − 2.3 − 1.6 − 0.7 − 0.9 − 9.4 − 11.4 − 38.8 Dec
0.8 − 4.7 0.0 − 4.8 4.9 3.7 4.2 1.2 0.1 1.1 30.4 31.0 − 40.2 2017 Jan − 0.2 − 6.1 − 0.6 − 5.4 4.0 4.2 2.1 − 0.2 0.0 − 0.2 8.2 11.7 21.6 Feb
0.2 − 4.7 − 4.4 − 0.3 − 1.2 1.7 2.1 − 2.9 0.4 − 3.3 5.5 7.5 − 34.5 Mar
1.2 − 2.6 0.8 − 3.4 − 2.1 − 3.3 1.1 1.2 0.9 0.3 − 8.2 − 7.4 1.4 Apr − 0.8 − 4.4 − 6.4 2.0 − 0.6 2.3 − 0.1 − 3.0 − 1.0 − 2.0 − 12.7 − 13.1 4.0 May
5.2 − 7.9 − 2.3 − 5.6 − 4.8 − 3.5 − 2.7 − 1.3 0.1 − 1.3 15.6 15.3 − 65.2 June
0.3 − 1.7 2.0 − 3.7 1.4 2.4 2.4 − 1.0 − 0.2 − 0.8 − 24.4 − 24.9 − 12.3 July0.6 − 3.0 − 4.9 1.9 − 1.2 − 0.8 1.5 − 0.4 0.0 − 0.4 − 12.9 − 11.3 16.0 Aug
− 1.5 − 4.9 − 4.2 − 0.7 − 0.2 0.2 2.4 − 0.4 − 0.2 − 0.2 8.3 9.0 − 33.1 Sep
0.1 − 0.7 0.2 − 0.9 − 3.4 − 1.8 − 0.4 − 1.6 0.6 − 2.2 − 11.3 − 11.3 − 6.6 Oct 5.6 − 0.4 − 0.1 − 0.3 − 3.9 − 4.3 − 3.1 0.4 − 0.6 1.0 − 2.5 − 3.6 − 7.3 Nov 2.5 − 10.1 − 2.8 − 7.2 − 5.2 − 4.3 − 5.4 − 0.8 0.0 − 0.9 − 8.3 − 9.5 − 16.9 Dec
− 0.6 − 4.1 − 0.8 − 3.3 6.5 7.7 6.3 − 1.2 − 0.1 − 1.2 29.4 24.6 0.7 2018 Jan − 3.0 − 8.4 − 5.2 − 3.3 1.0 1.7 1.7 − 0.7 − 0.2 − 0.5 10.6 11.1 − 5.4 Feb − 2.2 − 4.5 − 1.9 − 2.6 − 2.9 − 1.6 − 0.4 − 1.3 0.1 − 1.4 − 5.5 − 8.2 2.8 Mar
3.5 − 2.6 0.7 − 3.3 − 3.1 − 3.3 0.0 0.1 0.1 0.0 − 13.2 − 11.9 − 6.2 Apr 0.9 − 5.8 − 4.3 − 1.4 4.1 5.2 2.4 − 1.1 − 0.1 − 1.1 43.9 42.0 28.3 May
exchange of equalisation claims. 3 Statistical breaks have been eliminated fromthe flow figures (see also footnote * in Table II.1).
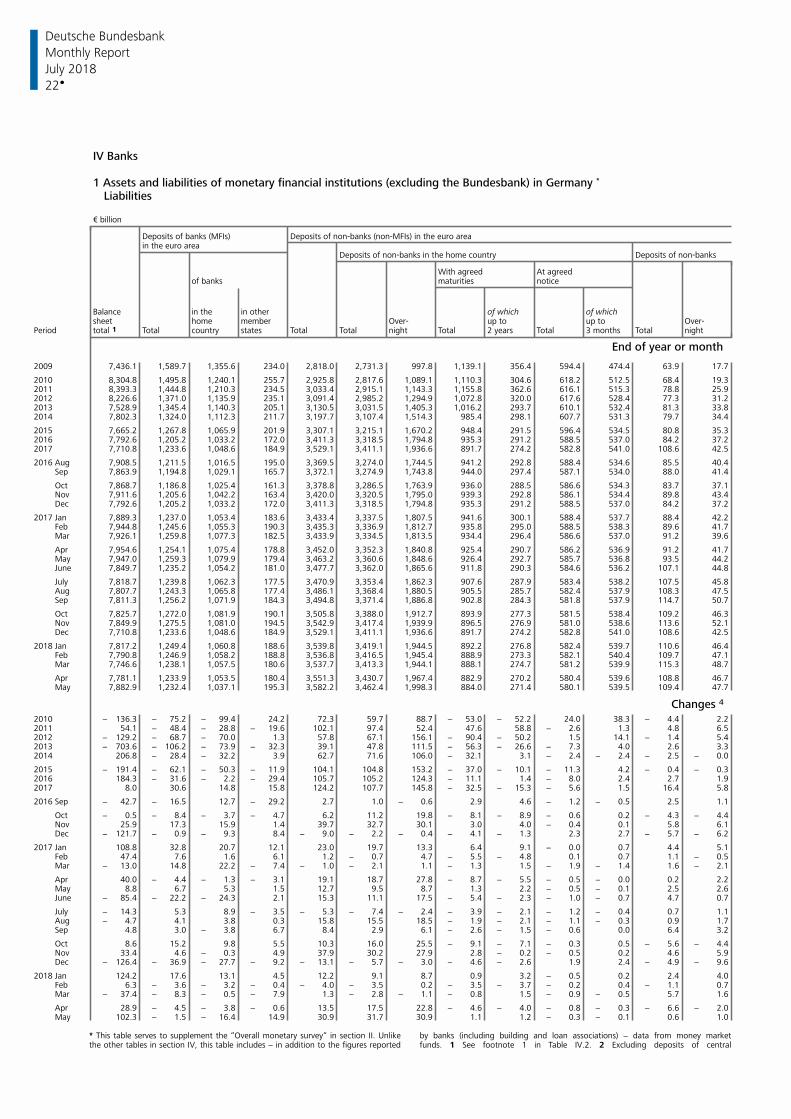
Deutsche Bundesbank
22
Monthly Report
July 2018
IV Banks
1 Assets and liabilities of monetary financial institutions (excluding the Bundesbank) in Germany *
Liabilities
€ billion
Deposits of banks (MFIs) Deposits of non-banks (non-MFIs) in the euro areain the euro area
Deposits of non-banks in the home country Deposits of non-banks
With agreed At agreedof banks maturities notice
Balance in the in other of which of whichsheet home member Over- up to up to Over-
Period total 1 Total country states Total Total night Total 2 years Total 3 months Total night
End of year or month
2009 7,436.1 1,589.7 1,355.6 234.0 2,818.0 2,731.3 997.8 1,139.1 356.4 594.4 474.4 63.9 17.7
2010 8,304.8 1,495.8 1,240.1 255.7 2,925.8 2,817.6 1,089.1 1,110.3 304.6 618.2 512.5 68.4 19.32011 8,393.3 1,444.8 1,210.3 234.5 3,033.4 2,915.1 1,143.3 1,155.8 362.6 616.1 515.3 78.8 25.92012 8,226.6 1,371.0 1,135.9 235.1 3,091.4 2,985.2 1,294.9 1,072.8 320.0 617.6 528.4 77.3 31.22013 7,528.9 1,345.4 1,140.3 205.1 3,130.5 3,031.5 1,405.3 1,016.2 293.7 610.1 532.4 81.3 33.82014 7,802.3 1,324.0 1,112.3 211.7 3,197.7 3,107.4 1,514.3 985.4 298.1 607.7 531.3 79.7 34.4
2015 7,665.2 1,267.8 1,065.9 201.9 3,307.1 3,215.1 1,670.2 948.4 291.5 596.4 534.5 80.8 35.32016 7,792.6 1,205.2 1,033.2 172.0 3,411.3 3,318.5 1,794.8 935.3 291.2 588.5 537.0 84.2 37.22017 7,710.8 1,233.6 1,048.6 184.9 3,529.1 3,411.1 1,936.6 891.7 274.2 582.8 541.0 108.6 42.5
2016 Aug 7,908.5 1,211.5 1,016.5 195.0 3,369.5 3,274.0 1,744.5 941.2 292.8 588.4 534.6 85.5 40.4 Sep 7,863.9 1,194.8 1,029.1 165.7 3,372.1 3,274.9 1,743.8 944.0 297.4 587.1 534.0 88.0 41.4
Oct 7,868.7 1,186.8 1,025.4 161.3 3,378.8 3,286.5 1,763.9 936.0 288.5 586.6 534.3 83.7 37.1 Nov 7,911.6 1,205.6 1,042.2 163.4 3,420.0 3,320.5 1,795.0 939.3 292.8 586.1 534.4 89.8 43.4 Dec 7,792.6 1,205.2 1,033.2 172.0 3,411.3 3,318.5 1,794.8 935.3 291.2 588.5 537.0 84.2 37.2
2017 Jan 7,889.3 1,237.0 1,053.4 183.6 3,433.4 3,337.5 1,807.5 941.6 300.1 588.4 537.7 88.4 42.2 Feb 7,944.8 1,245.6 1,055.3 190.3 3,435.3 3,336.9 1,812.7 935.8 295.0 588.5 538.3 89.6 41.7 Mar 7,926.1 1,259.8 1,077.3 182.5 3,433.9 3,334.5 1,813.5 934.4 296.4 586.6 537.0 91.2 39.6
Apr 7,954.6 1,254.1 1,075.4 178.8 3,452.0 3,352.3 1,840.8 925.4 290.7 586.2 536.9 91.2 41.7 May 7,947.0 1,259.3 1,079.9 179.4 3,463.2 3,360.6 1,848.6 926.4 292.7 585.7 536.8 93.5 44.2 June 7,849.7 1,235.2 1,054.2 181.0 3,477.7 3,362.0 1,865.6 911.8 290.3 584.6 536.2 107.1 44.8
July 7,818.7 1,239.8 1,062.3 177.5 3,470.9 3,353.4 1,862.3 907.6 287.9 583.4 538.2 107.5 45.8 Aug 7,807.7 1,243.3 1,065.8 177.4 3,486.1 3,368.4 1,880.5 905.5 285.7 582.4 537.9 108.3 47.5 Sep 7,811.3 1,256.2 1,071.9 184.3 3,494.8 3,371.4 1,886.8 902.8 284.3 581.8 537.9 114.7 50.7
Oct 7,825.7 1,272.0 1,081.9 190.1 3,505.8 3,388.0 1,912.7 893.9 277.3 581.5 538.4 109.2 46.3 Nov 7,849.9 1,275.5 1,081.0 194.5 3,542.9 3,417.4 1,939.9 896.5 276.9 581.0 538.6 113.6 52.1 Dec 7,710.8 1,233.6 1,048.6 184.9 3,529.1 3,411.1 1,936.6 891.7 274.2 582.8 541.0 108.6 42.5
2018 Jan 7,817.2 1,249.4 1,060.8 188.6 3,539.8 3,419.1 1,944.5 892.2 276.8 582.4 539.7 110.6 46.4 Feb 7,790.8 1,246.9 1,058.2 188.8 3,536.8 3,416.5 1,945.4 888.9 273.3 582.1 540.4 109.7 47.1 Mar 7,746.6 1,238.1 1,057.5 180.6 3,537.7 3,413.3 1,944.1 888.1 274.7 581.2 539.9 115.3 48.7
Apr 7,781.1 1,233.9 1,053.5 180.4 3,551.3 3,430.7 1,967.4 882.9 270.2 580.4 539.6 108.8 46.7 May 7,882.9 1,232.4 1,037.1 195.3 3,582.2 3,462.4 1,998.3 884.0 271.4 580.1 539.5 109.4 47.7
Changes 4
2010 − 136.3 − 75.2 − 99.4 24.2 72.3 59.7 88.7 − 53.0 − 52.2 24.0 38.3 − 4.4 2.22011 54.1 − 48.4 − 28.8 − 19.6 102.1 97.4 52.4 47.6 58.8 − 2.6 1.3 4.8 6.52012 − 129.2 − 68.7 − 70.0 1.3 57.8 67.1 156.1 − 90.4 − 50.2 1.5 14.1 − 1.4 5.42013 − 703.6 − 106.2 − 73.9 − 32.3 39.1 47.8 111.5 − 56.3 − 26.6 − 7.3 4.0 2.6 3.32014 206.8 − 28.4 − 32.2 3.9 62.7 71.6 106.0 − 32.1 3.1 − 2.4 − 2.4 − 2.5 − 0.0
2015 − 191.4 − 62.1 − 50.3 − 11.9 104.1 104.8 153.2 − 37.0 − 10.1 − 11.3 4.2 − 0.4 − 0.32016 184.3 − 31.6 − 2.2 − 29.4 105.7 105.2 124.3 − 11.1 1.4 − 8.0 2.4 2.7 1.92017 8.0 30.6 14.8 15.8 124.2 107.7 145.8 − 32.5 − 15.3 − 5.6 1.5 16.4 5.8
2016 Sep − 42.7 − 16.5 12.7 − 29.2 2.7 1.0 − 0.6 2.9 4.6 − 1.2 − 0.5 2.5 1.1
Oct − 0.5 − 8.4 − 3.7 − 4.7 6.2 11.2 19.8 − 8.1 − 8.9 − 0.6 0.2 − 4.3 − 4.4 Nov 25.9 17.3 15.9 1.4 39.7 32.7 30.1 3.0 4.0 − 0.4 0.1 5.8 6.1 Dec − 121.7 − 0.9 − 9.3 8.4 − 9.0 − 2.2 − 0.4 − 4.1 − 1.3 2.3 2.7 − 5.7 − 6.2
2017 Jan 108.8 32.8 20.7 12.1 23.0 19.7 13.3 6.4 9.1 − 0.0 0.7 4.4 5.1 Feb 47.4 7.6 1.6 6.1 1.2 − 0.7 4.7 − 5.5 − 4.8 0.1 0.7 1.1 − 0.5 Mar − 13.0 14.8 22.2 − 7.4 − 1.0 − 2.1 1.1 − 1.3 1.5 − 1.9 − 1.4 1.6 − 2.1
Apr 40.0 − 4.4 − 1.3 − 3.1 19.1 18.7 27.8 − 8.7 − 5.5 − 0.5 − 0.0 0.2 2.2 May 8.8 6.7 5.3 1.5 12.7 9.5 8.7 1.3 2.2 − 0.5 − 0.1 2.5 2.6 June − 85.4 − 22.2 − 24.3 2.1 15.3 11.1 17.5 − 5.4 − 2.3 − 1.0 − 0.7 4.7 0.7
July − 14.3 5.3 8.9 − 3.5 − 5.3 − 7.4 − 2.4 − 3.9 − 2.1 − 1.2 − 0.4 0.7 1.1 Aug − 4.7 4.1 3.8 0.3 15.8 15.5 18.5 − 1.9 − 2.1 − 1.1 − 0.3 0.9 1.7 Sep 4.8 3.0 − 3.8 6.7 8.4 2.9 6.1 − 2.6 − 1.5 − 0.6 0.0 6.4 3.2
Oct 8.6 15.2 9.8 5.5 10.3 16.0 25.5 − 9.1 − 7.1 − 0.3 0.5 − 5.6 − 4.4 Nov 33.4 4.6 − 0.3 4.9 37.9 30.2 27.9 2.8 − 0.2 − 0.5 0.2 4.6 5.9 Dec − 126.4 − 36.9 − 27.7 − 9.2 − 13.1 − 5.7 − 3.0 − 4.6 − 2.6 1.9 2.4 − 4.9 − 9.6
2018 Jan 124.2 17.6 13.1 4.5 12.2 9.1 8.7 0.9 3.2 − 0.5 0.2 2.4 4.0 Feb 6.3 − 3.6 − 3.2 − 0.4 − 4.0 − 3.5 0.2 − 3.5 − 3.7 − 0.2 0.4 − 1.1 0.7 Mar − 37.4 − 8.3 − 0.5 − 7.9 1.3 − 2.8 − 1.1 − 0.8 1.5 − 0.9 − 0.5 5.7 1.6
Apr 28.9 − 4.5 − 3.8 − 0.6 13.5 17.5 22.8 − 4.6 − 4.0 − 0.8 − 0.3 − 6.6 − 2.0 May 102.3 − 1.5 − 16.4 14.9 30.9 31.7 30.9 1.1 1.2 − 0.3 − 0.1 0.6 1.0
* This table serves to supplement the “Overall monetary survey“ in section II. Unlike by banks (including building and loan associations) − data from money marketthe other tables in section IV, this table includes − in addition to the figures reported funds. 1 See footnote 1 in Table IV.2. 2 Excluding deposits of central
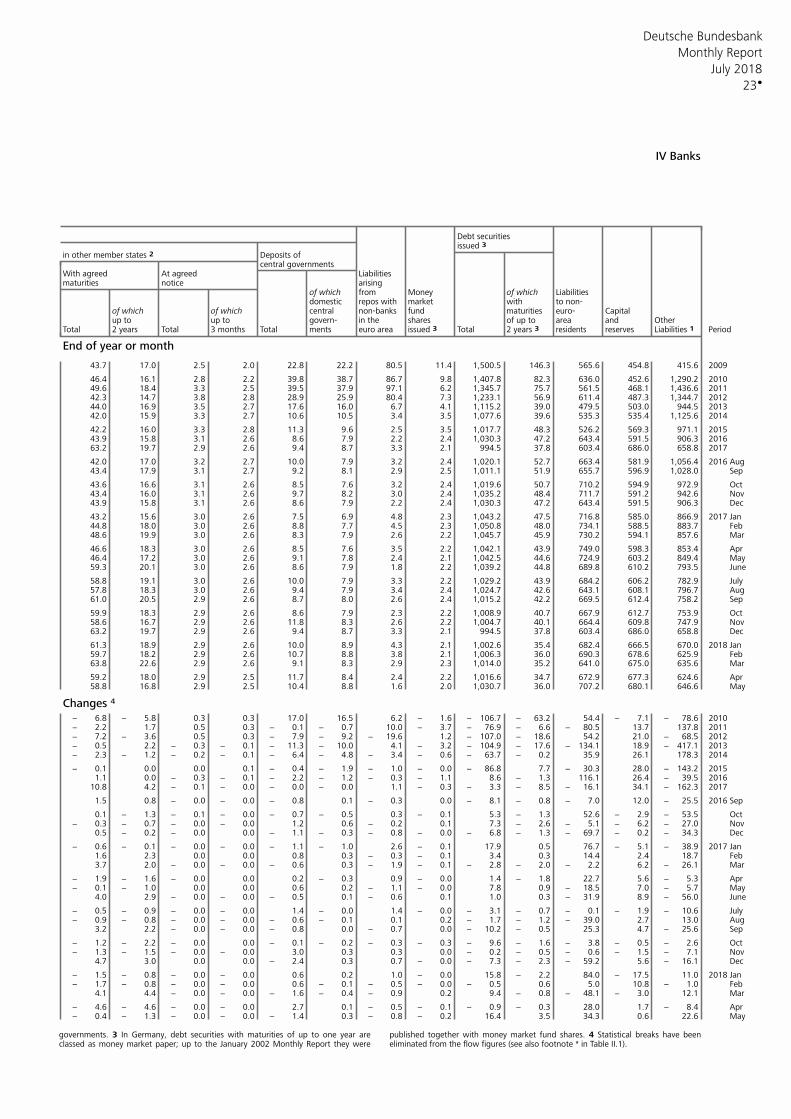
Deutsche Bundesbank
23
Monthly Report
July 2018
IV Banks
Debt securitiesissued 3
in other member states 2 Deposits ofcentral governments
With agreed At agreed Liabilitiesmaturities notice arising
of which from Money of which Liabilitiesdomestic market with to non-repos with
of which of which central non-banks fund euro- Capitalmaturitiesup to up to govern- in the shares of up to area and Other
Total 2 years Total 3 months Total ments euro area issued 3 Total reserves Period2 years 3 residents Liabilities 1
End of year or month
43.7 17.0 2.5 2.0 22.8 22.2 80.5 11.4 1,500.5 146.3 565.6 454.8 415.6 2009
46.4 16.1 2.8 2.2 39.8 38.7 86.7 9.8 1,407.8 82.3 636.0 452.6 1,290.2 201049.6 18.4 3.3 2.5 39.5 37.9 97.1 6.2 1,345.7 75.7 561.5 468.1 1,436.6 201142.3 14.7 3.8 2.8 28.9 25.9 80.4 7.3 1,233.1 56.9 611.4 487.3 1,344.7 201244.0 16.9 3.5 2.7 17.6 16.0 6.7 4.1 1,115.2 39.0 479.5 503.0 944.5 201342.0 15.9 3.3 2.7 10.6 10.5 3.4 3.5 1,077.6 39.6 535.3 535.4 1,125.6 2014
42.2 16.0 3.3 2.8 11.3 9.6 2.5 3.5 1,017.7 48.3 526.2 569.3 971.1 201543.9 15.8 3.1 2.6 8.6 7.9 2.2 2.4 1,030.3 47.2 643.4 591.5 906.3 201663.2 19.7 2.9 2.6 9.4 8.7 3.3 2.1 994.5 37.8 603.4 686.0 658.8 2017
42.0 17.0 3.2 2.7 10.0 7.9 3.2 2.4 1,020.1 52.7 663.4 581.9 1,056.4 2016 Aug 43.4 17.9 3.1 2.7 9.2 8.1 2.9 2.5 1,011.1 51.9 655.7 596.9 1,028.0 Sep
43.6 16.6 3.1 2.6 8.5 7.6 3.2 2.4 1,019.6 50.7 710.2 594.9 972.9 Oct 43.4 16.0 3.1 2.6 9.7 8.2 3.0 2.4 1,035.2 48.4 711.7 591.2 942.6 Nov 43.9 15.8 3.1 2.6 8.6 7.9 2.2 2.4 1,030.3 47.2 643.4 591.5 906.3 Dec
43.2 15.6 3.0 2.6 7.5 6.9 4.8 2.3 1,043.2 47.5 716.8 585.0 866.9 2017 Jan 44.8 18.0 3.0 2.6 8.8 7.7 4.5 2.3 1,050.8 48.0 734.1 588.5 883.7 Feb 48.6 19.9 3.0 2.6 8.3 7.9 2.6 2.2 1,045.7 45.9 730.2 594.1 857.6 Mar
46.6 18.3 3.0 2.6 8.5 7.6 3.5 2.2 1,042.1 43.9 749.0 598.3 853.4 Apr 46.4 17.2 3.0 2.6 9.1 7.8 2.4 2.1 1,042.5 44.6 724.9 603.2 849.4 May59.3 20.1 3.0 2.6 8.6 7.9 1.8 2.2 1,039.2 44.8 689.8 610.2 793.5 June
58.8 19.1 3.0 2.6 10.0 7.9 3.3 2.2 1,029.2 43.9 684.2 606.2 782.9 July57.8 18.3 3.0 2.6 9.4 7.9 3.4 2.4 1,024.7 42.6 643.1 608.1 796.7 Aug 61.0 20.5 2.9 2.6 8.7 8.0 2.6 2.4 1,015.2 42.2 669.5 612.4 758.2 Sep
59.9 18.3 2.9 2.6 8.6 7.9 2.3 2.2 1,008.9 40.7 667.9 612.7 753.9 Oct 58.6 16.7 2.9 2.6 11.8 8.3 2.6 2.2 1,004.7 40.1 664.4 609.8 747.9 Nov 63.2 19.7 2.9 2.6 9.4 8.7 3.3 2.1 994.5 37.8 603.4 686.0 658.8 Dec
61.3 18.9 2.9 2.6 10.0 8.9 4.3 2.1 1,002.6 35.4 682.4 666.5 670.0 2018 Jan 59.7 18.2 2.9 2.6 10.7 8.8 3.8 2.1 1,006.3 36.0 690.3 678.6 625.9 Feb 63.8 22.6 2.9 2.6 9.1 8.3 2.9 2.3 1,014.0 35.2 641.0 675.0 635.6 Mar
59.2 18.0 2.9 2.5 11.7 8.4 2.4 2.2 1,016.6 34.7 672.9 677.3 624.6 Apr 58.8 16.8 2.9 2.5 10.4 8.8 1.6 2.0 1,030.7 36.0 707.2 680.1 646.6 May
Changes 4
− 6.8 − 5.8 0.3 0.3 17.0 16.5 6.2 − 1.6 − 106.7 − 63.2 54.4 − 7.1 − 78.6 2010− 2.2 1.7 0.5 0.3 − 0.1 − 0.7 10.0 − 3.7 − 76.9 − 6.6 − 80.5 13.7 137.8 2011− 7.2 − 3.6 0.5 0.3 − 7.9 − 9.2 − 19.6 1.2 − 107.0 − 18.6 54.2 21.0 − 68.5 2012− 0.5 2.2 − 0.3 − 0.1 − 11.3 − 10.0 4.1 − 3.2 − 104.9 − 17.6 − 134.1 18.9 − 417.1 2013− 2.3 − 1.2 − 0.2 − 0.1 − 6.4 − 4.8 − 3.4 − 0.6 − 63.7 − 0.2 35.9 26.1 178.3 2014
− 0.1 0.0 0.0 0.1 − 0.4 − 1.9 − 1.0 − 0.0 − 86.8 7.7 − 30.3 28.0 − 143.2 20151.1 0.0 − 0.3 − 0.1 − 2.2 − 1.2 − 0.3 − 1.1 8.6 − 1.3 116.1 26.4 − 39.5 2016
10.8 4.2 − 0.1 − 0.0 − 0.0 − 0.0 1.1 − 0.3 − 3.3 − 8.5 − 16.1 34.1 − 162.3 2017
1.5 0.8 − 0.0 − 0.0 − 0.8 0.1 − 0.3 0.0 − 8.1 − 0.8 − 7.0 12.0 − 25.5 2016 Sep
0.1 − 1.3 − 0.1 − 0.0 − 0.7 − 0.5 0.3 − 0.1 5.3 − 1.3 52.6 − 2.9 − 53.5 Oct − 0.3 − 0.7 − 0.0 − 0.0 1.2 0.6 − 0.2 0.1 7.3 − 2.6 − 5.1 − 6.2 − 27.0 Nov
0.5 − 0.2 − 0.0 0.0 − 1.1 − 0.3 − 0.8 − 0.0 − 6.8 − 1.3 − 69.7 − 0.2 − 34.3 Dec
− 0.6 − 0.1 − 0.0 − 0.0 − 1.1 − 1.0 2.6 − 0.1 17.9 0.5 76.7 − 5.1 − 38.9 2017 Jan 1.6 2.3 0.0 0.0 0.8 0.3 − 0.3 − 0.1 3.4 0.3 14.4 2.4 18.7 Feb 3.7 2.0 − 0.0 − 0.0 − 0.6 0.3 − 1.9 − 0.1 − 2.8 − 2.0 − 2.2 6.2 − 26.1 Mar
− 1.9 − 1.6 − 0.0 0.0 0.2 − 0.3 0.9 − 0.0 1.4 − 1.8 22.7 5.6 − 5.3 Apr − 0.1 − 1.0 0.0 0.0 0.6 0.2 − 1.1 − 0.0 7.8 0.9 − 18.5 7.0 − 5.7 May
4.0 2.9 − 0.0 − 0.0 − 0.5 0.1 − 0.6 0.1 1.0 0.3 − 31.9 8.9 − 56.0 June
− 0.5 − 0.9 − 0.0 − 0.0 1.4 − 0.0 1.4 − 0.0 − 3.1 − 0.7 − 0.1 − 1.9 − 10.6 July− 0.9 − 0.8 − 0.0 − 0.0 − 0.6 − 0.1 0.1 0.2 − 1.7 − 1.2 − 39.0 2.7 13.0 Aug
3.2 2.2 − 0.0 − 0.0 − 0.8 0.0 − 0.7 0.0 − 10.2 − 0.5 25.3 4.7 − 25.6 Sep
− 1.2 − 2.2 − 0.0 0.0 − 0.1 − 0.2 − 0.3 − 0.3 − 9.6 − 1.6 − 3.8 − 0.5 − 2.6 Oct − 1.3 − 1.5 − 0.0 − 0.0 3.0 0.3 0.3 0.0 − 0.2 − 0.5 − 0.6 − 1.5 − 7.1 Nov
4.7 3.0 0.0 0.0 − 2.4 0.3 0.7 − 0.0 − 7.3 − 2.3 − 59.2 5.6 − 16.1 Dec
− 1.5 − 0.8 − 0.0 − 0.0 0.6 0.2 1.0 − 0.0 15.8 − 2.2 84.0 − 17.5 11.0 2018 Jan − 1.7 − 0.8 − 0.0 − 0.0 0.6 − 0.1 − 0.5 − 0.0 − 0.5 0.6 5.0 10.8 − 1.0 Feb
4.1 4.4 − 0.0 − 0.0 − 1.6 − 0.4 − 0.9 0.2 9.4 − 0.8 − 48.1 − 3.0 12.1 Mar
− 4.6 − 4.6 − 0.0 − 0.0 2.7 0.1 − 0.5 − 0.1 − 0.9 − 0.3 28.0 1.7 − 8.4 Apr − 0.4 − 1.3 − 0.0 − 0.0 − 1.4 0.3 − 0.8 − 0.2 16.4 3.5 34.3 0.6 22.6 May
governments. 3 In Germany, debt securities with maturities of up to one year are published together with money market fund shares. 4 Statistical breaks have beenclassed as money market paper; up to the January 2002 Monthly Report they were eliminated from the flow figures (see also footnote * in Table II.1).
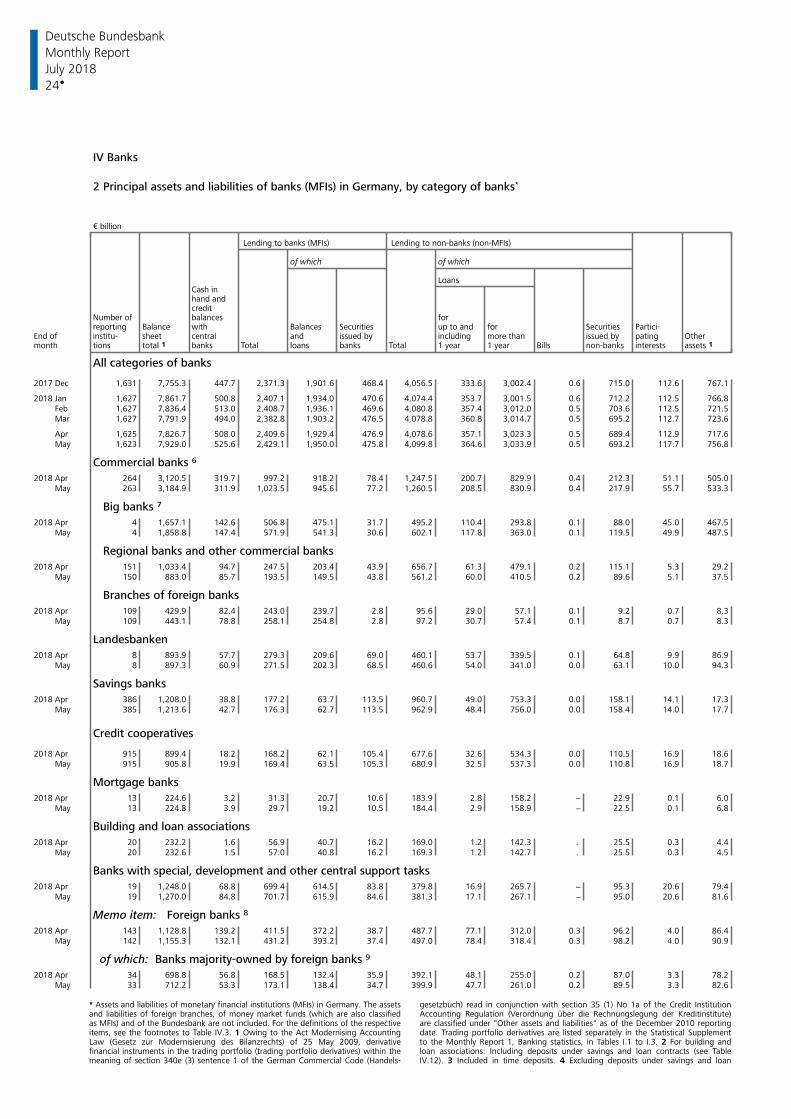
Deutsche Bundesbank
24
Monthly Report
July 2018
IV Banks
2 Principal assets and liabilities of banks (MFIs) in Germany, by category of banks*
€ billion
Lending to banks (MFIs) Lending to non-banks (non-MFIs) of which of which
Loans Cash in hand and creditNumber of balances forreporting Balance with Balances up to and for Partici-Securities Securities
End of institu- sheet central and issued by including more than issued by pating Othermonth tions total 1 banks Total loans banks Total 1 year 1 year Bills non-banks interests assets 1
All categories of banks
2017 Dec 1,631 7,755.3 447.7 2,371.3 1,901.6 468.4 4,056.5 333.6 3,002.4 0.6 715.0 112.6 767.1
2018 Jan 1,627 7,861.7 500.8 2,407.1 1,934.0 470.6 4,074.4 353.7 3,001.5 0.6 712.2 112.5 766.8 Feb 1,627 7,836.4 513.0 2,408.7 1,936.1 469.6 4,080.8 357.4 3,012.0 0.5 703.6 112.5 721.5 Mar 1,627 7,791.9 494.0 2,382.8 1,903.2 476.5 4,078.8 360.8 3,014.7 0.5 695.2 112.7 723.6
Apr 1,625 7,826.7 508.0 2,409.6 1,929.4 476.9 4,078.6 357.1 3,023.3 0.5 689.4 112.9 717.6 May 1,623 7,929.0 525.6 2,429.1 1,950.0 475.8 4,099.8 364.6 3,033.9 0.5 693.2 117.7 756.8
Commercial banks 6
2018 Apr 264 3,120.5 319.7 997.2 918.2 78.4 1,247.5 200.7 829.9 0.4 212.3 51.1 505.0 May 263 3,184.9 311.9 1,023.5 945.6 77.2 1,260.5 208.5 830.9 0.4 217.9 55.7 533.3
Big banks 7
2018 Apr 4 1,657.1 142.6 506.8 475.1 31.7 495.2 110.4 293.8 0.1 88.0 45.0 467.5 May 4 1,858.8 147.4 571.9 541.3 30.6 602.1 117.8 363.0 0.1 119.5 49.9 487.5
Regional banks and other commercial banks
2018 Apr 151 1,033.4 94.7 247.5 203.4 43.9 656.7 61.3 479.1 0.2 115.1 5.3 29.2 May 150 883.0 85.7 193.5 149.5 43.8 561.2 60.0 410.5 0.2 89.6 5.1 37.5
Branches of foreign banks
2018 Apr 109 429.9 82.4 243.0 239.7 2.8 95.6 29.0 57.1 0.1 9.2 0.7 8.3 May 109 443.1 78.8 258.1 254.8 2.8 97.2 30.7 57.4 0.1 8.7 0.7 8.3
Landesbanken
2018 Apr 8 893.9 57.7 279.3 209.6 69.0 460.1 53.7 339.5 0.1 64.8 9.9 86.9 May 8 897.3 60.9 271.5 202.3 68.5 460.6 54.0 341.0 0.0 63.1 10.0 94.3
Savings banks
2018 Apr 386 1,208.0 38.8 177.2 63.7 113.5 960.7 49.0 753.3 0.0 158.1 14.1 17.3 May 385 1,213.6 42.7 176.3 62.7 113.5 962.9 48.4 756.0 0.0 158.4 14.0 17.7
Credit cooperatives
2018 Apr 915 899.4 18.2 168.2 62.1 105.4 677.6 32.6 534.3 0.0 110.5 16.9 18.6 May 915 905.8 19.9 169.4 63.5 105.3 680.9 32.5 537.3 0.0 110.8 16.9 18.7
Mortgage banks
2018 Apr 13 224.6 3.2 31.3 20.7 10.6 183.9 2.8 158.2 − 22.9 0.1 6.0 May 13 224.8 3.9 29.7 19.2 10.5 184.4 2.9 158.9 − 22.5 0.1 6.8
Building and loan associations
2018 Apr 20 232.2 1.6 56.9 40.7 16.2 169.0 1.2 142.3 . 25.5 0.3 4.4 May 20 232.6 1.5 57.0 40.8 16.2 169.3 1.2 142.7 . 25.5 0.3 4.5
Banks with special, development and other central support tasks
2018 Apr 19 1,248.0 68.8 699.4 614.5 83.8 379.8 16.9 265.7 − 95.3 20.6 79.4 May 19 1,270.0 84.8 701.7 615.9 84.6 381.3 17.1 267.1 − 95.0 20.6 81.6
Memo item: Foreign banks 8
2018 Apr 143 1,128.8 139.2 411.5 372.2 38.7 487.7 77.1 312.0 0.3 96.2 4.0 86.4 May 142 1,155.3 132.1 431.2 393.2 37.4 497.0 78.4 318.4 0.3 98.2 4.0 90.9
of which: Banks majority-owned by foreign banks 9
2018 Apr 34 698.8 56.8 168.5 132.4 35.9 392.1 48.1 255.0 0.2 87.0 3.3 78.2 May 33 712.2 53.3 173.1 138.4 34.7 399.9 47.7 261.0 0.2 89.5 3.3 82.6
* Assets and liabilities of monetary financial institutions (MFIs) in Germany. The assets gesetzbuch) read in conjunction with section 35 (1) No 1a of the Credit Institutionand liabilities of foreign branches, of money market funds (which are also classified Accounting Regulation (Verordnung über die Rechnungslegung der Kreditinstitute)as MFIs) and of the Bundesbank are not included. For the definitions of the respective are classified under "Other assets and liabilities" as of the December 2010 reportingitems, see the footnotes to Table IV.3. 1 Owing to the Act Modernising Accounting date. Trading portfolio derivatives are listed separately in the Statistical SupplementLaw (Gesetz zur Modernisierung des Bilanzrechts) of 25 May 2009, derivative to the Monthly Report 1, Banking statistics, in Tables I.1 to I.3. 2 For building andfinancial instruments in the trading portfolio (trading portfolio derivatives) within the loan associations: Including deposits under savings and loan contracts (see Tablemeaning of section 340e (3) sentence 1 of the German Commercial Code (Handels- IV.12). 3 Included in time deposits. 4 Excluding deposits under savings and loan
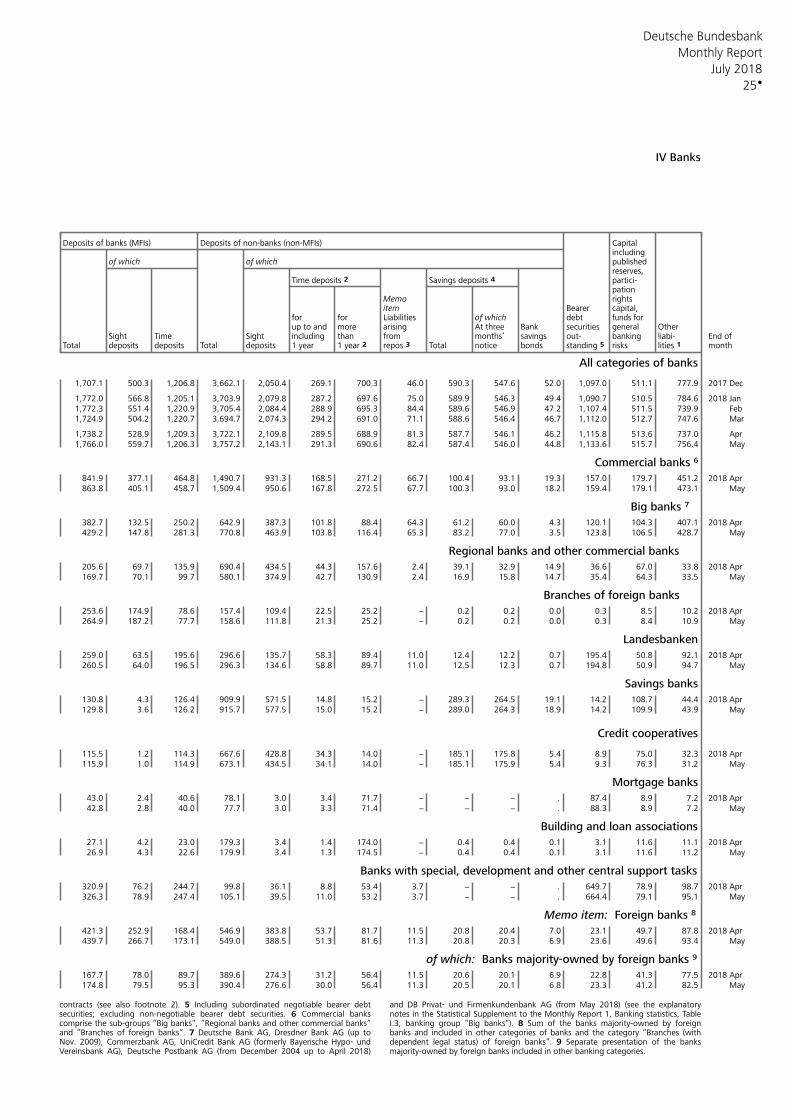
Deutsche Bundesbank
25
Monthly Report
July 2018
IV Banks
Deposits of banks (MFIs) Deposits of non-banks (non-MFIs) Capital including
of which of which publishedreserves,
Time deposits 2 Savings deposits 4 partici-pation
Memo rightsitem Bearer capital,
for for of which debtLiabilities funds forup to and more arising At three Bank general Othersecurities
Sight Time Sight including than from savings out- banking liabi- End ofmonths’Total deposits deposits Total deposits 1 year 1 year 2 repos 3 Total notice bonds risks lities 1 monthstanding 5
All categories of banks
1,707.1 500.3 1,206.8 3,662.1 2,050.4 269.1 700.3 46.0 590.3 547.6 52.0 1,097.0 511.1 777.9 2017 Dec
1,772.0 566.8 1,205.1 3,703.9 2,079.8 287.2 697.6 75.0 589.9 546.3 49.4 1,090.7 510.5 784.6 2018 Jan 1,772.3 551.4 1,220.9 3,705.4 2,084.4 288.9 695.3 84.4 589.6 546.9 47.2 1,107.4 511.5 739.9 Feb 1,724.9 504.2 1,220.7 3,694.7 2,074.3 294.2 691.0 71.1 588.6 546.4 46.7 1,112.0 512.7 747.6 Mar
1,738.2 528.9 1,209.3 3,722.1 2,109.8 289.5 688.9 81.3 587.7 546.1 46.2 1,115.8 513.6 737.0 Apr 1,766.0 559.7 1,206.3 3,757.2 2,143.1 291.3 690.6 82.4 587.4 546.0 44.8 1,133.6 515.7 756.4 May
Commercial banks 6
841.9 377.1 464.8 1,490.7 931.3 168.5 271.2 66.7 100.4 93.1 19.3 157.0 179.7 451.2 2018 Apr 863.8 405.1 458.7 1,509.4 950.6 167.8 272.5 67.7 100.3 93.0 18.2 159.4 179.1 473.1 May
Big banks 7
382.7 132.5 250.2 642.9 387.3 101.8 88.4 64.3 61.2 60.0 4.3 120.1 104.3 407.1 2018 Apr 429.2 147.8 281.3 770.8 463.9 103.8 116.4 65.3 83.2 77.0 3.5 123.8 106.5 428.7 May
Regional banks and other commercial banks
205.6 69.7 135.9 690.4 434.5 44.3 157.6 2.4 39.1 32.9 14.9 36.6 67.0 33.8 2018 Apr 169.7 70.1 99.7 580.1 374.9 42.7 130.9 2.4 16.9 15.8 14.7 35.4 64.3 33.5 May
Branches of foreign banks
253.6 174.9 78.6 157.4 109.4 22.5 25.2 − 0.2 0.2 0.0 0.3 8.5 10.2 2018 Apr 264.9 187.2 77.7 158.6 111.8 21.3 25.2 − 0.2 0.2 0.0 0.3 8.4 10.9 May
Landesbanken
259.0 63.5 195.6 296.6 135.7 58.3 89.4 11.0 12.4 12.2 0.7 195.4 50.8 92.1 2018 Apr 260.5 64.0 196.5 296.3 134.6 58.8 89.7 11.0 12.5 12.3 0.7 194.8 50.9 94.7 May
Savings banks
130.8 4.3 126.4 909.9 571.5 14.8 15.2 − 289.3 264.5 19.1 14.2 108.7 44.4 2018 Apr 129.8 3.6 126.2 915.7 577.5 15.0 15.2 − 289.0 264.3 18.9 14.2 109.9 43.9 May
Credit cooperatives
115.5 1.2 114.3 667.6 428.8 34.3 14.0 − 185.1 175.8 5.4 8.9 75.0 32.3 2018 Apr 115.9 1.0 114.9 673.1 434.5 34.1 14.0 − 185.1 175.9 5.4 9.3 76.3 31.2 May
Mortgage banks
43.0 2.4 40.6 78.1 3.0 3.4 71.7 − − − . 87.4 8.9 7.2 2018 Apr 42.8 2.8 40.0 77.7 3.0 3.3 71.4 − − − . 88.3 8.9 7.2 May
Building and loan associations
27.1 4.2 23.0 179.3 3.4 1.4 174.0 − 0.4 0.4 0.1 3.1 11.6 11.1 2018 Apr 26.9 4.3 22.6 179.9 3.4 1.3 174.5 − 0.4 0.4 0.1 3.1 11.6 11.2 May
Banks with special, development and other central support tasks
320.9 76.2 244.7 99.8 36.1 8.8 53.4 3.7 − − . 649.7 78.9 98.7 2018 Apr 326.3 78.9 247.4 105.1 39.5 11.0 53.2 3.7 − − . 664.4 79.1 95.1 May
Memo item: Foreign banks 8
421.3 252.9 168.4 546.9 383.8 53.7 81.7 11.5 20.8 20.4 7.0 23.1 49.7 87.8 2018 Apr 439.7 266.7 173.1 549.0 388.5 51.3 81.6 11.3 20.8 20.3 6.9 23.6 49.6 93.4 May
of which: Banks majority-owned by foreign banks 9
167.7 78.0 89.7 389.6 274.3 31.2 56.4 11.5 20.6 20.1 6.9 22.8 41.3 77.5 2018 Apr 174.8 79.5 95.3 390.4 276.6 30.0 56.4 11.3 20.5 20.1 6.8 23.3 41.2 82.5 May
contracts (see also footnote 2). 5 Including subordinated negotiable bearer debt and DB Privat- und Firmenkundenbank AG (from May 2018) (see the explanatorysecurities; excluding non-negotiable bearer debt securities. 6 Commercial banks notes in the Statistical Supplement to the Monthly Report 1, Banking statistics, Tablecomprise the sub-groups ”Big banks”, ”Regional banks and other commercial banks” I.3, banking group ”Big banks”). 8 Sum of the banks majority-owned by foreignand ”Branches of foreign banks”. 7 Deutsche Bank AG, Dresdner Bank AG (up to banks and included in other categories of banks and the category ”Branches (withNov. 2009), Commerzbank AG, UniCredit Bank AG (formerly Bayerische Hypo- und dependent legal status) of foreign banks”. 9 Separate presentation of the banksVereinsbank AG), Deutsche Postbank AG (from December 2004 up to April 2018) majority-owned by foreign banks included in other banking categories.
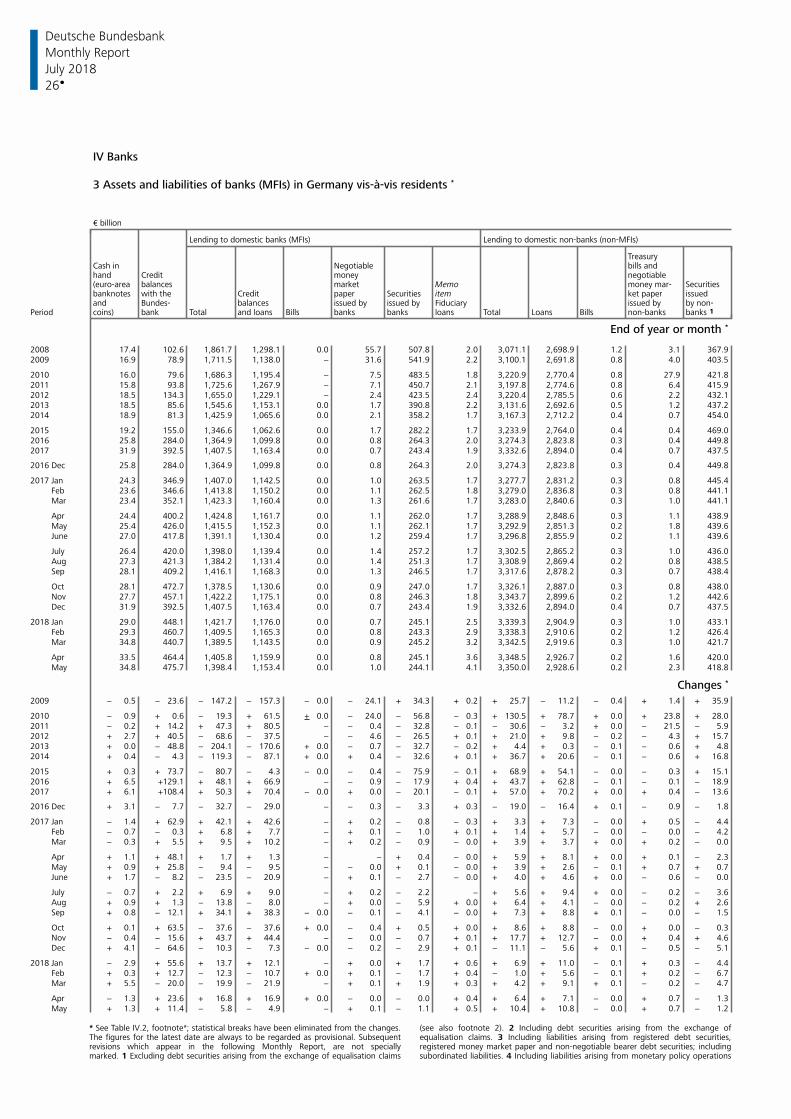
Deutsche Bundesbank
26
Monthly Report
July 2018
IV Banks
3 Assets and liabilities of banks (MFIs) in Germany vis-à-vis residents *
€ billion
Lending to domestic banks (MFIs) Lending to domestic non-banks (non-MFIs)
TreasuryCash in Negotiable bills andhand Credit money negotiable
balances market Memo money mar-(euro-area Securitiesbanknotes with the Credit paper item ket paper issuedSecuritiesand Bundes- balances issued by issued by Fiduciary issued by by non-
Period coins) bank Total and loans Bills banks banks loans Total Loans Bills non-banks banks 1
End of year or month *
2008 17.4 102.6 1,861.7 1,298.1 0.0 55.7 507.8 2.0 3,071.1 2,698.9 1.2 3.1 367.92009 16.9 78.9 1,711.5 1,138.0 − 31.6 541.9 2.2 3,100.1 2,691.8 0.8 4.0 403.5
2010 16.0 79.6 1,686.3 1,195.4 − 7.5 483.5 1.8 3,220.9 2,770.4 0.8 27.9 421.82011 15.8 93.8 1,725.6 1,267.9 − 7.1 450.7 2.1 3,197.8 2,774.6 0.8 6.4 415.92012 18.5 134.3 1,655.0 1,229.1 − 2.4 423.5 2.4 3,220.4 2,785.5 0.6 2.2 432.12013 18.5 85.6 1,545.6 1,153.1 0.0 1.7 390.8 2.2 3,131.6 2,692.6 0.5 1.2 437.22014 18.9 81.3 1,425.9 1,065.6 0.0 2.1 358.2 1.7 3,167.3 2,712.2 0.4 0.7 454.0
2015 19.2 155.0 1,346.6 1,062.6 0.0 1.7 282.2 1.7 3,233.9 2,764.0 0.4 0.4 469.02016 25.8 284.0 1,364.9 1,099.8 0.0 0.8 264.3 2.0 3,274.3 2,823.8 0.3 0.4 449.82017 31.9 392.5 1,407.5 1,163.4 0.0 0.7 243.4 1.9 3,332.6 2,894.0 0.4 0.7 437.5
2016 Dec 25.8 284.0 1,364.9 1,099.8 0.0 0.8 264.3 2.0 3,274.3 2,823.8 0.3 0.4 449.8
2017 Jan 24.3 346.9 1,407.0 1,142.5 0.0 1.0 263.5 1.7 3,277.7 2,831.2 0.3 0.8 445.4 Feb 23.6 346.6 1,413.8 1,150.2 0.0 1.1 262.5 1.8 3,279.0 2,836.8 0.3 0.8 441.1 Mar 23.4 352.1 1,423.3 1,160.4 0.0 1.3 261.6 1.7 3,283.0 2,840.6 0.3 1.0 441.1
Apr 24.4 400.2 1,424.8 1,161.7 0.0 1.1 262.0 1.7 3,288.9 2,848.6 0.3 1.1 438.9 May 25.4 426.0 1,415.5 1,152.3 0.0 1.1 262.1 1.7 3,292.9 2,851.3 0.2 1.8 439.6 June 27.0 417.8 1,391.1 1,130.4 0.0 1.2 259.4 1.7 3,296.8 2,855.9 0.2 1.1 439.6
July 26.4 420.0 1,398.0 1,139.4 0.0 1.4 257.2 1.7 3,302.5 2,865.2 0.3 1.0 436.0 Aug 27.3 421.3 1,384.2 1,131.4 0.0 1.4 251.3 1.7 3,308.9 2,869.4 0.2 0.8 438.5 Sep 28.1 409.2 1,416.1 1,168.3 0.0 1.3 246.5 1.7 3,317.6 2,878.2 0.3 0.7 438.4
Oct 28.1 472.7 1,378.5 1,130.6 0.0 0.9 247.0 1.7 3,326.1 2,887.0 0.3 0.8 438.0 Nov 27.7 457.1 1,422.2 1,175.1 0.0 0.8 246.3 1.8 3,343.7 2,899.6 0.2 1.2 442.6 Dec 31.9 392.5 1,407.5 1,163.4 0.0 0.7 243.4 1.9 3,332.6 2,894.0 0.4 0.7 437.5
2018 Jan 29.0 448.1 1,421.7 1,176.0 0.0 0.7 245.1 2.5 3,339.3 2,904.9 0.3 1.0 433.1 Feb 29.3 460.7 1,409.5 1,165.3 0.0 0.8 243.3 2.9 3,338.3 2,910.6 0.2 1.2 426.4 Mar 34.8 440.7 1,389.5 1,143.5 0.0 0.9 245.2 3.2 3,342.5 2,919.6 0.3 1.0 421.7
Apr 33.5 464.4 1,405.8 1,159.9 0.0 0.8 245.1 3.6 3,348.5 2,926.7 0.2 1.6 420.0 May 34.8 475.7 1,398.4 1,153.4 0.0 1.0 244.1 4.1 3,350.0 2,928.6 0.2 2.3 418.8
Changes *
2009 − 0.5 − 23.6 − 147.2 − 157.3 − 0.0 − 24.1 + 34.3 + 0.2 + 25.7 − 11.2 − 0.4 + 1.4 + 35.9
2010 − 0.9 + 0.6 − 19.3 + 61.5 + 0.0 − 24.0 − 56.8 − 0.3 + 130.5 + 78.7 + 0.0 + 23.8 + 28.02011 − 0.2 + 14.2 + 47.3 + 80.5 − − 0.4 − 32.8 − 0.1 − 30.6 − 3.2 + 0.0 − 21.5 − 5.92012 + 2.7 + 40.5 − 68.6 − 37.5 − − 4.6 − 26.5 + 0.1 + 21.0 + 9.8 − 0.2 − 4.3 + 15.72013 + 0.0 − 48.8 − 204.1 − 170.6 + 0.0 − 0.7 − 32.7 − 0.2 + 4.4 + 0.3 − 0.1 − 0.6 + 4.82014 + 0.4 − 4.3 − 119.3 − 87.1 + 0.0 + 0.4 − 32.6 + 0.1 + 36.7 + 20.6 − 0.1 − 0.6 + 16.8
2015 + 0.3 + 73.7 − 80.7 − 4.3 − 0.0 − 0.4 − 75.9 − 0.1 + 68.9 + 54.1 − 0.0 − 0.3 + 15.12016 + 6.5 +129.1 + 48.1 + 66.9 − − 0.9 − 17.9 + 0.4 + 43.7 + 62.8 − 0.1 − 0.1 − 18.92017 + 6.1 +108.4 + 50.3 + 70.4 − 0.0 + 0.0 − 20.1 − 0.1 + 57.0 + 70.2 + 0.0 + 0.4 − 13.6
2016 Dec + 3.1 − 7.7 − 32.7 − 29.0 − − 0.3 − 3.3 + 0.3 − 19.0 − 16.4 + 0.1 − 0.9 − 1.8
2017 Jan − 1.4 + 62.9 + 42.1 + 42.6 − + 0.2 − 0.8 − 0.3 + 3.3 + 7.3 − 0.0 + 0.5 − 4.4 Feb − 0.7 − 0.3 + 6.8 + 7.7 − + 0.1 − 1.0 + 0.1 + 1.4 + 5.7 − 0.0 − 0.0 − 4.2 Mar − 0.3 + 5.5 + 9.5 + 10.2 − + 0.2 − 0.9 − 0.0 + 3.9 + 3.7 + 0.0 + 0.2 − 0.0
Apr + 1.1 + 48.1 + 1.7 + 1.3 − − + 0.4 − 0.0 + 5.9 + 8.1 + 0.0 + 0.1 − 2.3 May + 0.9 + 25.8 − 9.4 − 9.5 − − 0.0 + 0.1 − 0.0 + 3.9 + 2.6 − 0.1 + 0.7 + 0.7 June + 1.7 − 8.2 − 23.5 − 20.9 − + 0.1 − 2.7 − 0.0 + 4.0 + 4.6 + 0.0 − 0.6 − 0.0
July − 0.7 + 2.2 + 6.9 + 9.0 − + 0.2 − 2.2 − + 5.6 + 9.4 + 0.0 − 0.2 − 3.6 Aug + 0.9 + 1.3 − 13.8 − 8.0 − + 0.0 − 5.9 + 0.0 + 6.4 + 4.1 − 0.0 − 0.2 + 2.6 Sep + 0.8 − 12.1 + 34.1 + 38.3 − 0.0 − 0.1 − 4.1 − 0.0 + 7.3 + 8.8 + 0.1 − 0.0 − 1.5
Oct + 0.1 + 63.5 − 37.6 − 37.6 + 0.0 − 0.4 + 0.5 + 0.0 + 8.6 + 8.8 − 0.0 + 0.0 − 0.3 Nov − 0.4 − 15.6 + 43.7 + 44.4 − − 0.0 − 0.7 + 0.1 + 17.7 + 12.7 − 0.0 + 0.4 + 4.6 Dec + 4.1 − 64.6 − 10.3 − 7.3 − 0.0 − 0.2 − 2.9 + 0.1 − 11.1 − 5.6 + 0.1 − 0.5 − 5.1
2018 Jan − 2.9 + 55.6 + 13.7 + 12.1 − + 0.0 + 1.7 + 0.6 + 6.9 + 11.0 − 0.1 + 0.3 − 4.4 Feb + 0.3 + 12.7 − 12.3 − 10.7 + 0.0 + 0.1 − 1.7 + 0.4 − 1.0 + 5.6 − 0.1 + 0.2 − 6.7 Mar + 5.5 − 20.0 − 19.9 − 21.9 − + 0.1 + 1.9 + 0.3 + 4.2 + 9.1 + 0.1 − 0.2 − 4.7
Apr − 1.3 + 23.6 + 16.8 + 16.9 + 0.0 − 0.0 − 0.0 + 0.4 + 6.4 + 7.1 − 0.0 + 0.7 − 1.3 May + 1.3 + 11.4 − 5.8 − 4.9 − + 0.1 − 1.1 + 0.5 + 10.4 + 10.8 − 0.0 + 0.7 − 1.2
* See Table IV.2, footnote*; statistical breaks have been eliminated from the changes. (see also footnote 2). 2 Including debt securities arising from the exchange ofThe figures for the latest date are always to be regarded as provisional. Subsequent equalisation claims. 3 Including liabilities arising from registered debt securities,revisions which appear in the following Monthly Report, are not specially registered money market paper and non-negotiable bearer debt securities; includingmarked. 1 Excluding debt securities arising from the exchange of equalisation claims subordinated liabilities. 4 Including liabilities arising from monetary policy operations
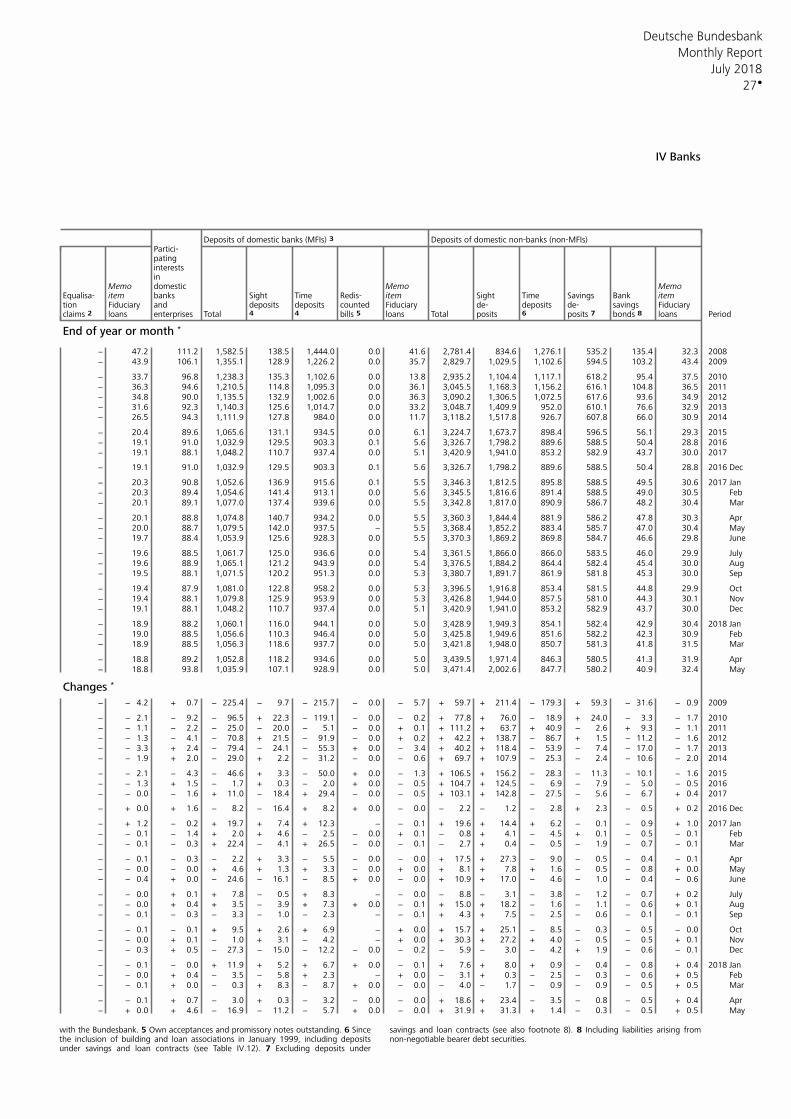
Deutsche Bundesbank
27
Monthly Report
July 2018
IV Banks
Deposits of domestic banks (MFIs) 3 Deposits of domestic non-banks (non-MFIs)Partici-patinginterestsin
Memo domestic Memo Memoitem banks Sight Time Redis- item Sight Time Savings Bank itemEqualisa-
tion Fiduciary and deposits deposits counted Fiduciary de- deposits de- savings Fiduciaryclaims 2 loans Total 4 4 bills 5 loans Total posits 6 posits 7 bonds 8 loans Periodenterprises
End of year or month *
− 47.2 111.2 1,582.5 138.5 1,444.0 0.0 41.6 2,781.4 834.6 1,276.1 535.2 135.4 32.3 2008− 43.9 106.1 1,355.1 128.9 1,226.2 0.0 35.7 2,829.7 1,029.5 1,102.6 594.5 103.2 43.4 2009
− 33.7 96.8 1,238.3 135.3 1,102.6 0.0 13.8 2,935.2 1,104.4 1,117.1 618.2 95.4 37.5 2010− 36.3 94.6 1,210.5 114.8 1,095.3 0.0 36.1 3,045.5 1,168.3 1,156.2 616.1 104.8 36.5 2011− 34.8 90.0 1,135.5 132.9 1,002.6 0.0 36.3 3,090.2 1,306.5 1,072.5 617.6 93.6 34.9 2012− 31.6 92.3 1,140.3 125.6 1,014.7 0.0 33.2 3,048.7 1,409.9 952.0 610.1 76.6 32.9 2013− 26.5 94.3 1,111.9 127.8 984.0 0.0 11.7 3,118.2 1,517.8 926.7 607.8 66.0 30.9 2014
− 20.4 89.6 1,065.6 131.1 934.5 0.0 6.1 3,224.7 1,673.7 898.4 596.5 56.1 29.3 2015− 19.1 91.0 1,032.9 129.5 903.3 0.1 5.6 3,326.7 1,798.2 889.6 588.5 50.4 28.8 2016− 19.1 88.1 1,048.2 110.7 937.4 0.0 5.1 3,420.9 1,941.0 853.2 582.9 43.7 30.0 2017
− 19.1 91.0 1,032.9 129.5 903.3 0.1 5.6 3,326.7 1,798.2 889.6 588.5 50.4 28.8 2016 Dec
− 20.3 90.8 1,052.6 136.9 915.6 0.1 5.5 3,346.3 1,812.5 895.8 588.5 49.5 30.6 2017 Jan − 20.3 89.4 1,054.6 141.4 913.1 0.0 5.6 3,345.5 1,816.6 891.4 588.5 49.0 30.5 Feb − 20.1 89.1 1,077.0 137.4 939.6 0.0 5.5 3,342.8 1,817.0 890.9 586.7 48.2 30.4 Mar
− 20.1 88.8 1,074.8 140.7 934.2 0.0 5.5 3,360.3 1,844.4 881.9 586.2 47.8 30.3 Apr − 20.0 88.7 1,079.5 142.0 937.5 − 5.5 3,368.4 1,852.2 883.4 585.7 47.0 30.4 May− 19.7 88.4 1,053.9 125.6 928.3 0.0 5.5 3,370.3 1,869.2 869.8 584.7 46.6 29.8 June
− 19.6 88.5 1,061.7 125.0 936.6 0.0 5.4 3,361.5 1,866.0 866.0 583.5 46.0 29.9 July− 19.6 88.9 1,065.1 121.2 943.9 0.0 5.4 3,376.5 1,884.2 864.4 582.4 45.4 30.0 Aug − 19.5 88.1 1,071.5 120.2 951.3 0.0 5.3 3,380.7 1,891.7 861.9 581.8 45.3 30.0 Sep
− 19.4 87.9 1,081.0 122.8 958.2 0.0 5.3 3,396.5 1,916.8 853.4 581.5 44.8 29.9 Oct − 19.4 88.1 1,079.8 125.9 953.9 0.0 5.3 3,426.8 1,944.0 857.5 581.0 44.3 30.1 Nov − 19.1 88.1 1,048.2 110.7 937.4 0.0 5.1 3,420.9 1,941.0 853.2 582.9 43.7 30.0 Dec
− 18.9 88.2 1,060.1 116.0 944.1 0.0 5.0 3,428.9 1,949.3 854.1 582.4 42.9 30.4 2018 Jan − 19.0 88.5 1,056.6 110.3 946.4 0.0 5.0 3,425.8 1,949.6 851.6 582.2 42.3 30.9 Feb − 18.9 88.5 1,056.3 118.6 937.7 0.0 5.0 3,421.8 1,948.0 850.7 581.3 41.8 31.5 Mar
− 18.8 89.2 1,052.8 118.2 934.6 0.0 5.0 3,439.5 1,971.4 846.3 580.5 41.3 31.9 Apr − 18.8 93.8 1,035.9 107.1 928.9 0.0 5.0 3,471.4 2,002.6 847.7 580.2 40.9 32.4 May
Changes *
− − 4.2 + 0.7 − 225.4 − 9.7 − 215.7 − 0.0 − 5.7 + 59.7 + 211.4 − 179.3 + 59.3 − 31.6 − 0.9 2009
− − 2.1 − 9.2 − 96.5 + 22.3 − 119.1 − 0.0 − 0.2 + 77.8 + 76.0 − 18.9 + 24.0 − 3.3 − 1.7 2010− − 1.1 − 2.2 − 25.0 − 20.0 − 5.1 − 0.0 + 0.1 + 111.2 + 63.7 + 40.9 − 2.6 + 9.3 − 1.1 2011− − 1.3 − 4.1 − 70.8 + 21.5 − 91.9 − 0.0 + 0.2 + 42.2 + 138.7 − 86.7 + 1.5 − 11.2 − 1.6 2012− − 3.3 + 2.4 − 79.4 − 24.1 − 55.3 + 0.0 − 3.4 + 40.2 + 118.4 − 53.9 − 7.4 − 17.0 − 1.7 2013− − 1.9 + 2.0 − 29.0 + 2.2 − 31.2 − 0.0 − 0.6 + 69.7 + 107.9 − 25.3 − 2.4 − 10.6 − 2.0 2014
− − 2.1 − 4.3 − 46.6 + 3.3 − 50.0 + 0.0 − 1.3 + 106.5 + 156.2 − 28.3 − 11.3 − 10.1 − 1.6 2015− − 1.3 + 1.5 − 1.7 + 0.3 − 2.0 + 0.0 − 0.5 + 104.7 + 124.5 − 6.9 − 7.9 − 5.0 − 0.5 2016− − 0.0 − 1.6 + 11.0 − 18.4 + 29.4 − 0.0 − 0.5 + 103.1 + 142.8 − 27.5 − 5.6 − 6.7 + 0.4 2017
− + 0.0 + 1.6 − 8.2 − 16.4 + 8.2 + 0.0 − 0.0 − 2.2 − 1.2 − 2.8 + 2.3 − 0.5 + 0.2 2016 Dec
− + 1.2 − 0.2 + 19.7 + 7.4 + 12.3 − − 0.1 + 19.6 + 14.4 + 6.2 − 0.1 − 0.9 + 1.0 2017 Jan − − 0.1 − 1.4 + 2.0 + 4.6 − 2.5 − 0.0 + 0.1 − 0.8 + 4.1 − 4.5 + 0.1 − 0.5 − 0.1 Feb − − 0.1 − 0.3 + 22.4 − 4.1 + 26.5 − 0.0 − 0.1 − 2.7 + 0.4 − 0.5 − 1.9 − 0.7 − 0.1 Mar
− − 0.1 − 0.3 − 2.2 + 3.3 − 5.5 − 0.0 − 0.0 + 17.5 + 27.3 − 9.0 − 0.5 − 0.4 − 0.1 Apr − − 0.0 − 0.0 + 4.6 + 1.3 + 3.3 − 0.0 + 0.0 + 8.1 + 7.8 + 1.6 − 0.5 − 0.8 + 0.0 May− − 0.4 + 0.0 − 24.6 − 16.1 − 8.5 + 0.0 − 0.0 + 10.9 + 17.0 − 4.6 − 1.0 − 0.4 − 0.6 June
− − 0.0 + 0.1 + 7.8 − 0.5 + 8.3 − − 0.0 − 8.8 − 3.1 − 3.8 − 1.2 − 0.7 + 0.2 July− − 0.0 + 0.4 + 3.5 − 3.9 + 7.3 + 0.0 − 0.1 + 15.0 + 18.2 − 1.6 − 1.1 − 0.6 + 0.1 Aug − − 0.1 − 0.3 − 3.3 − 1.0 − 2.3 − − 0.1 + 4.3 + 7.5 − 2.5 − 0.6 − 0.1 − 0.1 Sep
− − 0.1 − 0.1 + 9.5 + 2.6 + 6.9 − + 0.0 + 15.7 + 25.1 − 8.5 − 0.3 − 0.5 − 0.0 Oct − − 0.0 + 0.1 − 1.0 + 3.1 − 4.2 − + 0.0 + 30.3 + 27.2 + 4.0 − 0.5 − 0.5 + 0.1 Nov − − 0.3 + 0.5 − 27.3 − 15.0 − 12.2 − 0.0 − 0.2 − 5.9 − 3.0 − 4.2 + 1.9 − 0.6 − 0.1 Dec
− − 0.1 − 0.0 + 11.9 + 5.2 + 6.7 + 0.0 − 0.1 + 7.6 + 8.0 + 0.9 − 0.4 − 0.8 + 0.4 2018 Jan − − 0.0 + 0.4 − 3.5 − 5.8 + 2.3 − + 0.0 − 3.1 + 0.3 − 2.5 − 0.3 − 0.6 + 0.5 Feb − − 0.1 + 0.0 − 0.3 + 8.3 − 8.7 + 0.0 − 0.0 − 4.0 − 1.7 − 0.9 − 0.9 − 0.5 + 0.5 Mar
− − 0.1 + 0.7 − 3.0 + 0.3 − 3.2 − 0.0 − 0.0 + 18.6 + 23.4 − 3.5 − 0.8 − 0.5 + 0.4 Apr − + 0.0 + 4.6 − 16.9 − 11.2 − 5.7 + 0.0 − 0.0 + 31.9 + 31.3 + 1.4 − 0.3 − 0.5 + 0.5 May
with the Bundesbank. 5 Own acceptances and promissory notes outstanding. 6 Since savings and loan contracts (see also footnote 8). 8 Including liabilities arising fromthe inclusion of building and loan associations in January 1999, including deposits non-negotiable bearer debt securities. under savings and loan contracts (see Table IV.12). 7 Excluding deposits under
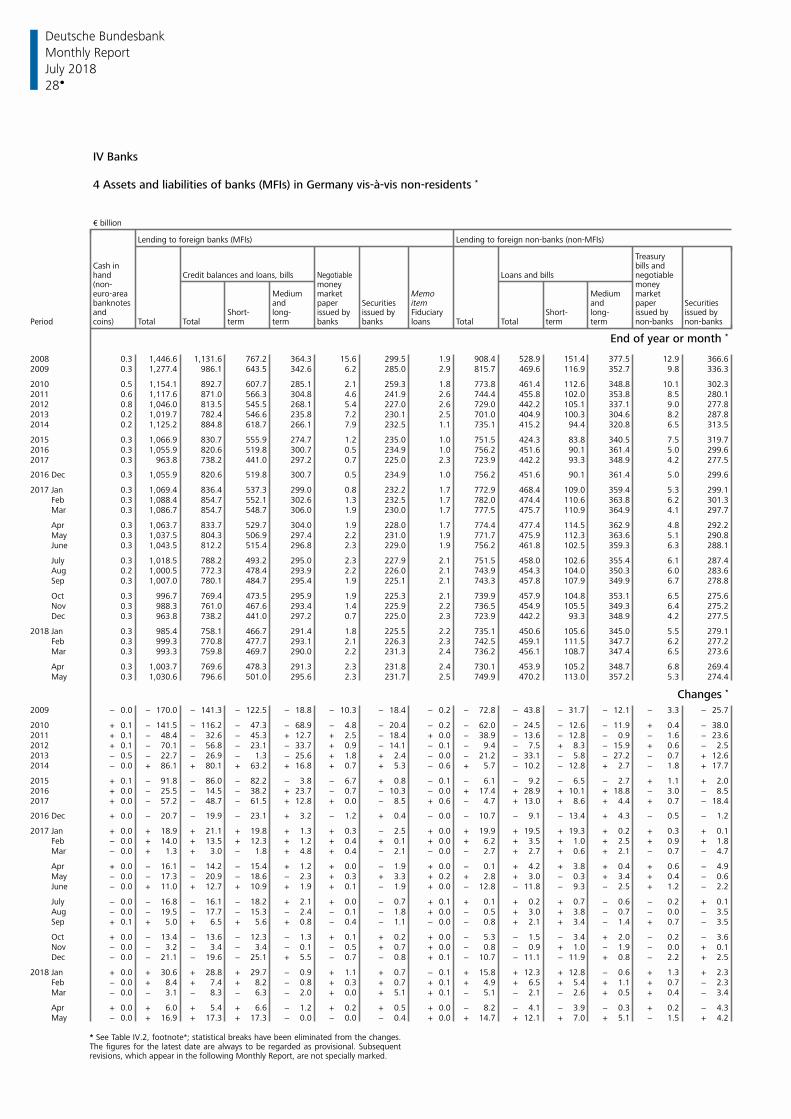
Deutsche Bundesbank
28
Monthly Report
July 2018
IV Banks
4 Assets and liabilities of banks (MFIs) in Germany vis-à-vis non-residents *
€ billion
Lending to foreign banks (MFIs) Lending to foreign non-banks (non-MFIs)
TreasuryCash in bills andhand Loans and bills negotiableCredit balances and loans, bills Negotiable(non- money moneyeuro-area Medium market Memo Medium marketbanknotes and paper item and paper SecuritiesSecuritiesand Short- long- issued by issued by Fiduciary Short- long- issued by issued by
Period coins) Total Total term term banks banks loans Total Total term term non-banks non-banks
End of year or month *
2008 0.3 1,446.6 1,131.6 767.2 364.3 15.6 299.5 1.9 908.4 528.9 151.4 377.5 12.9 366.62009 0.3 1,277.4 986.1 643.5 342.6 6.2 285.0 2.9 815.7 469.6 116.9 352.7 9.8 336.3
2010 0.5 1,154.1 892.7 607.7 285.1 2.1 259.3 1.8 773.8 461.4 112.6 348.8 10.1 302.32011 0.6 1,117.6 871.0 566.3 304.8 4.6 241.9 2.6 744.4 455.8 102.0 353.8 8.5 280.12012 0.8 1,046.0 813.5 545.5 268.1 5.4 227.0 2.6 729.0 442.2 105.1 337.1 9.0 277.82013 0.2 1,019.7 782.4 546.6 235.8 7.2 230.1 2.5 701.0 404.9 100.3 304.6 8.2 287.82014 0.2 1,125.2 884.8 618.7 266.1 7.9 232.5 1.1 735.1 415.2 94.4 320.8 6.5 313.5
2015 0.3 1,066.9 830.7 555.9 274.7 1.2 235.0 1.0 751.5 424.3 83.8 340.5 7.5 319.72016 0.3 1,055.9 820.6 519.8 300.7 0.5 234.9 1.0 756.2 451.6 90.1 361.4 5.0 299.62017 0.3 963.8 738.2 441.0 297.2 0.7 225.0 2.3 723.9 442.2 93.3 348.9 4.2 277.5
2016 Dec 0.3 1,055.9 820.6 519.8 300.7 0.5 234.9 1.0 756.2 451.6 90.1 361.4 5.0 299.6
2017 Jan 0.3 1,069.4 836.4 537.3 299.0 0.8 232.2 1.7 772.9 468.4 109.0 359.4 5.3 299.1 Feb 0.3 1,088.4 854.7 552.1 302.6 1.3 232.5 1.7 782.0 474.4 110.6 363.8 6.2 301.3 Mar 0.3 1,086.7 854.7 548.7 306.0 1.9 230.0 1.7 777.5 475.7 110.9 364.9 4.1 297.7
Apr 0.3 1,063.7 833.7 529.7 304.0 1.9 228.0 1.7 774.4 477.4 114.5 362.9 4.8 292.2 May 0.3 1,037.5 804.3 506.9 297.4 2.2 231.0 1.9 771.7 475.9 112.3 363.6 5.1 290.8 June 0.3 1,043.5 812.2 515.4 296.8 2.3 229.0 1.9 756.2 461.8 102.5 359.3 6.3 288.1
July 0.3 1,018.5 788.2 493.2 295.0 2.3 227.9 2.1 751.5 458.0 102.6 355.4 6.1 287.4 Aug 0.2 1,000.5 772.3 478.4 293.9 2.2 226.0 2.1 743.9 454.3 104.0 350.3 6.0 283.6 Sep 0.3 1,007.0 780.1 484.7 295.4 1.9 225.1 2.1 743.3 457.8 107.9 349.9 6.7 278.8
Oct 0.3 996.7 769.4 473.5 295.9 1.9 225.3 2.1 739.9 457.9 104.8 353.1 6.5 275.6 Nov 0.3 988.3 761.0 467.6 293.4 1.4 225.9 2.2 736.5 454.9 105.5 349.3 6.4 275.2 Dec 0.3 963.8 738.2 441.0 297.2 0.7 225.0 2.3 723.9 442.2 93.3 348.9 4.2 277.5
2018 Jan 0.3 985.4 758.1 466.7 291.4 1.8 225.5 2.2 735.1 450.6 105.6 345.0 5.5 279.1 Feb 0.3 999.3 770.8 477.7 293.1 2.1 226.3 2.3 742.5 459.1 111.5 347.7 6.2 277.2 Mar 0.3 993.3 759.8 469.7 290.0 2.2 231.3 2.4 736.2 456.1 108.7 347.4 6.5 273.6
Apr 0.3 1,003.7 769.6 478.3 291.3 2.3 231.8 2.4 730.1 453.9 105.2 348.7 6.8 269.4 May 0.3 1,030.6 796.6 501.0 295.6 2.3 231.7 2.5 749.9 470.2 113.0 357.2 5.3 274.4
Changes *
2009 − 0.0 − 170.0 − 141.3 − 122.5 − 18.8 − 10.3 − 18.4 − 0.2 − 72.8 − 43.8 − 31.7 − 12.1 − 3.3 − 25.7
2010 + 0.1 − 141.5 − 116.2 − 47.3 − 68.9 − 4.8 − 20.4 − 0.2 − 62.0 − 24.5 − 12.6 − 11.9 + 0.4 − 38.02011 + 0.1 − 48.4 − 32.6 − 45.3 + 12.7 + 2.5 − 18.4 + 0.0 − 38.9 − 13.6 − 12.8 − 0.9 − 1.6 − 23.62012 + 0.1 − 70.1 − 56.8 − 23.1 − 33.7 + 0.9 − 14.1 − 0.1 − 9.4 − 7.5 + 8.3 − 15.9 + 0.6 − 2.52013 − 0.5 − 22.7 − 26.9 − 1.3 − 25.6 + 1.8 + 2.4 − 0.0 − 21.2 − 33.1 − 5.8 − 27.2 − 0.7 + 12.62014 − 0.0 + 86.1 + 80.1 + 63.2 + 16.8 + 0.7 + 5.3 − 0.6 + 5.7 − 10.2 − 12.8 + 2.7 − 1.8 + 17.7
2015 + 0.1 − 91.8 − 86.0 − 82.2 − 3.8 − 6.7 + 0.8 − 0.1 − 6.1 − 9.2 − 6.5 − 2.7 + 1.1 + 2.02016 + 0.0 − 25.5 − 14.5 − 38.2 + 23.7 − 0.7 − 10.3 − 0.0 + 17.4 + 28.9 + 10.1 + 18.8 − 3.0 − 8.52017 + 0.0 − 57.2 − 48.7 − 61.5 + 12.8 + 0.0 − 8.5 + 0.6 − 4.7 + 13.0 + 8.6 + 4.4 + 0.7 − 18.4
2016 Dec + 0.0 − 20.7 − 19.9 − 23.1 + 3.2 − 1.2 + 0.4 − 0.0 − 10.7 − 9.1 − 13.4 + 4.3 − 0.5 − 1.2
2017 Jan + 0.0 + 18.9 + 21.1 + 19.8 + 1.3 + 0.3 − 2.5 + 0.0 + 19.9 + 19.5 + 19.3 + 0.2 + 0.3 + 0.1 Feb − 0.0 + 14.0 + 13.5 + 12.3 + 1.2 + 0.4 + 0.1 + 0.0 + 6.2 + 3.5 + 1.0 + 2.5 + 0.9 + 1.8 Mar − 0.0 + 1.3 + 3.0 − 1.8 + 4.8 + 0.4 − 2.1 − 0.0 − 2.7 + 2.7 + 0.6 + 2.1 − 0.7 − 4.7
Apr + 0.0 − 16.1 − 14.2 − 15.4 + 1.2 + 0.0 − 1.9 + 0.0 − 0.1 + 4.2 + 3.8 + 0.4 + 0.6 − 4.9 May − 0.0 − 17.3 − 20.9 − 18.6 − 2.3 + 0.3 + 3.3 + 0.2 + 2.8 + 3.0 − 0.3 + 3.4 + 0.4 − 0.6 June − 0.0 + 11.0 + 12.7 + 10.9 + 1.9 + 0.1 − 1.9 + 0.0 − 12.8 − 11.8 − 9.3 − 2.5 + 1.2 − 2.2
July − 0.0 − 16.8 − 16.1 − 18.2 + 2.1 + 0.0 − 0.7 + 0.1 + 0.1 + 0.2 + 0.7 − 0.6 − 0.2 + 0.1 Aug − 0.0 − 19.5 − 17.7 − 15.3 − 2.4 − 0.1 − 1.8 + 0.0 − 0.5 + 3.0 + 3.8 − 0.7 − 0.0 − 3.5 Sep + 0.1 + 5.0 + 6.5 + 5.6 + 0.8 − 0.4 − 1.1 − 0.0 − 0.8 + 2.1 + 3.4 − 1.4 + 0.7 − 3.5
Oct + 0.0 − 13.4 − 13.6 − 12.3 − 1.3 + 0.1 + 0.2 + 0.0 − 5.3 − 1.5 − 3.4 + 2.0 − 0.2 − 3.6 Nov − 0.0 − 3.2 − 3.4 − 3.4 − 0.1 − 0.5 + 0.7 + 0.0 − 0.8 − 0.9 + 1.0 − 1.9 − 0.0 + 0.1 Dec − 0.0 − 21.1 − 19.6 − 25.1 + 5.5 − 0.7 − 0.8 + 0.1 − 10.7 − 11.1 − 11.9 + 0.8 − 2.2 + 2.5
2018 Jan + 0.0 + 30.6 + 28.8 + 29.7 − 0.9 + 1.1 + 0.7 − 0.1 + 15.8 + 12.3 + 12.8 − 0.6 + 1.3 + 2.3 Feb − 0.0 + 8.4 + 7.4 + 8.2 − 0.8 + 0.3 + 0.7 + 0.1 + 4.9 + 6.5 + 5.4 + 1.1 + 0.7 − 2.3 Mar − 0.0 − 3.1 − 8.3 − 6.3 − 2.0 + 0.0 + 5.1 + 0.1 − 5.1 − 2.1 − 2.6 + 0.5 + 0.4 − 3.4
Apr + 0.0 + 6.0 + 5.4 + 6.6 − 1.2 + 0.2 + 0.5 + 0.0 − 8.2 − 4.1 − 3.9 − 0.3 + 0.2 − 4.3 May − 0.0 + 16.9 + 17.3 + 17.3 − 0.0 − 0.0 − 0.4 + 0.0 + 14.7 + 12.1 + 7.0 + 5.1 − 1.5 + 4.2
* See Table IV.2, footnote*; statistical breaks have been eliminated from the changes. The figures for the latest date are always to be regarded as provisional. Subsequent revisions, which appear in the following Monthly Report, are not specially marked.
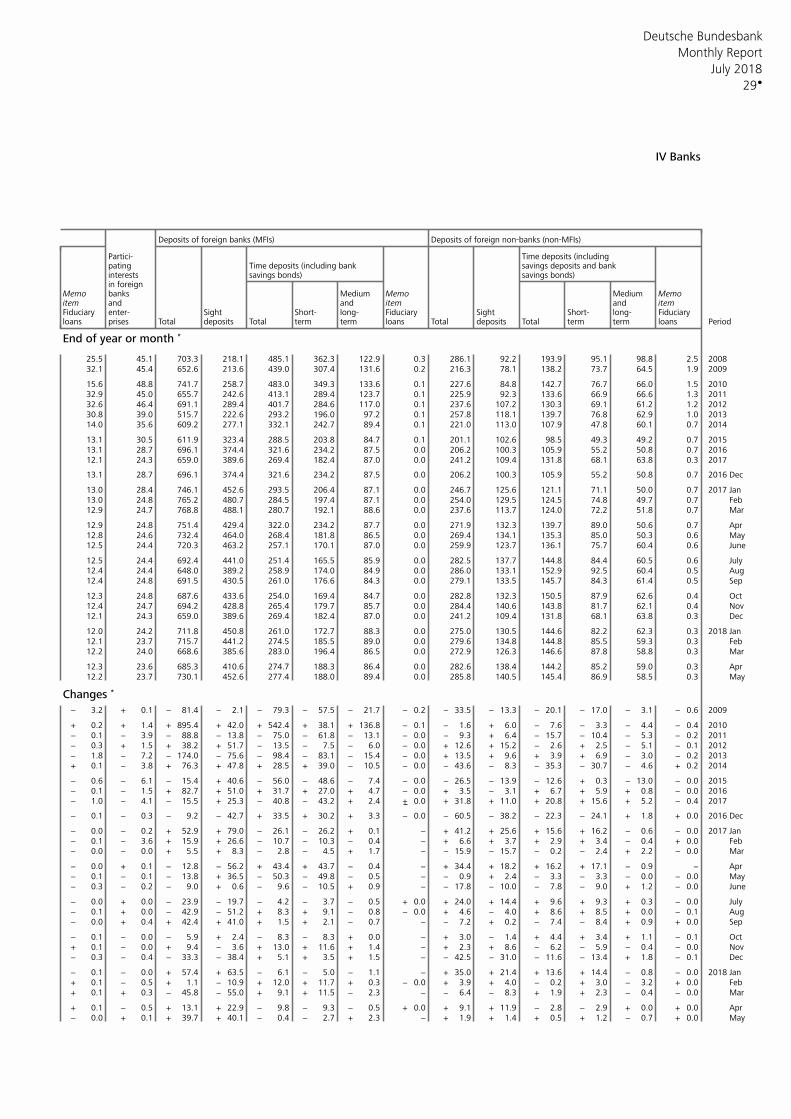
Deutsche Bundesbank
29
Monthly Report
July 2018
IV Banks
Deposits of foreign banks (MFIs) Deposits of foreign non-banks (non-MFIs)
Partici- Time deposits (includingpating Time deposits (including bank savings deposits and bankinterests savings bonds) savings bonds)in foreign
Memo banks Medium Memo Medium Memoitem and and item and itemFiduciary enter- Sight Short- long- Fiduciary Sight Short- long- Fiduciaryloans prises Total deposits Total term term loans Total deposits Total term term loans Period
End of year or month *
25.5 45.1 703.3 218.1 485.1 362.3 122.9 0.3 286.1 92.2 193.9 95.1 98.8 2.5 200832.1 45.4 652.6 213.6 439.0 307.4 131.6 0.2 216.3 78.1 138.2 73.7 64.5 1.9 2009
15.6 48.8 741.7 258.7 483.0 349.3 133.6 0.1 227.6 84.8 142.7 76.7 66.0 1.5 201032.9 45.0 655.7 242.6 413.1 289.4 123.7 0.1 225.9 92.3 133.6 66.9 66.6 1.3 201132.6 46.4 691.1 289.4 401.7 284.6 117.0 0.1 237.6 107.2 130.3 69.1 61.2 1.2 201230.8 39.0 515.7 222.6 293.2 196.0 97.2 0.1 257.8 118.1 139.7 76.8 62.9 1.0 201314.0 35.6 609.2 277.1 332.1 242.7 89.4 0.1 221.0 113.0 107.9 47.8 60.1 0.7 2014
13.1 30.5 611.9 323.4 288.5 203.8 84.7 0.1 201.1 102.6 98.5 49.3 49.2 0.7 201513.1 28.7 696.1 374.4 321.6 234.2 87.5 0.0 206.2 100.3 105.9 55.2 50.8 0.7 201612.1 24.3 659.0 389.6 269.4 182.4 87.0 0.0 241.2 109.4 131.8 68.1 63.8 0.3 2017
13.1 28.7 696.1 374.4 321.6 234.2 87.5 0.0 206.2 100.3 105.9 55.2 50.8 0.7 2016 Dec
13.0 28.4 746.1 452.6 293.5 206.4 87.1 0.0 246.7 125.6 121.1 71.1 50.0 0.7 2017 Jan 13.0 24.8 765.2 480.7 284.5 197.4 87.1 0.0 254.0 129.5 124.5 74.8 49.7 0.7 Feb 12.9 24.7 768.8 488.1 280.7 192.1 88.6 0.0 237.6 113.7 124.0 72.2 51.8 0.7 Mar
12.9 24.8 751.4 429.4 322.0 234.2 87.7 0.0 271.9 132.3 139.7 89.0 50.6 0.7 Apr 12.8 24.6 732.4 464.0 268.4 181.8 86.5 0.0 269.4 134.1 135.3 85.0 50.3 0.6 May12.5 24.4 720.3 463.2 257.1 170.1 87.0 0.0 259.9 123.7 136.1 75.7 60.4 0.6 June
12.5 24.4 692.4 441.0 251.4 165.5 85.9 0.0 282.5 137.7 144.8 84.4 60.5 0.6 July12.4 24.4 648.0 389.2 258.9 174.0 84.9 0.0 286.0 133.1 152.9 92.5 60.4 0.5 Aug 12.4 24.8 691.5 430.5 261.0 176.6 84.3 0.0 279.1 133.5 145.7 84.3 61.4 0.5 Sep
12.3 24.8 687.6 433.6 254.0 169.4 84.7 0.0 282.8 132.3 150.5 87.9 62.6 0.4 Oct 12.4 24.7 694.2 428.8 265.4 179.7 85.7 0.0 284.4 140.6 143.8 81.7 62.1 0.4 Nov 12.1 24.3 659.0 389.6 269.4 182.4 87.0 0.0 241.2 109.4 131.8 68.1 63.8 0.3 Dec
12.0 24.2 711.8 450.8 261.0 172.7 88.3 0.0 275.0 130.5 144.6 82.2 62.3 0.3 2018 Jan 12.1 23.7 715.7 441.2 274.5 185.5 89.0 0.0 279.6 134.8 144.8 85.5 59.3 0.3 Feb 12.2 24.0 668.6 385.6 283.0 196.4 86.5 0.0 272.9 126.3 146.6 87.8 58.8 0.3 Mar
12.3 23.6 685.3 410.6 274.7 188.3 86.4 0.0 282.6 138.4 144.2 85.2 59.0 0.3 Apr 12.2 23.7 730.1 452.6 277.4 188.0 89.4 0.0 285.8 140.5 145.4 86.9 58.5 0.3 May
Changes *
− 3.2 + 0.1 − 81.4 − 2.1 − 79.3 − 57.5 − 21.7 − 0.2 − 33.5 − 13.3 − 20.1 − 17.0 − 3.1 − 0.6 2009
+ 0.2 + 1.4 + 895.4 + 42.0 + 542.4 + 38.1 + 136.8 − 0.1 − 1.6 + 6.0 − 7.6 − 3.3 − 4.4 − 0.4 2010− 0.1 − 3.9 − 88.8 − 13.8 − 75.0 − 61.8 − 13.1 − 0.0 − 9.3 + 6.4 − 15.7 − 10.4 − 5.3 − 0.2 2011− 0.3 + 1.5 + 38.2 + 51.7 − 13.5 − 7.5 − 6.0 − 0.0 + 12.6 + 15.2 − 2.6 + 2.5 − 5.1 − 0.1 2012− 1.8 − 7.2 − 174.0 − 75.6 − 98.4 − 83.1 − 15.4 − 0.0 + 13.5 + 9.6 + 3.9 + 6.9 − 3.0 − 0.2 2013+ 0.1 − 3.8 + 76.3 + 47.8 + 28.5 + 39.0 − 10.5 − 0.0 − 43.6 − 8.3 − 35.3 − 30.7 − 4.6 + 0.2 2014
− 0.6 − 6.1 − 15.4 + 40.6 − 56.0 − 48.6 − 7.4 − 0.0 − 26.5 − 13.9 − 12.6 + 0.3 − 13.0 − 0.0 2015− 0.1 − 1.5 + 82.7 + 51.0 + 31.7 + 27.0 + 4.7 − 0.0 + 3.5 − 3.1 + 6.7 + 5.9 + 0.8 − 0.0 2016− 1.0 − 4.1 − 15.5 + 25.3 − 40.8 − 43.2 + 2.4 + 0.0 + 31.8 + 11.0 + 20.8 + 15.6 + 5.2 − 0.4 2017
− 0.1 − 0.3 − 9.2 − 42.7 + 33.5 + 30.2 + 3.3 − 0.0 − 60.5 − 38.2 − 22.3 − 24.1 + 1.8 + 0.0 2016 Dec
− 0.0 − 0.2 + 52.9 + 79.0 − 26.1 − 26.2 + 0.1 − + 41.2 + 25.6 + 15.6 + 16.2 − 0.6 − 0.0 2017 Jan − 0.1 − 3.6 + 15.9 + 26.6 − 10.7 − 10.3 − 0.4 − + 6.6 + 3.7 + 2.9 + 3.4 − 0.4 + 0.0 Feb − 0.0 − 0.0 + 5.5 + 8.3 − 2.8 − 4.5 + 1.7 − − 15.9 − 15.7 − 0.2 − 2.4 + 2.2 − 0.0 Mar
− 0.0 + 0.1 − 12.8 − 56.2 + 43.4 + 43.7 − 0.4 − + 34.4 + 18.2 + 16.2 + 17.1 − 0.9 − Apr − 0.1 − 0.1 − 13.8 + 36.5 − 50.3 − 49.8 − 0.5 − − 0.9 + 2.4 − 3.3 − 3.3 − 0.0 − 0.0 May− 0.3 − 0.2 − 9.0 + 0.6 − 9.6 − 10.5 + 0.9 − − 17.8 − 10.0 − 7.8 − 9.0 + 1.2 − 0.0 June
− 0.0 + 0.0 − 23.9 − 19.7 − 4.2 − 3.7 − 0.5 + 0.0 + 24.0 + 14.4 + 9.6 + 9.3 + 0.3 − 0.0 July− 0.1 + 0.0 − 42.9 − 51.2 + 8.3 + 9.1 − 0.8 − 0.0 + 4.6 − 4.0 + 8.6 + 8.5 + 0.0 − 0.1 Aug − 0.0 + 0.4 + 42.4 + 41.0 + 1.5 + 2.1 − 0.7 − − 7.2 + 0.2 − 7.4 − 8.4 + 0.9 + 0.0 Sep
− 0.1 − 0.0 − 5.9 + 2.4 − 8.3 − 8.3 + 0.0 − + 3.0 − 1.4 + 4.4 + 3.4 + 1.1 − 0.1 Oct + 0.1 − 0.0 + 9.4 − 3.6 + 13.0 + 11.6 + 1.4 − + 2.3 + 8.6 − 6.2 − 5.9 − 0.4 − 0.0 Nov − 0.3 − 0.4 − 33.3 − 38.4 + 5.1 + 3.5 + 1.5 − − 42.5 − 31.0 − 11.6 − 13.4 + 1.8 − 0.1 Dec
− 0.1 − 0.0 + 57.4 + 63.5 − 6.1 − 5.0 − 1.1 − + 35.0 + 21.4 + 13.6 + 14.4 − 0.8 − 0.0 2018 Jan + 0.1 − 0.5 + 1.1 − 10.9 + 12.0 + 11.7 + 0.3 − 0.0 + 3.9 + 4.0 − 0.2 + 3.0 − 3.2 + 0.0 Feb + 0.1 + 0.3 − 45.8 − 55.0 + 9.1 + 11.5 − 2.3 − − 6.4 − 8.3 + 1.9 + 2.3 − 0.4 − 0.0 Mar
+ 0.1 − 0.5 + 13.1 + 22.9 − 9.8 − 9.3 − 0.5 + 0.0 + 9.1 + 11.9 − 2.8 − 2.9 + 0.0 + 0.0 Apr − 0.0 + 0.1 + 39.7 + 40.1 − 0.4 − 2.7 + 2.3 − + 1.9 + 1.4 + 0.5 + 1.2 − 0.7 + 0.0 May
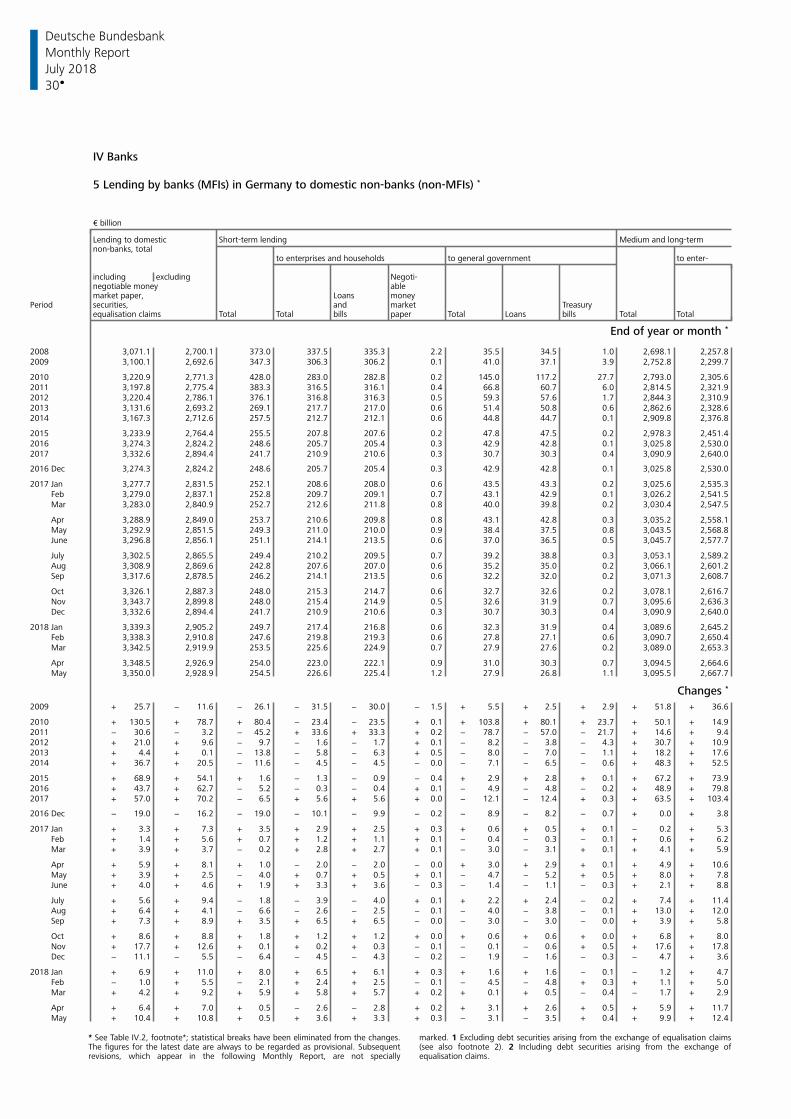
Deutsche Bundesbank
30
Monthly Report
July 2018
IV Banks
5 Lending by banks (MFIs) in Germany to domestic non-banks (non-MFIs) *
€ billion
Lending to domestic Short-term lending Medium and long-termnon-banks, total
to enterprises and households to general government to enter-
including excluding Negoti-negotiable money ablemarket paper, Loans money
Period securities, and market Treasuryequalisation claims Total Total bills paper Total Loans bills Total Total
End of year or month *
2008 3,071.1 2,700.1 373.0 337.5 335.3 2.2 35.5 34.5 1.0 2,698.1 2,257.82009 3,100.1 2,692.6 347.3 306.3 306.2 0.1 41.0 37.1 3.9 2,752.8 2,299.7
2010 3,220.9 2,771.3 428.0 283.0 282.8 0.2 145.0 117.2 27.7 2,793.0 2,305.62011 3,197.8 2,775.4 383.3 316.5 316.1 0.4 66.8 60.7 6.0 2,814.5 2,321.92012 3,220.4 2,786.1 376.1 316.8 316.3 0.5 59.3 57.6 1.7 2,844.3 2,310.92013 3,131.6 2,693.2 269.1 217.7 217.0 0.6 51.4 50.8 0.6 2,862.6 2,328.62014 3,167.3 2,712.6 257.5 212.7 212.1 0.6 44.8 44.7 0.1 2,909.8 2,376.8
2015 3,233.9 2,764.4 255.5 207.8 207.6 0.2 47.8 47.5 0.2 2,978.3 2,451.42016 3,274.3 2,824.2 248.6 205.7 205.4 0.3 42.9 42.8 0.1 3,025.8 2,530.02017 3,332.6 2,894.4 241.7 210.9 210.6 0.3 30.7 30.3 0.4 3,090.9 2,640.0
2016 Dec 3,274.3 2,824.2 248.6 205.7 205.4 0.3 42.9 42.8 0.1 3,025.8 2,530.0
2017 Jan 3,277.7 2,831.5 252.1 208.6 208.0 0.6 43.5 43.3 0.2 3,025.6 2,535.3 Feb 3,279.0 2,837.1 252.8 209.7 209.1 0.7 43.1 42.9 0.1 3,026.2 2,541.5 Mar 3,283.0 2,840.9 252.7 212.6 211.8 0.8 40.0 39.8 0.2 3,030.4 2,547.5
Apr 3,288.9 2,849.0 253.7 210.6 209.8 0.8 43.1 42.8 0.3 3,035.2 2,558.1 May 3,292.9 2,851.5 249.3 211.0 210.0 0.9 38.4 37.5 0.8 3,043.5 2,568.8 June 3,296.8 2,856.1 251.1 214.1 213.5 0.6 37.0 36.5 0.5 3,045.7 2,577.7
July 3,302.5 2,865.5 249.4 210.2 209.5 0.7 39.2 38.8 0.3 3,053.1 2,589.2 Aug 3,308.9 2,869.6 242.8 207.6 207.0 0.6 35.2 35.0 0.2 3,066.1 2,601.2 Sep 3,317.6 2,878.5 246.2 214.1 213.5 0.6 32.2 32.0 0.2 3,071.3 2,608.7
Oct 3,326.1 2,887.3 248.0 215.3 214.7 0.6 32.7 32.6 0.2 3,078.1 2,616.7 Nov 3,343.7 2,899.8 248.0 215.4 214.9 0.5 32.6 31.9 0.7 3,095.6 2,636.3 Dec 3,332.6 2,894.4 241.7 210.9 210.6 0.3 30.7 30.3 0.4 3,090.9 2,640.0
2018 Jan 3,339.3 2,905.2 249.7 217.4 216.8 0.6 32.3 31.9 0.4 3,089.6 2,645.2 Feb 3,338.3 2,910.8 247.6 219.8 219.3 0.6 27.8 27.1 0.6 3,090.7 2,650.4 Mar 3,342.5 2,919.9 253.5 225.6 224.9 0.7 27.9 27.6 0.2 3,089.0 2,653.3
Apr 3,348.5 2,926.9 254.0 223.0 222.1 0.9 31.0 30.3 0.7 3,094.5 2,664.6 May 3,350.0 2,928.9 254.5 226.6 225.4 1.2 27.9 26.8 1.1 3,095.5 2,667.7
Changes *
2009 + 25.7 − 11.6 − 26.1 − 31.5 − 30.0 − 1.5 + 5.5 + 2.5 + 2.9 + 51.8 + 36.6
2010 + 130.5 + 78.7 + 80.4 − 23.4 − 23.5 + 0.1 + 103.8 + 80.1 + 23.7 + 50.1 + 14.92011 − 30.6 − 3.2 − 45.2 + 33.6 + 33.3 + 0.2 − 78.7 − 57.0 − 21.7 + 14.6 + 9.42012 + 21.0 + 9.6 − 9.7 − 1.6 − 1.7 + 0.1 − 8.2 − 3.8 − 4.3 + 30.7 + 10.92013 + 4.4 + 0.1 − 13.8 − 5.8 − 6.3 + 0.5 − 8.0 − 7.0 − 1.1 + 18.2 + 17.62014 + 36.7 + 20.5 − 11.6 − 4.5 − 4.5 − 0.0 − 7.1 − 6.5 − 0.6 + 48.3 + 52.5
2015 + 68.9 + 54.1 + 1.6 − 1.3 − 0.9 − 0.4 + 2.9 + 2.8 + 0.1 + 67.2 + 73.92016 + 43.7 + 62.7 − 5.2 − 0.3 − 0.4 + 0.1 − 4.9 − 4.8 − 0.2 + 48.9 + 79.82017 + 57.0 + 70.2 − 6.5 + 5.6 + 5.6 + 0.0 − 12.1 − 12.4 + 0.3 + 63.5 + 103.4
2016 Dec − 19.0 − 16.2 − 19.0 − 10.1 − 9.9 − 0.2 − 8.9 − 8.2 − 0.7 + 0.0 + 3.8
2017 Jan + 3.3 + 7.3 + 3.5 + 2.9 + 2.5 + 0.3 + 0.6 + 0.5 + 0.1 − 0.2 + 5.3 Feb + 1.4 + 5.6 + 0.7 + 1.2 + 1.1 + 0.1 − 0.4 − 0.3 − 0.1 + 0.6 + 6.2 Mar + 3.9 + 3.7 − 0.2 + 2.8 + 2.7 + 0.1 − 3.0 − 3.1 + 0.1 + 4.1 + 5.9
Apr + 5.9 + 8.1 + 1.0 − 2.0 − 2.0 − 0.0 + 3.0 + 2.9 + 0.1 + 4.9 + 10.6 May + 3.9 + 2.5 − 4.0 + 0.7 + 0.5 + 0.1 − 4.7 − 5.2 + 0.5 + 8.0 + 7.8 June + 4.0 + 4.6 + 1.9 + 3.3 + 3.6 − 0.3 − 1.4 − 1.1 − 0.3 + 2.1 + 8.8
July + 5.6 + 9.4 − 1.8 − 3.9 − 4.0 + 0.1 + 2.2 + 2.4 − 0.2 + 7.4 + 11.4 Aug + 6.4 + 4.1 − 6.6 − 2.6 − 2.5 − 0.1 − 4.0 − 3.8 − 0.1 + 13.0 + 12.0 Sep + 7.3 + 8.9 + 3.5 + 6.5 + 6.5 − 0.0 − 3.0 − 3.0 − 0.0 + 3.9 + 5.8
Oct + 8.6 + 8.8 + 1.8 + 1.2 + 1.2 + 0.0 + 0.6 + 0.6 + 0.0 + 6.8 + 8.0 Nov + 17.7 + 12.6 + 0.1 + 0.2 + 0.3 − 0.1 − 0.1 − 0.6 + 0.5 + 17.6 + 17.8 Dec − 11.1 − 5.5 − 6.4 − 4.5 − 4.3 − 0.2 − 1.9 − 1.6 − 0.3 − 4.7 + 3.6
2018 Jan + 6.9 + 11.0 + 8.0 + 6.5 + 6.1 + 0.3 + 1.6 + 1.6 − 0.1 − 1.2 + 4.7 Feb − 1.0 + 5.5 − 2.1 + 2.4 + 2.5 − 0.1 − 4.5 − 4.8 + 0.3 + 1.1 + 5.0 Mar + 4.2 + 9.2 + 5.9 + 5.8 + 5.7 + 0.2 + 0.1 + 0.5 − 0.4 − 1.7 + 2.9
Apr + 6.4 + 7.0 + 0.5 − 2.6 − 2.8 + 0.2 + 3.1 + 2.6 + 0.5 + 5.9 + 11.7 May + 10.4 + 10.8 + 0.5 + 3.6 + 3.3 + 0.3 − 3.1 − 3.5 + 0.4 + 9.9 + 12.4
* See Table IV.2, footnote*; statistical breaks have been eliminated from the changes. marked. 1 Excluding debt securities arising from the exchange of equalisation claimsThe figures for the latest date are always to be regarded as provisional. Subsequent (see also footnote 2). 2 Including debt securities arising from the exchange ofrevisions, which appear in the following Monthly Report, are not specially equalisation claims.
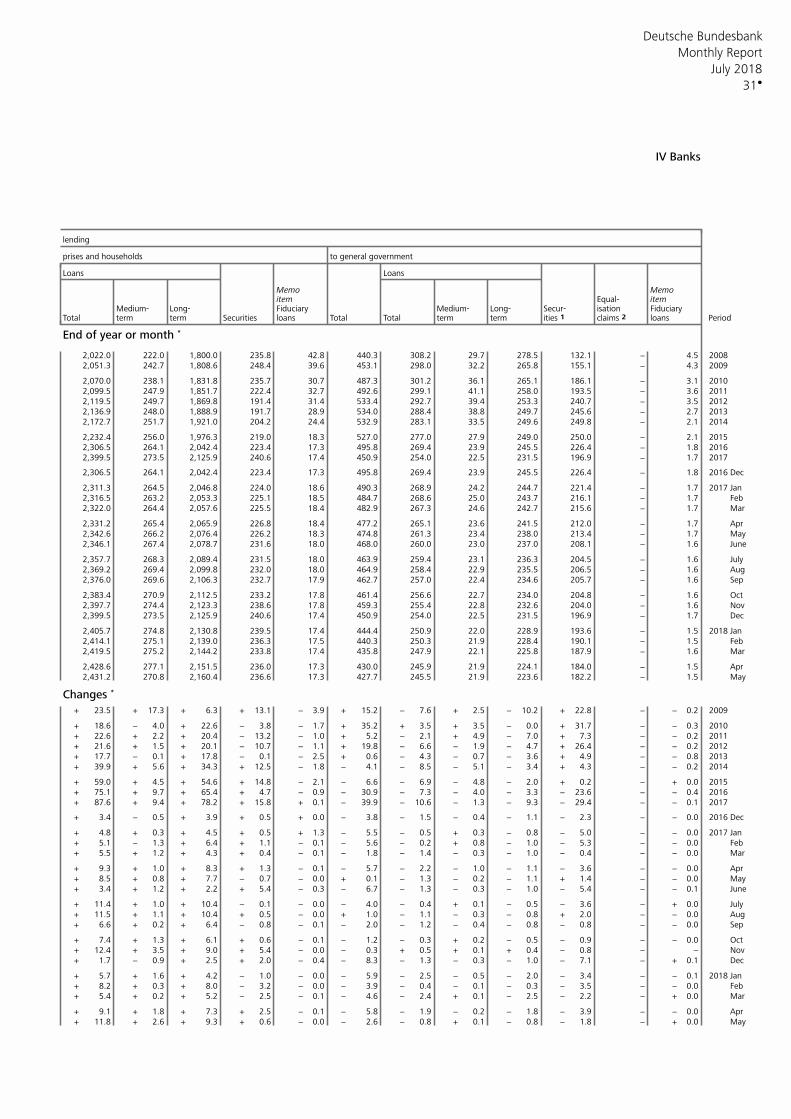
Deutsche Bundesbank
31
Monthly Report
July 2018
IV Banks
lending
prises and households to general government
Loans Loans
Memo Memoitem Equal- item
Medium- Long- Fiduciary Medium- Long- Secur- isation FiduciaryTotal term term loans Total Total term term ities 1 claims 2 loans PeriodSecurities
End of year or month *
2,022.0 222.0 1,800.0 235.8 42.8 440.3 308.2 29.7 278.5 132.1 − 4.5 20082,051.3 242.7 1,808.6 248.4 39.6 453.1 298.0 32.2 265.8 155.1 − 4.3 2009
2,070.0 238.1 1,831.8 235.7 30.7 487.3 301.2 36.1 265.1 186.1 − 3.1 20102,099.5 247.9 1,851.7 222.4 32.7 492.6 299.1 41.1 258.0 193.5 − 3.6 20112,119.5 249.7 1,869.8 191.4 31.4 533.4 292.7 39.4 253.3 240.7 − 3.5 20122,136.9 248.0 1,888.9 191.7 28.9 534.0 288.4 38.8 249.7 245.6 − 2.7 20132,172.7 251.7 1,921.0 204.2 24.4 532.9 283.1 33.5 249.6 249.8 − 2.1 2014
2,232.4 256.0 1,976.3 219.0 18.3 527.0 277.0 27.9 249.0 250.0 − 2.1 20152,306.5 264.1 2,042.4 223.4 17.3 495.8 269.4 23.9 245.5 226.4 − 1.8 20162,399.5 273.5 2,125.9 240.6 17.4 450.9 254.0 22.5 231.5 196.9 − 1.7 2017
2,306.5 264.1 2,042.4 223.4 17.3 495.8 269.4 23.9 245.5 226.4 − 1.8 2016 Dec
2,311.3 264.5 2,046.8 224.0 18.6 490.3 268.9 24.2 244.7 221.4 − 1.7 2017 Jan 2,316.5 263.2 2,053.3 225.1 18.5 484.7 268.6 25.0 243.7 216.1 − 1.7 Feb 2,322.0 264.4 2,057.6 225.5 18.4 482.9 267.3 24.6 242.7 215.6 − 1.7 Mar
2,331.2 265.4 2,065.9 226.8 18.4 477.2 265.1 23.6 241.5 212.0 − 1.7 Apr 2,342.6 266.2 2,076.4 226.2 18.3 474.8 261.3 23.4 238.0 213.4 − 1.7 May2,346.1 267.4 2,078.7 231.6 18.0 468.0 260.0 23.0 237.0 208.1 − 1.6 June
2,357.7 268.3 2,089.4 231.5 18.0 463.9 259.4 23.1 236.3 204.5 − 1.6 July2,369.2 269.4 2,099.8 232.0 18.0 464.9 258.4 22.9 235.5 206.5 − 1.6 Aug 2,376.0 269.6 2,106.3 232.7 17.9 462.7 257.0 22.4 234.6 205.7 − 1.6 Sep
2,383.4 270.9 2,112.5 233.2 17.8 461.4 256.6 22.7 234.0 204.8 − 1.6 Oct 2,397.7 274.4 2,123.3 238.6 17.8 459.3 255.4 22.8 232.6 204.0 − 1.6 Nov 2,399.5 273.5 2,125.9 240.6 17.4 450.9 254.0 22.5 231.5 196.9 − 1.7 Dec
2,405.7 274.8 2,130.8 239.5 17.4 444.4 250.9 22.0 228.9 193.6 − 1.5 2018 Jan 2,414.1 275.1 2,139.0 236.3 17.5 440.3 250.3 21.9 228.4 190.1 − 1.5 Feb 2,419.5 275.2 2,144.2 233.8 17.4 435.8 247.9 22.1 225.8 187.9 − 1.6 Mar
2,428.6 277.1 2,151.5 236.0 17.3 430.0 245.9 21.9 224.1 184.0 − 1.5 Apr 2,431.2 270.8 2,160.4 236.6 17.3 427.7 245.5 21.9 223.6 182.2 − 1.5 May
Changes *
+ 23.5 + 17.3 + 6.3 + 13.1 − 3.9 + 15.2 − 7.6 + 2.5 − 10.2 + 22.8 − − 0.2 2009
+ 18.6 − 4.0 + 22.6 − 3.8 − 1.7 + 35.2 + 3.5 + 3.5 − 0.0 + 31.7 − − 0.3 2010+ 22.6 + 2.2 + 20.4 − 13.2 − 1.0 + 5.2 − 2.1 + 4.9 − 7.0 + 7.3 − − 0.2 2011+ 21.6 + 1.5 + 20.1 − 10.7 − 1.1 + 19.8 − 6.6 − 1.9 − 4.7 + 26.4 − − 0.2 2012+ 17.7 − 0.1 + 17.8 − 0.1 − 2.5 + 0.6 − 4.3 − 0.7 − 3.6 + 4.9 − − 0.8 2013+ 39.9 + 5.6 + 34.3 + 12.5 − 1.8 − 4.1 − 8.5 − 5.1 − 3.4 + 4.3 − − 0.2 2014
+ 59.0 + 4.5 + 54.6 + 14.8 − 2.1 − 6.6 − 6.9 − 4.8 − 2.0 + 0.2 − + 0.0 2015+ 75.1 + 9.7 + 65.4 + 4.7 − 0.9 − 30.9 − 7.3 − 4.0 − 3.3 − 23.6 − − 0.4 2016+ 87.6 + 9.4 + 78.2 + 15.8 + 0.1 − 39.9 − 10.6 − 1.3 − 9.3 − 29.4 − − 0.1 2017
+ 3.4 − 0.5 + 3.9 + 0.5 + 0.0 − 3.8 − 1.5 − 0.4 − 1.1 − 2.3 − − 0.0 2016 Dec
+ 4.8 + 0.3 + 4.5 + 0.5 + 1.3 − 5.5 − 0.5 + 0.3 − 0.8 − 5.0 − − 0.0 2017 Jan + 5.1 − 1.3 + 6.4 + 1.1 − 0.1 − 5.6 − 0.2 + 0.8 − 1.0 − 5.3 − − 0.0 Feb + 5.5 + 1.2 + 4.3 + 0.4 − 0.1 − 1.8 − 1.4 − 0.3 − 1.0 − 0.4 − − 0.0 Mar
+ 9.3 + 1.0 + 8.3 + 1.3 − 0.1 − 5.7 − 2.2 − 1.0 − 1.1 − 3.6 − − 0.0 Apr + 8.5 + 0.8 + 7.7 − 0.7 − 0.0 + 0.1 − 1.3 − 0.2 − 1.1 + 1.4 − − 0.0 May+ 3.4 + 1.2 + 2.2 + 5.4 − 0.3 − 6.7 − 1.3 − 0.3 − 1.0 − 5.4 − − 0.1 June
+ 11.4 + 1.0 + 10.4 − 0.1 − 0.0 − 4.0 − 0.4 + 0.1 − 0.5 − 3.6 − + 0.0 July+ 11.5 + 1.1 + 10.4 + 0.5 − 0.0 + 1.0 − 1.1 − 0.3 − 0.8 + 2.0 − − 0.0 Aug + 6.6 + 0.2 + 6.4 − 0.8 − 0.1 − 2.0 − 1.2 − 0.4 − 0.8 − 0.8 − − 0.0 Sep
+ 7.4 + 1.3 + 6.1 + 0.6 − 0.1 − 1.2 − 0.3 + 0.2 − 0.5 − 0.9 − − 0.0 Oct + 12.4 + 3.5 + 9.0 + 5.4 − 0.0 − 0.3 + 0.5 + 0.1 + 0.4 − 0.8 − − Nov + 1.7 − 0.9 + 2.5 + 2.0 − 0.4 − 8.3 − 1.3 − 0.3 − 1.0 − 7.1 − + 0.1 Dec
+ 5.7 + 1.6 + 4.2 − 1.0 − 0.0 − 5.9 − 2.5 − 0.5 − 2.0 − 3.4 − − 0.1 2018 Jan + 8.2 + 0.3 + 8.0 − 3.2 − 0.0 − 3.9 − 0.4 − 0.1 − 0.3 − 3.5 − − 0.0 Feb + 5.4 + 0.2 + 5.2 − 2.5 − 0.1 − 4.6 − 2.4 + 0.1 − 2.5 − 2.2 − + 0.0 Mar
+ 9.1 + 1.8 + 7.3 + 2.5 − 0.1 − 5.8 − 1.9 − 0.2 − 1.8 − 3.9 − − 0.0 Apr + 11.8 + 2.6 + 9.3 + 0.6 − 0.0 − 2.6 − 0.8 + 0.1 − 0.8 − 1.8 − + 0.0 May
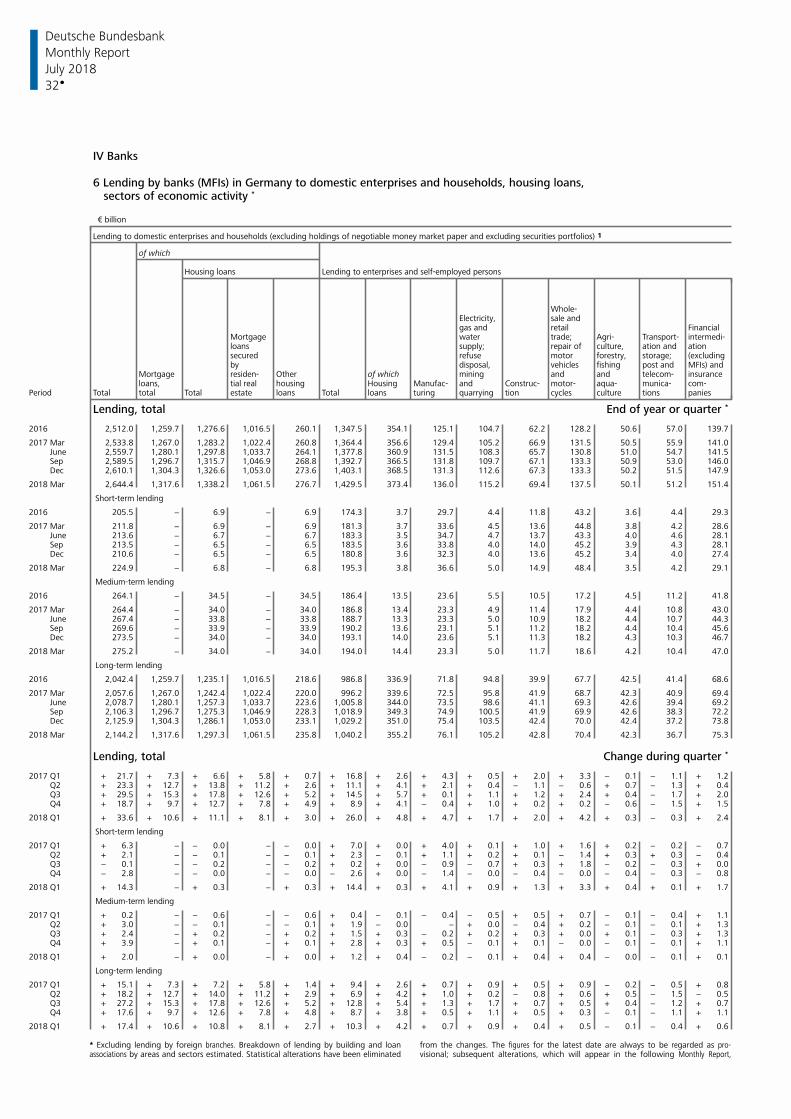
Deutsche Bundesbank
32
Monthly Report
July 2018
IV Banks
6 Lending by banks (MFIs) in Germany to domestic enterprises and households, housing loans,sectors of economic activity *
€ billion
Lending to domestic enterprises and households (excluding holdings of negotiable money market paper and excluding securities portfolios) 1
of which
Housing loans Lending to enterprises and self-employed persons
Whole-sale andElectricity,
gas and retail FinancialMortgage water trade; Agri- Transport- intermedi-loans supply; repair of culture, ation and ationsecured refuse motor forestry, storage; (excludingby disposal, vehicles fishing post and MFIs) and
Mortgage residen- Other of which mining and and telecom- insuranceloans, tial real housing Housing Manufac- and Construc- motor- aqua- munica- com-
Period Total total Total estate loans Total loans turing quarrying tion cycles culture tions panies
Lending, total End of year or quarter *
2016 2,512.0 1,259.7 1,276.6 1,016.5 260.1 1,347.5 354.1 125.1 104.7 62.2 128.2 50.6 57.0 139.7
2017 Mar 2,533.8 1,267.0 1,283.2 1,022.4 260.8 1,364.4 356.6 129.4 105.2 66.9 131.5 50.5 55.9 141.0 June 2,559.7 1,280.1 1,297.8 1,033.7 264.1 1,377.8 360.9 131.5 108.3 65.7 130.8 51.0 54.7 141.5 Sep 2,589.5 1,296.7 1,315.7 1,046.9 268.8 1,392.7 366.5 131.8 109.7 67.1 133.3 50.9 53.0 146.0 Dec 2,610.1 1,304.3 1,326.6 1,053.0 273.6 1,403.1 368.5 131.3 112.6 67.3 133.3 50.2 51.5 147.9
2018 Mar 2,644.4 1,317.6 1,338.2 1,061.5 276.7 1,429.5 373.4 136.0 115.2 69.4 137.5 50.1 51.2 151.4
Short-term lending
2016 205.5 − 6.9 − 6.9 174.3 3.7 29.7 4.4 11.8 43.2 3.6 4.4 29.3
2017 Mar 211.8 − 6.9 − 6.9 181.3 3.7 33.6 4.5 13.6 44.8 3.8 4.2 28.6 June 213.6 − 6.7 − 6.7 183.3 3.5 34.7 4.7 13.7 43.3 4.0 4.6 28.1 Sep 213.5 − 6.5 − 6.5 183.5 3.6 33.8 4.0 14.0 45.2 3.9 4.3 28.1 Dec 210.6 − 6.5 − 6.5 180.8 3.6 32.3 4.0 13.6 45.2 3.4 4.0 27.4
2018 Mar 224.9 − 6.8 − 6.8 195.3 3.8 36.6 5.0 14.9 48.4 3.5 4.2 29.1
Medium-term lending
2016 264.1 − 34.5 − 34.5 186.4 13.5 23.6 5.5 10.5 17.2 4.5 11.2 41.8
2017 Mar 264.4 − 34.0 − 34.0 186.8 13.4 23.3 4.9 11.4 17.9 4.4 10.8 43.0 June 267.4 − 33.8 − 33.8 188.7 13.3 23.3 5.0 10.9 18.2 4.4 10.7 44.3 Sep 269.6 − 33.9 − 33.9 190.2 13.6 23.1 5.1 11.2 18.2 4.4 10.4 45.6 Dec 273.5 − 34.0 − 34.0 193.1 14.0 23.6 5.1 11.3 18.2 4.3 10.3 46.7
2018 Mar 275.2 − 34.0 − 34.0 194.0 14.4 23.3 5.0 11.7 18.6 4.2 10.4 47.0
Long-term lending
2016 2,042.4 1,259.7 1,235.1 1,016.5 218.6 986.8 336.9 71.8 94.8 39.9 67.7 42.5 41.4 68.6
2017 Mar 2,057.6 1,267.0 1,242.4 1,022.4 220.0 996.2 339.6 72.5 95.8 41.9 68.7 42.3 40.9 69.4 June 2,078.7 1,280.1 1,257.3 1,033.7 223.6 1,005.8 344.0 73.5 98.6 41.1 69.3 42.6 39.4 69.2 Sep 2,106.3 1,296.7 1,275.3 1,046.9 228.3 1,018.9 349.3 74.9 100.5 41.9 69.9 42.6 38.3 72.2 Dec 2,125.9 1,304.3 1,286.1 1,053.0 233.1 1,029.2 351.0 75.4 103.5 42.4 70.0 42.4 37.2 73.8
2018 Mar 2,144.2 1,317.6 1,297.3 1,061.5 235.8 1,040.2 355.2 76.1 105.2 42.8 70.4 42.3 36.7 75.3
Lending, total Change during quarter *
2017 Q1 + 21.7 + 7.3 + 6.6 + 5.8 + 0.7 + 16.8 + 2.6 + 4.3 + 0.5 + 2.0 + 3.3 − 0.1 − 1.1 + 1.2 Q2 + 23.3 + 12.7 + 13.8 + 11.2 + 2.6 + 11.1 + 4.1 + 2.1 + 0.4 − 1.1 − 0.6 + 0.7 − 1.3 + 0.4 Q3 + 29.5 + 15.3 + 17.8 + 12.6 + 5.2 + 14.5 + 5.7 + 0.1 + 1.1 + 1.2 + 2.4 + 0.4 − 1.7 + 2.0 Q4 + 18.7 + 9.7 + 12.7 + 7.8 + 4.9 + 8.9 + 4.1 − 0.4 + 1.0 + 0.2 + 0.2 − 0.6 − 1.5 + 1.5
2018 Q1 + 33.6 + 10.6 + 11.1 + 8.1 + 3.0 + 26.0 + 4.8 + 4.7 + 1.7 + 2.0 + 4.2 + 0.3 − 0.3 + 2.4
Short-term lending
2017 Q1 + 6.3 − − 0.0 − − 0.0 + 7.0 + 0.0 + 4.0 + 0.1 + 1.0 + 1.6 + 0.2 − 0.2 − 0.7 Q2 + 2.1 − − 0.1 − − 0.1 + 2.3 − 0.1 + 1.1 + 0.2 + 0.1 − 1.4 + 0.3 + 0.3 − 0.4 Q3 − 0.1 − − 0.2 − − 0.2 + 0.2 + 0.0 − 0.9 − 0.7 + 0.3 + 1.8 − 0.2 − 0.3 + 0.0 Q4 − 2.8 − − 0.0 − − 0.0 − 2.6 + 0.0 − 1.4 − 0.0 − 0.4 − 0.0 − 0.4 − 0.3 − 0.8
2018 Q1 + 14.3 − + 0.3 − + 0.3 + 14.4 + 0.3 + 4.1 + 0.9 + 1.3 + 3.3 + 0.4 + 0.1 + 1.7
Medium-term lending
2017 Q1 + 0.2 − − 0.6 − − 0.6 + 0.4 − 0.1 − 0.4 − 0.5 + 0.5 + 0.7 − 0.1 − 0.4 + 1.1 Q2 + 3.0 − − 0.1 − − 0.1 + 1.9 − 0.0 − + 0.0 − 0.4 + 0.2 − 0.1 − 0.1 + 1.3 Q3 + 2.4 − + 0.2 − + 0.2 + 1.5 + 0.3 − 0.2 + 0.2 + 0.3 + 0.0 + 0.1 − 0.3 + 1.3 Q4 + 3.9 − + 0.1 − + 0.1 + 2.8 + 0.3 + 0.5 − 0.1 + 0.1 − 0.0 − 0.1 − 0.1 + 1.1
2018 Q1 + 2.0 − + 0.0 − + 0.0 + 1.2 + 0.4 − 0.2 − 0.1 + 0.4 + 0.4 − 0.0 − 0.1 + 0.1
Long-term lending
2017 Q1 + 15.1 + 7.3 + 7.2 + 5.8 + 1.4 + 9.4 + 2.6 + 0.7 + 0.9 + 0.5 + 0.9 − 0.2 − 0.5 + 0.8 Q2 + 18.2 + 12.7 + 14.0 + 11.2 + 2.9 + 6.9 + 4.2 + 1.0 + 0.2 − 0.8 + 0.6 + 0.5 − 1.5 − 0.5 Q3 + 27.2 + 15.3 + 17.8 + 12.6 + 5.2 + 12.8 + 5.4 + 1.3 + 1.7 + 0.7 + 0.5 + 0.4 − 1.2 + 0.7 Q4 + 17.6 + 9.7 + 12.6 + 7.8 + 4.8 + 8.7 + 3.8 + 0.5 + 1.1 + 0.5 + 0.3 − 0.1 − 1.1 + 1.1
2018 Q1 + 17.4 + 10.6 + 10.8 + 8.1 + 2.7 + 10.3 + 4.2 + 0.7 + 0.9 + 0.4 + 0.5 − 0.1 − 0.4 + 0.6
* Excluding lending by foreign branches. Breakdown of lending by building and loan from the changes. The figures for the latest date are always to be regarded as pro-associations by areas and sectors estimated. Statistical alterations have been eliminated visional; subsequent alterations, which will appear in the following Monthly Report,
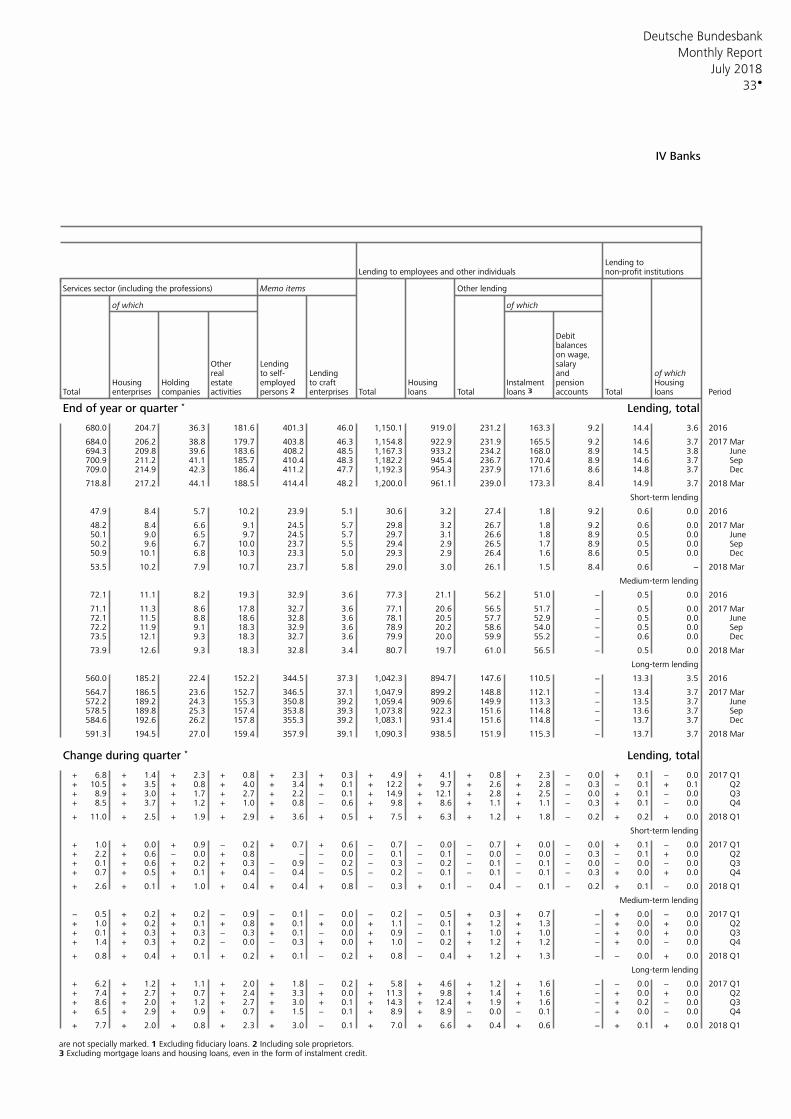
Deutsche Bundesbank
33
Monthly Report
July 2018
IV Banks
Lending to Lending to employees and other individuals non-profit institutions
Memo items Other lendingServices sector (including the professions)
of which of which
Debitbalanceson wage,
Other Lending salaryreal to self- Lending and of which
Housing Holding estate employed to craft Housing pension HousingInstalmentTotal companies Total loans Total loans 3 accounts Total loans Periodenterprises activities persons 2 enterprises
End of year or quarter * Lending, total
680.0 204.7 36.3 181.6 401.3 46.0 1,150.1 919.0 231.2 163.3 9.2 14.4 3.6 2016
684.0 206.2 38.8 179.7 403.8 46.3 1,154.8 922.9 231.9 165.5 9.2 14.6 3.7 2017 Mar 694.3 209.8 39.6 183.6 408.2 48.5 1,167.3 933.2 234.2 168.0 8.9 14.5 3.8 June700.9 211.2 41.1 185.7 410.4 48.3 1,182.2 945.4 236.7 170.4 8.9 14.6 3.7 Sep 709.0 214.9 42.3 186.4 411.2 47.7 1,192.3 954.3 237.9 171.6 8.6 14.8 3.7 Dec
718.8 217.2 44.1 188.5 414.4 48.2 1,200.0 961.1 239.0 173.3 8.4 14.9 3.7 2018 Mar
Short-term lending
47.9 8.4 5.7 10.2 23.9 5.1 30.6 3.2 27.4 1.8 9.2 0.6 0.0 2016
48.2 8.4 6.6 9.1 24.5 5.7 29.8 3.2 26.7 1.8 9.2 0.6 0.0 2017 Mar 50.1 9.0 6.5 9.7 24.5 5.7 29.7 3.1 26.6 1.8 8.9 0.5 0.0 June50.2 9.6 6.7 10.0 23.7 5.5 29.4 2.9 26.5 1.7 8.9 0.5 0.0 Sep 50.9 10.1 6.8 10.3 23.3 5.0 29.3 2.9 26.4 1.6 8.6 0.5 0.0 Dec
53.5 10.2 7.9 10.7 23.7 5.8 29.0 3.0 26.1 1.5 8.4 0.6 − 2018 Mar
Medium-term lending
72.1 11.1 8.2 19.3 32.9 3.6 77.3 21.1 56.2 51.0 − 0.5 0.0 2016
71.1 11.3 8.6 17.8 32.7 3.6 77.1 20.6 56.5 51.7 − 0.5 0.0 2017 Mar 72.1 11.5 8.8 18.6 32.8 3.6 78.1 20.5 57.7 52.9 − 0.5 0.0 June72.2 11.9 9.1 18.3 32.9 3.6 78.9 20.2 58.6 54.0 − 0.5 0.0 Sep 73.5 12.1 9.3 18.3 32.7 3.6 79.9 20.0 59.9 55.2 − 0.6 0.0 Dec
73.9 12.6 9.3 18.3 32.8 3.4 80.7 19.7 61.0 56.5 − 0.5 0.0 2018 Mar
Long-term lending
560.0 185.2 22.4 152.2 344.5 37.3 1,042.3 894.7 147.6 110.5 − 13.3 3.5 2016
564.7 186.5 23.6 152.7 346.5 37.1 1,047.9 899.2 148.8 112.1 − 13.4 3.7 2017 Mar 572.2 189.2 24.3 155.3 350.8 39.2 1,059.4 909.6 149.9 113.3 − 13.5 3.7 June578.5 189.8 25.3 157.4 353.8 39.3 1,073.8 922.3 151.6 114.8 − 13.6 3.7 Sep 584.6 192.6 26.2 157.8 355.3 39.2 1,083.1 931.4 151.6 114.8 − 13.7 3.7 Dec
591.3 194.5 27.0 159.4 357.9 39.1 1,090.3 938.5 151.9 115.3 − 13.7 3.7 2018 Mar
Change during quarter * Lending, total
+ 6.8 + 1.4 + 2.3 + 0.8 + 2.3 + 0.3 + 4.9 + 4.1 + 0.8 + 2.3 − 0.0 + 0.1 − 0.0 2017 Q1+ 10.5 + 3.5 + 0.8 + 4.0 + 3.4 + 0.1 + 12.2 + 9.7 + 2.6 + 2.8 − 0.3 − 0.1 + 0.1 Q2+ 8.9 + 3.0 + 1.7 + 2.7 + 2.2 − 0.1 + 14.9 + 12.1 + 2.8 + 2.5 − 0.0 + 0.1 − 0.0 Q3+ 8.5 + 3.7 + 1.2 + 1.0 + 0.8 − 0.6 + 9.8 + 8.6 + 1.1 + 1.1 − 0.3 + 0.1 − 0.0 Q4
+ 11.0 + 2.5 + 1.9 + 2.9 + 3.6 + 0.5 + 7.5 + 6.3 + 1.2 + 1.8 − 0.2 + 0.2 + 0.0 2018 Q1
Short-term lending
+ 1.0 + 0.0 + 0.9 − 0.2 + 0.7 + 0.6 − 0.7 − 0.0 − 0.7 + 0.0 − 0.0 + 0.1 − 0.0 2017 Q1+ 2.2 + 0.6 − 0.0 + 0.8 − − 0.0 − 0.1 − 0.1 − 0.0 − 0.0 − 0.3 − 0.1 + 0.0 Q2+ 0.1 + 0.6 + 0.2 + 0.3 − 0.9 − 0.2 − 0.3 − 0.2 − 0.1 − 0.1 − 0.0 − 0.0 − 0.0 Q3+ 0.7 + 0.5 + 0.1 + 0.4 − 0.4 − 0.5 − 0.2 − 0.1 − 0.1 − 0.1 − 0.3 + 0.0 + 0.0 Q4
+ 2.6 + 0.1 + 1.0 + 0.4 + 0.4 + 0.8 − 0.3 + 0.1 − 0.4 − 0.1 − 0.2 + 0.1 − 0.0 2018 Q1
Medium-term lending
− 0.5 + 0.2 + 0.2 − 0.9 − 0.1 − 0.0 − 0.2 − 0.5 + 0.3 + 0.7 − + 0.0 − 0.0 2017 Q1+ 1.0 + 0.2 + 0.1 + 0.8 + 0.1 + 0.0 + 1.1 − 0.1 + 1.2 + 1.3 − + 0.0 + 0.0 Q2+ 0.1 + 0.3 + 0.3 − 0.3 + 0.1 − 0.0 + 0.9 − 0.1 + 1.0 + 1.0 − + 0.0 + 0.0 Q3+ 1.4 + 0.3 + 0.2 − 0.0 − 0.3 + 0.0 + 1.0 − 0.2 + 1.2 + 1.2 − + 0.0 − 0.0 Q4
+ 0.8 + 0.4 + 0.1 + 0.2 + 0.1 − 0.2 + 0.8 − 0.4 + 1.2 + 1.3 − − 0.0 + 0.0 2018 Q1
Long-term lending
+ 6.2 + 1.2 + 1.1 + 2.0 + 1.8 − 0.2 + 5.8 + 4.6 + 1.2 + 1.6 − − 0.0 − 0.0 2017 Q1+ 7.4 + 2.7 + 0.7 + 2.4 + 3.3 + 0.0 + 11.3 + 9.8 + 1.4 + 1.6 − + 0.0 + 0.0 Q2+ 8.6 + 2.0 + 1.2 + 2.7 + 3.0 + 0.1 + 14.3 + 12.4 + 1.9 + 1.6 − + 0.2 − 0.0 Q3+ 6.5 + 2.9 + 0.9 + 0.7 + 1.5 − 0.1 + 8.9 + 8.9 − 0.0 − 0.1 − + 0.0 − 0.0 Q4
+ 7.7 + 2.0 + 0.8 + 2.3 + 3.0 − 0.1 + 7.0 + 6.6 + 0.4 + 0.6 − + 0.1 + 0.0 2018 Q1
are not specially marked. 1 Excluding fiduciary loans. 2 Including sole proprietors. 3 Excluding mortgage loans and housing loans, even in the form of instalment credit.
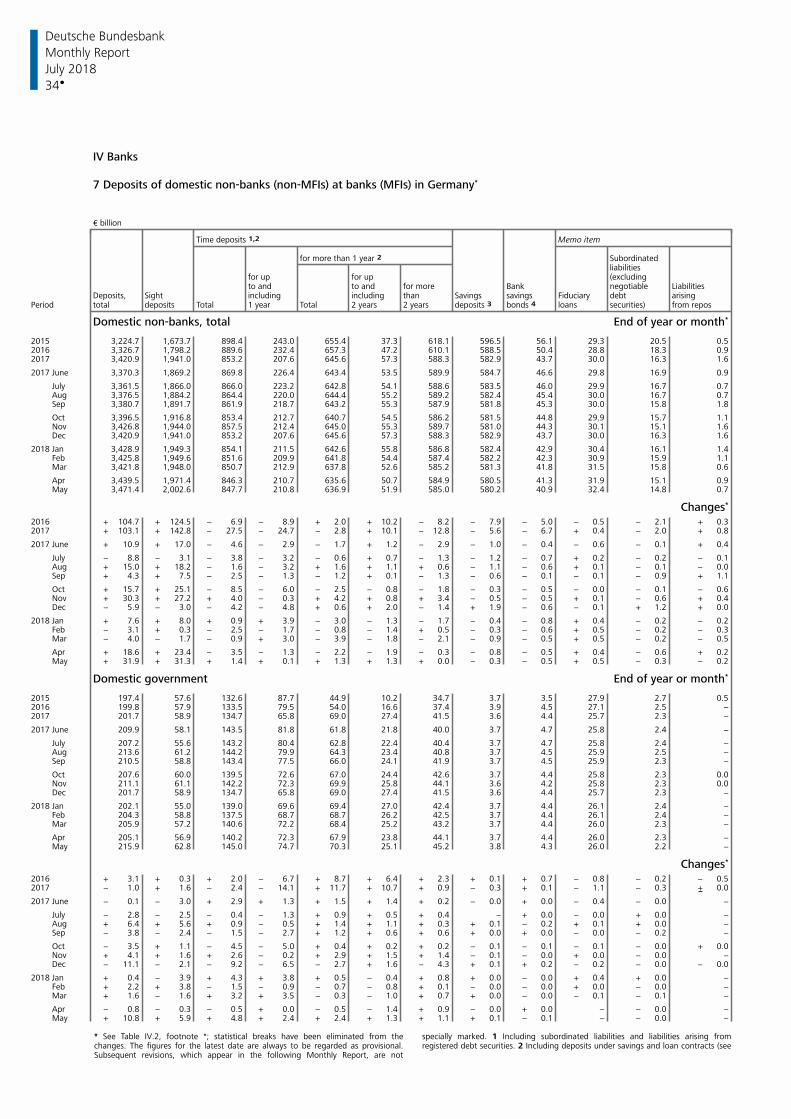
Deutsche Bundesbank
34
Monthly Report
July 2018
IV Banks
7 Deposits of domestic non-banks (non-MFIs) at banks (MFIs) in Germany*
€ billion
Time deposits 1,2 Memo item
for more than 1 year 2 Subordinated liabilities
for up for up (excludingto and to and for more Bank negotiable Liabilities
Deposits, Sight including including than Savings savings Fiduciary debt arisingPeriod total deposits Total 1 year Total 2 years 2 years bonds 4 loans securities) from reposdeposits 3
Domestic non-banks, total End of year or month*
2015 3,224.7 1,673.7 898.4 243.0 655.4 37.3 618.1 596.5 56.1 29.3 20.5 0.52016 3,326.7 1,798.2 889.6 232.4 657.3 47.2 610.1 588.5 50.4 28.8 18.3 0.92017 3,420.9 1,941.0 853.2 207.6 645.6 57.3 588.3 582.9 43.7 30.0 16.3 1.6
2017 June 3,370.3 1,869.2 869.8 226.4 643.4 53.5 589.9 584.7 46.6 29.8 16.9 0.9
July 3,361.5 1,866.0 866.0 223.2 642.8 54.1 588.6 583.5 46.0 29.9 16.7 0.7 Aug 3,376.5 1,884.2 864.4 220.0 644.4 55.2 589.2 582.4 45.4 30.0 16.7 0.7 Sep 3,380.7 1,891.7 861.9 218.7 643.2 55.3 587.9 581.8 45.3 30.0 15.8 1.8
Oct 3,396.5 1,916.8 853.4 212.7 640.7 54.5 586.2 581.5 44.8 29.9 15.7 1.1 Nov 3,426.8 1,944.0 857.5 212.4 645.0 55.3 589.7 581.0 44.3 30.1 15.1 1.6 Dec 3,420.9 1,941.0 853.2 207.6 645.6 57.3 588.3 582.9 43.7 30.0 16.3 1.6
2018 Jan 3,428.9 1,949.3 854.1 211.5 642.6 55.8 586.8 582.4 42.9 30.4 16.1 1.4 Feb 3,425.8 1,949.6 851.6 209.9 641.8 54.4 587.4 582.2 42.3 30.9 15.9 1.1 Mar 3,421.8 1,948.0 850.7 212.9 637.8 52.6 585.2 581.3 41.8 31.5 15.8 0.6
Apr 3,439.5 1,971.4 846.3 210.7 635.6 50.7 584.9 580.5 41.3 31.9 15.1 0.9 May 3,471.4 2,002.6 847.7 210.8 636.9 51.9 585.0 580.2 40.9 32.4 14.8 0.7
Changes*
2016 + 104.7 + 124.5 − 6.9 − 8.9 + 2.0 + 10.2 − 8.2 − 7.9 − 5.0 − 0.5 − 2.1 + 0.32017 + 103.1 + 142.8 − 27.5 − 24.7 − 2.8 + 10.1 − 12.8 − 5.6 − 6.7 + 0.4 − 2.0 + 0.8
2017 June + 10.9 + 17.0 − 4.6 − 2.9 − 1.7 + 1.2 − 2.9 − 1.0 − 0.4 − 0.6 − 0.1 + 0.4
July − 8.8 − 3.1 − 3.8 − 3.2 − 0.6 + 0.7 − 1.3 − 1.2 − 0.7 + 0.2 − 0.2 − 0.1 Aug + 15.0 + 18.2 − 1.6 − 3.2 + 1.6 + 1.1 + 0.6 − 1.1 − 0.6 + 0.1 − 0.1 − 0.0 Sep + 4.3 + 7.5 − 2.5 − 1.3 − 1.2 + 0.1 − 1.3 − 0.6 − 0.1 − 0.1 − 0.9 + 1.1
Oct + 15.7 + 25.1 − 8.5 − 6.0 − 2.5 − 0.8 − 1.8 − 0.3 − 0.5 − 0.0 − 0.1 − 0.6 Nov + 30.3 + 27.2 + 4.0 − 0.3 + 4.2 + 0.8 + 3.4 − 0.5 − 0.5 + 0.1 − 0.6 + 0.4 Dec − 5.9 − 3.0 − 4.2 − 4.8 + 0.6 + 2.0 − 1.4 + 1.9 − 0.6 − 0.1 + 1.2 + 0.0
2018 Jan + 7.6 + 8.0 + 0.9 + 3.9 − 3.0 − 1.3 − 1.7 − 0.4 − 0.8 + 0.4 − 0.2 − 0.2 Feb − 3.1 + 0.3 − 2.5 − 1.7 − 0.8 − 1.4 + 0.5 − 0.3 − 0.6 + 0.5 − 0.2 − 0.3 Mar − 4.0 − 1.7 − 0.9 + 3.0 − 3.9 − 1.8 − 2.1 − 0.9 − 0.5 + 0.5 − 0.2 − 0.5
Apr + 18.6 + 23.4 − 3.5 − 1.3 − 2.2 − 1.9 − 0.3 − 0.8 − 0.5 + 0.4 − 0.6 + 0.2 May + 31.9 + 31.3 + 1.4 + 0.1 + 1.3 + 1.3 + 0.0 − 0.3 − 0.5 + 0.5 − 0.3 − 0.2
Domestic government End of year or month*
2015 197.4 57.6 132.6 87.7 44.9 10.2 34.7 3.7 3.5 27.9 2.7 0.52016 199.8 57.9 133.5 79.5 54.0 16.6 37.4 3.9 4.5 27.1 2.5 −2017 201.7 58.9 134.7 65.8 69.0 27.4 41.5 3.6 4.4 25.7 2.3 −
2017 June 209.9 58.1 143.5 81.8 61.8 21.8 40.0 3.7 4.7 25.8 2.4 −
July 207.2 55.6 143.2 80.4 62.8 22.4 40.4 3.7 4.7 25.8 2.4 − Aug 213.6 61.2 144.2 79.9 64.3 23.4 40.8 3.7 4.5 25.9 2.5 − Sep 210.5 58.8 143.4 77.5 66.0 24.1 41.9 3.7 4.5 25.9 2.3 −
Oct 207.6 60.0 139.5 72.6 67.0 24.4 42.6 3.7 4.4 25.8 2.3 0.0 Nov 211.1 61.1 142.2 72.3 69.9 25.8 44.1 3.6 4.2 25.8 2.3 0.0 Dec 201.7 58.9 134.7 65.8 69.0 27.4 41.5 3.6 4.4 25.7 2.3 −
2018 Jan 202.1 55.0 139.0 69.6 69.4 27.0 42.4 3.7 4.4 26.1 2.4 − Feb 204.3 58.8 137.5 68.7 68.7 26.2 42.5 3.7 4.4 26.1 2.4 − Mar 205.9 57.2 140.6 72.2 68.4 25.2 43.2 3.7 4.4 26.0 2.3 −
Apr 205.1 56.9 140.2 72.3 67.9 23.8 44.1 3.7 4.4 26.0 2.3 − May 215.9 62.8 145.0 74.7 70.3 25.1 45.2 3.8 4.3 26.0 2.2 −
Changes*
2016 + 3.1 + 0.3 + 2.0 − 6.7 + 8.7 + 6.4 + 2.3 + 0.1 + 0.7 − 0.8 − 0.2 − 0.52017 − 1.0 + 1.6 − 2.4 − 14.1 + 11.7 + 10.7 + 0.9 − 0.3 + 0.1 − 1.1 − 0.3 + 0.0
2017 June − 0.1 − 3.0 + 2.9 + 1.3 + 1.5 + 1.4 + 0.2 − 0.0 + 0.0 − 0.4 − 0.0 −
July − 2.8 − 2.5 − 0.4 − 1.3 + 0.9 + 0.5 + 0.4 − + 0.0 − 0.0 + 0.0 − Aug + 6.4 + 5.6 + 0.9 − 0.5 + 1.4 + 1.1 + 0.3 + 0.1 − 0.2 + 0.1 + 0.0 − Sep − 3.8 − 2.4 − 1.5 − 2.7 + 1.2 + 0.6 + 0.6 + 0.0 + 0.0 − 0.0 − 0.2 −
Oct − 3.5 + 1.1 − 4.5 − 5.0 + 0.4 + 0.2 + 0.2 − 0.1 − 0.1 − 0.1 − 0.0 + 0.0 Nov + 4.1 + 1.6 + 2.6 − 0.2 + 2.9 + 1.5 + 1.4 − 0.1 − 0.0 + 0.0 − 0.0 − Dec − 11.1 − 2.1 − 9.2 − 6.5 − 2.7 + 1.6 − 4.3 + 0.1 + 0.2 − 0.2 − 0.0 − 0.0
2018 Jan + 0.4 − 3.9 + 4.3 + 3.8 + 0.5 − 0.4 + 0.8 + 0.0 − 0.0 + 0.4 + 0.0 − Feb + 2.2 + 3.8 − 1.5 − 0.9 − 0.7 − 0.8 + 0.1 − 0.0 − 0.0 + 0.0 − 0.0 − Mar + 1.6 − 1.6 + 3.2 + 3.5 − 0.3 − 1.0 + 0.7 + 0.0 − 0.0 − 0.1 − 0.1 −
Apr − 0.8 − 0.3 − 0.5 + 0.0 − 0.5 − 1.4 + 0.9 − 0.0 + 0.0 − − 0.0 − May + 10.8 + 5.9 + 4.8 + 2.4 + 2.4 + 1.3 + 1.1 + 0.1 − 0.1 − − 0.0 −
* See Table IV.2, footnote *; statistical breaks have been eliminated from the specially marked. 1 Including subordinated liabilities and liabilities arising fromchanges. The figures for the latest date are always to be regarded as provisional. registered debt securities. 2 Including deposits under savings and loan contracts (seeSubsequent revisions, which appear in the following Monthly Report, are not
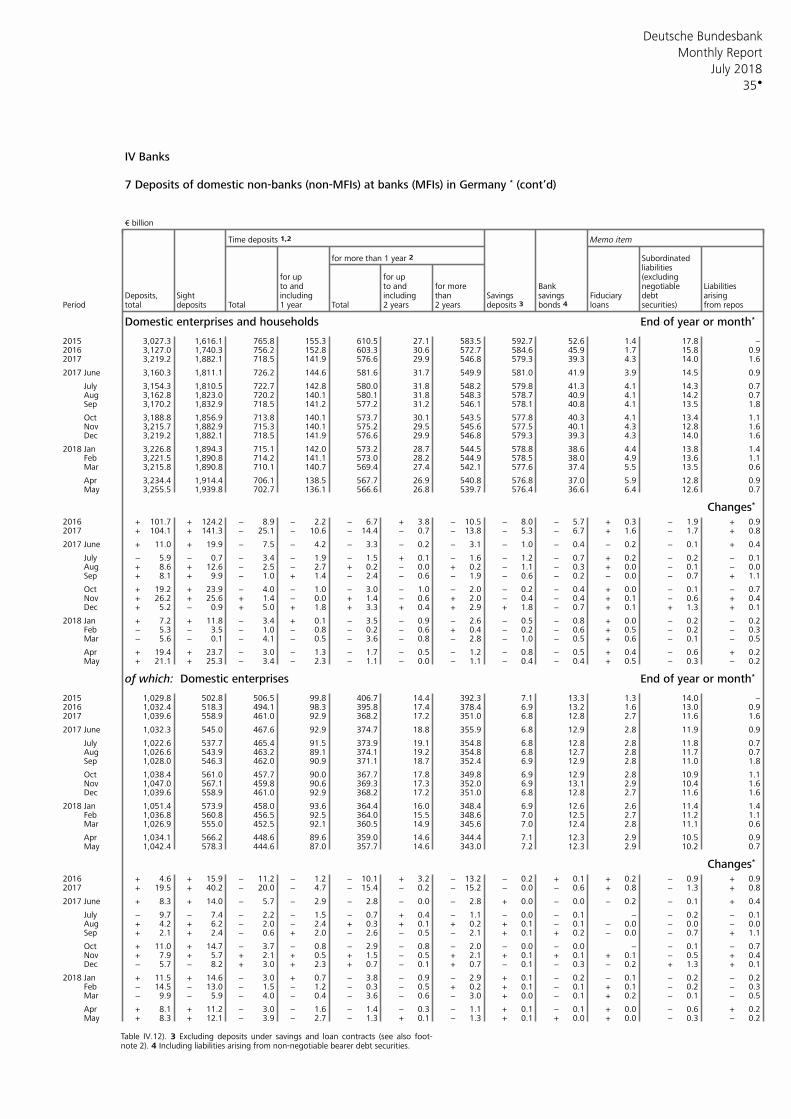
Deutsche Bundesbank
35
Monthly Report
July 2018
IV Banks
7 Deposits of domestic non-banks (non-MFIs) at banks (MFIs) in Germany * (cont’d)
€ billion
Time deposits 1,2 Memo item
for more than 1 year 2 Subordinated liabilities
for up for up (excludingto and to and for more Bank negotiable Liabilities
Deposits, Sight including including than Savings savings Fiduciary debt arisingPeriod total deposits Total 1 year Total 2 years 2 years bonds 4 loans securities) from reposdeposits 3
Domestic enterprises and households End of year or month*
2015 3,027.3 1,616.1 765.8 155.3 610.5 27.1 583.5 592.7 52.6 1.4 17.8 −2016 3,127.0 1,740.3 756.2 152.8 603.3 30.6 572.7 584.6 45.9 1.7 15.8 0.92017 3,219.2 1,882.1 718.5 141.9 576.6 29.9 546.8 579.3 39.3 4.3 14.0 1.6
2017 June 3,160.3 1,811.1 726.2 144.6 581.6 31.7 549.9 581.0 41.9 3.9 14.5 0.9
July 3,154.3 1,810.5 722.7 142.8 580.0 31.8 548.2 579.8 41.3 4.1 14.3 0.7 Aug 3,162.8 1,823.0 720.2 140.1 580.1 31.8 548.3 578.7 40.9 4.1 14.2 0.7 Sep 3,170.2 1,832.9 718.5 141.2 577.2 31.2 546.1 578.1 40.8 4.1 13.5 1.8
Oct 3,188.8 1,856.9 713.8 140.1 573.7 30.1 543.5 577.8 40.3 4.1 13.4 1.1 Nov 3,215.7 1,882.9 715.3 140.1 575.2 29.5 545.6 577.5 40.1 4.3 12.8 1.6 Dec 3,219.2 1,882.1 718.5 141.9 576.6 29.9 546.8 579.3 39.3 4.3 14.0 1.6
2018 Jan 3,226.8 1,894.3 715.1 142.0 573.2 28.7 544.5 578.8 38.6 4.4 13.8 1.4 Feb 3,221.5 1,890.8 714.2 141.1 573.0 28.2 544.9 578.5 38.0 4.9 13.6 1.1 Mar 3,215.8 1,890.8 710.1 140.7 569.4 27.4 542.1 577.6 37.4 5.5 13.5 0.6
Apr 3,234.4 1,914.4 706.1 138.5 567.7 26.9 540.8 576.8 37.0 5.9 12.8 0.9 May 3,255.5 1,939.8 702.7 136.1 566.6 26.8 539.7 576.4 36.6 6.4 12.6 0.7
Changes*
2016 + 101.7 + 124.2 − 8.9 − 2.2 − 6.7 + 3.8 − 10.5 − 8.0 − 5.7 + 0.3 − 1.9 + 0.92017 + 104.1 + 141.3 − 25.1 − 10.6 − 14.4 − 0.7 − 13.8 − 5.3 − 6.7 + 1.6 − 1.7 + 0.8
2017 June + 11.0 + 19.9 − 7.5 − 4.2 − 3.3 − 0.2 − 3.1 − 1.0 − 0.4 − 0.2 − 0.1 + 0.4
July − 5.9 − 0.7 − 3.4 − 1.9 − 1.5 + 0.1 − 1.6 − 1.2 − 0.7 + 0.2 − 0.2 − 0.1 Aug + 8.6 + 12.6 − 2.5 − 2.7 + 0.2 − 0.0 + 0.2 − 1.1 − 0.3 + 0.0 − 0.1 − 0.0 Sep + 8.1 + 9.9 − 1.0 + 1.4 − 2.4 − 0.6 − 1.9 − 0.6 − 0.2 − 0.0 − 0.7 + 1.1
Oct + 19.2 + 23.9 − 4.0 − 1.0 − 3.0 − 1.0 − 2.0 − 0.2 − 0.4 + 0.0 − 0.1 − 0.7 Nov + 26.2 + 25.6 + 1.4 − 0.0 + 1.4 − 0.6 + 2.0 − 0.4 − 0.4 + 0.1 − 0.6 + 0.4 Dec + 5.2 − 0.9 + 5.0 + 1.8 + 3.3 + 0.4 + 2.9 + 1.8 − 0.7 + 0.1 + 1.3 + 0.1
2018 Jan + 7.2 + 11.8 − 3.4 + 0.1 − 3.5 − 0.9 − 2.6 − 0.5 − 0.8 + 0.0 − 0.2 − 0.2 Feb − 5.3 − 3.5 − 1.0 − 0.8 − 0.2 − 0.6 + 0.4 − 0.2 − 0.6 + 0.5 − 0.2 − 0.3 Mar − 5.6 − 0.1 − 4.1 − 0.5 − 3.6 − 0.8 − 2.8 − 1.0 − 0.5 + 0.6 − 0.1 − 0.5
Apr + 19.4 + 23.7 − 3.0 − 1.3 − 1.7 − 0.5 − 1.2 − 0.8 − 0.5 + 0.4 − 0.6 + 0.2 May + 21.1 + 25.3 − 3.4 − 2.3 − 1.1 − 0.0 − 1.1 − 0.4 − 0.4 + 0.5 − 0.3 − 0.2
of which: Domestic enterprises End of year or month*
2015 1,029.8 502.8 506.5 99.8 406.7 14.4 392.3 7.1 13.3 1.3 14.0 −2016 1,032.4 518.3 494.1 98.3 395.8 17.4 378.4 6.9 13.2 1.6 13.0 0.92017 1,039.6 558.9 461.0 92.9 368.2 17.2 351.0 6.8 12.8 2.7 11.6 1.6
2017 June 1,032.3 545.0 467.6 92.9 374.7 18.8 355.9 6.8 12.9 2.8 11.9 0.9
July 1,022.6 537.7 465.4 91.5 373.9 19.1 354.8 6.8 12.8 2.8 11.8 0.7 Aug 1,026.6 543.9 463.2 89.1 374.1 19.2 354.8 6.8 12.7 2.8 11.7 0.7 Sep 1,028.0 546.3 462.0 90.9 371.1 18.7 352.4 6.9 12.9 2.8 11.0 1.8
Oct 1,038.4 561.0 457.7 90.0 367.7 17.8 349.8 6.9 12.9 2.8 10.9 1.1 Nov 1,047.0 567.1 459.8 90.6 369.3 17.3 352.0 6.9 13.1 2.9 10.4 1.6 Dec 1,039.6 558.9 461.0 92.9 368.2 17.2 351.0 6.8 12.8 2.7 11.6 1.6
2018 Jan 1,051.4 573.9 458.0 93.6 364.4 16.0 348.4 6.9 12.6 2.6 11.4 1.4 Feb 1,036.8 560.8 456.5 92.5 364.0 15.5 348.6 7.0 12.5 2.7 11.2 1.1 Mar 1,026.9 555.0 452.5 92.1 360.5 14.9 345.6 7.0 12.4 2.8 11.1 0.6
Apr 1,034.1 566.2 448.6 89.6 359.0 14.6 344.4 7.1 12.3 2.9 10.5 0.9 May 1,042.4 578.3 444.6 87.0 357.7 14.6 343.0 7.2 12.3 2.9 10.2 0.7
Changes*
2016 + 4.6 + 15.9 − 11.2 − 1.2 − 10.1 + 3.2 − 13.2 − 0.2 + 0.1 + 0.2 − 0.9 + 0.92017 + 19.5 + 40.2 − 20.0 − 4.7 − 15.4 − 0.2 − 15.2 − 0.0 − 0.6 + 0.8 − 1.3 + 0.8
2017 June + 8.3 + 14.0 − 5.7 − 2.9 − 2.8 − 0.0 − 2.8 + 0.0 − 0.0 − 0.2 − 0.1 + 0.4
July − 9.7 − 7.4 − 2.2 − 1.5 − 0.7 + 0.4 − 1.1 − 0.0 − 0.1 − − 0.2 − 0.1 Aug + 4.2 + 6.2 − 2.0 − 2.4 + 0.3 + 0.1 + 0.2 + 0.1 − 0.1 − 0.0 − 0.0 − 0.0 Sep + 2.1 + 2.4 − 0.6 + 2.0 − 2.6 − 0.5 − 2.1 + 0.1 + 0.2 − 0.0 − 0.7 + 1.1
Oct + 11.0 + 14.7 − 3.7 − 0.8 − 2.9 − 0.8 − 2.0 − 0.0 − 0.0 − − 0.1 − 0.7 Nov + 7.9 + 5.7 + 2.1 + 0.5 + 1.5 − 0.5 + 2.1 + 0.1 + 0.1 + 0.1 − 0.5 + 0.4 Dec − 5.7 − 8.2 + 3.0 + 2.3 + 0.7 − 0.1 + 0.7 − 0.1 − 0.3 − 0.2 + 1.3 + 0.1
2018 Jan + 11.5 + 14.6 − 3.0 + 0.7 − 3.8 − 0.9 − 2.9 + 0.1 − 0.2 − 0.1 − 0.2 − 0.2 Feb − 14.5 − 13.0 − 1.5 − 1.2 − 0.3 − 0.5 + 0.2 + 0.1 − 0.1 + 0.1 − 0.2 − 0.3 Mar − 9.9 − 5.9 − 4.0 − 0.4 − 3.6 − 0.6 − 3.0 + 0.0 − 0.1 + 0.2 − 0.1 − 0.5
Apr + 8.1 + 11.2 − 3.0 − 1.6 − 1.4 − 0.3 − 1.1 + 0.1 − 0.1 + 0.0 − 0.6 + 0.2 May + 8.3 + 12.1 − 3.9 − 2.7 − 1.3 + 0.1 − 1.3 + 0.1 + 0.0 + 0.0 − 0.3 − 0.2
Table IV.12). 3 Excluding deposits under savings and loan contracts (see also foot- note 2). 4 Including liabilities arising from non-negotiable bearer debt securities.
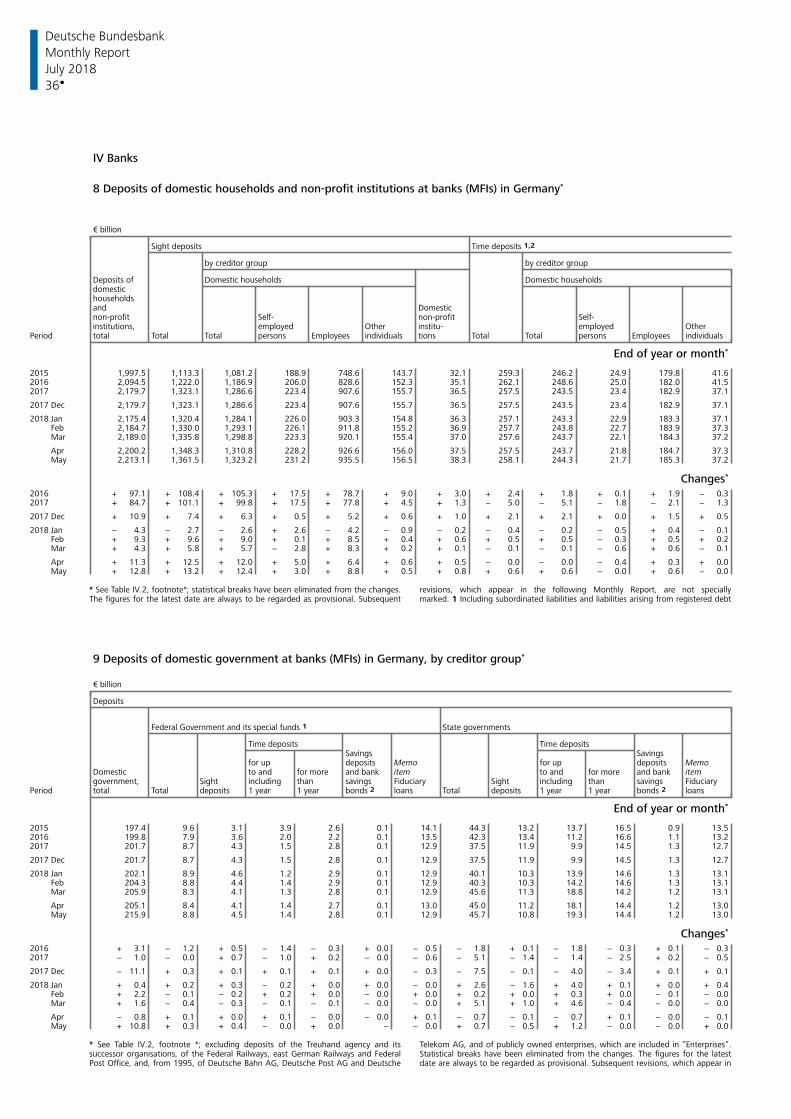
Deutsche Bundesbank
36
Monthly Report
July 2018
IV Banks
8 Deposits of domestic households and non-profit institutions at banks (MFIs) in Germany*
€ billion
Sight deposits Time deposits 1,2
by creditor group by creditor group
Deposits of Domestic households Domestic householdsdomestichouseholdsand Domesticnon-profit Self- non-profit Self-
employed Other institu- employed Otherinstitutions,Period total Total Total persons Employees tions Total Total persons Employeesindividuals individuals
End of year or month*
2015 1,997.5 1,113.3 1,081.2 188.9 748.6 143.7 32.1 259.3 246.2 24.9 179.8 41.62016 2,094.5 1,222.0 1,186.9 206.0 828.6 152.3 35.1 262.1 248.6 25.0 182.0 41.52017 2,179.7 1,323.1 1,286.6 223.4 907.6 155.7 36.5 257.5 243.5 23.4 182.9 37.1
2017 Dec 2,179.7 1,323.1 1,286.6 223.4 907.6 155.7 36.5 257.5 243.5 23.4 182.9 37.1
2018 Jan 2,175.4 1,320.4 1,284.1 226.0 903.3 154.8 36.3 257.1 243.3 22.9 183.3 37.1 Feb 2,184.7 1,330.0 1,293.1 226.1 911.8 155.2 36.9 257.7 243.8 22.7 183.9 37.3 Mar 2,189.0 1,335.8 1,298.8 223.3 920.1 155.4 37.0 257.6 243.7 22.1 184.3 37.2
Apr 2,200.2 1,348.3 1,310.8 228.2 926.6 156.0 37.5 257.5 243.7 21.8 184.7 37.3 May 2,213.1 1,361.5 1,323.2 231.2 935.5 156.5 38.3 258.1 244.3 21.7 185.3 37.2
Changes*
2016 + 97.1 + 108.4 + 105.3 + 17.5 + 78.7 + 9.0 + 3.0 + 2.4 + 1.8 + 0.1 + 1.9 − 0.32017 + 84.7 + 101.1 + 99.8 + 17.5 + 77.8 + 4.5 + 1.3 − 5.0 − 5.1 − 1.8 − 2.1 − 1.3
2017 Dec + 10.9 + 7.4 + 6.3 + 0.5 + 5.2 + 0.6 + 1.0 + 2.1 + 2.1 + 0.0 + 1.5 + 0.5
2018 Jan − 4.3 − 2.7 − 2.6 + 2.6 − 4.2 − 0.9 − 0.2 − 0.4 − 0.2 − 0.5 + 0.4 − 0.1 Feb + 9.3 + 9.6 + 9.0 + 0.1 + 8.5 + 0.4 + 0.6 + 0.5 + 0.5 − 0.3 + 0.5 + 0.2 Mar + 4.3 + 5.8 + 5.7 − 2.8 + 8.3 + 0.2 + 0.1 − 0.1 − 0.1 − 0.6 + 0.6 − 0.1
Apr + 11.3 + 12.5 + 12.0 + 5.0 + 6.4 + 0.6 + 0.5 − 0.0 − 0.0 − 0.4 + 0.3 + 0.0 May + 12.8 + 13.2 + 12.4 + 3.0 + 8.8 + 0.5 + 0.8 + 0.6 + 0.6 − 0.0 + 0.6 − 0.0
* See Table IV.2, footnote*; statistical breaks have been eliminated from the changes. revisions, which appear in the following Monthly Report, are not speciallyThe figures for the latest date are always to be regarded as provisional. Subsequent marked. 1 Including subordinated liabilities and liabilities arising from registered debt
9 Deposits of domestic government at banks (MFIs) in Germany, by creditor group*
€ billion
Deposits
Federal Government and its special funds 1 State governments
Time deposits Time depositsSavings Savings
for up deposits Memo for up deposits MemoDomestic to and for more and bank item to and for more and bank itemgovernment, Sight including than savings Fiduciary Sight including than savings Fiduciary
Period total Total deposits 1 year 1 year bonds 2 loans Total deposits 1 year 1 year bonds 2 loans
End of year or month*
2015 197.4 9.6 3.1 3.9 2.6 0.1 14.1 44.3 13.2 13.7 16.5 0.9 13.52016 199.8 7.9 3.6 2.0 2.2 0.1 13.5 42.3 13.4 11.2 16.6 1.1 13.22017 201.7 8.7 4.3 1.5 2.8 0.1 12.9 37.5 11.9 9.9 14.5 1.3 12.7
2017 Dec 201.7 8.7 4.3 1.5 2.8 0.1 12.9 37.5 11.9 9.9 14.5 1.3 12.7
2018 Jan 202.1 8.9 4.6 1.2 2.9 0.1 12.9 40.1 10.3 13.9 14.6 1.3 13.1 Feb 204.3 8.8 4.4 1.4 2.9 0.1 12.9 40.3 10.3 14.2 14.6 1.3 13.1 Mar 205.9 8.3 4.1 1.3 2.8 0.1 12.9 45.6 11.3 18.8 14.2 1.2 13.1
Apr 205.1 8.4 4.1 1.4 2.7 0.1 13.0 45.0 11.2 18.1 14.4 1.2 13.0 May 215.9 8.8 4.5 1.4 2.8 0.1 12.9 45.7 10.8 19.3 14.4 1.2 13.0
Changes*
2016 + 3.1 − 1.2 + 0.5 − 1.4 − 0.3 + 0.0 − 0.5 − 1.8 + 0.1 − 1.8 − 0.3 + 0.1 − 0.32017 − 1.0 − 0.0 + 0.7 − 1.0 + 0.2 − 0.0 − 0.6 − 5.1 − 1.4 − 1.4 − 2.5 + 0.2 − 0.5
2017 Dec − 11.1 + 0.3 + 0.1 + 0.1 + 0.1 + 0.0 − 0.3 − 7.5 − 0.1 − 4.0 − 3.4 + 0.1 + 0.1
2018 Jan + 0.4 + 0.2 + 0.3 − 0.2 + 0.0 + 0.0 − 0.0 + 2.6 − 1.6 + 4.0 + 0.1 + 0.0 + 0.4 Feb + 2.2 − 0.1 − 0.2 + 0.2 + 0.0 − 0.0 + 0.0 + 0.2 + 0.0 + 0.3 + 0.0 − 0.1 − 0.0 Mar + 1.6 − 0.4 − 0.3 − 0.1 − 0.1 − 0.0 − 0.0 + 5.1 + 1.0 + 4.6 − 0.4 − 0.0 − 0.0
Apr − 0.8 + 0.1 + 0.0 + 0.1 − 0.0 − 0.0 + 0.1 − 0.7 − 0.1 − 0.7 + 0.1 − 0.0 − 0.1 May + 10.8 + 0.3 + 0.4 − 0.0 + 0.0 − − 0.0 + 0.7 − 0.5 + 1.2 − 0.0 − 0.0 + 0.0
* See Table IV.2, footnote *; excluding deposits of the Treuhand agency and its Telekom AG, and of publicly owned enterprises, which are included in ”Enterprises”.successor organisations, of the Federal Railways, east German Railways and Federal Statistical breaks have been eliminated from the changes. The figures for the latestPost Office, and, from 1995, of Deutsche Bahn AG, Deutsche Post AG and Deutsche date are always to be regarded as provisional. Subsequent revisions, which appear in
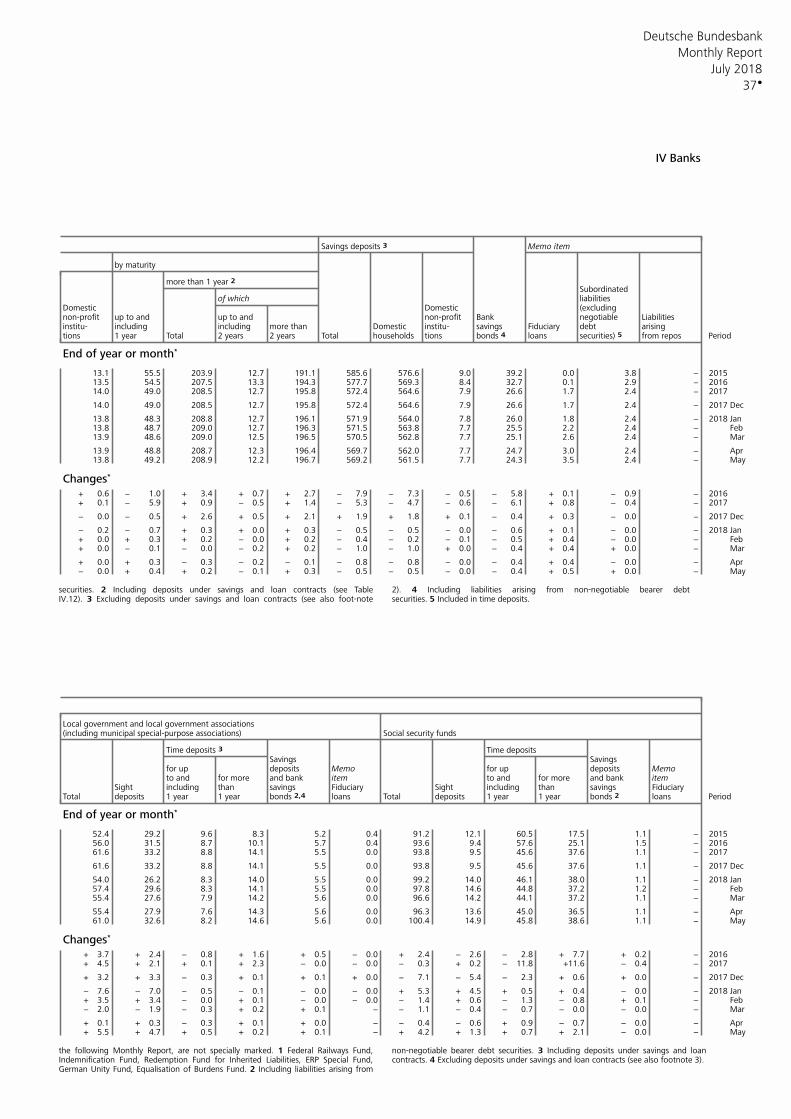
Deutsche Bundesbank
37
Monthly Report
July 2018
IV Banks
Savings deposits 3 Memo item
by maturity
more than 1 year 2 Subordinated
of which liabilitiesDomestic Domestic (excluding
up to and up to and Bank negotiable Liabilitiesnon-profit non-profitinstitu- including including more than Domestic institu- savings Fiduciary debt arisingtions 1 year Total 2 years 2 years Total tions bonds 4 loans from repos Periodhouseholds securities) 5
End of year or month*
13.1 55.5 203.9 12.7 191.1 585.6 576.6 9.0 39.2 0.0 3.8 − 201513.5 54.5 207.5 13.3 194.3 577.7 569.3 8.4 32.7 0.1 2.9 − 201614.0 49.0 208.5 12.7 195.8 572.4 564.6 7.9 26.6 1.7 2.4 − 2017
14.0 49.0 208.5 12.7 195.8 572.4 564.6 7.9 26.6 1.7 2.4 − 2017 Dec
13.8 48.3 208.8 12.7 196.1 571.9 564.0 7.8 26.0 1.8 2.4 − 2018 Jan 13.8 48.7 209.0 12.7 196.3 571.5 563.8 7.7 25.5 2.2 2.4 − Feb 13.9 48.6 209.0 12.5 196.5 570.5 562.8 7.7 25.1 2.6 2.4 − Mar
13.9 48.8 208.7 12.3 196.4 569.7 562.0 7.7 24.7 3.0 2.4 − Apr 13.8 49.2 208.9 12.2 196.7 569.2 561.5 7.7 24.3 3.5 2.4 − May
Changes*
+ 0.6 − 1.0 + 3.4 + 0.7 + 2.7 − 7.9 − 7.3 − 0.5 − 5.8 + 0.1 − 0.9 − 2016+ 0.1 − 5.9 + 0.9 − 0.5 + 1.4 − 5.3 − 4.7 − 0.6 − 6.1 + 0.8 − 0.4 − 2017
− 0.0 − 0.5 + 2.6 + 0.5 + 2.1 + 1.9 + 1.8 + 0.1 − 0.4 + 0.3 − 0.0 − 2017 Dec
− 0.2 − 0.7 + 0.3 + 0.0 + 0.3 − 0.5 − 0.5 − 0.0 − 0.6 + 0.1 − 0.0 − 2018 Jan + 0.0 + 0.3 + 0.2 − 0.0 + 0.2 − 0.4 − 0.2 − 0.1 − 0.5 + 0.4 − 0.0 − Feb + 0.0 − 0.1 − 0.0 − 0.2 + 0.2 − 1.0 − 1.0 + 0.0 − 0.4 + 0.4 + 0.0 − Mar
+ 0.0 + 0.3 − 0.3 − 0.2 − 0.1 − 0.8 − 0.8 − 0.0 − 0.4 + 0.4 − 0.0 − Apr − 0.0 + 0.4 + 0.2 − 0.1 + 0.3 − 0.5 − 0.5 − 0.0 − 0.4 + 0.5 + 0.0 − May
securities. 2 Including deposits under savings and loan contracts (see Table 2). 4 Including liabilities arising from non-negotiable bearer debtIV.12). 3 Excluding deposits under savings and loan contracts (see also foot-note securities. 5 Included in time deposits.
Local government and local government associations(including municipal special-purpose associations) Social security funds
Time deposits 3 Time depositsSavings Savings
for up deposits Memo for up deposits Memoto and for more and bank item to and for more and bank item
Sight including than savings Fiduciary Sight including than savings FiduciaryTotal deposits 1 year 1 year bonds 2,4 loans Total deposits 1 year 1 year bonds 2 loans Period
End of year or month*
52.4 29.2 9.6 8.3 5.2 0.4 91.2 12.1 60.5 17.5 1.1 − 201556.0 31.5 8.7 10.1 5.7 0.4 93.6 9.4 57.6 25.1 1.5 − 201661.6 33.2 8.8 14.1 5.5 0.0 93.8 9.5 45.6 37.6 1.1 − 2017
61.6 33.2 8.8 14.1 5.5 0.0 93.8 9.5 45.6 37.6 1.1 − 2017 Dec
54.0 26.2 8.3 14.0 5.5 0.0 99.2 14.0 46.1 38.0 1.1 − 2018 Jan 57.4 29.6 8.3 14.1 5.5 0.0 97.8 14.6 44.8 37.2 1.2 − Feb 55.4 27.6 7.9 14.2 5.6 0.0 96.6 14.2 44.1 37.2 1.1 − Mar
55.4 27.9 7.6 14.3 5.6 0.0 96.3 13.6 45.0 36.5 1.1 − Apr 61.0 32.6 8.2 14.6 5.6 0.0 100.4 14.9 45.8 38.6 1.1 − May
Changes*
+ 3.7 + 2.4 − 0.8 + 1.6 + 0.5 − 0.0 + 2.4 − 2.6 − 2.8 + 7.7 + 0.2 − 2016+ 4.5 + 2.1 + 0.1 + 2.3 − 0.0 − 0.0 − 0.3 + 0.2 − 11.8 +11.6 − 0.4 − 2017
+ 3.2 + 3.3 − 0.3 + 0.1 + 0.1 + 0.0 − 7.1 − 5.4 − 2.3 + 0.6 + 0.0 − 2017 Dec
− 7.6 − 7.0 − 0.5 − 0.1 − 0.0 − 0.0 + 5.3 + 4.5 + 0.5 + 0.4 − 0.0 − 2018 Jan + 3.5 + 3.4 − 0.0 + 0.1 − 0.0 − 0.0 − 1.4 + 0.6 − 1.3 − 0.8 + 0.1 − Feb − 2.0 − 1.9 − 0.3 + 0.2 + 0.1 − − 1.1 − 0.4 − 0.7 − 0.0 − 0.0 − Mar
+ 0.1 + 0.3 − 0.3 + 0.1 + 0.0 − − 0.4 − 0.6 + 0.9 − 0.7 − 0.0 − Apr + 5.5 + 4.7 + 0.5 + 0.2 + 0.1 − + 4.2 + 1.3 + 0.7 + 2.1 − 0.0 − May
the following Monthly Report, are not specially marked. 1 Federal Railways Fund, non-negotiable bearer debt securities. 3 Including deposits under savings and loanIndemnification Fund, Redemption Fund for Inherited Liabilities, ERP Special Fund, contracts. 4 Excluding deposits under savings and loan contracts (see also footnote 3). German Unity Fund, Equalisation of Burdens Fund. 2 Including liabilities arising from
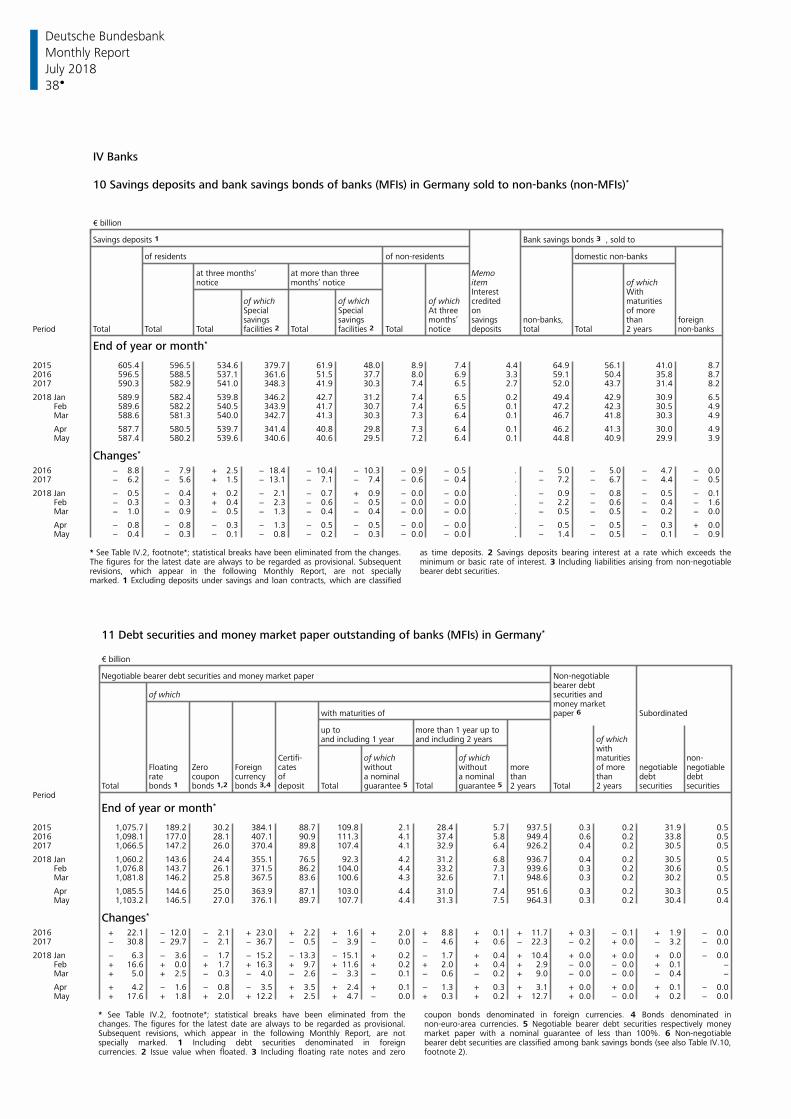
Deutsche Bundesbank
38
Monthly Report
July 2018
IV Banks
10 Savings deposits and bank savings bonds of banks (MFIs) in Germany sold to non-banks (non-MFIs)*
€ billion
Savings deposits 1 Bank savings bonds 3 , sold to
of residents of non-residents domestic non-banks
at three months’ at more than three Memonotice months’ notice item of which
Interest Withof which of which of which credited maturitiesSpecial Special At three on of moresavings savings savings non-banks, than foreignmonths’
Period Total Total Total Total Total notice deposits total Total 2 yearsfacilities 2 facilities 2 non-banks
End of year or month*
2015 605.4 596.5 534.6 379.7 61.9 48.0 8.9 7.4 4.4 64.9 56.1 41.0 8.72016 596.5 588.5 537.1 361.6 51.5 37.7 8.0 6.9 3.3 59.1 50.4 35.8 8.72017 590.3 582.9 541.0 348.3 41.9 30.3 7.4 6.5 2.7 52.0 43.7 31.4 8.2
2018 Jan 589.9 582.4 539.8 346.2 42.7 31.2 7.4 6.5 0.2 49.4 42.9 30.9 6.5 Feb 589.6 582.2 540.5 343.9 41.7 30.7 7.4 6.5 0.1 47.2 42.3 30.5 4.9 Mar 588.6 581.3 540.0 342.7 41.3 30.3 7.3 6.4 0.1 46.7 41.8 30.3 4.9
Apr 587.7 580.5 539.7 341.4 40.8 29.8 7.3 6.4 0.1 46.2 41.3 30.0 4.9 May 587.4 580.2 539.6 340.6 40.6 29.5 7.2 6.4 0.1 44.8 40.9 29.9 3.9
Changes*
2016 − 8.8 − 7.9 + 2.5 − 18.4 − 10.4 − 10.3 − 0.9 − 0.5 . − 5.0 − 5.0 − 4.7 − 0.02017 − 6.2 − 5.6 + 1.5 − 13.1 − 7.1 − 7.4 − 0.6 − 0.4 . − 7.2 − 6.7 − 4.4 − 0.5
2018 Jan − 0.5 − 0.4 + 0.2 − 2.1 − 0.7 + 0.9 − 0.0 − 0.0 . − 0.9 − 0.8 − 0.5 − 0.1 Feb − 0.3 − 0.3 + 0.4 − 2.3 − 0.6 − 0.5 − 0.0 − 0.0 . − 2.2 − 0.6 − 0.4 − 1.6 Mar − 1.0 − 0.9 − 0.5 − 1.3 − 0.4 − 0.4 − 0.0 − 0.0 . − 0.5 − 0.5 − 0.2 − 0.0
Apr − 0.8 − 0.8 − 0.3 − 1.3 − 0.5 − 0.5 − 0.0 − 0.0 . − 0.5 − 0.5 − 0.3 + 0.0 May − 0.4 − 0.3 − 0.1 − 0.8 − 0.2 − 0.3 − 0.0 − 0.0 . − 1.4 − 0.5 − 0.1 − 0.9
* See Table IV.2, footnote*; statistical breaks have been eliminated from the changes. as time deposits. 2 Savings deposits bearing interest at a rate which exceeds theThe figures for the latest date are always to be regarded as provisional. Subsequent minimum or basic rate of interest. 3 Including liabilities arising from non-negotiablerevisions, which appear in the following Monthly Report, are not specially bearer debt securities. marked. 1 Excluding deposits under savings and loan contracts, which are classified
11 Debt securities and money market paper outstanding of banks (MFIs) in Germany*
€ billion
Negotiable bearer debt securities and money market paper Non-negotiablebearer debt
of which securities andmoney market
with maturities of paper 6 Subordinated
up to more than 1 year up toand including 1 year of whichand including 2 years
withCertifi- of which of which non-maturities
Floating Zero Foreign cates without without more of more negotiable negotiablerate coupon currency of a nominal a nominal than than debt debt
Total bonds 1 deposit Total Total 2 years Total 2 years securities securitiesbonds 1,2 bonds 3,4 guarantee 5 guarantee 5 Period
End of year or month*
2015 1,075.7 189.2 30.2 384.1 88.7 109.8 2.1 28.4 5.7 937.5 0.3 0.2 31.9 0.52016 1,098.1 177.0 28.1 407.1 90.9 111.3 4.1 37.4 5.8 949.4 0.6 0.2 33.8 0.52017 1,066.5 147.2 26.0 370.4 89.8 107.4 4.1 32.9 6.4 926.2 0.4 0.2 30.5 0.5
2018 Jan 1,060.2 143.6 24.4 355.1 76.5 92.3 4.2 31.2 6.8 936.7 0.4 0.2 30.5 0.5 Feb 1,076.8 143.7 26.1 371.5 86.2 104.0 4.4 33.2 7.3 939.6 0.3 0.2 30.6 0.5 Mar 1,081.8 146.2 25.8 367.5 83.6 100.6 4.3 32.6 7.1 948.6 0.3 0.2 30.2 0.5
Apr 1,085.5 144.6 25.0 363.9 87.1 103.0 4.4 31.0 7.4 951.6 0.3 0.2 30.3 0.5 May 1,103.2 146.5 27.0 376.1 89.7 107.7 4.4 31.3 7.5 964.3 0.3 0.2 30.4 0.4
Changes*
2016 + 22.1 − 12.0 − 2.1 + 23.0 + 2.2 + 1.6 + 2.0 + 8.8 + 0.1 + 11.7 + 0.3 − 0.1 + 1.9 − 0.02017 − 30.8 − 29.7 − 2.1 − 36.7 − 0.5 − 3.9 − 0.0 − 4.6 + 0.6 − 22.3 − 0.2 + 0.0 − 3.2 − 0.0
2018 Jan − 6.3 − 3.6 − 1.7 − 15.2 − 13.3 − 15.1 + 0.2 − 1.7 + 0.4 + 10.4 + 0.0 + 0.0 + 0.0 − 0.0 Feb + 16.6 + 0.0 + 1.7 + 16.3 + 9.7 + 11.6 + 0.2 + 2.0 + 0.4 + 2.9 − 0.0 − 0.0 + 0.1 − Mar + 5.0 + 2.5 − 0.3 − 4.0 − 2.6 − 3.3 − 0.1 − 0.6 − 0.2 + 9.0 − 0.0 − 0.0 − 0.4 −
Apr + 4.2 − 1.6 − 0.8 − 3.5 + 3.5 + 2.4 + 0.1 − 1.3 + 0.3 + 3.1 + 0.0 + 0.0 + 0.1 − 0.0 May + 17.6 + 1.8 + 2.0 + 12.2 + 2.5 + 4.7 − 0.0 + 0.3 + 0.2 + 12.7 + 0.0 − 0.0 + 0.2 − 0.0
* See Table IV.2, footnote*; statistical breaks have been eliminated from the coupon bonds denominated in foreign currencies. 4 Bonds denominated inchanges. The figures for the latest date are always to be regarded as provisional. non-euro-area currencies. 5 Negotiable bearer debt securities respectively moneySubsequent revisions, which appear in the following Monthly Report, are not market paper with a nominal guarantee of less than 100%. 6 Non-negotiablespecially marked. 1 Including debt securities denominated in foreign bearer debt securities are classified among bank savings bonds (see also Table IV.10,currencies. 2 Issue value when floated. 3 Including floating rate notes and zero footnote 2).
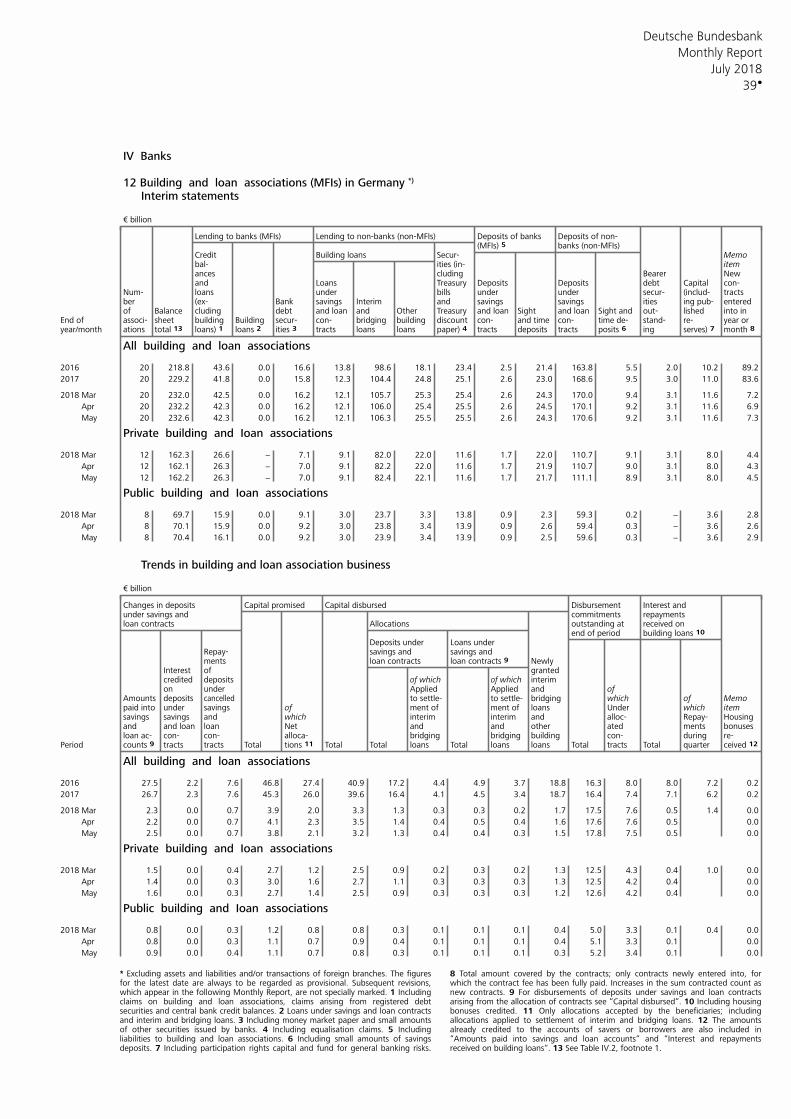
Deutsche Bundesbank
39
Monthly Report
July 2018
IV Banks 12 Building and loan associations (MFIs) in Germany *)
Interim statements € billion
Lending to banks (MFIs) Lending to non-banks (non-MFIs) Deposits of banks Deposits of non-(MFIs) 5 banks (non-MFIs)
Credit Building loans Secur- Memobal- itemities (in-ances cluding Bearer Newand Loans Treasury Deposits Deposits debt Capital con-
Num- loans under bills under under secur- (includ- tractsber (ex- Bank savings Interim and savings savings ities ing pub- enteredof Balance cluding debt and loan and Other Treasury and loan Sight and loan Sight and out- lished into in
End of sheet building Building secur- con- bridging building discount con- and time con- time de- stand- re- year orassoci-year/month ations loans 2 ities 3 tracts loans loans tracts deposits tracts posits 6 ing month 8 total 13 loans) 1 paper) 4 serves) 7
All building and loan associations
2016 20 218.8 43.6 0.0 16.6 13.8 98.6 18.1 23.4 2.5 21.4 163.8 5.5 2.0 10.2 89.2
2017 20 229.2 41.8 0.0 15.8 12.3 104.4 24.8 25.1 2.6 23.0 168.6 9.5 3.0 11.0 83.6
2018 Mar 20 232.0 42.5 0.0 16.2 12.1 105.7 25.3 25.4 2.6 24.3 170.0 9.4 3.1 11.6 7.2
Apr 20 232.2 42.3 0.0 16.2 12.1 106.0 25.4 25.5 2.6 24.5 170.1 9.2 3.1 11.6 6.9
May 20 232.6 42.3 0.0 16.2 12.1 106.3 25.5 25.5 2.6 24.3 170.6 9.2 3.1 11.6 7.3
Private building and Ioan associations
2018 Mar 12 162.3 26.6 − 7.1 9.1 82.0 22.0 11.6 1.7 22.0 110.7 9.1 3.1 8.0 4.4
Apr 12 162.1 26.3 − 7.0 9.1 82.2 22.0 11.6 1.7 21.9 110.7 9.0 3.1 8.0 4.3
May 12 162.2 26.3 − 7.0 9.1 82.4 22.1 11.6 1.7 21.7 111.1 8.9 3.1 8.0 4.5
Public building and Ioan associations
2018 Mar 8 69.7 15.9 0.0 9.1 3.0 23.7 3.3 13.8 0.9 2.3 59.3 0.2 − 3.6 2.8
Apr 8 70.1 15.9 0.0 9.2 3.0 23.8 3.4 13.9 0.9 2.6 59.4 0.3 − 3.6 2.6
May 8 70.4 16.1 0.0 9.2 3.0 23.9 3.4 13.9 0.9 2.5 59.6 0.3 − 3.6 2.9
Trends in building and loan association business
€ billion
Changes in deposits Capital promised Capital disbursed Disbursement Interest andunder savings and commitments repaymentsloan contracts Allocations outstanding at received on
end of period building loans 10 Deposits under Loans under
Repay- savings and savings andments loan contracts loan contracts 9 Newly
Interest of grantedcredited interimdeposits of which of whichon under Applied Applied and of
which of MemoAmounts deposits cancelled to settle- to settle- bridgingunder savings of ment of ment of loans Under which itempaid into
savings savings and which interim interim and alloc- Repay- Housingand and loan loan Net and and other ated ments bonusesloan ac- con- con- alloca- bridging bridging building con- during re-
Period tracts tracts Total Total Total loans Total loans loans Total tracts Total quartercounts 9 tions 11 ceived 12
All building and loan associations
2016 27.5 2.2 7.6 46.8 27.4 40.9 17.2 4.4 4.9 3.7 18.8 16.3 8.0 8.0 7.2 0.2
2017 26.7 2.3 7.6 45.3 26.0 39.6 16.4 4.1 4.5 3.4 18.7 16.4 7.4 7.1 6.2 0.2
2018 Mar 2.3 0.0 0.7 3.9 2.0 3.3 1.3 0.3 0.3 0.2 1.7 17.5 7.6 0.5 1.4 0.0
Apr 2.2 0.0 0.7 4.1 2.3 3.5 1.4 0.4 0.5 0.4 1.6 17.6 7.6 0.5 0.0
May 2.5 0.0 0.7 3.8 2.1 3.2 1.3 0.4 0.4 0.3 1.5 17.8 7.5 0.5 0.0
Private building and Ioan associations
2018 Mar 1.5 0.0 0.4 2.7 1.2 2.5 0.9 0.2 0.3 0.2 1.3 12.5 4.3 0.4 1.0 0.0
Apr 1.4 0.0 0.3 3.0 1.6 2.7 1.1 0.3 0.3 0.3 1.3 12.5 4.2 0.4 0.0
May 1.6 0.0 0.3 2.7 1.4 2.5 0.9 0.3 0.3 0.3 1.2 12.6 4.2 0.4 0.0
Public building and Ioan associations
2018 Mar 0.8 0.0 0.3 1.2 0.8 0.8 0.3 0.1 0.1 0.1 0.4 5.0 3.3 0.1 0.4 0.0
Apr 0.8 0.0 0.3 1.1 0.7 0.9 0.4 0.1 0.1 0.1 0.4 5.1 3.3 0.1 0.0
May 0.9 0.0 0.4 1.1 0.7 0.8 0.3 0.1 0.1 0.1 0.3 5.2 3.4 0.1 0.0
* Excluding assets and liabilities and/or transactions of foreign branches. The figures 8 Total amount covered by the contracts; only contracts newly entered into, forfor the latest date are always to be regarded as provisional. Subsequent revisions, which the contract fee has been fully paid. Increases in the sum contracted count aswhich appear in the following Monthly Report, are not specially marked. 1 Including new contracts. 9 For disbursements of deposits under savings and loan contractsclaims on building and loan associations, claims arising from registered debt arising from the allocation of contracts see “Capital disbursed“. 10 Including housingsecurities and central bank credit balances. 2 Loans under savings and loan contracts bonuses credited. 11 Only allocations accepted by the beneficiaries; includingand interim and bridging loans. 3 Including money market paper and small amounts allocations applied to settlement of interim and bridging loans. 12 The amountsof other securities issued by banks. 4 Including equalisation claims. 5 Including already credited to the accounts of savers or borrowers are also included inliabilities to building and loan associations. 6 Including small amounts of savings “Amounts paid into savings and loan accounts“ and “Interest and repaymentsdeposits. 7 Including participation rights capital and fund for general banking risks. received on building loans“. 13 See Table IV.2, footnote 1.
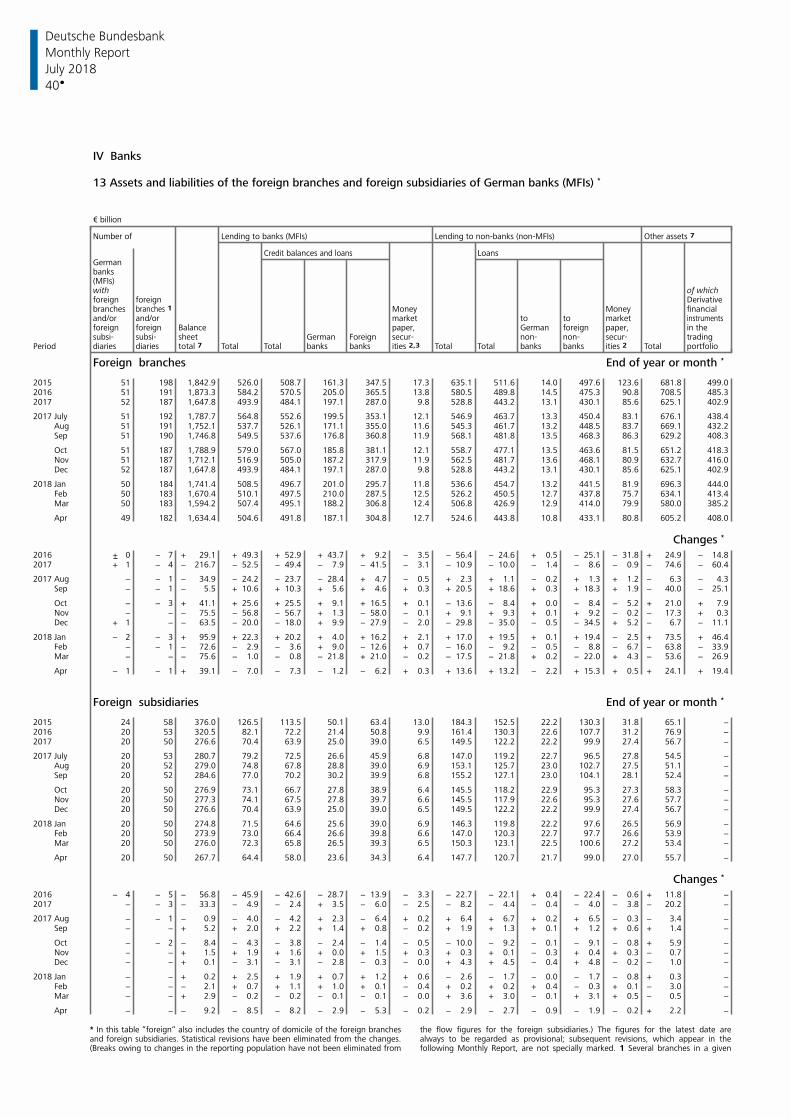
Deutsche Bundesbank
40
Monthly Report
July 2018
IV Banks
13 Assets and liabilities of the foreign branches and foreign subsidiaries of German banks (MFIs) *
€ billion
Number of Lending to banks (MFIs) Lending to non-banks (non-MFIs) Other assets 7
LoansCredit balances and loansGerman banks(MFIs) with of whichforeign foreign Derivativebranches Money Money financialbranches 1 and/or and/or market to to market instrumentsforeign foreign Balance paper, German foreign paper, in thesubsi- subsi- sheet German Foreign secur- non- non- secur- trading
Period diaries diaries total 7 Total Total banks banks Total Total banks banks ities 2 Total portfolioities 2,3
Foreign branches End of year or month *
2015 51 198 1,842.9 526.0 508.7 161.3 347.5 17.3 635.1 511.6 14.0 497.6 123.6 681.8 499.02016 51 191 1,873.3 584.2 570.5 205.0 365.5 13.8 580.5 489.8 14.5 475.3 90.8 708.5 485.32017 52 187 1,647.8 493.9 484.1 197.1 287.0 9.8 528.8 443.2 13.1 430.1 85.6 625.1 402.9
2017 July 51 192 1,787.7 564.8 552.6 199.5 353.1 12.1 546.9 463.7 13.3 450.4 83.1 676.1 438.4 Aug 51 191 1,752.1 537.7 526.1 171.1 355.0 11.6 545.3 461.7 13.2 448.5 83.7 669.1 432.2 Sep 51 190 1,746.8 549.5 537.6 176.8 360.8 11.9 568.1 481.8 13.5 468.3 86.3 629.2 408.3
Oct 51 187 1,788.9 579.0 567.0 185.8 381.1 12.1 558.7 477.1 13.5 463.6 81.5 651.2 418.3 Nov 51 187 1,712.1 516.9 505.0 187.2 317.9 11.9 562.5 481.7 13.6 468.1 80.9 632.7 416.0 Dec 52 187 1,647.8 493.9 484.1 197.1 287.0 9.8 528.8 443.2 13.1 430.1 85.6 625.1 402.9
2018 Jan 50 184 1,741.4 508.5 496.7 201.0 295.7 11.8 536.6 454.7 13.2 441.5 81.9 696.3 444.0 Feb 50 183 1,670.4 510.1 497.5 210.0 287.5 12.5 526.2 450.5 12.7 437.8 75.7 634.1 413.4 Mar 50 183 1,594.2 507.4 495.1 188.2 306.8 12.4 506.8 426.9 12.9 414.0 79.9 580.0 385.2
Apr 49 182 1,634.4 504.6 491.8 187.1 304.8 12.7 524.6 443.8 10.8 433.1 80.8 605.2 408.0
Changes *
2016 + 0 − 7 + 29.1 + 49.3 + 52.9 + 43.7 + 9.2 − 3.5 − 56.4 − 24.6 + 0.5 − 25.1 − 31.8 + 24.9 − 14.82017 + 1 − 4 − 216.7 − 52.5 − 49.4 − 7.9 − 41.5 − 3.1 − 10.9 − 10.0 − 1.4 − 8.6 − 0.9 − 74.6 − 60.4
2017 Aug − − 1 − 34.9 − 24.2 − 23.7 − 28.4 + 4.7 − 0.5 + 2.3 + 1.1 − 0.2 + 1.3 + 1.2 − 6.3 − 4.3 Sep − − 1 − 5.5 + 10.6 + 10.3 + 5.6 + 4.6 + 0.3 + 20.5 + 18.6 + 0.3 + 18.3 + 1.9 − 40.0 − 25.1
Oct − − 3 + 41.1 + 25.6 + 25.5 + 9.1 + 16.5 + 0.1 − 13.6 − 8.4 + 0.0 − 8.4 − 5.2 + 21.0 + 7.9 Nov − − − 75.5 − 56.8 − 56.7 + 1.3 − 58.0 − 0.1 + 9.1 + 9.3 + 0.1 + 9.2 − 0.2 − 17.3 + 0.3 Dec + 1 − − 63.5 − 20.0 − 18.0 + 9.9 − 27.9 − 2.0 − 29.8 − 35.0 − 0.5 − 34.5 + 5.2 − 6.7 − 11.1
2018 Jan − 2 − 3 + 95.9 + 22.3 + 20.2 + 4.0 + 16.2 + 2.1 + 17.0 + 19.5 + 0.1 + 19.4 − 2.5 + 73.5 + 46.4 Feb − − 1 − 72.6 − 2.9 − 3.6 + 9.0 − 12.6 + 0.7 − 16.0 − 9.2 − 0.5 − 8.8 − 6.7 − 63.8 − 33.9 Mar − − − 75.6 − 1.0 − 0.8 − 21.8 + 21.0 − 0.2 − 17.5 − 21.8 + 0.2 − 22.0 + 4.3 − 53.6 − 26.9
Apr − 1 − 1 + 39.1 − 7.0 − 7.3 − 1.2 − 6.2 + 0.3 + 13.6 + 13.2 − 2.2 + 15.3 + 0.5 + 24.1 + 19.4
Foreign subsidiaries End of year or month *
2015 24 58 376.0 126.5 113.5 50.1 63.4 13.0 184.3 152.5 22.2 130.3 31.8 65.1 −2016 20 53 320.5 82.1 72.2 21.4 50.8 9.9 161.4 130.3 22.6 107.7 31.2 76.9 −2017 20 50 276.6 70.4 63.9 25.0 39.0 6.5 149.5 122.2 22.2 99.9 27.4 56.7 −
2017 July 20 53 280.7 79.2 72.5 26.6 45.9 6.8 147.0 119.2 22.7 96.5 27.8 54.5 − Aug 20 52 279.0 74.8 67.8 28.8 39.0 6.9 153.1 125.7 23.0 102.7 27.5 51.1 − Sep 20 52 284.6 77.0 70.2 30.2 39.9 6.8 155.2 127.1 23.0 104.1 28.1 52.4 −
Oct 20 50 276.9 73.1 66.7 27.8 38.9 6.4 145.5 118.2 22.9 95.3 27.3 58.3 − Nov 20 50 277.3 74.1 67.5 27.8 39.7 6.6 145.5 117.9 22.6 95.3 27.6 57.7 − Dec 20 50 276.6 70.4 63.9 25.0 39.0 6.5 149.5 122.2 22.2 99.9 27.4 56.7 −
2018 Jan 20 50 274.8 71.5 64.6 25.6 39.0 6.9 146.3 119.8 22.2 97.6 26.5 56.9 − Feb 20 50 273.9 73.0 66.4 26.6 39.8 6.6 147.0 120.3 22.7 97.7 26.6 53.9 − Mar 20 50 276.0 72.3 65.8 26.5 39.3 6.5 150.3 123.1 22.5 100.6 27.2 53.4 −
Apr 20 50 267.7 64.4 58.0 23.6 34.3 6.4 147.7 120.7 21.7 99.0 27.0 55.7 −
Changes *
2016 − 4 − 5 − 56.8 − 45.9 − 42.6 − 28.7 − 13.9 − 3.3 − 22.7 − 22.1 + 0.4 − 22.4 − 0.6 + 11.8 −2017 − − 3 − 33.3 − 4.9 − 2.4 + 3.5 − 6.0 − 2.5 − 8.2 − 4.4 − 0.4 − 4.0 − 3.8 − 20.2 −
2017 Aug − − 1 − 0.9 − 4.0 − 4.2 + 2.3 − 6.4 + 0.2 + 6.4 + 6.7 + 0.2 + 6.5 − 0.3 − 3.4 − Sep − − + 5.2 + 2.0 + 2.2 + 1.4 + 0.8 − 0.2 + 1.9 + 1.3 + 0.1 + 1.2 + 0.6 + 1.4 −
Oct − − 2 − 8.4 − 4.3 − 3.8 − 2.4 − 1.4 − 0.5 − 10.0 − 9.2 − 0.1 − 9.1 − 0.8 + 5.9 − Nov − − + 1.5 + 1.9 + 1.6 + 0.0 + 1.5 + 0.3 + 0.3 + 0.1 − 0.3 + 0.4 + 0.3 − 0.7 − Dec − − + 0.1 − 3.1 − 3.1 − 2.8 − 0.3 − 0.0 + 4.3 + 4.5 − 0.4 + 4.8 − 0.2 − 1.0 −
2018 Jan − − + 0.2 + 2.5 + 1.9 + 0.7 + 1.2 + 0.6 − 2.6 − 1.7 − 0.0 − 1.7 − 0.8 + 0.3 − Feb − − − 2.1 + 0.7 + 1.1 + 1.0 + 0.1 − 0.4 + 0.2 + 0.2 + 0.4 − 0.3 + 0.1 − 3.0 − Mar − − + 2.9 − 0.2 − 0.2 − 0.1 − 0.1 − 0.0 + 3.6 + 3.0 − 0.1 + 3.1 + 0.5 − 0.5 −
Apr − − − 9.2 − 8.5 − 8.2 − 2.9 − 5.3 − 0.2 − 2.9 − 2.7 − 0.9 − 1.9 − 0.2 + 2.2 −
* In this table “foreign“ also includes the country of domicile of the foreign branches the flow figures for the foreign subsidiaries.) The figures for the latest date areand foreign subsidiaries. Statistical revisions have been eliminated from the changes. always to be regarded as provisional; subsequent revisions, which appear in the(Breaks owing to changes in the reporting population have not been eliminated from following Monthly Report, are not specially marked. 1 Several branches in a given
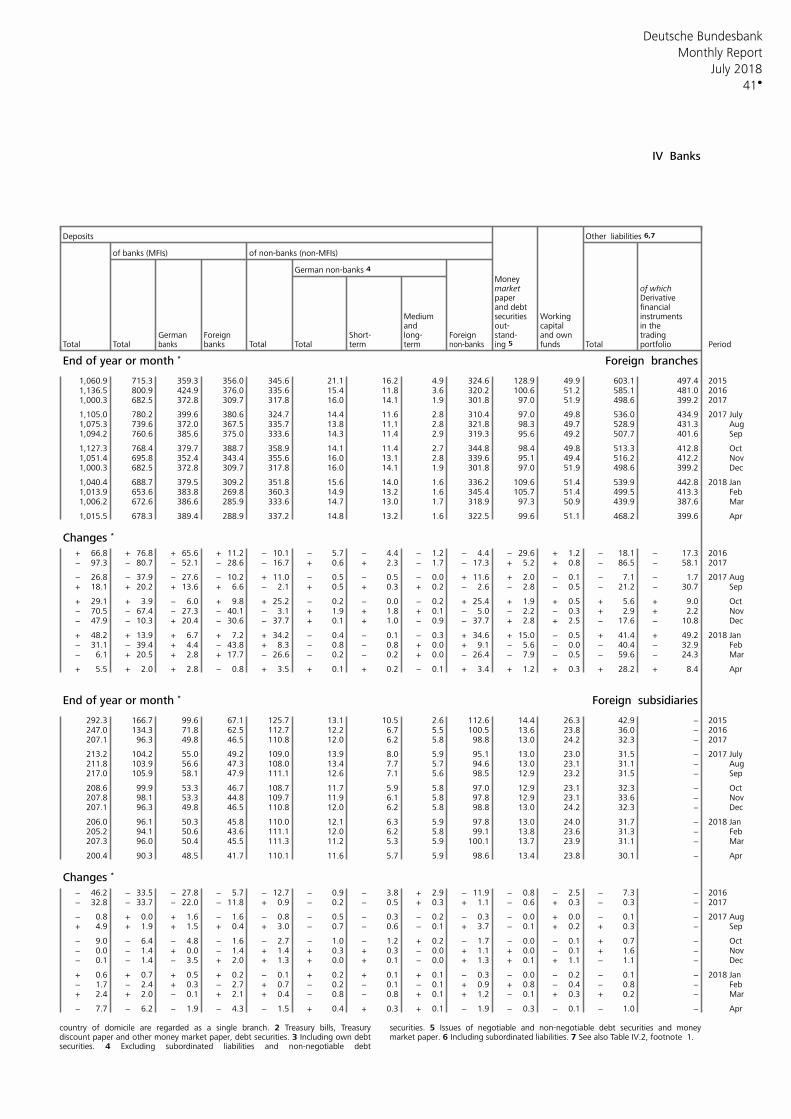
Deutsche Bundesbank
41
Monthly Report
July 2018
IV Banks
Deposits Other liabilities 6,7
of banks (MFIs) of non-banks (non-MFIs)
German non-banks 4 Moneymarket of whichpaper Derivativeand debt financial
Medium Working instrumentssecuritiesand out- capital in the
German Foreign Short- long- Foreign stand- and own tradingTotal Total banks Total Total term term ing 5 funds Total portfolio Periodbanks non-banks
End of year or month * Foreign branches
1,060.9 715.3 359.3 356.0 345.6 21.1 16.2 4.9 324.6 128.9 49.9 603.1 497.4 20151,136.5 800.9 424.9 376.0 335.6 15.4 11.8 3.6 320.2 100.6 51.2 585.1 481.0 20161,000.3 682.5 372.8 309.7 317.8 16.0 14.1 1.9 301.8 97.0 51.9 498.6 399.2 2017
1,105.0 780.2 399.6 380.6 324.7 14.4 11.6 2.8 310.4 97.0 49.8 536.0 434.9 2017 July1,075.3 739.6 372.0 367.5 335.7 13.8 11.1 2.8 321.8 98.3 49.7 528.9 431.3 Aug 1,094.2 760.6 385.6 375.0 333.6 14.3 11.4 2.9 319.3 95.6 49.2 507.7 401.6 Sep
1,127.3 768.4 379.7 388.7 358.9 14.1 11.4 2.7 344.8 98.4 49.8 513.3 412.8 Oct 1,051.4 695.8 352.4 343.4 355.6 16.0 13.1 2.8 339.6 95.1 49.4 516.2 412.2 Nov 1,000.3 682.5 372.8 309.7 317.8 16.0 14.1 1.9 301.8 97.0 51.9 498.6 399.2 Dec
1,040.4 688.7 379.5 309.2 351.8 15.6 14.0 1.6 336.2 109.6 51.4 539.9 442.8 2018 Jan 1,013.9 653.6 383.8 269.8 360.3 14.9 13.2 1.6 345.4 105.7 51.4 499.5 413.3 Feb 1,006.2 672.6 386.6 285.9 333.6 14.7 13.0 1.7 318.9 97.3 50.9 439.9 387.6 Mar
1,015.5 678.3 389.4 288.9 337.2 14.8 13.2 1.6 322.5 99.6 51.1 468.2 399.6 Apr
Changes *
+ 66.8 + 76.8 + 65.6 + 11.2 − 10.1 − 5.7 − 4.4 − 1.2 − 4.4 − 29.6 + 1.2 − 18.1 − 17.3 2016− 97.3 − 80.7 − 52.1 − 28.6 − 16.7 + 0.6 + 2.3 − 1.7 − 17.3 + 5.2 + 0.8 − 86.5 − 58.1 2017
− 26.8 − 37.9 − 27.6 − 10.2 + 11.0 − 0.5 − 0.5 − 0.0 + 11.6 + 2.0 − 0.1 − 7.1 − 1.7 2017 Aug + 18.1 + 20.2 + 13.6 + 6.6 − 2.1 + 0.5 + 0.3 + 0.2 − 2.6 − 2.8 − 0.5 − 21.2 − 30.7 Sep
+ 29.1 + 3.9 − 6.0 + 9.8 + 25.2 − 0.2 − 0.0 − 0.2 + 25.4 + 1.9 + 0.5 + 5.6 + 9.0 Oct − 70.5 − 67.4 − 27.3 − 40.1 − 3.1 + 1.9 + 1.8 + 0.1 − 5.0 − 2.2 − 0.3 + 2.9 + 2.2 Nov − 47.9 − 10.3 + 20.4 − 30.6 − 37.7 + 0.1 + 1.0 − 0.9 − 37.7 + 2.8 + 2.5 − 17.6 − 10.8 Dec
+ 48.2 + 13.9 + 6.7 + 7.2 + 34.2 − 0.4 − 0.1 − 0.3 + 34.6 + 15.0 − 0.5 + 41.4 + 49.2 2018 Jan − 31.1 − 39.4 + 4.4 − 43.8 + 8.3 − 0.8 − 0.8 + 0.0 + 9.1 − 5.6 − 0.0 − 40.4 − 32.9 Feb − 6.1 + 20.5 + 2.8 + 17.7 − 26.6 − 0.2 − 0.2 + 0.0 − 26.4 − 7.9 − 0.5 − 59.6 − 24.3 Mar
+ 5.5 + 2.0 + 2.8 − 0.8 + 3.5 + 0.1 + 0.2 − 0.1 + 3.4 + 1.2 + 0.3 + 28.2 + 8.4 Apr
End of year or month * Foreign subsidiaries
292.3 166.7 99.6 67.1 125.7 13.1 10.5 2.6 112.6 14.4 26.3 42.9 − 2015247.0 134.3 71.8 62.5 112.7 12.2 6.7 5.5 100.5 13.6 23.8 36.0 − 2016207.1 96.3 49.8 46.5 110.8 12.0 6.2 5.8 98.8 13.0 24.2 32.3 − 2017
213.2 104.2 55.0 49.2 109.0 13.9 8.0 5.9 95.1 13.0 23.0 31.5 − 2017 July211.8 103.9 56.6 47.3 108.0 13.4 7.7 5.7 94.6 13.0 23.1 31.1 − Aug 217.0 105.9 58.1 47.9 111.1 12.6 7.1 5.6 98.5 12.9 23.2 31.5 − Sep
208.6 99.9 53.3 46.7 108.7 11.7 5.9 5.8 97.0 12.9 23.1 32.3 − Oct 207.8 98.1 53.3 44.8 109.7 11.9 6.1 5.8 97.8 12.9 23.1 33.6 − Nov 207.1 96.3 49.8 46.5 110.8 12.0 6.2 5.8 98.8 13.0 24.2 32.3 − Dec
206.0 96.1 50.3 45.8 110.0 12.1 6.3 5.9 97.8 13.0 24.0 31.7 − 2018 Jan 205.2 94.1 50.6 43.6 111.1 12.0 6.2 5.8 99.1 13.8 23.6 31.3 − Feb 207.3 96.0 50.4 45.5 111.3 11.2 5.3 5.9 100.1 13.7 23.9 31.1 − Mar
200.4 90.3 48.5 41.7 110.1 11.6 5.7 5.9 98.6 13.4 23.8 30.1 − Apr
Changes *
− 46.2 − 33.5 − 27.8 − 5.7 − 12.7 − 0.9 − 3.8 + 2.9 − 11.9 − 0.8 − 2.5 − 7.3 − 2016− 32.8 − 33.7 − 22.0 − 11.8 + 0.9 − 0.2 − 0.5 + 0.3 + 1.1 − 0.6 + 0.3 − 0.3 − 2017
− 0.8 + 0.0 + 1.6 − 1.6 − 0.8 − 0.5 − 0.3 − 0.2 − 0.3 − 0.0 + 0.0 − 0.1 − 2017 Aug + 4.9 + 1.9 + 1.5 + 0.4 + 3.0 − 0.7 − 0.6 − 0.1 + 3.7 − 0.1 + 0.2 + 0.3 − Sep
− 9.0 − 6.4 − 4.8 − 1.6 − 2.7 − 1.0 − 1.2 + 0.2 − 1.7 − 0.0 − 0.1 + 0.7 − Oct − 0.0 − 1.4 + 0.0 − 1.4 + 1.4 + 0.3 + 0.3 − 0.0 + 1.1 + 0.0 − 0.1 + 1.6 − Nov − 0.1 − 1.4 − 3.5 + 2.0 + 1.3 + 0.0 + 0.1 − 0.0 + 1.3 + 0.1 + 1.1 − 1.1 − Dec
+ 0.6 + 0.7 + 0.5 + 0.2 − 0.1 + 0.2 + 0.1 + 0.1 − 0.3 − 0.0 − 0.2 − 0.1 − 2018 Jan − 1.7 − 2.4 + 0.3 − 2.7 + 0.7 − 0.2 − 0.1 − 0.1 + 0.9 + 0.8 − 0.4 − 0.8 − Feb + 2.4 + 2.0 − 0.1 + 2.1 + 0.4 − 0.8 − 0.8 + 0.1 + 1.2 − 0.1 + 0.3 + 0.2 − Mar
− 7.7 − 6.2 − 1.9 − 4.3 − 1.5 + 0.4 + 0.3 + 0.1 − 1.9 − 0.3 − 0.1 − 1.0 − Apr
country of domicile are regarded as a single branch. 2 Treasury bills, Treasury securities. 5 Issues of negotiable and non-negotiable debt securities and moneydiscount paper and other money market paper, debt securities. 3 Including own debt market paper. 6 Including subordinated liabilities. 7 See also Table IV.2, footnote 1. securities. 4 Excluding subordinated liabilities and non-negotiable debt
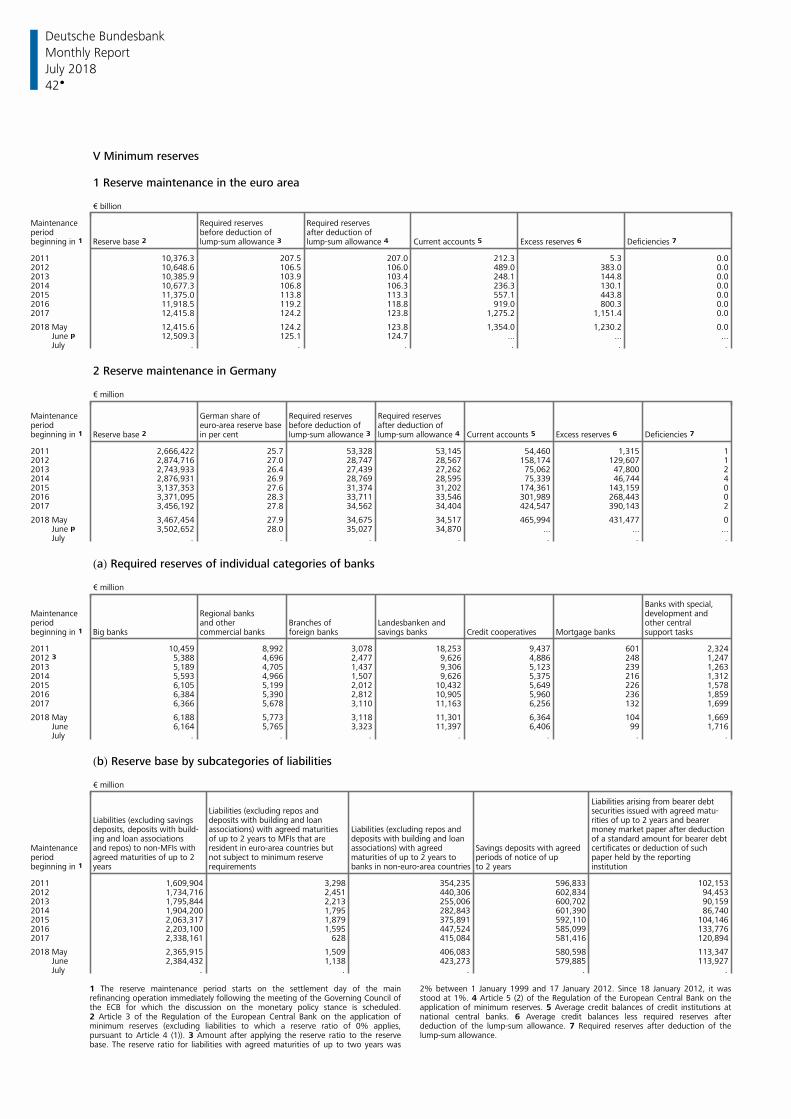
Deutsche Bundesbank
42
Monthly Report
July 2018
V Minimum reserves
1 Reserve maintenance in the euro area
€ billion
Maintenance Required reserves Required reservesperiod before deduction of after deduction of
Reserve base 2 lump-sum allowance 3 lump-sum allowance 4 Current accounts 5 Excess reserves 6 Deficiencies 7 beginning in 1
2011 10,376.3 207.5 207.0 212.3 5.3 0.02012 10,648.6 106.5 106.0 489.0 383.0 0.02013 10,385.9 103.9 103.4 248.1 144.8 0.02014 10,677.3 106.8 106.3 236.3 130.1 0.02015 11,375.0 113.8 113.3 557.1 443.8 0.02016 11,918.5 119.2 118.8 919.0 800.3 0.02017 12,415.8 124.2 123.8 1,275.2 1,151.4 0.0
2018 May 12,415.6 124.2 123.8 1,354.0 1,230.2 0.0 June p 12,509.3 125.1 124.7 ... ... ... July . . . . . .
2 Reserve maintenance in Germany
€ million
Maintenance German share of Required reserves Required reservesperiod before deduction of after deduction ofeuro-area reserve base
Reserve base 2 in per cent Current accounts 5 Excess reserves 6 Deficiencies 7 beginning in 1 lump-sum allowance 3 lump-sum allowance 4
2011 2,666,422 25.7 53,328 53,145 54,460 1,315 12012 2,874,716 27.0 28,747 28,567 158,174 129,607 12013 2,743,933 26.4 27,439 27,262 75,062 47,800 22014 2,876,931 26.9 28,769 28,595 75,339 46,744 42015 3,137,353 27.6 31,374 31,202 174,361 143,159 02016 3,371,095 28.3 33,711 33,546 301,989 268,443 02017 3,456,192 27.8 34,562 34,404 424,547 390,143 2
2018 May 3,467,454 27.9 34,675 34,517 465,994 431,477 0 June p 3,502,652 28.0 35,027 34,870 ... ... ... July . . . . . . .
(a) Required reserves of individual categories of banks
€ million
Banks with special,Maintenance Regional banks development andperiod and other Branches of Landesbanken and other central
Big banks commercial banks foreign banks savings banks Credit cooperatives Mortgage banks support tasksbeginning in 1
2011 10,459 8,992 3,078 18,253 9,437 601 2,3242012 3 5,388 4,696 2,477 9,626 4,886 248 1,2472013 5,189 4,705 1,437 9,306 5,123 239 1,2632014 5,593 4,966 1,507 9,626 5,375 216 1,3122015 6,105 5,199 2,012 10,432 5,649 226 1,5782016 6,384 5,390 2,812 10,905 5,960 236 1,8592017 6,366 5,678 3,110 11,163 6,256 132 1,699
2018 May 6,188 5,773 3,118 11,301 6,364 104 1,669 June 6,164 5,765 3,323 11,397 6,406 99 1,716 July . . . . . . .
(b) Reserve base by subcategories of liabilities
€ million
Liabilities arising from bearer debtLiabilities (excluding repos and securities issued with agreed matu-deposits with building and loanLiabilities (excluding savings rities of up to 2 years and bearer
deposits, deposits with build- associations) with agreed maturities Liabilities (excluding repos and money market paper after deductioning and loan associations of up to 2 years to MFIs that are deposits with building and loan of a standard amount for bearer debt
Maintenance associations) with agreedand repos) to non-MFIs with resident in euro-area countries but Savings deposits with agreed certificates or deduction of suchperiod not subject to minimum reserve periods of notice of up paper held by the reportingagreed maturities of up to 2 maturities of up to 2 years to
years requirements to 2 years institutionbeginning in 1 banks in non-euro-area countries
2011 1,609,904 3,298 354,235 596,833 102,1532012 1,734,716 2,451 440,306 602,834 94,4532013 1,795,844 2,213 255,006 600,702 90,1592014 1,904,200 1,795 282,843 601,390 86,7402015 2,063,317 1,879 375,891 592,110 104,1462016 2,203,100 1,595 447,524 585,099 133,7762017 2,338,161 628 415,084 581,416 120,894
2018 May 2,365,915 1,509 406,083 580,598 113,347 June 2,384,432 1,138 423,273 579,885 113,927 July . . . . .
1 The reserve maintenance period starts on the settlement day of the main 2% between 1 January 1999 and 17 January 2012. Since 18 January 2012, it wasrefinancing operation immediately following the meeting of the Governing Council of stood at 1%. 4 Article 5 (2) of the Regulation of the European Central Bank on thethe ECB for which the discussion on the monetary policy stance is scheduled. application of minimum reserves. 5 Average credit balances of credit institutions at2 Article 3 of the Regulation of the European Central Bank on the application of national central banks. 6 Average credit balances less required reserves afterminimum reserves (excluding liabilities to which a reserve ratio of 0% applies, deduction of the lump-sum allowance. 7 Required reserves after deduction of thepursuant to Article 4 (1)). 3 Amount after applying the reserve ratio to the reserve lump-sum allowance. base. The reserve ratio for liabilities with agreed maturities of up to two years was
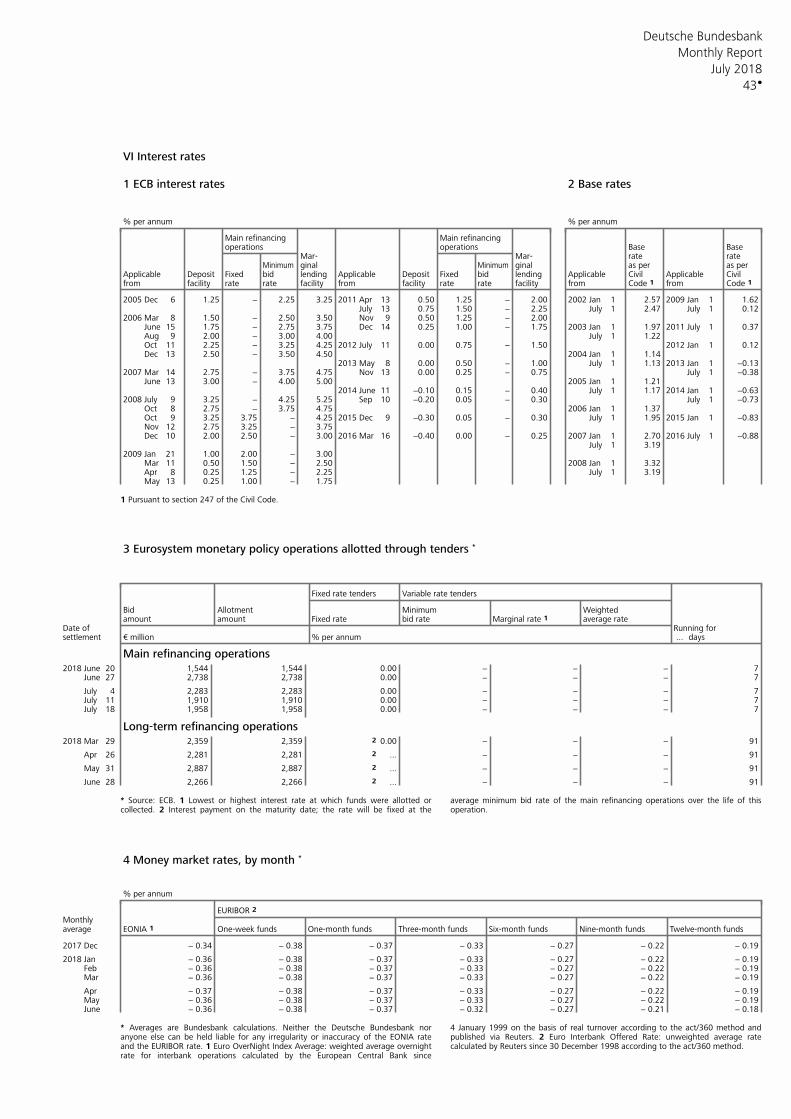
Deutsche Bundesbank
43
Monthly Report
July 2018
VI Interest rates
1 ECB interest rates 2 Base rates
% per annum % per annum
Main refinancing Main refinancingoperations operations Base Base
Mar- Mar- rate rateginal ginal as per as perMinimum Minimum
Applicable Deposit Fixed bid lending Applicable Deposit Fixed bid lending Applicable Civil Applicable Civilfrom facility rate rate facility from facility rate rate facility from Code 1 from Code 1
2005 Dec 6 1.25 − 2.25 3.25 2011 Apr 13 0.50 1.25 − 2.00 2002 Jan 1 2.57 2009 Jan 1 1.62 July 13 0.75 1.50 − 2.25 July 1 2.47 July 1 0.12
2006 Mar 8 1.50 − 2.50 3.50 Nov 9 0.50 1.25 − 2.00 June 15 1.75 − 2.75 3.75 Dec 14 0.25 1.00 − 1.75 2003 Jan 1 1.97 2011 July 1 0.37 Aug 9 2.00 − 3.00 4.00 July 1 1.22 Oct 11 2.25 − 3.25 4.25 2012 July 11 0.00 0.75 − 1.50 2012 Jan 1 0.12 Dec 13 2.50 − 3.50 4.50 2004 Jan 1 1.14
2013 May 8 0.00 0.50 − 1.00 July 1 1.13 2013 Jan 1 −0.132007 Mar 14 2.75 − 3.75 4.75 Nov 13 0.00 0.25 − 0.75 July 1 −0.38 June 13 3.00 − 4.00 5.00 2005 Jan 1 1.21
2014 June 11 −0.10 0.15 − 0.40 July 1 1.17 2014 Jan 1 −0.632008 July 9 3.25 − 4.25 5.25 Sep 10 −0.20 0.05 − 0.30 July 1 −0.73 Oct 8 2.75 − 3.75 4.75 2006 Jan 1 1.37 Oct 9 3.25 3.75 − 4.25 2015 Dec 9 −0.30 0.05 − 0.30 July 1 1.95 2015 Jan 1 −0.83 Nov 12 2.75 3.25 − 3.75 Dec 10 2.00 2.50 − 3.00 2016 Mar 16 −0.40 0.00 − 0.25 2007 Jan 1 2.70 2016 July 1 −0.88
July 1 3.192009 Jan 21 1.00 2.00 − 3.00 Mar 11 0.50 1.50 − 2.50 2008 Jan 1 3.32 Apr 8 0.25 1.25 − 2.25 July 1 3.19 May 13 0.25 1.00 − 1.75
1 Pursuant to section 247 of the Civil Code.
3 Eurosystem monetary policy operations allotted through tenders *
Fixed rate tenders Variable rate tenders
Bid Allotment Minimum Weightedamount amount Fixed rate bid rate Marginal rate 1 average rate
Date of Running forsettlement € million % per annum ... days
Main refinancing operations2018 June 20 1,544 1,544 0.00 − − − 7 June 27 2,738 2,738 0.00 − − − 7
July 4 2,283 2,283 0.00 − − − 7 July 11 1,910 1,910 0.00 − − − 7 July 18 1,958 1,958 0.00 − − − 7
Long-term refinancing operations2018 Mar 29 2,359 2,359 2 0.00 − − − 91
Apr 26 2,281 2,281 2 ... − − − 91
May 31 2,887 2,887 2 ... − − − 91
June 28 2,266 2,266 2 ... − − − 91
* Source: ECB. 1 Lowest or highest interest rate at which funds were allotted or average minimum bid rate of the main refinancing operations over the life of thiscollected. 2 Interest payment on the maturity date; the rate will be fixed at the operation.
4 Money market rates, by month *
% per annum
EURIBOR 2 Monthlyaverage EONIA 1 One-week funds One-month funds Three-month funds Six-month funds Nine-month funds Twelve-month funds
2017 Dec − 0.34 − 0.38 − 0.37 − 0.33 − 0.27 − 0.22 − 0.19
2018 Jan − 0.36 − 0.38 − 0.37 − 0.33 − 0.27 − 0.22 − 0.19 Feb − 0.36 − 0.38 − 0.37 − 0.33 − 0.27 − 0.22 − 0.19 Mar − 0.36 − 0.38 − 0.37 − 0.33 − 0.27 − 0.22 − 0.19
Apr − 0.37 − 0.38 − 0.37 − 0.33 − 0.27 − 0.22 − 0.19 May − 0.36 − 0.38 − 0.37 − 0.33 − 0.27 − 0.22 − 0.19 June − 0.36 − 0.38 − 0.37 − 0.32 − 0.27 − 0.21 − 0.18
* Averages are Bundesbank calculations. Neither the Deutsche Bundesbank nor 4 January 1999 on the basis of real turnover according to the act/360 method andanyone else can be held liable for any irregularity or inaccuracy of the EONIA rate published via Reuters. 2 Euro Interbank Offered Rate: unweighted average rateand the EURIBOR rate. 1 Euro OverNight Index Average: weighted average overnight calculated by Reuters since 30 December 1998 according to the act/360 method. rate for interbank operations calculated by the European Central Bank since
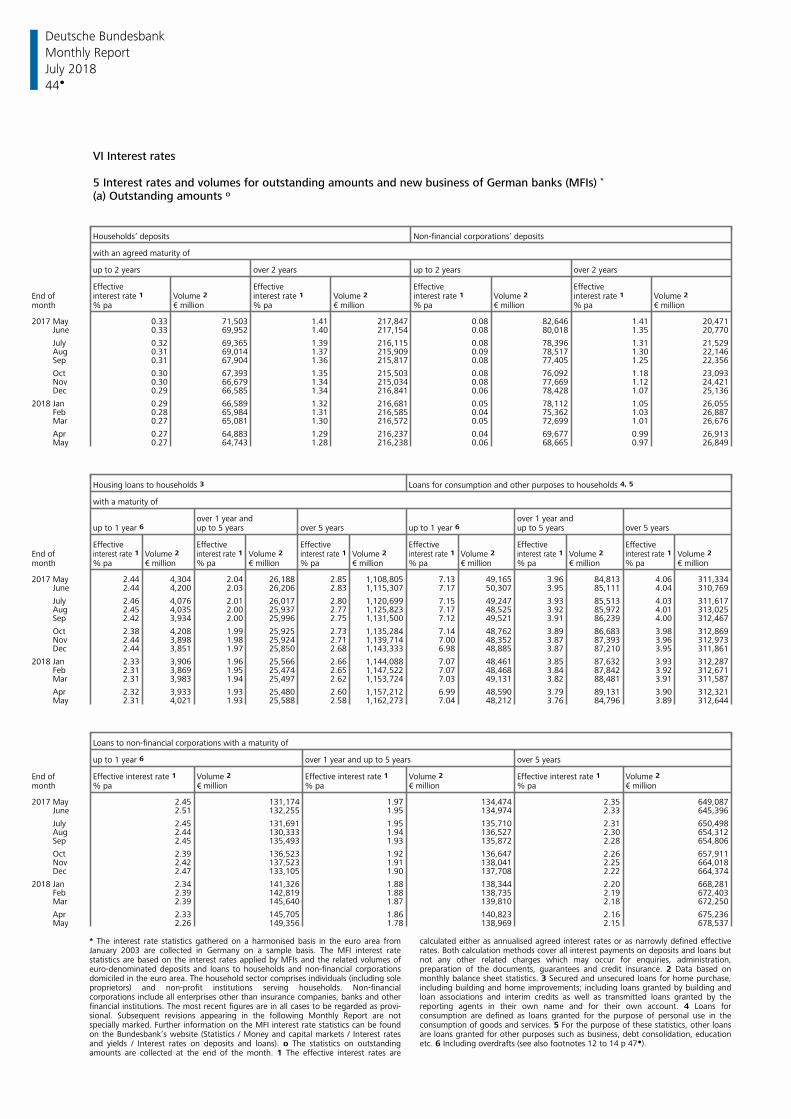
Deutsche Bundesbank
44
Monthly Report
July 2018
VI Interest rates
5 Interest rates and volumes for outstanding amounts and new business of German banks (MFIs) *
(a) Outstanding amounts o
Households’ deposits Non-financial corporations’ deposits
with an agreed maturity of
up to 2 years over 2 years up to 2 years over 2 years
Effective Effective Effective EffectiveEnd of interest rate 1 Volume 2 interest rate 1 Volume 2 interest rate 1 Volume 2 interest rate 1 Volume 2 month % pa € million % pa € million % pa € million % pa € million
2017 May 0.33 71,503 1.41 217,847 0.08 82,646 1.41 20,471 June 0.33 69,952 1.40 217,154 0.08 80,018 1.35 20,770
July 0.32 69,365 1.39 216,115 0.08 78,396 1.31 21,529 Aug 0.31 69,014 1.37 215,909 0.09 78,517 1.30 22,146 Sep 0.31 67,904 1.36 215,817 0.08 77,405 1.25 22,356
Oct 0.30 67,393 1.35 215,503 0.08 76,092 1.18 23,093 Nov 0.30 66,679 1.34 215,034 0.08 77,669 1.12 24,421 Dec 0.29 66,585 1.34 216,841 0.06 78,428 1.07 25,136
2018 Jan 0.29 66,589 1.32 216,681 0.05 78,112 1.05 26,055 Feb 0.28 65,984 1.31 216,585 0.04 75,362 1.03 26,887 Mar 0.27 65,081 1.30 216,572 0.05 72,699 1.01 26,676
Apr 0.27 64,883 1.29 216,237 0.04 69,677 0.99 26,913 May 0.27 64,743 1.28 216,238 0.06 68,665 0.97 26,849
Housing loans to households 3 Loans for consumption and other purposes to households 4, 5
with a maturity of
over 1 year and over 1 year andup to 1 year 6 up to 5 years over 5 years up to 1 year 6 up to 5 years over 5 years
Effective Effective Effective Effective Effective EffectiveEnd of Volume 2 Volume 2 Volume 2 Volume 2 Volume 2 Volume 2 interest rate 1 interest rate 1 interest rate 1 interest rate 1 interest rate 1 interest rate 1 month % pa % pa % pa % pa % pa % pa€ million € million € million € million € million € million
2017 May 2.44 4,304 2.04 26,188 2.85 1,108,805 7.13 49,165 3.96 84,813 4.06 311,334 June 2.44 4,200 2.03 26,206 2.83 1,115,307 7.17 50,307 3.95 85,111 4.04 310,769
July 2.46 4,076 2.01 26,017 2.80 1,120,699 7.15 49,247 3.93 85,513 4.03 311,617 Aug 2.45 4,035 2.00 25,937 2.77 1,125,823 7.17 48,525 3.92 85,972 4.01 313,025 Sep 2.42 3,934 2.00 25,996 2.75 1,131,500 7.12 49,521 3.91 86,239 4.00 312,467
Oct 2.38 4,208 1.99 25,925 2.73 1,135,284 7.14 48,762 3.89 86,683 3.98 312,869 Nov 2.44 3,898 1.98 25,924 2.71 1,139,714 7.00 48,352 3.87 87,393 3.96 312,973 Dec 2.44 3,851 1.97 25,850 2.68 1,143,333 6.98 48,885 3.87 87,210 3.95 311,861
2018 Jan 2.33 3,906 1.96 25,566 2.66 1,144,088 7.07 48,461 3.85 87,632 3.93 312,287 Feb 2.31 3,869 1.95 25,474 2.65 1,147,522 7.07 48,468 3.84 87,842 3.92 312,671 Mar 2.31 3,983 1.94 25,497 2.62 1,153,724 7.03 49,131 3.82 88,481 3.91 311,587
Apr 2.32 3,933 1.93 25,480 2.60 1,157,212 6.99 48,590 3.79 89,131 3.90 312,321 May 2.31 4,021 1.93 25,588 2.58 1,162,273 7.04 48,212 3.76 84,796 3.89 312,644
Loans to non-financial corporations with a maturity of
up to 1 year 6 over 1 year and up to 5 years over 5 years
End of Volume 2 Volume 2 Volume 2 Effective interest rate 1 Effective interest rate 1 Effective interest rate 1 month % pa € million % pa € million % pa € million
2017 May 2.45 131,174 1.97 134,474 2.35 649,087 June 2.51 132,255 1.95 134,974 2.33 645,396
July 2.45 131,691 1.95 135,710 2.31 650,498 Aug 2.44 130,333 1.94 136,527 2.30 654,312 Sep 2.45 135,493 1.93 135,872 2.28 654,806
Oct 2.39 136,523 1.92 136,647 2.26 657,911 Nov 2.42 137,523 1.91 138,041 2.25 664,018 Dec 2.47 133,105 1.90 137,708 2.22 664,374
2018 Jan 2.34 141,326 1.88 138,344 2.20 668,281 Feb 2.39 142,819 1.88 138,735 2.19 672,403 Mar 2.39 145,640 1.87 139,810 2.18 672,250
Apr 2.33 145,705 1.86 140,823 2.16 675,236 May 2.26 149,356 1.78 138,969 2.15 678,537
* The interest rate statistics gathered on a harmonised basis in the euro area from calculated either as annualised agreed interest rates or as narrowly defined effectiveJanuary 2003 are collected in Germany on a sample basis. The MFI interest rate rates. Both calculation methods cover all interest payments on deposits and loans butstatistics are based on the interest rates applied by MFIs and the related volumes of not any other related charges which may occur for enquiries, administration,euro-denominated deposits and loans to households and non-financial corporations preparation of the documents, guarantees and credit insurance. 2 Data based ondomiciled in the euro area. The household sector comprises individuals (including sole monthly balance sheet statistics. 3 Secured and unsecured loans for home purchase,proprietors) and non-profit institutions serving households. Non-financial including building and home improvements; including loans granted by building andcorporations include all enterprises other than insurance companies, banks and other loan associations and interim credits as well as transmitted loans granted by thefinancial institutions. The most recent figures are in all cases to be regarded as provi- reporting agents in their own name and for their own account. 4 Loans forsional. Subsequent revisions appearing in the following Monthly Report are not consumption are defined as loans granted for the purpose of personal use in thespecially marked. Further information on the MFI interest rate statistics can be found consumption of goods and services. 5 For the purpose of these statistics, other loanson the Bundesbank’s website (Statistics / Money and capital markets / Interest rates are loans granted for other purposes such as business, debt consolidation, educationand yields / Interest rates on deposits and loans). o The statistics on outstanding etc. 6 Including overdrafts (see also footnotes 12 to 14 p 47 ). amounts are collected at the end of the month. 1 The effective interest rates are
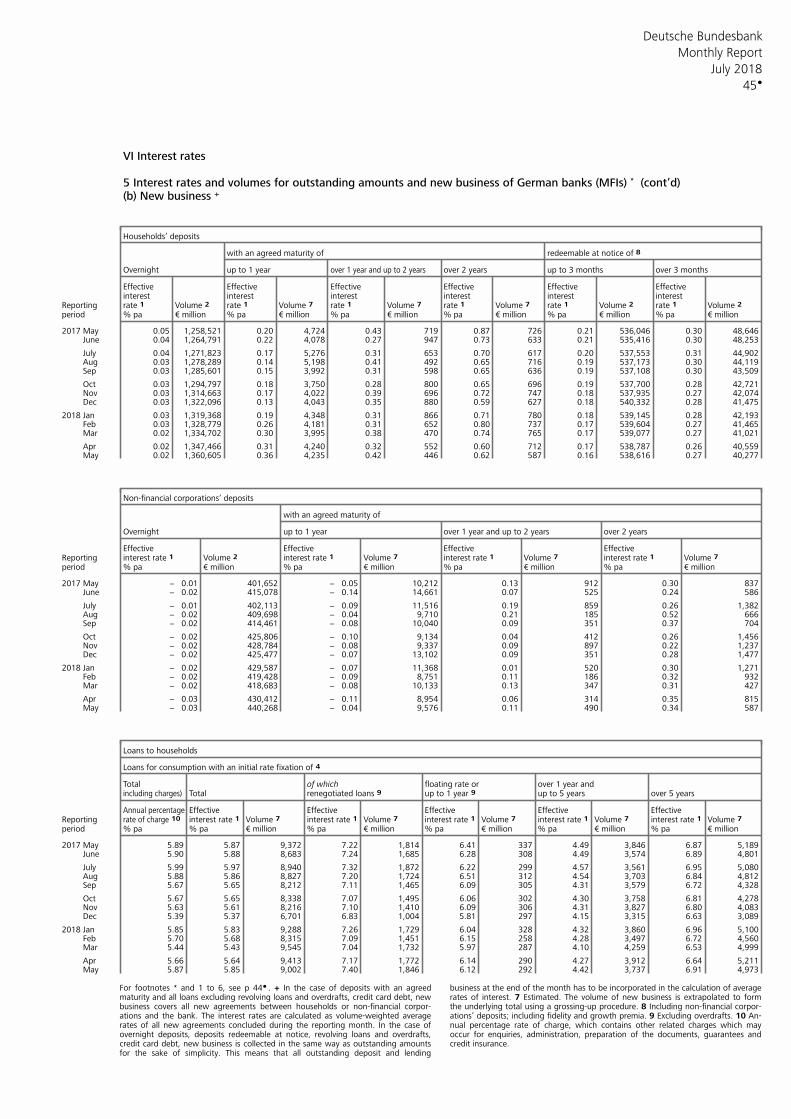
Deutsche Bundesbank
45
Monthly Report
July 2018
VI Interest rates
5 Interest rates and volumes for outstanding amounts and new business of German banks (MFIs) * (cont’d)(b) New business +
Households’ deposits
with an agreed maturity of redeemable at notice of 8
Overnight up to 1 year over 2 years up to 3 months over 3 monthsover 1 year and up to 2 years
Effective Effective Effective Effective Effective Effectiveinterest interest interest interest interest interest
Reporting rate 1 Volume 2 rate 1 Volume 7 rate 1 Volume 7 rate 1 Volume 7 rate 1 Volume 2 rate 1 Volume 2 period % pa % pa % pa % pa % pa % pa€ million € million € million € million € million € million
2017 May 0.05 1,258,521 0.20 4,724 0.43 719 0.87 726 0.21 536,046 0.30 48,646 June 0.04 1,264,791 0.22 4,078 0.27 947 0.73 633 0.21 535,416 0.30 48,253
July 0.04 1,271,823 0.17 5,276 0.31 653 0.70 617 0.20 537,553 0.31 44,902 Aug 0.03 1,278,289 0.14 5,198 0.41 492 0.65 716 0.19 537,173 0.30 44,119 Sep 0.03 1,285,601 0.15 3,992 0.31 598 0.65 636 0.19 537,108 0.30 43,509
Oct 0.03 1,294,797 0.18 3,750 0.28 800 0.65 696 0.19 537,700 0.28 42,721 Nov 0.03 1,314,663 0.17 4,022 0.39 696 0.72 747 0.18 537,935 0.27 42,074 Dec 0.03 1,322,096 0.13 4,043 0.35 880 0.59 627 0.18 540,332 0.28 41,475
2018 Jan 0.03 1,319,368 0.19 4,348 0.31 866 0.71 780 0.18 539,145 0.28 42,193 Feb 0.03 1,328,779 0.26 4,181 0.31 652 0.80 737 0.17 539,604 0.27 41,465 Mar 0.02 1,334,702 0.30 3,995 0.38 470 0.74 765 0.17 539,077 0.27 41,021
Apr 0.02 1,347,466 0.31 4,240 0.32 552 0.60 712 0.17 538,787 0.26 40,559 May 0.02 1,360,605 0.36 4,235 0.42 446 0.62 587 0.16 538,616 0.27 40,277
Non-financial corporations’ deposits
with an agreed maturity of
Overnight up to 1 year over 1 year and up to 2 years over 2 years
Effective Effective Effective EffectiveReporting interest rate 1 Volume 2 interest rate 1 Volume 7 interest rate 1 Volume 7 interest rate 1 Volume 7 period % pa € million % pa € million % pa € million % pa € million
2017 May − 0.01 401,652 − 0.05 10,212 0.13 912 0.30 837 June − 0.02 415,078 − 0.14 14,661 0.07 525 0.24 586
July − 0.01 402,113 − 0.09 11,516 0.19 859 0.26 1,382 Aug − 0.02 409,698 − 0.04 9,710 0.21 185 0.52 666 Sep − 0.02 414,461 − 0.08 10,040 0.09 351 0.37 704
Oct − 0.02 425,806 − 0.10 9,134 0.04 412 0.26 1,456 Nov − 0.02 428,784 − 0.08 9,337 0.09 897 0.22 1,237 Dec − 0.02 425,477 − 0.07 13,102 0.09 351 0.28 1,477
2018 Jan − 0.02 429,587 − 0.07 11,368 0.01 520 0.30 1,271 Feb − 0.02 419,428 − 0.09 8,751 0.11 186 0.32 932 Mar − 0.02 418,683 − 0.08 10,133 0.13 347 0.31 427
Apr − 0.03 430,412 − 0.11 8,954 0.06 314 0.35 815 May − 0.03 440,268 − 0.04 9,576 0.11 490 0.34 587
Loans to households
Loans for consumption with an initial rate fixation of 4
Total of which floating rate or over 1 year andTotal renegotiated loans 9 up to 1 year 9 up to 5 years over 5 yearsincluding charges)
Effective Effective Effective Effective EffectiveAnnual percentageReporting Volume 7 Volume 7 Volume 7 Volume 7 Volume 7 rate of charge 10 interest rate 1 interest rate 1 interest rate 1 interest rate 1 interest rate 1 period % pa % pa € million % pa € million % pa % pa % pa€ million € million € million
2017 May 5.89 5.87 9,372 7.22 1,814 6.41 337 4.49 3,846 6.87 5,189 June 5.90 5.88 8,683 7.24 1,685 6.28 308 4.49 3,574 6.89 4,801
July 5.99 5.97 8,940 7.32 1,872 6.22 299 4.57 3,561 6.95 5,080 Aug 5.88 5.86 8,827 7.20 1,724 6.51 312 4.54 3,703 6.84 4,812 Sep 5.67 5.65 8,212 7.11 1,465 6.09 305 4.31 3,579 6.72 4,328
Oct 5.67 5.65 8,338 7.07 1,495 6.06 302 4.30 3,758 6.81 4,278 Nov 5.63 5.61 8,216 7.10 1,410 6.09 306 4.31 3,827 6.80 4,083 Dec 5.39 5.37 6,701 6.83 1,004 5.81 297 4.15 3,315 6.63 3,089
2018 Jan 5.85 5.83 9,288 7.26 1,729 6.04 328 4.32 3,860 6.96 5,100 Feb 5.70 5.68 8,315 7.09 1,451 6.15 258 4.28 3,497 6.72 4,560 Mar 5.44 5.43 9,545 7.04 1,732 5.97 287 4.10 4,259 6.53 4,999
Apr 5.66 5.64 9,413 7.17 1,772 6.14 290 4.27 3,912 6.64 5,211 May 5.87 5.85 9,002 7.40 1,846 6.12 292 4.42 3,737 6.91 4,973
For footnotes * and 1 to 6, see p 44 . + In the case of deposits with an agreed business at the end of the month has to be incorporated in the calculation of averagematurity and all loans excluding revolving loans and overdrafts, credit card debt, new rates of interest. 7 Estimated. The volume of new business is extrapolated to formbusiness covers all new agreements between households or non-financial corpor- the underlying total using a grossing-up procedure. 8 Including non-financial corpor-ations and the bank. The interest rates are calculated as volume-weighted average ations’ deposits; including fidelity and growth premia. 9 Excluding overdrafts. 10 An-rates of all new agreements concluded during the reporting month. In the case of nual percentage rate of charge, which contains other related charges which mayovernight deposits, deposits redeemable at notice, revolving loans and overdrafts, occur for enquiries, administration, preparation of the documents, guarantees andcredit card debt, new business is collected in the same way as outstanding amounts credit insurance. for the sake of simplicity. This means that all outstanding deposit and lending
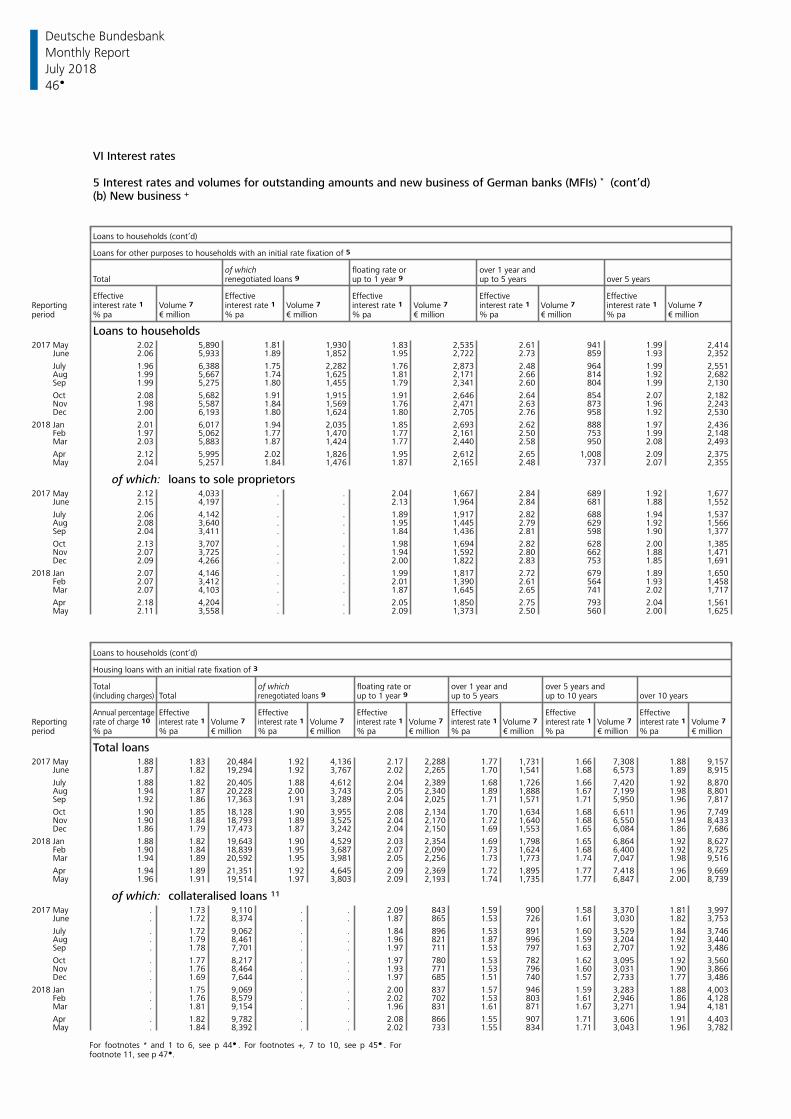
Deutsche Bundesbank
46
Monthly Report
July 2018
VI Interest rates
5 Interest rates and volumes for outstanding amounts and new business of German banks (MFIs) * (cont’d)(b) New business +
Loans to households (cont’d)
Loans for other purposes to households with an initial rate fixation of 5
of which floating rate or over 1 year andTotal renegotiated loans 9 up to 1 year 9 up to 5 years over 5 years
Effective Effective Effective Effective EffectiveReporting Volume 7 Volume 7 Volume 7 Volume 7 Volume 7 interest rate 1 interest rate 1 interest rate 1 interest rate 1 interest rate 1 period % pa € million % pa € million % pa € million % pa € million % pa € million
Loans to households2017 May 2.02 5,890 1.81 1,930 1.83 2,535 2.61 941 1.99 2,414 June 2.06 5,933 1.89 1,852 1.95 2,722 2.73 859 1.93 2,352
July 1.96 6,388 1.75 2,282 1.76 2,873 2.48 964 1.99 2,551 Aug 1.99 5,667 1.74 1,625 1.81 2,171 2.66 814 1.92 2,682 Sep 1.99 5,275 1.80 1,455 1.79 2,341 2.60 804 1.99 2,130
Oct 2.08 5,682 1.91 1,915 1.91 2,646 2.64 854 2.07 2,182 Nov 1.98 5,587 1.84 1,569 1.76 2,471 2.63 873 1.96 2,243 Dec 2.00 6,193 1.80 1,624 1.80 2,705 2.76 958 1.92 2,530
2018 Jan 2.01 6,017 1.94 2,035 1.85 2,693 2.62 888 1.97 2,436 Feb 1.97 5,062 1.77 1,470 1.77 2,161 2.50 753 1.99 2,148 Mar 2.03 5,883 1.87 1,424 1.77 2,440 2.58 950 2.08 2,493
Apr 2.12 5,995 2.02 1,826 1.95 2,612 2.65 1,008 2.09 2,375 May 2.04 5,257 1.84 1,476 1.87 2,165 2.48 737 2.07 2,355
of which: loans to sole proprietors2017 May 2.12 4,033 . . 2.04 1,667 2.84 689 1.92 1,677 June 2.15 4,197 . . 2.13 1,964 2.84 681 1.88 1,552
July 2.06 4,142 . . 1.89 1,917 2.82 688 1.94 1,537 Aug 2.08 3,640 . . 1.95 1,445 2.79 629 1.92 1,566 Sep 2.04 3,411 . . 1.84 1,436 2.81 598 1.90 1,377
Oct 2.13 3,707 . . 1.98 1,694 2.82 628 2.00 1,385 Nov 2.07 3,725 . . 1.94 1,592 2.80 662 1.88 1,471 Dec 2.09 4,266 . . 2.00 1,822 2.83 753 1.85 1,691
2018 Jan 2.07 4,146 . . 1.99 1,817 2.72 679 1.89 1,650 Feb 2.07 3,412 . . 2.01 1,390 2.61 564 1.93 1,458 Mar 2.07 4,103 . . 1.87 1,645 2.65 741 2.02 1,717
Apr 2.18 4,204 . . 2.05 1,850 2.75 793 2.04 1,561 May 2.11 3,558 . . 2.09 1,373 2.50 560 2.00 1,625
Loans to households (cont’d)
Housing loans with an initial rate fixation of 3
of which floating rate or over 1 year and over 5 years andTotalTotal up to 1 year 9 up to 5 years up to 10 years over 10 years(including charges) renegotiated loans 9
Effective Effective Effective Effective Effective EffectiveAnnual percentageReporting Volume 7 Volume 7 rate of charge 10 interest rate 1 interest rate 1 interest rate 1 Volume 7 interest rate 1 Volume 7 interest rate 1 Volume 7 interest rate 1 Volume 7 period % pa % pa % pa % pa % pa % pa % pa€ million € million € million € million € million € million
Total loans2017 May 1.88 1.83 20,484 1.92 4,136 2.17 2,288 1.77 1,731 1.66 7,308 1.88 9,157 June 1.87 1.82 19,294 1.92 3,767 2.02 2,265 1.70 1,541 1.68 6,573 1.89 8,915
July 1.88 1.82 20,405 1.88 4,612 2.04 2,389 1.68 1,726 1.66 7,420 1.92 8,870 Aug 1.94 1.87 20,228 2.00 3,743 2.05 2,340 1.89 1,888 1.67 7,199 1.98 8,801 Sep 1.92 1.86 17,363 1.91 3,289 2.04 2,025 1.71 1,571 1.71 5,950 1.96 7,817
Oct 1.90 1.85 18,128 1.90 3,955 2.08 2,134 1.70 1,634 1.68 6,611 1.96 7,749 Nov 1.90 1.84 18,793 1.89 3,525 2.04 2,170 1.72 1,640 1.68 6,550 1.94 8,433 Dec 1.86 1.79 17,473 1.87 3,242 2.04 2,150 1.69 1,553 1.65 6,084 1.86 7,686
2018 Jan 1.88 1.82 19,643 1.90 4,529 2.03 2,354 1.69 1,798 1.65 6,864 1.92 8,627 Feb 1.90 1.84 18,839 1.95 3,687 2.07 2,090 1.73 1,624 1.68 6,400 1.92 8,725 Mar 1.94 1.89 20,592 1.95 3,981 2.05 2,256 1.73 1,773 1.74 7,047 1.98 9,516
Apr 1.94 1.89 21,351 1.92 4,645 2.09 2,369 1.72 1,895 1.77 7,418 1.96 9,669 May 1.96 1.91 19,514 1.97 3,803 2.09 2,193 1.74 1,735 1.77 6,847 2.00 8,739
of which: collateralised loans 11
2017 May . 1.73 9,110 . . 2.09 843 1.59 900 1.58 3,370 1.81 3,997 June . 1.72 8,374 . . 1.87 865 1.53 726 1.61 3,030 1.82 3,753
July . 1.72 9,062 . . 1.84 896 1.53 891 1.60 3,529 1.84 3,746 Aug . 1.79 8,461 . . 1.96 821 1.87 996 1.59 3,204 1.92 3,440 Sep . 1.78 7,701 . . 1.97 711 1.53 797 1.63 2,707 1.92 3,486
Oct . 1.77 8,217 . . 1.97 780 1.53 782 1.62 3,095 1.92 3,560 Nov . 1.76 8,464 . . 1.93 771 1.53 796 1.60 3,031 1.90 3,866 Dec . 1.69 7,644 . . 1.97 685 1.51 740 1.57 2,733 1.77 3,486
2018 Jan . 1.75 9,069 . . 2.00 837 1.57 946 1.59 3,283 1.88 4,003 Feb . 1.76 8,579 . . 2.02 702 1.53 803 1.61 2,946 1.86 4,128 Mar . 1.81 9,154 . . 1.96 831 1.61 871 1.67 3,271 1.94 4,181
Apr . 1.82 9,782 . . 2.08 866 1.55 907 1.71 3,606 1.91 4,403 May . 1.84 8,392 . . 2.02 733 1.55 834 1.71 3,043 1.96 3,782
For footnotes * and 1 to 6, see p 44 . For footnotes +, 7 to 10, see p 45 . For footnote 11, see p 47 .
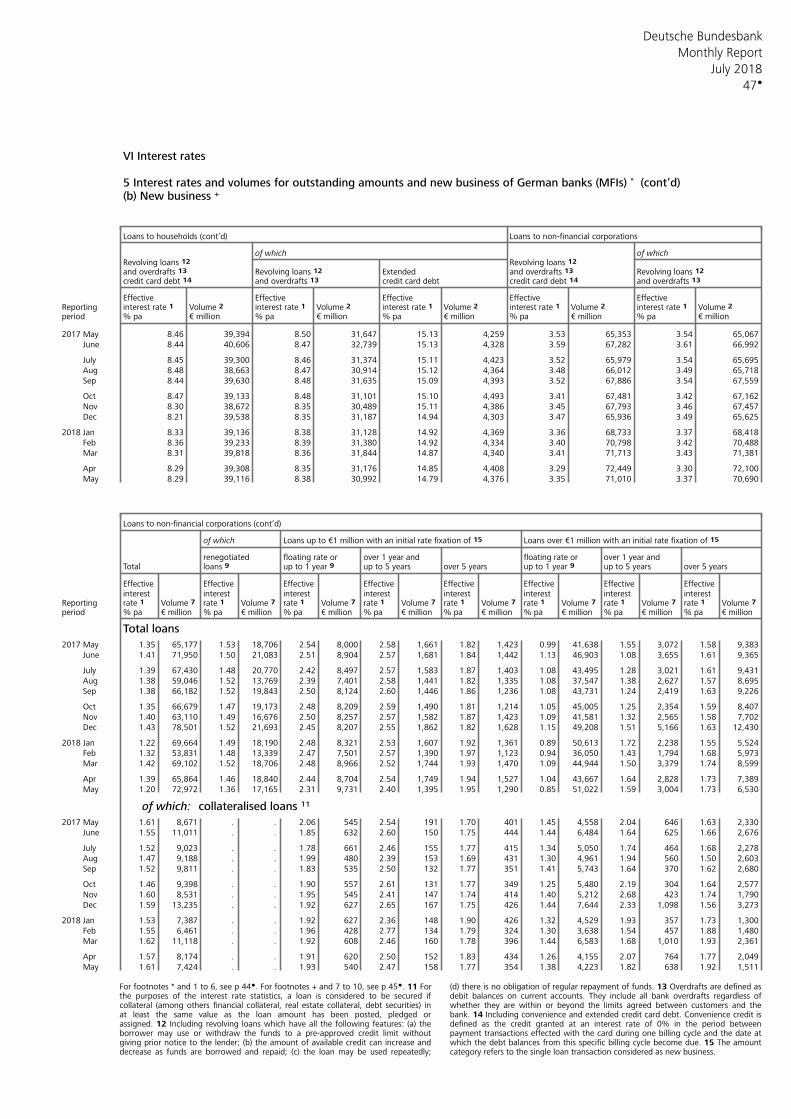
Deutsche Bundesbank
47
Monthly Report
July 2018
VI Interest rates
5 Interest rates and volumes for outstanding amounts and new business of German banks (MFIs) * (cont’d)(b) New business +
Loans to households (cont’d) Loans to non-financial corporations
of which of whichRevolving loans 12 Revolving loans 12 and overdrafts 13 Revolving loans 12 Extended and overdrafts 13 Revolving loans 12 credit card debt 14 and overdrafts 13 credit card debt credit card debt 14 and overdrafts 13
Effective Effective Effective Effective EffectiveReporting Volume 2 Volume 2 Volume 2 Volume 2 Volume 2 interest rate 1 interest rate 1 interest rate 1 interest rate 1 interest rate 1 period % pa € million % pa € million % pa € million % pa € million % pa € million
2017 May 8.46 39,394 8.50 31,647 15.13 4,259 3.53 65,353 3.54 65,067 June 8.44 40,606 8.47 32,739 15.13 4,328 3.59 67,282 3.61 66,992
July 8.45 39,300 8.46 31,374 15.11 4,423 3.52 65,979 3.54 65,695 Aug 8.48 38,663 8.47 30,914 15.12 4,364 3.48 66,012 3.49 65,718 Sep 8.44 39,630 8.48 31,635 15.09 4,393 3.52 67,886 3.54 67,559
Oct 8.47 39,133 8.48 31,101 15.10 4,493 3.41 67,481 3.42 67,162 Nov 8.30 38,672 8.35 30,489 15.11 4,386 3.45 67,793 3.46 67,457 Dec 8.21 39,538 8.35 31,187 14.94 4,303 3.47 65,936 3.49 65,625
2018 Jan 8.33 39,136 8.38 31,128 14.92 4,369 3.36 68,733 3.37 68,418 Feb 8.36 39,233 8.39 31,380 14.92 4,334 3.40 70,798 3.42 70,488 Mar 8.31 39,818 8.36 31,844 14.87 4,340 3.41 71,713 3.43 71,381
Apr 8.29 39,308 8.35 31,176 14.85 4,408 3.29 72,449 3.30 72,100 May 8.29 39,116 8.38 30,992 14.79 4,376 3.35 71,010 3.37 70,690
Loans to non-financial corporations (cont’d)
of which Loans up to €1 million with an initial rate fixation of 15 Loans over €1 million with an initial rate fixation of 15
renegotiated floating rate or over 1 year and floating rate or over 1 year andTotal loans 9 up to 1 year 9 up to 5 years over 5 years up to 1 year 9 up to 5 years over 5 years
Effective Effective Effective Effective Effective Effective Effective Effectiveinterest interest interest interest interest interest interest interest
Reporting rate 1 rate 1 rate 1 rate 1 rate 1 rate 1 rate 1 rate 1 Volume 7 Volume 7 Volume 7 Volume 7 Volume 7 Volume 7 Volume 7 Volume 7 period % pa % pa % pa % pa % pa % pa % pa % pa€ million € million € million € million € million € million € million € million
Total loans
2017 May 1.35 65,177 1.53 18,706 2.54 8,000 2.58 1,661 1.82 1,423 0.99 41,638 1.55 3,072 1.58 9,383 June 1.41 71,950 1.50 21,083 2.51 8,904 2.57 1,681 1.84 1,442 1.13 46,903 1.08 3,655 1.61 9,365
July 1.39 67,430 1.48 20,770 2.42 8,497 2.57 1,583 1.87 1,403 1.08 43,495 1.28 3,021 1.61 9,431 Aug 1.38 59,046 1.52 13,769 2.39 7,401 2.58 1,441 1.82 1,335 1.08 37,547 1.38 2,627 1.57 8,695 Sep 1.38 66,182 1.52 19,843 2.50 8,124 2.60 1,446 1.86 1,236 1.08 43,731 1.24 2,419 1.63 9,226
Oct 1.35 66,679 1.47 19,173 2.48 8,209 2.59 1,490 1.81 1,214 1.05 45,005 1.25 2,354 1.59 8,407 Nov 1.40 63,110 1.49 16,676 2.50 8,257 2.57 1,582 1.87 1,423 1.09 41,581 1.32 2,565 1.58 7,702 Dec 1.43 78,501 1.52 21,693 2.45 8,207 2.55 1,862 1.82 1,628 1.15 49,208 1.51 5,166 1.63 12,430
2018 Jan 1.22 69,664 1.49 18,190 2.48 8,321 2.53 1,607 1.92 1,361 0.89 50,613 1.72 2,238 1.55 5,524 Feb 1.32 53,831 1.48 13,339 2.47 7,501 2.57 1,390 1.97 1,123 0.94 36,050 1.43 1,794 1.68 5,973 Mar 1.42 69,102 1.52 18,706 2.48 8,966 2.52 1,744 1.93 1,470 1.09 44,944 1.50 3,379 1.74 8,599
Apr 1.39 65,864 1.46 18,840 2.44 8,704 2.54 1,749 1.94 1,527 1.04 43,667 1.64 2,828 1.73 7,389 May 1.20 72,972 1.36 17,165 2.31 9,731 2.40 1,395 1.95 1,290 0.85 51,022 1.59 3,004 1.73 6,530
of which: collateralised loans 11
2017 May 1.61 8,671 . . 2.06 545 2.54 191 1.70 401 1.45 4,558 2.04 646 1.63 2,330 June 1.55 11,011 . . 1.85 632 2.60 150 1.75 444 1.44 6,484 1.64 625 1.66 2,676
July 1.52 9,023 . . 1.78 661 2.46 155 1.77 415 1.34 5,050 1.74 464 1.68 2,278 Aug 1.47 9,188 . . 1.99 480 2.39 153 1.69 431 1.30 4,961 1.94 560 1.50 2,603 Sep 1.52 9,811 . . 1.83 535 2.50 132 1.77 351 1.41 5,743 1.64 370 1.62 2,680
Oct 1.46 9,398 . . 1.90 557 2.61 131 1.77 349 1.25 5,480 2.19 304 1.64 2,577 Nov 1.60 8,531 . . 1.95 545 2.41 147 1.74 414 1.40 5,212 2.68 423 1.74 1,790 Dec 1.59 13,235 . . 1.92 627 2.65 167 1.75 426 1.44 7,644 2.33 1,098 1.56 3,273
2018 Jan 1.53 7,387 . . 1.92 627 2.36 148 1.90 426 1.32 4,529 1.93 357 1.73 1,300 Feb 1.55 6,461 . . 1.96 428 2.77 134 1.79 324 1.30 3,638 1.54 457 1.88 1,480 Mar 1.62 11,118 . . 1.92 608 2.46 160 1.78 396 1.44 6,583 1.68 1,010 1.93 2,361
Apr 1.57 8,174 . . 1.91 620 2.50 152 1.83 434 1.26 4,155 2.07 764 1.77 2,049 May 1.61 7,424 . . 1.93 540 2.47 158 1.77 354 1.38 4,223 1.82 638 1.92 1,511
For footnotes * and 1 to 6, see p 44 . For footnotes + and 7 to 10, see p 45 . 11 For (d) there is no obligation of regular repayment of funds. 13 Overdrafts are defined asthe purposes of the interest rate statistics, a loan is considered to be secured if debit balances on current accounts. They include all bank overdrafts regardless ofcollateral (among others financial collateral, real estate collateral, debt securities) in whether they are within or beyond the limits agreed between customers and theat least the same value as the loan amount has been posted, pledged or bank. 14 Including convenience and extended credit card debt. Convenience credit isassigned. 12 Including revolving loans which have all the following features: (a) the defined as the credit granted at an interest rate of 0% in the period betweenborrower may use or withdraw the funds to a pre-approved credit limit without payment transactions effected with the card during one billing cycle and the date atgiving prior notice to the lender; (b) the amount of available credit can increase and which the debt balances from this specific billing cycle become due. 15 The amountdecrease as funds are borrowed and repaid; (c) the loan may be used repeatedly; category refers to the single loan transaction considered as new business.
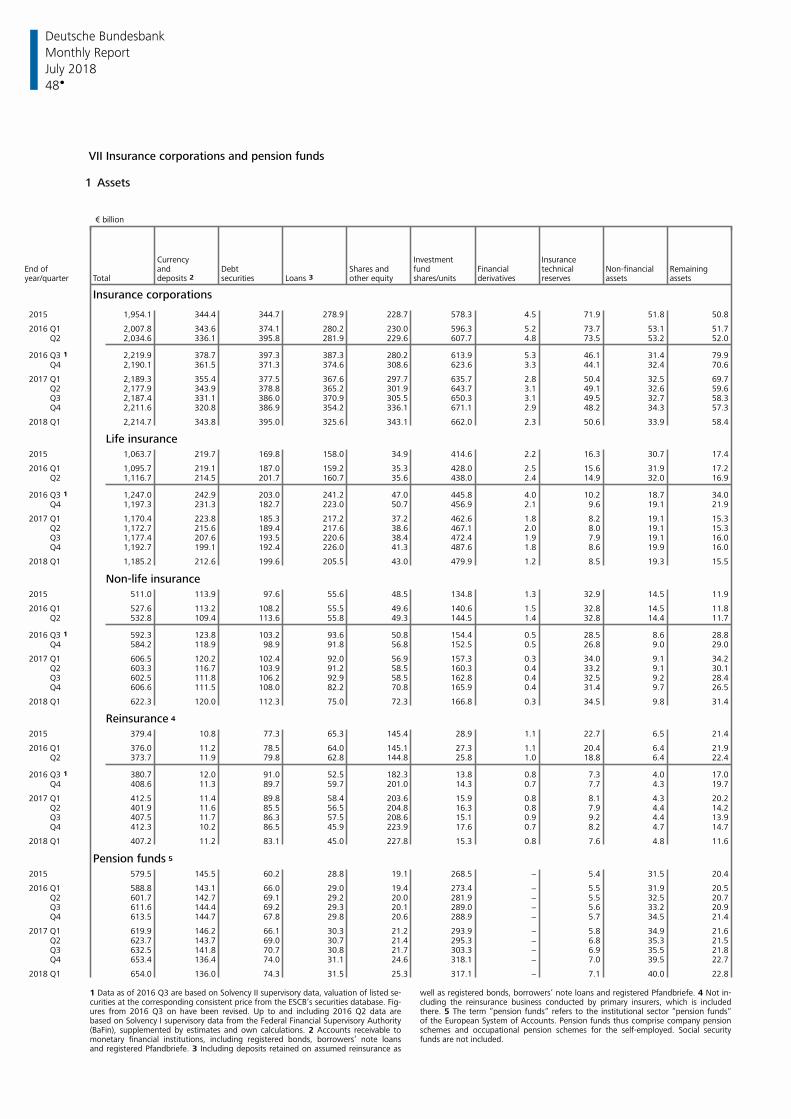
Deutsche Bundesbank
48
Monthly Report
July 2018
VII Insurance corporations and pension funds
1 Assets € billion
Currency Investment InsuranceEnd of and Debt Shares and fund Financial technical Non-financial Remainingyear/quarter Total deposits 2 securities Loans 3 other equity shares/units derivatives reserves assets assets
Insurance corporations
2015 1,954.1 344.4 344.7 278.9 228.7 578.3 4.5 71.9 51.8 50.8
2016 Q1 2,007.8 343.6 374.1 280.2 230.0 596.3 5.2 73.7 53.1 51.7 Q2 2,034.6 336.1 395.8 281.9 229.6 607.7 4.8 73.5 53.2 52.0
2016 Q3 1 2,219.9 378.7 397.3 387.3 280.2 613.9 5.3 46.1 31.4 79.9 Q4 2,190.1 361.5 371.3 374.6 308.6 623.6 3.3 44.1 32.4 70.6
2017 Q1 2,189.3 355.4 377.5 367.6 297.7 635.7 2.8 50.4 32.5 69.7 Q2 2,177.9 343.9 378.8 365.2 301.9 643.7 3.1 49.1 32.6 59.6 Q3 2,187.4 331.1 386.0 370.9 305.5 650.3 3.1 49.5 32.7 58.3 Q4 2,211.6 320.8 386.9 354.2 336.1 671.1 2.9 48.2 34.3 57.3
2018 Q1 2,214.7 343.8 395.0 325.6 343.1 662.0 2.3 50.6 33.9 58.4
Life insurance2015 1,063.7 219.7 169.8 158.0 34.9 414.6 2.2 16.3 30.7 17.4
2016 Q1 1,095.7 219.1 187.0 159.2 35.3 428.0 2.5 15.6 31.9 17.2 Q2 1,116.7 214.5 201.7 160.7 35.6 438.0 2.4 14.9 32.0 16.9
2016 Q3 1 1,247.0 242.9 203.0 241.2 47.0 445.8 4.0 10.2 18.7 34.0 Q4 1,197.3 231.3 182.7 223.0 50.7 456.9 2.1 9.6 19.1 21.9
2017 Q1 1,170.4 223.8 185.3 217.2 37.2 462.6 1.8 8.2 19.1 15.3 Q2 1,172.7 215.6 189.4 217.6 38.6 467.1 2.0 8.0 19.1 15.3 Q3 1,177.4 207.6 193.5 220.6 38.4 472.4 1.9 7.9 19.1 16.0 Q4 1,192.7 199.1 192.4 226.0 41.3 487.6 1.8 8.6 19.9 16.0
2018 Q1 1,185.2 212.6 199.6 205.5 43.0 479.9 1.2 8.5 19.3 15.5
Non-life insurance2015 511.0 113.9 97.6 55.6 48.5 134.8 1.3 32.9 14.5 11.9
2016 Q1 527.6 113.2 108.2 55.5 49.6 140.6 1.5 32.8 14.5 11.8 Q2 532.8 109.4 113.6 55.8 49.3 144.5 1.4 32.8 14.4 11.7
2016 Q3 1 592.3 123.8 103.2 93.6 50.8 154.4 0.5 28.5 8.6 28.8 Q4 584.2 118.9 98.9 91.8 56.8 152.5 0.5 26.8 9.0 29.0
2017 Q1 606.5 120.2 102.4 92.0 56.9 157.3 0.3 34.0 9.1 34.2 Q2 603.3 116.7 103.9 91.2 58.5 160.3 0.4 33.2 9.1 30.1 Q3 602.5 111.8 106.2 92.9 58.5 162.8 0.4 32.5 9.2 28.4 Q4 606.6 111.5 108.0 82.2 70.8 165.9 0.4 31.4 9.7 26.5
2018 Q1 622.3 120.0 112.3 75.0 72.3 166.8 0.3 34.5 9.8 31.4
Reinsurance 4
2015 379.4 10.8 77.3 65.3 145.4 28.9 1.1 22.7 6.5 21.4
2016 Q1 376.0 11.2 78.5 64.0 145.1 27.3 1.1 20.4 6.4 21.9 Q2 373.7 11.9 79.8 62.8 144.8 25.8 1.0 18.8 6.4 22.4
2016 Q3 1 380.7 12.0 91.0 52.5 182.3 13.8 0.8 7.3 4.0 17.0 Q4 408.6 11.3 89.7 59.7 201.0 14.3 0.7 7.7 4.3 19.7
2017 Q1 412.5 11.4 89.8 58.4 203.6 15.9 0.8 8.1 4.3 20.2 Q2 401.9 11.6 85.5 56.5 204.8 16.3 0.8 7.9 4.4 14.2 Q3 407.5 11.7 86.3 57.5 208.6 15.1 0.9 9.2 4.4 13.9 Q4 412.3 10.2 86.5 45.9 223.9 17.6 0.7 8.2 4.7 14.7
2018 Q1 407.2 11.2 83.1 45.0 227.8 15.3 0.8 7.6 4.8 11.6
Pension funds 5
2015 579.5 145.5 60.2 28.8 19.1 268.5 − 5.4 31.5 20.4
2016 Q1 588.8 143.1 66.0 29.0 19.4 273.4 − 5.5 31.9 20.5 Q2 601.7 142.7 69.1 29.2 20.0 281.9 − 5.5 32.5 20.7 Q3 611.6 144.4 69.2 29.3 20.1 289.0 − 5.6 33.2 20.9 Q4 613.5 144.7 67.8 29.8 20.6 288.9 − 5.7 34.5 21.4
2017 Q1 619.9 146.2 66.1 30.3 21.2 293.9 − 5.8 34.9 21.6 Q2 623.7 143.7 69.0 30.7 21.4 295.3 − 6.8 35.3 21.5 Q3 632.5 141.8 70.7 30.8 21.7 303.3 − 6.9 35.5 21.8 Q4 653.4 136.4 74.0 31.1 24.6 318.1 − 7.0 39.5 22.7
2018 Q1 654.0 136.0 74.3 31.5 25.3 317.1 − 7.1 40.0 22.8
1 Data as of 2016 Q3 are based on Solvency II supervisory data, valuation of listed se- well as registered bonds, borrowers’ note loans and registered Pfandbriefe. 4 Not in-curities at the corresponding consistent price from the ESCB’s securities database. Fig- cluding the reinsurance business conducted by primary insurers, which is includedures from 2016 Q3 on have been revised. Up to and including 2016 Q2 data are there. 5 The term “pension funds“ refers to the institutional sector “pension funds“based on Solvency I supervisory data from the Federal Financial Supervisory Authority of the European System of Accounts. Pension funds thus comprise company pension(BaFin), supplemented by estimates and own calculations. 2 Accounts receivable to schemes and occupational pension schemes for the self-employed. Social securitymonetary financial institutions, including registered bonds, borrowers’ note loans funds are not included. and registered Pfandbriefe. 3 Including deposits retained on assumed reinsurance as
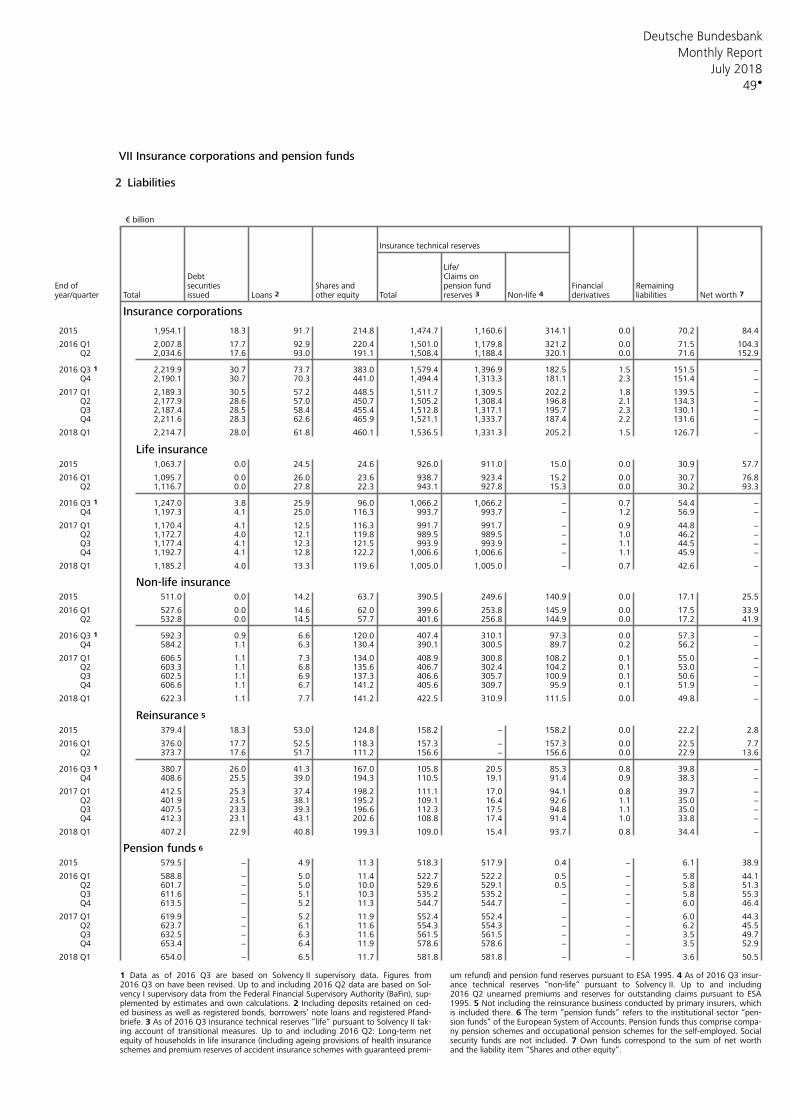
Deutsche Bundesbank
49
Monthly Report
July 2018
VII Insurance corporations and pension funds
2 Liabilities € billion
Insurance technical reserves
Life/Debt Claims on
End of securities Shares and pension fund Financial Remainingyear/quarter Total issued Loans 2 other equity Total reserves 3 Non-life 4 derivatives liabilities Net worth 7
Insurance corporations
2015 1,954.1 18.3 91.7 214.8 1,474.7 1,160.6 314.1 0.0 70.2 84.4
2016 Q1 2,007.8 17.7 92.9 220.4 1,501.0 1,179.8 321.2 0.0 71.5 104.3 Q2 2,034.6 17.6 93.0 191.1 1,508.4 1,188.4 320.1 0.0 71.6 152.9
2016 Q3 1 2,219.9 30.7 73.7 383.0 1,579.4 1,396.9 182.5 1.5 151.5 − Q4 2,190.1 30.7 70.3 441.0 1,494.4 1,313.3 181.1 2.3 151.4 −
2017 Q1 2,189.3 30.5 57.2 448.5 1,511.7 1,309.5 202.2 1.8 139.5 − Q2 2,177.9 28.6 57.0 450.7 1,505.2 1,308.4 196.8 2.1 134.3 − Q3 2,187.4 28.5 58.4 455.4 1,512.8 1,317.1 195.7 2.3 130.1 − Q4 2,211.6 28.3 62.6 465.9 1,521.1 1,333.7 187.4 2.2 131.6 −
2018 Q1 2,214.7 28.0 61.8 460.1 1,536.5 1,331.3 205.2 1.5 126.7 −
Life insurance2015 1,063.7 0.0 24.5 24.6 926.0 911.0 15.0 0.0 30.9 57.7
2016 Q1 1,095.7 0.0 26.0 23.6 938.7 923.4 15.2 0.0 30.7 76.8 Q2 1,116.7 0.0 27.8 22.3 943.1 927.8 15.3 0.0 30.2 93.3
2016 Q3 1 1,247.0 3.8 25.9 96.0 1,066.2 1,066.2 − 0.7 54.4 − Q4 1,197.3 4.1 25.0 116.3 993.7 993.7 − 1.2 56.9 −
2017 Q1 1,170.4 4.1 12.5 116.3 991.7 991.7 − 0.9 44.8 − Q2 1,172.7 4.0 12.1 119.8 989.5 989.5 − 1.0 46.2 − Q3 1,177.4 4.1 12.3 121.5 993.9 993.9 − 1.1 44.5 − Q4 1,192.7 4.1 12.8 122.2 1,006.6 1,006.6 − 1.1 45.9 −
2018 Q1 1,185.2 4.0 13.3 119.6 1,005.0 1,005.0 − 0.7 42.6 −
Non-life insurance2015 511.0 0.0 14.2 63.7 390.5 249.6 140.9 0.0 17.1 25.5
2016 Q1 527.6 0.0 14.6 62.0 399.6 253.8 145.9 0.0 17.5 33.9 Q2 532.8 0.0 14.5 57.7 401.6 256.8 144.9 0.0 17.2 41.9
2016 Q3 1 592.3 0.9 6.6 120.0 407.4 310.1 97.3 0.0 57.3 − Q4 584.2 1.1 6.3 130.4 390.1 300.5 89.7 0.2 56.2 −
2017 Q1 606.5 1.1 7.3 134.0 408.9 300.8 108.2 0.1 55.0 − Q2 603.3 1.1 6.8 135.6 406.7 302.4 104.2 0.1 53.0 − Q3 602.5 1.1 6.9 137.3 406.6 305.7 100.9 0.1 50.6 − Q4 606.6 1.1 6.7 141.2 405.6 309.7 95.9 0.1 51.9 −
2018 Q1 622.3 1.1 7.7 141.2 422.5 310.9 111.5 0.0 49.8 −
Reinsurance 5
2015 379.4 18.3 53.0 124.8 158.2 − 158.2 0.0 22.2 2.8
2016 Q1 376.0 17.7 52.5 118.3 157.3 − 157.3 0.0 22.5 7.7 Q2 373.7 17.6 51.7 111.2 156.6 − 156.6 0.0 22.9 13.6
2016 Q3 1 380.7 26.0 41.3 167.0 105.8 20.5 85.3 0.8 39.8 − Q4 408.6 25.5 39.0 194.3 110.5 19.1 91.4 0.9 38.3 −
2017 Q1 412.5 25.3 37.4 198.2 111.1 17.0 94.1 0.8 39.7 − Q2 401.9 23.5 38.1 195.2 109.1 16.4 92.6 1.1 35.0 − Q3 407.5 23.3 39.3 196.6 112.3 17.5 94.8 1.1 35.0 − Q4 412.3 23.1 43.1 202.6 108.8 17.4 91.4 1.0 33.8 −
2018 Q1 407.2 22.9 40.8 199.3 109.0 15.4 93.7 0.8 34.4 −
Pension funds 6
2015 579.5 − 4.9 11.3 518.3 517.9 0.4 − 6.1 38.9
2016 Q1 588.8 − 5.0 11.4 522.7 522.2 0.5 − 5.8 44.1 Q2 601.7 − 5.0 10.0 529.6 529.1 0.5 − 5.8 51.3 Q3 611.6 − 5.1 10.3 535.2 535.2 − − 5.8 55.3 Q4 613.5 − 5.2 11.3 544.7 544.7 − − 6.0 46.4
2017 Q1 619.9 − 5.2 11.9 552.4 552.4 − − 6.0 44.3 Q2 623.7 − 6.1 11.6 554.3 554.3 − − 6.2 45.5 Q3 632.5 − 6.3 11.6 561.5 561.5 − − 3.5 49.7 Q4 653.4 − 6.4 11.9 578.6 578.6 − − 3.5 52.9
2018 Q1 654.0 − 6.5 11.7 581.8 581.8 − − 3.6 50.5
1 Data as of 2016 Q3 are based on Solvency II supervisory data. Figures from um refund) and pension fund reserves pursuant to ESA 1995. 4 As of 2016 Q3 insur-2016 Q3 on have been revised. Up to and including 2016 Q2 data are based on Sol- ance technical reserves “non-life“ pursuant to Solvency II. Up to and includingvency I supervisory data from the Federal Financial Supervisory Authority (BaFin), sup- 2016 Q2 unearned premiums and reserves for outstanding claims pursuant to ESAplemented by estimates and own calculations. 2 Including deposits retained on ced- 1995. 5 Not including the reinsurance business conducted by primary insurers, whiched business as well as registered bonds, borrowers’ note loans and registered Pfand- is included there. 6 The term “pension funds“ refers to the institutional sector “pen-briefe. 3 As of 2016 Q3 insurance technical reserves “life“ pursuant to Solvency II tak- sion funds“ of the European System of Accounts. Pension funds thus comprise compa-ing account of transitional measures. Up to and including 2016 Q2: Long-term net ny pension schemes and occupational pension schemes for the self-employed. Socialequity of households in life insurance (including ageing provisions of health insurance security funds are not included. 7 Own funds correspond to the sum of net worthschemes and premium reserves of accident insurance schemes with guaranteed premi- and the liability item “Shares and other equity“.
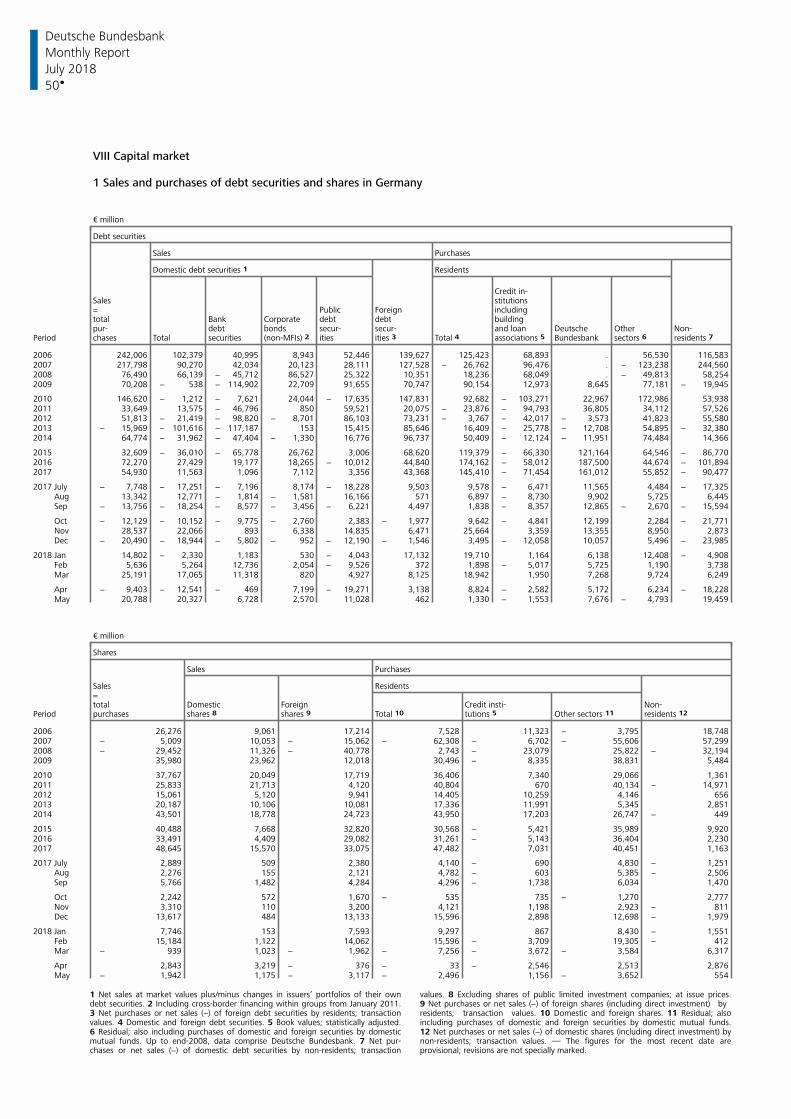
Deutsche Bundesbank
50
Monthly Report
July 2018
VIII Capital market
1 Sales and purchases of debt securities and shares in Germany
€ million
Debt securities
Sales Purchases
Domestic debt securities 1 Residents
Credit in-Sales stitutions= Public Foreign includingtotal Bank Corporate debt debt buildingpur- debt bonds secur- secur- and loan Deutsche Other Non-
Period chases Total securities ities ities 3 Total 4 Bundesbank sectors 6 residents 7 (non-MFIs) 2 associations 5
2006 242,006 102,379 40,995 8,943 52,446 139,627 125,423 68,893 . 56,530 116,5832007 217,798 90,270 42,034 20,123 28,111 127,528 − 26,762 96,476 . − 123,238 244,5602008 76,490 66,139 − 45,712 86,527 25,322 10,351 18,236 68,049 . − 49,813 58,2542009 70,208 − 538 − 114,902 22,709 91,655 70,747 90,154 12,973 8,645 77,181 − 19,945
2010 146,620 − 1,212 − 7,621 24,044 − 17,635 147,831 92,682 − 103,271 22,967 172,986 53,9382011 33,649 13,575 − 46,796 850 59,521 20,075 − 23,876 − 94,793 36,805 34,112 57,5262012 51,813 − 21,419 − 98,820 − 8,701 86,103 73,231 − 3,767 − 42,017 − 3,573 41,823 55,5802013 − 15,969 − 101,616 − 117,187 153 15,415 85,646 16,409 − 25,778 − 12,708 54,895 − 32,3802014 64,774 − 31,962 − 47,404 − 1,330 16,776 96,737 50,409 − 12,124 − 11,951 74,484 14,366
2015 32,609 − 36,010 − 65,778 26,762 3,006 68,620 119,379 − 66,330 121,164 64,546 − 86,7702016 72,270 27,429 19,177 18,265 − 10,012 44,840 174,162 − 58,012 187,500 44,674 − 101,8942017 54,930 11,563 1,096 7,112 3,356 43,368 145,410 − 71,454 161,012 55,852 − 90,477
2017 July − 7,748 − 17,251 − 7,196 8,174 − 18,228 9,503 9,578 − 6,471 11,565 4,484 − 17,325 Aug 13,342 12,771 − 1,814 − 1,581 16,166 571 6,897 − 8,730 9,902 5,725 6,445 Sep − 13,756 − 18,254 − 8,577 − 3,456 − 6,221 4,497 1,838 − 8,357 12,865 − 2,670 − 15,594
Oct − 12,129 − 10,152 − 9,775 − 2,760 2,383 − 1,977 9,642 − 4,841 12,199 2,284 − 21,771 Nov 28,537 22,066 893 6,338 14,835 6,471 25,664 3,359 13,355 8,950 2,873 Dec − 20,490 − 18,944 − 5,802 − 952 − 12,190 − 1,546 3,495 − 12,058 10,057 5,496 − 23,985
2018 Jan 14,802 − 2,330 1,183 530 − 4,043 17,132 19,710 1,164 6,138 12,408 − 4,908 Feb 5,636 5,264 12,736 2,054 − 9,526 372 1,898 − 5,017 5,725 1,190 3,738 Mar 25,191 17,065 11,318 820 4,927 8,125 18,942 1,950 7,268 9,724 6,249
Apr − 9,403 − 12,541 − 469 7,199 − 19,271 3,138 8,824 − 2,582 5,172 6,234 − 18,228 May 20,788 20,327 6,728 2,570 11,028 462 1,330 − 1,553 7,676 − 4,793 19,459
€ million
Shares
Sales Purchases
Sales Residents=total Domestic Foreign Credit insti- Non-
Period purchases shares 8 shares 9 Total 10 tutions 5 Other sectors 11 residents 12
2006 26,276 9,061 17,214 7,528 11,323 − 3,795 18,7482007 − 5,009 10,053 − 15,062 − 62,308 − 6,702 − 55,606 57,2992008 − 29,452 11,326 − 40,778 2,743 − 23,079 25,822 − 32,1942009 35,980 23,962 12,018 30,496 − 8,335 38,831 5,484
2010 37,767 20,049 17,719 36,406 7,340 29,066 1,3612011 25,833 21,713 4,120 40,804 670 40,134 − 14,9712012 15,061 5,120 9,941 14,405 10,259 4,146 6562013 20,187 10,106 10,081 17,336 11,991 5,345 2,8512014 43,501 18,778 24,723 43,950 17,203 26,747 − 449
2015 40,488 7,668 32,820 30,568 − 5,421 35,989 9,9202016 33,491 4,409 29,082 31,261 − 5,143 36,404 2,2302017 48,645 15,570 33,075 47,482 7,031 40,451 1,163
2017 July 2,889 509 2,380 4,140 − 690 4,830 − 1,251 Aug 2,276 155 2,121 4,782 − 603 5,385 − 2,506 Sep 5,766 1,482 4,284 4,296 − 1,738 6,034 1,470
Oct 2,242 572 1,670 − 535 735 − 1,270 2,777 Nov 3,310 110 3,200 4,121 1,198 2,923 − 811 Dec 13,617 484 13,133 15,596 2,898 12,698 − 1,979
2018 Jan 7,746 153 7,593 9,297 867 8,430 − 1,551 Feb 15,184 1,122 14,062 15,596 − 3,709 19,305 − 412 Mar − 939 1,023 − 1,962 − 7,256 − 3,672 − 3,584 6,317
Apr 2,843 3,219 − 376 − 33 − 2,546 2,513 2,876 May − 1,942 1,175 − 3,117 − 2,496 1,156 − 3,652 554
1 Net sales at market values plus/minus changes in issuers’ portfolios of their own values. 8 Excluding shares of public limited investment companies; at issue prices.debt securities. 2 Including cross-border financing within groups from January 2011. 9 Net purchases or net sales (−) of foreign shares (including direct investment) by 3 Net purchases or net sales (−) of foreign debt securities by residents; transaction residents; transaction values. 10 Domestic and foreign shares. 11 Residual; alsovalues. 4 Domestic and foreign debt securities. 5 Book values; statistically adjusted. including purchases of domestic and foreign securities by domestic mutual funds.6 Residual; also including purchases of domestic and foreign securities by domestic 12 Net purchases or net sales (−) of domestic shares (including direct investment) bymutual funds. Up to end-2008, data comprise Deutsche Bundesbank. 7 Net pur- non-residents; transaction values. — The figures for the most recent date arechases or net sales (−) of domestic debt securities by non-residents; transaction provisional; revisions are not specially marked.
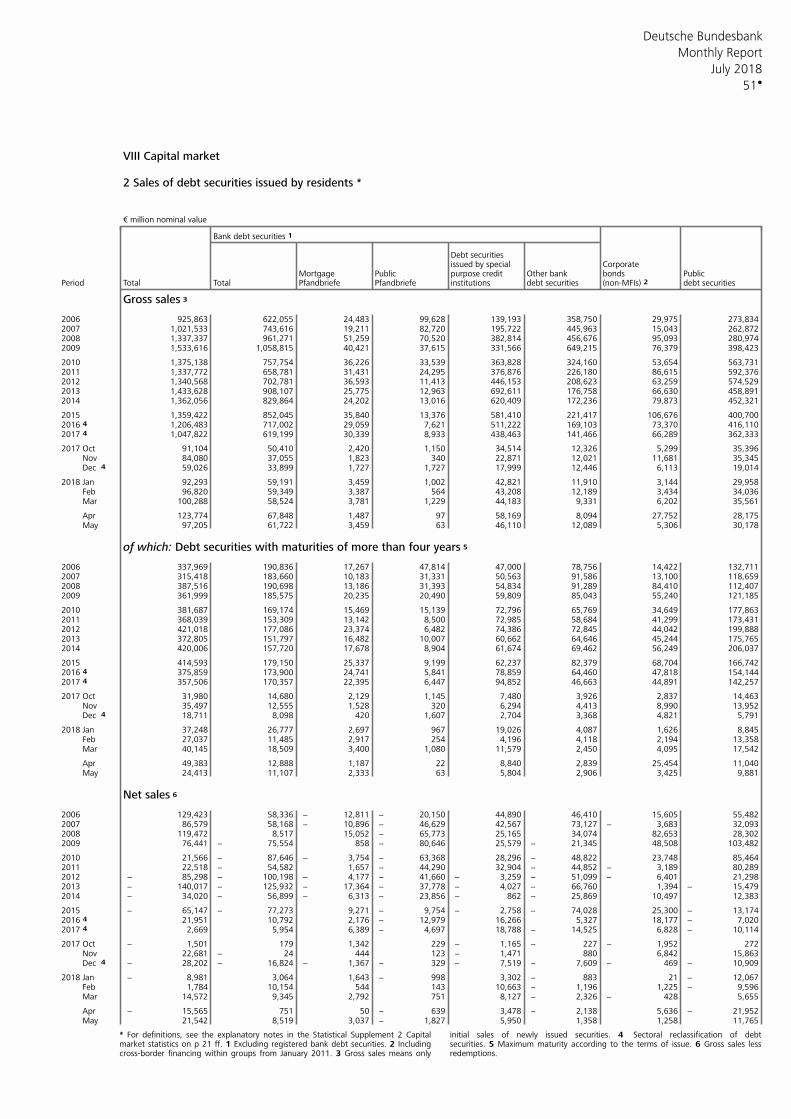
Deutsche Bundesbank
51
Monthly Report
July 2018
VIII Capital market
2 Sales of debt securities issued by residents *
€ million nominal value
Bank debt securities 1
Debt securitiesCorporateissued by special
Mortgage Public purpose credit Other bank bonds PublicPeriod Total Total Pfandbriefe Pfandbriefe institutions debt securities (non-MFIs) 2 debt securities
Gross sales 3
2006 925,863 622,055 24,483 99,628 139,193 358,750 29,975 273,8342007 1,021,533 743,616 19,211 82,720 195,722 445,963 15,043 262,8722008 1,337,337 961,271 51,259 70,520 382,814 456,676 95,093 280,9742009 1,533,616 1,058,815 40,421 37,615 331,566 649,215 76,379 398,423
2010 1,375,138 757,754 36,226 33,539 363,828 324,160 53,654 563,7312011 1,337,772 658,781 31,431 24,295 376,876 226,180 86,615 592,3762012 1,340,568 702,781 36,593 11,413 446,153 208,623 63,259 574,5292013 1,433,628 908,107 25,775 12,963 692,611 176,758 66,630 458,8912014 1,362,056 829,864 24,202 13,016 620,409 172,236 79,873 452,321
2015 1,359,422 852,045 35,840 13,376 581,410 221,417 106,676 400,7002016 4 1,206,483 717,002 29,059 7,621 511,222 169,103 73,370 416,1102017 4 1,047,822 619,199 30,339 8,933 438,463 141,466 66,289 362,333
2017 Oct 91,104 50,410 2,420 1,150 34,514 12,326 5,299 35,396 Nov 84,080 37,055 1,823 340 22,871 12,021 11,681 35,345 Dec 4 59,026 33,899 1,727 1,727 17,999 12,446 6,113 19,014
2018 Jan 92,293 59,191 3,459 1,002 42,821 11,910 3,144 29,958 Feb 96,820 59,349 3,387 564 43,208 12,189 3,434 34,036 Mar 100,288 58,524 3,781 1,229 44,183 9,331 6,202 35,561
Apr 123,774 67,848 1,487 97 58,169 8,094 27,752 28,175 May 97,205 61,722 3,459 63 46,110 12,089 5,306 30,178
of which: Debt securities with maturities of more than four years 5
2006 337,969 190,836 17,267 47,814 47,000 78,756 14,422 132,7112007 315,418 183,660 10,183 31,331 50,563 91,586 13,100 118,6592008 387,516 190,698 13,186 31,393 54,834 91,289 84,410 112,4072009 361,999 185,575 20,235 20,490 59,809 85,043 55,240 121,185
2010 381,687 169,174 15,469 15,139 72,796 65,769 34,649 177,8632011 368,039 153,309 13,142 8,500 72,985 58,684 41,299 173,4312012 421,018 177,086 23,374 6,482 74,386 72,845 44,042 199,8882013 372,805 151,797 16,482 10,007 60,662 64,646 45,244 175,7652014 420,006 157,720 17,678 8,904 61,674 69,462 56,249 206,037
2015 414,593 179,150 25,337 9,199 62,237 82,379 68,704 166,7422016 4 375,859 173,900 24,741 5,841 78,859 64,460 47,818 154,1442017 4 357,506 170,357 22,395 6,447 94,852 46,663 44,891 142,257
2017 Oct 31,980 14,680 2,129 1,145 7,480 3,926 2,837 14,463 Nov 35,497 12,555 1,528 320 6,294 4,413 8,990 13,952 Dec 4 18,711 8,098 420 1,607 2,704 3,368 4,821 5,791
2018 Jan 37,248 26,777 2,697 967 19,026 4,087 1,626 8,845 Feb 27,037 11,485 2,917 254 4,196 4,118 2,194 13,358 Mar 40,145 18,509 3,400 1,080 11,579 2,450 4,095 17,542
Apr 49,383 12,888 1,187 22 8,840 2,839 25,454 11,040 May 24,413 11,107 2,333 63 5,804 2,906 3,425 9,881
Net sales 6
2006 129,423 58,336 − 12,811 − 20,150 44,890 46,410 15,605 55,4822007 86,579 58,168 − 10,896 − 46,629 42,567 73,127 − 3,683 32,0932008 119,472 8,517 15,052 − 65,773 25,165 34,074 82,653 28,3022009 76,441 − 75,554 858 − 80,646 25,579 − 21,345 48,508 103,482
2010 21,566 − 87,646 − 3,754 − 63,368 28,296 − 48,822 23,748 85,4642011 22,518 − 54,582 1,657 − 44,290 32,904 − 44,852 − 3,189 80,2892012 − 85,298 − 100,198 − 4,177 − 41,660 − 3,259 − 51,099 − 6,401 21,2982013 − 140,017 − 125,932 − 17,364 − 37,778 − 4,027 − 66,760 1,394 − 15,4792014 − 34,020 − 56,899 − 6,313 − 23,856 − 862 − 25,869 10,497 12,383
2015 − 65,147 − 77,273 9,271 − 9,754 − 2,758 − 74,028 25,300 − 13,1742016 4 21,951 10,792 2,176 − 12,979 16,266 5,327 18,177 − 7,0202017 4 2,669 5,954 6,389 − 4,697 18,788 − 14,525 6,828 − 10,114
2017 Oct − 1,501 179 1,342 229 − 1,165 − 227 − 1,952 272 Nov 22,681 − 24 444 123 − 1,471 880 6,842 15,863 Dec 4 − 28,202 − 16,824 − 1,367 − 329 − 7,519 − 7,609 − 469 − 10,909
2018 Jan − 8,981 3,064 1,643 − 998 3,302 − 883 21 − 12,067 Feb 1,784 10,154 544 143 10,663 − 1,196 1,225 − 9,596 Mar 14,572 9,345 2,792 751 8,127 − 2,326 − 428 5,655
Apr − 15,565 751 50 − 639 3,478 − 2,138 5,636 − 21,952 May 21,542 8,519 3,037 − 1,827 5,950 1,358 1,258 11,765
* For definitions, see the explanatory notes in the Statistical Supplement 2 Capital initial sales of newly issued securities. 4 Sectoral reclassification of debtmarket statistics on p 21 ff. 1 Excluding registered bank debt securities. 2 Including securities. 5 Maximum maturity according to the terms of issue. 6 Gross sales lesscross-border financing within groups from January 2011. 3 Gross sales means only redemptions.
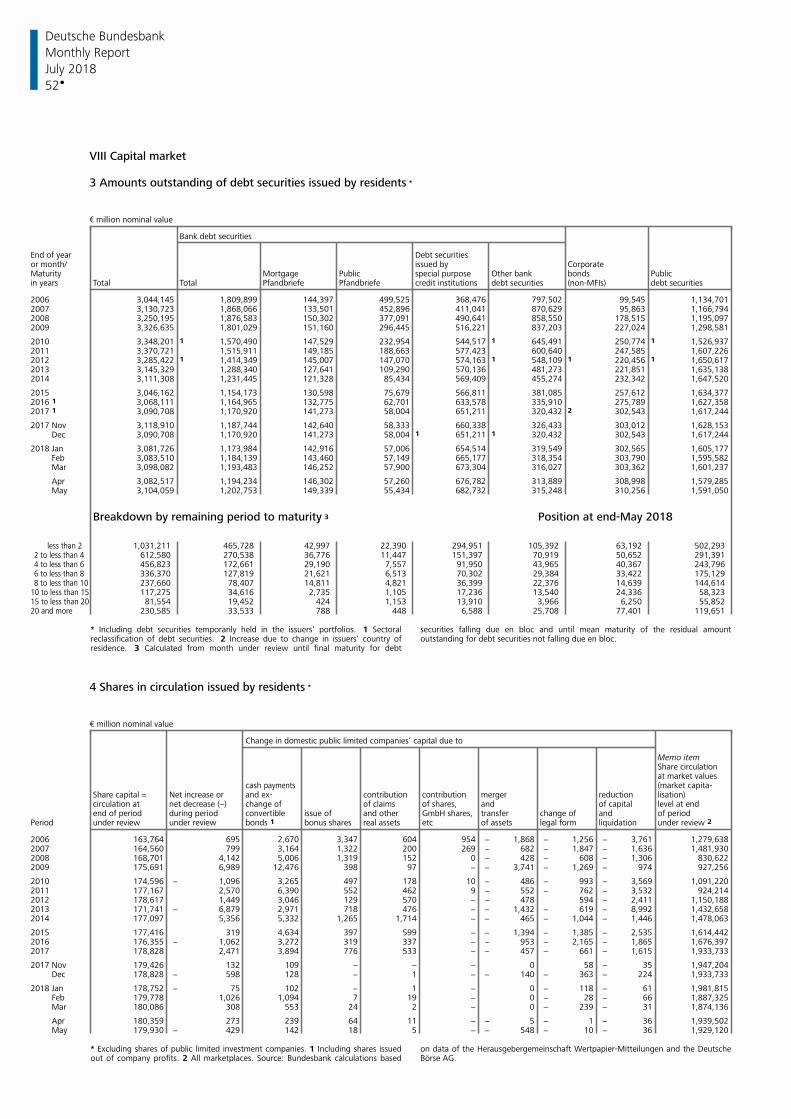
Deutsche Bundesbank
52
Monthly Report
July 2018
VIII Capital market 3 Amounts outstanding of debt securities issued by residents *
€ million nominal value
Bank debt securities End of year Debt securitiesor month/ issued by CorporateMaturity Mortgage Public special purpose Other bank bonds Publicin years Total Total Pfandbriefe Pfandbriefe credit institutions debt securities (non-MFIs) debt securities
2006 3,044,145 1,809,899 144,397 499,525 368,476 797,502 99,545 1,134,7012007 3,130,723 1,868,066 133,501 452,896 411,041 870,629 95,863 1,166,7942008 3,250,195 1,876,583 150,302 377,091 490,641 858,550 178,515 1,195,0972009 3,326,635 1,801,029 151,160 296,445 516,221 837,203 227,024 1,298,581
2010 3,348,201 1 1,570,490 147,529 232,954 544,517 1 645,491 250,774 1 1,526,9372011 3,370,721 1,515,911 149,185 188,663 577,423 600,640 247,585 1,607,2262012 3,285,422 1 1,414,349 145,007 147,070 574,163 1 548,109 1 220,456 1 1,650,6172013 3,145,329 1,288,340 127,641 109,290 570,136 481,273 221,851 1,635,1382014 3,111,308 1,231,445 121,328 85,434 569,409 455,274 232,342 1,647,520
2015 3,046,162 1,154,173 130,598 75,679 566,811 381,085 257,612 1,634,3772016 1 3,068,111 1,164,965 132,775 62,701 633,578 335,910 275,789 1,627,3582017 1 3,090,708 1,170,920 141,273 58,004 651,211 320,432 2 302,543 1,617,244
2017 Nov 3,118,910 1,187,744 142,640 58,333 660,338 326,433 303,012 1,628,153 Dec 3,090,708 1,170,920 141,273 58,004 1 651,211 1 320,432 302,543 1,617,244
2018 Jan 3,081,726 1,173,984 142,916 57,006 654,514 319,549 302,565 1,605,177 Feb 3,083,510 1,184,139 143,460 57,149 665,177 318,354 303,790 1,595,582 Mar 3,098,082 1,193,483 146,252 57,900 673,304 316,027 303,362 1,601,237
Apr 3,082,517 1,194,234 146,302 57,260 676,782 313,889 308,998 1,579,285 May 3,104,059 1,202,753 149,339 55,434 682,732 315,248 310,256 1,591,050
Breakdown by remaining period to maturity 3 Position at end-May 2018
1,031,211 465,728 42,997 22,390 294,951 105,392 63,192 502,293 less than 2612,580 270,538 36,776 11,447 151,397 70,919 50,652 291,3912 to less than 4456,823 172,661 29,190 7,557 91,950 43,965 40,367 243,7964 to less than 6336,370 127,819 21,621 6,513 70,302 29,384 33,422 175,1296 to less than 8237,660 78,407 14,811 4,821 36,399 22,376 14,639 144,6148 to less than 10117,275 34,616 2,735 1,105 17,236 13,540 24,336 58,32310 to less than 1581,554 19,452 424 1,153 13,910 3,966 6,250 55,85215 to less than 20
230,585 33,533 788 448 6,588 25,708 77,401 119,65120 and more
* Including debt securities temporarily held in the issuers’ portfolios. 1 Sectoral securities falling due en bloc and until mean maturity of the residual amountreclassification of debt securities. 2 Increase due to change in issuers’ country of outstanding for debt securities not falling due en bloc. residence. 3 Calculated from month under review until final maturity for debt
4 Shares in circulation issued by residents *
€ million nominal value
Change in domestic public limited companies’ capital due to
Memo itemShare circulationat market values(market capita-cash payments
Share capital = Net increase or and ex- contribution contribution merger reduction lisation)circulation at net decrease (−) change of of claims of shares, and of capital level at endend of period during period convertible issue of and other GmbH shares, transfer change of and of period
Period under review under review bonds 1 bonus shares real assets etc of assets legal form liquidation under review 2
2006 163,764 695 2,670 3,347 604 954 − 1,868 − 1,256 − 3,761 1,279,6382007 164,560 799 3,164 1,322 200 269 − 682 − 1,847 − 1,636 1,481,9302008 168,701 4,142 5,006 1,319 152 0 − 428 − 608 − 1,306 830,6222009 175,691 6,989 12,476 398 97 − − 3,741 − 1,269 − 974 927,256
2010 174,596 − 1,096 3,265 497 178 10 − 486 − 993 − 3,569 1,091,2202011 177,167 2,570 6,390 552 462 9 − 552 − 762 − 3,532 924,2142012 178,617 1,449 3,046 129 570 − − 478 594 − 2,411 1,150,1882013 171,741 − 6,879 2,971 718 476 − − 1,432 − 619 − 8,992 1,432,6582014 177,097 5,356 5,332 1,265 1,714 − − 465 − 1,044 − 1,446 1,478,063
2015 177,416 319 4,634 397 599 − − 1,394 − 1,385 − 2,535 1,614,4422016 176,355 − 1,062 3,272 319 337 − − 953 − 2,165 − 1,865 1,676,3972017 178,828 2,471 3,894 776 533 − − 457 − 661 − 1,615 1,933,733
2017 Nov 179,426 132 109 − − − 0 58 − 35 1,947,204 Dec 178,828 − 598 128 − 1 − − 140 − 363 − 224 1,933,733
2018 Jan 178,752 − 75 102 − 1 − 0 − 118 − 61 1,981,815 Feb 179,778 1,026 1,094 7 19 − 0 − 28 − 66 1,887,325 Mar 180,086 308 553 24 2 − 0 − 239 − 31 1,874,136
Apr 180,359 273 239 64 11 − − 5 − 1 − 36 1,939,502 May 179,930 − 429 142 18 5 − − 548 − 10 − 36 1,929,120
* Excluding shares of public limited investment companies. 1 Including shares issued on data of the Herausgebergemeinschaft Wertpapier-Mitteilungen and the Deutscheout of company profits. 2 All marketplaces. Source: Bundesbank calculations based Börse AG.
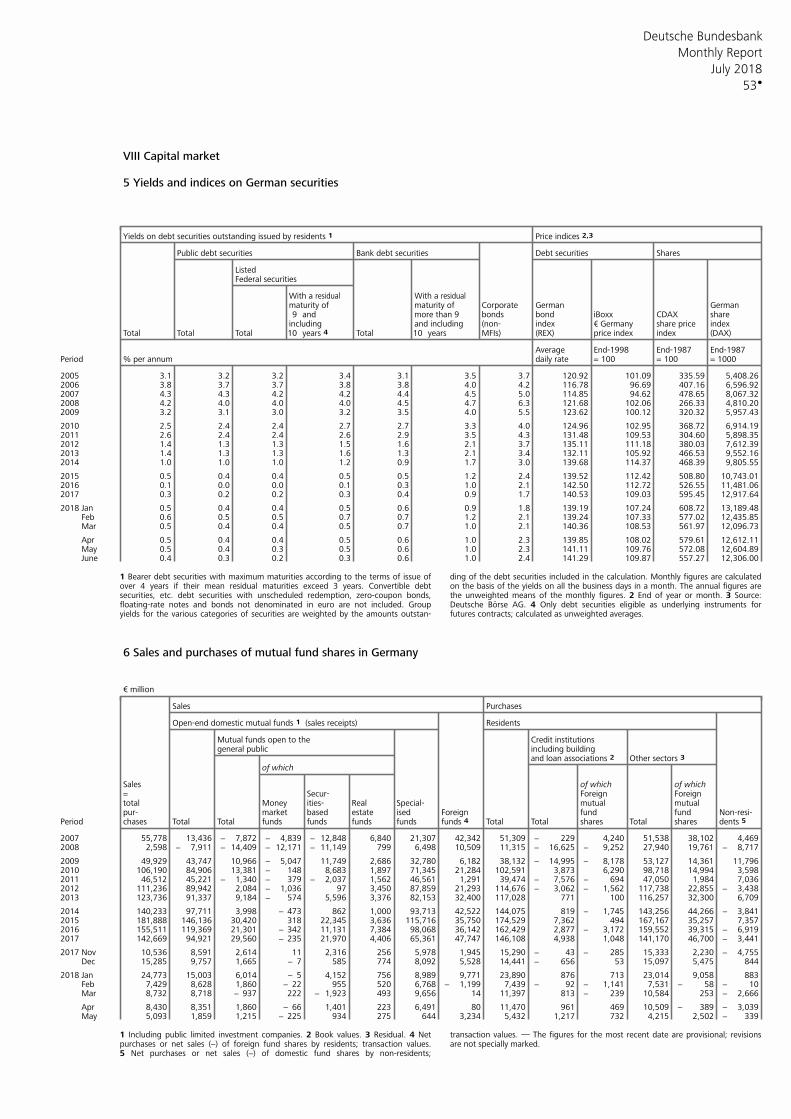
Deutsche Bundesbank
53
Monthly Report
July 2018
VIII Capital market
5 Yields and indices on German securities
Yields on debt securities outstanding issued by residents 1 Price indices 2,3
Public debt securities Bank debt securities Debt securities Shares
ListedFederal securities
With a residualWith a residualmaturity of maturity of Corporate German German9 and more than 9 bonds bond iBoxx CDAX share
including and including (non- index share price index€ GermanyTotal Total Total 10 years 4 Total 10 years MFIs) (REX) price index index (DAX)
Average End-1998 End-1987 End-1987Period % per annum daily rate = 100 = 100 = 1000
2005 3.1 3.2 3.2 3.4 3.1 3.5 3.7 120.92 101.09 335.59 5,408.262006 3.8 3.7 3.7 3.8 3.8 4.0 4.2 116.78 96.69 407.16 6,596.922007 4.3 4.3 4.2 4.2 4.4 4.5 5.0 114.85 94.62 478.65 8,067.322008 4.2 4.0 4.0 4.0 4.5 4.7 6.3 121.68 102.06 266.33 4,810.202009 3.2 3.1 3.0 3.2 3.5 4.0 5.5 123.62 100.12 320.32 5,957.43
2010 2.5 2.4 2.4 2.7 2.7 3.3 4.0 124.96 102.95 368.72 6,914.192011 2.6 2.4 2.4 2.6 2.9 3.5 4.3 131.48 109.53 304.60 5,898.352012 1.4 1.3 1.3 1.5 1.6 2.1 3.7 135.11 111.18 380.03 7,612.392013 1.4 1.3 1.3 1.6 1.3 2.1 3.4 132.11 105.92 466.53 9,552.162014 1.0 1.0 1.0 1.2 0.9 1.7 3.0 139.68 114.37 468.39 9,805.55
2015 0.5 0.4 0.4 0.5 0.5 1.2 2.4 139.52 112.42 508.80 10,743.012016 0.1 0.0 0.0 0.1 0.3 1.0 2.1 142.50 112.72 526.55 11,481.062017 0.3 0.2 0.2 0.3 0.4 0.9 1.7 140.53 109.03 595.45 12,917.64
2018 Jan 0.5 0.4 0.4 0.5 0.6 0.9 1.8 139.19 107.24 608.72 13,189.48 Feb 0.6 0.5 0.5 0.7 0.7 1.2 2.1 139.24 107.33 577.02 12,435.85 Mar 0.5 0.4 0.4 0.5 0.7 1.0 2.1 140.36 108.53 561.97 12,096.73
Apr 0.5 0.4 0.4 0.5 0.6 1.0 2.3 139.85 108.02 579.61 12,612.11 May 0.5 0.4 0.3 0.5 0.6 1.0 2.3 141.11 109.76 572.08 12,604.89 June 0.4 0.3 0.2 0.3 0.6 1.0 2.4 141.29 109.87 557.27 12,306.00
1 Bearer debt securities with maximum maturities according to the terms of issue of ding of the debt securities included in the calculation. Monthly figures are calculatedover 4 years if their mean residual maturities exceed 3 years. Convertible debt on the basis of the yields on all the business days in a month. The annual figures aresecurities, etc. debt securities with unscheduled redemption, zero-coupon bonds, the unweighted means of the monthly figures. 2 End of year or month. 3 Source:floating-rate notes and bonds not denominated in euro are not included. Group Deutsche Börse AG. 4 Only debt securities eligible as underlying instruments foryields for the various categories of securities are weighted by the amounts outstan- futures contracts; calculated as unweighted averages.
6 Sales and purchases of mutual fund shares in Germany
€ million
Sales Purchases
Open-end domestic mutual funds 1 (sales receipts) Residents
Mutual funds open to the Credit institutionsgeneral public including building
Other sectors 3 and loan associations 2 of which
Sales of which of which= Secur- Foreign Foreigntotal Money ities- Real Special- mutual mutualpur- market based estate ised Foreign fund fund Non-resi-
Period chases Total Total funds funds funds funds funds 4 Total Total shares Total shares dents 5
2007 55,778 13,436 − 7,872 − 4,839 − 12,848 6,840 21,307 42,342 51,309 − 229 4,240 51,538 38,102 4,4692008 2,598 − 7,911 − 14,409 − 12,171 − 11,149 799 6,498 10,509 11,315 − 16,625 − 9,252 27,940 19,761 − 8,717
2009 49,929 43,747 10,966 − 5,047 11,749 2,686 32,780 6,182 38,132 − 14,995 − 8,178 53,127 14,361 11,7962010 106,190 84,906 13,381 − 148 8,683 1,897 71,345 21,284 102,591 3,873 6,290 98,718 14,994 3,5982011 46,512 45,221 − 1,340 − 379 − 2,037 1,562 46,561 1,291 39,474 − 7,576 − 694 47,050 1,984 7,0362012 111,236 89,942 2,084 − 1,036 97 3,450 87,859 21,293 114,676 − 3,062 − 1,562 117,738 22,855 − 3,4382013 123,736 91,337 9,184 − 574 5,596 3,376 82,153 32,400 117,028 771 100 116,257 32,300 6,709
2014 140,233 97,711 3,998 − 473 862 1,000 93,713 42,522 144,075 819 − 1,745 143,256 44,266 − 3,8412015 181,888 146,136 30,420 318 22,345 3,636 115,716 35,750 174,529 7,362 494 167,167 35,257 7,3572016 155,511 119,369 21,301 − 342 11,131 7,384 98,068 36,142 162,429 2,877 − 3,172 159,552 39,315 − 6,9192017 142,669 94,921 29,560 − 235 21,970 4,406 65,361 47,747 146,108 4,938 1,048 141,170 46,700 − 3,441
2017 Nov 10,536 8,591 2,614 11 2,316 256 5,978 1,945 15,290 − 43 − 285 15,333 2,230 − 4,755 Dec 15,285 9,757 1,665 − 7 585 774 8,092 5,528 14,441 − 656 53 15,097 5,475 844
2018 Jan 24,773 15,003 6,014 − 5 4,152 756 8,989 9,771 23,890 876 713 23,014 9,058 883 Feb 7,429 8,628 1,860 − 22 955 520 6,768 − 1,199 7,439 − 92 − 1,141 7,531 − 58 − 10 Mar 8,732 8,718 − 937 222 − 1,923 493 9,656 14 11,397 813 − 239 10,584 253 − 2,666
Apr 8,430 8,351 1,860 − 66 1,401 223 6,491 80 11,470 961 469 10,509 − 389 − 3,039 May 5,093 1,859 1,215 − 225 934 275 644 3,234 5,432 1,217 732 4,215 2,502 − 339
1 Including public limited investment companies. 2 Book values. 3 Residual. 4 Net transaction values. — The figures for the most recent date are provisional; revisionspurchases or net sales (−) of foreign fund shares by residents; transaction values. are not specially marked. 5 Net purchases or net sales (−) of domestic fund shares by non-residents;
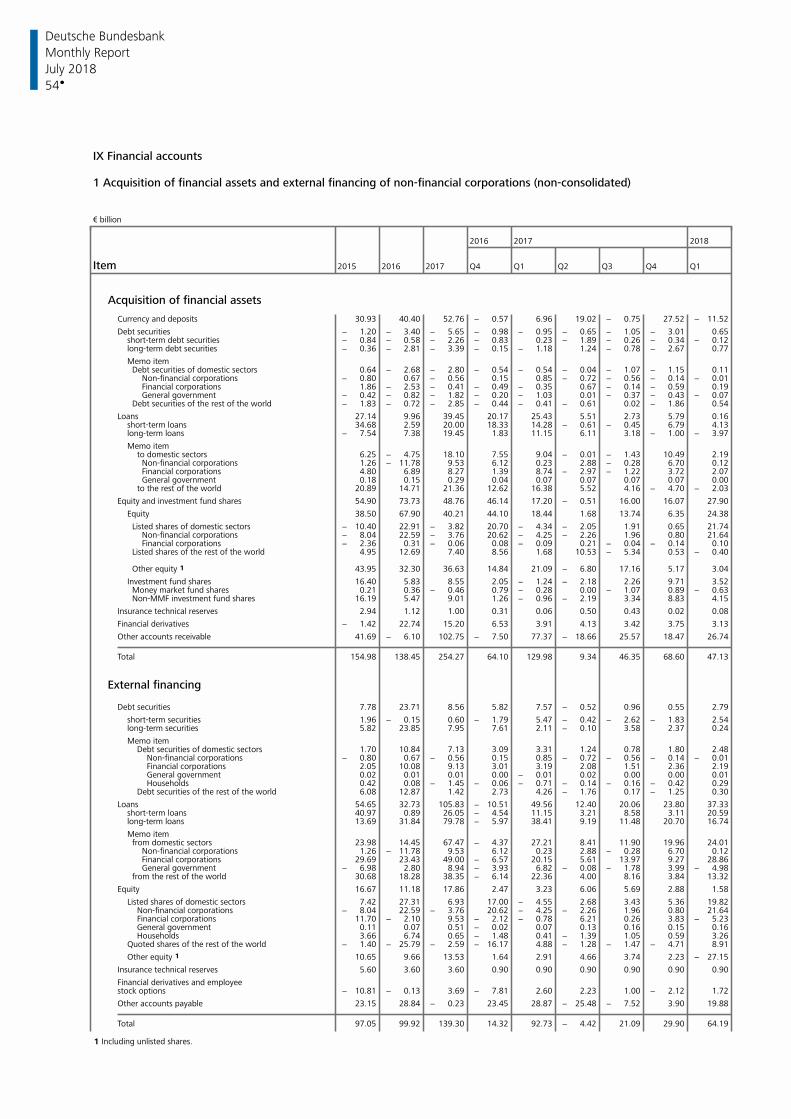
Deutsche Bundesbank
54
Monthly Report
July 2018
IX Financial accounts
1 Acquisition of financial assets and external financing of non-financial corporations (non-consolidated) € billion
2016 2017 2018
Item 2015 2016 2017 Q4 Q1 Q2 Q3 Q4 Q1
Acquisition of financial assets
Currency and deposits 30.93 40.40 52.76 − 0.57 6.96 19.02 − 0.75 27.52 − 11.52
Debt securities − 1.20 − 3.40 − 5.65 − 0.98 − 0.95 − 0.65 − 1.05 − 3.01 0.65short-term debt securities − 0.84 − 0.58 − 2.26 − 0.83 0.23 − 1.89 − 0.26 − 0.34 − 0.12long-term debt securities − 0.36 − 2.81 − 3.39 − 0.15 − 1.18 1.24 − 0.78 − 2.67 0.77
Memo itemDebt securities of domestic sectors 0.64 − 2.68 − 2.80 − 0.54 − 0.54 − 0.04 − 1.07 − 1.15 0.11
Non-financial corporations − 0.80 0.67 − 0.56 0.15 0.85 − 0.72 − 0.56 − 0.14 − 0.01Financial corporations 1.86 − 2.53 − 0.41 − 0.49 − 0.35 0.67 − 0.14 − 0.59 0.19General government − 0.42 − 0.82 − 1.82 − 0.20 − 1.03 0.01 − 0.37 − 0.43 − 0.07
Debt securities of the rest of the world − 1.83 − 0.72 − 2.85 − 0.44 − 0.41 − 0.61 0.02 − 1.86 0.54
Loans 27.14 9.96 39.45 20.17 25.43 5.51 2.73 5.79 0.16short-term loans 34.68 2.59 20.00 18.33 14.28 − 0.61 − 0.45 6.79 4.13long-term loans − 7.54 7.38 19.45 1.83 11.15 6.11 3.18 − 1.00 − 3.97
Memo itemto domestic sectors 6.25 − 4.75 18.10 7.55 9.04 − 0.01 − 1.43 10.49 2.19
Non-financial corporations 1.26 − 11.78 9.53 6.12 0.23 2.88 − 0.28 6.70 0.12Financial corporations 4.80 6.89 8.27 1.39 8.74 − 2.97 − 1.22 3.72 2.07General government 0.18 0.15 0.29 0.04 0.07 0.07 0.07 0.07 0.00
to the rest of the world 20.89 14.71 21.36 12.62 16.38 5.52 4.16 − 4.70 − 2.03
Equity and investment fund shares 54.90 73.73 48.76 46.14 17.20 − 0.51 16.00 16.07 27.90
Equity 38.50 67.90 40.21 44.10 18.44 1.68 13.74 6.35 24.38
Listed shares of domestic sectors − 10.40 22.91 − 3.82 20.70 − 4.34 − 2.05 1.91 0.65 21.74Non-financial corporations − 8.04 22.59 − 3.76 20.62 − 4.25 − 2.26 1.96 0.80 21.64Financial corporations − 2.36 0.31 − 0.06 0.08 − 0.09 0.21 − 0.04 − 0.14 0.10
Listed shares of the rest of the world 4.95 12.69 7.40 8.56 1.68 10.53 − 5.34 0.53 − 0.40
Other equity 1 43.95 32.30 36.63 14.84 21.09 − 6.80 17.16 5.17 3.04
Investment fund shares 16.40 5.83 8.55 2.05 − 1.24 − 2.18 2.26 9.71 3.52Money market fund shares 0.21 0.36 − 0.46 0.79 − 0.28 0.00 − 1.07 0.89 − 0.63Non-MMF investment fund shares 16.19 5.47 9.01 1.26 − 0.96 − 2.19 3.34 8.83 4.15
Insurance technical reserves 2.94 1.12 1.00 0.31 0.06 0.50 0.43 0.02 0.08
Financial derivatives − 1.42 22.74 15.20 6.53 3.91 4.13 3.42 3.75 3.13
Other accounts receivable 41.69 − 6.10 102.75 − 7.50 77.37 − 18.66 25.57 18.47 26.74
Total 154.98 138.45 254.27 64.10 129.98 9.34 46.35 68.60 47.13
External financing
Debt securities 7.78 23.71 8.56 5.82 7.57 − 0.52 0.96 0.55 2.79
short-term securities 1.96 − 0.15 0.60 − 1.79 5.47 − 0.42 − 2.62 − 1.83 2.54long-term securities 5.82 23.85 7.95 7.61 2.11 − 0.10 3.58 2.37 0.24
Memo itemDebt securities of domestic sectors 1.70 10.84 7.13 3.09 3.31 1.24 0.78 1.80 2.48
Non-financial corporations − 0.80 0.67 − 0.56 0.15 0.85 − 0.72 − 0.56 − 0.14 − 0.01Financial corporations 2.05 10.08 9.13 3.01 3.19 2.08 1.51 2.36 2.19General government 0.02 0.01 0.01 0.00 − 0.01 0.02 0.00 0.00 0.01Households 0.42 0.08 − 1.45 − 0.06 − 0.71 − 0.14 − 0.16 − 0.42 0.29
Debt securities of the rest of the world 6.08 12.87 1.42 2.73 4.26 − 1.76 0.17 − 1.25 0.30
Loans 54.65 32.73 105.83 − 10.51 49.56 12.40 20.06 23.80 37.33short-term loans 40.97 0.89 26.05 − 4.54 11.15 3.21 8.58 3.11 20.59long-term loans 13.69 31.84 79.78 − 5.97 38.41 9.19 11.48 20.70 16.74
Memo itemfrom domestic sectors 23.98 14.45 67.47 − 4.37 27.21 8.41 11.90 19.96 24.01
Non-financial corporations 1.26 − 11.78 9.53 6.12 0.23 2.88 − 0.28 6.70 0.12Financial corporations 29.69 23.43 49.00 − 6.57 20.15 5.61 13.97 9.27 28.86General government − 6.98 2.80 8.94 − 3.93 6.82 − 0.08 − 1.78 3.99 − 4.98
from the rest of the world 30.68 18.28 38.35 − 6.14 22.36 4.00 8.16 3.84 13.32
Equity 16.67 11.18 17.86 2.47 3.23 6.06 5.69 2.88 1.58
Listed shares of domestic sectors 7.42 27.31 6.93 17.00 − 4.55 2.68 3.43 5.36 19.82Non-financial corporations − 8.04 22.59 − 3.76 20.62 − 4.25 − 2.26 1.96 0.80 21.64Financial corporations 11.70 − 2.10 9.53 − 2.12 − 0.78 6.21 0.26 3.83 − 5.23General government 0.11 0.07 0.51 − 0.02 0.07 0.13 0.16 0.15 0.16Households 3.66 6.74 0.65 − 1.48 0.41 − 1.39 1.05 0.59 3.26
Quoted shares of the rest of the world − 1.40 − 25.79 − 2.59 − 16.17 4.88 − 1.28 − 1.47 − 4.71 8.91
Other equity 1 10.65 9.66 13.53 1.64 2.91 4.66 3.74 2.23 − 27.15
Insurance technical reserves 5.60 3.60 3.60 0.90 0.90 0.90 0.90 0.90 0.90
Financial derivatives and employeestock options − 10.81 − 0.13 3.69 − 7.81 2.60 2.23 1.00 − 2.12 1.72
Other accounts payable 23.15 28.84 − 0.23 23.45 28.87 − 25.48 − 7.52 3.90 19.88
Total 97.05 99.92 139.30 14.32 92.73 − 4.42 21.09 29.90 64.19
1 Including unlisted shares.
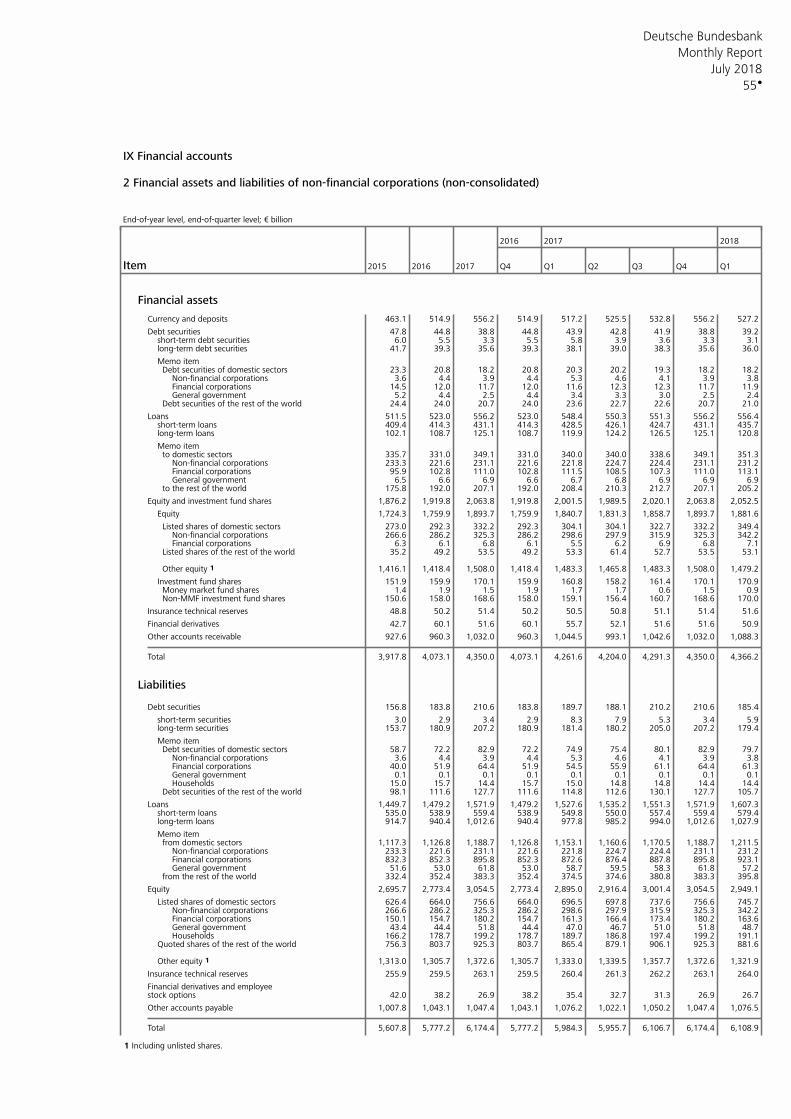
Deutsche Bundesbank
55
Monthly Report
July 2018
IX Financial accounts
2 Financial assets and liabilities of non-financial corporations (non-consolidated) End-of-year level, end-of-quarter level; € billion
2016 2017 2018
Item 2015 2016 2017 Q4 Q1 Q2 Q3 Q4 Q1
Financial assets
Currency and deposits 463.1 514.9 556.2 514.9 517.2 525.5 532.8 556.2 527.2
Debt securities 47.8 44.8 38.8 44.8 43.9 42.8 41.9 38.8 39.2short-term debt securities 6.0 5.5 3.3 5.5 5.8 3.9 3.6 3.3 3.1long-term debt securities 41.7 39.3 35.6 39.3 38.1 39.0 38.3 35.6 36.0
Memo itemDebt securities of domestic sectors 23.3 20.8 18.2 20.8 20.3 20.2 19.3 18.2 18.2
Non-financial corporations 3.6 4.4 3.9 4.4 5.3 4.6 4.1 3.9 3.8Financial corporations 14.5 12.0 11.7 12.0 11.6 12.3 12.3 11.7 11.9General government 5.2 4.4 2.5 4.4 3.4 3.3 3.0 2.5 2.4
Debt securities of the rest of the world 24.4 24.0 20.7 24.0 23.6 22.7 22.6 20.7 21.0
Loans 511.5 523.0 556.2 523.0 548.4 550.3 551.3 556.2 556.4short-term loans 409.4 414.3 431.1 414.3 428.5 426.1 424.7 431.1 435.7long-term loans 102.1 108.7 125.1 108.7 119.9 124.2 126.5 125.1 120.8
Memo itemto domestic sectors 335.7 331.0 349.1 331.0 340.0 340.0 338.6 349.1 351.3
Non-financial corporations 233.3 221.6 231.1 221.6 221.8 224.7 224.4 231.1 231.2Financial corporations 95.9 102.8 111.0 102.8 111.5 108.5 107.3 111.0 113.1General government 6.5 6.6 6.9 6.6 6.7 6.8 6.9 6.9 6.9
to the rest of the world 175.8 192.0 207.1 192.0 208.4 210.3 212.7 207.1 205.2
Equity and investment fund shares 1,876.2 1,919.8 2,063.8 1,919.8 2,001.5 1,989.5 2,020.1 2,063.8 2,052.5
Equity 1,724.3 1,759.9 1,893.7 1,759.9 1,840.7 1,831.3 1,858.7 1,893.7 1,881.6
Listed shares of domestic sectors 273.0 292.3 332.2 292.3 304.1 304.1 322.7 332.2 349.4Non-financial corporations 266.6 286.2 325.3 286.2 298.6 297.9 315.9 325.3 342.2Financial corporations 6.3 6.1 6.8 6.1 5.5 6.2 6.9 6.8 7.1
Listed shares of the rest of the world 35.2 49.2 53.5 49.2 53.3 61.4 52.7 53.5 53.1
Other equity 1 1,416.1 1,418.4 1,508.0 1,418.4 1,483.3 1,465.8 1,483.3 1,508.0 1,479.2
Investment fund shares 151.9 159.9 170.1 159.9 160.8 158.2 161.4 170.1 170.9Money market fund shares 1.4 1.9 1.5 1.9 1.7 1.7 0.6 1.5 0.9Non-MMF investment fund shares 150.6 158.0 168.6 158.0 159.1 156.4 160.7 168.6 170.0
Insurance technical reserves 48.8 50.2 51.4 50.2 50.5 50.8 51.1 51.4 51.6
Financial derivatives 42.7 60.1 51.6 60.1 55.7 52.1 51.6 51.6 50.9
Other accounts receivable 927.6 960.3 1,032.0 960.3 1,044.5 993.1 1,042.6 1,032.0 1,088.3
Total 3,917.8 4,073.1 4,350.0 4,073.1 4,261.6 4,204.0 4,291.3 4,350.0 4,366.2
Liabilities
Debt securities 156.8 183.8 210.6 183.8 189.7 188.1 210.2 210.6 185.4
short-term securities 3.0 2.9 3.4 2.9 8.3 7.9 5.3 3.4 5.9long-term securities 153.7 180.9 207.2 180.9 181.4 180.2 205.0 207.2 179.4
Memo itemDebt securities of domestic sectors 58.7 72.2 82.9 72.2 74.9 75.4 80.1 82.9 79.7
Non-financial corporations 3.6 4.4 3.9 4.4 5.3 4.6 4.1 3.9 3.8Financial corporations 40.0 51.9 64.4 51.9 54.5 55.9 61.1 64.4 61.3General government 0.1 0.1 0.1 0.1 0.1 0.1 0.1 0.1 0.1Households 15.0 15.7 14.4 15.7 15.0 14.8 14.8 14.4 14.4
Debt securities of the rest of the world 98.1 111.6 127.7 111.6 114.8 112.6 130.1 127.7 105.7
Loans 1,449.7 1,479.2 1,571.9 1,479.2 1,527.6 1,535.2 1,551.3 1,571.9 1,607.3short-term loans 535.0 538.9 559.4 538.9 549.8 550.0 557.4 559.4 579.4long-term loans 914.7 940.4 1,012.6 940.4 977.8 985.2 994.0 1,012.6 1,027.9
Memo itemfrom domestic sectors 1,117.3 1,126.8 1,188.7 1,126.8 1,153.1 1,160.6 1,170.5 1,188.7 1,211.5
Non-financial corporations 233.3 221.6 231.1 221.6 221.8 224.7 224.4 231.1 231.2Financial corporations 832.3 852.3 895.8 852.3 872.6 876.4 887.8 895.8 923.1General government 51.6 53.0 61.8 53.0 58.7 59.5 58.3 61.8 57.2
from the rest of the world 332.4 352.4 383.3 352.4 374.5 374.6 380.8 383.3 395.8
Equity 2,695.7 2,773.4 3,054.5 2,773.4 2,895.0 2,916.4 3,001.4 3,054.5 2,949.1
Listed shares of domestic sectors 626.4 664.0 756.6 664.0 696.5 697.8 737.6 756.6 745.7Non-financial corporations 266.6 286.2 325.3 286.2 298.6 297.9 315.9 325.3 342.2Financial corporations 150.1 154.7 180.2 154.7 161.3 166.4 173.4 180.2 163.6General government 43.4 44.4 51.8 44.4 47.0 46.7 51.0 51.8 48.7Households 166.2 178.7 199.2 178.7 189.7 186.8 197.4 199.2 191.1
Quoted shares of the rest of the world 756.3 803.7 925.3 803.7 865.4 879.1 906.1 925.3 881.6
Other equity 1 1,313.0 1,305.7 1,372.6 1,305.7 1,333.0 1,339.5 1,357.7 1,372.6 1,321.9
Insurance technical reserves 255.9 259.5 263.1 259.5 260.4 261.3 262.2 263.1 264.0
Financial derivatives and employeestock options 42.0 38.2 26.9 38.2 35.4 32.7 31.3 26.9 26.7
Other accounts payable 1,007.8 1,043.1 1,047.4 1,043.1 1,076.2 1,022.1 1,050.2 1,047.4 1,076.5
Total 5,607.8 5,777.2 6,174.4 5,777.2 5,984.3 5,955.7 6,106.7 6,174.4 6,108.9
1 Including unlisted shares.
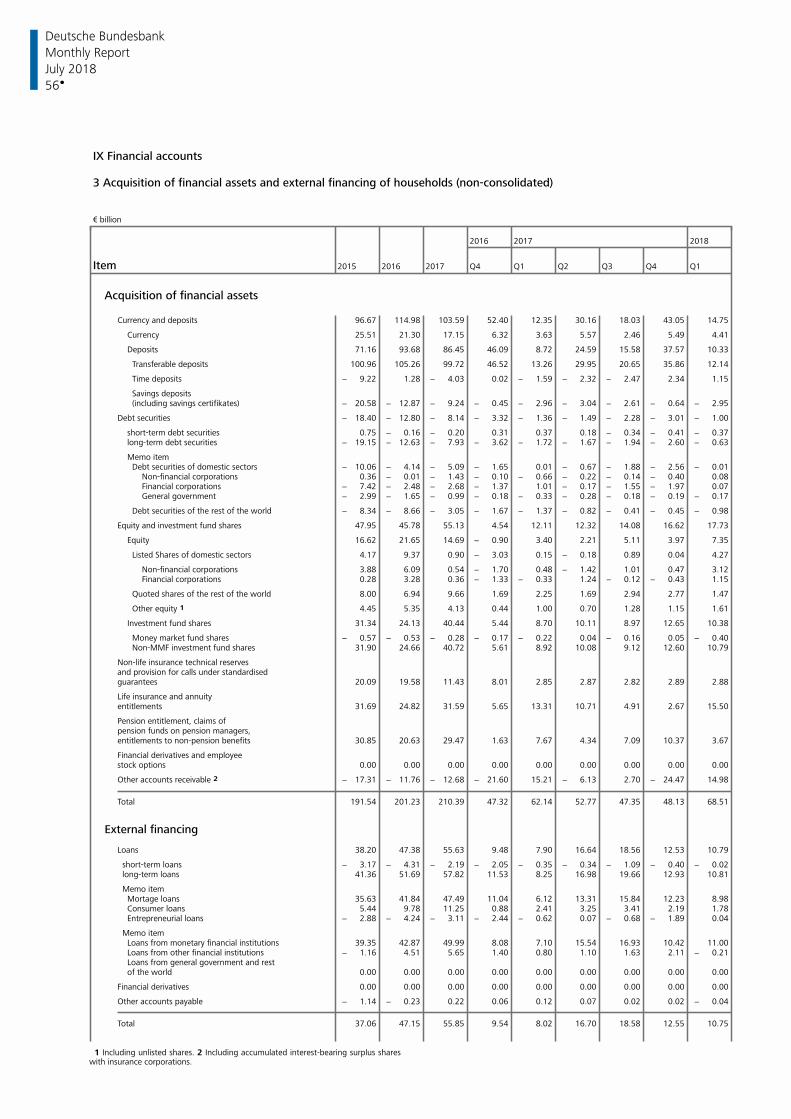
Deutsche Bundesbank
56
Monthly Report
July 2018
IX Financial accounts
3 Acquisition of financial assets and external financing of households (non-consolidated) € billion
2016 2017 2018
Item 2015 2016 2017 Q4 Q1 Q2 Q3 Q4 Q1
Acquisition of financial assets
Currency and deposits 96.67 114.98 103.59 52.40 12.35 30.16 18.03 43.05 14.75
Currency 25.51 21.30 17.15 6.32 3.63 5.57 2.46 5.49 4.41
Deposits 71.16 93.68 86.45 46.09 8.72 24.59 15.58 37.57 10.33
Transferable deposits 100.96 105.26 99.72 46.52 13.26 29.95 20.65 35.86 12.14
Time deposits − 9.22 1.28 − 4.03 0.02 − 1.59 − 2.32 − 2.47 2.34 1.15
Savings deposits(including savings certifikates) − 20.58 − 12.87 − 9.24 − 0.45 − 2.96 − 3.04 − 2.61 − 0.64 − 2.95
Debt securities − 18.40 − 12.80 − 8.14 − 3.32 − 1.36 − 1.49 − 2.28 − 3.01 − 1.00
short-term debt securities 0.75 − 0.16 − 0.20 0.31 0.37 0.18 − 0.34 − 0.41 − 0.37long-term debt securities − 19.15 − 12.63 − 7.93 − 3.62 − 1.72 − 1.67 − 1.94 − 2.60 − 0.63
Memo itemDebt securities of domestic sectors − 10.06 − 4.14 − 5.09 − 1.65 0.01 − 0.67 − 1.88 − 2.56 − 0.01
Non-financial corporations 0.36 − 0.01 − 1.43 − 0.10 − 0.66 − 0.22 − 0.14 − 0.40 0.08Financial corporations − 7.42 − 2.48 − 2.68 − 1.37 1.01 − 0.17 − 1.55 − 1.97 0.07General government − 2.99 − 1.65 − 0.99 − 0.18 − 0.33 − 0.28 − 0.18 − 0.19 − 0.17
Debt securities of the rest of the world − 8.34 − 8.66 − 3.05 − 1.67 − 1.37 − 0.82 − 0.41 − 0.45 − 0.98
Equity and investment fund shares 47.95 45.78 55.13 4.54 12.11 12.32 14.08 16.62 17.73
Equity 16.62 21.65 14.69 − 0.90 3.40 2.21 5.11 3.97 7.35
Listed Shares of domestic sectors 4.17 9.37 0.90 − 3.03 0.15 − 0.18 0.89 0.04 4.27
Non-financial corporations 3.88 6.09 0.54 − 1.70 0.48 − 1.42 1.01 0.47 3.12Financial corporations 0.28 3.28 0.36 − 1.33 − 0.33 1.24 − 0.12 − 0.43 1.15
Quoted shares of the rest of the world 8.00 6.94 9.66 1.69 2.25 1.69 2.94 2.77 1.47
Other equity 1 4.45 5.35 4.13 0.44 1.00 0.70 1.28 1.15 1.61
Investment fund shares 31.34 24.13 40.44 5.44 8.70 10.11 8.97 12.65 10.38
Money market fund shares − 0.57 − 0.53 − 0.28 − 0.17 − 0.22 0.04 − 0.16 0.05 − 0.40Non-MMF investment fund shares 31.90 24.66 40.72 5.61 8.92 10.08 9.12 12.60 10.79
Non-life insurance technical reservesand provision for calls under standardisedguarantees 20.09 19.58 11.43 8.01 2.85 2.87 2.82 2.89 2.88
Life insurance and annuityentitlements 31.69 24.82 31.59 5.65 13.31 10.71 4.91 2.67 15.50
Pension entitlement, claims ofpension funds on pension managers,entitlements to non-pension benefits 30.85 20.63 29.47 1.63 7.67 4.34 7.09 10.37 3.67
Financial derivatives and employeestock options 0.00 0.00 0.00 0.00 0.00 0.00 0.00 0.00 0.00
Other accounts receivable 2 − 17.31 − 11.76 − 12.68 − 21.60 15.21 − 6.13 2.70 − 24.47 14.98
Total 191.54 201.23 210.39 47.32 62.14 52.77 47.35 48.13 68.51
External financing
Loans 38.20 47.38 55.63 9.48 7.90 16.64 18.56 12.53 10.79
short-term loans − 3.17 − 4.31 − 2.19 − 2.05 − 0.35 − 0.34 − 1.09 − 0.40 − 0.02long-term loans 41.36 51.69 57.82 11.53 8.25 16.98 19.66 12.93 10.81
Memo itemMortage loans 35.63 41.84 47.49 11.04 6.12 13.31 15.84 12.23 8.98Consumer loans 5.44 9.78 11.25 0.88 2.41 3.25 3.41 2.19 1.78Entrepreneurial loans − 2.88 − 4.24 − 3.11 − 2.44 − 0.62 0.07 − 0.68 − 1.89 0.04
Memo itemLoans from monetary financial institutions 39.35 42.87 49.99 8.08 7.10 15.54 16.93 10.42 11.00Loans from other financial institutions − 1.16 4.51 5.65 1.40 0.80 1.10 1.63 2.11 − 0.21Loans from general government and restof the world 0.00 0.00 0.00 0.00 0.00 0.00 0.00 0.00 0.00
Financial derivatives 0.00 0.00 0.00 0.00 0.00 0.00 0.00 0.00 0.00
Other accounts payable − 1.14 − 0.23 0.22 0.06 0.12 0.07 0.02 0.02 − 0.04
Total 37.06 47.15 55.85 9.54 8.02 16.70 18.58 12.55 10.75
1 Including unlisted shares. 2 Including accumulated interest-bearing surplus shares with insurance corporations.
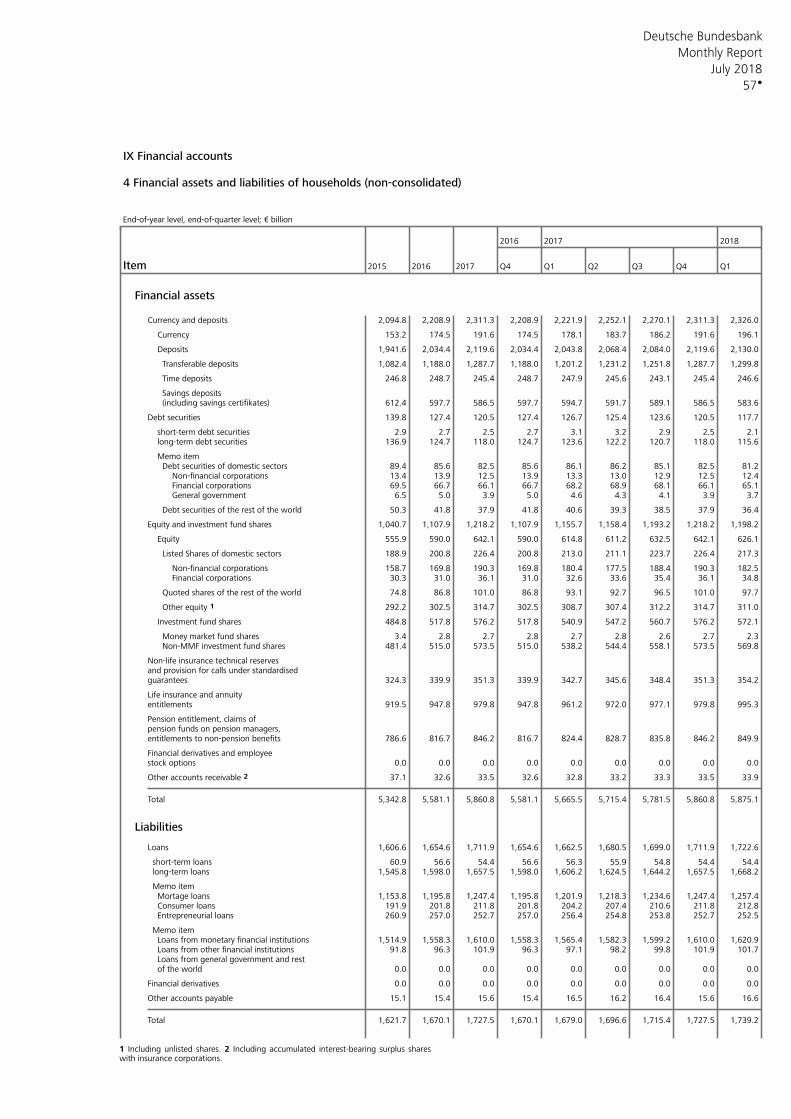
Deutsche Bundesbank
57
Monthly Report
July 2018
IX Financial accounts
4 Financial assets and liabilities of households (non-consolidated) End-of-year level, end-of-quarter level; € billion
2016 2017 2018
Item 2015 2016 2017 Q4 Q1 Q2 Q3 Q4 Q1
Financial assets
Currency and deposits 2,094.8 2,208.9 2,311.3 2,208.9 2,221.9 2,252.1 2,270.1 2,311.3 2,326.0
Currency 153.2 174.5 191.6 174.5 178.1 183.7 186.2 191.6 196.1
Deposits 1,941.6 2,034.4 2,119.6 2,034.4 2,043.8 2,068.4 2,084.0 2,119.6 2,130.0
Transferable deposits 1,082.4 1,188.0 1,287.7 1,188.0 1,201.2 1,231.2 1,251.8 1,287.7 1,299.8
Time deposits 246.8 248.7 245.4 248.7 247.9 245.6 243.1 245.4 246.6
Savings deposits(including savings certifikates) 612.4 597.7 586.5 597.7 594.7 591.7 589.1 586.5 583.6
Debt securities 139.8 127.4 120.5 127.4 126.7 125.4 123.6 120.5 117.7
short-term debt securities 2.9 2.7 2.5 2.7 3.1 3.2 2.9 2.5 2.1long-term debt securities 136.9 124.7 118.0 124.7 123.6 122.2 120.7 118.0 115.6
Memo itemDebt securities of domestic sectors 89.4 85.6 82.5 85.6 86.1 86.2 85.1 82.5 81.2
Non-financial corporations 13.4 13.9 12.5 13.9 13.3 13.0 12.9 12.5 12.4Financial corporations 69.5 66.7 66.1 66.7 68.2 68.9 68.1 66.1 65.1General government 6.5 5.0 3.9 5.0 4.6 4.3 4.1 3.9 3.7
Debt securities of the rest of the world 50.3 41.8 37.9 41.8 40.6 39.3 38.5 37.9 36.4
Equity and investment fund shares 1,040.7 1,107.9 1,218.2 1,107.9 1,155.7 1,158.4 1,193.2 1,218.2 1,198.2
Equity 555.9 590.0 642.1 590.0 614.8 611.2 632.5 642.1 626.1
Listed Shares of domestic sectors 188.9 200.8 226.4 200.8 213.0 211.1 223.7 226.4 217.3
Non-financial corporations 158.7 169.8 190.3 169.8 180.4 177.5 188.4 190.3 182.5Financial corporations 30.3 31.0 36.1 31.0 32.6 33.6 35.4 36.1 34.8
Quoted shares of the rest of the world 74.8 86.8 101.0 86.8 93.1 92.7 96.5 101.0 97.7
Other equity 1 292.2 302.5 314.7 302.5 308.7 307.4 312.2 314.7 311.0
Investment fund shares 484.8 517.8 576.2 517.8 540.9 547.2 560.7 576.2 572.1
Money market fund shares 3.4 2.8 2.7 2.8 2.7 2.8 2.6 2.7 2.3Non-MMF investment fund shares 481.4 515.0 573.5 515.0 538.2 544.4 558.1 573.5 569.8
Non-life insurance technical reservesand provision for calls under standardisedguarantees 324.3 339.9 351.3 339.9 342.7 345.6 348.4 351.3 354.2
Life insurance and annuityentitlements 919.5 947.8 979.8 947.8 961.2 972.0 977.1 979.8 995.3
Pension entitlement, claims ofpension funds on pension managers,entitlements to non-pension benefits 786.6 816.7 846.2 816.7 824.4 828.7 835.8 846.2 849.9
Financial derivatives and employeestock options 0.0 0.0 0.0 0.0 0.0 0.0 0.0 0.0 0.0
Other accounts receivable 2 37.1 32.6 33.5 32.6 32.8 33.2 33.3 33.5 33.9
Total 5,342.8 5,581.1 5,860.8 5,581.1 5,665.5 5,715.4 5,781.5 5,860.8 5,875.1
Liabilities
Loans 1,606.6 1,654.6 1,711.9 1,654.6 1,662.5 1,680.5 1,699.0 1,711.9 1,722.6
short-term loans 60.9 56.6 54.4 56.6 56.3 55.9 54.8 54.4 54.4long-term loans 1,545.8 1,598.0 1,657.5 1,598.0 1,606.2 1,624.5 1,644.2 1,657.5 1,668.2
Memo itemMortage loans 1,153.8 1,195.8 1,247.4 1,195.8 1,201.9 1,218.3 1,234.6 1,247.4 1,257.4Consumer loans 191.9 201.8 211.8 201.8 204.2 207.4 210.6 211.8 212.8Entrepreneurial loans 260.9 257.0 252.7 257.0 256.4 254.8 253.8 252.7 252.5
Memo itemLoans from monetary financial institutions 1,514.9 1,558.3 1,610.0 1,558.3 1,565.4 1,582.3 1,599.2 1,610.0 1,620.9Loans from other financial institutions 91.8 96.3 101.9 96.3 97.1 98.2 99.8 101.9 101.7Loans from general government and restof the world 0.0 0.0 0.0 0.0 0.0 0.0 0.0 0.0 0.0
Financial derivatives 0.0 0.0 0.0 0.0 0.0 0.0 0.0 0.0 0.0
Other accounts payable 15.1 15.4 15.6 15.4 16.5 16.2 16.4 15.6 16.6
Total 1,621.7 1,670.1 1,727.5 1,670.1 1,679.0 1,696.6 1,715.4 1,727.5 1,739.2
1 Including unlisted shares. 2 Including accumulated interest-bearing surplus shares with insurance corporations.
Deutsche Bundesbank
58
Monthly Report
July 2018
X Public finances in Germany 1 General government: deficit/surplus and debt level as defined in the Maastricht Treaty
Social SocialGeneral Central State Local security General Central State Local securitygovernment government government government funds government government government government funds
Period € billion as a percentage of GDP
Deficit/surplus1
2011 − 25.9 − 29.4 − 11.4 − 0.3 + 15.3 − 1.0 − 1.1 − 0.4 − 0.0 + 0.62012 − 0.9 − 16.1 − 5.5 + 2.2 + 18.4 − 0.0 − 0.6 − 0.2 + 0.1 + 0.72013 − 4.0 − 7.4 − 2.5 + 0.5 + 5.4 − 0.1 − 0.3 − 0.1 + 0.0 + 0.22014 p + 15.5 + 14.7 − 1.1 − 1.2 + 3.2 + 0.5 + 0.5 − 0.0 − 0.0 + 0.1
2015 p + 25.4 + 15.7 + 3.8 + 3.1 + 2.7 + 0.8 + 0.5 + 0.1 + 0.1 + 0.12016 p + 31.9 + 13.6 + 4.9 + 5.2 + 8.2 + 1.0 + 0.4 + 0.2 + 0.2 + 0.32017 pe + 38.2 + 7.1 + 10.8 + 9.9 + 10.5 + 1.2 + 0.2 + 0.3 + 0.3 + 0.3
2016 H1 p + 20.6 + 8.1 + 4.1 + 1.9 + 6.6 + 1.3 + 0.5 + 0.3 + 0.1 + 0.4 H2 p + 11.2 + 5.5 + 0.8 + 3.3 + 1.6 + 0.7 + 0.3 + 0.0 + 0.2 + 0.1
2017 H1 pe + 22.2 + 2.1 + 6.3 + 6.7 + 7.1 + 1.4 + 0.1 + 0.4 + 0.4 + 0.4 H2 pe + 16.0 + 5.0 + 4.4 + 3.2 + 3.4 + 1.0 + 0.3 + 0.3 + 0.2 + 0.2
Debt level2 End of year or quarter
2011 2,125.1 1,344.1 653.8 143.5 1.3 78.6 49.7 24.2 5.3 0.02012 2,202.3 1,387.9 683.6 147.5 1.2 79.8 50.3 24.8 5.3 0.02013 2,190.5 1,390.4 665.6 150.6 1.3 77.5 49.2 23.5 5.3 0.02014 p 2,192.0 1,396.5 660.1 152.0 1.4 74.7 47.6 22.5 5.2 0.0
2015 p 2,161.8 1,372.6 656.5 152.2 1.4 71.0 45.1 21.6 5.0 0.02016 p 2,145.5 1,366.8 639.5 153.4 1.1 68.2 43.5 20.3 4.9 0.02017 p 2,092.6 1,351.6 612.1 147.2 0.8 64.1 41.4 18.8 4.5 0.0
2016 Q1 p 2,170.2 1,382.5 649.6 154.4 1.2 70.8 45.1 21.2 5.0 0.0 Q2 p 2,173.6 1,391.1 646.1 154.0 1.1 70.1 44.8 20.8 5.0 0.0 Q3 p 2,167.0 1,381.1 646.5 154.8 1.0 69.4 44.2 20.7 5.0 0.0 Q4 p 2,145.5 1,366.8 639.5 153.4 1.1 68.2 43.5 20.3 4.9 0.0
2017 Q1 p 2,118.2 1,351.0 629.0 152.0 1.2 66.7 42.5 19.8 4.8 0.0 Q2 p 2,112.5 1,353.6 622.2 151.4 0.9 66.1 42.3 19.5 4.7 0.0 Q3 p 2,105.6 1,353.0 620.1 149.7 0.8 65.2 41.9 19.2 4.6 0.0 Q4 p 2,092.6 1,351.6 612.1 147.2 0.8 64.1 41.4 18.8 4.5 0.0
2018 Q1 p 2,071.4 1,338.8 602.1 147.5 1.0 62.9 40.7 18.3 4.5 0.0
Sources: Federal Statistical Office and Bundesbank calculations. 1 The deficit/surplus GDP ratios are based on the national output of the four preceding quarters. in accordance with ESA 2010 corresponds to the Maastricht definition. 2 Quarterly
2 General government: revenue, expenditure and deficit/surplus as shown in the national accounts*
Revenue Expenditure
of which of which
Compen- Inter- Gross Memo itemSocial con- Social sation of mediate capital Deficit/ Total tax
Period Total Taxes tributions Other Total benefits employees formation Interest Other surplus burden 1 consumption
€ billion2011 1,182.7 598.8 442.3 141.7 1,208.6 633.9 208.6 124.1 61.4 67.5 113.1 − 25.9 1,045.62012 1,220.9 624.9 454.3 141.7 1,221.8 645.5 212.3 126.5 61.5 63.1 112.8 − 0.9 1,083.72013 1,259.0 651.0 465.0 143.0 1,263.0 666.4 217.8 133.0 60.1 55.5 130.2 − 4.0 1,120.32014 p 1,308.3 674.1 482.0 152.3 1,292.8 691.0 224.0 137.4 60.0 45.3 135.2 + 15.5 1,160.7
2015 p 1,354.3 704.3 500.8 149.2 1,328.8 722.3 229.2 142.2 64.2 40.4 130.6 + 25.4 1,212.22016 p 1,414.2 739.0 523.8 151.5 1,382.4 754.9 236.5 150.0 66.8 35.4 138.8 + 31.9 1,269.62017 pe 1,473.3 772.0 548.0 153.4 1,435.1 784.0 246.1 155.7 70.3 33.8 145.2 + 38.2 1,326.7
as a percentage of GDP2011 43.8 22.2 16.4 5.2 44.7 23.4 7.7 4.6 2.3 2.5 4.2 − 1.0 38.72012 44.3 22.7 16.5 5.1 44.3 23.4 7.7 4.6 2.2 2.3 4.1 − 0.0 39.32013 44.5 23.0 16.5 5.1 44.7 23.6 7.7 4.7 2.1 2.0 4.6 − 0.1 39.62014 p 44.6 23.0 16.4 5.2 44.1 23.6 7.6 4.7 2.0 1.5 4.6 + 0.5 39.6
2015 p 44.5 23.1 16.5 4.9 43.7 23.7 7.5 4.7 2.1 1.3 4.3 + 0.8 39.82016 p 45.0 23.5 16.7 4.8 44.0 24.0 7.5 4.8 2.1 1.1 4.4 + 1.0 40.42017 pe 45.1 23.7 16.8 4.7 44.0 24.0 7.5 4.8 2.2 1.0 4.4 + 1.2 40.7
Percentage growth rates2011 + 6.5 + 7.7 + 3.8 + 10.7 − 0.9 − 0.1 + 2.5 + 5.1 + 3.3 + 5.7 − 19.2 . + 6.02012 + 3.2 + 4.4 + 2.7 + 0.0 + 1.1 + 1.8 + 1.8 + 2.0 + 0.2 − 6.5 − 0.3 . + 3.62013 + 3.1 + 4.2 + 2.4 + 1.0 + 3.4 + 3.2 + 2.6 + 5.1 − 2.2 − 12.0 + 15.4 . + 3.42014 p + 3.9 + 3.6 + 3.6 + 6.4 + 2.4 + 3.7 + 2.9 + 3.3 − 0.3 − 18.5 + 3.9 . + 3.6
2015 p + 3.5 + 4.5 + 3.9 − 2.0 + 2.8 + 4.5 + 2.3 + 3.5 + 7.0 − 10.7 − 3.4 . + 4.42016 p + 4.4 + 4.9 + 4.6 + 1.6 + 4.0 + 4.5 + 3.2 + 5.5 + 4.1 − 12.4 + 6.2 . + 4.72017 pe + 4.2 + 4.5 + 4.6 + 1.2 + 3.8 + 3.9 + 4.1 + 3.8 + 5.2 − 4.6 + 4.6 . + 4.5
Source: Federal Statistical Office. * Figures in accordance with ESA 2010. 1 Taxes and lution Fund established at the European level. social contributions plus customs duties and levies from banks to the Single Reso-
Deutsche Bundesbank
59
Monthly Report
July 2018
X Public finances in Germany 3 General government: budgetary development (as per government’s financial statistics) € billion
Central, state and local government 1 Social security funds 2 General government, total
Revenue Expenditure
of which of which 3
Finan- Person- Fixed Finan-cial nel asset cialtransac- expend- Current forma- transac- Deficit / Rev- Expend- Deficit / Rev- Expend- Deficit /
Period Total 4 Taxes tions 5 Total 4 iture grants Interest tion tions 5 surplus enue 6 iture surplus enue iture surplus
2011 689.6 573.4 22.8 711.6 194.3 301.3 56.8 38.5 13.7 − 22.0 526.3 511.2 + 15.1 1,104.2 1,111.1 − 6.92012 p 745.0 600.0 14.7 770.2 218.8 285.2 69.9 42.6 25.5 − 25.2 536.2 518.8 + 17.4 1,171.1 1,178.8 − 7.82013 p 761.8 619.7 14.7 773.6 225.3 286.9 65.7 42.8 23.5 − 11.8 536.7 531.9 + 4.9 1,198.1 1,205.0 − 6.92014 p 791.8 643.6 11.3 786.7 236.0 292.9 57.1 45.9 17.6 + 5.1 554.5 551.1 + 3.5 1,245.3 1,236.7 + 8.6
2015 p 829.5 673.3 10.4 804.1 244.1 302.6 49.8 46.4 12.5 + 25.5 575.0 573.1 + 1.9 1,300.8 1,273.4 + 27.42016 p 862.1 705.8 9.0 843.4 251.3 320.5 43.4 49.0 11.8 + 18.7 601.8 594.8 + 7.1 1,355.0 1,329.2 + 25.82017 p 900.0 734.5 7.9 872.1 261.6 325.9 42.0 52.3 13.8 + 27.9 630.9 621.6 + 9.4 1,416.7 1,379.4 + 37.3
2015 Q1 p 196.0 160.9 2.4 198.8 58.5 80.5 18.4 7.7 2.5 − 2.8 137.3 142.8 − 5.4 307.6 315.8 − 8.2 Q2 p 208.4 167.7 1.5 185.2 59.5 72.8 7.2 9.1 3.0 + 23.1 142.4 142.3 + 0.1 325.0 301.8 + 23.2 Q3 p 202.8 166.5 3.8 198.0 62.3 71.3 16.6 11.6 3.4 + 4.7 141.2 143.4 − 2.1 318.1 315.5 + 2.6 Q4 p 221.5 178.2 2.6 219.3 63.4 77.4 7.3 17.3 3.5 + 2.2 152.7 145.3 + 7.4 348.4 338.8 + 9.6
2016 Q1 p 206.1 169.9 1.4 206.0 60.0 81.2 17.7 8.4 2.2 + 0.1 143.0 146.6 − 3.6 322.2 325.7 − 3.5 Q2 p 216.7 176.6 2.4 194.1 60.7 77.7 5.4 10.4 2.4 + 22.7 148.7 147.0 + 1.7 338.5 314.2 + 24.3 Q3 p 207.1 169.3 2.9 210.4 62.0 78.8 14.5 12.3 2.4 − 3.3 148.3 149.7 − 1.4 328.2 332.9 − 4.7 Q4 p 232.6 189.2 2.1 233.2 68.1 83.1 7.7 17.2 4.8 − 0.6 160.1 152.2 + 7.8 365.3 358.1 + 7.2
2017 Q1 p 216.0 180.4 0.9 200.1 62.9 80.3 13.8 10.2 1.9 + 15.9 150.3 155.1 − 4.8 338.0 326.9 + 11.1 Q2 p 217.9 177.3 1.2 206.7 63.9 83.6 6.6 8.8 3.6 + 11.3 156.4 154.3 + 2.1 346.1 332.8 + 13.4 Q3 p 219.6 180.4 3.5 215.4 64.4 78.1 14.5 13.4 4.2 + 4.3 154.8 155.7 − 0.9 346.1 342.7 + 3.3 Q4 p 243.8 196.3 2.1 244.4 69.8 85.1 6.9 19.2 4.1 − 0.6 168.2 158.0 + 10.2 383.4 373.8 + 9.6
2018 Q1 p 223.3 189.1 1.0 207.9 61.1 81.0 11.5 8.8 2.5 + 15.4 156.1 160.8 − 4.7 350.4 339.7 + 10.7
Source: Bundesbank calculations based on Federal Statistical Office data. 1 Annual fig- latter are all provisional. The quarterly figures for some insurance sectors are esti-ures based on the calculations of the Federal Statistical Office. Bundesbank supple- mated. 3 The development of the types of expenditure recorded here is influenced inmentary estimations for the reporting years after 2011 that are not yet available. The part by statistical changeovers. 4 Including discrepancies in clearing transactions be-quarterly figures contain numerous off-budget entities which are assigned to the tween central, state and local government. 5 On the revenue side, this contains pro-general government sector as defined in the national accounts but are not yet in- ceeds booked as disposals of equity interests and as loan repayments. On the expend-cluded in the annual calculations. From 2012, also including the bad bank iture side, this contains the acquisition of equity interests and loans granted. 6 In-FMSW. 2 The annual figures do not tally with the sum of the quarterly figures, as the cluding central government liquidity assistance to the Federal Employment Agency.
4 Central, state and local government: budgetary development (as per government’s financial statistics) € billion
Central government State government 2,3 Local government 3
Period Revenue 1 Expenditure Deficit / surplus Revenue Expenditure Deficit / surplus Revenue Expenditure Deficit / surplus
2011 307.1 324.9 − 17.7 286.5 295.9 − 9.4 183.9 184.9 − 1.02012 p 312.5 335.3 − 22.8 311.0 316.1 − 5.1 200.0 198.5 + 1.52013 p 313.2 335.6 − 22.4 324.3 323.9 + 0.4 207.6 206.3 + 1.32014 p 322.9 323.3 − 0.3 338.3 336.1 + 2.1 218.7 218.7 − 0.1
2015 p 338.3 326.5 + 11.8 355.1 350.6 + 4.5 232.7 229.1 + 3.62016 p 344.7 338.4 + 6.2 381.1 372.4 + 8.8 248.9 243.1 + 5.82017 p 357.8 352.8 + 5.0 397.7 385.8 + 11.8 260.3 249.1 + 11.2
2015 Q1 p 74.4 81.6 − 7.1 84.2 84.5 − 0.3 46.3 52.1 − 5.8 Q2 p 86.5 72.6 + 13.9 87.0 83.6 + 3.4 58.1 53.4 + 4.7 Q3 p 85.9 89.0 − 3.2 87.8 84.2 + 3.6 57.5 56.3 + 1.2 Q4 p 91.5 83.4 + 8.1 94.1 96.8 − 2.8 69.0 65.9 + 3.0
2016 Q1 p 81.1 82.7 − 1.6 90.5 88.2 + 2.4 49.0 55.1 − 6.1 Q2 p 87.5 73.6 + 13.8 92.7 88.2 + 4.4 61.1 57.9 + 3.2 Q3 p 85.2 88.2 − 3.0 91.5 90.0 + 1.5 60.7 60.7 + 0.1 Q4 p 90.9 93.9 − 3.0 104.3 104.4 − 0.0 76.3 68.0 + 8.3
2017 Q1 p 88.2 83.3 + 4.8 95.6 90.0 + 5.6 52.7 57.7 − 4.9 Q2 p 81.5 80.1 + 1.4 96.3 93.6 + 2.7 65.0 59.5 + 5.5 Q3 p 88.6 93.1 − 4.6 98.9 91.4 + 7.5 63.4 61.5 + 1.9 Q4 p 99.5 96.2 + 3.3 104.7 109.2 − 4.5 77.2 69.1 + 8.2
2018 Q1 p 87.9 84.4 + 3.5 100.0 92.7 + 7.3 54.9 60.3 − 5.3
Source: Bundesbank calculations based on Federal Statistical Office data. 1 Any assigned to the general government sector. Annual figures up to and including 2011:amounts of the Bundesbank’s profit distribution exceeding the reference value that excluding off-budget entities, but including special accounts and special purposewere used to repay parts of the debt of central government’s special funds are not in- associations based on the calculations of the Federal Statistical Office. For the follow-cluded here. 2 Including the local authority level of the city-states Berlin, Bremen and ing years, Bundesbank supplementary estimations. Hamburg. 3 Quarterly data of core budgets and off-budget entities which are
Deutsche Bundesbank
60
Monthly Report
July 2018
X Public finances in Germany 5 Central, state and local government: tax revenue € million
Central and state government and European Union
Memo itemBalance of Amounts deducted
Central State Local untransferred in the federalPeriod Total Total government 1 government 1 European Union 2 government 3 tax shares 4 budget 5
2011 573,352 496,738 276,598 195,676 24,464 76,570 + 43 28,6152012 600,046 518,963 284,801 207,846 26,316 81,184 − 101 28,4982013 619,708 535,173 287,641 216,430 31,101 84,274 + 262 27,7752014 643,624 556,008 298,518 226,504 30,986 87,418 + 198 27,772
2015 673,276 580,485 308,849 240,698 30,938 93,003 − 212 27,2412016 705,797 606,965 316,854 260,837 29,273 98,648 + 186 27,8362017 734,540 629,458 336,730 271,046 21,682 105,158 − 76 27,368
2016 Q1 170,358 144,841 74,113 61,972 8,755 17,121 + 8,396 6,488 Q2 176,879 152,042 82,184 64,684 5,175 25,169 − 332 6,512 Q3 169,374 145,700 76,638 61,573 7,489 23,839 − 165 7,584 Q4 189,186 164,382 83,919 72,608 7,855 32,518 − 7,714 7,253
2017 Q1 181,506 154,154 85,256 66,704 2,194 17,950 + 9,403 6,606 Q2 177,090 149,915 76,391 66,605 6,918 27,631 − 456 6,825 Q3 180,407 155,250 82,576 66,718 5,957 25,517 − 361 7,467 Q4 195,537 170,139 92,507 71,019 6,613 34,060 − 8,662 6,471
2018 Q1 189,457 159,974 83,370 69,413 7,191 19,173 + 10,310 6,398
2017 Apr . 45,841 23,674 19,826 2,341 . . 2,275 May . 45,515 24,364 18,876 2,276 . . 2,275
2018 Apr . 47,500 24,298 20,936 2,267 . . 2,197 May . 48,495 26,351 20,364 1,780 . . 2,197
Sources: Federal Ministry of Finance, Federal Statistical Office and Bundesbank calcu- government tax revenue. 3 Including local government taxes in the city-states Berlin,lations. 1 Before deducting or adding supplementary central government grants, Bremen and Hamburg. Including revenue from offshore wind farms. 4 Difference be-regionalisation funds (local public transport), compensation for the transfer of motor tween local government’s share in the joint taxes received by the state governmentvehicle tax to central government and consolidation assistance, which central govern- cash offices in the period in question (see Table X. 6) and the amounts passed on toment remits to state government. See the last column for the volume of these local government in the same period. 5 Volume of the positions mentioned underamounts which are deducted from tax revenue in the federal budget. 2 Custom footnote 1. duties and shares in VAT and gross national income accruing to the EU from central
6 Central and state government and European Union: tax revenue, by type € million
Joint taxesMemo
Income taxes 2 Turnover taxes 5 itemLocal
Local govern-Invest- business Central State ment
Assessed ment Turnover tax govern- govern- EU share inWage income Corpora- income Turnover tax on trans- ment ment customs joint
Period Total 1 Total tax 3 tax tion tax tax 4 Total tax imports fers 6 taxes 7 taxes 7 duties taxes
2011 527,255 213,534 139,749 31,996 15,634 26,155 190,033 138,957 51,076 6,888 99,133 13,095 4,571 30,5172012 551,785 231,555 149,065 37,262 16,934 28,294 194,635 142,439 52,196 7,137 99,794 14,201 4,462 32,8222013 570,213 245,909 158,198 42,280 19,508 25,923 196,843 148,315 48,528 7,053 100,454 15,723 4,231 35,0402014 593,039 258,875 167,983 45,613 20,044 25,236 203,110 154,228 48,883 7,142 101,804 17,556 4,552 37,031
2015 620,287 273,258 178,891 48,580 19,583 26,204 209,921 159,015 50,905 7,407 104,204 20,339 5,159 39,8022016 648,309 291,492 184,826 53,833 27,442 25,391 217,090 165,932 51,157 7,831 104,441 22,342 5,113 41,3452017 674,598 312,462 195,524 59,428 29,259 28,251 226,355 170,498 55,856 8,580 99,934 22,205 5,063 45,141
2016 Q1 154,892 70,790 42,583 14,569 8,433 5,204 54,408 42,268 12,141 173 22,553 5,673 1,294 10,051 Q2 162,096 74,489 45,311 12,943 7,329 8,905 52,705 40,195 12,510 1,957 25,783 5,952 1,210 10,054 Q3 155,524 68,137 44,656 11,898 5,546 6,037 53,906 40,877 13,029 2,046 24,857 5,263 1,316 9,824 Q4 175,797 78,076 52,275 14,422 6,134 5,245 56,071 42,593 13,478 3,656 31,247 5,454 1,293 11,415
2017 Q1 165,352 76,990 45,309 17,009 8,511 6,161 57,502 44,196 13,306 438 23,364 5,834 1,224 11,198 Q2 161,036 78,178 48,256 14,825 7,872 7,225 54,243 39,885 14,358 2,059 19,868 5,407 1,281 11,121 Q3 165,923 75,218 47,253 12,720 6,034 9,211 56,481 42,571 13,911 2,214 25,114 5,580 1,315 10,673 Q4 182,288 82,077 54,707 14,873 6,843 5,654 58,128 43,846 14,282 3,868 31,587 5,384 1,243 12,149
2018 Q1 172,111 81,713 48,059 17,640 9,418 6,595 59,248 45,272 13,977 291 23,752 5,836 1,271 12,136
2017 Apr 49,018 20,035 16,149 1,389 551 1,946 17,302 12,328 4,975 1,772 7,789 1,669 450 3,177 May 48,352 18,182 14,788 292 280 2,822 19,062 14,434 4,628 294 8,579 1,850 385 2,837
2018 Apr 50,927 21,339 17,136 1,548 413 2,241 16,997 12,345 4,652 1,794 8,036 2,355 405 3,426 May 51,621 20,479 16,047 198 853 3,382 19,903 14,889 5,014 418 8,680 1,808 332 3,125
Source: Federal Ministry of Finance and Bundesbank calculations. 1 This total, unlike deducting child benefit and subsidies for supplementary private pensionthat in Table X. 5, does not include the receipts from the equalisation of burdens plans. 4 Final withholding tax on interest income and capital gains, non-assessedlevies, local business tax (less local business tax transfers to central and state govern- taxes on earnings. 5 The allocation of revenue to central, state and local govern-ment), real property taxes and other local government taxes, or the balance of un- ment, which is adjusted at more regular intervals, is regulated in section 1 of the Rev-transferred tax shares. 2 Respective percentage share of central, state and local enue Adjustment Act. Respective percentage share of central, state and local govern-government in revenue: wage tax and assessed income tax 42.5:42.5:15, corpor- ment in revenue for 2017: 50.7:46.6:2.7. The EU share is deducted from centralation tax and non-assessed taxes on earnings 50:50:-, final withholding tax on inter- government’s share. 6 Respective percentage share of central and state governmentest income and capital gains, non-assessed taxes on earnings 44:44:12. 3 After for 2017: 22.6:77.4. 7 For the breakdown, see Table X. 7.
Deutsche Bundesbank
61
Monthly Report
July 2018
X Public finances in Germany 7 Central, state and local government: individual taxes € million
Central government taxes 1 State government taxes 1 Local government taxes
Tax on of whichthe acqui- Betting
Soli- Motor sition of Inherit- and Local RealEnergy darity Tobacco Insurance vehicle Electri- Alcohol land and ance lottery business property
Period tax surcharge tax tax tax city tax tax Other buildings tax tax Other Total tax 2 taxes
2011 40,036 12,781 14,414 10,755 8,422 7,247 2,149 3,329 6,366 4,246 1,420 1,064 52,984 40,424 11,674
2012 39,305 13,624 14,143 11,138 8,443 6,973 2,121 4,047 7,389 4,305 1,432 1,076 55,398 42,345 12,017
2013 39,364 14,378 13,820 11,553 8,490 7,009 2,102 3,737 8,394 4,633 1,635 1,060 56,549 43,027 12,377
2014 39,758 15,047 14,612 12,046 8,501 6,638 2,060 3,143 9,339 5,452 1,673 1,091 57,728 43,763 12,691
2015 39,594 15,930 14,921 12,419 8,805 6,593 2,070 3,872 11,249 6,290 1,712 1,088 60,396 45,752 13,215
2016 40,091 16,855 14,186 12,763 8,952 6,569 2,070 2,955 12,408 7,006 1,809 1,119 65,319 50,103 13,654
2017 41,022 17,953 14,399 13,269 8,948 6,944 2,094 − 4,695 13,139 6,114 1,837 1,115 68,522 52,899 13,966
2016 Q1 4,620 3,979 2,722 5,946 2,489 1,685 565 547 3,217 1,668 451 336 15,639 12,090 3,121
Q2 9,860 4,470 4,139 2,269 2,366 1,515 473 691 2,952 2,283 451 267 16,740 12,635 3,715
Q3 10,149 3,938 3,010 2,510 2,198 1,641 499 911 3,050 1,501 446 266 15,896 11,699 3,794
Q4 15,461 4,468 4,315 2,038 1,899 1,728 532 806 3,189 1,554 460 251 17,045 13,679 3,024
2017 Q1 4,812 4,324 2,637 6,178 2,536 1,746 578 553 3,359 1,641 490 343 16,593 12,905 3,228
Q2 10,091 4,809 3,634 2,353 2,374 1,784 476 − 5,652 3,129 1,538 474 265 18,113 13,881 3,832
Q3 10,497 4,144 3,867 2,669 2,132 1,628 502 −324 3,394 1,497 417 273 16,698 12,443 3,824
Q4 15,622 4,677 4,261 2,070 1,906 1,786 538 727 3,257 1,438 456 233 17,118 13,670 3,082
2018 Q1 4,865 4,587 2,425 6,388 2,602 1,725 591 569 3,576 1,431 479 350 17,638 13,880 3,291
2017 Apr 2,994 1,138 1,218 751 756 582 140 211 926 503 158 82 . . .
May 3,583 1,226 1,146 944 774 516 182 208 1,130 472 159 90 . . .
2018 Apr 3,405 1,198 960 788 742 591 134 218 1,121 992 163 79 . . .
May 3,145 1,354 1,470 980 799 540 191 202 1,052 522 147 87 . . .
Sources: Federal Ministry of Finance, Federal Statistical Office and Bundesbank calcu-lations. 1 For the sum total, see Table X. 6. 2 Including revenue from offshore wind farms.
8 German pension insurance scheme: budgetary development and assets*
€ million
Revenue 1,2 Expenditure 1,2 Assets 1,4
of which of whichEquity
Payments interests, Memofrom Pen- mort- itemcentral sioners’ gages Adminis-
Contri- govern- Pension health Deficit/ and other Real trativePeriod Total butions 3 ment Total payments insurance surplus Total Deposits 5 Securities loans 6 estate assets
2011 254,968 177,424 76,200 250,241 212,602 15,015 + 4,727 24,965 22,241 2,519 88 117 4,379
2012 259,700 181,262 77,193 254,604 216,450 15,283 + 5,096 30,481 28,519 1,756 104 102 4,315
2013 260,166 181,991 77,067 258,268 219,560 15,528 + 1,898 33,114 29,193 3,701 119 100 4,250
2014 269,115 189,080 78,940 265,949 226,204 15,978 + 3,166 36,462 32,905 3,317 146 94 4,263
2015 276,129 194,486 80,464 277,717 236,634 16,705 − 1,588 35,556 32,795 2,506 167 88 4,228
2016 286,399 202,249 83,154 288,641 246,118 17,387 − 2,242 34,094 31,524 2,315 203 52 4,147
2017 299,826 211,424 87,502 299,297 255,261 18,028 + 529 35,366 33,740 1,335 238 53 4,032
2015 Q1 65,923 45,653 20,025 68,435 58,671 4,125 − 2,512 34,084 31,583 2,262 148 92 4,255
Q2 68,700 48,483 19,945 68,443 58,390 4,113 + 257 34,319 31,797 2,276 152 93 4,254
Q3 67,538 47,280 20,006 70,165 59,931 4,228 − 2,627 32,246 29,722 2,276 156 92 4,259
Q4 73,393 53,096 19,971 70,326 59,963 4,233 + 3,067 35,574 32,794 2,506 158 117 4,242
2016 Q1 68,182 47,397 20,665 70,076 60,143 4,239 − 1,894 33,865 31,194 2,406 179 86 4,223
Q2 71,291 50,372 20,548 70,418 60,097 4,238 + 873 34,427 31,892 2,265 183 87 4,220
Q3 70,218 49,333 20,670 73,782 63,081 4,453 − 3,564 31,412 28,776 2,365 187 84 4,213
Q4 76,136 55,171 20,733 74,016 63,117 4,450 + 2,120 34,088 31,529 2,315 192 53 4,161
2017 Q1 71,301 49,388 21,715 73,731 63,263 4,460 − 2,430 31,660 29,133 2,270 205 52 4,140
Q2 74,581 52,739 21,632 73,785 63,016 4,440 + 796 32,535 30,372 1,901 210 52 4,136
Q3 73,295 51,374 21,738 75,569 64,628 4,560 − 2,274 30,801 28,831 1,701 214 54 4,115
Q4 79,956 57,910 21,790 75,842 64,694 4,562 + 4,114 35,362 33,750 1,335 224 53 4,045
2018 Q1 74,368 51,726 22,489 75,482 64,885 4,569 − 1,114 34,219 32,775 1,146 240 58 4,029
Sources: Federal Ministry of Labour and Social Affairs and German pension insurance sequently. 2 Including financial compensation payments. Excluding investment spend-scheme. * Excluding the German pension insurance scheme for the mining, railway ing and proceeds. 3 Including contributions for recipients of government cash bene-and maritime industries. 1 The final annual figures generally differ from the total of fits. 4 Largely corresponds to the sustainability reserves. End of year or quarter. 5 In-the reported provisional quarterly figures as the latter are not revised sub- cluding cash. 6 Excluding loans to other social security funds.
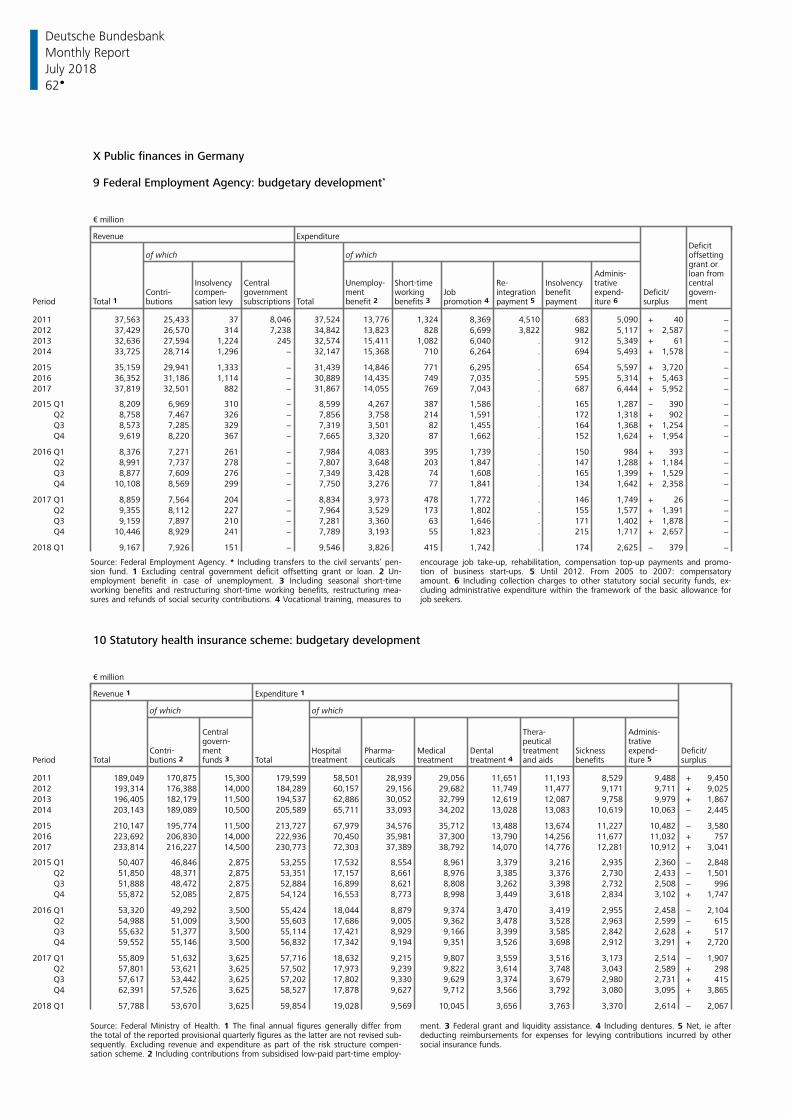
Deutsche Bundesbank
62
Monthly Report
July 2018
X Public finances in Germany 9 Federal Employment Agency: budgetary development*
€ million
Revenue ExpenditureDeficit
of which of which offsettinggrant or
Adminis- loan fromInsolvency Central Unemploy- Short-time Re- Insolvency trative central
Contri- compen- government ment working Job integration benefit expend- Deficit/ govern-Period Total 1 butions sation levy subscriptions Total benefit 2 benefits 3 promotion 4 payment 5 payment iture 6 surplus ment
2011 37,563 25,433 37 8,046 37,524 13,776 1,324 8,369 4,510 683 5,090 + 40 −
2012 37,429 26,570 314 7,238 34,842 13,823 828 6,699 3,822 982 5,117 + 2,587 −
2013 32,636 27,594 1,224 245 32,574 15,411 1,082 6,040 . 912 5,349 + 61 −
2014 33,725 28,714 1,296 − 32,147 15,368 710 6,264 . 694 5,493 + 1,578 −
2015 35,159 29,941 1,333 − 31,439 14,846 771 6,295 . 654 5,597 + 3,720 −
2016 36,352 31,186 1,114 − 30,889 14,435 749 7,035 . 595 5,314 + 5,463 −
2017 37,819 32,501 882 − 31,867 14,055 769 7,043 . 687 6,444 + 5,952 −
2015 Q1 8,209 6,969 310 − 8,599 4,267 387 1,586 . 165 1,287 − 390 −
Q2 8,758 7,467 326 − 7,856 3,758 214 1,591 . 172 1,318 + 902 −
Q3 8,573 7,285 329 − 7,319 3,501 82 1,455 . 164 1,368 + 1,254 −
Q4 9,619 8,220 367 − 7,665 3,320 87 1,662 . 152 1,624 + 1,954 −
2016 Q1 8,376 7,271 261 − 7,984 4,083 395 1,739 . 150 984 + 393 −
Q2 8,991 7,737 278 − 7,807 3,648 203 1,847 . 147 1,288 + 1,184 −
Q3 8,877 7,609 276 − 7,349 3,428 74 1,608 . 165 1,399 + 1,529 −
Q4 10,108 8,569 299 − 7,750 3,276 77 1,841 . 134 1,642 + 2,358 −
2017 Q1 8,859 7,564 204 − 8,834 3,973 478 1,772 . 146 1,749 + 26 −
Q2 9,355 8,112 227 − 7,964 3,529 173 1,802 . 155 1,577 + 1,391 −
Q3 9,159 7,897 210 − 7,281 3,360 63 1,646 . 171 1,402 + 1,878 −
Q4 10,446 8,929 241 − 7,789 3,193 55 1,823 . 215 1,717 + 2,657 −
2018 Q1 9,167 7,926 151 − 9,546 3,826 415 1,742 . 174 2,625 − 379 −
Source: Federal Employment Agency. * Including transfers to the civil servants’ pen- encourage job take-up, rehabilitation, compensation top-up payments and promo-sion fund. 1 Excluding central government deficit offsetting grant or loan. 2 Un- tion of business start-ups. 5 Until 2012. From 2005 to 2007: compensatoryemployment benefit in case of unemployment. 3 Including seasonal short-time amount. 6 Including collection charges to other statutory social security funds, ex-working benefits and restructuring short-time working benefits, restructuring mea- cluding administrative expenditure within the framework of the basic allowance forsures and refunds of social security contributions. 4 Vocational training, measures to job seekers.
10 Statutory health insurance scheme: budgetary development € million
Revenue 1 Expenditure 1
of which of which
Central Thera- Adminis-govern- peutical trative
Contri- ment Hospital Pharma- Medical Dental treatment Sickness expend- Deficit/Period Total butions 2 funds 3 Total treatment ceuticals treatment treatment 4 and aids benefits iture 5 surplus
2011 189,049 170,875 15,300 179,599 58,501 28,939 29,056 11,651 11,193 8,529 9,488 + 9,450
2012 193,314 176,388 14,000 184,289 60,157 29,156 29,682 11,749 11,477 9,171 9,711 + 9,025
2013 196,405 182,179 11,500 194,537 62,886 30,052 32,799 12,619 12,087 9,758 9,979 + 1,867
2014 203,143 189,089 10,500 205,589 65,711 33,093 34,202 13,028 13,083 10,619 10,063 − 2,445
2015 210,147 195,774 11,500 213,727 67,979 34,576 35,712 13,488 13,674 11,227 10,482 − 3,580
2016 223,692 206,830 14,000 222,936 70,450 35,981 37,300 13,790 14,256 11,677 11,032 + 757
2017 233,814 216,227 14,500 230,773 72,303 37,389 38,792 14,070 14,776 12,281 10,912 + 3,041
2015 Q1 50,407 46,846 2,875 53,255 17,532 8,554 8,961 3,379 3,216 2,935 2,360 − 2,848
Q2 51,850 48,371 2,875 53,351 17,157 8,661 8,976 3,385 3,376 2,730 2,433 − 1,501
Q3 51,888 48,472 2,875 52,884 16,899 8,621 8,808 3,262 3,398 2,732 2,508 − 996
Q4 55,872 52,085 2,875 54,124 16,553 8,773 8,998 3,449 3,618 2,834 3,102 + 1,747
2016 Q1 53,320 49,292 3,500 55,424 18,044 8,879 9,374 3,470 3,419 2,955 2,458 − 2,104
Q2 54,988 51,009 3,500 55,603 17,686 9,005 9,362 3,478 3,528 2,963 2,599 − 615
Q3 55,632 51,377 3,500 55,114 17,421 8,929 9,166 3,399 3,585 2,842 2,628 + 517
Q4 59,552 55,146 3,500 56,832 17,342 9,194 9,351 3,526 3,698 2,912 3,291 + 2,720
2017 Q1 55,809 51,632 3,625 57,716 18,632 9,215 9,807 3,559 3,516 3,173 2,514 − 1,907
Q2 57,801 53,621 3,625 57,502 17,973 9,239 9,822 3,614 3,748 3,043 2,589 + 298
Q3 57,617 53,442 3,625 57,202 17,802 9,330 9,629 3,374 3,679 2,980 2,731 + 415
Q4 62,391 57,526 3,625 58,527 17,878 9,627 9,712 3,566 3,792 3,080 3,095 + 3,865
2018 Q1 57,788 53,670 3,625 59,854 19,028 9,569 10,045 3,656 3,763 3,370 2,614 − 2,067
Source: Federal Ministry of Health. 1 The final annual figures generally differ from ment. 3 Federal grant and liquidity assistance. 4 Including dentures. 5 Net, ie afterthe total of the reported provisional quarterly figures as the latter are not revised sub- deducting reimbursements for expenses for levying contributions incurred by othersequently. Excluding revenue and expenditure as part of the risk structure compen- social insurance funds. sation scheme. 2 Including contributions from subsidised low-paid part-time employ-
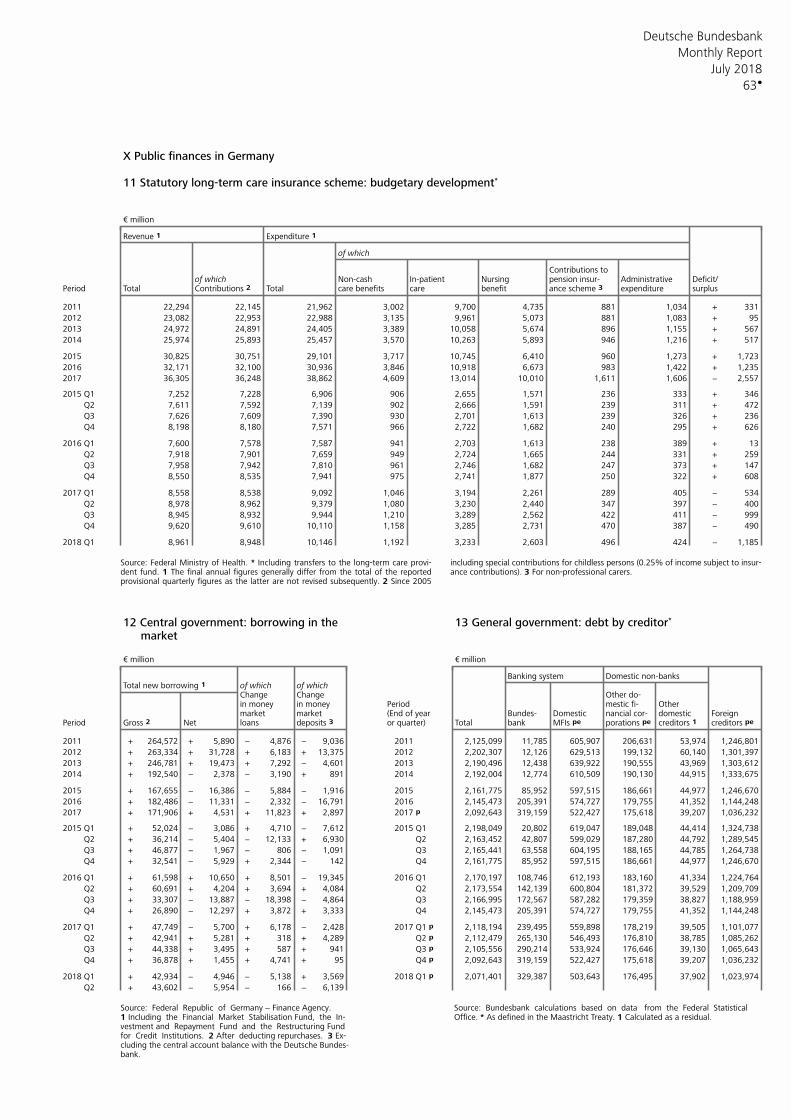
Deutsche Bundesbank
63
Monthly Report
July 2018
X Public finances in Germany 11 Statutory long-term care insurance scheme: budgetary development*
€ million
Revenue 1 Expenditure 1
of which
Contributions toof which Non-cash In-patient Nursing pension insur- Administrative Deficit/
Period Total Contributions 2 Total care benefits care benefit ance scheme 3 expenditure surplus
2011 22,294 22,145 21,962 3,002 9,700 4,735 881 1,034 + 331
2012 23,082 22,953 22,988 3,135 9,961 5,073 881 1,083 + 95
2013 24,972 24,891 24,405 3,389 10,058 5,674 896 1,155 + 567
2014 25,974 25,893 25,457 3,570 10,263 5,893 946 1,216 + 517
2015 30,825 30,751 29,101 3,717 10,745 6,410 960 1,273 + 1,723
2016 32,171 32,100 30,936 3,846 10,918 6,673 983 1,422 + 1,235
2017 36,305 36,248 38,862 4,609 13,014 10,010 1,611 1,606 − 2,557
2015 Q1 7,252 7,228 6,906 906 2,655 1,571 236 333 + 346
Q2 7,611 7,592 7,139 902 2,666 1,591 239 311 + 472
Q3 7,626 7,609 7,390 930 2,701 1,613 239 326 + 236
Q4 8,198 8,180 7,571 966 2,722 1,682 240 295 + 626
2016 Q1 7,600 7,578 7,587 941 2,703 1,613 238 389 + 13
Q2 7,918 7,901 7,659 949 2,724 1,665 244 331 + 259
Q3 7,958 7,942 7,810 961 2,746 1,682 247 373 + 147
Q4 8,550 8,535 7,941 975 2,741 1,877 250 322 + 608
2017 Q1 8,558 8,538 9,092 1,046 3,194 2,261 289 405 − 534
Q2 8,978 8,962 9,379 1,080 3,230 2,440 347 397 − 400
Q3 8,945 8,932 9,944 1,210 3,289 2,562 422 411 − 999
Q4 9,620 9,610 10,110 1,158 3,285 2,731 470 387 − 490
2018 Q1 8,961 8,948 10,146 1,192 3,233 2,603 496 424 − 1,185
Source: Federal Ministry of Health. * Including transfers to the long-term care provi- including special contributions for childless persons (0.25% of income subject to insur-dent fund. 1 The final annual figures generally differ from the total of the reported ance contributions). 3 For non-professional carers. provisional quarterly figures as the latter are not revised subsequently. 2 Since 2005
12 Central government: borrowing in the 13 General government: debt by creditor*
market € million € million
Banking system Domestic non-banksTotal new borrowing 1 of which of which
Change Change Other do-in money in money Period mestic fi- Othermarket market (End of year Bundes- Domestic nancial cor- domestic Foreign
Period Gross 2 Net loans deposits 3 or quarter) Total bank MFIs pe porations pe creditors 1 creditors pe
2011 + 264,572 + 5,890 − 4,876 − 9,036 2011 2,125,099 11,785 605,907 206,631 53,974 1,246,801
2012 + 263,334 + 31,728 + 6,183 + 13,375 2012 2,202,307 12,126 629,513 199,132 60,140 1,301,397
2013 + 246,781 + 19,473 + 7,292 − 4,601 2013 2,190,496 12,438 639,922 190,555 43,969 1,303,612
2014 + 192,540 − 2,378 − 3,190 + 891 2014 2,192,004 12,774 610,509 190,130 44,915 1,333,675
2015 + 167,655 − 16,386 − 5,884 − 1,916 2015 2,161,775 85,952 597,515 186,661 44,977 1,246,670
2016 + 182,486 − 11,331 − 2,332 − 16,791 2016 2,145,473 205,391 574,727 179,755 41,352 1,144,248
2017 + 171,906 + 4,531 + 11,823 + 2,897 2017 p 2,092,643 319,159 522,427 175,618 39,207 1,036,232
2015 Q1 + 52,024 − 3,086 + 4,710 − 7,612 2015 Q1 2,198,049 20,802 619,047 189,048 44,414 1,324,738
Q2 + 36,214 − 5,404 − 12,133 + 6,930 Q2 2,163,452 42,807 599,029 187,280 44,792 1,289,545
Q3 + 46,877 − 1,967 − 806 − 1,091 Q3 2,165,441 63,558 604,195 188,165 44,785 1,264,738
Q4 + 32,541 − 5,929 + 2,344 − 142 Q4 2,161,775 85,952 597,515 186,661 44,977 1,246,670
2016 Q1 + 61,598 + 10,650 + 8,501 − 19,345 2016 Q1 2,170,197 108,746 612,193 183,160 41,334 1,224,764
Q2 + 60,691 + 4,204 + 3,694 + 4,084 Q2 2,173,554 142,139 600,804 181,372 39,529 1,209,709
Q3 + 33,307 − 13,887 − 18,398 − 4,864 Q3 2,166,995 172,567 587,282 179,359 38,827 1,188,959
Q4 + 26,890 − 12,297 + 3,872 + 3,333 Q4 2,145,473 205,391 574,727 179,755 41,352 1,144,248
2017 Q1 + 47,749 − 5,700 + 6,178 − 2,428 2017 Q1 p 2,118,194 239,495 559,898 178,219 39,505 1,101,077
Q2 + 42,941 + 5,281 + 318 + 4,289 Q2 p 2,112,479 265,130 546,493 176,810 38,785 1,085,262
Q3 + 44,338 + 3,495 + 587 + 941 Q3 p 2,105,556 290,214 533,924 176,646 39,130 1,065,643
Q4 + 36,878 + 1,455 + 4,741 + 95 Q4 p 2,092,643 319,159 522,427 175,618 39,207 1,036,232
2018 Q1 + 42,934 − 4,946 − 5,138 + 3,569 2018 Q1 p 2,071,401 329,387 503,643 176,495 37,902 1,023,974
Q2 + 43,602 − 5,954 − 166 − 6,139
Source: Federal Republic of Germany − Finance Agency. Source: Bundesbank calculations based on data from the Federal Statistical 1 Including the Financial Market Stabilisation Fund, the In- Office. * As defined in the Maastricht Treaty. 1 Calculated as a residual. vestment and Repayment Fund and the Restructuring Fund for Credit Institutions. 2 After deducting repurchases. 3 Ex- cluding the central account balance with the Deutsche Bundes- bank.
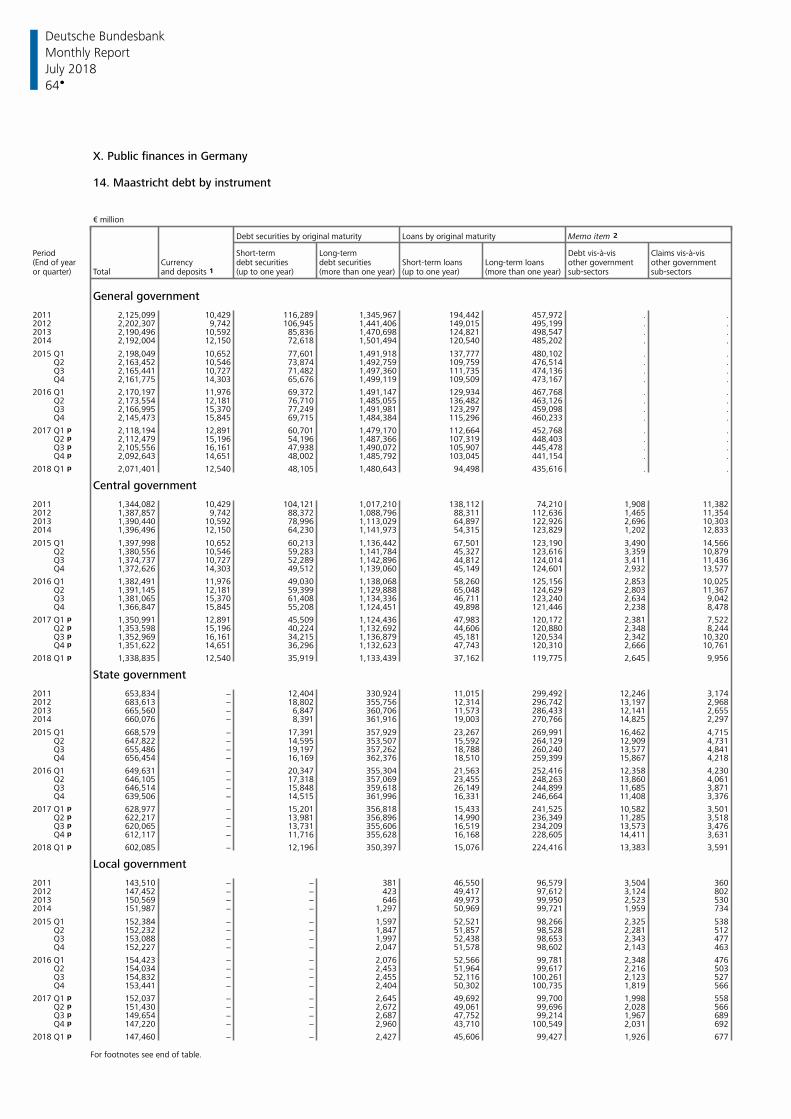
Deutsche Bundesbank
64
Monthly Report
July 2018
X. Public finances in Germany 14. Maastricht debt by instrument € million
Debt securities by original maturity Loans by original maturity Memo item 2
Period Short-term Long-term Debt vis-à-vis Claims vis-à-vis(End of year Currency debt securities debt securities Short-term loans Long-term loans other government other governmentor quarter) Total and deposits 1 (up to one year) (more than one year) (up to one year) (more than one year) sub-sectors sub-sectors
General government
2011 2,125,099 10,429 116,289 1,345,967 194,442 457,972 . .2012 2,202,307 9,742 106,945 1,441,406 149,015 495,199 . .2013 2,190,496 10,592 85,836 1,470,698 124,821 498,547 . .2014 2,192,004 12,150 72,618 1,501,494 120,540 485,202 . .
2015 Q1 2,198,049 10,652 77,601 1,491,918 137,777 480,102 . . Q2 2,163,452 10,546 73,874 1,492,759 109,759 476,514 . . Q3 2,165,441 10,727 71,482 1,497,360 111,735 474,136 . . Q4 2,161,775 14,303 65,676 1,499,119 109,509 473,167 . .
2016 Q1 2,170,197 11,976 69,372 1,491,147 129,934 467,768 . . Q2 2,173,554 12,181 76,710 1,485,055 136,482 463,126 . . Q3 2,166,995 15,370 77,249 1,491,981 123,297 459,098 . . Q4 2,145,473 15,845 69,715 1,484,384 115,296 460,233 . .
2017 Q1 p 2,118,194 12,891 60,701 1,479,170 112,664 452,768 . . Q2 p 2,112,479 15,196 54,196 1,487,366 107,319 448,403 . . Q3 p 2,105,556 16,161 47,938 1,490,072 105,907 445,478 . . Q4 p 2,092,643 14,651 48,002 1,485,792 103,045 441,154 . .
2018 Q1 p 2,071,401 12,540 48,105 1,480,643 94,498 435,616 . .
Central government
2011 1,344,082 10,429 104,121 1,017,210 138,112 74,210 1,908 11,3822012 1,387,857 9,742 88,372 1,088,796 88,311 112,636 1,465 11,3542013 1,390,440 10,592 78,996 1,113,029 64,897 122,926 2,696 10,3032014 1,396,496 12,150 64,230 1,141,973 54,315 123,829 1,202 12,833
2015 Q1 1,397,998 10,652 60,213 1,136,442 67,501 123,190 3,490 14,566 Q2 1,380,556 10,546 59,283 1,141,784 45,327 123,616 3,359 10,879 Q3 1,374,737 10,727 52,289 1,142,896 44,812 124,014 3,411 11,436 Q4 1,372,626 14,303 49,512 1,139,060 45,149 124,601 2,932 13,577
2016 Q1 1,382,491 11,976 49,030 1,138,068 58,260 125,156 2,853 10,025 Q2 1,391,145 12,181 59,399 1,129,888 65,048 124,629 2,803 11,367 Q3 1,381,065 15,370 61,408 1,134,336 46,711 123,240 2,634 9,042 Q4 1,366,847 15,845 55,208 1,124,451 49,898 121,446 2,238 8,478
2017 Q1 p 1,350,991 12,891 45,509 1,124,436 47,983 120,172 2,381 7,522 Q2 p 1,353,598 15,196 40,224 1,132,692 44,606 120,880 2,348 8,244 Q3 p 1,352,969 16,161 34,215 1,136,879 45,181 120,534 2,342 10,320 Q4 p 1,351,622 14,651 36,296 1,132,623 47,743 120,310 2,666 10,761
2018 Q1 p 1,338,835 12,540 35,919 1,133,439 37,162 119,775 2,645 9,956
State government
2011 653,834 − 12,404 330,924 11,015 299,492 12,246 3,1742012 683,613 − 18,802 355,756 12,314 296,742 13,197 2,9682013 665,560 − 6,847 360,706 11,573 286,433 12,141 2,6552014 660,076 − 8,391 361,916 19,003 270,766 14,825 2,297
2015 Q1 668,579 − 17,391 357,929 23,267 269,991 16,462 4,715 Q2 647,822 − 14,595 353,507 15,592 264,129 12,909 4,731 Q3 655,486 − 19,197 357,262 18,788 260,240 13,577 4,841 Q4 656,454 − 16,169 362,376 18,510 259,399 15,867 4,218
2016 Q1 649,631 − 20,347 355,304 21,563 252,416 12,358 4,230 Q2 646,105 − 17,318 357,069 23,455 248,263 13,860 4,061 Q3 646,514 − 15,848 359,618 26,149 244,899 11,685 3,871 Q4 639,506 − 14,515 361,996 16,331 246,664 11,408 3,376
2017 Q1 p 628,977 − 15,201 356,818 15,433 241,525 10,582 3,501 Q2 p 622,217 − 13,981 356,896 14,990 236,349 11,285 3,518 Q3 p 620,065 − 13,731 355,606 16,519 234,209 13,573 3,476 Q4 p 612,117 − 11,716 355,628 16,168 228,605 14,411 3,631
2018 Q1 p 602,085 − 12,196 350,397 15,076 224,416 13,383 3,591
Local government
2011 143,510 − − 381 46,550 96,579 3,504 3602012 147,452 − − 423 49,417 97,612 3,124 8022013 150,569 − − 646 49,973 99,950 2,523 5302014 151,987 − − 1,297 50,969 99,721 1,959 734
2015 Q1 152,384 − − 1,597 52,521 98,266 2,325 538 Q2 152,232 − − 1,847 51,857 98,528 2,281 512 Q3 153,088 − − 1,997 52,438 98,653 2,343 477 Q4 152,227 − − 2,047 51,578 98,602 2,143 463
2016 Q1 154,423 − − 2,076 52,566 99,781 2,348 476 Q2 154,034 − − 2,453 51,964 99,617 2,216 503 Q3 154,832 − − 2,455 52,116 100,261 2,123 527 Q4 153,441 − − 2,404 50,302 100,735 1,819 566
2017 Q1 p 152,037 − − 2,645 49,692 99,700 1,998 558 Q2 p 151,430 − − 2,672 49,061 99,696 2,028 566 Q3 p 149,654 − − 2,687 47,752 99,214 1,967 689 Q4 p 147,220 − − 2,960 43,710 100,549 2,031 692
2018 Q1 p 147,460 − − 2,427 45,606 99,427 1,926 677
For footnotes see end of table.
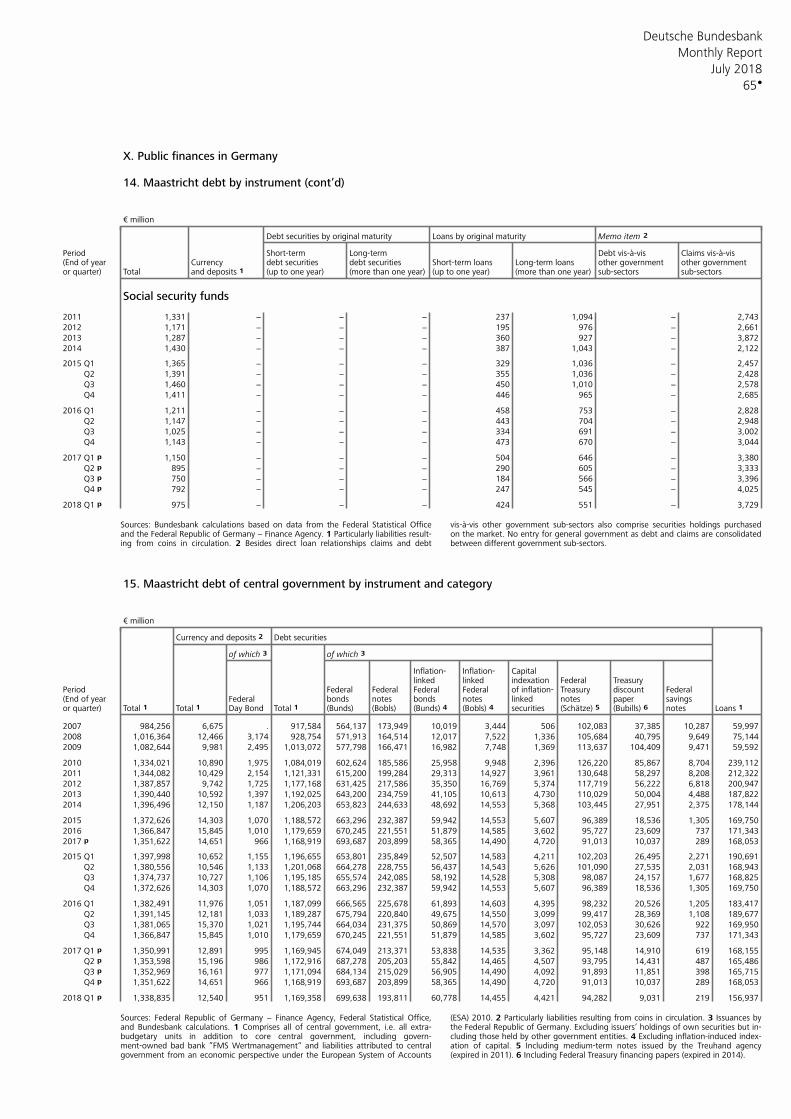
Deutsche Bundesbank
65
Monthly Report
July 2018
X. Public finances in Germany 14. Maastricht debt by instrument (cont’d) € million
Debt securities by original maturity Loans by original maturity Memo item 2
Period Short-term Long-term Debt vis-à-vis Claims vis-à-vis(End of year Currency debt securities debt securities Short-term loans Long-term loans other government other governmentor quarter) Total and deposits 1 (up to one year) (more than one year) (up to one year) (more than one year) sub-sectors sub-sectors
Social security funds
2011 1,331 − − − 237 1,094 − 2,743
2012 1,171 − − − 195 976 − 2,661
2013 1,287 − − − 360 927 − 3,872
2014 1,430 − − − 387 1,043 − 2,122
2015 Q1 1,365 − − − 329 1,036 − 2,457
Q2 1,391 − − − 355 1,036 − 2,428
Q3 1,460 − − − 450 1,010 − 2,578
Q4 1,411 − − − 446 965 − 2,685
2016 Q1 1,211 − − − 458 753 − 2,828
Q2 1,147 − − − 443 704 − 2,948
Q3 1,025 − − − 334 691 − 3,002
Q4 1,143 − − − 473 670 − 3,044
2017 Q1 p 1,150 − − − 504 646 − 3,380
Q2 p 895 − − − 290 605 − 3,333
Q3 p 750 − − − 184 566 − 3,396
Q4 p 792 − − − 247 545 − 4,025
2018 Q1 p 975 − − − 424 551 − 3,729
Sources: Bundesbank calculations based on data from the Federal Statistical Office vis-à-vis other government sub-sectors also comprise securities holdings purchasedand the Federal Republic of Germany − Finance Agency. 1 Particularly liabilities result- on the market. No entry for general government as debt and claims are consolidateding from coins in circulation. 2 Besides direct loan relationships claims and debt between different government sub-sectors.
15. Maastricht debt of central government by instrument and category € million
Currency and deposits 2 Debt securities
of which 3of which 3
Inflation- Inflation- Capitallinked linked indexation Federal Treasury
Period Federal Federal Federal Federal Treasury discount Federalof inflation-(End of year Federal bonds notes bonds notes linked notes paper savingsor quarter) Total 1 Total 1 Day Bond Total 1 (Bunds) (Bobls) (Bunds) 4 (Bobls) 4 securities (Schätze) 5 (Bubills) 6 notes Loans 1
2007 984,256 6,675 . 917,584 564,137 173,949 10,019 3,444 506 102,083 37,385 10,287 59,997
2008 1,016,364 12,466 3,174 928,754 571,913 164,514 12,017 7,522 1,336 105,684 40,795 9,649 75,144
2009 1,082,644 9,981 2,495 1,013,072 577,798 166,471 16,982 7,748 1,369 113,637 104,409 9,471 59,592
2010 1,334,021 10,890 1,975 1,084,019 602,624 185,586 25,958 9,948 2,396 126,220 85,867 8,704 239,112
2011 1,344,082 10,429 2,154 1,121,331 615,200 199,284 29,313 14,927 3,961 130,648 58,297 8,208 212,322
2012 1,387,857 9,742 1,725 1,177,168 631,425 217,586 35,350 16,769 5,374 117,719 56,222 6,818 200,947
2013 1,390,440 10,592 1,397 1,192,025 643,200 234,759 41,105 10,613 4,730 110,029 50,004 4,488 187,822
2014 1,396,496 12,150 1,187 1,206,203 653,823 244,633 48,692 14,553 5,368 103,445 27,951 2,375 178,144
2015 1,372,626 14,303 1,070 1,188,572 663,296 232,387 59,942 14,553 5,607 96,389 18,536 1,305 169,750
2016 1,366,847 15,845 1,010 1,179,659 670,245 221,551 51,879 14,585 3,602 95,727 23,609 737 171,343
2017 p 1,351,622 14,651 966 1,168,919 693,687 203,899 58,365 14,490 4,720 91,013 10,037 289 168,053
2015 Q1 1,397,998 10,652 1,155 1,196,655 653,801 235,849 52,507 14,583 4,211 102,203 26,495 2,271 190,691
Q2 1,380,556 10,546 1,133 1,201,068 664,278 228,755 56,437 14,543 5,626 101,090 27,535 2,031 168,943
Q3 1,374,737 10,727 1,106 1,195,185 655,574 242,085 58,192 14,528 5,308 98,087 24,157 1,677 168,825
Q4 1,372,626 14,303 1,070 1,188,572 663,296 232,387 59,942 14,553 5,607 96,389 18,536 1,305 169,750
2016 Q1 1,382,491 11,976 1,051 1,187,099 666,565 225,678 61,893 14,603 4,395 98,232 20,526 1,205 183,417
Q2 1,391,145 12,181 1,033 1,189,287 675,794 220,840 49,675 14,550 3,099 99,417 28,369 1,108 189,677
Q3 1,381,065 15,370 1,021 1,195,744 664,034 231,375 50,869 14,570 3,097 102,053 30,626 922 169,950
Q4 1,366,847 15,845 1,010 1,179,659 670,245 221,551 51,879 14,585 3,602 95,727 23,609 737 171,343
2017 Q1 p 1,350,991 12,891 995 1,169,945 674,049 213,371 53,838 14,535 3,362 95,148 14,910 619 168,155
Q2 p 1,353,598 15,196 986 1,172,916 687,278 205,203 55,842 14,465 4,507 93,795 14,431 487 165,486
Q3 p 1,352,969 16,161 977 1,171,094 684,134 215,029 56,905 14,490 4,092 91,893 11,851 398 165,715
Q4 p 1,351,622 14,651 966 1,168,919 693,687 203,899 58,365 14,490 4,720 91,013 10,037 289 168,053
2018 Q1 p 1,338,835 12,540 951 1,169,358 699,638 193,811 60,778 14,455 4,421 94,282 9,031 219 156,937
Sources: Federal Republic of Germany − Finance Agency, Federal Statistical Office, (ESA) 2010. 2 Particularly liabilities resulting from coins in circulation. 3 Issuances byand Bundesbank calculations. 1 Comprises all of central government, i.e. all extra- the Federal Republic of Germany. Excluding issuers’ holdings of own securities but in-budgetary units in addition to core central government, including govern- cluding those held by other government entities. 4 Excluding inflation-induced index-ment-owned bad bank ”FMS Wertmanagement“ and liabilities attributed to central ation of capital. 5 Including medium-term notes issued by the Treuhand agencygovernment from an economic perspective under the European System of Accounts (expired in 2011). 6 Including Federal Treasury financing papers (expired in 2014).
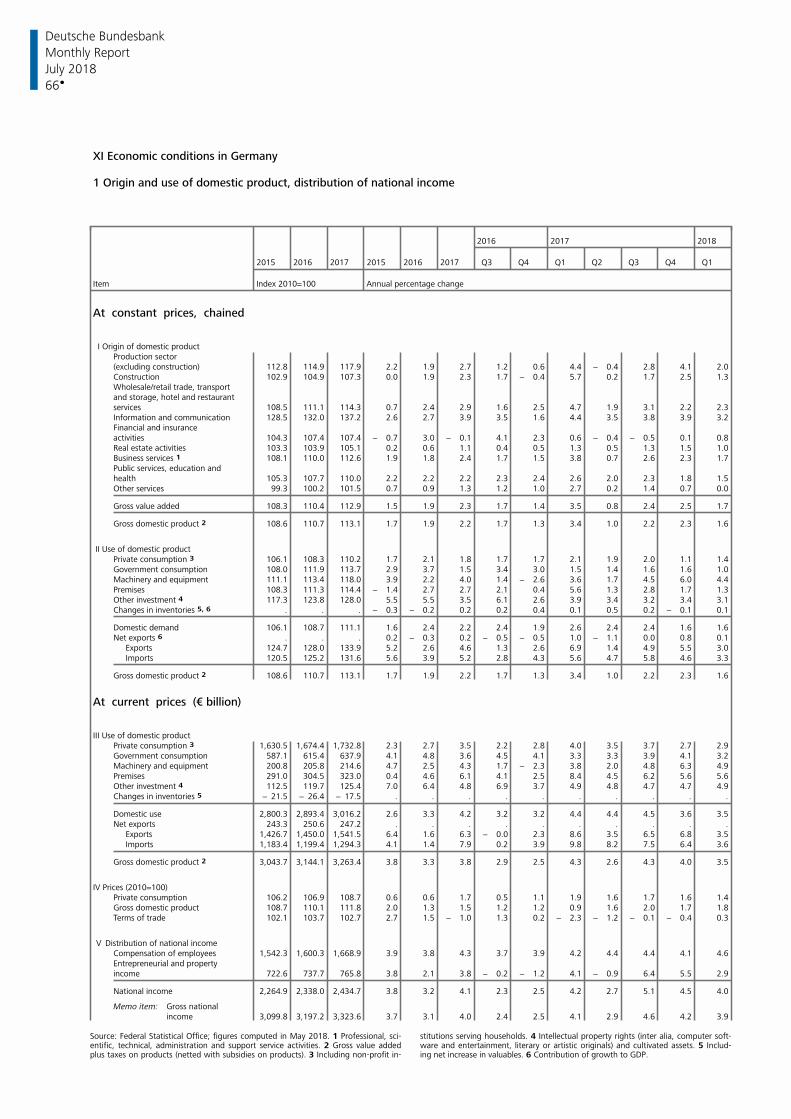
Deutsche Bundesbank
66
Monthly Report
July 2018
XI Economic conditions in Germany
1 Origin and use of domestic product, distribution of national income
2016 2017 2018
2015 2016 2017 2015 2016 2017 Q3 Q4 Q1 Q2 Q3 Q4 Q1
Item Index 2010=100 Annual percentage change
At constant prices, chained
I Origin of domestic productProduction sector(excluding construction) 112.8 114.9 117.9 2.2 1.9 2.7 1.2 0.6 4.4 − 0.4 2.8 4.1 2.0Construction 102.9 104.9 107.3 0.0 1.9 2.3 1.7 − 0.4 5.7 0.2 1.7 2.5 1.3Wholesale/retail trade, transportand storage, hotel and restaurantservices 108.5 111.1 114.3 0.7 2.4 2.9 1.6 2.5 4.7 1.9 3.1 2.2 2.3Information and communication 128.5 132.0 137.2 2.6 2.7 3.9 3.5 1.6 4.4 3.5 3.8 3.9 3.2Financial and insuranceactivities 104.3 107.4 107.4 − 0.7 3.0 − 0.1 4.1 2.3 0.6 − 0.4 − 0.5 0.1 0.8Real estate activities 103.3 103.9 105.1 0.2 0.6 1.1 0.4 0.5 1.3 0.5 1.3 1.5 1.0Business services 1 108.1 110.0 112.6 1.9 1.8 2.4 1.7 1.5 3.8 0.7 2.6 2.3 1.7Public services, education andhealth 105.3 107.7 110.0 2.2 2.2 2.2 2.3 2.4 2.6 2.0 2.3 1.8 1.5Other services 99.3 100.2 101.5 0.7 0.9 1.3 1.2 1.0 2.7 0.2 1.4 0.7 0.0
Gross value added 108.3 110.4 112.9 1.5 1.9 2.3 1.7 1.4 3.5 0.8 2.4 2.5 1.7
Gross domestic product 2 108.6 110.7 113.1 1.7 1.9 2.2 1.7 1.3 3.4 1.0 2.2 2.3 1.6
II Use of domestic productPrivate consumption 3 106.1 108.3 110.2 1.7 2.1 1.8 1.7 1.7 2.1 1.9 2.0 1.1 1.4Government consumption 108.0 111.9 113.7 2.9 3.7 1.5 3.4 3.0 1.5 1.4 1.6 1.6 1.0Machinery and equipment 111.1 113.4 118.0 3.9 2.2 4.0 1.4 − 2.6 3.6 1.7 4.5 6.0 4.4Premises 108.3 111.3 114.4 − 1.4 2.7 2.7 2.1 0.4 5.6 1.3 2.8 1.7 1.3Other investment 4 117.3 123.8 128.0 5.5 5.5 3.5 6.1 2.6 3.9 3.4 3.2 3.4 3.1Changes in inventories 5, 6 . . . − 0.3 − 0.2 0.2 0.2 0.4 0.1 0.5 0.2 − 0.1 0.1
Domestic demand 106.1 108.7 111.1 1.6 2.4 2.2 2.4 1.9 2.6 2.4 2.4 1.6 1.6Net exports 6 . . . 0.2 − 0.3 0.2 − 0.5 − 0.5 1.0 − 1.1 0.0 0.8 0.1
Exports 124.7 128.0 133.9 5.2 2.6 4.6 1.3 2.6 6.9 1.4 4.9 5.5 3.0Imports 120.5 125.2 131.6 5.6 3.9 5.2 2.8 4.3 5.6 4.7 5.8 4.6 3.3
Gross domestic product 2 108.6 110.7 113.1 1.7 1.9 2.2 1.7 1.3 3.4 1.0 2.2 2.3 1.6
At current prices (€ billion)
III Use of domestic productPrivate consumption 3 1,630.5 1,674.4 1,732.8 2.3 2.7 3.5 2.2 2.8 4.0 3.5 3.7 2.7 2.9Government consumption 587.1 615.4 637.9 4.1 4.8 3.6 4.5 4.1 3.3 3.3 3.9 4.1 3.2Machinery and equipment 200.8 205.8 214.6 4.7 2.5 4.3 1.7 − 2.3 3.8 2.0 4.8 6.3 4.9Premises 291.0 304.5 323.0 0.4 4.6 6.1 4.1 2.5 8.4 4.5 6.2 5.6 5.6Other investment 4 112.5 119.7 125.4 7.0 6.4 4.8 6.9 3.7 4.9 4.8 4.7 4.7 4.9Changes in inventories 5 − 21.5 − 26.4 − 17.5 . . . . . . . . . .
Domestic use 2,800.3 2,893.4 3,016.2 2.6 3.3 4.2 3.2 3.2 4.4 4.4 4.5 3.6 3.5Net exports 243.3 250.6 247.2 . . . . . . . . . .
Exports 1,426.7 1,450.0 1,541.5 6.4 1.6 6.3 − 0.0 2.3 8.6 3.5 6.5 6.8 3.5Imports 1,183.4 1,199.4 1,294.3 4.1 1.4 7.9 0.2 3.9 9.8 8.2 7.5 6.4 3.6
Gross domestic product 2 3,043.7 3,144.1 3,263.4 3.8 3.3 3.8 2.9 2.5 4.3 2.6 4.3 4.0 3.5
IV Prices (2010=100)Private consumption 106.2 106.9 108.7 0.6 0.6 1.7 0.5 1.1 1.9 1.6 1.7 1.6 1.4Gross domestic product 108.7 110.1 111.8 2.0 1.3 1.5 1.2 1.2 0.9 1.6 2.0 1.7 1.8Terms of trade 102.1 103.7 102.7 2.7 1.5 − 1.0 1.3 0.2 − 2.3 − 1.2 − 0.1 − 0.4 0.3
V Distribution of national incomeCompensation of employees 1,542.3 1,600.3 1,668.9 3.9 3.8 4.3 3.7 3.9 4.2 4.4 4.4 4.1 4.6Entrepreneurial and propertyincome 722.6 737.7 765.8 3.8 2.1 3.8 − 0.2 − 1.2 4.1 − 0.9 6.4 5.5 2.9
National income 2,264.9 2,338.0 2,434.7 3.8 3.2 4.1 2.3 2.5 4.2 2.7 5.1 4.5 4.0
Memo item: Gross nationalincome 3,099.8 3,197.2 3,323.6 3.7 3.1 4.0 2.4 2.5 4.1 2.9 4.6 4.2 3.9
Source: Federal Statistical Office; figures computed in May 2018. 1 Professional, sci- stitutions serving households. 4 Intellectual property rights (inter alia, computer soft-entific, technical, administration and support service activities. 2 Gross value added ware and entertainment, literary or artistic originals) and cultivated assets. 5 Includ-plus taxes on products (netted with subsidies on products). 3 Including non-profit in- ing net increase in valuables. 6 Contribution of growth to GDP.
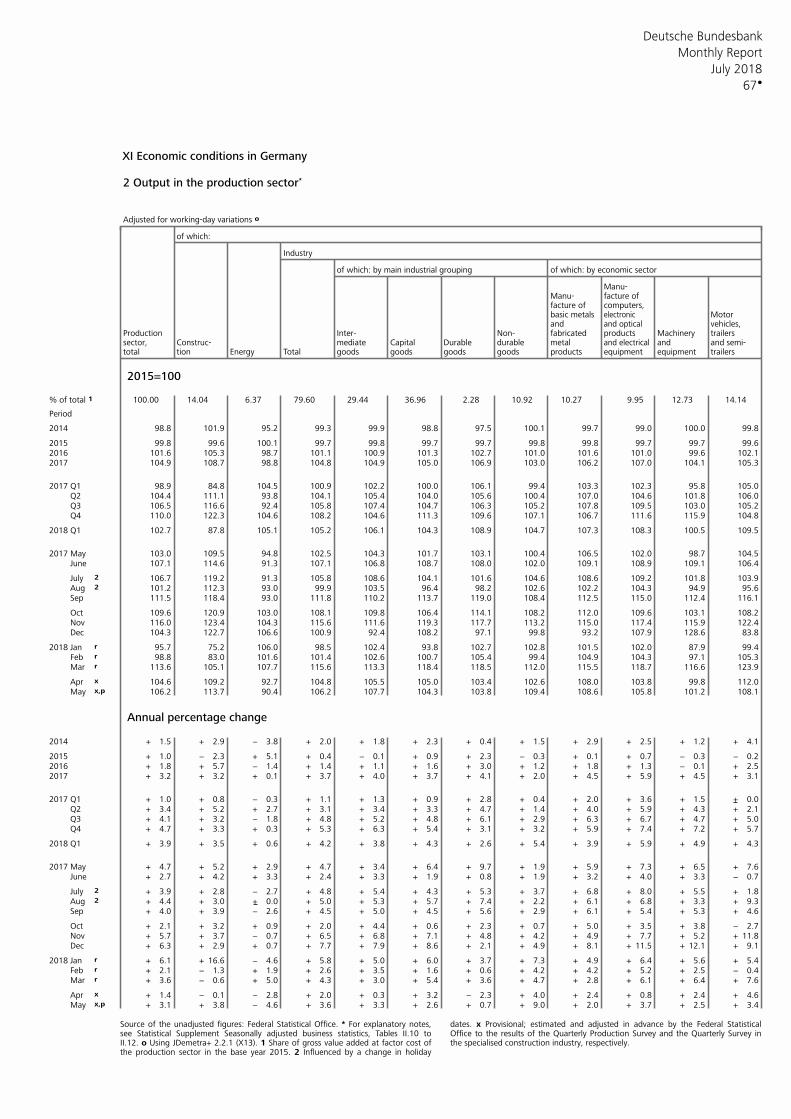
Deutsche Bundesbank
67
Monthly Report
July 2018
XI Economic conditions in Germany
2 Output in the production sector*
Adjusted for working-day variations o
of which:
Industry
of which: by main industrial grouping of which: by economic sector
Manu-Manu- facture offacture of computers,basic metals Motorelectronicand vehicles,and optical
Production Inter- Non- fabricated products Machinery trailerssector, Construc- mediate Capital Durable durable metal and and semi-and electricaltotal tion Energy Total goods goods goods goods products equipment equipment trailers
2015=100
% of total 1 100.00 14.04 6.37 79.60 29.44 36.96 2.28 10.92 10.27 9.95 12.73 14.14
Period
2014 98.8 101.9 95.2 99.3 99.9 98.8 97.5 100.1 99.7 99.0 100.0 99.8
2015 99.8 99.6 100.1 99.7 99.8 99.7 99.7 99.8 99.8 99.7 99.7 99.62016 101.6 105.3 98.7 101.1 100.9 101.3 102.7 101.0 101.6 101.0 99.6 102.12017 104.9 108.7 98.8 104.8 104.9 105.0 106.9 103.0 106.2 107.0 104.1 105.3
2017 Q1 98.9 84.8 104.5 100.9 102.2 100.0 106.1 99.4 103.3 102.3 95.8 105.0 Q2 104.4 111.1 93.8 104.1 105.4 104.0 105.6 100.4 107.0 104.6 101.8 106.0 Q3 106.5 116.6 92.4 105.8 107.4 104.7 106.3 105.2 107.8 109.5 103.0 105.2 Q4 110.0 122.3 104.6 108.2 104.6 111.3 109.6 107.1 106.7 111.6 115.9 104.8
2018 Q1 102.7 87.8 105.1 105.2 106.1 104.3 108.9 104.7 107.3 108.3 100.5 109.5
2017 May 103.0 109.5 94.8 102.5 104.3 101.7 103.1 100.4 106.5 102.0 98.7 104.5 June 107.1 114.6 91.3 107.1 106.8 108.7 108.0 102.0 109.1 108.9 109.1 106.4
July 2 106.7 119.2 91.3 105.8 108.6 104.1 101.6 104.6 108.6 109.2 101.8 103.9 Aug 2 101.2 112.3 93.0 99.9 103.5 96.4 98.2 102.6 102.2 104.3 94.9 95.6 Sep 111.5 118.4 93.0 111.8 110.2 113.7 119.0 108.4 112.5 115.0 112.4 116.1
Oct 109.6 120.9 103.0 108.1 109.8 106.4 114.1 108.2 112.0 109.6 103.1 108.2 Nov 116.0 123.4 104.3 115.6 111.6 119.3 117.7 113.2 115.0 117.4 115.9 122.4 Dec 104.3 122.7 106.6 100.9 92.4 108.2 97.1 99.8 93.2 107.9 128.6 83.8
2018 Jan r 95.7 75.2 106.0 98.5 102.4 93.8 102.7 102.8 101.5 102.0 87.9 99.4 Feb r 98.8 83.0 101.6 101.4 102.6 100.7 105.4 99.4 104.9 104.3 97.1 105.3 Mar r 113.6 105.1 107.7 115.6 113.3 118.4 118.5 112.0 115.5 118.7 116.6 123.9
Apr x 104.6 109.2 92.7 104.8 105.5 105.0 103.4 102.6 108.0 103.8 99.8 112.0 May x,p 106.2 113.7 90.4 106.2 107.7 104.3 103.8 109.4 108.6 105.8 101.2 108.1
Annual percentage change
2014 + 1.5 + 2.9 − 3.8 + 2.0 + 1.8 + 2.3 + 0.4 + 1.5 + 2.9 + 2.5 + 1.2 + 4.1
2015 + 1.0 − 2.3 + 5.1 + 0.4 − 0.1 + 0.9 + 2.3 − 0.3 + 0.1 + 0.7 − 0.3 − 0.22016 + 1.8 + 5.7 − 1.4 + 1.4 + 1.1 + 1.6 + 3.0 + 1.2 + 1.8 + 1.3 − 0.1 + 2.52017 + 3.2 + 3.2 + 0.1 + 3.7 + 4.0 + 3.7 + 4.1 + 2.0 + 4.5 + 5.9 + 4.5 + 3.1
2017 Q1 + 1.0 + 0.8 − 0.3 + 1.1 + 1.3 + 0.9 + 2.8 + 0.4 + 2.0 + 3.6 + 1.5 + 0.0 Q2 + 3.4 + 5.2 + 2.7 + 3.1 + 3.4 + 3.3 + 4.7 + 1.4 + 4.0 + 5.9 + 4.3 + 2.1 Q3 + 4.1 + 3.2 − 1.8 + 4.8 + 5.2 + 4.8 + 6.1 + 2.9 + 6.3 + 6.7 + 4.7 + 5.0 Q4 + 4.7 + 3.3 + 0.3 + 5.3 + 6.3 + 5.4 + 3.1 + 3.2 + 5.9 + 7.4 + 7.2 + 5.7
2018 Q1 + 3.9 + 3.5 + 0.6 + 4.2 + 3.8 + 4.3 + 2.6 + 5.4 + 3.9 + 5.9 + 4.9 + 4.3
2017 May + 4.7 + 5.2 + 2.9 + 4.7 + 3.4 + 6.4 + 9.7 + 1.9 + 5.9 + 7.3 + 6.5 + 7.6 June + 2.7 + 4.2 + 3.3 + 2.4 + 3.3 + 1.9 + 0.8 + 1.9 + 3.2 + 4.0 + 3.3 − 0.7
July 2 + 3.9 + 2.8 − 2.7 + 4.8 + 5.4 + 4.3 + 5.3 + 3.7 + 6.8 + 8.0 + 5.5 + 1.8 Aug 2 + 4.4 + 3.0 + 0.0 + 5.0 + 5.3 + 5.7 + 7.4 + 2.2 + 6.1 + 6.8 + 3.3 + 9.3 Sep + 4.0 + 3.9 − 2.6 + 4.5 + 5.0 + 4.5 + 5.6 + 2.9 + 6.1 + 5.4 + 5.3 + 4.6
Oct + 2.1 + 3.2 + 0.9 + 2.0 + 4.4 + 0.6 + 2.3 + 0.7 + 5.0 + 3.5 + 3.8 − 2.7 Nov + 5.7 + 3.7 − 0.7 + 6.5 + 6.8 + 7.1 + 4.8 + 4.2 + 4.9 + 7.7 + 5.2 + 11.8 Dec + 6.3 + 2.9 + 0.7 + 7.7 + 7.9 + 8.6 + 2.1 + 4.9 + 8.1 + 11.5 + 12.1 + 9.1
2018 Jan r + 6.1 + 16.6 − 4.6 + 5.8 + 5.0 + 6.0 + 3.7 + 7.3 + 4.9 + 6.4 + 5.6 + 5.4 Feb r + 2.1 − 1.3 + 1.9 + 2.6 + 3.5 + 1.6 + 0.6 + 4.2 + 4.2 + 5.2 + 2.5 − 0.4 Mar r + 3.6 − 0.6 + 5.0 + 4.3 + 3.0 + 5.4 + 3.6 + 4.7 + 2.8 + 6.1 + 6.4 + 7.6
Apr x + 1.4 − 0.1 − 2.8 + 2.0 + 0.3 + 3.2 − 2.3 + 4.0 + 2.4 + 0.8 + 2.4 + 4.6 May x,p + 3.1 + 3.8 − 4.6 + 3.6 + 3.3 + 2.6 + 0.7 + 9.0 + 2.0 + 3.7 + 2.5 + 3.4
Source of the unadjusted figures: Federal Statistical Office. * For explanatory notes, dates. x Provisional; estimated and adjusted in advance by the Federal Statisticalsee Statistical Supplement Seasonally adjusted business statistics, Tables II.10 to Office to the results of the Quarterly Production Survey and the Quarterly Survey inII.12. o Using JDemetra+ 2.2.1 (X13). 1 Share of gross value added at factor cost of the specialised construction industry, respectively. the production sector in the base year 2015. 2 Influenced by a change in holiday
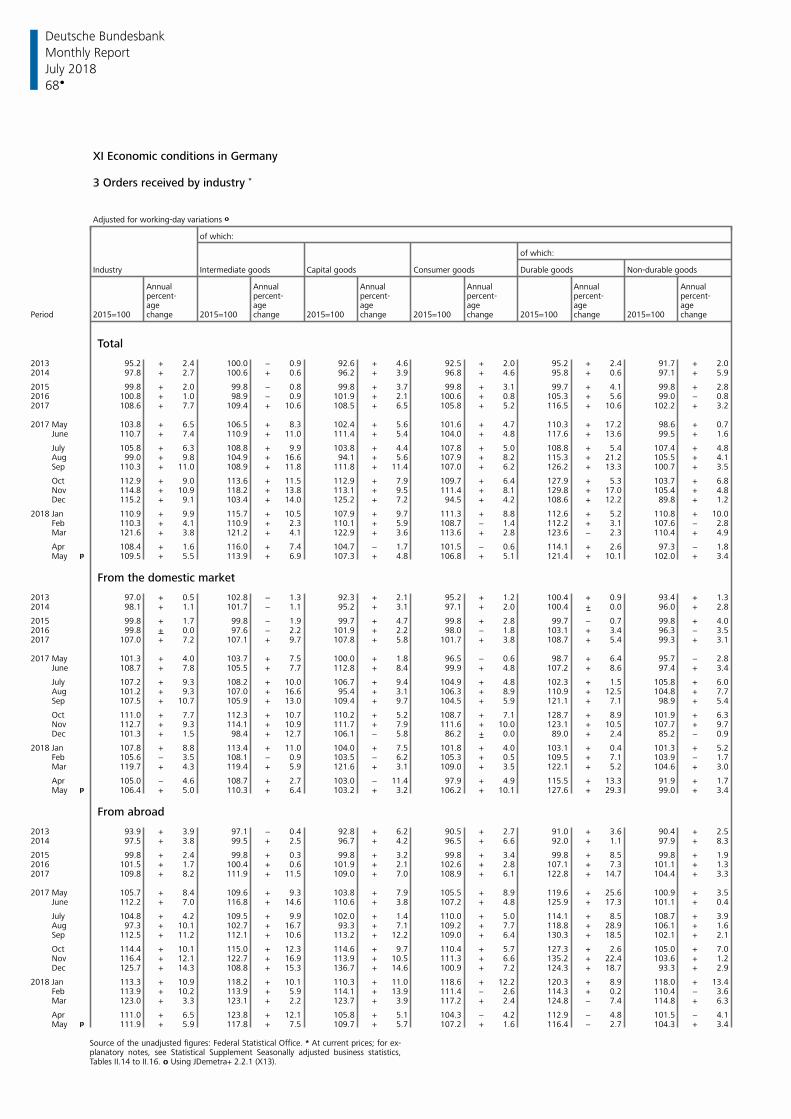
Deutsche Bundesbank
68
Monthly Report
July 2018
XI Economic conditions in Germany 3 Orders received by industry *
Adjusted for working-day variations o
of which:
of which:
Industry Intermediate goods Capital goods Consumer goods Durable goods Non-durable goods
Annual Annual Annual Annual Annual Annualpercent- percent- percent- percent- percent- percent-age age age age age age
Period 2015=100 change 2015=100 change 2015=100 change 2015=100 change 2015=100 change 2015=100 change
Total
2013 95.2 + 2.4 100.0 − 0.9 92.6 + 4.6 92.5 + 2.0 95.2 + 2.4 91.7 + 2.02014 97.8 + 2.7 100.6 + 0.6 96.2 + 3.9 96.8 + 4.6 95.8 + 0.6 97.1 + 5.9
2015 99.8 + 2.0 99.8 − 0.8 99.8 + 3.7 99.8 + 3.1 99.7 + 4.1 99.8 + 2.82016 100.8 + 1.0 98.9 − 0.9 101.9 + 2.1 100.6 + 0.8 105.3 + 5.6 99.0 − 0.82017 108.6 + 7.7 109.4 + 10.6 108.5 + 6.5 105.8 + 5.2 116.5 + 10.6 102.2 + 3.2
2017 May 103.8 + 6.5 106.5 + 8.3 102.4 + 5.6 101.6 + 4.7 110.3 + 17.2 98.6 + 0.7 June 110.7 + 7.4 110.9 + 11.0 111.4 + 5.4 104.0 + 4.8 117.6 + 13.6 99.5 + 1.6
July 105.8 + 6.3 108.8 + 9.9 103.8 + 4.4 107.8 + 5.0 108.8 + 5.4 107.4 + 4.8 Aug 99.0 + 9.8 104.9 + 16.6 94.1 + 5.6 107.9 + 8.2 115.3 + 21.2 105.5 + 4.1 Sep 110.3 + 11.0 108.9 + 11.8 111.8 + 11.4 107.0 + 6.2 126.2 + 13.3 100.7 + 3.5
Oct 112.9 + 9.0 113.6 + 11.5 112.9 + 7.9 109.7 + 6.4 127.9 + 5.3 103.7 + 6.8 Nov 114.8 + 10.9 118.2 + 13.8 113.1 + 9.5 111.4 + 8.1 129.8 + 17.0 105.4 + 4.8 Dec 115.2 + 9.1 103.4 + 14.0 125.2 + 7.2 94.5 + 4.2 108.6 + 12.2 89.8 + 1.2
2018 Jan 110.9 + 9.9 115.7 + 10.5 107.9 + 9.7 111.3 + 8.8 112.6 + 5.2 110.8 + 10.0 Feb 110.3 + 4.1 110.9 + 2.3 110.1 + 5.9 108.7 − 1.4 112.2 + 3.1 107.6 − 2.8 Mar 121.6 + 3.8 121.2 + 4.1 122.9 + 3.6 113.6 + 2.8 123.6 − 2.3 110.4 + 4.9
Apr 108.4 + 1.6 116.0 + 7.4 104.7 − 1.7 101.5 − 0.6 114.1 + 2.6 97.3 − 1.8 May p 109.5 + 5.5 113.9 + 6.9 107.3 + 4.8 106.8 + 5.1 121.4 + 10.1 102.0 + 3.4
From the domestic market
2013 97.0 + 0.5 102.8 − 1.3 92.3 + 2.1 95.2 + 1.2 100.4 + 0.9 93.4 + 1.32014 98.1 + 1.1 101.7 − 1.1 95.2 + 3.1 97.1 + 2.0 100.4 + 0.0 96.0 + 2.8
2015 99.8 + 1.7 99.8 − 1.9 99.7 + 4.7 99.8 + 2.8 99.7 − 0.7 99.8 + 4.02016 99.8 + 0.0 97.6 − 2.2 101.9 + 2.2 98.0 − 1.8 103.1 + 3.4 96.3 − 3.52017 107.0 + 7.2 107.1 + 9.7 107.8 + 5.8 101.7 + 3.8 108.7 + 5.4 99.3 + 3.1
2017 May 101.3 + 4.0 103.7 + 7.5 100.0 + 1.8 96.5 − 0.6 98.7 + 6.4 95.7 − 2.8 June 108.7 + 7.8 105.5 + 7.7 112.8 + 8.4 99.9 + 4.8 107.2 + 8.6 97.4 + 3.4
July 107.2 + 9.3 108.2 + 10.0 106.7 + 9.4 104.9 + 4.8 102.3 + 1.5 105.8 + 6.0 Aug 101.2 + 9.3 107.0 + 16.6 95.4 + 3.1 106.3 + 8.9 110.9 + 12.5 104.8 + 7.7 Sep 107.5 + 10.7 105.9 + 13.0 109.4 + 9.7 104.5 + 5.9 121.1 + 7.1 98.9 + 5.4
Oct 111.0 + 7.7 112.3 + 10.7 110.2 + 5.2 108.7 + 7.1 128.7 + 8.9 101.9 + 6.3 Nov 112.7 + 9.3 114.1 + 10.9 111.7 + 7.9 111.6 + 10.0 123.1 + 10.5 107.7 + 9.7 Dec 101.3 + 1.5 98.4 + 12.7 106.1 − 5.8 86.2 + 0.0 89.0 + 2.4 85.2 − 0.9
2018 Jan 107.8 + 8.8 113.4 + 11.0 104.0 + 7.5 101.8 + 4.0 103.1 + 0.4 101.3 + 5.2 Feb 105.6 − 3.5 108.1 − 0.9 103.5 − 6.2 105.3 + 0.5 109.5 + 7.1 103.9 − 1.7 Mar 119.7 + 4.3 119.4 + 5.9 121.6 + 3.1 109.0 + 3.5 122.1 + 5.2 104.6 + 3.0
Apr 105.0 − 4.6 108.7 + 2.7 103.0 − 11.4 97.9 + 4.9 115.5 + 13.3 91.9 + 1.7 May p 106.4 + 5.0 110.3 + 6.4 103.2 + 3.2 106.2 + 10.1 127.6 + 29.3 99.0 + 3.4
From abroad
2013 93.9 + 3.9 97.1 − 0.4 92.8 + 6.2 90.5 + 2.7 91.0 + 3.6 90.4 + 2.52014 97.5 + 3.8 99.5 + 2.5 96.7 + 4.2 96.5 + 6.6 92.0 + 1.1 97.9 + 8.3
2015 99.8 + 2.4 99.8 + 0.3 99.8 + 3.2 99.8 + 3.4 99.8 + 8.5 99.8 + 1.92016 101.5 + 1.7 100.4 + 0.6 101.9 + 2.1 102.6 + 2.8 107.1 + 7.3 101.1 + 1.32017 109.8 + 8.2 111.9 + 11.5 109.0 + 7.0 108.9 + 6.1 122.8 + 14.7 104.4 + 3.3
2017 May 105.7 + 8.4 109.6 + 9.3 103.8 + 7.9 105.5 + 8.9 119.6 + 25.6 100.9 + 3.5 June 112.2 + 7.0 116.8 + 14.6 110.6 + 3.8 107.2 + 4.8 125.9 + 17.3 101.1 + 0.4
July 104.8 + 4.2 109.5 + 9.9 102.0 + 1.4 110.0 + 5.0 114.1 + 8.5 108.7 + 3.9 Aug 97.3 + 10.1 102.7 + 16.7 93.3 + 7.1 109.2 + 7.7 118.8 + 28.9 106.1 + 1.6 Sep 112.5 + 11.2 112.1 + 10.6 113.2 + 12.2 109.0 + 6.4 130.3 + 18.5 102.1 + 2.1
Oct 114.4 + 10.1 115.0 + 12.3 114.6 + 9.7 110.4 + 5.7 127.3 + 2.6 105.0 + 7.0 Nov 116.4 + 12.1 122.7 + 16.9 113.9 + 10.5 111.3 + 6.6 135.2 + 22.4 103.6 + 1.2 Dec 125.7 + 14.3 108.8 + 15.3 136.7 + 14.6 100.9 + 7.2 124.3 + 18.7 93.3 + 2.9
2018 Jan 113.3 + 10.9 118.2 + 10.1 110.3 + 11.0 118.6 + 12.2 120.3 + 8.9 118.0 + 13.4 Feb 113.9 + 10.2 113.9 + 5.9 114.1 + 13.9 111.4 − 2.6 114.3 + 0.2 110.4 − 3.6 Mar 123.0 + 3.3 123.1 + 2.2 123.7 + 3.9 117.2 + 2.4 124.8 − 7.4 114.8 + 6.3
Apr 111.0 + 6.5 123.8 + 12.1 105.8 + 5.1 104.3 − 4.2 112.9 − 4.8 101.5 − 4.1 May p 111.9 + 5.9 117.8 + 7.5 109.7 + 5.7 107.2 + 1.6 116.4 − 2.7 104.3 + 3.4
Source of the unadjusted figures: Federal Statistical Office. * At current prices; for ex- planatory notes, see Statistical Supplement Seasonally adjusted business statistics, Tables II.14 to II.16. o Using JDemetra+ 2.2.1 (X13).
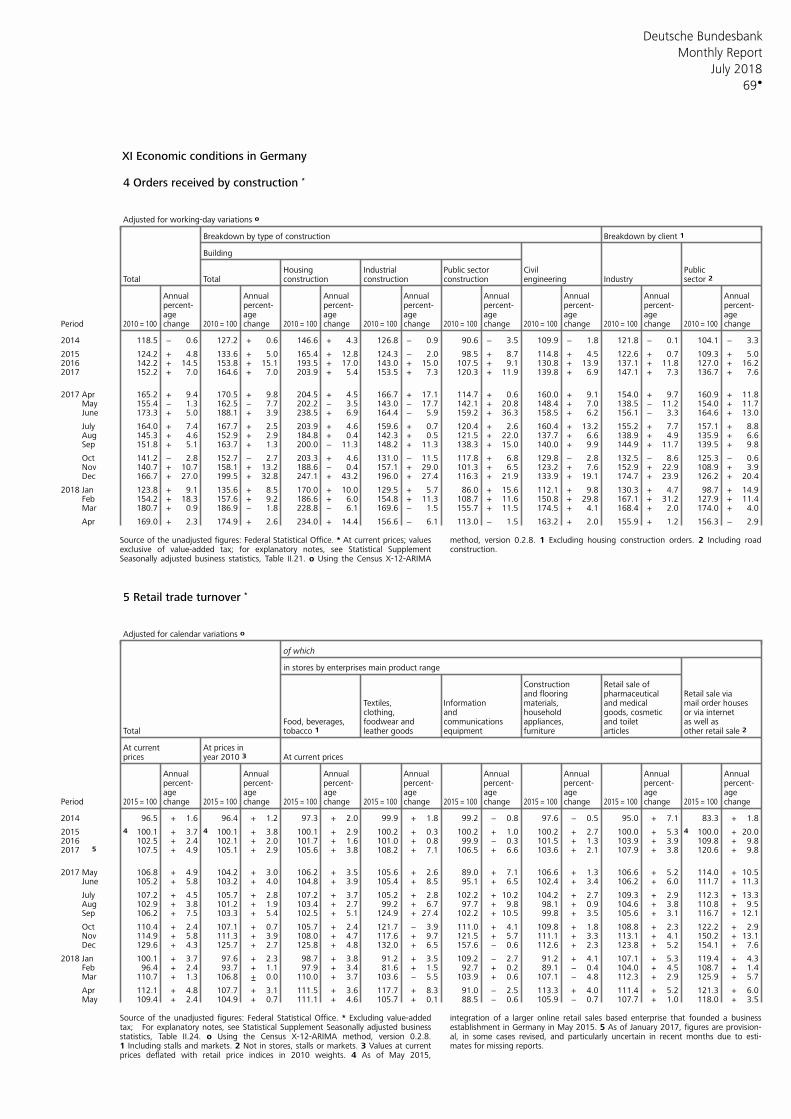
Deutsche Bundesbank
69
Monthly Report
July 2018
XI Economic conditions in Germany 4 Orders received by construction * Adjusted for working-day variations o
Breakdown by type of construction Breakdown by client 1
Building
Housing Industrial Public sector Civil PublicTotal Total construction construction construction engineering Industry sector 2
Annual Annual Annual Annual Annual Annual Annual Annualpercent- percent- percent- percent- percent- percent- percent- percent-age age age age age age age age
Period change change change change change change change change2010 = 100 2010 = 100 2010 = 100 2010 = 100 2010 = 100 2010 = 100 2010 = 100 2010 = 100
2014 118.5 − 0.6 127.2 + 0.6 146.6 + 4.3 126.8 − 0.9 90.6 − 3.5 109.9 − 1.8 121.8 − 0.1 104.1 − 3.3
2015 124.2 + 4.8 133.6 + 5.0 165.4 + 12.8 124.3 − 2.0 98.5 + 8.7 114.8 + 4.5 122.6 + 0.7 109.3 + 5.02016 142.2 + 14.5 153.8 + 15.1 193.5 + 17.0 143.0 + 15.0 107.5 + 9.1 130.8 + 13.9 137.1 + 11.8 127.0 + 16.22017 152.2 + 7.0 164.6 + 7.0 203.9 + 5.4 153.5 + 7.3 120.3 + 11.9 139.8 + 6.9 147.1 + 7.3 136.7 + 7.6
2017 Apr 165.2 + 9.4 170.5 + 9.8 204.5 + 4.5 166.7 + 17.1 114.7 + 0.6 160.0 + 9.1 154.0 + 9.7 160.9 + 11.8 May 155.4 − 1.3 162.5 − 7.7 202.2 − 3.5 143.0 − 17.7 142.1 + 20.8 148.4 + 7.0 138.5 − 11.2 154.0 + 11.7 June 173.3 + 5.0 188.1 + 3.9 238.5 + 6.9 164.4 − 5.9 159.2 + 36.3 158.5 + 6.2 156.1 − 3.3 164.6 + 13.0
July 164.0 + 7.4 167.7 + 2.5 203.9 + 4.6 159.6 + 0.7 120.4 + 2.6 160.4 + 13.2 155.2 + 7.7 157.1 + 8.8 Aug 145.3 + 4.6 152.9 + 2.9 184.8 + 0.4 142.3 + 0.5 121.5 + 22.0 137.7 + 6.6 138.9 + 4.9 135.9 + 6.6 Sep 151.8 + 5.1 163.7 + 1.3 200.0 − 11.3 148.2 + 11.3 138.3 + 15.0 140.0 + 9.9 144.9 + 11.7 139.5 + 9.8
Oct 141.2 − 2.8 152.7 − 2.7 203.3 + 4.6 131.0 − 11.5 117.8 + 6.8 129.8 − 2.8 132.5 − 8.6 125.3 − 0.6 Nov 140.7 + 10.7 158.1 + 13.2 188.6 − 0.4 157.1 + 29.0 101.3 + 6.5 123.2 + 7.6 152.9 + 22.9 108.9 + 3.9 Dec 166.7 + 27.0 199.5 + 32.8 247.1 + 43.2 196.0 + 27.4 116.3 + 21.9 133.9 + 19.1 174.7 + 23.9 126.2 + 20.4
2018 Jan 123.8 + 9.1 135.6 + 8.5 170.0 + 10.0 129.5 + 5.7 86.0 + 15.6 112.1 + 9.8 130.3 + 4.7 98.7 + 14.9 Feb 154.2 + 18.3 157.6 + 9.2 186.6 + 6.0 154.8 + 11.3 108.7 + 11.6 150.8 + 29.8 167.1 + 31.2 127.9 + 11.4 Mar 180.7 + 0.9 186.9 − 1.8 228.8 − 6.1 169.6 − 1.5 155.7 + 11.5 174.5 + 4.1 168.4 + 2.0 174.0 + 4.0
Apr 169.0 + 2.3 174.9 + 2.6 234.0 + 14.4 156.6 − 6.1 113.0 − 1.5 163.2 + 2.0 155.9 + 1.2 156.3 − 2.9
Source of the unadjusted figures: Federal Statistical Office. * At current prices; values method, version 0.2.8. 1 Excluding housing construction orders. 2 Including roadexclusive of value-added tax; for explanatory notes, see Statistical Supplement construction. Seasonally adjusted business statistics, Table II.21. o Using the Census X-12-ARIMA
5 Retail trade turnover * Adjusted for calendar variations o
of which
in stores by enterprises main product range
Construction Retail sale ofand flooring pharmaceutical Retail sale via
Textiles, Information materials, and medical mail order housesclothing, and household goods, cosmetic or via internet
Food, beverages, foodwear and communications appliances, and toilet as well asTotal tobacco 1 leather goods equipment furniture articles other retail sale 2
At current At prices inprices year 2010 3 At current prices
Annual Annual Annual Annual Annual Annual Annual Annualpercent- percent- percent- percent- percent- percent- percent- percent-age age age age age age age age
Period change change change change change change change change2015 = 100 2015 = 100 2015 = 100 2015 = 100 2015 = 100 2015 = 100 2015 = 100 2015 = 100
2014 96.5 + 1.6 96.4 + 1.2 97.3 + 2.0 99.9 + 1.8 99.2 − 0.8 97.6 − 0.5 95.0 + 7.1 83.3 + 1.8
2015 4 100.1 + 3.7 4 100.1 + 3.8 100.1 + 2.9 100.2 + 0.3 100.2 + 1.0 100.2 + 2.7 100.0 + 5.3 4 100.0 + 20.02016 102.5 + 2.4 102.1 + 2.0 101.7 + 1.6 101.0 + 0.8 99.9 − 0.3 101.5 + 1.3 103.9 + 3.9 109.8 + 9.82017 5 107.5 + 4.9 105.1 + 2.9 105.6 + 3.8 108.2 + 7.1 106.5 + 6.6 103.6 + 2.1 107.9 + 3.8 120.6 + 9.8
2017 May 106.8 + 4.9 104.2 + 3.0 106.2 + 3.5 105.6 + 2.6 89.0 + 7.1 106.6 + 1.3 106.6 + 5.2 114.0 + 10.5 June 105.2 + 5.8 103.2 + 4.0 104.8 + 3.9 105.4 + 8.5 95.1 + 6.5 102.4 + 3.4 106.2 + 6.0 111.7 + 11.3
July 107.2 + 4.5 105.7 + 2.8 107.2 + 3.7 105.2 + 2.8 102.2 + 10.2 104.2 + 2.7 109.3 + 2.9 112.3 + 13.3 Aug 102.9 + 3.8 101.2 + 1.9 103.4 + 2.7 99.2 + 6.7 97.7 + 9.8 98.1 + 0.9 104.6 + 3.8 110.8 + 9.5 Sep 106.2 + 7.5 103.3 + 5.4 102.5 + 5.1 124.9 + 27.4 102.2 + 10.5 99.8 + 3.5 105.6 + 3.1 116.7 + 12.1
Oct 110.4 + 2.4 107.1 + 0.7 105.7 + 2.4 121.7 − 3.9 111.0 + 4.1 109.8 + 1.8 108.8 + 2.3 122.2 + 2.9 Nov 114.9 + 5.8 111.3 + 3.9 108.0 + 4.7 117.6 + 9.7 121.5 + 5.7 111.1 + 3.3 113.1 + 4.1 150.2 + 13.1 Dec 129.6 + 4.3 125.7 + 2.7 125.8 + 4.8 132.0 + 6.5 157.6 − 0.6 112.6 + 2.3 123.8 + 5.2 154.1 + 7.6
2018 Jan 100.1 + 3.7 97.6 + 2.3 98.7 + 3.8 91.2 + 3.5 109.2 − 2.7 91.2 + 4.1 107.1 + 5.3 119.4 + 4.3 Feb 96.4 + 2.4 93.7 + 1.1 97.9 + 3.4 81.6 + 1.5 92.7 + 0.2 89.1 − 0.4 104.0 + 4.5 108.7 + 1.4 Mar 110.7 + 1.3 106.8 + 0.0 110.0 + 3.7 103.6 − 5.5 103.9 + 0.6 107.1 − 4.8 112.3 + 2.9 125.9 + 5.7
Apr 112.1 + 4.8 107.7 + 3.1 111.5 + 3.6 117.7 + 8.3 91.0 − 2.5 113.3 + 4.0 111.4 + 5.2 121.3 + 6.0 May 109.4 + 2.4 104.9 + 0.7 111.1 + 4.6 105.7 + 0.1 88.5 − 0.6 105.9 − 0.7 107.7 + 1.0 118.0 + 3.5
Source of the unadjusted figures: Federal Statistical Office. * Excluding value-added integration of a larger online retail sales based enterprise that founded a businesstax; For explanatory notes, see Statistical Supplement Seasonally adjusted business establishment in Germany in May 2015. 5 As of January 2017, figures are provision-statistics, Table II.24. o Using the Census X-12-ARIMA method, version 0.2.8. al, in some cases revised, and particularly uncertain in recent months due to esti-1 Including stalls and markets. 2 Not in stores, stalls or markets. 3 Values at current mates for missing reports. prices deflated with retail price indices in 2010 weights. 4 As of May 2015,
Deutsche Bundesbank
70
Monthly Report
July 2018
XI Economic conditions in Germany 6 Labour market *
Employment 1 Employment subject to social contributions 2 Short time workers 3 Unemployment 4
Total of which: of which: of which:
Assignedto thelegalcategory
Solely of thejobs Third Book
Services exempt of theexcluding from Social
Produc- temporary social Unem-Temporary Securitytion employ- employ- contri- Cyclically Code ploy- Vacan-
Annual Annual sector ment ment butions 2 Total induced Total (SGB III) ment cies, 4,6 Thou- percentage Thou- rate 4,5 thou-percentage
Period sands change sands change Thousands in % sands
2013 42,319 + 0.6 29,713 + 1.3 8,783 19,958 743 5,017 191 77 2,950 970 6.9 4572014 42,672 + 0.8 30,197 + 1.6 8,860 20,332 770 5,029 134 49 2,898 933 6.7 490
2015 43,069 + 0.9 30,823 + 2.1 8,938 20,840 806 4,856 130 44 2,795 859 6.4 5692016 43,638 + 1.3 31,508 + 2.2 9,028 21,407 834 4,804 128 42 2,691 822 6.1 6552017 44,271 + 1.5 32,234 + 2.3 9,146 21,980 868 4,742 113 24 2,533 7 855 5.7 731
2015 Q2 42,998 + 0.8 30,671 + 2.0 8,895 20,740 792 4,863 61 47 2,772 822 6.3 560 Q3 43,286 + 1.0 30,928 + 2.1 8,974 20,865 840 4,868 47 33 2,759 827 6.3 595 Q4 43,476 + 1.2 31,333 + 2.3 9,049 21,204 837 4,829 101 46 2,655 775 6.0 604
2016 Q1 43,096 + 1.4 31,077 + 2.4 8,929 21,131 793 4,785 312 50 2,892 932 6.6 610 Q2 43,557 + 1.3 31,350 + 2.2 8,988 21,298 820 4,823 59 47 2,674 782 6.1 653 Q3 43,832 + 1.3 31,593 + 2.1 9,056 21,431 858 4,827 46 35 2,651 808 6.0 682 Q4 44,066 + 1.4 32,014 + 2.2 9,137 21,770 866 4,781 93 36 2,547 766 5.8 677
2017 Q1 43,738 + 1.5 31,790 + 2.3 9,040 21,697 830 4,728 307 41 2,734 7 987 6.2 671 Q2 44,200 + 1.5 32,064 + 2.3 9,110 21,857 852 4,762 36 25 2,513 822 5.6 717 Q3 44,483 + 1.5 32,324 + 2.3 9,172 22,011 892 4,766 28 16 2,504 833 5.6 763 Q4 44,663 + 1.4 32,759 + 2.3 9,263 22,354 900 4,711 79 15 2,381 780 5.3 771
2018 Q1 8 44,347 8 + 1.4 9 32,573 9 + 2.5 9 9,215 9 22,288 9 844 9 4,658 ... 9 13 2,525 909 5.7 760 Q2 ... ... ... ... ... ... ... ... ... ... 2,325 760 10 5.1 794
2015 Feb 42,470 + 0.7 30,342 + 1.9 8,818 20,546 756 4,821 352 52 3,017 1,034 6.9 519 Mar 42,638 + 0.8 30,528 + 2.0 8,865 20,651 777 4,829 251 50 2,932 955 6.8 542 Apr 42,832 + 0.8 30,645 + 1.9 8,895 20,723 784 4,850 67 54 2,843 868 6.5 552 May 43,013 + 0.8 30,718 + 2.0 8,901 20,776 794 4,875 57 44 2,762 815 6.3 557 June 43,150 + 0.9 30,771 + 2.0 8,915 20,788 819 4,902 59 45 2,711 782 6.2 572 July 43,190 + 0.9 30,744 + 2.1 8,934 20,724 840 4,908 49 35 2,773 830 6.3 589 Aug 43,245 + 1.0 30,988 + 2.2 8,993 20,901 846 4,841 40 26 2,796 851 6.4 597 Sep 43,422 + 1.0 31,333 + 2.2 9,076 21,153 850 4,810 51 39 2,708 799 6.2 600 Oct 43,508 + 1.0 31,368 + 2.3 9,068 21,206 846 4,814 61 47 2,649 764 6.0 612 Nov 43,545 + 1.2 31,389 + 2.5 9,060 21,247 842 4,846 66 52 2,633 764 6.0 610 Dec 43,374 + 1.3 31,150 + 2.5 8,964 21,167 798 4,843 177 39 2,681 798 6.1 591
2016 Jan 43,005 + 1.3 30,983 + 2.3 8,906 21,073 784 4,774 343 48 2,920 961 6.7 581 Feb 43,059 + 1.4 31,069 + 2.4 8,923 21,127 793 4,769 343 50 2,911 947 6.6 614 Mar 43,224 + 1.4 31,209 + 2.2 8,954 21,217 804 4,782 252 52 2,845 888 6.5 635 Apr 43,388 + 1.3 31,314 + 2.2 8,983 21,279 809 4,806 67 55 2,744 817 6.3 640 May 43,577 + 1.3 31,410 + 2.3 9,000 21,337 826 4,838 57 45 2,664 774 6.0 655 June 43,707 + 1.3 31,443 + 2.2 9,010 21,339 846 4,865 54 42 2,614 754 5.9 665 July 43,689 + 1.2 31,378 + 2.1 9,007 21,273 853 4,863 43 31 2,661 805 6.0 674 Aug 43,807 + 1.3 31,675 + 2.2 9,076 21,486 865 4,802 50 38 2,684 830 6.1 685 Sep 43,999 + 1.3 32,007 + 2.2 9,157 21,729 869 4,768 46 35 2,608 787 5.9 687 Oct 44,086 + 1.3 32,045 + 2.2 9,154 21,773 871 4,767 50 39 2,540 756 5.8 691 Nov 44,131 + 1.3 32,069 + 2.2 9,147 21,807 876 4,794 52 40 2,532 756 5.7 681 Dec 43,982 + 1.4 31,848 + 2.2 9,063 21,731 835 4,794 178 30 2,568 785 5.8 658
2017 Jan 43,654 + 1.5 31,707 + 2.3 9,017 21,648 825 4,719 370 43 2,777 7 1,010 6.3 647 Feb 43,702 + 1.5 31,774 + 2.3 9,032 21,690 828 4,706 335 42 2,762 1,014 6.3 675 Mar 43,857 + 1.5 31,930 + 2.3 9,078 21,777 838 4,722 216 40 2,662 935 6.0 692 Apr 44,030 + 1.5 32,013 + 2.2 9,101 21,831 838 4,748 39 27 2,569 861 5.8 706 May 44,209 + 1.5 32,131 + 2.3 9,124 21,900 859 4,775 36 25 2,498 810 5.6 714 June 44,360 + 1.5 32,165 + 2.3 9,135 21,902 878 4,802 33 22 2,473 796 5.5 731 July 44,379 + 1.6 32,128 + 2.4 9,123 21,869 890 4,803 30 18 2,518 842 5.6 750 Aug 44,449 + 1.5 32,396 + 2.3 9,189 22,060 896 4,739 28 15 2,545 855 5.7 765 Sep 44,622 + 1.4 32,732 + 2.3 9,272 22,304 901 4,711 28 16 2,449 800 5.5 773 Oct 44,687 + 1.4 32,778 + 2.3 9,274 22,355 901 4,696 27 16 2,389 772 5.4 780 Nov 44,727 + 1.4 32,830 + 2.4 9,278 22,395 916 4,720 26 16 2,368 772 5.3 772 Dec 44,574 + 1.3 32,609 + 2.4 9,202 22,319 867 4,722 183 12 2,385 796 5.3 761
2018 Jan 44,275 + 1.4 9 32,508 9 + 2.5 9 9,190 9 22,255 9 841 9 4,648 ... 9 14 2,570 941 5.8 736 Feb 44,312 + 1.4 9 32,572 9 + 2.5 9 9,226 9 22,279 9 839 9 4,639 ... 9 12 2,546 927 5.7 764 Mar 8 44,455 8 + 1.4 9 32,674 9 + 2.3 9 9,256 9 22,345 9 837 9 4,652 ... 9 12 2,458 859 5.5 778 Apr 8 44,622 8 + 1.3 9 32,784 9 + 2.4 9 9,291 9 22,409 9 839 9 4,686 ... 9 10 2,384 796 5.3 784 May 8 44,802 8 + 1.3 ... ... ... ... ... ... ... ... 2,315 751 10 5.1 793 June ... ... ... ... ... ... ... ... ... ... 2,276 735 5.0 805
Sources: Federal Statistical Office; Federal Employment Agency. * Annual and of the Social Security Code (SGB III). 8 Initial preliminary estimate by the Federal Statis-quarterly figures: averages; calculated by the Bundesbank; deviations from the offi- tical Office. 9 Unadjusted figures estimated by the Federal Employment Agency. Incial figures are due to rounding. 1 Workplace concept; averages. 2 Monthly figures: 2016 and 2017, the estimated values for Germany deviated from the final data by aend of month. 3 Number within a given month. 4 Mid-month level. 5 Relative to the maximum of 1.1 % for employees subject to social contributions, by a maximum oftotal civilian labour force. 6 Excluding government-assisted forms of employment 0.4 % for persons solely in jobs exempt from social contributions, and by a maximumand seasonal jobs, including jobs located abroad. 7 From January 2017, persons of 70.0 % for cyclically induced short-time work. 10 From May 2018 calculated onreceiving additional income assistance (unemployment benefit and unemployment the basis of new labour force figures. benefit II at the same time) shall be assigned to the legal category of the Third Book
Deutsche Bundesbank
71
Monthly Report
July 2018
XI Economic conditions in Germany
7 Prices
Harmonised Index of Consumer Prices HWWIIndex of Indices of Index of World Market
of which 1 producer foreign trade prices Prices of Raw Materials 6 prices ofindustrialof whichproducts Index ofMemo item:
Non- Consumer Con- producersold onenergy struction the prices ofprice index
(national price domestic Other rawagriculturalindustrial HousingTotal Food 2 Energy 3 Services rents 4 concept) index market 5 Exports Imports Energy 7 products 5)goods materials 8
Period 2015 = 100 2010 = 100 2015 = 100
Index level
2013 99.1 97.4 98.7 109.8 97.4 97.3 105.7 107.9 106.9 120.7 104.3 105.9 160.2 117.62014 99.9 98.8 99.2 107.5 98.8 98.8 106.6 109.7 105.8 111.1 104.0 103.6 142.8 108.3
2015 100.0 100.0 100.0 100.0 100.0 100.0 106.9 111.3 103.9 106.9 104.9 100.9 100.0 100.02016 100.4 101.3 101.0 94.6 101.2 101.2 107.4 113.4 102.1 106.6 104.0 97.8 83.2 98.42017 102.1 104.0 102.3 97.5 102.5 102.9 109.3 117.0 104.8 9) 115.1 105.9 101.5 99.6 107.1
2016 Aug 100.6 100.9 100.3 94.3 102.3 101.4 107.6 113.7 102.2 106.7 104.0 97.7 83.9 98.6 Sep 100.6 101.2 101.5 94.9 101.4 101.5 107.7 102.0 104.7 104.0 97.8 83.9 97.0
Oct 100.8 101.2 102.0 96.2 101.2 101.7 107.9 102.7 108.8 104.3 98.7 96.2 99.8 Nov 100.8 102.0 102.0 95.2 101.1 101.8 108.0 114.1 103.0 111.3 104.8 99.4 95.4 108.5 Dec 101.8 102.6 101.6 97.3 102.8 102.0 108.8 103.4 113.1 105.2 101.3 106.6 114.0
2017 Jan 101.0 103.2 100.7 98.2 101.0 102.2 108.1 104.1 114.8 105.8 102.2 108.9 115.9 Feb 101.7 104.6 101.0 98.4 101.9 102.3 108.8 115.5 104.3 116.2 106.0 102.9 110.2 118.9 Mar 101.8 103.4 102.6 97.5 102.0 102.4 109.0 104.3 117.6 106.0 102.4 99.7 116.4
Apr 101.8 103.4 102.7 98.3 101.5 102.6 109.0 104.7 119.9 106.2 102.3 100.4 110.1 May 101.6 103.5 102.7 96.9 101.5 102.8 108.8 116.6 104.5 120.9 106.0 101.3 93.1 104.2 June 101.8 103.6 102.0 96.1 102.5 102.9 109.0 104.5 121.3 105.8 100.2 85.7 100.4
July 102.2 103.8 101.4 95.9 103.8 103.0 109.4 104.7 120.2 105.7 99.8 86.5 102.9 Aug 102.4 103.8 101.8 96.3 103.8 103.1 109.5 117.5 104.9 121.2 105.6 99.8 90.1 103.3 Sep 102.4 104.1 102.9 97.5 102.8 103.2 109.6 105.2 9) 115.9 105.8 100.7 96.3 102.8
Oct 102.3 104.8 103.2 97.4 102.2 103.3 109.6 105.5 114.3 105.9 101.3 101.6 102.7 Nov 102.6 104.8 103.2 98.7 102.6 103.5 109.9 118.4 105.6 114.7 106.1 102.1 110.3 103.8 Dec 103.4 105.5 102.8 98.5 104.2 103.6 110.6 105.8 114.3 106.2 102.4 113.7 103.6
2018 Jan 102.4 106.2 101.8 98.9 102.4 103.9 109.8 106.3 110.5 106.5 102.9 115.9 105.4 Feb 102.9 106.2 102.2 98.5 103.3 104.0 110.3 120.4 106.2 110.0 106.5 102.3 108.7 106.0 Mar 103.3 106.4 103.2 97.9 103.7 104.1 110.7 106.3 111.3 106.7 102.3 109.5 104.9
Apr 103.2 106.8 103.4 99.5 102.7 104.3 110.7 106.8 110.7 106.9 102.9 116.7 106.1 May 103.8 106.9 103.3 101.9 103.4 104.4 111.2 121.7 107.3 109.5 107.4 104.5 129.9 112.5 June 103.9 106.9 102.9 102.4 103.8 104.5 111.3 ... ... ... ... 130.5 111.3
Annual percentage change
2013 + 1.6 + 3.4 + 0.7 + 1.8 + 1.5 + 1.3 + 1.5 + 2.1 − 0.1 + 1.1 − 0.6 − 2.6 − 4.0 − 8.62014 + 0.8 + 1.5 + 0.5 − 2.1 + 1.4 + 1.6 + 0.9 + 1.7 − 1.0 − 8.0 − 0.3 − 2.2 − 10.9 − 7.9
2015 + 0.1 + 1.2 + 0.8 − 7.0 + 1.2 + 1.2 + 0.3 + 1.5 − 1.8 − 3.8 + 0.9 − 2.6 − 30.0 − 7.72016 + 0.4 + 1.3 + 1.0 − 5.4 + 1.2 + 1.2 + 0.5 + 1.9 − 1.7 − 0.3 − 0.9 − 3.1 − 16.8 − 1.62017 + 1.7 + 2.7 + 1.3 + 3.1 + 1.3 + 1.7 + 1.8 + 3.2 + 2.6 9) + 8.0 + 1.8 + 3.8 + 19.7 + 8.8
2016 Aug + 0.3 + 1.2 + 0.7 − 5.9 + 1.3 + 1.3 + 0.4 + 2.0 − 1.6 + 4.5 − 0.9 − 2.6 − 8.3 + 2.7 Sep + 0.5 + 1.2 + 0.8 − 3.6 + 1.3 + 1.3 + 0.7 − 1.4 − 2.5 − 0.6 − 1.8 − 7.6 + 3.1
Oct + 0.7 + 0.8 + 0.8 − 1.4 + 1.2 + 1.4 + 0.8 − 0.4 − 0.1 − 0.1 − 0.6 + 5.0 + 6.9 Nov + 0.7 + 1.5 + 1.0 − 2.6 + 1.0 + 1.4 + 0.8 + 2.1 + 0.1 + 3.4 + 0.3 + 0.3 + 6.5 + 17.0 Dec + 1.7 + 2.4 + 1.2 + 2.4 + 1.6 + 1.6 + 1.7 + 1.0 + 5.4 + 1.1 + 3.5 + 37.5 + 27.5
2017 Jan + 1.9 + 2.8 + 1.0 + 5.9 + 1.1 + 1.6 + 1.9 + 2.4 + 7.5 + 1.8 + 6.0 + 68.8 + 31.4 Feb + 2.2 + 3.8 + 1.1 + 7.2 + 1.3 + 1.6 + 2.2 + 2.7 + 3.1 + 9.6 + 2.5 + 7.4 + 72.2 + 34.2 Mar + 1.5 + 2.2 + 1.6 + 5.2 + 0.5 + 1.6 + 1.6 + 3.1 + 10.3 + 2.3 + 6.1 + 37.9 + 24.4
Apr + 2.0 + 1.8 + 1.2 + 5.0 + 1.8 + 1.7 + 2.0 + 3.4 + 13.2 + 2.6 + 6.1 + 33.7 + 15.3 May + 1.4 + 2.2 + 1.3 + 2.0 + 1.0 + 1.8 + 1.5 + 3.1 + 2.8 + 14.1 + 2.2 + 4.1 + 12.7 + 7.2 June + 1.5 + 2.6 + 1.3 − 0.1 + 1.6 + 1.8 + 1.6 + 2.4 + 14.0 + 1.8 + 2.5 − 2.5 + 1.5
July + 1.5 + 2.5 + 1.4 + 0.8 + 1.6 + 1.8 + 1.7 + 2.3 + 9.3 + 1.5 + 1.9 + 2.5 + 2.7 Aug + 1.8 + 2.9 + 1.5 + 2.1 + 1.5 + 1.7 + 1.8 + 3.3 + 2.6 + 13.6 + 1.5 + 2.1 + 7.4 + 4.8 Sep + 1.8 + 2.9 + 1.4 + 2.7 + 1.4 + 1.7 + 1.8 + 3.1 9) + 10.7 + 1.7 + 3.0 + 14.8 + 6.0
Oct + 1.5 + 3.6 + 1.2 + 1.2 + 1.0 + 1.6 + 1.6 + 2.7 + 5.1 + 1.5 + 2.6 + 5.6 + 2.9 Nov + 1.8 + 2.7 + 1.2 + 3.7 + 1.5 + 1.7 + 1.8 + 3.8 + 2.5 + 3.1 + 1.2 + 2.7 + 15.6 − 4.3 Dec + 1.6 + 2.8 + 1.2 + 1.2 + 1.4 + 1.6 + 1.7 + 2.3 + 1.1 + 1.0 + 1.1 + 6.7 − 9.1
2018 Jan + 1.4 + 2.9 + 1.1 + 0.7 + 1.4 + 1.7 + 1.6 + 2.1 − 3.7 + 0.7 + 0.7 + 6.4 − 9.1 Feb + 1.2 + 1.5 + 1.2 + 0.1 + 1.4 + 1.7 + 1.4 + 4.2 + 1.8 − 5.3 + 0.5 − 0.6 − 1.4 − 10.8 Mar + 1.5 + 2.9 + 0.6 + 0.4 + 1.7 + 1.7 + 1.6 + 1.9 − 5.4 + 0.7 − 0.1 + 9.8 − 9.9
Apr + 1.4 + 3.3 + 0.7 + 1.2 + 1.2 + 1.7 + 1.6 + 2.0 − 7.7 + 0.7 + 0.6 + 16.2 − 3.6 May + 2.2 + 3.3 + 0.6 + 5.2 + 1.9 + 1.6 + 2.2 + 4.4 + 2.7 − 9.4 + 1.3 + 3.2 + 39.5 + 8.0 June + 2.1 + 3.2 + 0.9 + 6.6 + 1.3 + 1.6 + 2.1 ... ... ... ... + 52.3 + 10.9
Sources: Eurostat; Federal Statistical Office and Bundesbank calculation based on transport fuels and lubricants. 4 Net rents. 5 Excluding value-added tax. 6 For thedata from the Federal Statistical Office; for the Index of World Market Prices of Raw euro area, in euro. 7 Coal, crude oil (Brent) and natural gas. 8 Food, beverages and to-Materials: HWWI. 1 Differences from the official figures are due to rounding. 2 Inclu- bacco as well as industrial raw materials. 9 From September 2017 onwards, provisio-ding alcoholic beverages and tobacco. 3 Electricity, gas and other fuels as well as nal figures.
Deutsche Bundesbank
72
Monthly Report
July 2018
XI Economic conditions in Germany
8 Households’ income *
Gross wages and Net wages and Monetary social Savingsalaries 1 salaries 2 Mass income 4 Saving 6 ratio 7 benefits received 3 Disposable income 5
Annual Annual Annual Annual Annual Annualpercent- percent- percent- percent- percent- percent- Asage age age age age age percent-
Period change change change change change change age€ billion € billion € billion € billion € billion € billion
2010 1,039.0 2.9 702.2 4.4 385.3 1.2 1,087.5 3.2 1,606.4 2.4 160.1 2.5 10.0
2011 1,088.6 4.8 729.4 3.9 380.4 − 1.3 1,109.8 2.0 1,653.7 2.9 158.2 − 1.2 9.6
2012 1,133.0 4.1 756.8 3.8 387.6 1.9 1,144.5 3.1 1,695.6 2.5 157.6 − 0.4 9.3
2013 1,167.4 3.0 778.3 2.8 388.1 0.1 1,166.4 1.9 1,717.2 1.3 153.7 − 2.5 8.9
2014 1,212.7 3.9 806.9 3.7 398.4 2.6 1,205.2 3.3 1,759.8 2.5 166.6 8.4 9.5
2015 1,260.8 4.0 836.6 3.7 417.0 4.7 1,253.7 4.0 1,804.0 2.5 173.5 4.2 9.6
2016 1,311.5 4.0 869.1 3.9 430.1 3.1 1,299.2 3.6 1,854.1 2.8 179.7 3.5 9.7
2017 1,369.5 4.4 906.0 4.2 444.6 3.4 1,350.6 4.0 1,922.8 3.7 190.0 5.8 9.9
2016 Q4 363.1 4.1 240.4 3.8 106.9 3.0 347.4 3.6 472.4 2.9 39.9 4.4 8.5
2017 Q1 319.1 4.4 211.5 4.5 112.9 4.2 324.4 4.4 477.2 4.4 62.6 7.0 13.1
Q2 333.7 4.4 215.8 3.9 109.9 3.7 325.7 3.9 479.2 3.5 45.0 3.2 9.4
Q3 338.3 4.6 228.7 4.6 111.7 2.6 340.4 4.0 479.8 3.9 40.0 6.2 8.3
Q4 378.4 4.2 250.0 4.0 110.1 3.0 360.1 3.7 486.7 3.0 42.5 6.4 8.7
2018 Q1 334.0 4.7 221.0 4.5 115.2 2.1 336.1 3.6 492.7 3.3 66.2 5.8 13.4
Source: Federal Statistical Office; figures computed in May 2018. * Households includ- salaries plus monetary social benefits received. 5 Mass income plus operating surplus,ing non-profit institutions serving households. 1 Residence concept. 2 After mixed income, property income (net), other current transfers received, income ofdeducting the wage tax payable on gross wages and salaries and employees’ non-profit institutions serving households, less taxes (excluding wage tax andcontributions to the social security funds. 3 Social security benefits in cash from the consumption-related taxes) and other current transfers paid. Including the increase insocial security funds, central, state and local government and foreign countries, claims on company pension funds. 6 Including the increase in claims on company pen-pension payments (net), private funded social benefits, less social contributions on sion funds. 7 Saving as a percentage of disposable income. social benefits, consumption-related taxes and public charges. 4 Net wages and
9 Negotiated pay rates (overall economy)
Index of negotiated wages 1
On a monthly basisMemo item:
Total excluding Wages and salariesOn an hourly basis Total one-off payments Basic pay rates 2 per employee 3
Annual Annual Annual Annual AnnualPeriod percentage percentage percentage percentage percentage
2010=100 change 2010=100 change 2010=100 change 2010=100 change 2010=100 change
2010 100.0 1.6 100.0 1.7 100.0 1.7 100.0 1.8 100.0 2.5
2011 101.7 1.7 101.8 1.8 101.8 1.8 101.8 1.8 103.4 3.4
2012 104.4 2.7 104.4 2.6 104.7 2.8 104.7 2.9 106.2 2.7
2013 107.0 2.4 107.0 2.4 107.3 2.5 107.2 2.4 108.4 2.1
2014 110.1 2.9 109.9 2.8 110.1 2.7 110.1 2.7 111.4 2.8
2015 112.6 2.3 112.4 2.2 112.6 2.3 112.7 2.3 114.5 2.8
2016 114.9 2.1 114.7 2.1 115.0 2.1 115.2 2.2 117.3 2.4
2017 117.4 2.1 117.1 2.1 117.5 2.2 117.8 2.3 120.5 2.7
2016 Q4 128.1 2.2 127.8 2.2 128.2 2.2 116.1 2.3 128.4 2.5
2017 Q1 109.1 2.6 108.8 2.5 109.1 2.5 116.8 2.5 113.6 2.7
Q2 110.1 2.1 109.9 2.1 110.2 2.4 117.6 2.4 117.7 2.7
Q3 119.9 2.1 119.6 2.0 120.0 2.0 118.3 2.1 118.7 2.8
Q4 130.5 1.9 130.1 1.8 130.6 1.9 118.6 2.1 131.6 2.5
2018 Q1 111.6 2.3 111.3 2.3 111.4 2.1 119.3 2.2 116.9 2.9
2017 Nov 167.9 1.6 167.5 1.6 168.1 1.6 118.6 2.1 . .
Dec 112.5 2.0 112.2 2.0 112.5 2.1 118.6 2.1 . .
2018 Jan 111.2 2.0 110.9 2.0 111.3 2.2 119.1 2.2 . .
Feb 111.3 2.1 111.0 2.1 111.3 2.0 119.2 2.0 . .
Mar 112.2 2.8 112.0 2.8 111.7 2.2 119.7 2.2 . .
Apr 113.3 2.8 113.1 2.8 113.2 2.6 120.6 2.6 . .
May 114.6 4.0 114.3 4.0 113.8 3.2 121.3 3.1 . .
1 Current data are normally revised on account of additional reports. 2 Excluding and retirement provisions). 3 Source: Federal Statistical Office; figures computed inone-off payments and covenants (capital formation benefits, special payments, such May 2018. as annual bonuses, holiday pay, Christmas bonuses (13th monthly salary payment)
Deutsche Bundesbank
73
Monthly Report
July 2018
XI Economic conditions in Germany 10 Assets, equity and liabilities of listed non-financial groups *
End-of-year/end-of-half data
Assets Equity and liabilities
of which of which Liabilities
Long-term Short-term
of which
Non- Trade of whichTotal current Intangible Tangible Financial Current Inven- receiv- Financial Financial Trade
Period assets assets assets assets assets assets tories ables Cash 1 Equity Total Total debt Total debt payables
Total (€ billion)
2014 2,078.8 1,284.1 431.0 520.3 249.6 794.7 203.1 187.3 132.4 582.9 1,495.9 812.0 426.8 683.9 207.2 175.82015 2,225.6 1,394.0 470.7 564.7 273.1 831.6 215.5 190.5 136.0 633.3 1,592.3 860.4 465.3 731.9 222.7 180.32016 2,366.2 1,476.7 493.0 594.9 288.9 889.5 226.8 217.9 150.4 671.8 1,694.4 888.2 481.6 806.2 249.0 192.82017 p 2,399.9 1,489.1 500.0 602.9 291.3 910.8 230.6 226.5 159.3 758.8 1,641.1 866.4 496.4 774.7 236.4 195.7
2016 H1 2,255.6 1,380.4 462.4 549.3 272.0 875.2 226.6 195.1 140.4 607.1 1,648.5 894.8 464.6 753.7 243.8 174.9 H2 2,366.2 1,476.7 493.0 594.9 288.9 889.5 226.8 217.9 150.4 671.8 1,694.4 888.2 481.6 806.2 249.0 192.8
2017 H1 2,383.1 1,469.8 501.7 582.8 288.6 913.3 238.2 220.7 149.8 701.1 1,682.0 886.5 496.9 795.5 246.1 194.9 H2 p 2,399.9 1,489.1 500.0 602.9 291.3 910.8 230.6 226.5 159.3 758.8 1,641.1 866.4 496.4 774.7 236.4 195.7
as a percentage of total assets
2014 100.0 61.8 20.7 25.0 12.0 38.2 9.8 9.0 6.4 28.0 72.0 39.1 20.5 32.9 10.0 8.52015 100.0 62.6 21.2 25.4 12.3 37.4 9.7 8.6 6.1 28.5 71.5 38.7 20.9 32.9 10.0 8.12016 100.0 62.4 20.8 25.1 12.2 37.6 9.6 9.2 6.4 28.4 71.6 37.5 20.4 34.1 10.5 8.22017 p 100.0 62.1 20.8 25.1 12.1 38.0 9.6 9.4 6.6 31.6 68.4 36.1 20.7 32.3 9.9 8.2
2016 H1 100.0 61.2 20.5 24.4 12.1 38.8 10.0 8.7 6.2 26.9 73.1 39.7 20.6 33.4 10.8 7.8 H2 100.0 62.4 20.8 25.1 12.2 37.6 9.6 9.2 6.4 28.4 71.6 37.5 20.4 34.1 10.5 8.2
2017 H1 100.0 61.7 21.1 24.5 12.1 38.3 10.0 9.3 6.3 29.4 70.6 37.2 20.9 33.4 10.3 8.2 H2 p 100.0 62.1 20.8 25.1 12.1 38.0 9.6 9.4 6.6 31.6 68.4 36.1 20.7 32.3 9.9 8.2
Groups with a focus on the production sector (€ billion) 2
2014 1,655.6 989.4 276.5 411.9 236.0 666.2 185.7 140.3 98.9 451.4 1,204.2 644.0 318.6 560.2 185.6 122.42015 1,781.1 1,076.8 304.0 446.3 259.0 704.3 198.8 147.0 104.3 485.0 1,296.1 689.4 353.1 606.7 198.3 127.52016 1,908.6 1,145.8 322.1 472.9 270.8 762.8 209.7 169.9 115.4 514.1 1,394.5 714.8 369.4 679.7 223.1 140.92017 p 1,935.4 1,149.4 323.1 474.5 277.2 786.0 212.5 176.0 128.1 588.2 1,347.1 697.5 381.6 649.7 215.5 148.4
2016 H1 1,817.3 1,058.7 296.6 432.0 254.2 758.6 210.0 149.8 112.2 465.7 1,351.6 717.4 350.9 634.3 219.2 129.9 H2 1,908.6 1,145.8 322.1 472.9 270.8 762.8 209.7 169.9 115.4 514.1 1,394.5 714.8 369.4 679.7 223.1 140.9
2017 H1 1,921.2 1,136.9 324.7 463.5 273.1 784.3 224.2 171.9 125.3 550.0 1,371.2 708.2 378.1 663.0 224.3 153.1 H2 p 1,935.4 1,149.4 323.1 474.5 277.2 786.0 212.5 176.0 128.1 588.2 1,347.1 697.5 381.6 649.7 215.5 148.4
as a percentage of total assets
2014 100.0 59.8 16.7 24.9 14.3 40.2 11.2 8.5 6.0 27.3 72.7 38.9 19.2 33.8 11.2 7.42015 100.0 60.5 17.1 25.1 14.5 39.6 11.2 8.3 5.9 27.2 72.8 38.7 19.8 34.1 11.1 7.22016 100.0 60.0 16.9 24.8 14.2 40.0 11.0 8.9 6.1 26.9 73.1 37.5 19.4 35.6 11.7 7.42017 p 100.0 59.4 16.7 24.5 14.3 40.6 11.0 9.1 6.6 30.4 69.6 36.0 19.7 33.6 11.1 7.7
2016 H1 100.0 58.3 16.3 23.8 14.0 41.7 11.6 8.3 6.2 25.6 74.4 39.5 19.3 34.9 12.1 7.2 H2 100.0 60.0 16.9 24.8 14.2 40.0 11.0 8.9 6.1 26.9 73.1 37.5 19.4 35.6 11.7 7.4
2017 H1 100.0 59.2 16.9 24.1 14.2 40.8 11.7 9.0 6.5 28.6 71.4 36.9 19.7 34.5 11.7 8.0 H2 p 100.0 59.4 16.7 24.5 14.3 40.6 11.0 9.1 6.6 30.4 69.6 36.0 19.7 33.6 11.1 7.7
Groups with a focus on the services sector (€ billion)
2014 423.2 294.7 154.6 108.4 13.6 128.6 17.4 47.0 33.5 131.5 291.7 168.0 108.3 123.7 21.6 53.42015 444.5 317.3 166.7 118.3 14.1 127.2 16.7 43.5 31.6 148.3 296.2 171.0 112.2 125.2 24.4 52.72016 457.6 330.9 170.9 122.0 18.1 126.7 17.1 48.0 34.9 157.7 299.9 173.4 112.3 126.5 25.9 51.92017 p 464.5 339.7 176.9 128.4 14.1 124.8 18.1 50.4 31.3 170.6 293.9 168.9 114.8 125.0 20.9 47.3
2016 H1 438.3 321.7 165.8 117.3 17.8 116.6 16.6 45.3 28.2 141.4 296.9 177.4 113.6 119.4 24.7 45.0 H2 457.6 330.9 170.9 122.0 18.1 126.7 17.1 48.0 34.9 157.7 299.9 173.4 112.3 126.5 25.9 51.9
2017 H1 461.9 332.9 177.0 119.3 15.5 129.0 14.0 48.8 24.5 151.1 310.7 178.3 118.9 132.5 21.8 41.8 H2 p 464.5 339.7 176.9 128.4 14.1 124.8 18.1 50.4 31.3 170.6 293.9 168.9 114.8 125.0 20.9 47.3
as a percentage of total assets
2014 100.0 69.6 36.5 25.6 3.2 30.4 4.1 11.1 7.9 31.1 68.9 39.7 25.6 29.2 5.1 12.62015 100.0 71.4 37.5 26.6 3.2 28.6 3.8 9.8 7.1 33.4 66.6 38.5 25.3 28.2 5.5 11.92016 100.0 72.3 37.3 26.7 4.0 27.7 3.7 10.5 7.6 34.5 65.5 37.9 24.5 27.7 5.7 11.32017 p 100.0 73.1 38.1 27.6 3.0 26.9 3.9 10.9 6.7 36.7 63.3 36.4 24.7 26.9 4.5 10.2
2016 H1 100.0 73.4 37.8 26.8 4.1 26.6 3.8 10.3 6.4 32.3 67.7 40.5 25.9 27.3 5.6 10.3 H2 100.0 72.3 37.3 26.7 4.0 27.7 3.7 10.5 7.6 34.5 65.5 37.9 24.5 27.7 5.7 11.3
2017 H1 100.0 72.1 38.3 25.8 3.4 27.9 3.0 10.6 5.3 32.7 67.3 38.6 25.7 28.7 4.7 9.0 H2 p 100.0 73.1 38.1 27.6 3.0 26.9 3.9 10.9 6.7 36.7 63.3 36.4 24.7 26.9 4.5 10.2
* Non-financial groups admitted to the Prime Standard segment of the Frankfurt Excluding groups engaged in real estate activities. 1 Including cash equivalents. 2 In-Stock Exchange which publish IFRS consolidated financial statements on a quarterly cluding groups in agriculture and forestry. or half-yearly basis and make a noteworthy contribution to value added in Germany.
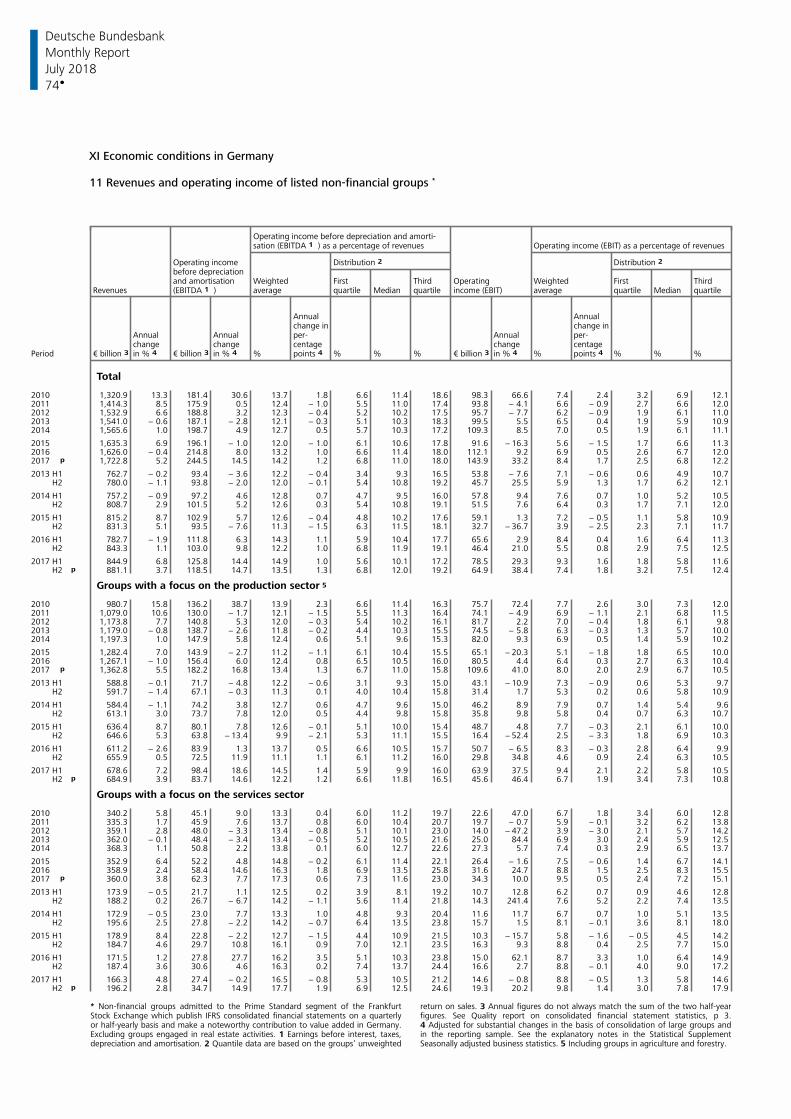
Deutsche Bundesbank
74
Monthly Report
July 2018
XI Economic conditions in Germany 11 Revenues and operating income of listed non-financial groups *
Operating income before depreciation and amorti-sation (EBITDA 1 ) as a percentage of revenues Operating income (EBIT) as a percentage of revenues
Operating income Distribution 2 Distribution 2 before depreciationand amortisation Weighted First Third Operating Weighted First Third
Revenues (EBITDA 1 ) average quartile Median quartile income (EBIT) average quartile Median quartile
Annual Annualchange in change in
Annual Annual per- Annual per-change change centage change centage
Period in % 4 in % 4 % points 4 % % % in % 4 % points 4 % % %€ billion 3 € billion 3 € billion 3
Total
2010 1,320.9 13.3 181.4 30.6 13.7 1.8 6.6 11.4 18.6 98.3 66.6 7.4 2.4 3.2 6.9 12.12011 1,414.3 8.5 175.9 0.5 12.4 − 1.0 5.5 11.0 17.4 93.8 − 4.1 6.6 − 0.9 2.7 6.6 12.02012 1,532.9 6.6 188.8 3.2 12.3 − 0.4 5.2 10.2 17.5 95.7 − 7.7 6.2 − 0.9 1.9 6.1 11.02013 1,541.0 − 0.6 187.1 − 2.8 12.1 − 0.3 5.1 10.3 18.3 99.5 5.5 6.5 0.4 1.9 5.9 10.92014 1,565.6 1.0 198.7 4.9 12.7 0.5 5.7 10.3 17.2 109.3 8.5 7.0 0.5 1.9 6.1 11.1
2015 1,635.3 6.9 196.1 − 1.0 12.0 − 1.0 6.1 10.6 17.8 91.6 − 16.3 5.6 − 1.5 1.7 6.6 11.32016 1,626.0 − 0.4 214.8 8.0 13.2 1.0 6.6 11.4 18.0 112.1 9.2 6.9 0.5 2.6 6.7 12.02017 p 1,722.8 5.2 244.5 14.5 14.2 1.2 6.8 11.0 18.0 143.9 33.2 8.4 1.7 2.5 6.8 12.2
2013 H1 762.7 − 0.2 93.4 − 3.6 12.2 − 0.4 3.4 9.3 16.5 53.8 − 7.6 7.1 − 0.6 0.6 4.9 10.7 H2 780.0 − 1.1 93.8 − 2.0 12.0 − 0.1 5.4 10.8 19.2 45.7 25.5 5.9 1.3 1.7 6.2 12.1
2014 H1 757.2 − 0.9 97.2 4.6 12.8 0.7 4.7 9.5 16.0 57.8 9.4 7.6 0.7 1.0 5.2 10.5 H2 808.7 2.9 101.5 5.2 12.6 0.3 5.4 10.8 19.1 51.5 7.6 6.4 0.3 1.7 7.1 12.0
2015 H1 815.2 8.7 102.9 5.7 12.6 − 0.4 4.8 10.2 17.6 59.1 1.3 7.2 − 0.5 1.1 5.8 10.9 H2 831.3 5.1 93.5 − 7.6 11.3 − 1.5 6.3 11.5 18.1 32.7 − 36.7 3.9 − 2.5 2.3 7.1 11.7
2016 H1 782.7 − 1.9 111.8 6.3 14.3 1.1 5.9 10.4 17.7 65.6 2.9 8.4 0.4 1.6 6.4 11.3 H2 843.3 1.1 103.0 9.8 12.2 1.0 6.8 11.9 19.1 46.4 21.0 5.5 0.8 2.9 7.5 12.5
2017 H1 844.9 6.8 125.8 14.4 14.9 1.0 5.6 10.1 17.2 78.5 29.3 9.3 1.6 1.8 5.8 11.6 H2 p 881.1 3.7 118.5 14.7 13.5 1.3 6.8 12.0 19.2 64.9 38.4 7.4 1.8 3.2 7.5 12.4
Groups with a focus on the production sector 5
2010 980.7 15.8 136.2 38.7 13.9 2.3 6.6 11.4 16.3 75.7 72.4 7.7 2.6 3.0 7.3 12.02011 1,079.0 10.6 130.0 − 1.7 12.1 − 1.5 5.5 11.3 16.4 74.1 − 4.9 6.9 − 1.1 2.1 6.8 11.52012 1,173.8 7.7 140.8 5.3 12.0 − 0.3 5.4 10.2 16.1 81.7 2.2 7.0 − 0.4 1.8 6.1 9.82013 1,179.0 − 0.8 138.7 − 2.6 11.8 − 0.2 4.4 10.3 15.5 74.5 − 5.8 6.3 − 0.3 1.3 5.7 10.02014 1,197.3 1.0 147.9 5.8 12.4 0.6 5.1 9.6 15.3 82.0 9.3 6.9 0.5 1.4 5.9 10.2
2015 1,282.4 7.0 143.9 − 2.7 11.2 − 1.1 6.1 10.4 15.5 65.1 − 20.3 5.1 − 1.8 1.8 6.5 10.02016 1,267.1 − 1.0 156.4 6.0 12.4 0.8 6.5 10.5 16.0 80.5 4.4 6.4 0.3 2.7 6.3 10.42017 p 1,362.8 5.5 182.2 16.8 13.4 1.3 6.7 11.0 15.8 109.6 41.0 8.0 2.0 2.9 6.7 10.5
2013 H1 588.8 − 0.1 71.7 − 4.8 12.2 − 0.6 3.1 9.3 15.0 43.1 − 10.9 7.3 − 0.9 0.6 5.3 9.7 H2 591.7 − 1.4 67.1 − 0.3 11.3 0.1 4.0 10.4 15.8 31.4 1.7 5.3 0.2 0.6 5.8 10.9
2014 H1 584.4 − 1.1 74.2 3.8 12.7 0.6 4.7 9.6 15.0 46.2 8.9 7.9 0.7 1.4 5.4 9.6 H2 613.1 3.0 73.7 7.8 12.0 0.5 4.4 9.8 15.8 35.8 9.8 5.8 0.4 0.7 6.3 10.7
2015 H1 636.4 8.7 80.1 7.8 12.6 − 0.1 5.1 10.0 15.4 48.7 4.8 7.7 − 0.3 2.1 6.1 10.0 H2 646.6 5.3 63.8 − 13.4 9.9 − 2.1 5.3 11.1 15.5 16.4 − 52.4 2.5 − 3.3 1.8 6.9 10.3
2016 H1 611.2 − 2.6 83.9 1.3 13.7 0.5 6.6 10.5 15.7 50.7 − 6.5 8.3 − 0.3 2.8 6.4 9.9 H2 655.9 0.5 72.5 11.9 11.1 1.1 6.1 11.2 16.0 29.8 34.8 4.6 0.9 2.4 6.3 10.5
2017 H1 678.6 7.2 98.4 18.6 14.5 1.4 5.9 9.9 16.0 63.9 37.5 9.4 2.1 2.2 5.8 10.5 H2 p 684.9 3.9 83.7 14.6 12.2 1.2 6.6 11.8 16.5 45.6 46.4 6.7 1.9 3.4 7.3 10.8
Groups with a focus on the services sector
2010 340.2 5.8 45.1 9.0 13.3 0.4 6.0 11.2 19.7 22.6 47.0 6.7 1.8 3.4 6.0 12.82011 335.3 1.7 45.9 7.6 13.7 0.8 6.0 10.4 20.7 19.7 − 0.7 5.9 − 0.1 3.2 6.2 13.82012 359.1 2.8 48.0 − 3.3 13.4 − 0.8 5.1 10.1 23.0 14.0 − 47.2 3.9 − 3.0 2.1 5.7 14.22013 362.0 − 0.1 48.4 − 3.4 13.4 − 0.5 5.2 10.5 21.6 25.0 84.4 6.9 3.0 2.4 5.9 12.52014 368.3 1.1 50.8 2.2 13.8 0.1 6.0 12.7 22.6 27.3 5.7 7.4 0.3 2.9 6.5 13.7
2015 352.9 6.4 52.2 4.8 14.8 − 0.2 6.1 11.4 22.1 26.4 − 1.6 7.5 − 0.6 1.4 6.7 14.12016 358.9 2.4 58.4 14.6 16.3 1.8 6.9 13.5 25.8 31.6 24.7 8.8 1.5 2.5 8.3 15.52017 p 360.0 3.8 62.3 7.7 17.3 0.6 7.3 11.6 23.0 34.3 10.0 9.5 0.5 2.4 7.2 15.1
2013 H1 173.9 − 0.5 21.7 1.1 12.5 0.2 3.9 8.1 19.2 10.7 12.8 6.2 0.7 0.9 4.6 12.8 H2 188.2 0.2 26.7 − 6.7 14.2 − 1.1 5.6 11.4 21.8 14.3 241.4 7.6 5.2 2.2 7.4 13.5
2014 H1 172.9 − 0.5 23.0 7.7 13.3 1.0 4.8 9.3 20.4 11.6 11.7 6.7 0.7 1.0 5.1 13.5 H2 195.6 2.5 27.8 − 2.2 14.2 − 0.7 6.4 13.5 23.8 15.7 1.5 8.1 − 0.1 3.6 8.1 18.0
2015 H1 178.9 8.4 22.8 − 2.2 12.7 − 1.5 4.4 10.9 21.5 10.3 − 15.7 5.8 − 1.6 − 0.5 4.5 14.2 H2 184.7 4.6 29.7 10.8 16.1 0.9 7.0 12.1 23.5 16.3 9.3 8.8 0.4 2.5 7.7 15.0
2016 H1 171.5 1.2 27.8 27.7 16.2 3.5 5.1 10.3 23.8 15.0 62.1 8.7 3.3 1.0 6.4 14.9 H2 187.4 3.6 30.6 4.6 16.3 0.2 7.4 13.7 24.4 16.6 2.7 8.8 − 0.1 4.0 9.0 17.2
2017 H1 166.3 4.8 27.4 − 0.2 16.5 − 0.8 5.3 10.5 21.2 14.6 − 0.8 8.8 − 0.5 1.3 5.8 14.6 H2 p 196.2 2.8 34.7 14.9 17.7 1.9 6.9 12.5 24.6 19.3 20.2 9.8 1.4 3.0 7.8 17.9
* Non-financial groups admitted to the Prime Standard segment of the Frankfurt return on sales. 3 Annual figures do not always match the sum of the two half-yearStock Exchange which publish IFRS consolidated financial statements on a quarterly figures. See Quality report on consolidated financial statement statistics, p 3.or half-yearly basis and make a noteworthy contribution to value added in Germany. 4 Adjusted for substantial changes in the basis of consolidation of large groups andExcluding groups engaged in real estate activities. 1 Earnings before interest, taxes, in the reporting sample. See the explanatory notes in the Statistical Supplementdepreciation and amortisation. 2 Quantile data are based on the groups’ unweighted Seasonally adjusted business statistics. 5 Including groups in agriculture and forestry.
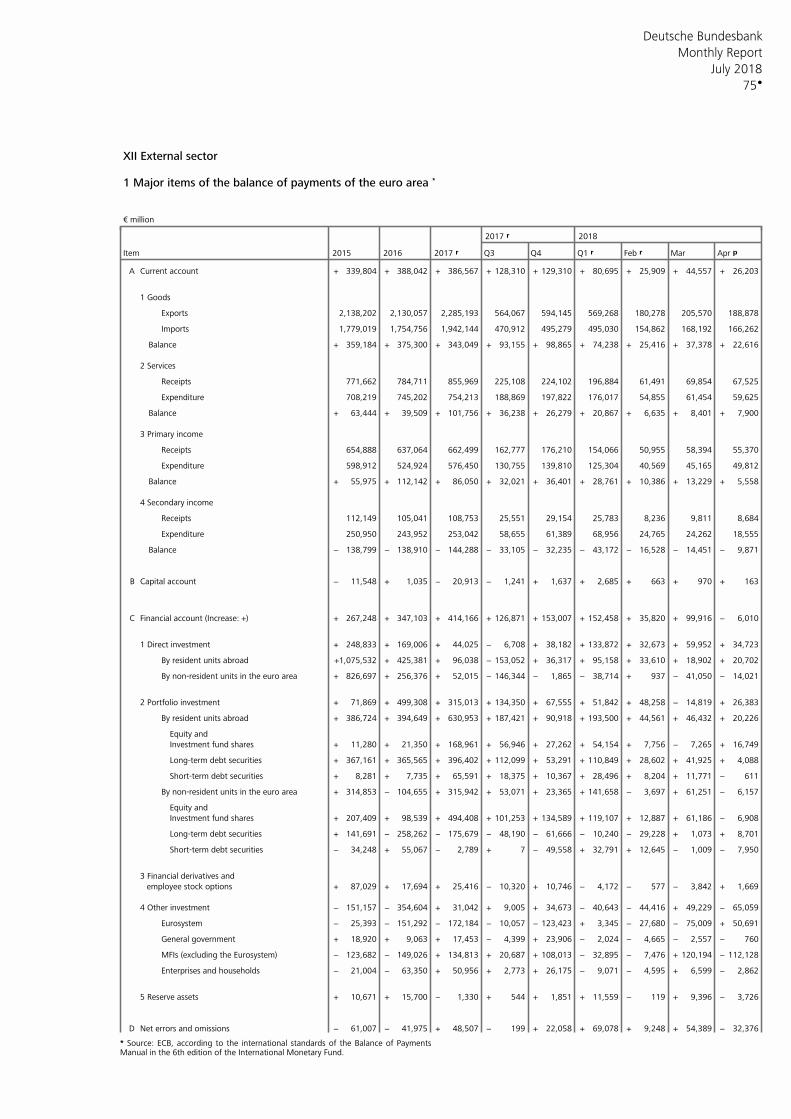
Deutsche Bundesbank
75
Monthly Report
July 2018
XII External sector 1 Major items of the balance of payments of the euro area *
€ million
2017 r 2018
Item 2015 2016 2017 r Q3 Q4 Q1 r Feb r Mar Apr p
Current account + 339,804 + 388,042 + 386,567 + 128,310 + 129,310 + 80,695 + 25,909 + 44,557 + 26,203A
1 Goods
Exports 2,138,202 2,130,057 2,285,193 564,067 594,145 569,268 180,278 205,570 188,878
Imports 1,779,019 1,754,756 1,942,144 470,912 495,279 495,030 154,862 168,192 166,262
Balance + 359,184 + 375,300 + 343,049 + 93,155 + 98,865 + 74,238 + 25,416 + 37,378 + 22,616
2 Services
Receipts 771,662 784,711 855,969 225,108 224,102 196,884 61,491 69,854 67,525
Expenditure 708,219 745,202 754,213 188,869 197,822 176,017 54,855 61,454 59,625
Balance + 63,444 + 39,509 + 101,756 + 36,238 + 26,279 + 20,867 + 6,635 + 8,401 + 7,900
3 Primary income
Receipts 654,888 637,064 662,499 162,777 176,210 154,066 50,955 58,394 55,370
Expenditure 598,912 524,924 576,450 130,755 139,810 125,304 40,569 45,165 49,812
Balance + 55,975 + 112,142 + 86,050 + 32,021 + 36,401 + 28,761 + 10,386 + 13,229 + 5,558
4 Secondary income
Receipts 112,149 105,041 108,753 25,551 29,154 25,783 8,236 9,811 8,684
Expenditure 250,950 243,952 253,042 58,655 61,389 68,956 24,765 24,262 18,555
Balance − 138,799 − 138,910 − 144,288 − 33,105 − 32,235 − 43,172 − 16,528 − 14,451 − 9,871
Capital account − 11,548 + 1,035 − 20,913 − 1,241 + 1,637 + 2,685 + 663 + 970 + 163B
Financial account (Increase: +) + 267,248 + 347,103 + 414,166 + 126,871 + 153,007 + 152,458 + 35,820 + 99,916 − 6,010C
1 Direct investment + 248,833 + 169,006 + 44,025 − 6,708 + 38,182 + 133,872 + 32,673 + 59,952 + 34,723
By resident units abroad +1,075,532 + 425,381 + 96,038 − 153,052 + 36,317 + 95,158 + 33,610 + 18,902 + 20,702
By non-resident units in the euro area + 826,697 + 256,376 + 52,015 − 146,344 − 1,865 − 38,714 + 937 − 41,050 − 14,021
2 Portfolio investment + 71,869 + 499,308 + 315,013 + 134,350 + 67,555 + 51,842 + 48,258 − 14,819 + 26,383
By resident units abroad + 386,724 + 394,649 + 630,953 + 187,421 + 90,918 + 193,500 + 44,561 + 46,432 + 20,226
Equity and
Investment fund shares + 11,280 + 21,350 + 168,961 + 56,946 + 27,262 + 54,154 + 7,756 − 7,265 + 16,749
Long-term debt securities + 367,161 + 365,565 + 396,402 + 112,099 + 53,291 + 110,849 + 28,602 + 41,925 + 4,088
Short-term debt securities + 8,281 + 7,735 + 65,591 + 18,375 + 10,367 + 28,496 + 8,204 + 11,771 − 611
By non-resident units in the euro area + 314,853 − 104,655 + 315,942 + 53,071 + 23,365 + 141,658 − 3,697 + 61,251 − 6,157
Equity and
Investment fund shares + 207,409 + 98,539 + 494,408 + 101,253 + 134,589 + 119,107 + 12,887 + 61,186 − 6,908
Long-term debt securities + 141,691 − 258,262 − 175,679 − 48,190 − 61,666 − 10,240 − 29,228 + 1,073 + 8,701
Short-term debt securities − 34,248 + 55,067 − 2,789 + 7 − 49,558 + 32,791 + 12,645 − 1,009 − 7,950
3 Financial derivatives and
employee stock options + 87,029 + 17,694 + 25,416 − 10,320 + 10,746 − 4,172 − 577 − 3,842 + 1,669
4 Other investment − 151,157 − 354,604 + 31,042 + 9,005 + 34,673 − 40,643 − 44,416 + 49,229 − 65,059
Eurosystem − 25,393 − 151,292 − 172,184 − 10,057 − 123,423 + 3,345 − 27,680 − 75,009 + 50,691
General government + 18,920 + 9,063 + 17,453 − 4,399 + 23,906 − 2,024 − 4,665 − 2,557 − 760
MFIs (excluding the Eurosystem) − 123,682 − 149,026 + 134,813 + 20,687 + 108,013 − 32,895 − 7,476 + 120,194 − 112,128
Enterprises and households − 21,004 − 63,350 + 50,956 + 2,773 + 26,175 − 9,071 − 4,595 + 6,599 − 2,862
5 Reserve assets + 10,671 + 15,700 − 1,330 + 544 + 1,851 + 11,559 − 119 + 9,396 − 3,726
Net errors and omissions − 61,007 − 41,975 + 48,507 − 199 + 22,058 + 69,078 + 9,248 + 54,389 − 32,376D
* Source: ECB, according to the international standards of the Balance of Payments Manual in the 6th edition of the International Monetary Fund.
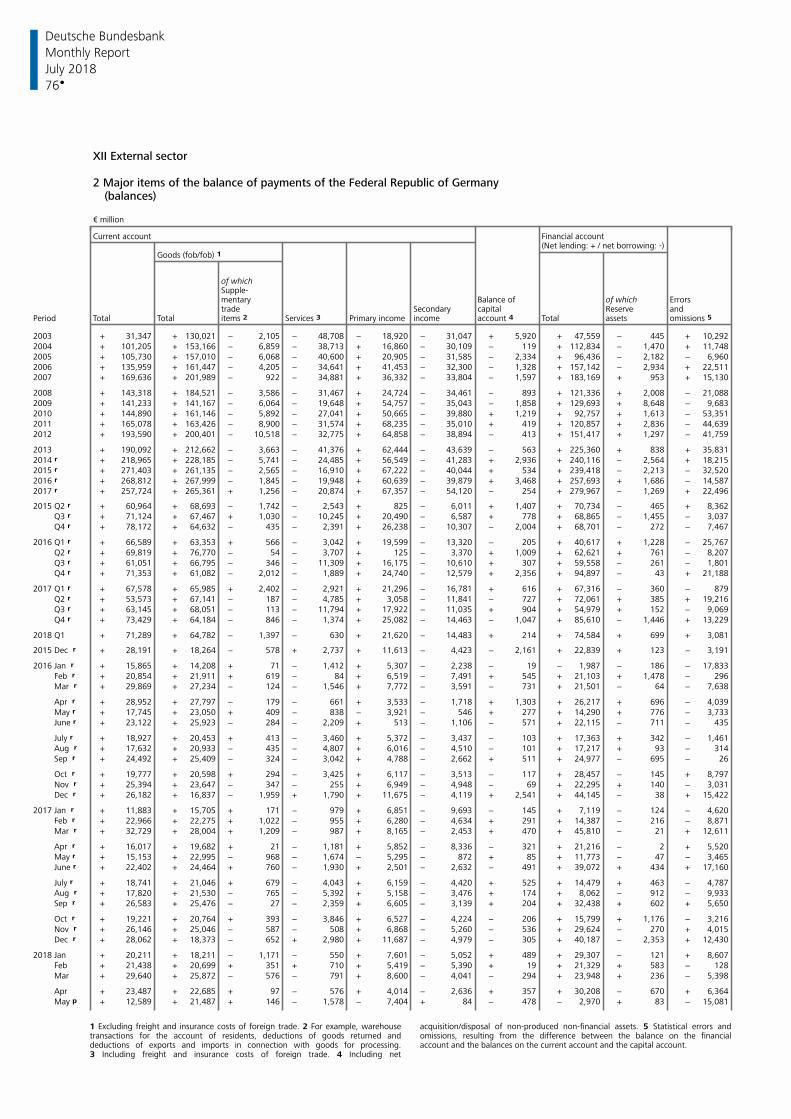
Deutsche Bundesbank
76
Monthly Report
July 2018
XII External sector 2 Major items of the balance of payments of the Federal Republic of Germany
(balances) € million
Current account Financial account (Net lending: + / net borrowing: -)
Goods (fob/fob) 1
of whichSupple-mentary Balance of of which Errorstrade Secondary capital Reserve and
Period Total Total items 2 Services 3 Primary income income account 4 Total assets omissions 5
2003 + 31,347 + 130,021 − 2,105 − 48,708 − 18,920 − 31,047 + 5,920 + 47,559 − 445 + 10,2922004 + 101,205 + 153,166 − 6,859 − 38,713 + 16,860 − 30,109 − 119 + 112,834 − 1,470 + 11,7482005 + 105,730 + 157,010 − 6,068 − 40,600 + 20,905 − 31,585 − 2,334 + 96,436 − 2,182 − 6,9602006 + 135,959 + 161,447 − 4,205 − 34,641 + 41,453 − 32,300 − 1,328 + 157,142 − 2,934 + 22,5112007 + 169,636 + 201,989 − 922 − 34,881 + 36,332 − 33,804 − 1,597 + 183,169 + 953 + 15,130
2008 + 143,318 + 184,521 − 3,586 − 31,467 + 24,724 − 34,461 − 893 + 121,336 + 2,008 − 21,0882009 + 141,233 + 141,167 − 6,064 − 19,648 + 54,757 − 35,043 − 1,858 + 129,693 + 8,648 − 9,6832010 + 144,890 + 161,146 − 5,892 − 27,041 + 50,665 − 39,880 + 1,219 + 92,757 + 1,613 − 53,3512011 + 165,078 + 163,426 − 8,900 − 31,574 + 68,235 − 35,010 + 419 + 120,857 + 2,836 − 44,6392012 + 193,590 + 200,401 − 10,518 − 32,775 + 64,858 − 38,894 − 413 + 151,417 + 1,297 − 41,759
2013 + 190,092 + 212,662 − 3,663 − 41,376 + 62,444 − 43,639 − 563 + 225,360 + 838 + 35,8312014 r + 218,965 + 228,185 − 5,741 − 24,485 + 56,549 − 41,283 + 2,936 + 240,116 − 2,564 + 18,2152015 r + 271,403 + 261,135 − 2,565 − 16,910 + 67,222 − 40,044 + 534 + 239,418 − 2,213 − 32,5202016 r + 268,812 + 267,999 − 1,845 − 19,948 + 60,639 − 39,879 + 3,468 + 257,693 + 1,686 − 14,5872017 r + 257,724 + 265,361 + 1,256 − 20,874 + 67,357 − 54,120 − 254 + 279,967 − 1,269 + 22,496
2015 Q2 r + 60,964 + 68,693 − 1,742 − 2,543 + 825 − 6,011 + 1,407 + 70,734 − 465 + 8,362 Q3 r + 71,124 + 67,467 + 1,030 − 10,245 + 20,490 − 6,587 + 778 + 68,865 − 1,455 − 3,037 Q4 r + 78,172 + 64,632 − 435 − 2,391 + 26,238 − 10,307 − 2,004 + 68,701 − 272 − 7,467
2016 Q1 r + 66,589 + 63,353 + 566 − 3,042 + 19,599 − 13,320 − 205 + 40,617 + 1,228 − 25,767 Q2 r + 69,819 + 76,770 − 54 − 3,707 + 125 − 3,370 + 1,009 + 62,621 + 761 − 8,207 Q3 r + 61,051 + 66,795 − 346 − 11,309 + 16,175 − 10,610 + 307 + 59,558 − 261 − 1,801 Q4 r + 71,353 + 61,082 − 2,012 − 1,889 + 24,740 − 12,579 + 2,356 + 94,897 − 43 + 21,188
2017 Q1 r + 67,578 + 65,985 + 2,402 − 2,921 + 21,296 − 16,781 + 616 + 67,316 − 360 − 879 Q2 r + 53,573 + 67,141 − 187 − 4,785 + 3,058 − 11,841 − 727 + 72,061 + 385 + 19,216 Q3 r + 63,145 + 68,051 − 113 − 11,794 + 17,922 − 11,035 + 904 + 54,979 + 152 − 9,069 Q4 r + 73,429 + 64,184 − 846 − 1,374 + 25,082 − 14,463 − 1,047 + 85,610 − 1,446 + 13,229
2018 Q1 + 71,289 + 64,782 − 1,397 − 630 + 21,620 − 14,483 + 214 + 74,584 + 699 + 3,081
2015 Dec r + 28,191 + 18,264 − 578 + 2,737 + 11,613 − 4,423 − 2,161 + 22,839 + 123 − 3,191
2016 Jan r + 15,865 + 14,208 + 71 − 1,412 + 5,307 − 2,238 − 19 − 1,987 − 186 − 17,833 Feb r + 20,854 + 21,911 + 619 − 84 + 6,519 − 7,491 + 545 + 21,103 + 1,478 − 296 Mar r + 29,869 + 27,234 − 124 − 1,546 + 7,772 − 3,591 − 731 + 21,501 − 64 − 7,638
Apr r + 28,952 + 27,797 − 179 − 661 + 3,533 − 1,718 + 1,303 + 26,217 + 696 − 4,039 May r + 17,745 + 23,050 + 409 − 838 − 3,921 − 546 + 277 + 14,290 + 776 − 3,733 June r + 23,122 + 25,923 − 284 − 2,209 + 513 − 1,106 − 571 + 22,115 − 711 − 435
July r + 18,927 + 20,453 + 413 − 3,460 + 5,372 − 3,437 − 103 + 17,363 + 342 − 1,461 Aug r + 17,632 + 20,933 − 435 − 4,807 + 6,016 − 4,510 − 101 + 17,217 + 93 − 314 Sep r + 24,492 + 25,409 − 324 − 3,042 + 4,788 − 2,662 + 511 + 24,977 − 695 − 26
Oct r + 19,777 + 20,598 + 294 − 3,425 + 6,117 − 3,513 − 117 + 28,457 − 145 + 8,797 Nov r + 25,394 + 23,647 − 347 − 255 + 6,949 − 4,948 − 69 + 22,295 + 140 − 3,031 Dec r + 26,182 + 16,837 − 1,959 + 1,790 + 11,675 − 4,119 + 2,541 + 44,145 − 38 + 15,422
2017 Jan r + 11,883 + 15,705 + 171 − 979 + 6,851 − 9,693 − 145 + 7,119 − 124 − 4,620 Feb r + 22,966 + 22,275 + 1,022 − 955 + 6,280 − 4,634 + 291 + 14,387 − 216 − 8,871 Mar r + 32,729 + 28,004 + 1,209 − 987 + 8,165 − 2,453 + 470 + 45,810 − 21 + 12,611
Apr r + 16,017 + 19,682 + 21 − 1,181 + 5,852 − 8,336 − 321 + 21,216 − 2 + 5,520 May r + 15,153 + 22,995 − 968 − 1,674 − 5,295 − 872 + 85 + 11,773 − 47 − 3,465 June r + 22,402 + 24,464 + 760 − 1,930 + 2,501 − 2,632 − 491 + 39,072 + 434 + 17,160
July r + 18,741 + 21,046 + 679 − 4,043 + 6,159 − 4,420 + 525 + 14,479 + 463 − 4,787 Aug r + 17,820 + 21,530 − 765 − 5,392 + 5,158 − 3,476 + 174 + 8,062 − 912 − 9,933 Sep r + 26,583 + 25,476 − 27 − 2,359 + 6,605 − 3,139 + 204 + 32,438 + 602 + 5,650
Oct r + 19,221 + 20,764 + 393 − 3,846 + 6,527 − 4,224 − 206 + 15,799 + 1,176 − 3,216 Nov r + 26,146 + 25,046 − 587 − 508 + 6,868 − 5,260 − 536 + 29,624 − 270 + 4,015 Dec r + 28,062 + 18,373 − 652 + 2,980 + 11,687 − 4,979 − 305 + 40,187 − 2,353 + 12,430
2018 Jan + 20,211 + 18,211 − 1,171 − 550 + 7,601 − 5,052 + 489 + 29,307 − 121 + 8,607 Feb + 21,438 + 20,699 + 351 + 710 + 5,419 − 5,390 + 19 + 21,329 + 583 − 128 Mar + 29,640 + 25,872 − 576 − 791 + 8,600 − 4,041 − 294 + 23,948 + 236 − 5,398
Apr + 23,487 + 22,685 + 97 − 576 + 4,014 − 2,636 + 357 + 30,208 − 670 + 6,364 May p + 12,589 + 21,487 + 146 − 1,578 − 7,404 + 84 − 478 − 2,970 + 83 − 15,081
1 Excluding freight and insurance costs of foreign trade. 2 For example, warehouse acquisition/disposal of non-produced non-financial assets. 5 Statistical errors andtransactions for the account of residents, deductions of goods returned and omissions, resulting from the difference between the balance on the financialdeductions of exports and imports in connection with goods for processing. account and the balances on the current account and the capital account. 3 Including freight and insurance costs of foreign trade. 4 Including net
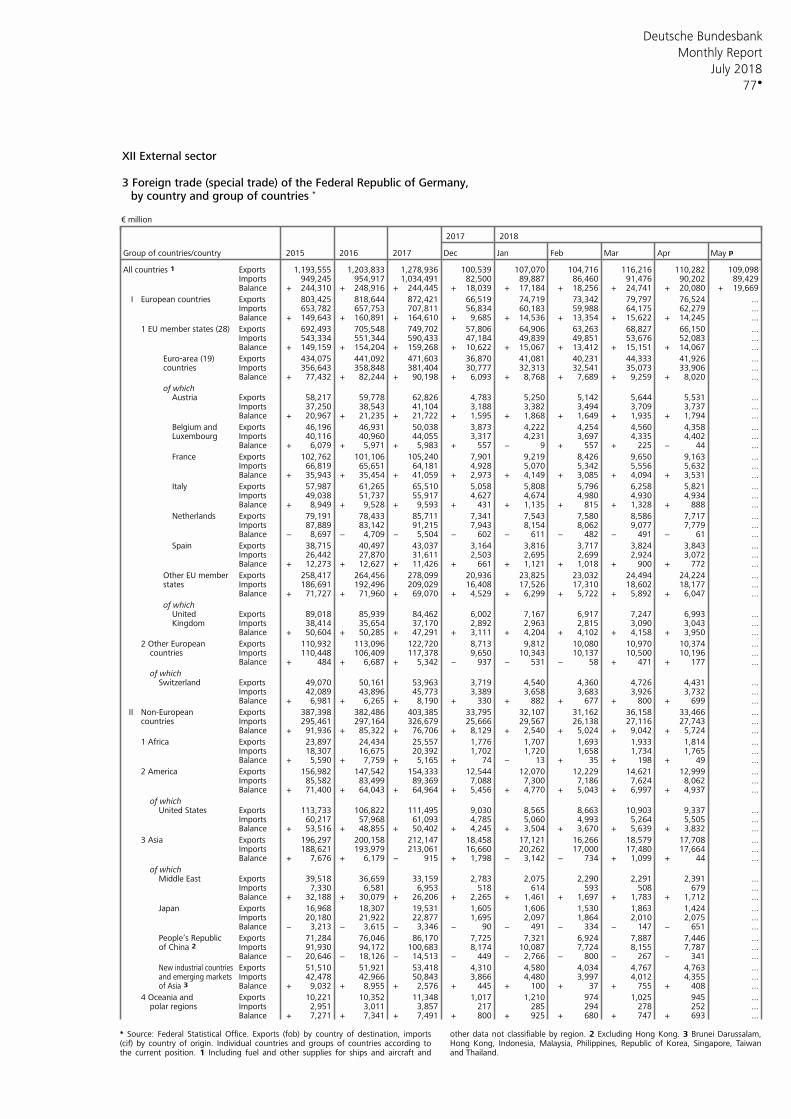
Deutsche Bundesbank
77
Monthly Report
July 2018
XII External sector 3 Foreign trade (special trade) of the Federal Republic of Germany,
by country and group of countries *
€ million
2017 2018
Group of countries/country 2015 2016 2017 Dec Jan Feb Mar Apr May p
All countries 1 Exports 1,193,555 1,203,833 1,278,936 100,539 107,070 104,716 116,216 110,282 109,098Imports 949,245 954,917 1,034,491 82,500 89,887 86,460 91,476 90,202 89,429Balance + 244,310 + 248,916 + 244,445 + 18,039 + 17,184 + 18,256 + 24,741 + 20,080 + 19,669
I Exports 803,425 818,644 872,421 66,519 74,719 73,342 79,797 76,524 ...European countriesImports 653,782 657,753 707,811 56,834 60,183 59,988 64,175 62,279 ...Balance + 149,643 + 160,891 + 164,610 + 9,685 + 14,536 + 13,354 + 15,622 + 14,245 ...
Exports 692,493 705,548 749,702 57,806 64,906 63,263 68,827 66,150 ...1 EU member states (28)Imports 543,334 551,344 590,433 47,184 49,839 49,851 53,676 52,083 ...Balance + 149,159 + 154,204 + 159,268 + 10,622 + 15,067 + 13,412 + 15,151 + 14,067 ...
Euro-area (19) Exports 434,075 441,092 471,603 36,870 41,081 40,231 44,333 41,926 ...countries Imports 356,643 358,848 381,404 30,777 32,313 32,541 35,073 33,906 ...
Balance + 77,432 + 82,244 + 90,198 + 6,093 + 8,768 + 7,689 + 9,259 + 8,020 ...
of whichAustria Exports 58,217 59,778 62,826 4,783 5,250 5,142 5,644 5,531 ...
Imports 37,250 38,543 41,104 3,188 3,382 3,494 3,709 3,737 ...Balance + 20,967 + 21,235 + 21,722 + 1,595 + 1,868 + 1,649 + 1,935 + 1,794 ...
Belgium and Exports 46,196 46,931 50,038 3,873 4,222 4,254 4,560 4,358 ...Luxembourg Imports 40,116 40,960 44,055 3,317 4,231 3,697 4,335 4,402 ...
Balance + 6,079 + 5,971 + 5,983 + 557 − 9 + 557 + 225 − 44 ...
France Exports 102,762 101,106 105,240 7,901 9,219 8,426 9,650 9,163 ...Imports 66,819 65,651 64,181 4,928 5,070 5,342 5,556 5,632 ...Balance + 35,943 + 35,454 + 41,059 + 2,973 + 4,149 + 3,085 + 4,094 + 3,531 ...
Italy Exports 57,987 61,265 65,510 5,058 5,808 5,796 6,258 5,821 ...Imports 49,038 51,737 55,917 4,627 4,674 4,980 4,930 4,934 ...Balance + 8,949 + 9,528 + 9,593 + 431 + 1,135 + 815 + 1,328 + 888 ...
Netherlands Exports 79,191 78,433 85,711 7,341 7,543 7,580 8,586 7,717 ...Imports 87,889 83,142 91,215 7,943 8,154 8,062 9,077 7,779 ...Balance − 8,697 − 4,709 − 5,504 − 602 − 611 − 482 − 491 − 61 ...
Spain Exports 38,715 40,497 43,037 3,164 3,816 3,717 3,824 3,843 ...Imports 26,442 27,870 31,611 2,503 2,695 2,699 2,924 3,072 ...Balance + 12,273 + 12,627 + 11,426 + 661 + 1,121 + 1,018 + 900 + 772 ...
Other EU member Exports 258,417 264,456 278,099 20,936 23,825 23,032 24,494 24,224 ...states Imports 186,691 192,496 209,029 16,408 17,526 17,310 18,602 18,177 ...
Balance + 71,727 + 71,960 + 69,070 + 4,529 + 6,299 + 5,722 + 5,892 + 6,047 ...
of whichUnited Exports 89,018 85,939 84,462 6,002 7,167 6,917 7,247 6,993 ...Kingdom Imports 38,414 35,654 37,170 2,892 2,963 2,815 3,090 3,043 ...
Balance + 50,604 + 50,285 + 47,291 + 3,111 + 4,204 + 4,102 + 4,158 + 3,950 ...
Exports 110,932 113,096 122,720 8,713 9,812 10,080 10,970 10,374 ...2 Other EuropeanImports 110,448 106,409 117,378 9,650 10,343 10,137 10,500 10,196 ...countriesBalance + 484 + 6,687 + 5,342 − 937 − 531 − 58 + 471 + 177 ...
of whichSwitzerland Exports 49,070 50,161 53,963 3,719 4,540 4,360 4,726 4,431 ...
Imports 42,089 43,896 45,773 3,389 3,658 3,683 3,926 3,732 ...Balance + 6,981 + 6,265 + 8,190 + 330 + 882 + 677 + 800 + 699 ...
II Exports 387,398 382,486 403,385 33,795 32,107 31,162 36,158 33,466 ...Non-EuropeanImports 295,461 297,164 326,679 25,666 29,567 26,138 27,116 27,743 ...countriesBalance + 91,936 + 85,322 + 76,706 + 8,129 + 2,540 + 5,024 + 9,042 + 5,724 ...
Exports 23,897 24,434 25,557 1,776 1,707 1,693 1,933 1,814 ...1 AfricaImports 18,307 16,675 20,392 1,702 1,720 1,658 1,734 1,765 ...Balance + 5,590 + 7,759 + 5,165 + 74 − 13 + 35 + 198 + 49 ...
Exports 156,982 147,542 154,333 12,544 12,070 12,229 14,621 12,999 ...2 AmericaImports 85,582 83,499 89,369 7,088 7,300 7,186 7,624 8,062 ...Balance + 71,400 + 64,043 + 64,964 + 5,456 + 4,770 + 5,043 + 6,997 + 4,937 ...
of whichExports 113,733 106,822 111,495 9,030 8,565 8,663 10,903 9,337 ...United StatesImports 60,217 57,968 61,093 4,785 5,060 4,993 5,264 5,505 ...Balance + 53,516 + 48,855 + 50,402 + 4,245 + 3,504 + 3,670 + 5,639 + 3,832 ...
Exports 196,297 200,158 212,147 18,458 17,121 16,266 18,579 17,708 ...3 AsiaImports 188,621 193,979 213,061 16,660 20,262 17,000 17,480 17,664 ...Balance + 7,676 + 6,179 − 915 + 1,798 − 3,142 − 734 + 1,099 + 44 ...
of whichMiddle East Exports 39,518 36,659 33,159 2,783 2,075 2,290 2,291 2,391 ...
Imports 7,330 6,581 6,953 518 614 593 508 679 ...Balance + 32,188 + 30,079 + 26,206 + 2,265 + 1,461 + 1,697 + 1,783 + 1,712 ...
Japan Exports 16,968 18,307 19,531 1,605 1,606 1,530 1,863 1,424 ...Imports 20,180 21,922 22,877 1,695 2,097 1,864 2,010 2,075 ...Balance − 3,213 − 3,615 − 3,346 − 90 − 491 − 334 − 147 − 651 ...
Exports 71,284 76,046 86,170 7,725 7,321 6,924 7,887 7,446 ...People‘s RepublicImports 91,930 94,172 100,683 8,174 10,087 7,724 8,155 7,787 ...of China 2 Balance − 20,646 − 18,126 − 14,513 − 449 − 2,766 − 800 − 267 − 341 ...
Exports 51,510 51,921 53,418 4,310 4,580 4,034 4,767 4,763 ...New industrial countriesImports 42,478 42,966 50,843 3,866 4,480 3,997 4,012 4,355 ...and emerging marketsBalance + 9,032 + 8,955 + 2,576 + 445 + 100 + 37 + 755 + 408 ...of Asia 3
Exports 10,221 10,352 11,348 1,017 1,210 974 1,025 945 ...4 Oceania andImports 2,951 3,011 3,857 217 285 294 278 252 ...polar regionsBalance + 7,271 + 7,341 + 7,491 + 800 + 925 + 680 + 747 + 693 ...
* Source: Federal Statistical Office. Exports (fob) by country of destination, imports other data not classifiable by region. 2 Excluding Hong Kong. 3 Brunei Darussalam,(cif) by country of origin. Individual countries and groups of countries according to Hong Kong, Indonesia, Malaysia, Philippines, Republic of Korea, Singapore, Taiwanthe current position. 1 Including fuel and other supplies for ships and aircraft and and Thailand.
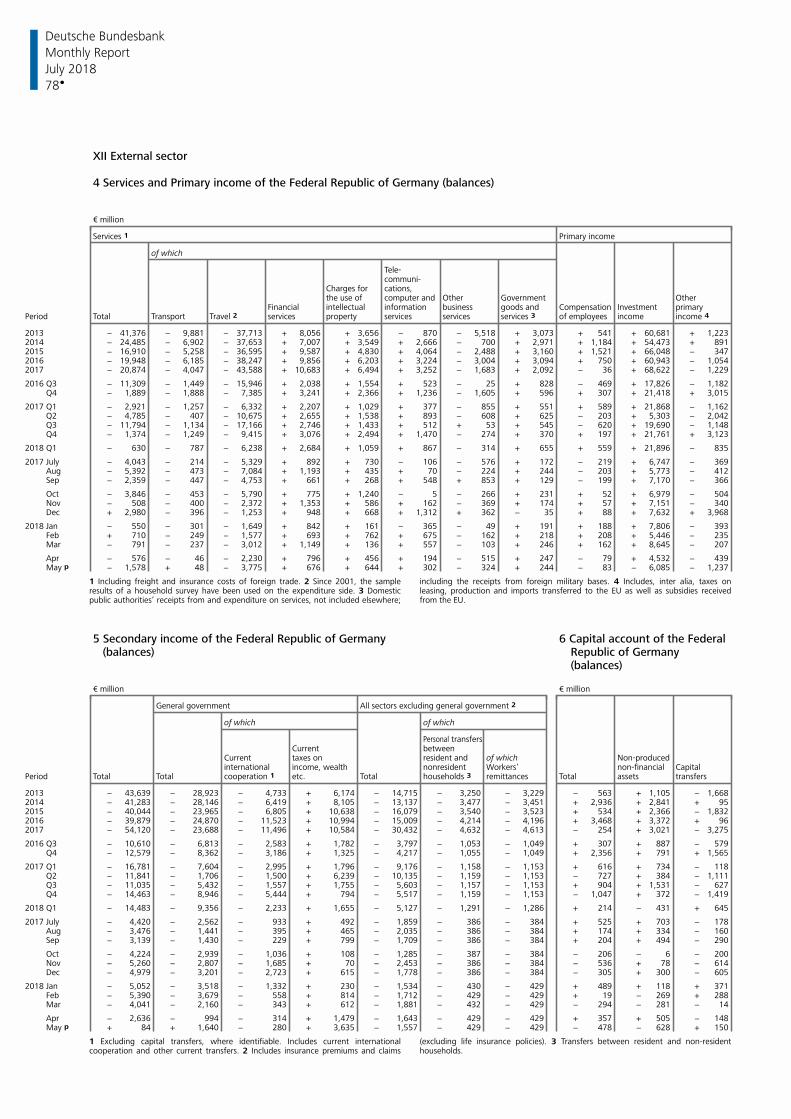
Deutsche Bundesbank
78
Monthly Report
July 2018
XII External sector 4 Services and Primary income of the Federal Republic of Germany (balances) € million
Services 1 Primary income
of which
Tele-communi-
Charges for cations,the use of Other Government Othercomputer and
Financial information business goods and Investment primaryintellectual CompensationPeriod Total Transport Travel 2 services property services services services 3 income income 4 of employees
2013 − 41,376 − 9,881 − 37,713 + 8,056 + 3,656 − 870 − 5,518 + 3,073 + 541 + 60,681 + 1,2232014 − 24,485 − 6,902 − 37,653 + 7,007 + 3,549 + 2,666 − 700 + 2,971 + 1,184 + 54,473 + 8912015 − 16,910 − 5,258 − 36,595 + 9,587 + 4,830 + 4,064 − 2,488 + 3,160 + 1,521 + 66,048 − 3472016 − 19,948 − 6,185 − 38,247 + 9,856 + 6,203 + 3,224 − 3,004 + 3,094 + 750 + 60,943 − 1,0542017 − 20,874 − 4,047 − 43,588 + 10,683 + 6,494 + 3,252 − 1,683 + 2,092 − 36 + 68,622 − 1,229
2016 Q3 − 11,309 − 1,449 − 15,946 + 2,038 + 1,554 + 523 − 25 + 828 − 469 + 17,826 − 1,182 Q4 − 1,889 − 1,888 − 7,385 + 3,241 + 2,366 + 1,236 − 1,605 + 596 + 307 + 21,418 + 3,015
2017 Q1 − 2,921 − 1,257 − 6,332 + 2,207 + 1,029 + 377 − 855 + 551 + 589 + 21,868 − 1,162 Q2 − 4,785 − 407 − 10,675 + 2,655 + 1,538 + 893 − 608 + 625 − 203 + 5,303 − 2,042 Q3 − 11,794 − 1,134 − 17,166 + 2,746 + 1,433 + 512 + 53 + 545 − 620 + 19,690 − 1,148 Q4 − 1,374 − 1,249 − 9,415 + 3,076 + 2,494 + 1,470 − 274 + 370 + 197 + 21,761 + 3,123
2018 Q1 − 630 − 787 − 6,238 + 2,684 + 1,059 + 867 − 314 + 655 + 559 + 21,896 − 835
2017 July − 4,043 − 214 − 5,329 + 892 + 730 − 106 − 576 + 172 − 219 + 6,747 − 369 Aug − 5,392 − 473 − 7,084 + 1,193 + 435 + 70 − 224 + 244 − 203 + 5,773 − 412 Sep − 2,359 − 447 − 4,753 + 661 + 268 + 548 + 853 + 129 − 199 + 7,170 − 366
Oct − 3,846 − 453 − 5,790 + 775 + 1,240 − 5 − 266 + 231 + 52 + 6,979 − 504 Nov − 508 − 400 − 2,372 + 1,353 + 586 + 162 − 369 + 174 + 57 + 7,151 − 340 Dec + 2,980 − 396 − 1,253 + 948 + 668 + 1,312 + 362 − 35 + 88 + 7,632 + 3,968
2018 Jan − 550 − 301 − 1,649 + 842 + 161 − 365 − 49 + 191 + 188 + 7,806 − 393 Feb + 710 − 249 − 1,577 + 693 + 762 + 675 − 162 + 218 + 208 + 5,446 − 235 Mar − 791 − 237 − 3,012 + 1,149 + 136 + 557 − 103 + 246 + 162 + 8,645 − 207
Apr − 576 − 46 − 2,230 + 796 + 456 + 194 − 515 + 247 − 79 + 4,532 − 439 May p − 1,578 + 48 − 3,775 + 676 + 644 + 302 − 324 + 244 − 83 − 6,085 − 1,237
1 Including freight and insurance costs of foreign trade. 2 Since 2001, the sample including the receipts from foreign military bases. 4 Includes, inter alia, taxes onresults of a household survey have been used on the expenditure side. 3 Domestic leasing, production and imports transferred to the EU as well as subsidies receivedpublic authorities’ receipts from and expenditure on services, not included elsewhere; from the EU.
5 Secondary income of the Federal Republic of Germany 6 Capital account of the Federal(balances) Republic of Germany
(balances)
€ million € million
General government All sectors excluding general government 2
of which of which
Personal transfersCurrent between
Current taxes on of whichresident and Non-producedinternational nonresident Workers’ Capitalincome, wealth non-financial
Period Total Total etc. Total remittances Total assets transferscooperation 1 households 3
2013 − 43,639 − 28,923 − 4,733 + 6,174 − 14,715 − 3,250 − 3,229 − 563 + 1,105 − 1,6682014 − 41,283 − 28,146 − 6,419 + 8,105 − 13,137 − 3,477 − 3,451 + 2,936 + 2,841 + 952015 − 40,044 − 23,965 − 6,805 + 10,638 − 16,079 − 3,540 − 3,523 + 534 + 2,366 − 1,8322016 − 39,879 − 24,870 − 11,523 + 10,994 − 15,009 − 4,214 − 4,196 + 3,468 + 3,372 + 962017 − 54,120 − 23,688 − 11,496 + 10,584 − 30,432 − 4,632 − 4,613 − 254 + 3,021 − 3,275
2016 Q3 − 10,610 − 6,813 − 2,583 + 1,782 − 3,797 − 1,053 − 1,049 + 307 + 887 − 579 Q4 − 12,579 − 8,362 − 3,186 + 1,325 − 4,217 − 1,055 − 1,049 + 2,356 + 791 + 1,565
2017 Q1 − 16,781 − 7,604 − 2,995 + 1,796 − 9,176 − 1,158 − 1,153 + 616 + 734 − 118 Q2 − 11,841 − 1,706 − 1,500 + 6,239 − 10,135 − 1,159 − 1,153 − 727 + 384 − 1,111 Q3 − 11,035 − 5,432 − 1,557 + 1,755 − 5,603 − 1,157 − 1,153 + 904 + 1,531 − 627 Q4 − 14,463 − 8,946 − 5,444 + 794 − 5,517 − 1,159 − 1,153 − 1,047 + 372 − 1,419
2018 Q1 − 14,483 − 9,356 − 2,233 + 1,655 − 5,127 − 1,291 − 1,286 + 214 − 431 + 645
2017 July − 4,420 − 2,562 − 933 + 492 − 1,859 − 386 − 384 + 525 + 703 − 178 Aug − 3,476 − 1,441 − 395 + 465 − 2,035 − 386 − 384 + 174 + 334 − 160 Sep − 3,139 − 1,430 − 229 + 799 − 1,709 − 386 − 384 + 204 + 494 − 290
Oct − 4,224 − 2,939 − 1,036 + 108 − 1,285 − 387 − 384 − 206 − 6 − 200 Nov − 5,260 − 2,807 − 1,685 + 70 − 2,453 − 386 − 384 − 536 + 78 − 614 Dec − 4,979 − 3,201 − 2,723 + 615 − 1,778 − 386 − 384 − 305 + 300 − 605
2018 Jan − 5,052 − 3,518 − 1,332 + 230 − 1,534 − 430 − 429 + 489 + 118 + 371 Feb − 5,390 − 3,679 − 558 + 814 − 1,712 − 429 − 429 + 19 − 269 + 288 Mar − 4,041 − 2,160 − 343 + 612 − 1,881 − 432 − 429 − 294 − 281 − 14
Apr − 2,636 − 994 − 314 + 1,479 − 1,643 − 429 − 429 + 357 + 505 − 148 May p + 84 + 1,640 − 280 + 3,635 − 1,557 − 429 − 429 − 478 − 628 + 150
1 Excluding capital transfers, where identifiable. Includes current international (excluding life insurance policies). 3 Transfers between resident and non-residentcooperation and other current transfers. 2 Includes insurance premiums and claims households.
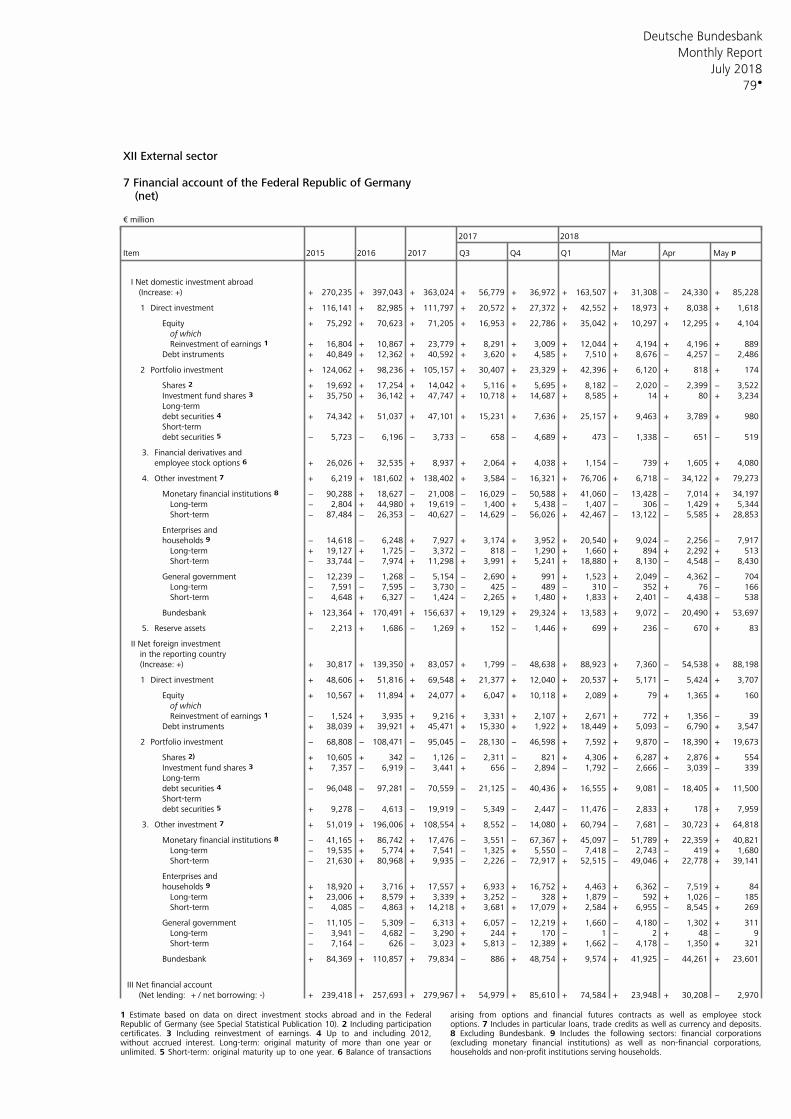
Deutsche Bundesbank
79
Monthly Report
July 2018
XII External sector 7 Financial account of the Federal Republic of Germany
(net)
€ million
2017 2018
Item 2015 2016 2017 Q3 Q4 Q1 Mar Apr May p
I Net domestic investment abroad(Increase: +) + 270,235 + 397,043 + 363,024 + 56,779 + 36,972 + 163,507 + 31,308 − 24,330 + 85,228
1 Direct investment + 116,141 + 82,985 + 111,797 + 20,572 + 27,372 + 42,552 + 18,973 + 8,038 + 1,618
Equity + 75,292 + 70,623 + 71,205 + 16,953 + 22,786 + 35,042 + 10,297 + 12,295 + 4,104of whichReinvestment of earnings 1 + 16,804 + 10,867 + 23,779 + 8,291 + 3,009 + 12,044 + 4,194 + 4,196 + 889
Debt instruments + 40,849 + 12,362 + 40,592 + 3,620 + 4,585 + 7,510 + 8,676 − 4,257 − 2,486
2 Portfolio investment + 124,062 + 98,236 + 105,157 + 30,407 + 23,329 + 42,396 + 6,120 + 818 + 174
Shares 2 + 19,692 + 17,254 + 14,042 + 5,116 + 5,695 + 8,182 − 2,020 − 2,399 − 3,522Investment fund shares 3 + 35,750 + 36,142 + 47,747 + 10,718 + 14,687 + 8,585 + 14 + 80 + 3,234Long-termdebt securities 4 + 74,342 + 51,037 + 47,101 + 15,231 + 7,636 + 25,157 + 9,463 + 3,789 + 980Short-termdebt securities 5 − 5,723 − 6,196 − 3,733 − 658 − 4,689 + 473 − 1,338 − 651 − 519
3. Financial derivatives andemployee stock options 6 + 26,026 + 32,535 + 8,937 + 2,064 + 4,038 + 1,154 − 739 + 1,605 + 4,080
4. Other investment 7 + 6,219 + 181,602 + 138,402 + 3,584 − 16,321 + 76,706 + 6,718 − 34,122 + 79,273
Monetary financial institutions 8 − 90,288 + 18,627 − 21,008 − 16,029 − 50,588 + 41,060 − 13,428 − 7,014 + 34,197Long-term − 2,804 + 44,980 + 19,619 − 1,400 + 5,438 − 1,407 − 306 − 1,429 + 5,344Short-term − 87,484 − 26,353 − 40,627 − 14,629 − 56,026 + 42,467 − 13,122 − 5,585 + 28,853
Enterprises andhouseholds 9 − 14,618 − 6,248 + 7,927 + 3,174 + 3,952 + 20,540 + 9,024 − 2,256 − 7,917
Long-term + 19,127 + 1,725 − 3,372 − 818 − 1,290 + 1,660 + 894 + 2,292 + 513Short-term − 33,744 − 7,974 + 11,298 + 3,991 + 5,241 + 18,880 + 8,130 − 4,548 − 8,430
General government − 12,239 − 1,268 − 5,154 − 2,690 + 991 + 1,523 + 2,049 − 4,362 − 704Long-term − 7,591 − 7,595 − 3,730 − 425 − 489 − 310 − 352 + 76 − 166Short-term − 4,648 + 6,327 − 1,424 − 2,265 + 1,480 + 1,833 + 2,401 − 4,438 − 538
Bundesbank + 123,364 + 170,491 + 156,637 + 19,129 + 29,324 + 13,583 + 9,072 − 20,490 + 53,697
5. Reserve assets − 2,213 + 1,686 − 1,269 + 152 − 1,446 + 699 + 236 − 670 + 83
II Net foreign investmentin the reporting country(Increase: +) + 30,817 + 139,350 + 83,057 + 1,799 − 48,638 + 88,923 + 7,360 − 54,538 + 88,198
1 Direct investment + 48,606 + 51,816 + 69,548 + 21,377 + 12,040 + 20,537 + 5,171 − 5,424 + 3,707
Equity + 10,567 + 11,894 + 24,077 + 6,047 + 10,118 + 2,089 + 79 + 1,365 + 160of whichReinvestment of earnings 1 − 1,524 + 3,935 + 9,216 + 3,331 + 2,107 + 2,671 + 772 + 1,356 − 39
Debt instruments + 38,039 + 39,921 + 45,471 + 15,330 + 1,922 + 18,449 + 5,093 − 6,790 + 3,547
2 Portfolio investment − 68,808 − 108,471 − 95,045 − 28,130 − 46,598 + 7,592 + 9,870 − 18,390 + 19,673
Shares 2) + 10,605 + 342 − 1,126 − 2,311 − 821 + 4,306 + 6,287 + 2,876 + 554Investment fund shares 3 + 7,357 − 6,919 − 3,441 + 656 − 2,894 − 1,792 − 2,666 − 3,039 − 339Long-termdebt securities 4 − 96,048 − 97,281 − 70,559 − 21,125 − 40,436 + 16,555 + 9,081 − 18,405 + 11,500Short-termdebt securities 5 + 9,278 − 4,613 − 19,919 − 5,349 − 2,447 − 11,476 − 2,833 + 178 + 7,959
3. Other investment 7 + 51,019 + 196,006 + 108,554 + 8,552 − 14,080 + 60,794 − 7,681 − 30,723 + 64,818
Monetary financial institutions 8 − 41,165 + 86,742 + 17,476 − 3,551 − 67,367 + 45,097 − 51,789 + 22,359 + 40,821Long-term − 19,535 + 5,774 + 7,541 − 1,325 + 5,550 − 7,418 − 2,743 − 419 + 1,680Short-term − 21,630 + 80,968 + 9,935 − 2,226 − 72,917 + 52,515 − 49,046 + 22,778 + 39,141
Enterprises andhouseholds 9 + 18,920 + 3,716 + 17,557 + 6,933 + 16,752 + 4,463 + 6,362 − 7,519 + 84
Long-term + 23,006 + 8,579 + 3,339 + 3,252 − 328 + 1,879 − 592 + 1,026 − 185Short-term − 4,085 − 4,863 + 14,218 + 3,681 + 17,079 + 2,584 + 6,955 − 8,545 + 269
General government − 11,105 − 5,309 − 6,313 + 6,057 − 12,219 + 1,660 − 4,180 − 1,302 + 311Long-term − 3,941 − 4,682 − 3,290 + 244 + 170 − 1 − 2 + 48 − 9Short-term − 7,164 − 626 − 3,023 + 5,813 − 12,389 + 1,662 − 4,178 − 1,350 + 321
Bundesbank + 84,369 + 110,857 + 79,834 − 886 + 48,754 + 9,574 + 41,925 − 44,261 + 23,601
III Net financial account(Net lending: + / net borrowing: -) + 239,418 + 257,693 + 279,967 + 54,979 + 85,610 + 74,584 + 23,948 + 30,208 − 2,970
1 Estimate based on data on direct investment stocks abroad and in the Federal arising from options and financial futures contracts as well as employee stockRepublic of Germany (see Special Statistical Publication 10). 2 Including participation options. 7 Includes in particular loans, trade credits as well as currency and deposits.certificates. 3 Including reinvestment of earnings. 4 Up to and including 2012, 8 Excluding Bundesbank. 9 Includes the following sectors: financial corporationswithout accrued interest. Long-term: original maturity of more than one year or (excluding monetary financial institutions) as well as non-financial corporations,unlimited. 5 Short-term: original maturity up to one year. 6 Balance of transactions households and non-profit institutions serving households.
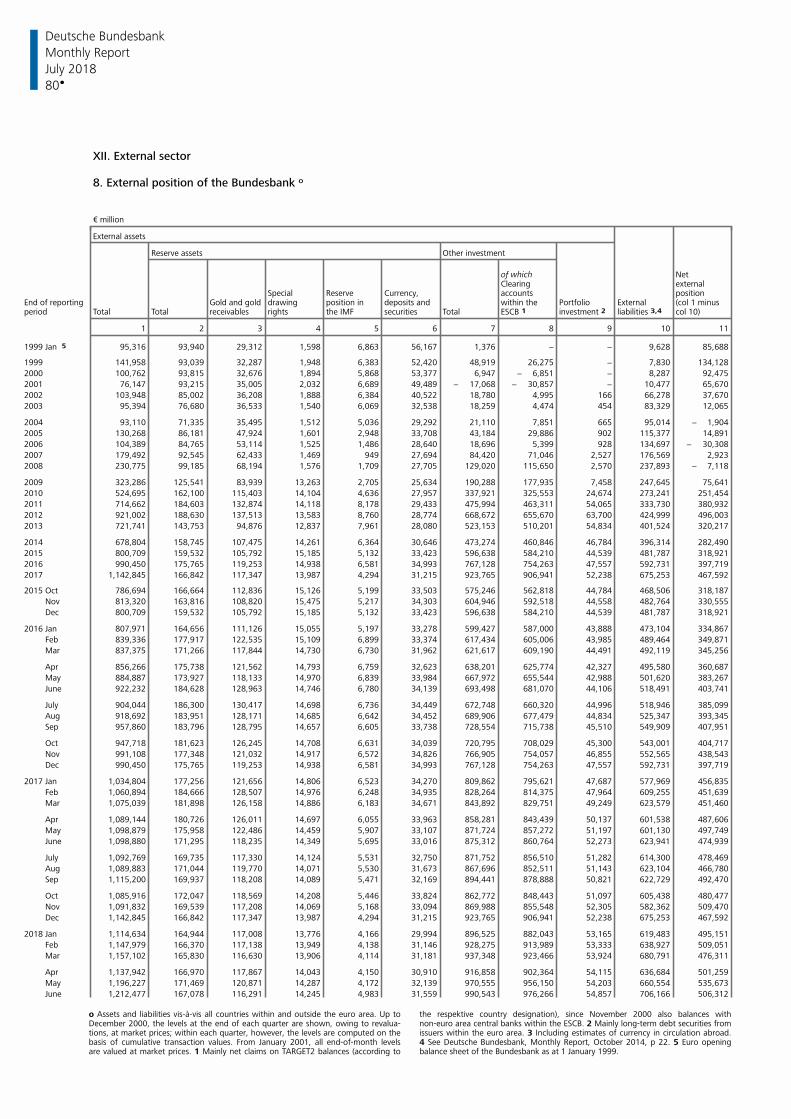
Deutsche Bundesbank
80
Monthly Report
July 2018
XII. External sector
8. External position of the Bundesbank o
€ million
External assets
Reserve assets Other investment
of which NetClearing external
Special Reserve Currency, accounts positiondrawing within the Portfolio ExternalGold and gold position in deposits and (col 1 minusEnd of reporting
period Total Total rights the IMF securities Total ESCB 1 col 10)receivables investment 2 liabilities 3,4
1 2 3 4 5 6 7 8 9 10 11
1999 Jan 5 95,316 93,940 29,312 1,598 6,863 56,167 1,376 − − 9,628 85,688
1999 141,958 93,039 32,287 1,948 6,383 52,420 48,919 26,275 − 7,830 134,128
2000 100,762 93,815 32,676 1,894 5,868 53,377 6,947 − 6,851 − 8,287 92,475
2001 76,147 93,215 35,005 2,032 6,689 49,489 − 17,068 − 30,857 − 10,477 65,670
2002 103,948 85,002 36,208 1,888 6,384 40,522 18,780 4,995 166 66,278 37,670
2003 95,394 76,680 36,533 1,540 6,069 32,538 18,259 4,474 454 83,329 12,065
2004 93,110 71,335 35,495 1,512 5,036 29,292 21,110 7,851 665 95,014 − 1,904
2005 130,268 86,181 47,924 1,601 2,948 33,708 43,184 29,886 902 115,377 14,891
2006 104,389 84,765 53,114 1,525 1,486 28,640 18,696 5,399 928 134,697 − 30,308
2007 179,492 92,545 62,433 1,469 949 27,694 84,420 71,046 2,527 176,569 2,923
2008 230,775 99,185 68,194 1,576 1,709 27,705 129,020 115,650 2,570 237,893 − 7,118
2009 323,286 125,541 83,939 13,263 2,705 25,634 190,288 177,935 7,458 247,645 75,641
2010 524,695 162,100 115,403 14,104 4,636 27,957 337,921 325,553 24,674 273,241 251,454
2011 714,662 184,603 132,874 14,118 8,178 29,433 475,994 463,311 54,065 333,730 380,932
2012 921,002 188,630 137,513 13,583 8,760 28,774 668,672 655,670 63,700 424,999 496,003
2013 721,741 143,753 94,876 12,837 7,961 28,080 523,153 510,201 54,834 401,524 320,217
2014 678,804 158,745 107,475 14,261 6,364 30,646 473,274 460,846 46,784 396,314 282,490
2015 800,709 159,532 105,792 15,185 5,132 33,423 596,638 584,210 44,539 481,787 318,921
2016 990,450 175,765 119,253 14,938 6,581 34,993 767,128 754,263 47,557 592,731 397,719
2017 1,142,845 166,842 117,347 13,987 4,294 31,215 923,765 906,941 52,238 675,253 467,592
2015 Oct 786,694 166,664 112,836 15,126 5,199 33,503 575,246 562,818 44,784 468,506 318,187
Nov 813,320 163,816 108,820 15,475 5,217 34,303 604,946 592,518 44,558 482,764 330,555
Dec 800,709 159,532 105,792 15,185 5,132 33,423 596,638 584,210 44,539 481,787 318,921
2016 Jan 807,971 164,656 111,126 15,055 5,197 33,278 599,427 587,000 43,888 473,104 334,867
Feb 839,336 177,917 122,535 15,109 6,899 33,374 617,434 605,006 43,985 489,464 349,871
Mar 837,375 171,266 117,844 14,730 6,730 31,962 621,617 609,190 44,491 492,119 345,256
Apr 856,266 175,738 121,562 14,793 6,759 32,623 638,201 625,774 42,327 495,580 360,687
May 884,887 173,927 118,133 14,970 6,839 33,984 667,972 655,544 42,988 501,620 383,267
June 922,232 184,628 128,963 14,746 6,780 34,139 693,498 681,070 44,106 518,491 403,741
July 904,044 186,300 130,417 14,698 6,736 34,449 672,748 660,320 44,996 518,946 385,099
Aug 918,692 183,951 128,171 14,685 6,642 34,452 689,906 677,479 44,834 525,347 393,345
Sep 957,860 183,796 128,795 14,657 6,605 33,738 728,554 715,738 45,510 549,909 407,951
Oct 947,718 181,623 126,245 14,708 6,631 34,039 720,795 708,029 45,300 543,001 404,717
Nov 991,108 177,348 121,032 14,917 6,572 34,826 766,905 754,057 46,855 552,565 438,543
Dec 990,450 175,765 119,253 14,938 6,581 34,993 767,128 754,263 47,557 592,731 397,719
2017 Jan 1,034,804 177,256 121,656 14,806 6,523 34,270 809,862 795,621 47,687 577,969 456,835
Feb 1,060,894 184,666 128,507 14,976 6,248 34,935 828,264 814,375 47,964 609,255 451,639
Mar 1,075,039 181,898 126,158 14,886 6,183 34,671 843,892 829,751 49,249 623,579 451,460
Apr 1,089,144 180,726 126,011 14,697 6,055 33,963 858,281 843,439 50,137 601,538 487,606
May 1,098,879 175,958 122,486 14,459 5,907 33,107 871,724 857,272 51,197 601,130 497,749
June 1,098,880 171,295 118,235 14,349 5,695 33,016 875,312 860,764 52,273 623,941 474,939
July 1,092,769 169,735 117,330 14,124 5,531 32,750 871,752 856,510 51,282 614,300 478,469
Aug 1,089,883 171,044 119,770 14,071 5,530 31,673 867,696 852,511 51,143 623,104 466,780
Sep 1,115,200 169,937 118,208 14,089 5,471 32,169 894,441 878,888 50,821 622,729 492,470
Oct 1,085,916 172,047 118,569 14,208 5,446 33,824 862,772 848,443 51,097 605,438 480,477
Nov 1,091,832 169,539 117,208 14,069 5,168 33,094 869,988 855,548 52,305 582,362 509,470
Dec 1,142,845 166,842 117,347 13,987 4,294 31,215 923,765 906,941 52,238 675,253 467,592
2018 Jan 1,114,634 164,944 117,008 13,776 4,166 29,994 896,525 882,043 53,165 619,483 495,151
Feb 1,147,979 166,370 117,138 13,949 4,138 31,146 928,275 913,989 53,333 638,927 509,051
Mar 1,157,102 165,830 116,630 13,906 4,114 31,181 937,348 923,466 53,924 680,791 476,311
Apr 1,137,942 166,970 117,867 14,043 4,150 30,910 916,858 902,364 54,115 636,684 501,259
May 1,196,227 171,469 120,871 14,287 4,172 32,139 970,555 956,150 54,203 660,554 535,673
June 1,212,477 167,078 116,291 14,245 4,983 31,559 990,543 976,266 54,857 706,166 506,312
o Assets and liabilities vis-à-vis all countries within and outside the euro area. Up to the respektive country designation), since November 2000 also balances withDecember 2000, the levels at the end of each quarter are shown, owing to revalua- non-euro area central banks within the ESCB. 2 Mainly long-term debt securities fromtions, at market prices; within each quarter, however, the levels are computed on the issuers within the euro area. 3 Including estimates of currency in circulation abroad.basis of cumulative transaction values. From January 2001, all end-of-month levels 4 See Deutsche Bundesbank, Monthly Report, October 2014, p 22. 5 Euro openingare valued at market prices. 1 Mainly net claims on TARGET2 balances (according to balance sheet of the Bundesbank as at 1 January 1999.
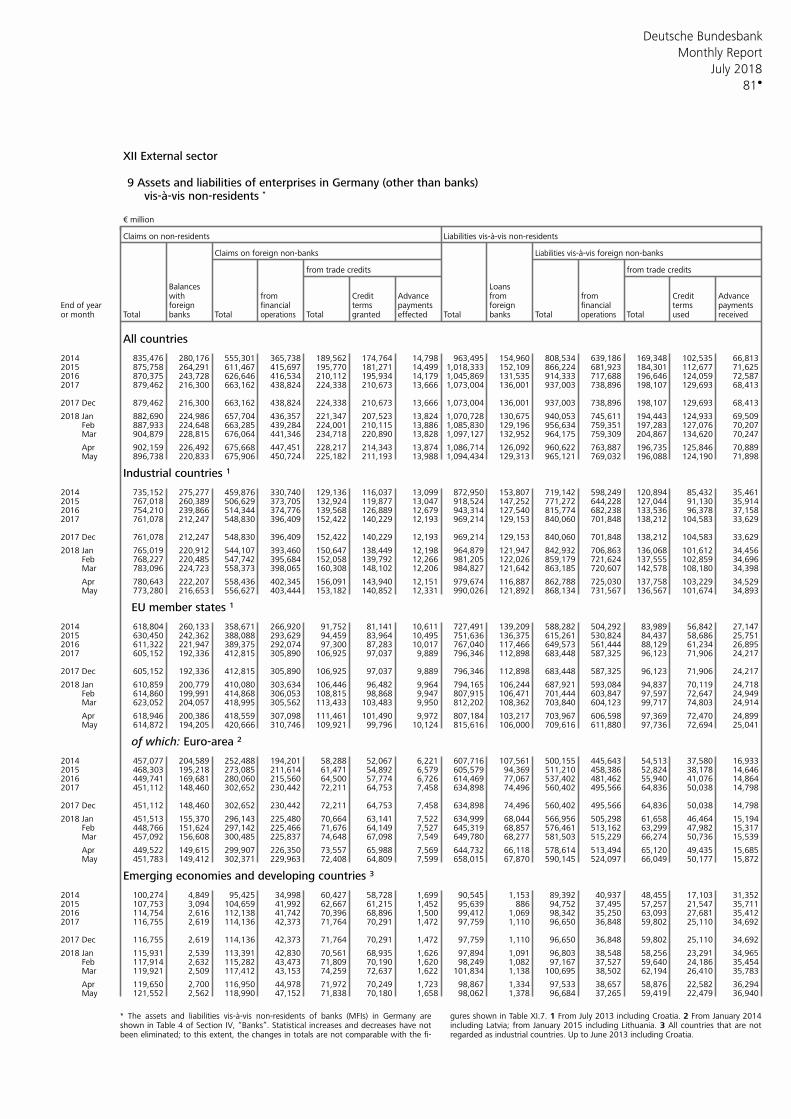
Deutsche Bundesbank
81
Monthly Report
July 2018
XII External sector 9 Assets and liabilities of enterprises in Germany (other than banks)
vis-à-vis non-residents *
€ million
Claims on non-residents Liabilities vis-à-vis non-residents
Claims on foreign non-banks Liabilities vis-à-vis foreign non-banks
from trade credits from trade credits
Balances Loanswith from Credit Advance from from Credit Advance
End of year foreign financial terms payments foreign financial terms paymentsor month Total banks Total Total granted effected Total banks Total Total used receivedoperations operations
All countries
2014 835,476 280,176 555,301 365,738 189,562 174,764 14,798 963,495 154,960 808,534 639,186 169,348 102,535 66,8132015 875,758 264,291 611,467 415,697 195,770 181,271 14,499 1,018,333 152,109 866,224 681,923 184,301 112,677 71,6252016 870,375 243,728 626,646 416,534 210,112 195,934 14,179 1,045,869 131,535 914,333 717,688 196,646 124,059 72,5872017 879,462 216,300 663,162 438,824 224,338 210,673 13,666 1,073,004 136,001 937,003 738,896 198,107 129,693 68,413
2017 Dec 879,462 216,300 663,162 438,824 224,338 210,673 13,666 1,073,004 136,001 937,003 738,896 198,107 129,693 68,413
2018 Jan 882,690 224,986 657,704 436,357 221,347 207,523 13,824 1,070,728 130,675 940,053 745,611 194,443 124,933 69,509 Feb 887,933 224,648 663,285 439,284 224,001 210,115 13,886 1,085,830 129,196 956,634 759,351 197,283 127,076 70,207 Mar 904,879 228,815 676,064 441,346 234,718 220,890 13,828 1,097,127 132,952 964,175 759,309 204,867 134,620 70,247
Apr 902,159 226,492 675,668 447,451 228,217 214,343 13,874 1,086,714 126,092 960,622 763,887 196,735 125,846 70,889 May 896,738 220,833 675,906 450,724 225,182 211,193 13,988 1,094,434 129,313 965,121 769,032 196,088 124,190 71,898
Industrial countries 1 2014 735,152 275,277 459,876 330,740 129,136 116,037 13,099 872,950 153,807 719,142 598,249 120,894 85,432 35,4612015 767,018 260,389 506,629 373,705 132,924 119,877 13,047 918,524 147,252 771,272 644,228 127,044 91,130 35,9142016 754,210 239,866 514,344 374,776 139,568 126,889 12,679 943,314 127,540 815,774 682,238 133,536 96,378 37,1582017 761,078 212,247 548,830 396,409 152,422 140,229 12,193 969,214 129,153 840,060 701,848 138,212 104,583 33,629
2017 Dec 761,078 212,247 548,830 396,409 152,422 140,229 12,193 969,214 129,153 840,060 701,848 138,212 104,583 33,629
2018 Jan 765,019 220,912 544,107 393,460 150,647 138,449 12,198 964,879 121,947 842,932 706,863 136,068 101,612 34,456 Feb 768,227 220,485 547,742 395,684 152,058 139,792 12,266 981,205 122,026 859,179 721,624 137,555 102,859 34,696 Mar 783,096 224,723 558,373 398,065 160,308 148,102 12,206 984,827 121,642 863,185 720,607 142,578 108,180 34,398
Apr 780,643 222,207 558,436 402,345 156,091 143,940 12,151 979,674 116,887 862,788 725,030 137,758 103,229 34,529 May 773,280 216,653 556,627 403,444 153,182 140,852 12,331 990,026 121,892 868,134 731,567 136,567 101,674 34,893
EU member states 1 2014 618,804 260,133 358,671 266,920 91,752 81,141 10,611 727,491 139,209 588,282 504,292 83,989 56,842 27,1472015 630,450 242,362 388,088 293,629 94,459 83,964 10,495 751,636 136,375 615,261 530,824 84,437 58,686 25,7512016 611,322 221,947 389,375 292,074 97,300 87,283 10,017 767,040 117,466 649,573 561,444 88,129 61,234 26,8952017 605,152 192,336 412,815 305,890 106,925 97,037 9,889 796,346 112,898 683,448 587,325 96,123 71,906 24,217
2017 Dec 605,152 192,336 412,815 305,890 106,925 97,037 9,889 796,346 112,898 683,448 587,325 96,123 71,906 24,217
2018 Jan 610,859 200,779 410,080 303,634 106,446 96,482 9,964 794,165 106,244 687,921 593,084 94,837 70,119 24,718 Feb 614,860 199,991 414,868 306,053 108,815 98,868 9,947 807,915 106,471 701,444 603,847 97,597 72,647 24,949 Mar 623,052 204,057 418,995 305,562 113,433 103,483 9,950 812,202 108,362 703,840 604,123 99,717 74,803 24,914
Apr 618,946 200,386 418,559 307,098 111,461 101,490 9,972 807,184 103,217 703,967 606,598 97,369 72,470 24,899 May 614,872 194,205 420,666 310,746 109,921 99,796 10,124 815,616 106,000 709,616 611,880 97,736 72,694 25,041
of which: Euro-area 2 2014 457,077 204,589 252,488 194,201 58,288 52,067 6,221 607,716 107,561 500,155 445,643 54,513 37,580 16,9332015 468,303 195,218 273,085 211,614 61,471 54,892 6,579 605,579 94,369 511,210 458,386 52,824 38,178 14,6462016 449,741 169,681 280,060 215,560 64,500 57,774 6,726 614,469 77,067 537,402 481,462 55,940 41,076 14,8642017 451,112 148,460 302,652 230,442 72,211 64,753 7,458 634,898 74,496 560,402 495,566 64,836 50,038 14,798
2017 Dec 451,112 148,460 302,652 230,442 72,211 64,753 7,458 634,898 74,496 560,402 495,566 64,836 50,038 14,798
2018 Jan 451,513 155,370 296,143 225,480 70,664 63,141 7,522 634,999 68,044 566,956 505,298 61,658 46,464 15,194 Feb 448,766 151,624 297,142 225,466 71,676 64,149 7,527 645,319 68,857 576,461 513,162 63,299 47,982 15,317 Mar 457,092 156,608 300,485 225,837 74,648 67,098 7,549 649,780 68,277 581,503 515,229 66,274 50,736 15,539
Apr 449,522 149,615 299,907 226,350 73,557 65,988 7,569 644,732 66,118 578,614 513,494 65,120 49,435 15,685 May 451,783 149,412 302,371 229,963 72,408 64,809 7,599 658,015 67,870 590,145 524,097 66,049 50,177 15,872
Emerging economies and developing countries 3 2014 100,274 4,849 95,425 34,998 60,427 58,728 1,699 90,545 1,153 89,392 40,937 48,455 17,103 31,3522015 107,753 3,094 104,659 41,992 62,667 61,215 1,452 95,639 886 94,752 37,495 57,257 21,547 35,7112016 114,754 2,616 112,138 41,742 70,396 68,896 1,500 99,412 1,069 98,342 35,250 63,093 27,681 35,4122017 116,755 2,619 114,136 42,373 71,764 70,291 1,472 97,759 1,110 96,650 36,848 59,802 25,110 34,692
2017 Dec 116,755 2,619 114,136 42,373 71,764 70,291 1,472 97,759 1,110 96,650 36,848 59,802 25,110 34,692
2018 Jan 115,931 2,539 113,391 42,830 70,561 68,935 1,626 97,894 1,091 96,803 38,548 58,256 23,291 34,965 Feb 117,914 2,632 115,282 43,473 71,809 70,190 1,620 98,249 1,082 97,167 37,527 59,640 24,186 35,454 Mar 119,921 2,509 117,412 43,153 74,259 72,637 1,622 101,834 1,138 100,695 38,502 62,194 26,410 35,783
Apr 119,650 2,700 116,950 44,978 71,972 70,249 1,723 98,867 1,334 97,533 38,657 58,876 22,582 36,294 May 121,552 2,562 118,990 47,152 71,838 70,180 1,658 98,062 1,378 96,684 37,265 59,419 22,479 36,940
* The assets and liabilities vis-à-vis non-residents of banks (MFIs) in Germany are gures shown in Table XI.7. 1 From July 2013 including Croatia. 2 From January 2014shown in Table 4 of Section IV, “Banks”. Statistical increases and decreases have not including Latvia; from January 2015 including Lithuania. 3 All countries that are notbeen eliminated; to this extent, the changes in totals are not comparable with the fi- regarded as industrial countries. Up to June 2013 including Croatia.
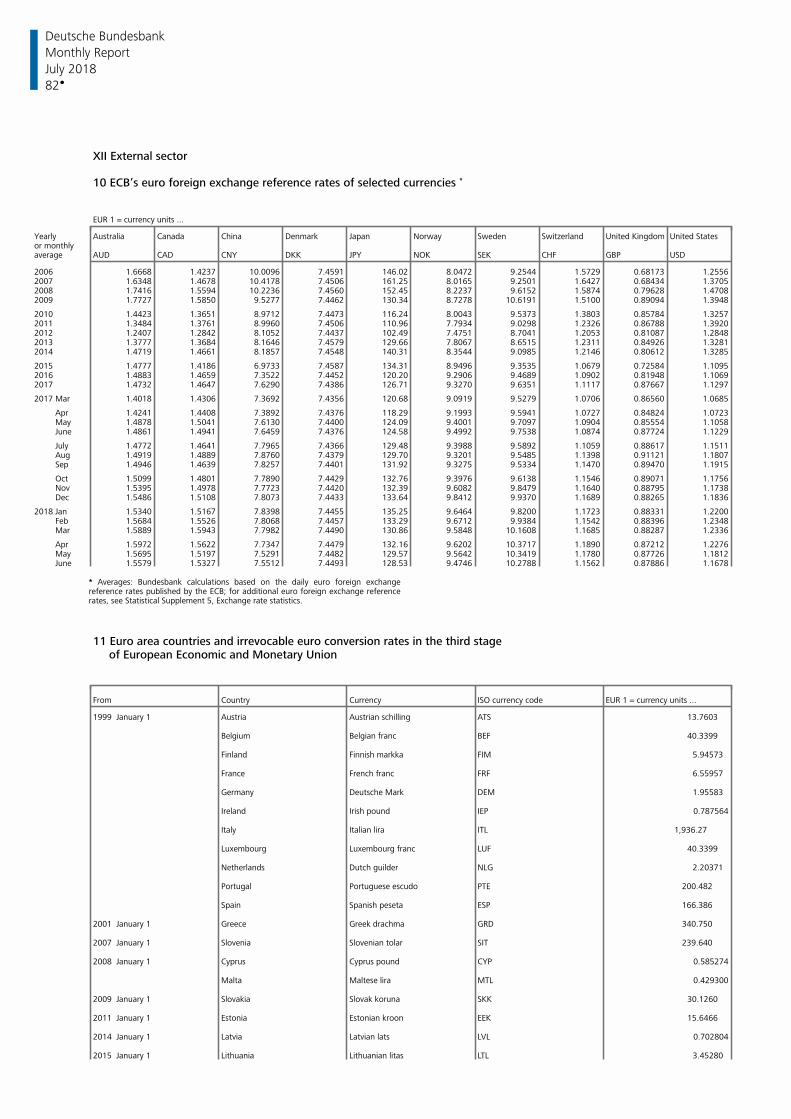
Deutsche Bundesbank
82
Monthly Report
July 2018
XII External sector
10 ECB’s euro foreign exchange reference rates of selected currencies *
EUR 1 = currency units ...
Yearly Australia Canada China Denmark Japan Norway Sweden Switzerland United StatesUnited Kingdomor monthly average AUD CAD CNY DKK JPY NOK SEK CHF GBP USD
2006 1.6668 1.4237 10.0096 7.4591 146.02 8.0472 9.2544 1.5729 0.68173 1.25562007 1.6348 1.4678 10.4178 7.4506 161.25 8.0165 9.2501 1.6427 0.68434 1.37052008 1.7416 1.5594 10.2236 7.4560 152.45 8.2237 9.6152 1.5874 0.79628 1.47082009 1.7727 1.5850 9.5277 7.4462 130.34 8.7278 10.6191 1.5100 0.89094 1.3948
2010 1.4423 1.3651 8.9712 7.4473 116.24 8.0043 9.5373 1.3803 0.85784 1.32572011 1.3484 1.3761 8.9960 7.4506 110.96 7.7934 9.0298 1.2326 0.86788 1.39202012 1.2407 1.2842 8.1052 7.4437 102.49 7.4751 8.7041 1.2053 0.81087 1.28482013 1.3777 1.3684 8.1646 7.4579 129.66 7.8067 8.6515 1.2311 0.84926 1.32812014 1.4719 1.4661 8.1857 7.4548 140.31 8.3544 9.0985 1.2146 0.80612 1.3285
2015 1.4777 1.4186 6.9733 7.4587 134.31 8.9496 9.3535 1.0679 0.72584 1.10952016 1.4883 1.4659 7.3522 7.4452 120.20 9.2906 9.4689 1.0902 0.81948 1.10692017 1.4732 1.4647 7.6290 7.4386 126.71 9.3270 9.6351 1.1117 0.87667 1.1297
2017 Mar 1.4018 1.4306 7.3692 7.4356 120.68 9.0919 9.5279 1.0706 0.86560 1.0685
Apr 1.4241 1.4408 7.3892 7.4376 118.29 9.1993 9.5941 1.0727 0.84824 1.0723 May 1.4878 1.5041 7.6130 7.4400 124.09 9.4001 9.7097 1.0904 0.85554 1.1058 June 1.4861 1.4941 7.6459 7.4376 124.58 9.4992 9.7538 1.0874 0.87724 1.1229
July 1.4772 1.4641 7.7965 7.4366 129.48 9.3988 9.5892 1.1059 0.88617 1.1511 Aug 1.4919 1.4889 7.8760 7.4379 129.70 9.3201 9.5485 1.1398 0.91121 1.1807 Sep 1.4946 1.4639 7.8257 7.4401 131.92 9.3275 9.5334 1.1470 0.89470 1.1915
Oct 1.5099 1.4801 7.7890 7.4429 132.76 9.3976 9.6138 1.1546 0.89071 1.1756 Nov 1.5395 1.4978 7.7723 7.4420 132.39 9.6082 9.8479 1.1640 0.88795 1.1738 Dec 1.5486 1.5108 7.8073 7.4433 133.64 9.8412 9.9370 1.1689 0.88265 1.1836
2018 Jan 1.5340 1.5167 7.8398 7.4455 135.25 9.6464 9.8200 1.1723 0.88331 1.2200 Feb 1.5684 1.5526 7.8068 7.4457 133.29 9.6712 9.9384 1.1542 0.88396 1.2348 Mar 1.5889 1.5943 7.7982 7.4490 130.86 9.5848 10.1608 1.1685 0.88287 1.2336
Apr 1.5972 1.5622 7.7347 7.4479 132.16 9.6202 10.3717 1.1890 0.87212 1.2276 May 1.5695 1.5197 7.5291 7.4482 129.57 9.5642 10.3419 1.1780 0.87726 1.1812 June 1.5579 1.5327 7.5512 7.4493 128.53 9.4746 10.2788 1.1562 0.87886 1.1678
* Averages: Bundesbank calculations based on the daily euro foreign exchange reference rates published by the ECB; for additional euro foreign exchange reference rates, see Statistical Supplement 5, Exchange rate statistics.
11 Euro area countries and irrevocable euro conversion rates in the third stageof European Economic and Monetary Union
From Country Currency ISO currency code EUR 1 = currency units ...
1999 January 1 Austria Austrian schilling ATS 13.7603
Belgium Belgian franc BEF 40.3399
Finland Finnish markka FIM 5.94573
France French franc FRF 6.55957
Germany Deutsche Mark DEM 1.95583
Ireland Irish pound IEP 0.787564
Italy Italian lira ITL 1,936.27
Luxembourg Luxembourg franc LUF 40.3399
Netherlands Dutch guilder NLG 2.20371
Portugal Portuguese escudo PTE 200.482
Spain Spanish peseta ESP 166.386
2001 January 1 Greece Greek drachma GRD 340.750
2007 January 1 Slovenia Slovenian tolar SIT 239.640
2008 January 1 Cyprus Cyprus pound CYP 0.585274
Malta Maltese lira MTL 0.429300
2009 January 1 Slovakia Slovak koruna SKK 30.1260
2011 January 1 Estonia Estonian kroon EEK 15.6466
2014 January 1 Latvia Latvian lats LVL 0.702804
2015 January 1 Lithuania Lithuanian litas LTL 3.45280
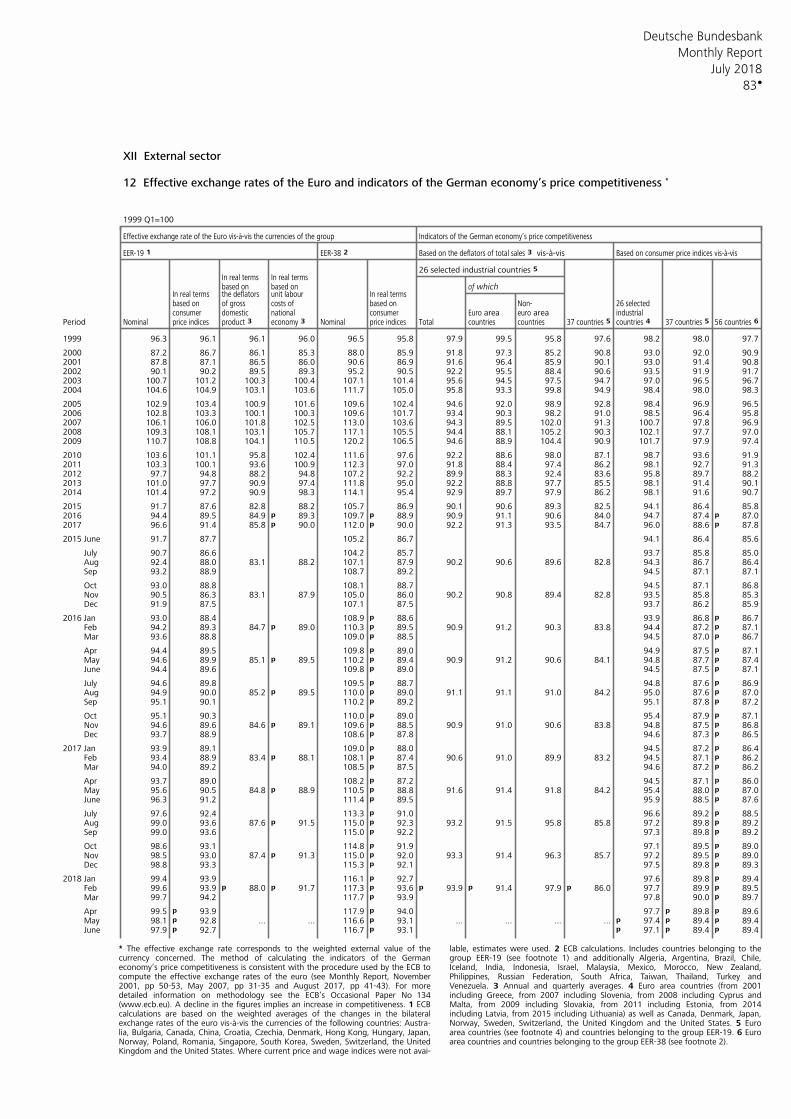
Deutsche Bundesbank
83
Monthly Report
July 2018
XII External sector
12 Effective exchange rates of the Euro and indicators of the German economy’s price competitiveness *
1999 Q1=100
Indicators of the German economy’s price competitivenessEffective exchange rate of the Euro vis-à-vis the currencies of the group
EER-19 1 EER-38 2 Based on the deflators of total sales 3 vis-à-vis Based on consumer price indices vis-à-vis
26 selected industrial countries 5 In real terms In real terms
of whichbased on based onIn real terms the deflators unit labour In real termsbased on of gross costs of based on Non- 26 selectedconsumer domestic national consumer Euro area euro area industrial
Period Nominal price indices product 3 economy 3 Nominal price indices Total countries countries 37 countries 5 countries 4 37 countries 5 56 countries 6
1999 96.3 96.1 96.1 96.0 96.5 95.8 97.9 99.5 95.8 97.6 98.2 98.0 97.7
2000 87.2 86.7 86.1 85.3 88.0 85.9 91.8 97.3 85.2 90.8 93.0 92.0 90.92001 87.8 87.1 86.5 86.0 90.6 86.9 91.6 96.4 85.9 90.1 93.0 91.4 90.82002 90.1 90.2 89.5 89.3 95.2 90.5 92.2 95.5 88.4 90.6 93.5 91.9 91.72003 100.7 101.2 100.3 100.4 107.1 101.4 95.6 94.5 97.5 94.7 97.0 96.5 96.72004 104.6 104.9 103.1 103.6 111.7 105.0 95.8 93.3 99.8 94.9 98.4 98.0 98.3
2005 102.9 103.4 100.9 101.6 109.6 102.4 94.6 92.0 98.9 92.8 98.4 96.9 96.52006 102.8 103.3 100.1 100.3 109.6 101.7 93.4 90.3 98.2 91.0 98.5 96.4 95.82007 106.1 106.0 101.8 102.5 113.0 103.6 94.3 89.5 102.0 91.3 100.7 97.8 96.92008 109.3 108.1 103.1 105.7 117.1 105.5 94.4 88.1 105.2 90.3 102.1 97.7 97.02009 110.7 108.8 104.1 110.5 120.2 106.5 94.6 88.9 104.4 90.9 101.7 97.9 97.4
2010 103.6 101.1 95.8 102.4 111.6 97.6 92.2 88.6 98.0 87.1 98.7 93.6 91.92011 103.3 100.1 93.6 100.9 112.3 97.0 91.8 88.4 97.4 86.2 98.1 92.7 91.32012 97.7 94.8 88.2 94.8 107.2 92.2 89.9 88.3 92.4 83.6 95.8 89.7 88.22013 101.0 97.7 90.9 97.4 111.8 95.0 92.2 88.8 97.7 85.5 98.1 91.4 90.12014 101.4 97.2 90.9 98.3 114.1 95.4 92.9 89.7 97.9 86.2 98.1 91.6 90.7
2015 91.7 87.6 82.8 88.2 105.7 86.9 90.1 90.6 89.3 82.5 94.1 86.4 85.82016 94.4 89.5 84.9 p 89.3 109.7 p 88.9 90.9 91.1 90.6 84.0 94.7 87.4 p 87.02017 96.6 91.4 85.8 p 90.0 112.0 p 90.0 92.2 91.3 93.5 84.7 96.0 88.6 p 87.8
2015 June 91.7 87.7 105.2 86.7 94.1 86.4 85.6
July 90.7 86.6 104.2 85.7 93.7 85.8 85.0 Aug 92.4 88.0 83.1 88.2 107.1 87.9 90.2 90.6 89.6 82.8 94.3 86.7 86.4 Sep 93.2 88.9 108.7 89.2 94.5 87.1 87.1
Oct 93.0 88.8 108.1 88.7 94.5 87.1 86.8 Nov 90.5 86.3 83.1 87.9 105.0 86.0 90.2 90.8 89.4 82.8 93.5 85.8 85.3 Dec 91.9 87.5 107.1 87.5 93.7 86.2 85.9
2016 Jan 93.0 88.4 108.9 p 88.6 93.9 86.8 p 86.7 Feb 94.2 89.3 84.7 p 89.0 110.3 p 89.5 90.9 91.2 90.3 83.8 94.4 87.2 p 87.1 Mar 93.6 88.8 109.0 p 88.5 94.5 87.0 p 86.7
Apr 94.4 89.5 109.8 p 89.0 94.9 87.5 p 87.1 May 94.6 89.9 85.1 p 89.5 110.2 p 89.4 90.9 91.2 90.6 84.1 94.8 87.7 p 87.4 June 94.4 89.6 109.8 p 89.0 94.5 87.5 p 87.1
July 94.6 89.8 109.5 p 88.7 94.8 87.6 p 86.9 Aug 94.9 90.0 85.2 p 89.5 110.0 p 89.0 91.1 91.1 91.0 84.2 95.0 87.6 p 87.0 Sep 95.1 90.1 110.2 p 89.2 95.1 87.8 p 87.2
Oct 95.1 90.3 110.0 p 89.0 95.4 87.9 p 87.1 Nov 94.6 89.6 84.6 p 89.1 109.6 p 88.5 90.9 91.0 90.6 83.8 94.8 87.5 p 86.8 Dec 93.7 88.9 108.6 p 87.8 94.6 87.3 p 86.5
2017 Jan 93.9 89.1 109.0 p 88.0 94.5 87.2 p 86.4 Feb 93.4 88.9 83.4 p 88.1 108.1 p 87.4 90.6 91.0 89.9 83.2 94.5 87.1 p 86.2 Mar 94.0 89.2 108.5 p 87.5 94.6 87.2 p 86.2
Apr 93.7 89.0 108.2 p 87.2 94.5 87.1 p 86.0 May 95.6 90.5 84.8 p 88.9 110.5 p 88.8 91.6 91.4 91.8 84.2 95.4 88.0 p 87.0 June 96.3 91.2 111.4 p 89.5 95.9 88.5 p 87.6
July 97.6 92.4 113.3 p 91.0 96.6 89.2 p 88.5 Aug 99.0 93.6 87.6 p 91.5 115.0 p 92.3 93.2 91.5 95.8 85.8 97.2 89.8 p 89.2 Sep 99.0 93.6 115.0 p 92.2 97.3 89.8 p 89.2
Oct 98.6 93.1 114.8 p 91.9 97.1 89.5 p 89.0 Nov 98.5 93.0 87.4 p 91.3 115.0 p 92.0 93.3 91.4 96.3 85.7 97.2 89.5 p 89.0 Dec 98.8 93.3 115.3 p 92.1 97.5 89.8 p 89.3
2018 Jan 99.4 93.9 116.1 p 92.7 97.6 89.8 p 89.4 Feb 99.6 93.9 p 88.0 p 91.7 117.3 p 93.6 p 93.9 p 91.4 97.9 p 86.0 97.7 89.9 p 89.5 Mar 99.7 94.2 117.7 p 93.9 97.8 90.0 p 89.7
Apr 99.5 p 93.9 117.9 p 94.0 97.7 p 89.8 p 89.6 May 98.1 p 92.8 ... ... 116.6 p 93.1 ... ... ... ... p 97.4 p 89.4 p 89.4 June 97.9 p 92.7 116.7 p 93.1 p 97.1 p 89.4 p 89.4
* The effective exchange rate corresponds to the weighted external value of the lable, estimates were used. 2 ECB calculations. Includes countries belonging to thecurrency concerned. The method of calculating the indicators of the German group EER-19 (see footnote 1) and additionally Algeria, Argentina, Brazil, Chile,economy’s price competitiveness is consistent with the procedure used by the ECB to Iceland, India, Indonesia, Israel, Malaysia, Mexico, Morocco, New Zealand,compute the effective exchange rates of the euro (see Monthly Report, November Philippines, Russian Federation, South Africa, Taiwan, Thailand, Turkey and2001, pp 50-53, May 2007, pp 31-35 and August 2017, pp 41-43). For more Venezuela. 3 Annual and quarterly averages. 4 Euro area countries (from 2001detailed information on methodology see the ECB’s Occasional Paper No 134 including Greece, from 2007 including Slovenia, from 2008 including Cyprus and(www.ecb.eu). A decline in the figures implies an increase in competitiveness. 1 ECB Malta, from 2009 including Slovakia, from 2011 including Estonia, from 2014calculations are based on the weighted averages of the changes in the bilateral including Latvia, from 2015 including Lithuania) as well as Canada, Denmark, Japan,exchange rates of the euro vis-à-vis the currencies of the following countries: Austra- Norway, Sweden, Switzerland, the United Kingdom and the United States. 5 Eurolia, Bulgaria, Canada, China, Croatia, Czechia, Denmark, Hong Kong, Hungary, Japan, area countries (see footnote 4) and countries belonging to the group EER-19. 6 EuroNorway, Poland, Romania, Singapore, South Korea, Sweden, Switzerland, the United area countries and countries belonging to the group EER-38 (see footnote 2). Kingdom and the United States. Where current price and wage indices were not avai-

Deutsche Bundesbank Monthly Report July 2018 84•
Overview of publications by the Deutsche Bundesbank
This overview provides information about selected recent economic and statistical publica-
tions by the Deutsche Bundesbank. Unless otherwise indicated, these publications are avail-
able in both English and German, in printed form and on the Bundesbank’s website.
The publications are available free of charge from the External Communication Division.
Up-to-date figures for some statistical datasets are also available on the Bundesbank’s web-
site.
Annual Report
Financial Stability Review
Monthly Report
For information on the articles published be-
tween 2000 and 2017 see the index attached
to the January 2018 Monthly Report.
Monthly Report articles
September 2017– Monetary policy indicators at the lower
bound based on term structure models
– Distributed ledger technologies in payments
and securities settlement: potential and risks
– The performance of German credit institu-
tions in 2016
– Changes to the investment funds statistics:
scope enhancements, results and outlook
October 2017– Global liquidity, foreign exchange reserves
and exchange rates of emerging market
economies
– The natural rate of interest
– The supervisory review and evaluation pro-
cess for smaller institutions and proportion-
ality considerations
– The Eurosystem’s new money market statis-
tical reporting – initial results for Germany
– The new ESCB insurance statistics – inte-
grated reporting flow and initial results
November 2017– The current economic situation in Germany
December 2017– Outlook for the German economy – macro-
economic projections for 2018 and 2019 and
an outlook for 2020
– German enterprises’ profitability and finan-
cing in 2016
– Mark-ups of firms in selected European
countries
– The Eurosystem’s financial market infrastruc-
ture – origin and future set- up
January 2018– The impact of the internationalisation of
German firms on domestic investment
– The importance of bank profitability and
bank capital for monetary policy
– Developments in corporate financing in the
euro area since the financial and economic
crisis
– Finalising Basel III
Deutsche Bundesbank Monthly Report
July 2018 85•
February 2018– The current economic situation in Germany
March 2018– German balance of payments in 2017
– The demand for euro banknotes at the Bun-
desbank
– Contingent convertible bonds: design, regu-
lation, usefulness
April 2018– Wage growth in Germany: assessment and
determinants of recent developments
– Germany’s external position: new statistical
approaches and results since the financial
crisis
– Current regulatory developments in the field
of payments and in the settlement of secur-
ities and derivatives
– Maastricht debt: methodological principles,
compilation and development in Germany
May 2018– The current economic situation in Germany
June 2018– Outlook for the German economy – macro-
economic projections for 2018 and 2019 and
an outlook for 2020
– Lower bound, inflation target and the an-
choring of inflation expectations
July 2018– The market for Federal securities: holder
structure and the main drivers of yield move-
ments
– The realignment of the Chinese economy
and its global implications
– Trends in the financing structures of German
non- financial corporations as reflected in the
corporate financial statements statistics
Statistical Supplements to the Monthly Report
1 Banking statistics1, 2
2 Capital market statistics1, 2
3 Balance of payments statistics1, 2
4 Seasonally adjusted business statistics1, 2
5 Exchange rate statistics2
Special Publications
Makro-ökonometrisches Mehr-Länder-Modell,
November 1996 3
Europäische Organisationen und Gremien im
Bereich von Währung und Wirtschaft, May
19973
Die Zahlungsbilanz der ehemaligen DDR 1975
bis 1989, August 19993
The market for German Federal securities,
May 2000
Macro-Econometric Multi-Country Model:
MEMMOD, June 2000
Bundesbank Act, September 2002
Weltweite Organisationen und Gremien im
Bereich von Währung und Wirtschaft, March
20133
Die Europäische Union: Grundlagen und Politik-
bereiche außerhalb der Wirtschafts- und Wäh-
rungsunion, April 20053
Die Deutsche Bundesbank – Aufgabenfelder,
rechtlicher Rahmen, Geschichte, April 20063
European economic and monetary union, April
2008
For footnotes, see p 88•.
Deutsche Bundesbank Monthly Report July 2018 86•
Special Statistical Publications
1 Banking statistics guidelines,
January 20182, 4
2 Banking statistics customer classification,
January 20182
3 Aufbau der bankstatistischen Tabellen,
July 20132, 3
4 Financial accounts for Germany 2011 to
2016, May 20172
5 Extrapolated results from financial state-
ments of German enterprises 1997 to 2015,
December 20162
6 Verhältniszahlen aus Jahresabschlüssen
deutscher Unternehmen von 2014 bis 2015,
May 20182, 3
7 Notes on the coding list for the balance of
payments statistics, September 20132
8 The balance of payments statistics of the
Federal Republic of Germany, 2nd edition,
February 1991o
9 Securities deposits, August 2005
10 Foreign direct investment stock statistics,
April 20181, 2
11 Balance of payments by region,
July 2013
12 Technologische Dienstleistungen in der
Zahlungsbilanz, June 20113
Discussion Papers*
17/ 2018
Offshoring and the polarisation of the demand
for capital
18/ 2018
Time- varying capital requirements and disclos-
ure rules: effects on capitalization and lending
decisions
19/ 2018
International trade and retail market perform-
ance and structure: theory and empirical evi-
dence
20/2018
Quantitative easing, portfolio rebalancing and
credit growth: micro evidence from Germany
21/2018
Pre-emptive sovereign debt restructuring and
holdout litigation
22/2018
Unconventional monetary policy, bank lending,
and security holdings: the yield-induced port-
folio rebalancing channel
23/2018
Love and money with inheritance: marital sort-
ing by labor income and inherited wealth in the
modern partnership
24/2018
Convertible bonds and bank risk-taking
25/2018
Interest rate pass-through to the rates of core
deposits – a new perspective
o Not available on the website.* As of 2000 these publications have been made available on the Bundesbank’s website in German and English. Since the beginning of 2012, no longer subdivided into series 1 and series 2.For footnotes, see p 88•.
Deutsche Bundesbank Monthly Report
July 2018 87•

Banking legislation
1 Bundesbank Act, July 2013, and Statute
of the European System of Central Banks
and of the European Central Bank, June
1998
2 Banking Act, July 20142
2a Solvency Regulation, December 20062
Liquidity Regulation, December 20062
1 Only the headings and explanatory notes to the data con-tained in the German originals are available in English.2 Available on the website only.3 Available in German only.4 Only some parts of the Special Statistical Publications are provided in English. The date refers to the German issue, which may be of a more recent date than the English one.
Deutsche Bundesbank Monthly Report July 2018 88•


