Embed Size (px)
Citation preview

MONTHLY REPORT
FEBRUARY MARCH APRIL MAY JUNE2005
Vol 57No 2

DEUTSCHEBUNDESBANKMonthly ReportFebruary 2005
Deutsche Bundesbank
Wilhelm-Epstein-Strasse 14
60431 Frankfurt am Main
Germany
Postal address
Postfach 10 06 02
60006 Frankfurt am Main
Germany
Tel +49 69 9566-1
Fax +49 69 5601071
Telex 41227 within Germany
414431 from abroad
Internet http://www.bundesbank.de
Reproduction permitted only if source is stated.
ISSN 0418-8292
The German original of this Monthly Report
went to press on 18 February 2005.
Annual and weekly publishing schedules for
selected statistics of the Deutsche Bundes-
bank can be downloaded from our website.
The statistical data are also published on the
internet.
The Monthly Report is published by the Deut-
sche Bundesbank, Frankfurt am Main, by vir-
tue of section 18 of the Bundesbank Act. It is
available to interested parties free of charge.
This is a translation of the original German-
language version, which is the sole authorita-
tive text.

DEUTSCHEBUNDESBANKMonthly ReportFebruary 2005
Contents The economic scene in Germany
around the turn of 2004-05 5
Overview 6
Global and European setting 10
Monetary policy, banking business and
the capital market 19
Money market management and
liquidity needs 20
An indicator to measure the liquidity
premium in the bond market 29
Economic conditions in Germany 33
Sharp increase in low-paid part-time
jobs 38
Foreign trade and payments 46
Public finances 53
The level of pension adjustments
following the introduction of the
“sustainability factor” 60
The current status of the excessive
deficit procedure against Germany 63
Statistical Section 1*
Key economic data for euro area 6*
Overall monetary survey in the euro area 8*
Consolidated financial statement
of the Eurosystem 16*
Banks 20*
Minimum reserves 42*
Interest rates 43*

DEUTSCHEBUNDESBANKMonthly ReportFebruary 2005
4
Capital market 48*
Public finances in Germany 52*
Economic conditions 60*
External sector 67*
Overview of publications by the
Deutsche Bundesbank 77*
DEUTSCHEBUNDESBANKMonthly ReportFebruary 2005
5
The economic scenein Germanyaround the turnof 2004-05

DEUTSCHEBUNDESBANKMonthly ReportFebruary 2005
6
Overview Still no upswing
The German economy has been stagnating
since the third quarter of 2004. Until then,
German economic activity had been fuelled
mainly by strong global economic growth
and the ensuing buoyant foreign demand.
Since those external impulses lost some of
their initial momentum, the dynamics of the
German economy have once again been
shaped by persistently weak domestic de-
mand. This was compounded by burdens re-
sulting from the sharp increase in oil prices
and the appreciation of the euro. According
to provisional figures from the Federal Statis-
tical Office, in the final quarter of 2004 real
GDP actually declined by 0.2% on the quarter
after adjustment for the usual seasonal vari-
ations and extra working days. Thus, the cur-
rent figures are less favourable than had been
expected in the light of the Federal Statistical
Office’s flash estimate a few weeks ago.
It should, however, be borne in mind when
interpreting the first release of the national
accounts data for the fourth quarter of 2004
that the working-day adjustment for this
period had a strong downward impact on the
recorded rate of change. Owing to the quirks
of the calendar, there were more working
days in the final quarter of 2004 compared
with the average in previous years. If this fac-
tor is discounted, the figures show an in-
crease of 0.4% instead of a decrease of ap-
proximately 0.2%. In so far as the additional
working hours were not exploited for produc-
tion to the usual extent, the adjusted output
figure, although absolutely correct in terms of
the number of working days, would under-
GDP in 2004Q4
Marked effectsof working-dayvariations

DEUTSCHEBUNDESBANKMonthly ReportFebruary 2005
7
state the true cyclical position. The fact that
the additional working days were concen-
trated in the last two weeks of the year, ie in
the traditional holiday period around Christ-
mas, supports this hypothesis. Quite apart
from the uncertainties associated with this,
however, there is no doubt that, after stag-
nating in the third quarter of 2004, the eco-
nomic recovery again failed to make any pro-
gress in the final quarter of the year. Enter-
prises’ investment demand appears to have
weakened again following a sharp rise in the
third quarter. Although there was a slight in-
crease in private consumption, it is too early
to conclude that this indicates a sustained in-
crease in the propensity to consume.
Nonetheless, there is no reason to be pessim-
istic about the outlook for the current year.
Evidently, many consumers and investors sub-
scribe to the view that the current flat move-
ment will give way to renewed growth. Enter-
prises, in any case, began the new year with
more favourable business expectations. This
is particularly so in the case of the wholesale/
retail trade sector. This may be due partly to
the fact that, according to consumer surveys,
there was a marked improvement in the
mood among households in January. Individ-
uals’ expectations concerning their income
and the economy turned positive and the
propensity to purchase rose considerably. Al-
though industry is somewhat more cautious
about its export prospects than it has previ-
ously been, business expectations remain
favourable.
Despite the burdens resulting from the appre-
ciation of the euro, the upward trend is clear-
ly expected to continue in this area, too. The
German economy is benefiting from its pres-
ence in the most important growth regions in
the world and from the restructuring and di-
versification of its production sites. The more
intensive utilisation of the international div-
ision of labour through relocating certain pro-
duction processes abroad is boosting Germa-
ny’s competitive position, while simultaneous-
ly rendering it less susceptible to temporary
exchange-rate fluctuations. In addition, the
German economy has improved its competi-
tiveness vis-�-vis the economies of the other
euro-area countries by exercising cost discip-
line on the wage front. Measures to create
greater flexibility in labour utilisation and
more efficient production processes have also
played a significant role. Measured by the de-
velopment of relative unit labour costs in the
1998 Q4 = 100, quarterly, log scale 1
86
88
90
92
94
96
98
100
...the other euro-area countries
...19 industrial countries
Indicator based on unit labourcosts in the enterprise sectorvis-à-vis...
1998 2005
German price competitiveness
1 Scale inverted: rising curve (decline invalues) denotes an increase in competitive-ness. — - = Latest position: estimate as per17 February 2005.
Deutsche Bundesbank
-
-
1999 2000 2001 2002 2003 2004
Improvedsentiment andexpectationssince the turnof the year
Externalcompetitiveness

DEUTSCHEBUNDESBANKMonthly ReportFebruary 2005
8
enterprise sector, since the start of monetary
union German suppliers have improved their
competitiveness by 7% compared with the
other euro-area countries.
This is also reflected in the favourable price
trend of recent years. The price climate has
remained essentially relaxed in the past few
months, too. In particular, external influences,
especially the appreciation of the euro, have
helped to ease inflationary pressures. The sta-
bilising of oil price developments and the eas-
ing of prices on some commodity markets
have been key factors in the decline, on aver-
age, of German import prices since October.
At the consumer level, however, this decline
was eclipsed up to the end of the year by the
further increase in tobacco tax in December
and the other tax measures which came into
force beforehand as well as the effects of the
health service reform. However, at 1.6% the
rise in the consumer price index in January
was down considerably on the year. Thus,
price developments are bolstering the pur-
chasing power of households’ disposable in-
come.
In view of the very subdued development to-
wards the end of the year, there was little
change in the labour market situation either.
Rising unemployment was once again accom-
panied by an increase in employment, how-
ever the latter consisted mainly of “mini-
jobs”, subsidised start-ups (“Me-PLCs”) or
“one-euro jobs” that allow benefit recipients
to earn a little extra income. By contrast, the
number of full-time employees subject to full
social security contributions continued to fall
up to the end of the period under review. At
first glance, this might appear to indicate a
trend towards the substitution of “normal”
jobs with publicly subsidised forms of employ-
ment. However, a closer examination of the
underlying changes shows that there is no
basis for such a sweeping assumption. In gen-
eral, jobs subject to social security contribu-
tions are not being eroded in the same areas
in which government subsidised jobs or low-
paid part-time work are simultaneously being
created. These new forms of employment
have provided a greater degree of flexibility
on the labour market which has, in turn,
created additional jobs (see p 37-40).
The sharp rise in the official unemployment
figure at the start of the year to more than
five million has led to a debate on the true
scale of the unemployment problem in Ger-
many. It certainly needs to be borne in mind
that the (seasonally-adjusted) rise of 225,000
in the number of people unemployed be-
tween the end of last year and the end of
January 2005 is due mainly to the first-time
registration of persons previously receiving
social assistance, even though they were
without work beforehand, too. Thus, the rise
in the official unemployment figure is purely
of a statistical nature. On the other hand, it
should not be overlooked that the shortage
of competitive jobs in Germany is greater
than the official unemployment figure imme-
diately implies. The macroeconomic costs
which this causes year after year are one of
main reasons behind the current strained
public finance situation.
Last year, the general government deficit re-
mained virtually unchanged from its level in
Relaxed priceclimate
New forms ofemployment
Rise inunemploymentin January...
...of a statisticalnature

DEUTSCHEBUNDESBANKMonthly ReportFebruary 2005
9
2003 (3.8% of GDP). The lack of improve-
ment was due primarily to a decline in rev-
enue. Two key factors behind this were the
extensive tax cuts made at the beginning of
2004 and the structure of macroeconomic
growth, biased as it was towards exports,
which yield less tax revenue than domestic
economic activity. By contrast, expenditure
was actually reduced, even in absolute terms.
The general government deficit could go
down significantly this year. The target of
keeping within the 3% ceiling for the first
time since 2001 seems feasible from today’s
perspective. However, major uncertainties,
especially surrounding the macroeconomic
development and the financial impact of the
numerous fiscal policy measures, entail sig-
nificant risks. The success of the consolidation
efforts this year will hinge on expenditure
growth remaining contained. This will require
efforts from all levels of government. In the
medium term, further consolidation measures
are needed to reduce the government def-
icits, observe the national deficit ceilings and
bring the debt ratio back down again. This is
made more difficult by the fact that a large
part of the planned deficit reduction for this
year is intended to be achieved through one-
off relief measures. The reduction of the def-
icit ratio to 11�2% in 2008 envisaged in the
updated stability programme of Decem-
ber 2004 does not appear ambitious enough
given the relatively optimistic assessment of
macroeconomic development in that pro-
gramme.
Monetary policy has maintained its expan-
sionary stance in the last few months. In the
fourth quarter of 2004, the money stock M3
grew at a (seasonally-adjusted) annual rate of
just under 71�2%, ie almost as strongly as it
had done in the preceding three-month
period. The main driving force behind this de-
velopment is the strong growth in private
credit which is, however, emanating less from
the German economy than from the other
euro-area countries. Given the ample provi-
sion of liquidity and the ensuing investment
pressure, the tendency towards an easing of
capital market conditions continued with little
interruption. Thus, in the fourth quarter of
2004, long-term interest rates in the euro
area clearly decoupled from the US dollar
interest rate trend and fell to 31�2%. They
have almost gone down to their historical low
reached in the third quarter of 2003. Thus,
from a financing perspective, the conditions
for private investors and consumers have be-
come slightly more favourable still. The
present monetary policy stance is thus not im-
peding an ongoing economic recovery.
Large generalgovernmentdeficit in 2004
Need forconsolidation
Expansionarymonetary policy
DEUTSCHEBUNDESBANKMonthly ReportFebruary 2005
10
Global andEuropean setting
World economic activity
In the autumn of 2004, the global economy
remained on the somewhat flatter growth
track on which it had embarked in the sum-
mer. The fact that crude oil prices, which had
reached a new all-time high at the end of
October, receded noticeably in the ensuing
period (at the end of December, the price of
North Sea Brent was a quarter down on the
price two months earlier) is likely to have
played a key role in stabilising the pace of
expansion. Since then, prices have again
shown a slight rising trend, however; in mid-
February, the price of crude oil (US$45) was
just under 50% up on the year compared
with 70% in October 2004. The way in which
the oil price increases have been dealt with
reaffirms that the upswing is very robust and
therefore able to absorb such disruptions
quite well. Bearing this in mind, the need to
support driving forces by means of an expan-
sionary economic policy also appears to be
increasingly unnecessary or associated with
greater risks. The Fed therefore continued on
its course of gradually tightening monetary
policy in the fourth quarter with two further
interest rate increases totalling 1�2 percentage
point in November and December and the
decision at the beginning of February for a
further rise of 25 basis points to 2.5%.
All in all, 2004 was a very successful year for
the world economy. According to IMF esti-
mates, at 5%, output growth was the highest
it had been since the mid-1970s. It was also
well above the long-term average of 31�2%.
Moreover, unemployment fell somewhat.
However, the global imbalances increased
Stable globaleconomy
2004:impressivegrowthperformance,but with flaws

DEUTSCHEBUNDESBANKMonthly ReportFebruary 2005
11
further. This was reflected in exchange rate
movements towards the end of 2004. The
euro, which appreciated sharply against the
US dollar, thus had to bear further adjustment
burdens (following the upward surges in
2002 and 2003). Although, if viewed in isol-
ation, the resulting deterioration in the price
competitiveness of the export sector damp-
ened growth in the euro area, it was offset by
better sales prospects on the part of produ-
cers in the dollar area.
The outlook for the global economy with re-
gard to above-average growth remains fa-
vourable for 2005; this was suggested not
least by the altogether good start to the new
year. The cyclical normalisation which oc-
curred in the course of 2004 means that the
conditions for sustained growth have tended
to improve even further. However, the risk of
potential setbacks is still considerable. For
one thing, the oil markets are likely to remain
volatile and prone to disruptions owing to the
limited spare capacity in crude oil production
worldwide and continuing geopolitical ten-
sions in the Middle East. The major external
imbalances are a further significant potential
risk factor.
In 2004, the US current account deficit
reached a new high of an estimated 53�4% of
gross domestic product (GDP). Furthermore,
it is being financed less and less through pri-
vate investment and increasingly through for-
eign currency purchases by central banks in
emerging market economies. The East Asian
central banks, which are thereby trying to
prevent their currencies from appreciating,
have a particular role in this. It is not yet cer-
tain how long these central banks will con-
tinue to pursue their policy of supporting the
dollar in view of the dollar holdings which
they have accumulated up to now. A sharp
reduction in or the discontinuance of the
exchange rate-motivated purchases of US
dollars would probably lead to a substantial
depreciation of the US currency and, at the
same time, to an interest rate rise on the
international capital markets, which are
currently exhibiting historically low rates of
return.
From a regional point of view, global eco-
nomic activity in the fourth quarter was char-
acterised by a somewhat slower but still fairly
strong rise in output in the USA and con-
tinued dynamic growth in the new EU mem-
ber states. In the autumn, the UK economy
again expanded somewhat more strongly
than before. By contrast, euro-area growth
continued to weaken. In Japan, overall eco-
nomic output fell slightly in the autumn for
the third time in succession. Overall output in
the major industrial countries and regions
(the USA, Japan, the United Kingdom and
the euro area), which reflects the weaker eco-
nomic developments in the euro area and
Japan more precisely than the global picture,
exceeded the third-quarter level by “only”
just under 1�2% after seasonal adjustment in
the October-December period. Growth in the
second half of the year as a whole, at 1%,
was markedly weaker than in the first half
of the year (+13�4%). The rise in consumer
prices in the industrial countries accelerated
to 2.5% – from 2.1% in the third quarter –
above all as a result of the sharp increase in
energy prices in the autumn. The average rise
Outlook andrisks for 2005
Global upswingwith distinctregionaldifferences

DEUTSCHEBUNDESBANKMonthly ReportFebruary 2005
12
for 2004 was 2.0%. Excluding Japan, which
in the autumn again reported slight price in-
creases following a long period of falling
prices, consumer prices in the fourth quarter
were 2.8% up on the year compared with an
increase of 1.7% in the first quarter of 2004.
The Commonwealth of Independent States
(CIS) and the majority of Latin American
economies benefited from the high prices on
the commodity markets up to the end of the
period under review. Furthermore, the im-
provements in the underlying economic con-
ditions of the past few years now increasingly
appear to be bearing fruit in several Latin
American countries. The list is headed by Bra-
zil which, in 2004, posted a sizeable current
account surplus and was able to attract ex-
tensive net foreign direct investment. Growth
in East Asia continued to be buoyed by the
economic boom in China. According to esti-
mates from China’s statistical office, overall
output rose by 91�2% in the fourth quarter of
2004 compared with the level at the end of
2003; this increase also corresponds to the
annual average growth rate. The tsunami
caused an enormous loss of human lives and
major damage to property in the countries
bordering the Indian Ocean. However, there
is much evidence to suggest that the high
level of growth in the countries concerned
will not be permanently dampened. Coastal
fishing and the tourist industry are of rather
minor economic significance (apart from in
the Maldives and Sri Lanka). In addition, it
will probably be possible to quickly rectify the
worst damage caused, for example, to the in-
frastructure, thanks to extensive international
aid.
Initial calculations show that fourth-quarter
aggregate output in the USA was up by 3�4%
on the quarter after adjustment for seasonal
and working-day variations. Year on year, it
rose by 33�4%. On average over the past year,
GDP growth amounted to 41�2%; this was the
highest rate of expansion since 1999. Accord-
ing to IMF estimates, with potential output
growth at 31�4%, the output gap was consid-
Seasonally adjusted%
%
%
%Euro area
United Kingdom
Japan
USA
Quarter-on-quarter change
Growth trends inselected industrial countries
Deutsche Bundesbank
1.0+
0.5+
0
0.5−
1.5+
1.0+
0.5+
0
2.0+
1.5+
1.0+
0.5+
0
0.5−
1.0−
2.0+
1.5+
1.0+
0.5+
0
0.5−
2000 2001 2002 2003 2004
Emergingmarketeconomies
USA

DEUTSCHEBUNDESBANKMonthly ReportFebruary 2005
13
erably reduced in 2004, although it has not
yet been completely eliminated. The strong-
est fourth-quarter expansionary stimuli again
came from private consumption, which rose
by just over 1% in seasonally adjusted terms.
Owing to a marked increase in disposable in-
come on account of exceptionally large divi-
dend payments in December, the saving ratio
rose quarter-on-quarter from 1�2% to 11�4%.
Commercial investment also continued to rise
substantially. By contrast, real expenditure on
new residential buildings hardly grew any fur-
ther. After adjustment for price and seasonal
variations, exports fell by 1%.1 With the con-
tinuing strong expansion of imports (+21�4%),
the deficit in the real foreign balance reached
a new high, amounting to 53�4% of GDP.
All in all, 2005 got off to a good start for the
US economy. According to a survey conduct-
ed by the Conference Board, consumer senti-
ment improved further in January owing to
an improved situation assessment; however,
expectations were no longer quite as optimis-
tic as in December. The intake of orders for
durable goods increased by a seasonally ad-
justed 11�4% in the autumn and was thus
71�2% up on the year. According to the most
recent reports from the Federal Reserve’s dis-
tricts, private consumption and corporate in-
vestment continued to expand at the turn of
2004-05. The moderate level of employment
growth also carried over into January; the
number of employed people outside the agri-
cultural sector was 11�2% up on the year. The
unemployment rate fell to 5.2% after season-
al adjustment.
The economic picture in the USA is being
clouded by stronger inflationary pressures,
however. In the fourth quarter of 2004, con-
sumer prices were 3.3% higher than one year
earlier, compared with 1.8% in the first three
months of the year and 2.7% on an annual
average. Excluding energy and food, the rate
of price increase rose from 1.4% in the first
quarter to 2.1% in the fourth quarter. How-
ever, this contrasts to a certain extent with
the core rate of the personal consumption ex-
penditure deflator, which is taken into par-
ticular account in the Fed’s price analyses; at
1.6%, it was significantly lower in the fourth
quarter and, moreover, only marginally higher
Quarterly%
Percent-agepoints
Difference
Core CPI rate
Core rate of the personalconsumption expenditure deflator
Core inflation * in the USA
* Consumer prices and the personal con-sumption expenditure deflator excludingenergy and food; annual rate of change.
Deutsche Bundesbank
1.5
1.0
0.5
0
3.5
3.0
2.5
2.0
1.5
1.0
0.5
0
2001 2002 2003 2004
1 According to the Bureau of Economic Analysis, which isresponsible for the US national accounts, an upward ad-justment of the export figures is becoming apparent. Ifviewed in isolation, this is also likely to lead to a slight up-ward revision of GDP growth data.

DEUTSCHEBUNDESBANKMonthly ReportFebruary 2005
14
than at the beginning of the year. The in-
creasing divergence between the two core
rates is attributable, amongst other things, to
the fact that the national accounts-based de-
flator, in accordance with the consumption
concept applied in the US national accounts
– and in contrast to the expenditure concept
of the consumer price statistics –, also in-
cludes the government-funded health care
services (Medicare and Medicaid), the price
pressures on which diminished noticeably in
the course of 2004.
Real GDP in Japan declined slightly again in
the autumn of 2004, denoting a fall of 1�2%
since the last peak at the beginning of 2004.
It was up by only just over 1�2% on the year in
the fourth quarter. Average growth for the
year was 21�2% owing to the strong growth
overhang from 2003 and the rapid rate of ex-
pansion at the start of 2004. Measured in
terms of the IMF and OECD autumn forecasts
of 4.4% and 4.0% respectively, the annual
result was certainly disappointing. Apart from
the economic downturn which has persisted
since the spring, it must also be borne in
mind that strongly revised national accounts
figures were published in early Decem-
ber 2004 showing, for example, growth rates
for 2003 and the first three quarters of 2004
which, respectively, were 1 and 11�2 percent-
age points lower. These corrections were re-
corded – so to speak – as a counterentry in
the GDP deflator, meaning that a lower level
of macroeconomic deflation is shown after
revision, which seems plausible on the whole.
The available economic indicators suggest an
upturn in production at the beginning of
2005. On an average of the fourth quarter,
consumer prices were 0.5% up on the year.
This was the first quarterly rise in consumer
prices since the end of 1998. The main rea-
sons for this were the surge in energy prices
and the sharp rise in the price of seasonal
food products owing to the extensive crop
damage caused by typhoons in the late sum-
mer of 2004.
According to initial estimates, in the fourth
quarter, the UK economy expanded by 3�4%
after adjustment for seasonal and working-
day variations, ie somewhat more strongly
than in the summer (+1�2%). The figure was
23�4% up on the end of 2003 compared with
an increase of 3% for 2004 as a whole. The
most important mainstay of growth in the au-
tumn was once again the services sector; as
in the summer already, the real value added
of this sector rose by a seasonally adjusted
1%. In addition, construction output in-
creased significantly. Although the value
added in the production sector (excluding
construction) declined again at the end of
2004, at 1�2%, the fall was no longer as pro-
nounced as in the preceding period. This con-
tributed materially to the slight rise in GDP
growth in comparison with the summer
months. All in all, however, the UK economy
slowed down noticeably after mid-year. The
distinct slowdown in price movements on the
property markets was particularly note-
worthy. According to the Halifax House Price
Index, fourth-quarter seasonally adjusted
house prices were barely higher than in the
preceding period. However, the year-on-year
increase was still 15%. Consumer prices,
affected by the sharp increase in energy
prices, picked up distinctly on an average of
Japan
UnitedKingdom

DEUTSCHEBUNDESBANKMonthly ReportFebruary 2005
15
the October-January period. The year-on-year
rise in the Harmonised Index of Consumer
Prices (HICP) remained fairly moderate at
1.5%, however. According to the Retail Price
Index excluding Mortgage Interest Payments
– which is methodologically different from
the HICP – prices went up by 2.2%.
The new EU member states were among the
fastest growing economies in the world in
2004. The expansionary process in this region
was driven by both burgeoning foreign trade
and strong domestic demand. Although eco-
nomic activity initially lost momentum after
mid-year – like in most industrial countries –,
aggregate industrial production was up by a
seasonally adjusted 11�4% in the fourth quar-
ter – following a decline in the preceding
period. The year-on-year rise was 53�4%. In-
dustrial production rose by an average of
91�2% over the past year. The altogether ro-
bust expansionary process is also helping to
improve the situation on the labour market.
After adjustment for seasonal variations,
the standardised unemployment rate in this
group of countries fell by 1�2 percentage point
to 13.8% between January and Decem-
ber 2004. The rate of consumer price in-
crease, which had accelerated significantly in
the second and third quarters, was more
moderate again in the autumn. Fourth-
quarter prices were 4.4% up on the year
compared with 4.9% in the July-September
period. The annual average rate of price in-
crease was 4.0% compared with only 1.9%
in 2003. This increased upward pressure on
prices was attributable primarily to the devel-
opment of economic activity, the sharp rise in
food and energy prices and increases in indir-
ect taxes in connection with EU accession on
1 May 2004.
Macroeconomic trends in the euro area
The pace of economic growth in the euro
area, which had already eased noticeably in
the summer, slowed down even further in the
fourth quarter. According to the Flash Esti-
mate, real GDP grew by a seasonally adjusted1�4% on the preceding period. Year-on-year
growth was 11�2%. At 13�4%, the average
growth rate for the whole of 2004 fell some-
what short of the potential rate, however. Al-
though more detailed information on the in-
dividual expenditure components is not yet
available, data from the balance of payments
statistics concerning nominal foreign trade
with non-EEA countries in October and No-
vember suggest that exports picked up again
in the autumn. The same is true for imports,
which means that the contribution of real net
exports to growth was probably limited.
Fourth-quarter real retail sales stagnated at
the same low level as in the previous quarter.
According to the European Commission’s
indicator-based short-run forecast, in sea-
sonally adjusted terms, economic growth in
the first two quarters of 2005 may range
between 0.2% and 0.6%.
The modest expansion in overall output in the
fourth quarter, if viewed from the value-
added side, is largely attributable to the de-
cline in industrial production, which amount-
ed to 1�2% in seasonally adjusted terms. The
previous year’s level was therefore exceeded
by only 3�4%. The production of durable con-
New EUmember states
Low GDPgrowth in thefourth quarter
Weak industrialactivity inthe autumn

DEUTSCHEBUNDESBANKMonthly ReportFebruary 2005
16
sumer goods, capital goods and energy was
particularly weak. Non-durable consumer
goods production also showed a downward
trend, albeit a less pronounced one. The
manufacture of intermediate goods stag-
nated. The fact that capacity utilisation in the
manufacturing sector, after adjustment for
seasonal variations, was no higher in Janu-
ary 2005 than it had been in October 2004 is
in keeping with these developments.
The leading economic indicators available to
date still present a mixed picture with regard
to industrial production in the first few
months of 2005. The intake of orders in the
order-based manufacturing industry was ex-
ceptionally buoyant in October and Novem-
ber. Major orders for the aviation industry
were a key factor in this development, how-
ever. The Purchasing Managers’ Index con-
tinued its upward trend in January. By con-
trast, industrial confidence deteriorated again
to a level only a little above its long-term
average. At the start of the year, the indicator
of consumer sentiment held firm at its low
level of the preceding months.
According to preliminary data released by
Eurostat, unemployment in the euro area ap-
pears to have reached its lower cyclical turn-
ing point. In the fourth quarter of 2004, the
seasonally adjusted number of unemployed
did not rise further in comparison with the
preceding quarter. Moreover, the figure was
barely higher than in the same period of
2003. The standardised unemployment rate
stood at 8.9% in December. Labour market
developments within the euro area were very
uneven in 2004. While, for example, the level
of underemployment increased even further
in Germany and the Netherlands, it fell – in
some cases quite sharply – in several other
countries. In Spain – traditionally the country
with the biggest labour market problem in
the euro area – the unemployment rate was
10.4% at the end of 2004 and thus only
slightly higher than the rate in Germany
(10.0%).
Euro-area consumer prices in the October-
December period were up by a seasonally ad-
justed 0.5% on the preceding quarter. The
rise in prices was therefore just as strong as in
the summer months. This was due to the fur-
ther hike in the cost of energy. Although en-
ergy prices already peaked in October and
then fell again, on an average of the quarter,
energy was 1.8% more expensive than in the
preceding three months. Excluding the par-
ticularly volatile components of energy and
unprocessed food, consumer prices rose by a
seasonally adjusted 0.4%. This corresponds
to an annualised rate of 1.6%. In the au-
tumn, the year-on-year rise in the overall
HICP increased from 2.2% to 2.3%; core
inflation fell from 2.1% to 2.0%, however. At
the start of 2005, the upward pressure on
prices in the euro area weakened, above all
as a result of baseline effects.
Exchange rates
There was a fairly distinct shift in sentiment
on the international foreign exchange mar-
kets at the turn of 2004-05. The euro appre-
ciated noticeably in the autumn of 2004 and
reached new all-time highs against the US
Mixed signalsfor thebeginningof 2005
Labour marketat a turningpoint
Price develop-ments markedby higherenergy prices
Shift insentiment onthe foreignexchangemarkets at theturn of the year

DEUTSCHEBUNDESBANKMonthly ReportFebruary 2005
17
dollar and the yen at the end of December;
the trend started to reverse at the beginning
of 2005, however. The single currency has
shown a tendency to depreciate as a result.
Market participants’ concerns about the
USA’s external imbalance were initially the
driving force behind the developments in the
euro-US dollar exchange rate. The euro con-
sequently made significant gains against the
US dollar. The single currency continued to
appreciate into December, boosted by the be-
lief that several central banks could switch
their foreign currency reserves – hitherto held
predominantly in US dollars – to euro. At the
end of December, the euro reached a new re-
cord high against the US dollar of more than
US$1.36. As a result of the Christmas and
New Year public holidays, however, only
small volumes were traded in the foreign ex-
change markets, which meant that compara-
tively minor orders not necessarily aligned
with fundamental data may have caused this
movement. This assessment is supported by
the fact that the euro depreciated again im-
mediately after the start of the year.
The Fed’s decisions in December and February
to raise the federal funds rate by a further
25 basis points in each case were generally
expected and thus of no direct relevance to
the exchange rate. The money market inter-
est rates in the USA rose steadily following
the Fed’s transition to a policy of gradual in-
creases in the key interest rate in the summer
of 2004; they are now higher than the short-
term interest rates in the euro area. The yield
advantage enjoyed by US government bonds
over similar euro-area instruments also tend-
ed to increase in the winter months. The
USA’s interest rate spread over other countries
– viewed in isolation – is making US invest-
ments more attractive and thus facilitating
the financing of the US current account def-
icit. However, this interest rate advantage
may not necessarily be reflected immediately
in exchange rate developments as a large
number of different factors have an effect on
Daily data, log scaleUS$
£
¥
Nominal effective exchange rate 2
1999 Q1 = 100
103.20 1
... pound sterling£ 0.7110 1
... Japanese yen
¥ 133.73 1
The euro’s exchange rateagainst the ...
... US dollar
$ 1.1789 1
Exchange rate of the euro
1 Level at the start of monetary union on4 January 1999. — 2 As calculated by theECB against the currencies of 23 countries.
Deutsche Bundesbank
109
106
103
100
0.72
0.70
0.68
0.66
142
139
136
133
130
127
1.36
1.33
1.30
1.27
1.24
1.21
1.18
F M A M J J A S O N D J F2004 2005
Developmentof the euro’sexchange rateagainst theUS dollar, ...

DEUTSCHEBUNDESBANKMonthly ReportFebruary 2005
18
the exchange rate. It undoubtedly gave the
US dollar a certain degree of support though.
Speculations on the foreign exchange market
that the Federal Reserve might increase the
speed at which it tightens its monetary policy
probably also contributed to the euro’s depre-
ciation since the beginning of the year. This
impression was reinforced by positive eco-
nomic data from the USA. Against this back-
drop, even reports about a new record deficit
in the US balance of trade in November 2004
were able to suspend the euro’s fall only tem-
porarily. As this report went to press, the euro
was trading at US$1.30, almost 41�2% below
its level at the end of 2004.
The euro initially also tended to appreciate
against the yen. This development was ac-
companied by negative economic data from
Japan. Reports that the Japanese trade sur-
plus had declined in November apparently
also put downward pressure on the yen. To-
wards the end of 2004, the single currency
reached a new record level of ¥141. However,
at the beginning of 2005, the euro also start-
ed to depreciate noticeably against the Jap-
anese currency. In this respect, the euro-yen
exchange rate essentially appears to have
mirrored the movements in the euro-US dol-
lar exchange rate. The supposition of market
participants that the Japanese monetary au-
thorities might intervene in the foreign ex-
change market in favour of the US dollar may
have been of relevance here. As this report
went to press, the euro was again trading at
a somewhat higher level of ¥138, but was
still around 11�2% below its value at the turn
of 2004-05.
The exchange rate of the euro against the
pound sterling fluctuated without a clear
trend between £0.68 and £0.71 in the report-
ing period. The short-term exchange rate
movements in both directions were, as a rule,
due to market participants’ rapidly changing
assessments of the Bank of England’s interest
rate policy. In the autumn, reports about a
slowdown in the UK economy and deflated
expectations of interest rate increases still
contributed to the euro’s virtually continuous
appreciation against the pound sterling. The
general weakening of the euro since the turn
of 2004-05 has caused the single currency to
lose around 2% of its value against the
pound sterling. As this report went to press,
the euro was trading at £0.69.
The effective nominal exchange rate of the
euro showed similar movements to those of
the bilateral exchange rates of the euro
against the US dollar and the yen. For ex-
ample, on average, the euro appreciated no-
ticeably against the currencies of 23 import-
ant euro-area trading partners up to the end
of 2004 and reached new all-time highs.
Since then, the single currency has lost 21�2%
of its value in trade-weighted terms. It was
thus 2% higher than its level at the start of
monetary union.
... against theyen ...
... and againstthe poundsterling
Effectiveexchange rateof the euro

DEUTSCHEBUNDESBANKMonthly ReportFebruary 2005
19
Monetary policy,banking businessand the capital market
Interest rate policy and the
money market
The Governing Council of the European Cen-
tral Bank did not change the Eurosystem’s his-
torically low key interest rates in the past few
months. The main refinancing operations
continued to be conducted as variable rate
tenders with a minimum bid rate of 2% while
the interest rates on the marginal refinancing
facility and the deposit facility remained at
3% and 1% respectively. The interest rate
policy decisions were based on the Governing
Council’s position that there are currently no
clear signs of increasing inflationary pressure
in the euro area. Owing to the high price of
oil, however, second-round effects in the
wage and price setting process cannot be en-
tirely ruled out. In addition, the ample liquid-
ity in the euro area, which is already reflected
in an increase of some asset prices, could also
lead to price effects in the product markets in
the medium term. Hence, there are still up-
ward risks to price stability. Some of these
have become more acute in the period under
review.
As market participants had expected interest
rate policy to hold steady, the overnight rate
(EONIA), with the exception of short-term
fluctuations at the end of the reserve main-
tenance period and at the end of the year,
remained virtually unchanged in the period
under review. The overnight interest rate
(EONIA) was mostly close to the marginal
lending rate, which was only a few basis
points above the minimum bid rate. The
other money market rates also remained
fairly steady. At just over 20 basis points, the
Eurosysteminterest ratesunchanged
Money marketrates

DEUTSCHEBUNDESBANKMonthly ReportFebruary 2005
20
Money market management and liquidity needs
During the three reserve maintenance periods from 12 Oc-tober 2004 to 18 January 2005, euro-area credit insitutions’need for central bank money arising from the autonomousfactors determining liquidity increased by 516.7 billion innet terms. This was mainly due to the further seasonally-induced increase in banknote circulation of 530.9 billion,which rose sharply in the pre-Christmas period, in particu-lar, although the rise was lower than in the same year-earlier period. On 22 December, the volume of banknotesin circulation exceeded 5500 billion for the first time. Bycontrast, seasonally-induced liquidity needs arising fromgeneral government deposits declined markedly by 512.9billion net. If, in order to eliminate valuation effects, thechanges in net reserve assets and other factors are takentogether, these two items resulted in a slightly lowerliquidity provision of 51.3 billion. The required level ofminimum reserves went down by 50.4 billion, resulting inwaning demand for central bank liquidity.
The greater need for liquidity was covered primarily by themain refinancing operations (MROs) being topped up by516.5 billion. The volume of longer-term refinancing oper-ations remained unchanged. In the period under review,the ECB carried out a fine-tuning operation on the last dayof each reserve maintenance period.
In the period under review, the EONIA rate was mostly at aslightly higher level, following to a large extent the sametrend as the slightly higher marginal rates of allotmentuntil the end of the year. The EONIA rates rose from2.05%/2.06% to 2.08%/2.09%. The period was character-ised by rises in the EONIA rate at the end of each monthand deviations following the allotment of the last MRO ineach reserve period.
During the reserve maintenance period starting on 12 Oc-tober, the market apparently assumed greater liquidityscarcity following the allotment of the last MRO. Followingthe rise in the EONIA rate to 2.24% on 4 November, theECB carried out a liquidity providing fine-tuning operationon the last day of the reserve maintenance period totalling56.5 billion. On 8 November, the EONIA rate was set at2.02%.
During the reserve maintenance period starting on 9 No-vember, the ECB began allotting liquidity above the bench-mark. The EONIA rate remained, however, at a slightlyhigher level. The days following the allotment of the lastMRO were the exception, when the market had antici-pated excess liquidity. After a liquidity absorbing fine-tuning operation was carried out with a volume of 515 bil-lion on the last day of the reserve period, the EONIA ratestood at 1.98%.
8 December was the start of an extended (by 42 days) re-serve maintenance period, during which the ECB also allot-ted liquidity above the benchmark in each MRO. The devi-ation from the benchmark was the greatest during theMRO of 30 December, when it amounted to 55 billion.Owing to the generous allocation policy and the extendedreserve period, things went relatively smoothly at the turnof the year. At the end of the year, the EONIA rate stood at2.21%. The ECB conducted a liquidity-providing fine-tuningoperation on the last day of the reserve period, after a smallliquidity deficit had become apparent on the preceding day.Nevertheless, on 18 January, the EONIA rate stood at 2.14%;this was due to a temporary interruption in the RTGSpluspayment system and an unexpected outflow caused by anincrease in the autonomous factors on this day. At the startof the new January/February reserve period, the EONIA ratefell to a still somewhat higher level of 2.08%.
Deutsche Bundesbank
Factors determining bank liquidity 1
5 billion; calculated on the basis ofdaily averages of the reserve maintenance periods
2004/2005
Item
12 Octto8 Nov
9 Novto7 Dec
8 Decto18 Jan
I Provision (+) or absorption (–) ofcentral bank balances by
1 Change in banknotes incirculation (increase: –) – 4.6 – 5.7 – 20.6
2 Change in general govern-ment deposits with theEurosystem (increase: –) + 3.1 – 5.1 + 14.9
3 Change in net foreignreserves 2 – 0.5 – 0.3 – 7.7
4 Other factors 2,3 + 0.0 + 3.9 + 5.9
Total – 2.0 – 7.2 – 7.5
II Monetary policy operationsof the Eurosystem
1 Open market operations
(a) Main refinancingoperations + 1.5 + 7.8 + 7.2
(b) Longer-term refinancingoperations + 0.0 € 0.0 € 0.0
(c) Other operations + 0.2 – 0.7 + 0.7
2 Standing facilities
(a) Marginal lending facility – 0.2 € 0.0 + 1.0
(b) Deposit facility (increase: –) – 0.3 + 0.2 + 0.0
Total + 1.2 + 7.3 + 8.0
III Change in credit institutions’current accounts (I + II) – 0.9 + 0.1 + 0.6
IV Change in the minimum reserverequirement (increase: –) + 0.9 – 0.1 – 0.4
1 For longer-term trends and the contribution of theDeutsche Bundesbank, see pages 14* and 15* of the Statis-tical Section of this Monthly Report. — 2 Including end-of-quarter valuation adjustments with no impact onliquidity. — 3 Including monetary policy operations con-cluded in the second stage and still outstanding in thethird stage of monetary union (outright transactions andthe issuance of debt certificates) as well as financial assetsnot connected with monetary policy.

DEUTSCHEBUNDESBANKMonthly ReportFebruary 2005
21
yield spread between twelve-month funds
and EONIA, for example, changed very little
over the period under review. Similarly, the
three-month forward rate, which also ex-
presses interest rate expectations, hardly
changed on balance in the period under re-
view. A 1�4 percentage point increase in inter-
est rates is currently not expected until the
fourth quarter of 2005.
Monetary developments in the euro area
The money stock M3 grew strongly again in
the fourth quarter of 2004. In seasonally ad-
justed terms, this aggregate grew by just
under 71�2% from October to December,
quite similar to the development in the previ-
ous quarter (81�2%) when monetary expan-
sion, following a phase of gradual weaken-
ing, had picked up the pace considerably.
The three-month moving average of annual
rates of change for the period from Octo-
ber to December was 6.1%. Hence, this
figure was again nearly a percentage point
higher than the figure for the period from
May to July 2004 when this rate (5.2%)
had dropped to the lowest level since June
2001.
Among the components of the money stock,
cash holdings grew very strongly at a season-
ally adjusted annual rate of 13% in the period
under review; this was, however, markedly
slower than in the previous quarters. Stagna-
tion in December was the sole cause for the
lower increase in currency in circulation. Since
seasonally adjusted overnight deposits at the
same time grew relatively slowly in the period
from October to December, the money stock
M1 also grew only moderately in this period
at an annualised rate of just under 41�2%.
Moreover, the increase in deposits with a
three-month period of notice, which in the
preceding quarters had grown strongly,
weakened considerably in the last quarter of
2004. These may have been invested in short-
term time deposits, which were particularly in
demand from domestic investors at the end
of the period under review. In the period
from October to December 2004, deposits
with an agreed maturity of up to two years
grew by an annualised rate of over 17%. This
was the strongest growth since late 2000,
when short-term interest rates reached their
highest level (5%) since the mid-1990s and
the interest rate disadvantage vis-�-vis long-
Seasonally adjusted, annual percentage change%
Reference value: 4½%
Three-month moving averageMonthly
Growth of the moneystock M3 in the euro area
Deutsche Bundesbank
9
8
7
6
5
4
3
1999 2000 2001 2002 2003 2004
Monetaryexpansionaccelerates
Componentsof the moneystock
DEUTSCHEBUNDESBANKMonthly ReportFebruary 2005
22
term fixed-interest securities was particularly
low at 1�4 percentage point. True, the quarter-
ly average of this interest rate discount was
around 13�4 percentage points. However, in
the light of low capital market rates, which
declined further over the quarter, liquid and
safe short-term time deposits were apparent-
ly viewed as being an attractive investment
alternative. This is also evidenced by a large
increase in repo transactions, which in eco-
nomic terms represent time deposits backed
by securities. Over and above that, among
the marketable financial instruments, short-
term bank debt securities were also in heavy
demand. By contrast, money market fund
shares experienced only moderate growth in
the fourth quarter.
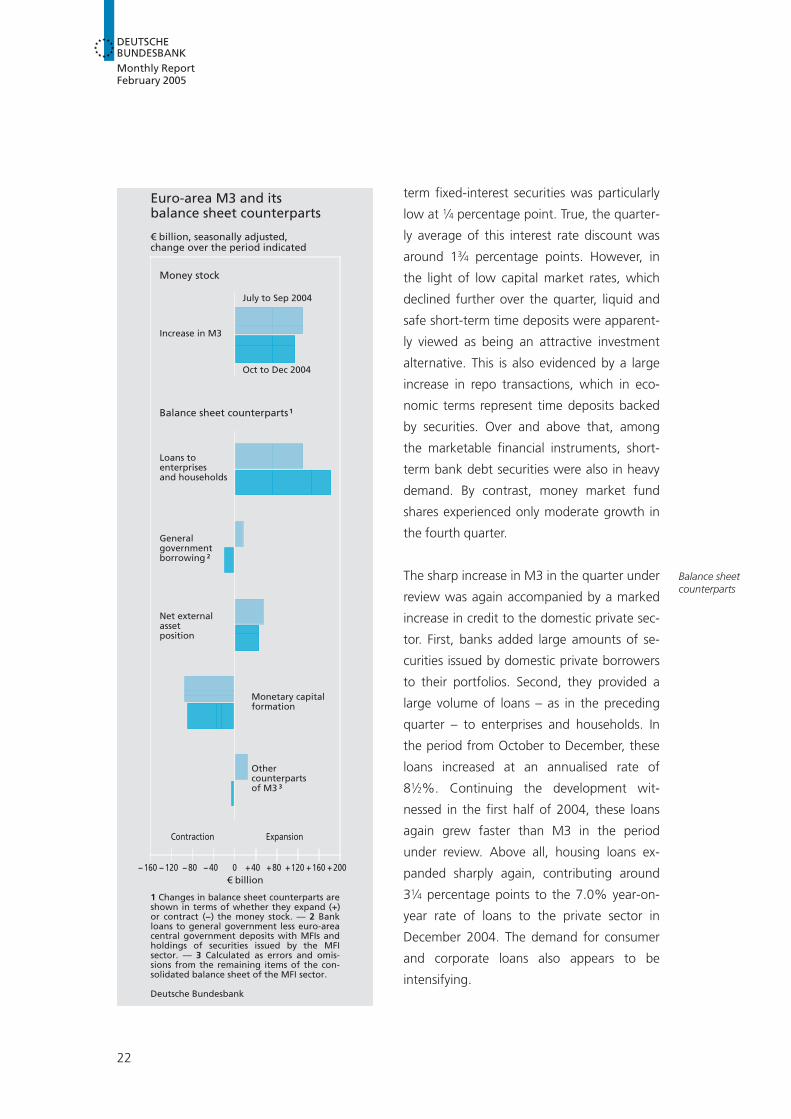
The sharp increase in M3 in the quarter under
review was again accompanied by a marked
increase in credit to the domestic private sec-
tor. First, banks added large amounts of se-
curities issued by domestic private borrowers
to their portfolios. Second, they provided a
large volume of loans – as in the preceding
quarter – to enterprises and households. In
the period from October to December, these
loans increased at an annualised rate of
81�2%. Continuing the development wit-
nessed in the first half of 2004, these loans
again grew faster than M3 in the period
under review. Above all, housing loans ex-
panded sharply again, contributing around
31�4 percentage points to the 7.0% year-on-
year rate of loans to the private sector in
December 2004. The demand for consumer
and corporate loans also appears to be
intensifying.
€ billion, seasonally adjusted,change over the period indicated
€ billion
Contraction Expansion
Balance sheet counterparts 1
Loans toenterprisesand households
Generalgovernmentborrowing 2
Net externalassetposition
Monetary capitalformation
Othercounterpartsof M3 3
Money stock
July to Sep 2004
Increase in M3
Oct to Dec 2004
Euro-area M3 and itsbalance sheet counterparts
1 Changes in balance sheet counterparts areshown in terms of whether they expand (+)or contract (−) the money stock. — 2 Bankloans to general government less euro-areacentral government deposits with MFIs andholdings of securities issued by the MFIsector. — 3 Calculated as errors and omis-sions from the remaining items of the con-solidated balance sheet of the MFI sector.
Deutsche Bundesbank
200+160+120+80+40+040−80−120−160−
Balance sheetcounterparts

DEUTSCHEBUNDESBANKMonthly ReportFebruary 2005
23
Furthermore, extensive inflows of funds from
foreign payment transactions stimulated
monetary growth in the euro area in the
fourth quarter. The net external assets of the
MFI sector, which reflects payment transac-
tions between domestic non-banks and non-
euro-area residents, rose by 3561�2 billion in
the fourth quarter. Inflows of merely 3201�2
billion were recorded in the same year-earlier
period.
By contrast, the decline in credit to govern-
ment in the euro area itself dampened mon-
etary expansion in the quarter under review.
In net terms, this was due exclusively to the
decline in securitised lending. This contrasted
with a reduction in central government de-
posits at domestic banks, meaning that the
repeated strong growth of monetary capital
formation represented an essential counter-
balance to the increase in banks’ asset-side
business. Alongside the marked increase in
longer-term time deposits, bank debt secur-
ities with a maturity of over two years made
strong gains for the second quarter in a row.
By contrast, savings deposits redeemable at
notice of over three months rose negligibly.
Deposit and lending business of
German banks with domestic customers
In contrast to the euro area, private non-
banks’ liquid bank deposits rose only slightly
in the fourth quarter in Germany. In the previ-
ous quarter, short-term deposits of domestic
enterprises and households were topped up
strongly on a broad front. The reasons for the
low preference for liquidity in the quarter
under review are to be found mainly in the
corporate sector. Whereas households invest-
ed their funds in the domestic banking sector
across the whole range of maturities to an ex-
tent which is typical for that time of the year,
enterprises began to shift their liquidity hold-
ings in the fourth quarter to higher-yielding
bank deposits with longer maturities or to
use them to repay their outstanding loans.
Turning to short-term bank deposits, over-
night deposits declined slightly in the period
under review. In the period from July to Sep-
tember 2004, by contrast, these deposits rose
sharply by an annualised rate of 81�2%. Apart
from insurance corporations, which normally
top up their liquid bank deposits towards the
end of the year, especially other financial in-
stitutions, such as investment companies or
Lending and deposits of monetaryfinancial institutions (MFIs)in Germany *
5 billion
2004 2003
ItemOct toDec
Oct toDec
Deposits of domestic non-MFIs 1
Overnight + 1.8 + 15.5With agreed maturities
of up to 2 years + 14.6 + 0.0of over 2 years + 8.4 + 2.8
Redeemable at agreed noticeof up to 3 months + 9.7 + 10.6of over 3 months + 2.6 + 1.4
Lendingto domestic enterprises andhouseholds
Unsecuritised – 0.6 + 4.2Securitised + 7.3 – 3.2
to domestic governmentUnsecuritised – 3.2 + 4.5Securitised – 5.8 – 2.1
* As well as banks (including building and loan associ-ations, but excluding the Bundesbank), monetary finan-cial institutions (MFIs) here also include money marketfunds; see also Table IV.1 in the Statistical Section of theMonthly Report. — 1 Enterprises, households and gov-ernment excluding central government.
Deutsche Bundesbank
Liquidityholding inGerman risesonly slightly
Slight decreasein overnightdeposits ...

DEUTSCHEBUNDESBANKMonthly ReportFebruary 2005
24
financing subsidiaries of larger enterprises, re-
duced their overnight money to a larger ex-
tent than usual in the fourth quarter. Con-
versely, the short-term time deposits of this
group of investors and non-financial corpor-
ations increased stongly. By contrast, house-
holds again preferred to invest their cash in
overnight money, a fact which is seen in a re-
duction in their short-term savings deposits.
Unlike the short-term deposits, the longer-
term bank deposits of domestic households
and enterprises rose sharply in the quarter
under review. Time deposits with a maturity
of over two years increased considerably
again. Besides insurance corporations, wage
and salary earners, in particular, topped up
their longer-term time deposits. Furthermore,
in the period from October to December, the
longer-term savings deposits (with an agreed
maturity of over three months) rose slightly
for the first time since the first quarter of
2001.
Lending by German banks to domestic non-
banks declined substantially in the fourth
quarter. The decline was attributed solely to
loans; domestic banks’ holdings of securities
issued by public and private domestic borrow-
ers remained practically unchanged. In par-
ticular, unsecuritised lending by German
banks to general government in Germany de-
clined markedly. In the period from October
to December, these loans decreased at an an-
nualised rate of over 8%. Over and above
that, loans to domestic enterprises and
households fell, after rising somewhat in the
previous quarter. The decline in unsecuritised
lending to domestic private non-banks in the
quarter under review was not limited to only
shorter-term maturities. Medium to long-
term loans to domestic enterprises and
households also declined perceptibly in the
period from October to December. In contrast
to the development in the rest of the euro
area, the subdued increase in housing loans
to households was not strong enough to off-
set the noticeable reduction in other loans to
households and unsecuritised lending to
enterprises.
According to the January results of the Euro-
system’s bank lending survey1, the reason be-
hind the low volume of lending continues to
Seasonally adjusted€ bn
%Lin scaleYear-on-year change
Log scaleLoans 1
Loans to domestic enterprisesand households
1 End of month; adjusted for statisticalchanges.
Deutsche Bundesbank
8
6
4
2
0
2250
2200
2150
2100
2050
2000
1950
1999 2000 2001 2002 2003 2004
1 See Deutsche Bundesbank, German results of euro-area bank lending survey, Monthly Report, June 2003,pp 67-76. The aggregate survey results for Germany canbe viewed under http://www.bundesbank.de/volks-wirtschaft/vo_veroeffentlichungen.en.php.
...but a sharprise in short-term timedeposits
Sharp increasein longer-termbank deposits
Credit declinessubstantially
Reason for lowvolume oflending moreon the demandside

DEUTSCHEBUNDESBANKMonthly ReportFebruary 2005
25
be more on the demand side. According to
the survey, participating banks did not funda-
mentally tighten their lending standards any
further. For the third quarter in a row, credit
institutions left their credit standards for cor-
porate loans, housing loans and household
consumer credit largely unchanged in the
fourth quarter of 2004.
For the first time since the launch of the Bank
Lending Survey, margins on corporate loans
with average risk remained steady, while mar-
gins on loans to households with average risk
exposure actually declined somewhat. Fur-
ther, albeit weaker widening of the margins
persisted only in the case of riskier loans
across all credit categories. At the same time,
the respondent banks also recorded a fairly
marked decline in demand for both corporate
loans and loans to households. According to
credit institutions participating in the survey,
this was mainly due to a repeated decline in
the financing needs for fixed investment and
the low level of consumer confidence.
As in the preceding quarters, the results for
Germany largely match those for Europe.2
However, credit demand remained weaker in
Germany than in the euro area.
With regard to new business, German banks,
in line with the declining interest rates in the
capital market, offered long-term loans at
cheaper rates in the fourth quarter of 2004.
For example, in the period under review, Ger-
man banks charged non-financial enterprises
between 4.3% and 4.6% for new long-term
%
%
%
%
%
%
Q4 Q1 Q2 Q3. Q4 Q1 Q2 Q3 Q4 Q11
2002 2005
Consumer credit
Loans to households
Housing loans
Changes in loan margins
Loans to enterprises
Average loans
Riskier loans
Consumer credit
Loans to householdsHousing loans
Changes in credit standards
Loans to enterprises
Bank Lending Survey *
* Difference between the sum of the per-centages for ”tightened considerably” and”tightened somewhat” and the sum of thepercentages for ”eased somewhat” and”eased considerably”. — 1 Expectations forQ1.
Deutsche Bundesbank
40+
20+
0
20−
40−
80+
60+
40+
20+
0
20−
40−
100+
80+
60+
40+
20+
0
40+
20+
0
20−
40+
20+
0
20−
60+
40+
20+
0
20−
2003 2004
2 See European Central Bank, Monthly Bulletin, Febru-ary 2005, pp 16 ff.
Spreadscontinue to riseon riskier loans
Demand forcredit againweaker than inthe euro areaas a whole
Long-termlending ratesdeclining

DEUTSCHEBUNDESBANKMonthly ReportFebruary 2005
26
lending depending on the loan amount. They
charged 4.7% for loans for house purchase
with an interest rate fixation of over ten years
and 8.0% for long-term consumer loans in
the period under review. Developments in
short-term lending were, by contrast, mixed
in the fourth quarter of 2004. Whereas banks
changed their interest rates very little in the
area of short-term corporate lending in the
period from October to December, the corres-
ponding rates for housing loans and con-
sumer credit dropped.
The interest rates on deposits at domestic
credit institutions remained virtually un-
changed in the fourth quarter. At the end of
the quarter, banks were paying 2.1% for sav-
ings deposits with a notice period of up to
three months and 2.5% for longer maturities.
Only interest rates on time deposits of house-
holds and non-financial enterprises dropped
somewhat in the longer maturity range. To-
wards the end of the period – depending on
the maturity – the rates on households’ time
deposits were between 1.9% and 2.6%,
while those for enterprises were between
2.0% and 3.8%.
Securities markets
The tendency towards relaxation in the cap-
ital markets which began last summer has,
with only a few interruptions, continued.
Against this backdrop, European bond yields
clearly decoupled from the dollar interest rate
trend in the fourth quarter of 2004. Whereas
yields on ten-year euro-area bonds declined
by a half a percentage point to just under
New business% per
annum
% perannum
% perannum
... over €1 million with an initial rate fixation of up to 1 year
... up to €1 million with an initial rate fixation of up to 1 year
... over €1 million with an initial rate fixation of over 5 years
Loans to non-financialcorporations ...
Loans to households
Consumer credit 1
2
Housing loans 3
Households’ deposits...
...overnight
...redeemable at notice of up to 3 months
...with an agreed maturity of up to 1 year
Bank interestrates in Germany
1 With an initial rate fixation of over 1 yearand up to 5 years. — 2 Decline owing tospecial effect. — 3 With an initial ratefixation of over 5 years and up to 10 years.
Deutsche Bundesbank
5.5
5.2
4.9
4.6
4.3
4.0
3.7
3.4
3.1
2.8
7.0
6.7
6.4
6.1
5.8
5.5
5.2
4.9
4.6
2.7
2.4
2.1
1.8
1.5
1.2
0.9
2003 2004
Again littlechange indeposit rates
Capital marketrates nearhistorical low

DEUTSCHEBUNDESBANKMonthly ReportFebruary 2005
27
3.5% since last October, comparable dollar
yields increased temporarily by approximately1�4 percentage point. The long-term interest
rates in the euro area are thus at the lowest
level in over a hundred years. A number of
determinants contributed to this develop-
ment, such as large excess liquidity in the
euro area and the associated investment pres-
sure. A certain strategic shift on the part of
internationally operating investors in favour
of euro-denominated investments may have
also had an influence. This was compounded
by the fact that economic growth in the euro
area in the fourth quarter of 2004 was weak-
er than had been originally expected and,
subsequently, the assessment of the outlook
for domestic economic growth in the markets
was also somewhat more subdued.
The importance of economic expectations is
also reflected in the fact that the decline in
the nominal yields in the euro area has been
accompanied by lower real interest rates. Ten-
year French inflation-linked bonds are cur-
rently yielding just over 1%, the lowest
amount since they were introduced in the
late 1990s. Other measures of real interest
rates have also fallen to their lowest level in
years. By contrast, euro-area market partici-
pants’ long-term inflation expectations have
persisted around the 2% mark for several
months, ie the figure which the Eurosystem
has defined as the upper ceiling for price sta-
bility.3 This feature also differentiates the
scenario of the fourth quarter of 2004 and
the summer of 2003, when market partici-
pants had been expecting lower interest
rates. In the light of unchanged price expect-
ations, the lower growth expectations led to
falling longer-term nominal rates of interest.
This – together with the widely steady short-
Daily data%
Per-cent-
agepoints
%
Per-cent-agepoints
Yield spreads of Europeancorporate bonds 2
2003 2004 2005
Spread of US bond yieldsover the euro-area average
Yield on ten-year governmentbonds outstanding
Euro-areaaverage 1
USA
Bond yields in theeuro area and the USA
1 Weighted average of the yields on ten-year government bonds of all euro-areacountries; GDP-weighted. — 2 Spread ofseven to ten-year BBB-rated European cor-porate bonds over euro-area governmentbonds with a comparable maturity. Source:Merrill Lynch Indices.
Deutsche Bundesbank
2.5
2.0
1.5
1.0
0.5
0.5+
0
0.5−
5.5
4.5
5.0
4.0
4.5
3.5
3.0
3 According to the results of a survey conducted by Con-sensus Economics, bank economists expect inflation torise by an average of just under 2% annually over thenext ten years. The corresponding break-even inflationrate – approximately the difference between the nominalyield of French government bonds and the real rate ofinterest on index-linked bonds of the same issuer – issomewhat higher at just under 21�4% per annum. How-ever, owing to the inflation risk premium component ofthe yield on nominal bonds, it is likely to overstate some-what the expected rate of inflation.
Subduedeconomicexpectationsdepress realrate of interest

DEUTSCHEBUNDESBANKMonthly ReportFebruary 2005
28
term rates of interest – contributed to a flat-
tening of the yield curve.
Given the overall favourable earnings outlook
for many enterprises, share prices in the Euro-
pean equity markets have risen in line with
those in the US and Japan. In the fourth quar-
ter of 2004 German equity prices – as meas-
ured by the broad CDAX index – rose by just
under 10%, comparable to a rise in the
equity prices of the enterprises listed in the
Dow Jones EuroStoxx index. Since the begin-
ning of the year, the shares of European en-
terprises have continued to rise by 5%. The
share prices of German enterprises rose
somewhat slower. As was the case in the
spring of 2003, in the fourth quarter of 2004,
the sharp reduction in the real interest rate
probably exerted a positive influence on
equity prices. One indicator of this influence
is the fact that equity prices rose in all sectors
represented in the EuroStoxx index, even in
those sectors which are susceptible to cyclical
swings, such as the chemical and capital
goods industry. In contrast to 2003, the
equity markets now appear to be rewarding
the intensified rationalisation and consolida-
tion efforts of many enterprises, which are re-
flected in another rise in expected earnings
for the year 2005.4
Analysts now expect corporate earnings to be
higher than during the equity boom five years
ago, and the range of their forecasts is at a
rather average level by historical standards.
Despite recent share price gains, the under-
lying price-to-earnings ratio of German and
European equities increased only marginally
to around 13 in the fourth quarter. This sug-
gests a comparatively large risk premium im-
plicit in the current market prices, as investors
demand compensation for the risks associ-
ated with investing in equities. This stands in
contrast to the low interest rate premia on
corporate bonds and to the low share price
uncertainty in the equity market, which is re-
flected in a reduction in the implied volatility
of DAX future options. Investors are appar-
ently expecting more of a tendency towards
less share price fluctuations than in the previ-
ous years. It is also possible that they do not
assess the earnings outlook of enterprises
quite as positively as equity analysts do.
Despite the favourable financing conditions,
more bonds were repaid in the German bond
Weekly averages%
Nominal yields on 10-yeareuro-area government bonds 1
Real yieldson 10-year inflation-indexedFrench government bonds 2
2005
Nominal and realbond yields
1 Weighted average of the yields onten-year euro-area government bonds; GDPweighted. — 2 Calculated from the 2001inflation-indexed French government bondOAT€i yielding 3%; maturity date: 25 July2012.
Deutsche Bundesbank
6.0
5.5
5.0
4.5
4.0
3.5
3.0
2.5
2.0
1.5
1.0
2002 2003 2004
4 I/B/E/S forecasts.
Rising equityprices inGermany andEurope ...
... against thebackdrop oflower realinterest ratesand morefavourableearningsforecasts
Continued lowequityvaluations ...
... reflect lowappetite for riskin the equitymarkets
Fewer fundsraised in theGerman bondmarket

DEUTSCHEBUNDESBANKMonthly ReportFebruary 2005
29
Deutsche Bundesbank
An indicator to measure the liquidity premium in the bond market
Bond yields consist of a benchmark rate corre-sponding to usual market rates, a default risk pre-mium and usually a liquidity premium. The latter compensates the investor for the risk that a pur-chase or sale at any time is either not possible or is possible only with considerable price effects. Bond investors are therefore generally willing to pay a premium for bonds which have a large trading volume and hence, high liquidity. The premium on such bonds, which include German Federal Bonds, is refl ected in lower yields. However, the sitze of the liquidity premium is not directly observable, but must be estimated. Longstaff (2004) presented a method for doing this in the case of the United States.1 He compares the yields on US Treasuries with bonds of a government agency whose repay-ments are explicitly guaranteed by the US govern-ment and hence have an identical default risk. The difference in the yields of these two bonds should thus be merely a result of liquidity differences and can therefore be interpreted as the price of liquidity.
This analysis can also be applied to German Fed-eral bonds. For instance, a comparison with bonds issued by the Kreditanstalt für Wiederaufbau (KfW) makes it possible to estimate the liquidity bonus contained in the prices of Federal bonds.2
The higher the yield spread is on KfW bonds vis-à-vis Bunds, the higher the value is which inves-tors place on the liquidity of Bunds in the form of higher prices and lower yields. The adjacent chart shows the liquidity premium calculated this way for bonds with various maturities. The size of the premium rises commensurate with the residual maturity; the average premium has been 17 basis points for two-year securities and 26 basis points for ten-year securities (since 1999). There has been a clearly recognisable fl uctuation in the liquidity premium over time. The higher fi gures in 2000 —
particularly in the case of ten-year bonds — might be a result of the large proceeds from the auction of the UMTS licenses. In this vein, in the expecta-tion that the supply of Bunds, and hence, their liquidity could drop in future, investors were apparently prepared to temporarily pay a higher price for liquidity. Since that time, however, the premium has fallen steadily. For several months now, it has been very low compared with the long-term average. An empirical determination of possible explanatory factors shows that fl uctua-tions in the liquidity premium show a positive cor-relation in particular with changes in the implied volatility in the equity market (measured by the VDAX). This indicates that investors prefer liquid forms of investment especially in times of height-ened uncertainty in the equity market. Therefore, in the current environment of low uncertainty, the price which market participants are willing to pay for liquidity is accordingly small.
1 F Longstaff (2004): The Flight-to-Liquidity Premium in U.S. Treasury Bond Prices, Journal of Business, vol 77, no 3, pp 511-526. — 2 Owing to the Federal government’s explicit liability for the bonds issued by the KfW (section 1 (a) “Guarantee of the Federal Republic”, Law Concerning KfW), the default risk of both bonds should be virtually identical. The volume of ten-year Bunds outstanding is €52 billion, compared with €10 billion at the KfW. Bunds and KfW bonds are both traded on the bonds trading system MTS, meaning that
a constant minimum amount of liquidity is ensured. It is therefore assumed that the relative liquidity of KfW bonds and Bunds is fairly stable over time. — 3 Liquidity premia are calculated as the difference between the constant maturity curves for different maturities provided by Bloomberg for Bunds and KfW bonds. To calculate the yield curve for KfW bonds, Bloomberg also uses a number of bonds issued by the Rentenbank, for which the Federal government has assumed a guarantee for ensuring solvency.
Basispoints
Basispoints
Ten-year residual maturity
Two-year residual maturity
1999 2000 2001 2002 2003 2004 2005
Liquidity premia forvarious residual maturities 3
60 60
50 50
40 40
30 30
20 20
10 10
0 0

DEUTSCHEBUNDESBANKMonthly ReportFebruary 2005
30
market in the fourth quarter of 2004 than
were issued. Although gross issuance of do-
mestic debt securities amounted to 32791�2
billion, redemptions and changes in issuers’
holdings were even higher, totalling 3293 bil-
lion. Hence, the amount outstanding of do-
mestic bonds fell by 314 billion between Oc-
tober and December, having grown by 333
billion in the preceding quarter. In the period
under review, foreign bonds raised 3151�2 bil-
lion in Germany. As a result, total funds raised
through the sale of domestic and foreign
bonds amounted to 311�2 billion compared
with 3561�2 billion in the preceding quarter.
The drop in funds raised in the German bond
market is essentially due to net redemptions
by domestic credit institutions, which reduced
their bonded debt by 201�2 billion in the
fourth quarter. In the third quarter they had
issued 323 billion (net) worth of own bonds.
In particular, public Pfandbriefe were re-
deemed on balance (-3241�2 billion), whereas
other bank debt securities and debt securities
issued by specialised credit institutions record-
ed net sales of 321�2 billion and 11�2 billion re-
spectively.
In the fourth quarter, general government
tapped the bond market to a lesser extent
(331�2 billion) than was the case in the preced-
ing quarter (35 billion). The decline was main-
ly the result of lower net issuance of Federal
securities (331�2 billion; third quarter: 3111�2
billion). Central government was mainly ac-
tive in the longer-term maturity range in the
fourth quarter. It sold ten-year Federal bonds
(Bund) worth 33 billion and five-year Federal
notes (Bobl) worth 321�2 billion (net). This con-
Monthly data
2005
Lin scale
Price-earnings ratio 2
DAX
Dow JonesEuroStoxx
Average expected earningsper share 2
DAX
Dow JonesEuroStoxx
Log scale
Dow Jones EuroStoxxshare price index 1
DAX share priceindex 1
Price movements and earningsestimates for Europeanand German publiclimited companies
1 March 2000 = 100; source: Deutsche BörseAG. — 2 Based on I / B / E / S forecasts of12-month forward earnings per share.Source: Thomson Financial Datastream.
Deutsche Bundesbank
30
27
24
21
18
15
12
9
130
115
100
85
70
85
70
40
85
60
50
45
40
35
30
2001 2002 2003 2004
Creditinstitutionsreducedbonded debt
Fewer fundsraised by thepublic sector

DEUTSCHEBUNDESBANKMonthly ReportFebruary 2005
31
trasted with redemptions of Federal Treasury
notes (“Sch�tze”) amounting to 311�2 billion.
In addition, a bond issued by the former Fed-
eral Post Office was redeemed for 331�2 bil-
lion. Consequently, the volume outstanding
of bonds issued by the various special funds
dropped to 321�2 billion. Five years ago the
volume outstanding of this kind of paper was
3163 billion. However, the special funds have
ceased using their own debt securities to gen-
erate resources but, owing to the more
favourable financing terms, are now issuing
debt jointly with the Federal Government. At
34 billion, state government borrowed more
funds than in the preceding period (321�2 bil-
lion).
Compared with the third quarter of 2004,
falling long-term interest rates, continued
low interest rate premia on corporate bonds5
and rising equity prices have further improved
the financing conditions for those enterprises
which are able to tap the capital markets. At
the same time, the more favourable earnings
situation has also improved the possibilities of
internal financing. Altogether, at 33 billion,
German enterprises tapped the bond market
to a lesser extent than in the previous period
(341�2 billion). As in the past quarter, they
used the low long-term interest rates to issue
paper with longer maturities in particular and
reduced the outstanding volume of money
market paper.
In the fourth quarter of 2004, foreign invest-
ors were the main purchasers in the German
bond market, topping up their holdings of
German bonds by 316 billion. By contrast,
domestic investors sold domestic bonds
worth 330 billion (net), buying foreign bonds
instead worth 3151�2 billion.
Although issuing activity in the German
equity market increased somewhat the fourth
quarter of 2004, it was still subdued. German
enterprises placed new shares to a market
value of 33 billion, having placed only 31 bil-
lion in the third quarter. A capital injection of
a large enterprise in the retail industry in De-
cember contributed to this result. In addition,
sales of foreign equities in the German mar-
ket raised 32 billion. On the buy side, be-
tween October and December there were
major portfolio shifts between credit institu-
Investment activity in the Germansecurities markets
5 billion
2004 2003
ItemJuly toSep
Oct toDec
Oct toDec
Bonds and notesResidents 28.5 – 14.5 18.6
Credit institutions 25.9 2.5 8.6of which
Foreign bonds and notes 13.4 17.3 13.4Non-banks 2.7 – 17.0 10.0of which
Domestic bonds and notes – 7.2 – 15.2 19.2Non-residents 27.8 15.9 10.5
SharesResidents – 16.1 4.3 – 9.4
Credit institutions – 7.3 11.0 9.2of which
Domestic shares – 3.5 8.8 7.0Non-banks – 8.9 – 6.7 – 18.6of which
Domestic shares – 2.5 – 6.6 – 21.9Non-residents 6.8 0.7 21.2
Mutual fund sharesInvestment in specialised funds – 4.9 7.4 5.2Investment in funds open to thegeneral public 1.0 – 6.5 – 0.4of which: Share-based funds – 1.8 1.1 0.9
Deutsche Bundesbank
5 At the time this article went to press, the spreads oncorporate bonds with a BBB rating (the lowest investmentgrade rating) over government bonds with the same ma-turities was at 60 basis points and therefore close to thelong-standing lows.
Enterprises
Purchases ofdomestic bonds
Few fundsraised in theequity market

DEUTSCHEBUNDESBANKMonthly ReportFebruary 2005
32
tions which topped up their holdings of do-
mestic equities by 39 billion, and non-banks,
which sold domestic equities worth 361�2 bil-
lion. Foreign investors invested 31�2 billion in
German equities.
The demand for mutual fund shares re-
covered only slightly in the fourth quarter.
After experiencing outflows of funds in the
third quarter, German investment companies
were able to again attract new funds in the
October to December period (31 billion), al-
though on balance, these accrued solely to
the special funds which manage institutional
investors’ monies (371�2 billion). By compari-
son, investment funds open to the general
public were redeemed for 361�2 billion, which
was primarily due to strong withdrawals from
money market funds (-37 billion). Among the
other categories of funds, mainly open-end
real estate funds recorded outflows (-31�2 bil-
lion), while share-based funds recorded in-
flows of 31 billion, in line with positive share
price movements. For the first time in a while,
foreign funds redeemed shares in net terms
(-31 billion). Both credit institutions and for-
eign investors topped up their holdings of
German funds shares by 33 billion and 31 bil-
lion respectively. In addition, banks purchased
foreign mutual funds shares for 32 billion. By
contrast, domestic non-banks reduced their
holdings in domestic and foreign investment
funds by 331�2 billion and 33 billion respective-
ly.
Mutual fundshares

DEUTSCHEBUNDESBANKMonthly ReportFebruary 2005
33
Economic conditionsin Germany
Underlying trends
In cyclical terms, the German economy failed
to make ground in the last few months of
2004. This means that it has been on a virtu-
ally flat path of growth since the summer of
last year. According to the latest calculations
of the Federal Statistical Office, real gross do-
mestic product (GDP) in the fourth quarter
was 0.2% down on the preceding three-
month period after adjustment for seasonal
variations and the comparatively large num-
ber of working days in the year. This takes ac-
count of the impact of additional working
days on output, which is calculated on a
multi-year average. It is conceivable, how-
ever, that the actual working-day effect
(which is not directly measurable) was smaller
in the fourth quarter of 2004 than might
have been expected on the basis of the multi-
year mean value. This could be due to the
additional working days falling in the Christ-
mas holiday period.
The year-on-year increase was 0.6%, com-
pared with +1.2% in the third quarter. Taking
into account the fact that there were two
and a half more working days in the reporting
period than in the same period of 2003 and a
corresponding increase in the number of
hours worked, the figure was +1.5%. The na-
tional accounts figures for 2004 that are now
available are therefore somewhat less positive
than those initially reported by the Federal
Statistical Office in mid-January of this year.
Average annual GDP growth is now put at
1.0% in working-day-adjusted terms and
1.6% according to the unadjusted figures.
Flat cyclicalmovement

DEUTSCHEBUNDESBANKMonthly ReportFebruary 2005
34
The faltering of the cyclical recovery process
is undoubtedly due, first and foremost, to the
growth path of the world economy having
become flatter since mid-2004 and the
dampening effect of the deterioration in price
competitiveness caused by the appreciation
of the euro. Exports, which had been the
main driving force behind the increase in
overall economic output, were now turning
out to be a vulnerable flank in terms of busi-
ness activity. Moreover, energy price inflation
stemming from the international crude oil
markets placed a strain on domestic demand,
especially on private consumption. In add-
ition, the combination of oil price and appre-
ciation effects has left a clear mark on the
overall economic production process since,
up to now, there has been no breakthrough
in domestic business activity. Seen in that
light, even after one and a half years, the
German economy is still in the initial phase of
an economic upturn. Despite external disrup-
tive influences, however, sentiment in trade
and industry as well as the consumer climate
among households have improved somewhat
recently. Evidently, many investors and con-
sumers subscribe to the view that the current
flat movement of the economy will lead into
an economic upturn again as the year pro-
gresses.
Nevertheless, developments in the fourth
quarter also reveal that the economy entered
the new year without momentum. That holds
true for all the major demand aggregates and
economic sectors. As industrial activity was
inclining to weakness in the last few months
of 2004, a large part of the somewhat higher
level of exports is likely to have come from
existing stocks. Expenditure on machinery
and other equipment, following the sharp in-
crease in the third quarter, may have been
somewhat lower again recently. With regard
to construction, a large amount of unoccu-
pied real estate (with an increasing number of
vacant premises in some regions) had a per-
sistently dampening impact. Weather-related
cutbacks in production, which are usual in
the fourth quarter, are likely to have been
comparatively minor in 2004, however.
Households’ retail purchases continued to be
restrained in the last few months of 2004. A
good start in October was nullified by a
marked decline in November, and even the
Christmas trading period failed to produce a
turnaround. Nevertheless, in autumn there
was no continuation of the reluctance to buy
motor vehicles that had been clearly felt in
Adjusted for seasonal and working-dayvariations, quarterly
%
DM bn € bn
Lin scale
Year-on-year change
900
920
940
960
980
1000
o
Log scale
Real GDP 1
Economic growth in Germany
1 At 1995 prices. — o From 1999, in euro.
Deutsche Bundesbank
4+
2+
0
2−
510
500
490
480
470
460
1998 1999 2000 2001 2002 2003 2004
Externaldisruptivefactors
Weak demandprofile

DEUTSCHEBUNDESBANKMonthly ReportFebruary 2005
35
the third quarter. On an average of the fourth
quarter, in fact, registrations of new motor
vehicles went up by no less than 211�2% in
seasonally adjusted terms hitting a multi-year
peak. In addition, purchases of refined petrol-
eum products – especially heating oil – in-
creased, having previously been deferred in
many cases owing to rising prices. Overall,
there was a slight increase in private con-
sumption in the last few months of 2004, al-
though it is not possible to conclude from this
that there was a sustained growth in the pro-
pensity to consume.
Output and labour market
In cyclical terms, the business situation in in-
dustry deteriorated somewhat in the last few
months of 2004. After adjustment for sea-
sonal variations and the quite large number
of working days, average output in the fourth
quarter was 1�2% down on the summer
months. The year-on-year increase in output,
which had been 5% in the third quarter,
went down to 11�2%. Taking sales as a yard-
stick, domestic deliveries and exports were al-
most equally affected.
The slow pace of economic growth affected
both the capital goods sector and the con-
sumer goods sector. In the case of capital
goods, the cutbacks in the production of
machinery, equipment and motor vehicles
as well as in telecommunications systems
had an impact. In the case of durable con-
sumer goods, developments in the major
branches of consumer electronics and furni-
ture manufacturing were rather unfavour-
Seasonally adjusted, monthly
Balance
Balance
Propensity to purchase
1998 99 00 01 02 03 04 2005
Households’ assessment of theeconomic situation 2
Monthly
Current situation
Businessexpectations
2000 = 100
Business climate in theindustrial sector 1
Sentiment in the industrialsector and among households
1 Source: Ifo Institute. — 2 According toGfK data. Moving five-month averages.
Deutsche Bundesbank
40+
20+
0
20−
40−
60−
40+
20+
0
20−
40−
105
100
95
90
85
80
110
105
100
95
90
85
Deteriorationin industry

DEUTSCHEBUNDESBANKMonthly ReportFebruary 2005
36
able. By contrast, production of intermediate
goods held up well. Comparatively slow
growth, say, in the glass and ceramics sector
as well in the manufacture of electrical
machinery and apparatus was more than off-
set by the continuing expansion in output in
the chemicals industry and in steel produc-
tion.
In the construction sector, there was no fur-
ther deterioration in business activity in the
last few months of 2004. In seasonally adjust-
ed terms, construction output in the fourth
quarter was largely at the same level as in the
previous months. Given the persistent decline
in demand, however, this is not yet a sign a
consolidation. It is rather the case that the
comparatively mild weather in early Decem-
ber, in particular, allowed work to continue
on quite a large scale. The even larger year-
on-year fall of 71�4% in the fourth quarter of
2004 shows how unfavourable the situation
in the construction sector still is. The applies
particularly to the building industry, where
seasonally adjusted output in the last three
months of 2004 continued to decline. To a
large extent, this is likely to be due to a fur-
ther reduction in housing construction activ-
ity, although the increasing amount of un-
occupied real estate, including vacant office
premises, has doubtless also contributed to a
reduction in the volume of construction. Civil
engineering work, which is sustained pre-
dominantly by public sector contracts, bene-
fited more from the quite mild temperatures.
In this subsector, output increased somewhat
in the fourth quarter, in fact. Owing to its
close link with the building industry, business
activity in the finishing trades is more likely to
have been negative. In the third quarter, the
number of hours worked, at -8%, was al-
ready further down on the year than before.
However, much the same is to be expected
for the fourth quarter, for which no statistics
are available yet.
The situation in trade remained unfavourable
towards the end of 2004. The price-adjusted
2000 = 100, seasonally adjusted, quarterly
%
%
Lin scale
Year-on-year change
Log scale
Construction
Lin scale
Year-on-year change
Log scale
Industry
Output in industryand in construction
Deutsche Bundesbank
10+
5+
0
5−
10−
15−
105
90
100
85
95
80
90
75
10+
5+
0
5−
105
100
95
90
1998 1999 2000 2001 2002 2003 2004
Constructionoutput stillweak

DEUTSCHEBUNDESBANKMonthly ReportFebruary 2005
37
level of sales was again clearly down on the
year. At least, there was no further acceler-
ation of the decline in the wholesale trade.
The main reasons for this were that trade in
agricultural products has improved recently
and that sales of fuels and refined petroleum
products showed an increase. This largely off-
set the weak development in food, drink and
tobacco and the deterioration in the machin-
ery and equipment sector, which is probably
connected to the faltering growth in industry.
In the retail trade (excluding motor vehicles
and sales of automotive fuel), the year-on-
year decline in sales was tending to increase
at the end of the period under review. In par-
ticular, sales of consumer electronics and of
books and magazines remained weak. Ac-
cording to the latest consumer surveys, there
has been some increase in the propensity to
make major purchases, but, overall, house-
holds tended to remain cautious as before.
The situation in the hotel and restaurant
trade, where the earlier identifiable gradual
recovery had been interrupted in the autumn
of 2004, was brightening up again somewhat
towards the end of the year. This applies par-
ticularly to the accommodation businesses,
where the volume of turnover was again up
on the year at the end of the period under re-
view. Restaurant businesses were still show-
ing a minus figure, however.
In the case of the commercial service pro-
viders, the cyclical flattening in the produc-
tion sector meant that many expectations for
the last few months of 2004 were not ful-
filled. Indeed, according to the surveys of the
Centre for European Economic Research, the
marked preponderance of firms that had still
been reporting a positive development in
sales in summer disappeared almost entirely.
Pessimistic reports were in a clear majority,
not least in the IT and telecoms sectors. In the
case of firms of architects, hope of the situ-
ation improving has largely faded. This was
not offset by more positive developments in
the case of management consultancy and ad-
vertising firms.
Towards the end of 2004, the labour market
was still marked by a rising level of employ-
ment as well as by unemployment. According
to Federal Statistical Office data, the season-
ally adjusted number of persons in work had
gone up to almost 38.6 million by Decem-
ber 2004. This signifies an increase of roughly
80,000 on the third quarter and around
290,000, or 0.8%, on the year. While em-
ployment in industry and construction was
declining up to the end of the period under
review – albeit at what tended to be a slower
pace – employment in the services sector was
showing an accelerated rise. This was focused
on commercial service providers and workers
employed in households, ie persons who are
likely, for the most part, to be low-paid part-
time workers. The numbers of these have
probably increased again in the past few
months. At the end of 2004, a total of
around 81�2 million jobs of this kind were
registered with the Miners’ Federal Statutory
Health Insurance Scheme. The rise in employ-
ment was also supported by formerly un-
employed persons who have become self-
employed – for example, as one-person busi-
nesses – with financial assistance from the la-
bour exchanges. Business start-up grants
were paid to nearly 225,000 persons, with
Unfavourabledevelopmentin trade
Slowdownin the caseof commercialserviceproviders
Continuous riseemployment

DEUTSCHEBUNDESBANKMonthly ReportFebruary 2005
38
Deutsche Bundesbank
Sharp increase in low-paid part-time jobs
With effect from 1 April 2003, new regulations for low-
paid part-time (and short-term) jobs were introduced as
part of the Hartz II Act. The ceiling for monthly earnings
was raised from €325 to €400, for example. At the same
time, the restriction to 15 hours worked per week was
abolished. The compensation of employees is exempted
from taxes and social security contributions. The employ-
ers pay a fl at rate of 25% of the earnings for the social
security contributions and income tax. Every employed
person subject to social security contributions can work
in a second job exempt from social security contributions.
For persons employed in households, there is a reduced
contribution rate of 12%; the employers receive an
additional tax allowance amounting to 10% of the costs
incurred up to a maximum tax savings of €510. A simple
reporting procedure to the Miners’ Federal Statutory
Health Insurance Scheme (Bundesknappschaft) facilitates
the establishment of jobs of this kind.
The new arrangements for “mini-jobs“ has considerably
enhanced the attractiveness of low-paid part-time jobs.
In particular, demand has been stimulated by the large
degree of fl exibility with regard to working hours as well
as the scope available with regard to pay and straightfor-
ward administrative reporting processes. Added to this
is a broad regional availability. In the nine months up to
the end of 2003, the number of low-paid part-time work-
ers had increased by around 700,000 to about six million.
Approximately a further 900,000 persons were added to
this fi gure during 2004. This means that the total number
has risen to nearly seven million. Roughly one-quarter
of these persons already had a main job fully subject to
social security contributions. In other words, their low-
paid employment was a second job. Roughly 1½% were
employed in a household.
As the sharp increase in low-paid part-time employ-
ment coincided with a marked reduction in employment
fully subject to social security contributions, it is often
assumed that, in many cases, full-time jobs have been
split up and reclassifi ed. At all events, the number of per-
sons subject to regular social security contributions fell by
450,000 between March and the end of 2003. In 2004, the
decline amounted to roughly 300,000. Looking at these
developments in terms of the sectors of the economy, the
changes in employment in hotels and restaurants as well
as in the retail trade, in particular, support this substitu-
tion theory. In both economic sectors, the sharp expan-
sion of low-paid part-time employment was accompanied
by marked reductions in “normal” employment. On the
other hand, the level of both categories of employment
was increased noticeably not least in the case of commer-
cial service providers and in the healthcare sector. A simi-
lar parallel situation is identifi able in a Federal Labour
Agency study 1 based on business data. In around 180,000
fi rms, a decline of just over half a million in the number
of persons subject to social security contributions in the
1 See Mini- und Midijobs in Deutschland, special report 2004. —
Year-on-year changes in thousandsMid-year level
Self-employed
Low-paid part-time employees
Employees subject to socialsecurity contributions
Components of theshift in employment
400+
200+
0
200–
400–
600–
2001 2002 2003 2004

DEUTSCHEBUNDESBANKMonthly ReportFebruary 2005
39
period from March 2003 to March 2004 was accompanied
by an increase of almost 400,000 in the case of mini-jobs.
There are not a few cases, however, where both types of
employment increased or where the rise in the number
of employees fully subject to social security contributions
was accompanied by a fall in the number of low-paid
part-time employees. Based on the group of employees,
at just under 450,000, almost exactly the same number of
persons switched from a low-paid part-time job to “nor-
mal” employment as vice versa. The cited study concludes
that there have been some exchange processes between
the two types of employment. Nevertheless, there is
likely to have been a greater number of cases in which
new job opportunities have been created.
A study by the Rheinisch-Westfälisches Institut (RWI) 2
investigated the question of unemployed persons being
integrated into a low-paid part-time job. According to
this study, around 15% of persons employed in mini-
jobs had been unemployed before taking up a low-paid
part-time job. Nevertheless, as the number of 15 hours
worked per week, which is needed for no longer being
counted in the unemployment statistics, is not achieved
in most cases, these persons generally remain registered
as unemployed. No more than 3% of all persons in low-
paid part-time employment exceed the statistical thresh-
old. While there are major differences in specifi c cases,
weekly working hours average somewhat less than ten
hours. The quite small percentage of persons in mini-jobs
who used to be unemployed is explained by the fact that
two-fi fths of the persons surveyed by RWI had previously
been housewives or “house-husbands” and roughly
another quarter was drawing a pension or in training.
The vast majority of low-paid part-time workers there-
fore come from what is known as the “hidden reserve”
or an expanded labour force potential.
The reorganisation of low-paid part-time employment
has probably contributed to a reduction in illicit working.
This is suggested, at least, by the reports from house-
holds. At the end of the third quarter of 2004, just under
90,000 “mini-jobbers” were involved in the household
cheque procedure, ie around 60,000 more than in June
2003 when the statistical recording began.
The fi gures available so far allow no more than an initial
assessment of part of the overall reform package. Gener-
ally speaking, the fi ndings are quite varied and can by
no means be interpreted as a failure of the approach to
reform. Rather, the boom in mini-jobs can be understood
as a call to make the core areas of the labour market
more fl exible as well. Moreover, it is important that
mini-jobs play a greater part in the integration of the
unemployed. A less restrictive practice in offsetting earn-
ings against benefi ts, which would increase the incentive
for recipients of “unemployment benefi t II” to take up
a mini-job – especially when compared with “one euro
jobs” – would therefore seem appropriate.
2 See Aspekte der Entwicklung der Minijobs, Gutachten im Auftrag der Minijob-Zentrale der Bundesknappschaft 2004. — 3 Also contains
the cases where there has been no change. — 4 Firms which had no employees either in March 2003 or in March 2004.
Shifts in employment subject to social securitycontributions and low-paid part-timeemployment
March 2003 to March 2004, in thousands
Category ChangeNumberof firms
Persons sub-ject to socialsecurity con-tributions A
Low-paidpart-timeemployeesB
AB
–+
182 – 558 + 379
AB
+ 3
+278 + 532 + 538
AB
+ 3
– 31,283 + 937 – 320
AB
–– 3
404 – 1,829 – 281
Cannot be allocated 4 646 + 354 + 207
Total 2,793 – 564 + 523

DEUTSCHEBUNDESBANKMonthly ReportFebruary 2005
40
90,000 persons received bridging payments
in December. Furthermore, more job oppor-
tunities with a work-related benefit bonus
(known as one-euro jobs) have been created.
The number of full-time workers subject to
full social security contributions – which is af-
fected more by cyclical developments – was
falling up to the end of the period under re-
view, however. This decline has, nevertheless,
become slower. The figure for November
(more recent statistics are unavailable at
present) was still more than 1% down on the
year, which was more than 300,000 persons.
In mid-2004, the decrease had been 1.6%, or
430,000 persons.
The cyclically unfavourable labour market
situation, which is evident from the develop-
ment of employment subject to social security
contributions, may have contributed to un-
employment rising in the autumn of last year,
too. According to the Federal Employment
Agency, at the end of December the season-
ally adjusted number of persons affected was
a good 40,000 higher than in September. The
sharp seasonally adjusted rise of 225,000 in
January 2005 was due mainly to persons able
to work who had previously been receiving
social assistance now registering as un-
employed. For these persons, registration was
necessary in order draw unemployment bene-
fit II. By the end of January, the number of
persons officially registered as unemployed
had risen to a 5.04 million (unadjusted fig-
ure). In cyclical terms, unemployment has re-
mained largely unchanged. The seasonally
adjusted unemployment rate, as calculated
by the Federal Employment Agency, was
11.4%.
The sharp increase in registered unemploy-
ment at the start of the year has led to a de-
bate on how the headline unemployment
rate is to be interpreted correctly. According
to the method currently employed by the
Federal Employment Agency, persons are
counted as unemployed who do not work, or
who work fewer than 15 hours a week, who
are seeking work with a greater number of
Quarterly, seasonally adjustedMillions
Millions
%
Thou-sands
Thou-sands
01 2
Unemployment rateJan
1998 99 00 01 02 03 04 2005
Jan
Lin scale
Year-on-year change
Reduced log scale
Unemployed - Jan
Lin scaleYear-on-year change
Log scale
Employed
Labour market
1 From January 2004, unemployed exclud-ing participants in aptitude testing andtraining measures. — 2 From January 2005,including persons formerly receiving socialassistance but able to work.
Deutsche Bundesbank
12
11
10
9
400+
0
400−
5.0
4.6
4.2
3.8
800+
400+
0
400−
38.8
38.4
38.0
37.6
37.2Steady rise inunemployment
Informativevalue of theunemploymentrate

DEUTSCHEBUNDESBANKMonthly ReportFebruary 2005
41
working hours, who are available for job
placement, and who are personally registered
at a labour exchange. However, statistical ef-
fects were already playing a considerable role
in 2003. Since January 2004, participants in
training and aptitude-testing schemes have
no longer been registered as unemployed. On
balance, the informative value of the un-
employment statistics has been improved by
the administrative measures and the revisions
of the methodology undertaken in the past
few years, even though they disrupt time
comparisons for a while. Nevertheless, for
quite a number of reasons, the unemploy-
ment rate is still an imperfect measure of the
scale and severity of the chronic under-
employment in Germany. Moreover, the
problems on the German labour market are
too complex to be captured by a single indi-
cator. The lack of competitive jobs is likely to
be a more important factor.
Demand
Demand for German industrial goods became
perceptibly more buoyant again in December.
In the fourth quarter as a whole, it was not
quite 2% up on the preceding three months.
Even so, the fact that the year-on-year in-
crease went down to 41�4% from 53�4% in the
third quarter shows that the pace of growth
was still restrained. This is all the more the
case given that there was an exceptional ac-
cumulation of major orders in December. This
applied, in particular, to parts of the mechan-
ical engineering and other transport equip-
ment sectors, the latter including building
and repairing of ships and boats as well as
construction of air transport equipment.
The major domestic orders were concen-
trated on these sectors. Overall, the seasonal-
ly adjusted average intake of domestic orders
in the last three months of the year was 3%
up on the quarter. The stronger flow of orders
was largely sustained by capital goods. Not
only producers of other transport equipment,
Volume, 2000 = 100,seasonally adjusted, quarterly
%
Domestic
Log scale
Foreign
Lin scale
Year-on-year change
Log scale
New orders total
Demand for industrial goods
Deutsche Bundesbank
105
100
95
90
100
115
95
110
90
105
85
100
80
75
15+
10+
5+
0
5−
10−
110
105
100
95
90
85
1998 1999 2000 2001 2002 2003 2004
Orders receivedby industry ...
... fromdomesticfirms ...

DEUTSCHEBUNDESBANKMonthly ReportFebruary 2005
42
but also manufacturers of road vehicles re-
corded a marked increase in orders. In the
consumer goods sector, the lull in orders dur-
ing the summer was offset, with the figures
nearly matching those of the second quarter.
By contrast, orders placed with producers of
intermediate goods were no higher in the
fourth quarter than they had been in the
summer.
In seasonally adjusted terms, foreign demand
for German industrial products was likewise
higher in the fourth quarter than it had been
in the July to September period, which was
also due to a large number of major orders in
December. In the capital goods sector, in par-
ticular, this resulted in an overall quarter-on-
quarter increase in orders in the final three
months of the year. There was also a marked
improvement in the order situation in the
consumer goods sector, where a seasonally
adjusted 51�2% increase in the last three
months of 2004 brought the best quarterly
result of the entire year. This helped to com-
pensate for the declining orders in the case of
intermediate goods. In this sector, steel pro-
ducers, in particular, suffered a decline from
the high level of orders in the summer, while
there was a further increase in demand in the
chemicals industry.
The situation in the construction sector re-
mained unfavourable throughout the report-
ing period. Whereas demand for construction
work during the summer had been pointing
to a gradual stabilisation of the situation,
there was a further setback in November. In
seasonally adjusted terms, the average figure
taking October and November together was
around 11�2% down on the third quarter,
when the level had already been low. The
year-on-year figure was down by more than
one-tenth. The decline was far sharper in resi-
dential construction, where orders fell by
roughly 18% on the year. In seasonally ad-
justed terms, in October and November
period they were 4% lower than in the third
quarter. With a seasonally adjusted figure of
no more than 11,800 units, construction per-
Volume, 2000 = 100, seasonally adjusted,quarterly, log scale
... in housing construction
... from the public sector
Construction orders ...
... from industrial enterprises
Total construction orders
Oct/Nov
Demand forconstruction work
Deutsche Bundesbank
130
120
110
100
90
80
70
60
120
100
110
90
100
80
110
90
100
80
90
70
120
110
100
90
80
7070
1998 1999 2000 2001 2002 2003 2004
-
-
-
-
Restrainedexport business
Persistentlyweakconstructiondemand

DEUTSCHEBUNDESBANKMonthly ReportFebruary 2005
43
mits for single-family housing were nearly
halved compared with the most recent peak
in 1999. In apartment house construction,
compared with 1994 – the first year for
which statistics are available for Germany as a
whole – orders have now fallen to less than
one-fifth. In seasonally adjusted terms, public
sector construction orders in the two months
of October and November were 23�4% down
on the third quarter. It was only industrial
construction that held up. After adjustment
for seasonal and working-day variations,
there was a slight increase in incoming
orders. Even though this means that the level
of orders had remained largely unchanged
since spring 2004, the year-on-year fall of
10% shows that there have been sharp cut-
backs in this sector, too.
In the case of commercial service providers,
the outlook for demand is brighter. According
to the European Centre for Economic Re-
search survey in the fourth quarter of 2004,
the enterprises in this sector take quite a posi-
tive view of the orders situation. Even so,
there are greater differences between the in-
dividual sectors than in the past. The most
positive assessment comes from the tele-
coms, closely followed by tax consultants and
auditors. This contrasts with the strongly
negative expectations of firms of architects as
well those of firms working in technical con-
sultancy and planning. This is likely to be con-
nected with the restrained investment activity
in industry, especially with regard to construc-
tion projects.
Prices
The overall rate of price increase remained
within limits in the last few months of 2004.
While tax factors again had a marked impact
domestically, there tended to be more damp-
ening effects from the external side. In sea-
sonally adjusted terms, German import prices
were declining slightly from their most recent
peak in October. In December, they were
scarcely higher than they had been in the
second quarter of 2004. The year-on-year
rate of increase went down from 4.1% to
2.2%. Cheaper imports of crude oil and re-
fined petroleum products, which had risen by
one-half on the year in early autumn, were
the crucial factor behind this. At all events,
the decline in prices was so sharp that it more
than offset the contrasting movement in gas,
Consumer prices
Annual percentage change
2004
Item Q2 Q3 Q4 Jan
Food – 0.3 – 0.6 – 1.0 – 1.1
Industrial goods 1.8 1.6 1.8 1.4of which
Tobacco 12.2 12.2 16.2 24.3Pharmaceuticals andtherapeutic appliances 23.2 23.2 23.1 5.4
Energy 4.9 6.1 7.1 5.3of which
Refined petroleumproducts 7.7 10.3 11.2 5.9
Services 2.4 2.3 2.4 2.4of which
Outpatient and inpatientmedical services 17.0 18.7 18.5 2.6
Rents 1.0 1.0 1.2 1.0
Total 1.7 1.8 2.0 1.6
Total excluding seasonalproducts, energy, tobacco,healthcare 0.5 0.5 0.4 0.7
Memo itemHarmonised Index 1.8 2.0 2.1 1.6
Deutsche Bundesbank
Positivedemandoutlook in thecase of someserviceproviders Import prices
decliningslightly

DEUTSCHEBUNDESBANKMonthly ReportFebruary 2005
44
which traditionally follows oil prices with a
time-lag of roughly half a year. Added to this
was an initial easing of upward price pressure
on steel products. This meant that raw mater-
ials and semi-finished became somewhat
cheaper on the whole. Probably not least
owing to the depreciation of the euro, the
price level of finished products, which has
been down on the year for quite some while,
fell back again slightly.
In the case of German domestic industrial
producer prices, cheaper energy coincided
with the second increase in tobacco tax. The
outcome of this was that there was no con-
tinuation of the decline in factory gate prices
in December. In seasonally adjusted terms, in
fact, there was a slight increase. The year-on-
year rate of increase, which had fallen to
2.8% in November, went up to 2.9%. Exclud-
ing tobacco, the figure went down from
2.6% to 2.4%. One factor in this was the
easing of steel prices, which meant that there
was no further rise in the prices of intermedi-
ate goods. Price changes in the case of other
industrial goods were moderate up to the
end of the period under review. In December,
capital goods and consumer goods (excluding
tobacco) were no more than 0.6% and 0.5%
more expensive respectively than in the same
month of 2003.
Construction prices, after a lengthy standstill,
had started moving upwards in the spring of
2004, and showed a further slight rise again
in the fourth quarter. The year-on-year figure
for construction prices went up to +1.7%.
The building industry was especially affected.
Commercial and industrial buildings were
2.6% more expensive. Office buildings and
housebuilding cost 2.0% and 1.7% more
respectively. The perceptibly higher steel
prices were a main cost factor. As steel is
much less important in road construction,
there were hardly any price changes in this
subsector.
According to the regional data supplied by
BulwienGesa AG, which has been aggregated
by the Bundesbank, in 2004 there was a fur-
ther decline in prices for residential buildings
(terraced houses and owner-occupied apart-
ment housing). In the case of newly built
housing, price reductions (as in 2003) were
around 1%. In the case of resale, the figure
was as much as just over 2%. This meant
that used property was no more expensive
last year than it had been in 1993. Purchase
2000 = 100, seasonally adjusted, log scale
Enlarged scale
Import prices
1998 99 00 01 02 03 04 2005
Commodity prices 1
Commodity and import prices
1 HWWA index “Euroland” on a euro basis;not seasonally adjusted.
Deutsche Bundesbank
105
100
95
90
95
120
110
100
90
80
70
60
50
Tobacco taxdrivingindustrialproducer prices
Higherconstructionprices
Falling houseprices in 2004

DEUTSCHEBUNDESBANKMonthly ReportFebruary 2005
45
prices for newly constructed houses and
apartments, including land, were similar to
those at the end of the 1990s.
According to both the national price index
and the (EMU) euro area Harmonised Index
of Consumer Prices (HICP), the prices of
goods and services purchased by households
were 1.6% up on the year in January. The de-
cline on December 2004, when the rate of
change had been 2.1% and 2.2% respective-
ly, was due, to a large extent, to a base effect
of the health system reform, which had start-
ed to affect prices at the beginning of last
year. Added to this were comparatively minor
price increases for food as well as quite sharp
falls in the prices of clothing and shoes in
connection with special sales. By contrast,
services became more expensive. The in-
creases in motor vehicle tax for older vehicles
with a higher pollutant emission and in motor
vehicle insurance had a particular impact in
this sector. Moreover, the price reductions for
package holidays and in accommodation ser-
vices were smaller than had been the case in
earlier years.
2000 = 100, annual averages, log scale
House prices 2
Newly built
Resale
1995 2004
Construction prices 1
Construction and house pricesin Germany
1 Bundesbank calculations based onFederal Statistical Office data. — 2 Terracedhouses and owner-occupied dwellings;Bundesbank calculations based on raw dataof BulwienGesa AG.
Deutsche Bundesbank
104
102
100
98
96
94
102
100
98
96 97 98 99 00 01 02 03
Lower rateof consumerinflation

DEUTSCHEBUNDESBANKMonthly ReportFebruary 2005
46
Foreign tradeand payments
Foreign trade and current account
The external conditions for German exporters
were no longer quite as favourable in the
fourth quarter of 2004 as in the preceding
months. One reason for this was that the
global economy lost momentum compared
with the first half of 2004, not least as a re-
sult of the rise in oil prices; all the same, eco-
nomic growth proved to be so robust that the
expansion of the global economy continued
on a somewhat flatter path. The other reason
was that German suppliers appeared to have
been burdened by the temporary appreci-
ation of the euro last year, especially in their
trade relations with the dollar area. Overall,
German exports stagnated as a result in the
final quarter of 2004. In respect of future de-
velopments in foreign trade, however, indus-
try appears fairly optimistic, even though ex-
port expectations were somewhat more cau-
tious at the start of this year than in the pre-
ceding months, according to a survey by the
Ifo institute. The latest easing on the foreign
exchange markets is likely to lend additional
support to this optimism.
Compared with the previous quarter, nominal
exports of goods went up by merely just
under 1�2% in the fourth quarter of 2004 after
seasonal and working-day adjustment, after
going up by almost 1% in the third quarter.
Exports therefore remained almost un-
changed on the quarter in real terms, ie after
allowing for the slight rise in export prices.
The seasonally and working-day-adjusted De-
cember figure, which was decidedly low, de-
termined the quarterly result. It is possible
that German exporters did not fully exploit
Externalenvironment
Exportsof goods

DEUTSCHEBUNDESBANKMonthly ReportFebruary 2005
47
the potential of the additional working days
in the month.1 In any case, external develop-
ments were noticeably more favourable until
November. This is also reflected in the figures
for individual countries.
A comparison of the average of October and
November 2004 – statistics on foreign trade
by region and sector are not yet available for
December – with the third quarter shows that
German exporters managed to increase the
value of exports to both the euro area and
third countries (+11�2% in each case). In par-
ticular, trade with the Netherlands and France
contributed towards the growth in exports to
other euro-area countries. In France’s case,
exports of aircraft were a major factor. Over-
all, German suppliers are likely to have con-
tinued to benefit from the comparatively ad-
vantageous price and cost developments in
Germany in terms of sales within the euro
area.
In view of the further appreciation of the
euro up to the end of 2004, however, Ger-
man exporters have been less able to com-
pete on price with third countries in recent
months. The shifts in exchange rate parities
and the economic differences between re-
gions have led to sales of German products in
the individual non-euro-area countries turn-
ing out very differently. In the period under
review, turnover from exports by German in-
dustry to the rapidly growing ten new EU
member states went up particularly dynamic-
ally (+101�2%). Owing to the great import-
ance of these countries to German exports –
9% of Germany’s total exports and 16% of
German exports to third countries are cur-
rently to these countries – this strong growth
was due primarily to the increase in sales out-
side the euro area. The value of exports to
€ bn
%
Seasonally adjusted, quarterly
2005
Jan
Lin scale
Export expectations 2
Orders receivedfrom abroadvalues, 2000 = 100
Monthly
Monthly 1Log scale
Exports
Export trend
1 Monthly values adjusted to match quar-terly level. — 2 Results of the Ifo businesssurvey; balances of positive and negativecompany reports.
Deutsche Bundesbank
20+
15+
10+
5+
0
5−
120
115
110
105
100
95
190
185
180
175
170
165
160
155
2001 2002 2003 2004
1 December 2004 had two more working days than De-cember 2003, for example. As working-day adjustment isbased on the monthly average number of working days,not making full use of the additional working days – forexample, when company holidays take place betweenChristmas and New Year independently of the number ofworking days in that period – would lead to relativelyfewer exports in (seasonally and) working-day-adjustedterms.
Breakdownof exports

DEUTSCHEBUNDESBANKMonthly ReportFebruary 2005
48
China (+3%) and the OPEC countries
(+11�2%) also rose somewhat in the period
under review. By contrast, export turnover in
most of the other important German sales
areas was, in some cases, considerably lower
than in the previous period, presumably due,
not least, to exchange rate movements. This
particularly affected Japan (-101�2%) and the
emerging markets in South-East Asia (-7%)
whereas the decline in exports to the United
States was smaller (-11�2%).
The greater foreign demand in October and
November as a whole was directed primarily
at the German consumer goods sector,
whose export turnover rose by just over
21�2%. However, it also gave rise to a nominal
increase of just under 2% in exports of capital
goods, the focal point of German exports,
and of 1% in intermediate goods. The in-
crease in products of the German chemical
industry and the information and communi-
cation sector was particularly noticeable
(+21�2% in each case). In addition, metal
products were in greater demand abroad.
However, exports of motor vehicle equipment
fell (-2%).
The value of German imports of goods in-
creased by just over 1�2% in seasonally adjust-
ed terms in the fourth quarter of 2004; they
therefore went up much more slowly than in
the previous quarter (+4%). Like exports,
they stagnated in real terms as import prices
rose by just under 1�2% in the three-month
period under review. Goods imported from
third countries actually became 1�2% cheaper.
The 6% average appreciation of the euro
against the dollar in the fourth quarter vis-�-
vis the previous quarter was one contributory
factor. The other factor that had a consider-
able effect on the moderate price develop-
ments was the sharp fall in oil prices in the
last two months of 2004.
Although there is not yet any information
available on the regional and product struc-
ture, imports, like exports, fell sharply in De-
cember. On an average of October and No-
vember compared with the average of the
third quarter, there was still an increase of
21�2%. This increase can be attributed exclu-
sively to increased imports from third coun-
tries (+4% in nominal terms). The value of
imports from the Russian Federation went up
by 12%. Imports, mainly of crude oil, from
the OPEC countries also showed a high nom-
inal rate of increase (+13%). In both cases,
Trend in foreign trade by region andby category of goods
Average of October and November 2004 comparedwith the average of July to September 2004%; seasonally adjusted
ItemEx-ports
Im-ports
Total + 1.3 + 2.1
Selected country/group of countries
Euro-area countries + 1.3 – 0.6Other EU countries + 6.8 + 5.6United States – 1.4 + 1.2Japan – 10.6 – 3.7China + 3.2 + 10.9Russian Federation – 2.2 + 11.8OPEC countries + 1.7 + 13.2Emerging marketsin South-East Asia – 6.8 – 2.5
Categories of goods
Selected main categoriesIntermediate goods + 1.2 + 0.4Capital goods + 1.8 + 3.2Consumer goods + 2.7 + 3.3Energy . – 0.6
Selected categoriesChemicals + 2.5 + 13.7Machinery – 0.4 + 1.1Motor vehicles and motor vehicleparts – 1.9 – 3.9Information technology + 2.4 + 0.6Metals and metal products + 2.1 + 2.0
Deutsche Bundesbank
Importsof goods
Breakdownof imports

DEUTSCHEBUNDESBANKMonthly ReportFebruary 2005
49
however, price effects are likely to have
played a significant role.2 Nevertheless, it was
not energy imports that led to the rise in im-
ports; these declined in value overall as Ger-
man energy importers were evidently reluc-
tant to place orders in view of the sharp price
fluctuations on the oil market. The decisive
factor was the greater domestic demand for
foreign capital and consumer goods as well
as for chemical engineering goods, although
it must be said here that exports, which were
more robust up until November anyway,
could also have triggered a greater need for
imports. Imports from China and the ten new
EU member states rose particularly sharply
(+11% and +81�2% respectively); these coun-
tries positioned themselves as, among other
things, important suppliers of information
and communications technology goods. By
contrast, imports from both Japan (-31�2%)
and South-East Asia (-21�2%) fell in value com-
pared with the preceding three-month
period. The same was true of imports from
the other euro-area countries (-1�2%), in
which there may have been substitution ef-
fects in view of the fact that imported prod-
ucts became 11�2% more expensive on an
average of October and November.
The seasonally adjusted trade surplus fell by
31�2 billion in the fourth quarter of 2004 com-
pared with the previous quarter to 3361�2 bil-
lion. The cause of this was the somewhat
sharper increase in nominal imports of goods
in comparison with exports. At the same
Major items of the balanceof payments
5 billion
2003 2004
Item Q4 Q3 Q4
I Current account
1 Foreign trade 1
Exports (fob) 172.0 179.7 190.1Imports (cif) 140.2 142.8 154.7
Balance + 31.8 + 36.9 + 35.4
2 Services (balance) – 5.6 – 13.4 – 7.9
3 Income (balance) + 0.3 – 3.8 + 3.5
4 Current transfers (balance) – 6.3 – 8.0 – 6.2
Balance on current account 2 + 18.4 + 8.5 + 21.6
Memo itemBalances, seasonally adjusted
1 Foreign trade + 34.2 + 37.1 + 36.7
2 Services – 8.8 – 9.3 – 10.7
3 Income – 0.5 – 3.2 + 2.9
4 Current transfers – 6.2 – 7.2 – 6.1
Current account 2 + 16.7 + 14.5 + 19.4
II Balance of capital transfers 3 – 0.0 + 0.2 – 0.3
III Balance of financial account 4 – 25.8 – 30.6 – 29.6
IV Change in the reserve assetsat transaction values(increase: –) 5 + 1.2 + 1.6 + 0.0
V Balance of unclassifiabletransactions + 6.2 + 20.3 + 8.3
1 Special trade according to the official foreign trade statistics(source: Federal Statistical Office). — 2 Includes supplementarytrade items. — 3 Including the acquisition/disposal of non-produced non-financial assets. — 4 For details see the table“Financial transactions” on page 51. — 5 Excluding allocation ofSDRs and changes due to value adjustments.
Deutsche Bundesbank
2 The greatest relief in import prices arising from declin-ing crude oil prices did not occur until December 2004and therefore cannot yet be reflected in these regionaldata, which only cover the period until November.
Currentaccount

DEUTSCHEBUNDESBANKMonthly ReportFebruary 2005
50
time, the deficit on invisible current transac-
tions fell by 36 billion to 314 billion. This fall
is attributable mainly to a sharp rise in net
cross-border income, which led to a surplus
on income of 33 billion. Besides this, slightly
smaller net current transfers were paid to
non-residents. The deficit on services was
311�2 billion up on the quarter. The German
current account therefore closed with a sea-
sonally adjusted surplus of 3191�2 billion in the
final quarter of 2004 following one of around
3141�2 billion in the previous quarter.
Financial transactions
Relatively favourable stock and bond markets
as well as exchange rate movements in fa-
vour of the euro determined events on the
international financial markets in the final
quarter of last year. The interest rate advan-
tage that dollar paper had on the capital mar-
ket increased further. At the short end, the in-
crease in the federal funds rate played a role.
On balance, some of the aforementioned in-
fluences cancelled each other out in German
financial transactions. If portfolio investment
and direct investment are taken together,
there were net inflows into Germany of
39 billion in the fourth quarter of 2004.
In portfolio investment alone, there were
slight (net) inflows of funds amounting to
31 billion; in the previous quarter, there had
been net capital imports of 318 billion.
Foreign investors played a crucial part in this
fall. They showed far less interest in German
securities in the final quarter than in late sum-
mer (318 billion compared with 3381�2 billion).
The main reason for this was the drop in de-
mand for German bonds and notes, which
evidently seemed less attractive to them in
view of the changed interest rate situation.
On balance, they added just 315 billion worth
of German bonds to their portfolios com-
pared with 3331�2 billion in the previous three-
month period. Public bonds accounted for
most of this figure (311 billion). By contrast,
bank bonds, which had been in high demand
between July and September, played a lesser
role in foreign investors’ portfolio decisions in
the period under review (331�2 billion).
There was also less foreign interest in the Ger-
man equity market in the final quarter of the
year. On balance, foreign investors acquired
just 31 billion worth of German equities com-
pared with 361�2 billion worth in the previous
three-month period. Owing to the compara-
tively strong performance of the DAX and the
simultaneous peaking of the euro, profit-
taking, especially by investors from outside
the euro area, could have reduced net acqui-
sitions.
German investors likewise reduced their new
investment in the international securities mar-
kets (317 billion compared with 3201�2 billion
before), albeit not to the same extent as for-
eign investors in Germany. In particular, they
bought foreign bonds and notes in the final
three months of last year (3171�2 billion).
Euro-denominated foreign long-term debt in-
struments accounted for the overwhelming
majority of these (315 billion), as has been
the case since the beginning of monetary
union. These instruments usually carry some-
Trendsin financialtransactions
Portfolioinvestment
Foreigninvestment in ...
... Germanbonds andnotes ...
... and Germanshares
Germaninvestment in ...
... foreignbonds andnotes
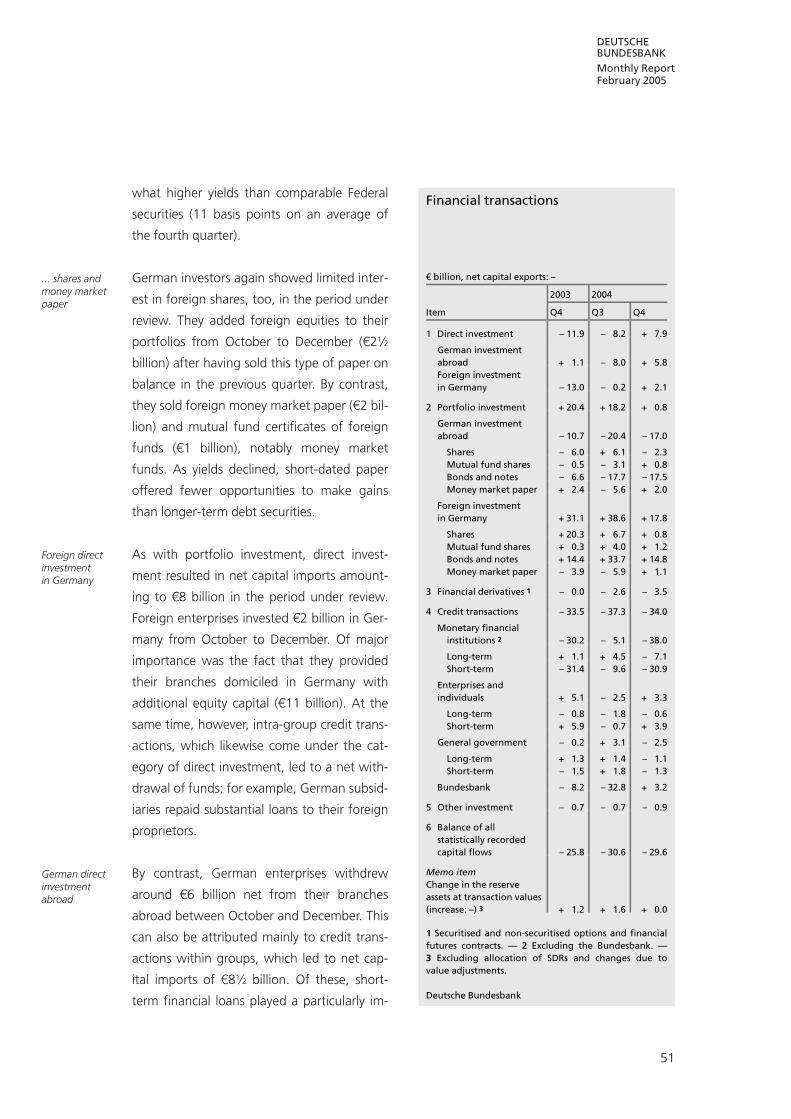
DEUTSCHEBUNDESBANKMonthly ReportFebruary 2005
51
what higher yields than comparable Federal
securities (11 basis points on an average of
the fourth quarter).
German investors again showed limited inter-
est in foreign shares, too, in the period under
review. They added foreign equities to their
portfolios from October to December (321�2
billion) after having sold this type of paper on
balance in the previous quarter. By contrast,
they sold foreign money market paper (32 bil-
lion) and mutual fund certificates of foreign
funds (31 billion), notably money market
funds. As yields declined, short-dated paper
offered fewer opportunities to make gains
than longer-term debt securities.
As with portfolio investment, direct invest-
ment resulted in net capital imports amount-
ing to 38 billion in the period under review.
Foreign enterprises invested 32 billion in Ger-
many from October to December. Of major
importance was the fact that they provided
their branches domiciled in Germany with
additional equity capital (311 billion). At the
same time, however, intra-group credit trans-
actions, which likewise come under the cat-
egory of direct investment, led to a net with-
drawal of funds: for example, German subsid-
iaries repaid substantial loans to their foreign
proprietors.
By contrast, German enterprises withdrew
around 36 billion net from their branches
abroad between October and December. This
can also be attributed mainly to credit trans-
actions within groups, which led to net cap-
ital imports of 381�2 billion. Of these, short-
term financial loans played a particularly im-
Financial transactions
5 billion, net capital exports: –
2003 2004
Item Q4 Q3 Q4
1 Direct investment – 11.9 – 8.2 + 7.9
German investmentabroad + 1.1 – 8.0 + 5.8Foreign investmentin Germany – 13.0 – 0.2 + 2.1
2 Portfolio investment + 20.4 + 18.2 + 0.8
German investmentabroad – 10.7 – 20.4 – 17.0
Shares – 6.0 + 6.1 – 2.3Mutual fund shares – 0.5 – 3.1 + 0.8Bonds and notes – 6.6 – 17.7 – 17.5Money market paper + 2.4 – 5.6 + 2.0
Foreign investmentin Germany + 31.1 + 38.6 + 17.8
Shares + 20.3 + 6.7 + 0.8Mutual fund shares + 0.3 + 4.0 + 1.2Bonds and notes + 14.4 + 33.7 + 14.8Money market paper – 3.9 – 5.9 + 1.1
3 Financial derivatives 1 – 0.0 – 2.6 – 3.5
4 Credit transactions – 33.5 – 37.3 – 34.0
Monetary financialinstitutions 2 – 30.2 – 5.1 – 38.0
Long-term + 1.1 + 4.5 – 7.1Short-term – 31.4 – 9.6 – 30.9
Enterprises andindividuals + 5.1 – 2.5 + 3.3
Long-term – 0.8 – 1.8 – 0.6Short-term + 5.9 – 0.7 + 3.9
General government – 0.2 + 3.1 – 2.5
Long-term + 1.3 + 1.4 – 1.1Short-term – 1.5 + 1.8 – 1.3
Bundesbank – 8.2 – 32.8 + 3.2
5 Other investment – 0.7 – 0.7 – 0.9
6 Balance of allstatistically recordedcapital flows – 25.8 – 30.6 – 29.6
Memo itemChange in the reserveassets at transaction values(increase: –) 3 + 1.2 + 1.6 + 0.0
1 Securitised and non-securitised options and financialfutures contracts. — 2 Excluding the Bundesbank. —3 Excluding allocation of SDRs and changes due tovalue adjustments.
Deutsche Bundesbank
... shares andmoney marketpaper
Foreign directinvestmentin Germany
German directinvestmentabroad

DEUTSCHEBUNDESBANKMonthly ReportFebruary 2005
52
portant role. At the same time, German pro-
prietors provided their foreign branches and
subsidiaries with 31 billion worth of equity
capital.
The non-securitised credit transactions of
non-banks led to net capital imports of 31 bil-
lion in the fourth quarter of 2004. Enterprises
and individuals repatriated funds amounting
to just under 331�2 billion net. As is usual at
the end of the year, the repatriation of bank
deposits held abroad played a decisive role in
this respect. Overall, however, the operations
of non-banks appear to have been less exten-
sive in the final month of 2004 than in previ-
ous years. Cross-border transactions by gen-
eral government resulted in net capital ex-
ports of 321�2 billion.
The non-securitised credit transactions of the
banks (including the Bundesbank), which es-
sentially reflect all other external transactions,
resulted in net capital exports amounting to
335 billion in the period under review com-
pared with 338 billion in the previous quarter.
This figure was due mainly to credit insti-
tutions’ external payments, which alone
accounted for outflows of 338 billion. By
contrast, the Bundesbank’s external assets fell
by 33 billion, primarily as a result of trans-
actions within the gross settlement system
TARGET.
The Bundesbank’s reserve assets, which are
shown separately from cross-border credit
transactions in the balance of payments, re-
mained broadly unchanged at transaction val-
ues between October and December. How-
ever, there was a 341�2 billion fall after revalu-
ation at current market prices. This was due
mainly to the depreciation of foreign ex-
change reserves as well as the reduction in
the price of gold. On balance, the reserve
assets stood at 3711�2 billion at the end of
2004 compared with 3761�2 billion at the end
of 2003.
Net capital exports: −€ bn
Q4 Q1 Q2 Q3 Q4
German investment inforeign securities
Foreign investment inGerman securities
Balance ofportfolioinvestment
Portfolio investment
Deutsche Bundesbank
40+
30+
20+
10+
0
10−
20−
30−
40−
2003 2004
Credittransactions ofnon-banks
Credittransactions ofthe bankingsystem
TheBundesbank’sreserve assets

DEUTSCHEBUNDESBANKMonthly ReportFebruary 2005
53
Public finances Central, state and local government
In the fourth quarter of 2004 central, state
and local government appear to have record-
ed a small surplus, thus improving somewhat
on the comparable position in the final quar-
ter of 2003. In 2004 as a whole the deficit
will probably be on a par with that run up in
2003, when a new record high of almost 370
billion was reached. On the revenue side tax
receipts stagnated owing above all to the
cuts in income tax, while non-tax receipts de-
clined, chiefly on account of the sharp drop in
the Bundesbank profit. Expenditure declined
slightly over twelve months amid countervail-
ing effects such as higher spending on social
benefits and a further fall in investment. It is
likely that interest expenditure, too, decreased
despite the high new borrowing during the
past few years thanks to the favourable finan-
cing terms. Personnel expenditure and other
operating expenditure were very muted.
For the current year the budget plans envis-
age a reduction in the deficits, not least in
view of the national budgetary ceilings for
new borrowing. To this end increased re-
course will be taken – especially by central
government – to asset disposals. Tax revenue
will remain subdued, in particular because of
the final stage of the income tax reform. In
contrast to the situation in the previous years,
however, it is expected to increase (albeit only
moderately). Tight curbs on spending remain
essential if the budget targets are to be met.
Overview

DEUTSCHEBUNDESBANKMonthly ReportFebruary 2005
54
Tax revenue decreased by 3.5% in the fourth
quarter compared with the same period in
2003.1 The main reason for this was the
sharp fall in wage tax receipts due above all
to the extensive income tax cuts. Receipts
from mineral oil tax and tobacco tax likewise
receded further.2 By contrast, revenue from
profit-related taxes was far more buoyant
overall. However, the positive basic tendency
weakened somewhat in comparison with the
preceding quarters, especially given that the
increase was strongly boosted by the surge in
receipts from the tax amnesty towards the
end of the year.
According to the preliminary outturn – which
includes only an estimate for local govern-
ment taxes – tax revenue in 2004 as a whole
largely matched the 2003 level, despite the
relatively robust overall economic growth.
The overall tax ratio (as defined in the govern-
ment’s financial statistics) consequently de-
creased by 0.5 percentage point to 20.3%.
This was principally attributable to the lower-
ing of income tax rates in 2004. In addition,
the overall structure of economic develop-
ment yielded disproportionately low tax rev-
enue since the growth of domestic demand
and gross wages and salaries remained sub-
dued, so that the assessment base for turn-
over tax and wage tax – the two biggest gen-
erators of tax revenue – likewise failed to
expand. Receipts from Federal taxes also
declined perceptibly in the wake of consumer
resistance to the increased prices of mineral
oil and the higher tobacco taxes. One offset-
ting factor was the positive development of
profit-related taxes which, given firms’ overall
improved profitability, yielded 161�2% more in
the aggregate. Corporation tax receipts, in
particular, grew sharply (by nearly 35 billion
or 581�2%). This was due in part to the mora-
torium on mobilising accrued corporation tax
credits imposed by the Act to Reduce Tax
Subsidies and to the limitation of the tax loss
carryforward facility. Furthermore, receipts
from assessed income tax grew appreciably
by 18%, primarily because of income from
the tax amnesty amounting to 30.9 billion.
Local business tax receipts (the outturn of
which for the fourth quarter is estimated)
likewise went up substantially.
Year-on-year change%
Tax receipts, total 1
1st hf 2nd hf 1st hf 2nd hf Q1 Q2 Q3 Q4
Tax revenue
1 Including EU shares in German tax rev-enue, but excluding receipts from localgovernment taxes, which are not yetknown for the last quarter recorded.
Deutsche Bundesbank
4+
3+
2+
1+
0
1−
2−
3−
4−
5−
2002 2003 2004
1 Including EU shares in German tax revenue but exclud-ing receipts from local government taxes, which are notyet known for the fourth quarter.2 The decrease in the fourth quarter was especially largeowing to the change in booking techniques made in2004 in respect of certain Federal taxes.
Tax revenuein fourthquarter...
... and in 2004as a whole

DEUTSCHEBUNDESBANKMonthly ReportFebruary 2005
55
While the deviations vis-�-vis the estimates in
the forecast from autumn 2003 (on a com-
parable basis, ie adjusted for changes in tax
law since then) were still considerable – at 36
billion – they were far smaller than in past
years. Besides revenue shortfalls in the case
of mineral oil tax and tobacco tax, the gap
between that forecast and the outturn is due
mainly to revisions of the pattern of macro-
economic growth, whereas the overall rise in
nominal GDP was merely 0.3 percentage
point lower than expected. In addition,
changes in tax legislation adopted in the
meantime caused revenue shortfalls of
around 351�2 billion. The result forecast in the
last official estimate from November 2004
was more or less matched.
It is expected that tax revenue in the current
year will be boosted above all by stronger
growth of domestic demand and of gross
wages and salaries. These positive influences
will be partly offset, however, by shortfalls en-
suing in particular from the entry into force of
the last stage of the income tax reform,
which lowers the bottom tax rate to 15%
and the top rate to 42%. It is especially diffi-
cult to gauge the likely evolution of profit-
related taxes. Although their momentum
waned somewhat in the fourth quarter of
2004, it seems probable that they will con-
tinue to grow significantly. According to the
official tax estimate of November 2004, over-
all tax revenue is expected to increase by
11�2% in 2005. The overall tax ratio would
then fall again marginally to 20.1%.
Central government recorded a surplus of
over 371�2 billion in the fourth quarter thanks
to large privatisation proceeds. In 2004 as a
whole the deficit exceeded the corresponding
figure in 2003 by just over 31�2 billion to reach
almost 340 billion and thus massively over-
shot the budget target of spring 2004 (3291�2
billion). However, it was 34 billion smaller
than the amount estimated in the supple-
mentary budget.
Revenue decreased in 2004 by just over 351�2
billion or 21�2% on the year despite higher
proceeds from asset disposals (+ 331�2 billion).
This was due mainly to a 21�2% fall in tax re-
ceipts caused notably by the weak momen-
tum of Federal taxes and a temporary change
in the allocation of turnover tax to the detri-
ment of central government. This was partly
offset, however, by the fact that the pay-
ments to the EU out of tax revenue unexpect-
Trends in the revenue from major taxes
Revenuein 5 billion
Full year
Type of tax 2003 2004
Annualpercent-agechange
Wage tax 133.1 123.9 – 6.9
Assessed income tax 4.6 5.4 + 18.1
Corporation tax 8.3 13.1 + 58.6
Turnover tax 137.0 137.4 + 0.3
of which Q4
Wage tax 38.7 35.5 – 8.3
Assessed income tax 4.4 5.0 + 12.6
Corporation tax 3.4 3.7 + 8.6
Turnover tax 35.8 35.5 – 0.8
Deutsche BundesbankOutlookfor 2005
Federal budgetin 2004...

DEUTSCHEBUNDESBANKMonthly ReportFebruary 2005
56
edly declined a little. Compared with the ori-
ginal plans, the Federal budget was addition-
ally burdened by the small size of the Bun-
desbank profit and the delay in introducing
motorway tolls for heavy goods vehicles.
Expenditure was reduced appreciably (-2%).
This owed much to the fact that no more
grants were paid in 2004 to the flood disaster
fund. Personnel and other operating expend-
iture, grants to enterprises and interest ex-
pense also decreased. By contrast, spending
on unemployment assistance rose substan-
tially (by 321�2 billion), although this was al-
most completely offset by the lower top-up
grant required by the Federal Employment
Agency.
The Federal Government’s net borrowing re-
quirement for 2005, as defined in the Budget
Act, amounts to 322 billion. This is less than
the figure budgeted for government invest-
ment and is thus in keeping with the Consti-
tution. However, the year-on-year reduction
in new borrowing is to be principally achieved
by doubling privatisation proceeds to 317 bil-
lion. In addition, the Federal grant to the Post
Office pension funds is to be cut by around
35 billion by the sale of pension claims. How-
ever, these measures merely paper over the
urgent need for structural consolidation in
the Federal budget.
The financial situation of the special funds de-
teriorated significantly in 2004. They closed
with a surplus of just 311�2 billion compared
with a positive balance of over 310 billion in
2003. The flood disaster fund recorded a def-
icit of 311�2 billion in the wake of disburse-
ments as opposed to a prior-year surplus of
331�2 billion. The surplus of the ERP Special
Fund fell from 34 billion to just over 32 billion
owing to smaller loan repayments. Finally, the
positive outcome of the Redemption Fund for
Inherited Liabilities declined by almost 32 bil-
lion compared with 2003 as no portion of the
Bundesbank profit accrued to it in 2004. As
things stand today, the special funds may
be expected to record a largely unchanged
budgetary position in the current year.
In the final quarter of 2004 the deficit of
state government amounted to 35 billion,
which is 331�2 billion less than the fourth-
quarter figure in 2003. Overall revenue grew
by 2% despite a slight decline in tax receipts.
This was evidently due above all to the repay-
€ bn
€ bn
Cumulative
2004
2003
Q1 Q2 Q3 Q4
Quarterly results
20032004
The Federal Government’sbalance of revenue andexpenditure in 2003 and 2004
Deutsche Bundesbank
20−
25−
30−
35−
40−
45−
50−
10+
5+
0
5−
10−
15−
20−
25−
30−
... and in 2005
Special funds
Stategovernment

DEUTSCHEBUNDESBANKMonthly ReportFebruary 2005
57
ment of grants by certain Landesbanks as de-
manded by a decision of the European Com-
mission in October 2004. In addition, expend-
iture was lowered by nearly 31�2%. This was
attributable not least to the fact that some
states cut their traditional bonus payments to
staff, or switched to paying monthly bonuses.
In 2004 as a whole the deficit run up by state
government decreased from the record level
of more than 330 billion in 2003 to just over
325 billion. The improvement vis-�-vis the
budgeted figure (326 billion) was ultimately
caused by the grant repayments, which so far
do not appear to have been neutralised by
commitments to return an equivalent amount
of funds to the Landesbanks in the form of
capital injections.
For the current year the budget plans envis-
age only a slight decline in the deficits to
3231�2 billion. Besides shortfalls resulting from
the final stage of the income tax reform,
state government budgets must also bear the
fiscal burden of returning to central govern-
ment turnover tax shares which it had as-
signed last year in exchange for the partial
advancement of the tax cuts. Based on the
current position, Berlin, Bremen, Lower Sax-
ony, Saarland and also Hesse (owing to its
more stringent state budget rules) will all
breach the statutory ceiling for new borrow-
ing – in some cases by a large margin. The
largest state, North Rhine-Westphalia, will
avoid this principally by raising the ceiling to
include the grant of almost 311�2 billion repaid
by WestLB and returned by the state to the
bank in the form of a capital injection. Even
the financially relatively robust state of Baden-
W�rttemberg is having to sell interest claims
on a major scale in order to keep its budget in
line with the constitution. The breaching of
the constitutional ceilings for new borrowing
is problematic, especially in the light of the
favourable macroeconomic assumptions on
which the budget plans are based. Further ex-
tensive consolidation measures are crucial.
For local government only the outturn for the
first three quarters of 2004 is currently avail-
able. It shows a deficit of 35 billion, which is
34 billion smaller on the year. Overall revenue
grew by 4%, with tax receipts expanding by
as much as 10%. The weak momentum of
receipts from income tax, in which local gov-
ernment shares, was outweighed by the
growth of local business tax receipts, only a
smaller part of which now has to be passed
on by local government to state and central
government. Overall spending was marginally
reduced, although spending on social bene-
fits exceeded the equivalent level in 2003 by
almost 6%. Cost relief was afforded by a
drop of 11�2% in personnel expenditure. The
marked downward trend in capital formation
likewise continued with a fall of 8%. The
tight budgetary borrowing limits appear to
have substantially curbed municipal invest-
ment. Consequently, the outstanding long-
term debt of local government has barely in-
creased since the end of 2000, whereas cash
advances, which are used to pre-finance cur-
rent expenditure, have been rising noticeably.
In 2004 as a whole the aggregate deficit of
local government may have halved compared
with the admittedly very high 2003 level of
381�2 billion. However, given the continuing
growth of bridging loans, this should not be
Localgovernment

DEUTSCHEBUNDESBANKMonthly ReportFebruary 2005
58
interpreted as a sign that the financial prob-
lems of local government are easing. In the
current year local government budgets will
receive additional relief, which is secured by a
contractual revision clause, from the amal-
gamation of unemployment assistance and
social assistance. Even so, the financial situ-
ation of many municipalities will remain
tense.
In the fourth quarter the indebtedness of cen-
tral, state and local government showed little
change. State government increased its liabil-
ities by 321�2 billion, while central government
reduced its debt by just under 321�2 billion.
Once again net borrowing mainly took the
form of issuing long and medium-term secur-
ities. They yielded 361�2 billion net, whereas
the stock of money market loans and cash
advances was run down by 331�2 billion al-
together. Short-term securities and other
loans were likewise redeemed on balance.
Social security funds
In the fourth quarter the statutory pension in-
surance scheme recorded a large surplus of
almost 34 billion compared with 311�2 billion
in the same quarter of 2003. A contributory
factor in this was that the disposal of the
GAGFAH equity stake yielded revenue of just
over 32 billion.3 Additional income accrued
from the fact that both the final payments of
the old unemployment assistance and the
first payments of the new unemployment
benefit II due at the beginning of January
were booked in December 2004. Moreover,
many public sector employers had failed to
forward any pension contributions in Decem-
ber 2003.4 Expenditure was further curbed
by the fact that in 2004 there was no mid-
year adjustment of state pensions and that
since April 2004 pensioners have had to pay
the full contribution rate to the statutory
long-term care insurance scheme themselves.
Total revenue grew by just over 4%, whereas
expenditure remained largely unchanged.
In 2004 as a whole the deficit amounted to
just under 311�2 billion as against almost 321�2
Net borrowing in the market bycentral, state and local government
5 billion
of which
Period TotalSecur-ities 1
Loansagainstborrow-ers’notes 2
MemoitemAcquisi-tion bynon-resi-dents
2003 + 81.2 + 73.4 – 0.8 + 26.9of which
Q1 + 35.3 + 32.6 + 2.7 + 19.4Q2 + 13.2 + 11.8 + 0.5 + 12.4Q3 + 20.0 + 9.4 + 5.0 – 0.3Q4 + 12.6 + 19.5 – 9.0 – 4.6
2004 pe + 71.7 + 71.0 – 16.4 ...Q1 + 45.3 + 34.6 + 4.1 + 16.9Q2 + 8.2 + 14.6 – 9.6 – 3.6Q3 + 17.9 + 17.2 – 0.6 + 18.6Q4 pe + 0.2 + 4.7 – 10.3 ...
1 Excluding equalisation claims. — 2 Including cash ad-vances and money market loans.
Deutsche Bundesbank
3 In the records of the pension insurance funds, by con-trast, only the balance of the proceeds in excess of thebook value of 31.6 billion was posted as revenue.4 As part of the latest public sector collective labouragreement employers were given the option, effectivefrom December 2003, of shifting wage and salary pay-ments from the middle to the end of the month. In thesecases the associated social insurance contributions wereonly due one month later in January.
Debt
Statutorypensioninsurancescheme

DEUTSCHEBUNDESBANKMonthly ReportFebruary 2005
59
billion in 2003. The reserves of the statutory
pension insurance fund at the end of the year
stood at 0.32 of a month’s expenditure. This
means that the expected value of 0.28 of a
month’s expenditure envisaged in the Pension
Insurance Report 2004 was exceeded by just
over 31�2 billion. Consequently, the danger of
liquidity shortages in the current year is now
less acute. Furthermore, following the sale of
the GAGFAH equity stake the reserves are in
effect fully liquid. However, this does not rule
out a possible need to resort prematurely to
government grants in the course of the year.
This applies all the more in that the sustain-
ability factor is unlikely to have an impact this
year. Given last year’s weak wage growth, a
negative pension adjustment would be war-
ranted on 1 July under the new pension for-
mula. This is prevented, however, by the
pension-cutting constraint contained in the
formula. The consequence of this is that the
differential between the growth of wages
and the increase in pensions envisaged in
order to stabilise the contribution rate will fail
to materialise whenever per capita wages rise
only marginally or fall (see box on page 60).
In the fourth quarter of 2004 the Federal Em-
ployment Agency recorded an unexpected
surplus of 31 billion. This compares with a
small deficit a year earlier. This improvement
was mainly brought about, however, by ex-
ceptional factors in December 2004. As in the
case of the statutory pension insurance fund,
a baseline effect arose from the delayed pay-
ment of public sector wages and salaries. As
a result, revenue from contributions grew by1�2%, whereas it had fallen during each of the
first three quarters. Another factor was extra
income in the form of refunds from the Fed-
eral Government of administrative costs in
connection with the labour market reforms.
Overall revenue increased by nearly 21�2%. Ex-
penditure was lowered by 6%. Despite an in-
crease in the number of unemployed persons,
2% less was spent on unemployment benefit.
Spending on active labour market policy
measures dropped further by 18%.
In 2004 as a whole the Agency’s deficit, and
hence its need for transfers from the Federal
budget, totalled 34.2 billion; this was 31 bil-
lion less than forecast owing mainly to the ex-
tensive curbing of active labour market policy.
The budget envisages a deficit of 34.0 billion
for 2005. The increases in revenue (over 7%)
and expenditure (61�2%) compared with the
actual outturn for 2004 are particularly high
Quarterly€ bn
€ bn
Lin scale
Surplus (+) or deficit (−)
Log scale
Expenditure
Revenue
Finances of theGerman statutorypension insurance scheme
Deutsche Bundesbank
4+
2+
0
2−
4−
62
60
58
56
54
52
2002 2003 2004
FederalEmploymentAgency

DEUTSCHEBUNDESBANKMonthly ReportFebruary 2005
60
Deutsche Bundesbank
The level of pension adjustments following the introductionof the “sustainability factor”
In general, statutory pensions are adjusted annually in line with the growth of average gross wages and sala-ries of insured persons in the previous year. However, the adjustment is smaller whenever the contribution rate to the statutory pension insurance scheme or the imputed contribution to a supplementary private pension plan (“Riester pension”) increases. In addition, pensions increase more slowly whenever the ratio of (equivalent) pensioners to (equivalent) contribution payers rises (pensioner quotient as part of the sustain-ability factor). Conversely, a pension increase in excess of wage growth is possible if the contribution rate or the pensioner quotient falls. Given the looming democ-raphic changes, this formula implies that in future pen-sions will increase more slowly than the incomes of insured persons on average so as to limit the rise in the contribution rate.
On the other hand, pensions may only be lowered if this is based on a decline in the income of insured persons. The other elements of the adjustment for-mula cannot trigger a pension cut in the event of only marginally growing or stagnating average incomes and cannot trigger a larger pension cut in the event of falling income levels. This pension-cutting constraint means that the adjustment mechanism will have its full dampening effect on the contribution rate only when wages and salaries grow by at least ½% to 1%. In the current year the combination of practically stagnant incomes and an increased ratio of pensioners to contri-bution payers in 2004 would imply a negative pension adjustment. Owing to the aforementioned constraint, however, pensions will “merely” be frozen this year. Other things being equal, this will lead to a higher pension level which in turn will necessitate a higher contribution rate.
he constraint of coupling pension cuts exclusively to falling wages could also affect the longer-term forecasts concerning the contribution rate and the pension level on which the introduction of the sustain-ability factor was based if wages and salaries do not, as assumed, grow by 3% annually from 2009 but instead grow much more slowly or display a very volatile pat-tern. Whenever the pension-cutting constraint applies, the expected gap between income growth and pen-sion growth will fail to materialise. This will result in a permanently higher pension level and a corresponding increase in the contribution rate. In turn, this could mean that the offi cially stated objective of preventing the contribution rate from rising above 22% up to 2030 will not be achieved.
If incomes do not grow at a constant annual rate of 3% in the long term but instead, for example, oscillate around this median between 0% and 6%, the pen-sion-cutting constraint will apply in those years when wages do not increase and in each case will necessitate a higher contribution rate. These effects will cumulate across the low-income years and by 2030 could make a contribution rate well above 22% necessary (see chart). The crucial factor is that every time the pension-cutting constraint applies, this has a positive baseline effect on the pension level that will not be reversed and so will necessitate a permanently higher contribution rate.
The risk of a steeper overall rise in the contribution rate stemming from coupling pension reductions exclusively to wage developments could be avoided if offsetting pension cuts were made in subsequent years of stronger wage growth. Pensions would have to be increased at a correspondingly slower rate in such years. In this way pension cuts not based on falling incomes of insured persons could be avoided without permanently increasing the contribution burden.
%
%
Gross pension level
Path given fluctuatingincome growth
Expectedpath
2000 05 10 15 20 25 2030
Contribution rate
Path given fluctuatingincome growth
Expectedpath
Key indicators of the Germanstatutory pension insurance scheme
50
48
46
44
42
40
24
22
20
18

DEUTSCHEBUNDESBANKMonthly ReportFebruary 2005
61
because the Federal Government will make
considerable refunds of administrative costs
to the Agency which will then have an impact
on its expenditure.
Only data for the first three quarters of 2004
are available at the moment on the financial
development of the statutory health insur-
ance funds. These show that between Janu-
ary and September the statutory health insur-
ance funds accumulated a surplus of just over
321�2 billion owing to the healthcare reform,
whereas in the same period of 2003 they had
sustained a deficit of a similar size. Most of
the surplus was presumably used to repay
debt.5 The financial result in the fourth quar-
ter, too, should show an improvement. The
spending level in the fourth quarter of 2003
was particularly high as patients sought treat-
ment ahead of the less generous terms intro-
duced at the start of 2004, and in Novem-
ber 2004 the second tranche of the new Fed-
eral grant amounting to 30.5 billion was
transferred. Furthermore, the contribution
trends of the statutory pension and un-
employment insurance funds indicate that a
more favourable revenue outcome may be
expected for the end ot the year.
In the current year the surplus is likely to be
markedly smaller. Although the Federal grant
has been raised from 31.0 billion to 32.5 bil-
lion, expenditure on pharmaceuticals is ex-
pected to rise again as the increase in the
manufacturers’ rebate only applied to 2004
and a price moratorium has expired. On the
one hand, the introduction of unemployment
benefit II will boost the income of the health
insurance institutions for previous recipients
of unemployment assistance as the contribu-
tion assessment base will be higher on aver-
Quarterly€ bn
€ bn
€ bn
Lin scale
Surplus (+) or deficit (−)
Expenditure on...
...unemployment benefit and short-time working benefits
...vocational training 2
Log scale
Expenditure, total
Revenue 1
Finances of theFederal Employment Agency
1 Excluding Federal Government liquidityassistance. — 2 Including job creation meas-ures.
Deutsche Bundesbank
1+
0
1−
2−
3−
8.5
8.0
7.5
7.0
6.5
6.0
5.5
5.0
4.5
4.0
16
15
14
13
12
11
2002 2003 2004
5 According to figures supplied by the Federal Ministry ofHealth and Social Security, net indebtedness up to theend of September was reduced by 32.7 billion to 33.3 bil-lion. The gross liabilities of 38.3 billion outstanding at theend of 2003 may therefore have been cut by a similarmargin. The health institutions are legally bound to repayeach year at least one-quarter of their debt accumulatedup to end-2003.
Statutoryhealthinsurance funds

DEUTSCHEBUNDESBANKMonthly ReportFebruary 2005
62
age.6 On the other hand, previous recipients
of social assistance who are able to work
now have to be insured on the basis of contri-
butions that do not cover costs.7
Development of the general government
sector as a whole
According to initial provisional figures from
the Federal Statistical Office published in
January, the general government deficit as
defined in the Maastricht Treaty came to
3.9% of GDP last year after reaching 3.8% in
2003.8 Based on present knowledge, how-
ever, the cyclically adjusted balance seems to
have improved somewhat. The expansion of
GDP was well above the medium-term trend.
But taking account of the composition of
GDP growth, which led to a relatively low
level of taxes and social security contribu-
tions, cyclical developments probably ham-
pered public finances on balance.
The development of pubic finances was
marked, on the one hand, by a decline in the
revenue ratio by 11�2 percentage points to
around 44%. This was caused mainly by the
extensive tax cuts and the structure of macro-
economic developments. Gross wages and
salaries and private consumption grew more
slowly than GDP as a whole, which dampen-
ed receipts from wage tax, social security
contributions and turnover tax. Moreover, re-
ceipts from excise taxes fell sharply. There
was also a steep decline in non-tax receipts,
which was principally attributable to the far
lower Bundesbank profit.
On the other hand, expenditure was reduced
in absolute terms and the expenditure ratio
fell likewise by around 11�2 percentage points
to just over 471�2%. Whereas in the previous
years growth in spending had been driven es-
pecially by the increase in pension payments,
the associated rise in 2004 was moderate
owing above all to the cost relief measures
taken. The healthcare reform – alongside
additional revenue – and also the greater re-
striction of labour market policy measures
had a noticeable dampening effect on spend-
ing. The precarious budgetary position of
central, state and local government led to a
restrained expenditure course in which invest-
ment spending and personnel expenditure, in
particular, decreased. Despite the sharp rise in
indebtedness, interest expenditure remained
flat since the relatively low level of interest
rates continued to facilitate refinancing of
maturing debt securities on favourable terms.
The general government deficits could de-
cline substantially in 2005. From the present
perspective the goal of complying with the
3% deficit limit for the first time since 2001
appears achievable. However, there are major
uncertainties concerning especially the path
of macroeconomic development and the fi-
6 Until 2004 the amount of unemployment assistancepaid (on average around 3500 per month) was the basisfor assessing the contribution due. As from 2005 thecontribution base is defined as 36.2% of the monthly ref-erence value (average pay of insured persons in the previ-ous year), which currently amounts to 3874 per month inwestern Germany and 3735 in eastern Germany.7 By contrast, the social assistance funds pay for thehealth services provided at the appropriate rate chargedby the statutory health insurance scheme.8 In view of the better-than-expected budgetary outturnsof central and state government, which have since be-come known, the deficit ratio may well be revised down-wards a little.
Generalgovernmentdeficit virtuallyunchangedin 2004
Fallingrevenue...
... andexpenditureratios
3% ceilingmust beadheredto in 2005

DEUTSCHEBUNDESBANKMonthly ReportFebruary 2005
63
The current status of the excessive deficit procedure against Germany
Last year Germany exceeded the 3% refer-ence value for the general government deficitratio for the third year in succession withoutbeing able to invoke any of the exemptionclauses specified in the Stability and GrowthPact. This means that Germany also failed tocomply with the recommendation made byECOFIN in January 2003. In establishing thatGermany had run up an excessive deficit,ECOFIN had urged Germany to bring the def-icit back down to the reference value by 2004at the latest. In November 2003 the Councilhad, it is true, adopted conclusions in whichthe deadline for correcting the excessive def-icit for Germany (and France) was extendedto 2005.1 The Council’s conclusions deviated,however, from the normal sequence of theexcessive deficit procedure. They were there-fore annulled by the European Court of Just-ice on 13 July 2004. In effect the excessive def-icit procedures continue to be suspended.From a legal point of view they are at thestage of the Council’s recommendations pur-suant to Article 104 (7) of the EC Treaty ofJanuary and June 2003 which, however, havesince been overtaken by events.2
The European Commission did not respond tothis unsatisfactory situation until 14 Decem-ber 2004 when it addressed a communicationon the status of the excessive deficit proced-ures to the Council. In it the Commission ex-pressed the view that the two countries con-cerned had the right to assume that theCouncil’s conclusions of November 2003 werevalid pending the judgement of the EuropeanCourt of Justice. It stated that, in the light ofthese unique circumstances, the assessment ofthe actions taken to correct the excessive def-icit situation within the framework of the Sta-bility and Growth Pact should refer to 2005.The Commission deemed the measures an-nounced by the two countries to be ad-equate. It concluded that no further stepswere necessary at this point under the exces-sive deficit procedure. Should failure in imple-menting the envisaged correction emerge at
a later stage, however, the Commission wouldhave to recommend to the Council to en-hance the budgetary surveillance and to takethe necessary action within the provisions ofthe EC Treaty and the Stability and GrowthPact.
On 18 January 2005 the Council noted theCommission’s communication and declaredthat it, too, considers no further steps withinthe excessive deficit procedures to be neces-sary at present. At the same time Germany(and France) reaffirmed their commitment totake all measures necessary to bring their def-icits back under 3% of GDP in 2005 and tokeep them below that level in 2006.
However, the logical course of action, in keep-ing with the spirit of the Stability and GrowthPact, would have been to initiate the nextstage in the excessive deficit procedures andto give notice to the two countries to takemeasures to remedy the situation. In Germa-ny’s case the aim of not exceeding the 3% ref-erence value in 2005 and 2006 appears achiev-able if the planned relief measures have thefull envisaged impact. At the moment, how-ever, there is no prospect of attaining a safetymargin below the 3% ceiling. Given theconsiderable uncertainty about the furthercourse of macroeconomic development andthe effect of the fiscal measures, there is thusa substantial risk that the reference value forthe deficit ratio will be breached in 2005 forthe fourth year in succession.
Owing to the unsatisfactory implementationof the Stability and Growth Pact and the con-tinuing discussion about changing its param-eters, public trust in the fiscal framework ofmonetary union has already been severelydamaged. To ensure that the credibility of arule-bound fiscal framework is not under-mined further, Germany must honour its com-mitments to the other member states. This ne-cessitates strict budgetary discipline at alllevels of government.
1 See also Deutsche Bundesbank, Monthly Report,February 2004, p 67 in particular. — 2 See also Deutsche
Bundesbank, Monthly Report, August 2004, p 64 inparticular.
Deutsche Bundesbank

DEUTSCHEBUNDESBANKMonthly ReportFebruary 2005
64
nancial impact of the numerous fiscal meas-
ures, so that the goal is subject to consider-
able risks. The Financial Planning Council and
the Federal Government have committed
themselves unambiguously to achieving this
goal – irrespective of the debate surrounding
the reform of the Stability and Growth Pact.9
The European Commission and ECOFIN have
declared that, if necessary, further steps in
the excessive deficit procedure will be initi-
ated if Germany fails to meet its obligations
and an infringement of the Maastricht ceiling
for the fourth year in a row seems likely (see
box on page 63).
The revenue ratio is expected to fall further
owing, above all, to the entry into force of
the final stage of the income tax reform, al-
though as things stand today this is likely to
be smaller than last year – inter alia because
the pattern of macroeconomic growth is like-
ly to stimulate greater inflows of taxes and
social security contributions. On top of this,
non-tax receipts may pick up appreciably, par-
ticularly on account of the motorway toll for
heavy goods vehicles introduced at the start
of this year and the repayment of subsidies by
the Landesbanks.
The success of the consolidation efforts this
year will hinge on further containing expend-
iture growth and further lowering the ex-
penditure ratio. This will require savings at all
levels of government so as to counterfinance
the commonly agreed tax cuts and the very
Key data of the Federal Government’s updated stability programme
in %
Item 2003 2004 2005 2006 2007 2008
Real GDP growth
Stability programme 2004 – 0,1 1,8 1,7 13�4 2 2
Stability programme 2003 – 0,1 1 1�2 – 2 2 1�4 2 1�4 2 1�4 –
Deficit ratio (–)
Stability programme 2004 – 3,8 – 3 3�4 – 3 – 2 1�2 – 2 – 11�2
Stability programme 2003 – 4 – 3 1�4 – 2 1�2 – 2 – 11�2 –
Debt ratio
Stability programme 2004 64,2 65 1�2 66 66 65 1�2 65
Stability programme 2003 64 65 65 1�2 65 1�2 65 –
Source: Federal Ministry of Finance.
Deutsche Bundesbank
9 In connection with the reform debate see DeutscheBundesbank’s Comments on reforming the Stability andGrowth Pact, Monthly Report, January 2005, pp 37 to 43.
Muted revenuetrend
Furtherloweringof expenditureratio crucial

DEUTSCHEBUNDESBANKMonthly ReportFebruary 2005
65
large deficits. A tight budgetary stance by all
tiers of government (which should be reflect-
ed not least in personnel expenditure, other
operating expenditure and subsidies), re-
strained spending on pensions and – in view
of the low interest rate level – on interest pay-
ments, plus savings in connection with labour
market-related outlays could all contribute to
this.
In the medium term, further consolidation
measures are needed to reduce the govern-
ment deficits, observe the national deficit
ceilings and bring the debt ratio back down
again. This is being hampered by the fact that
a sizeable part of the planned deficit reduc-
tion in the current year is to be achieved by
non-recurrent relief measures (non-payment
of the Federal transfers thanks to the sale of
claims of the Post Office pension funds, re-
payment of interest rate subsidies by the
Landesbanks). This partly involves easing
present-day budgets at the cost of future
budgets. According to the updated stability
programme of December, the deficit ratio is
to be trimmed to 11�2% by 2008 (see table on
page 64). The debt ratio is to rise to 66% in
2005 and 2006 and then decline only mar-
ginally to 65% in 2008. These plans are
based on the assumption of a largely con-
stant revenue ratio, with consolidation to be
achieved by containing expenditure growth.
Although this strategy is to be welcomed as
such, a more ambitious target definition
permitting the achievement of a close-to-
balance budget position would have been a
more appropriate approach to tackling the
fiscal problems. This applies all the more since
the programme is based on a relatively opti-
mistic assessment of the likely course of
macroeconomic development.
Stabilityprogramme

DEUTSCHEBUNDESBANKMonthly ReportFebruary 2005
66

StatisticalSection
1*
DEUTSCHEBUNDESBANKMonthly ReportFebruary 2005

Contents I Key economic data for the euro area
1 Monetary developments and interest
rates 6*
2 External transactions and positions 6*
3 General economic indicators 7*
II Overall monetary survey in the
euro area
1 The money stock and its counterparts 8*
2 Consolidated balance sheet of mon-
etary financial institutions (MFIs) 10*
3 Banking system’s liquidity position 14*
III Consolidated financial statement
of the Eurosystem
1 Assets 16*
2 Liabilities 18*
IV Banks
1 Assets and liabilities of monetary
financial institutions (excluding the
Bundesbank) in Germany 20*
2 Principal assets and liabilities of banks
(MFIs) in Germany, by category of
banks 24*
3 Assets and liabilities of banks (MFIs)
in Germany vis-�-vis residents 26*
4 Assets and liabilities of banks (MFIs)
in Germany vis-�-vis non-residents 28*
2*
DEUTSCHEBUNDESBANKMonthly ReportFebruary 2005

5 Lending by banks (MFIs) in Germany
to domestic non-banks (non-MFIs) 30*
6 Lending by banks (MFIs) in Germany
to domestic enterprises and resident
individuals, housing loans, sectors
of economic activity 32*
7 Deposits of domestic non-banks
(non-MFIs) at banks (MFIs)
in Germany 34*
8 Deposits of resident individuals and
domestic non-profit institutions at
banks (MFIs) in Germany 36*
9 Deposits of domestic public
authorities at banks (MFIs) in
Germany, by creditor group 36*
10 Savings deposits and bank savings
bonds of banks (MFIs) in Germany
sold to non-banks (non-MFIs) 38*
11 Debt securities and money market
paper outstanding of banks (MFIs)
in Germany 38*
12 Building and loan associations (MFIs)
in Germany 39*
13 Assets and liabilities of the foreign
branches and foreign subsidiaries of
German banks (MFIs) 40*
V Minimum reserves
1 Reserve ratios 42*
2 Reserve maintenance in Germany up
to the end of 1998 42*
3 Reserve maintenance in the euro
area 42*
VI Interest rates
1 ECB interest rates 43*
2 Base rates 43*
3 Eurosystem monetary policy oper-
ations allotted through tenders 43*
4 Money market rates, by month 43*
5 Interest rates for outstanding
amounts and new business of
banks (MFIs) in the euro area 44*
6 Interest rates and volumes for out-
standing amounts and new business
of German banks (MFIs) 45*
VII Capital market
1 Sales and purchases of debt securities
and shares in Germany 48*
2 Sales of debt securities issued by
residents 49*
3 Amounts outstanding of debt
securities issued by residents 50*
4 Shares in circulation issued by
residents 50*
5 Yields and indices on German
securities 51*
6 Sales and purchases of mutual
fund shares in Germany 51*
VIII Public finances in Germany
1 General government budgetary
position 52*
2 Budgetary position of central,
state and local government 52*
3*
DEUTSCHEBUNDESBANKMonthly ReportFebruary 2005

3 Government fiscal position as
defined in the national accounts 53*
4 Tax revenue of central, state and
local government 53*
5 Tax revenue, by type 54*
6 Specific taxes levied by central,
state and local government 54*
7 General government debt 55*
8 Change in general government
debt 57*
9 Loans raised by general govern-
ment against borrowers’ notes 57*
10 Central government debt 58*
11 Central government borrowing
in the market 58*
12 Revenue, expenditure and assets
of the wage and salary earners’
pension insurance fund 59*
13 Revenue and expenditure of the
Federal Employment Agency 59*
IX Economic conditions
1 Origin and use of domestic product,
distribution of national income 60*
2 Output in the production sector 61*
3 Orders received by industry 62*
4 Orders received by construction 63*
5 Retail trade turnover 63*
6 Labour market 64*
7 Prices 65*
8 Households’ income 66*
9 Pay rates and actual earnings 66*
X External sector
1 Major items of the balance of
payments of the euro area 67*
2 Major items of the balance of
payments of the Federal Republic
of Germany 68*
3 Foreign trade (special trade) of the
Federal Republic of Germany, by
country and group of countries 69*
4 Services and factor income of the
Federal Republic of Germany 70*
5 Current transfers of the Federal
Republic of Germany 70*
6 Capital transfers 70*
7 Financial account of the Federal
Republic of Germany 71*
8 External position of the Bundesbank 72*
9 External position of the Bundesbank
in the euro area 72*
10 Assets and liabilities of enterprises
in Germany (other than banks)
vis-�-vis non-residents 73*
11 Deutsche Mark and euro exchange
rates of selected currencies 74*
12 Exchange rates for the national
currencies of the euro-area member
states, the Deutsche Mark value of
the ECU and euro conversion rates 74*
13 Effective exchange rates of the euro
and selected foreign currencies 75*
4*
DEUTSCHEBUNDESBANKMonthly ReportFebruary 2005

Abbreviations and symbols
e Estimated
p Provisional
pe Partly estimated
r Revised
... Data available at a later date
. Data unknown, not to be published or
not meaningful
0 Less than 0.5 but more than nil
– Nil
Discrepancies in the totals are due to round-
ing.
5*
DEUTSCHEBUNDESBANKMonthly ReportFebruary 2005

DEUTSCHEBUNDESBANKMonthly ReportFebruary 2005
I Key economic data for the euro area 1 Monetary developments and interest rates
Money stock in various definitions 1,2 Determinants of the money stock 1 Interest rates
M 3 3 MFI lending to Yield on Euro-
3-month enterprises Monetary pean govern-MFI lending, and capital 3-month ment bondsmoving average
M1 M2 (centred) total households formation 4 Eonia 5,7 Euribor 6,7 outstanding 8
Period Annual percentage change % per annum as a monthly average
2003 June 11.3 8.4 8.5 8.6 4.8 5.1 5.3 2.21 2.15 3.7
July 11.3 8.6 8.7 8.5 5.4 5.5 5.5 2.08 2.13 4.0 Aug 11.7 8.7 8.3 8.2 5.5 5.6 5.5 2.10 2.14 4.2 Sep 11.1 8.2 7.5 7.9 5.5 5.4 5.6 2.02 2.15 4.2
Oct 11.6 8.1 7.9 7.6 5.7 5.4 6.0 2.01 2.14 4.3 Nov 10.5 7.6 7.3 7.4 6.2 6.0 6.2 1.97 2.16 4.4 Dec 10.6 7.6 7.1 7.0 5.9 5.8 6.0 2.06 2.15 4.4
2004 Jan 11.5 7.5 6.5 6.6 5.7 5.7 6.0 2.02 2.09 4.2 Feb 10.7 6.8 6.1 6.3 5.7 5.7 6.1 2.03 2.07 4.2 Mar 11.4 6.7 6.2 5.9 5.9 5.7 7.0 2.01 2.03 4.0
Apr 10.9 6.2 5.4 5.5 5.9 5.9 7.5 2.08 2.05 4.2 May 9.4 5.5 4.9 5.2 6.0 5.9 7.5 2.02 2.09 4.4 June 9.5 5.6 5.3 5.2 6.4 6.2 7.6 2.03 2.11 4.4
July 10.1 5.9 5.5 5.4 6.3 6.3 7.5 2.07 2.12 4.3 Aug 9.2 5.7 5.5 5.7 6.1 6.0 7.5 2.04 2.11 4.1 Sep 9.7 6.3 6.0 5.8 6.1 6.3 7.9 2.05 2.12 4.1
Oct 9.0 6.3 5.8 5.9 6.1 6.5 7.8 2.11 2.15 4.0 Nov 9.8 6.5 6.0 6.1 6.0 6.7 7.8 2.09 2.17 3.9 Dec 8.4 6.5 6.4 ... 6.0 7.0 8.1 2.05 2.17 3.7
2005 Jan ... ... ... ... ... ... ... 2.08 2.15 3.6
1 Source: ECB. — 2 Seasonally adjusted. — 3 Excluding money market fund euro-area non-MFIs. — 5 Euro OverNight Index Average. — 6 Euroshares/units, money market paper and debt securities with a maturity of up Interbank Offered Rate. — 7 See also footnotes to Table VI.5, p 44*. —to two years held by non-euro-area residents. — 4 Longer-term liabilities to 8 GDP-weighted yield on ten-year government bonds.
2 External transactions and positions *
Selected items of the euro-area balance of payments Euro exchange rates 1
Current account Capital account Effective exchange rate 3
of which Direct Securities Credit ReserveBalance Trade balance Balance investment transactions assets Dollar rate Nominal Real 4 transactions 2
Period € million Euro/US-$ Q1 1999 = 100
2003 June + 1,651 + 9,705 − 14,066 + 12,208 + 34,255 − 61,288 + 760 1.1663 102.2 104.2
July + 2,518 + 15,732 − 4,440 − 4,113 − 36,583 + 34,417 + 1,838 1.1372 101.0 102.9 Aug + 3,302 + 10,226 − 3,086 − 7,696 − 41,384 + 45,740 + 254 1.1139 99.8 101.8 Sep + 5,680 + 10,904 − 5,025 − 10,297 + 13,192 − 7,869 − 51 1.1222 99.6 101.7
Oct + 6,977 + 13,092 + 3,354 − 4,302 + 36,681 − 29,782 + 757 1.1692 101.3 103.3 Nov + 2,802 + 8,329 + 11,705 + 4,577 + 2,424 − 822 + 5,526 1.1702 101.2 103.3 Dec + 6,146 + 8,445 − 22,586 − 8,926 − 33,587 + 12,599 + 7,328 1.2286 104.2 106.2
2004 Jan − 2,689 + 5,254 − 18,686 − 7,187 − 7,352 − 1,145 − 3,002 1.2613 105.4 107.4 Feb + 5,376 + 9,796 + 18,216 + 9,131 + 14,588 − 14,140 + 8,637 1.2646 105.3 107.3 Mar + 10,957 + 13,580 − 11,736 − 25,539 − 3,718 + 13,798 + 3,722 1.2262 103.4 105.4
Apr − 198 + 9,772 − 17,529 − 1,899 − 8,701 − 4,275 − 2,655 1.1985 101.6 103.7 May + 1,649 + 10,154 + 11,360 − 20 − 1,370 + 12,074 + 677 1.2007 102.4 104.4 June + 4,381 + 11,587 + 5,979 − 11,022 + 31,342 − 13,503 − 837 1.2138 102.3 104.2
July + 4,618 + 13,780 − 18,071 − 4,543 − 42,210 + 28,455 + 226 1.2266 102.8 104.8 Aug + 3,768 + 5,758 + 5,141 + 7,325 − 5,301 − 627 + 3,744 1.2176 102.7 104.8 Sep + 1,500 + 5,021 + 8,854 + 2,473 + 46,657 − 39,751 − 525 1.2218 103.0 105.2
Oct + 1,192 + 7,672 − 21,500 − 11,593 + 2,929 − 13,786 + 948 1.2490 104.2 106.3 Nov + 3,247 + 6,076 + 30,454 − 119 − 9,240 + 39,947 − 134 1.2991 105.6 107.6 Dec ... ... ... ... ... ... ... 1.3408 107.1 109.3
2005 Jan ... ... ... ... ... ... ... 1.3119 105.8 108.1
* Source: ECB. — 1 See also Tables X.12 and 13, pp 74−75. — 2 Includingfinancial derivatives. — 3 Vis-à-vis the currencies of The-EER-23 group. —4 Based on consumer prices.
6*
I Key economic data for the euro area

DEUTSCHEBUNDESBANKMonthly ReportFebruary 2005
I Key economic data for the euro area
3 General economic indicators
Luxem- Nether- EuroPeriod Belgium Germany Finland France Greece Ireland Italy bourg lands Austria Portugal Spain area
Real gross domestic product 1
2002 0.9 0.1 2.3 1.2 3.6 6.1 0.4 2.5 0.6 1.4 0.4 2.2 0.92003 1.3 − 0.1 2.0 0.5 4.5 3.7 0.3 2.9 − 0.9 0.7 − 1.1 2.5 0.52004 ... 1.6 ... ... ... ... ... ... 1.3 ... ... 2.6 ...
2003 Q3 1.0 − 0.3 2.4 0.3 4.6 0.5 0.1 − 1.4 0.7 − 1.0 2.3 0.3 Q4 1.6 0.2 1.7 1.4 4.5 5.1 − 0.1 − 0.5 0.6 − 0.1 3.0 0.8
2004 Q1 3.2 1.6 2.9 2.5 4.0 6.1 0.9 1.2 0.8 0.5 2.7 1.9 Q2 2.8 1.9 3.2 3.6 3.9 4.1 1.6 1.3 1.9 1.8 2.5 2.4 Q3 2.7 1.2 3.2 1.7 3.8 5.8 1.4 1.5 ... 0.8 2.5 1.7 Q4 ... 1.5 ... ... ... ... ... 1.3 ... ... ... ...
Industrial production 1,2
2002 1.3 − 1.0 2.1 − 1.5 0.8 7.5 − 1.6 2.1 − 0.3 0.8 − 0.4 0.2 − 0.52003 0.8 0.4 0.7 − 0.5 0.3 5.0 − 0.6 5.2 − 2.4 2.0 − 0.1 1.4 0.22004 3.0 6 2.9 4.6 1.7 ... ... ... 6.6 ... ... − 3.2 1.6 ...
2003 Q3 0.5 − 1.0 1.6 − 0.7 1.6 4.2 − 0.5 7.6 − 4.0 2.2 1.1 1.0 − 0.4 Q4 1.5 1.6 0.7 1.1 0.1 14.7 0.0 3.4 − 1.2 2.3 1.0 1.1 1.4
2004 Q1 1.8 1.6 − 0.5 0.4 1.5 4.1 − 0.2 6.4 1.1 2.3 − 2.9 1.3 1.0 Q2 2.0 4.1 4.6 3.2 2.1 3.1 1.4 8.4 3.1 5.8 − 1.8 2.5 3.1 Q3 5.6 4.6 6.4 1.9 0.9 1.7 − 0.8 6.9 2.8 7.6 − 3.9 2.2 2.8 Q4 2.7 6 1.4 7.3 1.4 ... ... ... 4.9 ... ... − 4.2 0.5 ...
Capacity utilisation in industry 3
2002 79.6 82.3 82.7 85.3 77.0 75.9 76.3 85.1 82.9 80.2 79.4 77.2 81.22003 78.7 82.0 81.9 84.8 76.5 75.1 76.3 84.7 81.7 80.0 79.0 78.9 81.12004 80.4 83.2 84.5 82.7 75.6 75.6 76.4 85.6 82.7 81.3 80.4 79.0 81.3
2003 Q4 79.0 82.9 82.0 84.4 76.1 73.6 76.1 83.9 81.4 80.3 84.3 79.3 81.4
2004 Q1 79.4 82.8 82.8 7 81.4 77.5 74.4 76.3 83.5 82.1 80.0 80.6 77.0 80.6 Q2 79.6 82.6 83.4 81.8 74.6 77.7 75.8 85.6 82.8 80.4 79.3 79.7 80.8 Q3 81.5 83.4 84.7 83.2 76.3 75.3 76.9 87.4 83.1 82.3 81.4 79.8 81.6 Q4 80.9 83.9 86.9 84.4 74.1 75.0 76.7 86.0 82.7 82.4 80.2 79.3 82.0
2005 Q1 80.9 83.9 85.5 84.0 71.9 72.2 76.4 84.9 82.3 82.2 81.6 80.1 82.0
Unemployment rate 4
2002 7.3 8.7 9.1 8.9 10.3 4.3 9.0 2.8 2.7 4.2 5.0 11.3 8.42003 8.0 9.6 9.0 9.5 9.7 4.6 8.6 3.7 3.8 4.3 6.3 11.3 8.92004 7.8 9.8 8.8 9.6 ... 4.5 ... 4.2 ... 4.5 6.6 10.8 8.9
2004 July 7.7 9.8 8.9 9.6 4.5 ... 4.2 4.7 4.5 6.8 10.7 8.8 Aug 7.7 9.9 8.9 9.7 4.5 ... 4.3 4.6 4.5 6.8 10.7 8.9 Sep 7.8 9.9 8.8 9.7 4.4 ... 4.3 4.6 4.5 6.8 10.6 8.9
Oct 7.9 9.9 8.7 9.6 4.4 ... 4.3 4.6 4.5 6.7 10.5 8.8 Nov 8.0 9.9 8.7 9.6 4.4 ... 4.4 4.7 4.5 6.7 10.4 8.8 Dec 8.0 10.0 8.6 9.7 4.3 ... 4.4 ... 4.5 6.7 10.4 8.9
2005 Jan 8.0 ... ... ... 4.3 ... ... ... 4.5 ... 10.3 ...
Harmonised Index of Consumer Prices 1
2002 1.6 1.3 2.0 1.9 3.9 4.7 2.6 2.1 3.9 1.7 3.7 3.6 2.32003 1.5 1.0 1.3 2.2 3.4 4.0 2.8 2.5 2.2 1.3 3.3 3.1 2.12004 1.9 1.8 0.1 2.3 3.0 2.3 2.3 3.2 1.4 2.0 2.5 3.1 p 2.1
2004 July 2.1 2.0 0.2 2.6 3.1 2.5 2.2 3.8 1.2 2.1 2.9 3.3 2.3 Aug 2.0 2.1 0.3 2.5 2.8 2.5 2.4 3.6 1.2 2.2 2.4 3.3 2.3 Sep 1.8 1.9 0.2 2.2 2.9 2.4 2.1 3.1 1.1 1.8 2.1 3.2 2.1
Oct 2.7 2.2 0.6 2.3 3.3 2.5 2.1 4.1 1.5 2.4 2.4 3.6 2.4 Nov 2.3 2.0 0.2 2.2 3.2 2.8 2.0 4.0 1.5 2.4 2.6 3.5 2.2 Dec 1.9 2.2 0.1 2.3 3.1 2.4 2.4 3.5 1.2 2.5 2.6 3.3 p 2.4
2005 Jan 2.0 e 1.6 − 0.2 ... ... 2.1 ... 2.8 p 1.3 ... 2.0 3.1 e 2.1
General government financial balance 5
2001 0.6 − 2.8 5.2 − 1.5 − 3.7 0.9 − 2.6 6.4 − 0.1 0.3 − 4.4 − 0.4 − 1.72002 0.1 − 3.7 4.3 − 3.2 − 3.7 − 0.2 − 2.3 2.8 − 1.9 − 0.2 − 2.7 − 0.1 − 2.42003 0.4 − 3.8 2.3 − 4.1 − 4.6 0.1 − 2.4 0.8 − 3.2 − 1.1 − 2.8 0.4 − 2.7
General government debt 5
2001 108.0 59.4 43.8 56.5 114.7 35.9 110.6 5.5 52.9 66.1 55.8 57.5 69.42002 105.4 60.9 42.6 58.8 112.5 32.7 107.9 5.7 52.6 65.7 58.4 54.4 69.42003 100.0 64.2 45.6 63.7 109.9 32.1 106.2 5.3 54.1 64.5 60.3 50.7 70.7
Sources: National data, European Commission, Eurostat, European Central adjusted. — 5 As a percentage of GDP; Maastricht Treaty definition;Bank. Latest data are partly based on press reports and are provisional. — including proceeds from sales of UMTS licences. — 6 Adjusted in advance by1 Annual percentage change; GDP of Greece and Portugal is calculated the Federal Statistical Office by way of estimates to the results of thefrom seasonally adjusted data. — 2 Manufacturing, mining and energy; ad- Quarterly Production Survey for the fourth quarter (industry in Germany: onjusted for working-day variations. — 3 Manufacturing, in %; seasonally average − 1.9%). — 7 France from first quarter 2004 not seasonallyadjusted; data are collected in January, April, July and October. — adjusted.4 Standardised, as a percentage of the civilian labour force; seasonally
7*
I Key economic data for the euro area

DEUTSCHEBUNDESBANKMonthly ReportFebruary 2005
II Overall monetary survey in the euro area
1 The money stock and its counterparts *
(a) Euro area
€ billion
I Lending to non-banks (non-MFIs) II Net claims on III Monetary capital formation at monetaryin the euro area non-euro-area residents financial institutions (MFIs) in the euro area
Enterprises Generaland households government Debt
Deposits securitiesLiabil- with an Deposits with
Claims ities to agreed at agreed maturitieson non- non-euro- maturity notice of of over Capital
of which of which euro-area area of over over 2 years andPeriod Total Total Total Total residents residents Total 2 years 3 months (net) 2 Securities Securities reserves 3
2003 May 64.7 42.8 14.3 21.9 25.9 40.0 43.1 3.1 19.2 6.6 − 1.3 20.1 − 6.1 June 12.1 25.1 − 7.1 − 13.0 − 13.7 61.3 38.9 − 22.5 17.6 2.9 − 1.6 8.9 7.3
July 38.6 15.4 − 4.7 23.2 15.3 − 37.5 − 30.5 7.0 32.4 5.2 − 2.1 19.4 9.8 Aug 0.5 10.6 4.1 − 10.1 − 3.7 − 32.9 − 71.7 − 38.8 16.8 7.7 − 1.6 3.5 7.2 Sep 57.3 32.3 1.4 25.1 23.3 13.8 31.5 17.6 26.1 0.6 − 0.6 19.3 6.8
Oct 51.3 32.7 3.5 18.6 18.7 11.5 49.8 38.4 27.5 4.9 0.1 20.7 1.8 Nov 91.3 67.7 14.6 23.6 13.9 18.3 44.3 25.9 28.9 7.9 0.2 16.6 4.2 Dec 21.7 44.4 4.4 − 22.7 − 32.7 − 9.5 − 12.5 − 3.0 20.1 16.7 1.1 0.2 2.1
2004 Jan 43.3 28.4 5.1 14.9 17.6 22.2 111.3 89.1 18.2 1.7 − 1.1 16.9 0.8 Feb 45.3 32.0 6.6 13.3 21.5 8.5 24.1 15.7 16.1 7.6 − 0.3 9.4 − 0.7 Mar 77.3 46.1 16.1 31.2 14.4 6.9 77.0 70.1 46.4 7.1 − 0.2 31.3 8.1
Apr 90.1 85.4 26.5 4.7 11.6 6.2 69.1 62.9 28.3 10.4 − 1.1 16.6 2.5 May 72.5 47.8 3.9 24.8 30.7 − 20.0 − 10.1 9.9 23.5 5.6 − 0.9 16.3 2.5 June 61.1 46.8 − 7.7 14.4 8.7 14.3 − 26.3 − 40.6 22.6 9.9 − 0.4 8.7 4.3
July 29.6 27.7 − 9.1 1.9 − 4.4 − 0.8 − 7.7 − 6.8 28.5 6.8 0.1 15.0 6.6 Aug − 18.8 − 13.5 − 10.1 − 5.3 − 0.0 30.1 45.6 15.5 18.5 6.6 − 0.0 9.3 2.5 Sep 53.7 57.4 − 2.8 − 3.7 3.1 34.7 22.4 − 12.3 44.9 3.7 − 0.3 31.6 10.0
Oct 54.5 55.1 5.7 − 0.7 − 0.9 19.6 30.5 10.9 24.8 7.3 0.9 15.7 1.0 Nov 89.9 87.0 17.8 2.9 6.8 9.5 106.3 96.8 29.0 14.8 0.8 7.3 6.1 Dec 21.1 66.9 16.7 − 45.8 − 51.0 27.4 − 12.3 − 39.7 37.4 23.5 1.2 11.7 1.0
(b) German contribution
I Lending to non-banks (non-MFIs) II Net claims on III Monetary capital formation at monetaryin the euro area non-euro-area residents financial institutions (MFIs) in the euro area
Enterprises Generaland households government Debt
Deposits securitiesLiabil- with an Deposits with
Claims ities to agreed at agreed maturitieson non- non-euro- maturity notice of of over Capital
of which of which euro-area area of over over 2 years andPeriod Total Total Total Total residents residents Total 2 years 3 months (net) 2 Securities Securities reserves 3
2003 May 1.9 4.0 3.0 − 2.1 2.4 27.6 22.6 − 5.0 − 2.8 − 1.6 − 1.5 4.8 − 4.4 June − 18.0 − 0.9 − 3.0 − 17.1 − 10.0 38.5 24.6 − 13.9 4.8 0.1 − 1.4 3.7 2.4
July 0.6 − 8.4 − 0.5 9.0 − 1.6 − 24.6 − 18.6 6.0 8.7 4.9 − 2.1 4.9 1.0 Aug − 13.6 2.7 0.9 − 16.3 − 11.0 16.7 − 20.6 − 37.3 5.7 3.2 − 1.5 2.2 1.8 Sep 17.7 12.8 − 3.6 4.9 10.8 − 1.8 10.5 12.3 2.3 − 1.3 − 0.7 9.1 − 4.8
Oct − 1.8 − 9.3 − 3.4 7.5 4.5 6.4 − 0.2 − 6.6 3.1 0.3 0.1 2.6 0.2 Nov 24.5 15.5 5.5 8.9 2.4 7.9 12.4 4.6 3.3 0.2 0.2 3.0 − 0.1 Dec − 10.1 0.0 1.1 − 10.2 − 7.8 11.4 12.4 1.1 − 0.2 1.5 1.0 − 2.9 0.2
2004 Jan − 0.6 − 6.8 1.4 6.2 6.1 23.0 34.9 11.9 2.6 − 0.2 − 1.1 6.5 − 2.7 Feb 16.6 2.9 − 3.6 13.7 22.4 − 23.5 − 2.7 20.8 − 5.8 0.6 − 0.4 0.5 − 6.5 Mar 28.7 10.4 9.6 18.3 5.8 − 2.0 10.3 12.3 9.4 0.0 − 0.2 9.4 0.2
Apr 10.8 16.4 13.3 − 5.6 1.1 14.8 22.0 7.2 13.0 4.5 − 1.2 6.2 3.4 May − 10.4 − 10.6 − 8.3 0.1 6.0 11.3 − 4.9 − 16.2 5.0 4.3 − 0.9 4.9 − 3.3 June − 9.2 − 12.4 − 12.7 3.2 8.5 21.1 − 8.6 − 29.7 7.9 4.0 − 0.3 − 1.8 6.0
July 6.4 − 4.1 − 1.5 10.5 1.5 − 3.3 − 9.4 − 6.1 7.8 1.7 0.1 2.2 3.9 Aug − 7.3 − 8.1 − 5.4 0.8 5.4 12.1 12.3 0.2 3.0 1.9 − 0.0 5.4 − 4.3 Sep 5.5 10.8 0.6 − 5.3 − 0.8 11.1 35.0 23.9 10.7 1.1 − 0.3 10.6 − 0.7
Oct 11.7 − 0.6 1.5 12.3 7.3 18.7 8.1 − 10.6 3.9 2.7 0.6 − 0.5 1.1 Nov 6.1 11.8 1.1 − 5.7 − 1.8 3.3 41.4 38.1 0.5 2.6 0.8 − 0.9 − 2.0 Dec − 13.6 − 1.8 9.9 − 11.8 − 7.7 10.4 − 25.6 − 35.9 2.0 3.7 1.1 − 5.2 2.3
* The data in this table are based on the consolidated balance sheet of deduction of inter-MFI participations. — 4 Including the counterparts ofmonetary financial institutions (MFIs) (Table II.2); statistical breaks have monetary liabilities of central governments. — 5 Including the monetarybeen eliminated from the flow figures (see also the “Notes on the figures“ liabilities of central governments (Post Office, Treasury). — 6 In Germany,in the “Explanatory notes“ in the Statistical Supplement to the Monthly only savings deposits. — 7 Paper held by residents outside the euro area hasReport 1, p 30). — 1 Source: ECB. — 2 Excluding MFIs’ portfolios. — 3 After been eliminated. — 8 Less German MFIs’ holdings of paper issued by
8*
II Overall monetary survey in the euro area

DEUTSCHEBUNDESBANKMonthly ReportFebruary 2005
II Overall monetary survey in the euro area
(a) Euro area
V Other factors VI Money stock M3 (balance I plus II less III less IV less V)
Money stock M2 Debt secur-of which ities withIntra- Money stock M1 maturitiesEurosystem Deposits of up toliability/ with an Deposits Money 2 years
IV De- claim agreed at agreed market (incl moneyposits of related to Currency maturity notice of Repo fund market
banknote in circu- Overnight of up to up to 3 transac- shares paper) central gov-ernments Total 4 issue Total Total Total lation deposits 5 2 years 5 tions (net) 2,7 Period(net) 2,7,8 months 5,6
10.4 23.2 − 52.0 64.2 37.5 7.4 30.0 19.1 7.7 1.3 7.0 − 20.6 2003 May30.2 17.0 − 8.7 29.8 55.3 7.3 48.0 − 38.9 13.4 − 16.7 − 1.4 − 3.0 June
− 24.6 − 12.6 − 5.8 − 4.5 − 18.9 11.1 − 30.0 3.1 11.3 5.2 9.6 − 4.5 July− 10.0 − 34.2 − − 5.1 − 2.7 − 13.8 1.2 − 15.0 3.9 7.2 − 2.9 2.2 − 1.7 Aug
20.9 26.0 − − 1.9 16.5 45.8 2.1 43.7 − 29.6 0.3 − 4.5 − 8.3 − 5.7 Sep
− 18.0 2.7 − 50.6 19.9 4.3 6.4 − 2.1 10.5 5.1 13.2 5.7 11.8 Oct 14.6 18.7 − 47.5 52.1 49.2 7.9 41.3 − 4.1 7.0 − 1.0 − 3.8 0.2 Nov
− 26.8 − 46.1 − 65.0 96.0 67.1 18.8 48.3 0.3 28.7 − 16.0 − 3.5 − 11.6 Dec
20.5 36.5 − − 9.7 − 30.4 − 26.7 − 8.8 − 18.0 − 21.2 17.5 6.9 9.6 4.4 2004 Jan 18.9 − 7.4 − 26.2 2.5 1.7 4.3 − 2.7 − 5.9 6.7 14.0 7.5 2.2 Feb
− 9.2 19.8 − 27.2 33.7 40.7 6.1 34.6 − 12.2 5.2 − 9.3 5.4 − 2.6 Mar
− 4.7 20.4 − 52.4 33.3 24.5 9.8 14.7 0.5 8.3 5.8 8.0 5.3 Apr 15.5 − 13.9 − 27.5 35.8 18.8 7.3 11.5 11.0 6.0 − 3.6 − 2.0 − 2.7 May28.7 − 2.4 − 26.6 30.2 44.0 6.4 37.6 − 26.1 12.3 − 4.2 − 3.8 4.3 June
− 22.2 − 3.7 − 26.3 19.4 1.1 13.3 − 12.1 10.6 7.6 5.2 3.9 − 2.2 July− 8.5 15.2 − − 13.9 − 28.9 − 38.1 − 2.8 − 35.3 3.5 5.7 3.0 11.0 1.0 Aug
11.1 − 2.6 − 35.0 57.2 63.9 4.6 59.2 − 8.7 2.0 − 8.3 − 13.3 − 0.6 Sep
− 6.7 − 4.1 − 60.0 42.0 10.1 6.4 3.7 27.8 4.1 13.1 7.4 − 2.4 Oct − 14.6 47.3 − 37.7 42.5 49.2 4.4 44.9 − 13.5 6.7 − 5.5 − 3.1 3.9 Nov − 20.2 − 67.7 − 99.1 102.5 30.6 19.8 10.8 41.8 30.1 2.6 − 9.2 3.2 Dec
(b) German contribution
V Other factors VI Money stock M3 (balance I plus II less III less IV less V) 10
of which Components of the money stock
Intra- Debt securitiesEurosystem Deposits withliability/ with an Deposits Money maturities
IV De- claim agreed at agreed market of up to 2 yearsposits of related to Currency maturity notice of Repo fund (incl money
banknote in circu- Overnight of up to up to 3 transac- shares market central gov-ernments Total issue 9,11 lation Total deposits 2 years months 6 tions (net) 7,8 paper)(net) 7 Period
2.2 14.8 2.4 1.3 15.3 6.8 7.4 0.7 1.0 0.4 − 1.0 2003 May0.4 13.3 0.6 2.8 1.9 16.4 − 11.8 1.0 − 1.5 − 0.5 − 1.6 June
− 2.8 − 15.7 1.1 3.4 − 14.2 − 12.5 − 1.3 2.0 0.2 − 0.4 − 2.2 July0.6 − 4.5 2.5 − 0.1 1.2 1.7 2.9 2.7 1.5 − 0.4 − 7.2 Aug 0.3 11.8 1.3 0.9 1.5 10.8 − 13.8 0.9 3.2 − 0.0 0.5 Sep
− 0.7 − 3.6 1.2 1.3 5.9 3.3 − 3.5 0.9 5.6 − 0.7 0.2 Oct 0.1 3.3 1.0 2.4 25.5 22.8 − 0.3 0.6 − 1.2 − 0.5 4.1 Nov 0.2 4.2 0.2 4.5 − 3.0 − 10.8 3.5 8.9 − 5.9 0.2 1.2 Dec
0.0 22.5 3.5 − 5.0 − 2.7 8.3 − 14.1 1.3 2.5 − 0.5 − 0.3 2004 Jan 1.3 − 1.8 1.1 0.9 − 0.6 5.7 − 5.2 1.2 0.9 − 0.2 − 3.0 Feb 0.6 12.2 1.2 2.3 4.4 1.2 − 0.1 0.1 0.8 − 0.5 3.0 Mar
− 0.6 12.7 1.9 2.7 0.5 5.8 − 5.0 0.9 − 1.0 0.1 − 0.3 Apr 1.0 − 10.7 1.0 2.3 5.5 − 2.7 8.7 0.2 − 0.3 0.3 − 0.8 May2.4 10.3 0.6 2.3 − 8.7 3.3 − 9.8 − 0.3 − 0.8 − 0.2 − 0.8 June
− 1.0 0.1 1.7 3.6 − 3.9 − 8.5 3.8 0.5 0.6 3.9 − 4.2 July2.4 − 3.2 3.0 − 0.8 2.6 1.7 0.7 0.7 − 2.5 1.3 0.8 Aug
− 3.9 0.6 2.3 1.3 9.2 14.6 − 5.1 0.1 3.9 − 2.3 − 2.0 Sep
− 2.6 29.4 1.4 1.0 − 0.3 − 3.5 2.3 0.5 3.1 − 1.3 − 1.4 Oct − 1.9 − 7.6 0.8 2.1 18.4 29.2 − 9.5 − 0.1 0.8 − 1.9 − 0.2 Nov
0.1 4.6 0.3 4.8 − 9.9 − 29.5 23.5 9.2 − 7.2 − 3.9 − 2.1 Dec
euro-area MFIs. — 9 Up to end-2002, including national banknotes and German money stocks M1, M2 or M3. — 11 The difference between thecoins still in circulation. — 10 The German contributions to the Eurosystem’s volume of euro banknotes actually issued by the Bundesbank and themonetary aggregates should on no account be interpreted as national amount disclosed in accordance with the accounting regime chosen by themonetary aggregates and are therefore not comparable with the erstwhile Eurosystem (see also footnote 3 on banknote circulation in Table III.2).
9*
II Overall monetary survey in the euro area

DEUTSCHEBUNDESBANKMonthly ReportFebruary 2005
II Overall monetary survey in the euro area
2 Consolidated balance sheet of monetary financial institutions (MFIs) *
Assets
Lending to non-banks (non-MFIs) in the euro area
Enterprises and households General government
ClaimsTotal Shares and on non-
End of assets or Debt other Debt euro-area Otheryear/month liabilities Total Total Loans securities 2 equities Total Loans securities 3 residents assets
Euro area (€ billion) 1
2002 Nov 14,010.9 9,761.8 7,678.2 6,754.5 356.8 566.9 2,083.6 829.2 1,254.4 2,936.5 1,312.6 Dec 13,931.2 9,779.2 7,721.0 6,781.2 367.1 572.7 2,058.2 837.2 1,221.0 2,839.5 1,312.4
2003 Jan 13,976.1 9,854.8 7,748.4 6,804.6 375.1 568.7 2,106.4 829.2 1,277.2 2,852.9 1,268.3 Feb 14,112.1 9,905.0 7,778.0 6,831.3 381.4 565.3 2,127.0 828.6 1,298.5 2,909.0 1,298.0 Mar 14,124.4 9,945.4 7,807.7 6,854.7 386.4 566.5 2,137.8 829.1 1,308.7 2,892.2 1,286.7
Apr 14,229.6 10,030.5 7,880.2 6,891.0 403.8 585.5 2,150.3 823.3 1,327.0 2,904.5 1,294.6 May 14,300.4 10,088.9 7,911.7 6,907.1 407.2 597.5 2,177.1 818.9 1,358.2 2,878.4 1,333.2 June 14,379.8 10,102.9 7,942.5 6,942.3 406.5 593.7 2,160.4 817.8 1,342.5 2,958.8 1,318.2
July 14,372.1 10,160.5 7,983.6 6,963.0 404.1 616.4 2,176.9 825.9 1,351.0 2,944.6 1,266.9 Aug 14,361.5 10,168.5 8,002.3 6,975.6 407.4 619.3 2,166.2 819.8 1,346.4 2,930.6 1,262.4 Sep 14,407.6 10,214.4 8,023.9 6,996.3 412.8 614.8 2,190.5 821.3 1,369.2 2,888.7 1,304.5
Oct 14,493.3 10,261.3 8,058.2 7,025.0 420.4 612.7 2,203.2 821.1 1,382.1 2,951.8 1,280.1 Nov 14,607.6 10,349.9 8,119.1 7,071.5 425.1 622.5 2,230.7 830.5 1,400.2 2,954.7 1,303.1 Dec 14,555.3 10,362.3 8,153.2 7,102.5 427.0 623.8 2,209.1 841.7 1,367.4 2,884.5 1,308.5
2004 Jan 14,766.4 10,411.2 8,177.1 7,117.8 426.5 632.8 2,234.1 838.7 1,395.4 3,015.6 1,339.7 Feb 14,861.9 10,455.1 8,205.0 7,138.8 432.2 634.0 2,250.1 830.4 1,419.7 3,034.5 1,372.3 Mar 15,063.8 10,533.9 8,253.4 7,170.8 433.2 649.4 2,280.5 846.0 1,434.5 3,152.9 1,377.0
Apr 15,226.0 10,623.9 8,338.5 7,228.9 437.5 672.1 2,285.5 840.3 1,445.2 3,229.6 1,372.5 May 15,254.4 10,687.6 8,379.8 7,268.7 441.8 669.3 2,307.7 834.4 1,473.4 3,197.2 1,369.6 June 15,331.2 10,755.4 8,429.7 7,320.4 446.3 662.9 2,325.7 840.5 1,485.2 3,181.1 1,394.7
July 15,354.5 10,786.7 8,458.1 7,356.5 448.4 653.3 2,328.6 846.8 1,481.8 3,183.3 1,384.5 Aug 15,385.1 10,765.5 8,439.4 7,348.1 448.0 643.3 2,326.1 841.5 1,484.6 3,223.4 1,396.2 Sep 15,486.9 10,812.2 8,491.5 7,401.9 446.6 643.1 2,320.6 834.5 1,486.2 3,211.8 1,463.0
Oct 15,578.8 10,864.7 8,544.2 7,448.0 449.2 647.0 2,320.4 834.5 1,486.0 3,216.3 1,497.9 Nov 15,775.6 10,949.8 8,626.3 7,511.3 454.8 660.2 2,323.5 830.4 1,493.1 3,279.2 1,546.6 Dec 15,715.2 10,959.0 8,681.5 7,550.2 464.4 666.9 2,277.4 835.9 1,441.5 3,228.5 1,527.7
German contribution (€ billion)
2002 Nov 4,413.9 3,341.1 2,615.3 2,299.5 69.6 246.2 725.8 481.7 244.1 879.3 193.5 Dec 4,359.5 3,344.6 2,630.8 2,304.4 66.6 259.8 713.8 478.4 235.4 823.8 191.1
2003 Jan 4,360.7 3,353.2 2,623.2 2,298.5 66.1 258.7 730.0 484.0 246.1 823.2 184.3 Feb 4,383.3 3,351.8 2,627.3 2,303.8 66.5 257.0 724.6 477.9 246.6 841.2 190.2 Mar 4,395.2 3,351.2 2,624.8 2,302.6 67.2 255.0 726.4 474.6 251.7 861.1 182.9
Apr 4,400.8 3,353.3 2,629.0 2,300.8 67.3 260.9 724.3 475.4 248.9 867.3 180.3 May 4,401.1 3,351.6 2,629.9 2,298.8 67.9 263.2 721.7 470.7 251.1 871.8 177.7 June 4,411.5 3,334.6 2,629.8 2,301.7 67.0 261.1 704.8 463.7 241.2 906.3 170.6
July 4,391.1 3,334.6 2,620.8 2,293.4 64.4 263.0 713.9 474.3 239.6 891.4 165.1 Aug 4,373.2 3,322.7 2,624.8 2,296.4 64.5 263.9 697.9 469.1 228.8 886.0 164.4 Sep 4,384.6 3,337.1 2,634.6 2,309.9 64.2 260.5 702.5 463.0 239.4 877.7 169.8
Oct 4,387.2 3,333.3 2,624.5 2,303.4 66.5 254.6 708.8 466.1 242.7 882.7 171.3 Nov 4,409.5 3,355.4 2,637.9 2,311.5 66.9 259.5 717.5 472.5 245.0 884.0 170.2 Dec 4,392.5 3,337.7 2,630.9 2,303.9 69.0 258.0 706.7 469.9 236.8 880.9 173.9
2004 Jan 4,416.6 3,334.2 2,621.1 2,291.7 68.4 260.9 713.2 470.2 242.9 921.4 161.0 Feb 4,424.0 3,346.3 2,619.5 2,295.4 67.9 256.2 726.7 461.6 265.2 916.1 161.5 Mar 4,479.7 3,374.8 2,629.5 2,295.8 66.6 267.0 745.3 474.2 271.1 939.4 165.5
Apr 4,514.1 3,385.7 2,646.0 2,299.2 65.4 281.5 739.6 467.5 272.2 962.8 165.7 May 4,495.6 3,374.2 2,634.5 2,296.1 66.2 272.3 739.7 461.6 278.0 952.1 169.3 June 4,477.8 3,364.6 2,621.6 2,295.8 66.5 259.2 742.9 456.3 286.6 944.6 168.6
July 4,479.3 3,372.7 2,619.4 2,292.9 70.7 255.8 753.4 465.2 288.2 937.4 169.1 Aug 4,477.2 3,362.1 2,608.0 2,286.8 69.1 252.1 754.2 460.6 293.6 949.3 165.8 Sep 4,507.8 3,365.6 2,616.9 2,294.9 69.5 252.6 748.6 455.9 292.7 974.8 167.4
Oct 4,522.7 3,376.3 2,615.4 2,291.9 69.3 254.3 760.9 460.8 300.0 976.6 169.8 Nov 4,559.3 3,380.9 2,626.0 2,301.2 68.5 256.2 754.9 456.8 298.2 1,005.9 172.4 Dec 4,512.2 3,363.6 2,620.3 2,285.7 68.7 265.9 743.3 453.1 290.2 969.6 179.1
* Monetary financial institutions (MFIs) comprise banks (including building and other money market paper issued by general government. — 4 Fromand loan associations), money market funds, and the European Central 2002, euro currency in circulation; up to end-2002, also including nationalBank and national central banks (the Eurosystem). — 1 Source: ECB. — banknotes and coins still in circulation (see also footnote 8 on p 12*).2 Including money market paper of enterprises. — 3 Including Treasury bills Excluding MFIs‘ cash in hand (in euro). From 2002, the German contribution
10*
II Overall monetary survey in the euro area

DEUTSCHEBUNDESBANKMonthly ReportFebruary 2005
II Overall monetary survey in the euro area
Liabilities
Deposits of non-banks (non-MFIs) in the euro area
Enterprises and households
With agreed At agreedmaturities of notice of 6
overCurrency 1 year andin of which up to up to over up to over
Total in euro 5 Total Overnight 1 year 2 years 2 years 3 months 3 months End ofcirculation 4 year/month
Euro area (€ billion) 1
321.4 5,799.5 5,467.0 5,504.7 1,927.1 956.8 82.4 1,148.4 1,284.7 105.3 2002 Nov 341.2 5,879.5 5,566.7 5,592.2 1,980.7 947.8 81.2 1,163.9 1,313.4 105.2 Dec
312.1 5,869.9 5,536.6 5,569.3 1,956.3 953.1 76.7 1,168.3 1,311.7 103.1 2003 Jan 319.3 5,913.0 5,560.3 5,586.5 1,956.1 952.7 75.4 1,175.6 1,324.8 101.9 Feb 327.2 5,963.8 5,610.4 5,640.1 1,995.3 948.3 75.9 1,182.7 1,337.5 100.4 Mar
336.3 5,979.6 5,640.1 5,671.4 2,012.8 961.3 74.1 1,179.6 1,345.8 97.7 Apr 343.8 6,041.4 5,695.7 5,715.4 2,035.9 972.4 73.0 1,185.2 1,352.6 96.4 May351.0 6,100.7 5,715.9 5,744.9 2,083.6 940.3 72.4 1,188.1 1,365.6 94.8 June
361.5 6,093.3 5,739.0 5,770.2 2,090.1 944.5 72.1 1,194.4 1,376.3 92.8 July362.7 6,089.2 5,741.0 5,779.2 2,078.5 951.1 72.2 1,203.8 1,382.4 91.2 Aug 364.8 6,118.0 5,754.9 5,789.2 2,117.6 922.4 73.0 1,203.3 1,382.3 90.6 Sep
371.2 6,118.4 5,769.3 5,806.7 2,112.8 934.7 73.9 1,208.4 1,386.3 90.6 Oct 379.2 6,179.9 5,818.3 5,851.8 2,151.0 927.4 75.5 1,215.5 1,391.5 90.8 Nov 397.9 6,239.3 5,916.5 5,936.2 2,191.0 921.6 74.9 1,232.2 1,424.6 91.8 Dec
389.1 6,244.5 5,891.5 5,923.5 2,177.9 904.2 75.1 1,235.3 1,440.3 90.8 2004 Jan 393.5 6,263.6 5,893.3 5,924.9 2,171.9 899.2 74.6 1,242.6 1,446.1 90.5 Feb 399.6 6,290.5 5,922.5 5,966.5 2,210.6 891.9 73.2 1,250.4 1,450.2 90.3 Mar
409.4 6,322.1 5,949.8 5,997.9 2,225.2 893.8 71.7 1,261.1 1,456.8 89.2 Apr 416.6 6,366.8 5,981.9 6,023.2 2,235.6 900.2 71.3 1,266.1 1,461.7 88.3 May423.0 6,432.9 6,023.5 6,060.0 2,275.8 875.4 71.6 1,276.2 1,473.0 88.0 June
436.2 6,417.2 6,029.9 6,068.8 2,260.9 886.6 70.8 1,283.0 1,479.5 88.0 July433.4 6,384.4 6,002.7 6,045.6 2,224.0 891.8 69.3 1,289.4 1,483.1 88.0 Aug 438.0 6,444.1 6,053.2 6,088.9 2,275.8 880.8 67.9 1,293.0 1,483.7 87.7 Sep
444.4 6,476.5 6,089.2 6,126.4 2,275.5 905.8 69.9 1,300.1 1,486.6 88.6 Oct 448.7 6,503.5 6,129.9 6,165.2 2,306.1 893.4 69.5 1,314.9 1,492.0 89.4 Nov 468.5 6,587.0 6,243.8 6,271.3 2,322.0 927.9 71.4 1,338.2 1,521.2 90.5 Dec
German contribution (€ billion)
89.9 2,147.3 2,066.9 2,035.6 569.5 237.6 17.9 645.7 462.0 102.9 2002 Nov 94.2 2,170.7 2,092.1 2,054.2 567.8 242.4 18.2 648.0 474.8 103.1 Dec
84.9 2,159.7 2,082.0 2,048.3 561.2 238.7 18.6 649.7 478.9 101.2 2003 Jan 86.6 2,173.9 2,094.9 2,058.5 564.8 237.3 18.5 656.1 481.8 100.0 Feb 89.0 2,175.8 2,098.2 2,063.3 572.0 232.8 18.6 657.9 483.5 98.4 Mar
91.9 2,176.7 2,100.4 2,068.2 580.4 233.5 18.1 655.8 484.6 95.8 Apr 93.2 2,189.4 2,112.0 2,073.9 585.9 236.9 17.8 653.8 485.3 94.3 May96.0 2,194.7 2,115.7 2,076.1 600.0 225.8 17.6 653.4 486.3 92.9 June
99.4 2,183.0 2,107.8 2,071.3 591.1 225.3 17.3 658.5 488.3 90.8 July99.3 2,193.4 2,117.6 2,082.5 593.2 228.9 17.5 662.7 491.0 89.3 Aug
100.2 2,188.3 2,112.7 2,079.6 603.5 217.2 17.5 661.0 491.8 88.5 Sep
101.5 2,188.7 2,113.6 2,083.5 606.9 216.1 17.8 661.3 492.8 88.6 Oct 103.9 2,211.8 2,137.8 2,105.1 628.8 214.6 18.3 661.2 493.4 88.9 Nov 108.5 2,215.1 2,143.0 2,105.2 616.1 216.3 18.5 662.1 502.3 89.9 Dec
103.5 2,209.9 2,137.7 2,102.7 626.1 202.7 18.5 662.9 503.6 88.8 2004 Jan 104.4 2,213.0 2,140.9 2,103.8 630.1 198.8 18.3 663.3 504.7 88.5 Feb 106.7 2,215.1 2,142.0 2,106.6 631.3 200.7 18.0 663.6 504.8 88.2 Mar
109.3 2,219.4 2,145.3 2,112.5 637.8 196.2 17.5 668.3 505.6 87.1 Apr 111.6 2,229.8 2,154.8 2,118.4 634.1 202.7 16.9 672.6 505.8 86.2 May113.8 2,229.2 2,151.6 2,114.1 636.3 193.0 16.6 676.9 505.5 85.8 June
117.4 2,226.0 2,149.7 2,113.7 629.2 197.9 16.2 678.5 506.0 85.9 July116.7 2,232.2 2,153.1 2,119.1 630.6 199.7 16.0 680.3 506.6 85.8 Aug 118.0 2,238.1 2,162.0 2,126.3 644.8 191.9 15.9 681.5 506.7 85.5 Sep
119.0 2,237.6 2,164.0 2,132.6 642.0 197.5 16.0 684.1 507.0 86.1 Oct 121.1 2,258.0 2,187.6 2,153.3 668.5 188.1 15.7 687.1 507.0 86.9 Nov 125.9 2,264.6 2,193.8 2,158.6 639.4 208.7 15.7 690.9 516.0 88.0 Dec
includes the volume of euro banknotes put into circulation by the calculated by adding to this total the item “Intra-Eurosystem liability/claimBundesbank in accordance with the accounting regime chosen by the related to banknote issue“ (see “Other liability items“). — 5 ExcludingEurosystem (see footnote 3 on banknote circulation in Table III.2). The central governments’ deposits. — 6 In Germany, only saving deposits. volume of currency actually put into circulation by the Bundesbank can be
11*
II Overall monetary survey in the euro area

DEUTSCHEBUNDESBANKMonthly ReportFebruary 2005
II Overall monetary survey in the euro area
2 Consolidated balance sheet of monetary financial institutions (MFIs) (cont’d) *
Liabilities (cont’d)
Deposits of non-banks (non-MFIs) in the euro area (cont’d)
General government Repo transactions Debt securitieswith non-banks
Other general government in the euro area
With agreed At agreedmaturities of notice of 2
Moneyover of which market of which
Central 1 year and Enterprises fund denom-End of govern- up to up to over up to over and shares inatedyear/month ments Total Overnight 1 year 2 years 2 years 3 months 3 months Total households (net) 3 Total in euro
Euro area (€ billion) 1
2002 Nov 147.5 147.4 71.9 45.6 1.3 25.6 2.5 0.4 229.6 225.8 477.6 1,829.5 1,494.1 Dec 136.4 150.9 75.6 45.1 1.4 25.6 2.8 0.4 226.9 224.4 470.5 1,816.9 1,490.3
2003 Jan 154.7 145.9 71.0 45.9 1.2 24.8 2.6 0.4 232.8 229.6 535.4 1,794.7 1,482.9 Feb 175.8 150.6 72.2 49.9 1.0 24.4 2.7 0.4 233.3 229.7 547.3 1,802.1 1,485.6 Mar 176.2 147.5 71.8 47.1 0.9 24.5 2.8 0.3 224.0 220.8 555.7 1,802.0 1,484.5
Apr 159.7 148.4 75.0 45.2 1.0 24.2 2.8 0.3 230.5 227.0 565.3 1,834.2 1,516.6 May 170.1 155.9 76.9 50.8 0.9 24.1 2.8 0.3 231.7 228.2 571.7 1,817.8 1,514.1 June 200.3 155.5 80.1 46.8 0.9 24.6 2.8 0.3 215.0 212.1 571.0 1,831.8 1,514.8
July 173.0 150.1 75.2 46.4 0.9 24.5 2.8 0.3 219.9 216.4 584.9 1,848.5 1,516.8 Aug 163.0 147.0 73.4 45.7 0.9 23.9 2.8 0.3 217.1 214.2 587.2 1,860.9 1,513.6 Sep 183.9 144.9 74.8 42.0 1.0 23.9 2.8 0.3 211.5 207.9 576.9 1,856.5 1,517.2
Oct 165.8 145.9 78.1 39.9 0.9 23.9 2.8 0.4 224.7 221.1 582.3 1,892.5 1,538.6 Nov 180.4 147.7 80.0 39.6 0.9 24.0 2.9 0.3 224.7 220.9 585.2 1,901.1 1,552.0 Dec 153.6 149.6 79.7 41.5 0.9 24.3 2.9 0.4 208.7 206.4 581.4 1,874.8 1,535.4
2004 Jan 174.1 146.9 78.4 41.2 0.9 23.2 2.9 0.3 214.6 211.9 591.6 1,899.9 1,549.1 Feb 193.0 145.7 76.7 41.3 0.9 23.5 3.0 0.4 228.6 225.3 599.2 1,909.9 1,558.5 Mar 183.8 140.3 73.5 39.1 0.9 23.3 3.1 0.4 219.4 215.8 602.6 1,947.7 1,576.0
Apr 179.6 144.7 77.7 39.2 1.0 23.1 3.2 0.4 225.5 222.5 610.9 1,972.2 1,586.3 May 195.1 148.5 78.3 42.5 1.0 23.1 3.3 0.4 221.9 218.5 609.0 1,982.7 1,589.2 June 223.7 149.2 81.1 40.6 1.0 22.8 3.3 0.4 217.7 214.3 609.2 1,996.4 1,598.9
July 201.5 146.9 77.6 41.5 1.0 22.9 3.4 0.4 223.0 219.5 613.1 2,013.7 1,607.8 Aug 193.0 145.8 78.0 40.8 1.0 22.1 3.5 0.5 226.0 221.9 624.1 2,022.3 1,616.6 Sep 204.1 151.1 81.4 42.9 1.0 21.8 3.5 0.5 217.6 214.2 609.5 2,045.2 1,635.2
Oct 197.4 152.7 83.7 42.0 1.2 21.6 3.7 0.5 230.7 227.6 617.1 2,053.5 1,640.6 Nov 182.8 155.4 89.2 39.2 1.2 21.6 3.7 0.5 225.1 222.0 613.4 2,055.6 1,644.6 Dec 162.6 153.1 84.8 42.3 1.3 20.3 3.8 0.5 227.5 224.7 603.8 2,062.3 1,654.3
German contribution (€ billion)
2002 Nov 47.7 64.1 13.1 26.2 0.9 21.9 1.6 0.4 6.4 6.4 33.9 844.9 728.7 Dec 47.7 68.7 15.7 27.7 1.0 22.2 1.6 0.4 3.3 3.3 32.9 826.4 716.6
2003 Jan 46.9 64.5 12.7 26.9 1.0 21.8 1.7 0.4 8.6 8.6 35.5 817.6 702.1 Feb 48.3 67.2 14.8 28.0 0.7 21.7 1.7 0.4 10.9 10.9 36.7 825.8 710.3 Mar 46.6 65.9 14.5 27.1 0.7 21.6 1.6 0.3 11.2 11.2 37.3 819.4 701.0
Apr 45.5 63.1 14.1 24.9 0.7 21.5 1.6 0.3 11.3 11.3 37.2 818.7 699.8 May 47.7 67.8 14.8 28.9 0.7 21.5 1.6 0.3 12.3 12.3 37.7 814.0 698.7 June 48.1 70.5 17.4 28.4 0.7 22.1 1.6 0.3 10.8 10.8 37.2 819.6 699.7
July 45.3 66.3 14.0 27.9 0.6 21.9 1.6 0.3 10.9 10.9 36.8 822.7 696.4 Aug 46.0 65.0 14.0 27.1 0.6 21.2 1.7 0.3 12.4 12.4 36.4 821.8 688.4 Sep 46.3 62.5 13.9 24.7 0.7 21.2 1.7 0.3 15.6 15.6 36.3 825.6 689.8
Oct 45.5 59.7 13.8 22.1 0.6 21.2 1.6 0.4 21.1 21.1 35.7 829.7 692.4 Nov 45.7 61.0 14.4 22.6 0.6 21.4 1.6 0.3 20.0 20.0 35.2 833.2 698.6 Dec 45.9 64.0 15.8 23.9 0.6 21.6 1.6 0.4 14.1 14.1 35.3 826.4 693.3
2004 Jan 46.0 61.3 14.4 23.6 0.6 20.7 1.7 0.3 16.6 16.6 34.9 836.4 695.5 Feb 47.3 62.0 15.2 23.3 0.6 20.9 1.7 0.4 17.5 17.5 34.7 833.7 695.2 Mar 47.9 60.6 15.4 21.7 0.6 20.7 1.8 0.4 18.2 18.2 34.2 851.5 698.5
Apr 47.3 59.7 14.9 21.4 0.6 20.6 1.8 0.4 17.3 17.3 34.2 858.7 698.9 May 48.3 63.1 15.7 24.1 0.6 20.5 1.8 0.4 17.0 17.0 34.6 861.5 701.5 June 50.7 64.4 17.3 24.0 0.6 20.3 1.8 0.4 16.1 16.1 34.4 859.1 697.1
July 49.7 62.6 15.6 23.7 0.6 20.4 1.9 0.4 16.8 16.8 38.2 860.1 692.4 Aug 52.1 61.0 15.7 22.8 0.6 19.5 2.0 0.5 14.2 14.2 39.5 865.1 696.9 Sep 48.1 63.6 15.8 25.4 0.6 19.3 2.0 0.5 18.1 18.1 37.4 869.5 699.7
Oct 45.6 59.4 15.0 21.9 0.7 19.2 2.1 0.5 21.2 21.2 36.1 865.5 691.2 Nov 43.7 61.1 16.7 21.8 0.7 19.3 2.0 0.5 22.0 22.0 34.2 860.8 687.5 Dec 43.8 62.2 16.0 24.8 0.6 18.1 2.2 0.5 14.8 14.8 30.4 850.2 678.1
* Monetary financial institutions (MFIs) comprise banks (including building with money market fund shares. — 5 Excluding liabilities arising fromand loan associations), money market funds, and the European Central securities issued. — 6 After deduction of inter-MFI participations. — 7 TheBank and national central banks (the Eurosystem). — 1 Source: ECB. — 2 In German contributions to the Eurosystem’s monetary aggregates should onGermany, only savings deposits. — 3 Excluding holdings of MFIs; for the no account be interpreted as national monetary aggregates and areGerman contribution, excluding German MFIs’ portfolios of securities issued therefore not comparable with the erstwhile German money stocks M1, M2by MFIs in the euro area. — 4 In Germany, bank debt securities with or M3. — 8 From 2003, including DM banknotes still in circulation (see alsomaturities of up to one year are classed as money market paper; up to the footnote 4 on p 10*). — 9 For the German contribution, the differenceJanuary 2002 Monthly Report, they were published in this table together
12*
II Overall monetary survey in the euro area

DEUTSCHEBUNDESBANKMonthly ReportFebruary 2005
II Overall monetary survey in the euro area
Memo item
Other liability items Monetary aggregates 7 (From 2002, German contributionissued (net) 3 excludes currency in circulation)
With maturities ofof which MonetaryIntra- liabilitiesEurosystem- of centralliability/ govern-
over Liabilities Excess claim Monetary ments1 year and to non- Capital of related to capital (Post
up to up to over euro-area and inter-MFI banknote forma- Office, End of1 year 4 2 years 2 years residents 5 reserves 6 liabilities Total 8 issue 9 M1 10 M2 11 M3 12 tion 13 year/monthTreasury) 14
Euro area (€ billion) 1
... ... 1,698.5 2,737.3 1,016.2 − 3.4 1,601.5 − 2,414.6 4,875.5 5,713.8 3,994.4 181.8 2002 Nov
... ... 1,689.3 2,627.1 1,006.4 10.8 1,550.9 − 2,499.4 4,981.4 5,806.4 3,990.8 192.4 Dec
... ... 1,684.1 2,662.2 1,016.9 9.2 1,541.9 − 2,440.9 4,923.6 5,802.5 3,997.6 192.8 2003 Jan
... ... 1,692.6 2,714.0 1,010.3 11.8 1,560.4 − 2,451.2 4,951.5 5,841.7 4,005.2 197.4 Feb
... ... 1,702.4 2,691.3 999.6 13.1 1,546.6 − 2,497.5 5,006.4 5,885.7 4,009.9 199.3 Mar
... ... 1,709.1 2,714.0 997.0 − 21.4 1,593.4 − 2,527.2 5,052.4 5,973.2 4,008.0 198.1 Apr
... ... 1,714.2 2,654.5 993.6 − 5.7 1,649.9 − 2,561.5 5,109.4 6,016.4 4,013.8 200.4 May
... ... 1,732.1 2,669.3 997.6 15.5 1,626.1 − 2,605.4 5,130.1 6,015.8 4,037.6 186.6 June
... ... 1,754.3 2,679.5 999.8 5.4 1,577.4 − 2,584.8 5,124.3 6,023.3 4,066.1 154.4 July
... ... 1,768.6 2,678.3 1,014.4 − 3.1 1,553.2 − 2,573.2 5,126.0 6,022.6 4,102.1 156.2 Aug
... ... 1,768.9 2,643.4 1,016.6 5.8 1,612.6 − 2,615.6 5,137.0 6,013.0 4,103.7 156.3 Sep
... ... 1,792.9 2,691.7 1,014.1 9.7 1,587.3 − 2,620.4 5,157.9 6,064.5 4,130.3 157.3 Oct
... ... 1,801.8 2,686.4 1,014.3 5.0 1,631.2 − 2,667.8 5,206.0 6,115.3 4,146.7 158.1 Nov
... ... 1,786.3 2,635.1 1,010.7 9.1 1,597.8 − 2,729.3 5,297.9 6,176.5 4,145.6 162.9 Dec
... ... 1,809.0 2,750.6 1,008.7 17.3 1,649.7 − 2,703.1 5,271.7 6,168.8 4,167.3 161.8 2004 Jan
... ... 1,817.7 2,766.5 1,008.0 21.8 1,670.4 − 2,703.6 5,273.5 6,193.5 4,182.6 166.4 Feb
... ... 1,858.1 2,857.4 1,025.8 21.5 1,699.1 − 2,745.8 5,310.2 6,221.8 4,248.3 168.2 Mar
... ... 1,877.8 2,938.0 1,021.8 16.2 1,709.6 − 2,771.0 5,344.5 6,275.4 4,273.4 166.4 Apr
... ... 1,891.6 2,932.0 1,019.1 17.5 1,688.4 − 2,788.9 5,377.4 6,299.4 4,288.7 167.0 May
... ... 1,901.4 2,895.0 1,024.1 16.4 1,716.0 − 2,833.5 5,407.9 6,329.9 4,312.9 163.2 June
... ... 1,921.0 2,898.9 1,031.6 19.9 1,700.3 − 2,834.7 5,428.2 6,356.9 4,347.0 170.6 July
... ... 1,928.5 2,904.1 1,038.3 21.2 1,729.8 − 2,796.2 5,398.4 6,342.3 4,366.7 173.5 Aug
... ... 1,950.2 2,862.9 1,044.7 15.2 1,808.6 − 2,858.4 5,452.1 6,374.2 4,397.9 177.0 Sep
... ... 1,960.4 2,849.0 1,047.0 15.8 1,843.2 − 2,867.2 5,491.4 6,432.3 4,418.2 178.7 Oct
... ... 1,958.2 2,907.0 1,055.8 43.4 1,921.2 − 2,913.7 5,528.7 6,464.6 4,440.4 185.7 Nov
... ... 1,961.5 2,839.4 1,050.8 23.5 1,851.0 − 2,942.7 5,627.9 6,560.0 4,462.0 184.5 Dec
German contribution (€ billion)
32.1 38.1 774.7 716.9 274.2 − 47.5 437.8 27.6 582.6 1,328.8 1,438.8 1,819.8 − 2002 Nov 32.1 39.0 755.3 661.0 277.7 − 56.9 444.3 29.1 583.5 1,349.2 1,456.6 1,806.8 − Dec
26.9 37.4 753.4 670.1 283.0 − 50.3 436.6 29.6 574.0 1,339.7 1,448.0 1,809.5 − 2003 Jan 34.6 37.7 753.4 679.1 279.5 − 63.2 440.5 31.9 579.5 1,347.5 1,467.5 1,811.1 − Feb 31.9 36.5 751.0 682.6 280.3 − 48.9 437.6 33.3 586.5 1,350.9 1,467.7 1,809.6 − Mar
33.5 36.3 748.9 686.4 281.1 − 55.5 444.9 34.2 594.5 1,357.8 1,476.1 1,803.5 − Apr 32.2 34.1 747.7 666.8 277.5 − 43.6 447.0 36.6 600.7 1,371.8 1,488.0 1,795.1 − May33.0 31.6 754.9 661.1 279.0 − 42.6 451.8 37.3 617.5 1,377.9 1,490.5 1,802.6 − June
30.6 31.7 760.4 668.9 280.4 − 63.1 451.5 38.4 605.0 1,366.0 1,476.0 1,812.5 − July25.7 29.5 766.7 640.5 285.5 − 67.4 450.4 40.8 607.2 1,374.0 1,477.8 1,825.8 − Aug 26.4 29.3 770.0 639.8 279.8 − 60.1 459.3 42.2 617.3 1,370.9 1,478.4 1,820.9 − Sep
25.7 30.1 773.9 638.2 279.6 − 63.5 457.6 43.4 620.7 1,371.7 1,484.4 1,825.0 − Oct 28.6 31.5 773.1 635.5 279.6 − 70.8 465.2 44.4 643.2 1,394.3 1,509.6 1,824.4 − Nov 30.0 31.3 765.1 625.5 279.6 − 67.8 464.3 44.6 631.9 1,395.2 1,505.9 1,818.7 − Dec
31.2 29.8 775.4 642.8 276.3 − 47.1 446.8 48.1 640.5 1,391.1 1,503.6 1,824.6 − 2004 Jan 26.7 31.3 775.8 663.0 270.2 − 60.8 452.6 49.2 645.3 1,392.7 1,502.8 1,819.0 − Feb 29.6 31.4 790.6 680.7 273.8 − 54.5 460.7 50.4 646.8 1,394.2 1,507.6 1,837.3 − Mar
29.8 31.1 797.7 690.9 274.2 − 52.8 472.2 52.3 652.7 1,395.8 1,508.3 1,848.3 − Apr 27.6 32.3 801.5 671.6 270.6 − 61.3 471.9 53.3 649.8 1,401.8 1,513.4 1,851.8 − May29.5 29.7 799.9 642.5 276.7 − 54.5 474.3 53.9 653.5 1,395.1 1,504.7 1,860.1 − June
27.2 27.7 805.2 638.2 280.6 − 59.0 478.3 55.6 644.8 1,391.0 1,501.0 1,871.1 − July29.2 26.5 809.4 636.6 278.9 − 69.5 480.2 58.6 646.4 1,394.0 1,503.4 1,874.5 − Aug 27.5 26.1 815.9 654.3 277.5 − 80.2 493.1 60.9 660.7 1,403.1 1,512.2 1,880.2 − Sep
27.2 25.1 813.3 639.6 278.9 − 58.8 502.5 62.3 656.9 1,402.1 1,511.6 1,882.2 − Oct 29.5 22.7 808.7 669.7 277.1 − 73.6 510.9 63.1 685.2 1,420.6 1,528.9 1,879.6 − Nov 27.5 22.5 800.2 627.6 277.4 − 69.6 516.8 63.4 655.4 1,423.3 1,518.5 1,875.0 − Dec
between the volume of euro banknotes actually issued by the Bundesbank years and at agreed notice of up to 3 months (excluding central govern-and the amount disclosed in accordance with the accounting regime chosen ments’ deposits) and (for the euro area) central governments’ monetaryby the Eurosystem (see also footnote 3 on banknote circulation in Table liabilities with such maturities. — 12 M2 plus repo transactions, moneyIII.2). — 10 Overnight deposits (excluding central governments’ deposits), market fund shares, money market paper and debt securities up to 2and (for the euro area) currency in circulation, central governments’ years. — 13 Deposits with agreed maturities of over 2 years and at agreedovernight monetary liabilities, which are not included in the consolidated notice of over 3 months, debt securities with maturities of over 2 years,balance sheet. — 11 M1 plus deposits with agreed maturities of up to 2 capital and reserves. — 14 Non-existent in Germany.
13*
II Overall monetary survey in the euro area

DEUTSCHEBUNDESBANKMonthly ReportFebruary 2005
II Overall monetary survey in the euro area
3 Banking system’s liquidity position *
Stocks
€ billion; period averages of daily positions
Liquidity-providing factors Liquidity-absorbing factors
Monetary policy operations of the EurosystemCreditinstitutions‘currentaccount
Net assets Longer- Other Other balancesReserve in gold Main term Marginal liquidity- liquidity- Banknotes Central Other (includingmaintenance and foreign refinancing refinancing lending providing Deposit absorbing in government factors minimum Baseperiod currency operations operations facility operations facility operations deposits (net) 4 reserves) 5 money 6 circulation 3 ending in 1
Eurosystem 2
2002 Oct 370.0 146.1 45.3 0.1 − 0.1 − 329.2 45.6 58.2 128.3 457.6 Nov 372.1 147.5 45.0 0.1 − 0.1 − 334.0 42.8 58.6 129.3 463.4 Dec 371.5 168.1 45.0 1.1 2.0 0.2 − 350.7 51.7 55.5 129.5 480.5
2003 Jan 360.9 176.3 45.0 0.5 − 0.3 − 353.9 43.7 53.3 131.6 485.8 Feb 356.4 168.6 45.0 0.3 − 0.3 − 340.7 50.2 48.0 131.1 472.2 Mar 352.5 179.5 45.0 0.2 − 0.1 − 347.8 59.1 40.6 129.6 477.5
Apr 337.4 179.4 45.0 0.1 − 0.2 − 358.5 52.1 20.5 130.6 489.3 May 333.1 177.1 45.0 0.4 − 0.2 0.1 366.2 42.6 15.5 130.9 497.3 June 331.3 194.7 45.0 0.4 − 0.3 0.2 373.2 52.6 13.2 131.9 505.3
July 320.4 204.7 45.0 0.4 − 0.3 − 382.7 52.4 2.9 132.2 515.2 Aug 315.8 213.4 45.0 0.2 − 0.1 − 391.6 51.5 − 1.6 132.8 524.6 Sep 315.0 214.0 45.0 0.1 − 0.6 − 391.7 54.4 − 4.4 132.0 524.2
Oct 321.3 208.4 45.0 0.1 − 0.2 − 395.5 48.3 − 1.1 131.9 527.5 Nov 321.8 205.8 45.0 0.1 − 0.3 − 399.4 43.4 − 2.2 131.8 531.4 Dec 320.1 235.5 45.0 0.6 − 0.1 − 416.1 57.0 − 4.5 132.6 548.7
2004 Jan 309.2 232.6 45.0 0.3 − 0.1 − 427.6 37.0 − 11.2 133.6 561.4 Feb . . . . . . . . . . . . Mar 303.3 219.4 56.7 0.4 − 0.2 − 418.0 48.6 − 21.1 134.1 552.3
Apr 301.4 217.9 67.1 0.4 − 0.4 − 425.3 51.5 − 25.7 135.3 561.0 May 310.7 213.2 75.0 0.1 − 0.1 0.4 436.4 46.0 − 18.9 135.0 571.5 June 311.3 224.7 75.0 0.1 − 0.5 − 442.5 52.2 − 21.1 137.1 580.1
July 308.2 245.4 75.0 0.3 − 0.1 − 449.1 65.0 − 24.1 138.8 588.1 Aug 300.8 253.6 75.0 0.0 − 0.2 − 460.9 61.1 − 31.8 139.1 600.1 Sep 299.4 251.6 75.0 0.1 − 0.2 − 462.8 56.3 − 32.4 139.3 602.3
Oct 298.8 256.4 75.0 0.3 − 0.0 − 465.1 58.2 − 32.1 139.3 604.4 Nov 298.3 257.9 75.0 0.1 0.2 0.3 − 469.7 55.1 − 32.1 138.4 608.4 Dec 298.0 265.7 75.0 0.1 − 0.1 0.5 475.4 60.2 − 36.0 138.5 614.1
2005 Jan 290.3 272.9 75.0 0.2 0.2 0.1 − 496.0 45.3 − 41.9 139.1 635.2
Deutsche Bundesbank
2002 Oct 84.0 69.0 31.7 0.1 − 0.1 − 94.0 0.1 53.0 37.6 131.6 Nov 84.3 73.2 31.6 0.1 − 0.1 − 94.6 0.1 56.5 37.9 132.6 Dec 84.4 91.1 33.8 0.9 0.7 0.2 − 99.3 0.1 73.5 37.8 137.3
2003 Jan 82.3 85.1 36.1 0.5 − 0.1 − 98.3 0.1 66.9 38.6 137.0 Feb 81.4 81.6 36.5 0.2 − 0.3 − 95.5 0.1 65.6 38.3 134.1 Mar 81.4 90.0 34.9 0.1 − 0.1 − 97.5 0.1 70.9 37.9 135.5
Apr 78.5 95.6 32.3 0.1 − 0.2 − 100.7 0.1 67.4 38.2 139.1 May 77.6 98.8 32.4 0.4 − 0.1 0.1 102.5 0.1 68.4 38.1 140.7 June 77.2 112.4 32.9 0.3 − 0.2 0.1 104.4 0.1 79.8 38.3 142.8
July 74.3 115.5 32.4 0.3 − 0.2 − 107.1 0.1 77.1 38.2 145.4 Aug 73.7 111.0 29.6 0.2 − 0.1 − 109.6 0.1 66.5 38.2 147.9 Sep 73.9 114.0 29.1 0.1 − 0.4 − 109.8 0.1 69.2 37.7 147.9
Oct 75.7 106.5 29.7 0.1 − 0.2 − 110.8 0.1 63.4 37.5 148.4 Nov 76.1 102.3 30.8 0.0 − 0.2 − 111.5 0.1 60.0 37.5 149.1 Dec 76.1 118.3 30.9 0.3 − 0.1 − 115.9 0.1 72.2 37.4 153.4
2004 Jan 73.1 119.5 32.3 0.2 − 0.1 − 116.2 0.1 70.9 37.9 154.1 Feb . . . . . . . . . . . . Mar 72.4 109.7 41.3 0.2 − 0.2 − 113.5 0.1 72.0 37.9 151.5
Apr 72.9 97.9 48.7 0.2 − 0.3 − 115.8 0.1 65.7 37.8 153.9 May 75.4 100.7 51.8 0.0 − 0.0 0.1 119.3 0.1 70.9 37.7 157.0 June 75.6 115.6 49.4 0.1 − 0.3 − 121.2 0.1 80.9 38.3 159.9
July 74.6 127.9 49.6 0.2 − 0.0 − 122.7 0.1 91.1 38.5 161.1 Aug 72.1 136.9 50.3 0.0 − 0.1 − 126.2 0.1 94.7 38.3 164.6 Sep 72.2 131.7 50.3 0.1 − 0.1 − 127.5 0.1 88.8 37.9 165.4
Oct 72.1 129.8 48.1 0.2 − 0.0 − 127.7 0.1 84.8 37.5 165.3 Nov 72.2 136.0 46.1 0.1 0.0 0.2 − 128.3 0.1 88.4 37.5 166.0 Dec 72.2 142.4 46.5 0.1 − 0.1 0.1 129.9 0.1 93.4 37.6 167.5
2005 Jan 70.2 144.7 46.9 0.1 0.0 0.1 − 135.2 0.1 89.1 37.4 172.7
Discrepancies may arise from rounding. — * The banking system’s liquidity maintenance period ending in February 2004. 2 Source: ECB. — 3 Fromposition is defined as the current account holdings in euro of euro-area 2002, euro banknotes and other banknotes which have been issued by thecredit institutions with the Eurosystem. Amounts are derived from the conso- national central banks of the Eurosystem and which are still in circulation. Inlidated financial statement of the Eurosystem and the financial statement accordance with the accounting procedure chosen by the Eurosystem forof the Bundesbank. — 1 Figures are daily averages for the reserve mainte- the issue of euro banknotes, 8% of the total value of the euro banknotes innance period ending in the month indicated. Owing to the changeover to circulation are allocated on a monthly basis to the ECB. The counterpart ofthe new operational framework for monetary policy, there is no reserve this adjustment is shown under “Other factors”. The remaining 92%
14*
II Overall monetary survey in the euro area
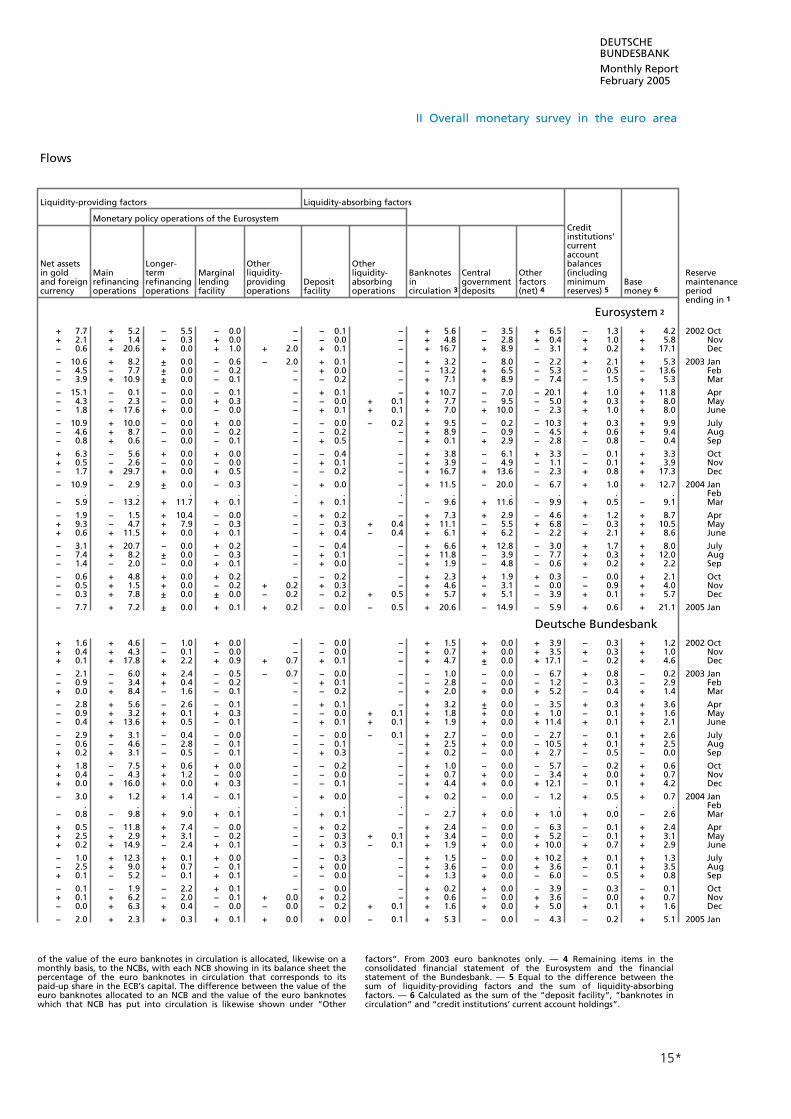
DEUTSCHEBUNDESBANKMonthly ReportFebruary 2005
II Overall monetary survey in the euro area
Flows
Liquidity-providing factors Liquidity-absorbing factors
Monetary policy operations of the EurosystemCreditinstitutions‘currentaccount
Net assets Longer- Other Other balancesin gold Main term Marginal liquidity- liquidity- Banknotes Central Other (including Reserveand foreign refinancing refinancing lending providing Deposit absorbing in government factors minimum Base maintenancecurrency operations operations facility operations facility operations deposits (net) 4 reserves) 5 money 6 periodcirculation 3
ending in 1
Eurosystem 2
+ 7.7 + 5.2 − 5.5 − 0.0 − − 0.1 − + 5.6 − 3.5 + 6.5 − 1.3 + 4.2 2002 Oct + 2.1 + 1.4 − 0.3 + 0.0 − − 0.0 − + 4.8 − 2.8 + 0.4 + 1.0 + 5.8 Nov − 0.6 + 20.6 + 0.0 + 1.0 + 2.0 + 0.1 − + 16.7 + 8.9 − 3.1 + 0.2 + 17.1 Dec
− 10.6 + 8.2 + 0.0 − 0.6 − 2.0 + 0.1 − + 3.2 − 8.0 − 2.2 + 2.1 + 5.3 2003 Jan − 4.5 − 7.7 + 0.0 − 0.2 − + 0.0 − − 13.2 + 6.5 − 5.3 − 0.5 − 13.6 Feb − 3.9 + 10.9 + 0.0 − 0.1 − − 0.2 − + 7.1 + 8.9 − 7.4 − 1.5 + 5.3 Mar
− 15.1 − 0.1 − 0.0 − 0.1 − + 0.1 − + 10.7 − 7.0 − 20.1 + 1.0 + 11.8 Apr − 4.3 − 2.3 − 0.0 + 0.3 − − 0.0 + 0.1 + 7.7 − 9.5 − 5.0 + 0.3 + 8.0 May− 1.8 + 17.6 + 0.0 − 0.0 − + 0.1 + 0.1 + 7.0 + 10.0 − 2.3 + 1.0 + 8.0 June
− 10.9 + 10.0 − 0.0 + 0.0 − − 0.0 − 0.2 + 9.5 − 0.2 − 10.3 + 0.3 + 9.9 July− 4.6 + 8.7 − 0.0 − 0.2 − − 0.2 − + 8.9 − 0.9 − 4.5 + 0.6 + 9.4 Aug − 0.8 + 0.6 − 0.0 − 0.1 − + 0.5 − + 0.1 + 2.9 − 2.8 − 0.8 − 0.4 Sep
+ 6.3 − 5.6 + 0.0 + 0.0 − − 0.4 − + 3.8 − 6.1 + 3.3 − 0.1 + 3.3 Oct + 0.5 − 2.6 − 0.0 − 0.0 − + 0.1 − + 3.9 − 4.9 − 1.1 − 0.1 + 3.9 Nov − 1.7 + 29.7 + 0.0 + 0.5 − − 0.2 − + 16.7 + 13.6 − 2.3 + 0.8 + 17.3 Dec
− 10.9 − 2.9 + 0.0 − 0.3 − + 0.0 − + 11.5 − 20.0 − 6.7 + 1.0 + 12.7 2004 Jan . . . . . . . . . . . . Feb
− 5.9 − 13.2 + 11.7 + 0.1 − + 0.1 − − 9.6 + 11.6 − 9.9 + 0.5 − 9.1 Mar
− 1.9 − 1.5 + 10.4 − 0.0 − + 0.2 − + 7.3 + 2.9 − 4.6 + 1.2 + 8.7 Apr + 9.3 − 4.7 + 7.9 − 0.3 − − 0.3 + 0.4 + 11.1 − 5.5 + 6.8 − 0.3 + 10.5 May+ 0.6 + 11.5 + 0.0 + 0.1 − + 0.4 − 0.4 + 6.1 + 6.2 − 2.2 + 2.1 + 8.6 June
− 3.1 + 20.7 − 0.0 + 0.2 − − 0.4 − + 6.6 + 12.8 − 3.0 + 1.7 + 8.0 July− 7.4 + 8.2 + 0.0 − 0.3 − + 0.1 − + 11.8 − 3.9 − 7.7 + 0.3 + 12.0 Aug − 1.4 − 2.0 − 0.0 + 0.1 − + 0.0 − + 1.9 − 4.8 − 0.6 + 0.2 + 2.2 Sep
− 0.6 + 4.8 + 0.0 + 0.2 − − 0.2 − + 2.3 + 1.9 + 0.3 − 0.0 + 2.1 Oct − 0.5 + 1.5 + 0.0 − 0.2 + 0.2 + 0.3 − + 4.6 − 3.1 − 0.0 − 0.9 + 4.0 Nov − 0.3 + 7.8 + 0.0 + 0.0 − 0.2 − 0.2 + 0.5 + 5.7 + 5.1 − 3.9 + 0.1 + 5.7 Dec
− 7.7 + 7.2 + 0.0 + 0.1 + 0.2 − 0.0 − 0.5 + 20.6 − 14.9 − 5.9 + 0.6 + 21.1 2005 Jan
Deutsche Bundesbank
+ 1.6 + 4.6 − 1.0 + 0.0 − − 0.0 − + 1.5 + 0.0 + 3.9 − 0.3 + 1.2 2002 Oct + 0.4 + 4.3 − 0.1 − 0.0 − − 0.0 − + 0.7 + 0.0 + 3.5 + 0.3 + 1.0 Nov + 0.1 + 17.8 + 2.2 + 0.9 + 0.7 + 0.1 − + 4.7 + 0.0 + 17.1 − 0.2 + 4.6 Dec
− 2.1 − 6.0 + 2.4 − 0.5 − 0.7 − 0.0 − − 1.0 − 0.0 − 6.7 + 0.8 − 0.2 2003 Jan − 0.9 − 3.4 + 0.4 − 0.2 − + 0.1 − − 2.8 − 0.0 − 1.2 − 0.3 − 2.9 Feb + 0.0 + 8.4 − 1.6 − 0.1 − − 0.2 − + 2.0 + 0.0 + 5.2 − 0.4 + 1.4 Mar
− 2.8 + 5.6 − 2.6 − 0.1 − + 0.1 − + 3.2 + 0.0 − 3.5 + 0.3 + 3.6 Apr − 0.9 + 3.2 + 0.1 + 0.3 − − 0.0 + 0.1 + 1.8 + 0.0 + 1.0 − 0.1 + 1.6 May− 0.4 + 13.6 + 0.5 − 0.1 − + 0.1 + 0.1 + 1.9 + 0.0 + 11.4 + 0.1 + 2.1 June
− 2.9 + 3.1 − 0.4 − 0.0 − − 0.0 − 0.1 + 2.7 − 0.0 − 2.7 − 0.1 + 2.6 July− 0.6 − 4.6 − 2.8 − 0.1 − − 0.1 − + 2.5 + 0.0 − 10.5 + 0.1 + 2.5 Aug + 0.2 + 3.1 − 0.5 − 0.1 − + 0.3 − + 0.2 − 0.0 + 2.7 − 0.5 − 0.0 Sep
+ 1.8 − 7.5 + 0.6 + 0.0 − − 0.2 − + 1.0 − 0.0 − 5.7 − 0.2 + 0.6 Oct + 0.4 − 4.3 + 1.2 − 0.0 − − 0.0 − + 0.7 + 0.0 − 3.4 + 0.0 + 0.7 Nov + 0.0 + 16.0 + 0.0 + 0.3 − − 0.1 − + 4.4 + 0.0 + 12.1 − 0.1 + 4.2 Dec
− 3.0 + 1.2 + 1.4 − 0.1 − + 0.0 − + 0.2 − 0.0 − 1.2 + 0.5 + 0.7 2004 Jan . . . . . . . . . . . . Feb
− 0.8 − 9.8 + 9.0 + 0.1 − + 0.1 − − 2.7 + 0.0 + 1.0 + 0.0 − 2.6 Mar
+ 0.5 − 11.8 + 7.4 − 0.0 − + 0.2 − + 2.4 − 0.0 − 6.3 − 0.1 + 2.4 Apr + 2.5 + 2.9 + 3.1 − 0.2 − − 0.3 + 0.1 + 3.4 − 0.0 + 5.2 − 0.1 + 3.1 May+ 0.2 + 14.9 − 2.4 + 0.1 − + 0.3 − 0.1 + 1.9 + 0.0 + 10.0 + 0.7 + 2.9 June
− 1.0 + 12.3 + 0.1 + 0.0 − − 0.3 − + 1.5 − 0.0 + 10.2 + 0.1 + 1.3 July− 2.5 + 9.0 + 0.7 − 0.1 − + 0.0 − + 3.6 − 0.0 + 3.6 − 0.1 + 3.5 Aug + 0.1 − 5.2 − 0.1 + 0.1 − − 0.0 − + 1.3 + 0.0 − 6.0 − 0.5 + 0.8 Sep
− 0.1 − 1.9 − 2.2 + 0.1 − − 0.0 − + 0.2 + 0.0 − 3.9 − 0.3 − 0.1 Oct + 0.1 + 6.2 − 2.0 − 0.1 + 0.0 + 0.2 − + 0.6 − 0.0 + 3.6 − 0.0 + 0.7 Nov − 0.0 + 6.3 + 0.4 − 0.0 − 0.0 − 0.2 + 0.1 + 1.6 + 0.0 + 5.0 + 0.1 + 1.6 Dec
− 2.0 + 2.3 + 0.3 + 0.1 + 0.0 + 0.0 − 0.1 + 5.3 − 0.0 − 4.3 − 0.2 + 5.1 2005 Jan
of the value of the euro banknotes in circulation is allocated, likewise on a factors”. From 2003 euro banknotes only. — 4 Remaining items in themonthly basis, to the NCBs, with each NCB showing in its balance sheet the consolidated financial statement of the Eurosystem and the financialpercentage of the euro banknotes in circulation that corresponds to its statement of the Bundesbank. — 5 Equal to the difference between thepaid-up share in the ECB’s capital. The difference between the value of the sum of liquidity-providing factors and the sum of liquidity-absorbingeuro banknotes allocated to an NCB and the value of the euro banknotes factors. — 6 Calculated as the sum of the “deposit facility”, “banknotes inwhich that NCB has put into circulation is likewise shown under “Other circulation” and “credit institutions’ current account holdings”.
15*
II Overall monetary survey in the euro area

DEUTSCHEBUNDESBANKMonthly ReportFebruary 2005
III Consolidated financial statement of the Eurosystem
1 Assets *
€ billion
Claims on non-euro-areaClaims on non-euro-area residents denominatedin foreign currency residents denominated in euro
Balances withClaims onbanks, security
On investments, euro-area Balances Claimsreporting external loans residents with banks, arising fromdate/ Gold and other denominated security the creditEnd of Total and gold Receivables external in foreign investments facility undermonth 1 assets receivables Total from the IMF assets currency Total and loans ERM II
Eurosystem 2
2004 June 4 870.1 136.2 173.3 29.5 143.8 16.2 7.7 7.7 − 11 869.1 136.1 174.7 29.5 145.2 16.0 7.2 7.2 − 18 867.8 136.1 174.8 29.2 145.5 16.0 7.0 7.0 − 25 895.8 136.1 173.9 28.6 145.4 16.5 7.1 7.1 −
July 2 3 882.4 3 127.4 3 174.1 28.4 3 145.7 16.6 6.9 6.9 − 9 881.0 127.4 175.6 28.4 147.2 16.4 6.7 6.7 − 16 868.8 127.4 173.7 28.2 145.6 16.9 7.0 7.0 − 23 887.6 127.4 174.8 28.1 146.7 17.0 7.7 7.7 − 30 883.7 127.4 172.1 28.0 144.1 17.3 7.9 7.9 −
Aug 6 880.2 127.4 170.7 28.1 142.7 17.8 7.7 7.7 − 13 871.6 127.4 170.1 28.1 142.0 18.2 7.7 7.7 − 20 872.0 127.4 173.0 27.8 145.2 17.1 7.3 7.3 − 27 881.9 127.4 170.0 27.8 142.3 16.8 7.8 7.8 −
Sep 3 876.6 127.4 168.8 27.6 141.2 17.9 7.7 7.7 − 10 874.6 127.4 167.5 27.4 140.1 17.6 7.9 7.9 − 17 875.2 127.4 167.7 27.5 140.2 17.5 7.6 7.6 − 24 885.8 127.4 168.8 27.2 141.6 17.3 8.1 8.1 −
2004 Oct 1 3 882.3 3 130.7 3 165.3 26.5 3 138.8 17.1 7.6 7.6 − 8 880.6 130.6 166.4 26.4 139.9 17.4 6.9 6.9 − 15 868.4 130.6 163.4 26.3 137.2 19.2 7.5 7.5 − 22 875.4 130.6 162.3 26.1 136.2 18.5 7.5 7.5 − 29 893.8 130.6 164.9 26.0 138.9 17.6 7.7 7.7 −
Nov 5 893.2 130.4 166.1 25.9 140.2 17.9 7.4 7.4 − 12 887.1 130.4 165.9 25.9 140.0 17.6 7.6 7.6 − 19 893.8 130.4 167.7 25.8 142.0 17.5 7.7 7.7 − 26 899.1 130.3 164.9 25.6 139.3 18.1 7.4 7.4 −
Dec 3 905.5 130.3 165.8 25.6 140.2 18.3 8.0 8.0 − 10 914.2 130.3 166.0 25.3 140.6 18.6 7.4 7.4 − 17 909.2 129.9 167.8 25.4 142.5 18.3 7.3 7.3 − 24 915.7 129.9 167.1 25.1 142.0 17.9 7.5 7.5 − 31 3 884.2 3 125.7 3 153.8 3 23.9 3 129.9 3 17.0 6.8 6.8 −
2005 Jan 7 873.6 125.7 156.5 23.9 132.5 16.4 7.4 7.4 − 14 881.0 125.7 156.1 23.7 132.4 17.2 7.1 7.1 − 21 896.2 125.6 154.7 23.7 131.0 17.1 7.3 7.3 − 28 894.8 125.6 154.4 23.7 130.7 17.6 6.7 6.7 −
Feb 4 899.5 125.5 155.2 23.6 131.6 17.1 6.5 6.5 −
Deutsche Bundesbank2003 Mar 3 239.2 3 34.1 3 48.4 8.3 3 40.1 − 0.3 0.3 −
Apr 230.5 34.1 47.0 8.2 38.7 − 0.3 0.3 − May 258.1 34.1 47.8 8.3 39.6 − 0.3 0.3 − June 3 258.2 3 33.4 3 45.0 8.3 3 36.7 − 0.3 0.3 −
July 246.9 33.4 44.8 8.3 36.5 − 0.3 0.3 − Aug 248.9 33.4 45.5 8.3 37.1 − 0.3 0.3 − Sep 3 257.5 3 36.5 3 44.7 8.5 3 36.2 − 0.3 0.3 −
Oct 257.6 36.5 45.0 8.5 36.5 − 0.3 0.3 − Nov 254.4 36.5 44.5 8.5 36.0 − 0.3 0.3 − Dec 3 267.7 36.5 3 40.1 7.6 3 32.5 − 0.3 0.3 −
2004 Jan 258.1 36.5 40.4 7.6 32.7 − 0.3 0.3 − Feb 258.2 36.5 40.4 7.6 32.7 − 0.3 0.3 − Mar 3 256.2 3 38.3 3 41.5 7.6 3 33.8 − 0.3 0.3 −
Apr 268.0 38.3 42.1 7.9 34.2 − 0.3 0.3 − May 276.6 38.3 41.5 7.8 33.7 − 0.3 0.3 − June 3 290.3 3 35.8 3 41.2 7.4 3 33.8 − 0.3 0.3 −
July 295.9 35.8 40.4 7.4 33.0 − 0.3 0.3 − Aug 284.2 35.8 39.8 7.4 32.4 − 0.3 0.3 − Sep 283.6 3 36.7 3 39.1 7.0 32.1 − 0.3 0.3 −
Oct 293.7 36.7 38.2 7.0 31.3 − 0.3 0.3 − Nov 298.6 36.7 38.4 6.9 31.5 − 0.3 0.3 − Dec 3 293.5 3 35.5 3 35.8 6.5 3 29.3 − 0.3 0.3 −
2005 Jan 287.9 35.5 36.2 6.5 29.7 − 0.3 0.3 −
* The consolidated financial statement of the Eurosystem comprises the statements of the national central banks of the euro-area member statesfinancial statement of the European Central Bank (ECB) and the financial (NCBs). The balance sheet items for foreign currency, securities, gold
16*
III Consolidated financial statement of the Eurosystem

DEUTSCHEBUNDESBANKMonthly ReportFebruary 2005
III Consolidated financial statement of the Eurosystem
Lending to euro-area credit institutions related to monetary policy operationsdenominated in euro
Other claims on euro-area credit Securities General OnCredits institutions of euro-area government reporting
Main Longer-term Fine-tuning Structural Marginal related denomi- residents debt date/refinancing refinancing reverse reverse lending to margin nated in denominated denominated Other End of
Total operations operations operations operations facility calls euro in euro in euro assets month 1
Eurosystem 2
311.1 236.0 75.0 − − 0.1 0.0 0.7 72.9 42.6 109.4 2004 June 4308.6 233.5 75.0 − − 0.1 0.0 0.9 73.6 42.6 109.4 11307.0 232.0 75.0 − − 0.0 0.0 1.0 73.8 42.6 109.6 18335.2 260.0 75.0 − − 0.2 0.0 0.8 73.7 42.6 109.9 25
331.0 256.0 75.0 − − 0.0 − 0.7 3 73.4 42.1 3 110.2 July 2328.0 253.0 75.0 − − 0.0 0.0 0.5 73.8 42.1 110.5 9317.5 242.5 75.0 − − 0.0 0.0 0.8 73.2 42.1 110.2 16334.5 259.5 75.0 − − − 0.0 0.9 72.9 42.1 110.5 23333.0 258.0 75.0 − − 0.0 0.0 0.9 67.5 42.1 115.5 30
330.0 255.0 75.0 − − − 0.0 0.8 68.0 42.1 115.7 Aug 6322.5 247.5 75.0 − − 0.0 0.0 1.0 68.0 42.1 114.7 13321.0 246.0 75.0 − − − 0.0 1.4 67.9 42.1 114.9 20334.0 259.0 75.0 − − 0.0 0.0 1.1 67.9 42.1 114.6 27
329.0 254.0 75.0 − − 0.0 0.0 1.5 67.9 42.1 114.3 Sep 3327.6 252.5 75.0 − − 0.1 0.0 1.5 67.9 42.1 115.2 10328.0 253.0 75.0 − − 0.0 0.0 1.6 68.0 42.1 115.4 17337.5 262.5 75.0 − − 0.0 0.0 1.6 67.6 42.1 115.4 24
334.0 259.0 75.0 − − 0.0 0.0 1.8 67.4 42.1 3 116.3 2004 Oct 1330.5 255.5 75.0 − − 0.0 0.0 2.0 68.0 42.1 116.7 8319.5 244.5 75.0 − − 0.0 0.0 1.8 67.5 42.1 116.8 15328.0 253.0 75.0 − − 0.0 0.0 1.8 67.6 42.1 117.1 22343.0 268.0 75.0 − − − 0.0 1.9 68.5 42.1 117.6 29
339.5 264.5 75.0 − − 0.0 0.0 2.2 69.5 42.1 118.1 Nov 5333.1 258.0 75.0 − − 0.0 0.0 1.9 70.3 42.0 118.3 12337.5 262.5 75.0 − − 0.0 0.0 1.6 71.0 42.0 118.3 19345.0 270.0 75.0 − − − 0.0 1.7 71.2 42.0 118.5 26
348.6 273.5 75.0 − − 0.1 0.0 1.8 71.2 42.0 119.4 Dec 3357.1 282.0 75.0 − − 0.0 0.1 2.2 71.0 42.0 119.7 10351.3 276.0 75.0 − − 0.3 0.0 3.0 70.1 41.9 119.6 17358.7 283.5 75.0 − − 0.2 0.0 3.7 69.8 41.5 119.5 24345.1 270.0 75.0 − − 0.1 0.0 3.8 70.2 41.3 3 120.4 31
334.0 259.0 75.0 − − 0.0 0.0 3.2 70.5 41.3 118.7 2005 Jan 7340.0 265.0 75.0 − − 0.0 0.0 3.4 71.0 41.3 119.2 14354.5 279.5 75.0 − − 0.0 0.0 3.5 71.8 41.3 120.3 21353.0 273.0 80.0 − − 0.0 0.0 3.6 72.6 41.3 120.0 28
357.5 277.5 80.0 − − − 0.0 3.4 72.8 41.3 120.1 Feb 4
Deutsche Bundesbank130.9 98.4 32.1 − − 0.4 − 0.0 − 4.4 21.1 2003 Mar
125.0 92.5 32.5 − − 0.0 − 0.0 − 4.4 19.7 Apr 151.8 118.7 32.9 − − 0.1 − 0.0 − 4.4 19.7 May155.0 122.5 32.4 − − 0.0 − 0.0 − 4.4 20.1 June
144.0 115.1 28.8 − − 0.1 − 0.0 − 4.4 19.9 July145.2 116.0 29.1 − − 0.0 − 0.0 − 4.4 20.1 Aug 151.4 121.5 29.7 − − 0.2 − 0.0 − 4.4 3 20.1 Sep
133.0 101.9 31.1 − − 0.0 − 0.0 − 4.4 38.4 Oct 145.4 115.0 30.4 − − 0.0 − 0.0 − 4.4 23.3 Nov 162.3 129.9 32.3 − − 0.1 − 0.0 − 4.4 24.0 Dec
157.4 117.4 40.0 − − 0.0 − 0.0 − 4.4 19.0 2004 Jan 157.6 109.9 47.5 − − 0.2 − 0.0 − 4.4 18.9 Feb 141.7 94.1 47.5 − − 0.2 − 0.0 − 4.4 30.1 Mar
153.7 104.3 49.4 − − 0.0 − 0.0 − 4.4 29.1 Apr 173.2 123.7 49.5 − − 0.0 − 0.0 − 4.4 18.9 May189.4 139.9 49.5 − − 0.1 − 0.0 − 4.4 19.1 June
196.0 145.1 50.9 − − 0.0 − 0.0 − 4.4 19.1 July184.8 135.3 49.5 − − 0.0 − 0.0 − 4.4 19.1 Aug 173.6 127.4 45.6 − − 0.6 − 0.0 − 4.4 29.5 Sep
195.1 148.1 46.9 − − − − 0.0 − 4.4 19.0 Oct 199.8 153.5 46.0 − − 0.3 − 0.0 − 4.4 19.0 Nov 190.4 143.0 47.3 − − 0.1 − 0.0 − 4.4 26.9 Dec
185.1 134.3 50.9 − − 0.0 − 0.0 − 4.4 26.3 2005 Jan
and financial instruments are valued at market rates at the end of the quar- for the Bundesbank: end-of month financial statement. — 2 Source: ECB. —ter.— 1 For the Eurosystem: financial statements for specific weekly dates; 3 Changes are due mainly to revalutions at the end of the quarter.
17*
III Consolidated financial statement of the Eurosystem

DEUTSCHEBUNDESBANKMonthly ReportFebruary 2005
III Consolidated financial statement of the Eurosystem
2 Liabilities *
€ billion
Liabilities to euro-area credit institutions related to Liabilities tomonetary policy operations denominated in euro other euro-area residents
denominated in euro
OtherCurrent liabilitiesaccounts to euro-
On (covering Fine- area creditreporting the tuning Deposits institutions Debtdate/ Banknotes minimum Fixed- reverse deno- certifi- Generalrelated toEnd of Total in circu- reserve Deposit term opera- margin minated cates govern- Othermonth 1 liabilities lation 2 Total system) facility deposits tions calls in euro issued Total ment liabilities
Eurosystem 4
2004 June 4 870.1 447.4 139.3 139.1 0.1 − − 0.0 0.3 1.1 63.6 57.5 6.1 11 869.1 448.4 141.1 141.0 0.1 − − 0.0 0.3 1.1 59.0 53.0 6.0 18 867.8 447.6 140.4 140.3 0.0 − − 0.0 0.3 1.1 57.7 51.5 6.2 25 895.8 448.1 136.8 136.7 0.0 − − 0.0 0.3 1.1 88.0 82.4 5.6
July 2 5 882.4 454.5 140.8 140.3 0.5 − − 0.0 0.3 1.1 73.1 67.2 5.9 9 881.0 458.2 137.6 137.5 0.1 − − 0.0 0.3 1.1 70.7 65.0 5.7 16 868.8 459.2 140.1 140.1 0.1 − − 0.0 0.3 1.1 56.1 50.4 5.6 23 887.6 458.7 136.8 136.8 0.0 − − 0.0 0.1 1.1 78.2 72.5 5.6 30 883.7 463.1 131.3 131.2 0.0 − − 0.0 0.1 1.1 77.1 71.2 5.9
Aug 6 880.2 467.9 140.1 140.1 0.0 − − 0.0 0.1 1.1 59.7 53.7 6.0 13 871.6 466.7 138.7 138.6 0.0 − − 0.0 0.1 1.1 55.9 49.9 5.9 20 872.0 462.2 140.4 140.3 0.0 − − 0.0 0.1 1.1 56.1 50.2 5.9 27 881.9 460.0 137.9 137.9 0.0 − − − 0.1 1.1 74.0 68.4 5.6
Sep 3 876.6 464.3 137.7 137.6 0.1 − − − 0.1 1.1 64.1 58.3 5.8 10 874.6 465.3 137.4 137.4 0.0 − − − 0.1 1.1 62.9 57.1 5.8 17 875.2 463.9 138.5 138.4 0.0 − − − 0.1 1.1 61.6 55.7 5.9 24 885.8 462.6 137.2 137.2 0.0 − − − 0.1 1.1 73.9 68.0 5.9
2004 Oct 1 5 882.3 466.8 142.5 142.4 0.0 − − 0.0 0.1 1.1 60.9 54.9 6.0 8 880.6 469.9 137.5 137.3 0.2 − − − 0.1 1.1 59.8 53.7 6.1 15 868.4 469.1 138.8 138.8 0.0 − − 0.0 0.1 1.1 47.6 41.7 5.9 22 875.4 467.3 137.8 137.8 0.0 − − − 0.1 1.1 58.7 52.5 6.2 29 893.8 471.3 122.0 122.0 0.0 − − − 0.1 1.1 84.3 78.1 6.3
Nov 5 893.2 474.0 142.5 141.3 1.2 − − − 0.1 − 62.5 56.8 5.7 12 887.1 473.4 138.3 138.2 0.1 − − − 0.1 − 61.9 55.5 6.4 19 893.8 472.0 137.0 136.9 0.1 − − − 0.1 − 68.9 62.9 6.0 26 899.1 473.6 137.7 137.7 0.1 − − 0.0 0.1 − 73.7 67.9 5.9
Dec 3 905.5 485.2 137.2 137.1 0.1 − − − 0.1 − 66.9 60.1 6.8 10 914.2 490.7 135.6 135.6 0.0 − − − 0.1 − 70.4 64.1 6.3 17 909.2 496.2 145.4 145.3 0.1 − − − 0.1 − 48.2 41.7 6.5 24 915.7 504.6 140.6 140.4 0.1 − − − 0.1 − 50.5 44.3 6.2 31 5 884.2 501.3 138.7 138.6 0.1 − − 0.0 0.1 − 42.2 36.0 6.2
2005 Jan 7 873.6 497.2 132.5 132.4 0.1 − − − 0.1 − 45.3 38.8 6.4 14 881.0 491.0 143.7 143.6 0.0 − − − 0.1 − 46.4 39.9 6.5 21 896.2 486.9 141.1 141.0 0.0 − − 0.0 0.1 − 70.1 63.4 6.7 28 894.8 486.1 139.7 139.6 0.0 − − 0.0 0.1 − 69.8 63.3 6.5
Feb 4 899.5 490.0 138.6 138.6 0.1 − − − 0.1 − 71.8 65.3 6.6
Deutsche Bundesbank2003 Mar 5 239.2 98.1 48.1 48.0 0.0 − − − − − 0.5 0.0 0.4
Apr 230.5 101.8 36.4 36.3 0.0 − − − − − 0.5 0.1 0.4 May 258.1 103.2 36.3 36.2 0.1 − − − − − 0.5 0.1 0.4 June 5 258.2 105.2 38.8 38.8 0.0 − − − − − 0.5 0.1 0.4
July 246.9 108.5 39.6 39.5 0.1 − − − − − 0.5 0.0 0.5 Aug 248.9 108.6 41.0 41.0 0.0 − − − − − 0.5 0.0 0.4 Sep 5 257.5 109.2 41.7 41.7 0.0 − − − − − 0.5 0.1 0.4
Oct 257.6 110.8 42.0 42.0 0.0 − − − − − 0.5 0.1 0.4 Nov 254.4 112.7 36.4 36.4 0.0 − − − − − 0.6 0.1 0.5 Dec 5 267.7 121.4 44.6 44.5 0.1 − − − 0.2 − 0.6 0.1 0.5
2004 Jan 258.1 112.4 39.8 39.8 0.0 − − − − − 0.4 0.0 0.4 Feb 258.2 113.3 36.8 36.7 0.1 − − − − − 0.7 0.3 0.4 Mar 5 256.2 115.0 31.0 31.0 0.0 − − − − − 0.7 0.4 0.4
Apr 268.0 117.7 38.3 38.3 0.0 − − − − − 0.5 0.1 0.4 May 276.6 120.8 43.4 43.4 0.0 − − − − − 0.4 0.0 0.4 June 5 290.3 122.3 36.6 36.6 0.0 − − − − − 0.5 0.1 0.4
July 295.9 126.0 39.3 39.3 0.0 − − − − − 0.4 0.0 0.4 Aug 284.2 125.2 41.4 40.9 0.4 − − − − − 0.5 0.0 0.4 Sep 283.6 126.5 40.1 40.1 0.0 − − − − − 0.5 0.1 0.4
Oct 293.7 128.2 35.5 35.5 0.0 − − − − − 0.5 0.1 0.4 Nov 298.6 129.5 48.3 48.3 0.0 − − − − − 0.7 0.3 0.4 Dec 5 293.5 136.3 41.3 41.2 0.1 − − − 0.2 − 0.4 0.0 0.4
2005 Jan 287.9 132.3 40.8 40.8 0.0 − − − − − 0.4 0.0 0.4
* The consolidated financial statement of the Eurosystem comprises the the Bundesbank: end-of-month financial statements. — 2 According to thefinancial statement of the European Central Bank (ECB) and the financial accounting regime chosen by the Eurosystem on the issue of euro bank-statements of the national central banks of the euro-area member states notes, a share of 8% of the total value of the euro banknotes in circulation(NCBs). The balance sheet items for foreign currency, securities, gold and is allocated to the ECB on a monthly basis. The counterpart of thisfinancial instruments are valued at market rates at the end of the quar- adjustment is disclosed as an “Intra-Eurosystem liability related to euro-ter. — 1 For Eurosystem: financial statements for specific weekly dates; for
18*
III Consolidated financial statement of the Eurosystem

DEUTSCHEBUNDESBANKMonthly ReportFebruary 2005
III Consolidated financial statement of the Eurosystem
Liabilities to non-euro-arearesidents denominated inforeign currency
Intra- Eurosystem
Liabilities Liabilities Liabilities Counterpart liability Onto non-euro- to euro-area Deposits, arising of special related to reportingarea residents residents balances from the drawing euro- Capital date/denominated in foreign and other rights allocated Other banknote Revaluation and End ofcredit facilityin euro currency Total liabilities under ERM II by the IMF issue 2 accounts reserves month 1 liabilities 3
Eurosystem 4
7.8 0.3 8.2 8.2 − 5.9 55.9 − 80.6 59.8 2004 June 47.9 0.3 9.3 9.3 − 5.9 55.6 − 80.6 59.8 117.8 0.3 9.9 9.9 − 5.9 56.5 − 80.6 59.8 188.0 0.2 10.3 10.3 − 5.9 56.8 − 80.6 59.8 25
9.0 0.2 11.5 11.5 − 5.9 5 56.0 − 5 70.2 59.8 July 28.2 0.2 13.1 13.1 − 5.9 55.8 − 70.2 59.8 98.2 0.2 11.3 11.3 − 5.9 56.6 − 70.2 59.8 168.6 0.2 11.5 11.5 − 5.9 56.6 − 70.2 59.8 238.8 0.2 9.4 9.4 − 5.9 56.8 − 70.2 59.8 30
8.5 0.2 9.8 9.8 − 5.9 56.8 − 70.2 59.8 Aug 68.7 0.2 9.9 9.9 − 5.9 54.5 − 70.2 59.8 139.0 0.2 11.9 11.9 − 5.9 55.1 − 70.2 59.8 209.0 0.2 8.8 8.8 − 5.9 55.0 − 70.2 59.8 27
9.3 0.3 8.9 8.9 − 5.9 55.1 − 70.2 59.8 Sep 39.1 0.3 7.4 7.4 − 5.9 55.2 − 70.2 59.8 109.1 0.4 7.4 7.4 − 5.9 57.3 − 70.2 59.8 179.3 0.4 8.4 8.4 − 5.9 56.9 − 70.2 59.8 24
9.2 0.3 8.2 8.2 − 5.8 5 56.9 − 70.7 59.9 2004 Oct 19.2 0.3 9.6 9.6 − 5.8 56.8 − 70.7 59.9 89.1 0.3 8.6 8.6 − 5.8 57.3 − 70.7 59.9 159.0 0.2 6.9 6.9 − 5.8 57.9 − 70.7 59.9 229.4 0.3 8.8 8.8 − 5.8 60.2 − 70.7 59.9 29
9.4 0.3 10.3 10.3 − 5.8 57.7 − 70.7 59.9 Nov 59.3 0.3 9.9 9.9 − 5.8 57.5 − 70.7 59.9 129.4 0.3 11.4 11.4 − 5.8 58.4 − 70.7 59.9 199.6 0.3 9.3 9.3 − 5.8 58.3 − 70.7 59.9 26
10.4 0.3 10.4 10.4 − 5.8 58.7 − 70.7 59.9 Dec 310.7 0.3 10.9 10.9 − 5.8 59.1 − 70.7 59.9 1010.2 0.3 13.2 13.2 − 5.8 59.3 − 70.7 59.9 1711.2 0.3 13.2 13.2 − 5.8 58.8 − 70.7 59.9 2410.9 0.2 5 10.7 5 10.7 − 5.6 5 51.4 − 5 64.8 5 58.2 31
8.0 0.2 11.5 11.5 − 5.6 50.4 − 64.8 58.1 2005 Jan 78.1 0.2 12.6 12.6 − 5.6 50.3 . 64.8 58.1 148.3 0.3 10.1 10.1 − 5.6 51.0 − 64.8 57.8 218.3 0.2 11.3 11.3 − 5.6 50.9 − 64.8 57.8 28
8.0 0.3 11.6 11.6 − 5.6 50.7 − 64.8 57.8 Feb 4
Deutsche Bundesbank7.1 0.0 3.4 3.4 − 1.5 5 11.7 33.3 5 30.4 5.0 2003 Mar
7.1 0.0 2.0 2.0 − 1.5 11.6 34.2 30.4 5.0 Apr 7.3 0.0 2.7 2.7 − 1.5 34.5 36.6 30.4 5.0 May7.4 0.0 3.2 3.2 − 1.5 31.3 37.3 5 28.2 5.0 June
7.3 0.0 3.0 3.0 − 1.5 14.9 38.4 28.2 5.0 July7.4 0.0 3.5 3.5 − 1.5 12.4 40.8 28.2 5.0 Aug 7.3 0.0 3.6 3.6 − 1.5 16.2 42.2 5 30.2 5.0 Sep
7.4 0.0 3.9 3.9 − 1.5 12.9 43.4 30.2 5.0 Oct 7.4 0.0 3.2 3.2 − 1.5 12.9 44.4 30.2 5.0 Nov 7.7 0.0 2.8 2.8 − 1.4 5 10.5 44.6 5 29.1 5.0 Dec
7.3 0.0 3.1 3.1 − 1.4 11.4 48.1 29.1 5.0 2004 Jan 7.0 0.0 3.0 3.0 − 1.4 12.7 49.2 29.1 5.0 Feb 6.5 0.0 3.1 3.1 − 1.5 10.8 50.4 5 32.2 5.0 Mar
6.2 0.0 3.4 3.4 − 1.5 10.9 52.3 32.2 5.0 Apr 5.8 0.0 2.7 2.7 − 1.5 11.5 53.3 32.2 5.0 May5.6 0.0 3.4 3.4 − 1.5 32.2 53.9 5 29.3 5.0 June
5.9 0.0 2.6 2.6 − 1.5 30.3 55.6 29.3 5.0 July5.8 0.0 2.0 2.0 − 1.5 15.2 58.6 29.3 5.0 Aug 5.6 0.0 2.0 2.0 − 1.4 12.0 60.9 29.6 5.0 Sep
5.9 0.0 1.3 1.3 − 1.4 24.1 62.3 29.6 5.0 Oct 5.6 0.0 1.5 1.5 − 1.4 13.9 63.1 29.6 5.0 Nov 5.9 0.0 2.0 2.0 − 1.4 5 9.7 63.4 5 27.8 5.0 Dec
3.5 0.0 2.7 2.7 − 1.4 9.5 64.5 27.8 5.0 2005 Jan
bank-note issue“. The remaining 92 % of the value of the euro banknote in the aforementioned accounting regime and the value of euro banknotescirculation is also allocated to the NCBs on a monthly basis, and each NCB put into circulation is also disclosed as an “Intra-Eurosystem claim/ liabilityshows in its balance sheet the share of the euro banknotes issued which related to banknote issue“. — 3 For the Deutsche Bundesbank: includingcorresponds to its paid-up share in the ECB’s capital. The difference DM banknotes still in circulation. — 4 Source: ECB. — 5 Changes are duebetween the value of the euro banknotes allocated to the NCB according to mainly to revaluations at the end of the quarter.
19*
III Consolidated financial statement of the Eurosystem

DEUTSCHEBUNDESBANKMonthly ReportFebruary 2005
IV Banks
1 Assets and liabilities of monetary financial institutions (excluding the Bundesbank) in Germany * Assets
Up to end-1998, DM billion; from 1999, € billion
Lending to banks (MFIs) in the euro area Lending to non-banks (non-MFIs) in the
to banks in the home country to banks in other member states to non-banks in the home country
Enterprises and house-holds
Secur- Secur-Balance ities itiessheet Cash issued issued
Period total in hand Total Total Loans by banks Total Loans by banks Total Total Total Loans
End of year or month
1996 8,540.5 30.3 2,523.0 2,301.1 1,585.7 715.4 221.9 181.2 40.7 5,084.7 4,981.9 3,812.8 3,543.01997 9,368.2 30.7 2,836.0 2,580.7 1,758.6 822.1 255.3 208.8 46.5 5,408.8 5,269.5 4,041.3 3,740.81998 10,355.5 29.9 3,267.4 2,939.4 1,977.4 962.0 328.1 264.9 63.1 5,833.9 5,615.9 4,361.0 3,966.51999 5,678.5 17.2 1,836.9 1,635.0 1,081.4 553.6 201.9 161.8 40.1 3,127.4 2,958.6 2,326.4 2,093.4
2000 6,083.9 16.1 1,977.4 1,724.2 1,108.9 615.3 253.2 184.5 68.6 3,249.9 3,062.6 2,445.7 2,186.62001 6,303.1 14.6 2,069.7 1,775.5 1,140.6 634.9 294.2 219.8 74.4 3,317.1 3,084.9 2,497.1 2,235.72002 6,394.2 17.9 2,118.0 1,769.1 1,164.3 604.9 348.9 271.7 77.2 3,340.2 3,092.2 2,505.8 2,240.82003 6,432.0 17.3 2,111.5 1,732.0 1,116.8 615.3 379.5 287.7 91.8 3,333.2 3,083.1 2,497.4 2,241.22004 6,617.7 15.1 2,174.4 1,750.2 1,122.9 627.3 424.2 306.3 117.9 3,359.1 3,083.8 2,479.7 2,223.8
2003 Mar 6,434.8 12.9 2,121.5 1,747.2 1,135.0 614.4 371.9 288.9 83.1 3,346.7 3,100.4 2,498.0 2,238.1
Apr 6,430.3 13.8 2,107.6 1,732.2 1,118.6 613.6 375.4 291.6 83.8 3,348.8 3,102.2 2,499.1 2,234.6 May 6,467.7 14.0 2,144.0 1,756.9 1,143.6 613.2 387.1 303.3 83.8 3,347.2 3,101.9 2,499.2 2,232.0 June 6,472.9 13.3 2,139.0 1,748.0 1,137.1 610.9 390.9 305.4 85.5 3,330.2 3,089.9 2,502.9 2,239.7
July 6,425.7 13.3 2,113.5 1,728.1 1,109.7 618.4 385.3 297.4 88.0 3,330.2 3,093.7 2,494.1 2,231.1 Aug 6,395.1 13.5 2,105.5 1,720.3 1,104.5 615.8 385.2 296.8 88.3 3,318.3 3,084.7 2,495.6 2,231.4 Sep 6,403.1 13.3 2,099.4 1,712.2 1,095.3 616.9 387.2 297.5 89.7 3,332.6 3,089.6 2,504.9 2,245.2
Oct 6,399.3 13.6 2,092.9 1,715.9 1,096.1 619.9 376.9 285.3 91.7 3,328.9 3,086.1 2,496.9 2,242.9 Nov 6,456.1 13.1 2,126.2 1,742.4 1,117.5 624.9 383.7 292.5 91.3 3,350.9 3,103.5 2,505.0 2,246.9 Dec 6,432.0 17.3 2,111.5 1,732.0 1,116.8 615.3 379.5 287.7 91.8 3,333.2 3,083.1 2,497.4 2,241.2
2004 Jan 6,424.2 13.2 2,084.1 1,713.6 1,101.3 612.4 370.4 278.3 92.1 3,329.8 3,078.3 2,489.0 2,230.4 Feb 6,448.7 13.2 2,100.2 1,722.7 1,101.9 620.8 377.5 282.5 94.9 3,341.8 3,081.9 2,483.5 2,230.2 Mar 6,506.7 12.7 2,106.5 1,725.6 1,098.7 626.9 380.9 282.2 98.7 3,370.4 3,102.9 2,491.9 2,228.9
Apr 6,568.8 12.9 2,132.5 1,749.7 1,115.1 634.6 382.9 282.4 100.4 3,381.2 3,110.1 2,506.6 2,230.4 May 6,583.5 13.8 2,163.3 1,771.6 1,127.6 644.0 391.7 289.0 102.7 3,369.7 3,101.0 2,497.0 2,229.7 June 6,551.3 13.1 2,150.2 1,746.3 1,112.7 633.6 404.0 299.5 104.4 3,360.1 3,090.4 2,483.2 2,229.4
July 6,574.9 13.2 2,171.4 1,765.1 1,130.4 634.7 406.3 303.2 103.0 3,368.3 3,093.3 2,477.1 2,225.1 Aug 6,567.5 13.2 2,167.2 1,759.6 1,126.4 633.2 407.6 301.7 105.9 3,357.7 3,086.1 2,470.3 2,221.8 Sep 6,597.6 13.2 2,165.1 1,759.6 1,123.8 635.8 405.6 295.9 109.6 3,361.1 3,091.0 2,478.1 2,229.6
Oct 6,627.7 13.9 2,178.3 1,759.5 1,128.1 631.4 418.7 306.4 112.4 3,371.9 3,094.1 2,475.6 2,226.8 Nov 6,683.4 13.3 2,197.3 1,771.7 1,137.6 634.1 425.6 310.6 115.1 3,376.5 3,098.8 2,482.9 2,233.7 Dec 6,617.7 15.1 2,174.4 1,750.2 1,122.9 627.3 424.2 306.3 117.9 3,359.1 3,083.8 2,479.7 2,223.8
Changes 11997 825.6 0.5 313.1 279.6 172.9 106.7 33.5 27.6 5.9 324.0 287.5 228.4 197.61998 1,001.0 − 0.8 422.2 355.7 215.1 140.6 66.4 56.2 10.2 440.4 363.3 337.5 245.21999 452.6 1.8 179.8 140.1 81.4 58.6 39.8 26.3 13.5 206.6 158.1 156.8 126.4
2000 401.5 − 1.2 143.0 91.7 28.1 63.6 51.4 22.8 28.6 123.2 105.4 116.8 89.52001 244.9 − 1.4 91.0 50.7 30.3 20.5 40.3 34.5 5.8 55.1 23.9 50.4 48.12002 165.7 3.3 63.6 6.5 23.7 − 17.1 57.1 51.9 5.2 34.1 15.7 16.5 10.42003 83.5 − 0.6 − 20.2 − 49.0 − 47.5 − 1.5 28.8 15.7 13.1 29.6 23.0 22.2 26.42004 208.1 − 2.1 68.9 22.6 9.5 13.1 46.4 15.8 30.5 44.7 18.0 − 0.3 − 1.1
2003 Apr 4.5 1.0 − 13.7 − 17.2 − 16.5 − 0.8 3.5 2.7 0.8 4.9 4.2 3.2 − 1.2 May 57.3 0.2 36.6 24.8 25.1 − 0.3 11.9 11.8 0.1 1.9 2.5 2.9 − 0.0 June − 5.9 − 0.7 − 5.2 − 8.9 − 6.5 − 2.4 3.8 2.0 1.7 − 18.0 − 12.5 3.2 7.2
July − 49.6 − 0.1 − 25.7 − 20.1 − 27.4 7.3 − 5.6 − 8.0 2.4 0.6 4.5 − 8.1 − 8.1 Aug − 43.7 0.3 − 8.1 − 7.9 − 5.2 − 2.7 − 0.3 − 0.5 0.3 − 13.6 − 10.0 0.5 − 0.6 Sep 26.2 − 0.2 − 5.9 − 8.1 − 9.2 1.2 2.1 0.7 1.4 17.7 7.4 11.8 16.2
Oct − 5.0 0.3 − 6.5 4.1 0.8 3.3 − 10.6 − 12.6 2.0 − 1.8 − 2.0 − 7.3 − 1.7 Nov 67.6 − 0.5 33.6 26.6 21.4 5.1 7.1 7.2 − 0.1 24.5 19.2 9.8 5.6 Dec − 8.6 4.2 − 14.4 − 10.3 − 0.7 − 9.6 − 4.1 − 4.7 0.7 − 10.1 − 13.7 − 1.4 0.3
2004 Jan − 15.4 − 4.1 − 26.5 − 18.1 − 15.5 − 2.6 − 8.5 − 9.4 0.9 − 0.6 − 1.0 − 4.6 − 6.6 Feb 26.4 0.0 17.3 9.0 0.4 8.6 8.3 4.2 4.1 16.6 8.0 − 1.1 2.5 Mar 47.2 − 0.5 6.2 2.8 − 3.2 6.0 3.4 − 0.3 3.7 28.7 21.7 9.0 − 0.9
Apr 57.9 0.1 26.1 24.1 16.4 7.7 1.9 0.2 1.7 10.8 7.1 14.6 1.4 May 19.5 1.0 30.7 21.9 12.5 9.3 8.9 6.5 2.3 − 10.4 − 8.2 − 8.8 0.1 June − 33.2 − 0.7 − 13.0 − 25.2 − 14.9 − 10.4 12.2 10.6 1.7 − 9.2 − 10.1 − 13.2 0.2
July 21.8 0.1 23.4 18.8 17.7 1.2 4.6 3.7 0.9 6.4 3.3 − 5.6 − 3.8 Aug − 5.3 − 0.1 − 7.0 − 5.5 − 4.0 − 1.5 − 1.5 − 4.3 2.9 − 7.3 − 6.8 − 6.4 − 2.9 Sep 39.7 0.0 − 1.6 0.3 − 2.6 2.9 − 1.9 − 5.8 3.8 5.5 6.3 9.3 9.5
Oct 36.3 0.7 13.2 0.0 4.3 − 4.3 13.2 10.4 2.7 11.7 3.9 − 1.8 − 2.0 Nov 67.8 − 0.6 19.3 12.2 9.5 2.7 7.1 4.2 2.9 6.1 5.7 8.3 7.9 Dec − 54.6 1.9 − 19.2 − 17.8 − 11.2 − 6.6 − 1.4 − 4.2 2.9 − 13.6 − 11.9 0.2 − 6.6
* This table serves to supplement the “Overall monetary survey“ in section the figures reported by banks (including building and loan associations) −II. Unlike the other tables in section IV, this table includes − in addition to data from money market funds. — 1 Statistical breaks have been eliminated
20*
IV Banks

DEUTSCHEBUNDESBANKMonthly ReportFebruary 2005
IV Banks
euro area Claims onnon-euro-area
to non-banks in other member states residents
General Enterprises and General government households government
Secur- Secur- of which Secur- of which Otherities Total Loans ities 2 Total Total Loans Total Loans 3 ities Total Loans assets Period
End of year or month
269.7 1,169.1 857.8 311.4 102.8 36.8 36.8 66.0 17.2 48.8 678.1 575.3 224.4 1996300.6 1,228.2 911.0 317.2 139.2 41.9 41.2 97.3 23.4 73.9 839.6 710.2 253.1 1997394.5 1,254.9 939.1 315.8 218.0 62.5 56.0 155.5 35.6 119.9 922.0 758.0 302.2 1998233.0 632.1 488.4 143.7 168.8 65.3 35.9 103.6 20.7 82.8 511.2 404.2 185.8 1999
259.1 616.9 478.5 138.4 187.3 83.8 44.2 103.5 20.0 83.5 622.4 481.7 218.1 2000261.3 587.8 468.7 119.1 232.3 111.3 53.7 121.0 26.2 94.8 727.3 572.0 174.3 2001265.0 586.4 448.5 137.9 248.0 125.0 63.6 123.0 25.5 97.5 738.1 589.2 179.9 2002256.2 585.6 439.6 146.1 250.2 133.5 62.7 116.6 25.9 90.7 803.7 645.6 166.4 2003255.9 604.2 423.0 181.2 275.3 140.6 61.9 134.7 25.7 109.0 897.8 730.4 171.3 2004
259.9 602.4 444.0 158.4 246.3 126.8 64.5 119.5 26.2 93.3 778.6 630.9 175.1 2003 Mar
264.5 603.1 445.8 157.4 246.6 129.9 66.2 116.7 25.2 91.5 787.6 641.1 172.5 Apr 267.2 602.7 439.8 162.9 245.3 130.7 66.7 114.6 26.5 88.2 792.4 644.3 170.2 May263.2 587.0 434.6 152.4 240.2 126.9 61.9 113.4 24.6 88.7 827.6 668.9 162.8 June
263.0 599.6 444.9 154.7 236.5 126.7 62.3 109.8 24.9 84.9 811.5 651.6 157.3 July264.1 589.1 440.6 148.5 233.6 129.2 65.0 104.4 24.1 80.3 801.2 642.0 156.6 Aug 259.8 584.6 435.2 149.4 243.1 129.7 64.7 113.4 23.4 90.0 795.8 642.4 161.9 Sep
254.0 589.2 436.6 152.6 242.8 127.6 60.6 115.2 25.1 90.1 800.6 643.9 163.3 Oct 258.1 598.5 442.5 156.0 247.4 132.9 64.7 114.5 25.6 89.0 803.7 648.2 162.2 Nov 256.2 585.6 439.6 146.1 250.2 133.5 62.7 116.6 25.9 90.7 803.7 645.6 166.4 Dec
258.6 589.2 440.2 149.0 251.5 132.0 61.2 119.5 25.6 93.9 843.7 683.0 153.4 2004 Jan 253.3 598.3 432.1 166.2 260.0 136.0 65.2 124.0 25.0 99.0 839.5 680.6 154.0 Feb 263.0 611.0 444.9 166.2 267.4 137.6 67.0 129.8 24.9 104.9 859.1 697.2 158.0 Mar
276.2 603.5 437.2 166.3 271.1 139.4 68.8 131.7 25.8 105.9 884.1 722.1 158.1 Apr 267.2 604.1 431.4 172.7 268.7 137.6 66.3 131.1 25.8 105.3 875.0 707.5 161.6 May253.9 607.2 426.2 181.0 269.7 138.4 66.5 131.3 25.7 105.6 867.0 695.6 160.8 June
252.0 616.2 434.4 181.8 275.0 142.3 67.7 132.8 26.4 106.4 860.7 687.7 161.3 July248.4 615.8 429.9 186.0 271.6 137.7 65.0 133.9 26.2 107.6 871.6 696.5 157.9 Aug 248.5 612.9 425.8 187.1 270.1 138.8 65.3 131.3 25.7 105.6 898.6 725.5 159.6 Sep
248.7 618.5 430.9 187.7 277.8 139.9 65.1 137.9 25.5 112.4 901.8 727.5 161.9 Oct 249.1 615.9 426.6 189.3 277.7 143.1 67.5 134.6 25.7 108.9 931.8 756.6 164.6 Nov 255.9 604.2 423.0 181.2 275.3 140.6 61.9 134.7 25.7 109.0 897.8 730.4 171.3 Dec
Changes 130.8 59.1 53.3 5.8 36.5 5.1 4.4 31.4 6.1 25.3 159.4 132.9 28.6 199792.3 25.8 28.1 − 2.3 77.1 18.9 13.0 58.3 12.5 45.7 83.9 52.0 55.3 199830.4 1.3 7.7 − 6.4 48.4 12.2 6.4 36.2 2.0 34.2 33.1 13.8 31.3 1999
27.3 − 11.4 − 6.7 − 4.6 17.8 16.8 7.2 1.0 − 0.3 1.2 103.9 71.9 32.5 20002.4 − 26.5 − 9.8 − 16.7 31.3 24.3 7.7 7.0 2.2 4.8 110.1 86.6 − 9.9 20016.2 − 0.8 − 20.2 19.4 18.3 15.9 12.0 2.4 − 0.6 3.0 65.7 64.1 − 0.4 2002
− 4.3 0.8 − 8.7 9.6 6.6 13.4 2.7 − 6.8 − 0.8 − 6.0 113.4 98.5 − 38.7 20030.9 18.3 − 17.0 35.3 26.7 8.2 3.2 18.5 0.0 18.4 114.3 100.6 − 17.6 2004
4.4 1.0 1.8 − 0.9 0.7 3.4 1.9 − 2.7 − 1.0 − 1.7 16.1 16.3 − 3.8 2003 Apr 2.9 − 0.4 − 5.9 5.5 − 0.6 1.1 1.0 − 1.7 1.5 − 3.1 21.8 18.8 − 3.2 May
− 4.0 − 15.7 − 5.2 − 10.5 − 5.6 − 4.1 − 5.1 − 1.4 − 1.9 0.5 25.4 16.1 − 7.5 June
0.0 12.6 10.3 2.3 − 3.9 − 0.3 0.3 − 3.6 0.3 − 3.9 − 18.6 − 19.0 − 5.9 July1.1 − 10.5 − 4.3 − 6.2 − 3.6 2.2 2.4 − 5.8 − 0.9 − 4.8 − 21.0 − 19.0 − 1.2 Aug
− 4.3 − 4.4 − 5.4 0.9 10.3 1.0 0.3 9.3 − 0.5 9.9 10.2 14.5 4.4 Sep
− 5.6 5.3 1.4 3.9 0.2 − 2.0 − 4.2 2.2 1.6 0.5 − 0.5 − 3.6 3.5 Oct 4.1 9.4 6.0 3.4 5.3 5.7 4.3 − 0.4 0.6 − 1.0 13.0 12.4 − 3.0 Nov
− 1.7 − 12.4 − 2.9 − 9.5 3.6 1.4 − 1.4 2.2 0.5 1.7 13.4 9.4 − 1.7 Dec
2.1 3.6 0.6 3.0 0.4 − 2.3 − 1.6 2.7 − 0.4 3.1 34.7 32.1 − 18.8 2004 Jan − 3.7 9.1 − 8.0 17.2 8.6 4.0 4.0 4.6 − 0.6 5.2 − 2.7 − 1.1 − 4.8 Feb
9.8 12.7 12.7 − 0.0 7.0 1.4 1.6 5.6 − 0.1 5.8 10.7 8.6 2.1 Mar
13.2 − 7.5 − 7.6 0.1 3.6 1.8 1.7 1.9 0.9 1.0 21.3 21.2 − 0.4 Apr − 8.9 0.6 − 5.9 6.5 − 2.2 − 1.7 − 2.4 − 0.5 0.1 − 0.5 − 4.4 − 10.4 2.6 May− 13.4 3.1 − 5.2 8.3 0.9 0.8 0.2 0.1 − 0.2 0.2 − 8.9 − 14.1 − 1.5 June
− 1.8 9.0 8.2 0.8 3.1 1.5 1.2 1.5 0.8 0.8 − 8.2 − 9.8 0.1 July− 3.6 − 0.3 − 4.5 4.2 − 0.6 − 1.7 0.2 1.1 − 0.1 1.2 12.6 10.6 − 3.6 Aug − 0.2 − 2.9 − 4.1 1.1 − 0.9 1.5 0.7 − 2.4 − 0.5 − 1.9 34.9 36.0 0.9 Sep
0.2 5.7 5.1 0.6 7.9 1.3 − 0.0 6.6 − 0.1 6.7 9.0 7.5 1.7 Oct 0.4 − 2.6 − 4.2 1.6 0.4 3.5 2.7 − 3.1 0.3 − 3.4 41.1 38.9 1.9 Nov 6.8 − 12.1 − 4.1 − 8.0 − 1.7 − 2.0 − 5.1 0.3 0.0 0.3 − 26.0 − 19.0 2.3 Dec
from the flow figures (see also footnote * in Table II.1). — 2 Including debtsecurities arising from the exchange of equalisation claims.
21*
IV Banks

DEUTSCHEBUNDESBANKMonthly ReportFebruary 2005
IV Banks
1 Assets and liabilities of monetary financial institutions (excluding the Bundesbank) in Germany * Liabilities
Up to end-1998, DM billion; from 1999, € billion
Deposits of banks (MFIs) Deposits of non-banks (non-MFIs) in the euro areain the euro area
Deposits of non-banks in the home country Deposits of non-banks
With agreed At agreedof banks maturities 2 notice 3
Balance in the in other of which of whichsheet home member Over- up to up to Over-
Period total Total country states Total Total night Total Total 3 months Total night2 years 4
End of year or month
1996 8,540.5 1,975.3 1,780.2 195.1 3,515.9 3,264.0 638.1 1,318.5 430.6 1,307.4 865.7 137.3 7.51997 9,368.2 2,195.6 1,959.1 236.5 3,647.1 3,376.2 654.5 1,364.9 426.8 1,356.9 929.2 162.5 7.31998 10,355.5 2,480.3 2,148.9 331.4 3,850.8 3,552.2 751.6 1,411.1 461.6 1,389.6 971.9 187.4 9.41999 5,678.5 1,288.1 1,121.8 166.3 2,012.4 1,854.7 419.5 820.6 247.0 614.7 504.4 111.1 6.5
2000 6,083.9 1,379.4 1,188.9 190.5 2,051.4 1,873.6 441.4 858.8 274.3 573.5 450.5 107.9 6.92001 6,303.1 1,418.0 1,202.1 215.9 2,134.0 1,979.7 525.0 880.2 290.6 574.5 461.9 105.2 7.62002 6,394.2 1,478.7 1,236.2 242.4 2,170.0 2,034.9 574.8 884.9 279.3 575.3 472.9 87.4 8.12003 6,432.0 1,471.0 1,229.4 241.6 2,214.6 2,086.9 622.1 874.5 248.0 590.3 500.8 81.8 9.32004 6,617.7 1,528.4 1,270.8 257.6 2,264.2 2,148.5 646.2 898.9 239.9 603.5 515.5 71.9 8.8
2003 Mar 6,434.8 1,471.5 1,218.2 253.2 2,175.3 2,040.7 578.3 883.1 266.2 579.3 481.6 88.0 7.7
Apr 6,430.3 1,455.5 1,200.9 254.6 2,176.2 2,044.3 585.8 880.6 264.8 577.9 482.7 86.5 8.2 May 6,467.7 1,508.5 1,253.9 254.6 2,188.9 2,053.8 591.4 885.3 270.9 577.1 483.4 87.4 8.8 June 6,472.9 1,509.2 1,252.8 256.4 2,194.2 2,059.3 608.2 874.5 260.2 576.7 484.4 86.7 9.0
July 6,425.7 1,457.9 1,207.6 250.3 2,182.5 2,051.4 595.2 879.5 259.0 576.8 486.5 85.7 9.3 Aug 6,395.1 1,450.5 1,198.0 252.5 2,193.0 2,061.5 597.8 885.7 261.3 578.0 489.3 85.5 8.9 Sep 6,403.1 1,451.2 1,188.3 262.9 2,187.8 2,057.4 607.3 871.8 248.1 578.3 490.2 84.2 9.6
Oct 6,399.3 1,439.5 1,179.5 260.0 2,188.2 2,057.3 609.5 868.5 243.9 579.4 491.2 85.4 10.7 Nov 6,456.1 1,463.6 1,214.6 249.0 2,211.2 2,082.4 632.7 869.4 244.7 580.3 491.9 83.1 9.9 Dec 6,432.0 1,471.0 1,229.4 241.6 2,214.6 2,086.9 622.1 874.5 248.0 590.3 500.8 81.8 9.3
2004 Jan 6,424.2 1,461.1 1,212.6 248.5 2,209.5 2,082.6 630.5 861.5 233.5 590.6 502.1 80.9 9.5 Feb 6,448.7 1,454.4 1,215.7 238.7 2,212.3 2,085.6 633.8 860.3 230.1 591.5 503.3 79.5 10.8 Mar 6,506.7 1,459.9 1,203.6 256.3 2,214.3 2,088.7 632.9 864.4 230.9 591.4 503.5 77.8 13.1
Apr 6,568.8 1,482.1 1,227.2 254.9 2,219.0 2,097.2 641.7 864.4 225.6 591.2 504.3 74.5 10.6 May 6,583.5 1,496.5 1,251.2 245.4 2,229.4 2,105.3 640.0 874.8 232.1 590.6 504.6 75.8 9.4 June 6,551.3 1,501.5 1,256.7 244.8 2,228.7 2,101.4 640.7 870.7 224.0 590.0 504.3 76.7 12.4
July 6,574.9 1,524.1 1,274.6 249.6 2,225.5 2,103.0 634.7 877.7 228.7 590.6 504.9 72.9 9.7 Aug 6,567.5 1,510.2 1,259.4 250.8 2,231.7 2,105.7 636.2 878.2 228.9 591.3 505.6 74.0 9.8 Sep 6,597.6 1,495.3 1,242.0 253.3 2,237.6 2,113.6 645.8 876.6 225.6 591.2 505.7 76.0 14.4
Oct 6,627.7 1,534.8 1,277.0 257.7 2,237.1 2,118.1 646.8 879.0 225.7 592.3 506.3 73.5 9.6 Nov 6,683.4 1,536.2 1,285.2 250.9 2,257.3 2,140.2 672.5 874.6 218.3 593.0 506.2 73.4 11.9 Dec 6,617.7 1,528.4 1,270.8 257.6 2,264.2 2,148.5 646.2 898.9 239.9 603.5 515.5 71.9 8.8
Changes 11997 825.6 223.7 185.5 38.3 130.8 112.1 16.3 46.4 − 3.8 49.4 60.3 25.0 − 0.31998 1,001.0 277.0 182.8 94.2 205.9 176.8 97.8 46.3 34.8 32.7 42.0 26.2 2.01999 452.6 70.2 66.4 3.7 75.0 65.6 34.2 36.7 13.5 − 5.3 7.4 7.5 1.7
2000 401.5 87.5 66.0 21.5 38.7 19.8 22.5 37.8 27.0 − 40.5 − 53.6 − 4.2 0.32001 244.9 32.4 8.4 24.0 80.6 105.2 83.0 21.2 16.2 1.1 11.4 − 4.0 0.42002 165.7 70.2 37.2 33.1 53.0 57.0 50.3 5.9 − 11.0 0.8 11.0 − 2.6 0.62003 83.5 3.8 − 3.3 7.1 44.7 50.3 48.8 − 13.6 − 31.6 15.1 28.0 − 3.8 1.42004 208.1 62.3 43.0 19.3 53.5 64.9 26.3 25.5 − 8.3 13.1 14.7 − 9.3 − 0.4
2003 Apr 4.5 − 14.0 − 16.5 2.5 1.6 3.9 7.7 − 2.4 − 1.4 − 1.4 1.1 − 1.2 0.5 May 57.3 54.5 52.0 2.5 13.9 10.2 6.1 4.9 6.3 − 0.8 0.7 1.5 0.7 June − 5.9 − 1.2 − 1.7 0.6 4.6 5.1 16.4 − 10.9 − 10.8 − 0.4 1.0 − 0.9 − 0.0
July − 49.6 − 52.1 − 45.6 − 6.4 − 11.8 − 7.9 − 13.0 5.1 − 1.1 0.1 2.1 − 1.1 0.5 Aug − 43.7 − 10.0 − 10.5 0.5 9.7 9.6 2.3 6.1 2.3 1.3 2.8 − 0.5 − 0.5 Sep 26.2 4.5 − 8.4 12.9 − 4.0 − 3.5 10.0 − 13.7 − 13.1 0.2 0.9 − 0.8 0.8
Oct − 5.0 − 10.3 − 7.5 − 2.8 0.3 − 0.1 2.2 − 3.4 − 4.2 1.1 1.0 1.1 1.1 Nov 67.6 26.1 35.8 − 9.7 23.6 25.4 23.5 1.0 0.9 0.9 0.7 − 2.0 − 0.7 Dec − 8.6 10.4 15.9 − 5.5 4.4 5.1 − 10.2 5.3 3.4 10.0 8.9 − 1.0 − 0.5
2004 Jan − 15.4 − 11.1 − 17.2 6.1 − 5.5 − 4.6 8.2 − 13.1 − 14.5 0.3 1.3 − 1.0 0.2 Feb 26.4 − 6.3 3.3 − 9.6 3.0 3.1 4.2 − 2.0 − 4.2 0.9 1.2 − 1.4 1.3 Mar 47.2 4.0 − 12.6 16.6 1.6 2.8 − 1.1 4.0 0.7 − 0.1 0.1 − 1.8 2.3
Apr 57.9 21.3 23.2 − 1.9 4.7 8.7 8.6 0.3 − 5.1 − 0.2 0.9 − 3.5 − 2.6 May 19.5 15.3 24.2 − 8.9 10.7 8.3 − 1.5 10.4 6.6 − 0.6 0.3 1.4 − 1.2 June − 33.2 4.7 5.5 − 0.7 − 0.7 − 4.0 0.3 − 3.7 − 7.7 − 0.6 − 0.3 0.8 3.0
July 21.8 22.3 17.8 4.6 − 3.3 1.5 − 5.8 6.6 4.3 0.7 0.5 − 3.9 − 2.8 Aug − 5.3 − 13.5 − 14.9 1.5 7.3 3.7 1.6 1.5 0.2 0.7 0.7 1.2 0.1 Sep 39.7 − 12.9 − 16.7 3.8 6.5 8.3 9.9 − 1.5 − 3.2 − 0.1 0.1 2.2 4.7
Oct 36.3 41.0 35.4 5.6 − 0.1 4.8 1.3 2.4 0.1 1.1 0.5 − 2.3 − 4.8 Nov 67.8 3.5 8.9 − 5.4 20.9 22.6 26.6 − 4.8 − 7.2 0.8 − 0.1 0.2 2.4 Dec − 54.6 − 6.0 − 13.7 7.7 8.5 9.6 − 26.1 25.3 21.7 10.4 9.3 − 1.3 − 3.1
* This table serves to supplement the “Overall monetary survey“ in section from the flow figures (see also footnote * in Table II.1). — 2 For the GermanII. Unlike the other tables in section IV, this table includes − in addition to contribution: from 1999, including deposits under savings and loanthe figures reported by banks (including building and loan associations) − contracts (see Table IV.12). — 3 For the German contribution: up to the enddata from money market funds. — 1 Statistical breaks have been eliminated of 1998, including deposits under savings and loan contracts (see also
22*
IV Banks

DEUTSCHEBUNDESBANKMonthly ReportFebruary 2005
IV Banks
Debt securitiesissued 7
in other member states 5 Deposits ofcentral governments
With agreed At agreed Liabilitiesmaturities notice arising
of which from Money of which Liabilitiesdomestic market with to non-repos with
of which of which central non-banks fund euro- Capitalmaturitiesup to up to govern- in the shares of up to area and Other
Total Total 3 months Total ments issued 7 Total reserves Period2 years 4 euro area 6 2 years 7 residents Liabilities
End of year or month
120.6 9.0 9.2 9.2 114.6 114.6 − 34.0 1,804.3 54.4 422.1 350.0 438.8 1996145.8 9.2 9.4 9.4 108.3 108.3 − 28.6 1,998.3 62.5 599.2 388.1 511.3 1997168.3 13.8 9.7 9.7 111.2 111.2 − 34.8 2,248.1 80.2 739.8 426.8 574.8 199899.7 8.9 4.8 3.7 46.6 45.9 2.0 20.8 1,323.6 97.4 487.9 262.6 281.1 1999
96.3 6.7 4.7 3.3 69.9 67.6 0.4 19.3 1,417.1 113.3 599.8 298.1 318.4 200092.4 9.0 5.2 3.8 49.1 46.9 4.9 33.2 1,445.4 129.3 647.6 319.2 300.8 200174.6 9.9 4.7 3.6 47.7 45.6 3.3 36.7 1,468.2 71.6 599.2 343.0 309.8 200268.6 11.4 3.9 3.1 45.9 44.2 14.1 36.7 1,486.9 131.3 567.8 340.2 300.8 200359.8 9.8 3.3 2.7 43.8 41.4 14.8 31.5 1,554.8 116.8 577.1 329.1 317.8 2004
75.7 13.0 4.6 3.6 46.6 45.2 11.2 40.2 1,467.9 143.5 612.1 353.1 303.6 2003 Mar
73.8 12.3 4.5 3.5 45.5 44.9 11.3 39.6 1,468.6 142.6 620.2 351.6 307.2 Apr 74.1 13.3 4.4 3.5 47.7 44.4 12.3 39.4 1,463.3 133.3 599.0 351.0 305.4 May73.4 12.2 4.4 3.5 48.1 44.6 10.8 38.7 1,470.0 128.7 594.8 348.2 307.0 June
72.1 12.1 4.3 3.4 45.3 43.8 10.9 38.4 1,482.8 133.0 603.6 348.1 301.6 July72.4 12.8 4.2 3.4 45.9 43.8 12.4 38.1 1,480.0 122.1 579.2 344.0 298.0 Aug 70.5 12.0 4.1 3.3 46.2 43.4 15.6 38.0 1,485.5 124.4 579.7 341.0 304.3 Sep
70.6 12.7 4.0 3.3 45.5 43.0 21.1 37.6 1,494.1 126.2 574.2 344.6 299.9 Oct 69.3 11.4 4.0 3.2 45.7 43.6 20.0 37.1 1,502.7 131.5 574.6 343.0 304.0 Nov 68.6 11.4 3.9 3.1 45.9 44.2 14.1 36.7 1,486.9 131.3 567.8 340.2 300.8 Dec
67.5 11.9 3.8 3.1 45.9 45.2 16.6 36.4 1,493.9 128.6 585.4 336.8 284.5 2004 Jan 64.9 10.9 3.8 3.1 47.3 45.8 17.5 36.2 1,503.7 127.3 604.4 332.2 288.0 Feb 60.9 10.1 3.7 3.1 47.8 46.2 18.2 35.8 1,532.3 134.7 623.1 330.1 292.8 Mar
60.2 10.2 3.7 3.1 47.2 46.2 17.3 35.7 1,549.0 135.3 632.3 333.7 299.7 Apr 62.7 12.3 3.7 3.0 48.3 45.8 17.0 36.1 1,559.8 132.3 612.5 336.4 295.8 May60.6 10.2 3.6 3.0 50.7 47.1 16.1 36.0 1,554.2 123.6 582.1 337.5 295.2 June
59.6 9.7 3.6 3.0 49.7 47.2 16.8 39.9 1,558.7 120.0 576.6 339.4 293.9 July60.6 10.2 3.6 3.0 52.1 47.6 14.2 41.1 1,562.9 120.7 577.2 336.9 293.3 Aug 58.0 8.2 3.5 2.9 48.1 46.0 18.1 38.7 1,575.0 119.7 595.6 335.1 302.2 Sep
60.4 10.3 3.5 2.9 45.6 42.6 21.2 37.4 1,569.6 118.0 582.7 335.5 309.3 Oct 58.1 8.0 3.4 2.8 43.7 41.3 22.0 35.6 1,569.6 116.1 616.1 332.3 314.4 Nov 59.8 9.8 3.3 2.7 43.8 41.4 14.8 31.5 1,554.8 116.8 577.1 329.1 317.8 Dec
Changes 125.1 0.2 0.2 0.2 − 6.2 − 6.2 − − 4.5 194.8 8.1 172.3 37.1 71.2 199724.0 4.6 0.3 0.3 2.9 2.9 − 6.2 263.3 28.1 151.4 28.8 68.3 19985.9 1.5 − 0.2 − 1.3 1.9 1.2 0.6 3.5 168.0 65.1 89.7 38.0 7.7 1999
− 4.5 − 0.5 − 0.1 − 0.3 23.1 21.6 − 1.6 − 1.5 90.6 15.9 97.8 35.3 54.6 2000− 4.6 1.6 0.2 0.4 − 20.5 − 20.4 4.6 13.3 59.5 18.6 34.8 20.9 − 1.1 2001− 2.6 1.1 − 0.5 − 0.3 − 1.4 − 1.3 − 1.6 4.1 18.8 14.8 − 2.1 25.6 − 2.7 2002− 4.4 2.0 − 0.8 − 0.4 − 1.8 − 1.4 10.7 0.0 49.8 − 2.2 4.6 − 3.9 − 26.3 2003− 8.3 − 1.4 − 0.6 − 0.4 − 2.1 − 2.8 0.8 − 5.2 74.1 − 14.5 21.8 − 10.9 11.8 2004
− 1.6 − 0.6 − 0.1 − 0.0 − 1.1 − 0.3 0.0 − 0.5 3.5 − 0.8 13.7 − 0.9 1.2 2003 Apr 0.9 1.2 − 0.1 − 0.0 2.2 − 0.5 1.0 − 0.2 3.4 − 6.9 − 8.2 0.7 − 7.8 May
− 0.8 − 1.0 − 0.1 − 0.0 0.4 0.2 − 1.5 − 0.7 3.1 − 4.5 − 11.4 − 3.6 4.7 June
− 1.5 − 0.2 − 0.1 − 0.1 − 2.8 − 0.8 0.2 − 0.4 12.1 4.3 7.0 − 0.2 − 4.6 July0.0 0.6 − 0.1 − 0.0 0.6 0.0 1.5 − 0.2 − 7.1 − 10.9 − 32.4 − 4.9 − 0.2 Aug
− 1.5 − 0.7 − 0.1 − 0.1 0.3 − 0.4 3.2 − 0.1 11.6 2.4 12.3 − 1.9 0.7 Sep
0.1 0.7 − 0.1 − 0.1 − 0.7 − 0.4 5.6 − 0.5 7.8 1.8 − 10.3 3.4 − 1.1 Oct − 1.1 − 1.2 − 0.1 − 0.1 0.1 0.6 − 1.2 − 0.5 12.3 5.3 6.8 − 1.0 1.3 Nov − 0.3 0.1 − 0.1 − 0.1 0.3 0.6 − 5.9 − 0.4 − 10.6 − 0.1 3.2 − 1.8 − 7.9 Dec
− 1.2 0.5 − 0.1 − 0.0 0.0 0.9 2.5 − 0.3 4.2 − 2.7 12.7 − 3.9 − 13.9 2004 Jan − 2.6 − 1.0 − 0.0 − 0.0 1.3 0.6 0.9 − 0.2 10.0 − 1.3 19.6 − 4.6 4.1 Feb − 4.1 − 0.8 − 0.0 − 0.0 0.5 0.4 0.8 − 0.5 23.2 7.5 14.0 − 2.5 6.7 Mar
− 0.8 0.1 − 0.0 − 0.0 − 0.6 − 0.0 − 1.0 − 0.0 15.5 0.3 6.4 3.4 7.7 Apr 2.6 2.1 − 0.0 − 0.0 1.0 − 0.4 − 0.3 0.3 12.2 − 2.8 − 16.7 2.6 − 4.6 May
− 2.1 − 2.1 − 0.0 − 0.0 2.4 1.3 − 0.8 − 0.1 − 5.9 − 8.6 − 31.0 1.1 − 0.5 June
− 1.1 − 0.5 − 0.0 − 0.0 − 1.0 0.0 0.6 3.9 3.6 − 3.6 − 7.0 1.8 − 0.1 July1.1 0.5 − 0.0 − 0.0 2.4 0.4 − 2.5 1.2 5.4 0.7 2.1 − 3.3 − 2.0 Aug
− 2.5 − 1.9 − 0.0 − 0.0 − 4.0 − 1.6 3.9 − 2.4 16.5 − 0.9 23.8 − 1.2 5.4 Sep
2.5 2.2 − 0.1 − 0.1 − 2.6 − 3.4 3.1 − 1.3 − 3.2 − 1.7 − 9.2 0.8 5.3 Oct − 2.1 − 2.3 − 0.1 − 0.1 − 1.9 − 1.3 0.8 − 1.8 3.8 − 1.9 40.6 − 2.6 2.6 Nov
1.9 1.9 − 0.1 − 0.1 0.1 0.2 − 7.2 − 4.1 − 11.2 0.8 − 33.3 − 2.6 1.3 Dec
footnote 2). — 4 Up to December 1998, with maturities of less than four with maturities of up to one year are classed as money market paper; up toyears. — 5 Excluding deposits of central governments. — 6 Data collected the January 2002 Monthly Report they were published together with moneyseparately from 1999 only; up to December 1998, included in the deposits market fund shares. with agreed maturities of up to two years. — 7 In Germany, debt securities
23*
IV Banks

DEUTSCHEBUNDESBANKMonthly ReportFebruary 2005
IV Banks
2 Principal assets and liabilities of banks (MFIs) in Germany, by category of banks *
€ billion
Lending to banks (MFIs) Lending to non-banks (non-MFIs) of which of which
Loans Cash in hand and creditNumber of balances forreporting Balance with Balances up to and for Partici-Securities Securities
End of institu- sheet central and issued by including more than issued by pating Othermonth tions total banks Total loans banks Total 1 year 1 year Bills non-banks interests assets
All categories of banks
2004 July 2,184 6,608.2 53.1 2,516.2 1,799.5 708.0 3,633.5 453.0 2,568.9 3.6 590.5 142.7 262.7 Aug 2,178 6,599.5 54.8 2,507.3 1,790.0 708.0 3,636.8 450.0 2,570.3 3.5 593.9 141.4 259.2 Sep 2,166 6,633.1 54.6 2,534.8 1,808.9 715.8 3,640.5 459.6 2,567.7 3.5 594.2 141.4 261.8
Oct 2,150 6,667.4 50.8 2,560.2 1,835.1 716.4 3,648.9 461.4 2,563.7 3.4 603.8 140.6 266.9 Nov 2,148 6,725.3 60.9 2,587.5 1,855.9 722.7 3,667.3 485.7 2,557.4 3.4 604.6 139.9 269.7 Dec 2,147 6,663.8 56.4 2,565.7 1,836.0 719.3 3,630.8 451.5 2,554.4 3.3 607.1 138.9 272.0
Commercial banks 5
2004 Nov 253 1,915.8 25.8 710.9 573.7 134.0 1,008.4 274.3 543.6 1.8 176.7 74.2 96.5 Dec 252 1,878.8 16.8 720.3 583.6 134.0 973.6 250.1 541.0 1.8 170.2 73.9 94.1
Big banks 6
2004 Nov 4 1,122.2 15.2 416.4 356.8 58.3 561.4 184.0 261.5 1.2 104.3 64.7 64.7 Dec 5 1,217.5 8.0 464.1 388.0 74.9 611.1 169.0 309.6 1.3 121.9 65.2 69.0
Regional banks and other commercial banks2004 Nov 164 702.6 9.5 245.3 170.9 73.2 409.6 72.6 264.8 0.6 70.3 9.5 28.7 Dec 163 568.0 8.1 202.1 145.4 55.7 327.1 65.0 214.4 0.4 46.3 8.7 22.0
Branches of foreign banks2004 Nov 85 91.0 1.1 49.2 46.0 2.5 37.4 17.7 17.3 0.0 2.2 0.1 3.1 Dec 84 93.3 0.7 54.1 50.2 3.3 35.4 16.0 17.0 0.0 2.0 0.0 3.1
Landesbanken2004 Nov 13 1,397.4 2.6 734.3 575.6 155.6 578.1 70.4 391.4 0.3 113.2 29.3 53.1 Dec 12 1,282.2 5.1 692.7 537.5 150.0 513.1 61.1 360.6 0.3 88.1 25.9 45.3
Savings banks2004 Nov 477 997.3 18.4 240.0 84.6 155.0 701.8 67.6 541.1 0.8 92.1 15.4 21.7 Dec 477 1,002.0 19.3 241.1 86.7 154.1 702.8 68.4 540.6 0.8 92.7 15.4 23.4
Regional institutions of credit cooperatives
2004 Nov 2 204.9 1.3 141.3 96.9 43.7 43.7 11.8 19.6 0.1 12.2 11.4 7.2 Dec 2 200.5 1.1 138.1 92.7 44.6 42.7 9.6 19.3 0.0 13.7 11.4 7.2
Credit cooperatives2004 Nov 1,336 575.8 11.5 154.3 69.1 84.1 386.9 41.0 304.2 0.5 41.0 6.0 17.1 Dec 1,336 576.4 12.2 151.3 67.8 82.3 389.3 40.8 306.7 0.4 41.2 6.1 17.4
Mortgage banks2004 Nov 25 866.8 0.9 229.3 138.3 90.8 616.1 12.1 480.6 − 122.8 0.8 19.6 Dec 25 865.8 1.1 226.1 137.7 88.2 615.4 11.6 479.4 − 124.4 0.8 22.4
Building and loan associations2004 Nov 27 183.0 0.1 45.1 33.1 11.9 120.7 1.5 106.1 . 13.1 0.4 16.7 Dec 27 183.9 0.1 44.5 32.9 11.6 121.8 1.5 106.1 . 14.2 0.4 17.1
Special purpose banks2004 Nov 15 584.4 0.3 332.3 284.6 47.5 211.7 7.0 170.9 − 33.5 2.2 37.9 Dec 16 674.2 0.6 351.5 297.0 54.4 272.1 8.5 200.7 − 62.6 4.9 45.2
Memo item: Foreign banks 7
2004 Nov 127 415.6 4.8 183.1 131.8 50.6 213.4 38.1 127.8 0.2 46.9 0.8 13.5 Dec 126 414.3 3.6 182.6 131.3 50.6 213.2 35.3 128.8 0.2 48.6 0.7 14.1
of which: Banks majority-owned by foreign banks 8
2004 Nov 42 324.6 3.7 134.0 85.7 48.1 176.0 20.4 110.6 0.2 44.8 0.7 10.4 Dec 42 320.9 2.9 128.5 81.2 47.3 177.8 19.2 111.8 0.2 46.7 0.7 11.0
* For the period up to December 1998, section IV (except for Table IV.1) included. For the definitions of the respective items, see the footnotes toshows the assets and liabilities of banks (excluding building and loan Table IV.3. — 1 For building and loan associations: Including deposits underassociations) in liabilities of monetary financial institutions (MFIs) in savings and loan contracts (see Table IV.12). — 2 Included in timeGermany. The assets and liabilities of foreign branches, of money market deposits. — 3 Excluding deposits under savings and loan contracts (see alsofunds (which are also classified as MFIs) and of the Bundesbank are not footnote 2). — 4 Including subordinated negotiable bearer debt
24*
IV Banks

DEUTSCHEBUNDESBANKMonthly ReportFebruary 2005
IV Banks
Deposits of banks (MFIs) Deposits of non-banks (non-MFIs) Capital including
of which of which publishedreserves,
Time deposits 1 Savings deposits 3 partici-pation
Memo rightsitem Bearer capital,
for for of which debtLiabilities funds forup to and more arising At three Bank generalsecurities
Sight Time Sight including than from savings out- banking Other End ofmonths’Total deposits deposits Total deposits 1 year 1 year 1 repos 2 Total notice bonds risks monthstanding 4 liabilities
All categories of banks
1,873.9 249.5 1,624.2 2,470.3 691.7 314.6 758.3 72.1 600.3 512.6 105.3 1,607.5 287.9 368.7 2004 July1,854.6 229.2 1,625.3 2,480.0 696.3 319.3 758.0 76.3 601.0 513.4 105.5 1,610.2 286.7 368.0 Aug 1,853.0 253.1 1,599.8 2,495.0 714.3 312.8 761.7 81.6 600.8 513.5 105.3 1,621.8 285.4 377.9 Sep
1,880.9 248.4 1,632.3 2,496.2 702.3 324.6 761.7 85.7 601.9 514.0 105.7 1,615.1 287.1 388.1 Oct 1,904.1 289.3 1,614.6 2,528.9 735.3 323.9 761.1 99.3 602.6 513.9 106.0 1,611.8 287.0 393.5 Nov 1,874.5 206.7 1,667.7 2,511.2 683.5 350.6 758.3 87.6 613.0 523.1 105.8 1,593.3 288.1 396.6 Dec
Commercial banks 5
742.3 155.6 586.5 746.7 340.0 164.4 128.9 87.4 104.0 94.6 9.4 209.9 89.5 127.4 2004 Nov 726.8 114.5 612.1 727.0 306.1 178.3 126.8 74.8 106.3 96.8 9.4 209.8 91.0 124.3 Dec
Big banks 6
463.4 111.6 351.8 387.6 158.3 121.6 74.7 86.2 32.5 30.7 0.5 146.9 49.9 74.5 2004 Nov 473.1 77.9 395.1 449.6 153.0 135.2 88.3 72.3 71.4 69.2 1.7 158.9 53.7 82.3 Dec
Regional banks and other commercial banks211.4 30.2 181.1 342.5 170.1 39.7 52.4 1.2 71.5 63.9 8.9 63.1 37.2 48.4 2004 Nov 184.1 26.0 158.0 260.9 144.5 36.9 36.9 2.5 34.9 27.6 7.6 50.9 34.7 37.4 Dec
Branches of foreign banks67.5 13.8 53.7 16.6 11.6 3.1 1.8 − 0.0 0.0 0.0 − 2.4 4.5 2004 Nov 69.6 10.6 59.0 16.5 8.6 6.3 1.6 − 0.0 0.0 0.1 0.0 2.6 4.6 Dec
Landesbanken468.2 73.9 394.3 318.2 50.2 36.4 215.8 8.1 15.0 14.2 0.8 490.8 60.2 59.9 2004 Nov 430.2 46.3 383.9 301.9 42.1 45.2 198.9 7.7 15.2 14.3 0.6 433.8 55.1 61.1 Dec
Savings banks216.1 5.3 210.8 639.0 204.3 50.8 11.4 − 302.2 249.7 70.3 44.4 47.6 50.2 2004 Nov 223.5 8.0 215.5 642.1 200.6 52.3 11.5 − 307.3 254.1 70.3 43.9 47.6 45.0 Dec
Regional institutions of credit cooperatives
123.9 40.5 83.4 30.4 6.6 7.5 15.6 3.6 − − 0.7 30.6 10.1 10.0 2004 Nov 121.4 30.4 90.9 30.5 4.0 10.1 15.7 5.0 − − 0.7 28.9 10.0 9.8 Dec
Credit cooperatives74.3 1.2 73.0 412.4 130.9 51.2 24.8 − 181.0 155.0 24.4 32.7 31.3 25.1 2004 Nov 74.9 1.8 73.1 413.4 127.1 53.2 25.2 − 183.8 157.6 24.2 32.0 31.5 24.5 Dec
Mortgage banks138.9 5.3 133.6 150.5 1.2 4.1 145.1 0.1 − − 0.2 530.4 21.8 25.2 2004 Nov 138.1 2.9 135.2 150.9 1.2 3.7 145.8 0.1 − − 0.2 525.6 22.0 29.2 Dec
Building and loan associations28.9 1.5 27.4 114.2 0.3 0.9 112.4 − 0.4 0.4 0.2 6.8 7.4 25.7 2004 Nov 27.9 0.8 27.1 117.8 0.4 0.9 115.9 − 0.4 0.4 0.3 6.8 7.4 24.1 Dec
Special purpose banks111.5 5.9 105.6 117.5 1.8 8.6 107.1 − − − − 266.2 19.2 70.0 2004 Nov 131.6 1.9 129.8 127.7 2.0 7.0 118.5 − − − 0.2 312.6 23.6 78.8 Dec
Memo item: Foreign banks 7
146.9 25.7 121.1 134.9 85.1 13.1 27.0 0.3 6.7 6.6 3.1 98.2 13.1 22.5 2004 Nov 147.6 22.3 125.3 134.7 82.6 14.8 27.5 0.1 6.8 6.6 3.0 96.1 13.4 22.4 Dec
of which: Banks majority-owned by foreign banks 8
79.4 11.9 67.5 118.4 73.4 9.9 25.2 0.3 6.7 6.6 3.1 98.2 10.6 18.0 2004 Nov 78.0 11.7 66.3 118.2 74.1 8.5 25.9 0.1 6.8 6.6 2.9 96.1 10.9 17.8 Dec
securities; excluding non-negotiable bearer debt securities. — 5 Commercial included in other categories of banks and the category ”Branches (withbanks comprise the sub-groups ”Big banks”, ”Regional banks and other dependent legal status) of foreign banks”. — 8 Separate presentation of thecommercial banks” and ”Branches of foreign banks”. — 6 Deutsche Bank banks majority-owned by foreign banks included in the categoriesAG, Dresdner Bank AG, Commerzbank AG and Bayerische Hypo- und Vereins- ”Regional banks and other commercial banks” and ”Mortgage banks”. bank AG. — 7 Sum of the banks majority-owned by foreign banks and
25*
IV Banks

DEUTSCHEBUNDESBANKMonthly ReportFebruary 2005
IV Banks
3 Assets and liabilities of banks (MFIs) in Germany vis-à-vis residents *
Up to end-1998, DM billion; from 1999, € billion
Lending to domestic banks (MFIs) 2,3 Lending to domestic non-banks (non-MFIs) 3,8
TreasuryCash in Negotiable bills andhand Credit money negotiable
balances market Memo money mar-(euro-area Securitiesbanknotes with the Credit paper item ket paper issuedSecuritiesand Bundes- balances issued by issued by Fiduciary issued by by non-
Period coins) 1 bank Total and loans Bills 4 banks 5 banks 6 loans 7 Total Loans Bills 4 non-banks banks 9
End of year or month *
1995 26.0 61.0 1,859.9 1,264.9 17.5 4.3 561.9 11.4 4,436.9 3,802.0 46.8 1.4 427.31996 28.9 59.7 2,134.0 1,443.3 17.9 3.4 657.2 12.2 4,773.1 4,097.9 44.8 5.9 437.21997 29.3 60.2 2,397.9 1,606.3 18.1 3.6 758.9 11.1 5,058.4 4,353.9 44.7 2.9 473.31998 28.5 63.6 2,738.2 1,814.7 14.6 12.2 887.7 9.1 5,379.8 4,639.7 32.8 5.0 527.81999 16.8 45.6 1,556.9 1,033.4 0.0 19.2 504.2 3.9 2,904.5 2,569.6 7.0 3.0 287.5
2000 15.6 50.8 1,639.6 1,056.1 0.0 26.8 556.6 3.6 3,003.7 2,657.3 6.5 2.3 304.72001 14.2 56.3 1,676.0 1,078.9 0.0 5.6 591.5 2.8 3,014.1 2,699.4 4.8 4.4 301.52002 17.5 45.6 1,691.3 1,112.3 0.0 7.8 571.2 2.7 2,997.2 2,685.0 4.1 3.3 301.92003 17.0 46.7 1,643.9 1,064.0 0.0 8.8 571.0 2.3 2,995.6 2,677.0 3.7 3.4 309.62004 14.9 41.2 1,676.3 1,075.8 0.0 7.4 592.9 2.1 3,001.3 2,644.0 2.7 2.6 351.0
2003 July 12.9 40.5 1,645.6 1,063.8 0.0 10.9 571.0 2.4 2,996.0 2,671.8 4.0 3.4 314.7 Aug 13.2 42.5 1,636.2 1,056.4 0.0 9.3 570.5 2.4 2,986.9 2,667.9 4.0 3.4 309.6 Sep 12.9 42.1 1,627.9 1,047.0 0.0 9.7 571.2 2.4 2,995.7 2,676.3 3.9 2.1 311.4
Oct 13.3 44.3 1,630.0 1,046.2 0.0 9.7 574.1 2.4 2,992.9 2,675.4 3.9 3.1 308.4 Nov 12.8 38.2 1,663.1 1,073.8 0.0 10.5 578.8 2.3 3,012.2 2,685.5 3.7 3.4 317.5 Dec 17.0 46.7 1,643.9 1,064.0 0.0 8.8 571.0 2.3 2,995.6 2,677.0 3.7 3.4 309.6
2004 Jan 12.9 39.5 1,632.9 1,055.9 0.0 8.4 568.5 2.3 2,992.0 2,667.0 3.5 2.6 316.8 Feb 12.9 37.6 1,645.1 1,058.5 0.0 8.5 578.0 2.3 2,994.8 2,658.8 3.4 2.5 328.1 Mar 12.4 31.1 1,656.6 1,062.0 0.0 8.1 586.4 2.4 3,015.7 2,670.4 3.2 2.1 338.0
Apr 12.6 39.4 1,673.5 1,070.7 0.0 8.6 594.1 2.4 3,022.9 2,664.3 3.2 3.0 350.5 May 13.5 41.4 1,693.0 1,081.2 0.0 7.7 604.1 2.4 3,013.6 2,657.8 3.2 2.9 347.8 June 12.8 37.3 1,671.7 1,070.0 0.0 7.7 594.0 2.3 3,003.5 2,652.5 3.0 3.6 342.6
July 12.8 39.9 1,687.1 1,082.3 0.0 6.9 597.9 2.3 3,007.5 2,656.4 3.0 6.8 340.2 Aug 12.8 41.6 1,679.0 1,075.6 0.0 7.4 596.0 2.3 3,001.8 2,648.6 3.0 5.9 343.3 Sep 12.9 41.4 1,680.5 1,073.4 0.0 7.9 599.2 2.1 3,006.1 2,652.3 2.9 3.9 345.9
Oct 13.5 37.0 1,686.4 1,083.4 0.0 6.5 596.4 2.2 3,009.8 2,654.8 2.8 4.5 346.7 Nov 12.8 47.5 1,688.7 1,083.2 0.0 6.7 598.8 2.2 3,014.6 2,657.4 2.8 3.9 349.4 Dec 14.9 41.2 1,676.3 1,075.8 0.0 7.4 592.9 2.1 3,001.3 2,644.0 2.7 2.6 351.0
Changes *
1996 + 2.9 − 1.3 + 257.8 + 161.8 + 0.4 − 1.1 + 95.8 + 0.8 + 336.3 + 311.7 − 2.0 + 4.7 + 10.61997 + 0.4 + 0.5 + 262.5 + 160.7 + 0.2 + 0.2 + 102.6 − 1.1 + 285.2 + 255.5 − 0.1 − 3.0 + 36.51998 − 0.8 + 3.4 + 343.3 + 210.3 − 3.6 + 8.6 + 130.0 − 2.0 + 335.3 + 302.1 − 11.9 + 2.1 + 52.11999 + 2.2 + 13.2 + 122.1 + 66.3 + 0.0 + 12.9 + 42.8 − 0.7 + 156.1 + 136.9 + 2.6 + 0.4 + 16.7
2000 − 1.1 + 5.1 + 83.6 + 21.7 − 0.0 + 7.6 + 54.3 − 0.3 + 100.7 + 83.7 − 0.5 − 0.8 + 19.02001 − 1.4 + 5.5 + 34.6 + 20.1 − 0.0 − 21.3 + 35.8 − 0.9 + 11.9 + 40.8 − 1.6 + 1.6 + 0.32002 + 3.3 − 10.7 + 15.0 + 33.1 + 0.0 + 2.3 − 20.3 − 0.2 − 19.2 − 18.0 − 0.8 − 1.1 + 1.72003 − 0.5 + 1.1 − 47.2 − 48.2 + 0.0 + 1.0 + 0.1 − 0.3 + 0.1 − 8.0 − 0.4 + 0.3 + 9.32004 − 2.1 − 5.5 + 35.9 + 15.1 + 0.0 − 1.4 + 22.1 − 0.2 + 3.3 − 35.0 − 1.0 + 1.1 + 39.2
2003 July − 0.0 − 0.4 − 20.1 − 27.2 − 0.0 + 0.8 + 6.3 − 0.0 + 3.8 + 1.6 + 0.1 − 0.3 + 3.4 Aug + 0.2 + 2.0 − 9.4 − 7.4 − 0.0 − 1.5 − 0.5 − 0.0 − 9.1 − 3.9 − 0.0 − 0.0 − 5.1 Sep − 0.2 − 0.3 − 7.8 − 9.4 + 0.0 + 0.4 + 1.2 − 0.0 + 9.6 + 8.4 − 0.1 − 1.3 + 2.6
Oct + 0.3 + 2.2 + 2.1 − 0.8 + 0.0 − 0.1 + 2.9 + 0.0 − 2.8 − 0.9 − 0.0 + 1.1 − 3.0 Nov − 0.5 − 6.1 + 33.1 + 27.6 − + 1.0 + 4.5 − 0.1 + 19.3 + 10.1 − 0.2 + 0.3 + 9.1 Dec + 4.2 + 8.5 − 19.3 − 9.8 − − 1.7 − 7.8 − 0.0 − 16.1 − 8.6 − 0.0 − 0.0 − 7.4
2004 Jan − 4.1 − 7.1 − 11.0 − 8.1 − − 0.4 − 2.6 − 0.0 − 3.7 − 10.0 − 0.1 − 0.7 + 7.2 Feb + 0.1 − 1.9 + 12.0 + 2.4 − + 0.1 + 9.5 − 0.0 + 2.8 − 8.1 − 0.2 − 0.2 + 11.3 Mar − 0.5 − 6.5 + 11.5 + 3.5 − 0.0 − 0.4 + 8.4 + 0.1 + 20.9 + 11.6 − 0.2 − 0.4 + 9.9
Apr + 0.1 + 8.3 + 16.9 + 8.7 + 0.0 + 0.5 + 7.7 + 0.0 + 7.3 − 6.1 + 0.0 + 0.8 + 12.6 May + 0.9 + 2.0 + 19.6 + 10.5 − 0.0 − 0.9 + 9.9 − 0.1 − 9.4 − 6.5 − 0.0 − 0.1 − 2.7 June − 0.7 − 4.1 − 21.3 − 11.2 − − 0.1 − 10.1 − 0.0 − 10.1 − 5.4 − 0.2 + 0.7 − 5.2
July + 0.1 + 2.5 + 15.4 + 12.2 + 0.0 − 0.8 + 3.9 − 0.0 + 4.0 + 4.0 + 0.0 + 3.2 − 2.3 Aug − 0.0 + 1.7 − 8.1 − 6.6 − 0.0 + 0.4 − 1.9 − 0.0 − 5.7 − 7.8 − 0.0 − 0.9 + 3.1 Sep + 0.0 − 0.2 + 1.8 − 2.2 − + 0.6 + 3.4 − 0.2 + 4.1 + 3.7 − 0.1 − 0.0 + 0.4
Oct + 0.7 − 4.5 + 5.9 + 10.0 + 0.0 − 1.4 − 2.8 + 0.1 + 3.8 + 2.4 − 0.1 + 0.6 + 0.8 Nov − 0.7 + 10.5 + 2.3 − 0.2 + 0.0 + 0.2 + 2.4 − 0.0 + 4.8 + 2.7 + 0.0 − 0.6 + 2.7 Dec + 2.1 − 6.3 − 9.0 − 3.9 − 0.0 + 0.7 − 5.8 − 0.1 − 15.4 − 15.5 − 0.1 − 1.3 + 1.6
* See Table IV.2, footnote*; statistical breaks have been eliminated from the prior to maturity). — 5 Up to November 1993, included in securities (see alsochanges. The figures for the latest date are always to be regarded as footnote 6). — 6 Up to November 1993, including negotiable money marketprovisional. Subsequent revisions which appear in the following Monthly paper; excluding registered debt securities. — 7 From 1999, no longerReport, are not specially marked. — 1 Up to December 1998, domestic included in loans or deposits (see also footnote 3). — 8 Up to Decemberbanknotes and coins. — 2 Up to December 1998, excluding loans to 1998, including loans to domestic building and loan associations. —domestic building and loan associations. — 3 Up to December 1998, 9 Excluding debt securities arising from the exchange of equalisation claimsincluding fiduciary loans (see also footnote 7). — 4 Up to December 1998, (see also footnote 10). — 10 Including debt securities arising from thebill-based lending (bill holdings plus endorsement liabilities arising from exchange of equalisation claims. — 11 Including liabilities arising fromrediscounted bills and bills sent for collection from the banks’ portfolios
26*
IV Banks

DEUTSCHEBUNDESBANKMonthly ReportFebruary 2005
IV Banks
Deposits of domestic banks (MFIs) 3,11,12 Deposits of domestic non-banks (non-MFIs) 3,17 Partici-patinginterestsin
Memo domestic Memo Memoitem banks Sight Time Redis- item Sight Time Savings Bank itemEqualisa-
tion Fiduciary and deposits deposits counted Fiduciary de- deposits de- savings Fiduciaryloans 7 Total 13,14 14,15 bills 16 loans 7 Total 15,18 bonds 20 loans 7 Periodclaims 10 enterprises posits 13 posits 19
End of year or month *
71.3 88.1 83.2 1,539.4 363.9 1,065.1 75.5 35.0 3,021.1 579.9 1,086.1 1,046.1 227.4 81.6 199581.3 106.0 89.7 1,731.0 401.1 1,202.4 75.4 52.2 3,241.5 675.1 1,109.8 1,143.0 227.8 85.8 199676.0 107.6 95.1 1,902.3 427.6 1,349.1 75.6 50.0 3,341.9 689.8 1,146.9 1,182.1 236.9 86.1 199771.6 102.8 129.2 2,086.9 472.5 1,505.2 59.4 49.7 3,520.3 799.5 1,194.1 1,211.0 234.9 80.9 199837.5 58.0 75.6 1,122.0 114.4 1,007.3 0.3 29.8 1,905.3 420.4 759.6 614.7 110.7 42.1 1999
33.1 58.5 82.7 1,189.2 113.4 1,075.3 0.4 30.1 1,945.8 443.4 819.9 573.5 109.0 42.1 20004.0 57.0 95.9 1,204.9 123.1 1,081.6 0.3 27.2 2,034.0 526.4 827.0 574.5 106.0 43.3 20013.0 54.8 119.0 1,244.0 127.6 1,116.2 0.2 25.6 2,085.9 575.6 830.6 575.3 104.4 42.1 20022.0 56.8 109.2 1,229.6 116.8 1,112.6 0.2 27.8 2,140.3 624.0 825.7 590.3 100.3 40.5 20031.0 61.8 99.6 1,271.2 119.7 1,151.4 0.1 30.3 2,200.0 646.9 851.2 603.5 98.4 43.7 2004
2.0 54.2 119.1 1,207.7 123.6 1,084.0 0.1 25.3 2,102.3 595.6 829.0 576.8 100.9 41.7 2003 July2.0 54.6 118.8 1,198.2 120.9 1,077.2 0.1 25.7 2,111.4 598.5 834.5 578.0 100.4 41.7 Aug 2.0 54.4 115.1 1,188.2 116.0 1,072.0 0.1 25.5 2,112.3 608.8 825.4 578.3 99.9 41.5 Sep
2.0 53.9 115.0 1,179.6 122.1 1,057.4 0.1 25.3 2,114.7 610.9 824.5 579.4 100.0 40.7 Oct 2.0 54.1 113.3 1,214.5 135.3 1,079.1 0.1 25.5 2,138.6 634.1 824.0 580.3 100.1 40.7 Nov 2.0 56.8 109.2 1,229.6 116.8 1,112.6 0.2 27.8 2,140.3 624.0 825.7 590.3 100.3 40.5 Dec
2.0 57.2 108.9 1,213.2 142.0 1,071.1 0.1 28.3 2,137.5 632.2 814.3 590.6 100.3 40.3 2004 Jan 2.0 56.6 108.8 1,215.7 134.0 1,081.6 0.1 28.2 2,141.8 635.4 814.8 591.5 100.1 40.5 Feb 2.0 54.9 107.2 1,204.3 140.0 1,064.2 0.1 27.8 2,145.8 635.3 819.2 591.4 99.8 39.3 Mar
2.0 54.4 106.6 1,227.8 143.2 1,084.5 0.1 27.7 2,154.0 644.0 819.6 591.2 99.2 39.0 Apr 2.0 54.3 107.1 1,252.0 134.2 1,117.7 0.1 27.6 2,162.4 642.7 830.2 590.6 98.9 39.0 May2.0 54.9 106.7 1,257.3 129.2 1,128.0 0.1 28.4 2,158.3 643.5 826.2 590.0 98.7 38.8 June
1.0 55.9 103.5 1,275.2 125.7 1,149.4 0.1 29.5 2,160.4 637.6 833.6 590.6 98.6 38.7 July1.0 55.8 102.2 1,260.2 122.4 1,137.7 0.1 29.4 2,161.3 639.1 832.2 591.3 98.7 38.6 Aug 1.0 57.0 102.6 1,243.1 124.4 1,118.6 0.1 30.7 2,169.7 649.5 830.4 591.2 98.6 38.5 Sep
1.0 59.9 101.8 1,278.0 129.8 1,148.1 0.1 30.5 2,172.9 647.2 834.6 592.3 98.8 41.8 Oct 1.0 60.2 101.8 1,286.4 148.4 1,137.9 0.1 30.4 2,195.4 673.0 830.7 593.1 98.7 42.1 Nov 1.0 61.8 99.6 1,271.2 119.7 1,151.4 0.1 30.3 2,200.0 646.9 851.2 603.5 98.4 43.7 Dec
Changes *
+ 8.0 + 3.3 + 6.5 + 175.9 + 36.6 + 137.7 − 0.2 + 1.7 + 218.4 + 94.3 + 23.2 + 96.9 + 0.7 + 3.3 1996− 5.3 + 1.6 + 5.4 + 175.9 + 31.6 + 146.7 + 0.2 − 2.6 + 100.5 + 13.0 + 37.1 + 39.1 + 9.2 + 2.1 1997− 4.4 − 4.8 + 34.1 + 179.0 + 39.7 + 156.4 − 16.2 − 0.9 + 179.3 + 110.6 + 47.2 + 28.9 − 2.1 − 5.3 1998− 0.6 + 0.1 + 9.3 + 69.0 − 1.8 + 81.8 − 11.1 − 0.4 + 67.3 + 32.7 + 48.4 − 4.5 − 9.3 + 0.7 1999
− 0.8 + 0.5 + 7.1 + 64.7 − 2.3 + 66.9 + 0.1 + 0.3 + 41.3 + 22.3 + 61.1 − 40.5 − 1.7 − 0.0 2000− 29.1 − 1.5 + 13.3 + 9.6 + 7.4 + 2.3 − 0.2 − 2.9 + 88.5 + 82.3 + 8.1 + 1.1 − 2.9 + 1.0 2001− 1.0 − 2.1 + 24.2 + 37.9 + 1.7 + 36.3 − 0.1 − 1.5 + 51.7 + 48.4 + 4.1 + 0.8 − 1.6 − 1.1 2002− 1.0 + 2.1 − 9.8 − 5.6 − 9.5 + 3.9 + 0.0 + 2.4 + 54.0 + 48.4 − 4.8 + 15.1 − 4.8 − 1.2 2003− 1.1 + 3.0 − 9.6 + 41.3 + 2.9 + 38.5 − 0.1 + 2.4 + 62.0 + 24.4 + 25.9 + 13.1 − 1.5 + 1.2 2004
− 1.0 − 0.2 + 1.0 − 44.9 − 27.0 − 18.0 − 0.0 − 0.1 − 7.1 − 13.3 + 6.5 + 0.1 − 0.4 − 0.0 2003 July− 0.0 + 0.3 − 0.3 − 9.5 − 2.7 − 6.8 − 0.0 + 0.4 + 9.1 + 2.9 + 5.5 + 1.3 − 0.5 − 0.1 Aug + 0.0 − 0.2 − 3.6 − 8.7 − 3.5 − 5.2 − 0.0 − 0.2 + 0.8 + 10.3 − 9.1 + 0.2 − 0.5 − 0.2 Sep
− 0.0 − 0.4 − 0.2 − 8.6 + 6.1 − 14.7 + 0.0 − 0.2 + 2.5 + 2.1 − 0.9 + 1.1 + 0.1 − 0.3 Oct − + 0.2 − 1.7 + 34.9 + 13.2 + 21.7 + 0.0 + 0.2 + 23.8 + 23.2 − 0.4 + 0.9 + 0.2 + 0.0 Nov
+ 0.0 + 2.7 − 4.1 + 15.1 − 18.6 + 33.6 + 0.1 + 2.3 + 1.7 − 10.1 + 1.7 + 10.0 + 0.1 − 0.2 Dec
− 0.0 + 0.3 − 0.3 − 16.3 + 25.3 − 41.5 − 0.1 + 0.4 − 2.8 + 8.2 − 11.4 + 0.3 + 0.1 − 0.2 2004 Jan − − 0.5 − 0.1 + 2.4 − 8.0 + 10.5 − 0.0 − 0.1 + 4.3 + 4.1 − 0.4 + 0.9 − 0.2 + 0.2 Feb
+ 0.0 − 1.8 − 1.6 − 11.4 + 6.0 − 17.4 + 0.0 − 0.3 + 4.0 − 0.0 + 4.5 − 0.1 − 0.3 − 1.2 Mar
− 0.0 − 0.5 − 0.6 + 23.2 + 3.2 + 20.0 + 0.0 − 0.2 + 8.5 + 8.7 + 0.3 − 0.2 − 0.2 − 0.2 Apr − − 0.1 + 0.4 + 24.2 − 9.0 + 33.2 + 0.0 − 0.1 + 8.4 − 1.4 + 10.6 − 0.6 − 0.2 − 0.0 May− + 0.6 − 0.4 + 5.3 − 5.0 + 10.3 + 0.0 + 0.8 − 4.1 + 0.4 − 3.6 − 0.6 − 0.3 − 0.2 June
− 0.9 + 1.1 − 3.1 + 17.9 − 3.4 + 21.4 − 0.0 + 1.1 + 2.1 − 5.5 + 7.0 + 0.7 − 0.0 − 0.1 July+ 0.0 − 0.2 − 1.4 − 15.0 − 3.4 − 11.7 − 0.0 − 0.1 + 1.9 + 1.5 − 0.4 + 0.7 + 0.1 − 0.1 Aug
− + 1.2 + 0.4 − 17.1 + 2.0 − 19.1 − 0.0 + 1.3 + 8.3 + 10.4 − 1.8 − 0.1 − 0.2 − 0.1 Sep
− + 3.0 − 0.8 + 34.9 + 5.4 + 29.5 − 0.0 − 0.2 + 3.2 − 2.3 + 4.2 + 1.1 + 0.2 + 3.3 Oct − + 0.3 + 0.1 + 8.4 + 18.6 − 10.2 − 0.0 − 0.1 + 22.5 + 26.4 − 4.5 + 0.8 − 0.1 + 0.3 Nov
− 0.1 − 0.3 − 2.2 − 15.2 − 28.8 + 13.5 − 0.0 − 0.1 + 5.6 − 26.1 + 21.5 + 10.4 − 0.3 − 0.4 Dec
registered debt securities, registered money market paper and up to December 1998, including endorsement liabilities arising fromnon-negotiable bearer debt securities; including subordinated liabilities. — rediscounted bills. — 17 Up to December 1998, including liabilities to12 Up to December 1998, excluding liabilities to domestic building and loan domestic building and loan associations and money market funds. —associations and money market funds. — 13 Up to December 1998, 18 Since the inclusion of building and loan associations in January 1999,including time deposits with terms of less than one month. — 14 Including including deposits under savings and loan contracts (see Table IV.12). —liabilities arising from monetary policy operations with the Bundesbank. — 19 Excluding deposits under savings and loan contracts (see also15 Up to December 1998, excluding time deposits with terms of less than footnote 18). — 20 Including liabilities arising from non-negotiable bearerone month. — 16 Own acceptances and promissory notes outstanding and, debt securities.
27*
IV Banks

DEUTSCHEBUNDESBANKMonthly ReportFebruary 2005
IV Banks
4 Assets and liabilities of banks (MFIs) in Germany vis-à-vis non-residents *
Up to end-1998, DM billion; from 1999, € billion
Lending to foreign banks (MFIs) 2 Lending to foreign non-banks (non-MFIs) 2
TreasuryCash in bills andhand Loans and bills 3 negotiableCredit balances and loans, bills 3 Negotiable(non- money moneyeuro-area Medium market Memo Medium marketbanknotes and paper item and paper SecuritiesSecuritiesand Short- long- issued by issued by Fiduciary Short- long- issued by issued by
Period coins) 1 Total Total term term banks 4 banks 5 loans 6 Total Total term term non-banks non-banks
End of year or month *
1995 1.2 538.4 500.8 349.7 151.1 0.1 25.6 11.8 289.2 191.1 42.1 148.9 1.7 79.71996 1.4 588.9 544.2 386.6 157.6 0.3 31.5 13.0 352.0 230.4 60.2 170.2 4.9 103.91997 1.5 689.1 635.3 456.1 179.2 0.2 43.1 10.5 474.8 312.7 96.2 216.5 6.0 140.31998 1.5 774.9 706.9 533.6 173.3 0.4 58.7 9.0 610.3 364.9 93.9 270.9 11.6 211.01999 0.4 427.1 383.5 279.5 104.1 0.4 43.2 4.2 396.1 235.8 52.7 183.1 7.5 152.7
2000 0.4 507.7 441.4 325.4 116.0 1.3 65.0 3.6 475.8 286.8 71.1 215.7 6.5 182.52001 0.4 596.1 521.7 383.7 138.0 0.8 73.6 3.5 570.3 347.2 99.7 247.5 5.2 217.92002 0.3 690.6 615.3 468.0 147.2 0.9 74.4 2.7 558.8 332.6 92.6 240.0 9.3 216.92003 0.3 769.6 675.8 515.7 160.1 1.5 92.3 1.6 576.3 344.8 110.9 233.9 6.0 225.42004 0.2 889.4 760.2 606.5 153.7 2.8 126.4 1.5 629.5 362.5 136.6 225.9 10.9 256.1
2003 July 0.3 779.1 689.4 533.9 155.5 1.4 88.3 2.6 567.4 345.3 106.5 238.8 6.8 215.3 Aug 0.3 771.9 682.3 522.9 159.4 1.3 88.3 2.6 561.3 344.3 101.3 243.0 7.4 209.5 Sep 0.4 769.8 680.3 520.2 160.1 1.3 88.2 2.3 569.4 346.6 110.3 236.3 7.2 215.6
Oct 0.4 757.0 664.9 502.0 162.9 0.9 91.2 1.6 576.6 348.6 106.0 242.6 8.0 219.9 Nov 0.3 764.6 672.3 512.8 159.5 1.3 91.1 1.6 583.8 357.5 118.0 239.6 6.4 219.8 Dec 0.3 769.6 675.8 515.7 160.1 1.5 92.3 1.6 576.3 344.8 110.9 233.9 6.0 225.4
2004 Jan 0.3 788.7 693.8 531.9 161.9 1.2 93.6 1.6 588.4 353.0 118.0 235.0 5.5 229.8 Feb 0.3 790.5 691.5 530.7 160.8 1.3 97.7 1.6 598.7 360.7 126.1 234.6 6.0 232.0 Mar 0.3 803.2 700.1 538.5 161.6 1.7 101.4 1.7 617.6 370.2 133.9 236.4 4.8 242.5
Apr 0.3 825.5 720.4 557.5 162.9 2.2 102.8 1.7 625.8 376.7 137.2 239.5 5.0 244.0 May 0.3 836.2 725.7 570.5 155.2 1.9 108.7 1.7 613.1 361.8 123.6 238.2 5.0 246.3 June 0.4 835.5 722.1 566.9 155.2 2.1 111.3 1.7 618.9 363.8 124.6 239.1 7.3 247.8
July 0.4 829.1 717.3 557.4 159.9 1.7 110.1 1.6 626.0 366.1 127.6 238.5 9.7 250.2 Aug 0.4 828.3 714.6 557.9 156.7 1.8 112.0 1.6 635.0 372.4 134.6 237.7 12.1 250.5 Sep 0.3 854.3 735.7 578.0 157.7 2.0 116.6 1.7 634.5 375.5 141.8 233.6 10.6 248.4
Oct 0.3 873.8 751.8 595.5 156.3 2.0 120.0 1.7 639.0 370.9 139.0 231.8 11.1 257.1 Nov 0.4 898.7 772.7 619.1 153.7 2.0 124.0 1.6 652.7 386.3 158.1 228.2 11.3 255.2 Dec 0.2 889.4 760.2 606.5 153.7 2.8 126.4 1.5 629.5 362.5 136.6 225.9 10.9 256.1
Changes *
1996 + 0.2 + 34.2 + 29.9 + 27.2 + 2.7 + 0.2 + 5.2 − 1.1 + 58.4 + 36.2 + 17.0 + 19.2 + 3.1 + 21.41997 + 0.1 + 80.6 + 71.5 + 53.3 + 18.2 − 0.1 + 10.4 − 1.2 + 109.3 + 73.0 + 33.7 + 39.3 + 0.7 + 32.91998 − 0.0 + 100.8 + 89.5 + 79.3 + 10.2 + 0.0 + 13.1 − 1.8 + 122.0 + 42.7 − 6.4 + 49.1 + 5.5 + 66.01999 − 0.3 + 17.7 + 5.7 − 5.3 + 11.0 + 0.2 + 11.7 − 0.0 + 85.8 + 42.8 + 8.4 + 34.4 + 1.3 + 41.8
2000 − 0.0 + 78.9 + 56.5 + 44.6 + 11.8 + 0.9 + 21.6 − 0.7 + 72.0 + 45.0 + 17.4 + 27.7 − 1.2 + 28.22001 + 0.0 + 83.7 + 75.6 + 54.4 + 21.2 − 0.5 + 8.5 − 0.2 + 88.3 + 53.4 + 27.0 + 26.4 − 1.5 + 36.32002 − 0.1 + 120.3 + 118.0 + 99.4 + 18.6 + 0.1 + 2.2 − 0.9 + 21.2 + 12.7 − 0.4 + 13.2 + 4.6 + 3.92003 − 0.1 + 103.8 + 84.6 + 65.2 + 19.3 + 0.6 + 18.7 − 0.4 + 46.3 + 35.1 + 24.0 + 11.0 − 2.7 + 13.92004 − 0.1 + 128.3 + 89.4 + 95.3 − 5.9 + 1.3 + 37.6 − 0.1 + 65.8 + 29.5 + 31.7 − 2.2 + 5.1 + 31.1
2003 July − 0.1 − 16.5 − 19.1 − 20.3 + 1.2 + 0.2 + 2.4 − 0.0 − 12.3 − 7.5 − 9.0 + 1.5 − 0.3 − 4.6 Aug + 0.0 − 13.2 − 12.8 − 15.3 + 2.5 − 0.1 − 0.3 + 0.0 − 13.0 − 6.1 − 6.4 + 0.2 + 0.5 − 7.3 Sep + 0.0 + 5.7 + 5.4 + 2.9 + 2.5 − 0.0 + 0.4 − 0.3 + 19.1 + 10.6 + 10.8 − 0.2 + 0.0 + 8.5
Oct − 0.0 − 14.4 − 17.0 − 18.8 + 1.8 − 0.4 + 3.0 − 0.0 + 3.1 − 1.9 − 4.4 + 2.5 + 0.8 + 4.2 Nov − 0.0 + 12.5 + 12.1 + 14.3 − 2.3 + 0.4 + 0.1 − 0.0 + 12.8 + 13.3 + 12.9 + 0.5 − 1.5 + 1.0 Dec − 0.0 + 11.7 + 9.9 + 7.6 + 2.3 + 0.3 + 1.5 − 0.0 + 0.5 − 6.0 − 5.7 − 0.4 − 0.2 + 6.8
2004 Jan + 0.0 + 16.3 + 14.8 + 14.0 + 0.8 − 0.3 + 1.8 + 0.0 + 7.6 + 5.3 + 6.4 − 1.1 − 0.6 + 2.9 Feb − 0.0 + 2.7 − 1.5 − 0.6 − 0.9 + 0.1 + 4.1 + 0.0 + 11.1 + 8.0 + 8.4 − 0.4 + 0.6 + 2.5 Mar + 0.0 + 6.1 + 2.2 + 5.3 − 3.1 + 0.3 + 3.6 + 0.0 + 15.6 + 7.4 + 7.0 + 0.4 − 1.3 + 9.4
Apr − + 20.3 + 18.4 + 17.6 + 0.8 + 0.6 + 1.4 + 0.0 + 5.6 + 4.2 + 3.1 + 1.1 + 0.2 + 1.3 May + 0.0 + 13.0 + 7.5 + 14.8 − 7.3 − 0.3 + 5.8 − 0.0 − 9.7 − 12.7 − 13.1 + 0.4 + 0.0 + 3.0 June + 0.0 − 1.1 − 4.1 − 3.9 − 0.2 + 0.2 + 2.9 − 0.0 + 5.4 + 0.4 + 1.0 − 0.6 + 2.3 + 2.7
July + 0.0 − 5.2 − 5.9 − 10.2 + 4.3 − 0.4 + 1.1 − 0.1 + 3.7 + 1.2 + 2.8 − 1.6 + 2.4 + 0.1 Aug − 0.0 − 2.5 − 4.5 − 1.7 − 2.8 + 0.1 + 1.9 − 0.0 + 12.8 + 10.0 + 9.8 + 0.2 + 2.4 + 0.5 Sep − 0.0 + 30.2 + 25.1 + 23.0 + 2.1 + 0.3 + 4.8 + 0.1 + 4.2 + 6.6 + 8.2 − 1.6 − 1.3 − 1.2
Oct − 0.0 + 22.7 + 19.3 + 19.8 − 0.5 − 0.0 + 3.5 − 0.0 + 8.0 − 1.6 − 2.1 + 0.6 + 0.4 + 9.2 Nov + 0.1 + 30.6 + 26.3 + 26.5 − 0.2 − 0.0 + 4.3 − 0.0 + 20.0 + 20.6 + 20.5 + 0.1 + 0.3 − 1.0 Dec − 0.2 − 4.9 − 8.3 − 9.4 + 1.1 + 0.9 + 2.5 − 0.1 − 18.6 − 20.1 − 20.3 + 0.3 − 0.3 + 1.8
* See Table IV.2, footnote*; statistical breaks have been eliminated from the banknotes and coins. — 2 Up to December 1998, including fiduciary loanschanges. The figures for the latest date are always to be regarded as (see also footnote 6). — 3 Up to December 1998, bill-based lending (billprovisional. Subsequent revisions, which appear in the following Monthly holdings plus endorsement liabilities arising from rediscounted bills and billsReport, are not specially marked. — 1 Up to December 1998, foreign sent for collection from the banks’ portfolios prior to maturity). —
28*
IV Banks

DEUTSCHEBUNDESBANKMonthly ReportFebruary 2005
IV Banks
Deposits of foreign banks (MFIs) 2 Deposits of foreign non-banks (non-MFIs) 2
Partici- Time deposits (includingpating Time deposits (including bank savings deposits and bankinterests savings bonds) savings bonds)in foreign
Memo banks Medium Memo Medium Memoitem and and item and itemFiduciary enter- Sight Short- long- Fiduciary Sight Short- long- Fiduciaryloans 6 prises 7 Total Total 9 term 9 term loans 6 Total Total 9 term 9 term loans 6 Perioddeposits 8 deposits 8
End of year or month *
16.7 38.8 463.7 116.9 339.7 191.6 148.2 7.0 224.4 22.1 198.0 45.3 152.6 4.4 199512.7 45.8 486.5 147.1 335.7 172.0 163.7 3.8 273.5 34.3 237.2 50.0 187.2 2.1 199615.7 54.7 670.3 226.0 440.2 254.3 185.9 4.0 333.9 43.5 285.7 63.0 222.7 4.8 199722.9 62.9 875.7 309.5 562.5 359.1 203.4 3.7 390.3 51.3 329.6 71.8 257.8 9.5 199813.6 33.9 483.6 65.6 418.0 332.3 85.6 2.0 284.4 23.8 260.6 64.9 195.7 5.8 1999
13.9 47.4 586.0 113.7 472.2 382.9 89.3 1.7 314.9 35.4 279.5 62.5 217.0 5.6 200013.8 47.6 622.7 91.9 530.8 434.5 96.3 1.4 350.6 34.0 316.6 97.6 219.0 5.3 200115.6 44.8 614.2 101.6 512.7 410.4 102.3 1.1 319.2 33.5 285.7 87.0 198.7 4.5 200211.6 41.4 590.7 95.1 495.6 387.7 107.9 0.4 307.3 32.2 275.1 102.4 172.7 3.6 20039.8 39.3 603.3 87.0 516.2 403.2 113.0 0.5 311.2 36.6 274.7 123.4 151.2 0.8 2004
15.2 43.1 617.2 123.6 493.7 384.1 109.6 0.9 328.0 40.3 287.7 108.5 179.2 3.9 2003 July15.3 43.1 601.1 108.0 493.1 386.3 106.8 0.3 324.7 39.5 285.2 103.5 181.7 4.7 Aug 15.0 43.7 607.5 144.2 463.3 361.2 102.1 0.3 326.6 40.0 286.6 109.5 177.1 6.8 Sep
11.7 43.0 597.1 129.1 468.0 360.1 107.9 0.3 332.0 38.2 293.8 116.4 177.5 3.4 Oct 11.7 41.3 583.1 113.9 469.2 361.3 107.9 0.3 333.5 38.8 294.7 121.6 173.1 3.3 Nov 11.6 41.4 590.7 95.1 495.6 387.7 107.9 0.4 307.3 32.2 275.1 102.4 172.7 3.6 Dec
11.7 40.9 606.8 138.7 468.2 359.1 109.0 0.5 315.6 44.8 270.8 99.6 171.2 3.7 2004 Jan 12.0 39.7 602.9 122.7 480.2 368.1 112.1 0.5 328.7 55.9 272.8 104.6 168.2 3.4 Feb 9.5 39.8 640.2 136.3 503.8 389.4 114.4 0.5 326.2 61.8 264.4 103.0 161.4 0.9 Mar
9.6 39.3 646.0 127.7 518.3 403.7 114.6 0.5 323.8 56.9 266.8 106.6 160.2 0.9 Apr 9.6 39.4 616.9 114.2 502.7 389.0 113.8 0.5 325.2 62.9 262.4 102.3 160.0 0.9 May9.6 38.9 603.8 129.4 474.4 360.2 114.2 0.5 310.2 60.6 249.6 90.0 159.7 0.9 June
9.7 39.2 598.6 123.8 474.8 359.8 115.1 0.5 309.9 54.1 255.8 96.6 159.1 0.9 July9.7 39.3 594.3 106.8 487.5 371.5 116.0 0.5 318.7 57.2 261.5 102.7 158.8 0.9 Aug 9.7 38.8 609.9 128.7 481.2 366.3 115.0 0.5 325.3 64.8 260.5 98.6 161.9 0.8 Sep
9.6 38.8 602.8 118.6 484.2 368.7 115.5 0.5 323.3 55.1 268.2 108.7 159.5 0.8 Oct 9.7 38.1 617.6 140.9 476.7 363.1 113.6 0.5 333.5 62.3 271.2 114.8 156.4 0.8 Nov 9.8 39.3 603.3 87.0 516.2 403.2 113.0 0.5 311.2 36.6 274.7 123.4 151.2 0.8 Dec
Changes *
− 2.3 + 5.9 + 11.3 + 27.1 − 13.9 − 26.6 + 12.7 − 1.9 + 44.7 + 11.7 + 35.0 + 3.7 + 31.3 − 2.0 1996+ 2.7 + 7.9 + 157.3 + 67.7 + 89.5 + 71.8 + 17.7 + 0.1 + 51.0 + 5.4 + 43.3 + 11.4 + 31.9 + 2.3 1997+ 7.7 + 8.8 + 215.6 + 87.7 + 128.1 + 108.1 + 20.0 − 0.3 + 64.7 + 10.4 + 48.9 + 10.3 + 38.6 + 5.5 1998+ 1.1 + 10.9 + 37.4 − 9.2 + 46.6 + 47.6 − 1.0 − 0.0 + 61.0 + 7.2 + 53.8 + 15.9 + 37.9 + 0.1 1999
− 0.2 + 12.8 + 90.0 + 47.0 + 43.0 + 42.9 + 0.1 − 0.4 + 24.4 + 11.1 + 13.3 − 2.9 + 16.2 − 0.8 2000− 0.5 − 0.5 + 23.5 − 23.6 + 47.0 + 42.4 + 4.6 − 0.4 + 30.8 − 1.8 + 32.6 + 33.3 − 0.7 − 0.6 2001+ 1.7 + 1.6 + 22.7 + 14.6 + 8.1 − 1.3 + 9.4 − 0.3 + 4.6 + 0.8 + 3.8 − 4.6 + 8.4 − 0.9 2002− 0.7 − 1.9 + 5.7 − 2.0 + 7.7 − 2.4 + 10.0 − 0.0 + 4.5 + 0.4 + 4.1 + 20.6 − 16.5 + 1.9 2003+ 0.7 − 1.5 + 19.8 − 6.1 + 25.9 + 21.1 + 4.8 + 0.1 + 13.0 + 5.4 + 7.6 + 22.8 − 15.2 − 0.3 2004
+ 0.0 + 0.3 − 6.9 − 19.8 + 12.8 + 10.4 + 2.4 − 0.1 + 2.7 − 3.6 + 6.4 + 8.5 − 2.1 − 0.0 2003 July+ 0.2 − 0.5 − 22.3 − 16.7 − 5.6 − 1.7 − 3.9 − 0.0 − 7.3 − 1.1 − 6.2 − 5.9 − 0.2 + 0.1 Aug − 0.3 + 1.2 + 16.1 + 37.6 − 21.5 − 18.4 − 3.1 − 0.0 + 7.8 + 1.1 + 6.7 + 7.5 − 0.8 + 2.1 Sep
+ 0.0 − 0.8 − 11.8 − 15.4 + 3.6 − 1.5 + 5.1 − + 1.4 − 1.8 + 3.2 + 6.7 − 3.6 + 0.0 Oct − 0.0 − 1.3 − 9.2 − 14.2 + 5.1 + 4.0 + 1.0 − + 4.9 + 0.9 + 4.0 + 6.0 − 2.0 − 0.1 Nov − 0.1 + 0.6 + 14.9 − 17.7 + 32.6 + 31.1 + 1.5 + 0.1 − 21.2 − 6.2 − 15.0 − 17.7 + 2.7 + 0.3 Dec
+ 0.1 − 0.8 + 12.9 + 43.2 − 30.2 − 30.7 + 0.5 + 0.1 + 5.8 + 12.5 − 6.7 − 3.5 − 3.2 + 0.1 2004 Jan + 0.3 − 1.3 − 3.2 − 15.9 + 12.7 + 9.4 + 3.2 − 0.0 + 13.2 + 11.1 + 2.2 + 5.1 − 2.9 − 0.3 Feb + 0.1 − 0.1 + 30.7 + 13.1 + 17.6 + 19.0 − 1.4 − 0.0 − 1.5 + 5.8 − 7.3 − 2.2 − 5.1 − 0.0 Mar
+ 0.0 − 0.6 + 3.8 − 9.1 + 12.8 + 13.1 − 0.3 + 0.0 − 3.8 − 5.1 + 1.3 + 3.1 − 1.9 − 0.0 Apr + 0.0 + 0.3 − 26.7 − 13.1 − 13.6 − 13.4 − 0.2 − 0.0 + 2.8 + 6.1 − 3.3 − 3.8 + 0.5 + 0.0 May+ 0.0 − 0.5 − 13.5 + 15.2 − 28.7 − 29.1 + 0.3 − − 15.1 − 2.3 − 12.8 − 12.4 − 0.4 + 0.0 June
+ 0.1 + 0.1 − 6.2 − 5.9 − 0.3 − 1.0 + 0.6 + 0.0 − 1.2 − 6.6 + 5.4 + 6.5 − 1.1 − 0.0 July− 0.0 + 0.1 − 3.4 − 16.9 + 13.5 + 12.4 + 1.1 + 0.0 + 9.6 + 3.1 + 6.4 + 6.2 + 0.2 − 0.0 Aug + 0.0 − 0.2 + 19.5 + 22.5 − 3.0 − 2.8 − 0.2 − 0.0 + 9.3 + 7.9 + 1.4 − 3.3 + 4.7 − 0.1 Sep
− 0.1 + 0.3 − 3.8 − 9.5 + 5.6 + 4.0 + 1.6 − 0.0 − 0.4 − 9.4 + 9.0 + 10.5 − 1.4 − 0.0 Oct + 0.0 − 0.4 + 19.8 + 23.2 − 3.4 − 2.6 − 0.8 + 0.0 + 13.6 + 7.6 + 6.0 + 7.2 − 1.2 + 0.0 Nov + 0.2 + 1.5 − 10.2 − 53.1 + 42.8 + 42.6 + 0.2 + 0.0 − 19.3 − 25.4 + 6.1 + 9.5 − 3.4 + 0.0 Dec
4 Up to November 1993, included in securities (see also footnote 5). — 5 Up capital supplied to branches abroad. — 8 Up to December 1998, includingto November 1993, including negotiable money market paper; excluding time deposits with terms of less than one month. — 9 Up to December 1998,registered debt securities. — 6 From 1999, no longer included in loans and excluding time deposits with terms of less than one month. deposits (see also footnote 2). — 7 Up to December 1998, including working
29*
IV Banks

DEUTSCHEBUNDESBANKMonthly ReportFebruary 2005
IV Banks
5 Lending by banks (MFIs) in Germany to domestic non-banks (non-MFIs) *
Up to end-1998, DM billion; from 1999, € billion
Lending to domestic Short-term lending Medium and long-termnon-banks, total 1,2
to general government to enter-to enterprises and households 1
including excluding Negoti-negotiable money ablemarket paper, Loans money
Period securities, and market Treasuryequalisation claims Total Total paper Total Loans bills 5 Total Totalbills 3,4
End of year or month *
1995 4,436.9 3,936.9 615.2 584.0 583.3 0.7 31.3 30.5 0.8 3,821.7 2,785.51996 4,773.1 4,248.7 662.2 617.2 616.2 1.0 45.1 40.2 4.9 4,110.8 3,007.21997 5,058.4 4,506.2 667.8 625.8 624.8 1.0 41.9 40.1 1.9 4,390.6 3,223.41998 5,379.8 4,775.4 704.3 661.3 660.8 0.5 43.0 38.5 4.5 4,675.5 3,482.41999 2,904.5 2,576.5 355.3 328.9 328.7 0.2 26.4 23.6 2.8 2,549.2 1,943.6
2000 3,003.7 2,663.7 371.2 348.2 347.7 0.5 22.9 21.2 1.7 2,632.5 2,038.62001 3,014.1 2,704.2 387.9 356.7 355.2 1.5 31.2 28.2 2.9 2,626.2 2,070.22002 2,997.2 2,689.1 365.4 331.9 331.0 1.0 33.5 31.1 2.4 2,631.8 2,079.72003 2,995.6 2,680.6 355.2 315.0 313.4 1.6 40.2 38.4 1.8 2,640.4 2,096.12004 3,001.3 2,646.7 320.9 283.8 283.0 0.8 37.1 35.3 1.8 2,680.4 2,114.2
2003 July 2,996.0 2,675.8 357.5 315.5 314.2 1.3 42.0 39.8 2.2 2,638.6 2,081.8 Aug 2,986.9 2,671.9 346.7 308.2 306.8 1.4 38.5 36.5 2.0 2,640.2 2,090.5 Sep 2,995.7 2,680.2 356.7 323.8 322.9 0.9 32.9 31.7 1.2 2,639.0 2,088.3
Oct 2,992.9 2,679.3 353.7 317.2 316.1 1.0 36.6 34.5 2.1 2,639.1 2,087.7 Nov 3,012.2 2,689.2 360.7 317.5 316.6 0.9 43.2 40.6 2.6 2,651.5 2,097.0 Dec 2,995.6 2,680.6 355.2 315.0 313.4 1.6 40.2 38.4 1.8 2,640.4 2,096.1
2004 Jan 2,992.0 2,670.5 346.6 305.7 304.4 1.3 41.0 39.6 1.4 2,645.3 2,097.7 Feb 2,994.8 2,662.2 339.5 306.0 304.8 1.1 33.6 32.2 1.3 2,655.2 2,091.2 Mar 3,015.7 2,673.6 353.0 306.8 305.9 0.8 46.3 45.0 1.3 2,662.7 2,098.5
Apr 3,022.9 2,667.5 346.1 304.0 303.3 0.7 42.2 39.9 2.3 2,676.8 2,116.1 May 3,013.6 2,661.0 335.4 297.1 296.2 0.9 38.3 36.3 2.0 2,678.2 2,113.0 June 3,003.5 2,655.4 331.5 294.9 294.2 0.7 36.7 33.8 2.9 2,672.0 2,102.1
July 3,007.5 2,659.4 335.7 287.6 287.0 0.6 48.2 42.0 6.2 2,671.7 2,104.4 Aug 3,001.8 2,651.6 324.8 281.2 280.5 0.6 43.6 38.4 5.2 2,677.0 2,105.5 Sep 3,006.1 2,655.2 325.1 287.2 286.7 0.5 37.9 34.5 3.4 2,681.0 2,106.8
Oct 3,009.8 2,657.6 330.2 283.5 282.9 0.6 46.8 42.8 3.9 2,679.6 2,108.6 Nov 3,014.6 2,660.3 335.0 293.1 292.0 1.1 41.9 39.0 2.8 2,679.6 2,106.4 Dec 3,001.3 2,646.7 320.9 283.8 283.0 0.8 37.1 35.3 1.8 2,680.4 2,114.2
Changes *
1996 + 336.3 + 312.9 + 44.3 + 32.6 + 32.2 + 0.4 + 11.7 + 7.4 + 4.3 + 292.0 + 221.51997 + 285.2 + 256.9 + 2.7 + 5.9 + 5.9 + 0.0 − 3.2 − 0.1 − 3.0 + 282.5 + 219.91998 + 335.3 + 285.5 + 51.7 + 50.6 + 51.2 − 0.6 + 1.1 − 1.6 + 2.7 + 283.6 + 258.31999 + 156.1 + 139.5 + 9.6 + 6.3 + 6.4 − 0.0 + 3.3 + 2.9 + 0.4 + 146.4 + 146.4
2000 + 100.7 + 83.2 + 14.5 + 18.1 + 17.8 + 0.3 − 3.6 − 2.5 − 1.1 + 86.1 + 93.82001 + 11.9 + 39.2 + 15.3 + 7.0 + 5.9 + 1.0 + 8.4 + 7.8 + 0.6 − 3.4 + 32.02002 − 19.2 − 18.8 − 23.4 − 25.7 − 25.2 − 0.5 + 2.3 + 2.9 − 0.6 + 4.3 + 7.62003 + 0.1 − 8.4 − 10.0 − 16.7 − 17.5 + 0.9 + 6.7 + 7.3 − 0.6 + 10.1 + 16.02004 + 3.3 − 36.0 − 31.7 − 30.5 − 29.7 − 0.8 − 1.2 − 3.2 + 1.9 + 35.0 + 15.6
2003 July + 3.8 + 1.7 − 1.9 − 13.2 − 12.7 − 0.5 + 11.3 + 11.0 + 0.2 + 5.7 + 4.3 Aug − 9.1 − 4.0 − 10.7 − 7.3 − 7.4 + 0.1 − 3.4 − 3.3 − 0.1 + 1.6 + 8.7 Sep + 9.6 + 8.3 + 10.0 + 15.6 + 16.1 − 0.5 − 5.6 − 4.8 − 0.9 − 0.4 − 2.2
Oct − 2.8 − 0.9 − 2.9 − 6.6 − 6.8 + 0.1 + 3.7 + 2.7 + 1.0 + 0.2 − 0.6 Nov + 19.3 + 9.9 + 6.9 + 0.3 + 0.5 − 0.2 + 6.6 + 6.2 + 0.4 + 12.4 + 9.3 Dec − 16.1 − 8.6 − 5.4 − 2.4 − 3.2 + 0.8 − 3.0 − 2.2 − 0.8 − 10.7 − 0.9
2004 Jan − 3.7 − 10.1 − 8.6 − 9.4 − 9.0 − 0.4 + 0.8 + 1.1 − 0.4 + 5.0 + 1.7 Feb + 2.8 − 8.3 − 7.1 + 0.3 + 0.4 − 0.1 − 7.4 − 7.4 − 0.0 + 9.9 − 6.5 Mar + 20.9 + 11.4 + 13.8 + 1.1 + 1.4 − 0.3 + 12.7 + 12.8 − 0.1 + 7.1 + 7.1
Apr + 7.3 − 6.1 − 7.0 − 2.8 − 2.7 − 0.1 − 4.2 − 5.1 + 0.9 + 14.3 + 17.6 May − 9.4 − 6.5 − 10.4 − 6.6 − 6.8 + 0.2 − 3.9 − 3.6 − 0.3 + 1.1 − 3.4 June − 10.1 − 5.6 − 3.7 − 2.0 − 1.8 − 0.2 − 1.6 − 2.6 + 0.9 − 6.4 − 11.2
July + 4.0 + 4.0 + 4.2 − 7.3 − 7.2 − 0.1 + 11.5 + 8.2 + 3.3 − 0.3 + 2.3 Aug − 5.7 − 7.9 − 10.9 − 6.4 − 6.5 + 0.1 − 4.5 − 3.6 − 0.9 + 5.3 + 1.1 Sep + 4.1 + 3.7 + 2.2 + 6.0 + 6.2 − 0.1 − 3.8 − 3.9 + 0.1 + 1.8 + 1.1
Oct + 3.8 + 2.3 + 5.2 − 3.7 − 3.8 + 0.1 + 8.9 + 8.3 + 0.6 − 1.4 + 1.9 Nov + 4.8 + 2.7 + 4.7 + 9.6 + 9.2 + 0.5 − 4.9 − 3.8 − 1.1 + 0.0 − 2.2 Dec − 15.4 − 15.6 − 14.1 − 9.3 − 9.0 − 0.2 − 4.8 − 3.7 − 1.0 − 1.4 + 6.2
* See Table IV.2, footnote*; statistical breaks have been eliminated from the including fiduciary loans (see also footnote 9). — 3 Up to December 1998,changes. The figures for the latest date are always to be regarded as bill-based lending (bill holdings plus endorsement liabilities arising fromprovisional. Subsequent revisions, which appear in the following Monthly rediscounted bills and bills sent for collection from the banks’ portfoliosReport, are not specially marked. — 1 Up to December 1998, including loans prior to maturity). — 4 From 1999, including small amounts of medium-termto domestic building and loan associations. — 2 Up to December 1998, series of bills. — 5 From December 1993, including other negotiable
30*
IV Banks

DEUTSCHEBUNDESBANKMonthly ReportFebruary 2005
IV Banks
lending 2,6
prises and households 1,2 to general government 2
Loans Loans
Memo Memoitem Equal- item
Medium- Long- Fiduciary Medium- Long- Secur- isation FiduciaryTotal term 7 term 8 loans 9 Total Total term 7 term 8 loans 9 PeriodSecurities 6 ities 6,10 claims 11
End of year or month *
2,522.0 214.1 2,307.9 192.9 70.6 1,036.2 713.0 74.5 638.4 234.4 71.3 17.5 19952,713.3 215.8 2,497.5 205.9 88.0 1,103.6 773.0 69.5 703.6 231.3 81.3 18.0 19962,900.0 216.2 2,683.8 234.1 89.3 1,167.2 833.8 53.0 780.8 239.2 76.0 18.3 19973,104.5 206.8 2,897.8 292.4 85.4 1,193.2 868.8 33.1 835.7 235.4 71.6 17.3 19981,764.8 182.5 1,582.3 178.9 49.2 605.6 459.5 30.9 428.6 108.6 37.5 8.7 1999
1,838.9 192.8 1,646.0 199.7 50.1 593.9 455.9 30.4 425.5 104.9 33.1 8.4 20001,880.5 191.1 1,689.4 189.7 48.9 556.0 440.3 25.6 414.6 111.8 4.0 8.0 20011,909.8 193.5 1,716.3 169.9 47.3 552.1 417.1 27.4 389.7 132.0 3.0 7.5 20021,927.7 195.0 1,732.8 168.3 49.9 544.3 401.0 34.6 366.4 141.3 2.0 7.0 20031,940.8 194.3 1,746.5 173.5 55.3 566.1 387.7 32.9 354.8 177.5 1.0 6.5 2004
1,916.9 193.9 1,723.0 164.9 46.9 556.8 404.9 31.3 373.6 149.8 2.0 7.3 2003 July1,924.6 195.5 1,729.1 165.9 47.3 549.7 403.9 32.9 371.1 143.7 2.0 7.2 Aug 1,922.2 195.0 1,727.2 166.1 47.2 550.6 403.3 33.7 369.6 145.3 2.0 7.2 Sep
1,926.8 195.7 1,731.1 160.9 46.8 551.4 402.0 32.5 369.4 147.5 2.0 7.2 Oct 1,930.3 195.9 1,734.3 166.7 47.0 554.5 401.7 33.1 368.6 150.8 2.0 7.1 Nov 1,927.7 195.0 1,732.8 168.3 49.9 544.3 401.0 34.6 366.4 141.3 2.0 7.0 Dec
1,926.0 195.0 1,731.0 171.7 50.1 547.6 400.5 33.9 366.5 145.1 2.0 7.1 2004 Jan 1,925.4 194.3 1,731.1 165.8 49.6 564.1 399.8 34.8 365.0 162.3 2.0 7.0 Feb 1,922.9 193.9 1,729.1 175.6 47.9 564.1 399.7 35.4 364.4 162.4 2.0 7.0 Mar
1,927.1 194.7 1,732.5 189.0 47.4 560.7 397.2 34.9 362.3 161.5 2.0 7.0 Apr 1,933.6 197.1 1,736.4 179.5 47.4 565.1 394.9 34.6 360.3 168.3 2.0 6.9 May1,935.2 198.2 1,737.0 166.9 48.1 569.9 392.3 34.4 357.9 175.7 2.0 6.8 June
1,938.2 199.0 1,739.2 166.2 49.2 567.3 392.3 34.1 358.2 174.0 1.0 6.7 July1,941.3 200.2 1,741.1 164.2 49.1 571.5 391.3 33.9 357.4 179.1 1.0 6.7 Aug 1,942.9 199.2 1,743.7 163.9 50.3 574.2 391.2 34.5 356.7 182.0 1.0 6.7 Sep
1,944.0 198.0 1,746.0 164.7 53.3 571.0 387.9 32.9 354.9 182.0 1.0 6.7 Oct 1,941.7 195.6 1,746.1 164.7 53.5 573.2 387.5 32.9 354.6 184.7 1.0 6.7 Nov 1,940.8 194.3 1,746.5 173.5 55.3 566.1 387.7 32.9 354.8 177.5 1.0 6.5 Dec
Changes *
+ 204.4 + 1.6 + 202.8 + 14.0 + 3.1 + 70.4 + 65.7 − 5.5 + 71.2 − 3.3 + 8.0 + 0.1 1996+ 189.0 + 0.3 + 188.7 + 29.5 + 1.4 + 62.6 + 60.6 − 18.0 + 78.6 + 7.0 − 5.3 + 0.2 1997+ 205.7 − 8.9 + 214.6 + 56.5 − 3.9 + 25.3 + 35.0 − 20.0 + 55.0 − 4.4 − 4.4 − 0.9 1998+ 121.8 + 25.1 + 96.8 + 24.6 + 0.3 + 0.0 + 8.5 + 6.2 + 2.3 − 7.8 − 0.6 − 0.1 1999
+ 71.8 + 6.9 + 64.9 + 22.1 + 0.8 − 7.7 − 3.8 − 0.4 − 3.5 − 3.1 − 0.8 − 0.3 2000+ 41.9 − 2.8 + 44.7 − 9.8 − 1.2 − 35.4 − 16.5 − 5.5 − 10.9 + 10.1 − 29.1 − 0.4 2001+ 26.6 − 2.1 + 28.7 − 19.0 − 1.6 − 3.4 − 23.1 + 1.0 − 24.1 + 20.7 − 1.0 − 0.5 2002+ 17.9 + 0.2 + 17.8 − 1.9 + 2.6 − 5.9 − 16.1 + 4.9 − 21.0 + 11.2 − 1.0 − 0.5 2003+ 10.7 + 0.2 + 10.5 + 4.9 + 3.6 + 19.4 − 13.8 − 0.9 − 12.9 + 34.3 − 1.1 − 0.6 2004
+ 4.1 + 0.4 + 3.7 + 0.3 − 0.1 + 1.4 − 0.7 − 0.2 − 0.6 + 3.1 − 1.0 − 0.1 2003 July+ 7.8 + 1.6 + 6.1 + 1.0 + 0.4 − 7.1 − 1.0 + 1.5 − 2.5 − 6.1 − 0.0 − 0.1 Aug − 2.4 − 0.5 − 1.9 + 0.2 − 0.2 + 1.8 − 0.6 + 0.9 − 1.5 + 2.4 + 0.0 − 0.0 Sep
+ 4.5 + 0.7 + 3.8 − 5.1 − 0.4 + 0.8 − 1.4 − 1.2 − 0.1 + 2.2 − 0.0 − 0.0 Oct + 3.5 + 0.2 + 3.3 + 5.8 + 0.2 + 3.1 − 0.2 + 0.6 − 0.8 + 3.3 − − 0.0 Nov − 2.5 − 1.0 − 1.6 + 1.6 + 2.9 − 9.7 − 0.7 + 1.5 − 2.2 − 9.0 + 0.0 − 0.1 Dec
− 1.7 + 0.0 − 1.7 + 3.4 + 0.2 + 3.3 − 0.5 − 0.6 + 0.1 + 3.8 − 0.0 + 0.1 2004 Jan − 0.7 − 0.8 + 0.1 − 5.9 − 0.5 + 16.4 − 0.7 + 0.9 − 1.6 + 17.1 − − 0.0 Feb − 2.7 + 0.3 − 3.0 + 9.8 − 1.7 + 0.1 − 0.1 + 1.5 − 1.5 + 0.1 + 0.0 − 0.0 Mar
+ 4.2 + 0.8 + 3.4 + 13.4 − 0.5 − 3.3 − 2.5 − 0.5 − 2.1 − 0.8 − 0.0 − 0.0 Apr + 6.1 + 2.5 + 3.7 − 9.5 − 0.1 + 4.4 − 2.3 − 0.3 − 2.0 + 6.8 − − 0.0 May+ 1.4 + 1.0 + 0.5 − 12.6 + 0.8 + 4.8 − 2.6 − 0.2 − 2.4 + 7.4 − − 0.2 June
+ 3.0 + 0.8 + 2.2 − 0.7 + 1.1 − 2.6 + 0.0 − 0.3 + 0.3 − 1.7 − 0.9 − 0.0 July+ 3.1 + 0.8 + 2.3 − 2.1 − 0.1 + 4.2 − 0.9 − 0.2 − 0.7 + 5.1 + 0.0 − 0.0 Aug + 1.6 − 0.9 + 2.6 − 0.5 + 1.2 + 0.7 − 0.2 + 0.6 − 0.8 + 0.9 − − 0.0 Sep
+ 1.1 − 0.9 + 2.0 + 0.8 + 3.0 − 3.2 − 3.3 − 1.6 − 1.7 + 0.0 − − 0.0 Oct − 2.2 − 2.0 − 0.2 + 0.0 + 0.3 + 2.3 − 0.4 − 0.2 − 0.2 + 2.7 − + 0.0 Nov − 2.5 − 1.3 − 1.2 + 8.8 − 0.1 − 7.6 − 0.3 + 0.0 − 0.3 − 7.2 − 0.1 − 0.2 Dec
money market paper; excluding mobilisation and liquidity paper. — 6 From notice of four years and more; from 1999, of more than five years. — 9 From1999, breakdown of securities by medium and long-term lending no longer 1999, no longer included in lending (see also footnote 2). — 10 Excludingpossible. — 7 Up to December 1998, maturity or period of notice of more debt securities arising from the exchange of equalisation claims (see alsothan one year to less than four years; from 1999, more than one year up to footnote 11). — 11 Including debt securities arising from the exchange ofand including five years. — 8 Up to December 1998, maturity or period of equalisation claims.
31*
IV Banks

DEUTSCHEBUNDESBANKMonthly ReportFebruary 2005
IV Banks 6 Lending by banks (MFIs) in Germany to domestic enterprises and households, housing loans,
sectors of economic activity * € billion
Lending to domestic enterprises and households (excluding holdings of negotiable money market paper and excluding securities portfolios) 1
of which
Housing loans Lending to enterprises and self-employed persons
FinancingMortgage institu-loans tionssecured Whole- Agri-Electricity, Transport, (excludingby gas and sale culture, storage MFIs) and
Mortgage residen- Other of which water and forestry and insuranceloans, tial real housing Housing Manufac- supply, Construc- retail and commu- corpor-
Period Total total Total estate loans Total loans turing mining 2 tion trade 3 fishing nication ations
Lending, total End of year or quarter *
2001 2,236.3 981.4 1,053.9 757.7 296.2 1,295.6 346.1 174.3 36.7 67.9 172.9 31.3 50.0 39.02002 2,241.2 1,008.9 1,068.7 776.3 292.4 1,277.3 340.1 161.5 37.4 64.6 162.6 31.3 51.3 39.5
2003 Dec 2,241.6 1,124.5 1,083.3 867.1 216.2 1,252.2 335.1 151.0 37.2 59.0 152.3 32.1 54.4 54.42004 Mar 2,229.2 1,124.8 1,075.2 861.7 213.5 1,242.1 329.3 149.3 37.7 58.4 148.6 31.9 56.3 57.5 June 2,229.7 1,125.6 1,081.5 865.7 215.9 1,235.2 329.0 145.9 37.8 57.5 147.0 32.3 57.6 53.8 Sep 2,229.9 1,129.0 1,087.8 869.9 217.9 1,226.6 326.8 142.3 37.7 56.2 144.6 32.7 56.6 56.1 Dec 2,224.2 1,127.7 1,086.0 869.7 216.3 1,211.6 320.4 136.7 37.1 53.0 141.4 31.9 56.1 60.0
Short-term lending
2001 355.8 − 15.9 − 15.9 304.1 10.6 59.6 5.5 17.8 63.5 4.1 9.3 14.22002 331.4 − 14.5 − 14.5 281.1 9.3 52.0 5.1 15.9 58.7 4.2 8.4 13.6
2003 Dec 313.9 − 14.1 − 14.1 266.7 8.9 46.6 4.2 13.2 55.9 3.9 8.0 25.82004 Mar 306.3 − 13.2 − 13.2 261.4 8.0 47.0 4.0 13.5 53.8 4.1 8.6 27.6 June 294.6 − 12.4 − 12.4 250.0 7.4 44.8 4.1 13.1 52.8 4.4 6.9 24.0 Sep 287.0 − 12.0 − 12.0 241.9 7.0 43.0 3.8 12.6 52.1 4.4 6.5 23.3 Dec 283.4 − 12.5 − 12.5 239.3 7.6 40.9 3.5 11.1 52.9 3.6 5.9 26.4
Medium-term lending
2001 191.1 − 37.1 − 37.1 120.1 12.0 18.5 1.9 6.5 13.4 3.2 7.2 7.72002 193.5 − 36.1 − 36.1 121.8 11.3 17.9 2.0 6.5 13.5 3.3 8.5 6.8
2003 Dec 195.0 − 38.2 − 38.2 121.2 12.0 17.5 2.3 6.0 11.9 3.4 10.9 6.52004 Mar 193.9 − 37.2 − 37.2 121.0 11.5 17.2 3.0 5.8 11.6 3.3 11.3 6.9 June 198.2 − 38.7 − 38.7 124.0 12.2 17.4 3.0 5.9 11.8 3.3 11.6 7.2 Sep 199.2 − 39.2 − 39.2 124.2 12.2 17.6 2.7 5.8 11.7 3.3 11.8 7.2 Dec 194.3 − 38.8 − 38.8 119.9 11.8 16.4 2.5 5.6 11.1 3.2 11.3 7.6
Long-term lending
2001 1,689.4 981.4 1,000.9 757.7 243.2 871.4 323.5 96.2 29.4 43.7 96.1 24.0 33.5 17.12002 1,716.3 1,008.9 1,018.1 776.3 241.9 874.4 319.4 91.5 30.3 42.2 90.3 23.8 34.4 19.0
2003 Dec 1,732.8 1,124.5 1,031.0 867.1 164.0 864.3 314.2 86.9 30.6 39.9 84.5 24.7 35.5 22.12004 Mar 1,729.0 1,124.8 1,024.8 861.7 163.0 859.7 309.8 85.0 30.6 39.1 83.3 24.5 36.4 23.0 June 1,737.0 1,125.6 1,030.4 865.7 164.8 861.2 309.4 83.6 30.8 38.5 82.4 24.6 39.1 22.6 Sep 1,743.7 1,129.0 1,036.5 869.9 166.7 860.5 307.6 81.6 31.2 37.8 80.8 24.9 38.3 25.7 Dec 1,746.5 1,127.7 1,034.7 869.7 165.0 852.4 301.0 79.4 31.2 36.2 77.3 25.0 38.9 26.0
Lending, total Change during quarter *
2003 Q4 − 4.0 + 1.7 + 5.0 + 4.5 + 0.5 − 9.9 − 2.6 − 3.4 + 0.9 − 2.7 − 1.0 − 0.8 + 0.8 + 0.52004 Q1 − 12.4 − 0.6 − 2.0 − 0.1 − 1.9 − 9.2 − 2.5 − 1.6 + 0.5 − 0.5 − 3.6 + 0.1 + 1.9 + 2.9 Q2 + 0.5 + 1.8 + 5.2 + 2.0 + 3.2 − 6.5 − 0.6 − 3.0 + 0.2 − 0.8 − 1.2 + 0.5 + 0.8 − 3.6 Q3 + 0.2 + 4.5 + 6.1 + 5.2 + 1.0 − 8.6 − 2.3 − 3.6 − 0.1 − 1.3 − 2.3 + 0.4 − 0.6 + 1.9 Q4 − 7.4 + 0.6 + 0.6 + 1.7 − 1.2 − 10.2 − 4.3 − 5.0 − 0.6 − 2.7 − 1.4 − 0.9 − 0.8 + 3.6
Short-term lending
2003 Q4 − 9.5 − + 0.1 − + 0.1 − 7.9 + 0.2 − 2.1 + 0.3 − 1.9 + 1.3 − 0.8 + 0.2 − 0.62004 Q1 − 7.3 − − 0.9 − − 0.9 − 5.1 − 0.9 + 0.5 − 0.2 + 0.3 − 2.1 + 0.1 + 0.6 + 2.0 Q2 − 11.3 − − 0.8 − − 0.8 − 10.9 − 0.7 − 2.2 + 0.1 − 0.4 − 0.8 + 0.3 − 1.7 − 3.5 Q3 − 7.5 − − 0.3 − − 0.3 − 8.1 − 0.3 − 1.8 − 0.3 − 0.5 − 0.6 + 0.1 − 0.5 − 0.8 Q4 − 3.6 − − 0.2 − − 0.2 − 2.6 − 0.1 − 2.1 − 0.3 − 1.5 + 0.8 − 0.8 − 0.6 + 3.1
Medium-term lending
2003 Q4 − 0.0 − + 0.2 − + 0.2 − 0.2 − 0.1 − 0.1 + 0.1 − 0.1 − 0.7 − 0.1 + 0.4 + 0.12004 Q1 − 0.4 − − 0.2 − − 0.2 − 0.1 − 0.2 − 0.3 + 0.7 − 0.2 − 0.3 − 0.1 + 0.5 − 0.0 Q2 + 4.2 − + 1.5 − + 1.5 + 2.8 + 0.6 + 0.1 − 0.1 + 0.1 + 0.3 − 0.0 + 0.3 + 0.0 Q3 + 0.7 − + 0.5 − + 0.5 + 0.0 + 0.0 + 0.2 − 0.2 − 0.1 − 0.2 + 0.0 + 0.2 − 0.1 Q4 − 4.3 − − 0.5 − − 0.5 − 3.5 − 0.5 − 1.2 − 0.3 − 0.3 − 0.6 − 0.1 − 0.5 + 0.5
Long-term lending
2003 Q4 + 5.5 + 1.7 + 4.7 + 4.5 + 0.2 − 1.8 − 2.7 − 1.2 + 0.6 − 0.8 − 1.6 + 0.0 + 0.3 + 1.02004 Q1 − 4.7 − 0.6 − 1.0 − 0.1 − 0.9 − 4.1 − 1.4 − 1.8 − 0.0 − 0.7 − 1.2 − 0.0 + 0.9 + 0.9 Q2 + 7.6 + 1.8 + 4.5 + 2.0 + 2.6 + 1.6 − 0.6 − 0.9 + 0.2 − 0.5 − 0.7 + 0.2 + 2.2 − 0.1 Q3 + 7.1 + 4.5 + 6.0 + 5.2 + 0.8 − 0.5 − 2.0 − 2.0 + 0.4 − 0.7 − 1.6 + 0.3 − 0.4 + 2.8 Q4 + 0.5 + 0.6 + 1.3 + 1.7 − 0.5 − 4.1 − 3.8 − 1.7 − 0.0 − 0.9 − 1.6 + 0.0 + 0.2 + 0.0
* Excluding lending by foreign branches. Breakdown of lending by building always to be regarded as provisional; subsequent alterations, which willand loan associations by areas and sectors estimated. Statistical alterations appear in the following Monthly Report, are not specially marked. —have been eliminated from the changes. The figures for the latest date are
32*
IV Banks

DEUTSCHEBUNDESBANKMonthly ReportFebruary 2005
IV Banks
Lending to Lending to employees and other individuals non-profit institutions
Memo items Other lendingServices sector (including the professions)
of which of which
Debitbalanceson wage,
Other Lending salaryreal to self- Lending and of which
Housing Holding estate employed to craft Housing pension HousingInstalmentTotal companies Total loans Total loans 5 accounts Total loans Periodenterprises enterprises persons 4 enterprises
End of year or quarter * Lending, total
723.3 169.4 50.3 194.3 458.6 74.7 926.7 704.3 222.4 110.7 22.9 14.1 3.5 2001729.2 165.0 50.2 207.2 451.8 72.4 949.5 725.1 224.3 114.3 23.0 14.4 3.5 2002
711.9 160.7 44.0 207.2 437.0 67.7 975.6 744.7 230.9 118.6 21.6 13.7 3.5 2003 Dec 702.5 158.7 43.6 206.2 429.5 66.5 973.4 742.6 230.9 119.1 20.1 13.7 3.3 2004 Mar 703.2 165.6 45.3 200.7 428.4 66.2 981.2 749.2 232.0 120.9 20.1 13.3 3.3 June700.4 166.5 43.9 203.0 426.8 64.6 989.9 757.8 232.1 122.5 20.4 13.4 3.2 Sep 695.5 163.7 42.5 204.2 419.0 61.7 999.4 762.4 237.0 129.2 19.9 13.2 3.2 Dec
Short-term lending
130.1 21.6 20.4 34.1 56.0 15.8 50.3 5.3 45.0 2.8 22.9 1.4 0.0 2001123.3 19.8 19.1 34.7 53.8 14.8 48.5 5.2 43.3 2.4 23.0 1.7 0.0 2002
109.1 17.9 14.6 31.2 49.4 12.9 45.9 5.1 40.8 2.4 21.6 1.2 0.0 2003 Dec 102.7 17.2 14.2 29.4 47.2 13.0 43.5 5.2 38.4 2.2 20.1 1.4 0.0 2004 Mar 99.9 17.2 14.9 27.4 46.5 12.7 43.5 5.0 38.5 2.3 20.1 1.1 0.0 June96.2 16.8 12.3 27.5 45.8 12.4 43.7 5.0 38.7 2.3 20.4 1.4 0.0 Sep 95.0 15.8 11.5 27.6 44.4 11.4 43.0 4.9 38.0 2.3 19.9 1.1 0.0 Dec
Medium-term lending
61.9 6.7 6.5 14.7 31.2 5.3 70.5 25.0 45.4 33.4 − 0.6 0.1 200163.2 6.2 7.2 16.7 31.2 4.8 71.1 24.7 46.4 35.3 − 0.5 0.1 2002
62.7 5.7 5.6 18.0 30.4 4.5 73.2 26.2 47.0 37.1 − 0.6 0.1 2003 Dec 61.9 5.5 5.8 18.1 29.6 4.2 72.3 25.6 46.7 37.3 − 0.6 0.1 2004 Mar 63.7 6.8 6.4 17.5 30.0 4.1 73.7 26.5 47.2 38.1 − 0.5 0.1 June63.9 6.7 6.7 17.7 30.0 4.0 74.5 26.9 47.6 38.3 − 0.5 0.1 Sep 62.3 6.5 6.5 17.2 29.6 3.9 73.8 26.9 46.9 37.7 − 0.5 0.1 Dec
Long-term lending
531.3 141.1 23.4 145.6 371.3 53.7 806.0 674.0 132.0 74.4 − 12.1 3.5 2001542.8 139.0 24.0 155.8 366.8 52.8 829.8 695.3 134.6 76.6 − 12.1 3.4 2002
540.0 137.1 23.8 158.0 357.2 50.4 856.5 713.4 143.1 79.1 − 11.9 3.4 2003 Dec 537.9 136.0 23.6 158.6 352.7 49.3 857.6 711.8 145.8 79.6 − 11.7 3.2 2004 Mar 539.6 141.5 24.0 155.8 352.0 49.3 864.1 717.8 146.3 80.6 − 11.7 3.2 June540.3 143.0 24.9 157.8 351.1 48.2 871.7 725.8 145.8 82.0 − 11.5 3.1 Sep 538.2 141.5 24.5 159.5 345.0 46.4 882.6 730.6 152.0 89.2 − 11.5 3.1 Dec
Change during quarter * Lending, total
− 4.2 − 0.5 − 4.6 + 0.4 − 4.8 − 1.9 + 6.0 + 7.6 − 1.6 + 0.4 − 1.6 − 0.1 − 0.0 2003 Q4− 8.8 − 2.1 − 0.3 − 0.7 − 6.6 − 1.2 − 3.1 + 0.6 − 3.7 + 0.5 − 1.5 − 0.1 − 0.2 2004 Q1+ 0.5 + 2.4 + 1.9 − 1.6 − 0.9 − 0.3 + 7.4 + 5.8 + 1.6 + 2.1 − 0.0 − 0.3 + 0.0 Q2− 2.8 + 1.8 − 1.4 + 1.2 − 1.8 − 1.6 + 8.7 + 8.5 + 0.2 + 1.7 + 0.2 + 0.1 − 0.1 Q3− 2.4 − 2.2 − 1.3 + 1.8 − 4.8 − 1.6 + 3.1 + 4.9 − 1.9 − 0.4 − 0.5 − 0.2 − 0.1 Q4
Short-term lending
− 4.4 − 0.0 − 3.7 − 0.9 − 1.1 − 1.5 − 1.3 − 0.1 − 1.2 + 0.0 − 1.6 − 0.2 + 0.0 2003 Q4− 6.3 − 0.7 − 0.4 − 1.8 − 2.3 + 0.1 − 2.4 + 0.1 − 2.4 − 0.2 − 1.5 + 0.1 − 2004 Q1− 2.7 + 0.1 + 0.7 − 2.0 − 0.7 − 0.3 − 0.1 − 0.2 + 0.1 + 0.1 − 0.0 − 0.3 − 0.0 Q2− 3.7 − 0.5 − 2.6 + 0.1 − 0.7 − 0.3 + 0.2 − 0.0 + 0.3 + 0.0 + 0.2 + 0.3 + 0.0 Q3− 1.2 − 1.0 − 0.8 + 0.1 − 1.4 − 1.0 − 0.7 − 0.1 − 0.6 + 0.0 − 0.5 − 0.3 − Q4
Medium-term lending
+ 0.3 − 0.2 − 0.5 + 0.3 − 0.4 − 0.1 + 0.1 + 0.3 − 0.2 − 0.2 − + 0.1 + 0.0 2003 Q4− 0.4 − 0.2 + 0.2 + 0.5 − 0.5 − 0.3 − 0.3 + 0.0 − 0.3 + 0.2 − − 0.0 − 0.0 2004 Q1+ 2.2 + 1.3 + 0.7 − 0.4 + 0.3 − 0.0 + 1.4 + 0.9 + 0.5 + 0.8 − − 0.0 + 0.0 Q2+ 0.1 − 0.1 + 0.3 + 0.2 − 0.3 − 0.1 + 0.7 + 0.5 + 0.2 + 0.3 − − 0.0 − 0.0 Q3− 1.1 − 0.3 − 0.2 − 0.2 − 0.6 − 0.1 − 0.8 − 0.0 − 0.7 − 0.7 − + 0.0 + 0.0 Q4
Long-term lending
− 0.1 − 0.2 − 0.4 + 1.0 − 3.3 − 0.3 + 7.3 + 7.5 − 0.2 + 0.5 − + 0.0 − 0.0 2003 Q4− 2.1 − 1.1 − 0.2 + 0.7 − 3.9 − 1.0 − 0.4 + 0.5 − 1.0 + 0.5 − − 0.2 − 0.2 2004 Q1+ 1.1 + 1.0 + 0.6 + 0.7 − 0.4 + 0.0 + 6.1 + 5.1 + 1.0 + 1.3 − − 0.1 + 0.0 Q2+ 0.7 + 2.3 + 0.9 + 0.9 − 0.8 − 1.1 + 7.8 + 8.1 − 0.3 + 1.5 − − 0.2 − 0.1 Q3− 0.2 − 0.9 − 0.3 + 1.9 − 2.8 − 0.5 + 4.6 + 5.1 − 0.5 + 0.2 − + 0.0 − 0.1 Q4
1 Excluding fiduciary loans. — 2 Including quarrying. — 3 Including the 4 Including sole proprietors. — 5 Excluding mortgage loans and housingmaintenance and repair of motor vehicles and durable consumer goods. — loans, even in the form of instalment credit.
33*
IV Banks

DEUTSCHEBUNDESBANKMonthly ReportFebruary 2005
IV Banks
7 Deposits of domestic non-banks (non-MFIs) at banks (MFIs) in Germany *
€ billion
Time deposits 1,2 Memo item
for more than 1 year 2 IncludedSubordinated liabilities in time
for up for up (excluding deposits:to and to and for more Bank negotiable liabilities
Deposits, Sight including including than Savings savings Fiduciary debt arisingPeriod total deposits Total 1 year Total 2 years 2 years bonds 4 loans securities) from reposdeposits 3
Domestic non-banks, total End of year or month *
2002 2,085.9 575.6 830.6 258.3 572.3 8.8 563.5 575.3 104.4 42.1 27.9 1.52003 2,140.3 624.0 825.7 237.8 587.9 8.3 579.6 590.3 100.3 40.5 30.4 9.32004 2,200.0 646.9 851.2 235.0 616.2 8.0 608.2 603.5 98.4 43.7 32.2 10.1
2004 Jan 2,137.5 632.2 814.3 225.0 589.3 8.3 581.0 590.6 100.3 40.3 30.7 9.8 Feb 2,141.8 635.4 814.8 223.4 591.4 8.3 583.1 591.5 100.1 40.5 30.8 10.4 Mar 2,145.8 635.3 819.2 225.3 594.0 8.6 585.4 591.4 99.8 39.3 31.2 10.9
Apr 2,154.0 644.0 819.6 220.8 598.8 8.5 590.3 591.2 99.2 39.0 31.3 10.6 May 2,162.4 642.7 830.2 227.9 602.3 8.4 593.9 590.6 98.9 39.0 31.3 11.4 June 2,158.3 643.5 826.2 220.4 605.8 8.2 597.5 590.0 98.7 38.8 31.4 9.9
July 2,160.4 637.6 833.6 225.8 607.7 8.2 599.5 590.6 98.6 38.7 31.5 10.3 Aug 2,161.3 639.1 832.2 224.5 607.7 8.0 599.7 591.3 98.7 38.6 31.9 8.2 Sep 2,169.7 649.5 830.4 222.1 608.3 8.0 600.3 591.2 98.6 38.5 32.0 10.2
Oct 2,172.9 647.2 834.6 223.8 610.8 8.1 602.6 592.3 98.8 41.8 32.1 12.3 Nov 2,195.4 673.0 830.7 216.9 613.8 8.1 605.6 593.1 98.7 42.1 32.1 14.0 Dec 2,200.0 646.9 851.2 235.0 616.2 8.0 608.2 603.5 98.4 43.7 32.2 10.1
Changes *2003 + 54.0 + 48.4 − 4.8 − 20.3 + 15.6 − 0.5 + 16.1 + 15.1 − 4.8 − 1.2 + 2.0 + 7.82004 + 62.0 + 24.4 + 25.9 − 3.7 + 29.7 − 0.3 + 29.9 + 13.1 − 1.5 + 1.2 + 1.7 + 0.9
2004 Jan − 2.8 + 8.2 − 11.4 − 12.9 + 1.5 + 0.0 + 1.5 + 0.3 + 0.1 − 0.2 + 0.3 + 0.5 Feb + 4.3 + 4.1 − 0.4 − 2.5 + 2.1 − 0.0 + 2.1 + 0.9 − 0.2 + 0.2 + 0.1 + 0.7 Mar + 4.0 − 0.0 + 4.5 + 1.9 + 2.6 + 0.3 + 2.3 − 0.1 − 0.3 − 1.2 + 0.4 + 0.5
Apr + 8.5 + 8.7 + 0.3 − 4.4 + 4.8 − 0.1 + 4.9 − 0.2 − 0.2 − 0.2 + 0.1 − 0.3 May + 8.4 − 1.4 + 10.6 + 7.1 + 3.5 − 0.1 + 3.5 − 0.6 − 0.2 − 0.0 − 0.0 + 0.7 June − 4.1 + 0.4 − 3.6 − 7.1 + 3.5 − 0.2 + 3.7 − 0.6 − 0.3 − 0.2 + 0.1 − 1.5
July + 2.1 − 5.5 + 7.0 + 5.1 + 1.9 − 0.1 + 2.0 + 0.7 − 0.0 − 0.1 + 0.1 + 0.5 Aug + 1.9 + 1.5 − 0.4 − 1.3 + 0.9 − 0.2 + 1.1 + 0.7 + 0.1 − 0.1 + 0.4 − 2.2 Sep + 8.3 + 10.4 − 1.8 − 2.5 + 0.7 + 0.0 + 0.7 − 0.1 − 0.2 − 0.1 + 0.1 + 2.1
Oct + 3.2 − 2.3 + 4.2 + 1.7 + 2.4 + 0.1 + 2.3 + 1.1 + 0.2 + 3.3 + 0.1 + 2.0 Nov + 22.5 + 26.4 − 4.5 − 6.9 + 2.4 + 0.0 + 2.4 + 0.8 − 0.1 + 0.3 + 0.1 + 1.7 Dec + 5.6 − 26.1 + 21.5 + 18.1 + 3.4 − 0.1 + 3.5 + 10.4 − 0.3 − 0.4 + 0.0 − 3.8
Domestic government End of year or month *
2002 113.9 16.6 93.3 30.9 62.4 0.9 61.5 2.1 1.9 36.3 1.2 −2003 108.1 17.8 86.6 29.1 57.5 0.5 57.0 2.0 1.7 34.9 1.1 −2004 103.6 16.8 82.5 30.5 52.0 0.9 51.1 2.7 1.5 34.6 1.1 −
2004 Jan 106.3 16.1 86.6 29.8 56.8 0.5 56.3 2.0 1.7 34.8 1.2 − Feb 107.4 16.6 87.2 30.0 57.1 0.5 56.7 2.1 1.6 34.8 1.2 − Mar 106.4 17.6 85.0 28.6 56.4 0.9 55.6 2.2 1.6 33.5 1.0 −
Apr 105.8 17.3 84.7 28.6 56.2 0.9 55.3 2.2 1.6 33.3 1.1 − May 108.9 18.5 86.6 30.6 56.0 0.9 55.0 2.2 1.6 33.2 1.0 − June 111.4 20.0 87.5 32.1 55.4 0.9 54.5 2.2 1.6 33.1 1.1 −
July 109.5 18.5 87.0 31.5 55.5 0.9 54.6 2.4 1.6 33.0 1.0 − Aug 108.6 18.7 85.8 31.2 54.7 0.9 53.8 2.4 1.6 33.0 1.0 − Sep 109.5 19.6 85.8 32.5 53.4 0.9 52.5 2.5 1.6 33.0 1.1 −
Oct 101.9 15.4 82.4 28.7 53.7 1.0 52.7 2.6 1.5 32.9 1.0 − Nov 102.1 17.0 81.0 27.4 53.6 1.0 52.6 2.6 1.6 33.1 1.1 − Dec 103.6 16.8 82.5 30.5 52.0 0.9 51.1 2.7 1.5 34.6 1.1 −
Changes *2003 − 4.8 + 1.2 − 5.7 − 1.6 − 4.1 − 0.4 − 3.7 − 0.1 − 0.2 − 1.6 − 0.1 −2004 − 1.9 − 1.0 − 1.5 + 1.4 − 2.8 + 0.4 − 3.2 + 0.7 − 0.1 − 2.2 − 0.1 −
2004 Jan − 1.8 − 1.7 − 0.0 + 0.7 − 0.7 − 0.0 − 0.7 − 0.0 − 0.0 − 0.1 + 0.0 − Feb + 1.1 + 0.5 + 0.6 + 0.2 + 0.4 − 0.0 + 0.4 + 0.1 − 0.0 + 0.0 − 0.0 − Mar − 1.0 + 1.0 − 2.1 − 1.4 − 0.7 + 0.4 − 1.1 + 0.1 − 0.0 − 1.3 − 0.1 −
Apr − 0.6 − 0.3 − 0.3 − 0.0 − 0.3 − 0.0 − 0.3 + 0.0 − 0.0 − 0.2 + 0.0 − May + 3.0 + 1.2 + 1.8 + 2.1 − 0.2 + 0.0 − 0.3 + 0.0 − 0.0 − 0.1 − 0.0 − June + 2.6 + 1.6 + 1.0 + 1.5 − 0.6 − 0.0 − 0.5 − 0.0 + 0.0 − 0.2 + 0.0 −
July − 1.9 − 1.5 − 0.5 − 0.6 + 0.1 + 0.0 + 0.1 + 0.1 − 0.0 − 0.1 − 0.0 − Aug − 0.0 + 0.2 − 0.2 − 0.4 + 0.1 − 0.0 + 0.1 + 0.1 − 0.0 − 0.0 − 0.0 − Sep + 1.3 + 0.9 + 0.3 + 1.3 − 1.0 + 0.0 − 1.0 + 0.1 + 0.0 + 0.0 + 0.0 −
Oct − 7.6 − 4.2 − 3.4 − 3.7 + 0.3 + 0.1 + 0.2 + 0.1 − 0.1 − 0.1 − 0.0 − Nov + 0.1 + 1.6 − 1.4 − 1.3 − 0.1 + 0.0 − 0.1 − 0.1 + 0.0 + 0.2 + 0.0 − Dec + 2.9 − 0.1 + 2.9 + 3.1 − 0.2 − 0.1 − 0.1 + 0.1 − 0.0 − 0.4 + 0.0 −
* See Table IV.2, footnote *; statistical breaks have been eliminated from provisional. Subsequent revisions, which appear in the following Monthlythe changes. The figures for the latest date are always to be regarded as Report, are not specially marked. — 1 Including subordinated liabilities and
34*
IV Banks

DEUTSCHEBUNDESBANKMonthly ReportFebruary 2005
IV Banks
7 Deposits of domestic non-banks (non-MFIs) at banks (MFIs) in Germany * (cont’d)
€ billion
Time deposits 1,2 Memo item
for more than 1 year 2 IncludedSubordinated liabilities in time
for up for up (excluding deposits:to and to and for more Bank negotiable liabilities
Deposits, Sight including including than Savings savings Fiduciary debt arisingPeriod total deposits Total 1 year Total 2 years 2 years bonds 4 loans securities) from reposdeposits 3
Domestic enterprises and households End of year or month *
2002 1,972.0 559.0 737.3 227.5 509.8 7.9 502.0 573.2 102.5 5.8 26.6 1.52003 2,032.2 606.2 739.1 208.7 530.4 7.8 522.6 588.3 98.6 5.7 29.3 9.32004 2,096.4 630.1 768.7 204.5 564.2 7.1 557.1 600.8 96.9 9.0 31.1 10.1
2004 Jan 2,031.1 616.1 727.7 195.2 532.6 7.8 524.7 588.6 98.7 5.6 29.6 9.8 Feb 2,034.3 618.8 727.6 193.4 534.3 7.8 526.4 589.4 98.5 5.7 29.6 10.4 Mar 2,039.3 617.7 734.2 196.7 537.6 7.7 529.8 589.2 98.2 5.8 30.1 10.9
Apr 2,048.2 626.8 734.9 192.3 542.7 7.6 535.0 589.0 97.5 5.8 30.2 10.6 May 2,053.5 624.2 743.6 197.3 546.3 7.5 538.8 588.3 97.3 5.8 30.2 11.4 June 2,046.8 623.4 738.7 188.3 550.4 7.4 543.0 587.7 97.1 5.7 30.4 9.9
July 2,050.9 619.0 746.6 194.3 552.2 7.3 545.0 588.3 97.0 5.7 30.5 10.3 Aug 2,052.8 620.4 746.4 193.4 553.0 7.1 545.9 588.9 97.2 5.6 30.9 8.2 Sep 2,060.2 629.9 744.6 189.6 555.0 7.1 547.9 588.7 97.0 5.5 30.9 10.2
Oct 2,070.9 631.8 752.2 195.1 557.1 7.2 550.0 589.6 97.3 8.9 31.0 12.3 Nov 2,093.4 656.0 749.7 189.5 560.2 7.1 553.1 590.5 97.1 9.0 31.1 14.0 Dec 2,096.4 630.1 768.7 204.5 564.2 7.1 557.1 600.8 96.9 9.0 31.1 10.1
Changes *2003 + 58.7 + 47.2 + 1.0 − 18.7 + 19.7 − 0.1 + 19.8 + 15.1 − 4.5 + 0.4 + 2.1 + 7.82004 + 63.9 + 25.3 + 27.4 − 5.1 + 32.5 − 0.7 + 33.1 + 12.5 − 1.3 + 3.4 + 1.8 + 0.9
2004 Jan − 1.1 + 9.9 − 11.4 − 13.6 + 2.2 + 0.1 + 2.1 + 0.3 + 0.1 − 0.1 + 0.3 + 0.5 Feb + 3.2 + 3.6 − 1.0 − 2.7 + 1.7 − 0.0 + 1.7 + 0.8 − 0.2 + 0.1 + 0.1 + 0.7 Mar + 5.0 − 1.1 + 6.6 + 3.3 + 3.3 − 0.1 + 3.4 − 0.2 − 0.3 + 0.1 + 0.5 + 0.5
Apr + 9.1 + 9.0 + 0.6 − 4.4 + 5.0 − 0.1 + 5.2 − 0.3 − 0.2 − 0.0 + 0.1 − 0.3 May + 5.3 − 2.6 + 8.7 + 5.0 + 3.7 − 0.1 + 3.8 − 0.6 − 0.2 + 0.0 − 0.0 + 0.7 June − 6.7 − 1.2 − 4.6 − 8.6 + 4.1 − 0.1 + 4.2 − 0.6 − 0.3 − 0.1 + 0.1 − 1.5
July + 4.1 − 4.0 + 7.5 + 5.7 + 1.8 − 0.1 + 1.9 + 0.6 − 0.0 − 0.0 + 0.1 + 0.5 Aug + 1.9 + 1.4 − 0.2 − 1.0 + 0.8 − 0.2 + 1.0 + 0.6 + 0.1 − 0.1 + 0.4 − 2.2 Sep + 7.1 + 9.6 − 2.1 − 3.7 + 1.6 − + 1.6 − 0.2 − 0.2 − 0.1 + 0.0 + 2.1
Oct + 10.8 + 1.9 + 7.6 + 5.5 + 2.1 + 0.1 + 2.1 + 1.0 + 0.3 + 3.3 + 0.1 + 2.0 Nov + 22.4 + 24.8 − 3.1 − 5.6 + 2.5 − 0.0 + 2.5 + 0.8 − 0.1 + 0.1 + 0.1 + 1.7 Dec + 2.7 − 25.9 + 18.6 + 15.0 + 3.6 − 0.0 + 3.6 + 10.3 − 0.2 + 0.0 + 0.0 − 3.8
of which: Domestic enterprises End of year or month *
2002 700.4 194.6 479.4 99.2 380.2 1.5 378.7 4.4 22.0 5.6 15.8 1.52003 730.8 205.8 498.1 102.1 396.0 1.6 394.4 4.8 22.1 5.4 17.3 9.32004 762.3 202.0 533.4 110.2 423.1 1.7 421.5 5.1 21.8 8.7 18.3 10.1
2004 Jan 726.6 211.6 488.2 90.4 397.9 1.8 396.1 4.9 21.9 5.3 17.4 9.8 Feb 723.7 207.6 489.3 90.0 399.3 1.8 397.5 5.1 21.7 5.4 17.4 10.4 Mar 730.9 207.4 496.5 94.6 401.9 1.9 400.0 5.1 21.8 5.5 17.8 10.9
Apr 740.0 213.5 499.5 92.7 406.8 2.0 404.9 5.2 21.8 5.5 17.8 10.6 May 741.6 205.6 509.0 98.2 410.8 1.9 408.9 5.3 21.8 5.5 17.8 11.4 June 737.6 204.6 506.2 91.6 414.5 1.9 412.7 5.1 21.7 5.5 18.0 9.9
July 742.9 200.6 515.4 99.0 416.4 1.9 414.5 5.2 21.8 5.4 18.0 10.3 Aug 746.1 203.8 515.3 98.7 416.6 1.8 414.8 5.2 21.8 5.3 18.1 8.2 Sep 753.0 212.1 513.9 95.7 418.2 1.9 416.4 5.2 21.8 5.3 18.1 10.2
Oct 759.4 210.3 522.0 101.9 420.1 1.8 418.3 5.2 21.9 8.6 18.2 12.3 Nov 769.4 221.5 520.9 97.3 423.6 1.7 421.9 5.1 21.9 8.7 18.3 14.0 Dec 762.3 202.0 533.4 110.2 423.1 1.7 421.5 5.1 21.8 8.7 18.3 10.1
Changes *2003 + 29.6 + 11.2 + 17.9 + 2.9 + 15.0 + 0.1 + 14.9 + 0.4 + 0.0 + 0.4 + 1.4 + 7.82004 + 31.1 − 2.3 + 33.0 + 7.3 + 25.7 + 0.0 + 25.7 + 0.2 + 0.1 + 3.3 + 1.0 + 0.9
2004 Jan − 4.2 + 5.8 − 9.9 − 11.7 + 1.8 + 0.1 + 1.7 + 0.1 − 0.2 − 0.1 + 0.1 + 0.5 Feb − 2.9 − 3.1 + 0.2 − 1.3 + 1.4 + 0.1 + 1.4 + 0.2 − 0.1 + 0.1 − 0.0 + 0.7 Mar + 7.1 − 0.2 + 7.2 + 4.6 + 2.6 + 0.1 + 2.5 + 0.0 + 0.1 + 0.1 + 0.4 + 0.5
Apr + 9.5 + 6.1 + 3.0 − 1.9 + 4.9 + 0.1 + 4.8 + 0.1 + 0.3 − 0.0 + 0.1 − 0.3 May + 1.6 − 7.9 + 9.4 + 5.5 + 4.0 − 0.1 + 4.0 + 0.1 + 0.0 + 0.0 − 0.0 + 0.7 June − 4.1 − 1.0 − 2.8 − 6.6 + 3.7 − 0.0 + 3.7 − 0.2 − 0.2 − 0.1 + 0.2 − 1.5
July + 5.3 − 4.1 + 9.2 + 7.4 + 1.8 + 0.0 + 1.8 + 0.1 + 0.1 − 0.0 + 0.0 + 0.5 Aug + 3.4 + 3.2 + 0.1 − 0.3 + 0.4 − 0.1 + 0.5 + 0.0 + 0.0 − 0.1 + 0.2 − 2.2 Sep + 6.6 + 8.3 − 1.8 − 3.0 + 1.3 + 0.1 + 1.2 + 0.0 + 0.0 − 0.1 + 0.0 + 2.1
Oct + 6.2 − 1.8 + 7.9 + 6.2 + 1.6 − 0.1 + 1.7 + 0.0 + 0.0 + 3.3 + 0.1 + 2.0 Nov + 10.0 + 11.7 − 1.7 − 4.6 + 2.9 − 0.1 + 3.0 − 0.1 + 0.0 + 0.1 + 0.1 + 1.7 Dec − 7.4 − 19.4 + 12.1 + 12.9 − 0.8 − 0.0 − 0.8 − 0.1 − 0.1 + 0.0 + 0.0 − 3.8
liabilities arising from registered debt securities. — 2 Including deposits under savings and loan contracts (see also footnote 2). — 4 Includingunder savings and loan contracts (see Table IV.12). — 3 Excluding deposits liabilities arising from non-negotiable bearer debt securities.
35*
IV Banks

DEUTSCHEBUNDESBANKMonthly ReportFebruary 2005
IV Banks
8 Deposits of domestic households and non-profit institutions at banks (MFIs) in Germany *
€ billion
Sight deposits Time deposits 1,2
by creditor group by creditor group
Deposits of Domestic households Domestic householdsdomestichouseholdsand Domesticnon-profit Self- non-profit Self-
employed Other institu- employed Otherinstitutions,Period total Total Total persons Employees tions Total Total persons Employeesindividuals individuals
End of year or month *
2002 1,271.6 364.5 352.8 61.3 241.4 50.0 11.7 257.9 238.3 35.2 180.5 22.62003 1,301.4 400.4 388.1 66.9 265.1 56.1 12.3 241.0 222.1 29.2 174.5 18.42004 1,334.2 428.1 414.8 71.7 283.5 59.6 13.2 235.3 216.9 25.7 175.1 16.2
2004 July 1,308.0 418.5 405.5 70.1 277.9 57.5 13.0 231.2 214.1 26.2 171.4 16.6 Aug 1,306.7 416.6 403.5 70.6 275.5 57.4 13.1 231.0 214.1 26.3 171.3 16.5 Sep 1,307.2 417.9 404.3 69.3 277.5 57.5 13.5 230.7 213.9 26.4 171.1 16.4
Oct 1,311.6 421.5 408.3 71.3 278.6 58.5 13.2 230.2 213.7 26.3 171.2 16.3 Nov 1,324.0 434.6 420.9 73.8 286.9 60.3 13.6 228.8 212.2 25.4 170.9 15.9 Dec 1,334.2 428.1 414.8 71.7 283.5 59.6 13.2 235.3 216.9 25.7 175.1 16.2
Changes *2003 + 29.2 + 36.0 + 35.3 + 5.6 + 23.7 + 6.0 + 0.6 − 16.9 − 16.2 − 6.0 − 6.0 − 4.22004 + 32.8 + 27.6 + 26.7 + 4.8 + 19.2 + 2.7 + 0.9 − 5.6 − 5.1 − 3.5 + 0.6 − 2.2
2004 July − 1.3 + 0.1 + 0.6 + 2.1 − 1.1 − 0.5 − 0.5 − 1.7 − 1.0 − 0.1 − 0.5 − 0.4 Aug − 1.5 − 1.9 − 2.0 + 0.6 − 2.4 − 0.2 + 0.1 − 0.3 − 0.2 − 0.1 − 0.1 − 0.0 Sep + 0.5 + 1.3 + 0.8 − 1.3 + 2.0 + 0.2 + 0.4 − 0.4 − 0.2 + 0.1 − 0.2 − 0.2
Oct + 4.6 + 3.7 + 4.0 + 2.0 + 1.5 + 0.5 − 0.3 − 0.3 + 0.0 + 0.1 + 0.0 − 0.1 Nov + 12.4 + 13.0 + 12.6 + 2.5 + 8.7 + 1.4 + 0.4 − 1.4 − 1.5 − 0.9 − 0.2 − 0.4 Dec + 10.2 − 6.5 − 6.1 − 2.1 − 3.3 − 0.7 − 0.4 + 6.5 + 4.7 + 0.3 + 4.2 + 0.3
* See Table IV.2, footnote*; statistical breaks have been eliminated from the Report, are not specially marked. — 1 Including subordinated liabilities andchanges. The figures for the latest date are always to be regarded as liabilities arising from registered debt securities. — 2 Including depositsprovisional. Subsequent revisions, which appear in the following Monthly
DEUTSCHEBUNDESBANKMonthly ReportFebruary 2005
9 Deposits of domestic government at banks (MFIs) in Germany, by creditor group *
€ billion
Deposits
Federal Government and its special funds 1 State governments
Time deposits Time depositsSavings Savings
for up deposits Memo for up deposits MemoDomestic to and for more and bank item to and for more and bank itemgovernment, Sight including than savings Fiduciary Sight including than savings Fiduciary
Period total Total deposits 1 year 1 year bonds 2 loans Total deposits 1 year 1 year bonds 2 loans
End of year or month *
2002 113.9 45.6 0.9 3.6 41.1 0.0 13.5 18.9 2.5 1.4 14.9 0.1 22.62003 108.1 44.2 2.0 5.2 36.9 0.0 12.6 18.5 3.1 1.3 14.1 0.1 21.92004 103.6 41.4 0.8 5.8 34.8 0.0 12.9 15.1 2.7 2.2 10.2 0.1 21.5
2004 July 109.5 47.2 3.0 8.1 36.0 0.0 12.5 19.4 3.2 3.4 12.7 0.1 20.2 Aug 108.6 47.6 3.0 8.5 36.1 0.0 12.5 16.8 2.5 2.5 11.8 0.1 20.1 Sep 109.5 46.0 3.8 7.1 35.0 0.0 12.6 19.3 3.3 4.2 11.7 0.1 20.1
Oct 101.9 42.6 0.5 6.9 35.2 0.0 12.7 16.8 2.5 2.6 11.7 0.1 20.0 Nov 102.1 41.3 0.5 5.7 35.1 0.0 12.9 16.0 2.3 1.9 11.7 0.1 19.9 Dec 103.6 41.4 0.8 5.8 34.8 0.0 12.9 15.1 2.7 2.2 10.2 0.1 21.5
Changes *2003 − 4.8 − 1.4 + 1.1 + 1.7 − 4.2 − 0.0 − 1.0 − 0.2 + 0.5 + 0.1 − 0.8 − 0.0 − 0.72004 − 1.9 − 2.8 − 1.2 + 0.6 − 2.1 + 0.0 + 0.2 − 1.0 − 0.4 + 0.9 − 1.6 − 0.0 − 2.4
2004 July − 1.9 + 0.0 + 0.2 − 0.1 − 0.0 − − 0.0 − 1.8 − 1.6 − 0.0 − 0.2 + 0.0 − 0.0 Aug − 0.0 + 0.4 + 0.0 + 0.4 + 0.0 + 0.0 + 0.0 − 1.6 − 0.7 − 0.9 + 0.0 + 0.0 − 0.0 Sep + 1.3 − 1.6 + 0.8 − 1.4 − 1.1 − + 0.1 + 2.4 + 0.8 + 1.7 − 0.1 − − 0.0
Oct − 7.6 − 3.4 − 3.3 − 0.2 + 0.2 + 0.0 + 0.1 − 2.5 − 0.9 − 1.6 − 0.0 + 0.0 − 0.1 Nov + 0.1 − 1.3 + 0.1 − 1.3 − 0.1 + 0.0 + 0.2 − 0.8 − 0.1 − 0.7 + 0.0 − 0.0 − 0.0 Dec + 2.9 + 0.2 + 0.3 + 0.1 − 0.3 + 0.0 − 0.0 + 0.5 + 0.3 + 0.3 − 0.1 − 0.0 − 0.4
* See Table IV.2, footnote *; excluding deposits of the Treuhand agency and which are included in ”Enterprises”. Statistical breaks have been eliminatedits successor organisations, of the Federal Railways, east German Railways from the changes. The figures for the latest date are always to be regardedand Federal Post Office, and, from 1995, of Deutsche Bahn AG, Deutsche as provisional. Subsequent revisions, which appear in the followingPost AG and Deutsche Telekom AG, and of publicly owned enterprises,
36*
IV Banks

DEUTSCHEBUNDESBANKMonthly ReportFebruary 2005
IV Banks
Savings deposits 3 Memo item
by maturity
more than 1 year 2 IncludedSubordinated
of which liabilities in timeDomestic Domestic (excluding deposits:
up to and up to and Bank negotiable liabilitiesnon-profit non-profitinstitu- including including more than Domestic institu- savings Fiduciary debt arisingtions 1 year Total 2 years 2 years Total tions bonds 4 loans from repos Periodhouseholds securities) 5
End of year or month *
19.6 128.3 129.6 6.3 123.3 568.8 559.9 8.9 80.4 0.2 10.8 − 200218.9 106.7 134.3 6.1 128.2 583.5 574.3 9.2 76.5 0.2 12.0 − 200318.4 94.3 141.0 5.5 135.6 595.7 586.3 9.5 75.1 0.3 12.8 − 2004
17.0 95.3 135.9 5.4 130.5 583.1 573.6 9.5 75.2 0.3 12.5 − 2004 July16.9 94.6 136.4 5.3 131.1 583.7 574.1 9.6 75.4 0.3 12.8 − Aug 16.8 93.9 136.8 5.3 131.5 583.5 573.8 9.6 75.2 0.3 12.8 − Sep
16.5 93.2 137.1 5.4 131.7 584.4 574.9 9.5 75.4 0.3 12.8 − Oct 16.6 92.2 136.6 5.5 131.2 585.3 576.0 9.3 75.2 0.3 12.8 − Nov 18.4 94.3 141.0 5.5 135.6 595.7 586.3 9.5 75.1 0.3 12.8 − Dec
Changes *− 0.7 − 21.6 + 4.7 − 0.2 + 4.9 + 14.7 + 14.4 + 0.3 − 4.6 + 0.0 + 0.6 − 2003− 0.5 − 12.3 + 6.7 − 0.7 + 7.4 + 12.2 + 12.0 + 0.2 − 1.4 + 0.1 + 0.8 − 2004
− 0.7 − 1.7 + 0.0 − 0.1 + 0.1 + 0.5 + 0.5 + 0.0 − 0.1 + 0.0 + 0.1 − 2004 July− 0.1 − 0.7 + 0.4 − 0.1 + 0.4 + 0.6 + 0.5 + 0.1 + 0.1 + 0.0 + 0.2 − Aug − 0.1 − 0.7 + 0.3 − 0.1 + 0.4 − 0.2 − 0.2 + 0.0 − 0.2 − 0.0 + 0.0 − Sep
− 0.3 − 0.7 + 0.5 + 0.1 + 0.4 + 0.9 + 1.1 − 0.1 + 0.2 + 0.0 + 0.0 − Oct + 0.1 − 1.0 − 0.4 + 0.1 − 0.5 + 0.9 + 1.1 − 0.2 − 0.2 − 0.0 − 0.0 − Nov + 1.8 + 2.1 + 4.4 − + 4.4 + 10.4 + 10.3 + 0.1 − 0.2 + 0.0 + 0.0 − Dec
under savings and loan contracts (see Table IV.12). — 3 Excluding deposits liabilities arising from non-negotiable bearer debt securities. — 5 Included inunder savings and loan contracts (see also footnote 2). — 4 Including time deposits.
DEUTSCHEBUNDESBANKMonthly ReportFebruary 2005
Local government and local government associations(including municipal special-purpose associations) Social security funds
Time deposits 3 Time depositsSavings Savings
for up deposits Memo for up deposits Memoto and for more and bank item to and for more and bank item
Sight including than savings Fiduciary Sight including than savings FiduciaryTotal deposits 1 year 1 year bonds 2,4 loans Total deposits 1 year 1 year bonds 2 loans Period
End of year or month *
27.6 10.5 12.2 2.0 3.0 0.2 21.7 2.7 13.7 4.5 0.9 0.1 200224.8 9.9 10.1 1.9 2.8 0.2 20.6 2.8 12.5 4.5 0.8 0.0 200325.7 10.5 9.6 2.3 3.3 0.3 21.4 2.9 12.9 4.8 0.8 0.0 2004
23.9 9.6 9.3 2.0 3.0 0.2 19.1 2.8 10.6 4.8 0.9 0.0 2004 July25.5 10.2 10.3 2.0 3.0 0.3 18.6 3.0 9.9 4.8 0.9 0.0 Aug 24.5 9.4 10.0 2.1 3.0 0.3 19.7 3.0 11.2 4.6 1.0 0.0 Sep
23.9 9.5 9.1 2.1 3.1 0.3 18.6 3.0 10.1 4.7 0.9 0.0 Oct 25.7 10.6 9.7 2.2 3.2 0.3 19.2 3.4 10.2 4.7 0.9 0.0 Nov 25.7 10.5 9.6 2.3 3.3 0.3 21.4 2.9 12.9 4.8 0.8 0.0 Dec
Changes *− 2.8 − 0.5 − 2.1 − 0.0 − 0.2 + 0.0 − 0.4 + 0.1 − 1.3 + 0.9 − 0.1 − 0.0 2003+ 0.8 + 0.5 − 0.5 + 0.4 + 0.5 + 0.0 + 1.1 + 0.1 + 0.4 + 0.5 + 0.1 − 0.0 2004
+ 0.0 + 0.2 − 0.2 + 0.0 + 0.0 − 0.0 − 0.2 − 0.2 − 0.3 + 0.3 + 0.0 − 2004 July+ 1.6 + 0.6 + 1.0 + 0.0 + 0.0 + 0.0 − 0.5 + 0.2 − 0.7 + 0.1 + 0.0 − Aug − 1.0 − 0.8 − 0.3 + 0.1 + 0.0 − 0.0 + 1.4 + 0.1 + 1.3 + 0.1 + 0.1 − 0.0 Sep
− 0.6 + 0.1 − 0.8 + 0.0 + 0.1 + 0.0 − 1.1 − 0.0 − 1.1 + 0.1 − 0.1 − Oct + 1.8 + 1.2 + 0.5 + 0.0 + 0.0 − + 0.5 + 0.4 + 0.1 − 0.0 − 0.0 − Nov − 0.0 − 0.2 − 0.1 + 0.1 + 0.1 + 0.0 + 2.2 − 0.6 + 2.7 + 0.1 − 0.0 − 0.0 Dec
Monthly Report, are not specially marked. — 1 Federal Railways Fund, liabilities arising from non-negotiable bearer debt securities. — 3 IncludingIndemnification Fund, Redemption Fund for Inherited Liabilities, ERP Special deposits under savings and loan contracts. — 4 Excluding deposits underFund, German Unity Fund, Equalisation of Burdens Fund. — 2 Including savings and loan contracts (see also footnote 3).
37*
IV Banks

DEUTSCHEBUNDESBANKMonthly ReportFebruary 2005
IV Banks
10 Savings deposits and bank savings bonds of banks (MFIs) in Germany sold to non-banks (non-MFIs) *
€ billion
Savings deposits 1 Bank savings bonds, 3 sold to
of residents of non-residents domestic non-banks
at three months’ at more than three Memonotice months’ notice item of which
Interest Withof which of which of which credited maturitiesSpecial Special At three on of moresavings savings savings non-banks, than foreignmonths’
Period Total Total Total Total Total notice deposits total Total 2 yearsfacilities 2 facilities 2 non-banks
End of year or month *
2002 586.2 575.3 472.8 343.5 102.4 88.5 10.9 8.1 17.6 111.3 104.4 86.3 6.92003 600.4 590.3 500.8 377.1 89.5 76.4 10.1 7.9 16.0 107.2 100.3 83.9 7.02004 613.0 603.5 515.5 397.9 88.0 76.7 9.6 7.7 14.2 105.8 98.4 85.2 7.4
2004 Aug 601.0 591.3 505.6 388.1 85.7 74.0 9.7 7.8 0.3 105.5 98.7 85.4 6.7 Sep 600.8 591.2 505.7 389.0 85.4 73.9 9.7 7.8 0.3 105.3 98.6 85.3 6.7
Oct 601.9 592.3 506.3 389.7 86.0 74.5 9.6 7.7 0.4 105.7 98.8 85.5 6.9 Nov 602.6 593.1 506.2 390.1 86.9 75.2 9.6 7.7 0.5 106.0 98.7 85.3 7.3 Dec 613.0 603.5 515.5 397.9 88.0 76.7 9.6 7.7 10.1 105.8 98.4 85.2 7.4
Changes *2003 + 14.2 + 15.1 + 28.0 + 23.8 − 12.9 − 12.1 − 0.8 − 0.2 . − 4.6 − 4.8 − 3.0 + 0.12004 + 12.6 + 13.1 + 14.7 + 20.1 − 1.5 + 0.2 − 0.5 − 0.3 . − 1.0 − 1.5 + 1.3 + 0.4
2004 Aug + 0.7 + 0.7 + 0.7 + 0.9 − 0.0 + 0.0 − 0.0 + 0.0 . + 0.2 + 0.1 + 0.2 + 0.0 Sep − 0.2 − 0.1 + 0.1 + 0.9 − 0.3 − 0.1 − 0.0 − 0.0 . − 0.2 − 0.2 − 0.0 − 0.0
Oct + 1.1 + 1.1 + 0.5 + 0.8 + 0.6 + 0.6 − 0.0 − 0.0 . + 0.4 + 0.2 + 0.2 + 0.2 Nov + 0.7 + 0.8 − 0.1 + 0.3 + 0.9 + 0.7 − 0.1 − 0.1 . + 0.3 − 0.1 − 0.1 + 0.5 Dec + 10.4 + 10.4 + 9.3 + 7.8 + 1.1 + 1.4 − 0.0 − 0.0 . − 0.2 − 0.3 − 0.2 + 0.1
* See Table IV.2, footnote*; statistical breaks have been eliminated from the loan contracts, which are classified as time deposits. — 2 Savings depositschanges. The figures for the latest date are always to be regarded as bearing interest at a rate which exceeds the minimum or basic rate ofprovisional. Subsequent revisions, which appear in the following Monthly interest. — 3 Including liabilities arising from non-negotiable bearer debtReport, are not specially marked. — 1 Excluding deposits under savings and securities.
11 Debt securities and money market paper outstanding of banks (MFIs) in Germany *
€ billion
Non-negotiable bearer debt securitiesNegotiable bearer debt securities and money market paper and money market paper 6
of which of whichwith maturities of Subordinated
with maturities of
Certifi- more more non-Floating Zero Foreign cates up to and more up to and morethan 1 year than 1 year negotiable negotiablerate coupon currency of including including than including including than debt debt
Period Total 1 bonds 2 deposit 1 year 1 Total 1 year 2 years 2 yearsbonds 2,3 bonds 4,5 2 years 1 2 years 1 securities securities
End of year or month *
2002 1,462.9 339.2 16.1 159.5 34.7 62.3 120.1 1,280.5 9.9 7.8 0.7 1.3 42.4 2.32003 1,490.1 353.4 20.8 177.5 39.0 70.1 105.2 1,314.8 2.4 0.6 0.5 1.2 40.2 3.22004 1,550.0 382.6 22.9 214.6 36.5 62.1 94.2 1,393.7 2.4 0.5 0.5 1.5 43.3 3.7
2004 Aug 1,568.8 382.2 21.3 218.5 42.4 69.9 99.0 1,400.0 2.5 0.6 0.4 1.5 41.4 3.5 Sep 1,580.1 384.9 21.1 219.3 41.3 68.8 98.6 1,412.7 2.5 0.6 0.4 1.5 41.8 3.6
Oct 1,573.6 385.1 22.2 223.3 39.6 66.3 98.0 1,409.3 2.5 0.5 0.4 1.5 41.5 3.6 Nov 1,569.8 387.7 23.6 219.6 37.4 65.6 93.6 1,410.6 2.7 0.7 0.4 1.5 42.1 3.6 Dec 1,550.0 382.6 22.9 214.6 36.5 62.1 94.2 1,393.7 2.4 0.5 0.5 1.5 43.3 3.7
Changes *2003 + 19.6 + 7.0 + 4.7 + 13.2 + 3.2 + 0.1 − 14.9 + 34.4 + 2.6 + 2.9 − 0.2 − 0.1 − 1.5 + 0.32004 + 57.4 + 27.9 + 1.8 + 34.7 − 7.9 − 8.0 − 11.0 + 76.4 + 0.0 − 0.2 − 0.1 + 0.2 + 3.1 + 0.5
2004 Aug + 2.2 + 4.4 − 0.8 + 0.0 − 0.5 + 0.5 − 1.3 + 3.1 + 0.2 + 0.2 − 0.0 + 0.0 + 0.5 + 0.2 Sep + 11.3 + 2.7 − 0.5 + 0.8 − 1.1 − 1.1 − 0.3 + 12.7 + 0.0 + 0.0 − 0.0 + 0.0 + 0.3 + 0.0
Oct − 6.4 + 0.2 + 1.1 + 4.0 − 1.7 − 2.5 − 0.6 − 3.4 − 0.0 − 0.0 + 0.0 + 0.0 − 0.3 + 0.0 Nov − 3.9 + 1.3 + 1.3 − 3.7 − 2.3 − 0.7 − 4.4 + 1.2 + 0.2 + 0.2 + 0.0 − 0.0 + 0.6 − 0.0 Dec − 19.8 − 5.1 − 0.7 − 5.0 − 0.9 − 3.5 + 0.5 − 16.8 − 0.3 − 0.3 + 0.0 − 0.0 + 1.2 + 0.1
* See Table IV.2, footnote*; statistical breaks have been eliminated from the 2 Including debt securities denominated in foreign currencies. — 3 Issuechanges. The figures for the latest date are always to be regarded as value when floated. — 4 Including floating rate notes and zero couponprovisional. Subsequent revisions, which appear in the following Monthly bonds denominated in foreign currencies. — 5 Bonds denominated inReport, are not specially marked. — 1 Decreases in June 2002 caused by non-euro-area currencies. — 6 Non-negotiable bearer debt securities aretransition to net recording of debt securities outstanding (ie less own debt classified among bank savings bonds (see also Table IV.10, footnote 3). securities). The statistical break has been eliminated from the changes. —
38*
IV Banks

DEUTSCHEBUNDESBANKMonthly ReportFebruary 2005
IV Banks
12 Building and loan associations (MFIs) in Germany * Interim statements
€ billion
Lending to banks (MFIs) Lending to non-banks (non-MFIs) Deposits of banks Deposits of non-(MFIs) 5 banks (non-MFIs)
Credit Building loans Secur- Memobal- itemities (in-ances cluding Bearer Newand Loans Treasury Deposits Deposits debt Capital con-
Num- loans under bills under under secur- (includ- tractsber (ex- Bank savings Interim and savings savings ities ing pub- enteredof Balance cluding debt and loan and Other Treasury and loan Sight and loan Sight and out- lished into in
End of sheet building Building secur- con- bridging building discount con- and time con- time de- stand- re- year orassoci-year/month ations total loans 2 ities 3 tracts loans loans tracts deposits tracts posits 6 ing month 8 loans) 1 paper) 4 serves) 7
All building and loan associations
2003 27 172.9 30.1 0.1 10.6 37.3 63.6 8.6 11.3 0.4 29.3 106.8 4.0 7.1 7.2 105.5
2004 Sep 27 180.0 32.5 0.1 12.0 35.4 62.9 9.2 13.8 0.4 29.5 109.2 4.3 6.9 7.4 7.2 Oct 27 182.0 31.6 0.1 11.8 35.3 63.0 9.3 13.8 0.4 28.5 109.3 4.3 6.5 7.4 6.8 Nov 27 183.0 33.1 0.1 12.0 34.9 63.4 9.3 13.1 0.4 28.5 109.8 4.4 6.8 7.4 7.4
Private building and Ioan associations
2004 Sep 16 131.5 26.1 0.0 6.2 22.6 45.1 8.5 9.8 0.3 22.1 74.3 4.1 6.9 4.8 4.6 Oct 16 133.5 25.0 0.0 6.1 22.5 45.1 8.5 9.8 0.3 21.4 74.3 4.1 6.5 4.8 4.2 Nov 16 133.9 26.3 0.0 5.8 22.2 45.5 8.5 9.1 0.3 20.9 74.7 4.2 6.8 4.8 4.6
Public building and Ioan associations
2004 Sep 11 48.5 6.4 0.0 5.8 12.9 17.9 0.8 4.0 0.1 7.3 34.9 0.2 − 2.6 2.6 Oct 11 48.5 6.6 0.0 5.7 12.8 17.8 0.8 4.0 0.1 7.2 35.0 0.2 − 2.6 2.6 Nov 11 49.1 6.8 0.0 6.2 12.7 17.9 0.8 4.0 0.1 7.5 35.1 0.2 − 2.6 2.8
Trends in building and loan association business
€ billion
Changes in deposits Capital promised Capital disbursed Disbursement Interest andunder savings and commitments repaymentsloan contracts Allocations outstanding at received on
end of period building loans 10 Deposits under Loans under
Repay- savings and savings andments loan contracts loan contracts 9 Newly
Interest of grantedcredited interimdeposits of which of whichon under Applied Applied and of
which of MemoAmounts deposits cancelled to settle- to settle- bridgingunder savings of ment of ment of loans Under which itempaid into
savings savings and which interim interim and alloc- Repay- Housingand and loan loan Net and and other ated ments bonusesloan ac- con- con- alloca- bridging bridging building con- during re-
Period tracts tracts Total Total Total loans Total loans loans Total tracts Total quartercounts 9 tions 11 ceived 12
All building and loan associations
2003 27.0 2.9 5.7 48.2 29.7 43.7 17.9 4.0 8.2 3.2 17.5 12.2 8.0 14.8 11.9 0.6
2004 Sep 2.0 0.1 0.4 3.1 2.1 3.2 1.3 0.3 0.6 0.3 1.3 10.9 7.8 1.1 2.6 0.0 Oct 1.9 0.1 0.4 3.4 2.5 3.3 1.4 0.4 0.7 0.4 1.1 10.8 7.9 1.0 0.0 Nov 2.0 0.1 0.4 2.8 1.8 2.8 1.2 0.2 0.5 0.2 1.1 10.5 7.8 1.1 0.0
Private building and Ioan associations
2004 Sep 1.3 0.0 0.3 2.1 1.3 2.3 0.9 0.2 0.4 0.2 1.0 6.5 3.8 0.7 1.7 0.0 Oct 1.3 0.1 0.3 2.4 1.7 2.4 1.0 0.3 0.5 0.3 0.9 6.4 3.9 0.7 0.0 Nov 1.3 0.1 0.3 1.9 1.1 2.0 0.8 0.2 0.3 0.1 0.9 6.2 3.8 0.7 0.0
Public building and Ioan associations
2004 Sep 0.7 0.0 0.2 1.0 0.8 0.9 0.4 0.1 0.2 0.1 0.2 4.4 4.0 0.3 0.9 0.0 Oct 0.6 0.0 0.2 1.0 0.8 0.9 0.4 0.1 0.2 0.1 0.2 4.4 4.0 0.3 0.0 Nov 0.7 0.0 0.2 0.9 0.7 0.8 0.4 0.1 0.2 0.1 0.2 4.4 4.0 0.3 0.0
* Excluding assets and liabilities and/or transactions of foreign branches. amount covered by the contracts; only contracts newly entered into, forThe figures for the latest date are always to be regarded as provisional. which the contract fee has been fully paid. Increases in the sum contractedSubsequent revisions, which appear in the following Monthly Report, are count as new contracts. — 9 For disbursements of deposits under savingsnot specially marked. — 1 Including postal giro account balances, claims on and loan contracts arising from the allocation of contracts see “Capitalbuilding and loan associations, claims arising from registered debt securities disbursed“. — 10 Including housing bonuses credited. — 11 Only allocationsand central bank credit balances. — 2 Loans under savings and loan accepted by the beneficiaries; including allocations applied to settlement ofcontracts and interim and bridging loans. — 3 Including money market interim and bridging loans. — 12 The amounts already credited to thepaper and small amounts of other securities issued by banks. — 4 Including accounts of savers or borrowers are also included in “Amounts paid intoequalisation claims. — 5 Including liabilities to building and loan savings and loan accounts“ and “Interest and repayments received onassociations. — 6 Including small amounts of savings deposits. — 7 Including building loans“. participation rights capital and fund for general banking risks. — 8 Total
39*
IV Banks

DEUTSCHEBUNDESBANKMonthly ReportFebruary 2005
IV Banks 13 Assets and liabilities of the foreign branches and foreign subsidiaries of German banks (MFIs) *
€ billion
Number of Lending to banks (MFIs) Lending to non-banks (non-MFIs)
LoansCredit balances and loansGerman banks to German(MFIs) non-bankswithforeign foreign of whichbranches Money enter- Moneybranches 1 and/or and/or market prises to marketforeign foreign Balance paper, and foreign paper,subsi- subsi- sheet German Foreign secur- house- non- secur- Other
Period diaries diaries total Total Total banks banks Total Total Total holds banks ities 2 assetsities 2,3
Foreign branches End of year or month *
2001 68 216 1,689.3 870.6 761.6 213.6 548.0 109.0 744.9 549.0 20.6 17.2 528.4 195.9 73.92002 60 205 1,407.4 679.9 572.3 198.3 374.0 107.6 668.5 484.0 18.8 15.0 465.1 184.6 59.02003 55 202 1,294.1 599.0 522.9 185.6 337.3 76.1 632.7 438.0 19.0 16.8 419.0 194.7 62.5
2004 Feb 55 203 1,413.6 666.3 587.2 190.0 397.2 79.1 679.6 482.5 19.3 17.1 463.1 197.1 67.8 Mar 55 203 1,466.2 689.6 607.6 198.5 409.1 82.0 708.6 506.9 19.0 16.9 487.9 201.7 67.9
Apr 55 205 1,493.1 713.2 631.2 207.6 423.6 82.0 711.1 509.6 18.8 16.6 490.8 201.5 68.8 May 55 206 1,435.9 672.9 591.4 199.1 392.3 81.5 691.9 506.0 18.1 16.0 487.9 185.9 71.2 June 55 205 1,435.5 670.2 588.8 190.3 398.5 81.5 681.9 486.5 18.3 16.7 468.1 195.4 83.3
July 54 204 1,447.9 675.6 589.2 177.6 411.6 86.4 686.8 500.5 17.1 15.7 483.4 186.3 85.6 Aug 54 206 1,451.9 676.3 588.8 174.4 414.3 87.6 686.5 492.2 17.6 16.3 474.7 194.3 89.1 Sep 53 205 1,452.0 684.1 597.8 179.7 418.0 86.3 680.6 484.4 17.7 16.3 466.8 196.2 87.3
Oct 53 206 1,454.2 667.4 577.6 171.6 405.9 89.9 693.2 492.1 16.5 15.1 475.6 201.1 93.6 Nov 53 205 1,483.9 691.7 602.1 176.7 425.4 89.6 692.1 492.1 16.9 15.6 475.1 200.1 100.1
Changes *2002 − 8 − 11 −139.1 −133.4 −139.9 − 15.4 −124.5 + 6.5 − 3.6 − 9.2 − 1.9 − 2.2 − 7.3 + 5.7 − 2.22003 − 5 − 3 − 6.8 − 45.3 − 17.4 − 12.7 − 4.7 − 27.9 + 22.5 − 2.5 + 0.2 + 1.7 − 2.7 + 24.9 + 15.9
2004 Feb − + 1 + 24.8 + 19.5 + 21.7 − 1.6 + 23.2 − 2.2 + 6.7 + 9.7 + 0.2 + 0.2 + 9.5 − 3.0 − 1.3 Mar − − + 36.7 + 16.7 + 14.4 + 8.5 + 5.9 + 2.4 + 20.1 + 18.3 − 0.3 − 0.3 + 18.6 + 1.8 − 0.2
Apr − + 2 + 19.9 + 21.1 + 21.4 + 9.1 + 12.3 − 0.2 − 1.9 − 0.7 − 0.2 − 0.2 − 0.4 − 1.2 + 0.7 May − + 1 − 44.9 − 36.0 − 35.8 − 8.5 − 27.4 − 0.1 − 13.0 + 0.7 − 0.7 − 0.6 + 1.4 − 13.7 + 4.0 June − − 1 − 2.1 − 3.3 − 3.2 − 8.8 + 5.6 − 0.1 − 10.7 − 19.9 + 0.3 + 0.6 − 20.1 + 9.2 + 12.0
July − 1 − 1 + 5.9 + 3.3 − 1.4 − 12.7 + 11.2 + 4.7 + 1.4 + 11.2 − 1.3 − 1.0 + 12.4 − 9.8 + 1.3 Aug − + 2 + 9.3 + 2.8 + 1.4 − 3.1 + 4.5 + 1.4 + 2.7 − 5.7 + 0.5 + 0.6 − 6.2 + 8.4 + 3.8 Sep − 1 − 1 + 20.3 + 15.0 + 15.7 + 5.3 + 10.4 − 0.6 + 4.4 − 0.4 + 0.1 − 0.0 − 0.5 + 4.8 + 0.8
Oct − + 1 + 16.5 − 11.0 − 15.0 − 8.1 − 6.9 + 4.0 + 20.7 + 14.0 − 1.2 − 1.2 + 15.2 + 6.7 + 6.8 Nov − − 1 + 53.8 + 33.4 + 32.9 + 5.1 + 27.8 + 0.5 + 13.1 + 10.1 + 0.5 + 0.6 + 9.6 + 3.0 + 7.3
Foreign subsidiaries End of year or month *
2001 46 200 811.5 342.4 262.8 105.7 157.1 79.6 382.2 293.1 51.9 47.7 241.2 89.2 87.02002 47 200 704.2 333.7 265.5 125.7 139.8 68.2 300.1 239.1 46.7 42.9 192.4 61.0 70.42003 46 179 645.8 307.2 246.4 127.3 119.1 60.7 277.0 213.8 41.5 37.9 172.3 63.3 61.6
2004 Feb 46 179 621.3 297.2 235.7 114.8 120.9 61.5 260.4 196.5 38.8 37.1 157.7 63.9 63.7 Mar 46 176 650.7 300.5 238.8 111.7 127.1 61.7 270.0 204.6 41.6 38.0 163.0 65.4 80.3
Apr 46 176 663.2 298.4 236.6 111.1 125.5 61.8 274.8 207.7 40.9 37.8 166.8 67.1 90.1 May 46 175 629.3 280.2 218.7 106.5 112.1 61.5 275.1 206.6 39.5 37.9 167.1 68.5 74.0 June 45 173 628.6 283.0 220.9 110.7 110.2 62.1 278.9 210.0 40.3 37.3 169.7 68.9 66.7
July 45 173 636.3 292.3 229.6 116.4 113.2 62.7 279.0 209.7 39.6 36.7 170.1 69.2 65.0 Aug 45 173 627.9 289.0 224.3 115.2 109.1 64.7 278.1 208.5 38.1 36.2 170.3 69.6 60.8 Sep 45 171 634.1 292.8 226.3 114.0 112.4 66.5 279.9 210.6 37.9 35.5 172.8 69.2 61.4
Oct 45 170 636.6 294.8 228.1 116.1 112.0 66.7 280.4 210.4 36.5 34.9 173.9 70.0 61.4 Nov 45 170 644.4 297.7 230.2 114.9 115.3 67.5 284.4 212.6 37.8 35.0 174.8 71.8 62.3
Changes *2002 + 1 + 0 − 78.3 + 6.7 + 13.3 + 20.0 − 6.7 − 6.6 − 70.0 − 42.0 − 5.2 − 4.8 − 36.8 − 28.1 − 15.02003 − 1 − 21 − 32.8 − 14.0 − 10.7 + 1.6 − 12.3 − 3.3 − 11.9 − 14.2 − 5.2 − 5.0 − 9.0 + 2.3 − 6.9
2004 Feb − + 2 + 3.6 + 1.5 + 2.6 − 0.4 + 3.0 − 1.1 − 2.6 − 2.3 − 2.8 − 0.7 + 0.5 − 0.3 + 4.7 Mar − − 3 + 26.7 + 1.8 + 2.1 − 3.1 + 5.2 − 0.3 + 8.5 + 7.1 + 2.8 + 0.8 + 4.3 + 1.5 + 16.4
Apr − − + 10.8 − 3.1 − 3.0 − 0.6 − 2.4 − 0.1 + 3.9 + 2.2 − 0.7 − 0.2 + 2.9 + 1.7 + 10.0 May − − 1 − 32.5 − 17.3 − 17.3 − 4.6 − 12.8 + 0.1 + 1.0 − 0.5 − 1.4 + 0.1 + 0.9 + 1.5 − 16.2 June − 1 − 2 − 0.9 + 2.7 + 2.1 + 4.2 − 2.0 + 0.5 + 3.7 + 3.3 + 0.8 − 0.6 + 2.5 + 0.4 − 7.2
July − − + 6.9 + 8.9 + 8.5 + 5.7 + 2.8 + 0.4 − 0.2 − 0.6 − 0.7 − 0.5 + 0.1 + 0.3 − 1.7 Aug − − − 7.6 − 2.8 − 5.0 − 1.2 − 3.8 + 2.1 − 0.5 − 0.9 − 1.5 − 0.5 + 0.6 + 0.4 − 4.2 Sep − − 2 + 9.3 + 5.5 + 3.1 − 1.2 + 4.3 + 2.4 + 3.1 + 3.4 − 0.3 − 0.7 + 3.7 − 0.4 + 0.8
Oct − − 1 + 4.8 + 3.2 + 2.5 + 2.1 + 0.4 + 0.7 + 1.5 + 0.7 − 1.4 − 0.6 + 2.1 + 0.8 + 0.2 Nov − − + 11.9 + 5.1 + 3.5 − 1.2 + 4.7 + 1.6 + 5.7 + 3.9 + 1.4 + 0.1 + 2.6 + 1.8 + 1.1
* From March 2000, including the foreign branches of building and loan population have not been eliminated from the flow figures for the foreignassociations. In this table “foreign“ also includes the country of domicile of subsidiaries.) The figures for the latest date are always to be regarded asthe foreign branches and foreign subsidiaries. Statistical revisions have been provisional; subsequent revisions, which appear in the following Monthlyeliminated from the changes. (Breaks owing to changes in the reporting Report, are not specially marked. — 1 Several branches in a given
40*
IV Banks

DEUTSCHEBUNDESBANKMonthly ReportFebruary 2005
IV Banks
Deposits
of banks (MFIs) of non-banks (non-MFIs)
German non-banks 4 Money
Short-term marketMedium and long-termpaper
of which of which and debtenter- enter- Workingsecurities
out- capital Otherprises and prises andGerman Foreign house- house- Foreign stand- and own liabil-
Total Total banks Total Total Total holds Total holds ing 5 funds ities 6 Periodbanks non-banks
End of year or month * Foreign branches
1,271.3 855.3 194.0 661.2 416.0 57.4 54.2 51.2 3.2 3.0 358.6 316.8 24.0 77.2 20011,116.0 758.5 250.1 508.4 357.5 62.6 58.4 55.0 4.2 3.8 294.9 212.1 25.9 53.6 20021,076.8 727.6 267.1 460.5 349.2 66.2 60.6 56.8 5.7 5.4 283.0 139.4 30.5 47.4 2003
1,186.4 790.4 267.1 523.2 396.1 72.4 66.3 62.6 6.1 5.7 323.7 144.6 28.9 53.7 2004 Feb 1,227.8 808.2 273.9 534.3 419.5 71.8 65.6 62.4 6.1 5.7 347.8 155.4 28.1 55.0 Mar
1,249.4 822.6 275.2 547.4 426.8 69.1 62.9 58.7 6.3 5.9 357.7 157.4 28.1 58.2 Apr 1,193.8 776.0 268.5 507.5 417.9 65.0 58.3 54.4 6.7 6.3 352.9 155.3 27.8 59.0 May1,187.6 775.6 267.1 508.5 412.0 65.9 59.2 55.8 6.7 6.4 346.1 160.2 28.0 59.7 June
1,199.1 774.5 261.5 513.0 424.6 69.2 62.0 58.9 7.1 6.8 355.4 161.9 28.0 58.9 July1,209.8 785.8 266.7 519.0 424.1 70.0 62.8 59.7 7.2 6.8 354.1 153.6 27.0 61.5 Aug 1,212.4 803.1 280.4 522.7 409.4 69.0 61.8 59.1 7.1 6.8 340.4 147.6 27.1 64.8 Sep
1,217.4 797.9 280.9 516.9 419.6 71.8 64.9 62.1 6.9 6.6 347.8 144.6 27.2 65.0 Oct 1,251.2 804.4 280.2 524.3 446.8 64.4 58.2 55.2 6.2 5.9 382.3 139.4 27.2 66.2 Nov
Changes *− 53.4 − 31.7 + 56.0 − 87.7 − 21.7 + 5.2 + 4.2 + 3.8 + 1.0 + 0.8 − 26.9 −104.8 + 1.8 + 17.2 2002+ 34.4 + 12.6 + 17.0 − 4.4 + 21.8 + 3.6 + 2.1 + 1.7 + 1.5 + 1.6 + 18.1 − 72.6 + 4.6 + 26.8 2003
+ 31.9 + 25.5 − 14.2 + 39.7 + 6.4 − 1.6 − 1.7 − 2.2 + 0.1 + 0.0 + 8.0 − 5.3 − 0.0 − 1.7 2004 Feb + 29.7 + 10.0 + 6.8 + 3.2 + 19.6 − 0.6 − 0.6 − 0.2 − 0.0 − 0.0 + 20.3 + 10.8 − 0.8 − 2.9 Mar
+ 14.8 + 10.7 + 1.3 + 9.5 + 4.1 − 2.7 − 2.8 − 3.6 + 0.1 + 0.1 + 6.8 + 2.1 − 0.0 + 3.0 Apr − 47.3 − 41.3 − 6.7 − 34.6 − 6.0 − 4.1 − 4.6 − 4.3 + 0.4 + 0.4 − 1.8 − 2.2 − 0.2 + 4.7 May− 7.2 − 1.2 − 1.4 + 0.2 − 6.0 + 1.0 + 1.0 + 1.4 + 0.0 + 0.1 − 7.0 + 4.9 + 0.2 + 0.0 June
+ 6.4 − 3.9 − 5.7 + 1.8 + 10.2 + 3.2 + 2.8 + 3.1 + 0.4 + 0.4 + 7.0 + 1.7 + 0.0 − 2.2 July+ 15.0 + 13.5 + 5.3 + 8.2 + 1.6 + 0.8 + 0.8 + 0.9 + 0.0 + 0.0 + 0.7 − 8.3 − 1.0 + 3.5 Aug + 16.6 + 25.8 + 13.6 + 12.2 − 9.2 − 1.0 − 1.0 − 0.6 − 0.0 − 0.0 − 8.2 − 6.0 + 0.1 + 9.6 Sep
+ 17.0 + 2.0 + 0.6 + 1.4 + 15.1 + 2.9 + 3.1 + 3.0 − 0.2 − 0.2 + 12.2 − 3.0 + 0.1 + 2.4 Oct + 53.0 + 18.4 − 0.8 + 19.2 + 34.6 − 7.4 − 6.7 − 7.0 − 0.7 − 0.7 + 42.0 − 5.3 − 0.0 + 6.1 Nov
End of year or month * Foreign subsidiaries
576.5 362.5 79.2 283.3 214.0 36.4 32.5 23.9 3.9 3.8 177.6 99.8 47.3 87.9 2001503.5 307.7 99.5 208.2 195.7 27.0 22.5 21.1 4.5 4.5 168.7 78.4 43.0 79.3 2002467.9 283.1 99.8 183.3 184.8 29.9 25.9 24.0 4.0 3.9 155.0 68.2 41.3 68.4 2003
447.4 263.5 86.0 177.4 183.9 30.1 26.1 25.7 4.0 3.9 153.8 68.3 39.0 66.7 2004 Feb 470.2 273.7 88.0 185.7 196.5 32.6 28.7 28.3 3.9 3.8 163.9 71.1 39.2 70.2 Mar
480.6 297.0 75.6 221.4 183.6 30.0 26.2 25.8 3.9 3.8 153.6 70.7 39.4 72.4 Apr 451.1 271.9 75.7 196.3 179.2 28.5 24.7 24.2 3.8 3.7 150.7 70.6 39.2 68.5 May449.2 273.7 81.0 192.6 175.5 29.4 25.6 25.1 3.8 3.7 146.1 70.3 39.5 69.6 June
457.0 279.0 83.1 195.9 178.0 30.0 26.1 25.3 3.9 3.9 148.0 71.4 39.9 68.0 July447.8 273.3 80.9 192.3 174.5 28.5 24.2 23.3 4.3 4.2 146.0 72.0 39.7 68.4 Aug 454.1 279.6 84.1 195.5 174.5 28.0 23.6 23.4 4.3 4.3 146.5 71.6 39.4 69.0 Sep
455.8 276.8 82.8 194.1 179.0 26.6 22.2 21.3 4.4 4.4 152.3 71.2 39.5 70.1 Oct 458.7 279.8 83.1 196.7 178.9 26.3 21.9 21.0 4.4 4.3 152.6 72.5 39.0 74.2 Nov
Changes *− 47.1 − 37.4 + 20.3 − 57.8 − 9.7 − 9.4 − 10.0 − 2.9 + 0.6 + 0.6 − 0.3 − 21.4 − 4.4 − 5.4 2002− 13.8 − 10.3 + 0.3 − 10.6 − 3.5 + 2.8 + 3.4 + 2.9 − 0.5 − 0.5 − 6.3 − 10.3 − 1.6 − 7.2 2003
+ 3.2 + 0.7 − 0.2 + 0.9 + 2.6 + 0.1 + 0.1 − 0.0 − 0.0 − 0.0 + 2.5 + 0.4 + 0.7 − 0.6 2004 Feb + 20.8 + 9.0 + 1.9 + 7.1 + 11.9 + 2.6 + 2.6 + 2.6 − 0.1 − 0.1 + 9.3 + 2.8 + 0.2 + 2.9 Mar
+ 8.8 + 22.5 − 12.4 + 34.9 − 13.7 − 2.6 − 2.6 − 2.5 − 0.0 − 0.1 − 11.1 − 0.4 + 0.3 + 2.2 Apr − 28.0 − 24.1 + 0.1 − 24.2 − 3.9 − 1.5 − 1.4 − 1.6 − 0.1 − 0.0 − 2.4 − 0.2 − 0.3 − 4.0 May− 2.1 + 1.6 + 5.4 − 3.8 − 3.7 + 0.9 + 0.9 + 0.8 + 0.0 + 0.0 − 4.6 − 0.2 + 0.3 + 1.1 June
+ 7.1 + 5.0 + 2.1 + 2.9 + 2.1 + 0.6 + 0.5 + 0.2 + 0.1 + 0.1 + 1.5 + 1.1 + 0.4 − 1.6 July− 8.3 − 5.2 − 2.2 − 3.1 − 3.1 − 1.5 − 1.8 − 2.0 + 0.4 + 0.4 − 1.6 + 0.6 − 0.2 + 0.4 Aug + 9.0 + 8.0 + 3.1 + 4.9 + 0.9 − 0.5 − 0.6 + 0.1 + 0.0 + 0.0 + 1.5 − 0.4 − 0.3 + 1.1 Sep
+ 3.9 − 1.5 − 1.3 − 0.2 + 5.3 − 1.3 − 1.4 − 2.1 + 0.1 + 0.1 + 6.7 − 0.4 + 0.2 + 1.2 Oct + 6.6 + 5.3 + 0.3 + 4.9 + 1.3 − 0.3 − 0.3 − 0.3 − 0.0 − 0.0 + 1.6 + 1.3 − 0.5 + 4.6 Nov
country of domicile are regarded as a single branch. — 2 Treasury bills, subordinated liabilities and non-negotiable debt securities. — 5 Issues ofTreasury discount paper and other money market paper, debt negotiable and non-negotiable debt securities and money marketsecurities. — 3 Including own debt securities. — 4 Excluding paper. — 6 Including subordinated liabilities.
41*
IV Banks

DEUTSCHEBUNDESBANKMonthly ReportFebruary 2005
V Minimum reserves
1 Reserve ratiosGermany Euro area
% of liabilities subject to reserve requirements % of reserve base 1
Sight TimeApplicable from liabilities liabilities Applicable from RatioSavings deposits
1995 Aug 1 2 2 1.5 1999 Jan 1 2
1 Article 3 of the Regulation of the European Central Bank on the appli-cation of minimum reserves (excluding liabilities to which a reserve ratio of0% applies pursuant to Article 4 (1)).
2 Reserve maintenance in Germany up to the end of 1998− pursuant to the Minimum Reserves Order of the Bundesbank
DM million
Liabilities subject to reserve requirements Excess reserves 4
Monthly Required % of theaverage 1 Total reserves 2 Level DeficienciesSight liabilities Time liabilities Savings deposits Actual reserves 3 required reserves
1995 Dec 2,066,565 579,337 519,456 967,772 36,492 37,337 845 2.3 31996 Dec 2,201,464 655,483 474,342 1,071,639 38,671 39,522 851 2.2 41997 Dec 2,327,879 734,986 476,417 1,116,477 40,975 41,721 745 1.8 31998 Dec 2,576,889 865,444 564,878 1,146,567 45,805 46,432 627 1.4 4
1 Pursuant to sections 5 to 7 of the Minimum Reserves Order. 2 Amount balances of the credit institutions subject to reserve requirements on theirafter applying the reserve ratios to the liabilities subject to reserve require- giro accounts at the Bundesbank. — 4 Actual reserves less required reserves. ments (section 5 (1) of the Minimum Reserves Order). — 3 Average credit
3 Reserve maintenance in the euro area− from 1999, pursuant to the ECB Regulation on the application of minimum reserves in accordance with
Article 19.1 of the Statute of the ESCB Maintenance Required reservesperiod before deduction Required reserves
of lump-sum Lump-sumbeginning in 1 after deduction ofReserve base 2 allowance 3 allowance 4 Deficiencies 7 lump-sum allowance Current account 5 Excess reserves 6
Euro area (€ billion)
2004 June 6,925.3 138.5 0.5 138.0 138.8 0.8 0.0
July 6,949.1 139.0 0.5 138.5 139.1 0.6 0.0 Aug 6,963.2 139.3 0.5 138.7 139.3 0.6 0.0 Sep 6,960.0 139.2 0.5 138.7 139.3 0.6 0.0
Oct 6,916.7 138.3 0.5 137.8 138.4 0.6 0.0 Nov 6,923.3 138.5 0.5 137.9 138.5 0.6 0.0 Dec 6,945.1 138.9 0.5 138.4 139.1 0.7 0.0
2005 Jan p,8 6,988.4 139.8 0.5 139.3 140.0 0.8 ... Feb p ... ... ... 140.5 ... ... ...
Of which: Germany (€ million)
2004 June 1,913,668 38,273 216 38,058 38,465 407 4
July 1,914,325 38,287 214 38,073 38,336 263 1 Aug 1,890,399 37,808 213 37,595 37,860 265 1 Sep 1,875,073 37,501 212 37,290 37,543 253 1
Oct 1,870,662 37,413 211 37,203 37,503 300 3 Nov 1,877,711 37,554 210 37,345 37,608 263 2 Dec 1,864,666 37,293 210 37,084 37,436 352 20
2005 Jan p 1,886,330 37,727 209 37,517 37,850 333 2 Feb p 1,870,260 37,405 209 37,196 ... ... ...
1 From March 2004, the reserve maintenance period will start on the reserve base. — 4 Article 5 (2) of the Regulation of the European Centralsettlement day of the main refinancing operation immediately following Bank on the application of minimum reserves. — 5 Average credit balancesthe meeting of the Governing Council of the ECB for which the monthly of the credit institutions at the national central banks. — 6 Average creditdiscussion of the monetary policy stance is scheduled. — 2 Article 3 of the balances less required reserves after deduction of the lump-sumRegulation of the European Central Bank on the application of minimum allowance. — 7 Required reserves after deduction of the lump-sumreserves (excluding liabilities to which a reserve ratio of 0% applies, pur- allowance. — 8 The total number of deficiencies was not available whensuant to Article 4 (1)). — 3 Amount after applying the reserve ratios to the this report went to press.
42*
V Minimum reserves

DEUTSCHEBUNDESBANKMonthly ReportFebruary 2005
VI Interest rates
1 ECB interest rates 2 Base rates
% per annum % per annum
Base rateas per
Main Main Discount Base rateMarginal Marginal Rate as perrefinancing refinancing
Applicable Deposit lending Applicable Deposit lending Applicable Applicable Civil Codeoperations operations Transitionfrom facility 1 facility from facility 1 facility from Act 2 from 3
1999 Jan 1 2.00 3.00 4.50 2002 Dec 6 1.75 2.75 3.75 1999 Jan 1 2.50 2002 Jan 1 2.57 Jan 4 2.75 3.00 3.25 May 1 1.95 July 1 2.47 Jan 22 2.00 3.00 4.50 2003 Mar 7 1.50 2.50 3.50 Apr 9 1.50 2.50 3.50 June 6 1.00 2.00 3.00 2000 Jan 1 2.68 2003 Jan 1 1.97 Nov 5 2.00 3.00 4.00 May 1 3.42 July 1 1.22
Sep 1 4.262000 Feb 4 2.25 3.25 4.25 2004 Jan 1 1.14 Mar 17 2.50 3.50 4.50 2001 Sep 1 3.62 July 1 1.13 Apr 28 2.75 3.75 4.75 June 9 3.25 4.25 5.25 2002 Jan 1 2.71 2005 Jan 1 1.21 Sep 1 3.50 4.50 5.50 to Oct 6 3.75 4.75 5.75 Apr 3
2001 May 11 3.50 4.50 5.50 Aug 31 3.25 4.25 5.25 Sep 18 2.75 3.75 4.75 Nov 9 2.25 3.25 4.25
1 Up to 21 June 2000, fixed rate tenders; from 28 June 2000, variable rate Act, read in conjunction with the Regulation Governing the Use of the Basetenders at minimum bid rate. — 2 Pursuant to the Discount Rate Transition Rate as a Reference Variable. — 3 Pursuant to section 247 of the Civil Code.
3 Eurosystem monetary policy operations allotted through tenders
Fixed rate tenders Variable rate tenders
Bid Allotment Minimum Weightedamount amount Fixed rate bid rate Marginal rate 1 average rate
Date of Running forsettlement € million % per annum ... days
Main refinancing operations2005 Jan 5 324,154 259,000 − 2.00 2.06 2.07 7 Jan 12 343,644 265,000 − 2.00 2.06 2.07 7 Jan 19 362,771 279,500 − 2.00 2.06 2.07 7 Jan 26 368,794 273,000 − 2.00 2.06 2.07 7
Feb 2 332,198 277,500 − 2.00 2.06 2.06 6 Feb 8 327,172 275,500 − 2.00 2.06 2.06 8 Feb 16 352,917 276,500 − 2.00 2.05 2.05 7
Longer-term refinancing operations2004 Oct 28 46,646 25,000 − − 2.10 2.11 91 Nov 25 51,095 25,000 − − 2.13 2.14 91 Dec 23 34,466 25,000 − − 2.12 2.14 98
2005 Jan 27 58,133 30,000 − − 2.09 2.10 91
Source: ECB. — 1 Lowest or highest interest rate at which funds were allotted or collected.
4 Money market rates, by month % per annum
Money market rates reported by Frankfurt banks 1 EURIBOR 3
One- One- Three- Six- Nine- Twelve-week month month month month month
Overnight money Three-month funds EONIA 2 funds funds funds funds funds funds
Reporting Monthly Lowest and Monthly Lowest andperiod averages highest rates averages highest rates Monthly averages
2004 July 2.06 2.02 − 2.45 2.10 2.08 − 2.12 2.07 2.07 2.08 2.12 2.19 2.26 2.36 Aug 2.04 1.85 − 2.12 2.09 2.07 − 2.11 2.04 2.07 2.08 2.11 2.17 2.22 2.30 Sep 2.05 1.95 − 2.50 2.10 2.07 − 2.15 2.05 2.07 2.08 2.12 2.20 2.28 2.38
Oct 2.11 2.03 − 2.95 2.13 2.11 − 2.15 2.11 2.08 2.09 2.15 2.19 2.25 2.32 Nov 2.09 2.05 − 2.40 2.15 2.12 − 2.17 2.09 2.09 2.11 2.17 2.22 2.27 2.33 Dec 2.05 4 1.70 − 2.12 2.15 2.12 − 2.17 2.05 2.13 2.17 2.17 2.21 2.25 2.30
2005 Jan 2.07 1.92 − 2.20 2.12 2.10 − 2.15 2.08 2.10 2.11 2.15 2.19 2.25 2.31
1 Money market rates are not fixed or quoted officially; the monthly aver- of real turnover according to the act/360 method and published viaages computed from daily quotations are unweighted. — 2 Euro OverNight Moneyline Telerate. — 3 Euro Interbank Offered Rate: unweighted averageIndex Average: weighted average overnight rate for interbank operations rate calculated by Moneyline Telerate since 30 December 1998 according tocalculated by the European Central Bank since 4 January 1999 on the basis the act/360 method. — 4 At end-December, 2.08% to 2.11%.
43*
VI Interest rates

DEUTSCHEBUNDESBANKMonthly ReportFebruary 2005
VI Interest rates
5 Interest rates for outstanding amounts and new business of banks (MFIs) in the European monetary union *(a) Outstanding amounts o
Effective interest rate % per annum 1
Non-financial Loans to households Loans toHouseholds’ corporations’ non-financialdeposits deposits Housing loans Consumer credit and other loans corporations
with an agreed maturity of with a maturity of
over 1 year over 1 year over 1 yearEnd of up to over up to over up to and up to over up to and up to over up to and up to overmonth 2 years 2 years 2 years 2 years 1 year 5 years 5 years 1 year 5 years 5 years 1 year 5 years 5 years
2004 Apr 1.90 3.35 2.08 4.17 4.90 4.75 5.01 8.03 7.08 5.85 4.51 3.91 4.59 May 1.89 3.28 2.07 4.15 4.89 4.72 4.99 7.99 7.04 5.82 4.50 3.87 4.55 June 1.88 3.27 2.08 4.12 4.87 4.69 4.97 7.93 6.99 5.80 4.47 3.89 4.53
July 1.89 3.25 2.09 4.11 4.91 4.63 4.94 7.93 6.98 5.76 4.48 3.88 4.50 Aug 1.89 3.22 2.12 4.03 4.88 4.58 4.91 7.93 6.95 5.77 4.45 3.84 4.48 Sep 1.90 3.22 2.12 3.97 4.82 4.58 4.90 8.06 7.14 5.85 4.46 3.99 4.52
Oct 1.90 3.27 2.11 3.89 4.69 4.53 4.88 8.05 7.08 5.80 4.42 3.97 4.48 Nov 1.90 3.26 2.12 3.86 4.67 4.52 4.86 7.93 6.99 5.82 4.41 3.96 4.48 Dec 1.92 3.24 2.16 3.76 4.72 4.49 4.83 7.94 7.02 5.80 4.35 3.97 4.44
(b) New business +
Effective interest rate % per annum 1
Households’ deposits Non-financial corporations’ deposits
with an agreed maturity of redeemable at notice of with an agreed maturity of
over 1 year over 1 yearReporting up to and up to over up to over up to and up to overperiod Overnight 1 year 2 years 2 years 3 months 3 months Overnight 1 year 2 years 2 years
2004 Apr 0.70 1.96 2.13 2.41 2.02 2.57 0.85 1.97 2.04 3.46 May 0.70 1.86 2.15 2.43 2.00 2.56 0.86 1.96 2.06 3.74 June 0.70 1.87 2.21 2.42 2.00 2.55 0.87 1.99 2.27 3.76
July 0.70 1.90 2.21 2.54 1.99 2.55 0.86 1.99 2.59 4.00 Aug 0.71 1.91 2.18 2.67 2.00 2.53 0.87 1.98 2.36 3.99 Sep 0.72 1.90 2.20 2.48 2.00 2.52 0.90 2.00 2.31 3.68
Oct 0.72 1.92 2.29 2.48 2.00 2.52 0.89 2.04 2.32 3.56 Nov 0.73 1.94 2.20 2.50 2.01 2.51 0.90 2.04 2.22 3.39 Dec 0.73 1.95 2.19 2.32 2.00 2.52 0.90 2.08 2.68 3.52
Loans to households
Consumer loans Housing loans Other loans
with an initial rate fixation with an initial rate fixation
floating floating floatingover 1 year over 1 year over 5 years over 1 yearReporting Over- rate or up and up to over rate or up and up to and up to over and up to overrate or upperiod drafts Total 2 to 1 year 5 years 5 years Total 2 to 1 year 5 years 10 years 10 years to 1 year 5 years 5 years
2004 Apr 9.73 7.86 7.35 6.64 8.30 4.24 3.42 4.06 4.77 4.69 3.89 4.97 4.95 May 9.68 7.96 7.33 6.77 8.27 4.17 3.40 4.05 4.75 4.61 4.14 4.87 4.94 June 9.55 7.96 7.12 6.74 8.42 4.17 3.42 4.12 4.82 4.69 3.93 4.97 5.01
July 9.57 8.07 7.18 6.86 8.52 4.20 3.47 4.16 4.81 4.69 4.04 4.94 5.01 Aug 9.62 8.26 7.67 6.89 8.58 4.29 3.50 4.19 4.87 4.65 3.91 5.07 5.02 Sep 9.59 8.18 7.45 6.96 8.45 4.24 3.49 4.14 4.82 4.66 3.90 4.98 5.00
Oct 9.53 7.98 7.37 6.87 8.34 4.18 3.50 4.12 4.77 4.64 4.08 4.87 4.92 Nov 9.47 7.97 7.43 6.85 8.23 4.09 3.45 4.07 4.66 4.58 3.96 4.89 4.82 Dec 9.51 7.71 7.24 6.60 7.67 4.07 3.43 3.95 4.49 4.41 3.82 4.59 4.66
Loans to non-financial corporations
Loans up to €1 million with an initial rate fixation Loans over €1 million with an initial rate fixation
Reporting floating rate or over 1 year and floating rate or over 1 year andperiod Overdrafts up to 1 year up to 5 years over 5 years up to 1 year up to 5 years over 5 years
2004 Apr 5.51 3.88 4.75 4.69 3.00 3.28 4.21 May 5.46 4.00 4.62 4.59 3.00 3.30 4.21 June 5.46 3.97 4.81 4.71 2.99 3.26 4.08
July 5.36 4.02 4.85 4.65 3.02 3.28 4.27 Aug 5.37 4.06 4.89 4.73 2.99 3.12 4.30 Sep 5.37 4.00 4.85 4.68 2.99 3.37 4.45
Oct 5.39 4.02 4.87 4.64 2.98 3.30 4.27 Nov 5.37 4.02 4.79 4.55 2.95 3.35 4.31 Dec 5.26 3.98 4.67 4.46 3.05 3.55 4.10
Source: ECB. — For footnotes *, o and 1 see p 45. For footnote + see p 46. — which contains other related charges which may occur for enquiries, adminis-2 Annual percentage rate of charge as defined in Directive 87/102/EEC, tration, preparation of the documents, guarantees and credit insurance.
44*
VI Interest rates

DEUTSCHEBUNDESBANKMonthly ReportFebruary 2005
VI Interest rates
6 Interest rates and volumes for outstanding amounts and new business of German banks (MFIs) *(a) Outstanding amounts o
Households’ deposits Non-financial corporations’ deposits
with an agreed maturity of
up to 2 years over 2 years up to 2 years over 2 years
Effective Effective Effective EffectiveEnd of interest rate 1 Volume 2 interest rate 1 Volume 2 interest rate 1 Volume 2 interest rate 1 Volume 2 month % pa € million % pa € million % pa € million % pa € million
2003 Dec 2.00 128,564 3.16 190,465 2.05 74,309 4.98 29,3632004 Jan 1.97 126,519 3.14 191,301 2.00 65,515 4.97 29,816 Feb 1.94 124,617 3.13 191,935 1.99 72,633 4.96 29,775 Mar 1.94 122,662 3.11 192,728 1.98 71,568 4.96 29,211 Apr 1.92 119,413 3.07 192,985 1.97 71,450 4.93 29,591 May 1.90 118,543 3.05 192,822 1.98 73,261 4.93 29,523 June 1.89 115,574 3.03 193,431 1.98 71,355 4.88 29,376 July 1.91 113,816 3.03 193,684 1.99 72,644 4.86 29,709 Aug 1.91 112,858 3.03 194,631 2.00 70,573 4.82 29,760 Sep 1.90 111,909 2.97 194,950 2.00 69,114 4.81 29,936 Oct 1.91 111,286 2.96 195,397 2.01 72,291 4.74 28,853 Nov 1.90 110,334 2.95 194,704 2.01 69,413 4.71 29,239 Dec 1.94 112,266 2.92 199,018 2.07 73,428 4.62 29,684
Housing loans to households 3 Consumer credit and other loans to households 4, 5
with a maturity of
over 1 year and over 1 year andup to 1 year 6 up to 5 years over 5 years up to 1 year 6 up to 5 years over 5 years
Effective Effective Effective Effective Effective Effectiveinterest interest interest interest interest interest
End of rate 1 Volume 2 rate 1 Volume 2 rate 1 Volume 2 rate 1 Volume 2 rate 1 Volume 2 rate 1 Volume 2 month % pa % pa % pa % pa % pa % pa€ million € million € million € million € million € million
2003 Dec 5.55 7,756 5.01 33,052 5.79 886,159 8.90 88,558 6.35 70,446 6.28 329,9252004 Jan 5.43 7,641 4.97 32,907 5.78 885,875 8.87 84,977 6.32 69,872 6.27 328,719 Feb 5.38 7,521 4.96 32,809 5.77 884,820 8.77 83,635 6.29 69,585 6.26 328,977 Mar 5.32 7,690 4.90 32,180 5.75 880,980 8.74 84,319 6.27 69,587 6.25 331,220 Apr 5.29 7,401 4.87 32,148 5.74 881,832 8.81 82,911 6.19 70,268 6.22 331,533 May 5.27 7,501 4.84 32,268 5.73 882,795 8.74 81,301 6.15 70,586 6.21 331,611 June 5.23 7,635 4.83 33,008 5.71 886,304 8.88 83,204 6.14 70,479 6.21 331,013 July 5.24 7,577 4.77 33,072 5.69 888,736 8.80 81,277 6.10 71,134 6.21 331,665 Aug 5.24 7,478 4.75 33,203 5.68 890,887 8.77 80,999 6.07 71,478 6.20 331,010 Sep 5.27 7,597 4.72 33,360 5.67 894,787 8.83 83,016 6.04 70,960 6.20 329,461 Oct 5.14 7,649 4.67 33,775 5.66 895,414 8.79 80,415 5.95 71,660 6.18 330,628 Nov 5.12 7,586 4.65 33,278 5.65 896,510 8.72 77,971 5.94 70,561 6.17 328,982 Dec 5.25 7,637 4.63 33,190 5.63 897,825 8.72 80,625 5.91 70,109 6.23 331,646
Loans to non-financial corporations with a maturity of
up to 1 year 6 over 1 year and up to 5 years over 5 years
End of Volume 2 Volume 2 Volume 2 Effective interest rate 1 Effective interest rate 1 Effective interest rate 1 month % pa € million % pa € million % pa € million
2003 Dec 4.84 187,742 4.46 87,966 5.33 488,7772004 Jan 4.82 181,660 4.40 88,474 5.30 487,166 Feb 4.78 181,186 4.37 87,879 5.29 488,299 Mar 4.76 183,464 4.34 87,519 5.27 487,244 Apr 4.75 179,606 4.32 87,478 5.25 489,214 May 4.77 174,716 4.28 89,876 5.23 491,825 June 4.79 176,791 4.32 90,154 5.22 488,805 July 4.72 171,094 4.26 90,072 5.21 487,135 Aug 4.68 170,136 4.21 90,723 5.19 487,903 Sep 4.75 171,070 4.25 89,980 5.25 485,483 Oct 4.68 169,423 4.18 87,915 5.23 485,720 Nov 4.61 174,233 4.14 87,256 5.20 486,256 Dec 4.64 166,966 4.15 87,044 5.19 483,878
* The MFI interest rate statistics are based on the interest rates applied by the end of the month. — 1 The effective interest rates may always beMFIs and the related volumes of euro-denominated deposits and loans to calculated either as annualised agreed interest rates or as narrowly definedhouseholds and non-financial corporations domiciled in the euro area. The effective rates. Both calculation methods cover all interest payments onhousehold sector comprises individuals (including sole proprietors) and deposits and loans but not any other related charges which may occur fornon-profit institutions serving households. Non-financial corporations in- enquiries, administration, preparation of the documents, guarantees andclude all enterprises other than insurance companies, banks and other finan- credit insurance. — 2 Data based on monthly balance sheet statistics. —cial institutions. The interest rate statistics gathered on a harmonised basis 3 Secured and unsecured loans for home purchase, including building andin the euro area from January 2003 are being collected in Germany on a home improvements; including loans granted by building and loansample basis. The most recent figures are in all cases to be regarded as provi- associations and interim credits as well as transmitted loans granted by thesional. Subsequent revisions appearing in the following Monthly Report are reporting agents in their own name and for their own account. —not specially marked. Further information on the new interest rate statistics 4 Consumer credits are loans granted for the purpose of personal use in thecan be found on the Bundesbank’s website (Statistics / Reporting System / consumption of goods and services. — 5 For the purpose of these statistics,Banking statistics / EWU-Zinsstatistik). This information is currently available other loans are loans granted for other purposes such as business, debtin German only. — o The statistics on outstanding amounts are collected at consolidation, education etc. — 6 Including overdrafts.
45*
VI Interest rates

DEUTSCHEBUNDESBANKMonthly ReportFebruary 2005
VI Interest rates
6 Interest rates and volumes for outstanding amounts and new business of German banks (MFIs) * (cont’d)(b) New business +
Households’ deposits
with an agreed maturity of redeemable at notice of 8
over 1 year andOvernight up to 1 year up to 2 years over 2 years up to 3 months over 3 months
Effective Effective Effective Effective Effective Effectiveinterest interest interest interest interest interest
Reporting rate 1 Volume 2 rate 1 Volume 7 rate 1 Volume 7 rate 1 Volume 7 rate 1 Volume 2 rate 1 Volume 2 period % pa % pa % pa % pa % pa % pa€ million € million € million € million € million € million
2003 Dec 1.08 400,936 1.89 29,428 2.84 1,512 2.91 2,519 2.17 502,167 2.72 89,5282004 Jan 1.10 405,052 1.92 30,791 2.78 1,542 3.15 3,852 2.18 503,431 2.68 88,506 Feb 1.10 411,617 1.95 23,387 2.41 1,056 2.86 2,340 2.12 504,560 2.66 88,115 Mar 1.12 410,717 2.03 28,021 2.31 840 2.66 2,357 2.10 504,583 2.62 87,863 Apr 1.13 412,968 2.01 32,020 2.30 1,243 2.76 2,061 2.13 505,420 2.60 86,706 May 1.13 418,859 1.88 30,506 2.33 1,097 2.74 2,404 2.10 505,649 2.58 85,838 June 1.13 419,073 1.88 25,696 2.46 838 2.71 1,725 2.13 505,366 2.57 85,480 July 1.14 418,729 1.90 25,693 2.43 1,071 2.86 2,113 2.10 505,800 2.57 85,562 Aug 1.16 416,996 1.96 24,546 2.50 701 3.12 2,459 2.11 506,415 2.56 85,491 Sep 1.17 418,189 1.89 23,981 2.50 913 2.78 2,724 2.13 506,492 2.55 85,177 Oct 1.17 421,839 1.92 22,905 2.67 960 3.03 2,649 2.13 506,856 2.54 85,738 Nov 1.15 434,898 1.92 23,384 2.41 856 3.04 2,839 2.16 506,807 2.54 86,549 Dec 1.17 428,608 1.90 25,454 2.39 929 2.59 2,791 2.13 515,840 2.55 87,804
Non-financial corporations’ deposits
with an agreed maturity of
Overnight up to 1 year over 1 year and up to 2 years over 2 years
Effective Effective Effective EffectiveReporting interest rate 1 Volume 2 interest rate 1 Volume 7 interest rate 1 Volume 7 interest rate 1 Volume 7 period % pa € million % pa € million % pa € million % pa € million
2003 Dec 1.05 138,713 1.96 36,247 2.76 360 4.09 1,0752004 Jan 1.16 136,443 1.92 35,633 2.43 174 3.90 823 Feb 1.11 128,210 1.95 38,596 2.18 197 4.26 697 Mar 1.11 130,095 1.92 34,914 2.28 201 3.82 1,274 Apr 1.10 134,285 1.90 30,589 1.85 222 3.93 1,075 May 1.10 131,703 1.92 32,753 2.44 115 4.24 1,535 June 1.09 134,255 1.92 31,971 2.59 163 4.22 1,273 July 1.08 131,254 1.95 32,273 3.10 334 4.25 2,601 Aug 1.08 135,739 1.94 30,356 2.56 102 4.29 1,823 Sep 1.11 138,157 1.95 30,538 2.51 274 3.94 2,033 Oct 1.13 137,992 1.97 29,266 2.56 258 4.13 1,151 Nov 1.13 142,752 1.95 29,259 2.24 176 4.04 2,678 Dec 1.15 144,573 2.02 51,828 2.39 211 3.81 2,215
Loans to households
Consumer loans with an initial rate fixation of 4 Other loans with an initial rate fixation of 5
floating rate or over 1 year and floating rate or over 1 year andTotal up to 1 year 10 up to 5 years over 5 years up to 1 year 10 up to 5 years over 5 years
AnnualEffective Effective Effective Effective Effective Effectivepercentage
rate of interest interest interest interest interest interestReporting charge 9 rate 1 Volume 7 rate 1 Volume 7 rate 1 Volume 7 rate 1 Volume 7 rate 1 Volume 7 rate 1 Volume 7 period % pa % pa % pa % pa % pa % pa % pa€ million € million € million € million € million € million
2003 Dec 6.90 5.02 1,541 5.80 5,234 7.81 3,701 3.57 12,315 4.93 2,578 5.13 3,9782004 Jan 8.01 5.30 1,427 6.62 4,233 9.00 3,746 3.85 8,611 5.08 1,992 5.27 1,998 Feb 7.98 4.98 1,308 6.50 4,963 9.08 3,539 3.85 5,613 5.04 1,588 5.07 2,112 Mar 7.83 5.28 1,553 6.29 5,806 8.88 4,494 3.69 8,974 5.11 2,037 5.00 3,549 Apr 7.56 5.05 1,664 6.08 6,345 8.86 4,074 3.50 9,264 4.92 1,658 5.00 2,903 May 7.77 5.21 1,147 6.21 5,257 8.94 3,147 3.94 5,901 4.85 1,552 5.10 1,725 June 7.87 5.34 1,402 6.21 5,371 9.11 3,794 3.48 8,704 5.00 2,816 5.07 3,278 July 8.02 5.25 1,492 6.34 5,020 9.27 3,792 3.64 9,119 4.90 1,908 5.15 2,018 Aug 8.13 5.42 1,090 6.44 5,187 9.16 3,038 3.52 8,837 5.07 1,379 5.17 1,365 Sep 8.03 5.09 1,365 6.41 4,878 9.19 3,058 3.42 9,097 4.88 1,474 5.07 2,577 Oct 7.95 4.77 1,210 6.30 4,579 9.17 2,927 3.74 7,395 4.80 1,590 4.90 1,415 Nov 7.70 4.86 1,251 6.20 4,159 8.88 3,133 3.46 8,436 4.84 1,164 4.75 1,989 Dec 7.18 4.90 1,550 5.95 4,551 8.04 2,846 3.44 10,026 4.54 2,853 4.69 2,967
For footnotes * and 1 to 6, see p 45*. — + In the case of deposits with an business at the end of the month has to be incorporated in the calculationagreed maturity and all loans excluding overdrafts, new business covers all of average rates of interest. — 7 Estimated. The volume of new business isnew agreements between households or non-financial corporations and the extrapolated to form the underlying total using the Horvitz-Thompson esti-bank. The interest rates are calculated as volumeweighted average rates mator. — 8 Including non-financial corporations’ deposits; including fidelityacross all new agreements concluded during the reporting month. In the and growth premia. — 9 Annual percentage rate of charge as defined in Dir-case of overnight deposits, deposits redeemable at notice and overdrafts, ective 87/102/EEC, which contains other related charges which may occur fornew business is collected in the same way as outstanding amounts for the enquiries, administration, preparation of the documents, guarantees andsake of simplicity. This means that all outstanding deposit and lending credit insurance. — 10 Excluding overdrafts.
46*
VI Interest rates

DEUTSCHEBUNDESBANKMonthly ReportFebruary 2005
VI Interest rates
6 Interest rates and volumes for outstanding amounts and new business of German banks (MFIs) * (cont’d)(b) New business +
Loans to households (cont’d)
Housing loans with an initial rate fixation of 3
floating rate or over 1 year and over 5 years andOverdrafts 11 Total up to 1 year 10 up to 5 years up to 10 years over 10 years
Annual per-Effective Effective Effective Effective Effectivecentage rate
Reporting Volume 12 Volume 7 Volume 7 Volume 7 Volume 7 interest rate 1 of charge 9 interest rate 1 interest rate 1 interest rate 1 interest rate 1 period % pa € million % pa % pa € milion % pa € million % pa € million % pa € million
2003 Dec 10.48 62,675 5.06 4.63 2,878 4.75 3,710 5.14 7,473 5.19 3,380
2004 Jan 10.40 59,768 5.02 4.57 2,827 4.65 3,280 5.15 5,978 5.19 3,201 Feb 10.40 57,555 4.95 4.56 1,999 4.61 2,457 5.06 4,262 5.03 2,628 Mar 10.38 57,884 4.85 4.43 2,504 4.48 3,240 4.99 5,417 4.98 2,983
Apr 10.36 56,755 4.76 4.26 2,706 4.32 3,127 4.91 5,106 4.95 2,964 May 10.35 55,144 4.80 4.49 2,079 4.37 2,736 4.91 4,497 4.94 2,865 June 10.38 56,024 4.83 4.49 2,314 4.32 3,479 4.96 5,292 5.09 2,934
July 10.35 54,012 4.84 4.26 3,233 4.51 3,279 4.92 5,963 5.11 2,873 Aug 10.33 53,601 4.88 4.37 2,071 4.59 2,291 5.04 3,844 4.99 2,648 Sep 10.33 55,219 4.87 4.44 2,058 4.53 2,371 4.96 4,139 4.97 2,551
Oct 10.26 53,107 4.78 4.30 3,091 4.48 2,343 4.89 4,077 4.88 2,730 Nov 10.22 50,788 4.72 4.45 1,887 4.40 2,131 4.78 3,961 4.76 3,164 Dec 10.30 52,465 4.61 4.37 2,297 4.29 2,682 4.63 5,217 4.67 3,598
Loans to non-financial corporations
Loans up to €1 million with an initial rate fixation of 13
Overdrafts 11 floating rate or up to 1 year 10 over 1 year and up to 5 years over 5 years
Effective Effective Effective EffectiveReporting interest rate 1 Volume 12 interest rate 1 Volume 7 interest rate 1 Volume 7 interest rate 1 Volume 7 period % pa € million % pa € million % pa € million % pa € million
2003 Dec 6.44 87,201 4.55 6,976 5.05 1,613 5.14 1,850
2004 Jan 6.33 84,562 4.52 6,495 5.13 1,152 5.20 1,579 Feb 6.26 86,480 4.58 6,151 5.12 1,510 5.04 1,068 Mar 6.22 87,095 4.44 7,140 5.00 1,262 5.20 1,385
Apr 6.11 84,844 4.43 6,733 4.89 1,419 5.04 1,211 May 6.27 81,810 4.52 6,616 5.00 987 4.93 1,186 June 6.23 84,291 4.54 7,185 4.98 1,268 5.19 1,509
July 6.21 80,484 4.62 7,193 5.01 1,360 5.05 1,171 Aug 6.25 77,547 4.42 6,177 5.08 1,030 5.00 1,098 Sep 6.25 81,220 4.51 7,522 4.92 1,207 4.97 1,216
Oct 6.11 79,457 4.55 7,213 4.96 1,238 4.92 1,200 Nov 5.96 80,969 4.61 6,218 4.83 1,336 4.62 1,141 Dec 6.01 76,863 4.50 6,458 4.75 1,520 4.64 2,147
Loans to non-financial corporations (cont’d)
Loans over €1 million with an initial rate fixation of 13
floating rate or up to 1 year 10 over 1 year and up to 5 years over 5 years
Reporting Volume 7 Volume 7 Volume 7 Effective interest rate 1 Effective interest rate 1 Effective interest rate 1 period % pa € million % pa € million % pa € million
2003 Dec 3.32 41,204 3.87 5,084 4.78 7,639
2004 Jan 3.25 32,666 4.33 4,274 4.99 4,169 Feb 3.24 26,802 3.60 2,681 4.58 3,317 Mar 3.20 35,662 3.85 3,509 4.85 5,627
Apr 3.25 30,662 3.79 3,034 4.57 5,536 May 3.26 26,670 3.93 3,403 4.79 4,593 June 3.26 32,704 3.93 3,754 4.63 5,444
July 3.27 35,348 3.91 4,012 4.89 4,475 Aug 3.26 28,221 3.60 3,766 4.70 3,971 Sep 3.31 31,752 3.65 4,204 4.41 5,135
Oct 3.26 30,755 3.85 3,246 4.51 4,502 Nov 3.16 30,886 3.68 3,855 4.46 4,913 Dec 3.34 43,091 3.95 7,061 4.33 8,567
For footnotes * and 1 to 6, see p 45*. For footnotes + and 7 to 10, see The volume of outstanding amounts reported is extrapolated to form thep 46*. — 11 Overdrafts are defined as debit balances on current accounts. underlying total using the Horvitz-Thompson estimator. — 13 The amountThey include all bank overdrafts regardless of whether they are within or refers to the single loan transaction considered as new business. beyond the limits agreed between customers and the bank. — 12 Estimated.
47*
VI Interest rates

DEUTSCHEBUNDESBANKMonthly ReportFebruary 2005
VII Capital market
1 Sales and purchases of debt securities and shares in Germany *
Debt securities
Sales Purchases
Domestic debt securities 1 Residents
Credit in- Bundes-Sales stitutions bank= Public Foreign including opentotal Bank debt debt building marketpur- debt Corporate secur- secur- and loan Non- oper- Non-
Period chases Total securities bonds ities 2 ities 3 Total 4 banks 6 ations 5 residents 7 associations 5
DM million
1992 291,762 284,054 106,857 − 175 177,376 7,708 170,873 132,236 37,368 1,269 120,8871993 395,110 382,571 151,812 200 230,560 12,539 183,195 164,436 20,095 − 1,336 211,9151994 303,339 276,058 117,185 − 65 158,939 27,281 279,989 126,808 154,738 − 1,557 23,349
1995 227,099 203,029 162,538 − 350 40,839 24,070 141,282 49,193 94,409 − 2,320 85,8151996 254,359 233,519 191,341 649 41,529 20,840 148,250 117,352 31,751 − 853 106,1091997 332,655 250,688 184,911 1,563 64,214 81,967 204,378 144,177 60,201 − 128,2761998 418,841 308,201 254,367 3,143 50,691 110,640 245,802 203,342 42,460 − 173,038
€ million
1999 292,663 198,068 156,399 2,184 39,485 94,595 155,766 74,728 81,038 − 136,898
2000 226,393 157,994 120,154 12,605 25,234 68,398 151,568 91,447 60,121 − 74,8252001 180,227 86,656 55,918 14,473 16,262 93,572 117,119 35,848 81,271 − 63,1082002 178,057 124,035 47,296 14,506 62,235 54,021 83,314 13,536 69,778 − 94,7432003 170,154 134,455 31,404 30,262 72,788 35,699 101,553 35,748 65,805 − 68,6012004 222,639 133,711 64,231 10,778 58,703 88,928 134,295 121,841 12,454 − 88,344
2004 Oct 15,988 6,806 − 5,086 1,669 10,223 9,182 − 1,941 7,509 − 9,450 − 17,929 Nov 13,044 10,373 − 544 4,769 6,148 2,671 9,957 3,875 6,082 − 3,087 Dec − 27,651 − 31,288 − 15,107 − 3,548 − 12,633 3,637 − 22,509 − 8,883 − 13,626 − − 5,142
Shares
Sales Purchases
Sales Residents=total Domestic Foreign Credit insti- Non-purchases shares 8 shares 9 Total 10 tutions 5,11 Non-banks 6 residents 12
PeriodDM million
1992 32,595 17,226 15,370 40,651 2,984 37,667 − 8,0551993 39,355 19,512 19,843 30,871 4,133 26,738 8,4851994 55,125 29,160 25,966 54,466 1,622 52,844 659
1995 46,422 23,600 22,822 49,354 11,945 37,409 − 2,9311996 72,491 34,212 38,280 55,962 12,627 43,335 16,5291997 119,522 22,239 97,280 96,844 8,547 88,297 22,6771998 249,504 48,796 200,708 149,151 20,252 128,899 100,352
€ million
1999 150,013 36,010 114,005 103,136 18,637 84,499 46,877
2000 140,461 22,733 117,729 164,654 23,293 141,361 − 24,1942001 81,546 17,575 63,971 − 3,371 − 14,714 11,343 84,9182002 39,700 9,232 30,470 19,058 − 23,236 42,294 20,6422003 17,382 16,838 544 − 7,885 7,056 − 14,941 25,2682004 3,092 10,157 − 7,066 4,220 5,052 − 832 − 1,127
2004 Oct 3,234 1,642 1,592 3,222 1,857 1,365 12 Nov 2,073 271 1,802 − 298 4,392 − 4,690 2,371 Dec − 262 1,032 − 1,294 1,385 4,747 − 3,362 − 1,647
* Up to end-1999, debt securities in this table comprise bonds and money funds. — 7 Net purchases or net sales (−) of domestic debt securities bymarket paper issued by domestic banks; from January 2000, they comprise non-residents; transaction values. — 8 At issue prices. — 9 Net purchases orall debt securities. For mutual fund shares, see Table VII.6. — 1 Net sales at net sales (−) of foreign shares (including direct investment) by residents;market values plus/minus changes in issuers’ portfolios of their own debt transaction values. — 10 Domestic and foreign shares. — 11 Up to end-1998,securities. — 2 Including Federal Railways Fund, Federal Post Office and excluding syndicated shares. — 12 Net purchases or net sales (−) of domesticTreuhand agency. — 3 Net purchases or net sales (−) of foreign debt shares (including direct investment) by non-residents; transaction values. —securities by residents; transaction values. — 4 Domestic and foreign debt The figures for the most recent date are provisional; revisions are notsecurities. — 5 Book values; statistically adjusted. — 6 Residual; also specially marked. including purchases of domestic and foreign securities by domestic mutual
48*
VII Capital market

DEUTSCHEBUNDESBANKMonthly ReportFebruary 2005
VII Capital market
2 Sales of debt securities issued by residents *
Up to end-1998, DM nominal million value; from 1999, € million nominal value
Bank debt securities 1 Memo item Foreign DM/euro
bonds issuedDebt securitiesby German-issued by special
Mortgage Public purpose credit Other bank Corporate Public managedPeriod Total Total Pfandbriefe Pfandbriefe institutions bonds 2 syndicatesdebt securities debt securities 3
Gross sales 4
1992 572,767 318,522 33,633 134,363 49,195 101,333 − 254,244 57,2821993 733,126 434,829 49,691 218,496 34,028 132,616 457 297,841 87,3091994 627,331 412,585 44,913 150,115 39,807 177,750 486 214,261 61,465
1995 620,120 470,583 43,287 208,844 41,571 176,877 200 149,338 102,7191996 731,992 563,076 41,439 246,546 53,508 221,582 1,742 167,173 112,3701997 846,567 621,683 53,168 276,755 54,829 236,933 1,915 222,972 114,8131998 1,030,827 789,035 71,371 344,609 72,140 300,920 3,392 238,400 149,542
€ million
1999 571,269 448,216 27,597 187,661 59,760 173,200 2,570 120,483 57,202
2000 659,148 500,895 34,528 143,107 94,556 228,703 8,114 150,137 31,5972001 687,988 505,646 34,782 112,594 106,166 252,103 11,328 171,012 10,6052002 818,725 569,232 41,496 119,880 117,506 290,353 17,574 231,923 10,3132003 958,917 668,002 47,828 107,918 140,398 371,858 22,510 268,406 2,8502004 990,399 688,844 33,774 90,815 162,353 401,904 31,517 270,040 12,344
2004 Sep 86,455 63,386 2,763 7,582 19,445 33,596 1,373 21,696 −
Oct 75,329 49,738 2,215 6,980 14,864 25,680 3,721 21,870 250 Nov 89,636 64,367 3,163 8,924 15,384 36,896 2,682 22,587 − Dec 61,917 46,740 2,531 4,219 8,133 31,857 1,197 13,980 170
of which: Debt securities with maturities of more than four years 5
1992 430,479 211,775 28,594 99,627 40,267 43,286 − 218,703 51,9391993 571,533 296,779 43,365 160,055 26,431 66,923 230 274,524 82,0491994 429,369 244,806 36,397 109,732 29,168 69,508 306 184,255 53,351
1995 409,469 271,763 30,454 141,629 28,711 70,972 200 137,503 85,2211996 473,560 322,720 27,901 167,811 35,522 91,487 1,702 149,139 92,5821997 563,333 380,470 41,189 211,007 41,053 87,220 1,820 181,047 98,4131998 694,414 496,444 59,893 288,619 54,385 93,551 2,847 195,122 139,645
€ million
1999 324,888 226,993 16,715 124,067 37,778 48,435 2,565 95,331 44,013
2000 319,330 209,187 20,724 102,664 25,753 60,049 6,727 103,418 27,0082001 299,751 202,337 16,619 76,341 42,277 67,099 7,479 89,933 6,4802002 309,157 176,486 16,338 59,459 34,795 65,892 12,149 120,527 9,2132003 369,336 220,103 23,210 55,165 49,518 92,209 10,977 138,256 2,8502004 424,769 275,808 20,060 48,249 54,075 153,423 20,286 128,676 4,320
2004 Sep 33,868 27,170 2,408 5,614 6,070 13,078 1,218 5,480 −
Oct 27,256 15,724 325 2,737 5,903 6,759 3,564 7,968 250 Nov 44,291 27,138 1,685 4,272 5,941 15,239 2,128 15,026 − Dec 16,456 13,639 1,051 2,406 1,632 8,550 1,074 1,743 170
Net sales 6
1992 304,751 115,786 13,104 58,235 19,585 24,864 − 175 189,142 34,1141993 403,212 159,982 22,496 122,917 − 13,156 27,721 180 243,049 43,7011994 270,088 116,519 18,184 54,316 − 6,897 50,914 − 62 153,630 21,634
1995 205,482 173,797 18,260 96,125 3,072 56,342 − 354 32,039 61,0201996 238,427 195,058 11,909 121,929 6,020 55,199 585 42,788 69,9511997 257,521 188,525 16,471 115,970 12,476 43,607 1,560 67,437 63,1811998 327,991 264,627 22,538 162,519 18,461 61,111 3,118 60,243 84,308
€ million
1999 209,096 170,069 2,845 80,230 31,754 55,238 2,185 36,840 22,728
2000 155,615 122,774 5,937 29,999 30,089 56,751 7,320 25,522 − 16,7052001 84,122 60,905 6,932 − 9,254 28,808 34,416 8,739 14,479 − 30,6572002 131,976 56,393 7,936 − 26,806 20,707 54,561 14,306 61,277 − 44,5462003 124,556 40,873 2,700 − 42,521 44,173 36,519 18,431 65,253 − 54,9902004 167,233 81,860 1,039 − 52,615 50,142 83,293 18,768 66,605 − 22,124
2004 Sep 3,981 11,478 − 258 − 1,821 7,796 5,761 1,129 − 8,626 − 2,261
Oct 10,809 − 2,428 338 − 8,597 4,699 1,133 3,017 10,220 − 4,899 Nov 7,844 1,173 − 808 − 3,471 − 714 6,165 2,165 4,506 − 322 Dec − 20,863 − 11,571 − 407 − 11,147 − 1,645 1,629 − 1,637 − 7,655 − 751
* For definitions, see the notes in the Statistical Supplement to Monthly Railways Fund, Federal Post Office and Treuhand agency. — 4 Gross salesReport 2, Capital market statistics. — 1 Excluding registered bank debt means only initial sales of newly issued securities. — 5 Maximum maturitysecurities. — 2 Debt securities issued by enterprises. — 3 Including Federal according to the terms of issue. — 6 Gross sales less redemptions.
49*
VII Capital market

DEUTSCHEBUNDESBANKMonthly ReportFebruary 2005
VII Capital market
3 Amounts outstanding of debt securities issued residents *
Up to end-1998, DM million nominal value; from 1999, € million nominal value
Bank debt securities 1 Memo item Foreign DM/euro
End of year Debt securities bonds issuedor month/ issued by by German-Maturity Mortgage Public Other bank Corporate Public managedspecial purposein years Total Total Pfandbriefe bonds syndicatescredit institutions debt securities debt securitiesPfandbriefe
DM million
1992 1,991,515 1,156,162 155,862 450,424 240,616 309,259 2,983 832,370 275,8731993 2,394,728 1,316,142 178,357 573,341 227,463 336,981 3,163 1,075,422 319,5751994 2,664,814 1,432,661 196,541 627,657 219,214 389,249 3,101 1,229,053 341,2101995 2,870,295 1,606,459 214,803 723,781 222,286 445,589 2,746 1,261,090 402,2291996 3,108,724 1,801,517 226,711 845,710 228,306 500,790 3,331 1,303,877 472,1801997 3,366,245 1,990,041 243,183 961,679 240,782 544,397 4,891 1,371,313 535,3591998 3,694,234 2,254,668 265,721 1,124,198 259,243 605,507 8,009 1,431,558 619,668
€ million
1999 2,097,926 1,322,863 134,814 655,024 163,284 369,741 6,280 768,783 339,5602000 2,265,121 1,445,736 140,751 685,122 157,374 462,488 13,599 805,786 322,8562001 2,349,243 1,506,640 147,684 675,868 201,721 481,366 22,339 820,264 292,1992002 2,481,220 1,563,034 155,620 649,061 222,427 535,925 36,646 881,541 247,6552003 2,605,775 1,603,906 158,321 606,541 266,602 572,442 55,076 946,793 192,6662004 2,773,007 1,685,766 159,360 553,927 316,745 655,734 73,844 1,013,397 170,5432004 Oct 2,786,026 1,696,164 160,576 568,545 319,104 647,940 73,316 1,016,546 171,616 Nov 2,793,870 1,697,337 159,767 565,074 318,390 654,105 75,481 1,021,052 171,294 Dec 2,773,007 1,685,766 159,360 553,927 316,745 655,734 73,844 1,013,397 170,543
Breakdown by remaining period to maturity 2 Position at end-December 2004
952,319 640,973 58,791 222,300 100,477 259,404 18,952 292,394 52,107 less than 2667,235 438,401 49,401 172,343 88,758 127,899 16,590 212,243 60,6052 to less than 4443,798 271,127 27,161 94,818 54,479 94,670 11,819 160,853 34,6024 to less than 6245,201 112,997 17,564 32,962 21,910 40,563 10,009 122,195 9,1116 to less than 8218,875 97,091 6,332 20,035 20,179 50,547 10,491 111,294 5,3038 to less than 10
94,590 76,470 77 6,836 6,683 62,873 1,842 16,278 4,94410 to less than 1526,373 12,467 35 923 8,318 3,191 618 13,288 2,08115 to less than 20
124,615 36,238 − 3,709 15,941 16,588 3,523 84,854 1,78920 and more
* Including debt securities temporarily held in the issuers’ portfolios. — debt securities falling due en bloc and until mean maturity of the residual1 Excluding debt securities handed to the trustee for temporary safe amount outstanding for debt securities not falling due en bloc. custody. — 2 Calculated from month under review until final maturity for
50*
4 Shares in circulation issued by residents
Up to end-1998, DM million nominal value; from 1999, € million nominal value
Change in domestic public limited companies’ capital due to
Memo itemShare circulationat market values
cash payments contribution (market capita-and ex- merger reduction lisation)Share capital = Net increase or contribution of shares,change of of claims andcirculation at net decrease (−) mining shares, of capital level at end
issue of and other transfer change of and of periodend of period during period convertible GmbH shares,Period under review under review bonds 1 etc of assetsbonus shares real assets legal form liquidation under review 2
DM million
1992 160,813 9,198 4,295 728 1,743 1,073 − 732 3,030 − 942 .1993 168,005 7,190 5,224 772 387 876 10 707 − 783 .1994 o 190,012 14,237 6,114 1,446 1,521 1,883 − 447 5,086 − 1,367 .1995 211,231 21,217 5,894 1,498 1,421 1,421 − 623 13,739 − 2,133 .1996 3 216,461 7,131 8,353 1,355 396 1,684 − 3,056 833 − 2,432 .1997 221,575 5,115 4,164 2,722 370 1,767 − 2,423 197 − 1,678 .1998 238,156 16,578 6,086 2,566 658 8,607 − 4,055 3,905 − 1,188 .
€ million
1999 133,513 11,747 5,519 2,008 190 1,075 2,099 1,560 − 708 1,603,3042000 147,629 14,115 3,620 3,694 618 8,089 − 1,986 1,827 − 1,745 1,353,0002001 166,187 18,561 7,987 4,057 1,106 8,448 1,018 − 905 − 3,152 1,205,6132002 168,716 2,528 4,307 1,291 486 1,690 − 868 − 2,152 − 2,224 647,4922003 162,131 − 6,585 4,482 923 211 513 − 322 − 10,806 − 1,584 851,0012004 164,802 2,669 3,960 1,566 276 696 220 − 1,760 − 2,286 887,2172004 Oct 165,170 458 880 124 0 3 − 68 − 434 − 47 837,257 Nov 164,975 − 195 84 6 0 25 78 − 296 − 92 868,529 Dec 164,802 − 173 631 0 200 34 − 15 − 747 − 278 887,217
o From January 1994, including the shares of east German companies market segment was closed down on 24 March 2003) and enterprises whose(resultant increase in share circulation: DM7,771 million). — 1 Including shares are traded on the free market. Source: Bundesbank calculations basedshares issued out of company profits. — 2 Enterprises whose shares are listed on data of the Herausgebergemeinschaft Wertpapier-Mitteilungen and theon the Official Market, on the regulated market or on the Neuer Markt (stock Deutsche Börse AG. — 3 Figure revised downwards by DM1,902 million.
50*
VII Capital market

DEUTSCHEBUNDESBANKMonthly ReportFebruary 2005
VII Capital market
5 Yields and indices on German securities
Yields on debt securities outstanding issued by residents 1 Price indices 2,3
Public debt securities Bank debt securities Debt securities Shares
Listed Memo itemFederal securities Foreign
DM/eurobondsWith a residualWith a residual
maturity of maturity of issued by German Germanmore than 9 more than 9 German- bond iBoxx CDAX shareand including and including Corporate managed index index€ Germany share price
Total Total Total 10 years 4 Total 10 years bonds (REX) price index index (DAX)syndicates 1,5
Average End-1998 End-1987 End-1987Period % per annum daily rate = 100 = 100 = 1000
1992 8.1 8.0 8.0 7.8 8.3 8.1 8.7 8.8 101.54 . 134.92 1,545.051993 6.4 6.3 6.3 6.5 6.5 6.8 6.9 6.8 109.36 . 191.13 2,266.681994 6.7 6.7 6.7 6.9 6.8 7.2 7.0 6.9 99.90 . 176.87 2,106.58
1995 6.5 6.5 6.5 6.9 6.5 7.2 6.9 6.8 109.18 . 181.47 2,253.881996 5.6 5.6 5.6 6.2 5.5 6.4 5.8 5.8 110.37 . 217.47 2,888.691997 5.1 5.1 5.1 5.6 5.0 5.9 5.2 5.5 111.01 . 301.47 4,249.691998 4.5 4.4 4.4 4.6 4.5 4.9 5.0 5.3 118.18 100.00 343.64 5,002.391999 4.3 4.3 4.3 4.5 4.3 4.9 5.0 5.4 110.60 92.52 445.95 6,958.14
2000 5.4 5.3 5.2 5.3 5.6 5.8 6.2 6.3 112.48 94.11 396.59 6,433.612001 4.8 4.7 4.7 4.8 4.9 5.3 5.9 6.2 113.12 94.16 319.38 5,160.102002 4.7 4.6 4.6 4.8 4.7 5.1 6.0 5.6 117.56 97.80 188.46 2,892.632003 3.7 3.8 3.8 4.1 3.7 4.3 5.0 4.5 117.36 97.09 252.48 3,965.162004 3.7 3.7 3.7 4.0 3.6 4.2 4.0 4.0 120.19 99.89 268.32 4,256.08
2004 Oct 3.6 3.6 3.6 3.9 3.4 4.1 4.3 3.8 119.44 98.89 250.29 3,960.25 Nov 3.4 3.5 3.5 3.8 3.3 4.0 4.0 3.7 120.11 99.61 260.53 4,126.00 Dec 3.3 3.3 3.3 3.6 3.2 3.8 3.9 3.5 120.19 99.89 268.32 4,256.08
2005 Jan 3.3 3.3 3.3 3.6 3.2 3.8 3.9 3.5 120.97 100.80 269.10 4,254.85
1 Bearer debt securities with maximum maturities according to the terms of the calculation. Monthly figures are calculated on the basis of the yields onissue of over 4 years if their mean residual maturities exceed 3 years. Conver- all the business days in a month. The annual figures are the unweightedtible debt securities, etc. debt securities with unscheduled redemption, zero means of the monthly figures. — 2 End of year or month. — 3 Source:-coupon bonds, floating -rate notes and bonds not denominated in DM or Deutsche Börse AG. — 4 Only debt securities eligible as underlyingeuro are not included. Group yields for the various categories of securities instruments for futures contracts; calculated as unweighted averages. — 5 Ifare weighted by the amounts outstanding of the debt securities included in quoted on German stock exchanges.
6 Sales and purchases of mutual fund shares in Germany
Sales of mutual fund shares Purchases
Domestic mutual funds (sales receipts) Residents
Mutual funds open to the Credit institutionsgeneral public including building
Non-banks 2 and loan associations 1 of which
Sales Open- of which of which= Secur- end Foreign Foreigntotal Money ities- real Special- mutual mutualpur- market based estate ised Foreign fund fund Non-resi-chases Total Total funds funds funds funds funds 3 Total Total shares Total shares dents 4
PeriodDM million
1992 81,514 20,474 − 3,102 − − 9,189 6,087 23,575 61,040 81,518 10,495 2,152 71,023 58,888 − 41993 80,259 61,672 20,791 − 6,075 14,716 40,881 18,587 76,258 16,982 2,476 59,276 16,111 4,0011994 130,995 108,914 63,263 31,180 24,385 7,698 45,650 22,081 125,943 9,849 − 689 116,094 22,770 5,052
1995 55,246 54,071 16,777 6,147 3,709 6,921 37,294 1,175 56,295 12,172 188 44,123 987 − 1,0491996 83,386 79,110 16,517 − 4,706 7,273 13,950 62,592 4,276 85,704 19,924 1,685 65,780 2,591 − 2,3181997 145,805 138,945 31,501 − 5,001 30,066 6,436 107,445 6,860 149,977 35,924 340 114,053 6,520 − 4,1721998 187,641 169,748 38,998 5,772 27,814 4,690 130,750 17,893 190,416 43,937 961 146,479 16,507 − 2,775
€ million
1999 111,282 97,197 37,684 3,347 23,269 7,395 59,513 14,086 105,521 19,862 − 637 85,659 14,722 5,761
2000 118,021 85,160 39,712 − 2,188 36,818 − 2,824 45,448 32,861 107,019 14,454 92 92,565 32,769 11,0002001 97,032 76,811 35,522 12,410 9,195 10,159 41,289 20,221 96,082 10,251 2,703 85,831 17,518 9512002 66,478 59,482 25,907 3,682 7,247 14,916 33,575 6,996 67,150 2,100 3,007 65,050 3,989 − 6732003 48,195 43,943 20,079 − 924 7,408 14,166 23,864 4,252 49,726 − 2,658 734 52,384 3,518 − 1,5302004 13,392 1,453 − 3,978 − 6,160 − 1,246 3,245 5,431 11,939 8,322 8,439 3,796 − 117 8,143 5,070
2004 Oct − 1,203 − 1,471 − 1,719 − 1,468 − 507 213 248 268 − 325 990 209 − 1,315 59 − 878 Nov − 495 − 307 − 1,433 − 1,557 496 − 389 1,126 − 188 − 2,623 − 11 115 − 2,612 − 303 2,128 Dec 1,770 2,613 − 3,395 − 3,955 992 − 413 6,008 − 843 1,839 4,179 1,717 − 2,340 − 2,560 − 69
1 Book values. — 2 Residual. — 3 Net purchases or net sales (−) of foreign end-1988 recorded under shares). — The figures for the most recent datefund shares by residents; transaction values. — 4 Net purchases or net sales are provisional; revisions are not specially marked. (−) of domestic fund shares by non-residents; transaction values (up to
51*
VII Capital market

DEUTSCHEBUNDESBANKMonthly ReportFebruary 2005
VIII Public finances in Germany 1 General government budgetary position *
Up to end-1998, DM billion; from 1999, € billion
Central, state and local government 1 Social security funds 2 General government, total
Revenue Expenditure
of which
Otheroperat- FixedCompen-
of ing ex- asset Finan- Ex- Ex-sationwhich pend- Current forma- cial Re- pend- Re- pend-of em-
Period Total Taxes Total 3 ployees iture grants Interest tion aid 4 Balance venue 5 iture Balance venue iture Balance
1993 928.7 749.1 1,060.2 296.8 136.0 340.5 102.1 97.0 87.3 −131.5 660.8 658.7 + 2.1 1,492.1 1,621.5 −129.41994 995.2 786.2 1,102.2 315.5 137.3 353.4 114.0 93.2 86.5 −106.9 694.1 693.7 + 0.4 1,596.4 1,702.9 −106.5
1995 1,026.4 814.2 1,136.4 324.8 135.5 367.2 129.0 90.1 86.3 −110.1 731.2 743.8 − 12.5 1,664.9 1,787.5 −122.61996 1,000.3 800.0 1,121.8 326.2 137.0 362.2 130.7 83.9 80.1 −121.5 769.4 784.0 − 14.6 1,665.6 1,801.6 −136.11997 1,014.3 797.2 1,108.9 325.0 135.7 356.3 132.1 80.1 79.2 − 94.5 797.3 794.5 + 2.9 1,705.3 1,797.0 − 91.71998 1,072.1 833.0 1,128.8 325.4 137.4 373.7 133.7 79.7 79.8 − 56.7 812.2 808.9 + 3.3 1,765.5 1,818.9 − 53.41999 566.1 453.1 592.9 168.7 72.4 202.7 69.8 40.8 38.0 − 26.8 429.1 425.6 + 3.5 925.2 948.6 − 23.4
2000 p 612.3 467.3 595.5 169.3 73.7 205.7 67.6 40.7 37.9 + 16.8 433.8 434.3 − 0.5 974.6 958.2 + 16.42001 6,p 555.8 446.2 599.9 169.9 69.8 213.8 66.6 40.1 39.2 − 44.1 445.0 449.1 − 4.1 923.5 971.7 − 48.22002 pe 550.9 441.7 608.0 173.3 69.5 225.9 66.1 38.7 33.5 − 57.1 457.9 466.4 − 8.5 924.1 989.7 − 65.62003 pe 546.6 442.2 615.2 174.0 68.8 236.4 65.7 36.3 32.5 − 68.6 466.8 473.3 − 6.5 924.5 999.6 − 75.1
2003 Q1 117.2 96.3 154.5 40.9 15.6 61.8 23.6 5.6 6.5 − 37.3 116.3 116.8 − 0.5 207.7 245.5 − 37.8 Q2 135.8 108.9 143.8 40.9 15.5 61.3 10.8 7.5 7.5 − 8.0 115.5 118.4 − 2.9 228.2 239.1 − 10.9 Q3 131.2 109.6 155.8 42.4 16.6 58.5 21.6 9.2 7.4 − 24.6 115.1 117.8 − 2.7 225.0 252.3 − 27.4 Q4 p 160.7 127.4 159.8 48.1 20.5 55.2 9.5 12.9 13.7 + 0.9 119.0 120.4 − 1.5 261.1 261.7 − 0.6
2004 Q1 p 116.1 97.0 157.9 41.7 15.4 62.8 25.3 5.4 6.3 − 41.8 116.4 116.8 − 0.4 206.1 248.3 − 42.2 Q2 p 133.1 112.8 141.8 41.3 15.7 59.6 10.0 6.8 6.4 − 8.7 115.8 116.4 − 0.6 226.1 235.5 − 9.3 Q3 p 133.7 107.9 152.7 41.9 16.1 57.5 20.4 8.5 6.9 − 19.0 114.0 116.0 − 2.1 226.6 247.7 − 21.1
Source: Bundesbank calculations based on data from the Federal Statistical the quarterly figures, as the latter are all provisional. The quarterly figuresOffice. — * The budgetary definition used here differs from that employed for some insurance sectors are estimated. — 3 Including discrepancies infor the government account in the national accounts and, in the case of the clearing transactions between central, state and local government. —quarterly figures, in some respects also from the financial statistics. — 4 Expenditure on investment grants, loans and acquisition of participating1 Including subsidiary budgets. Unlike the annual figure based on the interests. — 5 Including Federal Government liquidity assistance to theannual accounts statistics of the Federal Statistical Office, the quarterly Federal Labour Office. — 6 Owing to modifications of the system offigures do not include municipal special purpose associations and various classification, shifts occurred, in particular, between other operatingspecial accounts. For more details on revenue from the Bundesbank profit, expenditure and current grants. see footnote 1 to Table VIII.2. — 2 The annual figures differ from the sum of
2 Budgetary position of central, state and local government * Up to end-1998, DM billion; from 1999, € billion
Central government State government Local government
Western 2,3 Eastern 3 Western 3 Eastern 3
Period Revenue 1 Expenditure Revenue Expenditure Revenue Expenditure Revenue Expenditure Revenue Expenditure
1993 401.6 462.5 326.5 352.8 76.4 92.5 222.5 230.9 54.4 59.01994 439.6 478.9 328.8 357.0 79.3 95.9 228.9 235.1 53.9 59.2
1995 439.3 489.9 338.6 370.2 88.4 101.5 225.6 237.9 58.7 60.81996 411.9 490.4 344.8 379.7 93.7 105.5 227.7 232.9 55.0 57.71997 416.8 480.3 349.2 376.5 94.3 105.2 222.9 226.9 52.6 54.21998 439.0 495.6 360.5 380.3 96.4 104.7 231.4 226.3 51.5 52.41999 240.3 266.5 191.6 196.6 50.0 53.3 119.8 117.5 26.1 26.3
2000 4 292.1 265.2 193.4 200.9 50.7 53.6 122.4 120.5 25.6 25.62001 p 240.6 261.3 184.6 207.1 50.5 52.5 119.0 123.2 24.7 25.22002 pe 238.9 271.6 183.5 207.4 47.8 53.2 119.9 124.5 25.1 25.32003 pe 239.6 278.8 182.3 208.7 48.3 53.5 117.1 125.0 24.7 25.5
2003 Q1 46.6 71.9 42.2 51.1 9.7 12.6 25.2 29.4 5.3 5.6 Q2 59.1 64.6 44.4 50.2 12.0 12.0 26.7 29.1 5.6 5.8 Q3 57.6 74.5 45.3 50.5 12.2 13.1 29.3 30.6 6.1 6.3 Q4 p 76.3 67.8 49.9 56.5 14.1 15.6 35.6 35.3 7.6 7.6
2004 Q1 p 44.8 73.4 42.4 51.5 11.1 12.8 25.8 29.7 5.4 5.5 Q2 p 56.4 62.3 46.5 51.2 11.3 11.5 28.8 29.0 5.7 5.8 Q3 p 58.3 71.2 45.1 50.5 12.5 12.5 29.9 30.5 6.2 6.2
52*
Source: Bundesbank calculations based on data from the Federal Statistical Inherited Liabilities. — 2 Including (eastern and western) Berlin, Bremen andOffice. — * See corresponding footnote to Table VIII.1. — 1 Up to 1994, the Hamburg. — 3 Unlike the annual figure based on the annual accountsBundesbank profit transfer is shown in full; from 1995 onwards, only the statistics of the Federal Statistical Office, the quarterly figures do notDM7 billion envisaged in the budget is shown. From 1995, revenue over and include various special accounts. — 4 Including proceeds from the sale ofabove the envisaged amount accrues directly to the Redemption Fund for UMTS licences.
52*
VIII Public finances in Germany

DEUTSCHEBUNDESBANKMonthly ReportFebruary 2005
VIII Public finances in Germany 3 Government fiscal position as defined in the national accounts *
Up to end-1998, DM billion; from 1999, € billion
Item 1997 1998 1999 2000 1 2001 2002 2003 2004 pe
Revenue 1,726.8 1,775.9 943.2 965.8 951.2 954.2 961.4 954.4
of which
Taxes 856.9 897.4 490.4 511.7 488.3 486.0 489.9 487.4
Social contributions 720.1 727.7 375.4 378.4 383.6 389.3 394.8 396.5
Expenditure 1,826.5 1,859.6 972.6 989.7 1,009.8 1,031.7 1,042.7 1,038.8
of which
Intermediate consumption 140.2 144.1 76.2 78.0 81.0 84.5 83.9 85.2
Compensation of employees 319.0 319.3 165.4 165.9 165.7 168.0 167.9 165.9
Interest 133.2 136.4 68.9 68.4 67.7 66.0 66.7 67.0
Social benefits 2 984.7 998.4 523.1 532.7 549.2 573.1 587.1 589.4
Gross capital formation 69.4 69.9 37.8 37.0 36.8 35.9 31.9 30.2
Net lending/net borrowing − 99.7 − 83.7 − 29.4 − 23.9 − 58.6 − 77.5 − 81.3 − 84.5
as a percentage of GDP − 2.7 − 2.2 − 1.5 − 1.2 − 2.8 − 3.7 − 3.8 − 3.9
Memo item
Debt as defined in the
Maastricht Treaty 2,232.9 2,298.2 1,210.3 1,221.8 1,232.8 1,283.6 1,366.6 ...
as a percentage of GDP 61.0 60.9 61.2 60.2 59.4 60.9 64.2 ...
Source: Federal Statistical Office. — * Figures in accordance with ESA 95. In of UMTS licences. The figures of the Federal Statistical Office record suchcontrast to the figures shown by the Federal Statistical Office, totals include proceeds (€50.85 billion) under "net increase in non-produced assets", with(without affecting net lending/net borrowing) customs duties, the EU share the result that government expenditure is lower and a surplus (€22.8 billionin VAT revenue and EU subsidies. — 1 Adjusted for proceeds from the sale or 1.1% of GDP) is shown. — 2 Including social benefits in kind.
4 Tax revenue of central, state and local government Up to end-1998, DM million; from 1999, € million
Central and state government and European Union Local government 4
State government
of which of which Balance ofCentral Eastern European Eastern untransferred
Period Total Total 1 government 2 Total Germany Union 3 Total Germany tax shares 5
1991 661,920 577,150 321,334 224,321 19,139 31,495 84,633 2,540 + 1371992 731,738 638,423 356,849 247,372 23,807 34,203 93,374 4,034 − 581993 749,119 653,015 360,250 256,131 27,542 36,634 95,809 5,863 + 2951994 786,162 688,785 386,145 261,947 32,052 40,692 97,116 7,677 + 260
1995 814,190 719,332 390,807 288,520 . 40,005 94,498 8,460 + 3591996 799,998 706,071 372,390 294,232 . 39,449 94,641 7,175 − 7141997 797,154 700,739 368,244 290,771 . 41,724 96,531 7,703 − 1171998 833,013 727,888 379,491 306,127 . 42,271 104,960 8,841 + 1641999 453,068 396,734 211,727 164,724 . 20,284 56,333 4,810 + 1
2000 467,253 410,117 219,034 169,249 . 21,833 57,241 4,895 − 1042001 446,248 392,189 213,342 159,115 . 19,732 54,047 4,590 + 122002 441,703 389,162 214,371 156,231 . 18,560 52,490 4,769 + 512003 442,235 390,437 214,002 155,510 . 20,925 51,671 4,751 + 1272004 ... 386,451 208,909 157,902 . 19,641 ... ... ...
2004 Q3 p 107,720 93,319 49,623 38,309 . 5,387 14,122 1,311 + 279 Q4 ... 110,996 64,160 43,262 . 3,574 ... ... ...
2004 Aug . 28,209 15,270 11,152 . 1,787 . . . Sep . 36,550 19,426 15,300 . 1,824 . . .
Oct . 26,653 14,546 10,746 . 1,361 . . . Nov . 28,001 15,538 11,172 . 1,291 . . . Dec . 56,342 34,076 21,344 . 922 . . .
Source: Federal Ministry of Finance. — 1 Including receipts from the 1988. — 4 Including local government taxes in Berlin, Bremen andEqualisation of Burdens levies. — 2 Before deducting supplementary Hamburg. — 5 Difference between the local government’s share in thecentral government grants and shares in the revenue of mineral oil tax income taxes received by the state government cash offices in the period inremitted to state government. — 3 Including the additional (GNP-related) question (see Table VIII.5) and the amounts passed on to local governmentrevenue accruing to the EU from the central government tax revenue from during the same period.
53*
VIII Public finances in Germany

DEUTSCHEBUNDESBANKMonthly ReportFebruary 2005
VIII Public finances in Germany 5 Tax revenue, by type
Up to end-1998, DM million; from 1999, € million
Joint taxes Memoitem
Income taxes 2 Turnover taxes 5,6 Localgovern-
As- Invest- Central State mentLocalsessed ment Value- Turnover govern- govern- EU share inbusiness
Wage income Corpora- income added tax on ment ment customs incometax trans-Period Total 1 Total tax 3 tax tion tax taxes 4 Total tax (VAT) imports taxes 8 taxes 8 duties taxes 9 fers 6,7
1991 615,506 298,804 214,175 41,532 31,716 11,381 179,672 98,797 80,875 5,986 92,583 29,113 8,307 38,3561992 681,751 331,310 247,322 41,531 31,184 11,273 197,712 117,274 80,438 6,923 104,802 32,963 7,742 43,3281993 697,988 341,785 257,987 33,234 27,830 22,734 216,306 174,492 41,814 4,181 93,678 34,720 7,240 44,9731994 734,234 343,055 266,522 25,510 19,569 31,455 235,698 195,265 40,433 6,271 105,410 36,551 7,173 45,450
1995 765,374 344,554 282,701 13,997 18,136 29,721 234,622 198,496 36,126 8,412 134,013 36,602 7,117 46,0421996 746,958 317,807 251,278 11,616 29,458 25,456 237,208 200,381 36,827 8,945 137,865 38,540 6,592 40,8871997 740,272 313,794 248,672 5,764 33,267 26,092 240,900 199,934 40,966 8,732 135,264 34,682 6,900 39,5331998 775,028 340,231 258,276 11,116 36,200 34,640 250,214 203,684 46,530 10,284 130,513 37,300 6,486 47,1401999 422,012 184,408 133,809 10,887 22,359 17,353 137,155 111,600 25,555 5,463 72,235 19,564 3,186 25,277
2000 436,115 192,381 135,733 12,225 23,575 20,849 140,871 107,140 33,732 5,521 75,504 18,444 3,394 25,9982001 417,358 170,817 132,626 8,771 − 426 29,845 138,935 104,463 34,472 5,510 79,277 19,628 3,191 25,1702002 414,008 165,096 132,190 7,541 2,864 22,502 138,195 105,463 32,732 5,752 83,494 18,576 2,896 24,8462003 414,846 162,567 133,090 4,568 8,275 16,633 136,996 103,162 33,834 7,085 86,609 18,713 2,877 24,4092004 409,509 159,104 123,896 5,394 13,123 16,691 137,366 104,715 32,651 5,653 84,554 19,774 3,059 23,058
2004 Q3 99,038 38,285 29,362 3,148 2,737 3,038 33,972 26,513 7,459 1,431 19,889 4,660 801 5,719 Q4 117,958 46,282 35,455 4,999 3,728 2,100 35,478 27,261 8,217 2,773 28,117 4,496 812 6,962
2004 Aug 29,797 8,720 9,721 − 1,116 − 982 1,098 11,891 9,246 2,645 486 6,887 1,542 272 1,588 Sep 38,995 19,139 8,796 5,695 4,070 579 11,332 8,938 2,394 2 6,737 1,516 269 2,445
Oct 28,102 8,049 8,864 − 1,013 − 569 766 10,992 8,500 2,492 982 6,388 1,422 268 1,449 Nov 29,511 8,278 8,887 − 866 − 336 593 12,392 9,627 2,765 440 6,628 1,527 247 1,510 Dec 60,345 29,955 17,704 6,877 4,632 742 12,094 9,133 2,961 1,351 15,101 1,548 297 4,003
Source: Federal Ministry of Finance. — 1 This total, unlike that in Table the statutory pension insurance scheme, with 2.2% of the balance accruingVIII.4, does not include the receipts from the Equalisation of Burdens levies, to local government; of the residual balance, 50.5% was allocated to centrallocal business tax on earnings and capital (less local business tax tranfers to government and 49.5% to state government; in 2000 and 2001, 50.25% wascentral and state government), the real property taxes and other local allocated to central government and 49.75% to state government; sincegovernment taxes, or the balance of untransferred tax shares. — 2 From 2002 49.6% has been allocated to central government and 50.4% to state1980, the revenue from wage tax and assessed income tax has been government. The EU share must also be deducted from the aforementionedallocated to central, state and local government in the ratio of 42.5:42.5:15, central government share. — 6 Since 1991 the distribution of turnover taxand revenue from corporation tax and investment income tax has been and the level and distribution of local business tax transfers have beenallocated to central and state government in the ratio of 50:50. — 3 From affected by the financing of the debt service of the German Unity Fund. —1996, after deducting child benefit. — 4 From February 1993, including 7 Central government and state government 50% each. From 1998, centralrevenue from the withholding tax on interest income, in which local government 42.2%, state government 57.8%. — 8 For the breakdown, seegovernment has a share of 12%. — 5 In 1998, 3.64% and from 1999, 5.63% Table VIII.6. — 9 From 1998, including the share in turnover taxes. was allocated to central government to finance the supplementary grant to
6 Specific taxes levied by central, state and local government Up to end-1998, DM million; from 1999, € million
Central government taxes State government taxes Local government taxes
Other Other Othercentral state local
Insur- Electri- govern- Motor Inherit- govern- Local Real govern-Mineral Tobacco Spirits ance city ment vehicle Wealth ance Beer ment busi- property ment
Period oil tax tax tax tax tax taxes 1 tax tax tax tax taxes ness tax 2 taxes taxes 3
1991 47,266 19,592 5,648 5,862 . 14,215 11,012 6,729 2,636 1,647 7,090 41,297 9,921 1,1811992 55,166 19,253 5,545 8,094 . 16,744 13,317 6,750 3,030 1,625 8,241 44,848 10,783 1,2811993 56,300 19,459 5,134 9,290 . 3,495 14,059 6,784 3,044 1,769 9,065 42,266 11,663 1,3831994 63,847 20,264 4,889 11,400 . 5,011 14,169 6,627 3,479 1,795 10,482 44,086 12,664 1,445
1995 64,888 20,595 4,837 14,104 . 29,590 13,806 7,855 3,548 1,779 9,613 42,058 13,744 1,4261996 68,251 20,698 5,085 14,348 . 29,484 13,743 9,035 4,054 1,718 9,990 45,880 14,642 1,4631997 66,008 21,155 4,662 14,127 . 29,312 14,418 1,757 4,061 1,698 12,749 48,601 15,503 1,5091998 66,677 21,652 4,426 13,951 . 23,807 15,171 1,063 4,810 1,662 14,594 50,508 16,228 1,5321999 36,444 11,655 2,233 7,116 1,816 12,973 7,039 537 3,056 846 8,086 27,060 8,636 824
2000 37,826 11,443 2,151 7,243 3,356 13,485 7,015 433 2,982 844 7,171 27,025 8,849 7842001 40,690 12,072 2,143 7,427 4,322 12,622 8,376 290 3,069 829 7,064 24,534 9,076 7902002 42,193 13,778 2,149 8,327 5,097 11,951 7,592 239 3,021 811 6,913 23,489 9,261 6962003 43,188 14,094 2,204 8,870 6,531 11,722 7,336 230 3,373 786 6,989 24,146 9,658 6712004 41,782 13,630 2,195 8,750 6,597 11,601 7,740 80 4,284 788 6,883 ... ... ...
2004 Q3 p 9,959 3,478 474 1,743 1,548 2,686 1,883 24 933 224 1,596 7,054 2,891 169 Q4 16,612 4,292 780 1,546 1,715 3,174 1,691 9 908 185 1,703 ... ... ...
2004 Aug 3,376 1,185 166 919 557 684 591 7 328 73 543 . . . Sep 3,388 1,163 128 404 407 1,247 600 8 312 75 520 . . .
Oct 3,331 1,242 205 375 598 637 572 1 254 67 528 . . . Nov 3,503 1,249 173 555 462 686 572 6 327 57 564 . . . Dec 9,778 1,800 402 615 655 1,851 547 2 327 61 612 . . .
Source: Federal Ministry of Finance. — 1 Other excise taxes and the income until mid-1992, and again since the beginning of 1995. — 2 On earnings andand corporation tax surcharge ("solidarity surcharge") levied from mid-1991 capital. — 3 Including tax-like revenue.
54*
VIII Public finances in Germany

DEUTSCHEBUNDESBANKMonthly ReportFebruary 2005
VIII Public finances in Germany 7 General government debt *
Up to end-1998, DM million; from 1999, € million
Loans from non-banks Old debtDirect
Treasury Five-year lending arising fromdiscount Federal Federal by credit Social German Equalisa-
End of year paper Treasury notes savings institu- security unifica- tionor month Total (Bubills) 1 notes 2,3 (Bobls) 2 notes Bonds 2 tions 4 funds Other 4 tion 5 claims Other 6
General government
1998 2,280,154 25,631 227,536 199,774 92,698 723,403 894,456 550 26,073 1,249 88,582 202
1999 1,199,975 12,594 102,364 120,998 41,621 416,051 450,111 281 10,200 476 45,175 105
2000 1,211,439 11,616 109,951 126,276 35,991 438,888 433,443 211 10,524 285 44,146 108
2001 1,223,929 23,036 151,401 130,045 26,395 448,148 422,440 174 13,110 85 8,986 108
2002 1,277,630 30,815 203,951 137,669 17,898 456,300 404,046 137 18,844 29 7,845 97
2003 1,358,121 36,022 246,414 153,616 12,810 471,129 396,832 341 34,163 − 1 6,711 86
2004 Mar 1,403,438 37,209 260,445 159,735 11,245 485,920 400,897 371 40,863 − 45 6,711 88
June 1,411,658 37,307 269,972 162,642 10,590 488,668 391,296 371 44,057 − 45 6,711 88
Sep 1,429,216 37,494 276,918 166,711 10,568 494,621 390,436 413 46,434 − 38 5,572 87
Central government 7,8
1998 957,983 24,666 84,760 199,274 92,698 519,718 24,125 − 2,603 1,270 8,684 186
1999 714,069 11,553 44,335 120,498 41,621 379,808 67,872 60 2,568 476 45,175 104
2000 715,819 11,516 44,678 123,642 35,991 400,490 52,836 29 2,099 285 44,146 107
2001 701,077 21,136 59,643 119,911 26,395 416,195 47,111 26 1,481 85 8,986 107
2002 725,405 30,227 78,584 127,484 17,898 422,558 39,517 0 1,167 29 7,845 97
2003 767,697 35,235 87,538 143,431 12,810 436,194 38,146 223 7,326 − 1 6,711 85
2004 Mar 802,690 36,463 88,901 150,050 11,245 450,711 49,888 223 8,456 − 45 6,711 87
June 803,991 35,630 92,190 152,957 10,590 453,479 43,026 223 9,144 − 45 6,711 88
Sep 814,356 35,866 95,200 157,026 10,568 459,482 39,864 268 10,463 − 38 5,572 86
Dec 812,086 34,440 95,638 159,272 10,817 460,381 34,835 333 10,751 − 38 5,572 83
State government (western)
1998 525,380 520 83,390 . . . 430,709 43 10,716 . − 2
1999 274,208 150 43,033 . . . 226,022 23 4,979 . − 1
2000 282,431 − 48,702 . . . 227,914 22 5,792 . . 1
2001 305,788 1,800 67,721 . . . 228,270 5 7,991 . . 1
2002 328,390 250 97,556 . . . 217,333 5 13,246 . . 1
2003 355,661 472 125,356 . . . 207,880 4 21,949 . . 1
2004 Mar 363,202 222 136,105 . . . 200,366 4 26,504 . . 1
June 368,240 900 141,270 . . . 197,032 4 29,033 . . 1
Sep 374,415 900 145,136 . . . 198,760 0 29,618 . . 1
Dec p 376,511 750 148,219 . . . 192,659 0 34,882 . . 1
State government (eastern)
1998 98,192 445 27,228 . . . 70,289 − 230 . . .
1999 53,200 891 14,517 . . . 37,602 − 189 . . .
2000 55,712 100 16,092 . . . 39,339 − 182 . . .
2001 58,771 100 20,135 . . . 37,382 − 1,154 . . .
2002 63,782 338 23,838 . . . 37,739 − 1,867 . . .
2003 68,076 315 28,833 . . . 37,022 − 1,906 . . .
2004 Mar 69,661 524 30,752 . . . 35,314 27 3,044 . . .
June 71,252 777 31,897 . . . 35,530 27 3,021 . . .
Sep 71,512 729 31,967 . . . 35,295 27 3,495 . . .
Dec p 72,026 533 31,476 . . . 36,179 37 3,801 . . .
For footnotes, see end of the table.
55*
VIII Public finances in Germany

DEUTSCHEBUNDESBANKMonthly ReportFebruary 2005
VIII Public finances in Germany 7 General government debt * (cont’d)
Up to end-1998, DM million; from 1999, € million
Loans from non-banks Old debtDirect
Treasury Five-year lending arising fromdiscount Federal Federal by credit Social German Equalisa-
End of year paper Treasury notes savings institu- security unifica- tionor month Total (Bubills) 1 notes 2,3 (Bobls) 2 notes Bonds 2 tions 4 funds Other 4 tion 5 claims Other 6
Local government (western) 9
1998 158,960 . 300 . . 1,330 153,208 119 4,003 . . .1999 81,511 . 153 . . 680 78,726 53 1,898 . . .2000 81,414 . 153 . . 680 78,656 33 1,891 . . .2001 82,203 . 153 . . 629 79,470 29 1,922 . . .2002 84,097 . 153 . . 629 81,307 22 1,986 . . .2003 90,906 . 77 . . 603 87,868 19 2,339 . . .
2004 Mar 92,400 . 77 . . 732 89,231 20 2,340 . . . June 93,250 . 77 . . 707 90,106 20 2,340 . . . Sep 93,800 . 77 . . 656 90,707 20 2,340 . . .
Local government (eastern) 9
1998 39,873 . 225 . . 460 38,777 255 156 . . .1999 20,726 . 51 . . 335 20,138 124 78 . . .2000 17,048 . 51 . . 335 16,497 114 50 . . .2001 17,005 . − . . 284 16,581 107 33 . . .2002 16,745 . − . . 284 16,318 102 41 . . .2003 16,951 . − . . 131 16,601 87 132 . . .
2004 Mar 16,900 . − . . 131 16,549 90 130 . . . June 16,900 . − . . 131 16,549 90 130 . . . Sep 17,000 . − . . 131 16,649 90 130 . . .
German Unity Fund/Indemnification Fund 7
1998 79,413 − − − . 47,998 30,975 − 440 . . .1999 40,234 − 275 500 . 28,978 10,292 − 189 . . .2000 40,629 − 275 2,634 . 29,797 7,790 − 133 . . .2001 39,923 − 3,748 10,134 . 21,577 4,315 − 149 . . .2002 39,810 − 3,820 10,134 . 22,685 3,146 − 26 . . .2003 39,568 − 4,610 10,134 . 24,032 793 − − . . .
2004 Mar 40,010 . 4,610 9,634 . 24,177 1,589 − − . . . June 39,500 . 4,538 9,634 . 24,183 1,144 − − . . . Sep 39,608 . 4,538 9,634 . 24,185 1,251 − − . . . Dec 39,053 . 4,538 9,634 . 24,187 694 − − . . .
ERP Special Fund 7
1998 34,159 . . . . 11,944 20,988 − 1,227 . . .1999 16,028 . . − . 6,250 9,458 21 299 . . .2000 18,386 . . − . 7,585 10,411 13 377 . . .2001 19,161 . . − . 9,462 9,310 8 381 . . .2002 19,400 . . 51 . 10,144 8,686 8 512 . . .2003 19,261 . . 51 . 10,169 8,522 8 512 . . .
2004 Mar 18,576 . . 51 . 10,169 7,960 8 389 . . . June 18,525 . . 51 . 10,169 7,909 8 389 . . . Sep 18,525 . . 51 . 10,169 7,909 8 389 . . . Dec 18,200 . . 51 . 10,169 7,584 8 389 . . .
Federal Railways Fund 7,8
1998 77,246 . − 500 . 31,648 42,488 79 2,531 . . .
1999 June 39,231 . − 1,023 . 16,805 20,401 34 968 . . .
Debt Processing Fund/Redemption Fund for Inherited Liabilities 7,8
1998 304,978 − 31,633 − . 110,006 79,226 54 4,167 − 20 79,899 15
1999 June 151,097 − 11,127 2,000 . 58,897 36,133 27 2,015 − 9 40,902 4
Equalisation Fund for Safeguarding the Use of Coal 7,8
1998 3,971 . . . . 300 3,671 − − . . .
1999 June 2,302 . . . . 153 2,148 − − . . .
Source: Bundesbank calculations based on data from the Federal Statistical 6 Old debt mainly denominated in foreign currency, in accordance with theOffice. — * Excluding intergovernment debt. — 1 Predominantly Treasury London Debts Agreement; excluding debt securities in own portfolios. —discount paper (Bubills). — 2 Excluding issuers’ holdings of their own 7 In contrast to the capital market statistics, the debt incurred through thesecurities. — 3 Treasury notes issued by state government include long-term joint issuance of Federal securities is recorded here under centralpaper. — 4 Mainly loans against borrowers’ notes. Including loans raised government and its special funds in accordance with the agreed distributionabroad. Other loans from non-banks, including loans from supplementary ratios. — 8 Since 1 July 1999 central government has assumed jointpublic pension funds and liabilities arising from the investment assistance responsibility for the debts of the Redemption Fund for Inherited Liabilities,levy. — 5 Old liabilities arising from housing construction and liabilities the Federal Railways Fund and the Equalisation Fund for Safeguarding thearising from housing construction by the former GDR’s armed forces and Use of Coal. From July, the aforementioned special funds are recordedfrom housing construction in connection with the return of the troops of under central government. — 9 Data other than year-end figures have beenthe former USSR stationed in eastern Germany to their home country. — estimated. Including debt of municipal special purpose associations.
56*
VIII Public finances in Germany

DEUTSCHEBUNDESBANKMonthly ReportFebruary 2005
VIII Public finances in Germany 8 Change in general government debt *
Net borrowing 1
End of 2003 2004
2003 Sep 2004 Total Q1 Q2 Q3 Q4 Q1 Q2 Q3
Item € million
Borrowers
Central government 2 767,697 814,356 + 42,292 + 19,995 + 4,520 + 16,293 + 1,484 + 34,993 + 1,301 + 10,365
German Unity Fund 39,099 39,210 − 342 + 588 − 503 + 131 − 558 + 520 − 516 + 107ERP Special Fund 19,261 18,525 − 139 − 31 + 30 − − 138 − 685 − 51 −Indemnification Fund 469 398 + 100 + 25 + 23 + 26 + 27 − 79 + 6 + 1
State government (western) 355,661 374,415 + 27,271 + 11,596 + 5,404 + 2,616 + 7,655 + 7,541 + 5,038 + 6,175State government (eastern) 68,076 71,512 + 4,294 + 1,183 + 1,945 − 315 + 1,481 + 1,585 + 1,592 + 260Local government (western) 3 90,906 93,800 + 7,439 + 2,003 + 1,739 + 1,154 + 2,543 + 1,961 + 1,114 + 491Local government (eastern) 3 16,951 17,000 + 249 − 46 + 63 + 111 + 121 − 30 + 4 + 110
Total 1,358,121 1,429,216 + 81,164 + 35,311 + 13,221 + 20,015 + 12,616 + 45,805 + 8,487 + 17,509
Debt by category
Treasury discount 36,022 37,494 + 5,207 − 185 + 535 + 2,258 + 2,598 + 1,187 + 99 + 187paper (Bubills) 4 Treasury notes 5 246,414 276,918 + 42,463 + 16,486 + 11,936 + 5,075 + 8,965 + 14,031 + 9,528 + 6,946Five-year Federal notes (Bobls) 5 153,616 166,711 + 15,947 + 5,504 + 7,455 − 3,898 + 6,887 + 6,119 + 2,907 + 4,070Federal savings notes 12,810 10,568 − 5,088 − 2,464 − 1,150 − 530 − 944 − 1,565 − 656 − 22Bonds 5 471,129 494,621 + 14,829 + 13,266 − 6,927 + 6,481 + 2,008 + 14,792 + 2,748 + 5,953
Direct lending bycredit institutions 6 396,832 390,436 − 6,541 − 945 − 1,554 + 4,977 − 9,019 + 4,553 − 9,333 − 910Loans from social security funds 341 413 + 204 − 2 + 1 + 181 + 24 + 31 − + 42Other loans 6 34,122 46,394 + 15,319 + 3,684 + 2,932 + 6,611 + 2,092 + 6,700 + 3,194 + 2,377
Old debt 7 85 49 − 41 − 33 − 6 − 3 + 0 − 42 + 0 + 6Equalisation claims 6,711 5,572 − 1,134 − + 0 − 1,139 + 5 + 0 + 0 − 1,139Investment assistance levy 41 41 − 0 + 0 − 0 − 0 + 0 − − −
Total 1,358,121 1,429,216 + 81,164 + 35,311 + 13,221 + 20,015 + 12,616 + 45,805 + 8,487 + 17,509
Creditors
Banking system
Bundesbank 4,440 4,440 − − − − − − − −Credit institutions 524,800 557,400 − 7,127 + 13,319 − 8,968 + 2,215 − 13,693 + 26,088 + 3,768 + 3,451
Domestic non-banks
Social security funds 341 413 + 204 − 2 + 1 + 181 + 24 + 31 − + 42Other 8 289,840 296,363 + 61,187 + 2,594 + 9,788 + 17,919 + 30,885 + 2,786 + 8,319 − 4,584
Foreign creditors pe 538,700 570,600 + 26,900 + 19,400 + 12,400 − 300 − 4,600 + 16,900 − 3,600 + 18,600
Total 1,358,121 1,429,216 + 81,164 + 35,311 + 13,221 + 20,015 + 12,616 + 45,805 + 8,487 + 17,509
Source: Bundesbank calculations based on data from the Federal Statistical own securities. — 6 Including loans raised abroad. — 7 Old liabilities arisingOffice. — * Excluding intergovernment debt. — 1 Net borrowing differs from housing construction and liabilities arising from the housingfrom the change in debt, which includes the assumption and transfer of construction of the former GDR’s armed forces and from housingdebts. — 2 See Table VIII.7, footnote 8. — 3 Data other than year-end construction in connection with the return of the troops of the former USSRfigures have been estimated. Including debt of municipal special purpose stationed in eastern Germany to their home country, and old debt inassociations. — 4 Excluding mobilisation and liquidity paper. Predominantly accordance with the London Debts Agreement. — 8 Ascertained as aTreasury discount paper (Bubills). — 5 Excluding issuers’ holdings of their residual.
9 Loans raised by general government against borrowers’ notes Up to end-1998, DM million; from 1999, € million
Redemption EqualisationCentral German ERP Federal Fund for Fund for Safe-
End of year govern- Unity Special State Local Railways Inherited guarding theor month Total 1 ment 2,3 Fund Fund government government 4,5 Fund 3 Liabilites 3 Use of Coal 3
1998 898,030 23,094 31,415 22,215 504,148 184,942 45,098 83,447 3,6711999 444,031 64,704 10,481 9,778 264,158 94,909 − − −2000 431,364 54,731 7,178 10,801 268,362 90,292 − − −2001 416,067 44,791 4,464 9,699 267,988 89,126 − − −2002 398,910 34,636 3,172 9,205 262,840 89,057 − − −
2003 Sep 398,318 38,309 793 9,180 260,264 89,773 − − −Dec 399,304 38,410 793 9,042 260,046 91,013 − − −
2004 Mar 396,842 38,307 793 8,357 258,808 90,578 − − −June 397,237 37,827 690 8,305 259,854 90,560 − − −Sep 399,706 38,664 690 8,305 261,515 90,531 − − −
Source: Bundesbank calculations based on data from the Federal Statistical 3 See Table VIII.7, footnote 8. — 4 Data other than year-end figures haveOffice. — 1 Excluding Debt Register claims and cash advances. Including been estimated. Including municipal special purpose associations. —small amounts of mortgage loans, land charges in annuity and other forms, 5 Including contractually agreed loans. and debts outstanding. — 2 Including Equalisation of Burdens Fund. —
57*
VIII Public finances in Germany

DEUTSCHEBUNDESBANKMonthly ReportFebruary 2005
VIII Public finances in Germany 10 Central government debt
Up to end-1998, DM million; from 1999, € million
Treasury discount Indebtednesspaper (Bubills) 1 to non-banks Old debt
of which DirectFederal Federal Five-year lending arising fromTreasury Treasury Federal Federal Federal by credit Social German Equal-
End of year financing notes notes savings bonds institu- security isationunifica-or month Total Total paper (Schätze) 2 (Bobls) 2 notes (Bunds) 2 tions 3,4 funds Other 3,5,6 tion 7 claims Other 8
1997 905,691 25,286 5,221 78,848 177,721 99,317 481,619 31,845 5 870 1,300 8,684 1971998 957,983 24,666 4,558 84,760 199,274 92,698 519,718 24,125 − 2,603 1,270 8,684 186
1999 9 714,069 11,553 1,584 44,335 120,498 41,621 379,808 67,872 60 2,568 476 45,175 1042000 715,819 11,516 1,805 44,678 123,642 35,991 400,490 52,836 29 2,099 285 44,146 1072001 701,077 21,136 1,658 59,643 119,911 26,395 416,195 47,111 26 1,481 85 8,986 1072002 725,405 30,227 1,618 78,584 127,484 17,898 422,558 39,517 0 1,167 29 7,845 972003 767,697 35,235 1,240 87,538 143,431 12,810 436,194 38,146 223 7,326 − 1 6,711 852004 812,086 34,440 1,074 95,638 159,272 10,817 460,381 34,835 333 10,751 − 38 5,572 83
2004 Jan 786,023 35,941 1,229 92,560 143,816 11,830 448,242 39,290 223 7,326 − 1 6,711 86 Feb 789,107 35,197 1,208 92,768 144,190 11,212 453,213 38,183 223 7,326 − 1 6,711 86 Mar 802,690 36,463 1,178 88,901 150,050 11,245 450,711 49,888 223 8,456 − 45 6,711 87
Apr 798,786 35,616 1,128 95,468 150,031 10,786 449,577 41,875 223 8,456 − 45 6,711 88 May 804,270 36,639 1,096 95,913 152,810 10,575 452,391 40,513 223 8,456 − 46 6,708 88 June 803,991 35,630 1,105 92,190 152,957 10,590 453,479 43,026 223 9,144 − 45 6,711 88
July 821,291 35,744 1,111 97,599 153,362 10,439 461,338 47,829 223 9,144 − 45 5,572 88 Aug 824,560 35,362 1,104 98,350 155,852 10,558 468,445 41,013 223 9,144 − 45 5,572 87 Sep 814,356 35,866 1,091 95,200 157,026 10,568 459,482 39,864 268 10,463 − 38 5,572 86
Oct 827,013 35,341 1,087 102,894 161,759 10,570 460,206 39,892 268 10,463 − 38 5,572 86 Nov 820,571 34,819 1,085 104,060 160,102 10,731 460,112 34,399 268 10,463 − 38 5,572 83 Dec 812,086 34,440 1,074 95,638 159,272 10,817 460,381 34,835 333 10,751 − 38 5,572 83
2005 Jan 10,p 874,418 34,943 1,062 106,345 169,241 10,818 490,981 45,389 333 10,751 − 38 5,572 83
1 Excluding mobilisation and liquidity paper. In November 1999, including Germany to their home country. — 8 Commutation and compensation debtcash bills. — 2 Excluding issuers’ holdings of their own securities. — and old debt mainly denominated in foreign currency. — 9 Since 1 July 19993 Including loans raised abroad. — 4 Including money market loans. — central government has assumed joint responsibility for the debts of the5 Including loans granted by supplementary pension funds for government Redemption Fund for Inherited Liabilities, the Federal Railways Fund andemployees. — 6 Including liabilities arising from the investment assistance the Equalisation Fund for Safeguarding the Use of Coal. — 10 Sincelevy. — 7 Assumption of liabilities arising from housing construction for the 1 January 2005 central government has assumed joint responsibility for theformer GDR’s armed forces and from housing construction in connection debts of the German Unity Fund. with the return of the troops of the former USSR stationed in eastern
11 Central government borrowing in the market Up to end-1998, DM million; from 1999, € million
of which
Five-year Loans against Change inTotal new borrowing Federal bonds (Bunds) Federal notes (Bobls) Other securities 2 borrowers’ notes Money money
market marketPeriod Gross 1 Net Gross 1 Net Gross 1 Net Gross 1 Net Gross Net loans deposits
1996 + 185,696 + 83,049 + 54,038 + 31,988 + 45,445 + 5,445 + 67,015 + 39,586 + 15,050 + 1,906 + 4,148 + 6,5481997 + 250,074 + 65,808 + 79,323 + 47,323 + 59,557 + 1,557 + 98,275 + 24,983 + 12,950 − 8,009 − 30 − 3,3041998 + 228,050 + 52,292 + 78,304 + 38,099 + 55,078 + 21,553 + 85,706 − 1,327 + 12,023 − 2,927 − 3,065 − 5,440
1999 + 139,865 + 31,631 + 53,931 + 114,080 + 22,229 + 18,610 + 44,904 − 5,836 + 14,861 + 52,897 + 3,937 + 1,8322000 + 122,725 + 1,750 + 49,395 + 20,682 + 26,342 + 3,144 + 45,278 − 5,323 + 7,273 − 9,973 − 5,563 − 9402001 + 135,018 − 14,741 + 36,511 + 15,705 + 19,603 − 3,730 + 69,971 + 14,989 + 5,337 − 9,941 + 3,595 − 1,4952002 + 178,203 + 24,328 + 41,378 + 6,364 + 36,037 + 7,572 + 93,853 + 19,535 + 4,716 − 10,155 + 2,221 + 222003 + 227,078 + 42,292 + 62,535 + 13,636 + 42,327 + 15,947 + 109,500 + 8,874 + 11,480 + 3,775 + 1,236 + 7,218
2003 Jan-Dec + 227,078 + 42,292 + 62,535 + 13,636 + 42,327 + 15,947 + 109,500 + 8,874 + 11,480 + 3,775 + 1,236 + 7,2182004 Jan-Dec + 228,122 + 44,389 + 52,701 + 24,187 + 35,589 + 15,842 + 130,801 + 5,313 + 7,186 − 1,620 + 1,844 + 802
2004 Jan + 26,811 + 18,326 + 12,047 + 12,048 + 385 + 385 + 11,926 + 4,748 + 533 − 776 + 1,920 − 321 Feb + 17,553 + 3,084 + 4,971 + 4,971 + 7,849 + 375 + 5,535 − 1,156 + 760 + 456 − 1,563 − 1,186 Mar + 36,156 + 13,583 + 1,580 − 2,502 + 5,860 + 5,860 + 15,425 − 2,567 + 673 + 217 + 12,619 + 6,423
Apr + 3,991 − 3,904 − 1,135 − 1,135 − 19 − 19 + 11,797 + 5,262 + 855 − 507 − 7,507 − 5,683 May + 17,688 + 5,484 + 6,903 + 2,815 + 4,133 + 2,779 + 7,549 + 1,257 + 448 − 17 − 1,345 + 3,254 June + 17,741 − 279 + 1,087 + 1,087 + 146 + 146 + 13,163 − 4,717 + 187 + 44 + 3,157 + 87
July + 30,551 + 17,300 + 12,942 + 7,859 + 405 + 405 + 11,629 + 5,371 + 1,111 + 340 + 4,464 + 7,072 Aug + 14,595 + 3,269 + 7,108 + 7,108 + 7,463 + 2,490 + 6,575 + 489 + 335 + 70 − 6,886 + 2,285 Sep + 18,757 − 10,204 + 1,200 − 8,964 + 1,175 + 1,175 + 15,619 − 2,637 + 977 + 428 − 213 − 11,104
Oct + 20,064 + 12,657 + 724 + 724 + 4,733 + 4,733 + 13,443 + 7,172 + 303 − 834 + 861 + 8,203 Nov + 11,485 − 6,442 + 5,004 − 94 + 4,289 − 1,657 + 6,808 + 804 + 640 − 237 − 5,256 − 8,455 Dec + 12,730 − 8,485 + 269 + 269 − 830 − 830 + 11,333 − 8,714 + 365 − 803 + 1,593 + 226
2005 Jan p + 36,915 + 23,679 + 13,085 + 6,813 + 334 + 334 + 12,850 + 6,672 + 285 − 502 + 10,362 + 4,588
1 After deduction of repurchases. — 2 Federal Treasury notes (Schätze), Federal savings notes, Treasury discount paper (Bubills), Federal Treasury financing paper.
58*
VIII Public finances in Germany

DEUTSCHEBUNDESBANKMonthly ReportFebruary 2005
VIII Public finances in Germany 12 Revenue, expenditure and assets of the wage and
salary earners’ pension insurance fund Up to end-1998, DM million; from 1999, € million
Revenue 1 Expenditure 1 Assets 5
of which of which
Payments Balance Mort- Memofrom Pen- of revenue gage itemcentral Pension sioners’ and and Adminis-
Contri- govern- pay- health expend- other Real trativePeriod Total butions 2 ment Total ments 3 insurance 4 iture Total Deposits 6 Securities loans 7 estate assets
Germany
1993 290,393 232,408 52,671 298,065 252,920 15,898 − 7,672 39,786 29,957 8,499 1,100 229 6,2971994 322,335 256,662 61,891 324,323 273,880 17,751 − 1,988 33,578 24,194 8,170 909 305 6,8901995 338,185 270,294 64,387 348,115 294,034 20,285 − 9,930 21,756 16,801 3,948 746 262 7,8001996 8 353,672 282,616 68,388 362,667 305,780 21,660 − 8,995 14,456 9,608 2,119 2,500 229 8,8631997 374,853 297,402 74,961 372,955 316,511 23,280 + 1,898 14,659 10,179 1,878 2,372 230 9,2611998 389,101 297,827 88,755 385,707 327,823 24,393 + 3,394 18,194 14,201 1,493 2,274 226 9,5731999 208,173 152,206 54,628 203,295 172,919 12,950 + 4,878 13,623 11,559 824 1,127 114 4,9042000 211,137 150,712 58,862 210,558 178,599 13,365 + 579 14,350 11,459 1,676 1,105 110 4,8892001 8 216,927 152,048 63,093 217,497 184,730 13,762 − 570 13,973 10,646 1,517 1,699 111 4,9172002 221,563 152,810 66,958 225,689 191,133 14,498 − 4,126 9,826 6,943 1,072 1,685 126 4,8782003 229,371 156,510 71,447 231,362 196,038 15,178 − 1,991 7,641 5,017 816 1,682 126 4,8622004 9,p 231,199 156,524 71,304 232,602 198,838 14,228 − 1,403 5,171 4,984 19 41 127 4,904
2003 Q1 55,374 37,289 17,761 57,255 48,883 3,727 − 1,881 8,686 5,649 1,230 1,685 122 4,874 Q2 56,442 38,349 17,749 57,396 48,763 3,735 − 954 7,698 4,906 980 1,686 126 4,867 Q3 57,241 39,085 17,830 58,256 49,409 3,858 − 1,015 6,348 3,822 727 1,683 116 4,855 Q4 59,796 41,772 17,703 58,269 49,363 3,916 + 1,527 7,641 5,017 816 1,682 126 4,862
2004 Q1 55,431 37,289 17,846 58,350 49,858 3,873 − 2,919 5,879 3,375 696 1,681 127 4,862 Q2 56,665 38,446 17,873 57,794 49,437 3,416 − 1,129 3,752 1,914 28 1,682 128 4,877 Q3 56,766 38,664 17,779 58,107 49,719 3,456 − 1,341 2,561 731 22 1,681 127 4,889 Q4 9 62,336 42,126 17,807 58,350 49,824 3,484 + 3,986 5,171 4,984 19 41 127 4,904
Source: Federal Minister of Labour and Social Affairs and Association of deducted from pension payments. — 4 From 1995, including long-term careGerman Pension Insurance Funds. — 1 The annual figures do not tally with insurance for pensioners. — 5 Largely corresponds to the sustainabilitythe sum of the quarterly figures, as the latter are all provisional. From 1993, reserves. End of year or quarter. From 1992, figures for the whole ofincluding financial compensation payments. Excluding investment spending Germany. — 6 Including cash. — 7 Excluding loans to other social securityand proceeds. — 2 Including contributions for recipients of government funds; including participating interests. — 8 Excluding income arising fromcash benefits. — 3 Payments by pension insurance funds to health insurance the revaluation of participating interests. — 9 Revenue includes proceedsinstitutions under section 50 of the Social Security Code V have been from the disposal of equity interests.
13 Revenue and expenditure of the Federal Employment Agency Up to end-1998, DM million; from 1999, € million
Revenue ExpenditureGrant or
of which of which workingcapital
Promo- loansUnemployment support 3,4 Job promotion 4,5 tion of from
winter centralContri- Western Eastern Western Eastern con- govern-
Period Total 1 butions Levies 2 Total Total Germany Germany Total Germany Germany struction Balance ment
Germany
1993 85,109 79,895 1,829 109,536 48,005 34,149 13,856 36,891 15,895 20,996 1,919 − 24,426 24,4191994 89,658 81,536 3,822 99,863 48,342 35,163 13,179 31,273 14,382 16,891 1,822 − 10,205 10,1421995 90,211 84,354 2,957 97,103 49,254 36,161 13,094 34,441 16,745 17,696 1,586 − 6,892 6,8871996 91,825 85,073 3,346 105,588 57,123 40,186 16,938 36,478 18,368 18,111 903 − 13,763 13,7561997 93,149 85,793 2,959 102,723 60,273 40,309 19,964 31,418 16,117 15,301 443 − 9,574 9,5741998 91,088 86,165 2,868 98,852 53,483 35,128 18,355 34,279 16,784 17,496 471 − 7,764 7,719
1999 47,954 45,141 1,467 51,694 25,177 16,604 8,573 20,558 10,480 10,078 279 − 3,740 3,7392000 49,606 46,359 1,403 50,473 23,946 15,615 8,331 20,324 10,534 9,790 294 − 868 8672001 50,682 47,337 1,640 52,613 25,036 16,743 8,294 20,713 11,094 9,619 268 − 1,931 1,9312002 50,885 47,405 2,088 56,508 27,610 19,751 7,860 21,011 11,568 9,443 245 − 5,623 5,6232003 50,635 47,337 2,081 56,850 29,735 21,528 8,207 19,155 10,564 8,591 272 − 6,215 6,2152004 50,314 47,211 1,674 54,490 29,746 21,821 7,925 16,843 9,831 7,011 217 − 4,176 4,175
2003 Q1 11,617 11,281 48 14,408 7,647 5,422 2,225 4,785 2,576 2,209 180 − 2,790 5,151 Q2 12,272 11,487 536 14,667 7,975 5,708 2,267 4,721 2,623 2,098 84 − 2,395 2,408 Q3 12,828 11,797 619 13,645 7,251 5,313 1,938 4,453 2,462 1,991 7 − 817 514 Q4 13,917 12,773 878 14,131 6,863 5,086 1,777 5,196 2,903 2,293 1 − 214 − 1,858
2004 Q1 11,524 11,261 47 14,448 8,200 6,001 2,199 4,389 2,491 1,898 144 − 2,924 5,244 Q2 12,042 11,419 394 13,949 7,782 5,673 2,109 4,268 2,510 1,758 67 − 1,907 1,946 Q3 12,516 11,709 481 12,818 7,044 5,189 1,855 3,919 2,309 1,610 4 − 303 166 Q4 14,233 12,821 753 13,275 6,721 4,958 1,762 4,267 2,522 1,745 3 + 958 − 3,181
Source: Federal Employment Agency. — 1 Excluding central government recipients of wage substitutes are paid in January instead of inliquidity assistance. — 2 Levies to promote winter construction and to pay in- December. — 5 Vocational training, measures to encourage job take-up,solvency compensation to employees. — 3 Unemployment benefit, rehabilitation, job creation measures, subsidies granted to Personnel Serviceshort-time working benefit. — 4 Including contributions to the statutory Agencies (PSAs), compensation top-up payments and business start-uphealth insurance funds and statutory pension insurance sheme. From 2003, grants. the January contributions to the statutory pension insurance scheme for
59*
VIII Public finances in Germany

DEUTSCHEBUNDESBANKMonthly ReportFebruary 2005
IX Economic conditions
1 Origin and use of domestic product, distribution of national income Germany
2000 2001 2002 2003 2004 2001 2002 2003 2004 2001 2002 2003 2004
Annual PercentageItem € billion percentage change of total
At 1995 prices
I Origin of domestic productProduction sector(excluding construction) 450.5 444.6 443.0 445.0 466.1 − 1.3 − 0.4 0.5 4.7 22.4 22.3 22.4 23.1Construction 102.6 96.9 92.3 88.2 86.1 − 5.6 − 4.8 − 4.4 − 2.4 4.9 4.6 4.4 4.3Wholesale/retail trade, hotel andrestaurant services, transportand storage 1 345.9 359.4 364.5 367.8 375.7 3.9 1.4 0.9 2.1 18.1 18.3 18.5 18.6Financing, renting and businessservices 2 572.9 594.6 595.2 598.5 607.9 3.8 0.1 0.5 1.6 29.9 29.9 30.1 30.1Public and private services 3 390.1 390.8 397.1 395.4 396.0 0.2 1.6 − 0.4 0.1 19.7 20.0 19.9 19.6
All economic sectors 1,886.5 1,910.9 1,916.2 1,918.9 1,956.4 1.3 0.3 0.1 2.0 96.2 96.4 96.7 96.9Memo item: Enterprise sector 1,657.7 1,683.0 1,688.5 1,693.3 1,731.7 1.5 0.3 0.3 2.3 84.7 85.0 85.3 85.8
Economic sectors, adjusted 4 1,786.2 1,805.9 1,811.3 1,812.7 1,849.2 1.1 0.3 0.1 2.0 90.9 91.1 91.3 91.6
Gross domestic product 1,969.5 1,986.0 1,987.6 1,985.2 2,018.2 0.8 0.1 − 0.1 1.7 100 100 100 100
II Use of domestic productPrivate consumption 5 1,121.2 1,140.7 1,132.5 1,132.5 1,129.4 1.7 − 0.7 0.0 − 0.3 57.4 57.0 57.0 56.0Government consumption 378.6 382.4 389.8 390.2 391.8 1.0 1.9 0.1 0.4 19.3 19.6 19.7 19.4Machinery and equipment 176.5 167.8 153.4 151.2 153.0 − 4.9 − 8.6 − 1.4 1.2 8.4 7.7 7.6 7.6Premises 242.1 230.5 217.2 210.1 204.9 − 4.8 − 5.8 − 3.2 − 2.5 11.6 10.9 10.6 10.2Other investment 6 25.5 26.9 27.3 27.8 28.5 5.5 1.4 1.7 2.4 1.4 1.4 1.4 1.4Changes in inventories 7 − 7.7 − 26.9 − 35.5 − 18.1 − 4.6 . . . . − 1.4 − 1.8 − 0.9 − 0.2
Domestic use 1,936.3 1,921.6 1,884.5 1,893.7 1,903.0 − 0.8 − 1.9 0.5 0.5 96.8 94.8 95.4 94.3Net exports 33.2 64.5 103.1 91.5 115.2 . . . . 3.2 5.2 4.6 5.7
Exports 660.4 698.1 726.6 740.0 800.7 5.7 4.1 1.8 8.2 35.2 36.6 37.3 39.7Imports 627.3 633.7 623.5 648.5 685.5 1.0 − 1.6 4.0 5.7 31.9 31.4 32.7 34.0
Gross domestic product 1,969.5 1,986.0 1,987.6 1,985.2 2,018.2 0.8 0.1 − 0.1 1.7 100 100 100 100
At current prices
III Use of domestic productPrivate consumption 5 1,196.8 1,237.2 1,242.2 1,255.3 1,271.0 3.4 0.4 1.1 1.3 59.7 58.9 59.0 58.4Government consumption 385.8 394.2 405.4 408.5 406.8 2.2 2.8 0.8 − 0.4 19.0 19.2 19.2 18.7Machinery and equipment 176.7 167.4 151.9 146.9 146.8 − 5.3 − 9.3 − 3.2 − 0.1 8.1 7.2 6.9 6.7Premises 240.2 228.9 215.4 208.3 205.7 − 4.7 − 5.9 − 3.3 − 1.2 11.0 10.2 9.8 9.4Other investment 6 23.2 24.3 24.5 24.5 24.7 5.0 0.6 0.2 0.5 1.2 1.2 1.2 1.1Changes in inventories 7 − 0.6 − 19.3 − 26.9 − 7.6 6.4 . . . . − 0.9 − 1.3 − 0.4 0.3
Domestic use 2,022.0 2,032.8 2,012.5 2,036.0 2,061.4 0.5 − 1.0 1.2 1.2 98.0 95.5 95.7 94.6Net exports 8.0 41.2 94.8 92.2 116.8 . . . . 2.0 4.5 4.3 5.4
Exports 685.3 730.7 761.6 769.3 832.0 6.6 4.2 1.0 8.2 35.2 36.1 36.1 38.2Imports 677.3 689.5 666.8 677.1 715.2 1.8 − 3.3 1.5 5.6 33.2 31.6 31.8 32.8
Gross domestic product 2,030.0 2,074.0 2,107.3 2,128.2 2,178.2 2.2 1.6 1.0 2.3 100 100 100 100
IV Prices (1995 = 100)Private consumption 106.7 108.5 109.7 110.8 112.5 1.6 1.1 1.0 1.5 . . . .Gross domestic product 103.1 104.4 106.0 107.2 107.9 1.3 1.5 1.1 0.7 . . . .Terms of trade 96.1 96.2 98.0 99.6 99.6 0.1 1.9 1.6 0.0 . . . .
V Distribution of national incomeCompensation of employees 1,099.1 1,120.8 1,129.4 1,132.2 1,132.3 2.0 0.8 0.2 0.0 72.9 72.8 72.1 70.1Entrepreneurial and propertyincome 410.4 417.6 422.4 437.1 484.0 1.7 1.2 3.5 10.7 27.1 27.2 27.9 29.9
National income 1,509.5 1,538.4 1,551.9 1,569.3 1,616.4 1.9 0.9 1.1 3.0 100 100 100 100
Memo item: Gross nationalincome 2,021.2 2,062.9 2,088.1 2,114.2 2,168.8 2.1 1.2 1.2 2.6 . . . .
Source: Federal Statistical Office; figures computed in January 2005. Prelimi- products). — 5 Including non-profit institutions serving households. — 6 In-nary figure. — 1 Including communication services. — 2 Financial interme- tangible fixed asset formation (inter alia, computer software and entertain-diation, real estate activities, renting and business services. — 3 Including ment, literary or artistic originals) and cultivated assets. — 7 Including net in-care-at-home services. — 4 Gross value added after deduction of assumed crease in valuables. bank charges, but excluding taxes on products (offset against subsidies on
60*
IX Economic conditions

DEUTSCHEBUNDESBANKMonthly ReportFebruary 2005
IX Economic conditions 2 Output in the production sector
Germany Adjusted for working-day variations o
of which
Industry 1
of which: by main industrial grouping of which: by economic sector
MotorChemicals vehicles,
Production Inter- Non- and Machinery trailerssector, Construc- mediate Capital Durable durable chemical Basic and and semi-total tion 2 Energy 3 Total goods 4 goods 5 goods goods 6 products metals equipment trailers
2000 = 100
1999 95.3 103.6 100.2 94.0 94.5 91.1 96.2 98.5 97.2 92.4 93.3 89.8
2000 99.9 100.0 99.9 99.9 99.9 99.9 99.9 99.9 99.9 100.0 99.9 99.92001 99.5 92.5 97.3 100.4 99.3 102.3 100.4 98.8 98.0 101.1 102.1 104.02002 98.3 89.0 97.4 99.3 98.9 101.1 92.0 98.2 101.7 101.8 99.5 105.42003 98.4 85.1 99.8 99.5 99.5 101.9 87.2 97.4 102.0 99.9 97.8 107.62004 x 100.7 80.4 101.2 102.5 103.5 105.6 87.5 97.8 104.6 104.2 101.1 113.0
2003 Apr 98.4 92.1 100.3 98.7 100.4 99.4 85.7 96.7 105.6 102.9 93.3 108.9 May 96.0 91.1 95.3 96.5 98.9 97.3 79.8 93.9 102.4 101.3 91.9 106.9 June 100.0 98.7 91.6 101.0 102.5 103.3 83.5 97.4 103.5 97.8 101.9 106.7
July 100.4 102.2 90.6 101.3 102.5 103.1 85.8 98.6 105.0 101.7 98.9 108.7 Aug 90.0 90.0 90.3 90.0 93.1 86.5 67.2 95.4 98.9 88.2 85.5 80.0 Sep 102.3 100.8 92.2 103.5 103.3 106.7 97.2 99.2 97.6 101.5 104.5 110.8
Oct 105.1 99.3 102.2 106.0 106.9 106.3 97.9 105.2 104.0 107.2 98.2 112.4 Nov 106.4 93.2 104.6 107.8 105.3 113.8 100.1 103.1 101.4 103.3 105.8 125.0 Dec 95.0 67.1 107.0 96.2 87.1 108.8 82.9 94.2 92.7 83.0 117.8 97.5
2004 Jan 92.0 49.3 115.8 93.3 96.5 90.7 83.4 93.7 101.9 104.6 82.2 99.0 Feb 94.1 56.7 105.8 96.3 98.6 97.0 86.5 92.1 101.6 103.1 87.4 112.0 Mar 105.1 76.2 109.7 107.3 107.8 111.9 96.0 99.6 107.3 111.6 105.9 123.6
Apr 100.9 85.9 102.3 102.1 104.4 104.1 88.2 96.4 107.4 104.1 98.2 116.3 May 99.9 86.8 97.1 101.4 103.5 104.3 86.3 94.9 102.3 105.4 98.3 117.2 June 103.6 93.0 90.6 106.0 107.2 111.4 87.1 97.3 103.2 111.3 106.1 122.6
July 103.3 95.5 92.3 105.3 107.2 108.3 87.2 99.3 105.8 106.6 105.1 113.7 Aug 93.8 85.5 90.3 94.9 98.7 93.4 68.3 95.9 103.7 94.0 89.3 91.9 Sep 106.7 95.0 94.2 109.2 109.1 114.7 97.1 101.5 106.0 107.3 112.4 122.4
Oct x 107.7 93.3 103.0 109.5 110.0 113.2 95.7 104.3 108.6 107.6 104.9 125.3 Nov x 105.8 85.7 104.9 107.8 107.7 111.7 93.5 103.9 108.0 106.0 105.2 118.7 Dec x 95.4 62.0 108.6 97.1 91.6 106.2 80.7 95.0 99.7 88.2 117.9 93.7
Annual percentage change
1999 + 1.1 + 0.5 + 0.1 + 1.2 + 1.5 + 1.0 − 0.4 + 1.9 + 3.5 − 3.6 − 2.3 + 3.2
2000 + 4.8 − 3.5 − 0.3 + 6.3 + 5.7 + 9.7 + 3.8 + 1.4 + 2.8 + 8.2 + 7.1 + 11.22001 − 0.4 − 7.5 − 2.6 + 0.5 − 0.6 + 2.4 + 0.5 − 1.1 − 1.9 + 1.1 + 2.2 + 4.12002 − 1.2 − 3.8 + 0.1 − 1.1 − 0.4 − 1.2 − 8.4 − 0.6 + 3.8 + 0.7 − 2.5 + 1.32003 + 0.1 − 4.4 + 2.5 + 0.2 + 0.6 + 0.8 − 5.2 − 0.8 + 0.3 − 1.9 − 1.7 + 2.12004 x + 2.3 − 5.5 + 1.4 + 3.0 + 4.0 + 3.6 + 0.3 + 0.4 + 2.5 + 4.3 + 3.4 + 5.0
2003 Apr + 0.3 − 4.3 + 3.5 + 0.3 + 1.1 − 0.4 − 4.9 + 1.0 + 3.1 − 1.4 − 4.0 + 2.8 May + 0.4 − 3.9 + 2.0 + 0.5 + 0.6 + 2.2 − 4.4 − 1.8 − 0.2 − 0.5 − 0.1 + 5.8 June − 2.0 − 1.5 + 5.3 − 2.7 − 0.5 − 5.1 − 12.1 − 0.3 − 0.3 − 8.8 − 6.6 − 7.8
July + 1.4 + 0.2 + 0.9 + 1.5 + 0.9 + 2.3 + 1.9 + 1.1 − 0.4 − 1.7 − 1.3 + 6.6 Aug − 2.6 − 4.3 + 1.1 − 2.8 − 2.4 − 3.9 − 9.2 − 0.5 − 1.0 − 7.3 + 0.4 − 12.8 Sep − 2.3 − 3.5 + 0.1 − 2.5 − 2.3 − 2.0 − 6.4 − 2.9 − 5.4 − 6.0 − 4.0 − 3.2
Oct + 1.1 − 2.6 + 0.3 + 1.4 + 1.9 + 2.1 − 2.7 − 0.1 + 0.1 + 0.1 − 1.1 + 0.9 Nov + 0.7 − 3.1 + 1.5 + 0.8 + 1.0 + 2.7 − 3.3 − 2.6 − 0.7 − 1.9 + 0.1 + 4.3 Dec + 2.7 + 5.3 + 0.4 + 2.8 + 3.1 + 3.3 − 0.5 + 1.5 + 4.9 + 1.8 − 0.6 + 7.7
2004 Jan + 1.9 − 4.8 + 5.0 + 1.7 + 2.8 + 0.9 + 1.7 + 0.9 − 0.6 + 3.7 + 1.7 − 2.8 Feb + 1.8 + 10.1 + 1.6 + 1.5 + 4.7 − 1.3 − 0.7 + 0.4 + 3.4 + 3.1 − 4.4 + 1.0 Mar + 0.5 − 9.2 + 0.7 + 1.2 + 1.8 + 1.8 − 1.1 − 1.0 − 4.3 + 1.0 + 2.4 + 1.8
Apr + 2.5 − 6.7 + 2.0 + 3.4 + 4.0 + 4.7 + 2.9 − 0.3 + 1.7 + 1.2 + 5.3 + 6.8 May + 4.1 − 4.7 + 1.9 + 5.1 + 4.7 + 7.2 + 8.1 + 1.1 − 0.1 + 4.0 + 7.0 + 9.6 June + 3.6 − 5.8 − 1.1 + 5.0 + 4.6 + 7.8 + 4.3 − 0.1 − 0.3 + 13.8 + 4.1 + 14.9
July + 2.9 − 6.6 + 1.9 + 3.9 + 4.6 + 5.0 + 1.6 + 0.7 + 0.8 + 4.8 + 6.3 + 4.6 Aug + 4.2 − 5.0 + 0.0 + 5.4 + 6.0 + 8.0 + 1.6 + 0.5 + 4.9 + 6.6 + 4.4 + 14.9 Sep + 4.3 − 5.8 + 2.2 + 5.5 + 5.6 + 7.5 − 0.1 + 2.3 + 8.6 + 5.7 + 7.6 + 10.5
Oct x + 2.5 − 6.0 + 0.8 + 3.3 + 2.9 + 6.5 − 2.2 − 0.9 + 4.4 + 0.4 + 6.8 + 11.5 Nov x − 0.6 − 8.0 + 0.3 + 0.0 + 2.3 − 1.8 − 6.6 + 0.8 + 6.5 + 2.6 − 0.6 − 5.0 Dec x + 0.4 − 7.6 + 1.5 + 0.9 + 5.2 − 2.4 − 2.7 + 0.8 + 7.6 + 6.3 + 0.1 − 3.9
Source of the unadjusted figures: Federal Statistical Office. — o Using the facture of refined petroleum products. — 4 Including mining andCensus X-12-ARIMA method, version 0.2.8. — 1 Manufacturing sector, unless quarrying. — 5 Including manufacture of motor vehicles, trailers andassigned to the main grouping energy, plus mining and quarrying. — 2 The semi-trailers. — 6 Including printing and service activities related to prin-figures refer to the economic classifications ”Site preparation” and ”Build- ting. — x Provisional; adjusted in advance by the Federal Statistical Office,ing of complete constructions or parts thereof; civil engineering”. — by way of estimates, to the results of the Quarterly Production Survey for3 Electricity, gas, steam and hot water supply, and, in particular, mining of the fourth quarter (industry: on average -1.9%). coal and lignite, extraction of crude petroleum and natural gas and manu-
61*
IX Economic conditions

DEUTSCHEBUNDESBANKMonthly ReportFebruary 2005
IX Economic conditions 3 Orders received by industry * Adjusted for working-day variations o
of which of which
Industry,total Domestic orders Foreign orders Intermediate goods Capital goods 1 Consumer goods 2
Annual Annual Annual Annual Annual Annualpercent- percent- percent- percent- percent- percent-age age age age age age
Period 2000=100 change 2000=100 change 2000=100 change 2000=100 change 2000=100 change 2000=100 change
Germany
2000 100.0 + 13.9 99.9 + 8.2 100.0 + 21.8 99.9 + 14.0 100.0 + 16.3 99.9 + 4.22001 98.3 − 1.7 97.6 − 2.3 99.1 − 0.9 95.9 − 4.0 99.4 − 0.6 101.4 + 1.52002 98.3 + 0.0 94.6 − 3.1 102.8 + 3.7 96.4 + 0.5 99.6 + 0.2 99.0 − 2.42003 99.0 + 0.7 94.7 + 0.1 104.4 + 1.6 97.8 + 1.5 100.7 + 1.1 95.4 − 3.62004 p 104.7 + 5.8 98.3 + 3.8 112.6 + 7.9 104.9 + 7.3 106.9 + 6.2 94.8 − 0.6
2003 Dec 98.0 + 6.8 89.7 + 1.5 108.5 + 12.9 91.1 + 5.3 106.4 + 8.9 86.9 + 1.5
2004 Jan 99.8 + 1.2 93.7 + 1.2 107.4 + 1.1 101.8 + 3.2 99.9 + 0.7 93.0 − 3.5 Feb 101.2 + 2.4 95.9 + 0.4 107.8 + 4.8 102.2 + 5.6 101.2 + 1.5 98.4 − 3.6 Mar 111.1 + 5.3 105.2 + 5.2 118.6 + 5.5 110.8 + 5.4 113.2 + 6.9 103.7 − 1.1
Apr 104.1 + 7.1 98.0 + 5.4 111.8 + 9.1 106.3 + 9.1 105.2 + 6.8 92.8 + 1.6 May 104.0 + 11.7 95.1 + 4.5 115.1 + 20.1 105.0 + 12.3 107.1 + 13.3 88.2 + 2.2 June 105.6 + 4.9 98.4 + 3.5 114.6 + 6.5 107.3 + 8.9 108.3 + 2.9 89.3 + 0.1
July 105.4 + 8.0 99.5 + 4.8 112.8 + 11.8 107.0 + 9.1 106.6 + 8.8 95.2 + 1.4 Aug 96.0 + 6.8 92.4 + 5.8 100.4 + 7.7 98.9 + 10.6 94.5 + 5.6 91.7 − 1.3 Sep 108.4 + 5.3 99.9 + 1.5 119.0 + 9.7 108.1 + 7.1 110.4 + 5.7 100.8 − 1.9
Oct 108.1 + 5.3 102.4 + 3.3 115.3 + 7.5 108.9 + 6.2 109.7 + 6.6 99.5 − 3.3 Nov 105.3 + 2.8 99.9 + 0.7 112.0 + 5.2 106.8 + 4.6 106.1 + 1.6 97.2 + 1.7 Dec p 106.9 + 9.1 99.4 + 10.8 116.4 + 7.3 96.1 + 5.5 120.3 + 13.1 87.5 + 0.7
Western Germany
2000 100.0 + 13.6 99.9 + 7.8 100.0 + 21.4 100.0 + 13.6 100.0 + 16.3 99.9 + 3.52001 97.8 − 2.2 97.2 − 2.7 98.5 − 1.5 95.0 − 5.0 99.1 − 0.9 101.1 + 1.22002 97.3 − 0.5 93.7 − 3.6 101.6 + 3.1 95.1 + 0.1 98.9 − 0.2 98.3 − 2.82003 97.6 + 0.3 93.2 − 0.5 102.9 + 1.3 95.7 + 0.6 99.9 + 1.0 94.3 − 4.12004 p 103.2 + 5.7 96.5 + 3.5 111.1 + 8.0 102.4 + 7.0 106.2 + 6.3 93.4 − 1.0
2003 Dec 96.0 + 6.1 88.0 + 1.3 105.5 + 11.4 89.7 + 4.9 103.4 + 7.9 85.3 + 0.7
2004 Jan 98.1 + 0.5 92.4 + 0.7 105.0 + 0.4 99.8 + 4.0 98.4 − 1.0 91.9 − 3.8 Feb 99.8 + 1.9 94.2 − 0.6 106.5 + 4.7 100.2 + 5.1 100.1 + 1.0 97.5 − 4.1 Mar 109.6 + 5.2 103.6 + 4.9 116.9 + 5.7 108.3 + 4.8 112.5 + 7.2 102.6 − 1.3
Apr 102.8 + 7.2 96.3 + 5.1 110.7 + 9.5 103.9 + 9.1 104.9 + 7.2 91.3 + 1.4 May 102.3 + 11.2 93.0 + 3.9 113.4 + 19.5 102.2 + 11.8 106.2 + 13.0 86.5 + 1.6 June 103.6 + 3.9 96.3 + 3.3 112.3 + 4.5 104.6 + 8.5 106.8 + 1.5 87.8 − 0.5
July 104.1 + 7.9 97.9 + 4.5 111.5 + 11.7 104.3 + 8.8 106.4 + 8.8 94.0 + 1.0 Aug 94.5 + 6.7 90.4 + 5.6 99.4 + 7.8 96.0 + 10.9 94.2 + 5.6 90.3 − 1.6 Sep 106.7 + 5.3 97.6 + 1.3 117.6 + 9.5 105.4 + 6.9 109.5 + 5.9 99.3 − 2.5
Oct 106.5 + 5.2 100.6 + 3.6 113.6 + 7.1 106.3 + 6.2 108.8 + 6.8 97.9 − 3.6 Nov 103.4 + 3.1 97.6 + 0.2 110.4 + 6.4 103.7 + 3.8 105.1 + 2.8 95.8 + 1.9 Dec p 106.4 + 10.8 98.4 + 11.8 115.9 + 9.9 93.6 + 4.3 121.4 + 17.4 85.6 + 0.4
Eastern Germany
2000 99.9 + 18.1 100.0 + 13.9 99.9 + 29.7 99.9 + 20.7 100.0 + 16.3 100.0 + 15.12001 104.9 + 5.0 102.4 + 2.4 110.9 + 11.0 106.0 + 6.1 103.4 + 3.4 106.1 + 6.12002 111.0 + 5.8 104.0 + 1.6 127.9 + 15.3 111.7 + 5.4 110.7 + 7.1 109.4 + 3.12003 117.9 + 6.2 110.8 + 6.5 135.1 + 5.6 122.8 + 9.9 114.1 + 3.1 112.7 + 3.02004 p 125.5 + 6.4 117.6 + 6.1 144.7 + 7.1 135.0 + 9.9 117.5 + 3.0 117.4 + 4.2
2003 Dec 127.3 + 14.5 108.3 + 3.2 173.2 + 37.2 106.8 + 7.8 152.6 + 20.3 112.5 + 13.9
2004 Jan 122.7 + 9.0 107.8 + 6.4 158.5 + 13.4 125.8 − 3.3 122.5 + 29.5 110.0 − 0.2 Feb 120.7 + 8.7 114.3 + 10.4 136.0 + 5.3 125.4 + 10.1 117.7 + 8.0 112.6 + 5.4 Mar 131.8 + 6.1 122.5 + 8.6 154.2 + 1.6 139.7 + 10.3 125.9 + 2.4 121.9 + 2.7
Apr 121.9 + 6.0 116.0 + 7.6 136.0 + 2.6 135.1 + 9.6 109.4 + 1.9 116.0 + 4.8 May 127.3 + 16.7 117.6 + 10.1 150.7 + 31.4 136.6 + 16.4 120.6 + 19.3 114.6 + 7.9 June 133.5 + 17.1 120.6 + 4.3 164.5 + 49.4 139.4 + 13.1 131.9 + 24.4 114.2 + 7.3
July 123.9 + 10.4 117.2 + 9.0 140.2 + 13.4 138.5 + 11.7 110.6 + 9.3 115.7 + 9.0 Aug 116.2 + 7.2 113.7 + 7.7 122.2 + 6.1 132.7 + 9.6 99.2 + 4.8 114.3 + 4.2 Sep 131.6 + 5.9 124.7 + 3.1 148.2 + 12.2 139.2 + 8.4 124.9 + 3.2 125.7 + 4.8
Oct 131.1 + 5.0 122.1 + 0.9 152.6 + 14.0 139.5 + 6.5 123.5 + 4.1 125.3 + 1.6 Nov 131.0 − 1.0 124.3 + 4.9 147.3 − 11.0 142.6 + 12.0 121.5 − 13.4 120.4 − 0.9 Dec p 114.8 − 9.8 110.0 + 1.6 126.2 − 27.1 125.9 + 17.9 102.3 − 33.0 117.8 + 4.7
Source of the unadjusted figures: Federal Statistical Office. — * Economic tax. — o Using the Census X-12-ARIMA method, version 0.2.8. — 1 Includingactivities of the manufacturing sector, in particular excluding manufacture manufacture of motor vehicles, trailers and semi-trailers. — 2 Including print-of food products, beverages, tobacco and refined petroleum products; ing and service activities related to printing. results for specific operational segments; figures excluding value-added
62*
IX Economic conditions

DEUTSCHEBUNDESBANKMonthly ReportFebruary 2005
IX Economic conditions 4 Orders received by construction *
Adjusted for working-day variations o
Germany Western Germany Eastern Germany
Public Public PublicHousing sector Housing sector Housing sectorIndustrial Industrial Industrialcon- construc- construc- con- construc- construc- con- construc- construc-
Total struction tion 1 tion Total struction tion 1 tion Total struction tion 1 tion
Annual Annual Annual per- per- per- centage centage centage
Period change 2000 = 100 change 2000 = 100 change 2000 = 1002000 = 100 2000 = 100 2000 = 100
2000 99.9 − 8.6 100.0 99.9 100.0 99.9 − 7.0 99.9 99.9 100.0 100.0 − 13.4 100.0 99.9 100.02001 94.5 − 5.4 82.9 96.9 99.0 97.4 − 2.5 87.6 99.9 100.6 85.2 − 14.8 68.3 86.4 94.12002 88.7 − 6.1 72.8 91.5 95.6 90.9 − 6.7 79.6 93.1 95.6 81.7 − 4.1 51.9 85.8 95.72003 79.2 − 10.7 67.5 78.4 87.4 80.8 − 11.1 74.5 78.3 87.8 74.2 − 9.2 46.0 79.2 86.2
2003 Nov 69.1 − 7.5 61.9 73.5 68.8 71.0 − 3.8 69.5 74.0 68.5 63.1 − 18.8 38.8 71.6 69.4 Dec 69.3 − 12.6 66.7 68.4 71.9 71.1 − 14.4 73.9 68.4 72.5 63.4 − 5.8 44.9 68.3 69.8
2004 Jan 53.2 − 6.2 41.4 65.7 46.5 55.3 − 5.5 47.8 67.6 45.4 46.7 − 8.8 22.0 58.7 49.8 Feb 66.2 + 2.8 58.3 75.3 60.8 67.3 − 0.3 64.7 79.2 54.9 62.6 + 15.3 38.7 61.8 77.7 Mar 81.8 − 7.7 70.8 72.6 99.2 83.4 − 9.1 81.0 70.8 99.9 76.8 − 2.8 39.5 79.2 96.9
Apr 77.1 − 6.5 62.8 72.4 91.2 78.7 − 7.4 71.6 73.3 89.6 71.9 − 3.5 36.1 69.4 95.9 May 75.8 − 8.3 66.6 65.2 93.5 77.0 − 5.6 73.8 64.3 94.0 71.9 − 16.6 44.7 68.4 91.8 June 89.6 − 5.1 72.9 82.6 107.9 92.0 − 4.1 82.3 83.7 107.9 81.8 − 8.7 44.2 78.5 107.6
July 78.9 − 12.9 63.4 71.9 96.6 80.9 − 11.3 70.8 71.9 97.8 72.9 − 18.2 41.0 72.1 92.8 Aug 77.6 − 4.2 60.7 74.2 91.9 78.0 − 4.4 68.6 73.5 89.3 76.1 − 3.9 36.4 76.6 99.3 Sep 85.9 − 5.8 71.1 80.2 101.7 88.5 − 3.1 82.2 82.5 99.7 77.7 − 14.6 37.4 72.0 107.6
Oct 74.9 − 6.5 59.3 72.6 87.2 78.1 − 6.4 69.3 74.2 88.3 64.6 − 7.2 28.8 66.9 83.8 Nov 61.3 − 11.3 51.0 61.7 67.2 62.6 − 11.8 58.2 61.9 66.1 57.2 − 9.4 28.9 61.1 70.4
Source of the unadjusted figures: Federal Statistical Office. — * Values exclu- of; civil engineering”. — o Bundesbank calculation. — 1 Including thesive of value-added tax. The figures refer to the economic classifications railways and post office. ”Site preparation” and ”Building of complete constructions or parts there- 5 Retail trade turnover * Germany Adjusted for working-day variations o
Retail trade 1 Memo item
of which: By enterprises’ main product range of which
Furniture andCosmetic, Textiles, lighting equip- Retail trade plus retailpharmaceutical clothing, ments, domestic sales of motor vehicles
Food, beverages, and medical footwear and and motorcycles and Retail sales ofappliances, build-Total tobacco 2 products 2 leather goods 2 ing materials 2 sales of automotive fuel motor vehicles 3
Annual percent- Annual percent-age change Annual Annual Annual Annual age change Annual
percent- percent- percent- percent- percent-Not age age age age Not agePrice- Price-
Period change change change change change2000 = 100 adjusted adjusted 4 2000 = 100 2000 = 100 2000 = 100 2000 = 100 2000 = 100 adjusted adjusted 4 2000 = 100
1996 96.8 − 0.2 − 1.1 96.6 − 0.7 81.6 + 3.6 103.0 − 1.2 96.2 − 1.5 95.9 + 0.9 + 0.0 91.0 + 5.71997 96.1 − 0.7 − 1.4 95.8 − 0.8 83.4 + 2.2 101.4 − 1.6 95.3 − 0.9 96.0 + 0.1 − 0.5 94.4 + 3.71998 97.0 + 0.9 + 1.1 97.3 + 1.6 88.1 + 5.6 100.2 − 1.2 98.4 + 3.3 97.5 + 1.6 + 1.5 98.9 + 4.81999 97.6 + 0.6 + 0.3 98.0 + 0.7 94.4 + 7.2 99.9 − 0.3 97.4 − 1.0 98.4 + 0.9 + 0.4 102.2 + 3.3
2000 100.0 + 2.5 + 1.3 99.9 + 1.9 100.1 + 6.0 99.9 + 0.0 99.9 + 2.6 100.0 + 1.6 + 0.4 100.0 − 2.22001 101.8 + 1.8 . 104.6 + 4.7 107.4 + 7.3 99.5 − 0.4 96.6 − 3.3 102.0 + 2.0 . 102.9 + 2.92002 100.2 − 1.6 − 2.1 107.3 + 2.6 111.2 + 3.5 94.5 − 5.0 89.0 − 7.9 101.2 − 0.8 − 1.4 105.9 + 2.92003 99.8 − 0.4 − 0.5 109.5 + 2.1 113.9 + 2.4 89.3 − 5.5 88.0 − 1.1 101.3 + 0.1 − 0.3 107.8 + 1.82004 e 97.7 − 2.1 − 2.3 107.6 − 1.7 113.0 − 0.8 87.9 − 1.6 87.2 − 0.9 98.9 − 2.4 − 2.8 ... ...
2003 Dec 120.9 − 0.7 − 1.1 127.3 + 1.0 144.2 + 12.0 109.9 − 7.0 103.9 − 1.9 116.1 − 1.0 − 1.6 100.2 − 2.7
2004 Jan 89.9 − 2.0 − 2.0 100.5 + 1.8 100.8 − 7.9 74.0 − 6.6 78.7 + 1.0 88.7 − 2.2 − 2.5 85.3 − 3.2 Feb 85.7 − 3.4 − 2.8 97.4 − 1.4 100.1 − 5.2 67.6 − 1.6 77.2 − 0.5 86.6 − 3.5 − 3.3 90.8 − 3.7 Mar 100.4 − 2.0 − 1.5 111.5 − 1.8 112.6 + 1.2 87.5 − 6.9 92.7 − 2.1 102.8 − 3.2 − 3.2 112.6 − 6.6
Apr 99.7 − 2.0 − 2.0 110.3 − 0.8 112.2 + 0.2 95.2 + 3.5 91.5 − 0.7 102.9 − 1.8 − 2.4 114.7 − 1.8 May 95.8 − 2.6 − 3.2 108.4 + 0.2 107.9 − 2.1 85.3 − 6.5 86.6 − 2.1 99.2 − 2.7 − 3.8 111.8 − 3.1 June 93.8 − 2.5 − 3.0 105.8 − 2.8 110.6 + 0.2 81.2 − 4.5 83.3 + 0.2 97.1 − 3.2 − 3.9 109.6 − 5.4
July 96.0 − 1.7 − 2.1 108.3 − 1.3 116.2 + 0.3 86.0 + 0.0 83.8 − 0.7 99.3 − 2.5 − 3.0 111.9 − 4.4 Aug 93.2 − 0.1 − 0.7 105.7 − 2.3 109.2 + 2.4 78.3 + 3.2 81.6 + 1.1 93.6 − 1.4 − 2.2 94.6 − 6.0 Sep 95.5 − 2.3 − 2.5 101.5 − 3.7 110.7 + 0.9 92.6 − 2.4 84.5 + 0.1 96.3 − 2.7 − 3.1 99.8 − 4.6
Oct 102.7 − 1.5 − 1.9 108.3 − 3.5 119.8 + 3.6 105.5 + 0.2 93.3 + 0.2 104.0 − 1.5 − 2.1 110.1 − 1.7 Nov 101.6 − 2.7 − 2.7 109.1 − 2.8 115.0 − 1.1 92.0 + 2.8 91.7 − 3.9 102.8 − 1.9 − 2.0 109.2 + 0.7 Dec e 118.0 − 2.4 − 2.8 124.6 − 2.1 140.4 − 2.6 110.0 + 0.1 101.4 − 2.4 113.5 − 2.2 − 2.6 ... ...
Source of the unadjusted figures: Federal Statistical Office. — * Excluding ding sales of motor vehicles and motorcycles and excluding the sale of auto-value-added tax; figures from 2003 provisional, partly revised and, judging motive fuel. — 2 Retail sales in stores. — 3 Including motor vehicle parts andby past experience, subject to considerable uncertainty in the most recent accessories.— 4 Up to (and including) 2000, at 1995 prices; from 2001, atmonths. — o Using the Census X-12-ARIMA method, version 0.2.8. — 1 Exclu- 2000 prices.
63*
IX Economic conditions

DEUTSCHEBUNDESBANKMonthly ReportFebruary 2005
IX Economic conditions 6 Labour market *
Persons inEmployed 1,2 Employees 1 employment 3 Unemployed 2
PersonsMining employed Personsand under under-manu- employ- goingfactur- Short- ment pro- vocationaling Con- time motion further Unem-
Annual change Annual sector 2 Annual ploy- Vacan-schemes 2,5 training 2 workers 2 struction 4 percen- change, ment cies,
Thou- Thou- Thou- tage Thou- thou- rate 2,6 thou-Period sands in % sands sands change Thousands sands sands in % sands 2
Germany
2002 38,698 − 0.6 − 225 34,598 − 0.7 6,217 7 883 207 207 340 4,061 + 209 9.8 4522003 38,316 − 1.0 − 382 34,146 − 1.3 8 6,136 817 195 146 260 4,377 + 315 10.5 3552004 o 38,441 o + 0.3 o + 125 ... ... ... ... 151 p 117 p 184 9 4,381 9 + 93 9 10.5 2862004 Jan 37,765 − 0.3 − 96 6,035 737 164 126 217 9 4,597 9 + 37 9 11.0 277 Feb 37,780 − 0.2 − 64 33,582 − 0.6 6,019 711 186 119 203 4,641 + 15 11.1 309 Mar 38,009 + 0.0 + 12 6,018 761 197 115 200 4,547 + 30 10.9 324 Apr 38,285 + 0.2 + 87 6,013 778 177 105 199 4,443 + 32 10.7 324 May 38,402 + 0.3 + 119 34,058 − 0.2 6,004 782 171 108 197 4,293 + 43 10 10.3 319 June 38,479 + 0.3 + 116 6,006 786 162 113 185 4,233 + 62 10.2 305 July 38,494 + 0.4 + 145 6,018 786 138 118 165 4,360 + 83 10.5 297 Aug 38,566 + 0.5 + 183 34,224 − 0.1 6,042 788 107 122 158 4,347 + 110 10.5 287 Sep 38,792 + 0.5 + 203 6,052 788 115 124 166 4,257 + 160 10.3 269 Oct 38,945 + 0.6 + 230 6,028 778 125 122 167 4,207 + 187 10.1 245 Nov 38,961 + 0.7 + 271 ... ... 6,009 768 133 p 114 p 163 4,257 + 208 10.3 229 Dec o 38,808 o + 0.8 o + 291 ... ... 133 p 100 p 149 4,464 + 244 10.8 2252005 Jan ... ... ... ... ... ... p 87 p 136 11 5,037 11 + 440 11 12.1 p 268
Western Germnay 12
2002 . . . . . 5,593 7 654 162 45 198 2,498 + 178 7.7 3782003 . . . . . 8 5,503 607 160 31 161 2,753 + 255 8.4 2922004 . . . . . ... ... 122 p 24 p 121 9 2,781 9 + 87 9 8.5 2392004 Jan . . . . . 5,401 553 135 23 139 9 2,927 9 + 71 9 8.9 234 Feb . . . . . 5,386 535 151 22 131 2,945 + 49 8.9 263 Mar . . . . . 5,384 571 159 22 130 2,871 + 52 8.7 275 Apr . . . . . 5,377 582 143 22 130 2,805 + 50 8.5 274 May . . . . . 5,368 584 139 24 130 2,710 + 58 10 8.2 265 June . . . . . 5,368 586 133 25 123 2,669 + 65 8.1 253 July . . . . . 5,378 585 112 26 110 2,760 + 79 8.4 247 Aug . . . . . 5,397 586 84 26 105 2,764 + 92 8.4 239 Sep . . . . . 5,405 586 92 27 111 2,700 + 119 8.2 222 Oct . . . . . 5,381 579 102 26 112 2,692 + 140 8.2 204 Nov . . . . . 5,363 572 105 p 25 p 109 2,727 + 149 8.3 191 Dec . . . . . ... ... 105 p 23 p 99 2,860 + 173 8.7 1922005 Jan . . . . . ... ... ... p 20 p 90 11 3,266 11 + 339 11 9.9 p 228
Eastern Germany 13
2002 . . . . . 624 7 229 45 161 142 1,563 + 31 17.7 742003 . . . . . 8 632 210 35 115 99 1,624 + 61 18.5 63
2004 . . . . . ... ... 29 p 93 p 63 9 1,600 9 + 6 9 18.4 472004 Jan . . . . . 634 183 29 103 78 9 1,670 9 − 33 9 19.1 43 Feb . . . . . 633 175 35 97 72 1,696 − 33 19.4 46 Mar . . . . . 633 190 37 93 70 1,676 − 22 19.2 49 Apr . . . . . 637 196 34 83 69 1,639 − 18 18.8 51 May . . . . . 637 198 32 85 67 1,583 − 15 10 18.3 54 June . . . . . 638 200 29 88 62 1,565 − 3 18.1 53 July . . . . . 641 201 26 93 55 1,600 + 4 18.5 50 Aug . . . . . 645 202 24 96 54 1,582 + 18 18.3 48 Sep . . . . . 647 202 24 98 55 1,557 + 41 18.0 47 Oct . . . . . 647 199 23 96 55 1,514 + 47 17.5 42 Nov . . . . . 646 196 27 p 89 p 54 1,530 + 59 17.7 38 Dec . . . . . ... ... 28 p 77 p 50 1,604 + 71 18.5 332005 Jan . . . . . ... ... ... p 67 p 47 11 1,771 11 + 101 11 20.5 p 40
Source: Federal Statistical Office; Federal Employment Agency. — * Monthly affected by the fact that firms which are required to report and which havefigures: end of month; employed persons and employees: averages; short- been identified in the course of drawing up the corporate register are inclu-time workers: mid-month; annual and quarterly figures: averages. — ded for the first time. — 9 From January 2004, unemployed persons1 Work-place concept.— 2 Annual figures, calculated by the Bundesbank; de- excluding all those participating in occupational aptitude testing andviations from the official figures are due to rounding. — 3 Including active training schemes. — 10 From May 2004, calculated on the basis of newproprietors. — 4 The figures refer to the economic classifications ”Site labour force figures. — 11 Provisional; Rise influenced by inclusion of socialpreparation” and ”Building of complete constructions or parts thereof; civil assistance recipients able to work, who were previously not registered asengineering”. — 5 Employees involved in job creation schemes and struc- unemployed. — 12 Excluding western Berlin; for the mining, manufacturingtural adjustment measures (SAM). — 6 Relative to the total civilian labour and construction sectors, including persons employed in western Berlin. —force. — 7 The figures from March 2002 onwards are positively affected by 13 Including western Berlin; for the mining, manufacturing and constructionthe fact that construction firms which are required to report and which sectors, excluding persons employed in western Berlin. — o First preliminaryhave been identified in the course of drawing up the corporate register are estimate. included for the first time. — 8 The figures from 2003 onwards are positively
64*
IX Economic conditions

DEUTSCHEBUNDESBANKMonthly ReportFebruary 2005
IX Economic conditions 7 Prices
Germany
Consumer price index HWWAIndices of Index of World Market
of which foreign trade prices Prices of Raw Materials 5
Other Index ofdurable producerand non- prices ofdurable industrial Index ofconsumer Services Con- products producergoods excluding struction prices ofsold on theexcluding house House price domestic Other rawagricultural
Total Food Energy 1 rents 2 rents index 2,3 market 4 Exports Imports Energy 6 products 4 materials 7 energy 1,2
Period 2000 = 100 2000 = 1001995 = 100
Index level
1999 98.6 100.6 100.3 87.7 99.0 98.8 99.3 2 97.0 89.9 97.0 90.8 57.6 83.1
2000 100.0 100.0 100.0 100.0 100.0 100.0 100.0 100.0 95.4 100.0 100.0 100.0 100.02001 102.0 105.1 100.3 105.7 102.4 101.2 100.3 103.0 100.8 101.0 100.6 91.4 91.92002 103.4 106.1 101.1 106.0 104.9 102.6 100.2 102.4 94.6 100.8 98.4 86.1 91.12003 104.5 106.0 101.4 110.2 106.4 103.8 100.3 104.1 94.8 100.6 96.2 82.9 86.92004 106.2 105.7 102.9 114.8 108.9 104.8 101.4 105.8 ... 101.1 97.2 101.4 96.3
2003 Apr 104.3 106.6 101.4 110.2 105.8 103.7 104.2 94.6 100.9 96.5 76.0 87.8 May 104.1 106.8 101.4 108.2 105.6 103.7 100.3 103.9 93.9 100.5 95.2 72.5 83.5 June 104.4 107.1 101.3 108.8 106.1 103.8 103.9 95.4 100.3 95.1 77.0 81.3
July 104.6 106.3 101.1 109.2 107.4 103.8 104.1 92.4 100.3 95.2 81.5 82.7 Aug 104.6 105.1 101.0 110.4 107.7 103.9 100.3 104.1 94.0 100.4 95.8 86.4 85.2 Sep 104.5 105.6 101.4 109.7 106.7 103.9 104.2 97.4 100.5 95.7 78.7 87.5
Oct 104.5 105.7 101.4 110.0 106.4 103.9 104.2 96.2 100.4 95.5 81.0 88.7 Nov 104.3 105.5 101.4 109.5 105.8 104.1 100.3 104.2 97.6 100.4 95.5 81.7 91.0 Dec 105.1 105.7 101.4 109.4 109.0 104.1 104.2 96.1 100.2 95.1 80.7 89.4
2004 Jan 105.2 106.9 102.1 110.5 107.2 104.4 104.0 96.6 100.2 95.2 82.6 92.8 Feb 105.4 106.4 101.9 110.2 108.3 104.5 100.5 104.1 97.8 100.3 95.3 82.2 96.2 Mar 105.7 106.1 103.1 111.4 108.0 104.6 104.7 98.2 100.8 96.4 91.2 103.5
Apr 106.0 106.3 103.3 113.1 108.1 104.7 105.1 96.8 101.1 96.9 94.9 105.1 May 106.2 106.6 103.1 116.1 108.1 104.7 101.4 105.6 96.0 101.3 97.6 104.5 101.1 June 106.2 106.7 103.1 114.2 108.6 104.8 105.5 97.6 101.1 97.0 100.8 99.1
July 106.5 106.0 102.8 115.5 109.9 104.8 106.1 97.0 101.2 97.3 104.7 97.6 Aug 106.7 104.9 102.8 117.3 110.3 105.0 101.8 106.4 94.5 101.5 98.2 114.3 94.6 Sep 106.4 104.3 102.9 116.6 109.2 105.0 106.6 94.5 101.5 98.3 112.7 93.5
Oct 106.6 104.2 102.9 120.4 108.9 105.1 107.6 93.3 101.7 99.4 123.0 92.0 Nov 106.2 104.1 103.0 117.2 108.4 105.2 102.0 107.1 p 93.6 101.6 98.1 108.1 91.4 Dec 107.3 105.3 103.7 114.5 111.7 105.2 107.2 p 94.1 101.2 97.2 96.8 89.2
2005 Jan e 106.9 ... ... ... ... ... ... ... ... ... 107.5 91.0
Annual percentage change
1999 + 0.6 − 1.1 + 0.1 + 4.0 + 0.3 + 1.1 − 0.3 2 − 1.0 − 6.0 − 0.5 − 0.5 + 37.1 − 6.2
2000 + 1.4 − 0.6 − 0.3 + 14.0 + 1.0 + 1.2 + 0.7 2 + 3.1 + 6.1 + 3.1 + 10.1 + 73.6 + 20.32001 + 2.0 + 5.1 + 0.3 + 5.7 + 2.4 + 1.2 + 0.3 + 3.0 + 5.7 + 1.0 + 0.6 − 8.6 − 8.12002 + 1.4 + 1.0 + 0.8 + 0.3 + 2.4 + 1.4 − 0.1 − 0.6 − 6.2 − 0.2 − 2.2 − 5.8 − 0.92003 + 1.1 − 0.1 + 0.3 + 4.0 + 1.4 + 1.2 + 0.1 + 1.7 + 0.2 − 0.2 − 2.2 − 3.7 − 4.62004 + 1.6 − 0.3 + 1.5 + 4.2 + 2.3 + 1.0 + 1.1 + 1.6 ... + 0.5 + 1.0 + 22.3 + 10.8
2003 Apr + 1.0 − 1.1 + 0.1 + 1.9 + 2.2 + 1.3 + 1.7 − 1.5 − 0.1 − 3.2 − 19.5 − 6.2 May + 0.7 − 0.8 + 0.2 + 1.2 + 1.1 + 1.2 + 0.1 + 1.4 − 0.6 − 0.4 − 4.0 − 20.7 − 8.0 June + 1.0 + 0.5 + 0.2 + 2.7 + 1.1 + 1.2 + 1.4 + 1.8 − 0.6 − 3.1 − 8.7 − 9.6
July + 0.9 + 0.4 + 0.2 + 3.1 + 0.8 + 1.1 + 1.9 − 1.2 − 0.5 − 2.4 − 3.0 − 7.5 Aug + 1.1 + 0.4 + 0.2 + 4.0 + 1.6 + 1.1 + 0.0 + 2.0 + 0.6 − 0.4 − 2.1 − 1.7 − 5.2 Sep + 1.1 + 1.1 + 0.5 + 2.3 + 1.3 + 1.1 + 2.0 + 3.0 − 0.4 − 2.6 − 15.3 − 4.7
Oct + 1.2 + 1.5 + 0.5 + 2.2 + 1.5 + 1.0 + 1.7 + 2.0 − 0.4 − 2.8 − 10.5 − 3.7 Nov + 1.3 + 1.8 + 0.4 + 4.2 + 1.4 + 1.1 + 0.1 + 2.0 + 3.0 − 0.3 − 1.8 + 1.5 + 0.2 Dec + 1.1 + 1.6 + 0.5 + 3.6 + 1.2 + 1.1 + 1.8 + 1.8 − 0.5 − 2.9 − 7.5 − 0.2
2004 Jan + 1.2 + 1.5 + 0.7 − 0.2 + 2.0 + 1.2 + 0.2 + 1.9 − 0.7 − 3.1 − 10.4 + 5.1 Feb + 0.9 + 0.5 + 0.3 − 2.5 + 2.5 + 1.1 + 0.2 − 0.1 + 1.5 − 0.7 − 3.2 − 15.5 + 7.2 Mar + 1.1 − 0.2 + 1.5 − 2.1 + 2.3 + 1.1 + 0.3 + 3.6 − 0.2 − 1.6 + 1.9 + 17.2
Apr + 1.6 − 0.3 + 1.9 + 2.6 + 2.2 + 1.0 + 0.9 + 2.3 + 0.2 + 0.4 + 24.9 + 19.7 May + 2.0 − 0.2 + 1.7 + 7.3 + 2.4 + 1.0 + 1.1 + 1.6 + 2.2 + 0.8 + 2.5 + 44.1 + 21.1 June + 1.7 − 0.4 + 1.8 + 5.0 + 2.4 + 1.0 + 1.5 + 2.3 + 0.8 + 2.0 + 30.9 + 21.9
July + 1.8 − 0.3 + 1.7 + 5.8 + 2.3 + 1.0 + 1.9 + 5.0 + 0.9 + 2.2 + 28.5 + 18.0 Aug + 2.0 − 0.2 + 1.8 + 6.3 + 2.4 + 1.1 + 1.5 + 2.2 + 0.5 + 1.1 + 2.5 + 32.3 + 11.0 Sep + 1.8 − 1.2 + 1.5 + 6.3 + 2.3 + 1.1 + 2.3 − 3.0 + 1.0 + 2.7 + 43.2 + 6.9
Oct + 2.0 − 1.4 + 1.5 + 9.5 + 2.3 + 1.2 + 3.3 − 3.0 + 1.3 + 4.1 + 51.9 + 3.7 Nov + 1.8 − 1.3 + 1.6 + 7.0 + 2.5 + 1.1 + 1.7 + 2.8 p − 4.1 + 1.2 + 2.7 + 32.3 + 0.4 Dec + 2.1 − 0.4 + 2.3 + 4.7 + 2.5 + 1.1 + 2.9 p − 2.1 + 1.0 + 2.2 + 20.0 − 0.2
2005 Jan e + 1.6 ... ... ... ... ... ... ... ... ... + 30.1 − 1.9
Source: Federal Statistical Office; HWWA Index of World Market Prices. — tion price level. — 4 Excluding value-added tax. — 5 For the euro area, in1 Electricity, gas and other fuels. — 2 Bundesbank calculation based on data euro. — 6 Coal and crude oil. — 7 Food, beverages and tobacco as well asprovided by the Federal Statistical Office. — 3 Previously: Overall construc- industrial raw materials.
65*
IX Economic conditions

DEUTSCHEBUNDESBANKMonthly ReportFebruary 2005
IX Economic conditions
8 Households’ income *Germany
Up to end-1998 DM billion; from 1999 € billion
Gross wages and Net wages and Monetary social Savingsalaries 1 salaries 2 Mass income 4 Saving 6 ratio 7 benefits received 3 Disposable income 5
Annual Annual Annual Annual Annual Annualpercent- percent- percent- percent- percent- percent-age age age age age age
Period DM / € change DM / € change DM / € change DM / € change DM / € change DM / € change %
1991 1,355.4 . 941.4 . 426.2 . 1,367.6 . 1,917.5 . 250.1 . 13.01992 1,467.3 8.3 1,003.0 6.5 473.9 11.2 1,476.9 8.0 2,054.3 7.1 266.1 6.4 13.01993 1,505.9 2.6 1,032.7 3.0 511.2 7.9 1,543.9 4.5 2,120.6 3.2 261.3 − 1.8 12.31994 1,528.1 1.5 1,029.3 − 0.3 529.4 3.6 1,558.6 1.0 2,181.9 2.9 254.0 − 2.8 11.6
1995 1,577.1 3.2 1,037.9 0.8 553.7 4.6 1,591.7 2.1 2,256.4 3.4 252.1 − 0.7 11.21996 1,594.0 1.1 1,032.7 − 0.5 595.7 7.6 1,628.3 2.3 2,307.5 2.3 249.5 − 1.0 10.81997 1,591.3 − 0.2 1,015.9 − 1.6 609.6 2.3 1,625.5 − 0.2 2,356.5 2.1 244.7 − 1.9 10.41998 1,624.3 2.1 1,038.9 2.3 621.5 1.9 1,660.3 2.1 2,422.8 2.8 249.6 2.0 10.31999 855.4 3.0 549.2 3.4 327.5 3.1 876.7 3.3 1,281.1 3.4 125.1 − 1.9 9.8
2000 884.7 3.4 571.8 4.1 336.8 2.8 908.6 3.6 1,325.8 3.5 129.0 3.1 9.72001 904.2 2.2 592.9 3.7 348.1 3.3 941.0 3.6 1,377.6 3.9 140.4 8.8 10.22002 911.2 0.8 595.3 0.4 364.4 4.7 959.7 2.0 1,388.5 0.8 146.3 4.2 10.52003 909.8 − 0.2 590.5 − 0.8 373.9 2.6 964.4 0.5 1,406.4 1.3 151.1 3.3 10.7
2002 Q4 254.3 0.3 164.4 0.1 91.5 4.1 255.8 1.5 357.9 1.2 34.1 6.4 9.5
2003 Q1 211.2 0.3 137.0 − 0.6 94.1 3.1 231.1 0.9 352.4 2.1 50.1 5.6 14.2 Q2 218.7 − 0.1 138.9 − 1.0 92.7 2.8 231.6 0.5 349.4 1.8 35.3 3.8 10.1 Q3 227.2 − 0.1 151.6 − 0.7 93.1 1.7 244.7 0.2 346.0 1.1 32.0 4.3 9.3 Q4 252.7 − 0.6 163.0 − 0.8 94.0 2.8 257.0 0.5 358.6 0.2 33.7 − 1.1 9.4
2004 Q1 211.7 0.2 138.9 1.4 95.2 1.1 234.0 1.3 356.5 1.2 50.9 1.5 14.3 Q2 219.4 0.3 142.3 2.4 92.4 − 0.3 234.7 1.3 353.5 1.2 36.7 3.9 10.4 Q3 226.3 − 0.4 153.1 1.0 92.3 − 0.9 245.4 0.3 350.9 1.4 33.2 3.5 9.4
Source: Federal Statistical Office; figures computed in November 2004. — plus monetary social benefits received. — 5 Mass income plus operating* Households including non-profit institutions serving households. — 1 Resi- surplus, mixed income, property income (net), other current transfersdence concept. — 2 After deducting the wage tax payable on gross wages received, income of non-profit institutions serving households, less taxes (ex-and salaries and employees’ contributions to the social security funds. — cluding wage tax and consumption-related taxes) and other current trans-3 Social security benefits in cash from the social security funds, central, state fers paid. Including the increase in claims on company pension funds. — 6 In-and local government and foreign countries, pension payments (net), cluding the increase in claims on company pension funds. — 7 Saving as aprivate funded social benefits, less social contributions on social benefits, percentage of disposable income. consumption-related taxes and public charges. — 4 Net wages and salaries
9 Pay rates and actual earningsGermany
Overall economy Production sector (including construction)
Negotiated wage and salary level 1 Wages and salaries Negotiated wage and salary level 1 Wages and salariesper employee per employee
on an hourly basis on a monthly basis on an hourly basis on a monthly basis(workplace concept) 2 (workplace concept) 3
Annual Annual Annual Annual Annual Annualpercentage percentage percentage percentage percentage percentage
Period 1995 = 100 change 1995 = 100 change 1995 = 100 change 1995 = 100 change 1995 = 100 change change1995 = 100
1995 100.0 4.9 100.0 4.6 100.0 3.2 100.0 6.1 100.0 5.5 100.0 4.11996 102.6 2.6 102.4 2.4 101.4 1.4 103.8 3.8 102.9 2.9 102.9 2.91997 104.1 1.5 103.9 1.5 101.7 0.3 105.8 1.9 104.6 1.7 104.7 1.71998 106.0 1.9 105.7 1.8 102.7 1.0 107.7 1.8 106.3 1.7 106.4 1.61999 109.2 2.9 108.7 2.8 104.3 1.5 111.0 3.1 109.6 3.0 108.3 1.8
2000 111.3 2.0 110.9 2.0 105.9 1.6 113.3 2.0 111.8 2.0 111.2 2.72001 113.5 1.9 113.0 1.9 107.9 1.9 115.3 1.8 113.6 1.7 113.7 2.22002 116.5 2.7 116.0 2.7 109.5 1.5 118.9 3.2 117.2 3.1 116.0 2.02003 118.8 1.9 118.3 2.0 110.8 1.1 121.9 2.5 120.0 2.4 . .2004 120.4 1.3 120.2 1.5 . . 124.2 1.9 122.3 1.9 . .
2003 Q1 109.2 2.8 108.7 2.9 104.0 1.9 109.6 3.1 108.0 3.0 . . Q2 109.9 2.2 109.5 2.2 106.7 1.5 111.8 2.5 110.0 2.4 . . Q3 122.6 1.9 122.2 2.0 110.4 1.1 131.0 2.2 128.9 2.1 . . Q4 133.5 1.1 133.0 1.2 122.1 0.2 135.2 2.3 133.1 2.2 . .
2004 Q1 111.1 1.7 110.8 1.9 104.7 0.8 113.1 3.2 111.4 3.2 . . Q2 111.6 1.5 111.3 1.7 107.2 0.5 113.4 1.4 111.7 1.5 . . Q3 123.9 1.0 123.6 1.2 110.1 − 0.3 132.1 0.8 130.1 0.9 . . Q4 135.0 1.1 134.8 1.4 . . 138.3 2.2 136.2 2.3 . .
2004 June 111.6 1.5 111.4 1.6 . . 113.2 1.1 111.5 1.2 . .
July 147.5 0.5 147.2 0.6 . . 169.5 1.3 167.0 1.4 . . Aug 112.1 1.7 111.8 1.8 . . 113.4 1.4 111.7 1.5 . . Sep 112.1 1.1 111.9 1.3 . . 113.4 − 0.4 111.7 − 0.3 . .
Oct 113.0 2.4 112.8 2.7 . . 116.2 3.8 114.5 3.9 . . Nov 179.6 0.0 179.4 0.3 . . 185.1 1.9 182.3 1.9 . . Dec 112.3 1.5 112.2 1.8 . . 113.5 1.2 111.8 1.3 . .
1 Current data are normally revised upwards on account of additional Calculated by the Bundesbank on the basis of data from the Federalreports. — 2 Source: Federal Statistical Office; figures computed in Statistical Office, using the old and new classifications of the economicNovember 2004. — 3 Production sector, excluding electricity, gas, steam and sectors. hot water supply, and excluding installation and building completion work.
66*
IX Economic conditions

DEUTSCHEBUNDESBANKMonthly ReportFebruary 2005
X External sector 1 Major items of the balance of payments of the euro area * € million
2004
Item 2001 1 2002 2003 Q1 Q2 Q3 Sep Oct Nov
Current account − 11,042 + 57,815 + 21,832 + 13,644 + 5,832 + 9,886 + 1,500 + 1,192 + 3,247A
1 Goods
Exports (fob) 1,034,831 1,062,941 1,040,226 265,894 285,730 280,455 95,829 100,115 101,286
Imports (fob) 961,438 934,034 934,945 237,265 254,217 255,895 90,808 92,443 95,210
Balance + 73,390 + 128,906 + 105,278 + 28,630 + 31,513 + 24,559 + 5,021 + 7,672 + 6,076
2 Services
Receipts 322,172 333,501 328,849 76,002 88,798 94,587 30,900 29,066 26,418
Expenditure 322,505 317,528 310,961 75,938 79,203 86,504 28,021 26,695 26,022
Balance − 336 + 15,973 + 17,886 + 64 + 9,596 + 8,082 + 2,879 + 2,371 + 396
3 Income − 32,588 − 38,509 − 44,830 − 8,047 − 18,865 − 5,135 − 182 − 3,274 + 1,364
4 Current transfers
Transfer payments from non-residents 78,834 85,398 80,792 31,678 15,476 15,866 5,140 4,192 5,528
Transfer payments to non-residents 130,345 133,949 137,295 38,680 31,887 33,486 11,358 9,770 10,117
Balance − 51,514 − 48,554 − 56,502 − 7,003 − 16,411 − 17,622 − 6,219 − 5,578 − 4,589
Capital account + 6,465 + 10,165 + 13,170 + 3,588 + 4,019 + 4,088 + 1,115 + 614 + 985B
Financial account (net capital exports: −) − 45,547 − 62,094 − 17,925 − 12,206 − 190 − 4,076 + 8,854 − 21,500 + 30,454C
1 Direct investment − 118,131 + 2,068 − 3,388 − 23,595 − 12,941 + 5,255 + 2,473 − 11,593 − 119
By resident units abroad − 311,900 − 175,141 − 130,291 − 27,802 − 28,551 − 12,228 − 5,074 − 25,480 − 11,854
By non-resident units in the euro area + 193,775 + 177,209 + 126,901 + 4,208 + 15,610 + 17,483 + 7,547 + 13,887 + 11,735
2 Portfolio investment + 66,111 + 107,323 + 41,678 − 3,058 + 21,718 + 3,585 + 43,874 + 6,211 − 10,454
By resident units abroad − 283,810 − 177,352 − 276,958 − 92,351 − 52,584 − 61,342 + 4,699 − 27,525 − 45,285
Equity − 101,584 − 38,963 − 67,604 − 30,821 − 16,092 − 5,528 + 14,684 − 6,222 − 16,949
Bonds and notes − 156,456 − 89,013 − 179,495 − 46,949 − 28,144 − 37,592 − 13,136 − 18,483 − 16,118
Money market instruments − 25,773 − 49,375 − 29,859 − 14,581 − 8,347 − 18,221 + 3,152 − 2,820 − 12,218
By non-resident units in the euro area + 349,921 + 284,677 + 318,635 + 89,293 + 74,301 + 64,925 + 39,174 + 33,737 + 34,831
Equity + 232,534 + 85,544 + 117,524 + 24,485 − 4,835 + 38,900 + 12,632 + 16,254 + 21,044
Bonds and notes + 113,261 + 157,186 + 188,737 + 42,122 + 80,168 + 33,453 + 38,531 + 15,644 + 18,821
Money market instruments + 4,129 + 41,947 + 12,376 + 22,687 − 1,030 − 7,426 − 11,989 + 1,839 − 5,034
3 Financial derivatives − 845 − 10,874 − 12,371 + 6,576 − 447 − 4,439 + 2,783 − 3,282 + 1,214
4 Other investment − 10,503 − 158,335 − 73,724 − 1,487 − 5,704 − 11,923 − 39,751 − 13,786 + 39,947
Eurosystem + 4,665 + 18,445 + 9,390 − 1,888 + 2,524 + 1,662 + 479 + 1,208 + 2,429
General government + 2,532 − 8,158 − 4,185 − 6,975 − 1,753 + 2,622 + 3,493 + 2,268 − 1,218
MFIs (excluding the Eurosystem) + 3,704 − 142,181 − 17,031 + 2,411 + 16,818 − 17,472 − 38,241 − 10,664 + 36,838
Long-term − 24,157 + 17,861 + 6,141 − 10,039 + 4,365 − 13,485 − 5,399 + 12,950 + 2,061
Short-term + 27,861 − 160,047 − 23,176 + 12,450 + 12,452 − 3,987 − 32,842 − 23,615 + 34,777
Other sectors 2 − 21,395 − 26,442 − 61,894 + 4,966 − 23,292 + 1,265 − 5,483 − 6,598 + 1,899
5 Reserve assets (Increase: −) + 17,815 − 2,277 + 29,880 + 9,357 − 2,815 + 3,445 − 525 + 948 − 134
Errors and omissions + 50,130 − 5,888 − 17,076 − 5,027 − 9,661 − 9,898 − 11,469 + 19,694 − 34,686D
* Source: European Central Bank. — 1 From January 2001, including Greece. — 2 Enterprises and households.
67*
X External sector

DEUTSCHEBUNDESBANKMonthly ReportFebruary 2005
X External sector 2 Major items of the balance of payments of the Federal Republic of Germany
(balances)
Current account Memo itemCapital trans-fers and Change in
the Bundes-acquisition/disposal of Change in bank’s net
Supple- non- the foreign externalBalance mentary produced reserves at Balance of assets aton current External trade Current Financial transaction transactionnon-financial unclassifiable
Period account 1 items 4,5 Services 6 Income transfers assets 7 account 7 values 8 values 8 trade 1,2,3 transactions
DM million
1991 − 36,298 + 21,899 − 2,804 − 30,724 + 33,144 − 57,812 − 4,565 + 12,614 + 9,605 + 18,643 − 3191992 − 30,013 + 33,656 − 1,426 − 44,983 + 33,962 − 51,222 − 1,963 + 69,792 − 52,888 + 15,072 − 68,7451993 − 23,062 + 60,304 − 3,038 − 52,549 + 27,373 − 55,151 − 1,915 + 21,442 + 22,795 − 19,260 + 35,7661994 − 46,749 + 71,762 − 1,104 − 62,803 + 4,852 − 59,455 − 2,637 + 57,871 + 2,846 − 11,332 − 12,242
1995 − 38,642 + 85,303 − 4,722 − 63,985 + 178 − 55,416 − 3,845 + 63,647 − 10,355 − 10,805 − 17,7541996 − 20,643 + 98,538 − 5,264 − 64,743 + 1,815 − 50,989 − 3,283 + 23,607 + 1,882 − 1,564 + 1,6101997 − 14,916 + 116,467 − 7,360 − 68,696 − 2,588 − 52,738 + 52 + 31 + 6,640 + 8,193 + 8,4681998 − 20,677 + 126,970 − 5,934 − 75,072 − 13,337 − 53,304 + 1,289 + 32,810 − 7,128 − 6,295 − 8,231
1999 − 43,915 + 127,542 − 13,656 − 90,099 − 18,775 − 48,927 − 301 − 44,849 + 24,517 + 64,548 − 72,3642000 − 54,471 + 115,645 − 13,505 − 95,967 − 5,166 − 55,478 + 13,345 + 55,434 + 11,429 − 25,737 + 94,3292001 + 3,421 + 186,771 − 10,499 − 98,323 − 20,889 − 53,639 − 756 − 51,306 + 11,797 + 36,844 + 63,911
€ million
1999 − 22,454 + 65,211 − 6,982 − 46,067 − 9,599 − 25,016 − 154 − 22,931 + 12,535 + 33,003 − 36,9992000 − 27,851 + 59,128 − 6,905 − 49,067 − 2,641 − 28,366 + 6,823 + 28,343 + 5,844 − 13,159 + 48,2302001 + 1,749 + 95,495 − 5,368 − 50,272 − 10,680 − 27,425 − 387 − 26,233 + 6,032 + 18,838 + 32,6772002 + 45,670 + 132,788 − 5,968 − 36,422 − 16,844 − 27,883 − 212 − 70,724 + 2,065 + 23,201 − 33,2922003 + 45,767 + 129,921 − 7,335 − 35,537 − 12,515 − 28,767 + 316 − 69,725 + 445 + 23,197 + 2,6582004 p + 77,898 + 156,765 − 10,054 − 37,728 − 4,163 − 26,923 + 509 −142,468 + 1,470 + 62,591 − 3,906
2002 Q1 + 9,445 + 33,328 − 1,028 − 10,633 − 6,722 − 5,500 + 160 + 5,740 − 1,352 − 13,993 − 18,496 Q2 + 10,420 + 31,721 − 1,383 − 8,605 − 2,682 − 8,631 − 75 − 9,488 + 2,432 − 3,289 + 1,694 Q3 + 9,507 + 35,543 − 1,552 − 12,652 − 5,563 − 6,269 + 62 − 17,554 + 87 + 7,899 − 17,588 Q4 + 16,299 + 32,195 − 2,005 − 4,532 − 1,877 − 7,483 − 359 − 49,422 + 898 + 32,584 + 1,099
2003 Q1 + 9,010 + 29,835 − 2,049 − 8,307 − 4,690 − 5,779 − 30 − 12,511 − 1,495 + 5,027 + 3,444 Q2 + 8,103 + 29,841 − 1,860 − 8,340 − 3,649 − 7,890 + 149 − 26,220 + 1,505 + 16,463 + 22,123 Q3 + 10,274 + 38,430 − 1,582 − 13,275 − 4,479 − 8,820 + 208 − 5,229 − 751 − 4,502 − 15,902 Q4 + 18,381 + 31,815 − 1,844 − 5,615 + 303 − 6,278 − 12 − 25,764 + 1,186 + 6,210 − 7,008
2004 Q1 r + 21,420 + 41,293 − 1,483 − 8,878 − 3,942 − 5,571 + 430 − 14,387 + 205 − 7,669 − 6,821 Q2 r + 26,400 + 43,233 − 2,223 − 7,566 + 46 − 7,090 + 206 − 67,869 − 339 + 41,602 + 30,993 Q3 r + 8,456 + 36,871 − 3,236 − 13,358 − 3,785 − 8,036 + 196 − 30,566 + 1,568 + 20,346 − 31,266 Q4 p + 21,622 + 35,368 − 3,113 − 7,925 + 3,517 − 6,226 − 324 − 29,646 + 37 + 8,311 + 3,189
2002 July + 1,110 + 13,224 − 770 − 3,705 − 5,416 − 2,224 − 203 − 11,194 − 548 + 10,836 − 15,567 Aug + 2,031 + 10,477 − 312 − 5,856 − 921 − 1,359 + 86 − 4,630 + 886 + 1,627 − 5,579 Sep + 6,367 + 11,842 − 471 − 3,092 + 773 − 2,686 + 179 − 1,730 − 252 − 4,564 + 3,559
Oct + 3,087 + 11,529 − 364 − 3,826 − 966 − 3,287 − 82 − 21,706 + 570 + 18,132 − 5,279 Nov + 8,450 + 12,283 − 632 − 1,346 + 446 − 2,301 − 137 − 5,800 − 842 − 1,670 + 4,265 Dec + 4,762 + 8,383 − 1,009 + 640 − 1,357 − 1,895 − 139 − 21,916 + 1,171 + 16,122 + 2,112
2003 Jan − 1,364 + 9,269 − 1,024 − 3,327 − 5,184 − 1,098 + 461 − 3,103 − 97 + 4,102 + 6,799 Feb + 3,854 + 10,667 − 635 − 2,974 − 522 − 2,682 − 504 − 22,323 − 320 + 19,293 + 677 Mar + 6,519 + 9,898 − 390 − 2,006 + 1,016 − 2,000 + 13 + 12,915 − 1,078 − 18,369 − 4,032
Apr + 3,006 + 9,111 − 752 − 2,310 − 339 − 2,704 − 126 − 3,639 + 1,449 − 690 + 1,477 May + 3,170 + 10,400 − 549 − 2,775 − 1,379 − 2,527 + 156 − 7,694 − 854 + 5,221 + 22,684 June + 1,927 + 10,330 − 559 − 3,255 − 1,931 − 2,659 + 119 − 14,887 + 910 + 11,931 − 2,037
July + 1,147 + 13,844 − 695 − 3,648 − 5,401 − 2,953 + 62 + 308 + 225 − 1,743 − 16,353 Aug + 1,353 + 10,170 − 356 − 5,401 − 74 − 2,987 + 224 − 10,171 − 717 + 9,311 − 3,057 Sep + 7,775 + 14,416 − 531 − 4,227 + 997 − 2,880 − 78 + 4,633 − 259 − 12,071 + 3,508
Oct + 6,529 + 10,996 − 510 − 3,786 + 1,704 − 1,874 − 27 − 6,460 − 255 + 213 − 21,689 Nov + 4,881 + 10,235 − 591 − 1,543 − 320 − 2,899 + 49 − 6,266 + 521 + 815 + 14,870 Dec + 6,970 + 10,584 − 742 − 286 − 1,081 − 1,505 − 35 − 13,038 + 921 + 5,182 − 190
2004 Jan r + 1,685 + 12,531 − 640 − 4,140 − 5,528 − 537 + 53 − 1,592 − 206 + 59 + 5,619 Feb r + 6,388 + 12,160 − 369 − 2,318 − 471 − 2,615 − 130 + 4,471 − 26 − 10,701 + 556 Mar r + 13,347 + 16,602 − 473 − 2,420 + 2,057 − 2,419 + 507 − 17,265 + 437 + 2,974 − 12,996
Apr r + 9,804 + 14,343 − 524 − 3,105 + 835 − 1,745 + 82 − 37,457 − 628 + 28,199 + 315 May r + 8,825 + 14,147 − 889 − 1,839 − 99 − 2,495 − 29 − 12,412 + 607 + 3,010 + 9,981 June r + 7,771 + 14,743 − 810 − 2,622 − 689 − 2,850 + 153 − 18,000 − 318 + 10,394 + 20,697
July r + 1,734 + 13,647 − 1,236 − 3,454 − 4,107 − 3,117 + 169 − 2,652 + 847 − 98 − 1,588 Aug r + 1,290 + 11,107 − 1,065 − 5,780 − 679 − 2,292 + 80 − 5,867 + 517 + 3,980 − 15,748 Sep r + 5,432 + 12,117 − 936 − 4,124 + 1,001 − 2,626 − 53 − 22,047 + 204 + 16,464 − 13,931
Oct r + 6,661 + 12,651 − 1,084 − 3,438 + 986 − 2,454 − 22 + 961 + 839 − 8,440 + 23,124 Nov + 9,106 + 11,979 − 931 − 2,026 + 2,400 − 2,317 − 186 − 17,889 − 182 + 9,151 − 10,787 Dec p + 5,855 + 10,738 − 1,097 − 2,461 + 131 − 1,456 − 116 − 12,717 − 621 + 7,599 − 9,147
1 From the beginning of 1993, figures subject to significant uncertainty included up to December 1992 in the supplementary trade items. —owing to changes in the method of data collection for foreign trade. — 4 Mainly warehouse transactions for account of residents and deduction of2 Special trade according to the official foreign trade statistics: imports cif, goods returned. — 5 See footnote 3. — 6 Excluding the expenditure onexports fob. — 3 From January 1993, including additional estimates for freight and insurance included in the cif import figure. — 7 Capitalexternal transactions which do not have to be reported and which are exports: −. — 8 Increase: −.
68*
X External sector

DEUTSCHEBUNDESBANKMonthly ReportFebruary 2005
X External sector 3 Foreign trade (special trade) of the Federal Republic of Germany,
by country and group of countries * € million
2004 1
Country / group of countries 2001 2002 2003 Jan / Nov Aug Sep Oct Nov Dec p
All countries 2 Exports 638,268 651,320 664,455 671,387 55,939 61,535 64,055 66,488 59,534Imports 542,774 518,532 534,534 525,360 44,832 49,418 51,404 54,509 48,796Balance + 95,495 + 132,788 + 129,921 + 146,027 + 11,107 + 12,117 + 12,651 + 11,979 + 10,738
I Exports 461,512 470,873 490,672 500,529 41,037 46,148 48,443 50,685 ...European countriesImports 384,901 372,955 384,939 378,028 31,606 35,259 36,274 38,887 ...Balance + 76,611 + 97,918 + 105,733 + 122,501 + 9,431 + 10,889 + 12,169 + 11,798 ...Exports 401,887 408,286 426,342 432,361 35,351 39,834 41,968 44,081 ...1 EU member states (25)Imports 325,968 314,981 324,043 318,035 26,503 29,056 30,590 32,356 ...Balance + 75,919 + 93,304 + 102,299 + 114,326 + 8,848 + 10,778 + 11,377 + 11,725 ...
Memo itemExports 351,611 354,813 369,776 375,429 30,559 34,799 36,503 38,313 ... EU member states (15)Imports 277,034 262,849 266,404 264,518 22,400 24,205 25,476 27,021 ...Balance + 74,577 + 91,964 + 103,372 + 110,912 + 8,159 + 10,594 + 11,027 + 11,292 ...
Euro-area Exports 275,384 276,270 288,668 294,015 23,710 27,470 28,666 30,057 ...countries Imports 221,680 211,642 215,705 214,900 17,989 19,629 20,463 21,641 ...
Balance + 53,704 + 64,628 + 72,963 + 79,115 + 5,722 + 7,841 + 8,203 + 8,415 ...of which
Austria Exports 33,486 33,863 35,857 36,287 3,189 3,434 3,649 3,845 ...Imports 20,664 21,047 21,453 22,354 1,984 2,026 2,167 2,286 ...Balance + 12,822 + 12,816 + 14,404 + 13,933 + 1,205 + 1,407 + 1,482 + 1,558 ...
Belgium and Exports 35,187 34,108 38,413 41,031 3,547 4,087 3,907 4,217 ...Luxembourg Imports 28,521 26,505 26,132 28,138 2,597 2,672 2,799 2,827 ...
Balance + 6,666 + 7,603 + 12,282 + 12,893 + 950 + 1,415 + 1,108 + 1,390 ...France Exports 69,601 68,721 69,025 69,407 5,519 6,399 6,724 6,969 ...
Imports 49,743 48,200 48,545 47,742 3,675 4,253 4,553 4,497 ...Balance + 19,858 + 20,521 + 20,480 + 21,665 + 1,844 + 2,146 + 2,171 + 2,471 ...
Italy Exports 47,119 47,335 48,414 48,516 3,323 4,427 4,639 4,950 ...Imports 35,280 33,482 34,259 32,076 2,576 2,872 3,108 3,204 ...Balance + 11,839 + 13,853 + 14,156 + 16,439 + 747 + 1,555 + 1,531 + 1,745 ...
Netherlands Exports 40,011 40,463 42,219 41,819 3,733 3,949 4,319 4,239 ...Imports 43,233 40,751 42,301 43,603 3,811 4,086 4,190 4,837 ...Balance − 3,222 − 288 − 83 − 1,784 − 78 − 137 + 129 − 598 ...
Spain Exports 27,841 29,436 32,364 34,011 2,465 3,044 3,232 3,532 ...Imports 15,226 15,532 16,518 15,915 1,219 1,421 1,484 1,641 ...Balance + 12,615 + 13,903 + 15,846 + 18,097 + 1,246 + 1,623 + 1,748 + 1,891 ...
Other EU member Exports 126,503 132,016 137,674 138,347 11,640 12,364 13,302 14,024 ...states Imports 104,288 103,339 108,337 103,135 8,514 9,428 10,128 10,715 ...
Balance + 22,215 + 28,677 + 29,336 + 35,211 + 3,127 + 2,937 + 3,174 + 3,309 ...of which
United Exports 52,764 53,761 55,597 56,455 4,647 4,999 5,231 5,698 ...Kingdom Imports 37,259 33,075 31,712 31,554 2,765 2,910 3,170 3,495 ...
Balance + 15,505 + 20,685 + 23,885 + 24,902 + 1,882 + 2,089 + 2,061 + 2,203 ...Exports 59,624 62,588 64,331 68,167 5,686 6,314 6,475 6,604 ...2 Other EuropeanImports 58,933 57,974 60,897 59,993 5,104 6,203 5,683 6,531 ...countriesBalance + 692 + 4,614 + 3,434 + 8,175 + 583 + 111 + 792 + 73 ...
II Exports 175,203 178,818 172,329 172,033 15,017 15,553 15,720 15,722 ...Non-EuropeanImports 157,199 144,950 148,895 149,753 13,482 14,433 15,422 15,567 ...countriesBalance + 18,003 + 33,869 + 23,434 + 22,280 + 1,535 + 1,120 + 298 + 155 ...Exports 12,042 11,797 12,072 12,358 1,282 1,130 1,100 1,131 ...1 AfricaImports 11,356 10,248 10,239 9,617 898 966 1,321 931 ...Balance + 686 + 1,549 + 1,832 + 2,740 + 383 + 164 − 222 + 200 ...Exports 89,801 89,081 79,629 77,200 6,493 7,030 7,168 7,072 ...2 AmericaImports 59,575 52,822 51,948 49,541 4,402 4,558 4,673 4,678 ...Balance + 30,226 + 36,259 + 27,681 + 27,660 + 2,091 + 2,472 + 2,496 + 2,394 ...
of whichExports 67,824 68,263 61,654 59,422 4,840 5,390 5,565 5,545 ...United StatesImports 45,982 40,376 39,231 36,948 3,082 3,367 3,469 3,532 ...Balance + 21,842 + 27,887 + 22,423 + 22,474 + 1,759 + 2,023 + 2,097 + 2,013 ...Exports 68,936 72,915 75,620 77,473 6,794 6,892 6,979 7,032 ...3 AsiaImports 84,220 79,892 84,783 88,717 7,978 8,749 9,266 9,772 ...Balance − 15,285 − 6,977 − 9,162 − 11,244 − 1,184 − 1,857 − 2,287 − 2,739 ...
of whichMiddle East Exports 14,130 15,045 15,511 15,708 1,432 1,360 1,465 1,603 ...
Imports 5,434 4,696 4,469 4,002 356 371 423 439 ...Balance + 8,696 + 10,349 + 11,043 + 11,707 + 1,076 + 989 + 1,042 + 1,165 ...
Japan Exports 13,103 12,576 11,889 11,635 1,067 1,079 1,053 1,066 ...Imports 22,910 19,896 19,684 19,266 1,598 1,766 1,716 1,929 ...Balance − 9,807 − 7,320 − 7,795 − 7,631 − 531 − 687 − 663 − 862 ...Exports 12,118 14,571 18,265 19,287 1,502 1,683 1,713 1,682 ...People‘s RepublicImports 19,942 21,338 25,681 29,524 2,756 3,026 3,577 3,599 ...of China 3 Balance − 7,824 − 6,768 − 7,417 − 10,236 − 1,254 − 1,343 − 1,863 − 1,917 ...Exports 4,424 5,026 5,008 5,002 448 501 474 487 ...4 Oceania andImports 2,048 1,988 1,925 1,878 204 160 163 186 ...polar regionsBalance + 2,375 + 3,038 + 3,083 + 3,124 + 244 + 340 + 311 + 300 ...
Memo itemExports 24,735 25,282 24,515 24,629 2,188 2,215 2,122 2,104 ...Emerging markets inImports 28,351 26,660 27,119 27,363 2,378 2,717 2,774 2,982 ...South-East Asia 4 Balance − 3,616 − 1,377 − 2,603 − 2,734 − 190 − 503 − 652 − 878 ...
* Source: Federal Statistical Office. Exports (fob) by country of destination, yet been broken down by region. — 2 Including fuel and other supplies forimports (cif) by country of origin. Individual countries and groups of ships and aircraft and other data not classifiable by region. — 3 Excludingcountries according to the current position. — 1 The figures for “All Hong Kong. — 4 Brunei Darussalam, Hong Kong, Indonesia, Malaysia,countries” include revisions from January until October 2004 which have not Philippines, Republic of Korea, Singapore, Taiwan and Thailand.
69*
X External sector

DEUTSCHEBUNDESBANKMonthly ReportFebruary 2005
X External sector
4 Services and income of the Federal Republicof Germany(balances)
€ million
Services
Other services
of which
Patents Compen-Services of Construction
Trans- Financial and sation of InvestmentGovernment self-employed and assemblyPeriod Total Travel 1 services licences Total incomeportation 2 transactions 3 persons 4 work, repairs employees 5
2000 − 49,067 − 37,249 + 3,386 + 1,668 − 3,012 + 2,221 − 16,081 − 2,757 − 753 − 512 − 2,1292001 − 50,272 − 37,955 + 4,151 + 1,079 − 2,455 + 3,488 − 18,581 − 2,538 − 619 − 257 − 10,4242002 − 36,422 − 35,445 + 2,750 + 1,380 − 1,461 + 5,237 − 8,883 − 2,035 + 403 − 144 − 16,7002003 − 35,537 − 36,869 + 1,825 + 1,529 − 882 + 5,050 − 6,190 − 1,863 + 1,419 − 86 − 12,4282004 − 37,728 − 37,170 + 4,327 + 1,422 − 628 + 5,418 − 11,097 − 1,402 + 483 − 94 − 4,069
2003 Q2 − 8,340 − 9,127 + 695 + 355 − 193 + 1,203 − 1,272 − 485 + 177 − 85 − 3,565 Q3 − 13,275 − 13,994 + 453 + 339 − 369 + 1,316 − 1,020 − 410 + 439 − 240 − 4,239 Q4 − 5,615 − 6,827 + 509 + 386 − 26 + 1,257 − 915 − 393 + 330 + 22 + 281
2004 Q1 − 8,878 − 7,018 + 517 + 351 − 188 + 1,317 − 3,858 − 342 + 214 + 210 − 4,152 Q2 − 7,566 − 8,965 + 1,529 + 255 − 344 + 1,438 − 1,478 − 303 − 13 − 57 + 103 Q3 − 13,358 − 14,036 + 960 + 483 + 20 + 1,433 − 2,219 − 406 + 102 − 233 − 3,552 Q4 − 7,925 − 7,150 + 1,322 + 332 − 116 + 1,230 − 3,542 − 351 + 181 − 14 + 3,531
2004 Feb − 2,318 − 1,907 + 134 + 112 + 7 + 426 − 1,091 − 93 + 114 + 64 − 534 Mar − 2,420 − 2,733 + 351 + 136 − 195 + 455 − 434 − 105 + 68 + 80 + 1,977
Apr − 3,105 − 2,689 + 578 + 66 − 125 + 470 − 1,405 − 83 − 58 − 20 + 855 May − 1,839 − 2,557 + 256 + 121 − 24 + 453 − 88 − 107 + 61 − 25 − 74 June − 2,622 − 3,719 + 695 + 68 − 195 + 515 + 14 − 113 − 17 − 12 − 677
July − 3,454 − 3,387 + 303 + 181 + 86 + 485 − 1,122 − 106 + 99 − 76 − 4,031 Aug − 5,780 − 6,359 + 495 + 122 + 2 + 443 − 484 − 89 + 30 − 85 − 594 Sep − 4,124 − 4,289 + 162 + 180 − 68 + 504 − 613 − 210 − 27 − 72 + 1,073
Oct − 3,438 − 3,796 + 465 + 110 − 1 + 399 − 615 − 76 + 110 − 6 + 992 Nov − 2,026 − 2,192 + 447 + 132 − 36 + 389 − 765 − 118 + 5 − 8 + 2,408 Dec − 2,461 − 1,162 + 410 + 90 − 79 + 442 − 2,162 − 157 + 66 + 0 + 131
1 From January 2002, figures subject to significant uncertainty. — 2 Ex- vices supplied. — 4 Engineering and other technical services, research andcluding the expenditure on freight included in the cif import figure. — development, commercial services, etc. — 5 Wages and salaries. 3 Including the receipts from foreign military agencies for goods and ser-
5 Current transfers of the Federal Republic of Germany 6 Capital transfers(balances) (balances)
€ million € million
Public 1 Private 1
Internationalorganisations 2
of which Other Remittances OtherEuropean current by foreign current
Period Total Total Total Communities Total workers transfers Total 4 Public 1 Private 1 transfers 3
2000 − 28,366 − 19,094 − 17,100 − 15,398 − 1,995 − 9,271 − 3,458 − 5,814 − 1,599 − 1,189 − 4102001 − 27,425 − 16,927 − 14,257 − 12,587 − 2,670 − 10,499 − 3,520 − 6,978 − 387 − 1,361 + 9742002 − 27,883 − 16,207 − 13,045 − 11,214 − 3,162 − 11,676 − 3,470 − 8,206 − 212 − 1,416 + 1,2042003 − 28,767 − 18,793 − 15,397 − 13,732 − 3,396 − 9,974 − 3,332 − 6,642 + 316 − 1,235 + 1,5512004 − 26,923 − 17,319 − 14,208 − 12,747 − 3,112 − 9,603 − 3,180 − 6,424 + 509 − 1,095 + 1,604
2003 Q2 − 7,890 − 5,403 − 5,375 − 4,790 − 28 − 2,487 − 833 − 1,654 + 149 − 276 + 425 Q3 − 8,820 − 6,017 − 4,896 − 4,650 − 1,121 − 2,803 − 833 − 1,970 + 208 − 249 + 457 Q4 − 6,278 − 4,057 − 2,829 − 2,665 − 1,227 − 2,222 − 833 − 1,389 − 12 − 457 + 445
2004 Q1 − 5,571 − 3,337 − 2,466 − 1,822 − 871 − 2,233 − 795 − 1,438 + 430 − 254 + 684 Q2 − 7,090 − 4,404 − 4,474 − 4,187 + 70 − 2,687 − 795 − 1,892 + 206 − 239 + 445 Q3 − 8,036 − 5,600 − 4,440 − 4,148 − 1,161 − 2,436 − 795 − 1,641 + 196 − 261 + 457 Q4 − 6,226 − 3,978 − 2,828 − 2,591 − 1,150 − 2,248 − 795 − 1,453 − 324 − 342 + 19
2004 Feb − 2,615 − 1,912 − 1,547 − 1,388 − 366 − 702 − 265 − 437 − 130 − 95 − 36 Mar − 2,419 − 1,703 − 1,420 − 1,296 − 282 − 716 − 265 − 451 + 507 − 75 + 582
Apr − 1,745 − 851 − 941 − 859 + 90 − 894 − 265 − 629 + 82 − 71 + 153 May − 2,495 − 1,475 − 1,538 − 1,422 + 63 − 1,020 − 265 − 755 − 29 − 91 + 62 June − 2,850 − 2,078 − 1,995 − 1,906 − 82 − 773 − 265 − 508 + 153 − 77 + 230
July − 3,117 − 2,140 − 1,623 − 1,501 − 518 − 977 − 265 − 712 + 169 − 102 + 271 Aug − 2,292 − 1,581 − 1,193 − 1,086 − 388 − 712 − 265 − 447 + 80 − 80 + 160 Sep − 2,626 − 1,879 − 1,624 − 1,561 − 255 − 747 − 265 − 482 − 53 − 79 + 26
Oct − 2,454 − 1,725 − 1,285 − 1,224 − 440 − 729 − 265 − 464 − 22 − 95 + 73 Nov − 2,317 − 1,610 − 1,213 − 1,126 − 397 − 707 − 265 − 442 − 186 − 117 − 69 Dec − 1,456 − 643 − 330 − 241 − 313 − 813 − 265 − 548 − 116 − 130 + 14
1 The classification of “public” and “private” transfers depends on the (excluding capital transfers). — 3 Payments to developing countries, pensionsector to which the participating domestic body belongs. — 2 Current contri- payments, tax revenue and refunds, etc. — 4 Where identifiable; inbutions to the budgets of international organisations and to the EU budget particular, debt forgiveness.
70*
X External sector

DEUTSCHEBUNDESBANKMonthly ReportFebruary 2005
X External sector
7 Financial account of the Federal Republic of Germany € million
2004
Item 2002 2003 2004 Q1 Q2 Q3 Q4 Oct Nov Dec
I Net German investment abroad(Increase/capital exports: −) − 249,672 − 189,429 − 229,941 − 77,020 − 10,199 − 97,309 − 45,414 − 10,418 − 61,686 + 26,690
1 Direct investment 1 − 9,161 − 2,268 + 5,519 + 10,210 − 2,503 − 7,995 + 5,807 − 610 − 3,728 + 10,144
Equity capital − 38,266 − 13,052 + 23,764 + 21,155 − 1,091 + 4,630 − 930 − 205 − 1,592 + 867Reinvested earnings 2 + 16,224 + 1,380 + 1,470 + 325 + 149 + 885 + 111 + 101 + 138 − 128Credit transactions ofGerman direct investors + 20,639 + 18,881 − 12,215 − 9,760 + 935 − 11,644 + 8,254 − 140 − 1,491 + 9,886Other capital − 7,759 − 9,477 − 7,500 − 1,511 − 2,496 − 1,866 − 1,628 − 365 − 783 − 480
2 Portfolio investment − 65,848 − 32,323 − 94,901 − 25,990 − 31,569 − 20,356 − 16,985 − 11,024 − 3,429 − 2,532
Equity 3 − 4,832 + 7,628 + 5,964 + 1,230 + 926 + 6,068 − 2,259 − 1,574 − 946 + 262Mutual fund shares 4 − 6,995 − 4,253 − 11,938 − 7,059 − 2,526 − 3,117 + 764 − 268 + 188 + 843Bonds and notes 5 − 49,056 − 37,811 − 86,961 − 26,144 − 25,642 − 17,664 − 17,511 − 9,950 − 2,890 − 4,671Money market instruments − 4,965 + 2,112 − 1,965 + 5,983 − 4,327 − 5,643 + 2,022 + 768 + 220 + 1,034
3 Financial derivatives 6 − 863 − 493 − 5,127 − 1,255 + 2,236 − 2,608 − 3,501 − 2,019 − 10 − 1,472
4 Credit transactions − 172,208 − 151,755 − 132,011 − 58,969 + 22,456 − 65,701 − 29,797 + 3,519 − 54,272 + 20,956
MFIs 7,8 − 132,536 − 122,307 − 121,391 − 36,597 − 14,365 − 33,208 − 37,222 − 18,257 − 46,848 + 27,883Long-term − 33,790 − 32,556 + 6,296 + 3,570 + 5,597 − 1,007 − 1,864 − 65 − 4 − 1,796Short-term − 98,746 − 89,750 − 127,687 − 40,167 − 19,962 − 32,201 − 35,358 − 18,192 − 46,845 + 29,679
Enterprises and households − 10,830 − 30,944 − 9,693 − 17,505 + 4,860 − 2,204 + 5,156 − 1,017 + 3,015 + 3,157Long-term − 1,187 − 2,729 − 2,849 − 669 − 480 − 971 − 729 − 462 − 393 + 126Short-term 7 − 9,643 − 28,215 − 6,844 − 16,836 + 5,340 − 1,233 + 5,885 − 554 + 3,408 + 3,031
General government + 7,168 + 1,265 + 1,999 + 1,158 + 64 + 1,191 − 414 + 49 + 43 − 506Long-term + 218 + 692 + 201 + 305 + 7 + 183 − 295 + 30 − 325 −Short-term 7 + 6,950 + 572 + 1,798 + 853 + 57 + 1,008 − 120 + 19 + 367 − 506
Bundesbank − 36,010 + 230 − 2,925 − 6,025 + 31,896 − 31,480 + 2,684 + 22,743 − 10,482 − 9,577
5 Other investment 9 − 1,592 − 2,590 − 3,422 − 1,016 − 819 − 649 − 938 − 285 − 246 − 407
II Net foreign investment in Germany(Increase/capital imports: +) + 178,948 + 119,704 + 87,473 + 62,633 − 57,670 + 66,743 + 15,768 + 11,379 + 43,797 − 39,408
1 Direct investment 1 + 38,269 + 11,400 − 35,152 − 32,076 − 5,025 − 185 + 2,134 − 3,388 + 3,876 + 1,645
Equity capital + 29,311 + 27,956 + 17,855 + 5,014 − 2,515 + 4,209 + 11,147 + 1,503 + 3,267 + 6,377Reinvested earnings 2 − 13,008 − 5,484 − 7,220 − 6,898 − 910 + 37 + 551 + 271 + 193 + 87Credit transactions offoreign direct investors + 22,162 − 10,886 − 45,773 − 30,246 − 1,581 − 4,418 − 9,528 − 5,153 + 427 − 4,801Other capital − 197 − 186 − 14 + 54 − 19 − 13 − 37 − 8 − 11 − 17
2 Portfolio investment + 109,783 + 91,276 + 91,983 + 34,063 + 1,523 + 38,568 + 17,829 + 17,069 + 7,569 − 6,809
Equity 3 + 15,712 + 24,204 − 1,432 + 2,793 − 11,739 + 6,740 + 774 + 17 + 2,355 − 1,598Mutual fund shares − 673 − 1,530 + 5,070 + 835 − 981 + 4,035 + 1,181 − 878 + 2,128 − 69Bonds and notes 5 + 83,473 + 69,243 + 106,817 + 42,914 + 15,436 + 33,672 + 14,795 + 15,248 + 687 − 1,141Money market instruments + 11,271 − 642 − 18,473 − 12,479 − 1,193 − 5,879 + 1,079 + 2,681 + 2,400 − 4,002
3 Credit transactions + 30,814 + 17,005 + 30,501 + 60,603 − 54,247 + 28,363 − 4,219 − 2,304 + 32,351 − 34,266
MFIs 7,8 + 28,453 + 12,160 + 32,314 + 57,886 − 52,845 + 28,076 − 802 − 4,284 + 33,656 − 30,175Long-term + 18,379 − 4,512 − 10,118 − 8,845 − 1,543 + 5,492 − 5,222 − 4 − 1,967 − 3,252Short-term + 10,075 + 16,672 + 42,432 + 66,730 − 51,302 + 22,584 + 4,420 − 4,280 + 35,623 − 26,923
Enterprises and households + 3,332 − 820 + 2,385 + 7,908 − 3,371 − 310 − 1,842 + 1,123 − 321 − 2,644Long-term + 5,250 − 1,901 + 2,536 + 3,078 + 95 − 802 + 165 + 121 + 986 − 942Short-term 7 − 1,918 + 1,081 − 151 + 4,830 − 3,467 + 492 − 2,007 + 1,002 − 1,307 − 1,702
General government − 1,625 + 3,682 − 1,747 − 4,188 + 2,534 + 1,950 − 2,043 + 1,316 − 861 − 2,499Long-term − 125 + 4,861 − 514 − 2,208 + 1,359 + 1,180 − 844 + 452 − 625 − 671Short-term 7 − 1,500 − 1,179 − 1,233 − 1,980 + 1,176 + 770 − 1,199 + 864 − 235 − 1,828
Bundesbank + 653 + 1,983 − 2,451 − 1,002 − 564 − 1,354 + 469 − 459 − 124 + 1,051
4 Other investment + 83 + 24 + 142 + 43 + 79 − 3 + 24 + 2 − 0 + 23
III Balance of all statisticallyrecorded financial movements(Net capital exports: −) − 70,724 − 69,725 − 142,468 − 14,387 − 67,869 − 30,566 − 29,646 + 961 − 17,889 − 12,717
1 From 1996, new definition for direct investment. — 2 Estimated. — action values shown here are mostly derived from changes in stocks. Purely3 Including participation rights. — 4 From 1991, including accumulated statistical changes have been eliminated as far as possible. — 8 Excludingearnings. — 5 From 1975, excluding accrued interest. — 6 Options, whether the Deutsche Bundesbank. — 9 In particular, subscriptions of the Federalevidenced by securities or not, and financial futures contracts. — 7 The trans- Government to international organisations.
71*
X External sector

DEUTSCHEBUNDESBANKMonthly ReportFebruary 2005
X External sector
8 External position of the Bundesbank *
DM million
Reserve assets and other claims on non-residents Liabilities vis-à-vis non-residents
Reserve assets
Reservepositionin theInter- Liabilitiesnational arising NetLiabilitiesMonetary arising from externalFund and Claims Loans and from liquidity position
Foreign special on the external Treasury (col 1other claimsEnd of year currency drawing ECB 2 on non- trans- discount lessor month Total Total Gold rights (net) Total paper col 8)balances 1 residents 3 actions 4
1 2 3 4 5 6 7 8 9 10 11
1992 143,959 141,351 13,688 85,845 8,199 33,619 2,608 26,506 26,506 − 117,4531993 122,763 120,143 13,688 61,784 8,496 36,176 2,620 39,541 23,179 16,362 83,2221994 115,965 113,605 13,688 60,209 7,967 31,742 2,360 24,192 19,581 4,611 91,774
1995 123,261 121,307 13,688 68,484 10,337 28,798 1,954 16,390 16,390 − 106,8711996 120,985 119,544 13,688 72,364 11,445 22,048 1,441 15,604 15,604 − 105,3811997 127,849 126,884 13,688 76,673 13,874 22,649 966 16,931 16,931 − 110,9181998 135,085 134,005 17,109 100,363 16,533 − 1,079 15,978 15,978 − 119,107
* Valuation of the gold holdings and the claims on non-residents in Monetary Cooperation Fund (EMCF)). — 3 Including loans to the Worldaccordance with section 26 (2) of the Bundesbank Act and the provisions of Bank. — 4 Including liquidity paper sold to non-residents by thethe Commercial Code, especially section 253. In the course of the year, Bundesbank; excluding the liquidity Treasury discount paper sold tovaluation at the preceding year’s balance sheet rates. — 1 Mainly US dollar non-residents between March 1993 and March 1995, as shown in column 10. assets. — 2 European Central Bank (up to 1993, claims on the European
9 External position of the Bundesbank in the euro area o
€ million
Reserve assets and other claims on non-residents
Reserve assets
Reserveposition
Otherin the Inter-national claims onMonetary Other residentsFund and claims on Claims in other Net external
Gold special Foreign non-euro- within the euro-area positionLiabilitiesEnd of year and gold drawing currency area Eurosystem member vis-à-vis non- (col 1 lessor month Total Total rights reserves (net) 2 states col 9)receivables residents 1,3 residents 3
1 2 3 4 5 6 7 8 9 10
1999 Jan 4 95,316 93,940 29,312 8,461 56,167 140 1,225 11 8,169 87,146
1999 141,958 93,039 32,287 8,332 52,420 9,162 39,746 11 6,179 135,7792000 100,762 93,815 32,676 7,762 53,377 313 6,620 14 6,592 94,1702001 76,147 93,215 35,005 8,721 49,489 312 − 17,385 5 8,752 67,3962002 103,948 85,002 36,208 8,272 40,522 312 18,466 167 9,005 94,9422003 95,394 76,680 36,533 7,609 32,538 312 17,945 456 10,443 84,9512004 93,110 71,335 35,495 6,548 29,292 312 20,796 667 7,935 85,175
2003 Aug 98,605 84,197 37,546 8,583 38,068 312 13,592 504 11,060 87,545 Sep 91,894 81,206 36,491 8,492 36,223 312 9,902 474 10,879 81,016
Oct 113,947 81,401 36,595 8,539 36,267 312 31,794 440 11,319 102,628 Nov 97,130 79,624 36,705 8,374 34,545 312 16,742 452 10,518 86,612 Dec 95,394 76,680 36,533 7,609 32,538 312 17,945 456 10,443 84,951
2004 Jan 89,895 76,992 35,834 7,726 33,432 312 12,135 456 10,522 79,374 Feb 87,987 76,089 34,930 7,736 33,423 312 11,140 446 10,078 77,910 Mar 104,464 79,717 38,266 7,610 33,841 312 23,981 454 9,545 94,920
Apr 102,021 78,143 35,849 7,880 34,414 312 23,134 432 9,694 92,327 May 89,877 76,473 35,705 7,685 33,083 312 12,641 451 8,537 81,340 June 69,837 76,996 35,793 7,390 33,813 312 − 7,951 480 9,003 60,834
July 70,865 76,076 35,721 7,395 32,960 312 − 6,009 486 8,545 62,320 Aug 87,570 77,171 37,195 7,395 32,581 312 9,455 632 7,755 79,815 Sep 100,176 75,729 36,680 6,996 32,054 312 23,480 655 7,625 92,552
Oct 76,043 74,334 36,935 6,889 30,510 312 740 656 7,128 68,915 Nov 85,702 73,506 37,527 6,685 29,294 312 11,233 651 6,937 78,765 Dec 93,110 71,335 35,495 6,548 29,292 312 20,796 667 7,935 85,175
2005 Jan 94,895 73,556 35,888 6,634 31,034 312 20,327 699 6,315 88,580
o Claims and liabilities vis-à-vis all countries within and outside the euro Bundesbank’s cross-border payments within the Eurosystem. Fromarea. Up to December 2000, the levels at the end of each quarter are shown, November 2000, including the TARGET positions which were previouslyowing to revaluations, at market prices; within each quarter, however, the shown (in columns 6 and 9) as bilateral assets and liabilities vis-à-vis nationallevels are computed on the basis of cumulative transaction values. From central banks outside the Eurosystem. — 3 See footnote 2. — 4 EuroJanuary 2001, all end-of-month levels are valued at market prices. — opening balance sheet of the Bundesbank as at 1 January 1999. 1 Including loans to the World Bank. — 2 Including the balances in the
72*
X External sector

DEUTSCHEBUNDESBANKMonthly ReportFebruary 2005
X External sector 10 Assets and liabilities of enterprises in Germany (other than banks)
vis-à-vis non-residents * € million
Claims on non-residents Liabilities vis-à-vis non-residents
Claims on foreign non-banks Liabilities vis-à-vis foreign non-banks
from trade credits from trade credits
Balances Loanswith from Credit Advance from from Credit Advance
End of year foreign financial terms payments foreign financial terms paymentsor month Total banks Total Total granted effected Total banks Total Total used receivedoperations operations
All countries
2001 358,120 62,434 295,686 171,939 123,747 114,857 8,890 505,266 60,132 445,134 354,561 90,573 65,988 24,5852002 4 331,671 63,817 267,854 148,913 118,941 111,406 7,535 533,423 57,696 475,727 387,850 87,877 62,622 25,2552003 357,399 86,627 270,772 154,953 115,819 108,515 7,304 543,186 54,822 488,364 400,431 87,933 60,464 27,4692004 372,840 98,632 274,208 155,064 119,144 112,342 6,802 503,434 50,211 453,223 358,111 95,112 63,762 31,350
2004 July r 384,727 99,250 285,477 164,940 120,537 112,958 7,579 523,260 54,475 468,785 378,146 90,639 58,787 31,852 Aug r 381,232 97,032 284,200 167,632 116,568 109,048 7,520 519,323 53,722 465,601 376,720 88,881 56,170 32,711 Sep r 390,749 99,491 291,258 169,936 121,322 113,937 7,385 518,390 54,046 464,344 371,025 93,319 61,985 31,334
Oct r 390,774 99,532 291,242 167,586 123,656 116,361 7,295 510,418 51,815 458,603 364,522 94,081 62,145 31,936 Nov 385,639 97,981 287,658 161,505 126,153 118,880 7,273 507,165 51,266 455,899 360,739 95,160 63,123 32,037 Dec 372,840 98,632 274,208 155,064 119,144 112,342 6,802 503,434 50,211 453,223 358,111 95,112 63,762 31,350
Industrial countries 2 2001 298,904 61,403 237,501 151,047 86,454 79,453 7,001 466,206 57,861 408,345 340,344 68,001 54,364 13,6372002 4 278,074 62,861 215,213 133,509 81,704 75,996 5,708 493,155 55,770 437,385 372,464 64,921 50,731 14,1902003 305,754 85,390 220,364 140,280 80,084 75,236 4,848 499,436 53,087 446,349 383,919 62,430 48,210 14,2202004 331,109 97,485 233,624 143,949 89,675 84,903 4,772 465,592 48,304 417,288 346,293 70,995 53,480 17,515
2004 July r 342,717 97,853 244,864 154,277 90,587 85,286 5,301 484,761 52,386 432,375 364,402 67,973 50,079 17,894 Aug r 339,570 95,681 243,889 156,974 86,915 81,610 5,305 480,574 51,593 428,981 363,522 65,459 47,726 17,733 Sep r 349,098 98,068 251,030 159,599 91,431 86,167 5,264 480,332 51,966 428,366 357,876 70,490 52,927 17,563
Oct r 348,162 98,053 250,109 156,888 93,221 88,176 5,045 472,794 49,840 422,954 351,882 71,072 53,127 17,945 Nov 343,410 96,661 246,749 150,954 95,795 90,756 5,039 469,173 49,330 419,843 348,217 71,626 53,497 18,129 Dec 331,109 97,485 233,624 143,949 89,675 84,903 4,772 465,592 48,304 417,288 346,293 70,995 53,480 17,515
EU member states 2 2001 198,118 58,039 140,079 79,205 60,874 55,371 5,503 372,937 53,683 319,254 275,749 43,505 34,716 8,7892002 4 200,930 60,118 140,812 84,643 56,169 51,693 4,476 402,561 52,503 350,058 307,920 42,138 32,650 9,4882003 225,973 81,430 144,543 89,392 55,151 51,459 3,692 411,811 50,304 361,507 321,010 40,497 30,855 9,6422004 254,780 92,867 161,913 96,554 65,359 61,563 3,796 373,461 43,838 329,623 281,173 48,450 36,494 11,956
2004 July r 260,893 90,783 170,110 105,315 64,795 60,688 4,107 395,332 47,539 347,793 301,084 46,709 33,963 12,746 Aug r 260,081 90,553 169,528 107,573 61,955 57,835 4,120 391,207 46,753 344,454 300,077 44,377 32,214 12,163 Sep r 265,981 93,212 172,769 107,724 65,045 60,936 4,109 389,096 47,248 341,848 293,705 48,143 36,042 12,101
Oct r 268,631 93,157 175,474 108,073 67,401 63,424 3,977 381,735 45,273 336,462 287,728 48,734 36,391 12,343 Nov 263,212 91,620 171,592 101,868 69,724 65,773 3,951 379,050 44,947 334,103 284,695 49,408 36,965 12,443 Dec 254,780 92,867 161,913 96,554 65,359 61,563 3,796 373,461 43,838 329,623 281,173 48,450 36,494 11,956
of which: Euro-area member states 1 2001 126,519 33,787 92,732 46,599 46,133 42,771 3,362 295,943 38,361 257,582 225,711 31,871 24,878 6,9932002 4 129,490 32,521 96,969 54,542 42,427 39,350 3,077 331,733 37,366 294,367 263,863 30,504 22,996 7,5082003 147,633 45,887 101,746 59,279 42,467 39,619 2,848 338,794 29,541 309,253 279,101 30,152 22,748 7,4042004 164,160 55,995 108,165 63,310 44,855 42,231 2,624 302,864 28,295 274,569 241,860 32,709 24,258 8,451
2004 July 161,410 50,688 110,722 66,161 44,561 41,628 2,933 326,069 32,148 293,921 262,381 31,540 22,224 9,316 Aug 161,538 51,458 110,080 67,626 42,454 39,493 2,961 321,685 31,454 290,231 260,921 29,310 20,610 8,700 Sep 165,174 53,460 111,714 67,401 44,313 41,462 2,851 318,509 31,835 286,674 254,478 32,196 23,506 8,690
Oct 164,409 51,756 112,653 67,201 45,452 42,652 2,800 311,309 29,948 281,361 248,696 32,665 23,847 8,818 Nov 163,387 50,458 112,929 65,585 47,344 44,579 2,765 309,154 29,166 279,988 247,189 32,799 23,918 8,881 Dec 164,160 55,995 108,165 63,310 44,855 42,231 2,624 302,864 28,295 274,569 241,860 32,709 24,258 8,451
Emerging economies and developing countries 3 2001 59,216 1,031 58,185 20,892 37,293 35,404 1,889 39,060 2,271 36,789 14,217 22,572 11,624 10,9482002 4 53,597 956 52,641 15,404 37,237 35,410 1,827 40,268 1,926 38,342 15,386 22,956 11,891 11,0652003 51,645 1,237 50,408 14,673 35,735 33,279 2,456 43,750 1,735 42,015 16,512 25,503 12,254 13,2492004 41,731 1,147 40,584 11,115 29,469 27,439 2,030 37,842 1,907 35,935 11,818 24,117 10,282 13,835
2004 July 42,010 1,397 40,613 10,663 29,950 27,672 2,278 38,499 2,089 36,410 13,744 22,666 8,708 13,958 Aug 41,662 1,351 40,311 10,658 29,653 27,438 2,215 38,749 2,129 36,620 13,198 23,422 8,444 14,978 Sep 41,651 1,423 40,228 10,337 29,891 27,770 2,121 38,058 2,080 35,978 13,149 22,829 9,058 13,771
Oct 42,612 1,479 41,133 10,698 30,435 28,185 2,250 37,624 1,975 35,649 12,640 23,009 9,018 13,991 Nov 42,229 1,320 40,909 10,551 30,358 28,124 2,234 37,992 1,936 36,056 12,522 23,534 9,626 13,908 Dec 41,731 1,147 40,584 11,115 29,469 27,439 2,030 37,842 1,907 35,935 11,818 24,117 10,282 13,835
* Including the assets and liabilities vis-à-vis non-residents of households in January 2001, including Greece. — 2 From May 2004, including the newGermany. The assets and liabilities vis-à-vis non-residents of banks (MFIs) in member states: Cyprus, the Czech Republic, Estonia, Hungary, Latvia,Germany are shown in Table 4 of Section IV, “Banks”. Statistical increases Lithuania, Malta, Poland, the Slovak Republic and Slovenia. — 3 Alland decreases have not been eliminated; to this extent, the changes in to- countries that are not regarded as industrial countries. — 4 Change in thetals are not comparable with the figures shown in Table X.7. — 1 From reporting population owing to an increase in the exemption limit.
73*
X External sector

DEUTSCHEBUNDESBANKMonthly ReportFebruary 2005
X External sector
11 Deutsche Mark and euro exchange rates of selected currencies *
Yearly Japan Denmark Sweden Norway Switzerland Canada Australia New ZealandUnited States United Kingdomor monthlyaverage USD JPY DKK SEK GBP NOK CHF CAD AUD 1 NZD 1
Historic spot middle rates on the Frankfurt exchange (1 or 100 currency units = DEM ...)
1991 1.6612 1.2346 25.932 27.421 2.926 25.580 115.740 1.4501 1.2942 0.95891992 1.5595 1.2313 25.869 26.912 2.753 25.143 111.198 1.2917 1.1476 0.84061993 1.6544 1.4945 25.508 21.248 2.483 23.303 111.949 1.2823 1.1235 0.89401994 1.6218 1.5870 25.513 21.013 2.4816 22.982 118.712 1.1884 1.1848 0.9605
1995 1.4338 1.5293 25.570 20.116 2.2620 22.614 121.240 1.0443 1.0622 0.93991996 1.5037 1.3838 25.945 22.434 2.3478 23.292 121.891 1.1027 1.1782 1.03571997 1.7348 1.4378 26.249 22.718 2.8410 24.508 119.508 1.2533 1.2889 1.14531998 1.7592 1.3484 26.258 22.128 2.9142 23.297 121.414 1.1884 1.1070 0.9445
Euro reference exchange rates published by the European Central Bank (EUR 1 = currency units ...) 2
1999 1.0658 121.32 7.4355 8.8075 0.65874 8.3104 1.6003 1.5840 1.6523 2.0145
2000 0.9236 99.47 7.4538 8.4452 0.60948 8.1129 1.5579 1.3706 1.5889 2.02882001 0.8956 108.68 7.4521 9.2551 0.62187 8.0484 1.5105 1.3864 1.7319 2.13002002 0.9456 118.06 7.4305 9.1611 0.62883 7.5086 1.4670 1.4838 1.7376 2.03662003 1.1312 130.97 7.4307 9.1242 0.69199 8.0033 1.5212 1.5817 1.7379 1.94382004 1.2439 134.44 7.4399 9.1243 0.67866 8.3697 1.5438 1.6167 1.6905 1.8731
2003 June 1.1663 138.05 7.4250 9.1182 0.70224 8.1619 1.5411 1.5798 1.7552 2.0069
July 1.1372 134.99 7.4332 9.1856 0.70045 8.2893 1.5476 1.5694 1.7184 1.9386 Aug 1.1139 132.38 7.4322 9.2378 0.69919 8.2558 1.5400 1.5570 1.7114 1.9137 Sep 1.1222 128.94 7.4273 9.0682 0.69693 8.1952 1.5474 1.5330 1.6967 1.9227
Oct 1.1692 128.12 7.4301 9.0105 0.69763 8.2274 1.5485 1.5489 1.6867 1.9446 Nov 1.1702 127.84 7.4370 8.9939 0.69278 8.1969 1.5590 1.5361 1.6337 1.8608 Dec 1.2286 132.43 7.4419 9.0228 0.70196 8.2421 1.5544 1.6131 1.6626 1.8982
2004 Jan 1.2613 134.13 7.4481 9.1368 0.69215 8.5925 1.5657 1.6346 1.6374 1.8751 Feb 1.2646 134.78 7.4511 9.1763 0.67690 8.7752 1.5734 1.6817 1.6260 1.8262 Mar 1.2262 133.13 7.4493 9.2346 0.67124 8.5407 1.5670 1.6314 1.6370 1.8566
Apr 1.1985 129.08 7.4436 9.1653 0.66533 8.2976 1.5547 1.6068 1.6142 1.8727 May 1.2007 134.48 7.4405 9.1277 0.67157 8.2074 1.5400 1.6541 1.7033 1.9484 June 1.2138 132.86 7.4342 9.1430 0.66428 8.2856 1.5192 1.6492 1.7483 1.9301
July 1.2266 134.08 7.4355 9.1962 0.66576 8.4751 1.5270 1.6220 1.7135 1.8961 Aug 1.2176 134.54 7.4365 9.1861 0.66942 8.3315 1.5387 1.6007 1.7147 1.8604 Sep 1.2218 134.51 7.4381 9.0920 0.68130 8.3604 1.5431 1.5767 1.7396 1.8538
Oct 1.2490 135.97 7.4379 9.0620 0.69144 8.2349 1.5426 1.5600 1.7049 1.8280 Nov 1.2991 136.09 7.4313 8.9981 0.69862 8.1412 1.5216 1.5540 1.6867 1.8540 Dec 1.3408 139.14 7.4338 8.9819 0.69500 8.2207 1.5364 1.6333 1.7462 1.8737
2005 Jan 1.3119 135.63 7.4405 9.0476 0.69867 8.2125 1.5469 1.6060 1.7147 1.8620
* Calculated from daily quotations. — 1 Exchange rates from Australia and central banks at 14.15. For additional euro reference exchange rates of theNew Zealand; those for New Zealand calculated from rates as at the middle ECB, see Statistical Supplement to the Monthly Report 5, Exchange rateand end of the month. — 2 The ECB publishes daily euro reference ex- statistics.change rates, which are calculated on the basis of the concertation between
12 Exchange rates for the national currencies of the euro-area member states, the Deutsche Mark value ofthe ECU * and euro conversion rates
France Italy Netherlands Belgium/ Austria Spain Finland Ireland Portugal Greece ECU values 1 Yearly Luxembourg GRD 100 /average FRF 100 ITL 1,000 NLG 100 BEF/LUF 100 ATS 100 ESP 100 FIM 100 IEP 1 PTE 100 EUR 1 2 ECU 1
Historic spot middle rates on the Frankfurt exchange in DEM
1991 29.409 1.3377 88.742 4.857 14.211 1.597 41.087 2.671 1.149 0.9103 2.050761992 29.500 1.2720 88.814 4.857 14.211 1.529 34.963 2.656 1.157 0.8178 2.020311993 29.189 1.0526 89.017 4.785 14.214 1.303 28.915 2.423 1.031 0.7213 1.936391994 29.238 1.0056 89.171 4.8530 14.214 1.2112 31.108 2.4254 0.9774 0.6683 1.92452
1995 28.718 0.8814 89.272 4.8604 14.214 1.1499 32.832 2.2980 0.9555 0.6182 1.873751996 29.406 0.9751 89.243 4.8592 14.214 1.1880 32.766 2.4070 0.9754 0.6248 1.909541997 29.705 1.0184 88.857 4.8464 14.210 1.1843 33.414 2.6297 0.9894 0.6349 1.964381998 29.829 1.0132 88.714 4.8476 14.213 1.1779 32.920 2.5049 0.9763 0.5952 1.969131999 . . . . . . . . . 325.76 .
2000 . . . . . . . . . 336.63 .
Irrevocable euro conversion rates (EUR 1 = currency units ...) 3
6.55957 1936.27 2.20371 40.3399 13.7603 166.386 5.94573 0.787564 200.482 4 340.750 5 1.95583
* Calculated from daily quotations. — 1 As per data from the European exchange rates of the ECB (EUR 1 = GRD ...). — 3 Applicable from 1 JanuaryCommission. — 2 Up to 1998, reciprocal values of the exchange rates for the 1999. — 4 Applicable from 1 January 2001. — 5 Deutsche Mark conversionDeutsche Mark, published by the Bank of Greece; from 1999, euro reference rate.
74*
X External sector

DEUTSCHEBUNDESBANKMonthly ReportFebruary 2005
X External sector
13 Effective exchange rates * of the euro and selected foreign currencies
1999 Q1 = 100
Memo item Effective nominal exchange rates ofIndicators of the German economy’s selected foreign currencies against the
Effective exchange rate of the euro price competitiveness 3,4 currencies of 19 industrial countries 3,5
EER-23 1 EER-42 2 19 industrial countries 5 49 countries 6
In real termsbased on the
In real terms unit labour In real termsbased on the In real terms costs of the based on the based on theconsumer national consumer Pound Japanesebased on the deflators of
Period Nominal prices Nominal prices US dollar sterling yenGDP deflator 7 economy 7 total sales 7 based on consumer prices
1999 95.9 95.9 95.8 96.4 96.5 95.8 97.8 98.2 97.7 100.8 102.3 105.1
2000 86.1 86.0 85.8 85.4 87.9 85.8 91.8 92.8 91.2 105.4 105.2 117.92001 86.7 86.8 86.9 85.3 90.4 87.0 92.0 93.2 91.5 112.0 103.6 106.72002 89.2 90.3 90.3 88.4 94.8 90.8 93.0 94.2 92.6 110.7 104.2 100.82003 99.9 101.7 101.7 99.5 106.6 101.5 96.6 97.9 97.2 97.7 99.2 99.92004 103.8 105.9 ... ... 111.0 105.3 p 97.1 99.3 98.8 89.8 103.4 101.7
1999 Q1 100.0 100.0 100.0 100.0 100.0 100.0 100.0 100.0 100.0 100.0 100.0 100.0 Q2 96.2 96.2 96.2 97.4 96.4 96.0 98.6 98.6 98.0 102.8 102.8 99.0 Q3 94.8 94.8 94.6 95.0 95.5 94.6 97.0 97.8 97.1 101.4 102.3 106.2 Q4 92.9 92.7 92.6 93.3 94.3 92.8 95.6 96.4 95.8 99.1 104.1 115.2
2000 Q1 89.5 89.3 89.1 88.4 91.0 89.1 93.6 94.8 93.4 101.5 106.4 114.9 Q2 86.5 86.4 86.2 86.0 88.2 86.2 91.9 92.8 91.4 104.3 105.4 118.4 Q3 85.1 85.1 84.9 84.5 87.0 84.8 91.3 92.1 90.3 106.2 103.9 119.2 Q4 83.2 83.3 83.1 82.6 85.5 83.1 90.2 91.5 89.5 109.4 105.0 119.2
2001 Q1 88.3 88.0 88.3 86.2 90.9 87.8 92.8 93.8 92.1 109.3 102.4 108.1 Q2 85.3 85.4 85.4 83.9 88.8 85.6 91.4 92.7 90.8 113.4 104.1 106.9 Q3 86.4 86.6 86.6 84.9 90.5 87.1 91.5 93.1 91.5 112.2 103.9 106.8 Q4 86.8 87.2 87.4 86.1 91.2 87.6 92.1 93.3 91.6 113.1 104.0 104.9
2002 Jan 86.5 87.4 . . 90.7 87.2 . 93.6 91.2 116.4 104.9 98.3 Feb 85.7 86.6 87.0 84.9 90.1 86.5 92.2 93.2 90.9 117.3 105.3 98.2 Mar 85.7 86.8 . . 90.3 86.7 . 93.2 90.9 116.1 104.6 99.8
Apr 86.1 87.1 . . 90.7 87.0 . 93.1 90.6 115.3 105.2 99.4 May 87.7 88.8 88.8 87.1 92.8 89.0 92.6 93.7 91.6 112.0 103.5 101.2 June 89.8 90.9 . . 95.5 91.6 . 94.5 92.9 109.0 101.9 101.7
July 91.2 92.4 . . 97.5 93.4 . 95.0 94.0 106.0 103.5 104.3 Aug 90.7 91.9 92.2 90.5 96.9 92.8 93.4 94.5 93.5 107.3 103.5 104.3 Sep 90.7 92.1 . . 97.2 93.1 . 94.6 93.5 107.6 104.7 102.5
Oct 91.1 92.5 . . 97.7 93.5 . 94.8 94.0 108.5 105.0 99.8 Nov 91.9 93.1 93.4 91.3 98.5 94.0 93.9 94.9 93.9 106.8 104.3 100.8 Dec 92.9 94.3 . . 99.6 95.0 . 95.5 94.5 106.0 104.0 99.6
2003 Jan 95.3 96.8 . . 102.3 97.6 . 96.2 95.5 103.0 102.6 100.4 Feb 96.6 98.2 97.8 96.0 103.7 99.0 95.5 96.8 96.3 102.2 101.2 99.2 Mar 97.4 99.0 . . 104.4 99.5 . 97.1 96.5 101.4 99.3 99.8
Apr 97.9 99.5 . . 104.6 99.5 . 97.3 96.5 101.4 98.7 98.6 May 101.8 103.5 102.5 100.5 108.5 103.2 97.2 98.8 98.0 96.7 96.9 97.7 June 102.2 104.2 . . 108.8 103.7 . 99.1 98.4 96.1 98.9 96.3
July 101.0 102.9 . . 107.2 102.2 . 98.4 97.5 97.8 98.5 97.3 Aug 99.8 101.8 102.1 100.2 106.0 101.2 96.8 98.0 96.9 99.1 98.1 98.3 Sep 99.6 101.7 . . 105.9 101.1 . 97.6 96.8 97.2 98.2 101.1
Oct 101.3 103.3 . . 108.0 102.9 . 98.1 97.5 93.3 98.8 103.7 Nov 101.2 103.3 104.5 101.5 108.0 102.9 96.9 98.2 97.6 93.0 99.5 103.9 Dec 104.2 106.2 . . 111.2 105.8 . 99.2 99.1 90.6 99.5 102.9
2004 Jan 105.4 107.4 . . 112.5 106.9 . 99.7 99.5 88.9 101.6 102.9 Feb 105.3 107.3 106.9 104.2 112.3 106.8 p 97.9 99.4 99.4 89.3 104.1 102.4 Mar 103.4 105.4 . . 110.2 104.7 . 99.0 98.6 90.9 104.2 102.1
Apr 101.6 103.7 . . 108.3 103.0 . 98.4 97.6 91.8 104.3 104.0 May 102.4 104.4 104.7 101.2 109.5 104.1 p 96.7 98.8 98.3 93.4 103.7 100.0 June 102.3 104.2 . . 109.6 104.0 . 98.5 98.1 91.9 104.9 101.6
July 102.8 104.8 . . 110.1 104.4 . 99.0 98.3 90.9 105.0 101.2 Aug 102.7 104.8 105.3 101.7 109.9 104.4 p 96.6 99.1 98.4 91.3 104.6 100.5 Sep 103.0 105.2 . . 110.3 104.7 . 99.3 98.4 90.7 102.8 100.8
Oct 104.2 106.3 . . 111.5 105.8 . 99.7 99.0 88.9 101.8 100.8 Nov 105.6 107.6 ... ... 113.1 107.0 p 97.3 100.1 99.4 85.4 101.4 102.6 Dec 107.1 109.3 . . 114.4 108.4 . 100.8 100.1 84.3 102.8 102.0
2005 Jan 105.8 108.1 . . 112.9 107.0 . 100.4 99.1 85.3 101.7 103.6
* The effective exchange rate corresponds to the weighted external value of to the EER-23 group (see footnote 1), this group also includes the followingthe currency concerned. — 1 ECB calculations based on the weighted countries: Algeria, Argentina, Brazil, Bulgaria, Croatia, India, Indonesia,averages of the effective exchange rates of the euro against the currencies Israel, Malaysia, Mexico, Morocco, New Zealand, Philippines, Romania,of the following countries: Australia, Canada, China, Cyprus, Czech Republic, Russian Federation, South Africa, Taiwan, Thailand and Turkey. — 3 TheDenmark, Estonia, Hong Kong, Hungary, Japan, Latvia, Lithuania, Malta, method of calculation is consistent with the procedure used by the ECB toNorway, Poland, Singapore, Slovakia, Slovenia, South Korea, Sweden, compute the effective exchange rates of the euro (see Monthly Bulletin,Switzerland, United Kingdom and United States. The weights used in these November 2001, pp 51−65). In contrast to footnote 1, the weights used arecalculations are based on manufactured goods trade between 1999 and based on the relevant trade in the period from 1995 to 1997. — 4 Decline in2001 and capture third-market effects. Where consumer prices were not yet the figures implies an increase in competitiveness. — 5 Euro-area countriesavailable, estimates have been used. For details of the methodology, see as well as Canada, Denmark, Japan, Norway, Sweden, Switzerland, UnitedECB, Monthly Bulletin, September 2004, pp 69−72 and the ECB’s Occasional Kingdom and United States. — 6 Euro-area countries and countriesPaper No 2, which can be downloaded from the ECB’s website belonging to the EER-42 group except Bulgaria, Latvia, Lithuania and(www.ecb.int). — 2 ECB calculations. In addition to the countries belonging Malta. — 7 Annual and quarterly averages.
75*
X External sector

76*
DEUTSCHEBUNDESBANKMonthly ReportFebruary 2005

Overview ofpublicationsby the DeutscheBundesbank
This overview provides information
about selected recent economic and
statistical publications by the Deutsche
Bundesbank. Unless otherwise indi-
cated, these publications are available
in both English and German, in printed
form and on the internet.
The publications are available free of
charge from the External Communica-
tion Division. For a small fee to cover
costs, a file which is updated monthly
and contains approximately 40,000
time series published by the Bundes-
bank can be obtained on magnetic
tape cassette or CD-ROM from the Div-
ision Statistical data processing, math-
ematical methods. Orders should be
sent, in writing, to one of the ad-
dresses listed on the reverse of the title
page. Selected time series can also be
downloaded from the internet.
Annual Report
Monthly Report
For information on the articles published between
1990 and 2004 see the index attached to the Janu-
ary 2005 Monthly Report.
March 2004
– Public finances in crisis – the causes and the
need for action
– German balance of payments in 2003
77*
DEUTSCHEBUNDESBANKMonthly ReportFebruary 2005

April 2004– Recent developments in the corporate bond
market
– Credit risk transfer instruments: their use by
German banks and aspects of financial stability
– The significance of information and communi-
cation technology
May 2004– Effects of eastward enlargement of the EU on
the German economy
– The economic scene in Germany in spring
2004
June 2004– Monetary policy under uncertainty
– Purchasing power parity theory as a concept
for evaluating price competitiveness
– Overall financial flows in 2003
July 2004– Financial development and outlook of the
statutory health insurance scheme
– Regulation of the European securites markets
– Initial experience with the new monetary
policy framework and the Bundesbank’s contri-
bution to liquidity management by the Euro-
system
August 2004– The economic scene in Germany in summer
2004
September 2004– The performance of German credit institutions
in 2003
– Greater flexibility on the German labour
market
– How the Bundesbank analyses enterprises’
creditworthiness
– New capital requirements for credit institutions
(Basel II)
October 2004– Report on the stability of the German financial
system
– Stress tests at German banks – methods and
results
November 2004– The economic scene in Germany in autumn
2004
December 2004– Demographic burdens on growth and wealth
in Germany
– The insurance sector as a financial intermediary
– Credit default swaps – functions, importance
and information content
January 2005– The relationship between money and prices
– German banks’ foreign direct investment and
cross-border services
– Comments on reforming the Stability and
Growth Pact
February 2005– The economic scene in Germany around the
turn of 2004-05
78*
DEUTSCHEBUNDESBANKMonthly ReportFebruary 2005

Statistical Supplements to the
Monthly Report1
1 Banking statistics (monthly)
2 Capital market statistics (monthly)
3 Balance of payments statistics (monthly)
4 Seasonally adjusted business statistics (monthly)
5 Exchange rate statistics (quarterly)
Special Publications
The monetary policy of the Bundesbank,
October 19952
Makro-�konometrisches Mehr-L�nder-Modell,
November 1996 3
Europ�ische Organisationen und Gremien im Be-
reich von W�hrung und Wirtschaft, May 19973
Die Zahlungsbilanz der ehemaligen DDR 1975 bis
1989, August 19993
The market for German Federal securities,
May 2000
Macro-Econometric Multi-Country Model: MEMMOD,
June 2000
Bundesbank Act, September 2002
Weltweite Organisationen und Gremien im Bereich
von W�hrung und Wirtschaft, March 20033
European economic and monetary union,
February 2004
Special Statistical Publications
1 Banking statistics guidelines and customer clas-
sification, January 20054
2 Bankenstatistik Kundensystematik Firmenver-
zeichnisse, December 20043,5
3 Aufbau der bankstatistischen Tabellen,
January 20003
4 Financial accounts for Germany 1991 to 2003,
September 20046
5 Annual accounts of west German enterprises
1971 to 1996, March 19991
6 Ratios from annual accounts of German enter-
prises between 2000 and 2002, Novem-
ber 20043
7 Erl�uterungen zu den Leistungspositionen der
Zahlungsbilanz, September 20013
8 Balance of payments statistics of the Fed-
eral Republic of Germany, 2nd edition,
February 1991o
9 Securities deposits,
September 2004
10 International capital links,
May 20041, 6
11 Balance of payments by region,
August 2004
12 Technologische Dienstleistungen in der Zah-
lungsbilanz, June 20043
79*
DEUTSCHEBUNDESBANKMonthly ReportFebruary 2005
1 Only the headings and explanatory notes to the datacontained in the German originals are available in English.2 Also available in French, Spanish, Russian and Chinese.3 Available in German only.4 Only available on the internet, updated at half-yearlyintervals. Only the sections “Monthly Balance Sheet Stat-istics”, “External position” and “Customer classification”(“Overall survey on sectoral classification”, “Survey onbreakdown by industry or activity” and “Explanatorynotes on the system of customer classification by industryor activity”) are available in English.5 Current version only available on the internet at quar-terly intervals.6 Available on the internet only.
o Not available on the internet.

80*
DEUTSCHEBUNDESBANKMonthly ReportFebruary 2005
Discussion Papers*
Series 1
Economic Research Centre
34/2004
The contribution of rapid financial development to
asymmetric growth of manufacturing industries:
Common Claims vs. evidence for Poland
35/2004
Fiscal rules and monetary policy in a dynamic
stochastic general equilibrium model
36/2004
Inflation and core money growth in the euro area
37/2004
Taylor rules for the euro area: the issue of real time
data
38/2004
What do deficits tell us about debt? Empirical
evidence on creative accounting with fiscal rules in
the EU
39/2004
Optimal lender of last resort policy in different
financial systems
40/2004
Expected budget deficits and interest rate swap
spreads – Evidence for France, Germany and Italy
41/2004
Testing for business cycle asymmetries based on
autoregressions with a Markov-switching intercept
1/2005
Financial constraints and capacity adjustment in
the United Kingdom – Evidence from a large panel
of survey data
2/2005
Common stationary and non-stationary factors in
the euro area analyzed in a large-scale factor model
Series 2
Banking and Financial Supervision
2/2004
Systematic Risk in Recovery Rates – An Empirical
Analysis of US Corporate Credit Exposures
3/2004
Does capital regulation matter for bank behaviour?
Evidence for German savings banks
4/2004
German bank lending during emerging market
crises: A bank level analysis
5/2004
How will Basel II affect bank lending to emerging
markets? An analysis based on German bank level
data
6/2004
Estimating probabilities of default for German
savings banks and credit cooperatives
Banking legislation
1 Bundesbank Act and Statute of the European
System of Central Banks and of the European
Central Bank, June 1998
2 Gesetz �ber das Kreditwesen, February 20013
2a Grundsatz I �ber die Eigenmittel der Institute,
January 20013
2b Grundsatz II �ber die Liquidit�t der Institute,
August 19993
7 Instruction sheet for the reporting of large ex-
posures and loans of 3 million Deutsche Mark
or more pursuant to sections 13 to 14 of the
Banking Act, September 1998
* Discussion Papers which appeared from 2000 onwardsare available on the internet.
For footnotes, see p 79*.


