Embed Size (px)
Citation preview

Siriraj Medical Journal
SMJVolume 73, Number 12, December 2021
E-ISSN 2228-8082
The world-leading biomedical science of Thailand
By Doonyaporn Wongsawaeng, et al.
MONTHLY
https://he02.tci-thaijo.org/index.php/sirirajmedj/indexE-mail: [email protected]
International Association of SurgeonsGastroenterologists & OncologistsThailand Chapter
Thai Association for Gastrointestinal Endoscopy
Indexed by
ORIGINAL ARTICLE
REVIEW ARTICLE
Siriraj Medical Journal SMJVolume 73, Number 12, December 2021
ORIGINAL ARTICLE
777 Incidence and Risk Factors of Retinopathy of Prematurity, a 10-year Experience of a Single-center, Referral, Hospital Kanya Chutasmit, et al.
786 Magnetic Resonance Hippocampal Subfield Volumetric Analysis for Differentiating among Healthy Older Adults and Older Adults with Mild Cognitive Impairment or Major Depressive Disorder Doonyaporn Wongsawaeng, et al.
793 Psychometric Properties of the PHQ-9, HADS, and CES-D Questionnaires and the Prevalence of Depression in Patients with Cancer Receiving Radiotherapy Kantanut Yutrirak, et al.
801 The Efficacy of Follow-up Phone Calls for Capillary Blood Glucose Lowering in Diabetic Patients in Primary Care Unit Possatorn Wongwutthiwet, et al.
808 Factors Associated with Severe Lower Respiratory Tract Infection from Respiratory Syncytial Virus (RSV) in Thai Children Atipotsawee Tungsupreechameth, et al.
815 Clinical Outcomes and Cost of Ventilator Weaning and Endotracheal Extubation Guided by an Established Ventilator Weaning Protocol in Patients Undergoing Elective Cardiac Surgery Supanan Innok, et al.
823 Cost-effectiveness Analysis Comparing Vonoprazan-based Triple Therapy with Proton Pump Inhibitor-based Therapy in the Treatment of Helicobacter pylori Infection in Thailand Jadesada Lertsirimunkong, et al.
832 The Relationship between Mental Health with the Level of Empathy Among Medical Students in Southern Thailand: A University-Based Cross-Sectional Study Katti Sathaporn, et al.
REVIEW ARTICLE
841 Melasma Clinical Features, Diagnosis, Epidemiology and Etiology: An Update Review Mohammad Ahmad Abdalla

SIRIRAJ MEDICAL JOURNAL
First Editor: Ouay Ketusinh Emeritus Editors: Somchai Bovornkitti, Adulya Viriyavejakul, Sommai Toongsuwan, Nanta Maranetra, Niphon Poungvarin, Prasit Watanapa, Vithya Vathanophas, Pipop Jirapinyo, Sanya Sukpanichnant, Somboon KunathikomExecutive Editor: Prasit Watanapa Editorial Director: Manee Rattanachaiyanont Managing Editor: Gulapar Srisawasdi, Chenchit Chayachinda
Editor-in-Chief: Thawatchai AkaraviputhAssociate Editor: Varut Lohsiriwat, Prapat Wanitpongpan Online Editor: Puttinun Patpituck
SIRIRAJ MEDICAL JOURNAL is published bimonthly, 6 issues a year (Jan-Feb, Mar-Apr, May-Jun, Jul-Aug, Sep-Oct and Nov-Dec) and distributed by the end of the last month of that issue.SIRIRAJ MEDICAL JOURNAL is listed as a journal following the Uniform Requirements for Manuscripts Submitted to Biomedical Journals (URM) by the International Committee of Medical Journal Editors (ICMJE) since 9 July 2010 [http://www.icmje.org/journals.html].
Philip Board (Australian National University, Australia)Richard J. Deckelbaum (Columbia University, USA) Yozo Miyake (Aichi Medical University, Japan)Yik Ying Teo (National University of Singapore, Singapore)Harland Winter (Massachusetts General Hospital, USA) Philip A. Brunell (State University of New York At Buffalo, USA) Noritaka Isogai (Kinki University, Japan) Yuji Murata (Aizenbashi Hospital, Japan)Keiichi Akita (Tokyo Medical and Dental University Hospital, Japan)Shuji Shimizu (Kyushu University Hospital, Japan)David S. Sheps (University of Florida, USA)Robin CN Williamson (Royal Postgraduate Medical School, UK) Tai-Soon Yong (Yonsei University, Korea) Anusak Yiengpruksawan (The Valley Robotic Institute, USA)Stanlay James Rogers (University of California, San Francisco, USA)Kyoichi Takaori (Kyoto University Hospital, Japan)Tomohisa Uchida (Oita University, Japan)Yoshiki Hirooka (Nagoya University Hospital, Japan)Hidemi Goto (Nagoya University Graduate School of Medicine, Japan)Kazuo Hara (Aichi Cancer Center Hospital, Japan)Shomei Ryozawa (Saitama Medical University, Japan)Christopher Khor (Singapore General Hospital, Singapore) Yasushi Sano (Director of Gastrointestinal Center, Japan) Mitsuhiro Kida (Kitasato University & Hospital, Japan)Seigo Kitano (Oita University, Japan)Ichizo Nishino (National Institute of Neuroscience NCNP, Japan)
Masakazu Yamamoto (Tokyo Women’s Medical University, Japan)Dong-Wan Seo (University of Ulsan College of Medicine, Korea)George S. Baillie (University of Glasgow, UK)G. Allen Finley (Delhousie University, Canada)Sara Schwanke Khilji (Oregon Health & Science University, USA) Matthew S. Dunne (Institute of Food, Nutrition, and Health, Switzerland) Marianne Hokland (University of Aarhus, Denmark) Marcela Hermoso Ramello (University of Chile, Chile) Ciro Isidoro (University of Novara, Italy) Moses Rodriguez (Mayo Clinic, USA)Robert W. Mann (University of Hawaii, USA)Wikrom Karnsakul (Johns Hopkins Children’s Center, USA) Frans Laurens Moll (University Medical Center Ultrecht, Netherlands)James P. Dolan (Oregon Health & Science University, USA)John Hunter (Oregon Health & Science University, USA)Nima Rezaei (Tehran University of Medical Sciences, Iran)Dennis J. Janisse (Subsidiary of DJO Global, USA)Folker Meyer (Argonne National Laboratory, USA) David Wayne Ussery (University of Arkansas for Medical Sciences, USA)Intawat Nookaew (University of Arkansas for Medical Sciences, USA)Victor Manuel Charoenrook de la Fuente (Centro de Oftalmologia Barraquer, Spain)Karl Thomas Moritz (Swedish University of Agricultural Sciences, Sweden)Nam H. CHO (University School of Medicine and Hospital, Korea)
www.smj.si.mahidol.ac.th
Statistician: Saowalak Hunnangkul (Mahidol University, Thailand) Medical Illustrator: Chananya Hokierti (Nopparat Rajathanee Hospital, Thailand)Online Assistant: Surang Promsorn, Wilailuck Amornmontien, Hatairat Ruangsuwan Editorial Office Secretary: Amornrat Sangkaew
International Editorial Board
Editorial BoardWatchara Kasinrerk (Chiang Mai University, Thailand)Rungroj Krittayaphong (Siriraj Hospital, Mahidol University, Thailand)Wiroon Laupattrakasem (Khon Kaen University, Thailand)Anuwat Pongkunakorn (Lampang Hospital, Thailand) Nopporn Sittisombut (Chiang Mai University, Thailand)Vasant Sumethkul (Ramathibodi Hospital, Mahidol University, Thailand)Yuen Tanniradorm (Chulalongkorn University, Thailand)Saranatra Waikakul (Siriraj Hospital, Mahidol University, Thailand)Pa-thai Yenchitsomanus (Siriraj Hospital, Mahidol University, Thailand) Surapol Issaragrisil (Siriraj Hospital, Mahidol University,Thailand)Jaturat Kanpittaya (Khon Kaen University, Thailand) Suneerat Kongsayreepong (Siriraj Hospital, Mahidol University, Thailand)
Pornchai O-Charoenrat (Siriraj Hospital, Mahidol University, Thailand)Nopphol Pausawasdi (Siriraj Hospital, Mahidol University, Thailand) Supakorn Rojananin (Siriraj Hospital, Mahidol University, Thailand) Jarupim Soongswang (Siriraj Hospital, Mahidol University, Thailand)Suttipong Wacharasindhu (Chulalongkorn University, Thailand)Prapon Wilairat (Mahidol University, Thailand) Pornprom Muangman (Siriraj Hospital, Mahidol University, Thailand)Ampaiwan Chuansumrit (Ramathibodi Hospital, Mahidol University, Thailand)Sayomporn Sirinavin (Ramathibodi Hospital, Mahidol University, Thailand)Vitoon Chinswangwatanakul (Siriraj Hospital, Mahidol University, Thailand)
SMJ
Volume 73, No.12: 2021 Siriraj Medical Journalhttps://he02.tci-thaijo.org/index.php/sirirajmedj/index 777
Original Article SMJ
Kanya Chutasmit, M.N.S., Pimol Wongsiridej, M.D. , Kanokwan Sommai, M.Sc. (Applied Statistics), Supharat
Siriwaeo, B.N.S., Pranchalee Insawang, B.N.S., Ratchada Kitsommart, M.D.Department of Pediatrics, Faculty of Medicine Siriraj Hospital, Mahidol University, Bangkok 10700, Thailand.
Incidence and Risk Factors of Retinopathy of Prematurity, a 10-year Experience of a Single-center, Referral, Hospital
ABSTRACTObjective: To explore the incidence and trend of ROP over the past 10 years. The secondary objective was to identify any association between clinical variables and threshold ROP.Materials and Methods: A cross-sectional, retrospective study of infants with <33 weeks’ gestational age (GA) or birth weight (BW) ≤1,500g were screened for ROP between January 2010 and December 2019 Infants who had threshold ROP, labelled as the T-group, were compared against non-threshold infants (either normal or prethreshold ROP), or the NT-group.Results: Of the 1,247 infants who were screened for ROP, 174 (14%) tested positive for ROP while 26 (2.1%) had threshold ROP. Infants who had ROP had a mean ±standard deviation (SD) GA 27.2 ± 2.2 weeks and 115 (66.1%) were <1000g at birth. Advanced GA was independently associated with lower risk of threshold ROP [adjusted odds ratio (95% confidence interval, CI); 0.71 (0.52, 0.98), p=0.04]. There was no difference in respiratory and hemodynamic outcomes between the T and NT-group, except for longer hospitalization (median [P25, P75]; 121[106.3, 160.5] and 93.5[72.3, 129] days, p=0.003]. Culture-positive septicemia was independently associated with threshold ROP [adjusted odds ratio (95% CI); 4.48 (1.72, 11.68), p=0.002].Conclusion: The incidence of different stages of ROP in infants was 14% and 2.1% for severe ROP which required treatment. Lower GA and positive-culture septicemia was associated with a higher incidence of severe ROP.
Keywords: Incidence; preterm infants; retinopathy of prematurity; screening; threshold disease (Siriraj Med J 2021; 73: 777-785)
Corresponding author: Ratchada Kitsommart E-mail: [email protected], [email protected] 24 February 2021 Revised 30 June 2021 Accepted 30 June 2021ORCID ID: http:orcid.org/0000-0002-7592-9899http://dx.doi.org/10.33192/Smj.2021.101
INTRODUCTION Retinopathy of prematurity (ROP) is the most common cause of avoidable severe visual impairment or blindness regardless of socioeconomic status.1-3 This condition has been well-documented in affecting not only visual outcomes but also neurodevelopmental outcomes.4,5
Multifactorial factors have been proposed as both risk factors and preventative measures of severe ROP such as oxygen management, transfusion practices, nutritional and postnatal growth status, and infections. Hence, ROP
is inevitably associated with premature birth as postnatal retinal vessel development is hastened due to postnatal oxygen exposure and lack of placental factors to promote normal growth of vessels, leading to an abnormal pattern of vessels. Therefore, despite improvements in perinatal and neonatal care in a bid to minimize the amount and duration of oxygen supplementation, retinal examinations for ROP screening remains a mandatory strategy to prevent severe ROP.

Volume 73, No.12: 2021 Siriraj Medical Journal https://he02.tci-thaijo.org/index.php/sirirajmedj/index778
Chutasmit et al.
While the incidence of very preterm infant birth has increased this century, advancements in perinatal care has provided hope in improving their associated morbidities, including severe ROP. Eye examinations screening for ROP require an interdisciplinary approach of pediatricians, ophthalmologists, and caregivers. International guidelines provide a strategy on how to screen for ROP in at-risk preterm infants at a certain postnatal age (PNA).6,7
Incidences of ROP vary among countries depending on socioeconomic status and accessibility to ophthalmologic examinations.1 Interestingly, genetic factors have also been proven to have an effect on ROP rates in different racial groups.8,9 Therefore, understanding the local incidence rate of ROP is important in order to guide strategic planning to minimize or eliminate the disease. Unfortunately, problems related to awareness of ROP in caregivers and a lack of experienced ophthalmologists leads to inadequate coverage of a screening program10, particularly in middle and low-income countries where preterm infants are more likely to exposed to risk factors, especially inadequate oxygen monitoring and oxygen titration devices or availability of experienced caregivers to monitor and control oxygenation throughout their postnatal period. We, therefore, wanted to explore incidence of ROP from 2010 until 2019 and identify risk factors associated with severe ROP cases.
MATERIALS AND METHODS This was a retrospective, cross-sectional, comparative study at the Division of Neonatology, Department of Pediatrics, Faculty of Medicine at Siriraj Hospital, Mahidol University, Bangkok, Thailand. As a teaching and regional tertiary referral hospital, patients in the study were both inborn and outborn infants who ranged between low-risk to high-risk. Preterm infants born <28 days before due date were admitted into a one of several neonatal wards, i.e; a neonatal intensive care unit (NICU), intermediate care unit, or high-risk nursery, depending on birth weight (BW) and respiratory or hemodynamic status, regardless of primary diagnosis.An ACOG guidance for antenatal corticosteroids administrations and intrapartum antibiotics11 was used throughout the study period. We followed the International Liaison Committee of Resuscitation (ILCOR) guideline for birth resuscitation.12,13 Respiratory management included encouraging the use of non-invasive ventilation (NIV) and oxygen titration and oxygen monitoring devices were available at delivery suites and neonatal wards. Surfactant replacement therapy was used in infants with a clinical diagnosis of surfactant deficiency and requiring FiO2 >0.6 (between 2013 to
2015) or >0.4 (from 2016 onwards) under NIV. Oxygen management for preterm infants was targeted between 88%-93% until mid-2013 at which point it was changed to 90%-95%. Nutritional management included early parenteral nutrition within the first few hours of life and encouraging early trophic feeding. Human-milk fortification was added once infants could tolerate 100 mL/kg/day feeds. Vitamin E 25 IU/day was also prescribed after infants were fully-fed until the 40-week PMA. According to institutional guidelines for screening of ROP, infants born prior to <33 weeks’ gestation or with a birth weight ≤1,500g are required to be screened. All eye examinations were performed under indirect ophthalmoscopy at the bedside by- or under the direct supervision of the pediatric ophthalmologist. The first examination was scheduled during the 4th week of chronological age. Subsequent examinations were scheduled over the next 1-4 weeks depending on previous findings and a plan of management was manually recorded following each examination as part of a quality improvement policy. The cases in which infants who had abnormal eye examination reached threshold levels between January 2010 to December 2019 (the threshold, T-group) were explored along with their associated risk factors. Each case was selectively matched with 4 controls of normal or pre-threshold ROP (the non-threshold, NT- group) using the same GA strata (≤27 or >27 weeks-GA) and admitted next to the corresponding case to minimize selective bias from level of prematurity and variation of general care practices over time. Infants who had normal eye examinations were prioritized in the NT group. However, in case there were not enough normal controls, which occurred in the ≤27 weeks-strata, infants who had abnormal examinations but did not meet the criteria for threshold (pre-threshold ROP) were selected. Therefore, the NT-group consisted of both normal and pre-threshold ROP disease. Clinical variables of eligible infants were extracted using pre-specified outcomes by an individual chart review for analysis. Incidence and demographic characters were presented as a number and percentage for categorical variables and as mean ± standard deviation (SD) or median [percentile 25th (P25), percentile 75th (P75)]. Comparisons of infants’ clinical and ophthalmologic outcomes between groups of gestational age (GA) ≤27 weeks and >27- weeks’ groups was done using the Chi-square test, Fisher’s exact test, paired t-test, and Mann-Whitney U test depending on the type and distribution of each variable. A univariate logistic regression analysis evaluated factors associated with occurrence of threshold ROP using the crude odds ratio (OR) with 95% confidence interval (CI) and adjusted

Volume 73, No.12: 2021 Siriraj Medical Journalhttps://he02.tci-thaijo.org/index.php/sirirajmedj/index 779
Original Article SMJOR for significantly different demographic variables with multivariate logistic regression analysis. All statistical analyses were performed using SPSS Statistics version 18.0 (SPSS, Inc., Chicago, IL, USA). A p-value of <0.05 was considered statistically significant.
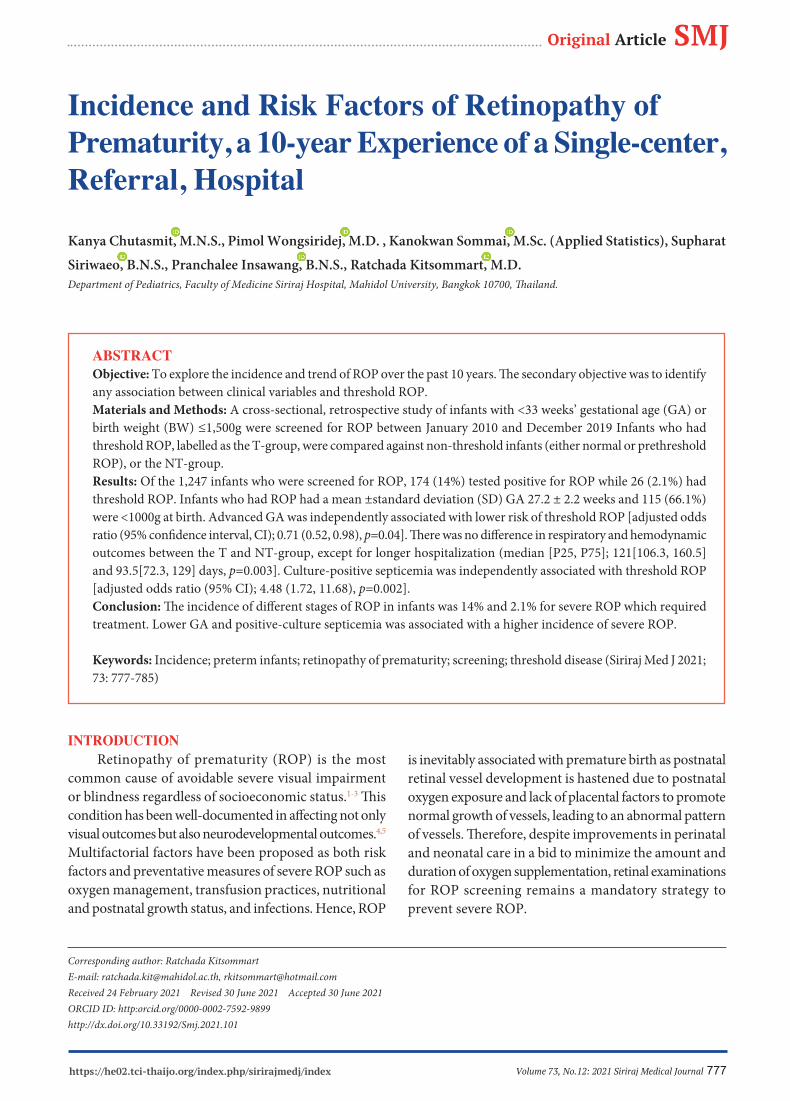
RESULTS The study protocol was approved by the institutional IRB. From January 2010 to December 2019, there were 1247 infants screened for ROP. Of these, 174 (14%) had ROP at various stages. Our annual incidence rate ranged from 9.2% to 24.4% (Fig 1). The mean ± standard deviation (SD) GA of 174 infants who had abnormal eye examinations was 27.2 ± 2.2 weeks and their mean ± SD birth weight was 923.0 ± 257.4 g. One-hundred and fifteen (66.1%) infants had BW <1,000 g. One-hundred and sixty-six (95.4%) were inborn infants, 32 (18.4%) were small-for-gestational age and 34 (19.5%) were born from multifetal pregnancies. Threshold ROP occurred in 26 infants (2.1%) and 14.9% of infants were in the T-group (those with ROP at different stages). Twenty-five infants had laser surgery performed, 5 received both laser surgery and intravitreal anti-VEGF therapy, and one infant received only anti-VEGF therapy. Of the 104 infants in the NT-group, 31 had normal eye examinations (11 infants with GA ≤27 weeks and 20 infants with GA >27 weeks) and 73 with prethreshold ROP (all GA ≤27 weeks). Table 1 compares baseline demographic characteristics between the T and NT-group. Although attempts were made to match GA, the median [P25, P75] GA of the T-group was significantly lower than the NT-group, 25.5 [25, 26] versus 26 [25, 27], p=0.02, and their corresponding BW was marginally different (775 [707.5, 932.5] and 870 [770, 1115], respectively; p=0.05). The other baseline characteristics were not significantly different. Table 2 demonstrates clinical outcomes during hospitalization
at birth between the groups. There were no differences in respiratory and hemodynamic outcomes between the groups. However, infants in the T-group had a higher rate of culture-positive septicemia (46.2% versus 17.3%, p=0.004) and a longer median hospitalization stay, 121 days [106.3, 160.5] and 93.5 days [72.3, 129], p=0.003]. Among infants who had ROP at various stages, the median [P25, P75] postnatal age (PNA) of initial eye examination was 30 days [28, 32] at 31 [30, 33] weeks’ postmenstrual age (PMA). The PNA of the first abnormal examination was 50 days [40, 58] at PMA at 34 weeks [32, 36]. Table 3 compares the characteristics of eye examinations between the groups. PNA and PMA of initial examinations and the first abnormal detection were not different between the groups. The T-group had a significantly higher number of eye examinations during birth hospitalization (12[9, 13.3] versus 8 [5, 11.8], respectively, p<0.001). Table 4 identifies the potential risk factors of developing threshold ROP. Culture-positive septicemia was independently associated with threshold ROP [adjusted OR (95%CI) 4.48 (1.72, 11.68), p =0.002] while advanced GA was associated with lower risk of threshold ROP [adjusted OR (95%CI) 0.71 (0.52, 0.98) for each week, p <0.001]. Fig 2 demonstrates the proportion of ROP screening results based on GA. The incidence trend of ROP at any stage or at threshold were inversely high with lower GA. (Table 5) compares characteristics of eye examinations and the outcomes of ROP in 174 infants based on GA strata. Infants ≤27 weeks GA had earlier both PMA for initial eye examination and first abnormal detection (30 [29, 31] versus 33 [32, 34] and 33 [31, 34] versus 35 [34, 37] weeks, respectively, both p<0.001). Infants ≤27 weeks GA had a higher rate of threshold ROP (19.8% versus 7.4%, p=0.03) and borderline different rates of laser therapy (18.9% versus 7.4%, p=0.05].
Fig 1. Trend in the incidences of retinopathy of prematurity from 2010 to 2019 (N=1,247)
Volume 73, No.12: 2021 Siriraj Medical Journal https://he02.tci-thaijo.org/index.php/sirirajmedj/index780
Chutasmit et al.
Variable Threshold disease Normal or p-value (n = 26) prethreshold disease (n = 104) Gestational age (week) 25.5 [25, 26] 26 [25, 27] 0.02*
Birth weight (g) 775 [707.5, 932.5] 870 [770, 1115] 0.05
Small-for-gestational age 4 (15.4) 12 (11.5) 0.59
Large-for-gestational age 0 2 (1.9) 0.48
Inborn 25 (96.2) 102 (98.1) 0.56
Multiples 4 (15.4) 19 (18.3) 0.73
Cesarean section 10 (38.5) 67 (64.4) 0.03
Maternal complications (n =128) (n = 26) (n = 102) Hypertension 2 (7.7) 18 (17.6) 0.36 Diabetes 3 (11.5) 12 (11.8) 1.00 Antepartum hemorrhage 3 (11.5) 4 (3.9) 0.15 Chorioamnionitis / infection 6 (23.1) 20 (19.6) 0.79
TABLE 1. Baseline demographic characteristics.
TABLE 2. Clinical characteristics during hospitalization at birth.
Data presented as number (percentage) or median [P25, P75].*A p-value<0.05 indicates statistical significance.
Variable Threshold disease Normal or p-value (n = 26) prethreshold disease (n = 104) Respiratory support Non-invasive ventilation 25 (96.2) 100 (96.2) 1.00 Mechanical ventilation 25 (96.2) 88 (84.6) 0.19Received theophylline 21 (80.8) 90 (86.5) 0.54Surfactant administration 11 (42.3) 34 (32.7) 0.49Pneumothorax 2 (7.7) 6 (5.8) 0.66Bronchopulmonary dysplasia 23 (88.5) 75 (72.1) 0.13Cardiovascular Inotropic agent (s) 17 (65.4) 50 (48.1) 0.13 Medical ligation 15 (57.7) 58 (55.8) 1.00 Surgical ligation 7 (26.9) 31 (29.8) 0.82Infection Positive blood culture 12 (46.2) 18 (17.3) 0.004* Parenteral antibiotics 26 (100) 104 (100) GI & Nutrition Breast milk 25 (96.2) 100 (96.2) 1.00 Pasteurized donor milk 2 (7.7) 6 (5.8) 0.66 Formula 23 (88.5) 90 (86.50 1.00 Diagnosis of NEC 8 (30.8) 40 (38.5) 0.51 Surgical NEC 0 7 (6.7) 0.34Days of mechanical ventilation 41 [21.0 , 61.0] 30 [10.8 , 56.5] 0.21Days of hospitalization 121 [106.3, 160.5] 93.5 [72.3, 129] 0.003*Death during birth hospitalization 1 (3.8) 5 (4.8) 0.28
Data presented as number (percentage) or median [P25, P75].*A p-value<0.05 indicates statistical significance.(Abbreviations: CPAP, continuous positive-airway pressure; CSF, cerebrospinal fluid; HFNC, high-flow nasal cannula; NEC, necrotizing enterocolitis; NIPPV, nasal intermittent positive-airway pressure)

Volume 73, No.12: 2021 Siriraj Medical Journalhttps://he02.tci-thaijo.org/index.php/sirirajmedj/index 781
Original Article SMJ
TABLE 3. Characteristics of eye examinations (N=130).
TABLE 4. Risk factors of threshold ROP.
Threshold Normal or
Variable disease prethreshold disease p-value
(n = 26) (n = 104)
Postnatal age of first eye examination, day 30 [28, 32.5] 29 [27.3, 32] 0.43
Postmenstrual age of first eye examination, week 29.5 [28.8, 32] 30 [29, 31] 0.09
Postnatal age of first abnormal detection, day (n = 99) 50 [44, 53] 52 [44.5, 61] 0.11
Postmenstrual age of first abnormal detection, week (n = 99) 32 [31, 34] 33 [31.5, 34] 0.16
Number of examinations during birth hospitalization 12 [9, 13.3] 8 [5, 11.8] <0.001*
Data presents as median [P25, P75].*A p-value<0.05 indicates statistical significance.
Variables OR (95%CI) P-value AOR (95%CI) p-value
Gestational age
(every week increment) 0.75 (0.56, 0.99) 0.05 0.71 (0.52, 0.98) 0.04*
Birth weight
(every 100-g increment) 0.84 (0.69, 1.02) 0.07 0.95 (0.72, 1.28) 0.75
Mechanical ventilation 4.55 (0.57, 35.97) 0.15 2.42 (0.28, 21.28) 0.43
Surfactant administration 1.51 (0.63, 3.64) 0.36 1.03 (0.39, 2.72) 0.95
Days of mechanical ventilation 1.00 (0.99, 1.01) 0.33 0.99 (0.98, 1.01) 0.78
Did not receive breast milk 1.00 (0.11, 9.34) 1.00 0.68 (0.07, 6.89) 0.75
Culture-positive septicemia 4.10 (1.63, 10.31) 0.003 4.48 (1.72, 11.68) 0.002*
Medical ligation for PDA 1.08 (0.45, 2.58) 0.86 0.64 (0.24, 1.70) 0.37
Surgical ligation for PDA 0.87 (0.33, 2.27) 0.77 0.54 (0.19, 1.54) 0.25
Inotropic agents 2.04 (0.83, 4.99) 0.12 1.11 (0.41, 3.01) 0.84
AOR, adjusted odds ratio, were adjusted by gestational age and positive blood culture.*A p-value<0.05 indicates statistical significance.

Volume 73, No.12: 2021 Siriraj Medical Journal https://he02.tci-thaijo.org/index.php/sirirajmedj/index782
Chutasmit et al.
Fig 2. Incidences of retinopathy of prematurity by gestational age (N=1,247)
TABLE 5. Characteristics of abnormal eye examinations (N=174).
GA ≤27 weeks GA >27 weeks p-value
(n = 106) (n = 68)
PNA of first eye examination (days) 30 [28, 33] 30 [28 ,32] 0.88
PMA of first eye examination (weeks) 30 [29, 31] 33 [32, 34] <0.001*
PNA of first abnormal detection (days) (n = 99) 51 [44, 59.3] 42.5 [32.3, 53.8] <0.001*
PMA age of first abnormal detection (weeks) (n = 99) 33 [31, 34] 35 [34, 37] <0.001*
Number of examinations during hospitalization 10 [8, 13] 6 [4, 9] <0.001*
Threshold disease 21 (19.8) 5 (7.4) 0.03*
Laser therapy 20 (18.9) 5 (7.4) 0.05*
PNA of LASER therapy (days) 75.5 [66.8, 85.8] 68 [38, 88] 0.37
Intravitreous anti-VEGF therapy 5 (4.7) 1 (1.5) 0.41
PNA of anti-VEGF therapy (days) 69 [61, 108] 43 [43, 43] 0.33
Data presents as median [P25, P75] or number (percentage). *A p-value<0.05 indicates statistical significance.Abbreviations: PMA, postmenstrual age; PNA, postnatal age; VEGF, vascular endothelial growth factor

Volume 73, No.12: 2021 Siriraj Medical Journalhttps://he02.tci-thaijo.org/index.php/sirirajmedj/index 783
Original Article SMJDISCUSSION Retinopathy of prematurity (ROP) remains an important morbidity factor in extremely preterm infants. Since its risk is the result of premature birth, total elimination of ROP remains a challenge even though various strategies have been attempted to minimize the risk of the disease. In fact, a standard screening program is mandatory to explore the magnitude of the disease and, more importantly, to identify early abnormal vessels to allow for early management that can save an infant’s long-term vision. Relatively recent reports about incidence of ROP at any stage of the disease ranges between 9% to 27%.14-17 However, it is a challenge to compare results because such a big range of incidence can be explained by a few possibilities. The first, and most important reason, is the availability to provide care for very premature infants and associated risk factors. Middle-income countries especially have a high burden of ROP due to improvements in survival rate of extremely premature infants, however, they still have limited resources to monitor and titration of oxygen devices.1 This phenomenon has been noted after studies have revealed the incidence of ROP in middle-income countries was as high as 69% in extremely-low birthweight infants.18 Second, criteria for ROP screening suggested from different expertise groups are not uniform, mainly included GA and BW.6,19 Generally, ROP screening is suggested for infants with GA ≤30 or 32 weeks or a BW of ≤1,500 g. Although we perform screening for all <33 weeks’ gestation or ≤1,500 g BW infants, only 7 out of 130 (5.4%) who were 31 to 32 weeks’ GA and had BW >1,500 g. So, proportion of at-risk infants who were screened overall should be comparable to the other reported incidence using minor different criterion. Third, various definitions of severe ROP were selected in each report and used treatment requiring ROP or threshold ROP to represent the severity. Our incidence of ROP at any stage of the disease was 14%, which was relatively low when compared to other upper middle-income countries where the incidence ranges between 19% to 33%.17,20,21 In fact, our incidence showed ROP rates decreased from 2010 to 2013. However, there was a sharp increase in ROP rate from 9.3% in 2013 to 14.3% in 2014. We suspect this rise was secondary due to changes of targeted oxygen saturation which was reported in a previous study.22,23 However, our incidence of threshold ROP at 2.1% was relatively stable throughout the study period and comparable to the other reports from developed countries.14
Timing of abnormal neovascularization usually found during vasoproliferative phase of ROP.19,24 We found median PNA of initial abnormal vessels detection were 50 days in threshold ROP and 52 days for prethreshold
ROP which were correspondence to 32- and 33-weeks PMA. Since their PNA and PMA were comparable between the groups, timing of initial abnormal detection cannot predict their subsequent results of abnormal vessels which emphasize the importance of subsequent follow-up examinations until full development of retinal vessels. Observational studies have shown several risk factors associated with either ROP at various stages of disease progression or threshold ROP. The most potent risk of baseline characteristics is premature birth,10,14,25 which was also demonstrated in our study [adjusted OR 0.71 (0.52, 0.98), p=0.04]. Although 66.1% of ROP cases in our study were extremely premature infants (birth weight <1,000 g), we did not find any significant association between BW and threshold ROP. So, premature birth is a more potent risk factor than intrauterine growth. Dysoxemia and clinical unstable are proposed to be at-risk for ROP.26-29 We did not find any differences in respiratory outcomes such as intubation, duration of mechanical ventilation, surfactant administration, pneumothorax, or bronchopulmonary dysplasia or in hemodynamic parameters (inotropic agents or treatment of patent ductus arteriosus) in infants with threshold ROP and the control group. Postnatal nutrition plays an important role on normal retinal vessels via optimal level of IGF-1 and antioxidative factors in breast milk.30
Hence, we did not find different rate of threshold ROP in infants who received maternal breast milk or pasteurized donor milk (PDM [adjusted OR 0.68 (0.07, 6.89), p=0.75]. However, due to the limited number of infants who did not receive breast milk, this phenomenon is deserved to be explored further with adequate sample size. The meta-analysis showed significant association between chorioamnionitis and severe ROP,31 but no study has found a similar association for postnatal septicemia. Interestingly, we noticed positive-culture septicemia as a risk factor [adjusted OR 4.48 (1.72, 11.68), p=0.002]. The possibility of this relationship can be attributed to inflammation cascade suppressed early retinal vascularization and cause severe neovascularization later or secondary to systemic instability during sepsis contributed to retinal hypoxia and develop ROP later.32
We reported our incidence rate in a large number of at-risk infants from the tertiary care referral center in Thailand where the ROP screening program, including patient selections, examination maneuvers and recording, follow-up practices and therapy is already established. All eye examinations were interpreted by only one pediatric ophthalmologist which ensured internal validity. However, some limitations must be considered. First,
Volume 73, No.12: 2021 Siriraj Medical Journal https://he02.tci-thaijo.org/index.php/sirirajmedj/index784
Chutasmit et al.
due to our cross-sectional design, we could not ensure timely association or if some variables occurred before or after detection of abnormal retinal vessels. Therefore, our results assumed association between these variables and ROP occurrence. Hence, PNA of abnormal findings occurred around 50 days when most clinical stability was already established or had subsided. This was assumed to occur before any findings of ROP. Second, our patients were mainly inborn infants where physicians, caregivers, devices, and monitoring equipment were available. Our incidence rate may not reflect the true incidence rate in the country, especially in rural areas where resources are limited, especially in coverage of the screening program.
CONCLUSION In conclusion, during the past 10 years, our incidence of ROP at any stage in infants born <33 weeks or with a BW <1,500 g was 14% and 2.1% for threshold ROP requiring treatment. Lower GA and positive-culture septicemia were found to be associated with occurrence of threshold ROP.
ACKNOWLEDGEMENTS We gratefully give thanks to Professor La-Ongsri Atchaneeyasakul for her contribution in performing eye examination throughout the study period.
REFERENCES1. Gilbert C, Rahi J, Eckstein M, O’Sullivan J, Foster A. Retinopathy of prematurity in middle-income countries. Lancet. 1997;350: 12-4.2. Solebo AL, Teoh L, Rahi J. Epidemiology of blindness in children. Arch Dis Child. 2017;102:853-7.3. Gilbert C. Retinopathy of prematurity: a global perspective of the epidemics, population of babies at risk and implications for control. Early Hum Dev. 2008;84:77-82.4. Drost FJ, Keunen K, Moeskops P, Claessens NHP, Kalken FV, Isgum I, et al. Severe retinopathy of prematurity is associated with reduced cerebellar and brainstem volumes at term and neurodevelopmental deficits at 2 years. Pediatr Res. 2018;83:818- 24.5. Jacobson L, Vollmer B, Kistner A, Bohm B. Severity of retinopathy of prematurity was associated with a higher risk of cerebral dysfunction in young adults born extremely preterm. Acta Paediatr. 2020;110:528-36.6. Fierson WM; American Academy of Pediatrics Section on Ophthalmology; American Academy of Ophthalmology; American Association for Pediatric Ophthalmology and Strabismus; American Association of Certified Orthoptists. Screening examination of premature infants for retinopathy of prematurity. Pediatrics. 2018;142(6):e20183061. Pediatrics. 2019;143(3):e20183810. 7. Sabri K, Woodward MA, Easterbrook B, Shivananda S, Canadian Neonatal Network. Retinopathy of prematurity practices: a national survey of Canadian Neonatal Intensive Care Units. J Perinatol. 2018;38:381-5.
8. Multicenter Trial of Cryotherapy for Retinopathy of Prematurity: One-year outcome--structure and function. Cryotherapy for Retinopathy of Prematurity Cooperative Group. Arch Ophthalmol. 1990;108:1408-16.9. Good WV, Hardy RJ, Wallace DK, Bremer D, Rogers DL, Siatkowski RM, et al. beta-Blocking and racial variation in the severity of retinopathy of prematurity. Arch Ophthalmol. 2012; 130:117-8.10. Bain LC, Dudley RA, Gould JB, Lee HC. Factors associated with failure to screen newborns for retinopathy of prematurity. J Pediatr. 2012;161:819-23.11. ACOG Committee Opinion No. 475: Antenatal corticosteroid therapy for fetal maturation. Obstet Gynecol. 2011;117:422-4.12. American Academy of Pediatrics and the American Heart Association. Textbook of Neonatal Resuscitation, 6th ed. Vol. 6. Illinois, US: American Academy of Pediatrics; 2011.13. American Academy of Pediatrics and the American Heart Association. Textbook of Neonatal Resuscitation. 7th ed. Vol. 7. Illinois, US: American Academy of Pediatrics; 2016.14. Gerull R, Brauer V, Bassler D, Laubscher B, Pfister RE, Nelle M, et al. Incidence of retinopathy of prematurity (ROP) and ROP treatment in Switzerland 2006-2015: a population-based analysis. Arch Dis Child Fetal Neonatal Ed. 2018;103:F337-42.15. Hussain N, Clive J, Bhandari V. Current incidence of retinopathy of prematurity, 1989-1997. Pediatrics. 1999;104:e26.16. Li Q, Wang Z, Wang R, Tang H, Chen H, Feng Z. A prospective study of the incidence of retinopathy of prematurity in China: evaluation of different screening criteria. J Ophthalmol. 2016; 2016:5918736.17. Zarei M, Bazvand F, Ebrahimiadib N, Roohipoor R, Karkhaneh R, Dastjani AF, et al. Prevalence and risk factors of retinopathy of prematurity in Iran. J Ophthalmic Vis Res. 2019;14:291-8.18. Ali AA, Gomaa NAS, Awadein AR, Al-Hayouti HH, Hegazy AI. Retrospective cohort study shows that the risks for retinopathy of prematurity included birth age and weight, medical conditions and treatment. Acta Paediatr. 2017;106:1919-27.19. Hartnett ME, Penn JS. Mechanisms and management of retinopathy of prematurity. N Engl J Med. 2013;368:1161-3.20. Freitas AM, Morschbacher R, Thorell MR, Rhoden EL. Incidence and risk factors for retinopathy of prematurity: a retrospective cohort study. Int J Retina Vitreous. 2018;4:1-8.21. Hakeem AH, Mohamed GB, Othman MF. Retinopathy of prematurity: a study of prevalence and risk factors. Middle East Afr J Ophthalmol. 2012;19:289-94.22. Manley BJ, Kuschel CA, Elder JE, Doyle LW, Davis PG. Higher Rates of Retinopathy of Prematurity after Increasing Oxygen Saturation Targets for Very Preterm Infants: Experience in a Single Center. J Pediatr. 2016;168:242-4.23. Soderstrom F, Normann E, Holmstrom G, Larsson E, Ahlsson F, Sindelar R, et al. Reduced rate of treated retinopathy of prematurity after implementing lower oxygen saturation targets. J Perinatol. 2019;39:409-14.24. Hellstrom A, Smith LE, Dammann O. Retinopathy of prematurity. Lancet. 2013;382:1445-57.25. Taner A, Tekle S, Hothorn T, Adams M, Bassler D, Gerth- Kahlert C. Higher incidence of retinopathy of prematurity in extremely preterm infants associated with improved survival rates. Acta Paediatr. 2020;109:2033-9.26. Imanishi Y, Hirata K, Nozaki M, Mochizuki N, Hirano S, Fukushima Y, et al. Effect of fluctuation of oxygenation on
Volume 73, No.12: 2021 Siriraj Medical Journalhttps://he02.tci-thaijo.org/index.php/sirirajmedj/index 785
Original Article SMJ the development of severe retinopathy of prematurity in extremely preterm infants. J Perinatol. 2020;40:515-21.27. Gantz MG, Carlo WA, Finer NN, Rich W, Faix RG, Yoder BA, et al. Achieved oxygen saturations and retinopathy of prematurity in extreme preterms. Arch Dis Child Fetal Neonatal Ed. 2020; 105:F138-44.28. Holmes JM, Zhang S, Leske DA, Lanier WL. Metabolic acidosis- induced retinopathy in the neonatal rat. Invest Ophthalmol Vis Sci. 1999;40:804-9.29. Holmes JM, Zhang S, Leske DA, Lanier WL. Carbon dioxide- induced retinopathy in the neonatal rat. Curr Eye Res. 1998;17: 608-16.
30. Zhou J, Shukla VV, John D, Chen C. Human milk feeding as a protective factor for retinopathy of prematurity: a meta- analysis. Pediatrics. 2015;136:e1576-86.31. Villamor-Martinez E, Cavallaro G, Raffaeli G, Mohammed Rahim OMM, Gulden S, Ghazi AMT, et al. Chorioamnionitis as a risk factor for retinopathy of prematurity: An updated systematic review and meta-analysis. PLoS One. 2018;13:1-20.32. Lundgren P, Klevebro S, Brodin P, Smith LEH, Hallberg B, Hellstrom A. Leucocytosis is associated with retinopathy of prematurity in extremely preterm infants. Acta Paediatr. 2019; 108:1357-8.
Volume 73, No.12: 2021 Siriraj Medical Journal https://he02.tci-thaijo.org/index.php/sirirajmedj/index786
Wongsawaeng et al.
Doonyaporn Wongsawaeng, M.D.*, Orasa Chawalparit, M.D.*, Siriwan Piyapittayanan, M.D.*, Tanyaluck Thientunyakit, M.D.*, Weerasak Muangpaisan, M.D.**, Kitikan Thana-udom, M.D. ***, Panida Charnchaowanish, B.Sc*, Chanon Ngamsombat, M.D.**Department of Radiology, **Department of Preventive and Social Medicine, ***Department of Psychiatry, Faculty of Medicine Siriraj Hospital,
Mahidol University, Bangkok 10700, Thailand.
Magnetic Resonance Hippocampal Subfield Volumetric Analysis for Differentiating among Healthy Older Adults and Older Adults with Mild Cognitive Impairment or Major Depressive Disorder
ABSTRACTObjective: Depression among older adults is frequently an early symptom of cognitive decline, and is believed to be a risk factor for Alzheimer’s disease (AD). Hippocampal subfield volume loss is found in both mild cognitive impairment (MCI) and major depressive disorder (MDD). We aimed to investigate the potential of MR hippocampal subfield volumetry for discriminating among healthy older adults (HOA) and older adults with MCI or MDD.Materials and Methods: Seventy age-matched subjects (29 non-depressed MCI, 12 MDD, and 29 HOA) underwent 3-Tesla MR imaging (MRI) with high-resolution 3D-T1W-TFE whole brain. Hippocampal subfield volumetric measurements were performed using FreeSurfer software to distinguish among MCI, MDD, and HOA. Subgroup analysis with amyloid PET result was also performed.Results: Significantly smaller bilateral hippocampal tail volume was observed in MCI compared to HOA (p=0.004 and p=0.04 on the left and right side, respectively). The same comparative finding was observed at left HATA (hippocampus-amygdala-transition-area) of MCI (p=0.046). Other regions showed non-significantly smaller size in MCI than in HOA [left molecular layer HP (p=0.06), left whole hippocampus (p=0.06), and left CA1 (p=0.07)]. There was a non-significant trend toward smaller size in almost all 13 subfield hippocampal regions of MCI compared to MDD, even in subgroup analysis with amyloid PET result. Conclusion: MR hippocampal subfield volumetry may have value in routine clinical practice for screening individuals with MCI, and may be a valuable adjunct to amyloid PET study for very early-stage diagnosis of AD.
Keywords: Magnetic resonance hippocampal subfield volumetric analysis, mild cognitive impairment (MCI), major depressive disorder (MDD), healthy older adults (HOA) (Siriraj Med J 2021; 73: 786-792)
Corresponding author: Chanon NgamsombatE-mail: [email protected] Received 9 March 2021 Revised 29 June 2021 Accepted 1 July 2021ORCID ID: https://orcid.org/0000-0001-5055-0711http://dx.doi.org/10.33192/Smj.2021.102
INTRODUCTION Mild cognitive impairment (MCI) is diagnosed when people have measurable changes in thinking ability noticed by the person affected, family members, or
friends even though the observed impairment does not affect the individual’s activities of daily living.1 The 2011 recommendations from the National Institute on Aging-Alzheimer’s Association diagnostic guideline for
Volume 73, No.12: 2021 Siriraj Medical Journalhttps://he02.tci-thaijo.org/index.php/sirirajmedj/index 787
Original Article SMJAlzheimer’s disease (AD) working groups suggest that some MCI cases reflect the early stage of AD.2 Depression, especially in older adults, frequently develops concomitantly with cognitive impairment, and it may be a psychological reaction or a risk factor for AD.3
One of the most mentioned structures in limbic system is hippocampus, which is known to involve in both neurodegenerative disease, especially AD, and emotional regulation.4 Hippocampal atrophy is usually detected in late stage of AD. Previous study found that subfield hippocampal atrophy evidenced by magnetic resonance imaging (MRI) might be helpful for early detection of mild cognitive impairment who have converted to AD (MCI-c).5 Concerning mood regulation, a previous meta-analysis found more hippocampal volume loss in MDD than in the control; however, the impact of illness on hippocampal volume is probably related to duration and severity.6 To date, no study has compared subfield hippocampal volume between MCI and MDD in older adults. Accordingly, the aim of this study was to investigate the potential of MR hippocampal subfield volumetry for discriminating among older adults with non-depressed MCI, older adults with treatment-naïve MDD, and healthy older adults (HOA).
MATERIALS AND METHODSStudy population This retrospective study reviewed the MRI DICOM files, clinical information, and neuropsychological test results of 72 subjects (30 MCI, 12 MDD, and 30 HOA) who were recruited at a single national tertiary referral center in Thailand during January 2016 to September 2020. The protocol for this study was approved by the Siriraj Institutional Review Board (SIRB) of the Faculty of Medicine Siriraj Hospital, Mahidol University, Bangkok, Thailand (Si 1037/2020). The 30 MCI and 30 HOA subjects, recruited from neurology and geriatric clinics at our center, were part from the SIRB-approved study (Si 137/2015). Clinical evaluation of MCI and HOA subjects was performed by a senior geriatric neurologist (WM) who specializes in dementia. The 12 MDD subjects, first-diagnosed treatment-naïve patients, recruited from the psychiatric clinic at our center, were part from a different SIRB-approved study (Si 239/2016). Diagnosis and severity of depression were determined by a board-certified psychiatrist. Two out of 72 subjects (1 MCI and 1 HOA) were excluded due to flaws in their MRI DICOM files. The
remaining 70 subjects (29 MCI, 12 MDD, and 29 HOA) were included and analyzed. The amyloid PET result for all of the 29 MCI patients were recorded and subcategorized as PET positive MCI (PET+ve MCI; n=12) or PET negative MCI (PET-ve MCI; n=17) patients. Age, gender, education level, Thai Mental State Examination (TMSE)7, Clinical Dementia Rating Scale (CDR), and Hamilton Rating Scale for Depression (HAM-D)8 were also collected and recorded. Two years of clinical follow-up among the 29 MCI subjects was achieved by the end of September 2020.
Operational definitions 1. Criteria for mild cognitive impairment (MCI) 1) Age equal to or greater than 60 years 2) Subjective memory complaint by the patient, family member, or clinician with preserved activities of daily living (ADL) 3) CDR score of 0.5 4) Absence of dementia by National Institute of Neurological and Communicative Disorders and Stroke and the Alzheimer’s Disease and Related Disorders Association (NINCDS-ADRDA) criteria 5) TMSE score from 24 to 30 6) No history of depressive symptom
2. Criteria for major depressive disorder (MDD) 1) Age equal to or greater than 60 years 2) First diagnosed approaching fulfillment of the Diagnostic and Statistical Manual of Mental Disorders, 5th Edition (DSM-5) criteria for MDD9
3) Depression severity was measured by HAM-D 4) TMSE score from 24 and 30 5) No other psychiatric disorders, antidepressant drug use, currently unstable medical or neurological condition
3. Criteria for healthy older adults (HOA) 1) Age equal to or greater than 60 years 2) TMSE score from 24 to 30 3) CDR score of 0 4) No neurological or psychiatric illness, non-demented, and normal ADL
Magnetic resonance imaging (MRI) acquisition All 70 enrolled subjects underwent 3T MRI scans (Ingenia, Philips Medical System, Best, the Netherlands) with a 32-channel head coil. The MRI protocol included a 3D high-resolution T1W-TFE sequence covering whole brain (field-of-view (FOV) 230×230×172 mm3, matrix size 352x352, voxel size 0.72×0.72×0.65 mm3, echo time
Volume 73, No.12: 2021 Siriraj Medical Journal https://he02.tci-thaijo.org/index.php/sirirajmedj/index788
Wongsawaeng et al.
(TE)/repetition time (TR) 4.8/9.8 ms, flip angle 8°, scan time 6 min). All MRI DICOM files were transferred to hippocampal subfield segmentation process.
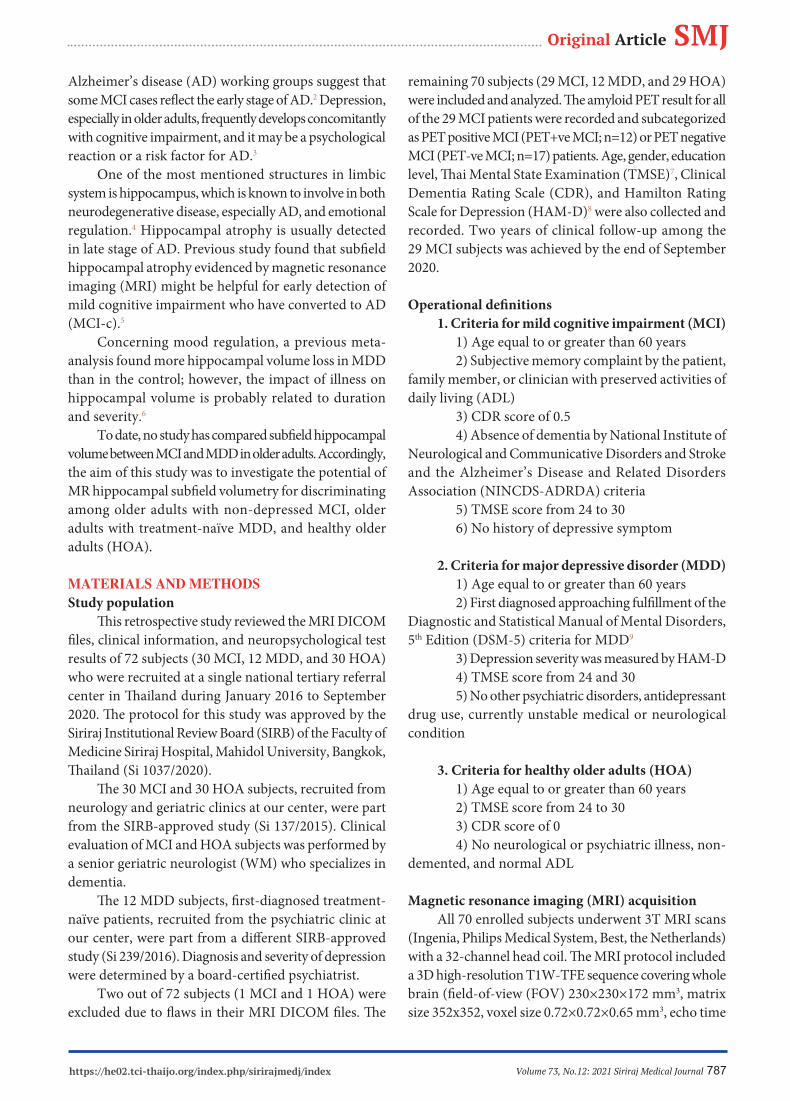
Hippocampal subfield segmentation The FreeSurfer image analysis pipeline (version 6.0)10 was used for automated hippocampal subfield segmentation. The validated ultra-high resolution 13 subfield hippocampal regions (Fig 1) were, as follows: presubiculum, subiculum, parasubiculum, cornu ammonis (CA)1, CA2/3, CA4, molecular layer hippocampus (HP), GC-ML-DG (granule cell layer and molecular layer of dentate gyrus), HATA (hippocampus-amygdala-transition-area), hippocampal tail, fimbria, hippocampal fissure, and the whole hippocampus, bilaterally. The raw volume data each of subfield was displayed and then normalized according to each subject’s intracranial
volume (ICV) derived from FreeSurfer software via this following formula: volume normalized = volume raw data x 1,000/ICV in cm3.10,11
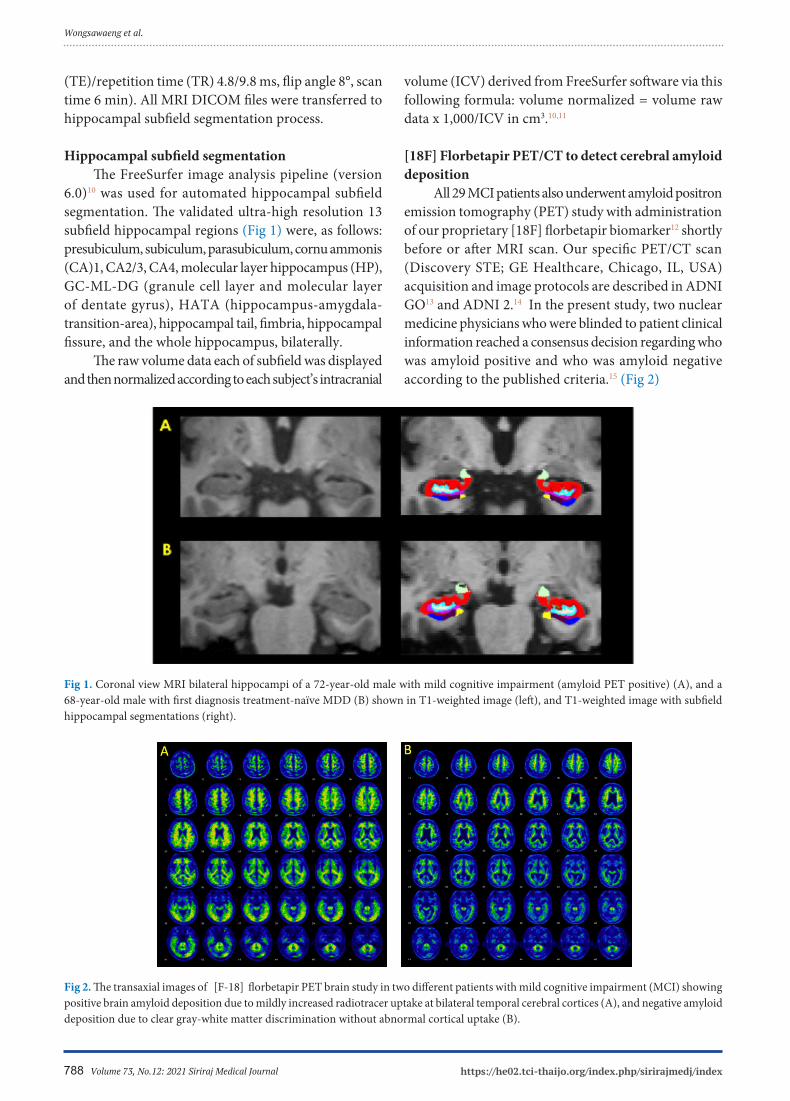
[18F] Florbetapir PET/CT to detect cerebral amyloid deposition All 29 MCI patients also underwent amyloid positron emission tomography (PET) study with administration of our proprietary [18F] florbetapir biomarker12 shortly before or after MRI scan. Our specific PET/CT scan (Discovery STE; GE Healthcare, Chicago, IL, USA) acquisition and image protocols are described in ADNI GO13 and ADNI 2.14 In the present study, two nuclear medicine physicians who were blinded to patient clinical information reached a consensus decision regarding who was amyloid positive and who was amyloid negative according to the published criteria.15 (Fig 2)
Fig 2. The transaxial images of [F-18] florbetapir PET brain study in two different patients with mild cognitive impairment (MCI) showing positive brain amyloid deposition due to mildly increased radiotracer uptake at bilateral temporal cerebral cortices (A), and negative amyloid deposition due to clear gray-white matter discrimination without abnormal cortical uptake (B).
Fig 1. Coronal view MRI bilateral hippocampi of a 72-year-old male with mild cognitive impairment (amyloid PET positive) (A), and a 68-year-old male with first diagnosis treatment-naïve MDD (B) shown in T1-weighted image (left), and T1-weighted image with subfield hippocampal segmentations (right).

Volume 73, No.12: 2021 Siriraj Medical Journalhttps://he02.tci-thaijo.org/index.php/sirirajmedj/index 789
Original Article SMJStatistical analysis All statistical analyses were performed using SPSS Statistics version 18.0 (SPSS, Inc., Chicago, IL, USA). Continuous variables were analyzed by analysis of variance (ANOVA) with Bonferroni post hoc comparisons, and the categorical variables were analyzed by chi-square test. A p-value <0.05 was considered to be statistically significant.
RESULTS1. Demographics, clinical and neuropsychological data Seventy age-matched subjects were included in this study (MCI=29, MDD=12, HOA=29). The mean ± SD age of these 3 groups was 68.1±4.3, 70.8±6.0, and 68.7±4.8 years, respectively. As expected, there were no statistically significant differences in TMSE score among the 3 study groups (Table 1). Six of the 29 MCI patients had clinically proven AD-converted MCI by the end of the 2-year follow-up, and all 6 of those patients had an initial amyloid PET result that was positive.
2. Hippocampal subfields 2.1 Comparison between MCI and HOA (Table 2) The bilateral hippocampal tails showed significantly smaller volume in the MCI group compared to the HOA group (p=0.004 and p=0.04 on the left and right side, respectively), as well as at the left HATA (hippocampus-amygdala-transition-area) (p=0.046). We also observed a trend towards significantly smaller size in the MCI
group compared to the HOA group for left molecular layer HP (p=0.06), left whole hippocampus (p=0.06), and left CA1 (p=0.07). 2.2 Comparison between MCI and MDD (Tables 2, 3) There was a non-significant trend toward smaller size in almost all of the 13 subfield hippocampal regions when compared between MCI and MDD subjects – even in subgroup analysis (MCI PET+ve and MCI PET-ve). 2.3 Comparison between MDD and HOA (Table 2) There was no significant difference between the MDD and HOA groups for any subfield hippocampal regions. 2.4 Comparison between MCI PET+ve and HOA (Table 3) In subgroup analysis combined with amyloid PET result, we found that the bilateral hippocampal tails showed a significantly smaller volume in the MCI PET+ve group than in the HOA group (p=0.002 and p=0.02 on the left and right side, respectively). The left whole hippocampus (p=0.05), left molecular layer HP (p=0.07), and left subiculum (p=0.07) all demonstrated smaller volume among MCI PET+ve subjects compared to HOA subjects. 2.5 Comparison between MCI PET-ve and HOA (Table 3) No statistically significant difference in hippocampal subfield volumes was observed between these two groups.
TABLE 1. Demographic, clinical and neuropsychological data of MCI, MDD, and HOA subjects.
Subject data
MCI MDD HOA
(n=29) (n=12) (n=29) p
Gender (male/female), n 15/14 5/7 10/19 0.41
Age (years), (mean±SD) 68.1±4.3 70.8±6.0 68.7±4.8 0.26
Education, n (%) <0.0001
- High school or lower 2 (6.9%) 8 (66.7%) 16 (55.2%)
- Higher than high school 27 (93.1%) 4 (33.3%) 13 (44.8%)
TMSE (mean±SD) 27.3±1.6 26.8±2.0 27.9±1.9 0.17
HAM-D (mean±SD) NA 24.5±4.3 NA NA
A p-value<0.05 indicates statistical significance Abbreviations: MCI, mild cognitive impairment; MDD, major depressive disorder; HOA, healthy older adults; SD, standard deviation; TMSE, Thai Mental State Examination, HAM-D; Hamilton Rating Scale for Depression; NA, not applicable

Volume 73, No.12: 2021 Siriraj Medical Journal https://he02.tci-thaijo.org/index.php/sirirajmedj/index790
Wongsawaeng et al.
TABLE 2. Normalized hippocampal subfield volume compared among MCI, MDD, and HOA subjects.
TABLE 3. Hippocampal subfield volume compared among MCI PET +ve, MCI PET -ve, MDD, and HOA subjects.
Parameters MCI (n=29) MDD (n=12) HOA (n=29) P (MCI vs HOA)
Left hippocampal tail 323.4±67.2 342.4±70.2 383.0±67.5 0.004a
Right hippocampal tail 345.3±78.2 368.0±54.0 392.4±70.1 0.04a
Left HATA 37.4±7.5 43.7±13.9 42.3±7.4 0.046a
Left molecular layer HP 352.1±67.7 385.6±88.0 394.1±58.2 0.06
Left whole hippocampus 2,151.5±376.2 2,338.6±521.6 2,396.6±337.1 0.06
Left CA1 394.4±79.9 435.0±88.3 440.8±68.5 0.07
a Statistically significant difference (p<0.05) between the MCI and HOA groupsAbbreviations: MCI, mild cognitive impairment; MDD, major depressive disorder; HOA, healthy older adults; HATA, hippocampus-amygdala-transition-area; HP, hippocampus; CA1, cornu ammonis 1
MCI PET+ve MCI PET-ve MDD HOA
P (MCI Parameters
(n=12) (n=17) (n=12) (n=29) PET+ve
vs HOA)
Left hippocampal tail 297.5±79.1 341.7±52.4 342.4±70.2 383.0±67.5 0.002a
Right hippocampal tail 318.2±87.5 364.4±67.0 368.0±54.0 392.4±70.1 0.02a
Left whole hippocampus 2,035.4±380.4 2,233.5±361.8 2,338.6±521.6 2,396.6±337.1 0.05
Left molecular layer HP 334.3±66.8 364.6±67.5 385.6±88.0 394.1±58.2 0.07
Left subiculum 261.9±56.5 292.6±50.6 310.1±78.2 311.6±48.4 0.07
a Statistically significant difference (p<0.05) between the MCI PET+ve and HOA groupsAbbreviations: MCI, mild cognitive impairment; MDD, major depressive disorder; HOA, healthy older adults; HP, hippocampus
DISCUSSION Interestingly, the significantly smaller volume of the bilateral hippocampal tails in the MCI compared to the HOA group, as well as in subgroup analysis, was observed in the MCI PET+ve, but not in the MCI PET-ve group. Previous study16,17 reported some differences in functionality between the ventral (anterior) and the dorsal (posterior) hippocampus in which the posterior part primarily performs cognitive functions, such as learning and memory, whereas the anterior part is more related to stress and emotion. Our 2-year clinical follow-up data showed that about 20% of our MCI patients (6/29
subjects) converted to clinically diagnosed Alzheimer’s disease (AD). More importantly, all 6 of those AD-converted MCI patients (MCI-c) also had an initial amyloid PET result that was positive. We propose that the structural change of the hippocampus demonstrated by MRI volumetric analysis, especially the small size of the hippocampal tail, might be a predictor of conversion to AD among MCI patients. The relatively smaller volume of the left molecular layer HP, left CA1, left subiculum, and left whole hippocampus in the MCI group (especially MCI PET+ve) compared to HOA subjects suggests that other hippocampal

Volume 73, No.12: 2021 Siriraj Medical Journalhttps://he02.tci-thaijo.org/index.php/sirirajmedj/index 791
Original Article SMJsubfield regions might also be affected in the early stage of neurodegenerative disease. Scharfman, et al. reported that neurons in the entorhinal cortex, especially the superficial layer, were believed to be particularly vulnerable to adverse effect in the early stage of Alzheimer’s disease (AD)18 and have been found interconnecting to axons within the hippocampal formation. From neuroanatomy, the subiculum is the grey structure that is located above the parahippocampal gyrus, which is part of the entorhinal cortex, and it superolaterally connects to the CA1 region. We postulate that the change in the entorhinal cortex in early AD might also propagate effect to the subiculum and CA1, as well as to the molecular layer HP adhering to both subiculum and CA1. In older adults, depression often develops concomitantly with cognitive impairment. This is likely a psychological reaction to cognitive decline, so it may manifest as an early symptom in early-stage dementia patients. However, recent data suggests that depression, particularly late-life depression, can also be a risk factor for AD.3 Two prior studies19,20 reported significant volume change in some subfield hippocampal regions in MDD patients with some specific conditions, such as recurrent episode of depressive symptom (decreased volume as the number of prior episodes increased)19, or continuous remission of drug-naive disease (increased volume in MDD patients who were in remission at least 6 months). Concerning our result, there was no statistically significant difference in volumetric analysis compared between first-diagnosed and untreated MDD and either MCI or HOA subjects. This may suggest that the hippocampus has some plasticity, especially relative to volumetric change in depressive condition, but not in early or late-stage neurodegenerative disease, which known to be associated with progressive permanent neuronal loss.
Strengths and limitations The strengths of our study were: 1) Clinical evaluation of MCI and HOA subjects was performed by a senior geriatric neurologist (WM) who specializes in dementia; 2) Amyloid-PET result was available for all MCI patients; and, 3) All MDD patients had first-diagnosed and untreated status without any confounding factors, such as repeated episode of depressive symptom or treatment-related issues. Limitations of the present study include 1) A lack of data specific to depressive illness duration, which may affect hippocampal subfield volume change as found from prior study21; 2) The fact that our MDD patients had only mild to moderate depressive severity, which
may not clearly demonstrate alteration of hippocampal volume; 3) Our study’s single-center retrospective design; and, 4) our overall small size and small group sample sizes may have limited the statistical power of our study to identify all significant differences between and among groups.
CONCLUSION MR hippocampal subfield volumetry may have value in routine clinical practice for screening individuals with MCI, and may be a valuable adjunct to amyloid PET study for very early-stage diagnosis of AD. Future study in subfield hippocampal volumetry compared between MCI patients with and without codepressive symptoms will further clarify the influence of depression on hippocampal atrophy, especially in some specific subfield regions. This information will improve our understanding of the underlying pathophysiology, and will help us to better guide disease management in the future.
ACKNOWLEDGEMENTS The authors gratefully acknowledge Dr. Orawan Supapueng for assistance with statistical analysis and Mrs. Angkana Jongsawaddipatana for assistance with data collection.
Conflict of interest declaration: All authors declare no personal or professional conflicts of interest, and no financial support from the companies that produce and/or distribute the drugs, devices, or materials described in this report.
Funding disclosure: DW, OC, SP, TT, WM, KT, and CN were each supported by a Chalermprakiat Grant from the Faculty of Medicine Siriraj Hospital, Mahidol University, Bangkok, Thailand.
REFERENCES1. Alzheimer’s Association. 2014 Alzheimer’s disease facts and figures. Alzheimers Dement 2014;10(2):e47-92. 2. Albert MS, DeKosky ST, Dickson D, Dubois B, Feldman HH, Fox NC, et al. The diagnosis of mild cognitive impairment due to Alzheimer’s disease: Recommendations from the National Institute on Aging-Alzheimer’s Association workgroups on diagnostic guidelines for Alzheimer’s disease. Alzheimer Dement. 2011;7(3):270-9. 3. Korczyn AD, Halperin I. Depression and dementia. J Neurol Sci. 2009;283(1-2):139-42. 4. Palazidou E. The neurobiology of depression. Vol. 101, British Medical Bulletin. 2012. p.127-45. 5. Khan W, Westman E, Jones N, Wahlund LO, Mecocci P, Vellas B, et al. Automated Hippocampal Subfield Measures as Predictors

Volume 73, No.12: 2021 Siriraj Medical Journal https://he02.tci-thaijo.org/index.php/sirirajmedj/index792
of Conversion from Mild Cognitive Impairment to Alzheimer’s Disease in Two Independent Cohorts. Brain Topogr. 2015;28(5): 746-59. 6. Mckinnon MC, Yucel K, Nazarov A, Macqueen GM, Mckinnon P. Presented as a poster at the 58th Annual Conference of the Canadian Psychiatric Assocation. J Psychiatry Neurosci. 2009;34: 7. Muangpaisan W, Md A, Sitthichai Bsc K, Richardson Phd K, Brayne C. The Distribution of Thai Mental State Examination Scores among Non-Demented Elderly in Suburban Bangkok Metropolitan and Associated Factors. J Med Assoc Thai. 2015; 98(9):916-24. 8. Lotrakul M, Sukanich P, Sukying C. The Reliability and Validity of Thai version of Hamilton Rating Scale for Depression. J Psychiat Assoc Thai. 1996;41(4):235-46. 9. American Psychiatric Association. Diagnostic and Statistical Manual of Mental Disorders, Fifth Edition. American Psychiatric Association; 2013. 10. Iglesias JE, Augustinack JC, Nguyen K, Player CM, Player A, Wright M, et al. A computational atlas of the hippocampal formation using ex vivo, ultra-high resolution MRI: Application to adaptive segmentation of in vivo MRI. Neuroimage. 2015; 115:117-37. 11. Westman E, Aguilar C, Muehlboeck JS, Simmons A. Regional magnetic resonance imaging measures for multivariate analysis in Alzheimer’s disease and mild cognitive impairment. Brain Topogr. 2013;26(1):9-23. 12. Thientunyakit T, Sethanandha C, Muangpaisan W, Chawalparit O, Arunrungvichian K, Siriprapa T, et al. Implementation of [18F]-labeled amyloid brain PET imaging biomarker in the
diagnosis of Alzheimer’s disease. Nucl Med Commun. 2018; 39(2):186-92. 13. ADNI-GO PET Technical Procedures Manual for FDG and AV-45 ADNI-GO PET Technical Procedures Manual, 2011. 14. ADNI 2 PET Technical Procedures Manual for FDG and AV- 45 ADNI 2 PET Technical Procedures Manual AV-45 (Florbetapir F 18) & FDG. 2011. 15. Minoshima S, Drzezga AE, Barthel H, Bohnen N, Djekidel M, Lewis DH, et al. SNMMI procedure standard/EANM practice guideline for amyloid PET imaging of the brain 1.0. J Nucl Med. 2016;57(8):1316–22. 16. Fanselow MS, Dong HW. Are the Dorsal and Ventral Hippocampus Functionally Distinct Structures? Neuron. 2010;65(1):7-19. 17. Samuels BA, Hen R. Neurogenesis and affective disorders. Eur J Neurosci. 2011;33(6):1152-9. 18. Scharfman HE, Chao MV. The entorhinal cortex and neurotrophin signaling in Alzheimer’s disease and other disorders. Cogn Neurosci. 2013;4(3-4):123-35. 19. Samuels BA, Leonardo ED, Hen R. Hippocampal subfields and major depressive disorder. Vol. 77, Biological Psychiatry. Elsevier USA; 2015. p. 210-1. 20. Katsuki A, Watanabe K, Nguyen L, Otsuka Y, Igata R, Ikenouchi A, et al. Structural changes in hippocampal subfields in patients with continuous remission of drug-naive major depressive disorder. Int J Mol Sci. 2020;21(9):3032. 21. Han KM, Kim A, Kang W, Kang Y, Kang J, Won E, et al. Hippocampal subfield volumes in major depressive disorder and bipolar disorder. Eur Psychiatry. 2019;57:70-77.
Wongsawaeng et al.

Volume 73, No.12: 2021 Siriraj Medical Journalhttps://he02.tci-thaijo.org/index.php/sirirajmedj/index 793
Original Article SMJ
Kantanut Yutrirak, M.D.*, Woraphat Ratta-apha, M.D., Ph.D.*, Pittaya Dankulchai, M.D.**, Panate Pukrittayakamee, M.D.* *Department of Psychiatry, **Division of Radiation Oncology, Department of Radiology, Faculty of Medicine Siriraj Hospital, Mahidol University,
Bangkok 10700, Thailand.
Psychometric Properties of the PHQ-9, HADS, and CES-D Questionnaires and the Prevalence of Depression in Patients with Cancer Receiving Radiotherapy
ABSTRACTObjective: The primary aim was to compare the psychometric properties among the Patient Health Questionnaire (PHQ-9) (both including and excluding somatic symptom items), the depression subscale of the Hospital Anxiety and Depression Scale (HADS-D), and the Center for Epidemiologic Studies Depression Scale (CES-D) in detecting depression in cancer patients receiving radiotherapy. The secondary aim was to investigate the prevalence of depression in this group of patients.Materials and Methods: Overall, 198 participants with cancer diagnosis from a radiotherapy clinic took part in the study. They completed PHQ-9, HADS-D, and CES-D questionnaires and were interviewed in line with the Mini-International Neuropsychiatric Interview (M.I.N.I.) to confirm the diagnosis. The PHQ-9 was analyzed for three scoring methods: sum-score, inclusive (including all items), and exclusive (excluding 4 somatic symptom items) methods. The psychometric properties of each questionnaire were analyzed. The prevalence of depression measured by the M.I.N.I. was evaluated.Results: The sum-score method of the PHQ-9 had an equal sensitivity (100%) to the HADS-D and CES-D, and had a slightly higher specificity (91.1%) than the HADS-D (87.4%) and CES-D (90.6%). When compared results within the PHQ-9, the sum-score method had greater sensitivity than the inclusive (71.4%) and exclusive (42.9%) methods, and had a slightly lower specificity than the inclusive (96.9%) and exclusive (97.4%) methods. The prevalence of depression assessed by the M.I.N.I was 3.5%.Conclusion: The sum-score method of the PHQ-9 seemed to be the best tool to use for depression screening in cancer patients receiving radiotherapy due to its excellent sensitivity and specificity.
Keywords: PHQ-9; HADS; CES-D; Depression; Cancer; Radiotherapy (Siriraj Med J 2021; 73: 793-800)
Corresponding author: Panate PukrittayakameeE-mail: [email protected] 8 April 2021 Revised 8 September 2021 Accepted 5 October 2021ORCID ID: https://orcid.org/0000-0001-8776-2427http://dx.doi.org/10.33192/Smj.2021.103
INTRODUCTION Depression is a common problem in patients with cancer. In one meta-analysis, the prevalence of depression among cancer patients was found to be 14.9%.1 It has been reported that depression increases the mortality rate2, decreases the quality of life3, and decreases the will
to live of patients with cancer.4,5 So, effective screening for depression is required among patients with cancer. The depression screening tools commonly used in patients with cancer include the Patient Health Questionnaire (PHQ-9)6, Hospital Anxiety and Depression Scale (HADS)7, and Center for Epidemiologic Studies Depression Scale
Volume 73, No.12: 2021 Siriraj Medical Journal https://he02.tci-thaijo.org/index.php/sirirajmedj/index794
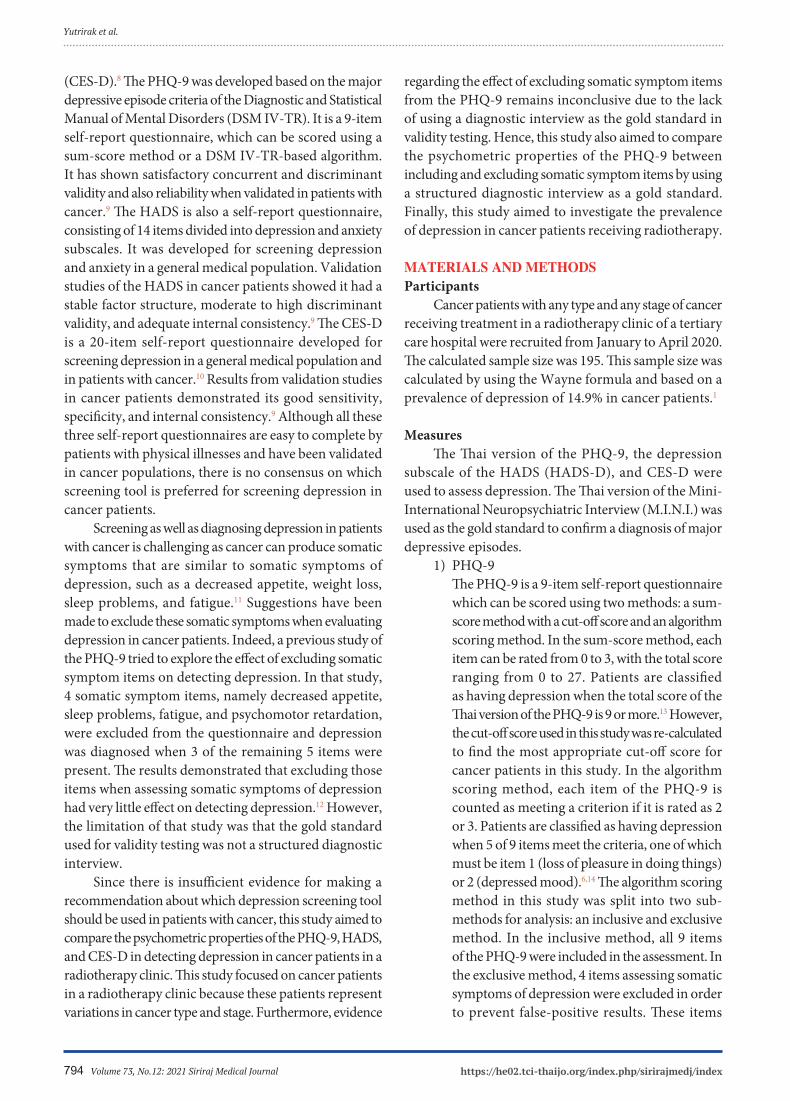
(CES-D).8 The PHQ-9 was developed based on the major depressive episode criteria of the Diagnostic and Statistical Manual of Mental Disorders (DSM IV-TR). It is a 9-item self-report questionnaire, which can be scored using a sum-score method or a DSM IV-TR-based algorithm. It has shown satisfactory concurrent and discriminant validity and also reliability when validated in patients with cancer.9 The HADS is also a self-report questionnaire, consisting of 14 items divided into depression and anxiety subscales. It was developed for screening depression and anxiety in a general medical population. Validation studies of the HADS in cancer patients showed it had a stable factor structure, moderate to high discriminant validity, and adequate internal consistency.9 The CES-D is a 20-item self-report questionnaire developed for screening depression in a general medical population and in patients with cancer.10 Results from validation studies in cancer patients demonstrated its good sensitivity, specificity, and internal consistency.9 Although all these three self-report questionnaires are easy to complete by patients with physical illnesses and have been validated in cancer populations, there is no consensus on which screening tool is preferred for screening depression in cancer patients. Screening as well as diagnosing depression in patients with cancer is challenging as cancer can produce somatic symptoms that are similar to somatic symptoms of depression, such as a decreased appetite, weight loss, sleep problems, and fatigue.11 Suggestions have been made to exclude these somatic symptoms when evaluating depression in cancer patients. Indeed, a previous study of the PHQ-9 tried to explore the effect of excluding somatic symptom items on detecting depression. In that study, 4 somatic symptom items, namely decreased appetite, sleep problems, fatigue, and psychomotor retardation, were excluded from the questionnaire and depression was diagnosed when 3 of the remaining 5 items were present. The results demonstrated that excluding those items when assessing somatic symptoms of depression had very little effect on detecting depression.12 However, the limitation of that study was that the gold standard used for validity testing was not a structured diagnostic interview. Since there is insufficient evidence for making a recommendation about which depression screening tool should be used in patients with cancer, this study aimed to compare the psychometric properties of the PHQ-9, HADS, and CES-D in detecting depression in cancer patients in a radiotherapy clinic. This study focused on cancer patients in a radiotherapy clinic because these patients represent variations in cancer type and stage. Furthermore, evidence
regarding the effect of excluding somatic symptom items from the PHQ-9 remains inconclusive due to the lack of using a diagnostic interview as the gold standard in validity testing. Hence, this study also aimed to compare the psychometric properties of the PHQ-9 between including and excluding somatic symptom items by using a structured diagnostic interview as a gold standard. Finally, this study aimed to investigate the prevalence of depression in cancer patients receiving radiotherapy.
MATERIALS AND METHODSParticipants Cancer patients with any type and any stage of cancer receiving treatment in a radiotherapy clinic of a tertiary care hospital were recruited from January to April 2020. The calculated sample size was 195. This sample size was calculated by using the Wayne formula and based on a prevalence of depression of 14.9% in cancer patients.1
Measures The Thai version of the PHQ-9, the depression subscale of the HADS (HADS-D), and CES-D were used to assess depression. The Thai version of the Mini-International Neuropsychiatric Interview (M.I.N.I.) was used as the gold standard to confirm a diagnosis of major depressive episodes. 1) PHQ-9 The PHQ-9 is a 9-item self-report questionnaire which can be scored using two methods: a sum- score method with a cut-off score and an algorithm scoring method. In the sum-score method, each item can be rated from 0 to 3, with the total score ranging from 0 to 27. Patients are classified as having depression when the total score of the Thai version of the PHQ-9 is 9 or more.13 However, the cut-off score used in this study was re-calculated to find the most appropriate cut-off score for cancer patients in this study. In the algorithm scoring method, each item of the PHQ-9 is counted as meeting a criterion if it is rated as 2 or 3. Patients are classified as having depression when 5 of 9 items meet the criteria, one of which must be item 1 (loss of pleasure in doing things) or 2 (depressed mood).6,14 The algorithm scoring method in this study was split into two sub- methods for analysis: an inclusive and exclusive method. In the inclusive method, all 9 items of the PHQ-9 were included in the assessment. In the exclusive method, 4 items assessing somatic symptoms of depression were excluded in order to prevent false-positive results. These items
Yutrirak et al.

Volume 73, No.12: 2021 Siriraj Medical Journalhttps://he02.tci-thaijo.org/index.php/sirirajmedj/index 795
Original Article SMJ were item 3 (sleep problems), 4 (fatigue), 5 (appetite changed), and 8 (psychomotor retardation). Patients were classified as having depression when 3 of the remaining 5 items met the criteria, one of which must be item 1 or 2.11,12,15
2) HADS The HADS is a 14-item self-report questionnaire, with 7 items for the anxiety subscale and 7 items for the depression subscale.7 However, only the depression subscale of HADS (HADS-D) was used in this study. For each subscale, each item can be rated from 0 to 3, with the total score ranging from 0 to 21. A sum score of 11 or more in the Thai version of the HADS represents depression.16 However, the cut-off score used in this study was re-calculated, as was also done with the PHQ-9.
3) CES-D The CES-D is a 20-item self-report questionnaire. Each item can be rated from 0 to 3, with the total score ranging from 0 to 60.8 A sum score of 19 or more in the Thai version of the CES-D represents depression.17 However, the cut-off score used in this study was re-calculated, as was also done with the PHQ-9 and the HADS.
4) M.I.N.I. The Thai version of the M.I.N.I. was translated from the M.I.N.I. 5.0.0/DSM-IV. It is a structured diagnostic interview comprising 16 modules for assessing common psychiatric disorders. In this study, the major depressive episode module was used as the diagnostic tool. This module had a sensitivity of 98% and specificity of 94%.18
Data collection Ethics approval was obtained from the Siriraj Institutional Review Board. All the participants completed the demographic data, PHQ-9, HADS-D, and CES-D questionnaires. They were interviewed using the M.I.N.I. either by a psychiatric resident or a psychologist who had been trained and certified in M.I.N.I.. Both interviewers were blinded from the result of the self-rated questionnaires. If depression was confirmed by M.I.N.I., the interviewers would notify the attending physician to consider referring the participant to consult psychiatrist for evaluation and proper treatment. Data about cancer type, stage, treatment, pain score, and opioid use were obtained from the patients’ medical records.
Statistical analysis The analysis was done with SPSS version 24. By using the M.I.N.I. as the gold standard, the cut-off scores of the PHQ-9, HADS-D, and CES-D were determined by plotting their receiver operating characteristic (ROC) curves. The psychometric properties of each questionnaire were analyzed and demonstrated in terms of sensitivity, specificity, positive predictive value (PPV), negative predictive value (NPV), and likelihood ratio. Convergent validity between the PHQ-9 and HADS-D, between PHQ-9 and CED-D, and between HADS-D and CES-D were analyzed by Spearman’s rho correlation. The internal consistency of each questionnaire was analyzed by Cronbach’s alpha. The prevalence of depression measured by each questionnaire and the M.I.N.I. were evaluated.
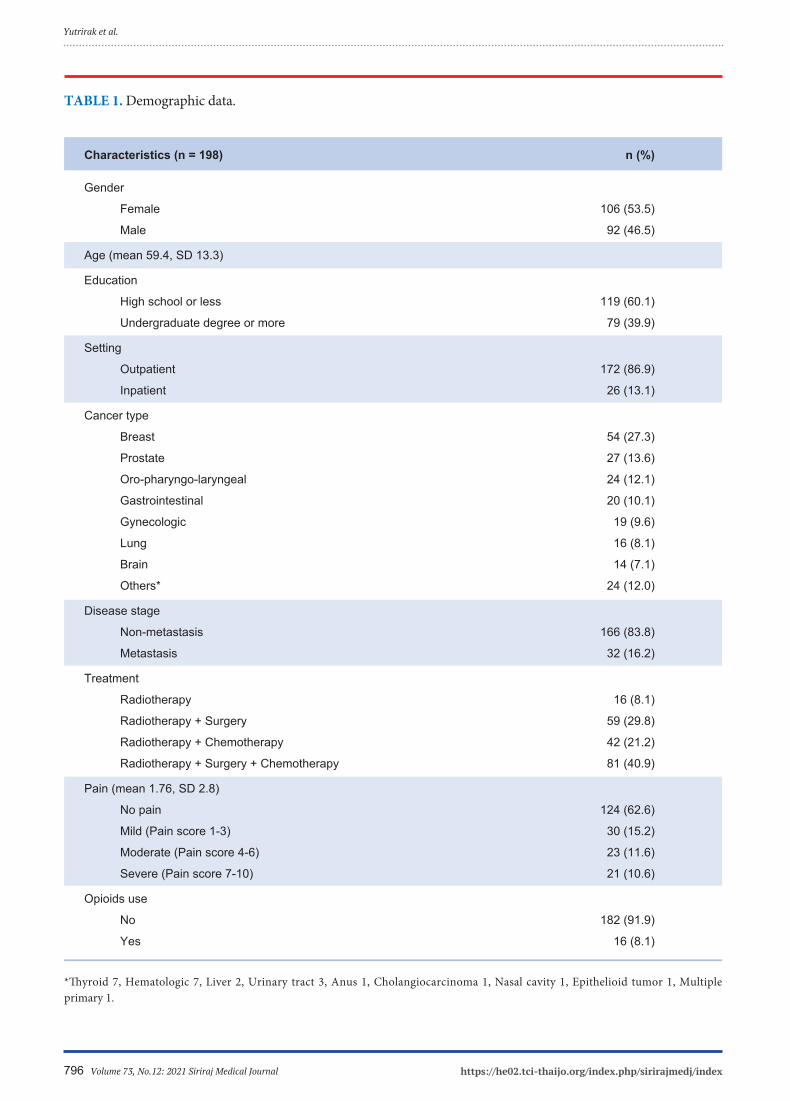
RESULTS In total, 198 participants were enrolled on the study, and their demographic data are shown in Table 1. There was nearly an equal number of female (53.3%) and male (46.5%) participants. Half the participants were more than 60 years old. The majority of participants (86.9%) were recruited from an outpatient clinic. The most common cancer types were breast (27.3%), prostate (13.6%), oro-pharyngo-laryngeal (12.1%), and gastrointestinal cancer (10.1%). The most common stage was the non-metastatic stage (83.8%). Most of the participants did not have pain (62.6%) and did not receive opioids (91.9%). The most appropriate cut-off scores were 11 for the PHQ-9, 7 for the HADS-D, and 20 for the CES-D. The ROC curves for these cut-off values are displayed in Fig 1. The area under the curve values for each were 0.97 (SD = 0.01; 95% CI 0.94 to 0.99) for the PHQ-9, 0.95 (SD = 0.02; 95% CI 0.91 to 0.98) for the HADS-D, and 0.98 (SD = 0.01; 95% CI 0.95 to 1.00) for the CES-D. All of these values show high accuracy.19
The psychometric properties of the PHQ-9, HADS-D, and CES-D are listed in Table 2. The sum-score method used for the PHQ-9, the HADS-D, and the CES-D demonstrated good sensitivity (100%) and good specificity (91.1%, 87.4%, and 90.6%, respectively). Although the inclusive and exclusive methods of the PHQ-9 demonstrated slightly higher specificity than the sum-score method (96.9% for the inclusive method and 97.4% for the exclusive method), their sensitivities were much lower (71.4% for the inclusive method and 42.9% for the exclusive method). Comparing the inclusive and exclusive method, the inclusive method demonstrated greater sensitivity with similar specificity. Convergent validity testing showed good correlations between the PHQ-9 and HADS-D (r = 0.67, p < 0.01), between the
Volume 73, No.12: 2021 Siriraj Medical Journal https://he02.tci-thaijo.org/index.php/sirirajmedj/index796
TABLE 1. Demographic data.
Characteristics (n = 198) n (%)
Gender
Female 106 (53.5)
Male 92 (46.5)
Age (mean 59.4, SD 13.3)
Education
High school or less 119 (60.1)
Undergraduate degree or more 79 (39.9)
Setting
Outpatient 172 (86.9)
Inpatient 26 (13.1)
Cancer type
Breast 54 (27.3)
Prostate 27 (13.6)
Oro-pharyngo-laryngeal 24 (12.1)
Gastrointestinal 20 (10.1)
Gynecologic 19 (9.6)
Lung 16 (8.1)
Brain 14 (7.1)
Others* 24 (12.0)
Disease stage
Non-metastasis 166 (83.8)
Metastasis 32 (16.2)
Treatment
Radiotherapy 16 (8.1)
Radiotherapy + Surgery 59 (29.8)
Radiotherapy + Chemotherapy 42 (21.2)
Radiotherapy + Surgery + Chemotherapy 81 (40.9)
Pain (mean 1.76, SD 2.8)
No pain 124 (62.6)
Mild (Pain score 1-3) 30 (15.2)
Moderate (Pain score 4-6) 23 (11.6)
Severe (Pain score 7-10) 21 (10.6)
Opioids use
No 182 (91.9)
Yes 16 (8.1)
*Thyroid 7, Hematologic 7, Liver 2, Urinary tract 3, Anus 1, Cholangiocarcinoma 1, Nasal cavity 1, Epithelioid tumor 1, Multiple primary 1.
Yutrirak et al.

Volume 73, No.12: 2021 Siriraj Medical Journalhttps://he02.tci-thaijo.org/index.php/sirirajmedj/index 797
Original Article SMJ
TABLE 2. Psychometric properties.
Sensitivity Specificity PPV NPV + likelihood - likelihood Internal consistency (Cronbach’s alpha)
PHQ-9 Sum-score 100 91.1 29.2 100 11.2 0 0.804 (cut-off 11)
Algorithm scoring Inclusive 71.4 96.9 45.5 98.9 22.7 0.3 - Exclusive 42.9 97.4 37.5 97.9 16.4 0.6 -
HADS-D (cut-off 7) 100 87.4 22.6 100 8 0 0.772
CES-D (cut-off 20) 100 90.6 28 100 10.6 0 0.815
PHQ-9 and CES-D (r = 0.68, p < 0.01), and between HADS-D and CES-D (r = 0.74, p < 0.01). The internal consistencies of the PHQ-9 and CES-D were good (Cronbach’s alpha = 0.80 and 0.82, respectively), while the internal consistency of the HADS-D was acceptable (Cronbach’s alpha = 0.77).20
The prevalence of depression measured by each questionnaire and the M.I.N.I. are presented in Table 3. The prevalence measured by the inclusive method (5.6%) and exclusive method (4.0%) of the PHQ-9 were close to the prevalence measured by the M.I.N.I. (3.5%), which represents the gold standard. However, the prevalence measured by the sum-score methods of the PHQ-9 (12.1%), HADS-D (15.7%), and CES-D (12.6%) were much higher than the prevalence measured by the M.I.N.I..
DISCUSSION The study aimed to test the psychometric properties of the three self-rating questionnaires PHQ-9, HADS-D, and CES-D for screening depression in cancer patients receiving radiotherapy. The results showed that the psychometric properties, both validity and reliability, of all questionnaires were nearly equivalent. Comparing the sum-score methods of the PHQ-9, HASD-D, and CES-D, the sum-score method of PHQ-9 is recommended for depression screening in cancer patients receiving radiotherapy because it showed high sensitivity and the highest specificity and all of its items are similar to the major depressive disorder criteria of the DSM-5.14
In addition, because the PHQ-9 consists of 9 items that can be completed within a few minutes, it is convenient
Fig 1. ROC curve

Volume 73, No.12: 2021 Siriraj Medical Journal https://he02.tci-thaijo.org/index.php/sirirajmedj/index798
for patients with physical illness. Although the CES-D showed a similar specificity to the sum-score method of the PHQ-9, the major limitation of the CES-D is it is time consuming to complete because it consists of 20 items. Regarding the PHQ-9, its sum-score method demonstrated a much higher sensitivity but with a similar specificity when compared to the algorithm scoring methods. This finding suggested that the sum-score method is better than the algorithm scoring methods for screening depression in patients with cancer. Comparing the methods within the algorithm scoring methods, the exclusive method had a much lower sensitivity than the inclusive method. This result reflected that the items concerning the somatic symptoms of depression should not be excluded from the PHQ-9 when screening for depression in cancer patients. This finding is supported by evidence from another study which demonstrated that the somatic symptoms of depression were more likely to be present in depressed than in non-depressed cancer patients.21
The cut-off scores of the screening tools were different from the recommendation from the previous study. According to our findings, the cut-off scores of the PHQ-9, HADS-D, and CES-D were 11, 7 and 20, respectively, while the cut-off scores of the Thai version recommended in previous studies were 9, 11, and 19, respectively.13,16,17 One of the reasons for this disparity may be the difference in somatic symptoms in the population between the studies. Previous studies of the Thai version of the PHQ-9 was conducted in family medicine clinic and the CES-D was conducted in general populations which tend to have less somatic symptoms. While the Thai HADS-D study was conducted in in-patients with
cancer which tend to have more somatic symptoms. To the best of our knowledge, the present study is the first one to investigate the cut-off score in this specific population. The prevalence of depression assessed by the structured interview (M.I.N.I.) was nearly equal to the prevalence assessed by the algorithm scoring methods of the PHQ-9. This may be explained by the high specificity of the algorithm scoring methods. Comparing the methods within the algorithm scoring methods, the inclusive method is preferred for assessing the prevalence or diagnostic purpose due to its high specificity and higher sensitivity than the exclusive method. However, inspection of the raw data showed that some patients had a diagnostic mismatch between the M.I.N.I. assessment and the PHQ-9 algorithm scoring methods. Thus, evaluation of the psychometric properties through a diagnostic interview conducted by a psychiatrist as the gold standard should be conducted in a further study in order to confirm whether the PHQ-9 algorithm scoring methods are appropriate for assessing the prevalence of depression in patients with cancer. In contrast, the prevalence as assessed by the PHQ-9 sum-score method, HADS-D, and CES-D was relatively high when compared with the M.I.N.I. due to the false-positive cases. Since these three questionnaires are scored using a sum-score method, the severity ratings of the somatic symptoms that overlap with cancer symptoms need to be taken into account. As a consequence, cancer symptoms may have an influence on increasing the somatic symptoms scores, leading to false-positive results.12
We suggest that these three questionnaires may not be appropriate for assessing the prevalence of depression in patients with cancer.
Yutrirak et al.
TABLE 3. Prevalence.
%
M.I.N.I. 3.5
PHQ-9
Sum-score method 12.1
Algorithm scoring methods
Inclusive method 5.6
Exclusive method 4.0
HADS-D 15.7
CES-D 12.6
Volume 73, No.12: 2021 Siriraj Medical Journalhttps://he02.tci-thaijo.org/index.php/sirirajmedj/index 799
Original Article SMJ The prevalence of depression assessed by the M.I.N.I. in our study was lower than the average prevalence in a meta-analysis in the literature (3.5% vs. 14.9%).1 This discrepancy may be due to the difference in cancer stage of participants among the studies. Our study and the studies with a similar prevalence were conducted in patients with cancer of any type and stage, mostly the non-metastatic stage.22-25 In contrast, the studies with a prevalence of around 14.9% were conducted in cancer patients within 12 months of diagnosis26, post-treatment cancer patients27, and patients with recurrent or metastatic cancer.28 This may imply that patients are more likely to develop depression when initially facing cancer diagnosis and when facing advanced cancer. Therefore, depression screening should be performed within the first year of cancer diagnosis and upon progressing to an advanced stage. Moreover, a systematic review reported that the rate of depression is higher in adolescents and young adults with cancer because of the disruptions in their school life, career path, or early marital life.29 It can be implied that if we include more young age patients in the study, we will gain more prevalence of depression. Further study should be designed to include patients in all age groups to improve the precision of the results.
Study limitations Several limitations in the present study should be considered. We use the M.I.N.I. as the gold standard for depression diagnosis instead of using the standard interview by psychiatrists because it consumed much less time when must deal with the high volume of participants. Therefore, it could have some false positive and false negative cases. The sensitivity and specificity in this study may be different from a previous study conducted in a population with a higher prevalence of depression.30 Hence, further studies should be investigated in cancer patients with a higher prevalence of depression, such as newly diagnosed cancer patients, post-treatment cancer patients, and patients with more advanced-stage cancer. Furthermore, patients in a surgery and chemotherapy clinic should be recruited to apply the results more broadly.
CONCLUSION The sum-score method of the PHQ-9 seemed to be the best tool to use for depression screening among cancer patients receiving radiotherapy. The inclusive method of the PHQ-9 may be useful for prevalence studies or could serve a diagnostic purpose due to its high specificity and acceptable sensitivity. The prevalence of depression assessed by the M.I.N.I. was 3.5%, nearly
equal to the prevalence assessed by the inclusive method of the PHQ-9, which was 5.6%.
ACKNOWLEDGEMENTS The authors would like to thank the Department of Radiology for allowing us to collect the data. We would like to thank Lakkhana Thongchot, psychologist, for helping collect the data and we also would like to thank to Naratip Sanguanpanich, statistician, for statistical analysis advice.
REFERENCES1. Mitchell AJ, Chan M, Bhatti H, Halto M, Grassi L, Johansen C, Meader N. Prevalence of depression, anxiety, and adjustment disorder in oncological, haematological, and palliative-care settings: a meta-analysis of 94 interview-based studies. Lancet Oncol 2011;12:160-74.2. Pinquart M, Duberstein PR. Depression and cancer mortality: a metaanalysis. Psychological Medicine 2010;40:1797-810.3. Smith HR. Depression in cancer patients: Pathogenesis, implications and treatment (Review). Oncology Letter 2015;9:1509-14.4. Chochinov HM, Tataryn D, Clinch JJ, Dudgeon D. Will to live in the terminally ill. Lancet 1999;354:816-9.5. Breirbart W, Rosenfeld B, Pessin H, Kaim M, Funesti-Esch J, Galietta M, Nelson CJ, Brescia R. Depression, hopelessness, and desire for hastened death in terminally ill patients with cancer. JAMA 2000;284(22):2907-11.6. Spitzer RL, Kroenke K, Williams JB. Validation and utility of a self-report version of PRIME-MD: the PHQ primary care study. JAMA 1999;282(18):1737-44.7. Zigmond AS, Snaith RP. The Hospital Anxiety and Depression Scale. Acta Psychiatr Scand 1983;67:361-70.8. Radloff LS. The CES-D scale: a self-report depression scale for research in the general population. Applied Psychological Measurement 1977;1:385-401.9. Vodermaier A, Linden W, Siu C. Screening for emotional distress in cancer patients: a systematic review of assessment instruments. J Natl Cancer Inst. 2009;101(21):1464-88.10. Chhabria KS, Carnaby GD. Psychometric validation of the Center for Epidemiological Studies Depression Scale in Head and Neck Cancer patients. Oral Oncology 2017; 75:158-62.11. Zimmerman M, Galione JN, Chelminski I, McGlinchey JB, Young D, Dalrymple K, Ruggero CJ, Witt CF. A simpler definition of major depressive disorder. Psychological Medicine 2010;40:451-7.12. Lie HC, Hjermstad MJ, Fayers P, Finset A, Kaasa S, Loge JH. Depression in advanced cancer – Assessment challenges and associations with disease load. Journal of Affective Disorders 2015;173:176-84. 13. Lotrakul M, Sumrithe S, Saipanish R. Reliability and validity of the Thai version of the PHQ-9. BMC Psychiatry 2008;8:46.14. American Psychiatric Association. Diagnostic and statistical manual of mental disorder. 5th ed. Arlington, VA: American Psychiatric Association; 2013.15. Zimmerman M, Emmert-Aronson BO, Brown TA. Concordance between a simpler definition of major depressive disorder and diagnostic and statistical manual of mental disorders, fourth edition:

Volume 73, No.12: 2021 Siriraj Medical Journal https://he02.tci-thaijo.org/index.php/sirirajmedj/index800
an independent replication in an outpatient sample. Comprehensive Psychiatry 2011;52:261-4.16. Nilchaikovit T, Lortrakul M, Phisansuthideth U. Development of Thai version of Hospital Anxiety and Depression Scale in cancer patients. J Psychiatr Assoc Thailand 1996;41(1):18-30.17. Kuptniratsaikul V, Pekuman P. The study of the Center for Epidemiologic Studies-Depression Scale (CES-D) in Thai people. Siriraj Hosp Gaz 1997;49:442-8.18. Kittirattanapaiboon P, Khamwongpin M. The Validity of the Mini International Neuropsychiatric Interview (M.I.N.I.)- Thai Version. Journal of Mental Health of Thailand 2005;13 (3)c.19. Streiner DL, Cairney J. What’s under the ROC? An introduction to receiver operating characteristics curves. Can J Psychiatry 2007; 52(2):121-8.20. George D, Mallery P. SPSS for Windows step by step: A simple guide and reference. 11.0 update (4th ed.). Boston: Allyn & Bacon; 2003.21. Mitchell AJ, Lord K, Symonds P. Which symptoms are indicative of DSMIV depression in cancer settings? An analysis of the diagnostic significance of somatic and non-somatic symptoms. J Affect Disord 2012;138(1-2):137-48.22. Hardman A, Maguire P, Crowther D. The recognition of psychiatric morbidity on a medical oncology ward. J Psychosom Res 1989;33:235-39.23. Derogatis LR, Morrow GR, Fetting J, Penman D, Piasetsky S,
Schmale AM, Henrichs M, Carnicke CL Jr. The prevalence of psychiatric disorders among cancer patients. JAMA 1983;249: 751-57.24. Kugaya A, Akechi T, Okuyama T, Okamura H, Uchitomi Y. Screening for psychological distress in Japanese cancer patients, Jpn J Clin Oncol 1998;28:333-38.25. Lansky SB, List MA, Herrmann CA, Ets-Hokin EG, DasGupta TK, Wilbanks GD, Hendrickson FR. Absence of major depressive disorder in female cancer patients. J Clin Oncol 1985;3:1553- 60.26. Akechi T, Okuyama T, Sugawara Y, Nakano T, Shima Y, Uchitomi Y. Major depression, adjustments, and post-traumatic stress disorder in terminally ill cancer patients: associated and predictive factors. J Clin Oncol 2004;22:1957-65.27. Gandubert C, Carrière I, Escot C, Soulier M, Hermès A, Boulet P, Ritchie K, Chaudieu I. Onset and relapse of psychiatric disorders following early breast cancer: a case–control study. Psychooncology 2009;18:1029-37.28. Razavi D, Delvaux N, Farvacques C, Robaye E. Screening for adjustment disorders and major depressive disorders in cancer in-patients. Br J Psychiatry 1990;156:79-83.29. Park EM, Rosenstein DL. Depression in adolescents and young adults with cancer. Dialogues Clin Neurosci 2015;17(2):171-80.30. Leeflang MM, Rutjes AW, Reitsma JB, Hooft L, Bossuyt PM. Variation of a test’s sensitivity and specificity with disease prevalence. CMAJ 2013;185(11):E537-E544.
Yutrirak et al.

Volume 73, No.12: 2021 Siriraj Medical Journalhttps://he02.tci-thaijo.org/index.php/sirirajmedj/index 801
Original Article SMJ
Possatorn Wongwutthiwet, M.D.* Tatree Bosittipichet, M.D.**, Thanakamon Leesri, Ph.D.****Bangkruai Hospital, Nontaburi 11130, Thailand. **Department of Social Medicine, Phra Nakhon Si Ayutthaya Hospital, Phra Nakhon Si Ayutthaya
13000, Thailand. ***Department of Community Health Nursing, Institute of Nursing, Suranaree University of Technology, Nakorn Ratchasima 30000,
Thailand.
The Efficacy of Follow-up Phone Calls for Capillary Blood Glucose Lowering in Diabetic Patients in Primary Care Unit
ABSTRACTObjective: To study the effect of telephone call intervention on glycemic control in diabetic patients for 2 monthsMaterials and Methods: The quasi-experimental research included 130 Patients from January 2020 to March 2020 in primary care. The 115 patients were divided into 2 groups through a simple randomization process, 61 in experimental group and 54 in control group after exclusion. 115 Patients will be tested for Capillary blood glucose (CBG) level at a period of 0-month, 1-month and 2-months. CBG level were presented in mean ± SD, mean difference ± SD and analyzed by Independent t-test and Paired t-test.Results: The phone call intervention can lower CBG level compared to the control group. Mean difference of CBG between 0 month and 2 months follow-up in phone calls group vs control group (-6.80 ± 4.86 vs -2.96 ± 4.82 mg/dL) and mean difference CBG level between 1 month and 2 months follow-up in phone calls group vs control group (-5.77 ± 4.09 vs -4.22 ± 5.10 mg/dL) but had no significant difference (p >0.05) Conclusion: The follow-up phone calls can lower CBG level in the experimental group more than the control group, but there is no significant difference.
Keywords: Diabetes mellitus type 2; phone call; glycemic control (Siriraj Med J 2021; 73: 801-807)
Corresponding author: Thanakamon LeesriE-mail: [email protected] 18 May 2021 Revised 2 September 2021 Accepted 21 September 2021ORCID ID: https://orcid.org/0000-0003-2841-5729http://dx.doi.org/10.33192/Smj.2021.104
INTRODUCTION It is expected that Thailand will completely enter an aging society by 2022, and elderly people will account for 20 percent of all Thai population.1 Non-communicable diseases (NCDs), such as diabetes and hypertension, would be an inevitable case for an aging society. Diabetes2 is a condition that impairs the body cell’s ability to convert sugar to energy which will be stored at liver, muscle and fat. These cause high blood sugar levels. Diabetes is currently a crucial non-communicable disease, and The World Health Organization (WHO) attaches great
importance to the promotion, prevention and control of disease to avoid complications. In Western Pacific, it was found that there were 162 million patients with diabetes in 20193, and Thailand ranked fourth regionally, coming after China, Indonesia and Japan as there were 4.4 million patients with diabetes found in Thailand. According to Health Data Center4 under the Department of Public Health, it was found that patients having well-controlled diabetes made up for only 28.32 percent (while the target proportion was 40 percent). In Nonthaburi Province, there were 45,457 patients with diabetes whereas only

Volume 73, No.12: 2021 Siriraj Medical Journal https://he02.tci-thaijo.org/index.php/sirirajmedj/index802
Wongwutthiwet et al.
12,252 of them had well-controlled diabetes, accounting for 26.95 percent. In Bang Kruai District, there were 4,580 patients with diabetes whereas only 4,232 of them had well-controlled diabetes, accounting for 26.03 percent. In Bang Kruai Health Promoting Hospital, there were 401 patients with diabetes whereas only 100 of them had well-controlled diabetes, accounting for 24.94 percent. Without a good control of a blood sugar level, patients can suffer from the complications and premature death. Comparing to the previous years, it is found that incidence of diabetes increases in a wider age range. Furthermore, according to the data from National Economic and Social Development Board (NESDB) in 20085, it was found that in Thailand, for Out Patients Department (OPD), the average medical fee of diabetes was 1,173 Baht per patient whereas for In Department Patients (IPD), the average medical fee was 10,217 Baht per patient. The total average medical fee was 3,984 million Baht per year. Hence, if there are 3 million patients with diabetes receiving medical service from healthcare centers, it will cost 47,596 million Baht per year for medical fees. Poor-controlled diabetes is caused by many reasons such as patient’s lack of knowledge regarding of self-care or lack of awareness in danger and severity of diabetes. By these reasons, it results in discontinuity of medicine taking, missing doctor’s appointments and inability to adjust eating or exercising habits, and this can lead to many complications such as chronic kidney disease (CKD), Diabetic Retinopathy (DR), Diabetic Ulcer and Cardiovascular Disease (CVD). These complications could worsen patient’s quality of life as well as financial burdens. Therefore, the researcher recognizes the significance of patient’s awareness, and many relevant studies also indicate that many patients with diabetes lack a good understanding of their conditions. The researcher, hence, decides to study about the effect of follow-up phone calls for glycemic control of diabetic patient. Currently, there is an involvement of technology in a medical treatment to enhance its efficiency, and it is found that the majority of people carry mobile phones with them most of the time. This study is conducted to provide guidance in giving care to patients with diabetes and boosting patient’s awareness of the disease, and this could encourage patients to adjust their habits and control their sugar blood level better. Furthermore, it could reduce patient’s risks of having complications and enhance their living standards. It could also reduce expenses given by patients for receiving medical service and commuting to hospital, given by family to provide care for patients, given by hospitals to treat several different
complications, and given by the nation to provide health welfare to patients. Accordingly, the aims of this study to investigate the efficacy of follow-up phone calls for Capillary blood glucose lowering in diabetic patients in primary care setting
MATERIALS AND METHODSStudy design & population This study is quasi-experimental research with two groups of samples, and there is an application of Pretest-Posttest Design with nonequivalent groups. The samples include 130 patients with diabetes who were 30 years old and older and continually received medical service at Bang Kruai Health Promoting Hospital, Bang Kruai District, Nonthaburi Province between January 2020 and March 2020. The Inclusion Criteria include abilities in understanding Thai language and using phones as well as their voluntariness of consent to research. The Exclusion Criteria are participant’s discontinuity in receiving medical treatment according to doctor’s appointment, their withdraw from the research and ineligibility. Some participants might be found ineligible later because they fail to meet inclusion criteria, and this could result from participant’s mistakes in giving information or researcher’s errors.
Study size Study size was estimate from the study of phone call intervention on glycemic control in diabetes patients.6
The hypothesis is that patient’s HbA1c level decrease by <7%. For the control group, it is 35.7%, while it is 60.9% in the phone call intervention group (p value <0.001), this is a two-sided experiment with type 1 error, significance at 5% and power at 80%. The sample size is calculated to be 122 participants, and 5 percent is calculated added in case of data loss. Therefore, the population was 130 participants divided by simple randomization into 65 participants in each intervention group and a control group.
Measurement and tools Measurement in this study consisted of a patient’s general data record, including gender, age, education level, monthly income, chronic disease, height, weight, and body mass index (BMI), as well as a record of patient’s CBG level and blood pressure noted at starting point (which will be referred as the 0 month) then one and two-month after that (or the 1 month and 2 months). This The participants were instructed to fast up to 8 hours before a blood test. This measurement was performed the same in both intervention and control groups.

Volume 73, No.12: 2021 Siriraj Medical Journalhttps://he02.tci-thaijo.org/index.php/sirirajmedj/index 803
Original Article SMJ The intervention group received follow-up phone calls every two weeks, accounting for 4 times across the whole study period. mean CBG of both the phone calls and control groups were assessed and compared at 0-month, 1 month and 2 months. The follow-up call consists of a procedure for asking about symptoms and details about taking medication.
Primary outcome was mean difference of CBG between 0-month, 1 month and 2 months and secondary outcomes were mean CBG at 0-month, 1 month and 2 months, mean systolic and diastolic blood pressure at 0-month, 1 month and 2 months, mean difference of systolic and diastolic blood pressure between 0-month, 1 month and 2 months.
Study Flow

Volume 73, No.12: 2021 Siriraj Medical Journal https://he02.tci-thaijo.org/index.php/sirirajmedj/index804
Wongwutthiwet et al.
Data analysis The data are analyzed by statistical analysis software, approved and recorded in a form of file by the following statistical analysis software: Patient’s general data are presented in number (percentage), mean ± standard deviation, median (inter quartile range), and the data are analyzed by Chi-square test, Independent t-test, Mann-Whitney U test. Patient’s data of blood sugar level and blood pressure level (systolic and diastolic) are presented in mean ± standard deviation, and the data are analyzed by Independent t-test and Paired t-test.
Ethical statements This study has been approved by the committee of research ethics regarding to human study of Nonthaburi
Public Health Office. (The number of projects: 2/2563, certified at January 14, 2020).
RESULTSPatient characteristics A total of 115 diabetic patients between January 2020 and March 2020. 61 patients in phone call group and 54 patients in control group. Table 1 provides the demographic details and information of each group. After comparing between the two study groups, beyond the education level, there were no differences found related to patient characteristics and baseline clinical data including mean HbA1C, mean systolic blood pressure, mean diastolic blood pressure and mean LDL
TABLE 1. The general information of the sample size (N = 115).
Phone calls Control n=61 n=54
p-value
Sex Male 21 (34.4) 16 (29.6) 0.583 Female 40 (65.6) 38 (70.4)
Age (years old) 63.16±8.65 66.0±7.48 0.064
Educational Level
None 2 (3.3) 3 (5.6) < 0.05* Pre-Primary School 9 (14.8) 20 (37.0) Primary School 17 (27.9) 6 (11.1) Pre-Secondary School 16 (26.2) 5 (9.3) Secondary School 11 (18.0) 13 (24.1) Bachelor degree 6 (9.8) 7 (13.0)
Income (bath) 2,500 (700, 6,500) 2,350 (700, 7,000) 0.772
Hypertension 54 (88.5) 44 (81.5) 0.288
Height (cm.) 158.89±7.33 159.52±8.06 0.660
Weight (kg.) 69.28±17.29 68.70±15.19 0.849
BMI (kg./m.2)
< 18.5 1 (1.6) 1 (1.6) 0.916 18.5 – 22.9 10 (16.4) 7 (13.0) 23.0 – 24.9 14 (23.0) 15 (27.8) ≥ 25 36 (59.0) 31 (57.4)
HbA1c (mg%) 7.83±1.48 7.45±1.29 0.940
Systolic blood pressure (mmHg) 141.16±18.54 144.26±16.59 0.350
Diastolic blood pressure (mmHg) 74.10±11.16 73.85±10.97 0.905
LDL (mg/dL) 106.64±33.73 110.17±33.83 0.577
*Chi-square test, Independent t-test, Mann-Whitney U test

Volume 73, No.12: 2021 Siriraj Medical Journalhttps://he02.tci-thaijo.org/index.php/sirirajmedj/index 805
Original Article SMJCapillary blood glucose level outcome Table 2 The mean difference of CBG between 0 month and 2 months in 2 groups showed that the mean difference of CBG in the phone calls group was greater than in the control group with no significance (-5.77±4.09 vs -4.22±5.10 P=0.812). Likewise, the mean difference of CBG between 0 month and 1 months in 2 groups showed the same trend with no significance (-6.80±4.86 vs -2.96.22±4.82 P=0.577) but the mean difference of CBG between 1 month and 2 months in 2 groups showed that the mean difference of CBG in the phone calls group was less than in the control group (1.03±4.09 vs -1.26±5.10 P = 0.724). Table 3 the mean CBG level at 0-month, 1-month and 2-months in the phone calls group was less than in the control group with no significance (CBG M0 144.49±33.54 vs 149.13±35.31 P= 0.472, CBG M1 137.69±37.35 vs 146.17±37.59 P= 0.228, CBG M2 138.72±32.66 vs 144.91±36.11, P= 0.337).
Systolic blood pressure (SBP) outcome Table 2 The mean difference of SBP between 0 month and 2 months in 2 groups showed that the mean difference of SBP in the phone calls group was lesser than in the control group with no significance (-9.33±1.64 vs -12.43±2.40 P=0.280). Likewise, the mean difference of SBP between 0 month and 1 months in 2 groups showed the same trend with no significance (-7.36±1.58 vs -11.44±2.55 P=0.166) but the mean difference of CBG
between 1 month and 2 months in 2 groups showed that the mean difference of CBG in the phone calls group was greater than in the control group (-1.97±1.48 vs -0.98±2.04 P = 0.692). Table 3 the mean SBP level at 0 month and 2 months in the phone calls group was less than in the control group with no significance (SBP M0 141.07±17.14 vs 144.50±16.49 P= 0.227, SBP M2 131.74±14.23 vs 132.07±14.59, P= 0.901) and the mean SBP level at 1 month the phone calls group was slightly greater than in the control group with no significance (SBP M1 133.70±16.14 vs 133.06±13.55 P= 0.817)
Diastolic blood pressure (DBP) outcomes Table 2 The mean difference of DBP between 0 month and 2 months in 2 groups showed that the mean difference of DBP in the phone calls group was greater than in the control group with no significance (-6.82±1.18 vs -5.91±1.43 P=0.622). Likewise, the mean difference of DBP between 0 month and 1 months in 2 groups showed the same trend with no significance (-3.57±1.16 vs -1.24±1.71 P=0.218) but the mean difference of CBG between 1 month and 2 months in 2 groups showed that the mean difference of CBG in the phone calls group was lesser than in the control group (-3.07±1.03 vs -4.67±1.56 P = 0.383). Table 3 the mean DBP level at 0 month in the phone calls group was slightly greater than in the control group with no significance (DBP M0 74.23±10.08 vs
TABLE 2. The comparation between Means of CBG level with blood pressure level (diastolic and systolic).
Phone calls Control n=61 n=54
p-value
Mean Difference of CBG Level (mg/dL)
Month 0 and 1 -6.80±4.86 -2.96±4.82 0.577
Month 1 and 2 1.03±4.64 -1.26±4.45 0.724
Month 0 and 2 -5.77±4.09 -4.22±5.10 0.812
Systolic blood pressure (mmHg)
Month 0 and 1 -7.36±1.58 -11.44±2.55 0.166
Month 1 and 2 -1.97±1.48 -0.98±2.04 0.692
Month 0 and 2 -9.33±1.64 -12.43±2.40 0.280
Diastolic blood pressure (mmHg)
Month 0 and 1 -3.75±1.16 -1.24±1.71 0.218
Month 1 and 2 -3.07±1.03 -4.67±1.56 0.383
Month 0 and 2 -6.82±1.18 -5.91±1.43 0.622
* Analyzed by Independent t-test, Paired t-test

Volume 73, No.12: 2021 Siriraj Medical Journal https://he02.tci-thaijo.org/index.php/sirirajmedj/index806
Wongwutthiwet et al.
TABLE 3. The comparison of CBG level with blood pressure level separated with systolic and diastolic blood pressure.
Phone calls Control n=61 n=54
p-value
CBG Level (mg/dL)
0 month (CBG M0) 144.49±33.54 149.13±35.31 0.472
1 month (CBG M1) 137.69±37.35 146.17±37.59 0.228
2 months (CBG M2) 138.72±32.66 144.91±36.11 0.337
Systolic blood pressure (mmHg)
0 month (SBP M0) 141.07±17.14 144.50±16.49 0.227
1 month (SBP M1) 133.70±16.14 133.06±13.55 0.817
2 months (SBP M2) 131.74±14.23 132.07±14.59 0.901
Diastolic blood pressure (mmHg)
0 month (DBP M0) 74.23±10.08 74.19±11.13 0.982
1 month (DBP M1) 70.48±9.51 72.94±14.21 0.271
2 months (DBP M2) 67.41±9.13 68.28±10.70 0.640
74.19±11.13 P= 0.982) and the mean DBP level at 1 month and 2 months the phone calls group was lesser than in the control group with no significance (DBP M1 70.48±9.51 vs 72.94±14.21 P= 0.271, DBP M2 67.41±9.13 vs 68.28±10.70, P= 0.640)
DISCUSSION Before the study, there was no difference in the average of blood sugar level (mg/DL) of phone calls and control groups (p>0.05). However, when comparing the average of blood sugar levels (mg/DL) recorded in the 0 month and 1 month, it was found that the phone calls group’s average blood sugar level decreased by a more substantial amount than that of the control group (-6.80±4.86 vs -2.96±4.82, p value = 0.577). Comparing the average of blood sugar levels (mg/DL) in the 0th and 2nd months, it was similarly found that the intervention group’s average blood sugar level decreased by a more substantial amount than that of the control group (-5.77±4.09 vs -4.22±5.10 p value = 0.812). Therefore, it could be concluded that there is clinical significance of the intervention group who received follow-up phone calls. This corresponds with Naeti Suksomboon’s study6 which conducted a systematic review and meta-analysis of follow-up phone calls as a way to control blood sugar levels, and it was found that follow-up phone calls might not be more effective in helping controlling blood sugar levels when comparing to those who were not given follow-up phone
calls. However, it is still beneficial for people living in a country with small to medium incomes. The reason why there was no statistical significance between two groups of the participants in the mentioned study might be because of too small sample size, insufficient time of research, too short time of phone calls, insufficient information instructed to patients via phone calls, infrequent phone calls or a lack of other media to follow up patients. These reasons might result in inefficiency in controlling of blood sugar levels. According to the study of Rattanaporn Jeerawattana7, with motivation-promoting activities and diabetes-instructing trainings before giving the participants phone calls, it was found that the intervention group’s average blood level decreased more significantly than that of the control group (11.43±1.92 vs 7.29±1.32 P<0.001). Likewise, according to Bogner’s study8, the overall phone calls given to participants were two times, and they lasted for 15 minutes, and this also included three direct talks which lasted for 30 minutes, given during three-month period. The findings indicated that the intervention group can control their blood sugar levels more effectively than the control group do (Achieved HbA1c <7%: 67 participants (60.9%) vs 25 participants (35.7%), p value <.001). Currently, technology plays a crucial role in people’s life and most people are able to use phones for communicative purposes. The researcher, therefore, aims that this study could be guidance of how to provide

Volume 73, No.12: 2021 Siriraj Medical Journalhttps://he02.tci-thaijo.org/index.php/sirirajmedj/index 807
Original Article SMJmore effective treatments to patients. Nevertheless, there are some limitations including insufficient samples and limited time for phone calls. Also, three-month period for follow-up might be insufficient, so the findings indicate no statistical significance. This study covers patients from only one medical center, so it might not be able to represent overall populations. However, since the findings illustrate that the intervention group has a more efficient control of blood sugar levels than the control group, the researcher would suggest that there should be an increase of study populations, areas and time period. Also, there should be some adjustments of the directions for follow-up phone calls, such as an increase in contents or time period. This would help follow-up phone calls to work more effectively.
CONCLUSION This quasi-experimental study’s results show that follow-up phone calls can assist patients with diabetes to control their blood sugar levels more effectively than the control group, but there is no statistical significance. Further studies may be needed for more explicit data.
REFERENCES1. Foundation of Thai Gerontology Research and Development Institute (TGRI) Institute for Population and Social Research, Mahidol University. Situation of Thai Elderly 2017 (1st Edition). Nakornpathom: Printory Company, 2018. 2. Diabetic Association of Thailand under the Patronage of Her Royal Highest Princess Maha Chakkri Siridhron. Clinical Practice Guideline for Diabetes 2017. Bangkok: Romyen Media Company; 2016.3. International Diabetes Federation. IDF DIABETES ATLAS Ninth edition 2019[Internet]. 2019 [cited 10 January 2020]. Available from: https://www.diabetesatlas.org/upload/resources/ 2019/IDF_Atlas_9th_Edition_2019.pdf
4. Hdcservice.moph.go.th [Internet]. Thailand: The percentage of blood sugar control among diabetic patients in 2019 [update November 17,2019].Available from: https://hdcservice.moph. go.th/hdc/reports/report.php?source=pformated/format1. php&cat_id=b2b59e64c4e6c92d4b1ec16a599d882b&id=137 a726340e4dfde7bbbc5d8aeee3ac35. The Office of the National Economic and Social Development Boar, MOPH, Thailand. Thailand Healthy Lifestyle Strategic Plan 2011-2020 [Internet].2553[cited 13 January 2020].Available from: http://wops.moph.go.th/ops/oic/data/20110316100703_1_. pdf6. Suksomboon N, Poolsup N, Nge YL. Impact of Phone Call Intervention on Glycemic Control in Diabetes Patients: A Systematic Review and Meta-Analysis of Randomized, Controlled Trials. PLoS ONE 2014;9(2):e89207. 7. Jerawatana R, Reutrakul S, Siripitayakunkit A. The Effect of Advanced Practice Nurse-Led Intervention Program on Outcomes in Diabetes Patients with Complex Problems. Rama Nurs J 2018;24(1):51-68. 8. Bogner HR, Morales KH, de Vries HF, Cappola AR. Integrated management of type2 diabetes mellitus and depression treatment to improve medication adherence: a randomized controlled trial. Ann Fam Med 2012;10:15–22.9. Dale J, Caramlau I, Sturt J, Friede T, Walker R. Telephone peer delivered intervention for diabetes motivation and support: the telecare exploratory RCT. Patient Educ Couns 2009;75:91–98.10. Walker EA, Shmukler C, Ullman R, Blanco E, Scollan-Koliopoulus M, et al. Results of a successful telephonic intervention to improve diabetes control in urban adults: a randomized trial. Diabetes Care 2011;34:2–7.11. Theeraakarawipas N. Effectiveness of a Model of Care for Diabetis Mellitus Patient Who Could not Control Blood Sugar. J Health Science 2019;28:466-77.12. American Diabetes Association. 2. Classification and diagnosis of diabetes: Standards of Medical Care in Diabetes 2020. Diabetes Care 2020;43(Suppl 1):S14–S31. 13. Thomas R. Freeman. McWhinney’s Textbook of Family Medicine. 4th Edition. NY: United States of America by Oxford University Press; 2016
Volume 73, No.12: 2021 Siriraj Medical Journal https://he02.tci-thaijo.org/index.php/sirirajmedj/index808
Atipotsawee Tungsupreechameth, M.D., Klaita Srisingh, M.D.Department of Pediatrics, Faculty of Medicine, Naresuan University, Phitsanulok 65000, Thailand.
Factors Associated with Severe Lower Respiratory Tract Infection from Respiratory Syncytial Virus (RSV) in Thai Children
ABSTRACTObjective: To determine the factors associated with severe ALRTI from RSV in children.Materials and Methods: A retrospective study of children aged 1-60 months were conducted from 2014 to 2018. Out of 269 patients diagnosed with RSV ALRTI, 100 children were enrolled in the study, 20 had severe RSV ALRTI, while 80 had non-severe RSV ALRTI as identified by the ReSVinet scale. A multivariable logistic model was conducted to select significant variables.Results: During the study period, 269 patients were diagnosed with RSV ALRTI. Mean age was 10.45 ± 3.53 months. Clinical manifestations of severe RSV ALRTI group had significant difference in abnormal general condition (P < 0.001), tachypnea (P < 0.001), SpO2 < 85% (P < 0.001), poor air entry in lungs (P < 0.001), and retraction (P < 0.001). The factors associated with severe RSV ALRTI group, were underlying congenital heart disease [aOR 32.45; 95% CI 3.38-311.87, P = 0.003] and duration of hospital stay >5 days [aOR 19.56; 95% CI 1.81-212.05, P = 0.014].Conclusion: Factors associated with severe RSV ALRTI in children were underlying congenital heart disease and duration of hospital stay >5 days.
Keywords: Lower respiratory tract infections; respiratory syncytial virus; risk factor (Siriraj Med J 2021; 73: 808-814)
Corresponding author: Klaita SrisinghE-mail: [email protected] 28 May 2021 Revised 6 September 2021 Accepted 21 September 2021ORCID ID: https://orcid.org/0000-0001-6398-9555http://dx.doi.org/10.33192/Smj.2021.105
INTRODUCTION RSV Acute lower respiratory tract infection (ALRTI) causes severe lower respiratory tract illness in the acute phase, leading to hospitalization, higher hospitalization costs, and high mortality rates, especially in young children.1-4 Approximately 66,000-199,000 died with RSV and 99% of these deaths occurred in developing countries.5 A study in Thailand reported an annual incidence rate of RSV ALRTI was 5.8-534 cases per 100,000 populations; however, the incidence rate may vary depending on the age demographic and the area where the study is conducted.6-10 Thailand is one of the developing countries facing RSV ALRTI problems and there were limited data
about severe RSV ALRTI. The data available on RSV infection are insufficient to cause change in the country’s policy.6-10 Thailand has no specific medical treatment and currently using supportive care as the mainstay of management for children with RSV ALRTI, identical to other developing countries.11 Prophylactic passive immunotherapy using palivizumab - a monoclonal antibody against RSV infection is a costly treatment in Thailand. Presently, palivizumab is not routinely used in Thai children and in other countries. There are many socio-cultural, demographic and environmental risk factors that predispose children to acquire respiratory tract infections especially RSV ALRTI.12
Tungsupreechameth et al.

Volume 73, No.12: 2021 Siriraj Medical Journalhttps://he02.tci-thaijo.org/index.php/sirirajmedj/index 809
Original Article SMJ Since there are no updated data for severe RSV ALRTI in Thailand or information about the factors related to severe infection, this study aimed to identify the factors associated with severe RSV ALRTI in children. The benefits of this study include documentation and data confirmation in order to recommend policy changes in Thailand about vaccine prioritization plan or palivizumab dispensation for prophylaxis of the RSV ALRTI.
MATERIALS AND METHODSStudy design and setting A retrospective case-control study was performed on children were admitted to the the Naresuan University Hospital from 2014 - 2018. The Ethics Committee approved study protocol of the Human Research Study of Naresuan University (No.0897/2019).
Definition Weight and height of preterm in this study refer to the weight and height of patients’ corrected age. Corrected age is used to adjust the age of preterm participants calculated using the equation: [corrected age = Chronological age + (40 - Gestational age)] Hospital-acquired pneumonia (HAP) refers to a pneumonia with clinical evidence of a new lung infiltrate caused by an infectious agent (new onset of fever, purulent sputum, leukocytosis, and a decrease in oxygenation) that occurs 48 hours or more after hospital admission and is not incubating at the time of admission. Cultures obtained from endotracheal aspirates are used to identify etiologic agents.
Eligibility criteria This study enrolled children aged between 1-60 months with acute lower respiratory tract infection (ALRTI) diagnosis from Respiratory Syncytial Virus (RSV) at time of data collection period.
Selection of cases and controls The data collectors identified children diagnosed with RSV ALRTI then used the ReSVinet scale as the clinical scoring method to assess the disease severity.13
The subjects were divided into two groups: the severe RSV ALRTI group (cases) and non-severe RSV ALRTI group (controls). The evaluation process utilized 7 parameters (feeding intolerance, medical intervention, respiratory difficulty, respiratory frequency, apnea, general condition, fever) that were assigned different values (from 0 to 3) for a total of 20 points. A score greater than or equal to 14 is classified as severe RSV ALRTI. The control group was selected based on ReSVinet scale score below 14 points, and applied gender matching.
Laboratory method Nasopharyngeal swab specimens are processed using the Quick NaviTM-RSV2 immunoassay (immuno-chromatographic assay technique) (Denka Seiken Co., Ltd., Tokyo, Japan) to identify RSV.
Sample size determination Population was estimated from the study of Zhang XB and et al.14 using a case-control study with binary formula outcomes. Low birthweight, congenital heart disease, bronchopulmonary dysplasia, and airway abnormalities were found to be risk factors for severe respiratory syncytial virus-associated acute lower respiratory tract infections (p < 0.001). P(exposure|case) = The proportions of exposure to severe respiratory syncytial virus-associated acute lower respiratory tract infections was 0.315. P(exposure|control) = The proportions of exposure to non- severe respiratory syncytial virus-associated acute lower respiratory tract infections was 0.685. Twenty patients from case group (severe RSV ALRTI) and 80 patients from control group (non-severe RSV ALRTI) were results of the calculations using P(exposure|case) = 0.315, P(exposure|control) = 0.685, Ratio (case:control) = 1:4, Alpha = 0.05, Beta = 0.20.
Sampling procedure The subjects were patients diagnosed with RSV ALRTI. Those who scored greater than or equal to 14 in the ReSVinet scale were assigned to the severe RSV ALRTI group (case group), while subjects with scores below 14 points were in the non-severe RSV ALRTI (control group). Matlab-program15 was used to generate a 1:4 (case: control) ratio, matching the sex and age of the participants at random to complete the data.
Collected data Naresuan University Hospital is a tertiary-care University hospital in the lower northern part of Thailand, all admissions were recorded in the hospital’s database. Coders enter the of clinical diagnoses information using the International Classification of Disease 10th revision (ICD-10). We identified subjects with a principal diagnosis of acute bronchitis, bronchiolitis, pneumonia, laryngotracheobronchitis and epiglottitis using the ‘J20, J21, J12, J05’ ICD-10 codes (J205- acute bronchitis due to respiratory syncytial virus, J209 - acute bronchitis, unspecified, J210-acute bronchiolitis due to respiratory syncytial virus, J219-acute bronchiolitis, unspecified; J121- Respiratory syncytial virus pneumonia, J129 -viral pneumonia, unspecified; J050-Acute obstructive laryngitis[croup], J051-Acute epiglottitis). We confirmed
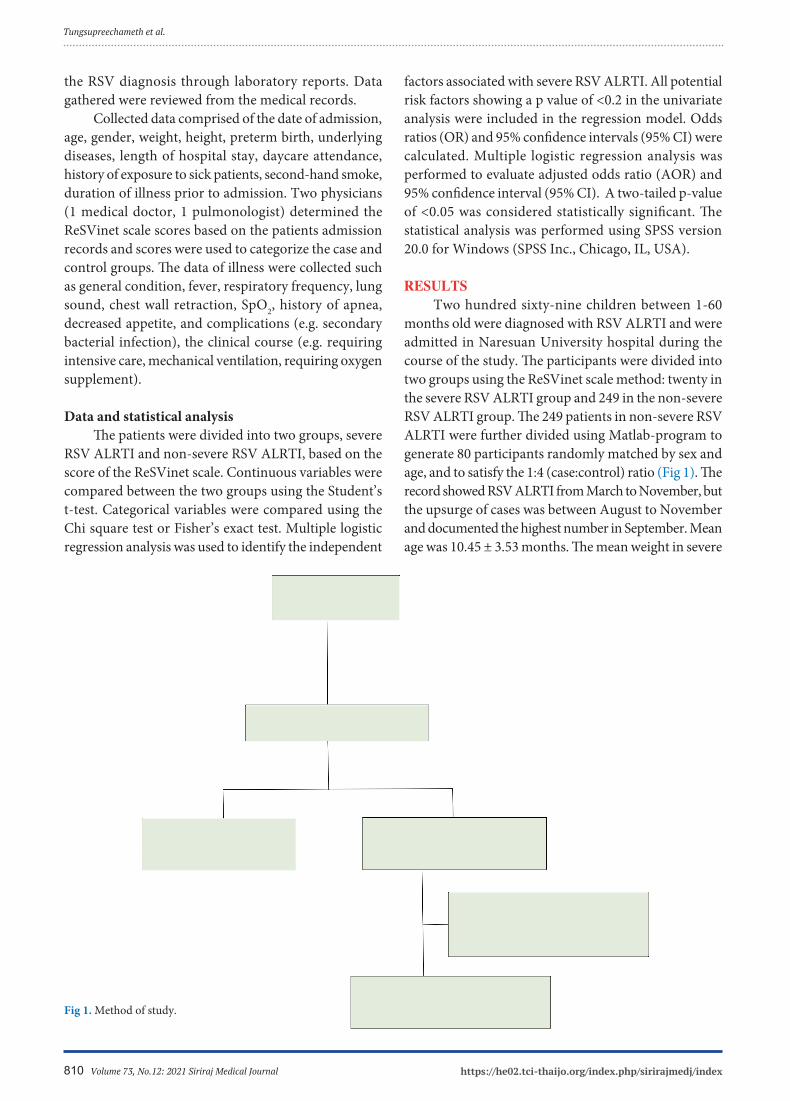
Volume 73, No.12: 2021 Siriraj Medical Journal https://he02.tci-thaijo.org/index.php/sirirajmedj/index810
the RSV diagnosis through laboratory reports. Data gathered were reviewed from the medical records. Collected data comprised of the date of admission, age, gender, weight, height, preterm birth, underlying diseases, length of hospital stay, daycare attendance, history of exposure to sick patients, second-hand smoke, duration of illness prior to admission. Two physicians (1 medical doctor, 1 pulmonologist) determined the ReSVinet scale scores based on the patients admission records and scores were used to categorize the case and control groups. The data of illness were collected such as general condition, fever, respiratory frequency, lung sound, chest wall retraction, SpO2, history of apnea, decreased appetite, and complications (e.g. secondary bacterial infection), the clinical course (e.g. requiring intensive care, mechanical ventilation, requiring oxygen supplement).
Data and statistical analysis The patients were divided into two groups, severe RSV ALRTI and non-severe RSV ALRTI, based on the score of the ReSVinet scale. Continuous variables were compared between the two groups using the Student’s t-test. Categorical variables were compared using the Chi square test or Fisher’s exact test. Multiple logistic regression analysis was used to identify the independent
factors associated with severe RSV ALRTI. All potential risk factors showing a p value of <0.2 in the univariate analysis were included in the regression model. Odds ratios (OR) and 95% confidence intervals (95% CI) were calculated. Multiple logistic regression analysis was performed to evaluate adjusted odds ratio (AOR) and 95% confidence interval (95% CI). A two-tailed p-value of <0.05 was considered statistically significant. The statistical analysis was performed using SPSS version 20.0 for Windows (SPSS Inc., Chicago, IL, USA).
RESULTS Two hundred sixty-nine children between 1-60 months old were diagnosed with RSV ALRTI and were admitted in Naresuan University hospital during the course of the study. The participants were divided into two groups using the ReSVinet scale method: twenty in the severe RSV ALRTI group and 249 in the non-severe RSV ALRTI group. The 249 patients in non-severe RSV ALRTI were further divided using Matlab-program to generate 80 participants randomly matched by sex and age, and to satisfy the 1:4 (case:control) ratio (Fig 1). The record showed RSV ALRTI from March to November, but the upsurge of cases was between August to November and documented the highest number in September. Mean age was 10.45 ± 3.53 months. The mean weight in severe
Fig 1. Method of study.
Tungsupreechameth et al.
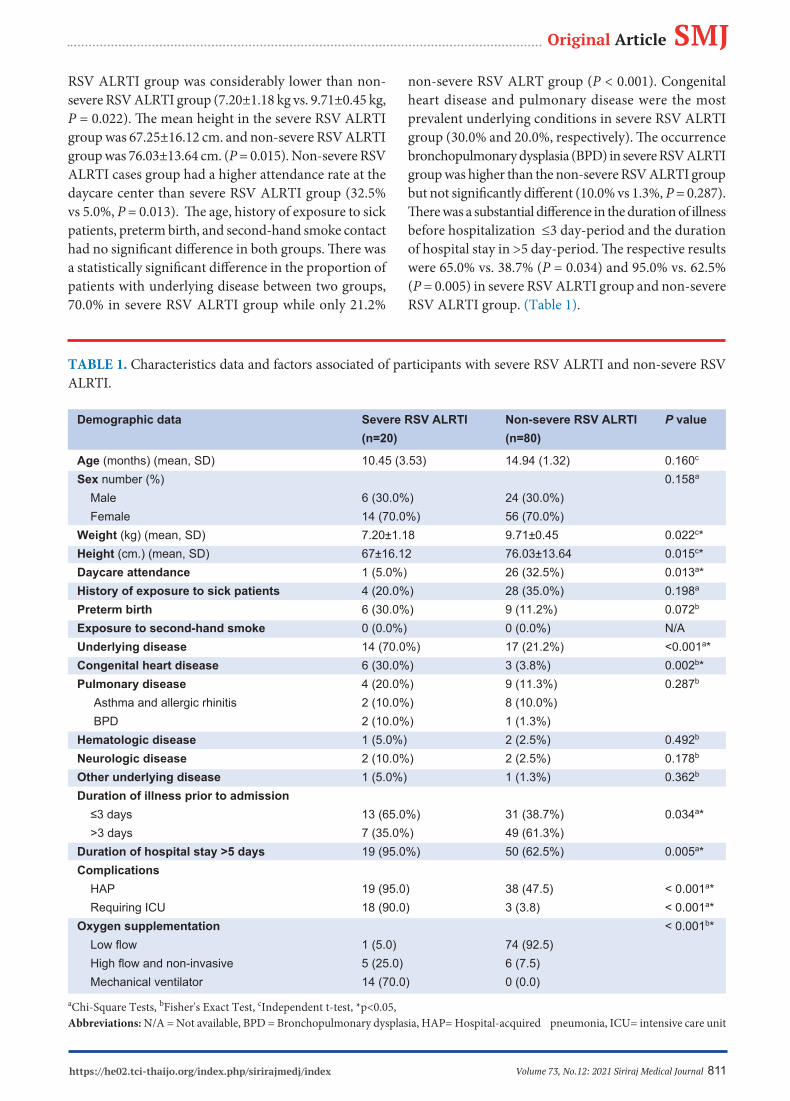
Volume 73, No.12: 2021 Siriraj Medical Journalhttps://he02.tci-thaijo.org/index.php/sirirajmedj/index 811
Original Article SMJRSV ALRTI group was considerably lower than non-severe RSV ALRTI group (7.20±1.18 kg vs. 9.71±0.45 kg, P = 0.022). The mean height in the severe RSV ALRTI group was 67.25±16.12 cm. and non-severe RSV ALRTI group was 76.03±13.64 cm. (P = 0.015). Non-severe RSV ALRTI cases group had a higher attendance rate at the daycare center than severe RSV ALRTI group (32.5% vs 5.0%, P = 0.013). The age, history of exposure to sick patients, preterm birth, and second-hand smoke contact had no significant difference in both groups. There was a statistically significant difference in the proportion of patients with underlying disease between two groups, 70.0% in severe RSV ALRTI group while only 21.2%
non-severe RSV ALRT group (P < 0.001). Congenital heart disease and pulmonary disease were the most prevalent underlying conditions in severe RSV ALRTI group (30.0% and 20.0%, respectively). The occurrence bronchopulmonary dysplasia (BPD) in severe RSV ALRTI group was higher than the non-severe RSV ALRTI group but not significantly different (10.0% vs 1.3%, P = 0.287). There was a substantial difference in the duration of illness before hospitalization ≤3 day-period and the duration of hospital stay in >5 day-period. The respective results were 65.0% vs. 38.7% (P = 0.034) and 95.0% vs. 62.5% (P = 0.005) in severe RSV ALRTI group and non-severe RSV ALRTI group. (Table 1).
TABLE 1. Characteristics data and factors associated of participants with severe RSV ALRTI and non-severe RSV ALRTI.
Demographic data Severe RSV ALRTI Non-severe RSV ALRTI P value (n=20) (n=80)
Age (months) (mean, SD) 10.45 (3.53) 14.94 (1.32) 0.160c Sex number (%) 0.158a
Male 6 (30.0%) 24 (30.0%) Female 14 (70.0%) 56 (70.0%) Weight (kg) (mean, SD) 7.20±1.18 9.71±0.45 0.022c*Height (cm.) (mean, SD) 67±16.12 76.03±13.64 0.015c*Daycare attendance 1 (5.0%) 26 (32.5%) 0.013a*History of exposure to sick patients 4 (20.0%) 28 (35.0%) 0.198a
Preterm birth 6 (30.0%) 9 (11.2%) 0.072b
Exposure to second-hand smoke 0 (0.0%) 0 (0.0%) N/AUnderlying disease 14 (70.0%) 17 (21.2%) <0.001a*Congenital heart disease 6 (30.0%) 3 (3.8%) 0.002b*Pulmonary disease 4 (20.0%) 9 (11.3%) 0.287b
Asthma and allergic rhinitis 2 (10.0%) 8 (10.0%) BPD 2 (10.0%) 1 (1.3%) Hematologic disease 1 (5.0%) 2 (2.5%) 0.492b
Neurologic disease 2 (10.0%) 2 (2.5%) 0.178b
Other underlying disease 1 (5.0%) 1 (1.3%) 0.362b
Duration of illness prior to admission ≤3 days 13 (65.0%) 31 (38.7%) 0.034a* >3 days 7 (35.0%) 49 (61.3%) Duration of hospital stay >5 days 19 (95.0%) 50 (62.5%) 0.005a*Complications HAP 19 (95.0) 38 (47.5) < 0.001a* Requiring ICU 18 (90.0) 3 (3.8) < 0.001a*Oxygen supplementation < 0.001b* Low flow 1 (5.0) 74 (92.5) High flow and non-invasive 5 (25.0) 6 (7.5) Mechanical ventilator 14 (70.0) 0 (0.0)
aChi-Square Tests, bFisher's Exact Test, cIndependent t-test, *p<0.05, Abbreviations: N/A = Not available, BPD = Bronchopulmonary dysplasia, HAP= Hospital-acquired pneumonia, ICU= intensive care unit

Volume 73, No.12: 2021 Siriraj Medical Journal https://he02.tci-thaijo.org/index.php/sirirajmedj/index812
On first-time admission, clinical manifestations of patients with severe and non-severe RSV ALRTI had significant differences in tachypnea (for infant <2 months, respiratory rate >60 /min; for children 2-12 months, respiratory rate >50 /min; for children >1-5 years, respiratory rate >40 /min) (P < 0.001), SpO2 <85% (P < 0.001), lung sound (poor air entry) (P < 0.001), and all retraction (suprasternal notch, intercostal and subcostal retraction) (P < 0.001). In contrast, there were no statistical differences in relation to abnormal general condition (e.g. lethargy, discomfort, agitation), fever and decreased appetite in both groups. No apnea was observed in all patients. When compared to patients with non-severe RSV ALRTI, patients with severe RSV ALRTI had a higher rate of HAP (95.0% vs. 47.5%, P < 0.001). The common pathogens of HAP found in our study were aerobic gram-negative bacilli [Acinetobacter baumannii (95%), Pseudomonas aeruginosa (2%), Escherichia coli (1.8%), Klebsiella pneumoniae (1%), Enterobacter spp. (0.2%)]. In addition, the number of patients with severe RSV ALRTI that required intensive care and mechanical ventilation was higher than the number of cases of non-severe RSV ALRTI (90.0% vs 3.8%, P < 0.001 and (70.0% vs.0.0%, P < 0.001, respectively). All patients needed oxygen supplementation during admission. Our research recorded four patient deaths (4.0%), three of them had underlying congenital heart diseases [1 case with dextrocardia, ventricular inversion, pulmonary stenosis (PS), patent ductus arteriosus (PDA); 1 case with CoA; and 1 case with ventricular septal defect (VSD)], and one had underlying asthma, all of whom were in the severe RSV ALRTI group. The results of the multiple logistic regression analysis adjusted by sex, age, daycare center attendance, and duration of illness prior to admission 3 days revealed the following risk factors for severe RSV ALRTI: underlying
cardiovascular disease [aOR 32.45; 95% CI 3.38-311.87, P = 0.003], and hospital stay >5 days [aOR 19.56; 95% CI 1.81-212.05, P = 0.014] (Table 2).
DISCUSSION This study showed that underlying cardiovascular diseases particularly congenital heart disease is one of the risk factors for severe RSV ALRTI (aOR = 32.45), which is comparable to previous studies.14,16-21 Infants with congenital heart disease have increased risk for severe RSV ALRTI with higher morbidity (need for assisted ventilation and longer duration of oxygen supplementation) and higher mortality rate of 37% as first reported by MacDonald, et al.22 Congenital heart disease and RSV-related rehospitalization rate were recorded at 3.0-16.4% in developed countries.16-19,21,23,24 This study supports the hypothesis that congenital heart disease (CHD) increases the risk for severe RSV ALRTI. Furthermore, the present study revealed that a hospital stay of more than 5 days is also a concomitant risk factor for severe RSV ALRTI, which is approximately 20 times more common than non-severe RSV ALRTI. This finding may suggest that care providers pay more attention to this group due to the slow recovery from disease and the need to avoid HAP. In our study, HAP was found to be 95.0% in the severe RSV ALRTI group. As a result, patients may undergo procedures to avoid disease-related complications, such as the insertion of intravenous catchers for fluid resuscitation and dehydration, intravenous antibiotics in case of bacterial superinfection, or airway suctioning for clearing secretions. Appropriate management which consists of alcohol-based disinfection and hand washing with alcohol-based rubs or soaps, is extremely effective in reducing RSV transmission and preventing nosocomial infections. We found that nosocomial infection was associated with severe RSV ALRTI group (P < 0.001) and the most common pathogen was Acinetobacter baumannii
TABLE 2. Multivariable analysis of risk factors of severe RSV-associated acute lower respiratory tract infections.
Factors Multivariable analysis
AOR 95% CI P value
Underlying cardiovascular disease 32.45 3.38-311.87 0.003
Duration of hospital stay >5 days 19.56 1.81-212.05 0.014
Adjusted by sex, age, daycare center attendance, duration of illness prior to admission ≤ 3 days
Tungsupreechameth et al.

Volume 73, No.12: 2021 Siriraj Medical Journalhttps://he02.tci-thaijo.org/index.php/sirirajmedj/index 813
Original Article SMJas reported by other studies.20,22,25,26 The number of infants admitted to hospitals during RSV season can be very high, resulting in overcrowded pediatric wards and an excessive workload for the staff. Furthermore, staying in the hospital for longer periods of time may increase the risk of cross-bacterial antimicrobial resistance infections. Thus, the importance of systematic preventive measures such as isolation of infected infants in single rooms, and handwashing are highly recommended. Groothuis, et al27 were the first to study the burden of early rehospitalization in infants with BPD due to RSV infection. However, we do not consider preterm birth and BPD as associated factors for severe RSV ALTI (P 0.287). This is so because our study had recorded preterm births of 6 out of 20 patients with severe RSV ALRTI (30.0%) and 9 out of 80 from non-severe RSV ALRTI group (11.2%) (P = 0.072). Moreover, the number of patients with underlying BPD was small (2 out of 20 (10.0%) patients from severe RSV ALRTI group and 1 out of 80 (1.3%) from non-severe RSV ALRTI group), and the majority of the patients in both groups were born at term (70% in severe RSV ALRTI and 89.8% in non-severe RSV ALRTI). Multivariable analysis revealed that daycare attendance, direct contact with sick patients prior to hospital admission, duration of illness prior to admission, and history of exposure to sick patients were not considered as risk factors for severe RSV ALTI, which contradicted the results of previous studies conducted in developed countries.16,23,28 This is partly explained by the limited utilization of daycare centers in the study population particularly in patients with severe RSV ALRTI (5%). A number of limitations should be considered in this current study. First, this research is retrospective, wherein the ReSVinet scores of the participants were based on their admission records instead on the peak of severity of the disease. Second, this cross-sectional study has small sample size. Finally, a full range PCR for the respiratory viral panel could not be performed. Notwithstanding these limitations, prospective studies should be carried out to clarify the correlation of associated factors.
CONCLUSION Our study demonstrated that factors associated with severe RSV ALRTI in children include underlying cardiovascular diseases and duration of hospital stay > 5 days.
ACKNOWLEDGMENTS The authors would like to thank Miss Kornthip
Jeephet, Statistics Technical Officer, Research Center of the Faculty of Medicine, Naresuan University for statistical analysis, and Miss Judely Marish Cañete, Miss Daisy Gonzales, International Relations Section, Faculty of Medicine, Naresuan University for their assistance in revising and editing the manuscript.
Conflicts of interest: ALL of the authors declare no conflict of interest.
REFERENCES1. Collins PL, Graham BS. Viral and Host Factors in Human Respiratory Syncytial Virus Pathogenesis. J Virol 2008;82(5):2040- 55. 2. Bohmwald K, Espinoza JA, Rey-Jurado E, Gómez RS, González PA, Bueno SM, et al. Human Respiratory Syncytial Virus: Infection and Pathology. Semin Respir Crit Care Med 2016;37:522– 37. 3. Thongpan I, Poovorawan Y. Respiratory syncytial virus (RSV). Thai J Pediatrics 2018;57(3):141-5. 4. Jain S, Williams DJ, Arnold SR, Ampofo K, Bramley AM, Reed C, et al. Community-acquired pneumonia requiring hospitalization among U.S. children. N Engl J Med 2015;372(9):835. 5. Nair H, Nokes DJ, Gessner BD, Dherani M, Madhi SA, Singleton RJ, et al. Global Burden of Acute Lower Respiratory Infections Due to Respiratory Syncytial Virus in Young Children: A Systematic Review and Meta-Analysis. Lancet 2010;375(9725):1545- 55. 6. Naorat S, Chittaganpitch M, Thamthitiwat S, Henchaichon S, Sawatwong P, Srisaengchai P. Hospitalizations for Acute Lower Respiratory Tract Infection Due to Respiratory syncytial Virus in Thailand, 2008–2011. J Infect Dis 2013;208 (Suppl 3):S238- 45. 7. Bunjoungmanee P, Rotejaratpaisan A, Tangsathapornpong A. Epidemiology, clinical manifestation and risk factors of respiratory syncytial virus infection in children at Thammasat University Hospital. Thammasat Medical Journal 2016;16(3):370-8. 8. Fry AM, Chittaganpitch M, Baggett HC, Peret TCT, Dare RK, Sawatwong P,et al. The Burden of Hospitalized Lower Respiratory Tract Infection Due to Respiratory Syncytial Virus in Rural Thailand. PLoS One 2010;5(11):e15098. 9. Suwanjutha S, Sunakorn P, Chantarojanasiri T, Siritantikorn S, Nawanoparatkul S, Rattanadilok Na Bhuket T, et al. Respiratory Syncytial Virus-Associated Lower Respiratory Tract Infection in under-5-year-old Children in a Rural Community of Central Thailand, a Population-Based Study. J Med Assoc Thai 2002;85 (Suppl 4):S1111-9. 10. Nolan T, Borja-Tabora C, Lopez P, Weckx L, Ulloa-Gutierrez R, Lazcano-Ponce E, et al. Prevalence and Incidence of Respiratory Syncytial Virus and Other Respiratory Viral Infections in Children Aged 6 Months to 10 Years With Influenza-like Illness Enrolled in a Randomized Trial. Clin Infect Dis 2015;60(11): e80-9. 11. Barben J, Kuchni CE, Trachsel D, Hammer J, Swiss Paediatric Respiratory Research Group. Management of acute bronchiolitis: can evidence based guideline alter clinical practice? Thorax 2008;63(12):1103-9. 12. Scheltema NM, Gentile A, Lucion F, Nokes DJ, Munywoki PK,

Volume 73, No.12: 2021 Siriraj Medical Journal https://he02.tci-thaijo.org/index.php/sirirajmedj/index814
Madhi SA, et al. Global respiratory syncytial virus-associated mortality in young children (RSC GOLD): a retrospective case series. Lancet Glob Healt 2017;5:e984-91. 13. Justicia-Grande AJ, Pardo-Seco J, Cebey-López M, Vilanova- Trillo L, Gómez-Carballa A, Rivero-Calle I, et al. Development and Validation of a New Clinical Scale for Infants With Acute Respiratory Infection: The ReSVinet Scale. PLoS One 2016;11(6): e0157665. 14. Zhang XB, Liu LJ, Qian LL, Jiang GL, Wang CK, Jia P, et al. Clinical Characteristics and Risk Factors of Severe Respiratory Syncytial Virus-Associated Acute Lower Respiratory Tract Infections in Hospitalized Infants. World J Pediatr 2014;10(4): 360-4. 15. Luki (2021). Age_gender_match (year_gap,group1,group2) (https://www.mathworks.com/matlabcentral/fileexchange/ 66984-age_gender_match-year_gap-group1-group2), MATLAB Central File Exchange. Retrieved August 28, 2021.16. Aujard Y, Fauroux B. Risk Factors for Severe Respiratory Syncytial Virus Infection in Infants. Respir Med 2002;96 Suppl B:S9-14. 17. MacDonald NE, Hall CB, Suffin SC, Alexson C, Harris PJ, Manning JA. Respiratory Syncytial Viral Infection in Infants With Congenital Heart Disease. N Engl J Med 1982;307(7):397- 400. 18. Navas L, Wang E, de Carvalho V, Robinson J. Improved Outcome of Respiratory Syncytial Virus Infection in a High-Risk Hospitalized Population of Canadian Children. Pediatric Investigators Collaborative Network on Infections in Canada. J Pediatr 1992;121(3):348-54. 19. Wang EE, Law BJ, Stephens D. Pediatric Investigators Collaborative Network on Infections in Canada (PICNIC) prospective study of risk factors and outcomes in patients hospitalized with respiratory syncytial viral lower respiratory tract infection. J Pediatr 1995;126(2):212-9.
20. Thorburn K. Pre-existing Disease Is Associated With a Significantly Higher Risk of Death in Severe Respiratory Syncytial Virus Infection. Arch Dis Child 2009 ;94(2):99-103. 21. Murray J, Bottle A, Sharland M, Modi N, Aylin P, Majeed A, et al. Risk Factors for Hospital Admission With RSV Bronchiolitis in England: A Population-Based Birth Cohort Study. PLoS One 2014;9(2):e89186. 22. Wu A, Budge PJ, Williams J, Griffin MR, Edwards KM, Johnson M, et al. Incidence and Risk Factors for Respiratory Syncytial Virus and Human Metapneumovirus Infections Among Children in the Remote Highlands of Peru. PLoS One 2015;10(6):e0130233. 23. Sommer C, Resch B, Simões EAF. Risk Factors for Severe Respiratory Syncytial Virus Lower Respiratory Tract Infection. Open Microbiol J 2011;5:144-54. 24. Kristensen K, Stensballe L G, Bjerre J, Roth D, Fisker N, Kongstad T, et al. Risk factors for respiratory syncytial virus hospitalisation in children with heart disease. Arch Dis Child 2009;94(10): 785-9. 25. Boyce TG, Mellen BG, Mitchel Jr EF, Wright PF, Griffin MR. Rates of Hospitalization for Respiratory Syncytial Virus Infection Among Children in Medicaid. J Pediatr 2000;137(6):865-70. 26. Keerasuntonpong A, Samakeenich C, Tribuddharat C, Thamlikitkul V. Epidemiology of Acinetobacter baumannii Infections in Siriraj Hospital 2002. Siriraj Med J 2006; 58: 951-954.27. Committee on Infectious Diseases. Modified Recommendations for Use of Palivizumab for Prevention of Respiratory Syncytial Virus Infections. Pediatrics 2009;124(6):1694-1701. 28. Figueras-Aloy J, Carbonell-Estrany X, Quero-Jiménez J, Fernández-Colomer B, Guzmán-Cabañas J, Echaniz-Urcelay I, et al. FLIP-2 Study: risk factors linked to respiratory syncytial virus infection requiring hospitalization in premature infants born in Spain at a gestational age of 32 to 35 weeks. Pediatr Infect Dis J 2008;27(9):788-93.
Tungsupreechameth et al.

Volume 73, No.12: 2021 Siriraj Medical Journalhttps://he02.tci-thaijo.org/index.php/sirirajmedj/index 815
Original Article SMJ
Supanan Innok, M.N.S*, Witchuda Dokphueng, M.N.S*, Kamol Udol, M.D., M.Sc.**, Worawong Slisatkorn, M.D.***, Prasert Sawasdiwipachai, M.D.*****Department of Nursing, Siriraj Hospital, Bangkok 10700, Thailand, **Department of Preventive and Social Medicine, ***Department of Surgery,
****Department of Anesthesiology, Faculty of Medicine Siriraj Hospital, Mahidol University, Bangkok 10700, Thailand
Clinical Outcomes and Cost of Ventilator Weaning and Endotracheal Extubation Guided by An Established Ventilator Weaning Protocol in Patients Undergoing Elective Cardiac Surgery
ABSTRACTObjective: To compare successful early extubation rates, complications, and cost before and after the use of an established ventilator weaning protocol in patients undergoing elective cardiac surgery.Materials and Methods: Subjects were adult patients undergoing elective cardiac surgery who were clinically stable within 2 hours after surgery. The control group underwent conventional ventilator weaning at the discretion of their attending staff. The intervention group underwent protocol-guided ventilator weaning. The primary outcome was a successful early extubation (within 6 hours after surgery). Secondary outcomes were complications from weaning to 24 hours after surgery, and the relevant cost related to respiratory and cardiovascular care within 24 hours after admission to the postoperative intensive care unit.Results: The primary outcome occurred in 37 out of 65 patients (56.9%) in the intervention group and in 5 out of 65 patients (7.7%) in the control group (adjusted odds ratio 20.6; 95% confidence interval 6.7–62.9, p<0.001). The complication rates were not statistically different between the intervention and control groups (26.2% vs. 20.0%, p=0.41). The relevant cost, approximated by the service charges, related to respiratory and cardiovascular care was significantly less in the intervention group than in the control group (median 2,491 vs. 2,711 Thai baht, p<0.001).Conclusion: The use of the established ventilator weaning protocol after elective cardiac surgery was associated with a higher rate of successful early extubation and lower cost related to respiratory and cardiovascular care compared to the conventional practices of ventilator weaning and extubation. The rates of overall complications were not significantly different.
Keywords: Early extubation; cardiac surgery; ventilator weaning protocol; complication; cost (Siriraj Med J 2021; 73: 815-822)
Corresponding author: Kamol UdolE-mail: [email protected] 18 May 2021 Revised 17 October 2021 Accepted 27 October 2021ORCID ID: https://orcid.org/0000-0002-1508-7749http://dx.doi.org/10.33192/Smj.2021.106
INTRODUCTION Open-heart surgery remains an important treatment option for patients with coronary artery disease, valvular heart disease, and congenital heart disease. After successful open-heart surgery, patients often require further ventilatory support for a period of time until the effects of general
anesthesia fade and their vital signs are stable. Timely ventilator weaning and endotracheal extubation is essential in order to avoid unnecessary prolonged ventilation and, at the same time, to minimize the adverse effects of too early weaning and extubation.

Volume 73, No.12: 2021 Siriraj Medical Journal https://he02.tci-thaijo.org/index.php/sirirajmedj/index816
At Siriraj Hospital, the process of ventilator weaning in elective cardiac surgery patients in the postoperative intensive care unit (ICU) has conventionally been handled primarily by the attending nurse, under the supervision of the attending ICU physician, without any specific guidance. The nurse initiates the process of ventilator weaning and regularly monitors the patient’s response and weaning parameters. When the patient is considered ready for extubation, the nurse notifies the attending ICU physician to confirm the evaluation and to perform the extubation. The ventilator weaning process depends considerably on the individual nurse’s experience and preference. This leads to a variation in practice and can result in an unnecessarily prolonged intubation in some patients, especially those who are ready for extubation during the night. Prolonged ventilatory support and delayed endotracheal extubation are associated with an increase in the length of ICU and hospital stay, adverse clinical outcomes, including an increase in mortality, and higher health care costs.1,2 Previous studies found that post cardiac surgery patients with stable hemodynamics could be safely extubated within 4–6 hours after surgery.3,4
In order to reduce variations in practice and to avoid delayed extubation, a team comprising postoperative ICU nurses, a cardiovascular-thoracic surgeon, and a cardiovascular anesthesiologist was formed to establish a protocol for ventilator weaning and extubation for postoperative cardiac surgery patients. The protocol specifies the steps and activities to be followed by the attending nurse, with an aim for early extubation within 6 hours after surgery. We conducted this study to evaluate the effects of using the established ventilator weaning protocol in patients undergoing elective cardiac surgery compared to conventional weaning practices.
MATERIALS AND METHODS This prospective pre-post intervention study was conducted at Siriraj Hospital in Bangkok, Thailand. The Institutional Review Board of the Faculty of Medicine Siriraj Hospital approved the study protocol. All the subjects provided written informed consent to participate in the study.
Study participants Patients were potentially eligible if they had coronary artery disease, valvular heart disease, or adult congenital heart disease that required elective cardiac surgery for the first time, were aged 18–75 years old, and had a left ventricular ejection fraction (LVEF) of ≥ 45%, and an echocardiographically estimated right ventricular systolic
pressure (RVSP) of ≤ 60 mmHg. After the surgery, patients were admitted to the postoperative ICU. At 2 hours after surgery, the patients were assessed for their final eligibility. Patients were excluded if they met at least one of the following exclusion criteria at 2 hours after surgery: a Richmond Agitation and Sedation Scale (RASS) of < –2; pulse oximetry oxygen saturation (SpO2) of < 95%; serious cardiac arrhythmia [symptomatic bradycardia with a heart rate of < 50 beats per minute (BPM), second- or third-degree atrioventricular block, atrial fibrillation with a ventricular rate of > 120 BPM, atrial flutter, supraventricular tachycardia, sustained ventricular tachycardia, ventricular fibrillation, or pulseless electrical activity]; unstable hemodynamics [sustained hypotension (mean arterial pressure (MAP) of < 65 mmHg or systolic blood pressure (SBP) of < 90 mmHg) for longer than 10 minutes, at least 2 episodes of hypotension (MAP of < 65 mmHg or SBP of < 90 mmHg) within the previous 2 hours, receiving at least 5 microgram/kg/min of dopamine or dobutamine, or at least 0.1 microgram/kg/min of adrenaline or norepinephrine, requiring mechanical circulatory support (intra-aortic balloon pump, ventricular assist device, or extra-corporeal membrane oxygenation), or had a urine output of < 1 mL/kg/hour]; chest drain content of > 100 mL/hour for 2 consecutive hours; and the occurrence of new stroke. Patients with a documented difficulty in intubation were also excluded.
Study procedures Patients enrolled before implementation of the established ventilator weaning protocol (i.e., the conventional weaning group) were managed conventionally regarding ventilator weaning and extubation by the attending nurse in consultation with the attending ICU physician in the postoperative ICU. Patients were put on mechanical ventilation upon ICU admission, usually in the assist/control mode. The weaning process started with a gradual reduction of the fraction of inspired oxygen (FiO2) to 0.4-0.5 while maintaining the SpO2 at 95% or higher. When this level of FiO2 was achieved and the patient was clinically stable and conscious, the ventilator mode was then switched to synchronized intermittent mandatory ventilation (SIMV) with pressure support (PS). When the attending staff were confident that the patient could tolerate this ventilator mode well and was clinically stable, the patient was put on spontaneous ventilation with either T-piece or continuous positive airway pressure (CPAP) with PS. When the patient’s respiratory and clinical conditions were ready, the attending ICU physician performed the extubation. The specific details and timing of each step
Innok et al.

Volume 73, No.12: 2021 Siriraj Medical Journalhttps://he02.tci-thaijo.org/index.php/sirirajmedj/index 817
Original Article SMJwere not specified and were left to the discretion of the attending nurse in consultation with the attending ICU physician. During the process, the patient’s conditions were regularly monitored and management was provided accordingly. The established ventilator weaning protocol was implemented in April 2016, and patients enrolled in the study thereafter comprised the protocol weaning group. The protocol provides details of and timing for the activities at each step, together with the criteria for the assessment of patients during the weaning process. The protocol aims for extubation to be performed within 6 hours after surgery if the patients are stable and do not have major complications. The protocol is summarized in Fig 1.
Outcomes The primary outcome was a successful extubation within 6 hours after the surgery. Extubation was considered successful if there were no respiratory, cardiovascular, or neurological complications until 24 hours after surgery, and no re-intubation within 48 hours after extubation. Secondary outcomes were complications recorded from the beginning of ventilator weaning to 24 hours after surgery, and the relevant cost related to respiratory and cardiovascular care within 24 hours after admission to the ICU. Respiratory complications included new or worsening atelectasis, pneumothorax, re-intubation within 48 hours after extubation, and moderate or severe acidosis or alkalosis. Cardiovascular complications included postoperative myocardial infarction, significant arrhythmias (atrial flutter, atrial fibrillation with rapid ventricular rate, supraventricular tachycardia, sustained ventricular tachycardia, ventricular fibrillation, pulseless electrical activities), and hypotension (MAP < 65 mmHg or SBP < 90 mmHg for longer than 10 minutes). Neurological complication was reflected by a Glasgow coma scale of < 13. The cost considered in this study was limited to that related to inotropic agents, antiarrhythmic agents, procedures related to respiratory care (endotracheal intubation, ventilator use, suction, chest x-ray, arterial blood gas analyses, and intercostal drainage), and cardiovascular care (intraarterial blood pressure monitoring, use of infusion pumps, electrocardiography, analyses of cardiac biomarkers, and electrical cardioversion). For each service item, we used the service charge determined by Siriraj Hospital as a proxy for its cost. The service charge for each service item was fixed throughout the study period.
Statistical analyses On the basis of our local ICU statistics, the rate of
successful extubation within 6 hours after cardiac surgery was approximately 25%. To demonstrate a doubling of the successful extubation rate after the use of the established ventilator weaning protocol with the power of 80% at a two-sided significance level of 0.05 and the assumption of a 10% loss of subjects, it was determined that a sample size of 65 subjects in each group would be required. The patients’ characteristics were summarized with the median and interquartile range (IQR), or number and percentage, and were compared between groups using the Mann–Whitney U test, chi-square test, or the Fisher’s exact test as appropriate. The primary outcome was analyzed using multiple logistic regression analysis, adjusted for imbalances in the baseline characteristics (characteristics with a p-value of < 0.2 in comparisons between groups). The magnitude of the effect is presented as an adjusted odds ratio (OR) and its 95% confidence interval (CI). The complication rates were compared between groups using the chi-square test. The cost was compared using the Mann–Whitney U test.
RESULTS In total, 130 patients participated in the study: 65 in the conventional weaning group and 65 in the protocol weaning group. All the patients completed the study protocol and were included in the analyses. The median age was 61.5 years old and 61.5% were male. Comorbidities were prevalent; almost 40% of the study participants had diabetes, about three-quarters had hypertension, and slightly more than half had dyslipidemia. Coronary artery bypass graft (CABG) surgery was performed, as a single procedure or combined with other procedures, in 74% of the subjects. Valve surgery, alone or combined with other procedures, was done in 32% of the subjects. The patients’ baseline characteristics were not statistically significantly different between the groups (Table 1).
Primary outcome The median (IQR) duration of intubation was 5.8 (5.3–6.0) hours in the protocol weaning group and 9.0 (7.4–11.1) hours in the conventional weaning group (p < 0.001). The primary outcome (successful extubation within 6 hours after surgery) occurred in 37 patients (56.9%) in the protocol weaning group and in 5 patients (7.7%) in the conventional weaning group (Table 2). The OR for the primary outcome, adjusted for sex, the presence of diabetes mellitus, and the presence of coronary artery disease, was 20.6 (95% CI 6.7–62.9, p < 0.001) for the intervention group compared to the control group.

Volume 73, No.12: 2021 Siriraj Medical Journal https://he02.tci-thaijo.org/index.php/sirirajmedj/index818
Innok et al.
No
No Yes
Step 4 Post-extubation care
Extubation
Step 3 Perform
extubation 5th–6th hour
Final assessment - Spontaneous breathing above the ventilator rate, RR 10–30/min - Spontaneous TV 5–7 ml/kg, Minute ventilation 5–10 L/min - SpO2 ≥ 95% - RSBI (f/VT) ≤ 105
Step 2 Prepare for extubation 3rd–4th hour
Initial assessment - Breathing spontaneously above the ventilator rate, RR 10–30/min - Spontaneous TV 5–7 ml/kg, Minute ventilation 5–10 L/min - ABG: pH 7.35–7.45, PaO2 ≥ 90 mmHg, PaCO2 35–45 mmHg, HCO3 22–26 mEq/L - PaO2/FiO2 > 200 - SpO2 ≥ 95%
RR 2 breaths q 15–30 minutes until achieving RR 4–6/min
Pre-extubation - Upright position - Clear airway and rest the patient for 30 minutes - Ask the patient to take deep breaths
O2 T-Piece 7–10 L/min After 30 minutes: ABG for evaluation of gas exchange
CPAP + PS 5–8 cmH2O After 30 minutes: ABG for evaluation of gas exchange
Assessment for extubation readiness - Good consciousness: Alert and cooperative - Adequate gas exchange: pH 7.35–7.45, PaO2 ≥ 90 mmHg, PaCO2 35–45 mmHg, HCO3 22–2 6 mEq/L, SpO2 ≥ 95 %, RR ≤ 24 /min - Stable hemodynamics: MAP ≥ 65 mmHg, SBP ≥ 90 mmHg, Dobutamine or Dopamine < 5 µg/kg/min, Adrenaline or Norepinephrine < 0.1 µg/kg/min - No bleeding: Chest tube output < 50 ml/hr - No significant arrhythmia: Symptomatic bradycardia, A-V Block, AF, Atrial flutter, SVT, Sustained VT, VF, PEA - No increased work of breathing: No rapid shallow breathing pattern, No paradoxical abdominal movement - Adequate Pain control: Pain score < 3 - No anxiety
- Rest the patient - Maintain ventilator setting - Reassess within 1 hour (total duration of this stage 3 hours)
- *If necessary, repeat ABG
If PaO2 ≤ 60 mmHg, SpO2 < 90%
- CXR, ABG - Consider re-intubation
- PaO2 ≥ 90 mmHg, SpO2 ≥ 95%
- Ability to maintain RR 10–30/min - Ability to cough and clear secretions - Deep breathing exercise
Figure 1. Ventilator weaning and extubation protocol after elective cardiac surgery
Step 1 Initiation of
ventilator weaning 1st–2nd hour
Evaluate physiologic criteria - Awake: Eye opening, moving spontaneously and following command - Adequate gas exchange: SpO2 ≥ 95% - No new onset arrhythmia or serious dysrhythmia: Symptomatic bradycardia, A-V Block, AF, Atrial flutter, SVT, Sustained VT, VF, PEA - Stable hemodynamics: MAP ≥ 65 mmHg, SBP ≥ 90 mmHg, urine > 1 ml/kg/hr, Dobutamine or Dopamine < 5 µg/kg/min, Adrenaline or Norepinephrine < 0.1 µg/kg/min, No IABP, No VAD, No ECMO
- No need of reoperation: Chest tube output < 100 ml/hr - No new stroke - No difficult intubation
Ventilator setting by anesthesiologist CMV rate 10–12/min
Verify baseline ABG within 20 minutes
Assessment of airway and cardiac conditions
Titrate FiO2 to 0.4–0.5 maintain SpO2 ≥ 95%
*Clear airway and confirm CXR if necessary
Wean Ventilator Settings - SIMV + PS 5–8 cmH2O, Limit PEEP ≤ 5 cmH2O - After 30 minutes, ABG for evaluation of gas exchange - Assess vital signs q 30 minutes
No - Maintain previous setting - Minimal sedation just for comfort
- Upright and comfortable position
Reassessment until appropriate conditions are met
Post cardiac surgery Admission to Postoperative ICU
All criteria met
Weaning as clinically indicated
Notify Physician
Fig 1. Ventilator weaning and extubation protocol after elective cardiac surgery

Volume 73, No.12: 2021 Siriraj Medical Journalhttps://he02.tci-thaijo.org/index.php/sirirajmedj/index 819
Original Article SMJ
TABLE 1. Characteristics of the study participants at enrolment.
Characteristic Total Protocol Conventional p-valuea
(n = 130) weaning weaning (n = 65) (n = 65)
Age (year) – median (IQR) 61.5 60.0 62.0 0.537b
(54.0–6 7.0) (52.5–67.0) (55.0–67.0)
Male – no. (%) 80 (61.5) 45 (69.2) 35 (53.8) 0.071
Comorbidities – no. (%)
Diabetes mellitus 48 (36.9) 20 (30.8) 28 (43.1) 0.146
Hypertension 99 (76.2) 52 (80.0) 47 (72.3) 0.303
Dyslipidemia 70 (53.8) 36 (55.4) 34 (52.3) 0.725
Chronic kidney disease 8 (6.2) 2 (3.1) 6 (9.2) 0.273c
COPD/Asthma 5 (3.8) 1 (1.5) 4 (6.2) 0.365c
eGFRd (mL/min/1.73 m2) – median (IQR) 75.4 75.8 75.1 0.524b
(62.6–91.8) (65.2–91.6) (60.8–91.8)
Smoking status – no. (%) 0.639
Current smoker 11 (8.5) 7 (10.8) 4 (6.2)
Ex-smoker 31 (23.8) 15 (23.1) 16 (24.6)
Non-smoker 88 (67.7) 43 (66.2) 45 (69.2)
ASA class – no. (%) 1.000c
2 5 (3.8) 2 (3.1) 3 (4.6)
3–4 124 (96.2) 63 (95.4) 62 (93.8)
Cardiac conditione – no. (%)
Coronary artery disease 96 (73.8) 52 (80.0) 43 (66.2) 0.075
Valvular heart disease 43 (33.1) 19 (29.2) 24 (36.9) 0.351
Congenital heart disease 8 (6.2) 4 (6.2) 5 (7.7) 0.730c
Type of surgery – no. (%) 0.367c
Single procedure
CABG surgery 83 (63.8) 44 (67.7) 39 (60.0)
Valve surgery 25 (19.2) 8 (12.3) 17 (26.2)
Closure of septal defect 4 (3.1) 2 (3.1) 2 (3.1)
Combined procedures
CABG and valve surgery 13 (10.0) 8 (12.3) 5 (7.7)
Valve surgery and closure of septal defect 4 (3.1) 2 (3.1) 2 (3.1)
Other 1(0.8) 1 (1.5) 0 (0.0)
Operation time (minutes) – median (IQR) 155 150 170 0.257b
(120–216) (120–199) (120–235)
a Conventional weaning vs. Protocol weaning, Chi-square test unless indicated otherwise.b Mann–Whitney U test.c Fisher’s exact test.d Calculated using the CKD–EPI creatinine equation.e Listed conditions are not mutually exclusive.IQR: Interquartile range, COPD: Chronic obstructive pulmonary disease, eGFR: Estimated glomerular filtration rate, CABG: Coronary artery bypass graft, ASA: American Society of Anesthesiologists.

Volume 73, No.12: 2021 Siriraj Medical Journal https://he02.tci-thaijo.org/index.php/sirirajmedj/index820
Secondary outcomes Overall, 30 subjects suffered at least 1 complication from the beginning of ventilator weaning to 24 hours after the surgery: 17 (26.2%) in the protocol weaning group and 13 (20.0%) in the conventional weaning group (p = 0.405) (Table 3). Atrial fibrillation developed more frequently in the protocol weaning group than in the conventional weaning group (8 vs. 3 subjects respectively). Two subjects in the protocol weaning group required
inotropic agents. In both groups, no subject required re-intubation within 48 hours. The service charges related to respiratory and cardiovascular care within 24 hours after admission to the ICU were significantly less in the protocol weaning group than in the conventional weaning group [median (IQR) 2,491 (2,308–2,652) Thai baht (THB) vs. 2,711 (2,479–2,945) THB, p < 0.001] (Table 3).
TABLE 2. Primary outcome.
TABLE 3. Secondary outcomes.
Protocol Conventional Adjusted ORa p-value weaning weaning (95% CI) (n = 65) (n = 65)
Successful extubation within 6 hours 37 (56.9) 5 (7.7) 20.6 < 0.001
after surgery – no. (%) (6.7–62.9)
a Adjusted for sex, presence of diabetes mellitus, presence of coronary artery disease.OR: odds ratio, CI: confidence interval.
Protocol Conventional p-value weaning weaning (n = 65) (n = 65)
Complicationsa – no. (%) 17 (26.2) 13 (20.0) 0.405
Respiratory – no. (%)
Atelectasis 4 (6.2) 4 (6.2)
Pneumothorax 1 (1.5) 1 (1.5)
Acidosis (arterial pH < 7.25) or alkalosis (arterial pH > 7.5) 1 (1.5) 1 (1.5)
Cardiovascular – no. (%)
Atrial fibrillation 8 (12.3) 3 (4.6)
Supraventricular tachycardia 1 (1.5) 0 (0.0)
Hypotension 3 (4.6) 2 (3.1)
Requirement of inotropic agents 2 (3.1) 0 (0.0)
New pathological Q wave or new LBBB in ECG – no./total (%) 1/52 (1.9) 3/44 (6.8)
Costsb (THB) – median (IQR) 2,491 2,711 < 0.001
(2,308–2,652) (2,479–2,945)
a Complications recorded from the beginning of ventilator weaning to 24 hours after surgery.b Approximated by the service charges related to respiratory and cardiovascular care within 24 hours after admission to the postoperative intensive care unit.LBBB: left bundle branch block, ECG: electrocardiography, THB: Thai baht, IQR: Interquartile range.
Innok et al.

Volume 73, No.12: 2021 Siriraj Medical Journalhttps://he02.tci-thaijo.org/index.php/sirirajmedj/index 821
Original Article SMJDISCUSSION In this prospective pre-post intervention study among patients undergoing elective cardiac surgery, the implementation of the established ventilator weaning protocol led to a remarkable increase in the rate of successful extubation within 6 hours after surgery and a decrease in service charges related to respiratory and cardiovascular care within 24 hours after admission to the postoperative ICU, when compared to the conventional weaning practices. There was no statistically significant increase in the rates of respiratory and cardiovascular complications. Early extubation in stable postoperative cardiac patients, when compared to late extubation, was shown in previous studies to shorten the length of ICU and hospital stay, and to reduce healthcare costs.3,5-9 Strategies that enhance early extubation would, therefore, be beneficial for both patients and the healthcare system. A number of studies have found that ventilator weaning guided by an established weaning protocol shortens the time to extubation and increases the rate of early extubation when compared to weaning without a guide among cardiac patients in a coronary care unit or post cardiac surgery patients.10-12 Moreover, early extubation in cardiac surgery patients was found to lead to a reduction in costs and an improvement in health resource utilization.5,9
The results of our study confirm the clinical and cost benefits of protocol-guided ventilator weaning in post cardiac surgery patients. Implementing the established ventilator weaning protocol appeared to be safe. In this study, no patients required re-intubation within 48 hours after extubation. The rates of respiratory and cardiovascular complications were similar between the 2 groups, except for atrial fibrillation, which was higher in the protocol weaning group. Previous studies did not observe an increased rate of atrial fibrillation in patients with early extubation. It is still not clear whether this increase in atrial fibrillation in our study was true or just a chance finding. Additional information is required before a definite conclusion regarding this issue can be made. The established ventilator weaning protocol clearly specifies the steps to take and time frames to follow during the weaning process; thereby reducing the variations in practice, hastening the process of weaning, and enhancing the success rate of early extubation. In addition, the protocol also provides monitoring criteria to determine the progression of the patients and the actions to be taken if the patients do not progress as expected. In conventional weaning practices, extubation in some patients who are ready during the night may be delayed until the next
morning due to concerns about safety, as the number of staff during the night may be less than that during the day. Moreover, it might be perceived that night staff may not be as vigilant as day staff in detecting complications after extubation. Our study provides assurances that following the established weaning protocol does not increase the risk of complications after extubation, regardless of the time of extubation. Experts have suggested that a ventilator weaning protocol should be developed using a multidisciplinary team approach.13 The ventilator weaning protocol implemented in this study was developed by a team of postoperative ICU nurses, a cardiovascular-thoracic surgeon, and a cardiovascular anesthesiologist. In our institution, and in this study, the attending nurse plays a primary role in the process of ventilator weaning, in consultation with the attending ICU physician when necessary. Nurses have important roles to play in various strategies essential for successful ventilator weaning, including enhancing the readiness to wean, frequent assessment of the readiness to wean, encouraging spontaneous breathing during weaning, and the use of spontaneous breathing trials.14 Other studies support the success of ventilator weaning and early extubation when directed by a nurse using a pre-specified protocol.12,15
Employing the result of our study to clinical practice has potential implications for post cardiac surgery patients and for health care system. For patients, early ventilator weaning and endotracheal extubation is likely to reduce discomfort and anxiety associated with mechanical ventilation and the endotracheal tube. The length of postoperative ICU stay is likely to be shortened. Mechanical ventilators and ICU beds could therefore be utilized more efficiently as they become more readily available to other patients in need. In Thailand, about 11,000 adults underwent CABG and/or valve surgery in 2019.16 Applying the protocol-guided early ventilator weaning and extubation could lead to millions of Thai baht being saved each year. However, our study had some limitations to note. Group allocations for each subject did not follow a process of randomization. Thus, selection bias and some effects of unmeasured or unknown confounding factors could not be entirely excluded. The successful extubation rate within 6 hours after surgery in the conventional weaning group (7.7%) was much lower than that estimated in our sample size calculation (25%). This would indicate bias in the study and may have led to an overestimation of the effect of protocol weaning compared to conventional weaning. The unadjusted OR estimated from the result of the study was 15.9 (95% CI 5.6–44.7, p < 0.001).

Volume 73, No.12: 2021 Siriraj Medical Journal https://he02.tci-thaijo.org/index.php/sirirajmedj/index822
However, if we assume an approximate 25% successful extubation rate in the conventional weaning group (16 subjects out of 65), the result would still be statistically significant in favor of protocol weaning, but the effect would be less pronounced, with an unadjusted OR of 4.0 (95% CI 1.9–8.6, p < 0.001). Also, we used relevant service charges related to respiratory and cardiovascular care in each group as proxies for the cost data. However, for any particular service in our institution, cost is a primary determinant of its service charge. Therefore, a comparison of service charges would provide a similar conclusion as the comparison of costs between groups. Last but not least, this study was conducted in a single university hospital in patients with elective cardiac surgery; the results may not be applicable to other care settings or to other groups of patients.
CONCLUSION In conclusion, ventilator weaning and extubation guided by an established weaning protocol in patients undergoing elective cardiac surgery was found to be associated with a higher rate of successful extubation within 6 hours after surgery and lower cost related to respiratory and cardiovascular care within 24 hours after admission to the postoperative ICU, compared to conventional practices of ventilator weaning and extubation. The rates of overall complications from the initiation of ventilator weaning to 24 hours after surgery were not significantly different.
ACKNOWLEDGEMENT This study was supported by a grant from the Siriraj Research Development Fund (managed by the Routine to Research Project), Faculty of Medicine Siriraj Hospital, Mahidol University.
REFERENCES1. Trouillet JL, Combes A, Vaissier E, Luyt CE, Ouattara A, Pavie A, et al. Prolonged mechanical ventilation after cardiac surgery: outcome and predictors. J Thorac Cardiovasc Surg 2009;138:948– 53.2. Zochios V, Chandan JS, Schultz MJ, Morris AC, Parhar KK, Giménez-Milà M, et al. The effects of escalation of respiratory support and prolonged invasive ventilation on outcomes of cardiac surgical patients: a retrospective cohort study. J Cardiothorac Vasc Anesth 2020;34:1226–34.
3. Guller U, Anstrom KJ, Holman WL, Allman RM, Sansom M, Peterson ED. Outcomes of early extubation after bypass surgery in the elderly. Ann Thorac Surg 2004;77:781–8.4. Amirghofran AA, Rayatpisheh M, Rayatpisheh S, Kaviani M. A comparative study of immediate and late extubation after open heart surgery. Iran Cardiovasc Res J 2007;1:42–7.5. Cheng DC, Karski J, Peniston C, Raveendran G, Asokumar B, Carroll J, et al. Early tracheal extubation after coronary artery bypass graft surgery reduces costs and improves resource use. a prospective, randomized, controlled trial. Anesthesiology 1996;85:1300–10.6. Reis J, Mota JC, Ponce P, Costa-Pereira A, Guerreiro M. Early extubation does not increase complication rates after coronary artery bypass graft surgery with cardiopulmonary bypass. Eur J Cardiothorac Surg 2002;21:1026–30.7. Litmathe J, Boeken U, Kurt M, Feindt P, Gams E. CABG- procedures in patients with advanced age: early extubation and fast track management as an option? The Cardiol 2008;4:7–10.8. Camp SL, Stamou SC, Stiegel RM, Reames MK, Skipper ER, Madjarov J, et al. Quality improvement program increases early tracheal extubation rate and decreases pulmonary complications and resource utilization after cardiac surgery. J Card Surg 2009;24:414–23.9. Holowachuk S, Zhang W, Gandhi SK, Anis AH, Potts JE, Harris KC. Cost savings analysis of early extubation following congenital heart surgery. Pediatr Cardiol 2019;40:138–46.10. Piotto RF, Maia LN, Machado MN, Orrico SP. Effects of the use of mechanical ventilation weaning protocol in the Coronary Care Unit: randomized study. Rev Bras Cir Cardiovasc 2011;26:213–21.11. Chan JL, Miller JG, Murphy M, Greenberg A, Iraola M, Horvath KA. A Multidisciplinary protocol-driven approach to improve extubation times after cardiac surgery. Ann Thorac Surg 2018; 105:1684–90.12. Serena G, Corredor C, Fletcher N, Sanfilippo F. Implementation of a nurse-led protocol for early extubation after cardiac surgery: a pilot study. World J Crit Care Med 2019;8:28–35.13. Chan PK, Fischer S, Stewart TE, Hallett DC, Hynes-Gay P, Lapinsky SE, et al. Practising evidence-based medicine: the design and implementation of a multidisciplinary team-driven extubation protocol. Crit Care 2001;5:349–54.14. Ward D, Fulbrook P. Nursing strategies for effective weaning of the critically ill mechanically ventilated patient. Crit Care Nurs Clin North Am 2016;28:499–512.15. Danckers M, Grosu H., Jean R, Cruz RB, Fidellaga A, Han Q, et. al. Nurse-driven, protocol-directed weaning from mechanical ventilation improves clinical outcomes and is well accepted by intensive care unit physicians. J Crit Care 2013;28:433–41.16. Society of thoracic surgeons of Thailand [Internet]. Bangkok: The society of thoracic surgeons of Thailand; 2021. Stats-2562; [cited 2021 October 16]. Available from: https://thaists.org/ en/stat-2562/.
Innok et al.

Volume 73, No.12: 2021 Siriraj Medical Journalhttps://he02.tci-thaijo.org/index.php/sirirajmedj/index 823
Original Article SMJ
Jadesada Lertsirimunkong, (Pharm.D.)*, Wiwat Thavornwattanayong, (B.Sc. in Pharm., R.Ph., LL.B., M.A.)**, Yosita Napuk, (Pharm.D. Student)**, Watcharapong Ajcharoen, (Pharm.D. Student)**, Vipavee Chaisitsanguan, (Pharm.D. Student)**, Supasuta Wachiranukornkul, (Pharm.D. Student)** *Department of Pharmacy Administration, College of Pharmacy, Rangsit University, Pathum Thani 12000, Thailand, **Department of Community
Pharmacy, Faculty of Pharmacy, Silpakorn University, Nakhon Pathom 73000, Thailand.
Cost-effectiveness Analysis Comparing Vonoprazan-based Triple Therapy with Proton Pump Inhibitor-based Therapy in the Treatment of Helicobacter pylori Infection in Thailand
ABSTRACTObjective: Helicobacter pylori (H. pylori) infection is one of the leading causes of gastrointestinal diseases such as dyspepsia, peptic ulcers. Thailand has a 45.9% prevalence of the infection and an increasing rate of resistance to clarithromycin, leading to standard treatments being less successful. Vonoprazan represents a novel drug offering a new treatment regimen. Although vonoprazan has been available in Thailand since 2019, its cost-effectiveness has not been studied previously. Materials and Methods: This study analysed the cost-effectiveness of vonoprazan-based triple therapy compared with PPI-based therapy, in treating clarithromycin resistant H. pylori, by using the markov model from a societal perspective. Results: The total cost of vonoprazan-based triple therapy, levofloxacin-PPI based triple therapy and concomitant-PPI therapy were 784,932.08 baht, 783,863.65 baht and 783,874.55 baht respectively. The quality-adjusted life years (QALYs) of vonoprazan-based triple therapy, levofloxacin-PPI based triple therapy and concomitant-PPI therapy were 25.1118 years, 25.1147 years and 25.1054 years respectively. The cost-effectiveness ratio (CER) of vonoprazan-based triple therapy, levofloxacin-PPI based triple therapy and concomitant-PPI therapy were 31,257.50 baht/QALYs, 31,211.35 baht/QALYs and 31,223.34 baht per QALYs respectively. Conclusion: Therefore, levofloxacin-PPI based triple therapy was found to be the most cost-effective regimen and the dominant strategy compared with concomitant-PPI or vonoprazan-based triple therapy. It provided higher QALYs and lower treatment costs. Levofloxacin-PPI based triple therapy should be the first choice of an alternative strategy in treating clarithromycin-resistant H. pylori. The results of this study can be used by policymakers to help inform their decisions.
Keywords: Cost-effectiveness; Vonoprazan; Proton pump inhibitors; Levofloxacin; Concomitant; Helicobacter pylori infection (Siriraj Med J 2021; 73: 823-831)
Corresponding author: Jadesada LertsirimunkongE-mail: [email protected] 7 July 2021 Revised 21 September 2021 Accepted 1 October 2021ORCID ID: https://orcid.org/0000-0003-2930-8810http://dx.doi.org/10.33192/Smj.2021.107

Volume 73, No.12: 2021 Siriraj Medical Journal https://he02.tci-thaijo.org/index.php/sirirajmedj/index824
INTRODUCTION Helicobactor pylori (H. pylori) is one of the leading causes of gastrointestinal diseases such as peptic ulcers and peptic cancer. This bacterium was found in the gastrointestinal tract of more than 90% of peptic ulcer patients. The worldwide prevalence of H. pylori infection is about 66%. The prevalence in developing countries is significantly higher than in developed countries. At present, Thailand has a 45.9% prevalence of infection.1
The incidence of infection in the Bangkok metropolitan region is 74%, of which 50-80% are infections in adults.2
For the treatment of H. pylori infection, the Thailand Consensus on Helicobacter pylori Management 2015 recommended using standard PPI-based triple therapy for the first regimen, including a proton pump inhibitor and 2 antibiotics for 7-14 days. However, the eradication rate of this regimen has since decreased below 80% due to clarithromycin resistance.3,4
In the Southeast Asia region, the country with the highest rate of clarithromycin resistance has a resistance rate of 43%, while Thailand’s rate is about 14%.5 In 2017, there was a conference to find new guidelines for H. pylori management in Asia called “Helicobacter pylori management in ASEAN: The Bangkok consensus report”. The conclusion of the report recommended that any countries which have a clarithromycin resistance rate of more than 10% should not use the standard regimen and should switch to other non-clarithromycin regimens instead.6,7 This was in contrast to the 2015 Thailand Consensus on Helicobacter pylori Management’s recommendation of only using alternative first-line regimens (sequential therapy and concomitant-PPI therapy) in patients whose first-line regimen therapy had been unsuccessful. Furthermore, the 2017 Bangkok consensus report also recommended using concomitant-PPI therapy over sequential therapy, due to the concern that sequential therapy will have a lower efficacy if H. pylori becomes resistant to clarithromycin and metronidazole at the same time. The recommended second-line regimens are levofloxacin-PPI based triple therapy and bismuth quadruple therapy, neither of which use clarithromycin. However, following with the recommendation, bismuth quadruple therapy has limitations of salt form of bismuth and dosage. Therefore, concomitant-PPI therapy and levofloxacin-PPI based triple therapy are more suitable regimens for H. pylori infected patients in Thailand. It is not only drug resistance that affects the treatment of H. pylori, but also pH levels in the stomach. Using an anti-gastric acid secretion drug is essential for maintaining stomach pH at 5 and for inhibiting H. pylori growth.8,9
The novel drug Vonoprazan was first used in a new
treatment regimen in Thailand in 2019. The mechanism is reversible H+,K+-ATPase inhibitor.10 A meta-analysis study showed that vonoprazan-based triple therapy has an era dication rate almost two-times higher than PPI-based Triple Therapy, especially in clarithromycin resistant H. pylori infected patients.11 Thus, vonoprazan-based triple therapy represents an interesting alternative regimen to eradicate clarithromycin resistant H. pylori. Until now there has been no cost-effectiveness study carried out comparing concomitant-PPI therapy, levofloxacin-PPI based triple therapy and vonoprazan-based triple therapy in Thailand. Consequently, the purpose of this study was to assess the cost-effectiveness of vonoprazan-based triple therapy compared with concomitant-PPI therapy and levofloxacin-PPI based triple therapy in the treatment of clarithromycin resistant H. pylori infection.
MATERIALS AND METHODSStudy design This study was a health economic evaluation using a model-based structure and presented humanistic outcomes in quality-adjusted life years (QALYs). The analysis was assessed using cost-effectiveness ratio (CER) and incremental cost-effectiveness ratio (ICER). The perspective of this study was societal. Future costs and utilities were discounted at 3% per year.12
Intervention This study compared three regimes of clarithromycin resistant Helicobacter pylori infection treatment, approved for use by the Thailand Consensus of Helicobacter pylori Management in 2015. The treatment included vonoprazan-based triple therapy13 (vonoprazan 20 mg, amoxicillin 750 mg and clarithromycin 250 mg, twice a day for 7 days) , levofloxacin-PPI based triple therapy (levofloxacin 500 mg once daily, amoxicillin 1 g twice daily, and standard dose PPI twice daily for 14 days) and concomitant-PPI therapy (standard dose PPI, amoxicillin 1 g, clarithromycin 500 mg and metronidazole 500 mg, twice a day for 10 days).3
Decision model This study used a Markov model to perform decision analysis through Microsoft Excel 2016. The model was developed from the 2015 Thailand Consensus on Helicobacter pylori Management3 and the Helicobacter pylori management in ASEAN: The Bangkok consensus report.7 This model was validated by two clinical experts in gastrointestinal diseases, to ensure its appropriateness for the treatment of H. pylori infection in Thailand. Initially, all patients were in a health status of H. pylori infection.
Lertsirimunkong et al.

Volume 73, No.12: 2021 Siriraj Medical Journalhttps://he02.tci-thaijo.org/index.php/sirirajmedj/index 825
Original Article SMJAfter treatment, patients who returned a negative urea breath test would have their health status recorded as ‘successful eradication’. If a positive urea breath test result was returned, the health status was recorded as ‘failure from the first regimen state’ and the patient would go on to receive hybrid therapy. If a patient in a successful eradication health state suffered a reinfection, they would return to the H. pylori infection health state again. Patients in all health status could be changed to the health status of death during the study. The model is demonstrated in Fig 1.
for 7 days, followed by a standard dose PPI, amoxicillin 1 g, clarithromycin 500 mg and metronidazole 500 mg twice a day for 7 days) because it is an effective therapy in high clarithromycin resistant areas.16
6. No treatment of side effects from any of the regimens (diarrhea and taste disturbance in vonoprazan-based triple therapy15,17, nausea and diarrhea in levofloxacin-PPI based triple therapy18, diarrhea and taste disturbance in concomitant-PPI therapy19-26) was required as side effects were mild.27
7. All patients treated with hybrid therapy regimen were assumed that have successful eradication. 8. The mortality rate of H. pylori infection was determined by the age range according to the Thai mortality rate28 due to H. pylori is not a significant risk factor for death from any cause.29
Time Horizon As most previous studies have examined H. pylori induced dyspepsia or peptic ulcers in patients aged 18-65 years19,30, the Markov model used in this study was developed to follow the treatment of H. pylori infection over a lifetime, from age 18 until death. In 2020, the average life expectancy in Thailand was 75.7 years.31 A cycle length of 6 weeks was considered appropriate to cover the period of clinical treatment, adverse drug reactions and H. pylori eradication, that was evaluated through the urea breath test at 4-6 weeks after the completion of treatment. H. pylori infection could relapse within 1 year.32
Probability of clinical outcomes A systematic search up to September 2020 was conducted in Pubmed, Cochrane library, Science Direct and Scopus databases. The keywords were “Vonoprazan, Levofloxacin triple therapy, Concomitant-PPI therapy, H. pylori or Helicobacter pylori” with “And” and filtered by randomized controlled trial, meta-analysis, full text and English published literature. Studies were identified as eligible for inclusion if they met the following criteria (i) published in English (ii) randomized control trial, systematic review, or meta-analysis. The studies were excluded if they met any of the following exclusion criteria (i) the outcome was not eradication rate (ii) prevalence of clarithromycin-resistant H. pylori was not similar to that found in Thailand (iii) not one of the treatment regimens recommended for use in Thailand (iv) did not analyse eradication rate by intention to treat analysis. All searched literature was evaluated and given a JADAD quality assessment score. The transitional probabilities are shown in Table 1.
Fig 1. Markov model structure of treatment for patients with H. pylori infection
Assumption of the model 1. Patient did not withdraw from any treatment during the study and remained until the end of the treatment. 2. Asymptomatic patients or patients with dyspepsia, who were confirmed to be infected with H. pylori and failed from the standard first-line treatment, were recruited. 3. Patients with H. pylori infection health status who failed the standard first-line treatment (Amoxicillin, Clarithromycin and PPI3 and treated by vonoprazan-based triple therapy, levofloxacin-PPI based triple therapy or concomitant-PPI therapy. 4. A successful eradication health status was confirmed by the negative results of a urea breath test conducted at least 4 weeks after treatment.14,15
5. Patients whose vonoprazan-based triple therapy, levofloxacin-PPI based triple therapy or concomitant-PPI therapy treatment failed, were switched to a hybrid therapy regimen (standard dose PPI and amoxicillin 1 g

Volume 73, No.12: 2021 Siriraj Medical Journal https://he02.tci-thaijo.org/index.php/sirirajmedj/index826
Parameters Distribution Mean ± SE References
Transitional probabilities Levofloxacin-PPI based triple therapy Success Beta 0.8481 ± 0.0404 18 Failure Beta 0.1519 ± 0.0404 18 Relapse Beta 0.0061 ± 0.0041 32Vonoprazan-based triple therapy Success Beta 0.7809 ± 0.0310 14, 15, 33 Failure Beta 0.2191 ± 0.0310 14, 15, 33 Relapse Beta 0.0061 ± 0.0041 32Concomitant-PPI therapy Success Beta 0.8286 ± 0.0083 19-26, 34 Failure Beta 0.1714 ± 0.0083 19-26, 34 Relapse Beta 0.0061 ± 0.0041 32
Probabilities of side effects Levofloxacin-PPI based triple therapy Nausea Beta 0.0253 ± 0.0177 18 Diarrhea Beta 0.0380 ± 0.0215 18Vonoprazan-based triple therapy Diarrhea Beta 0.1172 ± 0.0161 15, 17 Taste disturbance Beta 0.0399 ± 0.0098 15, 17Concomitant-PPI therapy Diarrhea Beta 0.1639 ± 0.0089 19-26 Taste disturbance Beta 0.2212 ± 0.0100 19-26
Costs (Baht) Medicine costs Omeprazole 20 mg (per tablet) Gamma 0.6245 ± 0.0624 35 Amoxicillin 250 mg (per tablet) Gamma 6.0432± 0.6043 36 Amoxicillin 500 mg (per tablet) Gamma 1.7122 ± 0.1712 35 Clarithromycin 250 mg (per tablet) Gamma 31.0200 ± 3.1020 35 Clarithromycin 500 mg (per tablet) Gamma 13.5368 ± 1.3537 35 Levofloxacin 500 mg (per tablet) Gamma 18.1296 ± 1.8130 35 Vonoprazan 20 mg (per tablet) Gamma 112.6251 ± 11.2625 36 Metronidazole 250 mg (per tablet) Gamma 0.3324 ± 0.0332 36Laboratory cost Urea Breath Test (per test) Gamma 3,100.00 ± 310.00 37-39 Gastrointestinal Endoscopy (per test) Gamma 1,712.24 ± 171.22 40 Biopsy (per test) Gamma 805.76 ± 80.58 40 Urease (per test) Gamma 40.29 ± 4.03 40Treatment and additional procedures OPD service (per visit) Gamma 120.86 ± 12.09 40 OPD prescription (per visit) Gamma 70.50 ± 7.05 40Direct non-medical cost Travel (per visit) Gamma 315.49 ± 31.55 41 Food (per visit) Gamma 63.14 ± 6.31 41
Utility H. pylori Infection Beta 0.9000 ± 0.0006 42 Nausea Beta 0.6000 ± 0.0500 43 Diarrhea Beta 0.8970 ± 0.0157 44 Taste disturbance Beta 0.9410 ± 0.2356 45
TABLE 1. Parameters used in Markov model.
Lertsirimunkong et al.
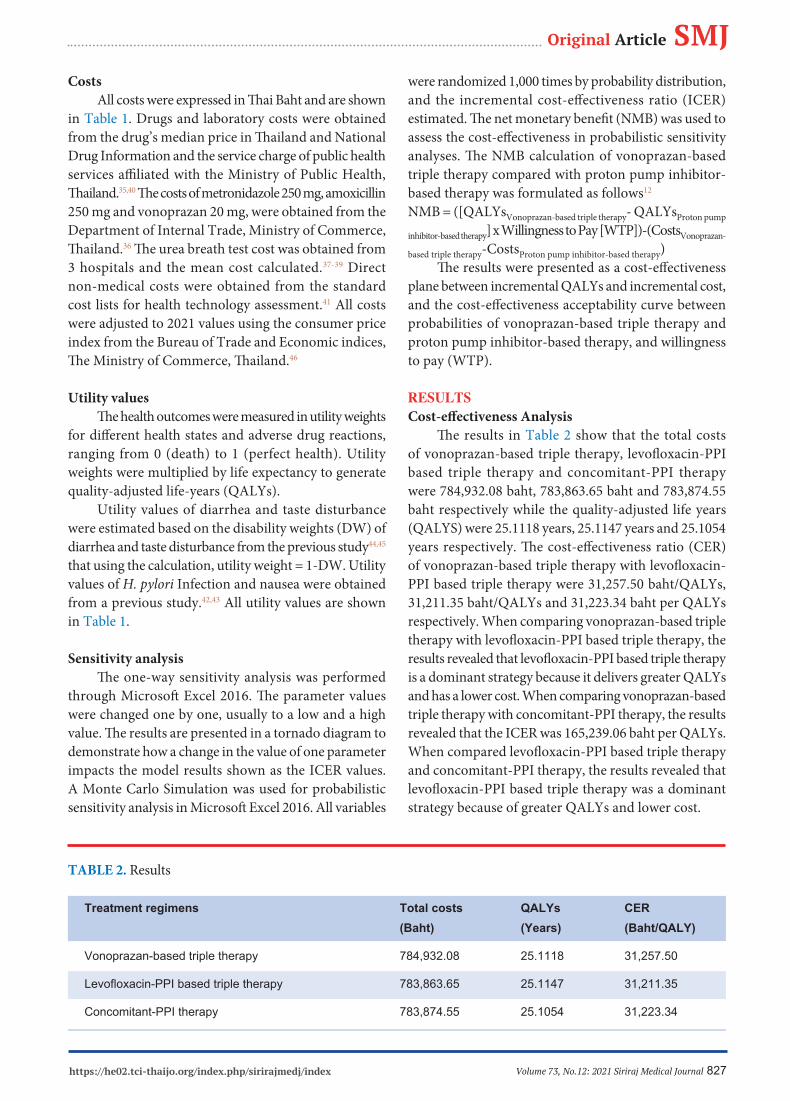
Volume 73, No.12: 2021 Siriraj Medical Journalhttps://he02.tci-thaijo.org/index.php/sirirajmedj/index 827
Original Article SMJCosts All costs were expressed in Thai Baht and are shown in Table 1. Drugs and laboratory costs were obtained from the drug’s median price in Thailand and National Drug Information and the service charge of public health services affiliated with the Ministry of Public Health, Thailand.35,40 The costs of metronidazole 250 mg, amoxicillin 250 mg and vonoprazan 20 mg, were obtained from the Department of Internal Trade, Ministry of Commerce, Thailand.36 The urea breath test cost was obtained from 3 hospitals and the mean cost calculated.37-39 Direct non-medical costs were obtained from the standard cost lists for health technology assessment.41 All costs were adjusted to 2021 values using the consumer price index from the Bureau of Trade and Economic indices, The Ministry of Commerce, Thailand.46
Utility values The health outcomes were measured in utility weights for different health states and adverse drug reactions, ranging from 0 (death) to 1 (perfect health). Utility weights were multiplied by life expectancy to generate quality-adjusted life-years (QALYs). Utility values of diarrhea and taste disturbance were estimated based on the disability weights (DW) of diarrhea and taste disturbance from the previous study44,45 that using the calculation, utility weight = 1-DW. Utility values of H. pylori Infection and nausea were obtained from a previous study.42,43 All utility values are shown in Table 1.
Sensitivity analysis The one-way sensitivity analysis was performed through Microsoft Excel 2016. The parameter values were changed one by one, usually to a low and a high value. The results are presented in a tornado diagram to demonstrate how a change in the value of one parameter impacts the model results shown as the ICER values. A Monte Carlo Simulation was used for probabilistic sensitivity analysis in Microsoft Excel 2016. All variables
were randomized 1,000 times by probability distribution, and the incremental cost-effectiveness ratio (ICER) estimated. The net monetary benefit (NMB) was used to assess the cost-effectiveness in probabilistic sensitivity analyses. The NMB calculation of vonoprazan-based triple therapy compared with proton pump inhibitor-based therapy was formulated as follows12
NMB = ([QALYsVonoprazan-based triple therapy- QALYsProton pump
inhibitor-based therapy] x Willingness to Pay [WTP])-(CostsVonoprazan-
based triple therapy-CostsProton pump inhibitor-based therapy) The results were presented as a cost-effectiveness plane between incremental QALYs and incremental cost, and the cost-effectiveness acceptability curve between probabilities of vonoprazan-based triple therapy and proton pump inhibitor-based therapy, and willingness to pay (WTP).
RESULTSCost-effectiveness Analysis The results in Table 2 show that the total costs of vonoprazan-based triple therapy, levofloxacin-PPI based triple therapy and concomitant-PPI therapy were 784,932.08 baht, 783,863.65 baht and 783,874.55 baht respectively while the quality-adjusted life years (QALYS) were 25.1118 years, 25.1147 years and 25.1054 years respectively. The cost-effectiveness ratio (CER) of vonoprazan-based triple therapy with levofloxacin-PPI based triple therapy were 31,257.50 baht/QALYs, 31,211.35 baht/QALYs and 31,223.34 baht per QALYs respectively. When comparing vonoprazan-based triple therapy with levofloxacin-PPI based triple therapy, the results revealed that levofloxacin-PPI based triple therapy is a dominant strategy because it delivers greater QALYs and has a lower cost. When comparing vonoprazan-based triple therapy with concomitant-PPI therapy, the results revealed that the ICER was 165,239.06 baht per QALYs. When compared levofloxacin-PPI based triple therapy and concomitant-PPI therapy, the results revealed that levofloxacin-PPI based triple therapy was a dominant strategy because of greater QALYs and lower cost.
TABLE 2. Results
Treatment regimens Total costs QALYs CER (Baht) (Years) (Baht/QALY)
Vonoprazan-based triple therapy 784,932.08 25.1118 31,257.50
Levofloxacin-PPI based triple therapy 783,863.65 25.1147 31,211.35
Concomitant-PPI therapy 783,874.55 25.1054 31,223.34

Volume 73, No.12: 2021 Siriraj Medical Journal https://he02.tci-thaijo.org/index.php/sirirajmedj/index828
Sensitivity analysis The one-way sensitivity analysis in Fig 2 is presented in a tornado diagram. The probability of relapse from levofloxacin-PPI based triple therapy had the most impact on the ICER. The probabilistic sensitivity analysis in Fig 3 presents the incremental cost and the QALYs of vonoprazan-based triple therapy compared with levofloxacin-PPI based therapy as a cost-effectiveness plane. Each variable was randomized 1,000 times by
Fig 3. Cost-effectiveness plane between vonoprazan-based triple therapy and levofloxacin-PPI based triple therapy
the Monte Carlo simulations. The base-case ICER is represented by a yellow dot in the figure and falls in quadrant 2 which mean levofloxacin-PPI based triple therapy was a dominant strategy because of greater QALYs and lower cost. This revealed that levofloxacin-PPI based therapy was more cost-effective than vonoprazan-based triple therapy. Nevertheless, the widely distributed ICERs in the cost-effectiveness plane shows uncertain results.
Fig 2. Tornado diagram showing the results of one-way sensitivity analysis
Lertsirimunkong et al.

Volume 73, No.12: 2021 Siriraj Medical Journalhttps://he02.tci-thaijo.org/index.php/sirirajmedj/index 829
Original Article SMJDISCUSSION This study is the first economic evaluation of the use of vonoprazan-based triple therapy and proton pump inhibitor-based therapy in clarithromycin-resistant H. pylori eradication. An increasing rate of resistance to clarithromycin has led to standard treatments being less successful in Thailand. The results showed that levofloxacin-PPI based triple therapy is the most cost-effective regimen. Although levofloxacin-PPI based triple therapy has a high eradication rate, it also increases the chances of levofloxacin resistance, which is now a reserved antibiotic for the treatment of drug-resistant tuberculosis and other infection diseases. In order to prevent drug resistance, this drug is not widely used.3 Therefore, vonoprazan-based triple therapy represents an interesting alternative therapy. Although it is not a cost-effective regimen at present, vonoprazan-based triple therapy will become more cost effective if it contributes to an increased eradication rate. A study by Yamasaki T. found that if the dosage of clarithromycin was increased from 400 mg to 800 mg, the eradication rate would be increased from 86.7% to 97.8%47 and a randomized controlled trial phase 315 confirmed that the efficacy of vonoprazan-based triple therapy in clarithromycin resistant H. pylori was higher than PPI-based triple therapy. Whereas, a study involving Thai people found that the H. pylori eradication rate of vonoprazan-based triple therapy was 63.2%14, which is lower than that reported in foreign studies. This could be because vonoprazan is mainly metabolized via CYP3A4. As the genes of Thai people may include enzyme enhancers, this would render Vonoprazan-based triple therapy less effective.48 Therefore, a possible area for further study is to compare the efficacy or the cost-effectiveness of using vonoprazan, with high dose clarithromycin (greater than 800 mg per day). The limitation of this study was scope to focusing on the efficacy of vonoprazan-based triple therapy and the proton pump inhibitor-based therapy. Other factors such as compliance4 and gastrointestinal pH while taking the drug49 which could affect the treatment were not considered.
CONCLUSION Levofloxacin-PPI based triple therapy in clarithromycin-resistant H. pylori is a more cost-effective and dominant strategy. It was found to deliver higher QALYs at lower treatment costs from a societal perspective. Levofloxacin-PPI based triple therapy should be the first-choice alternative strategy in treating clarithromycin-resistant H. pylori. The results of this study could contribute to informed decision making by policymakers.
This study has been reviewed and approved by the Human Research Ethics Committee of Silpakorn University (COE Number: COE 64.0113-003)
ACKNOWLEDGEMENTS We would also like to thank Assoc. Prof. Dr. Srisombat Nawanopparatsak and Dr. Kittiyot Yotsombut for their recommendations in the development of the decision model, as well as Mr. Paul Mines for proofreading the article.
REFERENCES1. Uchida T, Miftahussurur M, Pittayanon R, Vilaichone R-k, Wisedopas N, Ratanachu-ek T, et al. Helicobacter pylori Infection in Thailand: A Nationwide Study of the CagA Phenotype. Plos One. 2015;10(9):e0136775.2. Phukpo W. The diagnostic test of bloodstream infection for Helicobacter pylori. Tham-Lab. 2018;5(3):3-8.3. The Gastroenterological Association of Thailand. Thailand Consensus on Helicobacter Pylori Management 2015. Bangkok: Concept Medicus Co.,Ltd; 2015. 1-35 p.4. Jaka H, Mueller A, Kasang C, Mshana SE. Predictors of triple therapy treatment failure among H. pylori infected patients attending at a tertiary hospital in Northwest Tanzania: a prospective study. BMC Infect Dis. 2019;19(1):447.5. Vilaichone RK, Quach DT, Yamaoka Y, Sugano K, Mahachai V. Prevalence and Pattern of Antibiotic Resistant Strains of Helicobacter Pylori Infection in ASEAN. Asian Pac J Cancer P. 2018;19(5):1411-3.6. Malfertheiner P, Megraud F, O’Morain CA, Gisbert JP, Kuipers EJ, Axon AT, et al. Management of Helicobacter pylori infection- the Maastricht V/Florence Consensus Report. Gut. 2017;66(1): 6-30.7. Mahachai V, Vilaichone RK, Pittayanon R, Rojborwonwitaya J, Leelakusolvong S, Maneerattanaporn M, et al. Helicobacter pylori management in ASEAN: The Bangkok consensus report. J Gastroenterol Hepatol. 2018;33(1):37-56.8. Sachs G, Scott DR, Wen Y. Gastric infection by Helicobacter pylori. Curr Gastroenterol Rep. 2011;13(6):540-6.9. Tantiwit J. Vonoprazan: The new acid blocker. Center for Continuing Pharmaceutical Education. 2020:1-23.10. Akazawa Y, Fukuda D, Fukuda Y. Vonoprazan-based therapy for Helicobacter pylori eradication: experience and clinical evidence. Ther Adv Gastroenter. 2016;9(6):845-52.11. Li M, Oshima T, Horikawa T, Tozawa K, Tomita T, Fukui H, et al. Systematic review with meta-analysis: Vonoprazan, a potent acid blocker, is superior to proton-pump inhibitors for eradication of clarithromycin-resistant strains of Helicobacter pylori. Helicobacter. 2018;23(4):e12495.12. The Subcommittee of National List of Essential Medicines Development. The Manual of Health Technology Assessment in Thailand. Nonthaburi: The Graphico Systems Co., Ltd.; 2009.13. Suzuki S, Gotoda T, Kusano C, Iwatsuka K, Moriyama M. The Efficacy and Tolerability of a Triple Therapy Containing a Potassium-Competitive Acid Blocker Compared With a 7-Day PPI-Based Low-Dose Clarithromycin Triple Therapy. Am J Gastroenterol. 2016;111(7):949-56.

Volume 73, No.12: 2021 Siriraj Medical Journal https://he02.tci-thaijo.org/index.php/sirirajmedj/index830
14. Sanglutong L, Aumpan N, Pornthisarn B, Chonprasertsuk S, Siramolpiwat S, Bhanthumkomol P, et al. Ineffectiveness of 14-Day Vonoprazan-Based Dual Therapy and Vonoprazan- Based Triple Therapy for Helicobacter Pylori Eradication in Area of High Clarithromycin Resistance: A Prospective Randomized Study. Gastroenterology. 2020;158(6):S-571.15. Murakami K, Sakurai Y, Shiino M, Funao N, Nishimura A, Asaka M. Vonoprazan, a novel potassium-competitive acid blocker, as a component of first-line and second-line triple therapy for Helicobacter pylori eradication: a phase III, randomised, double- blind study. Gut. 2016;65(9):1439-46.16. Kim SY, Chung J-W. Best Helicobacter pylori Eradication Strategy in the Era of Antibiotic Resistance. Antibiotics. 2020; 9(8):436.17. Maruyama M, Tanaka N, Kubota D, Miyajima M, Kimura T, Tokutake K, et al. Vonoprazan-Based Regimen Is More Useful than PPI-Based One as a First-Line Helicobacter pylori Eradication: A Randomized Controlled Trial. Can J Gastroenterol Hepatol. 2017;2017:4385161-.18. Tai W-C, Lee C-H, Chiou S-S, Kuo C-M, Kuo C-H, Liang C-M, et al. The Clinical and Bacteriological Factors for Optimal Levofloxacin-Containing Triple Therapy in Second-Line Helicobacter pylori Eradication. Plos One. 2014;9(8):e105822.19. Chung JW, Han JP, Kim KO, Kim SY, Hong SJ, Kim TH, et al. Ten-day empirical sequential or concomitant therapy is more effective than triple therapy for Helicobacter pylori eradication: A multicenter, prospective study. Dig Liver Dis. 2016;48(8):888- 92.20. Kim BJ, Lee H, Lee YC, Jeon SW, Kim GH, Kim H-S, et al. Ten- Day Concomitant, 10-Day Sequential, and 7-Day Triple Therapy as First-Line Treatment for Helicobacter pylori Infection: A Nationwide Randomized Trial in Korea. Gut Liver. 2019;13(5): 531-40.21. Park SM, Kim JS, Kim BW, Ji JS, Choi H. Randomized clinical trial comparing 10- or 14-day sequential therapy and 10- or 14-day concomitant therapy for the first line empirical treatment of Helicobacter pylori infection. J Gastroenterol Hepatol. 2017; 32(3):589-94.22. Kim SY, Lee SW, Choe JW, Jung SW, Hyun JJ, Jung YK, et al. Helicobacter pylori eradication rates of concomitant and sequential therapies in Korea. Helicobacter. 2017;22(6).23. Liou JM, Fang YJ, Chen CC, Bair MJ, Chang CY, Lee YC, et al. Concomitant, bismuth quadruple, and 14-day triple therapy in the first-line treatment of Helicobacter pylori: a multicentre, open-label, randomised trial. Lancet. 2016;388(10058):2355-65.24. Heo J, Jeon SW, Jung JT, Kwon JG, Lee DW, Kim HS, et al. Concomitant and hybrid therapy for Helicobacter pylori infection: A randomized clinical trial. J Gastroenterol Hepatol. 2015;30(9): 1361-6.25. Heo J, Jeon SW, Jung JT, Kwon JG, Kim EY, Lee DW, et al. A randomised clinical trial of 10-day concomitant therapy and standard triple therapy for Helicobacter pylori eradication. Dig Liver Dis. 2014;46(11):980-4.26. Kim SJ, Chung J-W, Woo HS, Kim SY, Kim JH, Kim YJ, et al. Two-week bismuth-containing quadruple therapy and concomitant therapy are effective first-line treatments for Helicobacter pylori eradication: A prospective open-label randomized trial. World J Gastroenterol. 2019;25(46):6790-8.27. Peura DA, LaMon JT, Moynihan LK, Bonis PAL. Helicobacter Pylori: Bay Area Houston Gastroenterology Associates; [cited
2020 6 Jun]. Available from: http://www.bayareahoustongastro. com/wp-content/uploads/Helicobacter-Pylori.pdf.28. Health Information System Development Office. Trend of health in Thailand 2017 [cited 2020 6 Nov]. Available from: https://www.hiso.or.th/health/data/html/search1.php?menu=1&i=.29. Chen Y, Segers S, Blaser MJ. Association between Helicobacter pylori and mortality in the NHANES III study. Gut. 2013;62(9): 1262-9.30. Apostolopoulos P, Koumoutsos I, Ekmektzoglou K, Dogantzis P, Vlachou E, Kalantzis C, et al. Concomitant versus sequential therapy for the treatment of Helicobacter pylori infection: a Greek randomized prospective study. Scand J Gastroentero. 2016;51(2): 145-51.31. Burden of Disease Thailand. Health Adjusted Life Expectancy: HALE. Burden of Disease Research Program Thailand; 2018.32. Vilaichone RK, Wongcha Um A, Chotivitayatarakorn P. Low Re-infection Rate of Helicobacter pylori after Successful Eradication in Thailand: A 2 Years Study. Asian Pac J Cancer P. 2017;18(3): 695-7.33. Tamaki H, Noda T, Morita M, Omura A, Kubo A, Ogawa C, et al. An Open-Label, Multi-Center, Randomized, Superiority Trial of Vonoprazan Versus Esomeprazole as Part of First-Line Triple Therapy for Helicobacter Pylori Infection. Gastroenterology. 2019;156(6):S-89.34. Ang TL, Fock KM, Song M, Ang D, Kwek AB, Ong J, et al. Ten-day triple therapy versus sequential therapy versus concomitant therapy as first-line treatment for Helicobacter pylori infection. J Gastroenterol Hepatol. 2015;30(7):1134-9.35. The drug’s median price in Thailand [Internet]. National Drug Information. 2020 [cited 20 Apr 2020]. Available from: http:// ndi.fda.moph.go.th/drug_value.36. Drugs price list [Internet]. Department of Internal Trade, Ministry of Commerce. 2020 [cited 9 Dec 2020]. Available from: https://hospitals.dit.go.th/app/drug_price_list.php.37. Specific screening program (H. pylori) [Internet]. Yanhee Hospital. 2020 [cited 6 Nov 2020]. Available from: https:// th.yanhee.net/.38. Urea Breath Test [Internet]. Bumrungrad International Hospital. 2020 [cited 6 Nov 2020]. Available from: https://www.bumrungrad. com/en/treatments/urea-breath-test.39. Urea Breath Test [Internet]. Vichaivej Nongkhaem International Hospital. [cited 6 Nov 2020]. Available from: https://vichaivej- nongkhaem.com/packages/ตรวจหาเชื้อ-h-pylori-ด้วยวิธีเป/.40. Ministry of Public Health, Thailand. The service charge of public health services affiliated with the Ministry of Public Health, Thailand. In: Ministry of Public Health, Thailand, editors.: Ministry of Public Health, Thailand; 2019. p. 4-88.41. Standard Cost Lists for Health Technology Assessment [Internet]. The Ministry of Public Health, Thailand. 2020 [cited 6 Nov 2020]. Available from: https://costingmenu.hitap.net/.42. Xie F, Luo N, Lee H-P. Cost effectiveness analysis of population- based serology screening and (13)C-Urea breath test for Helicobacter pylori to prevent gastric cancer: a markov model. World J Gastroentero. 2008;14(19):3021-7.43. Grunberg SM, Magnan WF, Herndon J, Naughton ML, Blackwell KL, Wood ME, et al. Determination of utility scores for control of chemotherapy-induced nausea or vomiting. J Support Oncol. 2009;7:W17-W22.44. Shlomai A, Leshno M, Goldstein DA. Regorafenib treatment for patients with hepatocellular carcinoma who progressed on
Lertsirimunkong et al.

Volume 73, No.12: 2021 Siriraj Medical Journalhttps://he02.tci-thaijo.org/index.php/sirirajmedj/index 831
Original Article SMJ sorafenib-A cost-effectiveness analysis. Plos One. 2018;13(11): e0207132.45. Sher DJ, Tishler RB, Pham NL, Punglia RS. Cost-Effectiveness Analysis of Intensity Modulated Radiation Therapy Versus Proton Therapy for Oropharyngeal Squamous Cell Carcinoma. Int J Radiat Oncol Biol Phys. 2018;101(4):875-82.46. Consumer Price Index [Internet]. 2021 [cited 15 February 2021]. Available from: http://www.price.moc.go.th/price/cpi/index_new. asp.47. Yamasaki T, Owari M, Tokai Y, Amano Y, Nakashima H, Sakaki
N, et al. High Dose CAM With Vonoprazan (P-CAB) PLUS AMX Regimen Is the Strongest H. pylori Eradication Triple Therapy Regimens to Improve Success Rate of CAM Based Regimens. Gastroenterology. 2016;150(4, Supplement 1):S879.48. Areesinpitak T, Kanjanawart S, Nakkam N, Tassaneeyakul W, Vannaphasaht S. Prevalence of CYP2C19, CYP3A4 and FMO3 genetic polymorphisms in healthy northeastern Thai volunteers. Scienceasia. 2020;46(3):397-402.49. Chuensuwan R. The Novel Drug for Acid Related Diseases. J Prapokklao Hosp Clin Med Educat Center. 2020;37(4):364-72.

Volume 73, No.12: 2021 Siriraj Medical Journal https://he02.tci-thaijo.org/index.php/sirirajmedj/index832
Sathaporn et al.
Katti Sathaporn, M.D., Jarurin Pitanupong, M.D.Department of Psychiatry, Faculty of Medicine, Prince of Songkla University, Hat Yai, Songkhla 90110, Thailand.
The Relationship between Mental Health with the Level of Empathy Among Medical Students in Southern Thailand: A University-Based Cross-Sectional Study
ABSTRACTObjective: To determine the level of and factors associated with empathy among medical students.Materials and Methods: This cross-sectional study surveyed all first- to sixth-year medical students at the Faculty of Medicines, Prince of Songkla University, at the end of the 2020 academic year. The questionnaires consisted of: 1) The personal and demographic information questionnaire, 2) The Toronto Empathy Questionnaire, and 3) Thai Mental Health Indicator-15. Data were analyzed using descriptive statistics, and factors associated with empathy level were assessed via chi-square and logistic regression analyses. Results: There were 1010 participants with response rate of 94%. Most of them were female (59%). More than half (54.9%) reported a high level of empathy. There was a statistically significant difference in empathy levels between pre-clinical and clinical medical students; in regards to empathy subgroups (P-value < 0.001). The assessment of emotional states in others by demonstrating appropriate sensitivity behavior, altruism, and empathic responding scores among the pre-clinical group were higher than those of the clinical group. Multivariate analysis indicated that female gender, pre-clinical training level, and minor specialty preference were factors associated with empathy level. The protective factor that significantly improved the level of empathy was having fair to good mental health.Conclusion: More than half of the surveyed medical students reported a high level of empathy. The protective factor that improved the level of empathy was good mental health. However, future qualitative methods, longitudinal surveillance, or long-term follow-up designs are required to ensure the trustworthiness of these findings.
Keywords: Empathy; factor; mental health; medical student (Siriraj Med J 2021; 73: 832-840)
Corresponding author: Jarurin Pitanupong E-mail: [email protected] 17 June 2021 Revised 17 August 2021 Accepted 30 August 2021ORCID: https://orcid.org/0000-0001-9312-9775http://dx.doi.org/10.33192/Smj.2021.108
INTRODUCTION Empathy is the ability to feel or understand what another person is experiencing from within their frame of reference. It is the capability to place oneself in another’s view. In the past, empathy was initially thought of as a unitary ability; thus, it was considered to consist of two components: a cognitive capacity that simplifies the meaning of the emotions of another person, an emotional aptitude that interprets the experience of the emotions of another person,1 or both concurrently.2,3 In recent studies, empathy has been defined as being underpinned
by three components: emotional contagion, emotional disconnection, and cognitive empathy.4,5
However, empathy is an emotional experience between a spectator and a subject in which the spectator, based on auditory and visual clues, recognizes and temporarily perceives the subject’s emotional condition.6 To be acknowledged as empathic, the spectator must communicate this purport to the subject. During the beginning aspect of this stage, the spectator must not only recognize but also comprehend the bottom of the subject’s emotions. Although, usually confounded with

Volume 73, No.12: 2021 Siriraj Medical Journalhttps://he02.tci-thaijo.org/index.php/sirirajmedj/index 833
Original Article SMJeach other, sympathy and empathy are different. Sympathy is a position of emotional attentive, while empathy reflects emotional comprehension or the capability to recognize another person’s emotional condition.7,8
Throughout medical school, the importance of empathy should be emphasized, because a successful treatment depends on an effective patient-physician interaction; of which empathy is a critical component. The physician who comprehends their patient on a personal status stands a better chance of perceiving and conducting empathy as well as healing said patient efficiently than the physician who does not have this level of comprehension.9 It is considered that physicians should have effective communication skills that enable them to communicate their actual feelings or experiences to patients. Physicians who are poor communicators and cannot manifest their feelings properly are more prone to being misunderstood by patients and people around them. Even though some physicians cannot empathize properly, they may still be able to create a suitable reaction, because they understand how they should respond in given situations, and may possess excellent communication skills.10,11 Besides this, the goal of medicine is not to simply cure the disease, but rather to treat the patient in a holistic sense by alleviating suffering of any kind; therefore, empathy is a key component of a physician’s clinical skills.12 When patients perceive that the physician understands their conditions, they may feel more content and willing to confide in the physician. The process of telling one’s story can be therapeutic13 and may also simplify the healing process.14,15 Finally, empathy is advantageous to physicians as well; it reflects that they can attune to the psychosocial aspects of their patients.16
Even though empathy is very important for a good physician-patient relationship, previous studies have suggested that the empathy level may decline as medical students go through clinical training. It has, therefore, been proposed that the course of medical education or clinical training may impact empathy among medical trainees negatively.17 Furthermore, it is a challenge for medical educators to ensure that empathy becomes a prominent component of medical professionalism. The Division of Medical Education, Faculty of Medicine, Prince of Songkla University proposes nine core competencies for medical graduates. According to these competencies, empathy is one constituent of professional habits, communication, and interpersonal skills.18,19 A prior study identified that most medical students at the Faculty of Medicine, Prince of Songkla University used adaptive coping strategies,20 and when they were medical doctors, who worked at hospitals either in the restive or
non-restive areas of the Southern Thailand insurgency, most of them were at normal levels of resilience.21 However, limited data concerning empathy levels are available. In Thailand, only one study on empathy levels among medical students has been conducted in the past nine years (2012). It found that female medical students at the pre-clinical level had higher empathy scores than their male counterparts that were undergoing clinical-level training.22 Therefore, it was deemed both interesting and helpful to study the level of empathy, and its associating factors among Thai medical students. This study provides useful information for the establishment of educational programs in the medical curriculum geared at enhancing medical professionalism among medical school graduates.
MATERIALS AND METHODS After approval from The Human Research Ethics Committee of the Faculty of Medicine, Prince of Songkla University (REC: 63-456-3-4), this cross-sectional study surveyed all the first- to sixth-year medical students enrolled at the Faculty of Medicines, Prince of Songkla University, including the Hat Yai Hospital Medical Education Center and the Yala Hospital Medical Education Center, at the end of the 2020 academic year. There were 1075 medical students, who were categorized by academic year as follows: 192 1st-year, 190 2nd-year, 184 3rd-year, 174 4th-year, 181 5th-year, and 154 6th-year medical students. To be included, one had to meet the criteria of being a medical student, aged no less than 18 years and completing all the questionnaires in full. Meanwhile, those who were foreign students, who declined to participate, or decided to withdraw from the study were excluded.
Data collection The data were collected as follows. The research assistant approached all the medical students in class and handed them an information sheet, which described the rationale for the study and the allotted time to complete the survey. They had at least 10-15 minutes to consider whether to join in the study or not. If they wished to participate, the research assistant distributed the questionnaires. Adhering to the policy of strict confidentiality, the signatures of the participants were not required, and they were informed that they retained the right to withdraw from the research at any time without having to provide any explanation or reason for doing so. All participants were allowed to finish, and return the questionnaires immediately or at a later time. They could submit the questionnaires via two options drop them in the case at the front of the classroom, or return and place them in the case located at the Psychiatry Department, protecting respondent

Volume 73, No.12: 2021 Siriraj Medical Journal https://he02.tci-thaijo.org/index.php/sirirajmedj/index834
Sathaporn et al.
confidentiality was retained. Furthermore, the data were stored securely, and only the researcher could access them via a password.
Instruments 1) The personal and demographic information questionnaire consisted of questions related to age, gender, religion, hometown, income, cumulative GPA, medical school, history of substance use, physical or psychiatric illness, and specialty preference. 2) The Toronto Empathy Questionnaire (TEQ), which was used to evaluate empathy, consisted of 16 questions and employed a 5-point rating scale for each question. The item responses were scored according to the following scale for positively worded items: 0 (never), 1 (rarely), 2 (sometimes), 3 (often), and 4 (always). The same scale was used to reverse score negatively worded items. The scores of all 16 questions were summed, and they ranged from 0 to 64. Higher scores indicated high levels of self-reported empathy, while total scores below 45 were indicative of below-average empathy levels. The Cronbach’s alpha coefficient for this tool was 0.85. Additionally, empathy was divided into six subgroups; perception of an emotional state in another that stimulates the same emotion in oneself; assessment of emotion comprehension in others; assessment of emotional states in others by indexing the frequency of behaviors demonstrating appropriate sensitivity; sympathetic physiological arousal; altruism; behaviors engaging higher-order empathic responding, such as pro-social helping behavior.23
3) The Thai Mental Health Indicator-15 (TMHI-15) consisted of 15 questions. The score of each question ranged from 1 to 4. The following scale was used to reverse score negatively worded items. The scores of all 15 questions were summed, and the total scores, which ranged from 15 to 60, were categorized as follows: less than 43 (poor mental health), 44-50 (fair mental health), and 51-60 (good mental health). The Cronbach’s alpha coefficient for this tool was 0.7.24
Statistical analysis Descriptive statistics; such as proportion, mean, and standard deviation (SD), or medians and inter-quartile ranges (IQR) were calculated. Bivariate and multivariate analyses using logistic regressions were employed to identify the association with level of empathy. The analyses were conducted using R version 3.4.1 (R Foundation for Statistical Computing). Statistical significance was defined as a p-value of less than 0.05.
RESULTSDemographic characteristics One thousand and ten first- to sixth-year medical students completed the questionnaires, from the total of 1075 students, who were approached; the response rate was 94%. The majority of them were female (59%), Buddhist (79.1%), and the accumulative GPA was 3.4 (3.1-3.6) (Table 1). Overall, the median age (IQR) was 21 years (20-23), and the income per month was 9,000 baht (6,500-10,000). No statistically significant differences in demographic data (gender, religion, and physical illnesses) between the pre-clinical and clinical groups of medical students were detected.
Empathy level Using the Toronto Empathy Questionnaire, 554 participants (54.9%) reported a high level of empathy (Table 1). The median TEQ score (IQR) of all participants was 45 (41-49.7). The median TEQ scores (IQR) of the pre-clinical and clinical student groups were 49 (45.8-52) and 46 (42.2-50), respectively. Of the six TEQ subgroups, the assessment of emotion comprehension in others, behaviors engaging higher-order empathic responding, and altruism had the highest median scores (IQR) (3 (2-3), 3 (2-3), and 3 (2.7-3.7), respectively), whereas perception of an emotional state in another that stimulates the same emotion in oneself exhibited the lowest score (IQR) [2.5 (2-3)] (Table 2). A statistically significant difference in the level of empathy, in terms of subgroups between the groups, was observed (P-value <0.001) (Table 1). Among the pre-clinical medical students, the empathy subgroups of assessment of emotional states in others by indexing the frequency of behaviors demonstrating appropriate sensitivity, behaviors engaging higher-order empathic responding, and altruism had higher scores than among those studying at the clinical level (Table 2).
Mental health Using the Thai Mental Health Indicator-15 (TMHI-15), most participants reported fair to good mental health (51.2% and 27.4%, respectively), and only 216 (21.4%) respondents had poor mental health (Table 1). There was a statistically significant difference in mental health between the pre-clinical and clinical groups of medical students (P-value <0.001). Concerning perceived stress, 920 (91.1%) participants reported having experienced stress within the previous year. The most common stresses were academic course work and examinations (92%), learning environment (38.9%), and living with friends (29.7%).

Volume 73, No.12: 2021 Siriraj Medical Journalhttps://he02.tci-thaijo.org/index.php/sirirajmedj/index 835
Original Article SMJ
TABLE 1. Demographic characteristics, mental health, and level of empathy between two groups of medical students.
Group N (%)Variables Total Pre-clinical Clinical Chi2
(n=1010) (n=544) (n=466) P-value
Gender 0.103 Male 409 (40.5) 207 (38.3) 202 (43.5) Female 596 (59.0) 334 (61.7) 262 (56.5) No answer 5 (0.5)
Religion 0.569 Buddhism 799 (79.1) 433 (83.8) 366 (85.3) Other (Islam, Christianity, other) 147 (14.6) 84 (16.2) 63 (14.7) No answer 64 (6.3)
GPA: median (IQR) 3.4 (3.1-3.6) 3.6 (3.3-3.8) 3.3 (3.0-3.5) <0.001a
Home province <0.001 Southern Region 905 (89.6) 471 (87.1) 434 (93.7) Other 99 (9.8) 70 (12.9) 29 (6.3) No answer 6 (0.6)
Physical illness 0.322 No 844 (83.6) 448 (82.7) 396 (85.2) Yes 163 (16.1) 94 (17.3) 69 (14.8) No answer 3 (0.3)
Psychiatric illness <0.001 No 947 (93.8) 527 (97.1) 420 (91.1) Yes 57 (5.6) 16 (2.9) 41 (8.9) No answer 6 (0.6)
Alcohol consumption 0.058 No 703 (69.6) 392 (72.7) 311 (67) Yes 300 (29.7) 147 (27.3) 153 (33) No answer 7 (0.7)
Substance use 1 No 999 (98.9) 540 (99.4) 459 (99.4) Yes 6 (0.6) 3 (0.6) 3 (0.6) No answer 5 (0.5)
Specialty preference <0.001 General / not specified 270 (26.7) 112 (20.6) 158 (33.9) Major 491 (48.6) 291 (53.5) 200 (42.9) Minor 249 (24.7) 141 (25.9) 108 (23.2)
Mental health <0.001 Poor 216 (21.4) 78 (14.3) 138 (29.6) Fair 517 (51.2) 280 (51.5) 237 (50.9) Good 277 (27.4) 186 (34.2) 91 (19.5)
Level of empathy <0.001 <45 456 (45.1) 190 (34.9) 266 (57.1) ≥45 554 (54.9) 354 (65.1) 200 (42.9)
Note: a = P-value from rank sum test

Volume 73, No.12: 2021 Siriraj Medical Journal https://he02.tci-thaijo.org/index.php/sirirajmedj/index836
Sathaporn et al.
TABLE 2. Subgroups of empathy.
Median (IQR)Domain of empathy Total Pre-clinical Clinical (n=1010) (n=544) (n=466)
Perception of an emotional state in another that 2.5 (2.0-3.0) 2.5 (2.5-3.0) 2.5 (2.0-3.0) stimulates the same emotion in oneself
Assessment of emotion comprehension in others 3.0 (2.0-3.0) 3.0 (2.0-3.0) 3.0 (2.0-3.0)
Assessment of emotional states in others by indexing the frequency of behaviors demonstrating 2.8 (2.4-3.2) 3.0 (2.6-3.2) 2.6 (2.4-3.0) appropriate sensitivity
Sympathetic physiological arousal 2.7 (2.5-3.0) 2.8 (2.5-3.2) 2.8 (2.5-3.0)
Altruism 3.0 (2.7-3.7) 3.3 (3.0-3.7) 3.0 (2.7-3.3)
Behaviors engaging higher-order empathic responding 3.0 (2.0-3.0) 3.0 (2.0-3.0) 2.0 (2.0-3.0) such as pro-social helping behavior
The association of demographic characteristics and mental health with level of empathy To identify factors associated with the level of empathy, demographic characteristics, and mental health were included in the multivariate analysis. Variables with p-values of less than 0.2 from the bivariate analysis were included in the initial model of the multivariate analysis (Table 3). The multivariate analysis indicated that females and pre-clinical level students had a higher level of empathy than their male and clinical-level counterparts [odds ratio 1.8 (1.36, 2.37) and 1.97 (1.49, 2.59), respectively]. Additionally, medical students who preferred minor specialties had a higher level of empathy than those who preferred pursuing general medicine, [odds ratio 1.87 (1.27, 2.74)] (Table 4). The same was true when comparing them with those who preferred major specialties [odds ratio 1.48 (1.05, 2.1)]. A protective factor that significantly improved the level of empathy was having fair to good mental health.
DISCUSSION This study found that more than half of our medical students (54.9%) reported a high level of empathy. However, being female, pre-clinical level medical students, and preferring minor specialties were associated with having a higher level of empathy than being male, a clinical-level student, and preferring general medicine or major specialties. In addition, having fair to good mental health was found to be a protective factor that statistically significantly improved the level of empathy of our respondents. Comparing the level of empathy
discovered by our study with those reported by previous studies, ours was similar to those of studies conducted in Thailand and the United States22,25 as well as to that of another recent systematic review of studies, which also suggested that empathy level worsens distinctly throughout medical school. The explication for this might point to the clinical practice phase of training, and the hardship generated by aspects of the “hidden,” “formal,” and “informal” curricula as the principal causes for the downfall in empathy level.26 Since, according to this study’s results, most participants (91.1%) reported having stress during the previous year and identified medical courses or examinations (92%) as well as learning environment (38.9%) as the most common causes of stress, it might be plausible that medical education or clinical training impacts empathy negatively.17 Although the deterioration in empathy is mainly observed as a valid research finding,27-29 previous systematic reviews of studies on empathy have highlighted the diversity of measurements available to survey empathy as well as the point that correlations between self-reported and observed empathy might be different. Hence, disagreements remain concerning the validity of self-report questionnaires as a precise measure of empathy results.30,31 Therefore, future in-depth studies with a qualitative research design are required in order to ensure the trustworthiness of the findings. Empathy comprises of the cognitive, affective or emotional domain. The cognitive domain refers to ‘the capacity to comprehend the patient’s inner experience and viewpoint, and an ability to communicate this

Volume 73, No.12: 2021 Siriraj Medical Journalhttps://he02.tci-thaijo.org/index.php/sirirajmedj/index 837
Original Article SMJ
TABLE 3. Bivariate analysis of level of empathy.
Level of empathy N (%)Variables Total N (%) <45 ≥45 Chi2
(n=1010) (n=456) (n=554) P-value
Gender <0.001 Male 409 (40.5) 219 (48.2) 190 (34.5) Female 596 (59.0) 235 (51.8) 361 (65.5) No answer 5 (0.5)
Medical training level < 0.001 Pre-clinical 544 (53.9) 190 (41.7) 354 (63.9) Clinical 466 (46.1) 266 (58.3) 200 (36.1)
Religion 1 Buddhism 799 (79.1) 359 (84.5) 440 (84.5) Others (Islam, Christ, others) 147 (14.6) 66 (15.5) 81 (15.5) No answer 64 (6.3)
GPA : median (IQR) 3.4 (3.1-3.6) 3.4 (3.0-3.6) 3.4 (3.1-3.7) 0.284a
Home province 0.09 South 905 (89.6) 415 (92) 490 (88.6) Others 99 (9.8) 36 (8) 63 (11.4) No answer 6 (0.6)
Physical illness 0.733 No 844 (83.6) 383 (84.4) 461 (83.4) Yes 163 (16.1) 71 (15.6) 92 (16.6) No answer 3 (0.3)
Psychiatric illness 0.574 No 947 (93.8) 427 (94.9) 520 (93.9) Yes 57 (5.6) 23 (5.1) 34 (6.1) No answer 6 (0.6)
Alcohol consumption 0.262 No 703 (69.6) 324 (72) 379 (68.5) Yes 300 (29.7) 126 (28) 174 (31.5) No answer 7 (0.7)
Substance use 1 No 999 (98.9) 450 (99.3) 549 (99.5) Yes 6 (0.6) 3 (0.7) 3 (0.5) No answer 5 (0.5)
Specialty preference <0.001 General / not specified 270 (26.7) 154 (33.8) 116 (20.9) Major 491 (48.6) 209 (45.8) 282 (50.9) Minor 249 (24.7) 93 (20.4) 156 (28.2)
Mental health <0.001 Poor 216 (21.4) 151 (33.1) 65 (11.7) Fair 517 (51.2) 249 (54.6) 268 (48.4) Good 277 (27.4) 56 (12.3) 221 (39.9)
Note: a = P-value from rank sum test

Volume 73, No.12: 2021 Siriraj Medical Journal https://he02.tci-thaijo.org/index.php/sirirajmedj/index838
Sathaporn et al.
TABLE 4. Factors associated with high level of empathy.
Factors Crude OR Adjusted OR P-value (95% CI) (95% CI) LR-test
Gender <0.001 Male Reference Reference Female 1.77 (1.37, 2.28) 1.8 (1.36, 2.37)
Medical training level <0.001 Clinical Reference Reference Pre-clinical 2.52 (1.95, 3.26) 1.97 (1.49, 2.59)
Specialty preference 0.005 General/ not specified Reference Reference Major 1.78 (1.31, 2.4) 1.26 (0.9, 1.75) Minor 2.20 (1.55, 3.13) 1.87 (1.27, 2.74)
Mental health <0.001 Poor Reference Reference Fair 2.46 (1.75, 3.45) 2.17 (1.53, 3.09) Good 9.27 (6.13, 14.04) 7.92 (5.14, 12.2)
comprehension’,32 whereas, the affective domain refers to ‘the capacity to conceive the patient’s emotions and aspects’.33 Concerning the empathy subgroups, this study showed that assessment of emotional states in others by indexing behaviors demonstrating appropriate sensitivity, behaviors engaging higher-order empathic responding, e.g., pro-social helping behavior, and altruism declined when the medical students progressed to clinical-level training. This might signify that most of our medical students can comprehend the patient’s inner experience as well as conceive the patient’s feelings or aspects, but they might lack the ability to express their empathy toward others, or that their empathy might decline with medical training. Moreover, this study identified that being female was associated with having a higher level of empathy than being male. Therefore, in clinical-level training, medical students; especially the male group, should be instructed to express empathy, which builds patient trust, calmness, and leads to increased patient gratification. This point should be a significant concern to medical educators. It is widely accepted that effective articulation or good communication skills on the part of physicians should enable them to convey their actual feelings or experiences to patients. Physicians who are poor communicators and do not express their feelings properly might be misapprehended by patients and people close to them.10 Therefore, many studies have tried to create a variety
of types of intervention aiming to promote empathy competency, by employing patient narrative and creative arts, writing, drama, and communication skills training.34
The patient narrative and creative arts interventions were based around the patient narrative and creative arts; such as imaginative composition, lyric, poem, fable, novel, and motion picture. Such interventions fit primarily into the affective dimension of empathy.35 Regarding writing interventions, studies have used various genres of writing to heighten empathy with the rationale that agendas that substantiate humanistic behavior might conduce towards the medical students’ continuance of empathy.36 Drama interventions, using drama to teach empathy, have undertaking the task of training students “how to act-in-role.” The means employed communication seminars directing the cognitive dimension, the exercises in such studies concentrated upon building the participants’ acting skills as a way to heighten their capacity to impersonate empathy, and were found to be successful in significantly increasing their level of empathy.37 Finally, concerning communication skills training interventions, the use of communication skills training as an intervention reflected the authors’ preference for the cognitive dimension of empathy. In such studies, communication skills training consisted of role-play and small-group interactive training.38-40
Moreover, findings from previous have suggested that medical curriculums could be successful in heightening

Volume 73, No.12: 2021 Siriraj Medical Journalhttps://he02.tci-thaijo.org/index.php/sirirajmedj/index 839
Original Article SMJand keeping up empathy in medical students. Continuing to achieve such strategies would help to further clarify best practices, and more precise studies, particularly, large-scale and suitably controlled longitudinal research, is required to instruct recommendations for medical education. Moving forward, medical education academics and investigators should consider addressing the widely reported phenomenon of the deterioration in empathy among medical students by focusing on psychological factors; such as, exhaustion and stress, the “hidden curriculum”, uncertain study setting, loss of enthusiasm, and the perceived need for detachment. Noteworthy, is also the need to highlight the prominence of role models and the reciprocal nature of empathy improvement in training; this suggests that “Indeed, perhaps students need to obtain more empathy from their faculty, other physicians, and even their patients before they can comprehend how to establish empathic connections”.41 Additionally, mental health includes having healthy self-esteem, being satisfied with life, feeling secure, having the sense of ‘appointment in life,’ being confident in emotional control, being empathetic and happy when helping others, and acknowledging or accepting problems that are difficult to solve.24 This study indicated that good mental health was a protective factor that significantly improved the level of empathy. Thus, medical educators should consider practicing relationship-centered care, promoting good mental health, preventing the negative impacts of stress, fatigue, burnout, poor sleep quality,42 and identifying the hidden curricula or mistreatment suffered by medical students43
as the fundamental building blocks medical of education. This could help foster the creation and powerful expression of empathy, which builds patient trust, calmness anxiety, leads to fewer mistakes, increases patient satisfaction, and improves health outcomes.
Strengths and limitations This study had a few noteworthy strengths and limitations. To our knowledge, this is the first study with a high response rate (94.0%) that explored the level of empathy and mental health as well as factors associated with empathy among Thai medical students. However, it was a cross-sectional survey, lacked baseline measurements and long-term follow-up, as well as which it utilized self-administered questionnaires. Some misunderstandings regarding the intended meaning of the questions might have occurred. Nevertheless, to minimize this, questionnaires with good reliability were utilized (good Cronbach’s alpha coefficient values). Other drawbacks were that our data were quantitative, and the sample size was
limited to medical students enrolled at only one faculty of medicine. Hence, this dataset may not fairly represent the situation of all Thai medical students in the faculties of medicine countrywide. Henceforward, studies are recommended to include all medical students from all faculties of medicine in Thailand. In other words, a comprehensive multi-center study should be conducted. Moreover, future research should concentrate upon the definite attributes that inspire a student to be more responsive to different interventions, utilize more qualitative designs, employ longitudinal surveillance or long-term follow-up, and include control groups.
CONCLUSION More than half of the surveyed medical students reported a high level of empathy. Those who were female, in the pre-clinical level of studies, and preferred a minor specialty had a higher empathy level than those who were male, studying at the clinical level, and preferred general medicine specialties. The protective factor that improved the level of empathy was good mental health. However, future qualitative methods, longitudinal surveillance, or long-term follow-up designs focusing on medical students’ empathy are to ensure the trustworthiness of these findings.
ACKNOWLEDGMENTS This project was endorsed by the Human Research Ethics Committee, and fully funded by the Faculty of Medicine, Prince of Songkla University (REC: 63-456-3-4). The authors gratefully acknowledge the invaluable contributions of the Student Affairs Division, Undergraduate Education Division, and Medical Education Division of the Faculty of Medicine, Prince of Songkla University as well as of Ms. Kruewan Jongborwanwiwat and Mrs. Nisan Werachattawanand regarding the collection of data and statistical analysis. Moreover, we genuinely appreciate the Department of International Affairs, Faculty of Medicine, Prince of Songkla University for their assistance in editing the manuscript.
Conflict of interest: The authors declare no conflict of interest.
REFERENCES1. Mehrabian A, Epstein N. A measure of emotional empathy. J Pers 1972;40:525-43.2. Cohen D, Strayer J.Empathy in conduct-disordered and comparison youth. Dev Psychol 1996;32.988-983. Davis MH. Measuring individual differences in empathy: evidence for a multidimensional approach. J Pers Soc Psychol 1983;44.

Volume 73, No.12: 2021 Siriraj Medical Journal https://he02.tci-thaijo.org/index.php/sirirajmedj/index840
113-26.4. Marcus ER. Empathy, humanism, and the professionalization process of medical education. Acad Med 1999;74.1211-5.5. Carre A, Stefaniak N, D’Ambrosio F, Bensalah L, Besche- Richard C. The Basic Empathy Scale in Adults (BES-A): factor Structure of a Revised Form. Psychol Assess 2013;25.679-91.6. Buie DH. Empathy: its nature and limitations. J Am Psychoanal Assoc 1981;29:281-307.7. Elam CL. Use of “emotional intelligence” as one measure of medical school applicants’ noncognitive characteristics. Acad Med 2000;75:445-6.8. Elam C, Stratton TD, Andrykowski MA. Measuring the emotional intelligence of medical school matriculants. Acad Med 2001;76: 507-8. 9. Hirsch EM. The role of empathy in medicine: a medical student’s perspective. AMA J Ethics 2007;9:423-7. 10. Larson EB, Yao X. Clinical empathy as emotional labor in the patient physician relationship. JAMA 2005;293:1100-6.11. Zinn W. The empathic physician. Arch Intern Med 1993;153: 306-12.12. Halpern J. What is clinical empathy? J Gen Intern Med 2003; 18:670-4.13. Adler HM. The history of the present illness as treatment: who’s listening, and why does it matter? J Am Board Fam Pract 1997;10:28-35.14. Suchman AL, Markakis K, Beckman HB, Frankel R. A model of empathic communication in the medical interview. JAMA 1997;277:678-82.15. Bellet PS, Maloney MJ. The importance of empathy as an interviewing skill. JAMA 1991;266:1831-2.16. Anfossi M, Numico G. Empathy in the doctor-patient relationship. J Clin Oncol 2004;22:2258-9.17. Chen D, Lew R, Hershman W, Orlander J. A Cross-sectional Measurement of Medical Student Empathy. J Gen Intern Med 2007;22:1434-8.18. Vitayanont A, Pitanupong J. Processes of communication. Songkla Med J 2011;29:195-201.19. Pitanupong J, Vitayanon A. Knowledge, attitude and insight regarding communication skills in medical students. Songkla Med J 2011;29:109-16.20. Norphun N, Pitanupong J, Jiraphan A. Stress and Coping Strategies among Thai Medical Students in a Southern Medical School. Siriraj Med J 2020;72.238-244.21. Jatchavala C, Pitanupong J. Resilience in Medical Doctors within the Areas of the Southern Thailand Insurgency. Siriraj Med J 2019;71.228-233.22. Jumroonrojana K, Zartrungpak S. Development of the Jefferson Scale of Physician Empathy-Student Version (Thai Version). J Psychiatr Assoc Thailand 2012;57:213-24.23. Spreng RN, McKinnon MC, Mar RA, Levine B. The Toronto Empathy Questionnaire: scale development and initial validation of a factor-analytic solution to multiple empathy measures. J Pers Assess 2009;91:62-71.24. Mongkol A, Huttapanom W. Thai Happiness Indicators (THI- 15) [monograph on the Internet]. Nonthaburi: Department of Mental Health, Ministry of Public Health; 2011 [cited 2020 Oct 5] Available from: http://www.dmh.go.th/test/qtest/25. Melanie N, Friedrich E, Diethard T, Martin RF, Markus W,
Christiane W, et al. Empathy decline and its reasons: a systematic review of studies with medical students and residents. Acad Med 2011;86:996-1009. 26. Hojat M, Shannon SC, DeSantis J, Speicher MR, Bragan L, Calabrese LH. Does empathy decline in the clinical phase of medical education? a nationwide, multi-institutional, cross- sectional study of students at do-granting medical schools. Acad Med 2020;95:911-8. 27. Hojat M, Gonnella JS, Veloski J. Rebuttals to critics of studies of the decline of empathy. Acad Med 2010;85:1812.28. Newton BW. Rebuttals to critics of studies of the decline of empathy. Acad Med 2010;85:1812-3.29. Sherman JJ, Cramer AP. Rebuttals to critics of studies of the decline of empathy. Acad Med 2010;85:1813.30. Hemmerdinger JM, Stoddart SD, Lilford RJ. A systematic review of tests of empathy in medicine. BMC Med Educ 2007; 7:24.31. Pedersen R. Empirical research on empathy in medicine-A critical review. Patient Educ Couns 2009;76:307-22.32. Hojat M, Gonnella JS, Mangione S, Nasca TJ, Magee M. Physician empathy in medical education and practice: experience with the Jefferson Scale of physician empathy. Semin Integr Med 2003;1:25-41.33. Beckman HB, Frankel RM. Training practitioners to communicate effectively in cancer care: it is the relationship that counts. Patient Educ Couns 2003;50:85-9.34. Batt-Rawden SA, Chisolm MS, Anton B, Flickinger TE. Teaching empathy to medical students: an updated, systematic review. Acad Med 2013;88:1171-7.35. Argent J, Faulkner A, Jones A, O’Keeffe C. Communication skills in palliative care: development and modification of a rating scale. Med Educ 1994;28,559-65.36. Rosenthal S, Howard B, Schlussel YR, Herrigel D, Smolarz BG, Gable B, et al. Humanism at heart: preserving empathy in third-year medical students. Acad Med 2011;86:350-8.37. Lim BT, Moriarty H, Huthwaite M. “Being-in-role”: a teaching innovation to enhance empathic communication skills in medical students. Med Teach 2011;33:663-9.38. Van Winkle LJ, Fjortoft N, Hojat M. Impact of a workshop about aging on the empathy scores of pharmacy and medical students. Am J Pharm Educ 2012;76:9.39. Bayne HB. Training medical students in empathic communication. J Spec Group Work 2011;36:316-29.40. Norfolk T, Birdi K, Walsh D. The role of empathy in establishing rapport in the consultation: a new model. Med Educ 2007;41: 690-7.41. Bombeke K, Van Roosbroeck S, De Winter B, Debaene L, Schol S, Van Hal G, et al. Medical students trained in communication skills show a decline in patient-centred attitudes: an observational study comparing two cohorts during clinical clerkships. Patient Educ Couns 2011;84:310-8.42. Chatlaong T, Pitanupong J, Wiwattanaworaset P. Sleep Quality and Burnout Syndrome among Residents in Training at the Faculty of Medicine, Prince of Songkla University. Siriraj Med J 2020; 72.307-314.43. Pitanupong J, Sathaporn K. The prevalence and factors associated with mistreatment perception among Thai medical students in a southern medical school. Siriraj Med J. 2019;71.310-7.
Sathaporn et al.

Volume 73, No.12: 2021 Siriraj Medical Journalhttps://he02.tci-thaijo.org/index.php/sirirajmedj/index 841
Review Article SMJ
Mohammad Ahmad Abdalla, Ph.D.Department of Human Anatomy, Tikrit University College of Medicine, Tikrit, Iraq
Melasma Clinical Features, Diagnosis, Epidemiology and Etiology: An Update Review
ABSTRACT Melasma is one of the commonest dermatological challenges that facing dermatologists in the whole world. Most of the previously published articles regarding melasma usually focused on its management and the newly discovered drugs; however, the understanding of the suspected etiology and the pathogenesis is very critical to treat this skin disorder in a correct manner. Therefore, this review is an attempt to do a comprehensive updating on the present understanding of the melasma epidemiology, etiology, its role in pregnant, post-menopausal women, and in males, besides its clinical features and diagnosis through searching in many scientific databases including EMBASE, Cochrane Library, PubMed, Pubmed Central (PMC), Medline, Web of Science, and Scopus. This review approaches recognizing the pathogenesis that can provide ideas to solve the therapeutic problems which connect to melasma. Therefore, this article is entirely established on previously performed studies so that no new studies on animal or human subjects were conducted by the author.
Keywords: Melanin; melanocortin; melasma (Siriraj Med J 2021; 73: 841-850)
Corresponding author: Mohammad Ahmad Abdalla E-mail: [email protected] 12 September 2021 Revised 28 September 2021 Accepted 13 October 2021ORCID ID: https://orcid.org/0000-0001-8122-3692http://dx.doi.org/10.33192/Smj.2021.109
INTRODUCTION Melasma is one of the common acquired hyperpigmentation conditions, mostly affects the face, with a high prevalence among females and the darker skin phenotype individuals.1 Many etiologies, including family history, hormonal influence, and sunlight exposure, have been involved in its pathogenesis.2 The overall prevalence reports wide ranges (1-50) %, because the values are usually determined in a particular ethnic group within a specific geographical area.3 Histologically, melasma may reveal enlarged melanocytes, increased dermal or/and epidermal pigmentation, increased melanosomes, dermal blood vessel, solar elastosis, and rarely perivascular lymphohistiocytic infiltrations.4
MethodologyMelanogenesis Melanogenesis is a process that occurs inside the melanosomes. There are two forms of melanin pigments
are produced within the melanosomes; pheomelanin and eumelanin. Pheomelanin is a soluble sulfur-containing bright red-yellowish polymer, while eumelanin is an insoluble dark brownish-black polymer.5 Tyrosinase is a copper-containing enzyme; however, before tyrosinase can act on tyrosine two cupric atoms present in tyrosinase must be reduced to cuprous atoms. Tyrosinase is responsible for the first 2 stages in the synthesis of melanin; the L-tyrosine hydroxylation into L-dihydroxyphenylalanine (L-DOPA) with the following stage of oxidation for this o-diphenol into the related quinone (L dopaquinone).6 It is worth noting that the L-tyrosine concentration required for melanogenesis is determined by the conversion of L-phenylalanine which is an essential amino acid through the action of the intracellular enzyme phenylalanine hydroxylase (PAH). The L-phenylalanine significance in melanogenesis is elucidated in phototypes of the skin I-VI as the epidermal PAH actions are linearly correlated.7

Volume 73, No.12: 2021 Siriraj Medical Journal https://he02.tci-thaijo.org/index.php/sirirajmedj/index842
Following the dopaquinone synthesis, the melaninpathway is split into the synthesis of red-yellowish pheomelanin and brownish-black eumelanin with spontaneous conversion into dopachrome and leucodopachrome. In the eumelanin formation pathway, the dopachrome consider as either spontaneously transformed into 5, 6-dihydroxyindole or it is enzymatically transformed into 5, 6-dihydroxyindole-2-carboxylic acid via dopachrome tautomerase (DCT), besides pointed out as tyrosine-related protein-2 (TRP-2). The tyrosinase-related proteins are of two types, TRP-1 and TRP-2 that are structurally associated with tyrosinase.8,9
TRP-1 and TRP-2 are melanosomal proteins that extend to the membrane of the melanosome like tyrosinase. There is a suggestion that TRP-1 elevates the eumelanin to pheomelanin ratio. Also, they may be explaining the high tyrosinase stability. Ultimately, the quinones and indoles polymerization results in eumelanin synthesis.10
The pathway of pheomelanin branches from that of eumelanin at the step of L-dopaquinone and it depends upon the cysteine existence that shows active transporting through the membrane of melanosomes. The L-dopaquinone interacts with cysteine to produce cysteinyl-dopa, which is then converted into the quinoleimine and alanine-hydroxyl dihydrobenzothazine that polymerized to pheomelanin. Besides, the tyrosinase enzyme may be indirectly triggered by the tyrosine hydroxylase isoenzyme 1 (TH1) which exists in the melanosomes that catalyze L-dopa formation. In turn, the latter L-dopa may play a role as the tyrosinase substrate.11
Redox (Reduction Oxidation Reaction) status within melanosomes is important for the equilibrium between the pheomelanin and eumelanin synthesis. This pheomelanin or eumelanin synthesis is directly affected by the glutathione (GSH) level, the low GSH
level related to pheomelanin, and the high related to eumelanin. Therefore, the functional and expressional activities of the antioxidant enzymes like glutathione reductase, glutathione peroxidase, thioredoxin reductase, and catalase are most likely modifying the melanosomes pathway.12
Each melanocyte that establishes at the basal layer of epithelium together with its dendrites reacts with about thirty-six keratinocyte cells to transmit melanosomes and cause skin protection from the ultraviolet radiation and photo-stimulated carcinogenesis. Besides, the type and amount of melanin synthesized and transferred into the keratinocyte cells with successive aggregation, incorporation, and degradation affects the epidermis coloration.12
The ratio of eumelanin to pheomelanin varies dramatically in the various skin phenotypes, found at the lowest level in type I and II and highest in type V and VI; and these types are:- 1. Type I :- (score ranges 0-6) never tans, always burns (pale white; red hair or blond; blue eyes; with freckles). 2. Type II :- (score ranges 7-13) minimally tans, usually burns (white; fair; red hair or blond; hazel, green or blue eyes). 3. Type III :- (score ranges 14-20) uniformly tans, sometimes mildly burns, (creamy white; fair; with any eye or hair colour). 4. Type IV :- (score ranges 21-27) always tans, minimally burns (moderate brown). 5. Type V :- (score ranges 28-34) very easily tans, very rarely burns (dark brown). 6. Type VI :- (score ranges 35-36) never tans, never burns (deep pigmented darkish brown to darkest brown).13
Fig 1. Melanin synthetic pathway5
Abdalla.

Volume 73, No.12: 2021 Siriraj Medical Journalhttps://he02.tci-thaijo.org/index.php/sirirajmedj/index 843
Review Article SMJMelasma The term “facial hyperpigmentation” or “melasma” is obtained from the Greek word “melas”, meaning “black”. It also refers to “chloasma gravidarum” or “the pregnancy mask”. Its onset starts commonly during the 2nd half of gestation, and it exists in 40-75% of all pregnancies. It occurs usually in dark hair, brown eyes, and dark-epidermis women. The main variations of melasma prevalence in various studies were accredited to the proven fact that explaining the pigmentary alterations are more visible in individuals with fair skin.14
Melasma commonly influences the principal photo-exposed skin regions, particularly the facial and neck areas. The commonly involved sites include the cheeks, chin, forehead, nose, upper lip, and temples; while the rarely involved sites may distress the sternal region and extensor arms. However; this condition considers as a benign disorder that usually with aesthetic implications only, but it can influence the self-esteem and self-image, with negative effects on an individual’s life quality.15
Clinical features of melasma Melasma is localized at sun-exposed regions, where symmetrical light or dark brownish confluent macules or punctate are present, most sharply delimited, particularly on the cheeks, forehead, chin, and upper lip. There are three kinds of melasma lesions; centrofacial type (implicates cheeks, forehead, nose, chin, and upper lip), mandibular type (over the mandibular ramus), and symmetrical malar type (localized to nose and cheeks).8,12,16 In male individuals, the malar type is the commonest, while the centrofacial is the common type revealed in females. Wood’s lamp may clinically divide the pigmentation depth; in the epidermal type may be shown highlighting multiple pigments in (50%) of cases, compared to dermal type (5%), were not.17 While the mixed type in (45%) of all cases just a partial pigmentation highlighting is found. Clinically, the dermal type becomes mildly visible bluish because of the Tyndall effect. The disease severity may be objectified with Melanin Index (MI) estimated by specific tools, Melanin Area and Severity Index (MASI) determining the regions and densities of involvements, with patient self-evaluations.18,19
Extra-facial melasma includes many features such as irregular, hyperchromic, symmetrical discolorations at the neck, cervical, sternal areas, arms, forearms, and eventually at the back. It affects the upper limbs predominantly among old adults, menopausal women, and those receiving hormonal replacement therapy.20
Diagnosis of Melasma 1. Melasma examination under normal light
The skin of melasma lesion is inspected by natural solar radiations, the macular lesions have irregular, quite sharply demarcated borders with a “stuck on” appearance The hypermelanosis type can be epidermal (brownish), a dermal (bluish-gray), or a mixed (brownish-gray).7,21
2. Wood’s lamp examination This procedure used to evaluate the melasma clinical status, depending upon Wood’s light (320-400 nm) and four types of melasma can be recorded:- A. The epidermal type: has increased melanin in suprabasal, basal, and stratum corneum layers. The pigmentary lesions are emphasized with Wood’s light. B. The dermal type: does not show enhancement with the Wood’s light. Melanophages exist in the deep and superficial dermis. C. The mixed type: the dermal and epidermal pigment type that shows no or slight enhancement with the Wood’s light. D. Wood’s light unapparent is seen in dark individuals. As the Wood’s lamp was utilized to determine the melanin pigment situation either in the dermis or epidermis (i.e. dermal versus epidermal melasma), the histopathological and confocal microscopy reports revealed that it is usually a mixture from the two types in the same patient even they have only epidermal type by Wood’s light.8,9,17,22
3. Hormonal assay The hormonal level assessments can be guaranteed because of the activity of hormones imbalance in melasma disease. FSH, LH, MSH, progesterone, thyroid, and prolactin hormones level must be estimated, just if indicated.23,24
4. Microscopic histopathology Melasma may be clinically diagnosed; however, the histological report may be also helpful. The histological findings are the same in both males and females. Furthermore, the histopathological features of melasma in males are still unclearly defined. These features include flattening in the rete ridge, solar elastosis, and mild infiltrations of the inflammatory cells.25 The amount of melanin is raised in the dermis or epidermis or even in both. In the epidermis, it presents in the keratinocyte cells of suprabasal and basal layers. The number of melanocyte cells is not increased but these cells are larger in size with more dendrites, greater melanosomal size, and; therefore, more activity will be produced. Dermal melanin amount increased in the middle and superficial dermis in macrophage cells, usually in aggregation at areas nearby the small dilated blood vessels. The epidermal melanization with the existence of melanophages at papillary dermis may be

Volume 73, No.12: 2021 Siriraj Medical Journal https://he02.tci-thaijo.org/index.php/sirirajmedj/index844
revealed in Fontana-Masson and Haematoxylin-Eosin staining.26 There is no proof of degeneration in the basal layer was recorded. Significantly elevated expressions for Stem Cell Factor (SCF) allover fibroblasts in the dermis with its C-kit receptors at the epidermal basal layer were present in diseased skin in comparison with non-diseased.27
Several special stains are present that facilitate the light microscopic visualization of melanocytes and their products including; silver stain, dopa reaction, and Fontana-Masson. Histologically, two types of pigmentation had been characterized, dermal and epidermal.11
Epidermal melasma appeared to be the most predominant type proceeded by mixed type. While melasma has classically been classified as epidermal- or dermal-based on the presence or absence of Wood’s light enhancement, respectively, most cases show both epidermal and dermal melanin. Dermal melanophages are a normal finding in sun-exposed skin.17,22
Increased melanophages may also recognize in several melasma individuals by reflectance confocal microscopy (RCM) examination. Interestingly, RCM examinations revealed that the topographic distribution of the melanophages is very diverse from one lesional area to another and also within the same lesional area. These findings supposed that histological classifications (dermal, epidermal, and mixed) regarding the depth of the pigment utilizing a single specimen of skin biopsy can be very risky. A reliable classification could be dependent upon the dermal/epidermal melan in ratio present over the entire involved skin area. Until nowadays, it is not clear, if the origin of dermal pigments comes from the epidermal layer. Besides, it is unclarified if dermal pigments may be resolved spontaneously when they are not supplemented from epidermis. In darkly pigmented individuals (e.g. those with indeterminate melasma), a skin biopsy is occasionally performed before treatment is initiated.6,28-32
5. Electron microscopy It shows high amounts of melanin within all layers of the epidermis and also within the dermis, according to the melasma histological type. Also, the numbers of melanocyte cells included the high numbers of melanosomes compared to melanocyte cells of the normal skin is high. It may reveal the increased melanosomes were associated with findings of many organelles in the melanocyte cells from the diseased lesions. The melasma lesions included more Golgi apparatus, mitochondria, rough endoplasmic retinaculum, dendrites, ribosomes, and supposing more production ability of those cells.33,34
6. Immunohistochemistry It may show high expression for stem cell factor in the dermal layer and for c-kit in epidermal layer with high expression for vascular endothelial growth factor, which can be the main factor achieved in the changed blood vessels occurs in melasma.27,35-37
7. Dermoscopy may play a principal role in melasma diagnosis and in demonstrating the melanin pigment deposition level. The main findings include pigmented dots, globules, more prominent vascularity, and telangiectasia. Also, the accentuation for the pseudo-reticular pigmentary network and Owl’s eye structures exist. In addition, dermoscopy can be used in the assessment of melasma severity.38,39 Epidemiology of melasma Although melasma may influence individuals from any race, it is usually common among darker skin phototypes and the commonest in persons with Fitzpatrick IV-VI skin types.4
In a random study including self-recording for melasma among Hispanic female individuals, it reported that the incidence about 8.8% but the previous incidence was 4%. A survey among Arab Americans who lived in the USA mentioned that the fifth commonest skin disease was melasma with 14.5% from a surveyed population,12 while another study screened 200 persons with melasma found men demonstrated 20.5%.20 Another published article reported the results of three studies that estimating the incidence of melasma among adult males of Latino laborers with 36.0%, 7.4%, and 14%.11 The average age in affected males was 33.5 years and the duration was about 3.5 years; however, it may be present also among older males and for more periods.9 It may cause embarrassment in men due to its awful-looking; and a general community stigma that classified it as a disorder or disease when affects pregnant women. It was recorded that its prevalence up to 75% among pregnant women, but it exists rarely before puberty and; therefore, it most commonly starts in the reproductive years of life.40
Melasma has recognizable psychological influences and significant emotions on affected individuals. The effect on the life quality of individuals with melasma may be standardized by the Melasma Quality of Life Scale (MELASQOL) or/and by the Dermatology Life Quality Index (DLQI); the individuals who have high DLQI scores signify poor Quality of Life (QOL).18
Etiology of melasma The exact causes of melasma have not been defined,
Abdalla.

Volume 73, No.12: 2021 Siriraj Medical Journalhttps://he02.tci-thaijo.org/index.php/sirirajmedj/index 845
Review Article SMJbut numerous factors are possible to be suspected including genetics, pregnancy, cosmetic use, sun exposure, antiepileptic medications, oral contraceptives, and thyroid dysfunction.41 Among these factors, the following are the most important:- 1. Risk Factors The precise melasma cause is still undetermined; even numerous factors may be involved in this lesion’s pathogenesis. These factors are implicated as etiologic or genetic predispositions and influences, in approximately 40% of melasma individuals there is one relative at least affected with this lesion.4 Other factors influencing the onset or/and triggering its onset including hormonal alterations during gestation or hormonal therapy, exposure to UV radiations, phototoxic drugs, cosmetics, chemicals, steroids, antiseizure therapy, and darker skin colorations.32,42,43 Psychotropics and anxiety traits may be strongly related to melasma development; so that melasma is regarded as “the stress mask”. All the previously mentioned factors are suggested to cause an increment in both melanocytosis and melanogenesis, the primary histological disturbances revealed in melasma. Furthermore, although its pathogenesis is unknown yet, the above factors are considered to trigger the disease in a population with genetic predispositions. Study of those factors may urge physicians to get better improvement for preventative measures, management of melasma individuals, expectation treatment result, and disease recurrence.20
The lesion onset is usually proved by deteriorated stratum corneum layer integrity with the overdue barrier recovery period, while a high amount of different inflammatory cells that exist in the lesional region are the common findings distinguished during melasma development in Asian population skin.10
2. Endocrine factors The levels of hormones either because of hormonal therapy or during pregnancy periods are regarded to be one of those most influencing factors or even the most remarkable factor on the onset and melasma development. During pregnancy, endocrine, immunologic, vascular, and metabolic alterations increase the susceptibility of pregnant women to obvious alterations in the skin with its related appendages.44 Progesterone, estrogen, and alpha-MSH which are commonly elevated during pregnancy time and especially at third trimester, are supposed to stimulate the melasma onset by for example through estrogen tentative pathway III that causing increase tyrosinase enzyme and melanosome transfer (Fig 2). Even with the multiple and various cases that found, no high
levels for the mentioned hormones proved. However, several researchers believed that hormonal changes with increased Luteinizing Hormone (LH) and decreased estrogen levels, as a result of ovarian dysfunctions, can underlie the pathogenesis process in some conditions of the idiopathic melasma.16,22,24
Fig 2. Tentative pathway III of the estrogen25
In addition to pregnancy, women taken contraceptive pills with progesterone or women at the post-menopausal period taken progesterone as hormonal therapy, the extra-facial melasma was usually common among them, therefore; the progesterone regarded as a principal factor in this disease. Impressively, the hyperpigmentation resulted from sequential or combined contraceptive pills are incompletely regressing after ceasing, contrary to melanoderma of pregnant women. Researchers; however, have mentioned that estrogen receptors and progesterone receptors expression at melasma-affected regions need more investigations and clarifications, these researches can cause better development for the topical anti-estrogen therapy of melasma.7,19,45
The thyroid autoimmune characteristic is also regarded as another important element in the melasma onset because a significant number of Hashimoto’s diseased women get melasma and also those women who get the disease during pregnancy, will or even already have thyroid autoimmunity.28
Finally, other factors have been involved having the main role in melasma development, like melanocytic nevi and lentigines. Although, the presence of these factors is not very closely connected to the disease onset and its development, like the previously mentioned factors; on the other hand, melasma is usually revealed in women,

Volume 73, No.12: 2021 Siriraj Medical Journal https://he02.tci-thaijo.org/index.php/sirirajmedj/index846
some articles have been done on men with melasma. In those articles, the most remarkable factors indicated for melasma development are regarded to be the usage of cosmetics, sunlight exposure, familial hyperpigmentation, hepatic disorders, and infections.9,11,21,46-48 Even there are a few studies that suggest the circulating LH is crucially increased in melasma men, while testosterone is remarkably decreased in the very same category, information that assumes that melasma can implicate precise testicular resistance.4
3. Genetic factors The skin phototypes III, IV, and V with the female gender regarded as the most recognized genetics, other inheritable characters, probably multi-genetic. One of the most important international researches in this scope was carried out in dermatological centers of 9 countries (USA, Germany, France, Mexico, Netherlands, Singapore, Italy, Hong Kong, and South Korea) and exhibited that 48% from 324 melasmic females had a positive familial history of this disease. Also in about 97% of total cases, another family member from the first degree of relativity is affected.48 Epidemiological information in this consideration may seriously differ in other countries individuals: the prevalence of positive familial history recorded in literature are 70.3% in male individuals and 56% in female individuals in Brazil,40 54.7% in Iran,23
33% in India.49 Although scattered and occasionally not implicating large patient’s sample, these articles that reveal important variations even between individuals living in the same environmental situations, suppose that the susceptibility to melasma lesion is polygenic and might be also affected by the epigenetic modulations of melanogenesis. A study reported that expression of 16 microRNA (miRNA) could differ between the melanocyte cells managed with (forskolin and solar-stimulated UV radiation) from untreated melanocyte cells; one of those miRNAs, known as miR-145, was remarkably down-regulated and also capable of affecting the expression of some main pigmentary genes (Tyr, Trp1, Rab27a, Sox9, Mitf, Myo5a, Fscn1).50,51
4. Sun exposure The most principal and obvious environmental stimulating factor for melasma is sunlight exposure. Among the various constituents of sunlight, UV radiation (A and B) has the main role; since they may induce or increase melanogenesis, migration directly, and melanocyte proliferations, but even indirectly, through triggering the formation of endothelin 1, interleukin 1 (IL-1), ACTH, and α-MSH by keratinocyte cells.52-54
The major role for the visible and the infrared radiation in the melanogenesis process is less remarkable, but not negligible; an association between occupational great exposure to the heat or the intense artificial lighting and exacerbation of melasma or/and low react to management was recorded by several researchers.4 The indirect proof for the effect of the visible light revealed that the sunscreen compounds causing absorption for ultraviolet irradiations, and also the visible light reinforces the depigmentation effect for hydroquinone further than the sunscreen that blocks UV radiation only.32,55
The UV light is regarded as another important agent or factor that has a specified and proven role by multiple previous studies and also case reports.12,13,39
The UV light is not regarded to be capable to develop melasma without any hormonal changes or genetic predispositions, but it is supposed to be essential in stimulating the lesion when the background presents. Apart from the genetic predispositions, autoimmunity and systemic disorders are highly associated with the development and appearance of the lesion. Systemic disorders like Addison’s disease could almost always be doubtful and required exclusion in the clinically relative cases.22,28
5. Drugs Melasma-like pigmentation has been noticed in individuals taking antiepileptic drugs like phenytoin or mephenytoin. Chlorpromazine and related phenothiazines may induce pigmentations at sun-exposed parts of skin especially those who received high doses for long periods. Other drugs include anti-tumor agents like cyclophosphamide, bleomycin, and adriamycin.4,7,56,57
In order to induce skin hyperpigmentation, sometimes even more than a single mechanism is involved. The tetracycline especially minocycline, tricyclic antidepressants particularly imipramine and desipramine, antimalarials, cytotoxic drugs, phenothiazines mostly chlorpromazine, amiodarone, anticonvulsants, sulfonylureas, and clofazimine are all could be listed as the drugs stimulating hyperpigmentation. Clofazimine stimulated pigmentations is a brown color, clarified in sun-exposed regions, sometimes unrecognizable from melasma. In most cases, those lesions are accompanied by nail involvement. The fixed drug eruption considers as a clinical distinctive kind of drug-stimulated hyperpigmentation presented by recurrent plaques in the same situations. It more frequently implicates genitalia, acral areas, and the lips. Many medications may develop this disease, but the greatly remarkable are sulfonamides, ibuprofen, and barbiturates.8,10,39,41,58,59
Abdalla.

Volume 73, No.12: 2021 Siriraj Medical Journalhttps://he02.tci-thaijo.org/index.php/sirirajmedj/index 847
Review Article SMJ 6. Cosmetic These include a wide variety of perfumes, soaps, creams, powders, shampoos, that contain psoralen, tar derivatives, or hexachlorophene substance which are photodynamic that may cause facial pigmentation.45 However, the pigmented cosmetic dermatitis consider as a variant of the pigmented contact dermatitis because the cosmetic ingredients are the primary allergens where the face is predominantly involved. Clinically, the patchy or diffuse brown hyperpigmentation presents over forehead and/or cheeks or the entire face making it hardly differentiate from melasma.60
7. Idiopathic Most cases among males and at least one-third of all cases among females are idiopathic.18
Melasma in pregnancy, post-menopausal women, and oral contraceptives role During pregnancy, particularly in the third trimester, females have elevated levels of pituitary, ovarian and placental hormones, which exhibit a trigger for melanogenesis that can describe the relations between pregnancy and melasma.23 High levels of progesterone, estrogens, and MSH also cause an increment in the transcription of dopachrome and tyrosinase tautomerase that can be implicated in developing pigmentations in this specific period.61 Those findings suggest that melasma lesions in pregnant women are more possible to be related to the circulated female hormone than the MSH peptides. In fact, the high levels of progesterone, which occurs during pregnancy; and the estrogen formation, which takes place from the 8th till the 31st week of gestation mirrors the perfect progressive patterns of hyperpigmentation. In melasma, the major role of female hormone onset is proposed by its increased incidence in women getting exogenous progesterone or/and estrogen and its association with the menstrual period.4,11
The onset of melasma mostly happens during the 2nd half of pregnancy and it may be present in 40-75% of all pregnancies.23 On contrary, a study done on 324 women who managed melasma disease in nine different clinics worldwide, recorded the melasma onset in 25% of females after using the OCP, in 27% of females during gestation, and in 41% of females after gestation.48
Melasma continues after gestation among less than 10%, though a single study report existence in about 30% of cases after ten years. If the melasma continues postpartum, some females notice a premenstrual hyperpigmentation flare. Regarding that UV exposure triggers up-regulation of melanocyte cells and their activity in the pathogenesis
of melasma, susceptible females could be recommended to protect unavoidable heavy sunlight exposures and guarantee preservation with broad-spectrum (UVB and UVA) sunscreens and suitable clothing.32,54
As the female sex hormones that exist within OCP show to be principal for melasma development, the same association could be expected in postmenopausal females on Hormone Replacement Therapy (HRT). Indeed, there are some case reports for melasma present in the postmenopausal. Melasma in the forearms appears to be a comparatively common sign particularly in old age individuals and postmenopausal females using estrogen therapy supplementations. As several of those persons had melasma in the face when young that may explain the presence of people with estrogen-sensitive melanocyte cells in forearm skin that show maturation at an older age.8,9,12,25 Tamoxifen considers a Selective Estrogen Receptor Modulator (SERM) and spends mixed estrogenic with antiestrogenic actions depending upon the tissues and cell types.57
Melasma in male Some articles of melasma developing in men were available; in 1957, the first recorded male melasma case was in a French primary hypogonadism man, presented with low testosterone level and high FSH and LH.62
Similarly, another study was done on fifteen Indian men who had idiopathic melasma, characterized by a low level of testosterone and high level of LH in comparison with same age controls; the estrogen level was undetected.20
In another study, a melasma case after oral therapies with triggers for production of testosterone, a compound containing indole-3-carbinol, androstenedione, dehydroepiandrosterone (DHEA), and Tribulus Terrestres, which is a gonadotropic trigger that elevates LH secretions.39
Melasma and the pituitary gland The melanocortins produced from intermediate lobe of the hypophysis gland, they regarded as a group of peptide hormones important for melanogenesis that activate the formation and release of melanin by melanocyte cells situated at skin and hairs. The melanocortins contain three different kinds of MSH (α-MSH, β-MSH, and γ-MSH) with ACTH; all of them are obtained from a similar precursor, the proopiomelanocortin prohormone (POMC), which secretions are stimulated by the Corticotropin-Releasing Hormone (CRH) created within the hypothalamus.4,52
In humans, ACTH and α-MSH are also created regionally in skin (both within keratinocyte and melanocyte cells) and have main roles in pigmentation, probably via autocrine or/and paracrine mechanisms. The CRH

Volume 73, No.12: 2021 Siriraj Medical Journal https://he02.tci-thaijo.org/index.php/sirirajmedj/index848
expression with CRH receptors found in the normal human melanocyte, melanoma, and nevus cells. The plasma immunoreactive β-MSH measured for individuals with/without melasma getting progesterone alone or a combination of estrogen-progesterone therapy; the β-MSH level was indifferent from gender and age-matched control group.7,12,53
It is essential to recognize melasma that is located mostly on the face and less considerably on neck or forearm, from the generalized hyperpigmentation due to some adrenal or pituitary disorders causing high levels of MSH and POMC-obtained ACTH with subsequent universal skin hyperpigmentation. The individuals influenced by major adrenal insufficiencies, ACTH-depending Cushing’s and Nelson’s syndromes, diagnosed by increased POMC-obtained ACTH levels.4,7,22,56
CONCLUSION Melasma is a clinical condition caused by multiple factors and etiopathogenetic mechanisms that are required in order to understand more effective management. The discovery of recent pathways and pathogenic mechanisms is essential in collocation the way for recent more effective melasma treatment agents or procedures. The pathogenic melasma mechanisms might be heterogeneous in various ethnic groups among the population. This review approaches toward recognizing the pathogenesis that can provide ideas to solve the therapeutic problems that connect to melasma. Therefore, this article is entirely established on previously performed studies so that no new studies on animal or human subjects were conducted by the author.
ACKNOWLEDGMENTS The author would like to thank Tikrit University College of Medicine (TUCOM) for its technical and editorial assistance.
Conflict of interest: None declared.
REFERENCES1. Griffiths C, Barker J, Bleiker TO, Chalmers RJG, Creamer D. Rook’s Textbook of Dermatology. 9th Edition. Oxford: Wiley- Blackwell Publishing Ltd; 2017.2. Habif TP. Clinical Dermatology: A Colour Guides to Diagnosis and Therapy. 6th Edition. Philadelphia: Elsevier Health Sciences; 2016.3. Goldsmith LA,Katz SI,Gilchrest BA,Paller AS,Leffell DJ, Wolff K. Fitzpatrick’s Dermatology in General Medicine. 8th
Edition. New York: McGraw-Hill Higher Education; 2012.4. Abdalla MA. Evaluation of Alpha-Melanocyte Stimulating Hormone and Vitamin D in patients with Vitiligo and Melasma.
[Dissertation]. Tikrit: Tikrit University College of Medicine; 2018. 5. Olejnik A, Glowka A, Nowak I. Release studies of undecylenoyl phenylalanine from topical formulations. Saudi Pharm J. 2018; 26(5):709-718.6. Sarkar R, Bansal A, Ailawadi P. Future therapies in melasma: What lies ahead? Indian J Dermatol Venereol Leprol. 2020;86: 8-17. 7. Lee BW, Schwartz RA, Janniger CK. Melasma. J Ital Dermatol Venereol. 2017;152(1):36-45.8. Zubair R, Lyons AB, Vellaichamy G, Peacock A, Hamzavi I. What’s New in Pigmentary Disorders? Dermatol Clin. 2019;37(2): 175-181. 9. Kwon SH, Na JI, Choi JY, Park KC. Melasma: Updates and perspectives. Exp Dermatol. 2019;28(6):704-708. 10. Chan IL, Cohen S, da Cunha MG, Maluf LC. Characteristics and management of Asian skin. Int J Dermatol. 2019;58(2):131- 143. 11. Bagherani N, Gianfaldoni S, Smoller BR. An overview on melasma. J Pigment Disord. 2015;2(10):218. 12. Abdalla MA, Nayaf MS. Evaluation of serum α-MSH Level in Melasma. WJPMR 2018;4(5):29-32.13. Roberts WE, Henry M, Burgess C, Saedi N, Chilukuri S, Campbell- Chambers DA. Laser Treatment of Skin of Color for Medical and Aesthetic Uses With a New 650-Microsecond Nd:YAG 1064nm Laser. J Drugs Dermatol. 2019;18(4):s135-137.14. Abdalla MA, Nayaf MS, Hussein SZ. Evaluation of Vitamin D in Melasma Patients. Rev Romana Med Lab. 2019;27(2):219- 21. 15. Passeron T, Genedy R, Salah L, Fusade T, Kositratna G, Laubach HJ, Marini L, Badawi A. Laser treatment of hyperpigmented lesions: position statement of the European Society of Laser in Dermatology. J Eur Acad Dermatol Venereol. 2019;33(6):987- 1005. 16. Leelaudomlipi P. Melasma. Siriraj Med J. 2007;59(1):24-5. 17. Leeyaphan C. Wood’s Lamp Examination: Evaluation of Basic Knowledge in General Physicians. Siriraj Med J. 2016;68(2):79- 83.18. Sarkar R, Ghunawat S, Narang I, Verma S, Garg VK, Dua R. Role of broad-spectrum sunscreen alone in the improvement of melasma area severity index (MASI) and Melasma Quality of Life Index in melasma. J Cosmet Dermatol. 2019;18(4):1066- 1073. 19. Rodrigues M, Ayala-Cortes AS, Rodriguez-Arambula A, Hynan LS, Pandya AG. Interpretability of the modified melasma area and severity index (mMASI) JAMA Dermatol. 2016;152(9):1051- 1052.20. Handa S, De D, Khullar G, Radotra B, Sachdeva N. The clinicoaetiological, hormonal and histopathological characteristics of melasma in men. Clin Exp Dermatol. 2018;43(1):36-41.21. Chinhiran K, Leeyaphan C. Posaconazole Induced Diffuse Lentigines: A Case Report. Siriraj Med J. 2018;70(2):182-3.22. Plensdorf S, Livieratos M, Dada N. Pigmentation Disorders: Diagnosis and Management. Am Fam Physician. 2017;96(12):797- 804.23. Moin A, Jabery Z, Fallah N. Prevalence and awareness of melasma during pregnancy. Int J Dermatol. 2006;45:285-288.24. Phophong P, Choavaratana R, Suppinyopong S, Loakirkkiat P, Karavakul C. Comparison of Human Menopausal Gonadotrophin
Abdalla.
Volume 73, No.12: 2021 Siriraj Medical Journalhttps://he02.tci-thaijo.org/index.php/sirirajmedj/index 849
Review Article SMJ and Recombinant Follicle-Stimulating Hormone in In-Vitro Fertilisation and Pregnancy Outcome. Siriraj Med J. 2020;53(11): 805-10.25. Lee AY. An updated review of melasma pathogenesis. Dermatologica Sinica. 2014;32(4):233-239.26. Lee AY. Recent progress in melasma pathogenesis. Pigment Cell Melanoma Res. 2015;28(6):648-660.27. Kang HY, Hwang JS, Lee JY, Ahn JH, Kim JY, Lee ES, et al. The dermal stem cell factor and c-kit are overexpressed in melasma. Br J Dermatol. 2005;154:1094-1099.28. Çakmak SK, Özcan N, Kiliç A, Koparal S, Artüz F, Çakmak A, et al. Etiopathogenetic factors, thyroid functions and thyroid autoimmunity in melasma patients. Postepy Dermatol Alergol. 2015;32:327-330.29. Handel AC, Miot LD, Miot HA. Melasma: a clinical and epidemiological review. An Bras Dermatol. 2014;89(5):771- 782.30. Serban ED, Farnetani F, Pellacani G, Constantin MM. Role of In Vivo Reflectance Confocal Microscopy in the Analysis of Melanocytic Lesions. Acta Dermatovenerol Croat. 2018;26(1): 64-67. 31. Agozzino M, Ferrari A, Cota C, Franceschini C, Buccini P, Eibenshutz L, Ardigò M. Reflectance confocal microscopy analysis of equivocal melanocytic lesions with severe regression. Skin Res Technol. 2018;24(1):9-15.32. Thangboonjit W, Limsaeng-u-rai S, Pluemsamran T, Panich U. Comparative Evaluation of Antityrosinase and Antioxidant Activities of Dietary Phenolics and their Activities in Melanoma Cells Exposed to UVA. Siriraj Med J. 2014;66(1):5-10.33. Noh S, Choi H, Kim JS, Kim IH, Mun JY. Study of hyperpigmentation in human skin disorder using different electron microscopy techniques. Microsc Res Tech. 2019;82(1):18-24. 34. El-Sinbawy ZG, Abdelnabi NM, Sarhan NE, Elgarhy LH. Clinical & ultrastructural evaluation of the effect of fractional CO2 laser on facial melasma. Ultrastruct Pathol. 2019;43(4-5): 135-144.35. Viac J, Palacio S, Schmitt D, Claudy A. Expression of vascular endothelial growth factor in normal epidermis, epithelial tumors and cultured keratinocytes. Arch Dermatol Res. 1997;289(3):158- 163. 36. Rahmatullah WS, Al-Obaidi MT, AL-Saadi WI, Selman MO, Faisal GG. Role of Vascular Endothelial Growth Factor (VEGF) and Doppler Sub-endometrial Parameters as Predictors of Successful Implantation in Intracytoplasmic Sperm Injection (ICSI) Patients. Siriraj Med J. 2020;72:33-40.37. Grimes PE, Yamada N, Bhawan J. Light microscopic, immunohistochemical and ultrastructural alterations in patients with melasma. A J Dermatopathol. 2005;27(2):96-101.38. Yan QU, Wang F, Junru L, Xia X. Clinical observation and dermoscopy evaluation of fractional CO2 laser combined with topical tranexamic acid in melasma treatments. J Cosmet Dermat. 2021;20(4):1110-1116.39. Sarkar R, Ailawadi P, Garg S. Melasma in men: A review of clinical, etiological, and management issues. J Clin Aesthet Dermatol. 2018;11(2):53-59.40. Hexsel D, Lacerda DA, Cavalcante AS, Machado Filho CA, Kalil CL, Ayres EL, et al. Epidemiology of melasma in Brazilian patients: a multicenter study. Int J Dermatol. 2014;53:440-444.41. Kim HJ, Moon SH, Cho SH, Lee JD, Sung Kim H. Efficacy and safety of Tranexamic acid in melasma: a meta-analysis and
systematic review. Acta Derm Venereol. 2017; 97(6-7):776-781.42. Handel AC, Lima PB, Tonolli VM, Miot LD, Miot HA. Risk factors for facial melasma in women: A case-control study. Br J Dermatol. 2014;171:588-594.43. Nayaf MS, Ahmed AA, Abdalla MA. Alopecia Areata and Serum Vitamin D in Iraqi Patients: A Case-Control Study. Prensa Med Argent. 2020;106(3):287.44. Gopichandani K, Arora P, Garga U, Bhardwaj M, Sharma N, Gautam RK. Hormonal profile of melasma in Indian females. Pigment Int. 2015;2:85-90. 45. Duteil L, Esdaile J, Maubert Y, Cathelineau AC, Bouloc A, Queille-Roussel C, et al. A method to assess the protective efficacy of sunscreens against visible light-induced pigmentation. Photodermatol Photoimmunol Photomed. 2017;33(5):260-266.46. Ching D, Amini E, Harvey NT, Wood BA, Mesbah Ardakani N. Cutaneous tumoural melanosis: a presentation of complete regression of cutaneous melanoma. Pathology. 2019;51(4):399- 404. 47. Abdalla MA, Nayaf MS, Hussein SZ. Correlation between serum α-MSH and vitamin D levels in vitiligo patients. Iran J Dermatology. 2020;23(4):163-167.48. Ortonne JP, Arellano I, Berneburg M, Cestari T, Chan H, Grimes P, et al. A global survey of the role of ultraviolet radiation and hormonal influences in the development of melasma. J Eur Acad Dermatol Venereol. 2009;23:1254-1262.49. Goh CL, Chuah SY, Tien S, Thng G, Vitale MA, Delgado-Rubin A. Double-blind, placebo-controlled trial to evaluate the effectiveness of Polypodium leucotomos extract in the treatment of melasma in Asian skin: A pilot study. J Clin Aesthet Dermatol. 2018;11(3):14-19.50. Tamega Ade A, Miot HA, Moco NP, Silva MG, Marques ME, Miot LD. Gene and protein expression of oestrogen-beta and progesterone receptors in facial melasma and adjacent healthy skin in women. Int J Cosmet Sci. 2015;37(2):222-228. 51. Niwano T, Terazawa S, Sato Y, Kato T, Nakajima H, Imokawa G. Glucosamine abrogates the stem cell factor + endothelin- 1-induced stimulation of melanogenesis via a deficiency in MITF expression due to the proteolytic degradation of CREB in human melanocytes. Arch Dermatol Res. 2018;310:625-637.52. Vâradi J, Harazin A, Fenyvesi F, Reti-Nagy K, Gogolâk P, Vâmosi G, et al. Alpha- Melanocyte Stimulating Hormone Protects against Cytokine-Induced Barrier Damage in Caco-2 Intestinal Epithelial Monolayers. PLOS ONE. 2017;12(1):e0170537.53. Fearce CT, Swope V, Abdel-Malek Z. The Use of Analogs of α-MSH as Tanning Agents for the Prevention of Melanoma. FASEB J. 2016;30(1):1500-1509.54. Saleh AA, Salam OHA, Metwally GH, Abdelsalam HA, Hassan MA. Comparison Treatment of Vitiligo by Co-culture of Melanocytes Derived from Hair Follicle with Adipose-Derived Stem Cells with and without NB-UVB. Pigmentary Disorders. 2017;4:256.55. Sarma N, Chakraborty S, Poojary SA, Rathi S, Kumaran S, Nirmal B, et al. Evidence-based review, grade of recommendation, and suggested treatment recommendations for melasma. Indian Dermatol Online J. 2017;8(6):406-442.56. Passeron T, Picardo M. Melasma, a photoaging disorder. Pigment Cell Melanoma Res. 2018;1-5.57. Kim SW, Yoon HS. Tamoxifen-induced melasma in a postmenopausal woman. J Eur Acad Dermatol Venereol. 2009;23:1199-1200.

Volume 73, No.12: 2021 Siriraj Medical Journal https://he02.tci-thaijo.org/index.php/sirirajmedj/index850
58. Rija FF, Hussein SZ, Abdalla MA. Physiological and Immunological Disturbance in Rheumatoid Arthritis Patients. Baghdad Sci J. 2021;18(2):247-252. doi: 10.21123/bsj.2021.18.2.0247 59. Abdalla MA. Pneumatization patterns of human sphenoid sinus associated with the internal carotid artery and optic nerve by CT scan. Ro J Neurol. 2020;19(4):244-251. doi: 10.37897/RJN.2020.4.5.60. Prabha N, Mahajan VK, Mehta KS, Chauhan PS, Gupta
M. Cosmetic Contact Sensitivity in Patients with Melasma: Results of a Pilot Study. Dermatology Research and Practice. 2014; 316219: 9. 61. Abdalla MA. The prevalence of pyramidal lobe of the thyroid gland among Iraqi Society. Tikrit Med J. 2016;21(1):135-140. 62. Poisson L. Chloasma in a man with total hypogonadism. Bull Soc Fr Dermatol Syphiligr. 1957;64:777-778.
Abdalla.