Embed Size (px)
Citation preview
June 2014
Statistical Supplement 5to the Monthly Report
Exchange rate statistics
Deutsche Bundesbank
Wilhelm-Epstein-Strasse 14
60431 Frankfurt am Main
Germany
Postal address
Postfach 10 06 02
60006 Frankfurt am Main
Germany
Tel +49 69 9566-0
or +49 69 9566 8604
Fax +49 69 9566 8606 or 3077
http://www.bundesbank.de
Reproduction permitted only if source is stated.
The German-language version of the Statis tical Supple-
ment Exchange rate statistics is published quarterly in
printed form. The Deutsche Bundesbank also publishes an
updated monthly edition in German and in English on its
website. In cases of doubt, the original German-language
version is the sole authoritative text.
ISSN 2190–8990 (online edition)
Cut-off date: 10 June 2014.
Deutsche Bundesbank
Exchange rate statistics
June 2014
2
The Statistical Supplement Exchange rate statistics is
published by the Deutsche Bundes bank, Frankfurt am
Main, by virtue of section 18 of the Bundesbank Act.
It is available to interested parties free of charge.
Further statistical data, supplementing the Monthly Report,
can be found in the follow ing supplements.
Banking statistics monthly
Capital market statistics monthly
Balance of payments statistics monthly
Seasonally adjusted
business statistics monthly
Selected updated statistics are also available on the website.
Additionally, a CD-ROM containing roughly 40,000 pub-
lished Bundesbank time series, which is updated monthly,
may be obtained for a fee from the Bundesbank‘s Statistical
Information Management and Mathematical Methods
Division or downloaded from the Bundesbank‘s ExtraNet
platform.
Contents
IEuroareaandexchangeratestabilityconvergencecriterion
1 Euro-area member states and irrevoc able euro conversion rates in the third stage of European Economic
and Monetary Union . . . . . . . . . . . . . . . . . . . . . . . . . . . . . . . . . . . . . . . . . . . . . . . . . . . . . . . . . . . . . . . . . . 7
2 Central rates and intervention rates in Exchange Rate Mechanism II . . . . . . . . . . . . . . . . . . . . . . . . . . . . . . . 7
IIEuroforeignexchangereferenceratesoftheEuropeanCentralBank
1 Daily rates . . . . . . . . . . . . . . . . . . . . . . . . . . . . . . . . . . . . . . . . . . . . . . . . . . . . . . . . . . . . . . . . . . . . . . . . . . 8
2 Monthly averages . . . . . . . . . . . . . . . . . . . . . . . . . . . . . . . . . . . . . . . . . . . . . . . . . . . . . . . . . . . . . . . . . . . . . 12
3 End-of-year rates and annual averages . . . . . . . . . . . . . . . . . . . . . . . . . . . . . . . . . . . . . . . . . . . . . . . . . . . . . 15
4 Exchange rates of major currencies (chart) . . . . . . . . . . . . . . . . . . . . . . . . . . . . . . . . . . . . . . . . . . . . . . . . . . 17
IIIEffectiveexchangeratesoftheeuro
1 Annual and monthly averages . . . . . . . . . . . . . . . . . . . . . . . . . . . . . . . . . . . . . . . . . . . . . . . . . . . . . . . . . . . . 18
2 Nominal and real effective exchange rates based on consumer price indices (chart) . . . . . . . . . . . . . . . . . . . . 19
IVOverviewofworldcurrencies
1 Currencies and exchange rates in individual countries . . . . . . . . . . . . . . . . . . . . . . . . . . . . . . . . . . . . . . . . . . 20
2 Currencies in selected territories and states in which the currency of another country is legal tender . . . . . . . 43
VValueofthespecialdrawingrightinselectedcurrencies
1 End of year . . . . . . . . . . . . . . . . . . . . . . . . . . . . . . . . . . . . . . . . . . . . . . . . . . . . . . . . . . . . . . . . . . . . . . . . . . 44
2 End of month . . . . . . . . . . . . . . . . . . . . . . . . . . . . . . . . . . . . . . . . . . . . . . . . . . . . . . . . . . . . . . . . . . . . . . . . 44
3 Daily rates . . . . . . . . . . . . . . . . . . . . . . . . . . . . . . . . . . . . . . . . . . . . . . . . . . . . . . . . . . . . . . . . . . . . . . . . . . . 45
VIGlobalexchangeratearrangementsandmonetarypolicyframework . . . . . . . . . . . . . . . . . . . . . . . . . . . . . . . . . . . . . . . . . . . . . 46
VIIISOcurrencycodes . . . . . . . . . . . . . . . . . . . . . . . . . . . . . . . . . . . . . . . . . . . . . . . . . . . . . . . . 48
ExcerptsfromofficialnotificationsandannouncementsontheeuroandExchangeRateMechanismII . . . . . . . . . . . . . . . . . . . . . . . . . . 51
Deutsche Bundesbank
Exchange rate statistics
June 2014
3
Explanatorynotes
Euro foreign exchange reference rates of the European Central Bank . . . . . . . . . . . . . . . . . . . . . . . . . . . . . . . . . . 59
Effective exchange rates of the euro . . . . . . . . . . . . . . . . . . . . . . . . . . . . . . . . . . . . . . . . . . . . . . . . . . . . . . . . . . . 59
Indicators of the German economy’s price competitiveness . . . . . . . . . . . . . . . . . . . . . . . . . . . . . . . . . . . . . . . . . . 59
Overview of world currencies . . . . . . . . . . . . . . . . . . . . . . . . . . . . . . . . . . . . . . . . . . . . . . . . . . . . . . . . . . . . . . . . 59
Value of the special drawing right . . . . . . . . . . . . . . . . . . . . . . . . . . . . . . . . . . . . . . . . . . . . . . . . . . . . . . . . . . . . . 61
Global exchange rate arrangements and monetary policy framework . . . . . . . . . . . . . . . . . . . . . . . . . . . . . . . . . . 62
Explanatorynotesonindividualcountries . . . . . . . . . . . . . . . . . . . . . . . . . . . . . . . 63
Deutsche Bundesbank
Exchange rate statistics
June 2014
4
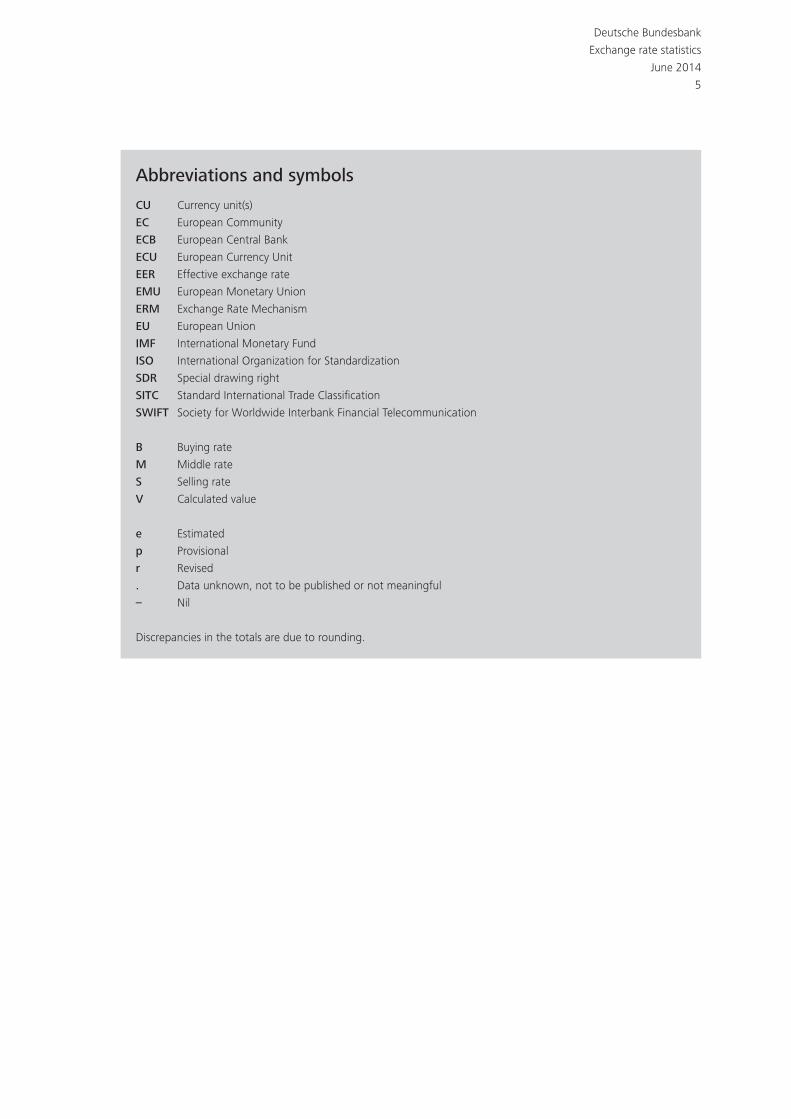
Abbreviationsandsymbols
CU Currency unit(s)
EC European Community
ECB European Central Bank
ECU European Currency Unit
EER Effective exchange rate
EMU European Monetary Union
ERM Exchange Rate Mechanism
EU European Union
IMF International Monetary Fund
ISO International Organization for Standardization
SDR Special drawing right
SITC Standard International Trade Classification
SWIFT Society for Worldwide Interbank Financial Telecommunication
B Buying rate
M Middle rate
S Selling rate
V Calculated value
e Estimated
p Provisional
r Revised
. Data unknown, not to be published or not meaningful
– Nil
Discrepancies in the totals are due to rounding.
Deutsche Bundesbank
Exchange rate statistics
June 2014
5

Deutsche Bundesbank
Exchange rate statistics
June 2014
6
Deutsche Bundesbank
7
Exchange rate statistics
June 2014
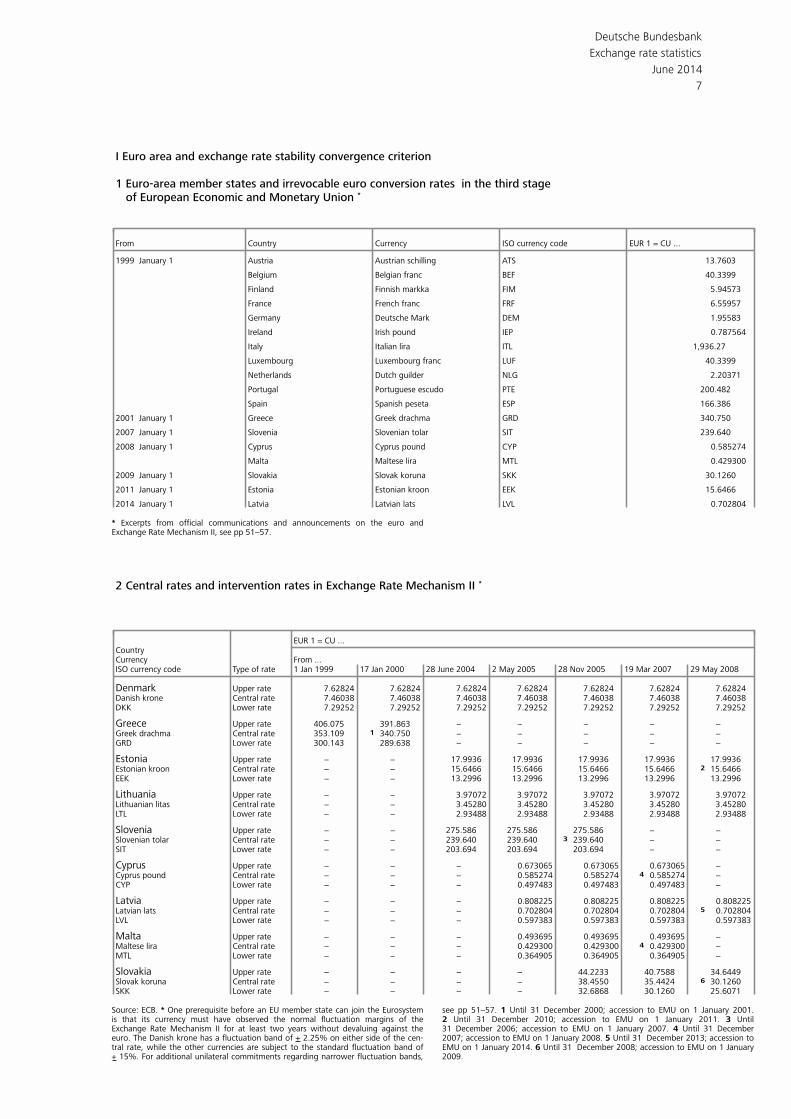
I Euro area and exchange rate stability convergence criterion
1 Euro-area member states and irrevocable euro conversion rates in the third stageof European Economic and Monetary Union *
From Country Currency ISO currency code EUR 1 = CU ...
1999 January 1 Austria Austrian schilling ATS 13.7603
Belgium Belgian franc BEF 40.3399
Finland Finnish markka FIM 5.94573
France French franc FRF 6.55957
Germany Deutsche Mark DEM 1.95583
Ireland Irish pound IEP 0.787564
Italy Italian lira ITL 1,936.27
Luxembourg Luxembourg franc LUF 40.3399
Netherlands Dutch guilder NLG 2.20371
Portugal Portuguese escudo PTE 200.482
Spain Spanish peseta ESP 166.386
2001 January 1 Greece Greek drachma GRD 340.750
2007 January 1 Slovenia Slovenian tolar SIT 239.640
2008 January 1 Cyprus Cyprus pound CYP 0.585274
Malta Maltese lira MTL 0.429300
2009 January 1 Slovakia Slovak koruna SKK 30.1260
2011 January 1 Estonia Estonian kroon EEK 15.6466
2014 January 1 Latvia Latvian lats LVL 0.702804
* Excerpts from official communications and announcements on the euro and Exchange Rate Mechanism II, see pp 51−57.
2 Central rates and intervention rates in Exchange Rate Mechanism II *
EUR 1 = CU ...CountryCurrency From ...ISO currency code 1 Jan 1999 17 Jan 2000 28 June 2004 2 May 2005 28 Nov 2005 19 Mar 2007 29 May 2008Type of rate
Denmark Upper rate 7.62824 7.62824 7.62824 7.62824 7.62824 7.62824 7.62824Danish krone 7.46038 7.46038 7.46038 7.46038 7.46038 7.46038 7.46038Central rateDKK Lower rate 7.29252 7.29252 7.29252 7.29252 7.29252 7.29252 7.29252
Greece Upper rate 406.075 391.863 − − − − −Greek drachma 353.109 340.750 − − − − −Central rate 1 GRD Lower rate 300.143 289.638 − − − − −
Estonia Upper rate − − 17.9936 17.9936 17.9936 17.9936 17.9936Estonian kroon − − 15.6466 15.6466 15.6466 15.6466 15.6466Central rate 2 EEK Lower rate − − 13.2996 13.2996 13.2996 13.2996 13.2996
Lithuania Upper rate − − 3.97072 3.97072 3.97072 3.97072 3.97072Lithuanian litas − − 3.45280 3.45280 3.45280 3.45280 3.45280Central rateLTL Lower rate − − 2.93488 2.93488 2.93488 2.93488 2.93488
Slovenia Upper rate − − 275.586 275.586 275.586 − −Slovenian tolar − − 239.640 239.640 239.640 − −Central rate 3 SIT Lower rate − − 203.694 203.694 203.694 − −
Cyprus Upper rate − − − 0.673065 0.673065 0.673065 −Cyprus pound − − − 0.585274 0.585274 0.585274 −Central rate 4 CYP Lower rate − − − 0.497483 0.497483 0.497483 −
Latvia Upper rate − − − 0.808225 0.808225 0.808225 0.808225Latvian lats − − − 0.702804 0.702804 0.702804 0.702804Central rate 5 LVL Lower rate − − − 0.597383 0.597383 0.597383 0.597383
Malta Upper rate − − − 0.493695 0.493695 0.493695 −Maltese lira − − − 0.429300 0.429300 0.429300 −Central rate 4 MTL Lower rate − − − 0.364905 0.364905 0.364905 −
Slovakia Upper rate − − − − 44.2233 40.7588 34.6449Slovak koruna − − − − 38.4550 35.4424 30.1260Central rate 6 SKK Lower rate − − − − 32.6868 30.1260 25.6071
Source: ECB. * One prerequisite before an EU member state can join the Eurosystem see pp 51−57. 1 Until 31 December 2000; accession to EMU on 1 January 2001.is that its currency must have observed the normal fluctuation margins of the 2 Until 31 December 2010; accession to EMU on 1 January 2011. 3 UntilExchange Rate Mechanism II for at least two years without devaluing against the 31 December 2006; accession to EMU on 1 January 2007. 4 Until 31 Decembereuro. The Danish krone has a fluctuation band of + 2.25% on either side of the cen- 2007; accession to EMU on 1 January 2008. 5 Until 31 December 2013; accession totral rate, while the other currencies are subject to the standard fluctuation band of EMU on 1 January 2014. 6 Until 31 December 2008; accession to EMU on 1 January+ 15%. For additional unilateral commitments regarding narrower fluctuation bands, 2009.
Deutsche Bundesbank
8
Exchange rate statistics
June 2014
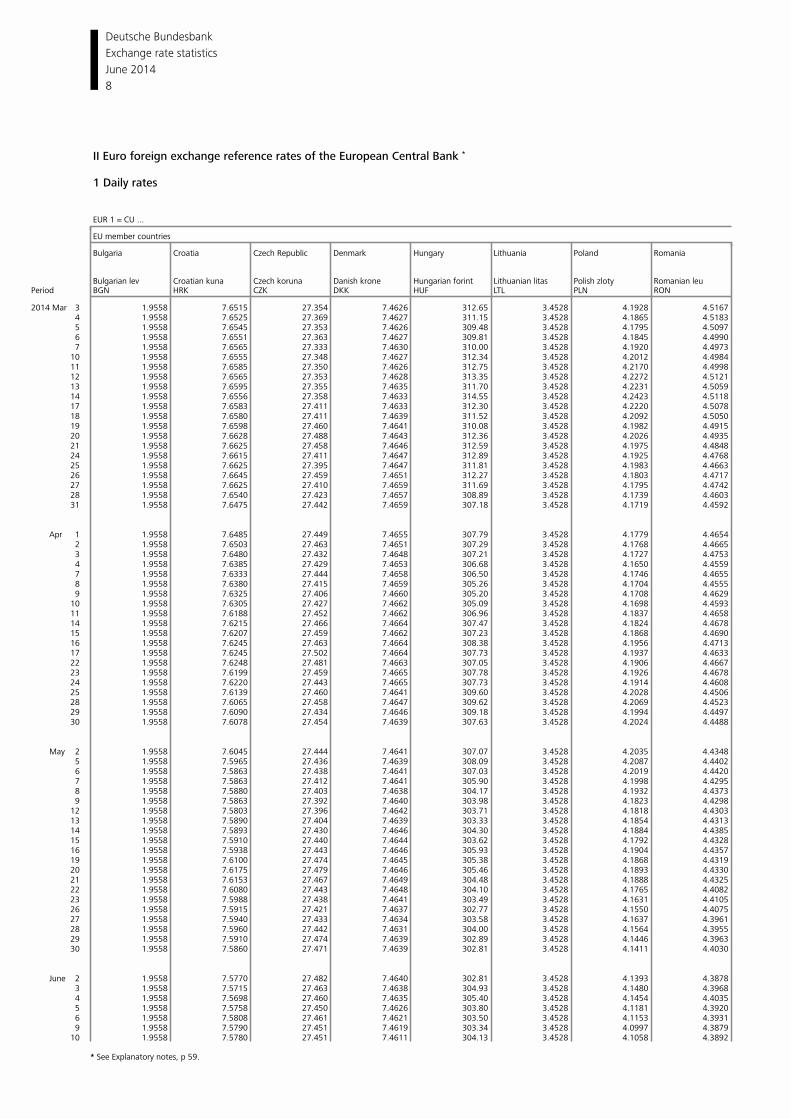
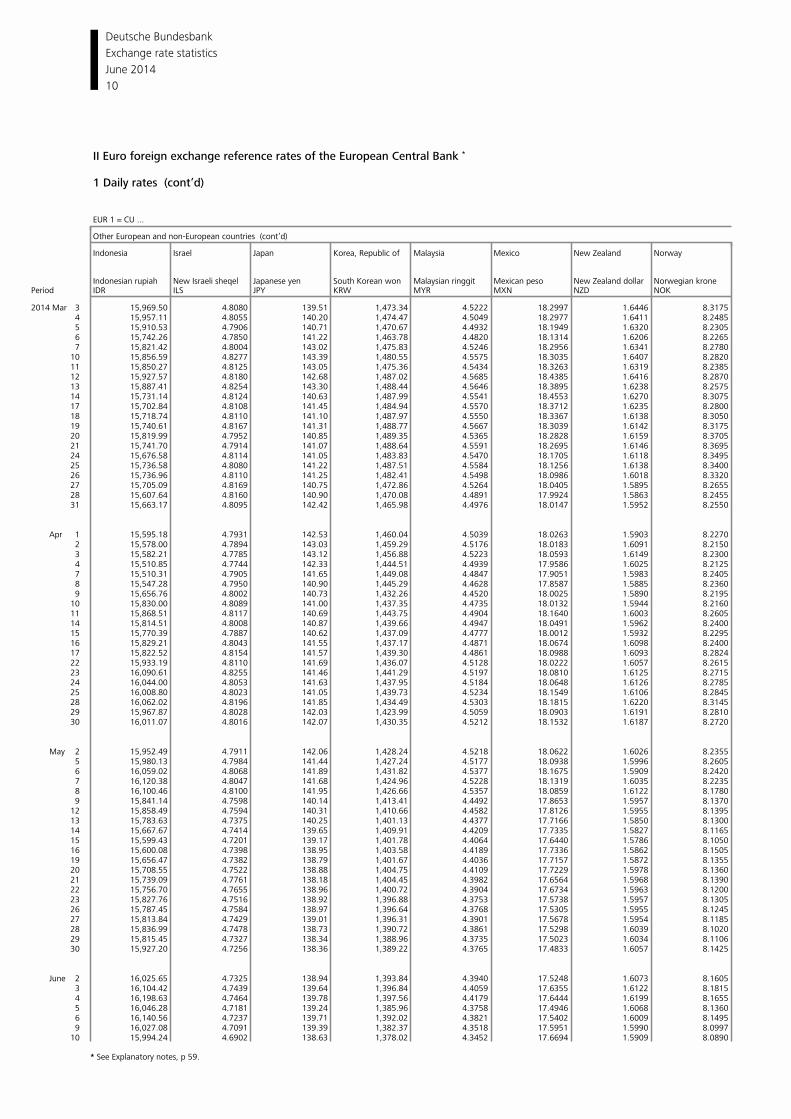
II Euro foreign exchange reference rates of the European Central Bank *
1 Daily rates
EUR 1 = CU ...
EU member countries
Bulgaria Croatia Czech Republic Denmark Hungary Lithuania Poland Romania
Bulgarian lev Croatian kuna Czech koruna Danish krone Hungarian forint Lithuanian litas Polish zloty Romanian leuPeriod BGN HRK CZK DKK HUF LTL PLN RON
2014 Mar 3 1.9558 7.6515 27.354 7.4626 312.65 3.4528 4.1928 4.5167 4 1.9558 7.6525 27.369 7.4627 311.15 3.4528 4.1865 4.5183 5 1.9558 7.6545 27.353 7.4626 309.48 3.4528 4.1795 4.5097 6 1.9558 7.6551 27.363 7.4627 309.81 3.4528 4.1845 4.4990 7 1.9558 7.6565 27.333 7.4630 310.00 3.4528 4.1920 4.4973 10 1.9558 7.6555 27.348 7.4627 312.34 3.4528 4.2012 4.4984 11 1.9558 7.6585 27.350 7.4626 312.75 3.4528 4.2170 4.4998 12 1.9558 7.6565 27.353 7.4628 313.35 3.4528 4.2272 4.5121 13 1.9558 7.6595 27.355 7.4635 311.70 3.4528 4.2231 4.5059 14 1.9558 7.6556 27.358 7.4633 314.55 3.4528 4.2423 4.5118 17 1.9558 7.6583 27.411 7.4633 312.30 3.4528 4.2220 4.5078 18 1.9558 7.6580 27.411 7.4639 311.52 3.4528 4.2092 4.5050 19 1.9558 7.6598 27.460 7.4641 310.08 3.4528 4.1982 4.4915 20 1.9558 7.6628 27.488 7.4643 312.36 3.4528 4.2026 4.4935 21 1.9558 7.6625 27.458 7.4646 312.59 3.4528 4.1975 4.4848 24 1.9558 7.6615 27.411 7.4647 312.89 3.4528 4.1925 4.4768 25 1.9558 7.6625 27.395 7.4647 311.81 3.4528 4.1983 4.4663 26 1.9558 7.6645 27.459 7.4651 312.27 3.4528 4.1803 4.4717 27 1.9558 7.6625 27.410 7.4659 311.69 3.4528 4.1795 4.4742 28 1.9558 7.6540 27.423 7.4657 308.89 3.4528 4.1739 4.4603 31 1.9558 7.6475 27.442 7.4659 307.18 3.4528 4.1719 4.4592
Apr 1 1.9558 7.6485 27.449 7.4655 307.79 3.4528 4.1779 4.4654 2 1.9558 7.6503 27.463 7.4651 307.29 3.4528 4.1768 4.4665 3 1.9558 7.6480 27.432 7.4648 307.21 3.4528 4.1727 4.4753 4 1.9558 7.6385 27.429 7.4653 306.68 3.4528 4.1650 4.4559 7 1.9558 7.6333 27.444 7.4658 306.50 3.4528 4.1746 4.4655 8 1.9558 7.6380 27.415 7.4659 305.26 3.4528 4.1704 4.4555 9 1.9558 7.6325 27.406 7.4660 305.20 3.4528 4.1708 4.4629 10 1.9558 7.6305 27.427 7.4662 305.09 3.4528 4.1698 4.4593 11 1.9558 7.6188 27.452 7.4662 306.96 3.4528 4.1837 4.4658 14 1.9558 7.6215 27.466 7.4664 307.47 3.4528 4.1824 4.4678 15 1.9558 7.6207 27.459 7.4662 307.23 3.4528 4.1868 4.4690 16 1.9558 7.6245 27.463 7.4664 308.38 3.4528 4.1956 4.4713 17 1.9558 7.6245 27.502 7.4664 307.73 3.4528 4.1937 4.4633 22 1.9558 7.6248 27.481 7.4663 307.05 3.4528 4.1906 4.4667 23 1.9558 7.6199 27.459 7.4665 307.78 3.4528 4.1926 4.4678 24 1.9558 7.6220 27.443 7.4665 307.73 3.4528 4.1914 4.4608 25 1.9558 7.6139 27.460 7.4641 309.60 3.4528 4.2028 4.4506 28 1.9558 7.6065 27.458 7.4647 309.62 3.4528 4.2069 4.4523 29 1.9558 7.6090 27.434 7.4646 309.18 3.4528 4.1994 4.4497 30 1.9558 7.6078 27.454 7.4639 307.63 3.4528 4.2024 4.4488
May 2 1.9558 7.6045 27.444 7.4641 307.07 3.4528 4.2035 4.4348 5 1.9558 7.5965 27.436 7.4639 308.09 3.4528 4.2087 4.4402 6 1.9558 7.5863 27.438 7.4641 307.03 3.4528 4.2019 4.4420 7 1.9558 7.5863 27.412 7.4641 305.90 3.4528 4.1998 4.4295 8 1.9558 7.5880 27.403 7.4638 304.17 3.4528 4.1932 4.4373 9 1.9558 7.5863 27.392 7.4640 303.98 3.4528 4.1823 4.4298 12 1.9558 7.5803 27.396 7.4642 303.71 3.4528 4.1818 4.4303 13 1.9558 7.5890 27.404 7.4639 303.33 3.4528 4.1854 4.4313 14 1.9558 7.5893 27.430 7.4646 304.30 3.4528 4.1884 4.4385 15 1.9558 7.5910 27.440 7.4644 303.62 3.4528 4.1792 4.4328 16 1.9558 7.5938 27.443 7.4646 305.93 3.4528 4.1904 4.4357 19 1.9558 7.6100 27.474 7.4645 305.38 3.4528 4.1868 4.4319 20 1.9558 7.6175 27.479 7.4646 305.46 3.4528 4.1893 4.4330 21 1.9558 7.6153 27.467 7.4649 304.48 3.4528 4.1888 4.4325 22 1.9558 7.6080 27.443 7.4648 304.10 3.4528 4.1765 4.4082 23 1.9558 7.5988 27.438 7.4641 303.49 3.4528 4.1631 4.4105 26 1.9558 7.5915 27.421 7.4637 302.77 3.4528 4.1550 4.4075 27 1.9558 7.5940 27.433 7.4634 303.58 3.4528 4.1637 4.3961 28 1.9558 7.5960 27.442 7.4631 304.00 3.4528 4.1564 4.3955 29 1.9558 7.5910 27.474 7.4639 302.89 3.4528 4.1446 4.3963 30 1.9558 7.5860 27.471 7.4639 302.81 3.4528 4.1411 4.4030
June 2 1.9558 7.5770 27.482 7.4640 302.81 3.4528 4.1393 4.3878 3 1.9558 7.5715 27.463 7.4638 304.93 3.4528 4.1480 4.3968 4 1.9558 7.5698 27.460 7.4635 305.40 3.4528 4.1454 4.4035 5 1.9558 7.5758 27.450 7.4626 303.80 3.4528 4.1181 4.3920 6 1.9558 7.5808 27.461 7.4621 303.50 3.4528 4.1153 4.3931 9 1.9558 7.5790 27.451 7.4619 303.34 3.4528 4.0997 4.3879 10 1.9558 7.5780 27.451 7.4611 304.13 3.4528 4.1058 4.3892
* See Explanatory notes, p 59.
Deutsche Bundesbank
9
Exchange rate statistics
June 2014
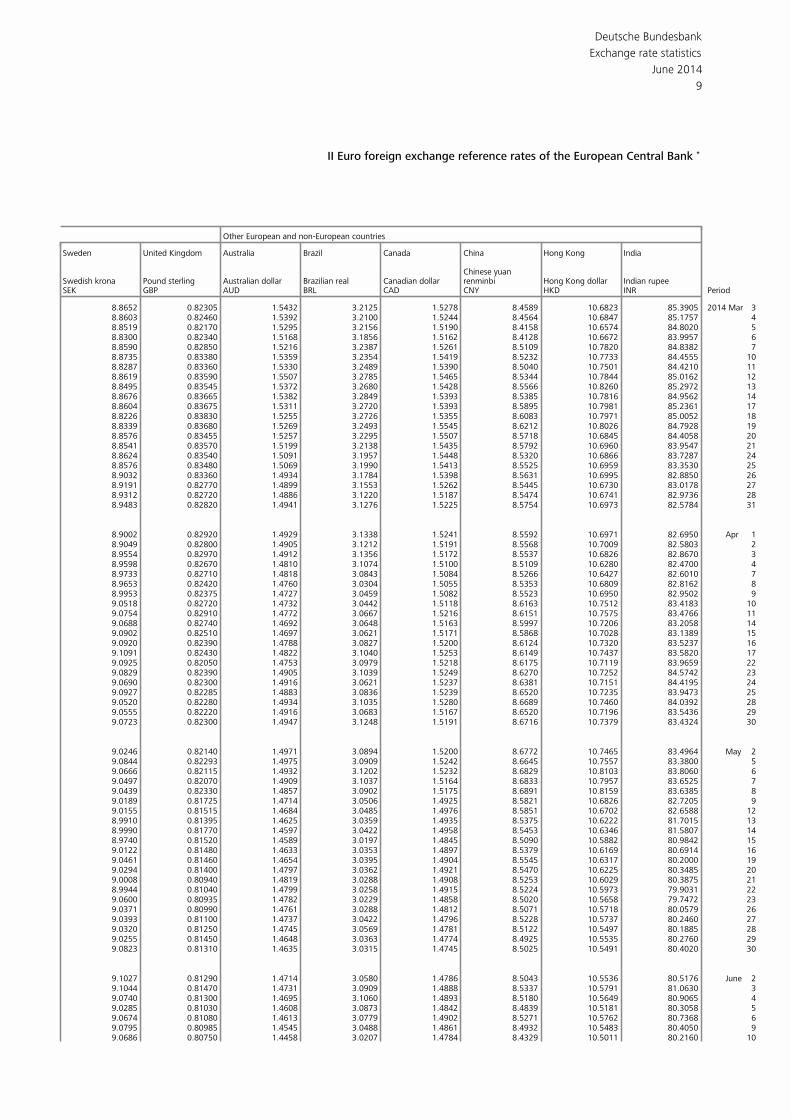
II Euro foreign exchange reference rates of the European Central Bank *
Other European and non-European countries
Sweden United Kingdom Australia Brazil Canada China Hong Kong India
Chinese yuanSwedish krona Pound sterling Australian dollar Brazilian real Canadian dollar renminbi Hong Kong dollar Indian rupeeSEK GBP AUD BRL CAD CNY HKD INR Period
8.8652 0.82305 1.5432 3.2125 1.5278 8.4589 10.6823 85.3905 2014 Mar 38.8603 0.82460 1.5392 3.2100 1.5244 8.4564 10.6847 85.1757 48.8519 0.82170 1.5295 3.2156 1.5190 8.4158 10.6574 84.8020 58.8300 0.82340 1.5168 3.1856 1.5162 8.4128 10.6672 83.9957 68.8590 0.82850 1.5216 3.2387 1.5261 8.5109 10.7820 84.8382 78.8735 0.83380 1.5359 3.2354 1.5419 8.5232 10.7733 84.4555 108.8287 0.83360 1.5330 3.2489 1.5390 8.5040 10.7501 84.4210 118.8619 0.83590 1.5507 3.2785 1.5465 8.5344 10.7844 85.0162 128.8495 0.83545 1.5372 3.2680 1.5428 8.5566 10.8260 85.2972 138.8676 0.83665 1.5382 3.2849 1.5393 8.5385 10.7816 84.9562 148.8604 0.83675 1.5311 3.2720 1.5393 8.5895 10.7981 85.2361 178.8226 0.83830 1.5255 3.2726 1.5355 8.6083 10.7971 85.0052 188.8339 0.83680 1.5269 3.2493 1.5545 8.6212 10.8026 84.7928 198.8576 0.83455 1.5257 3.2295 1.5507 8.5718 10.6845 84.4058 208.8541 0.83570 1.5199 3.2138 1.5435 8.5792 10.6960 83.9547 218.8624 0.83540 1.5091 3.1957 1.5448 8.5320 10.6866 83.7287 248.8576 0.83480 1.5069 3.1990 1.5413 8.5525 10.6959 83.3530 258.9032 0.83360 1.4934 3.1784 1.5398 8.5631 10.6995 82.8850 268.9191 0.82770 1.4899 3.1553 1.5262 8.5445 10.6730 83.0178 278.9312 0.82720 1.4886 3.1220 1.5187 8.5474 10.6741 82.9736 288.9483 0.82820 1.4941 3.1276 1.5225 8.5754 10.6973 82.5784 31
8.9002 0.82920 1.4929 3.1338 1.5241 8.5592 10.6971 82.6950 Apr 18.9049 0.82800 1.4905 3.1212 1.5191 8.5568 10.7009 82.5803 28.9554 0.82970 1.4912 3.1356 1.5172 8.5537 10.6826 82.8670 38.9598 0.82670 1.4810 3.1074 1.5100 8.5109 10.6280 82.4700 48.9733 0.82710 1.4818 3.0843 1.5084 8.5266 10.6427 82.6010 78.9653 0.82420 1.4760 3.0304 1.5055 8.5353 10.6809 82.8162 88.9953 0.82375 1.4727 3.0459 1.5082 8.5523 10.6950 82.9502 99.0518 0.82720 1.4732 3.0442 1.5118 8.6163 10.7512 83.4183 109.0754 0.82910 1.4772 3.0667 1.5216 8.6151 10.7575 83.4766 119.0688 0.82740 1.4692 3.0648 1.5163 8.5997 10.7206 83.2058 149.0902 0.82510 1.4697 3.0621 1.5171 8.5868 10.7028 83.1389 159.0920 0.82390 1.4788 3.0827 1.5200 8.6124 10.7320 83.5237 169.1091 0.82430 1.4822 3.1040 1.5253 8.6149 10.7437 83.5820 179.0925 0.82050 1.4753 3.0979 1.5218 8.6175 10.7119 83.9659 229.0829 0.82390 1.4905 3.1039 1.5249 8.6270 10.7252 84.5742 239.0690 0.82300 1.4916 3.0621 1.5237 8.6381 10.7151 84.4195 249.0927 0.82285 1.4883 3.0836 1.5239 8.6520 10.7235 83.9473 259.0520 0.82280 1.4934 3.1035 1.5280 8.6689 10.7460 84.0392 289.0555 0.82220 1.4916 3.0683 1.5167 8.6520 10.7196 83.5436 299.0723 0.82300 1.4947 3.1248 1.5191 8.6716 10.7379 83.4324 30
9.0246 0.82140 1.4971 3.0894 1.5200 8.6772 10.7465 83.4964 May 29.0844 0.82293 1.4975 3.0909 1.5242 8.6645 10.7557 83.3800 59.0666 0.82115 1.4932 3.1202 1.5232 8.6829 10.8103 83.8060 69.0497 0.82070 1.4909 3.1037 1.5164 8.6833 10.7957 83.6525 79.0439 0.82330 1.4857 3.0902 1.5175 8.6891 10.8159 83.6385 89.0189 0.81725 1.4714 3.0506 1.4925 8.5821 10.6826 82.7205 99.0155 0.81515 1.4684 3.0485 1.4976 8.5851 10.6702 82.6588 128.9910 0.81395 1.4625 3.0359 1.4935 8.5375 10.6222 81.7015 138.9990 0.81770 1.4597 3.0422 1.4958 8.5453 10.6346 81.5807 148.9740 0.81520 1.4589 3.0197 1.4845 8.5090 10.5882 80.9842 159.0122 0.81480 1.4633 3.0353 1.4897 8.5379 10.6169 80.6914 169.0461 0.81460 1.4654 3.0395 1.4904 8.5545 10.6317 80.2000 199.0294 0.81400 1.4797 3.0362 1.4921 8.5470 10.6225 80.3485 209.0008 0.80940 1.4819 3.0288 1.4908 8.5253 10.6029 80.3875 218.9944 0.81040 1.4799 3.0258 1.4915 8.5224 10.5973 79.9031 229.0600 0.80935 1.4782 3.0229 1.4858 8.5020 10.5658 79.7472 239.0371 0.80990 1.4761 3.0288 1.4812 8.5071 10.5718 80.0579 269.0393 0.81100 1.4737 3.0422 1.4796 8.5228 10.5737 80.2460 279.0320 0.81250 1.4745 3.0569 1.4781 8.5122 10.5497 80.1885 289.0255 0.81450 1.4648 3.0363 1.4774 8.4925 10.5535 80.2760 299.0823 0.81310 1.4635 3.0315 1.4745 8.5025 10.5491 80.4020 30
9.1027 0.81290 1.4714 3.0580 1.4786 8.5043 10.5536 80.5176 June 29.1044 0.81470 1.4731 3.0909 1.4888 8.5337 10.5791 81.0630 39.0740 0.81300 1.4695 3.1060 1.4893 8.5180 10.5649 80.9065 49.0285 0.81030 1.4608 3.0873 1.4842 8.4839 10.5181 80.3058 59.0674 0.81080 1.4613 3.0779 1.4902 8.5271 10.5762 80.7368 69.0795 0.80985 1.4545 3.0488 1.4861 8.4932 10.5483 80.4050 99.0686 0.80750 1.4458 3.0207 1.4784 8.4329 10.5011 80.2160 10
Deutsche Bundesbank
10
Exchange rate statistics
June 2014
II Euro foreign exchange reference rates of the European Central Bank *
1 Daily rates (cont’d)
EUR 1 = CU ...
Other European and non-European countries (cont’d)
Indonesia Israel Japan Korea, Republic of Malaysia Mexico New Zealand Norway
Indonesian rupiah New Israeli sheqel Japanese yen South Korean won Malaysian ringgit Mexican peso New Zealand dollar Norwegian kronePeriod IDR ILS JPY KRW MYR MXN NZD NOK
2014 Mar 3 15,969.50 4.8080 139.51 1,473.34 4.5222 18.2997 1.6446 8.3175 4 15,957.11 4.8055 140.20 1,474.47 4.5049 18.2977 1.6411 8.2485 5 15,910.53 4.7906 140.71 1,470.67 4.4932 18.1949 1.6320 8.2305 6 15,742.26 4.7850 141.22 1,463.78 4.4820 18.1314 1.6206 8.2265 7 15,821.42 4.8004 143.02 1,475.83 4.5246 18.2956 1.6341 8.2780 10 15,856.59 4.8277 143.39 1,480.55 4.5575 18.3035 1.6407 8.2820 11 15,850.27 4.8125 143.05 1,475.36 4.5434 18.3263 1.6319 8.2385 12 15,927.57 4.8180 142.68 1,487.02 4.5685 18.4385 1.6416 8.2870 13 15,887.41 4.8254 143.30 1,488.44 4.5646 18.3895 1.6238 8.2575 14 15,731.14 4.8124 140.63 1,487.99 4.5541 18.4553 1.6270 8.3075 17 15,702.84 4.8108 141.45 1,484.94 4.5570 18.3712 1.6235 8.2800 18 15,718.74 4.8110 141.10 1,487.97 4.5550 18.3367 1.6138 8.3050 19 15,740.61 4.8167 141.31 1,488.77 4.5667 18.3039 1.6142 8.3175 20 15,819.99 4.7952 140.85 1,489.35 4.5365 18.2828 1.6159 8.3705 21 15,741.70 4.7914 141.07 1,488.64 4.5591 18.2695 1.6146 8.3695 24 15,676.58 4.8114 141.05 1,483.83 4.5470 18.1705 1.6118 8.3495 25 15,736.58 4.8080 141.22 1,487.51 4.5584 18.1256 1.6138 8.3400 26 15,736.96 4.8110 141.25 1,482.41 4.5498 18.0986 1.6018 8.3320 27 15,705.09 4.8169 140.75 1,472.86 4.5264 18.0405 1.5895 8.2655 28 15,607.64 4.8160 140.90 1,470.08 4.4891 17.9924 1.5863 8.2455 31 15,663.17 4.8095 142.42 1,465.98 4.4976 18.0147 1.5952 8.2550
Apr 1 15,595.18 4.7931 142.53 1,460.04 4.5039 18.0263 1.5903 8.2270 2 15,578.00 4.7894 143.03 1,459.29 4.5176 18.0183 1.6091 8.2150 3 15,582.21 4.7785 143.12 1,456.88 4.5223 18.0593 1.6149 8.2300 4 15,510.85 4.7744 142.33 1,444.51 4.4939 17.9586 1.6025 8.2125 7 15,510.31 4.7905 141.65 1,449.08 4.4847 17.9051 1.5983 8.2405 8 15,547.28 4.7950 140.90 1,445.29 4.4628 17.8587 1.5885 8.2360 9 15,656.76 4.8002 140.73 1,432.26 4.4520 18.0025 1.5890 8.2195 10 15,830.00 4.8089 141.00 1,437.35 4.4735 18.0132 1.5944 8.2160 11 15,868.51 4.8117 140.69 1,443.75 4.4904 18.1640 1.6003 8.2605 14 15,814.51 4.8008 140.87 1,439.66 4.4947 18.0491 1.5962 8.2400 15 15,770.39 4.7887 140.62 1,437.09 4.4777 18.0012 1.5932 8.2295 16 15,829.21 4.8043 141.55 1,437.17 4.4871 18.0674 1.6098 8.2400 17 15,822.52 4.8154 141.57 1,439.30 4.4861 18.0988 1.6093 8.2824 22 15,933.19 4.8110 141.69 1,436.07 4.5128 18.0222 1.6057 8.2615 23 16,090.61 4.8255 141.46 1,441.29 4.5197 18.0810 1.6125 8.2715 24 16,044.00 4.8053 141.63 1,437.95 4.5184 18.0648 1.6126 8.2785 25 16,008.80 4.8023 141.05 1,439.73 4.5234 18.1549 1.6106 8.2845 28 16,062.02 4.8196 141.85 1,434.49 4.5303 18.1815 1.6220 8.3145 29 15,967.87 4.8028 142.03 1,423.99 4.5059 18.0903 1.6191 8.2810 30 16,011.07 4.8016 142.07 1,430.35 4.5212 18.1532 1.6187 8.2720
May 2 15,952.49 4.7911 142.06 1,428.24 4.5218 18.0622 1.6026 8.2355 5 15,980.13 4.7984 141.44 1,427.24 4.5177 18.0938 1.5996 8.2605 6 16,059.02 4.8068 141.89 1,431.82 4.5377 18.1675 1.5909 8.2420 7 16,120.38 4.8047 141.68 1,424.96 4.5228 18.1319 1.6035 8.2235 8 16,100.46 4.8100 141.95 1,426.66 4.5357 18.0859 1.6122 8.1780 9 15,841.14 4.7598 140.14 1,413.41 4.4492 17.8653 1.5957 8.1370 12 15,858.49 4.7594 140.31 1,410.66 4.4582 17.8126 1.5955 8.1395 13 15,783.63 4.7375 140.25 1,401.13 4.4377 17.7166 1.5850 8.1300 14 15,667.67 4.7414 139.65 1,409.91 4.4209 17.7335 1.5827 8.1165 15 15,599.43 4.7201 139.17 1,401.78 4.4064 17.6440 1.5786 8.1050 16 15,600.08 4.7398 138.95 1,403.58 4.4189 17.7336 1.5862 8.1505 19 15,656.47 4.7382 138.79 1,401.67 4.4036 17.7157 1.5872 8.1355 20 15,708.55 4.7522 138.88 1,404.75 4.4109 17.7229 1.5978 8.1360 21 15,739.09 4.7761 138.18 1,404.45 4.3982 17.6564 1.5968 8.1390 22 15,756.70 4.7655 138.96 1,400.72 4.3904 17.6734 1.5963 8.1200 23 15,827.76 4.7516 138.92 1,396.88 4.3753 17.5738 1.5957 8.1305 26 15,787.45 4.7584 138.97 1,396.64 4.3768 17.5305 1.5955 8.1245 27 15,813.84 4.7429 139.01 1,396.31 4.3901 17.5678 1.5954 8.1185 28 15,836.99 4.7478 138.73 1,390.72 4.3861 17.5298 1.6039 8.1020 29 15,815.45 4.7327 138.34 1,388.96 4.3735 17.5023 1.6034 8.1106 30 15,927.20 4.7256 138.36 1,389.22 4.3765 17.4833 1.6057 8.1425
June 2 16,025.65 4.7325 138.94 1,393.84 4.3940 17.5248 1.6073 8.1605 3 16,104.42 4.7439 139.64 1,396.84 4.4059 17.6355 1.6122 8.1815 4 16,198.63 4.7464 139.78 1,397.56 4.4179 17.6444 1.6199 8.1655 5 16,046.28 4.7181 139.24 1,385.96 4.3758 17.4946 1.6068 8.1360 6 16,140.56 4.7237 139.71 1,392.02 4.3821 17.5402 1.6009 8.1495 9 16,027.08 4.7091 139.39 1,382.37 4.3518 17.5951 1.5990 8.0997 10 15,994.24 4.6902 138.63 1,378.02 4.3452 17.6694 1.5909 8.0890
* See Explanatory notes, p 59.
Deutsche Bundesbank
11
Exchange rate statistics
June 2014
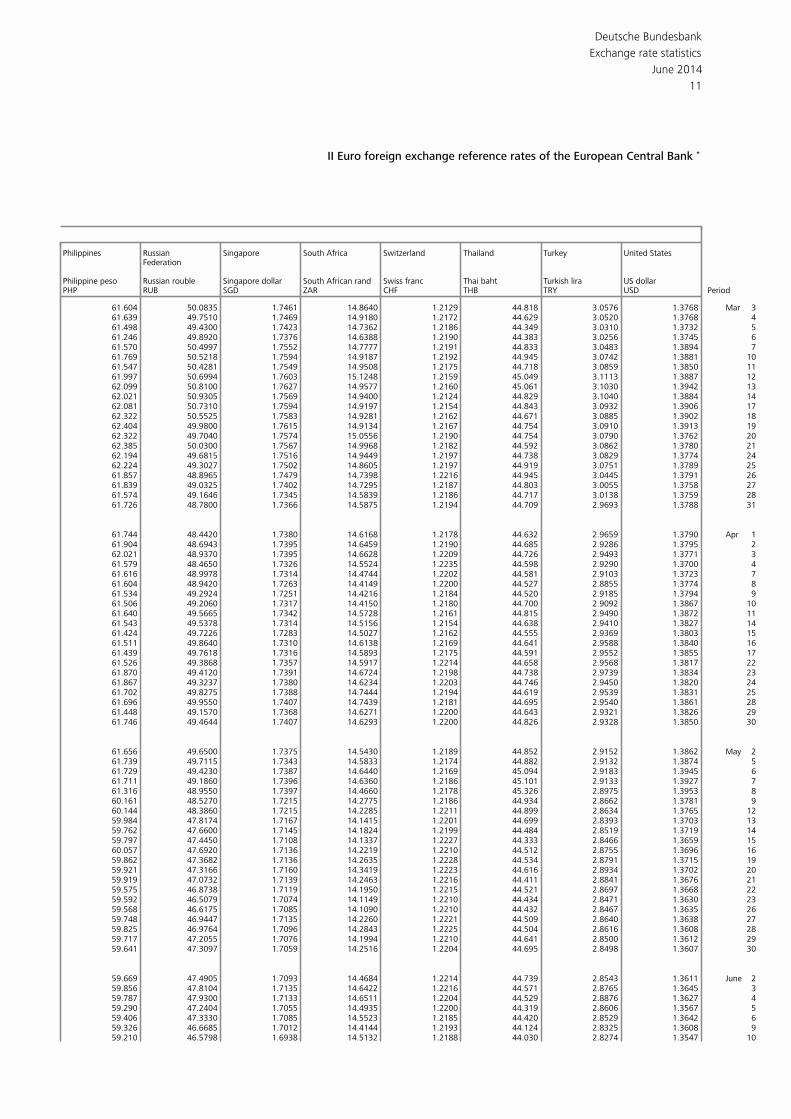
II Euro foreign exchange reference rates of the European Central Bank *
Philippines Russian Singapore South Africa Switzerland Thailand Turkey United StatesFederation
Philippine peso Russian rouble Singapore dollar South African rand Swiss franc Thai baht Turkish lira US dollarPHP RUB SGD ZAR CHF THB TRY USD Period
61.604 50.0835 1.7461 14.8640 1.2129 44.818 3.0576 1.3768 Mar 361.639 49.7510 1.7469 14.9180 1.2172 44.629 3.0520 1.3768 461.498 49.4300 1.7423 14.7362 1.2186 44.349 3.0310 1.3732 561.246 49.8920 1.7376 14.6388 1.2190 44.383 3.0256 1.3745 661.570 50.4997 1.7552 14.7777 1.2191 44.833 3.0483 1.3894 761.769 50.5218 1.7594 14.9187 1.2192 44.945 3.0742 1.3881 1061.547 50.4281 1.7549 14.9508 1.2175 44.718 3.0859 1.3850 1161.997 50.6994 1.7603 15.1248 1.2159 45.049 3.1113 1.3887 1262.099 50.8100 1.7627 14.9577 1.2160 45.061 3.1030 1.3942 1362.021 50.9305 1.7569 14.9400 1.2124 44.829 3.1040 1.3884 1462.081 50.7310 1.7594 14.9197 1.2154 44.843 3.0932 1.3906 1762.322 50.5525 1.7583 14.9281 1.2162 44.671 3.0885 1.3902 1862.404 49.9800 1.7615 14.9134 1.2167 44.754 3.0910 1.3913 1962.322 49.7040 1.7574 15.0556 1.2190 44.754 3.0790 1.3762 2062.385 50.0300 1.7567 14.9968 1.2182 44.592 3.0862 1.3780 2162.194 49.6815 1.7516 14.9449 1.2197 44.738 3.0829 1.3774 2462.224 49.3027 1.7502 14.8605 1.2197 44.919 3.0751 1.3789 2561.857 48.8965 1.7479 14.7398 1.2216 44.945 3.0445 1.3791 2661.839 49.0325 1.7402 14.7295 1.2187 44.803 3.0055 1.3758 2761.574 49.1646 1.7345 14.5839 1.2186 44.717 3.0138 1.3759 2861.726 48.7800 1.7366 14.5875 1.2194 44.709 2.9693 1.3788 31
61.744 48.4420 1.7380 14.6168 1.2178 44.632 2.9659 1.3790 Apr 161.904 48.6943 1.7395 14.6459 1.2190 44.685 2.9286 1.3795 262.021 48.9370 1.7395 14.6628 1.2209 44.726 2.9493 1.3771 361.579 48.4650 1.7326 14.5524 1.2235 44.598 2.9290 1.3700 461.616 48.9978 1.7314 14.4744 1.2202 44.581 2.9103 1.3723 761.604 48.9420 1.7263 14.4149 1.2200 44.527 2.8855 1.3774 861.534 49.2924 1.7251 14.4216 1.2184 44.520 2.9185 1.3794 961.506 49.2060 1.7317 14.4150 1.2180 44.700 2.9092 1.3867 1061.640 49.5665 1.7342 14.5728 1.2161 44.815 2.9490 1.3872 1161.543 49.5378 1.7314 14.5156 1.2154 44.638 2.9410 1.3827 1461.424 49.7226 1.7283 14.5027 1.2162 44.555 2.9369 1.3803 1561.511 49.8640 1.7310 14.6138 1.2169 44.641 2.9588 1.3840 1661.439 49.7618 1.7316 14.5893 1.2175 44.591 2.9552 1.3855 1761.526 49.3868 1.7357 14.5917 1.2214 44.658 2.9568 1.3817 2261.870 49.4120 1.7391 14.6724 1.2198 44.738 2.9739 1.3834 2361.867 49.3237 1.7380 14.6234 1.2203 44.746 2.9450 1.3820 2461.702 49.8275 1.7388 14.7444 1.2194 44.619 2.9539 1.3831 2561.696 49.9550 1.7407 14.7439 1.2181 44.695 2.9540 1.3861 2861.448 49.1570 1.7368 14.6271 1.2200 44.643 2.9321 1.3826 2961.746 49.4644 1.7407 14.6293 1.2200 44.826 2.9328 1.3850 30
61.656 49.6500 1.7375 14.5430 1.2189 44.852 2.9152 1.3862 May 261.739 49.7115 1.7343 14.5833 1.2174 44.882 2.9132 1.3874 561.729 49.4230 1.7387 14.6440 1.2169 45.094 2.9183 1.3945 661.711 49.1860 1.7396 14.6360 1.2186 45.101 2.9133 1.3927 761.316 48.9550 1.7397 14.4660 1.2178 45.326 2.8975 1.3953 860.161 48.5270 1.7215 14.2775 1.2186 44.934 2.8662 1.3781 960.144 48.3860 1.7215 14.2285 1.2211 44.899 2.8634 1.3765 1259.984 47.8174 1.7167 14.1415 1.2201 44.699 2.8393 1.3703 1359.762 47.6600 1.7145 14.1824 1.2199 44.484 2.8519 1.3719 1459.797 47.4450 1.7108 14.1337 1.2227 44.333 2.8466 1.3659 1560.057 47.6920 1.7136 14.2219 1.2210 44.512 2.8755 1.3696 1659.862 47.3682 1.7136 14.2635 1.2228 44.534 2.8791 1.3715 1959.921 47.3166 1.7160 14.3419 1.2223 44.616 2.8934 1.3702 2059.919 47.0732 1.7139 14.2463 1.2216 44.411 2.8841 1.3676 2159.575 46.8738 1.7119 14.1950 1.2215 44.521 2.8697 1.3668 2259.592 46.5079 1.7074 14.1149 1.2210 44.434 2.8471 1.3630 2359.568 46.6175 1.7085 14.1090 1.2210 44.432 2.8467 1.3635 2659.748 46.9447 1.7135 14.2260 1.2221 44.509 2.8640 1.3638 2759.825 46.9764 1.7096 14.2843 1.2225 44.504 2.8616 1.3608 2859.717 47.2055 1.7076 14.1994 1.2210 44.641 2.8500 1.3612 2959.641 47.3097 1.7059 14.2516 1.2204 44.695 2.8498 1.3607 30
59.669 47.4905 1.7093 14.4684 1.2214 44.739 2.8543 1.3611 June 259.856 47.8104 1.7135 14.6422 1.2216 44.571 2.8765 1.3645 359.787 47.9300 1.7133 14.6511 1.2204 44.529 2.8876 1.3627 459.290 47.2404 1.7055 14.4935 1.2200 44.319 2.8606 1.3567 559.406 47.3330 1.7085 14.5523 1.2185 44.420 2.8529 1.3642 659.326 46.6685 1.7012 14.4144 1.2193 44.124 2.8325 1.3608 959.210 46.5798 1.6938 14.5132 1.2188 44.030 2.8274 1.3547 10
Deutsche Bundesbank
12
Exchange rate statistics
June 2014
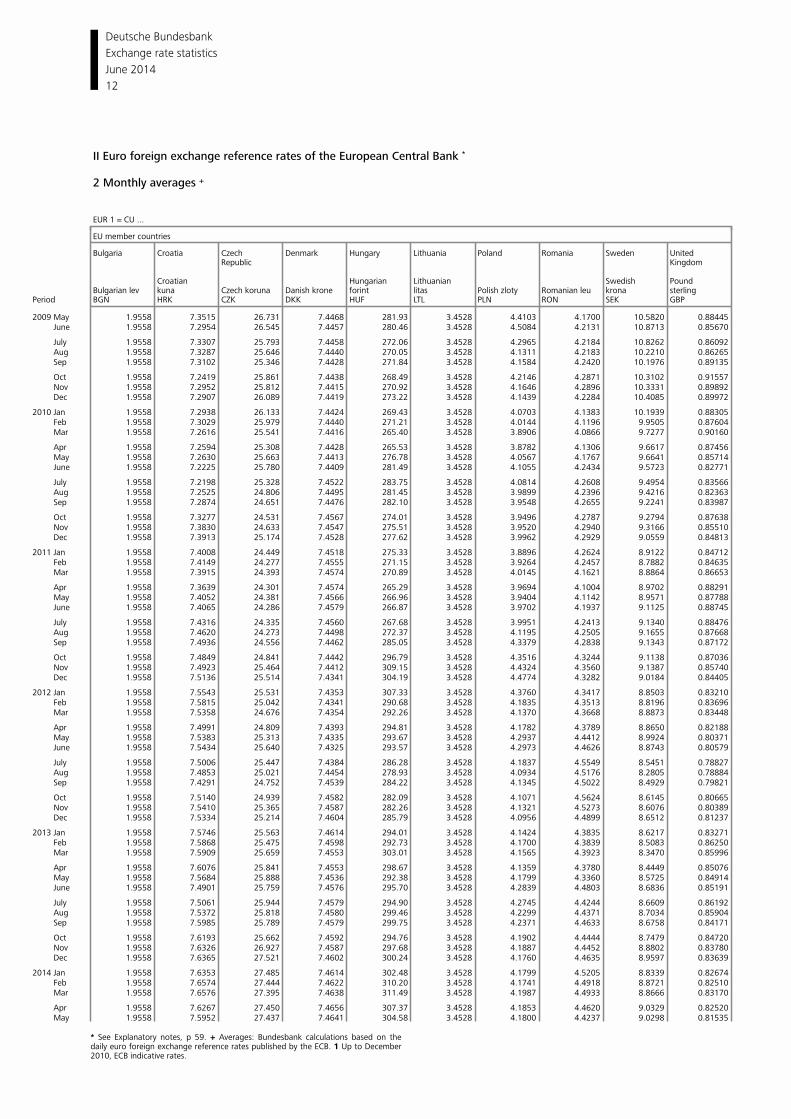
II Euro foreign exchange reference rates of the European Central Bank *
2 Monthly averages +
EUR 1 = CU ...
EU member countries
Bulgaria Croatia Czech Denmark Hungary Lithuania Poland Romania Sweden United Republic Kingdom
Croatian Hungarian Lithuanian Swedish Pound
Bulgarian lev kuna Czech koruna Danish krone forint litas Polish zloty Romanian leu krona sterlingPeriod BGN HRK CZK DKK HUF LTL PLN RON SEK GBP
2009 May 1.9558 7.3515 26.731 7.4468 281.93 3.4528 4.4103 4.1700 10.5820 0.88445 June 1.9558 7.2954 26.545 7.4457 280.46 3.4528 4.5084 4.2131 10.8713 0.85670
July 1.9558 7.3307 25.793 7.4458 272.06 3.4528 4.2965 4.2184 10.8262 0.86092 Aug 1.9558 7.3287 25.646 7.4440 270.05 3.4528 4.1311 4.2183 10.2210 0.86265 Sep 1.9558 7.3102 25.346 7.4428 271.84 3.4528 4.1584 4.2420 10.1976 0.89135
Oct 1.9558 7.2419 25.861 7.4438 268.49 3.4528 4.2146 4.2871 10.3102 0.91557 Nov 1.9558 7.2952 25.812 7.4415 270.92 3.4528 4.1646 4.2896 10.3331 0.89892 Dec 1.9558 7.2907 26.089 7.4419 273.22 3.4528 4.1439 4.2284 10.4085 0.89972
2010 Jan 1.9558 7.2938 26.133 7.4424 269.43 3.4528 4.0703 4.1383 10.1939 0.88305 Feb 1.9558 7.3029 25.979 7.4440 271.21 3.4528 4.0144 4.1196 9.9505 0.87604 Mar 1.9558 7.2616 25.541 7.4416 265.40 3.4528 3.8906 4.0866 9.7277 0.90160
Apr 1.9558 7.2594 25.308 7.4428 265.53 3.4528 3.8782 4.1306 9.6617 0.87456 May 1.9558 7.2630 25.663 7.4413 276.78 3.4528 4.0567 4.1767 9.6641 0.85714 June 1.9558 7.2225 25.780 7.4409 281.49 3.4528 4.1055 4.2434 9.5723 0.82771
July 1.9558 7.2198 25.328 7.4522 283.75 3.4528 4.0814 4.2608 9.4954 0.83566 Aug 1.9558 7.2525 24.806 7.4495 281.45 3.4528 3.9899 4.2396 9.4216 0.82363 Sep 1.9558 7.2874 24.651 7.4476 282.10 3.4528 3.9548 4.2655 9.2241 0.83987
Oct 1.9558 7.3277 24.531 7.4567 274.01 3.4528 3.9496 4.2787 9.2794 0.87638 Nov 1.9558 7.3830 24.633 7.4547 275.51 3.4528 3.9520 4.2940 9.3166 0.85510 Dec 1.9558 7.3913 25.174 7.4528 277.62 3.4528 3.9962 4.2929 9.0559 0.84813
2011 Jan 1.9558 7.4008 24.449 7.4518 275.33 3.4528 3.8896 4.2624 8.9122 0.84712 Feb 1.9558 7.4149 24.277 7.4555 271.15 3.4528 3.9264 4.2457 8.7882 0.84635 Mar 1.9558 7.3915 24.393 7.4574 270.89 3.4528 4.0145 4.1621 8.8864 0.86653
Apr 1.9558 7.3639 24.301 7.4574 265.29 3.4528 3.9694 4.1004 8.9702 0.88291 May 1.9558 7.4052 24.381 7.4566 266.96 3.4528 3.9404 4.1142 8.9571 0.87788 June 1.9558 7.4065 24.286 7.4579 266.87 3.4528 3.9702 4.1937 9.1125 0.88745
July 1.9558 7.4316 24.335 7.4560 267.68 3.4528 3.9951 4.2413 9.1340 0.88476 Aug 1.9558 7.4620 24.273 7.4498 272.37 3.4528 4.1195 4.2505 9.1655 0.87668 Sep 1.9558 7.4936 24.556 7.4462 285.05 3.4528 4.3379 4.2838 9.1343 0.87172
Oct 1.9558 7.4849 24.841 7.4442 296.79 3.4528 4.3516 4.3244 9.1138 0.87036 Nov 1.9558 7.4923 25.464 7.4412 309.15 3.4528 4.4324 4.3560 9.1387 0.85740 Dec 1.9558 7.5136 25.514 7.4341 304.19 3.4528 4.4774 4.3282 9.0184 0.84405
2012 Jan 1.9558 7.5543 25.531 7.4353 307.33 3.4528 4.3760 4.3417 8.8503 0.83210 Feb 1.9558 7.5815 25.042 7.4341 290.68 3.4528 4.1835 4.3513 8.8196 0.83696 Mar 1.9558 7.5358 24.676 7.4354 292.26 3.4528 4.1370 4.3668 8.8873 0.83448
Apr 1.9558 7.4991 24.809 7.4393 294.81 3.4528 4.1782 4.3789 8.8650 0.82188 May 1.9558 7.5383 25.313 7.4335 293.67 3.4528 4.2937 4.4412 8.9924 0.80371 June 1.9558 7.5434 25.640 7.4325 293.57 3.4528 4.2973 4.4626 8.8743 0.80579
July 1.9558 7.5006 25.447 7.4384 286.28 3.4528 4.1837 4.5549 8.5451 0.78827 Aug 1.9558 7.4853 25.021 7.4454 278.93 3.4528 4.0934 4.5176 8.2805 0.78884 Sep 1.9558 7.4291 24.752 7.4539 284.22 3.4528 4.1345 4.5022 8.4929 0.79821
Oct 1.9558 7.5140 24.939 7.4582 282.09 3.4528 4.1071 4.5624 8.6145 0.80665 Nov 1.9558 7.5410 25.365 7.4587 282.26 3.4528 4.1321 4.5273 8.6076 0.80389 Dec 1.9558 7.5334 25.214 7.4604 285.79 3.4528 4.0956 4.4899 8.6512 0.81237
2013 Jan 1.9558 7.5746 25.563 7.4614 294.01 3.4528 4.1424 4.3835 8.6217 0.83271 Feb 1.9558 7.5868 25.475 7.4598 292.73 3.4528 4.1700 4.3839 8.5083 0.86250 Mar 1.9558 7.5909 25.659 7.4553 303.01 3.4528 4.1565 4.3923 8.3470 0.85996
Apr 1.9558 7.6076 25.841 7.4553 298.67 3.4528 4.1359 4.3780 8.4449 0.85076 May 1.9558 7.5684 25.888 7.4536 292.38 3.4528 4.1799 4.3360 8.5725 0.84914 June 1.9558 7.4901 25.759 7.4576 295.70 3.4528 4.2839 4.4803 8.6836 0.85191
July 1.9558 7.5061 25.944 7.4579 294.90 3.4528 4.2745 4.4244 8.6609 0.86192 Aug 1.9558 7.5372 25.818 7.4580 299.46 3.4528 4.2299 4.4371 8.7034 0.85904 Sep 1.9558 7.5985 25.789 7.4579 299.75 3.4528 4.2371 4.4633 8.6758 0.84171
Oct 1.9558 7.6193 25.662 7.4592 294.76 3.4528 4.1902 4.4444 8.7479 0.84720 Nov 1.9558 7.6326 26.927 7.4587 297.68 3.4528 4.1887 4.4452 8.8802 0.83780 Dec 1.9558 7.6365 27.521 7.4602 300.24 3.4528 4.1760 4.4635 8.9597 0.83639
2014 Jan 1.9558 7.6353 27.485 7.4614 302.48 3.4528 4.1799 4.5205 8.8339 0.82674 Feb 1.9558 7.6574 27.444 7.4622 310.20 3.4528 4.1741 4.4918 8.8721 0.82510 Mar 1.9558 7.6576 27.395 7.4638 311.49 3.4528 4.1987 4.4933 8.8666 0.83170
Apr 1.9558 7.6267 27.450 7.4656 307.37 3.4528 4.1853 4.4620 9.0329 0.82520 May 1.9558 7.5952 27.437 7.4641 304.58 3.4528 4.1800 4.4237 9.0298 0.81535
* See Explanatory notes, p 59. + Averages: Bundesbank calculations based on the daily euro foreign exchange reference rates published by the ECB. 1 Up to December 2010, ECB indicative rates.
Deutsche Bundesbank
13
Exchange rate statistics
June 2014
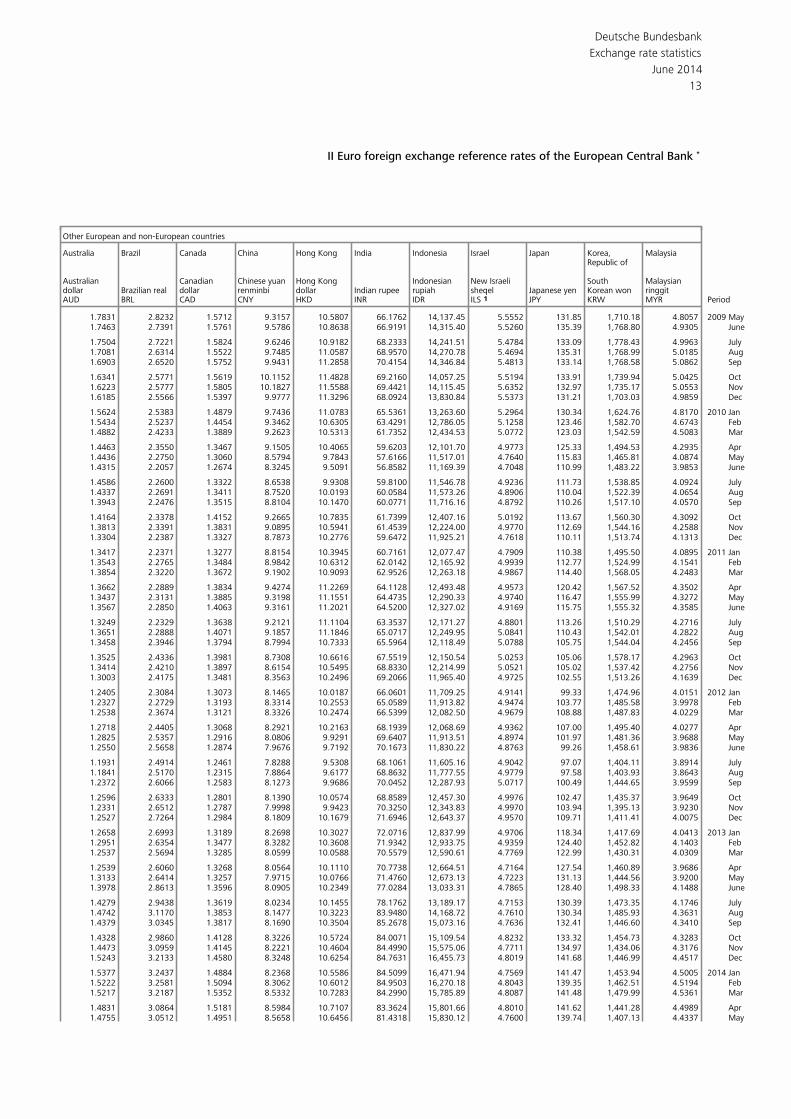
II Euro foreign exchange reference rates of the European Central Bank *
Other European and non-European countries
Australia Brazil Canada China Hong Kong India Indonesia Israel Japan Korea, MalaysiaRepublic of
Australian Canadian Chinese yuan Hong Kong Indonesian New Israeli South Malaysiandollar Brazilian real dollar renminbi dollar Indian rupee rupiah sheqel Japanese yen Korean won ringgitAUD BRL CAD CNY HKD INR IDR ILS 1 JPY KRW MYR Period
1.7831 2.8232 1.5712 9.3157 10.5807 66.1762 14,137.45 5.5552 131.85 1,710.18 4.8057 2009 May1.7463 2.7391 1.5761 9.5786 10.8638 66.9191 14,315.40 5.5260 135.39 1,768.80 4.9305 June
1.7504 2.7221 1.5824 9.6246 10.9182 68.2333 14,241.51 5.4784 133.09 1,778.43 4.9963 July1.7081 2.6314 1.5522 9.7485 11.0587 68.9570 14,270.78 5.4694 135.31 1,768.99 5.0185 Aug 1.6903 2.6520 1.5752 9.9431 11.2858 70.4154 14,346.84 5.4813 133.14 1,768.58 5.0862 Sep
1.6341 2.5771 1.5619 10.1152 11.4828 69.2160 14,057.25 5.5194 133.91 1,739.94 5.0425 Oct 1.6223 2.5777 1.5805 10.1827 11.5588 69.4421 14,115.45 5.6352 132.97 1,735.17 5.0553 Nov 1.6185 2.5566 1.5397 9.9777 11.3296 68.0924 13,830.84 5.5373 131.21 1,703.03 4.9859 Dec
1.5624 2.5383 1.4879 9.7436 11.0783 65.5361 13,263.60 5.2964 130.34 1,624.76 4.8170 2010 Jan 1.5434 2.5237 1.4454 9.3462 10.6305 63.4291 12,786.05 5.1258 123.46 1,582.70 4.6743 Feb 1.4882 2.4233 1.3889 9.2623 10.5313 61.7352 12,434.53 5.0772 123.03 1,542.59 4.5083 Mar
1.4463 2.3550 1.3467 9.1505 10.4065 59.6203 12,101.70 4.9773 125.33 1,494.53 4.2935 Apr 1.4436 2.2750 1.3060 8.5794 9.7843 57.6166 11,517.01 4.7640 115.83 1,465.81 4.0874 May1.4315 2.2057 1.2674 8.3245 9.5091 56.8582 11,169.39 4.7048 110.99 1,483.22 3.9853 June
1.4586 2.2600 1.3322 8.6538 9.9308 59.8100 11,546.78 4.9236 111.73 1,538.85 4.0924 July1.4337 2.2691 1.3411 8.7520 10.0193 60.0584 11,573.26 4.8906 110.04 1,522.39 4.0654 Aug 1.3943 2.2476 1.3515 8.8104 10.1470 60.0771 11,716.16 4.8792 110.26 1,517.10 4.0570 Sep
1.4164 2.3378 1.4152 9.2665 10.7835 61.7399 12,407.16 5.0192 113.67 1,560.30 4.3092 Oct 1.3813 2.3391 1.3831 9.0895 10.5941 61.4539 12,224.00 4.9770 112.69 1,544.16 4.2588 Nov 1.3304 2.2387 1.3327 8.7873 10.2776 59.6472 11,925.21 4.7618 110.11 1,513.74 4.1313 Dec
1.3417 2.2371 1.3277 8.8154 10.3945 60.7161 12,077.47 4.7909 110.38 1,495.50 4.0895 2011 Jan 1.3543 2.2765 1.3484 8.9842 10.6312 62.0142 12,165.92 4.9939 112.77 1,524.99 4.1541 Feb 1.3854 2.3220 1.3672 9.1902 10.9093 62.9526 12,263.18 4.9867 114.40 1,568.05 4.2483 Mar
1.3662 2.2889 1.3834 9.4274 11.2269 64.1128 12,493.48 4.9573 120.42 1,567.52 4.3502 Apr 1.3437 2.3131 1.3885 9.3198 11.1551 64.4735 12,290.33 4.9740 116.47 1,555.99 4.3272 May1.3567 2.2850 1.4063 9.3161 11.2021 64.5200 12,327.02 4.9169 115.75 1,555.32 4.3585 June
1.3249 2.2329 1.3638 9.2121 11.1104 63.3537 12,171.27 4.8801 113.26 1,510.29 4.2716 July1.3651 2.2888 1.4071 9.1857 11.1846 65.0717 12,249.95 5.0841 110.43 1,542.01 4.2822 Aug 1.3458 2.3946 1.3794 8.7994 10.7333 65.5964 12,118.49 5.0788 105.75 1,544.04 4.2456 Sep
1.3525 2.4336 1.3981 8.7308 10.6616 67.5519 12,150.54 5.0253 105.06 1,578.17 4.2963 Oct 1.3414 2.4210 1.3897 8.6154 10.5495 68.8330 12,214.99 5.0521 105.02 1,537.42 4.2756 Nov 1.3003 2.4175 1.3481 8.3563 10.2496 69.2066 11,965.40 4.9725 102.55 1,513.26 4.1639 Dec
1.2405 2.3084 1.3073 8.1465 10.0187 66.0601 11,709.25 4.9141 99.33 1,474.96 4.0151 2012 Jan 1.2327 2.2729 1.3193 8.3314 10.2553 65.0589 11,913.82 4.9474 103.77 1,485.58 3.9978 Feb 1.2538 2.3674 1.3121 8.3326 10.2474 66.5399 12,082.50 4.9679 108.88 1,487.83 4.0229 Mar
1.2718 2.4405 1.3068 8.2921 10.2163 68.1939 12,068.69 4.9362 107.00 1,495.40 4.0277 Apr 1.2825 2.5357 1.2916 8.0806 9.9291 69.6407 11,913.51 4.8974 101.97 1,481.36 3.9688 May1.2550 2.5658 1.2874 7.9676 9.7192 70.1673 11,830.22 4.8763 99.26 1,458.61 3.9836 June
1.1931 2.4914 1.2461 7.8288 9.5308 68.1061 11,605.16 4.9042 97.07 1,404.11 3.8914 July1.1841 2.5170 1.2315 7.8864 9.6177 68.8632 11,777.55 4.9779 97.58 1,403.93 3.8643 Aug 1.2372 2.6066 1.2583 8.1273 9.9686 70.0452 12,287.93 5.0717 100.49 1,444.65 3.9599 Sep
1.2596 2.6333 1.2801 8.1390 10.0574 68.8589 12,457.30 4.9976 102.47 1,435.37 3.9649 Oct 1.2331 2.6512 1.2787 7.9998 9.9423 70.3250 12,343.83 4.9970 103.94 1,395.13 3.9230 Nov 1.2527 2.7264 1.2984 8.1809 10.1679 71.6946 12,643.37 4.9570 109.71 1,411.41 4.0075 Dec
1.2658 2.6993 1.3189 8.2698 10.3027 72.0716 12,837.99 4.9706 118.34 1,417.69 4.0413 2013 Jan 1.2951 2.6354 1.3477 8.3282 10.3608 71.9342 12,933.75 4.9359 124.40 1,452.82 4.1403 Feb 1.2537 2.5694 1.3285 8.0599 10.0588 70.5579 12,590.61 4.7769 122.99 1,430.31 4.0309 Mar
1.2539 2.6060 1.3268 8.0564 10.1110 70.7738 12,664.51 4.7164 127.54 1,460.89 3.9686 Apr 1.3133 2.6414 1.3257 7.9715 10.0766 71.4760 12,673.13 4.7223 131.13 1,444.56 3.9200 May1.3978 2.8613 1.3596 8.0905 10.2349 77.0284 13,033.31 4.7865 128.40 1,498.33 4.1488 June
1.4279 2.9438 1.3619 8.0234 10.1455 78.1762 13,189.17 4.7153 130.39 1,473.35 4.1746 July1.4742 3.1170 1.3853 8.1477 10.3223 83.9480 14,168.72 4.7610 130.34 1,485.93 4.3631 Aug 1.4379 3.0345 1.3817 8.1690 10.3504 85.2678 15,073.16 4.7636 132.41 1,446.60 4.3410 Sep
1.4328 2.9860 1.4128 8.3226 10.5724 84.0071 15,109.54 4.8232 133.32 1,454.73 4.3283 Oct 1.4473 3.0959 1.4145 8.2221 10.4604 84.4990 15,575.06 4.7711 134.97 1,434.06 4.3176 Nov 1.5243 3.2133 1.4580 8.3248 10.6254 84.7631 16,455.73 4.8019 141.68 1,446.99 4.4517 Dec
1.5377 3.2437 1.4884 8.2368 10.5586 84.5099 16,471.94 4.7569 141.47 1,453.94 4.5005 2014 Jan 1.5222 3.2581 1.5094 8.3062 10.6012 84.9503 16,270.18 4.8043 139.35 1,462.51 4.5194 Feb 1.5217 3.2187 1.5352 8.5332 10.7283 84.2990 15,785.89 4.8087 141.48 1,479.99 4.5361 Mar
1.4831 3.0864 1.5181 8.5984 10.7107 83.3624 15,801.66 4.8010 141.62 1,441.28 4.4989 Apr 1.4755 3.0512 1.4951 8.5658 10.6456 81.4318 15,830.12 4.7600 139.74 1,407.13 4.4337 May
Deutsche Bundesbank
14
Exchange rate statistics
June 2014
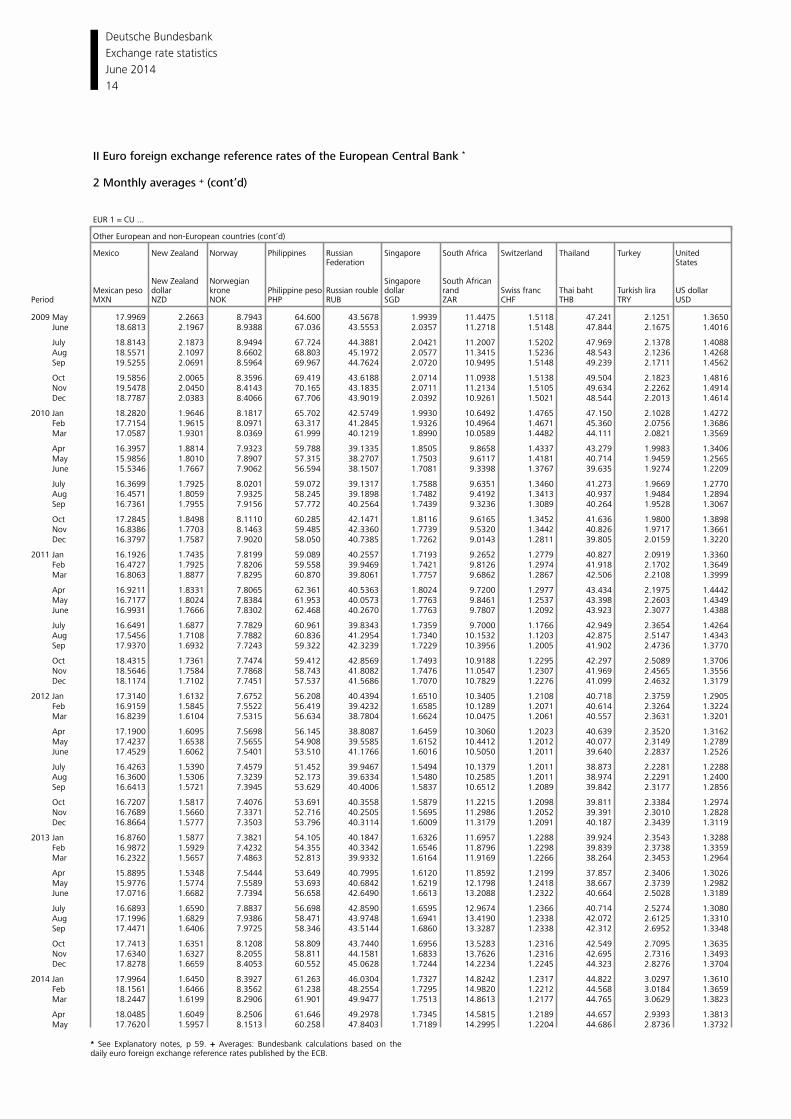
II Euro foreign exchange reference rates of the European Central Bank *
2 Monthly averages + (cont’d)
EUR 1 = CU ...
Other European and non-European countries (cont’d)
Mexico New Zealand Norway Philippines Russian Singapore South Africa Switzerland Thailand Turkey United Federation States
New Zealand Norwegian Singapore South African
Mexican peso dollar krone Philippine peso Russian rouble dollar rand Swiss franc Thai baht Turkish lira US dollarPeriod MXN NZD NOK PHP RUB SGD ZAR CHF THB TRY USD
2009 May 17.9969 2.2663 8.7943 64.600 43.5678 1.9939 11.4475 1.5118 47.241 2.1251 1.3650 June 18.6813 2.1967 8.9388 67.036 43.5553 2.0357 11.2718 1.5148 47.844 2.1675 1.4016
July 18.8143 2.1873 8.9494 67.724 44.3881 2.0421 11.2007 1.5202 47.969 2.1378 1.4088 Aug 18.5571 2.1097 8.6602 68.803 45.1972 2.0577 11.3415 1.5236 48.543 2.1236 1.4268 Sep 19.5255 2.0691 8.5964 69.967 44.7624 2.0720 10.9495 1.5148 49.239 2.1711 1.4562
Oct 19.5856 2.0065 8.3596 69.419 43.6188 2.0714 11.0938 1.5138 49.504 2.1823 1.4816 Nov 19.5478 2.0450 8.4143 70.165 43.1835 2.0711 11.2134 1.5105 49.634 2.2262 1.4914 Dec 18.7787 2.0383 8.4066 67.706 43.9019 2.0392 10.9261 1.5021 48.544 2.2013 1.4614
2010 Jan 18.2820 1.9646 8.1817 65.702 42.5749 1.9930 10.6492 1.4765 47.150 2.1028 1.4272 Feb 17.7154 1.9615 8.0971 63.317 41.2845 1.9326 10.4964 1.4671 45.360 2.0756 1.3686 Mar 17.0587 1.9301 8.0369 61.999 40.1219 1.8990 10.0589 1.4482 44.111 2.0821 1.3569
Apr 16.3957 1.8814 7.9323 59.788 39.1335 1.8505 9.8658 1.4337 43.279 1.9983 1.3406 May 15.9856 1.8010 7.8907 57.315 38.2707 1.7503 9.6117 1.4181 40.714 1.9459 1.2565 June 15.5346 1.7667 7.9062 56.594 38.1507 1.7081 9.3398 1.3767 39.635 1.9274 1.2209
July 16.3699 1.7925 8.0201 59.072 39.1317 1.7588 9.6351 1.3460 41.273 1.9669 1.2770 Aug 16.4571 1.8059 7.9325 58.245 39.1898 1.7482 9.4192 1.3413 40.937 1.9484 1.2894 Sep 16.7361 1.7955 7.9156 57.772 40.2564 1.7439 9.3236 1.3089 40.264 1.9528 1.3067
Oct 17.2845 1.8498 8.1110 60.285 42.1471 1.8116 9.6165 1.3452 41.636 1.9800 1.3898 Nov 16.8386 1.7703 8.1463 59.485 42.3360 1.7739 9.5320 1.3442 40.826 1.9717 1.3661 Dec 16.3797 1.7587 7.9020 58.050 40.7385 1.7262 9.0143 1.2811 39.805 2.0159 1.3220
2011 Jan 16.1926 1.7435 7.8199 59.089 40.2557 1.7193 9.2652 1.2779 40.827 2.0919 1.3360 Feb 16.4727 1.7925 7.8206 59.558 39.9469 1.7421 9.8126 1.2974 41.918 2.1702 1.3649 Mar 16.8063 1.8877 7.8295 60.870 39.8061 1.7757 9.6862 1.2867 42.506 2.2108 1.3999
Apr 16.9211 1.8331 7.8065 62.361 40.5363 1.8024 9.7200 1.2977 43.434 2.1975 1.4442 May 16.7177 1.8024 7.8384 61.953 40.0573 1.7763 9.8461 1.2537 43.398 2.2603 1.4349 June 16.9931 1.7666 7.8302 62.468 40.2670 1.7763 9.7807 1.2092 43.923 2.3077 1.4388
July 16.6491 1.6877 7.7829 60.961 39.8343 1.7359 9.7000 1.1766 42.949 2.3654 1.4264 Aug 17.5456 1.7108 7.7882 60.836 41.2954 1.7340 10.1532 1.1203 42.875 2.5147 1.4343 Sep 17.9370 1.6932 7.7243 59.322 42.3239 1.7229 10.3956 1.2005 41.902 2.4736 1.3770
Oct 18.4315 1.7361 7.7474 59.412 42.8569 1.7493 10.9188 1.2295 42.297 2.5089 1.3706 Nov 18.5646 1.7584 7.7868 58.743 41.8082 1.7476 11.0547 1.2307 41.969 2.4565 1.3556 Dec 18.1174 1.7102 7.7451 57.537 41.5686 1.7070 10.7829 1.2276 41.099 2.4632 1.3179
2012 Jan 17.3140 1.6132 7.6752 56.208 40.4394 1.6510 10.3405 1.2108 40.718 2.3759 1.2905 Feb 16.9159 1.5845 7.5522 56.419 39.4232 1.6585 10.1289 1.2071 40.614 2.3264 1.3224 Mar 16.8239 1.6104 7.5315 56.634 38.7804 1.6624 10.0475 1.2061 40.557 2.3631 1.3201
Apr 17.1900 1.6095 7.5698 56.145 38.8087 1.6459 10.3060 1.2023 40.639 2.3520 1.3162 May 17.4237 1.6538 7.5655 54.908 39.5585 1.6152 10.4412 1.2012 40.077 2.3149 1.2789 June 17.4529 1.6062 7.5401 53.510 41.1766 1.6016 10.5050 1.2011 39.640 2.2837 1.2526
July 16.4263 1.5390 7.4579 51.452 39.9467 1.5494 10.1379 1.2011 38.873 2.2281 1.2288 Aug 16.3600 1.5306 7.3239 52.173 39.6334 1.5480 10.2585 1.2011 38.974 2.2291 1.2400 Sep 16.6413 1.5721 7.3945 53.629 40.4006 1.5837 10.6512 1.2089 39.842 2.3177 1.2856
Oct 16.7207 1.5817 7.4076 53.691 40.3558 1.5879 11.2215 1.2098 39.811 2.3384 1.2974 Nov 16.7689 1.5660 7.3371 52.716 40.2505 1.5695 11.2986 1.2052 39.391 2.3010 1.2828 Dec 16.8664 1.5777 7.3503 53.796 40.3114 1.6009 11.3179 1.2091 40.187 2.3439 1.3119
2013 Jan 16.8760 1.5877 7.3821 54.105 40.1847 1.6326 11.6957 1.2288 39.924 2.3543 1.3288 Feb 16.9872 1.5929 7.4232 54.355 40.3342 1.6546 11.8796 1.2298 39.839 2.3738 1.3359 Mar 16.2322 1.5657 7.4863 52.813 39.9332 1.6164 11.9169 1.2266 38.264 2.3453 1.2964
Apr 15.8895 1.5348 7.5444 53.649 40.7995 1.6120 11.8592 1.2199 37.857 2.3406 1.3026 May 15.9776 1.5774 7.5589 53.693 40.6842 1.6219 12.1798 1.2418 38.667 2.3739 1.2982 June 17.0716 1.6682 7.7394 56.658 42.6490 1.6613 13.2088 1.2322 40.664 2.5028 1.3189
July 16.6893 1.6590 7.8837 56.698 42.8590 1.6595 12.9674 1.2366 40.714 2.5274 1.3080 Aug 17.1996 1.6829 7.9386 58.471 43.9748 1.6941 13.4190 1.2338 42.072 2.6125 1.3310 Sep 17.4471 1.6406 7.9725 58.346 43.5144 1.6860 13.3287 1.2338 42.312 2.6952 1.3348
Oct 17.7413 1.6351 8.1208 58.809 43.7440 1.6956 13.5283 1.2316 42.549 2.7095 1.3635 Nov 17.6340 1.6327 8.2055 58.811 44.1581 1.6833 13.7626 1.2316 42.695 2.7316 1.3493 Dec 17.8278 1.6659 8.4053 60.552 45.0628 1.7244 14.2234 1.2245 44.323 2.8276 1.3704
2014 Jan 17.9964 1.6450 8.3927 61.263 46.0304 1.7327 14.8242 1.2317 44.822 3.0297 1.3610 Feb 18.1561 1.6466 8.3562 61.238 48.2554 1.7295 14.9820 1.2212 44.568 3.0184 1.3659 Mar 18.2447 1.6199 8.2906 61.901 49.9477 1.7513 14.8613 1.2177 44.765 3.0629 1.3823
Apr 18.0485 1.6049 8.2506 61.646 49.2978 1.7345 14.5815 1.2189 44.657 2.9393 1.3813 May 17.7620 1.5957 8.1513 60.258 47.8403 1.7189 14.2995 1.2204 44.686 2.8736 1.3732
* See Explanatory notes, p 59. + Averages: Bundesbank calculations based on the daily euro foreign exchange reference rates published by the ECB.
Deutsche Bundesbank
15
Exchange rate statistics
June 2014
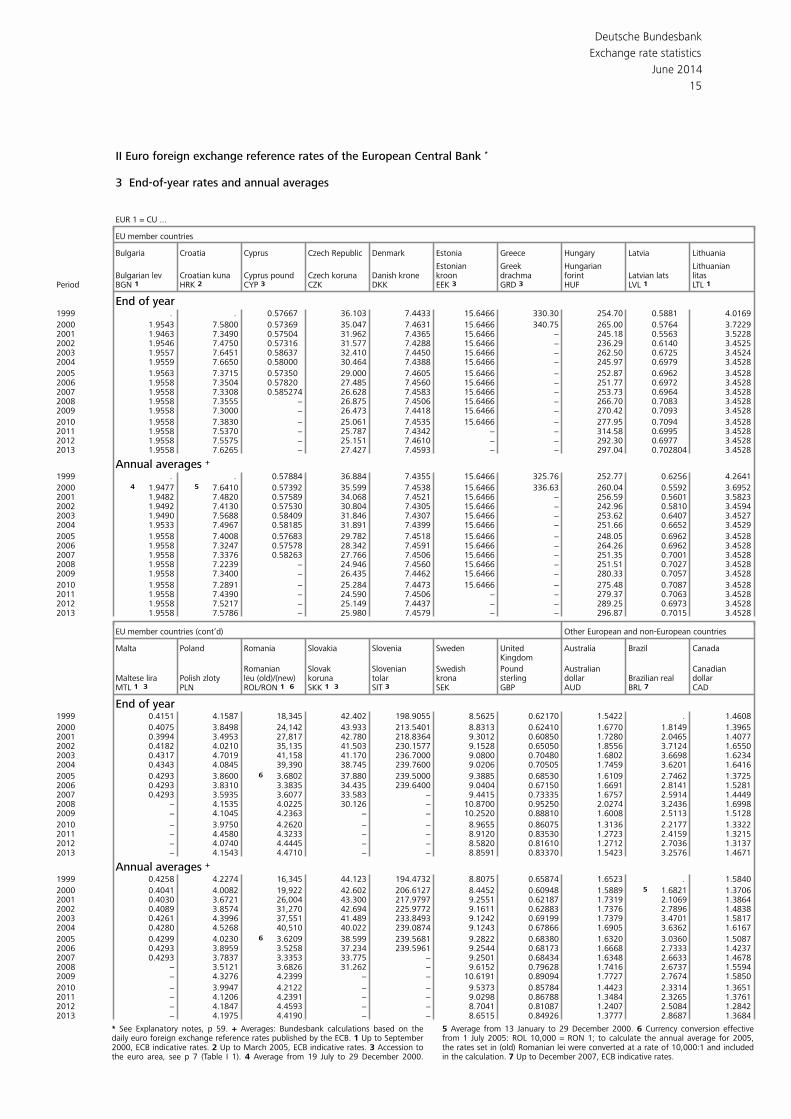
II Euro foreign exchange reference rates of the European Central Bank *
3 End-of-year rates and annual averages
EUR 1 = CU ...
EU member countries
Bulgaria Croatia Cyprus Denmark Estonia Greece Hungary Latvia LithuaniaCzech Republic
Estonian Greek Hungarian LithuanianCyprus pound Czech koruna Danish krone kroon drachma forint Latvian lats litasBulgarian lev Croatian kuna
Period BGN 1 HRK 2 CYP 3 CZK DKK EEK 3 GRD 3 HUF LVL 1 LTL 1
End of year1999 . . 0.57667 36.103 7.4433 15.6466 330.30 254.70 0.5881 4.0169
2000 1.9543 7.5800 0.57369 35.047 7.4631 15.6466 340.75 265.00 0.5764 3.72292001 1.9463 7.3490 0.57504 31.962 7.4365 15.6466 − 245.18 0.5563 3.52282002 1.9546 7.4750 0.57316 31.577 7.4288 15.6466 − 236.29 0.6140 3.45252003 1.9557 7.6451 0.58637 32.410 7.4450 15.6466 − 262.50 0.6725 3.45242004 1.9559 7.6650 0.58000 30.464 7.4388 15.6466 − 245.97 0.6979 3.4528
2005 1.9563 7.3715 0.57350 29.000 7.4605 15.6466 − 252.87 0.6962 3.45282006 1.9558 7.3504 0.57820 27.485 7.4560 15.6466 − 251.77 0.6972 3.45282007 1.9558 7.3308 0.585274 26.628 7.4583 15.6466 − 253.73 0.6964 3.45282008 1.9558 7.3555 − 26.875 7.4506 15.6466 − 266.70 0.7083 3.45282009 1.9558 7.3000 − 26.473 7.4418 15.6466 − 270.42 0.7093 3.4528
2010 1.9558 7.3830 − 25.061 7.4535 15.6466 − 277.95 0.7094 3.45282011 1.9558 7.5370 − 25.787 7.4342 − − 314.58 0.6995 3.45282012 1.9558 7.5575 − 25.151 7.4610 − − 292.30 0.6977 3.45282013 1.9558 7.6265 − 27.427 7.4593 − − 297.04 0.702804 3.4528
Annual averages +
1999 . . 0.57884 36.884 7.4355 15.6466 325.76 252.77 0.6256 4.2641
2000 4 1.9477 5 7.6410 0.57392 35.599 7.4538 15.6466 336.63 260.04 0.5592 3.69522001 1.9482 7.4820 0.57589 34.068 7.4521 15.6466 − 256.59 0.5601 3.58232002 1.9492 7.4130 0.57530 30.804 7.4305 15.6466 − 242.96 0.5810 3.45942003 1.9490 7.5688 0.58409 31.846 7.4307 15.6466 − 253.62 0.6407 3.45272004 1.9533 7.4967 0.58185 31.891 7.4399 15.6466 − 251.66 0.6652 3.4529
2005 1.9558 7.4008 0.57683 29.782 7.4518 15.6466 − 248.05 0.6962 3.45282006 1.9558 7.3247 0.57578 28.342 7.4591 15.6466 − 264.26 0.6962 3.45282007 1.9558 7.3376 0.58263 27.766 7.4506 15.6466 − 251.35 0.7001 3.45282008 1.9558 7.2239 − 24.946 7.4560 15.6466 − 251.51 0.7027 3.45282009 1.9558 7.3400 − 26.435 7.4462 15.6466 − 280.33 0.7057 3.4528
2010 1.9558 7.2891 − 25.284 7.4473 15.6466 − 275.48 0.7087 3.45282011 1.9558 7.4390 − 24.590 7.4506 − − 279.37 0.7063 3.45282012 1.9558 7.5217 − 25.149 7.4437 − − 289.25 0.6973 3.45282013 1.9558 7.5786 − 25.980 7.4579 − − 296.87 0.7015 3.4528
EU member countries (cont’d) Other European and non-European countries
Malta Poland Romania Slovakia Slovenia Sweden United Australia Brazil CanadaKingdom
Romanian Slovak Slovenian Swedish Pound Australian CanadianMaltese lira Polish zloty koruna tolar krona sterling dollar dollarleu (old)/(new) Brazilian realMTL 1 3 PLN SKK 1 3 SIT 3 SEK GBP AUD BRL 7 CADROL/RON 1 6
End of year1999 0.4151 4.1587 18,345 42.402 198.9055 8.5625 0.62170 1.5422 . 1.4608
2000 0.4075 3.8498 24,142 43.933 213.5401 8.8313 0.62410 1.6770 1.8149 1.39652001 0.3994 3.4953 27,817 42.780 218.8364 9.3012 0.60850 1.7280 2.0465 1.40772002 0.4182 4.0210 35,135 41.503 230.1577 9.1528 0.65050 1.8556 3.7124 1.65502003 0.4317 4.7019 41,158 41.170 236.7000 9.0800 0.70480 1.6802 3.6698 1.62342004 0.4343 4.0845 39,390 38.745 239.7600 9.0206 0.70505 1.7459 3.6201 1.6416
2005 0.4293 3.8600 6 3.6802 37.880 239.5000 9.3885 0.68530 1.6109 2.7462 1.37252006 0.4293 3.8310 3.3835 34.435 239.6400 9.0404 0.67150 1.6691 2.8141 1.52812007 0.4293 3.5935 3.6077 33.583 − 9.4415 0.73335 1.6757 2.5914 1.44492008 − 4.1535 4.0225 30.126 − 10.8700 0.95250 2.0274 3.2436 1.69982009 − 4.1045 4.2363 − − 10.2520 0.88810 1.6008 2.5113 1.5128
2010 − 3.9750 4.2620 − − 8.9655 0.86075 1.3136 2.2177 1.33222011 − 4.4580 4.3233 − − 8.9120 0.83530 1.2723 2.4159 1.32152012 − 4.0740 4.4445 − − 8.5820 0.81610 1.2712 2.7036 1.31372013 − 4.1543 4.4710 − − 8.8591 0.83370 1.5423 3.2576 1.4671
Annual averages +
1999 0.4258 4.2274 16,345 44.123 194.4732 8.8075 0.65874 1.6523 . 1.5840
2000 0.4041 4.0082 19,922 42.602 206.6127 8.4452 0.60948 1.5889 5 1.6821 1.37062001 0.4030 3.6721 26,004 43.300 217.9797 9.2551 0.62187 1.7319 2.1069 1.38642002 0.4089 3.8574 31,270 42.694 225.9772 9.1611 0.62883 1.7376 2.7896 1.48382003 0.4261 4.3996 37,551 41.489 233.8493 9.1242 0.69199 1.7379 3.4701 1.58172004 0.4280 4.5268 40,510 40.022 239.0874 9.1243 0.67866 1.6905 3.6362 1.6167
2005 0.4299 4.0230 6 3.6209 38.599 239.5681 9.2822 0.68380 1.6320 3.0360 1.50872006 0.4293 3.8959 3.5258 37.234 239.5961 9.2544 0.68173 1.6668 2.7333 1.42372007 0.4293 3.7837 3.3353 33.775 − 9.2501 0.68434 1.6348 2.6633 1.46782008 − 3.5121 3.6826 31.262 − 9.6152 0.79628 1.7416 2.6737 1.55942009 − 4.3276 4.2399 − − 10.6191 0.89094 1.7727 2.7674 1.5850
2010 − 3.9947 4.2122 − − 9.5373 0.85784 1.4423 2.3314 1.36512011 − 4.1206 4.2391 − − 9.0298 0.86788 1.3484 2.3265 1.37612012 − 4.1847 4.4593 − − 8.7041 0.81087 1.2407 2.5084 1.28422013 − 4.1975 4.4190 − − 8.6515 0.84926 1.3777 2.8687 1.3684
* See Explanatory notes, p 59. + Averages: Bundesbank calculations based on the 5 Average from 13 January to 29 December 2000. 6 Currency conversion effectivedaily euro foreign exchange reference rates published by the ECB. 1 Up to September from 1 July 2005: ROL 10,000 = RON 1; to calculate the annual average for 2005,2000, ECB indicative rates. 2 Up to March 2005, ECB indicative rates. 3 Accession to the rates set in (old) Romanian lei were converted at a rate of 10,000:1 and includedthe euro area, see p 7 (Table I 1). 4 Average from 19 July to 29 December 2000. in the calculation. 7 Up to December 2007, ECB indicative rates.
Deutsche Bundesbank
16
Exchange rate statistics
June 2014
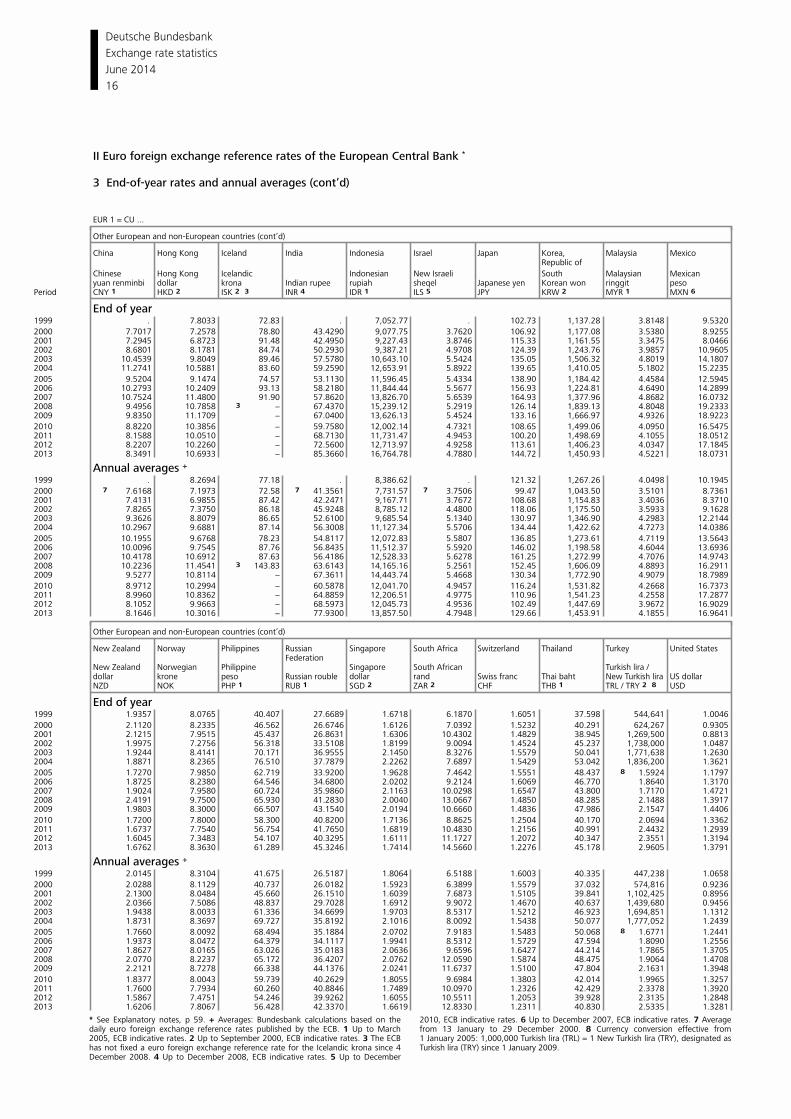
II Euro foreign exchange reference rates of the European Central Bank *
3 End-of-year rates and annual averages (cont’d)
EUR 1 = CU ...
Other European and non-European countries (cont’d)
China Hong Kong Iceland India Indonesia Israel Japan Korea, Malaysia MexicoRepublic of
Chinese Hong Kong Icelandic Indonesian New Israeli South Malaysian Mexicandollar krona Indian rupee rupiah sheqel Japanese yen Korean won ringgit pesoyuan renminbi
Period CNY 1 HKD 2 ISK 2 3 INR 4 IDR 1 ILS 5 JPY KRW 2 MYR 1 MXN 6
End of year1999 . 7.8033 72.83 . 7,052.77 . 102.73 1,137.28 3.8148 9.5320
2000 7.7017 7.2578 78.80 43.4290 9,077.75 3.7620 106.92 1,177.08 3.5380 8.92552001 7.2945 6.8723 91.48 42.4950 9,227.43 3.8746 115.33 1,161.55 3.3475 8.04662002 8.6801 8.1781 84.74 50.2930 9,387.21 4.9708 124.39 1,243.76 3.9857 10.96052003 10.4539 9.8049 89.46 57.5780 10,643.10 5.5424 135.05 1,506.32 4.8019 14.18072004 11.2741 10.5881 83.60 59.2590 12,653.91 5.8922 139.65 1,410.05 5.1802 15.2235
2005 9.5204 9.1474 74.57 53.1130 11,596.45 5.4334 138.90 1,184.42 4.4584 12.59452006 10.2793 10.2409 93.13 58.2180 11,844.44 5.5677 156.93 1,224.81 4.6490 14.28992007 10.7524 11.4800 91.90 57.8620 13,826.70 5.6539 164.93 1,377.96 4.8682 16.07322008 9.4956 10.7858 3 − 67.4370 15,239.12 5.2919 126.14 1,839.13 4.8048 19.23332009 9.8350 11.1709 − 67.0400 13,626.13 5.4524 133.16 1,666.97 4.9326 18.9223
2010 8.8220 10.3856 − 59.7580 12,002.14 4.7321 108.65 1,499.06 4.0950 16.54752011 8.1588 10.0510 − 68.7130 11,731.47 4.9453 100.20 1,498.69 4.1055 18.05122012 8.2207 10.2260 − 72.5600 12,713.97 4.9258 113.61 1,406.23 4.0347 17.18452013 8.3491 10.6933 − 85.3660 16,764.78 4.7880 144.72 1,450.93 4.5221 18.0731
Annual averages +
1999 . 8.2694 77.18 . 8,386.62 . 121.32 1,267.26 4.0498 10.1945
2000 7 7.6168 7.1973 72.58 7 41.3561 7,731.57 7 3.7506 99.47 1,043.50 3.5101 8.73612001 7.4131 6.9855 87.42 42.2471 9,167.71 3.7672 108.68 1,154.83 3.4036 8.37102002 7.8265 7.3750 86.18 45.9248 8,785.12 4.4800 118.06 1,175.50 3.5933 9.16282003 9.3626 8.8079 86.65 52.6100 9,685.54 5.1340 130.97 1,346.90 4.2983 12.21442004 10.2967 9.6881 87.14 56.3008 11,127.34 5.5706 134.44 1,422.62 4.7273 14.0386
2005 10.1955 9.6768 78.23 54.8117 12,072.83 5.5807 136.85 1,273.61 4.7119 13.56432006 10.0096 9.7545 87.76 56.8435 11,512.37 5.5920 146.02 1,198.58 4.6044 13.69362007 10.4178 10.6912 87.63 56.4186 12,528.33 5.6278 161.25 1,272.99 4.7076 14.97432008 10.2236 11.4541 3 143.83 63.6143 14,165.16 5.2561 152.45 1,606.09 4.8893 16.29112009 9.5277 10.8114 − 67.3611 14,443.74 5.4668 130.34 1,772.90 4.9079 18.7989
2010 8.9712 10.2994 − 60.5878 12,041.70 4.9457 116.24 1,531.82 4.2668 16.73732011 8.9960 10.8362 − 64.8859 12,206.51 4.9775 110.96 1,541.23 4.2558 17.28772012 8.1052 9.9663 − 68.5973 12,045.73 4.9536 102.49 1,447.69 3.9672 16.90292013 8.1646 10.3016 − 77.9300 13,857.50 4.7948 129.66 1,453.91 4.1855 16.9641
Other European and non-European countries (cont’d)
New Zealand Norway Philippines Russian Singapore South Africa Switzerland Thailand Turkey United StatesFederation
New Zealand Norwegian Philippine Singapore South African Turkish lira /dollar krone peso dollar rand Swiss franc Thai baht US dollarRussian rouble New Turkish liraNZD NOK PHP 1 RUB 1 SGD 2 ZAR 2 CHF THB 1 USDTRL / TRY 2 8
End of year1999 1.9357 8.0765 40.407 27.6689 1.6718 6.1870 1.6051 37.598 544,641 1.0046
2000 2.1120 8.2335 46.562 26.6746 1.6126 7.0392 1.5232 40.291 624,267 0.93052001 2.1215 7.9515 45.437 26.8631 1.6306 10.4302 1.4829 38.945 1,269,500 0.88132002 1.9975 7.2756 56.318 33.5108 1.8199 9.0094 1.4524 45.237 1,738,000 1.04872003 1.9244 8.4141 70.171 36.9555 2.1450 8.3276 1.5579 50.041 1,771,638 1.26302004 1.8871 8.2365 76.510 37.7879 2.2262 7.6897 1.5429 53.042 1,836,200 1.3621
2005 1.7270 7.9850 62.719 33.9200 1.9628 7.4642 1.5551 48.437 8 1.5924 1.17972006 1.8725 8.2380 64.546 34.6800 2.0202 9.2124 1.6069 46.770 1.8640 1.31702007 1.9024 7.9580 60.724 35.9860 2.1163 10.0298 1.6547 43.800 1.7170 1.47212008 2.4191 9.7500 65.930 41.2830 2.0040 13.0667 1.4850 48.285 2.1488 1.39172009 1.9803 8.3000 66.507 43.1540 2.0194 10.6660 1.4836 47.986 2.1547 1.4406
2010 1.7200 7.8000 58.300 40.8200 1.7136 8.8625 1.2504 40.170 2.0694 1.33622011 1.6737 7.7540 56.754 41.7650 1.6819 10.4830 1.2156 40.991 2.4432 1.29392012 1.6045 7.3483 54.107 40.3295 1.6111 11.1727 1.2072 40.347 2.3551 1.31942013 1.6762 8.3630 61.289 45.3246 1.7414 14.5660 1.2276 45.178 2.9605 1.3791
Annual averages +
1999 2.0145 8.3104 41.675 26.5187 1.8064 6.5188 1.6003 40.335 447,238 1.0658
2000 2.0288 8.1129 40.737 26.0182 1.5923 6.3899 1.5579 37.032 574,816 0.92362001 2.1300 8.0484 45.660 26.1510 1.6039 7.6873 1.5105 39.841 1,102,425 0.89562002 2.0366 7.5086 48.837 29.7028 1.6912 9.9072 1.4670 40.637 1,439,680 0.94562003 1.9438 8.0033 61.336 34.6699 1.9703 8.5317 1.5212 46.923 1,694,851 1.13122004 1.8731 8.3697 69.727 35.8192 2.1016 8.0092 1.5438 50.077 1,777,052 1.2439
2005 1.7660 8.0092 68.494 35.1884 2.0702 7.9183 1.5483 50.068 8 1.6771 1.24412006 1.9373 8.0472 64.379 34.1117 1.9941 8.5312 1.5729 47.594 1.8090 1.25562007 1.8627 8.0165 63.026 35.0183 2.0636 9.6596 1.6427 44.214 1.7865 1.37052008 2.0770 8.2237 65.172 36.4207 2.0762 12.0590 1.5874 48.475 1.9064 1.47082009 2.2121 8.7278 66.338 44.1376 2.0241 11.6737 1.5100 47.804 2.1631 1.3948
2010 1.8377 8.0043 59.739 40.2629 1.8055 9.6984 1.3803 42.014 1.9965 1.32572011 1.7600 7.7934 60.260 40.8846 1.7489 10.0970 1.2326 42.429 2.3378 1.39202012 1.5867 7.4751 54.246 39.9262 1.6055 10.5511 1.2053 39.928 2.3135 1.28482013 1.6206 7.8067 56.428 42.3370 1.6619 12.8330 1.2311 40.830 2.5335 1.3281
* See Explanatory notes, p 59. + Averages: Bundesbank calculations based on the 2010, ECB indicative rates. 6 Up to December 2007, ECB indicative rates. 7 Averagedaily euro foreign exchange reference rates published by the ECB. 1 Up to March from 13 January to 29 December 2000. 8 Currency conversion effective from2005, ECB indicative rates. 2 Up to September 2000, ECB indicative rates. 3 The ECB 1 January 2005: 1,000,000 Turkish lira (TRL) = 1 New Turkish lira (TRY), designated ashas not fixed a euro foreign exchange reference rate for the Icelandic krona since 4 Turkish lira (TRY) since 1 January 2009. December 2008. 4 Up to December 2008, ECB indicative rates. 5 Up to December
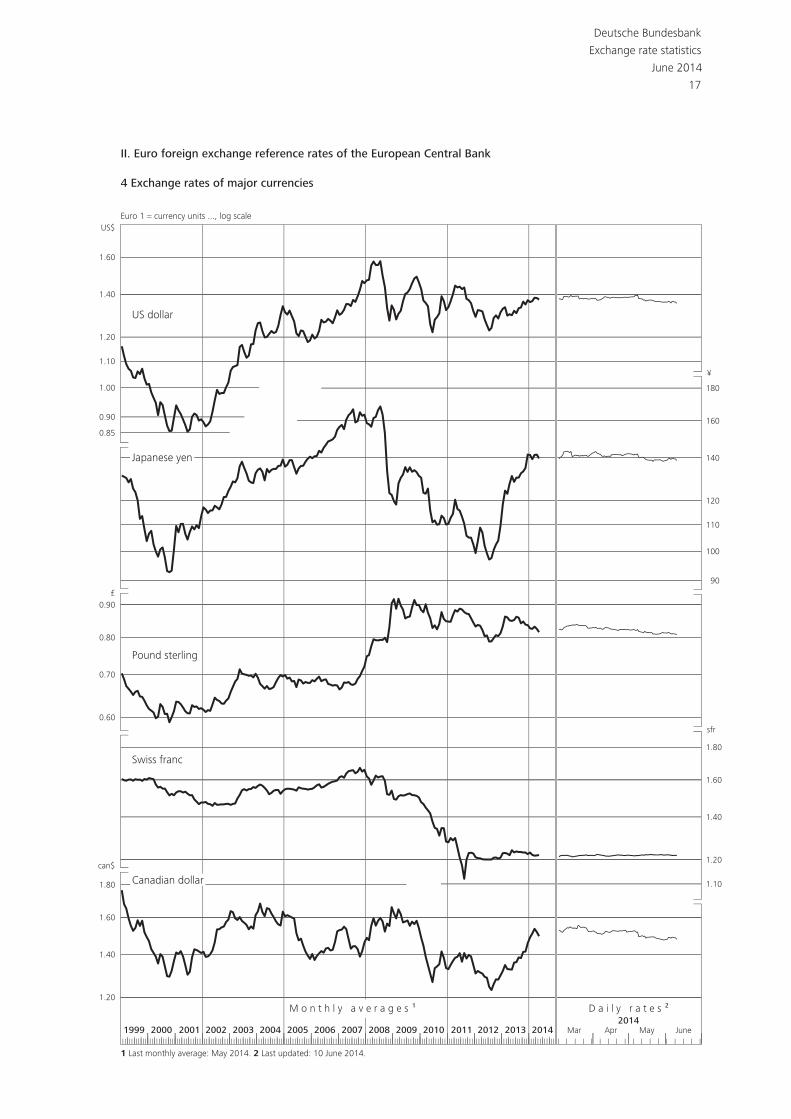
II. Euro foreign exchange reference rates of the European Central Bank
4 Exchange rates of major currencies
1 Last monthly average: May 2014. 2 Last updated: 10 June 2014.
0.85
0.90
1.00
1.10
1.20
1.40
1.60
90
100
110
120
140
160
180
0.60
0.70
0.80
0.90
1.10
1.20
1.40
1.60
1.80
1.20
1.40
1.60
1.80
Mar Apr May June2014
1999 2000 2001 2002 2003 2004 2005 2006 2007 2008 2009 2010 2011 2012 2013 2014
Euro 1 = currency units ..., log scale
Deutsche Bundesbank
Exchange rate statistics
June 2014
17
M o n t h l y a v e r a g e s 1 D a i l y r a t e s 2
US dollar
Japanese yen
Pound sterling
Swiss franc
Canadian dollarcan$
sfr
¥
£
US$
Deutsche Bundesbank
18
Exchange rate statistics
June 2014
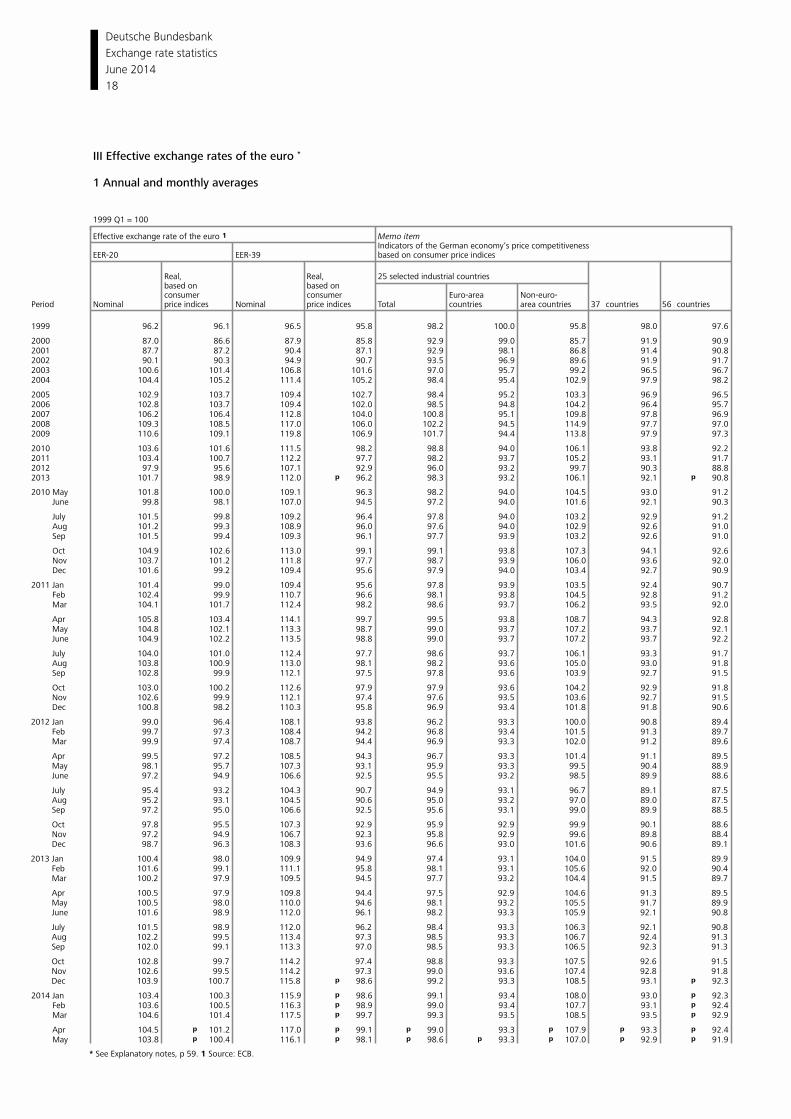
III Effective exchange rates of the euro *
1 Annual and monthly averages
1999 Q1 = 100
Effective exchange rate of the euro 1 Memo itemIndicators of the German economy‘s price competitiveness
EER-20 EER-39 based on consumer price indices
Real, Real, 25 selected industrial countriesbased on based onconsumer consumer Euro-area Non-euro-
Period Nominal price indices Nominal price indices Total countries area countries 37 countries 56 countries
1999 96.2 96.1 96.5 95.8 98.2 100.0 95.8 98.0 97.6
2000 87.0 86.6 87.9 85.8 92.9 99.0 85.7 91.9 90.92001 87.7 87.2 90.4 87.1 92.9 98.1 86.8 91.4 90.82002 90.1 90.3 94.9 90.7 93.5 96.9 89.6 91.9 91.72003 100.6 101.4 106.8 101.6 97.0 95.7 99.2 96.5 96.72004 104.4 105.2 111.4 105.2 98.4 95.4 102.9 97.9 98.2
2005 102.9 103.7 109.4 102.7 98.4 95.2 103.3 96.9 96.52006 102.8 103.7 109.4 102.0 98.5 94.8 104.2 96.4 95.72007 106.2 106.4 112.8 104.0 100.8 95.1 109.8 97.8 96.92008 109.3 108.5 117.0 106.0 102.2 94.5 114.9 97.7 97.02009 110.6 109.1 119.8 106.9 101.7 94.4 113.8 97.9 97.3
2010 103.6 101.6 111.5 98.2 98.8 94.0 106.1 93.8 92.22011 103.4 100.7 112.2 97.7 98.2 93.7 105.2 93.1 91.72012 97.9 95.6 107.1 92.9 96.0 93.2 99.7 90.3 88.82013 101.7 98.9 112.0 p 96.2 98.3 93.2 106.1 92.1 p 90.8
2010 May 101.8 100.0 109.1 96.3 98.2 94.0 104.5 93.0 91.2 June 99.8 98.1 107.0 94.5 97.2 94.0 101.6 92.1 90.3
July 101.5 99.8 109.2 96.4 97.8 94.0 103.2 92.9 91.2 Aug 101.2 99.3 108.9 96.0 97.6 94.0 102.9 92.6 91.0 Sep 101.5 99.4 109.3 96.1 97.7 93.9 103.2 92.6 91.0
Oct 104.9 102.6 113.0 99.1 99.1 93.8 107.3 94.1 92.6 Nov 103.7 101.2 111.8 97.7 98.7 93.9 106.0 93.6 92.0 Dec 101.6 99.2 109.4 95.6 97.9 94.0 103.4 92.7 90.9
2011 Jan 101.4 99.0 109.4 95.6 97.8 93.9 103.5 92.4 90.7 Feb 102.4 99.9 110.7 96.6 98.1 93.8 104.5 92.8 91.2 Mar 104.1 101.7 112.4 98.2 98.6 93.7 106.2 93.5 92.0
Apr 105.8 103.4 114.1 99.7 99.5 93.8 108.7 94.3 92.8 May 104.8 102.1 113.3 98.7 99.0 93.7 107.2 93.7 92.1 June 104.9 102.2 113.5 98.8 99.0 93.7 107.2 93.7 92.2
July 104.0 101.0 112.4 97.7 98.6 93.7 106.1 93.3 91.7 Aug 103.8 100.9 113.0 98.1 98.2 93.6 105.0 93.0 91.8 Sep 102.8 99.9 112.1 97.5 97.8 93.6 103.9 92.7 91.5
Oct 103.0 100.2 112.6 97.9 97.9 93.6 104.2 92.9 91.8 Nov 102.6 99.9 112.1 97.4 97.6 93.5 103.6 92.7 91.5 Dec 100.8 98.2 110.3 95.8 96.9 93.4 101.8 91.8 90.6
2012 Jan 99.0 96.4 108.1 93.8 96.2 93.3 100.0 90.8 89.4 Feb 99.7 97.3 108.4 94.2 96.8 93.4 101.5 91.3 89.7 Mar 99.9 97.4 108.7 94.4 96.9 93.3 102.0 91.2 89.6
Apr 99.5 97.2 108.5 94.3 96.7 93.3 101.4 91.1 89.5 May 98.1 95.7 107.3 93.1 95.9 93.3 99.5 90.4 88.9 June 97.2 94.9 106.6 92.5 95.5 93.2 98.5 89.9 88.6
July 95.4 93.2 104.3 90.7 94.9 93.1 96.7 89.1 87.5 Aug 95.2 93.1 104.5 90.6 95.0 93.2 97.0 89.0 87.5 Sep 97.2 95.0 106.6 92.5 95.6 93.1 99.0 89.9 88.5
Oct 97.8 95.5 107.3 92.9 95.9 92.9 99.9 90.1 88.6 Nov 97.2 94.9 106.7 92.3 95.8 92.9 99.6 89.8 88.4 Dec 98.7 96.3 108.3 93.6 96.6 93.0 101.6 90.6 89.1
2013 Jan 100.4 98.0 109.9 94.9 97.4 93.1 104.0 91.5 89.9 Feb 101.6 99.1 111.1 95.8 98.1 93.1 105.6 92.0 90.4 Mar 100.2 97.9 109.5 94.5 97.7 93.2 104.4 91.5 89.7
Apr 100.5 97.9 109.8 94.4 97.5 92.9 104.6 91.3 89.5 May 100.5 98.0 110.0 94.6 98.1 93.2 105.5 91.7 89.9 June 101.6 98.9 112.0 96.1 98.2 93.3 105.9 92.1 90.8
July 101.5 98.9 112.0 96.2 98.4 93.3 106.3 92.1 90.8 Aug 102.2 99.5 113.4 97.3 98.5 93.3 106.7 92.4 91.3 Sep 102.0 99.1 113.3 97.0 98.5 93.3 106.5 92.3 91.3
Oct 102.8 99.7 114.2 97.4 98.8 93.3 107.5 92.6 91.5 Nov 102.6 99.5 114.2 97.3 99.0 93.6 107.4 92.8 91.8 Dec 103.9 100.7 115.8 p 98.6 99.2 93.3 108.5 93.1 p 92.3
2014 Jan 103.4 100.3 115.9 p 98.6 99.1 93.4 108.0 93.0 p 92.3 Feb 103.6 100.5 116.3 p 98.9 99.0 93.4 107.7 93.1 p 92.4 Mar 104.6 101.4 117.5 p 99.7 99.3 93.5 108.5 93.5 p 92.9
Apr 104.5 p 101.2 117.0 p 99.1 p 99.0 93.3 p 107.9 p 93.3 p 92.4 May 103.8 p 100.4 116.1 p 98.1 p 98.6 p 93.3 p 107.0 p 92.9 p 91.9
* See Explanatory notes, p 59. 1 Source: ECB.
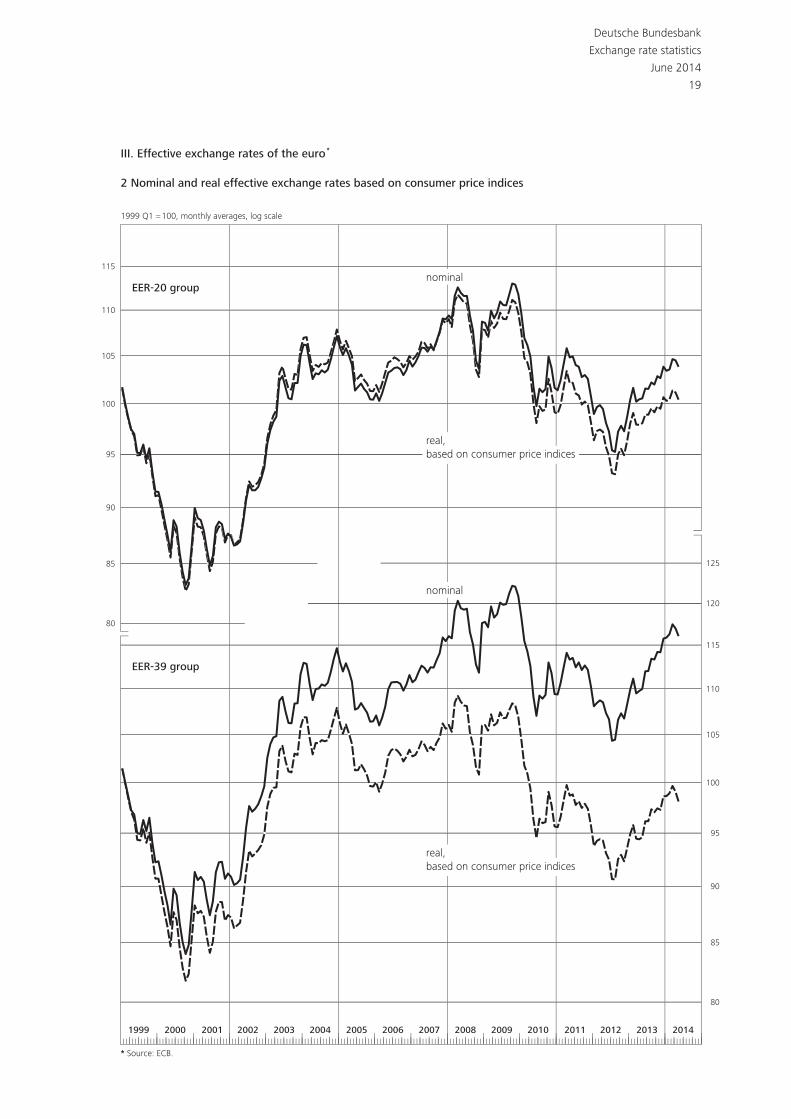
III. Effective exchange rates of the euro *
2 Nominal and real effective exchange rates based on consumer price indices
1999 2000 2001 2002 2003 2004 2005 2006 2007 2008 2009 2010 2011 2012 2013 2014
80
85
90
95
100
105
110
115
Deutsche Bundesbank
Exchange rate statistics
June 2014
19
nominal
real,based on consumer price indices
real,based on consumer price indices
EER-20 groupnominal
EER-39 group
* Source: ECB.
1999 Q1 = 100, monthly averages, log scale
80
85
90
95
100
105
110
115
120
125
Deutsche Bundesbank
20
Exchange rate statistics
June 2014
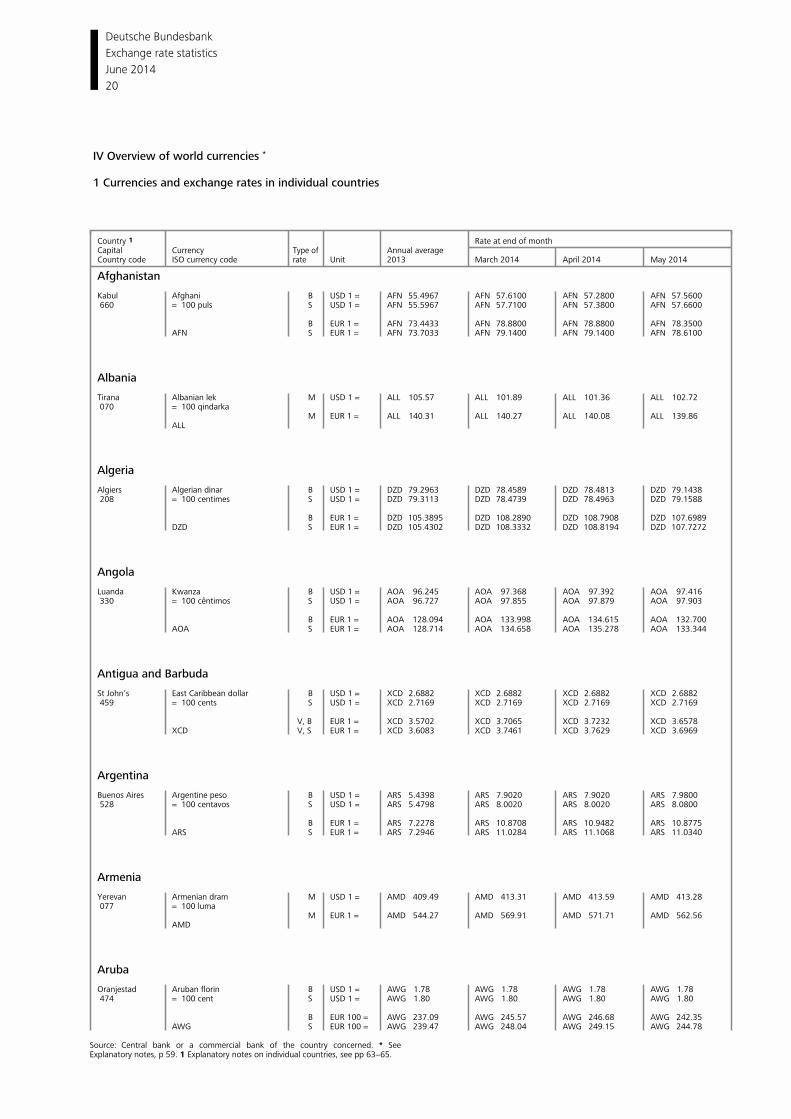
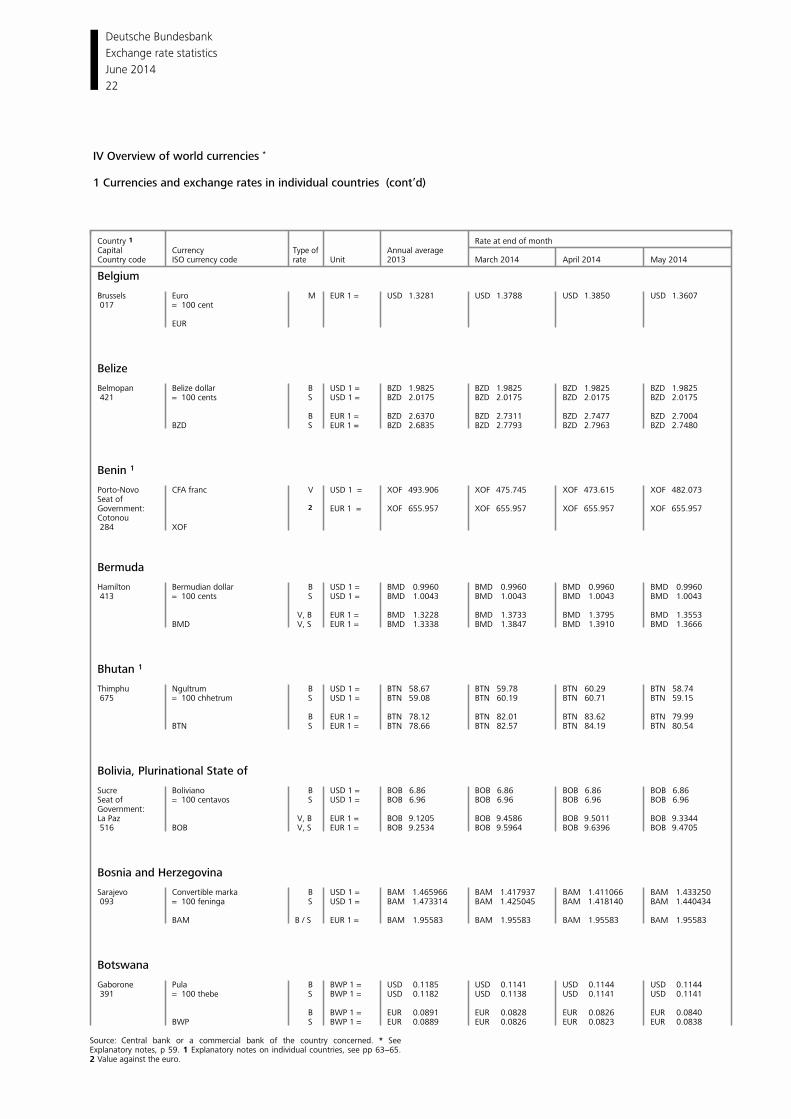
IV Overview of world currencies *
1 Currencies and exchange rates in individual countries
Country 1 Rate at end of monthCapital Currency Annual average Type of
ISO currency code Unit 2013 March 2014 April 2014 May 2014Country code rate
Afghanistan Kabul Afghani B USD 1 = AFN 55.4967 AFN 57.6100 AFN 57.2800 AFN 57.5600 660 = 100 puls S USD 1 = AFN 55.5967 AFN 57.7100 AFN 57.3800 AFN 57.6600
B EUR 1 = AFN 73.4433 AFN 78.8800 AFN 78.8800 AFN 78.3500AFN S EUR 1 = AFN 73.7033 AFN 79.1400 AFN 79.1400 AFN 78.6100
Albania Tirana Albanian lek M USD 1 = ALL 105.57 ALL 101.89 ALL 101.36 ALL 102.72 070 = 100 qindarka
M EUR 1 = ALL 140.31 ALL 140.27 ALL 140.08 ALL 139.86ALL
Algeria Algiers Algerian dinar B USD 1 = DZD 79.2963 DZD 78.4589 DZD 78.4813 DZD 79.1438 208 = 100 centimes S USD 1 = DZD 79.3113 DZD 78.4739 DZD 78.4963 DZD 79.1588
B EUR 1 = DZD 105.3895 DZD 108.2890 DZD 108.7908 DZD 107.6989DZD S EUR 1 = DZD 105.4302 DZD 108.3332 DZD 108.8194 DZD 107.7272
Angola Luanda Kwanza B USD 1 = AOA 96.245 AOA 97.368 AOA 97.392 AOA 97.416 330 = 100 cêntimos S USD 1 = AOA 96.727 AOA 97.855 AOA 97.879 AOA 97.903
B EUR 1 = AOA 128.094 AOA 133.998 AOA 134.615 AOA 132.700AOA S EUR 1 = AOA 128.714 AOA 134.658 AOA 135.278 AOA 133.344
Antigua and Barbuda St John’s East Caribbean dollar B USD 1 = XCD 2.6882 XCD 2.6882 XCD 2.6882 XCD 2.6882 459 = 100 cents S USD 1 = XCD 2.7169 XCD 2.7169 XCD 2.7169 XCD 2.7169
V, B EUR 1 = XCD 3.5702 XCD 3.7065 XCD 3.7232 XCD 3.6578XCD V, S EUR 1 = XCD 3.6083 XCD 3.7461 XCD 3.7629 XCD 3.6969
Argentina Buenos Aires Argentine peso B USD 1 = ARS 5.4398 ARS 7.9020 ARS 7.9020 ARS 7.9800 528 = 100 centavos S USD 1 = ARS 5.4798 ARS 8.0020 ARS 8.0020 ARS 8.0800
B EUR 1 = ARS 7.2278 ARS 10.8708 ARS 10.9482 ARS 10.8775ARS S EUR 1 = ARS 7.2946 ARS 11.0284 ARS 11.1068 ARS 11.0340
Armenia Yerevan Armenian dram M USD 1 = AMD 409.49 AMD 413.31 AMD 413.59 AMD 413.28 077 = 100 luma
M EUR 1 = AMD 544.27 AMD 569.91 AMD 571.71 AMD 562.56AMD
Aruba Oranjestad Aruban florin B USD 1 = AWG 1.78 AWG 1.78 AWG 1.78 AWG 1.78 474 = 100 cent S USD 1 = AWG 1.80 AWG 1.80 AWG 1.80 AWG 1.80
B EUR 100 = AWG 237.09 AWG 245.57 AWG 246.68 AWG 242.35AWG S EUR 100 = AWG 239.47 AWG 248.04 AWG 249.15 AWG 244.78
Source: Central bank or a commercial bank of the country concerned. * See Explanatory notes, p 59. 1 Explanatory notes on individual countries, see pp 63−65.
Deutsche Bundesbank
21
Exchange rate statistics
June 2014
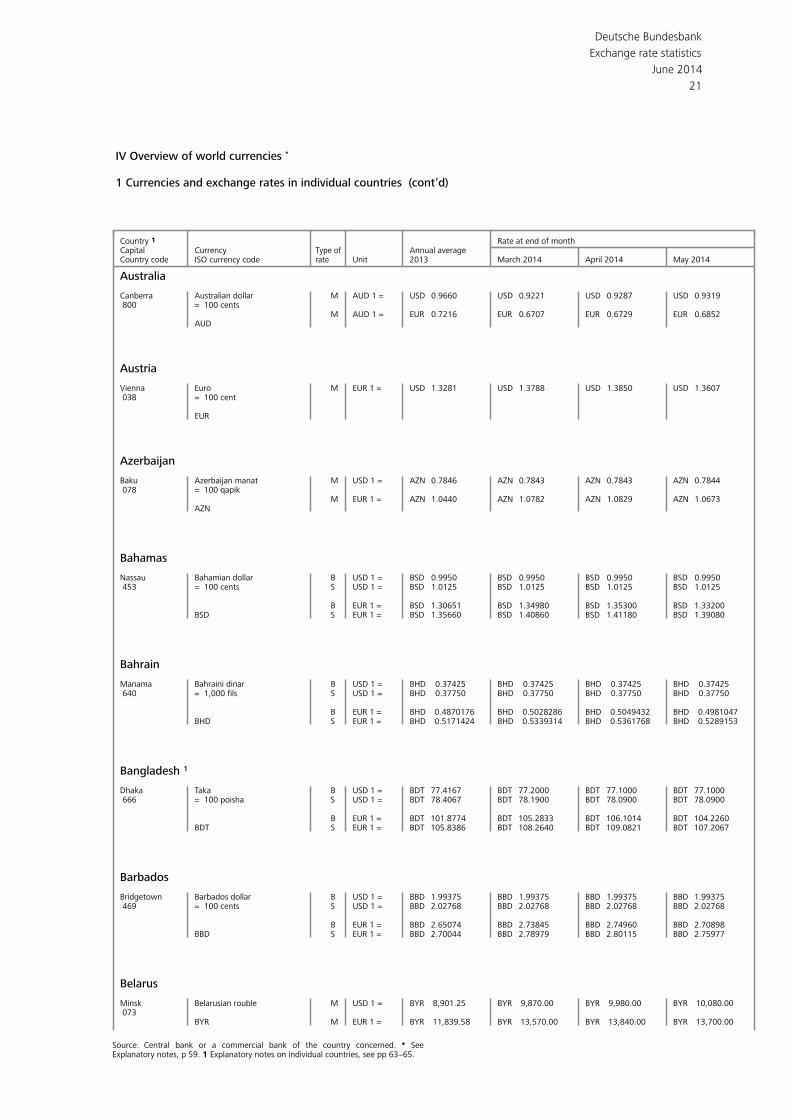
IV Overview of world currencies *
1 Currencies and exchange rates in individual countries (cont’d)
Country 1 Rate at end of monthCapital Currency Annual average Type of
ISO currency code Unit 2013 March 2014 April 2014 May 2014Country code rate
Australia Canberra Australian dollar M AUD 1 = USD 0.9660 USD 0.9221 USD 0.9287 USD 0.9319 800 = 100 cents
M AUD 1 = EUR 0.7216 EUR 0.6707 EUR 0.6729 EUR 0.6852AUD
Austria Vienna Euro M EUR 1 = USD 1.3281 USD 1.3788 USD 1.3850 USD 1.3607 038 = 100 cent
EUR
Azerbaijan Baku Azerbaijan manat M USD 1 = AZN 0.7846 AZN 0.7843 AZN 0.7843 AZN 0.7844 078 = 100 qapik
M EUR 1 = AZN 1.0440 AZN 1.0782 AZN 1.0829 AZN 1.0673AZN
Bahamas Nassau Bahamian dollar B USD 1 = BSD 0.9950 BSD 0.9950 BSD 0.9950 BSD 0.9950 453 = 100 cents S USD 1 = BSD 1.0125 BSD 1.0125 BSD 1.0125 BSD 1.0125
B EUR 1 = BSD 1.30651 BSD 1.34980 BSD 1.35300 BSD 1.33200BSD S EUR 1 = BSD 1.35660 BSD 1.40860 BSD 1.41180 BSD 1.39080
Bahrain Manama Bahraini dinar B USD 1 = BHD 0.37425 BHD 0.37425 BHD 0.37425 BHD 0.37425 640 = 1,000 fils S USD 1 = BHD 0.37750 BHD 0.37750 BHD 0.37750 BHD 0.37750
B EUR 1 = BHD 0.4870176 BHD 0.5028286 BHD 0.5049432 BHD 0.4981047BHD S EUR 1 = BHD 0.5171424 BHD 0.5339314 BHD 0.5361768 BHD 0.5289153
Bangladesh 1 Dhaka Taka B USD 1 = BDT 77.4167 BDT 77.2000 BDT 77.1000 BDT 77.1000 666 = 100 poisha S USD 1 = BDT 78.4067 BDT 78.1900 BDT 78.0900 BDT 78.0900
B EUR 1 = BDT 101.8774 BDT 105.2833 BDT 106.1014 BDT 104.2260BDT S EUR 1 = BDT 105.8386 BDT 108.2640 BDT 109.0821 BDT 107.2067
Barbados Bridgetown Barbados dollar B USD 1 = BBD 1.99375 BBD 1.99375 BBD 1.99375 BBD 1.99375 469 = 100 cents S USD 1 = BBD 2.02768 BBD 2.02768 BBD 2.02768 BBD 2.02768
B EUR 1 = BBD 2.65074 BBD 2.73845 BBD 2.74960 BBD 2.70898BBD S EUR 1 = BBD 2.70044 BBD 2.78979 BBD 2.80115 BBD 2.75977
Belarus Minsk Belarusian rouble M USD 1 = BYR 8,901.25 BYR 9,870.00 BYR 9,980.00 BYR 10,080.00 073
BYR M EUR 1 = BYR 11,839.58 BYR 13,570.00 BYR 13,840.00 BYR 13,700.00
Source: Central bank or a commercial bank of the country concerned. * See Explanatory notes, p 59. 1 Explanatory notes on individual countries, see pp 63−65.
Deutsche Bundesbank
22
Exchange rate statistics
June 2014
IV Overview of world currencies *
1 Currencies and exchange rates in individual countries (cont’d)
Country 1 Rate at end of monthCapital Currency Annual average Type of
ISO currency code Unit 2013 March 2014 April 2014 May 2014Country code rate
Belgium Brussels Euro M EUR 1 = USD 1.3281 USD 1.3788 USD 1.3850 USD 1.3607 017 = 100 cent
EUR
Belize Belmopan Belize dollar B USD 1 = BZD 1.9825 BZD 1.9825 BZD 1.9825 BZD 1.9825 421 = 100 cents S USD 1 = BZD 2.0175 BZD 2.0175 BZD 2.0175 BZD 2.0175
B EUR 1 = BZD 2.6370 BZD 2.7311 BZD 2.7477 BZD 2.7004BZD S EUR 1 = BZD 2.6835 BZD 2.7793 BZD 2.7963 BZD 2.7480
Benin 1 Porto-Novo CFA franc V USD 1 = XOF 493.906 XOF 475.745 XOF 473.615 XOF 482.073Seat ofGovernment: 2 EUR 1 = XOF 655.957 XOF 655.957 XOF 655.957 XOF 655.957Cotonou 284 XOF
Bermuda Hamilton Bermudian dollar B USD 1 = BMD 0.9960 BMD 0.9960 BMD 0.9960 BMD 0.9960 413 = 100 cents S USD 1 = BMD 1.0043 BMD 1.0043 BMD 1.0043 BMD 1.0043
V, B EUR 1 = BMD 1.3228 BMD 1.3733 BMD 1.3795 BMD 1.3553BMD V, S EUR 1 = BMD 1.3338 BMD 1.3847 BMD 1.3910 BMD 1.3666
Bhutan 1 Thimphu Ngultrum B USD 1 = BTN 58.67 BTN 59.78 BTN 60.29 BTN 58.74 675 = 100 chhetrum S USD 1 = BTN 59.08 BTN 60.19 BTN 60.71 BTN 59.15
B EUR 1 = BTN 78.12 BTN 82.01 BTN 83.62 BTN 79.99BTN S EUR 1 = BTN 78.66 BTN 82.57 BTN 84.19 BTN 80.54
Bolivia, Plurinational State of Sucre Boliviano B USD 1 = BOB 6.86 BOB 6.86 BOB 6.86 BOB 6.86Seat of = 100 centavos S USD 1 = BOB 6.96 BOB 6.96 BOB 6.96 BOB 6.96Government:La Paz V, B EUR 1 = BOB 9.1205 BOB 9.4586 BOB 9.5011 BOB 9.3344 516 BOB V, S EUR 1 = BOB 9.2534 BOB 9.5964 BOB 9.6396 BOB 9.4705
Bosnia and Herzegovina Sarajevo Convertible marka B USD 1 = BAM 1.465966 BAM 1.417937 BAM 1.411066 BAM 1.433250 093 = 100 feninga S USD 1 = BAM 1.473314 BAM 1.425045 BAM 1.418140 BAM 1.440434
BAM B / S EUR 1 = BAM 1.95583 BAM 1.95583 BAM 1.95583 BAM 1.95583
Botswana Gaborone Pula B BWP 1 = USD 0.1185 USD 0.1141 USD 0.1144 USD 0.1144 391 = 100 thebe S BWP 1 = USD 0.1182 USD 0.1138 USD 0.1141 USD 0.1141
B BWP 1 = EUR 0.0891 EUR 0.0828 EUR 0.0826 EUR 0.0840BWP S BWP 1 = EUR 0.0889 EUR 0.0826 EUR 0.0823 EUR 0.0838
Source: Central bank or a commercial bank of the country concerned. * See Explanatory notes, p 59. 1 Explanatory notes on individual countries, see pp 63−65. 2 Value against the euro.
Deutsche Bundesbank
23
Exchange rate statistics
June 2014
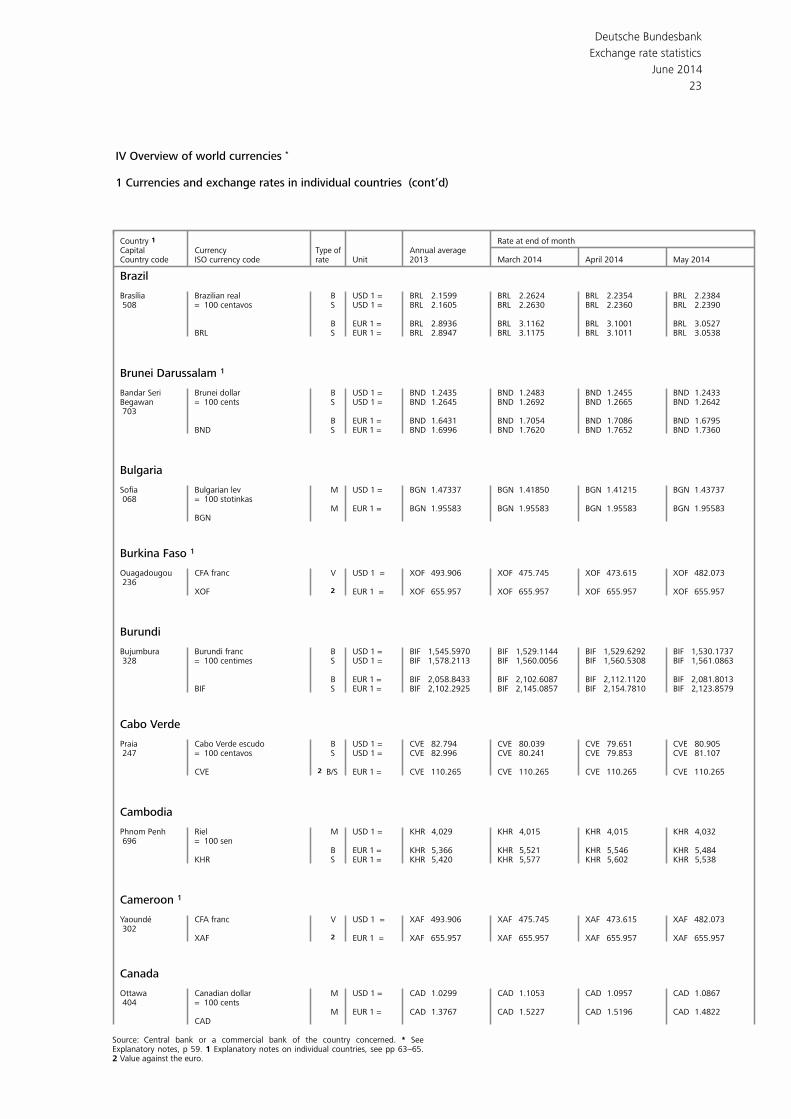
IV Overview of world currencies *
1 Currencies and exchange rates in individual countries (cont’d)
Country 1 Rate at end of monthCapital Currency Annual average Type of
ISO currency code Unit 2013 March 2014 April 2014 May 2014Country code rate
Brazil Brasília Brazilian real B USD 1 = BRL 2.1599 BRL 2.2624 BRL 2.2354 BRL 2.2384 508 = 100 centavos S USD 1 = BRL 2.1605 BRL 2.2630 BRL 2.2360 BRL 2.2390
B EUR 1 = BRL 2.8936 BRL 3.1162 BRL 3.1001 BRL 3.0527BRL S EUR 1 = BRL 2.8947 BRL 3.1175 BRL 3.1011 BRL 3.0538
Brunei Darussalam 1 Bandar Seri Brunei dollar B USD 1 = BND 1.2435 BND 1.2483 BND 1.2455 BND 1.2433Begawan = 100 cents S USD 1 = BND 1.2645 BND 1.2692 BND 1.2665 BND 1.2642 703
B EUR 1 = BND 1.6431 BND 1.7054 BND 1.7086 BND 1.6795BND S EUR 1 = BND 1.6996 BND 1.7620 BND 1.7652 BND 1.7360
Bulgaria Sofia Bulgarian lev M USD 1 = BGN 1.47337 BGN 1.41850 BGN 1.41215 BGN 1.43737 068 = 100 stotinkas
M EUR 1 = BGN 1.95583 BGN 1.95583 BGN 1.95583 BGN 1.95583BGN
Burkina Faso 1 Ouagadougou CFA franc V USD 1 = XOF 493.906 XOF 475.745 XOF 473.615 XOF 482.073 236
XOF 2 EUR 1 = XOF 655.957 XOF 655.957 XOF 655.957 XOF 655.957
Burundi Bujumbura Burundi franc B USD 1 = BIF 1,545.5970 BIF 1,529.1144 BIF 1,529.6292 BIF 1,530.1737 328 = 100 centimes S USD 1 = BIF 1,578.2113 BIF 1,560.0056 BIF 1,560.5308 BIF 1,561.0863
B EUR 1 = BIF 2,058.8433 BIF 2,102.6087 BIF 2,112.1120 BIF 2,081.8013BIF S EUR 1 = BIF 2,102.2925 BIF 2,145.0857 BIF 2,154.7810 BIF 2,123.8579
Cabo Verde Praia Cabo Verde escudo B USD 1 = CVE 82.794 CVE 80.039 CVE 79.651 CVE 80.905 247 = 100 centavos S USD 1 = CVE 82.996 CVE 80.241 CVE 79.853 CVE 81.107
CVE B/S EUR 1 = CVE 110.265 CVE 110.265 CVE 110.265 CVE 110.2652
Cambodia Phnom Penh Riel M USD 1 = KHR 4,029 KHR 4,015 KHR 4,015 KHR 4,032 696 = 100 sen
B EUR 1 = KHR 5,366 KHR 5,521 KHR 5,546 KHR 5,484KHR S EUR 1 = KHR 5,420 KHR 5,577 KHR 5,602 KHR 5,538
Cameroon 1 Yaoundé CFA franc V USD 1 = XAF 493.906 XAF 475.745 XAF 473.615 XAF 482.073 302
XAF 2 EUR 1 = XAF 655.957 XAF 655.957 XAF 655.957 XAF 655.957
Canada Ottawa Canadian dollar M USD 1 = CAD 1.0299 CAD 1.1053 CAD 1.0957 CAD 1.0867 404 = 100 cents
M EUR 1 = CAD 1.3767 CAD 1.5227 CAD 1.5196 CAD 1.4822CAD
Source: Central bank or a commercial bank of the country concerned. * See Explanatory notes, p 59. 1 Explanatory notes on individual countries, see pp 63−65. 2 Value against the euro.
Deutsche Bundesbank
24
Exchange rate statistics
June 2014
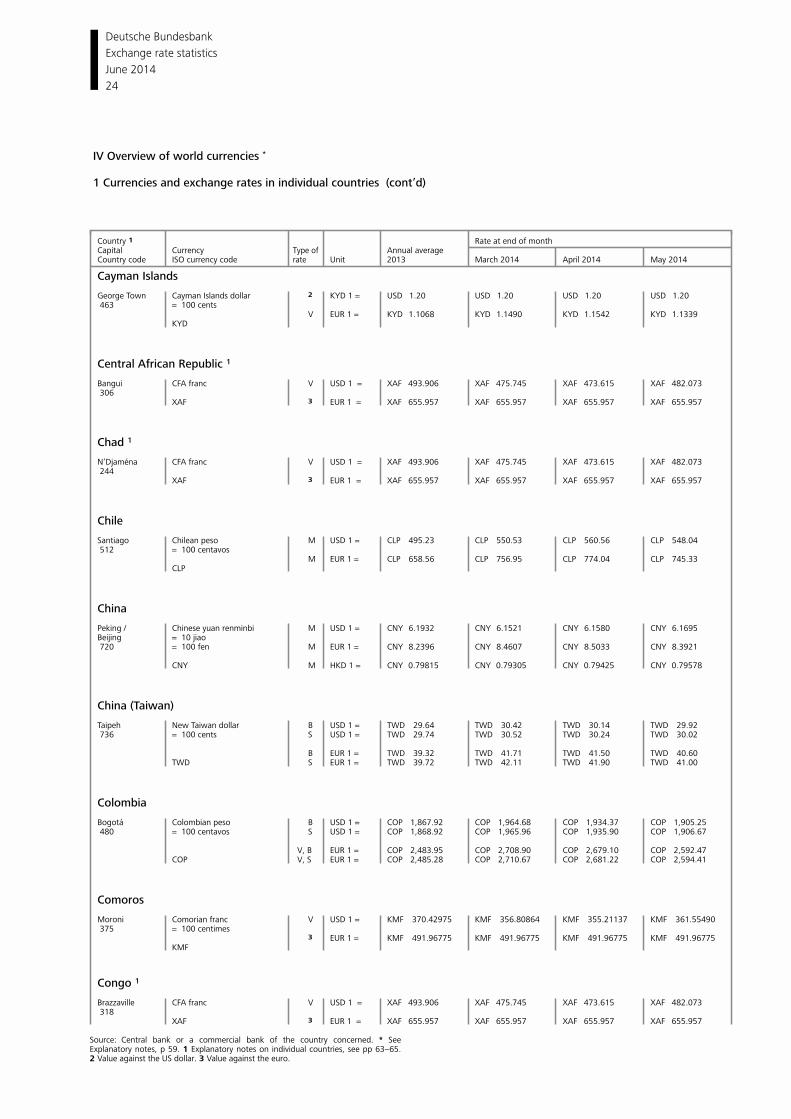
IV Overview of world currencies *
1 Currencies and exchange rates in individual countries (cont’d)
Country 1 Rate at end of monthCapital Currency Annual average Type of
ISO currency code Unit 2013 March 2014 April 2014 May 2014Country code rate
Cayman Islands George Town Cayman Islands dollar 2 KYD 1 = USD 1.20 USD 1.20 USD 1.20 USD 1.20 463 = 100 cents
V EUR 1 = KYD 1.1068 KYD 1.1490 KYD 1.1542 KYD 1.1339 KYD
Central African Republic 1 Bangui CFA franc V USD 1 = XAF 493.906 XAF 475.745 XAF 473.615 XAF 482.073 306
XAF 3 EUR 1 = XAF 655.957 XAF 655.957 XAF 655.957 XAF 655.957
Chad 1 N’Djaména CFA franc V USD 1 = XAF 493.906 XAF 475.745 XAF 473.615 XAF 482.073 244
XAF 3 EUR 1 = XAF 655.957 XAF 655.957 XAF 655.957 XAF 655.957
Chile Santiago Chilean peso M USD 1 = CLP 495.23 CLP 550.53 CLP 560.56 CLP 548.04 512 = 100 centavos
M EUR 1 = CLP 658.56 CLP 756.95 CLP 774.04 CLP 745.33 CLP
China Peking / M USD 1 = CNY 6.1932 CNY 6.1521 CNY 6.1580 CNY 6.1695Chinese yuan renminbiBeijing = 10 jiao 720 = 100 fen M EUR 1 = CNY 8.2396 CNY 8.4607 CNY 8.5033 CNY 8.3921
CNY M HKD 1 = CNY 0.79815 CNY 0.79305 CNY 0.79425 CNY 0.79578
China (Taiwan) Taipeh New Taiwan dollar B USD 1 = TWD 29.64 TWD 30.42 TWD 30.14 TWD 29.92 736 = 100 cents S USD 1 = TWD 29.74 TWD 30.52 TWD 30.24 TWD 30.02
B EUR 1 = TWD 39.32 TWD 41.71 TWD 41.50 TWD 40.60TWD S EUR 1 = TWD 39.72 TWD 42.11 TWD 41.90 TWD 41.00
Colombia Bogotá Colombian peso B USD 1 = COP 1,867.92 COP 1,964.68 COP 1,934.37 COP 1,905.25 480 = 100 centavos S USD 1 = COP 1,868.92 COP 1,965.96 COP 1,935.90 COP 1,906.67
V, B EUR 1 = COP 2,483.95 COP 2,708.90 COP 2,679.10 COP 2,592.47COP V, S EUR 1 = COP 2,485.28 COP 2,710.67 COP 2,681.22 COP 2,594.41
Comoros Moroni Comorian franc V USD 1 = KMF 370.42975 KMF 356.80864 KMF 355.21137 KMF 361.55490 375 = 100 centimes
3 EUR 1 = KMF 491.96775 KMF 491.96775 KMF 491.96775 KMF 491.96775KMF
Congo 1 Brazzaville CFA franc V USD 1 = XAF 493.906 XAF 475.745 XAF 473.615 XAF 482.073 318
XAF 3 EUR 1 = XAF 655.957 XAF 655.957 XAF 655.957 XAF 655.957
Source: Central bank or a commercial bank of the country concerned. * See Explanatory notes, p 59. 1 Explanatory notes on individual countries, see pp 63−65. 2 Value against the US dollar. 3 Value against the euro.
Deutsche Bundesbank
25
Exchange rate statistics
June 2014
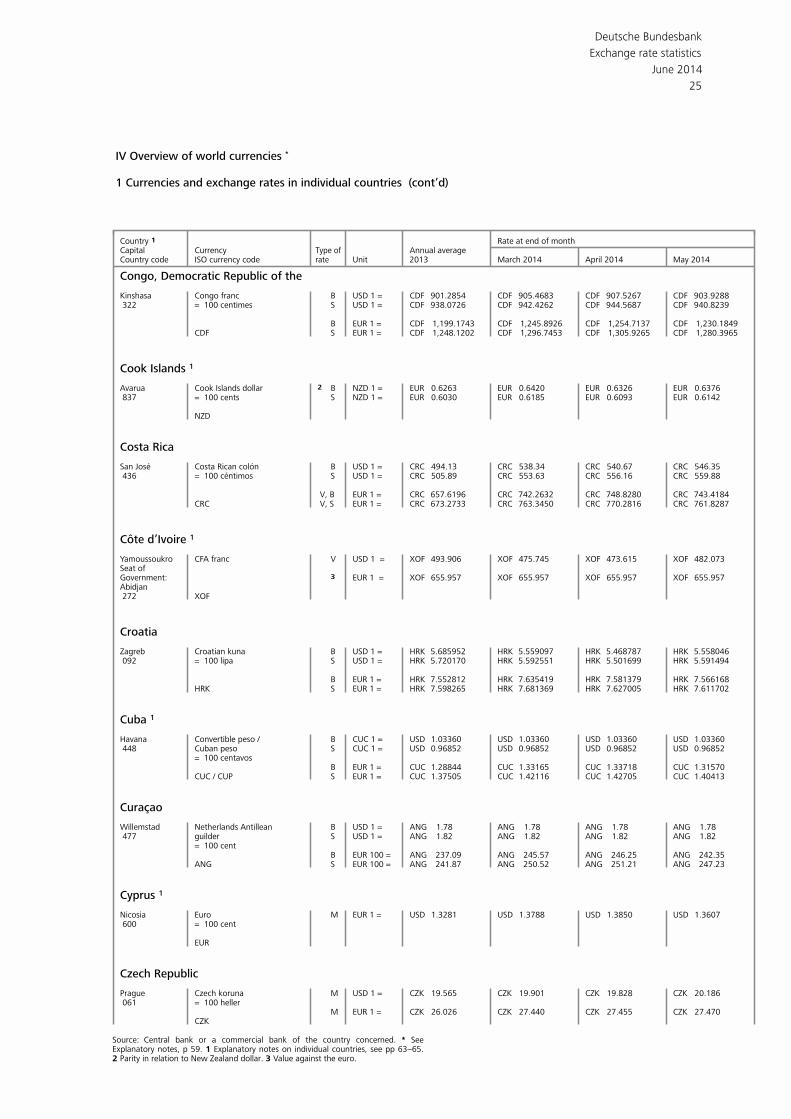
IV Overview of world currencies *
1 Currencies and exchange rates in individual countries (cont’d)
Country 1 Rate at end of monthCapital Currency Annual average Type of
ISO currency code Unit 2013 March 2014 April 2014 May 2014Country code rate
Congo, Democratic Republic of the Kinshasa Congo franc B USD 1 = CDF 901.2854 CDF 905.4683 CDF 907.5267 CDF 903.9288 322 = 100 centimes S USD 1 = CDF 938.0726 CDF 942.4262 CDF 944.5687 CDF 940.8239
B EUR 1 = CDF 1,199.1743 CDF 1,245.8926 CDF 1,254.7137 CDF 1,230.1849CDF S EUR 1 = CDF 1,248.1202 CDF 1,296.7453 CDF 1,305.9265 CDF 1,280.3965
Cook Islands 1 Avarua Cook Islands dollar 2 B NZD 1 = EUR 0.6263 EUR 0.6420 EUR 0.6326 EUR 0.6376 837 = 100 cents S NZD 1 = EUR 0.6030 EUR 0.6185 EUR 0.6093 EUR 0.6142
NZD
Costa Rica San José Costa Rican colón B USD 1 = CRC 494.13 CRC 538.34 CRC 540.67 CRC 546.35 436 = 100 céntimos S USD 1 = CRC 505.89 CRC 553.63 CRC 556.16 CRC 559.88
V, B EUR 1 = CRC 657.6196 CRC 742.2632 CRC 748.8280 CRC 743.4184CRC V, S EUR 1 = CRC 673.2733 CRC 763.3450 CRC 770.2816 CRC 761.8287
Côte d’Ivoire 1 Yamoussoukro CFA franc V USD 1 = XOF 493.906 XOF 475.745 XOF 473.615 XOF 482.073Seat ofGovernment: 3 EUR 1 = XOF 655.957 XOF 655.957 XOF 655.957 XOF 655.957Abidjan 272 XOF
Croatia Zagreb Croatian kuna B USD 1 = HRK 5.685952 HRK 5.559097 HRK 5.468787 HRK 5.558046 092 = 100 lipa S USD 1 = HRK 5.720170 HRK 5.592551 HRK 5.501699 HRK 5.591494
B EUR 1 = HRK 7.552812 HRK 7.635419 HRK 7.581379 HRK 7.566168HRK S EUR 1 = HRK 7.598265 HRK 7.681369 HRK 7.627005 HRK 7.611702
Cuba 1 Havana Convertible peso / B CUC 1 = USD 1.03360 USD 1.03360 USD 1.03360 USD 1.03360 448 Cuban peso S CUC 1 = USD 0.96852 USD 0.96852 USD 0.96852 USD 0.96852 = 100 centavos
B EUR 1 = CUC 1.28844 CUC 1.33165 CUC 1.33718 CUC 1.31570CUC / CUP S EUR 1 = CUC 1.37505 CUC 1.42116 CUC 1.42705 CUC 1.40413
Curaçao Willemstad Netherlands Antillean B USD 1 = ANG 1.78 ANG 1.78 ANG 1.78 ANG 1.78 477 guilder S USD 1 = ANG 1.82 ANG 1.82 ANG 1.82 ANG 1.82 = 100 cent
B EUR 100 = ANG 237.09 ANG 245.57 ANG 246.25 ANG 242.35ANG S EUR 100 = ANG 241.87 ANG 250.52 ANG 251.21 ANG 247.23
Cyprus 1 Nicosia Euro M EUR 1 = USD 1.3281 USD 1.3788 USD 1.3850 USD 1.3607 600 = 100 cent
EUR
Czech Republic Prague Czech koruna M USD 1 = CZK 19.565 CZK 19.901 CZK 19.828 CZK 20.186 061 = 100 heller
M EUR 1 = CZK 26.026 CZK 27.440 CZK 27.455 CZK 27.470CZK
Source: Central bank or a commercial bank of the country concerned. * See Explanatory notes, p 59. 1 Explanatory notes on individual countries, see pp 63−65. 2 Parity in relation to New Zealand dollar. 3 Value against the euro.
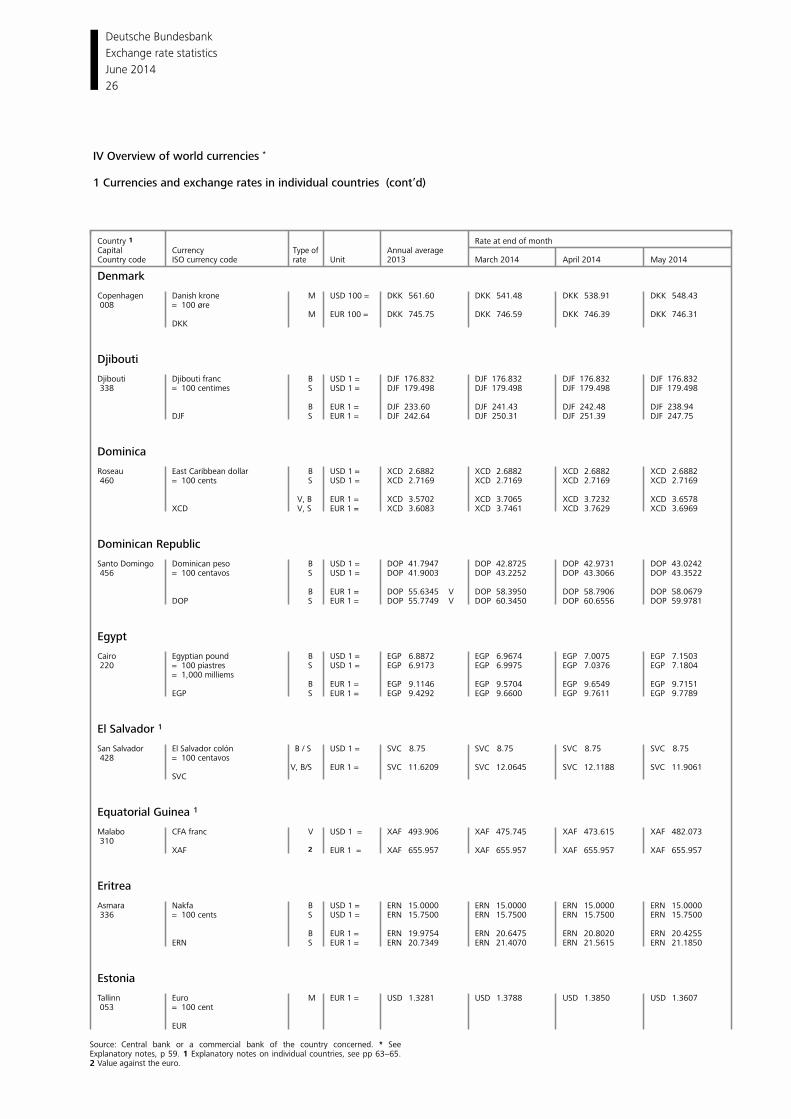
Deutsche Bundesbank
26
Exchange rate statistics
June 2014
IV Overview of world currencies *
1 Currencies and exchange rates in individual countries (cont’d)
Country 1 Rate at end of monthCapital Currency Annual average Type of
ISO currency code Unit 2013 March 2014 April 2014 May 2014Country code rate
Denmark Copenhagen Danish krone M USD 100 = DKK 561.60 DKK 541.48 DKK 538.91 DKK 548.43 008 = 100 øre
M EUR 100 = DKK 745.75 DKK 746.59 DKK 746.39 DKK 746.31DKK
Djibouti Djibouti Djibouti franc B USD 1 = DJF 176.832 DJF 176.832 DJF 176.832 DJF 176.832 338 = 100 centimes S USD 1 = DJF 179.498 DJF 179.498 DJF 179.498 DJF 179.498
B EUR 1 = DJF 233.60 DJF 241.43 DJF 242.48 DJF 238.94DJF S EUR 1 = DJF 242.64 DJF 250.31 DJF 251.39 DJF 247.75
Dominica Roseau East Caribbean dollar B USD 1 = XCD 2.6882 XCD 2.6882 XCD 2.6882 XCD 2.6882 460 = 100 cents S USD 1 = XCD 2.7169 XCD 2.7169 XCD 2.7169 XCD 2.7169
V, B EUR 1 = XCD 3.5702 XCD 3.7065 XCD 3.7232 XCD 3.6578XCD V, S EUR 1 = XCD 3.6083 XCD 3.7461 XCD 3.7629 XCD 3.6969
Dominican Republic Santo Domingo Dominican peso B USD 1 = DOP 41.7947 DOP 42.8725 DOP 42.9731 DOP 43.0242 456 = 100 centavos S USD 1 = DOP 41.9003 DOP 43.2252 DOP 43.3066 DOP 43.3522
B EUR 1 = DOP 55.6345 DOP 58.3950 DOP 58.7906 DOP 58.0679VDOP S EUR 1 = DOP 55.7749 DOP 60.3450 DOP 60.6556 DOP 59.9781V
Egypt Cairo Egyptian pound B USD 1 = EGP 6.8872 EGP 6.9674 EGP 7.0075 EGP 7.1503 220 = 100 piastres S USD 1 = EGP 6.9173 EGP 6.9975 EGP 7.0376 EGP 7.1804 = 1,000 milliems
B EUR 1 = EGP 9.1146 EGP 9.5704 EGP 9.6549 EGP 9.7151EGP S EUR 1 = EGP 9.4292 EGP 9.6600 EGP 9.7611 EGP 9.7789
El Salvador 1 San Salvador El Salvador colón B / S USD 1 = SVC 8.75 SVC 8.75 SVC 8.75 SVC 8.75 428 = 100 centavos
V, B/S EUR 1 = SVC 11.6209 SVC 12.0645 SVC 12.1188 SVC 11.9061SVC
Equatorial Guinea 1 Malabo CFA franc V USD 1 = XAF 493.906 XAF 475.745 XAF 473.615 XAF 482.073 310
XAF 2 EUR 1 = XAF 655.957 XAF 655.957 XAF 655.957 XAF 655.957
Eritrea Asmara Nakfa B USD 1 = ERN 15.0000 ERN 15.0000 ERN 15.0000 ERN 15.0000 336 = 100 cents S USD 1 = ERN 15.7500 ERN 15.7500 ERN 15.7500 ERN 15.7500
B EUR 1 = ERN 19.9754 ERN 20.6475 ERN 20.8020 ERN 20.4255ERN S EUR 1 = ERN 20.7349 ERN 21.4070 ERN 21.5615 ERN 21.1850
Estonia Tallinn Euro M EUR 1 = USD 1.3281 USD 1.3788 USD 1.3850 USD 1.3607 053 = 100 cent
EUR
Source: Central bank or a commercial bank of the country concerned. * See Explanatory notes, p 59. 1 Explanatory notes on individual countries, see pp 63−65. 2 Value against the euro.
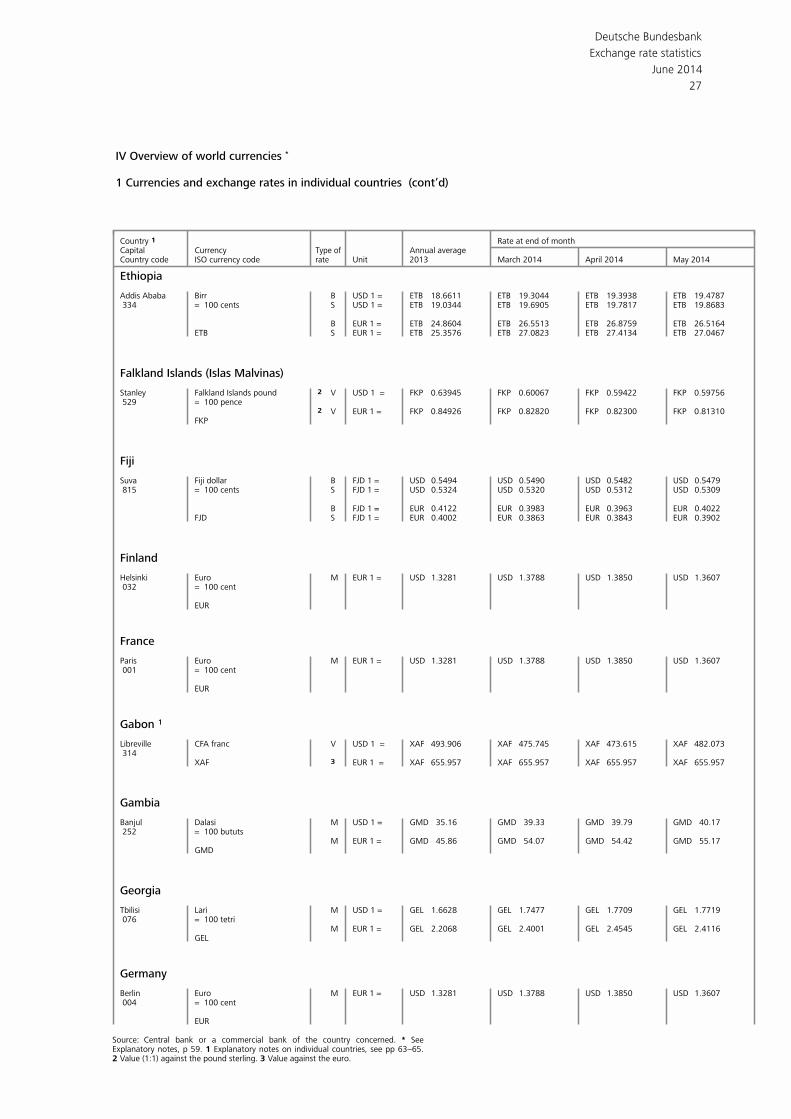
Deutsche Bundesbank
27
Exchange rate statistics
June 2014
IV Overview of world currencies *
1 Currencies and exchange rates in individual countries (cont’d)
Country 1 Rate at end of monthCapital Currency Annual average Type of
ISO currency code Unit 2013 March 2014 April 2014 May 2014Country code rate
Ethiopia Addis Ababa Birr B USD 1 = ETB 18.6611 ETB 19.3044 ETB 19.3938 ETB 19.4787 334 = 100 cents S USD 1 = ETB 19.0344 ETB 19.6905 ETB 19.7817 ETB 19.8683
B EUR 1 = ETB 24.8604 ETB 26.5513 ETB 26.8759 ETB 26.5164ETB S EUR 1 = ETB 25.3576 ETB 27.0823 ETB 27.4134 ETB 27.0467
Falkland Islands (Islas Malvinas) Stanley Falkland Islands pound 2 V USD 1 = FKP 0.63945 FKP 0.60067 FKP 0.59422 FKP 0.59756 529 = 100 pence
2 V EUR 1 = FKP 0.84926 FKP 0.82820 FKP 0.82300 FKP 0.81310FKP
Fiji Suva Fiji dollar B FJD 1 = USD 0.5494 USD 0.5490 USD 0.5482 USD 0.5479 815 = 100 cents S FJD 1 = USD 0.5324 USD 0.5320 USD 0.5312 USD 0.5309
B FJD 1 = EUR 0.4122 EUR 0.3983 EUR 0.3963 EUR 0.4022FJD S FJD 1 = EUR 0.4002 EUR 0.3863 EUR 0.3843 EUR 0.3902
Finland Helsinki Euro M EUR 1 = USD 1.3281 USD 1.3788 USD 1.3850 USD 1.3607 032 = 100 cent
EUR
France Paris Euro M EUR 1 = USD 1.3281 USD 1.3788 USD 1.3850 USD 1.3607 001 = 100 cent
EUR
Gabon 1 Libreville CFA franc V USD 1 = XAF 493.906 XAF 475.745 XAF 473.615 XAF 482.073 314
XAF 3 EUR 1 = XAF 655.957 XAF 655.957 XAF 655.957 XAF 655.957
Gambia Banjul Dalasi M USD 1 = GMD 35.16 GMD 39.33 GMD 39.79 GMD 40.17 252 = 100 bututs
M EUR 1 = GMD 45.86 GMD 54.07 GMD 54.42 GMD 55.17GMD
Georgia Tbilisi Lari M USD 1 = GEL 1.6628 GEL 1.7477 GEL 1.7709 GEL 1.7719 076 = 100 tetri
M EUR 1 = GEL 2.2068 GEL 2.4001 GEL 2.4545 GEL 2.4116GEL
Germany Berlin Euro M EUR 1 = USD 1.3281 USD 1.3788 USD 1.3850 USD 1.3607 004 = 100 cent
EUR
Source: Central bank or a commercial bank of the country concerned. * See Explanatory notes, p 59. 1 Explanatory notes on individual countries, see pp 63−65. 2 Value (1:1) against the pound sterling. 3 Value against the euro.
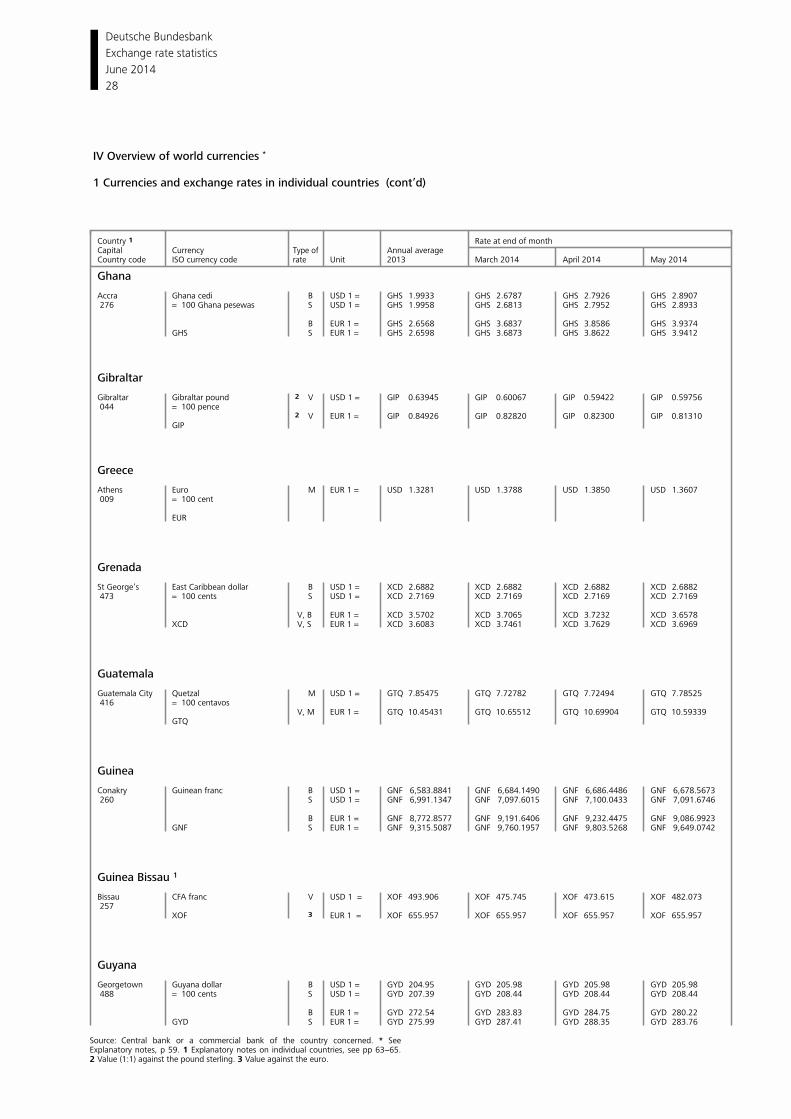
Deutsche Bundesbank
28
Exchange rate statistics
June 2014
IV Overview of world currencies *
1 Currencies and exchange rates in individual countries (cont’d)
Country 1 Rate at end of monthCapital Currency Annual average Type of
ISO currency code Unit 2013 March 2014 April 2014 May 2014Country code rate
Ghana Accra Ghana cedi B USD 1 = GHS 1.9933 GHS 2.6787 GHS 2.7926 GHS 2.8907 276 = 100 Ghana pesewas S USD 1 = GHS 1.9958 GHS 2.6813 GHS 2.7952 GHS 2.8933
B EUR 1 = GHS 2.6568 GHS 3.6837 GHS 3.8586 GHS 3.9374GHS S EUR 1 = GHS 2.6598 GHS 3.6873 GHS 3.8622 GHS 3.9412
Gibraltar Gibraltar Gibraltar pound 2 V USD 1 = GIP 0.63945 GIP 0.60067 GIP 0.59422 GIP 0.59756 044 = 100 pence
2 V EUR 1 = GIP 0.84926 GIP 0.82820 GIP 0.82300 GIP 0.81310GIP
Greece Athens Euro M EUR 1 = USD 1.3281 USD 1.3788 USD 1.3850 USD 1.3607 009 = 100 cent
EUR
Grenada St George’s East Caribbean dollar B USD 1 = XCD 2.6882 XCD 2.6882 XCD 2.6882 XCD 2.6882 473 = 100 cents S USD 1 = XCD 2.7169 XCD 2.7169 XCD 2.7169 XCD 2.7169
V, B EUR 1 = XCD 3.5702 XCD 3.7065 XCD 3.7232 XCD 3.6578XCD V, S EUR 1 = XCD 3.6083 XCD 3.7461 XCD 3.7629 XCD 3.6969
Guatemala Guatemala City Quetzal M USD 1 = GTQ 7.85475 GTQ 7.72782 GTQ 7.72494 GTQ 7.78525 416 = 100 centavos
V, M EUR 1 = GTQ 10.45431 GTQ 10.65512 GTQ 10.69904 GTQ 10.59339GTQ
Guinea Conakry Guinean franc B USD 1 = GNF 6,583.8841 GNF 6,684.1490 GNF 6,686.4486 GNF 6,678.5673 260 S USD 1 = GNF 6,991.1347 GNF 7,097.6015 GNF 7,100.0433 GNF 7,091.6746
B EUR 1 = GNF 8,772.8577 GNF 9,191.6406 GNF 9,232.4475 GNF 9,086.9923GNF S EUR 1 = GNF 9,315.5087 GNF 9,760.1957 GNF 9,803.5268 GNF 9,649.0742
Guinea Bissau 1 Bissau CFA franc V USD 1 = XOF 493.906 XOF 475.745 XOF 473.615 XOF 482.073 257
XOF 3 EUR 1 = XOF 655.957 XOF 655.957 XOF 655.957 XOF 655.957
Guyana Georgetown Guyana dollar B USD 1 = GYD 204.95 GYD 205.98 GYD 205.98 GYD 205.98 488 = 100 cents S USD 1 = GYD 207.39 GYD 208.44 GYD 208.44 GYD 208.44
B EUR 1 = GYD 272.54 GYD 283.83 GYD 284.75 GYD 280.22GYD S EUR 1 = GYD 275.99 GYD 287.41 GYD 288.35 GYD 283.76
Source: Central bank or a commercial bank of the country concerned. * See Explanatory notes, p 59. 1 Explanatory notes on individual countries, see pp 63−65. 2 Value (1:1) against the pound sterling. 3 Value against the euro.
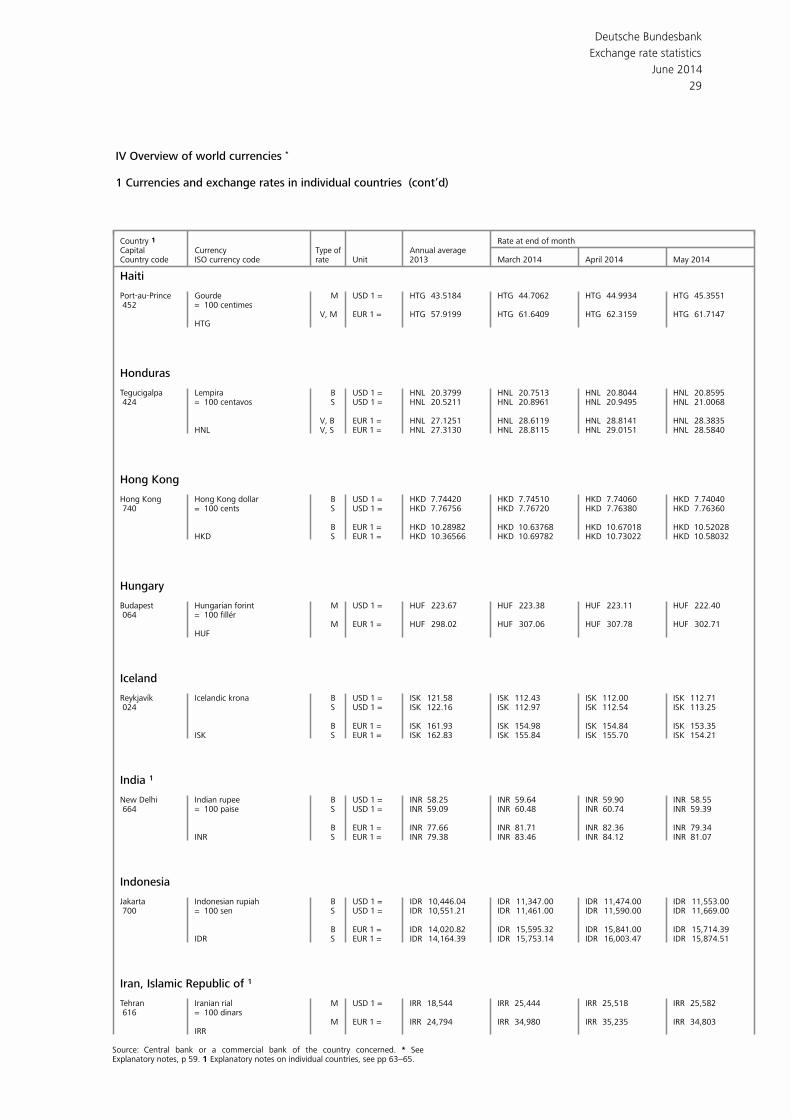
Deutsche Bundesbank
29
Exchange rate statistics
June 2014
IV Overview of world currencies *
1 Currencies and exchange rates in individual countries (cont’d)
Country 1 Rate at end of monthCapital Currency Annual average Type of
ISO currency code Unit 2013 March 2014 April 2014 May 2014Country code rate
Haiti Port-au-Prince Gourde M USD 1 = HTG 43.5184 HTG 44.7062 HTG 44.9934 HTG 45.3551 452 = 100 centimes
V, M EUR 1 = HTG 57.9199 HTG 61.6409 HTG 62.3159 HTG 61.7147HTG
Honduras Tegucigalpa Lempira B USD 1 = HNL 20.3799 HNL 20.7513 HNL 20.8044 HNL 20.8595 424 = 100 centavos S USD 1 = HNL 20.5211 HNL 20.8961 HNL 20.9495 HNL 21.0068
V, B EUR 1 = HNL 27.1251 HNL 28.6119 HNL 28.8141 HNL 28.3835HNL V, S EUR 1 = HNL 27.3130 HNL 28.8115 HNL 29.0151 HNL 28.5840
Hong Kong Hong Kong Hong Kong dollar B USD 1 = HKD 7.74420 HKD 7.74510 HKD 7.74060 HKD 7.74040 740 = 100 cents S USD 1 = HKD 7.76756 HKD 7.76720 HKD 7.76380 HKD 7.76360
B EUR 1 = HKD 10.28982 HKD 10.63768 HKD 10.67018 HKD 10.52028HKD S EUR 1 = HKD 10.36566 HKD 10.69782 HKD 10.73022 HKD 10.58032
Hungary Budapest Hungarian forint M USD 1 = HUF 223.67 HUF 223.38 HUF 223.11 HUF 222.40 064 = 100 fillér
M EUR 1 = HUF 298.02 HUF 307.06 HUF 307.78 HUF 302.71HUF
Iceland Reykjavík Icelandic krona B USD 1 = ISK 121.58 ISK 112.43 ISK 112.00 ISK 112.71 024 S USD 1 = ISK 122.16 ISK 112.97 ISK 112.54 ISK 113.25
B EUR 1 = ISK 161.93 ISK 154.98 ISK 154.84 ISK 153.35ISK S EUR 1 = ISK 162.83 ISK 155.84 ISK 155.70 ISK 154.21
India 1 New Delhi Indian rupee B USD 1 = INR 58.25 INR 59.64 INR 59.90 INR 58.55 664 = 100 paise S USD 1 = INR 59.09 INR 60.48 INR 60.74 INR 59.39
B EUR 1 = INR 77.66 INR 81.71 INR 82.36 INR 79.34INR S EUR 1 = INR 79.38 INR 83.46 INR 84.12 INR 81.07
Indonesia Jakarta Indonesian rupiah B USD 1 = IDR 10,446.04 IDR 11,347.00 IDR 11,474.00 IDR 11,553.00 700 = 100 sen S USD 1 = IDR 10,551.21 IDR 11,461.00 IDR 11,590.00 IDR 11,669.00
B EUR 1 = IDR 14,020.82 IDR 15,595.32 IDR 15,841.00 IDR 15,714.39IDR S EUR 1 = IDR 14,164.39 IDR 15,753.14 IDR 16,003.47 IDR 15,874.51
Iran, Islamic Republic of 1 Tehran Iranian rial M USD 1 = IRR 18,544 IRR 25,444 IRR 25,518 IRR 25,582 616 = 100 dinars
M EUR 1 = IRR 24,794 IRR 34,980 IRR 35,235 IRR 34,803IRR
Source: Central bank or a commercial bank of the country concerned. * See Explanatory notes, p 59. 1 Explanatory notes on individual countries, see pp 63−65.
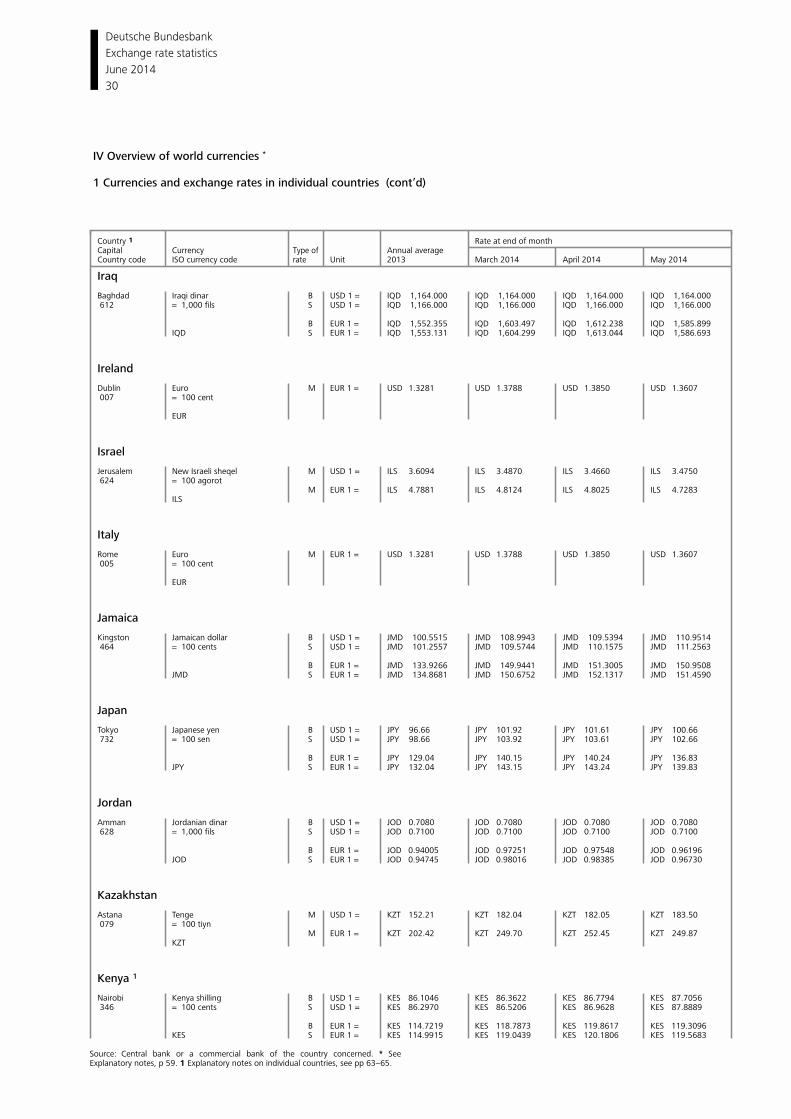
Deutsche Bundesbank
30
Exchange rate statistics
June 2014
IV Overview of world currencies *
1 Currencies and exchange rates in individual countries (cont’d)
Country 1 Rate at end of monthCapital Currency Annual average Type of
ISO currency code Unit 2013 March 2014 April 2014 May 2014Country code rate
Iraq Baghdad Iraqi dinar B USD 1 = IQD 1,164.000 IQD 1,164.000 IQD 1,164.000 IQD 1,164.000 612 = 1,000 fils S USD 1 = IQD 1,166.000 IQD 1,166.000 IQD 1,166.000 IQD 1,166.000
B EUR 1 = IQD 1,552.355 IQD 1,603.497 IQD 1,612.238 IQD 1,585.899IQD S EUR 1 = IQD 1,553.131 IQD 1,604.299 IQD 1,613.044 IQD 1,586.693
Ireland Dublin Euro M EUR 1 = USD 1.3281 USD 1.3788 USD 1.3850 USD 1.3607 007 = 100 cent EUR
Israel Jerusalem New Israeli sheqel M USD 1 = ILS 3.6094 ILS 3.4870 ILS 3.4660 ILS 3.4750
624 = 100 agorotM EUR 1 = ILS 4.7881 ILS 4.8124 ILS 4.8025 ILS 4.7283
ILS
Italy Rome Euro M EUR 1 = USD 1.3281 USD 1.3788 USD 1.3850 USD 1.3607 005 = 100 cent EUR
Jamaica Kingston Jamaican dollar B USD 1 = JMD 100.5515 JMD 108.9943 JMD 109.5394 JMD 110.9514 464 = 100 cents S USD 1 = JMD 101.2557 JMD 109.5744 JMD 110.1575 JMD 111.2563
B EUR 1 = JMD 133.9266 JMD 149.9441 JMD 151.3005 JMD 150.9508JMD S EUR 1 = JMD 134.8681 JMD 150.6752 JMD 152.1317 JMD 151.4590
Japan Tokyo Japanese yen B USD 1 = JPY 96.66 JPY 101.92 JPY 101.61 JPY 100.66 732 = 100 sen S USD 1 = JPY 98.66 JPY 103.92 JPY 103.61 JPY 102.66
B EUR 1 = JPY 129.04 JPY 140.15 JPY 140.24 JPY 136.83JPY S EUR 1 = JPY 132.04 JPY 143.15 JPY 143.24 JPY 139.83
Jordan Amman Jordanian dinar B USD 1 = JOD 0.7080 JOD 0.7080 JOD 0.7080 JOD 0.7080 628 = 1,000 fils S USD 1 = JOD 0.7100 JOD 0.7100 JOD 0.7100 JOD 0.7100
B EUR 1 = JOD 0.94005 JOD 0.97251 JOD 0.97548 JOD 0.96196JOD S EUR 1 = JOD 0.94745 JOD 0.98016 JOD 0.98385 JOD 0.96730
Kazakhstan Astana Tenge M USD 1 = KZT 152.21 KZT 182.04 KZT 182.05 KZT 183.50 079 = 100 tiyn
M EUR 1 = KZT 202.42 KZT 249.70 KZT 252.45 KZT 249.87 KZT
Kenya 1 Nairobi Kenya shilling B USD 1 = KES 86.1046 KES 86.3622 KES 86.7794 KES 87.7056 346 = 100 cents S USD 1 = KES 86.2970 KES 86.5206 KES 86.9628 KES 87.8889
B EUR 1 = KES 114.7219 KES 118.7873 KES 119.8617 KES 119.3096KES S EUR 1 = KES 114.9915 KES 119.0439 KES 120.1806 KES 119.5683
Source: Central bank or a commercial bank of the country concerned. * See Explanatory notes, p 59. 1 Explanatory notes on individual countries, see pp 63−65.
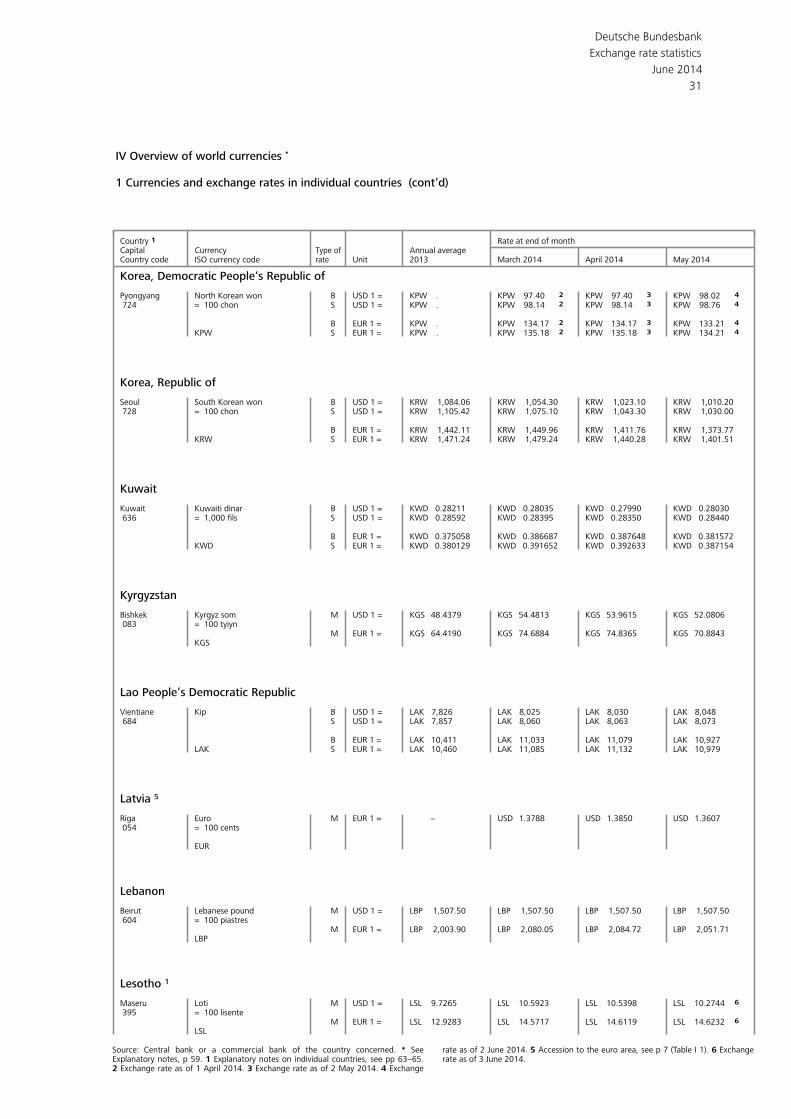
Deutsche Bundesbank
31
Exchange rate statistics
June 2014
IV Overview of world currencies *
1 Currencies and exchange rates in individual countries (cont’d)
Country 1 Rate at end of monthCapital Currency Annual average Type of
ISO currency code Unit 2013 March 2014 April 2014 May 2014Country code rate
Korea, Democratic People‘s Republic of Pyongyang North Korean won B USD 1 = KPW . KPW 97.40 KPW 97.40 KPW 98.02 4 3 2 724 = 100 chon S USD 1 = KPW . KPW 98.14 KPW 98.14 KPW 98.76 4 3 2
B EUR 1 = KPW . KPW 134.17 KPW 134.17 KPW 133.212 3 4 KPW S EUR 1 = KPW . KPW 135.18 KPW 135.18 KPW 134.212 3 4
Korea, Republic of Seoul South Korean won B USD 1 = KRW 1,084.06 KRW 1,054.30 KRW 1,023.10 KRW 1,010.20 728 = 100 chon S USD 1 = KRW 1,105.42 KRW 1,075.10 KRW 1,043.30 KRW 1,030.00
B EUR 1 = KRW 1,442.11 KRW 1,449.96 KRW 1,411.76 KRW 1,373.77KRW S EUR 1 = KRW 1,471.24 KRW 1,479.24 KRW 1,440.28 KRW 1,401.51
Kuwait Kuwait Kuwaiti dinar B USD 1 = KWD 0.28211 KWD 0.28035 KWD 0.27990 KWD 0.28030 636 = 1,000 fils S USD 1 = KWD 0.28592 KWD 0.28395 KWD 0.28350 KWD 0.28440
B EUR 1 = KWD 0.375058 KWD 0.386687 KWD 0.387648 KWD 0.381572KWD S EUR 1 = KWD 0.380129 KWD 0.391652 KWD 0.392633 KWD 0.387154
Kyrgyzstan Bishkek Kyrgyz som M USD 1 = KGS 48.4379 KGS 54.4813 KGS 53.9615 KGS 52.0806
083 = 100 tyiynM EUR 1 = KGS 64.4190 KGS 74.6884 KGS 74.8365 KGS 70.8843
KGS
Lao People’s Democratic Republic Vientiane Kip B USD 1 = LAK 7,826 LAK 8,025 LAK 8,030 LAK 8,048 684 S USD 1 = LAK 7,857 LAK 8,060 LAK 8,063 LAK 8,073
B EUR 1 = LAK 10,411 LAK 11,033 LAK 11,079 LAK 10,927LAK S EUR 1 = LAK 10,460 LAK 11,085 LAK 11,132 LAK 10,979
Latvia 5 Riga Euro M EUR 1 = − USD 1.3788 USD 1.3850 USD 1.3607 054 = 100 cents
EUR
Lebanon Beirut Lebanese pound M USD 1 = LBP 1,507.50 LBP 1,507.50 LBP 1,507.50 LBP 1,507.50 604 = 100 piastres
M EUR 1 = LBP 2,003.90 LBP 2,080.05 LBP 2,084.72 LBP 2,051.71 LBP
Lesotho 1 Maseru Loti M USD 1 = LSL 9.7265 LSL 10.5923 LSL 10.5398 LSL 10.2744 6 395 = 100 lisente
M EUR 1 = LSL 12.9283 LSL 14.5717 LSL 14.6119 LSL 14.6232 6 LSL
Source: Central bank or a commercial bank of the country concerned. * See rate as of 2 June 2014. 5 Accession to the euro area, see p 7 (Table I 1). 6 ExchangeExplanatory notes, p 59. 1 Explanatory notes on individual countries, see pp 63−65. rate as of 3 June 2014. 2 Exchange rate as of 1 April 2014. 3 Exchange rate as of 2 May 2014. 4 Exchange
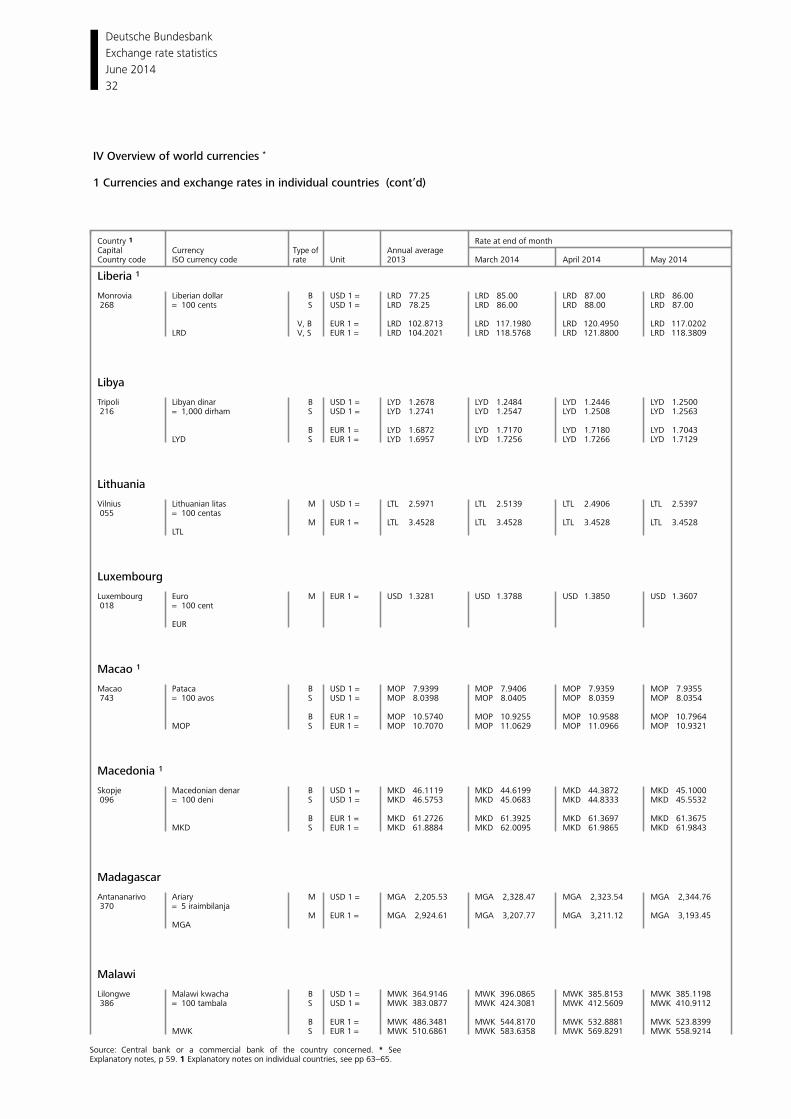
Deutsche Bundesbank
32
Exchange rate statistics
June 2014
IV Overview of world currencies *
1 Currencies and exchange rates in individual countries (cont’d)
Country 1 Rate at end of monthCapital Currency Annual average Type of
ISO currency code Unit 2013 March 2014 April 2014 May 2014Country code rate
Liberia 1 Monrovia Liberian dollar B USD 1 = LRD 77.25 LRD 85.00 LRD 87.00 LRD 86.00 268 = 100 cents S USD 1 = LRD 78.25 LRD 86.00 LRD 88.00 LRD 87.00
V, B EUR 1 = LRD 102.8713 LRD 117.1980 LRD 120.4950 LRD 117.0202LRD V, S EUR 1 = LRD 104.2021 LRD 118.5768 LRD 121.8800 LRD 118.3809
Libya Tripoli Libyan dinar B USD 1 = LYD 1.2678 LYD 1.2484 LYD 1.2446 LYD 1.2500
216 = 1,000 dirham S USD 1 = LYD 1.2741 LYD 1.2547 LYD 1.2508 LYD 1.2563
B EUR 1 = LYD 1.6872 LYD 1.7170 LYD 1.7180 LYD 1.7043 LYD S EUR 1 = LYD 1.6957 LYD 1.7256 LYD 1.7266 LYD 1.7129
Lithuania Vilnius Lithuanian litas M USD 1 = LTL 2.5971 LTL 2.5139 LTL 2.4906 LTL 2.5397 055 = 100 centas
M EUR 1 = LTL 3.4528 LTL 3.4528 LTL 3.4528 LTL 3.4528 LTL
Luxembourg Luxembourg Euro M EUR 1 = USD 1.3281 USD 1.3788 USD 1.3850 USD 1.3607 018 = 100 cent EUR
Macao 1 Macao Pataca B USD 1 = MOP 7.9399 MOP 7.9406 MOP 7.9359 MOP 7.9355 743 = 100 avos S USD 1 = MOP 8.0398 MOP 8.0405 MOP 8.0359 MOP 8.0354
B EUR 1 = MOP 10.5740 MOP 10.9255 MOP 10.9588 MOP 10.7964MOP S EUR 1 = MOP 10.7070 MOP 11.0629 MOP 11.0966 MOP 10.9321
Macedonia 1 Skopje Macedonian denar B USD 1 = MKD 46.1119 MKD 44.6199 MKD 44.3872 MKD 45.1000 096 = 100 deni S USD 1 = MKD 46.5753 MKD 45.0683 MKD 44.8333 MKD 45.5532
B EUR 1 = MKD 61.2726 MKD 61.3925 MKD 61.3697 MKD 61.3675MKD S EUR 1 = MKD 61.8884 MKD 62.0095 MKD 61.9865 MKD 61.9843
Madagascar Antananarivo Ariary M USD 1 = MGA 2,205.53 MGA 2,328.47 MGA 2,323.54 MGA 2,344.76 370 = 5 iraimbilanja
M EUR 1 = MGA 2,924.61 MGA 3,207.77 MGA 3,211.12 MGA 3,193.45MGA
Malawi Lilongwe Malawi kwacha B USD 1 = MWK 364.9146 MWK 396.0865 MWK 385.8153 MWK 385.1198 386 = 100 tambala S USD 1 = MWK 383.0877 MWK 424.3081 MWK 412.5609 MWK 410.9112
B EUR 1 = MWK 486.3481 MWK 544.8170 MWK 532.8881 MWK 523.8399MWK S EUR 1 = MWK 510.6861 MWK 583.6358 MWK 569.8291 MWK 558.9214
Source: Central bank or a commercial bank of the country concerned. * See Explanatory notes, p 59. 1 Explanatory notes on individual countries, see pp 63−65.
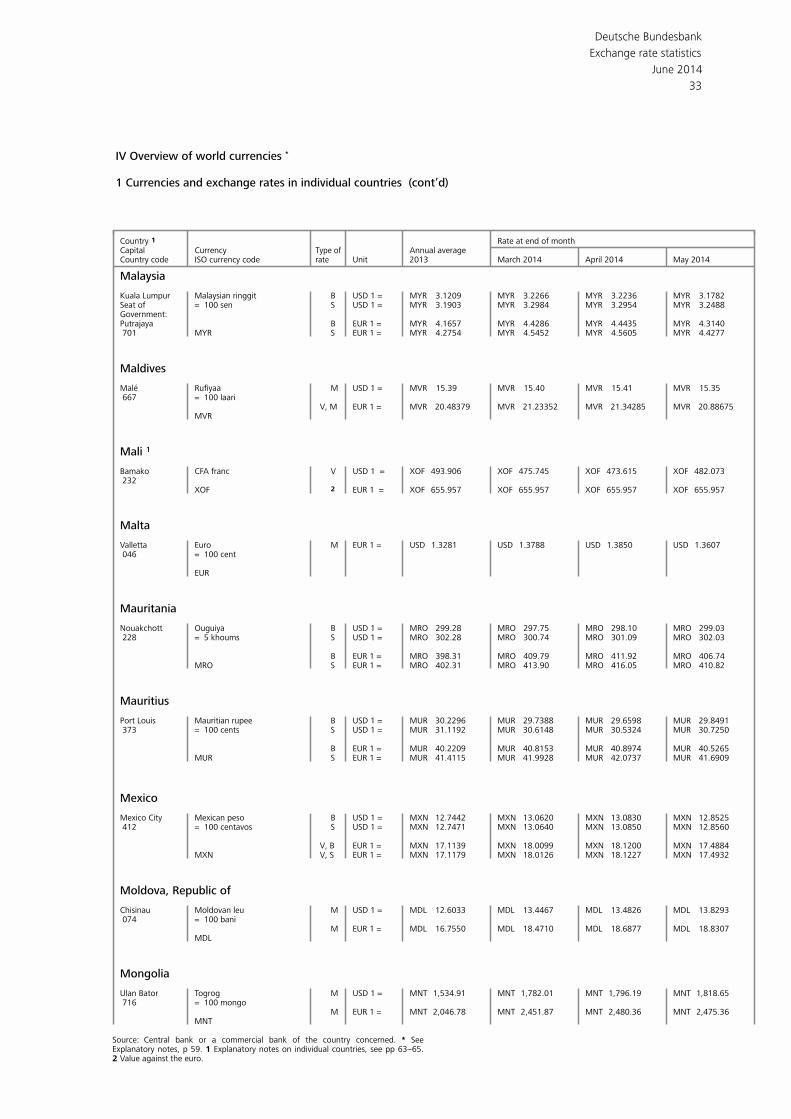
Deutsche Bundesbank
33
Exchange rate statistics
June 2014
IV Overview of world currencies *
1 Currencies and exchange rates in individual countries (cont’d)
Country 1 Rate at end of monthCapital Currency Annual average Type of
ISO currency code Unit 2013 March 2014 April 2014 May 2014Country code rate
Malaysia Kuala Lumpur Malaysian ringgit B USD 1 = MYR 3.1209 MYR 3.2266 MYR 3.2236 MYR 3.1782Seat of = 100 sen S USD 1 = MYR 3.1903 MYR 3.2984 MYR 3.2954 MYR 3.2488Government:Putrajaya B EUR 1 = MYR 4.1657 MYR 4.4286 MYR 4.4435 MYR 4.3140 701 MYR S EUR 1 = MYR 4.2754 MYR 4.5452 MYR 4.5605 MYR 4.4277
Maldives Malé Rufiyaa M USD 1 = MVR 15.39 MVR 15.40 MVR 15.41 MVR 15.35 667 = 100 laari
V, M EUR 1 = MVR 20.48379 MVR 21.23352 MVR 21.34285 MVR 20.88675MVR
Mali 1 Bamako CFA franc V USD 1 = XOF 493.906 XOF 475.745 XOF 473.615 XOF 482.073 232
XOF 2 EUR 1 = XOF 655.957 XOF 655.957 XOF 655.957 XOF 655.957
Malta Valletta Euro M EUR 1 = USD 1.3281 USD 1.3788 USD 1.3850 USD 1.3607 046 = 100 cent
EUR
Mauritania Nouakchott Ouguiya B USD 1 = MRO 299.28 MRO 297.75 MRO 298.10 MRO 299.03 228 = 5 khoums S USD 1 = MRO 302.28 MRO 300.74 MRO 301.09 MRO 302.03
B EUR 1 = MRO 398.31 MRO 409.79 MRO 411.92 MRO 406.74MRO S EUR 1 = MRO 402.31 MRO 413.90 MRO 416.05 MRO 410.82
Mauritius Port Louis Mauritian rupee B USD 1 = MUR 30.2296 MUR 29.7388 MUR 29.6598 MUR 29.8491 373 = 100 cents S USD 1 = MUR 31.1192 MUR 30.6148 MUR 30.5324 MUR 30.7250
B EUR 1 = MUR 40.2209 MUR 40.8153 MUR 40.8974 MUR 40.5265MUR S EUR 1 = MUR 41.4115 MUR 41.9928 MUR 42.0737 MUR 41.6909
Mexico Mexico City B USD 1 = MXN 12.7442 MXN 13.0620 MXN 13.0830 MXN 12.8525Mexican peso 412 = 100 centavos S USD 1 = MXN 12.7471 MXN 13.0640 MXN 13.0850 MXN 12.8560
V, B EUR 1 = MXN 17.1139 MXN 18.0099 MXN 18.1200 MXN 17.4884MXN V, S EUR 1 = MXN 17.1179 MXN 18.0126 MXN 18.1227 MXN 17.4932
Moldova, Republic of Chisinau Moldovan leu M USD 1 = MDL 12.6033 MDL 13.4467 MDL 13.4826 MDL 13.8293 074 = 100 bani
M EUR 1 = MDL 16.7550 MDL 18.4710 MDL 18.6877 MDL 18.8307 MDL
Mongolia Ulan Bator Togrog M USD 1 = MNT 1,534.91 MNT 1,782.01 MNT 1,796.19 MNT 1,818.65 716 = 100 mongo
M EUR 1 = MNT 2,046.78 MNT 2,451.87 MNT 2,480.36 MNT 2,475.36 MNT
Source: Central bank or a commercial bank of the country concerned. * See Explanatory notes, p 59. 1 Explanatory notes on individual countries, see pp 63−65. 2 Value against the euro.
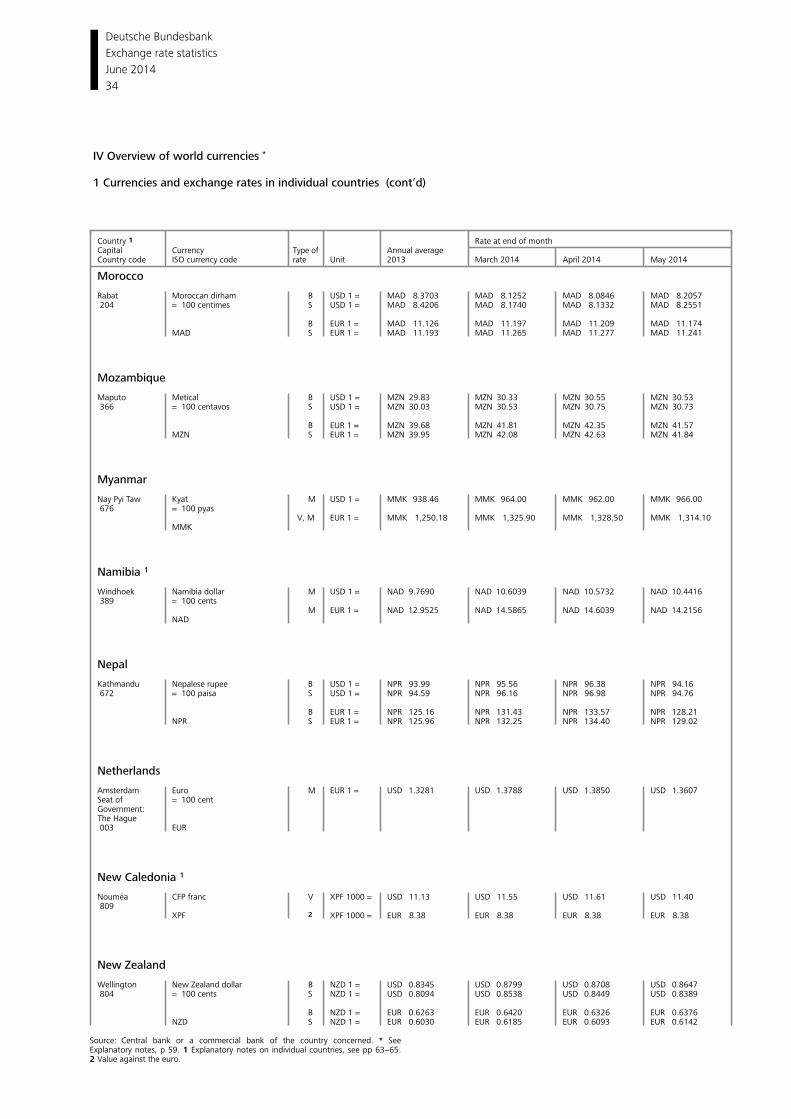
Deutsche Bundesbank
34
Exchange rate statistics
June 2014
IV Overview of world currencies *
1 Currencies and exchange rates in individual countries (cont’d)
Country 1 Rate at end of monthCapital Currency Annual average Type of
ISO currency code Unit 2013 March 2014 April 2014 May 2014Country code rate
Morocco Rabat Moroccan dirham B USD 1 = MAD 8.3703 MAD 8.1252 MAD 8.0846 MAD 8.2057 204 = 100 centimes S USD 1 = MAD 8.4206 MAD 8.1740 MAD 8.1332 MAD 8.2551
B EUR 1 = MAD 11.126 MAD 11.197 MAD 11.209 MAD 11.174MAD S EUR 1 = MAD 11.193 MAD 11.265 MAD 11.277 MAD 11.241
Mozambique Maputo Metical B USD 1 = MZN 29.83 MZN 30.33 MZN 30.55 MZN 30.53 366 = 100 centavos S USD 1 = MZN 30.03 MZN 30.53 MZN 30.75 MZN 30.73
B EUR 1 = MZN 39.68 MZN 41.81 MZN 42.35 MZN 41.57MZN S EUR 1 = MZN 39.95 MZN 42.08 MZN 42.63 MZN 41.84
Myanmar Nay Pyi Taw Kyat M USD 1 = MMK 938.46 MMK 964.00 MMK 962.00 MMK 966.00
676 = 100 pyas V, M EUR 1 = MMK 1,250.18 MMK 1,325.90 MMK 1,328.50 MMK 1,314.10
MMK
Namibia 1 Windhoek Namibia dollar M USD 1 = NAD 9.7690 NAD 10.6039 NAD 10.5732 NAD 10.4416 389 = 100 cents
M EUR 1 = NAD 12.9525 NAD 14.5865 NAD 14.6039 NAD 14.2156 NAD
Nepal Kathmandu Nepalese rupee B USD 1 = NPR 93.99 NPR 95.56 NPR 96.38 NPR 94.16 672 = 100 paisa S USD 1 = NPR 94.59 NPR 96.16 NPR 96.98 NPR 94.76
B EUR 1 = NPR 125.16 NPR 131.43 NPR 133.57 NPR 128.21NPR S EUR 1 = NPR 125.96 NPR 132.25 NPR 134.40 NPR 129.02
Netherlands Amsterdam Euro M EUR 1 = USD 1.3281 USD 1.3788 USD 1.3850 USD 1.3607Seat of = 100 centGovernment:
The Hague 003 EUR
New Caledonia 1 Nouméa CFP franc V XPF 1000 = USD 11.13 USD 11.55 USD 11.61 USD 11.40 809
XPF 2 XPF 1000 = EUR 8.38 EUR 8.38 EUR 8.38 EUR 8.38
New Zealand Wellington New Zealand dollar B NZD 1 = USD 0.8345 USD 0.8799 USD 0.8708 USD 0.8647 804 = 100 cents S NZD 1 = USD 0.8094 USD 0.8538 USD 0.8449 USD 0.8389
B NZD 1 = EUR 0.6263 EUR 0.6420 EUR 0.6326 EUR 0.6376NZD S NZD 1 = EUR 0.6030 EUR 0.6185 EUR 0.6093 EUR 0.6142
Source: Central bank or a commercial bank of the country concerned. * See Explanatory notes, p 59. 1 Explanatory notes on individual countries, see pp 63−65. 2 Value against the euro.
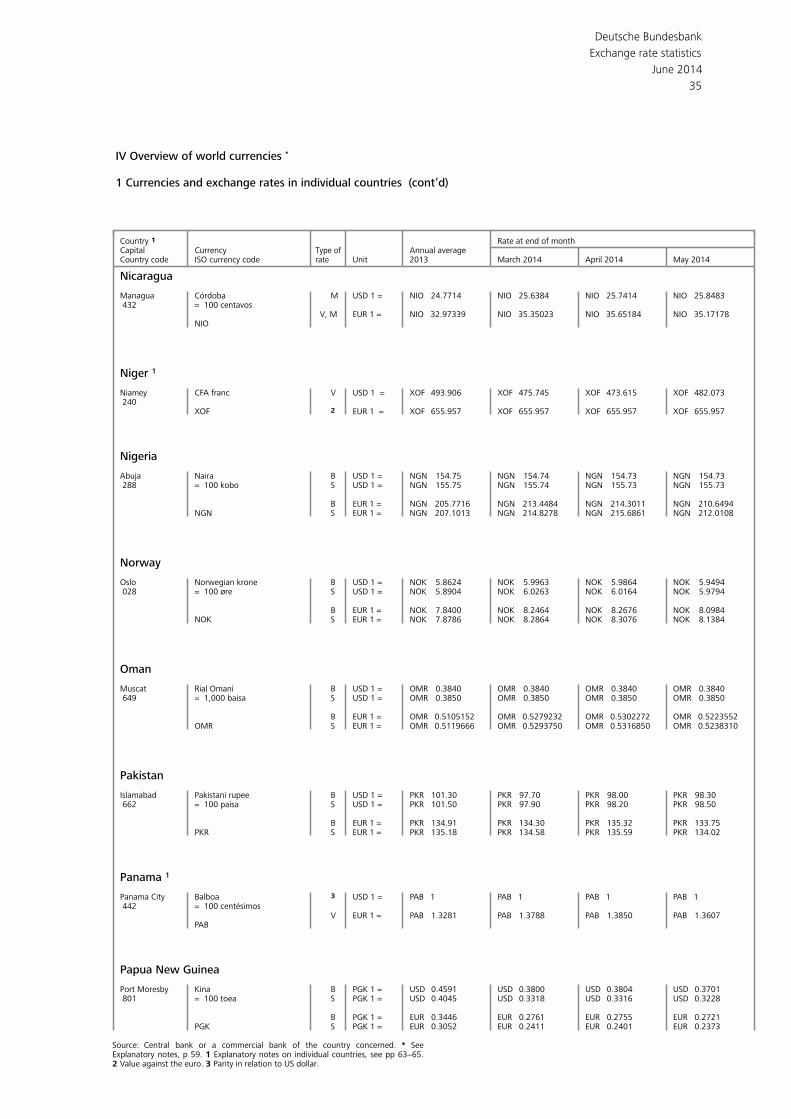
Deutsche Bundesbank
35
Exchange rate statistics
June 2014
IV Overview of world currencies *
1 Currencies and exchange rates in individual countries (cont’d)
Country 1 Rate at end of monthCapital Currency Annual average Type of
ISO currency code Unit 2013 March 2014 April 2014 May 2014Country code rate
Nicaragua Managua Córdoba M USD 1 = NIO 24.7714 NIO 25.6384 NIO 25.7414 NIO 25.8483 432 = 100 centavos
V, M EUR 1 = NIO 32.97339 NIO 35.35023 NIO 35.65184 NIO 35.17178NIO
Niger 1 Niamey CFA franc V USD 1 = XOF 493.906 XOF 475.745 XOF 473.615 XOF 482.073 240
XOF 2 EUR 1 = XOF 655.957 XOF 655.957 XOF 655.957 XOF 655.957
Nigeria Abuja Naira B USD 1 = NGN 154.75 NGN 154.74 NGN 154.73 NGN 154.73 288 = 100 kobo S USD 1 = NGN 155.75 NGN 155.74 NGN 155.73 NGN 155.73
B EUR 1 = NGN 205.7716 NGN 213.4484 NGN 214.3011 NGN 210.6494NGN S EUR 1 = NGN 207.1013 NGN 214.8278 NGN 215.6861 NGN 212.0108
Norway Oslo Norwegian krone B USD 1 = NOK 5.8624 NOK 5.9963 NOK 5.9864 NOK 5.9494 028 = 100 øre S USD 1 = NOK 5.8904 NOK 6.0263 NOK 6.0164 NOK 5.9794
B EUR 1 = NOK 7.8400 NOK 8.2464 NOK 8.2676 NOK 8.0984NOK S EUR 1 = NOK 7.8786 NOK 8.2864 NOK 8.3076 NOK 8.1384
Oman Muscat Rial Omani B USD 1 = OMR 0.3840 OMR 0.3840 OMR 0.3840 OMR 0.3840 649 = 1,000 baisa S USD 1 = OMR 0.3850 OMR 0.3850 OMR 0.3850 OMR 0.3850
B EUR 1 = OMR 0.5105152 OMR 0.5279232 OMR 0.5302272 OMR 0.5223552OMR S EUR 1 = OMR 0.5119666 OMR 0.5293750 OMR 0.5316850 OMR 0.5238310
Pakistan Islamabad Pakistani rupee B USD 1 = PKR 101.30 PKR 97.70 PKR 98.00 PKR 98.30 662 = 100 paisa S USD 1 = PKR 101.50 PKR 97.90 PKR 98.20 PKR 98.50
B EUR 1 = PKR 134.91 PKR 134.30 PKR 135.32 PKR 133.75PKR S EUR 1 = PKR 135.18 PKR 134.58 PKR 135.59 PKR 134.02
Panama 1 Panama City Balboa 3 USD 1 = PAB 1 PAB 1 PAB 1 PAB 1 442 = 100 centésimos V EUR 1 = PAB 1.3281 PAB 1.3788 PAB 1.3850 PAB 1.3607
PAB
Papua New Guinea Port Moresby Kina B PGK 1 = USD 0.4591 USD 0.3800 USD 0.3804 USD 0.3701 801 = 100 toea S PGK 1 = USD 0.4045 USD 0.3318 USD 0.3316 USD 0.3228
B PGK 1 = EUR 0.3446 EUR 0.2761 EUR 0.2755 EUR 0.2721PGK S PGK 1 = EUR 0.3052 EUR 0.2411 EUR 0.2401 EUR 0.2373
Source: Central bank or a commercial bank of the country concerned. * See Explanatory notes, p 59. 1 Explanatory notes on individual countries, see pp 63−65. 2 Value against the euro. 3 Parity in relation to US dollar.
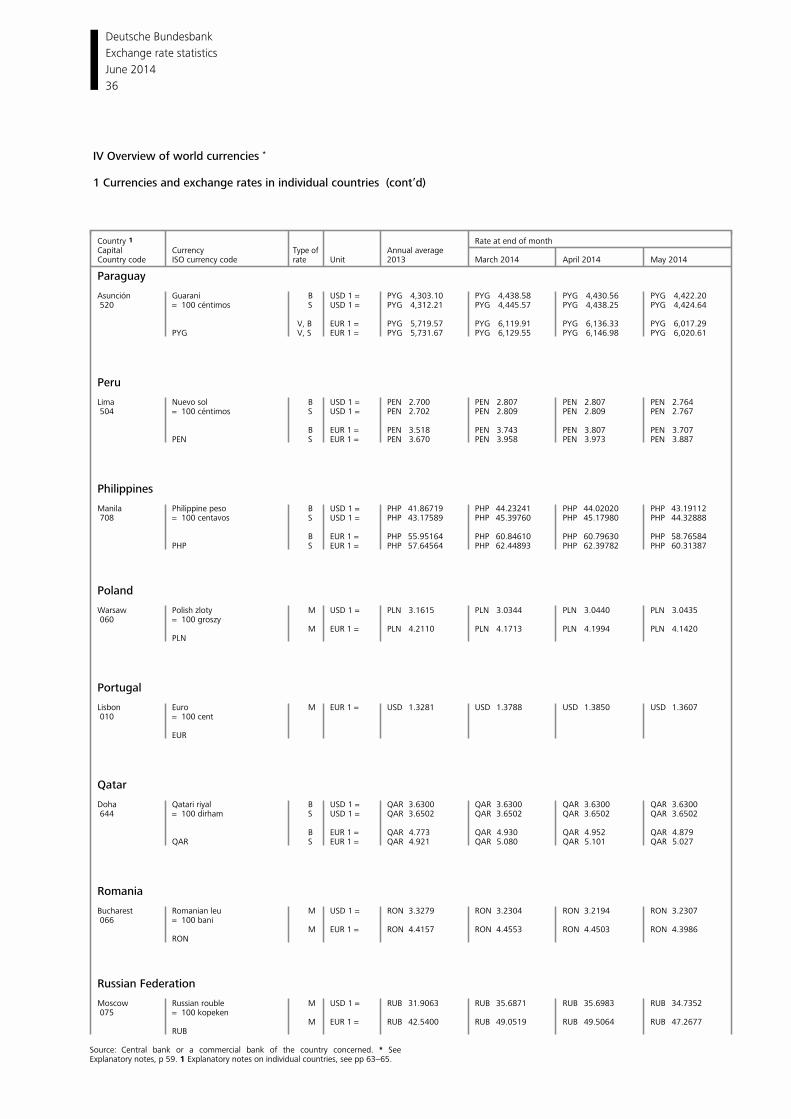
Deutsche Bundesbank
36
Exchange rate statistics
June 2014
IV Overview of world currencies *
1 Currencies and exchange rates in individual countries (cont’d)
Country 1 Rate at end of monthCapital Currency Annual average Type of
ISO currency code Unit 2013 March 2014 April 2014 May 2014Country code rate
Paraguay Asunción Guaraní B USD 1 = PYG 4,303.10 PYG 4,438.58 PYG 4,430.56 PYG 4,422.20 520 = 100 céntimos S USD 1 = PYG 4,312.21 PYG 4,445.57 PYG 4,438.25 PYG 4,424.64
V, B EUR 1 = PYG 5,719.57 PYG 6,119.91 PYG 6,136.33 PYG 6,017.29PYG V, S EUR 1 = PYG 5,731.67 PYG 6,129.55 PYG 6,146.98 PYG 6,020.61
Peru Lima Nuevo sol B USD 1 = PEN 2.700 PEN 2.807 PEN 2.807 PEN 2.764
504 = 100 céntimos S USD 1 = PEN 2.702 PEN 2.809 PEN 2.809 PEN 2.767
B EUR 1 = PEN 3.518 PEN 3.743 PEN 3.807 PEN 3.707 PEN S EUR 1 = PEN 3.670 PEN 3.958 PEN 3.973 PEN 3.887
Philippines Manila Philippine peso B USD 1 = PHP 41.86719 PHP 44.23241 PHP 44.02020 PHP 43.19112
708 = 100 centavos S USD 1 = PHP 43.17589 PHP 45.39760 PHP 45.17980 PHP 44.32888
B EUR 1 = PHP 55.95164 PHP 60.84610 PHP 60.79630 PHP 58.76584 PHP S EUR 1 = PHP 57.64564 PHP 62.44893 PHP 62.39782 PHP 60.31387
Poland Warsaw Polish zloty M USD 1 = PLN 3.1615 PLN 3.0344 PLN 3.0440 PLN 3.0435 060 = 100 groszy
M EUR 1 = PLN 4.2110 PLN 4.1713 PLN 4.1994 PLN 4.1420PLN
Portugal Lisbon Euro M EUR 1 = USD 1.3281 USD 1.3788 USD 1.3850 USD 1.3607 010 = 100 cent EUR
Qatar Doha Qatari riyal B USD 1 = QAR 3.6300 QAR 3.6300 QAR 3.6300 QAR 3.6300 644 = 100 dirham S USD 1 = QAR 3.6502 QAR 3.6502 QAR 3.6502 QAR 3.6502
B EUR 1 = QAR 4.773 QAR 4.930 QAR 4.952 QAR 4.879QAR S EUR 1 = QAR 4.921 QAR 5.080 QAR 5.101 QAR 5.027
Romania Bucharest Romanian leu M USD 1 = RON 3.3279 RON 3.2304 RON 3.2194 RON 3.2307 066 = 100 bani
M EUR 1 = RON 4.4157 RON 4.4553 RON 4.4503 RON 4.3986RON
Russian Federation Moscow Russian rouble M USD 1 = RUB 31.9063 RUB 35.6871 RUB 35.6983 RUB 34.7352 075 = 100 kopeken
M EUR 1 = RUB 42.5400 RUB 49.0519 RUB 49.5064 RUB 47.2677 RUB
Source: Central bank or a commercial bank of the country concerned. * See Explanatory notes, p 59. 1 Explanatory notes on individual countries, see pp 63−65.
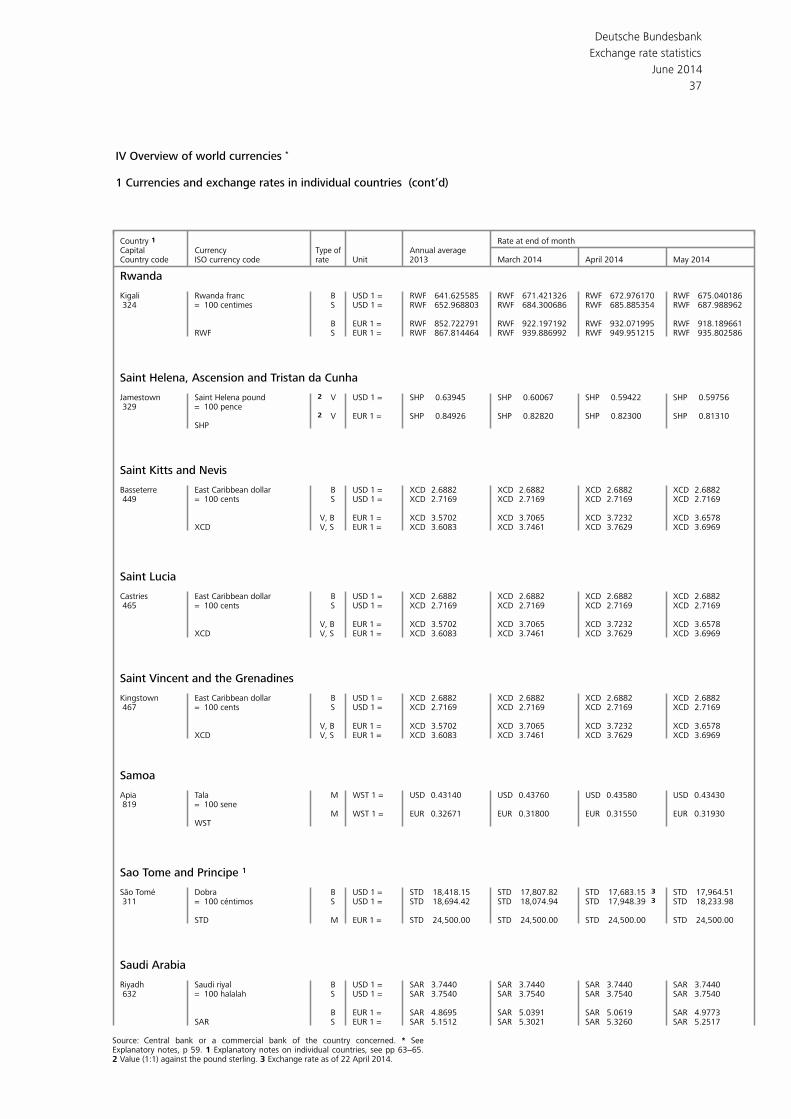
Deutsche Bundesbank
37
Exchange rate statistics
June 2014
IV Overview of world currencies *
1 Currencies and exchange rates in individual countries (cont’d)
Country 1 Rate at end of monthCapital Currency Annual average Type of
ISO currency code Unit 2013 March 2014 April 2014 May 2014Country code rate
Rwanda Kigali Rwanda franc B USD 1 = RWF 641.625585 RWF 671.421326 RWF 672.976170 RWF 675.040186 324 = 100 centimes S USD 1 = RWF 652.968803 RWF 684.300686 RWF 685.885354 RWF 687.988962
B EUR 1 = RWF 852.722791 RWF 922.197192 RWF 932.071995 RWF 918.189661RWF S EUR 1 = RWF 867.814464 RWF 939.886992 RWF 949.951215 RWF 935.802586
Saint Helena, Ascension and Tristan da Cunha Jamestown Saint Helena pound 2 V USD 1 = SHP 0.63945 SHP 0.60067 SHP 0.59422 SHP 0.59756 329 = 100 pence
2 V EUR 1 = SHP 0.84926 SHP 0.82820 SHP 0.82300 SHP 0.81310SHP
Saint Kitts and Nevis Basseterre East Caribbean dollar B USD 1 = XCD 2.6882 XCD 2.6882 XCD 2.6882 XCD 2.6882 449 = 100 cents S USD 1 = XCD 2.7169 XCD 2.7169 XCD 2.7169 XCD 2.7169
V, B EUR 1 = XCD 3.5702 XCD 3.7065 XCD 3.7232 XCD 3.6578XCD V, S EUR 1 = XCD 3.6083 XCD 3.7461 XCD 3.7629 XCD 3.6969
Saint Lucia Castries East Caribbean dollar B USD 1 = XCD 2.6882 XCD 2.6882 XCD 2.6882 XCD 2.6882 465 = 100 cents S USD 1 = XCD 2.7169 XCD 2.7169 XCD 2.7169 XCD 2.7169
V, B EUR 1 = XCD 3.5702 XCD 3.7065 XCD 3.7232 XCD 3.6578XCD V, S EUR 1 = XCD 3.6083 XCD 3.7461 XCD 3.7629 XCD 3.6969
Saint Vincent and the Grenadines Kingstown East Caribbean dollar B USD 1 = XCD 2.6882 XCD 2.6882 XCD 2.6882 XCD 2.6882 467 = 100 cents S USD 1 = XCD 2.7169 XCD 2.7169 XCD 2.7169 XCD 2.7169
V, B EUR 1 = XCD 3.5702 XCD 3.7065 XCD 3.7232 XCD 3.6578XCD V, S EUR 1 = XCD 3.6083 XCD 3.7461 XCD 3.7629 XCD 3.6969
Samoa Apia Tala M WST 1 = USD 0.43140 USD 0.43760 USD 0.43580 USD 0.43430 819 = 100 sene
M WST 1 = EUR 0.32671 EUR 0.31800 EUR 0.31550 EUR 0.31930WST
Sao Tome and Principe 1 São Tomé Dobra B USD 1 = STD 18,418.15 STD 17,807.82 STD 17,683.15 STD 17,964.513 311 = 100 céntimos S USD 1 = STD 18,694.42 STD 18,074.94 STD 17,948.39 STD 18,233.983
STD M EUR 1 = STD 24,500.00 STD 24,500.00 STD 24,500.00 STD 24,500.00
Saudi Arabia Riyadh Saudi riyal B USD 1 = SAR 3.7440 SAR 3.7440 SAR 3.7440 SAR 3.7440 632 = 100 halalah S USD 1 = SAR 3.7540 SAR 3.7540 SAR 3.7540 SAR 3.7540
B EUR 1 = SAR 4.8695 SAR 5.0391 SAR 5.0619 SAR 4.9773SAR S EUR 1 = SAR 5.1512 SAR 5.3021 SAR 5.3260 SAR 5.2517
Source: Central bank or a commercial bank of the country concerned. * See Explanatory notes, p 59. 1 Explanatory notes on individual countries, see pp 63−65. 2 Value (1:1) against the pound sterling. 3 Exchange rate as of 22 April 2014.
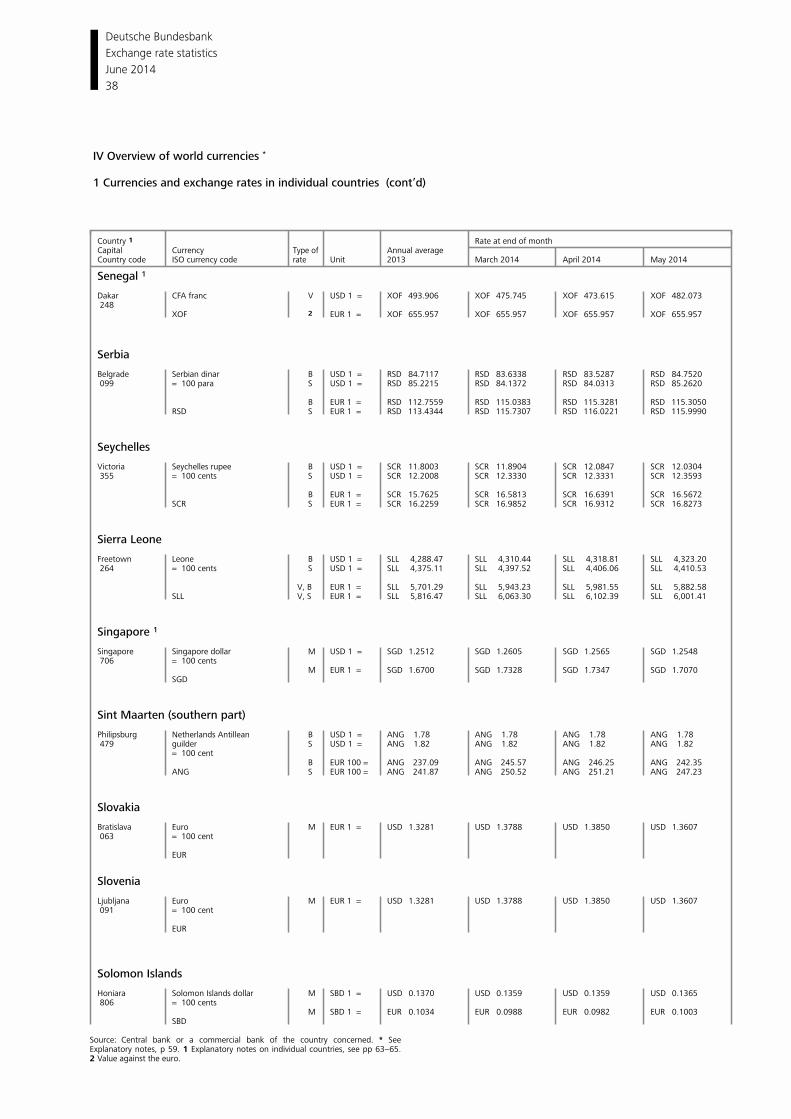
Deutsche Bundesbank
38
Exchange rate statistics
June 2014
IV Overview of world currencies *
1 Currencies and exchange rates in individual countries (cont’d)
Country 1 Rate at end of monthCapital Currency Annual average Type of
ISO currency code Unit 2013 March 2014 April 2014 May 2014Country code rate
Senegal 1 Dakar CFA franc V USD 1 = XOF 493.906 XOF 475.745 XOF 473.615 XOF 482.073 248
XOF 2 EUR 1 = XOF 655.957 XOF 655.957 XOF 655.957 XOF 655.957
Serbia Belgrade Serbian dinar B USD 1 = RSD 84.7117 RSD 83.6338 RSD 83.5287 RSD 84.7520
099 = 100 para S USD 1 = RSD 85.2215 RSD 84.1372 RSD 84.0313 RSD 85.2620
B EUR 1 = RSD 112.7559 RSD 115.0383 RSD 115.3281 RSD 115.3050RSD S EUR 1 = RSD 113.4344 RSD 115.7307 RSD 116.0221 RSD 115.9990
Seychelles Victoria Seychelles rupee B USD 1 = SCR 11.8003 SCR 11.8904 SCR 12.0847 SCR 12.0304 355 = 100 cents S USD 1 = SCR 12.2008 SCR 12.3330 SCR 12.3331 SCR 12.3593
B EUR 1 = SCR 15.7625 SCR 16.5813 SCR 16.6391 SCR 16.5672SCR S EUR 1 = SCR 16.2259 SCR 16.9852 SCR 16.9312 SCR 16.8273
Sierra Leone Freetown Leone B USD 1 = SLL 4,288.47 SLL 4,310.44 SLL 4,318.81 SLL 4,323.20
264 = 100 cents S USD 1 = SLL 4,375.11 SLL 4,397.52 SLL 4,406.06 SLL 4,410.53
V, B EUR 1 = SLL 5,701.29 SLL 5,943.23 SLL 5,981.55 SLL 5,882.58 SLL V, S EUR 1 = SLL 5,816.47 SLL 6,063.30 SLL 6,102.39 SLL 6,001.41
Singapore 1 Singapore Singapore dollar M USD 1 = SGD 1.2512 SGD 1.2605 SGD 1.2565 SGD 1.2548 706 = 100 cents
M EUR 1 = SGD 1.6700 SGD 1.7328 SGD 1.7347 SGD 1.7070SGD
Sint Maarten (southern part) Philipsburg Netherlands Antillean B USD 1 = ANG 1.78 ANG 1.78 ANG 1.78 ANG 1.78
479 guilder S USD 1 = ANG 1.82 ANG 1.82 ANG 1.82 ANG 1.82= 100 cent
B EUR 100 = ANG 237.09 ANG 245.57 ANG 246.25 ANG 242.35ANG S EUR 100 = ANG 241.87 ANG 250.52 ANG 251.21 ANG 247.23
Slovakia Bratislava Euro M EUR 1 = USD 1.3281 USD 1.3788 USD 1.3850 USD 1.3607 063 = 100 cent EUR
Slovenia Ljubljana Euro M EUR 1 = USD 1.3281 USD 1.3788 USD 1.3850 USD 1.3607 091 = 100 cent EUR
Solomon Islands Honiara Solomon Islands dollar M SBD 1 = USD 0.1370 USD 0.1359 USD 0.1359 USD 0.1365 806 = 100 cents
M SBD 1 = EUR 0.1034 EUR 0.0988 EUR 0.0982 EUR 0.1003SBD
Source: Central bank or a commercial bank of the country concerned. * See Explanatory notes, p 59. 1 Explanatory notes on individual countries, see pp 63−65. 2 Value against the euro.
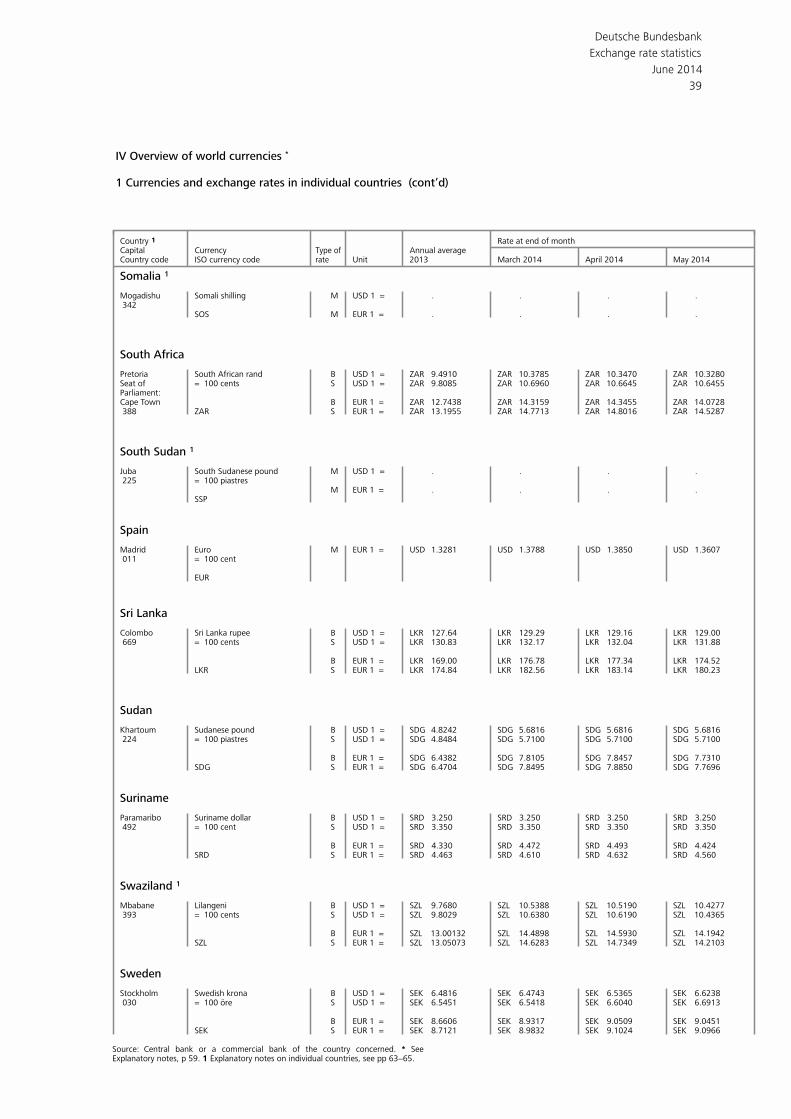
Deutsche Bundesbank
39
Exchange rate statistics
June 2014
IV Overview of world currencies *
1 Currencies and exchange rates in individual countries (cont’d)
Country 1 Rate at end of monthCapital Currency Annual average Type of
ISO currency code Unit 2013 March 2014 April 2014 May 2014Country code rate
Somalia 1 Mogadishu Somali shilling M USD 1 = . . . .
342 SOS M EUR 1 = . . . .
South Africa Pretoria South African rand B USD 1 = ZAR 9.4910 ZAR 10.3785 ZAR 10.3470 ZAR 10.3280Seat of = 100 cents S USD 1 = ZAR 9.8085 ZAR 10.6960 ZAR 10.6645 ZAR 10.6455Parliament:Cape Town B EUR 1 = ZAR 12.7438 ZAR 14.3159 ZAR 14.3455 ZAR 14.0728 388 ZAR S EUR 1 = ZAR 13.1955 ZAR 14.7713 ZAR 14.8016 ZAR 14.5287
South Sudan 1 Juba South Sudanese pound M USD 1 = . . . .
225 = 100 piastres M EUR 1 = . . . .
SSP
Spain Madrid Euro M EUR 1 = USD 1.3281 USD 1.3788 USD 1.3850 USD 1.3607 011 = 100 cent EUR
Sri Lanka Colombo Sri Lanka rupee B USD 1 = LKR 127.64 LKR 129.29 LKR 129.16 LKR 129.00 669 = 100 cents S USD 1 = LKR 130.83 LKR 132.17 LKR 132.04 LKR 131.88
B EUR 1 = LKR 169.00 LKR 176.78 LKR 177.34 LKR 174.52LKR S EUR 1 = LKR 174.84 LKR 182.56 LKR 183.14 LKR 180.23
Sudan Khartoum Sudanese pound B USD 1 = SDG 4.8242 SDG 5.6816 SDG 5.6816 SDG 5.6816 224 = 100 piastres S USD 1 = SDG 4.8484 SDG 5.7100 SDG 5.7100 SDG 5.7100
B EUR 1 = SDG 6.4382 SDG 7.8105 SDG 7.8457 SDG 7.7310SDG S EUR 1 = SDG 6.4704 SDG 7.8495 SDG 7.8850 SDG 7.7696
Suriname Paramaribo Suriname dollar B USD 1 = SRD 3.250 SRD 3.250 SRD 3.250 SRD 3.250 492 = 100 cent S USD 1 = SRD 3.350 SRD 3.350 SRD 3.350 SRD 3.350
B EUR 1 = SRD 4.330 SRD 4.472 SRD 4.493 SRD 4.424SRD S EUR 1 = SRD 4.463 SRD 4.610 SRD 4.632 SRD 4.560
Swaziland 1 Mbabane Lilangeni B USD 1 = SZL 9.7680 SZL 10.5388 SZL 10.5190 SZL 10.4277 393 = 100 cents S USD 1 = SZL 9.8029 SZL 10.6380 SZL 10.6190 SZL 10.4365
B EUR 1 = SZL 13.00132 SZL 14.4898 SZL 14.5930 SZL 14.1942SZL S EUR 1 = SZL 13.05073 SZL 14.6283 SZL 14.7349 SZL 14.2103
Sweden Stockholm Swedish krona B USD 1 = SEK 6.4816 SEK 6.4743 SEK 6.5365 SEK 6.6238 030 = 100 öre S USD 1 = SEK 6.5451 SEK 6.5418 SEK 6.6040 SEK 6.6913
B EUR 1 = SEK 8.6606 SEK 8.9317 SEK 9.0509 SEK 9.0451SEK S EUR 1 = SEK 8.7121 SEK 8.9832 SEK 9.1024 SEK 9.0966
Source: Central bank or a commercial bank of the country concerned. * See Explanatory notes, p 59. 1 Explanatory notes on individual countries, see pp 63−65.
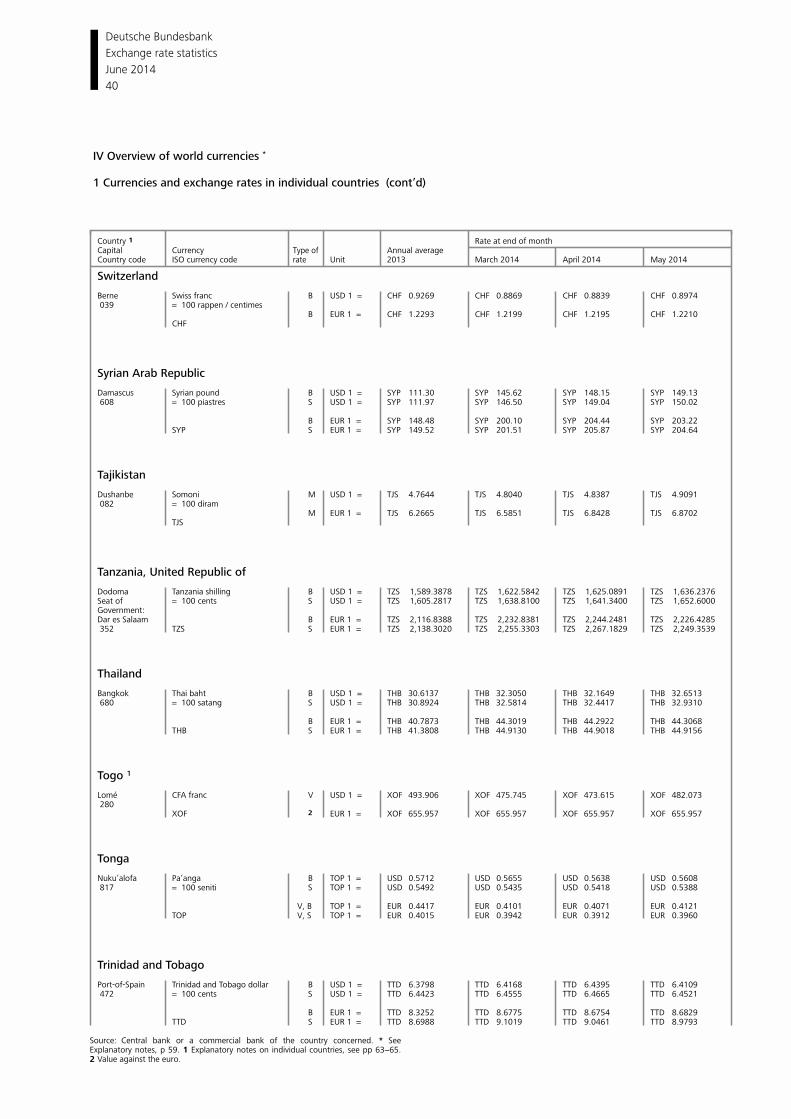
Deutsche Bundesbank
40
Exchange rate statistics
June 2014
IV Overview of world currencies *
1 Currencies and exchange rates in individual countries (cont’d)
Country 1 Rate at end of monthCapital Currency Annual average Type of
ISO currency code Unit 2013 March 2014 April 2014 May 2014Country code rate
Switzerland Berne Swiss franc B USD 1 = CHF 0.9269 CHF 0.8869 CHF 0.8839 CHF 0.8974 039 = 100 rappen / centimes
B EUR 1 = CHF 1.2293 CHF 1.2199 CHF 1.2195 CHF 1.2210CHF
Syrian Arab Republic Damascus Syrian pound B USD 1 = SYP 111.30 SYP 145.62 SYP 148.15 SYP 149.13 608 = 100 piastres S USD 1 = SYP 111.97 SYP 146.50 SYP 149.04 SYP 150.02
B EUR 1 = SYP 148.48 SYP 200.10 SYP 204.44 SYP 203.22SYP S EUR 1 = SYP 149.52 SYP 201.51 SYP 205.87 SYP 204.64
Tajikistan Dushanbe Somoni M USD 1 = TJS 4.7644 TJS 4.8040 TJS 4.8387 TJS 4.9091
082 = 100 diramM EUR 1 = TJS 6.2665 TJS 6.5851 TJS 6.8428 TJS 6.8702
TJS
Tanzania, United Republic of Dodoma Tanzania shilling B USD 1 = TZS 1,589.3878 TZS 1,622.5842 TZS 1,625.0891 TZS 1,636.2376Seat of = 100 cents S USD 1 = TZS 1,605.2817 TZS 1,638.8100 TZS 1,641.3400 TZS 1,652.6000Government:Dar es Salaam B EUR 1 = TZS 2,116.8388 TZS 2,232.8381 TZS 2,244.2481 TZS 2,226.4285 352 TZS S EUR 1 = TZS 2,138.3020 TZS 2,255.3303 TZS 2,267.1829 TZS 2,249.3539
Thailand Bangkok Thai baht B USD 1 = THB 30.6137 THB 32.3050 THB 32.1649 THB 32.6513 680 = 100 satang S USD 1 = THB 30.8924 THB 32.5814 THB 32.4417 THB 32.9310
B EUR 1 = THB 40.7873 THB 44.3019 THB 44.2922 THB 44.3068THB S EUR 1 = THB 41.3808 THB 44.9130 THB 44.9018 THB 44.9156
Togo 1 Lomé CFA franc V USD 1 = XOF 493.906 XOF 475.745 XOF 473.615 XOF 482.073 280
XOF 2 EUR 1 = XOF 655.957 XOF 655.957 XOF 655.957 XOF 655.957
Tonga Nuku’alofa Pa’anga B TOP 1 = USD 0.5712 USD 0.5655 USD 0.5638 USD 0.5608
817 = 100 seniti S TOP 1 = USD 0.5492 USD 0.5435 USD 0.5418 USD 0.5388
V, B TOP 1 = EUR 0.4417 EUR 0.4101 EUR 0.4071 EUR 0.4121TOP V, S TOP 1 = EUR 0.4015 EUR 0.3942 EUR 0.3912 EUR 0.3960
Trinidad and Tobago Port-of-Spain Trinidad and Tobago dollar B USD 1 = TTD 6.3798 TTD 6.4168 TTD 6.4395 TTD 6.4109 472 = 100 cents S USD 1 = TTD 6.4423 TTD 6.4555 TTD 6.4665 TTD 6.4521
B EUR 1 = TTD 8.3252 TTD 8.6775 TTD 8.6754 TTD 8.6829TTD S EUR 1 = TTD 8.6988 TTD 9.1019 TTD 9.0461 TTD 8.9793
Source: Central bank or a commercial bank of the country concerned. * See Explanatory notes, p 59. 1 Explanatory notes on individual countries, see pp 63−65. 2 Value against the euro.
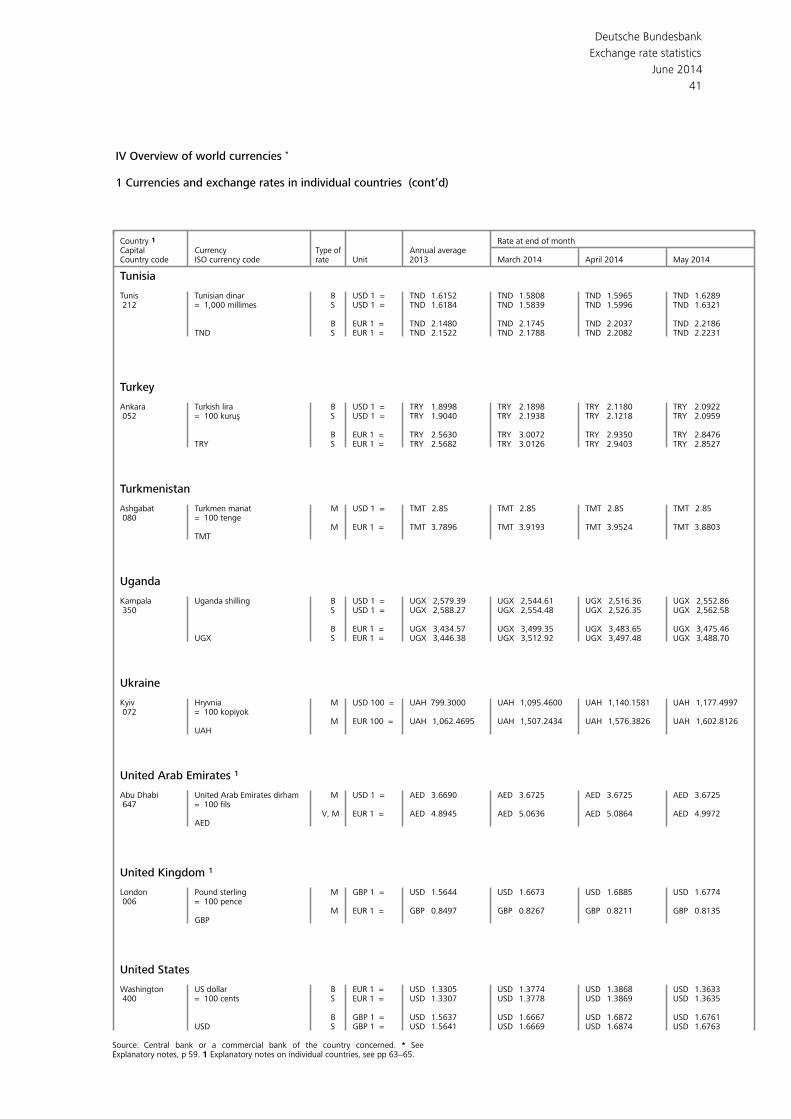
Deutsche Bundesbank
41
Exchange rate statistics
June 2014
IV Overview of world currencies *
1 Currencies and exchange rates in individual countries (cont’d)
Country 1 Rate at end of monthCapital Currency Annual average Type of
ISO currency code Unit 2013 March 2014 April 2014 May 2014Country code rate
Tunisia Tunis Tunisian dinar B USD 1 = TND 1.6152 TND 1.5808 TND 1.5965 TND 1.6289 212 = 1,000 millimes S USD 1 = TND 1.6184 TND 1.5839 TND 1.5996 TND 1.6321
B EUR 1 = TND 2.1480 TND 2.1745 TND 2.2037 TND 2.2186TND S EUR 1 = TND 2.1522 TND 2.1788 TND 2.2082 TND 2.2231
Turkey Ankara Turkish lira B USD 1 = TRY 1.8998 TRY 2.1898 TRY 2.1180 TRY 2.0922 052 S USD 1 = TRY 1.9040 TRY 2.1938 TRY 2.1218 TRY 2.0959= 100 kurus,
B EUR 1 = TRY 2.5630 TRY 3.0072 TRY 2.9350 TRY 2.8476TRY S EUR 1 = TRY 2.5682 TRY 3.0126 TRY 2.9403 TRY 2.8527
Turkmenistan Ashgabat M USD 1 = TMT 2.85 TMT 2.85 TMT 2.85 TMT 2.85Turkmen manat 080 = 100 tenge
M EUR 1 = TMT 3.7896 TMT 3.9193 TMT 3.9524 TMT 3.8803TMT
Uganda Kampala Uganda shilling B USD 1 = UGX 2,579.39 UGX 2,544.61 UGX 2,516.36 UGX 2,552.86 350 S USD 1 = UGX 2,588.27 UGX 2,554.48 UGX 2,526.35 UGX 2,562.58
B EUR 1 = UGX 3,434.57 UGX 3,499.35 UGX 3,483.65 UGX 3,475.46UGX S EUR 1 = UGX 3,446.38 UGX 3,512.92 UGX 3,497.48 UGX 3,488.70
Ukraine Kyiv Hryvnia M USD 100 = UAH 799.3000 UAH 1,095.4600 UAH 1,140.1581 UAH 1,177.4997 072 = 100 kopiyok
M EUR 100 = UAH 1,062.4695 UAH 1,507.2434 UAH 1,576.3826 UAH 1,602.8126 UAH
United Arab Emirates 1 Abu Dhabi M USD 1 = AED 3.6690 AED 3.6725 AED 3.6725 AED 3.6725United Arab Emirates dirham 647 = 100 fils
V, M EUR 1 = AED 4.8945 AED 5.0636 AED 5.0864 AED 4.9972AED
United Kingdom 1 London Pound sterling M GBP 1 = USD 1.5644 USD 1.6673 USD 1.6885 USD 1.6774
006 = 100 penceM EUR 1 = GBP 0.8497 GBP 0.8267 GBP 0.8211 GBP 0.8135
GBP
United States Washington US dollar B EUR 1 = USD 1.3305 USD 1.3774 USD 1.3868 USD 1.3633 400 = 100 cents S EUR 1 = USD 1.3307 USD 1.3778 USD 1.3869 USD 1.3635
B GBP 1 = USD 1.5637 USD 1.6667 USD 1.6872 USD 1.6761USD S GBP 1 = USD 1.5641 USD 1.6669 USD 1.6874 USD 1.6763
Source: Central bank or a commercial bank of the country concerned. * See Explanatory notes, p 59. 1 Explanatory notes on individual countries, see pp 63−65.
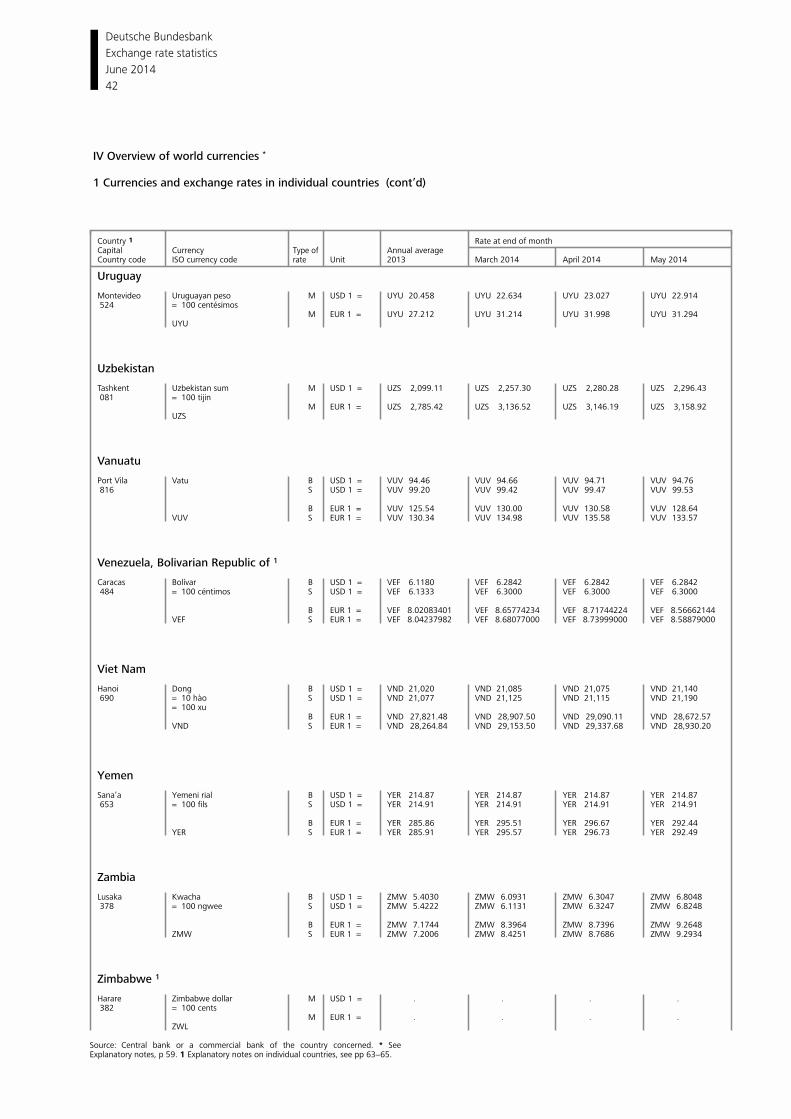
Deutsche Bundesbank
42
Exchange rate statistics
June 2014
IV Overview of world currencies *
1 Currencies and exchange rates in individual countries (cont’d)
Country 1 Rate at end of monthCapital Currency Annual average Type of
ISO currency code Unit 2013 March 2014 April 2014 May 2014Country code rate
Uruguay Montevideo M USD 1 = UYU 20.458 UYU 22.634 UYU 23.027 UYU 22.914Uruguayan peso 524 = 100 centésimos
M EUR 1 = UYU 27.212 UYU 31.214 UYU 31.998 UYU 31.294UYU
Uzbekistan Tashkent Uzbekistan sum M USD 1 = UZS 2,099.11 UZS 2,257.30 UZS 2,280.28 UZS 2,296.43
081 = 100 tijinM EUR 1 = UZS 2,785.42 UZS 3,136.52 UZS 3,146.19 UZS 3,158.92
UZS
Vanuatu Port Vila Vatu B USD 1 = VUV 94.46 VUV 94.66 VUV 94.71 VUV 94.76 816 S USD 1 = VUV 99.20 VUV 99.42 VUV 99.47 VUV 99.53
B EUR 1 = VUV 125.54 VUV 130.00 VUV 130.58 VUV 128.64VUV S EUR 1 = VUV 130.34 VUV 134.98 VUV 135.58 VUV 133.57
Venezuela, Bolivarian Republic of 1 Caracas B USD 1 = VEF 6.1180 VEF 6.2842 VEF 6.2842 VEF 6.2842Bolívar 484 = 100 céntimos S USD 1 = VEF 6.1333 VEF 6.3000 VEF 6.3000 VEF 6.3000
B EUR 1 = VEF 8.02083401 VEF 8.65774234 VEF 8.71744224 VEF 8.56662144VEF S EUR 1 = VEF 8.04237982 VEF 8.68077000 VEF 8.73999000 VEF 8.58879000
Viet Nam Hanoi Dong B USD 1 = VND 21,020 VND 21,085 VND 21,075 VND 21,140 690 = 10 hào S USD 1 = VND 21,077 VND 21,125 VND 21,115 VND 21,190 = 100 xu
B EUR 1 = VND 27,821.48 VND 28,907.50 VND 29,090.11 VND 28,672.57VND S EUR 1 = VND 28,264.84 VND 29,153.50 VND 29,337.68 VND 28,930.20
Yemen Sana’a Yemeni rial B USD 1 = YER 214.87 YER 214.87 YER 214.87 YER 214.87 653 = 100 fils S USD 1 = YER 214.91 YER 214.91 YER 214.91 YER 214.91
B EUR 1 = YER 285.86 YER 295.51 YER 296.67 YER 292.44YER S EUR 1 = YER 285.91 YER 295.57 YER 296.73 YER 292.49
Zambia Lusaka Kwacha B USD 1 = ZMW 5.4030 ZMW 6.0931 ZMW 6.3047 ZMW 6.8048 378 = 100 ngwee S USD 1 = ZMW 5.4222 ZMW 6.1131 ZMW 6.3247 ZMW 6.8248
B EUR 1 = ZMW 7.1744 ZMW 8.3964 ZMW 8.7396 ZMW 9.2648ZMW S EUR 1 = ZMW 7.2006 ZMW 8.4251 ZMW 8.7686 ZMW 9.2934
Zimbabwe 1 Harare M USD 1 = . . . .Zimbabwe dollar
382 = 100 cents M EUR 1 = . . . .
ZWL
Source: Central bank or a commercial bank of the country concerned. * See Explanatory notes, p 59. 1 Explanatory notes on individual countries, see pp 63−65.
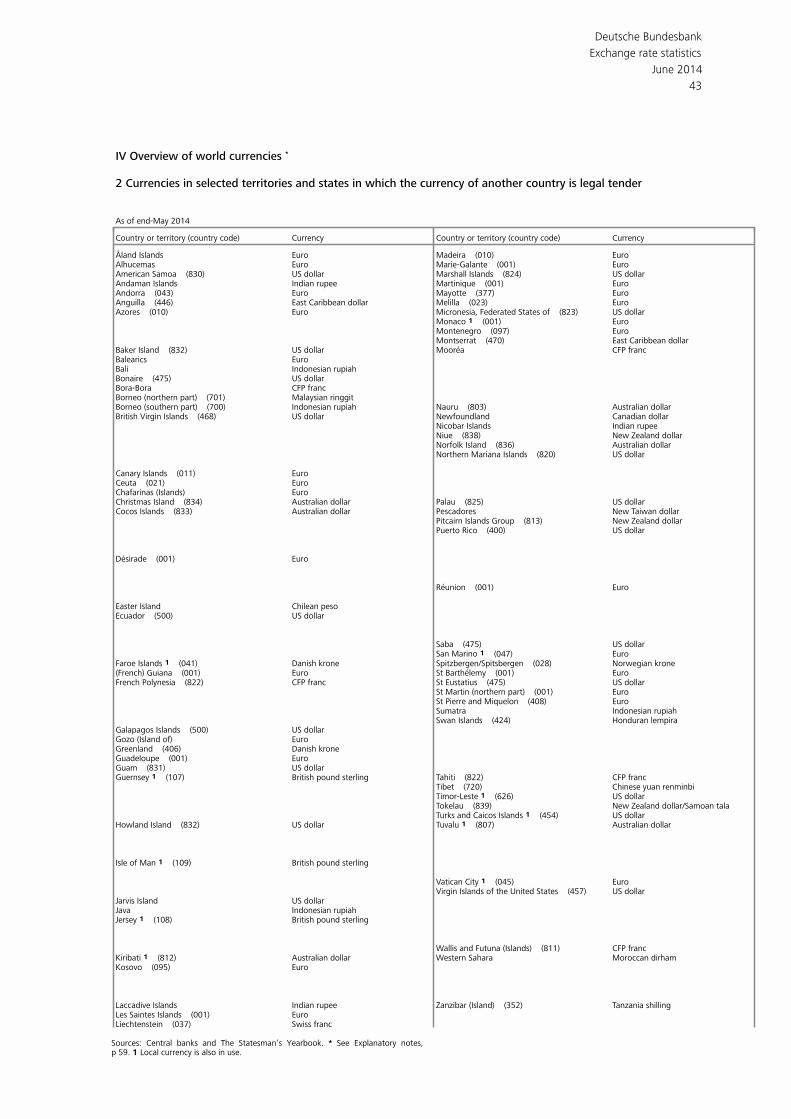
Deutsche Bundesbank
43
Exchange rate statistics
June 2014
IV Overview of world currencies *
2 Currencies in selected territories and states in which the currency of another country is legal tender As of end-May 2014
Currency CurrencyCountry or territory (country code) Country or territory (country code)
Åland Islands Euro Madeira (010) EuroAlhucemas Euro Marie-Galante (001) EuroAmerican Samoa (830) US dollar Marshall Islands (824) US dollarAndaman Islands Indian rupee Martinique (001) EuroAndorra (043) Euro Mayotte (377) EuroAnguilla (446) East Caribbean dollar Melilla (023) EuroAzores (010) Euro Micronesia, Federated States of (823) US dollar Monaco 1 (001) Euro Montenegro (097) Euro Montserrat (470) East Caribbean dollarBaker Island (832) US dollar Mooréa CFP francBalearics Euro Bali Indonesian rupiah Bonaire (475) US dollar Bora-Bora CFP franc Borneo (northern part) (701) Malaysian ringgit Borneo (southern part) (700) Indonesian rupiah Nauru (803) Australian dollarBritish Virgin Islands (468) US dollar Newfoundland Canadian dollar Nicobar Islands Indian rupee Niue (838) New Zealand dollar Norfolk Island (836) Australian dollar Northern Mariana Islands (820) US dollar Canary Islands (011) Euro Ceuta (021) Euro Chafarinas (Islands) Euro Christmas Island (834) Australian dollar Palau (825) US dollarCocos Islands (833) Australian dollar Pescadores New Taiwan dollar Pitcairn Islands Group (813) New Zealand dollar Puerto Rico (400) US dollar Désirade (001) Euro Réunion (001) Euro Easter Island Chilean peso Ecuador (500) US dollar Saba (475) US dollar San Marino 1 (047) EuroFaroe Islands 1 (041) Danish krone Spitzbergen/Spitsbergen (028) Norwegian krone(French) Guiana (001) Euro St Barthélemy (001) EuroFrench Polynesia (822) CFP franc St Eustatius (475) US dollar St Martin (northern part) (001) Euro St Pierre and Miquelon (408) Euro Sumatra Indonesian rupiah Swan Islands (424) Honduran lempiraGalapagos Islands (500) US dollar Gozo (Island of) Euro Greenland (406) Danish krone Guadeloupe (001) Euro Guam (831) US dollar Guernsey 1 (107) British pound sterling Tahiti (822) CFP franc Tibet (720) Chinese yuan renminbi Timor-Leste 1 (626) US dollar Tokelau (839) New Zealand dollar/Samoan tala Turks and Caicos Islands 1 (454) US dollarHowland Island (832) US dollar Tuvalu 1 (807) Australian dollar Isle of Man 1 (109) British pound sterling Vatican City 1 (045) Euro Virgin Islands of the United States (457) US dollarJarvis Island US dollar Java Indonesian rupiah Jersey 1 (108) British pound sterling Wallis and Futuna (Islands) (811) CFP francKiribati 1 (812) Australian dollar Western Sahara Moroccan dirhamKosovo (095) Euro Laccadive Islands Indian rupee Zanzibar (Island) (352) Tanzania shillingLes Saintes Islands (001) EuroLiechtenstein (037) Swiss franc
Sources: Central banks and The Statesman’s Yearbook. * See Explanatory notes, p 59. 1 Local currency is also in use.
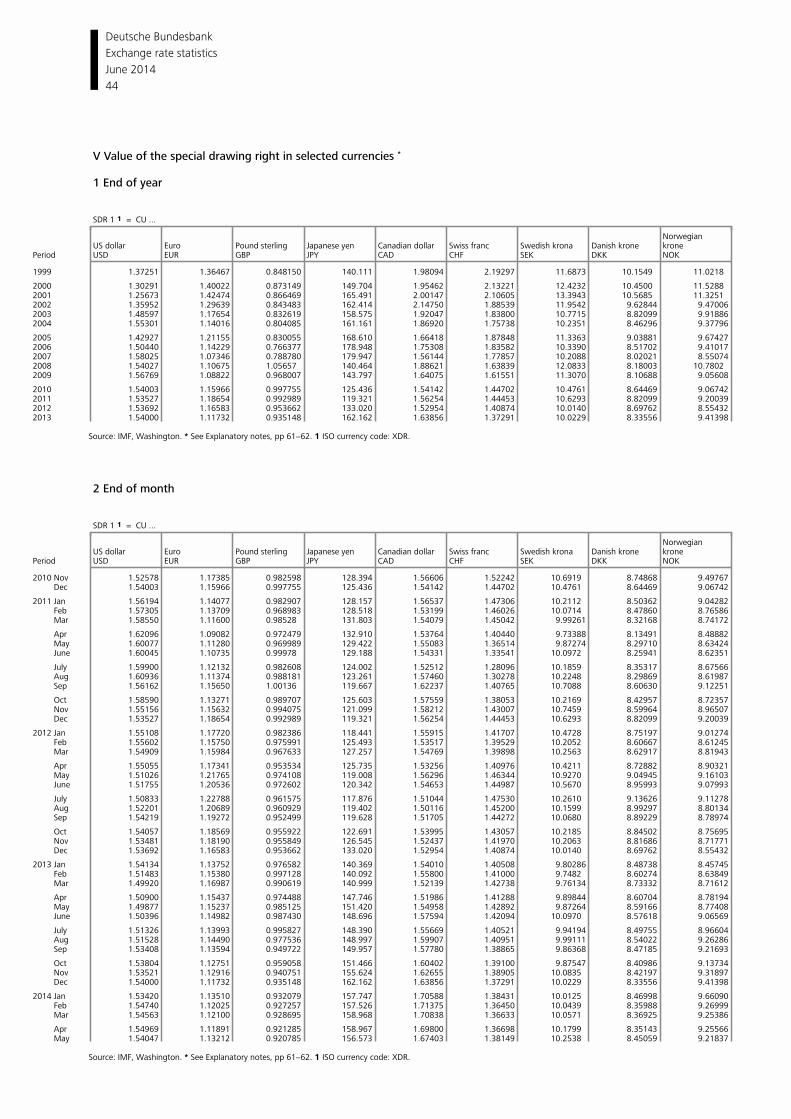
Deutsche Bundesbank
44
Exchange rate statistics
June 2014
V Value of the special drawing right in selected currencies *
1 End of year
SDR 1 1 = CU ...
NorwegianUS dollar Euro Japanese yen Swiss franc Danish krone kronePound sterling Canadian dollar Swedish krona
Period USD EUR GBP JPY CAD CHF SEK DKK NOK
1999 1.37251 1.36467 0.848150 140.111 1.98094 2.19297 11.6873 10.1549 11.0218
2000 1.30291 1.40022 0.873149 149.704 1.95462 2.13221 12.4232 10.4500 11.5288 2001 1.25673 1.42474 0.866469 165.491 2.00147 2.10605 13.3943 10.5685 11.3251 2002 1.35952 1.29639 0.843483 162.414 2.14750 1.88539 11.9542 9.62844 9.470062003 1.48597 1.17654 0.832619 158.575 1.92047 1.83800 10.7715 8.82099 9.918862004 1.55301 1.14016 0.804085 161.161 1.86920 1.75738 10.2351 8.46296 9.37796
2005 1.42927 1.21155 0.830055 168.610 1.66418 1.87848 11.3363 9.03881 9.674272006 1.50440 1.14229 0.766377 178.948 1.75308 1.83582 10.3390 8.51702 9.410172007 1.58025 1.07346 0.788780 179.947 1.56144 1.77857 10.2088 8.02021 8.550742008 1.54027 1.10675 1.05657 140.464 1.88621 1.63839 12.0833 8.18003 10.7802 2009 1.56769 1.08822 0.968007 143.797 1.64075 1.61551 11.3070 8.10688 9.05608
2010 1.54003 1.15966 0.997755 125.436 1.54142 1.44702 10.4761 8.64469 9.067422011 1.53527 1.18654 0.992989 119.321 1.56254 1.44453 10.6293 8.82099 9.200392012 1.53692 1.16583 0.953662 133.020 1.52954 1.40874 10.0140 8.69762 8.554322013 1.54000 1.11732 0.935148 162.162 1.63856 1.37291 10.0229 8.33556 9.41398
Source: IMF, Washington. * See Explanatory notes, pp 61−62. 1 ISO currency code: XDR.
2 End of month
SDR 1 1 = CU ...
NorwegianUS dollar Euro Japanese yen Swiss franc Danish krone kronePound sterling Canadian dollar Swedish krona
Period USD EUR GBP JPY CAD CHF SEK DKK NOK
2010 Nov 1.52578 1.17385 0.982598 128.394 1.56606 1.52242 10.6919 8.74868 9.49767 Dec 1.54003 1.15966 0.997755 125.436 1.54142 1.44702 10.4761 8.64469 9.06742
2011 Jan 1.56194 1.14077 0.982907 128.157 1.56537 1.47306 10.2112 8.50362 9.04282 Feb 1.57305 1.13709 0.968983 128.518 1.53199 1.46026 10.0714 8.47860 8.76586 Mar 1.58550 1.11600 0.98528 131.803 1.54079 1.45042 9.99261 8.32168 8.74172
Apr 1.62096 1.09082 0.972479 132.910 1.53764 1.40440 9.73388 8.13491 8.48882 May 1.60077 1.11280 0.969989 129.422 1.55083 1.36514 9.87274 8.29710 8.63424 June 1.60045 1.10735 0.99978 129.188 1.54331 1.33541 10.0972 8.25941 8.62351
July 1.59900 1.12132 0.982608 124.002 1.52512 1.28096 10.1859 8.35317 8.67566 Aug 1.60936 1.11374 0.988181 123.261 1.57460 1.30278 10.2248 8.29869 8.61987 Sep 1.56162 1.15650 1.00136 119.667 1.62237 1.40765 10.7088 8.60630 9.12251
Oct 1.58590 1.13271 0.989707 125.603 1.57559 1.38053 10.2169 8.42957 8.72357 Nov 1.55156 1.15632 0.994075 121.099 1.58212 1.43007 10.7459 8.59964 8.96507 Dec 1.53527 1.18654 0.992989 119.321 1.56254 1.44453 10.6293 8.82099 9.20039
2012 Jan 1.55108 1.17720 0.982386 118.441 1.55915 1.41707 10.4728 8.75197 9.01274 Feb 1.55602 1.15750 0.975991 125.493 1.53517 1.39529 10.2052 8.60667 8.61245 Mar 1.54909 1.15984 0.967633 127.257 1.54769 1.39898 10.2563 8.62917 8.81943
Apr 1.55055 1.17341 0.953534 125.735 1.53256 1.40976 10.4211 8.72882 8.90321 May 1.51026 1.21765 0.974108 119.008 1.56296 1.46344 10.9270 9.04945 9.16103 June 1.51755 1.20536 0.972602 120.342 1.54653 1.44987 10.5670 8.95993 9.07993
July 1.50833 1.22788 0.961575 117.876 1.51044 1.47530 10.2610 9.13626 9.11278 Aug 1.52201 1.20689 0.960929 119.402 1.50116 1.45200 10.1599 8.99297 8.80134 Sep 1.54219 1.19272 0.952499 119.628 1.51705 1.44272 10.0680 8.89229 8.78974
Oct 1.54057 1.18569 0.955922 122.691 1.53995 1.43057 10.2185 8.84502 8.75695 Nov 1.53481 1.18190 0.955849 126.545 1.52437 1.41970 10.2063 8.81686 8.71771 Dec 1.53692 1.16583 0.953662 133.020 1.52954 1.40874 10.0140 8.69762 8.55432
2013 Jan 1.54134 1.13752 0.976582 140.369 1.54010 1.40508 9.80286 8.48738 8.45745 Feb 1.51483 1.15380 0.997128 140.092 1.55800 1.41000 9.7482 8.60274 8.63849 Mar 1.49920 1.16987 0.990619 140.999 1.52139 1.42738 9.76134 8.73332 8.71612
Apr 1.50900 1.15437 0.974488 147.746 1.51986 1.41288 9.89844 8.60704 8.78194 May 1.49877 1.15237 0.985125 151.420 1.54958 1.42892 9.87264 8.59166 8.77408 June 1.50396 1.14982 0.987430 148.696 1.57594 1.42094 10.0970 8.57618 9.06569
July 1.51326 1.13993 0.995827 148.390 1.55669 1.40521 9.94194 8.49755 8.96604 Aug 1.51528 1.14490 0.977536 148.997 1.59907 1.40951 9.99111 8.54022 9.26286 Sep 1.53408 1.13594 0.949722 149.957 1.57780 1.38865 9.86368 8.47185 9.21693
Oct 1.53804 1.12751 0.959058 151.466 1.60402 1.39100 9.87547 8.40986 9.13734 Nov 1.53521 1.12916 0.940751 155.624 1.62655 1.38905 10.0835 8.42197 9.31897 Dec 1.54000 1.11732 0.935148 162.162 1.63856 1.37291 10.0229 8.33556 9.41398
2014 Jan 1.53420 1.13510 0.932079 157.747 1.70588 1.38431 10.0125 8.46998 9.66090 Feb 1.54740 1.12025 0.927257 157.526 1.71375 1.36450 10.0439 8.35988 9.26999 Mar 1.54563 1.12100 0.928695 158.968 1.70838 1.36633 10.0571 8.36925 9.25386
Apr 1.54969 1.11891 0.921285 158.967 1.69800 1.36698 10.1799 8.35143 9.25566 May 1.54047 1.13212 0.920785 156.573 1.67403 1.38149 10.2538 8.45059 9.21837
Source: IMF, Washington. * See Explanatory notes, pp 61−62. 1 ISO currency code: XDR.
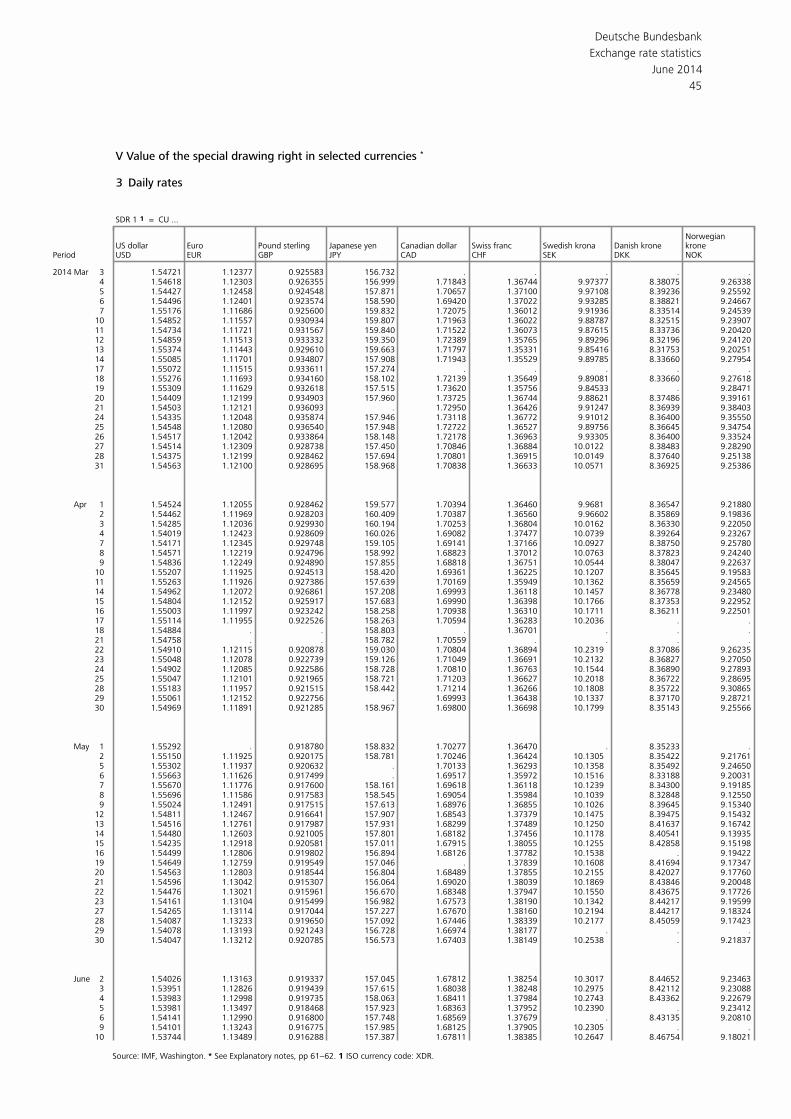
Deutsche Bundesbank
45
Exchange rate statistics
June 2014
V Value of the special drawing right in selected currencies *
3 Daily rates
SDR 1 1 = CU ...
NorwegianUS dollar Euro Pound sterling Japanese yen Canadian dollar Swiss franc Swedish krona Danish krone krone
Period USD EUR GBP JPY CAD CHF SEK DKK NOK
2014 Mar 3 1.54721 1.12377 0.925583 156.732 . . . . . 4 1.54618 1.12303 0.926355 156.999 1.71843 1.36744 9.97377 8.38075 9.26338 5 1.54427 1.12458 0.924548 157.871 1.70657 1.37100 9.97108 8.39236 9.25592 6 1.54496 1.12401 0.923574 158.590 1.69420 1.37022 9.93285 8.38821 9.24667 7 1.55176 1.11686 0.925600 159.832 1.72075 1.36012 9.91936 8.33514 9.24539 10 1.54852 1.11557 0.930934 159.807 1.71963 1.36022 9.88787 8.32515 9.23907 11 1.54734 1.11721 0.931567 159.840 1.71522 1.36073 9.87615 8.33736 9.20420 12 1.54859 1.11513 0.933332 159.350 1.72389 1.35765 9.89296 8.32196 9.24120 13 1.55374 1.11443 0.929610 159.663 1.71797 1.35331 9.85416 8.31753 9.20251 14 1.55085 1.11701 0.934807 157.908 1.71943 1.35529 9.89785 8.33660 9.27954 17 1.55072 1.11515 0.933611 157.274 . . . . . 18 1.55276 1.11693 0.934160 158.102 1.72139 1.35649 9.89081 8.33660 9.27618 19 1.55309 1.11629 0.932618 157.515 1.73620 1.35756 9.84533 . 9.28471 20 1.54409 1.12199 0.934903 157.960 1.73725 1.36744 9.88621 8.37486 9.39161 21 1.54503 1.12121 0.936093 . 1.72950 1.36426 9.91247 8.36939 9.38403 24 1.54335 1.12048 0.935874 157.946 1.73118 1.36772 9.91012 8.36400 9.35550 25 1.54548 1.12080 0.936540 157.948 1.72722 1.36527 9.89756 8.36645 9.34754 26 1.54517 1.12042 0.933864 158.148 1.72178 1.36963 9.93305 8.36400 9.33524 27 1.54514 1.12309 0.928738 157.450 1.70846 1.36884 10.0122 8.38483 9.28290 28 1.54375 1.12199 0.928462 157.694 1.70801 1.36915 10.0149 8.37640 9.25138 31 1.54563 1.12100 0.928695 158.968 1.70838 1.36633 10.0571 8.36925 9.25386
Apr 1 1.54524 1.12055 0.928462 159.577 1.70394 1.36460 9.9681 8.36547 9.21880 2 1.54462 1.11969 0.928203 160.409 1.70387 1.36560 9.96602 8.35869 9.19836 3 1.54285 1.12036 0.929930 160.194 1.70253 1.36804 10.0162 8.36330 9.22050 4 1.54019 1.12423 0.928609 160.026 1.69082 1.37477 10.0739 8.39264 9.23267 7 1.54171 1.12345 0.929748 159.105 1.69141 1.37166 10.0927 8.38750 9.25780 8 1.54571 1.12219 0.924796 158.992 1.68823 1.37012 10.0763 8.37823 9.24240 9 1.54836 1.12249 0.924890 157.855 1.68818 1.36751 10.0544 8.38047 9.22637 10 1.55207 1.11925 0.924513 158.420 1.69361 1.36225 10.1207 8.35645 9.19583 11 1.55263 1.11926 0.927386 157.639 1.70169 1.35949 10.1362 8.35659 9.24565 14 1.54962 1.12072 0.926861 157.208 1.69993 1.36118 10.1457 8.36778 9.23480 15 1.54804 1.12152 0.925917 157.683 1.69990 1.36398 10.1766 8.37353 9.22952 16 1.55003 1.11997 0.923242 158.258 1.70938 1.36310 10.1711 8.36211 9.22501 17 1.55114 1.11955 0.922526 158.263 1.70594 1.36283 10.2036 . . 18 1.54884 . . 158.803 . 1.36701 . . . 21 1.54758 . . 158.782 1.70559 . . . . 22 1.54910 1.12115 0.920878 159.030 1.70804 1.36894 10.2319 8.37086 9.26235 23 1.55048 1.12078 0.922739 159.126 1.71049 1.36691 10.2132 8.36827 9.27050 24 1.54902 1.12085 0.922586 158.728 1.70810 1.36763 10.1544 8.36890 9.27893 25 1.55047 1.12101 0.921965 158.721 1.71203 1.36627 10.2018 8.36722 9.28695 28 1.55183 1.11957 0.921515 158.442 1.71214 1.36266 10.1808 8.35722 9.30865 29 1.55061 1.12152 0.922756 . 1.69993 1.36438 10.1337 8.37170 9.28721 30 1.54969 1.11891 0.921285 158.967 1.69800 1.36698 10.1799 8.35143 9.25566
May 1 1.55292 . 0.918780 158.832 1.70277 1.36470 . 8.35233 . 2 1.55150 1.11925 0.920175 158.781 1.70246 1.36424 10.1305 8.35422 9.21761 5 1.55302 1.11937 0.920632 . 1.70133 1.36293 10.1358 8.35492 9.24650 6 1.55663 1.11626 0.917499 . 1.69517 1.35972 10.1516 8.33188 9.20031 7 1.55670 1.11776 0.917600 158.161 1.69618 1.36118 10.1239 8.34300 9.19185 8 1.55696 1.11586 0.917583 158.545 1.69054 1.35984 10.1039 8.32848 9.12550 9 1.55024 1.12491 0.917515 157.613 1.68976 1.36855 10.1026 8.39645 9.15340 12 1.54811 1.12467 0.916641 157.907 1.68543 1.37379 10.1475 8.39475 9.15432 13 1.54516 1.12761 0.917987 157.931 1.68299 1.37489 10.1250 8.41637 9.16742 14 1.54480 1.12603 0.921005 157.801 1.68182 1.37456 10.1178 8.40541 9.13935 15 1.54235 1.12918 0.920581 157.011 1.67915 1.38055 10.1255 8.42858 9.15198 16 1.54499 1.12806 0.919802 156.894 1.68126 1.37782 10.1538 . 9.19422 19 1.54649 1.12759 0.919549 157.046 . 1.37839 10.1608 8.41694 9.17347 20 1.54563 1.12803 0.918544 156.804 1.68489 1.37855 10.2155 8.42027 9.17760 21 1.54596 1.13042 0.915307 156.064 1.69020 1.38039 10.1869 8.43846 9.20048 22 1.54476 1.13021 0.915961 156.670 1.68348 1.37947 10.1550 8.43675 9.17726 23 1.54161 1.13104 0.915499 156.982 1.67573 1.38190 10.1342 8.44217 9.19599 27 1.54265 1.13114 0.917044 157.227 1.67670 1.38160 10.2194 8.44217 9.18324 28 1.54087 1.13233 0.919650 157.092 1.67446 1.38339 10.2177 8.45059 9.17423 29 1.54078 1.13193 0.921243 156.728 1.66974 1.38177 . . . 30 1.54047 1.13212 0.920785 156.573 1.67403 1.38149 10.2538 . 9.21837
June 2 1.54026 1.13163 0.919337 157.045 1.67812 1.38254 10.3017 8.44652 9.23463 3 1.53951 1.12826 0.919439 157.615 1.68038 1.38248 10.2975 8.42112 9.23088 4 1.53983 1.12998 0.919735 158.063 1.68411 1.37984 10.2743 8.43362 9.22679 5 1.53981 1.13497 0.918468 157.923 1.68363 1.37952 10.2390 . 9.23412 6 1.54141 1.12990 0.916800 157.748 1.68569 1.37679 . 8.43135 9.20810 9 1.54101 1.13243 0.916775 157.985 1.68125 1.37905 10.2305 . . 10 1.53744 1.13489 0.916288 157.387 1.67811 1.38385 10.2647 8.46754 9.18021
Source: IMF, Washington. * See Explanatory notes, pp 61−62. 1 ISO currency code: XDR.
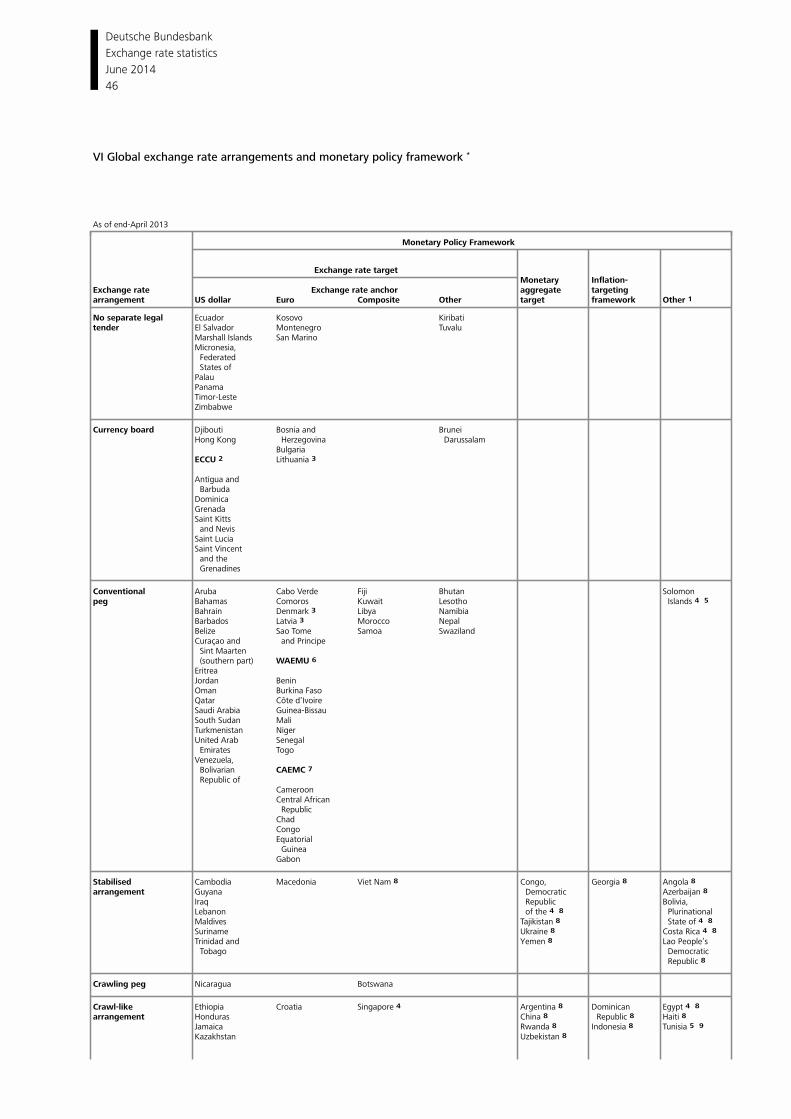
Deutsche Bundesbank
46
Exchange rate statistics
June 2014
VI Global exchange rate arrangements and monetary policy framework *
As of end-April 2013
Monetary Policy Framework
Exchange rate target
Monetary Inflation-Exchange rate Exchange rate anchor aggregate targetingarrangement US dollar Euro Composite Other target framework Other 1
No separate legal Ecuador Kosovo Kiribatitender El Salvador Montenegro Tuvalu
Marshall Islands San MarinoMicronesia,
FederatedStates of
PalauPanamaTimor-LesteZimbabwe
Currency board Djibouti Bosnia and BruneiHong Kong Herzegovina Darussalam
BulgariaECCU 2 Lithuania 3 Antigua and
BarbudaDominicaGrenadaSaint Kitts
and NevisSaint LuciaSaint Vincent
and theGrenadines
Conventional Aruba Cabo Verde Fiji Bhutan Solomonpeg Bahamas Comoros Kuwait Lesotho Islands 4 5
Bahrain Denmark 3 Libya NamibiaBarbados Latvia 3 Morocco NepalBelize Sao Tome Samoa SwazilandCuraçao and and Principe
Sint MaartenWAEMU 6 (southern part)
EritreaJordan BeninOman Burkina FasoQatar Côte d’IvoireSaudi Arabia Guinea-BissauSouth Sudan MaliTurkmenistan NigerUnited Arab Senegal
Emirates TogoVenezuela,
Bolivarian CAEMC 7 Republic of
CameroonCentral African
RepublicChadCongoEquatorial
GuineaGabon
Stabilised Cambodia Macedonia Viet Nam 8 Congo, Georgia 8 Angola 8 arrangement Guyana Democratic Azerbaijan 8
Iraq Republic Bolivia,Lebanon of the 4 8 PlurinationalMaldives Tajikistan 8 State of 4 8 Suriname Ukraine 8 Costa Rica 4 8 Trinidad and Yemen 8 Lao People’s
Tobago DemocraticRepublic 8
Crawling peg Nicaragua Botswana
Crawl-like Ethiopia Croatia Singapore 4 Argentina 8 Dominican Egypt 4 8 arrangement Honduras China 8 Republic 8 Haiti 8
Jamaica Rwanda 8 Indonesia 8 Tunisia 5 9 Kazakhstan Uzbekistan 8
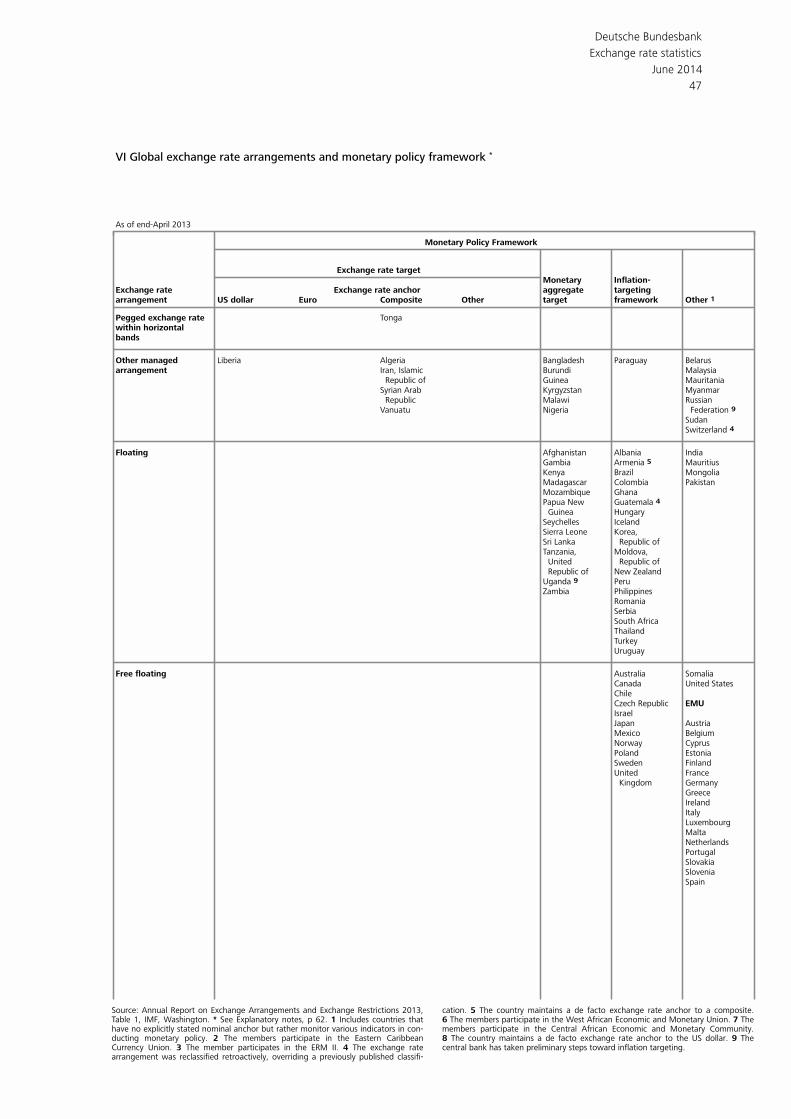
Deutsche Bundesbank
47
Exchange rate statistics
June 2014
VI Global exchange rate arrangements and monetary policy framework *
As of end-April 2013
Monetary Policy Framework
Exchange rate target
Monetary Inflation-Exchange rate Exchange rate anchor aggregate targetingarrangement US dollar Euro Composite Other target framework Other 1
TongaPegged exchange ratewithin horizontalbands
Other managed Liberia Algeria Bangladesh Paraguay Belarusarrangement Iran, Islamic Burundi Malaysia
Republic of Guinea MauritaniaSyrian Arab Kyrgyzstan Myanmar
Republic Malawi RussianVanuatu Nigeria Federation 9
SudanSwitzerland 4
Floating Afghanistan Albania IndiaGambia Armenia 5 MauritiusKenya Brazil MongoliaMadagascar Colombia PakistanMozambique GhanaPapua New Guatemala 4
Guinea HungarySeychelles IcelandSierra Leone Korea,Sri Lanka Republic ofTanzania, Moldova,
United Republic ofRepublic of New Zealand
Uganda 9 PeruZambia Philippines
RomaniaSerbiaSouth AfricaThailandTurkeyUruguay
Free floating Australia SomaliaCanada United StatesChile
EMUCzech RepublicIsraelJapan AustriaMexico BelgiumNorway CyprusPoland EstoniaSweden FinlandUnited France
Kingdom GermanyGreeceIrelandItalyLuxembourgMaltaNetherlandsPortugalSlovakiaSloveniaSpain
Source: Annual Report on Exchange Arrangements and Exchange Restrictions 2013, cation. 5 The country maintains a de facto exchange rate anchor to a composite.Table 1, IMF, Washington. * See Explanatory notes, p 62. 1 Includes countries that 6 The members participate in the West African Economic and Monetary Union. 7 Thehave no explicitly stated nominal anchor but rather monitor various indicators in con- members participate in the Central African Economic and Monetary Community.ducting monetary policy. 2 The members participate in the Eastern Caribbean 8 The country maintains a de facto exchange rate anchor to the US dollar. 9 TheCurrency Union. 3 The member participates in the ERM II. 4 The exchange rate central bank has taken preliminary steps toward inflation targeting. arrangement was reclassified retroactively, overriding a previously published classifi-
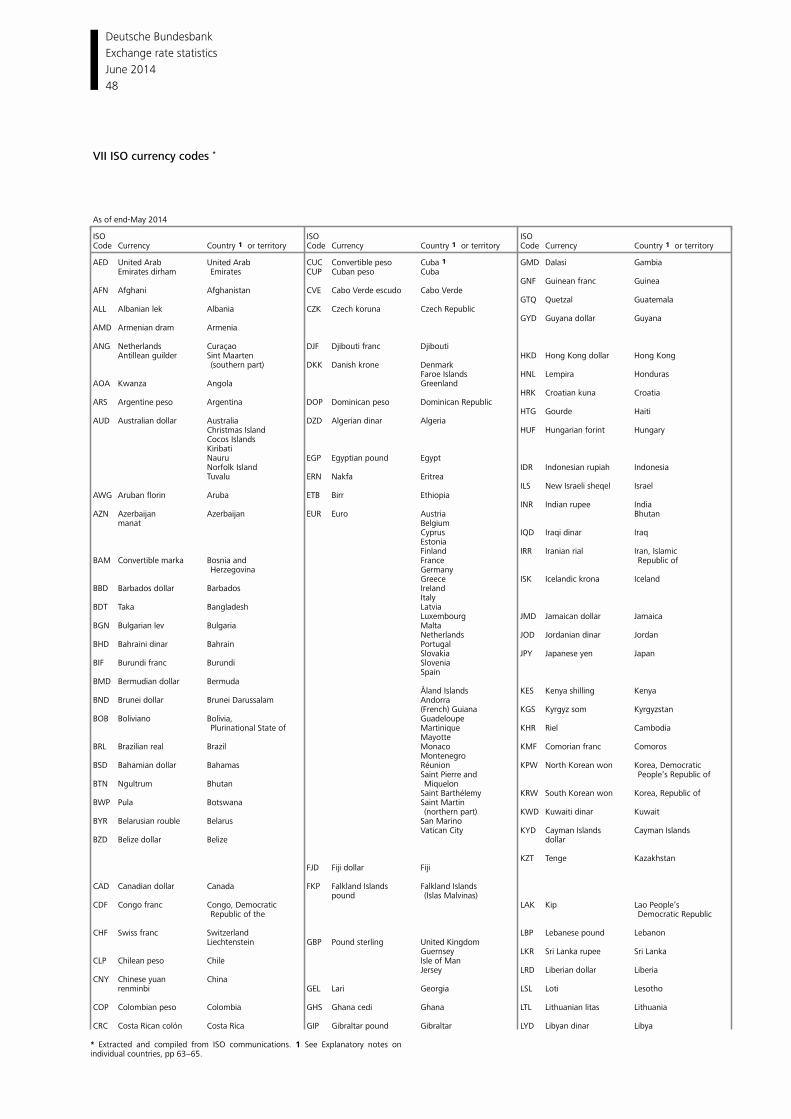
Deutsche Bundesbank
48
Exchange rate statistics
June 2014
VII ISO currency codes *
As of end-May 2014
ISO ISO ISOCode Currency Country 1 or territory Code Currency Country 1 or territory Code Currency Country 1 or territory
AED United Arab United Arab CUC Convertible peso Cuba 1 GMD Dalasi GambiaEmirates dirham Emirates CUP Cuban peso Cuba
GNF Guinean franc GuineaAFN Afghani Afghanistan CVE Cabo Verde escudo Cabo Verde
GTQ Quetzal GuatemalaALL Albanian lek Albania CZK Czech koruna Czech Republic
GYD Guyana dollar GuyanaAMD Armenian dram Armenia
ANG Netherlands Curaçao DJF Djibouti franc Djibouti
Antillean guilder Sint Maarten HKD Hong Kong dollar Hong Kong(southern part) DKK Danish krone Denmark
Faroe Islands HNL Lempira HondurasAOA Kwanza Angola Greenland
HRK Croatian kuna CroatiaARS Argentine peso Argentina DOP Dominican peso Dominican Republic
HTG Gourde HaitiAUD Australian dollar Australia DZD Algerian dinar Algeria
Christmas Island HUF Hungarian forint HungaryCocos Islands Kiribati Nauru EGP Egyptian pound Egypt Norfolk Island IDR Indonesian rupiah IndonesiaTuvalu ERN Nakfa Eritrea
ILS New Israeli sheqel IsraelAWG Aruban florin Aruba ETB Birr Ethiopia
INR Indian rupee IndiaAZN Azerbaijan Azerbaijan EUR Euro Austria Bhutan
manat Belgium Cyprus IQD Iraqi dinar IraqEstoniaFinland IRR Iranian rial Iran, Islamic
BAM Convertible marka Bosnia and France Republic ofHerzegovina Germany
Greece ISK Icelandic krona IcelandBBD Barbados dollar Barbados Ireland
ItalyBDT Taka Bangladesh Latvia
Luxembourg JMD Jamaican dollar JamaicaBGN Bulgarian lev Bulgaria Malta
Netherlands JOD Jordanian dinar JordanBHD Bahraini dinar Bahrain Portugal
Slovakia JPY Japanese yen JapanBIF Burundi franc Burundi Slovenia
Spain BMD Bermudian dollar Bermuda
Åland Islands KES Kenya shilling KenyaBND Brunei dollar Brunei Darussalam Andorra
(French) Guiana KGS Kyrgyz som KyrgyzstanBOB Boliviano Bolivia, Guadeloupe
Plurinational State of Martinique KHR Riel CambodiaMayotte
BRL Brazilian real Brazil Monaco KMF Comorian franc Comoros Montenegro BSD Bahamian dollar Bahamas Réunion KPW North Korean won Korea, Democratic
Saint Pierre and People‘s Republic ofBTN Ngultrum Bhutan Miquelon
Saint Barthélemy KRW South Korean won Korea, Republic ofBWP Pula Botswana Saint Martin
(northern part) KWD Kuwaiti dinar KuwaitBYR Belarusian rouble Belarus San Marino
Vatican City KYD Cayman Islands Cayman IslandsBZD Belize dollar Belize dollar
KZT Tenge Kazakhstan
FJD Fiji dollar Fiji
CAD Canadian dollar Canada FKP Falkland Islands Falkland Islands pound (Islas Malvinas)CDF Congo franc Congo, Democratic LAK Kip Lao People‘s
Republic of the Democratic Republic CHF Swiss franc Switzerland LBP Lebanese pound Lebanon
Liechtenstein GBP Pound sterling United Kingdom Guernsey LKR Sri Lanka rupee Sri LankaCLP Chilean peso Chile Isle of Man
Jersey LRD Liberian dollar LiberiaCNY Chinese yuan China
renminbi GEL Lari Georgia LSL Loti Lesotho COP Colombian peso Colombia GHS Ghana cedi Ghana LTL Lithuanian litas Lithuania
CRC Costa Rican colón Costa Rica GIP Gibraltar pound Gibraltar LYD Libyan dinar Libya
* Extracted and compiled from ISO communications. 1 See Explanatory notes on individual countries, pp 63−65.
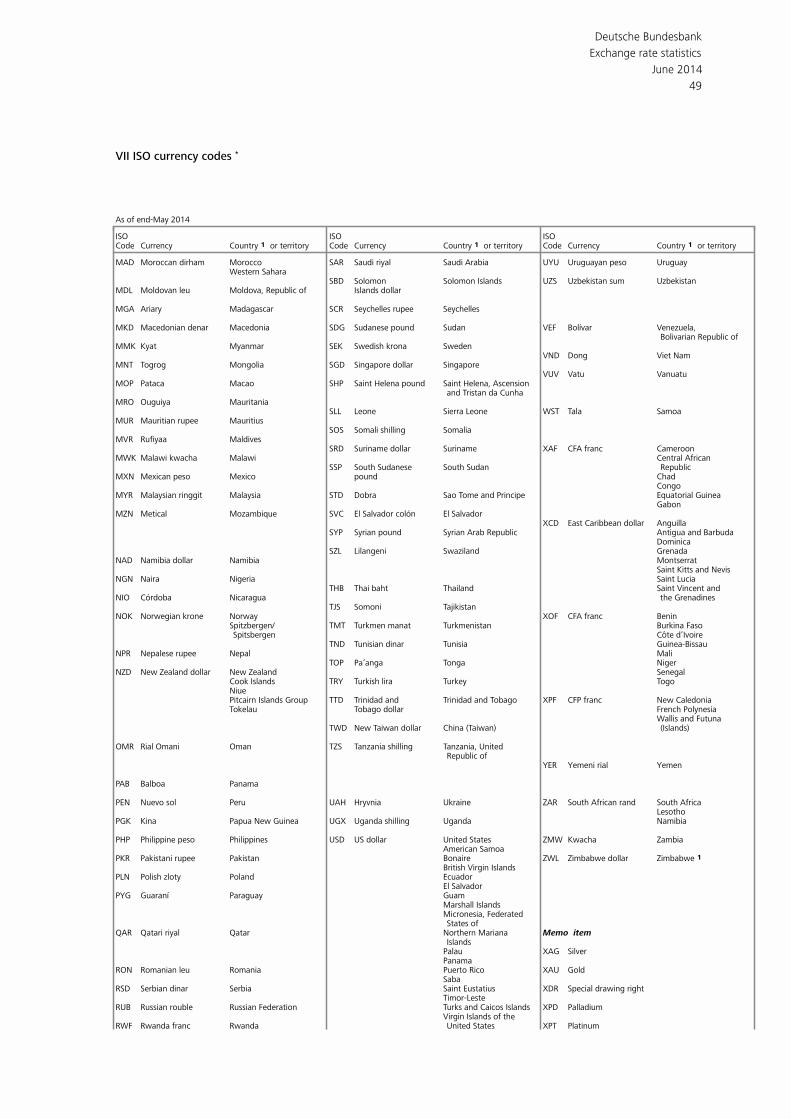
Deutsche Bundesbank
49
Exchange rate statistics
June 2014
VII ISO currency codes *
As of end-May 2014
ISO ISO ISOCode Currency Country 1 or territory Code Currency Country 1 or territory Code Currency Country 1 or territory
MAD Moroccan dirham Morocco SAR Saudi riyal Saudi Arabia UYU Uruguayan peso UruguayWestern Sahara
SBD Solomon Solomon Islands UZS Uzbekistan sum UzbekistanMDL Moldovan leu Moldova, Republic of Islands dollar
MGA Ariary Madagascar SCR Seychelles rupee Seychelles
MKD Macedonian denar Macedonia SDG Sudanese pound Sudan VEF Bolívar Venezuela,
Bolivarian Republic of MMK Kyat Myanmar SEK Swedish krona Sweden
VND Dong Viet NamMNT Togrog Mongolia SGD Singapore dollar Singapore
VUV Vatu VanuatuMOP Pataca Macao SHP Saint Helena pound Saint Helena, Ascension
and Tristan da Cunha MRO Ouguiya Mauritania
SLL Leone Sierra Leone WST Tala SamoaMUR Mauritian rupee Mauritius
SOS Somali shilling Somalia MVR Rufiyaa Maldives
SRD Suriname dollar Suriname XAF CFA franc CameroonMWK Malawi kwacha Malawi Central African
SSP South Sudanese South Sudan RepublicMXN Mexican peso Mexico pound Chad
CongoMYR Malaysian ringgit Malaysia STD Dobra Sao Tome and Principe Equatorial Guinea
GabonMZN Metical Mozambique SVC El Salvador colón El Salvador
XCD East Caribbean dollar AnguillaSYP Syrian pound Syrian Arab Republic Antigua and Barbuda
DominicaSZL Lilangeni Swaziland Grenada
NAD Namibia dollar Namibia Montserrat Saint Kitts and NevisNGN Naira Nigeria Saint Lucia
THB Thai baht Thailand Saint Vincent andNIO Córdoba Nicaragua the Grenadines
TJS Somoni Tajikistan NOK Norwegian krone Norway XOF CFA franc Benin
Spitzbergen/ TMT Turkmen manat Turkmenistan Burkina FasoSpitsbergen Côte d’Ivoire
TND Tunisian dinar Tunisia Guinea-BissauNPR Nepalese rupee Nepal Mali
TOP Pa’anga Tonga NigerNZD New Zealand dollar New Zealand Senegal
Cook Islands TRY Turkish lira Turkey TogoNiue Pitcairn Islands Group TTD Trinidad and Trinidad and Tobago XPF CFP franc New CaledoniaTokelau Tobago dollar French Polynesia
Wallis and Futuna TWD New Taiwan dollar China (Taiwan) (Islands) OMR Rial Omani Oman TZS Tanzania shilling Tanzania, United
Republic of YER Yemeni rial Yemen PAB Balboa Panama
PEN Nuevo sol Peru UAH Hryvnia Ukraine ZAR South African rand South Africa
LesothoPGK Kina Papua New Guinea UGX Uganda shilling Uganda Namibia
PHP Philippine peso Philippines USD US dollar United States ZMW Kwacha Zambia
American SamoaPKR Pakistani rupee Pakistan Bonaire ZWL Zimbabwe dollar Zimbabwe 1
British Virgin IslandsPLN Polish zloty Poland Ecuador
El SalvadorPYG Guaraní Paraguay Guam
Marshall Islands Micronesia, Federated States ofQAR Qatari riyal Qatar Northern Mariana Memo item
IslandsPalau XAG SilverPanama
RON Romanian leu Romania Puerto Rico XAU Gold Saba RSD Serbian dinar Serbia Saint Eustatius XDR Special drawing right
Timor-Leste RUB Russian rouble Russian Federation Turks and Caicos Islands XPD Palladium
Virgin Islands of the RWF Rwanda franc Rwanda United States XPT Platinum

Deutsche Bundesbank
Exchange rate statistics
June 2014
50
CouncilRegulation(EC) No2866/98 of31December1998ontheconversionrates betweentheeuroandthecurrenciesofthe MemberStatesadoptingtheeuro(published intheOfficialJournaloftheEuropean
CommunitiesL359of31December1998)
TheCounciloftheEuropeanUnion,
Having regard to the Treaty establishing the European
Community 1, and in particular Article 109I(4), first sen-
tence thereof,
Having regard to the proposal from the Commission,
Having regard to the opinion of the European Central
Bank,
(1) Whereas according to Article 109j(4) of the Treaty,
the third stage of Economic and Monetary Union shall
start on 1 January 1999; whereas the Council, meeting
in the composition of Heads of State or Government,
has confirmed on 3 May 1998 that Belgium, Germany,
Spain, France, Ireland, Italy, Luxembourg, the Nether-
lands, Aus tria, Portugal and Finland fulfil the neces-
sary conditions for the adoption of a single currency on
1 January 1999;
(2) Whereas according to Council Regulation (EC) No
974/98 of 3 May 1998 on the introduction of the euro,
the euro shall be the currency of the Member States which
adopt the single currency as from 1 January 1999; whereas
the introduction of the euro requires the adop tion of the
conversion rates at which the euro will be sub stituted for
the national currencies and at which rates the euro will be
divided into national currency units; whereas the conver-
sion rates in Article 1 are the conversion rates referred to in
the third indent of Ar ticle 1 of Regulation (EC) No 974/98;
(3) Whereas according to Council Regulation (EC) No
1103/97 of 17 June 1997 on certain provisions relating to
the introduction of the euro, every reference to the ECU
in a legal instrument shall be replaced by a reference to
the euro at a rate of one euro to one ECU; whereas Article
109I(4), second sentence, of the Treaty, provides that the
adoption of the conversion rates shall by itself not mod-
ify the external value of the ECU; whereas this is ensured
by adopting as the conversion rates, the exchange rates
against the ECU of the currencies of the Member States
adopting the euro, as calculated by the Commission on
31 December 1998 according to the established proced-
ure for the calculation of the daily official ECU rates;
(4) Whereas the Ministers of the Member States adopt-
ing the euro as their single currency, the Governors of
the Central Banks of these Member States, the Commis-
sion and the European Monetary Institute/the European
Central Bank, have issued two Communiqués on the
determin ation and on the adoption of the irrevoc able
conversion rates for the euro dated 3 May 1998 and
26 September 1998, respectively;
(5) Whereas Regulation (EC) No 1103/97 stipulates that
the conversion rates shall be adopted as one euro ex-
pressed in terms of each of the national currencies of the
Member States adopting the euro; whereas in order to en-
sure a high degree of accuracy, these rates will be adopted
with six significant figures and no inverse rates nor bilateral
rates between the currencies of the Member States adopt-
ing the euro will be defined,
hasadoptedthisRegulation:
Article 1
The irrevocably fixed conversion rates between the euro
and the currencies of the Member States adopting the
euro are:
Excerptsfromofficialnotificationsand announcementsontheeuroandExchangeRateMechanismII
1 Editorial note: in the wording of the Treaty of Maastricht of 7 February 1992.
Deutsche Bundesbank
Exchange rate statistics
June 2014
51
CouncilRegulation(EC) No1478/2000 of19June2000amendingRegulation(EC) No2866/98ontheconversionratesbetween theeuroandthecurrenciesoftheMember Statesadoptingtheeuro(publishedinthe OfficialJournaloftheEuropeanCommunities
L167of7July2000)
TheCounciloftheEuropeanUnion,
Having regard to the Treaty establishing the European
Community 1, and in particular Article 123(5) thereof,
Having regard to the proposal from the Commission,
Having regard to the opinion of the European Central
Bank,
Whereas:
(1) Council Regulation (EC) No 2866/98 of 31 Decem ber
1998 on the conversion rates between the euro and the
currencies of the Member States adopting the euro deter-
mines the conversion rates as from 1 January 1999 pursu-
ant to Council Regulation (EC) No 974/98 of 3 May 1998
on the introduction of the euro.
(2) Council Decision 98/317/EC of 3 May 1998 in accord-
ance with Article 121(4) of the Treaty stipulated that
Greece did not fulfil the necessary conditions for the adop-
tion of the single currency.
(3) Pursuant to Council Decision 2000/427/EC of 19 June
2000 in accordance with Article 122(2) of the Treaty on
the adoption by Greece of the single currency on 1 Janu-
ary 2001 Greece now fulfils the necessary conditions, and
the derogation of Greece should be abrogated with effect
from 1 January 2001.
(4) The introduction of the euro in Greece requires the
adoption of the conversion rate between the euro and the
drachma,
1 Editorial note: in the wording of the Treaty of Amsterdam of 2 October 1997.
1 euro = 40.3399 Belgian francs
= 1.95583 German marks
= 166.386 Spanish pesetas
= 6.55957 French francs
= 0.787564 Irish pounds
= 1936.27 Italian lire
= 40.3399 Luxembourg francs
= 2.20371 Dutch guilders
= 13.7603 Austrian schillings
= 200.482 Portuguese escudos
= 5.94573 Finnish marks.
Article 2
This Regulation shall enter into force on 1 January 1999.
This Regulation shall be binding in its entirety and directly
applicable in all Member States.
CommuniquéoftheEuropeanUnionof31December1998
The ministers of the euro-area Member States of the
European Community, the European Central Bank and the
ministers and the central bank governors of Denmark and
Greece have decided, following a common procedure in-
volving the European Commission and after consultation
of the Monetary Committee, to fix the central rates of the
participant currencies in the Exchange Rate Mechanism
which comes into operation on 1 January 1999.
The euro central rates of the Danish krone and Greek
drachma are as follows (units of national currency per
euro):
Danish krone 7.46038
Greek drachma 353.109
A fluctuation band of plus or minus 2.25% will be ob-
served around the central rate for the Danish krone. The
standard fluctuation band of plus or minus 15% will be
observed around the central rate for the Greek drachma.
The compulsory intervention points in the exchange rate
mechanism will be communicated by the ECB and the cen-
tral banks of Denmark and Greece in time for the opening
of foreign exchange markets on 4 January 1999.
Deutsche Bundesbank
Exchange rate statistics
June 2014
52
CouncilRegulation(EC) No1086/2006 of11July2006amendingRegulation(EC) No2866/98ontheconversionratesbetween theeuroandthecurrenciesoftheMember Statesadoptingtheeuro(publishedinthe OfficialJournaloftheEuropeanUnionL195
of15July2006)
TheCounciloftheEuropeanUnion,
Having regard to the Treaty establishing the European
Community 1, and in particular Article 123(5) thereof,
Having regard to the proposal from the Commission,
Having regard to the opinion of the European Central
Bank,
Whereas:
(1) Council Regulation (EC) No 2866/98 of 31 Decem ber
1998 on the conversion rates between the euro and the
currencies of the Member States adopting the euro deter-
mines the conversion rates as from 1 January 1999.
(2) According to Article 4 of the 2003 Act of Accession,
Slovenia is a Member State with a derogation as defined in
Article 122 of the Treaty.
(3) Pursuant to Council Decision 2006/495/EC of 11 July
2006 in accordance with Article 122(2) of the Treaty on
the adoption by Slovenia of the single currency on Janu-
ary 2007, Slovenia fulfils the necessary conditions for the
adoption of the single currency and the derogation of Slo-
venia is abrogated with effect from 1 January 2007.
(4) The introduction of the euro in Slovenia requires the
adoption of the conversion rate between the euro and the
tolar. This conversion rate should be set at 239.640 Slo-
venian tolars to 1 euro, which corresponds to the cur rent
central rate of the tolar in the exchange rate mecha nism
(ERM II).
(5) Regulation (EC) No 2866/98 should therefore be
amended accordingly,
1 Editorial note: in the wording of the Treaty of Amsterdam of 2 October 1997.
hasadoptedthisRegulation:
Article 1
In the list of conversion rates in Article 1 of Regulation (EC)
No 2866/98, the following shall be inserted between the
rates of the German mark and the Spanish peseta:
“= 340.750 Greek drachma“.
Article 2
This Regulation shall enter into force on 1 January 2001.
This Regulation shall be binding in its entirety and directly
applicable in all Member States.
CommuniquéoftheEuropeanUnionof27June2004
At the request of the Lithuanian authorities, the minis-
ters of the euro area Member States of the European
Union, the President of the European Central Bank and
the min isters and the central bank governors of Den-
mark and Lithuania have decided, by mutual agreement,
following a common procedure involving the European
Com mission and after consultation of the Economic and
Financial Committee, to include the Lithuanian litas in the
Exchange Rate Mechanism II (ERM II).
The central rate of the Lithuanian litas is set at
1 euro = 3.45280 litas.
The standard fluctuation band of plus or minus 15% will
be observed around the central rate of the litas.
Following a careful assessment of the appropriateness and
sustainability of Lithuania`s currency board, it was accept-
ed that Lithuania is joining the exchange rate mechanism
with its existing currency board arrangement in place, as a
unilateral commitment, thus placing no additional obliga-
tions on the ECB.
…
The compulsory intervention points in the exchange rate
mechanism will be communicated by the ECB and the
Bank of Lithuania, in time for the opening of the foreign
exchange markets on 28 June 2004.
Deutsche Bundesbank
Exchange rate statistics
June 2014
53
(4) The introduction of the euro in Malta requires the
adoption of the conversion rate between the euro and the
Maltese lira. This conversion rate should be set at 0.4293
lira per 1 euro, which corresponds to the current central
rate of the lira in the exchange rate mechanism (ERM II).
(5) Regulation (EC) No 2866/98 should therefore be
amended accordingly,
hasadoptedthisRegulation:
Article 1
In Article 1 of Regulation (EC) No 2866/98, the following
line shall be inserted between the conversion rates applic-
able to the Luxembourg franc and the Dutch guilder:
“= 0.429300 Maltese liras”.
Article 2
This Regulation shall enter into force on 1 January 2008.
This Regulation shall be binding in its entirety and
directly applicable in all Member States.
CouncilRegulation(EC) No1135/2007 of10July2007amendingRegulation(EC) No2866/98asregardstheconversionrate totheeuroforCyprus(publishedinthe OfficialJournaloftheEuropeanUnionL256
of2October2007)
TheCounciloftheEuropeanUnion,
Having regard to the Treaty establishing the European
Community1, and in particular Article 123(5) thereof,
Having regard to the proposal from the Commission,
Having regard to the opinion of the European Central
Bank,
hasadoptedthisRegulation:
Article 1
In the list of conversion rates in Article 1 of Regulation (EC)
No 2866/98, the following shall be inserted between the
rates of the Portuguese escudo and the Finnish mark:
“= 239.640 Slovenian tolars“.
Article 2
This Regulation shall enter into force on 1 January 2007.
This Regulation shall be binding in its entirety and directly
applicable in all Member States.
CouncilRegulation(EC) No1134/2007 of10July2007amendingRegulation(EC) No2866/98asregardstheconversionrate totheeuroforMalta(publishedinthe OfficialJournaloftheEuropeanUnionL256
of2October2007)
TheCounciloftheEuropeanUnion,
Having regard to the Treaty establishing the European
Community 1, and in particular Article 123(5) thereof,
Having regard to the proposal from the Commission,
Having regard to the opinion of the European Central
Bank,
Whereas:
(1) Council Regulation (EC) No 2866/98 of 31 Decem-
ber 1998 on the conversion rates between the euro and
the currencies of the Member States adopting the euro
deter mines the conversion rates as from 1 January 1999.
(2) According to Article 4 of the 2003 Act of Accession,
Malta is a Member State with a derogation as defined in
Article 122 of the Treaty.
(3) Pursuant to Council Decision 2007/504/EC of 10 July
2007 in accordance with Article 122(2) of the Treaty on
the adoption by Malta of the single currency on 1 January
2008, Malta fulfils the necessary conditions for the adop-
tion of the single currency and the derogation of Malta is
abrogated with effect from 1 January 2008. 1 Editorial note: in the wording of the Treaty of Amsterdam of 2 October 1997.
Deutsche Bundesbank
Exchange rate statistics
June 2014
54
CouncilRegulation(EC) No694/2008 of8July2008amendingRegulation(EC) No2866/98asregardstheconversionrate totheeuroforSlovakia(publishedinthe OfficialJournaloftheEuropeanUnionL195
of24July2008)
TheCounciloftheEuropeanUnion,
Having regard to the Treaty establishing the European
Community 1, and in particular Article 123(5) thereof,
Having regard to the proposal from the Commission,
Having regard to the opinion of the European Central
Bank,
Whereas:
(1) Council Regulation (EC) No 2866/98 of 31 December
1998 on the conversion rates between the euro and the
currencies of the Member States adopting the euro deter-
mines the conversion rates as from 1 January 1999.
(2) According to Article 4 of the 2003 Act of Accession,
Slovakia is a Member State with a derogation within the
meaning of Article 122 of the Treaty.
(3) Pursuant to Council Decision 2008/608/EC of 8 July
2008 in accordance with Article 122(2) of the Treaty
on the adoption by Slovakia of the single currency on
1 Janu ary 2009, Slovakia fulfils the necessary conditions
for the adoption of the single currency and the derogation
in favour of Slovakia shall be abrogated with effect from
1 January 2009.
(4) The introduction of the euro in Slovakia requires the
adoption of the conversion rate between the euro and the
Slovak koruna. This conversion rate shall be set at 30.1260
korunas per 1 euro, which corresponds to the current cen-
tral rate of the koruna in the exchange rate mechanism
(ERM II).
(5) Regulation (EC) No 2866/98 should therefore be
amended accordingly,
1 Editorial note: in the wording of the Treaty of Amsterdam of 2 October 1997.
Whereas:
(1) Council Regulation (EC) No 2866/98 of 31 Decem ber
1998 on the conversion rates between the euro and the
currencies of the Member States adopting the euro deter-
mines the conversion rates as from 1 January 1999.
(2) According to Article 4 of the 2003 Act of Accession,
Cyprus is a Member State with a derogation as defined in
Article 122 of the Treaty.
(3) Pursuant to Council Decision 2007/503/EC of 10 July
2007 in accordance with Article 122(2) of the Treaty on
the adoption by Cyprus of the single currency on 1 January
2008, Cyprus fulfils the necessary conditions for the adop-
tion of the single currency and the derogation of Cyprus is
abrogated with effect from 1 January 2008.
(4) The introduction of the euro in Cyprus requires the
adoption of the conversion rate between the euro and
the Cyprus pound. This conversion rate should be set at
0.585274 pound per 1 euro, which corresponds to the
current central rate of the pound in the exchange rate
mechanism (ERM II).
(5) Regulation (EC) No 2866/98 should therefore be
amended accordingly,
hasadoptedthisRegulation:
Article 1
In Article 1 of Regulation (EC) No 2866/98, the following
line shall be inserted between the conversion rates applic-
able to the Italian lira and the Luxembourg franc:
“= 0.585274 Cyprus pounds”.
Article 2
This Regulation shall enter into force on 1 January 2008.
This Regulation shall be binding in its entirety and directly
applicable in all Member States.
Deutsche Bundesbank
Exchange rate statistics
June 2014
55
the euro and the derogation of Estonia is abrogated with
effect from 1 January 2011.
(4) The introduction of the euro in Estonia requires the
adoption of the conversion rate between the euro and the
Estonian kroon. This conversion rate shall be set at 15.6466
kroon per 1 euro, which corresponds to the current central
rate of the kroon in the exchange rate mechanism (ERM II).
(5) Regulation (EC) No 2866/98 should therefore be
amended accordingly,
hasadoptedthisRegulation:
Article 1
In Article 1 of Regulation (EC) No 2866/98, the following
line is inserted between the conversion rates applicable to
the German mark and the Greek drachma:
“= 15.6466 Estonian kroons”.
Article 2
This Regulation shall enter into force on 1 January 2011.
This Regulation shall be binding in its entirety and directly
applicable in all Member States.
CouncilRegulation(EU) No870/2013 of9July2013amendingRegulation(EC) No2866/98asregardstheconversionrate totheeuroforLatvia(publishedinthe OfficialJournaloftheEuropeanUnion
L243of12September2013)
TheCounciloftheEuropeanUnion,
Having regard to the Treaty on the Functioning of the
European Union, and in particular Article 140(3) thereof,
Having regard to the proposal from the European Com-
mission,
Having regard to the opinion of the European Central
Bank,
Whereas:
(1) Council Regulation (EC) No 2866/98 of 31 December
1998 on the conversion rates between the euro and
hasadoptedthisRegulation:
Article 1
In Article 1 of Regulation (EC) No 2866/98, the following
shall be inserted between the conversion rates applicable
to the Slovenian tolar and the Finnish mark:
“= 30.1260 Slovak korunas”.
Article 2
This Regulation shall enter into force on 1 January 2009.
This Regulation shall be binding in its entirety and directly
applicable in all Member States.
CouncilRegulation(EU) No671/2010 of13July2010amendingRegulation(EC) No2866/98asregardstheconversionrate totheeuroforEstonia(publishedinthe OfficialJournaloftheEuropeanUnion
L196of28July2010)
TheCounciloftheEuropeanUnion,
Having regard to the Treaty on the Functioning of the Eu-
ropean Union, and in particular Article 140(3) thereof,
Having regard to the proposal from the European Com-
mission,
Having regard to the opinion of the European Central
Bank,
Whereas:
(1) Council Regulation (EC) No 2866/98 of 31 December
1998 on the conversion rates between the euro and the
currencies of the Member States adopting the euro deter-
mines the conversion rates as from 1 January 1999.
(2) According to Article 4 of the 2003 Act of Accession,
Estonia is a Member State with a derogation as defined
in Article 139(1) of the Treaty on the Functioning of the
European Union (hereinafter ‘the Treaty’).
(3) Pursuant to Council Decision 2010/416/EU of 13 July
2010 in accordance with Article 140(2) of the Treaty on
the adoption by Estonia of the euro on 1 January 2011,
Estonia fulfils the necessary conditions for the adoption of
Deutsche Bundesbank
Exchange rate statistics
June 2014
56
the currencies of the Member States adopting the euro
determines the conversion rates as from 1 January 1999.
(2) According to Article 4 of the 2003 Act of Accession,
Latvia is a Member State with a derogation as defined
in Article 139(1) of the Treaty on the Functioning of the
European Union.
(3) Pursuant to Council Decision 2013/387/EU of
9 July 2013 on the adoption by Latvia of the euro on
1 January 2014, Latvia fulfils the necessary conditions for
the adoption of the euro and the derogation in favour of
Latvia is abrogated with effect from 1 January 2014.
(4) The introduction of the euro in Latvia requires the
adoption of the conversion rate between the euro and the
Latvian lats. This conversion rate should be set at 0.702804
lats per 1 euro, which corresponds to the current central
rate of the lats in the exchange rate mechanism (ERM II).
(5) Regulation (EC) No 2866/98 should therefore
be amended accordingly,
hasadoptedthisRegulation:
Article 1
In Article 1 of Regulation (EC) No 2866/98, the following
line is inserted between the conversion rates applicable to
the Cyprus pound and the Luxembourg franc:
“= 0.702804 Latvian lats“.
Article 2
This Regulation shall enter into force on 1 January 2014.
This Regulation shall be binding in its entirety and directly
applicable in all Member States.
Deutsche Bundesbank
Exchange rate statistics
June 2014
57

Deutsche Bundesbank
Exchange rate statistics
June 2014
58
of two consecutive weighting periods are chain-linked be-
yond the end of the first period. For information on the
revision of trade weights carried out in February 2012, see
ECB Monthly Bulletin, March 2012, pp 17-21.
The real effective exchange rates of the euro addition ally
take account of the differences in price move ments be-
tween the groups of countries concerned. If the price
in dices for determining the real effective ex change rate
based on consumer price indices are not yet available,
estimates are used for the calculation.
For further information on the calculation method, see the
ECB’s methodological notes relating to the daily nominal
effective exchange rate of the euro and ECB Oc casional
Paper No 134 of June 2012, which can be downloaded
from the ECB’s website (www.ecb.europa.eu).
Indicatorsofthe Germaneconomy’spricecompetitiveness
The calculation of indicators of the German economy’s
price competitiveness, shown as a memo item, is methodi-
cally consistent with the ECB’s procedure for determining
the effective exchange rates of the euro (see Deutsche
Bundesbank, Monthly Report, November 2001, pp 50-53,
May 2007, pp 31-35 and February 2012, pp 34-35).
The indicators are broken down into three groups in
Table III 1 (p 18).
The selected industrialised countries in the group of 25
comprise the respective euro-area countries (see Table I 1,
p 7) as well as Canada, Denmark, Japan, Norway, Sweden,
Switzerland, the United Kingdom and the United States.
The group of 37 countries comprise the euro-area coun-
tries and the EER-20 group. The group of 56 countries con-
sist of the euro-area countries as well as the EER-39 group.
Overviewofworldcurrencies
The exchange rates listed in Table IV 1 (pp 20-42) are, in
all cases, the latest end-of-month rates known to us in a
given month; in general, they have been taken from reli-
Explanatorynotes
Euroforeignexchange referenceratesofthe EuropeanCentralBank
On 1 January 1999, 11 member states of the European
Union initially adopted the euro as their single currency
(see Excerpts from official notifications and announce-
ments, pp 51-57). On 1 January 2001, Greece joined the
European Monetary Union, followed by Slovenia on 1 Jan-
uary 2007, Cyprus and Malta on 1 January 2008, Slovakia
on 1 January 2009, Estonia on 1 January 2011 and Latvia
on 1 January 2014 (for details, see Table I 1, p 7).
Since the introduction of the euro, there has been no
autonomous foreign exchange market for the currencies
replaced by the euro; the euro alone is quoted against
non-euro-area currencies, such as the US dollar and the
Japanese yen.
Since 4 January 1999, the ECB has published euro foreign
exchange refer ence rates for selected currencies each
working day. These rates are calculated on the basis of
the daily concertation between central banks which takes
place at 2.15 pm CET. Only one reference rate, ie the mid-
dle rate, is established by this procedure.
Effectiveexchangeratesoftheeuro
The indices of the nominal effective exchange rates of
the euro are designed to measure, in aggregated form,
the impact of changes in exchange rates on price com-
petitiveness in the euro-area industrial sector. They are
calculated by the ECB on the basis of weighted averages
of the bilateral euro exchange rates against the curren cies
of selected trading partners of the euro area, with 1999
Q1 = 100. An increase in the index rate indicates an appre-
ciation of the euro and thus, taken in isolation, a decrease
in the price competitiveness of the domestic economy. The
weights are based on trade in manufactured goods (SITC
5-8) and also capture third-market effects.
The table entitled “Overall trade weights used in the calcu-
lation of the effective exchange rates (EER) of the euro“ on
page 60 shows trading partners’ membership of the EER-
12, EER-20 and EER-39 groups as well as their percentage
weights. To prevent breaks in the time series, the indices
Deutsche Bundesbank
Exchange rate statistics
June 2014
59
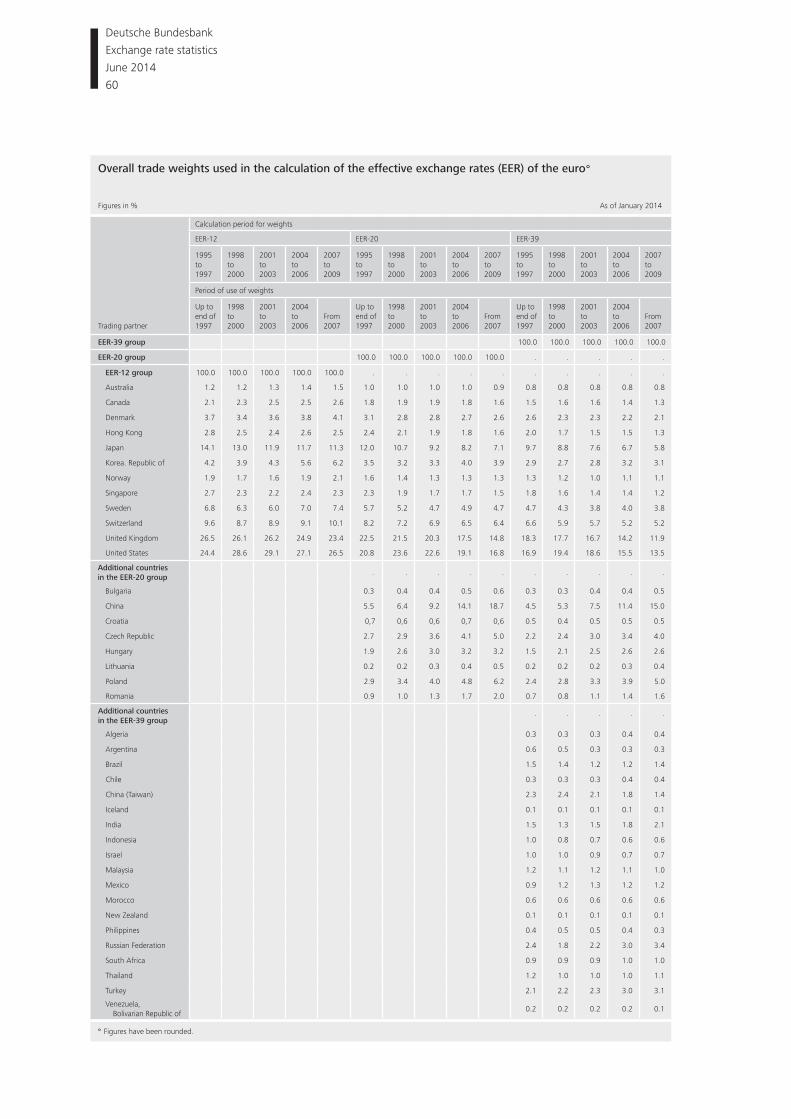
Overalltradeweightsusedinthecalculationoftheeffectiveexchangerates(EER)oftheeuro°
Figures in % As of January 2014
Trading partner
Calculation period for weights
EER-12 EER-20 EER-39
1995 to 1997
1998 to2000
2001 to 2003
2004 to 2006
2007to2009
1995 to 1997
1998 to 2000
2001 to 2003
2004 to 2006
2007to2009
1995 to 1997
1998 to 2000
2001 to 2003
2004 to 2006
2007to2009
Period of use of weights
Up to end of 1997
1998 to 2000
2001 to 2003
2004 to2006
From2007
Up to end of 1997
1998 to 2000
2001 to 2003
2004 to2006
From2007
Up to end of 1997
1998 to 2000
2001 to 2003
2004 to 2006
From2007
EER-39group 100.0 100.0 100.0 100.0 100.0
EER-20group 100.0 100.0 100.0 100.0 100.0 . . . . .
EER-12group 100.0 100.0 100.0 100.0 100.0 . . . . . . . . . .
Australia 1.2 1.2 1.3 1.4 1.5 1.0 1.0 1.0 1.0 0.9 0.8 0.8 0.8 0.8 0.8
Canada 2.1 2.3 2.5 2.5 2.6 1.8 1.9 1.9 1.8 1.6 1.5 1.6 1.6 1.4 1.3
Denmark 3.7 3.4 3.6 3.8 4.1 3.1 2.8 2.8 2.7 2.6 2.6 2.3 2.3 2.2 2.1
Hong Kong 2.8 2.5 2.4 2.6 2.5 2.4 2.1 1.9 1.8 1.6 2.0 1.7 1.5 1.5 1.3
Japan 14.1 13.0 11.9 11.7 11.3 12.0 10.7 9.2 8.2 7.1 9.7 8.8 7.6 6.7 5.8
Korea. Republic of 4.2 3.9 4.3 5.6 6.2 3.5 3.2 3.3 4.0 3.9 2.9 2.7 2.8 3.2 3.1
Norway 1.9 1.7 1.6 1.9 2.1 1.6 1.4 1.3 1.3 1.3 1.3 1.2 1.0 1.1 1.1
Singapore 2.7 2.3 2.2 2.4 2.3 2.3 1.9 1.7 1.7 1.5 1.8 1.6 1.4 1.4 1.2
Sweden 6.8 6.3 6.0 7.0 7.4 5.7 5.2 4.7 4.9 4.7 4.7 4.3 3.8 4.0 3.8
Switzerland 9.6 8.7 8.9 9.1 10.1 8.2 7.2 6.9 6.5 6.4 6.6 5.9 5.7 5.2 5.2
United Kingdom 26.5 26.1 26.2 24.9 23.4 22.5 21.5 20.3 17.5 14.8 18.3 17.7 16.7 14.2 11.9
United States 24.4 28.6 29.1 27.1 26.5 20.8 23.6 22.6 19.1 16.8 16.9 19.4 18.6 15.5 13.5
AdditionalcountriesintheEER-20group
. . . . . . . . . .
Bulgaria 0.3 0.4 0.4 0.5 0.6 0.3 0.3 0.4 0.4 0.5
China 5.5 6.4 9.2 14.1 18.7 4.5 5.3 7.5 11.4 15.0
Croatia 0,7 0,6 0,6 0,7 0,6 0.5 0.4 0.5 0.5 0.5
Czech Republic 2.7 2.9 3.6 4.1 5.0 2.2 2.4 3.0 3.4 4.0
Hungary 1.9 2.6 3.0 3.2 3.2 1.5 2.1 2.5 2.6 2.6
Lithuania 0.2 0.2 0.3 0.4 0.5 0.2 0.2 0.2 0.3 0.4
Poland 2.9 3.4 4.0 4.8 6.2 2.4 2.8 3.3 3.9 5.0
Romania 0.9 1.0 1.3 1.7 2.0 0.7 0.8 1.1 1.4 1.6
AdditionalcountriesintheEER-39group
. . . . .
Algeria 0.3 0.3 0.3 0.4 0.4
Argentina 0.6 0.5 0.3 0.3 0.3
Brazil 1.5 1.4 1.2 1.2 1.4
Chile 0.3 0.3 0.3 0.4 0.4
China (Taiwan) 2.3 2.4 2.1 1.8 1.4
Iceland 0.1 0.1 0.1 0.1 0.1
India 1.5 1.3 1.5 1.8 2.1
Indonesia 1.0 0.8 0.7 0.6 0.6
Israel 1.0 1.0 0.9 0.7 0.7
Malaysia 1.2 1.1 1.2 1.1 1.0
Mexico 0.9 1.2 1.3 1.2 1.2
Morocco 0.6 0.6 0.6 0.6 0.6
New Zealand 0.1 0.1 0.1 0.1 0.1
Philippines 0.4 0.5 0.5 0.4 0.3
Russian Federation 2.4 1.8 2.2 3.0 3.4
South Africa 0.9 0.9 0.9 1.0 1.0
Thailand 1.2 1.0 1.0 1.0 1.1
Turkey 2.1 2.2 2.3 3.0 3.1
Venezuela, Bolivarian Republic of
0.2 0.2 0.2 0.2 0.1
°Figures have been rounded.
Deutsche Bundesbank
Exchange rate statistics
June 2014
60
(a) (b)
US dollar 0.660 41.9
Euro 0.423 37.4
Japanese yen 12.1 9.4
Pound sterling 0.111 11.3
The introduction of the euro as the single currency of
initially 11 member states of the European Union neces-
sitated an adjustment of the criteria used for selecting the
currencies of the SDR valuation basket. The former criter-
ion, according to which the currencies of the member
states with the highest exports of goods and ser vices were
chosen, was extended to include exports by monetary
unions incorporating IMF members. In a monetary union,
exports of goods and services exclude cross-border trade
between the members of the monetary union.
Moreover, a second selection criterion was introduced
so as to ensure that the currencies included in the basket
are actually the currencies used most commonly in inter-
national transactions. This includes the stipulation that
the IMF must classify a currency included in the basket as
being “freely usable”. A currency is deemed to be freely
usable if, in the estimation of the IMF Executive Board, it is
widely used in payments for international transactions and
is heavily traded in the major foreign exchange markets.
The respective weights of the various SDR basket curren-
cies continue to depend on the value of exports of goods
and services and the amount of reserves denominated in
those currencies held by other member states of the IMF in
the five years preceding the year of review.
The above-mentioned currency amounts are converted
into US dollars on every business day on the basis of mar-
ket rates. These market rates are normally the middle rates
between the buying and selling rates fixed at noon in the
London spot exchange market. The value of the SDR in
terms of the US dollar is the sum of the US dollar equiva-
lents of the currency amounts. Exchange rates for the SDR
in terms of all other currencies are ascertained, using the
rate for the SDR in terms of the US dollar, from the repre-
sentative market exchange rates of these currencies for the
US dollar; for the euro, it is the reference exchange rate of
the European Central Bank.
The SDR is used by the IMF as the unit of account for its
transactions and for all conversions into national curren-
cies. In addition, the SDR is used by public and private
organisations in Germany and abroad, inter alia, as the
able sources (central bank or a commercial bank in the
country in question). However, we do not know whether
transactions were actually executed at those rates in all
cases. If no exchange rates for the euro are available from
a country, we have calculated comparative values at the
exchange rates or parities available and identified them
with a “V” in the column “type of rate”.
The previous-year average specified in this table was
basically calculated from all of the rates or comparable fig-
ures available to us.
In addition to the generally accepted currency designa-
tion and its abbreviation, the three-character alphabetical
ISO currency code is specified (see Table VII, pp 48-49).
This was developed by the International Organization
for Standardization as ISO Standard 4217. This currency
code is designed to enable uniformly abbreviated desig-
nations for currency-related values to be used in inter-
national financial transactions. This applies, inter alia, to all
external payments under the SWIFT system. The ISO code
should not, however, be confused with the official national
cur rency abbreviations.
The numerical country code is based on the list of countries
for foreign trade and payments statistics of the Federal Re-
public of Germany, which can be found on the Deutsche
Bundesbank’s website under Service / Reporting systems /
External sector / Code lists.
Valueofthespecialdrawingright
The value of a SDR (ISO code: XDR) is currently defined as
the sum of the values of fixed amounts of four currencies.
The composition of the currency basket as well as the
weights and amounts of the currency units in the basket
are reviewed every five years. As a result of the latest re-
view, conducted in 2010, since 1 January 2011, the SDR
basket has contained the fixed currency amounts shown
in column (a). These were fixed on 30 December 2010 on
the basis of the average exchange rates in the London spot
exchange market in the fourth quarter of 2010 and the
initial new percentage weights (column b) such that, on
30 December 2010, the new SDR value corresponded with
the value calculated on the basis of the old basket.
Deutsche Bundesbank
Exchange rate statistics
June 2014
61
system presents members’ exchange rate arrangements
against alternative monetary policy frameworks in or der
to highlight the role of the exchange rate in broad eco-
nomic policy and to illustrate that different ex change rate
arrangements can be consistent with similar monetary
frameworks.
The monetary policy frameworks listed are as follows.
Exchangerateanchor
The monetary authority buys or sells foreign exchange
to maintain the exchange rate at its predetermined level
or within a range. The exchange rate thus serves as the
nominal anchor or intermediate target of monetary policy.
These frameworks are associated with exchange rate ar-
rangements with no separate legal tender, cur rency board
arrangements, exchange rate pegs (or sta bilised arrange-
ments) with or without bands, crawling pegs (or crawl-like
arrangements) and other managed arrangements.
Monetaryaggregatetarget
The monetary authority uses its instruments to achieve
a target growth rate for a monetary aggregate, such as
reserve money, M1 or M2, and the targeted aggregate
becomes the nominal anchor or intermediate target of
monetary policy.
Inflation-targetingframework
This involves the public announcement of numerical
targets for inflation, with an institutional commitment by
the monetary authorities to achieve these targets, typically
over a medium-term horizon. Additional key features nor-
mally include increased communication with the public and
the markets about the plans and objectives of monetary
policymakers and increased ac countability of the central
bank for achieving its inflation objectives. Monetary policy
decisions are often guided by the deviation of forecasts of
future inflation from the announced inflation target, with
the inflation forecast acting (implicitly or explicitly) as the
intermediate target of monetary policy.
Other
The country has no explicitly stated nominal anchor, but
instead monitors various indicators in conducting mon-
etary policy. This category is also used when no relevant
information on the country is available.
“successor” to those units of account which had hitherto
been defined in terms of gold (eg gold francs).
Globalexchangerate arrangementsandmonetarypolicyframework
The overview of the exchange rate arrangements and
monetary policy framework as at the end of April 2013
(see Table VI, pp 46-47) is based on the IMF’s Annual
Report on Exchange Arrangements and Exchange Re
strictions 2013, which can be purchased from the IMF
(http://www.imfbookstore.org).
The IMF’s classification system is generally based on the
actual, de facto exchange rate regimes identified and
operating in member countries. These may differ from
the official, de jure exchange rate arrangements in these
countries.
Exchange rate arrangements are primarily classified on the
basis of the degree to which the exchange rate is deter-
mined by the market rather than by official action, with
market-determined exchange rates being on the whole
more flexible. A distinction is made between hard pegs
(fixed exchange rate anchors) – such as exchange ar-
rangements with no separate legal tender and a cur rency
board arrangement (institutionalised, unilateral exchange
rate peg) – and soft pegs (less stringent de jure and/or
de facto exchange rate anchors). The lat ter comprise con-
ventional pegged arrangements with a fixed exchange
rate (exchange rate guarantee but no irrevocable par-
ity), stabilised arrangements (exchange rate within a nar-
row band without any political obli gation), crawling pegs
(moving central rate without a band), crawl-like arrange-
ments (moving central rate with an annual minimum rate
of change) and pegged exchange rates within horizontal
bands with or without a fixed central rate. In the case of
floating exchange rate arrangements, a distinction is made
between floating rates (market-determined with more
frequent modes of intervention) and free-floating rates
(market-deter mined with intervention in exceptional cases
only). All other exchange rate arrangements are grouped
under “Other managed arrangements”. The classification
Deutsche Bundesbank
Exchange rate statistics
June 2014
62
Chad
See Explanatory notes on Cameroon.
Congo
See Explanatory notes on Cameroon.
CookIslands
The New Zealand dollar is also legal tender alongside the
Cook Islands dollar (convertible at par).
Côted’Ivoire
See Explanatory notes on Benin.
Cuba
Alongside the Cuban peso (CUP), which is used by resi-
dents to purchase their basic needs, there is a convertible
peso (CUC), which is used particularly by foreigners.
Foreign currencies can be freely exchanged in Cuba for
convertible pesos (CUC), and they enable both residents
and foreigners to purchase items which the government
considers to be luxury articles.
In its national accounts, the Cuban government fixes the
ratio of convertible peso (CUC) to Cuban peso (CUP) at 1:1.
In reality, Cuban pesos can only be exchanged for convert-
ible pesos at a considerable discount.
The euro is also an accepted means of payment in some
tourist centres.
Cyprus
After the closure of Cypriot commercial banks in mid-
March, the Cypriot parliament authorised the Central Bank
of Cyprus and the finance minister to carry out far-reaching
capital controls on 22 March 2013. Following the reopen-
ing of the banks on 28 March, these have been repeatedly
renewed and amended.
Explanatorynotesonindividualcountries
Bangladesh
Units of account for larger amounts: 1 lakh (in digits:
1,00,000) = 100,000 taka; 1 crore (in digits: 1,00,00,000)
= 100 lakh = 10,000,000 taka.
Benin
Benin, Burkina Faso, Côte d’Ivoire, Guinea-Bissau, Mali, Ni-
ger, Senegal and Togo all belong to the West African Eco-
nomic and Monetary Union (UEMOA = Union Économique
et Monétaire Ouest Africaine). The responsible monetary
authority is the “Banque Centrale des Etats de l’Afrique
de l’Ouest”, whose CFA franc (F.CFA = Franc de la Com-
munauté Financière Africaine) is legal tender only in the
aforementioned countries.
Bhutan
The Indian rupee is likewise legal tender alongside the
Bhutanese ngultrum (convertible at par).
BruneiDarussalam
Under an agreement between Brunei Darussalam and
Singa pore, the Singapore dollar (convertible at par) is also
accepted as legal tender.
BurkinaFaso
See Explanatory notes on Benin.
Cameroon
Cameroon, the Central African Republic, Chad, Congo,
Equatorial Guinea and Gabon all belong to the Central
African Economic and Monetary Community (CEMAC =
Communauté Économique et Monétaire de l’Afrique Cen-
trale). The responsible monetary authority is the “Banque
des Etats de l’Afrique Centrale”, whose CFA franc (F.CFA =
Franc de la Coopération Financière en Afrique Centrale) is
legal tender only in the aforementioned countries.
CentralAfricanRepublic
See Explanatory notes on Cameroon.
Deutsche Bundesbank
Exchange rate statistics
June 2014
63
Macedonia
On 8 April 1993, Macedonia was admitted to the United
Nations under the temporary designation “Former Yugo-
slavian Republic of Macedonia“; this designation is in use
within the European Union until further notice.
Mali
See Explanatory notes on Benin.
Namibia
The South African rand is likewise legal tender alongside the
Namibia dollar.
NewCaledonia
CFP was originally the abbreviation for “Colonies Fran-
çaises du Pacifique“ and is still used as a currency symbol
(in connection with the franc).
Niger
See Explanatory notes on Benin.
Panama
The US dollar is legal tender alongside the balboa, which is
in circulation exclusively in coin form.
SaoTomeandPrincipe
The unit of account for 1,000 dobras is 1 conto.
Senegal
See Explanatory notes on Benin.
Singapore
Under an agreement between Singapore and Brunei
Darussalam, the Brunei dollar (convertible at par) is also
accepted as legal tender.
Somalia
No exchange rates have been available for the Somali shilling.
SouthSudan
No exchange rates have been available for the South
Sudanese pound.
ElSalvador
The US dollar is likewise legal tender alongside the El
Salvador colón.
EquatorialGuinea
See Explanatory notes on Cameroon.
Gabon
See Explanatory notes on Cameroon.
Guinea-Bissau
See Explanatory notes on Benin.
India
Units of account for larger amounts are as follows: 1 lakh
(in digits: 1,00,000) = 100,000 rupees; 1 crore (in digits:
1,00,00,000) = 100 lakh = 10,000,000 rupees.
Iran,IslamicRepublicof
Alongside the published exchange rates, there are bureau
de change rates, which deviate significantly and stood at
USD 1 = IRR 32,750 and EUR 1 = IRR 44,850 at the end of
May 2014, according to the German Embassy in Tehran.
The term “toman“ (an old Persian currency) is also used to
denote 10 Iranian rials.
Kenya
The term “Kenya pound“ is a unit of account equivalent to
20 Kenya shillings.
Lesotho
The South African rand is likewise legal tender alongside
the loti.
Liberia
The US dollar is likewise legal tender alongside the Libe rian
dollar.
Macao
The Hong Kong dollar, to which the pataca is pegged at a
rate of HKD 100 = MOP 103, is in circulation as a common
currency alongside the pataca.
Deutsche Bundesbank
Exchange rate statistics
June 2014
64
Zimbabwe
On 2 February 2009, five currencies were named as “of-
ficial means of payment”: US dollar, rand, euro, pound
sterling and pula. They do not, however, have the status
of legal tender, which remains the de facto abandoned
Zimbabwe dollar.
On 27 April 2010, the US dollar was declared as the princi-
pal currency of this multiple currency system.
In January 2014, the group of currencies designated as
“official means of payment” was extended by the Japa-
nese yen, Chinese yuan renminbi, Indian rupee and Aus-
tralian dollar.
Swaziland
The South African rand is likewise legal tender alongside
the lilangeni.
Togo
See Explanatory notes on Benin.
UnitedArabEmirates
The United Arab Emirates include Abu Dhabi, Ajman, Dubai,
Fujairah, Ras al Khaimah, Sharjah and Umm al Qaiwain.
UnitedKingdom
In Scotland and Northern Ireland, a small volume of
bank notes issued by commercial banks in these territo-
ries is in cir culation alongside notes issued by the Bank
of England.
Venezuela,BolivarianRepublicof
In addition to the limited allocation of foreign exchange at
the official rate of USD 1 = VEF 6.30, registered importers
of important goods and registered domestic households
(inter alia for studying abroad and for health, sport and
cultural purposes) can participate in foreign exchange
auctions (SICAD = Sistema Complementario de Adminis-
tración de Divisas). The exchange rate on 7 April 2014 was
USD 1 = VEF 10.00.
Furthermore, the forex trading system SICAD II (Sistema
Cambiario Alternativo de Divisas) was introduced with
effect from 24 March 2014. The exchange rate is deter-
mined by supply and demand; on 30 May 2014, it stood
at USD 1 = VEF 49.9738.
Deutsche Bundesbank
Exchange rate statistics
June 2014
65


