Embed Size (px)
Citation preview

Short CommunicationMolecular Signatures of Sepsis
Multiorgan Gene Expression Profiles of Systemic Inflammation
Arul M. Chinnaiyan, Markus Huber-Lang,Chandan Kumar-Sinha, Terrence R. Barrette,Sunita Shankar-Sinha, Vidya J. Sarma,Vaishalee A. Padgaonkar, and Peter A. WardFrom the Department of Pathology, University of Michigan
Medical School, Ann Arbor, Michigan
During sepsis the host’s system-wide response to mi-crobial invasion seems dysregulated. Here we explorethe diverse multiorgan transcriptional programs acti-vated during systemic inflammation in a cecal liga-tion/puncture model of sepsis in rats. Using DNA mi-croarrays representing 7398 genes, we examined thetemporal sequence of sepsis-induced gene expressionpatterns in major organ systems including lung,liver, kidney, thymus, spleen, and brain. Althoughgenes known to be associated with systemic inflam-mation were identified by our global transcript anal-ysis, many genes and expressed sequence tags notpreviously linked to the septic response were alsoelucidated. Taken together, our results suggest activa-tion of a highly complex transcriptional response inindividual organs of the septic animal. Several over-lying themes emerged from our genome-scale analy-sis that includes 1) the sepsis response elicited geneexpression profiles that were either organ-specific,common to more than one organ, or distinctly oppo-site in some organs; 2) the brain is protected fromsepsis-induced gene activation relative to other or-gans; 3) the thymus and spleen have an interestingcohort of genes with opposing gene expression pat-terns; 4) genes with proinflammatory effects were oftenbalanced by genes with anti-inflammatory effects (eg,interleukin-1�/decoy receptor, xanthine oxidase/su-peroxide dismutase, Ca2�-dependent PLA2/Ca2�-inde-pendent PLA2); and 5) differential gene expression wasobserved in proteins responsible for preventing tissueinjury and promoting homeostasis including anti-pro-teases (TIMP-1, Cpi-26), oxidant neutralizing enzymes(metallothionein), cytokine decoy receptors (interleu-kin-1RII), and tissue/vascular permeability factors(aquaporin 5, vascular endothelial growth factor). This
global perspective of the sepsis response should pro-vide a molecular framework for future research into thepathophysiology of systemic inflammation. Under-standing, on a genome scale, how an organism re-sponds to infection, may facilitate the development ofenhanced detection and treatment modalities for sepsis.(Am J Pathol 2001, 159:1199–1209)
The systemic inflammatory response seems to be initi-ated by the release of bacterial lipopolysaccharide orother microbial substances into the lymphatics and cir-culation. Once the sepsis cascade is triggered, an un-regulated systemic response ensues that can progress tomultiple organ failure. Sepsis-induced multiple organ fail-ure is associated with a high mortality rate in humans andis characterized clinically by profound pulmonary, car-diovascular, renal, and gastrointestinal dysfunction.1,2
The systemic appearance of diverse biological mediatorsplays a central role in the pathophysiology of sepsisincluding microbial signal molecules, cytokines, comple-ment activation products, coagulation factors, and cell-adhesion molecules.3,4 Although a sepsis-like state canbe induced experimentally by infusion of lipopolysaccha-ride or live bacteria, cecal ligation puncture (CLP) inrodents mimics many features of the septic state in hu-mans.5 Animals develop progressive bacteremia, ap-pearance of multiple cytokines and chemokines inplasma, fever, hypermetabolism, and other clinical fea-tures analogous to those found in humans with sepsis.6
DNA microarray (or DNA chip) technology is promisingto revolutionize the way fundamental biological questionsare addressed in the postgenomic era. Rather than thetraditional approach of focusing on one gene at a time,
Supported by the National Institutes of Health (grants HL-31963 andGM-29507 to P. A. W.).
A. M. C. and M. H.-L. contributed equally to this work.
Accepted for publication June 18, 2001.
Address reprint requests to Arul M. Chinnaiyan, M.D., Ph.D., Depart-ment of Pathology, The University of Michigan Medical School, 1301Catherine Rd., MSI Rm. 4237, Ann Arbor, Michigan 48109-0602. E-mail:[email protected].
American Journal of Pathology, Vol. 159, No. 4, October 2001
Copyright © American Society for Investigative Pathology
1199

genomic-scale methodologies allow for a global per-spective to be achieved. DNA microarrays have success-fully been used to molecularly classify cancers, identifysingle nucleotide polymorphisms, genotype viruses, andmonitor patterns of coordinated gene expression after avariety of biological stimuli. Obtaining large-scale geneexpression profiles of cancers should theoretically allowfor the identification of subsets of genes that function asprognostic disease markers or biological predictors of atherapeutic response. Oligonucleotide chips have beenused for the molecular classification of acute leukemias,7
demonstrating the feasibility of using microarrays foridentifying new cancer classes and for assigning tumorsto known classes. Similarly, diffuse large B-cell lym-phoma has been dissected into two prognostic catego-ries by gene expression profiling.8
Although numerous studies have been undertaken toassess global gene expression patterns in cancer,7–10
few have been used in the context of inflammation orsepsis. In a proof of concept study, a 1000-element DNAmicroarray has been used to analyze gene expressionchanges in cytokine-activated monocytes, synovial fluidspecimens from patients with rheumatoid arthritis, andintestinal mucosa biopsies from patients with inflamma-tory bowel disease.11 A similar global expression profil-ing study was performed characterizing transcript alter-ations in the lung using a rodent model of pulmonaryfibrosis.12
As described above, a major complication of septicpatients is development of acute respiratory distress syn-drome and onset of multiple organ failure. It has beendemonstrated both experimentally and clinically that sep-sis causes the appearance in plasma of a series of cy-tokines, such as interleukin (IL)-1, tumor necrosis factor(TNF)-�, and IL-6. This phenomenon seems to placeorgans (liver, lung, and kidney) at risk of injury and failure.Why these organs become targets of injury during sepsisis poorly understood. Characterizing the molecular fin-gerprint (or gene profile) of sepsis in this context mayhelp elucidate the mechanism of sepsis-induced multipleorgan failure and suggest further approaches for thera-peutic intervention.
In the present study, we developed an 8064 element(8K) rat cDNA microarray to analyze multiorgan/multisys-tem gene expression patterns in a well-characterized ratCLP model of sepsis.13,14 We propose that the responseto sepsis induces both distinct and shared gene expres-sion programs in various organs—perhaps to minimizetissue injury by the host’s own immune system. Usually,these mediators are measured in plasma in the face of avery dynamic and rapidly changing environment of sep-sis. Extrapolations to individual organs is not possible.Our hypothesis is that microarray analysis of genes ex-pressed in organs during sepsis may be predictive ofoutcome, especially in organs that are known to be com-promised during sepsis. Such studies may provide im-portant insight into multiorgan failure during sepsis. Al-though several studies have successfully used DNAmicroarrays to molecularly classify malignancies,7,8 thisis the first gene-profiling study to address an importantdisease process at a multiorgan, multisystem level.
Materials and Methods
Rat Model of Sepsis
Sepsis was induced in rats by CLP as described in detailelsewhere.13,14 Briefly, male Long-Evans-specific patho-gen-free rats (275 to 300 g; Harlan, Indianapolis, IN) wereused in all studies. Anesthesia was induced by intraperi-toneal administration of ketamine (20 mg/100 g bodyweight). Through a 2-cm abdominal midline incision, thececum was ligated below the ileocecal valve withoutobstructing the ileum or colon. The cecum was thensubjected to a single through and through perforationwith a 21-gauge needle. After repositioning the bowel,the abdominal incision was closed with plain surgicalsuture 4-0 and metallic skin clips. Sham-operated ratsunderwent the same procedure except for ligation andpuncture of the cecum. Lung, liver, thymus, spleen, kid-neys, and brain were harvested from CLP rats, sham-rats,and control untreated rats. Various time points (6, 12, 18,and 24 hours) after surgery were used in the CLP andsham animals. Organs from three rats from each condi-tion were pooled, snap-frozen, and stored at �80°C.
Microarray Analysis
DNA microarray analysis of gene expression was doneessentially as described by the Brown and Derisi Labs(available at www.microarrays.org). The sequence-veri-fied cDNA clones on the rat cDNA microarray are listed inthe Supplementary Information and are available fromResearch Genetics (www.resgen.com). Purified polymer-ase chain reaction products, generated using the cloneinserts as template, were spotted onto poly-L-lysine-coated microscope slides using an Omnigrid robotic ar-rayer (GeneMachines, CA) equipped with quill-type pins(Majer Scientific, AZ). One full print run generated �100DNA microarrays. All chips have various control ele-ments, which include human, rat, and yeast genomicDNAs, standard saline citrate, yeast genes, housekeepinggenes, among others. In addition, we have separately ob-tained �500 inflammation- and apoptosis- related cDNAsfrom Research Genetics to serve as independent controlsfor clone tracking and function as duplicates for qualitycontrol. Protocols for printing and postprocessing of arraysare available in the public domain (www.microarrays.org)and described previously.15
Pooled rat organs were homogenized and poly-(A)�mRNA was isolated using a commercial kit (Fasttrack 2.0;Invitrogen, Carlsbad, CA). Once isolated, mRNA wasused as a template for cDNA generation using reversetranscriptase. Inclusion of amino allyl-dUTP in the reversetranscriptase reaction allowed for subsequent fluores-cent labeling of cDNA using monofunctional N-hydroxysuccinimidyl (NHS) ester dyes (as described at www.microarrays.org). In each experiment, fluorescent cDNAprobes were prepared from an experimental mRNA sam-ple (Cy5 labeled) and a control mRNA sample (Cy3 la-beled) isolated from untreated, control rat organs. Forexample, lung isolated from CLP and sham rats wascompared against control lung from untreated rats (other
1200 Chinnaiyan et alAJP October 2001, Vol. 159, No. 4

organs were compared similarly). The experimental cDNAsample was coupled to a monofunctional Cy5-NHS esterand the reference cDNA sample to a Cy3-NHS ester (Am-ersham, Arlington Heights, IL). The labeled probes werethen hybridized to 8K rat cDNA microarrays. Fluorescentimages of hybridized microarrays were obtained using aGenePix 4000A microarray scanner (www.axon.com; AxonInstruments, CA).
Data Analysis
Primary analysis was done using the Genepix softwarepackage. Images of scanned microarrays were griddedand linked to a gene print list. Initially, data are viewed asa scatter plot of Cy3 versus Cy5 intensities. Cy3 to Cy5ratios are determined for the individual genes along withvarious other quality control parameters (eg, intensityover local background). The Genepix software analysispackage flags spots as absent based on spot character-istics (refer to web site). Additionally, bad spots or areasof the array with obvious defects were manually flagged.Spots with small diameters (�50 �m) and spots with lowsignal strengths �350 fluorescence intensity units overlocal background in the more intense channel were dis-carded. Flagged spots were not included in subsequentanalyses. Data were scaled such that the average me-dian ratio values for all spots were normalized to 1.0(done separately for each array). An arbitrary cut-off ratioof twofold was used to select genes as significantly up- ordown-regulated relative to the control sample.
Normalized fluorescence ratios of nonflagged arrayelements were uploaded to a Microsoft Access Database(Microsoft, WA). The data sets for each organ were indi-vidually queried for genes that were differentially ex-pressed in the CLP organs as compared to control or-gans (ratios �2.0 or �0.5) but not in the sham-operatedorgans (ratios between 0.5 and 2.0). The data sets fromindividual organ analyses were then combined and im-ported into M. Eisen’s Gene Cluster Program and arrayelements that were not represented in at least 75% of theexperimentals were excluded. The data were log2 trans-formed and hierarchically clustered with average linkageclustering and visualized using the TreeView Program.16
In some cases, inclusion thresholds were increased tofocus the returned clusters.
Northern Blot Analysis
Five �g of poly A� RNA were resolved by denaturingformaldehyde-agarose gel and transferred onto Hybondmembrane (Amersham) by a capillary transfer set up.Hybridizations were performed by the method describedby Church and Gilbert.17 Briefly, prehybridization wasperformed for 1 hour at 65°C in a solution containing 1%bovine serum albumin (fraction V), 8% sodium dodecylsulfate, 0.5 mol/L phosphate buffer, pH 7.0, and 1 mmol/Lethylenediaminetetraacetic acid, pH 8.0. Hybridizationwas performed in prehybridization buffer for 16 hours at65°C after adding the denatured probe at 2 to 3 � 106
cpm/ml concentration. Blots were washed with 2� stan-
dard saline citrate/0.1% sodium dodecyl sulfate at roomtemperature three times for a period of 30 minutes. Sub-sequently the blots were washed twice in 0.2� standardsaline citrate/0.1% sodium dodecyl sulfate at room tem-perature at 65° twice for 10 minutes each. Signal wasvisualized and quantitated by phosphorimager. For rela-tive fold estimation, the ratio of the intensity of the respec-tive transcript in the CLP animal over the transcript inten-sity in the sham animal was determined. Similarly, formicroarray analysis, the normalized Cy5/Cy3 ratio of thetranscript in CLP animals is compared to the Cy5/Cy3ratio in sham animals.
Results
Profiling Sepsis Using High-Density Rat cDNAMicroarrays
The glass slide cDNA microarrays developed here include�2000 known, named genes from the Research Geneticsrat cDNA clone set, 5000 expressed sequence tags (ESTs),and 500 control elements (which include genomic human,rat, and yeast DNAs, yeast genes, and so forth). We alsoincluded a separate set of �500 inflammation-relatedgenes to serve as replicates on the microarray and provideinternal controls for reproducibility of gene expressionquantitation (See Supplementary Information for the com-plete annotated list of these cDNAs). Using this 8K-rat mi-croarray, we profiled gene expression across multiple timepoints in the lung, liver, kidney, spleen, thymus, and brain ofCLP and sham-operated rats. Organs were pooled from atleast three rats for each time point of the study, thus mini-mizing variation between animals. Fluorescently labeled(Cy5) cDNA was prepared from mRNA from each experi-mental sample. For each organ, a reference sample wasprepared from three unoperated, untreated rats (control)and labeled using a second distinguishable fluorescentnucleotide (Cy3).
In all, more than 40 8K rat cDNA microarrays wereused to assess gene expression in six different tissues(120 rat organs) at four time points (6, 12, 18, and 24hours) during CLP-induced sepsis. Figure 1 provides anoverview of the variation in gene expression across dif-ferent organs/systems. Scatter plots of Cy5 versus Cy3intensities are shown for each organ at an early time point(6 hours) and at a late time point (24 hours) of CLP-induced sepsis. As expected, control lung cDNA labeledwith Cy5 compared against control lung cDNA labeledwith Cy3 revealed a strong linear relationship (R2 � 0.97).Organs harvested from septic animals, however, dis-played various increases in scatter with R2 varying from0.89 (24-hour septic brain) to 0.43 (24-hour septic liver).Differential gene expression was greatest in the early andlate time points of the sepsis liver (R2 � 0.50 at 6 hours,R2 � 0.43 at 24 hours), an organ known to produce largequantities of acute phase reactants. Interestingly, thebrain had very limited changes in gene expression duringsepsis (R2 � 0.86 and 0.89), presumably because of theblood-brain barrier that prevents passage of blood com-ponents into brain tissue.
Molecular Signatures of Sepsis 1201AJP October 2001, Vol. 159, No. 4

Clustering of Gene Expression Patterns Inducedby Sepsis
Organs harvested from sham-operated rats displayednumerous changes in gene expression when comparedto organs from control rats (see Supplementary Material).Sham animals underwent the same procedure as CLPanimals except for ligation and puncture of the cecumand thus, these gene expression patterns are likely char-acteristic of the sham operation that includes anesthesia,abdominal incision, and closure. Although anesthesia-and surgery-induced changes are of interest, the primaryfocus of this study was to monitor changes induced bythe sepsis state. Thus, the gene expression data sets(sham and experimentals) for each organ were queriedfor genes that had at least a twofold or higher variation ofthe Cy5/Cy3 ratio in the septic sample but not in thematched sham samples. As sepsis induces a systemicresponse involving multiple organs, we chose to explorethe gene expression data using a hierarchical clusteringformat in which intraorgan and interorgan relationshipscould be evaluated (Figure 2). The colored bars on theright of Figure 2 indicate clusters of coordinately ex-pressed genes highlighting interrelationships betweenorgan systems. For example, cluster A includes genesthat were up-regulated in most if not all of the tissuesprofiled. By contrast, cluster H highlights genes that werecoordinately down-regulated in both the lung and thespleen. Interestingly, there were even groups with discor-dant gene expression, as exemplified by cluster E, whichincludes genes that were up-regulated in the spleen butdown-regulated in the thymus. Organ-specific gene ex-pression alterations are also evident in clusters B, F, andL (Figure 2). Taken together, Figure 2 illustrates the di-verse and interrelated gene expression patterns of awhole organism responding to a systemic inflammatorystimulus (CLP). The entire data set underlying Figure 2can be obtained from the Supplementary Materials.
Several of the sepsis clusters shown in Figure 2, wereexamined in more detail (Figure 3). Cluster A is especially
interesting because it harbors genes that were up-regu-lated in most of the organs profiled, defining a set ofgenes with a relatively universal response to sepsis. Asexpected, well-known mediators of the inflammatory re-sponse are included in cluster A including IL-1�, phos-pholipase A2 (PLA2), and complement components C1qand C3. IL-1� has a central role in the pathogenesis ofsepsis and mediates its proinflammatory effects by bind-ing to its cognate receptor (IL-1R) and subsequentlyactivating the transcription factor nuclear factor-�B.18 Bymicroarray analysis, IL-1� transcript was found to beincreased in all of the organs tested excluding the brain.Interestingly, IL-1 receptor type II (IL-1RII), which func-tions as a decoy receptor for IL-1,19,20 was shown to beup-regulated in a similar set of tissues (Figure 3). ClusterA also includes PLA2, an important mediator of arachi-donic acid metabolism and recently implicated in thepathogenesis of sepsis-induced lung injury.21 Becauseits transcript was increased in most of the tissues weexamined, PLA2 may have a more encompassing role insepsis-induced tissue injury than previously recognized.Many other known inflammatory markers are contained incluster A, including complement proteins, proteases, an-ti-proteases, and oxidant scavenging enzymes, amongothers. These mediators are discussed in more detail inthe context of the functional clusters described in Figure4. In addition to uncharacterized ESTs, there are numer-ous genes that were identified by our screen but notpreviously known to be involved in the sepsis response.For example, a member of cluster A, n-chimaerin, ap21rac-GTPase-activating protein and phorbol ester re-ceptor22 presumed to have an important role in neuronalsignaling, is highly induced in many of the tissues fromanimals with sepsis. N-chimaerin has previously beenshown to enhance the biological activities of p21rac,including actin cytoskeletal mobilization and superoxidegeneration (in conjunction with NADPH oxidase assem-bly).23 However, the precise role of n-chimaerin up-reg-ulation during sepsis is unclear. A number of previouslyuncharacterized ESTs are also presented in this cluster.
Figure 1. Scatter plot representations of gene expression changes in multiple organs during sepsis. Green (Cy3) intensity ranging from 100 to 105 is shown inlog scale on the horizontal axes, whereas (Cy5) intensity is similarly represented on the vertical axes. Respective reference samples consisted of control organs(from untreated rats) and were labeled with Cy3, whereas the experimentals consisted of organs harvested from CLP rats at the 6- and 24-hour time points andwere labeled with Cy5. Control lung (labeled with Cy5) compared to itself (labeled with Cy3) displayed a strong linear relationship (R2 � 0.97). By contrast, whenorgans from septic animals were compared to respective control organs, differential gene expression was observed (with R2 varying form 0.43 to 0.89). Organsfrom three animals were combined before mRNA extraction for each time point to minimize animal to animal variation. Microarray hybridizations were done usingan 8K rat cDNA chip. Linear fit R2 value for each scatter plot is provided.
1202 Chinnaiyan et alAJP October 2001, Vol. 159, No. 4
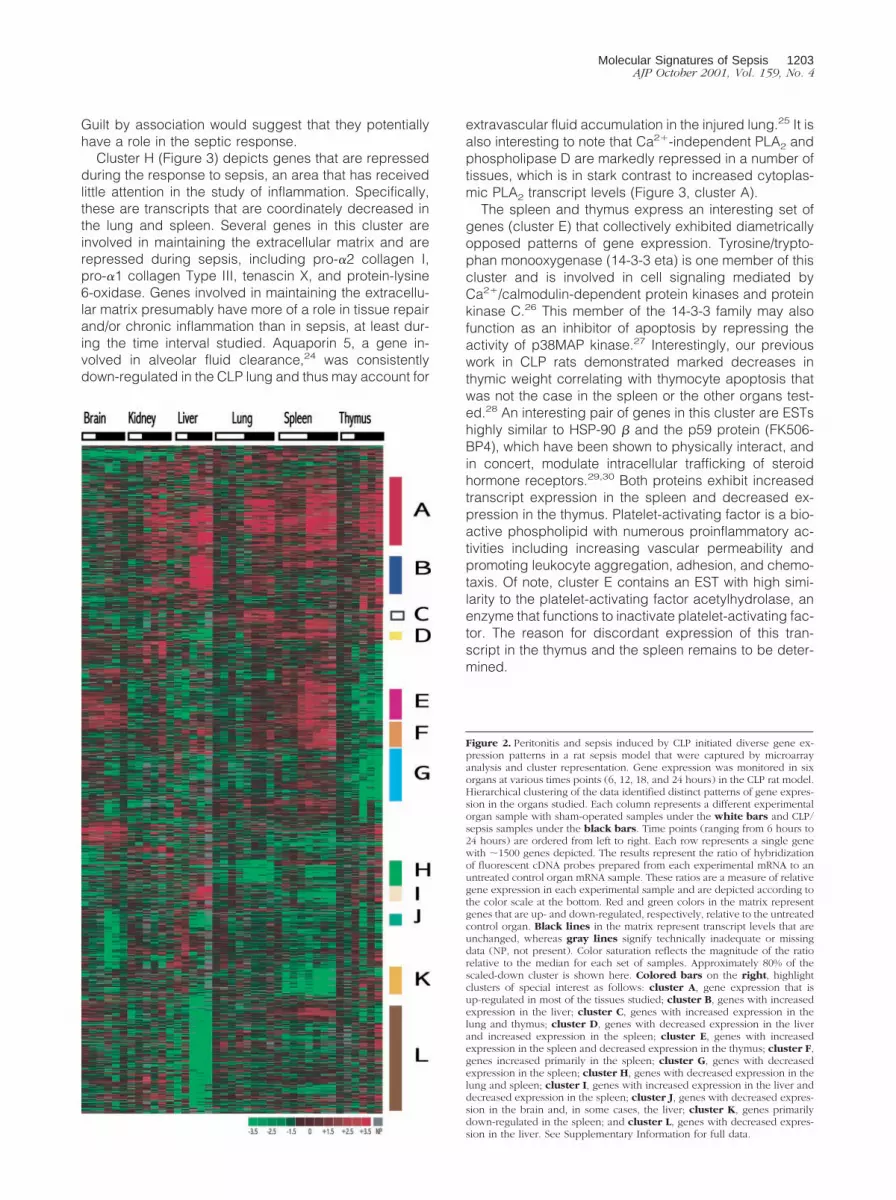
Guilt by association would suggest that they potentiallyhave a role in the septic response.
Cluster H (Figure 3) depicts genes that are repressedduring the response to sepsis, an area that has receivedlittle attention in the study of inflammation. Specifically,these are transcripts that are coordinately decreased inthe lung and spleen. Several genes in this cluster areinvolved in maintaining the extracellular matrix and arerepressed during sepsis, including pro-�2 collagen I,pro-�1 collagen Type III, tenascin X, and protein-lysine6-oxidase. Genes involved in maintaining the extracellu-lar matrix presumably have more of a role in tissue repairand/or chronic inflammation than in sepsis, at least dur-ing the time interval studied. Aquaporin 5, a gene in-volved in alveolar fluid clearance,24 was consistentlydown-regulated in the CLP lung and thus may account for
extravascular fluid accumulation in the injured lung.25 It isalso interesting to note that Ca2�-independent PLA2 andphospholipase D are markedly repressed in a number oftissues, which is in stark contrast to increased cytoplas-mic PLA2 transcript levels (Figure 3, cluster A).
The spleen and thymus express an interesting set ofgenes (cluster E) that collectively exhibited diametricallyopposed patterns of gene expression. Tyrosine/trypto-phan monooxygenase (14-3-3 eta) is one member of thiscluster and is involved in cell signaling mediated byCa2�/calmodulin-dependent protein kinases and proteinkinase C.26 This member of the 14-3-3 family may alsofunction as an inhibitor of apoptosis by repressing theactivity of p38MAP kinase.27 Interestingly, our previouswork in CLP rats demonstrated marked decreases inthymic weight correlating with thymocyte apoptosis thatwas not the case in the spleen or the other organs test-ed.28 An interesting pair of genes in this cluster are ESTshighly similar to HSP-90 � and the p59 protein (FK506-BP4), which have been shown to physically interact, andin concert, modulate intracellular trafficking of steroidhormone receptors.29,30 Both proteins exhibit increasedtranscript expression in the spleen and decreased ex-pression in the thymus. Platelet-activating factor is a bio-active phospholipid with numerous proinflammatory ac-tivities including increasing vascular permeability andpromoting leukocyte aggregation, adhesion, and chemo-taxis. Of note, cluster E contains an EST with high simi-larity to the platelet-activating factor acetylhydrolase, anenzyme that functions to inactivate platelet-activating fac-tor. The reason for discordant expression of this tran-script in the thymus and the spleen remains to be deter-mined.
Figure 2. Peritonitis and sepsis induced by CLP initiated diverse gene ex-pression patterns in a rat sepsis model that were captured by microarrayanalysis and cluster representation. Gene expression was monitored in sixorgans at various times points (6, 12, 18, and 24 hours) in the CLP rat model.Hierarchical clustering of the data identified distinct patterns of gene expres-sion in the organs studied. Each column represents a different experimentalorgan sample with sham-operated samples under the white bars and CLP/sepsis samples under the black bars. Time points (ranging from 6 hours to24 hours) are ordered from left to right. Each row represents a single genewith �1500 genes depicted. The results represent the ratio of hybridizationof fluorescent cDNA probes prepared from each experimental mRNA to anuntreated control organ mRNA sample. These ratios are a measure of relativegene expression in each experimental sample and are depicted according tothe color scale at the bottom. Red and green colors in the matrix representgenes that are up- and down-regulated, respectively, relative to the untreatedcontrol organ. Black lines in the matrix represent transcript levels that areunchanged, whereas gray lines signify technically inadequate or missingdata (NP, not present). Color saturation reflects the magnitude of the ratiorelative to the median for each set of samples. Approximately 80% of thescaled-down cluster is shown here. Colored bars on the right, highlightclusters of special interest as follows: cluster A, gene expression that isup-regulated in most of the tissues studied; cluster B, genes with increasedexpression in the liver; cluster C, genes with increased expression in thelung and thymus; cluster D, genes with decreased expression in the liverand increased expression in the spleen; cluster E, genes with increasedexpression in the spleen and decreased expression in the thymus; cluster F,genes increased primarily in the spleen; cluster G, genes with decreasedexpression in the spleen; cluster H, genes with decreased expression in thelung and spleen; cluster I, genes with increased expression in the liver anddecreased expression in the spleen; cluster J, genes with decreased expres-sion in the brain and, in some cases, the liver; cluster K, genes primarilydown-regulated in the spleen; and cluster L, genes with decreased expres-sion in the liver. See Supplementary Information for full data.
Molecular Signatures of Sepsis 1203AJP October 2001, Vol. 159, No. 4

Validation of Selected Genes Identified byMicroarray Analysis
Selected genes identified by our microarray screen werecorroborated by Northern analysis of the six organs stud-ied (Figure 4). For example, TIMP1 was found to be 3.8-,4.4-, 3.1-, 3.7-, 1.2-, and 2.3-fold up-regulated by mi-croarray in the CLP liver, lung, spleen, thymus, brain, andkidney, respectively (Figure 4A). Similarly by Northernanalysis TIMP1 transcript was up-regulated in the sameset of organs 12.3-, 2.5-, 4.6-, 17.8-, 2.3-, and 2.2-fold,respectively. Similar qualitative concordance between
Northern and microarray analysis was achieved withother genes tested including N-chimaerin, PLA2, andCa2�-independent PLA2 (Figure 4, B and C).
Functional Analysis of Sepsis-Induced GeneExpression Patterns
We next assessed the data by examining functionalgroups of known, named genes (Figure 5). During theresponse to sepsis, bacterially derived lipopolysaccha-ride induces the appearance of a number of cytokines in
Figure 3. Selected clusters from Figure 2. Clusters A, E, and H are examined in detail (see Figure 2 legend). Cluster A defines a systemic sepsis signature inthat this group depicts genes that are up-regulated in most of the tissues studied. Cluster E illustrates a group of genes that have diametrically opposite geneexpression patterns in the spleen and in the thymus. Cluster H depicts genes that are down-regulated during the septic response (and in this case down-regulatedin the lung and spleen). Unnamed genes are in most cases ESTs. See Supplementary Information for full data.
1204 Chinnaiyan et alAJP October 2001, Vol. 159, No. 4

circulation that mediate the systemic response includingTNF-�, IL-1, and IL-6. In the organs analyzed, increasedTNF-� expression was only observed at the 6-hour timepoint in the CLP lung. This may be because of the higherconcentrations of mononuclear phagocytes found in lungtissue or because of an increase in TNF-� that may occurbefore the 6-hour time point in CLP animals. As dis-cussed earlier, it is interesting to note the coordinatedgene expression of IL-1� and its negative regulator, IL-1RII (Figure 5). Coordinated up-regulation of these pro-teins is seen in the liver, lung, spleen, and thymus. Al-though IL-1� transcript is increased in the kidney, the
corresponding transcript for IL-1RII is not. Differentialregulation of either protein does not occur in the brain.Up-regulation of an inflammatory agonist (IL-1�) and itsdecoy receptor (IL-1RII) in the diverse organs testedlikely represents a physiological mechanism to tightlyregulate the inflammatory response. Although IL-6 is no-tably absent from our chip, IL-6 ST(gp130), which inconjunction with IL-6 receptor mediates IL-6 signaling, isup-regulated in the kidney, lung, and spleen. Interest-ingly, STAT3, which is a transcription factor integral to thegp130-signaling pathway, exhibited increased transcriptexpression in the liver, lung, and spleen. Thus, our data
Figure 4. Validation of microarray results by Northern blot analysis. Fold up- or down-regulation of the respective transcript in CLP rats (24-hour time point) versussham rats as determined by Northern blotting and cDNA microarray analysis. Asterisk refers to a microarray measurement that was not present. Ca2�-independentPLA2 transcript was not detected by Northern blot in brain or kidney tissue and was thus not reported. See Materials and Methods for details.
Molecular Signatures of Sepsis 1205AJP October 2001, Vol. 159, No. 4
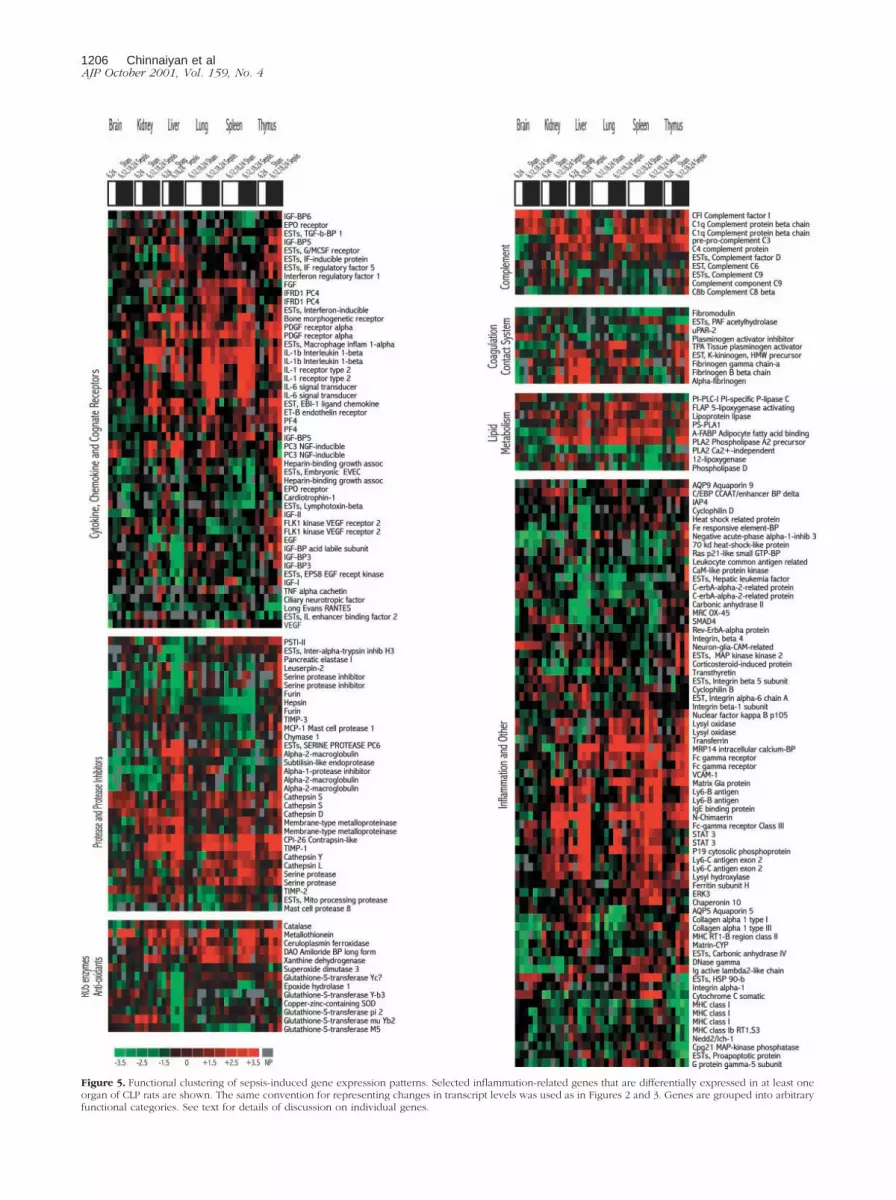
Figure 5. Functional clustering of sepsis-induced gene expression patterns. Selected inflammation-related genes that are differentially expressed in at least oneorgan of CLP rats are shown. The same convention for representing changes in transcript levels was used as in Figures 2 and 3. Genes are grouped into arbitraryfunctional categories. See text for details of discussion on individual genes.
1206 Chinnaiyan et alAJP October 2001, Vol. 159, No. 4

suggest that several tissues mobilize downstream com-ponents of the IL-6 signaling pathway in response tosepsis and are presumably primed for activation by IL-6.
Cytokines involved in angiogenesis are also regulatedduring sepsis. FLK1 kinase [vascular endothelial growthfactor (VEGF) receptor 2], along with its ligand VEGF, arespecifically down-regulated in the lung. Although activa-tion of the VEGF pathway induces vascular permeability,decreased transcript levels of VEGF and its receptor, asobserved during the sepsis response, may prevent in-creases in vascular permeability and promote homeosta-sis during sepsis. Similarly, endothelin receptor, whichmediates the vasoconstrictor activities of endothelin, wasshown to have enhanced expression in the lung, possiblyfunctioning as a mechanism to minimize fluid losses (intothe lung).
Tissue injury during sepsis occurs by a variety ofmechanisms including that mediated by reactive oxygenspecies and proteolytic enzymes. In the protease andanti-protease groups it is evident that the rat serine pro-tease inhibitor, Cpi-26 (contrapsin-like inhibitor) and themetalloproteinase inhibitor, TIMP-1 are induced duringsepsis in most of the tissues studied, suggesting that thisfunctions as a mechanism for attenuating protease-me-diated tissue damage. It is also reassuring to observeup-regulation of �-2 macroglobulin and �-2 anti-protein-ase inhibitor in the liver, two classic acute-phase reac-tants. Other less characterized proteases and anti-pro-teases described in the rat are also differentiallyregulated during the septic response (Figure 5). En-zymes known to produce oxidative metabolites such asdeamine oxidase (amiloride binding protein 1) and xan-thine dehydrogenase are transcriptionally up-regulatedduring sepsis in most of the tissues studied (Figure 5). Inaddition to generating oxidants, deamine oxidase de-grades histamine,31 which has a central role in promotingallergic and acute inflammatory states. Xanthine dehy-drogenase is produced by both epithelial cells and neu-trophils and has been shown to be a major source ofinjurious reactive oxygen metabolites during tissue inju-ry.32,33 Similarly, proteins that have anti-oxidant effectssuch as metallothionein and ceruloplasmin are also up-regulated in a similar set of tissues. Both proteins havethe ability to scavenge superoxide anion and may repre-sent a defense mechanism against oxidant-mediated tis-sue injury.26,34
Activation of the complement system together withassembly of the membrane attack complex C5b-9 playsan important role in host defense and sepsis.35 Compo-nents of the complement system such as C1q, C3, and toa lesser extent C4 are up-regulated in many tissues of theCLP animal (Figure 5). By contrast, C6, C8, and C9 do notdisplay a similar gene expression pattern. Interestingly,the complement regulatory protein, Factor I (CFI), aserine protease that inactivates C3b and C4b,36,37 is alsoup-regulated in many of the tissues tested. ConcordantCFI up-regulation may serve as a defense mechanismagainst renegade activation of the complement systemduring the systemic response to sepsis.
Various proteins involved in arachidonic acid metabo-lism are induced in tissues of CLP rats. Cytosolic PLA2,
which is responsible for the release of arachidonic acidfrom phospholipid stores, is activated by submicromolarconcentrations of Ca2� and has recently been implicatedin sepsis-induced lung injury.21 Here we discover thatPLA2 is up-regulated at the gene expression level inmany of the tissues we analyzed in the CLP rat includingthe lung (Figure 5). Interestingly, we observed coordinatedecreases in the transcript levels of the Ca2�-indepen-dent forms of PLA2. This may represent another site ofphysiological regulatory control in the systemic inflamma-tory pathway. A number of other named genes (inflam-mation-related or otherwise) with twofold increases ordecreases in transcripts relative to the respective controlorgans are also displayed in Figure 5 (Inflammation andOther). Notable examples of genes with increased ex-pression in this group include Fc� receptor, MRP14, p19cytosolic protein, and matrix G1a protein. Similarly,genes with decreased expression, in selected organs ofthis arbitrary grouping, include c-erb-A-�-2-related pro-tein, negative acute phase apha-1 protein, and MHCclass I proteins.
Discussion
A daunting clinical challenge has been the successfultreatment of humans with sepsis despite the availability ofpowerful, broad-spectrum antibiotics. In surgical andmedical intensive care units, sepsis often leads to func-tional impairment of the lungs, resulting in acute lunginjury or development of the adult respiratory distresssyndrome. Other frequent complications include hepaticand renal failure, the triad commonly being referred to as“multiorgan failure syndrome.”38–41 Although this patternof organ failure is well-known clinically, its pathogenesisis poorly understood. It has been postulated that sepsisafter blunt trauma, penetrating injuries, ischemia, andvarious other clinical conditions, especially when the ab-domen is involved, may be the result of gram-negativebacteria translocating into the gut wall from mucosalsurfaces, appearing subsequently in adjacent lymphaticsand/or the blood stream,42 and may cause systemicchanges that first present as hyperdynamic events (eg,increased cardiac output, tachypnea, hyperthermia, leu-kocytosis, hypocapnia, hypermetabolism, and so forth)followed, as sepsis proceeds, by development of thehypodynamic state (eg, reduced cardiac output, de-creased peripheral vascular resistance, hypothermia, hy-percapnia, reduced PaO2, and so forth).43,44 Sepsis isassociated with a systemic inflammatory response syn-drome that is characterized by the appearance in plasmaof cytokines (eg, IL-6, TNF-�, IL-1), suggesting that reg-ulation of the inflammatory response has been compro-mised.4,45 There is evidence of complement activation,as reflected by falling levels in plasma of the hemolyticactivity of complement (CH50) and the appearance inplasma of complement activation products such as C3aand C5a, together with the membrane attack complex,C5b-9.45,46 Although the complement system (especiallycomplement activation products, C3b, iC3b, and C5b-9)is a vital defensive system against invasion by bacteria,
Molecular Signatures of Sepsis 1207AJP October 2001, Vol. 159, No. 4
there also exists the possibility that excessive comple-ment activation can result in compromised host de-fenses.
Several overriding themes emerge from our multiorgangene expression study of sepsis. Microbial infection andthe associated systemic sepsis response triggers a mas-sive activation of transcriptional programs in the individ-ual organs/tissues of a whole organism. Not only is anarray of genes induced during sepsis but an equallyinteresting set of genes is repressed. One of the mostintriguing aspects of this study is the comparison of geneexpression patterns of different tissues to a systemicstimulus. Although there are subsets of genes that sharesimilar expression patterns in many organs (with the brainbeing a frequent exception), each organ has a distinctivemolecular response to systemic inflammation. The blood-brain barrier may be responsible for the apparent lack ofthe common sepsis signature in the brain. There arealso interesting associations between organs. For ex-ample, a distinct set of genes is up-regulated in thethymus and coordinately down-regulated in the spleen(Figure 3). Does this have to do with different sepsisresponses by thymocytes versus B and T lymphocytes?Further experimentation will be needed to decipher thisinteraction between the thymus and the spleen. Finally,it is also quite evident that a specific set of genes isdifferentially expressed in an organ-specific manner(Figure 3). The molecular basis for these tissue-com-mon and tissue-specific responses remains to be dis-covered.
Genes with proinflammatory effects were often bal-anced by genes with anti-inflammatory effects illustratingthe regulatory controls embedded in this complex path-way. Examples of this Yin-Yang gene expression include:1) IL-1� and its decoy receptor; 2) reactive oxygen me-tabolite generating enzymes and superoxide destroyingenzymes; 3) complement components (C1q, C3, C4) andan inactivator of complement components (CFI); and 4)induction of Ca2�-dependent PLA2 and coordinated re-pression of Ca2�-independent PLA2.
Differential gene expression was observed in proteinsresponsible for preventing tissue injury and promotinghomeostasis including anti-proteases (TIMP-1, Cpi-26),oxidant neutralizing enzymes (metallothionein), cytokinedecoy receptors (IL-1RII), and tissue/vascular permeabil-ity factors (aquaporin 5, VEGF). Genes previously impli-cated in the inflammatory process were studied in thecontext of sepsis at a multiorgan level. Likewise, genesnot known to be involved in sepsis were also character-ized. Numerous ESTs were assigned by gene expressionpatterns to the sepsis clusters described in Figure 2 (guiltby association). Further characterization of the sepsis-induced gene expression profiles obtained here mayidentify novel sepsis biomarkers and shed light into theetiology of multiple organ failure, an often-fatal complica-tion of systemic inflammation. By profiling gene expres-sion at a multiorgan level in an animal model of systemicinflammation, it will soon be possible to determine poten-tial anti-inflammatory effects of emerging therapeutics.
Supplementary Information
Sepsis profiling datasets (DNA microarray datasets) willbe available at the author’s website: http://chinnaiyan.path.med.umich.edu/.
Acknowledgments
We thank Anjana Menon and Robin Kunkel for assistancein preparing the rat cDNA clones and preparation offigures, respectively.
References
1. Wheeler AP, Bernard GR: Treating patients with severe sepsis. N EnglJ Med 1999, 340:207–214
2. Bone RC, Grodzin CJ, Balk RA: Sepsis: a new hypothesis for patho-genesis of the disease process. Chest 1997, 112:235–243
3. Ebong SJ, Call DR, Bolgos G, Newcomb DE, Granger JI, O’Reilly M,Remick DG: Immunopathologic responses to non-lethal sepsis.Shock 1999, 12:118–126
4. Takakuwa T, Endo S, Inada K, Kasai T, Yamada Y, Ogawa M: As-sessment of inflammatory cytokines, nitrate/nitrite, type II phospho-lipase A2, and soluble adhesion molecules in systemic inflammatoryresponse syndrome. Res Commun Mol Pathol Pharmacol 1997, 98:43–52
5. Deitch EA: Animal models of sepsis and shock: a review and lessonslearned. Shock 1998, 9:1–11
6. Wichterman KA, Baue AE, Chaudry IH: Sepsis and septic shock—areview of laboratory models and a proposal. J Surg Res 1980, 29:189–201
7. Golub TR, Slonim DK, Tamayo P, Huard C, Gaasenbeek M, MesirovJP, Coller H, Loh ML, Downing JR, Caligiuri MA, Bloomfield CD,Lander ES: Molecular classification of cancer: class discovery andclass prediction by gene expression monitoring. Science 1999, 286:531–537
8. Alizadeh AA, Eisen MB, Davis RE, Ma C, Lossos IS, Rosenwald A,Boldrick JC, Sabet H, Tran T, Yu X, Powell JI, Yang L, Marti GE, MooreT, Hudson Jr J, Lu L, Lewis DB, Tibshirani R, Sherlock G, Chan WC,Greiner TC, Weisenburger DD, Armitage JO, Warnke R, Staudt LM:Distinct types of diffuse large B-cell lymphoma identified by geneexpression profiling. Nature 2000, 403:503–511
9. Perou CM, Sorlie T, Eisen MB, van de Rijn M, Jeffrey SS, Rees CA,Pollack JR, Ross DT, Johnsen H, Akslen LA, Fluge O, Pergamen-schikov A, Williams C, Zhu SX, Lonning PE, Borresen-Dale AL, BrownPO, Botstein D: Molecular portraits of human breast tumours. Nature2000, 406:747–752
10. Bittner M, Meltzer P, Chen Y, Jiang Y, Seftor E, Hendrix M, Radma-cher M, Simon R, Yakhini Z, Ben-Dor A, Sampas N, Dougherty E,Wang E, Marincola F, Gooden C, Lueders J, Glatfelter A, Pollock P,Carpten J, Gillanders E, Leja D, Dietrich K, Beaudry C, Berens M,Alberts D, Sondak V: Molecular classification of cutaneous malignantmelanoma by gene expression profiling. Nature 2000, 406:536–540
11. Heller RA, Schena M, Chai A, Shalon D, Bedilion T, Gilmore J, WoolleyDE, Davis RW: Discovery and analysis of inflammatory disease-re-lated genes using cDNA microarrays. Proc Natl Acad Sci USA 1997,94:2150–2155
12. Kaminski N, Allard JD, Pittet JF, Zuo F, Griffiths MJ, Morris D, HuangX, Sheppard D, Heller RA: Global analysis of gene expression inpulmonary fibrosis reveals distinct programs regulating lung inflam-mation and fibrosis. Proc Natl Acad Sci USA 2000, 97:1778–1783
13. Czermak BJ, Sarma V, Pierson CL, Warner RL, Huber-Lang M, BlessNM, Schmal H, Friedl HP, Ward PA: Protective effects of C5a block-ade in sepsis. Nat Med 1999, 5:788–792
14. Czermak BJ, Breckwoldt M, Ravage ZB, Huber-Lang M, Schmal H,Bless NM, Friedl HP, Ward PA: Mechanisms of enhanced lung injuryduring sepsis. Am J Pathol 1999, 154:1057–1065
15. Eisen MB, Brown PB: DNA Arrays for the Analysis of Gene Expres-sion. Edited by SM Weissman. San Diego, Academic Press, 1999
1208 Chinnaiyan et alAJP October 2001, Vol. 159, No. 4

16. Eisen MB, Spellman PT, Brown PO, Botstein D: Cluster analysis anddisplay of genome-wide expression patterns. Proc Natl Acad Sci USA1998, 95:14863–14868
17 Church GM, Gilbert W: Genomic sequencing. Proc Natl Acad Sci USA1984, 81:1991–1995
18. Dinarello CA: Proinflammatory cytokines. Chest 2000, 118:503–50819. Neumann D, Kollewe C, Martin MU, Boraschi D: The membrane form
of the type II IL-1 receptor accounts for inhibitory function. J Immunol2000, 165:3350–3357
20. Dinarello CA: The role of the interleukin-1-receptor antagonist inblocking inflammation mediated by interleukin-1. N Engl J Med 2000,343:732–734
21. Nagase T, Uozumi N, Ishii S, Kume K, Izumi T, Ouchi Y, Shimizu T:Acute lung injury by sepsis and acid aspiration: a key role for cyto-solic phospholipase A2. Nature Immunology 2000, 1:42–46
22. Kozma R, Ahmed S, Best A, Lim L: The GTPase-activating proteinn-chimaerin cooperates with Rac1 and Cdc42Hs to induce the for-mation of lamellipodia and filopodia. Mol Cell Biol 1996, 16:5069–5080
23. Geijsen N, van Delft S, Raaijmakers JA, Lammers JW, Collard JG,Koenderman L, Coffer PJ: Regulation of p21rac activation in humanneutrophils. Blood 1999, 94:1121–1130
24. Dibas AI, Mia AJ, Yorio T: Aquaporins (water channels): role invasopressin-activated water transport. Proc Soc Exp Biol Med 1998,219:183–199
25. Song Y, Fukuda N, Bai C, Ma T, Matthay MA, Verkman AS: Role ofaquaporins in alveolar fluid clearance in neonatal and adult lung, andin oedema formation following acute lung injury: studies in transgenicaquaporin null mice. J Physiol 2000, 525:771–779
26. Rebhan M, Chalifa-Caspi V, Prilusky J, Lancet D: Gene Cards: Ency-clopedia for Genes, Proteins, and Diseases. Rehovot, Israel, Weiz-mann Institute of Science, Bioinformatics Unit and Genome Center,1997
27. Xing H, Zhang S, Weinheimer C, Kovacs A, Muslin AJ: 14-3-3 proteinsblock apoptosis and differentially regulate MAPK cascades. EMBO J2000, 19:349–358
28. Guo RF, Huber-Lang M, Wang X, Sarma V, Padgaonkar VA, Craig RA,Riedemann NC, McClintock SD, Hlaing T, Shi MM, Ward PA: Protec-tive effects of anti-C5a in sepsis-induced thymocyte apoptosis. J ClinInvest 2000, 106:1271–1280
29. Miyata Y, Chambraud B, Radanyi C, Leclerc J, Lebeau MC, RenoirJM, Shirai R, Catelli MG, Yahara I, Baulieu EE: Phosphorylation of theimmunosuppressant FK506-binding protein FKBP52 by casein ki-nase II: regulation of HSP90-binding activity of FKBP52. Proc NatlAcad Sci USA 1997, 94:14500–14505
30. Tai PK, Chang H, Albers MW, Schreiber SL, Toft DO, Faber LE: P59(FK506 binding protein 59) interaction with heat shock proteins is
highly conserved and may involve proteins other than steroid recep-tors. Biochemistry 1993, 32:8842–8847
31. Tachibana T, Taniguchi S, Furukawa F, Imamura S: Histamine me-tabolism in the Arthus reaction. Exp Mol Pathol 1986, 44:76–82
32. Pfeffer KD, Huecksteadt TP, Hoidal JR: Xanthine dehydrogenase andxanthine oxidase activity and gene expression in renal epithelial cells.Cytokine and steroid regulation. J Immunol 1994, 153:1789–1797
33. Varani J, Ward PA: Mechanisms of neutrophil-dependent and neu-trophil-independent endothelial cell injury. Biol Signals 1994, 3:1–14
34. Demiryurek AT, Wadsworth RM: Superoxide in the pulmonary circu-lation. Pharmacol Ther 1999, 84:355–365
35. Nakae H, Endo S, Inada K, Yoshida M: Chronological changes in thecomplement system in sepsis. Surg Today 1996, 26:225–229
36. Minta JO, Fung M, Turner S, Eren R, Zemach L, Rits M, Goldberger G:Cloning and characterization of the promoter for the human comple-ment factor I (C3b/C4b inactivator) gene. Gene 1998, 208:17–24
37. Leitao MF, Vilela MM, Rutz R, Grumach AS, Condino-Neto A, Kir-schfink M: Complement factor I deficiency in a family with recurrentinfections. Immunopharmacology 1997, 38:207–213
38. Bone RC: The sepsis syndrome. Definition and general approach tomanagement. Clin Chest Med 1996, 17:175–181
39. Moore FA, Moore EE: Evolving concepts in the pathogenesis ofpostinjury multiple organ failure. Surg Clin North Am 1995, 75:257–277
40. Yao YM, Redl H, Bahrami S, Schlag G: The inflammatory basis oftrauma/shock-associated multiple organ failure. Inflamm Res 1998,47:201–210
41. Baue AE, Durham R, Faist E: Systemic inflammatory response syn-drome (SIRS), multiple organ dysfunction syndrome (MODS), multipleorgan failure (MOF): are we winning the battle? Shock 1998, 10:79–89
42. Cicalese L, Aitouche A, Ploskina TM, Ford HR, Rao AS: The role oflaparotomy, gut manipulation and immunosuppression on bacterialtranslocation from the intestinal tract. Transplant Proc 1999, 31:1922–1923
43. Baue AE. MOF/MODS, SIRS: an update. Shock 1996, 6(Suppl 1):S1–S5
44. Parrillo JE: Pathogenetic mechanisms of septic shock. N Engl J Med1993, 328:1471–1477
45. Presterl E, Staudinger T, Pettermann M, Lassnigg A, Burgmann H,Winkler S, Frass M, Graninger W: Cytokine profile and correlation tothe APACHE III and MPM II scores in patients with sepsis. Am JRespir Crit Care Med 1997, 156:825–832
46. Nakae H, Endo S, Inada K, Takakuwa T, Kasai T, Yoshida M: Serumcomplement levels and severity of sepsis. Res Commun Chem PatholPharmacol 1994, 84:189–195
Molecular Signatures of Sepsis 1209AJP October 2001, Vol. 159, No. 4


