Embed Size (px)
Citation preview
Integrated Systems and Technologies
CancerResearch
Combined Gene Expression and Genomic Profiling DefineTwo Intrinsic Molecular Subtypes of Urothelial Carcinomaand Gene Signatures for Molecular Grading and Outcome
David Lindgren1, Attila Frigyesi2, Sigurdur Gudjonsson3, Gottfrid Sjödahl1, Christer Hallden4, Gunilla Chebil5,Srinivas Veerla1, Tobias Ryden6, Wiking Månsson3, Fredrik Liedberg7, and Mattias Höglund1
Abstract
Authors' AUniversity,Care, LunUrology, LuClinical C5Departme6Centre foUrology, Vä
Note: SupResearch O
CorresponBLU GenomC13, SE 22hoglund@m
doi: 10.115
©2010 Am
www.aacr
In the present investigation, we sought to refine the classification of urothelial carcinoma by combininginformation on gene expression, genomic, and gene mutation levels. For these purposes, we performed geneexpression analysis of 144 carcinomas, and whole genome array-CGH analysis and mutation analyses ofFGFR3, PIK3CA, KRAS, HRAS, NRAS, TP53, CDKN2A, and TSC1 in 103 of these cases. Hierarchical cluster anal-ysis identified two intrinsic molecular subtypes, MS1 and MS2, which were validated and defined by the sameset of genes in three independent bladder cancer data sets. The two subtypes differed with respect to geneexpression and mutation profiles, as well as with the level of genomic instability. The data show that genomicinstability was the most distinguishing genomic feature of MS2 tumors, and that this trait was not dependenton TP53/MDM2 alterations. By combining molecular and pathologic data, it was possible to distinguish twomolecular subtypes of Ta and T1 tumors, respectively. In addition, we define gene signatures validated in twoindependent data sets that classify urothelial carcinoma into low-grade (G1/G2) and high-grade (G3) tumors aswell as non-muscle and muscle-invasive tumors with high precisions and sensitivities, suggesting moleculargrading as a relevant complement to standard pathologic grading. We also present a gene expression signaturewith independent prognostic effect on metastasis and disease-specific survival. We conclude that the combi-nation of molecular and histopathologic classification systems might provide a strong improvement for blad-der cancer classification and produce new insights into the development of this tumor type. Cancer Res; 70(9);3463–72. ©2010 AACR.
Introduction
Urothelial carcinomas originate from the epithelial cells ofthe inner lining of the bladder wall. The majority of the tu-mors are papillary and confined to the urothelial mucosa(stage Ta) or to the lamina propria (stage T1), whereas theremaining are muscle-invasive (T2–T4). Most Ta tumors areof low grade, rarely progress, and are associated with a favor-able prognosis, whereas high-grade Ta (TaG3) and T1 tumorsrepresent a significant risk of tumor progression. Patients
ffiliations: 1Department of Clinical Sciences, Oncology, LundLund, Sweden; 2Department of Anesthesiology and Intensived University Hospital; 3Department of Clinical Sciences,nd University Hospital; 4Department of Laboratory Medicine,hemistry, Malmö University Hospital, Malmö, Sweden;nt of Pathology, Helsingborg Hospital, Helsingborg, Sweden;r Mathematical Sciences, Lund University; 7Department ofxjö County Hospital, Växjö, Sweden
plementary data for this article are available at Cancernline (http://cancerres.aacrjournals.org/).
ding Author: Mattias Höglund, Department of Oncology/SCI-ics, DNA Microarray Resource Centre, Lund University, BMC1 84 Lund, Sweden. Phone: 46-46222-0393; E-mail: mattias.ed.lu.se.
8/0008-5472.CAN-09-4213
erican Association for Cancer Research.
journals.org
with Ta and T1 tumors are typically treated by transurethralresection; however, in spite of treatment, up to 70% of pa-tients show local recurrences, making a regular follow-upby cystoscopy necessary. Cytogenetic studies have revealedseveral recurring chromosomal changes associated with tu-mor stage (1, 2). Traditional CGH and array-GCH have cor-roborated many of these findings but have also definedseveral recurrent high-level amplifications and deletions(3–8). The key results of these investigations are losses ofchromosome 9, or 9p and 9q, frequent amplification of6p22 (9–11), and loss of RB1 (12). Apart from chromosomalchanges, several genes are known to be mutated in bladdercancer including FGFR3, PIK3CA, KRAS, HRAS, NRAS, TP53,CDKN2A, and TSC1, of which activating mutations in FGFR3and inactivating mutations in TP53 are the most frequent.The accumulated data have shown that FGFR3 mutationsare characteristic for low-grade and low-stage tumors (13),whereas TP53 mutations are characteristic for invasivetumors. This has led to the suggestion that urothelial carci-noma develop through at least two molecular pathways,one related to FGFR3 and one related to TP53 (14). Hence,urothelial carcinomas show characteristic genetic changesboth at the chromosome and at the gene level. Gene expres-sion profiling has further increased our molecular knowledgeof urothelial carcinoma (15–26). Apart from defining possible
3463

Lindgren et al.
3464
molecular subtypes (15, 17, 20), studies have reported geneexpression signatures associated with carcinoma in situand superficial bladder carcinoma (16, 18), clinical outcome(18, 22), and progression to invasive growth (24). The be-havior of individual tumors is most likely a consequence offactors operating at the chromosomal, gene, and gene ex-pression levels. Hence, for a proper molecular understandingof urothelial carcinomas, more than one molecular level hasto be considered. We therefore performed gene expressionanalyses of 144 cases of urothelial carcinoma representingall stages and grades, and in addition, produced genomicprofiles using array-CGH as well as mutation profiles basedon FGFR3, PIK3CA, KRAS, HRAS, NRAS, TP53, CDKN2A, andTSC1 gene mutations.
Materials and Methods
Tumors. Urothelial carcinomas (pathologic and clinicaldata are given in Supplementary Table S1) were collected bycold-cup biopsies from the exophytic part of the bladdertumor in 144 patients undergoing transurethral resection atthe University Hospital of Lund, Sweden. Normal urothelialtissue was obtained frompatients in surgery for non-urothelialcarcinoma–related disorders. Informed consent was obtainedfrom all patients and the study was approved by the LocalEthical Committee of Lund University.Isolation of nucleic acids. RNA was isolated using Trizol
(Invitrogen) and purified on RNeasy columns (Qiagen). RNAsample integrity was assessed on an Agilent 2100 Bioanalyzer(Agilent) and samples with RNA integrity numbers lowerthan 7 were excluded. DNA from 72 of the samples was ex-tracted using the DNeasy Tissue kit protocol (Qiagen) andfrom 31 of the samples using the organic phase of the Trizollysate.Gene expression profiling. Data from two different mi-
croarray platforms were used; a 25K cDNA array and a35K oligonucleotide array. cDNA were labeled and hybrid-ized to cDNA microarrays as described in Lindgren and col-leagues (20). For the oligonucleotide arrays, labeling andmicroarray hybridization was performed using the ProntoPlus System (Promega). Arrays were scanned with an Agi-lent G2565AA scanner (Agilent Technologies), images wereanalyzed in Genepix 4.0 (Axon Instruments), and quality fil-tered and normalized within BioArray Software Environ-ment (27). A pin-based Lowess-fit normalization algorithmwas used for normalization (28). Reporters were merged ongene symbols using a signal-to-noise–based weighted ap-proach (29) and features with more than 20% missing valuesremoved. To correct for platform-specific biases, e.g., differ-ences in dynamic ranges, a set of 14 samples were hybridizedto both platforms and the linear regression line for each genepresent on both platforms was calculated over the 14 samples.The regression lines were then used to rescale expression va-lues for samples hybridized to the oligo platform. Also, a cor-relation-cutoff was applied (r < 0.6). This operation removesgenes with low interplatform correlations but also has a sim-ilar effect as a variance filter (Supplementary Fig. S1A and B).
Cancer Res; 70(9) May 1, 2010
The robustness of the merging process was then confirmed byhierarchical cluster analysis (HCA) using an additional set of10 samples hybridized to both platforms (SupplementaryFig. S1B). Finally, missing values were imputed when presentin less than 20% of the cases using the MultiExperimentViewer software suite (k = 10; ref. 30). After merging, the finaldata set included 144 tumors, 12 normal samples, and 2,506high-quality genes. All microarray slides were obtained fromthe Swegene DNA microarray resource center (31). Data areavailable through the Gene Expression Omnibus (32) withaccession number GSE19915.External data sets. Data sets from Sanchez-Carbayo and
colleagues (22), Stransky and colleagues (25), and Blaveri andcolleagues (15) were used as external independent validationdata. The Sanchez-Carbayo data were downloaded from thehome page of the Journal of Clinical Oncology (33) and theStransky data were from ArrayExpress (ref. 34; accessionE-TABM-147). For both data sets, a signal filter of 300 wasapplied, the values in each column normalized, and the rows(genes) divided with the mean of the row to produce geneexpression ratios that were converted to log 2 ratios. Repor-ters for the same genes were merged and genes present in<80% of the samples were removed, followed by imputationof missing values. The final Sanchez-Carbayo data set includ-ed 90 unique tumors and 4,769 genes, whereas the Stranskyset had 55 unique tumors and 3,987 genes. The Blaveri data,downloaded from the home page of Clinical Cancer Research(35), were comprised of 75 tumors and 1,261 genes.Functional analyses. The Gene Set Enrichment Analysis
(GSEA) software (36) was used for interpretations of genesignatures. Genes were ranked according to their t statisticsand used as an input to the GSEA. We used gene sets madeavailable through the Molecular Signatures Database (37): forE2F3, BILD_E2F3 (38), and for chromosomal instability,CARTER_GENOMIC_INST (39). P values, false discoveryrates, and family-wise errors of the obtained enrichmentscores were estimated by permutation tests and adjustedfor multiple testing. GO analyses were performed using EASEsoftware (40).Gene predictors. We used the GEMS algorithm (41) to
construct support vector machine (SVM) predictors using30-fold cross-validation for the stage, grade, CI/CII, disease-specific survival (DSS) predictors, and 10-fold cross-validationsfor the progression predictors. We used a polynomial kernel,default values for the SVM variables, and a preselectionof genes by a Kruskal-Wallis nonparametric ANOVA. Weoptimized the number of genes by using a preselected rangeof 100 to 160 and using trials with a step size of 15. Theefficiency of the predictor was estimated by a receiver oper-ator characteristic (ROC) analysis and recorded as the areaunder the curve (AUC). When the Sanchez-Carbayo and theStransky data sets were used for cross-validation, pairs ofdata sets were constructed that included genes in both thepresent and the selected validation set, reducing the numberof genes to 1,540 and 1,202, respectively. The SVM was thenrepeated as above except that a fixed number of genes (150)was used for the predictor. Our ROC-based predictor used ahold-out procedure repeated 100 times with one-third of the
Cancer Research

Molecular Profile of Urothelial Carcinoma
cases for testing, from which average AUC was calculated foreach gene. The average expression for the top 100 rankinggenes with respect to absolute AUC values was selected, i.e., both genes positively and negatively correlated with thefeature. A score was calculated for each case by computingthe sum of expression values for genes positively correlatedwith the feature, minus the sum of expression values forgenes negatively correlated with the feature, which subse-quently was used to classify the cases into high and lowscoring. The performance of this classifier was evaluated us-ing ROC analysis. The Blaveri data were not used in theseinvestigations due to the small number of overlapping genes(n = 329).Array CGH genomic profiling. DNA from 103 samples
were hybridized to 32K BAC arrays (CHORI BACPACResources; ref. 42) produced at the SWEGENE DNAMicroarrayResource Center (43). BAC clones were mapped to thehg17 build (44). Array-CGH hybridizations for 36 of the sam-
www.aacrjournals.org
ples were previously published (8). Images were analyzedusing Genepix v4.0 (Axon) and loaded into BioArray SoftwareEnvironment (27, 28). Flagged spots were removed andpositive and nonsaturated spots were background-correctedand then log 2 ratios were calculated. The data were filteredfor signal to noise ratio ≥5 in both channels. Log 2 ratios oneach array were normalized and corrected for intensity-dependent log ratio biases using the popLowess method(45). After normalization, log 2 ratios for each sample weresegmented using a circularly binary segmentation algorithm(46) and default variables, except for SD which was set to 1and the number of consecutive clones in each segment to beat least 4. Segmented log 2 ratios >0.8 were considered ampli-fications, −0.2 to −0.8 as deletions, and those lower than −0.8 ashomozygous deletions. Focal amplifications and deletionswere manually evaluated.Mutation analyses. Genomic DNA was amplified using the
Illustra GenomiPhi V2 DNA Amplification Kit (GE Healthcare).
Figure 1. Gene expression analyses. A, HCA showing the two major gene expression subtypes of urothelial carcinomas. Green, G1 and G2; red, G3;black, nested variant or normal cases. B, heat map of the coclustering frequencies reorganized by hierarchal clustering. Red, coclustering frequency closeto 1; green, coclustering frequency close to 0; black, coclustering frequency equal to 0.5. C, each tumor was scored for the mean expression levels ofthe genes in the MS1_UP and MS2_UP gene sets and plotted in the diagram with MS2_UP scores on the X-axis and MS1_UP on the Y-axis. Green,Ta tumors; blue, T1 tumors; red, ≥T2 tumors; open circles, nested or Tx tumors.
Cancer Res; 70(9) May 1, 2010 3465
Lindgren et al.
3466
Coding regions in FGFR3, PIK3CA, KRAS, HRAS, NRAS, TP53,CDKN2A, and TSC1 were selected and PCR-amplified using ol-igonucleotide primers (Supplementary Table S2). Reactionswere sequenced using the BigDye terminator v1.1, or 3.1 cyclesequencing kit on a 3130 Genetic Analyzer (Applied Biosys-tems). Sequence traces were analyzed in SeqScape v2.5 (Ap-plied Biosystems). Sequence variations were resequencedusing an independent PCR.Statistical analysis. Expression data were analyzed by
HCA and multidimensional scaling using Euclidean dis-tances. For HCA, 1-Pearson correlation was used as distancemeasure and average linkage and Wards algorithm for ag-glomeration. To identify stable tumor classes in the data,we used a bootstrap procedure. The cases were first clusteredwith HCA producing two major clusters in all four data sets.The data sets were then bootstrapped 20,000 times, analyzedby HCA, and the number of coclustering instances recorded,producing a matrix of coclustering frequencies. The resultingmatrices were then analyzed with HCA as before. To identifydifferentially expressed genes, significance analysis of micro-arrays, as implemented in the MultiExperiment Viewer wasused. Cox regression was used to analyze the continuousvariables associated with clinical parameters and Kaplan-Meier estimators to analyze differences in clinical behaviorbetween groups.
Results
Two molecular classes of urothelial carcinoma asdefined by gene expression. The tumor cases were groupedwith a 91% concordance for grade and 78% concordance forstage by the initial HCA (Fig. 1A). The lower concordance forstage was mainly caused by 23 T1 high-grade (G3) tumorsclustering with the muscle-invasive (≥T2) tumors. The multi-dimensional scaling analysis corroborated the presence oftwo major tumor clusters, one densely organized composedof Ta and G1/G2 tumors, and one more heterogeneous clustercomposed of ≥T1 and high-grade tumors (SupplementaryFig. S2A and B). The robustness of the HCA results wasinvestigated by estimating the coclustering frequency usinga bootstrap approach. The resulting coclustering frequencymatrix was reorganized by HCA and revealed the presenceof two intrinsic molecular subtypes of urothelial carcinoma(Fig. 1B), MS1 and MS2, respectively. A significance analysisof microarrays was used to define sets of genes with higherrelative expression in MS1 and in MS2 tumors, MS1_UP andMS2_UP, respectively (Supplementary Table S3). Each tumorwas then assigned a gene signature score based on the aver-age expression level of the genes in the respective gene sets.A scatter plot of these scores revealed two distinct groups oftumors, one dominated by Ta and one by ≥T2 cases whereasthe T1 cases were equally distributed between the two groups(Fig. 1C). Thus, the genes that define the MS1 and MS2subtypes clearly separate the tumors in two distinct groups.We then analyzed the data sets of Sanchez-Carbayo
(n = 90), Stransky (n = 55), and Blaveri (n = 75) using thesame clustering algorithms and bootstrap analyses. All threedata sets produced two clearly separated groups of tumors
Cancer Res; 70(9) May 1, 2010
dominated by noninvasive/low-grade and muscle-invasive/high-grade tumors (Supplementary Figs. S3, S4, and S5).The subsequent bootstrap analyses clearly indicated thepresence of two robust tumor clusters in all three data sets.Both the MS1_UP and the MS2_UP gene signatures weresignificantly enriched in the corresponding tumor clustersin all three data sets with P < 0.001 in all comparisons.Hence, the MS1 and MS2 signatures identified in the presentinvestigation clearly define two molecular subtypes intrinsicto bladder cancer.We used GSEA to clarify possible biological differences
between the MS1 and MS2 subtypes. This analysis showedsignificant enrichment in the MS2 tumors for six cellcycle gene sets, for two meta-profiles derived for neoplas-tic and undifferentiated cells, as well as for three sig-natures associated with poor prognosis (SupplementaryTable S4). Two gene sets related to serum response andwound healing, respectively, were also enriched in MS2tumors as well as gene sets for E2F3 activation andfor genomic instability (Supplementary Fig. S6). Taken to-gether, the functional analysis clearly shows that the MS2
Table 1. Evaluation of predictor gene signa-tures
Class
Lindgren/Lindgren*AUC
Lindgren/Sanchez†
AUC
C
Lindgren/Stransky‡
AUC
SVM-based gene signature predictions§
MS
0.95 (160) 0.91 0.91 Grade 0.95 (160) 0.89 0.80 Stage 0.82 (115) 0.98 0.84 DSS 0.78 (50) 0.66 na Progress 0.67 (40) na naROC-based gene signature predictions∥
MS
0.99 0.84 0.91 Grade 0.93 0.79 0.86 Stage 0.90 0.91 0.89 DSS 0.75 0.60 na Progress 0.64 na naAbbreviations: MS, molecular subtype; na, not applicable.*Gene predictors and predictions made in the present dataset with cross validation.†Gene predictors made in the Lindgren data set andpredictions made in the Sanchez-Carbayo data set.‡Gene predictors made in the Lindgren data set andpredictions made in the Stransky data set.§Genes in the respective gene signatures are reported inSupplementary Table S3.The number of genes in the pre-dictor signatures is in parentheses except for the Lindgren/Sanchez and the Lindgren/Stransky analyses in which allsignatures contained 150 genes.∥Genes in the respective gene signatures are reported inSupplementary Table S4. All gene signatures contained100 genes.
ancer Research

Molecular Profile of Urothelial Carcinoma
tumors are strongly associated with aggressive growthand poor prognosis.Prediction of pathologic and clinical entities using
expression profiles. We then used two different algorithms,one SVM-based and one ROC-based, to predict molecularsubtype assignment, grade, stage, DSS, and progression tomuscle-invasive growth. Using the SVM algorithm, it waspossible to predict molecular subtype assignment, grade,and stage with high performance whereas survival was pre-dicted to a lesser extent (Table 1). Similarly, high perfor-mances were obtained for stage, grade, and molecularsubtype assignment when using the independent validationdata sets (Table 1). Genes included in the respective SVMpredictors are listed in Supplementary Table S5. The ROC-based predictors showed excellent performance for molecu-lar subtype, grade, and stage prediction, both in the presentand in the two independent data sets, whereas DSS was pre-dicted with moderate efficiency (Table 1). The genes includedin the respective ROC predictors are listed in SupplementaryTable S6. Cox regression analysis was then performed foreach of the ROC-based predictors with DSS, metastasis,and progression to muscle-invasive tumors as end points(Table 2). A DSS score based on the top 100 AUC genes
www.aacrjournals.org
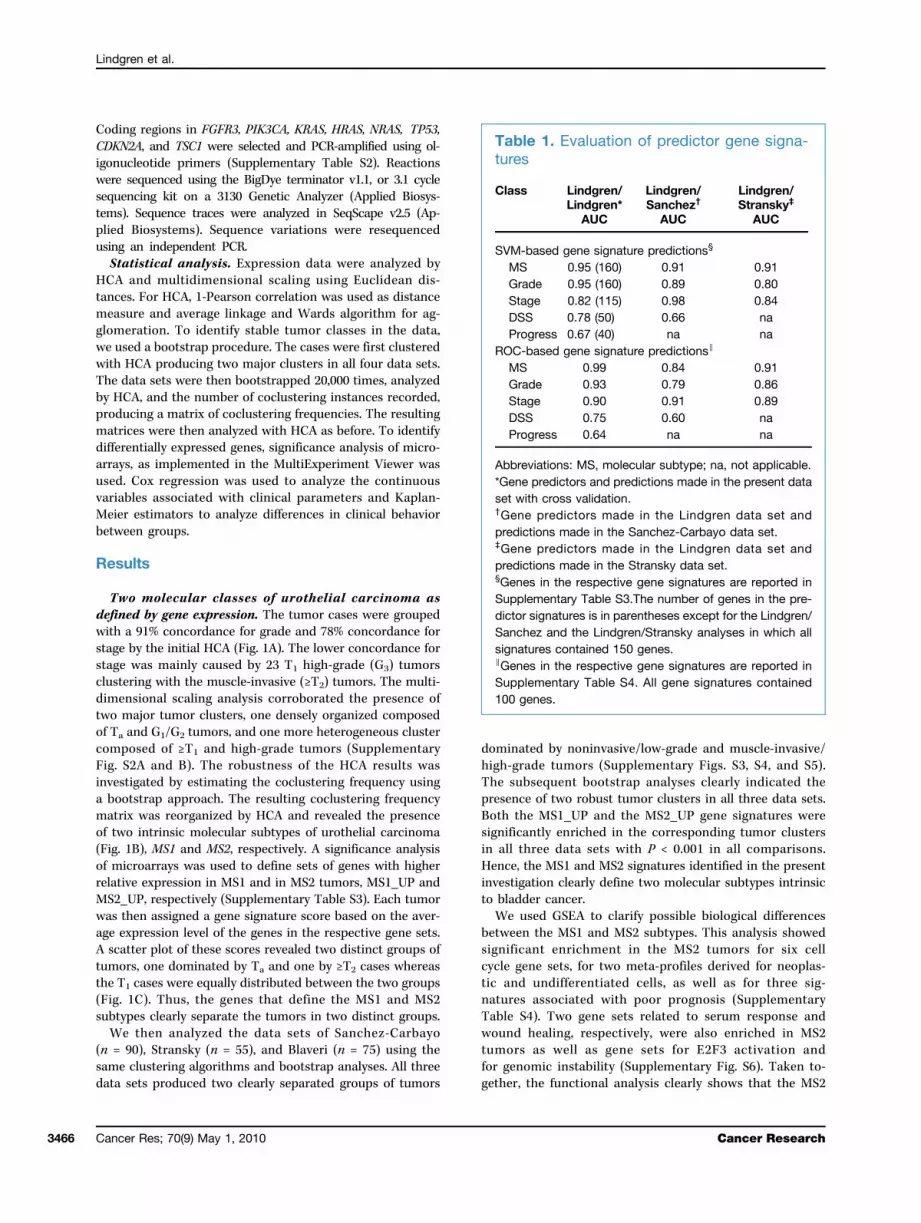
proved to be an excellent prognostic marker for all threeend points with hazard ratios ranging from 6.5 to 7.6. TheDSS predictor signature also proved to be a prognosticmarker for DSS and metastasis independent of tumor grade,molecular subtype, stage, and treatment with cystectomy,respectively (Table 2). Kaplan-Meier graphs were then pro-duced for DSS and metastasis as end points (Fig. 2). TheDSS signature clearly identifies high-risk and low-risk pa-tients independently of tumor grade and treatment with cy-stectomy. The DSS signature also proved to have aprognostic effect (hazard ratios, 4.6; 95% confidence interval,1.55–14; P = 0.007) among cystectomized patients in a multi-variate test when correcting for node status (N0 versus N+)and pathologic stage (pTa, pT1, and pT2 versus pT3 and pT3).Genes in the DSS signature were significantly enriched forthe GO category “extracellular” and included MMP11 andSPARC that influence the structure of extra cellular matrix(ECM), as well as several cell proliferation genes, e.g., BIRC5(survivin) and CDK4, and a member of the Polycomb groupgene family, EZH2.Genomic alterations. FGFR3 and PIK3CA mutations were
seen in 73% and 34% of the MS1 cases, respectively (Fig. 3A;Supplementary Table S7) and a total of 82% of the MS1 cases
Table 2. Cox regression analyses using the 100 gene ROC signatures
Signature*
End point/subclass† Hazard ratios (95% confidence interval)Cancer Res; 70(9) Ma
P‡
MS
DSS 2.4 (1.5–3.8) 0.0002 Metastasis 3.3 (1.6–6.7) 0.0003 Progression§ 2.5 (1.4–4.5) 0.0012Grade
DSS 2.7 (1.6–4.8) 0.0001 Metastasis 4.0 (1.7–9.1) 0.0002 Progression 2.9 (1.5–5.6) 0.0009Stage
DSS 2.8 (1.7–4.5) 0.0000 Metastasis 3.3 (1.7–6.4) 0.0001 Progression 2.8 (1.4–5.8) 0.0025DSS
DSS 7.6 (3.9–15.0) 0.0000 Metastasis 7.6 (3.1–18.4) 0.0000 Progression 6.5 (2.2–19.3) 0.0003DSS
DSS/G3 7.8 (3.0–20.3) 0.0000 DSS/MS2 7.3 (2.9–18.4) 0.0000 DSS/≥T2 4.0 (1.4–11.7) 0.0073 DSS/cystectomy 6.1 (2.0–18.7) 0.0012 Metastasis/G3 5.5 (1.7–17.7) 0.0026 Metastasis/MS2 6.2 (1.9–19.7) 0.0012 Metastasis/≥T2 3.1 (0.8–11.1) 0.0816 Metastasis/cystectomy 4.4 (1.5–13.2) 0.0068 Progression/≤T1,G3 2.0 (0.2–19.6) 0.5320Abbreviation: MS, molecular subtype.*The same signatures as in Table 1.†When no subclass is indicated, the reported hazards ratios correspond to the whole data set (144 cases) and the given end point.When subclass is indicated, the reported hazards ratios correspond to this subclass and the given end point.‡P value of log rank test.§Progression from non–muscle-invasive growth (Ta and T1) to muscle-invasive growth.
y 1, 2010 3467
Lindgren et al.
3468
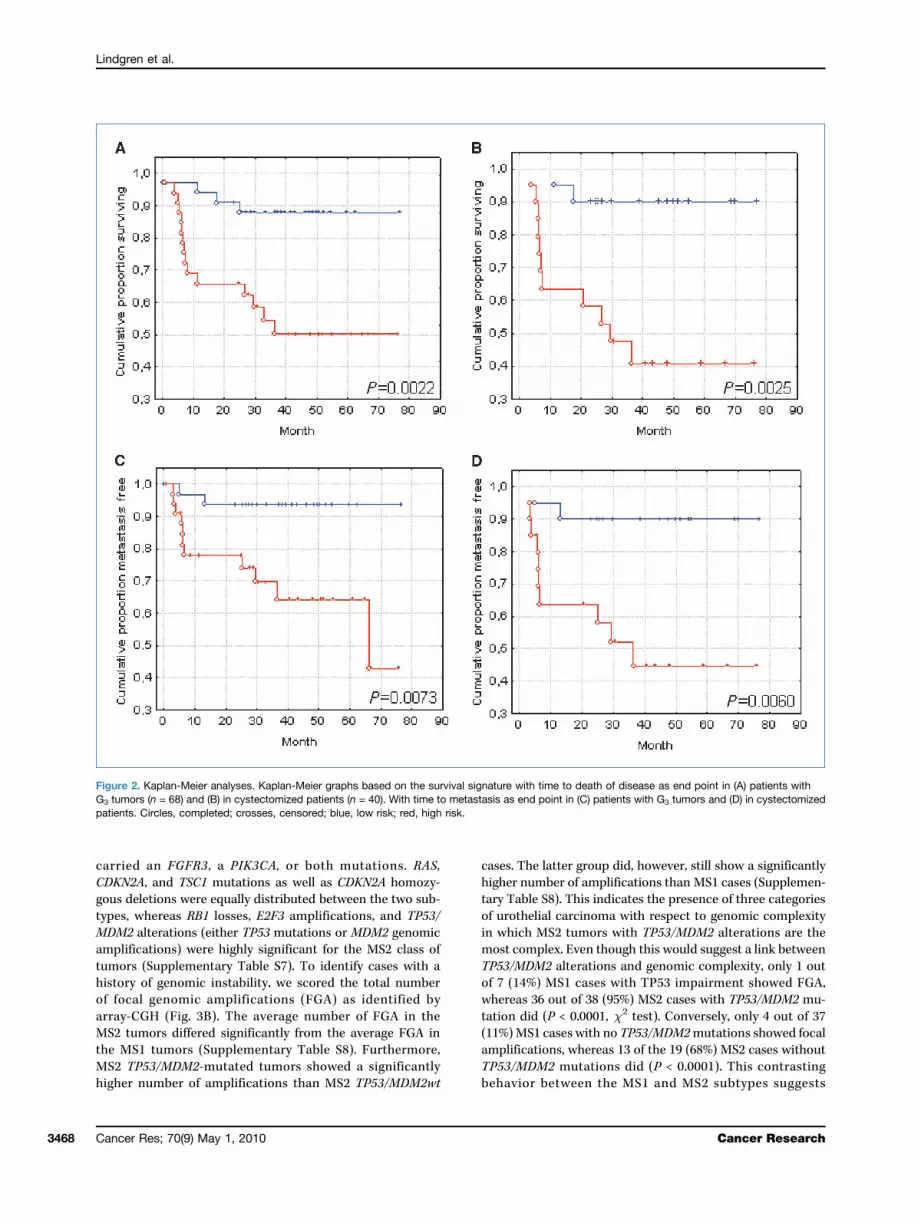
carried an FGFR3, a PIK3CA, or both mutations. RAS,CDKN2A, and TSC1 mutations as well as CDKN2A homozy-gous deletions were equally distributed between the two sub-types, whereas RB1 losses, E2F3 amplifications, and TP53/MDM2 alterations (either TP53 mutations or MDM2 genomicamplifications) were highly significant for the MS2 class oftumors (Supplementary Table S7). To identify cases with ahistory of genomic instability, we scored the total numberof focal genomic amplifications (FGA) as identified byarray-CGH (Fig. 3B). The average number of FGA in theMS2 tumors differed significantly from the average FGA inthe MS1 tumors (Supplementary Table S8). Furthermore,MS2 TP53/MDM2-mutated tumors showed a significantlyhigher number of amplifications than MS2 TP53/MDM2wt
Cancer Res; 70(9) May 1, 2010
cases. The latter group did, however, still show a significantlyhigher number of amplifications than MS1 cases (Supplemen-tary Table S8). This indicates the presence of three categoriesof urothelial carcinoma with respect to genomic complexityin which MS2 tumors with TP53/MDM2 alterations are themost complex. Even though this would suggest a link betweenTP53/MDM2 alterations and genomic complexity, only 1 outof 7 (14%) MS1 cases with TP53 impairment showed FGA,whereas 36 out of 38 (95%) MS2 cases with TP53/MDM2 mu-tation did (P < 0.0001, χ2 test). Conversely, only 4 out of 37(11%) MS1 cases with no TP53/MDM2mutations showed focalamplifications, whereas 13 of the 19 (68%) MS2 cases withoutTP53/MDM2 mutations did (P < 0.0001). This contrastingbehavior between the MS1 and MS2 subtypes suggests
Figure 2. Kaplan-Meier analyses. Kaplan-Meier graphs based on the survival signature with time to death of disease as end point in (A) patients withG3 tumors (n = 68) and (B) in cystectomized patients (n = 40). With time to metastasis as end point in (C) patients with G3 tumors and (D) in cystectomizedpatients. Circles, completed; crosses, censored; blue, low risk; red, high risk.
Cancer Research
Molecular Profile of Urothelial Carcinoma
that the major difference between MS1 and MS2 are signsof genomic instability among the MS2 cases rather than thepresence or absence of TP53/MDM2 alterations.Molecular pathologic classification of bladder cancer.
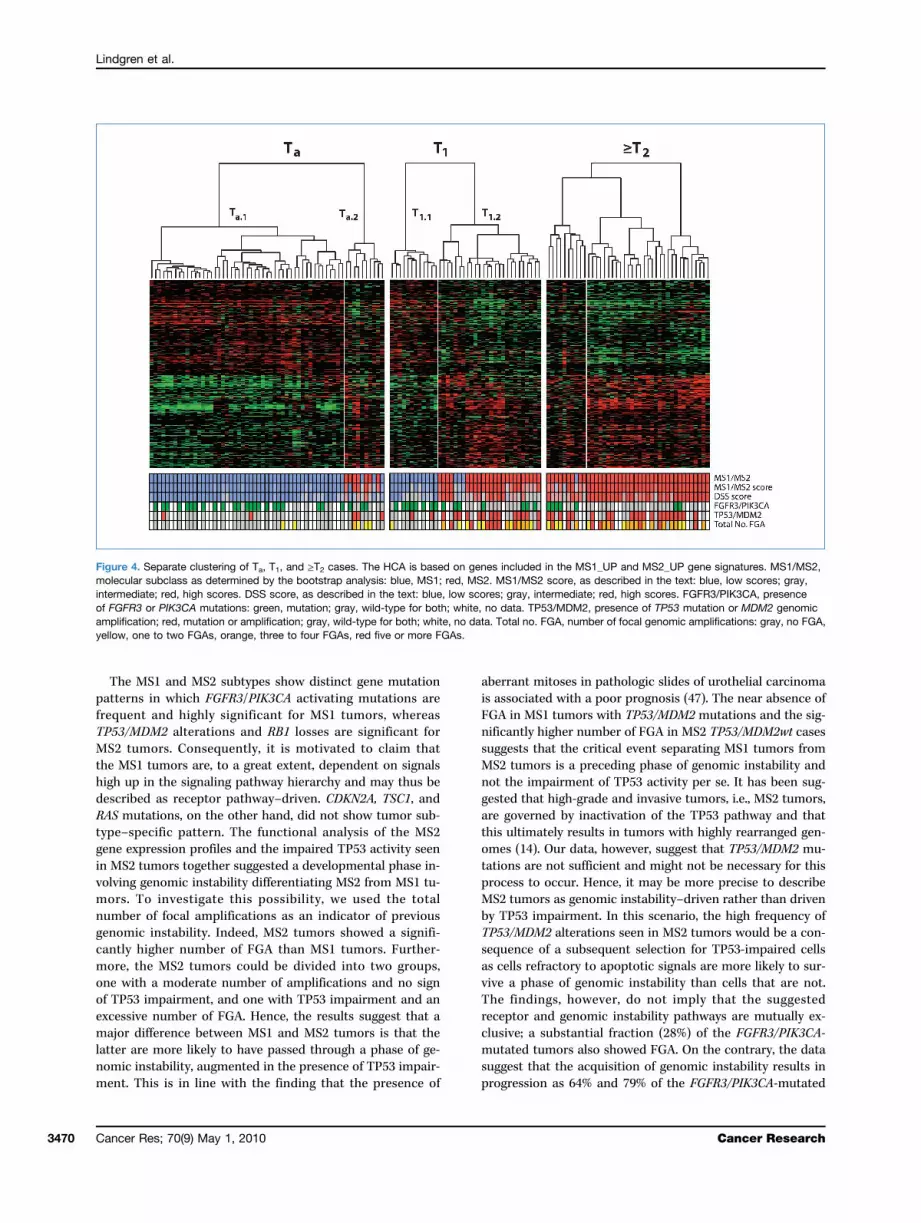
To combine molecular classification with pathologic staging,we performed supervised HCA on Ta, T1, and muscle-invasive(≥T2) cases separately using the MS1/MS2 defining genes(Fig. 4). The HCA of the Ta tumors produced two well-separated clusters, referred to as Ta.1 and Ta.2. The MS1/MS2and DSS predictor scores for the Ta.2 group were mixed andmoderately high/intermediate, but generally higher than forTa.1 cases. The Ta.1 and Ta.2 groups did not differ with respectto the frequency of FGFR3/PIK3CAmutations (P > 0.05,χ2 testwith Yates correction) or TP53/MDM2 alterations (P > 0.05),but differed significantly with respect to number of tumorswith FGA (P < 0.020). The T1 tumors also produced two sub-sets, T1.1 and T1.2. The T1.1 group showed a significantly higherfrequency of FGFR3/PIK3CAmutations (P < 0.020) and a signif-icantly lower number of cases with FGA (P < 0.001), whereasthe TP53/MDM2mutation frequency did not differ significantly(P > 0.05) between the subgroups. The T1.2 tumors did,however, show significantly higher DSS scores. Hence, theTa.2 and T1.2 groups resemble each other by showing FGA,higher MS1/MS2, and DSS predictor scores, and consequently,represent tumor subtypes with genomic instability andan increased risk as distinguishing features. The HCA didnot segregate the ≥T2 cases into distinct tumor subgroupsbut did, however, indicate the presence of one group oftumors with a significantly higher frequency of FGFR3/PIK3CAmutations (P < 0.003). This FGFR3/PIK3CAmut ≥T2 subtype
www.aacrjournals.org
did not differ with respect to TP53/MDM2 alterationsor FGA but did show lower MS1/MS2 and DSS predictorscores.
Discussion
In the present study, we show that urothelial carcinoma ischaracterized by two major molecular subtypes with distinctfeatures at the gene expression, genomic, and gene mutationlevels. The two subtypes were defined by gene expressionanalysis using several statistical means, including bootstrapanalysis. In addition, the presence of two analogous molecu-lar subtypes, defined by the same set of genes, was also pres-ent in three independent and previously published bladdercancer data sets. From this, we conclude that urothelial car-cinoma is defined by at least two intrinsic molecular sub-types, MS1 and MS2. To further validate the existence ofthese subtypes, we hypothesized that the statistically ob-tained tumor groups should also show distinct biological fea-tures. Indeed, the GSEA analysis indicated that the MS1 andMS2 subtypes differed in many important aspects. The MS2subtype showed significant enrichment for cell cycle–relatedgene sets as well as for gene sets associated with cellulartransformation, genomic instability, and serum response, re-flecting the more aggressive behavior of the MS2 subtype.Taken together, the molecular classification of urothelialcarcinoma into MS1 and MS2 subtypes based on geneexpression is not only motivated from a statistical point ofview but also from a biological/clinical standpoint.
Figure 3. Summary of gene mutation and aCGH analyses. A, occurrence of FGFR3, PIK3CA, RAS (HRAS, KRAS, or NRAS), CDKN2A, TSC1, RB1, and E2F3alterations. TP53/MDM2 indicates a TP53 mutation or MDM2 genomic amplification. CDKN2A mutations include both gene sequence mutations andhomozygous deletions. RB1 indicates deletion at the RB1 locus and E2F3 focal amplification of E2F3. Black or gray boxes, presence of the indicatedmutation. B, occurrences of FGAs. Open circles, wt TP53/MDM2; filled circles, either TP53-mutated or MDM2 gene amplified cases.
Cancer Res; 70(9) May 1, 2010 3469
Lindgren et al.
3470
The MS1 and MS2 subtypes show distinct gene mutationpatterns in which FGFR3/PIK3CA activating mutations arefrequent and highly significant for MS1 tumors, whereasTP53/MDM2 alterations and RB1 losses are significant forMS2 tumors. Consequently, it is motivated to claim thatthe MS1 tumors are, to a great extent, dependent on signalshigh up in the signaling pathway hierarchy and may thus bedescribed as receptor pathway–driven. CDKN2A, TSC1, andRAS mutations, on the other hand, did not show tumor sub-type–specific pattern. The functional analysis of the MS2gene expression profiles and the impaired TP53 activity seenin MS2 tumors together suggested a developmental phase in-volving genomic instability differentiating MS2 from MS1 tu-mors. To investigate this possibility, we used the totalnumber of focal amplifications as an indicator of previousgenomic instability. Indeed, MS2 tumors showed a signifi-cantly higher number of FGA than MS1 tumors. Further-more, the MS2 tumors could be divided into two groups,one with a moderate number of amplifications and no signof TP53 impairment, and one with TP53 impairment and anexcessive number of FGA. Hence, the results suggest that amajor difference between MS1 and MS2 tumors is that thelatter are more likely to have passed through a phase of ge-nomic instability, augmented in the presence of TP53 impair-ment. This is in line with the finding that the presence of
Cancer Res; 70(9) May 1, 2010
aberrant mitoses in pathologic slides of urothelial carcinomais associated with a poor prognosis (47). The near absence ofFGA in MS1 tumors with TP53/MDM2 mutations and the sig-nificantly higher number of FGA in MS2 TP53/MDM2wt casessuggests that the critical event separating MS1 tumors fromMS2 tumors is a preceding phase of genomic instability andnot the impairment of TP53 activity per se. It has been sug-gested that high-grade and invasive tumors, i.e., MS2 tumors,are governed by inactivation of the TP53 pathway and thatthis ultimately results in tumors with highly rearranged gen-omes (14). Our data, however, suggest that TP53/MDM2 mu-tations are not sufficient and might not be necessary for thisprocess to occur. Hence, it may be more precise to describeMS2 tumors as genomic instability–driven rather than drivenby TP53 impairment. In this scenario, the high frequency ofTP53/MDM2 alterations seen in MS2 tumors would be a con-sequence of a subsequent selection for TP53-impaired cellsas cells refractory to apoptotic signals are more likely to sur-vive a phase of genomic instability than cells that are not.The findings, however, do not imply that the suggestedreceptor and genomic instability pathways are mutually ex-clusive; a substantial fraction (28%) of the FGFR3/PIK3CA-mutated tumors also showed FGA. On the contrary, the datasuggest that the acquisition of genomic instability results inprogression as 64% and 79% of the FGFR3/PIK3CA-mutated
Figure 4. Separate clustering of Ta, T1, and ≥T2 cases. The HCA is based on genes included in the MS1_UP and MS2_UP gene signatures. MS1/MS2,molecular subclass as determined by the bootstrap analysis: blue, MS1; red, MS2. MS1/MS2 score, as described in the text: blue, low scores; gray,intermediate; red, high scores. DSS score, as described in the text: blue, low scores; gray, intermediate; red, high scores. FGFR3/PIK3CA, presenceof FGFR3 or PIK3CA mutations: green, mutation; gray, wild-type for both; white, no data. TP53/MDM2, presence of TP53 mutation or MDM2 genomicamplification; red, mutation or amplification; gray, wild-type for both; white, no data. Total no. FGA, number of focal genomic amplifications: gray, no FGA,yellow, one to two FGAs, orange, three to four FGAs, red five or more FGAs.
Cancer Research

Molecular Profile of Urothelial Carcinoma
tumors with FGA were high grade (G3) or belonged to theMS2 class of tumors, respectively, whereas the correspondingfrequencies for FGFR3/PIK3CA-mutated tumors with no FGAwere 13% and 8%, respectively. Furthermore, even though ge-nomic instability ultimately will result in gross genomic/transcriptomic alterations, the original growth processesmay still show an imprint in the most progressed tumors,as seen by the grouping of FGFR3/PIK3CA-mutated ≥T2 tu-mors by the ≥T2-specific HCA.By combining molecular classification and pathologic
staging, we defined two molecular classes each of Ta andT1 tumors of which the Ta.2 and T1.2 subtypes showed astrong mark of genomic instability, and high MS1/MS2 andDSS predictor scores. Hence, these analyses molecularly de-scribe low- and high-risk subtypes of Ta and T1 tumors basedon their behavior at the genome and transcriptome levels.TP53 and FGFR3 mutation status only had a moderate effecton this division. We used two independent algorithms to pro-duce gene signatures specific for class assignments, i.e., in-trinsic molecular subtype (MS1/MS2), grade (G1, G2/G3), orstage (Ta, T1/≥T2), or for specific clinical outcomes, i.e., sur-vival and progression. Both algorithms produced excellentprediction results for class assignments that were validatedin independent and previously published bladder cancer datasets. This shows that molecular grading by gene expressionprofiling might be a forceful method for urothelial carcinomatumor classification. Not only are the classifications highlyaccurate; each tumor is assigned an unbiased value on acontinuous scale that easily identifies borderline and extreme
www.aacrjournals.org
cases. Even though the DSS signature proved to have a strongprognostic value, predictions of survival were less efficientand declined when applied to the validation data. Theremight be several reasons for this. One obvious reason is thatthe most efficient and stable predictor genes were not part ofthe genes present in the data sets. An additional observationis that although molecular subtype (MS1/MS2), tumor grade,and stage are tumor-specific characteristics, survival and tu-mor progression might also be influenced by host (patient)–specific factors. Recently, allelic variants of the RRP1B andSIPA1 genes were shown to influence the risk for breast can-cer progression and metastasis (48, 49). Hence, patient geno-type information might be needed to optimize predictors forprogression and survival in patients with bladder cancer.
Disclosure of Potential Conflicts of Interest
No potential conflicts of interest were disclosed.
Grant Support
The Swedish Cancer Society, The Swedish Research Council, Lund Univer-sity Research Funds, the Crafoord, the Lars Hiertas Minne, the Magn. Bergvall,the Gester, and the Gunnar, Arvid, and Elisabeth Nilsson Cancer Foundations.
The costs of publication of this article were defrayed in part by the paymentof page charges. This article must therefore be hereby marked advertisement inaccordance with 18 U.S.C. Section 1734 solely to indicate this fact.
Received 11/17/2009; revised 01/25/2010; accepted 02/23/2010; publishedOnlineFirst 04/20/2010.
References
1. Fadl-Elmula I. Chromosomal changes in uroepithelial carcinomas.Cell Chromosome 2005;4:1–5.2. Höglund M, Säll T, Heim S, et al. Identification of cytogenetic
subgroups and karyotypic pathways in transitional cell carcinoma.Cancer Res 2001;61:8241–6.
3. Richter J, Jiang F, Gorog JP, et al. Marked genetic differences be-tween stage pTa and stage pT1 papillary bladder cancer detected bycomparative genomic hybridization. Cancer Res 1997;57:2860–4.
4. Richter J, Beffa L, Wagner U, et al. Patterns of chromosomal imbal-ances in advanced urinary bladder cancer detected by comparativegenomic hybridization. Am J Pathol 1998;153:1615–21.
5. Zhao J, Richter J, Wagner U, et al. Chromosomal imbalances in non-invasive papillary bladder neoplasms (pTa). Cancer Res 1999;59:4658–61.
6. Veltman JA, Fridlyand J, Pejavar S, et al. Array-based comparativegenomic hybridization for genome-wide screening of DNA copynumber in bladder tumors. Cancer Res 2003;63:2872–80.
7. Blaveri E, Brewer JL, Roydasgupta R, et al. Bladder cancer stage andoutcome by array-based comparative genomic hybridization. ClinCancer Res 2005;11:7012–22.
8. Heidenblad M, Lindgren D, Jonson T, et al. Tiling resolution arrayCGH and high density expression profiling of urothelial carcinomasdelineate genomic amplicons and candidate target genes specific foradvanced tumors. BMC Med Genomics 2008;1:3–15.
9. Chapman EJ, Harnden P, Chambers P, et al. A comprehensive anal-ysis of CDKN2A status in micro dissected urothelial cell carcinomareveals potential haploinsufficiency, a high frequency of homozygousco-deletion and associations with clinical phenotype. Clin CancerRes 2005;11:5740–7.
10. Oeggerli M, Tomovska S, Schraml P, et al. E2F3 amplification and
over expression is associated with invasive tumor growth and rapidtumor cell proliferation in urinary bladder cancer. Oncogene 2004;23:5616–23.
11. Feber A, Clark J, Goodwin G, et al. Amplification and overexpressionof E2F3 in human bladder cancer. Oncogene 2004;23:1627–30.
12. Knowles MA. Molecular subtypes of bladder cancer: Jekyll and Hydeor chalk and cheese? Carcinogenesis 2006;27:361–73.
13. Billerey C, Chopin D, Aubriot-Lorton MH, et al. Frequent FGFR3 mu-tations in papillary non-invasive bladder (pTa) tumors. Am J Pathol2001;158:1955–9.
14. Wu XR. Urothelial tumorigenesis: a tale of divergent pathways. NatRev Cancer 2005;5:713–25.
15. Blaveri E, Simko JP, Korkola JE, et al. Bladder cancer outcome andsubtype classification by gene expression. Clin Cancer Res 2005;11:4044–5.
16. Dyrskjøt L, Kruhoffer M, Thykjaer T, et al. Gene expression in the uri-nary bladder: a common carcinoma in situ gene expression signatureexists disregarding histopathological classification. Cancer Res2004;64:4040–8.
17. Dyrskjøt L, Thykjaer T, Kruhøffer M, et al. Identifying distinct classesof bladder carcinoma using microarrays. Nat Genet 2003;33:90–6.
18. Dyrskjøt L, Zieger K, Kruhøffer M, et al. A molecular signature in su-perficial bladder carcinoma predicts clinical outcome. Clin CancerRes 2005;11:4029–36.
19. Kim JH, Tuziak T, Hu L, et al. Alterations in transcription clusters un-derlie development of bladder cancer along papillary and nonpapil-lary pathways. Lab Invest 2005;85:532–49.
20. Lindgren D, Liedberg F, Andersson A, et al. Molecular characteriza-tion of early-stage bladder carcinomas by expression profiles,FGFR3 mutation status, and loss of 9q. Oncogene 2006;25:2685–96.
Cancer Res; 70(9) May 1, 2010 3471

Lindgren et al.
3472
21. Mor O, Nativ O, Stein A, et al. Molecular analysis of transitionalcell carcinoma using cDNA microarray. Oncogene 2003;22:7702–10.
22. Sanchez-Carbayo M, Socci ND, Lozano J, et al. Defining molecularprofiles of poor outcome in patients with invasive bladder cancerusing oligonucleotide microarrays. J Clin Oncol 2006;24:778–89.
23. Thykjaer T, Workman C, Kruhøffer M, et al. Identification of geneexpression patterns in superficial and invasive human bladdercancer. Cancer Res 2001;61:2492–9.
24. Wild PJ, Herr A, Wissmann C, et al. Gene expression profiling ofprogressive papillary noninvasive carcinomas of the urinary bladder.Clin Cancer Res 2005;11:4415–29.
25. Stransky N, Vallot C, Reyal F, et al. Regional copy number-independentderegulation of transcription in cancer. Nat Genet 2006;38:1386–96.
26. Dyrskjøt L, Zieger K, Real FX, et al. Gene expression signaturespredict outcome in non-muscle-invasive bladder carcinoma: amulticenter validation study. Clin Cancer Res 2007;13:3545–51.
27. Saal LH, Troein C, Vallon-Christersson J, et al. BioArray SoftwareEnvironment (BASE): a platform for comprehensive managementand analysis of microarray data. Genome Biol 2003;3:SOFT-WARE0003.
28. Yang YH, Dudoit S, Luu P, et al. Normalization for cDNA microarraydata: a robust composite method addressing single and multipleslide systematic variation. Nucleic Acids Res 2002;30:e15.
29. Andersson A, Edén P, Lindgren D, et al. Gene expression profiling ofleukemic cell lines reveals conserved molecular signatures amongsubtypes with specific genetic aberrations. Leukemia 2005;19:1042–50.
30. Saeed AI, Sharov V, White J, et al. TM4: a free, open-source systemfor microarray data management and analysis. Biotechniques 2003;34:374–8.
31. The Swegene DNA micro array resource center. Available from:http://www-lth.se/sciblu.
32. Gene Expression Omnibus. Available from: http://www.ncbi.nlm.nih.gov/geo/.
33. Journal of Clinical Oncology home page. Available from: http://www.jco.org.
34. Array Express home page. Available from: http://www.ebi.ac.uk/microarray-as/ae/.
35. Clinical Cancer Research home page. Available from: http://clincancerres.aacrjournals.org/.
Cancer Res; 70(9) May 1, 2010
36. Subramanian A, Tamayo P, Mootha VK, et al. Gene Set EnrichmentAnalysis: a knowledge-based approach for interpreting genome-wide expression profiles. Proc Natl Acad Sci U S A 2005;102:15545–50.
37. Molecular Signatures Database. Available from: http://www.broadinstitute.org/gsea/msigdb/index.jsp.
38. Bild AH, Yao G, Chang JT, et al. Oncogenic pathway signatures inhuman cancers as a guide to targeted therapies. Nature 2006;439:353–7.
39. Carter SL, Eklund AC, Kohane IS, et al. A signature of chromo-somal instability inferred from gene expression profiles predictsclinical outcome in multiple human cancers. Nat Genet 2006;38:1043–8.
40. Hosack DA, Dennis G, Jr., Sherman BT, et al. Identifying biologicalthemes within lists of genes with EASE. Genome Biol 2003;4:P4.
41. Statnikov A, Tsamardinos I, Dosbayev Y, et al. GEMS: a system forautomated cancer diagnosis and biomarker discovery from microarray gene expression data. Int J Med Inform 2005;74:491–3.
42. The CHORI BACPAC resources. Available from: http://bacpac.chori.org/genomicRearrays.php.
43. Jönsson G, Staaf J, Olsson E, et al. High-resolution genomicprofiles of breast cancer cell lines assessed by tiling BAC arraycomparative genomic hybridization. Genes Chromosomes Cancer2007;46:543–58.
44. The UCSC genome browser. Available from: http://www.genome.ucsc.edu/.
45. Staaf J, Jönsson G, Ringnér M, et al. Normalization of array-CGHdata: influence of copy number imbalances. BMC Genomics 2007;8:382.
46. Venkatraman ES, Olshen AB. A faster circular binary segmentationalgorithm for the analysis of array CGH data. Bioinformatics 2007;23:657–63.
47. Jin Y, Stewénius Y, Lindgren D, et al. Distinct mitotic segregationerrors mediate chromosomal instability in aggressive urothelialcancers. Clin Cancer Res 2007;13:1703–12.
48. Crawford NP, Qian X, Ziogas A, et al. Rrp1b, a new candidatesusceptibility gene for breast cancer progression and metastasis.PLoS Genet 2007;3:e214.
49. Crawford NP, Ziogas A, Peel DJ, et al. Germline polymorphisms inSIPA1 are associated with metastasis and other indicators of poorprognosis in breast cancer. Breast Cancer Res 2006;8:R16.
Cancer Research


