Embed Size (px)
Citation preview
sustainability
Article
Moderating Effects of Firm Size and Leverage on theWorking Capital Finance–Profitability Relationship:Evidence from China
Faisal Mahmood 1,*, Dongping Han 1, Nazakat Ali 2, Riaqa Mubeen 1 and Umeair Shahzad 3
1 School of Economy & Management, Harbin Institute of Technology, Harbin 150001, China;[email protected] (D.H.); [email protected] (R.M.)
2 School of Management, Iqra University, Islamabad 44000, Pakistan; [email protected] School of Management, Ocean University, Qingdao 266100, China; [email protected]* Correspondence: [email protected]
Received: 25 February 2019; Accepted: 2 April 2019; Published: 5 April 2019�����������������
Abstract: We evaluated the moderating effects of firm size and leverage on the working capitalfinance (WCF)–profitability relationship among Chinese companies during 2000–2017. Applyingthe generalized method of moments (GMM) technique on panel data, we observed that firm sizeand leverage have strong moderating roles in the WCF–profitability relationship. We observed thatsmall or low-leverage firms have an inverted U-shaped WCF–profitability relationship. However,this relationship is U-shaped for large or high-leverage firms. We report break-even points in theserelationships that show the portion of short-term debt in working capital financing. The results revealthat the break-even point for all subgroups (small, large, low-leverage, and high-leverage firms)decreases compared to the break-even point of the full sample. This study shows how the break-evenpoint of the WCF–profitability relationship shifts when a company expands or its leverage levelchanges. Managers can use this information for profit maximization.
Keywords: working capital finance; short-term borrowings; profitability; breakeven point;generalized method of moments; firm size; leverage
1. Introduction
The relationship between profitability and working capital has remained a critical issue since thelate 1990s. The literature defines working capital as the value of current assets after excluding currentliabilities [1–3] and refers to the management of current assets, current liabilities, and inventoriesfor profit maximization and sustainable growth [4–8]. Working capital management significantlycontributes to firm value by maintaining a balance between risk and profitability [5,7,9–13]. Dependingupon managers’ preferences, this balance may have a range of strategies including high risk–highprofit (aggressive strategy) or low risk–low profit (conservative strategy) [14].
The literature discusses how investment in working capital influences profit [15–18]. However,the financing of these investments is equally essential for profit maximization. Therefore, studies notonly describe the importance of investment but explain how investments should be financed. Financingdecisions play an essential role in firm performance. For instance, leverage explains the financingdetails of a firm and is frequently used in the literature for evaluation of firm performance [15,19–22].A firm can have multiple sources financing working capital. These sources may be internal, includingretained earnings and debt collection, or external, via short- and long-term borrowing [15].
One important external financing decision involves selecting short- or long-term borrowing.When investing in working capital, making good financing decisions are crucial because short-term
Sustainability 2019, 11, 2029; doi:10.3390/su11072029 www.mdpi.com/journal/sustainability
Sustainability 2019, 11, 2029 2 of 14
and long-term borrowing have advantages and disadvantages that significantly affect profit and risk.For instance, long-term financing may be a safe strategy as it is free from refinancing uncertaintiesand interest rate fluctuations. Refinancing uncertainty means the lender, on unsatisfactory firmperformance, may refuse to renew the loan on the maturity date. However, short-term financing takesadvantage of low interest rates and favorable credit conditions when compared to long-term debt [23].Short-term financing reduces possible agency problems between creditors, shareholders, and managersof the firm [24]. All these factors support that both short- and long-term debts should be used tofinance working capital. Against this background, their best combination should be determined formaximal profit.
Several studies have examined the impact of working capital finance (WCF) on firm performance.Banos et al. [23] analyzed Spanish companies regarding short-term financing with working capitaland reported an inverted U-shaped relationship between WCF and profitability. Here, WCF refersto the financing of working capital via short-term borrowing. If a firm finances its working capitalby short-term borrowing, a positive WCF–profitability relationship exists, where WCF affects profitpositively. However, as short-term borrowing increases, this positive relationship gradually diminishes,and ultimately the firm achieves a break-even point where short-term financing has zero effect onprofitability. After this break-even point, a negative WCF–profitability relationship, where WCF affectsprofit negatively, starts to dominate. This positive and negative combination is cumulatively called aninverted U-shaped relationship. Banos et al. [23] evaluated the influence of financial flexibility on theWCF–profitability relationship and revealed that the WCF–profitability break-even point changes forhighly flexible and inflexible firms. Financial flexibility is the capability of a firm to access its financingat low cost [23]. Break-even point shows the proportion of short- and long-term debts in WCF. If itsvalue is 0.60, WCF carries 60% short-term and 40% long-term debts. At the break-even point, WCF haszero effect on profitability. Panda and Nanda [25] analyzed six manufacturing sectors in India andreported changes in the WCF–profitability relationship for each sector. They evaluated the influence ofmarkup (sales to profit margin) on the WCF–profitability relationship and devised a different financingstrategy for each manufacturing sector.
From this discussion, small and big companies may behave differently in the WCF–profitabilityrelationship due to different ownership structures, financial flexibility, and tax provisions. Also,other factors such as leverage may influence the WCF–profitability relationship, but have been ignoredin previous studies. The current study fills the gap in the literature by evaluating the influence of firmsize and leverage on the WCF–profitability relationship. To the best of our knowledge, the moderatingeffects of these two factors on this relationship have not yet been studied.
Apart from this fundamental contribution, we contribute to the existing literature in numerousways. First, we observed the changes in the break-even point of the WCF–profitability relationshipas the size and leverage level of firms change. Second, we considered a long time period of 18 yearswith a large number of observations (12,610). Third, this is the first study in China to evaluate theWCF–profitability relationship in the context of firm size and leverage. China is a world-leadingeconomy, with private firms growing remarkably since the introduction of the opening up policy [26].Finally, we used panel data and conducted analyses using the generalized method of moments(GMM), a modern dynamic technique used to handle numerous data problems including endogeneityand heterogeneity.
The rest of the paper is organized as follows. Section 2 explains the relationship of WCF with firmperformance along with the potential influence of firm size and leverage on this relationship. Section 3discusses the research models and variables used. Section 4 presents the analysis and results. Section 5summarizes and concludes the study.
Sustainability 2019, 11, 2029 3 of 14
2. WCF, Profitability, Size, and Leverage
2.1. WCF and Firm Profitability
Modigliani and Miller [27] explained that financing methods are significantly related toprofitability in the presence of interest and taxes. Financing methods may be short- or long-term.Both methods have their pros and cons depending upon firm-related characteristics, managers’intentions, and macroeconomic factors. However, short-term financing is generally preferredamong shareholders, creditors, and policy makers of the firm [28], enabling lenders to observe firmperformance in detail, and thus modify the terms of credit renewals [20].
Firms use different WCF strategies to maximize profit. Aggressive and conservative strategiesare commonly practiced [25]. An aggressive strategy prevails when there is a large proportion ofshort-term debts in WCF. In a conservative strategy, long-term debts have a dominant share. Firms thathave an inverted U-shaped relationship in WCF and profitability follow a conservative WCF policy forprofit maximization. Conversely, firms that have a U-shaped relationship in WCF and profitabilityadopt an aggressive strategy to gain maximum profit. The U-shaped relationship is a combinationof negative trend, break-even point, and positive trend. Baños-Caballero et al. [23] described aninverted U-shaped relationship in Spanish companies that followed a conservative strategy. Panda andNanda [25] found inverted U-shaped and U-shaped relationships in various Indian manufacturingsectors that followed conservative and aggressive strategies, respectively.
An increase in short-term debts in WCF gradually increases profit because short-term debtshave low interest rates and are free from inflation uncertainties. These two factors become moreinfluential in long-term debts [29]. Short-term borrowing is more flexible to the financial requirementsof a firm [29]. Similarly, short-term debts improve firm–lender relationships via repeated renewals,which ultimately reduces interest rates on future debts [30]. Short-term borrowing reduces agencydifferences among debt holders and shareholders [23]. Similarly, when a lender, via frequent renewals,closely monitors firm performance, it increases investors’ confidence. This helps a firm to overcomeproblems of underinvestment and subsequent underwriting [31]. Lastly, firms that have more attractiveinvestment opportunities use short-term borrowing to promote their positive prospects among externalstakeholders [32]. Thus, due to all these factors, short-term debts in WCF have a positive effect on profit.However, this positive WCF–profitability relationship gradually weakens and ultimately approaches apeak level (break-even point) where WCF has zero effect on profitability. After this break-even point,WCF starts affecting profit negatively, establishing an inverted U-shaped relationship between WCFand profitability.
Higher interest charges and refinancing uncertainties are the two main factors that turn aninitially positive WCF–profitability relationship into a negative one [29]. When a firm uses moreshort-term debt, the lender is concerned about timely return. Therefore, the lender not only chargeshigh interest rates on further debt, but is also reluctant to renew this debt on the maturity date.Thus, higher interest charges and renewal uncertainties affect profit adversely, causing a negativeWCF–profitability relationship.
From the above discussion, we expected an inverted U-shaped WCF–profitability relationship inChinese companies and formulated our first hypothesis as follows:
Hypothesis 1. An inverted U-shaped relationship and a break-even point in WCF–profitability exist.
2.2. WCF and Profitability Under the Moderating Role of Firm Size
The literature demonstrates that large firms have strong market reputations and more assets toinvest and therefore enjoy better access to both short- and long-term debt. As a result, these firms havea large portion of WCF in short-term borrowing due to these advantages linked with such debt. Fazzariand Petersen [33] report that small firms have more financial constraints than large firms. Therefore,
Sustainability 2019, 11, 2029 4 of 14
these firms experience unfavorable debt conditions and higher interest charges. Niskanen andNiskanen [34] reported a positive relationship of credit availability with capital market access. Largefirms have better access to capital markets, so enjoy better credit availability. Small firms suffer fromlow lender confidence because they provide informal and asymmetrical financial information [35], andare pursued less by market analysts [36]. Lenders are more confident in large firms as their portfoliosare more diversified and hence have a lower risk of bankruptcy [36]. Baños-Caballero et al. [23] andPanda and Nanda [25] agreed that firm size significantly affects the WCF–profitability relationship.
The above discussion reflects a significant moderating role of firm size on the WCF–profitabilityU-shaped relationship. As small firms suffer from high interest rates on debt, they may demonstratea reduced positive and extended negative trend in the U-shaped relationship. Also, the break-evenpoint of these firms may appear early and is expected to be lower than the break-even point of thefull sample. However, large firms enjoy low interest rates on debt and invest in high-margin projects,so their WCF–profitability U-shaped relationship may prolong positive and reduce negative trends.Their break-even point may appear later and is expected to be higher than the break-even point of thefull sample.
Given the above discussion, we formulated the next hypothesis regarding WCF and firm size,as follows:
Hypothesis 2a. The break-even point in the WCF–profitability relationship of small firms is lower than thebreak-even point of the full sample.
Hypothesis 2b. The break-even point in the WCF–profitability relationship of large firms is higher than thebreak-even point of the full sample.
2.3. WCF and Profitability Under the Moderating Role of Leverage
Panda and Nanda [25] and Baños-Caballero et al. [23] significantly contributed to theunderstanding of the WCF–profitability relationship under different moderating factors. However,they agreed that their results might vary when the leverage level of a firm changes. Nyeadi andSare [37] reported that different leverage levels significantly affect profit. Firms with high leveragesuffer from the higher cost of short-term debt [22,24]. Such firms mostly use internal sources to repaydebt and have to rely on external debt for working capital [4]. Lenders have severe liquidity concernswith high-leverage firms because a significant portion of liquid assets is required to pay back debtcharges [37]. High-leverage firms already suffer from heavy debt load and lenders are not willing toprovide further loans with normal interest rates, so these firms have to pay premium interest rates onfurther debt. Also, these firms have a high risk of insolvency and bankruptcy, so may have limitedinvestment opportunities. As a result, these firms are not able to earn as much profit as low-leveragefirms. High interest charges further reduce profit. Therefore, we expected leverage to have a strongmoderating effect on the WCF–profitability relationship.
Due to low profit, the WCF–profitability relationship of high-leverage firms may reduce thepositive and extend the negative trends. Also, their break-even point may appear early and have alower value compared to the break-even point of the full sample. Conversely, low-leverage firms mayhave large positive and short negative trends in their WCF–profitability relationship. Their break-evenpoint may appear later and have a higher value compared to the break-even point of the full sample.So, we formulated the next hypothesis as follows:
Hypothesis 3a. The break-even point in the WCF–profitability relationship of high-leverage firms is lower thanthe break-even point of the full sample.
Hypothesis 3b. The break-even point in the WCF–profitability relationship of low-leverage firms is higher thanthe break-even point of the full sample.
Sustainability 2019, 11, 2029 5 of 14
3. Empirical Model and Variables
We designed Equation (1) to test the relationship between WCF and profitability. This model usesthe WCF square variable along with WCF to capture the break-even point. The model is
ROEit = α +β1WCFit + β2WCF2it + β3Sizeit−1
+β4Growthit−1 + β5Leverageit−1 + λt + ηi+εit,
(1)
where ROEit is a dependent variable, return on equity, which is a proxy for profitability measuredby the ratio of net profit to equity [8,9]; WCFit (working capital finance) is an independent variablemeasured as (short-term borrowing/(current assets − accounts payable)) [8,11]. The control variablesrepeatedly used in the literature include Sizeit−1 is the log of total assets, Growthit−1 is the sales growthrate, and Leverageit−1 is the ratio of total debts to total assets [2,3,6,8,9,24]. Control variables are usedto keep the firm performance free from other possible influences and are lagged by one level to addressthe problem of endogeneity. λt is the time dummy variable, which changes over time but remainsunchanged in the selected time period; ηi represents unique features of firms, such as geographicalposition, which remain constant over time and enable us to manage these individual effects; and εit isthe error term of the equation. All variables used in the equation are frequently used in the literature,and we also measure these variables through proxies, which are common in the literature.
Firm size is an important variable in this study. Its various proxies, including value of assets,value of sales, market capitalization, log of assets, log of sales, and log of market capitalization, areavailable in the literature [38]. These proxies have different levels of sensitivity to firm performance [39].We reviewed the literature and found log of assets to be a more frequently proxy used in the workingcapital context. Following this, we used the same proxy in our study.
We evaluated changes in the break-even point of the WCF–performance relationship under themoderating effects of size and leverage, so coefficients of WCF and its square were the primary focus.The break-even point in this equation is calculated by −β1/2β2. Both the signs and values of thesecoefficients are important for drawing a concrete conclusion about the WCF–performance relationshipand its break-even point.
3.1. Firm Size
We evaluated the influence of firm size on the WCF–profitability break-even point. Firm size iscalculated as the log of the total assets of the firm. We calculated the median of the firm size variableto divide the sample into small and large firms. Firms with a size value lower than the median wereconsidered small firms, whereas firms with a higher value than the median were considered large firms.We incorporated these effects into Equation (1) by introducing a size dummy variable. This variablehas values of 0 and 1 for large and small firms, respectively.
So, Equation (1) was modified to determine the moderating role of firm size on theWCF–profitability relationship:
ROEit = α +β1WCFit + β2WCF2it + γ1WCFit
×Sizeit Dummy + γ2WCF2it × Sizeit Dummy
+β3Sizeit−1 + β4Growthit−1 + β5Leverageit−1+λt + ηi + εit.
(2)
This equation has a new break-even point of the WCF–profitability relationship under themoderating effect of firm size, which is calculated as −(β1 + γ1)/2(β2 + γ2).
Sustainability 2019, 11, 2029 6 of 14
3.2. Leverage
We also evaluated the influence of leverage on the WCF–profitability relationship. The literaturedefines leverage as the ratio of total debts to total assets [22]. We calculated the median of the leveragevariable to divide firms into high- and low-leverage firms. All firms with a leverage value lower thanthe median were considered low-leverage firms, whereas firms with higher leverage than the medianwere considered high-leverage firms. To capture the moderating effect of leverage, we propose aleverage dummy variable. It has values of 0 and 1 for low- and high-leverage firms, respectively.
We therefore modified Equation (1) to capture the moderating effect of leverage on theWCF–profitability relationship:
ROEit = α +β1WCFit + β2WCF2it + ϕ1WCFit
×Levit Dummy + ϕ2WCF2it × Levit Dummy
+β3Sizeit−1 + β4Growthit−1 + β5Leverageit−1+λt + ηi + εit.
(3)
This equation introduces a new break-even point of the WCF–profitability relationship under themoderating role of leverage, which is calculated as −(β1 + ϕ1)/2(β2 + ϕ2).
We used panel data and the GMM estimator to address heteroskedasticity, unobservedheterogeneity, and endogeneity. Endogeneity refers to the correlation of explanatory variables witherror terms [40]. There are various techniques used to address endogeneity, including lagged dependentvariables, lagged independent variables, control variables, GMM, and fixed effects [41]. Among these,the best is the GMM estimator, which has the highest power to deal with endogeneity [41]. Weestimated all models using GMM, a dynamic panel data estimator introduced by Arellano andBond [42]. GMM transforms data to remove the effects of all sources of endogeneity, includingunobserved heterogeneity, simultaneity, and dynamic endogeneity [43]. Transformation occurs whenendogenous variables are converted into instrumental variables by taking their lag values. GMM offersmultiple lags, and we selected the lags that best address the endogeneity. The Sargan–Hansen test wasused to evaluate the effectiveness of these instrumental variables. GMM is also robust to heterogeneityand heteroskedasticity issues with data.
We observed an endogeneity problem in the control variables and therefore took their lags at thefirst level in all models to remove its potential effects. We used STATA software for analysis.
3.3. Data and Sample
The current study is based in China, and we collected 18 years’ worth of secondary data(2000–2017). The source of data was the China Securities Market and Accounting Research (CSMAR)database, which has extensive detail of financial statement data of Chinese companies on a quarterlyand annual basis [44]. The initial sample size had 18,445 observations of manufacturing firms.We condensed the data in the following ways. First, we eliminated all observations with negativeor WCF values more than 1. Second, we removed observations with negative values of assets,liabilities, inventories, accounts receivable, accounts payable, and short-term borrowing. We alsoexcluded the extreme top and bottom values of each variable used. We obtained a final sample with12,609 observations.
4. Analysis and Results
4.1. Descriptive Statistics
Descriptive details of the data, i.e., number of observations, sum, mean, median, standarddeviation, minimum, and maximum, for all dependent, independent, and control variables, are listedin Table 1.
Sustainability 2019, 11, 2029 7 of 14
Table 1. Descriptive statistics.
Variable N Sum Mean Median SD Min Max
ROE 12,609 3842 0.305 0.305 0.475 −2.816 3.041WCF 12,609 4631 0.367 0.367 0.252 0.00432 1.000WCF2 12,609 2505 0.199 0.199 0.232 1.87 × 10⁻⁵ 0.999Size 12,609 119,224 9.455 9.455 0.512 7.580 11.54Growth 12,609 28,303 2.245 2.245 3.552 −0.937 55.39Leverage 12,609 5684 0.451 0.451 0.205 0.0188 7.872
4.2. Correlation Matrix and Variance Inflation Factor (VIF)
A correlation matrix for all variables is provided in Table 2. A correlation analysis measuresmulticollinearity among independent and control variables. Table 2 shows that return on equity isnegatively correlated with our primary independent variable, WCF, and its square. Table 2 reflects thatall firm-related control variables, i.e., growth, size, and leverage, are significantly correlated with thedependent variable. All independent and control variables, except WCF–growth, are also significantlycorrelated with each other, but this correlation is not so strong as to cause multicollinearity problems.
Table 2. Correlation matrix.
ROE WCF WCF2 Size Growth Leverage
ROE 1WCF −0.174 *** 1WCF2 −0.150 *** 0.957 *** 1Size 0.215 *** −0.0489 *** −0.0453 *** 1Growth 0.225 *** 0.0135 0.0346 *** 0.103 *** 1Leverage −0.207 *** 0.393 *** 0.350 *** 0.261 *** −0.0372 *** 1
Note: * p < 0.05, ** p < 0.01, *** p < 0.001.
We also calculated the variance inflation factor (VIF) for all independent and control variablesto confirm the absence of multicollinearity in the sample. A value of VIF higher than five might bean indication that a specific variable suffers multicollinearity [45]. The VIF values for all explanatoryvariables were far lower than five, confirming that the data are free from multicollinearity. The detailsof VIF analysis are outlined in Table 3.
Table 3. Variance inflation factor (VIF) statistics.
Variable VIF 1/VIF
WCF 1.22 0.818654Size 1.12 0.890622
Growth 1.02 0.982236Leverage 1.31 0.076497
4.3. WCF and Return on Equity
Equation (1) explains the WCF–profitability relationship in Chinese firms. The results ofEquation (1) are presented in Table 4, which show that the coefficients of all independent and controlvariables are highly significant. The coefficient of WCF (β1) has a positive value, which indicates apositive WCF–profitability relationship. The coefficient of WCF2 (β2) has a negative value, whichshows a negative WCF–profitability relationship. These positive and negative relationships areseparated by a break-even point. The positive and negative relationships and the break-even pointjointly form an inverted U-shaped WCF–profitability relationship. These results validate our firsthypothesis, which stated that an inverted U-shaped WCF–profitability relationship exists. These resultsare strongly consistent with the results reported by Baños-Caballero et al. [8], and partially support
Sustainability 2019, 11, 2029 8 of 14
Panda and Nanda’s [11] findings. This relationship shows that an increase in WCF first establishes apositive WCF–profitability trend. This is due to benefits related to short-term debt, including lowerinterest charges, favorable credit conditions, mitigation of agency costs, and promotion of positiveprospects among external stakeholders. However, a further increase in short-term borrowing weakensthe positive trend that ultimately becomes zero. This is the break-even point of this relationship.After the break-even point, the relationship becomes negative. This negative relationship proves thedisadvantages of large WCF financing via short-term borrowing, specifically higher interest chargesand refinancing uncertainties [29]. Here, the break-even point is 0.80, calculated as [−0.83/(−0.51 ×2)] using the formula −β1/2β2. This means firms can support working capital with 80% short-termand 20% long-term debt to maximize profit.
Robustness of the First Hypothesis
Following Reference [46], we revised our first equation to determine the robustness of the resultsobtained in Section 4.3.
ROEit = α +β1WCF(0,0.80) + β2WCF(0.80,max) + β3Sizeit−1
+β4Growthit−1 + β5Leverageit−1 + λt + ηi+εit.
(4)
In this equation, we replace WCF and WCF2 with WCF(0, 0.80) and WCF(0.80, max). We split WCFinto two categories using the break-even point of Equation (1): WCF with value lower than 0.80 isconsidered low-WCF and others are high-WCF. WCF(0, 0.80) is equal to WCF if WCF has a value from 0to 0.80, and 0.80 otherwise. Similarly, WCF(0.80, max) has a value of WCF minus 0.80 if WCF is greaterthan 0.80, and 0 otherwise. Other variables remain unchanged.
The results of Equation (4) indicate that WCF(0, 0.80) and WCF(0.80, max) have positive and negativecoefficients, respectively. Both coefficients are highly significant and validate the results of Equation (1):An inverted U-shaped WCF–profitability relationship exists. Details of the results of this equation areprovided in Table 4.
Table 4. Working capital finance (WCF) and profitability.
Variables Equation (1) Equation (4)
WCF 0.829 ***(0.160)
WCF2 −0.514 ***(0.120)
WCF(0, 0.80) 0.422 ***(0.079)
WCF(0.80, max) −0.547 ***(0.233)
Size 1.197 *** 1.208 ***(0.087) (0.087)
Growth 0.022 *** 0.022 ***(0.004) (0.004)
Leverage −2.540 *** −2.536 ***(0.231) (0.230)
Constant −10.506 *** −10.562 ***(0.833) (0.831)
Observations 12,609 12,609Wald Test 538.44 540.52
Sargan Test 232.83 235.31AR (1) −7.29 −7.28AR (2) −2.06 −2.10
Note: Dependent variable is the return on equity; time dummy variables are included in the model but not reported.Wald test evaluates heteroskedasticity. Sargan test was used for overidentifying restrictions that measure the validityof instruments. AR (1) and AR (2) measure the first- and second-order correlation, respectively. Standard errors inparentheses. *** p < 0.01, ** p < 0.05, * p < 0.1.
Sustainability 2019, 11, 2029 9 of 14
4.4. WCF and ROE Under the Moderating Role of Firm Size
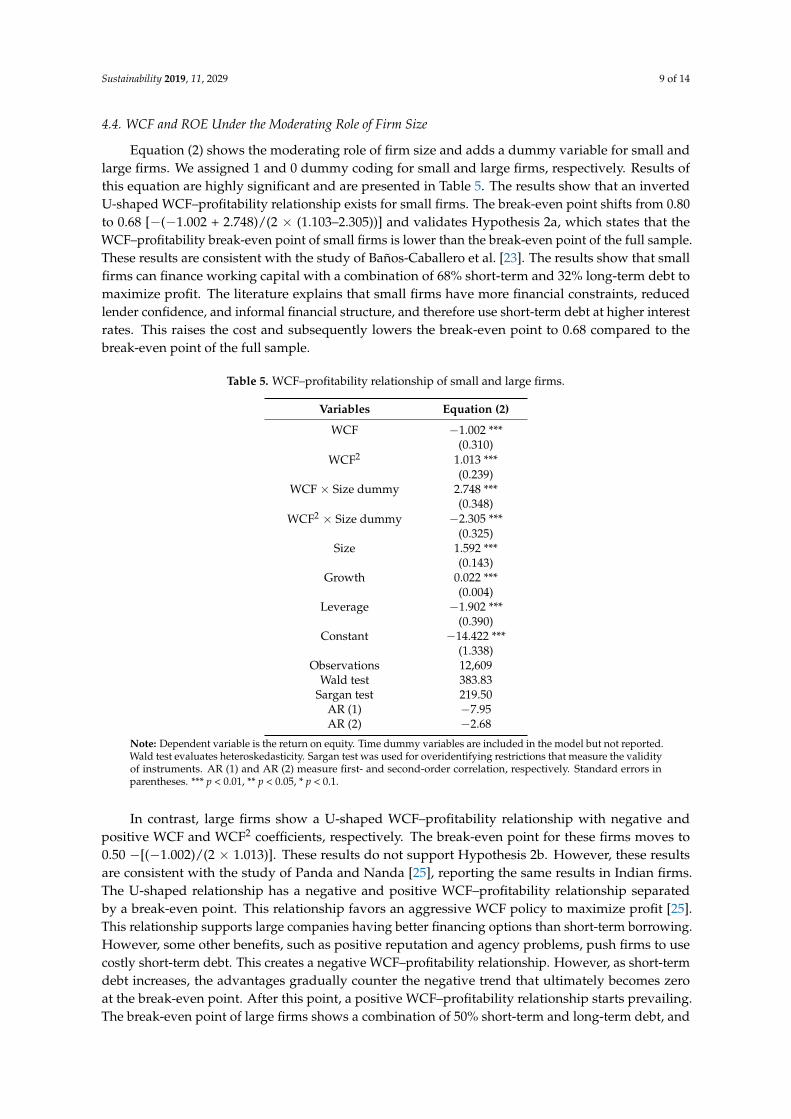
Equation (2) shows the moderating role of firm size and adds a dummy variable for small andlarge firms. We assigned 1 and 0 dummy coding for small and large firms, respectively. Results ofthis equation are highly significant and are presented in Table 5. The results show that an invertedU-shaped WCF–profitability relationship exists for small firms. The break-even point shifts from 0.80to 0.68 [−(−1.002 + 2.748)/(2 × (1.103–2.305))] and validates Hypothesis 2a, which states that theWCF–profitability break-even point of small firms is lower than the break-even point of the full sample.These results are consistent with the study of Baños-Caballero et al. [23]. The results show that smallfirms can finance working capital with a combination of 68% short-term and 32% long-term debt tomaximize profit. The literature explains that small firms have more financial constraints, reducedlender confidence, and informal financial structure, and therefore use short-term debt at higher interestrates. This raises the cost and subsequently lowers the break-even point to 0.68 compared to thebreak-even point of the full sample.
Table 5. WCF–profitability relationship of small and large firms.
Variables Equation (2)
WCF −1.002 ***(0.310)
WCF2 1.013 ***(0.239)
WCF × Size dummy 2.748 ***(0.348)
WCF2 × Size dummy −2.305 ***(0.325)
Size 1.592 ***(0.143)
Growth 0.022 ***(0.004)
Leverage −1.902 ***(0.390)
Constant −14.422 ***(1.338)
Observations 12,609Wald test 383.83
Sargan test 219.50AR (1) −7.95AR (2) −2.68
Note: Dependent variable is the return on equity. Time dummy variables are included in the model but not reported.Wald test evaluates heteroskedasticity. Sargan test was used for overidentifying restrictions that measure the validityof instruments. AR (1) and AR (2) measure first- and second-order correlation, respectively. Standard errors inparentheses. *** p < 0.01, ** p < 0.05, * p < 0.1.
In contrast, large firms show a U-shaped WCF–profitability relationship with negative andpositive WCF and WCF2 coefficients, respectively. The break-even point for these firms moves to0.50 −[(−1.002)/(2 × 1.013)]. These results do not support Hypothesis 2b. However, these resultsare consistent with the study of Panda and Nanda [25], reporting the same results in Indian firms.The U-shaped relationship has a negative and positive WCF–profitability relationship separatedby a break-even point. This relationship favors an aggressive WCF policy to maximize profit [25].This relationship supports large companies having better financing options than short-term borrowing.However, some other benefits, such as positive reputation and agency problems, push firms to usecostly short-term debt. This creates a negative WCF–profitability relationship. However, as short-termdebt increases, the advantages gradually counter the negative trend that ultimately becomes zeroat the break-even point. After this point, a positive WCF–profitability relationship starts prevailing.The break-even point of large firms shows a combination of 50% short-term and long-term debt, and

Sustainability 2019, 11, 2029 10 of 14
profit is minimal at this point. The graph in Figure 1 explains the movement of the break-even pointunder the moderating role of firm size.
Sustainability 2019, 11, x FOR PEER REVIEW 10 of 15
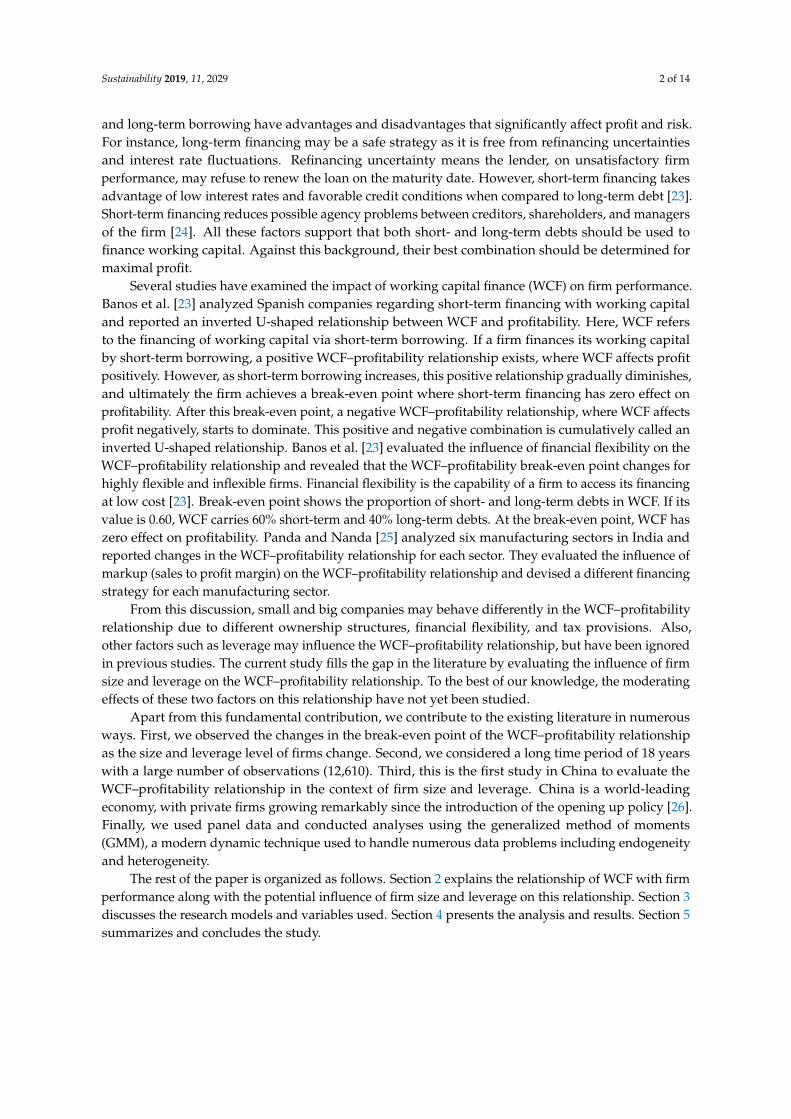
Figure 1. Changes in break-even points for firm size.
The graph shows inverted U-shaped and U-shaped WCF–profitability relationships for small
and large firms, respectively. Red lines are showing the “Inverted U-shaped” and “U-shaped” WCF–
profitability relationships that contain break-even points. The break-even point for small companies
falls to 0.68 compared to the break-even point of the full sample. For large companies, it is further
reduced to 0.50. According to this graph, small companies should adopt a conservative strategy and
WCF should not exceed 68% short-term borrowing. In contrast, large companies should adopt an
aggressive financing strategy in which a dominant portion of working capital should be obtained
from short-term borrowing.
4.5. WCF and ROE under the Moderating Role of Leverage
Equation (3) shows a moderating role of leverage in the WCF–profitability relationship. The
results of this equation were also significant for all independent and control variables except growth.
Details of the results are presented in Table 6. The results show that high-leverage firms have a U-
shaped WCF–profitability relationship. The break-even point for these firms drops to 0.29 [(–3.982 +
5.428)/(2 × (7.578–10.53))], supporting hypothesis 3a. These results are also consistent with the study
of Baños-Caballero et al. [23]. These firms are already under the intense pressure of massive loans, so
can access additional loans only at high interest rates. The break-even point falls due to high interest
charges and explains that in high-leverage firms, 29% of WCF should be achieved through short-term
borrowing, beyond which a negative WCF–profitability relationship starts prevailing.
Table 6. WCF–profitability relationships for high- and low-leverage firms.
Variables Equation (3)
WCF –3.984 ***
(1.227)
WCF2 7.578 ***
(2.314)
WCF × Lev dummy 5.428 ***
(1.653)
WCF2 × Lev dummy –10.053 ***
(2.774)
Size –0.898 **
(0.385)
Growth –0.002
(0.008)
Leverage –1.893 *
Figure 1. Changes in break-even points for firm size.
The graph shows inverted U-shaped and U-shaped WCF–profitability relationships for smalland large firms, respectively. Red lines are showing the “Inverted U-shaped” and “U-shaped”WCF–profitability relationships that contain break-even points. The break-even point for smallcompanies falls to 0.68 compared to the break-even point of the full sample. For large companies,it is further reduced to 0.50. According to this graph, small companies should adopt a conservativestrategy and WCF should not exceed 68% short-term borrowing. In contrast, large companies shouldadopt an aggressive financing strategy in which a dominant portion of working capital should beobtained from short-term borrowing.
4.5. WCF and ROE under the Moderating Role of Leverage
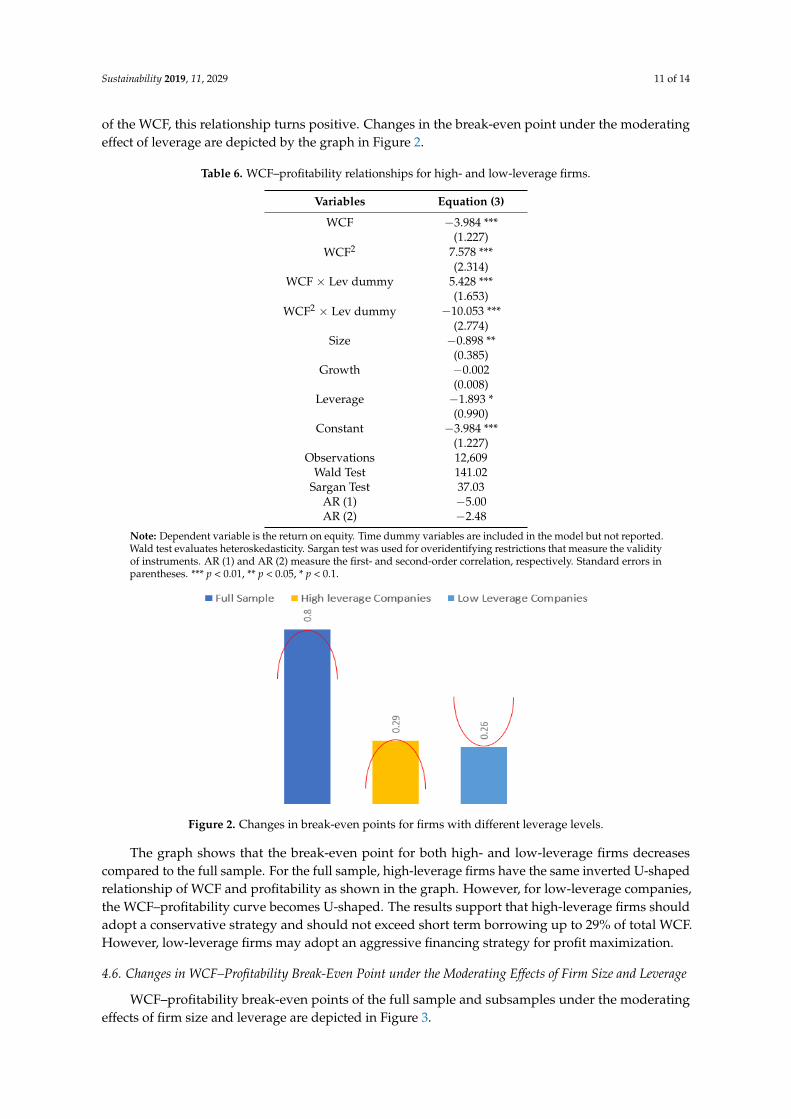
Equation (3) shows a moderating role of leverage in the WCF–profitability relationship. The resultsof this equation were also significant for all independent and control variables except growth.Details of the results are presented in Table 6. The results show that high-leverage firms have aU-shaped WCF–profitability relationship. The break-even point for these firms drops to 0.29 [(−3.982+ 5.428)/(2 × (7.578–10.53))], supporting Hypothesis 3a. These results are also consistent with thestudy of Baños-Caballero et al. [23]. These firms are already under the intense pressure of massiveloans, so can access additional loans only at high interest rates. The break-even point falls due to highinterest charges and explains that in high-leverage firms, 29% of WCF should be achieved throughshort-term borrowing, beyond which a negative WCF–profitability relationship starts prevailing.
In contrast, low-leverage firms show a U-shaped WCF–profitability relationship. WCF and WCF2
have highly significant negative and positive trend coefficient values, respectively. These results donot support Hypothesis 3b but are consistent with the results reported by Panda and Nanda [25].The U-shaped relationship means that these firms can generate more profit by following an aggressiveWCF policy [25]. This relationship may exist because low-leverage firms have a good reputation amongstakeholders and therefore have better alternative financing opportunities than short-term borrowing.Using this costly option adversely affects profit, so a negative WCF–profitability relationship exists.However, these firms have better investment opportunities, which gradually diminish the initialnegative trend; subsequently, a positive WCF–profitability relationship prevails. The break-even pointfor these firms falls to 0.26 [−(−3.984)/(2 × 7.578)], which is an indication that these firms have aminimal negative WCF–Profitability relationship, and as short-term borrowing increases beyond 26%
Sustainability 2019, 11, 2029 11 of 14
of the WCF, this relationship turns positive. Changes in the break-even point under the moderatingeffect of leverage are depicted by the graph in Figure 2.
Table 6. WCF–profitability relationships for high- and low-leverage firms.
Variables Equation (3)
WCF −3.984 ***(1.227)
WCF2 7.578 ***(2.314)
WCF × Lev dummy 5.428 ***(1.653)
WCF2 × Lev dummy −10.053 ***(2.774)
Size −0.898 **(0.385)
Growth −0.002(0.008)
Leverage −1.893 *(0.990)
Constant −3.984 ***(1.227)
Observations 12,609Wald Test 141.02
Sargan Test 37.03AR (1) −5.00AR (2) −2.48
Note: Dependent variable is the return on equity. Time dummy variables are included in the model but not reported.Wald test evaluates heteroskedasticity. Sargan test was used for overidentifying restrictions that measure the validityof instruments. AR (1) and AR (2) measure the first- and second-order correlation, respectively. Standard errors inparentheses. *** p < 0.01, ** p < 0.05, * p < 0.1.
Sustainability 2019, 11, x FOR PEER REVIEW 11 of 15
(0.990)
Constant –3.984 ***
(1.227)
Observations 12,609
Wald Test 141.02
Sargan Test 37.03
AR (1) –5.00
AR (2) –2.48
Note: Dependent variable is the return on equity. Time dummy variables are included in the model
but not reported. Wald test evaluates heteroskedasticity. Sargan test was used for overidentifying
restrictions that measure the validity of instruments. AR (1) and AR (2) measure the first- and second-
order correlation, respectively. Standard errors in parentheses. ***p < 0.01, **p < 0.05, *p < 0.1.
In contrast, low-leverage firms show a U-shaped WCF–profitability relationship. WCF and
WCF2 have highly significant negative and positive trend coefficient values, respectively. These
results do not support hypothesis 3b but are consistent with the results reported by Panda and Nanda
[25]. The U-shaped relationship means that these firms can generate more profit by following an
aggressive WCF policy [25]. This relationship may exist because low-leverage firms have a good
reputation among stakeholders and therefore have better alternative financing opportunities than
short-term borrowing. Using this costly option adversely affects profit, so a negative WCF–
profitability relationship exists. However, these firms have better investment opportunities, which
gradually diminish the initial negative trend; subsequently, a positive WCF–profitability relationship
prevails. The break-even point for these firms falls to 0.26 [–(–3.984)/(2 × 7.578)], which is an indication
that these firms have a minimal negative WCF-Profitability relationship, and as short-term borrowing
increases beyond 26% of the WCF, this relationship turns positive. Changes in the break-even point
under the moderating effect of leverage are depicted by the graph in Figure 2.
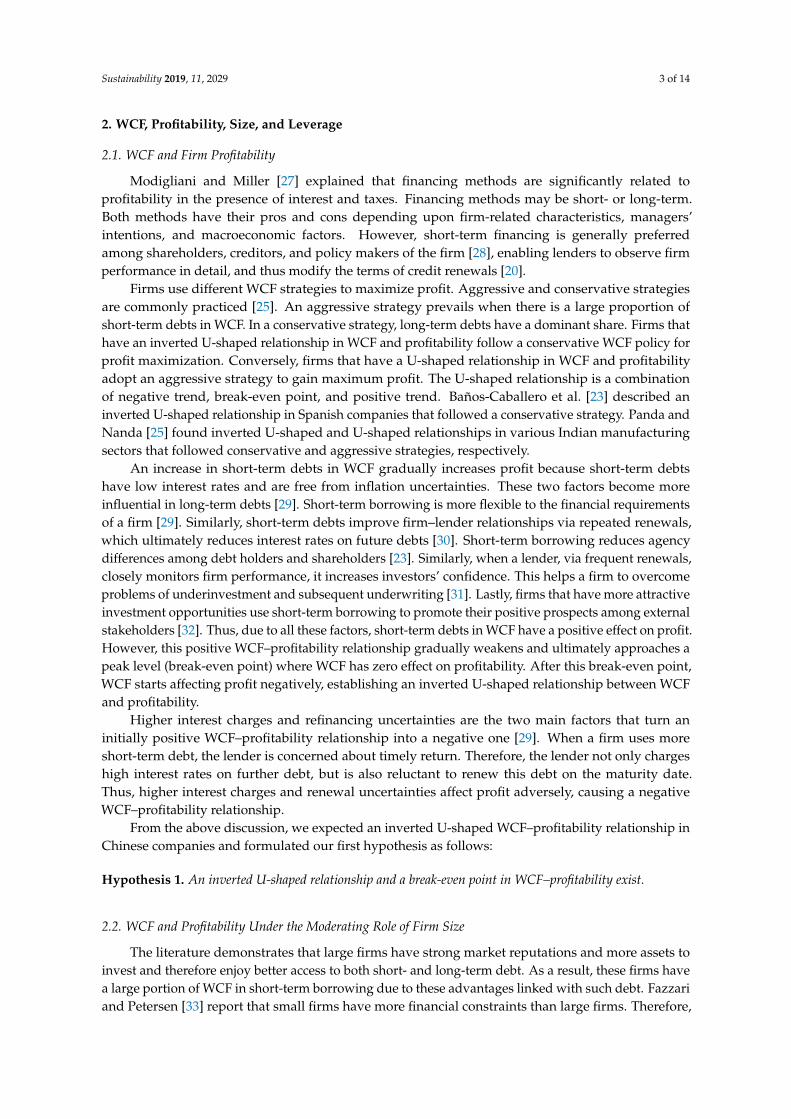
Figure 2. Changes in break-even points for firms with different leverage levels.
The graph shows that the break-even point for both high- and low-leverage firms decreases
compared to the full sample. For the full sample, high-leverage firms have the same inverted U-
shaped relationship of WCF and profitability as shown in the graph. However, for low-leverage
companies, the WCF–profitability curve becomes U-shaped. The results support that high-leverage
firms should adopt a conservative strategy and should not exceed short term borrowing up to 29%
of total WCF. However, low-leverage firms may adopt an aggressive financing strategy for profit
maximization.
4.6. Changes in WCF–Profitability Break-Even Point under the Moderating Effects of Firm Size and
Leverage
WCF–profitability break-even points of the full sample and subsamples under the moderating
effects of firm size and leverage are depicted in Figure 3.
Figure 2. Changes in break-even points for firms with different leverage levels.
The graph shows that the break-even point for both high- and low-leverage firms decreasescompared to the full sample. For the full sample, high-leverage firms have the same inverted U-shapedrelationship of WCF and profitability as shown in the graph. However, for low-leverage companies,the WCF–profitability curve becomes U-shaped. The results support that high-leverage firms shouldadopt a conservative strategy and should not exceed short term borrowing up to 29% of total WCF.However, low-leverage firms may adopt an aggressive financing strategy for profit maximization.
4.6. Changes in WCF–Profitability Break-Even Point under the Moderating Effects of Firm Size and Leverage
WCF–profitability break-even points of the full sample and subsamples under the moderatingeffects of firm size and leverage are depicted in Figure 3.
Sustainability 2019, 11, 2029 12 of 14Sustainability 2019, 11, x FOR PEER REVIEW 12 of 15
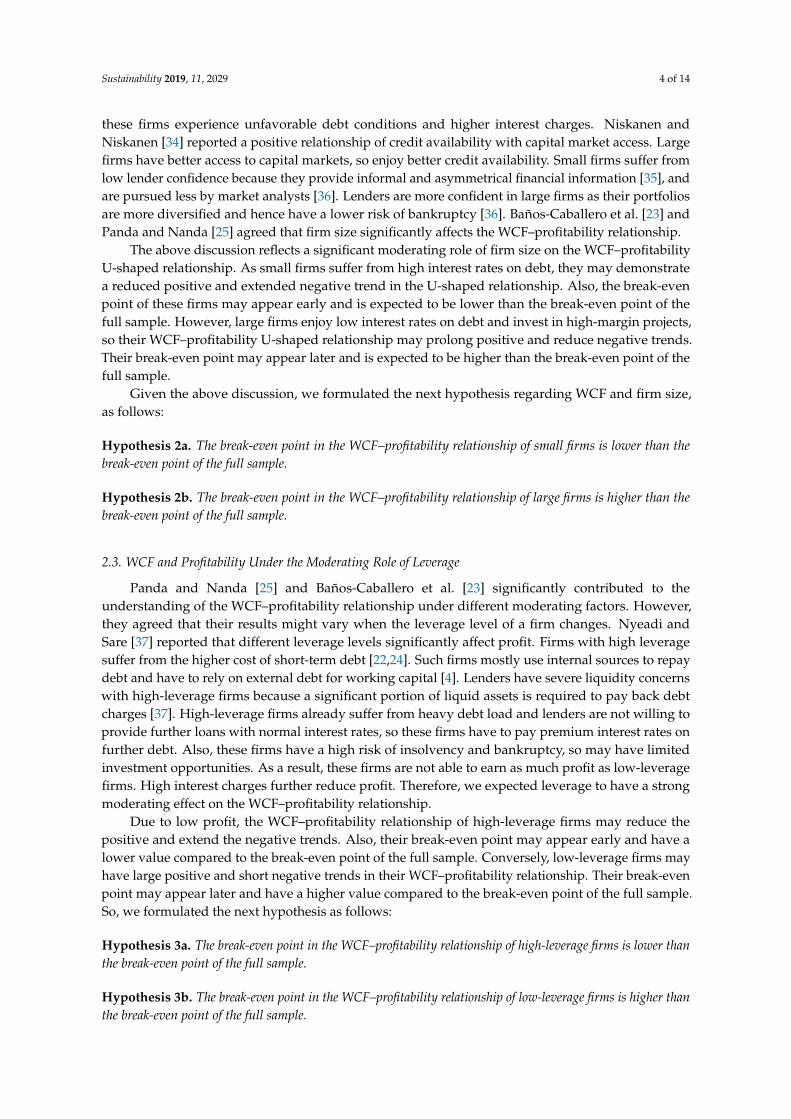
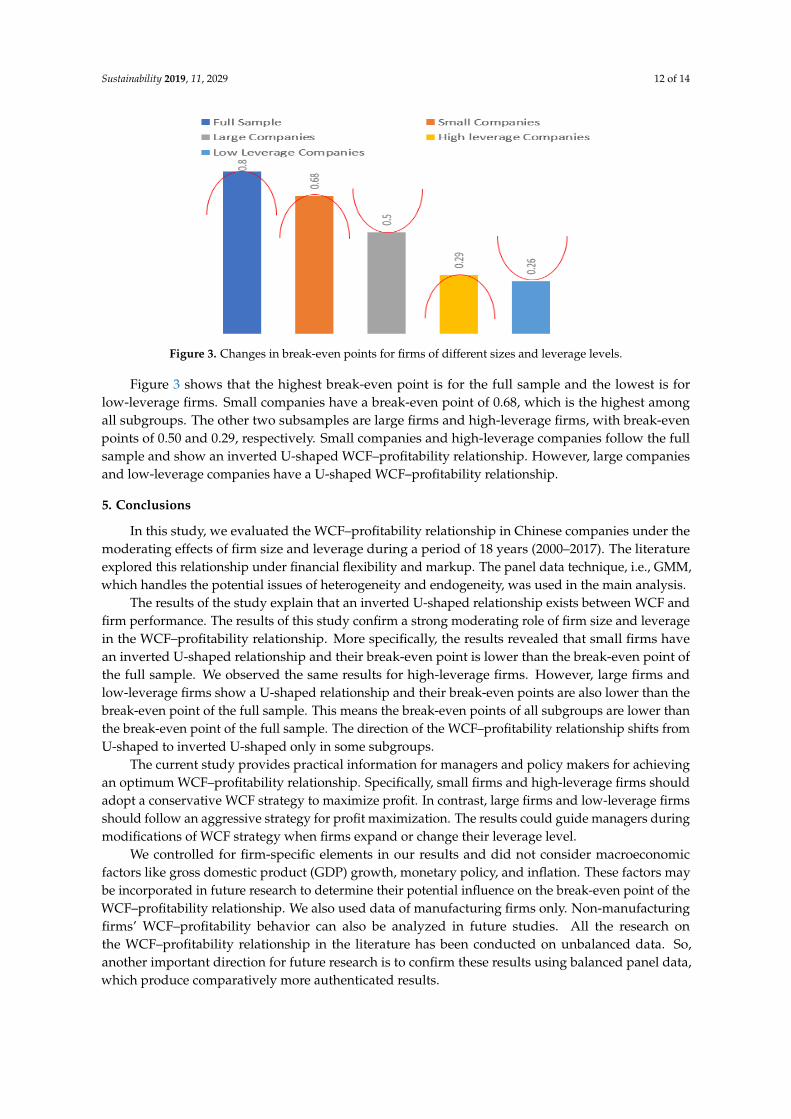
Figure 3. Changes in break-even points for firms of different sizes and leverage levels.
Figure 3 shows that the highest break-even point is for the full sample and the lowest is for low-
leverage firms. Small companies have a break-even point of 0.68, which is the highest among all
subgroups. The other two subsamples are large firms and high-leverage firms, with break-even
points of 0.50 and 0.29, respectively. Small companies and high-leverage companies follow the full
sample and show an inverted U-shaped WCF–profitability relationship. However, large companies
and low-leverage companies have a U-shaped WCF–profitability relationship.
5. Conclusion
In this study, we evaluated the WCF–profitability relationship in Chinese companies under the
moderating effects of firm size and leverage during a period of 18 years (2000–2017). The literature
explored this relationship under financial flexibility and markup. The panel data technique, i.e.,
GMM, which handles the potential issues of heterogeneity and endogeneity, was used in the main
analysis.
The results of the study explain that an inverted U-shaped relationship exists between WCF and
firm performance. The results of this study confirm a strong moderating role of firm size and leverage
in the WCF–profitability relationship. More specifically, the results revealed that small firms have an
inverted U-shaped relationship and their break-even point is lower than the break-even point of the
full sample. We observed the same results for high-leverage firms. However, large firms and low-
leverage firms show a U-shaped relationship and their break-even points are also lower than the
break-even point of the full sample. This means the break-even points of all subgroups are lower than
the break-even point of the full sample. The direction of the WCF–profitability relationship shifts
from U-shaped to inverted U-shaped only in some subgroups.
The current study provides practical information for managers and policy makers for achieving
an optimum WCF–profitability relationship. Specifically, small firms and high-leverage firms should
adopt a conservative WCF strategy to maximize profit. In contrast, large firms and low-leverage firms
should follow an aggressive strategy for profit maximization. The results could guide managers
during modifications of WCF strategy when firms expand or change their leverage level.
We controlled for firm-specific elements in our results and did not consider macroeconomic
factors like gross domestic product (GDP) growth, monetary policy, and inflation. These factors may
be incorporated in future research to determine their potential influence on the break-even point of
the WCF–profitability relationship. We also used data of manufacturing firms only. Non-
manufacturing firms’ WCF–profitability behavior can also be analyzed in future studies. All the
research on the WCF–profitability relationship in the literature has been conducted on unbalanced
data. So, another important direction for future research is to confirm these results using balanced
panel data, which produce comparatively more authenticated results.
Figure 3. Changes in break-even points for firms of different sizes and leverage levels.
Figure 3 shows that the highest break-even point is for the full sample and the lowest is forlow-leverage firms. Small companies have a break-even point of 0.68, which is the highest amongall subgroups. The other two subsamples are large firms and high-leverage firms, with break-evenpoints of 0.50 and 0.29, respectively. Small companies and high-leverage companies follow the fullsample and show an inverted U-shaped WCF–profitability relationship. However, large companiesand low-leverage companies have a U-shaped WCF–profitability relationship.
5. Conclusions
In this study, we evaluated the WCF–profitability relationship in Chinese companies under themoderating effects of firm size and leverage during a period of 18 years (2000–2017). The literatureexplored this relationship under financial flexibility and markup. The panel data technique, i.e., GMM,which handles the potential issues of heterogeneity and endogeneity, was used in the main analysis.
The results of the study explain that an inverted U-shaped relationship exists between WCF andfirm performance. The results of this study confirm a strong moderating role of firm size and leveragein the WCF–profitability relationship. More specifically, the results revealed that small firms havean inverted U-shaped relationship and their break-even point is lower than the break-even point ofthe full sample. We observed the same results for high-leverage firms. However, large firms andlow-leverage firms show a U-shaped relationship and their break-even points are also lower than thebreak-even point of the full sample. This means the break-even points of all subgroups are lower thanthe break-even point of the full sample. The direction of the WCF–profitability relationship shifts fromU-shaped to inverted U-shaped only in some subgroups.
The current study provides practical information for managers and policy makers for achievingan optimum WCF–profitability relationship. Specifically, small firms and high-leverage firms shouldadopt a conservative WCF strategy to maximize profit. In contrast, large firms and low-leverage firmsshould follow an aggressive strategy for profit maximization. The results could guide managers duringmodifications of WCF strategy when firms expand or change their leverage level.
We controlled for firm-specific elements in our results and did not consider macroeconomicfactors like gross domestic product (GDP) growth, monetary policy, and inflation. These factors maybe incorporated in future research to determine their potential influence on the break-even point of theWCF–profitability relationship. We also used data of manufacturing firms only. Non-manufacturingfirms’ WCF–profitability behavior can also be analyzed in future studies. All the research onthe WCF–profitability relationship in the literature has been conducted on unbalanced data. So,another important direction for future research is to confirm these results using balanced panel data,which produce comparatively more authenticated results.
Sustainability 2019, 11, 2029 13 of 14
Author Contributions: Conceptualization, F.M.; methodology, H.D.; software, F.M.; validation, H.D.; formalanalysis, F.M.; investigation, R.M.; resources, H.D.; data curation, N.A.; writing, F.M.; review and editing, U.S.;supervision, H.D.; funding acquisition, H.D.
Funding: This project is funded by Heilongjiang Natural Science Foundation (G201107).
Conflicts of Interest: Authors bear no conflict of interest in any part of paper including designing, resultsinterpretations and policy implications. “The funders have no role in the design of the study; in the collection,analyses, or interpretation of data; in the writing of the manuscript, or in the decision to publish the results”.
References
1. Jiang, W.; Lu, M.; Shan, Y.; Zhu, T. Evidence of Avoiding Working Capital Deficits in Australia. Aust. Account.Rev. 2016, 26, 107–118. [CrossRef]
2. Jamalinesari, S.; Soheili, H. The Relationship between the Efficiency of Working Capital ManagementCompanies and Corporate Rule in Tehran Stock Exchange. Procedia Soc. Behav. Sci. 2015, 205, 499–504.[CrossRef]
3. Tran, H.; Abbott, M.; Jin Yap, C. How does working capital management affect the profitability of Vietnamesesmall- and medium-sized enterprises? J. Small Bus. Enterp. Dev. 2017, 24, 2–11. [CrossRef]
4. Chiou, J.-R.; Cheng, L.; Wu, H.-W. The determinants of working capital management. J. Am. Acad. Bus. 2006,10, 149–155.
5. Bot,oc, C.; Anton, S.G. Is profitability driven by working capital management? evidence for high-growthfirms from emerging Europe. J. Bus. Econ. Manag. 2017, 18, 1135–1155. [CrossRef]
6. Gao, J.; Wang, J. Is Working Capital Information Useful for Financial Analysts? Evidence from China.Emerg. Mark. Financ. Trade 2017, 53, 1135–1151. [CrossRef]
7. Enqvist, J.; Graham, M.; Nikkinen, J. The impact of working capital management on firm profitability indifferent business cycles: Evidence from Finland. Res. Int. Bus. Financ. 2014, 32, 36–49. [CrossRef]
8. Amelia, M.; Paulo, P.; Gama, M. Working capital management and SMEs profitability: Portuguese evidence.Int. J. Manag. Financ. 2015, 11, 183–191.
9. Tahir, M.; Anuar, M.B.A. The determinants of working capital management and firms performance of textilesector in pakistan. Qual. Quant. 2016, 50, 605–618. [CrossRef]
10. Vahid, T.K.; Elham, G.; Mohsen, A.K.; Mohammadreza, E. Working Capital Management and CorporatePerformance: Evidence from Iranian Companies. Procedia Soc. Behav. Sci. 2012, 62, 1313–1318. [CrossRef]
11. Abuzayed, B. Working capital management and firms’ performance in emerging markets: The case of Jordan.Int. J. Manag. Financ. 2012, 8, 155–179. [CrossRef]
12. Mun, S.G.; Jang, S.C.S. Working capital, cash holding, and profitability of restaurant firms. Int. J. Hosp.Manag. 2015, 48, 1–11. [CrossRef]
13. Knauer, T.; Wöhrmann, A. Working capital management and firm profitability. J. Manag. Control 2013, 24,77–87. [CrossRef]
14. Masri, H.; Abdulla, Y. A multiple objective stochastic programming model for working capital management.Technol. Forecast. Soc. Chang. 2018, 131, 141–146. [CrossRef]
15. Akinlo, O.O. Determinants of working capital requirements in selected quoted companies in Nigeria. J. Afr.Bus. 2012, 13, 40–50. [CrossRef]
16. Wasiuzzaman, S. Working capital and firm value in an emerging market. Int. J. Manag. Financ. 2015, 11,60–79. [CrossRef]
17. Baños-Caballero, S.; García-Teruel, P.J.; Martínez-Solano, P. Working capital management, corporateperformance, and financial constraints. J. Bus. Res. 2014, 67, 332–338. [CrossRef]
18. Ben-Nasr, H. State and foreign ownership and the value of working capital management. J. Corp. Financ.2016, 41, 217–240. [CrossRef]
19. Singh, H.P.; Kumar, S. Working capital requirements of manufacturing SMEs: Evidence from emergingeconomy. Rev. Int. Bus. Strateg. 2017, 27, 369–385. [CrossRef]
20. Díaz-Díaz, N.L.; García-Teruel, P.J.; Martínez-Solano, P. Debt maturity structure in private firms: Does thefamily control matter? J. Corp. Financ. 2016, 37, 393–411. [CrossRef]
21. De Almeida, J.R.; Eid, W. Access to finance, working capital management and company value: Evidencesfrom Brazilian companies listed on BM & FBOVESPA. J. Bus. Res. 2014, 67, 924–934.
Sustainability 2019, 11, 2029 14 of 14
22. Dalci, I.; Ozyapici, H. Working capital management policy in health care: The effect of leverage. Health Policy(N. Y.) 2018, 122, 1266–1272. [CrossRef] [PubMed]
23. Baños-Caballero, S.; GARCÍA-TERUEL, P.J.; MARTÍNEZ-SOLANO, P. Financing of working capitalrequirement, financial flexibility and SME performance. J. Bus. Econ. Manag. 2016, 17, 1189–1204. [CrossRef]
24. Ozkan, A. Determinants of capital structure and adjustment to long run target: Evidence from UK companypanel data. J. Bus. Financ. Account. 2001, 28, 175–198. [CrossRef]
25. Panda, A.K.; Nanda, S. Working capital financing and corporate profitability of Indian manufacturing firms.Manag. Decis. 2018, 56, 441–457. [CrossRef]
26. Ding, S.; Guariglia, A.; Knight, J. Investment and financing constraints in China: Does working capitalmanagement make a difference? J. Bank. Financ. 2013, 37, 1490–1507. [CrossRef]
27. Modigliani, F.; Miller, M.H. The Cost of Capital, Corporation Finance and THeory of Investment. Am. Econ.Rev. 1958, 48, 261–297.
28. García-Teruel, P.J.; Martínez-Solano, P. Ownership structure and debt maturity: New evidence from Spain.Rev. Quant. Financ. Account. 2010, 35, 473–491. [CrossRef]
29. Jun, S.-G.; Jen, F.C. Trade-off model of debt maturity structure. Rev. Quant. Financ. Account. 2003, 20, 5–34.[CrossRef]
30. Petersen, M.A.; Rajan, R.G. The benefits of lending relationships: Evidence from small business data. J. Financ.1994, 49, 3–37. [CrossRef]
31. Barclay, M.J.; Smith, C.W., Jr. The Maturity Structure of Corporate Debt. J. Financ. 1995, 50, 609–631.[CrossRef]
32. Kale, J.R.; Noe, T.H. Risky debt maturity choice in a sequential game equilibrium. J. Financ. Res. 1990, 13,155–166. [CrossRef]
33. Fazzari, S.M.; Petersen, B.C. Working capital and fixed investment: new evidence on financing constraints.RAND J. Econ. 1993, 24, 328–342. [CrossRef]
34. Niskanen, J.; Niskanen, M. The determinants of corporate trade credit policies in a bank-dominated financialenvironment: The case of Finnish small firms. Eur. Financ. Manag. 2006, 12, 81–102. [CrossRef]
35. Jordan, J.; Lowe, J.; Taylor, P. Strategy and financial policy in UK small firms. J. Bus. Financ. Account. 1998,25, 1–27. [CrossRef]
36. Caballero, B.-S.; Martínez, S.P.; García, T.P. Working capital management in SMEs. Account. Financ. 2010, 50,511–527. [CrossRef]
37. Nyeadi, J.D.; Sare, Y.A.; Aawaar, G. Determinants of working capital requirement in listed firms: Empiricalevidence using a dynamic system GMM. Cogent Econ. Financ. 2018, 6, 1–14. [CrossRef]
38. Aregbeyen, O. The effects of working capital management on the profitability of Nigerian manufacturingfirms. J. Bus. Econ. Manag. 2013, 14, 520–534. [CrossRef]
39. Dang, C.; Li, Z.F.; Yang, C. Measuring Firm Size in Empirical Corporate Finance. J. Bank. Financ. 2017, 86,159–176. [CrossRef]
40. Wintoki, M.B.; Linck, J.S.; Netter, J.M. Endogeneity and the Dynamics of Corporate Governance. J. Financ.Econ. 2012, 105, 581–606. [CrossRef]
41. Li, F. Endogeneity in CEO power: A survey and experiment. Invest. Anal. J. 2016, 45, 149–162. [CrossRef]42. Arellano, M.; Bond, S. Some tests of specification foSome Tests of Specification for Panel Data: Monte Carlo
Evidence and an Application to Employment Equations. Rev. Econ. Stud. 1991, 58, 277–297. [CrossRef]43. Ullah, S.; Akhtar, P.; Zaefarian, G. Dealing with endogeneity bias: The generalized method of moments
(GMM) for panel data. Ind. Mark. Manag. 2018, 71, 69–78. [CrossRef]44. CSMAR. The CSMAR Economic and Financial Research Database. Available online: http://www.csmar.
com/ (accessed on 29 March 2019).45. Studenmund, A.H.; Cassidy, H.J. Using Econometrics: A Practical Guide; Addison-Wesley Educational
Publishers: Boston, MA, USA, 1992.46. Ghosh, A.; Moon, D. Corporate debt financing and earnings quality. J. Bus. Financ. Account. 2010, 37, 538–559.
[CrossRef]
© 2019 by the authors. Licensee MDPI, Basel, Switzerland. This article is an open accessarticle distributed under the terms and conditions of the Creative Commons Attribution(CC BY) license (http://creativecommons.org/licenses/by/4.0/).