Embed Size (px)
Citation preview
Microenvironment and Effect of Energy Depletion in the NucleusAnalyzed by Mobility of Multiple Oligomeric EGFPs
Changi Pack, Kenta Saito, Mamoru Tamura, and Masataka KinjoLaboratory of Supramolecular Biophysics, Research Institute for Electronic Science, Hokkaido University, Sapporo 060-0812, Japan
ABSTRACT Four different tandem EGFPs were constructed to elucidate the nuclear microenvironment by quantifying its diffu-sional properties in both aqueous solution and the nuclei of living cells. Diffusion of tandem EGFP was dependent on the lengthof the protein as a rod-like molecule or molecular ruler in solution. On the other hand, we found two kinds of mobility, fast diffusionalmobility and much slower diffusional mobility depending on cellular compartments in living cells. Diffusion in the cytoplasm andthe nucleoplasm was mainly measured as fast diffusional mobility. In contrast, diffusion in the nucleolus was complex andmainly much slower diffusional mobility, although both the fast and the slow diffusional mobilities were dependent on the proteinlength. Interestingly, we found that diffusion in the nucleolus was clearly changed by energy depletion, even though the diffusionin the cytoplasm and the nucleoplasm was not changed. Our results suggest that the nucleolar microenvironment is sensitive toenergy depletion and very different from the nucleoplasm.
INTRODUCTION
The cell nucleus contains many proteins that form a multi-
molecular complex or a material such as chromatin and a
nucleolus. Most of the proteins in the nucleus are concerned
with molecular processing such as ribosome biogenesis, mRNA
synthesis, transcription and molecular transportation to and
from the nucleus. For these processes to be accomplished
properly, proteins related to each process are expected to act
dynamically and precisely in the nucleus. Consequently, the
dynamics of various molecules such as RNAs and nuclear
proteins in living cells have become a subject of major in-
terest because mobilities of such molecules in the nucleus
could provide important information about the molecular
functions of the nucleus (1–3). On the other hand, such mobi-
lity of functional protein molecules in the nucleus might be
mainly affected by the nuclear architecture and microenvi-
ronment (1,4) as well as their function because the chromo-
somes and the nucleoli occupy a large portion of the nuclear
space and changes depending on many factors such as gene
expression, cell cycle progression, and other metabolic state
of the cell. Therefore, for understanding the relation between
functional proteins and nuclear microenvironment, it is help-
ful to analyze mobility of standard protein molecules with
well-defined hydrodynamic properties as well as functional
nuclear proteins (1,5,6) or labeled macromolecules (7).
In the last few years, many studies based on fluorescence
microscopic techniques such as FRAP, single particle track-
ing (SPT), and fluorescence correlation spectroscopy (FCS)
have been carried out for cell biology (8–15). The studies
showed that a variety of small fluorescent probes such as
BCECF (9), fluorescein-labeled macromolecules (dextran
and Ficoll) from 3 to 1000 kD (13), and monomeric EGFP
(14), move rapidly in the cytoplasm, whereas labeled linear
dsDNA diffuses very slowly and has a size dependence of
the diffusion constant (16). The key point of these studies is
that the diffusion of small dextrans and Ficolls in the cyto-
plasm is only restricted mildly whereas that for large macro-
molecules can be greatly slowed.
On the other hand, a few studies of protein mobility in the
cell nucleus have been carried out (10,13,14) with biologi-
cally inert protein, even though many studies have been
carried out with nuclear proteins (1,3,6). A study based on
FRAP and microinjection with diverse sizes of fluorescein-
labeled dextrans (13) showed that diffusion in the nucleus was
slowed approximately fourfold compared with their diffusion
in water. However, more variability in the measured data for
the nucleus was found than for cytoplasm. Monomer GFP
molecule showed much more complex diffusion in nucleus
than in cytoplasm (14). Recent studies of FRAP (1,17) and
FCS combined with FRAP experiment (18) using living cells
have shown that various EGFP-fused nuclear proteins diffuse
at different rates depending on their localization and function.
Nuclear proteins could interact with target molecules or
immobile structures such as chromatin, which slowed down
the mobility of the proteins (5,6,19). An FCS experiment with
monomeric EGFP showed that diffusion of EGFP, which is
presumably inert to other proteins, was restricted depending
on the position in the nucleus compared to diffusion in the
cytoplasm (14). Furthermore, whether intranuclear mobility
of many molecules results from passive diffusion or active
Submitted December 9, 2005, and accepted for publication August 11, 2006.
Address reprint requests to Masataka Kinjo, Laboratory of Supramolecular
Biophysics, R.I.E.S, Hokkaido University, N12W6, Kita-Ku, Sapporo
060-0812, Japan. Tel.: 81-11-7062890; Fax: 81-7064964; E-mail: kinjo@
imd.es.hokudai.ac.jp.
Abbreviations used: cps, count per second; Cyt, cytoplasm; 2-DG,
2-deoxyglucose; DT, diffusion time; EGFPn, tandemly linked oligomeric
EGFP; FAF, fluorescence autocorrelation function; MR, molecular ruler;
FCS, fluorescence correlation spectroscopy; FRAP, fluorescence recovery
after photobleach; mRFP, monomeric red fluorescent protein; NP, nucle-
oplasm; NL, nucleolus; SPT, single particle tracking; TSA, Trichostatin A.
� 2006 by the Biophysical Society
0006-3495/06/11/3921/16 $2.00 doi: 10.1529/biophysj.105.079467
Biophysical Journal Volume 91 November 2006 3921–3936 3921
transport is still controversial (3,20). The nuclear microenvi-
ronment, which may be one of the reasons, has not yet been
clearly quantified under various physiological conditions.
FCS has been applied as a powerful technique for asses-
sing biomolecular diffusion and interactions both in aqueous
conditions and in living cells with single-molecule sensitiv-
ity (21–26). FCS detects fluorescence intensity fluctuations
caused by Brownian motion of fluorescent probe molecules
in a tiny detection volume (;0.3 fL) generated by confocal
illumination. Through time correlation analysis of the fluore-
scence fluctuations, the diffusion coefficient, the molecular
concentration, and the molecular interaction of probe mole-
cules are accessible. Because FCS need only a very small
detection volume and has high sensitivity, it will also be
useful to measure diffusional mobility of proteins in very
small regions of subnuclear microenvironments in living
cells. Although FRAP is adequate for measuring the diffu-
sion of fluorescent molecules and possible exchange in target
organelles in the living cell (3,7), the measurable minimal
fluorescent intensity and diffusional speed range are limited
to brighter and slower ranges than those for FCS. Therefore,
we can anticipate that FCS will provide complementary
information for faster movement at lower expression levels
of various functional proteins in the nucleus.
EGFP is a powerful fluorescent bioprobe molecule with a
well-known cylindrical structure (27–29). It has recently
been used for various cell measurements in fluorescent imag-
ing of cells as well as for analysis of molecular diffusion
using FRAP and FCS. To develop a standard and reproduc-
ible method for diffusion analysis of proteins, we designed
multiple oligomeric EGFPs with different molecular weights,
which can be used as molecular rulers (MRs) for quantifi-
cation of protein mobility in the nucleus. For this purpose,
we constructed plasmids with different levels of oligomeric
EGFPn (EGFP2–EGFP5, n¼ 2–5) with molecular weights of
60, 90, 120, and 150 kD, respectively, tandemly linked by a
random amino acid linker. Using multiple oligomeric EGFPs
and FCS, we determined the diffusion of the proteins in the
cytoplasm, nucleoplasm, and nucleoli of living HEK293,
HeLa, and COS7 cells. For strict recognition of the two
compartments in the nucleus, mRFP-fibrillarin and H2B-
mRFP were used as red fluorescent markers for the nucleolus
and the nucleoplasm, respectively.
In this study, FCS analysis by a one-component model
showed that the diffusional mobility of EGFPn in aqueous
solution was dependent on the length of EGFPn and was well
consistent with the diffusion model of a rod-like structure. On
the other hand, the diffusion of EGFPn in living cells analyzed
by a two-component model showed that fast diffusional
mobility in the cytoplasm and the nucleoplasm was consistent
with the model of a rod-like molecule as shown in aqueous
solution. The fast diffusion rates in the cytoplasm and the
nucleoplasm were almost the same, and ;3.5-fold slower
than in solution, regardless of the size of tandem EGFPn and
cell type. Mobilities of tandem EGFPn found in the nucleoli of
HeLa and COS7 cells were fivefold and sevenfold slower than
the fast diffusional mobility in the cytoplasm and the nu-
cleoplasm, respectively. Moreover, the much slower diffu-
sional mobility in the nucleolus was also dependent on the
length of EGFPn, demonstrating tandem EGFP molecules
were well-defined both in solution and in living cells. Inter-
estingly, the slow diffusion in the nucleolus was related to the
energy level of the living cell, because the slow diffusion of
EGFP5 in the nucleolus, but not in the cytoplasm and the
nucleoplasm, was further slowed by ATP depletion.
MATERIALS AND METHODS
Plasmid construction of tandem EGFP
Plasmids expressing each tandem EGFPn were synthesized with the plasmid
expressing EGFP-C1 (Clontech, Palo Alto, CA). The EGFP-C1 was excised
at the NdeI and the SmaI restriction sites and ligated between the NdeI and
Eco47 III restriction sites of another EGFP-C1. The linker between EGFPn
containing 25 random amino acid residues (SGLRSRAQASNSAVDG-
TAGPLPVAT) originated from the remaining bases of the multiple-cloning
site. Plasmid constructs of H2B-mRFP and mRFP-fibrillarin were obtained
as gifts from Drs. H. Kimura (Kyoto University, Kyoto, Japan) (30,31) and
T. Saiwaki (Osaka University, Osaka, Japan) (32), respectively. All plasmid
constructs for transfection were purified using a plasmid DNA midiprep kit
(QIAGEN, Hilden, Germany).
Cell culture and expression of tandemEGFPn proteins
For transient expression of tandem EGFPn, human embryonic kidney 293
(HEK293), HeLa, and COS7 cells were plated at confluence levels of 10–20%
on LAB-TEK chambered coverslips with eight wells (Nalge Nunc Interna-
tional, Rochester, NY) for 12 or 24 h before transfection. Cells were
transfected with a EGFPn vector or cotransfected with a vector of EGFPn and
H2B-mRFP or mRFP-fibrillarin, and grown in a 5% CO2 humidified atmo-
sphere at 37�C in Dulbecco’s modified Eagle’s medium (DMEM, Sigma-
Aldrich, St. Louis, MO) supplemented with 10% fetal bovine serum, 100 U/ml
penicillin, and 10 mg/ml streptomycin. Transfection was carried out with
FuGENE 6 (Roche Molecular Biochemicals, Mannheim, Germany) or
Effectene (QIAGEN) as indicated by the manufacturer. The transfected cells
were incubated for 24 or 48 h and washed with Opti-MEM to remove phenol
red dye in DMEM, and then the medium was replaced by Opti-MEM before
LSM and FCS measurements. Energy depletion was performed by addition of
6 mM 2-deoxyglucose (2-DG, Sigma-Aldrich) and 10 mM sodium azide
(NaN3, Sigma) to the culture medium (3,20). LSM images were collected for
the same cells before and after 2-DG and NaN3 treatment.
Western immunoblotting
The immunoblot analysis was performed according to the standard method.
Cells expressing tandem EGFPn were grown on 10-cm culture plates for 48 h
after transfection, the BD Living Colors A.v. peptide antibody (BD Biosciences
Clontech, Mountain View, CA) was used as the primary antibody. Primary
antibody-bound protein bands were detected with an alkaline phosphatase-
conjugated secondary antibody (mouse anti-rabbit IgG, Chemicon Interna-
tional, Temecula, CA) by BCIP/NBT dye solution (Sigma-Aldrich).
Cell homogenization
After FCS measurements, the cultured cells on a Lab-Tek (Nalge Nunc
International) chambered coverslip were collected by centrifugation at
3922 Pack et al.
Biophysical Journal 91(10) 3921–3936
1500 rpm for 5 min and then the pellets of cells were homogenized in 50 ml
of buffer (10 mM Hepes pH 7.9 containing 10 mM NaCl, 3 mM MgCl2,
1 mM DTT, 0.4 mM PMSF, and 0.1 mM sodium orthovanadate). Each
EGFPn protein solution was collected from the supernatant after centrifu-
gation at 100,000 rpm for 20 min and measured by FCS again.
Live cell imaging
Fluorescence microscopy was performed using an LSM510 inverted con-
focal laser scanning microscopy (LSM; Carl Zeiss, Jena, Germany). LSM
observations were all performed at 25�C. EGFPn was excited at 488 nm of a
CW Ar1 laser through a water immersion objective lens (C-Apochromat,
403, 1.2 NA; Carl Zeiss) with emission detected above 505 nm for single
scanning experiments using cells expressing EGFPn. Monomeric RFP-
fibrillarin or H2B-mRFP was imaged using a 543-nm laser light and detec-
tion was above 560 nm. The pinhole diameters for confocal imaging were
adjusted to 70 mm and 80 mm for EGFP and mRFP, respectively. To avoid
bleed-through effects in double-scanning experiments, EGFP and mRFP
were scanned independently in a multitracking mode.
FCS measurements and quantitative analysis
FCS measurements were all performed at 25�C on a ConfoCor 2 (Carl Zeiss)
as described previously (24,33). Excitation of EGFP was carried out at
488 nm and 6.3 mW by adjusting an acousto-optical tunable filter (AOTF) to
0.1%. Fluorescence autocorrelation functions ((FAF) G (t)), from which the
average residence time (ti) and the absolute number of fluorescent proteins
in the detection volume were obtained as follows:
GðtÞ ¼ ÆIðtÞIðt 1 tÞæÆIðtÞæ2 ; (1)
where I (t 1 t) is the fluorescence intensity in single photon counting method
obtained from the detection volume at delay time t. Brackets denote ensemble
averages. The curve fitting for the multicomponent model is given by:
GðtÞ ¼ 1 11
N+
i
yi 1 1t
ti
� ��1
1 1t
s2ti
� ��½
; (2)
where yi and ti are the fraction and diffusion time of component i, respec-
tively. N is the number of fluorescent molecules in the detection volume
defined by the beam waist w0 and the axial radius z0, s is the structure
parameter representing the ratio of w0 and z0. The detection volume made by
w0 and z0 was approximated as a cylinder.
All FAFs in aqueous solutions were measured for 30 s five times at 5-s
intervals. In the case of intracellular measurement, FAFs were measured for
15 s one or three times, and very low fluorescent cells under concentration of
20 molecules (,0.1 M) per detection volume (0.3 fL) were chosen for FCS
measurement. Under these conditions, the effect of photobleaching on FCS
analysis was minimized. The measurement position was chosen in the LSM
image. Because the optical passes of LSM and FCS are not the same, the real
position of FCS measurement was tuned to the position on LSM images with
a coverglass coated by dried rhodamine 6G (Rh6G), following the protocol
provided by the manufacturer (34). The real position of FCS measurement
was also checked with bleaching of H2B-mRFP in living cells. Although
there was no significant difference between the position of FCS measure-
ments checked by a coverglass and living cells, misalignment under 1 mm
was found. This range of misalignment may not affect analysis of diffusion
in the region of nucleoplasm and nucleolus, diameters of which were of the
order of 10 and 2 mm, respectively. The detection pinhole for FCS was fixed
to a diameter of 70 mm and emission was recorded through a 505–550-nm
bandpass filter for measurement of cells expressing EGFPn or through a
505–530-nm bandpass filter for measurement of cells coexpressing EGFPn
and mRFP tagged proteins for excluding any cross-talk signal from mRFP.
In practice, there was almost no cross-talk signal from mRFP using the three
cell types expressing mRFP only. The fluorescence of cells expressing
mRFP shows almost the same background fluorescence signal under 15 cps
when a 505–550-nm bandpass filter was used. All measured FAFs were
fitted by the fit program installed on the ConfoCor 2 system using the model
Eq. 2. FAFs in aqueous solutions were fitted by a one-component model
(i ¼ 1), and FAFs in cells by a one- or two-component model (i ¼ 1 or 2) to
consider free diffusion and restricted diffusion, respectively (see also the
text). The pinhole adjustment of the FCS setup, structure parameter, and
detection volume were calibrated everyday by FCS measurements of Rh6G
solution with a concentration of 10�7 M. Although the structure parameters
determined by Rh6G after the pinhole adjustment were changed and ranged
from 4 to 8 each day, FCS analysis was carried out with data sets with
structure parameters ranging from 5 to 6, which are known to be a stable
condition for FCS measurement. An average value of structure parameter
was fixed for FCS analysis of all data carried out in a day under the same
conditions. Diffusion time of component i, ti, is related to the translational
diffusion constant D of component i by
ti ¼w
2
4Di
: (3)
Diffusion of a spheroidal molecule is related to various physical parameters
by the Stokes-Einstein equation as follows
Di ¼kBT
6phri
; (4)
where T is the absolute temperature, ri is the hydrodynamic radius of the
spheroidal molecule, h is the fluid-phase viscosity of the solvent, and kB is
the Boltzman constant. Because ti is proportional to viscosity, the relative
viscosity (tcell/tsolution) can be easily estimated. When the diffusion time of
Rh6G is measured and the molecular weight of the sample molecule is
known, the diffusion time of the sample molecule as a spherical shape can be
simply calculated by the following equation (23).
tsphere ¼ tRh6G
MWsphere
MWRh6G
� �1=3
: (5)
The diffusion time t is also related to the frictional coefficient of the dif-
fusing molecules, which depends on the shapes of molecules undergoing
diffusion in a solution of defined viscosity. The ratio of the frictional coef-
ficient between spheroidal (f0) and ellipsoidal (f) molecules and the relation-
ship between the diffusion time and frictional coefficient are given by
Perrin’s equation (35,36)
f
f0
¼ ðp2 � 1Þ1=2
p1=3lnðp 1 ðp2 � 1Þ1=2Þ
(6)
tellips ¼ tsphere
f
f0
; (7)
where f and f0 are frictional coefficients of ellipsoidal and spherical mole-
cules, respectively, p is the axial ratio of the ellipsoidal molecule, tellips and
tsphere are the diffusion times of ellipsoidal and spherical molecules, re-
spectively. Based on the known size of the EGFP molecule, 4 nm in length
and 3 nm in diameter, and the average length of 25 amino acids, the
predicted diffusion time of tandem EGFPn was calculated for spherical and
ellipsoidal models using Eqs. 5, 6, and 7. The lengths of amino acid linkers
used for the calculation were 3.7 nm for an a-helix structure and 9.1 nm for a
simple linear structure of 25 amino acids. The diffusion constants of EGFPns
(Dgfpn) in the solution and cells were calculated from the published diffusion
constant of Rh6G, DRh6G (280 mm2/s) (37), and measured diffusion times of
Rh6G (tRh6G) and EGFPns (tgfpn) as follows:
Dgfpn
DRh6G
¼ tRh6G
tgfpn
: (8)
Microenvironment Analyzed by (EGFP)n and FCS 3923
Biophysical Journal 91(10) 3921–3936
RESULTS
LSM observation
Expressed oligomeric EGFPn localized in the nucleus
To observe the distribution and localization of monomer
EGFP and oligomeric EGFPn in HEK293, COS7, and HeLa
cells, the cells were transiently transfected with DNA plas-
mids encoding EGFPn or cotransfected with plasmids en-
coding each EGFPn and H2B-mRFP. Cells expressing each
oligomeric EGFP were observed at 24–48 h after transfec-
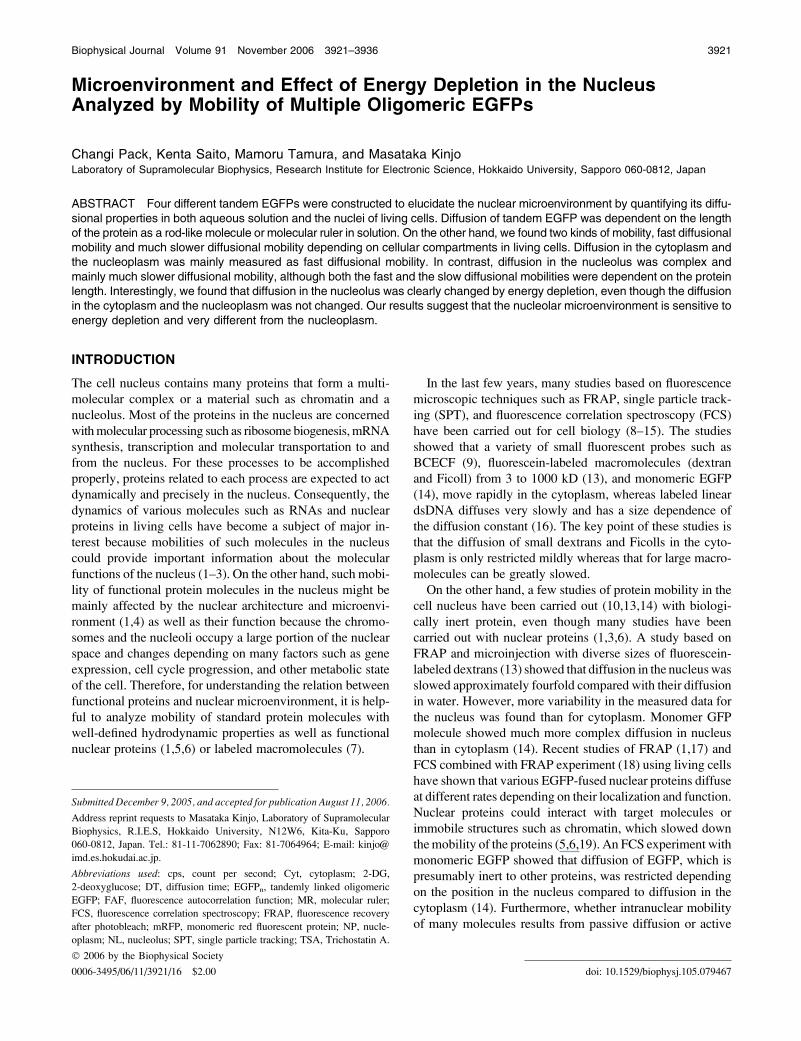
tion. Typical LSM images of HeLa cells expressing each
EGFPn taken at 24 h after transfection are shown in Fig. 1.
Monomer EGFP and EGFP2 were uniformly distributed
through the cytoplasm and nucleus in each cell except in the
nucleolus (Fig. 1 A (F) and B (G)). In contrast, EGFP3,
EGFP4, and EGFP5 showed different distribution patterns in
the cytoplasm and the nucleus. In the case of EGFP3, the
fluorescent intensity of proteins in the cytoplasm was higher
than that in the nucleus, although the difference was not
significant (Fig. 1, C and H). For EGFP4 and EGFP5, the
fluorescent intensity in the nucleus was much weaker than
that in the cytoplasm (Fig. 1 D (I) and E (J)). However, the
fluorescence intensity of EGFP4 and EGFP5 in the nucleus
was sufficient to be detected by LSM measurement (Fig. 1, Iand J). The fluorescent intensities in the nucleus for EGFP2,
EGFP3, EGFP4, and EGFP5 at 48 h were increased compared
with these at 24 h. For all oligomeric EGFPn, there was no
speckled or aggregated distribution in the cytoplasm and the
nucleoplasm and the fluorescence in the nucleoplasm except
in the nucleolus had a uniform pattern (Fig. 1, F–J). This
uniform pattern of fluorescence in the nucleoplasm was
confirmed by comparing the fluorescence of tandem EGFP
with that of H2B-mRFP on HeLa or COS7 cells coexpressing
EGFP3 and H2B-mRFP or EGFP5 and H2B-mRFP, respec-
tively (Fig. S1 in Supplementary Material), because it is known
that H2B-GFP show heterogeneous fluorescent pattern in the
nucleus depending on the density of chromatin (4,31,38). In the
case of HEK293 and COS7 cells transfected with the tandem
EGFPn, the difference of fluorescence intensity between the
cytoplasm and nucleus was clearly discriminated from EGFP3
regardless of the expression level, and the fluorescent intensity
in the nucleus was decreased with the increase in size of
tandem GFP (C. Pack and M. Kinjo, unpublished data).
LSM observations of HeLa cell indicated that tandem
EGFP bigger than EGFP3 (.90 kD) had difficulty localizing
in the nucleus. The localization of EGFPn in the nucleus was
dependent on the size of the EGFPn molecule. Although all
types of tandem GFPn could be localized in the nucleus,
there was less tandem EGFP4 and EGFP5 in the nucleus than
monomeric EGFP, EGFP2, and EGFP3. The small number of
EGFP molecules in the nucleus (from 50 to 5 molecules in
the detection volume of 0.3 fL) might be sufficient to be
detected by FCS measurement even in very weak fluorescent
cells. For the weak fluorescent intensity in the nucleus
for EGFP3, EGFP4, and EGFP5, we did not need to select
weakly expressing cells as explained in Materials and
Methods, and could easily perform FCS measurement in
the nucleus.
FCS measurement in aqueous solution
Tandem EGFPn diffuse in solution like a rod-like molecule
For analysis of the diffusion properties of monomer EGFP
and oligomeric EGFPn in aqueous solution, cells transfected
FIGURE 1 Tandem EGFP located in the nucleus. LSM images of HeLa cells expressing (A) monomer EGFP, (B) EGFP2, (C) EGFP3, (D) EGFP4, and (E)
EGFP5, are shown. The images were taken at 24 h and 48 h after transfection with EGFP and tandem EGFPn, respectively. Bars, 20 mm. Panels F and J show
enlarged images of cells expressing EGFPn from EGFP1 to EGFP5, respectively, showing their location on the nucleus. Bars, 10 mm. The fluorescent intensity
in the nucleus decreased with the increase in size of the oligomers. Tandem EGFPs, regardless of their size, were equally distributed in the nucleoplasm except
the nucleolus (see also supplementary Fig. S1).
3924 Pack et al.
Biophysical Journal 91(10) 3921–3936
with the EGFPn were homogenized and the proteins from the
cell lysate were extracted and measured in aqueous solution.
There was no drastic change or burst of average fluorescent
intensity during FCS measurement resulting from aggre-
gated EGFP molecules or contaminants from the homo-
genized cell extracts during the measurement time of 60 s.
The FAF of each tandem EGFPn was analyzed by a one-
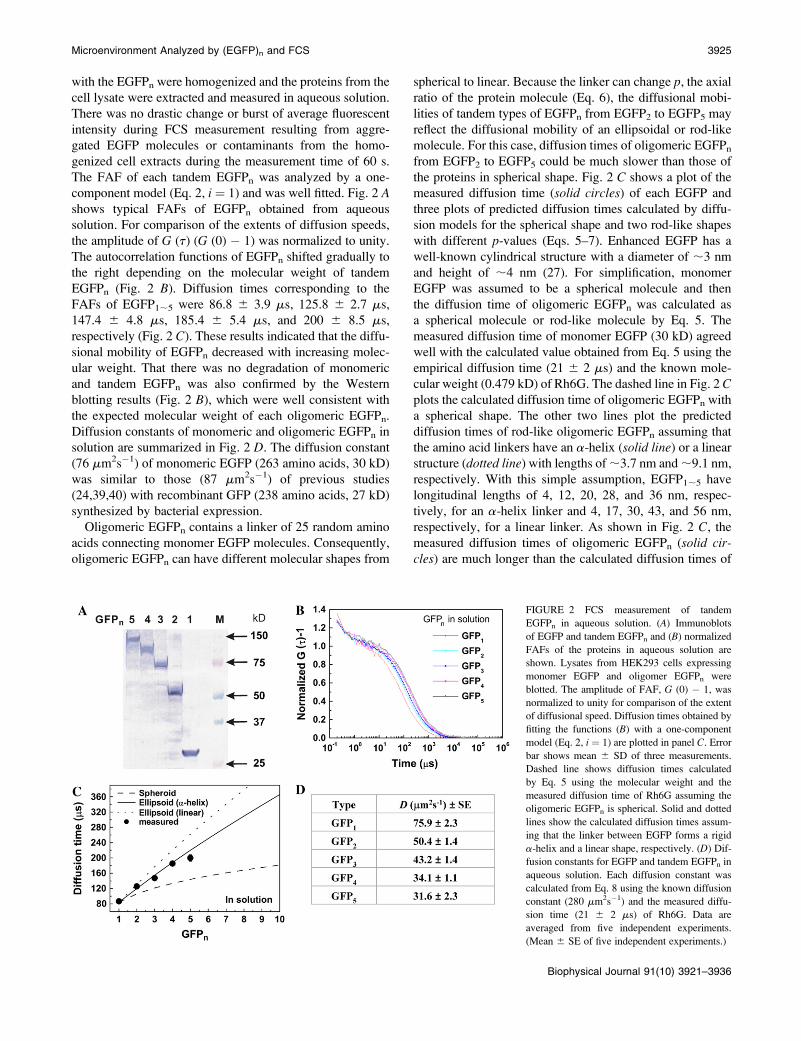
component model (Eq. 2, i ¼ 1) and was well fitted. Fig. 2 Ashows typical FAFs of EGFPn obtained from aqueous
solution. For comparison of the extents of diffusion speeds,
the amplitude of G (t) (G (0) � 1) was normalized to unity.
The autocorrelation functions of EGFPn shifted gradually to
the right depending on the molecular weight of tandem
EGFPn (Fig. 2 B). Diffusion times corresponding to the
FAFs of EGFP1;5 were 86.8 6 3.9 ms, 125.8 6 2.7 ms,
147.4 6 4.8 ms, 185.4 6 5.4 ms, and 200 6 8.5 ms,
respectively (Fig. 2 C). These results indicated that the diffu-
sional mobility of EGFPn decreased with increasing molec-
ular weight. That there was no degradation of monomeric
and tandem EGFPn was also confirmed by the Western
blotting results (Fig. 2 B), which were well consistent with
the expected molecular weight of each oligomeric EGFPn.
Diffusion constants of monomeric and oligomeric EGFPn in
solution are summarized in Fig. 2 D. The diffusion constant
(76 mm2s�1) of monomeric EGFP (263 amino acids, 30 kD)
was similar to those (87 mm2s�1) of previous studies
(24,39,40) with recombinant GFP (238 amino acids, 27 kD)
synthesized by bacterial expression.
Oligomeric EGFPn contains a linker of 25 random amino
acids connecting monomer EGFP molecules. Consequently,
oligomeric EGFPn can have different molecular shapes from
spherical to linear. Because the linker can change p, the axial
ratio of the protein molecule (Eq. 6), the diffusional mobi-
lities of tandem types of EGFPn from EGFP2 to EGFP5 may
reflect the diffusional mobility of an ellipsoidal or rod-like
molecule. For this case, diffusion times of oligomeric EGFPn
from EGFP2 to EGFP5 could be much slower than those of
the proteins in spherical shape. Fig. 2 C shows a plot of the
measured diffusion time (solid circles) of each EGFP and
three plots of predicted diffusion times calculated by diffu-
sion models for the spherical shape and two rod-like shapes
with different p-values (Eqs. 5–7). Enhanced EGFP has a
well-known cylindrical structure with a diameter of ;3 nm
and height of ;4 nm (27). For simplification, monomer
EGFP was assumed to be a spherical molecule and then
the diffusion time of oligomeric EGFPn was calculated as
a spherical molecule or rod-like molecule by Eq. 5. The
measured diffusion time of monomer EGFP (30 kD) agreed
well with the calculated value obtained from Eq. 5 using the
empirical diffusion time (21 6 2 ms) and the known mole-
cular weight (0.479 kD) of Rh6G. The dashed line in Fig. 2 Cplots the calculated diffusion time of oligomeric EGFPn with
a spherical shape. The other two lines plot the predicted
diffusion times of rod-like oligomeric EGFPn assuming that
the amino acid linkers have an a-helix (solid line) or a linear
structure (dotted line) with lengths of ;3.7 nm and ;9.1 nm,
respectively. With this simple assumption, EGFP1;5 have
longitudinal lengths of 4, 12, 20, 28, and 36 nm, respec-
tively, for an a-helix linker and 4, 17, 30, 43, and 56 nm,
respectively, for a linear linker. As shown in Fig. 2 C, the
measured diffusion times of oligomeric EGFPn (solid cir-cles) are much longer than the calculated diffusion times of
FIGURE 2 FCS measurement of tandem
EGFPn in aqueous solution. (A) Immunoblots
of EGFP and tandem EGFPn and (B) normalized
FAFs of the proteins in aqueous solution are
shown. Lysates from HEK293 cells expressing
monomer EGFP and oligomer EGFPn were
blotted. The amplitude of FAF, G (0) � 1, was
normalized to unity for comparison of the extent
of diffusional speed. Diffusion times obtained by
fitting the functions (B) with a one-component
model (Eq. 2, i ¼ 1) are plotted in panel C. Error
bar shows mean 6 SD of three measurements.
Dashed line shows diffusion times calculated
by Eq. 5 using the molecular weight and the
measured diffusion time of Rh6G assuming the
oligomeric EGFPn is spherical. Solid and dotted
lines show the calculated diffusion times assum-
ing that the linker between EGFP forms a rigid
a-helix and a linear shape, respectively. (D) Dif-
fusion constants for EGFP and tandem EGFPn in
aqueous solution. Each diffusion constant was
calculated from Eq. 8 using the known diffusion
constant (280 mm2s�1) and the measured diffu-
sion time (21 6 2 ms) of Rh6G. Data are
averaged from five independent experiments.
(Mean 6 SE of five independent experiments.)
Microenvironment Analyzed by (EGFP)n and FCS 3925
Biophysical Journal 91(10) 3921–3936
the EGFPn as a spherical molecule and well agreed with the
rod-like model for the a-helix linker, even though the dif-
fusion time of EGFP5 was slightly shorter than the calculated
value. This indicated that diffusion of monomer and oligo-
meric EGFPn from EGFP2 to EGFP5 in solution reflected
free diffusion of rod-like molecules and depended on the
putative length of the oligomeric EGFP. Consequently, we
concluded that monomeric and oligomeric EGFPn could be
used as molecular rulers that change the diffusion time
according to their own longitudinal length. This property of
tandem EGFPn will be useful to analyze mobility of proteins
in organelles, particularly in the subnuclear microenvironment.
LSM and FCS measurement in cells
FCS measurements of oligomeric EGFPn in vivo were per-
formed using three cell lines, HEK293, COS7, and HeLa.
Cells expressing a comparatively low concentration of
EGFPn under ;20 molecules (,0.1 mM) per detection
volume (0.3 fL) were chosen because a dilute concentration
of fluorescent molecules is adequate for FCS measurement.
Even with this condition, there might be photobleaching
effect on FCS measurements. Recently, a method combining
FCS with photobleaching analysis was reported for studying
intracellular binding and diffusion of functional proteins
(41). This study suggested that the method is applicable to
analyze mobility of monomer EGFP even in highly fluores-
cent cells. Nevertheless, it is noted that our study focused on
the mobility of freely moving tandem EGFPn in the micro-
environment containing the detection volume, but not that of
immobile tandem EGFPn, which gives rise to a photo-
bleaching and make FCS analysis more complex. For exclud-
ing a possible photobleaching effect, we carefully selected
cells with weak fluorescence or without photobleaching
during FCS measurement.
All FCS measurements were performed after taking LSM
images and multiple positions for FCS measurements in the
cytoplasm excepting endoplasmic reticulum and plasma
membrane, and multiple positions in the nucleus were chosen
in the LSM image of a cell. After FCS measurements, an
LSM image was taken again to check whether measured
positions of FCS were deviated from the LSM images. In
weakly fluorescent cells, it was not easy to discriminate the
nucleolus from the nucleoplasm, particularly, in cells expres-
sing EGFP3, EGFP4, and EGFP5, in which most of the
proteins were located in the cytoplasm and only a few EGFP
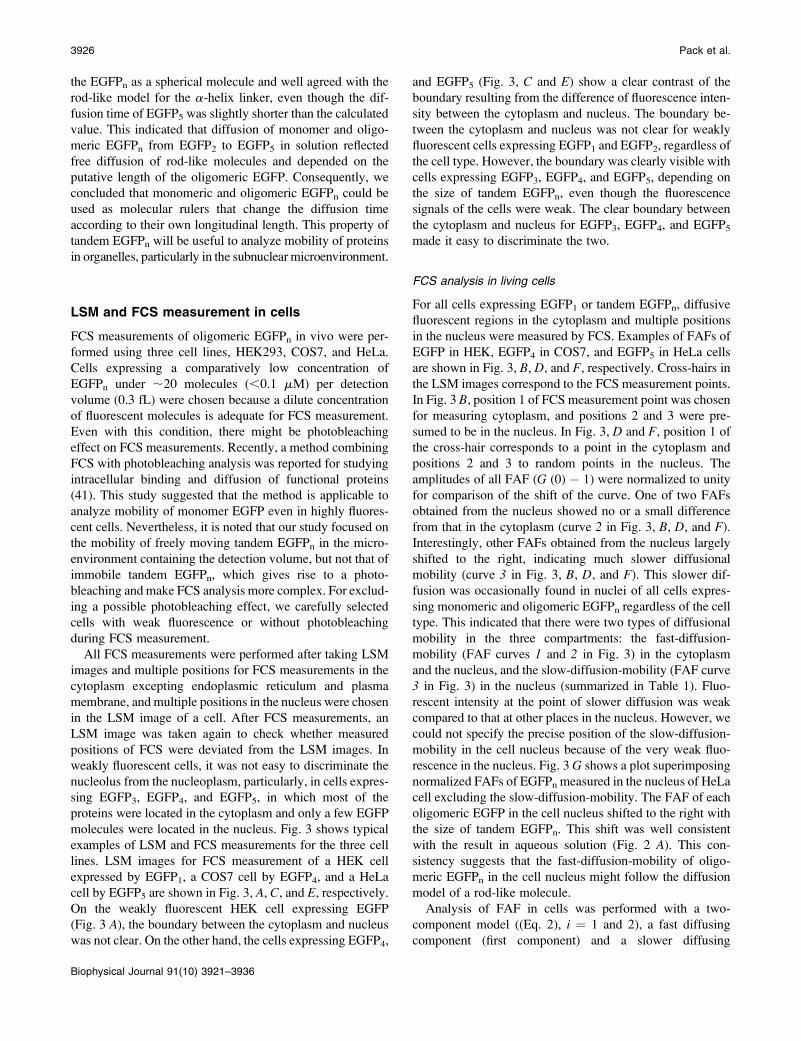
molecules were located in the nucleus. Fig. 3 shows typical
examples of LSM and FCS measurements for the three cell
lines. LSM images for FCS measurement of a HEK cell
expressed by EGFP1, a COS7 cell by EGFP4, and a HeLa
cell by EGFP5 are shown in Fig. 3, A, C, and E, respectively.
On the weakly fluorescent HEK cell expressing EGFP
(Fig. 3 A), the boundary between the cytoplasm and nucleus
was not clear. On the other hand, the cells expressing EGFP4,
and EGFP5 (Fig. 3, C and E) show a clear contrast of the
boundary resulting from the difference of fluorescence inten-
sity between the cytoplasm and nucleus. The boundary be-
tween the cytoplasm and nucleus was not clear for weakly
fluorescent cells expressing EGFP1 and EGFP2, regardless of
the cell type. However, the boundary was clearly visible with
cells expressing EGFP3, EGFP4, and EGFP5, depending on
the size of tandem EGFPn, even though the fluorescence
signals of the cells were weak. The clear boundary between
the cytoplasm and nucleus for EGFP3, EGFP4, and EGFP5
made it easy to discriminate the two.
FCS analysis in living cells
For all cells expressing EGFP1 or tandem EGFPn, diffusive
fluorescent regions in the cytoplasm and multiple positions
in the nucleus were measured by FCS. Examples of FAFs of
EGFP in HEK, EGFP4 in COS7, and EGFP5 in HeLa cells
are shown in Fig. 3, B, D, and F, respectively. Cross-hairs in
the LSM images correspond to the FCS measurement points.
In Fig. 3 B, position 1 of FCS measurement point was chosen
for measuring cytoplasm, and positions 2 and 3 were pre-
sumed to be in the nucleus. In Fig. 3, D and F, position 1 of
the cross-hair corresponds to a point in the cytoplasm and
positions 2 and 3 to random points in the nucleus. The
amplitudes of all FAF (G (0) � 1) were normalized to unity
for comparison of the shift of the curve. One of two FAFs
obtained from the nucleus showed no or a small difference
from that in the cytoplasm (curve 2 in Fig. 3, B, D, and F).
Interestingly, other FAFs obtained from the nucleus largely
shifted to the right, indicating much slower diffusional
mobility (curve 3 in Fig. 3, B, D, and F). This slower dif-
fusion was occasionally found in nuclei of all cells expres-
sing monomeric and oligomeric EGFPn regardless of the cell
type. This indicated that there were two types of diffusional
mobility in the three compartments: the fast-diffusion-
mobility (FAF curves 1 and 2 in Fig. 3) in the cytoplasm
and the nucleus, and the slow-diffusion-mobility (FAF curve
3 in Fig. 3) in the nucleus (summarized in Table 1). Fluo-
rescent intensity at the point of slower diffusion was weak
compared to that at other places in the nucleus. However, we
could not specify the precise position of the slow-diffusion-
mobility in the cell nucleus because of the very weak fluo-
rescence in the nucleus. Fig. 3 G shows a plot superimposing
normalized FAFs of EGFPn measured in the nucleus of HeLa
cell excluding the slow-diffusion-mobility. The FAF of each
oligomeric EGFP in the cell nucleus shifted to the right with
the size of tandem EGFPn. This shift was well consistent
with the result in aqueous solution (Fig. 2 A). This con-
sistency suggests that the fast-diffusion-mobility of oligo-
meric EGFPn in the cell nucleus might follow the diffusion
model of a rod-like molecule.
Analysis of FAF in cells was performed with a two-
component model ((Eq. 2), i ¼ 1 and 2), a fast diffusing
component (first component) and a slower diffusing
3926 Pack et al.
Biophysical Journal 91(10) 3921–3936
component (second component), because FAF of each
tandem EGFPn cannot be fitted by a one-component model,
but best fitted by the two-component model. However, some
FAFs were best fitted by a one-component model. In this
case, we adopted the result of one-component analysis
(supplementary Fig. S2). The first component was consid-
ered to be a freely diffusing component and the second
component was assumed to be a slowly diffusing component
(14,24,42). High density of the cellular solutes and some
restricted mobility in a cellular microstructure may slow
FIGURE 3 Two kinds of diffusional mobil-
ity in the nucleus. For FCS analysis, very weakly
fluorescent and nonphotobleaching cells less
than the molecular number of N ¼ 20 in the
detection volume of FCS, which corresponds to
a concentration under 10�7 M, were selected at
24 h after transfection. After recording LSM
images of selected (A) HEK, (C) COS7, and (E)
HeLa cells, FCS measurements were per-
formed on multiple places in the cytoplasm
and in the nucleus. Bars, 5 mm. For clarifica-
tion, only three typical and normalized FAFs of
EGFP1, EGFP4, and EGFP5 in the cytoplasm
(curve 1) and the nucleus (curves 2 and 3) in
HEK, COS7, and HeLa cells are shown in
panels B, D, and F, respectively. The rightward
shift of the FAF curve indicates the slow-
diffusion-mobility. The nucleus has both fast
diffusion (curve 2) and much slower diffusion
(curve 3). The normalized FAFs of EGFP and
tandem EGFPn in the nucleus of a HeLa cell
with the fast-diffusion-mobility (curve 2) are
summarized in panel G. The normalized FAFs
of the fast-diffusion-mobility were gradually
shifted to the right according their molecular
size. (Cyt, cytoplasm).
Microenvironment Analyzed by (EGFP)n and FCS 3927
Biophysical Journal 91(10) 3921–3936
down free diffusion. With conditions of cells having a con-
centration under 20 EGFPn molecules (,0.1 mM) and a
comparatively short measurement time under 30 s, the
influence of photobleaching on diffusion time, which gives
rise to a very long diffusion time and an increase of the
fraction (yi value in Eq. 2), could be minimized. Photo-
bleaching effects were checked from the time trace of fluo-
rescent intensity for all FCS data (supplementary Fig. S3).
Increasing the incubation time after transfection for a few
days made the effect of photobleach on FCS measurement
much stronger, because the promoter for protein expression
is strong and not a controlled one. In practice, photo-
bleaching effect was very small for weakly fluorescent cells
at an early stage after expression of tandem GFP (supple-
mentary Fig. S4). Background fluorescent signals under 2 3
103 cps and 10 3 103 cps were detected in medium and non-
transfected HeLa, HEK, and COS7 cells (14). No signifi-
cant correlation amplitudes were detected in the culture
medium. In contrast, very weak correlations with very long
diffusion times above 105 ms were sometimes detected in
each cell type when FCS measurement was carried out over
longer duration over 60 s. This was derived from very slow
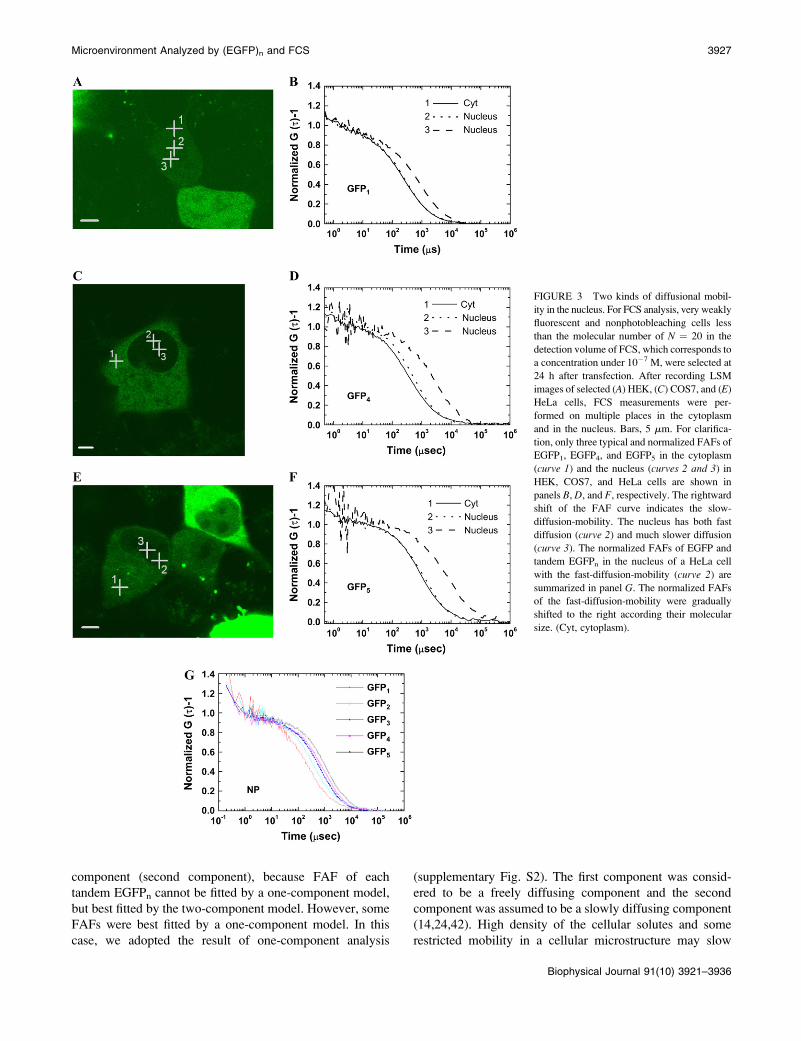
TABLE 1 Diffusion constants of monomeric EGFP and tandem EGFPn in the cytoplasm, the nucleoplasm, and the nucleolus in three
different living cells (23)
Fast (fraction) Slow (fraction) Very slow (fraction)
*Fast-diffusion-mobility (Cyt and NP) (.90%) – (,10%)
Slow-diffusion-mobility (NL) (,80%) (20%;100%) –
Cyt (fast/first components) NP (fast/first components)
yCell line Type of GFP D (mm2s�1) Fraction (%) D (mm2s�1) Fraction (%)
HeLa GFP1 23.4 6 2.5 95 22.7 6 2.3 96
GFP2 16.4 6 0.8 92 14.9 6 0.8 93
GFP3 13.1 6 1.4 91 11.6 6 1.7 91
GFP4 9.0 6 0.8 93 8.6 6 0.6 90
GFP5 8.3 6 1.1 90 7.8 6 1.2 90
COS7 GFP1 27.1 6 3.0 90 22.3 6 1.3 95
GFP2 15.8 6 1.0 93 14.9 6 0.3 92
GFP3 14.7 6 0.6 91 11.1 6 0.8 94
GFP4 10.8 6 1.0 92 9.2 6 0.8 91
GFP5 9.5 6 1.0 90 7.9 6 0.4 90
HEK GFP1 21.0 6 1.6 95 24.9 6 2.1 93
GFP2 17.4 6 3.5 92 16.4 6 2.2 95
GFP3 14.1 6 1.4 91 13.2 6 0.9 91
GFP4 10.3 6 1.1 90 10.5 6 1.8 90
GFP5 10.4 6 0.5 92 9.6 6 0.4 92
NL (fast/first components) NL (slow/second components)
Cell line Type of GFP Dz (mm2s�1) Fraction (%) Dz (mm2s�1) Fraction (%)
HeLa GFP1 24.2 6 1.3 – 5.8 6 1.6 –
GFP2 17.6 6 1.2 – 3.8 6 0.5 –
GFP3 13.0 6 1.0 – 2.1 6 0.3 –
GFP4 11.0 6 0.7 – 1.9 6 0.1 –
GFP5 8.9 6 0.4 – 1.6 6 0.4 –
COS7 GFP1 22.8 6 1.7 – 5.7 6 1.6 –
GFP2 16.1 6 2.9 – 3.7 6 0.8 –
GFP3 13.3 6 1.5 – 1.7 6 0.2 –
GFP4 9.0 6 0.3 – 1.3 6 0.2 –
GFP5 9.1 6 0.8 – 1.1 6 0.2 –
*Two kinds of mobility, fast-diffusion-mobility and slow-diffusion-mobility, were differentiated by two-component analysis of G (t). The fast-diffusion-
mobility has ‘‘fast’’ and ‘‘very slow’’ components. In contrast, the slow-diffusion-mobility has ‘‘fast’’ and ‘‘slow’’ components. These three components
have different ranges for the diffusion time and fraction.yThe diffusion constants and fractions in cytoplasm (Cyt) and nucleoplasm (NP) correspond to the average diffusion constants and fractions for the first
component of the fast-diffusion-mobility (‘‘fast’’ in top part of table). The diffusion constant and fractions of the second component (‘‘very slow’’ in top part
of table) is not shown. The diffusion constant in the nucleolus (NL) corresponds to those for the first component (‘‘fast’’ in top part of table) and the second
component (‘‘slow’’ in top part of table) of the slow-diffusion-mobility. The fraction in the NL was not shown because the values were very variable (see also
the text). The values of D in NL indicated those having a fraction .50%. Data were averaged over 15–20 cells for HeLa, COS7, and HEK293 (Mean 6 SE of
three independent experiments).zThe average values of D in the nucleolus were obtained from cells only expressing monomer EGFP and tandem EGFPn without mRFP-fibrillarin. These
values were consistent with the result of Fig.5 E obtained by coexpressed cells.
3928 Pack et al.
Biophysical Journal 91(10) 3921–3936
and large fluctuation of fluorescence but not from photo-
bleaching. To solve the background with very slow fluctu-
ation, we adapted a shorter measurement time as described
above. Considering each tandem EGFP has much larger
brightness per molecule than that of monomer EGFP (C.
Pack and M. Kinjo, unpublished data) and the diffusion time
of the proteins was an order of millisecond ranges, the short
measurement time of FCS might be enough to obtain a
reliable autocorrelation function.
Two diffusional mobility in the nucleus
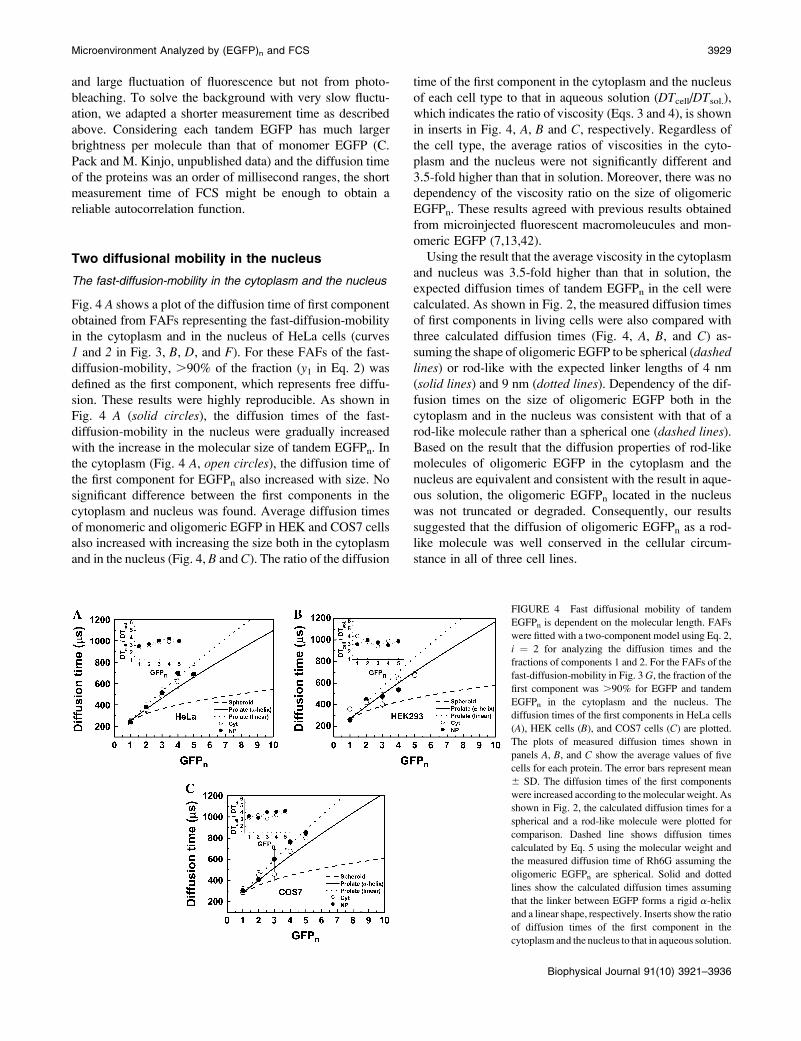
The fast-diffusion-mobility in the cytoplasm and the nucleus
Fig. 4 A shows a plot of the diffusion time of first component
obtained from FAFs representing the fast-diffusion-mobility
in the cytoplasm and in the nucleus of HeLa cells (curves
1 and 2 in Fig. 3, B, D, and F). For these FAFs of the fast-
diffusion-mobility, .90% of the fraction (y1 in Eq. 2) was
defined as the first component, which represents free diffu-
sion. These results were highly reproducible. As shown in
Fig. 4 A (solid circles), the diffusion times of the fast-
diffusion-mobility in the nucleus were gradually increased
with the increase in the molecular size of tandem EGFPn. In
the cytoplasm (Fig. 4 A, open circles), the diffusion time of
the first component for EGFPn also increased with size. No
significant difference between the first components in the
cytoplasm and nucleus was found. Average diffusion times
of monomeric and oligomeric EGFP in HEK and COS7 cells
also increased with increasing the size both in the cytoplasm
and in the nucleus (Fig. 4, B and C). The ratio of the diffusion
time of the first component in the cytoplasm and the nucleus
of each cell type to that in aqueous solution (DTcell/DTsol.),
which indicates the ratio of viscosity (Eqs. 3 and 4), is shown
in inserts in Fig. 4, A, B and C, respectively. Regardless of
the cell type, the average ratios of viscosities in the cyto-
plasm and the nucleus were not significantly different and
3.5-fold higher than that in solution. Moreover, there was no
dependency of the viscosity ratio on the size of oligomeric
EGFPn. These results agreed with previous results obtained
from microinjected fluorescent macromoleucules and mon-
omeric EGFP (7,13,42).
Using the result that the average viscosity in the cytoplasm
and nucleus was 3.5-fold higher than that in solution, the
expected diffusion times of tandem EGFPn in the cell were
calculated. As shown in Fig. 2, the measured diffusion times
of first components in living cells were also compared with
three calculated diffusion times (Fig. 4, A, B, and C) as-
suming the shape of oligomeric EGFP to be spherical (dashedlines) or rod-like with the expected linker lengths of 4 nm
(solid lines) and 9 nm (dotted lines). Dependency of the dif-
fusion times on the size of oligomeric EGFP both in the
cytoplasm and in the nucleus was consistent with that of a
rod-like molecule rather than a spherical one (dashed lines).
Based on the result that the diffusion properties of rod-like
molecules of oligomeric EGFP in the cytoplasm and the
nucleus are equivalent and consistent with the result in aque-
ous solution, the oligomeric EGFPn located in the nucleus
was not truncated or degraded. Consequently, our results
suggested that the diffusion of oligomeric EGFPn as a rod-
like molecule was well conserved in the cellular circum-
stance in all of three cell lines.
FIGURE 4 Fast diffusional mobility of tandem
EGFPn is dependent on the molecular length. FAFs
were fitted with a two-component model using Eq. 2,
i ¼ 2 for analyzing the diffusion times and the
fractions of components 1 and 2. For the FAFs of the
fast-diffusion-mobility in Fig. 3 G, the fraction of the
first component was .90% for EGFP and tandem
EGFPn in the cytoplasm and the nucleus. The
diffusion times of the first components in HeLa cells
(A), HEK cells (B), and COS7 cells (C) are plotted.
The plots of measured diffusion times shown in
panels A, B, and C show the average values of five
cells for each protein. The error bars represent mean
6 SD. The diffusion times of the first components
were increased according to the molecular weight. As
shown in Fig. 2, the calculated diffusion times for a
spherical and a rod-like molecule were plotted for
comparison. Dashed line shows diffusion times
calculated by Eq. 5 using the molecular weight and
the measured diffusion time of Rh6G assuming the
oligomeric EGFPn are spherical. Solid and dotted
lines show the calculated diffusion times assuming
that the linker between EGFP forms a rigid a-helix
and a linear shape, respectively. Inserts show the ratio
of diffusion times of the first component in the
cytoplasm and the nucleus to that in aqueous solution.
Microenvironment Analyzed by (EGFP)n and FCS 3929
Biophysical Journal 91(10) 3921–3936
Other diffusion times (second component) of the FAFs for
the fast-diffusion-mobility (curves 1 and 2 in Fig. 3, B, D,
and F) were very slow, and ranged from 104 to 105 ms in the
nucleus as well as in the cytoplasm. The range of these long
diffusion times was very broad and so it is not clear that the
diffusion time of the second component was also dependent
on the size of tandem EGFPn. The fraction of the second
component (y2 in Eq. 2) was very small (,10%), regardless
of the size of tandem EGFPn. The slow drift of fluorescence
could come from cell mobility or very large organelles such
as vesicles in cytoplasm (24,42) and such as a compact
structure of chromatin in nucleus (4) during FCS measure-
ment. Otherwise very weak photobleaching might be not
completely excluded, even though data of photobleached
samples were checked and excluded. However, a possibility
of trapped diffusion in complex chromatin structures cannot
be completely excluded. To analyze an effect of chromatin
structures on the very slow diffusion time, we treated cells
coexpressing tandem EGFP3 and H2B-mRFP or EGFP5 and
H2B-mRFP, respectively, with Trichostatin A (TSA) (sup-
plementary Fig. S5). It was previously reported that TSA
inhibits histone deacetylation and so increases chromatin
accessibility of relatively larger dextrans (4,43). In LSM
observation, no significant changes of fluorescent pattern for
tandem EGFP3 and EGFP5 were found, although that of
H2B-mRFP was significantly changed after TSA treatment
(supplementary Figs. S1 and S5). This result suggests that
tandem EGFPn can freely and equally access to all regions of
euchromatin and heterochromatin and so no effect of TSA
treatment occurred. Moreover, there were no significant
changes of diffusion time and fraction for the very slow com-
ponent in the nucleoplasm after TSA treatment when FCS
measurements on euchromatin (dilute H2B-mRFP fluores-
cent region) and heterochromatin (dense H2B-mRFP fluo-
rescent region) were carried out) (C. Pack and M. Kinjo,
unpublished data). Because the fraction of the very slow
component was very small (,10%) and the diffusion times
were very broad with large standard deviation even before
TSA treatment, it is likely that the effect of TSA treatment on
mobility of tandem EGFPn in the nucleus cannot be
detectable in our experimental system. Nevertheless, the
result of LSM observation was consistent with the result of
FCS measurement. Details and discussion of such very slow
diffusion can be omitted in this article because the fraction is
small and we focus on well-defined diffusion property of
tandem EGFPn as molecular ruler.
The slow-diffusion-mobility in the nucleus
On the other hand, the right-shifted FAFs for tandem EGFPn,
which represent the slow diffusion-mobility, found in the
nucleus (curves 3, dashed lines in Fig. 3, B, D, and F)
showed a different range of diffusion times and a different
fraction for the second component compared to those for the
fast-diffusion-mobility (curves 1 and 2, solid and dotted lines
in Fig. 3, B, D, and F). Obviously, although the diffusion
times of the first component for the slow-diffusion-mobility in
the nucleus were consistent with those for the fast-diffusion-
mobility in the cytoplasm and in the nucleus (Table 1), the
diffusion times of the second component for the slow-dif-
fusion-mobility ranged from 800 to 5000 ms, increasing with
the size of tandem EGFP (e.g., curve 3 in Fig. 3, B, D, and F).
Moreover, the fraction of the second component for the
slow-diffusion-mobility varied from 20 to 100% depending
on the cells, and even the measured position in the same nu-
cleus. This observation was very reproducible, and was con-
sistent among the three cell types. Obviously, our results
indicated that the protein mobility in the nuclear microen-
vironment might be separated into two kinds of diffusing
species (i.e., the first component of fast-diffusion-mobility
and the second component of slow-diffusion-mobility). These
two kinds of diffusing species had different ranges of dif-
fusion time (or apparent viscosity) depending on the position
inside the nucleus.
The slow-diffusion-mobility of tandem EGFPn in the nucleolus
Fluorescent intensity at the position of the slow-diffusion-
mobility (i.e., the right-shifted FAFs) in the nucleus (position
3 of Fig. 3, A, C, and E) was weak compared to other places
inside the nucleus. In addition, the slow-diffusion-mobility
was often found in the nucleolus in the cells expressing
EGFP4 and EGFP5 with large and clear nucleoli. The den-
sity, the number, and the morphology of the nucleolus
changed according to the cell cycle as well as cell type and
other cell conditions. Recently, the nucleolus has been de-
tected by fluorescence microscopy in cell lines expressing
fluorescent protein-tagged nucleolar proteins such as fibril-
larin and B23 (32,44). Fibrillarin is related to various steps of
pre-rRNA processing and ribosome assembly and located in
the dense fibrillar component (DFC) of the nucleolus during
interphase (45). Using a nucleolar protein tagged with dif-
ferent fluorescent proteins will help in discriminating the nu-
cleolar structures from nucleoplasm and tracing the changes
of the nuclear structure during the cell cycle or depending on
physiological cell conditions.
Fig. 5 shows an LSM image and FCS measurement of a
HeLa cell coexpressing EGFP4 and mRFP-fibrillarin. The
strong red fluorescence in the nucleus (Fig. 5 A) indicates
the nucleolus. A weak green fluorescence signal was also
detected in the nucleoplasm (Fig. 5 B). This LSM observa-
tion for fibrillarin agreed with the previous results (12,32).
The shape, the size, and the number of nucleoli were differ-
ent from cell to cell. Using cotransfected HeLa cells, FCS
measurement was carried out for positions of green fluores-
cent nucleoplasm and the red fluorescent nucleolus with a
diameter of over 2 mm in the x-y plane of the LSM image.
FAF inside the nucleolus (Fig. 5 D, red line) shifted to the
right compared to that in the nucleoplasm (Fig. 5 D, blackline), which meant that the diffusion in the nucleolus was
3930 Pack et al.
Biophysical Journal 91(10) 3921–3936
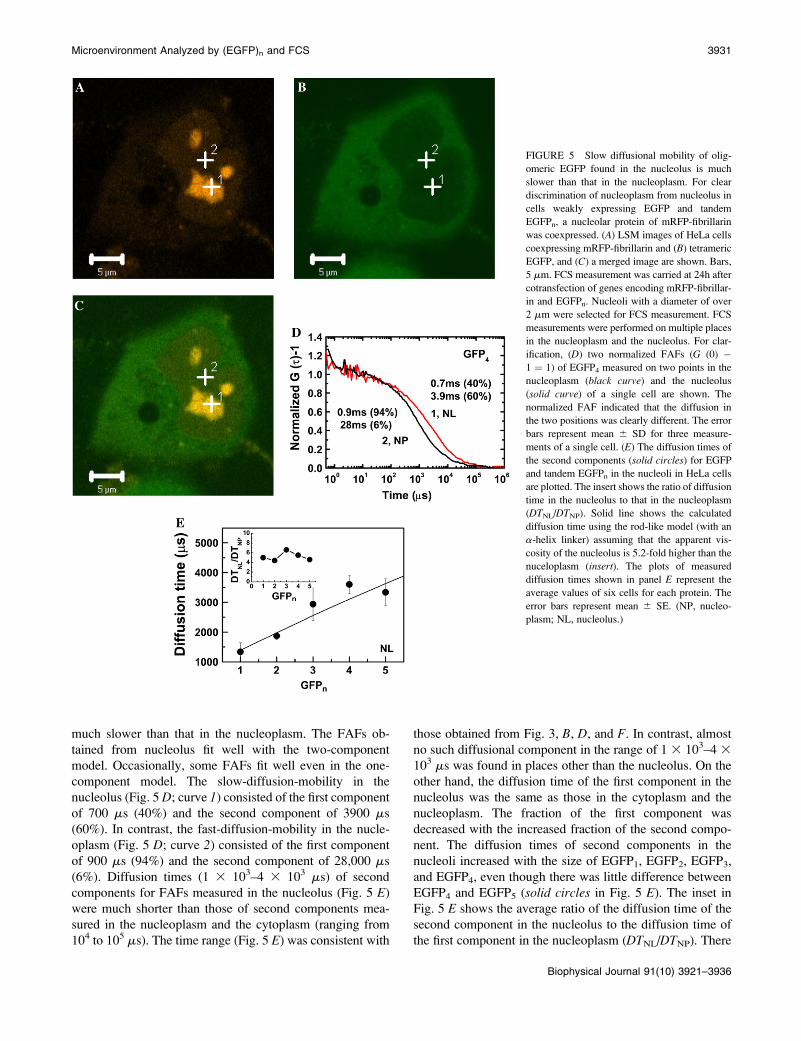
much slower than that in the nucleoplasm. The FAFs ob-
tained from nucleolus fit well with the two-component
model. Occasionally, some FAFs fit well even in the one-
component model. The slow-diffusion-mobility in the
nucleolus (Fig. 5 D; curve 1) consisted of the first component
of 700 ms (40%) and the second component of 3900 ms
(60%). In contrast, the fast-diffusion-mobility in the nucle-
oplasm (Fig. 5 D; curve 2) consisted of the first component
of 900 ms (94%) and the second component of 28,000 ms
(6%). Diffusion times (1 3 103–4 3 103 ms) of second
components for FAFs measured in the nucleolus (Fig. 5 E)
were much shorter than those of second components mea-
sured in the nucleoplasm and the cytoplasm (ranging from
104 to 105 ms). The time range (Fig. 5 E) was consistent with
those obtained from Fig. 3, B, D, and F. In contrast, almost
no such diffusional component in the range of 1 3 103–4 3
103 ms was found in places other than the nucleolus. On the
other hand, the diffusion time of the first component in the
nucleolus was the same as those in the cytoplasm and the
nucleoplasm. The fraction of the first component was
decreased with the increased fraction of the second compo-
nent. The diffusion times of second components in the
nucleoli increased with the size of EGFP1, EGFP2, EGFP3,
and EGFP4, even though there was little difference between
EGFP4 and EGFP5 (solid circles in Fig. 5 E). The inset in
Fig. 5 E shows the average ratio of the diffusion time of the
second component in the nucleolus to the diffusion time of
the first component in the nucleoplasm (DTNL/DTNP). There
FIGURE 5 Slow diffusional mobility of olig-
omeric EGFP found in the nucleolus is much
slower than that in the nucleoplasm. For clear
discrimination of nucleoplasm from nucleolus in
cells weakly expressing EGFP and tandem
EGFPn, a nucleolar protein of mRFP-fibrillarin
was coexpressed. (A) LSM images of HeLa cells
coexpressing mRFP-fibrillarin and (B) tetrameric
EGFP, and (C) a merged image are shown. Bars,
5 mm. FCS measurement was carried at 24h after
cotransfection of genes encoding mRFP-fibrillar-
in and EGFPn. Nucleoli with a diameter of over
2 mm were selected for FCS measurement. FCS
measurements were performed on multiple places
in the nucleoplasm and the nucleolus. For clar-
ification, (D) two normalized FAFs (G (0) �1 ¼ 1) of EGFP4 measured on two points in the
nucleoplasm (black curve) and the nucleolus
(solid curve) of a single cell are shown. The
normalized FAF indicated that the diffusion in
the two positions was clearly different. The error
bars represent mean 6 SD for three measure-
ments of a single cell. (E) The diffusion times of
the second components (solid circles) for EGFP
and tandem EGFPn in the nucleoli in HeLa cells
are plotted. The insert shows the ratio of diffusion
time in the nucleolus to that in the nucleoplasm
(DTNL/DTNP). Solid line shows the calculated
diffusion time using the rod-like model (with an
a-helix linker) assuming that the apparent vis-
cosity of the nucleolus is 5.2-fold higher than the
nuceloplasm (insert). The plots of measured
diffusion times shown in panel E represent the
average values of six cells for each protein. The
error bars represent mean 6 SE. (NP, nucleo-
plasm; NL, nucleolus.)
Microenvironment Analyzed by (EGFP)n and FCS 3931
Biophysical Journal 91(10) 3921–3936
was no dependency of the ratio on the size of EGFPn and
average value of the ratio for all tandem EGFPn was ;5.2.
The solid line in Fig. 5 E shows the calculated diffusion
times of tandem EGFPn as a rod-like molecule with an
a-helix linker when the relative viscosity in the nucleolus is
fixed by the average ratio of diffusion time (Fig. 5 E, inset).The measured diffusion times of tandem EGFPn were
consistent with the calculated values. Our results indicated
that the slow-diffusion-mobility in the nucleolus also re-
flected the diffusion of a rod-like molecule rather than a
spherical molecule.
Table 1 summarizes the diffusion constants of the fast-
diffusion-mobility (the first component with a fraction
.90%) found in the cytoplasm and the nucleoplasm, and
the diffusion constants of the slow-diffusion-mobility (first
and second components) found in the nucleolus. The average
values were obtained from living cells only expressing mono-
mer EGFP and tandem EGFPn without mRFP-fibrillarin.
Diffusion constants of the fast-diffusion-mobility both in the
nucleoplasm and in the cytoplasm decreased with the length
of tandem EGFPn in HeLa, COS7, and HEK cells, even
though the diffusion constants of EGFP4 and EGFP5 in the
cytoplasm of HEK cells did not change. Diffusion constants
of the first and the second components in the nucleoli of
HeLa and COS7 cells also decreased with the length of
EGFPn. There was little difference between diffusion con-
stants in the cytoplasm and the nucleoplasm of HEK293 and
HeLa cells. In contrast, diffusion constants in the cytoplasm
of COS7 cells were slightly larger than those in the nucleo-
plasm. Based on these results, it was concluded that the
diffusional motion of tandem EGFPn in the nucleous as well
as in the cytoplasm and the nucleoplasm was well consistent
with free diffusion of rod-like molecules, regardless of the
cell type. It is emphasized that the microenvironment of the
nucleolus as well as the nucleoplasm and the cytoplasm
could be quantitatively understood by diffusion analysis of
the oligomeric EGFPn as molecular rulers (MR). Moreover,
our results indicated that the microenvironment and apparent
viscosity of the cytoplasm and the nucleoplasm were almost
same, even though the constituents of the two compartments
were very different.
Compared with those of the first component in the nucleo-
plasm, the fractions of the second components in the nucleoli
were significantly changed from 20 to 100% depending on
the nucleolus, even in the same cell (C. Pack and M. Kinjo,
unpublished data). Because the length of the z axis (optical
axis) of detection volume (,2 mm) was six times longer than
the diameter in the x-y plane (,0.2 mm), FCS measurement
of a nucleolus with a length in the z axis shorter than 2 mm
might contain both the nucleoplasm and the nucleolus. This
might affect the variability of the fraction. However, it is also
presumed that the diffusion of oligomeric EGFPn in the nu-
cleolus has more variability than that found in the cytoplasm
and the nucleoplasm, indicating the dynamic change of the
nucleolar microenvironment or the complexity of subnu-
cleolar structures such as DFC, fibrillar centers, and the
granular region (45,46). More detailed study using two-color
3D imaging combined with FCS measurement is in progress
for elucidating the large diffusion changes in the nucleolus
according to a long-time scale or the cell cycle of a single
cell. Nevertheless, our results showed that the mobility of
MR in the nucleolus was dependent onto length of them, but
was much slower than those in the cytoplasm and the nu-
cleoplasm. Consequently, it was concluded that the diffusion
of protein in the nucleus must be separated into two sig-
nificant diffusing components, fast-diffusion-mobility in the
nucleoplasm and slow-diffusion-mobility in the nucleolus.
Nucleolar microenvironment is sensitive toenergy depletion
To examine effect of energy depletion on the mobility of
oligomeric EGFP in the nuclear microenvironment, the
culture medium containing HeLa cells expressing EGFP4 or
EGFP5 was perfused with 2-DG and NaN3 solution (3,20) at
25 or 37�C. LSM and FCS measurements were carried out
with HeLa cells expressing EGFP5 or coexpressing EGFP5
and mRFP-fibrillarin (or H2B-mRFP). For FCS measure-
ment of cells transfected with EGFP5, HeLa cells with clear
and large nucleoli (.4 mm in diameter) were chosen despite
the fluorescence signals of the cytoplasm being a little strong
(for example, right upper cell in Fig. 3 E). FCS measurement
was carried on the same position of single cells before and
after the energy depletion. We confirmed the redistribution
of H2B-mRFP and nuclear shrinkage through LSM images
of cells coexpressing H2B-mRFP and EGFP5 after ATP
depletion at room temperature for 30 min (C. Pack and M.
Kinjo, unpublished data). This result was consistent with a
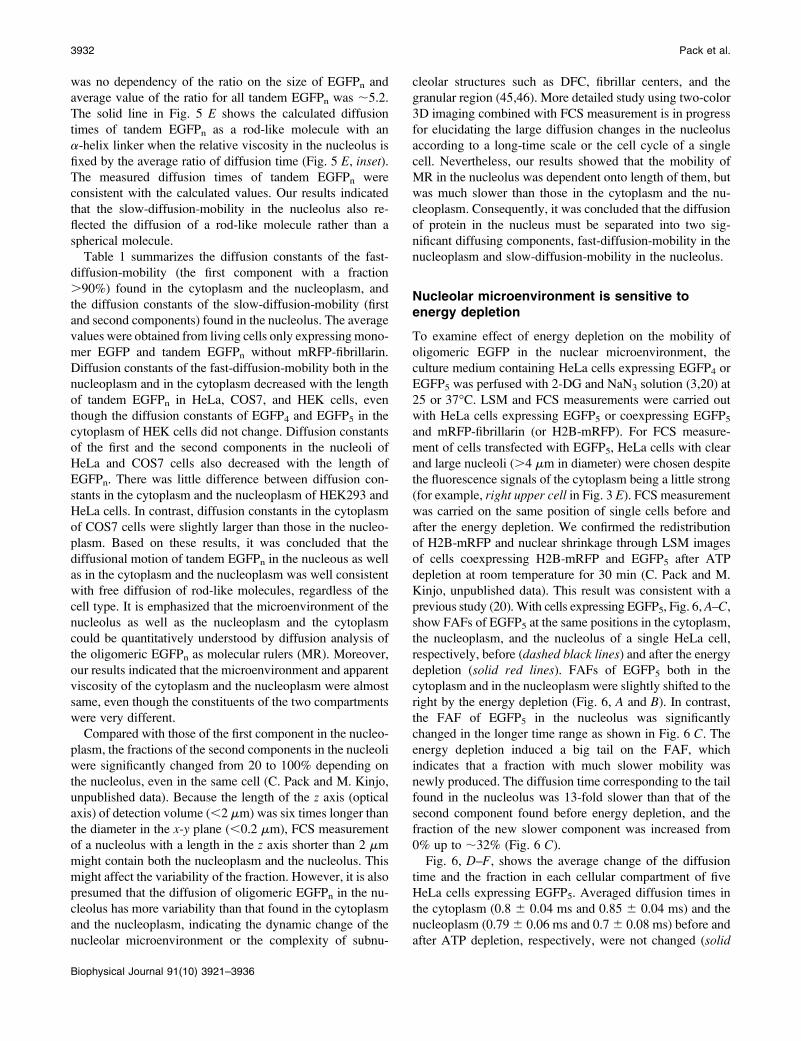
previous study (20). With cells expressing EGFP5, Fig. 6, A–C,
show FAFs of EGFP5 at the same positions in the cytoplasm,
the nucleoplasm, and the nucleolus of a single HeLa cell,
respectively, before (dashed black lines) and after the energy
depletion (solid red lines). FAFs of EGFP5 both in the
cytoplasm and in the nucleoplasm were slightly shifted to the
right by the energy depletion (Fig. 6, A and B). In contrast,
the FAF of EGFP5 in the nucleolus was significantly
changed in the longer time range as shown in Fig. 6 C. The
energy depletion induced a big tail on the FAF, which
indicates that a fraction with much slower mobility was
newly produced. The diffusion time corresponding to the tail
found in the nucleolus was 13-fold slower than that of the
second component found before energy depletion, and the
fraction of the new slower component was increased from
0% up to ;32% (Fig. 6 C).
Fig. 6, D–F, shows the average change of the diffusion
time and the fraction in each cellular compartment of five
HeLa cells expressing EGFP5. Averaged diffusion times in
the cytoplasm (0.8 6 0.04 ms and 0.85 6 0.04 ms) and the
nucleoplasm (0.79 6 0.06 ms and 0.7 6 0.08 ms) before and
after ATP depletion, respectively, were not changed (solid
3932 Pack et al.
Biophysical Journal 91(10) 3921–3936
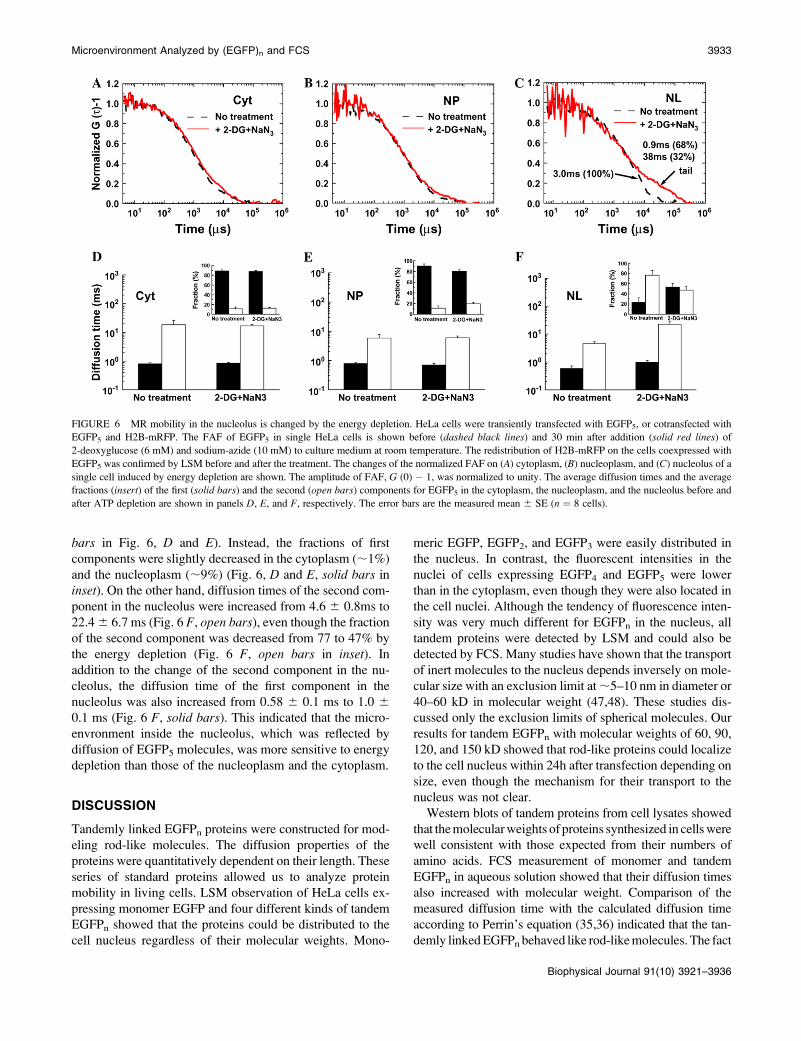
bars in Fig. 6, D and E). Instead, the fractions of first
components were slightly decreased in the cytoplasm (;1%)
and the nucleoplasm (;9%) (Fig. 6, D and E, solid bars in
inset). On the other hand, diffusion times of the second com-
ponent in the nucleolus were increased from 4.6 6 0.8ms to
22.4 6 6.7 ms (Fig. 6 F, open bars), even though the fraction
of the second component was decreased from 77 to 47% by
the energy depletion (Fig. 6 F, open bars in inset). In
addition to the change of the second component in the nu-
cleolus, the diffusion time of the first component in the
nucleolus was also increased from 0.58 6 0.1 ms to 1.0 6
0.1 ms (Fig. 6 F, solid bars). This indicated that the micro-
envronment inside the nucleolus, which was reflected by
diffusion of EGFP5 molecules, was more sensitive to energy
depletion than those of the nucleoplasm and the cytoplasm.
DISCUSSION
Tandemly linked EGFPn proteins were constructed for mod-
eling rod-like molecules. The diffusion properties of the
proteins were quantitatively dependent on their length. These
series of standard proteins allowed us to analyze protein
mobility in living cells. LSM observation of HeLa cells ex-
pressing monomer EGFP and four different kinds of tandem
EGFPn showed that the proteins could be distributed to the
cell nucleus regardless of their molecular weights. Mono-
meric EGFP, EGFP2, and EGFP3 were easily distributed in
the nucleus. In contrast, the fluorescent intensities in the
nuclei of cells expressing EGFP4 and EGFP5 were lower
than in the cytoplasm, even though they were also located in
the cell nuclei. Although the tendency of fluorescence inten-
sity was very much different for EGFPn in the nucleus, all
tandem proteins were detected by LSM and could also be
detected by FCS. Many studies have shown that the transport
of inert molecules to the nucleus depends inversely on mole-
cular size with an exclusion limit at ;5–10 nm in diameter or
40–60 kD in molecular weight (47,48). These studies dis-
cussed only the exclusion limits of spherical molecules. Our
results for tandem EGFPn with molecular weights of 60, 90,
120, and 150 kD showed that rod-like proteins could localize
to the cell nucleus within 24h after transfection depending on
size, even though the mechanism for their transport to the
nucleus was not clear.
Western blots of tandem proteins from cell lysates showed
that the molecular weights of proteins synthesized in cells were
well consistent with those expected from their numbers of
amino acids. FCS measurement of monomer and tandem
EGFPn in aqueous solution showed that their diffusion times
also increased with molecular weight. Comparison of the
measured diffusion time with the calculated diffusion time
according to Perrin’s equation (35,36) indicated that the tan-
demly linked EGFPn behaved like rod-like molecules. The fact
FIGURE 6 MR mobility in the nucleolus is changed by the energy depletion. HeLa cells were transiently transfected with EGFP5, or cotransfected with
EGFP5 and H2B-mRFP. The FAF of EGFP5 in single HeLa cells is shown before (dashed black lines) and 30 min after addition (solid red lines) of
2-deoxyglucose (6 mM) and sodium-azide (10 mM) to culture medium at room temperature. The redistribution of H2B-mRFP on the cells coexpressed with
EGFP5 was confirmed by LSM before and after the treatment. The changes of the normalized FAF on (A) cytoplasm, (B) nucleoplasm, and (C) nucleolus of a
single cell induced by energy depletion are shown. The amplitude of FAF, G (0) � 1, was normalized to unity. The average diffusion times and the average
fractions (insert) of the first (solid bars) and the second (open bars) components for EGFP5 in the cytoplasm, the nucleoplasm, and the nucleolus before and
after ATP depletion are shown in panels D, E, and F, respectively. The error bars are the measured mean 6 SE (n ¼ 8 cells).
Microenvironment Analyzed by (EGFP)n and FCS 3933
Biophysical Journal 91(10) 3921–3936
that diffusion times of tandem series of EGFP are proportional
to their lengths in aqueous solution indicates that the proteins
could be employed as molecular rulers (MR) in living cells.
Combining a well-defined MR with the high sensitivity of
FCS measurement make possible analysis of protein mobil-
ity in living cells, in particular in the nucleus. In contrast to
the cytoplasm, our results showed that there were two kinds
of diffusional mobility in the nucleus, both of which also
depended on the length of MR as shown in solution and
cytoplasm. One was the fast-diffusion-mobility of tandem
EGFPn found in the nucleoplasm as well as in the cytoplasm,
in which the first component had a fraction above 90%,
reflecting the free diffusion of the MR (represented by D of
the first components in NP; Table 1). The other was the slow-
diffusion-mobility (represented by D of the second compo-
nents in NL; Table 1) observed in the nucleolus. The second
component of the fast-diffusion-mobility in nucleoplasm
showed a very slow diffusion (104–105 ms) with fractions under
10%, indicating no length dependency and no significant
change by TSA treatment. The first component of the slow-
diffusion-mobility (represented by D of the first components
in NL, Table 1) in nucleolus was almost equivalent to the
first component of the fast-diffusion-mobility in nucleoplasm
(represented by D of the first components in NP, Table 1).
There was no significant change in the diffusion time and the
fraction for the first component of the fast-diffusion-mobility
and for the second component of the slow-diffusion-mobility
by TSA treatment (C. Pack and M. Kinjo, unpublished data).
The result of FCS before and after TSA treatment was well
consistent with LSM observation using two-color imaging
(supplementary Figs. S1 and S5). Previous studies (4,38,43)
using LSM observation of labeled dextran with various sizes
showed that a globular protein with molecular weight of
1 MD (an apparent pore size of 14 nm) might be no lim-
itation in access to chromatin. Because molecular weights of
tandem EGFPn are much smaller than 1 MD, tandem EGFPn
might freely access the two types of chromatin.
A study of FCS and monomer EGFP using both a two-
component model and an anomalous subdiffusion model
analysis (14) has shown that the diffusion of EGFP in the
nucleus was much more complex than in the cytosol. The
study described averaged diffusional mobility of EGFP in the
entire nucleus but not in each compartments in the nucleus
such as the nucleolus, and suggested that the ratio of diffusion
mobilities in cells and in solution was not dependent on the
two models used. The fast-diffusion-mobility of tandem
GFPn in the cytoplasm and the nucleoplasm was dependent
on length. The ratio of diffusion time in each compartment to
that in solution showed that the apparent viscosities of the
cytoplasm and nucleoplasm were identical. In addition, the
apparent viscosity in the three cell lines (HeLa, COS7, and
HEK293) was found to be ;3.5-fold higher than in aqueous
solution. The viscosities in the cytoplasm and the nucleo-
plasm were well consistent with previous studies using FRAP
(9,13) and using FCS (14).
We investigated the protein mobility in the nucleolar mi-
croenvironment of living cells in detail. The size and shape
of the nucleolus during each phase of the cell cycle are not
constant. Moreover, it was not easy to discriminate between
the nucleoplasm and nucleolus in the cells weakly expressing
the monomer and tandem EGFPn. We marked the nucleolus
with mRFP-tagged fibrillarin to distinguish it from the nu-
cleoplasm. Our observations in the nucleolus (Fig. 5 E and
Table 1) indicated that mobility of the inert EGFP and tandem
EGFPn in the nucleolus was also dependent on the length of
the protein, but that the mobility was ;17-fold slower for
HeLa and 24-fold slower for COS7 than in aqueous solution.
Nevertheless, assuming a random walk model, the result
suggested that it would take the tandem proteins just a few
seconds to travel a distance of 4 mm, roughly the diameter of
a nucleolus. Rapid association or exchange of GFP-fibrillarin
(0.046 mm2s�1) (12) and GFP-B23 (0.08 mm2s�1) (32) in the
nucleolus was observed by FRAP. These results suggested
that the nucleolus is not a static protein mass such as aggre-
gates, and that proteins were dynamically exchanged between
the nucleoplasm and the nucleolus. EGFP tagged fibrillarin
was shown to have diffusion constants of 0.53 mm2s�1 even
in the nucleoplasm (12). On the other hand, diffusion of the
MR in the nucleolus was much faster than for the nucleolar
proteins (Table 1). For instance, the diffusion constants of
tandem EGFP2 were 14.9 6 0.8 and 3.8 6 0.5 mm2s�1 in the
nuceloplasm and the nucleolus of the HeLa cell, respec-
tively, although the molecular weight and shape of EGFP2
might be similar to EGFP-tagged fibrillarin (60 kD). Our
observations indicated that the architecture of nucleolus was
not very tight and some proteins, at least GFPn, could be
almost freely accessible inside of the compartment, because
the mobility of GFPn was only slowed down about one-fifth
compared with the nucleoplasm and the cytoplasm. Conse-
quently, our study of MR mobility in the nucleoplasm and
the nucleolus might be very helpful to understand the
variability of mobility of microinjected labeled macromol-
ecules in the nucleus (3,13) or the restricted mobility of mo-
nomeric EGFP (14) and various nuclear proteins (12,20,
32,41,49). In those studies, the complex microenvironment
inside of the nucleolus was not considered in detail, even
though the mobilities of the nuclear proteins were measured
in the nucleolus and the interactions with nucleoli were
analyzed.
Recent LSM observation of human U2OS cells expressing
yellow fluorescent protein tagged H2B and electron micro-
scopic observation of ATP-depleted cells have shown that the
chromatin structure changes with nuclear shrinkage under
energy depletion, and suggest that movement of mRNA-
protein complexes (mRNPs) is constrained by the structural
changes in the nucleus (20). It would be interesting to know
whether the redistribution of the chromatin structure by en-
ergy depletion also affects other small proteins, and whether
the nucleolar microenvironment is also changed by ATP
depletion. To determine whether the diffusion of the longest
3934 Pack et al.
Biophysical Journal 91(10) 3921–3936
EGFP5 in the nucleolar microenvironment was affected by
the cellular metabolism, we treated HeLa cells expressing
EGFP5 with metabolic inhibitors 2-DG and NaN3. Interest-
ingly, our results showed that the diffusion of EGFP5 in the
nucleolus was slowed down by ATP depletion, but that in the
cytoplasm and the nucleoplasm it was only slightly changed.
The small change of EGFP5 mobility (Fig. 6 B) in the
nucleoplasm suggested that the microenvironment of nucle-
oplasm was not so changed. This result indicated that the
mobility of proteins smaller than mRNP complex was not
sensitive to the structural change in the nucleoplasm (20).
Otherwise, the energy depletion would change large nuclear
matrix structures (50–52), which affect the much larger mole-
cular size of mRNP (r ; 133 nm as a circular mRNP with
2.8 kb) rather than that of EGFP5 (longitudinal length,
;28 nm). Recent reports have indicated that nuclear diffu-
sion can be limited by a mesoscale viscosity for particles that
are larger than 100 nm in diameter (53). In contrast, the
change of EGFP5 mobility in the nucleolus induced by ATP
depletion suggested that the effect of energy depletion on the
microenvironment of the nucleolus was bigger than that of
the nucleoplasm and cytoplasm, even though the origin of the
significant mobility change in the nucleolus was not clear.
Nevertheless, our results clearly indicate that the microen-
vironment of the nucleolus is physiologically very different
from that of the nucleoplasm. It is interesting to note that the
two motor proteins, nuclear actin and myosin I are related to
rDNA and are required for RNA polymerase I transcription
(54). Such ATP-binding motor proteins can modify the
nucleolar microenvironment.
In this study, we have demonstrated that combination of
FCS and oligomeric EGFPn with different lengths is a novel
method to elucidate the nuclear microenvironment of living
cells. The microenvironment of the two compartments in the
nucleus can now be differentiated and analyzed by using
tandem MR, two-color imaging, and FCS. We found that
MR EGFPn, which is presumably inert, could rapidly diffuse
inside of the cell nucleolus as well as the nucleoplasm
depending only on the length of the protein. Our experi-
mental system can be applied to understanding the mobility
of other functional proteins in the nucleolus as well as in the
cytoplasm and the nucleoplasm. More importantly, it is also
suggested that the microenvironment of the nucleolus is very
sensitive to pharmacological energy depletion compared to
that of the cytoplasm and the nucleoplasm. Consequently, it
is concluded that the physiological state of the nucleolar
microenvironment can be understood through mobility
analysis of tandem MR in living cells. Combining this
method with other fluorescence microscopic methods such
as time-lapse microscopy will allow complementary analysis
of the nucleolar microenvironment of various cell types and
single cells while varying the cell cycle or other physiolog-
ical conditions such as cell stresses. Effects of GTP depletion
or specific inhibitors such as actinomycin D, which primarily
affects ribosome biogenesis in the nucleolus through the
inhibition of RNA polymerase transcription, will also be
important to understand the relations between the nucleolar
microenvironment and physiological conditions in detail.
SUPPLEMENTARY MATERIAL
An online supplement to this article can be found by visiting
BJ Online at http://www.biophysj.org.
The authors thank Professor Hiroshi Kimura (Kyoto University, Japan) and
Dr. Takuya Saiwaki (Osaka University, Japan) for providing H2B-mRFP
and mRFP-fibrillarin clones, respectively. The authors also thank Dr. Isse
Nagao for technical advice for the Western blot experiment.
This research was partly supported by KAKENHI, Grand-in-Aid for Scienti-
fic Research (B) by Japan Society for the Promotion of Science (15370062)
and Grand-in-Aid for Scientific Research on Priority Areas ‘‘Nuclear
Dynamics’’ by MEXT (17050001). C.P. gratefully acknowledges support
from 21st Century COE Program for ‘‘Advance Life Science on the Base of
Bioscience and Nanotechnology’’ in Hokkaido University, and for
‘‘Topological Science and Technology’’ in Hokkaido University. C.P. is
a Postdoctoral Fellow of the JSPS (1705456) in Japan.
REFERENCES
1. Misteli, T. 2001. Protein dynamics: implications for nuclear architec-ture and gene expression. Science. 291:843–847.
2. Pederson, T. 2000. Diffusional protein transport within the nucleus: amessage in the medium. Nat. Cell Biol. 2:E73–E74.
3. Carmo-Fonseca, M., M. Platani, and J. R. Swedlow. 2002. Macromo-lecular mobility inside the cell nucleus. Trends in Cell Biol. 12: 491–5.
4. Gorisch, S. M., P. Lichter, and K. Rippe. 2005. Mobility of multi-subunit complexes in the nucleus: accessibility and dynamics of chro-matin subcompartments. Histochem. Cell Biol. 123:217–228.
5. Houtsmuller, A. B., S. Rademakers, A. L. Nigg, D. Hoogstraten, J. H. J.Hoeijmakers, and W. Vermeulen. 1999. Action of DNA repairendonuclease ERCC1/XPF in living cells. Science. 284:958–961.
6. Phair, R. D., P. Scaffidi, C. Elbi, J. Vecerova, A. Dey, K. Ozato, D. T.Brown, G. Hager, M. Bustin, and T. Misteli. 2004. Global nature ofdynamic protein-chromatin interactions in vivo: three-dimensionalgenome scanning and dynamic interaction networks of chromatinproteins. Mol. Cell. Biol. 24:6393–6402.
7. Verkman, A. S. 2002. Solute and macromolecule diffusion in cellularaqueous compartments. Trends Biochem. Sci. 27:27–33.
8. Brock, R., M. A. Hink, and T. M. Jovin. 1998. Fluorescence correlationmicroscopy of cells in the presence of autofluorescence. Biophys. J. 75:2547–2557.
9. Kao, H. P., J. R. Abney, and A. S. Verkman. 1993. Determinants of thetranslational mobility of a small solute in cell cytoplasm. J. Cell Biol.120:175–184.
10. Kues, T. R. Peters, and U. Kubitscheck 2001 Visualization and trackingof single protein molecules in the cell nucleus. Biophys. J. 80: 2954–67.
11. Luby-Phelps, K. P.E. Castle, D.L. Taylor, and F. Lanni 1987. Hindereddiffusion of inert tracer particles in the cytoplasm of mouse 3T3 cells.Proc. Natl. Acad. Sci. USA. 84: 4910–3.
12. Phair, R. D., and T. Misteli. 2000. High mobility of proteins in the mam-malian cell nucleus. Nature. 404:604–609.
13. Seksek, O., J. Biwersi, and A. S. Verkman. 1997. Translational diffu-sion of macromolecule-sized solutes in cytoplasm and nucleus. J. CellBiol. 138:131–142.
14. Wachsmuth, M., W. Waldeck, and J. Langowski. 2000. Anomalous dif-fusion of fluorescent probes inside living cell nuclei investigated byspatially resolved fluorescence correlation spectroscopy. J. Mol. Biol.298:677–689.
Microenvironment Analyzed by (EGFP)n and FCS 3935
Biophysical Journal 91(10) 3921–3936
15. Weiss, M. M. Elsner, F. Kartberg, and T. Nilsson. 2004. Anomaloussubdiffusion is a measure for cytoplasmic crowding in living cells.Biophys. J. 87: 3518–24.
16. Lukacs, G. L., P. Haggie, O. Seksek, D. Lechardeur, N. Freedman, andA. S. Verkman. 2000. Size-dependent DNA mobility in cytoplasm andnucleus. J. Biol. Chem. 275:1625–1629.
17. Sprague, B. L., R. L. Pego, D. A. Stavreva, and J. G. McNally. 2004.Analysis of binding reactions by fluorescence recovery after photo-bleaching. Biophys. J. 86:3473–3495.
18. Schmiedeberg, L., K. Weisshart, S. Diekmann, G. M. Hoerste, andP. Hemmerich. 2004. High- and low-mobility populations of HP1 inheterochromatin of mammalian cells. Mol. Biol. Cell. 15:2819–2833.
19. McNally, J. G., W. G. Muller, D. Walker, R. Wolford, and G. L. Hager.2000. The glucocorticoid receptor: rapid exchange with regulatory sitesin living cells. Science. 287:1262–1265.
20. Shav-Tal, Y., X. Darzacq, S. M. Shenoy, D. Fusco, S. M. Janicki, D. L.Spector, and R. H. Singer. 2004. Dynamics of single mRNPs in nucleiof living cells. Science. 304:1797–1800.
21. Kinjo, M., and R. Rigler. 1995. Ultrasensitive hybridization analysisusing fluorescence correlation spectroscopy. Nucleic Acids Res. 23:1795–1799.
22. Nomura, Y., H. Tanaka, L. Poellinger, F. Higashino, and M. Kinjo.2001. Monitoring of in vitro and in vivo translation of green fluorescentprotein and its fusion proteins by fluorescence correlation spectros-copy. Cytometry. 44:1–6.
23. Pack, C., K. Aoki, H. Taguchi, M. Yoshida, M. Kinjo, and M. Tamura.2000. Effect of electrostatic interactions on the binding of chargedsubstrate to GroEL studied by highly sensitive fluorescence correlationspectroscopy. Biochem. Biophys. Res. Commun. 267:300–304.
24. Saito, K., E. Ito, Y. Takakuwa, M. Tamura, and M. Kinjo. 2003. In situobservation of mobility and anchoring of PKCbI in plasma membrane.FEBS Lett. 541:126–131.
25. Terada, S., M. Kinjo, and N. Hirokawa. 2000 Oligomeric tubulin inlarge transporting complex is transported via kinesin in squid giantaxons. Cell. 103:141–55.
26. Yoshida, N., M. Kinjo, and M. Tamura. 2001. Microenvironment ofendosomal aqueous phase investigated by the mobility of micropar-ticles using fluorescence correlation spectroscopy. Biochem. Biophys.Res. Commun. 280:312–318.
27. Ormo, M., A. B. Cubitt, K. Kallio, L. A. Gross, R. Y. Tsien, and S. J.Remington. 1996. Crystal structure of the Aequorea Victoria greenfluorescent protein. Science 273:1392–5.
28. Tsien, R. Y. 1998. The green fluorescent protein. Annu. Rev. Biochem.57:509–544.
29. Yang, F., L. G. Moss, and G. N. Phillips. 1996. The molecular structureof green fluorescent protein. Nat. Biotechnol. 14:1246–1251.
30. Kimura, H., and P. R. Cook. 2001. Kinetics of core histones in livinghuman cells: little exchange of H3 and H4 and some rapid exchange ofH2B. J. Cell Biol. 153:1341–1353.
31. Kanda, T., K. F. Sullivan, and G. M. Wahl. 1998. Histone-GFP fusionprotein enables sensitive analysis of chromosome dynamics in livingmammalian cells. Curr. Biol. 8:377–385.
32. Chen, D., and S. Huang. 2001. Nucleolar components involved inribosome biogenesis cycle between the nucleolus and nucleoplasm ininterphase cells. J. Cell Biol. 153:169–176.
33. Saito, K., M. Tamura, and M. Kinjo. 2004. Direct detection of caspase-3 activation in single live cells by cross-correlation analysis. Biochem.Biophys. Res. Commun. 324:849–854.
34. Weisshart, K., V. Jungel, and S. J. Briddon. 2004. The LSM 510META-ConfoCor 2 system: an integrated imaging and spectroscopicplatform for single-molecule detection. Cur. Pharm. Biotech. 5:135–154.
35. Cantor, C. R., and P. R. Schimmel. 1980. In Biophysical ChemistryPart II: Chapter 10. Techniques for the Study of Biological Structureand Function. W. H. Freeman, New York. 560–567.
36. Bjorling, S., M. Kinjo, Z. Foldes-Papp, E. Hagman, P. Thyberg, and R.Rigler. 1998. Fluorescence correlation spectroscopy of enzymatic DNApolymerization. Biochemistry. 37:12971–12978.
37. Rigler, R., U. Mets, J. Widengren, and P. Kask. 1993. Fluorescencecorrelation spectroscopy with high count rate and low background:analysis of translational diffusion. Eur. Biophys. J. 22:169–175.
38. Gorisch, S. M., K. Richter, M. O. Scheuermann, H. Herrmann, andP. Lichter. 2003. Diffusion-limited compartmentalization of mamma-lian cell nuclei assessed by microinjected macromolecules. Exp. CellRes. 289:282–294.
39. Swaminathan, R., C. P. Hoang, and A. S. Verkman. 1997. Photo-bleaching recovery and anisotropy decay of green fluorescent proteinEGFP-S65T in solution and cells: cytoplasmic viscosity probed bygreen fluorescent protein translational and rotational diffusion. Biophys.J. 72:1900–1907.
40. Terry, B. R., E. K. Matthews, and J. Haseloff. 1995. Molecular char-acterization of recombinant green fluorescent protein by fluorescencecorrelation microscopy. Biochem. Biophys. Res. Commun. 217: 21–7.
41. Wachsmuth M., T. Weidemann, G. Muller, U. W. Hoffmann-Rohrer,T. A. Knoch, W. Waldeck, and J. Langowski. 2003. Analyzing intra-cellular binding and diffusion with continuous fluorescence photo-bleaching. Biophys. J. 84:3353–3363.
42. Larson, D. R., Y. M. Ma, V. M. Vogt, and W. W. Webb. 2003. Directmeasurement of Gag-Gag interaction during retrovirus assembly withFRET and fluorescence correlation spectroscopy. J. Cell Biol. 162:1233–1244.
43. Gorisch, S. M., M. Wachsmuth, K. Fejes Toth, P. Lichter, andK. Rippe. 2005. Histone acetylation increases chromatin accessibility.J. Cell Sci. 118:5825–5834.
44. Leung, A. K., D. Gerlich, G. Miller, C. Lyon, Y. W. Lam, D. Lleres,N. Daigle, J. Zomerdijk, J. Ellenberg, and A. I. Lamond. 2004.Quantitative kinetic analysis of nucleolar breakdown and reassemblyduring mitosis in live human cells. J. Cell Biol. 166:787–800.
45. Olson, M. O. J., and M. Dundr. 2005. The moving parts of the nu-cleolus. Histochem. Cell Biol. 123:203–216.
46. Olson, M. O. J., M. Dundr, and A. Szebeni. 2000. The nucleolus: anold factory with unexpected capabilities. Trends Cell Biol. 10:189–196.
47. Peters, R. 1983. Nuclear envelope permeability measured by fluores-cence microphotolysis of single liver cell nuclei. J. Biol. Chem. 258:11427–11429.
48. Davis, L. I. 1995. The nuclear pore complex. Annu. Rev. Biochem.64:865–896.
49. Weidemann T., M. Wachsmuth, T. A. Knoch, G. Muller, W. Waldeck,and J. Langowski 2003. Counting nucleosomes in living cells with acombination of fluorescence correlation spectroscopy and confocalimaging. J. Mol. Biol. 334:229–40.
50. Nickerson, J. A. 2001. Experimental observations of a nuclear matrix.J. Cell Sci. 114:463–474.
51. Rando, O. J., K. Zhao, and G. R. Crabtree. 2000. Searching for afunction for nuclear actin. Trends Cell Biol. 10:92–97.
52. Pederson, T., and U. Aebi. 2003. Actin in the nucleus: what form andwhat for? J. Struct. Biol. 140:3–9.
53. Tseng, Y., J. S. Lee, T. P. Kole, I. Jiang, and D. Wirtz. 2004. Micro-organization and visco-elasticity of the interphase nucleus revealed byparticle nanotracking. J. Cell Sci. 117:2159–2167.
54. Philimonenko, V. V., J. Zhao, S. Iben, H. Dingova, K. Kysela,M. Kahle, H. Zentgraf, W. A. Hofmann, P. Lanerolle, P. Hozak, andI. Grummt. 2004. Nuclear actin and myosin I are required for RNApolymerase I transcription. Nat. Cell Biol. 6:1165–1172.
3936 Pack et al.
Biophysical Journal 91(10) 3921–3936


![Evidence for the Oligomeric State of [] Elastic'Titin In Muscle Sarcomeres](https://img.dokumen.tips/doc/110x75/633266f483bb92fe9804650c/evidence-for-the-oligomeric-state-of-elastictitin-in-muscle-sarcomeres.jpg)


