Embed Size (px)
Citation preview
UNITED STATES SECURITIES AND EXCHANGE COMMISSION
Washington, D.C. 20549
______________________________________
Form 10-Q(Mark One)
þ QUARTERLY REPORT PURSUANT TO SECTION 13 OR 15(d) OF THE SECURITIES EXCHANGE ACT OF 1934FOR THE QUARTERLY PERIOD ENDED SEPTEMBER 30, 2018
or
¨ TRANSITION REPORT PURSUANT TO SECTION 13 OR 15(d) OF THE SECURITIES EXCHANGE ACT OF 1934FOR THE TRANSITION PERIOD FROM TO
Commission file number: 001-15787
________________________________________
MetLife, Inc.(Exactnameofregistrantasspecifiedinitscharter)
Delaware 13-4075851(State or other jurisdiction of
incorporation or organization) (I.R.S. Employer
Identification No.)
200 Park Avenue, New York, N.Y. 10166-0188(Address of principal executive offices) (Zip Code)
(212) 578-9500
(Registrant’stelephonenumber,includingareacode)
Indicate by check mark whether the registrant: (1) has filed all reports required to be filed by Section 13 or 15(d) of the Securities Exchange Act of 1934 during the preceding 12 months (orfor such shorter period that the registrant was required to file such reports), and (2) has been subject to such filing requirements for the past 90 days. Yes þNo ¨
Indicate by check mark whether the registrant has submitted electronically every Interactive Data File required to be submitted pursuant to Rule 405 of Regulation S-T (§ 232.405 of thischapter) during the preceding 12 months (or for such shorter period that the registrant was required to submit such files). Yes þNo ¨
Indicate by check mark whether the registrant is a large accelerated filer, an accelerated filer, a non-accelerated filer, a smaller reporting company, or an emerging growth company. See thedefinitions of “large accelerated filer,” “accelerated filer,” “smaller reporting company,” and “emerging growth company” in Rule 12b-2 of the Exchange Act.
Large accelerated filer þ Accelerated filer ¨
Non-accelerated filer ¨ Smaller reporting company ¨
Emerging growth company ¨
If an emerging growth company, indicate by check mark if the registrant has elected not to use the extended transition period for complying with any new or revised financial accountingstandards provided pursuant to Section 13(a) of the Exchange Act. ¨
Indicate by check mark whether the registrant is a shell company (as defined in Rule 12b-2 of the Exchange Act). Yes ¨No þ
At October 31, 2018 , 986,838,252 shares of the registrant’s common stock, $0.01 par value per share, were outstanding.
Table of Contents
PagePart I — Financial Information
Item 1. Financial Statements (Unaudited) (at September 30, 2018 and December 31, 2017 and for the Three Months and Nine Months EndedSeptember 30, 2018 and 2017)
Interim Condensed Consolidated Balance Sheets 3 Interim Condensed Consolidated Statements of Operations and Comprehensive Income (Loss) 4 Interim Condensed Consolidated Statements of Equity 5 Interim Condensed Consolidated Statements of Cash Flows 6 Notes to the Interim Condensed Consolidated Financial Statements: Note 1 — Business, Basis of Presentation and Summary of Significant Accounting Policies 7 Note 2 — Segment Information 14 Note 3 — Dispositions 22 Note 4 — Insurance 26 Note 5 — Closed Block 28 Note 6 — Investments 31 Note 7 — Derivatives 46 Note 8 — Fair Value 63 Note 9 — Long-Term Debt 83 Note 10 — Equity 83 Note 11 — Other Expenses 91 Note 12 — Employee Benefit Plans 92 Note 13 — Income Tax 93 Note 14 — Earnings Per Common Share 94 Note 15 — Contingencies, Commitments and Guarantees 95 Note 16 — Subsequent Events 101
Item 2. Management’s Discussion and Analysis of Financial Condition and Results of Operations 102Item 3. Quantitative and Qualitative Disclosures About Market Risk 182Item 4. Controls and Procedures 183
Part II — Other Information Item 1. Legal Proceedings 184Item 1A. Risk Factors 184Item 2. Unregistered Sales of Equity Securities and Use of Proceeds 184Item 6. Exhibits 185
Signatures 186
Table of Contents
As used in this Form 10 ‑ Q, “MetLife,” the “Company,” “we,” “our” and “us” refer to MetLife, Inc., a Delaware corporation incorporated in 1999, itssubsidiaries and affiliates.
Note Regarding Forward-Looking Statements
This Quarterly Report on Form 10‑Q, including Management’s Discussion and Analysis of Financial Condition and Results of Operations, may contain orincorporate by reference information that includes or is based upon forward-looking statements within the meaning of the Private Securities Litigation Reform Actof 1995. Forward-looking statements give expectations or forecasts of future events. These statements can be identified by the fact that they do not relate strictly tohistorical or current facts. They use words and terms such as “anticipate,” “estimate,” “expect,” “project,” “intend,” “plan,” “believe,” “will,” and other words andterms of similar meaning, or are tied to future periods, in connection with a discussion of future performance. In particular, these include statements relating tofuture actions, prospective services or products, future performance or results of current and anticipated services or products, sales efforts, expenses, the outcomeof contingencies such as legal proceedings, trends in operations and financial results.
Many factors will be important in determining the results of MetLife, Inc., its subsidiaries and affiliates. Forward-looking statements are based on ourassumptions and current expectations, which may be inaccurate, and on the current economic environment, which may change. These statements are not guaranteesof future performance. They involve a number of risks and uncertainties that are difficult to predict. Results could differ materially from those expressed or impliedin the forward-looking statements. Risks, uncertainties, and other factors that might cause such differences include the risks, uncertainties and other factorsidentified in MetLife, Inc.’s filings with the U.S. Securities and Exchange Commission. These factors include: (1) adverse effects which may arise in connectionwith the material weaknesses in our internal control over financial reporting or our failure to promptly remediate them; (2) difficult conditions in the global capitalmarkets; (3) increased volatility and disruption of the global capital and credit markets, which may affect our ability to meet liquidity needs and access capital,including through our credit facilities, generate fee income and market-related revenue and finance statutory reserve requirements and may require us to pledgecollateral or make payments related to declines in value of specified assets, including assets supporting risks ceded to certain of our captive reinsurers or hedgingarrangements associated with those risks; (4) exposure to global financial and capital market risks, including as a result of the United Kingdom’s notice ofwithdrawal from the European Union or other disruption in global political, security or economic conditions; (5) impact on us of comprehensive financial servicesregulation reform; (6) numerous rulemaking initiatives required or permitted by the Dodd-Frank Wall Street Reform and Consumer Protection Act which mayimpact how we conduct our business, including those compelling the liquidation of certain financial institutions; (7) regulatory, legislative or tax changes relatingto our insurance, international, or other operations that may affect the cost of, or demand for, our products or services, or increase the cost or administrativeburdens of providing benefits to employees; (8) adverse results or other consequences from litigation, arbitration or regulatory investigations; (9) potential liquidityand other risks resulting from our participation in a securities lending program and other transactions; (10) investment losses and defaults, and changes toinvestment valuations; (11) changes in assumptions related to investment valuations, deferred policy acquisition costs, deferred sales inducements, value ofbusiness acquired or goodwill; (12) impairments of goodwill and realized losses or market value impairments to illiquid assets; (13) defaults on our mortgageloans; (14) the defaults or deteriorating credit of other financial institutions that could adversely affect us; (15) economic, political, legal, currency and other risksrelating to our international operations, including with respect to fluctuations of exchange rates; (16) downgrades in our claims paying ability, financial strength orcredit ratings; (17) a deterioration in the experience of the closed block established in connection with the reorganization of Metropolitan Life Insurance Company;(18) availability and effectiveness of reinsurance, hedging or indemnification arrangements, as well as any default or failure of counterparties to perform;(19) differences between actual claims experience and underwriting and reserving assumptions; (20) ineffectiveness of risk management policies and procedures;(21) catastrophe losses; (22) increasing cost and limited market capacity for statutory life insurance reserve financings; (23) heightened competition, including withrespect to pricing, entry of new competitors, consolidation of distributors, the development of new products by new and existing competitors, and for personnel;(24) exposure to losses related to variable annuity guarantee benefits, including from significant and sustained downturns or extreme volatility in equity markets,reduced interest rates, unanticipated policyholder behavior, mortality or longevity, and any adjustment for nonperformance risk; (25) our ability to addressdifficulties, unforeseen liabilities, asset impairments, or rating agency actions arising from (a) business acquisitions and integrating and managing the growth ofsuch acquired businesses, (b) dispositions of businesses via sale, initial public offering, spin-off or otherwise, including failure to achieve projected operationalbenefits from such transactions and any restrictions, liabilities, losses or indemnification obligations arising from any transitional services or tax arrangementsrelated to the separation of any business, or from the failure of such a separation to qualify for any intended tax-free treatment, (c) entry into joint ventures, or (d)legal entity reorganizations; (26) unanticipated or adverse developments that could adversely affect our achieving expected operational or other benefits from theseparation of Brighthouse Financial, Inc. and its subsidiaries (“Brighthouse”); (27) liabilities, losses or indemnification obligations arising from our transitionalservices, investment management or tax arrangements or other agreements with Brighthouse; (28) failure of the separation of Brighthouse to qualify for intendedtax-free treatment; (29) legal, regulatory and other restrictions affecting MetLife, Inc.’s ability to pay dividends and repurchase common stock; (30) MetLife, Inc.’sand its subsidiary holding companies’ primary reliance, as holding companies, on dividends from subsidiaries to meet free cash flow targets and debt paymentobligations and the applicable regulatory restrictions on the ability of the subsidiaries to pay such dividends; (31) the possibility that MetLife, Inc.’s Board ofDirectors may influence the outcome of stockholder votes through the voting provisions of the MetLife Policyholder Trust; (32) changes in accounting standards,practices and/or policies; (33) increased expenses relating to pension and postretirement benefit plans, as well as health care and other employee benefits;(34) inability to protect our intellectual property rights or claims of infringement of the intellectual property rights of others; (35) difficulties in marketing anddistributing products through our distribution channels; (36) provisions of laws and our incorporation documents that may delay, deter or prevent takeovers andcorporate combinations involving MetLife; (37) the effects of business disruption or economic contraction due to disasters such as terrorist attacks, cyberattacks,other hostilities, or natural catastrophes, including any related impact on the value of our investment portfolio, our disaster recovery systems, cyber- or otherinformation security systems and management continuity planning; (38) any failure to protect the confidentiality of client information; (39) the effectiveness of ourprograms and practices in avoiding giving our associates incentives to take excessive risks; (40) the impact of technological changes on our businesses; and(41) other risks and uncertainties described from time to time in MetLife, Inc.’s filings with the U.S. Securities and Exchange Commission.
MetLife, Inc. does not undertake any obligation to publicly correct or update any forward-looking statement if MetLife, Inc. later becomes aware that suchstatement is not likely to be achieved. Please consult any further disclosures MetLife, Inc. makes on related subjects in reports to the U.S. Securities and ExchangeCommission.
Corporate Information
We announce financial and other information about MetLife to our investors through the MetLife Investor Relations web page at www.metlife.com, as well asU.S. Securities and Exchange Commission filings, news releases, public conference calls and webcasts. MetLife encourages investors to visit the Investor Relationsweb page from time to time, as information is updated and new information is posted. The information found on our website is not incorporated by reference intothis Quarterly Report on Form 10-Q or in any other report or document we file with the U.S. Securities and Exchange Commission, and any references to ourwebsite are intended to be inactive textual references only.
Note Regarding Reliance on Statements in Our Contracts

See “Exhibits — Note Regarding Reliance on Statements in Our Contracts” for information regarding agreements included as exhibits to this Quarterly Reporton Form 10-Q.
2

Table of Contents
Part I — Financial InformationItem 1. Financial Statements
MetLife, Inc.Interim Condensed Consolidated Balance Sheets
September 30, 2018 and December 31, 2017 (Unaudited)(In millions, except share and per share data)
September 30, 2018 December 31, 2017
Assets
Investments:
Fixed maturity securities available-for-sale, at estimated fair value (amortized cost: $293,268 and $286,069, respectively) $ 304,840 $ 308,931
Equity securities, at estimated fair value 1,479 2,513
Contractholder-directed equity securities and fair value option securities, at estimated fair value (includes $5 and $6, respectively, relating to variable interest entities) 13,540 16,745
Mortgage loans (net of valuation allowances of $336 and $314, respectively; includes $323 and $520, respectively, under the fair value option) 72,461 68,731
Policy loans 9,703 9,669
Real estate and real estate joint ventures (includes $631 and $25, respectively, of real estate held-for-sale) 9,977 9,637
Other limited partnership interests 6,374 5,708
Short-term investments, principally at estimated fair value 5,231 4,870
Other invested assets (includes $128 and $125, respectively, relating to variable interest entities) 16,336 17,263
Total investments 439,941 444,067
Cash and cash equivalents, principally at estimated fair value (includes $10 and $12, respectively, relating to variable interest entities) 12,490 12,701
Accrued investment income 3,691 3,524
Premiums, reinsurance and other receivables (includes $3 and $3, respectively, relating to variable interest entities) 19,820 18,423
Deferred policy acquisition costs and value of business acquired 19,160 18,419
Goodwill 9,440 9,590
Other assets (includes $2 and $2, respectively, relating to variable interest entities) 8,493 8,167
Separate account assets 185,416 205,001
Total assets $ 698,451 $ 719,892
Liabilities and Equity
Liabilities
Future policy benefits $ 185,476 $ 177,974
Policyholder account balances 184,094 182,518
Other policy-related balances 16,207 15,515
Policyholder dividends payable 709 682
Policyholder dividend obligation 456 2,121
Payables for collateral under securities loaned and other transactions 26,075 25,723
Short-term debt 290 477
Long-term debt (includes $5 and $6, respectively, at estimated fair value, relating to variable interest entities) 13,408 15,686
Collateral financing arrangement 1,073 1,121
Junior subordinated debt securities 3,146 3,144
Current income tax payable 166 311
Deferred income tax liability 4,924 6,767
Other liabilities (includes $1 and $3, respectively, relating to variable interest entities) 25,202 23,982
Separate account liabilities 185,416 205,001
Total liabilities 646,642 661,022
Contingencies, Commitments and Guarantees (Note 15)
Equity
MetLife, Inc.’s stockholders’ equity:
Preferred stock, par value $0.01 per share; $3,405 and $2,100 aggregate liquidation preference, respectively — —Common stock, par value $0.01 per share; 3,000,000,000 shares authorized; 1,171,428,557 and 1,168,710,101 shares issued, respectively; 986,644,069 and 1,043,588,396 shares
outstanding, respectively 12 12
Additional paid-in capital 32,475 31,111
Retained earnings 27,331 26,527
Treasury stock, at cost; 184,784,488 and 125,121,705 shares, respectively (9,193) (6,401)
Accumulated other comprehensive income (loss) 1,000 7,427
Total MetLife, Inc.’s stockholders’ equity 51,625 58,676

Noncontrolling interests 184 194
Total equity 51,809 58,870
Total liabilities and equity $ 698,451 $ 719,892
See accompanying notes to the interim condensed consolidated financial statements.
3
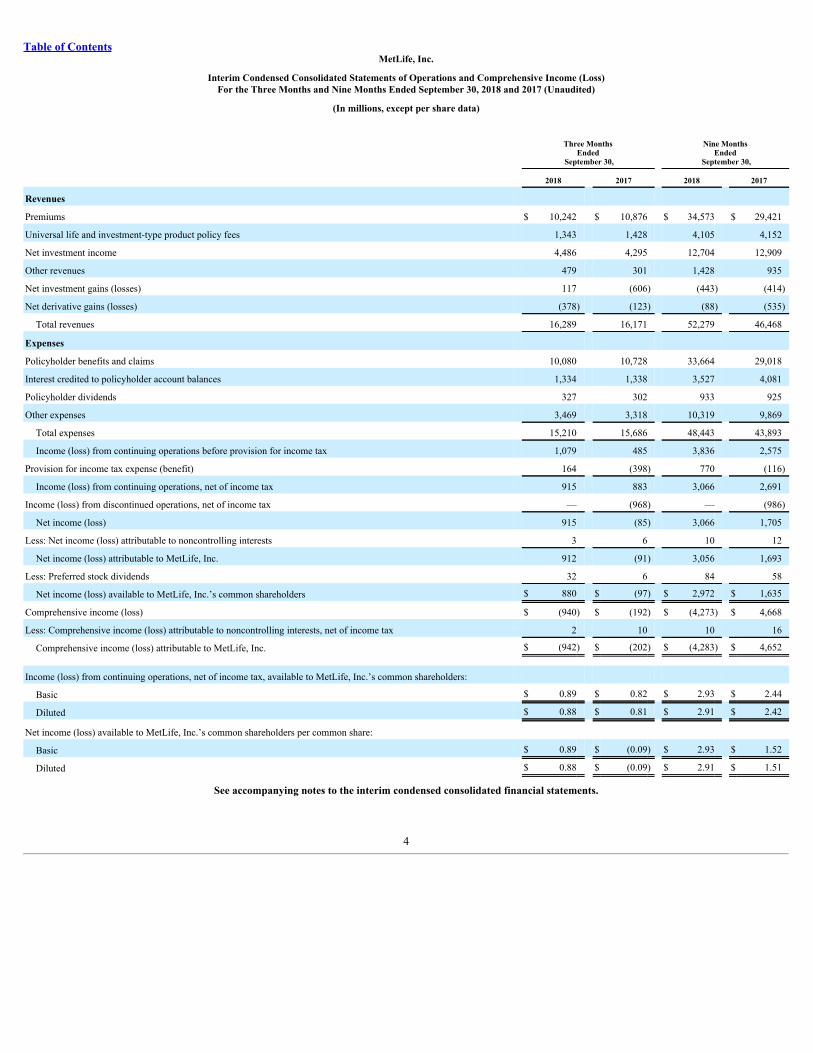
Table of ContentsMetLife, Inc.
Interim Condensed Consolidated Statements of Operations and Comprehensive Income (Loss)For the Three Months and Nine Months Ended September 30, 2018 and 2017 (Unaudited)
(In millions, except per share data)
Three Months
Ended September 30,
Nine Months Ended
September 30,
2018 2017 2018 2017
Revenues
Premiums $ 10,242 $ 10,876 $ 34,573 $ 29,421
Universal life and investment-type product policy fees 1,343 1,428 4,105 4,152
Net investment income 4,486 4,295 12,704 12,909
Other revenues 479 301 1,428 935
Net investment gains (losses) 117 (606) (443) (414)
Net derivative gains (losses) (378) (123) (88) (535)
Total revenues 16,289 16,171 52,279 46,468
Expenses
Policyholder benefits and claims 10,080 10,728 33,664 29,018
Interest credited to policyholder account balances 1,334 1,338 3,527 4,081
Policyholder dividends 327 302 933 925
Other expenses 3,469 3,318 10,319 9,869
Total expenses 15,210 15,686 48,443 43,893
Income (loss) from continuing operations before provision for income tax 1,079 485 3,836 2,575
Provision for income tax expense (benefit) 164 (398) 770 (116)
Income (loss) from continuing operations, net of income tax 915 883 3,066 2,691
Income (loss) from discontinued operations, net of income tax — (968) — (986)
Net income (loss) 915 (85) 3,066 1,705
Less: Net income (loss) attributable to noncontrolling interests 3 6 10 12
Net income (loss) attributable to MetLife, Inc. 912 (91) 3,056 1,693
Less: Preferred stock dividends 32 6 84 58
Net income (loss) available to MetLife, Inc.’s common shareholders $ 880 $ (97) $ 2,972 $ 1,635
Comprehensive income (loss) $ (940) $ (192) $ (4,273) $ 4,668
Less: Comprehensive income (loss) attributable to noncontrolling interests, net of income tax 2 10 10 16
Comprehensive income (loss) attributable to MetLife, Inc. $ (942) $ (202) $ (4,283) $ 4,652
Income (loss) from continuing operations, net of income tax, available to MetLife, Inc.’s common shareholders:
Basic $ 0.89 $ 0.82 $ 2.93 $ 2.44
Diluted $ 0.88 $ 0.81 $ 2.91 $ 2.42
Net income (loss) available to MetLife, Inc.’s common shareholders per common share:
Basic $ 0.89 $ (0.09) $ 2.93 $ 1.52
Diluted $ 0.88 $ (0.09) $ 2.91 $ 1.51
See accompanying notes to the interim condensed consolidated financial statements.
4
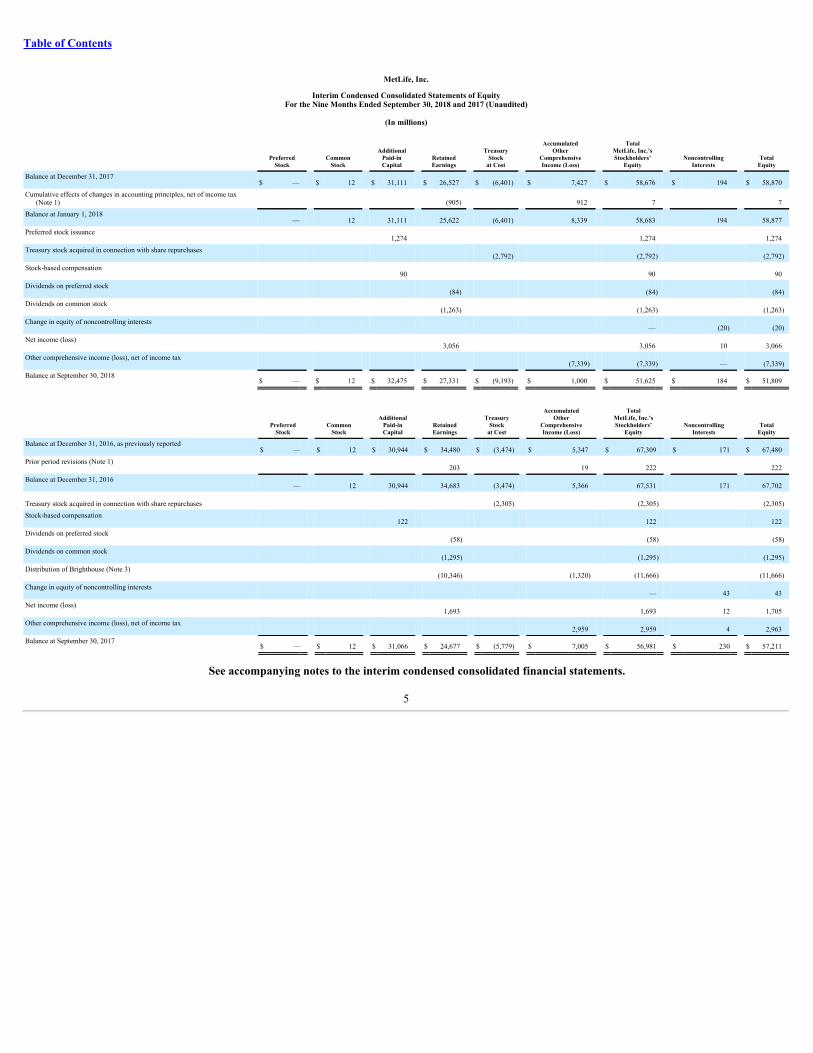
Table of Contents
MetLife, Inc.
Interim Condensed Consolidated Statements of EquityFor the Nine Months Ended September 30, 2018 and 2017 (Unaudited)
(In millions)
PreferredStock Common
Stock Additional
Paid-inCapital Retained
Earnings Treasury
Stockat Cost
AccumulatedOther
ComprehensiveIncome (Loss)
TotalMetLife, Inc.’sStockholders’
Equity NoncontrollingInterests Total
Equity
Balance at December 31, 2017 $ — $ 12 $ 31,111 $ 26,527 $ (6,401) $ 7,427 $ 58,676 $ 194 $ 58,870Cumulative effects of changes in accounting principles, net of income tax
(Note 1) (905) 912 7 7Balance at January 1, 2018 — 12 31,111 25,622 (6,401) 8,339 58,683 194 58,877Preferred stock issuance 1,274 1,274 1,274Treasury stock acquired in connection with share repurchases (2,792) (2,792) (2,792)Stock-based compensation 90 90 90Dividends on preferred stock (84) (84) (84)Dividends on common stock (1,263) (1,263) (1,263)Change in equity of noncontrolling interests — (20) (20)Net income (loss) 3,056 3,056 10 3,066Other comprehensive income (loss), net of income tax (7,339) (7,339) — (7,339)Balance at September 30, 2018 $ — $ 12 $ 32,475 $ 27,331 $ (9,193) $ 1,000 $ 51,625 $ 184 $ 51,809
PreferredStock Common
Stock Additional
Paid-inCapital Retained
Earnings Treasury
Stockat Cost
AccumulatedOther
ComprehensiveIncome (Loss)
TotalMetLife, Inc.’sStockholders’
Equity NoncontrollingInterests Total
Equity
Balance at December 31, 2016, as previously reported $ — $ 12 $ 30,944 $ 34,480 $ (3,474) $ 5,347 $ 67,309 $ 171 $ 67,480Prior period revisions (Note 1) 203 19 222 222Balance at December 31, 2016 — 12 30,944 34,683 (3,474) 5,366 67,531 171 67,702
Treasury stock acquired in connection with share repurchases (2,305) (2,305) (2,305)Stock-based compensation 122 122 122Dividends on preferred stock (58) (58) (58)Dividends on common stock (1,295) (1,295) (1,295)Distribution of Brighthouse (Note 3) (10,346) (1,320) (11,666) (11,666)Change in equity of noncontrolling interests — 43 43Net income (loss) 1,693 1,693 12 1,705Other comprehensive income (loss), net of income tax 2,959 2,959 4 2,963Balance at September 30, 2017 $ — $ 12 $ 31,066 $ 24,677 $ (5,779) $ 7,005 $ 56,981 $ 230 $ 57,211
See accompanying notes to the interim condensed consolidated financial statements.
5
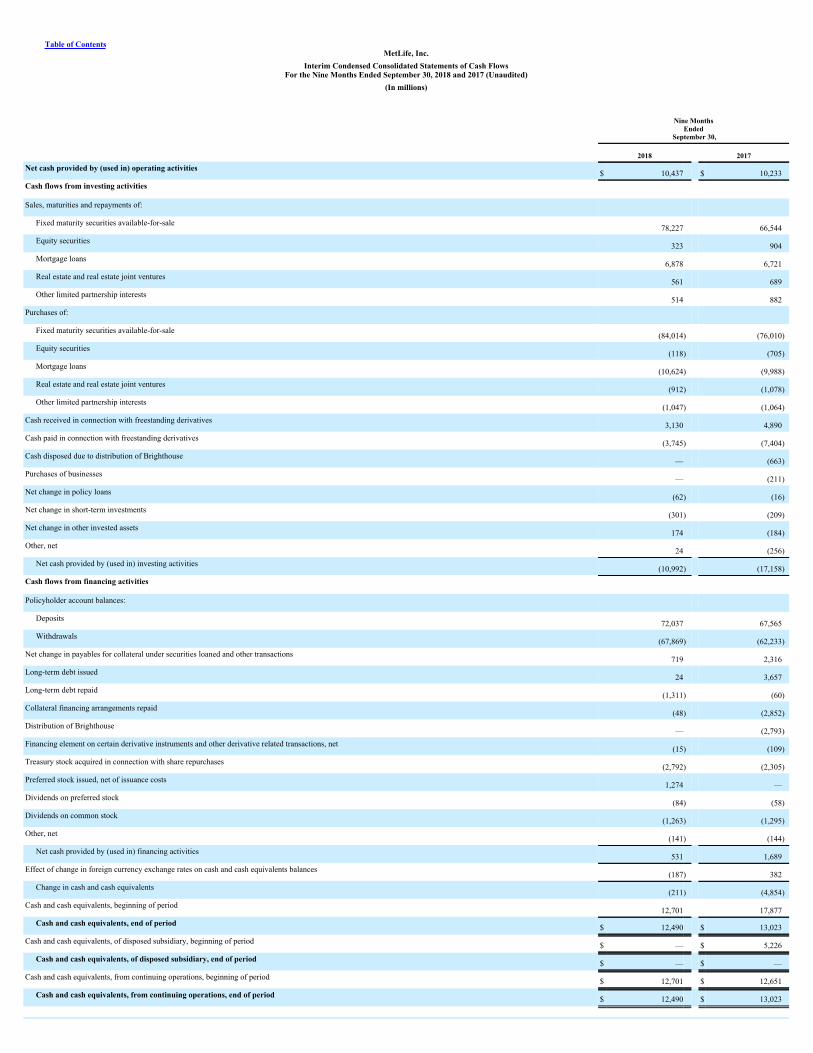
Table of ContentsMetLife, Inc.
Interim Condensed Consolidated Statements of Cash FlowsFor the Nine Months Ended September 30, 2018 and 2017 (Unaudited)
(In millions)
Nine Months
Ended September 30,
2018 2017
Net cash provided by (used in) operating activities$ 10,437 $ 10,233
Cash flows from investing activities Sales, maturities and repayments of:
Fixed maturity securities available-for-sale78,227 66,544
Equity securities323 904
Mortgage loans6,878 6,721
Real estate and real estate joint ventures561 689
Other limited partnership interests514 882
Purchases of: Fixed maturity securities available-for-sale
(84,014) (76,010)Equity securities
(118) (705)Mortgage loans
(10,624) (9,988)Real estate and real estate joint ventures
(912) (1,078)Other limited partnership interests
(1,047) (1,064)Cash received in connection with freestanding derivatives
3,130 4,890Cash paid in connection with freestanding derivatives
(3,745) (7,404)Cash disposed due to distribution of Brighthouse
— (663)Purchases of businesses
— (211)Net change in policy loans
(62) (16)Net change in short-term investments
(301) (209)Net change in other invested assets
174 (184)Other, net
24 (256)Net cash provided by (used in) investing activities
(10,992) (17,158)Cash flows from financing activities Policyholder account balances:
Deposits72,037 67,565
Withdrawals(67,869) (62,233)
Net change in payables for collateral under securities loaned and other transactions719 2,316
Long-term debt issued24 3,657
Long-term debt repaid(1,311) (60)
Collateral financing arrangements repaid(48) (2,852)
Distribution of Brighthouse— (2,793)
Financing element on certain derivative instruments and other derivative related transactions, net(15) (109)
Treasury stock acquired in connection with share repurchases(2,792) (2,305)
Preferred stock issued, net of issuance costs1,274 —
Dividends on preferred stock(84) (58)
Dividends on common stock(1,263) (1,295)
Other, net(141) (144)
Net cash provided by (used in) financing activities531 1,689
Effect of change in foreign currency exchange rates on cash and cash equivalents balances(187) 382
Change in cash and cash equivalents(211) (4,854)
Cash and cash equivalents, beginning of period12,701 17,877
Cash and cash equivalents, end of period $ 12,490 $ 13,023
Cash and cash equivalents, of disposed subsidiary, beginning of period $ — $ 5,226
Cash and cash equivalents, of disposed subsidiary, end of period $ — $ —
Cash and cash equivalents, from continuing operations, beginning of period $ 12,701 $ 12,651
Cash and cash equivalents, from continuing operations, end of period $ 12,490 $ 13,023
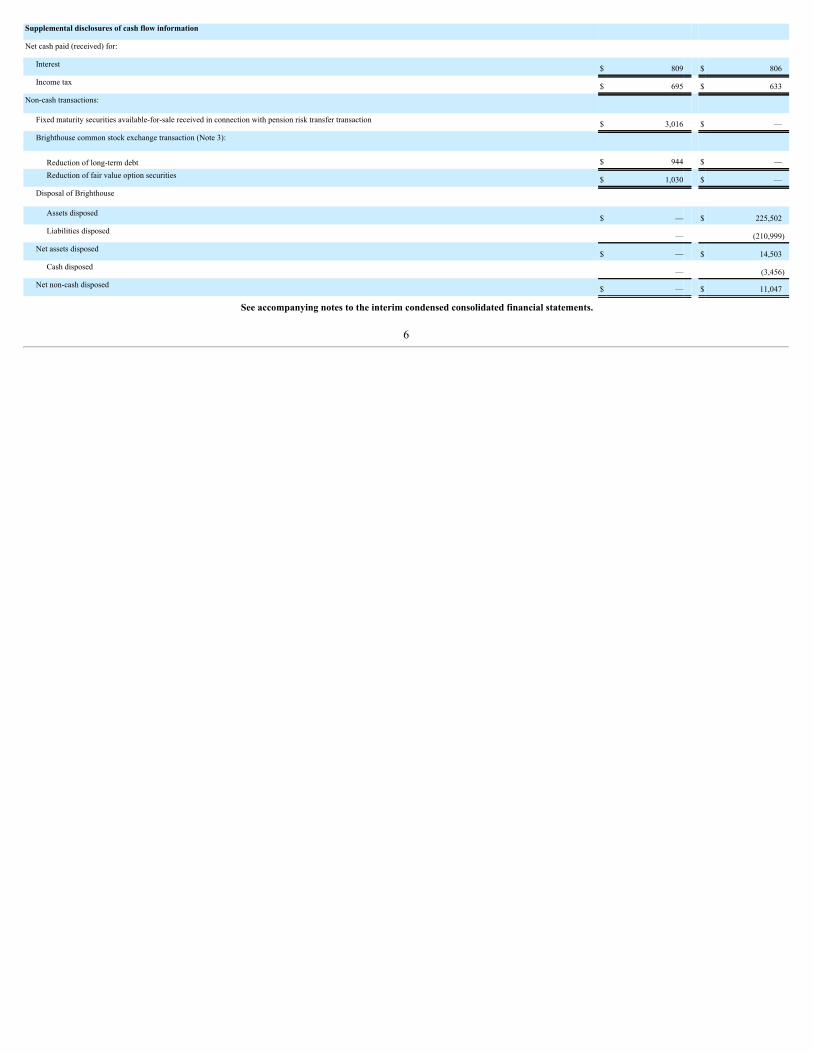
Supplemental disclosures of cash flow information Net cash paid (received) for:
Interest $ 809 $ 806
Income tax $ 695 $ 633
Non-cash transactions: Fixed maturity securities available-for-sale received in connection with pension risk transfer transaction $ 3,016 $ —
Brighthouse common stock exchange transaction (Note 3):
Reduction of long-term debt $ 944 $ —
Reduction of fair value option securities $ 1,030 $ —
Disposal of Brighthouse Assets disposed
$ — $ 225,502Liabilities disposed
— (210,999)Net assets disposed
$ — $ 14,503Cash disposed
— (3,456)Net non-cash disposed $ — $ 11,047
See accompanying notes to the interim condensed consolidated financial statements.
6
Table of Contents
MetLife, Inc.
Notes to the Interim Condensed Consolidated Financial Statements (Unaudited)
1. Business, Basis of Presentation and Summary of Significant Accounting Policies
Business
“MetLife” and the “Company” refer to MetLife, Inc., a Delaware corporation incorporated in 1999, its subsidiaries and affiliates. MetLife is one of the world’sleading financial services companies, providing insurance, annuities, employee benefits and asset management. MetLife is organized into five segments: U.S.;Asia; Latin America; Europe, the Middle East and Africa (“EMEA”); and MetLife Holdings.
BasisofPresentation
The preparation of financial statements in conformity with accounting principles generally accepted in the United States of America (“GAAP”) requiresmanagement to adopt accounting policies and make estimates and assumptions that affect amounts reported on the interim condensed consolidated financialstatements. In applying these policies and estimates, management makes subjective and complex judgments that frequently require assumptions about matters thatare inherently uncertain. Many of these policies, estimates and related judgments are common in the insurance and financial services industries; others are specificto the Company’s business and operations. Actual results could differ from these estimates.
The accompanying interim condensed consolidated financial statements are unaudited and reflect all adjustments (including normal recurring adjustments)necessary to present fairly the financial position, results of operations and cash flows for the interim periods presented in conformity with GAAP. Interim resultsare not necessarily indicative of full year performance. The December 31, 2017 consolidated balance sheet data was derived from audited consolidated financialstatements included in MetLife, Inc.’s Annual Report on Form 10-K for the year ended December 31, 2017 (the “2017 Annual Report”), which include alldisclosures required by GAAP. Therefore, these interim condensed consolidated financial statements should be read in conjunction with the consolidated financialstatements of the Company included in the 2017 Annual Report.
Consolidation
The accompanying interim condensed consolidated financial statements include the accounts of MetLife, Inc. and its subsidiaries, as well as partnershipsand joint ventures in which the Company has control, and variable interest entities (“VIEs”) for which the Company is the primary beneficiary. Intercompanyaccounts and transactions have been eliminated.
The Company uses the equity method of accounting for equity securities when it has significant influence or at least 20% interest and for real estate jointventures and other limited partnership interests (“investees”) when it has more than a minor ownership interest or more than a minor influence over theinvestee’s operations. The Company generally recognizes its share of the investee’s earnings on a three-month lag in instances where the investee’s financialinformation is not sufficiently timely or when the investee’s reporting period differs from the Company’s reporting period. Subsequent to the adoption ofguidance relating to the recognition and measurement of financial instruments on January 1, 2018, the Company accounts for interests in unconsolidated entitiesthat are not accounted for under the equity method, at estimated fair value. Such investments were previously accounted for under the cost method of accounting.See “— Adoption of New Accounting Pronouncements.”
DiscontinuedOperations
The results of operations of a component of the Company that has either been disposed of or is classified as held-for-sale are reported in discontinuedoperations if certain criteria are met. A disposal of a component is reported in discontinued operations if the disposal represents a strategic shift that has or willhave a major effect on the Company’s operations and financial results.
On August 4, 2017, MetLife, Inc. completed the separation of Brighthouse Financial, Inc. and its subsidiaries (“Brighthouse”) through a distribution of96,776,670 shares of Brighthouse Financial, Inc. common stock to the MetLife, Inc. common shareholders (the “Separation”). The results of Brighthouse arereflected in MetLife, Inc.’s interim condensed consolidated financial statements as discontinued operations and, therefore, are presented as income (loss) fromdiscontinued operations on the consolidated statements of operations and comprehensive income (loss). Intercompany transactions between the Company andBrighthouse prior to the Separation have been eliminated. Transactions between the Company and Brighthouse after the Separation are reflected in continuingoperations for the Company. See Note 3 for information on discontinued operations and transactions with Brighthouse.
7
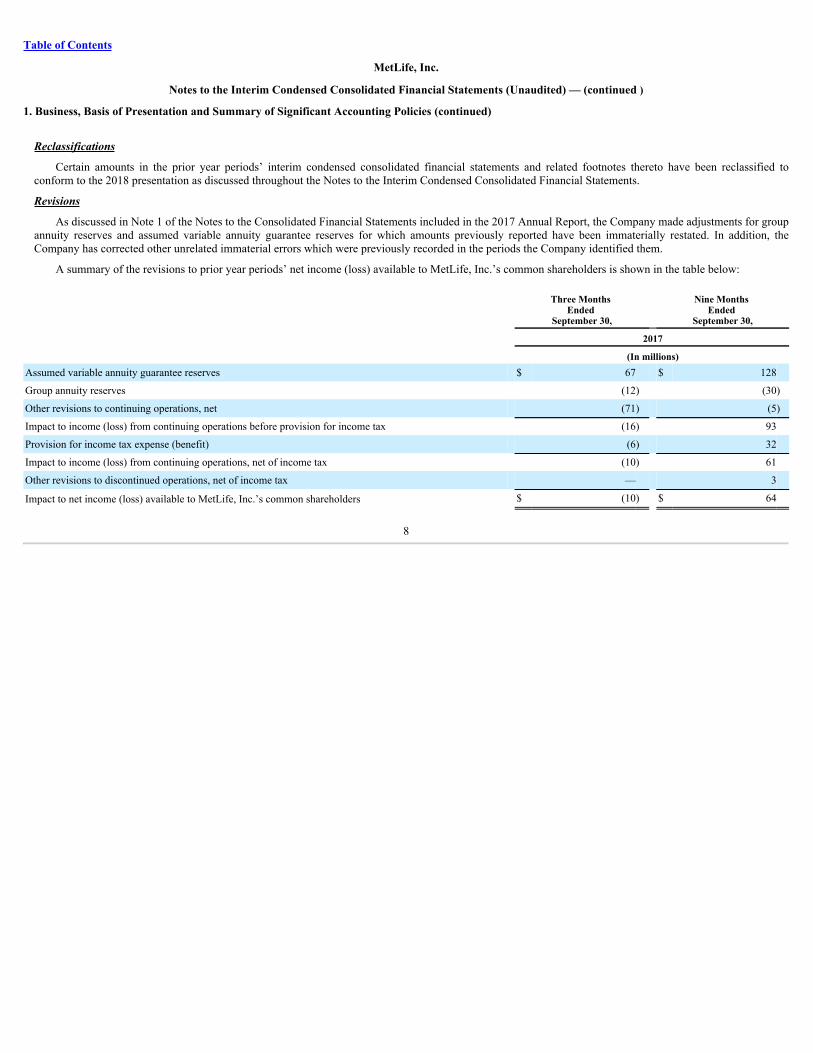
Table of Contents
MetLife, Inc.
Notes to the Interim Condensed Consolidated Financial Statements (Unaudited) — (continued )
1. Business, Basis of Presentation and Summary of Significant Accounting Policies (continued)
Reclassifications
Certain amounts in the prior year periods’ interim condensed consolidated financial statements and related footnotes thereto have been reclassified toconform to the 2018 presentation as discussed throughout the Notes to the Interim Condensed Consolidated Financial Statements.
Revisions
As discussed in Note 1 of the Notes to the Consolidated Financial Statements included in the 2017 Annual Report, the Company made adjustments for groupannuity reserves and assumed variable annuity guarantee reserves for which amounts previously reported have been immaterially restated. In addition, theCompany has corrected other unrelated immaterial errors which were previously recorded in the periods the Company identified them.
A summary of the revisions to prior year periods’ net income (loss) available to MetLife, Inc.’s common shareholders is shown in the table below:
Three Months Ended
September 30,
Nine Months Ended
September 30, 2017 (In millions)Assumed variable annuity guarantee reserves $ 67 $ 128
Group annuity reserves (12) (30)
Other revisions to continuing operations, net (71) (5)
Impact to income (loss) from continuing operations before provision for income tax (16) 93
Provision for income tax expense (benefit) (6) 32
Impact to income (loss) from continuing operations, net of income tax (10) 61
Other revisions to discontinued operations, net of income tax — 3
Impact to net income (loss) available to MetLife, Inc.’s common shareholders $ (10) $ 64
8
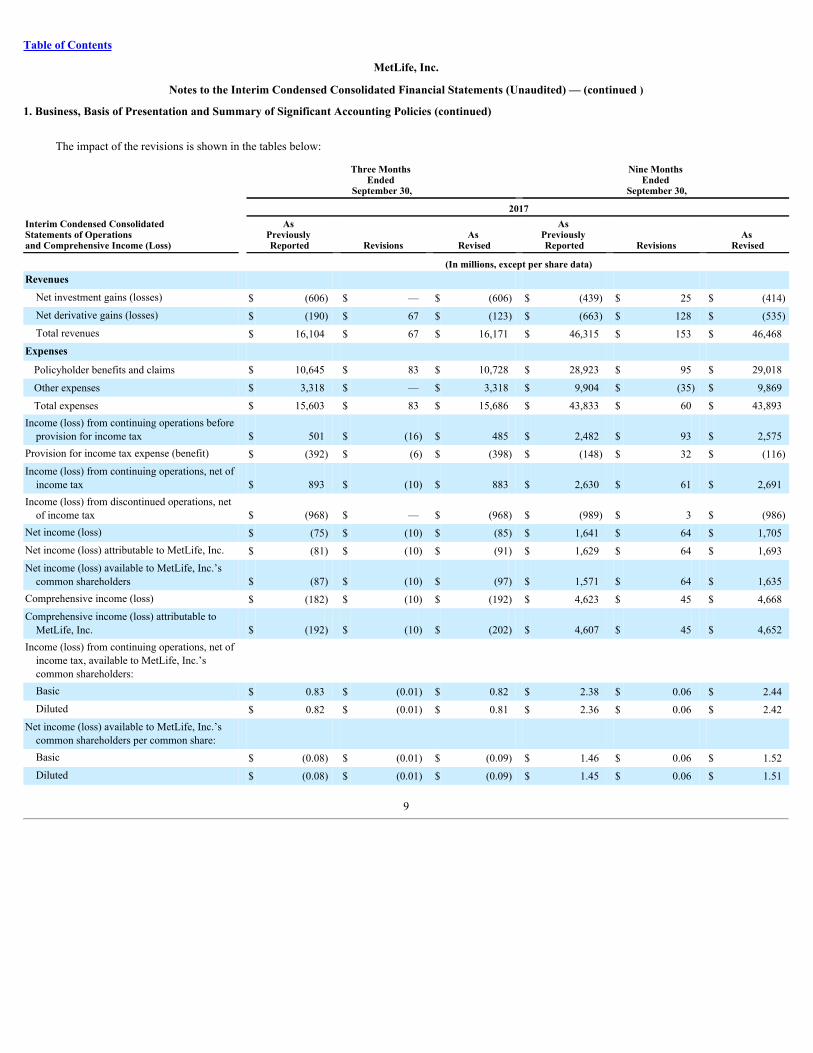
Table of Contents
MetLife, Inc.
Notes to the Interim Condensed Consolidated Financial Statements (Unaudited) — (continued )
1. Business, Basis of Presentation and Summary of Significant Accounting Policies (continued)
The impact of the revisions is shown in the tables below:
Three Months Ended
September 30,
Nine Months Ended
September 30, 2017Interim Condensed ConsolidatedStatements of Operationsand Comprehensive Income (Loss)
As Previously Reported Revisions
As Revised
As Previously Reported Revisions
As Revised
(In millions, except per share data)Revenues
Net investment gains (losses) $ (606) $ — $ (606) $ (439) $ 25 $ (414)Net derivative gains (losses) $ (190) $ 67 $ (123) $ (663) $ 128 $ (535)Total revenues $ 16,104 $ 67 $ 16,171 $ 46,315 $ 153 $ 46,468
Expenses Policyholder benefits and claims $ 10,645 $ 83 $ 10,728 $ 28,923 $ 95 $ 29,018
Other expenses $ 3,318 $ — $ 3,318 $ 9,904 $ (35) $ 9,869
Total expenses $ 15,603 $ 83 $ 15,686 $ 43,833 $ 60 $ 43,893Income (loss) from continuing operations before
provision for income tax $ 501 $ (16) $ 485 $ 2,482 $ 93 $ 2,575Provision for income tax expense (benefit) $ (392) $ (6) $ (398) $ (148) $ 32 $ (116)Income (loss) from continuing operations, net of
income tax $ 893 $ (10) $ 883 $ 2,630 $ 61 $ 2,691Income (loss) from discontinued operations, net
of income tax $ (968) $ — $ (968) $ (989) $ 3 $ (986)Net income (loss) $ (75) $ (10) $ (85) $ 1,641 $ 64 $ 1,705Net income (loss) attributable to MetLife, Inc. $ (81) $ (10) $ (91) $ 1,629 $ 64 $ 1,693Net income (loss) available to MetLife, Inc.’s
common shareholders $ (87) $ (10) $ (97) $ 1,571 $ 64 $ 1,635Comprehensive income (loss) $ (182) $ (10) $ (192) $ 4,623 $ 45 $ 4,668Comprehensive income (loss) attributable to
MetLife, Inc. $ (192) $ (10) $ (202) $ 4,607 $ 45 $ 4,652Income (loss) from continuing operations, net of
income tax, available to MetLife, Inc.’scommon shareholders: Basic $ 0.83 $ (0.01) $ 0.82 $ 2.38 $ 0.06 $ 2.44Diluted $ 0.82 $ (0.01) $ 0.81 $ 2.36 $ 0.06 $ 2.42
Net income (loss) available to MetLife, Inc.’scommon shareholders per common share: Basic $ (0.08) $ (0.01) $ (0.09) $ 1.46 $ 0.06 $ 1.52Diluted $ (0.08) $ (0.01) $ (0.09) $ 1.45 $ 0.06 $ 1.51
9
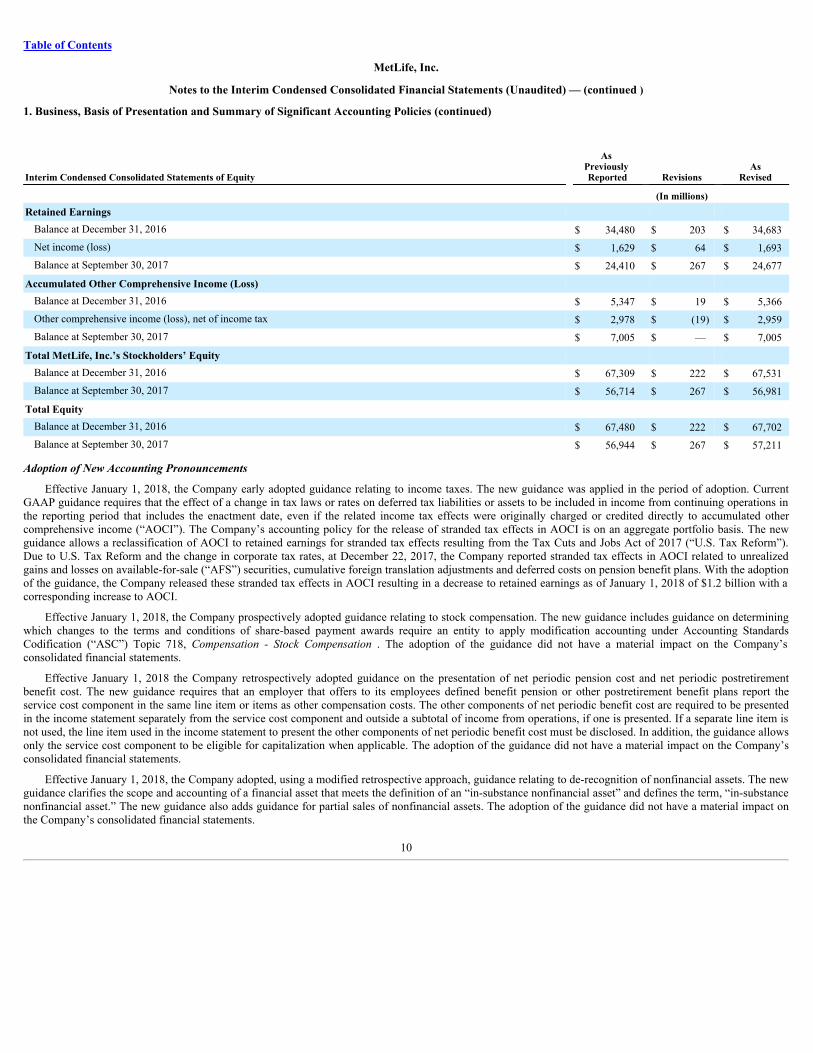
Table of Contents
MetLife, Inc.
Notes to the Interim Condensed Consolidated Financial Statements (Unaudited) — (continued )
1. Business, Basis of Presentation and Summary of Significant Accounting Policies (continued)
Interim Condensed Consolidated Statements of Equity
As Previously Reported Revisions
AsRevised
(In millions)Retained Earnings
Balance at December 31, 2016 $ 34,480 $ 203 $ 34,683Net income (loss) $ 1,629 $ 64 $ 1,693Balance at September 30, 2017 $ 24,410 $ 267 $ 24,677
Accumulated Other Comprehensive Income (Loss) Balance at December 31, 2016 $ 5,347 $ 19 $ 5,366Other comprehensive income (loss), net of income tax $ 2,978 $ (19) $ 2,959Balance at September 30, 2017 $ 7,005 $ — $ 7,005
Total MetLife, Inc.’s Stockholders’ Equity Balance at December 31, 2016 $ 67,309 $ 222 $ 67,531Balance at September 30, 2017 $ 56,714 $ 267 $ 56,981
Total Equity Balance at December 31, 2016 $ 67,480 $ 222 $ 67,702Balance at September 30, 2017 $ 56,944 $ 267 $ 57,211
AdoptionofNewAccountingPronouncements
Effective January 1, 2018, the Company early adopted guidance relating to income taxes. The new guidance was applied in the period of adoption. CurrentGAAP guidance requires that the effect of a change in tax laws or rates on deferred tax liabilities or assets to be included in income from continuing operations inthe reporting period that includes the enactment date, even if the related income tax effects were originally charged or credited directly to accumulated othercomprehensive income (“AOCI”). The Company’s accounting policy for the release of stranded tax effects in AOCI is on an aggregate portfolio basis. The newguidance allows a reclassification of AOCI to retained earnings for stranded tax effects resulting from the Tax Cuts and Jobs Act of 2017 (“U.S. Tax Reform”).Due to U.S. Tax Reform and the change in corporate tax rates, at December 22, 2017, the Company reported stranded tax effects in AOCI related to unrealizedgains and losses on available-for-sale (“AFS”) securities, cumulative foreign translation adjustments and deferred costs on pension benefit plans. With the adoptionof the guidance, the Company released these stranded tax effects in AOCI resulting in a decrease to retained earnings as of January 1, 2018 of $1.2 billion with acorresponding increase to AOCI.
Effective January 1, 2018, the Company prospectively adopted guidance relating to stock compensation. The new guidance includes guidance on determiningwhich changes to the terms and conditions of share-based payment awards require an entity to apply modification accounting under Accounting StandardsCodification (“ASC”) Topic 718, Compensation - Stock Compensation . The adoption of the guidance did not have a material impact on the Company’sconsolidated financial statements.
Effective January 1, 2018 the Company retrospectively adopted guidance on the presentation of net periodic pension cost and net periodic postretirementbenefit cost. The new guidance requires that an employer that offers to its employees defined benefit pension or other postretirement benefit plans report theservice cost component in the same line item or items as other compensation costs. The other components of net periodic benefit cost are required to be presentedin the income statement separately from the service cost component and outside a subtotal of income from operations, if one is presented. If a separate line item isnot used, the line item used in the income statement to present the other components of net periodic benefit cost must be disclosed. In addition, the guidance allowsonly the service cost component to be eligible for capitalization when applicable. The adoption of the guidance did not have a material impact on the Company’sconsolidated financial statements.
Effective January 1, 2018, the Company adopted, using a modified retrospective approach, guidance relating to de-recognition of nonfinancial assets. The newguidance clarifies the scope and accounting of a financial asset that meets the definition of an “in-substance nonfinancial asset” and defines the term, “in-substancenonfinancial asset.” The new guidance also adds guidance for partial sales of nonfinancial assets. The adoption of the guidance did not have a material impact onthe Company’s consolidated financial statements.
10
Table of Contents
MetLife, Inc.
Notes to the Interim Condensed Consolidated Financial Statements (Unaudited) — (continued )
1. Business, Basis of Presentation and Summary of Significant Accounting Policies (continued)
Effective January 1, 2018, the Company retrospectively adopted guidance relating to restricted cash. The new guidance requires that a statement of cash flowsexplain the change during the period in the total of cash, cash equivalents, and amounts generally described as restricted cash or restricted cash equivalents. As aresult, the new guidance requires that amounts generally described as restricted cash and restricted cash equivalents should be included with cash and cashequivalents when reconciling the beginning-of-period and end-of-period total amounts shown on the statement of cash flows. The new guidance does not provide adefinition of restricted cash or restricted cash equivalents. The adoption of the guidance did not have a material impact on the Company’s consolidated financialstatements.
Effective January 1, 2018, the Company adopted, using a modified retrospective approach, guidance relating to tax accounting for intra-entity transfers ofassets. Prior guidance prohibited the recognition of current and deferred income taxes for an intra-entity asset transfer until the asset has been sold to an outsideparty. The new guidance requires an entity to recognize the income tax consequences of an intra-entity transfer of an asset other than inventory when the transferoccurs. The adoption of the guidance did not have a material impact on the Company’s consolidated financial statements.
Effective January 1, 2018, the Company retrospectively adopted guidance relating to cash flow statement presentation. The new guidance addresses diversityin how certain cash receipts and cash payments are presented and classified in the statement of cash flows. The adoption of the guidance did not have a materialimpact on the Company’s consolidated financial statements.
Effective January 1, 2018, the Company adopted, using a modified retrospective approach, guidance relating to recognition and measurement of financialinstruments. The guidance changes the current accounting guidance related to (i) the classification and measurement of certain equity investments, (ii) thepresentation of changes in the fair value of financial liabilities measured under the fair value option (“FVO”) that are due to instrument-specific credit risk, and(iii) certain disclosures associated with the fair value of financial instruments. Effective January 1, 2018, there will no longer be a requirement to assess equitysecurities for impairment since such securities will be measured at fair value through net income. Additionally, there will no longer be a requirement to assessequity securities for embedded derivatives requiring bifurcation. The adoption of this guidance resulted in a $328 million , net of income tax, increase to retainedearnings largely offset by a decrease to AOCI that was primarily attributable to $1.7 billion of equity securities previously classified and measured as equitysecurities AFS. At December 31, 2017, equity securities of $16.0 billion primarily associated with contractholder-directed investments are accounted for using theFVO and therefore were unaffected by the new guidance. The Company has included the required disclosures related to equity securities within Note 6 .
Effective January 1, 2018, the Company adopted, using a modified retrospective approach, guidance relating to revenue recognition. The new guidancesupersedes nearly all existing revenue recognition guidance under U.S. GAAP. However, it does not impact the accounting for insurance and investment contractswithin the scope of ASC Topic 944, Financial Services - Insurance , leases, financial instruments and certain guarantees. For those contracts that are impacted, thenew guidance requires an entity to recognize revenue upon the transfer of promised goods or services to customers in an amount that reflects the consideration towhich the entity expects to be entitled, in exchange for those goods or services. The adoption of the guidance did not have a material impact on the Company’sconsolidated financial statements.
For the three months and nine months ended September 30, 2018 , the Company identified $329 million and $ 979 million , respectively, of revenue streamswithin the scope of the guidance that are all included within other revenues on the interim condensed consolidated statements of operations and comprehensiveincome (loss). Such amounts primarily consisted of: (i) prepaid legal plans and administrative-only contracts within the U.S. segment of $127 million and $382million for the three months and nine months ended September 30, 2018 , respectively, (ii) distribution and administrative services fees within the MetLifeHoldings segment of $56 million and $ 170 million for the three months and nine months ended September 30, 2018 , respectively, and (iii) fee-based investmentmanagement services within Corporate & Other of $74 million and $219 million for the three months and nine months ended September 30, 2018 , respectively.
Substantially all of the revenue from these services is recognized over time as the applicable services are provided or are made available to the customers andcontrol is transferred continuously. The consideration received for these services is variable and constrained to the amount not probable of a significant revenuereversal.
11
Table of Contents
MetLife, Inc.
Notes to the Interim Condensed Consolidated Financial Statements (Unaudited) — (continued )
1. Business, Basis of Presentation and Summary of Significant Accounting Policies (continued)
Other
Effective January 16, 2018, the London Clearing House (“LCH”) amended its rulebook, resulting in the characterization of variation margin transfers assettlement payments, as opposed to adjustments to collateral. These amendments impacted the accounting treatment of the Company’s centrally cleared derivatives,for which the LCH serves as the central clearing party. As of the effective date, the application of the amended rulebook reduced gross derivative assets by $369million , gross derivative liabilities by $203 million , accrued investment income by $14 million , collateral receivables recorded within premiums, reinsurance andother receivables by $184 million , and collateral payables recorded within payables for collateral under securities loaned and other transactions by $365 million .The application of the amended rulebook increased accrued investment expense recorded within other liabilities by $1 million .
FutureAdoptionofNewAccountingPronouncements
In October 2018, the Financial Accounting Standards Board (“FASB”) issued new guidance on consolidation (Accounting Standards Update (“ASU”) 2018-17, Consolidation (Topic 810): Targeted Improvements to Related Party Guidance for Variable Interest Entities) . The new guidance is effective for fiscal yearsbeginning after December 15, 2019 and interim periods within those fiscal years and should be applied retrospectively with a cumulative effect adjustment toretained earnings at the beginning of the earliest period presented. Early adoption is permitted. The new guidance provides that indirect interests held throughrelated parties in common control arrangements should be considered on a proportional basis for determining whether fees paid to decisionmakers and serviceproviders are variable interests. The Company is currently evaluating the impact of the new guidance on its consolidated financial statements.
In October 2018, the FASB issued new guidance regarding derivatives (ASU 2018-16, Derivatives and Hedging (Topic 815): Inclusion of the SecuredOvernight Financing Rate (SOFR) Overnight Index Swap (OIS) Rate as a Benchmark Interest Rate for Hedge Accounting Purposes) . The new guidance iseffective for fiscal years beginning after December 15, 2018 and interim periods within those fiscal years and should be applied prospectively for qualifying new orredesignated hedging relationships entered into after January 1, 2019. The amendments permit the use of the overnight index swap rate based on the SecuredOvernight Financing Rate to be used as a U.S. benchmark interest rate for hedge accounting purposes under Topic 815. The Company is currently evaluating theimpact of the new guidance on its consolidated financial statements.
In August 2018, the FASB issued new guidance on implementation costs in a cloud computing arrangement that is a service contract (ASU 2018-15,Intangibles—Goodwill and Other—Internal-Use Software: Customer’s Accounting for Implementation Costs Incurred in a Cloud Computing Arrangement That Isa Service Contract) . The new guidance is effective for fiscal years beginning after December 15, 2019 and interim periods within those fiscal years. Early adoptionis permitted. The new guidance can be applied either prospectively to eligible costs incurred on or after the guidance is first applied, or retrospectively to all periodspresented. The new guidance requires a customer in a cloud computing arrangement that is a service contract to follow the internal-use software guidance todetermine which implementation costs to capitalize as assets. The Company is currently evaluating the impact of the new guidance on its consolidated financialstatements.
In August 2018, the FASB issued new guidance on defined benefit pension or other postretirement plans (ASU 2018-14, Compensation—Retirement Benefits—Defined Benefit Plans—General (Subtopic 715-20): Disclosure Framework—Changes to the Disclosure Requirements for Defined Benefit Plans). The newguidance is effective for fiscal years ending after December 15, 2020. Early adoption is permitted. The new guidance should be applied on a retrospective basis toall periods presented. The new guidance modifies and clarifies certain disclosure requirements. The Company is currently evaluating the impact of the newguidance on its consolidated financial statements.
In August 2018, the FASB issued new guidance on fair value measurement (ASU 2018-13, Fair Value Measurement (Topic 820): Disclosure Framework—Changes to the Disclosure Requirements for Fair Value Measurement) . The new guidance is effective for fiscal years beginning after December 15, 2019 andinterim periods within those fiscal years. Early adoption is permitted. The guidance modifies the disclosure requirements on fair value by removing somerequirements, modifying others, adding changes in unrealized gains and losses included in other comprehensive income (loss) (“OCI”) for recurring Level 3 fairvalue measurements, and providing the option to disclose certain other quantitative information with respect to significant unobservable inputs in lieu of a weightedaverage. The Company is currently evaluating the impact of the new guidance on its consolidated financial statements.
12
Table of Contents
MetLife, Inc.
Notes to the Interim Condensed Consolidated Financial Statements (Unaudited) — (continued )
1. Business, Basis of Presentation and Summary of Significant Accounting Policies (continued)
In August 2018, the FASB issued new guidance on long-duration insurance contracts (ASU 2018-12, Financial Services—Insurance (Topic 944): TargetedImprovements to the Accounting for Long-Duration Contracts). The new guidance is effective for fiscal years beginning after December 15, 2020 and interimperiods within those fiscal years, with required retrospective application to January 1, 2019. Early adoption is permitted. The new guidance (i) prescribes thediscount rate to be used in measuring the liability for future policy benefits for traditional and limited payment long-duration contracts, and requires assumptionsfor those liability valuations to be updated after contract inception, (ii) requires more market-based product guarantees on certain separate account and otheraccount balance long-duration contracts to be accounted for at fair value, (iii) simplifies the amortization of deferred policy acquisition costs (“DAC”) for virtuallyall long-duration contracts, and (iv) introduces certain financial statement presentation requirements, as well as significant additional quantitative and qualitativedisclosures. The Company has just begun its implementation efforts and is currently evaluating the impact of the new guidance. Given the nature and extent of therequired changes to a significant portion of the Company’s operations, the adoption of this standard is expected to have a material impact on the consolidatedfinancial statements.
In August 2017, the FASB issued new guidance on hedging activities (ASU 2017-12, Derivatives and Hedging (Topic 815): Targeted Improvements toAccounting for Hedging Activities) . The new guidance is effective for fiscal years beginning after December 15, 2018 and interim periods within those fiscal yearsand should be applied on a modified retrospective basis through a cumulative effect adjustment to retained earnings. Early adoption is permitted. The new guidancesimplifies the application of hedge accounting in certain situations and amends the hedge accounting model to enable entities to better portray the economics oftheir risk management activities in their financial statements. Upon the adoption of ASU 2017-12, the Company will make certain changes to its assessment ofhedge effectiveness for fair value hedging relationships, and the Company will also reclassify hedge ineffectiveness for cash flow hedging relationships existing asof the adoption date, which was previously recorded to earnings, to AOCI. The estimated impact of adoption is a decrease to retained earnings of approximately$100 million to $250 million .
In March 2017, the FASB issued new guidance on purchased callable debt securities (ASU 2017-08, Receivables—Nonrefundable Fees and Other Costs(Subtopic 310-20), Premium Amortization on Purchased Callable Debt Securities ). The new guidance is effective for fiscal years beginning after December 15,2018 and interim periods within those fiscal years and should be applied on a modified retrospective basis through a cumulative effect adjustment to retainedearnings. Early adoption is permitted. The ASU shortens the amortization period for certain callable debt securities held at a premium and requires the premium tobe amortized to the earliest call date. However, the new guidance does not require an accounting change for securities held at a discount whose discount continuesto be amortized to maturity. The Company does not expect the adoption to have a material impact on its consolidated financial statements.
In January 2017, the FASB issued new guidance on goodwill impairment (ASU 2017-04, Intangibles—Goodwill and Other (Topic 350): Simplifying the Testfor Goodwill Impairment ). The new guidance is effective for fiscal years beginning after December 15, 2019 and interim periods within those fiscal years, andshould be applied on a prospective basis. Early adoption is permitted for interim or annual goodwill impairment tests performed on testing dates after January 1,2017. The new guidance simplifies the current two-step goodwill impairment test by eliminating Step 2 of the test. See Note 11 of the Notes to the ConsolidatedFinancial Statements included in the 2017 Annual Report for a description of the two-step test. The new guidance requires a one-step impairment test in which anentity compares the fair value of a reporting unit with its carrying amount and recognizes an impairment charge for the amount by which the carrying amountexceeds the reporting unit’s fair value, if any. The Company expects the adoption of this new guidance will reduce the complexity involved with the evaluation ofgoodwill for impairment. The impact of the new guidance will depend on the outcomes of future goodwill impairment tests.
13
Table of Contents
MetLife, Inc.
Notes to the Interim Condensed Consolidated Financial Statements (Unaudited) — (continued )
1. Business, Basis of Presentation and Summary of Significant Accounting Policies (continued)
In June 2016, the FASB issued new guidance on measurement of credit losses on financial instruments (ASU 2016-13, Financial Instruments—Credit Losses(Topic 326): Measurement of Credit Losses on Financial Instruments ). The new guidance is effective for fiscal years beginning after December 15, 2019,including interim periods within those fiscal years. For substantially all financial assets, the ASU should be applied on a modified retrospective basis through acumulative effect adjustment to retained earnings. For previously impaired debt securities and certain debt securities acquired with evidence of credit qualitydeterioration since origination, the new guidance should be applied prospectively. Early adoption is permitted for fiscal years, and interim periods within thosefiscal years, beginning after December 15, 2018. This ASU replaces the incurred loss impairment methodology with one that reflects expected credit losses. Themeasurement of expected credit losses should be based on historical loss information, current conditions, and reasonable and supportable forecasts. The newguidance requires that an other-than-temporary impairment (“ OTTI”) on a debt security will be recognized as an allowance going forward, such that improvementsin expected future cash flows after an impairment will no longer be reflected as a prospective yield adjustment through net investment income, but rather a reversalof the previous impairment and recognized through realized investment gains and losses. The guidance also requires enhanced disclosures. The Company hasassessed the asset classes impacted by the new guidance and is currently assessing the accounting and reporting system changes that will be required to complywith the new guidance. The Company believes that the most significant impact upon adoption will be to its mortgage loan investments. The Company is currentlyevaluating the impact of the new guidance on its consolidated financial statements.
In February 2016, the FASB issued new guidance on leasing transactions (ASU 2016-02, Leases (Topic 842 )). The new guidance is effective for the fiscalyears beginning after December 15, 2018, including interim periods within those fiscal years. The new guidance requires a lessee to recognize assets and liabilitiesfor leases with lease terms of more than 12 months. Leases would be classified as finance or operating leases and both types of leases will be recognized on thebalance sheet. Lessor accounting will remain largely unchanged from current guidance except for certain targeted changes. The new guidance will also require newqualitative and quantitative disclosures. In July 2018, the FASB issued ASU 2018-10, Codification Improvements to Topic 842, Leases , amending certain aspectsof the new leases standard. Also in July 2018, the FASB issued ASU 2018-11, Leases (Topic 842): Targeted Improvements , which provides lessors with apractical expedient not to separate lease and non-lease components for certain operating leases and with an additional transition method.
The Company will adopt the new guidance under ASU 2016-02 and related amendments on January 1, 2019 and expects to elect certain practical expedientspermitted under the transition guidance. In addition, the Company expects to elect the transition option, which allows the Company to use the modifiedretrospective transition method and recognize a cumulative effect adjustment to the opening balance of retained earnings in the period of adoption but does notrequire restatement of prior periods. The Company has developed an integrated implementation plan and formed a multi-functional working group with a projectgovernance structure to address any resource, system, data and process gaps related to the implementation of the new standard. The Company is currently in theprocess of integrating a lease accounting technology solution and developing updated reporting processes and internal controls to facilitate compliance with thenew guidance.
While the Company is in the process of evaluating the impact of this guidance on its consolidated financial statements, the Company believes the mostsignificant changes relate to (i) the recognition of new right of use assets and lease liabilities on the consolidated balance sheet for real estate operating leases; and(ii) the recognition of deferred gains associated with previous sale-leaseback transactions as a cumulative effect adjustment to retained earnings. On adoption, theCompany expects to recognize additional operating liabilities, with corresponding right of use assets of the same amount adjusted for prepaid/deferred rent,unamortized initial direct costs and potential impairment of right of use assets based on the present value of the remaining minimum rental payments. These assetsand liabilities are expected to represent less than 1% of the Company’s total assets and total liabilities, and the Company does not expect the adoption to have amaterial impact on its consolidated financial statements.
2. Segment Information
MetLife is organized into five segments: U.S.; Asia; Latin America; EMEA; and MetLife Holdings. In addition, the Company reports certain of its results ofoperations in Corporate & Other.
14
Table of Contents
MetLife, Inc.
Notes to the Interim Condensed Consolidated Financial Statements (Unaudited) — (continued)
2. Segment Information (continued)
U.S.
The U.S. segment offers a broad range of protection products and services aimed at serving the financial needs of customers throughout their lives. Theseproducts are sold to corporations and their respective employees, other institutions and their respective members, as well as individuals. The U.S. segment isorganized into three businesses: Group Benefits, Retirement and Income Solutions (“RIS”) and Property & Casualty.
• The Group Benefits business offers insurance products and services which include life, dental, group short- and long-term disability, individual disability,accidental death and dismemberment, vision and accident & health coverages, as well as prepaid legal plans. This business also sells administrativeservices-only arrangements to some employers.
• The RIS business offers a broad range of annuity and investment products, including stable value and pension risk transfer products, institutional incomeannuities, tort settlements, capital market investment products, as well as postretirement benefits and company-, bank- or trust-owned life insurance.
• The Property & Casualty business offers personal and commercial lines of property and casualty insurance, including private passenger automobile,homeowners’ and personal excess liability insurance. In addition, Property & Casualty offers small business owners property, liability and businessinterruption insurance.
Asia
The Asia segment offers a broad range of products to both individuals and corporations, as well as other institutions and their respective employees, whichinclude whole and term life, endowments, universal and variable life, accident & health insurance and fixed and variable annuities.
LatinAmerica
The Latin America segment offers a broad range of products to both individuals and corporations, as well as other institutions and their respective employees,which include life insurance, retirement and savings products, accident & health insurance and credit insurance.
EMEA
The EMEA segment offers a broad range of products to both individuals and corporations, as well as other institutions and their respective employees, whichinclude life insurance, accident & health insurance, retirement and savings products and credit insurance.
MetLifeHoldings
The MetLife Holdings segment consists of operations relating to products and businesses no longer actively marketed by the Company in the United States,such as variable, universal, term and whole life insurance, variable, fixed and index-linked annuities, long-term care insurance, as well as the assumed variableannuity guarantees from the Company’s former operating joint venture in Japan.
Corporate&Other
Corporate & Other contains the excess capital, as well as certain charges and activities, not allocated to the segments, including external integration anddisposition costs, internal resource costs for associates committed to acquisitions and dispositions, enterprise-wide strategic initiative restructuring charges andvarious start-up businesses (including the investment management business through which the Company offers fee-based investment management services toinstitutional clients). Additionally, Corporate & Other includes run-off businesses such as the direct to consumer portion of the U.S. Direct business. Corporate &Other also includes interest expense related to the majority of the Company’s outstanding debt, as well as expenses associated with certain legal proceedings andincome tax audit issues. In addition, Corporate & Other includes the elimination of intersegment amounts, which generally relate to affiliated reinsurance andintersegment loans, which bear interest rates commensurate with related borrowings.
15
Table of Contents
MetLife, Inc.
Notes to the Interim Condensed Consolidated Financial Statements (Unaudited) — (continued)
2. Segment Information (continued)
FinancialMeasuresandSegmentAccountingPolicies
Adjusted earnings is used by management to evaluate performance and allocate resources. Consistent with GAAP guidance for segment reporting, adjustedearnings is also the Company’s GAAP measure of segment performance and is reported below. Adjusted earnings should not be viewed as a substitute for income(loss) from continuing operations, net of income tax. The Company believes the presentation of adjusted earnings, as the Company measures it for managementpurposes, enhances the understanding of its performance by highlighting the results of operations and the underlying profitability drivers of the business.
Adjusted earnings is defined as adjusted revenues less adjusted expenses, net of income tax.
The financial measures of adjusted revenues and adjusted expenses focus on the Company’s primary businesses principally by excluding the impact of marketvolatility, which could distort trends, and revenues and costs related to non-core products and certain entities required to be consolidated under GAAP. Also, thesemeasures exclude results of discontinued operations under GAAP and other businesses that have been or will be sold or exited by MetLife but do not meet thediscontinued operations criteria under GAAP and are referred to as divested businesses. Divested businesses also includes the net impact of transactions with exitedbusinesses that have been eliminated in consolidation under GAAP and costs relating to businesses that have been or will be sold or exited by MetLife that do notmeet the criteria to be included in results of discontinued operations under GAAP. Adjusted revenues also excludes net investment gains (losses) and net derivativegains (losses). Adjusted expenses also excludes goodwill impairments.
The following additional adjustments are made to revenues, in the line items indicated, in calculating adjusted revenues:
• Universal life and investment-type product policy fees excludes the amortization of unearned revenue related to net investment gains (losses) and netderivative gains (losses) and certain variable annuity guaranteed minimum income benefits (“GMIBs”) fees (“GMIB fees”);
• Net investment income: (i) includes earned income on derivatives and amortization of premium on derivatives that are hedges of investments or that areused to replicate certain investments, but do not qualify for hedge accounting treatment, (ii) excludes post-tax adjusted earnings adjustments relating toinsurance joint ventures accounted for under the equity method, (iii) excludes certain amounts related to contractholder-directed unit-linked investments,(iv) excludes certain amounts related to securitization entities that are VIEs consolidated under GAAP and (v) includes distributions of profits fromcertain other limited partnership interests that were previously accounted for under the cost method, but are now accounted for at estimated fair value,where the change in estimated fair value is recognized in net investment gains (losses) for GAAP; and
• Other revenues is adjusted for settlements of foreign currency earnings hedges and excludes fees received in association with services provided undertransition service agreements (“TSA fees”).
16
Table of Contents
MetLife, Inc.
Notes to the Interim Condensed Consolidated Financial Statements (Unaudited) — (continued)
2. Segment Information (continued)
The following additional adjustments are made to expenses, in the line items indicated, in calculating adjusted expenses:
• Policyholder benefits and claims and policyholder dividends excludes: (i) changes in the policyholder dividend obligation related to net investment gains(losses) and net derivative gains (losses), (ii) inflation-indexed benefit adjustments associated with contracts backed by inflation-indexed investments andamounts associated with periodic crediting rate adjustments based on the total return of a contractually referenced pool of assets and other pass-throughadjustments, (iii) benefits and hedging costs related to GMIBs (“GMIB costs”) and (iv) market value adjustments associated with surrenders orterminations of contracts (“Market value adjustments”);
• Interest credited to policyholder account balances includes adjustments for earned income on derivatives and amortization of premium on derivatives thatare hedges of policyholder account balances but do not qualify for hedge accounting treatment and excludes amounts related to net investment incomeearned on contractholder-directed unit-linked investments;
• Amortization of DAC and value of business acquired (“VOBA”) excludes amounts related to: (i) net investment gains (losses) and net derivativegains (losses), (ii) GMIB fees and GMIB costs and (iii) Market value adjustments;
• Amortization of negative VOBA excludes amounts related to Market value adjustments;
• Interest expense on debt excludes certain amounts related to securitization entities that are VIEs consolidated under GAAP; and
• Other expenses excludes costs related to: (i) noncontrolling interests, (ii) implementation of new insurance regulatory requirements and (iii) acquisition,integration and other costs. Other expenses includes TSA fees.
Adjusted earnings also excludes the recognition of certain contingent assets and liabilities that could not be recognized at acquisition or adjusted for during themeasurement period under GAAP business combination accounting guidance.
The tax impact of the adjustments mentioned above are calculated net of the U.S. or foreign statutory tax rate, which could differ from the Company’seffective tax rate. Additionally, the provision for income tax (expense) benefit also includes the impact related to the timing of certain tax credits, as well as certaintax reforms.
Set forth in the tables below is certain financial information with respect to the Company’s segments, as well as Corporate & Other, for the three months andnine months ended September 30, 2018 and 2017 . The segment accounting policies are the same as those used to prepare the Company’s consolidated financialstatements, except for adjusted earnings adjustments as defined above. In addition, segment accounting policies include the method of capital allocation describedbelow.
Economic capital is an internally developed risk capital model, the purpose of which is to measure the risk in the business and to provide a basis upon whichcapital is deployed. The economic capital model accounts for the unique and specific nature of the risks inherent in the Company’s business.
The Company’s economic capital model, coupled with considerations of local capital requirements, aligns segment allocated equity with emerging standardsand consistent risk principles. The model applies statistics-based risk evaluation principles to the material risks to which the Company is exposed. These consistentrisk principles include calibrating required economic capital shock factors to a specific confidence level and time horizon while applying an industry standardmethod for the inclusion of diversification benefits among risk types. The Company’s management is responsible for the ongoing production and enhancement ofthe economic capital model and reviews its approach periodically to ensure that it remains consistent with emerging industry practice standards.
Segment net investment income is credited or charged based on the level of allocated equity; however, changes in allocated equity do not impact theCompany’s consolidated net investment income, income (loss) from continuing operations, net of income tax, or adjusted earnings.
Net investment income is based upon the actual results of each segment’s specifically identifiable investment portfolios adjusted for allocated equity. Othercosts are allocated to each of the segments based upon: (i) a review of the nature of such costs; (ii) time studies analyzing the amount of employee compensationcosts incurred by each segment; and (iii) cost estimates included in the Company’s product pricing.
17
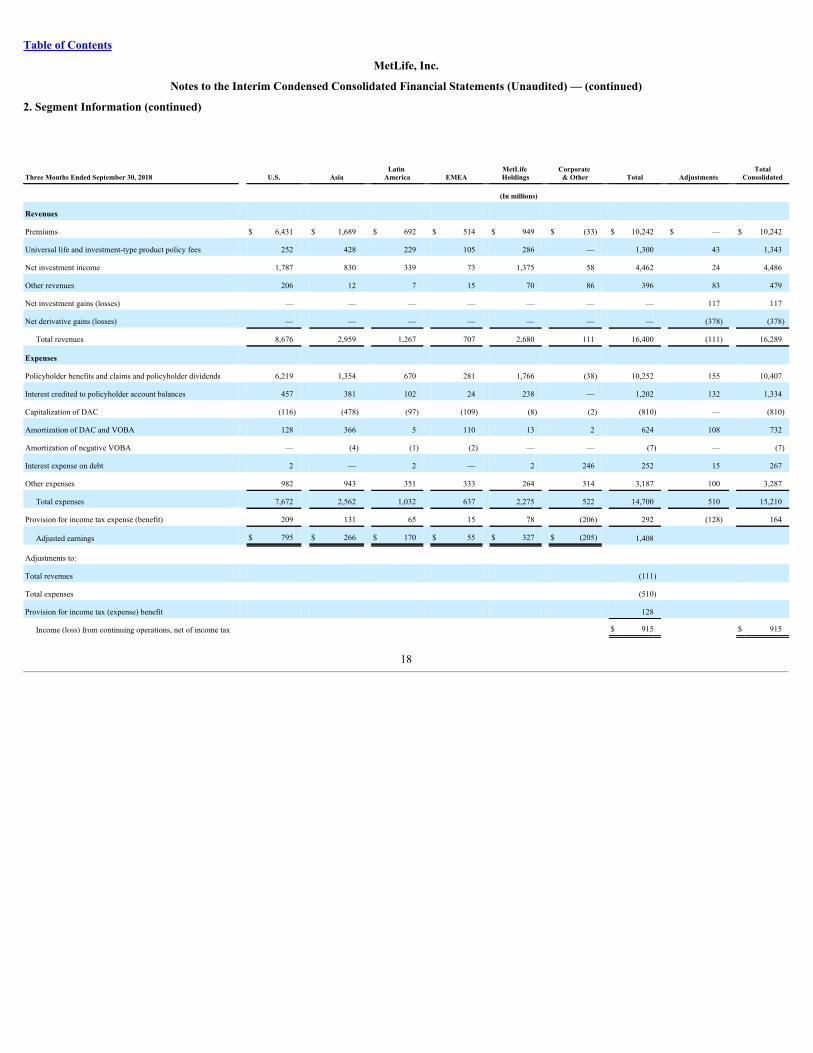
Table of Contents
MetLife, Inc.
Notes to the Interim Condensed Consolidated Financial Statements (Unaudited) — (continued)
2. Segment Information (continued)
Three Months Ended September 30, 2018 U.S. Asia Latin America EMEA MetLife
Holdings Corporate & Other Total Adjustments Total
Consolidated
(In millions)
Revenues
Premiums $ 6,431 $ 1,689 $ 692 $ 514 $ 949 $ (33) $ 10,242 $ — $ 10,242
Universal life and investment-type product policy fees 252 428 229 105 286 — 1,300 43 1,343
Net investment income 1,787 830 339 73 1,375 58 4,462 24 4,486
Other revenues 206 12 7 15 70 86 396 83 479
Net investment gains (losses) — — — — — — — 117 117
Net derivative gains (losses) — — — — — — — (378) (378)
Total revenues 8,676 2,959 1,267 707 2,680 111 16,400 (111) 16,289
Expenses
Policyholder benefits and claims and policyholder dividends 6,219 1,354 670 281 1,766 (38) 10,252 155 10,407
Interest credited to policyholder account balances 457 381 102 24 238 — 1,202 132 1,334
Capitalization of DAC (116) (478) (97) (109) (8) (2) (810) — (810)
Amortization of DAC and VOBA 128 366 5 110 13 2 624 108 732
Amortization of negative VOBA — (4) (1) (2) — — (7) — (7)
Interest expense on debt 2 — 2 — 2 246 252 15 267
Other expenses 982 943 351 333 264 314 3,187 100 3,287
Total expenses 7,672 2,562 1,032 637 2,275 522 14,700 510 15,210
Provision for income tax expense (benefit) 209 131 65 15 78 (206) 292 (128) 164
Adjusted earnings $ 795 $ 266 $ 170 $ 55 $ 327 $ (205) 1,408
Adjustments to:
Total revenues (111)
Total expenses (510)
Provision for income tax (expense) benefit 128
Income (loss) from continuing operations, net of income tax $ 915 $ 915
18
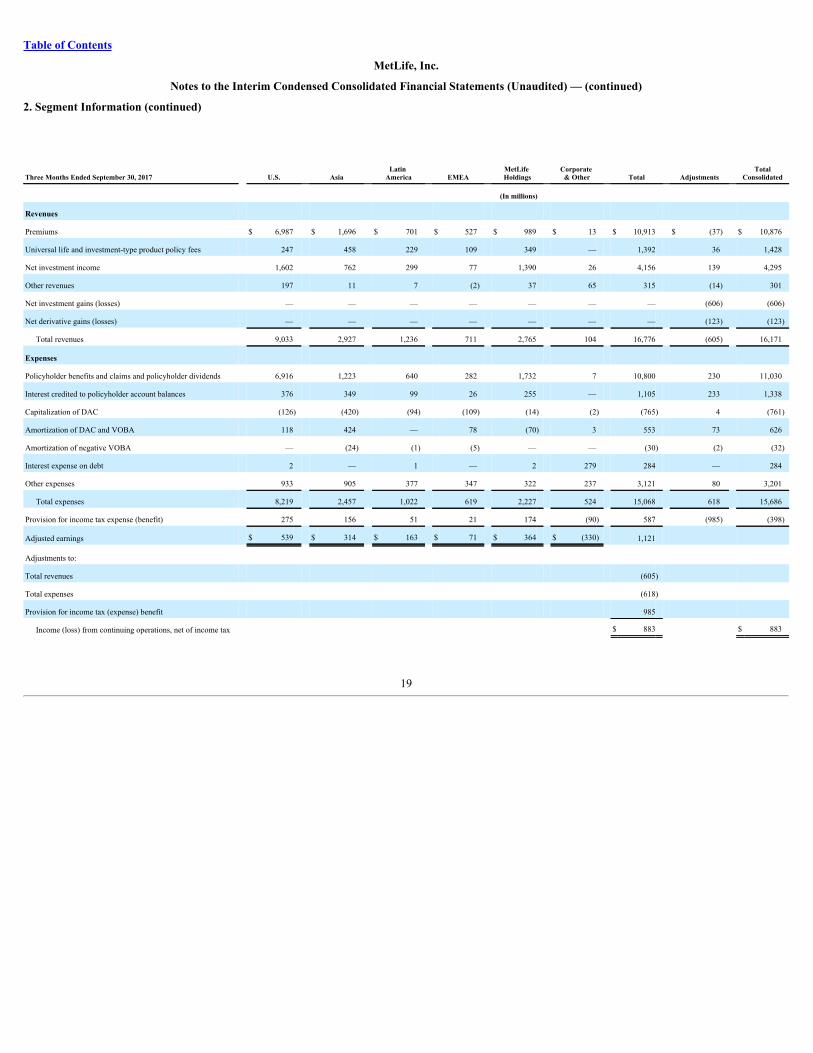
Table of Contents
MetLife, Inc.
Notes to the Interim Condensed Consolidated Financial Statements (Unaudited) — (continued)
2. Segment Information (continued)
Three Months Ended September 30, 2017 U.S. Asia Latin America EMEA MetLife
Holdings Corporate & Other Total Adjustments Total
Consolidated
(In millions)
Revenues
Premiums $ 6,987 $ 1,696 $ 701 $ 527 $ 989 $ 13 $ 10,913 $ (37) $ 10,876
Universal life and investment-type product policy fees 247 458 229 109 349 — 1,392 36 1,428
Net investment income 1,602 762 299 77 1,390 26 4,156 139 4,295
Other revenues 197 11 7 (2) 37 65 315 (14) 301
Net investment gains (losses) — — — — — — — (606) (606)
Net derivative gains (losses) — — — — — — — (123) (123)
Total revenues 9,033 2,927 1,236 711 2,765 104 16,776 (605) 16,171
Expenses
Policyholder benefits and claims and policyholder dividends 6,916 1,223 640 282 1,732 7 10,800 230 11,030
Interest credited to policyholder account balances 376 349 99 26 255 — 1,105 233 1,338
Capitalization of DAC (126) (420) (94) (109) (14) (2) (765) 4 (761)
Amortization of DAC and VOBA 118 424 — 78 (70) 3 553 73 626
Amortization of negative VOBA — (24) (1) (5) — — (30) (2) (32)
Interest expense on debt 2 — 1 — 2 279 284 — 284
Other expenses 933 905 377 347 322 237 3,121 80 3,201
Total expenses 8,219 2,457 1,022 619 2,227 524 15,068 618 15,686
Provision for income tax expense (benefit) 275 156 51 21 174 (90) 587 (985) (398)
Adjusted earnings $ 539 $ 314 $ 163 $ 71 $ 364 $ (330) 1,121
Adjustments to:
Total revenues (605)
Total expenses (618)
Provision for income tax (expense) benefit 985
Income (loss) from continuing operations, net of income tax $ 883 $ 883
19
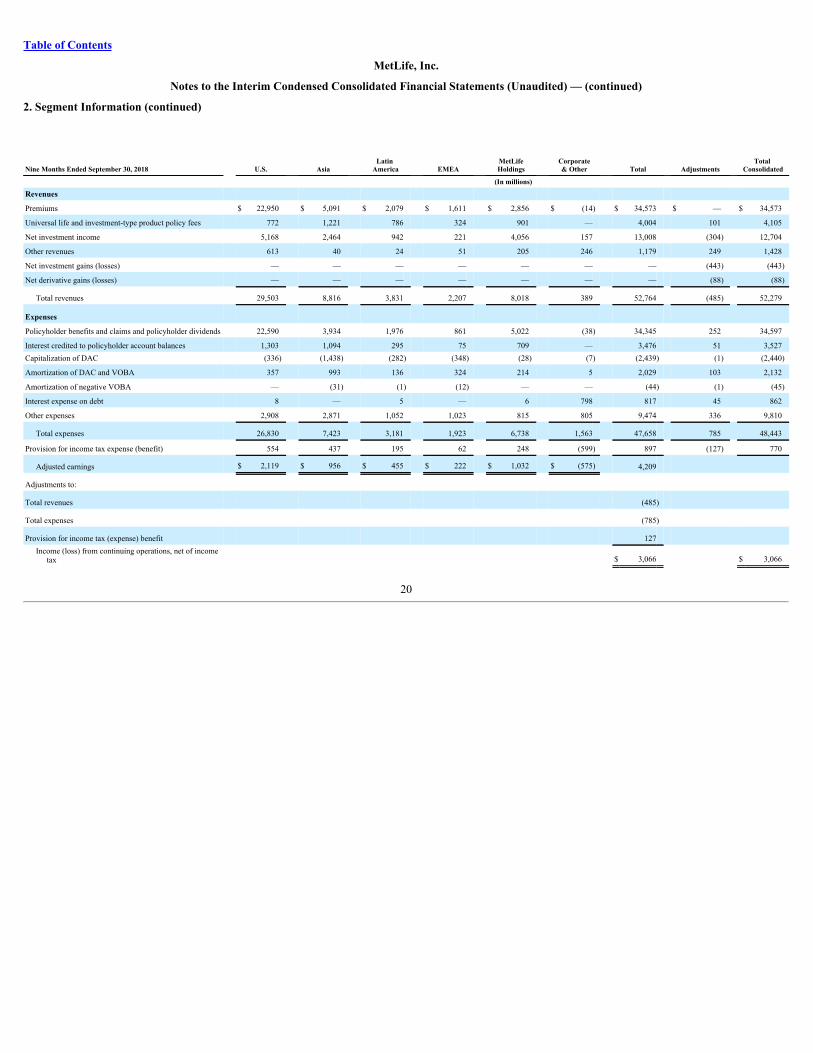
Table of Contents
MetLife, Inc.
Notes to the Interim Condensed Consolidated Financial Statements (Unaudited) — (continued)
2. Segment Information (continued)
Nine Months Ended September 30, 2018 U.S. Asia Latin America EMEA MetLife
Holdings Corporate& Other Total Adjustments Total
Consolidated
(In millions)
Revenues
Premiums $ 22,950 $ 5,091 $ 2,079 $ 1,611 $ 2,856 $ (14) $ 34,573 $ — $ 34,573
Universal life and investment-type product policy fees 772 1,221 786 324 901 — 4,004 101 4,105
Net investment income 5,168 2,464 942 221 4,056 157 13,008 (304) 12,704
Other revenues 613 40 24 51 205 246 1,179 249 1,428
Net investment gains (losses) — — — — — — — (443) (443)
Net derivative gains (losses) — — — — — — — (88) (88)
Total revenues 29,503 8,816 3,831 2,207 8,018 389 52,764 (485) 52,279
Expenses Policyholder benefits and claims and policyholder dividends 22,590 3,934 1,976 861 5,022 (38) 34,345 252 34,597
Interest credited to policyholder account balances 1,303 1,094 295 75 709 — 3,476 51 3,527Capitalization of DAC (336) (1,438) (282) (348) (28) (7) (2,439) (1) (2,440)
Amortization of DAC and VOBA 357 993 136 324 214 5 2,029 103 2,132
Amortization of negative VOBA — (31) (1) (12) — — (44) (1) (45)
Interest expense on debt 8 — 5 — 6 798 817 45 862
Other expenses 2,908 2,871 1,052 1,023 815 805 9,474 336 9,810
Total expenses 26,830 7,423 3,181 1,923 6,738 1,563 47,658 785 48,443
Provision for income tax expense (benefit) 554 437 195 62 248 (599) 897 (127) 770
Adjusted earnings $ 2,119 $ 956 $ 455 $ 222 $ 1,032 $ (575) 4,209
Adjustments to:
Total revenues (485)
Total expenses (785)
Provision for income tax (expense) benefit 127 Income (loss) from continuing operations, net of income
tax $ 3,066 $ 3,066
20
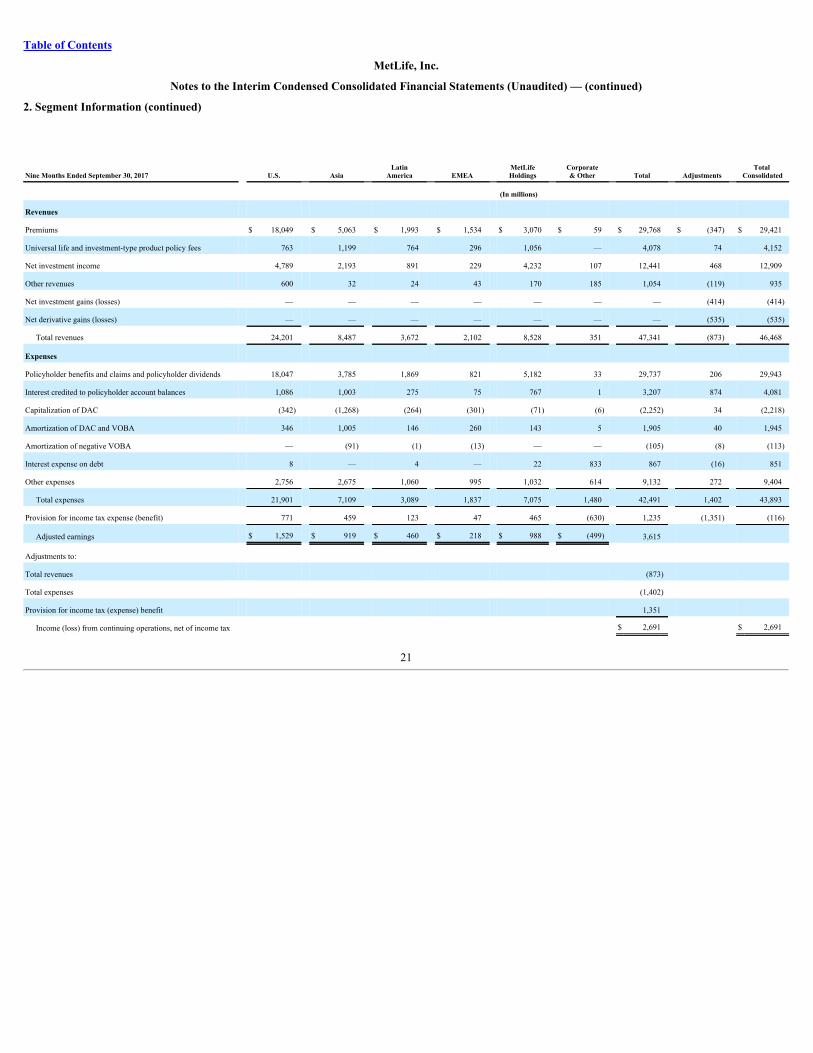
Table of Contents
MetLife, Inc.
Notes to the Interim Condensed Consolidated Financial Statements (Unaudited) — (continued)
2. Segment Information (continued)
Nine Months Ended September 30, 2017 U.S. Asia LatinAmerica EMEA MetLife
Holdings Corporate& Other Total Adjustments Total
Consolidated
(In millions)
Revenues
Premiums $ 18,049 $ 5,063 $ 1,993 $ 1,534 $ 3,070 $ 59 $ 29,768 $ (347) $ 29,421
Universal life and investment-type product policy fees 763 1,199 764 296 1,056 — 4,078 74 4,152
Net investment income 4,789 2,193 891 229 4,232 107 12,441 468 12,909
Other revenues 600 32 24 43 170 185 1,054 (119) 935
Net investment gains (losses) — — — — — — — (414) (414)
Net derivative gains (losses) — — — — — — — (535) (535)
Total revenues 24,201 8,487 3,672 2,102 8,528 351 47,341 (873) 46,468
Expenses
Policyholder benefits and claims and policyholder dividends 18,047 3,785 1,869 821 5,182 33 29,737 206 29,943
Interest credited to policyholder account balances 1,086 1,003 275 75 767 1 3,207 874 4,081
Capitalization of DAC (342) (1,268) (264) (301) (71) (6) (2,252) 34 (2,218)
Amortization of DAC and VOBA 346 1,005 146 260 143 5 1,905 40 1,945
Amortization of negative VOBA — (91) (1) (13) — — (105) (8) (113)
Interest expense on debt 8 — 4 — 22 833 867 (16) 851
Other expenses 2,756 2,675 1,060 995 1,032 614 9,132 272 9,404
Total expenses 21,901 7,109 3,089 1,837 7,075 1,480 42,491 1,402 43,893
Provision for income tax expense (benefit) 771 459 123 47 465 (630) 1,235 (1,351) (116)
Adjusted earnings $ 1,529 $ 919 $ 460 $ 218 $ 988 $ (499) 3,615
Adjustments to:
Total revenues (873)
Total expenses (1,402)
Provision for income tax (expense) benefit 1,351
Income (loss) from continuing operations, net of income tax $ 2,691 $ 2,691
21
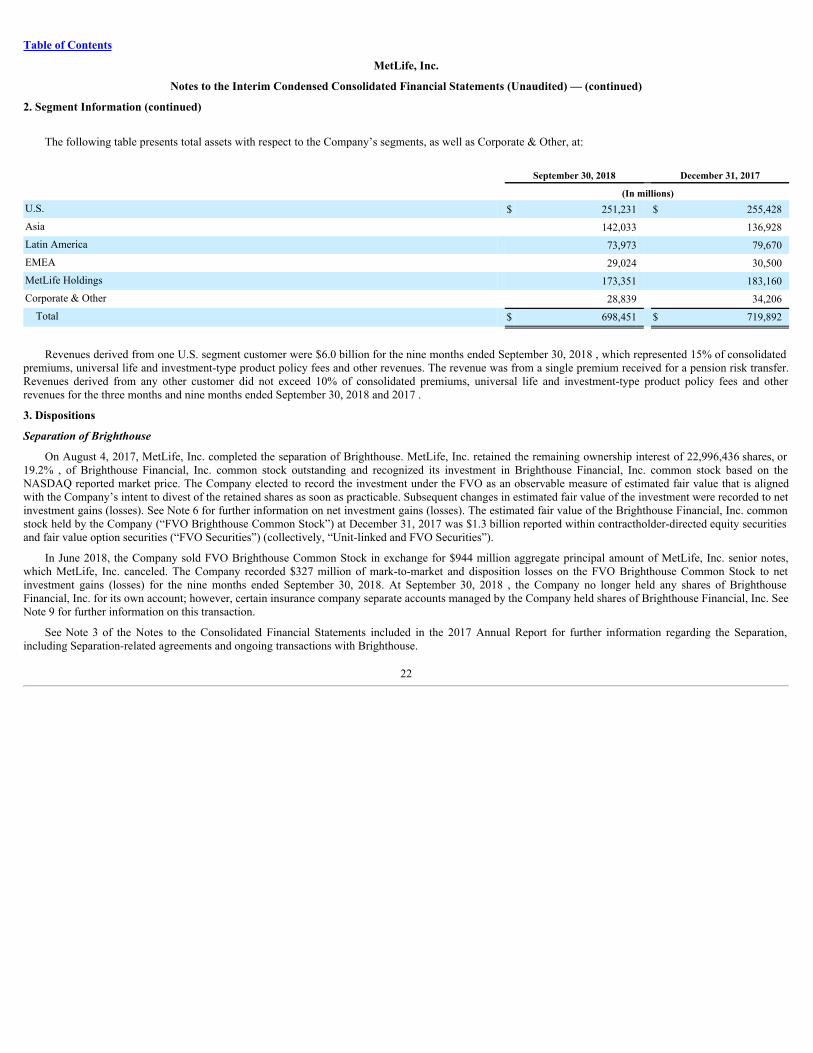
Table of Contents
MetLife, Inc.
Notes to the Interim Condensed Consolidated Financial Statements (Unaudited) — (continued)
2. Segment Information (continued)
The following table presents total assets with respect to the Company’s segments, as well as Corporate & Other, at:
September 30, 2018 December 31, 2017 (In millions)U.S. $ 251,231 $ 255,428Asia 142,033 136,928Latin America 73,973 79,670EMEA 29,024 30,500MetLife Holdings 173,351 183,160Corporate & Other 28,839 34,206
Total $ 698,451 $ 719,892
Revenues derived from one U.S. segment customer were $6.0 billion for the nine months ended September 30, 2018 , which represented 15% of consolidatedpremiums, universal life and investment-type product policy fees and other revenues. The revenue was from a single premium received for a pension risk transfer.Revenues derived from any other customer did not exceed 10% of consolidated premiums, universal life and investment-type product policy fees and otherrevenues for the three months and nine months ended September 30, 2018 and 2017 .
3. Dispositions
SeparationofBrighthouse
On August 4, 2017, MetLife, Inc. completed the separation of Brighthouse. MetLife, Inc. retained the remaining ownership interest of 22,996,436 shares, or19.2% , of Brighthouse Financial, Inc. common stock outstanding and recognized its investment in Brighthouse Financial, Inc. common stock based on theNASDAQ reported market price. The Company elected to record the investment under the FVO as an observable measure of estimated fair value that is alignedwith the Company’s intent to divest of the retained shares as soon as practicable. Subsequent changes in estimated fair value of the investment were recorded to netinvestment gains (losses). See Note 6 for further information on net investment gains (losses). The estimated fair value of the Brighthouse Financial, Inc. commonstock held by the Company (“FVO Brighthouse Common Stock”) at December 31, 2017 was $1.3 billion reported within contractholder-directed equity securitiesand fair value option securities (“FVO Securities”) (collectively, “Unit-linked and FVO Securities”).
In June 2018, the Company sold FVO Brighthouse Common Stock in exchange for $944 million aggregate principal amount of MetLife, Inc. senior notes,which MetLife, Inc. canceled. The Company recorded $327 million of mark-to-market and disposition losses on the FVO Brighthouse Common Stock to netinvestment gains (losses) for the nine months ended September 30, 2018. At September 30, 2018 , the Company no longer held any shares of BrighthouseFinancial, Inc. for its own account; however, certain insurance company separate accounts managed by the Company held shares of Brighthouse Financial, Inc. SeeNote 9 for further information on this transaction.
See Note 3 of the Notes to the Consolidated Financial Statements included in the 2017 Annual Report for further information regarding the Separation,including Separation-related agreements and ongoing transactions with Brighthouse.
22
Table of Contents
MetLife, Inc.
Notes to the Interim Condensed Consolidated Financial Statements (Unaudited) — (continued)
3. Dispositions (continued)
Agreements
In connection with the Separation, MetLife and Brighthouse entered into various agreements. See Note 3 of the Notes to the Consolidated FinancialStatements included in the 2017 Annual Report for further information regarding significant agreements.
Tax Agreements
Immediately prior to the Separation, MetLife entered into tax agreements with Brighthouse.
In accordance with the tax separation agreement, at both September 30, 2018 and December 31, 2017 , the Company’s current income tax receivable andcorresponding payable to Brighthouse, reported in other liabilities, were $726 million .
As part of the tax receivable agreement, MetLife Inc. has the right to receive future payments from Brighthouse for a tax asset that Brighthouse receivedas a result of restructuring prior to the Separation. Included in other assets at both September 30, 2018 and December 31, 2017 , is a receivable fromBrighthouse of $333 million related to these future payments.
OngoingTransactionswithBrighthouse
The Company considered all of its continuing involvement with Brighthouse in determining whether to deconsolidate and present Brighthouse results asdiscontinued operations, including the agreements entered into between MetLife and Brighthouse and the ongoing transactions described below.
The Company entered into reinsurance, committed facility, structured settlement, and contract administrative services transactions with Brighthouse in thenormal course of business and such transactions will continue based upon business needs. In addition, prior to and in connection with the Separation, theCompany entered into various other agreements, including investment management, transition services and employee matters agreements, with Brighthouse forservices necessary for both the Company and Brighthouse to conduct their activities. Intercompany transactions prior to the Separation between the Companyand Brighthouse are eliminated and excluded from the interim condensed consolidated statements of operations and comprehensive income (loss). Transactionsbetween the Company and Brighthouse that continue after the Separation are included on the Company’s interim condensed consolidated statements ofoperations and comprehensive income (loss) and interim condensed consolidated balance sheets.
23
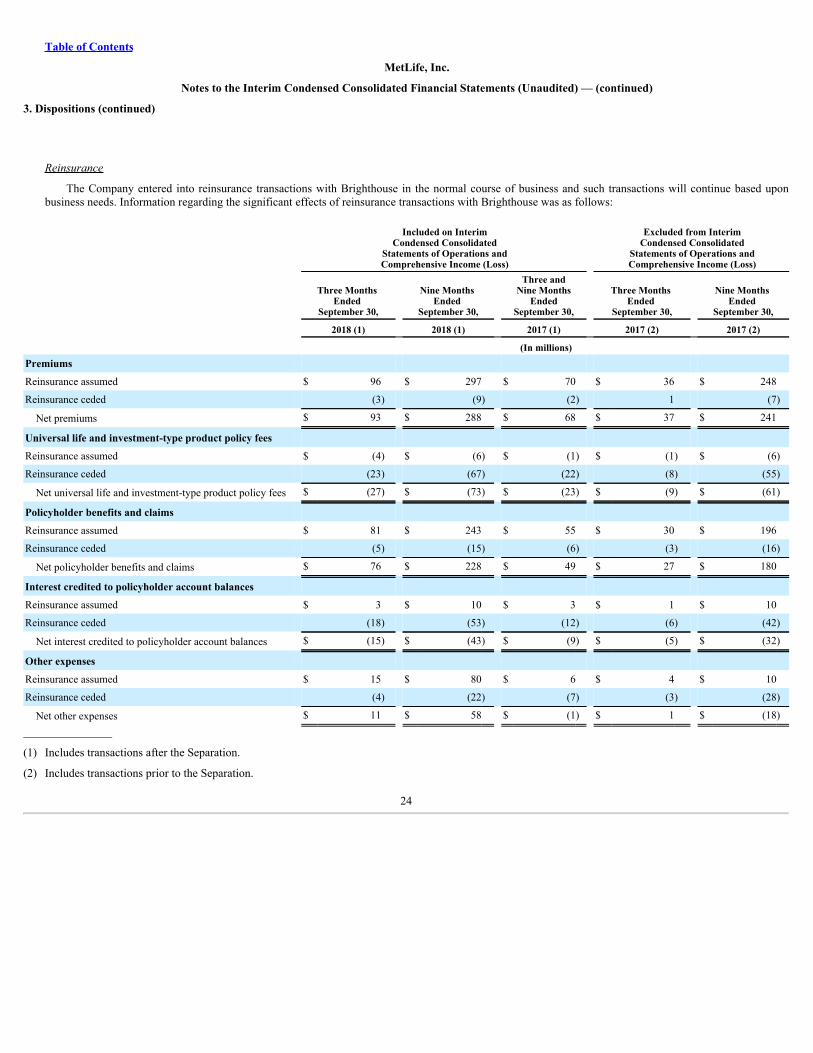
Table of Contents
MetLife, Inc.
Notes to the Interim Condensed Consolidated Financial Statements (Unaudited) — (continued)
3. Dispositions (continued)
Reinsurance
The Company entered into reinsurance transactions with Brighthouse in the normal course of business and such transactions will continue based uponbusiness needs. Information regarding the significant effects of reinsurance transactions with Brighthouse was as follows:
Included on InterimCondensed Consolidated
Statements of Operations andComprehensive Income (Loss)
Excluded from InterimCondensed Consolidated
Statements of Operations andComprehensive Income (Loss)
Three Months Ended
September 30,
Nine Months Ended
September 30,
Three andNine Months
EndedSeptember 30,
Three Months Ended
September 30,
Nine Months Ended
September 30, 2018 (1) 2018 (1) 2017 (1) 2017 (2) 2017 (2) (In millions)Premiums Reinsurance assumed $ 96 $ 297 $ 70 $ 36 $ 248
Reinsurance ceded (3) (9) (2) 1 (7)
Net premiums $ 93 $ 288 $ 68 $ 37 $ 241
Universal life and investment-type product policy fees Reinsurance assumed $ (4) $ (6) $ (1) $ (1) $ (6)
Reinsurance ceded (23) (67) (22) (8) (55)
Net universal life and investment-type product policy fees $ (27) $ (73) $ (23) $ (9) $ (61)
Policyholder benefits and claims Reinsurance assumed $ 81 $ 243 $ 55 $ 30 $ 196
Reinsurance ceded (5) (15) (6) (3) (16)
Net policyholder benefits and claims $ 76 $ 228 $ 49 $ 27 $ 180
Interest credited to policyholder account balances Reinsurance assumed $ 3 $ 10 $ 3 $ 1 $ 10
Reinsurance ceded (18) (53) (12) (6) (42)
Net interest credited to policyholder account balances $ (15) $ (43) $ (9) $ (5) $ (32)
Other expenses Reinsurance assumed $ 15 $ 80 $ 6 $ 4 $ 10
Reinsurance ceded (4) (22) (7) (3) (28)
Net other expenses $ 11 $ 58 $ (1) $ 1 $ (18)__________________
(1) Includes transactions after the Separation.
(2) Includes transactions prior to the Separation.
24
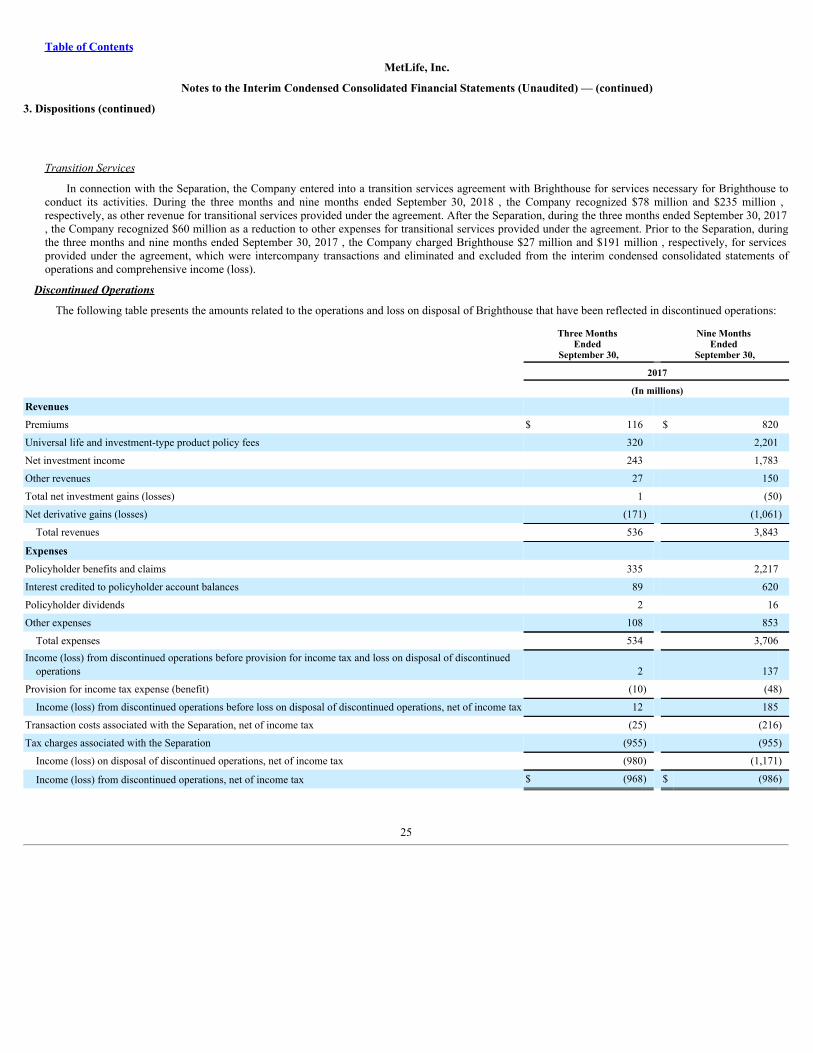
Table of Contents
MetLife, Inc.
Notes to the Interim Condensed Consolidated Financial Statements (Unaudited) — (continued)
3. Dispositions (continued)
Transition Services
In connection with the Separation, the Company entered into a transition services agreement with Brighthouse for services necessary for Brighthouse toconduct its activities. During the three months and nine months ended September 30, 2018 , the Company recognized $78 million and $235 million ,respectively, as other revenue for transitional services provided under the agreement. After the Separation, during the three months ended September 30, 2017, the Company recognized $60 million as a reduction to other expenses for transitional services provided under the agreement. Prior to the Separation, duringthe three months and nine months ended September 30, 2017 , the Company charged Brighthouse $27 million and $191 million , respectively, for servicesprovided under the agreement, which were intercompany transactions and eliminated and excluded from the interim condensed consolidated statements ofoperations and comprehensive income (loss).
DiscontinuedOperations
The following table presents the amounts related to the operations and loss on disposal of Brighthouse that have been reflected in discontinued operations:
Three Months Ended
September 30,
Nine Months Ended
September 30, 2017 (In millions)Revenues Premiums $ 116 $ 820
Universal life and investment-type product policy fees 320 2,201
Net investment income 243 1,783
Other revenues 27 150
Total net investment gains (losses) 1 (50)
Net derivative gains (losses) (171) (1,061)
Total revenues 536 3,843
Expenses Policyholder benefits and claims 335 2,217
Interest credited to policyholder account balances 89 620
Policyholder dividends 2 16
Other expenses 108 853
Total expenses 534 3,706Income (loss) from discontinued operations before provision for income tax and loss on disposal of discontinued
operations 2 137
Provision for income tax expense (benefit) (10) (48)
Income (loss) from discontinued operations before loss on disposal of discontinued operations, net of income tax 12 185
Transaction costs associated with the Separation, net of income tax (25) (216)
Tax charges associated with the Separation (955) (955)
Income (loss) on disposal of discontinued operations, net of income tax (980) (1,171)
Income (loss) from discontinued operations, net of income tax $ (968) $ (986)
25
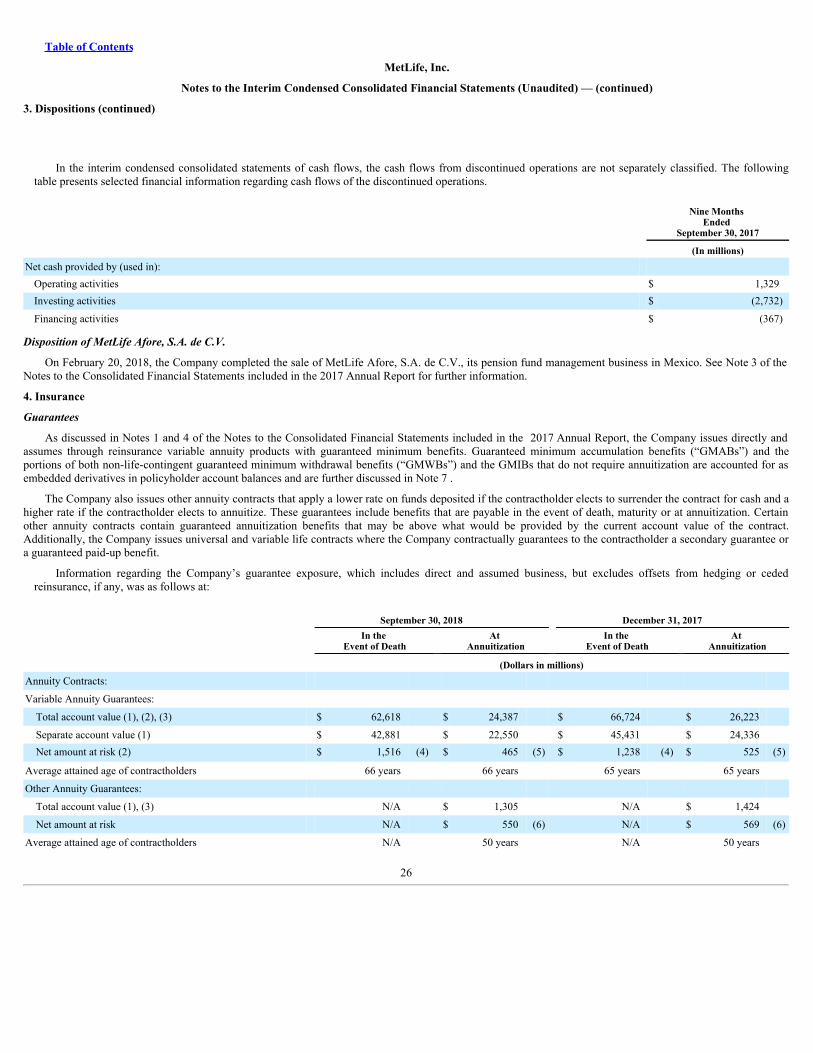
Table of Contents
MetLife, Inc.
Notes to the Interim Condensed Consolidated Financial Statements (Unaudited) — (continued)
3. Dispositions (continued)
In the interim condensed consolidated statements of cash flows, the cash flows from discontinued operations are not separately classified. The followingtable presents selected financial information regarding cash flows of the discontinued operations.
Nine Months Ended
September 30, 2017 (In millions)Net cash provided by (used in):
Operating activities $ 1,329Investing activities $ (2,732)
Financing activities $ (367)
DispositionofMetLifeAfore,S.A.deC.V.
On February 20, 2018, the Company completed the sale of MetLife Afore, S.A. de C.V., its pension fund management business in Mexico. See Note 3 of theNotes to the Consolidated Financial Statements included in the 2017 Annual Report for further information.
4. Insurance
Guarantees
As discussed in Notes 1 and 4 of the Notes to the Consolidated Financial Statements included in the 2017 Annual Report, the Company issues directly andassumes through reinsurance variable annuity products with guaranteed minimum benefits. Guaranteed minimum accumulation benefits (“GMABs”) and theportions of both non-life-contingent guaranteed minimum withdrawal benefits (“GMWBs”) and the GMIBs that do not require annuitization are accounted for asembedded derivatives in policyholder account balances and are further discussed in Note 7 .
The Company also issues other annuity contracts that apply a lower rate on funds deposited if the contractholder elects to surrender the contract for cash and ahigher rate if the contractholder elects to annuitize. These guarantees include benefits that are payable in the event of death, maturity or at annuitization. Certainother annuity contracts contain guaranteed annuitization benefits that may be above what would be provided by the current account value of the contract.Additionally, the Company issues universal and variable life contracts where the Company contractually guarantees to the contractholder a secondary guarantee ora guaranteed paid-up benefit.
Information regarding the Company’s guarantee exposure, which includes direct and assumed business, but excludes offsets from hedging or cededreinsurance, if any, was as follows at:
September 30, 2018 December 31, 2017
In the
Event of Death At
Annuitization In the
Event of Death At
Annuitization
(Dollars in millions) Annuity Contracts: Variable Annuity Guarantees:
Total account value (1), (2), (3) $ 62,618 $ 24,387 $ 66,724 $ 26,223 Separate account value (1) $ 42,881 $ 22,550 $ 45,431 $ 24,336 Net amount at risk (2) $ 1,516 (4) $ 465 (5) $ 1,238 (4) $ 525 (5)
Average attained age of contractholders 66 years 66 years 65 years 65 years Other Annuity Guarantees:
Total account value (1), (3) N/A $ 1,305 N/A $ 1,424 Net amount at risk N/A $ 550 (6) N/A $ 569 (6)
Average attained age of contractholders N/A 50 years N/A 50 years
26
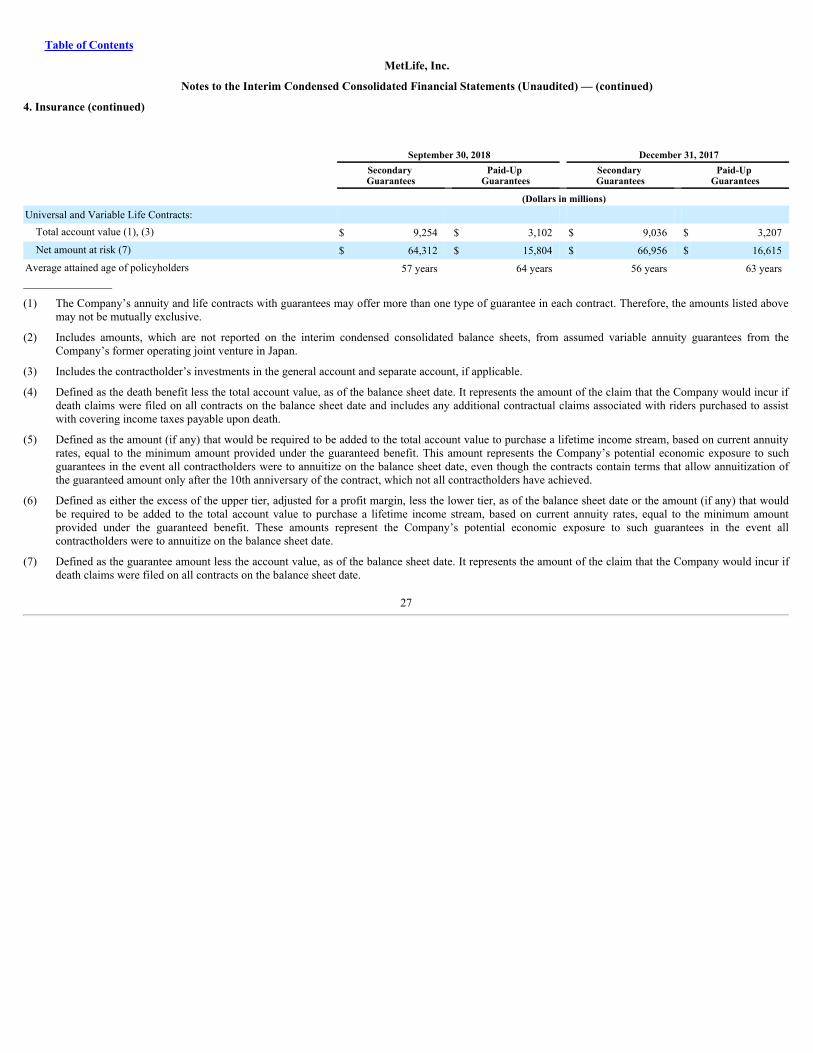
Table of Contents
MetLife, Inc.
Notes to the Interim Condensed Consolidated Financial Statements (Unaudited) — (continued)
4. Insurance (continued)
September 30, 2018 December 31, 2017
Secondary Guarantees
Paid-Up Guarantees
Secondary Guarantees
Paid-Up Guarantees
(Dollars in millions)Universal and Variable Life Contracts:
Total account value (1), (3) $ 9,254 $ 3,102 $ 9,036 $ 3,207Net amount at risk (7) $ 64,312 $ 15,804 $ 66,956 $ 16,615
Average attained age of policyholders 57 years 64 years 56 years 63 years__________________
(1) The Company’s annuity and life contracts with guarantees may offer more than one type of guarantee in each contract. Therefore, the amounts listed abovemay not be mutually exclusive.
(2) Includes amounts, which are not reported on the interim condensed consolidated balance sheets, from assumed variable annuity guarantees from theCompany’s former operating joint venture in Japan.
(3) Includes the contractholder’s investments in the general account and separate account, if applicable.
(4) Defined as the death benefit less the total account value, as of the balance sheet date. It represents the amount of the claim that the Company would incur ifdeath claims were filed on all contracts on the balance sheet date and includes any additional contractual claims associated with riders purchased to assistwith covering income taxes payable upon death.
(5) Defined as the amount (if any) that would be required to be added to the total account value to purchase a lifetime income stream, based on current annuityrates, equal to the minimum amount provided under the guaranteed benefit. This amount represents the Company’s potential economic exposure to suchguarantees in the event all contractholders were to annuitize on the balance sheet date, even though the contracts contain terms that allow annuitization ofthe guaranteed amount only after the 10th anniversary of the contract, which not all contractholders have achieved.
(6) Defined as either the excess of the upper tier, adjusted for a profit margin, less the lower tier, as of the balance sheet date or the amount (if any) that wouldbe required to be added to the total account value to purchase a lifetime income stream, based on current annuity rates, equal to the minimum amountprovided under the guaranteed benefit. These amounts represent the Company’s potential economic exposure to such guarantees in the event allcontractholders were to annuitize on the balance sheet date.
(7) Defined as the guarantee amount less the account value, as of the balance sheet date. It represents the amount of the claim that the Company would incur ifdeath claims were filed on all contracts on the balance sheet date.
27
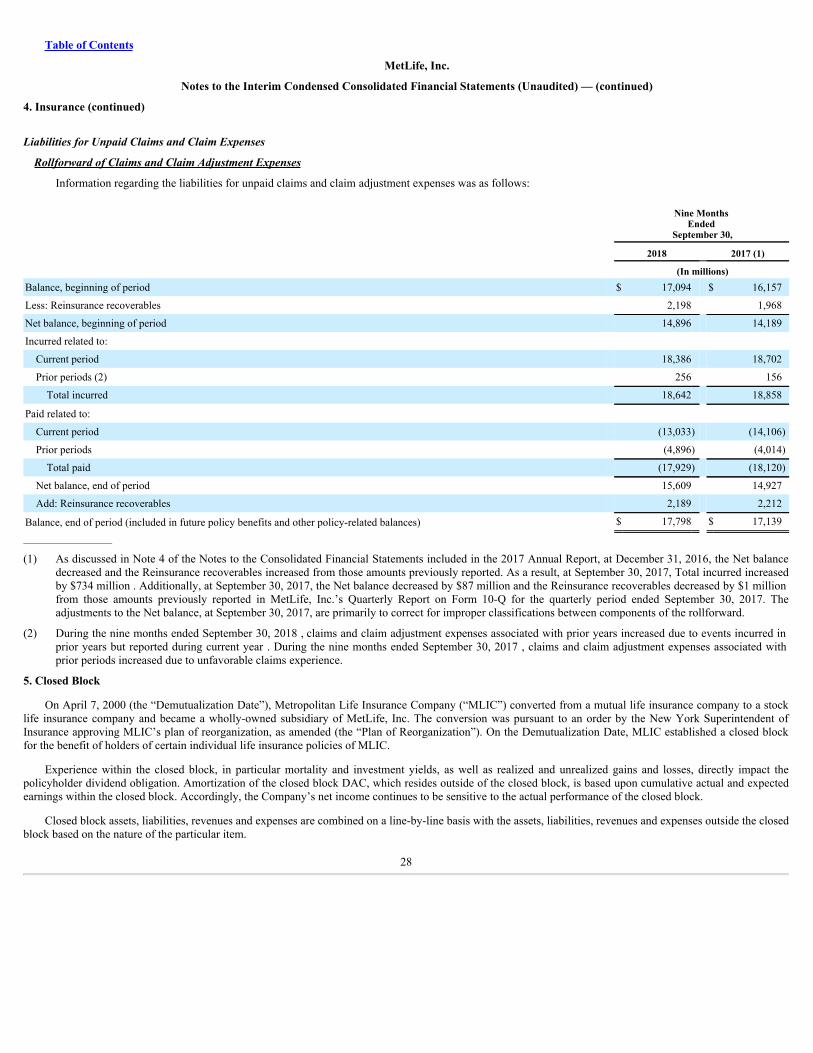
Table of Contents
MetLife, Inc.
Notes to the Interim Condensed Consolidated Financial Statements (Unaudited) — (continued)
4. Insurance (continued)
LiabilitiesforUnpaidClaimsandClaimExpenses
RollforwardofClaimsandClaimAdjustmentExpenses
Information regarding the liabilities for unpaid claims and claim adjustment expenses was as follows:
Nine Months Ended
September 30,
2018 2017 (1) (In millions)Balance, beginning of period $ 17,094 $ 16,157
Less: Reinsurance recoverables 2,198 1,968
Net balance, beginning of period 14,896 14,189
Incurred related to: Current period 18,386 18,702
Prior periods (2) 256 156
Total incurred 18,642 18,858
Paid related to: Current period (13,033) (14,106)
Prior periods (4,896) (4,014)
Total paid (17,929) (18,120)
Net balance, end of period 15,609 14,927
Add: Reinsurance recoverables 2,189 2,212
Balance, end of period (included in future policy benefits and other policy-related balances) $ 17,798 $ 17,139__________________
(1) As discussed in Note 4 of the Notes to the Consolidated Financial Statements included in the 2017 Annual Report, at December 31, 2016, the Net balancedecreased and the Reinsurance recoverables increased from those amounts previously reported. As a result, at September 30, 2017, Total incurred increasedby $734 million . Additionally, at September 30, 2017, the Net balance decreased by $87 million and the Reinsurance recoverables decreased by $1 millionfrom those amounts previously reported in MetLife, Inc.’s Quarterly Report on Form 10-Q for the quarterly period ended September 30, 2017. Theadjustments to the Net balance, at September 30, 2017, are primarily to correct for improper classifications between components of the rollforward.
(2) During the nine months ended September 30, 2018 , claims and claim adjustment expenses associated with prior years increased due to events incurred inprior years but reported during current year . During the nine months ended September 30, 2017 , claims and claim adjustment expenses associated withprior periods increased due to unfavorable claims experience.
5. Closed Block
On April 7, 2000 (the “Demutualization Date”), Metropolitan Life Insurance Company (“MLIC”) converted from a mutual life insurance company to a stocklife insurance company and became a wholly-owned subsidiary of MetLife, Inc. The conversion was pursuant to an order by the New York Superintendent ofInsurance approving MLIC’s plan of reorganization, as amended (the “Plan of Reorganization”). On the Demutualization Date, MLIC established a closed blockfor the benefit of holders of certain individual life insurance policies of MLIC.
Experience within the closed block, in particular mortality and investment yields, as well as realized and unrealized gains and losses, directly impact thepolicyholder dividend obligation. Amortization of the closed block DAC, which resides outside of the closed block, is based upon cumulative actual and expectedearnings within the closed block. Accordingly, the Company’s net income continues to be sensitive to the actual performance of the closed block.
Closed block assets, liabilities, revenues and expenses are combined on a line-by-line basis with the assets, liabilities, revenues and expenses outside the closedblock based on the nature of the particular item.
28
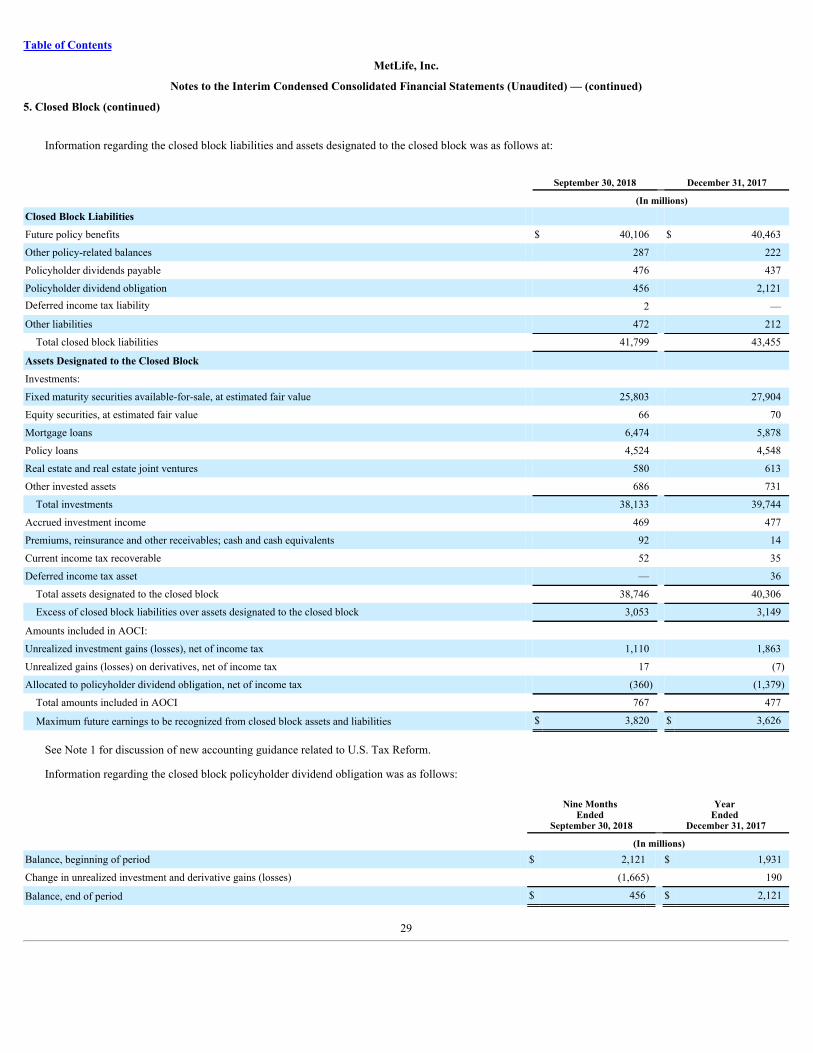
Table of Contents
MetLife, Inc.
Notes to the Interim Condensed Consolidated Financial Statements (Unaudited) — (continued)
5. Closed Block (continued)
Information regarding the closed block liabilities and assets designated to the closed block was as follows at:
September 30, 2018 December 31, 2017 (In millions)Closed Block Liabilities Future policy benefits $ 40,106 $ 40,463
Other policy-related balances 287 222
Policyholder dividends payable 476 437
Policyholder dividend obligation 456 2,121Deferred income tax liability 2 —
Other liabilities 472 212
Total closed block liabilities 41,799 43,455
Assets Designated to the Closed Block Investments: Fixed maturity securities available-for-sale, at estimated fair value 25,803 27,904
Equity securities, at estimated fair value 66 70
Mortgage loans 6,474 5,878
Policy loans 4,524 4,548
Real estate and real estate joint ventures 580 613
Other invested assets 686 731
Total investments 38,133 39,744
Accrued investment income 469 477
Premiums, reinsurance and other receivables; cash and cash equivalents 92 14
Current income tax recoverable 52 35
Deferred income tax asset — 36
Total assets designated to the closed block 38,746 40,306
Excess of closed block liabilities over assets designated to the closed block 3,053 3,149
Amounts included in AOCI: Unrealized investment gains (losses), net of income tax 1,110 1,863
Unrealized gains (losses) on derivatives, net of income tax 17 (7)
Allocated to policyholder dividend obligation, net of income tax (360) (1,379)
Total amounts included in AOCI 767 477
Maximum future earnings to be recognized from closed block assets and liabilities $ 3,820 $ 3,626
See Note 1 for discussion of new accounting guidance related to U.S. Tax Reform.
Information regarding the closed block policyholder dividend obligation was as follows:
Nine Months Ended
September 30, 2018
Year Ended
December 31, 2017 (In millions)Balance, beginning of period $ 2,121 $ 1,931
Change in unrealized investment and derivative gains (losses) (1,665) 190
Balance, end of period $ 456 $ 2,121
29
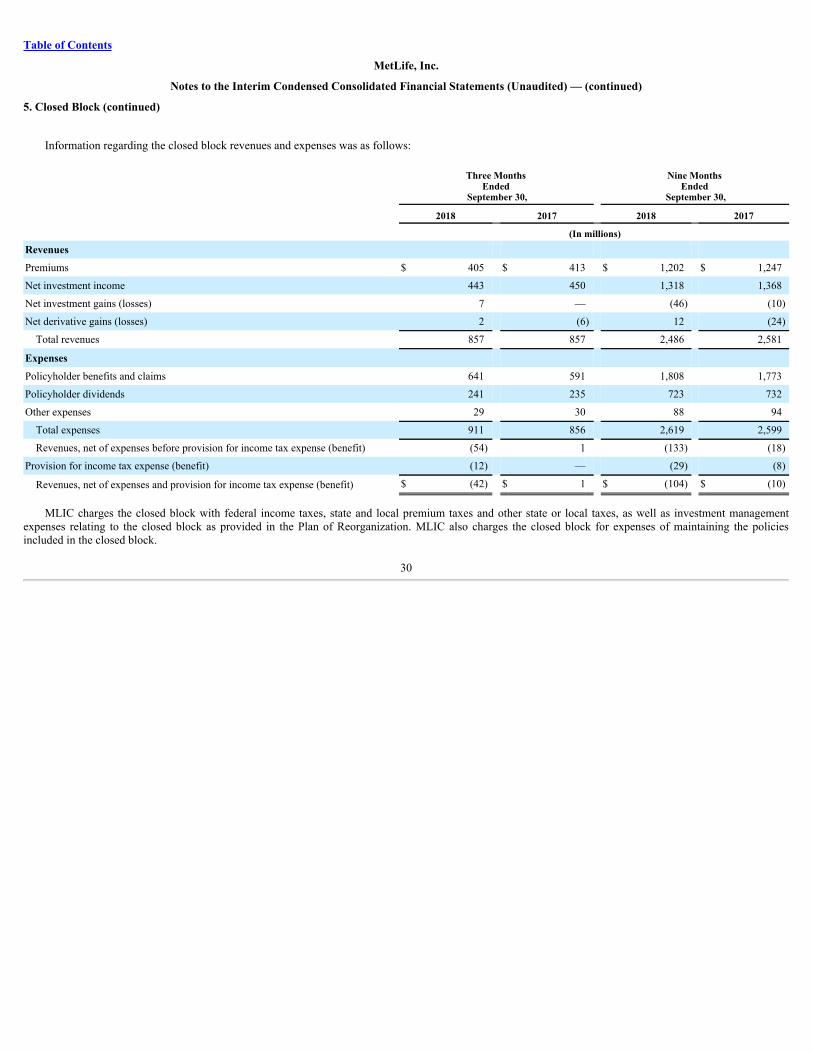
Table of Contents
MetLife, Inc.
Notes to the Interim Condensed Consolidated Financial Statements (Unaudited) — (continued)
5. Closed Block (continued)
Information regarding the closed block revenues and expenses was as follows:
Three Months Ended
September 30,
Nine Months Ended
September 30,
2018 2017 2018 2017 (In millions)Revenues Premiums $ 405 $ 413 $ 1,202 $ 1,247
Net investment income 443 450 1,318 1,368
Net investment gains (losses) 7 — (46) (10)
Net derivative gains (losses) 2 (6) 12 (24)
Total revenues 857 857 2,486 2,581
Expenses Policyholder benefits and claims 641 591 1,808 1,773
Policyholder dividends 241 235 723 732
Other expenses 29 30 88 94
Total expenses 911 856 2,619 2,599
Revenues, net of expenses before provision for income tax expense (benefit) (54) 1 (133) (18)
Provision for income tax expense (benefit) (12) — (29) (8)
Revenues, net of expenses and provision for income tax expense (benefit) $ (42) $ 1 $ (104) $ (10)
MLIC charges the closed block with federal income taxes, state and local premium taxes and other state or local taxes, as well as investment managementexpenses relating to the closed block as provided in the Plan of Reorganization. MLIC also charges the closed block for expenses of maintaining the policiesincluded in the closed block.
30
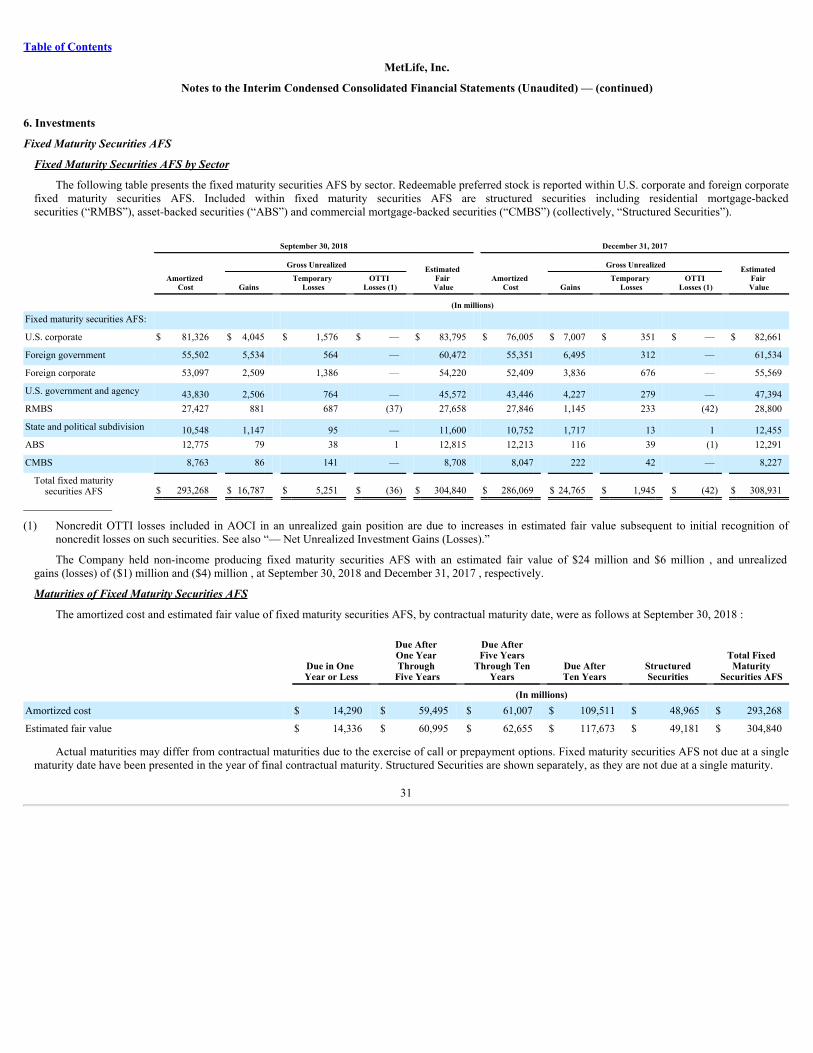
Table of Contents
MetLife, Inc.
Notes to the Interim Condensed Consolidated Financial Statements (Unaudited) — (continued)
6. Investments
FixedMaturitySecuritiesAFS
FixedMaturitySecuritiesAFSbySector
The following table presents the fixed maturity securities AFS by sector. Redeemable preferred stock is reported within U.S. corporate and foreign corporatefixed maturity securities AFS. Included within fixed maturity securities AFS are structured securities including residential mortgage-backedsecurities (“RMBS”), asset-backed securities (“ABS”) and commercial mortgage-backed securities (“CMBS”) (collectively, “Structured Securities”).
September 30, 2018 December 31, 2017
Amortized
Cost
Gross Unrealized Estimated
Fair Value Amortized
Cost
Gross Unrealized Estimated
Fair Value Gains Temporary
Losses OTTI Losses (1) Gains Temporary
Losses OTTI Losses (1)
(In millions)
Fixed maturity securities AFS: U.S. corporate $ 81,326 $ 4,045 $ 1,576 $ — $ 83,795 $ 76,005 $ 7,007 $ 351 $ — $ 82,661
Foreign government 55,502 5,534 564 — 60,472 55,351 6,495 312 — 61,534
Foreign corporate 53,097 2,509 1,386 — 54,220 52,409 3,836 676 — 55,569
U.S. government and agency 43,830 2,506 764 — 45,572 43,446 4,227 279 — 47,394RMBS 27,427 881 687 (37) 27,658 27,846 1,145 233 (42) 28,800
State and political subdivision 10,548 1,147 95 — 11,600 10,752 1,717 13 1 12,455ABS 12,775 79 38 1 12,815 12,213 116 39 (1) 12,291
CMBS 8,763 86 141 — 8,708 8,047 222 42 — 8,227
Total fixed maturitysecurities AFS $ 293,268 $ 16,787 $ 5,251 $ (36) $ 304,840 $ 286,069 $ 24,765 $ 1,945 $ (42) $ 308,931
__________________
(1) Noncredit OTTI losses included in AOCI in an unrealized gain position are due to increases in estimated fair value subsequent to initial recognition ofnoncredit losses on such securities. See also “— Net Unrealized Investment Gains (Losses).”
The Company held non-income producing fixed maturity securities AFS with an estimated fair value of $24 million and $6 million , and unrealizedgains (losses) of ($1) million and ($4) million , at September 30, 2018 and December 31, 2017 , respectively.
MaturitiesofFixedMaturitySecuritiesAFS
The amortized cost and estimated fair value of fixed maturity securities AFS, by contractual maturity date, were as follows at September 30, 2018 :
Due in One Year or Less
Due After One Year Through
Five Years
Due AfterFive Years
Through TenYears
Due AfterTen Years
StructuredSecurities
Total FixedMaturity
Securities AFS (In millions)Amortized cost $ 14,290 $ 59,495 $ 61,007 $ 109,511 $ 48,965 $ 293,268
Estimated fair value $ 14,336 $ 60,995 $ 62,655 $ 117,673 $ 49,181 $ 304,840
Actual maturities may differ from contractual maturities due to the exercise of call or prepayment options. Fixed maturity securities AFS not due at a singlematurity date have been presented in the year of final contractual maturity. Structured Securities are shown separately, as they are not due at a single maturity.
31
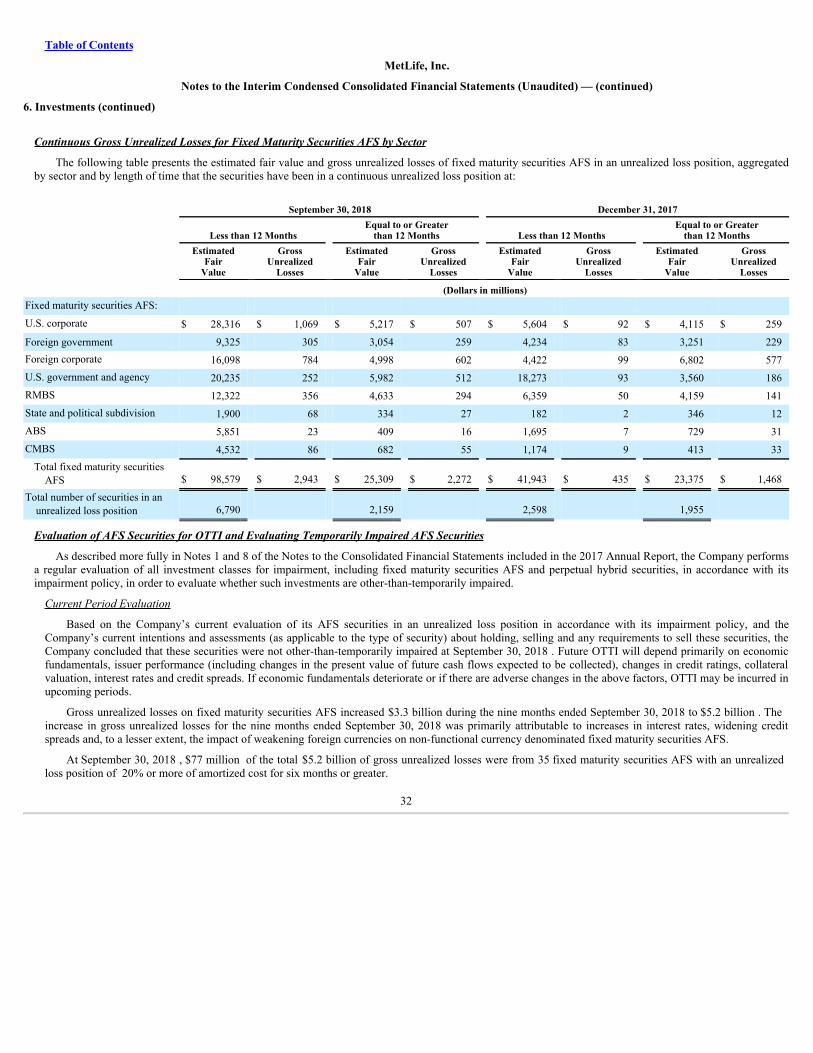
Table of Contents
MetLife, Inc.
Notes to the Interim Condensed Consolidated Financial Statements (Unaudited) — (continued)
6. Investments (continued)
ContinuousGrossUnrealizedLossesforFixedMaturitySecuritiesAFSbySector
The following table presents the estimated fair value and gross unrealized losses of fixed maturity securities AFS in an unrealized loss position, aggregatedby sector and by length of time that the securities have been in a continuous unrealized loss position at:
September 30, 2018 December 31, 2017
Less than 12 Months Equal to or Greater
than 12 Months Less than 12 Months Equal to or Greater
than 12 Months
EstimatedFair
Value
GrossUnrealized
Losses
EstimatedFair
Value
GrossUnrealized
Losses
EstimatedFair
Value
GrossUnrealized
Losses
EstimatedFair
Value
GrossUnrealized
Losses (Dollars in millions)Fixed maturity securities AFS: U.S. corporate $ 28,316 $ 1,069 $ 5,217 $ 507 $ 5,604 $ 92 $ 4,115 $ 259
Foreign government 9,325 305 3,054 259 4,234 83 3,251 229Foreign corporate 16,098 784 4,998 602 4,422 99 6,802 577U.S. government and agency 20,235 252 5,982 512 18,273 93 3,560 186RMBS 12,322 356 4,633 294 6,359 50 4,159 141State and political subdivision 1,900 68 334 27 182 2 346 12ABS 5,851 23 409 16 1,695 7 729 31CMBS 4,532 86 682 55 1,174 9 413 33
Total fixed maturity securitiesAFS $ 98,579 $ 2,943 $ 25,309 $ 2,272 $ 41,943 $ 435 $ 23,375 $ 1,468
Total number of securities in anunrealized loss position 6,790 2,159 2,598 1,955
EvaluationofAFSSecuritiesforOTTIandEvaluatingTemporarilyImpairedAFSSecurities
As described more fully in Notes 1 and 8 of the Notes to the Consolidated Financial Statements included in the 2017 Annual Report, the Company performsa regular evaluation of all investment classes for impairment, including fixed maturity securities AFS and perpetual hybrid securities, in accordance with itsimpairment policy, in order to evaluate whether such investments are other-than-temporarily impaired.
Current Period Evaluation
Based on the Company’s current evaluation of its AFS securities in an unrealized loss position in accordance with its impairment policy, and theCompany’s current intentions and assessments (as applicable to the type of security) about holding, selling and any requirements to sell these securities, theCompany concluded that these securities were not other-than-temporarily impaired at September 30, 2018 . Future OTTI will depend primarily on economicfundamentals, issuer performance (including changes in the present value of future cash flows expected to be collected), changes in credit ratings, collateralvaluation, interest rates and credit spreads. If economic fundamentals deteriorate or if there are adverse changes in the above factors, OTTI may be incurred inupcoming periods.
Gross unrealized losses on fixed maturity securities AFS increased $3.3 billion during the nine months ended September 30, 2018 to $5.2 billion . Theincrease in gross unrealized losses for the nine months ended September 30, 2018 was primarily attributable to increases in interest rates, widening creditspreads and, to a lesser extent, the impact of weakening foreign currencies on non-functional currency denominated fixed maturity securities AFS.
At September 30, 2018 , $77 million of the total $5.2 billion of gross unrealized losses were from 35 fixed maturity securities AFS with an unrealizedloss position of 20% or more of amortized cost for six months or greater.
32
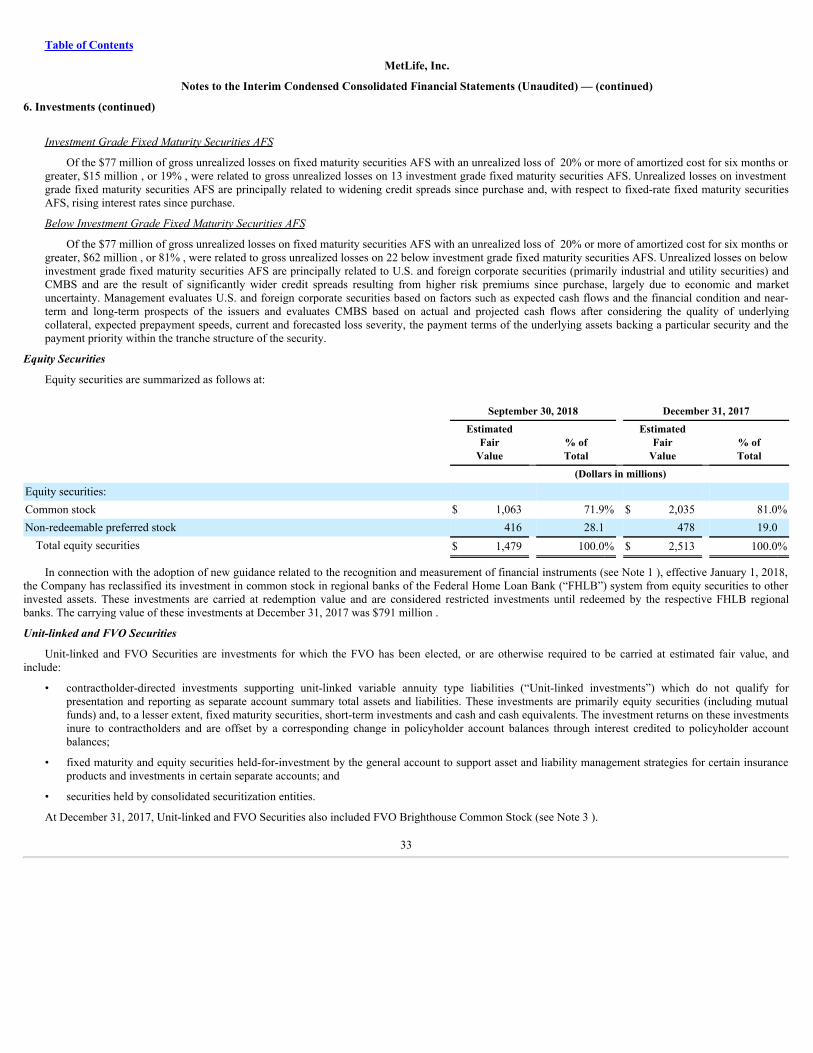
Table of Contents
MetLife, Inc.
Notes to the Interim Condensed Consolidated Financial Statements (Unaudited) — (continued)
6. Investments (continued)
Investment Grade Fixed Maturity Securities AFS
Of the $77 million of gross unrealized losses on fixed maturity securities AFS with an unrealized loss of 20% or more of amortized cost for six months orgreater, $15 million , or 19% , were related to gross unrealized losses on 13 investment grade fixed maturity securities AFS. Unrealized losses on investmentgrade fixed maturity securities AFS are principally related to widening credit spreads since purchase and, with respect to fixed-rate fixed maturity securitiesAFS, rising interest rates since purchase.
Below Investment Grade Fixed Maturity Securities AFS
Of the $77 million of gross unrealized losses on fixed maturity securities AFS with an unrealized loss of 20% or more of amortized cost for six months orgreater, $62 million , or 81% , were related to gross unrealized losses on 22 below investment grade fixed maturity securities AFS. Unrealized losses on belowinvestment grade fixed maturity securities AFS are principally related to U.S. and foreign corporate securities (primarily industrial and utility securities) andCMBS and are the result of significantly wider credit spreads resulting from higher risk premiums since purchase, largely due to economic and marketuncertainty. Management evaluates U.S. and foreign corporate securities based on factors such as expected cash flows and the financial condition and near-term and long-term prospects of the issuers and evaluates CMBS based on actual and projected cash flows after considering the quality of underlyingcollateral, expected prepayment speeds, current and forecasted loss severity, the payment terms of the underlying assets backing a particular security and thepayment priority within the tranche structure of the security.
EquitySecurities
Equity securities are summarized as follows at:
September 30, 2018 December 31, 2017
EstimatedFair
Value % ofTotal
EstimatedFair
Value % ofTotal
(Dollars in millions)
Equity securities: Common stock $ 1,063 71.9% $ 2,035 81.0%Non-redeemable preferred stock 416 28.1 478 19.0
Total equity securities $ 1,479 100.0% $ 2,513 100.0%
In connection with the adoption of new guidance related to the recognition and measurement of financial instruments (see Note 1 ), effective January 1, 2018,the Company has reclassified its investment in common stock in regional banks of the Federal Home Loan Bank (“FHLB”) system from equity securities to otherinvested assets. These investments are carried at redemption value and are considered restricted investments until redeemed by the respective FHLB regionalbanks. The carrying value of these investments at December 31, 2017 was $791 million .
Unit-linkedandFVOSecurities
Unit-linked and FVO Securities are investments for which the FVO has been elected, or are otherwise required to be carried at estimated fair value, andinclude:
• contractholder-directed investments supporting unit-linked variable annuity type liabilities (“Unit-linked investments”) which do not qualify forpresentation and reporting as separate account summary total assets and liabilities. These investments are primarily equity securities (including mutualfunds) and, to a lesser extent, fixed maturity securities, short-term investments and cash and cash equivalents. The investment returns on these investmentsinure to contractholders and are offset by a corresponding change in policyholder account balances through interest credited to policyholder accountbalances;
• fixed maturity and equity securities held-for-investment by the general account to support asset and liability management strategies for certain insuranceproducts and investments in certain separate accounts; and
• securities held by consolidated securitization entities.
At December 31, 2017, Unit-linked and FVO Securities also included FVO Brighthouse Common Stock (see Note 3 ).
33
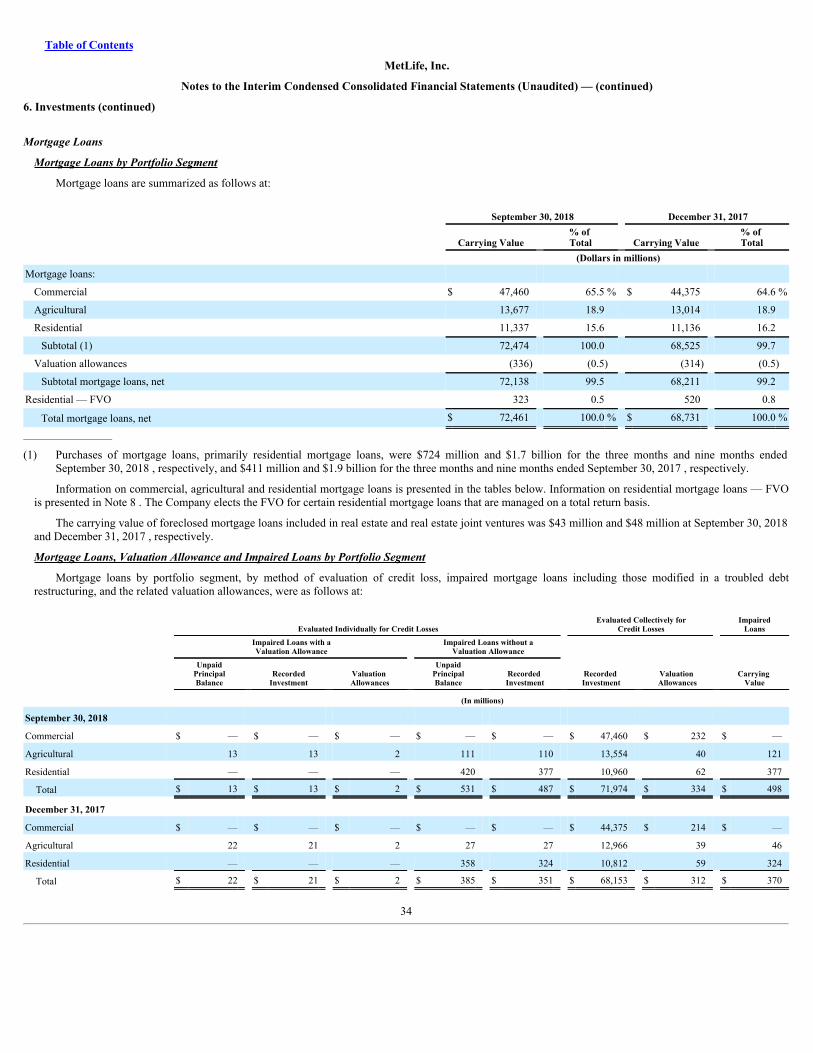
Table of Contents
MetLife, Inc.
Notes to the Interim Condensed Consolidated Financial Statements (Unaudited) — (continued)
6. Investments (continued)
MortgageLoans
MortgageLoansbyPortfolioSegment
Mortgage loans are summarized as follows at:
September 30, 2018 December 31, 2017
Carrying Value % of Total Carrying Value
% of Total
(Dollars in millions)Mortgage loans:
Commercial $ 47,460 65.5 % $ 44,375 64.6 %
Agricultural 13,677 18.9 13,014 18.9
Residential 11,337 15.6 11,136 16.2
Subtotal (1) 72,474 100.0 68,525 99.7
Valuation allowances (336) (0.5) (314) (0.5)
Subtotal mortgage loans, net 72,138 99.5 68,211 99.2
Residential — FVO 323 0.5 520 0.8
Total mortgage loans, net $ 72,461 100.0 % $ 68,731 100.0 %__________________
(1) Purchases of mortgage loans, primarily residential mortgage loans, were $724 million and $1.7 billion for the three months and nine months endedSeptember 30, 2018 , respectively, and $411 million and $1.9 billion for the three months and nine months ended September 30, 2017 , respectively.
Information on commercial, agricultural and residential mortgage loans is presented in the tables below. Information on residential mortgage loans — FVOis presented in Note 8 . The Company elects the FVO for certain residential mortgage loans that are managed on a total return basis.
The carrying value of foreclosed mortgage loans included in real estate and real estate joint ventures was $43 million and $48 million at September 30, 2018and December 31, 2017 , respectively.
MortgageLoans,ValuationAllowanceandImpairedLoansbyPortfolioSegment
Mortgage loans by portfolio segment, by method of evaluation of credit loss, impaired mortgage loans including those modified in a troubled debtrestructuring, and the related valuation allowances, were as follows at:
Evaluated Individually for Credit Losses Evaluated Collectively forCredit Losses Impaired
Loans
Impaired Loans with aValuation Allowance Impaired Loans without a
Valuation Allowance
Unpaid
PrincipalBalance Recorded
Investment Valuation Allowances
UnpaidPrincipalBalance Recorded
Investment Recorded Investment Valuation
Allowances Carrying Value
(In millions)
September 30, 2018
Commercial $ — $ — $ — $ — $ — $ 47,460 $ 232 $ —
Agricultural 13 13 2 111 110 13,554 40 121
Residential — — — 420 377 10,960 62 377
Total $ 13 $ 13 $ 2 $ 531 $ 487 $ 71,974 $ 334 $ 498
December 31, 2017
Commercial $ — $ — $ — $ — $ — $ 44,375 $ 214 $ —
Agricultural 22 21 2 27 27 12,966 39 46
Residential — — — 358 324 10,812 59 324
Total $ 22 $ 21 $ 2 $ 385 $ 351 $ 68,153 $ 312 $ 370
34
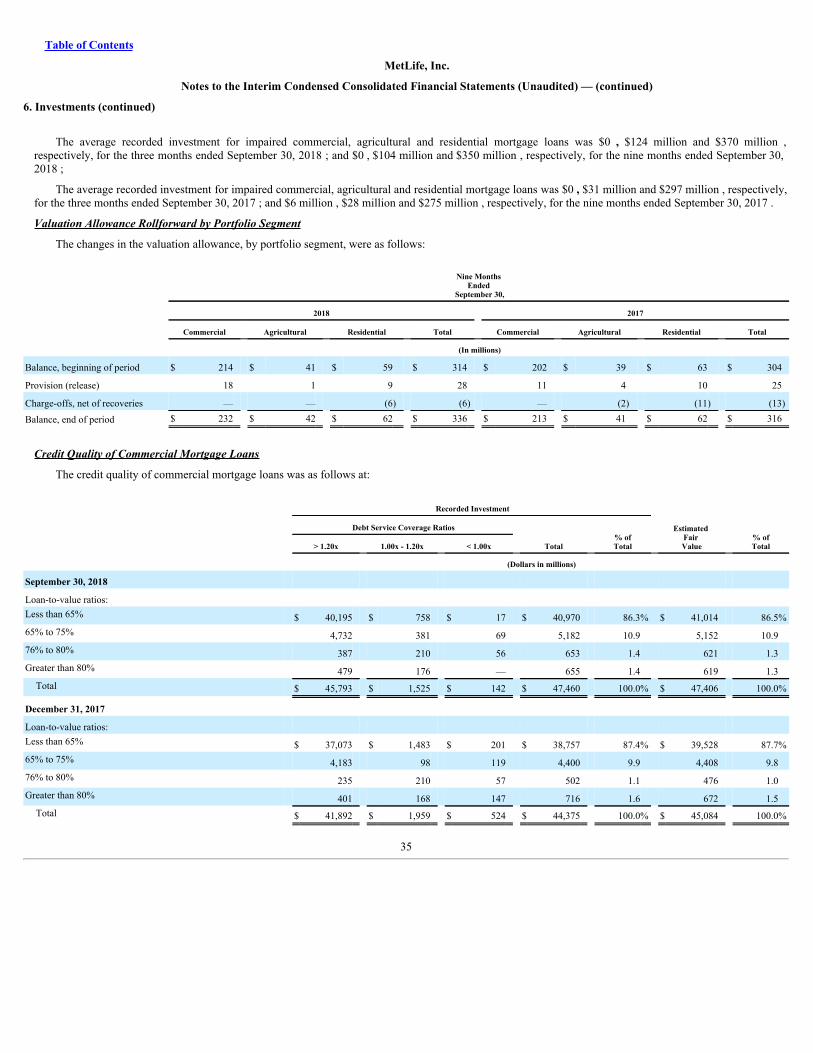
Table of Contents
MetLife, Inc.
Notes to the Interim Condensed Consolidated Financial Statements (Unaudited) — (continued)
6. Investments (continued)
The average recorded investment for impaired commercial, agricultural and residential mortgage loans was $0 , $124 million and $370 million ,respectively, for the three months ended September 30, 2018 ; and $0 , $104 million and $350 million , respectively, for the nine months ended September 30,2018 ;
The average recorded investment for impaired commercial, agricultural and residential mortgage loans was $0 , $31 million and $297 million , respectively,for the three months ended September 30, 2017 ; and $6 million , $28 million and $275 million , respectively, for the nine months ended September 30, 2017 .
ValuationAllowanceRollforwardbyPortfolioSegment
The changes in the valuation allowance, by portfolio segment, were as follows:
Nine Months
Ended September 30,
2018 2017
Commercial Agricultural Residential Total Commercial Agricultural Residential Total
(In millions)
Balance, beginning of period $ 214 $ 41 $ 59 $ 314 $ 202 $ 39 $ 63 $ 304
Provision (release) 18 1 9 28 11 4 10 25
Charge-offs, net of recoveries — — (6) (6) — (2) (11) (13)Balance, end of period $ 232 $ 42 $ 62 $ 336 $ 213 $ 41 $ 62 $ 316
CreditQualityofCommercialMortgageLoans
The credit quality of commercial mortgage loans was as follows at:
Recorded Investment
Estimated Fair Value % of
Total
Debt Service Coverage Ratios % ofTotal > 1.20x 1.00x - 1.20x < 1.00x Total
(Dollars in millions)
September 30, 2018
Loan-to-value ratios: Less than 65% $ 40,195 $ 758 $ 17 $ 40,970 86.3% $ 41,014 86.5%65% to 75% 4,732 381 69 5,182 10.9 5,152 10.976% to 80% 387 210 56 653 1.4 621 1.3Greater than 80% 479 176 — 655 1.4 619 1.3
Total $ 45,793 $ 1,525 $ 142 $ 47,460 100.0% $ 47,406 100.0%
December 31, 2017
Loan-to-value ratios: Less than 65% $ 37,073 $ 1,483 $ 201 $ 38,757 87.4% $ 39,528 87.7%65% to 75% 4,183 98 119 4,400 9.9 4,408 9.876% to 80% 235 210 57 502 1.1 476 1.0Greater than 80% 401 168 147 716 1.6 672 1.5
Total $ 41,892 $ 1,959 $ 524 $ 44,375 100.0% $ 45,084 100.0%
35
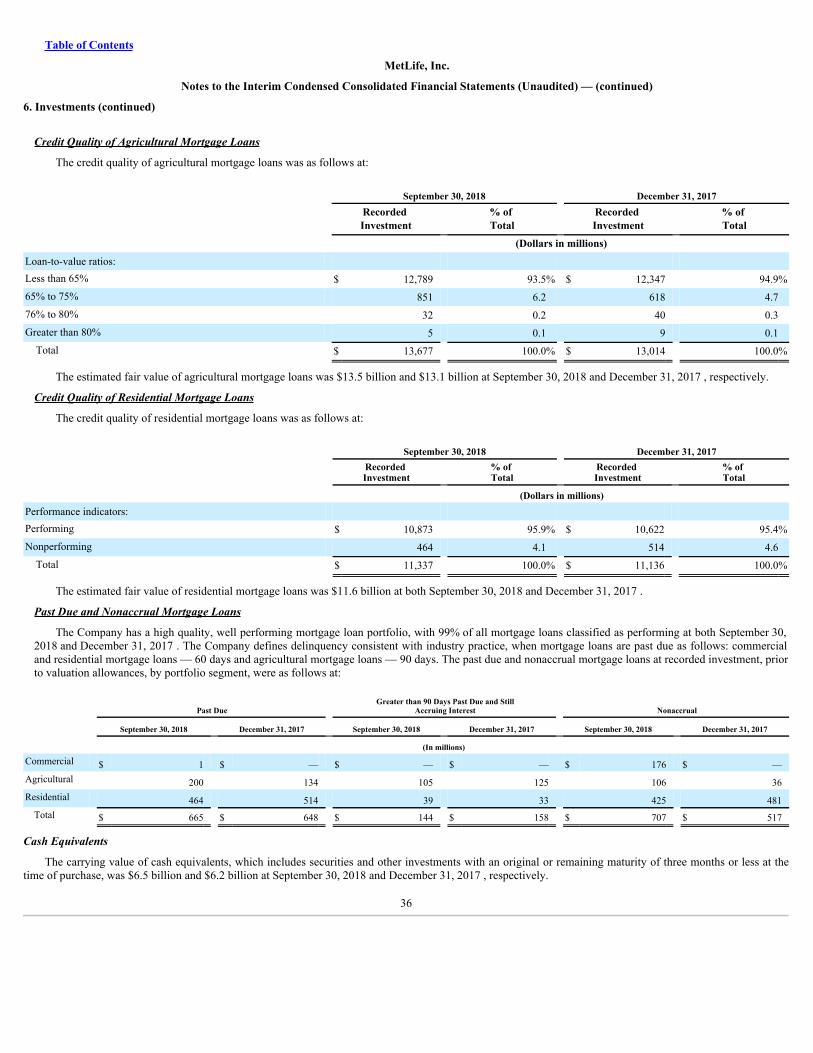
Table of Contents
MetLife, Inc.
Notes to the Interim Condensed Consolidated Financial Statements (Unaudited) — (continued)
6. Investments (continued)
CreditQualityofAgriculturalMortgageLoans
The credit quality of agricultural mortgage loans was as follows at:
September 30, 2018 December 31, 2017
Recorded Investment
% of Total
Recorded Investment
% of Total
(Dollars in millions)
Loan-to-value ratios: Less than 65% $ 12,789 93.5% $ 12,347 94.9%65% to 75% 851 6.2 618 4.776% to 80% 32 0.2 40 0.3Greater than 80% 5 0.1 9 0.1
Total $ 13,677 100.0% $ 13,014 100.0%
The estimated fair value of agricultural mortgage loans was $13.5 billion and $13.1 billion at September 30, 2018 and December 31, 2017 , respectively.
CreditQualityofResidentialMortgageLoans
The credit quality of residential mortgage loans was as follows at:
September 30, 2018 December 31, 2017
Recorded Investment
% of Total
Recorded Investment
% of Total
(Dollars in millions)Performance indicators: Performing $ 10,873 95.9% $ 10,622 95.4%Nonperforming 464 4.1 514 4.6
Total $ 11,337 100.0% $ 11,136 100.0%
The estimated fair value of residential mortgage loans was $11.6 billion at both September 30, 2018 and December 31, 2017 .
PastDueandNonaccrualMortgageLoans
The Company has a high quality, well performing mortgage loan portfolio, with 99% of all mortgage loans classified as performing at both September 30,2018 and December 31, 2017 . The Company defines delinquency consistent with industry practice, when mortgage loans are past due as follows: commercialand residential mortgage loans — 60 days and agricultural mortgage loans — 90 days. The past due and nonaccrual mortgage loans at recorded investment, priorto valuation allowances, by portfolio segment, were as follows at:
Past Due Greater than 90 Days Past Due and StillAccruing Interest Nonaccrual
September 30, 2018 December 31, 2017 September 30, 2018 December 31, 2017 September 30, 2018 December 31, 2017
(In millions)
Commercial $ 1 $ — $ — $ — $ 176 $ —Agricultural 200 134 105 125 106 36Residential 464 514 39 33 425 481
Total $ 665 $ 648 $ 144 $ 158 $ 707 $ 517
CashEquivalents
The carrying value of cash equivalents, which includes securities and other investments with an original or remaining maturity of three months or less at thetime of purchase, was $6.5 billion and $6.2 billion at September 30, 2018 and December 31, 2017 , respectively.
36
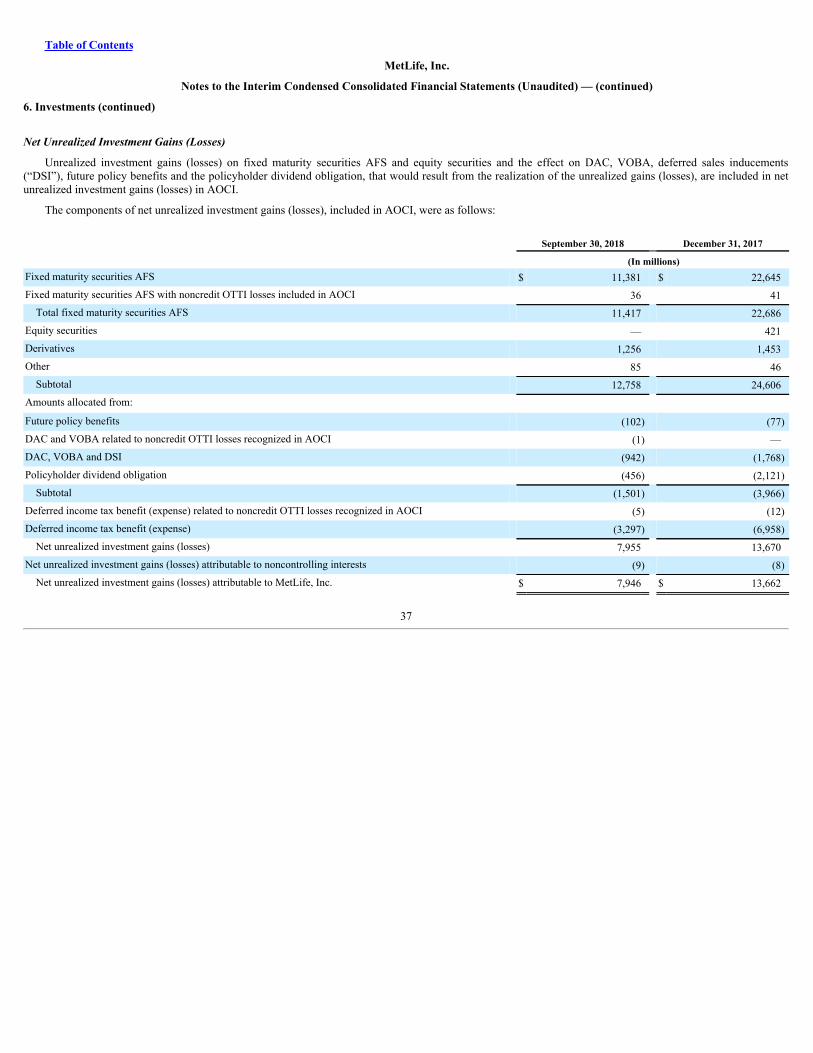
Table of Contents
MetLife, Inc.
Notes to the Interim Condensed Consolidated Financial Statements (Unaudited) — (continued)
6. Investments (continued)
NetUnrealizedInvestmentGains(Losses)
Unrealized investment gains (losses) on fixed maturity securities AFS and equity securities and the effect on DAC, VOBA, deferred sales inducements(“DSI”), future policy benefits and the policyholder dividend obligation, that would result from the realization of the unrealized gains (losses), are included in netunrealized investment gains (losses) in AOCI.
The components of net unrealized investment gains (losses), included in AOCI, were as follows:
September 30, 2018 December 31, 2017 (In millions)Fixed maturity securities AFS $ 11,381 $ 22,645Fixed maturity securities AFS with noncredit OTTI losses included in AOCI 36 41
Total fixed maturity securities AFS 11,417 22,686Equity securities — 421Derivatives 1,256 1,453Other 85 46
Subtotal 12,758 24,606Amounts allocated from: Future policy benefits (102) (77)DAC and VOBA related to noncredit OTTI losses recognized in AOCI (1) —DAC, VOBA and DSI (942) (1,768)Policyholder dividend obligation (456) (2,121)
Subtotal (1,501) (3,966)Deferred income tax benefit (expense) related to noncredit OTTI losses recognized in AOCI (5) (12)Deferred income tax benefit (expense) (3,297) (6,958)
Net unrealized investment gains (losses) 7,955 13,670Net unrealized investment gains (losses) attributable to noncontrolling interests (9) (8)
Net unrealized investment gains (losses) attributable to MetLife, Inc. $ 7,946 $ 13,662
37
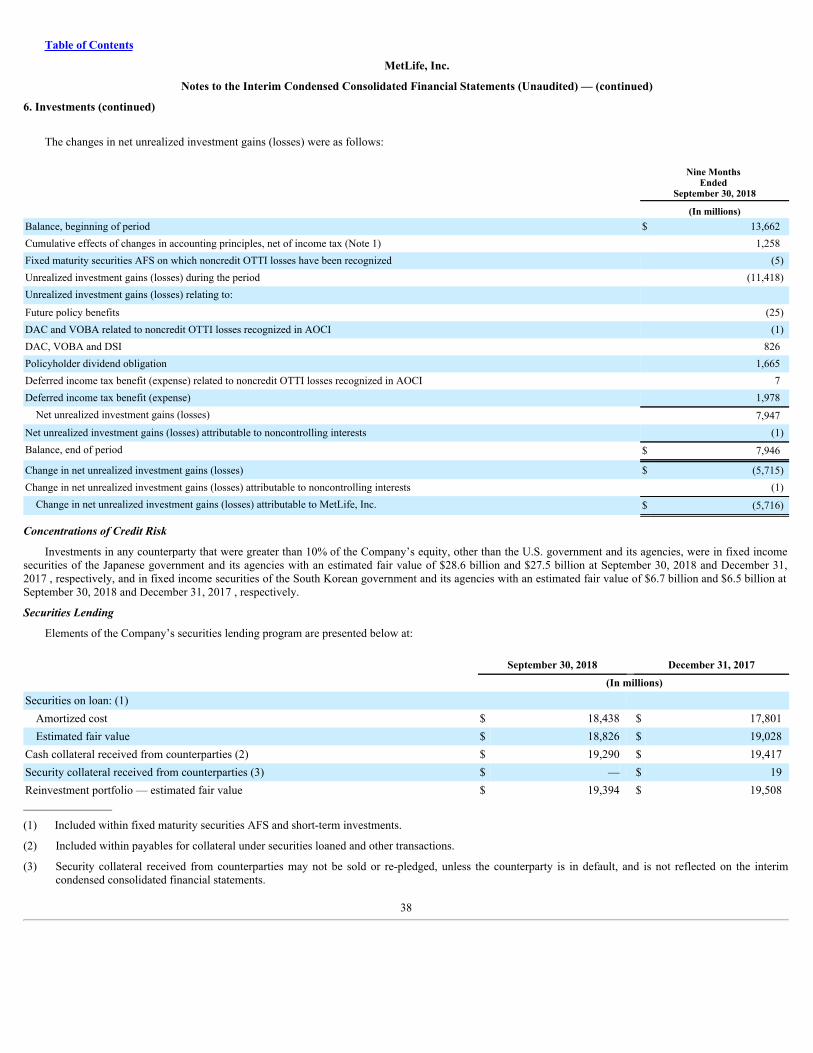
Table of Contents
MetLife, Inc.
Notes to the Interim Condensed Consolidated Financial Statements (Unaudited) — (continued)
6. Investments (continued)
The changes in net unrealized investment gains (losses) were as follows:
Nine Months Ended
September 30, 2018 (In millions)Balance, beginning of period $ 13,662Cumulative effects of changes in accounting principles, net of income tax (Note 1) 1,258Fixed maturity securities AFS on which noncredit OTTI losses have been recognized (5)Unrealized investment gains (losses) during the period (11,418)Unrealized investment gains (losses) relating to: Future policy benefits (25)DAC and VOBA related to noncredit OTTI losses recognized in AOCI (1)DAC, VOBA and DSI 826Policyholder dividend obligation 1,665Deferred income tax benefit (expense) related to noncredit OTTI losses recognized in AOCI 7Deferred income tax benefit (expense) 1,978
Net unrealized investment gains (losses) 7,947Net unrealized investment gains (losses) attributable to noncontrolling interests (1)Balance, end of period $ 7,946
Change in net unrealized investment gains (losses) $ (5,715)Change in net unrealized investment gains (losses) attributable to noncontrolling interests (1)
Change in net unrealized investment gains (losses) attributable to MetLife, Inc. $ (5,716)
ConcentrationsofCreditRisk
Investments in any counterparty that were greater than 10% of the Company’s equity, other than the U.S. government and its agencies, were in fixed incomesecurities of the Japanese government and its agencies with an estimated fair value of $28.6 billion and $27.5 billion at September 30, 2018 and December 31,2017 , respectively, and in fixed income securities of the South Korean government and its agencies with an estimated fair value of $6.7 billion and $6.5 billion atSeptember 30, 2018 and December 31, 2017 , respectively.
SecuritiesLending
Elements of the Company’s securities lending program are presented below at:
September 30, 2018 December 31, 2017
(In millions)
Securities on loan: (1) Amortized cost $ 18,438 $ 17,801Estimated fair value $ 18,826 $ 19,028
Cash collateral received from counterparties (2) $ 19,290 $ 19,417Security collateral received from counterparties (3) $ — $ 19Reinvestment portfolio — estimated fair value $ 19,394 $ 19,508__________________
(1) Included within fixed maturity securities AFS and short-term investments.
(2) Included within payables for collateral under securities loaned and other transactions.
(3) Security collateral received from counterparties may not be sold or re-pledged, unless the counterparty is in default, and is not reflected on the interimcondensed consolidated financial statements.
38
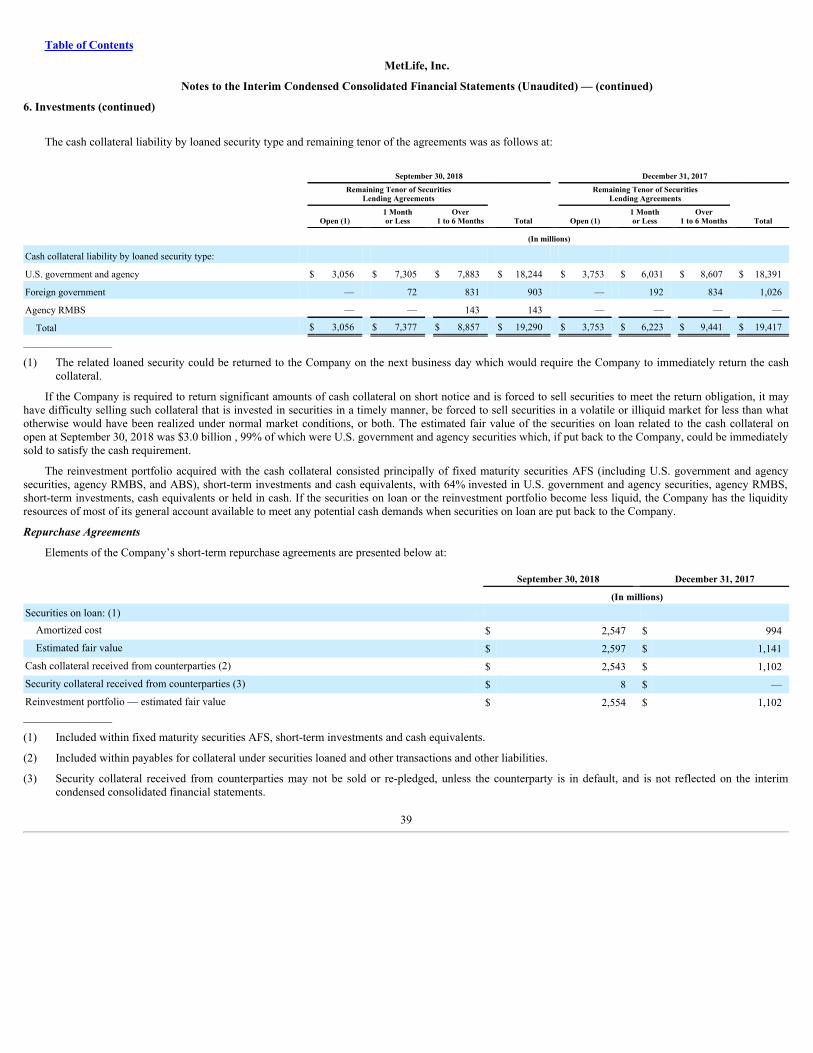
Table of Contents
MetLife, Inc.
Notes to the Interim Condensed Consolidated Financial Statements (Unaudited) — (continued)
6. Investments (continued)
The cash collateral liability by loaned security type and remaining tenor of the agreements was as follows at:
September 30, 2018 December 31, 2017
Remaining Tenor of SecuritiesLending Agreements Remaining Tenor of Securities
Lending Agreements
Open (1) 1 Monthor Less Over
1 to 6 Months Total Open (1) 1 Monthor Less Over
1 to 6 Months Total
(In millions)
Cash collateral liability by loaned security type:
U.S. government and agency $ 3,056 $ 7,305 $ 7,883 $ 18,244 $ 3,753 $ 6,031 $ 8,607 $ 18,391
Foreign government — 72 831 903 — 192 834 1,026
Agency RMBS — — 143 143 — — — —
Total $ 3,056 $ 7,377 $ 8,857 $ 19,290 $ 3,753 $ 6,223 $ 9,441 $ 19,417__________________
(1) The related loaned security could be returned to the Company on the next business day which would require the Company to immediately return the cashcollateral.
If the Company is required to return significant amounts of cash collateral on short notice and is forced to sell securities to meet the return obligation, it mayhave difficulty selling such collateral that is invested in securities in a timely manner, be forced to sell securities in a volatile or illiquid market for less than whatotherwise would have been realized under normal market conditions, or both. The estimated fair value of the securities on loan related to the cash collateral onopen at September 30, 2018 was $3.0 billion , 99% of which were U.S. government and agency securities which, if put back to the Company, could be immediatelysold to satisfy the cash requirement.
The reinvestment portfolio acquired with the cash collateral consisted principally of fixed maturity securities AFS (including U.S. government and agencysecurities, agency RMBS, and ABS), short-term investments and cash equivalents, with 64% invested in U.S. government and agency securities, agency RMBS,short-term investments, cash equivalents or held in cash. If the securities on loan or the reinvestment portfolio become less liquid, the Company has the liquidityresources of most of its general account available to meet any potential cash demands when securities on loan are put back to the Company.
RepurchaseAgreements
Elements of the Company’s short-term repurchase agreements are presented below at:
September 30, 2018 December 31, 2017 (In millions)Securities on loan: (1)
Amortized cost $ 2,547 $ 994Estimated fair value $ 2,597 $ 1,141
Cash collateral received from counterparties (2) $ 2,543 $ 1,102Security collateral received from counterparties (3) $ 8 $ —Reinvestment portfolio — estimated fair value $ 2,554 $ 1,102__________________
(1) Included within fixed maturity securities AFS, short-term investments and cash equivalents.
(2) Included within payables for collateral under securities loaned and other transactions and other liabilities.
(3) Security collateral received from counterparties may not be sold or re-pledged, unless the counterparty is in default, and is not reflected on the interimcondensed consolidated financial statements.
39
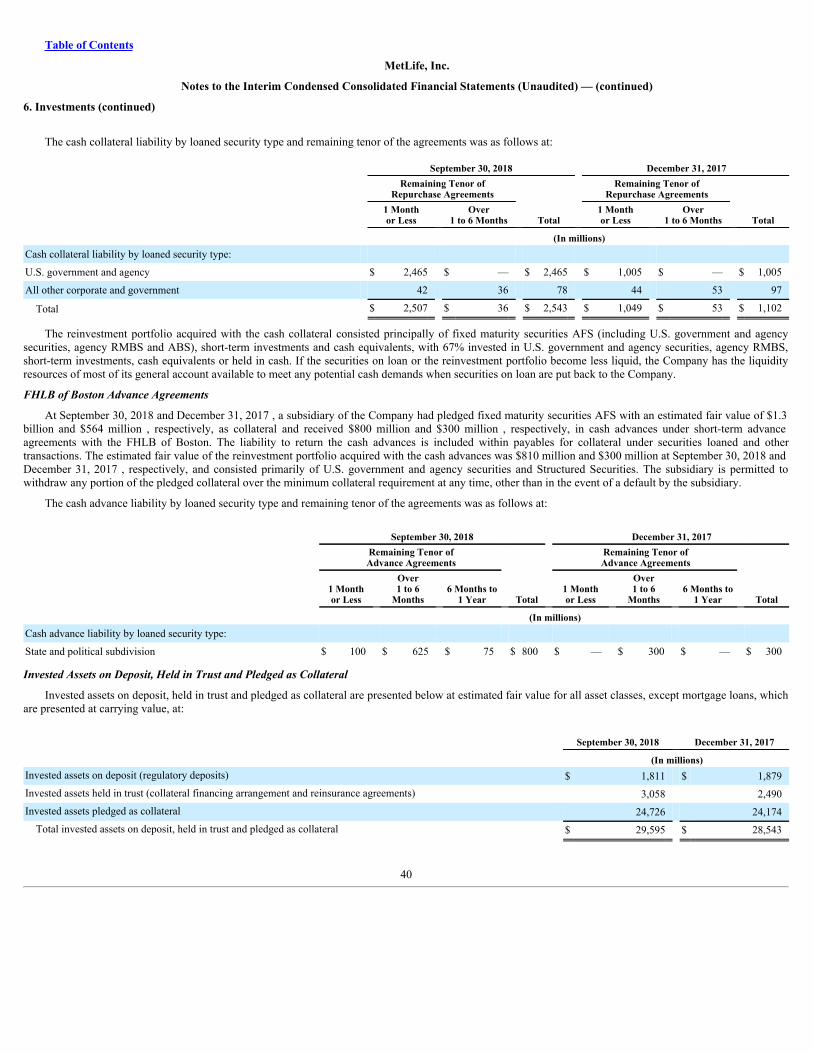
Table of Contents
MetLife, Inc.
Notes to the Interim Condensed Consolidated Financial Statements (Unaudited) — (continued)
6. Investments (continued)
The cash collateral liability by loaned security type and remaining tenor of the agreements was as follows at:
September 30, 2018 December 31, 2017
Remaining Tenor of
Repurchase Agreements Remaining Tenor of
Repurchase Agreements
1 Monthor Less
Over1 to 6 Months Total
1 Monthor Less
Over1 to 6 Months Total
(In millions)Cash collateral liability by loaned security type: U.S. government and agency $ 2,465 $ — $ 2,465 $ 1,005 $ — $ 1,005
All other corporate and government 42 36 78 44 53 97
Total $ 2,507 $ 36 $ 2,543 $ 1,049 $ 53 $ 1,102
The reinvestment portfolio acquired with the cash collateral consisted principally of fixed maturity securities AFS (including U.S. government and agencysecurities, agency RMBS and ABS), short-term investments and cash equivalents, with 67% invested in U.S. government and agency securities, agency RMBS,short-term investments, cash equivalents or held in cash. If the securities on loan or the reinvestment portfolio become less liquid, the Company has the liquidityresources of most of its general account available to meet any potential cash demands when securities on loan are put back to the Company.
FHLBofBostonAdvanceAgreements
At September 30, 2018 and December 31, 2017 , a subsidiary of the Company had pledged fixed maturity securities AFS with an estimated fair value of $1.3billion and $564 million , respectively, as collateral and received $800 million and $300 million , respectively, in cash advances under short-term advanceagreements with the FHLB of Boston. The liability to return the cash advances is included within payables for collateral under securities loaned and othertransactions. The estimated fair value of the reinvestment portfolio acquired with the cash advances was $810 million and $300 million at September 30, 2018 andDecember 31, 2017 , respectively, and consisted primarily of U.S. government and agency securities and Structured Securities. The subsidiary is permitted towithdraw any portion of the pledged collateral over the minimum collateral requirement at any time, other than in the event of a default by the subsidiary.
The cash advance liability by loaned security type and remaining tenor of the agreements was as follows at:
September 30, 2018 December 31, 2017
Remaining Tenor ofAdvance Agreements
Remaining Tenor ofAdvance Agreements
1 Monthor Less
Over1 to 6
Months 6 Months to
1 Year Total 1 Monthor Less
Over1 to 6
Months 6 Months to
1 Year Total (In millions)Cash advance liability by loaned security type: State and political subdivision $ 100 $ 625 $ 75 $ 800 $ — $ 300 $ — $ 300
InvestedAssetsonDeposit,HeldinTrustandPledgedasCollateral
Invested assets on deposit, held in trust and pledged as collateral are presented below at estimated fair value for all asset classes, except mortgage loans, whichare presented at carrying value, at:
September 30, 2018 December 31, 2017 (In millions)Invested assets on deposit (regulatory deposits) $ 1,811 $ 1,879Invested assets held in trust (collateral financing arrangement and reinsurance agreements) 3,058 2,490Invested assets pledged as collateral 24,726 24,174
Total invested assets on deposit, held in trust and pledged as collateral $ 29,595 $ 28,543
40
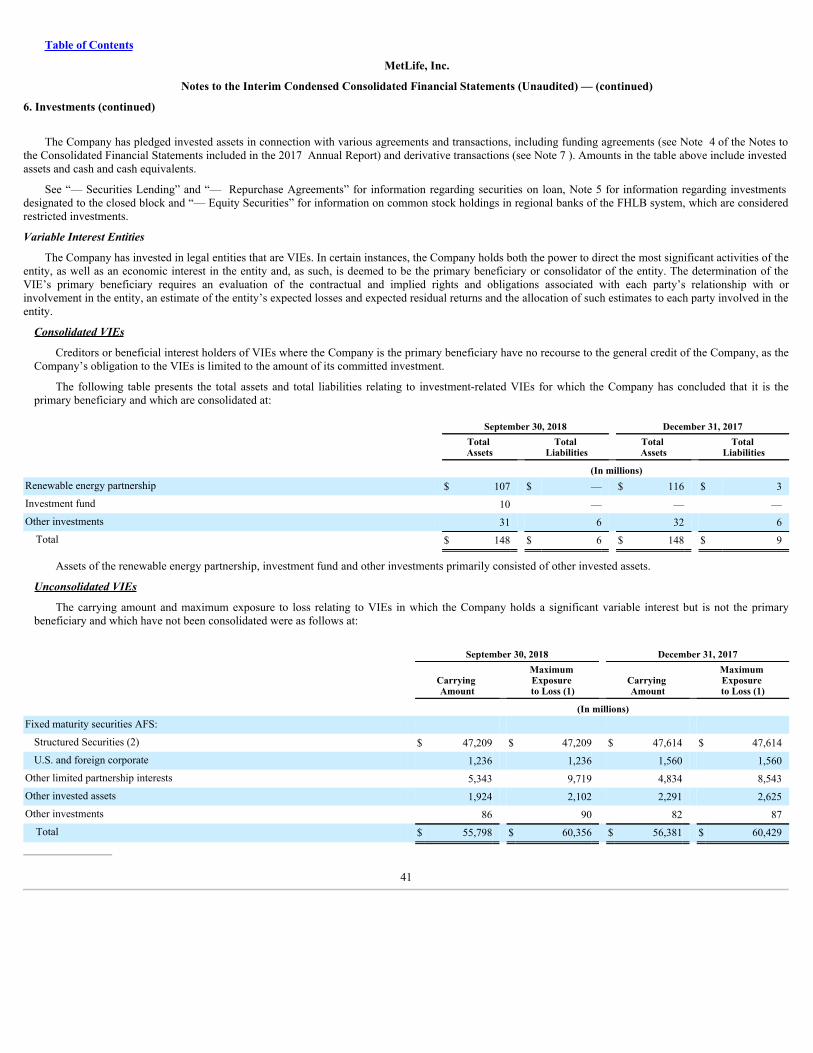
Table of Contents
MetLife, Inc.
Notes to the Interim Condensed Consolidated Financial Statements (Unaudited) — (continued)
6. Investments (continued)
The Company has pledged invested assets in connection with various agreements and transactions, including funding agreements (see Note 4 of the Notes tothe Consolidated Financial Statements included in the 2017 Annual Report) and derivative transactions (see Note 7 ). Amounts in the table above include investedassets and cash and cash equivalents.
See “— Securities Lending” and “— Repurchase Agreements” for information regarding securities on loan, Note 5 for information regarding investmentsdesignated to the closed block and “— Equity Securities” for information on common stock holdings in regional banks of the FHLB system, which are consideredrestricted investments.
VariableInterestEntities
The Company has invested in legal entities that are VIEs. In certain instances, the Company holds both the power to direct the most significant activities of theentity, as well as an economic interest in the entity and, as such, is deemed to be the primary beneficiary or consolidator of the entity. The determination of theVIE’s primary beneficiary requires an evaluation of the contractual and implied rights and obligations associated with each party’s relationship with orinvolvement in the entity, an estimate of the entity’s expected losses and expected residual returns and the allocation of such estimates to each party involved in theentity.
ConsolidatedVIEs
Creditors or beneficial interest holders of VIEs where the Company is the primary beneficiary have no recourse to the general credit of the Company, as theCompany’s obligation to the VIEs is limited to the amount of its committed investment.
The following table presents the total assets and total liabilities relating to investment-related VIEs for which the Company has concluded that it is theprimary beneficiary and which are consolidated at:
September 30, 2018 December 31, 2017
Total Assets
Total Liabilities
Total Assets
Total Liabilities
(In millions)Renewable energy partnership $ 107 $ — $ 116 $ 3Investment fund 10 — — —Other investments 31 6 32 6
Total $ 148 $ 6 $ 148 $ 9
Assets of the renewable energy partnership, investment fund and other investments primarily consisted of other invested assets.
UnconsolidatedVIEs
The carrying amount and maximum exposure to loss relating to VIEs in which the Company holds a significant variable interest but is not the primarybeneficiary and which have not been consolidated were as follows at:
September 30, 2018 December 31, 2017
Carrying Amount
Maximum Exposure to Loss (1)
Carrying Amount
Maximum Exposure to Loss (1)
(In millions)Fixed maturity securities AFS:
Structured Securities (2) $ 47,209 $ 47,209 $ 47,614 $ 47,614U.S. and foreign corporate 1,236 1,236 1,560 1,560
Other limited partnership interests 5,343 9,719 4,834 8,543Other invested assets 1,924 2,102 2,291 2,625Other investments 86 90 82 87
Total $ 55,798 $ 60,356 $ 56,381 $ 60,429__________________
41
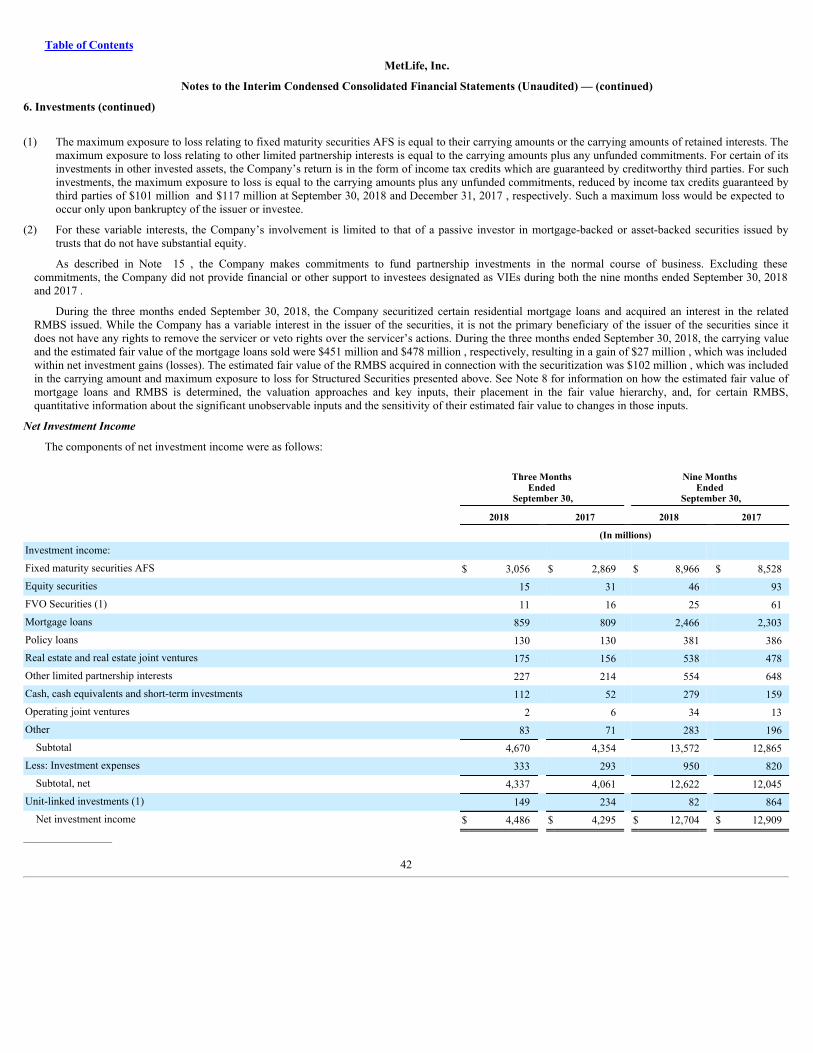
Table of Contents
MetLife, Inc.
Notes to the Interim Condensed Consolidated Financial Statements (Unaudited) — (continued)
6. Investments (continued)
(1) The maximum exposure to loss relating to fixed maturity securities AFS is equal to their carrying amounts or the carrying amounts of retained interests. Themaximum exposure to loss relating to other limited partnership interests is equal to the carrying amounts plus any unfunded commitments. For certain of itsinvestments in other invested assets, the Company’s return is in the form of income tax credits which are guaranteed by creditworthy third parties. For suchinvestments, the maximum exposure to loss is equal to the carrying amounts plus any unfunded commitments, reduced by income tax credits guaranteed bythird parties of $101 million and $117 million at September 30, 2018 and December 31, 2017 , respectively. Such a maximum loss would be expected tooccur only upon bankruptcy of the issuer or investee.
(2) For these variable interests, the Company’s involvement is limited to that of a passive investor in mortgage-backed or asset-backed securities issued bytrusts that do not have substantial equity.
As described in Note 15 , the Company makes commitments to fund partnership investments in the normal course of business. Excluding thesecommitments, the Company did not provide financial or other support to investees designated as VIEs during both the nine months ended September 30, 2018and 2017 .
During the three months ended September 30, 2018, the Company securitized certain residential mortgage loans and acquired an interest in the relatedRMBS issued. While the Company has a variable interest in the issuer of the securities, it is not the primary beneficiary of the issuer of the securities since itdoes not have any rights to remove the servicer or veto rights over the servicer’s actions. During the three months ended September 30, 2018, the carrying valueand the estimated fair value of the mortgage loans sold were $451 million and $478 million , respectively, resulting in a gain of $27 million , which was includedwithin net investment gains (losses). The estimated fair value of the RMBS acquired in connection with the securitization was $102 million , which was includedin the carrying amount and maximum exposure to loss for Structured Securities presented above. See Note 8 for information on how the estimated fair value ofmortgage loans and RMBS is determined, the valuation approaches and key inputs, their placement in the fair value hierarchy, and, for certain RMBS,quantitative information about the significant unobservable inputs and the sensitivity of their estimated fair value to changes in those inputs.
NetInvestmentIncome
The components of net investment income were as follows:
Three Months Ended
September 30,
Nine Months Ended
September 30,
2018 2017 2018 2017 (In millions)Investment income: Fixed maturity securities AFS $ 3,056 $ 2,869 $ 8,966 $ 8,528Equity securities 15 31 46 93FVO Securities (1) 11 16 25 61Mortgage loans 859 809 2,466 2,303Policy loans 130 130 381 386Real estate and real estate joint ventures 175 156 538 478Other limited partnership interests 227 214 554 648Cash, cash equivalents and short-term investments 112 52 279 159Operating joint ventures 2 6 34 13Other 83 71 283 196
Subtotal 4,670 4,354 13,572 12,865Less: Investment expenses 333 293 950 820
Subtotal, net 4,337 4,061 12,622 12,045Unit-linked investments (1) 149 234 82 864
Net investment income $ 4,486 $ 4,295 $ 12,704 $ 12,909__________________
42

Table of Contents
MetLife, Inc.
Notes to the Interim Condensed Consolidated Financial Statements (Unaudited) — (continued)
6. Investments (continued)
(1) Changes in estimated fair value subsequent to purchase for investments still held as of the end of the respective periods included in net investment incomewere principally from Unit-linked investments, and were $109 million and ($59) million for the three months and nine months ended September 30, 2018 ,respectively, and $154 million and $540 million for the three months and nine months ended September 30, 2017 , respectively.
The Company invests in real estate joint ventures, other limited partnership interests and tax credit and renewable energy partnerships, and also does businessthrough certain operating joint ventures, the majority of which are accounted for under the equity method. Net investment income from other limited partnershipinterests and operating joint ventures, accounted for under the equity method; and real estate joint ventures and tax credit and renewable energy partnerships,primarily accounted for under the equity method, totaled $180 million and $482 million for the three months and nine months ended September 30, 2018 ,respectively, and $164 million and $448 million for the three months and nine months ended September 30, 2017 , respectively.
43
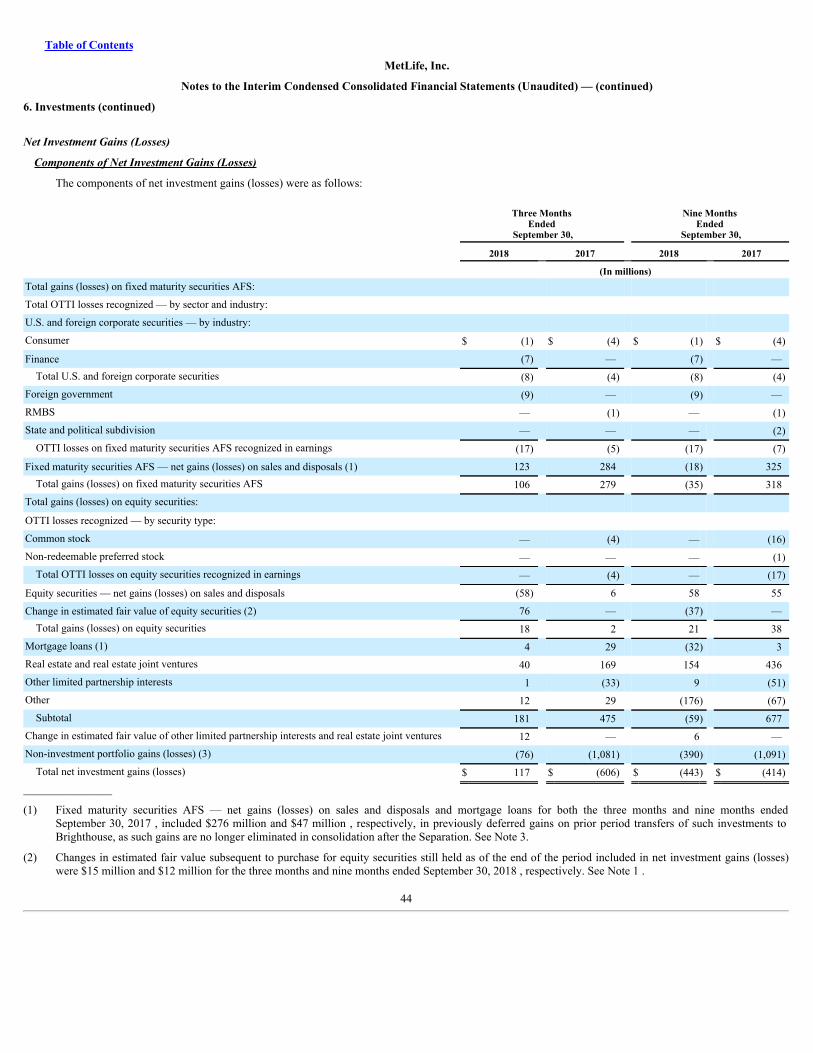
Table of Contents
MetLife, Inc.
Notes to the Interim Condensed Consolidated Financial Statements (Unaudited) — (continued)
6. Investments (continued)
NetInvestmentGains(Losses)
ComponentsofNetInvestmentGains(Losses)
The components of net investment gains (losses) were as follows:
Three Months Ended
September 30,
Nine Months Ended
September 30,
2018 2017 2018 2017 (In millions)Total gains (losses) on fixed maturity securities AFS: Total OTTI losses recognized — by sector and industry: U.S. and foreign corporate securities — by industry: Consumer $ (1) $ (4) $ (1) $ (4)
Finance (7) — (7) —Total U.S. and foreign corporate securities (8) (4) (8) (4)
Foreign government (9) — (9) —RMBS — (1) — (1)State and political subdivision — — — (2)
OTTI losses on fixed maturity securities AFS recognized in earnings (17) (5) (17) (7)
Fixed maturity securities AFS — net gains (losses) on sales and disposals (1) 123 284 (18) 325Total gains (losses) on fixed maturity securities AFS 106 279 (35) 318
Total gains (losses) on equity securities: OTTI losses recognized — by security type: Common stock — (4) — (16)Non-redeemable preferred stock — — — (1)
Total OTTI losses on equity securities recognized in earnings — (4) — (17)
Equity securities — net gains (losses) on sales and disposals (58) 6 58 55
Change in estimated fair value of equity securities (2) 76 — (37) —Total gains (losses) on equity securities 18 2 21 38
Mortgage loans (1) 4 29 (32) 3Real estate and real estate joint ventures 40 169 154 436Other limited partnership interests 1 (33) 9 (51)Other 12 29 (176) (67)
Subtotal 181 475 (59) 677Change in estimated fair value of other limited partnership interests and real estate joint ventures 12 — 6 —Non-investment portfolio gains (losses) (3) (76) (1,081) (390) (1,091)
Total net investment gains (losses) $ 117 $ (606) $ (443) $ (414)__________________
(1) Fixed maturity securities AFS — net gains (losses) on sales and disposals and mortgage loans for both the three months and nine months endedSeptember 30, 2017 , included $276 million and $47 million , respectively, in previously deferred gains on prior period transfers of such investments toBrighthouse, as such gains are no longer eliminated in consolidation after the Separation. See Note 3.
(2) Changes in estimated fair value subsequent to purchase for equity securities still held as of the end of the period included in net investment gains (losses)were $15 million and $12 million for the three months and nine months ended September 30, 2018 , respectively. See Note 1 .
44
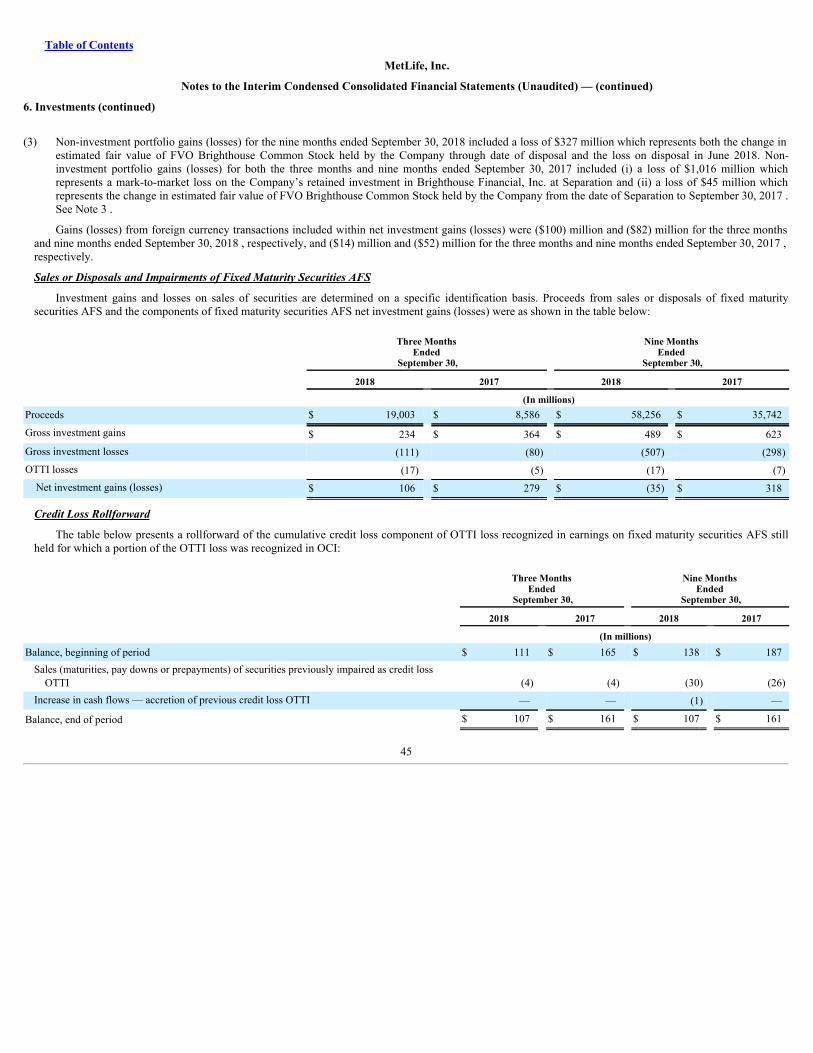
Table of Contents
MetLife, Inc.
Notes to the Interim Condensed Consolidated Financial Statements (Unaudited) — (continued)
6. Investments (continued)
(3) Non-investment portfolio gains (losses) for the nine months ended September 30, 2018 included a loss of $327 million which represents both the change inestimated fair value of FVO Brighthouse Common Stock held by the Company through date of disposal and the loss on disposal in June 2018. Non-investment portfolio gains (losses) for both the three months and nine months ended September 30, 2017 included (i) a loss of $1,016 million whichrepresents a mark-to-market loss on the Company’s retained investment in Brighthouse Financial, Inc. at Separation and (ii) a loss of $45 million whichrepresents the change in estimated fair value of FVO Brighthouse Common Stock held by the Company from the date of Separation to September 30, 2017 .See Note 3 .
Gains (losses) from foreign currency transactions included within net investment gains (losses) were ($100) million and ($82) million for the three monthsand nine months ended September 30, 2018 , respectively, and ($14) million and ($52) million for the three months and nine months ended September 30, 2017 ,respectively.
SalesorDisposalsandImpairmentsofFixedMaturitySecuritiesAFS
Investment gains and losses on sales of securities are determined on a specific identification basis. Proceeds from sales or disposals of fixed maturitysecurities AFS and the components of fixed maturity securities AFS net investment gains (losses) were as shown in the table below:
Three Months Ended
September 30,
Nine Months Ended
September 30,
2018 2017 2018 2017 (In millions)Proceeds $ 19,003 $ 8,586 $ 58,256 $ 35,742
Gross investment gains $ 234 $ 364 $ 489 $ 623Gross investment losses (111) (80) (507) (298)OTTI losses (17) (5) (17) (7)
Net investment gains (losses) $ 106 $ 279 $ (35) $ 318
CreditLossRollforward
The table below presents a rollforward of the cumulative credit loss component of OTTI loss recognized in earnings on fixed maturity securities AFS stillheld for which a portion of the OTTI loss was recognized in OCI:
Three Months Ended
September 30,
Nine Months Ended
September 30,
2018 2017 2018 2017 (In millions)Balance, beginning of period $ 111 $ 165 $ 138 $ 187
Sales (maturities, pay downs or prepayments) of securities previously impaired as credit lossOTTI (4) (4) (30) (26)
Increase in cash flows — accretion of previous credit loss OTTI — — (1) —
Balance, end of period $ 107 $ 161 $ 107 $ 161
45
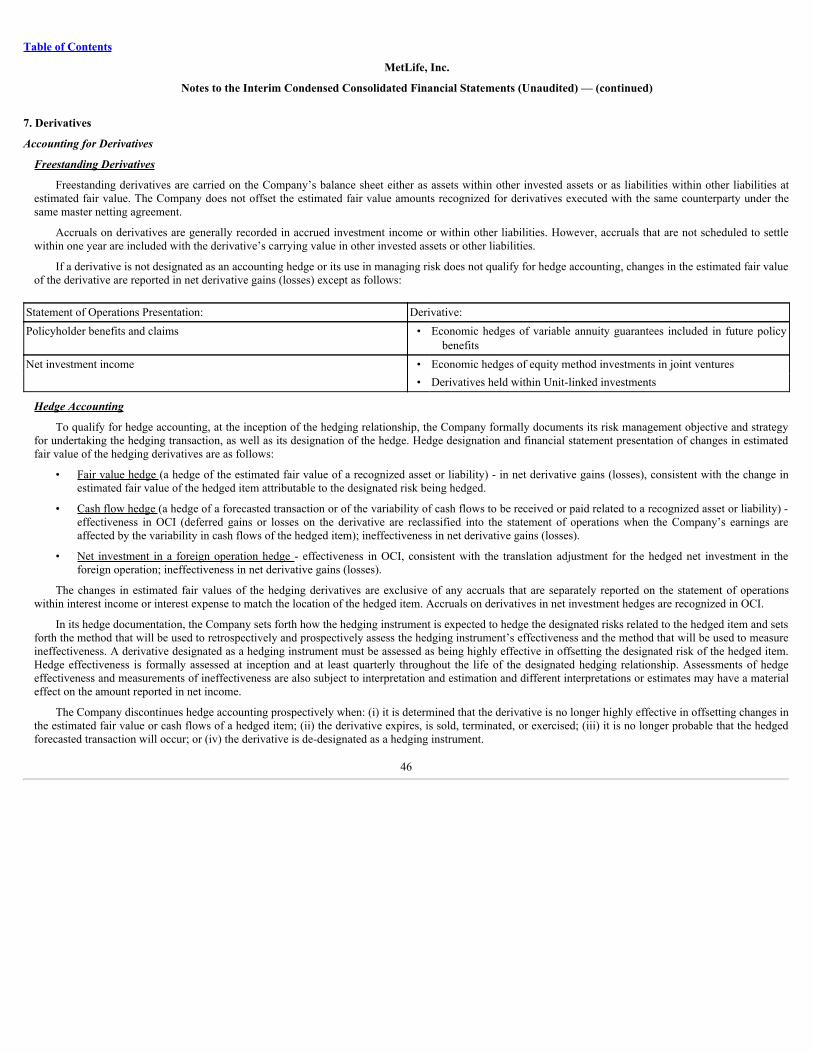
Table of Contents
MetLife, Inc.
Notes to the Interim Condensed Consolidated Financial Statements (Unaudited) — (continued)
7. Derivatives
AccountingforDerivatives
FreestandingDerivatives
Freestanding derivatives are carried on the Company’s balance sheet either as assets within other invested assets or as liabilities within other liabilities atestimated fair value. The Company does not offset the estimated fair value amounts recognized for derivatives executed with the same counterparty under thesame master netting agreement.
Accruals on derivatives are generally recorded in accrued investment income or within other liabilities. However, accruals that are not scheduled to settlewithin one year are included with the derivative’s carrying value in other invested assets or other liabilities.
If a derivative is not designated as an accounting hedge or its use in managing risk does not qualify for hedge accounting, changes in the estimated fair valueof the derivative are reported in net derivative gains (losses) except as follows:
Statement of Operations Presentation: Derivative:Policyholder benefits and claims • Economic hedges of variable annuity guarantees included in future policy
benefitsNet investment income • Economic hedges of equity method investments in joint ventures • Derivatives held within Unit-linked investments
HedgeAccounting
To qualify for hedge accounting, at the inception of the hedging relationship, the Company formally documents its risk management objective and strategyfor undertaking the hedging transaction, as well as its designation of the hedge. Hedge designation and financial statement presentation of changes in estimatedfair value of the hedging derivatives are as follows:
• Fair value hedge (a hedge of the estimated fair value of a recognized asset or liability) - in net derivative gains (losses), consistent with the change inestimated fair value of the hedged item attributable to the designated risk being hedged.
• Cash flow hedge (a hedge of a forecasted transaction or of the variability of cash flows to be received or paid related to a recognized asset or liability) -effectiveness in OCI (deferred gains or losses on the derivative are reclassified into the statement of operations when the Company’s earnings areaffected by the variability in cash flows of the hedged item); ineffectiveness in net derivative gains (losses).
• Net investment in a foreign operation hedge - effectiveness in OCI, consistent with the translation adjustment for the hedged net investment in theforeign operation; ineffectiveness in net derivative gains (losses).
The changes in estimated fair values of the hedging derivatives are exclusive of any accruals that are separately reported on the statement of operationswithin interest income or interest expense to match the location of the hedged item. Accruals on derivatives in net investment hedges are recognized in OCI.
In its hedge documentation, the Company sets forth how the hedging instrument is expected to hedge the designated risks related to the hedged item and setsforth the method that will be used to retrospectively and prospectively assess the hedging instrument’s effectiveness and the method that will be used to measureineffectiveness. A derivative designated as a hedging instrument must be assessed as being highly effective in offsetting the designated risk of the hedged item.Hedge effectiveness is formally assessed at inception and at least quarterly throughout the life of the designated hedging relationship. Assessments of hedgeeffectiveness and measurements of ineffectiveness are also subject to interpretation and estimation and different interpretations or estimates may have a materialeffect on the amount reported in net income.
The Company discontinues hedge accounting prospectively when: (i) it is determined that the derivative is no longer highly effective in offsetting changes inthe estimated fair value or cash flows of a hedged item; (ii) the derivative expires, is sold, terminated, or exercised; (iii) it is no longer probable that the hedgedforecasted transaction will occur; or (iv) the derivative is de-designated as a hedging instrument.
46
Table of Contents
MetLife, Inc.
Notes to the Interim Condensed Consolidated Financial Statements (Unaudited) — (continued)
7. Derivatives (continued)
When hedge accounting is discontinued because it is determined that the derivative is not highly effective in offsetting changes in the estimated fair value orcash flows of a hedged item, the derivative continues to be carried on the balance sheet at its estimated fair value, with changes in estimated fair value recognizedin net derivative gains (losses). The carrying value of the hedged recognized asset or liability under a fair value hedge is no longer adjusted for changes in itsestimated fair value due to the hedged risk, and the cumulative adjustment to its carrying value is amortized into income over the remaining life of the hedgeditem. Provided the hedged forecasted transaction is still probable of occurrence, the changes in estimated fair value of derivatives recorded in OCI related todiscontinued cash flow hedges are released into the statement of operations when the Company’s earnings are affected by the variability in cash flows of thehedged item.
When hedge accounting is discontinued because it is no longer probable that the forecasted transactions will occur on the anticipated date or within twomonths of that date, the derivative continues to be carried on the balance sheet at its estimated fair value, with changes in estimated fair value recognizedcurrently in net derivative gains (losses). Deferred gains and losses of a derivative recorded in OCI pursuant to the discontinued cash flow hedge of a forecastedtransaction that is no longer probable are recognized immediately in net derivative gains (losses).
In all other situations in which hedge accounting is discontinued, the derivative is carried at its estimated fair value on the balance sheet, with changes in itsestimated fair value recognized in the current period as net derivative gains (losses).
EmbeddedDerivatives
The Company sells variable annuities and issues certain insurance products and investment contracts and is a party to certain reinsurance agreements thathave embedded derivatives. The Company assesses each identified embedded derivative to determine whether it is required to be bifurcated. The embeddedderivative is bifurcated from the host contract and accounted for as a freestanding derivative if:
• the combined instrument is not accounted for in its entirety at estimated fair value with changes in estimated fair value recorded in earnings;
• the terms of the embedded derivative are not clearly and closely related to the economic characteristics of the host contract; and
• a separate instrument with the same terms as the embedded derivative would qualify as a derivative instrument.
Such embedded derivatives are carried on the balance sheet at estimated fair value with the host contract and changes in their estimated fair value aregenerally reported in net derivative gains (losses). If the Company is unable to properly identify and measure an embedded derivative for separation from its hostcontract, the entire contract is carried on the balance sheet at estimated fair value, with changes in estimated fair value recognized in the current period in netinvestment gains (losses) or net investment income. Additionally, the Company may elect to carry an entire contract on the balance sheet at estimated fair value,with changes in estimated fair value recognized in the current period in net investment gains (losses) or net investment income if that contract contains anembedded derivative that requires bifurcation. At inception, the Company attributes to the embedded derivative a portion of the projected future guarantee fees tobe collected from the policyholder equal to the present value of projected future guaranteed benefits. Any additional fees represent “excess” fees and are reportedin universal life and investment-type product policy fees.
See Note 8 for information about the fair value hierarchy for derivatives.
DerivativeStrategies
The Company is exposed to various risks relating to its ongoing business operations, including interest rate, foreign currency exchange rate, credit and equitymarket. The Company uses a variety of strategies to manage these risks, including the use of derivatives.
Derivatives are financial instruments with values derived from interest rates, foreign currency exchange rates, credit spreads and/or other financial indices.Derivatives may be exchange-traded or contracted in the over-the-counter (“OTC”) market. Certain of the Company’s OTC derivatives are cleared and settledthrough central clearing counterparties (“OTC-cleared”), while others are bilateral contracts between two counterparties (“OTC-bilateral”). The types of derivativesthe Company uses include swaps, forwards, futures and option contracts. To a lesser extent, the Company uses credit default swaps and structured interest rateswaps to synthetically replicate investment risks and returns which are not readily available in the cash markets.
47
Table of Contents
MetLife, Inc.
Notes to the Interim Condensed Consolidated Financial Statements (Unaudited) — (continued)
7. Derivatives (continued)
InterestRateDerivatives
The Company uses a variety of interest rate derivatives to reduce its exposure to changes in interest rates, including interest rate swaps, interest rate totalreturn swaps, caps, floors, swaptions, futures and forwards.
Interest rate swaps are used by the Company primarily to reduce market risks from changes in interest rates and to alter interest rate exposure arising frommismatches between assets and liabilities (duration mismatches). In an interest rate swap, the Company agrees with another party to exchange, at specifiedintervals, the difference between fixed rate and floating rate interest amounts as calculated by reference to an agreed notional amount. The Company utilizesinterest rate swaps in fair value, cash flow and nonqualifying hedging relationships.
The Company uses structured interest rate swaps to synthetically create investments that are either more expensive to acquire or otherwise unavailable in thecash markets. These transactions are a combination of a derivative and a cash instrument such as a U.S. government and agency, or other fixed maturity securityAFS. Structured interest rate swaps are included in interest rate swaps and are not designated as hedging instruments.
Interest rate total return swaps are swaps whereby the Company agrees with another party to exchange, at specified intervals, the difference between theeconomic risk and reward of an asset or a market index and the London Interbank Offered Rate (“LIBOR”), calculated by reference to an agreed notionalamount. No cash is exchanged at the outset of the contract. Cash is paid and received over the life of the contract based on the terms of the swap. Thesetransactions are entered into pursuant to master agreements that provide for a single net payment to be made by the counterparty at each due date. Interest ratetotal return swaps are used by the Company to reduce market risks from changes in interest rates and to alter interest rate exposure arising from mismatchesbetween assets and liabilities (duration mismatches). The Company utilizes interest rate total return swaps in nonqualifying hedging relationships.
The Company purchases interest rate caps primarily to protect its floating rate liabilities against rises in interest rates above a specified level, and againstinterest rate exposure arising from mismatches between assets and liabilities, and interest rate floors primarily to protect its minimum rate guarantee liabilitiesagainst declines in interest rates below a specified level. In certain instances, the Company locks in the economic impact of existing purchased caps and floors byentering into offsetting written caps and floors. The Company utilizes interest rate caps and floors in nonqualifying hedging relationships.
In exchange-traded interest rate (Treasury and swap) futures transactions, the Company agrees to purchase or sell a specified number of contracts, the valueof which is determined by the different classes of interest rate securities, to post variation margin on a daily basis in an amount equal to the difference in the dailymarket values of those contracts and to pledge initial margin based on futures exchange requirements. The Company enters into exchange-traded futures withregulated futures commission merchants that are members of the exchange. Exchange-traded interest rate (Treasury and swap) futures are used primarily tohedge mismatches between the duration of assets in a portfolio and the duration of liabilities supported by those assets, to hedge against changes in value ofsecurities the Company owns or anticipates acquiring, to hedge against changes in interest rates on anticipated liability issuances by replicating Treasury or swapcurve performance, and to hedge minimum guarantees embedded in certain variable annuity products offered by the Company. The Company utilizes exchange-traded interest rate futures in nonqualifying hedging relationships.
Swaptions are used by the Company to hedge interest rate risk associated with the Company’s long-term liabilities and invested assets. A swaption is anoption to enter into a swap with a forward starting effective date. In certain instances, the Company locks in the economic impact of existing purchasedswaptions by entering into offsetting written swaptions. The Company pays a premium for purchased swaptions and receives a premium for written swaptions.The Company utilizes swaptions in nonqualifying hedging relationships. Swaptions are included in interest rate options.
The Company enters into interest rate forwards to buy and sell securities. The price is agreed upon at the time of the contract and payment for such acontract is made at a specified future date. The Company utilizes interest rate forwards in cash flow and nonqualifying hedging relationships.
A synthetic guaranteed interest contract (“GIC”) is a contract that simulates the performance of a traditional GIC through the use of financial instruments.Under a synthetic GIC, the contractholder owns the underlying assets. The Company guarantees a rate of return on those assets for a premium. Synthetic GICsare not designated as hedging instruments.
48

Table of Contents
MetLife, Inc.
Notes to the Interim Condensed Consolidated Financial Statements (Unaudited) — (continued)
7. Derivatives (continued)
ForeignCurrencyExchangeRateDerivatives
The Company uses foreign currency exchange rate derivatives, including foreign currency swaps, foreign currency forwards, currency options andexchange-traded currency futures, to reduce the risk from fluctuations in foreign currency exchange rates associated with its assets and liabilities denominated inforeign currencies. The Company also uses foreign currency derivatives to hedge the foreign currency exchange rate risk associated with certain of its netinvestments in foreign operations.
In a foreign currency swap transaction, the Company agrees with another party to exchange, at specified intervals, the difference between one currency andanother at a fixed exchange rate, generally set at inception, calculated by reference to an agreed upon notional amount. The notional amount of each currency isexchanged at the inception and termination of the currency swap by each party. The Company utilizes foreign currency swaps in fair value, cash flow andnonqualifying hedging relationships.
In a foreign currency forward transaction, the Company agrees with another party to deliver a specified amount of an identified currency at a specified futuredate. The price is agreed upon at the time of the contract and payment for such a contract is made at the specified future date. The Company utilizes foreigncurrency forwards in fair value, net investment in foreign operations and nonqualifying hedging relationships.
The Company enters into currency options that give it the right, but not the obligation, to sell the foreign currency amount in exchange for a functionalcurrency amount within a limited time at a contracted price. The contracts may also be net settled in cash, based on differentials in the foreign currency exchangerate and the strike price. The Company uses currency options to hedge against the foreign currency exposure inherent in certain of its variable annuity products.The Company also uses currency options as an economic hedge of foreign currency exposure related to the Company’s international subsidiaries. The Companyutilizes currency options in net investment in foreign operations and nonqualifying hedging relationships.
To a lesser extent, the Company uses exchange-traded currency futures to hedge currency mismatches between assets and liabilities, and to hedge minimumguarantees embedded in certain variable annuity products offered by the Company. The Company utilizes exchange-traded currency futures in nonqualifyinghedging relationships.
CreditDerivatives
The Company enters into purchased credit default swaps to hedge against credit-related changes in the value of its investments. In a credit default swaptransaction, the Company agrees with another party to pay, at specified intervals, a premium to hedge credit risk. If a credit event occurs, as defined by thecontract, the contract may be cash settled or it may be settled gross by the delivery of par quantities of the referenced investment equal to the specified swapnotional amount in exchange for the payment of cash amounts by the counterparty equal to the par value of the investment surrendered. Credit events vary bytype of issuer but typically include bankruptcy, failure to pay debt obligations and involuntary restructuring for corporate obligors, as well as repudiation,moratorium or governmental intervention for sovereign obligors. In each case, payout on a credit default swap is triggered only after the Credit DerivativesDeterminations Committee of the International Swaps and Derivatives Association, Inc. (“ISDA”) deems that a credit event has occurred. The Company utilizescredit default swaps in nonqualifying hedging relationships.
The Company enters into written credit default swaps to synthetically create credit investments that are either more expensive to acquire or otherwiseunavailable in the cash markets. These transactions are a combination of a derivative and one or more cash instruments, such as U.S. government and agencysecurities, or other fixed maturity securities AFS. These credit default swaps are not designated as hedging instruments.
The Company enters into forwards to lock in the price to be paid for forward purchases of certain securities. The price is agreed upon at the time of thecontract and payment for the contract is made at a specified future date. When the primary purpose of entering into these transactions is to hedge against the riskof changes in purchase price due to changes in credit spreads, the Company designates these transactions as credit forwards. The Company utilizes creditforwards in cash flow hedging relationships.
EquityDerivatives
The Company uses a variety of equity derivatives to reduce its exposure to equity market risk, including equity index options, equity variance swaps,exchange-traded equity futures and equity total return swaps.
49
Table of Contents
MetLife, Inc.
Notes to the Interim Condensed Consolidated Financial Statements (Unaudited) — (continued)
7. Derivatives (continued)
Equity index options are used by the Company primarily to hedge minimum guarantees embedded in certain variable annuity products offered by theCompany. To hedge against adverse changes in equity indices, the Company enters into contracts to sell the underlying equity index within a limited time at acontracted price. The contracts will be net settled in cash based on differentials in the indices at the time of exercise and the strike price. Certain of thesecontracts may also contain settlement provisions linked to interest rates. In certain instances, the Company may enter into a combination of transactions to hedgeadverse changes in equity indices within a pre-determined range through the purchase and sale of options. The Company utilizes equity index options innonqualifying hedging relationships.
Equity variance swaps are used by the Company primarily to hedge minimum guarantees embedded in certain variable annuity products offered by theCompany. In an equity variance swap, the Company agrees with another party to exchange amounts in the future, based on changes in equity volatility over adefined period. The Company utilizes equity variance swaps in nonqualifying hedging relationships.
In exchange-traded equity futures transactions, the Company agrees to purchase or sell a specified number of contracts, the value of which is determined bythe different classes of equity securities, to post variation margin on a daily basis in an amount equal to the difference in the daily market values of thosecontracts and to pledge initial margin based on futures exchange requirements. The Company enters into exchange-traded futures with regulated futurescommission merchants that are members of the exchange. Exchange-traded equity futures are used primarily to hedge minimum guarantees embedded in certainvariable annuity products offered by the Company. The Company utilizes exchange-traded equity futures in nonqualifying hedging relationships.
In an equity total return swap, the Company agrees with another party to exchange, at specified intervals, the difference between the economic risk andreward of an asset or a market index and LIBOR, calculated by reference to an agreed notional amount. No cash is exchanged at the outset of the contract. Cashis paid and received over the life of the contract based on the terms of the swap. The Company uses equity total return swaps to hedge its equity marketguarantees in certain of its insurance products. Equity total return swaps can be used as hedges or to synthetically create investments. The Company utilizesequity total return swaps in nonqualifying hedging relationships.
50
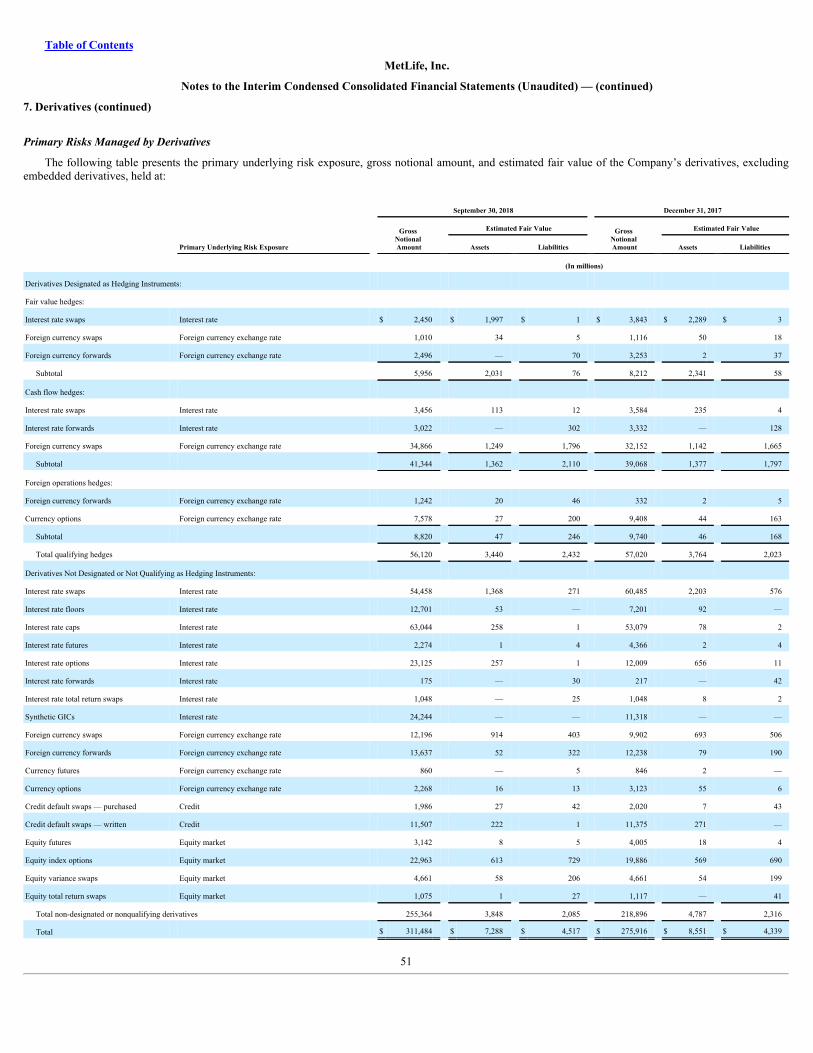
Table of Contents
MetLife, Inc.
Notes to the Interim Condensed Consolidated Financial Statements (Unaudited) — (continued)
7. Derivatives (continued)
PrimaryRisksManagedbyDerivatives
The following table presents the primary underlying risk exposure, gross notional amount, and estimated fair value of the Company’s derivatives, excludingembedded derivatives, held at:
September 30, 2018 December 31, 2017
Primary Underlying Risk Exposure Gross
Notional Amount
Estimated Fair Value Gross Notional Amount
Estimated Fair Value
Assets Liabilities Assets Liabilities
(In millions)
Derivatives Designated as Hedging Instruments:
Fair value hedges:
Interest rate swaps Interest rate $ 2,450 $ 1,997 $ 1 $ 3,843 $ 2,289 $ 3
Foreign currency swaps Foreign currency exchange rate 1,010 34 5 1,116 50 18
Foreign currency forwards Foreign currency exchange rate 2,496 — 70 3,253 2 37
Subtotal 5,956 2,031 76 8,212 2,341 58
Cash flow hedges:
Interest rate swaps Interest rate 3,456 113 12 3,584 235 4
Interest rate forwards Interest rate 3,022 — 302 3,332 — 128
Foreign currency swaps Foreign currency exchange rate 34,866 1,249 1,796 32,152 1,142 1,665
Subtotal 41,344 1,362 2,110 39,068 1,377 1,797
Foreign operations hedges:
Foreign currency forwards Foreign currency exchange rate 1,242 20 46 332 2 5
Currency options Foreign currency exchange rate 7,578 27 200 9,408 44 163
Subtotal 8,820 47 246 9,740 46 168
Total qualifying hedges 56,120 3,440 2,432 57,020 3,764 2,023
Derivatives Not Designated or Not Qualifying as Hedging Instruments:
Interest rate swaps Interest rate 54,458 1,368 271 60,485 2,203 576
Interest rate floors Interest rate 12,701 53 — 7,201 92 —
Interest rate caps Interest rate 63,044 258 1 53,079 78 2
Interest rate futures Interest rate 2,274 1 4 4,366 2 4
Interest rate options Interest rate 23,125 257 1 12,009 656 11
Interest rate forwards Interest rate 175 — 30 217 — 42
Interest rate total return swaps Interest rate 1,048 — 25 1,048 8 2
Synthetic GICs Interest rate 24,244 — — 11,318 — —
Foreign currency swaps Foreign currency exchange rate 12,196 914 403 9,902 693 506
Foreign currency forwards Foreign currency exchange rate 13,637 52 322 12,238 79 190
Currency futures Foreign currency exchange rate 860 — 5 846 2 —
Currency options Foreign currency exchange rate 2,268 16 13 3,123 55 6
Credit default swaps — purchased Credit 1,986 27 42 2,020 7 43
Credit default swaps — written Credit 11,507 222 1 11,375 271 —
Equity futures Equity market 3,142 8 5 4,005 18 4
Equity index options Equity market 22,963 613 729 19,886 569 690
Equity variance swaps Equity market 4,661 58 206 4,661 54 199
Equity total return swaps Equity market 1,075 1 27 1,117 — 41
Total non-designated or nonqualifying derivatives 255,364 3,848 2,085 218,896 4,787 2,316
Total $ 311,484 $ 7,288 $ 4,517 $ 275,916 $ 8,551 $ 4,339
51
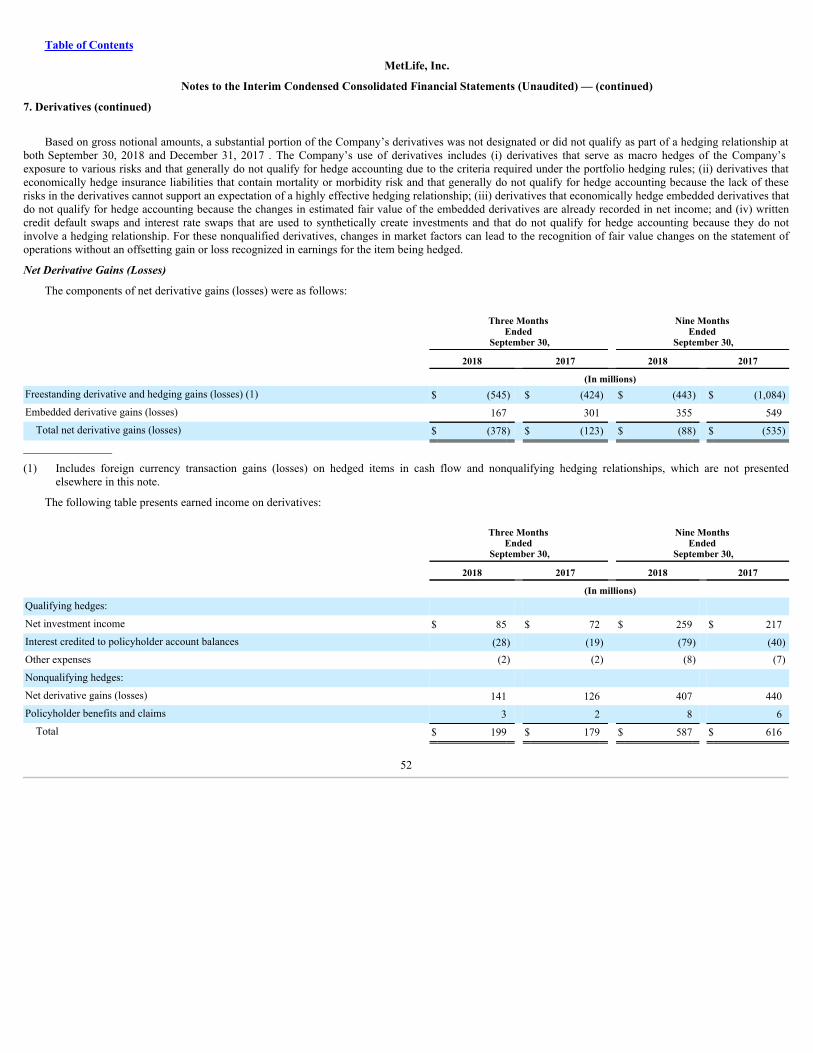
Table of Contents
MetLife, Inc.
Notes to the Interim Condensed Consolidated Financial Statements (Unaudited) — (continued)
7. Derivatives (continued)
Based on gross notional amounts, a substantial portion of the Company’s derivatives was not designated or did not qualify as part of a hedging relationship atboth September 30, 2018 and December 31, 2017 . The Company’s use of derivatives includes (i) derivatives that serve as macro hedges of the Company’sexposure to various risks and that generally do not qualify for hedge accounting due to the criteria required under the portfolio hedging rules; (ii) derivatives thateconomically hedge insurance liabilities that contain mortality or morbidity risk and that generally do not qualify for hedge accounting because the lack of theserisks in the derivatives cannot support an expectation of a highly effective hedging relationship; (iii) derivatives that economically hedge embedded derivatives thatdo not qualify for hedge accounting because the changes in estimated fair value of the embedded derivatives are already recorded in net income; and (iv) writtencredit default swaps and interest rate swaps that are used to synthetically create investments and that do not qualify for hedge accounting because they do notinvolve a hedging relationship. For these nonqualified derivatives, changes in market factors can lead to the recognition of fair value changes on the statement ofoperations without an offsetting gain or loss recognized in earnings for the item being hedged.
NetDerivativeGains(Losses)
The components of net derivative gains (losses) were as follows:
Three Months Ended
September 30,
Nine Months Ended
September 30,
2018 2017 2018 2017 (In millions)Freestanding derivative and hedging gains (losses) (1) $ (545) $ (424) $ (443) $ (1,084)Embedded derivative gains (losses) 167 301 355 549
Total net derivative gains (losses) $ (378) $ (123) $ (88) $ (535)__________________
(1) Includes foreign currency transaction gains (losses) on hedged items in cash flow and nonqualifying hedging relationships, which are not presentedelsewhere in this note.
The following table presents earned income on derivatives:
Three Months Ended
September 30,
Nine Months Ended
September 30,
2018 2017 2018 2017 (In millions)Qualifying hedges: Net investment income $ 85 $ 72 $ 259 $ 217Interest credited to policyholder account balances (28) (19) (79) (40)Other expenses (2) (2) (8) (7)
Nonqualifying hedges: Net derivative gains (losses) 141 126 407 440Policyholder benefits and claims 3 2 8 6
Total $ 199 $ 179 $ 587 $ 616
52
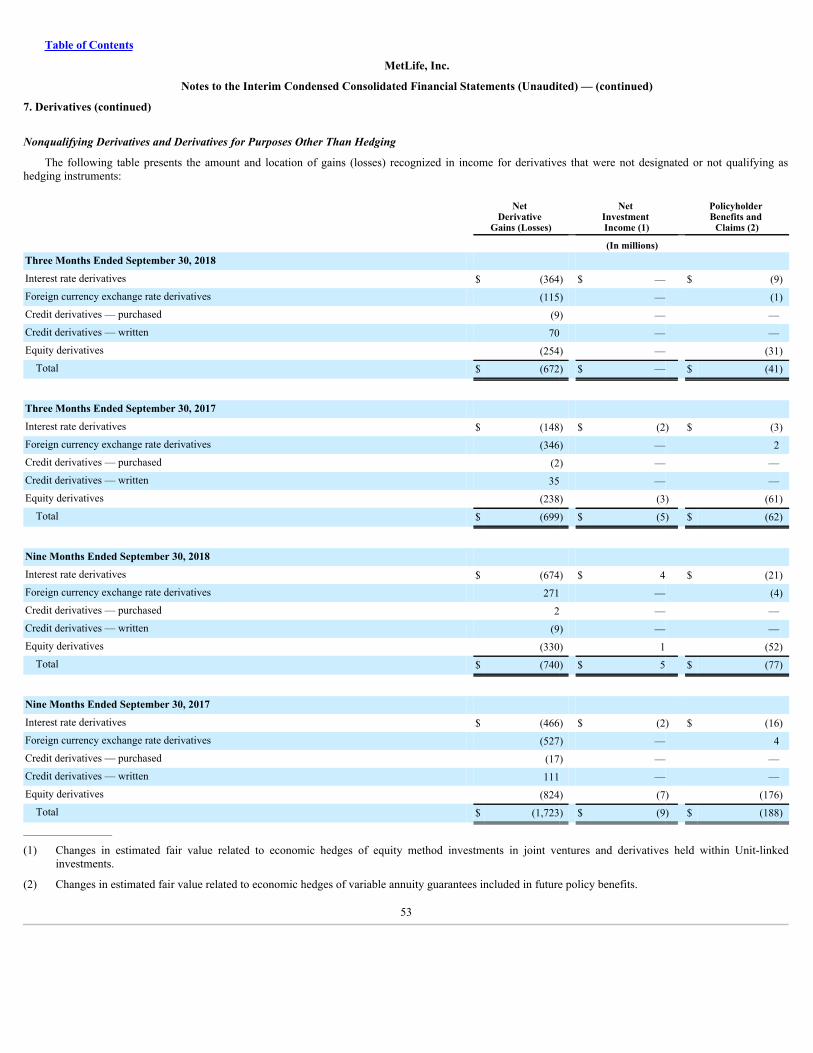
Table of Contents
MetLife, Inc.
Notes to the Interim Condensed Consolidated Financial Statements (Unaudited) — (continued)
7. Derivatives (continued)
NonqualifyingDerivativesandDerivativesforPurposesOtherThanHedging
The following table presents the amount and location of gains (losses) recognized in income for derivatives that were not designated or not qualifying ashedging instruments:
Net Derivative
Gains (Losses)
Net Investment Income (1)
Policyholder Benefits and
Claims (2) (In millions)Three Months Ended September 30, 2018 Interest rate derivatives $ (364) $ — $ (9)Foreign currency exchange rate derivatives (115) — (1)Credit derivatives — purchased (9) — —Credit derivatives — written 70 — —Equity derivatives (254) — (31)
Total $ (672) $ — $ (41)
Three Months Ended September 30, 2017 Interest rate derivatives $ (148) $ (2) $ (3)Foreign currency exchange rate derivatives (346) — 2Credit derivatives — purchased (2) — —Credit derivatives — written 35 — —Equity derivatives (238) (3) (61)
Total $ (699) $ (5) $ (62)
Nine Months Ended September 30, 2018 Interest rate derivatives $ (674) $ 4 $ (21)Foreign currency exchange rate derivatives 271 — (4)Credit derivatives — purchased 2 — —Credit derivatives — written (9) — —Equity derivatives (330) 1 (52)
Total $ (740) $ 5 $ (77)
Nine Months Ended September 30, 2017 Interest rate derivatives $ (466) $ (2) $ (16)Foreign currency exchange rate derivatives (527) — 4Credit derivatives — purchased (17) — —Credit derivatives — written 111 — —Equity derivatives (824) (7) (176)
Total $ (1,723) $ (9) $ (188)__________________
(1) Changes in estimated fair value related to economic hedges of equity method investments in joint ventures and derivatives held within Unit-linkedinvestments.
(2) Changes in estimated fair value related to economic hedges of variable annuity guarantees included in future policy benefits.
53

Table of Contents
MetLife, Inc.
Notes to the Interim Condensed Consolidated Financial Statements (Unaudited) — (continued)
7. Derivatives (continued)
FairValueHedges
The Company designates and accounts for the following as fair value hedges when they have met the requirements of fair value hedging: (i) interest rate swapsto convert fixed rate assets and liabilities to floating rate assets and liabilities; (ii) foreign currency swaps to hedge the foreign currency fair value exposure offoreign currency denominated assets and liabilities; and (iii) foreign currency forwards to hedge the foreign currency fair value exposure of foreign currencydenominated investments.
The Company recognizes gains and losses on derivatives and the related hedged items in fair value hedges within net derivative gains (losses). The followingtable presents the amount of such net derivative gains (losses):
54
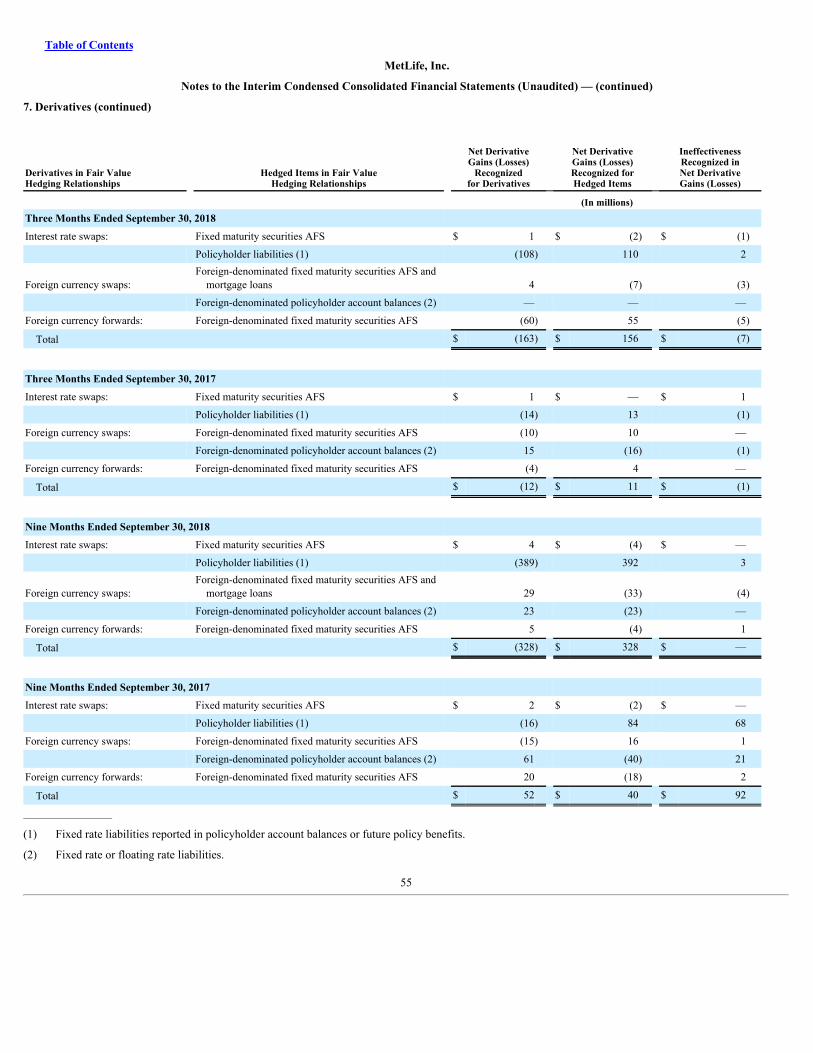
Table of Contents
MetLife, Inc.
Notes to the Interim Condensed Consolidated Financial Statements (Unaudited) — (continued)
7. Derivatives (continued)
Derivatives in Fair ValueHedging Relationships
Hedged Items in Fair ValueHedging Relationships
Net DerivativeGains (Losses)
Recognizedfor Derivatives
Net DerivativeGains (Losses)Recognized forHedged Items
IneffectivenessRecognized inNet DerivativeGains (Losses)
(In millions)Three Months Ended September 30, 2018 Interest rate swaps: Fixed maturity securities AFS $ 1 $ (2) $ (1)
Policyholder liabilities (1) (108) 110 2
Foreign currency swaps: Foreign-denominated fixed maturity securities AFS and
mortgage loans 4 (7) (3)
Foreign-denominated policyholder account balances (2) — — —
Foreign currency forwards: Foreign-denominated fixed maturity securities AFS (60) 55 (5)
Total $ (163) $ 156 $ (7)
Three Months Ended September 30, 2017 Interest rate swaps: Fixed maturity securities AFS $ 1 $ — $ 1
Policyholder liabilities (1) (14) 13 (1)
Foreign currency swaps: Foreign-denominated fixed maturity securities AFS (10) 10 —
Foreign-denominated policyholder account balances (2) 15 (16) (1)
Foreign currency forwards: Foreign-denominated fixed maturity securities AFS (4) 4 —
Total $ (12) $ 11 $ (1)
Nine Months Ended September 30, 2018 Interest rate swaps: Fixed maturity securities AFS $ 4 $ (4) $ —
Policyholder liabilities (1) (389) 392 3
Foreign currency swaps: Foreign-denominated fixed maturity securities AFS and
mortgage loans 29 (33) (4)
Foreign-denominated policyholder account balances (2) 23 (23) —
Foreign currency forwards: Foreign-denominated fixed maturity securities AFS 5 (4) 1
Total $ (328) $ 328 $ —
Nine Months Ended September 30, 2017 Interest rate swaps: Fixed maturity securities AFS $ 2 $ (2) $ —
Policyholder liabilities (1) (16) 84 68
Foreign currency swaps: Foreign-denominated fixed maturity securities AFS (15) 16 1
Foreign-denominated policyholder account balances (2) 61 (40) 21
Foreign currency forwards: Foreign-denominated fixed maturity securities AFS 20 (18) 2
Total $ 52 $ 40 $ 92
__________________
(1) Fixed rate liabilities reported in policyholder account balances or future policy benefits.
(2) Fixed rate or floating rate liabilities.
55

Table of Contents
MetLife, Inc.
Notes to the Interim Condensed Consolidated Financial Statements (Unaudited) — (continued)
7. Derivatives (continued)
For the Company’s foreign currency forwards, the change in the estimated fair value of the derivative related to the changes in the difference between the spotprice and the forward price is excluded from the assessment of hedge effectiveness. For all other derivatives, all components of each derivative’s gain or loss wereincluded in the assessment of hedge effectiveness. For the three months and nine months ended September 30, 2018 , the component of the change in estimated fairvalue of derivatives that was excluded from the assessment of hedge effectiveness was ($7) million and ($27) million , respectively. For the three months and ninemonths ended September 30, 2017 , the component of the change in estimated fair value of derivatives that was excluded from the assessment of hedgeeffectiveness was ($6) million and ($30) million , respectively.
CashFlowHedges
The Company designates and accounts for the following as cash flow hedges when they have met the requirements of cash flow hedging: (i) interest rateswaps to convert floating rate assets and liabilities to fixed rate assets and liabilities; (ii) foreign currency swaps to hedge the foreign currency cash flow exposureof foreign currency denominated assets and liabilities; (iii) interest rate forwards and credit forwards to lock in the price to be paid for forward purchases ofinvestments; (iv) interest rate swaps and interest rate forwards to hedge the forecasted purchases of fixed-rate investments; and (v) interest rate swaps and interestrate forwards to hedge forecasted fixed-rate borrowings.
In certain instances, the Company discontinued cash flow hedge accounting because the forecasted transactions were no longer probable of occurring. Becausecertain of the forecasted transactions also were not probable of occurring within two months of the anticipated date, the Company reclassified amounts from AOCIinto net derivative gains (losses). These amounts were less than $1 million and $6 million for the three months and nine months ended September 30, 2018 ,respectively, and ($4) million and $16 million for the three months and nine months ended September 30, 2017 , respectively.
At September 30, 2018 and December 31, 2017 , the maximum length of time over which the Company was hedging its exposure to variability in future cashflows for forecasted transactions did not exceed four years and five years , respectively.
At September 30, 2018 and December 31, 2017 , the balance in AOCI associated with cash flow hedges was $1.3 billion and $1.5 billion , respectively. Uponthe Separation, the Company recorded a reduction of $414 million of deferred gains within AOCI.
For the three months and nine months ended September 30, 2017, the amount of deferred gains (losses) in AOCI related to Brighthouse derivatives was ($40)million and ($92) million , respectively. For the three months and nine months ended September 30, 2017, the amount of income reclassified from AOCI intoincome (loss) from discontinued operations was less than $1 million and $16 million , respectively.
56
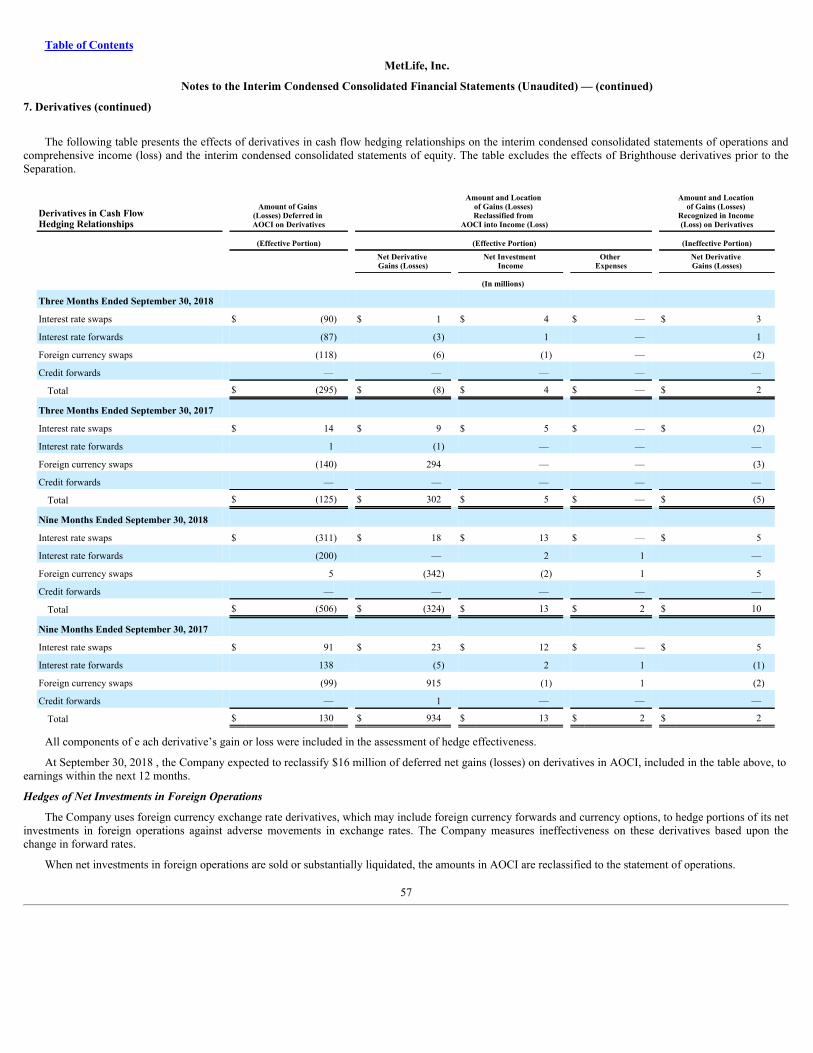
Table of Contents
MetLife, Inc.
Notes to the Interim Condensed Consolidated Financial Statements (Unaudited) — (continued)
7. Derivatives (continued)
The following table presents the effects of derivatives in cash flow hedging relationships on the interim condensed consolidated statements of operations andcomprehensive income (loss) and the interim condensed consolidated statements of equity. The table excludes the effects of Brighthouse derivatives prior to theSeparation.
Derivatives in Cash Flow Hedging Relationships
Amount of Gains (Losses) Deferred in AOCI on Derivatives
Amount and Location of Gains (Losses) Reclassified from
AOCI into Income (Loss)
Amount and Location of Gains (Losses)
Recognized in Income (Loss) on Derivatives
(Effective Portion) (Effective Portion) (Ineffective Portion)
Net Derivative Gains (Losses) Net Investment
Income Other Expenses Net Derivative
Gains (Losses)
(In millions)
Three Months Ended September 30, 2018
Interest rate swaps $ (90) $ 1 $ 4 $ — $ 3
Interest rate forwards (87) (3) 1 — 1
Foreign currency swaps (118) (6) (1) — (2)
Credit forwards — — — — —
Total $ (295) $ (8) $ 4 $ — $ 2
Three Months Ended September 30, 2017
Interest rate swaps $ 14 $ 9 $ 5 $ — $ (2)
Interest rate forwards 1 (1) — — —
Foreign currency swaps (140) 294 — — (3)
Credit forwards — — — — —
Total $ (125) $ 302 $ 5 $ — $ (5)
Nine Months Ended September 30, 2018
Interest rate swaps $ (311) $ 18 $ 13 $ — $ 5
Interest rate forwards (200) — 2 1 —
Foreign currency swaps 5 (342) (2) 1 5
Credit forwards — — — — —
Total $ (506) $ (324) $ 13 $ 2 $ 10
Nine Months Ended September 30, 2017
Interest rate swaps $ 91 $ 23 $ 12 $ — $ 5
Interest rate forwards 138 (5) 2 1 (1)
Foreign currency swaps (99) 915 (1) 1 (2)
Credit forwards — 1 — — —
Total $ 130 $ 934 $ 13 $ 2 $ 2
All components of e ach derivative’s gain or loss were included in the assessment of hedge effectiveness.
At September 30, 2018 , the Company expected to reclassify $16 million of deferred net gains (losses) on derivatives in AOCI, included in the table above, toearnings within the next 12 months.
HedgesofNetInvestmentsinForeignOperations
The Company uses foreign currency exchange rate derivatives, which may include foreign currency forwards and currency options, to hedge portions of its netinvestments in foreign operations against adverse movements in exchange rates. The Company measures ineffectiveness on these derivatives based upon thechange in forward rates.
When net investments in foreign operations are sold or substantially liquidated, the amounts in AOCI are reclassified to the statement of operations.
57
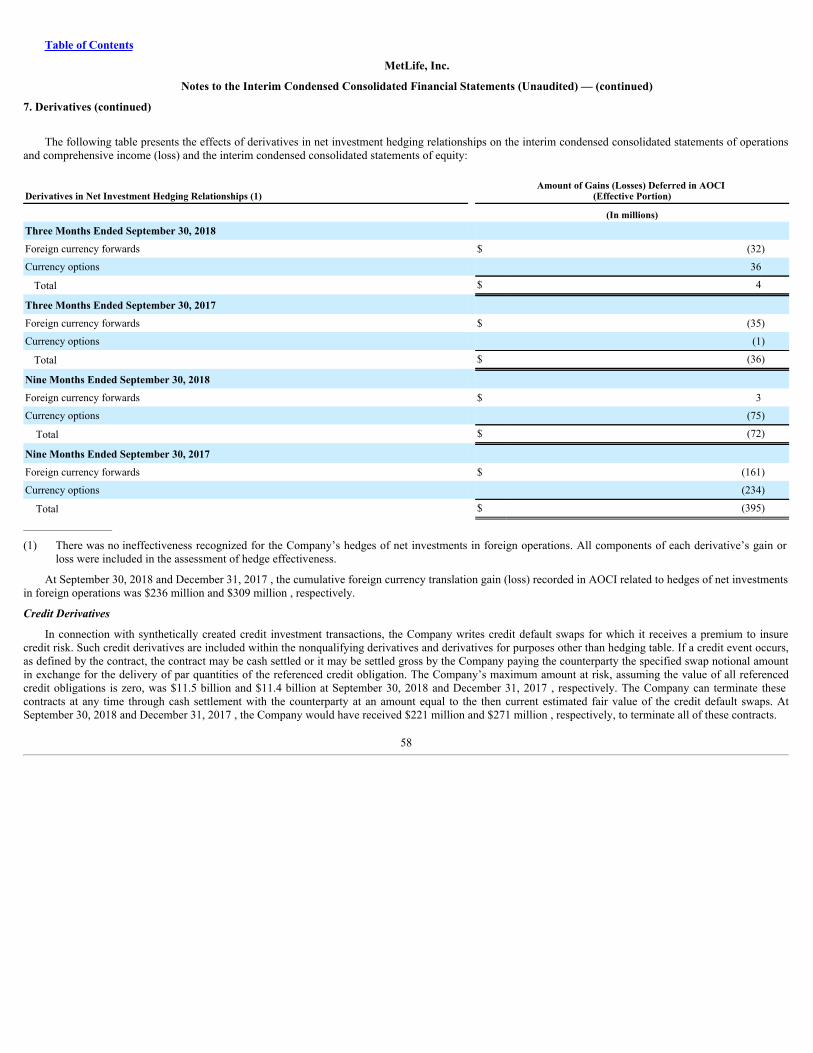
Table of Contents
MetLife, Inc.
Notes to the Interim Condensed Consolidated Financial Statements (Unaudited) — (continued)
7. Derivatives (continued)
The following table presents the effects of derivatives in net investment hedging relationships on the interim condensed consolidated statements of operationsand comprehensive income (loss) and the interim condensed consolidated statements of equity:
Derivatives in Net Investment Hedging Relationships (1) Amount of Gains (Losses) Deferred in AOCI
(Effective Portion)
(In millions)Three Months Ended September 30, 2018 Foreign currency forwards $ (32)
Currency options 36
Total $ 4
Three Months Ended September 30, 2017 Foreign currency forwards $ (35)
Currency options (1)
Total $ (36)
Nine Months Ended September 30, 2018 Foreign currency forwards $ 3
Currency options (75)
Total $ (72)
Nine Months Ended September 30, 2017 Foreign currency forwards $ (161)
Currency options (234)
Total $ (395)__________________
(1) There was no ineffectiveness recognized for the Company’s hedges of net investments in foreign operations. All components of each derivative’s gain orloss were included in the assessment of hedge effectiveness.
At September 30, 2018 and December 31, 2017 , the cumulative foreign currency translation gain (loss) recorded in AOCI related to hedges of net investmentsin foreign operations was $236 million and $309 million , respectively.
CreditDerivatives
In connection with synthetically created credit investment transactions, the Company writes credit default swaps for which it receives a premium to insurecredit risk. Such credit derivatives are included within the nonqualifying derivatives and derivatives for purposes other than hedging table. If a credit event occurs,as defined by the contract, the contract may be cash settled or it may be settled gross by the Company paying the counterparty the specified swap notional amountin exchange for the delivery of par quantities of the referenced credit obligation. The Company’s maximum amount at risk, assuming the value of all referencedcredit obligations is zero, was $11.5 billion and $11.4 billion at September 30, 2018 and December 31, 2017 , respectively. The Company can terminate thesecontracts at any time through cash settlement with the counterparty at an amount equal to the then current estimated fair value of the credit default swaps. AtSeptember 30, 2018 and December 31, 2017 , the Company would have received $221 million and $271 million , respectively, to terminate all of these contracts.
58
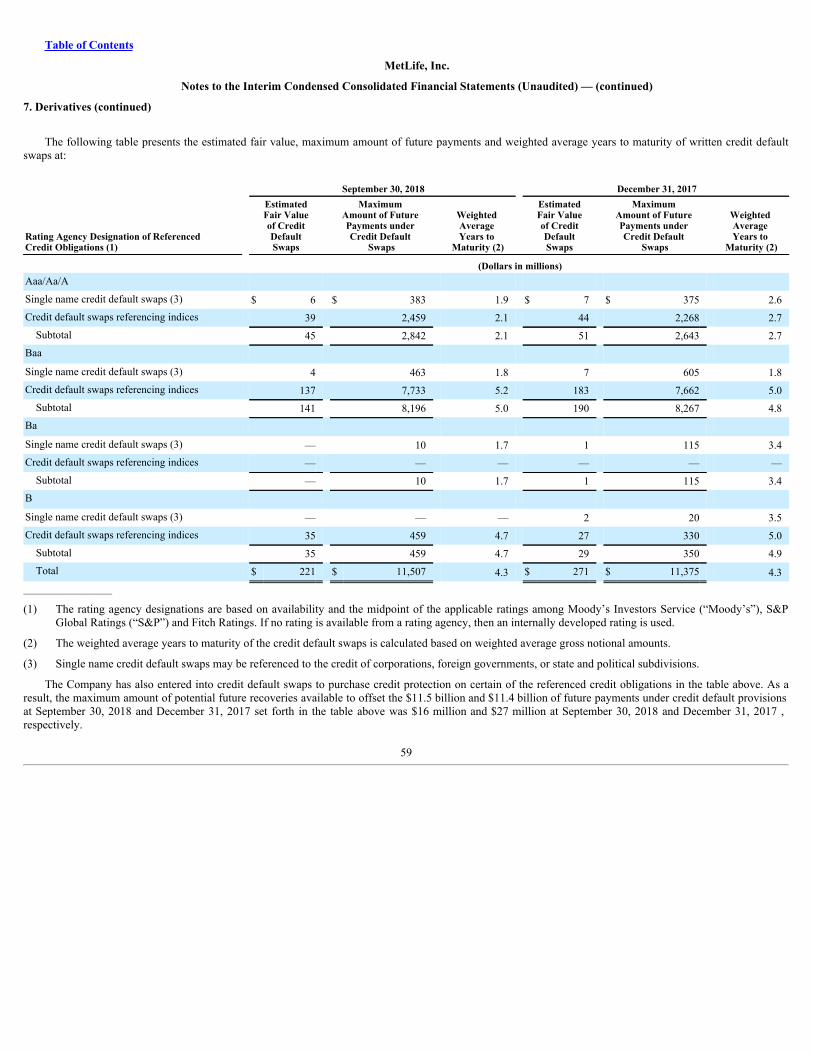
Table of Contents
MetLife, Inc.
Notes to the Interim Condensed Consolidated Financial Statements (Unaudited) — (continued)
7. Derivatives (continued)
The following table presents the estimated fair value, maximum amount of future payments and weighted average years to maturity of written credit defaultswaps at:
September 30, 2018 December 31, 2017
Rating Agency Designation of ReferencedCredit Obligations (1)
EstimatedFair Valueof CreditDefaultSwaps
Maximum Amount of Future Payments under Credit Default
Swaps
Weighted Average Years to
Maturity (2)
EstimatedFair Valueof CreditDefaultSwaps
Maximum Amount of Future Payments under Credit Default
Swaps
Weighted Average Years to
Maturity (2)
(Dollars in millions)Aaa/Aa/A Single name credit default swaps (3) $ 6 $ 383 1.9 $ 7 $ 375 2.6Credit default swaps referencing indices 39 2,459 2.1 44 2,268 2.7
Subtotal 45 2,842 2.1 51 2,643 2.7Baa Single name credit default swaps (3) 4 463 1.8 7 605 1.8Credit default swaps referencing indices 137 7,733 5.2 183 7,662 5.0
Subtotal 141 8,196 5.0 190 8,267 4.8Ba Single name credit default swaps (3) — 10 1.7 1 115 3.4Credit default swaps referencing indices — — — — — —
Subtotal — 10 1.7 1 115 3.4B Single name credit default swaps (3) — — — 2 20 3.5Credit default swaps referencing indices 35 459 4.7 27 330 5.0
Subtotal 35 459 4.7 29 350 4.9Total $ 221 $ 11,507 4.3 $ 271 $ 11,375 4.3
__________________
(1) The rating agency designations are based on availability and the midpoint of the applicable ratings among Moody’s Investors Service (“Moody’s”), S&PGlobal Ratings (“S&P”) and Fitch Ratings. If no rating is available from a rating agency, then an internally developed rating is used.
(2) The weighted average years to maturity of the credit default swaps is calculated based on weighted average gross notional amounts.
(3) Single name credit default swaps may be referenced to the credit of corporations, foreign governments, or state and political subdivisions.
The Company has also entered into credit default swaps to purchase credit protection on certain of the referenced credit obligations in the table above. As aresult, the maximum amount of potential future recoveries available to offset the $11.5 billion and $11.4 billion of future payments under credit default provisionsat September 30, 2018 and December 31, 2017 set forth in the table above was $16 million and $27 million at September 30, 2018 and December 31, 2017 ,respectively.
59
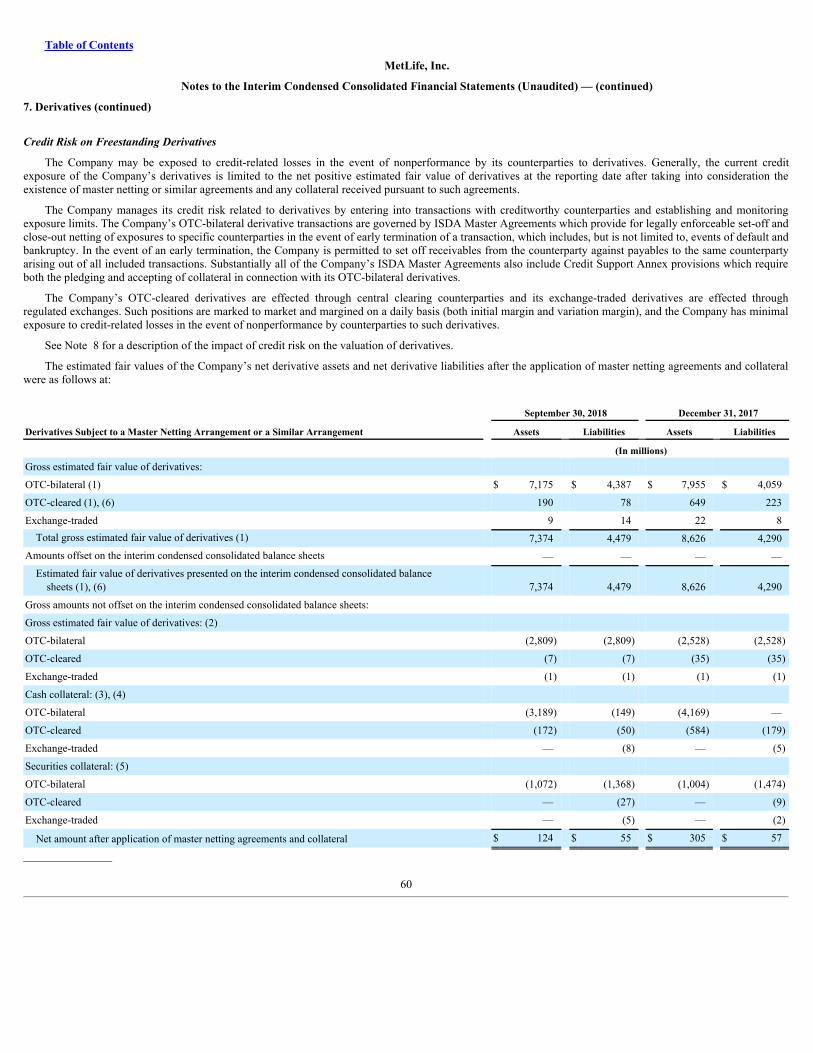
Table of Contents
MetLife, Inc.
Notes to the Interim Condensed Consolidated Financial Statements (Unaudited) — (continued)
7. Derivatives (continued)
CreditRiskonFreestandingDerivatives
The Company may be exposed to credit-related losses in the event of nonperformance by its counterparties to derivatives. Generally, the current creditexposure of the Company’s derivatives is limited to the net positive estimated fair value of derivatives at the reporting date after taking into consideration theexistence of master netting or similar agreements and any collateral received pursuant to such agreements.
The Company manages its credit risk related to derivatives by entering into transactions with creditworthy counterparties and establishing and monitoringexposure limits. The Company’s OTC-bilateral derivative transactions are governed by ISDA Master Agreements which provide for legally enforceable set-off andclose-out netting of exposures to specific counterparties in the event of early termination of a transaction, which includes, but is not limited to, events of default andbankruptcy. In the event of an early termination, the Company is permitted to set off receivables from the counterparty against payables to the same counterpartyarising out of all included transactions. Substantially all of the Company’s ISDA Master Agreements also include Credit Support Annex provisions which requireboth the pledging and accepting of collateral in connection with its OTC-bilateral derivatives.
The Company’s OTC-cleared derivatives are effected through central clearing counterparties and its exchange-traded derivatives are effected throughregulated exchanges. Such positions are marked to market and margined on a daily basis (both initial margin and variation margin), and the Company has minimalexposure to credit-related losses in the event of nonperformance by counterparties to such derivatives.
See Note 8 for a description of the impact of credit risk on the valuation of derivatives.
The estimated fair values of the Company’s net derivative assets and net derivative liabilities after the application of master netting agreements and collateralwere as follows at:
September 30, 2018 December 31, 2017
Derivatives Subject to a Master Netting Arrangement or a Similar Arrangement Assets Liabilities Assets Liabilities
(In millions)Gross estimated fair value of derivatives: OTC-bilateral (1) $ 7,175 $ 4,387 $ 7,955 $ 4,059
OTC-cleared (1), (6) 190 78 649 223
Exchange-traded 9 14 22 8Total gross estimated fair value of derivatives (1) 7,374 4,479 8,626 4,290
Amounts offset on the interim condensed consolidated balance sheets — — — —Estimated fair value of derivatives presented on the interim condensed consolidated balance
sheets (1), (6) 7,374 4,479 8,626 4,290
Gross amounts not offset on the interim condensed consolidated balance sheets: Gross estimated fair value of derivatives: (2) OTC-bilateral (2,809) (2,809) (2,528) (2,528)
OTC-cleared (7) (7) (35) (35)
Exchange-traded (1) (1) (1) (1)
Cash collateral: (3), (4) OTC-bilateral (3,189) (149) (4,169) —
OTC-cleared (172) (50) (584) (179)
Exchange-traded — (8) — (5)
Securities collateral: (5) OTC-bilateral (1,072) (1,368) (1,004) (1,474)
OTC-cleared — (27) — (9)
Exchange-traded — (5) — (2)
Net amount after application of master netting agreements and collateral $ 124 $ 55 $ 305 $ 57
__________________
60
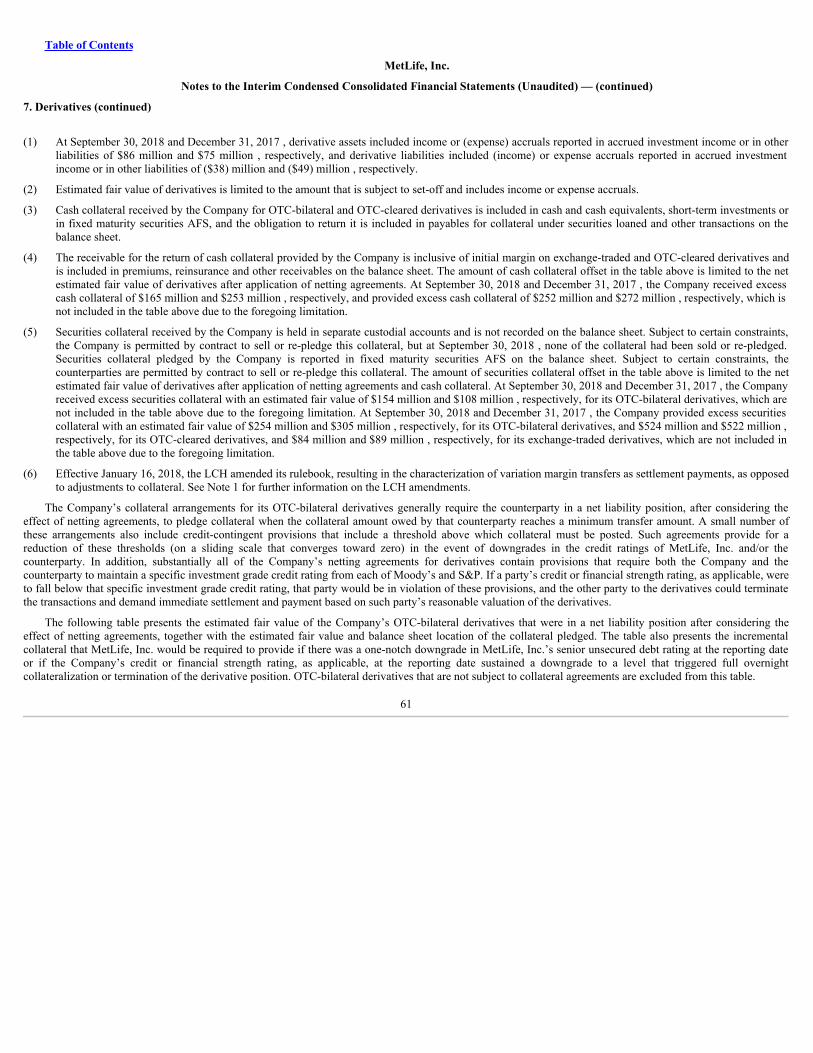
Table of Contents
MetLife, Inc.
Notes to the Interim Condensed Consolidated Financial Statements (Unaudited) — (continued)
7. Derivatives (continued)
(1) At September 30, 2018 and December 31, 2017 , derivative assets included income or (expense) accruals reported in accrued investment income or in otherliabilities of $86 million and $75 million , respectively, and derivative liabilities included (income) or expense accruals reported in accrued investmentincome or in other liabilities of ($38) million and ($49) million , respectively.
(2) Estimated fair value of derivatives is limited to the amount that is subject to set-off and includes income or expense accruals.
(3) Cash collateral received by the Company for OTC-bilateral and OTC-cleared derivatives is included in cash and cash equivalents, short-term investments orin fixed maturity securities AFS, and the obligation to return it is included in payables for collateral under securities loaned and other transactions on thebalance sheet.
(4) The receivable for the return of cash collateral provided by the Company is inclusive of initial margin on exchange-traded and OTC-cleared derivatives andis included in premiums, reinsurance and other receivables on the balance sheet. The amount of cash collateral offset in the table above is limited to the netestimated fair value of derivatives after application of netting agreements. At September 30, 2018 and December 31, 2017 , the Company received excesscash collateral of $165 million and $253 million , respectively, and provided excess cash collateral of $252 million and $272 million , respectively, which isnot included in the table above due to the foregoing limitation.
(5) Securities collateral received by the Company is held in separate custodial accounts and is not recorded on the balance sheet. Subject to certain constraints,the Company is permitted by contract to sell or re-pledge this collateral, but at September 30, 2018 , none of the collateral had been sold or re-pledged.Securities collateral pledged by the Company is reported in fixed maturity securities AFS on the balance sheet. Subject to certain constraints, thecounterparties are permitted by contract to sell or re-pledge this collateral. The amount of securities collateral offset in the table above is limited to the netestimated fair value of derivatives after application of netting agreements and cash collateral. At September 30, 2018 and December 31, 2017 , the Companyreceived excess securities collateral with an estimated fair value of $154 million and $108 million , respectively, for its OTC-bilateral derivatives, which arenot included in the table above due to the foregoing limitation. At September 30, 2018 and December 31, 2017 , the Company provided excess securitiescollateral with an estimated fair value of $254 million and $305 million , respectively, for its OTC-bilateral derivatives, and $524 million and $522 million ,respectively, for its OTC-cleared derivatives, and $84 million and $89 million , respectively, for its exchange-traded derivatives, which are not included inthe table above due to the foregoing limitation.
(6) Effective January 16, 2018, the LCH amended its rulebook, resulting in the characterization of variation margin transfers as settlement payments, as opposedto adjustments to collateral. See Note 1 for further information on the LCH amendments.
The Company’s collateral arrangements for its OTC-bilateral derivatives generally require the counterparty in a net liability position, after considering theeffect of netting agreements, to pledge collateral when the collateral amount owed by that counterparty reaches a minimum transfer amount. A small number ofthese arrangements also include credit-contingent provisions that include a threshold above which collateral must be posted. Such agreements provide for areduction of these thresholds (on a sliding scale that converges toward zero) in the event of downgrades in the credit ratings of MetLife, Inc. and/or thecounterparty. In addition, substantially all of the Company’s netting agreements for derivatives contain provisions that require both the Company and thecounterparty to maintain a specific investment grade credit rating from each of Moody’s and S&P. If a party’s credit or financial strength rating, as applicable, wereto fall below that specific investment grade credit rating, that party would be in violation of these provisions, and the other party to the derivatives could terminatethe transactions and demand immediate settlement and payment based on such party’s reasonable valuation of the derivatives.
The following table presents the estimated fair value of the Company’s OTC-bilateral derivatives that were in a net liability position after considering theeffect of netting agreements, together with the estimated fair value and balance sheet location of the collateral pledged. The table also presents the incrementalcollateral that MetLife, Inc. would be required to provide if there was a one-notch downgrade in MetLife, Inc.’s senior unsecured debt rating at the reporting dateor if the Company’s credit or financial strength rating, as applicable, at the reporting date sustained a downgrade to a level that triggered full overnightcollateralization or termination of the derivative position. OTC-bilateral derivatives that are not subject to collateral agreements are excluded from this table.
61
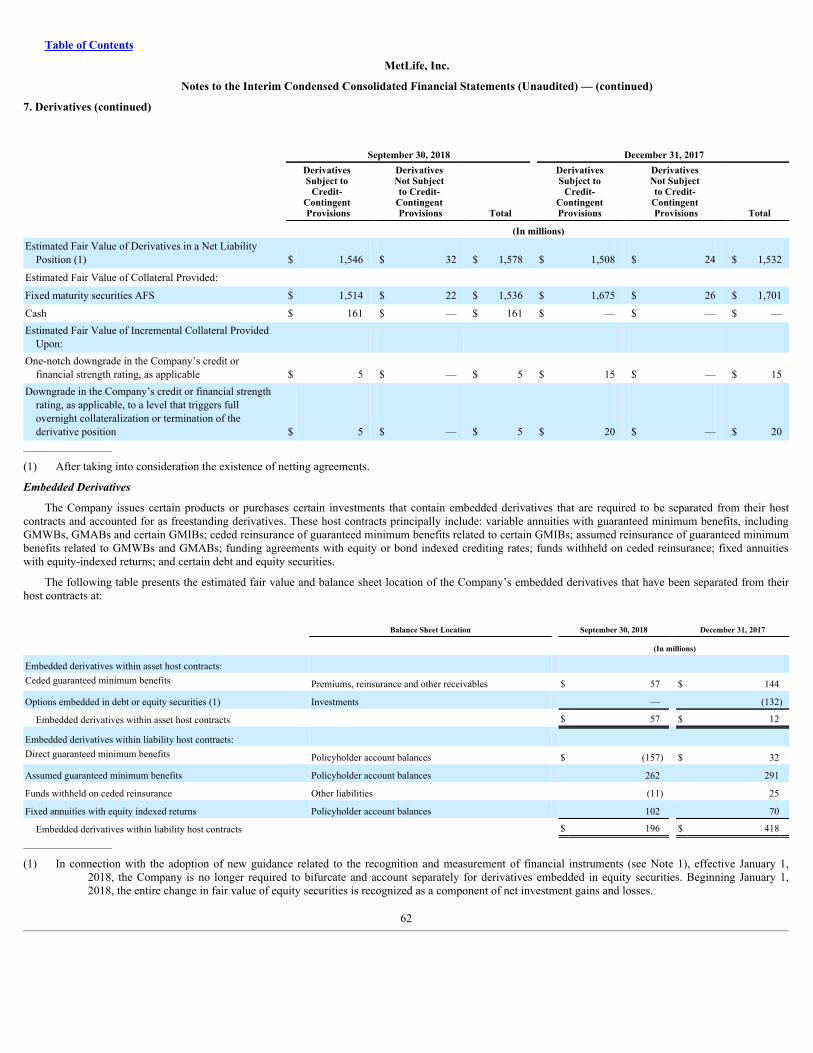
Table of Contents
MetLife, Inc.
Notes to the Interim Condensed Consolidated Financial Statements (Unaudited) — (continued)
7. Derivatives (continued)
September 30, 2018 December 31, 2017
Derivatives Subject to
Credit- Contingent Provisions
Derivatives Not Subject to Credit-
Contingent Provisions Total
DerivativesSubject to
Credit-ContingentProvisions
Derivatives Not Subject to Credit-
Contingent Provisions Total
(In millions)Estimated Fair Value of Derivatives in a Net Liability
Position (1) $ 1,546 $ 32 $ 1,578 $ 1,508 $ 24 $ 1,532
Estimated Fair Value of Collateral Provided: Fixed maturity securities AFS $ 1,514 $ 22 $ 1,536 $ 1,675 $ 26 $ 1,701
Cash $ 161 $ — $ 161 $ — $ — $ —Estimated Fair Value of Incremental Collateral Provided
Upon: One-notch downgrade in the Company’s credit or
financial strength rating, as applicable $ 5 $ — $ 5 $ 15 $ — $ 15Downgrade in the Company’s credit or financial strength
rating, as applicable, to a level that triggers fullovernight collateralization or termination of thederivative position $ 5 $ — $ 5 $ 20 $ — $ 20
__________________
(1) After taking into consideration the existence of netting agreements.
EmbeddedDerivatives
The Company issues certain products or purchases certain investments that contain embedded derivatives that are required to be separated from their hostcontracts and accounted for as freestanding derivatives. These host contracts principally include: variable annuities with guaranteed minimum benefits, includingGMWBs, GMABs and certain GMIBs; ceded reinsurance of guaranteed minimum benefits related to certain GMIBs; assumed reinsurance of guaranteed minimumbenefits related to GMWBs and GMABs; funding agreements with equity or bond indexed crediting rates; funds withheld on ceded reinsurance; fixed annuitieswith equity-indexed returns; and certain debt and equity securities.
The following table presents the estimated fair value and balance sheet location of the Company’s embedded derivatives that have been separated from theirhost contracts at:
Balance Sheet Location September 30, 2018 December 31, 2017
(In millions)
Embedded derivatives within asset host contracts: Ceded guaranteed minimum benefits Premiums, reinsurance and other receivables $ 57 $ 144
Options embedded in debt or equity securities (1) Investments — (132)
Embedded derivatives within asset host contracts $ 57 $ 12
Embedded derivatives within liability host contracts: Direct guaranteed minimum benefits Policyholder account balances $ (157) $ 32
Assumed guaranteed minimum benefits Policyholder account balances 262 291
Funds withheld on ceded reinsurance Other liabilities (11) 25
Fixed annuities with equity indexed returns Policyholder account balances 102 70
Embedded derivatives within liability host contracts $ 196 $ 418__________________
(1) In connection with the adoption of new guidance related to the recognition and measurement of financial instruments (see Note 1), effective January 1,2018, the Company is no longer required to bifurcate and account separately for derivatives embedded in equity securities. Beginning January 1,2018, the entire change in fair value of equity securities is recognized as a component of net investment gains and losses.
62
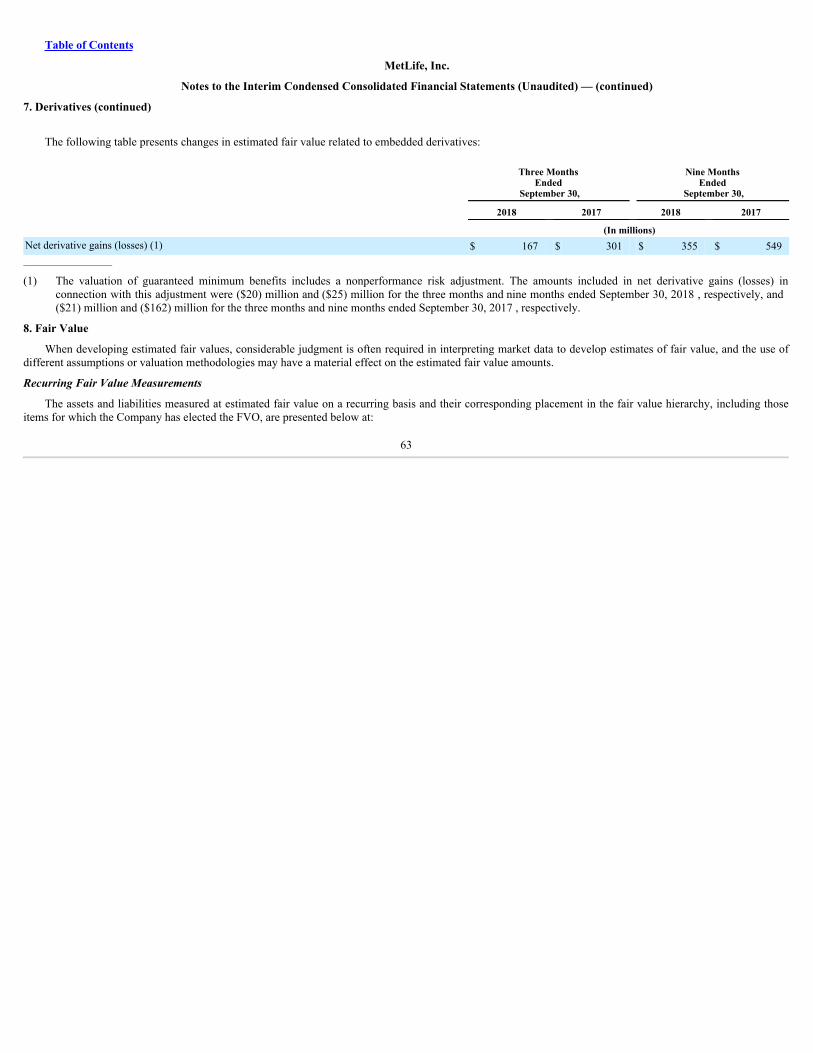
Table of Contents
MetLife, Inc.
Notes to the Interim Condensed Consolidated Financial Statements (Unaudited) — (continued)
7. Derivatives (continued)
The following table presents changes in estimated fair value related to embedded derivatives:
Three Months Ended
September 30,
Nine Months Ended
September 30,
2018 2017 2018 2017 (In millions)Net derivative gains (losses) (1) $ 167 $ 301 $ 355 $ 549__________________
(1) The valuation of guaranteed minimum benefits includes a nonperformance risk adjustment. The amounts included in net derivative gains (losses) inconnection with this adjustment were ($20) million and ($25) million for the three months and nine months ended September 30, 2018 , respectively, and($21) million and ($162) million for the three months and nine months ended September 30, 2017 , respectively.
8. Fair Value
When developing estimated fair values, considerable judgment is often required in interpreting market data to develop estimates of fair value, and the use ofdifferent assumptions or valuation methodologies may have a material effect on the estimated fair value amounts.
RecurringFairValueMeasurements
The assets and liabilities measured at estimated fair value on a recurring basis and their corresponding placement in the fair value hierarchy, including thoseitems for which the Company has elected the FVO, are presented below at:
63
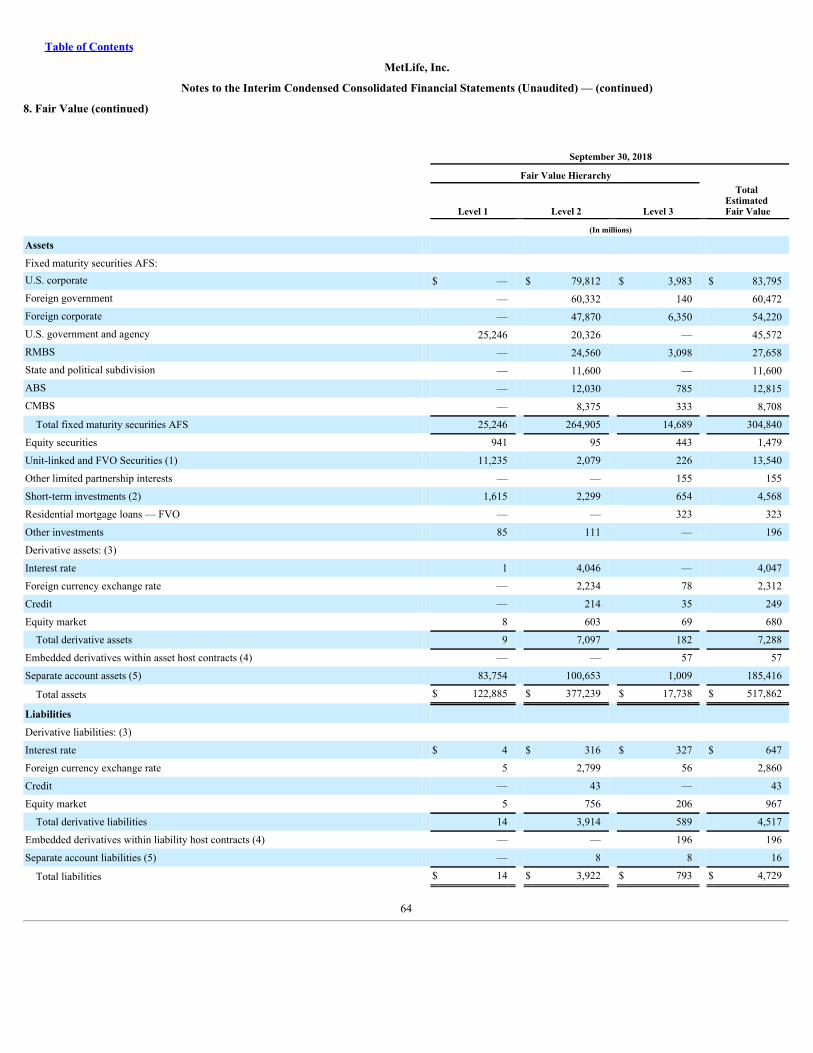
Table of Contents
MetLife, Inc.
Notes to the Interim Condensed Consolidated Financial Statements (Unaudited) — (continued)
8. Fair Value (continued)
September 30, 2018
Fair Value Hierarchy
Level 1 Level 2 Level 3
Total Estimated Fair Value
(In millions)
Assets Fixed maturity securities AFS: U.S. corporate $ — $ 79,812 $ 3,983 $ 83,795Foreign government — 60,332 140 60,472Foreign corporate — 47,870 6,350 54,220U.S. government and agency 25,246 20,326 — 45,572RMBS — 24,560 3,098 27,658State and political subdivision — 11,600 — 11,600ABS — 12,030 785 12,815CMBS — 8,375 333 8,708
Total fixed maturity securities AFS 25,246 264,905 14,689 304,840
Equity securities 941 95 443 1,479
Unit-linked and FVO Securities (1) 11,235 2,079 226 13,540
Other limited partnership interests — — 155 155
Short-term investments (2) 1,615 2,299 654 4,568
Residential mortgage loans — FVO — — 323 323
Other investments 85 111 — 196
Derivative assets: (3) Interest rate 1 4,046 — 4,047
Foreign currency exchange rate — 2,234 78 2,312
Credit — 214 35 249
Equity market 8 603 69 680
Total derivative assets 9 7,097 182 7,288
Embedded derivatives within asset host contracts (4) — — 57 57
Separate account assets (5) 83,754 100,653 1,009 185,416
Total assets $ 122,885 $ 377,239 $ 17,738 $ 517,862
Liabilities Derivative liabilities: (3) Interest rate $ 4 $ 316 $ 327 $ 647
Foreign currency exchange rate 5 2,799 56 2,860
Credit — 43 — 43
Equity market 5 756 206 967
Total derivative liabilities 14 3,914 589 4,517
Embedded derivatives within liability host contracts (4) — — 196 196
Separate account liabilities (5) — 8 8 16
Total liabilities $ 14 $ 3,922 $ 793 $ 4,729
64
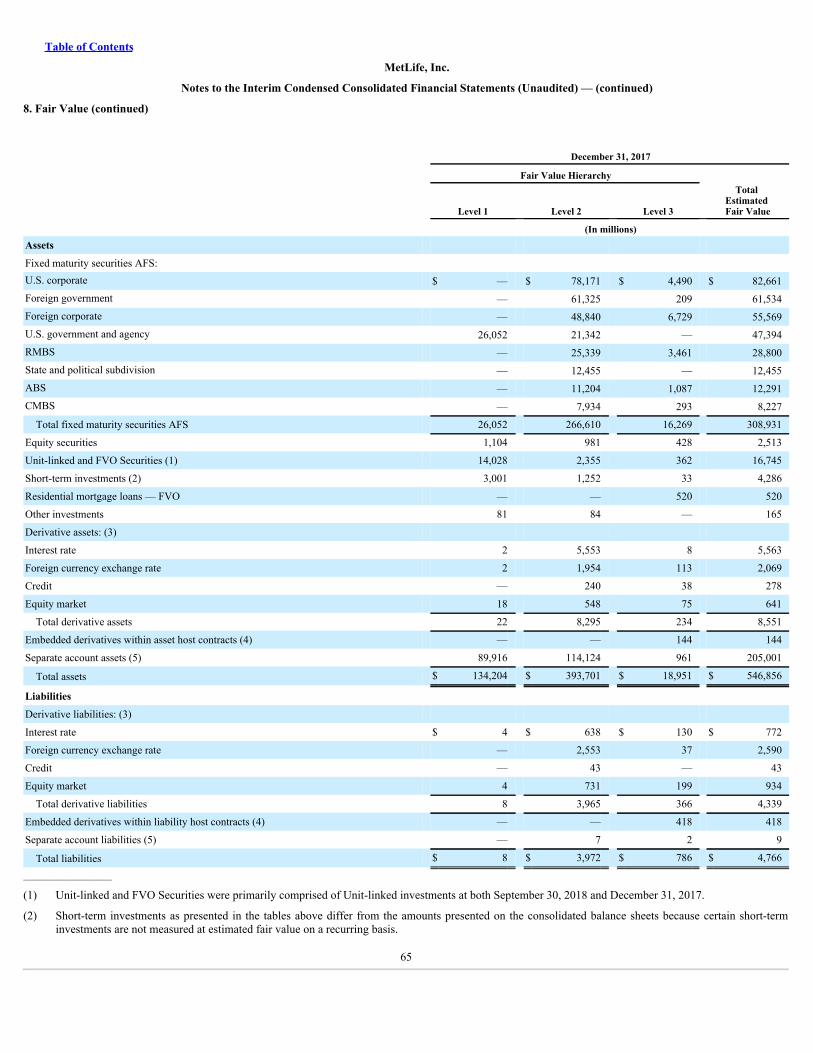
Table of Contents
MetLife, Inc.
Notes to the Interim Condensed Consolidated Financial Statements (Unaudited) — (continued)
8. Fair Value (continued)
December 31, 2017
Fair Value Hierarchy
Level 1 Level 2 Level 3
Total Estimated Fair Value
(In millions)Assets Fixed maturity securities AFS: U.S. corporate $ — $ 78,171 $ 4,490 $ 82,661Foreign government — 61,325 209 61,534Foreign corporate — 48,840 6,729 55,569U.S. government and agency 26,052 21,342 — 47,394RMBS — 25,339 3,461 28,800State and political subdivision — 12,455 — 12,455ABS — 11,204 1,087 12,291CMBS — 7,934 293 8,227
Total fixed maturity securities AFS 26,052 266,610 16,269 308,931
Equity securities 1,104 981 428 2,513
Unit-linked and FVO Securities (1) 14,028 2,355 362 16,745
Short-term investments (2) 3,001 1,252 33 4,286
Residential mortgage loans — FVO — — 520 520
Other investments 81 84 — 165
Derivative assets: (3) Interest rate 2 5,553 8 5,563
Foreign currency exchange rate 2 1,954 113 2,069
Credit — 240 38 278
Equity market 18 548 75 641
Total derivative assets 22 8,295 234 8,551
Embedded derivatives within asset host contracts (4) — — 144 144
Separate account assets (5) 89,916 114,124 961 205,001
Total assets $ 134,204 $ 393,701 $ 18,951 $ 546,856
Liabilities Derivative liabilities: (3) Interest rate $ 4 $ 638 $ 130 $ 772
Foreign currency exchange rate — 2,553 37 2,590
Credit — 43 — 43
Equity market 4 731 199 934
Total derivative liabilities 8 3,965 366 4,339
Embedded derivatives within liability host contracts (4) — — 418 418
Separate account liabilities (5) — 7 2 9
Total liabilities $ 8 $ 3,972 $ 786 $ 4,766__________________
(1) Unit-linked and FVO Securities were primarily comprised of Unit-linked investments at both September 30, 2018 and December 31, 2017.
(2) Short-term investments as presented in the tables above differ from the amounts presented on the consolidated balance sheets because certain short-terminvestments are not measured at estimated fair value on a recurring basis.
65
Table of Contents
MetLife, Inc.
Notes to the Interim Condensed Consolidated Financial Statements (Unaudited) — (continued)
8. Fair Value (continued)
(3) Derivative assets are presented within other invested assets on the interim condensed consolidated balance sheets and derivative liabilities are presentedwithin other liabilities on the interim condensed consolidated balance sheets. The amounts are presented gross in the tables above to reflect the presentationon the interim condensed consolidated balance sheets, but are presented net for purposes of the rollforward in the Fair Value Measurements UsingSignificant Unobservable Inputs (Level 3) tables.
(4) Embedded derivatives within asset host contracts are presented within premiums, reinsurance and other receivables and other invested assets on the interimcondensed consolidated balance sheets. Embedded derivatives within liability host contracts are presented within policyholder account balances and otherliabilities on the interim condensed consolidated balance sheets. At September 30, 2018 and December 31, 2017 , debt and equity securities also includedembedded derivatives of $0 and ($132) million , respectively.
(5) Investment performance related to separate account assets is fully offset by corresponding amounts credited to contractholders whose liability is reflectedwithin separate account liabilities. Separate account liabilities are set equal to the estimated fair value of separate account assets. Separate account liabilitiespresented in the tables above represent derivative liabilities.
The following describes the valuation methodologies used to measure assets and liabilities at fair value. The description includes the valuation techniquesand key inputs for each category of assets or liabilities that are classified within Level 2 and Level 3 of the fair value hierarchy.
Investments
Valuation Controls and Procedures
On behalf of the Company’s Chief Investment Officer and Chief Financial Officer (“CFO”), a pricing and valuation committee that is independent of thetrading and investing functions and comprised of senior management provides oversight of control systems and valuation policies for securities, mortgageloans and derivatives. On a quarterly basis, this committee reviews and approves new transaction types and markets, ensures that observable market prices andmarket-based parameters are used for valuation, wherever possible, and determines that judgmental valuation adjustments, when applied, are based uponestablished policies and are applied consistently over time. This committee also provides oversight of the selection of independent third-party pricing providersand the controls and procedures to evaluate third-party pricing. Periodically, the Chief Accounting Officer reports to the Audit Committee of MetLife, Inc.’sBoard of Directors regarding compliance with fair value accounting standards.
The Company reviews its valuation methodologies on an ongoing basis and revises those methodologies when necessary based on changing marketconditions. Assurance is gained on the overall reasonableness and consistent application of input assumptions, valuation methodologies and compliance withfair value accounting standards through controls designed to ensure valuations represent an exit price. Several controls are utilized, including certain monthlycontrols, which include, but are not limited to, analysis of portfolio returns to corresponding benchmark returns, comparing a sample of executed prices ofsecurities sold to the fair value estimates, comparing fair value estimates to management’s knowledge of the current market, reviewing the bid/ask spreads toassess activity, comparing prices from multiple independent pricing services and ongoing due diligence to confirm that independent pricing services usemarket-based parameters. The process includes a determination of the observability of inputs used in estimated fair values received from independent pricingservices or brokers by assessing whether these inputs can be corroborated by observable market data. The Company ensures that prices received fromindependent brokers, also referred to herein as “consensus pricing,” represent a reasonable estimate of fair value by considering such pricing relative to theCompany’s knowledge of the current market dynamics and current pricing for similar financial instruments. While independent non-binding broker quotationsare utilized, they are not used for a significant portion of the portfolio. For example, fixed maturity securities AFS priced using independent non-bindingbroker quotations represent less than 1% of the total estimated fair value of fixed maturity securities AFS and 3% of the total estimated fair value of Level 3fixed maturity securities AFS at September 30, 2018 .
66
Table of Contents
MetLife, Inc.
Notes to the Interim Condensed Consolidated Financial Statements (Unaudited) — (continued)
8. Fair Value (continued)
The Company also applies a formal process to challenge any prices received from independent pricing services that are not considered representative ofestimated fair value. If prices received from independent pricing services are not considered reflective of market activity or representative of estimated fairvalue, independent non-binding broker quotations are obtained, or an internally developed valuation is prepared. Internally developed valuations of currentestimated fair value, which reflect internal estimates of liquidity and nonperformance risks, compared with pricing received from the independent pricingservices, did not produce material differences in the estimated fair values for the majority of the portfolio; accordingly, overrides were not material. This is, inpart, because internal estimates of liquidity and nonperformance risks are generally based on available market evidence and estimates used by other marketparticipants. In the absence of such market-based evidence, management’s best estimate is used.
Securities, Short-term Investments and Other Investments
When available, the estimated fair value of these financial instruments is based on quoted prices in active markets that are readily and regularlyobtainable. Generally, these are the most liquid of the Company’s securities holdings and valuation of these securities does not involve management’sjudgment.
When quoted prices in active markets are not available, the determination of estimated fair value is based on market standard valuation methodologies,giving priority to observable inputs. The significant inputs to the market standard valuation methodologies for certain types of securities with reasonable levelsof price transparency are inputs that are observable in the market or can be derived principally from, or corroborated by, observable market data. Whenobservable inputs are not available, the market standard valuation methodologies rely on inputs that are significant to the estimated fair value that are notobservable in the market or cannot be derived principally from, or corroborated by, observable market data. These unobservable inputs can be based in largepart on management’s judgment or estimation and cannot be supported by reference to market activity. Even though these inputs are unobservable,management believes they are consistent with what other market participants would use when pricing such securities and are considered appropriate given thecircumstances.
The estimated fair value of other investments is determined on a basis consistent with the methodologies described herein for securities.
Other Limited Partnership Interests
The estimated fair values of other limited partnership interests are generally based on the Company’s share of the net asset value (“NAV”) of the otherlimited partnership interests as provided on the financial statements of the investee. In certain circumstances, management may adjust the NAV when it hassufficient evidence to support applying such adjustments.
67
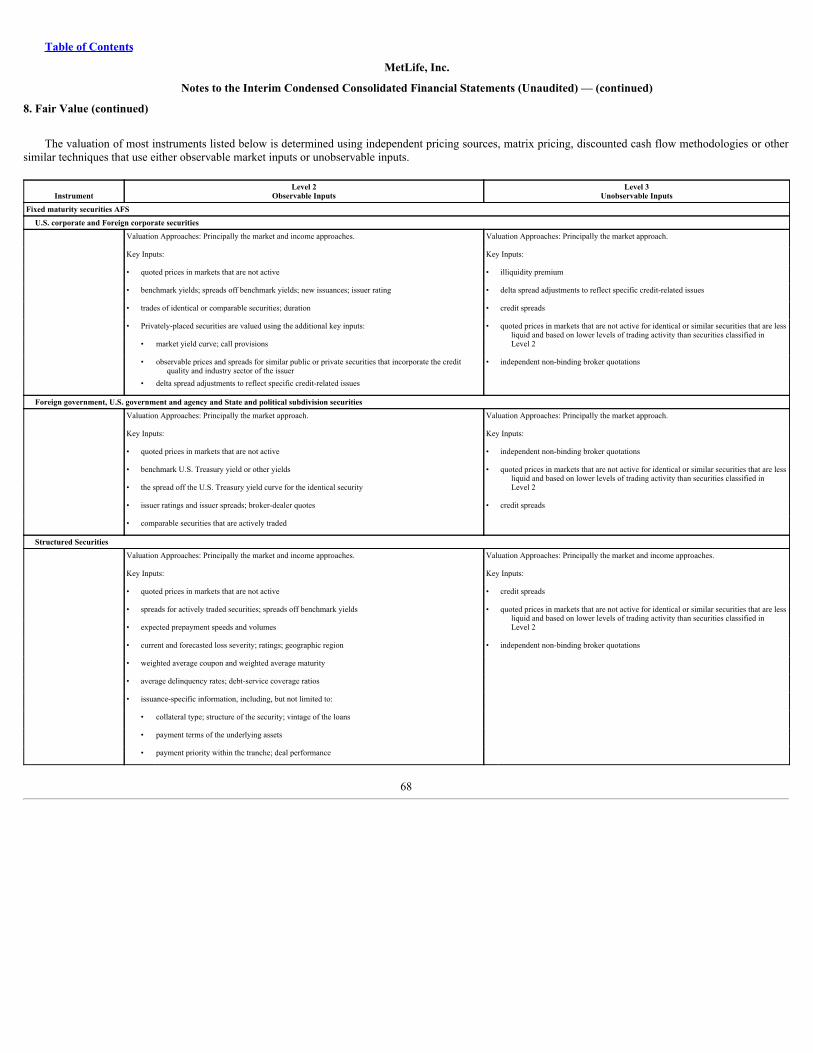
Table of Contents
MetLife, Inc.
Notes to the Interim Condensed Consolidated Financial Statements (Unaudited) — (continued)
8. Fair Value (continued)
The valuation of most instruments listed below is determined using independent pricing sources, matrix pricing, discounted cash flow methodologies or othersimilar techniques that use either observable market inputs or unobservable inputs.
InstrumentLevel 2
Observable InputsLevel 3
Unobservable Inputs
Fixed maturity securities AFS
U.S. corporate and Foreign corporate securities
Valuation Approaches: Principally the market and income approaches. Valuation Approaches: Principally the market approach.
Key Inputs: Key Inputs:
• quoted prices in markets that are not active • illiquidity premium
• benchmark yields; spreads off benchmark yields; new issuances; issuer rating • delta spread adjustments to reflect specific credit-related issues
• trades of identical or comparable securities; duration • credit spreads
• Privately-placed securities are valued using the additional key inputs: • quoted prices in markets that are not active for identical or similar securities that are lessliquid and based on lower levels of trading activity than securities classified inLevel 2 • market yield curve; call provisions
• observable prices and spreads for similar public or private securities that incorporate the creditquality and industry sector of the issuer
• independent non-binding broker quotations
• delta spread adjustments to reflect specific credit-related issues Foreign government, U.S. government and agency and State and political subdivision securities
Valuation Approaches: Principally the market approach. Valuation Approaches: Principally the market approach.
Key Inputs: Key Inputs:
• quoted prices in markets that are not active • independent non-binding broker quotations
• benchmark U.S. Treasury yield or other yields • quoted prices in markets that are not active for identical or similar securities that are lessliquid and based on lower levels of trading activity than securities classified inLevel 2 • the spread off the U.S. Treasury yield curve for the identical security
• issuer ratings and issuer spreads; broker-dealer quotes • credit spreads
• comparable securities that are actively traded Structured Securities
Valuation Approaches: Principally the market and income approaches. Valuation Approaches: Principally the market and income approaches.
Key Inputs: Key Inputs:
• quoted prices in markets that are not active • credit spreads
• spreads for actively traded securities; spreads off benchmark yields • quoted prices in markets that are not active for identical or similar securities that are lessliquid and based on lower levels of trading activity than securities classified inLevel 2 • expected prepayment speeds and volumes
• current and forecasted loss severity; ratings; geographic region • independent non-binding broker quotations
• weighted average coupon and weighted average maturity • average delinquency rates; debt-service coverage ratios • issuance-specific information, including, but not limited to: • collateral type; structure of the security; vintage of the loans • payment terms of the underlying assets • payment priority within the tranche; deal performance
68
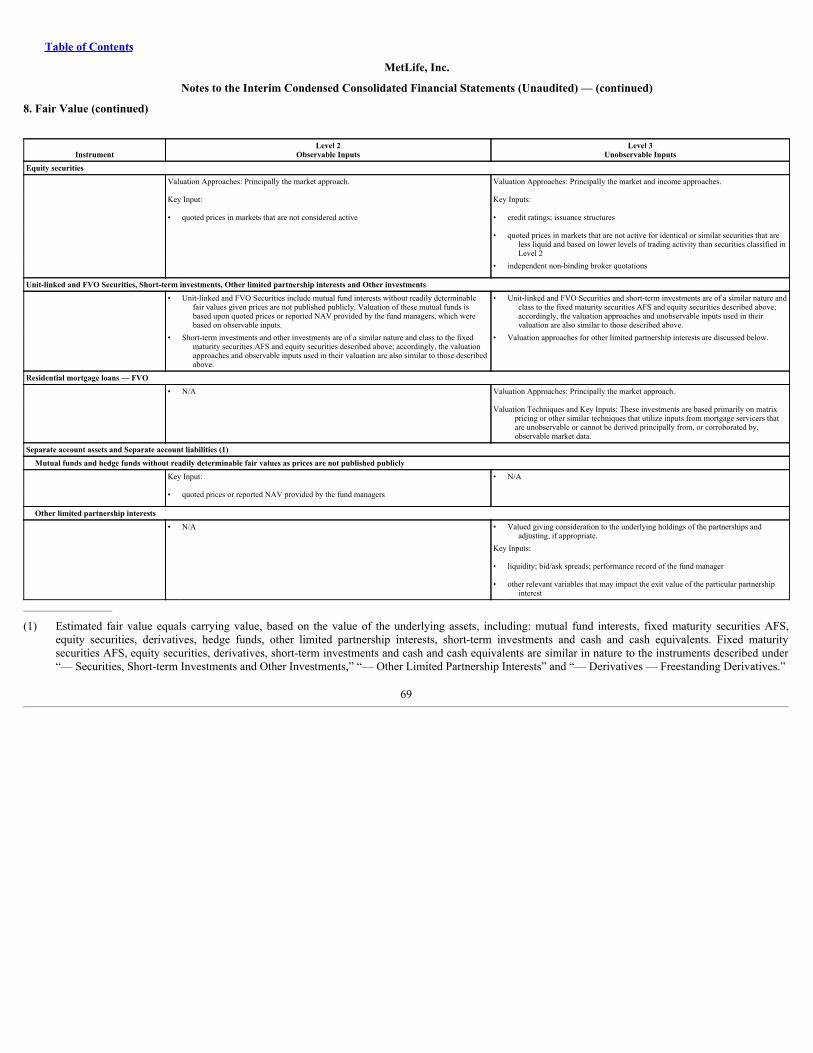
Table of Contents
MetLife, Inc.
Notes to the Interim Condensed Consolidated Financial Statements (Unaudited) — (continued)
8. Fair Value (continued)
InstrumentLevel 2
Observable InputsLevel 3
Unobservable Inputs
Equity securities
Valuation Approaches: Principally the market approach. Valuation Approaches: Principally the market and income approaches.
Key Input: Key Inputs:
• quoted prices in markets that are not considered active • credit ratings; issuance structures
• quoted prices in markets that are not active for identical or similar securities that are
less liquid and based on lower levels of trading activity than securities classified inLevel 2
• independent non-binding broker quotations
Unit-linked and FVO Securities, Short-term investments, Other limited partnership interests and Other investments
• Unit-linked and FVO Securities include mutual fund interests without readily determinablefair values given prices are not published publicly. Valuation of these mutual funds isbased upon quoted prices or reported NAV provided by the fund managers, which werebased on observable inputs.
• Unit-linked and FVO Securities and short-term investments are of a similar nature andclass to the fixed maturity securities AFS and equity securities described above;accordingly, the valuation approaches and unobservable inputs used in theirvaluation are also similar to those described above.
• Short-term investments and other investments are of a similar nature and class to the fixedmaturity securities AFS and equity securities described above; accordingly, the valuationapproaches and observable inputs used in their valuation are also similar to those describedabove.
• Valuation approaches for other limited partnership interests are discussed below.
Residential mortgage loans — FVO
• N/A Valuation Approaches: Principally the market approach.
Valuation Techniques and Key Inputs: These investments are based primarily on matrixpricing or other similar techniques that utilize inputs from mortgage servicers thatare unobservable or cannot be derived principally from, or corroborated by,observable market data.
Separate account assets and Separate account liabilities (1)
Mutual funds and hedge funds without readily determinable fair values as prices are not published publicly
Key Input: • N/A
• quoted prices or reported NAV provided by the fund managers Other limited partnership interests
• N/A • Valued giving consideration to the underlying holdings of the partnerships andadjusting, if appropriate.
Key Inputs:
• liquidity; bid/ask spreads; performance record of the fund manager
• other relevant variables that may impact the exit value of the particular partnershipinterest
__________________
(1) Estimated fair value equals carrying value, based on the value of the underlying assets, including: mutual fund interests, fixed maturity securities AFS,equity securities, derivatives, hedge funds, other limited partnership interests, short-term investments and cash and cash equivalents. Fixed maturitysecurities AFS, equity securities, derivatives, short-term investments and cash and cash equivalents are similar in nature to the instruments described under“— Securities, Short-term Investments and Other Investments,” “— Other Limited Partnership Interests” and “— Derivatives — Freestanding Derivatives.”
69
Table of Contents
MetLife, Inc.
Notes to the Interim Condensed Consolidated Financial Statements (Unaudited) — (continued)
8. Fair Value (continued)
Derivatives
The estimated fair value of derivatives is determined through the use of quoted market prices for exchange-traded derivatives, or through the use of pricingmodels for OTC-bilateral and OTC-cleared derivatives. The determination of estimated fair value, when quoted market values are not available, is based onmarket standard valuation methodologies and inputs that management believes are consistent with what other market participants would use when pricing suchinstruments. Derivative valuations can be affected by changes in interest rates, foreign currency exchange rates, financial indices, credit spreads, default risk,nonperformance risk, volatility, liquidity and changes in estimates and assumptions used in the pricing models. The valuation controls and procedures forderivatives are described in “— Investments.”
The significant inputs to the pricing models for most OTC-bilateral and OTC-cleared derivatives are inputs that are observable in the market or can bederived principally from, or corroborated by, observable market data. Certain OTC-bilateral and OTC-cleared derivatives may rely on inputs that are significantto the estimated fair value that are not observable in the market or cannot be derived principally from, or corroborated by, observable market data. Theseunobservable inputs may involve significant management judgment or estimation. Even though unobservable, these inputs are based on assumptions deemedappropriate given the circumstances and management believes they are consistent with what other market participants would use when pricing such instruments.
Most inputs for OTC-bilateral and OTC-cleared derivatives are mid-market inputs but, in certain cases, liquidity adjustments are made when they aredeemed more representative of exit value. Market liquidity, as well as the use of different methodologies, assumptions and inputs, may have a material effect onthe estimated fair values of the Company’s derivatives and could materially affect net income.
The credit risk of both the counterparty and the Company are considered in determining the estimated fair value for all OTC-bilateral and OTC-clearedderivatives, and any potential credit adjustment is based on the net exposure by counterparty after taking into account the effects of netting agreements andcollateral arrangements. The Company values its OTC-bilateral and OTC-cleared derivatives using standard swap curves which may include a spread to the risk-free rate, depending upon specific collateral arrangements. This credit spread is appropriate for those parties that execute trades at pricing levels consistent withsimilar collateral arrangements. As the Company and its significant derivative counterparties generally execute trades at such pricing levels and hold sufficientcollateral, additional credit risk adjustments are not currently required in the valuation process. The Company’s ability to consistently execute at such pricinglevels is in part due to the netting agreements and collateral arrangements that are in place with all of its significant derivative counterparties. An evaluation ofthe requirement to make additional credit risk adjustments is performed by the Company each reporting period.
Freestanding Derivatives
Level 2 Valuation Approaches and Key Inputs:
This level includes all types of derivatives utilized by the Company with the exception of exchange-traded derivatives included within Level 1 andthose derivatives with unobservable inputs as described in Level 3.
Level 3 Valuation Approaches and Key Inputs:
These valuation methodologies generally use the same inputs as described in the corresponding sections for Level 2 measurements of derivatives.However, these derivatives result in Level 3 classification because one or more of the significant inputs are not observable in the market or cannot bederived principally from, or corroborated by, observable market data.
70
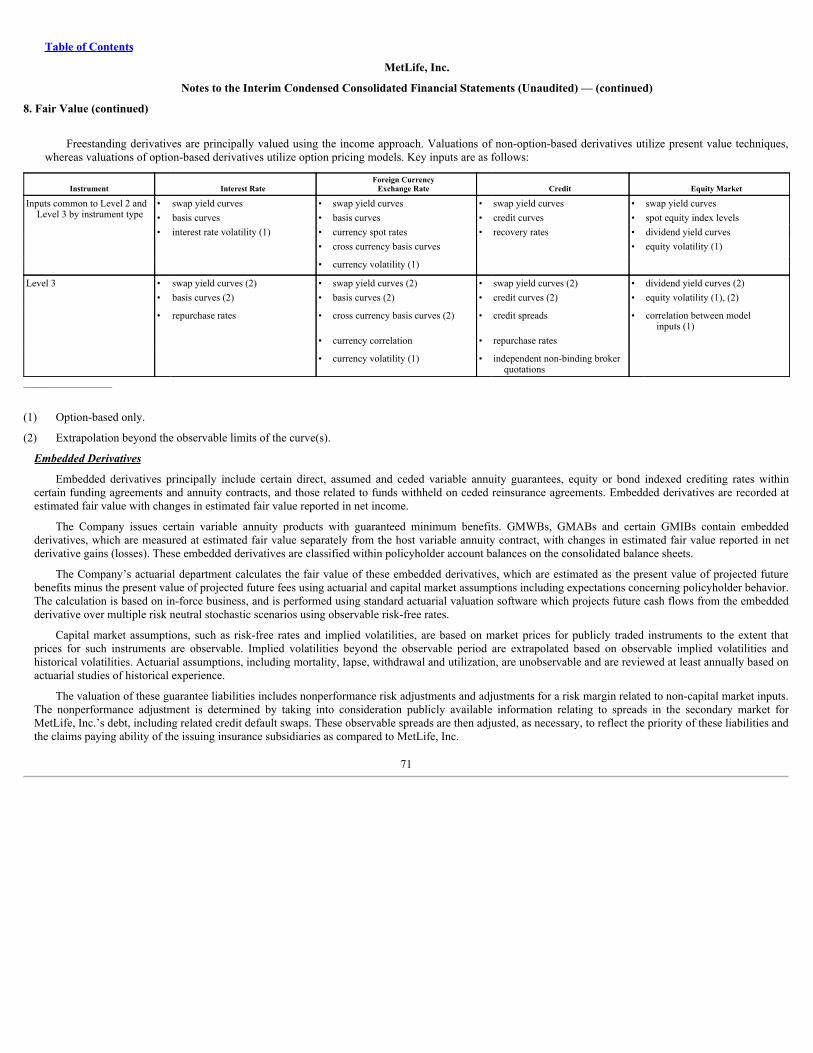
Table of Contents
MetLife, Inc.
Notes to the Interim Condensed Consolidated Financial Statements (Unaudited) — (continued)
8. Fair Value (continued)
Freestanding derivatives are principally valued using the income approach. Valuations of non-option-based derivatives utilize present value techniques,whereas valuations of option-based derivatives utilize option pricing models. Key inputs are as follows:
Instrument Interest Rate Foreign CurrencyExchange Rate Credit Equity Market
Inputs common to Level 2 andLevel 3 by instrument type
• swap yield curves • swap yield curves • swap yield curves • swap yield curves• basis curves • basis curves • credit curves • spot equity index levels• interest rate volatility (1) • currency spot rates • recovery rates • dividend yield curves
• cross currency basis curves • equity volatility (1)
• currency volatility (1) Level 3 • swap yield curves (2) • swap yield curves (2) • swap yield curves (2) • dividend yield curves (2) • basis curves (2) • basis curves (2) • credit curves (2) • equity volatility (1), (2)
• repurchase rates • cross currency basis curves (2) • credit spreads • correlation between model
inputs (1) • currency correlation • repurchase rates
• currency volatility (1) • independent non-binding broker
quotations __________________
(1) Option-based only.
(2) Extrapolation beyond the observable limits of the curve(s).
EmbeddedDerivatives
Embedded derivatives principally include certain direct, assumed and ceded variable annuity guarantees, equity or bond indexed crediting rates withincertain funding agreements and annuity contracts, and those related to funds withheld on ceded reinsurance agreements. Embedded derivatives are recorded atestimated fair value with changes in estimated fair value reported in net income.
The Company issues certain variable annuity products with guaranteed minimum benefits. GMWBs, GMABs and certain GMIBs contain embeddedderivatives, which are measured at estimated fair value separately from the host variable annuity contract, with changes in estimated fair value reported in netderivative gains (losses). These embedded derivatives are classified within policyholder account balances on the consolidated balance sheets.
The Company’s actuarial department calculates the fair value of these embedded derivatives, which are estimated as the present value of projected futurebenefits minus the present value of projected future fees using actuarial and capital market assumptions including expectations concerning policyholder behavior.The calculation is based on in-force business, and is performed using standard actuarial valuation software which projects future cash flows from the embeddedderivative over multiple risk neutral stochastic scenarios using observable risk-free rates.
Capital market assumptions, such as risk-free rates and implied volatilities, are based on market prices for publicly traded instruments to the extent thatprices for such instruments are observable. Implied volatilities beyond the observable period are extrapolated based on observable implied volatilities andhistorical volatilities. Actuarial assumptions, including mortality, lapse, withdrawal and utilization, are unobservable and are reviewed at least annually based onactuarial studies of historical experience.
The valuation of these guarantee liabilities includes nonperformance risk adjustments and adjustments for a risk margin related to non-capital market inputs.The nonperformance adjustment is determined by taking into consideration publicly available information relating to spreads in the secondary market forMetLife, Inc.’s debt, including related credit default swaps. These observable spreads are then adjusted, as necessary, to reflect the priority of these liabilities andthe claims paying ability of the issuing insurance subsidiaries as compared to MetLife, Inc.
71
Table of Contents
MetLife, Inc.
Notes to the Interim Condensed Consolidated Financial Statements (Unaudited) — (continued)
8. Fair Value (continued)
Risk margins are established to capture the non-capital market risks of the instrument which represent the additional compensation a market participantwould require to assume the risks related to the uncertainties of such actuarial assumptions as annuitization, premium persistency, partial withdrawal andsurrenders. The establishment of risk margins requires the use of significant management judgment, including assumptions of the amount and cost of capitalneeded to cover the guarantees. These guarantees may be more costly than expected in volatile or declining equity markets. Market conditions including, but notlimited to, changes in interest rates, equity indices, market volatility and foreign currency exchange rates; changes in nonperformance risk; and variations inactuarial assumptions regarding policyholder behavior, mortality and risk margins related to non-capital market inputs, may result in significant fluctuations inthe estimated fair value of the guarantees that could materially affect net income.
The Company ceded the risk associated with certain of the GMIBs previously described. These reinsurance agreements contain embedded derivatives whichare included within premiums, reinsurance and other receivables on the consolidated balance sheets with changes in estimated fair value reported in netderivative gains (losses) or policyholder benefits and claims depending on the statement of operations classification of the direct risk. The value of the embeddedderivatives on the ceded risk is determined using a methodology consistent with that described previously for the guarantees directly written by the Companywith the exception of the input for nonperformance risk that reflects the credit of the reinsurer.
The estimated fair value of the embedded derivatives within funds withheld related to certain ceded reinsurance is determined based on the change inestimated fair value of the underlying assets held by the Company in a reference portfolio backing the funds withheld liability. The estimated fair value of theunderlying assets is determined as described in “— Investments — Securities, Short-term Investments and Other Investments.” The estimated fair value of theseembedded derivatives is included, along with their funds withheld hosts, in other liabilities on the consolidated balance sheets with changes in estimated fairvalue recorded in net derivative gains (losses). Changes in the credit spreads on the underlying assets, interest rates and market volatility may result in significantfluctuations in the estimated fair value of these embedded derivatives that could materially affect net income.
The estimated fair value of the embedded equity and bond indexed derivatives contained in certain funding agreements is determined using market standardswap valuation models and observable market inputs, including a nonperformance risk adjustment. The estimated fair value of these embedded derivatives areincluded, along with their funding agreements host, within policyholder account balances with changes in estimated fair value recorded in net derivativegains (losses). Changes in equity and bond indices, interest rates and the Company’s credit standing may result in significant fluctuations in the estimated fairvalue of these embedded derivatives that could materially affect net income.
The Company issues certain annuity contracts which allow the policyholder to participate in returns from equity indices. These equity indexed features areembedded derivatives which are measured at estimated fair value separately from the host fixed annuity contract, with changes in estimated fair value reported innet derivative gains (losses). These embedded derivatives are classified within policyholder account balances on the consolidated balance sheets.
The estimated fair value of the embedded equity indexed derivatives, based on the present value of future equity returns to the policyholder using actuarialand present value assumptions including expectations concerning policyholder behavior, is calculated by the Company’s actuarial department. The calculation isbased on in-force business and uses standard capital market techniques, such as Black-Scholes, to calculate the value of the portion of the embedded derivativefor which the terms are set. The portion of the embedded derivative covering the period beyond where terms are set is calculated as the present value of amountsexpected to be spent to provide equity indexed returns in those periods. The valuation of these embedded derivatives also includes the establishment of a riskmargin, as well as changes in nonperformance risk.
72

Table of Contents
MetLife, Inc.
Notes to the Interim Condensed Consolidated Financial Statements (Unaudited) — (continued)
8. Fair Value (continued)
Embedded Derivatives Within Asset and Liability Host Contracts
Level 3 Valuation Approaches and Key Inputs:
Direct and assumed guaranteed minimum benefits
These embedded derivatives are principally valued using the income approach. Valuations are based on option pricing techniques, which utilizesignificant inputs that may include swap yield curves, currency exchange rates and implied volatilities. These embedded derivatives result in Level 3classification because one or more of the significant inputs are not observable in the market or cannot be derived principally from, or corroborated by,observable market data. Significant unobservable inputs generally include: the extrapolation beyond observable limits of the swap yield curves andimplied volatilities, actuarial assumptions for policyholder behavior and mortality and the potential variability in policyholder behavior and mortality,nonperformance risk and cost of capital for purposes of calculating the risk margin.
Reinsurance ceded on certain guaranteed minimum benefits
These embedded derivatives are principally valued using the income approach. The valuation techniques and significant market standardunobservable inputs used in their valuation are similar to those described above in “— Direct and assumed guaranteed minimum benefits” and alsoinclude counterparty credit spreads.
TransfersbetweenLevels
Overall, transfers between levels occur when there are changes in the observability of inputs and market activity. Transfers into or out of any level areassumed to occur at the beginning of the period.
Transfers between Levels 1 and 2:
There were no transfers between Levels 1 and 2 for assets and liabilities measured at estimated fair value and still held at September 30, 2018 andDecember 31, 2017 .
Transfers into or out of Level 3:
Assets and liabilities are transferred into Level 3 when a significant input cannot be corroborated with market observable data. This occurs when marketactivity decreases significantly and underlying inputs cannot be observed, current prices are not available, and/or when there are significant variances inquoted prices, thereby affecting transparency. Assets and liabilities are transferred out of Level 3 when circumstances change such that a significant input canbe corroborated with market observable data. This may be due to a significant increase in market activity, a specific event, or one or more significant input(s)becoming observable.
73
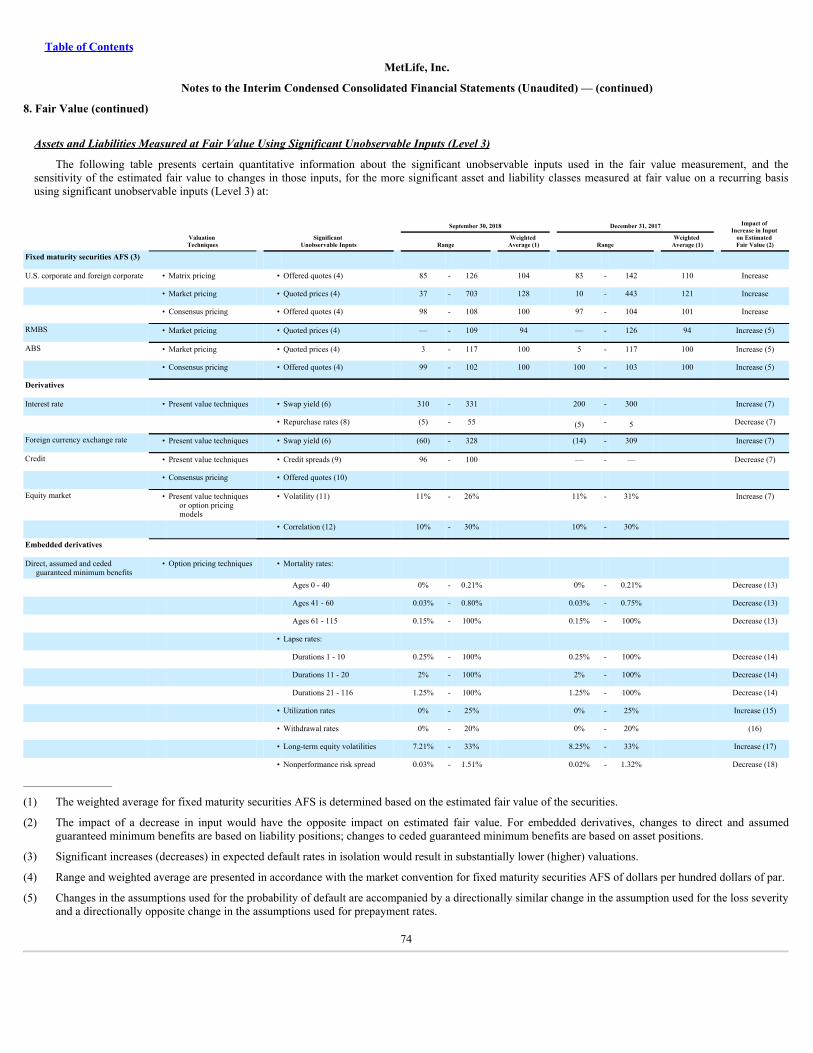
Table of Contents
MetLife, Inc.
Notes to the Interim Condensed Consolidated Financial Statements (Unaudited) — (continued)
8. Fair Value (continued)
AssetsandLiabilitiesMeasuredatFairValueUsingSignificantUnobservableInputs(Level3)
The following table presents certain quantitative information about the significant unobservable inputs used in the fair value measurement, and thesensitivity of the estimated fair value to changes in those inputs, for the more significant asset and liability classes measured at fair value on a recurring basisusing significant unobservable inputs (Level 3) at:
September 30, 2018 December 31, 2017 Impact of Increase in Input
on Estimated Fair Value (2) Valuation
Techniques Significant Unobservable Inputs Range Weighted
Average (1) Range Weighted Average (1)
Fixed maturity securities AFS (3) U.S. corporate and foreign corporate • Matrix pricing • Offered quotes (4) 85 - 126 104 83 - 142 110 Increase
• Market pricing • Quoted prices (4) 37 - 703 128 10 - 443 121 Increase
• Consensus pricing • Offered quotes (4) 98 - 108 100 97 - 104 101 Increase
RMBS • Market pricing • Quoted prices (4) — - 109 94 — - 126 94 Increase (5)
ABS • Market pricing • Quoted prices (4) 3 - 117 100 5 - 117 100 Increase (5)
• Consensus pricing • Offered quotes (4) 99 - 102 100 100 - 103 100 Increase (5)
Derivatives Interest rate • Present value techniques • Swap yield (6) 310 - 331 200 - 300 Increase (7)
• Repurchase rates (8) (5) - 55 (5) - 5 Decrease (7)
Foreign currency exchange rate • Present value techniques • Swap yield (6) (60) - 328 (14) - 309 Increase (7)
Credit • Present value techniques • Credit spreads (9) 96 - 100 — - — Decrease (7)
• Consensus pricing • Offered quotes (10) Equity market • Present value techniques
or option pricingmodels
• Volatility (11)
11% - 26%
11% - 31%
Increase (7)
• Correlation (12) 10% - 30% 10% - 30% Embedded derivatives Direct, assumed and ceded
guaranteed minimum benefits• Option pricing techniques • Mortality rates:
Ages 0 - 40 0% - 0.21% 0% - 0.21% Decrease (13)
Ages 41 - 60 0.03% - 0.80% 0.03% - 0.75% Decrease (13)
Ages 61 - 115 0.15% - 100% 0.15% - 100% Decrease (13)
• Lapse rates: Durations 1 - 10 0.25% - 100% 0.25% - 100% Decrease (14)
Durations 11 - 20 2% - 100% 2% - 100% Decrease (14)
Durations 21 - 116 1.25% - 100% 1.25% - 100% Decrease (14)
• Utilization rates 0% - 25% 0% - 25% Increase (15)
• Withdrawal rates 0% - 20% 0% - 20% (16)
• Long-term equity volatilities 7.21% - 33% 8.25% - 33% Increase (17)
• Nonperformance risk spread 0.03% - 1.51% 0.02% - 1.32% Decrease (18)
__________________
(1) The weighted average for fixed maturity securities AFS is determined based on the estimated fair value of the securities.
(2) The impact of a decrease in input would have the opposite impact on estimated fair value. For embedded derivatives, changes to direct and assumedguaranteed minimum benefits are based on liability positions; changes to ceded guaranteed minimum benefits are based on asset positions.
(3) Significant increases (decreases) in expected default rates in isolation would result in substantially lower (higher) valuations.
(4) Range and weighted average are presented in accordance with the market convention for fixed maturity securities AFS of dollars per hundred dollars of par.
(5) Changes in the assumptions used for the probability of default are accompanied by a directionally similar change in the assumption used for the loss severityand a directionally opposite change in the assumptions used for prepayment rates.
74
Table of Contents
MetLife, Inc.
Notes to the Interim Condensed Consolidated Financial Statements (Unaudited) — (continued)
8. Fair Value (continued)
(6) Ranges represent the rates across different yield curves and are presented in basis points. The swap yield curves are utilized among different types ofderivatives to project cash flows, as well as to discount future cash flows to present value. Since this valuation methodology uses a range of inputs across ayield curve to value the derivative, presenting a range is more representative of the unobservable input used in the valuation.
(7) Changes in estimated fair value are based on long U.S. dollar net asset positions and will be inversely impacted for short U.S. dollar net asset positions.
(8) Ranges represent different repurchase rates utilized as components within the valuation methodology and are presented in basis points.
(9) Represents the risk quoted in basis points of a credit default event on the underlying instrument. Credit derivatives with significant unobservable inputs areprimarily comprised of written credit default swaps.
(10) At both September 30, 2018 and December 31, 2017 , independent non-binding broker quotations were used in the determination of less than 1% of the totalnet derivative estimated fair value.
(11) Ranges represent the underlying equity volatility quoted in percentage points. Since this valuation methodology uses a range of inputs across multiplevolatility surfaces to value the derivative, presenting a range is more representative of the unobservable input used in the valuation.
(12) Ranges represent the different correlation factors utilized as components within the valuation methodology. Presenting a range of correlation factors is morerepresentative of the unobservable input used in the valuation. Increases (decreases) in correlation in isolation will increase (decrease) the significance of thechange in valuations.
(13) Mortality rates vary by age and by demographic characteristics such as gender. Mortality rate assumptions are based on company experience. A mortalityimprovement assumption is also applied. For any given contract, mortality rates vary throughout the period over which cash flows are projected for purposesof valuing the embedded derivative.
(14) Base lapse rates are adjusted at the contract level based on a comparison of the actuarially calculated guaranteed values and the current policyholder accountvalue, as well as other factors, such as the applicability of any surrender charges. A dynamic lapse function reduces the base lapse rate when the guaranteedamount is greater than the account value as in the money contracts are less likely to lapse. Lapse rates are also generally assumed to be lower in periodswhen a surrender charge applies. For any given contract, lapse rates vary throughout the period over which cash flows are projected for purposes of valuingthe embedded derivative.
(15) The utilization rate assumption estimates the percentage of contractholders with a GMIB or lifetime withdrawal benefit who will elect to utilize the benefitupon becoming eligible. The rates may vary by the type of guarantee, the amount by which the guaranteed amount is greater than the account value, thecontract’s withdrawal history and by the age of the policyholder. For any given contract, utilization rates vary throughout the period over which cash flowsare projected for purposes of valuing the embedded derivative.
(16) The withdrawal rate represents the percentage of account balance that any given policyholder will elect to withdraw from the contract each year. Thewithdrawal rate assumption varies by age and duration of the contract, and also by other factors such as benefit type. For any given contract, withdrawalrates vary throughout the period over which cash flows are projected for purposes of valuing the embedded derivative. For GMWBs, any increase (decrease)in withdrawal rates results in an increase (decrease) in the estimated fair value of the guarantees. For GMABs and GMIBs, any increase (decrease) inwithdrawal rates results in a decrease (increase) in the estimated fair value.
(17) Long-term equity volatilities represent equity volatility beyond the period for which observable equity volatilities are available. For any given contract,long-term equity volatility rates vary throughout the period over which cash flows are projected for purposes of valuing the embedded derivative.
(18) Nonperformance risk spread varies by duration and by currency. For any given contract, multiple nonperformance risk spreads will apply, depending on theduration of the cash flow being discounted for purposes of valuing the embedded derivative.
75
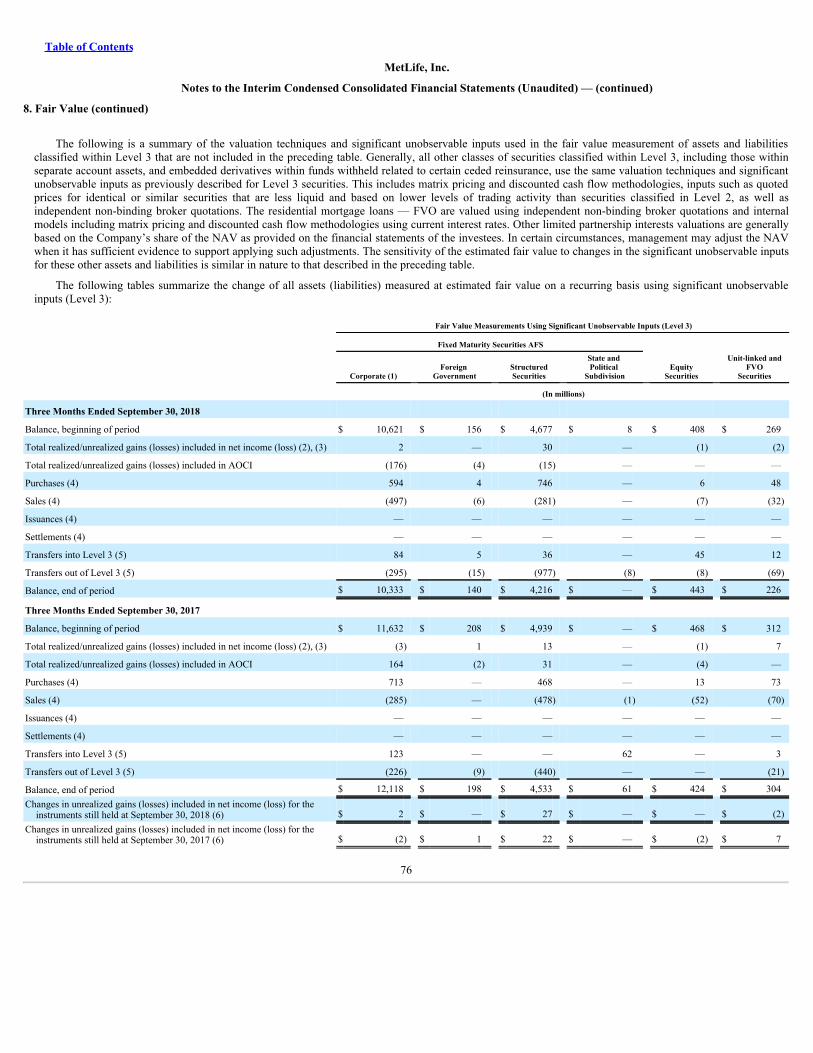
Table of Contents
MetLife, Inc.
Notes to the Interim Condensed Consolidated Financial Statements (Unaudited) — (continued)
8. Fair Value (continued)
The following is a summary of the valuation techniques and significant unobservable inputs used in the fair value measurement of assets and liabilitiesclassified within Level 3 that are not included in the preceding table. Generally, all other classes of securities classified within Level 3, including those withinseparate account assets, and embedded derivatives within funds withheld related to certain ceded reinsurance, use the same valuation techniques and significantunobservable inputs as previously described for Level 3 securities. This includes matrix pricing and discounted cash flow methodologies, inputs such as quotedprices for identical or similar securities that are less liquid and based on lower levels of trading activity than securities classified in Level 2, as well asindependent non-binding broker quotations. The residential mortgage loans — FVO are valued using independent non-binding broker quotations and internalmodels including matrix pricing and discounted cash flow methodologies using current interest rates. Other limited partnership interests valuations are generallybased on the Company’s share of the NAV as provided on the financial statements of the investees. In certain circumstances, management may adjust the NAVwhen it has sufficient evidence to support applying such adjustments. The sensitivity of the estimated fair value to changes in the significant unobservable inputsfor these other assets and liabilities is similar in nature to that described in the preceding table.
The following tables summarize the change of all assets (liabilities) measured at estimated fair value on a recurring basis using significant unobservableinputs (Level 3):
Fair Value Measurements Using Significant Unobservable Inputs (Level 3)
Fixed Maturity Securities AFS
Corporate (1) Foreign Government Structured
Securities State and Political
Subdivision EquitySecurities
Unit-linked andFVO
Securities
(In millions)
Three Months Ended September 30, 2018
Balance, beginning of period $ 10,621 $ 156 $ 4,677 $ 8 $ 408 $ 269
Total realized/unrealized gains (losses) included in net income (loss) (2), (3) 2 — 30 — (1) (2)
Total realized/unrealized gains (losses) included in AOCI (176) (4) (15) — — —
Purchases (4) 594 4 746 — 6 48
Sales (4) (497) (6) (281) — (7) (32)
Issuances (4) — — — — — —
Settlements (4) — — — — — —
Transfers into Level 3 (5) 84 5 36 — 45 12
Transfers out of Level 3 (5) (295) (15) (977) (8) (8) (69)
Balance, end of period $ 10,333 $ 140 $ 4,216 $ — $ 443 $ 226
Three Months Ended September 30, 2017
Balance, beginning of period $ 11,632 $ 208 $ 4,939 $ — $ 468 $ 312
Total realized/unrealized gains (losses) included in net income (loss) (2), (3) (3) 1 13 — (1) 7
Total realized/unrealized gains (losses) included in AOCI 164 (2) 31 — (4) —
Purchases (4) 713 — 468 — 13 73
Sales (4) (285) — (478) (1) (52) (70)
Issuances (4) — — — — — —
Settlements (4) — — — — — —
Transfers into Level 3 (5) 123 — — 62 — 3
Transfers out of Level 3 (5) (226) (9) (440) — — (21)
Balance, end of period $ 12,118 $ 198 $ 4,533 $ 61 $ 424 $ 304Changes in unrealized gains (losses) included in net income (loss) for the
instruments still held at September 30, 2018 (6) $ 2 $ — $ 27 $ — $ — $ (2)Changes in unrealized gains (losses) included in net income (loss) for the
instruments still held at September 30, 2017 (6) $ (2) $ 1 $ 22 $ — $ (2) $ 7
76
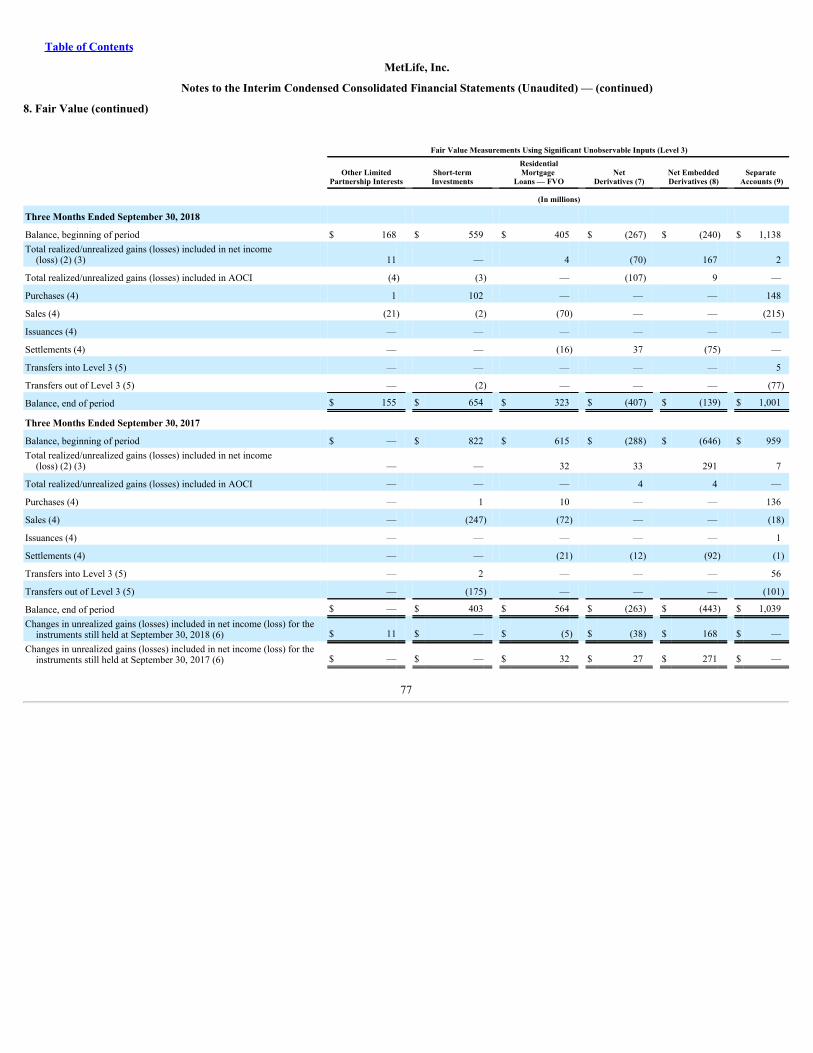
Table of Contents
MetLife, Inc.
Notes to the Interim Condensed Consolidated Financial Statements (Unaudited) — (continued)
8. Fair Value (continued)
Fair Value Measurements Using Significant Unobservable Inputs (Level 3)
Other LimitedPartnership Interests Short-term
Investments ResidentialMortgage
Loans — FVO NetDerivatives (7) Net Embedded
Derivatives (8) Separate Accounts (9)
(In millions)
Three Months Ended September 30, 2018
Balance, beginning of period $ 168 $ 559 $ 405 $ (267) $ (240) $ 1,138Total realized/unrealized gains (losses) included in net income
(loss) (2) (3) 11 — 4 (70) 167 2
Total realized/unrealized gains (losses) included in AOCI (4) (3) — (107) 9 —
Purchases (4) 1 102 — — — 148
Sales (4) (21) (2) (70) — — (215)
Issuances (4) — — — — — —
Settlements (4) — — (16) 37 (75) —
Transfers into Level 3 (5) — — — — — 5
Transfers out of Level 3 (5) — (2) — — — (77)
Balance, end of period $ 155 $ 654 $ 323 $ (407) $ (139) $ 1,001
Three Months Ended September 30, 2017
Balance, beginning of period $ — $ 822 $ 615 $ (288) $ (646) $ 959Total realized/unrealized gains (losses) included in net income
(loss) (2) (3) — — 32 33 291 7
Total realized/unrealized gains (losses) included in AOCI — — — 4 4 —
Purchases (4) — 1 10 — — 136
Sales (4) — (247) (72) — — (18)
Issuances (4) — — — — — 1
Settlements (4) — — (21) (12) (92) (1)
Transfers into Level 3 (5) — 2 — — — 56
Transfers out of Level 3 (5) — (175) — — — (101)
Balance, end of period $ — $ 403 $ 564 $ (263) $ (443) $ 1,039Changes in unrealized gains (losses) included in net income (loss) for the
instruments still held at September 30, 2018 (6) $ 11 $ — $ (5) $ (38) $ 168 $ —Changes in unrealized gains (losses) included in net income (loss) for the
instruments still held at September 30, 2017 (6) $ — $ — $ 32 $ 27 $ 271 $ —
77
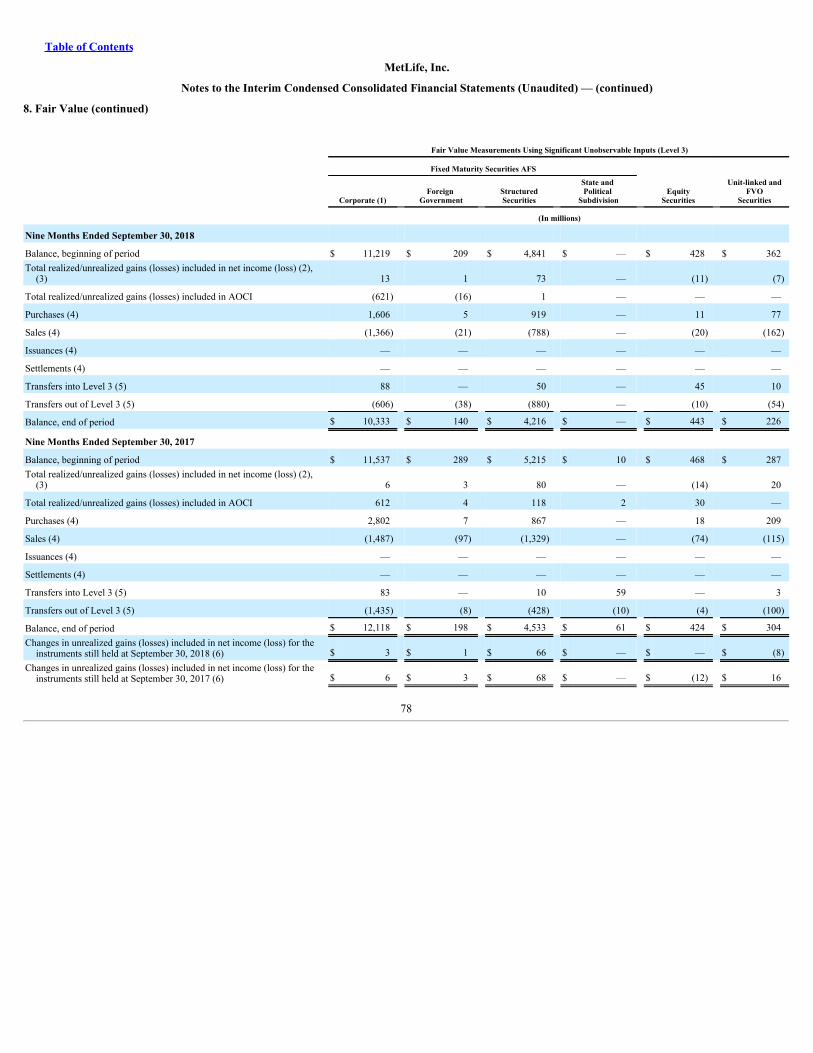
Table of Contents
MetLife, Inc.
Notes to the Interim Condensed Consolidated Financial Statements (Unaudited) — (continued)
8. Fair Value (continued)
Fair Value Measurements Using Significant Unobservable Inputs (Level 3)
Fixed Maturity Securities AFS
Corporate (1) Foreign Government Structured
Securities State and Political
Subdivision EquitySecurities
Unit-linked andFVO
Securities
(In millions)
Nine Months Ended September 30, 2018
Balance, beginning of period $ 11,219 $ 209 $ 4,841 $ — $ 428 $ 362Total realized/unrealized gains (losses) included in net income (loss) (2),
(3) 13 1 73 — (11) (7)
Total realized/unrealized gains (losses) included in AOCI (621) (16) 1 — — —
Purchases (4) 1,606 5 919 — 11 77
Sales (4) (1,366) (21) (788) — (20) (162)
Issuances (4) — — — — — —
Settlements (4) — — — — — —
Transfers into Level 3 (5) 88 — 50 — 45 10
Transfers out of Level 3 (5) (606) (38) (880) — (10) (54)
Balance, end of period $ 10,333 $ 140 $ 4,216 $ — $ 443 $ 226
Nine Months Ended September 30, 2017
Balance, beginning of period $ 11,537 $ 289 $ 5,215 $ 10 $ 468 $ 287Total realized/unrealized gains (losses) included in net income (loss) (2),
(3) 6 3 80 — (14) 20
Total realized/unrealized gains (losses) included in AOCI 612 4 118 2 30 —
Purchases (4) 2,802 7 867 — 18 209
Sales (4) (1,487) (97) (1,329) — (74) (115)
Issuances (4) — — — — — —
Settlements (4) — — — — — —
Transfers into Level 3 (5) 83 — 10 59 — 3
Transfers out of Level 3 (5) (1,435) (8) (428) (10) (4) (100)
Balance, end of period $ 12,118 $ 198 $ 4,533 $ 61 $ 424 $ 304Changes in unrealized gains (losses) included in net income (loss) for the
instruments still held at September 30, 2018 (6) $ 3 $ 1 $ 66 $ — $ — $ (8)Changes in unrealized gains (losses) included in net income (loss) for the
instruments still held at September 30, 2017 (6) $ 6 $ 3 $ 68 $ — $ (12) $ 16
78
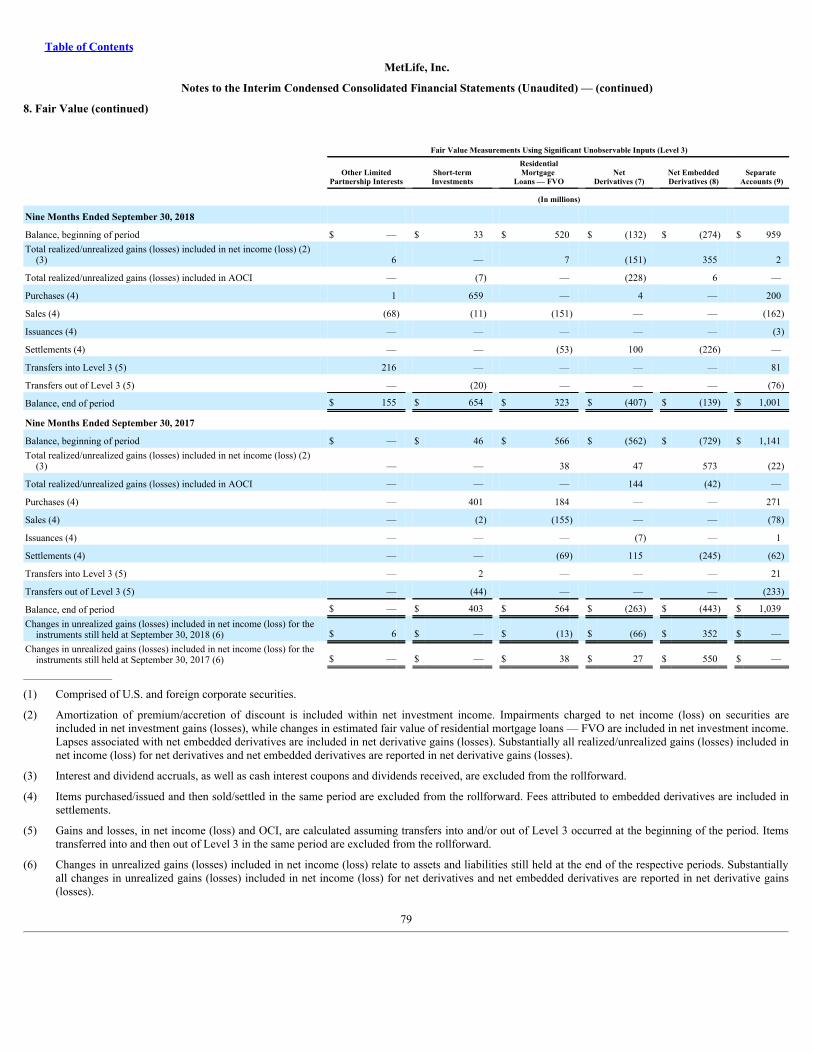
Table of Contents
MetLife, Inc.
Notes to the Interim Condensed Consolidated Financial Statements (Unaudited) — (continued)
8. Fair Value (continued)
Fair Value Measurements Using Significant Unobservable Inputs (Level 3)
Other LimitedPartnership Interests Short-term
Investments ResidentialMortgage
Loans — FVO NetDerivatives (7) Net Embedded
Derivatives (8) Separate Accounts (9)
(In millions)
Nine Months Ended September 30, 2018
Balance, beginning of period $ — $ 33 $ 520 $ (132) $ (274) $ 959Total realized/unrealized gains (losses) included in net income (loss) (2)
(3) 6 — 7 (151) 355 2
Total realized/unrealized gains (losses) included in AOCI — (7) — (228) 6 —
Purchases (4) 1 659 — 4 — 200
Sales (4) (68) (11) (151) — — (162)
Issuances (4) — — — — — (3)
Settlements (4) — — (53) 100 (226) —
Transfers into Level 3 (5) 216 — — — — 81
Transfers out of Level 3 (5) — (20) — — — (76)
Balance, end of period $ 155 $ 654 $ 323 $ (407) $ (139) $ 1,001
Nine Months Ended September 30, 2017
Balance, beginning of period $ — $ 46 $ 566 $ (562) $ (729) $ 1,141Total realized/unrealized gains (losses) included in net income (loss) (2)
(3) — — 38 47 573 (22)
Total realized/unrealized gains (losses) included in AOCI — — — 144 (42) —
Purchases (4) — 401 184 — — 271
Sales (4) — (2) (155) — — (78)
Issuances (4) — — — (7) — 1
Settlements (4) — — (69) 115 (245) (62)
Transfers into Level 3 (5) — 2 — — — 21
Transfers out of Level 3 (5) — (44) — — — (233)
Balance, end of period $ — $ 403 $ 564 $ (263) $ (443) $ 1,039Changes in unrealized gains (losses) included in net income (loss) for the
instruments still held at September 30, 2018 (6) $ 6 $ — $ (13) $ (66) $ 352 $ —Changes in unrealized gains (losses) included in net income (loss) for the
instruments still held at September 30, 2017 (6) $ — $ — $ 38 $ 27 $ 550 $ —__________________
(1) Comprised of U.S. and foreign corporate securities.
(2) Amortization of premium/accretion of discount is included within net investment income. Impairments charged to net income (loss) on securities areincluded in net investment gains (losses), while changes in estimated fair value of residential mortgage loans — FVO are included in net investment income.Lapses associated with net embedded derivatives are included in net derivative gains (losses). Substantially all realized/unrealized gains (losses) included innet income (loss) for net derivatives and net embedded derivatives are reported in net derivative gains (losses).
(3) Interest and dividend accruals, as well as cash interest coupons and dividends received, are excluded from the rollforward.
(4) Items purchased/issued and then sold/settled in the same period are excluded from the rollforward. Fees attributed to embedded derivatives are included insettlements.
(5) Gains and losses, in net income (loss) and OCI, are calculated assuming transfers into and/or out of Level 3 occurred at the beginning of the period. Itemstransferred into and then out of Level 3 in the same period are excluded from the rollforward.
(6) Changes in unrealized gains (losses) included in net income (loss) relate to assets and liabilities still held at the end of the respective periods. Substantiallyall changes in unrealized gains (losses) included in net income (loss) for net derivatives and net embedded derivatives are reported in net derivative gains(losses).
79
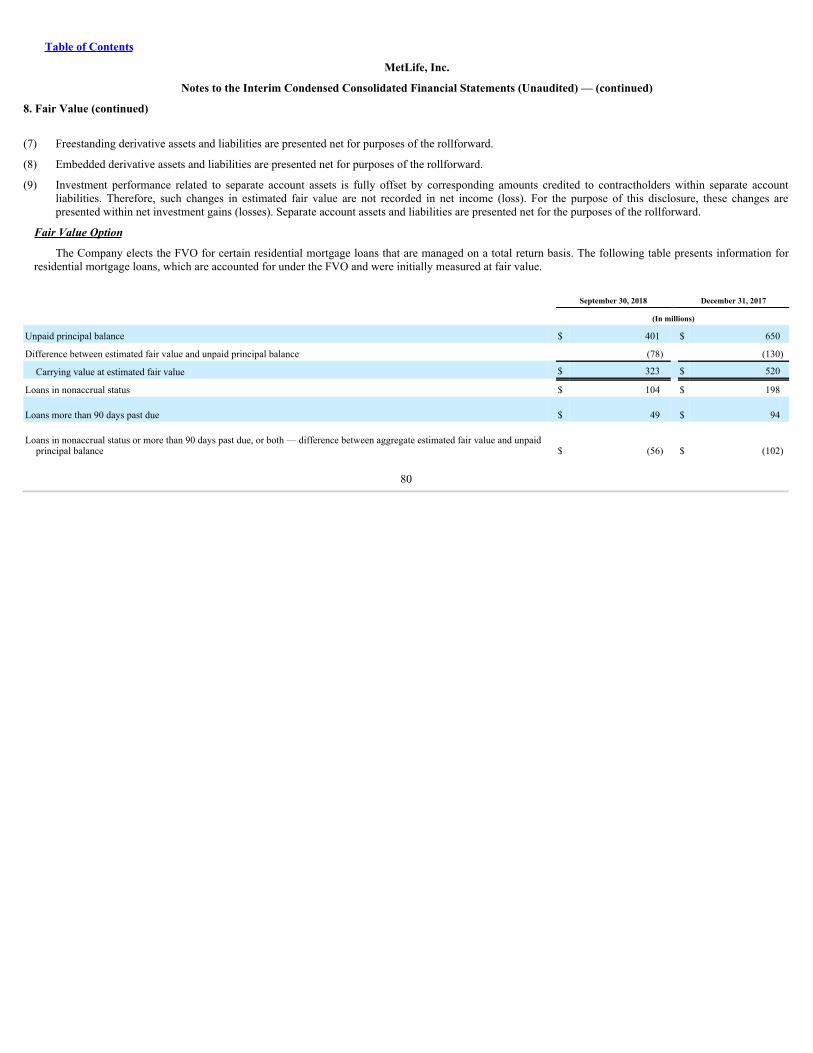
Table of Contents
MetLife, Inc.
Notes to the Interim Condensed Consolidated Financial Statements (Unaudited) — (continued)
8. Fair Value (continued)
(7) Freestanding derivative assets and liabilities are presented net for purposes of the rollforward.
(8) Embedded derivative assets and liabilities are presented net for purposes of the rollforward.
(9) Investment performance related to separate account assets is fully offset by corresponding amounts credited to contractholders within separate accountliabilities. Therefore, such changes in estimated fair value are not recorded in net income (loss). For the purpose of this disclosure, these changes arepresented within net investment gains (losses). Separate account assets and liabilities are presented net for the purposes of the rollforward.
FairValueOption
The Company elects the FVO for certain residential mortgage loans that are managed on a total return basis. The following table presents information forresidential mortgage loans, which are accounted for under the FVO and were initially measured at fair value.
September 30, 2018 December 31, 2017
(In millions)
Unpaid principal balance $ 401 $ 650
Difference between estimated fair value and unpaid principal balance (78) (130)
Carrying value at estimated fair value $ 323 $ 520
Loans in nonaccrual status $ 104 $ 198
Loans more than 90 days past due $ 49 $ 94
Loans in nonaccrual status or more than 90 days past due, or both — difference between aggregate estimated fair value and unpaidprincipal balance $ (56) $ (102)
80
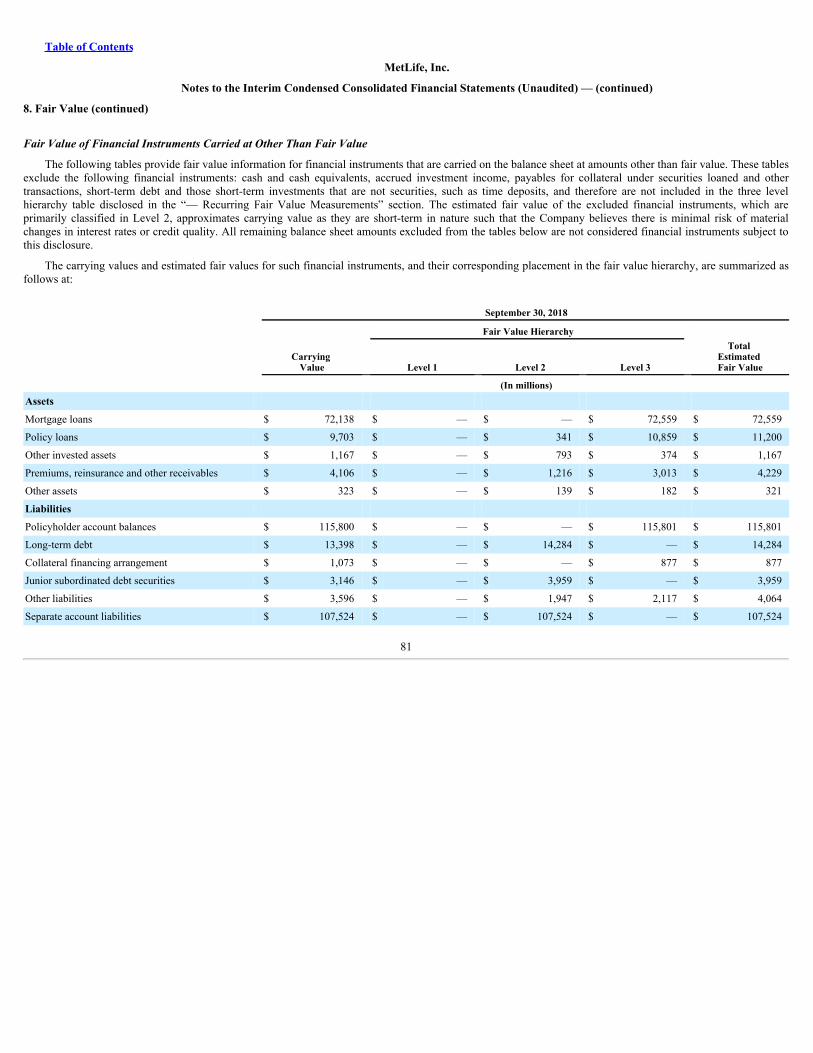
Table of Contents
MetLife, Inc.
Notes to the Interim Condensed Consolidated Financial Statements (Unaudited) — (continued)
8. Fair Value (continued)
FairValueofFinancialInstrumentsCarriedatOtherThanFairValue
The following tables provide fair value information for financial instruments that are carried on the balance sheet at amounts other than fair value. These tablesexclude the following financial instruments: cash and cash equivalents, accrued investment income, payables for collateral under securities loaned and othertransactions, short-term debt and those short-term investments that are not securities, such as time deposits, and therefore are not included in the three levelhierarchy table disclosed in the “— Recurring Fair Value Measurements” section. The estimated fair value of the excluded financial instruments, which areprimarily classified in Level 2, approximates carrying value as they are short-term in nature such that the Company believes there is minimal risk of materialchanges in interest rates or credit quality. All remaining balance sheet amounts excluded from the tables below are not considered financial instruments subject tothis disclosure.
The carrying values and estimated fair values for such financial instruments, and their corresponding placement in the fair value hierarchy, are summarized asfollows at:
September 30, 2018
Fair Value Hierarchy
Carrying
Value Level 1 Level 2 Level 3
Total Estimated Fair Value
(In millions)Assets Mortgage loans $ 72,138 $ — $ — $ 72,559 $ 72,559
Policy loans $ 9,703 $ — $ 341 $ 10,859 $ 11,200
Other invested assets $ 1,167 $ — $ 793 $ 374 $ 1,167
Premiums, reinsurance and other receivables $ 4,106 $ — $ 1,216 $ 3,013 $ 4,229
Other assets $ 323 $ — $ 139 $ 182 $ 321
Liabilities Policyholder account balances $ 115,800 $ — $ — $ 115,801 $ 115,801
Long-term debt $ 13,398 $ — $ 14,284 $ — $ 14,284
Collateral financing arrangement $ 1,073 $ — $ — $ 877 $ 877
Junior subordinated debt securities $ 3,146 $ — $ 3,959 $ — $ 3,959
Other liabilities $ 3,596 $ — $ 1,947 $ 2,117 $ 4,064
Separate account liabilities $ 107,524 $ — $ 107,524 $ — $ 107,524
81
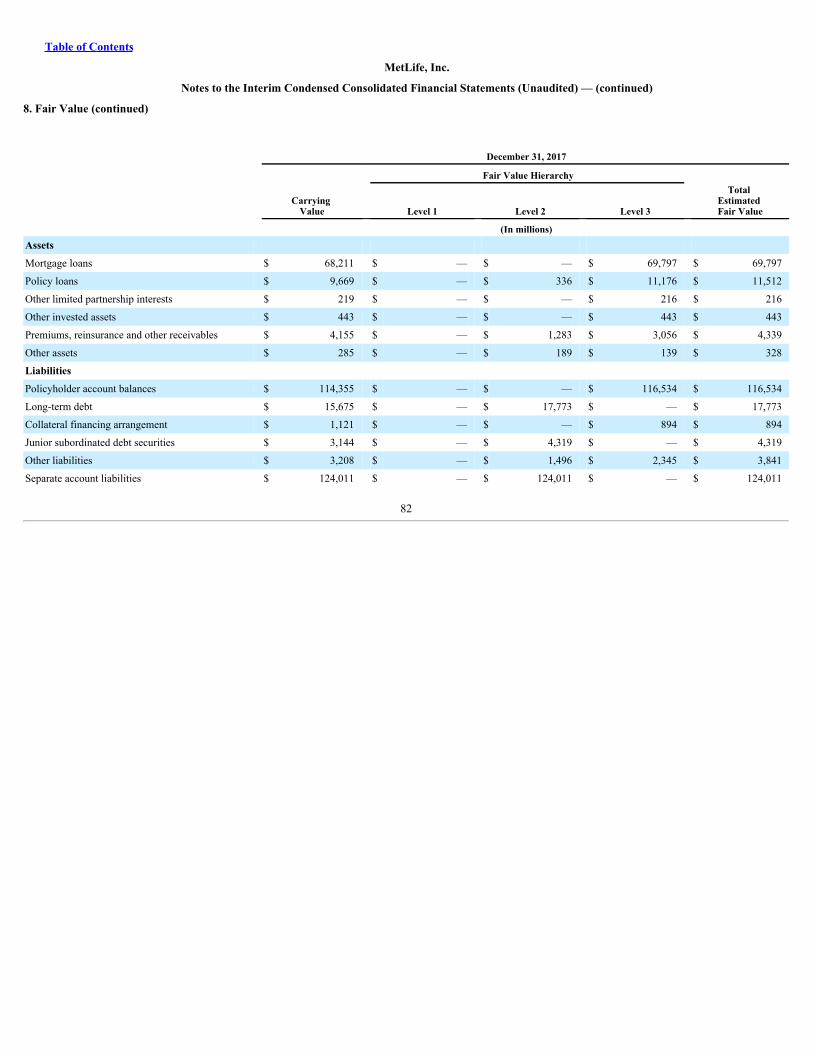
Table of Contents
MetLife, Inc.
Notes to the Interim Condensed Consolidated Financial Statements (Unaudited) — (continued)
8. Fair Value (continued)
December 31, 2017
Fair Value Hierarchy
Carrying
Value Level 1 Level 2 Level 3
Total Estimated Fair Value
(In millions)Assets Mortgage loans $ 68,211 $ — $ — $ 69,797 $ 69,797
Policy loans $ 9,669 $ — $ 336 $ 11,176 $ 11,512
Other limited partnership interests $ 219 $ — $ — $ 216 $ 216
Other invested assets $ 443 $ — $ — $ 443 $ 443
Premiums, reinsurance and other receivables $ 4,155 $ — $ 1,283 $ 3,056 $ 4,339
Other assets $ 285 $ — $ 189 $ 139 $ 328
Liabilities Policyholder account balances $ 114,355 $ — $ — $ 116,534 $ 116,534
Long-term debt $ 15,675 $ — $ 17,773 $ — $ 17,773
Collateral financing arrangement $ 1,121 $ — $ — $ 894 $ 894
Junior subordinated debt securities $ 3,144 $ — $ 4,319 $ — $ 4,319
Other liabilities $ 3,208 $ — $ 1,496 $ 2,345 $ 3,841
Separate account liabilities $ 124,011 $ — $ 124,011 $ — $ 124,011
82
Table of Contents
MetLife, Inc.
Notes to the Interim Condensed Consolidated Financial Statements (Unaudited) — (continued)
9. Long-Term Debt
SeniorNotes
In June 2018, MetLife, Inc. sold FVO Brighthouse Common Stock in exchange for $944 million aggregate principal amount of MetLife Inc.'s senior notes.MetLife, Inc. purchased and canceled $343 million of its $1,035 million aggregate principal amount 6.817% senior notes due August 2018; $469 million of its$1,035 million aggregate principal amount 7.717% senior notes due February 2019 and $132 million of its $1,000 million aggregate principal amount 4.750%senior notes due February 2021. In June 2018, MetLife, Inc. additionally purchased for cash and canceled $160 million of its $1,035 million aggregate principalamount 6.817% senior notes due August 2018. The Company recorded a premium of $30 million paid in excess of the debt principal and incurred $37 million ofadvisory and other fees related to the exchange transaction to other expenses for the nine months ended September 30, 2018 . See Note 3 for additional informationon the FVO Brighthouse Common Stock exchange transaction.
In August 2018, MetLife, Inc. purchased for cash and canceled the remaining $566 million of its $1,035 million aggregate principal amount 7.717% seniornotes due February 2019. The Company recorded a premium of $14 million paid in excess of the debt principal and accrued, unpaid interest to other expenses forthe three months and nine months ended September 30, 2018 .
10. Equity
PreferredStock
In June 2018, MetLife, Inc. issued 32,200 shares of 5.625% Non-Cumulative Preferred Stock, Series E (the “Series E preferred stock”), with a $0.01 par valueper share and a liquidation preference of $25,000 per share, for aggregate net proceeds of $780 million . MetLife, Inc. deposited the Series E preferred stock undera deposit agreement with a depositary, which issued interests in fractional shares of the Series E preferred stock in the form of depositary shares (“DepositaryShares”) evidenced by depositary receipts; each Depositary Share representing 1/1,000th interest in a share of the Series E preferred stock. In connection with theoffering of the Depositary Shares, MetLife, Inc. incurred approximately $25 million of issuance costs which have been recorded as a reduction of additional paid-incapital.
The Series E preferred stock ranks senior to MetLife, Inc.’s common stock with respect to the payment of dividends and distributions upon liquidation,dissolution or winding-up. Holders of the Depositary Shares will be entitled to receive dividend payments only when, as and if declared by MetLife, Inc.’s Board ofDirectors or a duly authorized committee thereof on the Series E preferred stock. If dividends are declared on the Series E preferred stock for any dividend period,they will be calculated on a non-cumulative basis at a fixed rate per annum of 5.625% . Dividends for any dividend period will be payable, if declared, quarterly inarrears on the 15th day of March, June, September and December of each year, commencing on September 15, 2018.
In March 2018, MetLife, Inc. issued 500,000 shares of 5.875% Fixed-to-Floating Rate Non-Cumulative Preferred Stock, Series D (the “Series D preferredstock”) with a $0.01 par value per share and a liquidation preference of $1,000 per share for aggregate net proceeds of $494 million . In connection with theoffering of the Series D preferred stock, MetLife, Inc. incurred approximately $6 million of issuance costs which have been recorded as a reduction of additionalpaid-in capital.
The Series D preferred stock ranks senior to MetLife, Inc.’s common stock with respect to the payment of dividends and distributions upon liquidation,dissolution or winding-up. Holders of the Series D preferred stock will be entitled to receive dividend payments only when, as and if declared by MetLife, Inc.’sBoard of Directors or a duly authorized committee thereof. If dividends are declared on the Series D preferred stock for any dividend period, they will be calculatedon a non-cumulative basis at a fixed rate per annum of 5.875% from the date of original issue to, but excluding, March 15, 2028 and at a floating rate per annumequal to three-month U.S. dollar LIBOR plus 2.959% on the related LIBOR determination date from and after March 15, 2028 . Dividends for any dividend periodwill be payable, if declared, semi-annually in arrears on the 15th day of March and September of each year commencing on September 15, 2018 and ending onMarch 15, 2028, and thereafter quarterly in arrears on the 15th day of June, September, December, and March of each year.
83
Table of Contents
MetLife, Inc.
Notes to the Interim Condensed Consolidated Financial Statements (Unaudited) — (continued)
10. Equity (continued)
Dividends on the Series D and Series E preferred stock will not be cumulative and will not be mandatory. Accordingly, if dividends are not declared on theSeries D or Series E preferred stock for any dividend period, then any accrued dividends for that dividend period will cease to accrue and be payable. If a dividendis not declared before the dividend payment date for any dividend period, MetLife, Inc. will have no obligation to pay dividends accrued for such dividend periodwhether or not dividends on the Series D or Series E preferred stock are declared for any future dividend period. No dividends may be paid or declared on MetLife,Inc.’s common stock (or any other securities ranking junior to the Series D or Series E preferred stock) and MetLife, Inc. may not purchase, redeem, or otherwiseacquire its common stock (or other such junior stock) unless the full dividends for the latest completed dividend period on all outstanding shares of Series D andSeries E preferred stock, and any parity stock, have been declared and paid or provided for.
Holders of the Series D and Series E preferred stock do not have voting rights except in certain circumstances, including where the dividends have not beenpaid for an equivalent of six or more dividend payment periods whether or not those periods are consecutive. Under such circumstances, the holders of the Series Dand Series E preferred stock have certain voting rights with respect to members of the Board of Directors of MetLife, Inc.
The Series D and Series E preferred stock are not subject to any mandatory redemption, sinking fund, retirement fund, purchase fund or similar provisions.MetLife, Inc. may, at its option, redeem the Series D preferred stock, (a) in whole but not in part, at any time prior to March 15, 2028, within 90 days after theoccurrence of a “rating agency event,” at a redemption price equal to $1,020 per share of Series D preferred stock, plus an amount equal to any accrued and unpaiddividends per share that have accrued but not been declared and paid for the then-current dividend period to but excluding the redemption date and (b) (i) in wholebut not in part, at any time prior to March 15, 2028, within 90 days after the occurrence of a “regulatory capital event” or (ii) in whole or in part, from time to time,on or after March 15, 2028, in each case, at a redemption price equal to $1,000 per share of Series D preferred stock, plus an amount equal to any accrued andunpaid dividends per share that have accrued but not been declared and paid for the then-current dividend period to, but excluding, such redemption date. MetLife,Inc. may, at its option, redeem the Series E preferred stock, (a) in whole but not in part, at any time prior to June 15, 2023, within 90 days after the occurrence of a“rating agency event,” at a redemption price equal to $25,500 per share of Series E preferred stock (equivalent to $25.50 per Depositary Share), plus an amountequal to any accrued and unpaid dividends per share that have accrued but not been declared and paid for the then-current dividend period to but excluding theredemption date and (b) (i) in whole but not in part, at any time prior to June 15, 2023, within 90 days after the occurrence of a “regulatory capital event” or (ii) inwhole or in part, from time to time, on or after June 15, 2023, in each case, at a redemption price equal to $25,000 per share of Series E preferred stock, plus anamount equal to any accrued and unpaid dividends per share that have accrued but not been declared and paid for the then-current dividend period to, butexcluding, such redemption date. A “rating agency event” means that any nationally recognized statistical rating organization that then publishes a rating forMetLife, Inc. amends, clarifies or changes the criteria it uses to assign equity credit to securities like the Series D or Series E preferred stock, which results in thelowering of the equity credit assigned to the Series D or Series E preferred stock, as applicable, or shortens the length of time that the Series D or Series E preferredstock, as applicable, is assigned a particular level of equity credit. A “regulatory capital event” could occur as a result of a change or proposed change in capitaladequacy rules (or the interpretation or application thereof) of any capital regulator, including but not limited to the Board of Governors of the Federal ReserveSystem (the “Federal Reserve Board”), the Federal Insurance Office, the National Association of Insurance Commissioners or any state insurance regulator, as maythen have group-wide oversight of MetLife, Inc.’s regulatory capital, from rules (or the interpretation or application thereof) in effect as of March 22, 2018, in thecase of the Series D preferred stock, or June 4, 2018, in the case of the Series E preferred stock, that would create a more than insubstantial risk, as determined byMetLife, Inc., that the Series D preferred stock or the Series E preferred stock, as applicable, would not be treated as “Tier 1 capital” or as capital with attributessimilar to those of Tier 1 capital, except that a “regulatory capital event” will not include a change or proposed change (or the interpretation or application thereof)that would result in the adoption of any criterion substantially the same as the criteria in the capital adequacy rules of the Federal Reserve Board applicable to bankholding companies as of March 22, 2018, in the case of the Series D preferred stock, or June 4, 2018, in the case of the Series E preferred stock.
84
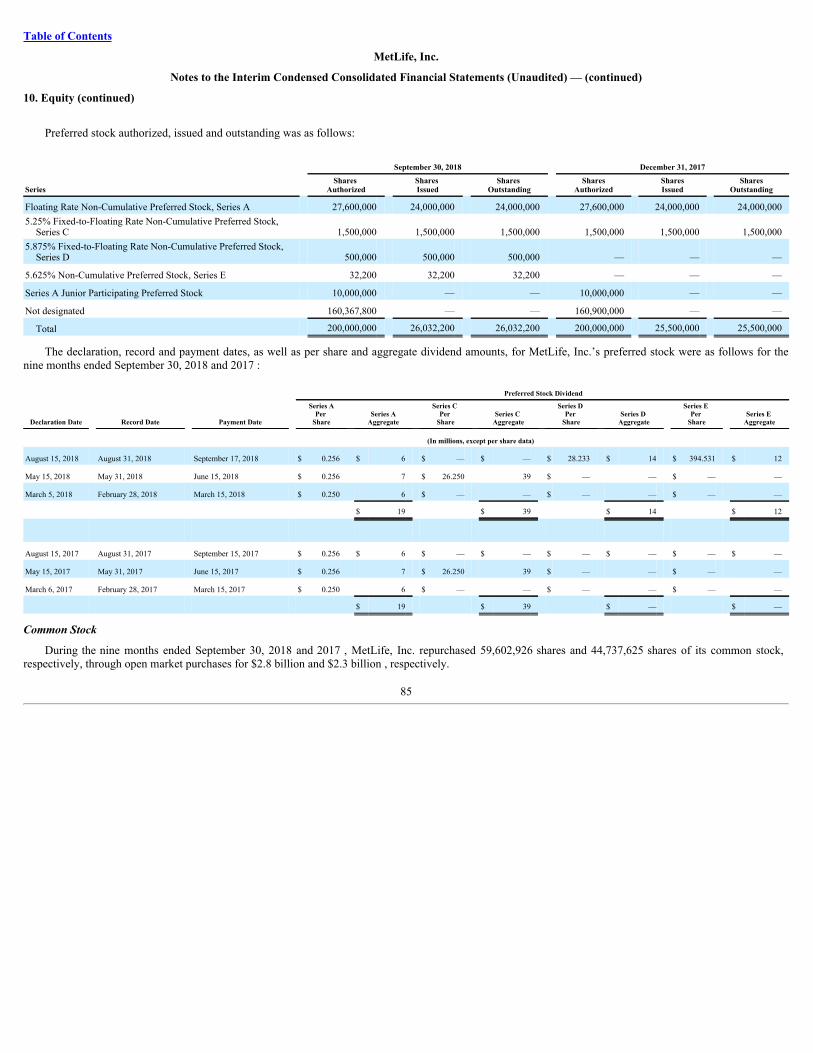
Table of Contents
MetLife, Inc.
Notes to the Interim Condensed Consolidated Financial Statements (Unaudited) — (continued)
10. Equity (continued)
Preferred stock authorized, issued and outstanding was as follows:
September 30, 2018 December 31, 2017
Series Shares Authorized Shares
Issued Shares Outstanding Shares
Authorized SharesIssued Shares
Outstanding
Floating Rate Non-Cumulative Preferred Stock, Series A 27,600,000 24,000,000 24,000,000 27,600,000 24,000,000 24,000,0005.25% Fixed-to-Floating Rate Non-Cumulative Preferred Stock,
Series C 1,500,000 1,500,000 1,500,000 1,500,000 1,500,000 1,500,0005.875% Fixed-to-Floating Rate Non-Cumulative Preferred Stock,
Series D 500,000 500,000 500,000 — — —
5.625% Non-Cumulative Preferred Stock, Series E 32,200 32,200 32,200 — — —
Series A Junior Participating Preferred Stock 10,000,000 — — 10,000,000 — —
Not designated 160,367,800 — — 160,900,000 — —
Total 200,000,000 26,032,200 26,032,200 200,000,000 25,500,000 25,500,000
The declaration, record and payment dates, as well as per share and aggregate dividend amounts, for MetLife, Inc.’s preferred stock were as follows for thenine months ended September 30, 2018 and 2017 :
Declaration Date Record Date Payment Date
Preferred Stock Dividend
Series APer
Share Series AAggregate
Series C Per
Share Series C Aggregate
Series D Per
Share Series D Aggregate
Series E Per
Share Series E Aggregate
(In millions, except per share data)
August 15, 2018 August 31, 2018 September 17, 2018 $ 0.256 $ 6 $ — $ — $ 28.233 $ 14 $ 394.531 $ 12
May 15, 2018 May 31, 2018 June 15, 2018 $ 0.256 7 $ 26.250 39 $ — — $ — —
March 5, 2018 February 28, 2018 March 15, 2018 $ 0.250 6 $ — — $ — — $ — —
$ 19 $ 39 $ 14 $ 12
August 15, 2017 August 31, 2017 September 15, 2017 $ 0.256 $ 6 $ — $ — $ — $ — $ — $ —
May 15, 2017 May 31, 2017 June 15, 2017 $ 0.256 7 $ 26.250 39 $ — — $ — —
March 6, 2017 February 28, 2017 March 15, 2017 $ 0.250 6 $ — — $ — — $ — —
$ 19 $ 39 $ — $ —
CommonStock
During the nine months ended September 30, 2018 and 2017 , MetLife, Inc. repurchased 59,602,926 shares and 44,737,625 shares of its common stock,respectively, through open market purchases for $2.8 billion and $2.3 billion , respectively.
85
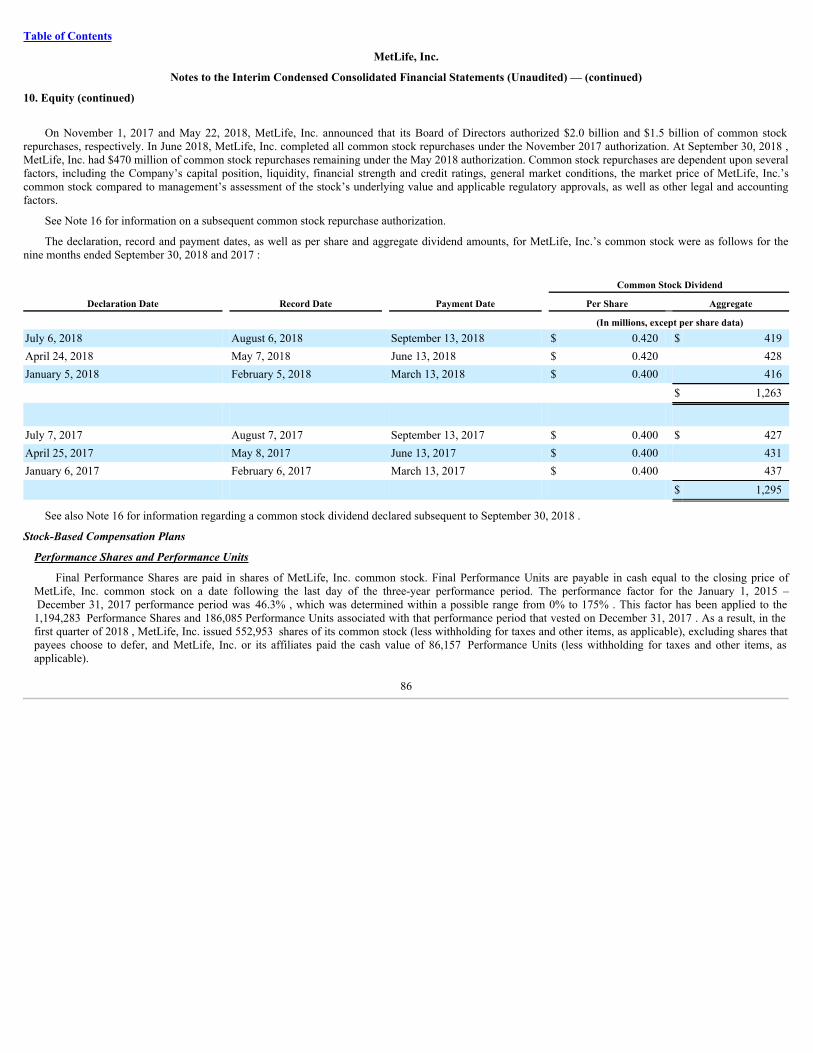
Table of Contents
MetLife, Inc.
Notes to the Interim Condensed Consolidated Financial Statements (Unaudited) — (continued)
10. Equity (continued)
On November 1, 2017 and May 22, 2018, MetLife, Inc. announced that its Board of Directors authorized $2.0 billion and $1.5 billion of common stockrepurchases, respectively. In June 2018, MetLife, Inc. completed all common stock repurchases under the November 2017 authorization. At September 30, 2018 ,MetLife, Inc. had $470 million of common stock repurchases remaining under the May 2018 authorization. Common stock repurchases are dependent upon severalfactors, including the Company’s capital position, liquidity, financial strength and credit ratings, general market conditions, the market price of MetLife, Inc.’scommon stock compared to management’s assessment of the stock’s underlying value and applicable regulatory approvals, as well as other legal and accountingfactors.
See Note 16 for information on a subsequent common stock repurchase authorization.
The declaration, record and payment dates, as well as per share and aggregate dividend amounts, for MetLife, Inc.’s common stock were as follows for thenine months ended September 30, 2018 and 2017 :
Declaration Date Record Date Payment Date Common Stock Dividend
Per Share Aggregate
(In millions, except per share data)July 6, 2018 August 6, 2018 September 13, 2018 $ 0.420 $ 419April 24, 2018 May 7, 2018 June 13, 2018 $ 0.420 428January 5, 2018 February 5, 2018 March 13, 2018 $ 0.400 416
$ 1,263
July 7, 2017 August 7, 2017 September 13, 2017 $ 0.400 $ 427April 25, 2017 May 8, 2017 June 13, 2017 $ 0.400 431January 6, 2017 February 6, 2017 March 13, 2017 $ 0.400 437
$ 1,295
See also Note 16 for information regarding a common stock dividend declared subsequent to September 30, 2018 .
Stock-BasedCompensationPlans
PerformanceSharesandPerformanceUnits
Final Performance Shares are paid in shares of MetLife, Inc. common stock. Final Performance Units are payable in cash equal to the closing price ofMetLife, Inc. common stock on a date following the last day of the three-year performance period. The performance factor for the January 1, 2015 – December 31, 2017 performance period was 46.3% , which was determined within a possible range from 0% to 175% . This factor has been applied to the1,194,283 Performance Shares and 186,085 Performance Units associated with that performance period that vested on December 31, 2017 . As a result, in thefirst quarter of 2018 , MetLife, Inc. issued 552,953 shares of its common stock (less withholding for taxes and other items, as applicable), excluding shares thatpayees choose to defer, and MetLife, Inc. or its affiliates paid the cash value of 86,157 Performance Units (less withholding for taxes and other items, asapplicable).
86
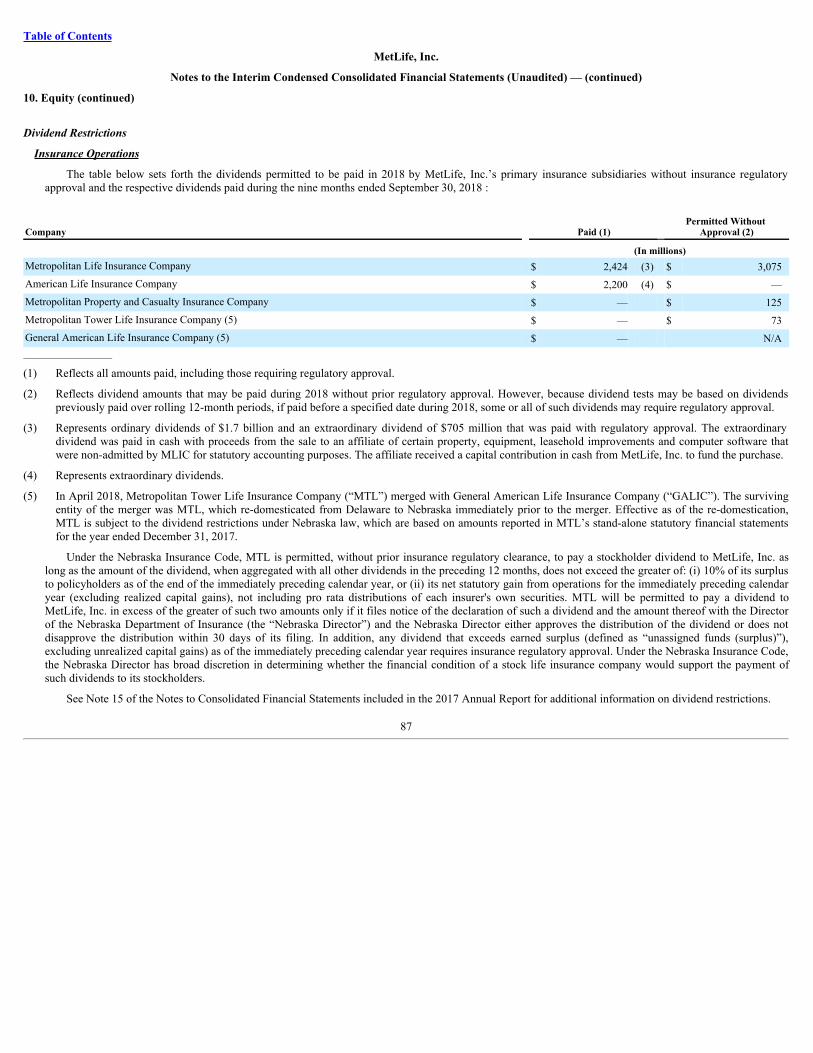
Table of Contents
MetLife, Inc.
Notes to the Interim Condensed Consolidated Financial Statements (Unaudited) — (continued)
10. Equity (continued)
DividendRestrictions
InsuranceOperations
The table below sets forth the dividends permitted to be paid in 2018 by MetLife, Inc.’s primary insurance subsidiaries without insurance regulatoryapproval and the respective dividends paid during the nine months ended September 30, 2018 :
Company Paid (1) Permitted Without
Approval (2)
(In millions)Metropolitan Life Insurance Company $ 2,424 (3) $ 3,075American Life Insurance Company $ 2,200 (4) $ —Metropolitan Property and Casualty Insurance Company $ — $ 125Metropolitan Tower Life Insurance Company (5) $ — $ 73General American Life Insurance Company (5) $ — N/A__________________
(1) Reflects all amounts paid, including those requiring regulatory approval.
(2) Reflects dividend amounts that may be paid during 2018 without prior regulatory approval. However, because dividend tests may be based on dividendspreviously paid over rolling 12-month periods, if paid before a specified date during 2018, some or all of such dividends may require regulatory approval.
(3) Represents ordinary dividends of $1.7 billion and an extraordinary dividend of $705 million that was paid with regulatory approval. The extraordinarydividend was paid in cash with proceeds from the sale to an affiliate of certain property, equipment, leasehold improvements and computer software thatwere non-admitted by MLIC for statutory accounting purposes. The affiliate received a capital contribution in cash from MetLife, Inc. to fund the purchase.
(4) Represents extraordinary dividends.
(5) In April 2018, Metropolitan Tower Life Insurance Company (“MTL”) merged with General American Life Insurance Company (“GALIC”). The survivingentity of the merger was MTL, which re-domesticated from Delaware to Nebraska immediately prior to the merger. Effective as of the re-domestication,MTL is subject to the dividend restrictions under Nebraska law, which are based on amounts reported in MTL’s stand-alone statutory financial statementsfor the year ended December 31, 2017.
Under the Nebraska Insurance Code, MTL is permitted, without prior insurance regulatory clearance, to pay a stockholder dividend to MetLife, Inc. aslong as the amount of the dividend, when aggregated with all other dividends in the preceding 12 months, does not exceed the greater of: (i) 10% of its surplusto policyholders as of the end of the immediately preceding calendar year, or (ii) its net statutory gain from operations for the immediately preceding calendaryear (excluding realized capital gains), not including pro rata distributions of each insurer's own securities. MTL will be permitted to pay a dividend toMetLife, Inc. in excess of the greater of such two amounts only if it files notice of the declaration of such a dividend and the amount thereof with the Directorof the Nebraska Department of Insurance (the “Nebraska Director”) and the Nebraska Director either approves the distribution of the dividend or does notdisapprove the distribution within 30 days of its filing. In addition, any dividend that exceeds earned surplus (defined as “unassigned funds (surplus)”),excluding unrealized capital gains) as of the immediately preceding calendar year requires insurance regulatory approval. Under the Nebraska Insurance Code,the Nebraska Director has broad discretion in determining whether the financial condition of a stock life insurance company would support the payment ofsuch dividends to its stockholders.
See Note 15 of the Notes to Consolidated Financial Statements included in the 2017 Annual Report for additional information on dividend restrictions.
87
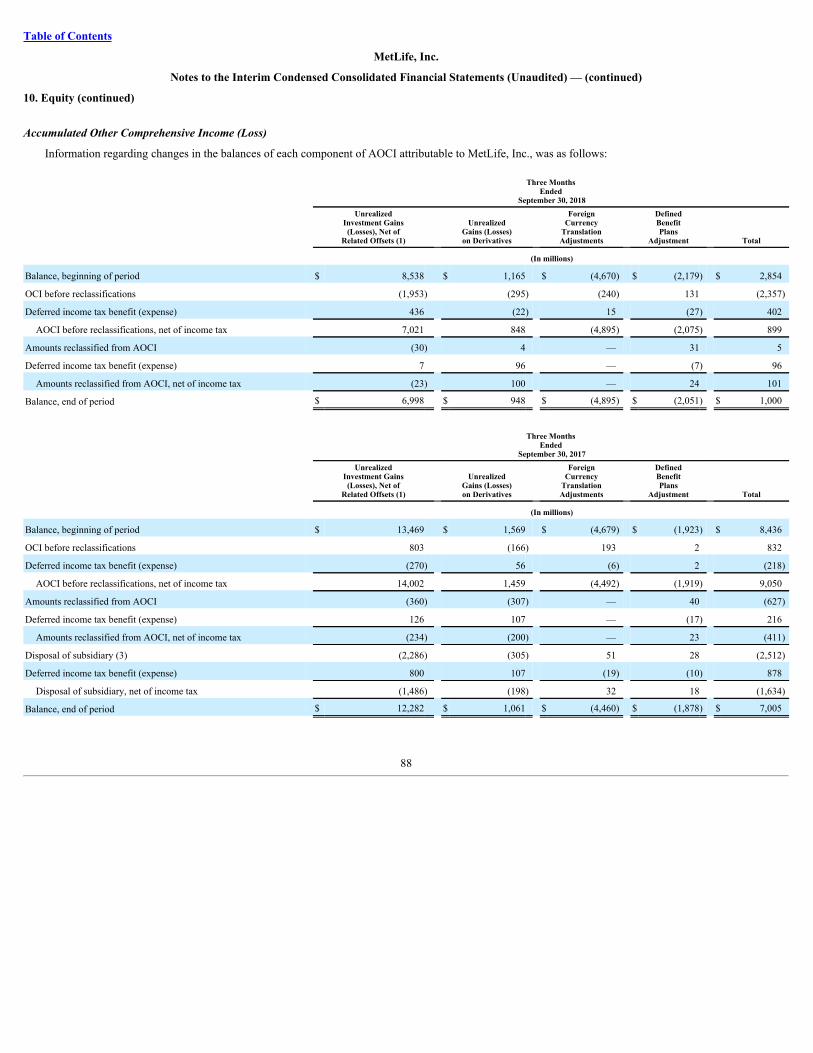
Table of Contents
MetLife, Inc.
Notes to the Interim Condensed Consolidated Financial Statements (Unaudited) — (continued)
10. Equity (continued)
AccumulatedOtherComprehensiveIncome(Loss)
Information regarding changes in the balances of each component of AOCI attributable to MetLife, Inc., was as follows:
Three Months
Ended September 30, 2018
UnrealizedInvestment Gains(Losses), Net of
Related Offsets (1) Unrealized
Gains (Losses)on Derivatives
ForeignCurrency
TranslationAdjustments
DefinedBenefitPlans
Adjustment Total
(In millions)
Balance, beginning of period $ 8,538 $ 1,165 $ (4,670) $ (2,179) $ 2,854
OCI before reclassifications (1,953) (295) (240) 131 (2,357)
Deferred income tax benefit (expense) 436 (22) 15 (27) 402
AOCI before reclassifications, net of income tax 7,021 848 (4,895) (2,075) 899
Amounts reclassified from AOCI (30) 4 — 31 5
Deferred income tax benefit (expense) 7 96 — (7) 96
Amounts reclassified from AOCI, net of income tax (23) 100 — 24 101
Balance, end of period $ 6,998 $ 948 $ (4,895) $ (2,051) $ 1,000
Three Months
Ended September 30, 2017
UnrealizedInvestment Gains(Losses), Net of
Related Offsets (1) Unrealized
Gains (Losses)on Derivatives
ForeignCurrency
TranslationAdjustments
DefinedBenefitPlans
Adjustment Total
(In millions)
Balance, beginning of period $ 13,469 $ 1,569 $ (4,679) $ (1,923) $ 8,436
OCI before reclassifications 803 (166) 193 2 832
Deferred income tax benefit (expense) (270) 56 (6) 2 (218)
AOCI before reclassifications, net of income tax 14,002 1,459 (4,492) (1,919) 9,050
Amounts reclassified from AOCI (360) (307) — 40 (627)
Deferred income tax benefit (expense) 126 107 — (17) 216
Amounts reclassified from AOCI, net of income tax (234) (200) — 23 (411)
Disposal of subsidiary (3) (2,286) (305) 51 28 (2,512)
Deferred income tax benefit (expense) 800 107 (19) (10) 878
Disposal of subsidiary, net of income tax (1,486) (198) 32 18 (1,634)
Balance, end of period $ 12,282 $ 1,061 $ (4,460) $ (1,878) $ 7,005
88
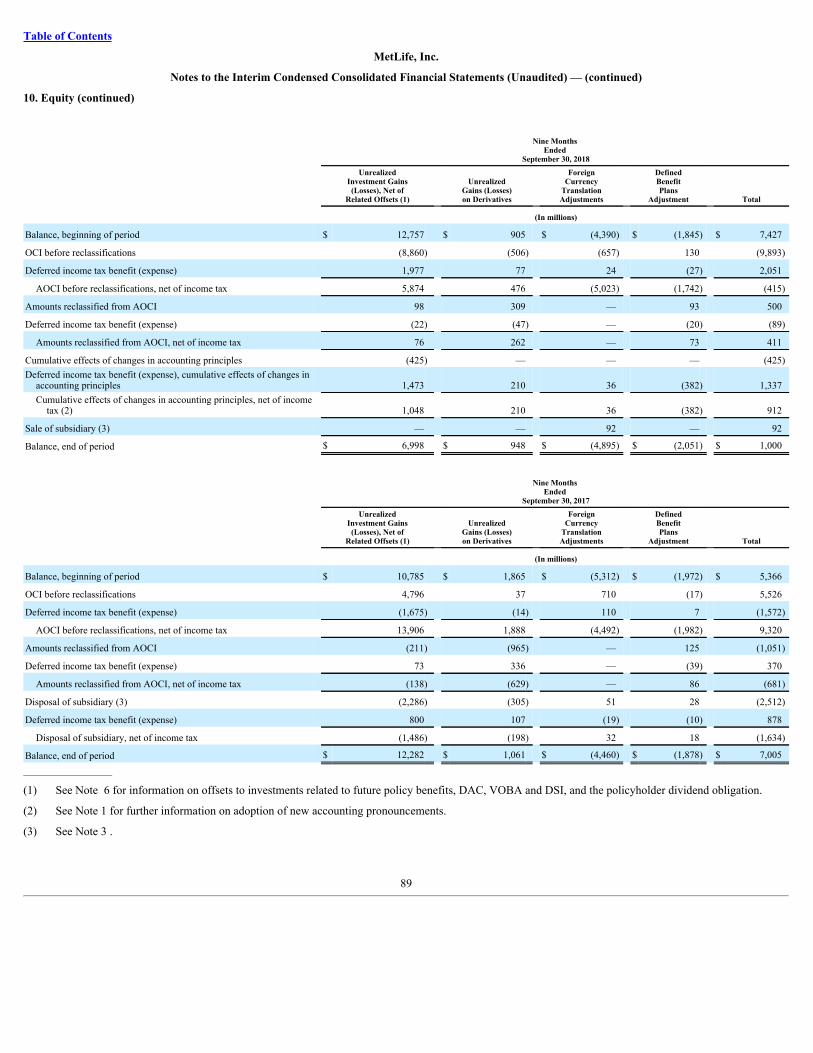
Table of Contents
MetLife, Inc.
Notes to the Interim Condensed Consolidated Financial Statements (Unaudited) — (continued)
10. Equity (continued)
Nine Months
Ended September 30, 2018
UnrealizedInvestment Gains(Losses), Net of
Related Offsets (1) Unrealized
Gains (Losses)on Derivatives
ForeignCurrency
TranslationAdjustments
DefinedBenefitPlans
Adjustment Total
(In millions)
Balance, beginning of period $ 12,757 $ 905 $ (4,390) $ (1,845) $ 7,427
OCI before reclassifications (8,860) (506) (657) 130 (9,893)
Deferred income tax benefit (expense) 1,977 77 24 (27) 2,051
AOCI before reclassifications, net of income tax 5,874 476 (5,023) (1,742) (415)
Amounts reclassified from AOCI 98 309 — 93 500
Deferred income tax benefit (expense) (22) (47) — (20) (89)
Amounts reclassified from AOCI, net of income tax 76 262 — 73 411
Cumulative effects of changes in accounting principles (425) — — — (425)Deferred income tax benefit (expense), cumulative effects of changes in
accounting principles 1,473 210 36 (382) 1,337Cumulative effects of changes in accounting principles, net of income
tax (2) 1,048 210 36 (382) 912
Sale of subsidiary (3) — — 92 — 92
Balance, end of period $ 6,998 $ 948 $ (4,895) $ (2,051) $ 1,000
Nine Months
Ended September 30, 2017
UnrealizedInvestment Gains(Losses), Net of
Related Offsets (1) Unrealized
Gains (Losses)on Derivatives
ForeignCurrency
TranslationAdjustments
DefinedBenefitPlans
Adjustment Total
(In millions)
Balance, beginning of period $ 10,785 $ 1,865 $ (5,312) $ (1,972) $ 5,366
OCI before reclassifications 4,796 37 710 (17) 5,526
Deferred income tax benefit (expense) (1,675) (14) 110 7 (1,572)
AOCI before reclassifications, net of income tax 13,906 1,888 (4,492) (1,982) 9,320
Amounts reclassified from AOCI (211) (965) — 125 (1,051)
Deferred income tax benefit (expense) 73 336 — (39) 370
Amounts reclassified from AOCI, net of income tax (138) (629) — 86 (681)
Disposal of subsidiary (3) (2,286) (305) 51 28 (2,512)
Deferred income tax benefit (expense) 800 107 (19) (10) 878
Disposal of subsidiary, net of income tax (1,486) (198) 32 18 (1,634)
Balance, end of period $ 12,282 $ 1,061 $ (4,460) $ (1,878) $ 7,005__________________
(1) See Note 6 for information on offsets to investments related to future policy benefits, DAC, VOBA and DSI, and the policyholder dividend obligation.
(2) See Note 1 for further information on adoption of new accounting pronouncements.
(3) See Note 3 .
89
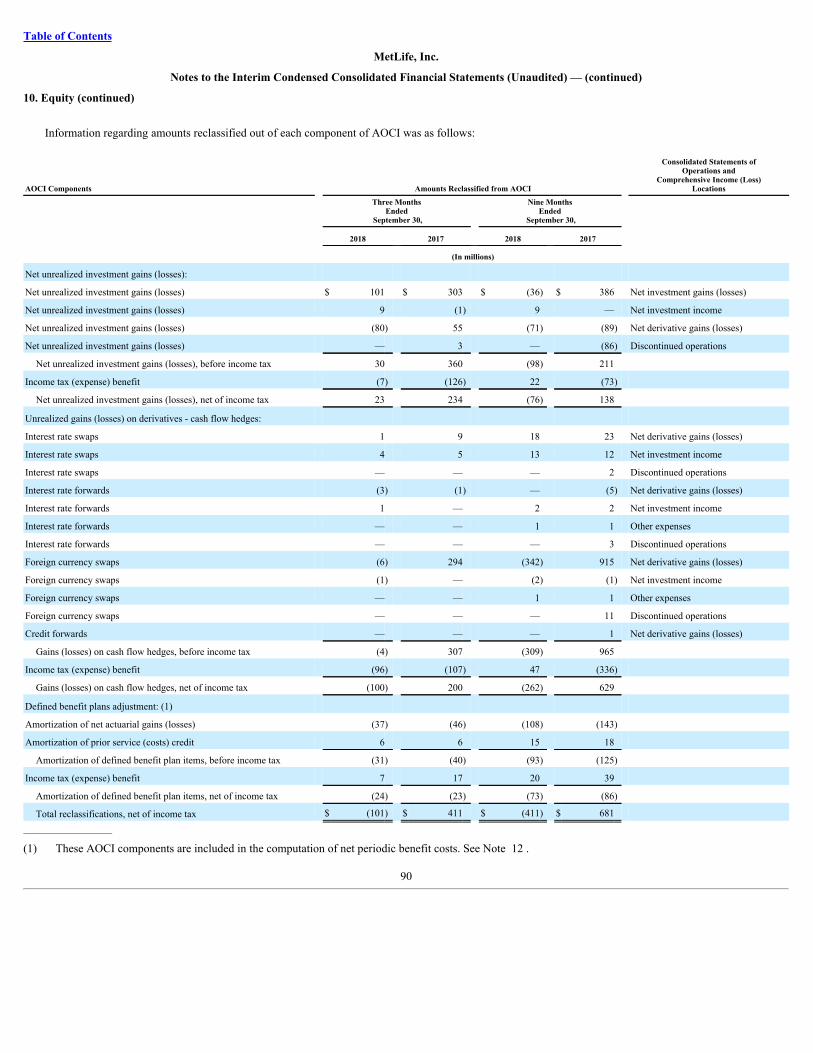
Table of Contents
MetLife, Inc.
Notes to the Interim Condensed Consolidated Financial Statements (Unaudited) — (continued)
10. Equity (continued)
Information regarding amounts reclassified out of each component of AOCI was as follows:
AOCI Components Amounts Reclassified from AOCI
Consolidated Statements ofOperations and
Comprehensive Income (Loss)Locations
Three Months
Ended September 30,
Nine Months Ended
September 30, 2018 2017 2018 2017 (In millions)
Net unrealized investment gains (losses):
Net unrealized investment gains (losses) $ 101 $ 303 $ (36) $ 386 Net investment gains (losses)
Net unrealized investment gains (losses) 9 (1) 9 — Net investment income
Net unrealized investment gains (losses) (80) 55 (71) (89) Net derivative gains (losses)
Net unrealized investment gains (losses) — 3 — (86) Discontinued operations
Net unrealized investment gains (losses), before income tax 30 360 (98) 211
Income tax (expense) benefit (7) (126) 22 (73)
Net unrealized investment gains (losses), net of income tax 23 234 (76) 138
Unrealized gains (losses) on derivatives - cash flow hedges:
Interest rate swaps 1 9 18 23 Net derivative gains (losses)
Interest rate swaps 4 5 13 12 Net investment income
Interest rate swaps — — — 2 Discontinued operations
Interest rate forwards (3) (1) — (5) Net derivative gains (losses)
Interest rate forwards 1 — 2 2 Net investment income
Interest rate forwards — — 1 1 Other expenses
Interest rate forwards — — — 3 Discontinued operations
Foreign currency swaps (6) 294 (342) 915 Net derivative gains (losses)
Foreign currency swaps (1) — (2) (1) Net investment income
Foreign currency swaps — — 1 1 Other expenses
Foreign currency swaps — — — 11 Discontinued operations
Credit forwards — — — 1 Net derivative gains (losses)
Gains (losses) on cash flow hedges, before income tax (4) 307 (309) 965
Income tax (expense) benefit (96) (107) 47 (336)
Gains (losses) on cash flow hedges, net of income tax (100) 200 (262) 629
Defined benefit plans adjustment: (1)
Amortization of net actuarial gains (losses) (37) (46) (108) (143)
Amortization of prior service (costs) credit 6 6 15 18
Amortization of defined benefit plan items, before income tax (31) (40) (93) (125)
Income tax (expense) benefit 7 17 20 39
Amortization of defined benefit plan items, net of income tax (24) (23) (73) (86)
Total reclassifications, net of income tax $ (101) $ 411 $ (411) $ 681 __________________
(1) These AOCI components are included in the computation of net periodic benefit costs. See Note 12 .
90
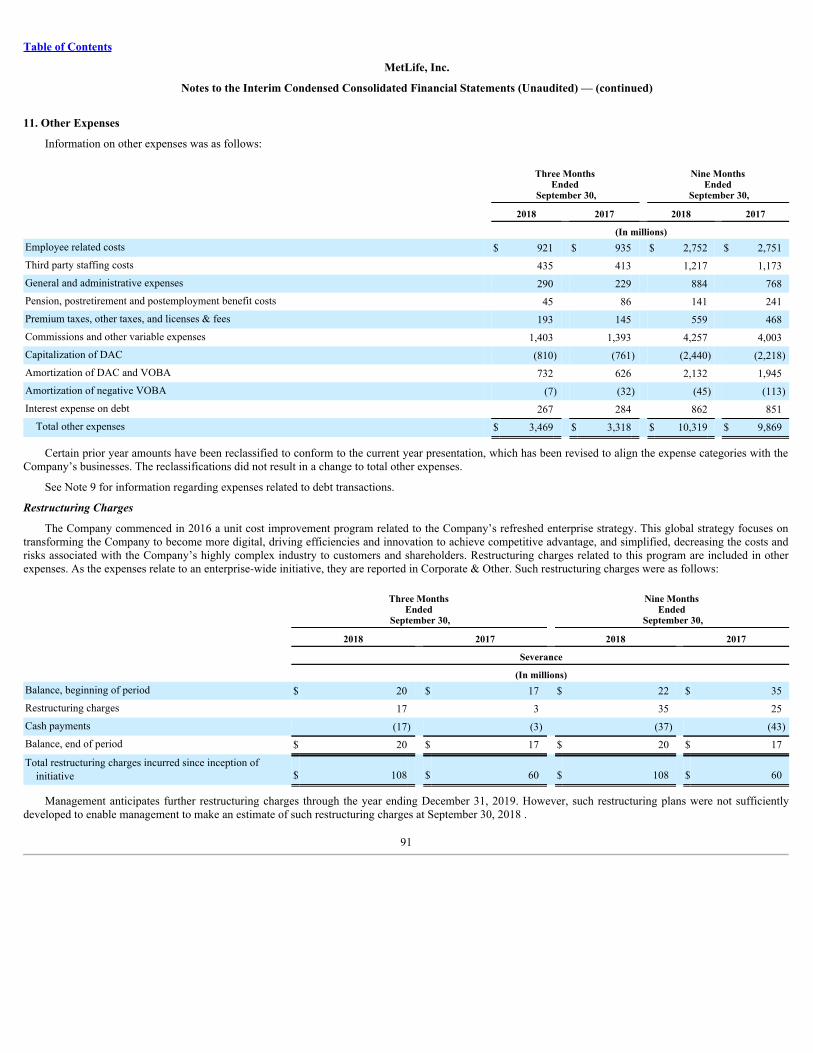
Table of Contents
MetLife, Inc.
Notes to the Interim Condensed Consolidated Financial Statements (Unaudited) — (continued)
11. Other Expenses
Information on other expenses was as follows:
Three Months Ended
September 30,
Nine Months Ended
September 30,
2018 2017 2018 2017 (In millions)Employee related costs $ 921 $ 935 $ 2,752 $ 2,751Third party staffing costs 435 413 1,217 1,173General and administrative expenses 290 229 884 768Pension, postretirement and postemployment benefit costs 45 86 141 241Premium taxes, other taxes, and licenses & fees 193 145 559 468Commissions and other variable expenses 1,403 1,393 4,257 4,003Capitalization of DAC (810) (761) (2,440) (2,218)Amortization of DAC and VOBA 732 626 2,132 1,945Amortization of negative VOBA (7) (32) (45) (113)Interest expense on debt 267 284 862 851
Total other expenses $ 3,469 $ 3,318 $ 10,319 $ 9,869
Certain prior year amounts have been reclassified to conform to the current year presentation, which has been revised to align the expense categories with theCompany’s businesses. The reclassifications did not result in a change to total other expenses.
See Note 9 for information regarding expenses related to debt transactions.
RestructuringCharges
The Company commenced in 2016 a unit cost improvement program related to the Company’s refreshed enterprise strategy. This global strategy focuses ontransforming the Company to become more digital, driving efficiencies and innovation to achieve competitive advantage, and simplified, decreasing the costs andrisks associated with the Company’s highly complex industry to customers and shareholders. Restructuring charges related to this program are included in otherexpenses. As the expenses relate to an enterprise-wide initiative, they are reported in Corporate & Other. Such restructuring charges were as follows:
Three Months Ended
September 30,
Nine Months Ended
September 30,
2018 2017 2018 2017 Severance (In millions)Balance, beginning of period $ 20 $ 17 $ 22 $ 35Restructuring charges 17 3 35 25Cash payments (17) (3) (37) (43)Balance, end of period $ 20 $ 17 $ 20 $ 17
Total restructuring charges incurred since inception ofinitiative $ 108 $ 60 $ 108 $ 60
Management anticipates further restructuring charges through the year ending December 31, 2019. However, such restructuring plans were not sufficientlydeveloped to enable management to make an estimate of such restructuring charges at September 30, 2018 .
91
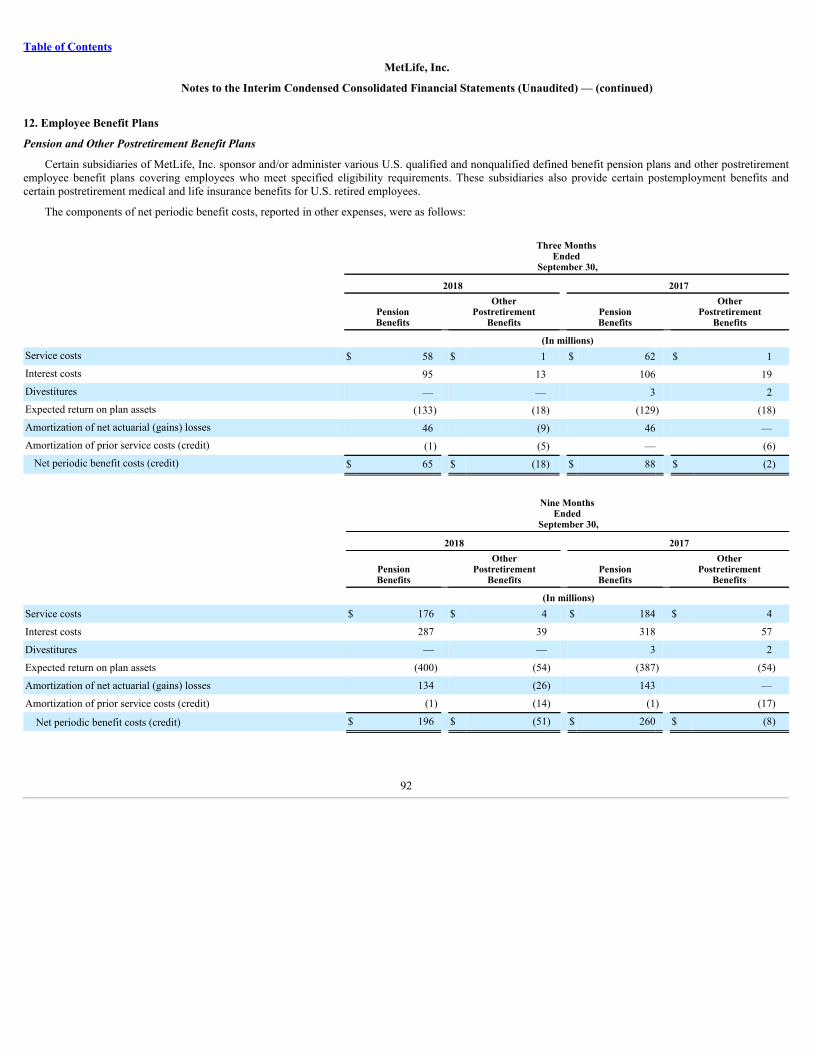
Table of Contents
MetLife, Inc.
Notes to the Interim Condensed Consolidated Financial Statements (Unaudited) — (continued)
12. Employee Benefit Plans
PensionandOtherPostretirementBenefitPlans
Certain subsidiaries of MetLife, Inc. sponsor and/or administer various U.S. qualified and nonqualified defined benefit pension plans and other postretirementemployee benefit plans covering employees who meet specified eligibility requirements. These subsidiaries also provide certain postemployment benefits andcertain postretirement medical and life insurance benefits for U.S. retired employees.
The components of net periodic benefit costs, reported in other expenses, were as follows:
Three Months Ended
September 30,
2018 2017
PensionBenefits
OtherPostretirement
Benefits PensionBenefits
OtherPostretirement
Benefits (In millions)Service costs $ 58 $ 1 $ 62 $ 1Interest costs 95 13 106 19Divestitures — — 3 2Expected return on plan assets (133) (18) (129) (18)Amortization of net actuarial (gains) losses 46 (9) 46 —Amortization of prior service costs (credit) (1) (5) — (6)
Net periodic benefit costs (credit) $ 65 $ (18) $ 88 $ (2)
Nine Months Ended
September 30,
2018 2017
PensionBenefits
OtherPostretirement
Benefits PensionBenefits
OtherPostretirement
Benefits (In millions)Service costs $ 176 $ 4 $ 184 $ 4
Interest costs 287 39 318 57
Divestitures — — 3 2
Expected return on plan assets (400) (54) (387) (54)
Amortization of net actuarial (gains) losses 134 (26) 143 —
Amortization of prior service costs (credit) (1) (14) (1) (17)
Net periodic benefit costs (credit) $ 196 $ (51) $ 260 $ (8)
92
Table of Contents
MetLife, Inc.
Notes to the Interim Condensed Consolidated Financial Statements (Unaudited) — (continued)
13. Income Tax
The Company’s effective tax rates differ from the U.S. statutory rate typically due to non-taxable investment income, tax credits, and foreign earnings taxed atdifferent rates than the U.S. statutory rate. The Company’s year-to-date results include tax charges of $69 million related to the non-deductible loss incurred on themark-to-market and disposition of FVO Brighthouse Common Stock, $17 million related to a tax adjustment in Chile and $5 million in Colombia to establish adeferred tax liability due to a change in tax status, partially offset by tax benefits of $36 million related to a non-cash transfer of assets from a wholly-owned U.K.investment subsidiary to its U.S. parent and $7 million related to the settlement of an audit. The Company’s prior period results include tax-related benefits of $554million related to the Separation and $27 million from the finalization of certain tax audits, partially offset by a net tax charge of $180 million . This charge was theresult of the repatriation of approximately $3.0 billion of cash following the post-Separation review of the Company’s capital needs, partially offset by a tax benefitassociated with dividends from the Company’s non-U.S. operations. The Company’s prior period results also include a tax benefit of $9 million related to thesettlement of an audit in Argentina.
On December 22, 2017, President Trump signed into law U.S. Tax Reform. U.S. Tax Reform includes numerous changes in tax law, including a permanentreduction in the U.S. federal corporate income tax rate from 35% to 21% , which took effect for taxable years beginning on or after January 1, 2018. U.S. TaxReform moves the United States from a worldwide tax system to a participation exemption system by providing corporations a 100% dividends received deductionfor dividends distributed by a controlled foreign corporation. To transition to that new system, U.S. Tax Reform imposed a one-time deemed repatriation tax onunremitted earnings and profits at a rate of 8.0% for illiquid assets and 15.5% for cash and cash equivalents.
In accordance with Staff Accounting Bulletin (“SAB”) 118 issued by the U.S. Securities and Exchange Commission (“SEC”) in December 2017, the Companyrecorded provisional amounts for certain items for which the income tax accounting is not complete. For these items, the Company recorded a reasonable estimateof the tax effects of U.S. Tax Reform. The estimates will be reported as provisional amounts during the measurement period, which will not exceed one year fromthe date of enactment of U.S. Tax Reform. The Company may reflect adjustments to its provisional amounts upon obtaining, preparing, or analyzing additionalinformation about facts and circumstances that existed as of the enactment date that, if known, would have affected the income tax effects initially reported asprovisional amounts.
At December 31, 2017 , the Company recorded provisional estimates for the deemed repatriation transition tax, global intangible low-tax income,compensation and fringe benefits, alternative minimum tax credits, and tax credit partnerships. At September 30, 2018 , updates were made to the provisionalamounts for tax credit partnerships, as described in the following paragraph. No other updates to provisional estimates were made.
Certain tax credit partnership investments derive returns in part from income tax credits. The Company recognizes changes in tax attributes at the partnershiplevel when reported by the investee in its financial information. The Company did not receive the necessary investee financial information to determine the impactsof U.S. Tax Reform on the tax attributes of its tax credit partnership investments until the third quarter of 2018 . Accordingly, prior to the third quarter of 2018 , theCompany applied prior law to these equity method investments in accordance with SAB 118. After receiving the information, an after tax reduction in tax creditpartnerships’ equity method income of $32 million was included in net investment income for both the three months and nine months ended September 30, 2018 .
See Note 18 of the Notes to the Consolidated Financial Statements included in the 2017 Annual Report for further information regarding SAB 118 items.
93
Table of Contents
MetLife, Inc.
Notes to the Interim Condensed Consolidated Financial Statements (Unaudited) — (continued)
14. Earnings Per Common Share
The following table presents the weighted average shares, basic earnings per common share and diluted earnings per common share for each income categorypresented:
Three Months Ended
September 30,
Nine Months Ended
September 30,
2018 2017 2018 2017 (In millions, except per share data)Weighted Average Shares: Weighted average common stock outstanding for basic earnings per common share 992.7 1,062.3 1,014.6 1,075.5
Incremental common shares from assumed exercise or issuance of stock-based awards 8.0 9.2 8.2 8.5
Weighted average common stock outstanding for diluted earnings per common share 1,000.7 1,071.5 1,022.8 1,084.0
Income (Loss) from Continuing Operations: Income (loss) from continuing operations, net of income tax $ 915 $ 883 $ 3,066 $ 2,691
Less: Income (loss) from continuing operations, net of income tax, attributable to noncontrolling interests 3 6 10 12
Less: Preferred stock dividends 32 6 84 58Income (loss) from continuing operations, net of income tax, available to MetLife, Inc.’s common
shareholders $ 880 $ 871 $ 2,972 $ 2,621
Basic $ 0.89 $ 0.82 $ 2.93 $ 2.44
Diluted $ 0.88 $ 0.81 $ 2.91 $ 2.42
Income (Loss) from Discontinued Operations: Income (loss) from discontinued operations, net of income tax $ — $ (968) $ — $ (986)
Less: Income (loss) from discontinued operations, net of income tax, attributable to noncontrollinginterests — — — —
Income (loss) from discontinued operations, net of income tax, available to MetLife, Inc.’s commonshareholders $ — $ (968) $ — $ (986)
Basic $ — $ (0.91) $ — $ (0.92)
Diluted $ — $ (0.90) $ — $ (0.91)
Net Income (Loss): Net income (loss) $ 915 $ (85) $ 3,066 $ 1,705
Less: Net income (loss) attributable to noncontrolling interests 3 6 10 12
Less: Preferred stock dividends 32 6 84 58
Net income (loss) available to MetLife, Inc.’s common shareholders $ 880 $ (97) $ 2,972 $ 1,635
Basic $ 0.89 $ (0.09) $ 2.93 $ 1.52
Diluted $ 0.88 $ (0.09) $ 2.91 $ 1.51
94
Table of Contents
MetLife, Inc.
Notes to the Interim Condensed Consolidated Financial Statements (Unaudited) — (continued)
15. Contingencies, Commitments and Guarantees
Contingencies
Litigation
The Company is a defendant in a large number of litigation matters. In some of the matters, very large and/or indeterminate amounts, including punitive andtreble damages, are sought. Modern pleading practice in the U.S. permits considerable variation in the assertion of monetary damages or other relief.Jurisdictions may permit claimants not to specify the monetary damages sought or may permit claimants to state only that the amount sought is sufficient toinvoke the jurisdiction of the trial court. In addition, jurisdictions may permit plaintiffs to allege monetary damages in amounts well exceeding reasonablypossible verdicts in the jurisdiction for similar matters. This variability in pleadings, together with the actual experience of the Company in litigating or resolvingthrough settlement numerous claims over an extended period of time, demonstrates to management that the monetary relief which may be specified in a lawsuitor claim bears little relevance to its merits or disposition value.
Due to the vagaries of litigation, the outcome of a litigation matter and the amount or range of potential loss at particular points in time may normally bedifficult to ascertain. Uncertainties can include how fact finders will evaluate documentary evidence and the credibility and effectiveness of witness testimony,and how trial and appellate courts will apply the law in the context of the pleadings or evidence presented, whether by motion practice, at trial or on appeal.Disposition valuations are also subject to the uncertainty of how opposing parties and their counsel will view the relevant evidence and applicable law.
The Company establishes liabilities for litigation and regulatory loss contingencies when it is probable that a loss has been incurred and the amount of theloss can be reasonably estimated. Liabilities have been established for a number of the matters noted below. It is possible that some of the matters could requirethe Company to pay damages or make other expenditures or establish accruals in amounts that could not be reasonably estimated at September 30, 2018 . Whilethe potential future charges could be material in the particular quarterly or annual periods in which they are recorded, based on information currently known tomanagement, management does not believe any such charges are likely to have a material effect on the Company’s financial position.
Matters as to Which an Estimate Can Be Made
For some of the matters disclosed below, the Company is able to estimate a reasonably possible range of loss. For such matters where a loss is believed tobe reasonably possible, but not probable, the Company has not made an accrual. As of September 30, 2018 , the Company estimates the aggregate range ofreasonably possible losses in excess of amounts accrued for these matters to be $0 to $600 million .
Matters as to Which an Estimate Cannot Be Made
For other matters disclosed below, the Company is not currently able to estimate the reasonably possible loss or range of loss. The Company is oftenunable to estimate the possible loss or range of loss until developments in such matters have provided sufficient information to support an assessment of therange of possible loss, such as quantification of a damage demand from plaintiffs, discovery from other parties and investigation of factual allegations, rulingsby the court on motions or appeals, analysis by experts, and the progress of settlement negotiations. On a quarterly and annual basis, the Company reviewsrelevant information with respect to litigation contingencies and updates its accruals, disclosures and estimates of reasonably possible losses or ranges of lossbased on such reviews.
95
Table of Contents
MetLife, Inc.
Notes to the Interim Condensed Consolidated Financial Statements (Unaudited) — (continued)
15. Contingencies, Commitments and Guarantees (continued)
Asbestos-Related Claims
MLIC is and has been a defendant in a large number of asbestos-related suits filed primarily in state courts. These suits principally allege that the plaintiffor plaintiffs suffered personal injury resulting from exposure to asbestos and seek both actual and punitive damages. MLIC has never engaged in the businessof manufacturing, producing, distributing, or selling asbestos or asbestos-containing products nor has MLIC issued liability or workers’ compensationinsurance to companies in the business of manufacturing, producing, distributing, or selling asbestos or asbestos-containing products. The lawsuits principallyhave focused on allegations with respect to certain research, publication and other activities of one or more of MLIC’s employees during the period from the1920’s through approximately the 1950’s and allege that MLIC learned or should have learned of certain health risks posed by asbestos and, among otherthings, improperly publicized or failed to disclose those health risks. MLIC believes that it should not have legal liability in these cases. The outcome of mostasbestos litigation matters, however, is uncertain and can be impacted by numerous variables, including differences in legal rulings in various jurisdictions, thenature of the alleged injury and factors unrelated to the ultimate legal merit of the claims asserted against MLIC. MLIC employs a number of resolutionstrategies to manage its asbestos loss exposure, including seeking resolution of pending litigation by judicial rulings and settling individual or groups of claimsor lawsuits under appropriate circumstances.
Claims asserted against MLIC have included negligence, intentional tort and conspiracy concerning the health risks associated with asbestos. MLIC’sdefenses (beyond denial of certain factual allegations) include that: (i) MLIC owed no duty to the plaintiffs— it had no special relationship with the plaintiffsand did not manufacture, produce, distribute, or sell the asbestos products that allegedly injured plaintiffs; (ii) plaintiffs did not rely on any actions of MLIC;(iii) MLIC’s conduct was not the cause of the plaintiffs’ injuries; (iv) plaintiffs’ exposure occurred after the dangers of asbestos were known; and (v) theapplicable time with respect to filing suit has expired. During the course of the litigation, certain trial courts have granted motions dismissing claims againstMLIC, while other trial courts have denied MLIC’s motions. There can be no assurance that MLIC will receive favorable decisions on motions in the future.While most cases brought to date have settled, MLIC intends to continue to defend aggressively against claims based on asbestos exposure, includingdefending claims at trials.
As reported in the 2017 Annual Report, MLIC received approximately 3,514 asbestos-related claims in 2017 . During the nine months endedSeptember 30, 2018 and 2017 , MLIC received approximately 2,558 and 2,742 new asbestos-related claims, respectively. See Note 20 of the Notes to theConsolidated Financial Statements included in the 2017 Annual Report for historical information concerning asbestos claims and MLIC’s increase in itsrecorded liability at December 31, 2017. The number of asbestos cases that may be brought, the aggregate amount of any liability that MLIC may incur, andthe total amount paid in settlements in any given year are uncertain and may vary significantly from year to year.
The ability of MLIC to estimate its ultimate asbestos exposure is subject to considerable uncertainty, and the conditions impacting its liability can bedynamic and subject to change. The availability of reliable data is limited and it is difficult to predict the numerous variables that can affect liability estimates,including the number of future claims, the cost to resolve claims, the disease mix and severity of disease in pending and future claims, the impact of thenumber of new claims filed in a particular jurisdiction and variations in the law in the jurisdictions in which claims are filed, the possible impact of tort reformefforts, the willingness of courts to allow plaintiffs to pursue claims against MLIC when exposure to asbestos took place after the dangers of asbestos exposurewere well known, and the impact of any possible future adverse verdicts and their amounts.
The ability to make estimates regarding ultimate asbestos exposure declines significantly as the estimates relate to years further in the future. In theCompany’s judgment, there is a future point after which losses cease to be probable and reasonably estimable. It is reasonably possible that the Company’stotal exposure to asbestos claims may be materially greater than the asbestos liability currently accrued and that future charges to income may be necessary.While the potential future charges could be material in the particular quarterly or annual periods in which they are recorded, based on information currentlyknown by management, management does not believe any such charges are likely to have a material effect on the Company’s financial position.
96
Table of Contents
MetLife, Inc.
Notes to the Interim Condensed Consolidated Financial Statements (Unaudited) — (continued)
15. Contingencies, Commitments and Guarantees (continued)
The Company believes adequate provision has been made in its consolidated financial statements for all probable and reasonably estimable losses forasbestos-related claims. MLIC’s recorded asbestos liability is based on its estimation of the following elements, as informed by the facts presently known to it,its understanding of current law and its past experiences: (i) the probable and reasonably estimable liability for asbestos claims already asserted against MLIC,including claims settled but not yet paid; (ii) the probable and reasonably estimable liability for asbestos claims not yet asserted against MLIC, but whichMLIC believes are reasonably probable of assertion; and (iii) the legal defense costs associated with the foregoing claims. Significant assumptions underlyingMLIC’s analysis of the adequacy of its recorded liability with respect to asbestos litigation include: (i) the number of future claims; (ii) the cost to resolveclaims; and (iii) the cost to defend claims.
MLIC reevaluates on a quarterly and annual basis its exposure from asbestos litigation, including studying its claims experience, reviewing externalliterature regarding asbestos claims experience in the United States, assessing relevant trends impacting asbestos liability and considering numerous variablesthat can affect its asbestos liability exposure on an overall or per claim basis. These variables include bankruptcies of other companies involved in asbestoslitigation, legislative and judicial developments, the number of pending claims involving serious disease, the number of new claims filed against it and otherdefendants and the jurisdictions in which claims are pending. Based upon its regular reevaluation of its exposure from asbestos litigation, MLIC has updatedits liability analysis for asbestos-related claims through September 30, 2018 .
Regulatory Matters
The Company receives and responds to subpoenas or other inquiries seeking a broad range of information from state regulators, including state insurancecommissioners; state attorneys general or other state governmental authorities; federal regulators, including the SEC; federal governmental authorities,including congressional committees; and the Financial Industry Regulatory Authority (“FINRA”), as well as from local and national regulators andgovernment authorities in jurisdictions outside the United States where MetLife conducts business. The issues involved in information requests and regulatorymatters vary widely. The Company cooperates in these inquiries.
In the Matter of Chemform, Inc. Site, Pompano Beach, Broward County, Florida
In July 2010, the Environmental Protection Agency (“EPA”) advised MLIC that it believed payments were due under two settlement agreements,known as “Administrative Orders on Consent,” that New England Mutual Life Insurance Company (“New England Mutual”) signed in 1989 and 1992 withrespect to the cleanup of a Superfund site in Florida (the “Chemform Site”). The EPA originally contacted MLIC (as successor to New England Mutual) anda third party in 2001, and advised that they owed additional clean-up costs for the Chemform Site. The matter was not resolved at that time. InSeptember 2012, the EPA, MLIC and the third party executed an Administrative Order on Consent under which MLIC and the third party agreed to beresponsible for certain environmental testing at the Chemform Site. The EPA may seek additional costs if the environmental testing identifies issues. TheEPA and MLIC have reached a settlement in principle on the EPA’s claim for past costs. The Company estimates that the aggregate cost to resolve thismatter, including the settlement for claims of past costs and the costs of environmental testing, will not exceed $300 thousand .
Sales Practices Regulatory Matters
Regulatory authorities in a number of states and FINRA, and occasionally the SEC, have had investigations or inquiries relating to sales of individuallife insurance policies or annuities or other products by MLIC and GALIC (which merged into MTL in April of 2018), as well as former subsidiaries of theCompany that are part of Brighthouse as a result of the Separation, and a former broker-dealer subsidiary. These investigations often focus on the conduct ofparticular financial services representatives and the sale of unregistered or unsuitable products or the misuse of client assets. Over the past several years,these and a number of investigations by other regulatory authorities were resolved for monetary payments and certain other relief, including restitutionpayments. The Company may continue to resolve investigations in a similar manner. The Company believes adequate provision has been made in itsconsolidated financial statements for all probable and reasonably estimable losses for these sales practices-related investigations or inquiries.
97
Table of Contents
MetLife, Inc.
Notes to the Interim Condensed Consolidated Financial Statements (Unaudited) — (continued)
15. Contingencies, Commitments and Guarantees (continued)
Unclaimed Property Litigation
City of Westland Police and Fire Retirement System v. MetLife, Inc., et al. (S.D.N.Y., filed January 12, 2012)
Seeking to represent a class of persons who purchased MetLife, Inc. common shares between February 2, 2010, and October 6, 2011, the plaintiffalleges that MetLife, Inc. and several current and former directors and executive officers of MetLife, Inc. violated the Securities Act of 1933, as well as theSecurities Exchange Act of 1934 (“Exchange Act”) and Rule 10b-5 promulgated thereunder by issuing, or causing MetLife, Inc. to issue, materially falseand misleading statements concerning MetLife, Inc.’s potential liability for millions of dollars in insurance benefits that should have been paid tobeneficiaries or escheated to the states. Plaintiff seeks unspecified compensatory damages and other relief. On September 22, 2017, the Court grantedplaintiff’s motion to certify its proposed class of persons who purchased or acquired MetLife, Inc. common stock in the Company’s August 3, 2010 offeringor the Company’s March 4, 2011 offering. The defendants intend to defend this action vigorously.
Total Asset Recovery Services, LLC. v. MetLife, Inc., et al. (Supreme Court of the State of New York, County of New York, filed November 17, 2017)
Alleging that MetLife, Inc., MLIC, and several other insurance companies violated the New York False Claims Act (the “Act”) by filing falseunclaimed property reports from 1986 to 2017 with New York to avoid having to escheat the proceeds of more than 25,000 life insurance policies, includingpolicies for which the defendants escheated funds as part of their demutualizations in the late 1990s, Total Asset Recovery Services (“The Relator”) hasbrought an action under the qui tam provision of the Act on behalf of itself and New York. The Relator originally filed this action under seal in 2010, andthe complaint was unsealed on December 19, 2017. The Relator seeks treble damages and other relief. The Company intends to defend this actionvigorously.
Total Control Accounts Litigation
MLIC is a defendant in a lawsuit related to its use of retained asset accounts, known as Total Control Accounts (“TCA”), as a settlement option for deathbenefits.
Owens v. Metropolitan Life Insurance Company (N.D. Ga., filed April 17, 2014)
Plaintiff filed this class action lawsuit on behalf of all persons for whom MLIC established a TCA to pay death benefits under an Employee RetirementIncome Security Act of 1974 (“ERISA”) plan. The action alleges that MLIC’s use of the TCA as the settlement option for life insurance benefits under somegroup life insurance policies violates MLIC’s fiduciary duties under ERISA. As damages, plaintiff seeks disgorgement of profits that MLIC realized onaccounts owned by members of the class. In addition, plaintiff, on behalf of a subgroup of the class, seeks interest under Georgia’s delayed settlementinterest statute, alleging that the use of the TCA as the settlement option did not constitute payment. On September 27, 2016, the court denied MLIC’ssummary judgment motion in full and granted plaintiff’s partial summary judgment motion. On September 29, 2017, the court certified a nationwide class.The court also certified a Georgia subclass. The Company intends to defend this action vigorously.
Inquiries into Pension Benefits and Assumed Variable Annuity Guarantee Reserves and Related Litigation
The Company informed its primary state regulator, the New York Department of Financial Services (“NYDFS”), about its practices in connection withthe payment of certain pension benefits to annuitants and related matters. The NYDFS is examining the issue. The Division of Enforcement of the SEC is alsoinvestigating this matter and several additional regulators have made inquiries into these practices, including as to related disclosures. It is possible that otherjurisdictions may pursue similar investigations or inquiries. On January 29, 2018, the Company announced that in connection with a review of practices andprocedures used to estimate reserves related to certain RIS group annuitants who have been unresponsive or missing over time, the Company had identified amaterial weakness in its internal control over financial reporting related to certain RIS group annuity reserves. In conjunction with the material weakness, theCompany increased reserves by $510 million pre-tax to reinstate reserves previously released, and to reflect accrued interest and other related liabilities. SeeNote 1 of the Notes to the Consolidated Financial Statements included in the 2017 Annual Report.
98

Table of Contents
MetLife, Inc.
Notes to the Interim Condensed Consolidated Financial Statements (Unaudited) — (continued)
15. Contingencies, Commitments and Guarantees (continued)
The Company informed the SEC that as a result of its review of the calculation of reserves associated with certain variable annuity guarantees assumedfrom the former operating joint venture in Japan, the Company had identified a material weakness in its internal control over financial reporting related tothese reserves. In conjunction with the material weakness, the Company decreased these reserves by $896 million pre-tax at December 31, 2017. See Note 1 ofthe Notes to the Consolidated Financial Statements included in the 2017 Annual Report. The Division of Enforcement of the SEC is investigating this matterand the Company has informed other regulators. It is possible that other regulators may pursue similar investigations or inquiries.
The Company is exposed to lawsuits and regulatory investigations, and could be exposed to additional legal actions relating to these matters. These mayresult in payments, including damages, fines, penalties, interest and other amounts assessed or awarded by courts or regulatory authorities under applicableescheat, tax, securities, ERISA, or other laws or regulations. The Company could incur significant costs in connection with these actions. The Company’sincrease in reserves does not reflect, and the Company has not recorded an accrual for, any such potential amounts. An estimate of the possible loss or range ofloss cannot be made at this time.
Parchmann v. MetLife, Inc., et al. (E.D.N.Y., filed February 5, 2018)
Seeking to represent a class of persons who purchased MetLife, Inc. common stock from February 27, 2013 through January 29, 2018, the plaintiffalleges that MetLife, Inc., its Chief Executive Officer and Chairman of the Board, and its CFO violated Section 10(b) of the Exchange Act and Rule 10b-5promulgated thereunder by issuing materially false and/or misleading statements because the defendants failed to disclose that MetLife’s practices andprocedures used to estimate its reserves set aside for annuity and pension payments were inadequate, and that MetLife had inadequate internal control overfinancial reporting. The plaintiff seeks unspecified compensatory damages and other relief. The defendants intend to defend this action vigorously.
Roycroft v. MetLife, Inc., et al. (S.D.N.Y., filed June 18, 2018)
Plaintiff filed this putative class action on behalf of all persons due benefits under group annuity contracts but who did not receive the entire amount towhich they were entitled. Plaintiff asserts claims for unjust enrichment, accounting, and restitution based on allegations that the Company failed to timelypay annuity benefits to certain group annuitants. Plaintiff seeks declaratory and injunctive relief, as well as unspecified compensatory and punitive damages,and other relief. The Company intends to defend this action vigorously.
In the Matter of MetLife, Inc. (Mass. Sec. Div., filed June 25, 2018)
The Enforcement Section of the Massachusetts Securities Division of the Office of the Secretary of the Commonwealth (the “MSD”) filed anadministrative complaint in order to commence an adjudicatory proceeding against the Company for alleged violations of Section 101 of the MassachusettsUniform Securities Act and regulations promulgated thereunder, alleging that the Company made materially misleading statements regarding the sufficiencyof its reserves related to group annuity contracts and the effectiveness of its internal control over financial reporting. The MSD seeks injunctive relief, aswell as an unspecified administrative fine and other relief. The Company intends to defend this action vigorously.
Demands
The MetLife, Inc. Board of Directors has received three letters, dated March 28, 2018, May 11, 2018, and July 16, 2018 written on behalf of individualstockholders, demanding that MetLife, Inc. take action against current and former directors and officers for alleged breaches of fiduciary duty and/orinvestigate, remediate, and recover damages allegedly suffered by the Company as a result of (i) the Company’s allegedly inadequate practices andprocedures used to estimate reserves for annuity and pension payments, (ii) the Company’s allegedly inadequate internal controls over financial reportingand corporate governance practices and procedures, and (iii) the alleged dissemination of false or misleading information related to these issues. TheMetLife, Inc. Board of Directors has appointed a special committee to investigate the allegations set forth in these three letters.
99
Table of Contents
MetLife, Inc.
Notes to the Interim Condensed Consolidated Financial Statements (Unaudited) — (continued)
15. Contingencies, Commitments and Guarantees (continued)
Other Litigation
Sun Life Assurance Company of Canada Indemnity Claim
In 2006, Sun Life Assurance Company of Canada (“Sun Life”), as successor to the purchaser of MLIC’s Canadian operations, filed a lawsuit inToronto, seeking a declaration that MLIC remains liable for “market conduct claims” related to certain individual life insurance policies sold by MLIC thatwere subsequently transferred to Sun Life. In January 2010, the court found that Sun Life had given timely notice of its claim for indemnification but,because it found that Sun Life had not yet incurred an indemnifiable loss, granted MLIC’s motion for summary judgment. In September 2010, Sun Lifenotified MLIC that a purported class action lawsuit was filed against Sun Life in Toronto alleging sales practices claims regarding the policies sold by MLICand transferred to Sun Life (the “Ontario Litigation”). On August 30, 2011, Sun Life notified MLIC that another purported class action lawsuit was filedagainst Sun Life in Vancouver, BC alleging sales practices claims regarding certain of the same policies sold by MLIC and transferred to Sun Life. Sun Lifecontends that MLIC is obligated to indemnify Sun Life for some or all of the claims in these lawsuits. In September 2018, the Court of Appeal for Ontarioaffirmed the lower court’s decision to not certify the sales practices claims in the Ontario Litigation. These sales practices cases against Sun Life areongoing, and the Company is unable to estimate the reasonably possible loss or range of loss arising from this litigation.
Voshall v. Metropolitan Life Insurance Company (Superior Court of the State of California, County of Los Angeles, April 8, 2015)
Plaintiff filed this putative class action lawsuit on behalf of himself and all persons covered under a long-term group disability income insurance policyissued by MLIC to public entities in California between April 8, 2011 and April 8, 2015. Plaintiff alleges that MLIC improperly reduced benefits byincluding cost of living adjustments and employee paid contributions in the employer retirement benefits and other income that reduces the benefit payableunder such policies. Plaintiff asserts causes of action for declaratory relief, violation of the California Business & Professions Code, breach of contract andbreach of the implied covenant of good faith and fair dealing. The Company intends to defend this action vigorously.
Martin v. Metropolitan Life Insurance Company, (Superior Court of the State of California, County of Contra Costa, filed December 17, 2015)
Plaintiffs filed this putative class action lawsuit on behalf of themselves and all California persons who have been charged compound interest by MLICin life insurance policy and/or premium loan balances within the last four years. Plaintiffs allege that MLIC has engaged in a pattern and practice ofcharging compound interest on life insurance policy and premium loans without the borrower authorizing such compounding, and that this constitutes anunlawful business practice under California law. Plaintiffs assert causes of action for declaratory relief, violation of California’s Unfair Competition Lawand Usury Law, and unjust enrichment. Plaintiffs seek declaratory and injunctive relief, restitution of interest, and damages in an unspecified amount. OnApril 12, 2016, the court granted MLIC’s motion to dismiss. Plaintiffs have appealed this ruling to the United States Court of Appeals for the Ninth Circuit.The Company intends to defend this action vigorously.
Newman v. Metropolitan Life Insurance Company (N.D. Ill., filed March 23, 2016)
Plaintiff filed this putative class action alleging causes of action for breach of contract, fraud, and violations of the Illinois Consumer Fraud andDeceptive Business Practices Act, based on MLIC’s class-wide increase in premiums charged for long-term care insurance policies. Plaintiff alleges a classconsisting of herself and all persons over age 65 who selected a Reduced Pay at Age 65 payment feature and whose premium rates were increased afterage 65. Plaintiff asserts that premiums could not be increased for these class members and/or that marketing material was misleading as to MLIC’s right toincrease premiums. Plaintiff seeks unspecified compensatory, statutory and punitive damages, as well as recessionary and injunctive relief. On April 12,2017, the court granted MLIC’s motion, dismissing the action with prejudice. Plaintiff appealed this ruling to the United States Court of Appeals for theSeventh Circuit (the “Seventh Circuit”) and on February 6, 2018, the Seventh Circuit reversed and remanded for further proceedings, ruling that Plaintiff isentitled to relief on her contract claim. Following MLIC’s petition for rehearing, the Seventh Circuit issued an amended opinion on March 22, 2018, holdingthat plaintiff’s claim survived MLIC’s motion to dismiss but finding that the policy is ambiguous as to MLIC’s right to raise plaintiff’s premiums. TheSeventh Circuit held that on remand to the district court, the parties may introduce evidence to try to resolve this ambiguity.
100
Table of Contents
MetLife, Inc.
Notes to the Interim Condensed Consolidated Financial Statements (Unaudited) — (continued)
15. Contingencies, Commitments and Guarantees (continued)
Miller, et al. v. MetLife, Inc., et al. (C.D. Cal., filed April 7, 2017)
Plaintiff filed this putative class action against MetLife, Inc. and MLIC in the U.S. District Court for the Central District of California, purporting toassert claims on behalf of all persons who replaced their MetLife Optional Term Life or Group Universal Life policy with a Group Variable Universal Lifepolicy wherein MetLife allegedly charged smoker rates for certain non-smokers. Plaintiff seeks unspecified compensatory and punitive damages, as well asother relief. On September 25, 2017, plaintiff dismissed the action and refiled the complaint in U.S. District Court for the Southern District of New York. OnNovember 9, 2017, plaintiff dismissed MetLife, Inc. without prejudice from the action. MLIC intends to defend this action vigorously.
Julian & McKinney v. Metropolitan Life Insurance Company (S.D.N.Y., filed February 9, 2017)
Plaintiffs filed this putative class and collective action on behalf of themselves and all current and former long-term disability (“LTD”) claimsspecialists between February 2011 and the present for alleged wage and hour violations under the Fair Labor Standards Act, the New York Labor Law, andthe Connecticut Minimum Wage Act. The suit alleges that MetLife improperly reclassified the plaintiffs and similarly situated LTD claims specialists fromnon-exempt to exempt from overtime pay in November 2013. As a result, they and members of the putative class were no longer eligible for overtime payeven though they allege they continued to work more than 40 hours per week. On March 22, 2018, the Court conditionally certified the case as a collectiveaction, requiring that notice be mailed to LTD claims specialists who worked for the Company from February 8, 2014 to the present. The Company intendsto defend this action vigorously.
Sales Practices Claims
Over the past several years, the Company has faced numerous claims, including class action lawsuits, alleging improper marketing or sales of individuallife insurance policies, annuities, mutual funds, other products or the misuse of client assets. Some of the current cases seek substantial damages, includingpunitive and treble damages and attorneys’ fees. The Company continues to defend vigorously against the claims in these matters. The Company believesadequate provision has been made in its consolidated financial statements for all probable and reasonably estimable losses for sales practices matters.
Summary
Putative or certified class action litigation and other litigation and claims and assessments against the Company, in addition to those discussed previouslyand those otherwise provided for in the Company’s consolidated financial statements, have arisen in the course of the Company’s business, including, but notlimited to, in connection with its activities as an insurer, mortgage lending bank, employer, investor, investment advisor and taxpayer. Further, state insuranceregulatory authorities and other federal and state authorities regularly make inquiries and conduct investigations concerning the Company’s compliance withapplicable insurance and other laws and regulations.
It is not possible to predict the ultimate outcome of all pending investigations and legal proceedings. In some of the matters referred to previously, verylarge and/or indeterminate amounts, including punitive and treble damages, are sought. Although in light of these considerations it is possible that an adverseoutcome in certain cases could have a material effect upon the Company’s financial position, based on information currently known by the Company’smanagement, in its opinion, the outcomes of such pending investigations and legal proceedings are not likely to have such an effect. However, given the largeand/or indeterminate amounts sought in certain of these matters and the inherent unpredictability of litigation, it is possible that an adverse outcome in certainmatters could, from time to time, have a material effect on the Company’s consolidated net income or cash flows in particular quarterly or annual periods.
Commitments
MortgageLoanCommitments
The Company commits to lend funds under mortgage loan commitments. The amounts of these mortgage loan commitments were $4.3 billion and$3.4 billion at September 30, 2018 and December 31, 2017 , respectively.
CommitmentstoFundPartnershipInvestments,BankCreditFacilities,BridgeLoansandPrivateCorporateBondInvestments
The Company commits to fund partnership investments and to lend funds under bank credit facilities, bridge loans and private corporate bond investments.The amounts of these unfunded commitments were $6.7 billion and $6.1 billion at September 30, 2018 and December 31, 2017 , respectively.
Guarantees
In the normal course of its business, the Company has provided certain indemnities, guarantees and commitments to third parties such that it may be requiredto make payments now or in the future. In the context of acquisition, disposition, investment and other transactions, the Company has provided indemnities andguarantees, including those related to tax, environmental and other specific liabilities and other indemnities and guarantees that are triggered by, among otherthings, breaches of representations, warranties or covenants provided by the Company. In addition, in the normal course of business, the Company providesindemnifications to counterparties in contracts with triggers similar to the foregoing, as well as for certain other liabilities, such as third-party lawsuits. Theseobligations are often subject to time limitations that vary in duration, including contractual limitations and those that arise by operation of law, such as applicablestatutes of limitation. In some cases, the maximum potential obligation under the indemnities and guarantees is subject to a contractual limitation ranging from lessthan $1 million to $329 million , with a cumulative maximum of $772 million , while in other cases such limitations are not specified or applicable. Since certain ofthese obligations are not subject to limitations, the Company does not believe that it is possible to determine the maximum potential amount that could become dueunder these guarantees in the future. Management believes that it is unlikely the Company will have to make any material payments under these indemnities,guarantees, or commitments.
In addition, the Company indemnifies its directors and officers as provided in its charters and by-laws. Also, the Company indemnifies its agents for liabilitiesincurred as a result of their representation of the Company’s interests. Since these indemnities are generally not subject to limitation with respect to duration oramount, the Company does not believe that it is possible to determine the maximum potential amount that could become due under these indemnities in the future.
The Company has also minimum fund yield requirements on certain international pension funds in accordance with local laws. Since these guarantees are notsubject to limitation with respect to duration or amount, the Company does not believe that it is possible to determine the maximum potential amount that couldbecome due under these guarantees in the future.
The Company’s recorded liabilities were $6 million and $5 million at September 30, 2018 and December 31, 2017 , respectively, for indemnities, guarantees

and commitments.
16. Subsequent Events
CommonStockRepurchaseAuthorization
On November 1, 2018, MetLife, Inc. announced that its Board of Directors authorized an additional $2.0 billion of common stock repurchases.
CommonStockDividend
On October 23, 2018, the MetLife, Inc. Board of Directors declared a fourth quarter 2018 common stock dividend of $0.42 per share payable onDecember 13, 2018 to shareholders of record as of November 6, 2018. The Company estimates that the aggregate dividend payment will be $416 million .
NewYorkSpecialConsiderationsLetter
The NYDFS issued its annual “Special Considerations” letter (“SCL”) to New York licensed insurers on November 2, 2018, including to one of theCompany’s primary insurance subsidiaries, MLIC. The SCL includes certain provisions that require such insurers, among other things, to use certain assumptionsand perform certain tests as part of year-end asset adequacy testing. The Company is currently evaluating the SCL’s potential impact.
101
Table of Contents
Item 2. Management’s Discussion and Analysis of Financial Condition and Results of Operations
Index to Management’s Discussion and Analysis of Financial Condition and Results of Operations
Page
Forward-Looking Statements and Other Financial Information 103Executive Summary 103Industry Trends 109Summary of Critical Accounting Estimates 113Economic Capital 114Acquisitions and Dispositions 115Results of Operations 116Investments 142Derivatives 156Off-Balance Sheet Arrangements 158Policyholder Liabilities 159Liquidity and Capital Resources 168Adoption of New Accounting Pronouncements 179Future Adoption of New Accounting Pronouncements 179Non-GAAP and Other Financial Disclosures 179Subsequent Events 181
102
Table of Contents
Forward-Looking Statements and Other Financial Information
For purposes of this discussion, “MetLife,” the “Company,” “we,” “our” and “us” refer to MetLife, Inc., a Delaware corporation incorporated in 1999, itssubsidiaries and affiliates. This discussion should be read in conjunction with MetLife, Inc.’s Annual Report on Form 10-K for the year ended December 31, 2017(the “2017 Annual Report”), the cautionary language regarding forward-looking statements included below, the “Risk Factors” set forth in Part II, Item 1A, and theadditional risk factors referred to therein, “Quantitative and Qualitative Disclosures About Market Risk” and the Company’s interim condensed consolidatedfinancial statements included elsewhere herein.
This Management’s Discussion and Analysis of Financial Condition and Results of Operations may contain or incorporate by reference information thatincludes or is based upon forward-looking statements within the meaning of the Private Securities Litigation Reform Act of 1995. Forward-looking statements giveexpectations or forecasts of future events. These statements can be identified by the fact that they do not relate strictly to historical or current facts. They use wordsand terms such as “anticipate,” “estimate,” “expect,” “project,” “intend,” “plan,” “believe,” “will,” and other words and terms of similar meaning, or are tied tofuture periods, in connection with a discussion of future performance. In particular, these include statements relating to future actions, prospective services orproducts, future performance or results of current and anticipated services or products, sales efforts, expenses, the outcome of contingencies such as legalproceedings, trends in operations and financial results. Many factors will be important in determining the results of MetLife, Inc., its subsidiaries and affiliates.Forward-looking statements are based on our assumptions and current expectations, which may be inaccurate, and on the current economic environment, whichmay change. These statements are not guarantees of future performance. They involve a number of risks and uncertainties that are difficult to predict. Results coulddiffer materially from those expressed or implied in the forward-looking statements. See “Note Regarding Forward-Looking Statements.”
This Management’s Discussion and Analysis of Financial Condition and Results of Operations includes references to our performance measures, adjustedearnings and adjusted earnings available to common shareholders, that are not based on accounting principles generally accepted in the United States of America(“GAAP”). These measures are used by management to evaluate performance and allocate resources. Consistent with GAAP guidance for segment reporting,adjusted earnings is also our GAAP measure of segment performance. Adjusted earnings and other financial measures based on adjusted earnings are also themeasures by which senior management’s and many other employees’ performance is evaluated for the purposes of determining their compensation underapplicable compensation plans. Adjusted earnings and other financial measures based on adjusted earnings allow analysis of our performance relative to ourbusiness plan and facilitate comparisons to industry results. Forward-looking guidance provided on a non-GAAP basis cannot be reconciled to the most directlycomparable GAAP measures on a forward-looking basis because net income may fluctuate significantly if net investment gains and losses and net derivative gainsand losses move outside of estimated ranges. See “— Non-GAAP and Other Financial Disclosures” for definitions and a discussion of these measures, and “—Results of Operations” for reconciliations of historical non-GAAP financial measures to the most directly comparable GAAP measures.
Executive Summary
Overview
MetLife is one of the world’s leading financial services companies, providing insurance, annuities, employee benefits and asset management. MetLife isorganized into five segments: U.S.; Asia; Latin America; Europe, the Middle East and Africa (“EMEA”); and MetLife Holdings. In addition, the Company reportscertain of its results of operations in Corporate & Other. See Note 2 of the Notes to the Interim Condensed Consolidated Financial Statements for furtherinformation on the Company’s segments and Corporate & Other. Management continues to evaluate the Company’s segment performance and allocated resourcesand may adjust related measurements in the future to better reflect segment profitability.
GroupAnnuityReserves,AssumedVariableAnnuityGuaranteeReservesandOtherRevisions
As discussed in “Management’s Discussion and Analysis of Financial Condition and Results of Operations — Executive Summary — Overview — GroupAnnuity Reserves, Assumed Variable Annuity Guarantee Reserves and Other Revisions” included in the 2017 Annual Report, material weaknesses wereidentified in internal control over financial reporting relating to the review of practices and procedures used to estimate (i) the Company’s reserves related tocertain Retirement and Income Solutions (“RIS”) group annuitants who have been unresponsive or missing over time and (ii) certain reserves associated withMetLife Holdings variable annuity guarantees assumed from a former operating joint venture in Japan. An update of the remediation plan to remove the materialweaknesses is further described in “Controls and Procedures.” Also, see Note 1 of the Notes to the Interim Condensed Consolidated Financial Statements forprior year periods’ revisions related to the Company’s consolidated results, as well as “Risk Factors” disclosed in the 2017 Annual Report, as amended orsupplemented in our subsequently filed Quarterly Reports on Form 10-Q under Item 1A. Risk Factors, for further information.
103

Table of Contents
U.S.TaxReform
On December 22, 2017, President Trump signed into law H.R.1, commonly referred to as the Tax Cuts and Jobs Act of 2017 (“U.S. Tax Reform”). U.S. TaxReform includes numerous changes in tax law, including a permanent reduction in the U.S. federal corporate income tax rate from 35% to 21%, which tookeffect for taxable years beginning on or after January 1, 2018, a participation exemption system which generally eliminates U.S. federal income tax on dividendsreceived from foreign subsidiaries, and a number of other revenue raisers.
Given the complexities of U.S. Tax Reform, amounts recorded may change, possibly materially, due to, among other things, changes in interpretations andassumptions made by the Company, additional guidance that may be issued and actions that the Company may take. The Company continues to anticipate its2018 effective tax rate to be in the range of 18% to 20%. See Notes 1 and 13 of the Notes to the Interim Condensed Consolidated Financial Statements for afurther discussion of U.S. Tax Reform and the impact to the Company in the third quarter of 2018.
SeparationofBrighthouse
On August 4, 2017, MetLife, Inc. completed the separation of Brighthouse Financial, Inc. and its subsidiaries (“Brighthouse”) through a distribution of96,776,670 shares of Brighthouse Financial, Inc. common stock to the MetLife, Inc. common shareholders (the “Separation”). MetLife, Inc. retained theremaining ownership interest of 22,996,436 shares, or 19.2%, of Brighthouse Financial, Inc. common stock outstanding. The Separation resulted in theelimination of the Brighthouse Financial segment. The results of Brighthouse are reflected in the Company’s interim condensed consolidated financial statementsas discontinued operations and, therefore, are presented as income (loss) from discontinued operations on the interim condensed consolidated statements ofoperations and comprehensive income (loss). The reporting of discontinued operations had no impact on total consolidated net income (loss) for any of theperiods presented.
In June 2018, the Company sold fair value option (“FVO”) Brighthouse Financial, Inc. common stock (“FVO Brighthouse Common Stock”) in exchange for$944 million aggregate principal amount of MetLife, Inc. senior notes, which MetLife, Inc. canceled. At September 30, 2018, the Company no longer held anyshares of Brighthouse Financial, Inc. for its own account; however, certain insurance company separate accounts managed by the Company held shares ofBrighthouse Financial, Inc.
See Notes 3 and 9 of the Notes to the Interim Condensed Consolidated Financial Statements for further information.
104
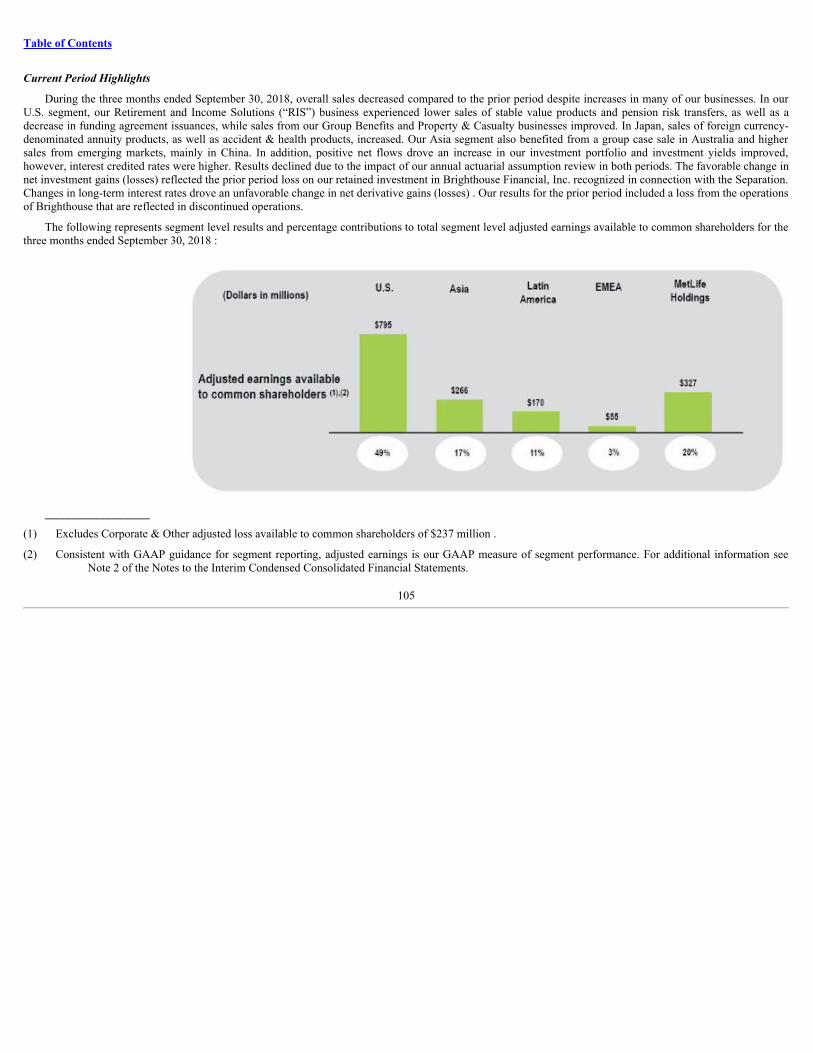
Table of Contents
CurrentPeriodHighlights
During the three months ended September 30, 2018, overall sales decreased compared to the prior period despite increases in many of our businesses. In ourU.S. segment, our Retirement and Income Solutions (“RIS”) business experienced lower sales of stable value products and pension risk transfers, as well as adecrease in funding agreement issuances, while sales from our Group Benefits and Property & Casualty businesses improved. In Japan, sales of foreign currency-denominated annuity products, as well as accident & health products, increased. Our Asia segment also benefited from a group case sale in Australia and highersales from emerging markets, mainly in China. In addition, positive net flows drove an increase in our investment portfolio and investment yields improved,however, interest credited rates were higher. Results declined due to the impact of our annual actuarial assumption review in both periods. The favorable change innet investment gains (losses) reflected the prior period loss on our retained investment in Brighthouse Financial, Inc. recognized in connection with the Separation.Changes in long-term interest rates drove an unfavorable change in net derivative gains (losses) . Our results for the prior period included a loss from the operationsof Brighthouse that are reflected in discontinued operations.
The following represents segment level results and percentage contributions to total segment level adjusted earnings available to common shareholders for thethree months ended September 30, 2018 :
__________________
(1) Excludes Corporate & Other adjusted loss available to common shareholders of $237 million .
(2) Consistent with GAAP guidance for segment reporting, adjusted earnings is our GAAP measure of segment performance. For additional information seeNote 2 of the Notes to the Interim Condensed Consolidated Financial Statements.
105
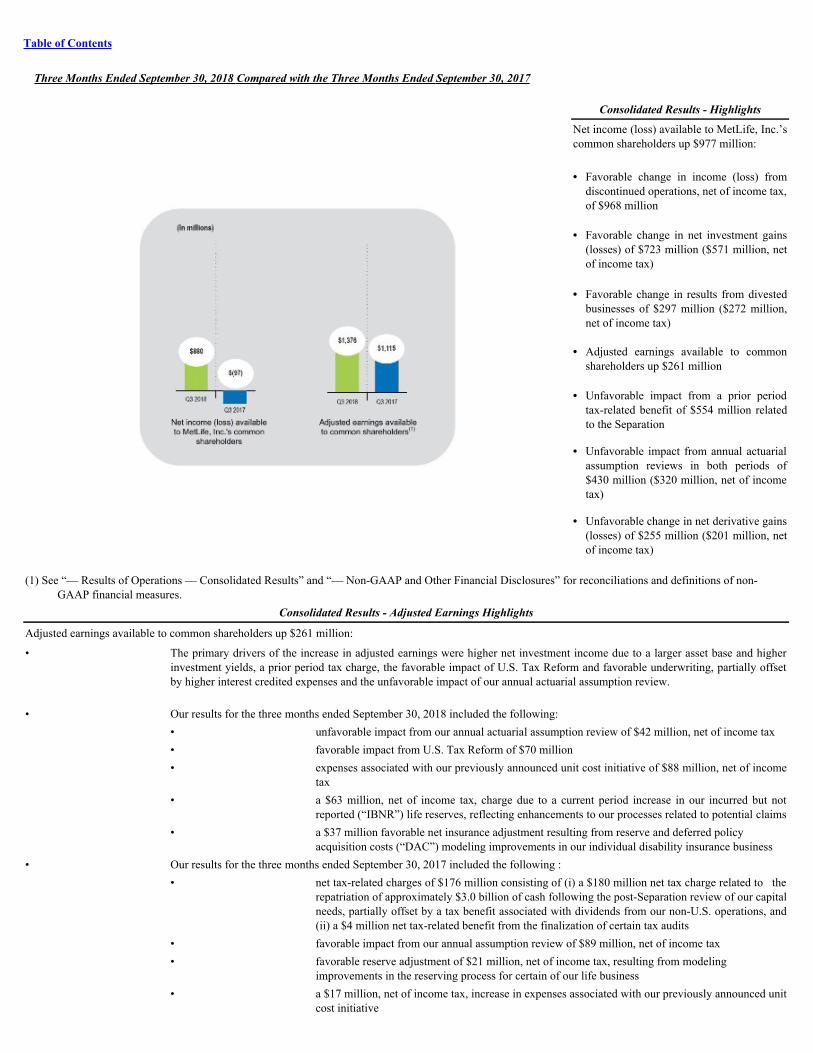
Table of Contents
ThreeMonthsEndedSeptember30,2018ComparedwiththeThreeMonthsEndedSeptember30,2017
ConsolidatedResults-Highlights
Net income (loss) available to MetLife, Inc.’scommon shareholders up $977 million: • Favorable change in income (loss) from
discontinued operations, net of income tax,of $968 million
• Favorable change in net investment gains
(losses) of $723 million ($571 million, netof income tax)
• Favorable change in results from divested
businesses of $297 million ($272 million,net of income tax)
• Adjusted earnings available to common
shareholders up $261 million • Unfavorable impact from a prior period
tax-related benefit of $554 million relatedto the Separation
• Unfavorable impact from annual actuarial
assumption reviews in both periods of$430 million ($320 million, net of incometax)
• Unfavorable change in net derivative gains
(losses) of $255 million ($201 million, netof income tax)
(1) See “— Results of Operations — Consolidated Results” and “— Non-GAAP and Other Financial Disclosures” for reconciliations and definitions of non-
GAAP financial measures.ConsolidatedResults-AdjustedEarningsHighlights
Adjusted earnings available to common shareholders up $261 million:
• The primary drivers of the increase in adjusted earnings were higher net investment income due to a larger asset base and higherinvestment yields, a prior period tax charge, the favorable impact of U.S. Tax Reform and favorable underwriting, partially offsetby higher interest credited expenses and the unfavorable impact of our annual actuarial assumption review.
• Our results for the three months ended September 30, 2018 included the following: • unfavorable impact from our annual actuarial assumption review of $42 million, net of income tax • favorable impact from U.S. Tax Reform of $70 million
• expenses associated with our previously announced unit cost initiative of $88 million, net of income
tax
• a $63 million, net of income tax, charge due to a current period increase in our incurred but not
reported (“IBNR”) life reserves, reflecting enhancements to our processes related to potential claims
• a $37 million favorable net insurance adjustment resulting from reserve and deferred policy
acquisition costs (“DAC”) modeling improvements in our individual disability insurance business• Our results for the three months ended September 30, 2017 included the following :
• net tax-related charges of $176 million consisting of (i) a $180 million net tax charge related to therepatriation of approximately $3.0 billion of cash following the post-Separation review of our capitalneeds, partially offset by a tax benefit associated with dividends from our non-U.S. operations, and(ii) a $4 million net tax-related benefit from the finalization of certain tax audits
• favorable impact from our annual assumption review of $89 million, net of income tax
• favorable reserve adjustment of $21 million, net of income tax, resulting from modeling
improvements in the reserving process for certain of our life business
• a $17 million, net of income tax, increase in expenses associated with our previously announced unit
cost initiative

106

Table of Contents
For a more in-depth discussion of our consolidated results, see “— Results of Operations — Consolidated Results,” “— Results of Operations —Consolidated Results — Adjusted Earnings” and “— Results of Operations — Segment Results and Corporate & Other.”
107
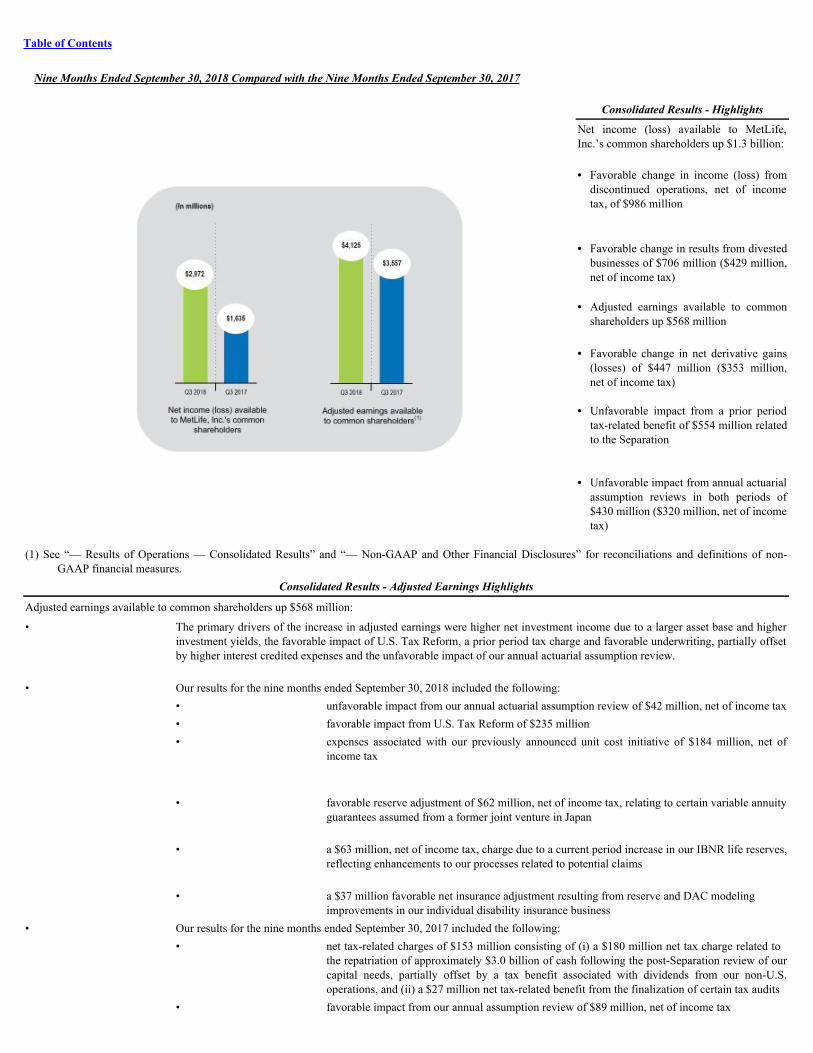
Table of Contents
NineMonthsEndedSeptember30,2018ComparedwiththeNineMonthsEndedSeptember30,2017
ConsolidatedResults-Highlights
Net income (loss) available to MetLife,Inc.’s common shareholders up $1.3 billion: • Favorable change in income (loss) from
discontinued operations, net of incometax, of $986 million
• Favorable change in results from divested
businesses of $706 million ($429 million,net of income tax)
• Adjusted earnings available to common
shareholders up $568 million • Favorable change in net derivative gains
(losses) of $447 million ($353 million,net of income tax)
• Unfavorable impact from a prior period
tax-related benefit of $554 million relatedto the Separation
• Unfavorable impact from annual actuarial
assumption reviews in both periods of$430 million ($320 million, net of incometax)
(1) See “— Results of Operations — Consolidated Results” and “— Non-GAAP and Other Financial Disclosures” for reconciliations and definitions of non-
GAAP financial measures.ConsolidatedResults-AdjustedEarningsHighlights
Adjusted earnings available to common shareholders up $568 million:
• The primary drivers of the increase in adjusted earnings were higher net investment income due to a larger asset base and higherinvestment yields, the favorable impact of U.S. Tax Reform, a prior period tax charge and favorable underwriting, partially offsetby higher interest credited expenses and the unfavorable impact of our annual actuarial assumption review.
• Our results for the nine months ended September 30, 2018 included the following: • unfavorable impact from our annual actuarial assumption review of $42 million, net of income tax • favorable impact from U.S. Tax Reform of $235 million
• expenses associated with our previously announced unit cost initiative of $184 million, net ofincome tax
• favorable reserve adjustment of $62 million, net of income tax, relating to certain variable annuityguarantees assumed from a former joint venture in Japan
• a $63 million, net of income tax, charge due to a current period increase in our IBNR life reserves,reflecting enhancements to our processes related to potential claims
• a $37 million favorable net insurance adjustment resulting from reserve and DAC modeling
improvements in our individual disability insurance business• Our results for the nine months ended September 30, 2017 included the following:
• net tax-related charges of $153 million consisting of (i) a $180 million net tax charge related to the repatriation of approximately $3.0 billion of cash following the post-Separation review of ourcapital needs, partially offset by a tax benefit associated with dividends from our non-U.S.operations, and (ii) a $27 million net tax-related benefit from the finalization of certain tax audits
• favorable impact from our annual assumption review of $89 million, net of income tax

• expenses associated with our previously announced unit cost initiative of $60 million, net of
income tax
• a $40 million, net of income tax, unfavorable impact from variable annuity and life reinsurance
recaptures • a charge of $36 million, net of income tax, for lease impairments
108

Table of Contents
• favorable reserve adjustments of $55 million, net of income tax, resulting from modeling improvements in the reserving process in certain of our life
businesses
• a $21 million, net of income tax, charge for expenses incurred related to a guaranty fund assessment for Penn Treaty Network America Insurance Company
(“Penn Treaty”) • a benefit of $12 million, net of income tax, related to a refinement to prior period reinsurance receivables in Australia
For a more in-depth discussion of our consolidated results, see “— Results of Operations — Consolidated Results,” “— Results of Operations —Consolidated Results — Adjusted Earnings” and “— Results of Operations — Segment Results and Corporate & Other.”
OtherKeyInformation
BasisofPresentation
Discontinued Operations
The results of Brighthouse are reflected in the Company’s consolidated financial statements as discontinued operations. See “— Overview — Separationof Brighthouse” and Note 3 of the Notes to the Interim Condensed Consolidated Financial Statements for information on discontinued operations andtransactions with Brighthouse.
Revisions
See Note 1 of the Notes to the Interim Condensed Consolidated Financial Statements for information regarding prior year periods’ revisions related to theCompany’s consolidated results.
Hurricanes
In October 2018, Hurricane Michael made landfall in the Florida Panhandle causing loss of lives and extensive property damage. MetLife is currentlyevaluating the impact of Hurricane Michael on its Property & Casualty business reported in the U.S. segment, and estimates a potential loss of approximately$10 million to $13 million ($8 million to $10 mil lion, net of income tax) , which has not yet been recorded as of September 30, 2018.
In September 2018, Hurricane Florence made landfall in North Carolina and South Carolina causing loss of lives and extensive property damage. As ofSeptember 30, 2018, MetLife’s Property & Casualty business recognized a loss from Hurricane Florence of $15 million ($12 million, net of income tax).
Additional storm-related losses may be recorded in future periods as claims are received from insureds.
ArgentinaHighlyInflationary
The inflation levels in Argentina have been elevated for several years. In the first half of 2018, Argentina’s reported inflation rates began to increasedramatically and the Argentine central bank significantly increased interest rates in an effort to combat inflation. Based on Argentina’s reported inflation ratesand trends, as of July 1, 2018, we designated Argentina as a highly inflationary economy for accounting purposes. In the third quarter of 2018, the change tohighly inflationary accounting did not have a material impact on the Company’s interim condensed consolidated financial statements.
Industry Trends
The following information on industry trends should be read in conjunction with “Management’s Discussion and Analysis of Financial Condition and Resultsof Operations — Industry Trends” in Part II, Item 7, of the 2017 Annual Report.
The changing global financial and economic environment that affects our industry also continues to affect us.
FinancialandEconomicEnvironment
Our business and results of operations are materially affected by conditions in the global capital markets and the economy generally. Stressed conditions,volatility and disruptions in global capital markets, particular markets, or financial asset classes can have an adverse effect on us, in part because we have a largeinvestment portfolio and our insurance liabilities and derivatives are sensitive to changing market factors. See “Risk Factors — Economic Environment and CapitalMarkets-Related Risks — We Are Exposed to Significant Global Financial and Capital Markets Risks Which May Adversely Affect Our Results of Operations,Financial Condition and Liquidity, and May Cause Our Net Investment Income to Vary from Period to Period” and “Risk Factors — Economic Environment andCapital Markets-Related Risks — Difficult Conditions in the Global Capital Markets and the Economy Generally May Materially Adversely Affect Our Businessand Results of Operations” in the 2017 Annual Report.
109
Table of Contents
We have market presence in numerous countries and, therefore, our business operations are exposed to risks posed by local and regional economic conditions.See “Risk Factors — Risks Related to Our Business — Our International Operations Face Political, Legal, Operational and Other Risks, Including Exposure toLocal and Regional Economic Conditions, That Could Negatively Affect Those Operations or Our Profitability” and “Risk Factors — Risks Related to OurBusiness — Fluctuations in Foreign Currency Exchange Rates Could Negatively Affect Our Profitability” in the 2017 Annual Report. See “— Executive Summary— Other Key Information — Argentina Highly Inflationary” for further information regarding the impact of Argentina’s highly inflationary economy on theCompany’s interim condensed consolidated financial statements.
We are closely monitoring political and economic conditions that might contribute to global market volatility and impact our business operations, investmentportfolio and derivatives. For example, events following the U.K.’s referendum on June 23, 2016 and the uncertainties, including foreign currency exchange risks,associated with its pending withdrawal from the European Union (“EU”), have contributed to market volatility, both in the U.S. and beyond. These factors couldcontribute to weakening Gross Domestic Product growth, primarily in the U.K. and, to a lesser degree, in continental Europe. The magnitude and longevity of thepotential negative economic impacts would depend on the detailed agreements reached by the U.K. and the EU as a result of the negotiations regarding future tradeand other arrangements. See “— Investments — Current Environment — Selected Country Investments.” We are also monitoring the imposition of tariffs or otherbarriers to international trade, changes to international trade agreements, and their potential impacts on our business, results of operations and financial condition.See “Risk Factors — Economic Environment and Capital Markets-Related Risks — Difficult Conditions in the Global Capital Markets and the Economy GenerallyMay Materially Adversely Affect Our Business and Results of Operations” and “Risk Factors — Risks Related to Our Business — Our International OperationsFace Political, Legal, Operational and Other Risks, Including Exposure to Local and Regional Economic Conditions, That Could Negatively Affect ThoseOperations or Our Profitability” in the 2017 Annual Report.
Central banks around the world are using monetary policy to address regional economic conditions. For example, in the United States, citing a strengtheningeconomy, the Board of Governors of the Federal Reserve System (“Federal Reserve Board”) has continued along its stated path of balance sheet tapering and theFederal Reserve Board’s Federal Open Market Committee has continued to increase the federal funds rate, most recently in September 2018. While the EuropeanCentral Bank has continued to expand its balance sheet via quantitative easing, it is doing so at a slower pace and is expected to end quantitative easing by the endof 2018. In Japan, however, the Japanese government and the Bank of Japan are maintaining stimulus measures in order to boost inflation expectations and achievesustainable economic growth in Japan. Such measures include the imposition of a negative rate on commercial bank deposits, continued government bondpurchases and tax reform, including the lowering of the Japanese corporate tax rate and the delay until 2019 of an increase in the consumption tax to 10%. Goingforward, Japan’s structural and demographic challenges may continue to limit its potential growth unless reforms that boost productivity are put into place. Japan’shigh public sector debt levels are mitigated by low refinancing risks. Further actions by central banks in the future may affect interest rates and risk markets in theU.S., Europe, Japan and other developed and emerging economies, and may ultimately result in market volatility. We cannot predict with certainty the effect ofthese actions or the impact on our business operations, investment portfolio or derivatives. See “— Investments — Current Environment.”
ImpactofaSustainedLowInterestRateEnvironment
During sustained periods of low interest rates, we may have to invest insurance cash flows and reinvest the cash flows we received as interest or return ofprincipal on our investments in lower yielding instruments. Moreover, borrowers may prepay or redeem the fixed income securities, mortgage loans and mortgage-backed securities in our investment portfolio with greater frequency in order to borrow at lower market rates. Therefore, some of our products expose us to the riskthat a reduction in interest rates will reduce the difference between the amounts that we are required to credit on contracts in our general account and the rate ofreturn we are able to earn on investments intended to support obligations under these contracts. This difference between interest earned and interest credited, ormargin, is a key metric for the management of, and reporting for, many of our businesses.
Our expectations regarding future margins are an important component impacting the amortization of certain intangible assets such as DAC and value ofbusiness acquired (“VOBA”). Significantly lower margins may cause us to accelerate the amortization, thereby reducing net income in the affected reportingperiod. Additionally, lower margins may also impact the recoverability of intangible assets such as goodwill, require the establishment of additional liabilities ortrigger loss recognition events on certain policyholder liabilities. We review this long-term margin assumption, along with other assumptions, as part of our annualactuarial assumption review. See “— Results of Operations — Consolidated Results — Three Months Ended September 30, 2018 Compared with the ThreeMonths Ended September 30, 2017 — Actuarial Assumption Review and Certain Other Insurance Adjustments ” for further information.
110
Table of Contents
Some of our separate account products, including variable annuities, have certain minimum guarantee benefits. Declining interest rates increase the reserveswe need to set up to protect the guarantee benefits, thereby reducing net income in the affected reporting period.
In formulating economic assumptions for its insurance contract assumptions, the Company uses projections that it makes regarding interest rates. Included inthese assumptions is the projection that the 10-year Treasury rate will rise to 4.25% by 2027. See “Management’s Discussion and Analysis of Financial Conditionand Results of Operations — Industry Trends — Impact of a Sustained Low Interest Rate Environment — Low Interest Rate Scenario” included in the 2017Annual Report for further information.
CompetitivePressures
The life insurance industry remains highly competitive. Product development is focused on differentiation leading to more intense competition with respect toproduct features and services. Several of the industry’s products can be quite homogeneous and subject to intense price competition. Cost reduction efforts are apriority for industry players, with benefits resulting in price adjustments to favor customers and reinvestment capacity. Larger companies have the ability to investin brand equity, product development, technology optimization, risk management, and innovation, which are among the fundamentals for sustained profitablegrowth in the life insurance industry. Insurers are focused on their core businesses, specifically in markets where they can achieve scale. Insurers are increasinglyseeking alternative sources of revenue; there is a focus on monetization of assets, fee-based services, and opportunities to offer comprehensive solutions, whichinclude providing value-added services along with traditional products. Financial strength and flexibility and technology modernization are prerequisites forsustainable growth in the life insurance industry. Larger market participants tend to have the capacity to invest in analytics, distribution, and informationtechnology and have the capability to engage with the new digital entrants. There is a shift in distribution from proprietary to third party models in mature markets,due to the lower cost structure. Evolving customer expectations are having a significant impact on the competitive environment as insurers strive to offer thesuperior customer service demanded by an increasingly sophisticated industry client base. We believe that the continued volatility of the financial markets and itsimpact on the capital position of many competitors will continue to strain the competitive environment. Legislative and other changes affecting the regulatoryenvironment can also affect the competitive environment within the life insurance industry and within the broader financial services industry. See “— IndustryTrends — Regulatory Developments,” as well as “Business — Regulation” in the 2017 Annual Report, as amended or supplemented in our subsequently filedQuarterly Reports on Form 10-Q under the caption “Management’s Discussion and Analysis of Financial Condition and Results of Operations — Industry Trends— Regulatory Developments.” We believe that the aforementioned factors have highlighted financial strength, technology efficiency, and organizational agility asthe most significant differentiators and, as a result, we believe the Company is well positioned to compete in this environment.
RegulatoryDevelopments
The following discussion on regulatory developments should be read in conjunction with “Business — Regulation” in the 2017 Annual Report, as amended orsupplemented in our subsequently filed Quarterly Reports on Form 10-Q under the caption “Management’s Discussion and Analysis of Financial Condition andResults of Operations — Industry Trends — Regulatory Developments.”
In the United States, our life insurance companies are regulated primarily at the state level by state insurance regulators, with some products and services alsosubject to federal regulation. In addition, MetLife, Inc. and its U.S. insurance subsidiaries are subject to regulation under the insurance holding company laws ofvarious U.S. jurisdictions. Furthermore, some of MetLife’s operations, products and services are subject to consumer protection laws, securities, broker-dealer andinvestment adviser regulations, environmental and unclaimed property laws and regulations, and to the Employee Retirement Income Security Act of 1974. See“— U.S. Regulation” below, as well as “Business — Regulation — U.S. Regulation,” “Risk Factors — Regulatory and Legal Risks — Our Insurance, Pensionsand Brokerage Businesses Are Highly Regulated, and Changes in Regulation and in Supervisory and Enforcement Policies May Reduce Our Profitability and LimitOur Growth,” “Risk Factors — Risks Related to Our Business — Our Statutory Life Insurance Reserve Financings May Be Subject to Cost Increases and NewFinancings May Be Subject to Limited Market Capacity,” and “Risk Factors — Regulatory and Legal Risks — Changes in U.S. Federal, State Securities and StateInsurance Laws and Regulations May Affect Our Operations and Our Profitability” included in the 2017 Annual Report, as amended or supplemented in oursubsequently filed Quarterly Reports on Form 10-Q under the caption “Management’s Discussion and Analysis of Financial Condition and Results of Operations— Industry Trends — Regulatory Developments” and similarly named sections under the caption “Risk Factors.”
111
Table of Contents
Our international insurance operations are principally regulated by insurance regulatory authorities in the jurisdictions in which they are located or operate. Inaddition, our investment and pension companies outside of the U.S. are subject to oversight by the relevant securities, pension and other authorities of thejurisdictions in which the companies operate. Our non-U.S. insurance businesses are also subject to current and developing solvency regimes which impose variouscapital and other requirements. Additionally, we may be subject in the future to enhanced capital standards, supervision and additional requirements of otherinternational and global regulatory initiatives. See “— International Regulation” below, as well as “Business — Regulation — International Regulation” and “RiskFactors — Regulatory and Legal Risks — Our Insurance, Pensions and Brokerage Businesses Are Highly Regulated, and Changes in Regulation and inSupervisory and Enforcement Policies May Reduce Our Profitability and Limit Our Growth,” included in the 2017 Annual Report, as amended or supplemented inour subsequently filed Quarterly Reports on Form 10-Q under the caption “Management’s Discussion and Analysis of Financial Condition and Results ofOperations — Industry Trends — Regulatory Developments” and similarly named sections under the caption “Risk Factors.”
U.S.Regulation
Insurance Regulation
NAIC
In 2015, the National Association of Insurance Commissioners (“NAIC”) commenced an initiative to study variable annuity solvency regulations, withthe goal of curtailing the use of variable annuity captives. In connection with this initiative, the NAIC engaged a third-party consultant to developrecommendations regarding reserve and capital requirements. Following several public exposures of the consultant’s recommendations, the NAIC recentlyadopted a new variable annuity framework, which is designed to reduce the level and volatility of the non-economic aspect of reserve and risk-based capital(“RBC”) requirements for variable annuity products. The NAIC will now prepare technical language in various NAIC manuals and guidelines that isnecessary to implement the new framework. We cannot predict the impact of this framework on our business until such technical requirements of theframework are completed, and we cannot predict whether the New York Department of Financial Services (“NYDFS”) or other state insurance regulatorswill adopt standards different from the NAIC framework.
Surplus and Capital; Risk-Based Capital
The NYDFS issued its annual “Special Considerations” letter (“SCL”) to New York licensed insurers on November 2, 2018, including to one of ourprimary insurance subsidiaries, Metropolitan Life Insurance Company. The SCL includes certain provisions that require us, among other things, to usecertain assumptions and perform certain tests as part of year-end asset adequacy testing. While we are currently evaluating the SCL’s potential impact, wedo not anticipate the SCL will affect our ratio of free cash flow to adjusted earnings guidance.
For developments that could affect our ratio of free cash flow to adjusted earnings results, see “Risk Factors” included in the 2017 Annual Report, asamended or supplemented in our subsequently filed Quarterly Reports on Form 10-Q.
112

Table of Contents
InternationalRegulation
On October 28, 2018, Chilean President Piñera announced a new pension reform proposal to be submitted to Congress. The proposal would increaseemployer mandatory contributions and affirms private pension fund administration. We are not able to predict with certainty whether such proposal will beadopted and cannot currently identify all of the risks or opportunities, if any, that may be posed to our business in Chile.
Other International and Global Regulatory Initiatives
The International Association of Insurance Supervisors (“IAIS”), an association of insurance supervisors and regulators and a member of the FinancialStability Board (“FSB”), an international entity established to coordinate, develop and promote regulatory, supervisory and other financial sector policies inthe interest of financial stability, is participating in the FSB’s initiative to identify and manage systemic risk globally. Beginning in 2013, the FSB annuallydesignated certain insurers as globally systemically important insurers (“G-SIIs”) using an assessment methodology developed and implemented by the IAIS.In November 2016, MetLife, Inc. and eight other firms were designated as G-SIIs; in November 2017, the FSB announced it would not publish a new list of G-SIIs pending further consideration in late 2018. The FSB also recommended that the IAIS continue development of an activities-based approach (“ABA”) toassessing and managing potential systemic risk in the insurance sector and in July 2018 the IAIS announced their intention to publicly consult on a holisticsystemic risk framework at the end of the year. As described, this would be a three pillar framework that follows many recommendations for appropriate ABAimplementation. The fate of the entity-based methodology for G-SII designation with an emphasis on size remains uncertain. In 2018, the IAIS collected dataand performed an assessment that excluded phase IV meetings with firms recommended for G-SII designation. We expect outcomes for 2018 to be madepublic during November 2018.
Current standards remain as drafted for entity-based designation and call for additional requirements for G-SIIs, which include higher loss absorbency(“HLA”) requirements, and more intensive supervision, among other requirements. In February 2017, the IAIS confirmed that the risk-based global insurancecapital standard (“ICS”) will replace basic capital requirements as the basis for a revised HLA and that work on revisions is deferred until adoption of the ICSby the IAIS in 2019. HLA implementation is to be delayed until 2022 for the 2020 group of G-SIIs. In November 2017, the IAIS announced an agreementregarding further development and implementation of the ICS, and the impact on timing of further development and implementation of HLA requirements isunclear.
All IAIS proposals would need to be implemented at the consolidated group level by legislation or regulation in each applicable jurisdiction. As MetLife,Inc. is no longer a U.S. non-bank systemically important financial institution and none of its regulators have proposed implementing the G-SII or other capitalrequirements, the impact on MetLife, Inc. of such global proposals is uncertain.
Summary of Critical Accounting Estimates
The preparation of financial statements in conformity with GAAP requires management to adopt accounting policies and make estimates and assumptions thataffect amounts reported on the Interim Condensed Consolidated Financial Statements. The most critical estimates include those used in determining:
(i) liabilities for future policy benefits and the accounting for reinsurance;
(ii) capitalization and amortization of DAC and the establishment and amortization of VOBA;
(iii) estimated fair values of investments in the absence of quoted market values;
(iv) investment impairments;
(v) estimated fair values of freestanding derivatives and the recognition and estimated fair value of embedded derivatives requiring bifurcation;
(vi) measurement of goodwill and related impairment;
(vii) measurement of employee benefit plan liabilities;
(viii) measurement of income taxes and the valuation of deferred tax assets; and
(ix) liabilities for litigation and regulatory matters.
113
Table of Contents
In addition, the application of acquisition accounting requires the use of estimation techniques in determining the estimated fair values of assets acquired andliabilities assumed — the most significant of which relate to the aforementioned critical accounting estimates. In applying these policies and estimates,management makes subjective and complex judgments that frequently require assumptions about matters that are inherently uncertain. Many of these policies,estimates and related judgments are common in the insurance and financial services industries; others are specific to our business and operations. Actual resultscould differ from these estimates.
The above critical accounting estimates are described in “Management’s Discussion and Analysis of Financial Condition and Results of Operations —Summary of Critical Accounting Estimates” and Note 1 of the Notes to the Consolidated Financial Statements included in the 2017 Annual Report.
Goodwill
Goodwill is tested for impairment at least annually or more frequently if events or circumstances, such as adverse changes in the business climate, indicate thatthere may be justification for conducting an interim test.
For purposes of goodwill impairment testing, if the carrying value of a reporting unit exceeds its estimated fair value, the implied fair value of the reportingunit goodwill is compared to the carrying value of that goodwill to measure the amount of impairment loss, if any. In such instances, the implied fair value of thegoodwill is determined in the same manner as the amount of goodwill that would be determined in a business acquisition. The key inputs, judgments andassumptions necessary in determining estimated fair value of the reporting units include projected operating earnings, current book value, the level of economiccapital required to support the mix of business, long-term growth rates, comparative market multiples, the account value of in-force business, projections of newand renewed business, as well as margins on such business, the level of interest rates, credit spreads, equity market levels, and the discount rate that we believe isappropriate for the respective reporting unit.
In the third quarter of 2018, the Company tested the MetLife Holdings life reporting unit for impairment using the actuarial based embedded value fairvaluation approach. The estimated fair value of the reporting unit exceeded the carrying value by approximately 25% and, therefore, the reporting unit was notimpaired. If we had assumed that the discount rate was 100 basis points higher than the discount rate used, the estimated fair value of the MetLife Holdings lifereporting unit would have been higher than the carrying value by approximately 5%. The MetLife Holdings life reporting unit consists of operations relating toproducts and businesses no longer actively marketed by the Company. As of September 30, 2018, the amount of goodwill allocated to the MetLife Holdings lifereporting unit was $887 million.
The Company also performed its annual goodwill impairment tests of all other reporting units during the third quarter of 2018 using a qualitative assessmentand/or quantitative assessments under the market multiple and discounted cash flow valuation approaches based on best available data as of June 30, 2018 andconcluded that the estimated fair values of all such reporting units were substantially in excess of their carrying values and, therefore, goodwill was not impaired.
We apply significant judgment when determining the estimated fair value of our reporting units and when assessing the relationship of market capitalization tothe aggregate estimated fair value of our reporting units. The valuation methodologies utilized are subject to key judgments and assumptions that are sensitive tochange. Estimates of fair value are inherently uncertain and represent only management’s reasonable expectation regarding future developments. These estimatesand the judgments and assumptions upon which the estimates are based will, in all likelihood, differ in some respects from actual future results. Declines in theestimated fair value of our reporting units could result in goodwill impairments in future periods which could materially adversely affect our results of operationsor financial position.
Economic Capital
Economic capital is an internally developed risk capital model, the purpose of which is to measure the risk in the business and to provide a basis upon whichcapital is deployed. The economic capital model accounts for the unique and specific nature of the risks inherent in our business.
Our economic capital model, coupled with considerations of local capital requirements, aligns segment allocated equity with emerging standards andconsistent risk principles. The model applies statistics-based risk evaluation principles to the material risks to which the Company is exposed. These consistent riskprinciples include calibrating required economic capital shock factors to a specific confidence level and time horizon while applying an industry standard methodfor the inclusion of diversification benefits among risk types. Economic capital-based risk estimation is an evolving science and industry best practices haveemerged and continue to evolve. Areas of evolving industry best practices include stochastic liability valuation techniques, alternative methodologies for thecalculation of diversification benefits, and the quantification of appropriate shock levels. MetLife’s management is responsible for the ongoing production andenhancement of the economic capital model and reviews its approach periodically to ensure that it remains consistent with emerging industry practice standards.
114

Table of Contents
Segment net investment income is credited or charged based on the level of allocated equity; however, changes in allocated equity do not impact ourconsolidated net investment income, income (loss) from continuing operations, net of income tax, or adjusted earnings.
Net investment income is based upon the actual results of each segment’s specifically identifiable investment portfolios adjusted for allocated equity. Othercosts are allocated to each of the segments based upon: (i) a review of the nature of such costs; (ii) time studies analyzing the amount of employee compensationcosts incurred by each segment; and (iii) cost estimates included in the Company’s product pricing.
Acquisitions and Dispositions
SeparationofBrighthouse
For information regarding the Company’s 2018 sale of the FVO Brighthouse Common Stock, see Notes 3 and 9 of the Notes to the Interim CondensedConsolidated Financial Statements.
In connection with the Separation and in the normal course of business, MetLife and Brighthouse entered into a number of transactions that are still ongoing.See Note 3 of the Notes to the Interim Condensed Consolidated Financial Statements. These ongoing agreements also include:
InvestmentManagement
The Company entered into investment management services agreements with Brighthouse. Each agreement has an initial term of 18 months after the date ofSeparation, after which period either party to the agreement is permitted to terminate upon notice to the other party. During the three months and nine monthsended September 30, 2018, the Company recognized $30 million and $91 million, respectively, in other revenues for services provided under such investmentmanagement services agreements. After the Separation, during both the three months and nine months ended September 30, 2017, the Company recognized $18million in other revenues for services provided under the agreements.
CommittedFacility
MetLife Reinsurance Company of Vermont and MetLife, Inc. have a $2.9 billion committed facility which is used as collateral for certain reinsuranceliabilities. At September 30, 2018, Brighthouse was a beneficiary of $2.4 billion of letters of credit issued under this facility and, in consideration, Brighthousereimburses MetLife, Inc. for a portion of the letter of credit fees.
DispositionofMetLifeAfore,S.A.deC.V.
See Note 3 of the Notes to the Interim Condensed Consolidated Financial Statements for information regarding the Company’s 2018 disposition of MetLifeAfore, S.A. de C.V., its pension fund management business in Mexico.
115
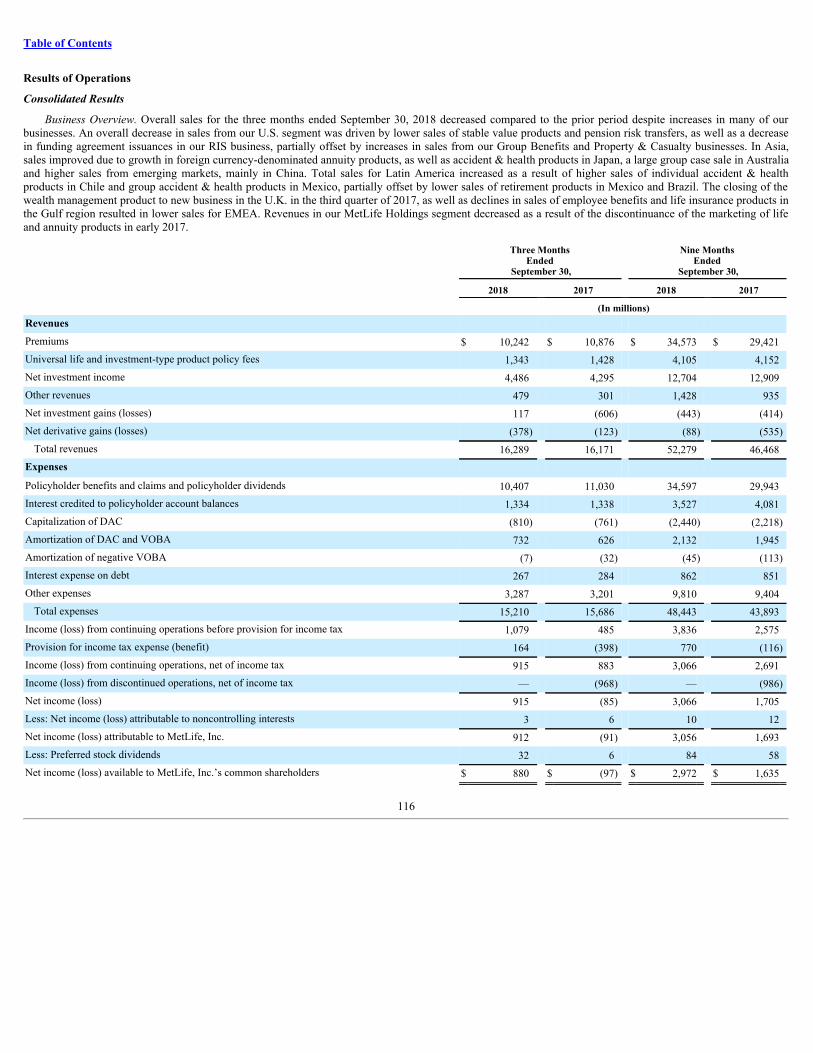
Table of Contents
Results of Operations
ConsolidatedResults
Business Overview. Overall sales for the three months ended September 30, 2018 decreased compared to the prior period despite increases in many of ourbusinesses. An overall decrease in sales from our U.S. segment was driven by lower sales of stable value products and pension risk transfers, as well as a decreasein funding agreement issuances in our RIS business, partially offset by increases in sales from our Group Benefits and Property & Casualty businesses. In Asia,sales improved due to growth in foreign currency-denominated annuity products, as well as accident & health products in Japan, a large group case sale in Australiaand higher sales from emerging markets, mainly in China. Total sales for Latin America increased as a result of higher sales of individual accident & healthproducts in Chile and group accident & health products in Mexico, partially offset by lower sales of retirement products in Mexico and Brazil. The closing of thewealth management product to new business in the U.K. in the third quarter of 2017, as well as declines in sales of employee benefits and life insurance products inthe Gulf region resulted in lower sales for EMEA. Revenues in our MetLife Holdings segment decreased as a result of the discontinuance of the marketing of lifeand annuity products in early 2017.
Three Months Ended
September 30,
Nine Months Ended
September 30,
2018 2017 2018 2017 (In millions)Revenues Premiums $ 10,242 $ 10,876 $ 34,573 $ 29,421Universal life and investment-type product policy fees 1,343 1,428 4,105 4,152Net investment income 4,486 4,295 12,704 12,909Other revenues 479 301 1,428 935Net investment gains (losses) 117 (606) (443) (414)Net derivative gains (losses) (378) (123) (88) (535)
Total revenues 16,289 16,171 52,279 46,468Expenses Policyholder benefits and claims and policyholder dividends 10,407 11,030 34,597 29,943Interest credited to policyholder account balances 1,334 1,338 3,527 4,081Capitalization of DAC (810) (761) (2,440) (2,218)Amortization of DAC and VOBA 732 626 2,132 1,945Amortization of negative VOBA (7) (32) (45) (113)Interest expense on debt 267 284 862 851Other expenses 3,287 3,201 9,810 9,404
Total expenses 15,210 15,686 48,443 43,893Income (loss) from continuing operations before provision for income tax 1,079 485 3,836 2,575Provision for income tax expense (benefit) 164 (398) 770 (116)Income (loss) from continuing operations, net of income tax 915 883 3,066 2,691Income (loss) from discontinued operations, net of income tax — (968) — (986)Net income (loss) 915 (85) 3,066 1,705Less: Net income (loss) attributable to noncontrolling interests 3 6 10 12Net income (loss) attributable to MetLife, Inc. 912 (91) 3,056 1,693Less: Preferred stock dividends 32 6 84 58Net income (loss) available to MetLife, Inc.’s common shareholders $ 880 $ (97) $ 2,972 $ 1,635
116
Table of Contents
ThreeMonthsEndedSeptember30,2018ComparedwiththeThreeMonthsEndedSeptember30,2017
During the three months ended September 30, 2018, net income (loss) increased $1.0 billion from the prior period, primarily driven by favorable changes inincome (loss) from discontinued operations, net investment gains (losses), results from our divested businesses and adjusted earnings, partially offset by a priorperiod tax-related benefit related to the Separation and an unfavorable change in net derivative gains (losses).
Management of Investment Portfolio and Hedging Market Risks with Derivatives. We manage our investment portfolio using disciplined asset/liabilitymanagement (“ALM”) principles, focusing on cash flow and duration to support our current and future liabilities. Our intent is to match the timing and amountof liability cash outflows with invested assets that have cash inflows of comparable timing and amount, while optimizing risk-adjusted net investment incomeand risk-adjusted total return. Our investment portfolio is heavily weighted toward fixed income investments, with over 80% of our portfolio invested in fixedmaturity securities available-for-sale (“AFS”) and mortgage loans. These securities and loans have varying maturities and other characteristics which cause themto be generally well suited for matching the cash flow and duration of insurance liabilities. In addition, our general account investment portfolio includes, withincontractholder-directed equity securities and fair value option securities (collectively, “Unit-linked and FVO Securities”), contractholder-directed equitysecurities supporting unit-linked variable annuity type liabilities (“Unit-linked investments”), which do not qualify as separate account assets. The returns onthese Unit-linked investments, which can vary significantly from period to period, include changes in estimated fair value subsequent to purchase, inure tocontractholders and are offset in earnings by a corresponding change in policyholder account balances through interest credited to policyholder account balances.
We purchase investments to support our insurance liabilities and not to generate net investment gains and losses. However, net investment gains and lossesare incurred and can change significantly from period to period due to changes in external influences, including changes in market factors such as interest rates,foreign currency exchange rates, credit spreads and equity markets; counterparty specific factors such as financial performance, credit rating and collateralvaluation; and internal factors such as portfolio rebalancing. Changes in these factors from period to period can significantly impact the levels of bothimpairments and realized gains and losses on investments sold.
We also use derivatives as an integral part of our management of the investment portfolio and insurance liabilities to hedge certain risks, including changesin interest rates, foreign currency exchange rates, credit spreads and equity market levels. We use freestanding interest rate, equity, credit and currencyderivatives to hedge certain invested assets and insurance liabilities. A small portion of these hedges are designated and qualify as accounting hedges, whichreduce volatility in earnings. For those hedges not designated as accounting hedges, changes in market factors lead to the recognition of fair value changes in netderivative gains (losses) generally without an offsetting gain or loss recognized in earnings for the item being hedged, which creates volatility in earnings.During 2017, we restructured certain derivative hedges to decrease volatility from nonqualified interest rate derivatives and to help meet prospective dividendand free cash flow objectives under varying interest rate scenarios. As part of this restructuring, we replaced certain nonqualified derivatives with derivatives thatqualify for hedge accounting treatment. In addition, we also entered into replication transactions using interest rate swaps, which are accounted for at amortizedcost under statutory guidelines and are nonqualified derivatives under GAAP. We actively evaluate market risk hedging needs and strategies to ensure our freecash flow and capital objectives are met under a range of market conditions.
Certain variable annuity products with guaranteed minimum benefits contain embedded derivatives that are measured at estimated fair value separately fromthe host variable annuity contract, with changes in estimated fair value recorded in net derivative gains (losses). We use freestanding derivatives to hedge themarket risks inherent in these variable annuity guarantees. Ongoing refinement of the strategy may be required to adapt to changing NAIC rules, which maybecome effective as early as January 1, 2019. The restructured hedge strategy is classified as a macro hedge program, included in the non-VA programderivatives section of the table below, to protect our overall statutory capital from significant adverse economic conditions. The valuation of these embeddedderivatives includes a nonperformance risk adjustment, which is unhedged, and can be a significant driver of net derivative gains (losses) and volatility inearnings, but does not have an economic impact on us.
117
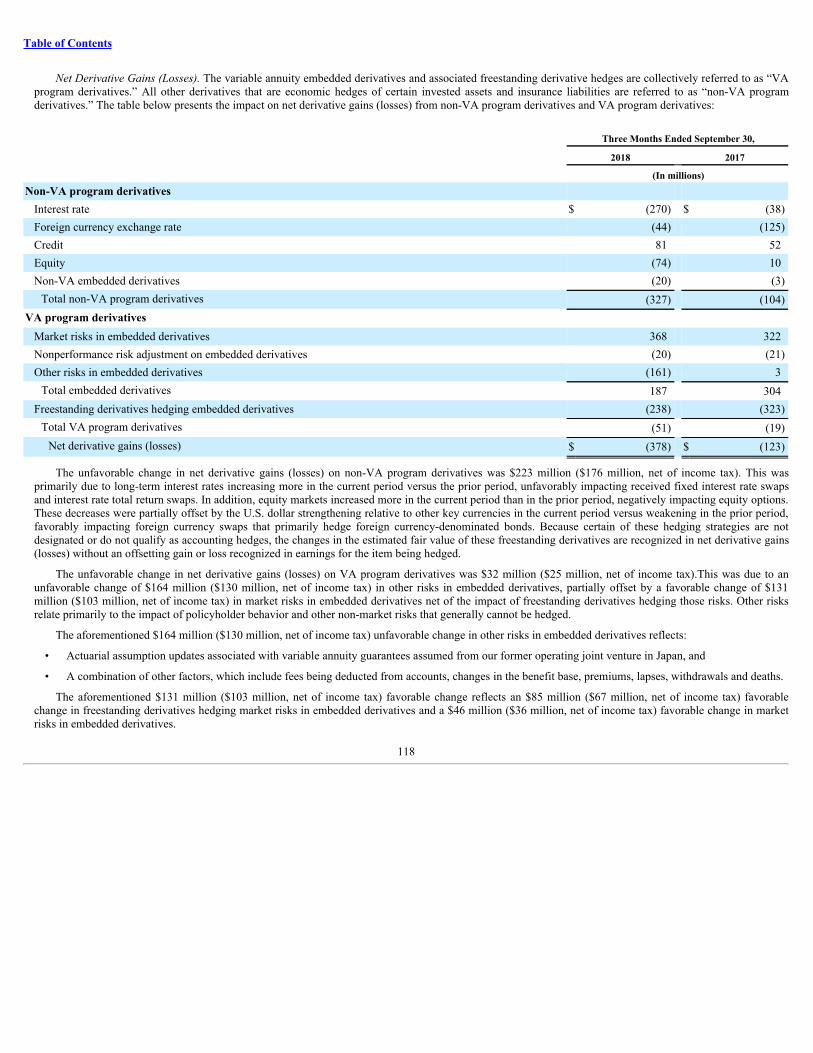
Table of Contents
Net Derivative Gains (Losses). The variable annuity embedded derivatives and associated freestanding derivative hedges are collectively referred to as “VAprogram derivatives.” All other derivatives that are economic hedges of certain invested assets and insurance liabilities are referred to as “non-VA programderivatives.” The table below presents the impact on net derivative gains (losses) from non-VA program derivatives and VA program derivatives:
Three Months Ended September 30,
2018 2017 (In millions)Non-VA program derivatives
Interest rate $ (270) $ (38)Foreign currency exchange rate (44) (125)Credit 81 52Equity (74) 10Non-VA embedded derivatives (20) (3)
Total non-VA program derivatives (327) (104)VA program derivatives
Market risks in embedded derivatives 368 322Nonperformance risk adjustment on embedded derivatives (20) (21)Other risks in embedded derivatives (161) 3
Total embedded derivatives 187 304Freestanding derivatives hedging embedded derivatives (238) (323)
Total VA program derivatives (51) (19)Net derivative gains (losses) $ (378) $ (123)
The unfavorable change in net derivative gains (losses) on non-VA program derivatives was $223 million ($176 million, net of income tax). This wasprimarily due to long-term interest rates increasing more in the current period versus the prior period, unfavorably impacting received fixed interest rate swapsand interest rate total return swaps. In addition, equity markets increased more in the current period than in the prior period, negatively impacting equity options.These decreases were partially offset by the U.S. dollar strengthening relative to other key currencies in the current period versus weakening in the prior period,favorably impacting foreign currency swaps that primarily hedge foreign currency-denominated bonds. Because certain of these hedging strategies are notdesignated or do not qualify as accounting hedges, the changes in the estimated fair value of these freestanding derivatives are recognized in net derivative gains(losses) without an offsetting gain or loss recognized in earnings for the item being hedged.
The unfavorable change in net derivative gains (losses) on VA program derivatives was $32 million ($25 million, net of income tax).This was due to anunfavorable change of $164 million ($130 million, net of income tax) in other risks in embedded derivatives, partially offset by a favorable change of $131million ($103 million, net of income tax) in market risks in embedded derivatives net of the impact of freestanding derivatives hedging those risks. Other risksrelate primarily to the impact of policyholder behavior and other non-market risks that generally cannot be hedged.
The aforementioned $164 million ($130 million, net of income tax) unfavorable change in other risks in embedded derivatives reflects:
• Actuarial assumption updates associated with variable annuity guarantees assumed from our former operating joint venture in Japan, and
• A combination of other factors, which include fees being deducted from accounts, changes in the benefit base, premiums, lapses, withdrawals and deaths.
The aforementioned $131 million ($103 million, net of income tax) favorable change reflects an $85 million ($67 million, net of income tax) favorablechange in freestanding derivatives hedging market risks in embedded derivatives and a $46 million ($36 million, net of income tax) favorable change in marketrisks in embedded derivatives.
118
Table of Contents
The primary changes in market factors are summarized as follows:
• Key equity index levels increased in the current period, contributing to current period losses on our freestanding derivatives and current period gains onour embedded derivatives. The current period impact was less pronounced than the prior period, despite equity markets increasing more in the currentperiod than in the prior period. This is due to the freestanding and embedded options becoming less sensitive to changes in equity index levels as thesepositions become further out of the money. F or example, the S&P Global Ratings (“S&P”) 500 Index increased 7% in the current period and increased4% in the prior period.
• Long-term U.S. interest rates increased in the current period and decreased in the prior period, contributing to a favorable change in our embeddedderivatives. Our freestanding interest rate derivatives were favorably impacted by the restructuring of the VA hedging strategy. For example, the 30-yearU.S. swap rate increased 20 basis points in the current period and decreased 1 basis point in the prior period.
Net Investment Gains (Losses) . The favorable change in net investment gains (losses) of $723 million ($571 million, net of income tax) primarily reflects aprior period mark-to-market loss on our retained investment in Brighthouse Financial, Inc. recognized in connection with the Separation, partially offset by lowergains on sales of fixed maturity securities AFS and lower gains on sales of real estate joint ventures in the current period.
Actuarial Assumption Review and Certain Other Insurance Adjustments. Results for the current period include a $358 million ($272 million, net of incometax) charge associated with our annual review of actuarial assumptions related to reserves and DAC, of which a $131 million loss ($94 million, net of incometax) was recognized in net derivative gains (losses).
Of the $358 million charge, $20 million ($20 million, net of income tax) was related to DAC and $338 million ($252 million, net of income tax) wasassociated with reserves. The portion of the $358 million charge that is included in adjusted earnings is $53 million ($42 million, net of income tax).
The $131 million loss recognized in net derivative gains (losses) associated with our annual review of actuarial assumptions was included within the otherrisks in embedded derivatives caption in the table above.
As a result of our annual review of actuarial assumptions, changes were made to economic, biometric, policyholder behavior, and operational assumptions.The most significant impacts were in the Asia and MetLife Holdings segments related to Japan variable annuities and the projection of closed block results,respectively, and are summarized as follows:
• Economic assumption updates resulted in net favorable changes of reserves and DAC of $38 million ($29 million, net of income tax).
• Changes to biometric assumptions resulted in net favorable changes of reserves and DAC of $55 million ($44 million, net of income tax).
• Changes in policyholder behavior assumptions resulted in a net charge of $321 million ($241 million, net of income tax).
• Changes in operational assumptions, most notably related to closed block projections, resulted in a net charge of $130 million ($104 million, net ofincome tax).
Results for the prior period include a $72 million ($48 million, net of prior period income tax) gain associated with our annual review of actuarialassumptions related to reserves and DAC, of which a $21 million ($14 million, net of prior period income tax) gain was recognized in net derivative gains(losses). Of the $72 million gain, a $131 million ($87 million, net of prior period income tax) gain was associated with DAC, and a loss of $59 million ($39million, net of prior period income tax) was related to reserves. The portion of the $72 million gain that is included in adjusted earnings is $135 million ($89million, net of prior period income tax).
Certain other insurance adjustments recorded in the current period include a $79 million ($63 million, net of income tax) charge due to a current periodincrease in our IBNR life reserves, reflecting enhancements to our processes related to potential claims in our MetLife Holdings segment, and a favorable netinsurance adjustment of $47 million ($37 million, net of income tax) resulting from reserve and DAC modeling improvements in our individual disabilityinsurance business in our U.S. segment. These adjustments are included in adjusted earnings.
Divested Businesses . Income (loss) before provision for income tax related to the divested businesses, excluding net investment gains (losses) and netderivative gains (losses), increased $297 million ($272 million, net of income tax) to a loss of $23 million ($18 million, net of income tax) in the current periodfrom a loss of $320 million ($290 million, net of income tax) in the prior period. Included in this increase was an increase in total revenues of $55 million, beforeincome tax, and a decrease in total expenses of $242 million, before income tax. Divested businesses primarily include activity related to the Separation.
119
Table of Contents
Discontinued Operations . Income (loss) from discontinued operations, net of income tax, increased $968 million for the three months ended September 30,2018 from a loss of $968 million, net of income tax, for the comparable prior period. Income (loss) from discontinued operations reflects the results of ourformer Brighthouse Financial segment. For further information, see Notes 3 and 9 of the Notes to the Interim Condensed Consolidated Financial Statements.
Taxes . Income tax expense for the three months ended September 30, 2018 was $164 million, or 15% of income (loss) from continuing operations beforeprovision for income tax, compared with an income tax benefit of $398 million, or 82% of income (loss) from continuing operations before provision for incometax, for the three months ended September 30, 2017. The Company’s effective tax rates differ from the U.S. statutory rate of 21% typically due to non-taxableinvestment income, tax credits for investments in low income housing, and foreign earnings taxed at different rates than the U.S. statutory rate. Our prior periodresults include tax-related benefits of $554 million related to the Separation and $4 million from the finalization of certain tax audits, partially offset by a net taxcharge of $180 million. This charge was the result of the repatriation of approximately $3.0 billion of cash following the post-Separation review of our capitalneeds, partially offset by a tax benefit associated with dividends from our non-U.S. operations. The changes from U.S. Tax Reform resulted in a net increase inearnings of $47 million for the third quarter of 2018 compared to the prior period , which includes a $32 million, net of income tax, reduction of net investmentincome in the current period related to tax credit partnership investments.
Adjusted Earnings . As more fully described in “— Non-GAAP and Other Financial Disclosures,” we use adjusted earnings, which does not equate toincome (loss) from continuing operations, net of income tax, as determined in accordance with GAAP, to analyze our performance, evaluate segmentperformance and allocate resources. We believe that the presentation of adjusted earnings and adjusted earnings available to common shareholders, as wemeasure it for management purposes, enhances the understanding of our performance by highlighting the results of operations and the underlying profitabilitydrivers of the business. Adjusted earnings and other financial measures based on adjusted earnings allow analysis of our performance relative to our businessplan and facilitate comparisons to industry results. Adjusted earnings and adjusted earnings available to common shareholders should not be viewed assubstitutes for net income (loss) and net income (loss) available to MetLife, Inc.’s common shareholders, respectively. Adjusted earnings available to commonshareholders increased $261 million, net of income tax, to $1.4 billion, net of income tax, for the three months ended September 30, 2018 from $1.1 billion, netof income tax, for the three months ended September 30, 2017.
120
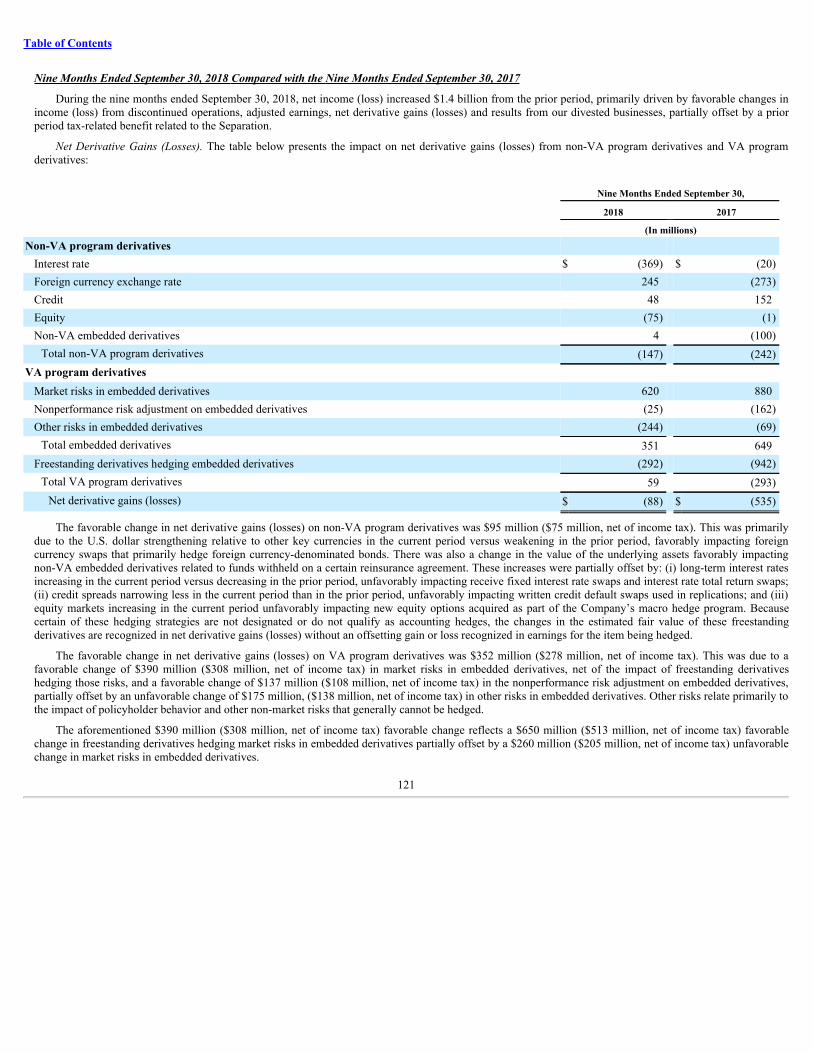
Table of Contents
NineMonthsEndedSeptember30,2018ComparedwiththeNineMonthsEndedSeptember30,2017
During the nine months ended September 30, 2018, net income (loss) increased $1.4 billion from the prior period, primarily driven by favorable changes inincome (loss) from discontinued operations, adjusted earnings, net derivative gains (losses) and results from our divested businesses, partially offset by a priorperiod tax-related benefit related to the Separation.
Net Derivative Gains (Losses). The table below presents the impact on net derivative gains (losses) from non-VA program derivatives and VA programderivatives:
Nine Months Ended September 30,
2018 2017 (In millions)Non-VA program derivatives
Interest rate $ (369) $ (20)Foreign currency exchange rate 245 (273)Credit 48 152Equity (75) (1)Non-VA embedded derivatives 4 (100)
Total non-VA program derivatives (147) (242)VA program derivatives
Market risks in embedded derivatives 620 880Nonperformance risk adjustment on embedded derivatives (25) (162)Other risks in embedded derivatives (244) (69)
Total embedded derivatives 351 649Freestanding derivatives hedging embedded derivatives (292) (942)
Total VA program derivatives 59 (293)Net derivative gains (losses) $ (88) $ (535)
The favorable change in net derivative gains (losses) on non-VA program derivatives was $95 million ($75 million, net of income tax). This was primarilydue to the U.S. dollar strengthening relative to other key currencies in the current period versus weakening in the prior period, favorably impacting foreigncurrency swaps that primarily hedge foreign currency-denominated bonds. There was also a change in the value of the underlying assets favorably impactingnon-VA embedded derivatives related to funds withheld on a certain reinsurance agreement. These increases were partially offset by: (i) long-term interest ratesincreasing in the current period versus decreasing in the prior period, unfavorably impacting receive fixed interest rate swaps and interest rate total return swaps;(ii) credit spreads narrowing less in the current period than in the prior period, unfavorably impacting written credit default swaps used in replications; and (iii)equity markets increasing in the current period unfavorably impacting new equity options acquired as part of the Company’s macro hedge program. Becausecertain of these hedging strategies are not designated or do not qualify as accounting hedges, the changes in the estimated fair value of these freestandingderivatives are recognized in net derivative gains (losses) without an offsetting gain or loss recognized in earnings for the item being hedged.
The favorable change in net derivative gains (losses) on VA program derivatives was $352 million ($278 million, net of income tax). This was due to afavorable change of $390 million ($308 million, net of income tax) in market risks in embedded derivatives, net of the impact of freestanding derivativeshedging those risks, and a favorable change of $137 million ($108 million, net of income tax) in the nonperformance risk adjustment on embedded derivatives,partially offset by an unfavorable change of $175 million, ($138 million, net of income tax) in other risks in embedded derivatives. Other risks relate primarily tothe impact of policyholder behavior and other non-market risks that generally cannot be hedged.
The aforementioned $390 million ($308 million, net of income tax) favorable change reflects a $650 million ($513 million, net of income tax) favorablechange in freestanding derivatives hedging market risks in embedded derivatives partially offset by a $260 million ($205 million, net of income tax) unfavorablechange in market risks in embedded derivatives.
121
Table of Contents
The primary changes in market factors are summarized as follows:
• Key equity index levels increased less in the current period versus the prior period, contributing to a favorable change in our freestanding derivatives andan unfavorable change in our embedded derivatives. For example, the S&P 500 Index increased 9% in the current period and increased 13% in the priorperiod.
• Long-term U.S. interest rates increased in the current period and decreased in the prior period, contributing to a favorable change in our embeddedderivatives and an unfavorable change in our freestanding derivatives. For example, the 10-year U.S. swap rate increased 72 basis points in the currentperiod and decreased 5 basis points in the prior period.
• Changes in foreign currency exchange rates contributed to a favorable change in our freestanding derivatives and an unfavorable change in our embeddedderivatives related to the assumed variable annuity guarantees from our former operating joint venture in Japan. For example, the Japanese yenstrengthened against the euro by 2% in the current period and weakened by 8% in the prior period.
The aforementioned $175 million ($138 million, net of income tax) unfavorable change in other risks in embedded derivatives reflects:
• Actuarial assumption updates associated with variable annuity guarantees assumed from our former operating joint venture in Japan,
• Updates to actuarial policyholder behavior assumptions within the valuation model, and
• A combination of other factors, which include fees being deducted from accounts, changes in the benefit base, premiums, lapses, withdrawals and deaths.
The aforementioned $137 million ($108 million, net of income tax) favorable change in the nonperformance risk adjustment on embedded derivativesresulted from a favorable change of $112 million, before income tax, related to changes in our own credit spread, in addition to a favorable change of $25million, before income tax, as a result of model changes and changes in capital market inputs, such as long-term interest rates and key equity index levels, onvariable annuity guarantees.
When equity index levels decrease in isolation, the variable annuity guarantees become more valuable to policyholders, which results in an increase in theundiscounted embedded derivative liability. Discounting this unfavorable change by the risk adjusted rate yields a smaller loss than by discounting at the risk-free rate, thus creating a gain from including an adjustment for nonperformance risk.
When the risk-free interest rate decreases in isolation, discounting the embedded derivative liability produces a higher valuation of the liability than if therisk-free interest rate had remained constant. Discounting this unfavorable change by the risk adjusted rate yields a smaller loss than by discounting at the risk-free interest rate, thus creating a gain from including an adjustment for nonperformance risk.
When our own credit spread increases in isolation, discounting the embedded derivative liability produces a lower valuation of the liability than if our owncredit spread had remained constant. As a result, a gain is created from including an adjustment for nonperformance risk. For each of these primary marketdrivers, the opposite effect occurs when they move in the opposite direction.
Net Investment Gains (Losses) . The unfavorable change in net investment gains (losses) of $29 million ($23 million, net of income tax) primarily reflectslosses on sales of fixed maturity securities AFS in the current period compared to gains in the prior period and lower gains on sales of real estate joint ventures,partially offset by lower mark-to-market losses on our retained investment in Brighthouse. In the current period, we incurred a loss representing both the changein estimated fair value of FVO Brighthouse Common Stock we held through date of disposal and the loss upon disposal in June 2018. In the prior period, werecognized a mark-to-market loss on our retained investment in Brighthouse Financial, Inc. in connection with the Separation.
Actuarial Assumption Review and Certain Other Insurance Adjustments. F or the results of our 2018 and 2017 annual assumption reviews and informationregarding certain other insurance adjustments, see “ — Three Months Ended September 30, 2018 Compared with the Three Months Ended September 30, 2017— Actuarial Assumption Review and Certain Other Insurance Adjustments.”
Divested Businesses . Income (loss) before provision for income tax related to the divested businesses, excluding net investment gains (losses) and netderivative gains (losses), increased $706 million ($429 million, net of income tax) to a loss of $108 million ($85 million, net of income tax) in the current periodfrom a loss of $814 million ($514 million, net of income tax) in the prior period. Included in this increase was an increase in total revenues of $570 million,before income tax, and a decrease in total expenses of $136 million, before income tax. Divested businesses primarily include activity related to the Separation.
122
Table of Contents
Discontinued Operations . Income (loss) from discontinued operations, net of income tax, increased $986 million for the nine months ended September 30,2018 from a loss of $986 million, net of income tax, for the comparable prior period. Income (loss) from discontinued operations reflects the results of ourformer Brighthouse Financial segment. For further information, see Notes 3 and 9 of the Notes to the Interim Condensed Consolidated Financial Statements.
Taxes . Income tax expense for the nine months ended September 30, 2018 was $770 million, or 20% of income (loss) from continuing operations beforeprovision for income tax, compared with an income tax benefit of $116 million, or 5% of income (loss) from continuing operations before provision for incometax, for the nine months ended September 30, 2017. The Company’s effective tax rates differ from the U.S. statutory rate of 21% typically due to non-taxableinvestment income, tax credits for investments in low income housing, and foreign earnings taxed at different rates than the U.S. statutory rate. Our currentperiod results include tax charges of $69 million related to the non-deductible loss incurred on the mark-to-market and disposition of FVO Brighthouse CommonStock, $17 million related to a tax adjustment in Chile and $5 million in Colombia to establish a deferred tax liability due to a change in tax status, partiallyoffset by tax benefits of $36 million related to a non-cash transfer of assets from a wholly-owned U.K. investment subsidiary to its U.S. parent and $7 millionrelated to the settlement of an audit. Our prior period results include tax-related benefits of $554 million related to the Separation and $27 million from thefinalization of certain tax audits, partially offset by a net tax charge of $180 million. This charge was the result of the repatriation of approximately $3.0 billionof cash following the post-Separation review of our capital needs, partially offset by a tax benefit associated with dividends from our non-U.S. operations. Ourprior period results also included a tax benefit of $9 million related to the settlement of an audit in Argentina. The changes from U.S. Tax Reform resulted in anet increase in earnings of $21 million for the nine months ended September 30, 2018 compared to the prior period , which includes a $32 million, net of incometax, reduction of net investment income in the current period related to tax credit partnership investments.
Adjusted Earnings . Adjusted earnings available to common shareholders increased $568 million, net of income tax, to $4.1 billion, net of income tax, forthe nine months ended September 30, 2018 from $3.6 billion, net of income tax, for the nine months ended September 30, 2017.
123
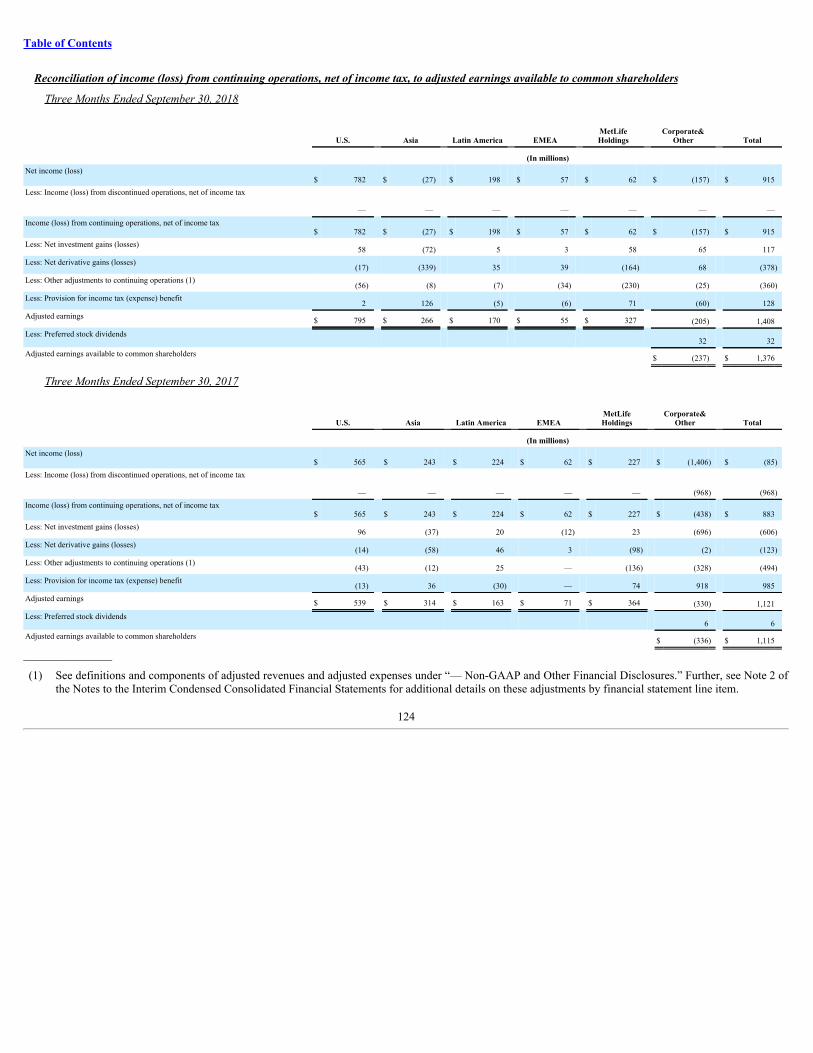
Table of Contents
Reconciliationofincome(loss)fromcontinuingoperations,netofincometax,toadjustedearningsavailabletocommonshareholders
Three Months Ended September 30, 2018
U.S. Asia Latin America EMEA MetLifeHoldings Corporate&
Other Total
(In millions)Net income (loss)
$ 782 $ (27) $ 198 $ 57 $ 62 $ (157) $ 915Less: Income (loss) from discontinued operations, net of income tax
— — — — — — —Income (loss) from continuing operations, net of income tax
$ 782 $ (27) $ 198 $ 57 $ 62 $ (157) $ 915Less: Net investment gains (losses)
58 (72) 5 3 58 65 117Less: Net derivative gains (losses)
(17) (339) 35 39 (164) 68 (378)Less: Other adjustments to continuing operations (1)
(56) (8) (7) (34) (230) (25) (360)Less: Provision for income tax (expense) benefit
2 126 (5) (6) 71 (60) 128Adjusted earnings $ 795 $ 266 $ 170 $ 55 $ 327 (205) 1,408Less: Preferred stock dividends 32 32Adjusted earnings available to common shareholders $ (237) $ 1,376
Three Months Ended September 30, 2017
U.S. Asia Latin America EMEA MetLifeHoldings Corporate&
Other Total
(In millions)Net income (loss)
$ 565 $ 243 $ 224 $ 62 $ 227 $ (1,406) $ (85)Less: Income (loss) from discontinued operations, net of income tax
— — — — — (968) (968)Income (loss) from continuing operations, net of income tax
$ 565 $ 243 $ 224 $ 62 $ 227 $ (438) $ 883Less: Net investment gains (losses)
96 (37) 20 (12) 23 (696) (606)Less: Net derivative gains (losses)
(14) (58) 46 3 (98) (2) (123)Less: Other adjustments to continuing operations (1)
(43) (12) 25 — (136) (328) (494)Less: Provision for income tax (expense) benefit
(13) 36 (30) — 74 918 985Adjusted earnings $ 539 $ 314 $ 163 $ 71 $ 364 (330) 1,121Less: Preferred stock dividends 6 6Adjusted earnings available to common shareholders $ (336) $ 1,115
__________________
(1) See definitions and components of adjusted revenues and adjusted expenses under “— Non-GAAP and Other Financial Disclosures.” Further, see Note 2 ofthe Notes to the Interim Condensed Consolidated Financial Statements for additional details on these adjustments by financial statement line item.
124
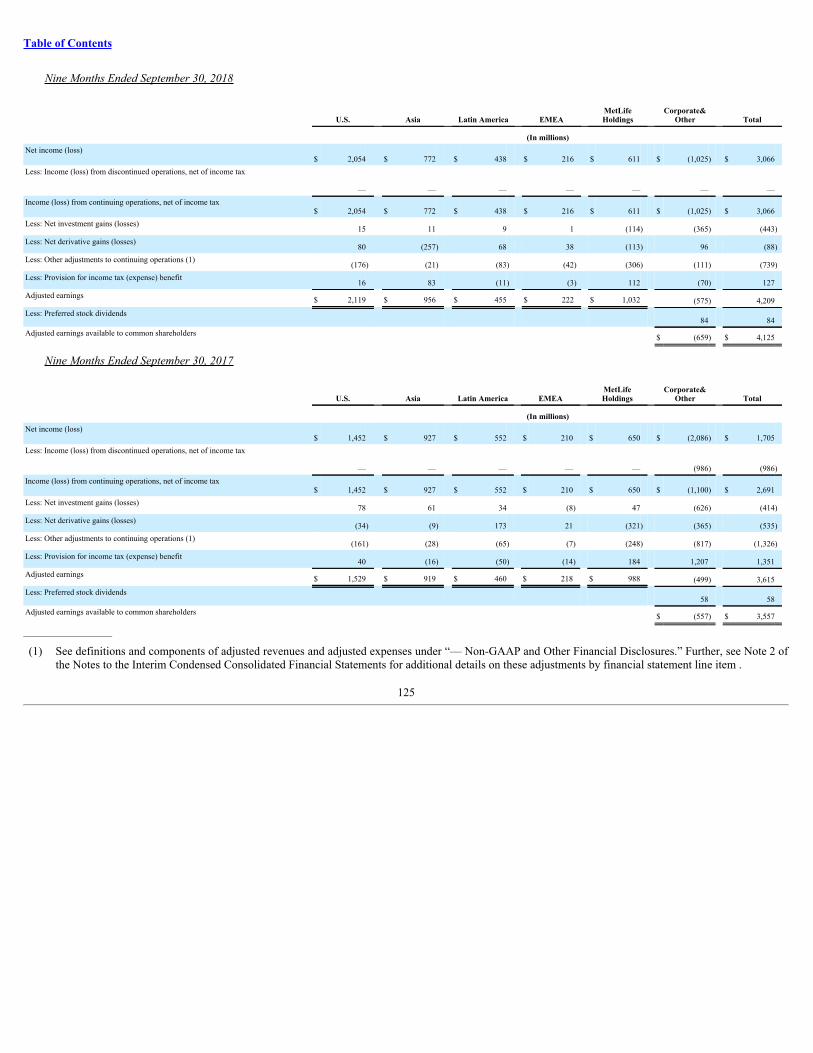
Table of Contents
Nine Months Ended September 30, 2018
U.S. Asia Latin America EMEA MetLifeHoldings Corporate&
Other Total
(In millions)Net income (loss)
$ 2,054 $ 772 $ 438 $ 216 $ 611 $ (1,025) $ 3,066Less: Income (loss) from discontinued operations, net of income tax
— — — — — — —Income (loss) from continuing operations, net of income tax
$ 2,054 $ 772 $ 438 $ 216 $ 611 $ (1,025) $ 3,066Less: Net investment gains (losses)
15 11 9 1 (114) (365) (443)Less: Net derivative gains (losses)
80 (257) 68 38 (113) 96 (88)Less: Other adjustments to continuing operations (1)
(176) (21) (83) (42) (306) (111) (739)Less: Provision for income tax (expense) benefit
16 83 (11) (3) 112 (70) 127Adjusted earnings $ 2,119 $ 956 $ 455 $ 222 $ 1,032 (575) 4,209Less: Preferred stock dividends 84 84Adjusted earnings available to common shareholders $ (659) $ 4,125
Nine Months Ended September 30, 2017
U.S. Asia Latin America EMEA MetLifeHoldings Corporate&
Other Total
(In millions)Net income (loss)
$ 1,452 $ 927 $ 552 $ 210 $ 650 $ (2,086) $ 1,705Less: Income (loss) from discontinued operations, net of income tax
— — — — — (986) (986)Income (loss) from continuing operations, net of income tax
$ 1,452 $ 927 $ 552 $ 210 $ 650 $ (1,100) $ 2,691Less: Net investment gains (losses)
78 61 34 (8) 47 (626) (414)Less: Net derivative gains (losses)
(34) (9) 173 21 (321) (365) (535)Less: Other adjustments to continuing operations (1)
(161) (28) (65) (7) (248) (817) (1,326)Less: Provision for income tax (expense) benefit
40 (16) (50) (14) 184 1,207 1,351Adjusted earnings $ 1,529 $ 919 $ 460 $ 218 $ 988 (499) 3,615Less: Preferred stock dividends 58 58Adjusted earnings available to common shareholders $ (557) $ 3,557
__________________
(1) See definitions and components of adjusted revenues and adjusted expenses under “— Non-GAAP and Other Financial Disclosures.” Further, see Note 2 ofthe Notes to the Interim Condensed Consolidated Financial Statements for additional details on these adjustments by financial statement line item .
125
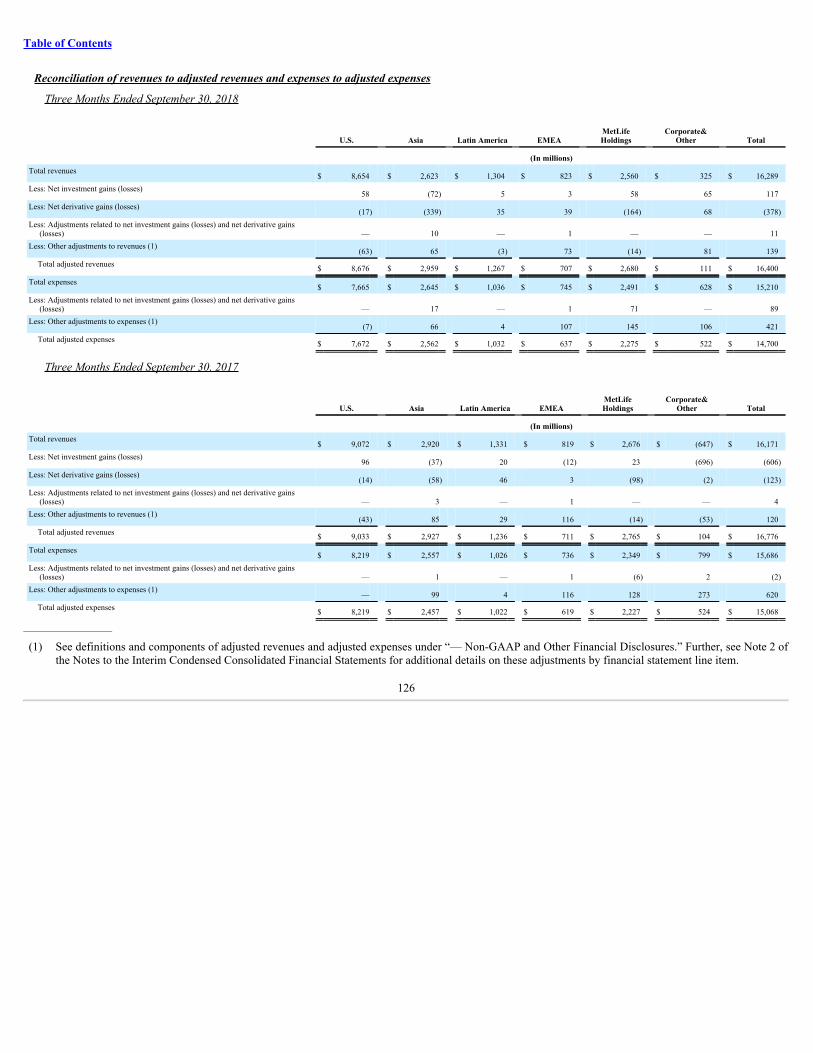
Table of Contents
Reconciliationofrevenuestoadjustedrevenuesandexpensestoadjustedexpenses
Three Months Ended September 30, 2018
U.S. Asia Latin America EMEA MetLifeHoldings Corporate&
Other Total
(In millions)Total revenues
$ 8,654 $ 2,623 $ 1,304 $ 823 $ 2,560 $ 325 $ 16,289Less: Net investment gains (losses)
58 (72) 5 3 58 65 117Less: Net derivative gains (losses)
(17) (339) 35 39 (164) 68 (378)Less: Adjustments related to net investment gains (losses) and net derivative gains
(losses) — 10 — 1 — — 11Less: Other adjustments to revenues (1)
(63) 65 (3) 73 (14) 81 139Total adjusted revenues $ 8,676 $ 2,959 $ 1,267 $ 707 $ 2,680 $ 111 $ 16,400
Total expenses$ 7,665 $ 2,645 $ 1,036 $ 745 $ 2,491 $ 628 $ 15,210
Less: Adjustments related to net investment gains (losses) and net derivative gains(losses) — 17 — 1 71 — 89
Less: Other adjustments to expenses (1)(7) 66 4 107 145 106 421
Total adjusted expenses $ 7,672 $ 2,562 $ 1,032 $ 637 $ 2,275 $ 522 $ 14,700
Three Months Ended September 30, 2017
U.S. Asia Latin America EMEA MetLifeHoldings Corporate&
Other Total
(In millions)Total revenues
$ 9,072 $ 2,920 $ 1,331 $ 819 $ 2,676 $ (647) $ 16,171Less: Net investment gains (losses)
96 (37) 20 (12) 23 (696) (606)Less: Net derivative gains (losses)
(14) (58) 46 3 (98) (2) (123)Less: Adjustments related to net investment gains (losses) and net derivative gains
(losses) — 3 — 1 — — 4Less: Other adjustments to revenues (1)
(43) 85 29 116 (14) (53) 120Total adjusted revenues $ 9,033 $ 2,927 $ 1,236 $ 711 $ 2,765 $ 104 $ 16,776
Total expenses$ 8,219 $ 2,557 $ 1,026 $ 736 $ 2,349 $ 799 $ 15,686
Less: Adjustments related to net investment gains (losses) and net derivative gains(losses) — 1 — 1 (6) 2 (2)
Less: Other adjustments to expenses (1)— 99 4 116 128 273 620
Total adjusted expenses $ 8,219 $ 2,457 $ 1,022 $ 619 $ 2,227 $ 524 $ 15,068
__________________
(1) See definitions and components of adjusted revenues and adjusted expenses under “— Non-GAAP and Other Financial Disclosures.” Further, see Note 2 ofthe Notes to the Interim Condensed Consolidated Financial Statements for additional details on these adjustments by financial statement line item.
126
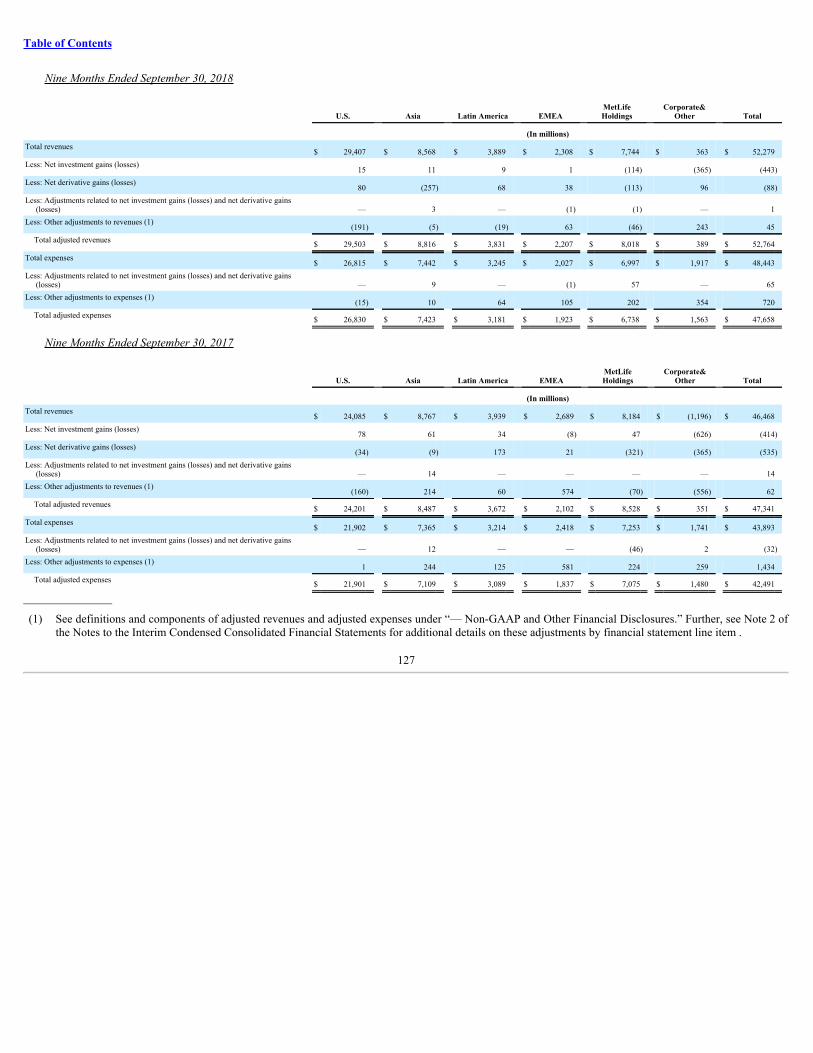
Table of Contents
Nine Months Ended September 30, 2018
U.S. Asia Latin America EMEA MetLifeHoldings Corporate&
Other Total
(In millions)Total revenues
$ 29,407 $ 8,568 $ 3,889 $ 2,308 $ 7,744 $ 363 $ 52,279Less: Net investment gains (losses)
15 11 9 1 (114) (365) (443)Less: Net derivative gains (losses)
80 (257) 68 38 (113) 96 (88)Less: Adjustments related to net investment gains (losses) and net derivative gains
(losses) — 3 — (1) (1) — 1Less: Other adjustments to revenues (1)
(191) (5) (19) 63 (46) 243 45Total adjusted revenues $ 29,503 $ 8,816 $ 3,831 $ 2,207 $ 8,018 $ 389 $ 52,764
Total expenses$ 26,815 $ 7,442 $ 3,245 $ 2,027 $ 6,997 $ 1,917 $ 48,443
Less: Adjustments related to net investment gains (losses) and net derivative gains(losses) — 9 — (1) 57 — 65
Less: Other adjustments to expenses (1)(15) 10 64 105 202 354 720
Total adjusted expenses $ 26,830 $ 7,423 $ 3,181 $ 1,923 $ 6,738 $ 1,563 $ 47,658
Nine Months Ended September 30, 2017
U.S. Asia Latin America EMEA MetLifeHoldings Corporate&
Other Total
(In millions)Total revenues
$ 24,085 $ 8,767 $ 3,939 $ 2,689 $ 8,184 $ (1,196) $ 46,468Less: Net investment gains (losses)
78 61 34 (8) 47 (626) (414)Less: Net derivative gains (losses)
(34) (9) 173 21 (321) (365) (535)Less: Adjustments related to net investment gains (losses) and net derivative gains
(losses) — 14 — — — — 14Less: Other adjustments to revenues (1)
(160) 214 60 574 (70) (556) 62Total adjusted revenues $ 24,201 $ 8,487 $ 3,672 $ 2,102 $ 8,528 $ 351 $ 47,341
Total expenses$ 21,902 $ 7,365 $ 3,214 $ 2,418 $ 7,253 $ 1,741 $ 43,893
Less: Adjustments related to net investment gains (losses) and net derivative gains(losses) — 12 — — (46) 2 (32)
Less: Other adjustments to expenses (1)1 244 125 581 224 259 1,434
Total adjusted expenses $ 21,901 $ 7,109 $ 3,089 $ 1,837 $ 7,075 $ 1,480 $ 42,491
__________________
(1) See definitions and components of adjusted revenues and adjusted expenses under “— Non-GAAP and Other Financial Disclosures.” Further, see Note 2 ofthe Notes to the Interim Condensed Consolidated Financial Statements for additional details on these adjustments by financial statement line item .
127
Table of Contents
ConsolidatedResults—AdjustedEarnings
ThreeMonthsEndedSeptember30,2018ComparedwiththeThreeMonthsEndedSeptember30,2017
Unless otherwise stated, all amounts discussed below are net of income tax.
Overview. The primary drivers of the increase in adjusted earnings were higher net investment income due to a larger asset base and higher investmentyields, a prior period tax charge, the favorable impact of U.S. Tax Reform and favorable underwriting, partially offset by higher interest credited expenses andthe unfavorable impact of our annual actuarial assumption review.
Foreign Currency. Changes in foreign currency exchange rates had a $22 million negative impact on adjusted earnings for the third quarter of 2018compared to the prior period. Unless otherwise stated, all amounts discussed below are net of foreign currency fluctuations. Foreign currency fluctuations canresult in significant variances in the financial statement line items.
U.S. Tax Reform . The changes from U.S. Tax Reform resulted in a net increase in adjusted earnings of $ 70 million for the third quarter of 2018 comparedto the prior period , which includes a $32 million, net of income tax, reduction of net investment income in the current period related to tax credit partnershipinvestments.
Business Growth. We benefited from positive net flows from many of our businesses, which increased our invested asset base. Growth in the investmentportfolios of our U.S., Asia, and Latin America segments resulted in higher net investment income. However, this was partially offset by a correspondingincrease in interest credited expense on certain insurance-related liabilities. In our U.S. segment, an increase in average premium per policy in our auto business,partially offset by a decrease in exposures, improved adjusted earnings. Higher asset-based fees, primarily from our Asia and EMEA segments, was partiallyoffset by lower fees in our MetLife Holdings segment. Business growth also drove an increase in commissions and other variable expenses, which were offset byhigher DAC capitalization. The combined impact of the items affecting our business growth resulted in a $32 million increase in adjusted earnings.
Market Factors. Market factors, including interest rate levels, variability in equity market returns, and foreign currency exchange rate fluctuations,continued to impact our results; however, certain impacts were mitigated by derivatives used to hedge these risks. Excluding the impact of changes in foreigncurrency exchange rates on net investment income in our non-U.S. segments and changes in inflation rates on our inflation-indexed investments, investmentyields increased. Investment yields were positively impacted by higher yields on fixed income securities, derivative income and prepayment fees. Theseincreases were partially offset by lower returns on private equities, driven by a decrease in certain partnership distributions. The increase in investment yieldswas partially offset by the impact of higher average interest credited rates, as well as an increase in the crediting rate on certain long-duration insurance contracts, which drove an increase in interest credited expenses, primarily in our U.S. segment. The changes in market factors discussed above resulted in a $109 millionincrease in adjusted earnings.
Underwriting, Actuarial Assumption Review and Other Insurance Adjustments . Favorable underwriting resulted in a $47 million increase in adjustedearnings, primarily as a result of lower catastrophe losses, as well as favorable morbidity in our U.S. and MetLife Holdings segments. This was partially offsetby unfavorable claims experience in our EMEA and Asia segments, as well as higher non-catastrophe claim costs. Unfavorable mortality in our MetLifeHoldings segment was mostly offset by favorable mortality in our U.S. and Latin America segments. The impact in both periods of our annual actuarialassumption review resulted in a decrease of $149 million in adjusted earnings, primarily due to less favorable assumption changes in our MetLife Holdings andAsia segments. Refinements to DAC and certain insurance-related liabilities, which were recorded in both periods across the majority of our segments, resultedin a $21 million decrease in adjusted earnings, most notably in our MetLife Holdings and U.S. segments.
Expenses and Taxes. A $12 million decrease in expenses was primarily due to lower Separation-related and employee-related expenses, largely offset by anincrease in costs associated with enterprise-wide initiatives, primarily due to a current period increase in expenses associated with our unit cost initiative. Oureffective tax rates differ from the U.S. statutory rate of 21% typically due to nontaxable investment income, tax credits for investments in low income housingand foreign earnings taxed at different rates than the U.S. statutory rate. Higher utilization of tax preferenced items increased adjusted earnings by $20 millioncompared to the prior period. Our prior period results include a net tax charge of $180 million related to the repatriation of approximately $3.0 billion of cashfollowing the post-Separation review of our capital needs, partially offset by a tax benefit associated with dividends from our non-U.S. operations and a tax-related benefit of $4 million from the finalization of certain tax audits.
NineMonthsEndedSeptember30,2018ComparedwiththeNineMonthsEndedSeptember30,2017
Unless otherwise stated, all amounts discussed below are net of income tax.
128
Table of Contents
Overview. The primary drivers of the increase in adjusted earnings were higher net investment income due to a larger asset base and higher investmentyields, the favorable impact of U.S. Tax Reform, a prior period tax charge and favorable underwriting, partially offset by higher interest credited expenses andthe unfavorable impact of our annual actuarial assumption review.
Foreign Currency. Changes in foreign currency exchange rates had a $16 million positive impact on adjusted earnings for the nine months ended September30, 2018 compared to the prior period. Unless otherwise stated, all amounts discussed below are net of foreign currency fluctuations. Foreign currencyfluctuations can result in significant variances in the financial statement line items.
U.S. Tax Reform . The changes from U.S. Tax Reform resulted in a net increase in adjusted earnings of $235 million for the nine months ended September30, 2018 compared to the prior period , which includes a $32 million, net of income tax, reduction of net investment income in the current period related to taxcredit partnership investments.
Business Growth. We benefited from positive net flows from many of our businesses, which increased our invested asset base. Growth in the investmentportfolios of our U.S., Asia, and Latin America segments resulted in higher net investment income. However, this was partially offset by a correspondingincrease in interest credited expense on certain insurance-related liabilities. In our U.S. segment, an increase in average premium per policy in our auto business,partially offset by a decrease in exposures, improved adjusted earnings. Business growth also drove an increase in commissions and other variable expenses,which were partially offset by higher DAC capitalization. The combined impact of the items affecting our business growth resulted in a $79 million increase inadjusted earnings.
Market Factors. Market factors, including interest rate levels, variability in equity market returns, and foreign currency exchange rate fluctuations,continued to impact our results; however, certain impacts were mitigated by derivatives used to hedge these risks. Excluding the impact of changes in foreigncurrency exchange rates on net investment income in our non-U.S. segments and changes in inflation rates on our inflation-indexed investments, investmentyields increased slightly. Investment yields were positively affected by higher yields on fixed income securities, returns on real estate investments, income onderivatives and prepayment fees. These increases were largely offset by lower returns on private equities, driven by a decrease in certain partnershipdistributions, lower returns on hedge funds and lower returns on fair value option securities (“FVO Securities”). The slight improvement in yield was more thanoffset by the impact of higher average interest credited rates, which drove an increase in interest credited expense, primarily in our U.S. segment. The changes inmarket factors discussed above resulted in an $18 million increase in adjusted earnings.
Underwriting, Actuarial Assumption Review and Other Insurance Adjustments . Favorable underwriting resulted in a $145 million increase in adjustedearnings primarily as a result of lower catastrophe losses, as well as favorable morbidity in our U.S. and MetLife Holdings segments, partially offset byunfavorable claims experience in our EMEA and Asia segments. In addition, favorable mortality in our Latin America and U.S. segments was partially offset byunfavorable mortality in our MetLife Holdings segment. The impact in both periods of our annual actuarial assumption review resulted in a decrease of$149 million in adjusted earnings, primarily due to less favorable assumption changes in our MetLife Holdings and Asia segments. Refinements to DAC andcertain insurance-related liabilities, which were recorded in both periods across the majority of our segments, resulted in a $14 million increase in adjustedearnings, most notably in our MetLife Holdings and U.S. segments.
Expenses and Taxes. A $61 million decrease in expenses resulted from declines in Separation-related expenses and employee-related costs, as well asexpenses incurred in the prior period related to the guaranty fund assessment for Penn Treaty, partially offset by higher costs associated with enterprise-wideinitiatives, driven by a current period increase in expenses associated with our unit cost initiative and higher litigation expenses. Our effective tax rates differfrom the U.S. statutory rate of 21% typically due to nontaxable investment income, tax credits for investments in low income housing and foreign earnings taxedat different rates than the U.S. statutory rate. Lower utilization of tax preferenced items decreased adjusted earnings by $26 million compared to the prior period.Our current period results include tax benefits of $36 million related to a non-cash transfer of assets from a wholly-owned U.K. investment subsidiary to its U.S.parent and $7 million related to the settlement of an audit, partially offset by tax charges of $17 million related to a tax adjustment in Chile and a $5 million taxcharge in Colombia to establish a deferred tax liability due to a change in tax status. Our prior period results include a net tax-related benefit of $27 million fromthe finalization of certain tax audits, as well as a net tax charge of $180 million related to the repatriation of approximately $3.0 billion of cash following thepost-Separation review of our capital needs, partially offset by a tax benefit associated with dividends from our non-U.S. operations. Our prior period results alsoinclude a tax benefit of $9 million related to the settlement of an audit in Argentina.
129
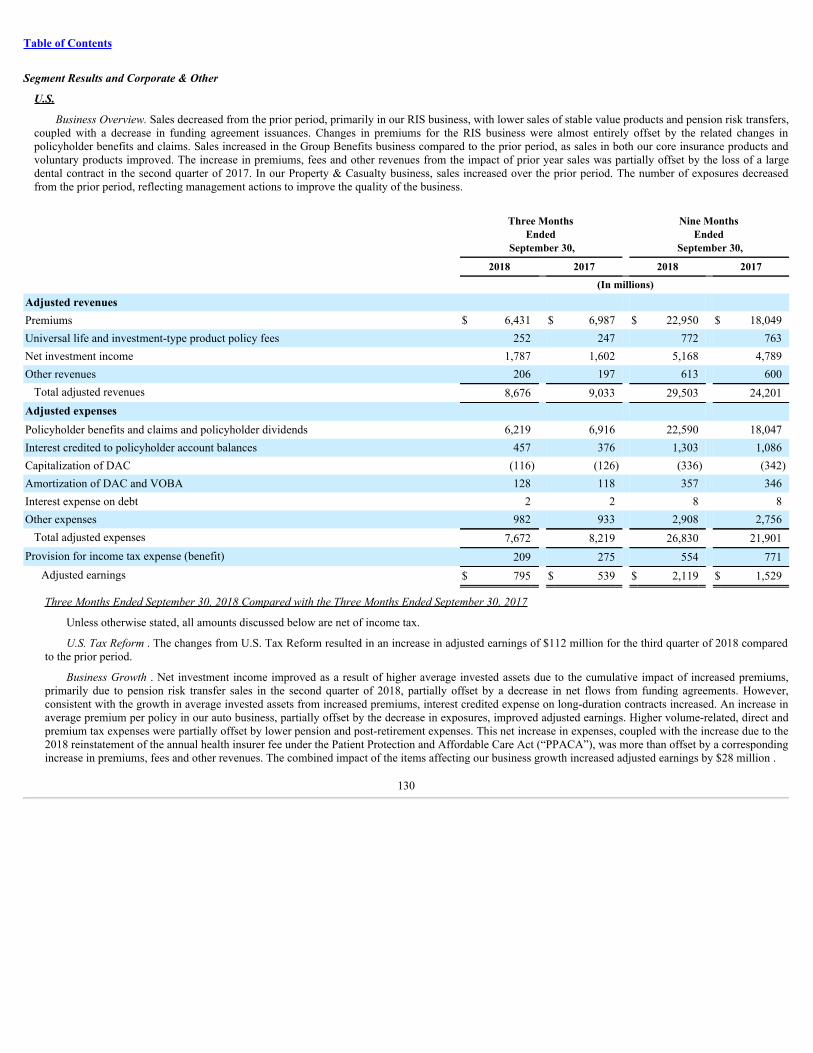
Table of Contents
SegmentResultsandCorporate&Other
U.S.
Business Overview. Sales decreased from the prior period, primarily in our RIS business, with lower sales of stable value products and pension risk transfers,coupled with a decrease in funding agreement issuances. Changes in premiums for the RIS business were almost entirely offset by the related changes inpolicyholder benefits and claims. Sales increased in the Group Benefits business compared to the prior period, as sales in both our core insurance products andvoluntary products improved. The increase in premiums, fees and other revenues from the impact of prior year sales was partially offset by the loss of a largedental contract in the second quarter of 2017. In our Property & Casualty business, sales increased over the prior period. The number of exposures decreasedfrom the prior period, reflecting management actions to improve the quality of the business.
Three Months Ended
September 30,
Nine Months Ended
September 30,
2018 2017 2018 2017
(In millions)
Adjusted revenues Premiums $ 6,431 $ 6,987 $ 22,950 $ 18,049Universal life and investment-type product policy fees 252 247 772 763Net investment income 1,787 1,602 5,168 4,789Other revenues 206 197 613 600
Total adjusted revenues 8,676 9,033 29,503 24,201Adjusted expenses Policyholder benefits and claims and policyholder dividends 6,219 6,916 22,590 18,047Interest credited to policyholder account balances 457 376 1,303 1,086Capitalization of DAC (116) (126) (336) (342)Amortization of DAC and VOBA 128 118 357 346Interest expense on debt 2 2 8 8Other expenses 982 933 2,908 2,756
Total adjusted expenses 7,672 8,219 26,830 21,901Provision for income tax expense (benefit) 209 275 554 771
Adjusted earnings $ 795 $ 539 $ 2,119 $ 1,529
Three Months Ended September 30, 2018 Compared with the Three Months Ended September 30, 2017
Unless otherwise stated, all amounts discussed below are net of income tax.
U.S. Tax Reform . The changes from U.S. Tax Reform resulted in an increase in adjusted earnings of $112 million for the third quarter of 2018 comparedto the prior period.
Business Growth . Net investment income improved as a result of higher average invested assets due to the cumulative impact of increased premiums,primarily due to pension risk transfer sales in the second quarter of 2018, partially offset by a decrease in net flows from funding agreements. However,consistent with the growth in average invested assets from increased premiums, interest credited expense on long-duration contracts increased. An increase inaverage premium per policy in our auto business, partially offset by the decrease in exposures, improved adjusted earnings. Higher volume-related, direct andpremium tax expenses were partially offset by lower pension and post-retirement expenses. This net increase in expenses, coupled with the increase due to the2018 reinstatement of the annual health insurer fee under the Patient Protection and Affordable Care Act (“PPACA”), was more than offset by a correspondingincrease in premiums, fees and other revenues. The combined impact of the items affecting our business growth increased adjusted earnings by $28 million .
130
Table of Contents
Market Factors . Market factors, including interest rate levels, variability in equity market returns and foreign currency exchange rate fluctuations,continued to impact our results; however, certain impacts were mitigated by derivatives used to hedge these risks. Investment yields increased, primarily dueto higher yields on fixed income securities and mortgage loans, coupled with an increase in derivative income, partially offset by lower returns on privateequities, as a result of a decrease in certain partnership distributions. The increase in investment yields was mostly offset by the impact of higher averageinterest credited rates, which drove an increase in interest credited expense, coupled with the increase in the crediting rate on certain long-duration insurancecontracts. The changes in market factors discussed above resulted in a slight increase in adjusted earnings.
Underwriting and Other Insurance Adjustments . In our Property & Casualty business, catastrophe-related losses decreased $30 million in the currentperiod due, in part, to lower hurricane-related claims. Non-catastrophe claim costs increased $10 million as a result of higher auto severities, partially offset bya decrease in homeowner severities. Losses from our commercial business increased $7 million. As a result of overall lower claim activity, loss adjustmentexpenses decreased, increasing adjusted earnings by $6 million. Favorable claims experience in our Group Benefits business resulted in a $27 million increasein adjusted earnings. This was primarily driven by favorable renewal results in our disability business, as well as lower incidence and severity, coupled withgrowth and favorable claims experience in our accident & health business, partially offset by less favorable claims experience in our dental and visionbusinesses. Mortality results were flat in the current period, as favorable claims experience in our universal life business was offset by less favorable mortalityin our term life and accidental death & dismemberment businesses. Favorable mortality in our specialized life insurance and pension risk transfer businessesincreased adjusted earnings by $6 million. Refinements to certain insurance and other liabilities, which were recorded in both periods, resulted in a $65 millionincrease in adjusted earnings. Such refinements include a current period favorable net insurance adjustment of $37 million resulting from reserve and DACmodeling improvements in our individual disability insurance business.
Nine Months Ended September 30, 2018 Compared with the Nine Months Ended September 30, 2017
Unless otherwise stated, all amounts discussed below are net of income tax.
U.S. Tax Reform . The changes from U.S. Tax Reform resulted in an increase in adjusted earnings of $314 million for the nine months ended September30, 2018 compared to the prior period.
Business Growth . Net investment income improved as a result of higher average invested assets due to the impact of increased premiums and deposits,primarily due to pension risk transfer sales, partially offset by a decrease in net flows from funding agreements. However, consistent with the growth inaverage invested assets from increased premiums, interest credited expense on long-duration contracts increased. An increase in average premium per policy inour auto business, partially offset by the decrease in exposures, improved adjusted earnings. Higher volume-related, direct and premium tax expenses werepartially offset by lower pension and post retirement expenses. This net increase in expenses, coupled with the increase due to the current period reinstatementof the annual health insurer fee under the PPACA, were more than offset by a corresponding increase in premiums, fees and other revenues. The combinedimpact of the items affecting our business growth increased adjusted earnings by $121 million .
Market Factors . Market factors, including interest rate levels, variability in equity market returns and foreign currency exchange rate fluctuations,continued to impact our results; however, certain impacts were mitigated by derivatives used to hedge these risks. Investment yields increased, primarily dueto higher yields on fixed income securities and mortgage loans, coupled with higher returns on real estate investments, partially offset by lower returns onprivate equities, as a result of a decrease in certain partnership distributions. The net increase in investment yields was more than offset by the impact of higheraverage interest credited rates, which drove an increase in interest credited expense; however, this was partially offset by an increase in adjusted earnings dueto a decrease in the crediting rate on certain long-duration insurance contracts. The changes in market factors discussed above resulted in a $63 milliondecrease in adjusted earnings.
131
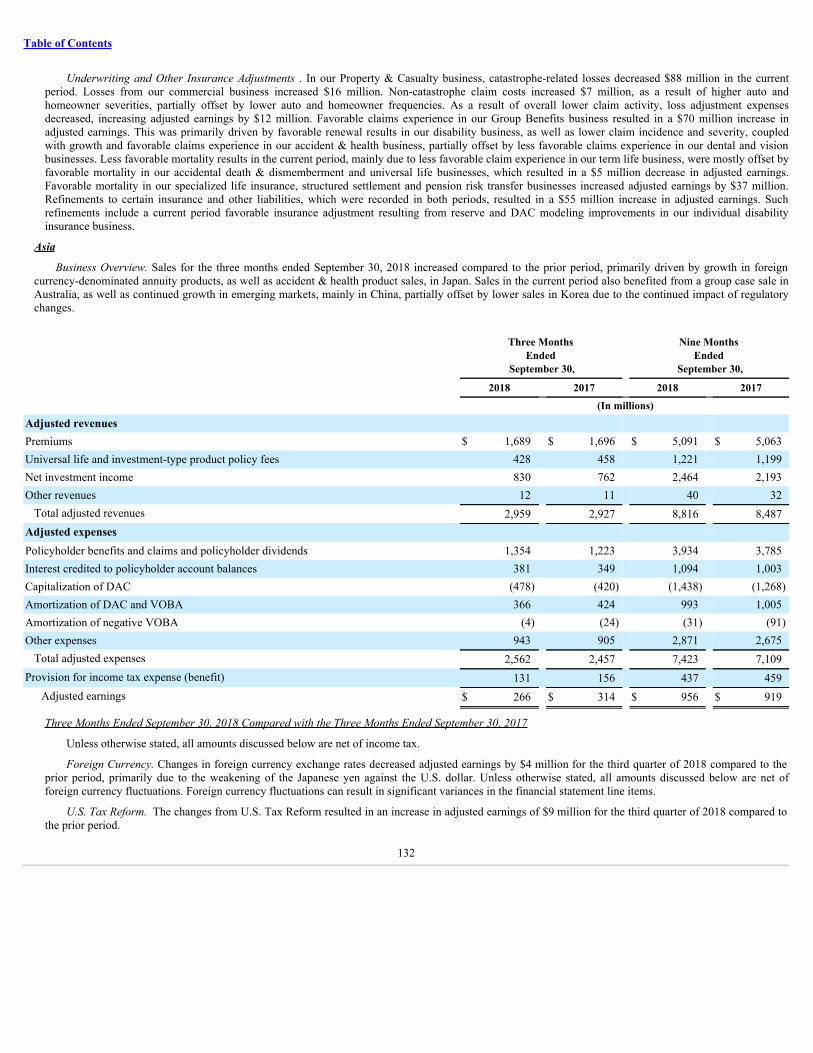
Table of Contents
Underwriting and Other Insurance Adjustments . In our Property & Casualty business, catastrophe-related losses decreased $88 million in the currentperiod. Losses from our commercial business increased $16 million. Non-catastrophe claim costs increased $7 million, as a result of higher auto andhomeowner severities, partially offset by lower auto and homeowner frequencies. As a result of overall lower claim activity, loss adjustment expensesdecreased, increasing adjusted earnings by $12 million. Favorable claims experience in our Group Benefits business resulted in a $70 million increase inadjusted earnings. This was primarily driven by favorable renewal results in our disability business, as well as lower claim incidence and severity, coupledwith growth and favorable claims experience in our accident & health business, partially offset by less favorable claims experience in our dental and visionbusinesses. Less favorable mortality results in the current period, mainly due to less favorable claim experience in our term life business, were mostly offset byfavorable mortality in our accidental death & dismemberment and universal life businesses, which resulted in a $5 million decrease in adjusted earnings.Favorable mortality in our specialized life insurance, structured settlement and pension risk transfer businesses increased adjusted earnings by $37 million.Refinements to certain insurance and other liabilities, which were recorded in both periods, resulted in a $55 million increase in adjusted earnings. Suchrefinements include a current period favorable insurance adjustment resulting from reserve and DAC modeling improvements in our individual disabilityinsurance business.
Asia
Business Overview. Sales for the three months ended September 30, 2018 increased compared to the prior period, primarily driven by growth in foreigncurrency-denominated annuity products, as well as accident & health product sales, in Japan. Sales in the current period also benefited from a group case sale inAustralia, as well as continued growth in emerging markets, mainly in China, partially offset by lower sales in Korea due to the continued impact of regulatorychanges.
Three Months Ended
September 30,
Nine Months Ended
September 30,
2018 2017 2018 2017
(In millions)
Adjusted revenues Premiums $ 1,689 $ 1,696 $ 5,091 $ 5,063Universal life and investment-type product policy fees 428 458 1,221 1,199Net investment income 830 762 2,464 2,193Other revenues 12 11 40 32
Total adjusted revenues 2,959 2,927 8,816 8,487Adjusted expenses Policyholder benefits and claims and policyholder dividends 1,354 1,223 3,934 3,785Interest credited to policyholder account balances 381 349 1,094 1,003Capitalization of DAC (478) (420) (1,438) (1,268)Amortization of DAC and VOBA 366 424 993 1,005Amortization of negative VOBA (4) (24) (31) (91)Other expenses 943 905 2,871 2,675
Total adjusted expenses 2,562 2,457 7,423 7,109Provision for income tax expense (benefit) 131 156 437 459
Adjusted earnings $ 266 $ 314 $ 956 $ 919
Three Months Ended September 30, 2018 Compared with the Three Months Ended September 30, 2017
Unless otherwise stated, all amounts discussed below are net of income tax.
Foreign Currency. Changes in foreign currency exchange rates decreased adjusted earnings by $4 million for the third quarter of 2018 compared to theprior period, primarily due to the weakening of the Japanese yen against the U.S. dollar. Unless otherwise stated, all amounts discussed below are net offoreign currency fluctuations. Foreign currency fluctuations can result in significant variances in the financial statement line items.
U.S. Tax Reform. The changes from U.S. Tax Reform resulted in an increase in adjusted earnings of $9 million for the third quarter of 2018 compared tothe prior period.
132
Table of Contents
Business Growth. Asia’s premiums, fees and other revenues decreased slightly from the prior period mainly due to a change in product mix frompremium-based products to fee-based products, primarily from Yen life products to foreign currency-denominated life products and accident & health productsin Japan. The decrease in premiums from Yen life products was partially offset by a related decline in policyholder benefits. Positive net flows in Japan andKorea resulted in higher average invested assets, which improved net investment income. The combined impact of the items discussed above improvedadjusted earnings by $29 million .
Market Factors. Market factors, including interest rate levels and variability in equity market returns, continued to impact our results; however, certainimpacts were mitigated by derivatives used to hedge these risks. Investment results were favorably impacted by higher returns on real estate investments, aswell as higher yields on fixed income securities due to the favorable impact of increased sales of life and annuity products in Japan, which drove an increase inhigher-yielding U.S. dollar-denominated fixed income securities. This increase in yields in Japan was partially offset by lower yields on fixed incomesecurities in Korea. Investment yields were negatively impacted by lower earnings from our operating joint ventures, primarily in China, and higherinvestment expenses. The combined impact of the items affecting our business growth increased adjusted earnings by $6 million .
Underwriting, Actuarial Assumption Review and Other Insurance Adjustments. Higher claims in Japan decreased adjusted earnings by $12 million . Theimpact in both periods of our annual actuarial assumption review resulted in a decrease of $63 million in adjusted earnings. Refinements to certain insuranceand other liabilities, which were recorded in both periods, resulted in a $14 million decrease in adjusted earnings. Our results for the current period include afavorable liability refinement of $4 million in Japan.
Nine Months Ended September 30, 2018 Compared with the Nine Months Ended September 30, 2017
Unless otherwise stated, all amounts discussed below are net of income tax.
Foreign Currency . Changes in foreign currency exchange rates increased adjusted earnings by $11 million for the nine months ended September 30, 2018compared to the prior period, primarily due to the strengthening of the Japanese yen and Korean won against the U.S. dollar. Unless otherwise stated, allamounts discussed below are net of foreign currency fluctuations. Foreign currency fluctuations can result in significant variances in the financial statementline items.
U.S. Tax Reform . The changes from U.S. Tax Reform resulted in an increase in adjusted earnings of $34 million for the nine months ended September30, 2018 compared to the prior period.
Business Growth . Asia’s premiums, fees and other revenues decreased slightly from the prior period mainly due to a change in product mix frompremium-based products to fee-based products, primarily from Yen life products to foreign currency-denominated life products and accident & health productsin Japan. The decrease in premiums from Yen life products was partially offset by a related decline in policyholder benefits. Positive net flows in Japan andKorea resulted in higher average invested assets, which improved net investment income. The combined impact of the items affecting our business growthimproved adjusted earnings by $77 million .
Market Factors . Market factors, including interest rate levels and variability in equity market returns, continued to impact our results; however, certainimpacts were mitigated by derivatives used to hedge these risks. Investment results were favorably impacted by higher returns on real estate investments,derivative income, and yields on mortgage loans. In addition, higher earnings from our operating joint venture in China improved net investment income.Increased sales of life and annuity products in Japan drove an increase in higher-yielding U.S. dollar-denominated fixed income securities. This increase inyields in Japan was partially offset by lower yields on fixed income securities in Korea. Investment yields were negatively impacted by increased investmentexpenses and lower returns on hedge funds. The combined impact of the items discussed above increased adjusted earnings by $44 million .
Underwriting, Actuarial Assumption Review and Other Insurance Adjustments. Higher lapses and claims in Japan decreased adjusted earnings by$33 million . The impact in both periods of our annual actuarial assumption review resulted in a decrease of $63 million in adjusted earnings. Refinements tocertain insurance and other liabilities, which were recorded in both periods, resulted in a slight decrease in adjusted earnings. Our results for the current periodinclude favorable liability refinements of $24 million in Japan, partially offset by an unfavorable liability refinement of $10 million in Bangladesh. Our priorperiod results include a favorable refinement of $12 million related to reinsurance receivables in Australia.
Expenses . Higher expenses, primarily driven by higher employee-related and project costs, as well as an increase in corporate overhead costs, reducedadjusted earnings by $24 million .
133
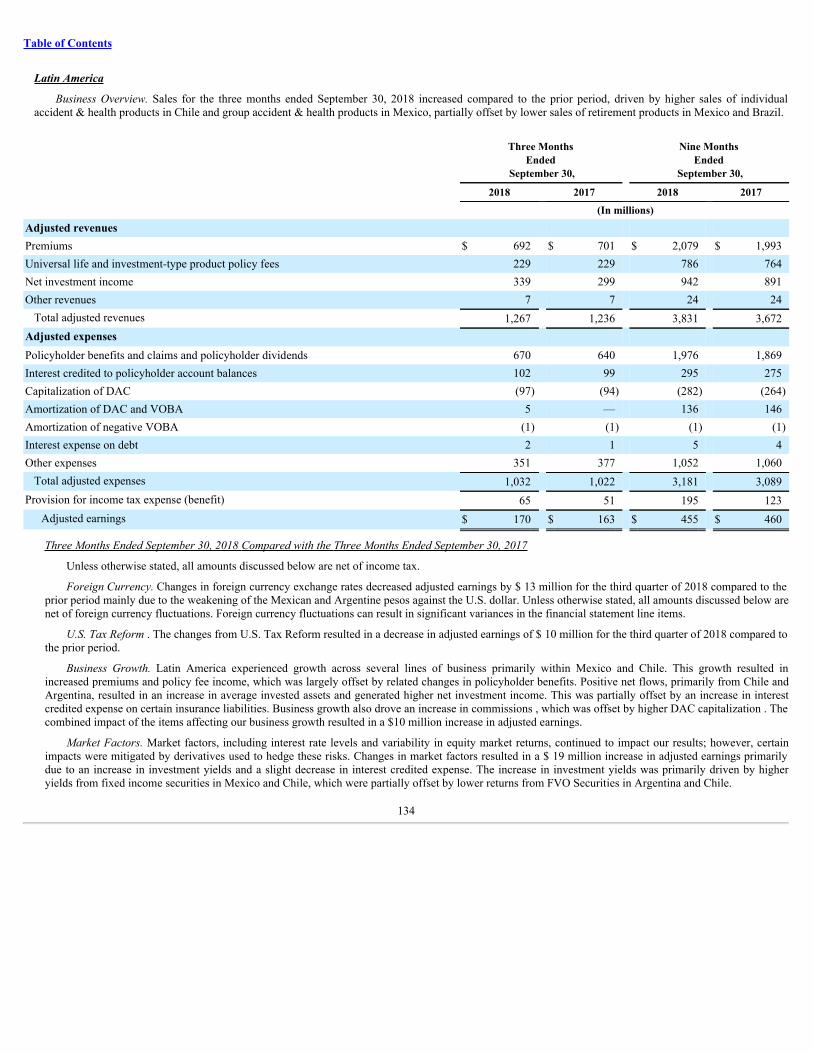
Table of Contents
LatinAmerica
Business Overview. Sales for the three months ended September 30, 2018 increased compared to the prior period, driven by higher sales of individualaccident & health products in Chile and group accident & health products in Mexico, partially offset by lower sales of retirement products in Mexico and Brazil.
Three Months Ended
September 30,
Nine Months Ended
September 30,
2018 2017 2018 2017
(In millions)
Adjusted revenues Premiums $ 692 $ 701 $ 2,079 $ 1,993Universal life and investment-type product policy fees 229 229 786 764Net investment income 339 299 942 891Other revenues 7 7 24 24
Total adjusted revenues 1,267 1,236 3,831 3,672Adjusted expenses Policyholder benefits and claims and policyholder dividends 670 640 1,976 1,869Interest credited to policyholder account balances 102 99 295 275Capitalization of DAC (97) (94) (282) (264)Amortization of DAC and VOBA 5 — 136 146Amortization of negative VOBA (1) (1) (1) (1)Interest expense on debt 2 1 5 4Other expenses 351 377 1,052 1,060
Total adjusted expenses 1,032 1,022 3,181 3,089Provision for income tax expense (benefit) 65 51 195 123
Adjusted earnings $ 170 $ 163 $ 455 $ 460
Three Months Ended September 30, 2018 Compared with the Three Months Ended September 30, 2017
Unless otherwise stated, all amounts discussed below are net of income tax.
Foreign Currency. Changes in foreign currency exchange rates decreased adjusted earnings by $ 13 million for the third quarter of 2018 compared to theprior period mainly due to the weakening of the Mexican and Argentine pesos against the U.S. dollar. Unless otherwise stated, all amounts discussed below arenet of foreign currency fluctuations. Foreign currency fluctuations can result in significant variances in the financial statement line items.
U.S. Tax Reform . The changes from U.S. Tax Reform resulted in a decrease in adjusted earnings of $ 10 million for the third quarter of 2018 compared tothe prior period.
Business Growth. Latin America experienced growth across several lines of business primarily within Mexico and Chile. This growth resulted inincreased premiums and policy fee income, which was largely offset by related changes in policyholder benefits. Positive net flows, primarily from Chile andArgentina, resulted in an increase in average invested assets and generated higher net investment income. This was partially offset by an increase in interestcredited expense on certain insurance liabilities. Business growth also drove an increase in commissions , which was offset by higher DAC capitalization . Thecombined impact of the items affecting our business growth resulted in a $10 million increase in adjusted earnings.
Market Factors. Market factors, including interest rate levels and variability in equity market returns, continued to impact our results; however, certainimpacts were mitigated by derivatives used to hedge these risks. Changes in market factors resulted in a $ 19 million increase in adjusted earnings primarilydue to an increase in investment yields and a slight decrease in interest credited expense. The increase in investment yields was primarily driven by higheryields from fixed income securities in Mexico and Chile, which were partially offset by lower returns from FVO Securities in Argentina and Chile.
134
Table of Contents
Underwriting, Actuarial Assumption Review and Other Insurance Adjustments. Favorable underwriting resulted in a $ 14 million increase to adjustedearnings primarily driven by lower claims experience in Mexico. The impact in both periods of our annual actuarial assumption review resulted in a $ 13million increase to adjusted earnings. In addition, refinements to certain insurance liabilities and other adjustments in both periods, primarily in Chile andMexico, resulted in a $ 23 million decrease to adjusted earnings.
Nine Months Ended September 30, 2018 Compared with the Nine Months Ended September 30, 2017
Unless otherwise stated, all amounts discussed below are net of income tax.
Foreign Currency. Changes in foreign currency exchange rates decreased adjusted earnings by $ 3 million for the nine months ended September 30, 2018compared to the prior period mainly due to the weakening of the Mexican and Argentine pesos against the U.S. dollar. Unless otherwise stated, all amountsdiscussed below are net of foreign currency fluctuations. Foreign currency fluctuations can result in significant variances in the financial statement line items.
U.S. Tax Reform . The changes from U.S. Tax Reform resulted in a decrease in adjusted earnings of $ 30 million for the nine months ended September 30,2018 compared to the prior period.
Business Growth. Latin America experienced growth across several lines of business primarily within Chile. This growth resulted in increased premiumsand policy fee income, which was largely offset by related changes in policyholder benefits. Positive net flows, primarily from Chile and Argentina, resulted inan increase in average invested assets and generated higher net investment income. This was partially offset by an increase in interest credited expense oncertain insurance liabilities. Business growth also drove an increase in commissions and other variable expenses , which were partially offset by higher DACcapitalization . The combined impact of the items affecting our business growth resulted in a slight decrease in adjusted earnings.
Market Factors. Market factors, including interest rate levels and variability in equity market returns, continued to impact our results; however, certainimpacts were mitigated by derivatives used to hedge these risks. Changes in market factors resulted in an $ 8 million decrease in adjusted earnings primarilydue to lower investment yields. The decrease in investment yields was primarily driven by lower returns from FVO Securities in Chile, partially offset byhigher yields from fixed income securities in Mexico and higher derivative income in Chile. A slight decrease in interest credited expense partially offset thedecline in adjusted earnings.
Underwriting, Actuarial Assumption Review and Other Insurance Adjustments. Favorable underwriting resulted in a $ 56 million increase to adjustedearnings primarily driven by lower claims experience in Mexico. The impact in both periods of our annual actuarial assumption review resulted in a $ 13million increase to adjusted earnings. In addition, refinements to certain insurance liabilities and other adjustments in both periods, primarily in Brazil, Mexicoand Chile, resulted in a $22 million decrease to adjusted earnings.
Expenses and Taxes. A $ 12 million decrease in expenses was primarily the result of a current period reduction of a litigation reserve in Argentina. Ourresults for the current period include a $17 million tax charge related to a tax adjustment in Chile and a $5 million tax charge in Colombia to establish adeferred tax liability due to a change in tax status. The prior period includes a tax benefit of $9 million related to the settlement of an audit. Other tax-relateditems in both periods, primarily due to the changes in the valuation of the peso in Argentina, resulted in a $12 million increase in adjusted earnings.
135
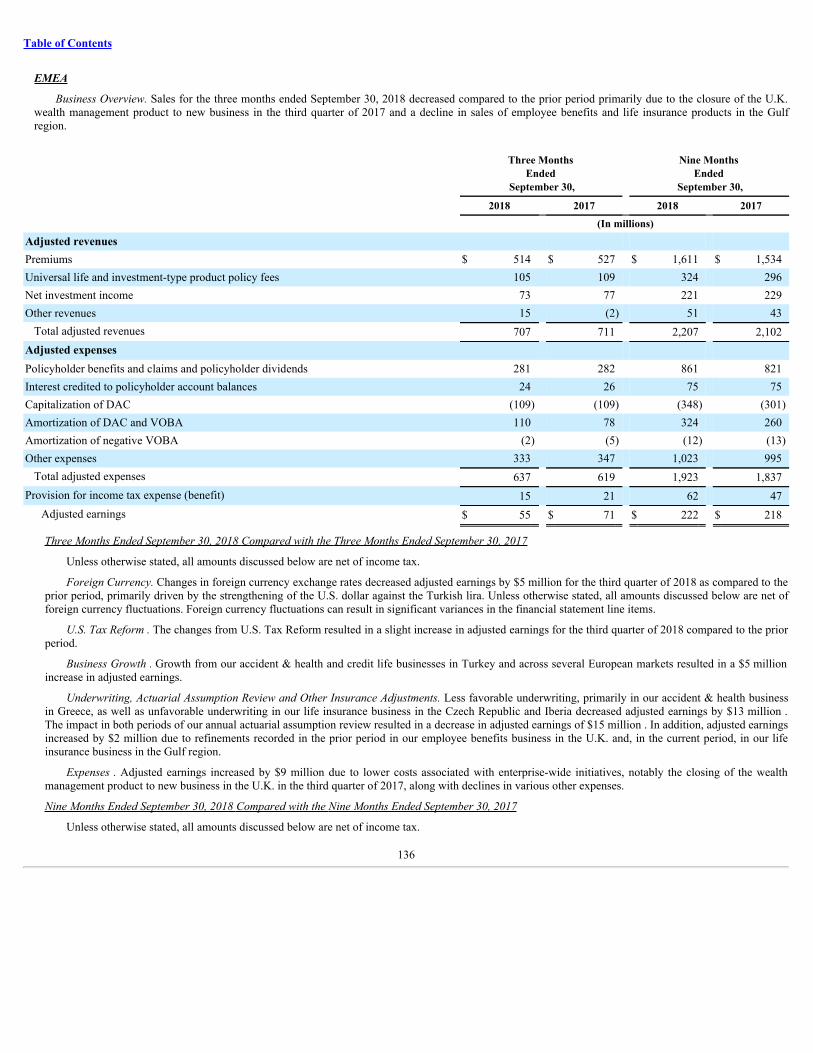
Table of Contents
EMEA
Business Overview. Sales for the three months ended September 30, 2018 decreased compared to the prior period primarily due to the closure of the U.K.wealth management product to new business in the third quarter of 2017 and a decline in sales of employee benefits and life insurance products in the Gulfregion.
Three Months Ended
September 30,
Nine Months Ended
September 30,
2018 2017 2018 2017
(In millions)
Adjusted revenues Premiums $ 514 $ 527 $ 1,611 $ 1,534Universal life and investment-type product policy fees 105 109 324 296Net investment income 73 77 221 229Other revenues 15 (2) 51 43
Total adjusted revenues 707 711 2,207 2,102Adjusted expenses Policyholder benefits and claims and policyholder dividends 281 282 861 821Interest credited to policyholder account balances 24 26 75 75Capitalization of DAC (109) (109) (348) (301)Amortization of DAC and VOBA 110 78 324 260Amortization of negative VOBA (2) (5) (12) (13)Other expenses 333 347 1,023 995
Total adjusted expenses 637 619 1,923 1,837Provision for income tax expense (benefit) 15 21 62 47
Adjusted earnings $ 55 $ 71 $ 222 $ 218
Three Months Ended September 30, 2018 Compared with the Three Months Ended September 30, 2017
Unless otherwise stated, all amounts discussed below are net of income tax.
Foreign Currency. Changes in foreign currency exchange rates decreased adjusted earnings by $5 million for the third quarter of 2018 as compared to theprior period, primarily driven by the strengthening of the U.S. dollar against the Turkish lira. Unless otherwise stated, all amounts discussed below are net offoreign currency fluctuations. Foreign currency fluctuations can result in significant variances in the financial statement line items.
U.S. Tax Reform . The changes from U.S. Tax Reform resulted in a slight increase in adjusted earnings for the third quarter of 2018 compared to the priorperiod.
Business Growth . Growth from our accident & health and credit life businesses in Turkey and across several European markets resulted in a $5 millionincrease in adjusted earnings.
Underwriting, Actuarial Assumption Review and Other Insurance Adjustments. Less favorable underwriting, primarily in our accident & health businessin Greece, as well as unfavorable underwriting in our life insurance business in the Czech Republic and Iberia decreased adjusted earnings by $13 million .The impact in both periods of our annual actuarial assumption review resulted in a decrease in adjusted earnings of $15 million . In addition, adjusted earningsincreased by $2 million due to refinements recorded in the prior period in our employee benefits business in the U.K. and, in the current period, in our lifeinsurance business in the Gulf region.
Expenses . Adjusted earnings increased by $9 million due to lower costs associated with enterprise-wide initiatives, notably the closing of the wealthmanagement product to new business in the U.K. in the third quarter of 2017, along with declines in various other expenses.
Nine Months Ended September 30, 2018 Compared with the Nine Months Ended September 30, 2017
Unless otherwise stated, all amounts discussed below are net of income tax.
136
Table of Contents
Foreign Currency. The impact of changes in foreign currency exchange rates increased adjusted earnings by $8 million for the nine months endedSeptember 30, 2018 compared to the prior period, primarily driven by the weakening of the U.S. dollar against the eu ro, the British pound, the Polish zloty,and the Czech koruna, partially offset by the strengthening of the U.S. dollar against the Turkish lira . Unless otherwise stated, all amounts discussed below arenet of foreign currency fluctuations. Foreign currency fluctuations can result in significant variances in the financial statement line items.
U.S. Tax Reform . The changes from U.S. Tax Reform resulted in a decrease in adjusted earnings of $14 million for the nine months ended September30, 2018 compared to the prior period .
Business Growth . Growth from our accident & health and credit life businesses in Turkey and across several European markets resulted in a $20 millionincrease in adjusted earnings.
Market Factors. Market factors, including interest rate levels and variability in equity market returns, continued to impact our results; however, certainimpacts were mitigated by derivatives used to hedge these risks. A slight decrease in net investment income was driven by lower investment yields on fixedincome securities.
Underwriting, Actuarial Assumption Review and Other Insurance Adjustments. Less favorable underwriting, primarily in our accident & health businessin Greece, as well as unfavorable underwriting in the Gulf region , our employee benefits business in the U.K., and i n our life insurance business in France,decreased adjusted earnings by $34 million . The impact in both periods of our annual actuarial assumption review resulted in a decrease in adjusted earningsof $15 million . In addition, adjusted earnings decreased by $2 million due to refinements recorded in the prior period in our employee benefits business in theU.K. and the Gulf region and, in the current period, in our life insurance business in the Gulf region.
Expenses . Adjusted earnings increased by $51 million due to lower costs associated with enterprise-wide initiatives, notably the closing of the wealthmanagement product to new business in the U.K. in the third quarter of 2017, declines in various other expenses and the release of provisions arising fromfinalization of historic corporate tax filings .
Other . A decrease in our invested asset base, primarily due to dividend payments, negatively impacted net investment income resulting in an $8 milliondecrease in adjusted earnings.
137
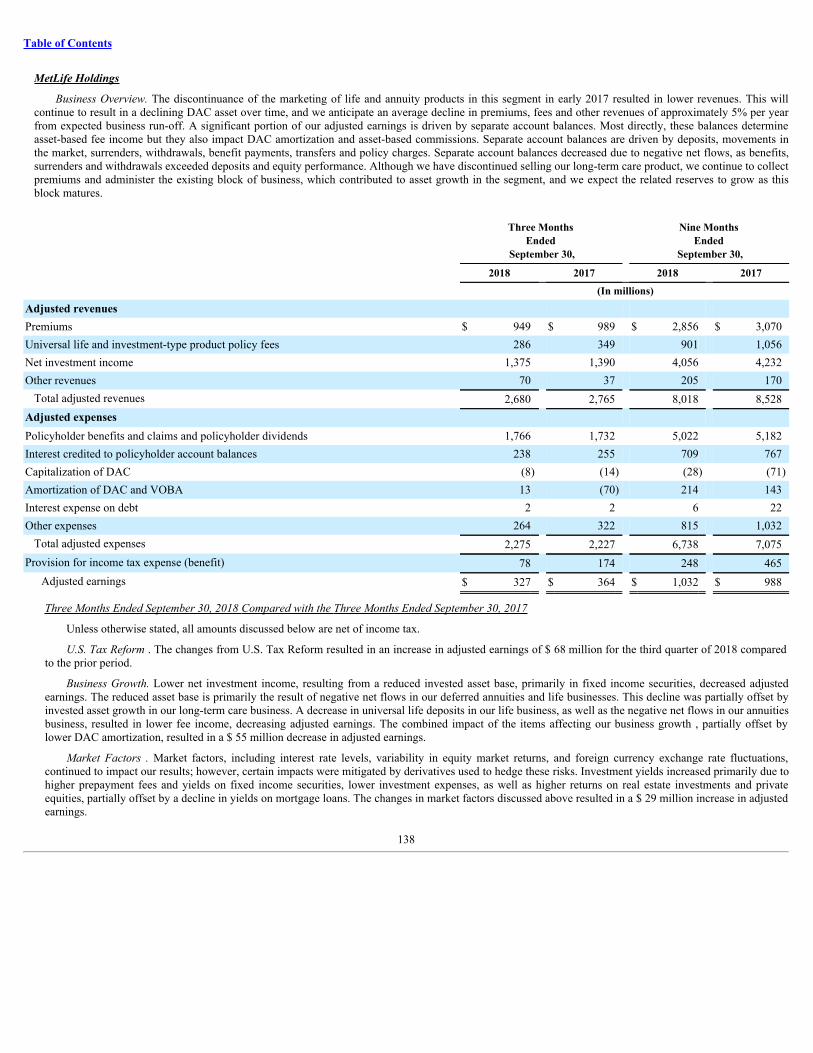
Table of Contents
MetLifeHoldings
Business Overview. The discontinuance of the marketing of life and annuity products in this segment in early 2017 resulted in lower revenues. This willcontinue to result in a declining DAC asset over time, and we anticipate an average decline in premiums, fees and other revenues of approximately 5% per yearfrom expected business run-off. A significant portion of our adjusted earnings is driven by separate account balances. Most directly, these balances determineasset-based fee income but they also impact DAC amortization and asset-based commissions. Separate account balances are driven by deposits, movements inthe market, surrenders, withdrawals, benefit payments, transfers and policy charges. Separate account balances decreased due to negative net flows, as benefits,surrenders and withdrawals exceeded deposits and equity performance. Although we have discontinued selling our long-term care product, we continue to collectpremiums and administer the existing block of business, which contributed to asset growth in the segment, and we expect the related reserves to grow as thisblock matures.
Three Months Ended
September 30,
Nine Months Ended
September 30,
2018 2017 2018 2017
(In millions)
Adjusted revenues Premiums $ 949 $ 989 $ 2,856 $ 3,070Universal life and investment-type product policy fees 286 349 901 1,056Net investment income 1,375 1,390 4,056 4,232Other revenues 70 37 205 170
Total adjusted revenues 2,680 2,765 8,018 8,528Adjusted expenses Policyholder benefits and claims and policyholder dividends 1,766 1,732 5,022 5,182Interest credited to policyholder account balances 238 255 709 767Capitalization of DAC (8) (14) (28) (71)Amortization of DAC and VOBA 13 (70) 214 143Interest expense on debt 2 2 6 22Other expenses 264 322 815 1,032
Total adjusted expenses 2,275 2,227 6,738 7,075Provision for income tax expense (benefit) 78 174 248 465
Adjusted earnings $ 327 $ 364 $ 1,032 $ 988
Three Months Ended September 30, 2018 Compared with the Three Months Ended September 30, 2017
Unless otherwise stated, all amounts discussed below are net of income tax.
U.S. Tax Reform . The changes from U.S. Tax Reform resulted in an increase in adjusted earnings of $ 68 million for the third quarter of 2018 comparedto the prior period.
Business Growth. Lower net investment income, resulting from a reduced invested asset base, primarily in fixed income securities, decreased adjustedearnings. The reduced asset base is primarily the result of negative net flows in our deferred annuities and life businesses. This decline was partially offset byinvested asset growth in our long-term care business. A decrease in universal life deposits in our life business, as well as the negative net flows in our annuitiesbusiness, resulted in lower fee income, decreasing adjusted earnings. The combined impact of the items affecting our business growth , partially offset bylower DAC amortization, resulted in a $ 55 million decrease in adjusted earnings.
Market Factors . Market factors, including interest rate levels, variability in equity market returns, and foreign currency exchange rate fluctuations,continued to impact our results; however, certain impacts were mitigated by derivatives used to hedge these risks. Investment yields increased primarily due tohigher prepayment fees and yields on fixed income securities, lower investment expenses, as well as higher returns on real estate investments and privateequities, partially offset by a decline in yields on mortgage loans. The changes in market factors discussed above resulted in a $ 29 million increase in adjustedearnings.
138
Table of Contents
Underwriting, Actuarial Assumption Review, and Other Insurance Adjustments. Favorable underwriting results, primarily due to the impact of favorablerate actions in our long-term care business, partially offset by unfavorable mortality in our life businesses and mortality losses on life-contingent annuities,resulted in a $ 5 million increase in adjusted earnings. The impact in both periods of our annual actuarial assumption review resulted in a decrease of $ 84million in adjusted earnings. Changes in operational assumptions, including updates to closed block projections, maintenance and other expenses, were lessfavorable in the current period. Refinements to DAC and certain insurance-related liabilities that were recorded in both periods resulted in a $ 51 milliondecrease in adjusted earnings. This includes a current period charge due to an increase in our IBNR life reserves, reflecting enhancements to our processesrelated to potential claims, as well as a favorable prior period reserve adjustment resulting from modeling improvements in our life business. Theseunfavorable impacts were partially offset by a current period benefit resulting from modeling improvements in our life business, as well as the impact of aprior period charge resulting from modeling improvements in our long-term care business.
Expenses. Adjusted earnings increased by $ 54 million as a result of lower expenses, primarily due to declines in Separation-related expenses, as well aslower employee-related costs.
Nine Months Ended September 30, 2018 Compared with the Nine Months Ended September 30, 2017
Unless otherwise stated, all amounts discussed below are net of income tax.
U.S. Tax Reform . The changes from U.S. Tax Reform resulted in an increase in adjusted earnings of $ 182 million for the nine months ended September30, 2018 compared to the prior period.
Business Growth. Lower net investment income, resulting from a reduced invested asset base, primarily in fixed income securities, decreased adjustedearnings. The reduced invested asset base is primarily the result of negative net flows in our deferred annuities and life businesses. This decline was partiallyoffset by invested asset growth in our long-term care business. The negative net flows in our annuities business and a decrease in universal life depositsresulted in lower fee income and lower interest credited expense. The continued maturing of the existing long-term care block of business resulted in higherinterest credited expense. The combined impact of the items affecting our business growth , partially offset by lower DAC amortization, resulted in a $160 million decrease in adjusted earnings.
Market Factors . Market factors, including interest rate levels, variability in equity market returns, and foreign currency exchange rate fluctuations,continued to impact our results; however, certain impacts were mitigated by derivatives used to hedge these risks. Investment yields increased primarily due tohigher returns on real estate investments, lower investment expenses, increased prepayment fees and higher fixed income securities yields, partially offset bylower returns on private equities and a decline in mortgage loan yields. In our deferred annuity business, higher equity returns drove an increase in averageseparate account balances, which resulted in higher asset-based fee income. The changes in market factors discussed above, partially offset by slightly higherDAC amortization, resulted in a $ 16 million increase in adjusted earnings.
Underwriting, Actuarial Assumption Review, and Other Insurance Adjustments. Unfavorable mortality in our life businesses, partially offset by favorableunderwriting, primarily due to the impact of favorable rate actions in our long-term care business, and mortality gains on life-contingent annuities, resulted inan $ 18 million decrease in adjusted earnings. The impact in both periods of our annual actuarial assumption review resulted in a decrease of $ 84 million inadjusted earnings. Changes in operational assumptions, including updates to closed block projections, maintenance and other expenses, were less favorable inthe current period. Refinements to DAC and certain insurance-related liabilities that were recorded in both periods resulted in a $ 16 million decrease inadjusted earnings. This includes the following current period refinements: (i) a charge due to an increase in our IBNR life reserves, reflecting enhancements toour processes related to potential claims; (ii) a favorable reserve adjustment relating to certain variable annuity guarantees assumed from a former joint venturein Japan; and (iii) a benefit resulting from modeling improvements in our life business. This also includes the following prior period refinements: (i) afavorable DAC adjustment related to certain assumed participating whole life business; (ii) two separate favorable reserve adjustments resulting frommodeling improvements in our life business; (iii) an unfavorable adjustment related to the recapture and novation of, as well as adjustments to, assumed andceded agreements covering certain variable annuity business; (iv) an unfavorable net impact from a life reinsurance recapture; and (v) an unfavorable reserveadjustment resulting from modeling improvements in our long-term care business.
Expenses . Adjusted earnings increased by $ 112 million as a result of lower expenses, primarily due to declines in Separation-related expenses, as well aslower employee-related costs.
139
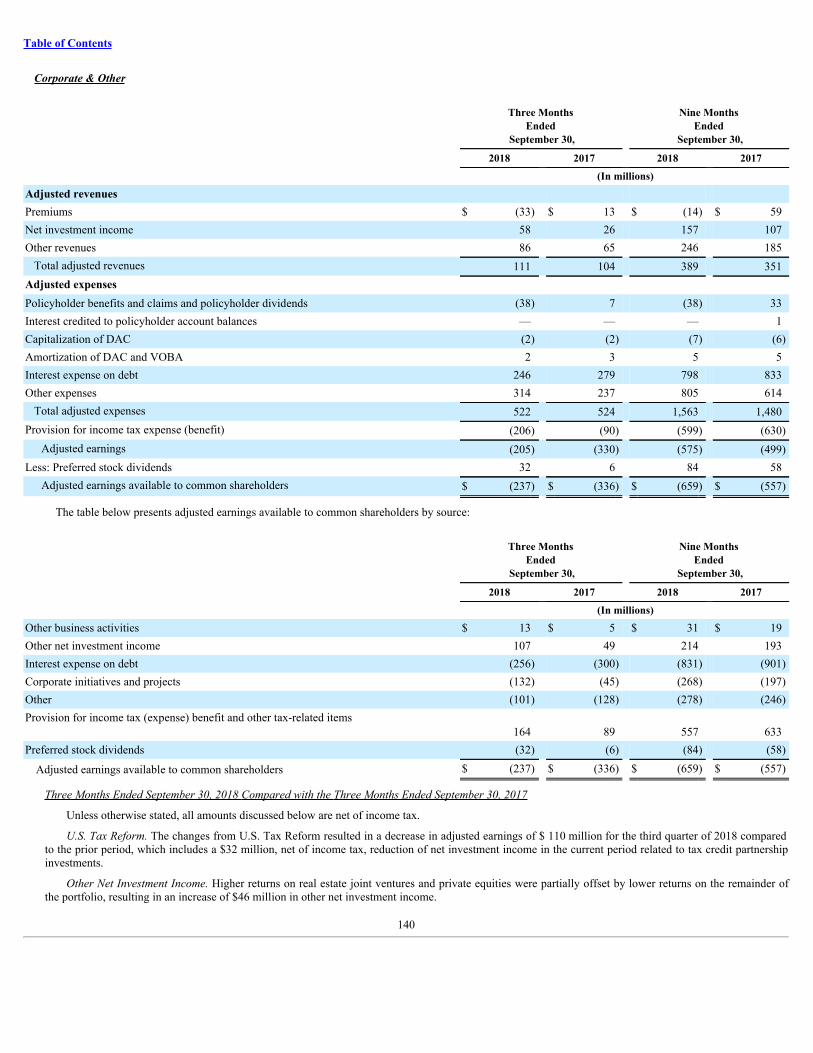
Table of Contents
Corporate&Other
Three Months Ended
September 30,
Nine Months Ended
September 30,
2018 2017 2018 2017
(In millions)
Adjusted revenues Premiums $ (33) $ 13 $ (14) $ 59Net investment income 58 26 157 107Other revenues 86 65 246 185
Total adjusted revenues 111 104 389 351Adjusted expenses Policyholder benefits and claims and policyholder dividends (38) 7 (38) 33Interest credited to policyholder account balances — — — 1Capitalization of DAC (2) (2) (7) (6)Amortization of DAC and VOBA 2 3 5 5Interest expense on debt 246 279 798 833Other expenses 314 237 805 614
Total adjusted expenses 522 524 1,563 1,480Provision for income tax expense (benefit) (206) (90) (599) (630)
Adjusted earnings (205) (330) (575) (499)Less: Preferred stock dividends 32 6 84 58
Adjusted earnings available to common shareholders $ (237) $ (336) $ (659) $ (557)
The table below presents adjusted earnings available to common shareholders by source:
Three Months Ended
September 30,
Nine Months Ended
September 30,
2018 2017 2018 2017
(In millions)
Other business activities $ 13 $ 5 $ 31 $ 19Other net investment income 107 49 214 193Interest expense on debt (256) (300) (831) (901)Corporate initiatives and projects (132) (45) (268) (197)Other (101) (128) (278) (246)Provision for income tax (expense) benefit and other tax-related items
164 89 557 633Preferred stock dividends (32) (6) (84) (58)
Adjusted earnings available to common shareholders $ (237) $ (336) $ (659) $ (557)
Three Months Ended September 30, 2018 Compared with the Three Months Ended September 30, 2017
Unless otherwise stated, all amounts discussed below are net of income tax.
U.S. Tax Reform. The changes from U.S. Tax Reform resulted in a decrease in adjusted earnings of $ 110 million for the third quarter of 2018 comparedto the prior period, which includes a $32 million, net of income tax, reduction of net investment income in the current period related to tax credit partnershipinvestments.
Other Net Investment Income. Higher returns on real estate joint ventures and private equities were partially offset by lower returns on the remainder ofthe portfolio, resulting in an increase of $46 million in other net investment income.
140
Table of Contents
Interest Expense on Debt. Interest expense on debt decreased by $ 35 million , primarily due to: (i) the exchange of senior notes for FVO BrighthouseCommon Stock; (ii) the redemption of senior notes for cash; (iii) the maturity of senior notes during the current period; (iv) lower interest rates on certainintercompany senior notes redenominated to Japanese yen; and (v) the maturity of $1.0 billion of senior notes in December 2017. The assets supporting theredenominated senior notes are owned by our business segments.
Corporate Initiatives and Projects . Expenses associated with corporate initiatives and projects increased by $ 69 million , primarily due to higherexpenses related to our unit cost initiative.
Provision for Income Tax (Expense) Benefit and Other Tax-Related Items. In addition to the impact of U.S. Tax Reform, Corporate & Other’s effectivetax rate differs from the U.S. statutory rate of 21% typically due to benefits from the impact of certain permanent tax-preferenced items, including non-taxableinvestment income, tax credits for investments in low income housing and foreign earnings taxed at different rates than the U.S. statutory rate. In the priorperiod, the Company recognized a $180 million net tax charge related to the repatriation of approximately $3.0 billion of cash following the post-Separationreview of our capital needs, partially offset by a tax benefit associated with dividends from our non-U.S. operations. The prior period also included a $4million net tax-related benefit from the finalization of certain tax audits. In addition, increased utilization of tax preferenced items increased adjusted earningsby $20 million from the prior period.
Other. Adjusted earnings increased $21 million, primarily as a result of a $24 million decrease in employee-related expenses, as well as declines invarious other expenses, partially offset by a $13 million increase in expenses for interest on tax positions.
Preferred Stock Dividends . Preferred stock dividends increased $ 26 million as a result of the issuance of Fixed-to-Floating Rate Non-CumulativePreferred Stock, Series D (“Series D preferred stock”) in March 2018 and Non-Cumulative Preferred Stock, Series E (“Series E preferred stock”) in June 2018.
Nine Months Ended September 30, 2018 Compared with the Nine Months Ended September 30, 2017
Unless otherwise stated, all amounts discussed below are net of income tax.
U.S. Tax Reform . The changes from U.S. Tax Reform resulted in a decrease in adjusted earnings of $ 251 million for the nine months ended September30, 2018 compared to the prior period, which includes a $32 million, net of income tax, reduction of net investment income in the current period related to taxcredit partnership investments.
Other Net Investment Income . Higher returns on real estate investments and private equities were partially offset by lower returns on the remainder of theportfolio, resulting in an increase of $17 million in other net investment income.
Interest Expense on Debt. Interest expense on debt decreased by $55 million, primarily due to: (i) the exchange of senior notes for FVO BrighthouseCommon Stock; (ii) the redemption of senior notes for cash; (iii) the maturity of senior notes during the current period; (iv) lower interest rates on certainintercompany senior notes redenominated to Japanese yen; and (v) the maturity of $1.0 billion of senior notes in December 2017. The assets supporting theredenominated senior notes are owned by our business segments.
Corporate Initiatives and Projects. Expenses associated with corporate initiatives and projects increased by $ 56 million , primarily due to higher costsassociated with our unit cost initiative, partially offset by prior period lease impairments and lower costs associated with certain other enterprise-wideinitiatives.
Provision for Income Tax (Expense) Benefit and Other Tax-Related Items. In addition to the impact of U.S. Tax Reform, Corporate & Other’s effectivetax rate differs from the U.S. statutory rate of 21% typically due to benefits from the impact of certain permanent tax-preferenced items, including non-taxableinvestment income, tax credits for investments in low income housing and foreign earnings taxed at different rates than the U.S. statutory rate. In the priorperiod, the Company recognized a $180 million net tax charge related to the repatriation of approximately $3.0 billion of cash following the post-Separationreview of our capital needs, partially offset by a tax benefit associated with dividends from our non-U.S. operations. The prior period also included a $27million net tax-related benefit from the finalization of certain tax audits. In the current period, the Company also recognized t ax benefits of $36 million relatedto a non-cash transfer of assets from a wholly-owned U.K. investment subsidiary to its U.S. parent and $5 million related to the settlement of an audit, as wellas a $17 million tax charge for decreased utilization of tax-preferenced items.
Other. Adjusted earnings decreased $25 million, primarily as a result of a $ 38 million increase in litigation accruals, a $28 million increase in certaincorporate-related expenses and a $ 20 million increase in expenses for interest on tax positions, partially offset by $21 million of expenses incurred in the priorperiod and taxed at the prior period rate related to the guaranty fund assessment for Penn Treaty and a $37 million decrease in employee-related expenses.
Preferred Stock Dividends . Preferred stock dividends increased $ 26 million as a result of the issuance of Series D and Series E preferred stock in thecurrent period.
141
Table of Contents
Investments
InvestmentRisks
Our primary investment objective is to optimize, net of income tax, risk-adjusted net investment income and risk-adjusted total return while ensuring thatassets and liabilities are managed on a cash flow and duration basis. The Investments Department, led by the Chief Investment Officer, manages investment risksthrough the Investments Risk Committee using a risk control framework comprised of policies, procedures, limits and tolerances. The Investments Risk Committeereviews and monitors the management of investment risks through this risk control framework. See “Management’s Discussion and Analysis of FinancialCondition and Results of Operations — Investments — Investment Risks” included in the 2017 Annual Report for an explanation of investment risks and our riskcontrol framework.
CurrentEnvironment
The global economy and markets continue to be affected by stress and volatility, which has adversely affected the financial services sector, in particular, andglobal capital markets. Political and economic instability has contributed to global market volatility which may have an impact on our investments.
As a global insurance company, we continue to be impacted by the changing global financial and economic environment, as well as the monetary policy ofcentral banks around the world. Measures taken by central banks, including with respect to the level of interest rates, may have an impact on the pricing levels ofrisk-bearing investments and may adversely impact our business operations, investment portfolio and derivatives. The current environment continues to impact ournet investment income, net investment gains (losses), net derivative gains (losses), level of unrealized gains (losses) within the various asset classes in ourinvestment portfolio, and our level of investment in lower yielding cash equivalents, short-term investments and government securities. See “— Industry Trends —Financial and Economic Environment,” as well as “Risk Factors — Economic Environment and Capital Markets-Related Risks — We Are Exposed to SignificantGlobal Financial and Capital Markets Risks Which May Adversely Affect Our Results of Operations, Financial Condition and Liquidity, and May Cause Our NetInvestment Income to Vary from Period to Period” included in the 2017 Annual Report.
EuropeanInvestments
We maintain general account investments in Europe to support our insurance operations and related policyholder liabilities in these countries and certain ofour non-European operations invest in Europe for diversification. In Europe, we have proactively mitigated risk in both direct and indirect exposures byinvesting in a diversified portfolio of high quality investments with a focus on the higher-rated countries, including the U.K., France, Germany, the Netherlands,Poland, Sweden and Switzerland. The sovereign debt of these countries continues to maintain investment grade credit ratings from all major rating agencies. OurEuropean fixed maturity securities AFS and perpetual hybrid securities classified as non-redeemable preferred stock are invested in a diversified portfolio ofprimarily non-financial services securities. At September 30, 2018 , our exposure to such securities in Europe totaled $37.8 billion , at estimated fair value, ofwhich $8.7 billion was in sovereign fixed maturity securities AFS. See “Management’s Discussion and Analysis of Financial Condition and Results ofOperations — Investments — Current Environment — European Investments” included in the 2017 Annual Report for further information.
SelectedCountryInvestments
We have country-specific exposure to volatility, as we maintain general account investments in the U.K., South Korea and Mexico to support our insuranceoperations and related policyholder liabilities in these countries. We also have exposure to volatility in these selected countries through our global portfoliodiversification. Our exposure to sovereign fixed maturity securities AFS and total fixed maturity securities AFS of the U.K., South Korea and Mexico totaled$9.6 billion and $25.3 billion , at estimated fair value, respectively, at September 30, 2018 .
We manage direct and indirect investment exposure in the selected countries through fundamental credit analysis and we continually monitor and adjust ourlevel of investment exposure. We do not expect any adverse impact to our general account investments in these countries will have a material adverse effect onour results of operations or financial condition.
142
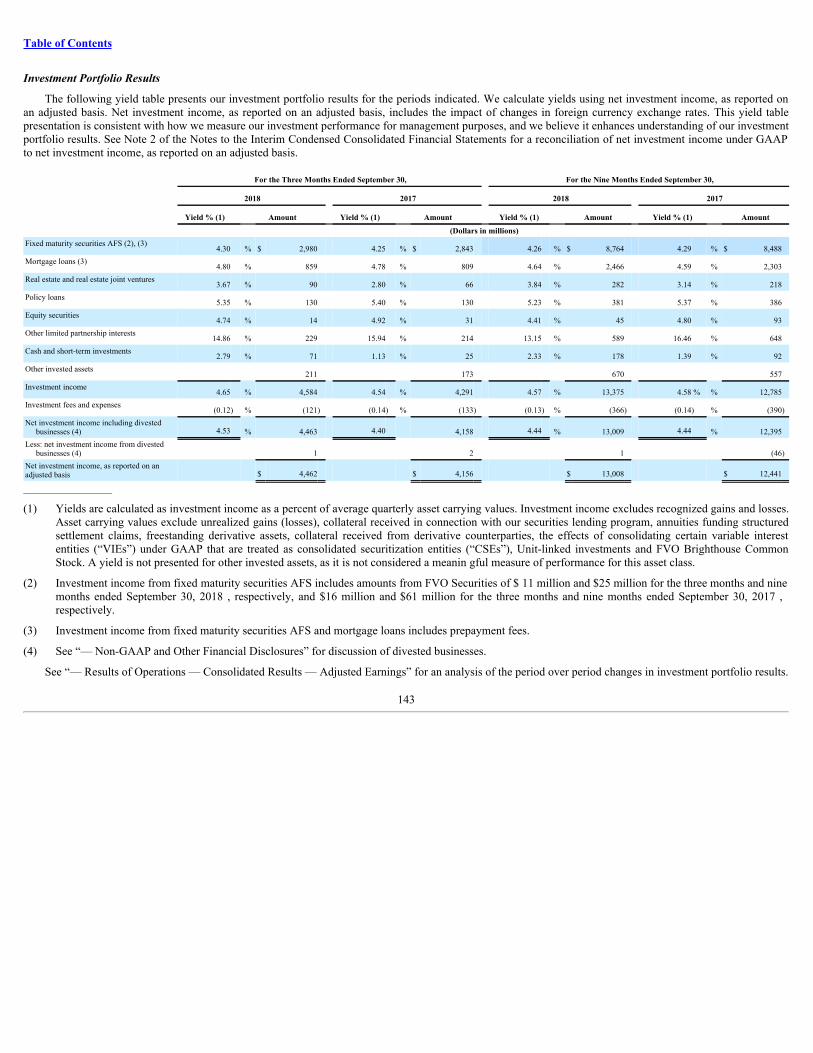
Table of Contents
InvestmentPortfolioResults
The following yield table presents our investment portfolio results for the periods indicated. We calculate yields using net investment income, as reported onan adjusted basis. Net investment income, as reported on an adjusted basis, includes the impact of changes in foreign currency exchange rates. This yield tablepresentation is consistent with how we measure our investment performance for management purposes, and we believe it enhances understanding of our investmentportfolio results. See Note 2 of the Notes to the Interim Condensed Consolidated Financial Statements for a reconciliation of net investment income under GAAPto net investment income, as reported on an adjusted basis.
For the Three Months Ended September 30, For the Nine Months Ended September 30,
2018 2017 2018 2017
Yield % (1) Amount Yield % (1) Amount Yield % (1) Amount Yield % (1) Amount
(Dollars in millions)Fixed maturity securities AFS (2), (3)
4.30 % $ 2,980 4.25 % $ 2,843 4.26 % $ 8,764 4.29 % $ 8,488Mortgage loans (3)
4.80 % 859 4.78 % 809 4.64 % 2,466 4.59 % 2,303Real estate and real estate joint ventures
3.67 % 90 2.80 % 66 3.84 % 282 3.14 % 218Policy loans
5.35 % 130 5.40 % 130 5.23 % 381 5.37 % 386Equity securities
4.74 % 14 4.92 % 31 4.41 % 45 4.80 % 93Other limited partnership interests
14.86 % 229 15.94 % 214 13.15 % 589 16.46 % 648Cash and short-term investments
2.79 % 71 1.13 % 25 2.33 % 178 1.39 % 92Other invested assets 211 173 670 557Investment income
4.65 % 4,584 4.54 % 4,291 4.57 % 13,375 4.58 % % 12,785Investment fees and expenses
(0.12) % (121) (0.14) % (133) (0.13) % (366) (0.14) % (390)Net investment income including divested
businesses (4) 4.53 % 4,463 4.40 4,158 4.44 % 13,009 4.44 % 12,395Less: net investment income from divested
businesses (4) 1 2 1 (46)Net investment income, as reported on anadjusted basis $ 4,462 $ 4,156 $ 13,008 $ 12,441
__________________
(1) Yields are calculated as investment income as a percent of average quarterly asset carrying values. Investment income excludes recognized gains and losses.Asset carrying values exclude unrealized gains (losses), collateral received in connection with our securities lending program, annuities funding structuredsettlement claims, freestanding derivative assets, collateral received from derivative counterparties, the effects of consolidating certain variable interestentities (“VIEs”) under GAAP that are treated as consolidated securitization entities (“CSEs”), Unit-linked investments and FVO Brighthouse CommonStock. A yield is not presented for other invested assets, as it is not considered a meanin gful measure of performance for this asset class.
(2) Investment income from fixed maturity securities AFS includes amounts from FVO Securities of $ 11 million and $25 million for the three months and ninemonths ended September 30, 2018 , respectively, and $16 million and $61 million for the three months and nine months ended September 30, 2017 ,respectively.
(3) Investment income from fixed maturity securities AFS and mortgage loans includes prepayment fees.
(4) See “— Non-GAAP and Other Financial Disclosures” for discussion of divested businesses.
See “— Results of Operations — Consolidated Results — Adjusted Earnings” for an analysis of the period over period changes in investment portfolio results.
143
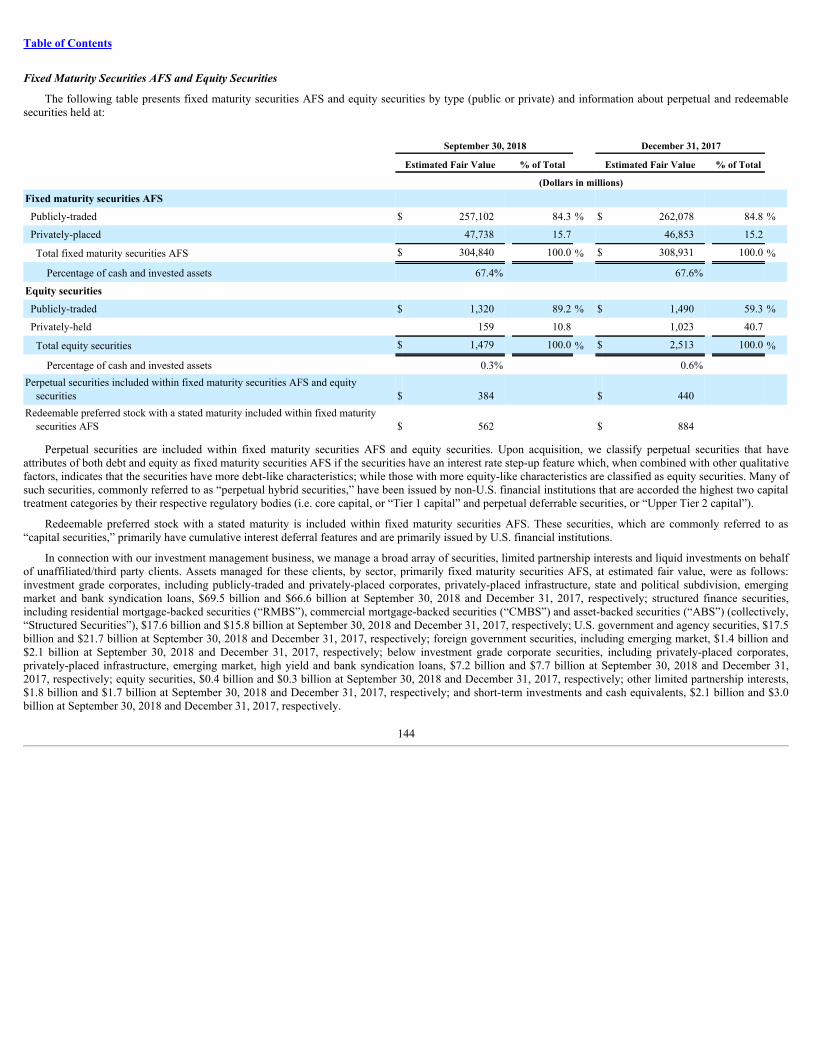
Table of Contents
FixedMaturitySecuritiesAFSandEquitySecurities
The following table presents fixed maturity securities AFS and equity securities by type (public or private) and information about perpetual and redeemablesecurities held at:
September 30, 2018 December 31, 2017 Estimated Fair Value % of Total Estimated Fair Value % of Total (Dollars in millions) Fixed maturity securities AFS Publicly-traded $ 257,102 84.3 % $ 262,078 84.8 %
Privately-placed 47,738 15.7 46,853 15.2 Total fixed maturity securities AFS $ 304,840 100.0 % $ 308,931 100.0 %
Percentage of cash and invested assets 67.4% 67.6% Equity securities Publicly-traded $ 1,320 89.2 % $ 1,490 59.3 %
Privately-held 159 10.8 1,023 40.7 Total equity securities $ 1,479 100.0 % $ 2,513 100.0 %
Percentage of cash and invested assets 0.3% 0.6% Perpetual securities included within fixed maturity securities AFS and equity
securities $ 384 $ 440 Redeemable preferred stock with a stated maturity included within fixed maturity
securities AFS $ 562 $ 884
Perpetual securities are included within fixed maturity securities AFS and equity securities. Upon acquisition, we classify perpetual securities that haveattributes of both debt and equity as fixed maturity securities AFS if the securities have an interest rate step-up feature which, when combined with other qualitativefactors, indicates that the securities have more debt-like characteristics; while those with more equity-like characteristics are classified as equity securities. Many ofsuch securities, commonly referred to as “perpetual hybrid securities,” have been issued by non-U.S. financial institutions that are accorded the highest two capitaltreatment categories by their respective regulatory bodies (i.e. core capital, or “Tier 1 capital” and perpetual deferrable securities, or “Upper Tier 2 capital”).
Redeemable preferred stock with a stated maturity is included within fixed maturity securities AFS. These securities, which are commonly referred to as“capital securities,” primarily have cumulative interest deferral features and are primarily issued by U.S. financial institutions.
In connection with our investment management business, we manage a broad array of securities, limited partnership interests and liquid investments on behalfof unaffiliated/third party clients. Assets managed for these clients, by sector, primarily fixed maturity securities AFS, at estimated fair value, were as follows:investment grade corporates, including publicly-traded and privately-placed corporates, privately-placed infrastructure, state and political subdivision, emergingmarket and bank syndication loans, $69.5 billion and $66.6 billion at September 30, 2018 and December 31, 2017, respectively; structured finance securities,including residential mortgage-backed securities (“RMBS”), commercial mortgage-backed securities (“CMBS”) and asset-backed securities (“ABS”) (collectively,“Structured Securities”), $17.6 billion and $15.8 billion at September 30, 2018 and December 31, 2017, respectively; U.S. government and agency securities, $17.5billion and $21.7 billion at September 30, 2018 and December 31, 2017, respectively; foreign government securities, including emerging market, $1.4 billion and$2.1 billion at September 30, 2018 and December 31, 2017, respectively; below investment grade corporate securities, including privately-placed corporates,privately-placed infrastructure, emerging market, high yield and bank syndication loans, $7.2 billion and $7.7 billion at September 30, 2018 and December 31,2017, respectively; equity securities, $0.4 billion and $0.3 billion at September 30, 2018 and December 31, 2017, respectively; other limited partnership interests,$1.8 billion and $1.7 billion at September 30, 2018 and December 31, 2017, respectively; and short-term investments and cash equivalents, $2.1 billion and $3.0billion at September 30, 2018 and December 31, 2017, respectively.
144
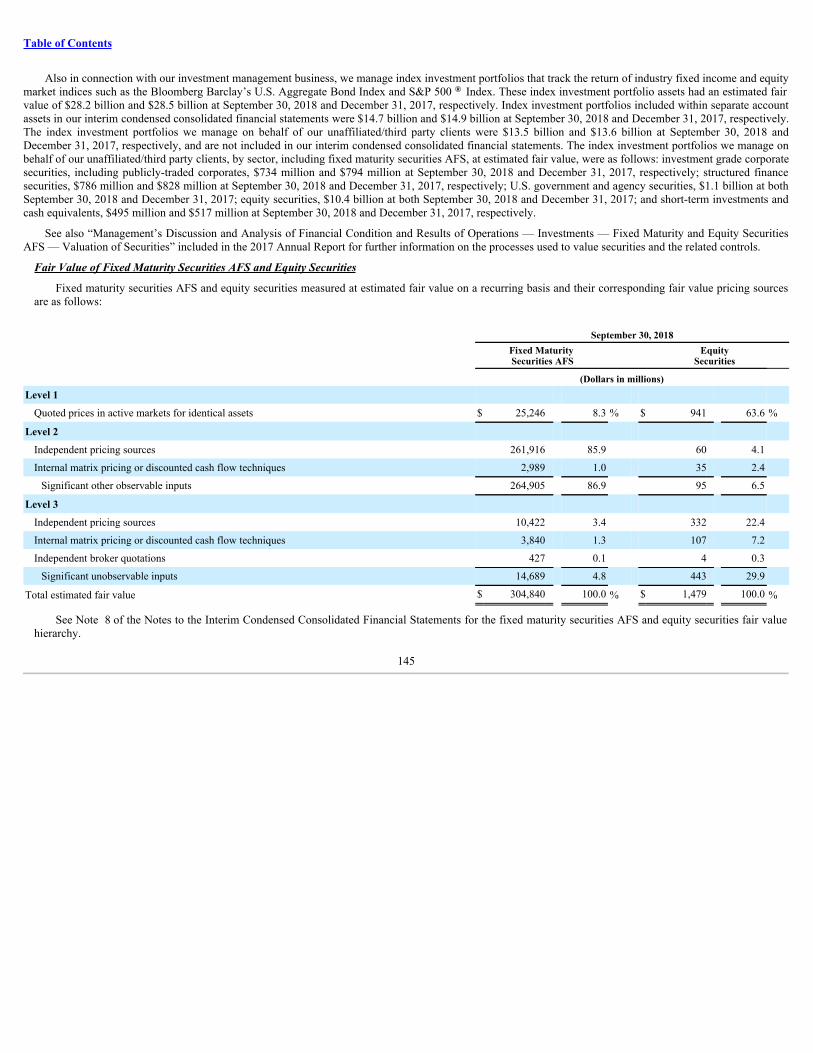
Table of Contents
Also in connection with our investment management business, we manage index investment portfolios that track the return of industry fixed income and equitymarket indices such as the Bloomberg Barclay’s U.S. Aggregate Bond Index and S&P 500 ® Index. These index investment portfolio assets had an estimated fairvalue of $28.2 billion and $28.5 billion at September 30, 2018 and December 31, 2017, respectively. Index investment portfolios included within separate accountassets in our interim condensed consolidated financial statements were $14.7 billion and $14.9 billion at September 30, 2018 and December 31, 2017, respectively.The index investment portfolios we manage on behalf of our unaffiliated/third party clients were $13.5 billion and $13.6 billion at September 30, 2018 andDecember 31, 2017, respectively, and are not included in our interim condensed consolidated financial statements. The index investment portfolios we manage onbehalf of our unaffiliated/third party clients, by sector, including fixed maturity securities AFS, at estimated fair value, were as follows: investment grade corporatesecurities, including publicly-traded corporates, $734 million and $794 million at September 30, 2018 and December 31, 2017, respectively; structured financesecurities, $786 million and $828 million at September 30, 2018 and December 31, 2017, respectively; U.S. government and agency securities, $1.1 billion at bothSeptember 30, 2018 and December 31, 2017; equity securities, $10.4 billion at both September 30, 2018 and December 31, 2017; and short-term investments andcash equivalents, $495 million and $517 million at September 30, 2018 and December 31, 2017, respectively.
See also “Management’s Discussion and Analysis of Financial Condition and Results of Operations — Investments — Fixed Maturity and Equity SecuritiesAFS — Valuation of Securities” included in the 2017 Annual Report for further information on the processes used to value securities and the related controls.
FairValueofFixedMaturitySecuritiesAFSandEquitySecurities
Fixed maturity securities AFS and equity securities measured at estimated fair value on a recurring basis and their corresponding fair value pricing sourcesare as follows:
September 30, 2018
Fixed Maturity Securities AFS
EquitySecurities
(Dollars in millions) Level 1
Quoted prices in active markets for identical assets $ 25,246 8.3 % $ 941 63.6 %
Level 2 Independent pricing sources 261,916 85.9 60 4.1 Internal matrix pricing or discounted cash flow techniques 2,989 1.0 35 2.4
Significant other observable inputs 264,905 86.9 95 6.5 Level 3
Independent pricing sources 10,422 3.4 332 22.4 Internal matrix pricing or discounted cash flow techniques 3,840 1.3 107 7.2 Independent broker quotations 427 0.1 4 0.3
Significant unobservable inputs 14,689 4.8 443 29.9 Total estimated fair value $ 304,840 100.0 % $ 1,479 100.0 %
See Note 8 of the Notes to the Interim Condensed Consolidated Financial Statements for the fixed maturity securities AFS and equity securities fair valuehierarchy.
145
Table of Contents
The composition of fair value pricing sources for and significant changes in Level 3 securities at September 30, 2018 are as follows:
• The majority of the Level 3 fixed maturity securities AFS and equity securities were concentrated in three sectors: U.S. corporate securities,foreign corporate securities and RMBS.
• Level 3 fixed maturity securities AFS are priced principally through market standard valuation methodologies, independent pricing services and, to amuch lesser extent, independent non-binding broker quotations using inputs that are not market observable or cannot be derived principally from orcorroborated by observable market data. Level 3 fixed maturity securities AFS consist of less liquid securities with very limited trading activity or whereless price transparency exists around the inputs to the valuation methodologies. Level 3 fixed maturity securities AFS include: sub-prime RMBS; certainbelow investment grade private U.S. and foreign corporate securities; less liquid investment grade U.S. and foreign corporate securities and less liquidABS and foreign government securities.
• During the three months ended September 30, 2018 , Level 3 fixed maturity securities AFS decreased by $773 million , or 5% . The decrease was drivenby transfers out of Level 3 in excess of transfers into Level 3, partially offset by purchases in excess of sales.
• During the nine months ended September 30, 2018 , Level 3 fixed maturity securities AFS decreased by $1.6 billion , or 10% . The decrease was drivenby transfers out of Level 3 in excess of transfers into Level 3, partially offset by purchases in excess of sales.
See Note 8 of the Notes to the Interim Condensed Consolidated Financial Statements for a rollforward of the fair value measurements for fixed maturitysecurities AFS and equity securities measured at estimated fair value on a recurring basis using significant unobservable (Level 3) inputs; transfers into and/orout of Level 3; and further information about the valuation approaches and inputs by level by major classes of invested assets that affect the amounts reportedabove. See “Management’s Discussion and Analysis of Financial Condition and Results of Operations — Summary of Critical Accounting Estimates —Estimated Fair Value of Investments” included in the 2017 Annual Report for further information on the estimates and assumptions that affect the amountsreported above.
FixedMaturitySecuritiesAFS
See Note 6 of the Notes to the Interim Condensed Consolidated Financial Statements for information about fixed maturity securities AFS by sector,contractual maturities and continuous gross unrealized losses.
FixedMaturitySecuritiesAFSCreditQuality—Ratings
See “Management’s Discussion and Analysis of Financial Condition and Results of Operations — Investments — Fixed Maturity and Equity Securities AFS— Fixed Maturity Securities Credit Quality — Ratings” included in the 2017 Annual Report for a discussion of the credit quality ratings assigned by NationallyRecognized Statistical Rating Organizations (“NRSRO”), credit quality designations assigned by and methodologies used by the Securities Valuation Office ofthe NAIC for fixed maturity securities AFS and the revised methodologies adopted by the NAIC for certain Structured Securities.
146
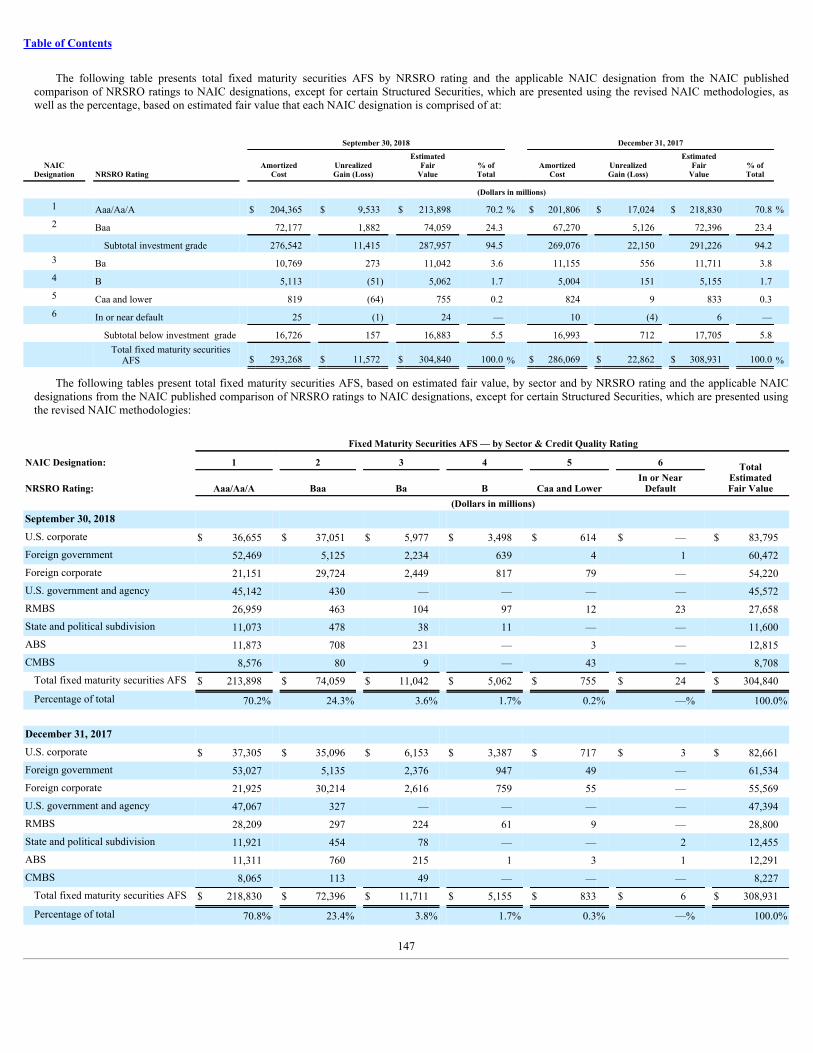
Table of Contents
The following table presents total fixed maturity securities AFS by NRSRO rating and the applicable NAIC designation from the NAIC publishedcomparison of NRSRO ratings to NAIC designations, except for certain Structured Securities, which are presented using the revised NAIC methodologies, aswell as the percentage, based on estimated fair value that each NAIC designation is comprised of at:
September 30, 2018 December 31, 2017
NAICDesignation NRSRO Rating Amortized
Cost UnrealizedGain (Loss)
EstimatedFair
Value % ofTotal Amortized
Cost UnrealizedGain (Loss)
EstimatedFair
Value % ofTotal
(Dollars in millions) 1 Aaa/Aa/A $ 204,365 $ 9,533 $ 213,898 70.2 % $ 201,806 $ 17,024 $ 218,830 70.8 %2 Baa 72,177 1,882 74,059 24.3 67,270 5,126 72,396 23.4
Subtotal investment grade 276,542 11,415 287,957 94.5 269,076 22,150 291,226 94.2 3 Ba 10,769 273 11,042 3.6 11,155 556 11,711 3.8 4 B 5,113 (51) 5,062 1.7 5,004 151 5,155 1.7 5 Caa and lower 819 (64) 755 0.2 824 9 833 0.3 6 In or near default 25 (1) 24 — 10 (4) 6 —
Subtotal below investment grade 16,726 157 16,883 5.5 16,993 712 17,705 5.8
Total fixed maturity securities
AFS $ 293,268 $ 11,572 $ 304,840 100.0 % $ 286,069 $ 22,862 $ 308,931 100.0 %
The following tables present total fixed maturity securities AFS, based on estimated fair value, by sector and by NRSRO rating and the applicable NAICdesignations from the NAIC published comparison of NRSRO ratings to NAIC designations, except for certain Structured Securities, which are presented usingthe revised NAIC methodologies:
Fixed Maturity Securities AFS — by Sector & Credit Quality Rating
NAIC Designation: 1 2 3 4 5 6 TotalEstimatedFair ValueNRSRO Rating: Aaa/Aa/A Baa Ba B Caa and Lower
In or NearDefault
(Dollars in millions)September 30, 2018 U.S. corporate $ 36,655 $ 37,051 $ 5,977 $ 3,498 $ 614 $ — $ 83,795Foreign government 52,469 5,125 2,234 639 4 1 60,472Foreign corporate 21,151 29,724 2,449 817 79 — 54,220U.S. government and agency 45,142 430 — — — — 45,572RMBS 26,959 463 104 97 12 23 27,658State and political subdivision 11,073 478 38 11 — — 11,600ABS 11,873 708 231 — 3 — 12,815CMBS 8,576 80 9 — 43 — 8,708
Total fixed maturity securities AFS $ 213,898 $ 74,059 $ 11,042 $ 5,062 $ 755 $ 24 $ 304,840
Percentage of total 70.2% 24.3% 3.6% 1.7% 0.2% —% 100.0%
December 31, 2017 U.S. corporate $ 37,305 $ 35,096 $ 6,153 $ 3,387 $ 717 $ 3 $ 82,661Foreign government 53,027 5,135 2,376 947 49 — 61,534Foreign corporate 21,925 30,214 2,616 759 55 — 55,569U.S. government and agency 47,067 327 — — — — 47,394RMBS 28,209 297 224 61 9 — 28,800State and political subdivision 11,921 454 78 — — 2 12,455ABS 11,311 760 215 1 3 1 12,291CMBS 8,065 113 49 — — — 8,227
Total fixed maturity securities AFS $ 218,830 $ 72,396 $ 11,711 $ 5,155 $ 833 $ 6 $ 308,931
Percentage of total 70.8% 23.4% 3.8% 1.7% 0.3% —% 100.0%
147
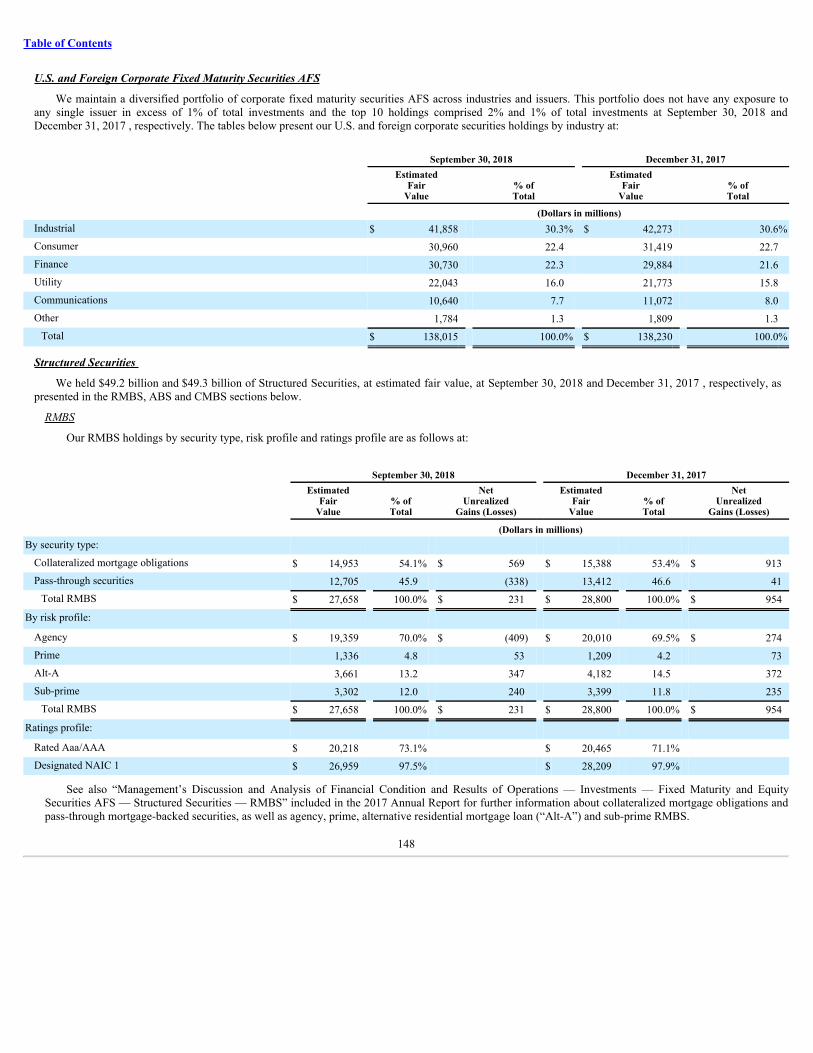
Table of Contents
U.S.andForeignCorporateFixedMaturitySecuritiesAFS
We maintain a diversified portfolio of corporate fixed maturity securities AFS across industries and issuers. This portfolio does not have any exposure toany single issuer in excess of 1% of total investments and the top 10 holdings comprised 2% and 1% of total investments at September 30, 2018 andDecember 31, 2017 , respectively. The tables below present our U.S. and foreign corporate securities holdings by industry at:
September 30, 2018 December 31, 2017
EstimatedFair
Value % ofTotal
EstimatedFair
Value % ofTotal
(Dollars in millions)Industrial $ 41,858 30.3% $ 42,273 30.6%Consumer 30,960 22.4 31,419 22.7Finance 30,730 22.3 29,884 21.6Utility 22,043 16.0 21,773 15.8Communications 10,640 7.7 11,072 8.0Other 1,784 1.3 1,809 1.3
Total $ 138,015 100.0% $ 138,230 100.0%
StructuredSecurities
We held $49.2 billion and $49.3 billion of Structured Securities, at estimated fair value, at September 30, 2018 and December 31, 2017 , respectively, aspresented in the RMBS, ABS and CMBS sections below.
RMBS
Our RMBS holdings by security type, risk profile and ratings profile are as follows at:
September 30, 2018 December 31, 2017
EstimatedFair
Value % ofTotal
NetUnrealized
Gains (Losses)
EstimatedFair
Value % ofTotal
NetUnrealized
Gains (Losses) (Dollars in millions)By security type:
Collateralized mortgage obligations $ 14,953 54.1% $ 569 $ 15,388 53.4% $ 913Pass-through securities 12,705 45.9 (338) 13,412 46.6 41
Total RMBS $ 27,658 100.0% $ 231 $ 28,800 100.0% $ 954
By risk profile: Agency $ 19,359 70.0% $ (409) $ 20,010 69.5% $ 274Prime 1,336 4.8 53 1,209 4.2 73Alt-A 3,661 13.2 347 4,182 14.5 372Sub-prime 3,302 12.0 240 3,399 11.8 235
Total RMBS $ 27,658 100.0% $ 231 $ 28,800 100.0% $ 954
Ratings profile: Rated Aaa/AAA $ 20,218 73.1% $ 20,465 71.1% Designated NAIC 1 $ 26,959 97.5% $ 28,209 97.9%
See also “Management’s Discussion and Analysis of Financial Condition and Results of Operations — Investments — Fixed Maturity and EquitySecurities AFS — Structured Securities — RMBS” included in the 2017 Annual Report for further information about collateralized mortgage obligations andpass-through mortgage-backed securities, as well as agency, prime, alternative residential mortgage loan (“Alt-A”) and sub-prime RMBS.
148
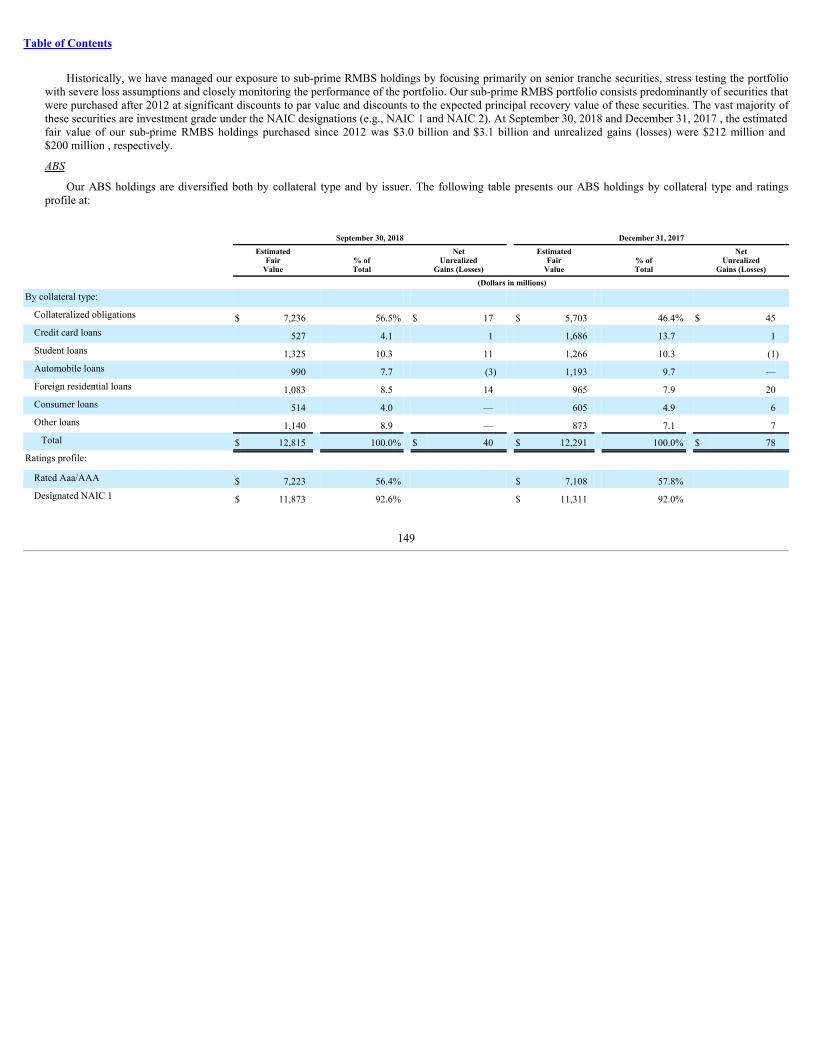
Table of Contents
Historically, we have managed our exposure to sub-prime RMBS holdings by focusing primarily on senior tranche securities, stress testing the portfoliowith severe loss assumptions and closely monitoring the performance of the portfolio. Our sub-prime RMBS portfolio consists predominantly of securities thatwere purchased after 2012 at significant discounts to par value and discounts to the expected principal recovery value of these securities. The vast majority ofthese securities are investment grade under the NAIC designations (e.g., NAIC 1 and NAIC 2). At September 30, 2018 and December 31, 2017 , the estimatedfair value of our sub-prime RMBS holdings purchased since 2012 was $3.0 billion and $3.1 billion and unrealized gains (losses) were $212 million and$200 million , respectively.
ABS
Our ABS holdings are diversified both by collateral type and by issuer. The following table presents our ABS holdings by collateral type and ratingsprofile at:
September 30, 2018 December 31, 2017
EstimatedFair
Value % ofTotal
NetUnrealized
Gains (Losses) Estimated
FairValue % of
Total Net
UnrealizedGains (Losses)
(Dollars in millions)
By collateral type: Collateralized obligations $ 7,236 56.5% $ 17 $ 5,703 46.4% $ 45Credit card loans 527 4.1 1 1,686 13.7 1Student loans 1,325 10.3 11 1,266 10.3 (1)Automobile loans 990 7.7 (3) 1,193 9.7 —Foreign residential loans 1,083 8.5 14 965 7.9 20Consumer loans 514 4.0 — 605 4.9 6Other loans 1,140 8.9 — 873 7.1 7
Total $ 12,815 100.0% $ 40 $ 12,291 100.0% $ 78Ratings profile:
Rated Aaa/AAA $ 7,223 56.4% $ 7,108 57.8% Designated NAIC 1 $ 11,873 92.6% $ 11,311 92.0%
149
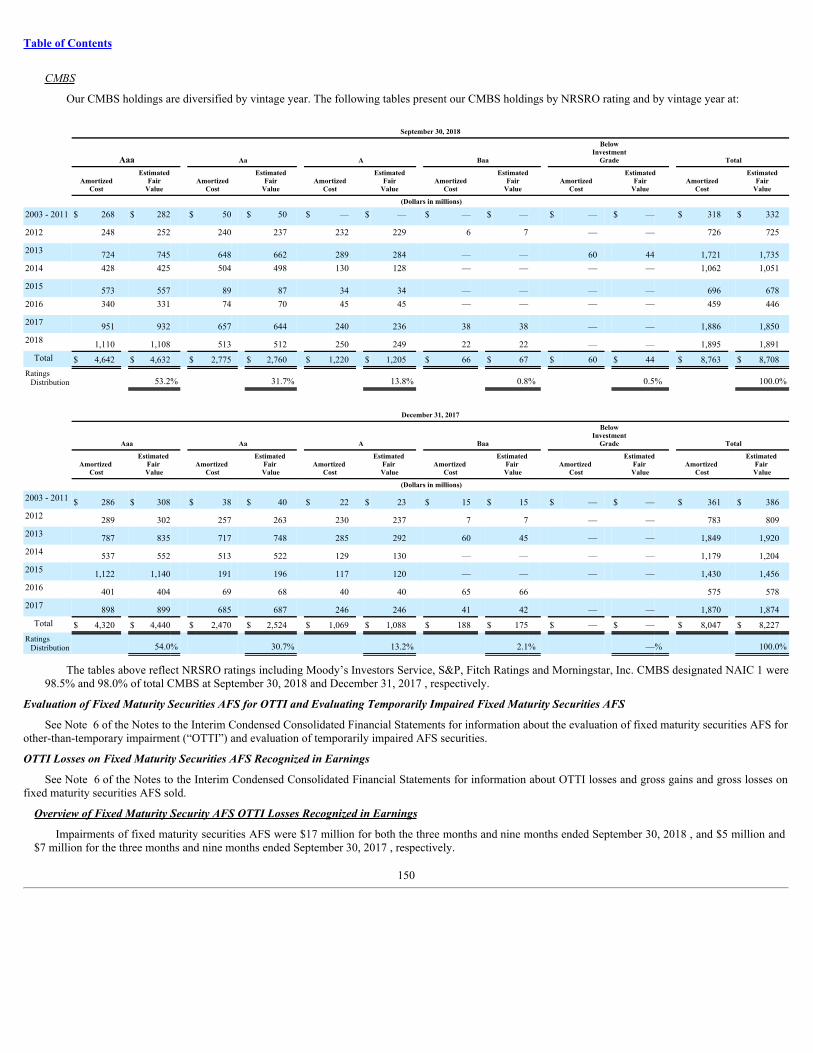
Table of Contents
CMBS
Our CMBS holdings are diversified by vintage year. The following tables present our CMBS holdings by NRSRO rating and by vintage year at:
September 30, 2018
Aaa Aa A Baa Below
InvestmentGrade Total
Amortized
Cost Estimated
FairValue Amortized
Cost Estimated
FairValue Amortized
Cost Estimated
FairValue Amortized
Cost Estimated
FairValue Amortized
Cost Estimated
FairValue Amortized
Cost Estimated
FairValue
(Dollars in millions)
2003 - 2011 $ 268 $ 282 $ 50 $ 50 $ — $ — $ — $ — $ — $ — $ 318 $ 332
2012 248 252 240 237 232 229 6 7 — — 726 725
2013 724 745 648 662 289 284 — — 60 44 1,721 1,7352014 428 425 504 498 130 128 — — — — 1,062 1,051
2015 573 557 89 87 34 34 — — — — 696 6782016 340 331 74 70 45 45 — — — — 459 446
2017 951 932 657 644 240 236 38 38 — — 1,886 1,8502018 1,110 1,108 513 512 250 249 22 22 — — 1,895 1,891
Total $ 4,642 $ 4,632 $ 2,775 $ 2,760 $ 1,220 $ 1,205 $ 66 $ 67 $ 60 $ 44 $ 8,763 $ 8,708Ratings
Distribution 53.2% 31.7% 13.8% 0.8% 0.5% 100.0%
December 31, 2017
Aaa Aa A Baa Below
InvestmentGrade Total
Amortized
Cost Estimated
Fair Value Amortized
Cost Estimated
Fair Value Amortized
Cost Estimated
Fair Value Amortized
Cost Estimated
Fair Value Amortized
Cost Estimated
Fair Value Amortized
Cost Estimated
Fair Value
(Dollars in millions)
2003 - 2011 $ 286 $ 308 $ 38 $ 40 $ 22 $ 23 $ 15 $ 15 $ — $ — $ 361 $ 3862012 289 302 257 263 230 237 7 7 — — 783 8092013 787 835 717 748 285 292 60 45 — — 1,849 1,9202014 537 552 513 522 129 130 — — — — 1,179 1,2042015 1,122 1,140 191 196 117 120 — — — — 1,430 1,4562016 401 404 69 68 40 40 65 66 575 5782017 898 899 685 687 246 246 41 42 — — 1,870 1,874
Total $ 4,320 $ 4,440 $ 2,470 $ 2,524 $ 1,069 $ 1,088 $ 188 $ 175 $ — $ — $ 8,047 $ 8,227Ratings
Distribution 54.0% 30.7% 13.2% 2.1% —% 100.0%
The tables above reflect NRSRO ratings including Moody’s Investors Service, S&P, Fitch Ratings and Morningstar, Inc. CMBS designated NAIC 1 were98.5% and 98.0% of total CMBS at September 30, 2018 and December 31, 2017 , respectively.
EvaluationofFixedMaturitySecuritiesAFSforOTTIandEvaluatingTemporarilyImpairedFixedMaturitySecuritiesAFS
See Note 6 of the Notes to the Interim Condensed Consolidated Financial Statements for information about the evaluation of fixed maturity securities AFS forother-than-temporary impairment (“OTTI”) and evaluation of temporarily impaired AFS securities.
OTTILossesonFixedMaturitySecuritiesAFSRecognizedinEarnings
See Note 6 of the Notes to the Interim Condensed Consolidated Financial Statements for information about OTTI losses and gross gains and gross losses onfixed maturity securities AFS sold.
OverviewofFixedMaturitySecurityAFSOTTILossesRecognizedinEarnings
Impairments of fixed maturity securities AFS were $17 million for both the three months and nine months ended September 30, 2018 , and $5 million and$7 million for the three months and nine months ended September 30, 2017 , respectively.
150
Table of Contents
Credit-related impairments of fixed maturity securities AFS were $17 million for both the three months and nine months ended September 30, 2018, and $5million and $7 million for the three months and nine months ended September 30, 2017, respectively.
Overall OTTI losses recognized in earnings on fixed maturity securities AFS were $17 million for both the three months and nine months endedSeptember 30, 2018, as compared to $5 million and $7 million for the three months and nine months ended September 30, 2017, respectively. The increase wasprimarily due to $9 million of OTTI losses on Argentine foreign government securities due to the weakening Argentine peso.
FutureImpairments
Future OTTI on fixed maturity securities AFS will depend primarily on economic fundamentals, issuer performance (including changes in the present valueof future cash flows expected to be collected), and changes in credit ratings, collateral valuation, interest rates and credit spreads. If economic fundamentalsdeteriorate or if there are adverse changes in the above factors, OTTI may be incurred in upcoming periods.
Contractholder-DirectedEquitySecuritiesandFairValueOptionSecurities
The estimated fair value of Unit-linked and FVO Securities was $13.5 billion and $16.7 billion , or 3.0% and 3.7% of cash and invested assets, atSeptember 30, 2018 and December 31, 2017 , respectively. Unit-linked and FVO Securities are primarily comprised of Unit-linked investments. See Notes 6 and 8of the Notes to the Interim Condensed Consolidated Financial Statements for a description of our Unit-linked and FVO Securities portfolio, the Unit-linked andFVO Securities fair value hierarchy and a rollforward of the fair value measurements for Unit-linked and FVO Securities measured at estimated fair value on arecurring basis using significant unobservable (Level 3) inputs.
SecuritiesLending
We participate in a securities lending program whereby securities are loaned to third parties, primarily brokerage firms and commercial banks. We obtaincollateral, usually cash, in an amount generally equal to 102% of the estimated fair value of the securities loaned, which is obtained at the inception of a loan andmaintained at a level greater than or equal to 100% for the duration of the loan. We monitor the estimated fair value of the securities loaned on a daily basis withadditional collateral obtained as necessary throughout the duration of the loan. Securities loaned under such transactions may be sold or re-pledged by thetransferee. We are liable to return to our counterparties the cash collateral under our control. Security collateral received from counterparties may not be sold or re-pledged, unless the counterparty is in default, and is not reflected on the consolidated financial statements. These transactions are treated as financing arrangementsand the associated cash collateral liability is recorded at the amount of the cash received.
See “— Liquidity and Capital Resources — The Company — Liquidity and Capital Uses — Securities Lending” and Note 6 of the Notes to the InterimCondensed Consolidated Financial Statements for information regarding our securities lending program.
RepurchaseAgreements
The Company participates in short-term repurchase agreements with unaffiliated financial institutions. Under these agreements, the Company lends fixedmaturity securities AFS and receives cash as collateral in an amount generally equal to 98% of the estimated fair value of the securities loaned at the inception ofthe transaction. The associated liability is recorded at the amount of cash received. The Company monitors the estimated fair value of the collateral and thesecurities loaned throughout the duration of the transaction and additional collateral is obtained as necessary. Securities loaned under such transactions may be soldor re-pledged by the transferee.
See Note 6 of the Notes to the Interim Condensed Consolidated Financial Statements for additional information regarding our repurchase agreements.
FHLBofBostonAdvanceAgreements
A subsidiary of the Company participates in short-term advance agreements with the Federal Home Loan Bank of Boston (“FHLB of Boston”). Under theseagreements, the Company pledges fixed maturity securities AFS and receives cash. The associated liability is recorded at the amount of cash received. The FHLBof Boston has minimum collateral requirements which vary depending on the type of collateral pledged. Securities pledged under such transactions may not be soldor re-pledged by the transferee.
See Note 6 of the Notes to the Interim Condensed Consolidated Financial Statements for information regarding our FHLB of Boston advance agreementtransactions.
151
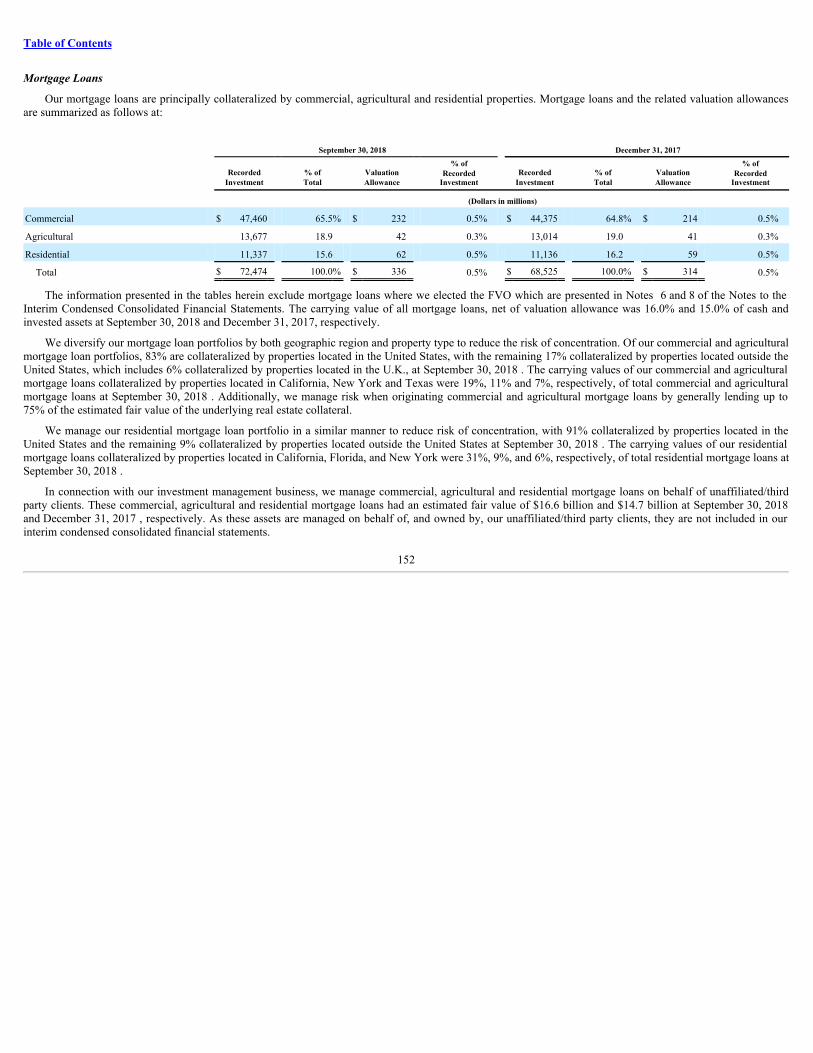
Table of Contents
MortgageLoans
Our mortgage loans are principally collateralized by commercial, agricultural and residential properties. Mortgage loans and the related valuation allowancesare summarized as follows at:
September 30, 2018 December 31, 2017
Recorded
Investment % ofTotal
ValuationAllowance
% ofRecorded
Investment Recorded
Investment % ofTotal
ValuationAllowance
% ofRecorded
Investment
(Dollars in millions)
Commercial $ 47,460 65.5% $ 232 0.5% $ 44,375 64.8% $ 214 0.5%
Agricultural 13,677 18.9 42 0.3% 13,014 19.0 41 0.3%
Residential 11,337 15.6 62 0.5% 11,136 16.2 59 0.5%
Total $ 72,474 100.0% $ 336 0.5% $ 68,525 100.0% $ 314 0.5%
The information presented in the tables herein exclude mortgage loans where we elected the FVO which are presented in Notes 6 and 8 of the Notes to theInterim Condensed Consolidated Financial Statements. The carrying value of all mortgage loans, net of valuation allowance was 16.0% and 15.0% of cash andinvested assets at September 30, 2018 and December 31, 2017, respectively.
We diversify our mortgage loan portfolios by both geographic region and property type to reduce the risk of concentration. Of our commercial and agriculturalmortgage loan portfolios, 83% are collateralized by properties located in the United States, with the remaining 17% collateralized by properties located outside theUnited States, which includes 6% collateralized by properties located in the U.K., at September 30, 2018 . The carrying values of our commercial and agriculturalmortgage loans collateralized by properties located in California, New York and Texas were 19%, 11% and 7%, respectively, of total commercial and agriculturalmortgage loans at September 30, 2018 . Additionally, we manage risk when originating commercial and agricultural mortgage loans by generally lending up to75% of the estimated fair value of the underlying real estate collateral.
We manage our residential mortgage loan portfolio in a similar manner to reduce risk of concentration, with 91% collateralized by properties located in theUnited States and the remaining 9% collateralized by properties located outside the United States at September 30, 2018 . The carrying values of our residentialmortgage loans collateralized by properties located in California, Florida, and New York were 31%, 9%, and 6%, respectively, of total residential mortgage loans atSeptember 30, 2018 .
In connection with our investment management business, we manage commercial, agricultural and residential mortgage loans on behalf of unaffiliated/thirdparty clients. These commercial, agricultural and residential mortgage loans had an estimated fair value of $16.6 billion and $14.7 billion at September 30, 2018and December 31, 2017 , respectively. As these assets are managed on behalf of, and owned by, our unaffiliated/third party clients, they are not included in ourinterim condensed consolidated financial statements.
152
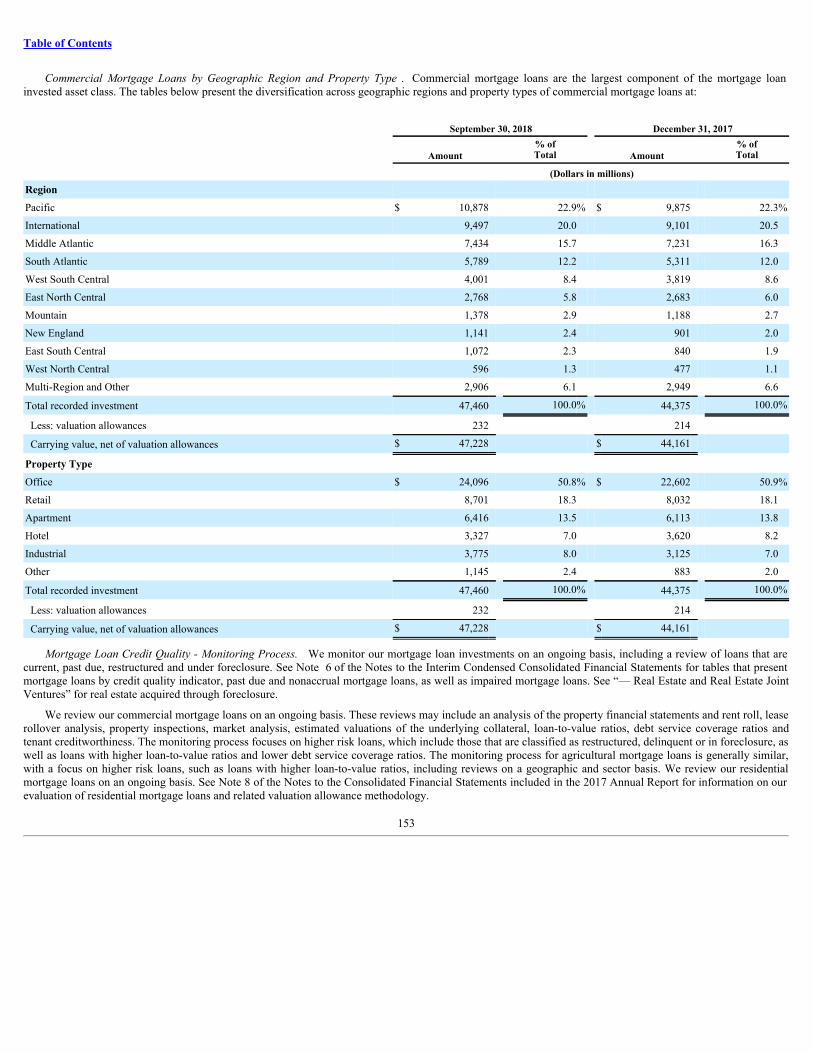
Table of Contents
Commercial Mortgage Loans by Geographic Region and Property Type . Commercial mortgage loans are the largest component of the mortgage loaninvested asset class. The tables below present the diversification across geographic regions and property types of commercial mortgage loans at:
September 30, 2018 December 31, 2017
Amount % ofTotal Amount
% ofTotal
(Dollars in millions)Region Pacific $ 10,878 22.9% $ 9,875 22.3%
International 9,497 20.0 9,101 20.5
Middle Atlantic 7,434 15.7 7,231 16.3
South Atlantic 5,789 12.2 5,311 12.0
West South Central 4,001 8.4 3,819 8.6
East North Central 2,768 5.8 2,683 6.0
Mountain 1,378 2.9 1,188 2.7
New England 1,141 2.4 901 2.0
East South Central 1,072 2.3 840 1.9
West North Central 596 1.3 477 1.1
Multi-Region and Other 2,906 6.1 2,949 6.6
Total recorded investment 47,460 100.0% 44,375 100.0%
Less: valuation allowances 232 214 Carrying value, net of valuation allowances $ 47,228 $ 44,161
Property Type Office $ 24,096 50.8% $ 22,602 50.9%
Retail 8,701 18.3 8,032 18.1
Apartment 6,416 13.5 6,113 13.8
Hotel 3,327 7.0 3,620 8.2
Industrial 3,775 8.0 3,125 7.0
Other 1,145 2.4 883 2.0
Total recorded investment 47,460 100.0% 44,375 100.0%
Less: valuation allowances 232 214 Carrying value, net of valuation allowances $ 47,228 $ 44,161
Mortgage Loan Credit Quality - Monitoring Process. We monitor our mortgage loan investments on an ongoing basis, including a review of loans that arecurrent, past due, restructured and under foreclosure. See Note 6 of the Notes to the Interim Condensed Consolidated Financial Statements for tables that presentmortgage loans by credit quality indicator, past due and nonaccrual mortgage loans, as well as impaired mortgage loans. See “— Real Estate and Real Estate JointVentures” for real estate acquired through foreclosure.
We review our commercial mortgage loans on an ongoing basis. These reviews may include an analysis of the property financial statements and rent roll, leaserollover analysis, property inspections, market analysis, estimated valuations of the underlying collateral, loan-to-value ratios, debt service coverage ratios andtenant creditworthiness. The monitoring process focuses on higher risk loans, which include those that are classified as restructured, delinquent or in foreclosure, aswell as loans with higher loan-to-value ratios and lower debt service coverage ratios. The monitoring process for agricultural mortgage loans is generally similar,with a focus on higher risk loans, such as loans with higher loan-to-value ratios, including reviews on a geographic and sector basis. We review our residentialmortgage loans on an ongoing basis. See Note 8 of the Notes to the Consolidated Financial Statements included in the 2017 Annual Report for information on ourevaluation of residential mortgage loans and related valuation allowance methodology.
153
Table of Contents
Loan-to-value ratios and debt service coverage ratios are common measures in the assessment of the quality of commercial mortgage loans. Loan-to-valueratios are a common measure in the assessment of the quality of agricultural mortgage loans. Loan-to-value ratios compare the amount of the loan to the estimatedfair value of the underlying collateral. A loan-to-value ratio greater than 100% indicates that the loan amount is greater than the collateral value. A loan-to-valueratio of less than 100% indicates an excess of collateral value over the loan amount. Generally, the higher the loan-to-value ratio, the higher the risk ofexperiencing a credit loss. The debt service coverage ratio compares a property’s net operating income to amounts needed to service the principal and interest dueunder the loan. Generally, the lower the debt service coverage ratio, the higher the risk of experiencing a credit loss. For our commercial mortgage loans, ouraverage loan-to-value ratio was 54% at both September 30, 2018 and December 31, 2017 , and our average debt service coverage ratio was 2.6.x and 2.7x forSeptember 30, 2018 and December 31, 2017 , respectively. The debt service coverage ratio, as well as the values utilized in calculating the ratio, is updatedannually, on a rolling basis, with a portion of the portfolio updated each quarter. In addition, the loan-to-value ratio is routinely updated for all but the lowest riskloans as part of our ongoing review of our commercial mortgage loan portfolio. For our agricultural mortgage loans, our average loan-to-value ratio was 45% and44% at September 30, 2018 and December 31, 2017 , respectively. The values utilized in calculating the agricultural mortgage loan loan-to-value ratio aredeveloped in connection with the ongoing review of the agricultural loan portfolio and are routinely updated.
Mortgage Loan Valuation Allowances . Our valuation allowances are established both on a loan specific basis for those loans considered impaired where aproperty specific or market specific risk has been identified that could likely result in a future loss, as well as for pools of loans with similar risk characteristicswhere a property specific or market specific risk has not been identified, but for which we expect to incur a loss. Accordingly, a valuation allowance is provided toabsorb these estimated probable credit losses.
The determination of the amount of valuation allowances is based upon our periodic evaluation and assessment of known and inherent risks associated withour loan portfolios. Such evaluations and assessments are based upon several factors, including our experience for loan losses, defaults and loss severity, and lossexpectations for loans with similar risk characteristics. These evaluations and assessments are revised as conditions change and new information becomesavailable, which can cause the valuation allowances to increase or decrease over time as such evaluations are revised. Negative credit migration, including anactual or expected increase in the level of problem loans, will result in an increase in the valuation allowance. Positive credit migration, including an actual orexpected decrease in the level of problem loans, will result in a decrease in the valuation allowance.
See Note 6 of the Notes to the Interim Condensed Consolidated Financial Statements for information about how valuation allowances are established andmonitored, and activity in and balances of the valuation allowance, as of and for the nine months ended September 30, 2018 and 2017 .
RealEstateandRealEstateJointVentures
Real estate and real estate joint ventures is comprised of wholly-owned real estate and joint ventures with interests in single property income-producing realestate and, to a lesser extent, joint ventures with interests in multi-property projects with varying strategies ranging from the development of properties to theoperation of income-producing properties, as well as a run-off portfolio of real estate private equity funds. We diversify our real estate investments by bothgeographic region and property type to reduce risk of concentration. The carrying values of real estate and real estate joint ventures were $10.0 billion and$9.6 billion , or 2.2% and 2.1% of cash and invested assets, at September 30, 2018 and December 31, 2017 , respectively. The estimated fair value of our real estateinvestments was $15.8 billion and $14.9 billion at September 30, 2018 and December 31, 2017 , respectively. The total gross market value of such real estateinvestments was $20.0 billion and $19.1 billion at September 30, 2018 and December 31, 2017 , respectively. Gross market value is the total fair value of theseinvestments regardless of encumbering debt.
I n connection with our investment management business, we manage commercial real estate investments on behalf of unaffiliated/third party clients. Thesecommercial real estate investments had an estimated fair value of $6.3 billion and $5.2 billion at September 30, 2018 and December 31, 2017, respectively. Thetotal gross market value of these commercial real estate investments was $8.1 billion and $6.7 billion at September 30, 2018 and December 31, 2017, respectively.As these assets are managed on behalf of, and owned by, our unaffiliated/third party clients, they are not included in our interim condensed consolidated financialstatements.
154
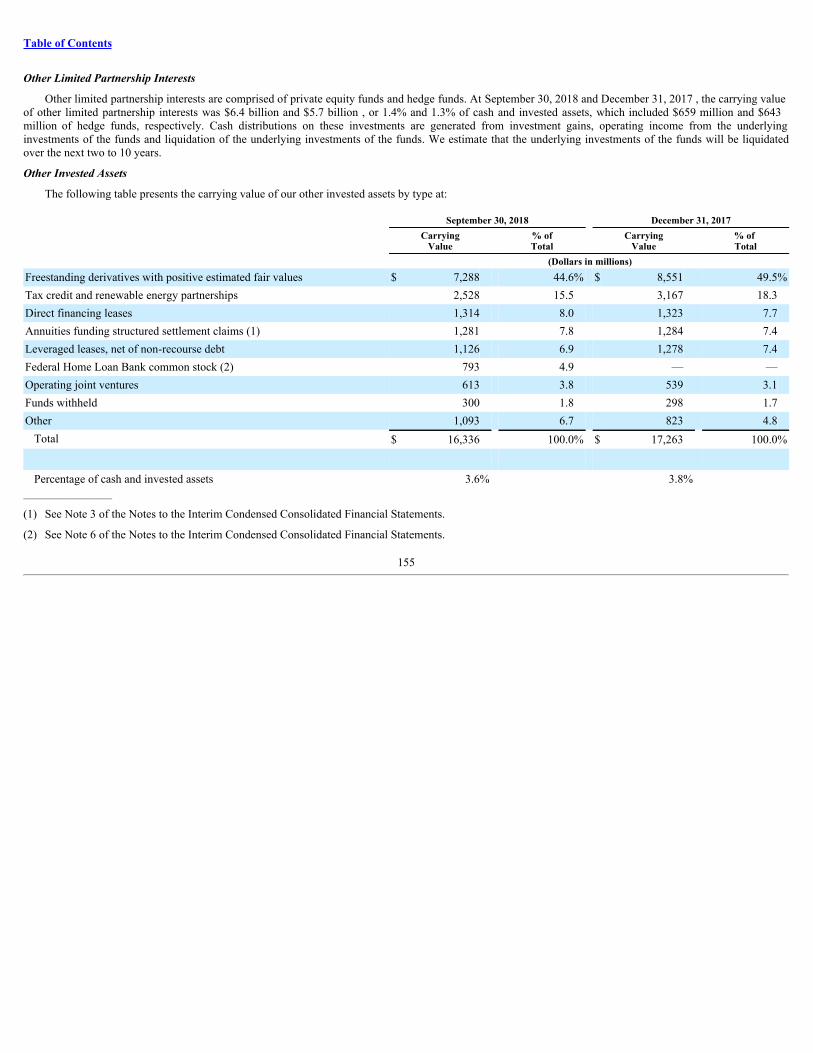
Table of Contents
OtherLimitedPartnershipInterests
Other limited partnership interests are comprised of private equity funds and hedge funds. At September 30, 2018 and December 31, 2017 , the carrying valueof other limited partnership interests was $6.4 billion and $5.7 billion , or 1.4% and 1.3% of cash and invested assets, which included $659 million and $643million of hedge funds, respectively. Cash distributions on these investments are generated from investment gains, operating income from the underlyinginvestments of the funds and liquidation of the underlying investments of the funds. We estimate that the underlying investments of the funds will be liquidatedover the next two to 10 years.
OtherInvestedAssets
The following table presents the carrying value of our other invested assets by type at:
September 30, 2018 December 31, 2017
Carrying
Value % ofTotal
CarryingValue
% of Total
(Dollars in millions)Freestanding derivatives with positive estimated fair values $ 7,288 44.6% $ 8,551 49.5%Tax credit and renewable energy partnerships 2,528 15.5 3,167 18.3Direct financing leases 1,314 8.0 1,323 7.7Annuities funding structured settlement claims (1) 1,281 7.8 1,284 7.4Leveraged leases, net of non-recourse debt 1,126 6.9 1,278 7.4Federal Home Loan Bank common stock (2) 793 4.9 — —Operating joint ventures 613 3.8 539 3.1Funds withheld 300 1.8 298 1.7Other 1,093 6.7 823 4.8
Total $ 16,336 100.0% $ 17,263 100.0%
Percentage of cash and invested assets 3.6% 3.8% __________________
(1) See Note 3 of the Notes to the Interim Condensed Consolidated Financial Statements.
(2) See Note 6 of the Notes to the Interim Condensed Consolidated Financial Statements.
155
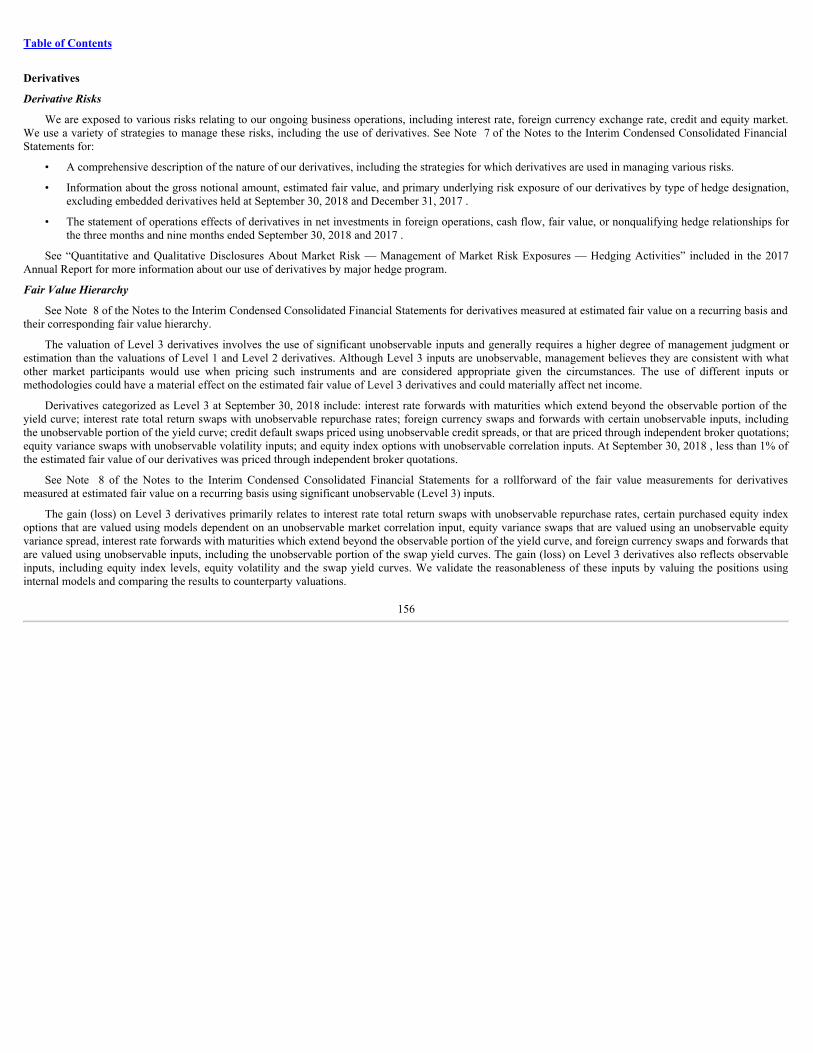
Table of Contents
Derivatives
DerivativeRisks
We are exposed to various risks relating to our ongoing business operations, including interest rate, foreign currency exchange rate, credit and equity market.We use a variety of strategies to manage these risks, including the use of derivatives. See Note 7 of the Notes to the Interim Condensed Consolidated FinancialStatements for:
• A comprehensive description of the nature of our derivatives, including the strategies for which derivatives are used in managing various risks.
• Information about the gross notional amount, estimated fair value, and primary underlying risk exposure of our derivatives by type of hedge designation,excluding embedded derivatives held at September 30, 2018 and December 31, 2017 .
• The statement of operations effects of derivatives in net investments in foreign operations, cash flow, fair value, or nonqualifying hedge relationships forthe three months and nine months ended September 30, 2018 and 2017 .
See “Quantitative and Qualitative Disclosures About Market Risk — Management of Market Risk Exposures — Hedging Activities” included in the 2017Annual Report for more information about our use of derivatives by major hedge program.
FairValueHierarchy
See Note 8 of the Notes to the Interim Condensed Consolidated Financial Statements for derivatives measured at estimated fair value on a recurring basis andtheir corresponding fair value hierarchy.
The valuation of Level 3 derivatives involves the use of significant unobservable inputs and generally requires a higher degree of management judgment orestimation than the valuations of Level 1 and Level 2 derivatives. Although Level 3 inputs are unobservable, management believes they are consistent with whatother market participants would use when pricing such instruments and are considered appropriate given the circumstances. The use of different inputs ormethodologies could have a material effect on the estimated fair value of Level 3 derivatives and could materially affect net income.
Derivatives categorized as Level 3 at September 30, 2018 include: interest rate forwards with maturities which extend beyond the observable portion of theyield curve; interest rate total return swaps with unobservable repurchase rates; foreign currency swaps and forwards with certain unobservable inputs, includingthe unobservable portion of the yield curve; credit default swaps priced using unobservable credit spreads, or that are priced through independent broker quotations;equity variance swaps with unobservable volatility inputs; and equity index options with unobservable correlation inputs. At September 30, 2018 , less than 1% ofthe estimated fair value of our derivatives was priced through independent broker quotations.
See Note 8 of the Notes to the Interim Condensed Consolidated Financial Statements for a rollforward of the fair value measurements for derivativesmeasured at estimated fair value on a recurring basis using significant unobservable (Level 3) inputs.
The gain (loss) on Level 3 derivatives primarily relates to interest rate total return swaps with unobservable repurchase rates, certain purchased equity indexoptions that are valued using models dependent on an unobservable market correlation input, equity variance swaps that are valued using an unobservable equityvariance spread, interest rate forwards with maturities which extend beyond the observable portion of the yield curve, and foreign currency swaps and forwards thatare valued using unobservable inputs, including the unobservable portion of the swap yield curves. The gain (loss) on Level 3 derivatives also reflects observableinputs, including equity index levels, equity volatility and the swap yield curves. We validate the reasonableness of these inputs by valuing the positions usinginternal models and comparing the results to counterparty valuations.
156
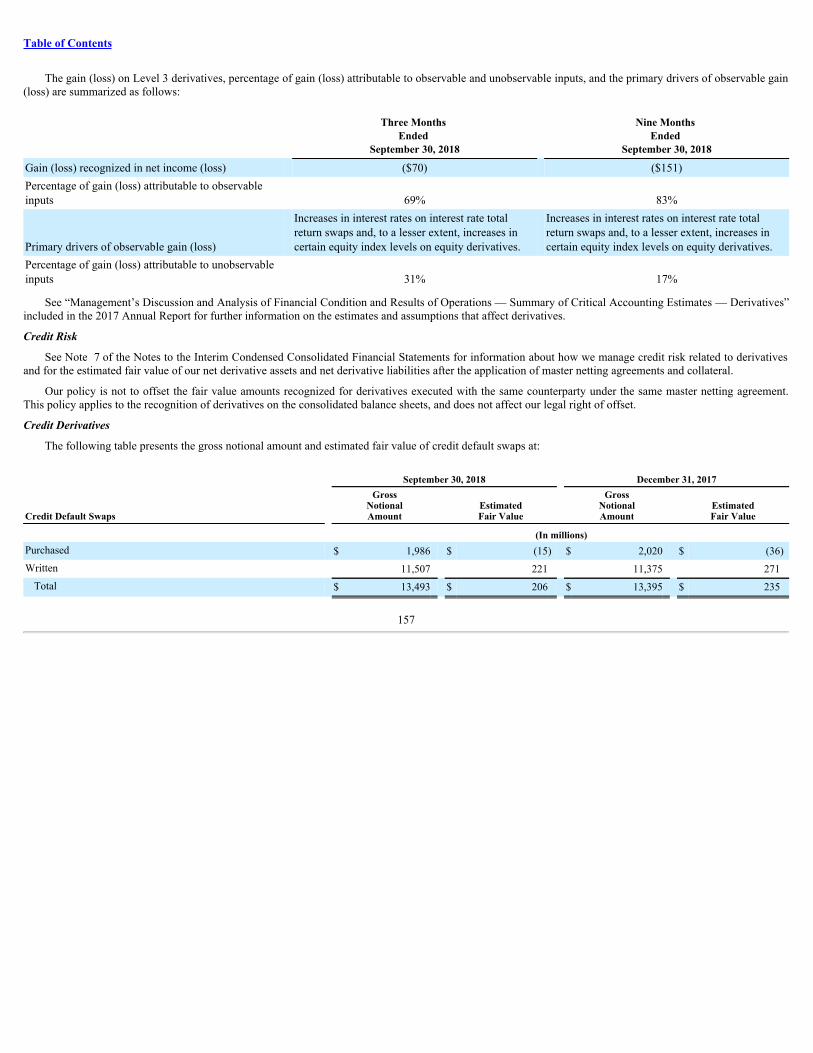
Table of Contents
The gain (loss) on Level 3 derivatives, percentage of gain (loss) attributable to observable and unobservable inputs, and the primary drivers of observable gain(loss) are summarized as follows:
Three Months Ended
September 30, 2018
Nine Months Ended
September 30, 2018
Gain (loss) recognized in net income (loss) ($70) ($151)Percentage of gain (loss) attributable to observableinputs 69% 83%
Primary drivers of observable gain (loss)
Increases in interest rates on interest rate totalreturn swaps and, to a lesser extent, increases incertain equity index levels on equity derivatives.
Increases in interest rates on interest rate totalreturn swaps and, to a lesser extent, increases incertain equity index levels on equity derivatives.
Percentage of gain (loss) attributable to unobservableinputs 31% 17%
See “Management’s Discussion and Analysis of Financial Condition and Results of Operations — Summary of Critical Accounting Estimates — Derivatives”included in the 2017 Annual Report for further information on the estimates and assumptions that affect derivatives.
CreditRisk
See Note 7 of the Notes to the Interim Condensed Consolidated Financial Statements for information about how we manage credit risk related to derivativesand for the estimated fair value of our net derivative assets and net derivative liabilities after the application of master netting agreements and collateral.
Our policy is not to offset the fair value amounts recognized for derivatives executed with the same counterparty under the same master netting agreement.This policy applies to the recognition of derivatives on the consolidated balance sheets, and does not affect our legal right of offset.
CreditDerivatives
The following table presents the gross notional amount and estimated fair value of credit default swaps at:
September 30, 2018 December 31, 2017
Credit Default Swaps
GrossNotionalAmount
EstimatedFair Value
GrossNotionalAmount
EstimatedFair Value
(In millions)Purchased $ 1,986 $ (15) $ 2,020 $ (36)Written 11,507 221 11,375 271
Total $ 13,493 $ 206 $ 13,395 $ 235
157
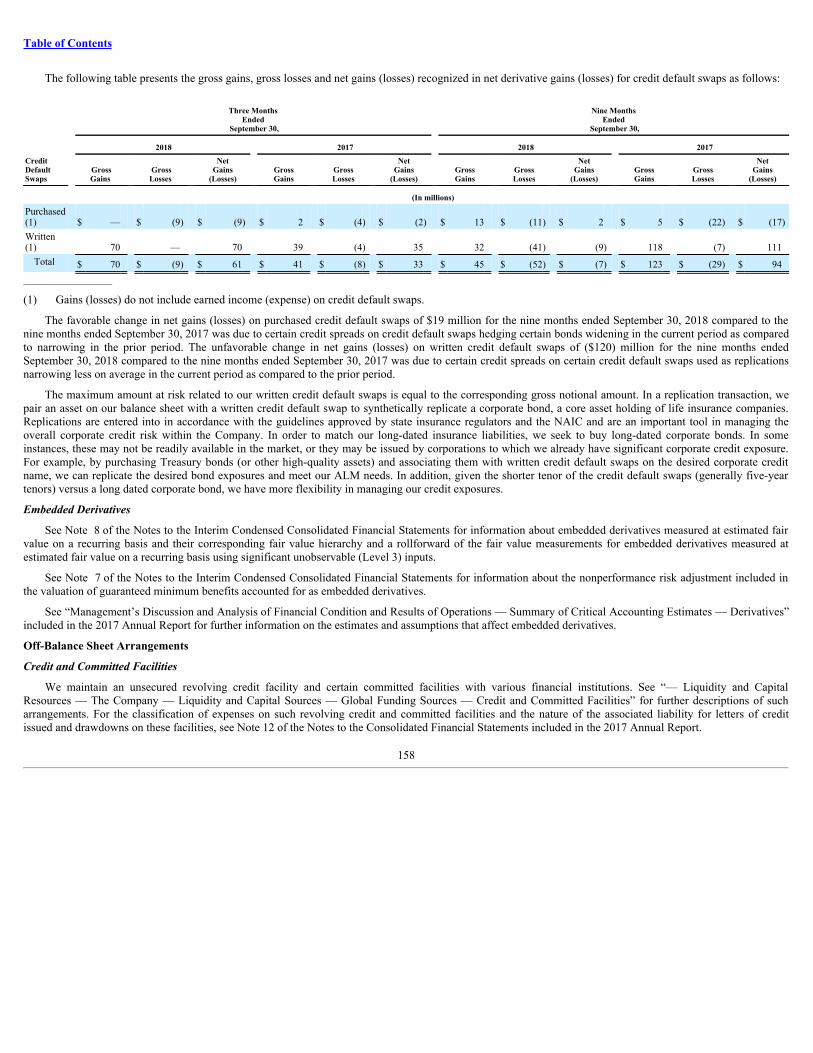
Table of Contents
The following table presents the gross gains, gross losses and net gains (losses) recognized in net derivative gains (losses) for credit default swaps as follows:
Three Months
Ended September 30,
Nine Months Ended
September 30,
2018 2017 2018 2017
CreditDefaultSwaps Gross
Gains GrossLosses
NetGains
(Losses) GrossGains Gross
Losses Net
Gains(Losses) Gross
Gains GrossLosses
NetGains
(Losses) GrossGains Gross
Losses Net
Gains(Losses)
(In millions)
Purchased(1) $ — $ (9) $ (9) $ 2 $ (4) $ (2) $ 13 $ (11) $ 2 $ 5 $ (22) $ (17)Written(1) 70 — 70 39 (4) 35 32 (41) (9) 118 (7) 111
Total $ 70 $ (9) $ 61 $ 41 $ (8) $ 33 $ 45 $ (52) $ (7) $ 123 $ (29) $ 94__________________
(1) Gains (losses) do not include earned income (expense) on credit default swaps.
The favorable change in net gains (losses) on purchased credit default swaps of $19 million for the nine months ended September 30, 2018 compared to thenine months ended September 30, 2017 was due to certain credit spreads on credit default swaps hedging certain bonds widening in the current period as comparedto narrowing in the prior period. The unfavorable change in net gains (losses) on written credit default swaps of ($120) million for the nine months endedSeptember 30, 2018 compared to the nine months ended September 30, 2017 was due to certain credit spreads on certain credit default swaps used as replicationsnarrowing less on average in the current period as compared to the prior period.
The maximum amount at risk related to our written credit default swaps is equal to the corresponding gross notional amount. In a replication transaction, wepair an asset on our balance sheet with a written credit default swap to synthetically replicate a corporate bond, a core asset holding of life insurance companies.Replications are entered into in accordance with the guidelines approved by state insurance regulators and the NAIC and are an important tool in managing theoverall corporate credit risk within the Company. In order to match our long-dated insurance liabilities, we seek to buy long-dated corporate bonds. In someinstances, these may not be readily available in the market, or they may be issued by corporations to which we already have significant corporate credit exposure.For example, by purchasing Treasury bonds (or other high-quality assets) and associating them with written credit default swaps on the desired corporate creditname, we can replicate the desired bond exposures and meet our ALM needs. In addition, given the shorter tenor of the credit default swaps (generally five-yeartenors) versus a long dated corporate bond, we have more flexibility in managing our credit exposures.
EmbeddedDerivatives
See Note 8 of the Notes to the Interim Condensed Consolidated Financial Statements for information about embedded derivatives measured at estimated fairvalue on a recurring basis and their corresponding fair value hierarchy and a rollforward of the fair value measurements for embedded derivatives measured atestimated fair value on a recurring basis using significant unobservable (Level 3) inputs.
See Note 7 of the Notes to the Interim Condensed Consolidated Financial Statements for information about the nonperformance risk adjustment included inthe valuation of guaranteed minimum benefits accounted for as embedded derivatives.
See “Management’s Discussion and Analysis of Financial Condition and Results of Operations — Summary of Critical Accounting Estimates — Derivatives”included in the 2017 Annual Report for further information on the estimates and assumptions that affect embedded derivatives.
Off-Balance Sheet Arrangements
CreditandCommittedFacilities
We maintain an unsecured revolving credit facility and certain committed facilities with various financial institutions. See “— Liquidity and CapitalResources — The Company — Liquidity and Capital Sources — Global Funding Sources — Credit and Committed Facilities” for further descriptions of sucharrangements. For the classification of expenses on such revolving credit and committed facilities and the nature of the associated liability for letters of creditissued and drawdowns on these facilities, see Note 12 of the Notes to the Consolidated Financial Statements included in the 2017 Annual Report.
158

Table of Contents
CollateralforSecuritiesLending,Third-PartyCustodianAdministeredRepurchaseProgramsandDerivatives
We participate in a securities lending program in the normal course of business for the purpose of enhancing the total return on our investment portfolio.Periodically, we receive non-cash collateral for securities lending from counterparties, which cannot be sold or re-pledged, and which has not been recorded on ourconsolidated balance sheets. The amount of this collateral was $0 and $19 million at estimated fair value at September 30, 2018 and December 31, 2017 ,respectively. See Note 6 of the Notes to the Interim Condensed Consolidated Financial Statements and “— Investments — Securities Lending,” as well as“Summary of Significant Accounting Policies — Investments — Securities Lending Program” in Note 1 of the Notes to the Consolidated Financial Statementsincluded in the 2017 Annual Report for a discussion of our securities lending program, the classification of revenues and expenses, and the nature of the securedfinancing arrangement and associated liability.
We also participate in third-party custodian administered repurchase programs for the purpose of enhancing the total return on our investment portfolio. Weloan certain of our fixed maturity securities AFS to financial institutions and, in exchange, non-cash collateral is put on deposit by the financial institutions on ourbehalf with third-party custodians. The estimated fair value of securities loaned in connection with these transactions was $176 million and $182 million atSeptember 30, 2018 and December 31, 2017 , respectively. Non-cash collateral on deposit with third-party custodians on our behalf was $186 million and$194 million at September 30, 2018 and December 31, 2017 , respectively, which cannot be sold or re-pledged, and which has not been recorded on ourconsolidated balance sheets.
We enter into derivatives to manage various risks relating to our ongoing business operations. We have non-cash collateral from counterparties for derivatives,which can be sold or re-pledged subject to certain constraints, and which has not been recorded on our consolidated balance sheets. The amount of this non-cashcollateral was $1.2 billion and $1.1 billion at September 30, 2018 and December 31, 2017 , respectively. See “— Liquidity and Capital Resources — TheCompany — Liquidity and Capital Uses — Pledged Collateral” and Note 7 of the Notes to the Interim Condensed Consolidated Financial Statements forinformation regarding the earned income on and the gross notional amount, estimated fair value of assets and liabilities and primary underlying risk exposure ofour derivatives.
LeaseCommitments
As lessee, we have entered into various lease and sublease agreements for office space, information technology and other equipment. Our commitments undersuch lease agreements are included within the contractual obligations table. See “Management’s Discussion and Analysis of Financial Condition and Results ofOperations — Liquidity and Capital Resources — The Company — Contractual Obligations” and Note 20 of the Notes to the Consolidated Financial Statementsincluded in the 2017 Annual Report.
Guarantees
See “Guarantees” in Note 15 of the Notes to the Interim Condensed Consolidated Financial Statements.
Other
We enter into the following additional commitments in the normal course of business for the purpose of enhancing the total return on our investment portfolio:mortgage loan commitments and commitments to fund partnerships, bank credit facilities, bridge loans and private corporate bond investments. See “NetInvestment Income” and “Net Investment Gains (Losses)” in Note 6 of the Notes to the Interim Condensed Consolidated Financial Statements for information onthe investment income, investment expense, and gains and losses from such investments. See also “— Investments — Fixed Maturity Securities AFS” and “—Investments — Mortgage Loans” for information on our investments in fixed maturity securities AFS and mortgage loans. See “— Investments — Real Estate andReal Estate Joint Ventures” and “— Investments — Other Limited Partnership Interests” for information on our partnership investments.
Other than the commitments disclosed in Note 15 of the Notes to the Interim Condensed Consolidated Financial Statements, there are no other materialobligations or liabilities arising from the commitments to fund mortgage loans, partnerships, bank credit facilities, bridge loans, and private corporate bondinvestments.
Policyholder Liabilities
We establish, and carry as liabilities, actuarially determined amounts that are calculated to meet policy obligations or to provide for future annuity payments.Amounts for actuarial liabilities are computed and reported on the interim condensed consolidated financial statements in conformity with GAAP. For more detailson Policyholder Liabilities, see “Management’s Discussion and Analysis of Financial Condition and Results of Operations — Summary of Critical AccountingEstimates” included in the 2017 Annual Report.
159
Table of Contents
Due to the nature of the underlying risks and the uncertainty associated with the determination of actuarial liabilities, we cannot precisely determine theamounts that will ultimately be paid with respect to these actuarial liabilities, and the ultimate amounts may vary from the estimated amounts, particularly whenpayments may not occur until well into the future.
We periodically review our estimates of actuarial liabilities for future benefits and compare them with our actual experience. We revise estimates, to the extentpermitted or required under GAAP, if we determine that future expected experience differs from assumptions used in the development of actuarial liabilities. Wecharge or credit changes in our liabilities to expenses in the period the liabilities are established or re-estimated. If the liabilities originally established for futurebenefit payments prove inadequate, we must increase them. Such an increase could adversely affect our earnings and have a material adverse effect on ourbusiness, results of operations and financial condition.
We have experienced, and will likely in the future experience, catastrophe losses and possibly acts of terrorism, as well as turbulent financial markets that mayhave an adverse impact on our business, results of operations and financial condition. Due to their nature, we cannot predict the incidence, timing, severity oramount of losses from catastrophes and acts of terrorism, but we make broad use of catastrophic and non-catastrophic reinsurance to manage risk from these perils.We also use hedging, reinsurance and other risk management activities to mitigate financial market volatility.
Insurance regulators in many of the non-U.S. jurisdictions in which we operate require certain MetLife entities to prepare a sufficiency analysis of the reservespresented in the locally required regulatory financial statements, and to submit that analysis to the regulatory authorities. See “— Industry Trends — RegulatoryDevelopments” and “Business — Regulation — U.S. Regulation — Insurance Regulation — Policy and Contract Reserve Adequacy Analysis” and “Business —Regulation — International Regulation” included in the 2017 Annual Report for further information.
FuturePolicyBenefits
We establish liabilities for amounts payable under insurance policies. See Notes 1 and 4 of the Notes to the Consolidated Financial Statements included in the2017 Annual Report for additional information. See also “Management’s Discussion and Analysis of Financial Condition and Results of Operations — IndustryTrends — Impact of a Sustained Low Interest Rate Environment — Low Interest Rate Scenario” included in the 2017 Annual Report and “— Variable AnnuityGuarantees.” A discussion of future policy benefits by segment (as well as Corporate & Other) follows.
U.S.
Amounts payable under insurance policies for this segment are comprised of group insurance and annuities, as well as property & casualty policies. Forgroup insurance, future policyholder benefits are comprised mainly of liabilities for disabled lives under disability waiver of premium policy provisions,liabilities for survivor income benefit insurance, active life policies and premium stabilization and other contingency liabilities held under life insurancecontracts. For group annuity contracts, future policyholder benefits are primarily related to payout annuities, including pension risk transfers, structuredsettlement annuities and institutional income annuities. There is no interest rate crediting flexibility on these liabilities. As a result, a sustained low interest rateenvironment could negatively impact earnings; however, we mitigate our risks by applying various ALM strategies, including the use of various interest ratederivative positions. The components of future policy benefits related to our property & casualty policies are liabilities for unpaid claims, estimated based uponassumptions such as rates of claim frequencies, levels of severities, inflation, judicial trends, legislative changes or regulatory decisions. Assumptions are basedupon our historical experience and analysis of historical development patterns of the relationship of loss adjustment expenses to losses for each line of business,and we consider the effects of current developments, anticipated trends and risk management programs, reduced for anticipated salvage and subrogation.
Asia
Future policy benefits for this segment are held primarily for traditional life, endowment, annuity and accident & health contracts. They are also held fortotal return pass-through provisions included in certain universal life and savings products. They include certain liabilities for variable annuity and variable lifeguarantees of minimum death benefits, and longevity guarantees. Factors impacting these liabilities include sustained periods of lower yields than ratesestablished at policy issuance, lower than expected asset reinvestment rates, market volatility, actual lapses resulting in lower than expected income, and actualmortality or morbidity resulting in higher than expected benefit payments. We mitigate our risks by applying various ALM strategies.
160
Table of Contents
LatinAmerica
Future policy benefits for this segment are held primarily for immediate annuities in Chile, Argentina and Mexico and traditional life contracts mainly inMexico, Brazil and Colombia. There are also liabilities held for total return pass-through provisions included in certain universal life and savings products inMexico. Factors impacting these liabilities include sustained periods of lower yields than rates established at policy issuance, lower than expected assetreinvestment rates, and mortality and lapses different than expected. We mitigate our risks by applying various ALM strategies.
EMEA
Future policy benefits for this segment include unearned premium reserves for group life and credit insurance contracts. Future policy benefits are also heldfor traditional life, endowment and annuity contracts with significant mortality risk and accident & health contracts. Factors impacting these liabilities includelower than expected asset reinvestment rates, market volatility, actual lapses resulting in lower than expected income, and actual mortality or morbidity resultingin higher than expected benefit payments. We mitigate our risks by having premiums which are adjustable or cancellable in some cases, and by applying variousALM strategies.
MetLifeHoldings
Future policy benefits for the life business are comprised mainly of liabilities for traditional life insurance contracts. In order to manage risk, we have oftenreinsured a portion of the mortality risk on life insurance policies. We routinely evaluate our reinsurance programs, which may result in increases or decreases toexisting coverage. We have entered into various interest rate derivative positions to mitigate the risk that investment of premiums received and reinvestment ofmaturing assets over the life of the policy will be at rates below those assumed in the original pricing of these contracts. For the annuities business, future policybenefits are comprised mainly of liabilities for life-contingent income annuities and liabilities for the variable annuity guaranteed minimum benefits that areaccounted for as insurance. Other future policyholder benefits are comprised mainly of liabilities for disabled lives under disability waiver of premium policyprovisions, and active life policies. In addition, for our other products, future policyholder benefits related to the reinsurance of our former Japan joint ventureare comprised of liabilities for the variable annuity guaranteed minimum benefits that are accounted for as insurance.
Corporate&Other
Future policy benefits primarily include liabilities for other reinsurance business. Additionally, future policy benefits include liabilities for the U.S directbusiness sold directly to consumers.
PolicyholderAccountBalances
Policyholder account balances are generally equal to the account value, which includes accrued interest credited, but excludes the impact of any applicablecharge that may be incurred upon surrender. See “Management’s Discussion and Analysis of Financial Condition and Results of Operations — Industry Trends —Impact of a Sustained Low Interest Rate Environment — Low Interest Rate Scenario” included in the 2017 Annual Report and “— Variable Annuity Guarantees.”See also Notes 1 and 4 of the Notes to the Consolidated Financial Statements included in the 2017 Annual Report for additional information. A discussion ofpolicyholder account balances by segment follows.
U.S.
Policyholder account balances in this segment are comprised of funding agreements, retained asset accounts, universal life policies, the fixed account ofvariable life insurance policies and specialized life insurance products for benefit programs.
Group Benefits
Policyholder account balances in this business are held for retained asset accounts, universal life policies, the fixed account of variable life insurancepolicies and specialized life insurance products for benefit programs. Policyholder account balances are credited interest at a rate we determine, which isinfluenced by current market rates. A sustained low interest rate environment could adversely impact liabilities and earnings as a result of the minimumcredited rate guarantees present in most of these policyholder account balances. We have various interest rate derivative positions to partially mitigate the risksassociated with such a scenario.
161
Table of Contents
The table below presents the breakdown of account value subject to minimum guaranteed crediting rates for Group Benefits:
September 30, 2018
Guaranteed Minimum Crediting RateAccount
Value
AccountValue at
Guarantee (In millions)
Greater than 0% but less than 2% $ 4,772 $ 4,649Equal to or greater than 2% but less than 4% $ 1,782 $ 1,782Equal to or greater than 4% $ 735 $ 707
Retirement and Income Solutions
Policyholder account balances in this business are primarily comprised of funding agreements. Interest crediting rates vary by type of contract, and can befixed or variable. Variable interest crediting rates are generally tied to an external index, most commonly (1-month or 3-month) London Interbank OfferedRate. We are exposed to interest rate risks, as well as foreign currency exchange rate risk, when guaranteeing payment of interest and return of principal at thecontractual maturity date. We may invest in floating rate assets or enter into receive-floating interest rate swaps, also tied to external indices, as well as interestrate caps, to mitigate the impact of changes in market interest rates. We also mitigate our risks by applying various ALM strategies and seek to hedge allforeign currency exchange rate risk through the use of foreign currency hedges, including cross currency swaps.
The table below presents the breakdown of account value subject to minimum guaranteed crediting rates for RIS:
September 30, 2018
Guaranteed Minimum Crediting RateAccount
Value
AccountValue at
Guarantee (In millions)
Greater than 0% but less than 2% $ 139 $ —Equal to or greater than 2% but less than 4% $ 1,106 $ 122Equal to or greater than 4% $ 4,606 $ 4,605
Asia
Policyholder account balances in this segment are held largely for fixed income retirement and savings plans, fixed deferred annuities, interest sensitivewhole life products, universal life and, to a lesser degree, liability amounts for unit-linked-type funds that do not meet the GAAP definition of separate accounts.Also included are certain liabilities for retirement and savings products sold in certain countries in Asia that generally are sold with minimum credited rateguarantees. Liabilities for guarantees on certain variable annuities in Asia are accounted for as embedded derivatives and recorded at estimated fair value and arealso included within policyholder account balances. A sustained low interest rate environment could adversely impact liabilities and earnings as a result of theminimum credited rate guarantees present in most of these policyholder account balances. We mitigate our risks by applying various ALM strategies and withreinsurance. Liabilities for unit-linked-type funds are impacted by changes in the fair value of the associated underlying investments, as the return on assets isgenerally passed directly to the policyholder.
162
Table of Contents
The table below presents the breakdown of account value subject to minimum guaranteed crediting rates for Asia:
September 30, 2018
Guaranteed Minimum Crediting RateAccount
Value
AccountValue at
Guarantee (In millions)Annuities
Greater than 0% but less than 2% $ 24,946 $ 1,963Equal to or greater than 2% but less than 4% $ 1,221 $ 402Equal to or greater than 4% $ 1 $ 1
Life & Other Greater than 0% but less than 2% $ 9,631 $ 9,344Equal to or greater than 2% but less than 4% $ 23,696 $ 8,980Equal to or greater than 4% $ 279 $ 279
LatinAmerica
Policyholder account balances in this segment are held largely for investment-type products and universal life products in Mexico and Chile, and deferredannuities in Brazil. Some of the deferred annuities in Brazil are unit-linked-type funds that do not meet the GAAP definition of separate accounts. The rest of thedeferred annuities have minimum credited rate guarantees, which could adversely impact liabilities and earnings in a sustained low interest rate environment.Liabilities for unit-linked-type funds are impacted by changes in the fair value of the associated investments, as the return on assets is generally passed directly tothe policyholder.
EMEA
Policyholder account balances in this segment are held mostly for universal life, deferred annuity, pension products, and unit-linked-type funds that do notmeet the GAAP definition of separate accounts. They are also held for endowment products without significant mortality risk. A sustained low interest rateenvironment could adversely impact liabilities and earnings as a result of the minimum credited rate guarantees present in many of these policyholder accountbalances. We mitigate our risks by applying various ALM strategies. Liabilities for unit-linked-type funds are impacted by changes in the fair value of theassociated investments, as the return on assets is generally passed directly to the policyholder.
MetLifeHoldings
Life policyholder account balances are held for retained asset accounts, universal life policies, the fixed account of variable life insurance policies, andfunding agreements. For annuities, policyholder account balances are held for fixed deferred annuities, the fixed account portion of variable annuities, non-lifecontingent income annuities, and embedded derivatives related to variable annuity guarantees. Interest is credited to the policyholder’s account at interest rateswe determine which are influenced by current market rates, subject to specified minimums. A sustained low interest rate environment could adversely impactliabilities and earnings as a result of the minimum credited rate guarantees present in most of these policyholder account balances. We have various interest ratederivative positions to partially mitigate the risks associated with such a scenario. Additionally, for our other products, policyholder account balances are held forvariable annuity guarantees assumed from a former operating joint venture in Japan that are accounted for as embedded derivatives.
The table below presents the breakdown of account value subject to minimum guaranteed crediting rates for the MetLife Holdings segment:
September 30, 2018
Guaranteed Minimum Crediting RateAccount
Value
AccountValue at
Guarantee (In millions)Greater than 0% but less than 2% $ 1,567 $ 1,475Equal to or greater than 2% but less than 4% $ 18,983 $ 16,539Equal to or greater than 4% $ 8,171 $ 5,497
163
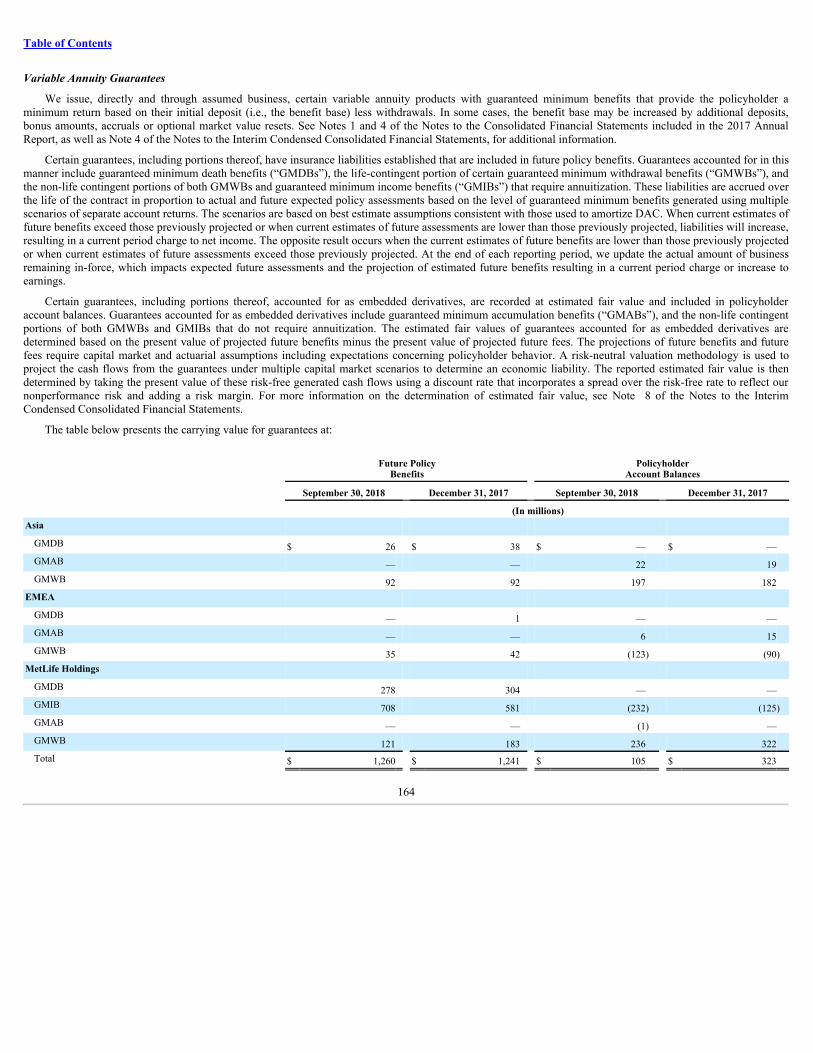
Table of Contents
VariableAnnuityGuarantees
We issue, directly and through assumed business, certain variable annuity products with guaranteed minimum benefits that provide the policyholder aminimum return based on their initial deposit (i.e., the benefit base) less withdrawals. In some cases, the benefit base may be increased by additional deposits,bonus amounts, accruals or optional market value resets. See Notes 1 and 4 of the Notes to the Consolidated Financial Statements included in the 2017 AnnualReport, as well as Note 4 of the Notes to the Interim Condensed Consolidated Financial Statements, for additional information.
Certain guarantees, including portions thereof, have insurance liabilities established that are included in future policy benefits. Guarantees accounted for in thismanner include guaranteed minimum death benefits (“GMDBs”), the life-contingent portion of certain guaranteed minimum withdrawal benefits (“GMWBs”), andthe non-life contingent portions of both GMWBs and guaranteed minimum income benefits (“GMIBs”) that require annuitization. These liabilities are accrued overthe life of the contract in proportion to actual and future expected policy assessments based on the level of guaranteed minimum benefits generated using multiplescenarios of separate account returns. The scenarios are based on best estimate assumptions consistent with those used to amortize DAC. When current estimates offuture benefits exceed those previously projected or when current estimates of future assessments are lower than those previously projected, liabilities will increase,resulting in a current period charge to net income. The opposite result occurs when the current estimates of future benefits are lower than those previously projectedor when current estimates of future assessments exceed those previously projected. At the end of each reporting period, we update the actual amount of businessremaining in-force, which impacts expected future assessments and the projection of estimated future benefits resulting in a current period charge or increase toearnings.
Certain guarantees, including portions thereof, accounted for as embedded derivatives, are recorded at estimated fair value and included in policyholderaccount balances. Guarantees accounted for as embedded derivatives include guaranteed minimum accumulation benefits (“GMABs”), and the non-life contingentportions of both GMWBs and GMIBs that do not require annuitization. The estimated fair values of guarantees accounted for as embedded derivatives aredetermined based on the present value of projected future benefits minus the present value of projected future fees. The projections of future benefits and futurefees require capital market and actuarial assumptions including expectations concerning policyholder behavior. A risk-neutral valuation methodology is used toproject the cash flows from the guarantees under multiple capital market scenarios to determine an economic liability. The reported estimated fair value is thendetermined by taking the present value of these risk-free generated cash flows using a discount rate that incorporates a spread over the risk-free rate to reflect ournonperformance risk and adding a risk margin. For more information on the determination of estimated fair value, see Note 8 of the Notes to the InterimCondensed Consolidated Financial Statements.
The table below presents the carrying value for guarantees at:
Future Policy
Benefits Policyholder
Account Balances
September 30, 2018 December 31, 2017 September 30, 2018 December 31, 2017 (In millions)Asia
GMDB $ 26 $ 38 $ — $ —GMAB — — 22 19GMWB 92 92 197 182
EMEA GMDB — 1 — —GMAB — — 6 15GMWB 35 42 (123) (90)
MetLife Holdings GMDB 278 304 — —GMIB 708 581 (232) (125)GMAB — — (1) —GMWB 121 183 236 322Total $ 1,260 $ 1,241 $ 105 $ 323
164
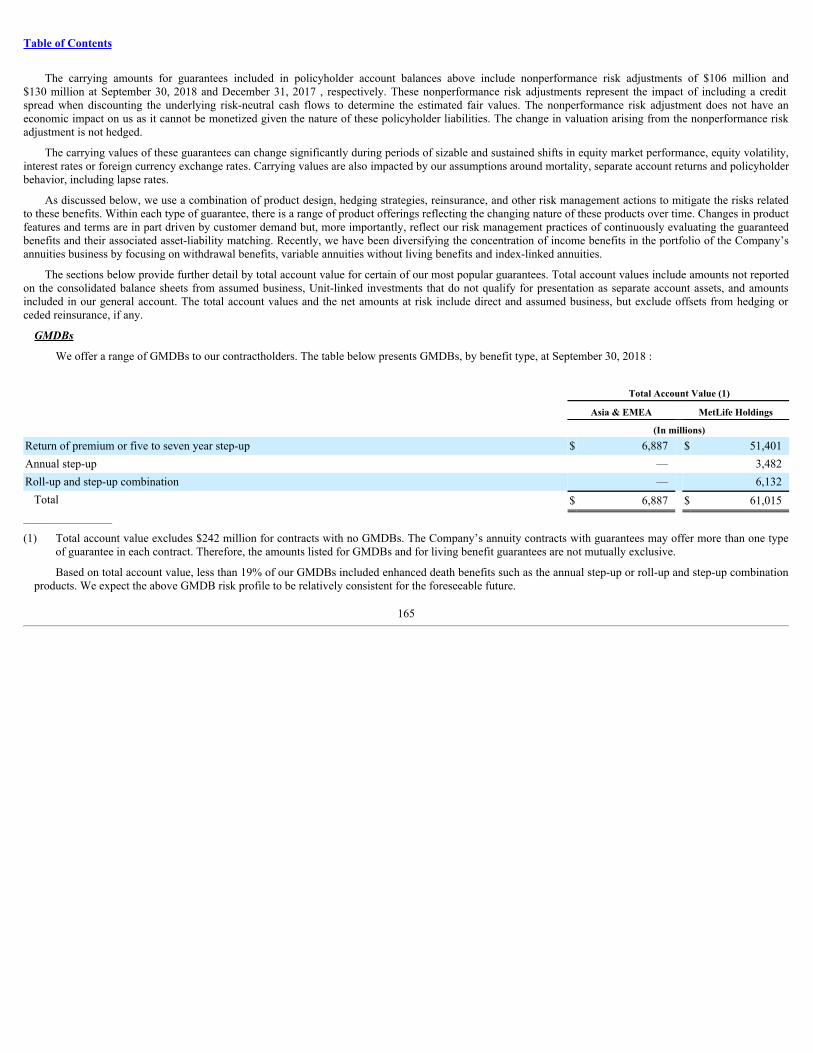
Table of Contents
The carrying amounts for guarantees included in policyholder account balances above include nonperformance risk adjustments of $106 million and$130 million at September 30, 2018 and December 31, 2017 , respectively. These nonperformance risk adjustments represent the impact of including a creditspread when discounting the underlying risk-neutral cash flows to determine the estimated fair values. The nonperformance risk adjustment does not have aneconomic impact on us as it cannot be monetized given the nature of these policyholder liabilities. The change in valuation arising from the nonperformance riskadjustment is not hedged.
The carrying values of these guarantees can change significantly during periods of sizable and sustained shifts in equity market performance, equity volatility,interest rates or foreign currency exchange rates. Carrying values are also impacted by our assumptions around mortality, separate account returns and policyholderbehavior, including lapse rates.
As discussed below, we use a combination of product design, hedging strategies, reinsurance, and other risk management actions to mitigate the risks relatedto these benefits. Within each type of guarantee, there is a range of product offerings reflecting the changing nature of these products over time. Changes in productfeatures and terms are in part driven by customer demand but, more importantly, reflect our risk management practices of continuously evaluating the guaranteedbenefits and their associated asset-liability matching. Recently, we have been diversifying the concentration of income benefits in the portfolio of the Company’sannuities business by focusing on withdrawal benefits, variable annuities without living benefits and index-linked annuities.
The sections below provide further detail by total account value for certain of our most popular guarantees. Total account values include amounts not reportedon the consolidated balance sheets from assumed business, Unit-linked investments that do not qualify for presentation as separate account assets, and amountsincluded in our general account. The total account values and the net amounts at risk include direct and assumed business, but exclude offsets from hedging orceded reinsurance, if any.
GMDBs
We offer a range of GMDBs to our contractholders. The table below presents GMDBs, by benefit type, at September 30, 2018 :
Total Account Value (1)
Asia & EMEA MetLife Holdings (In millions)Return of premium or five to seven year step-up $ 6,887 $ 51,401Annual step-up — 3,482Roll-up and step-up combination — 6,132
Total $ 6,887 $ 61,015__________________
(1) Total account value excludes $242 million for contracts with no GMDBs. The Company’s annuity contracts with guarantees may offer more than one typeof guarantee in each contract. Therefore, the amounts listed for GMDBs and for living benefit guarantees are not mutually exclusive.
Based on total account value, less than 19% of our GMDBs included enhanced death benefits such as the annual step-up or roll-up and step-up combinationproducts. We expect the above GMDB risk profile to be relatively consistent for the foreseeable future.
165
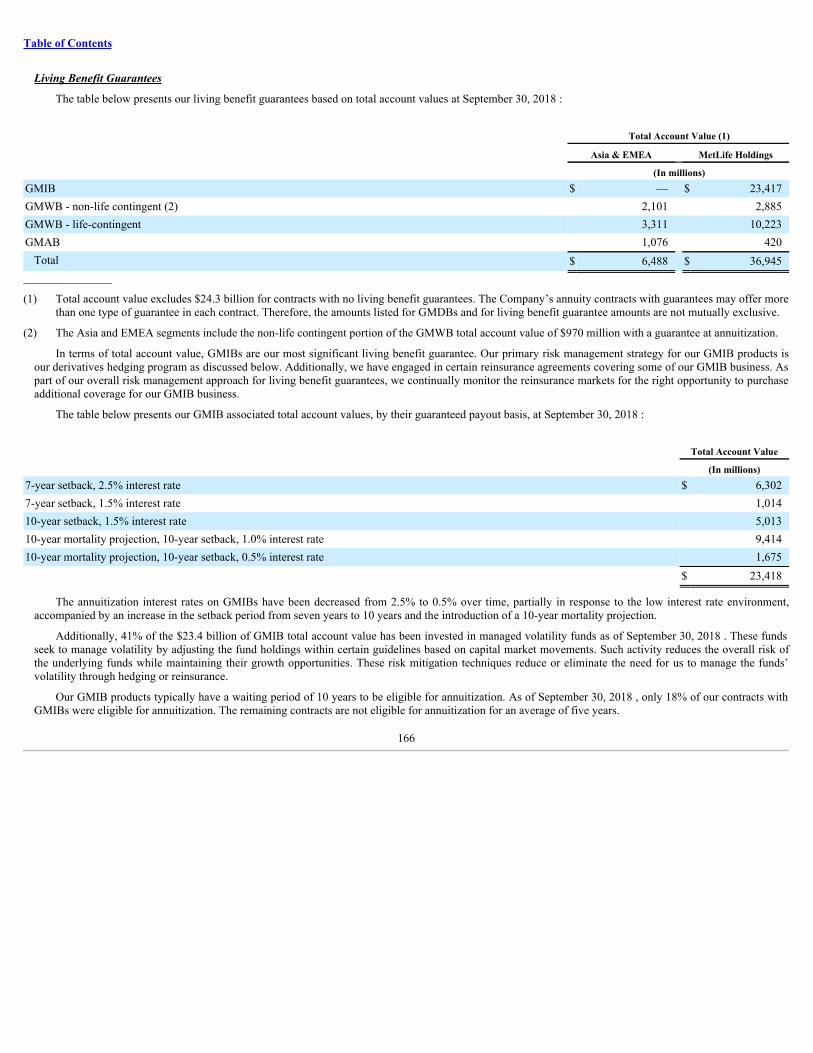
Table of Contents
LivingBenefitGuarantees
The table below presents our living benefit guarantees based on total account values at September 30, 2018 :
Total Account Value (1)
Asia & EMEA MetLife Holdings (In millions)GMIB $ — $ 23,417GMWB - non-life contingent (2) 2,101 2,885GMWB - life-contingent 3,311 10,223GMAB 1,076 420
Total $ 6,488 $ 36,945__________________
(1) Total account value excludes $24.3 billion for contracts with no living benefit guarantees. The Company’s annuity contracts with guarantees may offer morethan one type of guarantee in each contract. Therefore, the amounts listed for GMDBs and for living benefit guarantee amounts are not mutually exclusive.
(2) The Asia and EMEA segments include the non-life contingent portion of the GMWB total account value of $970 million with a guarantee at annuitization.
In terms of total account value, GMIBs are our most significant living benefit guarantee. Our primary risk management strategy for our GMIB products isour derivatives hedging program as discussed below. Additionally, we have engaged in certain reinsurance agreements covering some of our GMIB business. Aspart of our overall risk management approach for living benefit guarantees, we continually monitor the reinsurance markets for the right opportunity to purchaseadditional coverage for our GMIB business.
The table below presents our GMIB associated total account values, by their guaranteed payout basis, at September 30, 2018 :
Total Account Value (In millions)7-year setback, 2.5% interest rate $ 6,3027-year setback, 1.5% interest rate 1,01410-year setback, 1.5% interest rate 5,01310-year mortality projection, 10-year setback, 1.0% interest rate 9,41410-year mortality projection, 10-year setback, 0.5% interest rate 1,675
$ 23,418
The annuitization interest rates on GMIBs have been decreased from 2.5% to 0.5% over time, partially in response to the low interest rate environment,accompanied by an increase in the setback period from seven years to 10 years and the introduction of a 10-year mortality projection.
Additionally, 41% of the $23.4 billion of GMIB total account value has been invested in managed volatility funds as of September 30, 2018 . These fundsseek to manage volatility by adjusting the fund holdings within certain guidelines based on capital market movements. Such activity reduces the overall risk ofthe underlying funds while maintaining their growth opportunities. These risk mitigation techniques reduce or eliminate the need for us to manage the funds’volatility through hedging or reinsurance.
Our GMIB products typically have a waiting period of 10 years to be eligible for annuitization. As of September 30, 2018 , only 18% of our contracts withGMIBs were eligible for annuitization. The remaining contracts are not eligible for annuitization for an average of five years.
166
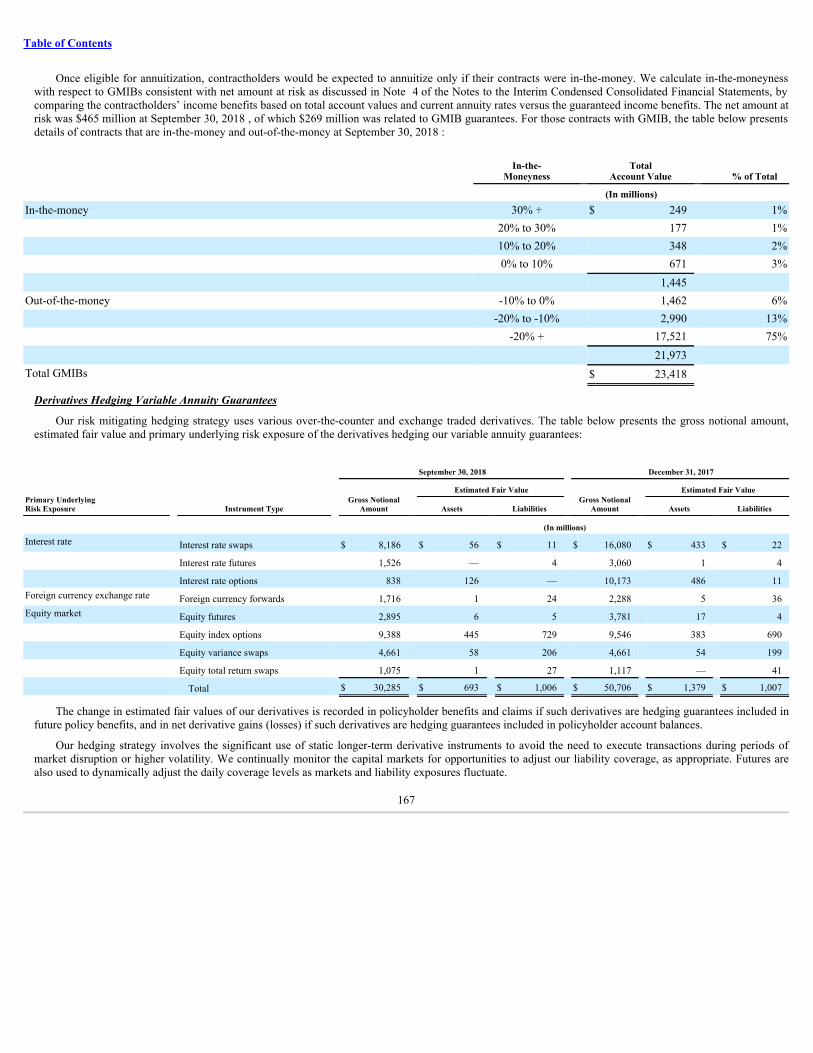
Table of Contents
Once eligible for annuitization, contractholders would be expected to annuitize only if their contracts were in-the-money. We calculate in-the-moneynesswith respect to GMIBs consistent with net amount at risk as discussed in Note 4 of the Notes to the Interim Condensed Consolidated Financial Statements, bycomparing the contractholders’ income benefits based on total account values and current annuity rates versus the guaranteed income benefits. The net amount atrisk was $465 million at September 30, 2018 , of which $269 million was related to GMIB guarantees. For those contracts with GMIB, the table below presentsdetails of contracts that are in-the-money and out-of-the-money at September 30, 2018 :
In-the-
Moneyness Total
Account Value % of Total (In millions)In-the-money 30% + $ 249 1% 20% to 30% 177 1% 10% to 20% 348 2% 0% to 10% 671 3% 1,445 Out-of-the-money -10% to 0% 1,462 6% -20% to -10% 2,990 13% -20% + 17,521 75% 21,973 Total GMIBs $ 23,418
DerivativesHedgingVariableAnnuityGuarantees
Our risk mitigating hedging strategy uses various over-the-counter and exchange traded derivatives. The table below presents the gross notional amount,estimated fair value and primary underlying risk exposure of the derivatives hedging our variable annuity guarantees:
Instrument Type
September 30, 2018 December 31, 2017
Primary UnderlyingRisk Exposure Gross Notional
Amount Estimated Fair Value
Gross NotionalAmount
Estimated Fair Value
Assets Liabilities Assets Liabilities
(In millions)
Interest rate Interest rate swaps $ 8,186 $ 56 $ 11 $ 16,080 $ 433 $ 22 Interest rate futures 1,526 — 4 3,060 1 4 Interest rate options 838 126 — 10,173 486 11Foreign currency exchange rate Foreign currency forwards 1,716 1 24 2,288 5 36Equity market Equity futures 2,895 6 5 3,781 17 4 Equity index options 9,388 445 729 9,546 383 690 Equity variance swaps 4,661 58 206 4,661 54 199 Equity total return swaps 1,075 1 27 1,117 — 41 Total $ 30,285 $ 693 $ 1,006 $ 50,706 $ 1,379 $ 1,007
The change in estimated fair values of our derivatives is recorded in policyholder benefits and claims if such derivatives are hedging guarantees included infuture policy benefits, and in net derivative gains (losses) if such derivatives are hedging guarantees included in policyholder account balances.
Our hedging strategy involves the significant use of static longer-term derivative instruments to avoid the need to execute transactions during periods ofmarket disruption or higher volatility. We continually monitor the capital markets for opportunities to adjust our liability coverage, as appropriate. Futures arealso used to dynamically adjust the daily coverage levels as markets and liability exposures fluctuate.
167

Table of Contents
We remain liable for the guaranteed benefits in the event that reinsurers or derivative counterparties are unable or unwilling to pay. Certain of ourreinsurance agreements and substantially all derivative positions are collateralized and derivatives positions are subject to master netting agreements, both ofwhich significantly reduce the exposure to counterparty risk. In addition, we are subject to the risk that hedging and other risk management actions proveineffective or that unanticipated policyholder behavior or mortality, combined with adverse market events, produces economic losses beyond the scope of therisk management techniques employed.
Liquidity and Capital Resources
Overview
Our business and results of operations are materially affected by conditions in the global capital markets and the economy generally. Stressed conditions,volatility and disruptions in global capital markets, particular markets, or financial asset classes can have an adverse effect on us, in part because we have a largeinvestment portfolio and our insurance liabilities and derivatives are sensitive to changing market factors. Changing conditions in the global capital markets and theeconomy may affect our financing costs and market interest for our debt or equity securities. For further information regarding market factors that could affect ourability to meet liquidity and capital needs, see “— Industry Trends” and “— Investments — Current Environment.”
LiquidityManagement
Based upon the strength of our franchise, diversification of our businesses, strong financial fundamentals and the substantial funding sources available to usas described herein, we continue to believe we have access to ample liquidity to meet business requirements under current market conditions and reasonablypossible stress scenarios. We continuously monitor and adjust our liquidity and capital plans for MetLife, Inc. and its subsidiaries in light of market conditions,as well as changing needs and opportunities.
Short-term Liquidity
We maintain a substantial short-term liquidity position, which was $10.2 billion and $10.0 billion at September 30, 2018 and December 31, 2017 ,respectively. Short-term liquidity includes cash and cash equivalents and short-term investments, excluding assets that are pledged or otherwise committed,including amounts received in connection with securities lending, repurchase agreements, derivatives, and secured borrowings, as well as amounts held in theclosed block.
Liquid Assets
An integral part of our liquidity management includes managing our level of liquid assets, which was $205.7 billion and $209.1 billion at September 30,2018 and December 31, 2017 , respectively. Liquid assets include cash and cash equivalents, short-term investments and publicly-traded securities, excludingassets that are pledged or otherwise committed. Assets pledged or otherwise committed include amounts received in connection with securities lending,repurchase agreements, derivatives, regulatory deposits, the collateral financing arrangement, funding agreements and secured borrowings, as well as amountsheld in the closed block.
CapitalManagement
We have established several senior management committees as part of our capital management process. These committees, including the CapitalManagement Committee and the Enterprise Risk Committee (“ERC”), regularly review actual and projected capital levels (under a variety of scenarios includingstress scenarios) and our annual capital plan in accordance with our capital policy. The Capital Management Committee is comprised of members of seniormanagement, including MetLife, Inc.’s Chief Financial Officer (“CFO”), Treasurer, and Chief Risk Officer (“CRO”). The ERC is also comprised of members ofsenior management, including MetLife, Inc.’s CFO, CRO and Chief Investment Officer.
Our Board of Directors and senior management are directly involved in the development and maintenance of our capital policy. The capital policy sets forth,among other things, minimum and target capital levels and the governance of the capital management process. All capital actions, including proposed changes tothe annual capital plan, capital targets or capital policy, are reviewed by the Finance and Risk Committee of the Board of Directors prior to obtaining full Boardof Directors approval. The Board of Directors approves the capital policy and the annual capital plan and authorizes capital actions, as required.
See “Risk Factors — Capital-Related Risks — Legal and Regulatory Restrictions and Uncertainty and Restrictions Under the Terms of Certain of OurSecurities May Prevent Us from Repurchasing Our Stock and Paying Dividends at the Level We Wish” and Note 15 of the Notes to the Consolidated FinancialStatements included in the 2017 Annual Report for information regarding restrictions on payment of dividends and stock repurchases. See also “— TheCompany — Liquidity and Capital Uses — Common Stock Repurchases” for information regarding MetLife, Inc.’s common stock repurchase authorization.
168
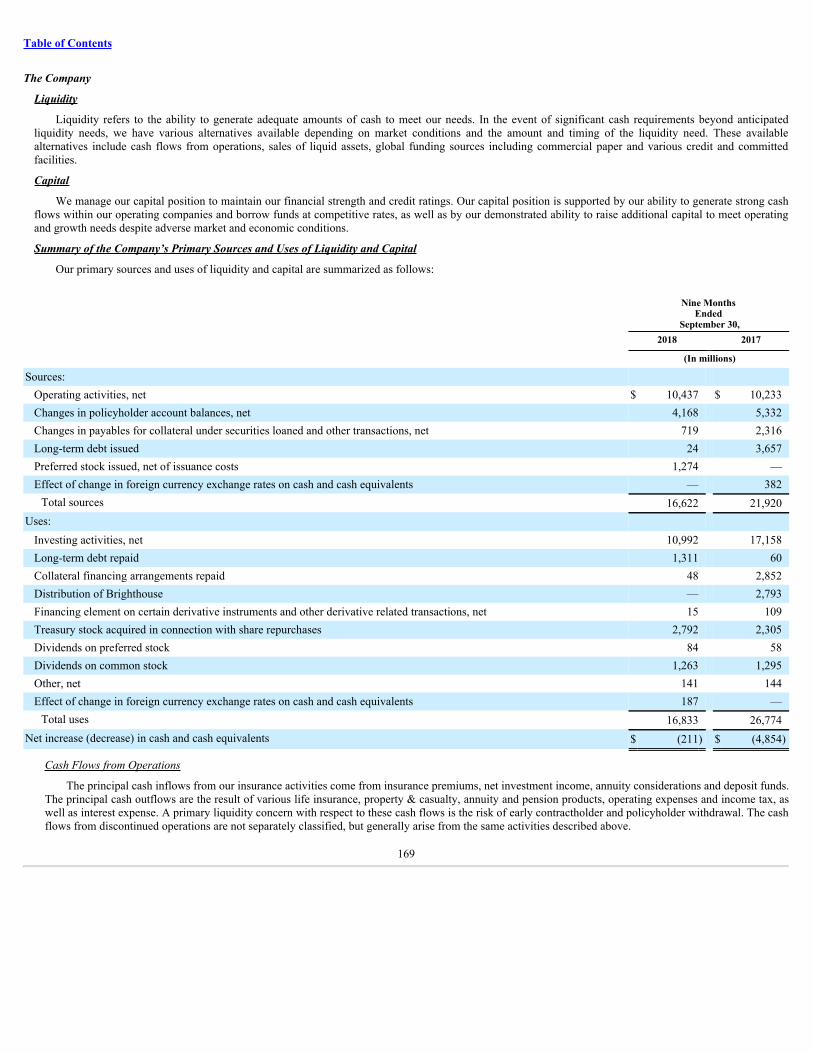
Table of Contents
TheCompany
Liquidity
Liquidity refers to the ability to generate adequate amounts of cash to meet our needs. In the event of significant cash requirements beyond anticipatedliquidity needs, we have various alternatives available depending on market conditions and the amount and timing of the liquidity need. These availablealternatives include cash flows from operations, sales of liquid assets, global funding sources including commercial paper and various credit and committedfacilities.
Capital
We manage our capital position to maintain our financial strength and credit ratings. Our capital position is supported by our ability to generate strong cashflows within our operating companies and borrow funds at competitive rates, as well as by our demonstrated ability to raise additional capital to meet operatingand growth needs despite adverse market and economic conditions.
SummaryoftheCompany’sPrimarySourcesandUsesofLiquidityandCapital
Our primary sources and uses of liquidity and capital are summarized as follows:
Nine Months Ended
September 30,
2018 2017
(In millions)
Sources: Operating activities, net $ 10,437 $ 10,233Changes in policyholder account balances, net 4,168 5,332Changes in payables for collateral under securities loaned and other transactions, net 719 2,316Long-term debt issued 24 3,657Preferred stock issued, net of issuance costs 1,274 —Effect of change in foreign currency exchange rates on cash and cash equivalents — 382
Total sources 16,622 21,920Uses:
Investing activities, net 10,992 17,158Long-term debt repaid 1,311 60Collateral financing arrangements repaid 48 2,852Distribution of Brighthouse — 2,793Financing element on certain derivative instruments and other derivative related transactions, net 15 109Treasury stock acquired in connection with share repurchases 2,792 2,305Dividends on preferred stock 84 58Dividends on common stock 1,263 1,295Other, net 141 144Effect of change in foreign currency exchange rates on cash and cash equivalents 187 —
Total uses 16,833 26,774Net increase (decrease) in cash and cash equivalents $ (211) $ (4,854)
Cash Flows from Operations
The principal cash inflows from our insurance activities come from insurance premiums, net investment income, annuity considerations and deposit funds.The principal cash outflows are the result of various life insurance, property & casualty, annuity and pension products, operating expenses and income tax, aswell as interest expense. A primary liquidity concern with respect to these cash flows is the risk of early contractholder and policyholder withdrawal. The cashflows from discontinued operations are not separately classified, but generally arise from the same activities described above.
169

Table of Contents
Cash Flows from Investments
The principal cash inflows from our investment activities come from repayments of principal, proceeds from maturities and sales of investments andsettlements of freestanding derivatives. The principal cash outflows relate to purchases of investments, issuances of policy loans and settlements offreestanding derivatives. Additional cash outflows relate to purchases of businesses. We typically have a net cash outflow from investing activities becausecash inflows from insurance operations are reinvested in accordance with our ALM discipline to fund insurance liabilities. We closely monitor and managethese risks through our comprehensive investment risk management process. The primary liquidity concerns with respect to these cash flows are the risk ofdefault by debtors and market disruption. The cash flows from discontinued operations are not separately classified, but generally arise from the sameactivities described above.
Cash Flows from Financing
The principal cash inflows from our financing activities come from issuances of debt and other securities, deposits of funds associated with policyholderaccount balances and lending of securities. The principal cash outflows come from repayments of debt and collateral financing arrangements, payments ofdividends on and repurchases of MetLife, Inc.’s securities, withdrawals associated with policyholder account balances and the return of securities on loan. Theprimary liquidity concerns with respect to these cash flows are market disruption and the risk of early contractholder and policyholder withdrawal. The cashflows from discontinued operations are not separately classified, but generally arise from the same activities described above.
LiquidityandCapitalSources
In addition to the general description of liquidity and capital sources in “— Summary of the Company’s Primary Sources and Uses of Liquidity andCapital,” the Company’s primary sources of liquidity and capital are set forth below. See Notes 3 and 9 of the Notes to the Interim Condensed ConsolidatedFinancial Statements for information regarding financing transactions related to the Separation.
Global Funding Sources
Liquidity is provided by a variety of global funding sources, including funding agreements, credit and committed facilities and commercial paper. Capitalis provided by a variety of global funding sources, including short-term and long-term debt, the collateral financing arrangement, junior subordinated debtsecurities, preferred securities, equity securities and equity-linked securities. The diversity of our global funding sources enhances our funding flexibility,limits dependence on any one market or source of funds and generally lowers the cost of funds. Our primary global funding sources include:
Preferred Stock
In June 2018, MetLife, Inc. issued 32,200 shares of 5.625% Non-Cumulative Preferred Stock, Series E (the “Series E preferred stock”) with a $0.01 parvalue per share and a liquidation preference of $25,000 per share, for aggregate net proceeds of $780 million .
In March 2018, MetLife, Inc. issued 500,000 shares of 5.875% Fixed-to-Floating Rate Non-Cumulative Preferred Stock, Series D (the “Series Dpreferred stock”) with a $0.01 par value per share and a liquidation preference of $1,000 per share, for aggregate net proceeds of $494 million .
See Note 10 of the Notes to the Interim Condensed Consolidated Financial Statements for further information.
Common Stock
During the nine months ended September 30, 2018 and 2017 , MetLife, Inc. issued 2,718,456 and 3,505,240 new shares of its common stock,respectively, for $97 million and $124 million , respectively, to satisfy various stock option exercises and other stock-based awards.
Commercial Paper, Reported in Short-term Debt
MetLife, Inc. and MetLife Funding, Inc. (“MetLife Funding”), a subsidiary of Metropolitan Life Insurance Company (“MLIC”), each have acommercial paper program that is supported by our unsecured revolving credit facility (see “— Credit and Committed Facilities”). MetLife Funding raisescash from its commercial paper program and uses the proceeds to extend loans through MetLife Credit Corp., another subsidiary of MLIC, to affiliates inorder to enhance the financial flexibility and liquidity of these companies.
170
Table of Contents
Federal Home Loan Bank Funding Agreements, Reported in Policyholder Account Balances
Certain of our domestic insurance subsidiaries are members of a regional Federal Home Loan Bank (“FHLB”). During the nine months endedSeptember 30, 2018 and 2017 , we issued $22.1 billion and $16.1 billion, respectively, and repaid $22.3 billion and $16.1 billion, respectively, underfunding agreements with certain regional FHLBs. At September 30, 2018 and December 31, 2017 , total obligations outstanding under these fundingagreements were $15.1 billion and $15.3 billion, respectively. See Note 4 of the Notes to the Consolidated Financial Statements included in the 2017 AnnualReport.
Federal Home Loan Bank Advance Agreements, Reported in Payables for Collateral Under Securities Loaned and Other Transactions
During the nine months ended September 30, 2018 , we issued $2.3 billion and repaid $1.8 billion, under advance agreements with a regional FHLB.There were no such transactions during the nine months ended September 30, 2017 . At September 30, 2018 and December 31, 2017 , total obligationsoutstanding under these advance agreements were $800 million and $300 million, respectively. See Note 6 of the Notes to the Interim CondensedConsolidated Financial Statements.
Special Purpose Entity Funding Agreements, Reported in Policyholder Account Balances
We issue fixed and floating rate funding agreements, which are denominated in either U.S. dollars or foreign currencies, to certain special purposeentities (“SPEs”) that have issued either debt securities or commercial paper for which payment of interest and principal is secured by such fundingagreements. During the nine months ended September 30, 2018 and 2017 , we issued $31.8 billion and $32.8 billion, respectively, and repaid $32.8 billionand $31.3 billion, respectively, under such funding agreements. At September 30, 2018 and December 31, 2017 , total obligations outstanding under thesefunding agreements were $33.3 billion and $34.2 billion, respectively. See Note 4 of the Notes to the Consolidated Financial Statements included in the2017 Annual Report.
Federal Agricultural Mortgage Corporation Funding Agreements, Reported in Policyholder Account Balances
We have issued funding agreements to a subsidiary of the Federal Agricultural Mortgage Corporation (“Farmer Mac”), as well as to certain SPEs thathave issued debt securities for which payment of interest and principal is secured by such funding agreements, and such debt securities are also guaranteedas to payment of interest and principal by Farmer Mac. The obligations under all such funding agreements are secured by a pledge of certain eligibleagricultural mortgage loans. During the nine months ended September 30, 2018 and 2017 , we issued $900 million and $1.0 billion, respectively, and repaid$900 million and $1.0 billion, respectively, under such funding agreements. At both September 30, 2018 and December 31, 2017 , total obligationsoutstanding under these funding agreements were $2.6 billion. See Note 4 of the Notes to the Consolidated Financial Statements included in the 2017Annual Report.
Credit and Committed Facilities
At September 30, 2018 , we maintained a $3.0 billion unsecured revolving credit facility and certain committed facilities aggregating $3.3 billion.When drawn upon, these facilities bear interest at varying rates in accordance with the respective agreements.
Our unsecured revolving credit facility is used for general corporate purposes, to support the borrowers’ commercial paper programs and for theissuance of letters of credit. At September 30, 2018 , we had outstanding $436 million in letters of credit and no drawdowns against this facility. Remainingavailability was $2.6 billion at September 30, 2018 .
Our committed facilities are used as collateral for certain of our reinsurance liabilities. At September 30, 2018 , we had outstanding $2.8 billion inletters of credit and no drawdowns against these facilities. Remaining availability was $508 million at September 30, 2018 . See “ — Acquisitions andDispositions.”
See Note 12 of the Notes to the Consolidated Financial Statements included in the 2017 Annual Report for further information about these facilities.
We have no reason to believe that our lending counterparties will be unable to fulfill their respective contractual obligations under these facilities. Ascommitments under our credit and committed facilities may expire unused, these amounts do not necessarily reflect our future cash funding requirements.
171
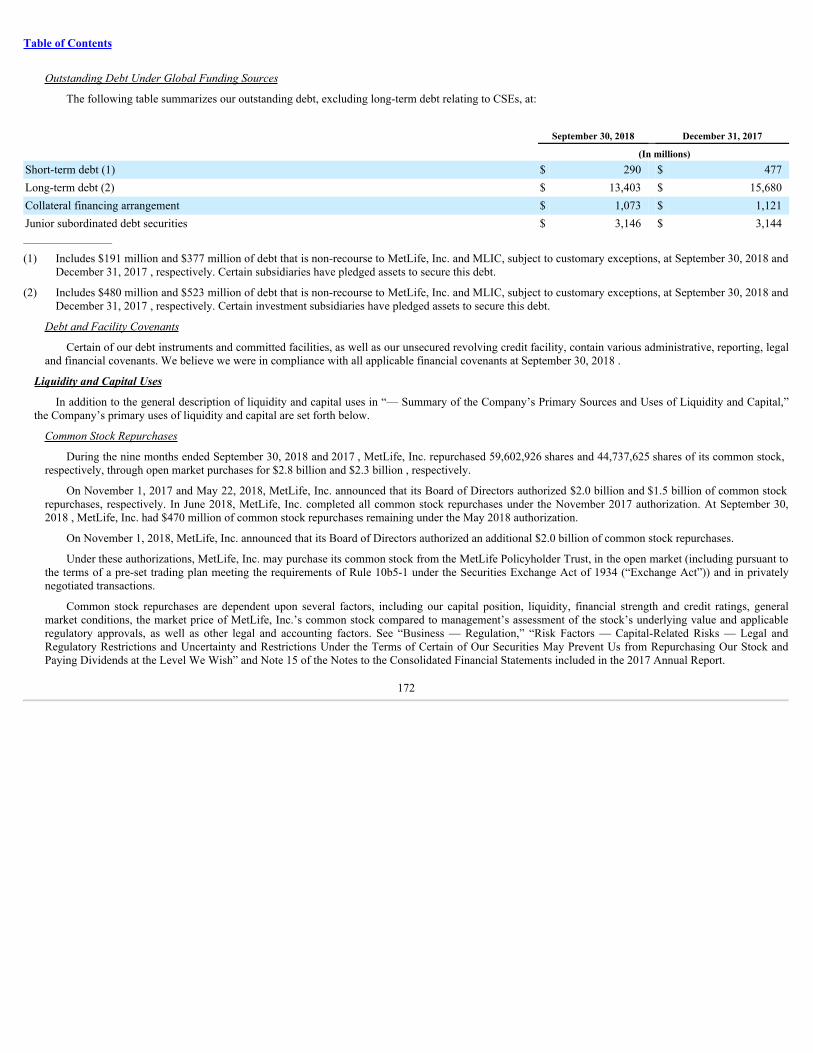
Table of Contents
Outstanding Debt Under Global Funding Sources
The following table summarizes our outstanding debt, excluding long-term debt relating to CSEs, at:
September 30, 2018 December 31, 2017 (In millions)Short-term debt (1) $ 290 $ 477Long-term debt (2) $ 13,403 $ 15,680Collateral financing arrangement $ 1,073 $ 1,121Junior subordinated debt securities $ 3,146 $ 3,144__________________
(1) Includes $191 million and $377 million of debt that is non-recourse to MetLife, Inc. and MLIC, subject to customary exceptions, at September 30, 2018 andDecember 31, 2017 , respectively. Certain subsidiaries have pledged assets to secure this debt.
(2) Includes $480 million and $523 million of debt that is non-recourse to MetLife, Inc. and MLIC, subject to customary exceptions, at September 30, 2018 andDecember 31, 2017 , respectively. Certain investment subsidiaries have pledged assets to secure this debt.
Debt and Facility Covenants
Certain of our debt instruments and committed facilities, as well as our unsecured revolving credit facility, contain various administrative, reporting, legaland financial covenants. We believe we were in compliance with all applicable financial covenants at September 30, 2018 .
LiquidityandCapitalUses
In addition to the general description of liquidity and capital uses in “— Summary of the Company’s Primary Sources and Uses of Liquidity and Capital,”the Company’s primary uses of liquidity and capital are set forth below.
Common Stock Repurchases
During the nine months ended September 30, 2018 and 2017 , MetLife, Inc. repurchased 59,602,926 shares and 44,737,625 shares of its common stock,respectively, through open market purchases for $2.8 billion and $2.3 billion , respectively.
On November 1, 2017 and May 22, 2018, MetLife, Inc. announced that its Board of Directors authorized $2.0 billion and $1.5 billion of common stockrepurchases, respectively. In June 2018, MetLife, Inc. completed all common stock repurchases under the November 2017 authorization. At September 30,2018 , MetLife, Inc. had $470 million of common stock repurchases remaining under the May 2018 authorization.
On November 1, 2018, MetLife, Inc. announced that its Board of Directors authorized an additional $2.0 billion of common stock repurchases.
Under these authorizations, MetLife, Inc. may purchase its common stock from the MetLife Policyholder Trust, in the open market (including pursuant tothe terms of a pre-set trading plan meeting the requirements of Rule 10b5-1 under the Securities Exchange Act of 1934 (“Exchange Act”)) and in privatelynegotiated transactions.
Common stock repurchases are dependent upon several factors, including our capital position, liquidity, financial strength and credit ratings, generalmarket conditions, the market price of MetLife, Inc.’s common stock compared to management’s assessment of the stock’s underlying value and applicableregulatory approvals, as well as other legal and accounting factors. See “Business — Regulation,” “Risk Factors — Capital-Related Risks — Legal andRegulatory Restrictions and Uncertainty and Restrictions Under the Terms of Certain of Our Securities May Prevent Us from Repurchasing Our Stock andPaying Dividends at the Level We Wish” and Note 15 of the Notes to the Consolidated Financial Statements included in the 2017 Annual Report.
172
Table of Contents
Dividends
During the nine months ended September 30, 2018 and 2017 , MetLife, Inc. paid dividends on its preferred stock of $84 million and $58 million ,respectively. During both the nine months ended September 30, 2018 and 2017 , MetLife, Inc. paid $1.3 billion of dividends on its common stock. See Note 10of the Notes to the Interim Condensed Consolidated Financial Statements for information regarding the calculation and timing of these dividend payments.
Dividends are paid quarterly on MetLife, Inc.’s Floating Rate Non-Cumulative Preferred Stock, Series A. Dividends are paid semi-annually on MetLife,Inc.’s 5.25% Fixed-to-Floating Rate Non-Cumulative Preferred Stock, Series C until June 15, 2020 and, thereafter, will be paid quarterly. Dividends are paidsemi-annually on MetLife, Inc.’s 5.875% Fixed-to-Floating Rate Non-Cumulative Preferred Stock, Series D, in September and March until March 15, 2028and, thereafter, will be paid quarterly. Dividends are paid quarterly on MetLife, Inc.’s 5.625% Non-Cumulative Preferred Stock, Series E.
The declaration and payment of common stock dividends is subject to the discretion of our Board of Directors, and will depend on MetLife, Inc.’sfinancial condition, results of operations, cash requirements, future prospects, regulatory restrictions on the payment of dividends by MetLife, Inc.’s insurancesubsidiaries and other factors deemed relevant by the Board. See Note 15 of the Notes to the Consolidated Financial Statements included in the 2017 AnnualReport for additional information. See also Note 16 of the Notes to the Interim Condensed Consolidated Financial Statements for information regarding acommon stock dividend declared subsequent to September 30, 2018 .
Dividend Restrictions
The payment of dividends is also subject to restrictions under the terms of our preferred stock and junior subordinated debentures in situations wherewe may be experiencing financial stress. See “Risk Factors — Capital-Related Risks — Legal and Regulatory Restrictions and Uncertainty and RestrictionsUnder the Terms of Certain of Our Securities May Prevent Us from Repurchasing Our Stock and Paying Dividends at the Level We Wish” in the 2017Annual Report, as amended or supplemented in our subsequently filed Quarterly Reports on Form 10-Q in similarly named sections under the caption “RiskFactors,” Note 15 of the Notes to the Consolidated Financial Statements included in the 2017 Annual Report and Note 10 of the Notes to the InterimCondensed Consolidated Financial Statements. If additional capital requirements are imposed on MetLife, Inc. as a global systemically important insurer(“G-SII”), its ability to pay dividends could be reduced. See “Business — Regulation — International Regulation — Other International and GlobalRegulatory Initiatives” in the 2017 Annual Report.
Debt Repayments
• During the nine months ended September 30, 2018 and 2017 , following regulatory approval, MetLife Reinsurance Company of Charleston, a wholly-owned subsidiary of MetLife, Inc., repurchased and canceled $48 million and $55 million, respectively, in aggregate principal amount of its surplus notes,which are reported in collateral financing arrangement on the consolidated balance sheets.
• In August 2018, MetLife, Inc. repaid at maturity the remaining $533 million of its 6.817% senior notes.
Debt Repurchases, Redemptions and Exchanges
We may from time to time seek to retire or purchase our outstanding debt through cash purchases, redemptions and/or exchanges for other securities, inopen market purchases, redemptions, privately negotiated transactions or otherwise. Any such repurchases, redemptions or exchanges will be dependent uponseveral factors, including our liquidity requirements, contractual restrictions, general market conditions, and applicable regulatory, legal and accountingfactors. Whether or not to repurchase or redeem any debt and the size and timing of any such repurchases or redemptions will be determined at our discretion.
In June 2018, MetLife, Inc. sold FVO Brighthouse Common Stock in exchange for $944 million in aggregate principal amount of its senior notes. InAugust and June 2018, MetLife, Inc. purchased for cash $566 million and $160 million, respectively, in aggregate principal amount of its senior notes. SeeNotes 3 and 9 of the Notes to the Interim Condensed Consolidated Financial Statements for additional information on these transactions.
173
Table of Contents
Support Agreements
MetLife, Inc. and several of its subsidiaries (each, an “Obligor”) are parties to various capital support commitments and guarantees with subsidiaries.Under these arrangements, each Obligor has agreed to cause the applicable entity to meet specified capital and surplus levels or has guaranteed certaincontractual obligations. We anticipate that in the event these arrangements place demands upon us, there will be sufficient liquidity and capital to enable us tomeet such demands. See “Management’s Discussion and Analysis of Financial Condition and Results of Operations — Liquidity and Capital Resources —MetLife, Inc. — Liquidity and Capital Uses — Support Agreements” included in the 2017 Annual Report.
Insurance Liabilities
Liabilities arising from our insurance activities primarily relate to benefit payments under various life insurance, property & casualty, annuity and grouppension products, as well as payments for policy surrenders, withdrawals and loans. For annuity or deposit type products, surrender or lapse behavior differssomewhat by segment. In the MetLife Holdings segment, which includes individual annuities, lapses and surrenders tend to occur in the normal course ofbusiness. During the nine months ended September 30, 2018 and 2017 , general account surrenders and withdrawals from annuity products were $1.3 billionand $1.1 billion, respectively. In the RIS business within the U.S. segment, which includes pension risk transfers, bank-owned life insurance and other fixedannuity contracts, as well as funding agreements and other capital market products, most of the products offered have fixed maturities or fairly predictablesurrenders or withdrawals. With regard to the RIS business products that provide customers with limited rights to accelerate payments, at September 30, 2018there were funding agreements totaling $176 million that could be put back to the Company.
Pledged Collateral
We pledge collateral to, and have collateral pledged to us by, counterparties in connection with our derivatives. At September 30, 2018 and December 31,2017 , we had received pledged cash collateral from counterparties of $3.5 billion and $5.0 billion , respectively. At September 30, 2018 and December 31,2017 , we had pledged cash collateral to counterparties of $459 million and $456 million , respectively. With respect to derivative contracts between twocounterparties which are in a net liability position and have credit contingent provisions, a one-notch downgrade in the Company’s credit or financial strengthrating, as applicable, would have required $5 million of additional collateral be provided to our counterparties as of September 30, 2018 . See Note 7 of theNotes to the Interim Condensed Consolidated Financial Statements for additional information about collateral pledged to us, collateral we pledge andderivatives subject to credit contingent provisions.
We pledge collateral and have had collateral pledged to us, and may be required from time to time to pledge additional collateral or be entitled to haveadditional collateral pledged to us, in connection with the collateral financing arrangement related to the reinsurance of closed block liabilities.
We pledge collateral from time to time in connection with funding agreements and advance agreements. See Note 4 of the Notes to the ConsolidatedFinancial Statements included in the 2017 Annual Report and Note 6 of the Notes to the Interim Condensed Consolidated Financial Statements.
Securities Lending
We participate in a securities lending program whereby securities are loaned to third parties, primarily brokerage firms and commercial banks. We obtaincollateral, usually cash, from the borrower, which must be returned to the borrower when the loaned securities are returned to us. Under our securities lendingprogram, we were liable for cash collateral under our control of $19.3 billion and $19.4 billion at September 30, 2018 and December 31, 2017 , respectively.Of these amounts, $3.1 billion and $3.8 billion at September 30, 2018 and December 31, 2017 , respectively, were on open, meaning that the related loanedsecurity could be returned to us on the next business day, requiring the immediate return of cash collateral we hold. The estimated fair value of the securitieson loan related to the cash collateral on open at September 30, 2018 was $3.0 billion , 99% of which were U.S. government and agency securities which, if putto us, could be immediately sold to satisfy the cash requirement. See Note 6 of the Notes to the Interim Condensed Consolidated Financial Statements.
174
Table of Contents
Repurchase Agreements
We participate in short-term repurchase agreements whereby securities are loaned to unaffiliated financial institutions. We obtain collateral, usually cash,from the borrower, which must be returned to the borrower when the loaned securities are returned to us. Under these repurchase agreements, we were liablefor cash collateral under our control of $2.5 billion and $1.1 billion at September 30, 2018 and December 31, 2017 , respectively. The estimated fair value ofthe securities on loan at September 30, 2018 was $2.6 billion which were primarily U.S. government and agency securities which, if put to us, could beimmediately sold to satisfy the cash requirement. See Note 6 of the Notes to the Interim Condensed Consolidated Financial Statements.
Litigation
Putative or certified class action litigation and other litigation, and claims and assessments against us, in addition to those discussed elsewhere herein andthose otherwise provided for on the consolidated financial statements, have arisen in the course of our business, including, but not limited to, in connectionwith our activities as an insurer, employer, investor, investment advisor, taxpayer and, formerly, a mortgage lending bank. Further, state insurance regulatoryauthorities and other federal and state authorities regularly make inquiries and conduct investigations concerning our compliance with applicable insurance andother laws and regulations. See Note 15 of the Notes to the Interim Condensed Consolidated Financial Statements.
We establish liabilities for litigation and regulatory loss contingencies when it is probable that a loss has been incurred and the amount of the loss can bereasonably estimated. For material matters where a loss is believed to be reasonably possible but not probable, no accrual is made but we disclose the nature ofthe contingency and an aggregate estimate of the reasonably possible range of loss in excess of amounts accrued, when such an estimate can be made. It is notpossible to predict or determine the ultimate outcome of all pending investigations and legal proceedings. In some of the matters referred to herein, very largeand/or indeterminate amounts, including punitive and treble damages, are sought. Although in light of these considerations, it is possible that an adverseoutcome in certain cases could have a material adverse effect upon our financial position, based on information currently known by us, in our opinion, theoutcome of such pending investigations and legal proceedings are not likely to have such an effect. However, given the large and/or indeterminate amountssought in certain of these matters and the inherent unpredictability of litigation, it is possible that an adverse outcome in certain matters could, from time totime, have a material adverse effect on our consolidated net income or cash flows in particular quarterly or annual periods.
ContractualObligations
See “Management’s Discussion and Analysis of Financial Condition and Results of Operations — Liquidity and Capital Resources — The Company —Contractual Obligations” included in the 2017 Annual Report for additional information regarding the Company’s contractual obligations.
MetLife,Inc.
LiquidityandCapitalManagement
Liquidity and capital are managed to preserve stable, reliable and cost-effective sources of cash to meet all current and future financial obligations and areprovided by a variety of sources, including a portfolio of liquid assets, a diversified mix of short- and long-term funding sources from the wholesale financialmarkets and the ability to borrow through credit and committed facilities. Liquidity is monitored through the use of internal liquidity risk metrics, including thecomposition and level of the liquid asset portfolio, timing differences in short-term cash flow obligations, access to the financial markets for capital and debttransactions and exposure to contingent draws on MetLife, Inc.’s liquidity. MetLife, Inc. is an active participant in the global financial markets through which itobtains a significant amount of funding. These markets, which serve as cost-effective sources of funds, are critical components of MetLife, Inc.’s liquidity andcapital management. Decisions to access these markets are based upon relative costs, prospective views of balance sheet growth and a targeted liquidity profileand capital structure. A disruption in the financial markets could limit MetLife, Inc.’s access to liquidity.
MetLife, Inc.’s ability to maintain regular access to competitively priced wholesale funds is fostered by its current credit ratings from the major credit ratingagencies. We view our capital ratios, credit quality, stable and diverse earnings streams, diversity of liquidity sources and our liquidity monitoring procedures ascritical to retaining such credit ratings.
Liquidity
For a summary of MetLife, Inc.’s liquidity, see “— The Company — Liquidity.”
175
Table of Contents
Capital
For a summary of MetLife, Inc.’s capital, see “— The Company — Capital.” For further information regarding potential capital restrictions and limitationson MetLife, Inc. as a G-SII, see “— Industry Trends — Regulatory Developments — International Regulation — Other International and Global RegulatoryInitiatives,” as well as “Business — Regulation — International Regulation — Other International and Global Regulatory Initiatives” included in the 2017Annual Report. See also “— The Company — Liquidity and Capital Uses — Common Stock Repurchases” for information regarding MetLife, Inc.’s commonstock repurchase authorizations.
LiquidAssets
At September 30, 2018 and December 31, 2017 , MetLife, Inc. and other MetLife holding companies had $4.5 billion and $5.7 billion, respectively, in liquidassets. Of these amounts, $3.6 billion and $4.1 billion were held by MetLife, Inc. and $882 million and $1.6 billion were held by other MetLife holdingcompanies at September 30, 2018 and December 31, 2017 , respectively. Liquid assets include cash and cash equivalents, short-term investments and publicly-traded securities excluding assets that are pledged or otherwise committed. Assets pledged or otherwise committed include amounts received in connection withderivatives and a collateral financing arrangement.
Liquid assets held in non-U.S. holding companies are generated in part through dividends from non-U.S. insurance operations. Such dividends are subject tolocal insurance regulatory requirements, as discussed in “— Liquidity and Capital Sources — Dividends from Subsidiaries.” The cumulative earnings of certainactive non-U.S. operations have historically been reinvested indefinitely in such non-U.S. operations. Following a post-Separation review of our capital needs inthe third quarter of 2017, we disclosed our intent to repatriate approximately $3.0 billion of pre-2017 earnings. See Note 18 of the Notes to the ConsolidatedFinancial Statements included in the 2017 Annual Report for information on the taxation of such cumulative earnings. The Company repatriated $2.6 billion inthe fourth quarter of 2017 and the remaining $400 million in the second quarter of 2018. As a result of U.S. Tax Reform, we expect to repatriate future foreignearnings back to the U.S. with minimal or no additional U.S. tax. See also Note 13 of the Notes to the Interim Condensed Consolidated Financial Statements.
See “Management’s Discussion and Analysis of Financial Condition and Results of Operations — Liquidity and Capital Resources — MetLife, Inc. —Liquid Assets” included in the 2017 Annual Report for additional information on the sources and uses of liquid assets, as well as sources and uses of liquid assetsincluded in free cash flow for MetLife, Inc. and other MetLife holding companies.
LiquidityandCapitalSources
In addition to the description of liquidity and capital sources in “— The Company — Summary of the Company’s Primary Sources and Uses of Liquidityand Capital” and “— The Company — Liquidity and Capital Sources,” MetLife, Inc.’s primary sources of liquidity and capital are set forth below.
Dividends from Subsidiaries
MetLife, Inc. relies, in part, on dividends from its subsidiaries to meet its cash requirements. MetLife, Inc.’s insurance subsidiaries are subject toregulatory restrictions on the payment of dividends imposed by the regulators of their respective domiciles. The dividend limitation for U.S. insurancesubsidiaries is generally based on the surplus to policyholders at the end of the immediately preceding calendar year and statutory net gain from operations forthe immediately preceding calendar year. Statutory accounting practices, as prescribed by insurance regulators of various states in which we conduct business,differ in certain respects from accounting principles used in financial statements prepared in conformity with GAAP. The significant differences relate to thetreatment of DAC, certain deferred income tax, required investment liabilities, statutory reserve calculation assumptions, goodwill and surplus notes.
176
Table of Contents
The table below sets forth the dividends permitted to be paid in 2018 by MetLife, Inc.’s primary insurance subsidiaries without insurance regulatoryapproval and the respective dividends paid during the nine months ended September 30, 2018 :
Company Paid (1) Permitted Without
Approval (2)
(In millions)Metropolitan Life Insurance Company $ 2,424 (3) $ 3,075American Life Insurance Company $ 2,200 (4) $ —Metropolitan Property and Casualty Insurance Company $ — $ 125Metropolitan Tower Life Insurance Company (5) $ — $ 73General American Life Insurance Company (5) $ — N/A__________________
(1) Reflects all amounts paid, including those requiring regulatory approval.
(2) Reflects dividend amounts that may be paid during 2018 without prior regulatory approval. However, because dividend tests may be based on dividendspreviously paid over rolling 12-month periods, if paid before a specified date during 2018 , some or all of such dividends may require regulatory approval.
(3) Represents ordinary dividends of $1.7 billion and an extraordinary dividend of $705 million that was paid with regulatory approval. The extraordinarydividend was paid in cash with proceeds from the sale to an affiliate of certain property, equipment, leasehold improvements and computer software thatwere non-admitted by Metropolitan Life Insurance Company for statutory accounting purposes. The affiliate received a capital contribution in cash fromMetLife, Inc. to fund the purchase.
(4) Represents extraordinary dividends.
(5) In April 2018, Metropolitan Tower Life Insurance Company (“MTL”) merged with General American Life Insurance Company. The surviving entity of themerger was MTL, which re-domesticated from Delaware to Nebraska immediately prior to the merger. Effective as of the re-domestication, MTL is subjectto the dividend restrictions under Nebraska law, which are based on amounts reported in MTL’s stand-alone statutory financial statements for the year endedDecember 31, 2017. See Note 10 of the Notes to the Interim Condensed Consolidated Financial Statements for additional information.
In addition to the amounts presented in the table above, during the nine months ended September 30, 2018 , MetLife, Inc. received cash of $32 million,representing returns of capital from certain subsidiaries.
The dividend capacity of our non-U.S. operations is subject to similar restrictions established by the local regulators. The non-U.S. regulatory regimesalso commonly limit dividend payments to the parent company to a portion of the subsidiary’s prior year statutory income, as determined by the localaccounting principles. The regulators of our non-U.S. operations, including Japan’s Financial Services Agency, may also limit or not permit profit repatriationsor other transfers of funds to the U.S. if such transfers are deemed to be detrimental to the solvency or financial strength of the non-U.S. operations, or forother reasons. Most of our non-U.S. subsidiaries are second tier subsidiaries which are owned by various non-U.S. holding companies. The capital and ratingconsiderations applicable to our first tier subsidiaries may also impact the dividend flow into MetLife, Inc.
We proactively manage target and excess capital levels and dividend flows and forecast local capital positions as part of the financial planning cycle. Thedividend capacity of certain U.S. and non-U.S. subsidiaries is also subject to business targets in excess of the minimum capital necessary to maintain thedesired rating or level of financial strength in the relevant market. See “Risk Factors — Capital-Related Risks — As a Holding Company, MetLife, Inc.Depends on the Ability of Its Subsidiaries to Pay Dividends, a Major Component of Holding Company Free Cash Flow” and Note 15 of the Notes to theConsolidated Financial Statements included in the 2017 Annual Report.
Short-term Debt
MetLife, Inc. maintains a commercial paper program, the proceeds of which can be used to finance the general liquidity needs of MetLife, Inc. and itssubsidiaries. MetLife, Inc. had no short-term debt outstanding at either September 30, 2018 or December 31, 2017 .
177
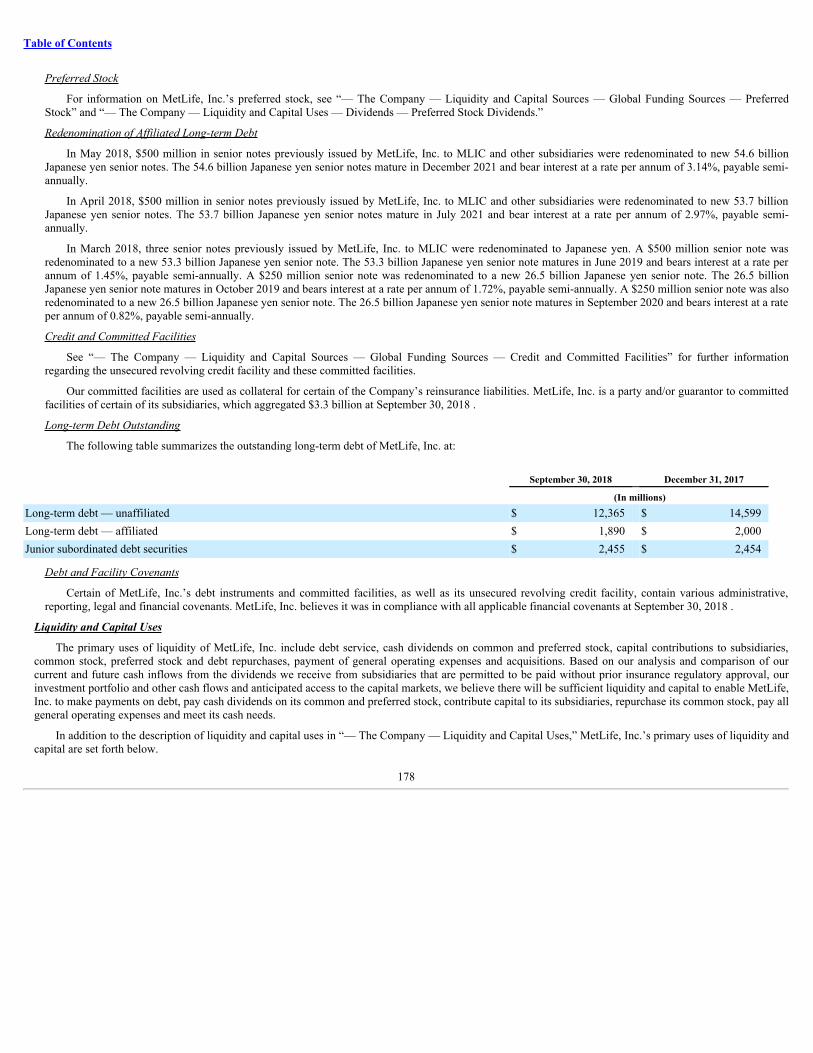
Table of Contents
Preferred Stock
For information on MetLife, Inc.’s preferred stock, see “— The Company — Liquidity and Capital Sources — Global Funding Sources — PreferredStock” and “— The Company — Liquidity and Capital Uses — Dividends — Preferred Stock Dividends.”
Redenomination of Affiliated Long-term Debt
In May 2018, $500 million in senior notes previously issued by MetLife, Inc. to MLIC and other subsidiaries were redenominated to new 54.6 billionJapanese yen senior notes. The 54.6 billion Japanese yen senior notes mature in December 2021 and bear interest at a rate per annum of 3.14%, payable semi-annually.
In April 2018, $500 million in senior notes previously issued by MetLife, Inc. to MLIC and other subsidiaries were redenominated to new 53.7 billionJapanese yen senior notes. The 53.7 billion Japanese yen senior notes mature in July 2021 and bear interest at a rate per annum of 2.97%, payable semi-annually.
In March 2018, three senior notes previously issued by MetLife, Inc. to MLIC were redenominated to Japanese yen. A $500 million senior note wasredenominated to a new 53.3 billion Japanese yen senior note. The 53.3 billion Japanese yen senior note matures in June 2019 and bears interest at a rate perannum of 1.45%, payable semi-annually. A $250 million senior note was redenominated to a new 26.5 billion Japanese yen senior note. The 26.5 billionJapanese yen senior note matures in October 2019 and bears interest at a rate per annum of 1.72%, payable semi-annually. A $250 million senior note was alsoredenominated to a new 26.5 billion Japanese yen senior note. The 26.5 billion Japanese yen senior note matures in September 2020 and bears interest at a rateper annum of 0.82%, payable semi-annually.
Credit and Committed Facilities
See “— The Company — Liquidity and Capital Sources — Global Funding Sources — Credit and Committed Facilities” for further informationregarding the unsecured revolving credit facility and these committed facilities.
Our committed facilities are used as collateral for certain of the Company’s reinsurance liabilities. MetLife, Inc. is a party and/or guarantor to committedfacilities of certain of its subsidiaries, which aggregated $3.3 billion at September 30, 2018 .
Long-term Debt Outstanding
The following table summarizes the outstanding long-term debt of MetLife, Inc. at:
September 30, 2018 December 31, 2017 (In millions)Long-term debt — unaffiliated $ 12,365 $ 14,599Long-term debt — affiliated $ 1,890 $ 2,000Junior subordinated debt securities $ 2,455 $ 2,454
Debt and Facility Covenants
Certain of MetLife, Inc.’s debt instruments and committed facilities, as well as its unsecured revolving credit facility, contain various administrative,reporting, legal and financial covenants. MetLife, Inc. believes it was in compliance with all applicable financial covenants at September 30, 2018 .
LiquidityandCapitalUses
The primary uses of liquidity of MetLife, Inc. include debt service, cash dividends on common and preferred stock, capital contributions to subsidiaries,common stock, preferred stock and debt repurchases, payment of general operating expenses and acquisitions. Based on our analysis and comparison of ourcurrent and future cash inflows from the dividends we receive from subsidiaries that are permitted to be paid without prior insurance regulatory approval, ourinvestment portfolio and other cash flows and anticipated access to the capital markets, we believe there will be sufficient liquidity and capital to enable MetLife,Inc. to make payments on debt, pay cash dividends on its common and preferred stock, contribute capital to its subsidiaries, repurchase its common stock, pay allgeneral operating expenses and meet its cash needs.
In addition to the description of liquidity and capital uses in “— The Company — Liquidity and Capital Uses,” MetLife, Inc.’s primary uses of liquidity andcapital are set forth below.
178
Table of Contents
Affiliated Capital and Debt Transactions
During the nine months ended September 30, 2018 and 2017 , MetLife, Inc. invested a net amount of $716 million and $735 million, respectively, invarious subsidiaries.
MetLife, Inc. lends funds, as necessary, to its subsidiaries and affiliates, some of which are regulated, to meet their capital requirements. MetLife, Inc. hadloans to subsidiaries outstanding of $100 million at both September 30, 2018 and December 31, 2017 .
Support Agreements
MetLife, Inc. is party to various capital support commitments and guarantees with certain of its subsidiaries. Under these arrangements, MetLife, Inc. hasagreed to cause each such entity to meet specified capital and surplus levels or has guaranteed certain contractual obligations. See “— The Company —Liquidity and Capital Uses — Support Agreements.”
Adoption of New Accounting Pronouncements
See Note 1 of the Notes to the Interim Condensed Consolidated Financial Statements.
Future Adoption of New Accounting Pronouncements
See Note 1 of the Notes to the Interim Condensed Consolidated Financial Statements.
Non-GAAP and Other Financial Disclosures
In this report, the Company presents certain measures of its performance that are not calculated in accordance with GAAP. We believe that these non-GAAPfinancial measures enhance the understanding of our performance by highlighting the results of operations and the underlying profitability drivers of our business.
The following non-GAAP financial measures should not be viewed as substitutes for the most directly comparable financial measures calculated in accordancewith GAAP:
Non-GAAP financial measures: Comparable GAAP financial measures:
(i) adjusted revenues (i) revenues(ii) adjusted expenses (ii) expenses(iii) adjusted earnings (iii) income (loss) from continuing operations, net of income tax(iv) adjusted earnings available to common
shareholders(iv)
net income (loss) available to MetLife, Inc.’s common shareholders
Reconciliations of these non-GAAP measures to the most directly comparable historical GAAP measures are included in the results of operations, see “—Results of Operations.” R econciliations of these non-GAAP measures to the most directly comparable GAAP measures are not accessible on a forward-lookingbasis because we believe it is not possible without unreasonable effort to provide other than a range of net investment gains and losses and net derivative gains andlosses, which can fluctuate significantly within or outside the range and from period to period and may have a material impact on net income.
Our definitions of the various non-GAAP and other financial measures discussed in this report may differ from those used by other companies.
Adjustedearningsandrelatedmeasures:
• adjusted earnings; and
• adjusted earnings available to common shareholders.
These measures are used by management to evaluate performance and allocate resources. Consistent with GAAP guidance for segment reporting, adjustedearnings is also our GAAP measure of segment performance. Adjusted earnings and other financial measures based on adjusted earnings are also the measures bywhich senior management’s and many other employees’ performance is evaluated for the purposes of determining their compensation under applicablecompensation plans. Adjusted earnings and other financial measures based on adjusted earnings allow analysis of our performance relative to our business plan andfacilitate comparisons to industry results.
179
Table of Contents
Adjusted earnings is defined as adjusted revenues less adjusted expenses, net of income tax. Adjusted loss is defined as negative adjusted earnings. Adjustedearnings available to common shareholders is defined as adjusted earnings less preferred stock dividends.
Adjustedrevenuesandadjustedexpenses
The financial measures o f adjusted revenues and adjusted expenses focus on our primary businesses principally by excluding the impact of marketvolatility, which could distort trends, and revenues and costs related to non-core products and certain entities required to be consolidated under GAAP. Also,these measures exclude results of discontinued operations under GAAP and other businesses that have been or will be sold or exited by MetLife but do not meetthe discontinued operations criteria under GAAP and are referred to as divested businesses. Divested businesses also includes the net impact of transactions withexited businesses that have been eliminated in consolidation under GAAP and costs relating to businesses that have been or will be sold or exited by MetLife thatdo not meet the criteria to be included in results of discontinued operations under GAAP. Adjusted revenues also excludes net investment gains (losses) and netderivative gains (losses). Adjusted expenses also excludes goodwill impairments.
The following additional adjustments are made to revenues, in the line items indicated, in calculating adjusted revenues:
• Universal life and investment-type product policy fees excludes the amortization of unearned revenue related to net investment gains (losses) and netderivative gains (losses) and certain variable annuity GMIB fees (“GMIB fees”);
• Net investment income: (i) includes earned income on derivatives and amortization of premium on derivatives that are hedges of investments or that areused to replicate certain investments, but do not qualify for hedge accounting treatment, (ii) excludes post-tax adjusted earnings adjustments relating toinsurance joint ventures accounted for under the equity method, (iii) excludes certain amounts related to contractholder-directed unit-linked investments,(iv) excludes certain amounts related to securitization entities that are VIEs consolidated under GAAP and (v) includes distributions of profits fromcertain other limited partnership interests that were previously accounted for under the cost method, but are now accounted for at estimated fair value,where the change in estimated fair value is recognized in net investment gains (losses) for GAAP; and
• Other revenues is adjusted for settlements of foreign currency earnings hedges and excludes fees received in association with services provided undertransition service agreements (“TSA fees”).
The following additional adjustments are made to expenses, in the line items indicated, in calculating adjusted expenses:
• Policyholder benefits and claims and policyholder dividends excludes: (i) changes in the policyholder dividend obligation related to net investment gains(losses) and net derivative gains (losses), (ii) inflation-indexed benefit adjustments associated with contracts backed by inflation-indexed investments andamounts associated with periodic crediting rate adjustments based on the total return of a contractually referenced pool of assets and other pass throughadjustments, (iii) benefits and hedging costs related to GMIBs (“GMIB costs”) and (iv) market value adjustments associated with surrenders orterminations of contracts (“Market value adjustments”);
• Interest credited to policyholder account balances includes adjustments for earned income on derivatives and amortization of premium on derivatives thatare hedges of policyholder account balances but do not qualify for hedge accounting treatment and excludes amounts related to net investment incomeearned on contractholder-directed unit-linked investments;
• Amortization of DAC and VOBA excludes amounts related to: (i) net investment gains (losses) and net derivative gains (losses), (ii) GMIB fees andGMIB costs and (iii) Market value adjustments;
• Amortization of negative VOBA excludes amounts related to Market value adjustments;
• Interest expense on debt excludes certain amounts related to securitization entities that are VIEs consolidated under GAAP; and
• Other expenses excludes costs related to: (i) noncontrolling interests, (ii) implementation of new insurance regulatory requirements and (iii) acquisition,integration and other costs. Other expenses includes TSA fees.
Adjusted earnings also excludes the recognition of certain contingent assets and liabilities that could not be recognized at acquisition or adjusted for duringthe measurement period under GAAP business combination accounting guidance.
The tax impact of the adjustments mentioned above are calculated net of the U.S. or foreign statutory tax rate, which could differ from the Company’seffective tax rate. Additionally, the provision for income tax (expense) benefit also includes the impact related to the timing of certain tax credits, as well ascertain tax reforms.
180
Table of Contents
Allocatedequity:
• Allocated equity is the portion of MetLife, Inc.’s common stockholders’ equity that management allocates to each of its segments and sub-segments basedon local capital requirements and economic capital. See “— Economic Capital.” Allocated equity excludes the impact of accumulated othercomprehensive income other than foreign currency translation adjustments.
The above measure represents a level of equity consistent with the view that, in the ordinary course of business, we do not plan to sell most investments for thesole purpose of realizing gains or losses. Also refer to the utilization of adjusted earnings and other financial measures based on adjusted earnings mentionedabove.
Thefollowingadditionalinformationisrelevanttoanunderstandingofourperformanceresults:
• The impact of changes in our foreign currency exchange rates is calculated using the average foreign currency exchange rates for the current period and isapplied to each of the comparable periods (“Constant Currency Basis”).
• We sometimes refer to sales activity for various products. These sales statistics do not correspond to revenues under GAAP, but are used as relevantmeasures of business activity. Further, sales statistics for our Latin America, Asia and EMEA segments are on a Constant Currency Basis.
• Asymmetrical and non-economic accounting refers to: (i) the portion of net derivative gains (losses) on embedded derivatives attributable to the inclusionof our credit spreads in the liability valuations, (ii) hedging activity that generates net derivative gains (losses) and creates fluctuations in net incomebecause hedge accounting cannot be achieved and the item being hedged does not a have an offsetting gain or loss recognized in earnings, (iii) inflation-indexed benefit adjustments associated with contracts backed by inflation-indexed investments and amounts associated with periodic crediting rateadjustments based on the total return of a contractually referenced pool of assets and other pass through adjustments, and (iv) impact of changes in foreigncurrency exchange rates on the re-measurement of foreign denominated unhedged funding agreements and financing transactions to the U.S. dollar andthe re-measurement of certain liabilities from non-functional currencies to functional currencies. We believe that excluding the impact of asymmetricaland non-economic accounting from total GAAP results enhances investor understanding of our performance by disclosing how these accounting practicesaffect reported GAAP results.
• The Company uses a measure of free cash flow to facilitate an understanding of its ability to generate cash for reinvestment into its businesses or use innon-mandatory capital actions. The Company defines free cash flow as the sum of cash available at MetLife’s holding companies from dividends fromoperating subsidiaries, expenses and other net flows of the holding companies (including capital contributions to subsidiaries), and net contributions fromdebt to be at or below target leverage ratios. This measure of free cash flow is prior to capital actions, such as common stock dividends and repurchases,debt reduction and mergers and acquisitions. Free cash flow should not be viewed as a substitute for net cash provided by (used in) operating activitiescalculated in accordance with GAAP. The free cash flow ratio is typically expressed as a percentage of annual adjusted earnings available to commonshareholders.
Subsequent Events
See Note 16 of the Notes to the Interim Condensed Consolidated Financial Statements.
181

Table of Contents
Item 3. Quantitative and Qualitative Disclosures About Market Risk
We regularly analyze our exposure to interest rate, equity market price and foreign currency exchange rate risks. As a result of that analysis, we havedetermined that the estimated fair values of certain assets and liabilities are materially exposed to changes in interest rates, foreign currency exchange rates andchanges in the equity markets. We have exposure to market risk through our insurance operations and investment activities. We use a variety of strategies tomanage interest rate, foreign currency exchange rate and equity market risk, including the use of derivatives. A description of our market risk exposures may befound under “Quantitative and Qualitative Disclosures About Market Risk” in Part II, Item 7A, of the 2017 Annual Report.
182
Table of Contents
Item 4. Controls and Procedures
Based on the Company’s review, MetLife, Inc.’s Chief Executive Officer (“CEO”) and former CFO identified material weaknesses in the design and operationof its internal control over financial reporting. Management concluded that the Company has not maintained effective controls over (i) the administrative andaccounting practices relating to certain RIS group annuity reserves and the timely communication and escalation of issues regarding those reserves throughout theCompany, and (ii) the calculation of reserves relating to variable annuity guarantees issued by a former operating joint venture in Japan and reinsured by theCompany and included within MetLife Holdings. Management identified errors in reserve balances in connection with these material weaknesses. For moreinformation on these reserve adjustments, see Note 1 of the Notes to the Consolidated Financial Statements included in the 2017 Annual Report.
While the Company is making progress toward remediating these material weaknesses (as described below under “Remediation Status of Reported MaterialWeaknesses”), the Company had not completed its remediation as of September 30, 2018.
EvaluationofDisclosureControlsandProcedures
Management, including the CEO and current CFO, evaluated the effectiveness of the design and operation of the Company’s disclosure controls andprocedures pursuant to Rules 13a-15(e) and 15d-15(e) under the Exchange Act as of September 30, 2018. Solely because of the material weaknesses in internalcontrol over financial reporting reported in the 2017 Annual Report, MetLife Inc.’s CEO and current CFO concluded that, as of September 30, 2018, our disclosurecontrols and procedures were not effective.
RemediationStatusofReportedMaterialWeaknesses
Management continues to execute its plan to remediate the material weaknesses. As of September 30, 2018, management had performed the followingactivities:
RISGroupAnnuityReserves:
• The Company completed its examination and analysis of the facts and circumstances giving rise to the material weakness under the supervision ofMetLife, Inc.’s Chief Risk Officer. The Company is addressing the examination findings through ongoing remediation. The Company continues to believethe remediation plan remains appropriate;
• The Company continued its enhanced search practices to identify, contact, and act upon responses from “unresponsive and missing” plan annuitants; and
• The Company enhanced the internal controls associated with the internal communication and escalation governance process it implemented for the 2017Annual Report, as well as subsequently filed Quarterly Reports on Form 10-Q.
MetLifeHoldingsAssumedVariableAnnuityGuaranteeReserves:
• The Company completed the examination and analysis of the facts and circumstances giving rise to the material weakness under the supervision of theChief Auditor. The Company is addressing the examination findings through ongoing remediation. The Company continues to believe the remediationplan remains appropriate.
The remediation steps outlined above will strengthen the Company’s internal control over financial reporting. Management continues to test the ongoingoperating effectiveness of all new and modified controls and will consider the material weaknesses remediated after the applicable controls operate effectively for asufficient period.
In addition, the Company continued to enhance the model risk management and data validation controls, policies and procedures. The Company will continueto evaluate, update and improve its internal control over financial reporting as management executes on its remediation plans.
ChangesinInternalControlOverFinancialReporting
There were no changes to the Company’s internal control over financial reporting as defined in Exchange Act Rules 13a-15(d) and 15d-15(d) that occurredduring the quarter ended September 30, 2018 that have materially affected, or are reasonably likely to materially affect, the Company’s internal control overfinancial reporting.
183
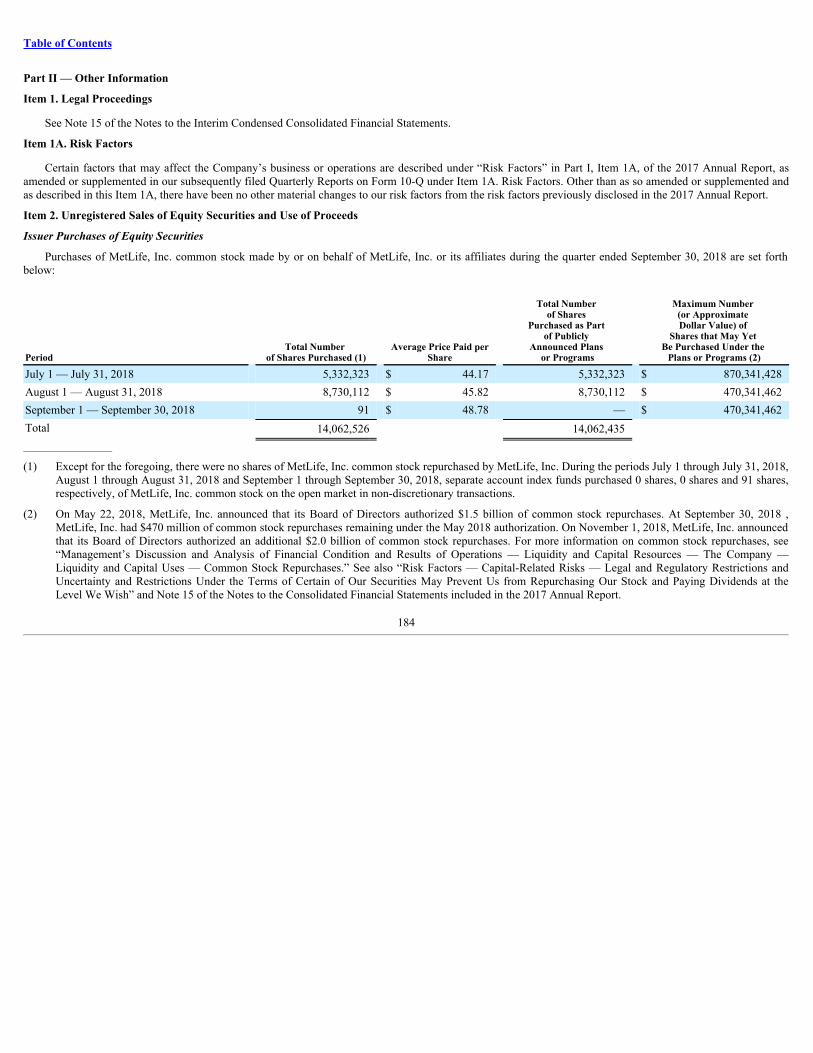
Table of Contents
Part II — Other Information
Item 1. Legal Proceedings
See Note 15 of the Notes to the Interim Condensed Consolidated Financial Statements.
Item 1A. Risk Factors
Certain factors that may affect the Company’s business or operations are described under “Risk Factors” in Part I, Item 1A, of the 2017 Annual Report, asamended or supplemented in our subsequently filed Quarterly Reports on Form 10-Q under Item 1A. Risk Factors. Other than as so amended or supplemented andas described in this Item 1A, there have been no other material changes to our risk factors from the risk factors previously disclosed in the 2017 Annual Report.
Item 2. Unregistered Sales of Equity Securities and Use of Proceeds
IssuerPurchasesofEquitySecurities
Purchases of MetLife, Inc. common stock made by or on behalf of MetLife, Inc. or its affiliates during the quarter ended September 30, 2018 are set forthbelow:
Period Total Number
of Shares Purchased (1) Average Price Paid per
Share
Total Number of Shares
Purchased as Part of Publicly
Announced Plans or Programs
Maximum Number (or Approximate Dollar Value) of
Shares that May Yet Be Purchased Under the
Plans or Programs (2)
July 1 — July 31, 2018 5,332,323 $ 44.17 5,332,323 $ 870,341,428August 1 — August 31, 2018 8,730,112 $ 45.82 8,730,112 $ 470,341,462September 1 — September 30, 2018 91 $ 48.78 — $ 470,341,462Total 14,062,526 14,062,435 __________________
(1) Except for the foregoing, there were no shares of MetLife, Inc. common stock repurchased by MetLife, Inc. During the periods July 1 through July 31, 2018,August 1 through August 31, 2018 and September 1 through September 30, 2018, separate account index funds purchased 0 shares, 0 shares and 91 shares,respectively, of MetLife, Inc. common stock on the open market in non-discretionary transactions.
(2) On May 22, 2018, MetLife, Inc. announced that its Board of Directors authorized $1.5 billion of common stock repurchases. At September 30, 2018 ,MetLife, Inc. had $470 million of common stock repurchases remaining under the May 2018 authorization. On November 1, 2018, MetLife, Inc. announcedthat its Board of Directors authorized an additional $2.0 billion of common stock repurchases. For more information on common stock repurchases, see“Management’s Discussion and Analysis of Financial Condition and Results of Operations — Liquidity and Capital Resources — The Company —Liquidity and Capital Uses — Common Stock Repurchases.” See also “Risk Factors — Capital-Related Risks — Legal and Regulatory Restrictions andUncertainty and Restrictions Under the Terms of Certain of Our Securities May Prevent Us from Repurchasing Our Stock and Paying Dividends at theLevel We Wish” and Note 15 of the Notes to the Consolidated Financial Statements included in the 2017 Annual Report.
184
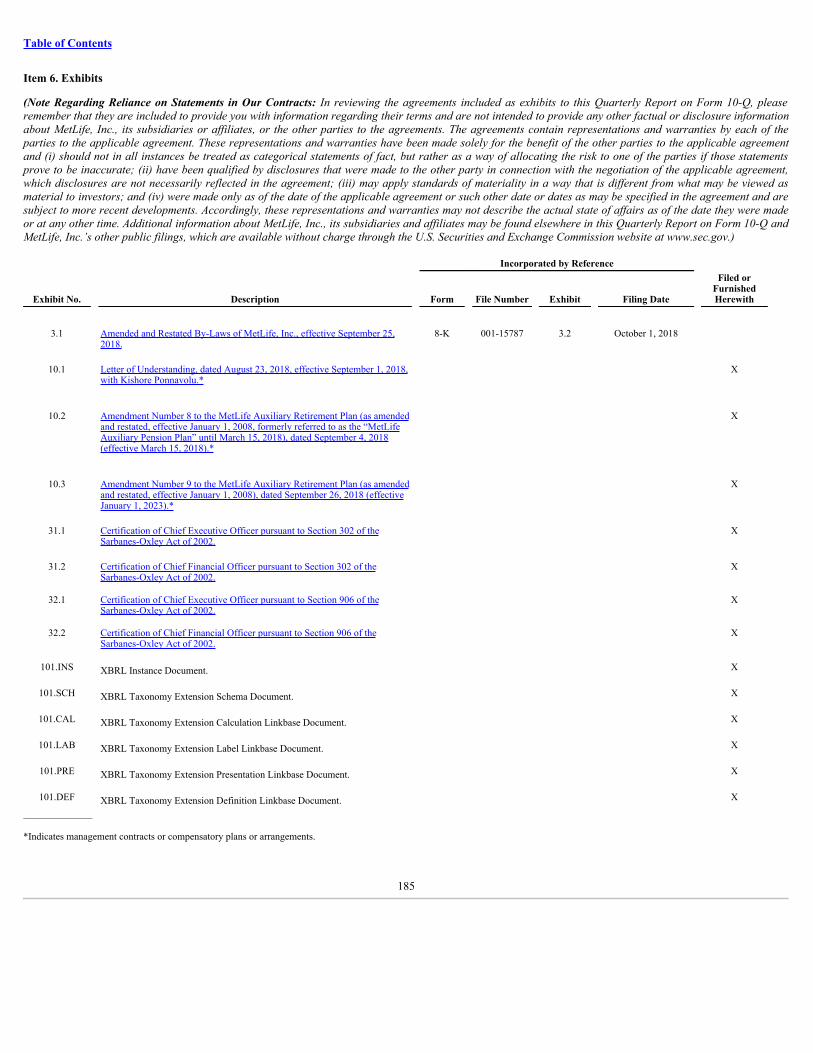
Table of Contents
Item 6. Exhibits
(Note RegardingReliance onStatements in OurContracts: In reviewing the agreements included as exhibits to this Quarterly Report on Form 10-Q, pleaseremember that they are included to provide you with information regarding their terms and are not intended to provide any other factual or disclosure informationabout MetLife, Inc., its subsidiaries or affiliates, or the other parties to the agreements. The agreements contain representations and warranties by each of theparties to the applicable agreement. These representations and warranties have been made solely for the benefit of the other parties to the applicable agreementand (i) should not in all instances be treated as categorical statements of fact, but rather as a way of allocating the risk to one of the parties if those statementsprove to be inaccurate; (ii) have been qualified by disclosures that were made to the other party in connection with the negotiation of the applicable agreement,which disclosures are not necessarily reflected in the agreement; (iii) may apply standards of materiality in a way that is different from what may be viewed asmaterial to investors; and (iv) were made only as of the date of the applicable agreement or such other date or dates as may be specified in the agreement and aresubject to more recent developments. Accordingly, these representations and warranties may not describe the actual state of affairs as of the date they were madeor at any other time. Additional information about MetLife, Inc., its subsidiaries and affiliates may be found elsewhere in this Quarterly Report on Form 10-Q andMetLife, Inc.’s other public filings, which are available without charge through the U.S. Securities and Exchange Commission website at www.sec.gov.)
Incorporated by Reference
Exhibit No. Description Form File Number Exhibit Filing Date
Filed orFurnishedHerewith
3.1
Amended and Restated By-Laws of MetLife, Inc., effective September 25,2018.
8-K
001-15787
3.2
October 1, 2018
10.1
Letter of Understanding, dated August 23, 2018, effective September 1, 2018,with Kishore Ponnavolu.*
X
10.2
Amendment Number 8 to the MetLife Auxiliary Retirement Plan (as amendedand restated, effective January 1, 2008, formerly referred to as the “MetLifeAuxiliary Pension Plan” until March 15, 2018), dated September 4, 2018(effective March 15, 2018).*
X
10.3
Amendment Number 9 to the MetLife Auxiliary Retirement Plan (as amendedand restated, effective January 1, 2008), dated September 26, 2018 (effectiveJanuary 1, 2023).*
X
31.1
Certification of Chief Executive Officer pursuant to Section 302 of theSarbanes-Oxley Act of 2002.
X
31.2
Certification of Chief Financial Officer pursuant to Section 302 of theSarbanes-Oxley Act of 2002.
X
32.1
Certification of Chief Executive Officer pursuant to Section 906 of theSarbanes-Oxley Act of 2002.
X
32.2
Certification of Chief Financial Officer pursuant to Section 906 of theSarbanes-Oxley Act of 2002.
X
101.INS XBRL Instance Document. X
101.SCH XBRL Taxonomy Extension Schema Document. X
101.CAL XBRL Taxonomy Extension Calculation Linkbase Document. X
101.LAB XBRL Taxonomy Extension Label Linkbase Document. X
101.PRE XBRL Taxonomy Extension Presentation Linkbase Document. X
101.DEF XBRL Taxonomy Extension Definition Linkbase Document. X______________
*Indicates management contracts or compensatory plans or arrangements.
185

Table of Contents
Signatures
Pursuant to the requirements of the Securities Exchange Act of 1934, the registrant has duly caused this report to be signed on its behalf by the undersignedthereunto duly authorized.
METLIFE, INC. By: /s/ William C. O’Donnell
Name: William C. O’DonnellTitle: Executive Vice President and Chief Accounting Officer (Authorized Signatory and Principal Accounting Officer)
Date: November 7, 2018
186
Exhibit 10.1
LETTER OF UNDERSTANDINGLONG TERM INTERNATIONAL ASSIGNMENT
UNITED STATES – HONG KONG
KISHORE PONNAVOLU
August 23, 2018
Dear Kishore:
We are pleased to offer you an international assignment from Rhode Island, United States to Hong Kong. This Letter of Understandingoutlines the terms and conditions of your assignment. The terms of this letter will govern. All terms and conditions are contingent on Boardapproval.
COMPENSATION AND BENEFITS
During your assignment, you will be employed by MetLife Group, Inc. (“MetLife Group” or “Company”) and you will be seconded toMetLife Asia Limited. MetLife Group will pay your annualized base salary of USD600,000 in the United States on a biweekly basis throughits normal payroll process. You will continue to be eligible for the various incentive compensation schemes in which you currentlyparticipate, subject to their applicable terms and conditions.
You remain eligible for the retirement plans and risk insurance coverage offered to employees of MetLife Group (subject to their terms andconditions), and you and your family will be eligible for the MetLife Worldwide Benefit Plan for medical and/or dental for the duration ofyour assignment. Further information regarding these benefits will be provided to you under separate cover.
ASSIGNMENT TERM
The anticipated effective date of your new role is September 1, 2018, with a start date at the assignment location of January 1, 2019, which isconditioned on your ability to secure all required work and residence permits by this date. You will not be allowed to start the assignment orreceive the assignment-related benefits outlined in this letter until all immigration formalities have been cleared. You will receiveimmigration assistance from our immigration vendor, whose outreach team will be in touch with you throughout the immigration process.
You will be based in the offices of MetLife Asia Limited as President, Asia, reporting to Steve Kandarian. The term of your assignment isanticipated to last through June 30, 2022. Since the Company is investing significant resources to place you on this assignment, it expects thatyou will complete this full term. However, this letter is not a guarantee of employment for any specific period of time.
MetLife International Assignment Office August 23, 2018 - Page 1 of 7
GLOBAL MOBILITY PROGRAM SUPPORT AND ADMINISTRATION
The International Assignment Office (IAO) in New York is responsible for all policies and processes related to international assignments. Ourthird party relocation partner, SIRVA, has assigned an International Assignment Partner (IAP), Denise Starrett, who will manage yourassignment on an ongoing basis. Denise will coordinate all aspects of your relocation and will review the applicable portions of these termswith you. You should contact Denise if you have any questions regarding your assignment.
ASSIGNMENT COMPENSATION AND ONGOING ASSIGNMENT SUPPORT
For purposes of this assignment, your Home location is Warwick, Rhode Island, United States and your Host location is Hong Kong. Thefollowing allowances and benefits will be provided to you based on the temporary nature of this assignment. All assignment-related benefitsand payments will be grossed-up for taxes unless otherwise stated. Tax Equalization
You will be covered by MetLife tax equalization during your assignment. Pursuant to this, you will be tax equalized to your Home country orlocation. The intent is to neutralize the income and social tax costs related to the assignment, so that your income and social tax cost remainswhat you would have paid had you lived and worked in Warwick, Rhode Island, United States.
Based on information MetLife and you provide to MetLife’s designated tax accounting firm, the firm will, based on an estimate of federal andstate tax that you would have paid had you remained in Warwick, Rhode Island, United States, calculate a hypothetical tax that will bewithheld from your compensation. This hypothetical tax will be calculated on your non-assignment related compensation (which consists ofyour base salary, annual incentives, and long-term incentives) and is in lieu of actual income tax withholding. Home country social insuranceand other required taxes, if applicable, will continue to be withheld.
The tax accounting firm will prepare an annual tax equalization summary shortly after the end of each tax year, which will set out the finalamount of hypothetical tax you paid (or owe) for the tax year, the amount of actual taxes MetLife paid on your behalf during the tax year, andthe final amount of actual taxes you owe for the tax year. The summary may indicate that you owe MetLife money, either because the amountof hypothetical tax withheld from your compensation was insufficient, or because the amount of actual tax MetLife paid on your behalf wastoo high. Alternatively, the summary may indicate that MetLife owes you money because you overpaid the hypothetical tax, and/or thatMetLife owes money to a tax authority because the amount of tax it paid on your behalf was too low.
MetLife will pay any money it owes to a tax authority due to your remuneration directly to the tax authority. Any amount owed to you byMetLife due to tax equalization will be paid to you as soon as the amount is determinable and payment is administratively practicable, but inno event later than the end of the second tax year following the year containing the deadline (including extensions) for filing the tax returns towhich the tax equalization payments relate. If an amount is due from you to MetLife, you are required to forward a check for that amount toMetLife within 30 days of notification of the amount due. Any amount not paid after the 30-day period will be deducted from yourassignment allowances and other compensation (i.e., base salary, bonus, etc.) until the total amount due is settled.
To assist you in understanding the elements of tax equalization, you are required to participate in a detailed Tax Briefing session withMetLife’s accounting firm. A representative will contact you to schedule an appointment.
MetLife International Assignment Office August 23, 2018 - Page 2 of 7
IMPORTANT : The tax consequences of changing your benefit selections or other indirect compensation (such as exercising stock options orunit options) during your assignment may be significant. You are required to consult the accounting firm representative before making such achange to determine impact on your and/or MetLife’s tax liability.
House Sale Support
The Company will provide you with property management services for your former residence in New Canaan, CT from September 1, 2018through June 30, 2019. Further, the Company will provide a one-time special allowance to help address closing costs and real estate agentfees up to USD225,000 provided the house is sold by June 30, 2019. This payment will not be grossed-up and is not benefitable. Your IAPwill provide you will details regarding this support.
Host Location Housing
You will receive a maximum housing allowance of HKD160,000 per month to cover the expense of your rental accommodations in the hostlocation. The Company will pay the rent directly to the landlord or estate agent on your behalf. In addition, you will receive a maximumutility allowance of HKD3,900 per month to cover the cost of utilities, if such are not included in the rental amount.
If you decide to buy a home in the host country, rather than occupy rented housing, you will be responsible for the entire costs of buying andselling the home, including any costs resulting from a delayed sale or currency fluctuation. The Company will not provide any housingallowance or other reimbursement to assist with the costs of an owned home, including property tax or utilities costs. In some countries,purchasing a home may change your tax status, in which case any increased tax liability would also be your responsibility.
Cost of Living Allowance (COLA)
A cost of living allowance (COLA) is provided when there is evidence that the cost of goods and services typically purchased by assignees(excluding housing, income taxes and automobile purchase) in the host location is greater than in the home location during the assignmentperiod. This allowance will be reviewed on a quarterly basis and adjusted up or down as necessary to account for FX rates and inflationbetween the host country and the United States. COLA is based on family size and capped on the first USD200,000 of your base salary. It isyour responsibility to notify your IAP of any changes in your on location family size. The adjustment, if any, will be effective as of the datethe change occurred.
The current COLA based on your family size of 4 is HKD31,240 monthly. The COLA will commence, and if required be updated, as of thedate you occupy your new long-term accommodation in the host location.
Home Leave Travel
The Company will provide you with an annual home leave budget of up to USD34,000, which can be used during each year of yourassignment for air travel and ground transportation to and from airports between Hong Kong and Connecticut for you, your spouse and yourdependents. The travel must be taken during the year provided (with no carry over) and no later than 3 months before the assignment enddate.
MetLife International Assignment Office August 23, 2018 - Page 3 of 7

Host Location Schooling – Elementary and Secondary
The Company will reimburse the customary schooling fees for your accompanying children to attend the nearest international or privateschool that provides a normal school curriculum for children in K to 12 th grade, or the local equivalent. Customary schooling fees includetuition, registration fees, and transportation, but do not include text books, meals, uniforms and any extracurricular activities such as musicalinstruments and lessons, school trips, scouts, sporting events, or additional courses not required by the school for the satisfactory completionof the grade.
Host Location Schooling – School Placement Counseling
The Company will provide the services of an external school placement counselor to help you identify the most appropriate school for yourchildren and support your family through the admissions and enrollment process. Your IAP will provide you with additional information.
Spouse/Partner Support
MetLife provides Accompanying Spouses/ Domestic Partners with support in settling into the host country through an external serviceprovider who specializes in delivering customized coaching, research and resources to assist with acclimation to the host country and culture.This support may include practical guidance and coaching on job search in the local market or pursuing education, training, volunteeropportunities or other career development pursuits. Your IAP will provide you with additional information.
PRE-ASSIGNMENT
Work Permit / Visa
MetLife will authorize an external immigration specialist to assist you with preparation of the required documentation to secure all requiredwork permits/visas for you and your accompanying spouse/partner and children. You will not be allowed to commence your assignment untilall immigration requirements have been completed. For this reason, you must work closely and diligently with our immigration specialist tocomplete the process on a timely basis.
Familiarization Trip
The Company will reimburse the costs for 1 familiarization trip for up to 5 days, 4 nights for you and your spouse/partner and children, whichincludes business class roundtrip airfare, meals and lodging, and ground transportation.
Destination Assistance
You are eligible to receive Destination Assistance to help you and accompanying spouse/partner and children become acclimated to the hostlocation. This may include assistance with orientation and housing search, coordination of services such as installation of telephone andutilities, school selection, banking and insurance services.
Cultural Training
It is recommended that you and your accompanying spouse/partner and children (8 years and older) participate in intercultural training, whichwill be provided pre-departure.
MetLife International Assignment Office August 23, 2018 - Page 4 of 7

RELOCATION
Air Shipment of Personal Articles
The Company will pay the cost of packing, unpacking, shipping and insuring in transit all eligible personal articles from Connecticut to thehost location. Your IAP will provide you with additional information.
Shipment of Furniture and Household Goods
The Company will pay for the standard shipment of your furniture and household goods from Connecticut to the host location. A companyapproved shipper must be utilized for the shipment. Standard shipping covers insurance, packing and loading of household goods, pickup atorigination point, over land and overseas transportation, shipment documentation and related dues, normal host country custom and importduties upon arrival at location, delivery, unpacking and uncrating in the host location.
In some instances, it may be practical to rent furniture rather than provide a surface shipment. In such cases, the Company will pay thereasonable cost of furniture rental (e.g., beds, tables, chairs, lamps) in the host location. Your IAP will provide you with additionalinformation.
Relocation Travel
The Company will reimburse the cost of one-way, business class airfare for you and your accompanying spouse/partner and children torelocate from the home location to the host location. The Company will also reimburse reasonable ground transportation and miscellaneousexpenses upon initial entry into the host country, including luggage handling, taxi and airport transfer expenses, and duties.
Temporary Living
The Company will provide you with up to 30 days of fully serviced housing, if required, until you have secured long-term housing and/ordelivery of your surface household goods shipment in the host location. During this period, you will also receive a per diem to cover mealsand incidentals.
Miscellaneous Relocation Allowance
You will receive a lump sum payment of USD10,000 (or local currency equivalent) to cover incidental expenses incurred as a result of yourrelocation.
HOLIDAY AND VACATION ELIGIBILITY
You will observe the Hong Kong office holidays and work schedule. You will be eligible for vacation per the MetLife Personal Time Off(PTO) policy of the United States. The Service Delivery Center (SDC) will track your paid time off (i.e., vacation, sick and/or personal days).
END OF ASSIGNMENT
International assignments at MetLife are meant to be temporary in nature. At the end of this assignment, MetLife may (i) repatriate you backto your Home country/employer, (ii) offer you a new international assignment, or (iii) offer to localize you in your current location (i.e.transfer your employment to the host country entity under terms and conditions to be communicated at that time). You will be provided with arepatriation, new assignment or localization
MetLife International Assignment Office August 23, 2018 - Page 5 of 7
letter (as the case may be) at that time. If you are repatriated, MetLife will make every effort to restore you to a suitable position given yourexperience and skills. If MetLife has not identified a suitable position for you, MetLife will make every attempt to provide you with noticeand time to explore employment opportunities within MetLife. If ultimately a position is not identified, you may be eligible to receivebenefits under the applicable severance plan or local labor laws depending on your jurisdiction of employment. Nothing contained in thisletter should be construed as guaranteeing employment for any specific period of time.
By accepting the assignment allowances and benefits described herein, you are committing to complete the full term of this assignment. If forany reason you decide to terminate the assignment early, you may forfeit your right to repatriation support and benefits. Although MetLifewill attempt to return you to a suitable position in your Home country, if such a position is not available MetLife may treat your decision toend the assignment early as a voluntary resignation, whereby you would not be entitled to any severance benefits.
Repayment Obligation
If you voluntarily resign or are terminated for misconduct at any time during the assignment, you must repay in full all relocation costsincluding any tax gross up as applicable and any applicable excess reimbursement or Tax Equalization payments, to the extent permissibleunder applicable law. If you complete the assignment but voluntarily resign or are terminated for misconduct within 12 months after the dateof repatriation, to the extent allowable under applicable law, you must repay in full all repatriation costs including any tax gross up asapplicable. You agree to this repayment obligation, and authorize the Company to deduct the reimbursement from your final paycheck and/orfrom any other monies payable to you by the Company or any other MetLife company, to the maximum extent permissible under law. Youare responsible for any reimbursement not satisfied by these deductions.
ADDITIONAL MATTERS
The Company may exercise its discretion to change any part of these terms at any time based on new practices or legal requirements. TheCompany will make every effort to notify you in advance of such changes.
You are entitled to receive the assignment benefits and allowances enumerated in this letter only for the portion of each calendar year that youremain actively employed by the Company and on international assignment as defined by the Company.
This Letter of Understanding is based on our confidence that this assignment and your continued employment with MetLife Group will be amutually rewarding and enriching experience, but it is not an employment contract, and does not represent a guarantee of continuedemployment for any specific period of time. Employment with MetLife Group is “employment at will.”
GOVERNING LAW
This Agreement shall be governed, construed, and enforced under the laws of the state of New York, United States, without regard to itsconflict of laws rule. Any dispute arising under or related to this Agreement shall be subject to the exclusive jurisdiction of the courts locatedin New York, NY.
MetLife International Assignment Office August 23, 2018 - Page 6 of 7
ACCEPTANCE
If you agree to the terms and conditions stated above and agree to abide by such provisions, please sign this letter in duplicate, retain a copyfor your reference, and return one to us in confirmation of your agreement and acceptance of its terms.
Yours sincerely, Agreed and Accepted by:
MetLife, Inc. as sole shareholder ofMetLife Group, Inc.
/s/ Susan M. Podlogar /s/ Kishore PonnavoluBy: Susan Podlogar Executive Vice President and Chief Human Resources Officer
Kishore Ponnavolu
cc: International Assignment Office Denise Starrett, International Assignment Partner
MetLife International Assignment Office August 23, 2018 - Page 7 of 7

Exhibit 10.2
AMENDMENT NUMBER 8 TO THEMETLIFE AUXILIARY PENSION PLAN (RESTATED JANUARY 1, 2008)
The MetLife Auxiliary Pension Plan (the "Plan") is hereby amended, effective as of March 15,2018, by replacing the preamble to the Plan with the following:
“Metropolitan Life Insurance Company (“Company”) hereby amends and restates Part I of the MetLife Auxiliary Pension Plan (“Plan”)effective January 1, 2008. Effective March 15, 2018, the Plan is renamed the MetLife Auxiliary Retirement Plan.
Part I
To the extent that there is any conflict between Part I and Part II of this Plan document, Part I contains the provisions of the Plan that govern409A Benefits as defined in Article 4.l(a) of Part I .All references to “409A” or “section 409A” in this Plan are references to section 409Aof the Internal Revenue Code (“Code”) and the regulations thereunder. Part II contains the provisions of the Plan (as in effect on October 3,2004) that govern Grandfathered Benefits as defined in Article 4.1(b) of Part I, if any, under the Plan.”
IN WITNESS WHEREOF, the Company has caused this Amendment to be adopted in its name and behalf this 4th day of September , 2018,by its officer thereunto duly authorized.
METROPOLITAN LIFE INSURANCE COMPANY
By: /s/ Andrew J. BernsteinAndrew J. BernsteinAdministrator
ATTEST: /s/ Elizabeth Critelli

Exhibit 10.3
AMENDMENT NUMBER NINE TO THEMETLIFE AUXILIARY RETIREMENT PLAN
(As amended and restated effective January 1, 2008)
The MetLife Auxiliary Retirement Plan is hereby amended, effective January 1, 2023, by adding the following as Section 4.6(d) thereof:
“(d) Notwithstanding any provision of this Plan to the contrary, for eligible Participants who are not Commissioned Employeesand who separate from service after December 31, 2022, Final Average Compensation for purposes of Calculation #1 andCalculation #3 in section (c) above shall be determined as of December 31, 2022 rather than at separation from service.”
IN WITNESS WHEREOF, the Company has caused this Amendment to be adopted in its name and behalf this 26 th
day of September ,
2018, by its officer thereunto duly authorized.
METROPOLITAN LIFE INSURANCE COMPANY
By: /s/ Andrew J. Bernstein
Andrew J. Bernstein, Plan Administrator
ATTEST:
/s/ Cheryl DeFalco
Exhibit 31.1
CERTIFICATIONS
I, Steven A. Kandarian, certify that:
1. I have reviewed this quarterly report on Form 10-Q of MetLife, Inc.;
2. Based on my knowledge, this report does not contain any untrue statement of a material fact or omit to state a material fact necessary to make the statementsmade, in light of the circumstances under which such statements were made, not misleading with respect to the period covered by this report;
3. Based on my knowledge, the financial statements, and other financial information included in this report, fairly present in all material respects the financialcondition, results of operations and cash flows of the registrant as of, and for, the periods presented in this report;
4. The registrant’s other certifying officer(s) and I are responsible for establishing and maintaining disclosure controls and procedures (as defined in ExchangeAct Rules 13a-15(e) and 15d-15(e)) and internal control over financial reporting (as defined in Exchange Act Rules 13a-15(f) and 15d-15(f)) for the registrant andhave:
a) Designed such disclosure controls and procedures, or caused such disclosure controls and procedures to be designed under our supervision, to ensure thatmaterial information relating to the registrant, including its consolidated subsidiaries, is made known to us by others within those entities, particularlyduring the period in which this report is being prepared;
b) Designed such internal control over financial reporting, or caused such internal control over financial reporting to be designed under our supervision, toprovide reasonable assurance regarding the reliability of financial reporting and the preparation of financial statements for external purposes in accordancewith generally accepted accounting principles;
c) Evaluated the effectiveness of the registrant’s disclosure controls and procedures and presented in this report our conclusions about the effectiveness ofthe disclosure controls and procedures, as of the end of the period covered by this report based on such evaluation; and
d) Disclosed in this report any change in the registrant’s internal control over financial reporting that occurred during the registrant’s most recent fiscalquarter (the registrant’s fourth fiscal quarter in the case of an annual report) that has materially affected, or is reasonably likely to materially affect, theregistrant’s internal control over financial reporting; and
5. The registrant’s other certifying officer(s) and I have disclosed, based on our most recent evaluation of internal control over financial reporting, to theregistrant’s auditors and the audit committee of the registrant’s board of directors (or persons performing the equivalent functions):
a) All significant deficiencies and material weaknesses in the design or operation of internal control over financial reporting which are reasonably likely toadversely affect the registrant’s ability to record, process, summarize and report financial information; and
b) Any fraud, whether or not material, that involves management or other employees who have a significant role in the registrant’s internal control overfinancial reporting.
Date: November 7, 2018
/s/ Steven A. KandarianSteven A. Kandarian
Chairman of the Board, President andChief Executive Officer
Exhibit 31.2
CERTIFICATIONS
I, John McCallion, certify that:
1. I have reviewed this quarterly report on Form 10-Q of MetLife, Inc.;
2. Based on my knowledge, this report does not contain any untrue statement of a material fact or omit to state a material fact necessary to make the statementsmade, in light of the circumstances under which such statements were made, not misleading with respect to the period covered by this report;
3. Based on my knowledge, the financial statements, and other financial information included in this report, fairly present in all material respects the financialcondition, results of operations and cash flows of the registrant as of, and for, the periods presented in this report;
4. The registrant’s other certifying officer(s) and I are responsible for establishing and maintaining disclosure controls and procedures (as defined in ExchangeAct Rules 13a-15(e) and 15d-15(e)) and internal control over financial reporting (as defined in Exchange Act Rules 13a-15(f) and 15d-15(f)) for the registrant andhave:
a) Designed such disclosure controls and procedures, or caused such disclosure controls and procedures to be designed under our supervision, to ensure thatmaterial information relating to the registrant, including its consolidated subsidiaries, is made known to us by others within those entities, particularlyduring the period in which this report is being prepared;
b) Designed such internal control over financial reporting, or caused such internal control over financial reporting to be designed under our supervision, toprovide reasonable assurance regarding the reliability of financial reporting and the preparation of financial statements for external purposes in accordancewith generally accepted accounting principles;
c) Evaluated the effectiveness of the registrant’s disclosure controls and procedures and presented in this report our conclusions about the effectiveness ofthe disclosure controls and procedures, as of the end of the period covered by this report based on such evaluation; and
d) Disclosed in this report any change in the registrant’s internal control over financial reporting that occurred during the registrant’s most recent fiscalquarter (the registrant’s fourth fiscal quarter in the case of an annual report) that has materially affected, or is reasonably likely to materially affect, theregistrant’s internal control over financial reporting; and
5. The registrant’s other certifying officer(s) and I have disclosed, based on our most recent evaluation of internal control over financial reporting, to theregistrant’s auditors and the audit committee of the registrant’s board of directors (or persons performing the equivalent functions):
a) All significant deficiencies and material weaknesses in the design or operation of internal control over financial reporting which are reasonably likely toadversely affect the registrant’s ability to record, process, summarize and report financial information; and
b) Any fraud, whether or not material, that involves management or other employees who have a significant role in the registrant’s internal control overfinancial reporting.
Date: November 7, 2018
/s/ John McCallionJohn McCallion
Executive Vice President andChief Financial Officer

Exhibit 32.1
SECTION 906 CERTIFICATION
CERTIFICATION PURSUANT TO SECTION 1350 OF CHAPTER 63 OF TITLE 18 OF THEUNITED STATES CODE
I, Steven A. Kandarian, certify that (i) MetLife, Inc.’s Quarterly Report on Form 10-Q for the quarter ended September 30, 2018 (the “Form 10-Q”) fullycomplies with the requirements of Section 13(a) or 15(d) of the Securities Exchange Act of 1934, and (ii) the information contained in the Form 10-Q fairlypresents, in all material respects, the financial condition and results of operations of MetLife, Inc.
Date: November 7, 2018
/s/ Steven A. KandarianSteven A. Kandarian
Chairman of the Board, President andChief Executive Officer
A signed original of this written statement required by Section 906 has been provided to MetLife, Inc. and will be retained by MetLife, Inc. and furnished tothe Securities and Exchange Commission or its staff upon request.

Exhibit 32.2
SECTION 906 CERTIFICATION
CERTIFICATION PURSUANT TO SECTION 1350 OF CHAPTER 63 OF TITLE 18 OF THEUNITED STATES CODE
I, John McCallion, certify that (i) MetLife, Inc.’s Quarterly Report on Form 10-Q for the quarter ended September 30, 2018 (the “Form 10-Q”) fully complieswith the requirements of Section 13(a) or 15(d) of the Securities Exchange Act of 1934, and (ii) the information contained in the Form 10-Q fairly presents, in allmaterial respects, the financial condition and results of operations of MetLife, Inc.
Date: November 7, 2018
/s/ John McCallionJohn McCallion
Executive Vice President andChief Financial Officer
A signed original of this written statement required by Section 906 has been provided to MetLife, Inc. and will be retained by MetLife, Inc. and furnished tothe Securities and Exchange Commission or its staff upon request.