Embed Size (px)
Citation preview

ANNUAL REPORT 2020-21
Navigating ChallengesDelivering Promises
DATA ANALYTICS
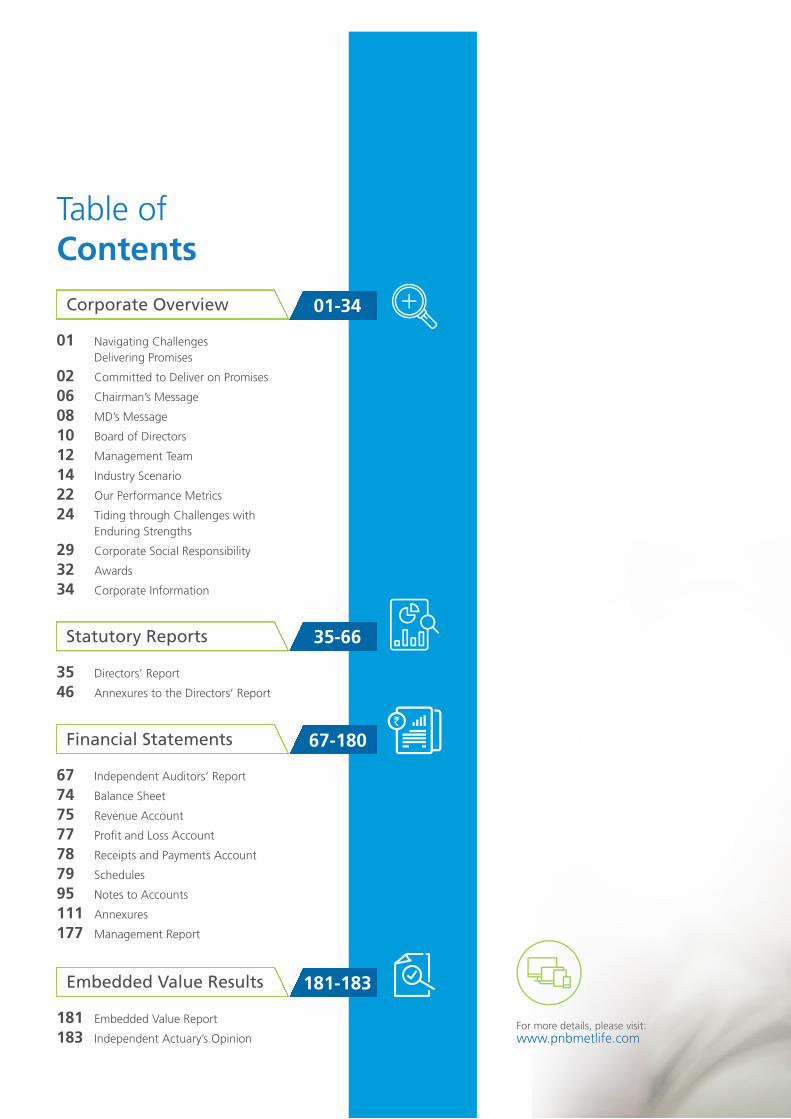
Table ofContents
01 Navigating Challenges Delivering Promises
02 Committed to Deliver on Promises
06 Chairman’s Message
08 MD’s Message
10 Board of Directors
12 Management Team
14 Industry Scenario
22 Our Performance Metrics
24 Tiding through Challenges with Enduring Strengths
29 Corporate Social Responsibility
32 Awards
34 Corporate Information
Corporate Overview 01-34
35 Directors’ Report
46 Annexures to the Directors’ Report
Statutory Reports 35-66
67 Independent Auditors’ Report
74 Balance Sheet
75 Revenue Account
77 Profit and Loss Account
78 Receipts and Payments Account
79 Schedules
95 Notes to Accounts
111 Annexures
177 Management Report
Financial Statements 67-180
181 Embedded Value Report
183 Independent Actuary’s Opinion
Embedded Value Results 181-183
For more details, please visit:www.pnbmetlife.com

FY 2020-21 was an exceptional year with the pandemic causing widespread disruption worldwide, India included. Navigating through these exceptional times, we stood resilient and moved with agility to make fast strategic shifts, leverage digital to push the limits of our intrinsic strengths and capabilities and delivered on our promises to our customers, employees, and shareholders.
Accelerating the pace of digitization and automation, we scaled up our service proposition to meet the full gamut of the transforming requirements of our customers through their lifecycle. As online became the new mantra to staying connected with customers and serving their myriad needs, our ‘khUshi’ app provided 24x7 convenience to our customers through seamless and hassle-free service. Our device-agnostic, web-based platform helped onboard customers digitally adhering to social distancing norms. This year, we leveraged the power of analytics to understand their changing requirements and adapt to the new norms of business in the evolving eco-system.
Our focus on employees gained impetus during these times with several innovative digitization initiatives like touchless hiring and customized digital learning interventions leading to enhanced efficiency and productivity for employees. This has been a year where mental stress has been very high. Our ‘We Care’ employee engagement programs supported our employees on various aspects and helped keep them safe and motivated. We also launched digital platforms to strengthen governance viz. the Compliance management system and the Litigation management system which eased the work for our employees helping them work digitally. The launch of Business Continuity Management System helped improve organization resilience, helped employees deliver on their commitments even with continuous disruptions.
Amid the turbulence in the business environment, we, at PNB MetLife, continue to push forward on our transformation journey to win the future.
Navigating ChallengesDelivering Promises

Committed to Deliver on Promises
As an organization committed to deliver on its promises, we, at PNB MetLife, do not just provide financial security, we deliver a legacy of trust, backed by our unmatched expertise, with total transparency. Our wide range of need-based life insurance products and plans are designed to support a growing clientele across India. We offer our products to cater to the customers ‘Circle of Life’ - from Long Term Savings to Family Protection and Retirement. They are crafted to empower customers to fulfill their responsibility towards their family, achieve their goals and save for later stages of life.
A robust platform of expertise, experience and capabilities enable PNB MetLife to create strong foundations of scalable products and solutions. It facilitates the delivery of long-term sustainable and profitable growth through an increasing number of customer touchpoints, particularly in the underpenetrated segments of India’s life insurance market.
02
Financial Statements Embedded Value ResultsStatutory ReportsCorporate Overview
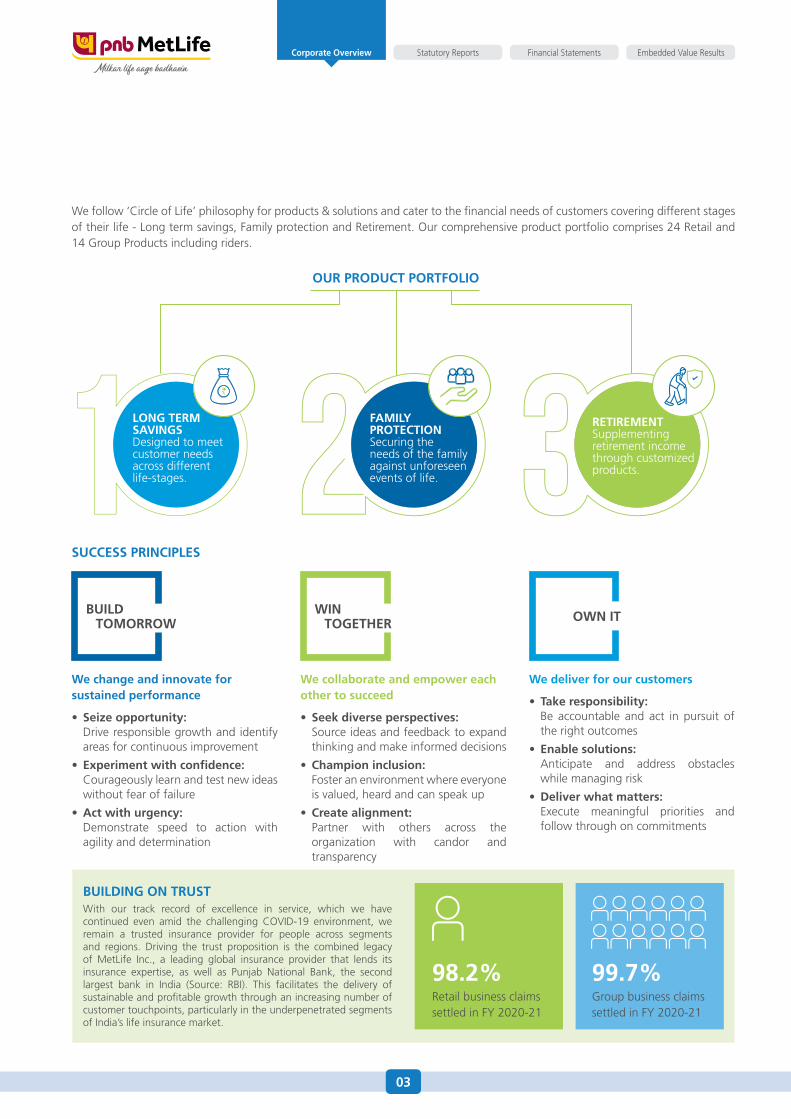
BUILDING ON TRUSTWith our track record of excellence in service, which we have continued even amid the challenging COVID-19 environment, we remain a trusted insurance provider for people across segments and regions. Driving the trust proposition is the combined legacy of MetLife Inc., a leading global insurance provider that lends its insurance expertise, as well as Punjab National Bank, the second largest bank in India (Source: RBI). This facilitates the delivery of sustainable and profitable growth through an increasing number of customer touchpoints, particularly in the underpenetrated segments of India’s life insurance market.
98.2%Retail business claims settled in FY 2020-21
99.7%Group business claims settled in FY 2020-21
We follow ‘Circle of Life’ philosophy for products & solutions and cater to the financial needs of customers covering different stages of their life - Long term savings, Family protection and Retirement. Our comprehensive product portfolio comprises 24 Retail and 14 Group Products including riders.
OUR PRODUCT PORTFOLIO
LONG TERM SAVINGS Designed to meet customer needs across different life-stages.
RETIREMENT Supplementing retirement income through customized products.
FAMILY PROTECTION Securing the needs of the family against unforeseen events of life.
BUILD TOMORROW
WIN TOGETHER OWN IT
We change and innovate for sustained performance
• Seizeopportunity: Drive responsible growth and identify
areas for continuous improvement
• Experimentwithconfidence: Courageously learn and test new ideas
without fear of failure
• Actwithurgency: Demonstrate speed to action with
agility and determination
We collaborate and empower each other to succeed
• Seekdiverseperspectives: Source ideas and feedback to expand
thinking and make informed decisions
• Championinclusion: Foster an environment where everyone
is valued, heard and can speak up
• Createalignment: Partner with others across the
organization with candor and transparency
We deliver for our customers
• Takeresponsibility: Be accountable and act in pursuit of
the right outcomes
• Enablesolutions: Anticipate and address obstacles
while managing risk
• Deliverwhatmatters: Execute meaningful priorities and
follow through on commitments
SUCCESS PRINCIPLES
03
Financial Statements Embedded Value ResultsStatutory ReportsCorporate Overview
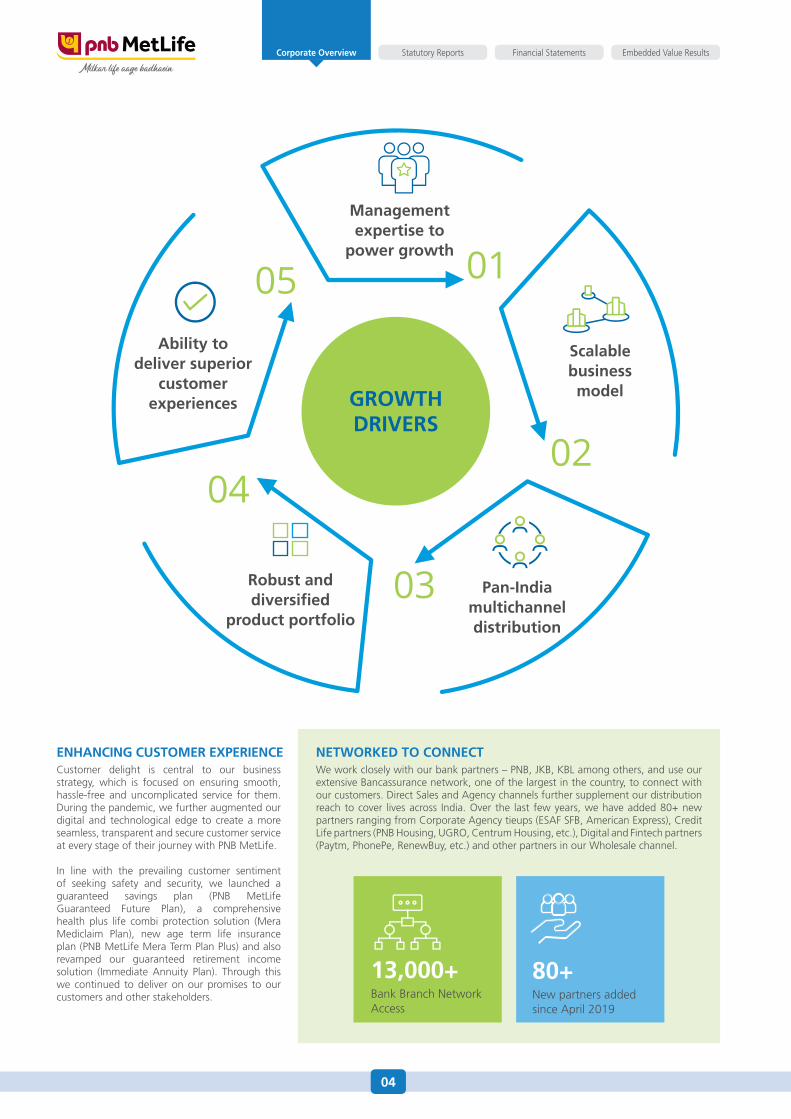
ENHANCING CUSTOMER EXPERIENCECustomer delight is central to our business strategy, which is focused on ensuring smooth, hassle-free and uncomplicated service for them. During the pandemic, we further augmented our digital and technological edge to create a more seamless, transparent and secure customer service at every stage of their journey with PNB MetLife.
In line with the prevailing customer sentiment of seeking safety and security, we launched a guaranteed savings plan (PNB MetLife Guaranteed Future Plan), a comprehensive health plus life combi protection solution (Mera Mediclaim Plan), new age term life insurance plan (PNB MetLife Mera Term Plan Plus) and also revamped our guaranteed retirement income solution (Immediate Annuity Plan). Through this we continued to deliver on our promises to our customers and other stakeholders.
NETWORKED TO CONNECTWe work closely with our bank partners – PNB, JKB, KBL among others, and use our extensive Bancassurance network, one of the largest in the country, to connect with our customers. Direct Sales and Agency channels further supplement our distribution reach to cover lives across India. Over the last few years, we have added 80+ new partners ranging from Corporate Agency tieups (ESAF SFB, American Express), Credit Life partners (PNB Housing, UGRO, Centrum Housing, etc.), Digital and Fintech partners (Paytm, PhonePe, RenewBuy, etc.) and other partners in our Wholesale channel.
13,000+Bank Branch Network Access
80+New partners added since April 2019
GROWTH DRIVERS
Management expertise to
power growth
Pan-India multichannel distribution
Robust and diversified
product portfolio
Scalable business model
Ability to deliver superior
customer experiences
04
Financial Statements Embedded Value ResultsStatutory ReportsCorporate Overview
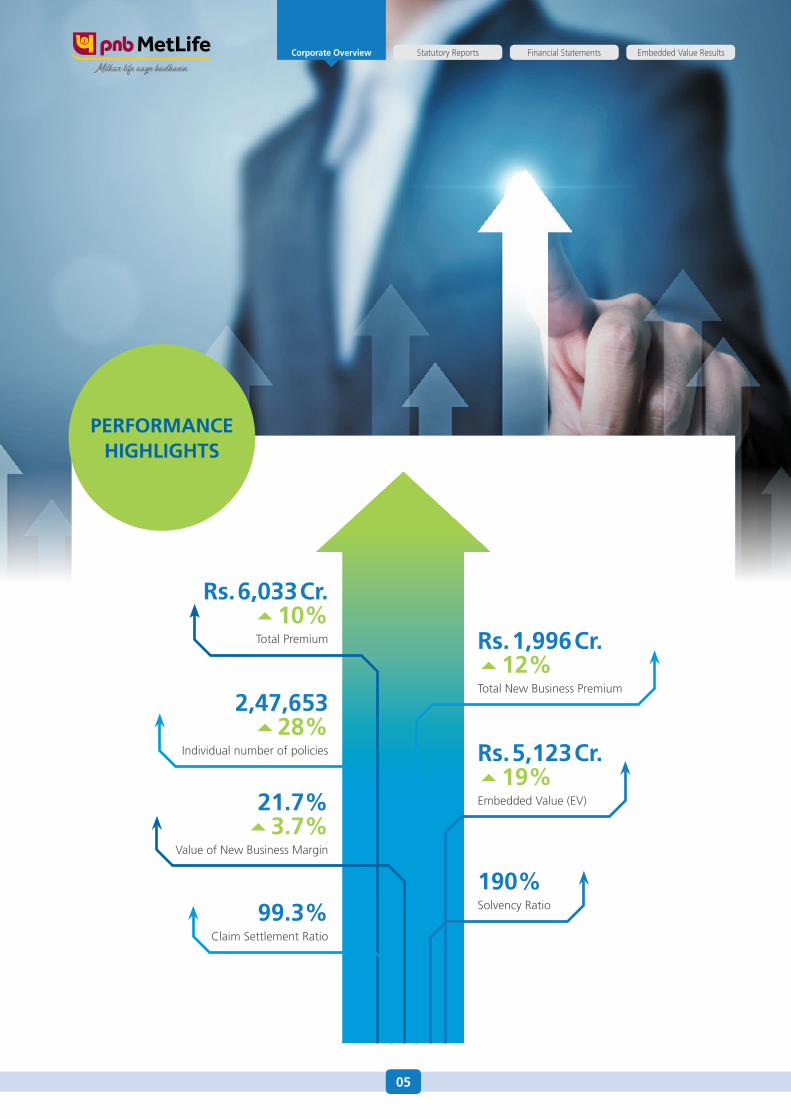
Rs.1,996Cr.12%Total New Business Premium
Rs.5,123Cr.19%Embedded Value (EV)
190%Solvency Ratio
Rs.6,033Cr. 10%Total Premium
2,47,65328%
Individual number of policies
21.7%3.7%
Value of New Business Margin
99.3%Claim Settlement Ratio
PERFORMANCE HIGHLIGHTS
05
Financial Statements Embedded Value ResultsStatutory ReportsCorporate Overview

Chairman’s Message
PNB MetLife has evolved continually, delivering new digital tools for a seamless and contactless 24x7 consumer experience. With our customer-centric approach, we transitioned from “phygital” to an entirely online model across our full customer journey from digital buying and onboarding to servicing customers.
MR. KISHORE PONNAVOLU Chairman, Non-Executive Director
06
Financial Statements Embedded Value ResultsStatutory ReportsCorporate Overview
DEAR SHAREHOLDERS
In the midst of the deadly coronavirus pandemic, I feel very privileged to be able to report that PNB MetLife has continued to deliver a strong performance in FY 2020-21, supported by our keen focus on our Next Horizon strategy and the commitment of our more than 25 thousand employees and agents. Basis New Business Premium in FY 2020-21, our Company has been ranked amongst the top 10 life insurance companies in India due, in large part, to their hard work.
A Challenging Year
This has been such a difficult year for everyone. FY 2020-21 saw significant disruptions in all our lives, across so many industries, and not the least, large shifts in the overall insurance industry landscape. The COVID-19 virus has spread across India in a devastating second wave which has had significant impact on its economic environment and on the lives of so many of our compatriots. In response, PNB MetLife has evolved continually, delivering new digital tools for a seamless and contactless 24x7 consumer experience. With our customer-centric approach, we transitioned from “phygital” to an entirely online model across our full customer journey from digital buying and onboarding to servicing customers. We particularly recognize the support of the regulator for the industry in minimizing the disruption through timely interventions enabling the shift towards the new normal.
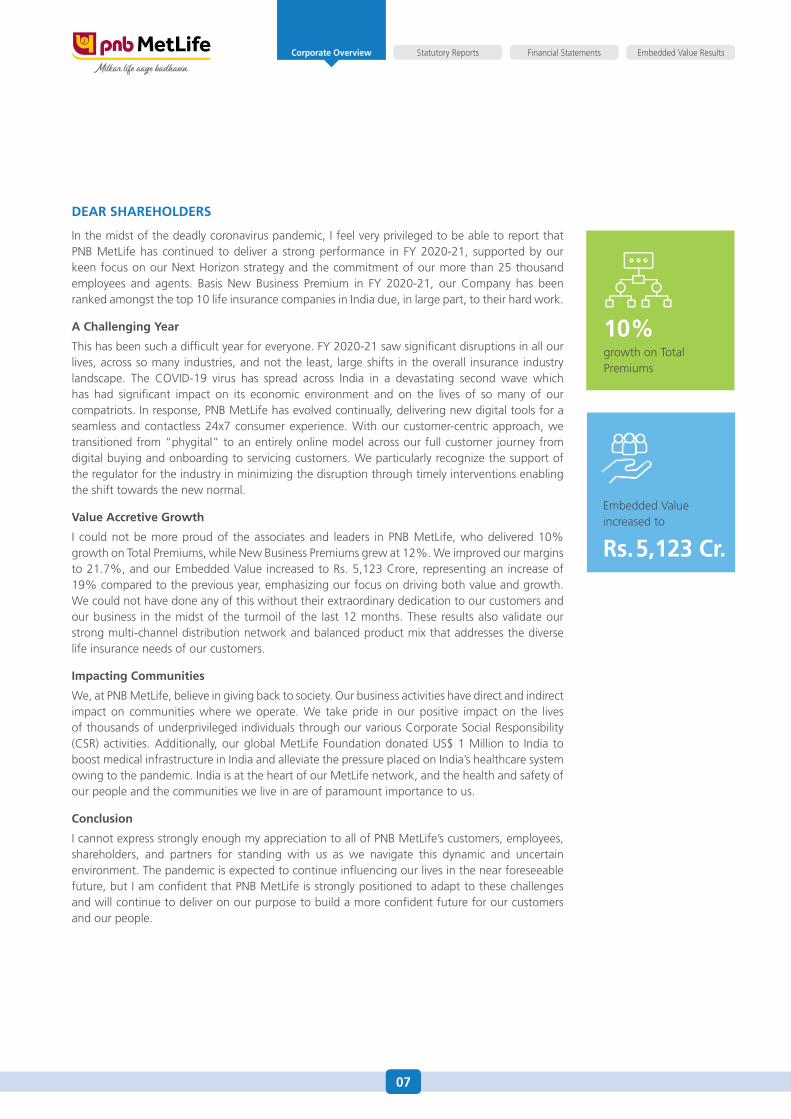
Value Accretive Growth
I could not be more proud of the associates and leaders in PNB MetLife, who delivered 10% growth on Total Premiums, while New Business Premiums grew at 12%. We improved our margins to 21.7%, and our Embedded Value increased to Rs. 5,123 Crore, representing an increase of 19% compared to the previous year, emphasizing our focus on driving both value and growth. We could not have done any of this without their extraordinary dedication to our customers and our business in the midst of the turmoil of the last 12 months. These results also validate our strong multi-channel distribution network and balanced product mix that addresses the diverse life insurance needs of our customers.
Impacting Communities
We, at PNB MetLife, believe in giving back to society. Our business activities have direct and indirect impact on communities where we operate. We take pride in our positive impact on the lives of thousands of underprivileged individuals through our various Corporate Social Responsibility (CSR) activities. Additionally, our global MetLife Foundation donated US$ 1 Million to India to boost medical infrastructure in India and alleviate the pressure placed on India’s healthcare system owing to the pandemic. India is at the heart of our MetLife network, and the health and safety of our people and the communities we live in are of paramount importance to us.
Conclusion
I cannot express strongly enough my appreciation to all of PNB MetLife’s customers, employees, shareholders, and partners for standing with us as we navigate this dynamic and uncertain environment. The pandemic is expected to continue influencing our lives in the near foreseeable future, but I am confident that PNB MetLife is strongly positioned to adapt to these challenges and will continue to deliver on our purpose to build a more confident future for our customers and our people.
10%growth on Total Premiums
Embedded Value increased to
Rs.5,123 Cr.
07
Financial Statements Embedded Value ResultsStatutory ReportsCorporate Overview
MD’s Message
MR. ASHISH KUMAR SRIVASTAVA MD & CEO
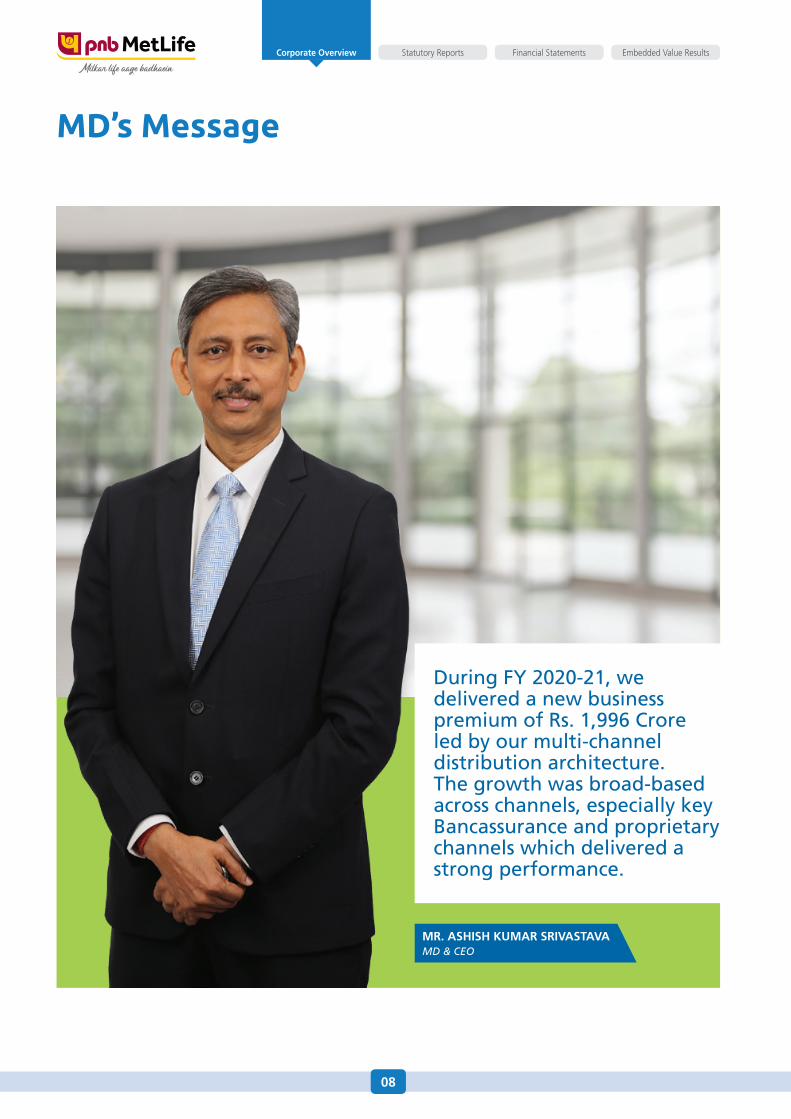
During FY 2020-21, we delivered a new business premium of Rs. 1,996 Crore led by our multi-channel distribution architecture. The growth was broad-based across channels, especially key Bancassurance and proprietary channels which delivered a strong performance.
08
Financial Statements Embedded Value ResultsStatutory ReportsCorporate Overview
DEAR SHAREHOLDERS
It gives me immense pleasure to share the FY 2020-21 results with you. Driven by a strong sense of purpose that drives “Customer Centricity”, we delivered a resilient performance this year in line with our value-accretive growth strategy. Combining the insurance expertise of MetLife Inc, a leading global insurance provider, and the vast distribution reach of Punjab National Bank, we stand tall today as one of the leading private life insurance companies in India.
Facing the disruption
Last 15 months have been unprecedented times for human mankind. There is a change in the way businesses are conducted and what consumers want - globally. For the insurance industry, consumer behavior has seen the pivots changing. This is substantiated by a report by MetLife, which covers customer behavior across Asia, and by a separate report published by Google.
In these times, a proactive approach by us, augmented by the regulator’s engagement with the Industry, helped support our customers in minimizing the disruption. Noteworthy initiatives like simplifying the Claims process, introduction of standard products like Saral Jeevan Bima Plan, etc., enhanced consumer confidence. Regulators support on relaxation of time for payment of premium and easier Know Your Customer (KYC) norms have boded well for the industry.
The “Black Swan” incident, has actually made us more determined. We are adopting / adapting new ways. We do see increased awareness amongst customers, and our endeavor will be to continue to serve them, add new, and continue to deliver on our value-accretive growth strategy.
BusinessContinuity&Digitization
Aligned with our brand purpose of “Milkar Life Aage Badhaein”, we ensured 24x7 service to our customers specially during these challenging times. Actions true to our values of customer-centricity and our robust technology-supported Business Continuity Processes helped ensure seamless online onboarding of new customers and servicing of existing customers. We also launched new products keeping customer’s needs during these times.
The pandemic acted as a catalyst towards digitization, and we continually evolved with new digital and technological tools to deliver a seamless consumer experience across business functions. Few key initiatives taken to support the customers include:
• Launched`ClaimAssure’,a3-hourclaimdecisioningengine
• DigitalPolicyservicingthrough‘khUshi’app
• IncreasedTeleandVideoMER(medicalexaminationreport)
• CentralizedhelpdesktomanageClaimsPayout
• Digitally-enabledsalesprocesses
Our employees are our greatest assets. Their safety and well-being is of paramount importance which we continued to ensure in the current environment. Some of the key initiatives taken to support the employees were:
• Provisionof12Oxygenconcentrators,providedbyMetLifeAsia Regional office, that will be available across key offices for employees and their families
• 24x7COVID-19Helplinemanagedby trainedDoctors toaddress initial response and concerns
• WellnessSessionswithExperts
• Enhanced Medical Insurance Coverage for employees and family
• AdditionalSickLeavesforCOVID-19aswellasvaccination
• Employeevolunteeredhelplinetosharedatabaseresourcesin association with an NGO
• Financialaidforvaccination
• Work fromhomewith a staggered return to office plan in place
Performance review
During FY 2020-21, we delivered a new business premium of Rs. 1,996 Crore led by our multi-channel distribution architecture. The growth was broad-based across channels, especially key Bancassurance and proprietary channels which delivered a strong performance. We continued to maintain a balanced product mix to meet our customers’ needs. In line with our strategy to widen our distribution access, we onboarded over 60 new partners. Despite the increased investments towards this, we have maintained our operating expense ratio. The hard work, dedication, and perseverance of our employees has been equally important, enabling us to emerge stronger through this crisis and in meeting our customer’s needs and better servicing them.
Commitment to Serve
We continue to serve society with our commitment to the well-being of underprivileged communities. I take great pride in sharing that even during these unprecedented times, we have provided education to 1,388 underprivileged girls through Damini and empowered 3,000 underprivileged women through skill development training. The MetLife Foundation donated an aid of US$ 1 Million for addressing the requirements of our community and for standing by us during these trying times. Our quest to give back to society remains our top priority and we will continue to add value to the lives of these communities.
Concluding Note
I would like to thank our key stakeholders – customers, employees, shareholders, partners – for their trust in us, as we continue on the journey of value-accretive growth thereby delivering strong outcomes for them. I am certain that we will successfully steer through the challenging times ahead and will continue to evolve our offering in line with customers’ changing needs.
09
Financial Statements Embedded Value ResultsStatutory ReportsCorporate Overview
Board of Directors
Mr. Kishore Ponnavolu Chairman, Non-Executive Director
He did his masters from Osmania University in Hyderabad, India, and a Ph.D from Drexel University. He is president of MetLife’s Asia region and a member of the Company’s Executive Group since 1st September 2018. Under his leadership, MetLife Auto and Home achieved strong financial results, while launching many first-to-market initiatives across product, distribution and customer areas.
Mr.PherozeKersaspMistry Non-Executive Director
Equipped with many years of experience in business administration, Mr. Mistry is associated with companies across the areas of logistics, industrial coating and painting, on a contract basis, as well as in setting up wind turbines. A fellow of the Institution of Engineers (India), he holds a Bachelor’s degree in Science from University of California, USA, and a Master’s degree in Business Administration from Cornell University, USA.
Mr. Ashish Kumar Srivastava Managing Director & CEO
He is an accomplished professional with over 29 years of experience in various sectors including insurance, banking, manufacturing, and service. He holds a post graduate diploma in Personnel Management from Xavier Institute, Ranchi and has attended advanced courses at Cornell University, Richard Ivy school and Michigan Business School.
Mr. Surbhit DabriwalaNon-Executive Director
He holds a bachelor’s degree in arts from University of Pennsylvania. He has many years of experience in manufacturing and real estate sectors. He is currently a promoter and non-executive non-independent director on the board of EIL.
Mr. CH. S.S. Mallikarjuna Rao Non-Executive Director
A professional banker for over 34 years, Mr. Rao is MD & CEO of Punjab National Bank (PNB). Presently, he is also the deputy chairman at India Bank’s Association and is a member of Insolvency Law Committee. He has vast exposure and experience in Credit, Recovery, Treasury, Risk Management, Information Technology, Management Information System, Retail Banking, Marketing, Publicity & Alternative Delivery Channels. He holds degrees in B.Sc., LLB and CAIIB.
Mr. Sanjay Kumar Non-Executive Director
He is the Executive Director of PNB. Earlier, he was Executive Director of United Bank of India. He holds degree in M.Sc., Certified Associate member of Indian Institute of Bankers and Diploma in Treasury, Investment and Risk Management from Indian Institute of Banking and Finance. Over the last 35 years, he has functioned in almost all areas of banking especially Treasury, Corporate Accounts, Credit, Recovery & Credit Monitoring and Branch Banking.
Mr. Atinder Jit SinghNon-Executive Director
He is currently Chief Distribution Officer for MetLife, Asia. He holds a Bachelor’s from National Defense Academy, India, Masters in Computer Science from the University of California and MBA from the Booth School of Business at the University of Chicago. He has served as Global Head of Retail Underwriting & Sales Support, Strategy, Planning & Governance for Global Operations.
Mr. Ashish BhatNon-Executive Director
Senior Vice President and Chief Financial Officer for MetLife, Asia, Mr. Bhat has more than 21 years of experience in the life insurance industry, across Europe and Asia. He holds a Bachelor’s degree in Technology from IIT Delhi and PGDM from IIM Calcutta.
10
Financial Statements Embedded Value ResultsStatutory ReportsCorporate Overview
Mr. Stephen BarnhamNon-Executive Director
Mr. Stephen Barnham is currently Chief Information Officer for MetLife, Asia. He holds Bachelor of Science in Computing from the University of Kent. He has more than 30 years of experience in Global Banking and Technology.
Mr. Thallapaka Venkateswara RaoNon-Executive Director
With over 36 years of experience in Banking, Foreign Trade and Housing Finance Sectors, Mr. T V Rao specializes in Management of Treasury, Investment and Corporate Finance Operations, Securitization and Structured Finance, Product Development (Reverse Mortgage etc.), Training, Research, Capacity Building and Regulation, as well as Supervision of Housing Finance Institutions. He is Director on the Boards of several corporates in NBFC, Housing Finance Companies and Manufacturing sectors.
Mr. Arvind Kumar JainNon-Executive Director
Armed with around 41 years of banking experience, Mr. Jain has expertise in Treasury & Credit. A former Executive Director of Punjab & Sind Bank, he has, during his career, headed various branches and controlled offices, besides working in the bank’s head office. He holds degrees in B.Sc (Hons) M.Sc, LLB, and CAIIB.
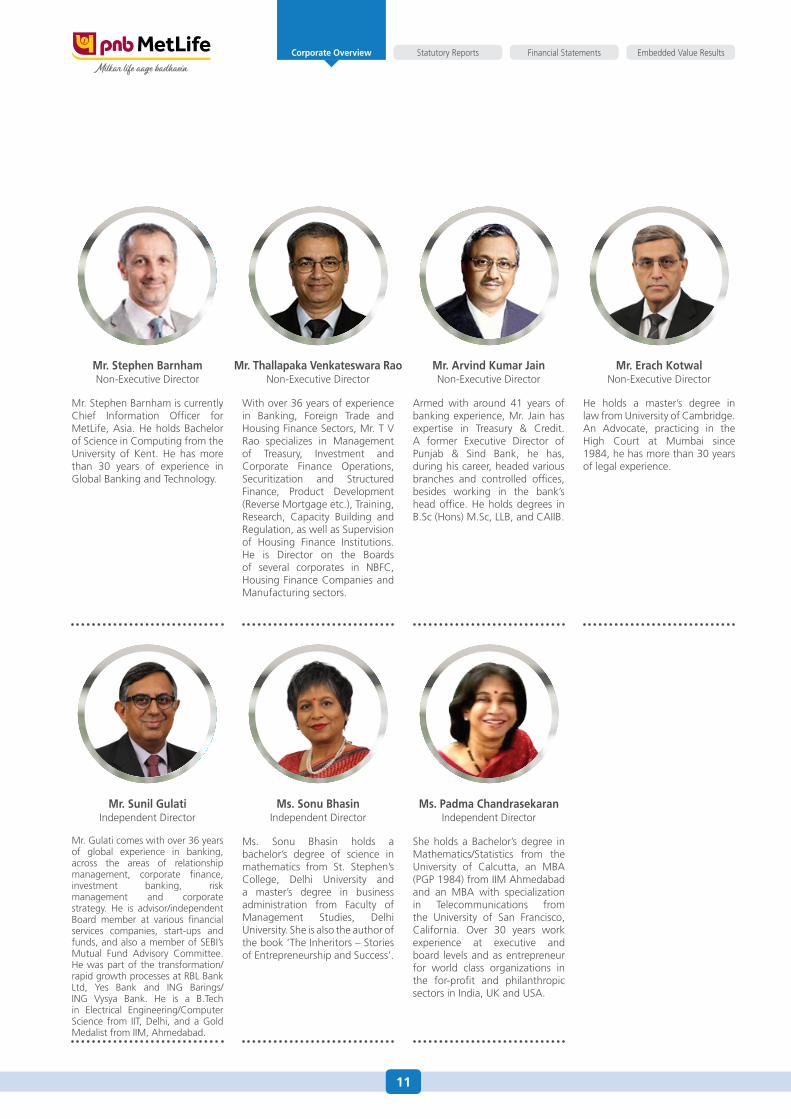
Ms. Sonu BhasinIndependent Director
Ms. Sonu Bhasin holds a bachelor’s degree of science in mathematics from St. Stephen’s College, Delhi University and a master’s degree in business administration from Faculty of Management Studies, Delhi University. She is also the author of the book ‘The Inheritors – Stories of Entrepreneurship and Success’.
Ms. Padma ChandrasekaranIndependent Director
She holds a Bachelor’s degree in Mathematics/Statistics from the University of Calcutta, an MBA (PGP 1984) from IIM Ahmedabad and an MBA with specialization in Telecommunications from the University of San Francisco, California. Over 30 years work experience at executive and board levels and as entrepreneur for world class organizations in the for-profit and philanthropic sectors in India, UK and USA.
Mr. Sunil Gulati Independent Director
Mr. Gulati comes with over 36 years of global experience in banking, across the areas of relationship management, corporate finance, investment banking, risk management and corporate strategy. He is advisor/independent Board member at various financial services companies, start-ups and funds, and also a member of SEBI’s Mutual Fund Advisory Committee. He was part of the transformation/ rapid growth processes at RBL Bank Ltd, Yes Bank and ING Barings/ ING Vysya Bank. He is a B.Tech in Electrical Engineering/Computer Science from IIT, Delhi, and a Gold Medalist from IIM, Ahmedabad.
Mr. Erach KotwalNon-Executive Director
He holds a master’s degree in law from University of Cambridge. An Advocate, practicing in the High Court at Mumbai since 1984, he has more than 30 years of legal experience.
11
Financial Statements Embedded Value ResultsStatutory ReportsCorporate Overview

Management Team
Mr. Khalid Ahmad Chief Financial Officer
He holds a bachelor’s degree in science from University of Calcutta and a postgraduate diploma in management studies from Management Development Institute, Gurgaon. He has 18 years of experience in insurance, banking and logistics.
Mr. Samrat Ashim Das Chief Operating Officer
He holds a master’s degree of business administration from Pune University. He has 25 years of experience across industries like pharmaceuticals, IT consulting, insurance and investment management and mutual funds.
Mr. P. K. Dinakar Chief Actuary & Products Officer
He holds a bachelor’s degree in science from Calicut University and a master’s degree in statistics from Cochin University of Science and Technology and is a fellow of the Institute of Actuaries of India. He has 31 years of experience in life insurance industry and handling actuarial functions.
Mr. Sanjay KumarChief Investment Officer
He holds a bachelor’s degree in chemical engineering from Jadavpur University and master’s degree in business administration from Faculty of Management Studies (FMS), University of Delhi. He has 26 years of experience in financial services.
Mr. Sameer Bansal Chief Distribution Officer
He holds a bachelor’s degree in engineering from Manipal Institute of Technology and Master’s degree in Marketing & Finance from International Management Institute. New Delhi. He has 24 years of experience in management.
Ms. Viraj Taneja Chief Internal Auditor
She holds a bachelor’s degree in commerce from University of Mumbai and is a chartered accountant, registered with the Institute of Chartered Accountants of India. She has more than 20 years of experience in governance, internal audit, risk management and assurance.
12
Financial Statements Embedded Value ResultsStatutory ReportsCorporate Overview
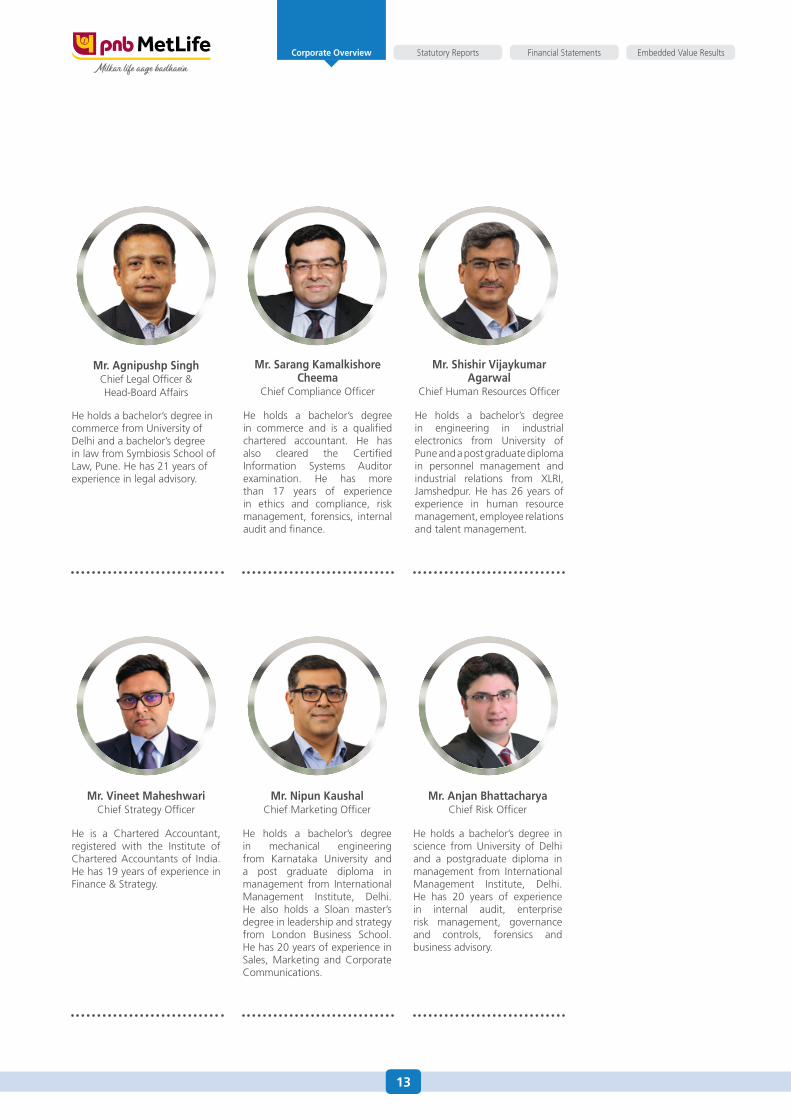
Mr. Agnipushp Singh Chief Legal Officer & Head-Board Affairs
He holds a bachelor’s degree in commerce from University of Delhi and a bachelor’s degree in law from Symbiosis School of Law, Pune. He has 21 years of experience in legal advisory.
Mr. Vineet MaheshwariChief Strategy Officer
He is a Chartered Accountant, registered with the Institute of Chartered Accountants of India. He has 19 years of experience in Finance & Strategy.
Mr. Sarang Kamalkishore Cheema
Chief Compliance Officer
He holds a bachelor’s degree in commerce and is a qualified chartered accountant. He has also cleared the Certified Information Systems Auditor examination. He has more than 17 years of experience in ethics and compliance, risk management, forensics, internal audit and finance.
Mr. Nipun Kaushal Chief Marketing Officer
He holds a bachelor’s degree in mechanical engineering from Karnataka University and a post graduate diploma in management from International Management Institute, Delhi. He also holds a Sloan master’s degree in leadership and strategy from London Business School. He has 20 years of experience in Sales, Marketing and Corporate Communications.
Mr. Shishir Vijaykumar Agarwal
Chief Human Resources Officer
He holds a bachelor’s degree in engineering in industrial electronics from University of Pune and a post graduate diploma in personnel management and industrial relations from XLRI, Jamshedpur. He has 26 years of experience in human resource management, employee relations and talent management.
Mr. Anjan Bhattacharya Chief Risk Officer
He holds a bachelor’s degree in science from University of Delhi and a postgraduate diploma in management from International Management Institute, Delhi. He has 20 years of experience in internal audit, enterprise risk management, governance and controls, forensics and business advisory.
13
Financial Statements Embedded Value ResultsStatutory ReportsCorporate Overview

Industry Scenario
Riding on recovering macro-economic environment, widespread digitalization, and greater public awareness about the need for life insurance following the pandemic, the life insurance industry is expected to witness strong growth in the coming years. PNB MetLife with its customer-centric approach and multiple digital initiatives is well-positioned to gain ground.
The Indian insurance industry has weathered a fiscal year dominated by two waves of the COVID-19 pandemic. It has though increased awareness among people to consider insurance to tackle unforeseen circumstances. In this scenario, life insurance companies with the best value proposition stand to gain substantially in a national market that has a huge mortality protection gap of 83%.
DATA ANALYTICS
14
Financial Statements Embedded Value ResultsStatutory ReportsCorporate Overview
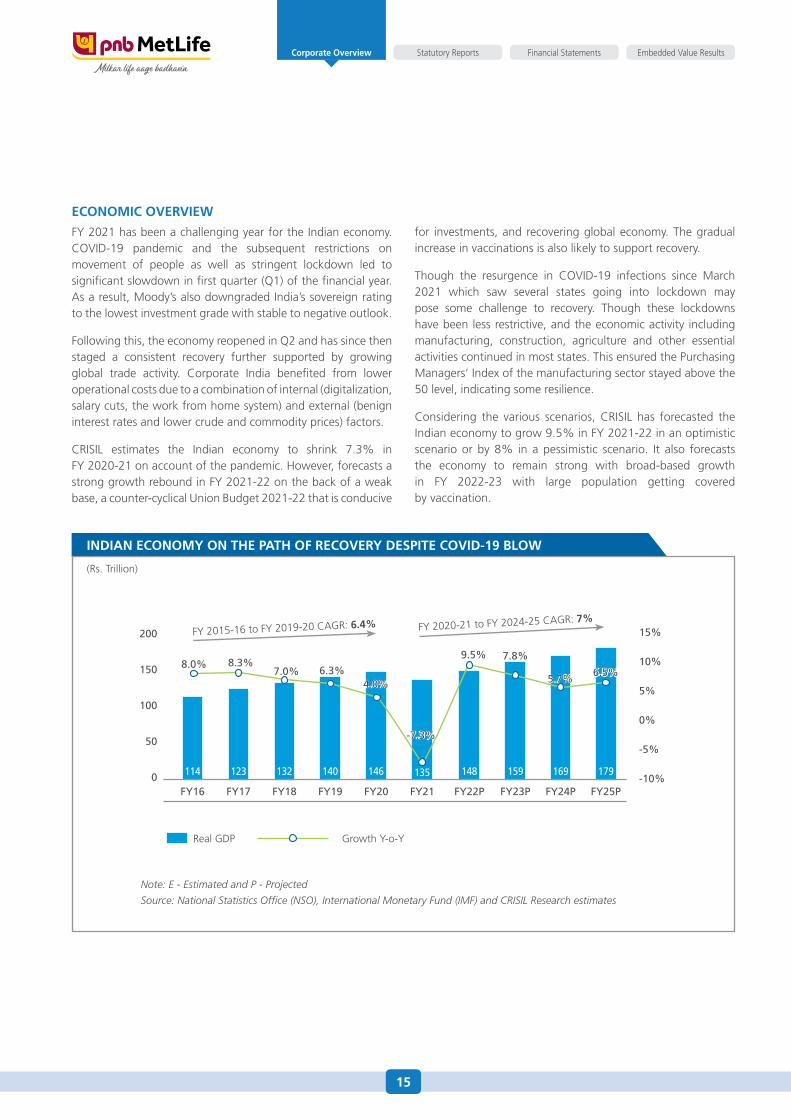
ECONOMIC OVERVIEW
FY 2021 has been a challenging year for the Indian economy. COVID-19 pandemic and the subsequent restrictions on movement of people as well as stringent lockdown led to significant slowdown in first quarter (Q1) of the financial year. As a result, Moody’s also downgraded India’s sovereign rating to the lowest investment grade with stable to negative outlook.
Following this, the economy reopened in Q2 and has since then staged a consistent recovery further supported by growing global trade activity. Corporate India benefited from lower operational costs due to a combination of internal (digitalization, salary cuts, the work from home system) and external (benign interest rates and lower crude and commodity prices) factors.
CRISIL estimates the Indian economy to shrink 7.3% in FY 2020-21 on account of the pandemic. However, forecasts a strong growth rebound in FY 2021-22 on the back of a weak base, a counter-cyclical Union Budget 2021-22 that is conducive
for investments, and recovering global economy. The gradual increase in vaccinations is also likely to support recovery.
Though the resurgence in COVID-19 infections since March 2021 which saw several states going into lockdown may pose some challenge to recovery. Though these lockdowns have been less restrictive, and the economic activity including manufacturing, construction, agriculture and other essential activities continued in most states. This ensured the Purchasing Managers’ Index of the manufacturing sector stayed above the 50 level, indicating some resilience.
Considering the various scenarios, CRISIL has forecasted the Indian economy to grow 9.5% in FY 2021-22 in an optimistic scenario or by 8% in a pessimistic scenario. It also forecasts the economy to remain strong with broad-based growth in FY 2022-23 with large population getting covered by vaccination.
INDIAN ECONOMY ON THE PATH OF RECOVERY DESPITE COVID-19 BLOW
8.0%
FY16 FY21
-7.3%
8.3%
FY17
9.5%
FY22P
7.0%
FY18 FY23P
7.8%6.3%
FY19 FY24P
5.7%4.0%
FY20 FY25P
6.5%
200
150
100
50
0
15%
10%
5%
0%
-5%
-10%
FY 2015-16 to FY 2019-20 CAGR: 6.4% FY 2020-21 to FY 2024-25 CAGR: 7%
Real GDP Growth Y-o-Y
Note: E - Estimated and P - Projected
Source: National Statistics Office (NSO), International Monetary Fund (IMF) and CRISIL Research estimates
(Rs. Trillion)
135114 123 132 140 146 148 159 169 179
15
Financial Statements Embedded Value ResultsStatutory ReportsCorporate Overview
LIFE INSURANCE INDUSTRY OVERVIEW
Global life insurance industry
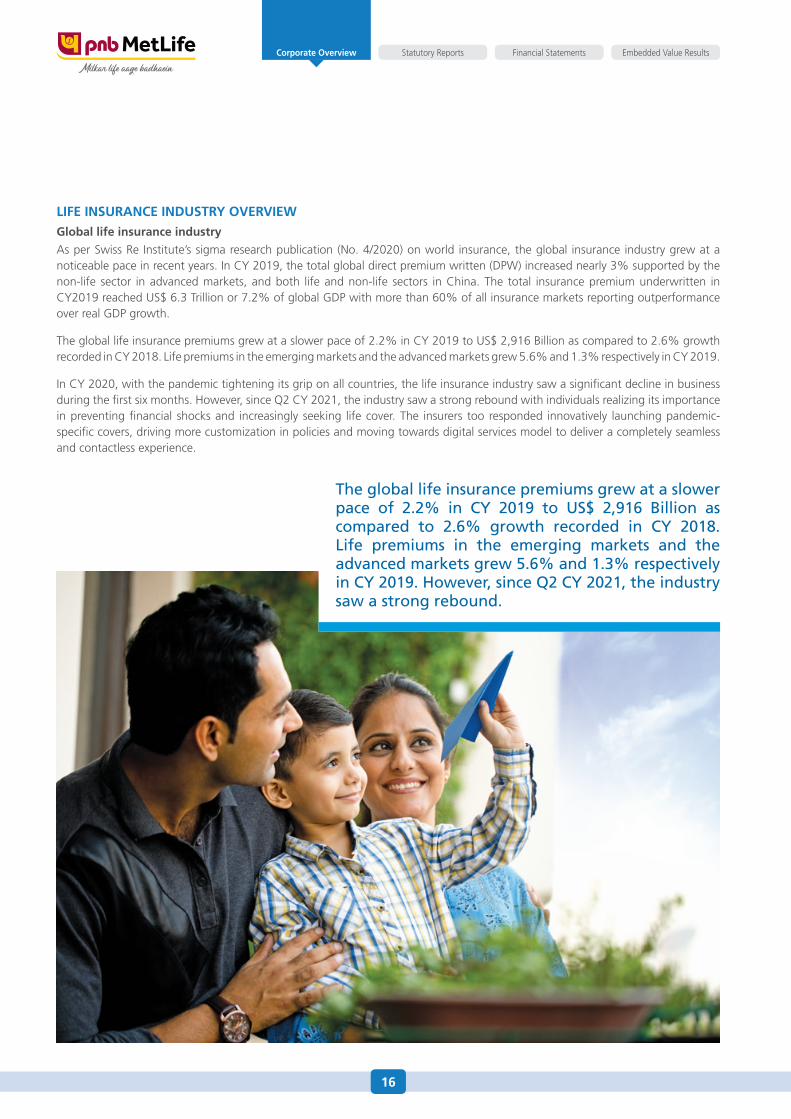
As per Swiss Re Institute’s sigma research publication (No. 4/2020) on world insurance, the global insurance industry grew at a noticeable pace in recent years. In CY 2019, the total global direct premium written (DPW) increased nearly 3% supported by the non-life sector in advanced markets, and both life and non-life sectors in China. The total insurance premium underwritten in CY2019 reached US$ 6.3 Trillion or 7.2% of global GDP with more than 60% of all insurance markets reporting outperformance over real GDP growth.
The global life insurance premiums grew at a slower pace of 2.2% in CY 2019 to US$ 2,916 Billion as compared to 2.6% growth recorded in CY 2018. Life premiums in the emerging markets and the advanced markets grew 5.6% and 1.3% respectively in CY 2019.
In CY 2020, with the pandemic tightening its grip on all countries, the life insurance industry saw a significant decline in business during the first six months. However, since Q2 CY 2021, the industry saw a strong rebound with individuals realizing its importance in preventing financial shocks and increasingly seeking life cover. The insurers too responded innovatively launching pandemic-specific covers, driving more customization in policies and moving towards digital services model to deliver a completely seamless and contactless experience.
The global life insurance premiums grew at a slower pace of 2.2% in CY 2019 to US$ 2,916 Billion as compared to 2.6% growth recorded in CY 2018. Life premiums in the emerging markets and the advanced markets grew 5.6% and 1.3% respectively in CY 2019. However, since Q2 CY 2021, the industry saw a strong rebound.
16
Financial Statements Embedded Value ResultsStatutory ReportsCorporate Overview
PERFORMANCE FY 2020-21
In FY 2020-21, the life insurance in India continued to be one of the fastest-growing segments with gross total premium reaching Rs. 6.1 Trillion, growing at 11% CAGR during FY 2016-21. This was driven by a ~7% growth in the new business premium (NBP) to Rs. 2.78 Trillion, though this was slower than the ~21% growth achieved last year. This temporary slump, especially in the first quarter, was due to the pandemic which impacted cash position of individuals, drove uncertainties and prevented in-person interaction which was a key mode of sales. However, since then, the industry adopted more digital ways of selling and servicing which led to some rebound.
The year saw surge in demand for guaranteed products as interest rates declined and for protection business as market volatility impacted linked business. Private sector grew at 16% and the public sector at 3%.
With increased awareness, large insurable population, improvement in economic environment, income levels and financial savings, and greater digital adoption, the industry is expected to grow in the coming years. As per CRISIL, during FY 2022-26, the industry’s total premium is likely to grow at a CAGR of 12-14% and NBP at 15-17%.
INDIAN LIFE INSURANCE INDUSTRY
Overview
In India, the life insurance industry has grown rapidly in the past two decades. Rising household savings and income levels, growing awareness, tax benefits, product innovation and customization have contributed to this growth.
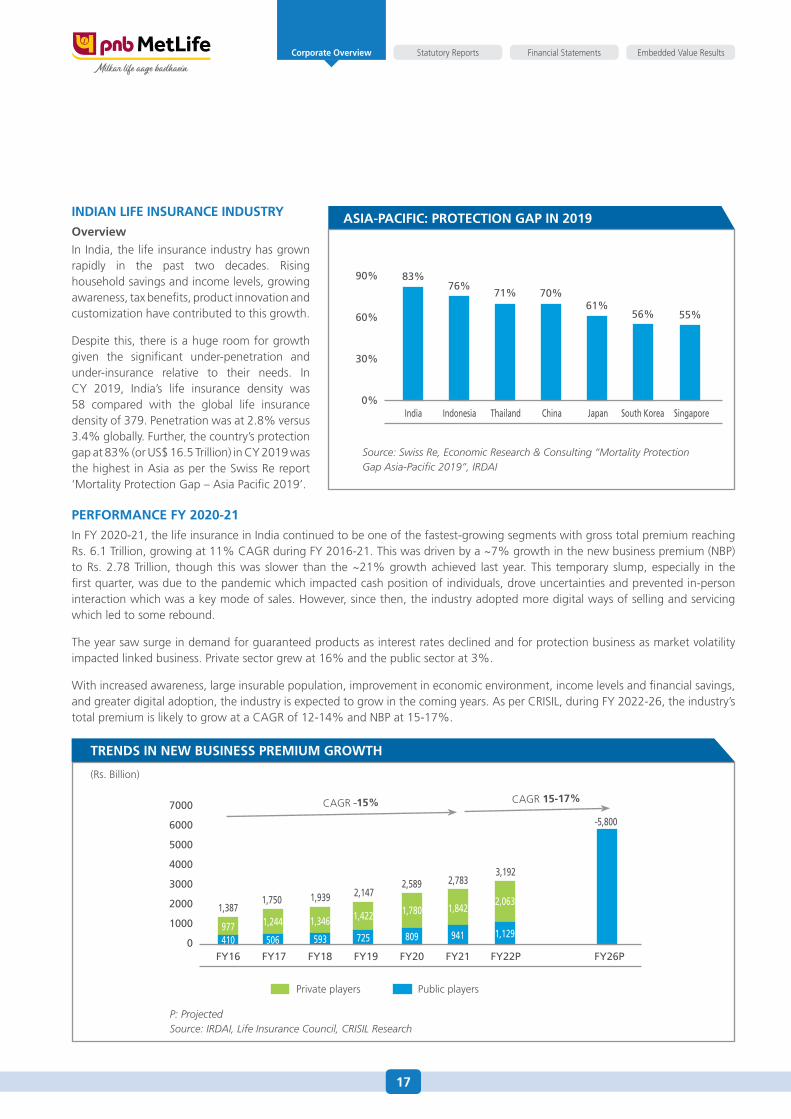
Despite this, there is a huge room for growth given the significant under-penetration and under-insurance relative to their needs. In CY 2019, India’s life insurance density was 58 compared with the global life insurance density of 379. Penetration was at 2.8% versus 3.4% globally. Further, the country’s protection gap at 83% (or US$ 16.5 Trillion) in CY 2019 was the highest in Asia as per the Swiss Re report ‘Mortality Protection Gap – Asia Pacific 2019’.
ASIA-PACIFIC:PROTECTIONGAPIN2019
Source: Swiss Re, Economic Research & Consulting “Mortality Protection Gap Asia-Pacific 2019”, IRDAI
83%
India
56%
76%
Indonesia
55%
71% 70%61%
90%
60%
30%
0%Thailand China Japan South Korea Singapore
(Rs. Billion)
TRENDS IN NEW BUSINESS PREMIUM GROWTH
Private players Public players
P: ProjectedSource: IRDAI, Life Insurance Council, CRISIL Research
410977
1,387
506
1,244
1,750
593
1,939
725
1,422
2,147
809
1,780
2,589
941
2,783
1,129
2,063
3,192
FY16 FY21FY17 FY22PFY18 FY19 FY20
7000
6000
5000
4000
3000
2000
1000
0
˜5,800
FY26P
CAGR ˜15% CAGR 15-17%
1,3461,842
17
Financial Statements Embedded Value ResultsStatutory ReportsCorporate Overview
FDIreform:
The Union Budget 2021-22’s proposal to increase the FDI limit in Indian insurance companies from 49% to 74% is likely to attract foreign investment. This will aid insurance penetration by facilitating funds for companies to expand and lead to more choices for consumers.
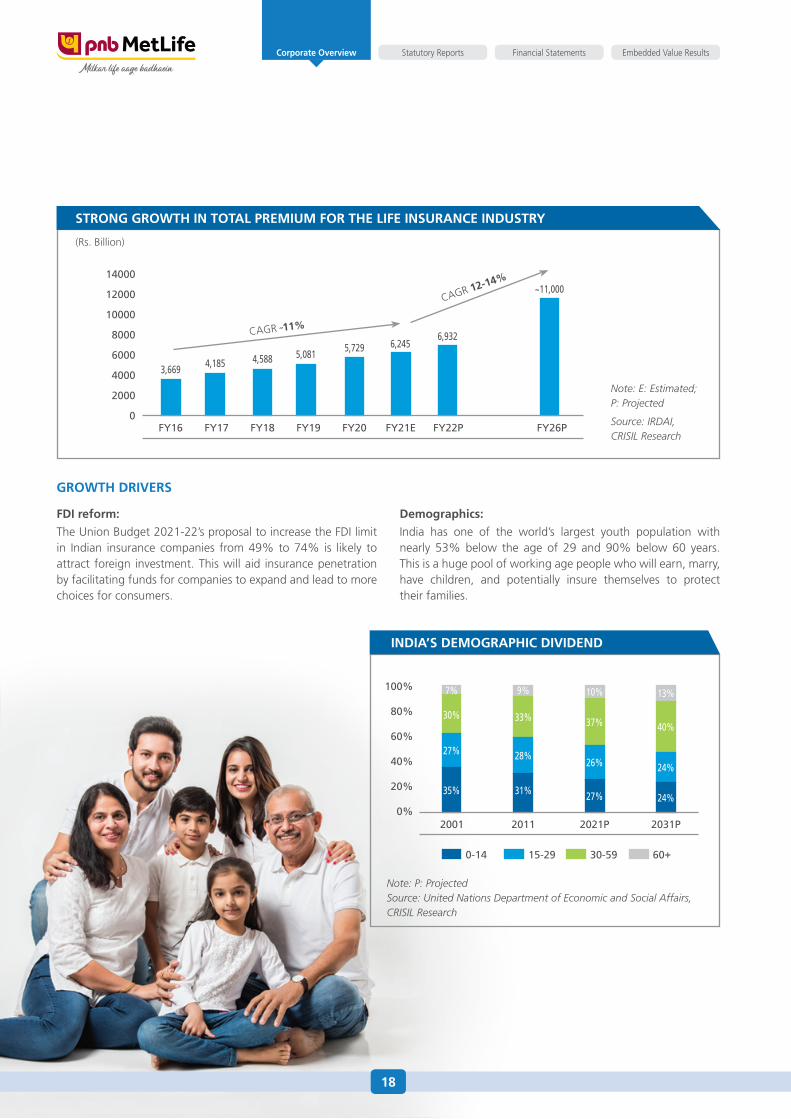
Demographics:
India has one of the world’s largest youth population with nearly 53% below the age of 29 and 90% below 60 years. This is a huge pool of working age people who will earn, marry, have children, and potentially insure themselves to protect their families.
GROWTH DRIVERS
(Rs. Billion)
STRONG GROWTH IN TOTAL PREMIUM FOR THE LIFE INSURANCE INDUSTRY
Note: E: Estimated; P: Projected
Source: IRDAI, CRISIL Research
3,669 4,185 4,588 5,0815,729 6,245
6,932
FY16 FY21EFY17 FY22PFY18 FY19 FY20
14000
12000
10000
8000
6000
4000
2000
0
~11,000
FY26P
CAGR ˜11%
CAGR 12-14%
INDIA’S DEMOGRAPHIC DIVIDEND
100%
80%
60%
40%
20%
0%
7%
30%
27%
35%
2001
13%
40%
24%
24%
2031P
9%
33%
28%
31%
2011
10%
37%
26%
27%
2021P
Note: P: ProjectedSource: United Nations Department of Economic and Social Affairs, CRISIL Research
0-14 15-29 30-59 60+
18
Financial Statements Embedded Value ResultsStatutory ReportsCorporate Overview
COVID-19insurancepolicy:
The pandemic has led to individuals increasingly opting to purchase all-encompassing life covers. Even the Government has increased its focus on offering innovative life cover products.
Emergenceofnewdistributionchannels:
With increasing internet and mobile penetration, digitization of life insurance products and development into a web-based/app-based models is likely to play a greater role in driving scalability and reducing costs. It will help in increasing insurance penetration by enabling remote access of services like policy buying, renewals and claims, and thus clients in remote areas can onboard without worrying about maintaining physical documentation. Digitalization will also facilitate in building applications that can drive financial literacy, especially in small towns and rural areas.
Despite emergence of new digital distribution channels, banks as distributors are likely to continue playing an active role. Their one-stop-shop model of providing multiple services through optimal use of technology is sustainable and it will be vital for life insurers to continue using this channel for sales.
Boostinhouseholdandfinancialsavings:
Household savings in India have declined from 23.6% in FY 2011-12 to 19.6% in FY 2019-20. However, with decline in discretionary spending during the pandemic and lower spending to be prepared for future exigencies, household savings is expected to rise. With growing financial literacy in India, a growing share of this savings is likely to channelize towards financial assets (i.e. insurance and mutual funds) over the next five years.
PradhanMantriJeevanJyotiBimaYojana(PMJJBY):
A universal social security system, especially for the poor and the under-privileged, PMJJBY is a one-year renewable life insurance scheme. Offering a cover of Rs. 0.2 Million at a nominal premium of Rs. 330 per annum per member, it is seeing increased acceptance and driving penetration.
IncreasinghealthcarespendingbyGovernment:
The Government has raised its healthcare budget by ~10% for FY 2020-21 to Rs. 690 Billion and intends to increase its healthcare spending to 2.5% of GDP by 2025 under the National Health Policy 2017. This is likely to boost health coverage in the coming years.
Advancementsindiagnosisandtreatments:
The healthcare industry is evolving with technology advancements which ensures faster and reliable services. This is likely to enhance reach and quality of healthcare delivery systems and improve efficiency of healthcare delivery providers with better resource planning and patient record maintenance. In the coming years, the advent of 5G, smartphone penetration and increasing health awareness is likely to enhance digital healthcare penetration and improve mortality rate.
19
Financial Statements Embedded Value ResultsStatutory ReportsCorporate Overview
CHALLENGES
Riseinmortalityrate:
Though the ultimate mortality impact of COVID-19 will depend on the timing and effectiveness of vaccine, it definitely has an increased risk of mortality among the elderly and individuals with comorbidities as suggestive in higher deaths. Life insurers in India are likely to be affected negatively with rising mortality as cases rise.
Non-applicabilityoftheforcemajeureclause:
Given that the force majeure clause is not applicable to COVID-19 death claims, the insurers have to pay out all such claims that fulfill the required conditions laid out in the agreements and are likely to be adversely impacted.
Newbusinessandriskselection:
Social distancing and Government restrictions have impacted new business applications and underwriting of life insurers as such activities were highly dependent on in-person contact. However, due to pandemic they are now being done remotely. All players are likely to be affected, and those who have increased their digital presence are likely to have a limited downside.
Marketenvironment:
While the Indian economy is gradually recovering from the second wave of COVID-19, consumers continue to face challenges of unemployment and income loss, impacting their appetite to buy life insurance and annuity products. It will be important for companies to monitor consumer behavior and manage their mix of business and risk appetite accordingly.
Life insurers got affected due to restricted in-person interactions. They are also likely to face increased competition from other financial savings instruments such as mutual funds, bank deposits, and small-savings instruments, apart from physical savings.
However, unlike others, life insurance products offers the dual benefits of protection and long-term savings which is likely to offset competition. It will be important for life insurers to focus on increasing awareness, value proposition, transparency, and ensuring cost competitiveness to make products more attractive.
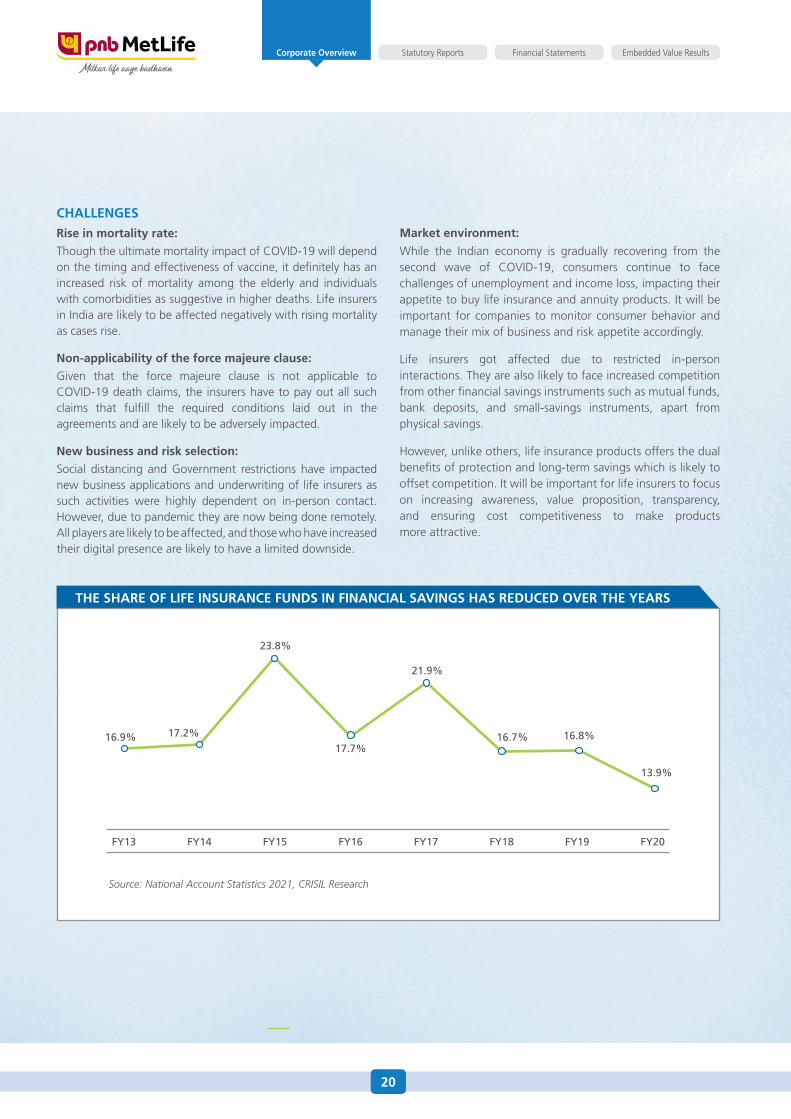
THE SHARE OF LIFE INSURANCE FUNDS IN FINANCIAL SAVINGS HAS REDUCED OVER THE YEARS
Source: National Account Statistics 2021, CRISIL Research
16.9%
23.8%
21.9%
16.8%
13.9%
17.2%17.7%
16.7%
FY16 FY17 FY18FY13 FY19FY14 FY20FY15
20
Financial Statements Embedded Value ResultsStatutory ReportsCorporate Overview

21
Financial Statements Embedded Value ResultsStatutory ReportsCorporate Overview
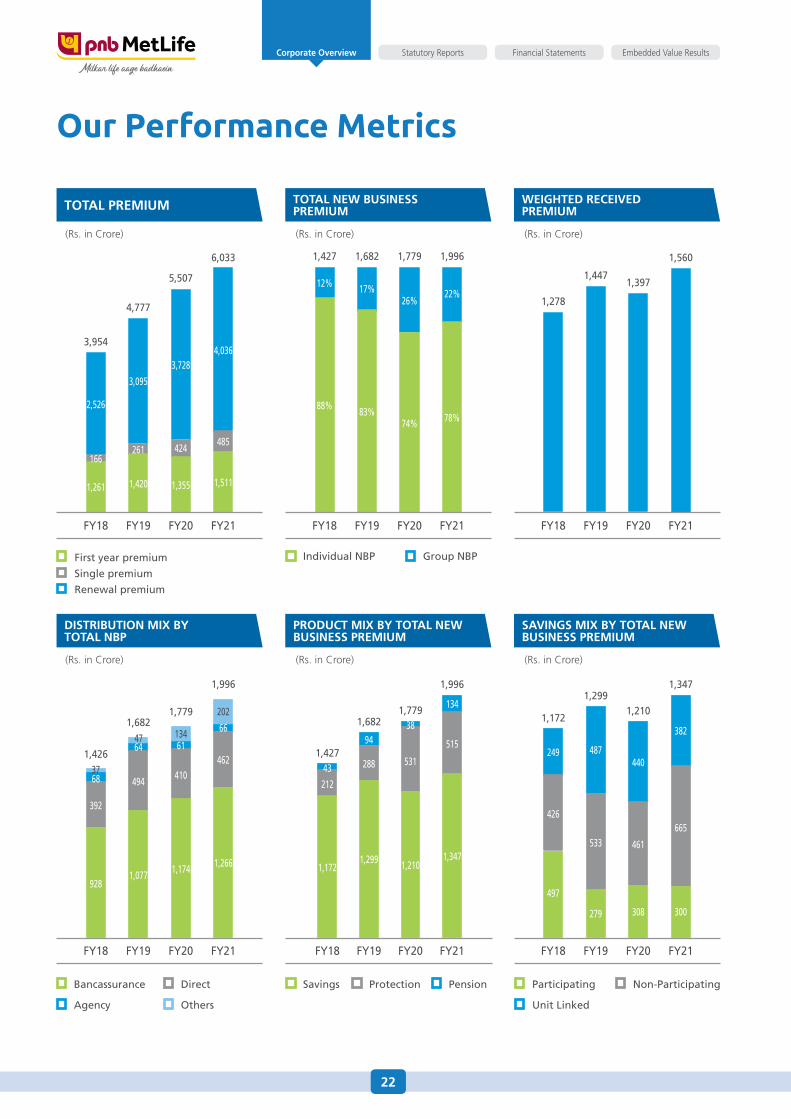
Our Performance Metrics
TOTAL NEW BUSINESSPREMIUM
WEIGHTED RECEIVEDPREMIUM
PRODUCT MIX BY TOTAL NEW BUSINESS PREMIUM
SAVINGS MIX BY TOTAL NEW BUSINESS PREMIUM
(Rs. in Crore)
Group NBP
(Rs. in Crore)
Savings Protection Pension
(Rs. in Crore)
(Rs. in Crore)
Participating Non-Participating
Unit Linked
TOTAL PREMIUM
(Rs. in Crore)
First year premium
Single premium
Renewal premium
DISTRIBUTION MIX BY TOTAL NBP
(Rs. in Crore)
Bancassurance
Agency
Direct
Others
FY19
1,278
FY18
1,447
FY19
1,397
FY20
1,560
FY21
1,779
FY20
26%
74%
1,996
FY21
22%
78%
1,682
17%
83%
1,427
FY18
12%
88%
5,507
FY20
3,728
1,355
424
6,033
FY21
4,036
1,511
485
3,954
FY18
2,526
1,261
166
4,777
FY19
3,095
1,420
261
1,996
FY21
134
515
1,347
1,347
FY21
382
665
300
1,779
FY20
1,210
531
381,210
FY20
308
461
440
1,682
FY19
1,299
288
94
1,299
FY19
279
533
487
FY18
1,427
1,172
212
43
1,172
FY18
497
426
249
Individual NBP
1,996
FY21
202
1,266
66
462
1,779
FY20
134
1,174
61
410
1,682
FY19
47
1,077
64
494
1,426
FY18
37
928
68
392
22
Financial Statements Embedded Value ResultsStatutory ReportsCorporate Overview
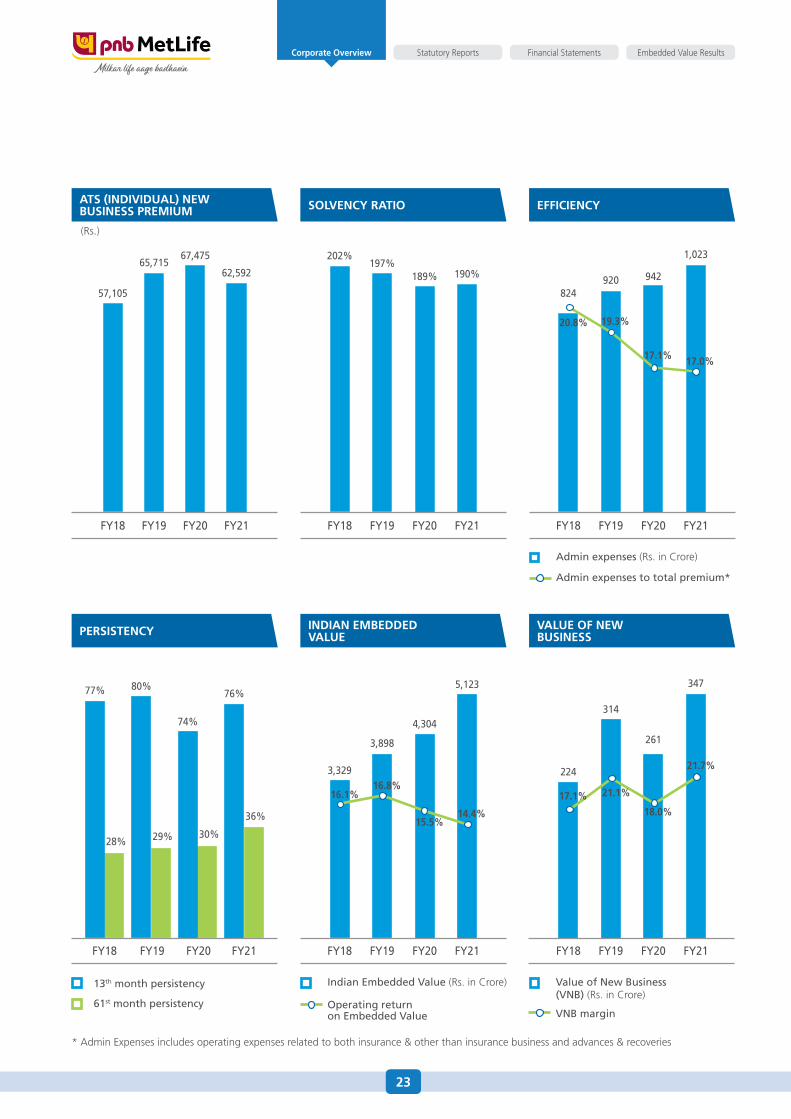
ATS (INDIVIDUAL) NEWBUSINESS PREMIUM SOLVENCY RATIO EFFICIENCY
PERSISTENCY INDIAN EMBEDDED VALUE
VALUE OF NEW BUSINESS
Admin expenses (Rs. in Crore)
Admin expenses to total premium*
Indian Embedded Value (Rs. in Crore)
Operating return on Embedded Value
Value of New Business (VNB) (Rs. in Crore)
VNB margin
824
FY18
920
FY19
942
FY20
1,023
FY21
20.8% 19.3%
17.1% 17.0%
202%
FY18
57,105
FY18
197%
FY19
65,715
FY19
189%
FY20
67,475
FY20
190%
FY21
62,592
FY21
13th month persistency
61st month persistency
28%
77%
FY18
29%
80%
FY19
30%
74%
FY20
36%
76%
FY21
3,329
FY18
3,898
FY19
4,304
FY20
5,123
FY21
224
FY18
314
FY19
261
FY20
347
FY21
16.1%16.8%
15.5%14.4%
17.1% 21.1%
18.0%
21.7%
(Rs.)
* Admin Expenses includes operating expenses related to both insurance & other than insurance business and advances & recoveries
23
Financial Statements Embedded Value ResultsStatutory ReportsCorporate Overview
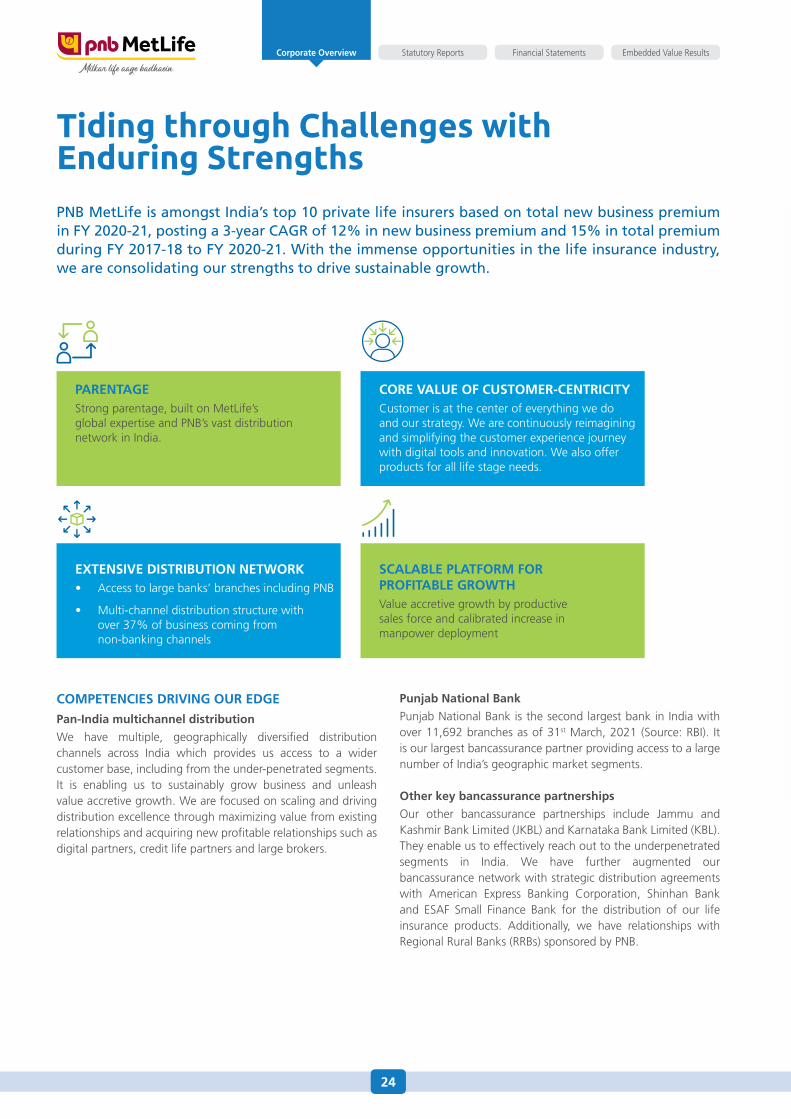
Tiding through Challenges with Enduring Strengths PNB MetLife is amongst India’s top 10 private life insurers based on total new business premium in FY 2020-21, posting a 3-year CAGR of 12% in new business premium and 15% in total premium during FY 2017-18 to FY 2020-21. With the immense opportunities in the life insurance industry, we are consolidating our strengths to drive sustainable growth.
PARENTAGE Strong parentage, built on MetLife’s global expertise and PNB’s vast distribution network in India.
CORE VALUE OF CUSTOMER-CENTRICITYCustomer is at the center of everything we do and our strategy. We are continuously reimagining and simplifying the customer experience journey with digital tools and innovation. We also offer products for all life stage needs.
COMPETENCIES DRIVING OUR EDGE
Pan-India multichannel distribution
We have multiple, geographically diversified distribution channels across India which provides us access to a wider customer base, including from the under-penetrated segments. It is enabling us to sustainably grow business and unleash value accretive growth. We are focused on scaling and driving distribution excellence through maximizing value from existing relationships and acquiring new profitable relationships such as digital partners, credit life partners and large brokers.
Punjab National Bank
Punjab National Bank is the second largest bank in India with over 11,692 branches as of 31st March, 2021 (Source: RBI). It is our largest bancassurance partner providing access to a large number of India’s geographic market segments.
Other key bancassurance partnerships
Our other bancassurance partnerships include Jammu and Kashmir Bank Limited (JKBL) and Karnataka Bank Limited (KBL). They enable us to effectively reach out to the underpenetrated segments in India. We have further augmented our bancassurance network with strategic distribution agreements with American Express Banking Corporation, Shinhan Bank and ESAF Small Finance Bank for the distribution of our life insurance products. Additionally, we have relationships with Regional Rural Banks (RRBs) sponsored by PNB.
EXTENSIVE DISTRIBUTION NETWORK• Accesstolargebanks’branchesincludingPNB
• Multi-channeldistributionstructurewith over 37% of business coming from non-banking channels
SCALABLE PLATFORM FOR PROFITABLE GROWTHValue accretive growth by productive sales force and calibrated increase in manpower deployment
24
Financial Statements Embedded Value ResultsStatutory ReportsCorporate Overview

Direct sales and agency
We had a well-entrenched network of 5,986 Insurance Managers and 9,286 exclusive agents during FY 2020-21, providing us a powerful avenue for reaching out to customers. We also had 396 loyalty managers who focus on servicing existing policies and cross-selling with the support of our lead management systems. We are continually undertaking efforts to develop and strengthen our Direct sales and Agency channels.
Others
We have tie-ups with 10 Insurance Marketing Firm (IMF) and 73 brokers as of 31st March 2021 which is further helping us reinforce our distribution network. We endeavor to look for profitable long-term distribution partners to complement the other channels.
New partner acquisition
With the ongoing evolution happening in the life insurance industry, we are exploring partnership opportunities with distributors in identified archetypes which can generate incremental business, drive profitable growth and help us to deliver superior customer value proposition. In FY 2020-21, we have made significant strides in this journey, on-boarding over 60 new partners including 4 in credit life space. Since April 2019, we have onboarded over 80 new partners which together generated new business premium of Rs. 129 Crore during FY 2020-21.
25
Financial Statements Embedded Value ResultsStatutory ReportsCorporate Overview
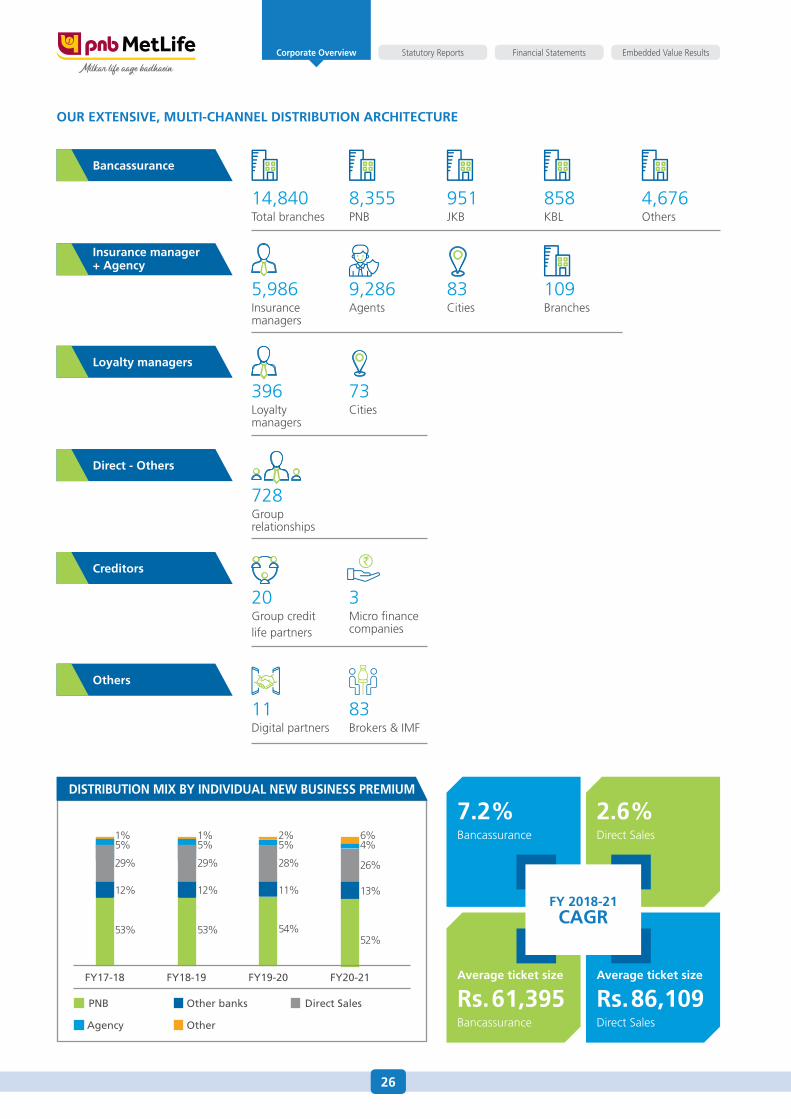
OUR EXTENSIVE, MULTI-CHANNEL DISTRIBUTION ARCHITECTURE
14,840Total branches
8,355PNB
951JKB
858KBL
4,676Others
Bancassurance
DISTRIBUTION MIX BY INDIVIDUAL NEW BUSINESS PREMIUM
7.2%Bancassurance
Rs.61,395Bancassurance
2.6%Direct Sales
Rs.86,109Direct Sales
Loyalty managers
396Loyalty managers
73Cities
5,986Insurance managers
9,286Agents
83Cities
109Branches
Insurance manager + Agency
Creditors
20Group creditlife partners
3Micro finance companies
Direct - Others
728Group relationships
Others
83Brokers & IMF
11Digital partners
FY 2018-21 CAGR
1%5%
29%
12%
53%
FY17-18
1%5%
29%
12%
53%
2%5%
28%
11%
54%
FY19-20
6%4%
26%
13%
52%
FY20-21
PNB Other banks Direct Sales
Agency Other
Averageticketsize AverageticketsizeFY18-19
26
Financial Statements Embedded Value ResultsStatutory ReportsCorporate Overview

ABILITY TO DELIVER SUPERIOR CUSTOMER EXPERIENCE
Our focus has been to build best-in-class digital capabilities to provide a seamless experience to our customers, partners, and employees.
In line with this, we have completely digitized processes right from onboarding to claim settlement to ensure a seamless and hassle-free experience. An ‘e-branch next’ platform was created which is greatly contributing towards improving on-boarding journey and making it completely paperless. Its adaptive user interface and simplicity delivers a user-friendly and delightful experience right until policy issuance.
In our effort to improve quality of sales, a concept of pre-issuance video verification has been initiated. It is helping validate customers’ understanding of the policy features and accuracy of contact details captured by sales team. This will help us to reduce queries and complaints. Corporate website being our first point of contact in many cases, we have revamped it with simplified content and customization capabilities based on user browsing behavior, location, etc.
Towards improving customer servicing, CRMNEXT, an end-to-end solution has been introduced. It allows designing dynamic workflows for service and lead management. Measures have been taken to simplify underwriting resulting in 74% straight-through processing. We have also widened digital payment modes to enable our customers make payment using their preferred mode.
On the claims side, we are continually undertaking efforts to improve experience. We have launched Claims Assure, a pioneering 3-hour claims decisioning process. It ensures a simplified claims journey and has considerably reduced time and documentation in case of any unfortunate event. With this, we are amongst the few in the industry to offer such a quick decisioning on claims and thus offering peace of mind to our customers.
27
Financial Statements Embedded Value ResultsStatutory ReportsCorporate Overview
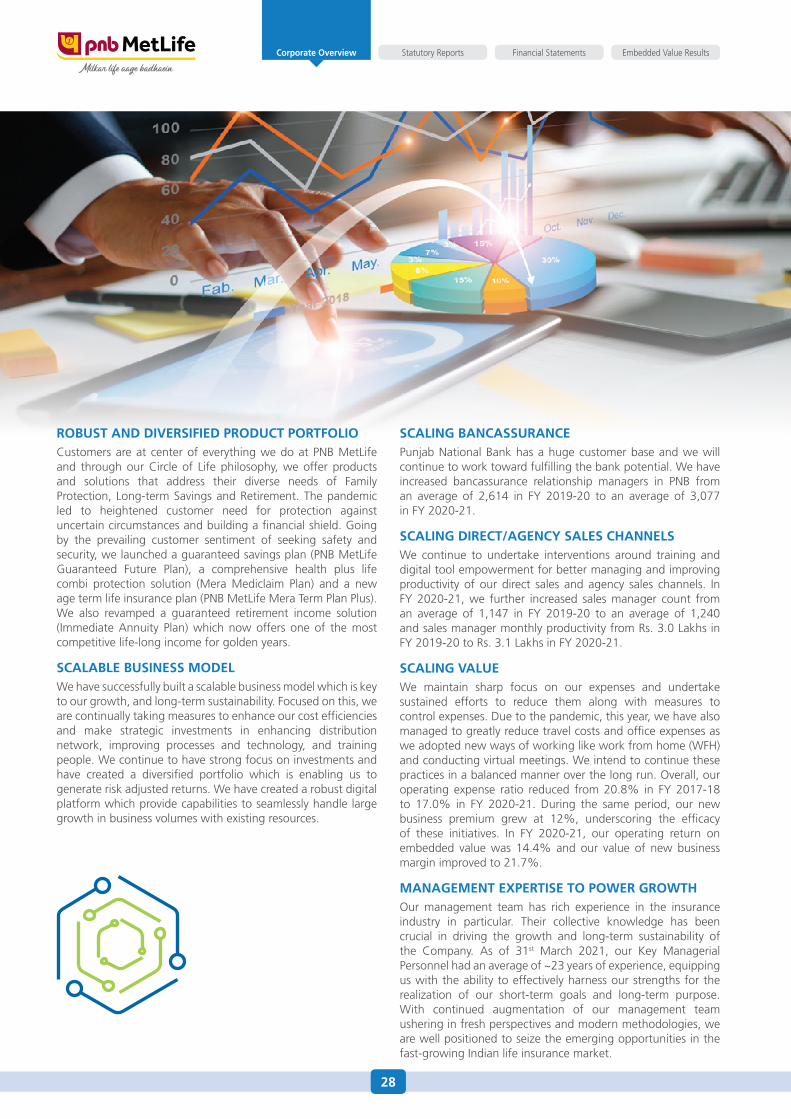
ROBUST AND DIVERSIFIED PRODUCT PORTFOLIOCustomers are at center of everything we do at PNB MetLife and through our Circle of Life philosophy, we offer products and solutions that address their diverse needs of Family Protection, Long-term Savings and Retirement. The pandemic led to heightened customer need for protection against uncertain circumstances and building a financial shield. Going by the prevailing customer sentiment of seeking safety and security, we launched a guaranteed savings plan (PNB MetLife Guaranteed Future Plan), a comprehensive health plus life combi protection solution (Mera Mediclaim Plan) and a new age term life insurance plan (PNB MetLife Mera Term Plan Plus). We also revamped a guaranteed retirement income solution (Immediate Annuity Plan) which now offers one of the most competitive life-long income for golden years.
SCALABLE BUSINESS MODEL We have successfully built a scalable business model which is key to our growth, and long-term sustainability. Focused on this, we are continually taking measures to enhance our cost efficiencies and make strategic investments in enhancing distribution network, improving processes and technology, and training people. We continue to have strong focus on investments and have created a diversified portfolio which is enabling us to generate risk adjusted returns. We have created a robust digital platform which provide capabilities to seamlessly handle large growth in business volumes with existing resources.
SCALING BANCASSURANCEPunjab National Bank has a huge customer base and we will continue to work toward fulfilling the bank potential. We have increased bancassurance relationship managers in PNB from an average of 2,614 in FY 2019-20 to an average of 3,077 in FY 2020-21.
SCALING DIRECT/AGENCY SALES CHANNELSWe continue to undertake interventions around training and digital tool empowerment for better managing and improving productivity of our direct sales and agency sales channels. In FY 2020-21, we further increased sales manager count from an average of 1,147 in FY 2019-20 to an average of 1,240 and sales manager monthly productivity from Rs. 3.0 Lakhs in FY 2019-20 to Rs. 3.1 Lakhs in FY 2020-21.
SCALING VALUEWe maintain sharp focus on our expenses and undertake sustained efforts to reduce them along with measures to control expenses. Due to the pandemic, this year, we have also managed to greatly reduce travel costs and office expenses as we adopted new ways of working like work from home (WFH) and conducting virtual meetings. We intend to continue these practices in a balanced manner over the long run. Overall, our operating expense ratio reduced from 20.8% in FY 2017-18 to 17.0% in FY 2020-21. During the same period, our new business premium grew at 12%, underscoring the efficacy of these initiatives. In FY 2020-21, our operating return on embedded value was 14.4% and our value of new business margin improved to 21.7%.
MANAGEMENT EXPERTISE TO POWER GROWTHOur management team has rich experience in the insurance industry in particular. Their collective knowledge has been crucial in driving the growth and long-term sustainability of the Company. As of 31st March 2021, our Key Managerial Personnel had an average of ~23 years of experience, equipping us with the ability to effectively harness our strengths for the realization of our short-term goals and long-term purpose. With continued augmentation of our management team ushering in fresh perspectives and modern methodologies, we are well positioned to seize the emerging opportunities in the fast-growing Indian life insurance market.
28
Financial Statements Embedded Value ResultsStatutory ReportsCorporate Overview
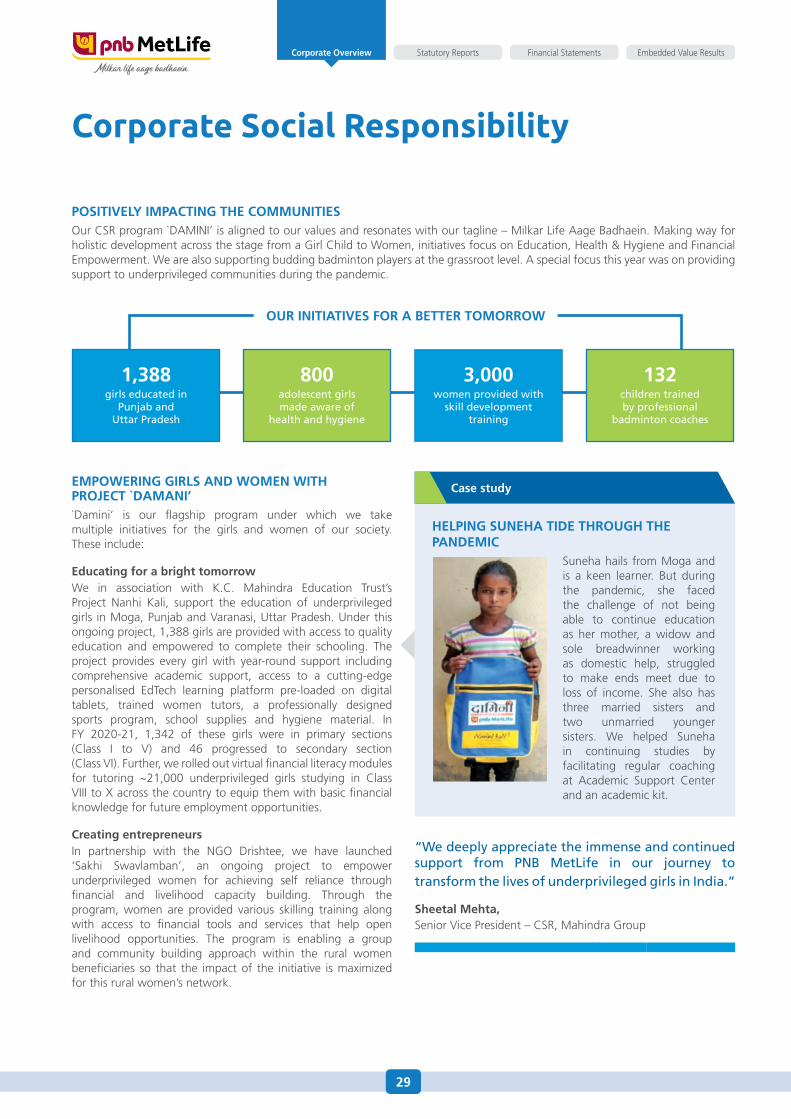
POSITIVELY IMPACTING THE COMMUNITIES OurCSRprogram`DAMINI’isalignedtoourvaluesandresonateswithourtagline–MilkarLifeAageBadhaein.Makingwayforholistic development across the stage from a Girl Child to Women, initiatives focus on Education, Health & Hygiene and Financial Empowerment. We are also supporting budding badminton players at the grassroot level. A special focus this year was on providing support to underprivileged communities during the pandemic.
EMPOWERING GIRLS AND WOMEN WITH PROJECT `DAMANI’`Damini’ is our flagship program under which we take multiple initiatives for the girls and women of our society. These include:
Educating for a bright tomorrowWe in association with K.C. Mahindra Education Trust’s Project Nanhi Kali, support the education of underprivileged girls in Moga, Punjab and Varanasi, Uttar Pradesh. Under this ongoing project, 1,388 girls are provided with access to quality education and empowered to complete their schooling. The project provides every girl with year-round support including comprehensive academic support, access to a cutting-edge personalised EdTech learning platform pre-loaded on digital tablets, trained women tutors, a professionally designed sports program, school supplies and hygiene material. In FY 2020-21, 1,342 of these girls were in primary sections (Class I to V) and 46 progressed to secondary section (Class VI). Further, we rolled out virtual financial literacy modules for tutoring ~21,000 underprivileged girls studying in Class VIII to X across the country to equip them with basic financial knowledge for future employment opportunities.
Creating entrepreneursIn partnership with the NGO Drishtee, we have launched ‘Sakhi Swavlamban’, an ongoing project to empower underprivileged women for achieving self reliance through financial and livelihood capacity building. Through the program, women are provided various skilling training along with access to financial tools and services that help open livelihood opportunities. The program is enabling a group and community building approach within the rural women beneficiaries so that the impact of the initiative is maximized for this rural women’s network.
1,388 girls educated in
Punjab and Uttar Pradesh
800 adolescent girls made aware of
health and hygiene
3,000 women provided with
skill development training
132children trained by professional
badminton coaches
HELPING SUNEHA TIDE THROUGH THE PANDEMIC
Suneha hails from Moga and is a keen learner. But during the pandemic, she faced the challenge of not being able to continue education as her mother, a widow and sole breadwinner working as domestic help, struggled to make ends meet due to loss of income. She also has three married sisters and two unmarried younger sisters. We helped Suneha in continuing studies by facilitating regular coaching at Academic Support Center and an academic kit.
Case study
“We deeply appreciate the immense and continued support from PNB MetLife in our journey to transform the lives of underprivileged girls in India.”
Sheetal Mehta, Senior Vice President – CSR, Mahindra Group
OUR INITIATIVES FOR A BETTER TOMORROW
Corporate Social Responsibility
29
Financial Statements Embedded Value ResultsStatutory ReportsCorporate Overview
In FY 2020-21, 3,000 women across 117 villages of Varanasi were reached for enrollment into Sakhi Swavlamban program. 80 women became a part of the different Micro Enterprise Groups (MEGs) producing value-added products and 1,000 rural women producers could be linked with various production opportunities.
Their goods including organic vegetables, textile, home furnishing, dairy farming, spices, and pickles were regularly supplied to ~2,750 households across the urban locations of the Varanasi district generating an income of ~Rs. 11.70 Lakhs.
To further support the beneficiaries and drive the Government’s agenda of financial inclusion, we also introduced Financial Literacy programs for these budding entrepreneurs. The course modules were based on RBI’s Financial Literacy Guide and were attended by 1,000 beneficiaries.
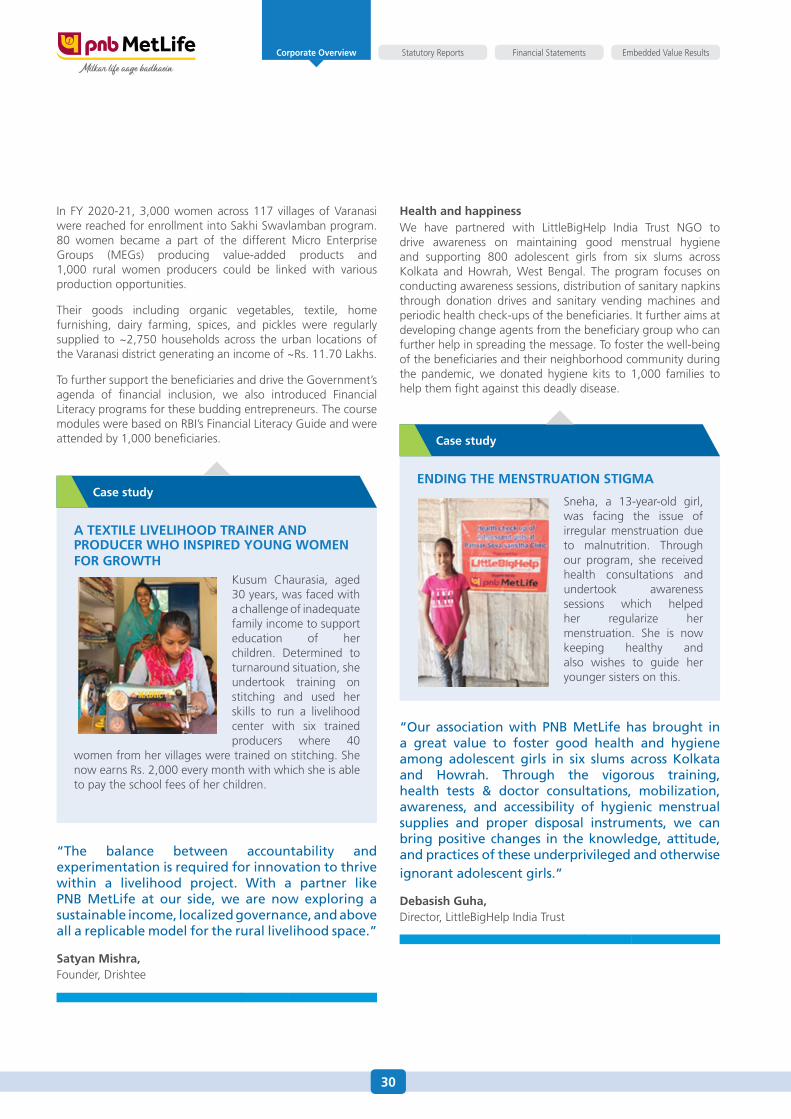
A TEXTILE LIVELIHOOD TRAINER AND PRODUCER WHO INSPIRED YOUNG WOMEN FOR GROWTH
Kusum Chaurasia, aged 30 years, was faced with a challenge of inadequate family income to support education of her children. Determined to turnaround situation, she undertook training on stitching and used her skills to run a livelihood center with six trained producers where 40
women from her villages were trained on stitching. She now earns Rs. 2,000 every month with which she is able to pay the school fees of her children.
Case study
“The balance between accountability and experimentation is required for innovation to thrive within a livelihood project. With a partner like PNB MetLife at our side, we are now exploring a sustainable income, localized governance, and above all a replicable model for the rural livelihood space.”
Satyan Mishra, Founder, Drishtee
Health and happiness We have partnered with LittleBigHelp India Trust NGO to drive awareness on maintaining good menstrual hygiene and supporting 800 adolescent girls from six slums across Kolkata and Howrah, West Bengal. The program focuses on conducting awareness sessions, distribution of sanitary napkins through donation drives and sanitary vending machines and periodic health check-ups of the beneficiaries. It further aims at developing change agents from the beneficiary group who can further help in spreading the message. To foster the well-being of the beneficiaries and their neighborhood community during the pandemic, we donated hygiene kits to 1,000 families to help them fight against this deadly disease.
“Our association with PNB MetLife has brought in a great value to foster good health and hygiene among adolescent girls in six slums across Kolkata and Howrah. Through the vigorous training, health tests & doctor consultations, mobilization, awareness, and accessibility of hygienic menstrual supplies and proper disposal instruments, we can bring positive changes in the knowledge, attitude, and practices of these underprivileged and otherwise ignorant adolescent girls.”
Debasish Guha, Director, LittleBigHelp India Trust
ENDING THE MENSTRUATION STIGMA
Sneha, a 13-year-old girl, was facing the issue of irregular menstruation due to malnutrition. Through our program, she received health consultations and undertook awareness sessions which helped her regularize her menstruation. She is now keeping healthy and also wishes to guide her younger sisters on this.
Case study
30
Financial Statements Embedded Value ResultsStatutory ReportsCorporate Overview
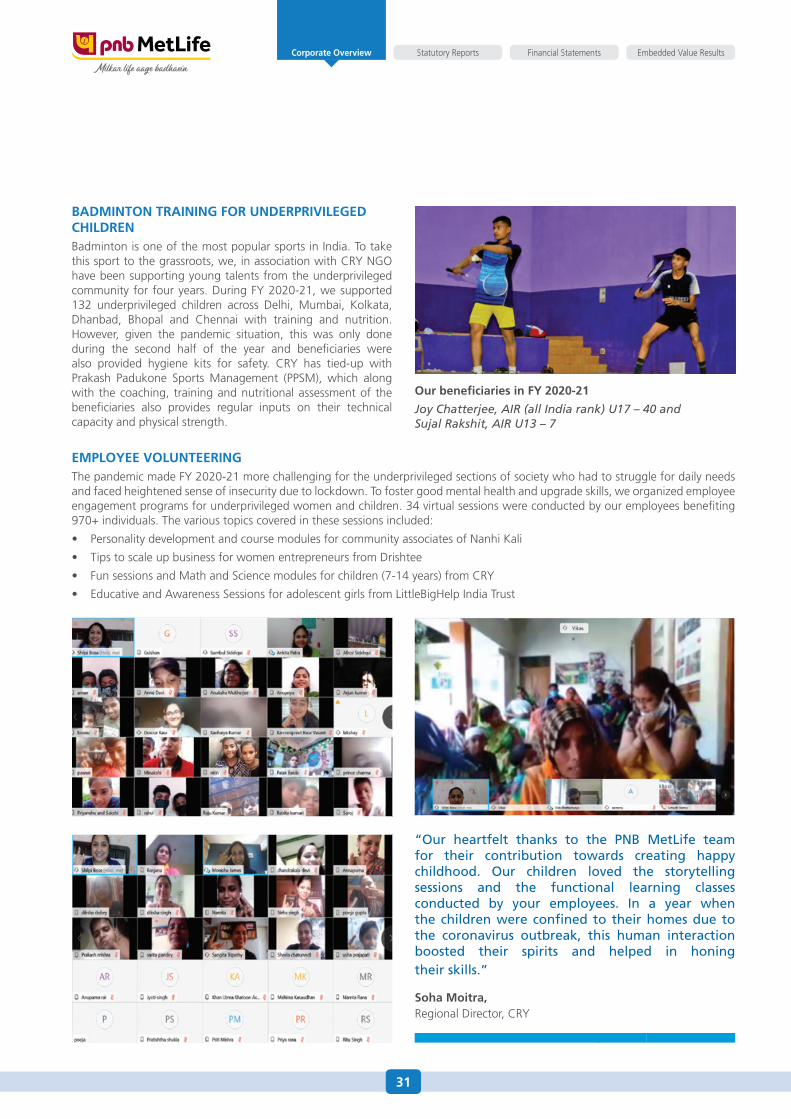
BADMINTON TRAINING FOR UNDERPRIVILEGED CHILDRENBadminton is one of the most popular sports in India. To take this sport to the grassroots, we, in association with CRY NGO have been supporting young talents from the underprivileged community for four years. During FY 2020-21, we supported 132 underprivileged children across Delhi, Mumbai, Kolkata, Dhanbad, Bhopal and Chennai with training and nutrition. However, given the pandemic situation, this was only done during the second half of the year and beneficiaries were also provided hygiene kits for safety. CRY has tied-up with Prakash Padukone Sports Management (PPSM), which along with the coaching, training and nutritional assessment of the beneficiaries also provides regular inputs on their technical capacity and physical strength.
Our beneficiaries in FY 2020-21
Joy Chatterjee, AIR (all India rank) U17 – 40 and Sujal Rakshit, AIR U13 – 7
EMPLOYEE VOLUNTEERING The pandemic made FY 2020-21 more challenging for the underprivileged sections of society who had to struggle for daily needs and faced heightened sense of insecurity due to lockdown. To foster good mental health and upgrade skills, we organized employee engagement programs for underprivileged women and children. 34 virtual sessions were conducted by our employees benefiting 970+ individuals. The various topics covered in these sessions included:
• PersonalitydevelopmentandcoursemodulesforcommunityassociatesofNanhiKali
• TipstoscaleupbusinessforwomenentrepreneursfromDrishtee
• FunsessionsandMathandSciencemodulesforchildren(7-14years)fromCRY
• EducativeandAwarenessSessionsforadolescentgirlsfromLittleBigHelpIndiaTrust
“Our heartfelt thanks to the PNB MetLife team for their contribution towards creating happy childhood. Our children loved the storytelling sessions and the functional learning classes conducted by your employees. In a year when the children were confined to their homes due to the coronavirus outbreak, this human interaction boosted their spirits and helped in honing their skills.”
Soha Moitra, Regional Director, CRY
31
Financial Statements Embedded Value ResultsStatutory ReportsCorporate Overview

Awards
Best Brands 2020 for the second year in a row by The Economic Times
Virtue Funds ranked among top 10 by globally renownedfundratingorganization
HR Excellence Awards 2020 – Certificate of Recognition for leading practices in Health & Well-Being and Diversity & Inclusion by People First
32
Financial Statements Embedded Value ResultsStatutory ReportsCorporate Overview

Initiative of the Year for 2020 by Indian Legal Awards
Data Driven Marketing – Gold at the 9th Global Customer Engagement Awards 2020, by ACEFandBronzeat Indian Digital Marketing Awards 2020, by Exchange4Media
33
Financial Statements Embedded Value ResultsStatutory ReportsCorporate Overview
Corporate Information
BOARD OF DIRECTORS
Mr. Kishore PonnavoluChairman & Non-Executive Director
Mr. Ashish Kumar SrivastavaManaging Director & CEO
Mr. CH. S.S. Mallikarjuna RaoNon-Executive Director
Mr. Sanjay KumarNon-Executive Director
Mr.PherozeKersaspMistryNon-Executive Director
Mr. Surbhit DabriwalaNon-Executive Director
Mr. Ashish BhatNon-Executive Director
Mr. Atinder Jit SinghNon-Executive Director
Mr. Stephen BarnhamNon-Executive Director
Mr. Thallapaka Venkateswara RaoNon-Executive Director
Mr. Arvind Kumar JainNon-Executive Director
Mr. Erach KotwalNon-Executive Director
Mr. Sunil GulatiIndependent Director
Ms. Sonu BhasinIndependent Director
Ms. Padma ChandrasekaranIndependent Director
MANAGEMENT COMMITTEE
Mr. Khalid AhmadChief Financial Officer
Mr. P. K. DinakarChief Actuary & Products Officer
Mr. Sameer BansalChief Distribution Officer
Mr. Samrat Ashim DasChief Operating Officer
Mr. Sanjay KumarChief Investment Officer
Ms. Viraj TanejaChief Internal Auditor
Mr. Agnipushp Singh Chief Legal Officer & Head - Board Affairs
Mr. Sarang Kamalkishore CheemaChief Compliance Officer
Mr. Shishir Vijaykumar AgarwalChief Human Resources Officer
Mr. Vineet MaheshwariChief Strategy Officer
Mr. Nipun KaushalChief Marketing Officer
Mr. Anjan BhattacharyaChief Risk Officer
STATUTORY AUDITORS
K. S. Aiyar & Co.Chartered Accountants
M. P. Chitale & Co.Chartered Accountants
COMPANY SECRETARY & COMPLIANCE OFFICER
Ms. Yagya Turker
BANKERS
Punjab National Bank
Citibank N.A.
HDFC Bank Limited
REGISTERED OFFICE
Unit No. 701, 702 & 703, 7th Floor,West Wing Raheja Towers,26/27, M G Road,Bangalore - 560001,Karnataka
CORPORATE OFFICES
1st Floor, Techniplex - 1,Techniplex Complex,Off Veer Savarkar Flyover,Goregaon (W),Mumbai - 400062
Unit no. 302, 3rd floor,Tower - 3, Worldmark,Sector 65, District Gurugram,Haryana - 122018
Website:www.pnbmetlife.com
CINNo.:U66010KA2001PLC028883
34
Financial Statements Embedded Value ResultsStatutory ReportsCorporate Overview
35
Financial Statements Embedded Value ResultsCorporate Overview Statutory Reports
Dear Shareholders,
PNB MetLife India Insurance Company Limited
Your Directors take pleasure in presenting the Twentieth Annual Report for the year ended 31st March 2021 along with audited financial statements for the year ended 31st March 2021.
INDUSTRY PERFORMANCE
The life insurance in India continues to be one of the fastest-growing segments, with gross total premium at Rs. 6.1 Trillion in FY 2020-21 and compounded at a robust 11% CAGR in the last five years. This has been made possible with high-teen growth in the new business premium in the same period. These double-digit growth numbers are attributable to factors such as rising household savings and income levels, increasing awareness/education about the products, tax benefits, product innovation and customization by the players and new distribution channels.
This fiscal, amid the COVID-19 pandemic, the new business premium (NBP) witnessed a temporary slump as the cash position of people has been unstable. Despite this, the inclination of people to avoid unforeseen risks amid COVID-19 and increasing penetration of the products in the online market caused NBP to grow ~7% to Rs. 2.78 Trillion in FY 2020-21 compared with Rs. 2.58 Trillion in FY 2019-20. This growth was significantly lower than the ~21% growth in FY 2019-20.
The life insurance sector in India has been growing rapidly in the past two decades, but it is still far from reaching its
Directors’ Report
potential. India remains significantly under-insured (density and penetration) compared with global peers.
In CY 2019, India’s life insurance density was 58 compared with the global life insurance density of 379. India’s life insurance industry penetration stood at 2.8% versus 3.4% globally.
THE STATE OF COMPANY AFFAIRSWe have consistently maintained our position in the top 10 private life insurance companies in India based on total New Business Premium (NBP). Our promoters are MetLife, which is a leading global insurance company (including its subsidiaries and affiliates), and PNB, which is the second largest banks in India based on total branches as of 31st March 2021 (Source: RBI). MetLife International Holdings, LLC, a subsidiary of MetLife, has been our shareholder since August 2001. PNB has been our shareholder since January 2013.
FY 2020-21 posed various challenges due to the onset of the global pandemic situation. Even then, we demonstrated strong delivery in business, while strengthening our core systems. During the year, we continued our ‘Circle of Life’ philosophy of partnering with our customers to cater to various financial needs at specific life stages depending on customers financial preparedness and risk appetite. At the same time, we also focused on strengthening our pan-India, multi-channel distribution network, comprehensive product portfolio and providing an end-to-end customer-centric service experience.
The FY 2020-21 results of the key performance metrics of your Company is summarized in the table below:
Key performance metrics FY 2020-21 FY 2019-20
Value metrics
Operating return on Embedded Value* 14.4% 15.5%
VNB margin* 21.7% 18.0%
Shareholders’ profit 101 93
Growth metrics
Individual New Business Premium 1,550 1,310
Total New business Premium 1,996 1,779
Total Premium 6,033 5,507
Efficiency and quality metrics
Admin expenses to total premium 1,023 942
13th month persistency# 76.1% 73.7%
All numbers in Rs. Crore
* As per report/ letter by Independent Actuary Willis Towers Watson Actuarial Advisory LLP; #13th month persistency for FY 2020-21 based on April 2019 to March 2020 block as on April 2021
36
Financial Statements Embedded Value ResultsCorporate Overview Statutory Reports
Our total Premium increased by 10% and total NBP increased by 12% in FY 2020-21 compared to FY 2019-20. Our admin expense ratio has been stable at 17.0% in FY 2020-21 from 17.1% in FY 2019-20. In FY 2020-21, our Embedded Value growth was 19% and our operating return on embedded value was 14.4%. Our value of new business margin has improved from 18.0% in FY 2019-20 to 21.7% in FY 2020-21.
Our distribution network consists of our bancassurance, direct sales, agency and other distribution channels, through which we generated 63%, 23%, 3% and 10% of our total NBP, respectively, and 64%, 26%, 4% and 6% of our individual NBP, respectively, in FY 2020-21. Customers are at center-stage of everything we do at PNB MetLife and through our Circle of Life philosophy, we offer products and solutions that address the needs of long-term savings, family protection, and retirement. The pandemic led to heightened customer need for protection against uncertain circumstances and building a financial shield. Going by the prevailing customer sentiment of seeking safety and security, we launched guaranteed savings plan (PNB MetLife Guaranteed Future Plan), a comprehensive health plus life combi protection solution (Mera Mediclaim Plan), new age term life insurance plan (MMTP Plus) and also revamped a guaranteed retirement income solution (Immediate Annuity Plan) offering one of the most competitive life-long income for golden years. During FY 2020-21, these customer need categories (long-term savings, family protection, and retirement) comprised 67%, 26% and 7% of our total NBP, respectively, and 87%, 6% and 7% of our individual NBP, respectively.
We expect that our product portfolio and our customer services will continue to drive improvements in our persistency ratios over the longer-term, including for subsequent premium. Our overall claims settlement ratio for FY 2020-21 was 99.30%; 98.17% for individual segment and 99.65% for group segment.
Our strategy is well defined and our focus is on execution. We have a clear vision of where we will focus, what will we simplify, and how can we differentiate.
• Focus:We are focused onmaximizing and reimaginingour distribution including onboarding new partners and fulfilling the potential of our partner bank branch network
• Simplify: We are strengthening the core and creatingefficiency, improving quality by adopting a value mind set.
• Differentiate: We have embarked on a well-definedlong-term digital transformation to simplify our process and services through digitization and enhance the experience of our customers PNB MetLife has some competitive strengths as a company that will help us drive growth this year:
o We have the parentage of PNB and MetLife - two big promoter companies that have stood the test of time. In times like these, ‘The PNB MetLife’ brand
gives our customers and employees the confidence that we are always there for a more secure future.
o We are focused on our core value of keeping the customer at the center of everything we do. Our business strategy is structured around this focus, and we are continuously crafting the customer journey experience with the intent of empowering the customer in everything we do
o We have access to large banks’ distribution network, including PNB. We have strong proprietary channels (Agency and Direct), and we are adding new partnerships every year to increase our distribution strength to reach customers. PNB MetLife has a successful multi-channel distribution structure in terms of geographical distribution, with over 37% of our business coming from non-banking channels.
THE AMOUNT, IF ANY, WHICH IT RECOMMENDS SHOULD BE PAID BY WAY OF DIVIDEND
The Company reported profits during the year. However, the Directors did not recommend any dividend in view of the accumulated losses.
THE AMOUNTS, IF ANY, WHICH IT PROPOSES TO CARRY TO ANY RESERVES
The Company has reported profits during the year. No amount is transferred to reserves due to accumulated losses as on 31st March 2021.
PARTICULARS OF LOANS, INVESTMENTS AND GUARANTEES
In line with the clarification given by the Ministry of Corporate Affairs under the Removal of Difficulty Order dated 13th February 2015, the provisions of Section 186 of the Companies Act 2013 relating to loans, guarantees and investments do not apply to the Company.
SUBSIDIARY / ASSOCIATE COMPANY / JOINT VENTURE COMPANY
The Company does not have any subsidiary or associate or Joint Venture company.
CHANGE IN NATURE OF BUSINESS
During the year under review, there has been no change in nature of the business activity of the Company.
DETAILS OF SIGNIFICANT AND MATERIAL ORDERS PASSED BY THE REGULATORS OR COURTS OR TRIBUNALS IMPACTING THE GOING CONCERN STATUS AND COMPANY’S OPERATIONS IN FUTURE
There are no material orders passed by the Regulators or courts or tribunals impacting the going concern status and Company’s operations in future.
37
Financial Statements Embedded Value ResultsCorporate Overview Statutory Reports
MATERIAL CHANGES AND COMMITMENTS, IF ANY, AFFECTING THE FINANCIAL PERFORMANCE OF THE COMPANY WHICH HAVE OCCURRED BETWEEN THE END OF THE FINANCIAL YEAR TO WHICH THE BALANCE SHEET RELATES TO AND DATE OF THIS REPORT
There have been no material changes and commitments, if any, affecting the financial performance of the Company which have occurred between the end of the financial year to which the Balance Sheet relates to and date of this report.
The Company has assessed the impact of COVID-19 to the extent possible, on its operations as well as on its financial statements, including but not limited to the areas of valuation of investment assets, valuation of policy liabilities and solvency as at 31st March 2021. Further, there is no material impact on the financial statements due to changes in the controls or processes followed during COVID-19 pandemic situation. The Company will however continue to monitor any material changes to the future economic conditions that may have any impact on its business and financial position. Further, the Company has activated the business continuity plan (BCP) since March 2020. Employee safety continues to be a key priority for the Company and work from home facilities are enabled for all employees.
DIRECTORS AND OTHER KEY MANAGERIAL PERSONNEL
Directors
The Board of Directors (‘’the Board’’) of the Company has been appointed in accordance with the provisions of the Companies Act, 2013 and in line with the provisions contained in the Articles of Association of the Company. As on the date of this report, the Board comprises of Fifteen (15) Directors with three (3) being Independent Directors, one (1) being the Managing Director & Chief Executive Officer and others being representatives of various shareholder groups.
As on the date of the Directors Report, following are the Directors and Key Managerial Personnel of the Company as defined under the Companies Act, 2013:
Sr. No.
Name of Director/KMPs Category
1. Kishore Ponnavolu Chairman - Non-Executive Director
2. Ashish Kumar Srivastava Managing Director & CEO
3. Ashish Bhat Non-Executive Director
4. Atinder Jit Singh Additional Director
5. Stephen Barnham Additional Director
6. CH. S.S. Mallikarjuna Rao Non-Executive Director
7. Thallapaka Venkateswara Rao
Non-Executive Director
8. Sanjay Kumar Additional Director
9. Arvind Kumar Jain Non-Executive Director
10. Pheroze Kersasp Mistry Non-Executive Director
11. Erach Homi Kotwal Non-Executive Director
Sr. No.
Name of Director/KMPs Category
12. Surbhit Dabriwala Non-Executive Director
13. Sunil Gulati Independent Director
14. Sonu Bhasin Additional Independent Director
15. Padma Chandrasekaran Additional Independent Director
16. Khalid Ahmad Chief Financial Officer
17. Yagya Turker Company Secretary
The change in composition of the Board during FY 2020-21 is covered under Corporate Governance Report, forming part of this Directors Report.
The Nomination and Remuneration Committee (NRC) scrutinizes the declarations and details submitted by the aspirants before being appointed as Director or Key Management Persons (KMPs). The Committee also assesses desired skill set, experience and competency profile of the applicants in line with the Company’s policy on appointment of Directors and KMPs and the requirements under the Insurance Regulatory and Development Authority of India (Corporate Governance) Guidelines, 2016. Thereafter, the Committee recommends the appointment of candidature for the approval of the Board of Directors. Basis this fit and proper criteria analysis performed by NRC before appointing and recommending candidature to the Board, the Board is of the opinion that the Directors of the Company appointed during the year are eminent persons with integrity and have necessary expertise and experience to continue to discharge their responsibilities as the Director of the Company. Further, the Non-Executive directors of the Company do not hold any shares and convertible instruments of the Company.
Declaration of Independent DirectorsThe Independent Directors have submitted their disclosures/ declarations to the Board that they fulfill all the requirements as stipulated in Section 149(6) of the Companies Act, 2013 so as to qualify themselves to be appointed / continue to be appointed as Independent Directors under the provisions of the Companies Act, 2013 and the rules framed thereunder.
Further, the Independent Directors have got their names registered and included in the databank maintained by the “Indian Institute of Corporate Affairs’’ (‘’Institute’’) as required under Rule 6(1) of the Companies (Appointment and Qualifications of Directors) Rules, 2014. Also, where applicable, Independent Directors have cleared proficiency self-assessment test conducted by the institute within the statutory timeline.
Separate Meeting of Independent Directors:As stipulated under Schedule IV of the Companies Act, 2013, a separate meeting of the Independent Directors of the Company was held on 10th February 2021 to review the performance of the Board as a whole, non-independent Directors and the Chairman of the Board. The Independent Directors also reviewed the quality, content and timeliness of the flow of information between the Management and the Board which is necessary to effectively and reasonably perform and discharge their duties.
38
Financial Statements Embedded Value ResultsCorporate Overview Statutory Reports
The manner of formal annual evaluation of the performance of the Board, its Committees and of individual directors
The annual performance evaluation by the Board is covered in the Corporate Governance Report under the heading ‘’Annual performance evaluation by the Board’’.
Retirement by Rotation
As per Article 7.26 of the Articles of Association of the Company, the term of office of all the Directors, other than the Managing Director and the Independent Directors expire at the ensuing Annual General Meeting (AGM) and all the retiring directors are eligible for re-appointment.
AUDITORS
Statutory Auditors
M/s. K S Aiyar & Co, (Registration No. 100186W) Chartered accountants and M/s. M. P. Chitale & Co., (Registration No. 101851W) Chartered Accountants, are the joint statutory auditors of the Company.
The joint statutory auditors have not made any qualification, reservation or adverse remark in their audit report for FY 2020-21. The report of the joint statutory auditors forms part of the Annual report.
In accordance with the provisions of the Section 139 of the Companies Act, 2013 and other relevant provisions of the Companies Act 2013 read with the Companies (Audit and Auditors) Rules, 2014, and other applicable provisions, if any, and guidelines issued by the Insurance Regulatory and Development Authority of India (“IRDAI”) for appointment of Statutory Auditors, M/s. K. S. Aiyar & Co. (Registration No. 100186W), Chartered Accountants & M/s. M. P. Chitale & Co. (Registration No. 101851W), Chartered Accountants have been appointed as the Joint Statutory Auditors of the Company till the conclusion of the 21st Annual General Meeting of the Company to be held for the financial year ending 31st March 2022 and till the conclusion of the 24th Annual General Meeting of the Company to be held for the financial year ending 31st March 2025 respectively.
Secretarial Auditors
Pursuant to the provisions of Section 204 of the Companies Act, 2013 and the Companies (Appointment and Remuneration of Managerial Personnel) Rules, 2014, the Company has appointed M/s. BMP & Co. LLP, Company Secretary in practice to undertake the Secretarial Audit of the Company. The Report of the Secretarial Audit Report is annexed herewith as “Annexure 1”. There is no qualification made by the Secretarial Auditors in their Report.
DETAILS IN RESPECT OF FRAUDS REPORTED BY AUDITORS UNDER SUB-SECTION (12) OF SECTION 143 OTHER THAN THOSE WHICH ARE REPORTABLE TO THE CENTRAL GOVERNMENT
None during the financial year.
MANAGEMENT REPORT
Pursuant to the provisions of Regulation 3 of The Insurance Regulatory and Development Authority of India (Preparation of Financial Statements and Auditors’ Report of Insurance Companies) Regulations 2000, and circulars/guidelines issued by IRDAI thereafter, the Management Report is placed separately and forms part of this Annual Report.
ANNUAL RETURN
An unsigned copy of the annual return for FY 2020-21 is placed on the website of the Company at https://www.pnbmetlife.com/investor-relations/financial-information/annual-return.html in accordance with the provisions of the Section 92 and 134 of the Companies Act, 2013. Since the statutory requirement of filing of MGT-7 is within 60 days from the date of Annual General Meeting (AGM), a copy of signed MGT-7 shall be updated as soon as possible but no later than 60 days from the date of the AGM.
PARTICULARS OF EMPLOYEES
The Company’s employee strength was 16,319 including 7,214 full-time employees and 9,105 part-time employees as on 31st March 2021.
RURAL AND SOCIAL BUSINESS
The Company complied with the Rural and Social Sector obligations as prescribed under the IRDAI Regulations.
SHARE CAPITAL
The Authorised Share Capital of the Company has remained at the same level as that of the previous year at Rs. 3,000 Crore. The Issued, Subscribed and Paid-up share capital of the Company, has also remained at the same level as that of previous year at Rs. 2,012.88 Crore.
THE DETAILS RELATING TO DEPOSITS, COVERED UNDER CHAPTER V OF THE ACT
During the year under review, the Company has not accepted any deposits from the public as per Section 73 of the Companies Act, 2013 read with the Companies (Acceptance of Deposits) Rules, 2014 (as amended).
CORPORATE SOCIAL RESPONSIBILITY (CSR) INITIATIVES
At PNB MetLife, our CSR initiative is in line with our overall brand ethos – ‘Milkar Life Aage Badhaein’ and focuses on spreading awareness and catalyzing change in a woman’s life, right from the stages of girl child to woman. The initiative is centered around aiding and standing by women across all their life stages through partnerships with various NGOs catering to their diverse needs. The program focuses on sensitizing communities about essential education, health, sanitation, and skills. Additionally, to inculcate fitness among the kids and take badminton to the grassroots level, PNB MetLife has been training several talented young badminton players across the country from underprivileged background.
39
Financial Statements Embedded Value ResultsCorporate Overview Statutory Reports
Damini
‘Damini’, exemplifies the inner light, and focuses on creating interventions across the various stages of girl to woman. PNB MetLife has partnered with leading NGOs to implement the initiatives under:
a) Girl Child Education – PNB MetLife in association ‘Nanhi Kali’, an NGO run by the K.C. Mahindra Education Trust, supports the education for the underprivileged girls from Moga district in Punjab and Varanasi district in Uttar Pradesh. This is an ongoing project, which provides grants to 1388 girls for pursuing education under a formal school structure. In FY 2020-21, out of 1388 beneficiaries, 1342 girls studied in primary sections, from Class I to Class V, and 46 girls progressed to Class VI – the secondary section.
In addition to education to girl child, the program also provided employment opportunity to 46 local women as Community Associates or part-time teachers during FY 2020-21. COVID-19 pandemic kept the schools closed throughout the year, however, the intervention of the Community Associates provided private coaching to the girls in small groups and imparted education through digital modules. This resulted in no school drop-out and continuity of the academic year even in unprecedented times like COVID-19.
An effort to tutor underprivileged girls studying in Class VIII to X, PNB MetLife launched virtual financial literacy modules for ~21,000 girls across country. The program was rolled out to equip the secondary standard girls with basic knowledge on financial literacy, as they seek future employment opportunities.
b) Women Empowerment – In partnership with Drishtee NGO, PNB MetLife launched the initiative, “Sakhi Swavlamban”, an ongoing project to financially empower the underprivileged women through various skilling programs, which will provide them access to livelihood opportunities. The program is enabling a group and community building approach within the rural women beneficiaries so that the impact of the initiative is maximised for this rural women’s network.
Through this program, 3,000 women have been reached across 117 villages of Varanasi in FY 2020-21. 80 women became a part of the different Micro Enterprise Groups (MEGs) producing value added products and 1,000 rural women producers could be linked with various production opportunities and the goods created by these beneficiaries have reached ~2,750 households across the urban locations of Varanasi district. There were 6 volume channels set-up during the year including – Organic Vegetables, Textile, Home Furnishing, Dairy-Farming, Spices and Pickles. Approximately Rs. 11.70 Lakhs income was generated this year from the sale of these goods.
To further support the beneficiaries and drive Government’s agenda of Financial Inclusion, PNB MetLife
also introduced Financial Literacy programs for these budding entrepreneurs. The course modules were based on the Financial Literacy Guide by RBI and was attended by 1,000 beneficiaries.
c) Awareness on Health and Hygiene for Adolescent girls: In an effort to build awareness on maintaining good menstrual among underprivileged adolescent girls, PNB MetLife partnered with ‘LittleBigHelp India Trust’ NGO to conduct awareness programs and support 800 adolescent girls from 6 slums of Kolkata, West Bengal. The program focuses on conducting awareness sessions on maintaining good menstrual hygiene, distribution of sanitary napkins through donation drives and sanitary vending machines, periodic health check-ups of the beneficiaries and developing change agents from the beneficiary group, who can further help in spreading the message of maintaining good menstrual health among the community members.
To ensure the overall well-being of its beneficiaries. PNB MetLife also donated hygiene kits to 1,000 families so that the community, where beneficiaries reside can fight against this deadly disease.
Badminton Training to the underprivileged children
Badminton is the second most popular sports in India. With an agenda to take this sport to the grassroots, PNB MetLife in association with its NGO partner – CRY, has been supporting the young talents from the underprivileged community since past 4 years.
During FY 2020-21, PNB MetLife supported 132 underprivileged children across 6 cities – Delhi, Mumbai, Kolkata, Dhanbad, Bhopal and Chennai with Badminton trainings and nutrition. The year was challenging for the young badminton players as COVID-19 pandemic and subsequent lockdowns, restricted them from outdoor trainings for first half of the year. Physical trainings were conducted during the latter half of the year to all 132 children along with nutrition support. PNB MetLife also assisted beneficiaries with hygiene kits to ensure their safety during the pandemic.
The NGO partner has tied-up with Prakash Padukone Sports Academy, which along with the coaching, training and nutritional assessment of the beneficiaries also provides regular inputs on their technical capacity and physical strength.
CSR Spends:
An amount of Rs. 2,14,57,300 has been spent on various CSR activities, as approved by the CSR Committee and the Board, during FY 2020-21 as against the initial budgeted amount of Rs. 2,58,49,000. The unspent amount of Rs. 43,91,700 has been allotted towards the ongoing projects – Girl Child Education and Sakhi Swavalamban.
The unspent amount has been deposited to a separate bank account – Citi Bank A/c no. - 0035216243.
40
Financial Statements Embedded Value ResultsCorporate Overview Statutory Reports
Below is a bifurcation of the overall CSR spend for FY 2020-21
Amount in Rs.
DetailsPrevious Year’s Balance 0CSR budget for FY 2020-21 on 2% avg. profit*
2,58,49,000
Total Funds available during the FY 2020-21 (A)
2,58,49,000
CSR Project and Implementation Partner
Budget (Rs.)
Spent (Rs.)
Education for underprivileged girls – Nanhi Kali
1. Education to 1388 girls - Rs. 69,99,000
2. Financial Literacy – Rs. 8,00,000
3. Additional amount spent from the contingency budget – Rs. 5,23,800
4. Additional budget allocated from Contingency fund – Rs. 20,00,000
1,03,22,800 83,22,800
Women Empowerment through Sakhi Swavlamban project – Drishtee
1. Project cost for Sakhi Swavlamban – Rs. 70,00,000
2. Financial Literacy – Rs. 15,02,000
3. Additional budget allocated from Contingency fund – Rs. 23,91,700
1,08,93,700 85,02,000
Awareness to adolescent girls on Health and Hygiene – LittleBigHelp India Trust
1. Health and hygiene program – Rs. 13,00,000
2. Additional amount spent from Contingency fund for distribution of hygiene kits – Rs. 3,00,000
16,00,000 16,00,000
Badminton coaching for underprivileged children – CRY
1. Badminton coaching to underprivileged children – Rs. 20,00,000
2. Additional amount spent from Contingency fund for distribution of hygiene kits – Rs. 22,500
20,22,500 20,22,500
Admin costCSR consultant fees – Soulace Consulting Pvt. Ltd
10,10,000 10,10,000
Total Expenditure 2,58,49,000 2,14,57,300Amount carried forward to FY 2021-22 towards the ongoing CSR projects
43,91,700
*Includes dividends received from other companies in India
The Annual report on CSR activities in accordance with the Companies (Corporate Social Responsibility Policy) Rules, 2014 is set out as ‘Annexure 2’ forming part of the Directors’ Report.
PARTICULARS OF CONTRACTS OR ARRANGEMENTS WITH RELATED PARTIES
All the Related Party Transactions entered during the financial year were on arm’s length basis and in ordinary course of business. All related party transactions are placed before the Audit Committee of the Board for its approval. During the year, there were no material contracts or arrangements or transactions with related parties that need to be disclosed in Form AOC-2 as per Rule 8 of the Companies (Accounts) Rules, 2014.
The Company has a Board approved policy on related party transactions, which has been hosted on the website of the Company.
INTERNAL FINANCIAL CONTROLS, COMPLIANCE, INTERNAL AUDIT AND FRAUD PREVENTION
The Company has established a governance framework and a control environment, commensurate with the size, scale and complexity of its operations. The corporate governance framework of the Company is based on an effective independent Board, separation of Board’s supervisory role from the executive management and constitution of Board Committees, generally comprising a majority of independent/non-executive directors and chaired by non-executive directors/independent directors to oversee critical areas. The Board committees are supported by executive committees to oversee at an operational level. All employees are bound by the Code of Business Ethics approved by the Board of Directors.
Statement in respect of adequacy of internal financial controls with reference to the financial statements
The Company has a reporting and review framework comprising quarterly reporting and review of audited financials and investment returns to key stakeholders. The financials are audited by joint statutory auditors and are reviewed by the Audit Committee on a quarterly basis and subsequently submitted to the IRDAI. The Company has in place adequate framework for monitoring internal financial controls across all major processes with respect to financial statements. There are processes in place to continuously monitor the adequacy of such controls.
Compliance
The Company follows a strong 3 lines of defense model, wherein the business functions form the first line of defense, the compliance and risk functions form the second line of defense and the internal audit function forms the third line of defense.
Our Board of Directors, through our Audit Committee, oversees our compliance framework. The Chief Compliance Officer of the Company reports to the Board Audit Committee on various compliance matters.
We have implemented Code of Business Ethics and various internal policies and procedures to support compliance and
41
Financial Statements Embedded Value ResultsCorporate Overview Statutory Reports
govern day to day activities. Compliance team identifies and disseminates to all functions, all relevant and applicable Corporate and IRDAI laws, regulations and circulars. These regulatory changes are monitored by the respective departments for compliances. Also, quarterly certification process has been established whereby the head of each Company department certifies compliance, on a quarterly basis, to their respective compliance requirements.
We also have a well-defined Compliance Risk Management Program (“CRMP”), and branch office review program to monitor compliance risks associated with our business and addresses any such risks through implementing required policies and procedures. Key issues observed as part of this monitoring are reported to the Board Audit Committee and implementation of recommendations is actively monitored. A compliance certificate signed by the Managing Director & CEO, based on the certification from respective functional heads, is placed at the Board Audit Committee on a quarterly basis.
Our compliance efforts are further supported through a risk-based internal audit approach, which is aimed to provide reasonable assurance to the Audit Committee and the senior management regarding the adequacy and effectiveness of the Company’s risk management and control framework.
Internal Audit
The Company has in place an internal audit framework with a risk based audit approach. The basic philosophy of risk based internal audit is to provide reasonable assurance to the Audit Committee and top management about the adequacy and effectiveness of the risk management and control framework in the Company. The scope and authority of the Internal Audit (IA) function is defined in the Internal Audit Charter. To maintain its objectivity and independence, the Chief Internal Auditor has a functional reporting relationship to the Audit Committee of the Board.
Review of controls is undertaken by internal audit through execution of internal audits as per risk based audit plan. The internal audit covers auditing of processes, transactions and systems, monitoring and evaluating the efficacy and adequacy of internal control system in the Company, its compliance with operating systems, accounting procedures and policies. Based on the report of internal audit function, process owners undertake corrective action in their respective areas and thereby strengthen the controls. Significant audit observations and corrective actions thereon are presented to the Audit Committee of the Board every quarter. Implementation of the corrective action is actively monitored.
Fraud prevention
The Company has a Board approved fraud risk management policy. The Company has an Executive Risk Management Committee (eRMC) which monitors attempted frauds, if any. The eRMC in turn reports to Board ALM and Risk Management Committee (BALMR). The fraud management framework consists of preventive measures and management of identified
/ reported incidents. Preventive management includes investigation triggers across policy life cycle, proactive use of analytics to identify fraud patterns and fraud risk assessment for design of processes, as required. Incident management includes recovery of loss, detailed investigation & root cause analysis and fraud incident reporting to eRMC and BALMR. The Company ensures financial recovery process, disciplinary action against involved employees, and actions through law enforcement authorities based on severity of the incident. The Company also undertakes several measures from time to time to create awareness amongst its employees and customers against fraudulent practices.
IND AS IMPLEMENTATION
• ICAI releases ExposureDraft of Amendments to IndAS117 - Insurance Contracts on 26th December 2020, with effective date for annual reporting periods beginning on or after 1st April 2023.
• Awaiting guidance on implementation modalitiesincluding effective date from the regulator.
• Company has started assessing the implementationrequirements along with the impact assessment.
ENTERPRISE RISK MANAGEMENT
The Company is committed to integrate and strengthen the role of risk management in business processes and decisions. The Company holds the certificate of compliance towards “ISO 31000:2018 Risk Management Framework” from British Standard Institute (BSI). The Company’s Business Continuity Management System (BCMS) is ISO 22301 certified and its Information Security Management System (ISMS) is ISO 27001 certified. This is a testimony of Company’s continuous efforts towards building a robust, resilient and efficient organization.
In compliance with the Corporate Governance Guidelines issued by IRDAI, the risk governance structure of the Company consists of
i) the Board of Directors
ii) the Board Asset Liability Management and Risk Management Committee (ALMR)
iii) the Executive Risk Management Committee (eRMC) and its supporting committees
iv) The Charter of the ALMR is two-fold
a. This is a supervisory body to set up the Company’s risk/reward objectives to formulate and implement optimal ALM strategies to meet these objectives,
b. Lay down the Company’s Risk Management Strategy
The Board approved Enterprise Risk Management policy (“the policy”) & processes support our business to control, manage and effectively mitigate critical risks. The Policy is aligned and in compliance to ISO 31000:2018 Risk Management Framework, and covers aspects related to:
42
Financial Statements Embedded Value ResultsCorporate Overview Statutory Reports
i. Financial Risk Management: covering market risk, capital risk, credit risk, liquidity risk and insurance risk
ii. Operational Risk Management: covering reputational, fraud, legal & regulatory, people, system, cyber, transactional, business execution and business continuity
iii. Risk Identification, Analysis, Measurement, and Treatment framework
The key objectives of the Policy are as follows:
• Determining the risk profile of the Company i.e.the aggregate level of risks that the Company has undertaken in pursuit of profitable business
• Identification, analysis, measuring, managing, treating,monitoring and reporting of risk for the purpose of protecting the interests of key stakeholders
• Enhancing theCompany’s ability to identify andpursueopportunities that offer attractive risk-adjusted returns by providing transparent, accurate and timely risk information
• Embeddingrisk-baseddecisionmakinginkeymanagementprocesses and fostering a culture of risk awareness
• Limiting the Company’s exposure to adverse outcomesthrough risk limits. The Company has formulated a comprehensive Risk Appetite Statement at the corporate as well as the functional level which are reviewed and monitored by the Board level Risk Management Committee and Executive Risk Management Committee respectively
• Ensuringcompliancewithregulatoryrequirements
• Focusing on ensuring that the Company possesses theappropriate capabilities and experience in managing and transferring risks
• Minimizingreputationalrisk
The risk management function is headed by the ‘Chief Risk Officer’ and is responsible for establishing sound risk management practices by proactively identifying, measuring, mitigating and monitoring the organization’s risk exposures. The risk management framework of the Company is based on four guiding principles viz. ‘Controlled Risk-Taking’, ‘Ownership, Accountability & Authority’, ‘Specialization’ & ‘Change Management’.
The Company’s risk exposure could be in the areas of business continuity in case of disasters / natural calamities including pandemics, adverse claims experience, shortfall in investment performance and high expense levels. Mitigation steps in each of these areas are being taken and monitored on an ongoing basis. From Regulatory standpoint, we continuously monitor new advisories and directives from Central / State / Insurance regulator and authorities, and ensure strict compliance & adherence to the guidelines.
• TheCompany’sunderwritingpolicyand implementationof the same are subject to continuous monitoring and review. Adequate and suitable reinsurance treaties
are in force with Internationally reputed and highly rated reinsurers
• TheinvestmentsoftheCompanyareinaccordancewithIRDAI guidelines and as per the Investment Policy approved by the Investment Committee (‘IC’) of the Board which stipulates appropriate risk exposures. For achieving the objectives, Credit, Liquidity and Market risks are evaluated on a continuous basis. The assets of the Company are invested in accordance with the requirements prescribed by the IRDAI.
• Expenses are continuously monitored to ensure thatthe expense levels are commensurate with the level of operations of the Company.
KEY POLICIES & FRAMEWORK
A. Corporate Social Responsibility (CSR) Policy
The Company has CSR policy in line with the provisions of Section 135 of the Companies Act, 2013 read with Schedule VII and the rules made thereunder. The Policy lays down the guiding principles for selection, implementation and monitoring of CSR initiatives at PNB MetLife. The CSR policy is uploaded on the website of the Company at https: / /www.pnbmetl i fe.com/investor-re lat ions/company-policies.html
B. Whistle Blower Policy/Vigil Mechanism
The Company has a Whistle Blower policy in place which encourages its employees to report matters without the risk of subsequent victimization. It provides a mechanism to employees and other persons dealing with the Company to report any instance of actual or suspected fraud, raise concerns internally about possible irregularities, governance weaknesses, financial reporting issues or other such matters. Access to the Chairperson of the Audit Committee is also provided to the employees under the policy to report any matter as well as a direct hotline number to raise any concerns. During FY 2020-21, the Company received 3 whistle blower complaints out of which 2 have been disposed of and actions have been taken as per Company’s policies. 1 case is under investigation.
C. Remuneration Policy
In terms of the provisions of Section 178 (4) of the Companies Act, 2013 and IRDAI (Corporate Governance) Guidelines, the Company has policy on appointment and remuneration of Non- Executive Directors, Managing Director/CEO and Whole-time Directors and also Compenzation Policy for its full time employees excluding the Managing Director/CEO and Whole-time Directors duly recommended by the Nomination and Remuneration Committee, and approved by the Board of Directors.
The aforesaid policies is placed on the website of the Company at https://www.pnbmetlife.com/investor-relations/company-policies.html
43
Financial Statements Embedded Value ResultsCorporate Overview Statutory Reports
D. Prevention of Sexual Harassment at Workplace Policy
The Sexual Harassment of Women at Workplace (Prevention, Prohibition and Redressal) Act, 2013 seeks to provide protection against sexual harassment of women at workplace and provides for the prevention and redressal of complaints of sexual harassment. The Company has laid down a policy to prevent and redress sexual harassment at workplace. The Policy is uploaded on the Company’s Intranet which is accessible to all employees. The Company believes in providing a safe and secure working environment at the workplace. On an ongoing basis, the Company creates awareness amongst employees through various mediums including but not limited to training program, e-mail campaigns etc. The Company has deployed an e-learning module “Respect at Workplace” to create understanding and awareness amongst all employees on mutual respect and to practice prevention of sexual harassment at workplace.
Further the Internal Complaints Committee as required to be constituted under the aforesaid act is duly constituted and the composition of the Committee as on date is as below:
Internal Committee
Designation Role
Ms. Monisha James
Director - Human Resources
Presiding Officer
Ms. Sonal Mattoo Advocate Independent third party
Mr. Motty John Director – Legal Member
Ms. Juhi Chaturvedi
Associate General Manager – Marketing
Member
Ms. Kamaldeep Kaur Kuldip Singh Sagar
Associate General Manager – Legal
Member
Internal Committee
Designation Role
Mr. Atanu Mandal Chief Manager – Employee Relations
IC Coordinator
Disclosure under the Sexual Harassment of Women at Workplace (Prevention Prohibition and Redressal) Act, 2013
The summary of sexual harassment complaints received and disposed of during the FY 2020-21:
• No.ofcomplaintsreceived:10
• Noofcomplaintsdisposedoff:10
• NoofcomplaintsOpen/inprocess:0
ADDITIONAL INFORMATION
Certificate of Registration
Pursuant to the provisions of the Insurance Laws Amendment Act, 2015, the process of annual renewal of Certificate of Registration issued to the Insurers u/s 3 of the Insurance Act, 1938 has been dispensed with and Certificate of Registration issued in 2014, pursuant to our payment of relevant fees for FY 2020-21, continues to remain valid.
Dematerialization of Equity Shares
The Company’s equity shares are admitted on the records of National Securities Depository Limited (“NSDL”) and Central Depository Services (India) Limited (“CDSL”). Members may note that the Company, being an unlisted Company and considering the provisions of the Articles of Association read with the Insurance Act, 1938, as amended, has kept its ISIN with CDSL and NSDL under frozen/ suspended status.
CONSERVATION OF ENERGY & TECHNOLOGY ABSORPTION
Information required as per Section 134(3)(m) of the Companies Act, 2013 read with rule 8 of the Companies (Accounts) Rules, 2014, is as below:
a) Technology Absorption
Technology absorption, adoption and innovation1. Efforts made towards
technology absorption• RealtimeverificationofthestatusofPAN(PermanentAccountNumber)Verification
• CIBILIncomeEstimator2. Benefits derived as a result of
the above efforts (eg product improvement, cost reduction, product development, import substitution and so on)
Benefits derived in terms of process / product improvement / cost reduction include:
• Realtimeverificationof the statusofPAN thathelpsblockingFake /Deleted /Not existing PANs there by reducing number of Fraud cases coming (where fake PAN is provided)
• Integrationwith Customer onboarding platform eBranch-NXT formaking it aSeamless journey for Sales.
• TransUnionCIBILLimitedisacreditinformationcompanyoperatinginIndia,ithelpsin realtime integration for fetching Estimated Income of an Individual basis their Identity & other details (Name, Gender, DOB, Occupation, Mobile Number etc.)
• Basistheeligibility,theinformationfetchedandfurtherlogicsapplied,Financialdocuments (Income Proof) of the customer are waived where criteria is met.
44
Financial Statements Embedded Value ResultsCorporate Overview Statutory Reports
Technology absorption, adoption and innovation3. In case of imported technology
(imported during the last three years reckoned from the beginning of the financial year) –
i. The details of technology imported;
ii. The year of import;
iii. Whether the technology been fully absorbed;
iv. If not fully absorbed, areas where absorption has not taken place, and the reasons thereof
Nil
4. Expenditure incurred on Research and Development
Nil
b) Conservation of energy
i) the steps taken or impact on conservation of energy
• MovingtoLEDbasedlightingfixtures.
• CorporateOfficehasLEDlightswhichismoreenergy efficient and has a longer life span.
• Similarly, in branches which are gettingrefurbished or where fixtures are replaced we are using LED tube lights which are cheaper as compared to LED fixtures and help conserve light.
ii) the steps taken by the company for utilizing alternate sources of energy - Nil
iii) the capital investment on energy conservation equipment – Nil
c) Foreign Exchange Earning & Outgo
There is a foreign exchange outgo of Rs. 39.96 Crore during the year under review.
SOLVENCY
The IRDAI requires life insurers to maintain a minimum Solvency Ratio of 150%. The Solvency Ratio is calculated as prescribed under Section 64VA of the Insurance Act, 1938 (as amended from time to time) and the IRDAI (Assets, Liabilities, and Solvency Margin of Life Insurance Business) Regulations, 2016. As compared to the minimum requirement of 150%, the Company’s Solvency Ratio, as on 31st March 2021, was at 190%.
ISSUE OF EQUITY SHARES WITH DIFFERENTIAL RIGHTS, SWEAT EQUITY, ESOP
NIL
NUMBER OF MEETINGS OF THE BOARD
The Board of Directors met four times during the year. Detailed information about dates of meetings and attendance
of Directors thereat is given in Corporate Governance Report, forming part of this Directors Report.
DETAILS OF COMMITTEES OF BOARD
At present, the Board has following seven (7) Committees:
• AuditCommittee
• Nomination&RemunerationCommittee
• CorporateSocialResponsibilityCommittee
• Policyholders’ProtectionCommittee
• InvestmentCommittee
• ALM&RiskManagementCommittee
• WithProfitCommittee
The composition of the Committees and relative compliances are in line with the applicable provisions of the Companies Act, 2013 and IRDAI Corporate Governance Guidelines. Key terms of reference of the Committees, Committees’ Membership and attendance at meetings of the Committees are provided in the Corporate Governance Report.
SECRETARIAL STANDARDS
The Directors state that applicable Secretarial Standards, i.e. SS-1 and SS-2, relating to ‘Meetings of the Board of Directors’ and ‘General Meeting’, respectively, have been duly followed by the Company.
CORPORATE GOVERNANCE REPORT
The Corporate Governance philosophy of the Company is to comply with not only the statutory requirements, but also to voluntarily formulate and adhere to a strong set of corporate governance practices which includes code of business conduct, corporate ethics, values, risk management etc. It has been our constant endeavor to enhance the economic value, trust and confidence of all the stakeholders through good corporate governance practices. A report on compliance with Corporate Governance Guidelines issued by IRDAI is contained as
45
Financial Statements Embedded Value ResultsCorporate Overview Statutory Reports
‘Annexure 3’ along with the Certificate from the Company Secretary of the Company.
DIRECTORS’ RESPONSIBILITY STATEMENT
In accordance with the requirements of Section 134(5) of the Companies Act, 2013, the Board of Directors confirm the following:
• thatinpreparationoftheannualaccounts,theapplicableaccounting standards have been followed along with proper explanation relating to material departures;
• thatthedirectorshaveselectedsuchaccountingpoliciesand applied them consistently and made judgements and estimates that are reasonable and prudent so as to give a true and fair view of the state of affairs of the Company as on 31st March 2021 and of the profit or loss of the Company for the year ended 31st March 2021;
• that thedirectorshave takenproper and sufficient carefor the maintenance of adequate accounting records in accordance with the provisions of the Act for safeguarding the assets of the Company and for preventing and detecting fraud and other irregularities;
• thatthedirectorshavepreparedtheannualaccountsonagoing concern basis and
• the directors have devised proper systems to ensurecompliance with the provisions of all applicable laws and that such systems were adequate and operating effectively.
ACKNOWLEDGEMENTS
The Directors are grateful for the support, guidance and the co-operation received from the Insurance & Regulatory Development Authority of India, Life Council and all other statutory/regulatory body. The Directors also wish to express their gratitude to its shareholders for their continued trust and support.
The Directors also take this opportunity to thank all Financial Advisors, Corporate Agents, Bank partners, Brokers and other business associates and the employees for their continued support during the year.
The Directors would also like to take this opportunity to express sincere thanks to its valued customers and policyholders for their continued patronage.
For and on behalf of the Board of Directors
Kishore PonnavoluPlace: Mumbai ChairmanDate: 12th August 2021 (DIN: 08226069)
46
Financial Statements Embedded Value ResultsCorporate Overview Statutory Reports
Annexure-1
FORM MR 3
SECRETARIAL AUDIT REPORT
FOR THE FINANCIAL YEAR ENDED 31ST MARCH 2021
[Pursuant to section 204(1) of the Companies Act, 2013 and rule No.9 of the Companies (Appointment and Remuneration of Managerial Personnel) Rules, 2014]
To,The Members,PNB Metlife India Insurance Company LimitedU66010KA2001PLC028883Unit No. 701, 702 & 703, 7th Floor,West Wing Raheja Towers, 26/27 M G Road,Bangalore - 560001
We have conducted the secretarial audit of the compliance of applicable statutory provisions and the adherence to good corporate practices, under the Companies Act, 2013, by PNB Metlife India Insurance Company Limited., (hereinafter called the ‘Company’). Secretarial Audit was conducted in a manner that provided us a reasonable basis for evaluating the corporate conducts/statutory compliances and expressing our opinion thereon.
Based on our verification of the Company’s books, papers, minute books, forms and returns filed and other records maintained by the company and also the information provided by the Company, its officers, agents and authorized representatives during the conduct of Secretarial Audit, We hereby report that in our opinion, the company has, during the audit period covering the financial year ended on 31st March 2021, has complied with the statutory provisions listed hereunder and also that the Company has proper Board processes and compliance mechanism in place to the extent, in the manner and subject to the reporting made hereinafter:
We have examined the books, papers, minute books, forms and returns filed and other records maintained by the Company for the financial year ended on 31st March 2021 according to the provisions of:
i. The Companies Act, 2013 (the Act) and the rules made thereunder;
ii. The Securities Contracts (Regulation) Act, 1956 (‘SCRA’) and the rules made thereunder – to the extent applicable to an unlisted Company;
iii. The Depositories Act, 1996 and the Regulations and Bye-laws framed thereunder;
iv. Foreign Exchange Management Act, 1999 and the rules and regulations made thereunder to the extent of Foreign Direct Investment, Overseas Direct Investment and External Commercial Borrowings;
v. Securities and Exchange Board of India Act, 1992 (‘SEBI Act.’) and the regulations framed thereunder to the extent of its applicability to an unlisted Company;
vi. Other laws applicable to the Company namely:
1. The Insurance Act, 1938;
2. Insurance Regulatory and Development Authority Act, 1999 and the regulations framed thereunder as amended from time to time;
3. Reserve Bank of India Act, 1934 and the rules, regulations, directions and orders made thereunder;
4. The Employees’ Provident Fund and Miscellaneous Provisions Act, 1952 & EPF, FPF Schemes;
5. The Maternity Benefit Act, 1961 & its Rules;
6. The Sexual Harassment of Women at Workplace (Prevention, Prohibition and Redressal) Act, 2013;
We have also examined compliance with following:
i. Secretarial Standards issued by The Institute of Company Secretaries of India;
ii. The Securities and Exchange Board of India (Listing Obligations and Disclosure Requirements) Regulations, 2015 – to the extent applicable to an unlisted Company;
iii. SEBI (Prohibition of Insider Trading) Regulations, 2015 as amended from time to time - to the extent applicable to an unlisted Company;
During the period under review the Company has materially complied with the provisions of the Act, Rules, Regulations, Guidelines, Standards, etc. mentioned above
We further report that
a) The Board of Directors of the Company is duly constituted. The changes in the composition of the Board of Directors that took place during the period under review were carried out in compliance with the provisions of the Act.
b) Adequate notice is given to all Directors to schedule the Board Meetings, agenda and detailed notes on agenda were sent at least seven days in advance, and a system exists for seeking and obtaining further information and clarifications on the agenda items before the meeting and for meaningful participation at the meeting.
c) Majority decision is carried through while the dissenting members’ views, if any, are captured and recorded as part of the minutes.
We further report that based on review of compliance mechanism established by the Company and on the basis of the Compliance Certificate(s) issued by the Chief Compliance
47
Financial Statements Embedded Value ResultsCorporate Overview Statutory Reports
Officer and Managing Director and reported by the Company Secretary to the Board of Directors at their meeting(s), we are of the opinion that the management has adequate systems and processes commensurate with its size and operations, to monitor and ensure compliance with all applicable laws, rules, regulations and guidelines.
Place: BangaloreDate: 12th August 2021UDIN: F008750C000773382
For BMP & Co. LLP,Company Secretaries
Pramod S M Partner FCS No: 7834CP No: 13784
This report is to be read with our letter of even date which is annexed as Annexure A and forms an integral part of this report
‘Annexure A’
To,The Members,PNB Metlife India Insurance Company LimitedCIN:U66010KA2001PLC028883Unit No. 701, 702 & 703, 7th Floor,West Wing Raheja Towers, 26/27 M G Road,Bangalore - 560001
Our report of even date is to be read along with this letter.
1. Maintenance of Secretarial record is the responsibility of the management of the Company. Our responsibility is to express an opinion on these secretarial records based on my audit.
2. We have followed the audit practices and process as were appropriate to obtain reasonable assurance about the correctness of the contents of the Secretarial records. The verification was done on test basis to ensure that correct facts are reflected in secretarial records. We believe that the processes and practices we followed provide a reasonable basis for my opinion.
3. We have not verified the correctness and appropriateness of financial records and Books of Accounts of the Company.
4. Where ever required, we have obtained the Management representation about the compliance of laws, rules and regulations and happening of events etc.
5. The compliance of the provisions of Corporate and other applicable laws, Rules, Regulations, standards is the responsibility of management. Our examination was limited to the verification of procedures on test basis.
6. The Secretarial Audit report is neither an assurance as to the future viability of the Company nor of the efficacy or effectiveness with which the management has conducted the affairs of the Company.
7. Due to the lockdown, only soft copies of the documents were verified.
8. We further report that, based on the information provided by the Company, its officers, authorized representatives during the conduct of the audit and also on the review of quarterly compliance report by the respective departmental heads/Company Secretary/Managing Director taken on record by the Board of the Company, in our opinion adequate systems and process and control mechanism exist in the Company to monitor compliance with applicable general laws.
9. We further report that the Compliance by the Company of applicable Financial laws like Direct & Indirect tax laws has not been reviewed in this audit since the same has been subject to review by the statutory financial audit and other designated professionals.
Place: BangaloreDate: 12th August 2021
For BMP & Co. LLP,Company Secretaries
Pramod S M Partner FCS No: 7834CP No: 13784
48
Financial Statements Embedded Value ResultsCorporate Overview Statutory Reports
ANNEXURE-2
ANNUAL REPORT ON CSR ACTIVITIES
(For the FY 2020-21)
1. Brief outline on CSR Policy of the Company.
We at PNB MetLife, believe in giving back to society. Our business activities have direct and indirect impacts on communities where we operate. We take pride in witnessing the lives we have been able to impact across India through our various Corporate Social Responsibility (CSR) activities.
Aligned with our values, our CSR programs are all about what we stand for - ‘Milkar Life Aage Badhaein’. Making way for an inclusive growth, our primary initiatives focus on spreading awareness and catalysing change in a woman’s life, across all stages of life. Our CSR programs have been classified under two broad heads 1) Damini, which focusses on creating intervention across various stages from girl child to women and 2) Badminton training for young players from underprivileged sections, thus aiming to take the sports to the grassroots.
2. Composition of CSR Committee (as on 31st March 2021):
Sl. No. Name of Director Designation / Nature of Directorship
Number of meetings of CSR Committee held
during the year
Number of meetings of CSR Committee attended
during the year
1 Mr. Neeraj Swaroop* Independent Director 1 1
2 Mr. Surbhit Dabriwala Director 1 1
3 Mr. Ashish Kumar Srivastava MD & CEO 1 1
*Ceased to be Director of the Company as of the date of the Report
3. Provide the web-link where Composition of CSR Committee, CSR Policy and CSR projects approved by the Board are disclosed on the website of the company.
The details of the CSR Committee composition, CSR Policy and CSR Projects approved by the Board are available at the website of PNB MetLife through the following links
a. CSR Committee – https://www.pnbmetlife.com/investor-relations/csr-committee-at-the-board.html
b. CSR Policy - https://www.pnbmetlife.com/investor-relations/company-policies.html
c. CSR Projects approved by the Board - https://www.pnbmetlife.com/investor-relations/projects-approved-by-the-csr-committee-for-fy-2020-21.html
4. Provide the details of Impact assessment of CSR projects carried out in pursuance of sub-rule (3) of rule 8 of the Companies (Corporate Social responsibility Policy) Rules, 2014, if applicable (attach the report).: Not Applicable
5. Details of the amount available for set off in pursuance of sub-rule (3) of rule 7 of the Companies (Corporate Social responsibility Policy) Rules, 2014 and amount required for set off for the financial year, if any.: NIL
Sl. No. Financial Year Amount available for set-off from preceding financial years (in Rs.)
Amount required to be set-off for the financial year, if any (in Rs.)
1 NIL
Total
6. Average net profit of the company as per section 135(5). – Rs. 1,292,468,000
7. (a) Two percent of average net profit of the company as per section 135(5) – Rs. 2,58,49,000
(b) Surplus arising out of the CSR projects or programs or activities of the previous financial years. - NIL
(c) Amount required to be set off for the financial year, if any. - NIL
(d) Total CSR obligation for the financial year (7a+7b- 7c). – Rs. 2,58,49,000
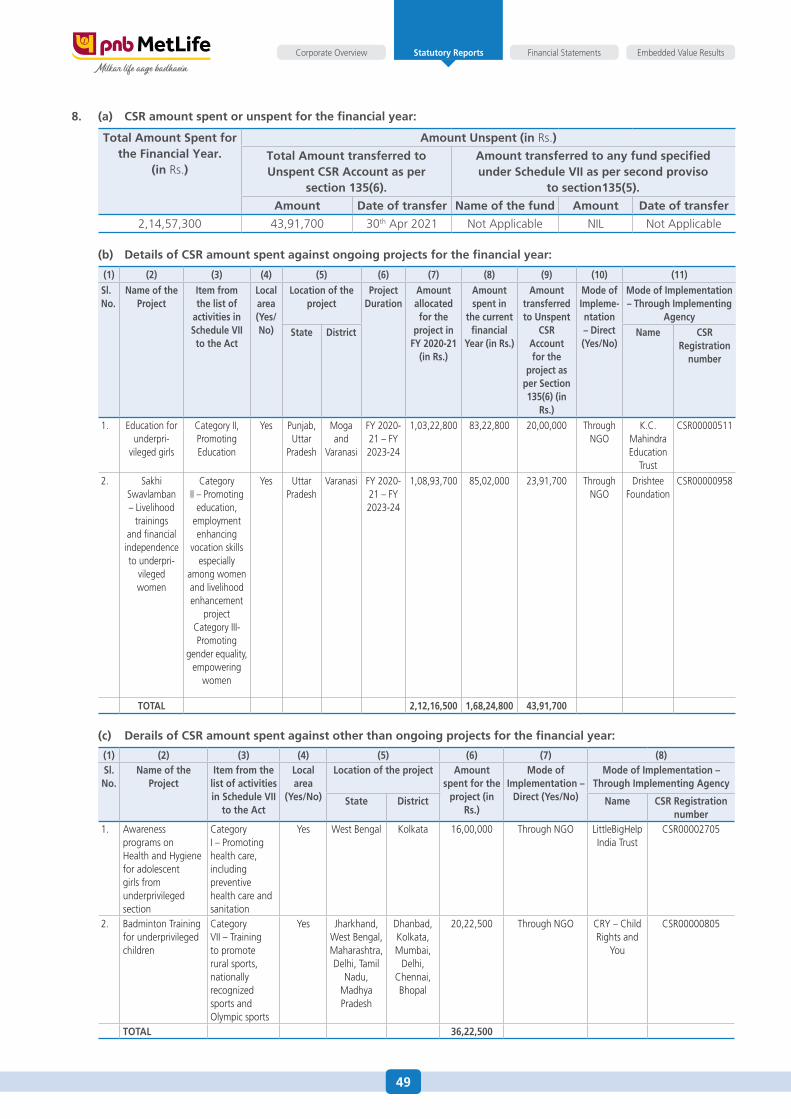
49
Financial Statements Embedded Value ResultsCorporate Overview Statutory Reports
8. (a) CSR amount spent or unspent for the financial year:
Total Amount Spent for the Financial Year.
(in Rs.)
Amount Unspent (in Rs.)
Total Amount transferred to Unspent CSR Account as per
section 135(6).
Amount transferred to any fund specified under Schedule VII as per second proviso
to section135(5).
Amount Date of transfer Name of the fund Amount Date of transfer
2,14,57,300 43,91,700 30th Apr 2021 Not Applicable NIL Not Applicable
(b) Details of CSR amount spent against ongoing projects for the financial year:
(1) (2) (3) (4) (5) (6) (7) (8) (9) (10) (11)Sl. No.
Name of the Project
Item from the list of
activities in Schedule VII to the Act
Local area (Yes/No)
Location of the project
Project Duration
Amount allocated for the
project in FY 2020-21
(in Rs.)
Amount spent in
the current financial
Year (in Rs.)
Amount transferred to Unspent
CSR Account for the
project as per Section 135(6) (in
Rs.)
Mode of Impleme-ntation – Direct (Yes/No)
Mode of Implementation – Through Implementing
AgencyState District Name CSR
Registration number
1. Education for underpri-
vileged girls
Category II, Promoting Education
Yes Punjab, Uttar
Pradesh
Moga and
Varanasi
FY 2020-21 – FY 2023-24
1,03,22,800 83,22,800 20,00,000 Through NGO
K.C. Mahindra Education
Trust
CSR00000511
2. Sakhi Swavlamban – Livelihood
trainings and financial
independence to underpri-
vileged women
Category II – Promoting
education, employment enhancing
vocation skills especially
among women and livelihood enhancement
projectCategory III-Promoting
gender equality, empowering
women
Yes Uttar Pradesh
Varanasi FY 2020-21 – FY 2023-24
1,08,93,700 85,02,000 23,91,700 Through NGO
Drishtee Foundation
CSR00000958
TOTAL 2,12,16,500 1,68,24,800 43,91,700
(c) Derails of CSR amount spent against other than ongoing projects for the financial year:
(1) (2) (3) (4) (5) (6) (7) (8)Sl. No.
Name of the Project
Item from the list of activities in Schedule VII
to the Act
Local area
(Yes/No)
Location of the project Amount spent for the
project (in Rs.)
Mode of Implementation –
Direct (Yes/No)
Mode of Implementation – Through Implementing Agency
State District Name CSR Registration number
1. Awareness programs on Health and Hygiene for adolescent girls from underprivileged section
Category I – Promoting health care, including preventive health care and sanitation
Yes West Bengal Kolkata 16,00,000 Through NGO LittleBigHelp India Trust
CSR00002705
2. Badminton Training for underprivileged children
Category VII – Training to promote rural sports, nationally recognized sports and Olympic sports
Yes Jharkhand, West Bengal, Maharashtra, Delhi, Tamil
Nadu, Madhya Pradesh
Dhanbad, Kolkata, Mumbai,
Delhi, Chennai, Bhopal
20,22,500 Through NGO CRY – Child Rights and
You
CSR00000805
TOTAL 36,22,500
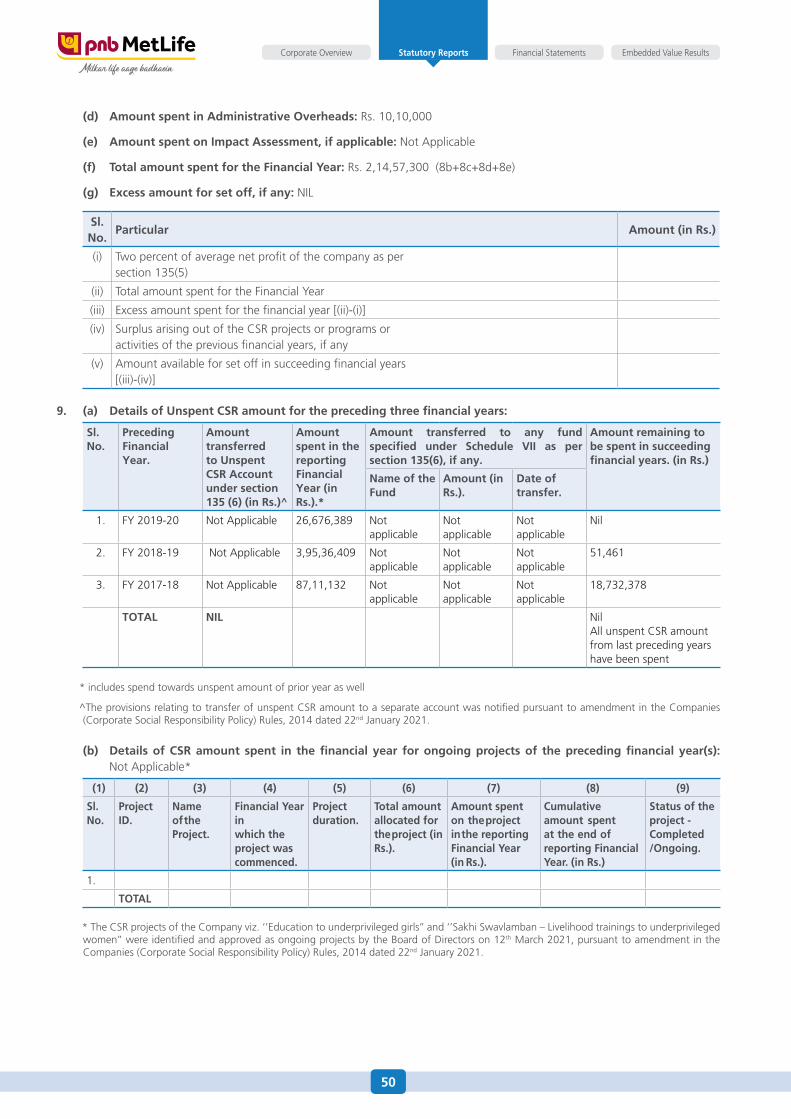
50
Financial Statements Embedded Value ResultsCorporate Overview Statutory Reports
(d) Amount spent in Administrative Overheads: Rs. 10,10,000
(e) Amount spent on Impact Assessment, if applicable: Not Applicable
(f) Total amount spent for the Financial Year: Rs. 2,14,57,300 (8b+8c+8d+8e)
(g) Excess amount for set off, if any: NIL
Sl. No.
Particular Amount (in Rs.)
(i) Two percent of average net profit of the company as persection 135(5)
(ii) Total amount spent for the Financial Year
(iii) Excess amount spent for the financial year [(ii)-(i)]
(iv) Surplus arising out of the CSR projects or programs oractivities of the previous financial years, if any
(v) Amount available for set off in succeeding financial years[(iii)-(iv)]
9. (a) Details of Unspent CSR amount for the preceding three financial years:
Sl.No.
Preceding Financial Year.
Amount transferred to Unspent CSR Account under section 135 (6) (in Rs.)^
Amount spent in thereporting Financial Year (in Rs.).*
Amount transferred to any fund specified under Schedule VII as per section 135(6), if any.
Amount remaining to be spent in succeeding financial years. (in Rs.)
Name of the Fund
Amount (in Rs.).
Date of transfer.
1. FY 2019-20 Not Applicable 26,676,389 Not applicable
Not applicable
Not applicable
Nil
2. FY 2018-19 Not Applicable 3,95,36,409 Not applicable
Not applicable
Not applicable
51,461
3. FY 2017-18 Not Applicable 87,11,132 Not applicable
Not applicable
Not applicable
18,732,378
TOTAL NIL NilAll unspent CSR amount from last preceding years have been spent
* includes spend towards unspent amount of prior year as well
^The provisions relating to transfer of unspent CSR amount to a separate account was notified pursuant to amendment in the Companies (Corporate Social Responsibility Policy) Rules, 2014 dated 22nd January 2021.
(b) Details of CSR amount spent in the financial year for ongoing projects of the preceding financial year(s): Not Applicable*
(1) (2) (3) (4) (5) (6) (7) (8) (9)
Sl.No.
Project ID.
Name of the Project.
Financial Year inwhich the project was commenced.
Project duration.
Total amount allocated for the project (in Rs.).
Amount spent on the project in the reporting Financial Year (in Rs.).
Cumulative amount spent at the end of reporting Financial Year. (in Rs.)
Status of the project -Completed/Ongoing.
1.
TOTAL
* The CSR projects of the Company viz. ‘’Education to underprivileged girls’’ and ‘’Sakhi Swavlamban – Livelihood trainings to underprivileged women’’ were identified and approved as ongoing projects by the Board of Directors on 12th March 2021, pursuant to amendment in the Companies (Corporate Social Responsibility Policy) Rules, 2014 dated 22nd January 2021.
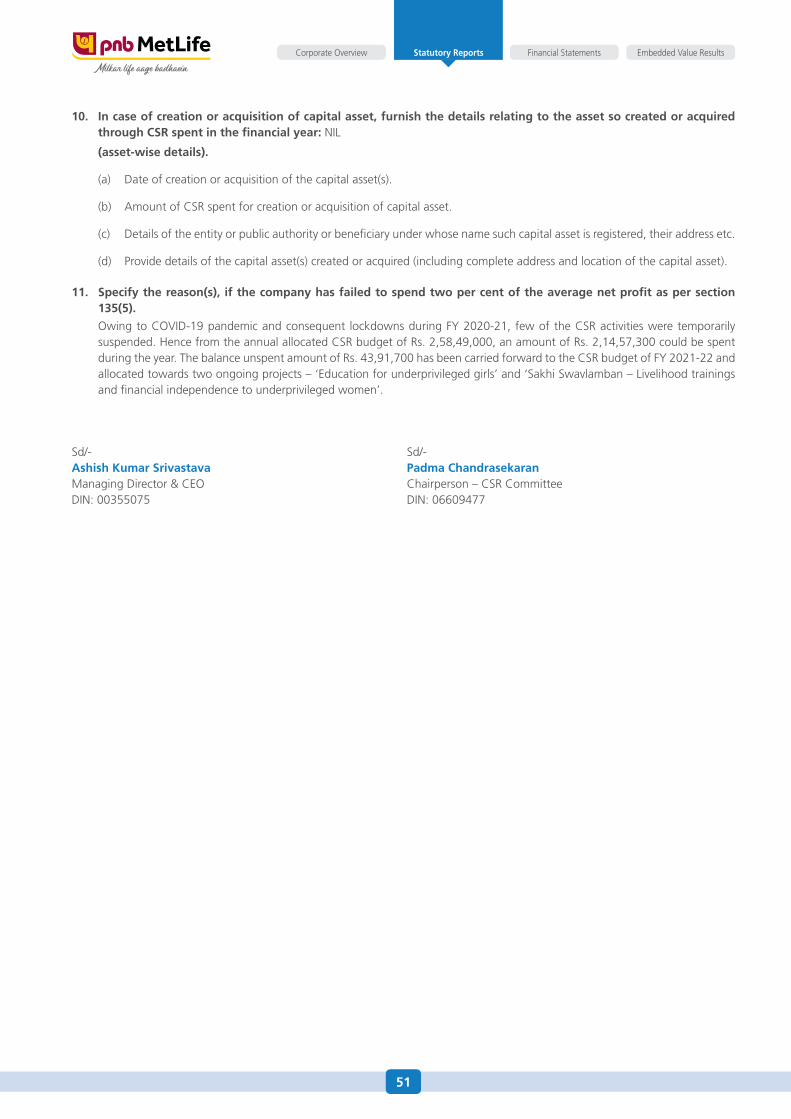
51
Financial Statements Embedded Value ResultsCorporate Overview Statutory Reports
10. In case of creation or acquisition of capital asset, furnish the details relating to the asset so created or acquired through CSR spent in the financial year: NIL
(asset-wise details).
(a) Date of creation or acquisition of the capital asset(s).
(b) Amount of CSR spent for creation or acquisition of capital asset.
(c) Details of the entity or public authority or beneficiary under whose name such capital asset is registered, their address etc.
(d) Provide details of the capital asset(s) created or acquired (including complete address and location of the capital asset).
11. Specify the reason(s), if the company has failed to spend two per cent of the average net profit as per section 135(5).
Owing to COVID-19 pandemic and consequent lockdowns during FY 2020-21, few of the CSR activities were temporarily suspended. Hence from the annual allocated CSR budget of Rs. 2,58,49,000, an amount of Rs. 2,14,57,300 could be spent during the year. The balance unspent amount of Rs. 43,91,700 has been carried forward to the CSR budget of FY 2021-22 and allocated towards two ongoing projects – ‘Education for underprivileged girls’ and ‘Sakhi Swavlamban – Livelihood trainings and financial independence to underprivileged women’.
Sd/- Sd/-Ashish Kumar Srivastava Padma ChandrasekaranManaging Director & CEO Chairperson – CSR CommitteeDIN: 00355075 DIN: 06609477
52
Financial Statements Embedded Value ResultsCorporate Overview Statutory Reports
COMPANY’S PHILOSOPHY ON CORPORATE GOVERNANCE
Your Company remains committed to transparency in all its dealings and places high emphasis on business ethics and principles. It strongly believes that good governance goes beyond working results and financial propriety and is a pre-requisite for attainment of excellence in performance. Your Company adheres to the philosophy of ethical corporate behaviour and fairness in its dealings with all its stakeholders, comprising policyholders, banks, regulatory authorities, employees and society at large. Your Company and your Board of Directors are committed to following the best corporate governance practices in their dealings.
GOVERNANCE STRUCTURE
PNB MetLife’s Governance structure broadly comprises of the Board of Directors and the Committees of the Board at the apex level and the Management structure at the operational level. This layered structure brings about a harmonious blend in governance as the Board sets the overall corporate objectives and gives direction and freedom to the Management to achieve these corporate objectives within a given framework, thereby bringing about an enabling environment for value creation through sustainable profitable growth.
BOARD OF DIRECTORS
The PNB MetLife Board plays a pivotal role in ensuring that the Company runs on sound and ethical business practices and that its resources are utilized for creating sustainable growth and societal wealth. The Board operates within the framework of a well-defined responsibility matrix which enables it to discharge its fiduciary duties of safeguarding the interests of the Company;
ANNEXURE 3
REPORT ON CORPORATE GOVERNANCE
The Board presents the Company’s Report on Corporate Governance for the year ended 31st March 2021.
ensuring fairness in the decision-making process, integrity and transparency in the Company’s dealings with its Members and other stakeholders.
COMPOSITION OF THE BOARDThe Composition of the Board of Directors of the Company is governed by the provisions of the Companies Act, 2013 and Clause 5.1 of the Corporate Governance Guidelines issued by the IRDAI. The Directors on the Board of the Company are from diverse backgrounds and possess a wide range of experience and expertise in various fields. The Board oversees the Company’s overall business affairs, its strategic direction, reviews corporate performance, authorizes and monitors investments, keeps an oversight on regulatory compliance and corporate governance matters. The Board is responsible for overall corporate strategy and other responsibilities as laid down by the IRDAI under the Corporate Governance guidelines and the Companies Act, 2013. The Board’s actions and decisions are aligned with the Company’s best interests. It oversees implementation of strategy and achievement of the business plan.
BOARD STRUCTUREThe Board of Directors of the Company represents an optimum combination of Executive, Non-Executive and Independent Directors for its independent functioning. The Board of Directors are eminent personalities with significant expertise in the fields of insurance, finance, law, banking, strategy etc. As on 31st March 2021, the Board strength was Fifteen (15) Directors comprising of One (1) Managing Director & CEO, Three (3) Independent Directors and Eleven (11) Non-Independent Non-Executive Directors. The composition of the Board is in conformity with the provisions of IRDAI Corporate Governance Guidelines 2016 and the Companies Act, 2013.
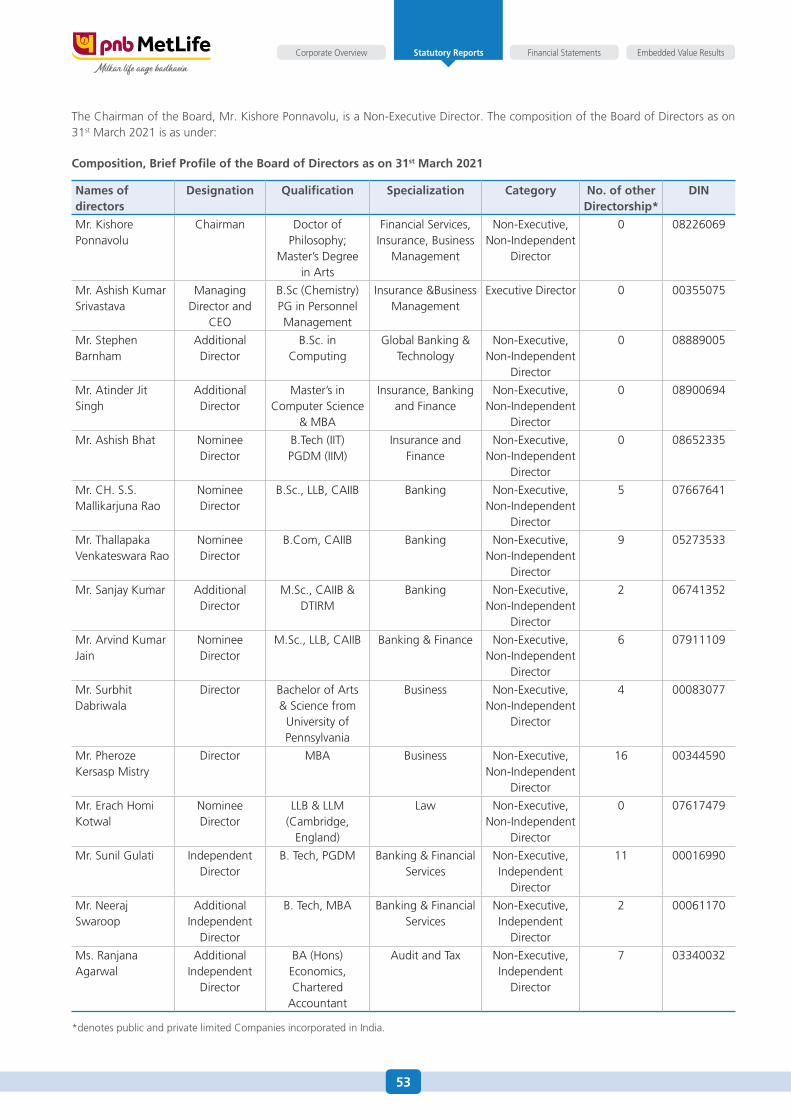
53
Financial Statements Embedded Value ResultsCorporate Overview Statutory Reports
The Chairman of the Board, Mr. Kishore Ponnavolu, is a Non-Executive Director. The composition of the Board of Directors as on 31st March 2021 is as under:
Composition, Brief Profile of the Board of Directors as on 31st March 2021
Names of directors
Designation Qualification Specialization Category No. of other Directorship*
DIN
Mr. Kishore Ponnavolu
Chairman Doctor of Philosophy;
Master’s Degree in Arts
Financial Services, Insurance, Business
Management
Non-Executive, Non-Independent
Director
0 08226069
Mr. Ashish Kumar Srivastava
Managing Director and
CEO
B.Sc (Chemistry)PG in Personnel Management
Insurance &Business Management
Executive Director 0 00355075
Mr. Stephen Barnham
Additional Director
B.Sc. in Computing
Global Banking & Technology
Non-Executive, Non-Independent
Director
0 08889005
Mr. Atinder Jit Singh
Additional Director
Master’s in Computer Science
& MBA
Insurance, Banking and Finance
Non-Executive, Non-Independent
Director
0 08900694
Mr. Ashish Bhat Nominee Director
B.Tech (IIT)PGDM (IIM)
Insurance and Finance
Non-Executive, Non-Independent
Director
0 08652335
Mr. CH. S.S. Mallikarjuna Rao
Nominee Director
B.Sc., LLB, CAIIB Banking Non-Executive, Non-Independent
Director
5 07667641
Mr. Thallapaka Venkateswara Rao
Nominee Director
B.Com, CAIIB Banking Non-Executive, Non-Independent
Director
9 05273533
Mr. Sanjay Kumar Additional Director
M.Sc., CAIIB & DTIRM
Banking Non-Executive, Non-Independent
Director
2 06741352
Mr. Arvind Kumar Jain
Nominee Director
M.Sc., LLB, CAIIB Banking & Finance Non-Executive, Non-Independent
Director
6 07911109
Mr. Surbhit Dabriwala
Director Bachelor of Arts & Science from
University of Pennsylvania
Business Non-Executive, Non-Independent
Director
4 00083077
Mr. Pheroze Kersasp Mistry
Director MBA Business Non-Executive, Non-Independent
Director
16 00344590
Mr. Erach Homi Kotwal
Nominee Director
LLB & LLM (Cambridge,
England)
Law Non-Executive, Non-Independent
Director
0 07617479
Mr. Sunil Gulati Independent Director
B. Tech, PGDM Banking & Financial Services
Non-Executive, Independent
Director
11 00016990
Mr. Neeraj Swaroop
AdditionalIndependent
Director
B. Tech, MBA Banking & Financial Services
Non-Executive, Independent
Director
2 00061170
Ms. Ranjana Agarwal
Additional Independent
Director
BA (Hons) Economics, Chartered
Accountant
Audit and Tax Non-Executive, Independent
Director
7 03340032
*denotes public and private limited Companies incorporated in India.
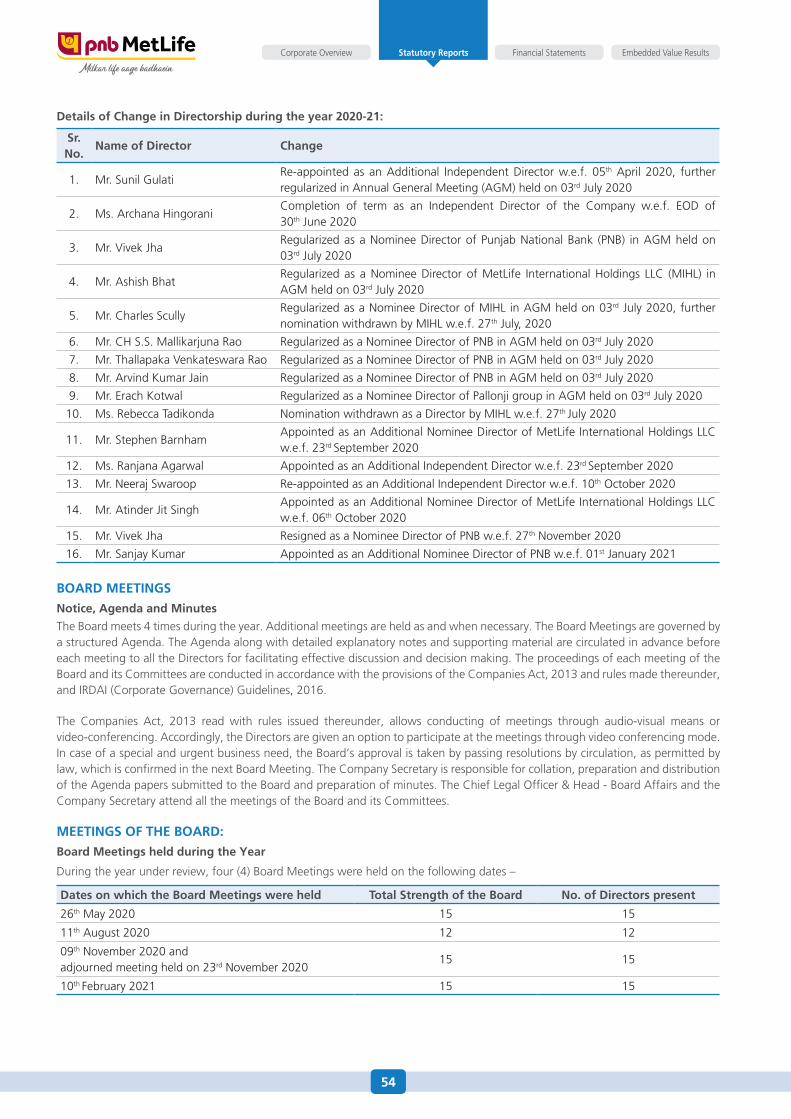
54
Financial Statements Embedded Value ResultsCorporate Overview Statutory Reports
Details of Change in Directorship during the year 2020-21:
Sr. No.
Name of Director Change
1. Mr. Sunil GulatiRe-appointed as an Additional Independent Director w.e.f. 05th April 2020, further regularized in Annual General Meeting (AGM) held on 03rd July 2020
2. Ms. Archana HingoraniCompletion of term as an Independent Director of the Company w.e.f. EOD of 30th June 2020
3. Mr. Vivek JhaRegularized as a Nominee Director of Punjab National Bank (PNB) in AGM held on 03rd July 2020
4. Mr. Ashish BhatRegularized as a Nominee Director of MetLife International Holdings LLC (MIHL) in AGM held on 03rd July 2020
5. Mr. Charles ScullyRegularized as a Nominee Director of MIHL in AGM held on 03rd July 2020, further nomination withdrawn by MIHL w.e.f. 27th July, 2020
6. Mr. CH S.S. Mallikarjuna Rao Regularized as a Nominee Director of PNB in AGM held on 03rd July 2020
7. Mr. Thallapaka Venkateswara Rao Regularized as a Nominee Director of PNB in AGM held on 03rd July 2020
8. Mr. Arvind Kumar Jain Regularized as a Nominee Director of PNB in AGM held on 03rd July 2020
9. Mr. Erach Kotwal Regularized as a Nominee Director of Pallonji group in AGM held on 03rd July 2020
10. Ms. Rebecca Tadikonda Nomination withdrawn as a Director by MIHL w.e.f. 27th July 2020
11. Mr. Stephen BarnhamAppointed as an Additional Nominee Director of MetLife International Holdings LLC w.e.f. 23rd September 2020
12. Ms. Ranjana Agarwal Appointed as an Additional Independent Director w.e.f. 23rd September 2020
13. Mr. Neeraj Swaroop Re-appointed as an Additional Independent Director w.e.f. 10th October 2020
14. Mr. Atinder Jit SinghAppointed as an Additional Nominee Director of MetLife International Holdings LLC w.e.f. 06th October 2020
15. Mr. Vivek Jha Resigned as a Nominee Director of PNB w.e.f. 27th November 2020
16. Mr. Sanjay Kumar Appointed as an Additional Nominee Director of PNB w.e.f. 01st January 2021
BOARD MEETINGS
Notice, Agenda and Minutes
The Board meets 4 times during the year. Additional meetings are held as and when necessary. The Board Meetings are governed by a structured Agenda. The Agenda along with detailed explanatory notes and supporting material are circulated in advance before each meeting to all the Directors for facilitating effective discussion and decision making. The proceedings of each meeting of the Board and its Committees are conducted in accordance with the provisions of the Companies Act, 2013 and rules made thereunder, and IRDAI (Corporate Governance) Guidelines, 2016.
The Companies Act, 2013 read with rules issued thereunder, allows conducting of meetings through audio-visual means or video-conferencing. Accordingly, the Directors are given an option to participate at the meetings through video conferencing mode. In case of a special and urgent business need, the Board’s approval is taken by passing resolutions by circulation, as permitted by law, which is confirmed in the next Board Meeting. The Company Secretary is responsible for collation, preparation and distribution of the Agenda papers submitted to the Board and preparation of minutes. The Chief Legal Officer & Head - Board Affairs and the Company Secretary attend all the meetings of the Board and its Committees.
MEETINGS OF THE BOARD:
Board Meetings held during the Year
During the year under review, four (4) Board Meetings were held on the following dates –
Dates on which the Board Meetings were held Total Strength of the Board No. of Directors present
26th May 2020 15 15
11th August 2020 12 12
09th November 2020 and adjourned meeting held on 23rd November 2020
15 15
10th February 2021 15 15
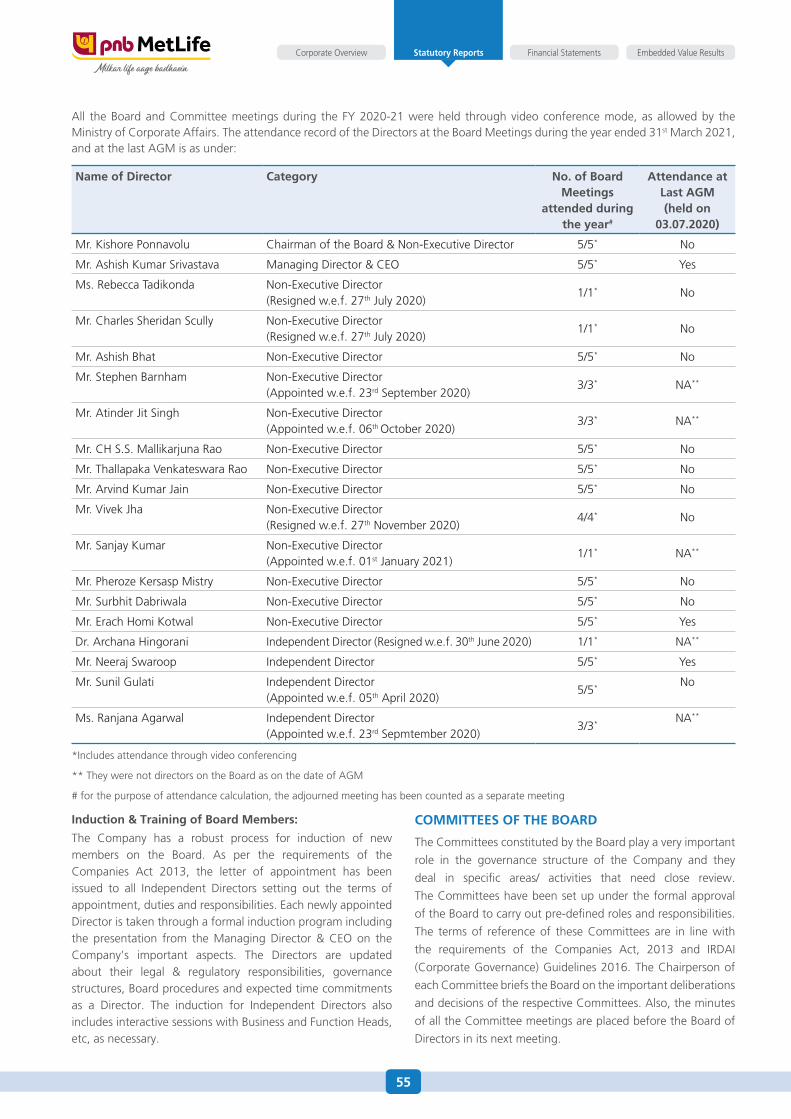
55
Financial Statements Embedded Value ResultsCorporate Overview Statutory Reports
All the Board and Committee meetings during the FY 2020-21 were held through video conference mode, as allowed by the Ministry of Corporate Affairs. The attendance record of the Directors at the Board Meetings during the year ended 31st March 2021, and at the last AGM is as under:
Name of Director Category No. of Board Meetings
attended during the year#
Attendance at Last AGM(held on
03.07.2020)
Mr. Kishore Ponnavolu Chairman of the Board & Non-Executive Director 5/5* No
Mr. Ashish Kumar Srivastava Managing Director & CEO 5/5* Yes
Ms. Rebecca Tadikonda Non-Executive Director(Resigned w.e.f. 27th July 2020)
1/1* No
Mr. Charles Sheridan Scully Non-Executive Director(Resigned w.e.f. 27th July 2020)
1/1* No
Mr. Ashish Bhat Non-Executive Director 5/5* No
Mr. Stephen Barnham Non-Executive Director (Appointed w.e.f. 23rd September 2020)
3/3* NA**
Mr. Atinder Jit Singh Non-Executive Director (Appointed w.e.f. 06th October 2020)
3/3* NA**
Mr. CH S.S. Mallikarjuna Rao Non-Executive Director 5/5* No
Mr. Thallapaka Venkateswara Rao Non-Executive Director 5/5* No
Mr. Arvind Kumar Jain Non-Executive Director 5/5* No
Mr. Vivek Jha Non-Executive Director (Resigned w.e.f. 27th November 2020)
4/4* No
Mr. Sanjay Kumar Non-Executive Director (Appointed w.e.f. 01st January 2021)
1/1* NA**
Mr. Pheroze Kersasp Mistry Non-Executive Director 5/5* No
Mr. Surbhit Dabriwala Non-Executive Director 5/5* No
Mr. Erach Homi Kotwal Non-Executive Director 5/5* Yes
Dr. Archana Hingorani Independent Director (Resigned w.e.f. 30th June 2020) 1/1* NA**
Mr. Neeraj Swaroop Independent Director 5/5* Yes
Mr. Sunil Gulati Independent Director(Appointed w.e.f. 05th April 2020)
5/5* No
Ms. Ranjana Agarwal Independent Director (Appointed w.e.f. 23rd Sepmtember 2020)
3/3* NA**
*Includes attendance through video conferencing
** They were not directors on the Board as on the date of AGM
# for the purpose of attendance calculation, the adjourned meeting has been counted as a separate meeting
Induction & Training of Board Members:
The Company has a robust process for induction of new members on the Board. As per the requirements of the Companies Act 2013, the letter of appointment has been issued to all Independent Directors setting out the terms of appointment, duties and responsibilities. Each newly appointed Director is taken through a formal induction program including the presentation from the Managing Director & CEO on the Company’s important aspects. The Directors are updated about their legal & regulatory responsibilities, governance structures, Board procedures and expected time commitments as a Director. The induction for Independent Directors also includes interactive sessions with Business and Function Heads, etc, as necessary.
COMMITTEES OF THE BOARD
The Committees constituted by the Board play a very important
role in the governance structure of the Company and they
deal in specific areas/ activities that need close review.
The Committees have been set up under the formal approval
of the Board to carry out pre-defined roles and responsibilities.
The terms of reference of these Committees are in line with
the requirements of the Companies Act, 2013 and IRDAI
(Corporate Governance) Guidelines 2016. The Chairperson of
each Committee briefs the Board on the important deliberations
and decisions of the respective Committees. Also, the minutes
of all the Committee meetings are placed before the Board of
Directors in its next meeting.
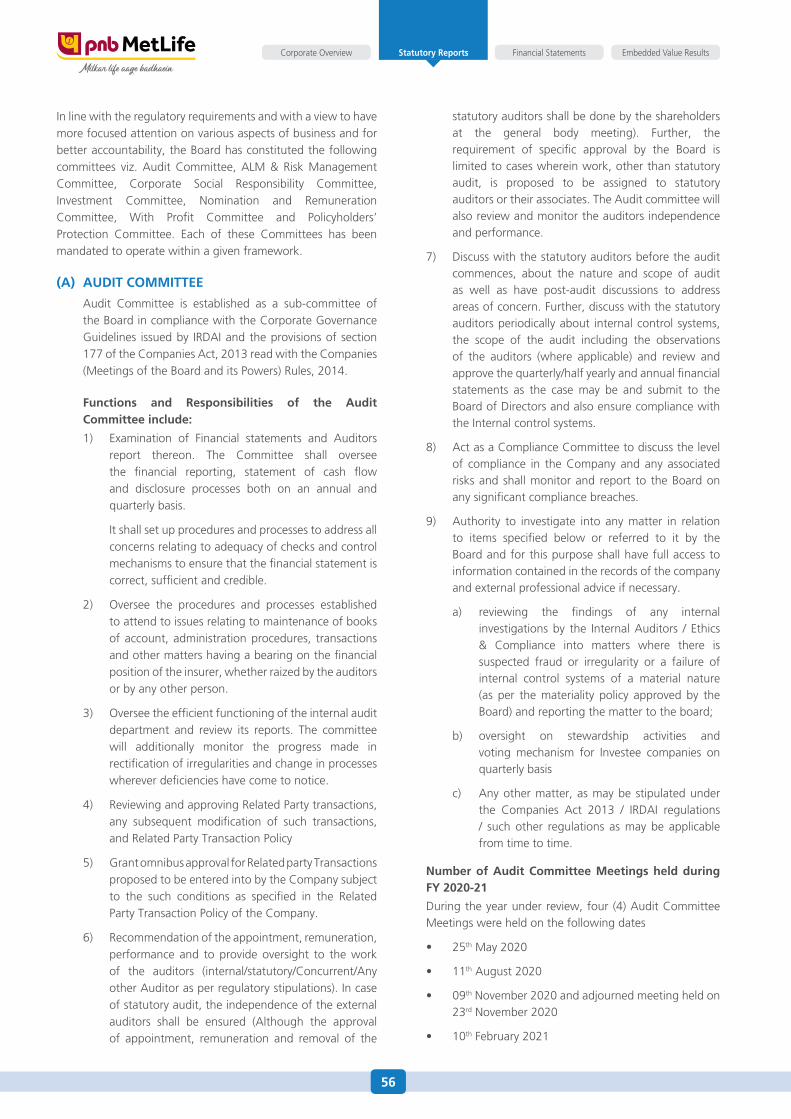
56
Financial Statements Embedded Value ResultsCorporate Overview Statutory Reports
In line with the regulatory requirements and with a view to have more focused attention on various aspects of business and for better accountability, the Board has constituted the following committees viz. Audit Committee, ALM & Risk Management Committee, Corporate Social Responsibility Committee, Investment Committee, Nomination and Remuneration Committee, With Profit Committee and Policyholders’ Protection Committee. Each of these Committees has been mandated to operate within a given framework.
(A) AUDIT COMMITTEE
Audit Committee is established as a sub-committee of the Board in compliance with the Corporate Governance Guidelines issued by IRDAI and the provisions of section 177 of the Companies Act, 2013 read with the Companies (Meetings of the Board and its Powers) Rules, 2014.
Functions and Responsibilities of the Audit Committee include:
1) Examination of Financial statements and Auditors report thereon. The Committee shall oversee the financial reporting, statement of cash flow and disclosure processes both on an annual and quarterly basis.
It shall set up procedures and processes to address all concerns relating to adequacy of checks and control mechanisms to ensure that the financial statement is correct, sufficient and credible.
2) Oversee the procedures and processes established to attend to issues relating to maintenance of books of account, administration procedures, transactions and other matters having a bearing on the financial position of the insurer, whether raized by the auditors or by any other person.
3) Oversee the efficient functioning of the internal audit department and review its reports. The committee will additionally monitor the progress made in rectification of irregularities and change in processes wherever deficiencies have come to notice.
4) Reviewing and approving Related Party transactions, any subsequent modification of such transactions, and Related Party Transaction Policy
5) Grant omnibus approval for Related party Transactions proposed to be entered into by the Company subject to the such conditions as specified in the Related Party Transaction Policy of the Company.
6) Recommendation of the appointment, remuneration, performance and to provide oversight to the work of the auditors (internal/statutory/Concurrent/Any other Auditor as per regulatory stipulations). In case of statutory audit, the independence of the external auditors shall be ensured (Although the approval of appointment, remuneration and removal of the
statutory auditors shall be done by the shareholders at the general body meeting). Further, the requirement of specific approval by the Board is limited to cases wherein work, other than statutory audit, is proposed to be assigned to statutory auditors or their associates. The Audit committee will also review and monitor the auditors independence and performance.
7) Discuss with the statutory auditors before the audit commences, about the nature and scope of audit as well as have post-audit discussions to address areas of concern. Further, discuss with the statutory auditors periodically about internal control systems, the scope of the audit including the observations of the auditors (where applicable) and review and approve the quarterly/half yearly and annual financial statements as the case may be and submit to the Board of Directors and also ensure compliance with the Internal control systems.
8) Act as a Compliance Committee to discuss the level of compliance in the Company and any associated risks and shall monitor and report to the Board on any significant compliance breaches.
9) Authority to investigate into any matter in relation to items specified below or referred to it by the Board and for this purpose shall have full access to information contained in the records of the company and external professional advice if necessary.
a) reviewing the findings of any internal investigations by the Internal Auditors / Ethics & Compliance into matters where there is suspected fraud or irregularity or a failure of internal control systems of a material nature (as per the materiality policy approved by the Board) and reporting the matter to the board;
b) oversight on stewardship activities and voting mechanism for Investee companies on quarterly basis
c) Any other matter, as may be stipulated under the Companies Act 2013 / IRDAI regulations / such other regulations as may be applicable from time to time.
Number of Audit Committee Meetings held during FY 2020-21
During the year under review, four (4) Audit Committee Meetings were held on the following dates
• 25th May 2020
• 11th August 2020
• 09th November 2020 and adjourned meeting held on 23rd November 2020
• 10th February 2021
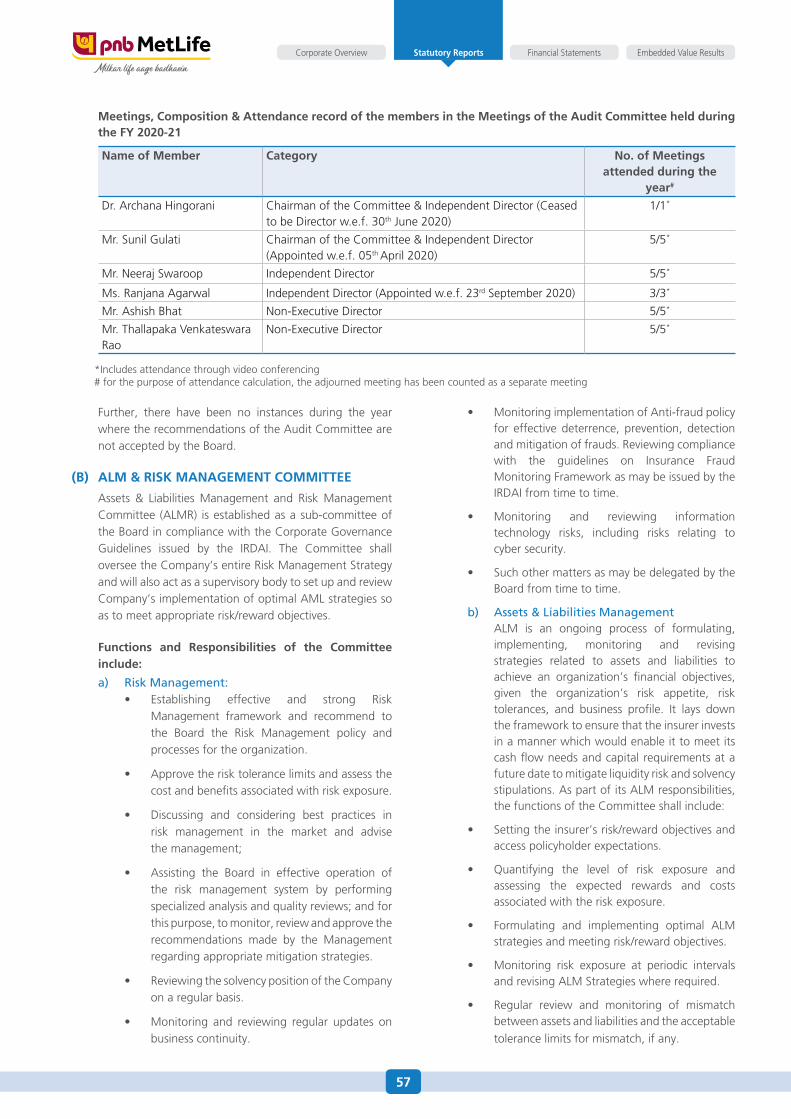
57
Financial Statements Embedded Value ResultsCorporate Overview Statutory Reports
Meetings, Composition & Attendance record of the members in the Meetings of the Audit Committee held during the FY 2020-21
Name of Member Category No. of Meetings attended during the
year#
Dr. Archana Hingorani Chairman of the Committee & Independent Director (Ceased to be Director w.e.f. 30th June 2020)
1/1*
Mr. Sunil Gulati Chairman of the Committee & Independent Director (Appointed w.e.f. 05th April 2020)
5/5*
Mr. Neeraj Swaroop Independent Director 5/5*
Ms. Ranjana Agarwal Independent Director (Appointed w.e.f. 23rd September 2020) 3/3*
Mr. Ashish Bhat Non-Executive Director 5/5*
Mr. Thallapaka Venkateswara Rao
Non-Executive Director 5/5*
*Includes attendance through video conferencing # for the purpose of attendance calculation, the adjourned meeting has been counted as a separate meeting
Further, there have been no instances during the year where the recommendations of the Audit Committee are not accepted by the Board.
(B) ALM & RISK MANAGEMENT COMMITTEE
Assets & Liabilities Management and Risk Management Committee (ALMR) is established as a sub-committee of the Board in compliance with the Corporate Governance Guidelines issued by the IRDAI. The Committee shall oversee the Company’s entire Risk Management Strategy and will also act as a supervisory body to set up and review Company’s implementation of optimal AML strategies so as to meet appropriate risk/reward objectives.
Functions and Responsibilities of the Committee include:
a) Risk Management:• Establishing effective and strong Risk
Management framework and recommend to the Board the Risk Management policy and processes for the organization.
• Approvetherisktolerancelimitsandassessthecost and benefits associated with risk exposure.
• Discussing and considering best practices inrisk management in the market and advise the management;
• Assisting the Board in effective operation ofthe risk management system by performing specialized analysis and quality reviews; and for this purpose, to monitor, review and approve the recommendations made by the Management regarding appropriate mitigation strategies.
• ReviewingthesolvencypositionoftheCompanyon a regular basis.
• Monitoring and reviewing regular updates onbusiness continuity.
• MonitoringimplementationofAnti-fraudpolicyfor effective deterrence, prevention, detection and mitigation of frauds. Reviewing compliance with the guidelines on Insurance Fraud Monitoring Framework as may be issued by the IRDAI from time to time.
• Monitoring and reviewing informationtechnology risks, including risks relating to cyber security.
• SuchothermattersasmaybedelegatedbytheBoard from time to time.
b) Assets & Liabilities Management ALM is an ongoing process of formulating,
implementing, monitoring and revising strategies related to assets and liabilities to achieve an organization’s financial objectives, given the organization’s risk appetite, risk tolerances, and business profile. It lays down the framework to ensure that the insurer invests in a manner which would enable it to meet its cash flow needs and capital requirements at a future date to mitigate liquidity risk and solvency stipulations. As part of its ALM responsibilities, the functions of the Committee shall include:
• Settingtheinsurer’srisk/rewardobjectivesandaccess policyholder expectations.
• Quantifying the level of risk exposure andassessing the expected rewards and costs associated with the risk exposure.
• Formulating and implementing optimal ALMstrategies and meeting risk/reward objectives.
• Monitoring risk exposure at periodic intervalsand revising ALM Strategies where required.
• Regular review and monitoring of mismatchbetween assets and liabilities and the acceptable
tolerance limits for mismatch, if any.
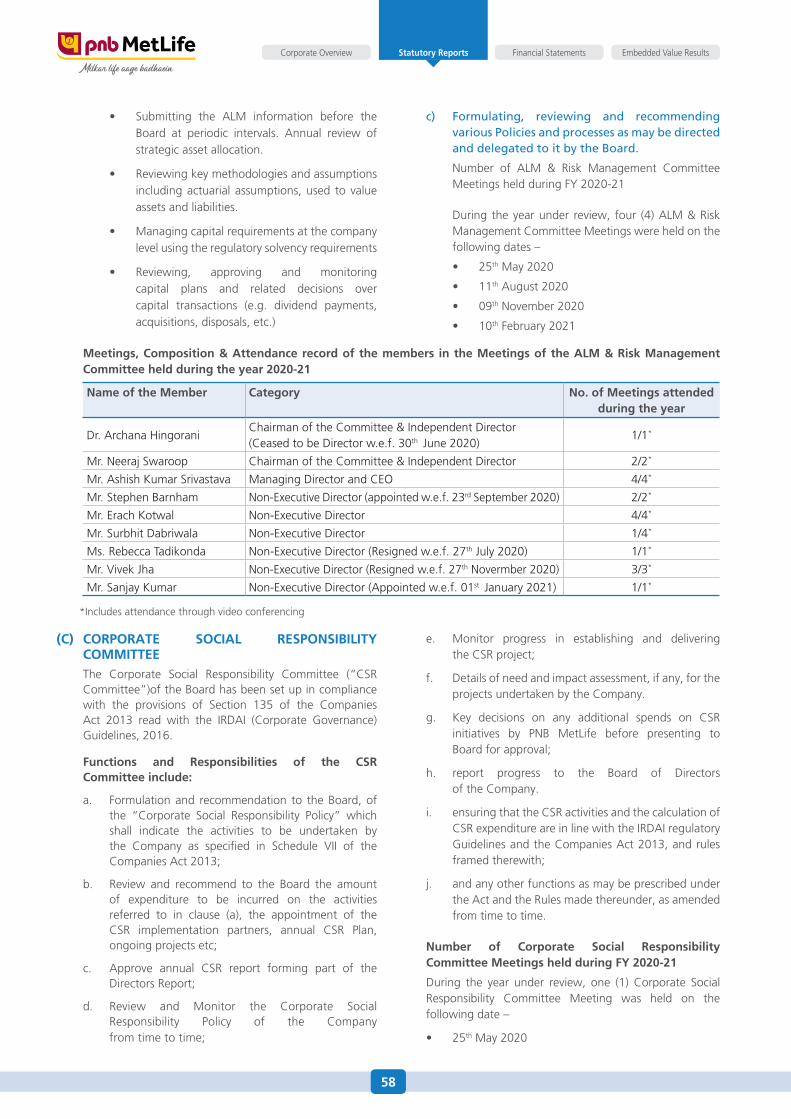
58
Financial Statements Embedded Value ResultsCorporate Overview Statutory Reports
• Submitting the ALM information before theBoard at periodic intervals. Annual review of strategic asset allocation.
• Reviewingkeymethodologiesandassumptionsincluding actuarial assumptions, used to value assets and liabilities.
• Managingcapitalrequirementsatthecompanylevel using the regulatory solvency requirements
• Reviewing, approving and monitoringcapital plans and related decisions over capital transactions (e.g. dividend payments, acquisitions, disposals, etc.)
c) Formulating, reviewing and recommending various Policies and processes as may be directed and delegated to it by the Board.
Number of ALM & Risk Management Committee Meetings held during FY 2020-21
During the year under review, four (4) ALM & Risk Management Committee Meetings were held on the following dates –
• 25th May 2020
• 11th August 2020
• 09th November 2020
• 10th February 2021
Meetings, Composition & Attendance record of the members in the Meetings of the ALM & Risk Management Committee held during the year 2020-21
Name of the Member Category No. of Meetings attended during the year
Dr. Archana HingoraniChairman of the Committee & Independent Director(Ceased to be Director w.e.f. 30th June 2020)
1/1*
Mr. Neeraj Swaroop Chairman of the Committee & Independent Director 2/2*
Mr. Ashish Kumar Srivastava Managing Director and CEO 4/4*
Mr. Stephen Barnham Non-Executive Director (appointed w.e.f. 23rd September 2020) 2/2*
Mr. Erach Kotwal Non-Executive Director 4/4*
Mr. Surbhit Dabriwala Non-Executive Director 1/4*
Ms. Rebecca Tadikonda Non-Executive Director (Resigned w.e.f. 27th July 2020) 1/1*
Mr. Vivek Jha Non-Executive Director (Resigned w.e.f. 27th Novermber 2020) 3/3*
Mr. Sanjay Kumar Non-Executive Director (Appointed w.e.f. 01st January 2021) 1/1*
*Includes attendance through video conferencing
(C) CORPORATE SOCIAL RESPONSIBILITY COMMITTEE
The Corporate Social Responsibility Committee (“CSR Committee”)of the Board has been set up in compliance with the provisions of Section 135 of the Companies Act 2013 read with the IRDAI (Corporate Governance) Guidelines, 2016.
Functions and Responsibilities of the CSR Committee include:
a. Formulation and recommendation to the Board, of the “Corporate Social Responsibility Policy” which shall indicate the activities to be undertaken by the Company as specified in Schedule VII of the Companies Act 2013;
b. Review and recommend to the Board the amount of expenditure to be incurred on the activities referred to in clause (a), the appointment of the CSR implementation partners, annual CSR Plan, ongoing projects etc;
c. Approve annual CSR report forming part of the Directors Report;
d. Review and Monitor the Corporate Social Responsibility Policy of the Company from time to time;
e. Monitor progress in establishing and delivering the CSR project;
f. Details of need and impact assessment, if any, for the projects undertaken by the Company.
g. Key decisions on any additional spends on CSR initiatives by PNB MetLife before presenting to Board for approval;
h. report progress to the Board of Directors of the Company.
i. ensuring that the CSR activities and the calculation of CSR expenditure are in line with the IRDAI regulatory Guidelines and the Companies Act 2013, and rules framed therewith;
j. and any other functions as may be prescribed under the Act and the Rules made thereunder, as amended from time to time.
Number of Corporate Social Responsibility Committee Meetings held during FY 2020-21
During the year under review, one (1) Corporate Social Responsibility Committee Meeting was held on the following date –
• 25th May 2020
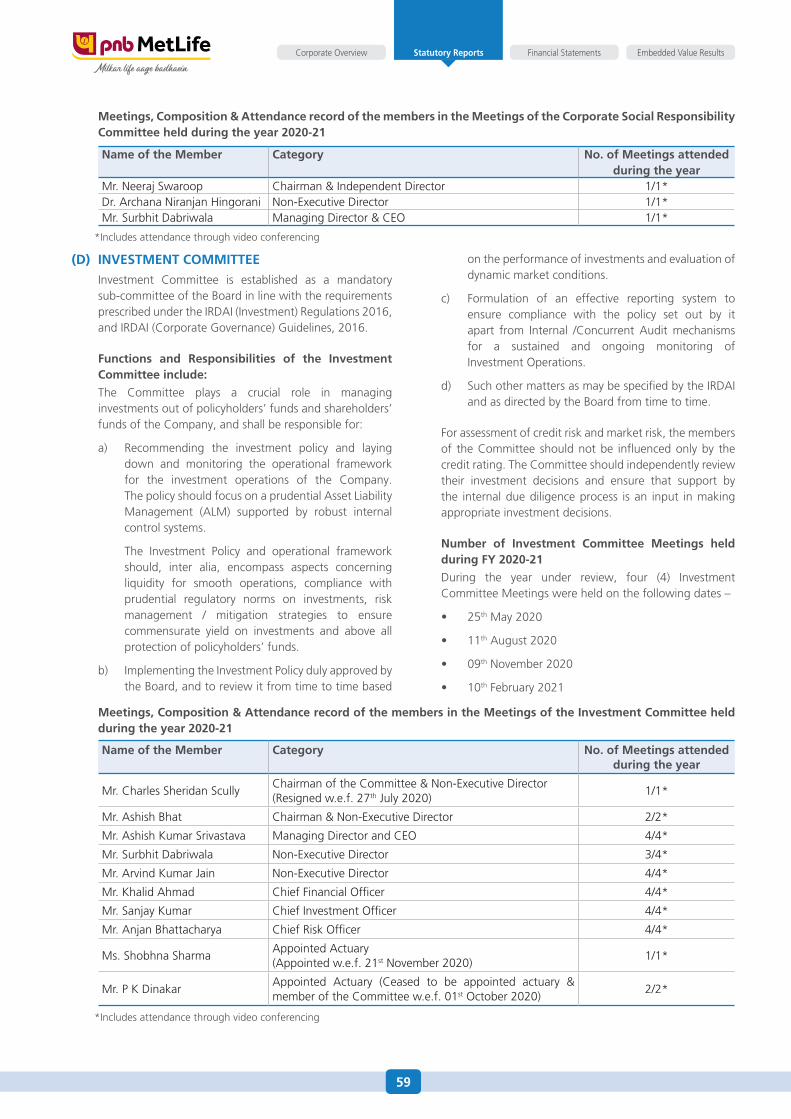
59
Financial Statements Embedded Value ResultsCorporate Overview Statutory Reports
Meetings, Composition & Attendance record of the members in the Meetings of the Corporate Social Responsibility Committee held during the year 2020-21
Name of the Member Category No. of Meetings attended during the year
Mr. Neeraj Swaroop Chairman & Independent Director 1/1*Dr. Archana Niranjan Hingorani Non-Executive Director 1/1*Mr. Surbhit Dabriwala Managing Director & CEO 1/1*
*Includes attendance through video conferencing
(D) INVESTMENT COMMITTEE
Investment Committee is established as a mandatory sub-committee of the Board in line with the requirements prescribed under the IRDAI (Investment) Regulations 2016, and IRDAI (Corporate Governance) Guidelines, 2016.
Functions and Responsibilities of the Investment Committee include:
The Committee plays a crucial role in managing investments out of policyholders’ funds and shareholders’ funds of the Company, and shall be responsible for:
a) Recommending the investment policy and laying down and monitoring the operational framework for the investment operations of the Company. The policy should focus on a prudential Asset Liability Management (ALM) supported by robust internal control systems.
The Investment Policy and operational framework should, inter alia, encompass aspects concerning liquidity for smooth operations, compliance with prudential regulatory norms on investments, risk management / mitigation strategies to ensure commensurate yield on investments and above all protection of policyholders’ funds.
b) Implementing the Investment Policy duly approved by the Board, and to review it from time to time based
on the performance of investments and evaluation of dynamic market conditions.
c) Formulation of an effective reporting system to ensure compliance with the policy set out by it apart from Internal /Concurrent Audit mechanisms for a sustained and ongoing monitoring of Investment Operations.
d) Such other matters as may be specified by the IRDAI and as directed by the Board from time to time.
For assessment of credit risk and market risk, the members of the Committee should not be influenced only by the credit rating. The Committee should independently review their investment decisions and ensure that support by the internal due diligence process is an input in making appropriate investment decisions.
Number of Investment Committee Meetings held during FY 2020-21
During the year under review, four (4) Investment Committee Meetings were held on the following dates –
• 25th May 2020
• 11th August 2020
• 09th November 2020
• 10th February 2021
Meetings, Composition & Attendance record of the members in the Meetings of the Investment Committee held during the year 2020-21
Name of the Member Category No. of Meetings attended during the year
Mr. Charles Sheridan ScullyChairman of the Committee & Non-Executive Director (Resigned w.e.f. 27th July 2020)
1/1*
Mr. Ashish Bhat Chairman & Non-Executive Director 2/2*
Mr. Ashish Kumar Srivastava Managing Director and CEO 4/4*
Mr. Surbhit Dabriwala Non-Executive Director 3/4*
Mr. Arvind Kumar Jain Non-Executive Director 4/4*
Mr. Khalid Ahmad Chief Financial Officer 4/4*
Mr. Sanjay Kumar Chief Investment Officer 4/4*
Mr. Anjan Bhattacharya Chief Risk Officer 4/4*
Ms. Shobhna SharmaAppointed Actuary(Appointed w.e.f. 21st November 2020)
1/1*
Mr. P K DinakarAppointed Actuary (Ceased to be appointed actuary & member of the Committee w.e.f. 01st October 2020)
2/2*
*Includes attendance through video conferencing
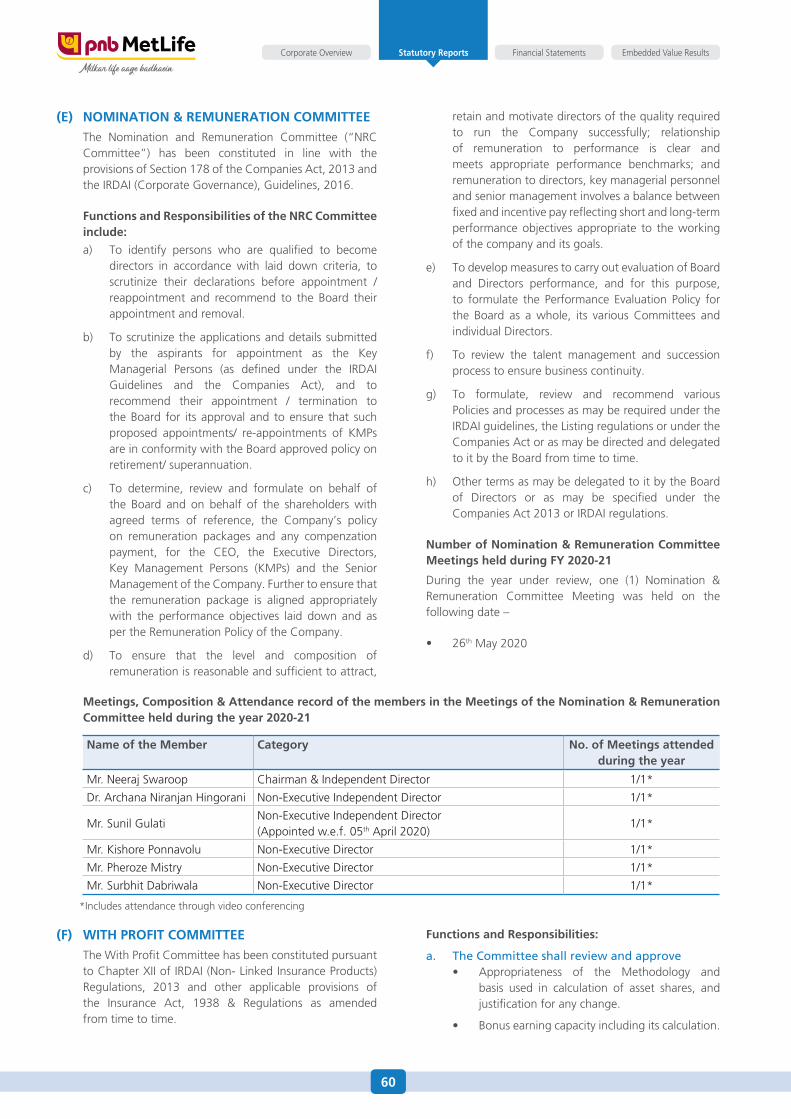
60
Financial Statements Embedded Value ResultsCorporate Overview Statutory Reports
(E) NOMINATION & REMUNERATION COMMITTEE
The Nomination and Remuneration Committee (“NRC Committee”) has been constituted in line with the provisions of Section 178 of the Companies Act, 2013 and the IRDAI (Corporate Governance), Guidelines, 2016.
Functions and Responsibilities of the NRC Committee include:
a) To identify persons who are qualified to become directors in accordance with laid down criteria, to scrutinize their declarations before appointment / reappointment and recommend to the Board their appointment and removal.
b) To scrutinize the applications and details submitted by the aspirants for appointment as the Key Managerial Persons (as defined under the IRDAI Guidelines and the Companies Act), and to recommend their appointment / termination to the Board for its approval and to ensure that such proposed appointments/ re-appointments of KMPs are in conformity with the Board approved policy on retirement/ superannuation.
c) To determine, review and formulate on behalf of the Board and on behalf of the shareholders with agreed terms of reference, the Company’s policy on remuneration packages and any compenzation payment, for the CEO, the Executive Directors, Key Management Persons (KMPs) and the Senior Management of the Company. Further to ensure that the remuneration package is aligned appropriately with the performance objectives laid down and as per the Remuneration Policy of the Company.
d) To ensure that the level and composition of remuneration is reasonable and sufficient to attract,
retain and motivate directors of the quality required to run the Company successfully; relationship of remuneration to performance is clear and meets appropriate performance benchmarks; and remuneration to directors, key managerial personnel and senior management involves a balance between fixed and incentive pay reflecting short and long-term performance objectives appropriate to the working of the company and its goals.
e) To develop measures to carry out evaluation of Board and Directors performance, and for this purpose, to formulate the Performance Evaluation Policy for the Board as a whole, its various Committees and individual Directors.
f) To review the talent management and succession process to ensure business continuity.
g) To formulate, review and recommend various Policies and processes as may be required under the IRDAI guidelines, the Listing regulations or under the Companies Act or as may be directed and delegated to it by the Board from time to time.
h) Other terms as may be delegated to it by the Board of Directors or as may be specified under the Companies Act 2013 or IRDAI regulations.
Number of Nomination & Remuneration Committee Meetings held during FY 2020-21
During the year under review, one (1) Nomination & Remuneration Committee Meeting was held on the following date –
• 26th May 2020
Meetings, Composition & Attendance record of the members in the Meetings of the Nomination & Remuneration Committee held during the year 2020-21
Name of the Member Category No. of Meetings attended during the year
Mr. Neeraj Swaroop Chairman & Independent Director 1/1*
Dr. Archana Niranjan Hingorani Non-Executive Independent Director 1/1*
Mr. Sunil GulatiNon-Executive Independent Director(Appointed w.e.f. 05th April 2020)
1/1*
Mr. Kishore Ponnavolu Non-Executive Director 1/1*
Mr. Pheroze Mistry Non-Executive Director 1/1*
Mr. Surbhit Dabriwala Non-Executive Director 1/1*
*Includes attendance through video conferencing
(F) WITH PROFIT COMMITTEE
The With Profit Committee has been constituted pursuant to Chapter XII of IRDAI (Non- Linked Insurance Products) Regulations, 2013 and other applicable provisions of the Insurance Act, 1938 & Regulations as amended from time to time.
Functions and Responsibilities:
a. The Committee shall review and approve• Appropriateness of the Methodology and
basis used in calculation of asset shares, and justification for any change.
• Bonusearningcapacityincludingitscalculation.
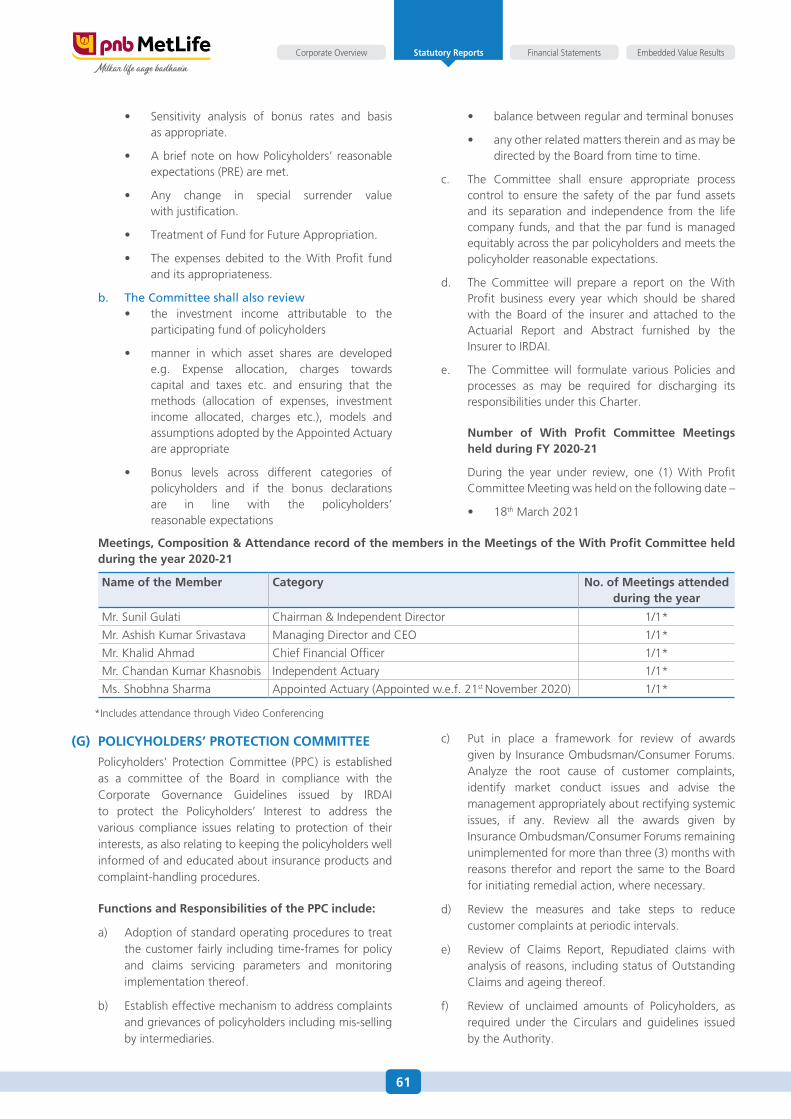
61
Financial Statements Embedded Value ResultsCorporate Overview Statutory Reports
• Sensitivity analysis of bonus rates and basisas appropriate.
• AbriefnoteonhowPolicyholders’reasonableexpectations (PRE) are met.
• Any change in special surrender valuewith justification.
• TreatmentofFundforFutureAppropriation.
• The expenses debited to theWith Profit fundand its appropriateness.
b. The Committee shall also review• the investment income attributable to the
participating fund of policyholders
• manner in which asset shares are developede.g. Expense allocation, charges towards capital and taxes etc. and ensuring that the methods (allocation of expenses, investment income allocated, charges etc.), models and assumptions adopted by the Appointed Actuary are appropriate
• Bonus levels across different categories ofpolicyholders and if the bonus declarations are in line with the policyholders’ reasonable expectations
• balancebetweenregularandterminalbonuses
• anyotherrelatedmattersthereinandasmaybedirected by the Board from time to time.
c. The Committee shall ensure appropriate process control to ensure the safety of the par fund assets and its separation and independence from the life company funds, and that the par fund is managed equitably across the par policyholders and meets the policyholder reasonable expectations.
d. The Committee will prepare a report on the With Profit business every year which should be shared with the Board of the insurer and attached to the Actuarial Report and Abstract furnished by the Insurer to IRDAI.
e. The Committee will formulate various Policies and processes as may be required for discharging its responsibilities under this Charter.
Number of With Profit Committee Meetings held during FY 2020-21
During the year under review, one (1) With Profit Committee Meeting was held on the following date –
• 18th March 2021
Meetings, Composition & Attendance record of the members in the Meetings of the With Profit Committee held during the year 2020-21
Name of the Member Category No. of Meetings attended during the year
Mr. Sunil Gulati Chairman & Independent Director 1/1*
Mr. Ashish Kumar Srivastava Managing Director and CEO 1/1*
Mr. Khalid Ahmad Chief Financial Officer 1/1*
Mr. Chandan Kumar Khasnobis Independent Actuary 1/1*
Ms. Shobhna Sharma Appointed Actuary (Appointed w.e.f. 21st November 2020) 1/1*
*Includes attendance through Video Conferencing
(G) POLICYHOLDERS’ PROTECTION COMMITTEE
Policyholders’ Protection Committee (PPC) is established as a committee of the Board in compliance with the Corporate Governance Guidelines issued by IRDAI to protect the Policyholders’ Interest to address the various compliance issues relating to protection of their interests, as also relating to keeping the policyholders well informed of and educated about insurance products and complaint-handling procedures.
Functions and Responsibilities of the PPC include:
a) Adoption of standard operating procedures to treat the customer fairly including time-frames for policy and claims servicing parameters and monitoring implementation thereof.
b) Establish effective mechanism to address complaints and grievances of policyholders including mis-selling by intermediaries.
c) Put in place a framework for review of awards given by Insurance Ombudsman/Consumer Forums. Analyze the root cause of customer complaints, identify market conduct issues and advise the management appropriately about rectifying systemic issues, if any. Review all the awards given by Insurance Ombudsman/Consumer Forums remaining unimplemented for more than three (3) months with reasons therefor and report the same to the Board for initiating remedial action, where necessary.
d) Review the measures and take steps to reduce customer complaints at periodic intervals.
e) Review of Claims Report, Repudiated claims with analysis of reasons, including status of Outstanding Claims and ageing thereof.
f) Review of unclaimed amounts of Policyholders, as required under the Circulars and guidelines issued by the Authority.
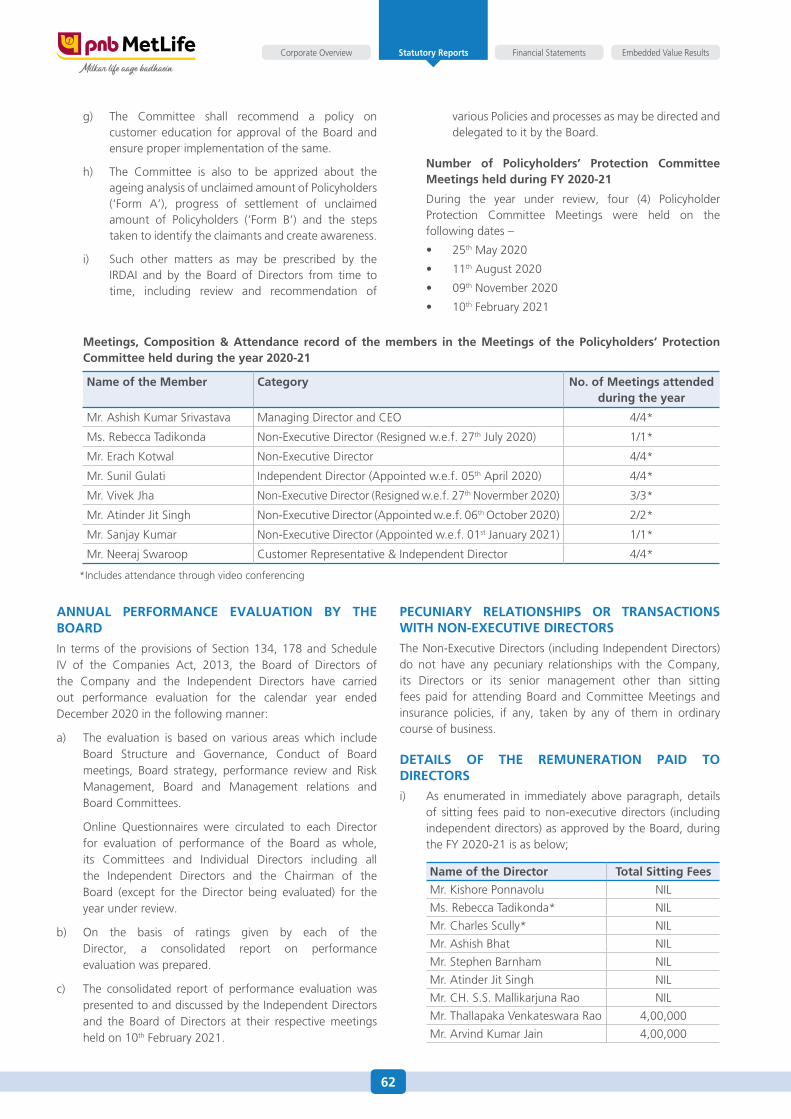
62
Financial Statements Embedded Value ResultsCorporate Overview Statutory Reports
g) The Committee shall recommend a policy on customer education for approval of the Board and ensure proper implementation of the same.
h) The Committee is also to be apprized about the ageing analysis of unclaimed amount of Policyholders (‘Form A’), progress of settlement of unclaimed amount of Policyholders (‘Form B’) and the steps taken to identify the claimants and create awareness.
i) Such other matters as may be prescribed by the IRDAI and by the Board of Directors from time to time, including review and recommendation of
various Policies and processes as may be directed and delegated to it by the Board.
Number of Policyholders’ Protection Committee Meetings held during FY 2020-21
During the year under review, four (4) Policyholder Protection Committee Meetings were held on the following dates –
• 25th May 2020
• 11th August 2020
• 09th November 2020
• 10th February 2021
Meetings, Composition & Attendance record of the members in the Meetings of the Policyholders’ Protection Committee held during the year 2020-21
Name of the Member Category No. of Meetings attended during the year
Mr. Ashish Kumar Srivastava Managing Director and CEO 4/4*
Ms. Rebecca Tadikonda Non-Executive Director (Resigned w.e.f. 27th July 2020) 1/1*
Mr. Erach Kotwal Non-Executive Director 4/4*
Mr. Sunil Gulati Independent Director (Appointed w.e.f. 05th April 2020) 4/4*
Mr. Vivek Jha Non-Executive Director (Resigned w.e.f. 27th Novermber 2020) 3/3*
Mr. Atinder Jit Singh Non-Executive Director (Appointed w.e.f. 06th October 2020) 2/2*
Mr. Sanjay Kumar Non-Executive Director (Appointed w.e.f. 01st January 2021) 1/1*
Mr. Neeraj Swaroop Customer Representative & Independent Director 4/4*
*Includes attendance through video conferencing
ANNUAL PERFORMANCE EVALUATION BY THE BOARD
In terms of the provisions of Section 134, 178 and Schedule IV of the Companies Act, 2013, the Board of Directors of the Company and the Independent Directors have carried out performance evaluation for the calendar year ended December 2020 in the following manner:
a) The evaluation is based on various areas which include Board Structure and Governance, Conduct of Board meetings, Board strategy, performance review and Risk Management, Board and Management relations and Board Committees.
Online Questionnaires were circulated to each Director for evaluation of performance of the Board as whole, its Committees and Individual Directors including all the Independent Directors and the Chairman of the Board (except for the Director being evaluated) for the year under review.
b) On the basis of ratings given by each of the Director, a consolidated report on performance evaluation was prepared.
c) The consolidated report of performance evaluation was presented to and discussed by the Independent Directors and the Board of Directors at their respective meetings held on 10th February 2021.
PECUNIARY RELATIONSHIPS OR TRANSACTIONS WITH NON-EXECUTIVE DIRECTORS
The Non-Executive Directors (including Independent Directors) do not have any pecuniary relationships with the Company, its Directors or its senior management other than sitting fees paid for attending Board and Committee Meetings and insurance policies, if any, taken by any of them in ordinary course of business.
DETAILS OF THE REMUNERATION PAID TO DIRECTORS
i) As enumerated in immediately above paragraph, details of sitting fees paid to non-executive directors (including independent directors) as approved by the Board, during the FY 2020-21 is as below;
Name of the Director Total Sitting Fees
Mr. Kishore Ponnavolu NIL
Ms. Rebecca Tadikonda* NIL
Mr. Charles Scully* NIL
Mr. Ashish Bhat NIL
Mr. Stephen Barnham NIL
Mr. Atinder Jit Singh NIL
Mr. CH. S.S. Mallikarjuna Rao NIL
Mr. Thallapaka Venkateswara Rao 4,00,000
Mr. Arvind Kumar Jain 4,00,000
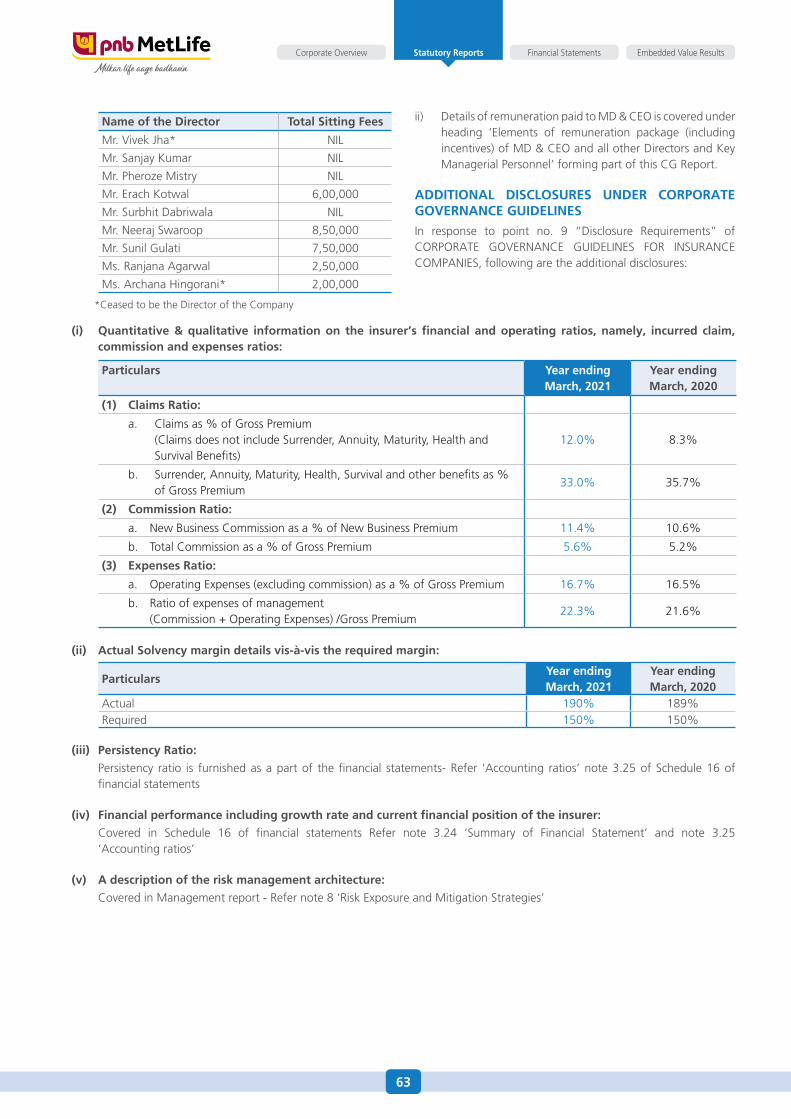
63
Financial Statements Embedded Value ResultsCorporate Overview Statutory Reports
Name of the Director Total Sitting Fees
Mr. Vivek Jha* NIL
Mr. Sanjay Kumar NIL
Mr. Pheroze Mistry NIL
Mr. Erach Kotwal 6,00,000
Mr. Surbhit Dabriwala NIL
Mr. Neeraj Swaroop 8,50,000
Mr. Sunil Gulati 7,50,000
Ms. Ranjana Agarwal 2,50,000
Ms. Archana Hingorani* 2,00,000
*Ceased to be the Director of the Company
ii) Details of remuneration paid to MD & CEO is covered under heading ‘Elements of remuneration package (including incentives) of MD & CEO and all other Directors and Key Managerial Personnel’ forming part of this CG Report.
ADDITIONAL DISCLOSURES UNDER CORPORATE GOVERNANCE GUIDELINES
In response to point no. 9 “Disclosure Requirements” of CORPORATE GOVERNANCE GUIDELINES FOR INSURANCE COMPANIES, following are the additional disclosures:
(i) Quantitative & qualitative information on the insurer’s financial and operating ratios, namely, incurred claim, commission and expenses ratios:
Particulars Year ending March, 2021
Year ending March, 2020
(1) Claims Ratio:
a. Claims as % of Gross Premium (Claims does not include Surrender, Annuity, Maturity, Health and
Survival Benefits)12.0% 8.3%
b. Surrender, Annuity, Maturity, Health, Survival and other benefits as % of Gross Premium
33.0% 35.7%
(2) Commission Ratio:
a. New Business Commission as a % of New Business Premium 11.4% 10.6%
b. Total Commission as a % of Gross Premium 5.6% 5.2%
(3) Expenses Ratio:
a. Operating Expenses (excluding commission) as a % of Gross Premium 16.7% 16.5%
b. Ratio of expenses of management (Commission + Operating Expenses) /Gross Premium
22.3% 21.6%
(ii) Actual Solvency margin details vis-à-vis the required margin:
ParticularsYear ending March, 2021
Year ending March, 2020
Actual 190% 189%Required 150% 150%
(iii) Persistency Ratio:
Persistency ratio is furnished as a part of the financial statements- Refer ‘Accounting ratios’ note 3.25 of Schedule 16 of financial statements
(iv) Financial performance including growth rate and current financial position of the insurer:
Covered in Schedule 16 of financial statements Refer note 3.24 ‘Summary of Financial Statement’ and note 3.25 ‘Accounting ratios’
(v) A description of the risk management architecture:
Covered in Management report - Refer note 8 ‘Risk Exposure and Mitigation Strategies’
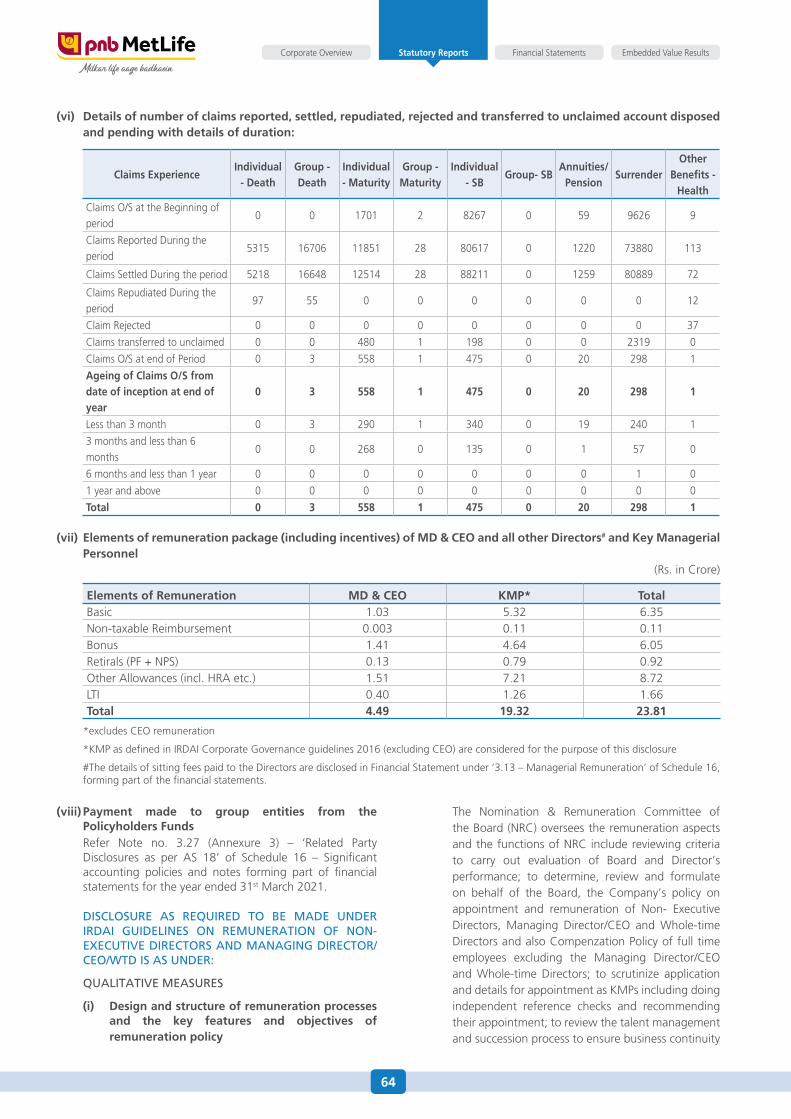
64
Financial Statements Embedded Value ResultsCorporate Overview Statutory Reports
(vi) Details of number of claims reported, settled, repudiated, rejected and transferred to unclaimed account disposed and pending with details of duration:
Claims ExperienceIndividual
- DeathGroup - Death
Individual - Maturity
Group - Maturity
Individual - SB
Group- SBAnnuities/
PensionSurrender
Other Benefits -
Health
Claims O/S at the Beginning of period
0 0 1701 2 8267 0 59 9626 9
Claims Reported During the period
5315 16706 11851 28 80617 0 1220 73880 113
Claims Settled During the period 5218 16648 12514 28 88211 0 1259 80889 72
Claims Repudiated During the period
97 55 0 0 0 0 0 0 12
Claim Rejected 0 0 0 0 0 0 0 0 37
Claims transferred to unclaimed 0 0 480 1 198 0 0 2319 0
Claims O/S at end of Period 0 3 558 1 475 0 20 298 1
Ageing of Claims O/S from date of inception at end of year
0 3 558 1 475 0 20 298 1
Less than 3 month 0 3 290 1 340 0 19 240 1
3 months and less than 6 months
0 0 268 0 135 0 1 57 0
6 months and less than 1 year 0 0 0 0 0 0 0 1 0
1 year and above 0 0 0 0 0 0 0 0 0
Total 0 3 558 1 475 0 20 298 1
(vii) Elements of remuneration package (including incentives) of MD & CEO and all other Directors# and Key Managerial Personnel
(Rs. in Crore)
Elements of Remuneration MD & CEO KMP* TotalBasic 1.03 5.32 6.35Non-taxable Reimbursement 0.003 0.11 0.11Bonus 1.41 4.64 6.05Retirals (PF + NPS) 0.13 0.79 0.92Other Allowances (incl. HRA etc.) 1.51 7.21 8.72LTI 0.40 1.26 1.66Total 4.49 19.32 23.81
*excludes CEO remuneration
*KMP as defined in IRDAI Corporate Governance guidelines 2016 (excluding CEO) are considered for the purpose of this disclosure
#The details of sitting fees paid to the Directors are disclosed in Financial Statement under ‘3.13 – Managerial Remuneration’ of Schedule 16, forming part of the financial statements.
(viii) Payment made to group entities from the Policyholders Funds
Refer Note no. 3.27 (Annexure 3) – ‘Related Party Disclosures as per AS 18’ of Schedule 16 – Significant accounting policies and notes forming part of financial statements for the year ended 31st March 2021.
DISCLOSURE AS REQUIRED TO BE MADE UNDER IRDAI GUIDELINES ON REMUNERATION OF NON-EXECUTIVE DIRECTORS AND MANAGING DIRECTOR/CEO/WTD IS AS UNDER:
QUALITATIVE MEASURES
(i) Design and structure of remuneration processes and the key features and objectives of remuneration policy
The Nomination & Remuneration Committee of the Board (NRC) oversees the remuneration aspects and the functions of NRC include reviewing criteria to carry out evaluation of Board and Director’s performance; to determine, review and formulate on behalf of the Board, the Company’s policy on appointment and remuneration of Non- Executive Directors, Managing Director/CEO and Whole-time Directors and also Compenzation Policy of full time employees excluding the Managing Director/CEO and Whole-time Directors; to scrutinize application and details for appointment as KMPs including doing independent reference checks and recommending their appointment; to review the talent management and succession process to ensure business continuity
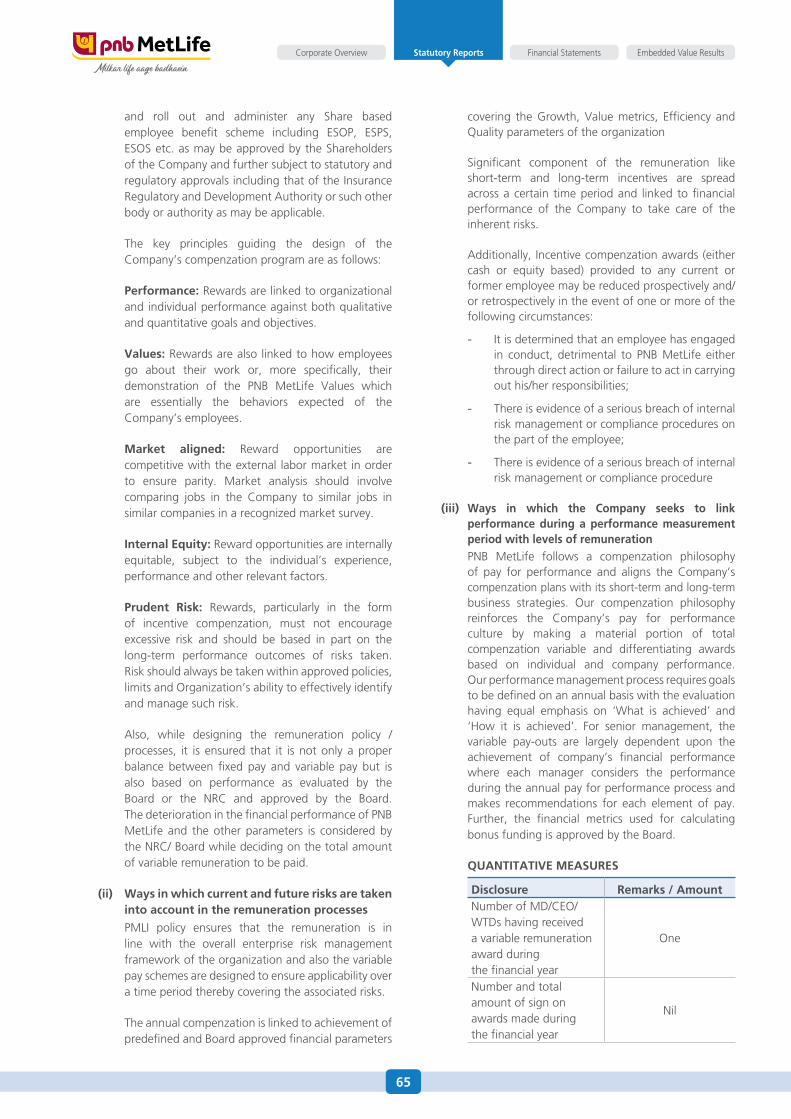
65
Financial Statements Embedded Value ResultsCorporate Overview Statutory Reports
and roll out and administer any Share based employee benefit scheme including ESOP, ESPS, ESOS etc. as may be approved by the Shareholders of the Company and further subject to statutory and regulatory approvals including that of the Insurance Regulatory and Development Authority or such other body or authority as may be applicable.
The key principles guiding the design of the Company’s compenzation program are as follows:
Performance: Rewards are linked to organizational and individual performance against both qualitative and quantitative goals and objectives.
Values: Rewards are also linked to how employees go about their work or, more specifically, their demonstration of the PNB MetLife Values which are essentially the behaviors expected of the Company’s employees.
Market aligned: Reward opportunities are competitive with the external labor market in order to ensure parity. Market analysis should involve comparing jobs in the Company to similar jobs in similar companies in a recognized market survey.
Internal Equity: Reward opportunities are internally equitable, subject to the individual’s experience, performance and other relevant factors.
Prudent Risk: Rewards, particularly in the form of incentive compenzation, must not encourage excessive risk and should be based in part on the long-term performance outcomes of risks taken. Risk should always be taken within approved policies, limits and Organization’s ability to effectively identify and manage such risk.
Also, while designing the remuneration policy / processes, it is ensured that it is not only a proper balance between fixed pay and variable pay but is also based on performance as evaluated by the Board or the NRC and approved by the Board. The deterioration in the financial performance of PNB MetLife and the other parameters is considered by the NRC/ Board while deciding on the total amount of variable remuneration to be paid.
(ii) Ways in which current and future risks are taken into account in the remuneration processes
PMLI policy ensures that the remuneration is in line with the overall enterprise risk management framework of the organization and also the variable pay schemes are designed to ensure applicability over a time period thereby covering the associated risks.
The annual compenzation is linked to achievement of predefined and Board approved financial parameters
covering the Growth, Value metrics, Efficiency and Quality parameters of the organization
Significant component of the remuneration like short-term and long-term incentives are spread across a certain time period and linked to financial performance of the Company to take care of the inherent risks.
Additionally, Incentive compenzation awards (either cash or equity based) provided to any current or former employee may be reduced prospectively and/or retrospectively in the event of one or more of the following circumstances:
- It is determined that an employee has engaged in conduct, detrimental to PNB MetLife either through direct action or failure to act in carrying out his/her responsibilities;
- There is evidence of a serious breach of internal risk management or compliance procedures on the part of the employee;
- There is evidence of a serious breach of internal risk management or compliance procedure
(iii) Ways in which the Company seeks to link performance during a performance measurement period with levels of remuneration
PNB MetLife follows a compenzation philosophy of pay for performance and aligns the Company’s compenzation plans with its short-term and long-term business strategies. Our compenzation philosophy reinforces the Company’s pay for performance culture by making a material portion of total compenzation variable and differentiating awards based on individual and company performance. Our performance management process requires goals to be defined on an annual basis with the evaluation having equal emphasis on ‘What is achieved’ and ‘How it is achieved’. For senior management, the variable pay-outs are largely dependent upon the achievement of company’s financial performance where each manager considers the performance during the annual pay for performance process and makes recommendations for each element of pay. Further, the financial metrics used for calculating bonus funding is approved by the Board.
QUANTITATIVE MEASURES
Disclosure Remarks / AmountNumber of MD/CEO/WTDs having received a variable remuneration award during the financial year
One
Number and total amount of sign on awards made during the financial year
Nil
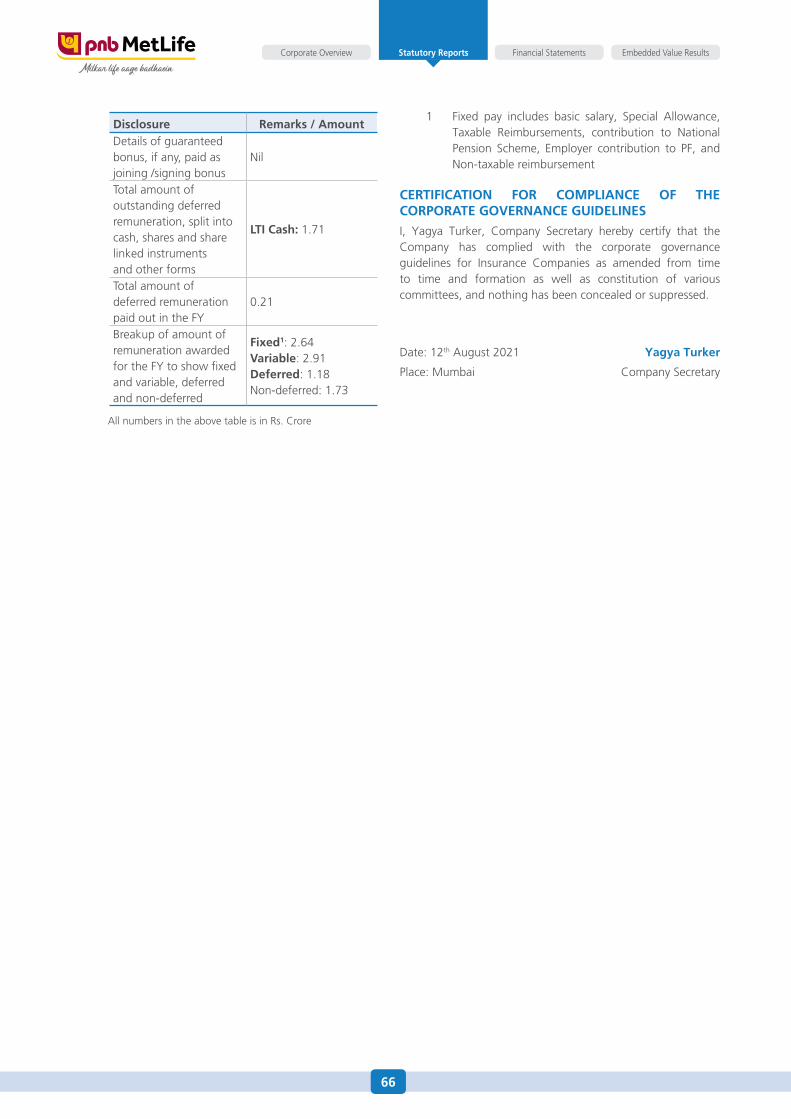
66
Financial Statements Embedded Value ResultsCorporate Overview Statutory Reports
Disclosure Remarks / AmountDetails of guaranteed bonus, if any, paid as joining /signing bonus
Nil
Total amount of outstanding deferred remuneration, split into cash, shares and share linked instruments and other forms
LTI Cash: 1.71
Total amount of deferred remuneration paid out in the FY
0.21
Breakup of amount of remuneration awarded for the FY to show fixed and variable, deferred and non-deferred
Fixed1: 2.64Variable: 2.91Deferred: 1.18Non-deferred: 1.73
1 Fixed pay includes basic salary, Special Allowance, Taxable Reimbursements, contribution to National Pension Scheme, Employer contribution to PF, and Non-taxable reimbursement
CERTIFICATION FOR COMPLIANCE OF THE CORPORATE GOVERNANCE GUIDELINES
I, Yagya Turker, Company Secretary hereby certify that the Company has complied with the corporate governance guidelines for Insurance Companies as amended from time to time and formation as well as constitution of various committees, and nothing has been concealed or suppressed.
Date: 12th August 2021 Yagya Turker
Place: Mumbai Company Secretary
All numbers in the above table is in Rs. Crore
67
Embedded Value ResultsStatutory ReportsCorporate Overview Financial Statements
To,The Shareholders PNB MetLife India Insurance Company Limited
RePoRT oN audIT of The fINaNCIaL sTaTeMeNTs foR The yeaR eNded oN 31sT MaRCh, 2021
1. OpiniOn
We have audited the accompanying financial statements of PNB MetLife India Insurance Company Limited (“the Company”), which comprise of the Balance sheet as at 31st March, 2021, the related Revenue account (also called the “Policy holders’ account” or “Technical account”), the Profit and Loss account (also called the “shareholders’ account” or “Non-Technical account”) and the Receipts and Payments account for the year ended on that date and notes to the financial statements, including a summary of significant accounting policies and other explanatory information.
In our opinion and to the best of our information and according to the explanations given to us the aforesaid financial statements are prepared in accordance with, and give the information required by the Insurance act, 1938 as amended from time to time (the “Insurance act”), the Insurance Regulatory and development authority act (the “IRdaI act”), the Insurance Regulatory and development authority (Preparation of financial statements and auditor’s Report of Insurance Companies) Regulations, 2002 (the “IRdaI financial statements Regulations”), orders/directions issued by the Insurance Regulatory and development authority of India (the “IRdaI”/“authority”) and the Companies act, 2013 (“the act”), to the extent applicable in this regard and the accounting standards specified under section 133 of the act read with Companies (accounts) Rules 2014, as amended from time to time, to the extent applicable and in the manner so required and give a true and fair view in conformity with the accounting principles generally accepted in India, as applicable to Insurance Companies;
(a) In the case of Balance sheet, of the state of affairs of the Company as at 31st March, 2021;
(b) In the case of Revenue account, of the surplus for the year ended on 31st March, 2021;
Independent Auditors’ Report
K. s. aiyar & Co.Chartered accountantsNo. f-7, shakti Mills Lane,off dr. e. Moses Road,Mahalaxmi, Mumbai-400011
M. P. Chitale & Co.Chartered accountantsfirst floor, hamam house,ambalal doshi Marg, fort, Mumbai- 400001
(c) In the case of the Profit and Loss account, of the profit for the year ended on 31st March, 2021; and
(d) In the case of the Receipts and Payments account, of the receipts and payments for the year ended on 31st March, 2021.
2. BaSiS fOr OpiniOn
We conducted our audit in accordance with the standards on auditing (sas) specified under section 143(10) of the act. our responsibilities under those standards are further described in the auditor’s Responsibilities for the audit of the financial statements section of our report. We are independent of the Company in accordance with the Code of ethics issued by the Institute of Chartered accountants of India together with the ethical requirements that are relevant to our audit of the financial statements under the provisions of the act and the Rules thereunder, and we have fulfilled our other ethical responsibilities in accordance with these requirements and the Code of ethics. We believe that the audit evidence we have obtained is sufficient and appropriate to provide a basis for our opinion.
3. EmphaSiS Of maTTEr
We draw attention to Note No. 3.3 of schedule 16 to the financial statements on the possible effects of the CoVId 19 Pandemic and management assessment of uncertainties related thereto.
our opinion is not modified in respect of these matters.
4. OThEr maTTErS
We report that the actuarial valuation of liabilities for life policies in force and for policies in respect of which premium is discontinued but liability exists as at 31st March, 2021 is the responsibility of the Company’s appointed actuary (‘the appointed actuary’) in accordance with regulations. The appointed actuary has estimated and duly certified the actuarial valuation of liabilities for policies as at 31st March, 2021 and has also certified that in his opinion the assumptions for such valuation are in accordance with the guidelines and norms issued by the Insurance Regulatory and development authority of India (‘IRdaI’) and the Institute of actuaries of India in concurrence with the IRdaI. accordingly, we have relied
68
Embedded Value ResultsStatutory ReportsCorporate Overview Financial Statements
upon the appointed actuary’s certificate in this regard for forming our opinion on the financial statements of the Company.
our opinion is not modified in respect of this matter.
5. infOrmaTiOn OThEr Than ThE financial STaTEmEnTS and audiTOr’S rEpOrT ThErEOn
The Company’s Board of directors is responsible for the other information. The other information comprises the information included in the director’s report, Corporate Governance Report but does not include the financial statements and our auditors’ report thereon. The other Information is expected to be made available to us after the date of this auditor’s report.
our opinion on the financial statements does not cover the other information and we do not express any form of assurance conclusion thereon.
In connection with our audit of the financial statements, our responsibility is to read the other information identified above and, in doing so, consider whether the other information is materially inconsistent with the financial statements or our knowledge obtained in the audit, or otherwise appears to be materially misstated.
When we read the other Information, if we conclude that there is a material misstatement therein, we are required to communicate the matters to those charged with governance.
6. rESpOnSiBiliTy Of managEmEnT fOr ThE financial STaTEmEnTS
The Company’s Board of directors is responsible for the matters stated in section 134(5) of the act with respect to the preparation of these financial statements that give a true and fair view of the financial position, financial performance, and receipts and payments of the Company in accordance with the requirements of the Insurance act read with IRda act, IRdaI financial statements Regulations, orders/directions/ circulars/guidelines issued by the Insurance Regulatory and development authority of India (‘authority’/‘IRdaI’) in this regard and in accordance with the accounting principles generally accepted in India and other applicable accounting standards specified under section 133 of the act read with Companies (accounts) Rules 2014, as amended from time to time, to the extent applicable and in the manner so required.
This responsibility also includes maintenance of adequate accounting records in accordance with the provisions of the act for safeguarding of the assets of the Company and for preventing and detecting frauds and other irregularities; selection and application of appropriate implementation and maintenance of accounting policies; making judgments and estimates that are reasonable and prudent; and design, implementation and maintenance of
adequate internal financial controls, that were operating effectively for ensuring the accuracy and completeness of the accounting records, relevant to the preparation and presentation of the financial statement that give a true and fair view and are free from material misstatement, whether due to fraud or error.
In preparing the financial statements, management is responsible for assessing the Company’s ability to continue as a going concern, disclosing, as applicable, matters related to going concern and using the going concern basis of accounting unless management either intends to liquidate the Company or to cease operations, or has no realistic alternative but to do so. The Board of directors is also responsible for overseeing the company’s financial reporting process.
7. audiTOr’S rESpOnSiBiliTy fOr ThE audiT Of ThE financial STaTEmEnTS
our objectives are to obtain reasonable assurance about whether the financial statements as a whole are free from material misstatement, whether due to fraud or error, and to issue an auditor’s report that includes our opinion. Reasonable assurance is a high level of assurance, but is not a guarantee that an audit conducted in accordance with sas will always detect a material misstatement when it exists. Misstatements can arise from fraud or error and are considered material if, individually or in the aggregate, they could reasonably be expected to influence the economic decisions of users taken on the basis of these financial statements.
as part of an audit in accordance with sas, we exercise professional judgment and maintain professional skepticism throughout the audit. We also:
• identifyandassesstherisksofmaterialmisstatementof the financial statements, whether due to fraud or error, design and perform audit procedures responsive to those risks, and obtain audit evidence that is sufficient and appropriate to provide a basis for our opinion. The risk of not detecting a material misstatement resulting from fraud is higher than for one resulting from error, as fraud may involve collusion, forgery, intentional omissions, misrepresentations, or the override of internal control.
• obtainanunderstandingofinternalcontrolrelevantto the audit in order to design audit procedures that are appropriate in the circumstances. under section 143(3)(i) of the Companies act, 2013, we are also responsible for expressing our opinion on whether the Company has adequate internal financial controls with reference to the financial statements, in place and the operating effectiveness of such controls.
• evaluate theappropriatenessofaccountingpoliciesused and the reasonableness of accounting estimates and related disclosures made by management.
69
Embedded Value ResultsStatutory ReportsCorporate Overview Financial Statements
• concludeon theappropriatenessofmanagement’suse of the going concern basis of accounting and, based on the audit evidence obtained, whether a material uncertainty exists related to events or conditions that may cast significant doubt on the Company’s ability to continue as a going concern. If we conclude that a material uncertainty exists, we are required to draw attention in our auditor’s report to the related disclosures in the financial statements or, if such disclosures are inadequate, to modify our opinion.
• Our conclusions are based on the audit evidenceobtained up to the date of our auditor’s report. however, future events or conditions may cause the Company to cease to continue as a going concern.
• Evaluate the overall presentation, structure andcontent of the financial statements, including the disclosures, and whether the financial statements represent the underlying transactions and events in a manner that achieves fair presentation.
We communicate with those charged with governance regarding, among other matters, the planned scope and timing of the audit and significant audit findings, including any significant deficiencies in internal control that we identify during our audit.
We also provide those charged with governance with a statement that we have complied with relevant ethical requirements regarding independence, and to communicate with them all relationships and other matters that may reasonably be thought to bear on our independence, and where applicable, related safeguards.
8. rEpOrT On OThEr lEgal and rEgulaTOry rEquirEmEnTS1. as required by the IRdaI financial statements
Regulations, we have issued a separate certificate dated 24th May, 2021 certifying the matters specified in paragraphs 3 and 4 of schedule C to the IRdaI financial statements Regulations.
2. as required by section 143(3) of the act, we report that:
a. We have sought and obtained all the information and explanations which to the best of our knowledge and belief were necessary for the purposes of our audit.
b. In our opinion and to the best of our information and according to the explanations given to us, proper books of account as required by law have been maintained by the Company so far as it appears from our examination of those books.
c. as the Company’s financial accounting system is centralized at head office, no returns for the purposes of our audit are prepared at the branches of the Company.
d. The Balance sheet, the Revenue account, the Profit and Loss account and Receipts and Payments account for the year ended on 31st March, 2021, dealt with by this Report are in agreement with the books of account.
e. In our opinion, the aforesaid financial statements comply with the accounting standards specified under section 133 of the act read with Companies (accounts) Rules 2014, as amended from time to time, to the extent they are not inconsistent with the accounting principles prescribed in the Regulations and orders/directions issued by the IRda in this regard.
f. on the basis of the written representations received from the directors as on 31st March, 2021 taken on record by the Board of directors, none of the directors is disqualified as on 31st March, 2021 from being appointed as a director in terms of section 164(2) of the Companies act, 2013.
g. in our opinion and to the best of our information and according to the explanations given to us, investments have been valued in accordance with the relevant provisions of the Insurance act, IRdaI financial statements Regulations and/or orders/directions issued by the IRdaI in this regard;
h. in our opinion and to the best of our information and according to the explanations given to us, the accounting policies selected by the Company are appropriate and are in compliance with orders the applicable accounting standards specified under section 133 of the act read with Companies (accounts) Rules 2014, as amended from time to time, to the extent they are not inconsistent with the accounting principles as prescribed in IRdaI financial statements Regulations and /directions issued by the IRdaI in this regard.
i. With respect to the internal financial controls with reference to the financial statements of the Company and the operating effectiveness of such controls, refer to our separate report in annexure a.
j. With respect to the other matters to be included in the auditor’s Report in accordance with the requirements of section 197(16) of the act, as amended, we report that managerial remuneration paid to the Managing director and Chief executive officer (Md & Ceo) of insurance companies is governed by section 34a of the Insurance act, 1938 and requires IRdaI approval. accordingly, the provisions of section 197 (16) read with schedule V to the act are not applicable. however, sitting fees
70
Embedded Value ResultsStatutory ReportsCorporate Overview Financial Statements
paid to the directors is in compliance with section 197(5) of the act.
3. With respect to the other matters to be included in the auditor’s Report in accordance with Rule 11 of the Companies (audit and auditors) Rules, 2014, in our opinion and to the best of our knowledge and belief and according to the information and explanations given to us:
i. The Company has disclosed the impact of pending litigations on its financial position
in its financial statements – Refer Note 3.1 of
schedule 16 to the financial statements;
ii. The Company did not have any long-term
contracts including derivative contracts, for
which there were any material foreseeable losses.
iii. There were no amounts which were required
to be transferred to the Investor education and
Protection fund by the Company for the year
ended 31st March, 2021.
for K. S. aiyar & cO for m. p. chitale & co.Chartered accountants Chartered accountantsfRN: 100186W fRN: 101851W
rajesh S Joshi murtuza VajihiPartner PartnerM. No. 038526 M. No. 112555udIN: 21038526aaaaBZ2690 udIN: 21112555aaaaBX3408
Place: Mumbai Place: Mumbaidate: May 25, 2021 date: May 25, 2021
71
Embedded Value ResultsStatutory ReportsCorporate Overview Financial Statements
report on the internal financial controls with reference to financial reporting under clause (i) of Sub-section 3 of Section 143 of the companies act, 2013 (“the act”)
We have audited the internal financial controls with reference to financial reporting of PNB MetLife India Insurance Company Limited (“the Company”) as of 31 March 2021 in conjunction with our audit of the financial statements of the Company for the year ended on that date.
managEmEnT’S rESpOnSiBiliTy fOr inTErnal financial cOnTrOlS
The Company’s management is responsible for establishing and maintaining internal financial controls based on the internal control with reference to financial statements criteria established by the Company considering the essential components of internal control stated in the Guidance Note on audit of Internal financial Controls over financial Reporting (‘the Guidance Note”) issued by the Institute of Chartered accountants of India (‘ICaI’). These responsibilities include the design, implementation and maintenance of adequate internal financial controls with reference to financial statements of the Company that were operating effectively for ensuring the orderly and efficient conduct of its business, including adherence to company’s policies, the safeguarding of its assets, the prevention and detection of frauds and errors, the accuracy and completeness of the accounting records, and the timely preparation of reliable financial information, as required under the Companies act, 2013 (“the act”), including the provisions of the Insurance act, 1938 as amended from time to time (the “Insurance act”), the Insurance Regulatory and development authority act, 1999 (the “IRda act”), development authority (Preparation of financial statements and auditor’s Report of Insurance Companies) Regulations 2002, (“the IRdaI financial statements Regulations”) and orders/directions issued by the Insurance Regulatory and development authority of India (the “IRdaI”) in this regard.
audiTOrS’ rESpOnSiBiliTy
our responsibility is to express an opinion on the Company’s internal financial controls with reference to financial reporting based on our audit. We conducted our audit in accordance with the Guidance Note on audit of Internal financial Controls over financial Reporting (the “Guidance Note”) and the standards on auditing, issued by ICaI and deemed to be prescribed under section 143(10) of the act, to the extent applicable to an audit of internal financial controls. Those standards and the Guidance Note require that we comply with ethical requirements and plan and perform the audit to obtain reasonable assurance about whether internal financial controls with reference to financial statements was established and maintained and if such controls operated effectively in all material respects.
Annexure - A referred to in paragraph 8 (2) (i) under report on Other legal and regulatory requirements of our report of even date.
our audit involves performing procedures to obtain audit evidence about the adequacy of the internal financial controls with reference to financial statements and their operating effectiveness. our audit of internal financial controls with reference to financial reporting included obtaining an understanding of internal financial controls with reference to financial reporting, assessing the risk that a material weakness exists, and testing and evaluating the design and operating effectiveness of internal control based on the assessed risk. The procedures selected depend on the auditor’s judgment, including the assessment of the risks of material misstatement of the financial statements, whether due to fraud or error.
We believe that the audit evidence we have obtained is sufficient and appropriate to provide a basis for our audit opinion on the Company’s internal financial controls with reference to financial statements.
mEaning Of inTErnal financial cOnTrOlS wiTh rEfErEncE TO financial rEpOrTing
a company’s internal financial control with reference to financial statements is a process designed to provide reasonable assurance regarding the reliability of financial reporting and the preparation of financial statements for external purposes in accordance with generally accepted accounting principles. a Company’s internal financial control over financial reporting includes those policies and procedures that:
1) pertain to the maintenance of records that, in reasonable detail, accurately and fairly reflect the transactions and dispositions of the assets of the company;
2) provide reasonable assurance that transactions are recorded as necessary to permit preparation of financial statements in accordance with generally accepted accounting principles, and that receipts and expenditures of the company are being made only in accordance with authorisations of management and directors of the company; and
3) provide reasonable assurance regarding prevention or timely detection of unauthorised acquisition, use, or disposition of the company’s assets that could have a material effect on the financial statements.
inhErEnT limiTaTiOnS Of inTErnal financial cOnTrOlS wiTh rEfErEncE TO financial rEpOrTing
Because of the inherent limitations of internal financial controls with reference to financial reporting, including the possibility of collusion or improper management override of controls, material misstatements due to error or fraud may occur and not
72
Embedded Value ResultsStatutory ReportsCorporate Overview Financial Statements
be detected. also, projections of any evaluation of the internal financial controls with reference to financial reporting to future periods are subject to the risk that the internal financial control with reference to financial statements may become inadequate because of changes in conditions, or that the degree of compliance with the policies or procedures may deteriorate.
OpiniOn
In our opinion, the Company has in all material respects, internal financial controls with reference to the financial statements of the Company and such internal financial controls with reference to financial statements were operating effectively as at 31st March, 2021, based on the internal control with reference to financial statements criteria established by the Company considering the essential components of internal control stated
in the Guidance Note on audit of Internal financial Controls with reference to financial Reporting issued by the Institute of Chartered accountants of India.
OThEr maTTEr
The actuarial valuation of liabilities for life policies in force and policies where premium is discontinued is required to be certified by the appointed actuary as per the regulations, and has been relied upon by us, as mentioned in “other matter” para of our audit report on the standalone financial statements for the year ended March 31, 2021. accordingly, our opinion on the internal financial controls with reference to financial statements does not include reporting on the operating effectiveness of the management’s internal controls over the valuation and accuracy of the aforesaid actuarial valuation.
for K. S. aiyar & cO for m. p. chitale & co.Chartered accountants Chartered accountantsfRN: 100186W fRN: 101851W
rajesh S Joshi murtuza VajihiPartner PartnerM. No. 038526 M. No. 112555udIN: 21038526aaaaBZ2690 udIN: 21112555aaaaBX3408
Place: Mumbai Place: Mumbaidate: May 25, 2021 date: May 25, 2021
73
Embedded Value ResultsStatutory ReportsCorporate Overview Financial Statements
(Referred to in paragraph 8 (1) of our Report on other Matters forming part of the Independent auditor’s Report dated 24th May, 2021)
This certificate is issued to PNB MetLife India Insurance Company Limited (the Company) to comply with the provisions of paragraph 3 and 4 of schedule C of the Insurance Regulatory and development authority (Preparation of financial statements and auditor’s Report of Insurance Companies) Regulations 2002, (“the IRdaI financial statements Regulations”) read with Regulation 3 of the IRdaI financial statements Regulations
The Company’s Board of directors is responsible for complying with the provisions of the Insurance act, 1938 as amended from time to time (the “Insurance act”), the Insurance Regulatory and development authority act, 1999 (the “IRdaI act”), the IRdaI financial statements Regulation and orders/directions issued by the Insurance Regulatory and development authority of India (the “IRdaI”) which includes the preparation of the Management Report. This includes collecting, collating and validating data and designing, implementing and monitoring of internal controls suitable for ensuring compliance as aforesaid.
our responsibility for the purpose of this certificate is limited to certifying matters contained in paragraphs 3 and 4 of schedule C of the IRda financial statements Regulations.
We conducted our examination in accordance with the Guidance Note on audit Reports and Certificates for special Purposes issued by the Institute of Chartered accountants of India (the ‘ICaI’), which include the concepts of test checks and materiality. The Guidance Note requires that we comply with the ethical requirements of the Code of ethics issued by the ICaI.
Independent Auditor’s CertificateTO ThE SharEhOldErS Of pnB mETlifE india inSurancE cOmpany limiTEd
K. s. aiyar & Co.Chartered accountantsNo. f-7, shakti Mills Lane,off dr. e. Moses Road,Mahalaxmi, Mumbai-400011
M. P. Chitale & Co.Chartered accountantsfirst floor, hamam house,ambalal doshi Marg, fort, Mumbai- 400001
Based on our audit of financial statements for the year ended March 31, 2021 and in accordance with the information and explanations given to us and to the best of our knowledge and belief and based on our examination of the books of account and other records maintained by the Company for the year ended 31st March, 2021, we certify that:
1. We have reviewed the Management Report attached to the financial statements for the year ended 31st March, 2021, and on the basis of our review, there is no apparent mistake or material inconsistencies with the financial statements.
2. Based on the management representations and compliance certificates submitted to the Board of directors by the officers of the Company charged with compliance and the same being noted by the Board, we certify that the Company has complied with the terms and conditions of registration stipulated by IRdaI;
3. We have verified the cash balances by actual inspection, to the extent considered necessary or on the basis of certificate/confirmation received from the Branches and on the basis of subsequent deposits thereof in the Bank and securities relating to the Company’s investments and policy loans as at March 31, 2021, on the basis of certificates/confirmations received from the Custodian and/or depository Participants appointed by the Company, as at March 31, 2021, the Company does not have reversions and life interests;
4. The Company is not a trustee of any trust; and
5. No part of the assets of the Policyholders’ funds has been directly or indirectly applied in contravention to the provisions of the Insurance act, 1938 as amended by the Insurance Laws (amendment) act, 2015 relating to the application and investments of the Policyholders’ funds.
for K. S. aiyar & cO for m. p. chitale & co.Chartered accountants Chartered accountantsfRN: 100186W fRN: 101851W
rajesh S Joshi murtuza VajihiPartner PartnerM. No. 038526 M. No. 112555
udIN: 21038526aaaaBZ2690 udIN: 21112555aaaaBX3408
Place: Mumbai Place: Mumbaidate: May 25, 2021 date: May 25, 2021
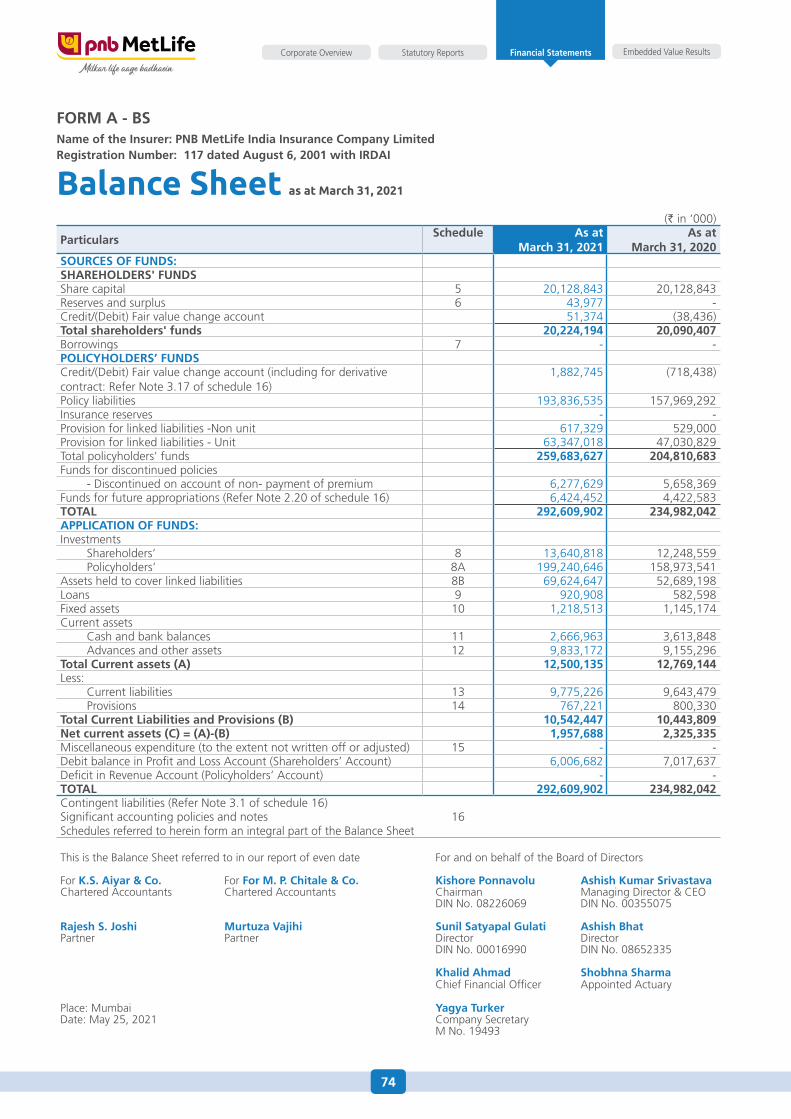
74
Embedded Value ResultsStatutory ReportsCorporate Overview Financial Statements
(` in ‘000)
particularsSchedule as at
march 31, 2021 as at
march 31, 2020SOurcES Of fundS:SharEhOldErS' fundSshare capital 5 20,128,843 20,128,843 Reserves and surplus 6 43,977 - Credit/(debit) fair value change account 51,374 (38,436)Total shareholders' funds 20,224,194 20,090,407 Borrowings 7 - - pOlicyhOldErS’ fundSCredit/(debit) fair value change account (including for derivative contract: Refer Note 3.17 of schedule 16)
1,882,745 (718,438)
Policy liabilities 193,836,535 157,969,292 Insurance reserves - - Provision for linked liabilities -Non unit 617,329 529,000 Provision for linked liabilities - unit 63,347,018 47,030,829 Total policyholders' funds 259,683,627 204,810,683 funds for discontinued policies - discontinued on account of non- payment of premium 6,277,629 5,658,369 funds for future appropriations (Refer Note 2.20 of schedule 16) 6,424,452 4,422,583 TOTal 292,609,902 234,982,042 applicaTiOn Of fundS:Investments shareholders’ 8 13,640,818 12,248,559 Policyholders’ 8a 199,240,646 158,973,541 assets held to cover linked liabilities 8B 69,624,647 52,689,198 Loans 9 920,908 582,598 fixed assets 10 1,218,513 1,145,174 Current assets Cash and bank balances 11 2,666,963 3,613,848 advances and other assets 12 9,833,172 9,155,296 Total current assets (a) 12,500,135 12,769,144 Less: Current liabilities 13 9,775,226 9,643,479 Provisions 14 767,221 800,330 Total current liabilities and provisions (B) 10,542,447 10,443,809 net current assets (c) = (a)-(B) 1,957,688 2,325,335 Miscellaneous expenditure (to the extent not written off or adjusted) 15 - - debit balance in Profit and Loss account (shareholders’ account) 6,006,682 7,017,637 deficit in Revenue account (Policyholders’ account) - - TOTal 292,609,902 234,982,042 Contingent liabilities (Refer Note 3.1 of schedule 16)significant accounting policies and notes 16schedules referred to herein form an integral part of the Balance sheet
fOrm a - BSname of the insurer: pnB metlife india insurance company limited registration number: 117 dated august 6, 2001 with irdai
Balance Sheet as at March 31, 2021
This is the Balance sheet referred to in our report of even date for and on behalf of the Board of directors
for K.S. aiyar & co. for for m. p. chitale & co. Kishore ponnavolu ashish Kumar SrivastavaChartered accountants Chartered accountants Chairman Managing director & Ceo
dIN No. 08226069 dIN No. 00355075
rajesh S. Joshi murtuza Vajihi Sunil Satyapal gulati ashish BhatPartner Partner director director
dIN No. 00016990 dIN No. 08652335
Khalid ahmad Shobhna SharmaChief financial officer appointed actuary
Place: Mumbai yagya Turkerdate: May 25, 2021 Company secretary
M No. 19493
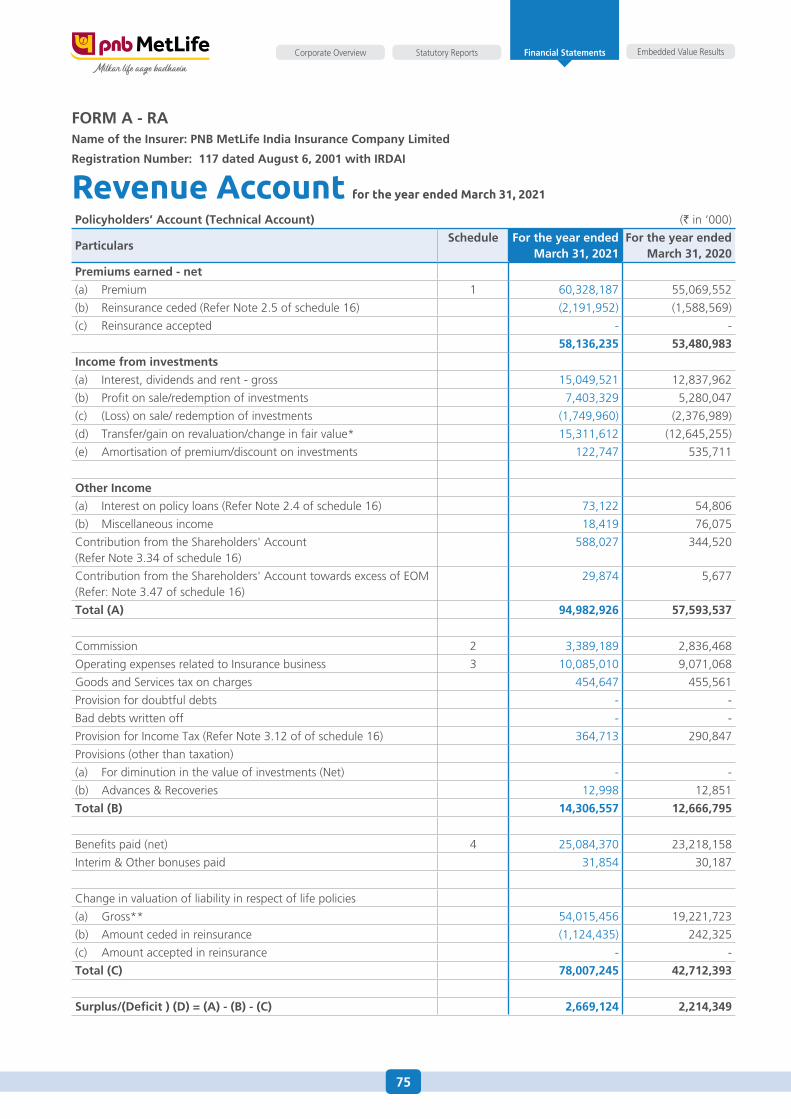
75
Embedded Value ResultsStatutory ReportsCorporate Overview Financial Statements
policyholders’ account (Technical account) (` in ‘000)
particularsSchedule for the year ended
march 31, 2021for the year ended
march 31, 2020
premiums earned - net
(a) Premium 1 60,328,187 55,069,552
(b) Reinsurance ceded (Refer Note 2.5 of schedule 16) (2,191,952) (1,588,569)
(c) Reinsurance accepted - -
58,136,235 53,480,983
income from investments
(a) Interest, dividends and rent - gross 15,049,521 12,837,962
(b) Profit on sale/redemption of investments 7,403,329 5,280,047
(c) (Loss) on sale/ redemption of investments (1,749,960) (2,376,989)
(d) Transfer/gain on revaluation/change in fair value* 15,311,612 (12,645,255)
(e) amortisation of premium/discount on investments 122,747 535,711
Other income
(a) Interest on policy loans (Refer Note 2.4 of schedule 16) 73,122 54,806
(b) Miscellaneous income 18,419 76,075
Contribution from the shareholders' account (Refer Note 3.34 of schedule 16)
588,027 344,520
Contribution from the shareholders' account towards excess of eoM (Refer: Note 3.47 of schedule 16)
29,874 5,677
Total (a) 94,982,926 57,593,537
Commission 2 3,389,189 2,836,468
operating expenses related to Insurance business 3 10,085,010 9,071,068
Goods and services tax on charges 454,647 455,561
Provision for doubtful debts - -
Bad debts written off - -
Provision for Income Tax (Refer Note 3.12 of of schedule 16) 364,713 290,847
Provisions (other than taxation)
(a) for diminution in the value of investments (Net) - -
(b) advances & Recoveries 12,998 12,851
Total (B) 14,306,557 12,666,795
Benefits paid (net) 4 25,084,370 23,218,158
Interim & other bonuses paid 31,854 30,187
Change in valuation of liability in respect of life policies
(a) Gross** 54,015,456 19,221,723
(b) amount ceded in reinsurance (1,124,435) 242,325
(c) amount accepted in reinsurance - -
Total (c) 78,007,245 42,712,393
Surplus/(deficit ) (d) = (a) - (B) - (c) 2,669,124 2,214,349
fOrm a - raname of the insurer: pnB metlife india insurance company limited
registration number: 117 dated august 6, 2001 with irdai
Revenue Account for the year ended March 31, 2021
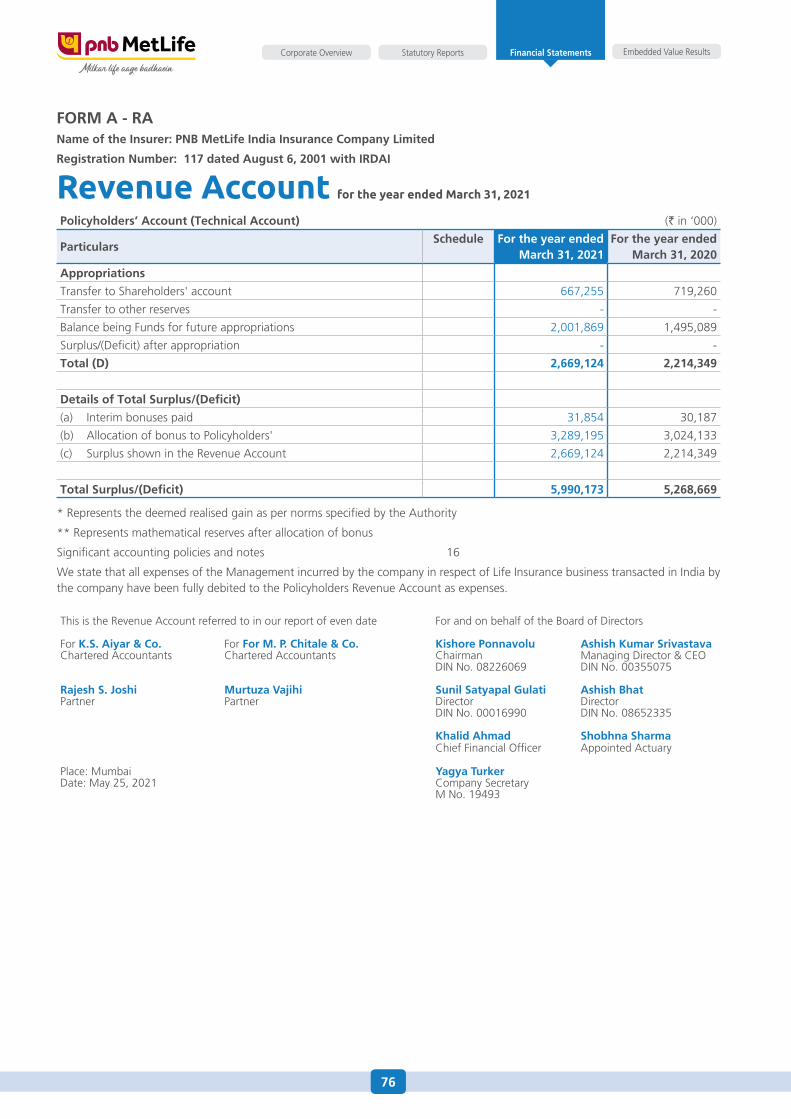
76
Embedded Value ResultsStatutory ReportsCorporate Overview Financial Statements
This is the Revenue account referred to in our report of even date for and on behalf of the Board of directors
for K.S. aiyar & co. for for m. p. chitale & co. Kishore ponnavolu ashish Kumar SrivastavaChartered accountants Chartered accountants Chairman Managing director & Ceo
dIN No. 08226069 dIN No. 00355075
rajesh S. Joshi murtuza Vajihi Sunil Satyapal gulati ashish BhatPartner Partner director director
dIN No. 00016990 dIN No. 08652335
Khalid ahmad Shobhna SharmaChief financial officer appointed actuary
Place: Mumbai yagya Turkerdate: May 25, 2021 Company secretary
M No. 19493
policyholders’ account (Technical account) (` in ‘000)
particularsSchedule for the year ended
march 31, 2021for the year ended
march 31, 2020
appropriations
Transfer to shareholders' account 667,255 719,260
Transfer to other reserves - -
Balance being funds for future appropriations 2,001,869 1,495,089
surplus/(deficit) after appropriation - -
Total (d) 2,669,124 2,214,349
details of Total Surplus/(deficit)
(a) Interim bonuses paid 31,854 30,187
(b) allocation of bonus to Policyholders' 3,289,195 3,024,133
(c) surplus shown in the Revenue account 2,669,124 2,214,349
Total Surplus/(deficit) 5,990,173 5,268,669
* Represents the deemed realised gain as per norms specified by the authority
** Represents mathematical reserves after allocation of bonus
significant accounting policies and notes 16
We state that all expenses of the Management incurred by the company in respect of Life Insurance business transacted in India by the company have been fully debited to the Policyholders Revenue account as expenses.
fOrm a - raname of the insurer: pnB metlife india insurance company limited
registration number: 117 dated august 6, 2001 with irdai
Revenue Account for the year ended March 31, 2021
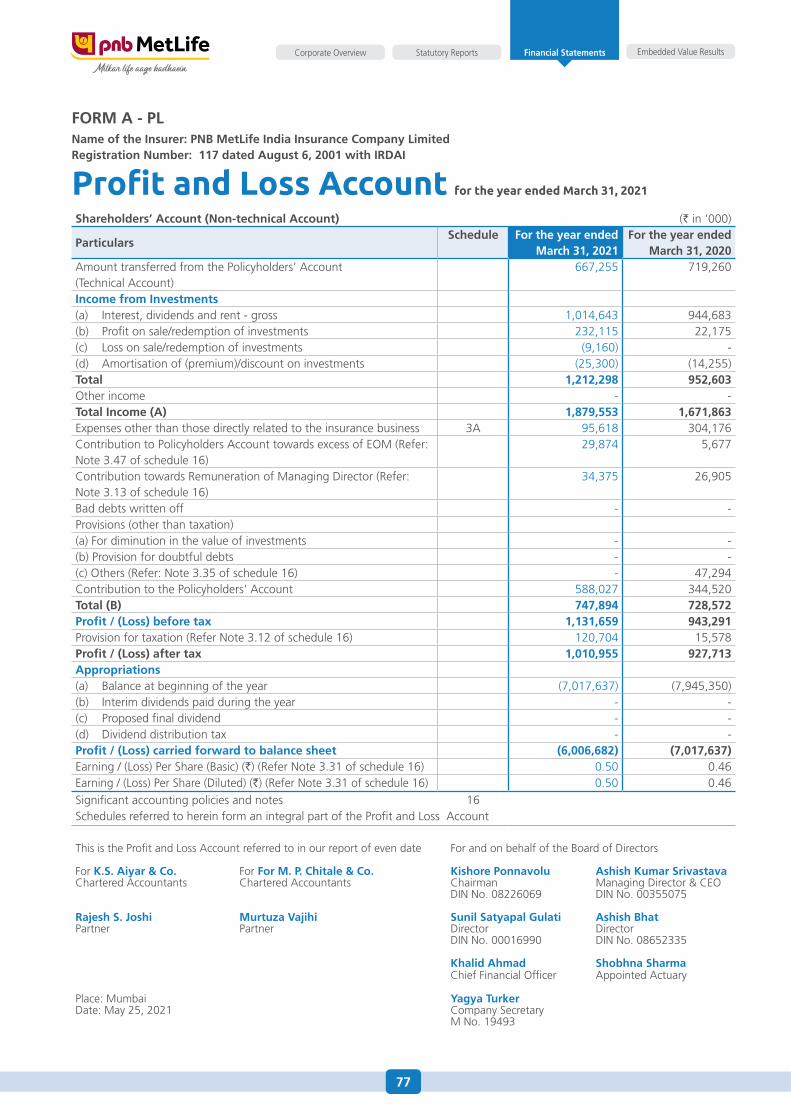
77
Embedded Value ResultsStatutory ReportsCorporate Overview Financial Statements
Shareholders’ account (non-technical account) (` in ‘000)
particularsSchedule for the year ended
march 31, 2021 for the year ended
march 31, 2020 amount transferred from the Policyholders’ account (Technical account)
667,255 719,260
income from investments(a) Interest, dividends and rent - gross 1,014,643 944,683 (b) Profit on sale/redemption of investments 232,115 22,175 (c) Loss on sale/redemption of investments (9,160) - (d) amortisation of (premium)/discount on investments (25,300) (14,255)Total 1,212,298 952,603 other income - -Total income (a) 1,879,553 1,671,863 expenses other than those directly related to the insurance business 3a 95,618 304,176 Contribution to Policyholders account towards excess of eoM (Refer: Note 3.47 of schedule 16)
29,874 5,677
Contribution towards Remuneration of Managing director (Refer: Note 3.13 of schedule 16)
34,375 26,905
Bad debts written off - - Provisions (other than taxation)(a) for diminution in the value of investments - - (b) Provision for doubtful debts - - (c) others (Refer: Note 3.35 of schedule 16) - 47,294 Contribution to the Policyholders' account 588,027 344,520 Total (B) 747,894 728,572 profit / (loss) before tax 1,131,659 943,291 Provision for taxation (Refer Note 3.12 of schedule 16) 120,704 15,578 profit / (loss) after tax 1,010,955 927,713 appropriations(a) Balance at beginning of the year (7,017,637) (7,945,350)(b) Interim dividends paid during the year - - (c) Proposed final dividend - - (d) dividend distribution tax - - profit / (loss) carried forward to balance sheet (6,006,682) (7,017,637)earning / (Loss) Per share (Basic) (`) (Refer Note 3.31 of schedule 16) 0.50 0.46 earning / (Loss) Per share (diluted) (`) (Refer Note 3.31 of schedule 16) 0.50 0.46 significant accounting policies and notes 16schedules referred to herein form an integral part of the Profit and Loss account
fOrm a - plname of the insurer: pnB metlife india insurance company limitedregistration number: 117 dated august 6, 2001 with irdai
Profit and Loss Account for the year ended March 31, 2021
This is the Profit and Loss account referred to in our report of even date for and on behalf of the Board of directors
for K.S. aiyar & co. for for m. p. chitale & co. Kishore ponnavolu ashish Kumar SrivastavaChartered accountants Chartered accountants Chairman Managing director & Ceo
dIN No. 08226069 dIN No. 00355075
rajesh S. Joshi murtuza Vajihi Sunil Satyapal gulati ashish BhatPartner Partner director director
dIN No. 00016990 dIN No. 08652335
Khalid ahmad Shobhna SharmaChief financial officer appointed actuary
Place: Mumbai yagya Turkerdate: May 25, 2021 Company secretary
M No. 19493
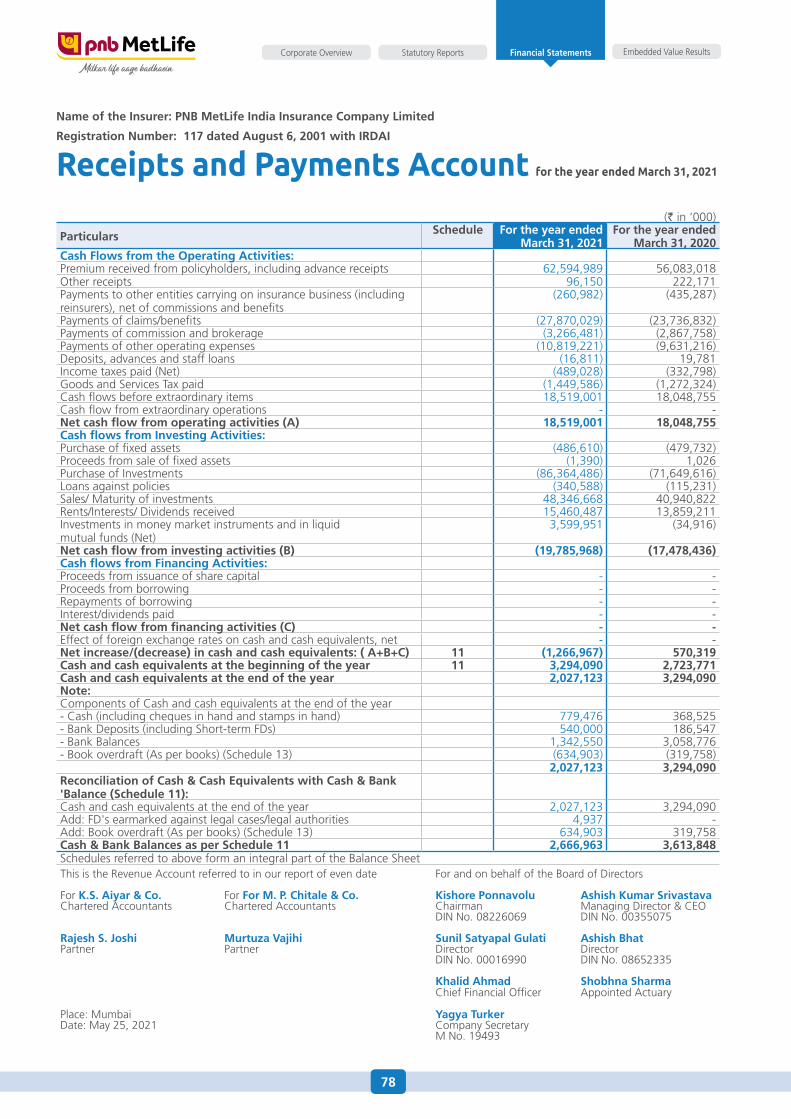
78
Embedded Value ResultsStatutory ReportsCorporate Overview Financial Statements
(` in ‘000)
particulars Schedule for the year ended march 31, 2021
for the year ended march 31, 2020
cash flows from the Operating activities:Premium received from policyholders, including advance receipts 62,594,989 56,083,018 other receipts 96,150 222,171 Payments to other entities carrying on insurance business (including reinsurers), net of commissions and benefits
(260,982) (435,287)
Payments of claims/benefits (27,870,029) (23,736,832)Payments of commission and brokerage (3,266,481) (2,867,758)Payments of other operating expenses (10,819,221) (9,631,216)deposits, advances and staff loans (16,811) 19,781 Income taxes paid (Net) (489,028) (332,798)Goods and services Tax paid (1,449,586) (1,272,324)Cash flows before extraordinary items 18,519,001 18,048,755 Cash flow from extraordinary operations - - net cash flow from operating activities (a) 18,519,001 18,048,755 cash flows from investing activities:Purchase of fixed assets (486,610) (479,732)Proceeds from sale of fixed assets (1,390) 1,026 Purchase of Investments (86,364,486) (71,649,616)Loans against policies (340,588) (115,231)sales/ Maturity of investments 48,346,668 40,940,822 Rents/Interests/ dividends received 15,460,487 13,859,211 Investments in money market instruments and in liquid mutual funds (Net)
3,599,951 (34,916)
net cash flow from investing activities (B) (19,785,968) (17,478,436)cash flows from financing activities:Proceeds from issuance of share capital - - Proceeds from borrowing - - Repayments of borrowing - - Interest/dividends paid - - net cash flow from financing activities (c) - - effect of foreign exchange rates on cash and cash equivalents, net - - net increase/(decrease) in cash and cash equivalents: ( a+B+c) 11 (1,266,967) 570,319 cash and cash equivalents at the beginning of the year 11 3,294,090 2,723,771 cash and cash equivalents at the end of the year 2,027,123 3,294,090 note:Components of Cash and cash equivalents at the end of the year- Cash (including cheques in hand and stamps in hand) 779,476 368,525 - Bank deposits (including short-term fds) 540,000 186,547 - Bank Balances 1,342,550 3,058,776 - Book overdraft (as per books) (schedule 13) (634,903) (319,758)
2,027,123 3,294,090 reconciliation of cash & cash Equivalents with cash & Bank 'Balance (Schedule 11):Cash and cash equivalents at the end of the year 2,027,123 3,294,090 add: fd's earmarked against legal cases/legal authorities 4,937 - add: Book overdraft (as per books) (schedule 13) 634,903 319,758 cash & Bank Balances as per Schedule 11 2,666,963 3,613,848 schedules referred to above form an integral part of the Balance sheet
name of the insurer: pnB metlife india insurance company limited
registration number: 117 dated august 6, 2001 with irdai
Receipts and Payments Account for the year ended March 31, 2021
This is the Revenue account referred to in our report of even date for and on behalf of the Board of directors
for K.S. aiyar & co. for for m. p. chitale & co. Kishore ponnavolu ashish Kumar SrivastavaChartered accountants Chartered accountants Chairman Managing director & Ceo
dIN No. 08226069 dIN No. 00355075
rajesh S. Joshi murtuza Vajihi Sunil Satyapal gulati ashish BhatPartner Partner director director
dIN No. 00016990 dIN No. 08652335
Khalid ahmad Shobhna SharmaChief financial officer appointed actuary
Place: Mumbai yagya Turkerdate: May 25, 2021 Company secretary
M No. 19493
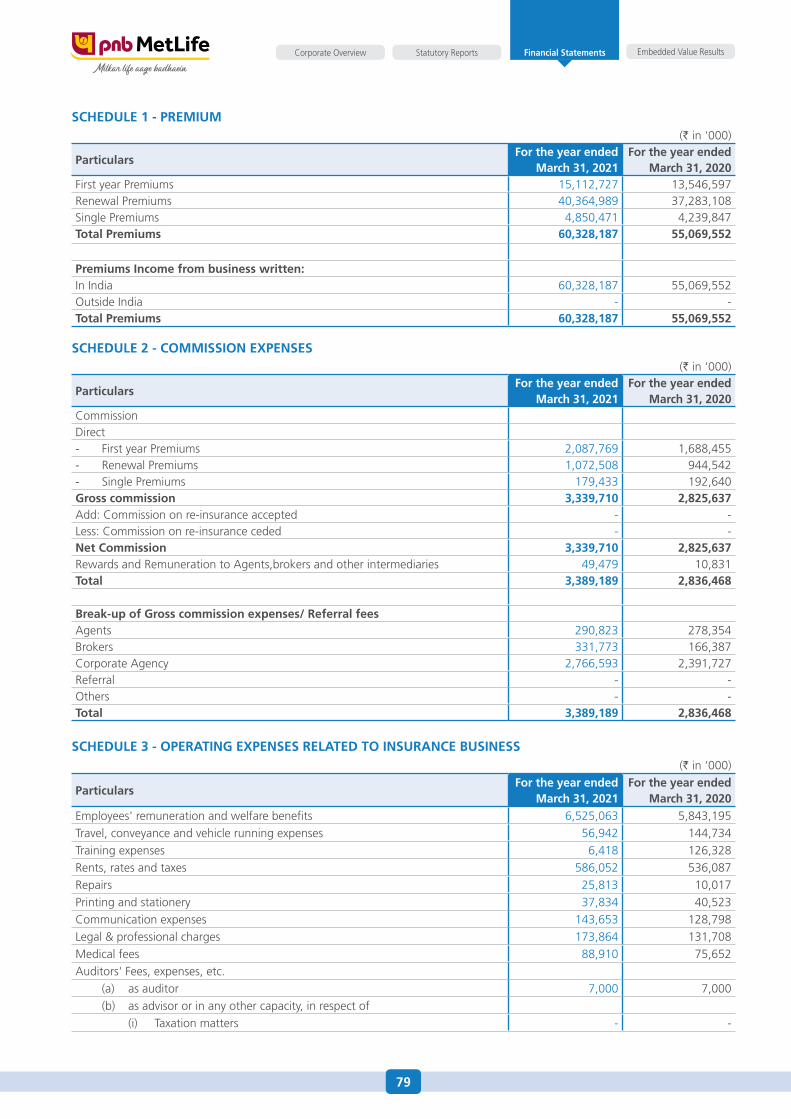
79
Embedded Value ResultsStatutory ReportsCorporate Overview Financial Statements
SchEdulE 1 - prEmium (` in ‘000)
particularsfor the year ended
march 31, 2021 for the year ended
march 31, 2020 first year Premiums 15,112,727 13,546,597 Renewal Premiums 40,364,989 37,283,108 single Premiums 4,850,471 4,239,847 Total premiums 60,328,187 55,069,552
premiums income from business written:In India 60,328,187 55,069,552 outside India - - Total premiums 60,328,187 55,069,552
SchEdulE 2 - cOmmiSSiOn ExpEnSES (` in ‘000)
particularsfor the year ended
march 31, 2021 for the year ended
march 31, 2020 Commissiondirect- first year Premiums 2,087,769 1,688,455 - Renewal Premiums 1,072,508 944,542 - single Premiums 179,433 192,640 gross commission 3,339,710 2,825,637 add: Commission on re-insurance accepted - - Less: Commission on re-insurance ceded - - net commission 3,339,710 2,825,637 Rewards and Remuneration to agents,brokers and other intermediaries 49,479 10,831 Total 3,389,189 2,836,468
Break-up of gross commission expenses/ referral feesagents 290,823 278,354 Brokers 331,773 166,387 Corporate agency 2,766,593 2,391,727 Referral - - others - - Total 3,389,189 2,836,468
SchEdulE 3 - OpEraTing ExpEnSES rElaTEd TO inSurancE BuSinESS (` in ‘000)
particularsfor the year ended
march 31, 2021 for the year ended
march 31, 2020 employees' remuneration and welfare benefits 6,525,063 5,843,195Travel, conveyance and vehicle running expenses 56,942 144,734Training expenses 6,418 126,328Rents, rates and taxes 586,052 536,087Repairs 25,813 10,017Printing and stationery 37,834 40,523Communication expenses 143,653 128,798Legal & professional charges 173,864 131,708Medical fees 88,910 75,652auditors' fees, expenses, etc. (a) as auditor 7,000 7,000 (b) as advisor or in any other capacity, in respect of (i) Taxation matters - -
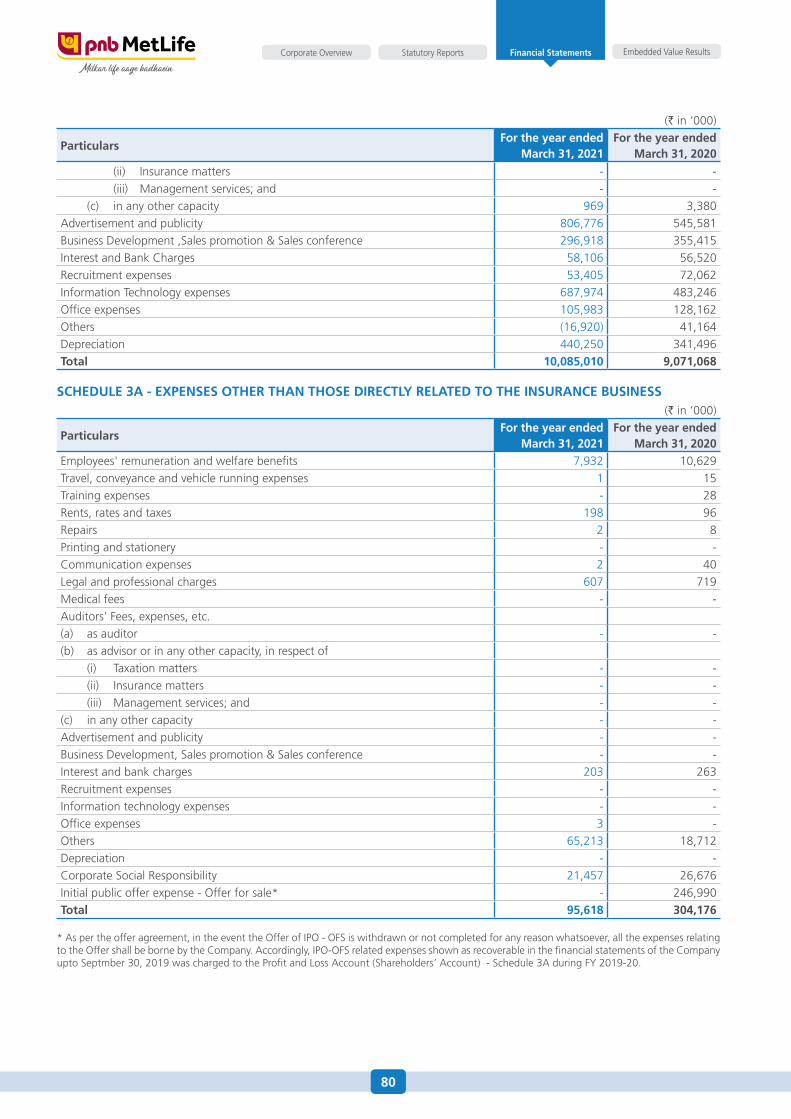
80
Embedded Value ResultsStatutory ReportsCorporate Overview Financial Statements
(` in ‘000)
particularsfor the year ended
march 31, 2021 for the year ended
march 31, 2020 (ii) Insurance matters - - (iii) Management services; and - - (c) in any other capacity 969 3,380advertisement and publicity 806,776 545,581Business development ,sales promotion & sales conference 296,918 355,415Interest and Bank Charges 58,106 56,520Recruitment expenses 53,405 72,062Information Technology expenses 687,974 483,246office expenses 105,983 128,162others (16,920) 41,164depreciation 440,250 341,496Total 10,085,010 9,071,068
SchEdulE 3a - ExpEnSES OThEr Than ThOSE dirEcTly rElaTEd TO ThE inSurancE BuSinESS (` in ‘000)
particularsfor the year ended
march 31, 2021 for the year ended
march 31, 2020 employees' remuneration and welfare benefits 7,932 10,629Travel, conveyance and vehicle running expenses 1 15Training expenses - 28Rents, rates and taxes 198 96Repairs 2 8Printing and stationery - -Communication expenses 2 40Legal and professional charges 607 719Medical fees - -auditors' fees, expenses, etc.(a) as auditor - -(b) as advisor or in any other capacity, in respect of (i) Taxation matters - - (ii) Insurance matters - - (iii) Management services; and - -(c) in any other capacity - -advertisement and publicity - -Business development, sales promotion & sales conference - -Interest and bank charges 203 263Recruitment expenses - -Information technology expenses - -office expenses 3 -others 65,213 18,712depreciation - -Corporate social Responsibility 21,457 26,676Initial public offer expense - offer for sale* - 246,990Total 95,618 304,176
* as per the offer agreement, in the event the offer of IPo - ofs is withdrawn or not completed for any reason whatsoever, all the expenses relating to the offer shall be borne by the Company. accordingly, IPo-ofs related expenses shown as recoverable in the financial statements of the Company upto septmber 30, 2019 was charged to the Profit and Loss account (shareholders’ account) - schedule 3a during fy 2019-20.
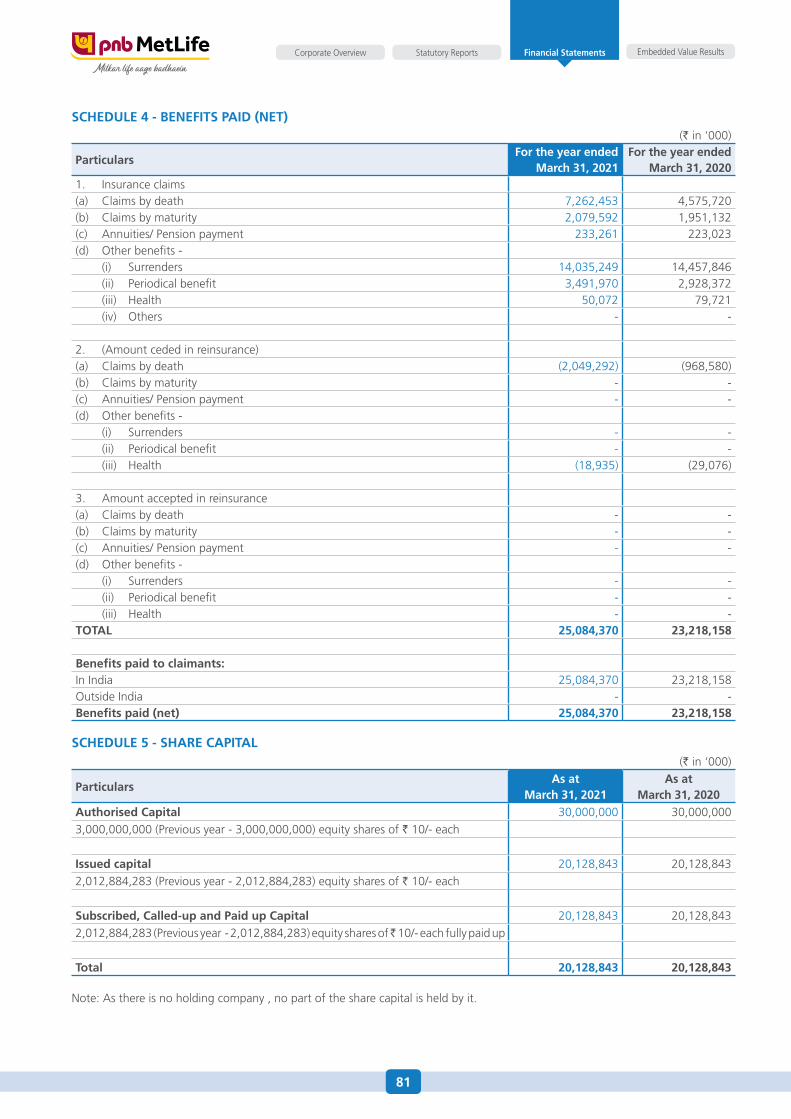
81
Embedded Value ResultsStatutory ReportsCorporate Overview Financial Statements
SchEdulE 4 - BEnEfiTS paid (nET) (` in ‘000)
particularsfor the year ended
march 31, 2021 for the year ended
march 31, 2020 1. Insurance claims(a) Claims by death 7,262,453 4,575,720(b) Claims by maturity 2,079,592 1,951,132(c) annuities/ Pension payment 233,261 223,023(d) other benefits - (i) surrenders 14,035,249 14,457,846 (ii) Periodical benefit 3,491,970 2,928,372 (iii) health 50,072 79,721 (iv) others - -
2. (amount ceded in reinsurance)(a) Claims by death (2,049,292) (968,580)(b) Claims by maturity - -(c) annuities/ Pension payment - -(d) other benefits - (i) surrenders - - (ii) Periodical benefit - - (iii) health (18,935) (29,076)
3. amount accepted in reinsurance(a) Claims by death - -(b) Claims by maturity - -(c) annuities/ Pension payment - -(d) other benefits - (i) surrenders - - (ii) Periodical benefit - - (iii) health - -TOTal 25,084,370 23,218,158
Benefits paid to claimants:In India 25,084,370 23,218,158outside India - -Benefits paid (net) 25,084,370 23,218,158
SchEdulE 5 - SharE capiTal (` in ‘000)
particularsas at
march 31, 2021 as at
march 31, 2020authorised capital 30,000,000 30,000,000 3,000,000,000 (Previous year - 3,000,000,000) equity shares of ` 10/- each
issued capital 20,128,843 20,128,843 2,012,884,283 (Previous year - 2,012,884,283) equity shares of ` 10/- each
Subscribed, called-up and paid up capital 20,128,843 20,128,843 2,012,884,283 (Previous year - 2,012,884,283) equity shares of ̀ 10/- each fully paid up
Total 20,128,843 20,128,843
Note: as there is no holding company , no part of the share capital is held by it.
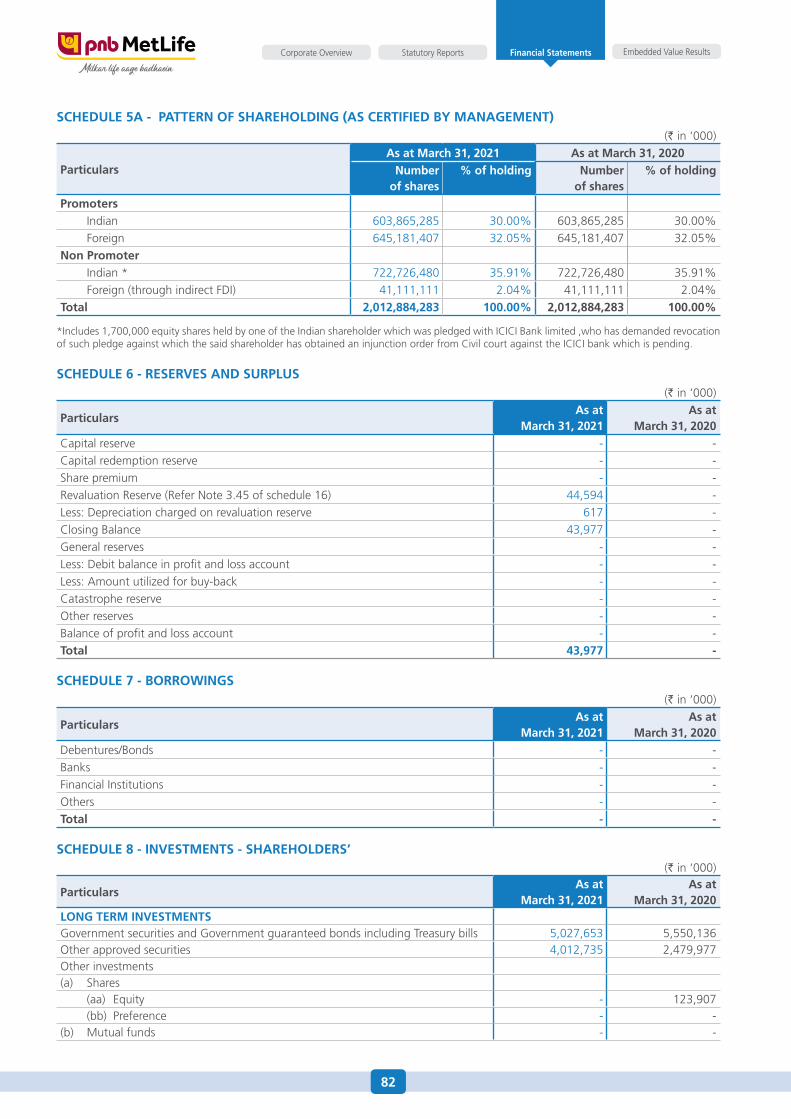
82
Embedded Value ResultsStatutory ReportsCorporate Overview Financial Statements
SchEdulE 5a - paTTErn Of SharEhOlding (aS cErTifiEd By managEmEnT) (` in ‘000)
particularsas at march 31, 2021 as at march 31, 2020
number of shares
% of holding number of shares
% of holding
promoters Indian 603,865,285 30.00% 603,865,285 30.00% foreign 645,181,407 32.05% 645,181,407 32.05%non promoter Indian * 722,726,480 35.91% 722,726,480 35.91% foreign (through indirect fdI) 41,111,111 2.04% 41,111,111 2.04%Total 2,012,884,283 100.00% 2,012,884,283 100.00%
*Includes 1,700,000 equity shares held by one of the Indian shareholder which was pledged with ICICI Bank limited ,who has demanded revocation of such pledge against which the said shareholder has obtained an injunction order from Civil court against the ICICI bank which is pending.
SchEdulE 6 - rESErVES and SurpluS (` in ‘000)
particularsas at
march 31, 2021 as at
march 31, 2020Capital reserve - - Capital redemption reserve - - share premium - - Revaluation Reserve (Refer Note 3.45 of schedule 16) 44,594 - Less: depreciation charged on revaluation reserve 617 - Closing Balance 43,977 - General reserves - - Less: debit balance in profit and loss account - - Less: amount utilized for buy-back - - Catastrophe reserve - - other reserves - - Balance of profit and loss account - - Total 43,977 -
SchEdulE 7 - BOrrOwingS (` in ‘000)
particularsas at
march 31, 2021 as at
march 31, 2020debentures/Bonds - - Banks - - financial Institutions - - others - - Total - -
SchEdulE 8 - inVESTmEnTS - SharEhOldErS’ (` in ‘000)
particularsas at
march 31, 2021as at
march 31, 2020lOng TErm inVESTmEnTSGovernment securities and Government guaranteed bonds including Treasury bills 5,027,653 5,550,136other approved securities 4,012,735 2,479,977other investments(a) shares (aa) equity - 123,907 (bb) Preference - -(b) Mutual funds - -
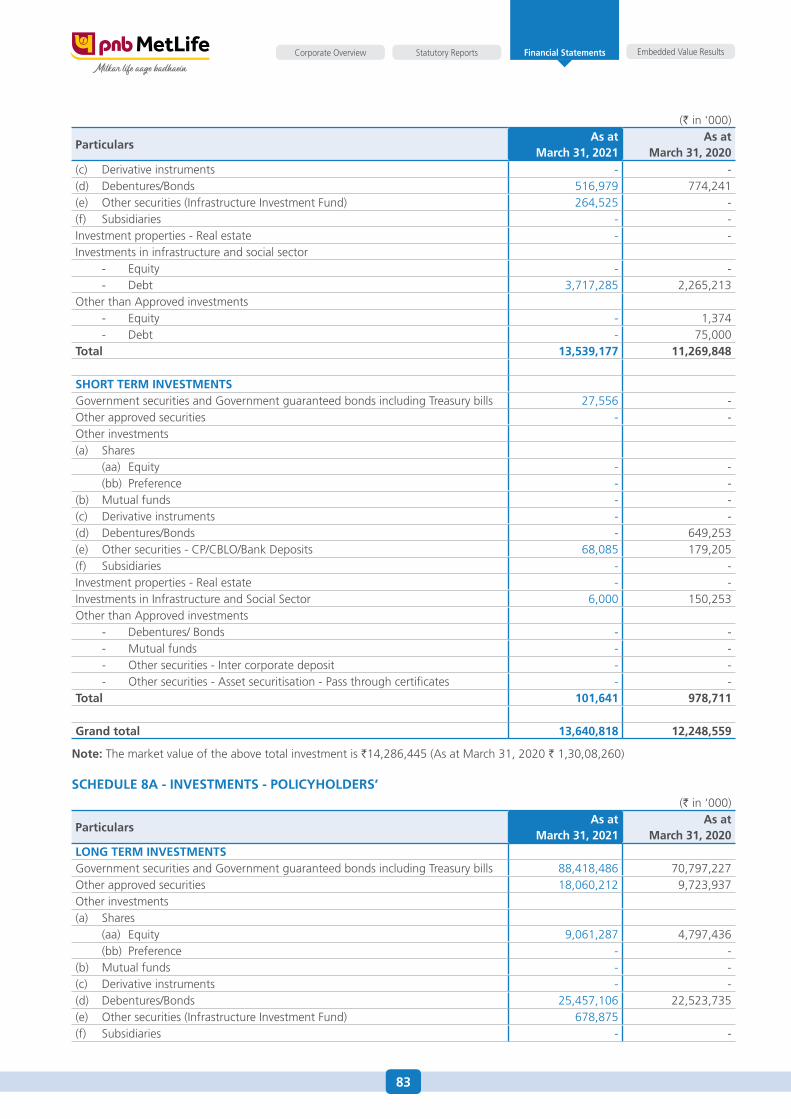
83
Embedded Value ResultsStatutory ReportsCorporate Overview Financial Statements
(` in ‘000)
particularsas at
march 31, 2021as at
march 31, 2020(c) derivative instruments - -(d) debentures/Bonds 516,979 774,241(e) other securities (Infrastructure Investment fund) 264,525 -(f) subsidiaries - -Investment properties - Real estate - -Investments in infrastructure and social sector - equity - - - debt 3,717,285 2,265,213other than approved investments - equity - 1,374 - debt - 75,000Total 13,539,177 11,269,848
ShOrT TErm inVESTmEnTSGovernment securities and Government guaranteed bonds including Treasury bills 27,556 -other approved securities - -other investments(a) shares (aa) equity - - (bb) Preference - -(b) Mutual funds - -(c) derivative instruments - -(d) debentures/Bonds - 649,253(e) other securities - CP/CBLo/Bank deposits 68,085 179,205(f) subsidiaries - -Investment properties - Real estate - -Investments in Infrastructure and social sector 6,000 150,253other than approved investments - debentures/ Bonds - - - Mutual funds - - - other securities - Inter corporate deposit - - - other securities - asset securitisation - Pass through certificates - -Total 101,641 978,711
grand total 13,640,818 12,248,559
note: The market value of the above total investment is `14,286,445 (as at March 31, 2020 ` 1,30,08,260)
SchEdulE 8a - inVESTmEnTS - pOlicyhOldErS’ (` in ‘000)
particularsas at
march 31, 2021as at
march 31, 2020lOng TErm inVESTmEnTSGovernment securities and Government guaranteed bonds including Treasury bills 88,418,486 70,797,227other approved securities 18,060,212 9,723,937other investments(a) shares (aa) equity 9,061,287 4,797,436 (bb) Preference - -(b) Mutual funds - -(c) derivative instruments - -(d) debentures/Bonds 25,457,106 22,523,735(e) other securities (Infrastructure Investment fund) 678,875(f) subsidiaries - -
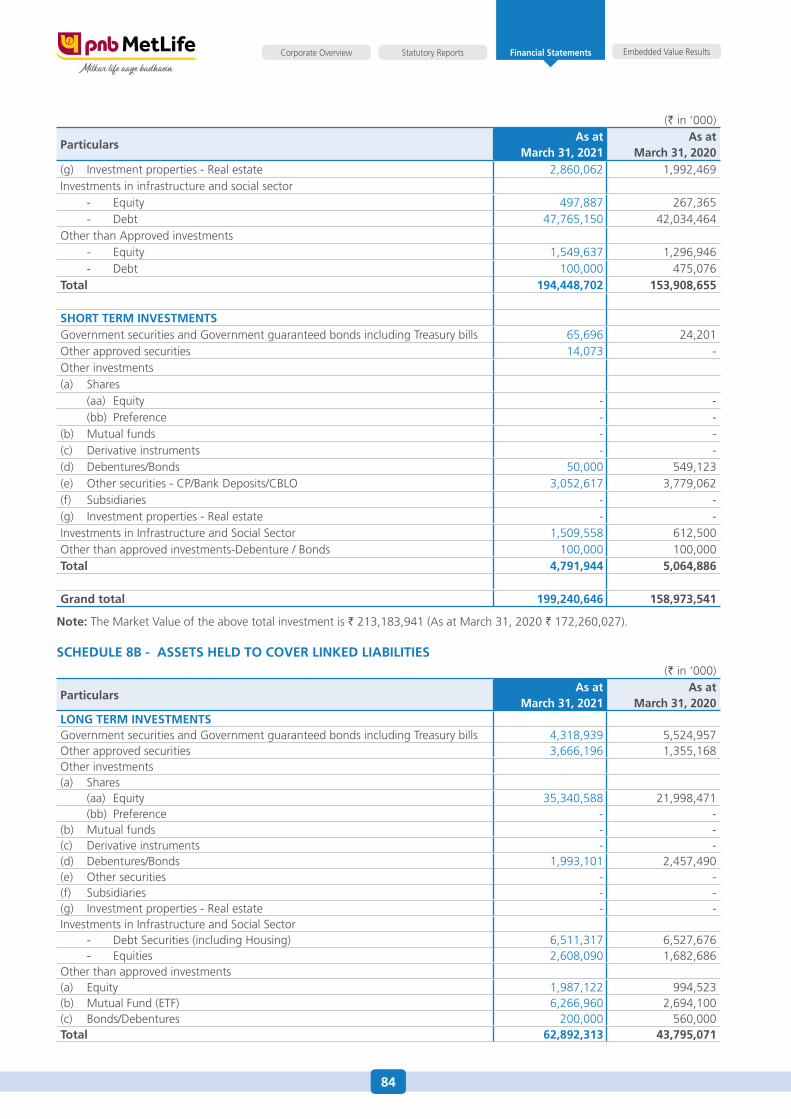
84
Embedded Value ResultsStatutory ReportsCorporate Overview Financial Statements
(` in ‘000)
particularsas at
march 31, 2021as at
march 31, 2020(g) Investment properties - Real estate 2,860,062 1,992,469Investments in infrastructure and social sector - equity 497,887 267,365 - debt 47,765,150 42,034,464other than approved investments - equity 1,549,637 1,296,946 - debt 100,000 475,076Total 194,448,702 153,908,655
ShOrT TErm inVESTmEnTSGovernment securities and Government guaranteed bonds including Treasury bills 65,696 24,201other approved securities 14,073 -other investments(a) shares (aa) equity - - (bb) Preference - -(b) Mutual funds - -(c) derivative instruments - -(d) debentures/Bonds 50,000 549,123(e) other securities - CP/Bank deposits/CBLo 3,052,617 3,779,062(f) subsidiaries - -(g) Investment properties - Real estate - -Investments in Infrastructure and social sector 1,509,558 612,500other than approved investments-debenture / Bonds 100,000 100,000Total 4,791,944 5,064,886
grand total 199,240,646 158,973,541
note: The Market Value of the above total investment is ` 213,183,941 (as at March 31, 2020 ` 172,260,027).
SchEdulE 8B - aSSETS hEld TO cOVEr linKEd liaBiliTiES (` in ‘000)
particularsas at
march 31, 2021as at
march 31, 2020lOng TErm inVESTmEnTSGovernment securities and Government guaranteed bonds including Treasury bills 4,318,939 5,524,957other approved securities 3,666,196 1,355,168other investments(a) shares (aa) equity 35,340,588 21,998,471 (bb) Preference - -(b) Mutual funds - -(c) derivative instruments - -(d) debentures/Bonds 1,993,101 2,457,490(e) other securities - -(f) subsidiaries - -(g) Investment properties - Real estate - -Investments in Infrastructure and social sector - debt securities (including housing) 6,511,317 6,527,676 - equities 2,608,090 1,682,686other than approved investments(a) equity 1,987,122 994,523(b) Mutual fund (eTf) 6,266,960 2,694,100(c) Bonds/debentures 200,000 560,000Total 62,892,313 43,795,071
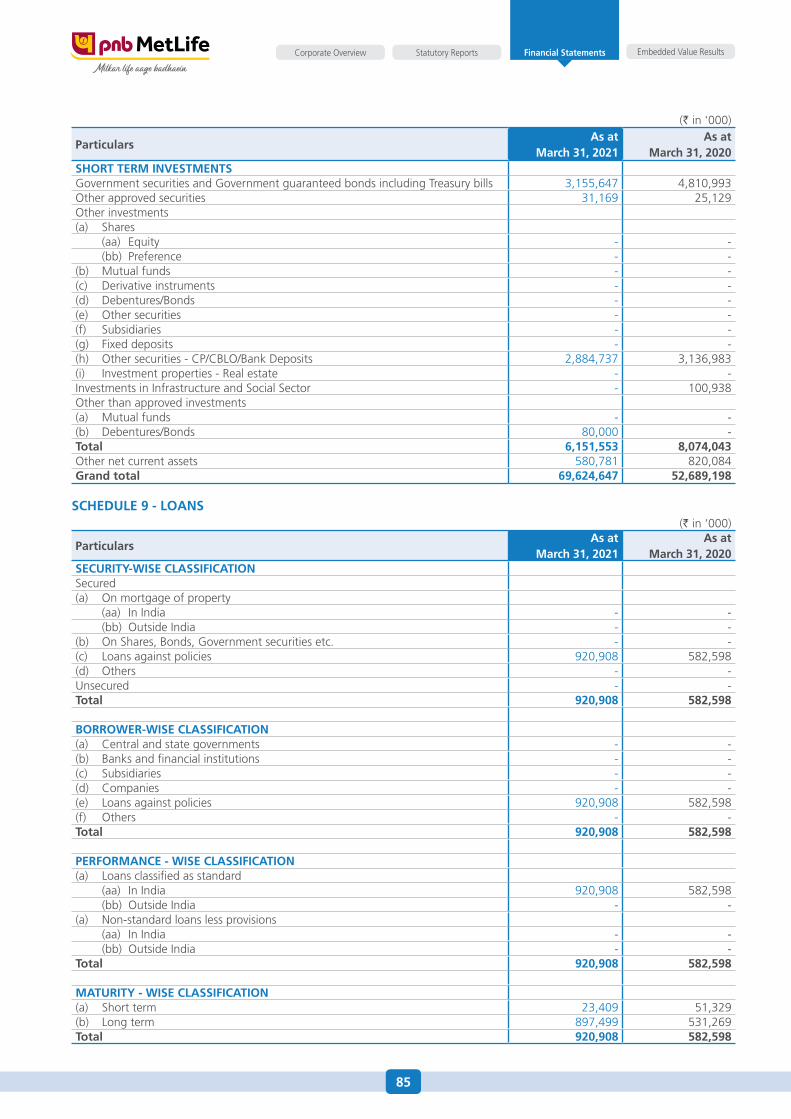
85
Embedded Value ResultsStatutory ReportsCorporate Overview Financial Statements
(` in ‘000)
particularsas at
march 31, 2021as at
march 31, 2020ShOrT TErm inVESTmEnTSGovernment securities and Government guaranteed bonds including Treasury bills 3,155,647 4,810,993other approved securities 31,169 25,129other investments(a) shares (aa) equity - - (bb) Preference - -(b) Mutual funds - -(c) derivative instruments - -(d) debentures/Bonds - -(e) other securities - -(f) subsidiaries - -(g) fixed deposits - -(h) other securities - CP/CBLo/Bank deposits 2,884,737 3,136,983(i) Investment properties - Real estate - -Investments in Infrastructure and social sector - 100,938other than approved investments(a) Mutual funds - -(b) debentures/Bonds 80,000 -Total 6,151,553 8,074,043other net current assets 580,781 820,084grand total 69,624,647 52,689,198
SchEdulE 9 - lOanS (` in ‘000)
particularsas at
march 31, 2021as at
march 31, 2020SEcuriTy-wiSE claSSificaTiOnsecured(a) on mortgage of property (aa) In India - - (bb) outside India - -(b) on shares, Bonds, Government securities etc. - -(c) Loans against policies 920,908 582,598(d) others - -unsecured - -Total 920,908 582,598
BOrrOwEr-wiSE claSSificaTiOn(a) Central and state governments - -(b) Banks and financial institutions - -(c) subsidiaries - -(d) Companies - -(e) Loans against policies 920,908 582,598(f) others - -Total 920,908 582,598
pErfOrmancE - wiSE claSSificaTiOn(a) Loans classified as standard (aa) In India 920,908 582,598 (bb) outside India - -(a) Non-standard loans less provisions (aa) In India - - (bb) outside India - -Total 920,908 582,598
maTuriTy - wiSE claSSificaTiOn(a) short term 23,409 51,329(b) Long term 897,499 531,269Total 920,908 582,598
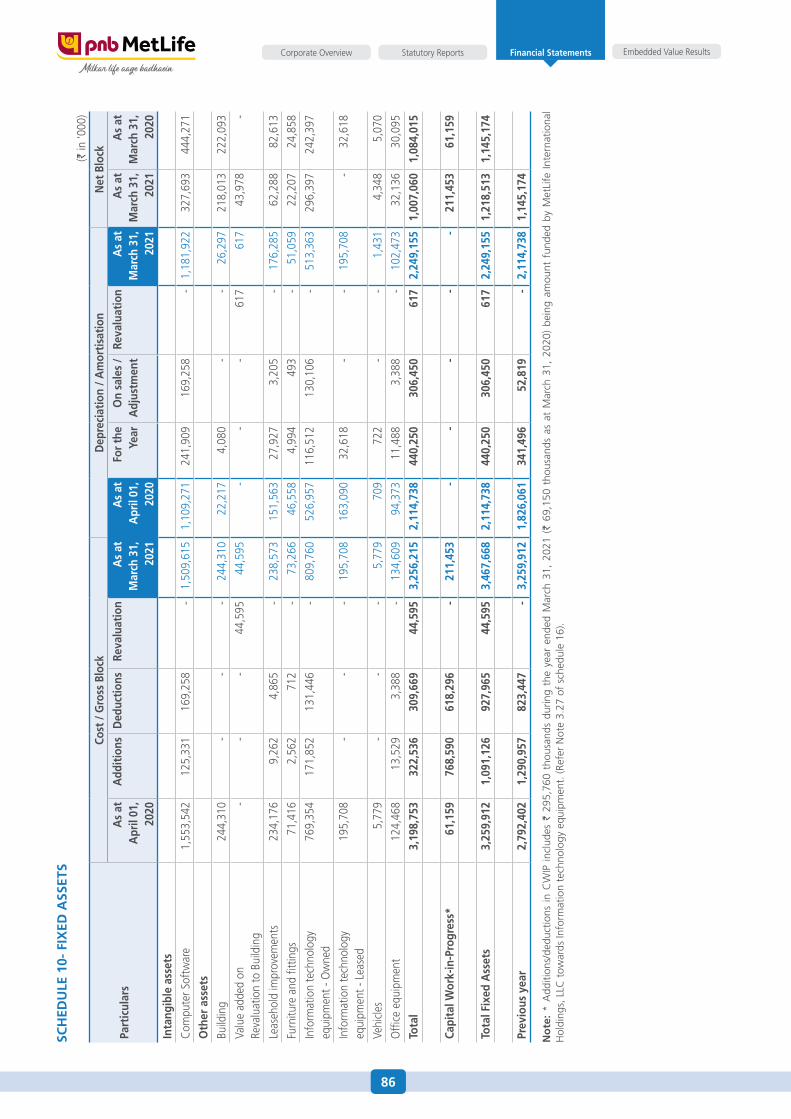
86
Embedded Value ResultsStatutory ReportsCorporate Overview Financial StatementsSc
hEd
ulE
10-
fix
Ed a
SSET
S (`
in ‘0
00)
part
icul
ars
cost
/ g
ross
Blo
ckd
epre
ciat
ion
/ am
ortis
atio
nn
et B
lock
as
at
apr
il 01
, 20
20
add
ition
sd
educ
tions
reva
luat
ion
as
at
mar
ch 3
1,
2021
as
at
apr
il 01
, 20
20
for t
he
year
On
sale
s /
adj
ustm
ent
reva
luat
ion
as
at
mar
ch 3
1,
2021
as
at
mar
ch 3
1,
2021
as
at
mar
ch 3
1,
2020
inta
ngib
le a
sset
s
Com
pute
r sof
twar
e 1,
553,
542
125
,331
1
69,2
58
- 1
,509
,615
1
,109
,271
2
41,9
09
169
,258
-
1,1
81,9
22
327
,693
4
44,2
71
Oth
er a
sset
s
Build
ing
244
,310
-
- -
244
,310
2
2,21
7 4
,080
-
- 2
6,29
7 2
18,0
13
222
,093
Valu
e ad
ded
on
Reva
luat
ion
to B
uild
ing
- -
- 4
4,59
5 4
4,59
5 -
- -
617
6
17
43,
978
-
Leas
ehol
d im
prov
emen
ts 2
34,1
76
9,2
62
4,8
65
- 2
38,5
73
151
,563
2
7,92
7 3
,205
-
176
,285
6
2,28
8 8
2,61
3
furn
iture
and
fitt
ings
71,
416
2,5
62
712
-
73,
266
46,
558
4,9
94
493
-
51,
059
22,
207
24,
858
Info
rmat
ion
tech
nolo
gy
equi
pmen
t - o
wne
d 7
69,3
54
171
,852
1
31,4
46
- 8
09,7
60
526
,957
1
16,5
12
130
,106
-
513
,363
2
96,3
97
242
,397
Info
rmat
ion
tech
nolo
gy
equi
pmen
t - L
ease
d 1
95,7
08
- -
- 1
95,7
08
163
,090
3
2,61
8 -
- 1
95,7
08
- 3
2,61
8
Vehi
cles
5,7
79
- -
- 5
,779
7
09
722
-
- 1
,431
4
,348
5
,070
offi
ce e
quip
men
t 1
24,4
68
13,
529
3,3
88
- 1
34,6
09
94,
373
11,
488
3,3
88
- 1
02,4
73
32,
136
30,
095
Tota
l 3
,198
,753
3
22,5
36
309
,669
4
4,59
5 3
,256
,215
2
,114
,738
4
40,2
50
306
,450
6
17
2,2
49,1
55
1,0
07,0
60
1,0
84,0
15
capi
tal w
ork-
in-p
rogr
ess*
61,
159
768
,590
6
18,2
96
- 2
11,4
53
- -
- -
- 21
1,45
3 6
1,15
9
Tota
l fix
ed a
sset
s3,
259,
912
1,09
1,12
6 92
7,96
5 44
,595
3,
467,
668
2,11
4,73
8 44
0,25
0 30
6,45
0 61
7 2,
249,
155
1,21
8,51
3 1,
145,
174
prev
ious
yea
r 2
,792
,402
1
,290
,957
8
23,4
47
- 3
,259
,912
1
,826
,061
3
41,4
96
52,
819
- 2
,114
,738
1
,145
,174
no
te:
* a
dditi
ons/
dedu
ctio
ns i
n C
WIP
inc
lude
s `
295,
760
thou
sand
s du
ring
the
year
end
ed M
arch
31,
202
1 (`
69,
150
thou
sand
s as
at
Mar
ch 3
1, 2
020)
bei
ng a
mou
nt f
unde
d by
Met
Life
Int
erna
tiona
l h
oldi
ngs,
LLC
tow
ards
Info
rmat
ion
tech
nolo
gy e
quip
men
t. (R
efer
Not
e 3.
27 o
f sc
hedu
le 1
6).
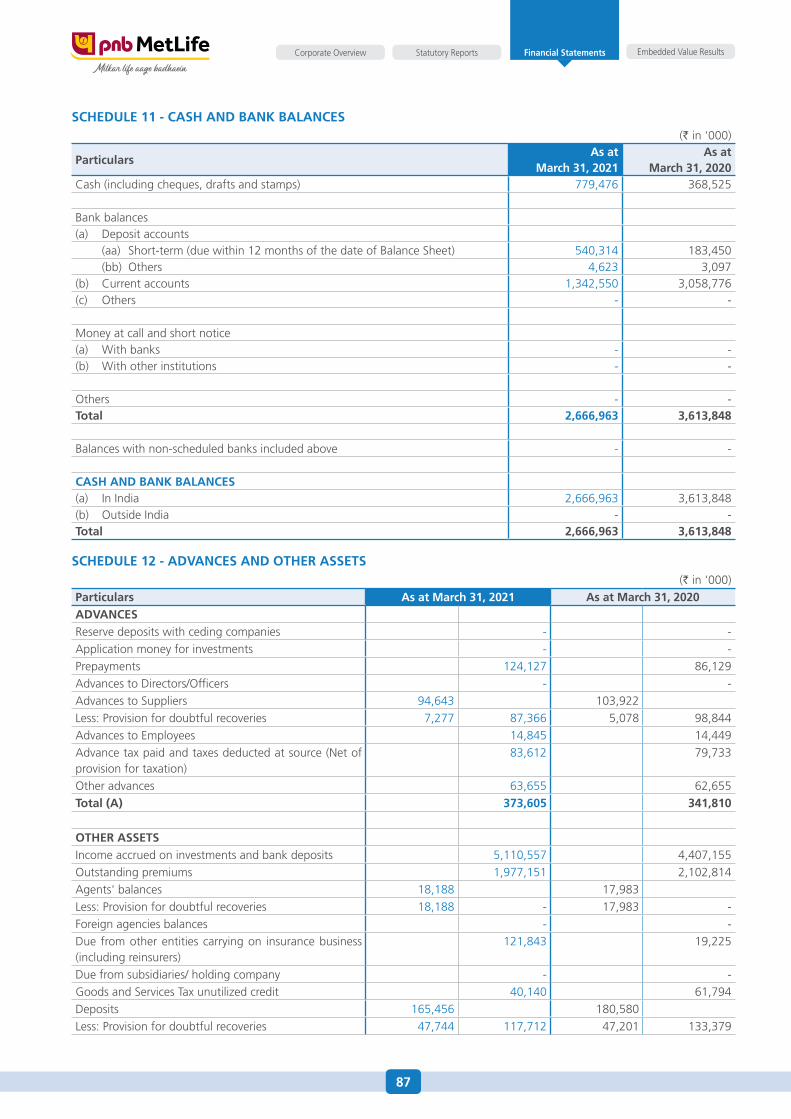
87
Embedded Value ResultsStatutory ReportsCorporate Overview Financial Statements
SchEdulE 11 - caSh and BanK BalancES (` in ‘000)
particularsas at
march 31, 2021as at
march 31, 2020Cash (including cheques, drafts and stamps) 779,476 368,525
Bank balances(a) deposit accounts (aa) short-term (due within 12 months of the date of Balance sheet) 540,314 183,450 (bb) others 4,623 3,097(b) Current accounts 1,342,550 3,058,776(c) others - -
Money at call and short notice(a) With banks - -(b) With other institutions - -
others - -Total 2,666,963 3,613,848
Balances with non-scheduled banks included above - -
caSh and BanK BalancES(a) In India 2,666,963 3,613,848(b) outside India - -Total 2,666,963 3,613,848
SchEdulE 12 - adVancES and OThEr aSSETS (` in ‘000)
particulars as at march 31, 2021 as at march 31, 2020adVancESReserve deposits with ceding companies - -application money for investments - -Prepayments 124,127 86,129advances to directors/officers - -advances to suppliers 94,643 103,922Less: Provision for doubtful recoveries 7,277 87,366 5,078 98,844advances to employees 14,845 14,449advance tax paid and taxes deducted at source (Net of provision for taxation)
83,612 79,733
other advances 63,655 62,655Total (a) 373,605 341,810
OThEr aSSETSIncome accrued on investments and bank deposits 5,110,557 4,407,155outstanding premiums 1,977,151 2,102,814agents' balances 18,188 17,983Less: Provision for doubtful recoveries 18,188 - 17,983 -foreign agencies balances - -due from other entities carrying on insurance business (including reinsurers)
121,843 19,225
due from subsidiaries/ holding company - -Goods and services Tax unutilized credit 40,140 61,794deposits 165,456 180,580Less: Provision for doubtful recoveries 47,744 117,712 47,201 133,379
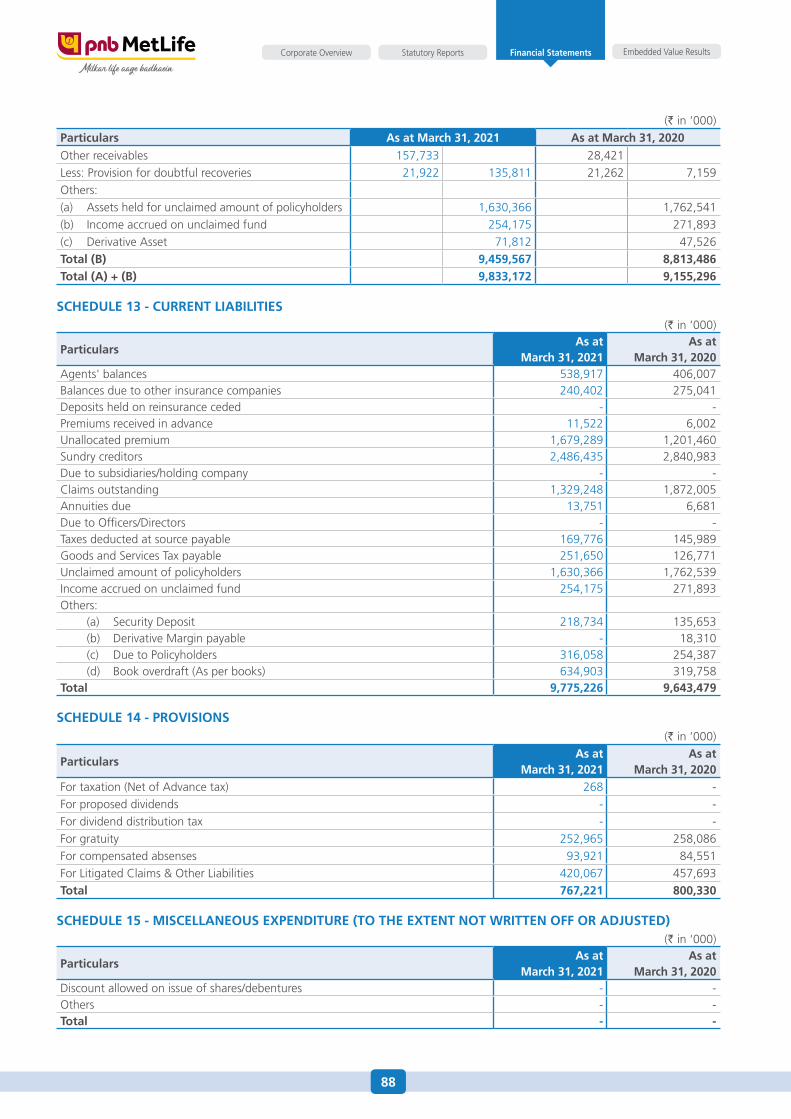
88
Embedded Value ResultsStatutory ReportsCorporate Overview Financial Statements
(` in ‘000)particulars as at march 31, 2021 as at march 31, 2020other receivables 157,733 28,421Less: Provision for doubtful recoveries 21,922 135,811 21,262 7,159others:(a) assets held for unclaimed amount of policyholders 1,630,366 1,762,541(b) Income accrued on unclaimed fund 254,175 271,893(c) derivative asset 71,812 47,526Total (B) 9,459,567 8,813,486Total (a) + (B) 9,833,172 9,155,296
SchEdulE 13 - currEnT liaBiliTiES (` in ‘000)
particularsas at
march 31, 2021as at
march 31, 2020agents' balances 538,917 406,007Balances due to other insurance companies 240,402 275,041deposits held on reinsurance ceded - -Premiums received in advance 11,522 6,002unallocated premium 1,679,289 1,201,460sundry creditors 2,486,435 2,840,983due to subsidiaries/holding company - -Claims outstanding 1,329,248 1,872,005annuities due 13,751 6,681due to officers/directors - -Taxes deducted at source payable 169,776 145,989Goods and services Tax payable 251,650 126,771unclaimed amount of policyholders 1,630,366 1,762,539Income accrued on unclaimed fund 254,175 271,893others: (a) security deposit 218,734 135,653 (b) derivative Margin payable - 18,310 (c) due to Policyholders 316,058 254,387 (d) Book overdraft (as per books) 634,903 319,758Total 9,775,226 9,643,479
SchEdulE 14 - prOViSiOnS (` in ‘000)
particularsas at
march 31, 2021 as at
march 31, 2020for taxation (Net of advance tax) 268 - for proposed dividends - - for dividend distribution tax - - for gratuity 252,965 258,086 for compensated absenses 93,921 84,551 for Litigated Claims & other Liabilities 420,067 457,693 Total 767,221 800,330
SchEdulE 15 - miScEllanEOuS ExpEndiTurE (TO ThE ExTEnT nOT wriTTEn Off Or adJuSTEd) (` in ‘000)
particularsas at
march 31, 2021 as at
march 31, 2020discount allowed on issue of shares/debentures - - others - - Total - -
89
Embedded Value ResultsStatutory ReportsCorporate Overview Financial Statements
1. cOrpOraTE infOrmaTiOn PNB MetLife India Insurance Company Limited (‘the
Company’) was incorporated in India on april 11, 2001 as a Private Limited Company and was converted into a Public Limited Company effective from January 9, 2008 under the Companies act, 1956. on august 6, 2001, the Company obtained the certificate of registration to engage in the business of life insurance from the Insurance Regulatory and development authority of India (‘IRdaI’). The certificate of registration continues to be in force as at March 31, 2021.
The Company’s life insurance business comprises of individual life and group business, including participating, non-participating, pension, immediate annuity, unit-linked insurance products, health and micro insurance. some of these policies have riders such as accident and disability benefit and critical illness.
2. SignificanT accOunTing pOliciES2.1 Basis of preparation The accompanying financial statements have been
prepared under the historical cost convention and on the accrual basis of accounting in accordance with the Generally accepted accounting Principles in India (Indian GaaP) in compliance with the applicable accounting standards as specified under section 133 of the Companies act, 2013 (the 2013 act),read together with Rule 7 of the Company (accounts) Rules, 2014, further amended by Companies (accounting standards) amendment Rules, 2016, to the extent applicable and as prescribed by the Insurance Regulatory and development authority (Preparation of financial statements and auditor’s Report of Insurance Companies) Regulations, 2002 (‘the IRdaI financial statements Regulations’), provisions of the Insurance Regulatory and development authority act, 1999, the Insurance act, 1938, the Insurance Laws (amendment) act 2015, to the extent applicable, the relevant provisions of the Companies act, 2013 and ‘ the IRdaI financial statements Regulations’, the Master Circular on Preparation of financial statements and filing of Returns of Life Insurance Business Ref No. IRda/f&a/Cir/232/12/2013 dated december 11, 2013 (‘the Master Circular’) and various orders/ directions/ circulars issued by the IRdaI and the practices prevailing within the insurance industry in India.
accounting policies have been consistently applied to the extent applicable and in the manner so required
2.2 use of Estimates The preparation of the financial statements in conformity
with Indian GaaP requires that the Company’s
SchEdulE – 16
SignificanT accOunTing pOliciES and nOTES fOrming parT Of financial STaTEmEnTS fOr ThE yEar EndEd march 31, 2021
management make estimates and assumptions that affect the reported amount of income and expense for the year, reported balances of assets and liabilities and disclosures related to contingent liabilities as at the date of the financial statements. The estimates and assumptions used in the accompanying financial statements are based upon management’s evaluation of the relevant facts and circumstances as at the date of the financial statements. Management believes that the estimates used in preparation of the financial statements are prudent and reasonable. actual results may differ from the estimates and assumptions used in preparing the financial statements. any differences of actual to such estimates are recognised in the year in which the results are known or materialised. any revision to accounting estimates is recognised prospectively in current and future periods.
2.3 revenue recognition
Premium: New business premium in respect of non-linked policies
including rider premium is recognised on acceptance of risk/when due from policyholders (net of goods and services tax). for all the policies which are in force as at the Balance sheet date, subsequent premium of the first year and renewal premium are recognised as income when due. In respect of linked policies, premium income including rider premium is recognised when the associated units are allotted.
Premium on lapsed policies are recognised as income when such policies are reinstated. Top up premiums are considered as single premium.
Income from unit linked policies: Income from unit linked policies, which includes fund
management charges, policy administration charges, mortality charges, etc., are recovered from the unit linked funds in accordance with the terms and conditions of policies issued and are recognized when due.
Income earned on Investments: Interest income is recognized on an accrual
basis for all funds.
amortization of premium or accretion of discount at the time of purchase of debt securities is recognized over the remaining period of maturity on a straight line basis.
dividend income is accounted for on “ex-dividend” date in case of listed equity and preference shares and in case of unlisted shares, income is recognized when the right to receive the dividend is established.
90
Embedded Value ResultsStatutory ReportsCorporate Overview Financial Statements
Rental income on Investment property is recognised on accrual basis and includes only the realizable rent and does not include any notional rent as prescribed by IRda (Preparation of financial statements and auditors’ Report of Insurance Companies) Regulations 2002. Costs related to operating and maintenance of investment property are recognised as expense in the Revenue account.
Profit or loss on sale/redemption of debt securities for unit linked business, is the difference between the net sale proceeds and the weighted average cost as on the date of sale and for other than unit linked business, it is the difference between the net sale proceeds and the weighted average amortized cost as on the date of sale.
Profit or loss on sale/redemption of equity shares, equity exchange traded fund (eTf), Bond eTfs, Infrastructure Investment Trusts (InvITs), Real estate Investment Trusts (ReITs) and mutual fund units for unit linked business, is the difference between the net sale proceeds and the weighted average cost as on the date of sale and for other than unit linked business, the profit or loss includes the accumulated changes in the fair value previously recognized under “fair Value Change account” in the Balance sheet.
unrealized gains or losses arising out of valuation of unit Linked – Policyholders’ Investments are recognized in the respective fund’s Revenue account.
2.4 income from loans against policies
Interest income on loans against policies is accounted for on an accrual basis.
2.5 reinsurance premium
Reinsurance premium ceded is accounted for on due basis at the time of recognition of premium income basis the treaty arrangement with the reinsures.
2.6 acquisition costs
acquisition costs are the expenses which are incurred to source and issue the insurance contract. These costs are expensed in the year in which they are incurred.
2.7 Benefits paid (including claims settlement costs)
death, health and surrender claims are accounted on receipt of intimation subject to eligibility as per policy terms and conditions. Maturity claims, periodical benefits & annuity benefits are accounted as and when due. surrenders, lapses (after expiry of lock in period) and withdrawals of unit linked policies are accounted in the respective funds when the associated units are deallocated.
Repudiated claims disputed before judicial authorities are provided for based on management prudence considering the facts and evidences available in respect of such claims.
Reinsurance claim recoverable is accounted for when the corresponding claim expenditure is recognized
2.8 liability for life policies in force and paid up policies
Liabilities for life policies in force and also policies in respect of which premium has been discontinued but a liability exists, is calculated by the appointed actuary on the basis of gross premium valuation method in accordance with accepted actuarial practice, professional guidance notes issued by the Institute of actuaries of India, provisions of the Insurance act, 1938 (as amended from time to time) and the relevant regulations notified by the IRdaI from time to time. The liabilities are calculated in a manner that together with estimated future premium income and investment income, the Company can meet estimated future claims (including bonus entitlements to Policyholders) and expenses. The linked policies carry two types of liabilities – unit liability representing the fund value of policies and non-unit liability to meet any likely deficiencies in the charges under the policy which might arise on account of mortality, expenses and other elements.
actuarial method and assumptions are given in note 3.2
2.9 investments:
Investments are made in accordance with the Insurance act, 1938 (as amended in 2015), the Insurance Regulatory and development authority (Investment) Regulations, 2016, and Insurance Regulatory and development authority (Preparation of financial statements and auditor’s Report of Insurance Companies) Regulations, 2002, Investment Policy of the Company and various other circulars/notifications issued by the IRdaI in this context from time to time.
Investments are recognised at cost on the date of purchase which includes brokerage and related taxes and excludes pre-acquisition interest accrued, if any.
Classification of Investments: Investments maturing within twelve months from Balance
sheet date and investment made with the specific intention to dispose them off within twelve months from Balance sheet date are classified as short term investments. Investments other than short term investments are classified as long term investments.
Valuation – Shareholders’ investments and non-linked Policyholders’ investments:
all debt securities, including Government securities, are considered as ‘held to maturity’ and accordingly stated at amortized cost.
The difference between the acquisition price and the face value of treasury bills, certificate of deposits, commercial papers /Triparty Repo (TRePs) is amortised and recognized as income/expense over the remaining term of these instruments, on a straight line basis. In case of zero coupon bonds, redemption value is considered as the face value.
as prescribed by IRdaI, for valuation of listed equity shares and equity exchange traded fund (eTf), Bond
91
Embedded Value ResultsStatutory ReportsCorporate Overview Financial Statements
eTfs, InvITs, ReITs, the Company has selected National stock exchange (Nse) as the primary exchange and the Bombay stock exchange (Bse) as the secondary exchange. accordingly, the closing price of Nse is used for the purpose of valuation of equity shares, equity eTf, Bond eTfs, InvITs and ReITs. If the security is not listed/not traded on the Nse but traded on the Bse, then the closing price of Bse is used. In case equity eTfs are not traded on the exchange then the equity eTfs are valued at previous day’s NaV as declared by the Mutual fund. Investment in unlisted equity shares are stated at historical cost. additional Tier I Bonds (aT-1 Bonds) are stated at market value, using applicable market yield rates published by seBI registered rating agency (Credit Rating Information services of India Ltd. (CRIsIL)) Bond Valuer.
Investments in Liquid Mutual fund units as at the Balance sheet date are valued at the previous business day’s net asset values (NaV).
Rights/Bonus entitlements, if any, are accounted on ex-date basis of the stock exchange.
unrealised gains/losses arising due to changes in the fair value of mutual funds, equity shares, InvITs and aT-1 Bonds are taken to “fair value change account” in the Balance sheet. In case of diminution, other than temporary, the amount of diminution is recognised as an expense in the Revenue/Profit and Loss account, as applicable.
Investment property is held to earn rental income or for capital appreciation and is not occupied by the Company. Investment property is initially valued at cost including any directly attributable transaction costs. Investment property is to be revalued at least once in every three years. The change in carrying amount of investment property is taken to “Revaluation reserve” in the Balance sheet. Impairment loss, if any, exceeding the amount of Revaluation Reserve is recognised as an expense in the Revenue account.
fixed deposits with banks and investments in reverse repo are valued at cost.
Valuation – Assets held to cover linked liabilities: all debt securities, including Government securities, are
valued at market value using CRIsIL Bond Valuer / CRIsIL Gilt Prices, as applicable.
Money market instruments – Treasury bills, certificate of deposits, commercial papers, TRePs are being stated at amortized cost.
as prescribed by IRdaI, for valuation of listed equity shares,equity eTfs, Bond eTfs InvITs and ReITs, the Company has selected Nse as the primary exchange and Bse as the secondary exchange. accordingly, the closing price of Nse is used for the purpose of valuation of equity shares, equity eTfs, bond eTfs, InvITs and ReITs If the
security is not listed/not traded on the Nse but traded on the Bse, then the closing price of Bse is used for valuation. In case eTfs are not traded on exchange then the equity and bond eTfs are valued at previous day’s NaV as declared by Mutual fund.
Investments in Liquid Mutual fund units as at the Balance sheet date are valued at the previous business day’s NaV.
Rights/Bonus entitlements, if any, are accounted on ex-date basis of the stock exchange.
fixed deposits with banks are valued at cost.
Impairment of Investment The Company periodically assesses using internal and
external sources and at each Balance sheet date whether there is an indication of impairment of investment. In case of impairment, other than temporary, the carrying value of such investment is reduced to its fair value and the impairment loss is recognised in the Revenue/Profit and Loss account, as applicable. however, at the Balance sheet date if there is an indication that a previously recognised impairment loss no longer exists, then such loss is reversed and the investment is restated to that extent.
Valuation of Derivative Instrument:• Aspartoftheproductofferings,theCompanyoffers
guaranteed products wherein the Policyholders are assured of a fixed rate of return for premiums to be received in future. These premiums are likely to be received over a longer tenure and the guaranteed rate of return is fixed at the beginning of the policy term. any fall in interest rates would mean that each incremental investment of the Company would earn a lower rate of return. accordingly, a fall in interest rates would mean lower interest earnings for the Company from future investments, thereby exposing the Company to interest rate risk.
• The Company enters into interest rate derivativetransactions to hedge the interest rate risk arising out of highly probable forecasted future cash inflows which arise from already written policies or from interest income and redemption of investments.
• Derivatives Instruments i.e., FRA is valued at thedifference between the market value of underlying bond at the spot reference yield taken from the seBI approved rating agency and present value of contracted forward price of underlying bond including present value of intermediate coupon inflows from valuation date till fRa contract settlement date, at applicable INR-oIs rate curve
• Derivatives Instruments i.e., FRA, are initiallyrecognized at fair value at the date of entering into the derivative contracts and are subsequently
92
Embedded Value ResultsStatutory ReportsCorporate Overview Financial Statements
re-measured to their fair value at the end of each reporting period.
The Company follows Cash flow hedge accounting. hedge effectiveness is ascertained at the inception of the hedge and periodically thereafter.
any fair value gain or loss on the date of inception of the transaction is recognized in Revenue account with a corresponding adjustment in the value of derivative asset or liability.
on subsequent re-measurement, in case the hedging Instrument is found effective, then the movement in fair value gain or loss is directly adjusted in to hedge Reserve which is included in ‘Credit/(debit) fair Value Change account’ under Policyholders funds in the Balance sheet with a corresponding adjustment in the value of derivative asset or liability.
on subsequent re-measurement, in case the hedging Instrument is found ineffective, the ineffective portion of the movement in fair value of such instruments is recognised in the Revenue account in the period in which they arise. derivatives are carried as assets when the fair values are positive and as liabilities when the fair values are negative.
• Hedgeaccountingisdiscontinuedwhenthehedginginstrument is terminated or when it becomes probable that the expected forecasted cash flow will no longer occur. on such termination, the accumulated fair value gains/ losses in hedge Reserve account is reclassified into Revenue account.
• IftheHedgeforecasttransactionsubsequentlyresultsin recognition of financial asset or financial liability, the associated gains/losses that were recognized directly in the hedge Reserve are reclassified into Revenue account in the same period or periods during which the financial assets acquired or the financial liability assumed affects the Revenue account.
• IRDAI (Investment) Regulations, 2016 allowsinsurers to deal in Rupee denominated interest rate derivatives. The Company has defined Board approved derivative Risk Management Policy and Process note covering various aspects related to functioning of the derivative transactions which are undertaken to mitigate interest rate risk as per the hedge strategy, thereby managing the volatility of returns from future fixed income investments, due to variations in market interest rates.
• Derivatives(FRA)areundertakenbyCompanysolelyfor the purpose of hedging interest rate risks on account of following forecasted transactions: a) Reinvestment of maturity proceeds of existing fixed income investments; b) Investment of interest income receivable; and c) expected policy premium income
receivable on insurance contracts which are already underwritten in Life and Pension & annuity business.
Transfer of Investments: Transfer of investments from shareholders to Policyholders
are effected at lower of cost (for debt securities net amortized cost) or market value on the previous day. The transfer of Investment between unit linked funds is done at the prevailing market price.
2.10 non-performing assets (npa) In accordance with the IRdaI regulations on “Prudential
norms for income recognition, asset classification, provisioning and other related matters in respect of debt portfolio”, all assets where the interest and / or instalment of principal repayment remain overdue for more than 90 days (i.e., one quarter) are classified as NPa as at the Balance sheet date.
2.11 fixed assets and depreciation/amortisation Tangible Assets and depreciation: an item of property, plant & equipment that qualifies for
recognition as an asset is stated at cost less accumulated depreciation and impairment losses, if any. Cost includes the purchase price and any cost directly attributable in bringing the asset to its working condition for its intended use.
subsequent expenditure related to an item of asset is added to its book value only if such expenditure results in an increase in the future economic benefit from the existing assets. all other expenditure on existing assets is charged to the Revenue account/ Profit & Loss account, as the case may be, for the period during which such expenditure is incurred. any additions to the original fixed assets are depreciated over the remaining useful life of the original asset.
depreciation is charged on pro-rata basis from the date of such addition or, as the case may be, up to the date on which such asset has been sold or discarded
depreciation is provided on the straight line method (sLM) as per the useful life of the assets as specified in schedule II of the Companies act, 2013. any asset costing ` 5,000 or less is fully depreciated in the year of purchase. The estimated useful life of various asset class is as follows:
asset class Estimated useful life
Building 60 yearsLeasehold improvements Lease period, not
exceeding 5 yearsfurniture and fittings 10 yearsInformation technology equipment 3 yearsLeased Information technologyequipment
3 years
Information technology server and network equipment
6 years
Vehicles 8 yearsoffice equipment 5 years
93
Embedded Value ResultsStatutory ReportsCorporate Overview Financial Statements
The residual value and the useful life of an asset is reviewed at each Balance sheet date and if expectations differ from the previous estimates, the change is accounted for as a change in accounting estimate in accordance with as 5 - accounting for net profit or loss for the period, prior period items and changes in accounting policies.
The increase in Net Book Value of the owned building due to revaluation is credited to the Revaluation Reserve account without routing through the Revenue account. depreciation provided on the incremental Net Book Value is recouped from Revaluation Reserve.
Revaluation of owned building will be done once in three years.
Intangible Assets and amortization: Intangible assets comprising of software are stated
at cost less amortisation. significant expenditure on improvements to software are added to its book value only when it is probable that such expenditure will enable the asset to generate future economic benefits in excess of its originally assessed standards of performance and such expenditure can be measured and attributed to the asset reliably.
software expenses are amortised using straight line method over license period not exceeding 3 years. subsequent expenditures are amortised over the remaining useful life of the original software.
Capital work-in-progress: Cost of fixed assets, which are not ready for its intended
use as at the Balance sheet date are disclosed as capital work-in-progress. similarly, advances paid towards the acquisition of fixed assets as at the Balance sheet date are disclosed as capital work-in-progress.
Funding for acquiring certain fixed assets: funding received by the Company from MetLife
International holdings, LLC for acquiring certain specified fixed assets for increasing efficiency and effectiveness of its existing processes/systems is shown as deduction from the gross value of that respective fixed asset in arriving at its book value.
2.12 leases:
Finance lease: Leases where lessor effectively transfers, substantially
all the risks and benefits incidental to ownership of the leased assets, are capitalized at the lower of the fair value and present value of the minimum lease payments at the inception of the lease term and disclosed as leased assets. Lease payments are apportioned between the finance charges and reduction of the lease liability based on the implicit rate of return. finance charges are charged to the Revenue account.
Operating lease: Leases, where the lessor effectively retains substantially
all the risks and benefits of ownership of the leased asset, are classified as operating leases. operating lease rentals including escalations are recognized as an expense in the Revenue account on a straight-line basis over the lease period.
2.13 impairment of assets
The Company periodically assesses, using internal and external sources at each Balance sheet date, whether there is an indication that an asset may be impaired. Impairment occurs where the carrying value exceeds the present value of future cash flows expected to arise from the continuing use of the asset and its eventual disposal. The impairment loss to be expensed is determined as the excess of the carrying amount over the higher of the asset’s net realisable value or value in use, as determined above.
2.14 policy loans
The loans against policies are stated at historical cost (less repayments), subject to provision for doubtful recovery, if any. Loans are classified as short term in case the maturity is less than twelve months. Loans other than short term are classified as long term.
2.15 foreign currency transactions
foreign currency transactions are initially recorded at the rates of exchange prevailing on the date of transactions. foreign currency monetary items are subsequently reported using the closing rate. Nonmonetary items which are carried in terms of historical cost denominated in a foreign currency are reported using the exchange rate at the date of the transaction. exchange differences arising on the settlement of monetary items or on reporting Company’s monetary items at rates different from those at which they were initially recorded during the year, or reported in previous financial statements, are recognised as income or as expenses in the year in which they arise.
2.16 Taxation
a. direct Taxes:
(i) Current taxes: Current tax is the amount expected to be paid to
the tax authorities after taking credit for allowances and exemptions in accordance with the section 44 and first schedule of Income Tax act, 1961, as amended from time to time, applicable to life insurance companies.
(ii) Deferred taxes: deferred tax is recognised on timing differences,
being the difference between the taxable income and the accounting income that originate in one period and are capable of reversal in one or more subsequent periods. deferred tax is measured using the tax rates and the tax laws enacted or substantively enacted as at the reporting date. In case
94
Embedded Value ResultsStatutory ReportsCorporate Overview Financial Statements
of unabsorbed depreciation and carry forward of losses, deferred tax assets are recognised only if there is virtual certainty supported by convincing evidence that there will be sufficient future taxable income available to realise the assets.
deferred tax assets and liabilities are offset if such items relate to taxes on income levied by the same governing tax laws and the Company has a legally enforceable right for such set off. deferred tax assets are reviewed at each Balance sheet date for their realisation.
B. indirect Taxes
Goods & services Tax (GsT) liability is set-off against eligible tax credits available from tax paid on input services. unutilized credits, if any, are carried forward for future set-off under ‘schedule 12 -advances and other assets’.
2.17 Employee benefits
Short-term employee benefits: all employee benefits payable within twelve months of
rendering the service are classified as short-term employee benefits. These benefits include performance incentives, short term compensated absence, etc. The undiscounted amount of short-term employee benefits expected to be paid are recognised during the period when the employee renders the service.
Defined contribution plans: The Company’s contribution to provident fund and
employee state insurance scheme are considered as defined contribution plans and are charged as an expense as they fall due based on the amount of contribution required to be made during the period when service is rendered by the employees. There are no other obligations other than the contribution payable to the respective funds.
Defined benefit plans: The Company has incorporated a PNB MetLife employee
Group Gratuity Trust to fund the gratuity liability. The Company makes contribution to a Gratuity fund administered by trustees. for defined benefit plans in the form of gratuity fund, the cost of providing benefits is determined using the projected unit credit method, with actuarial valuation being carried out at each Balance sheet date. actuarial gains and/or losses are recognised in the Revenue account/Profit and Loss account, as the case may be, in the period in which they occur. Past service cost is recognised immediately to the extent that the benefits are already vested and otherwise is amortised on a straight-line basis over the average period until the benefits become vested. The retirement benefit obligation recognised in the Balance sheet represents the present value of the defined benefit obligation and the same is determined based on the actuarial valuation as at the Balance sheet date using the projected unit credit method.
Long-term employee benefits: Compensated absences which are not expected to occur
within twelve months after the end of the period in which the employee renders the related service are recognised as a liability at the present value of the defined benefit obligation as at the Balance sheet date. actuarial gains and/or losses due to change in actuarial valuation of such employee benefit plans are recognised in the statement of Revenue account/Profit and Loss account in the period of occurrence for all employee benefits.
Long term Incentive plan (LTIP): Performance stock units (Psu) and restricted stock units
(Rsu) were granted to eligible employees’ basis defined parameters until december 31st, 2016. The vesting price of these stock units were based on common stock (share) price of MetLife Inc. as at the vesting date. The liability and corresponding expense is accounted for on the basis of actuarial valuation carried out by an independent actuary as at the Balance sheet date and is trued-up at the time of vesting/payment.
The Company has also formulated other LTI schemes such as local LTI, Cash LTI and deferred LTI for the eligible employees subject to fulfilment of defined criteria as per policy. The proportionate liability and corresponding expenses are accounted for in line with the vesting period.
2.18 Statement of receipts and payments
The statement of receipts and payments has been prepared in accordance with the direct method prescribed in accounting standard 3, ‘Cash flow statement’.
2.19 Segment reporting
as per accounting standard 17 on ‘segment Reporting’ read with the IRdaI Regulations, the Company is required to prepare Revenue account and Balance sheet separately for the primary business segments (‘the business segments’) namely participating, non-participating, linked business for ordinary life, general annuity, pension and health. accordingly, the Company has provided segment information for the business segments, as disclosed in annexure 4.
There are no reportable geographical segments since the Company provides services to customers in the Indian market only and does not distinguish any reportable regions within India.
The following basis has been used for allocation of revenue, expenses, assets and liabilities to the business segments:
(a) Premium income, commission, benefits paid, operating expenses, investments and Policyholders’ liabilities which are directly identifiable with business segments are disclosed under respective business segment.
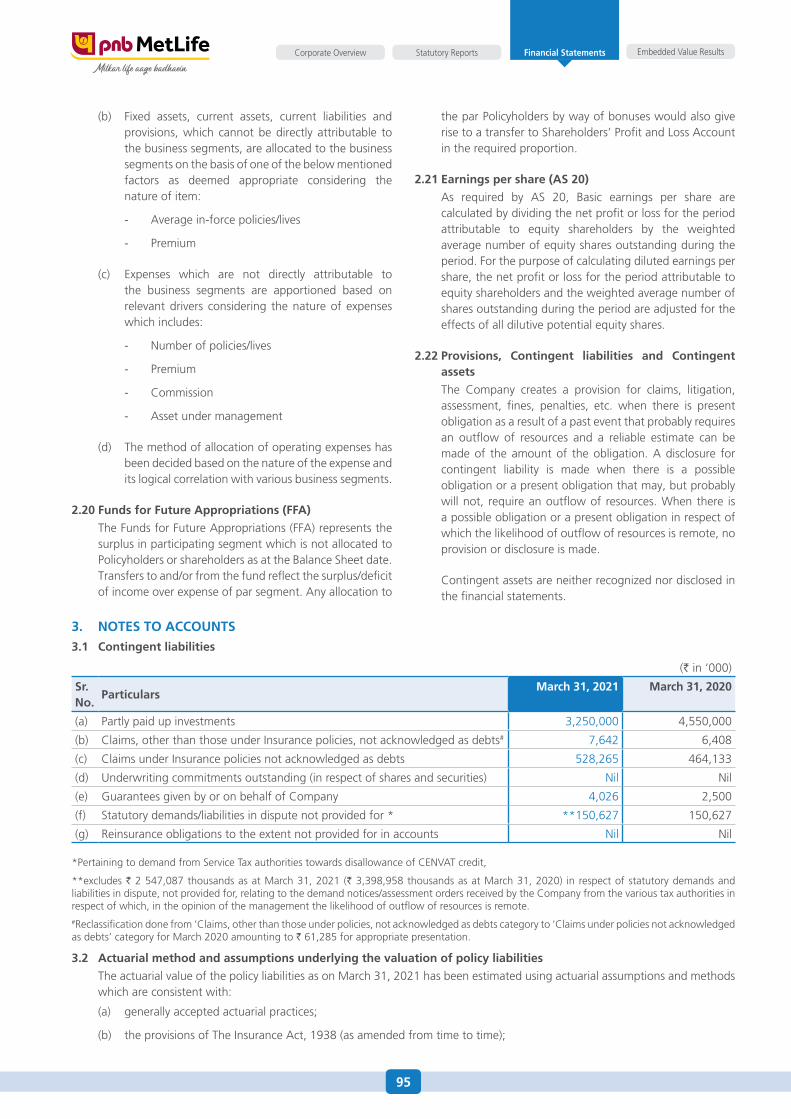
95
Embedded Value ResultsStatutory ReportsCorporate Overview Financial Statements
(b) fixed assets, current assets, current liabilities and provisions, which cannot be directly attributable to the business segments, are allocated to the business segments on the basis of one of the below mentioned factors as deemed appropriate considering the nature of item:
- average in-force policies/lives
- Premium
(c) expenses which are not directly attributable to the business segments are apportioned based on relevant drivers considering the nature of expenses which includes:
- Number of policies/lives
- Premium
- Commission
- asset under management
(d) The method of allocation of operating expenses has been decided based on the nature of the expense and its logical correlation with various business segments.
2.20 funds for future appropriations (ffa)
The funds for future appropriations (ffa) represents the surplus in participating segment which is not allocated to Policyholders or shareholders as at the Balance sheet date. Transfers to and/or from the fund reflect the surplus/deficit of income over expense of par segment. any allocation to
the par Policyholders by way of bonuses would also give rise to a transfer to shareholders’ Profit and Loss account in the required proportion.
2.21 Earnings per share (aS 20)
as required by as 20, Basic earnings per share are calculated by dividing the net profit or loss for the period attributable to equity shareholders by the weighted average number of equity shares outstanding during the period. for the purpose of calculating diluted earnings per share, the net profit or loss for the period attributable to equity shareholders and the weighted average number of shares outstanding during the period are adjusted for the effects of all dilutive potential equity shares.
2.22 provisions, contingent liabilities and contingent assets
The Company creates a provision for claims, litigation, assessment, fines, penalties, etc. when there is present obligation as a result of a past event that probably requires an outflow of resources and a reliable estimate can be made of the amount of the obligation. a disclosure for contingent liability is made when there is a possible obligation or a present obligation that may, but probably will not, require an outflow of resources. When there is a possible obligation or a present obligation in respect of which the likelihood of outflow of resources is remote, no provision or disclosure is made.
Contingent assets are neither recognized nor disclosed in the financial statements.
3. nOTES TO accOunTS
3.1 contingent liabilities
(` in ‘000)
Sr. no.
particularsmarch 31, 2021 march 31, 2020
(a) Partly paid up investments 3,250,000 4,550,000
(b) Claims, other than those under Insurance policies, not acknowledged as debts# 7,642 6,408
(c) Claims under Insurance policies not acknowledged as debts 528,265 464,133
(d) underwriting commitments outstanding (in respect of shares and securities) Nil Nil
(e) Guarantees given by or on behalf of Company 4,026 2,500
(f) statutory demands/liabilities in dispute not provided for * **150,627 150,627
(g) Reinsurance obligations to the extent not provided for in accounts Nil Nil
*Pertaining to demand from service Tax authorities towards disallowance of CeNVaT credit,
**excludes ` 2 547,087 thousands as at March 31, 2021 (` 3,398,958 thousands as at March 31, 2020) in respect of statutory demands and liabilities in dispute, not provided for, relating to the demand notices/assessment orders received by the Company from the various tax authorities in respect of which, in the opinion of the management the likelihood of outflow of resources is remote.#Reclassification done from ‘Claims, other than those under policies, not acknowledged as debts category to ‘Claims under policies not acknowledged as debts’ category for March 2020 amounting to ` 61,285 for appropriate presentation.
3.2 actuarial method and assumptions underlying the valuation of policy liabilities
The actuarial value of the policy liabilities as on March 31, 2021 has been estimated using actuarial assumptions and methods which are consistent with:
(a) generally accepted actuarial practices;
(b) the provisions of The Insurance act, 1938 (as amended from time to time);
96
Embedded Value ResultsStatutory ReportsCorporate Overview Financial Statements
(c) regulations and guidelines issued by the IRdaI; and
(d) the relevant actuarial Practice standards (aPs) and Guidance notes issued by the Institute of actuaries of India
The following summarises the assumptions used for the year ended March 31, 2021 as compared to the same period last year i.e. March 31, 2020.
The assumptions are based on prudent estimates of the future experience, and hence include margins for adverse deviations over and above the best estimate assumptions. a brief on the assumptions used in actuarial valuation is as below:
• Valuationrateofinterest: for Participating products, the valuation rate of interest has been taken as 6.30 per cent for first 5 years and 5.80 per
cent thereafter per annum. same period last year the valuation rate of interest rate was taken as 6.30 per cent for first 5 years and 5.85 per cent thereafter per annum.
o for Non-Participating Individual and health products, there are no changes in valuation rate of interest as compared to the same period last year (i.e. the valuation rate of interest has been taken as 5.70 per cent for first 5 years and 5.40 per cent thereafter).
o for Non-Participating annuity products, there are no changes in valuation rate of interest as compared to the same period last year (i.e. the valuation rate of interest has been taken as 6.20 per cent for first 5 years and 5.60 per cent thereafter per annum).
o for Non-Participating Group Credit products, there are no changes in valuation rate of interest as compared to the same period last year (i.e. the valuation rate of interest has been taken as 6.40 per cent for first 5 years and 5.80 per cent thereafter per annum).
o These interest rates reflect the expected long term yields on the investments backing these liabilities with a margin for adverse deviations.
• Mortality: Valuation mortality assumptions are set in accordance with Clause 5(2) of schedule II of the IRdaI (assets, Liabilities and solvency Margin of Life Insurance Business) Regulations, 2016. for the year ending March 31, 2021 the mortality rates used are basis the published Indian assured Lives Mortality (IaLM) table (2012-14) in line with latest experience analysis of the business. In the case of annuity benefits for Non-participating policies, mortality assumption is based on the LIC annuitants (1996-1998) table adjusted for mortality improvement. Morbidity rates used are based on CIBT 93 table, adjusted for expected experience.
• expenses: The allowance for commissions is on the basis of the actual rates of renewal commission payable as per the applicable file & use document. The renewal expenses are allowed in the valuation both as a percentage of premium and on per policy basis. Claim related expenses have also been factored for all the individual products. The expense inflation is taken as 5.50 per cent (which is same as last year same period) per annum.
• Persistency: The expected persistency has been assumed based on the experience of the Company and varies by duration of the policy and by nature of products.
• future Bonuses: Provision made for future bonuses based on the estimated expected bonus payouts, allowing for the reserving interest rate.
The policy liability for the Group one-year renewable products has been calculated as the unexpired premium reserve. In case of group products with term more than one year, Gross Premium Valuation Method has been used. for group products administered as cash accumulation account, the account values of the policies are considered as reserve.
The reserves for unit-linked life and pension products comprise two parts - unit reserves and non-unit reserves. unit reserves represent the value of units attached to the unit linked policies as on the valuation date. Non-unit reserves are calculated taking into consideration the future expected cash outgoes and incomes in respect of all in-force unit linked policies.
The reinsurance cash flows have been appropriately factored into the calculation of the reserves by projecting the expected mortality benefits that would arise on account of reinsurance net of the expected reinsurance premiums payable.
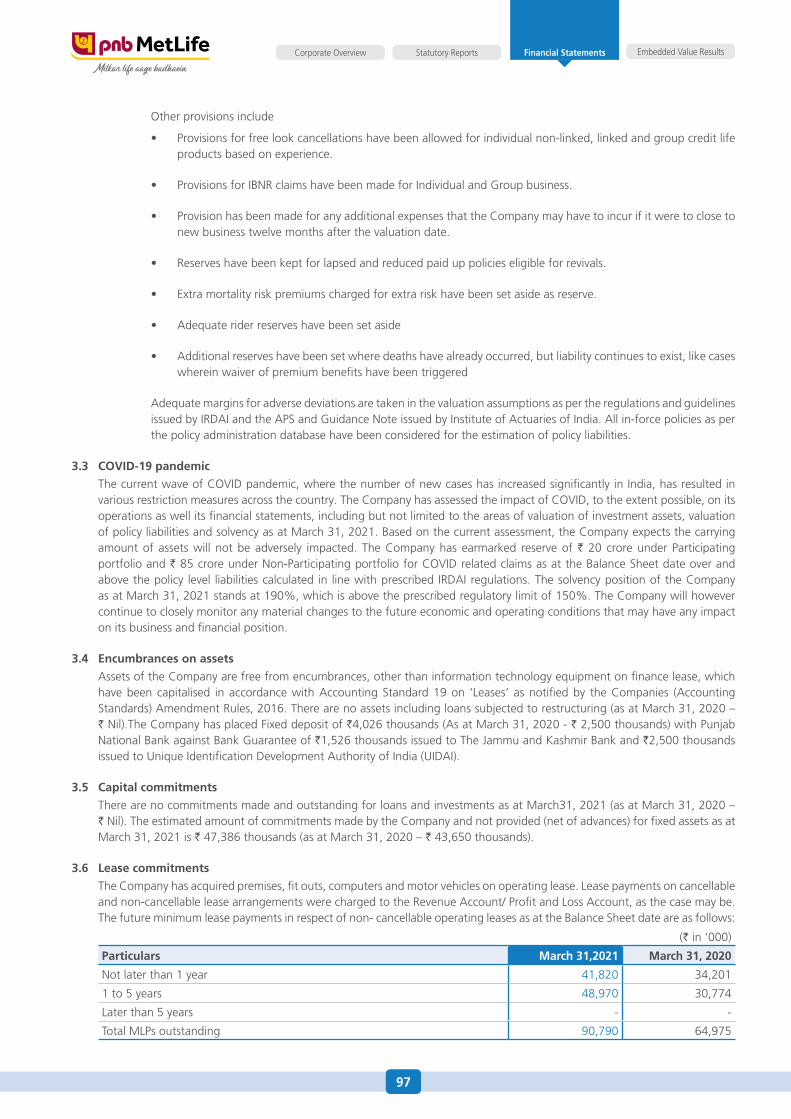
97
Embedded Value ResultsStatutory ReportsCorporate Overview Financial Statements
other provisions include
• Provisionsforfreelookcancellationshavebeenallowedforindividualnon-linked,linkedandgroupcreditlifeproducts based on experience.
• ProvisionsforIBNRclaimshavebeenmadeforIndividualandGroupbusiness.
• ProvisionhasbeenmadeforanyadditionalexpensesthattheCompanymayhavetoincurifitweretoclosetonew business twelve months after the valuation date.
• Reserveshavebeenkeptforlapsedandreducedpaiduppolicieseligibleforrevivals.
• Extramortalityriskpremiumschargedforextrariskhavebeensetasideasreserve.
• Adequateriderreserveshavebeensetaside
• Additionalreserveshavebeensetwheredeathshavealreadyoccurred,butliabilitycontinuestoexist,likecaseswherein waiver of premium benefits have been triggered
adequate margins for adverse deviations are taken in the valuation assumptions as per the regulations and guidelines issued by IRdaI and the aPs and Guidance Note issued by Institute of actuaries of India. all in-force policies as per the policy administration database have been considered for the estimation of policy liabilities.
3.3 cOVid-19 pandemic
The current wave of CoVId pandemic, where the number of new cases has increased significantly in India, has resulted in various restriction measures across the country. The Company has assessed the impact of CoVId, to the extent possible, on its operations as well its financial statements, including but not limited to the areas of valuation of investment assets, valuation of policy liabilities and solvency as at March 31, 2021. Based on the current assessment, the Company expects the carrying amount of assets will not be adversely impacted. The Company has earmarked reserve of ` 20 crore under Participating portfolio and ` 85 crore under Non-Participating portfolio for CoVId related claims as at the Balance sheet date over and above the policy level liabilities calculated in line with prescribed IRdaI regulations. The solvency position of the Company as at March 31, 2021 stands at 190%, which is above the prescribed regulatory limit of 150%. The Company will however continue to closely monitor any material changes to the future economic and operating conditions that may have any impact on its business and financial position.
3.4 Encumbrances on assets
assets of the Company are free from encumbrances, other than information technology equipment on finance lease, which have been capitalised in accordance with accounting standard 19 on ‘Leases’ as notified by the Companies (accounting standards) amendment Rules, 2016. There are no assets including loans subjected to restructuring (as at March 31, 2020 – ` Nil).The Company has placed fixed deposit of `4,026 thousands (as at March 31, 2020 - ` 2,500 thousands) with Punjab National Bank against Bank Guarantee of `1,526 thousands issued to The Jammu and Kashmir Bank and `2,500 thousands issued to unique Identification development authority of India (uIdaI).
3.5 capital commitments
There are no commitments made and outstanding for loans and investments as at March31, 2021 (as at March 31, 2020 – ` Nil). The estimated amount of commitments made by the Company and not provided (net of advances) for fixed assets as at March 31, 2021 is ` 47,386 thousands (as at March 31, 2020 – ` 43,650 thousands).
3.6 lease commitments
The Company has acquired premises, fit outs, computers and motor vehicles on operating lease. Lease payments on cancellable and non-cancellable lease arrangements were charged to the Revenue account/ Profit and Loss account, as the case may be. The future minimum lease payments in respect of non- cancellable operating leases as at the Balance sheet date are as follows:
(` in ‘000)
particulars march 31,2021 march 31, 2020
Not later than 1 year 41,820 34,201
1 to 5 years 48,970 30,774
Later than 5 years - -
Total MLPs outstanding 90,790 64,975
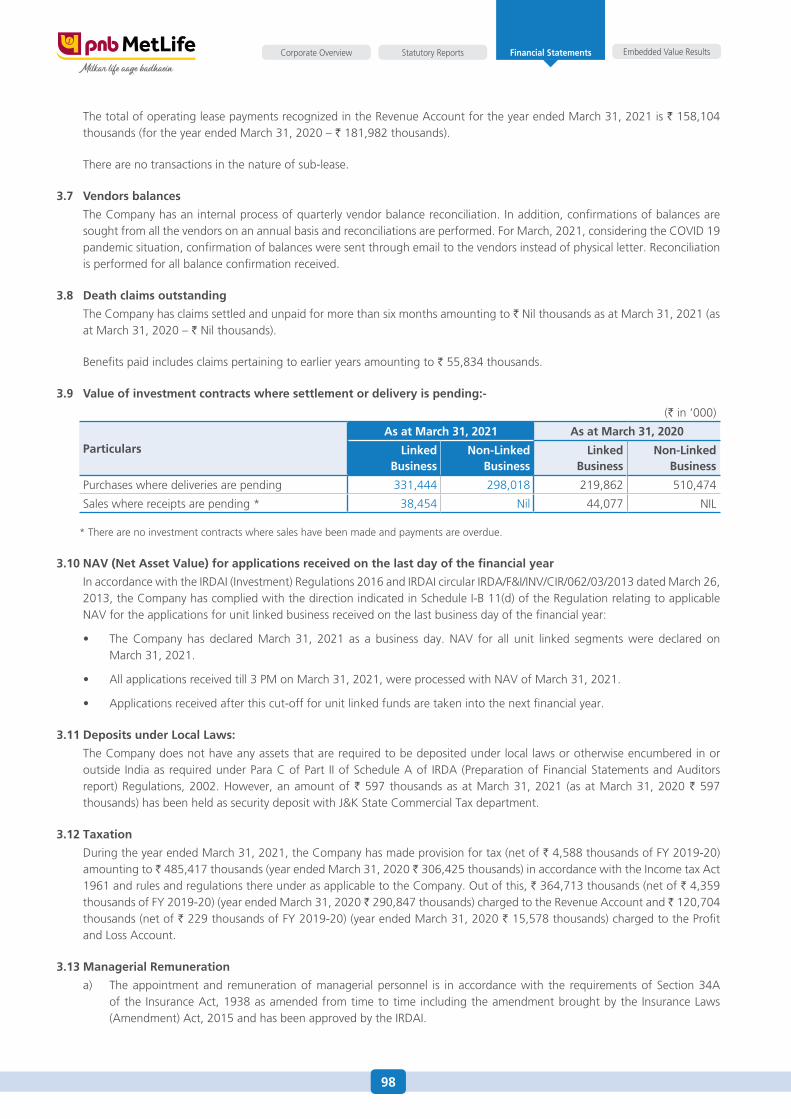
98
Embedded Value ResultsStatutory ReportsCorporate Overview Financial Statements
The total of operating lease payments recognized in the Revenue account for the year ended March 31, 2021 is ` 158,104 thousands (for the year ended March 31, 2020 – ` 181,982 thousands).
There are no transactions in the nature of sub-lease.
3.7 Vendors balances
The Company has an internal process of quarterly vendor balance reconciliation. In addition, confirmations of balances are sought from all the vendors on an annual basis and reconciliations are performed. for March, 2021, considering the CoVId 19 pandemic situation, confirmation of balances were sent through email to the vendors instead of physical letter. Reconciliation is performed for all balance confirmation received.
3.8 death claims outstanding
The Company has claims settled and unpaid for more than six months amounting to ` Nil thousands as at March 31, 2021 (as at March 31, 2020 – ` Nil thousands).
Benefits paid includes claims pertaining to earlier years amounting to ` 55,834 thousands.
3.9 Value of investment contracts where settlement or delivery is pending:-
(` in ‘000)
particularsas at march 31, 2021 as at march 31, 2020
linked Business
non-linked Business
linked Business
non-linked Business
Purchases where deliveries are pending 331,444 298,018 219,862 510,474
sales where receipts are pending * 38,454 Nil 44,077 NIL
* There are no investment contracts where sales have been made and payments are overdue.
3.10 naV (net asset Value) for applications received on the last day of the financial year
In accordance with the IRdaI (Investment) Regulations 2016 and IRdaI circular IRda/f&I/INV/CIR/062/03/2013 dated March 26, 2013, the Company has complied with the direction indicated in schedule I-B 11(d) of the Regulation relating to applicable NaV for the applications for unit linked business received on the last business day of the financial year:
• TheCompany has declaredMarch 31, 2021 as a business day.NAV for all unit linked segmentswere declared onMarch 31, 2021.
• Allapplicationsreceivedtill3PMonMarch31,2021,wereprocessedwithNAVofMarch31,2021.
• Applicationsreceivedafterthiscut-offforunitlinkedfundsaretakenintothenextfinancialyear.
3.11 deposits under local laws:
The Company does not have any assets that are required to be deposited under local laws or otherwise encumbered in or outside India as required under Para C of Part II of schedule a of IRda (Preparation of financial statements and auditors report) Regulations, 2002. however, an amount of ` 597 thousands as at March 31, 2021 (as at March 31, 2020 ` 597 thousands) has been held as security deposit with J&K state Commercial Tax department.
3.12 Taxation
during the year ended March 31, 2021, the Company has made provision for tax (net of ` 4,588 thousands of fy 2019-20) amounting to ` 485,417 thousands (year ended March 31, 2020 ` 306,425 thousands) in accordance with the Income tax act 1961 and rules and regulations there under as applicable to the Company. out of this, ` 364,713 thousands (net of ` 4,359 thousands of fy 2019-20) (year ended March 31, 2020 ̀ 290,847 thousands) charged to the Revenue account and ̀ 120,704 thousands (net of ` 229 thousands of fy 2019-20) (year ended March 31, 2020 ` 15,578 thousands) charged to the Profit and Loss account.
3.13 managerial remuneration
a) The appointment and remuneration of managerial personnel is in accordance with the requirements of section 34a of the Insurance act, 1938 as amended from time to time including the amendment brought by the Insurance Laws (amendment) act, 2015 and has been approved by the IRdaI.
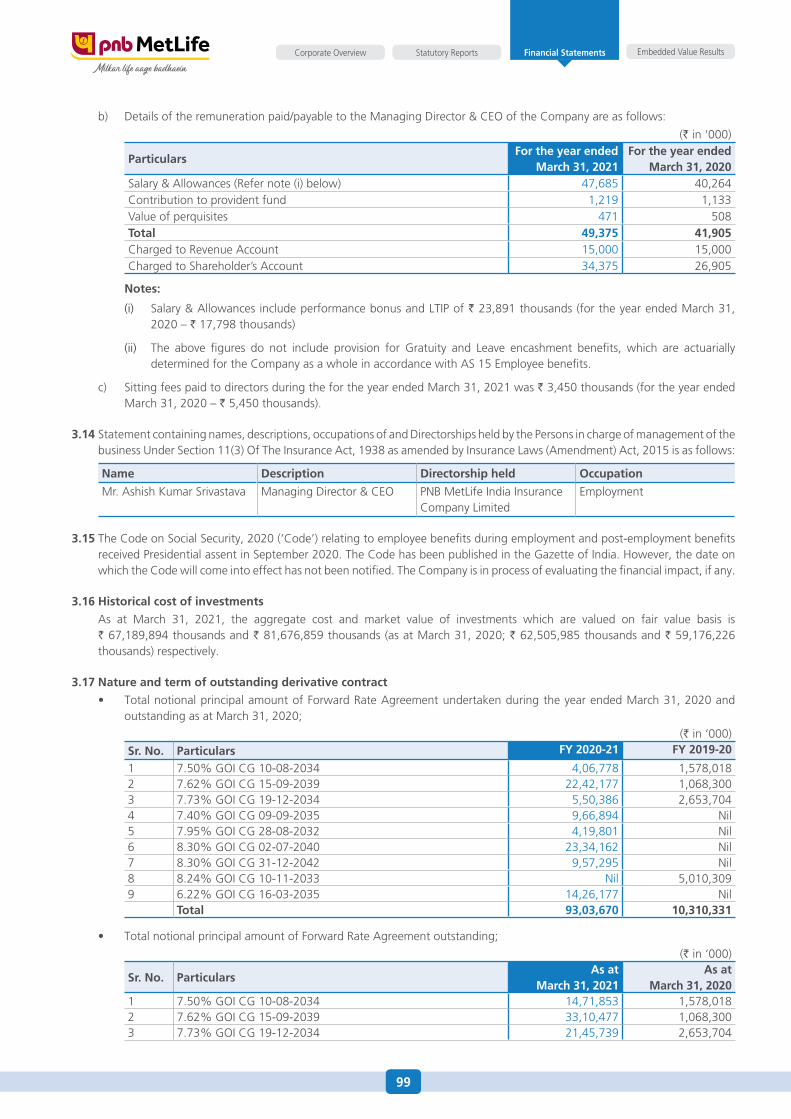
99
Embedded Value ResultsStatutory ReportsCorporate Overview Financial Statements
b) details of the remuneration paid/payable to the Managing director & Ceo of the Company are as follows:
(` in ‘000)
particularsfor the year ended
march 31, 2021 for the year ended
march 31, 2020 salary & allowances (Refer note (i) below) 47,685 40,264Contribution to provident fund 1,219 1,133Value of perquisites 471 508Total 49,375 41,905Charged to Revenue account 15,000 15,000Charged to shareholder’s account 34,375 26,905
notes:
(i) salary & allowances include performance bonus and LTIP of ` 23,891 thousands (for the year ended March 31, 2020 – ` 17,798 thousands)
(ii) The above figures do not include provision for Gratuity and Leave encashment benefits, which are actuarially determined for the Company as a whole in accordance with as 15 employee benefits.
c) sitting fees paid to directors during the for the year ended March 31, 2021 was ` 3,450 thousands (for the year ended March 31, 2020 – ` 5,450 thousands).
3.14 statement containing names, descriptions, occupations of and directorships held by the Persons in charge of management of the business under section 11(3) of The Insurance act, 1938 as amended by Insurance Laws (amendment) act, 2015 is as follows:
name description directorship held Occupation
Mr. ashish Kumar srivastava Managing director & Ceo PNB MetLife India Insurance Company Limited
employment
3.15 The Code on social security, 2020 (‘Code’) relating to employee benefits during employment and post-employment benefits received Presidential assent in september 2020. The Code has been published in the Gazette of India. however, the date on which the Code will come into effect has not been notified. The Company is in process of evaluating the financial impact, if any.
3.16 historical cost of investments
as at March 31, 2021, the aggregate cost and market value of investments which are valued on fair value basis is ` 67,189,894 thousands and ` 81,676,859 thousands (as at March 31, 2020; ` 62,505,985 thousands and ` 59,176,226 thousands) respectively.
3.17 nature and term of outstanding derivative contract
• TotalnotionalprincipalamountofForwardRateAgreementundertakenduringtheyearendedMarch31,2020andoutstanding as at March 31, 2020;
(` in ‘000)Sr. no. particulars fy 2020-21 fy 2019-20
1 7.50% GoI CG 10-08-2034 4,06,778 1,578,0182 7.62% GoI CG 15-09-2039 22,42,177 1,068,3003 7.73% GoI CG 19-12-2034 5,50,386 2,653,7044 7.40% GoI CG 09-09-2035 9,66,894 Nil5 7.95% GoI CG 28-08-2032 4,19,801 Nil6 8.30% GoI CG 02-07-2040 23,34,162 Nil7 8.30% GoI CG 31-12-2042 9,57,295 Nil8 8.24% GoI CG 10-11-2033 Nil 5,010,3099 6.22% GoI CG 16-03-2035 14,26,177 Nil
Total 93,03,670 10,310,331
• TotalnotionalprincipalamountofForwardRateAgreementoutstanding;
(` in ‘000)
Sr. no. particularsas at
march 31, 2021as at
march 31, 20201 7.50% GoI CG 10-08-2034 14,71,853 1,578,0182 7.62% GoI CG 15-09-2039 33,10,477 1,068,3003 7.73% GoI CG 19-12-2034 21,45,739 2,653,704
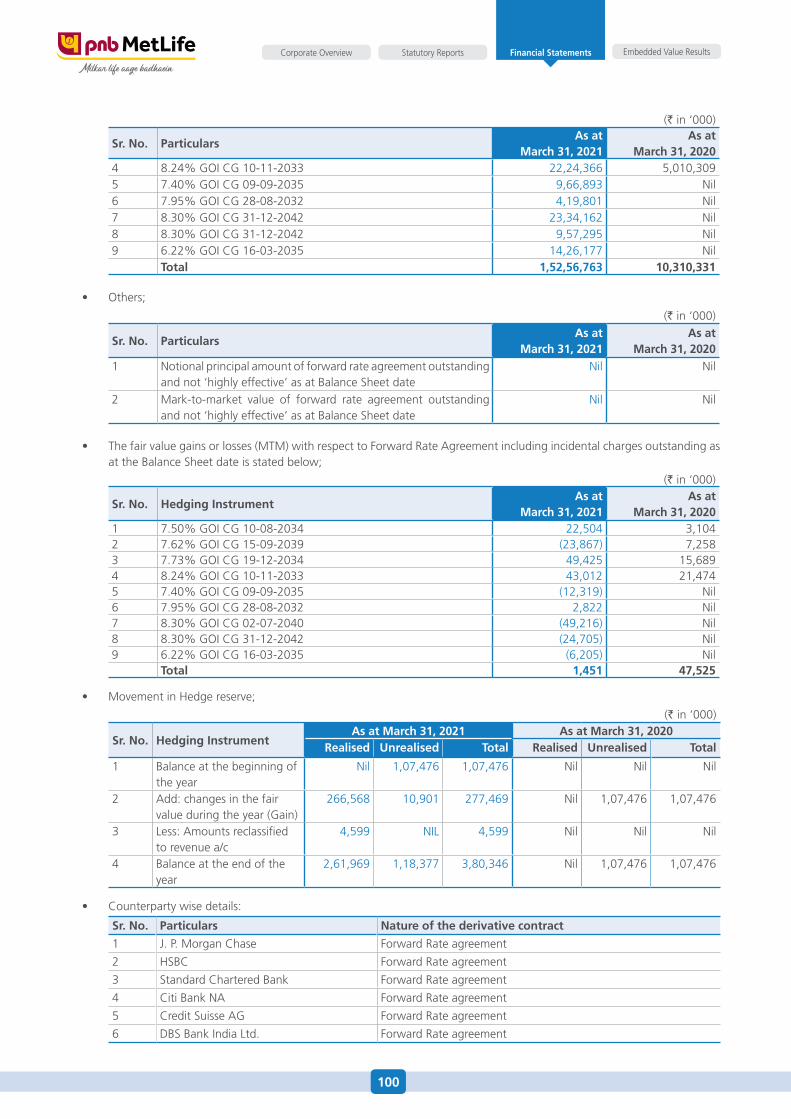
100
Embedded Value ResultsStatutory ReportsCorporate Overview Financial Statements
(` in ‘000)
Sr. no. particularsas at
march 31, 2021as at
march 31, 20204 8.24% GoI CG 10-11-2033 22,24,366 5,010,3095 7.40% GoI CG 09-09-2035 9,66,893 Nil6 7.95% GoI CG 28-08-2032 4,19,801 Nil7 8.30% GoI CG 31-12-2042 23,34,162 Nil8 8.30% GoI CG 31-12-2042 9,57,295 Nil9 6.22% GoI CG 16-03-2035 14,26,177 Nil
Total 1,52,56,763 10,310,331
• Others;
(` in ‘000)
Sr. no. particularsas at
march 31, 2021as at
march 31, 20201 Notional principal amount of forward rate agreement outstanding
and not ‘highly effective’ as at Balance sheet dateNil Nil
2 Mark-to-market value of forward rate agreement outstanding and not ‘highly effective’ as at Balance sheet date
Nil Nil
• Thefairvaluegainsorlosses(MTM)withrespecttoForwardRateAgreementincludingincidentalchargesoutstandingasat the Balance sheet date is stated below;
(` in ‘000)
Sr. no. hedging instrumentas at
march 31, 2021as at
march 31, 20201 7.50% GoI CG 10-08-2034 22,504 3,1042 7.62% GoI CG 15-09-2039 (23,867) 7,2583 7.73% GoI CG 19-12-2034 49,425 15,6894 8.24% GoI CG 10-11-2033 43,012 21,4745 7.40% GoI CG 09-09-2035 (12,319) Nil6 7.95% GoI CG 28-08-2032 2,822 Nil7 8.30% GoI CG 02-07-2040 (49,216) Nil 8 8.30% GoI CG 31-12-2042 (24,705) Nil9 6.22% GoI CG 16-03-2035 (6,205) Nil
Total 1,451 47,525
• MovementinHedgereserve;
(` in ‘000)
Sr. no. hedging instrumentas at march 31, 2021 as at march 31, 2020
realised unrealised Total realised unrealised Total
1 Balance at the beginning of the year
Nil 1,07,476 1,07,476 Nil Nil Nil
2 add: changes in the fair value during the year (Gain)
266,568 10,901 277,469 Nil 1,07,476 1,07,476
3 Less: amounts reclassified to revenue a/c
4,599 NIL 4,599 Nil Nil Nil
4 Balance at the end of the year
2,61,969 1,18,377 3,80,346 Nil 1,07,476 1,07,476
• Counterpartywisedetails:
Sr. no. particulars nature of the derivative contract
1 J. P. Morgan Chase forward Rate agreement
2 hsBC forward Rate agreement
3 standard Chartered Bank forward Rate agreement
4 Citi Bank Na forward Rate agreement
5 Credit suisse aG forward Rate agreement
6 dBs Bank India Ltd. forward Rate agreement
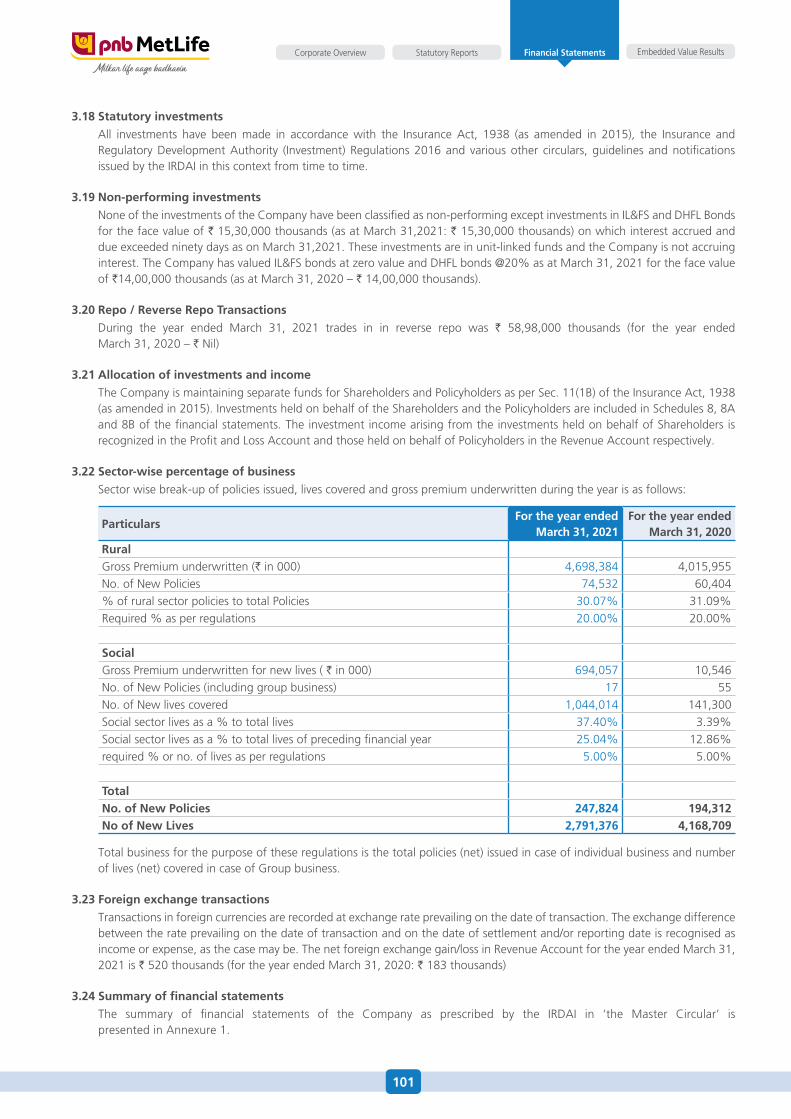
101
Embedded Value ResultsStatutory ReportsCorporate Overview Financial Statements
3.18 Statutory investments
all investments have been made in accordance with the Insurance act, 1938 (as amended in 2015), the Insurance and Regulatory development authority (Investment) Regulations 2016 and various other circulars, guidelines and notifications issued by the IRdaI in this context from time to time.
3.19 non-performing investments
None of the investments of the Company have been classified as non-performing except investments in IL&fs and dhfL Bonds for the face value of ` 15,30,000 thousands (as at March 31,2021: ` 15,30,000 thousands) on which interest accrued and due exceeded ninety days as on March 31,2021. These investments are in unit-linked funds and the Company is not accruing interest. The Company has valued IL&fs bonds at zero value and dhfL bonds @20% as at March 31, 2021 for the face value of `14,00,000 thousands (as at March 31, 2020 – ` 14,00,000 thousands).
3.20 repo / reverse repo Transactions
during the year ended March 31, 2021 trades in in reverse repo was ` 58,98,000 thousands (for the year ended March 31, 2020 – ` Nil)
3.21 allocation of investments and income
The Company is maintaining separate funds for shareholders and Policyholders as per sec. 11(1B) of the Insurance act, 1938 (as amended in 2015). Investments held on behalf of the shareholders and the Policyholders are included in schedules 8, 8a and 8B of the financial statements. The investment income arising from the investments held on behalf of shareholders is recognized in the Profit and Loss account and those held on behalf of Policyholders in the Revenue account respectively.
3.22 Sector-wise percentage of business
sector wise break-up of policies issued, lives covered and gross premium underwritten during the year is as follows:
particularsfor the year ended
march 31, 2021 for the year ended
march 31, 2020 ruralGross Premium underwritten (` in 000) 4,698,384 4,015,955No. of New Policies 74,532 60,404% of rural sector policies to total Policies 30.07% 31.09%Required % as per regulations 20.00% 20.00%
SocialGross Premium underwritten for new lives ( ` in 000) 694,057 10,546No. of New Policies (including group business) 17 55No. of New lives covered 1,044,014 141,300social sector lives as a % to total lives 37.40% 3.39%social sector lives as a % to total lives of preceding financial year 25.04% 12.86%required % or no. of lives as per regulations 5.00% 5.00%
Totalno. of new policies 247,824 194,312no of new lives 2,791,376 4,168,709
Total business for the purpose of these regulations is the total policies (net) issued in case of individual business and number of lives (net) covered in case of Group business.
3.23 foreign exchange transactions
Transactions in foreign currencies are recorded at exchange rate prevailing on the date of transaction. The exchange difference between the rate prevailing on the date of transaction and on the date of settlement and/or reporting date is recognised as income or expense, as the case may be. The net foreign exchange gain/loss in Revenue account for the year ended March 31, 2021 is ` 520 thousands (for the year ended March 31, 2020: ` 183 thousands)
3.24 Summary of financial statements
The summary of financial statements of the Company as prescribed by the IRdaI in ‘the Master Circular’ is presented in annexure 1.
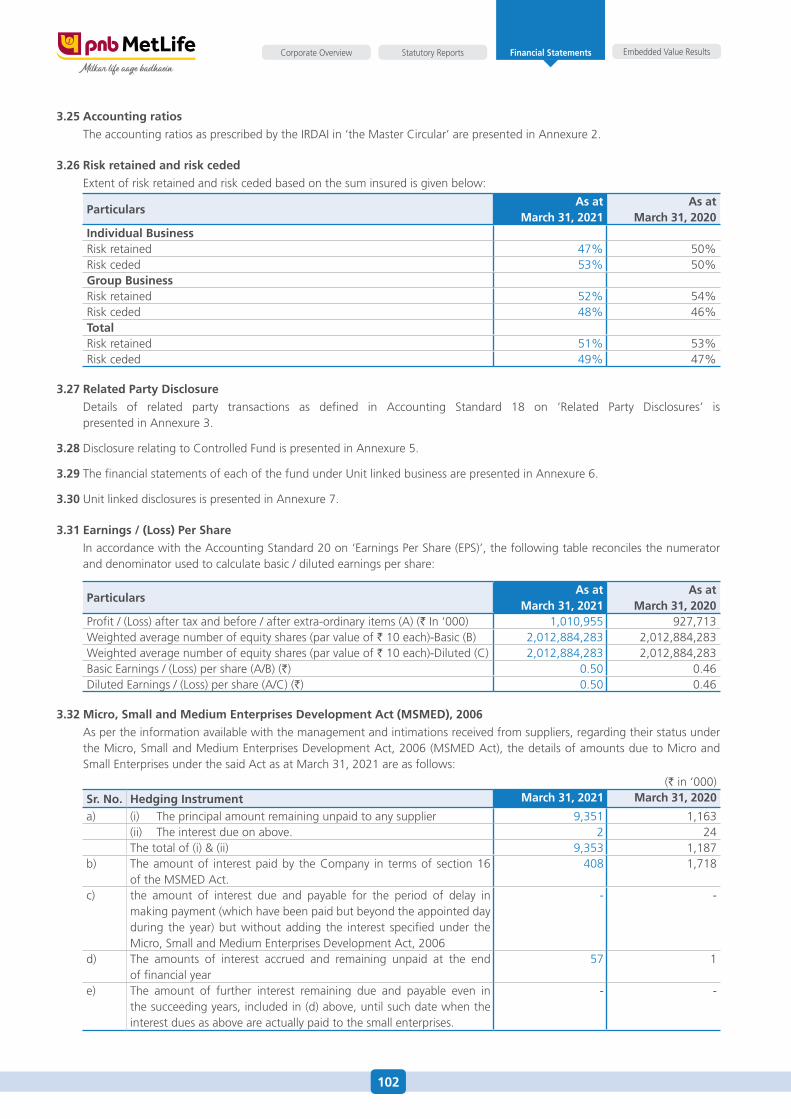
102
Embedded Value ResultsStatutory ReportsCorporate Overview Financial Statements
3.25 accounting ratios
The accounting ratios as prescribed by the IRdaI in ‘the Master Circular’ are presented in annexure 2.
3.26 risk retained and risk ceded
extent of risk retained and risk ceded based on the sum insured is given below:
particularsas at
march 31, 2021 as at
march 31, 2020individual BusinessRisk retained 47% 50%Risk ceded 53% 50%group BusinessRisk retained 52% 54%Risk ceded 48% 46%TotalRisk retained 51% 53%Risk ceded 49% 47%
3.27 related party disclosure
details of related party transactions as defined in accounting standard 18 on ‘Related Party disclosures’ is presented in annexure 3.
3.28 disclosure relating to Controlled fund is presented in annexure 5.
3.29 The financial statements of each of the fund under unit linked business are presented in annexure 6.
3.30 unit linked disclosures is presented in annexure 7.
3.31 Earnings / (loss) per Share
In accordance with the accounting standard 20 on ‘earnings Per share (ePs)’, the following table reconciles the numerator and denominator used to calculate basic / diluted earnings per share:
particularsas at
march 31, 2021 as at
march 31, 2020Profit / (Loss) after tax and before / after extra-ordinary items (a) (` In ‘000) 1,010,955 927,713Weighted average number of equity shares (par value of ` 10 each)-Basic (B) 2,012,884,283 2,012,884,283Weighted average number of equity shares (par value of ` 10 each)-diluted (C) 2,012,884,283 2,012,884,283Basic earnings / (Loss) per share (a/B) (`) 0.50 0.46diluted earnings / (Loss) per share (a/C) (`) 0.50 0.46
3.32 micro, Small and medium Enterprises development act (mSmEd), 2006
as per the information available with the management and intimations received from suppliers, regarding their status under the Micro, small and Medium enterprises development act, 2006 (MsMed act), the details of amounts due to Micro and small enterprises under the said act as at March 31, 2021 are as follows:
(` in ‘000)Sr. no. hedging instrument march 31, 2021 march 31, 2020
a) (i) The principal amount remaining unpaid to any supplier 9,351 1,163(ii) The interest due on above. 2 24The total of (i) & (ii) 9,353 1,187
b) The amount of interest paid by the Company in terms of section 16 of the MsMed act.
408 1,718
c) the amount of interest due and payable for the period of delay in making payment (which have been paid but beyond the appointed day during the year) but without adding the interest specified under the Micro, small and Medium enterprises development act, 2006
- -
d) The amounts of interest accrued and remaining unpaid at the end of financial year
57 1
e) The amount of further interest remaining due and payable even in the succeeding years, included in (d) above, until such date when the interest dues as above are actually paid to the small enterprises.
- -
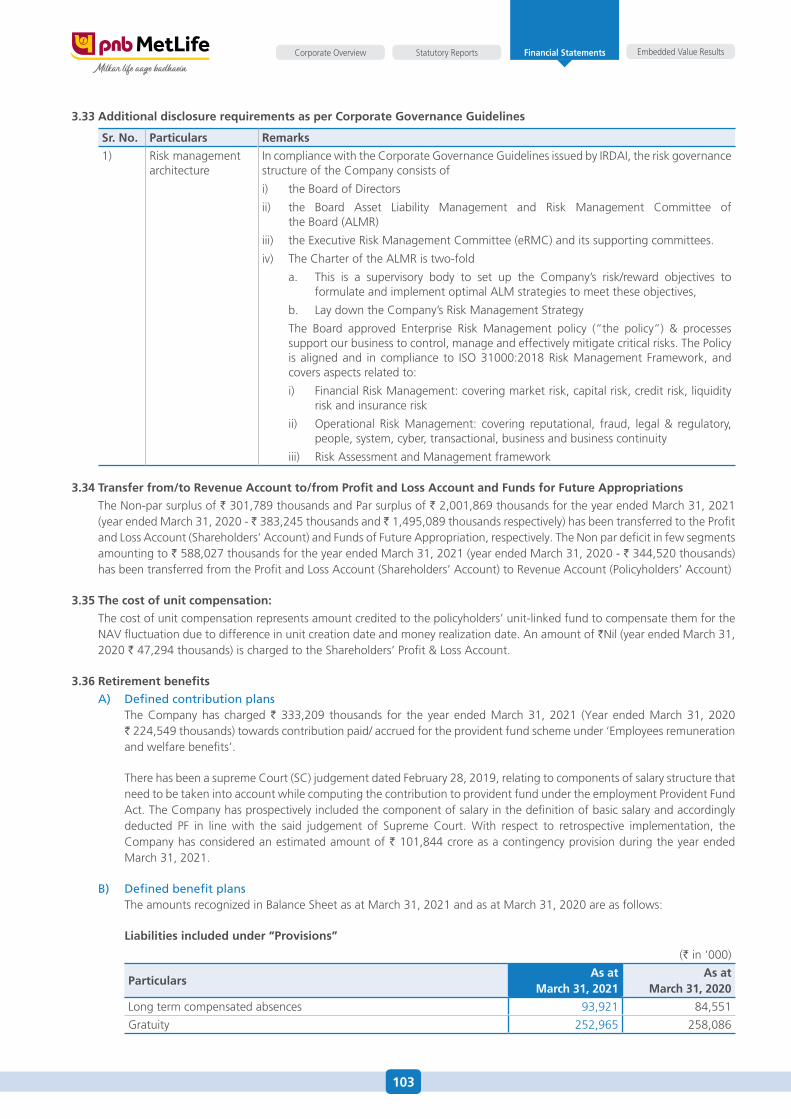
103
Embedded Value ResultsStatutory ReportsCorporate Overview Financial Statements
3.33 additional disclosure requirements as per corporate governance guidelines
Sr. no. particulars remarks
1) Risk management architecture
In compliance with the Corporate Governance Guidelines issued by IRdaI, the risk governance structure of the Company consists of
i) the Board of directors
ii) the Board asset Liability Management and Risk Management Committee of the Board (aLMR)
iii) the executive Risk Management Committee (eRMC) and its supporting committees.
iv) The Charter of the aLMR is two-fold
a. This is a supervisory body to set up the Company’s risk/reward objectives to formulate and implement optimal aLM strategies to meet these objectives,
b. Lay down the Company’s Risk Management strategy
The Board approved enterprise Risk Management policy (“the policy”) & processes support our business to control, manage and effectively mitigate critical risks. The Policy is aligned and in compliance to Iso 31000:2018 Risk Management framework, and covers aspects related to:
i) financial Risk Management: covering market risk, capital risk, credit risk, liquidity risk and insurance risk
ii) operational Risk Management: covering reputational, fraud, legal & regulatory, people, system, cyber, transactional, business and business continuity
iii) Risk assessment and Management framework
3.34 Transfer from/to revenue account to/from profit and loss account and funds for future appropriations
The Non-par surplus of ` 301,789 thousands and Par surplus of ` 2,001,869 thousands for the year ended March 31, 2021 (year ended March 31, 2020 - ̀ 383,245 thousands and ̀ 1,495,089 thousands respectively) has been transferred to the Profit and Loss account (shareholders’ account) and funds of future appropriation, respectively. The Non par deficit in few segments amounting to ` 588,027 thousands for the year ended March 31, 2021 (year ended March 31, 2020 - ` 344,520 thousands) has been transferred from the Profit and Loss account (shareholders’ account) to Revenue account (Policyholders’ account)
3.35 The cost of unit compensation:
The cost of unit compensation represents amount credited to the policyholders’ unit-linked fund to compensate them for the NaV fluctuation due to difference in unit creation date and money realization date. an amount of `Nil (year ended March 31, 2020 ` 47,294 thousands) is charged to the shareholders’ Profit & Loss account.
3.36 retirement benefits
A) Defined contribution plans The Company has charged ` 333,209 thousands for the year ended March 31, 2021 (year ended March 31, 2020
` 224,549 thousands) towards contribution paid/ accrued for the provident fund scheme under ‘employees remuneration and welfare benefits’.
There has been a supreme Court (sC) judgement dated february 28, 2019, relating to components of salary structure that need to be taken into account while computing the contribution to provident fund under the employment Provident fund act. The Company has prospectively included the component of salary in the definition of basic salary and accordingly deducted Pf in line with the said judgement of supreme Court. With respect to retrospective implementation, the Company has considered an estimated amount of ` 101,844 crore as a contingency provision during the year ended March 31, 2021.
B) Defined benefit plans The amounts recognized in Balance sheet as at March 31, 2021 and as at March 31, 2020 are as follows:
liabilities included under “provisions”
(` in ‘000)
particularsas at
march 31, 2021 as at
march 31, 2020
Long term compensated absences 93,921 84,551
Gratuity 252,965 258,086
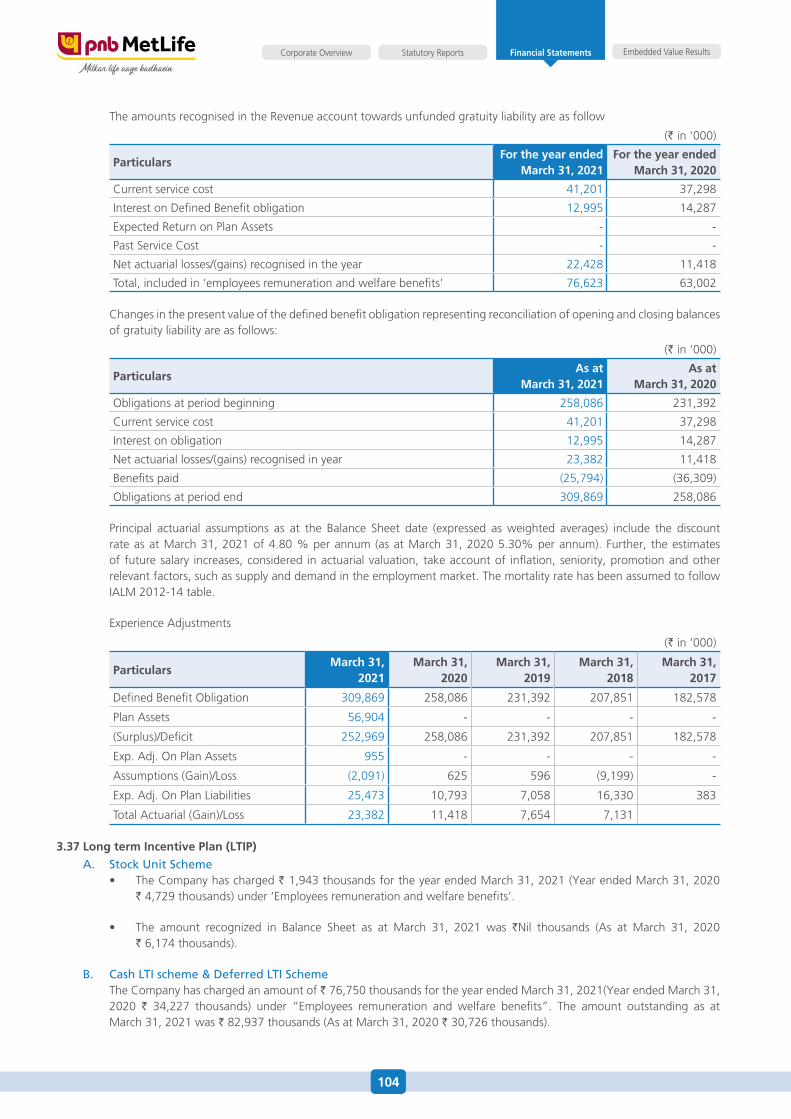
104
Embedded Value ResultsStatutory ReportsCorporate Overview Financial Statements
The amounts recognised in the Revenue account towards unfunded gratuity liability are as follow
(` in ‘000)
particularsfor the year ended
march 31, 2021 for the year ended
march 31, 2020
Current service cost 41,201 37,298
Interest on defined Benefit obligation 12,995 14,287
expected Return on Plan assets - -
Past service Cost - -
Net actuarial losses/(gains) recognised in the year 22,428 11,418
Total, included in ‘employees remuneration and welfare benefits’ 76,623 63,002
Changes in the present value of the defined benefit obligation representing reconciliation of opening and closing balances of gratuity liability are as follows:
(` in ‘000)
particularsas at
march 31, 2021 as at
march 31, 2020
obligations at period beginning 258,086 231,392
Current service cost 41,201 37,298
Interest on obligation 12,995 14,287
Net actuarial losses/(gains) recognised in year 23,382 11,418
Benefits paid (25,794) (36,309)
obligations at period end 309,869 258,086
Principal actuarial assumptions as at the Balance sheet date (expressed as weighted averages) include the discount rate as at March 31, 2021 of 4.80 % per annum (as at March 31, 2020 5.30% per annum). further, the estimates of future salary increases, considered in actuarial valuation, take account of inflation, seniority, promotion and other relevant factors, such as supply and demand in the employment market. The mortality rate has been assumed to follow IaLM 2012-14 table.
experience adjustments
(` in ‘000)
particularsmarch 31,
2021march 31,
2020march 31,
2019march 31,
2018march 31,
2017
defined Benefit obligation 309,869 258,086 231,392 207,851 182,578
Plan assets 56,904 - - - -
(surplus)/deficit 252,969 258,086 231,392 207,851 182,578
exp. adj. on Plan assets 955 - - - -
assumptions (Gain)/Loss (2,091) 625 596 (9,199) -
exp. adj. on Plan Liabilities 25,473 10,793 7,058 16,330 383
Total actuarial (Gain)/Loss 23,382 11,418 7,654 7,131
3.37 long term incentive plan (lTip)
A. Stock Unit Scheme• TheCompanyhascharged` 1,943 thousands for the year ended March 31, 2021 (year ended March 31, 2020
` 4,729 thousands) under ‘employees remuneration and welfare benefits’.
• The amount recognized in Balance Sheet as at March 31, 2021 was `Nil thousands (as at March 31, 2020 ` 6,174 thousands).
B. Cash LTI scheme & Deferred LTI Scheme The Company has charged an amount of ` 76,750 thousands for the year ended March 31, 2021(year ended March 31,
2020 ` 34,227 thousands) under “employees remuneration and welfare benefits”. The amount outstanding as at March 31, 2021 was ` 82,937 thousands (as at March 31, 2020 ` 30,726 thousands).
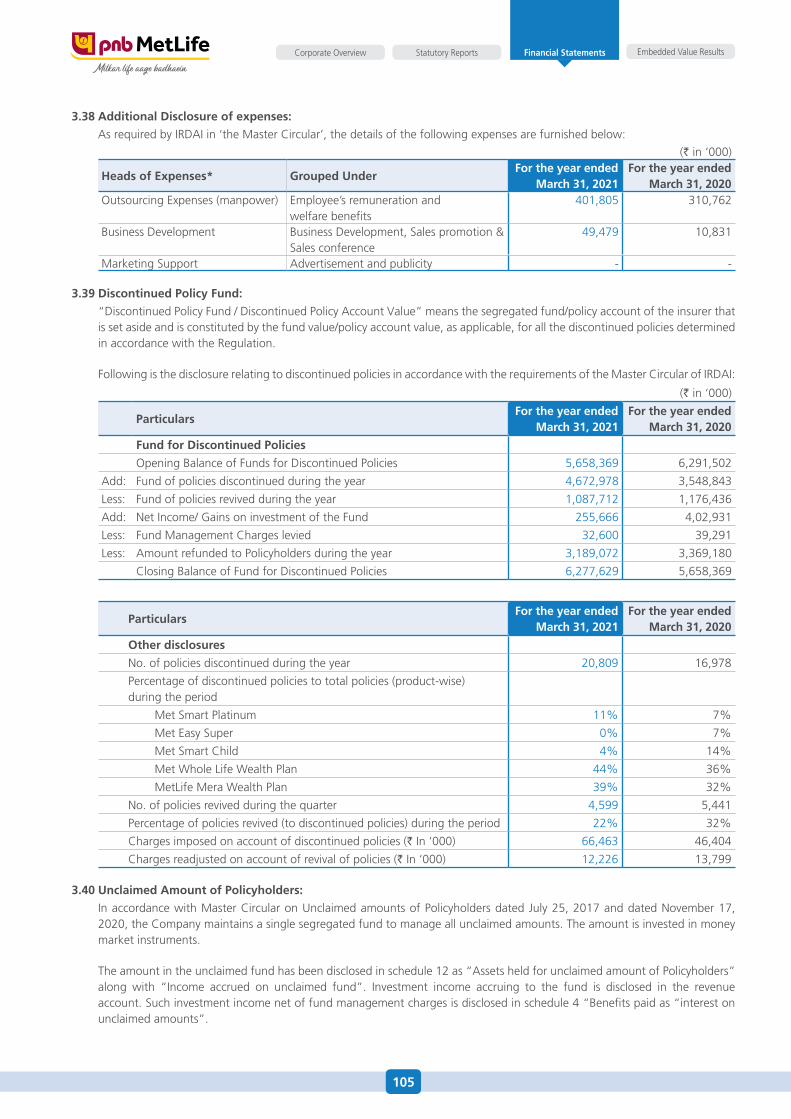
105
Embedded Value ResultsStatutory ReportsCorporate Overview Financial Statements
3.38 additional disclosure of expenses:
as required by IRdaI in ‘the Master Circular’, the details of the following expenses are furnished below:
(` in ‘000)
heads of Expenses* grouped underfor the year ended
march 31, 2021 for the year ended
march 31, 2020 outsourcing expenses (manpower) employee’s remuneration and
welfare benefits401,805 310,762
Business development Business development, sales promotion & sales conference
49,479 10,831
Marketing support advertisement and publicity - -
3.39 discontinued policy fund:
“discontinued Policy fund / discontinued Policy account Value” means the segregated fund/policy account of the insurer that is set aside and is constituted by the fund value/policy account value, as applicable, for all the discontinued policies determined in accordance with the Regulation.
following is the disclosure relating to discontinued policies in accordance with the requirements of the Master Circular of IRdaI:
(` in ‘000)
particularsfor the year ended
march 31, 2021 for the year ended
march 31, 2020
fund for discontinued policies
opening Balance of funds for discontinued Policies 5,658,369 6,291,502
add: fund of policies discontinued during the year 4,672,978 3,548,843
Less: fund of policies revived during the year 1,087,712 1,176,436
add: Net Income/ Gains on investment of the fund 255,666 4,02,931
Less: fund Management Charges levied 32,600 39,291
Less: amount refunded to Policyholders during the year 3,189,072 3,369,180
Closing Balance of fund for discontinued Policies 6,277,629 5,658,369
particularsfor the year ended
march 31, 2021 for the year ended
march 31, 2020
Other disclosures
No. of policies discontinued during the year 20,809 16,978
Percentage of discontinued policies to total policies (product-wise) during the period
Met smart Platinum 11% 7%
Met easy super 0% 7%
Met smart Child 4% 14%
Met Whole Life Wealth Plan 44% 36%
MetLife Mera Wealth Plan 39% 32%
No. of policies revived during the quarter 4,599 5,441
Percentage of policies revived (to discontinued policies) during the period 22% 32%
Charges imposed on account of discontinued policies (` In ‘000) 66,463 46,404
Charges readjusted on account of revival of policies (` In ‘000) 12,226 13,799
3.40 unclaimed amount of policyholders:
In accordance with Master Circular on unclaimed amounts of Policyholders dated July 25, 2017 and dated November 17, 2020, the Company maintains a single segregated fund to manage all unclaimed amounts. The amount is invested in money market instruments.
The amount in the unclaimed fund has been disclosed in schedule 12 as “assets held for unclaimed amount of Policyholders” along with “Income accrued on unclaimed fund”. Investment income accruing to the fund is disclosed in the revenue account. such investment income net of fund management charges is disclosed in schedule 4 “Benefits paid as “interest on unclaimed amounts”.
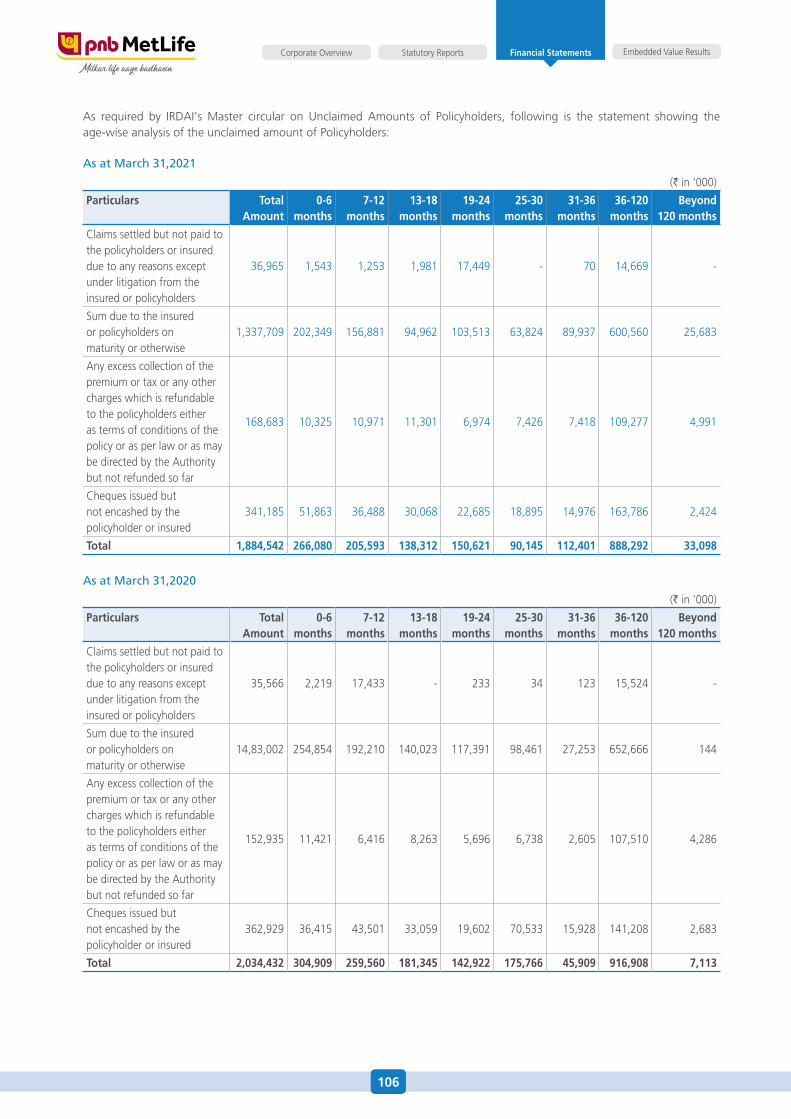
106
Embedded Value ResultsStatutory ReportsCorporate Overview Financial Statements
as required by IRdaI’s Master circular on unclaimed amounts of Policyholders, following is the statement showing the age-wise analysis of the unclaimed amount of Policyholders:
As at March 31,2021
(` in ‘000)
particulars Total amount
0-6 months
7-12 months
13-18 months
19-24 months
25-30 months
31-36 months
36-120 months
Beyond 120 months
Claims settled but not paid to the policyholders or insured due to any reasons except under litigation from the insured or policyholders
36,965 1,543 1,253 1,981 17,449 - 70 14,669 -
sum due to the insured or policyholders on maturity or otherwise
1,337,709 202,349 156,881 94,962 103,513 63,824 89,937 600,560 25,683
any excess collection of the premium or tax or any other charges which is refundable to the policyholders either as terms of conditions of the policy or as per law or as may be directed by the authority but not refunded so far
168,683 10,325 10,971 11,301 6,974 7,426 7,418 109,277 4,991
Cheques issued but not encashed by the policyholder or insured
341,185 51,863 36,488 30,068 22,685 18,895 14,976 163,786 2,424
Total 1,884,542 266,080 205,593 138,312 150,621 90,145 112,401 888,292 33,098
As at March 31,2020
(` in ‘000)
particulars Total amount
0-6 months
7-12 months
13-18 months
19-24 months
25-30 months
31-36 months
36-120 months
Beyond 120 months
Claims settled but not paid to the policyholders or insured due to any reasons except under litigation from the insured or policyholders
35,566 2,219 17,433 - 233 34 123 15,524 -
sum due to the insured or policyholders on maturity or otherwise
14,83,002 254,854 192,210 140,023 117,391 98,461 27,253 652,666 144
any excess collection of the premium or tax or any other charges which is refundable to the policyholders either as terms of conditions of the policy or as per law or as may be directed by the authority but not refunded so far
152,935 11,421 6,416 8,263 5,696 6,738 2,605 107,510 4,286
Cheques issued but not encashed by the policyholder or insured
362,929 36,415 43,501 33,059 19,602 70,533 15,928 141,208 2,683
Total 2,034,432 304,909 259,560 181,345 142,922 175,766 45,909 916,908 7,113
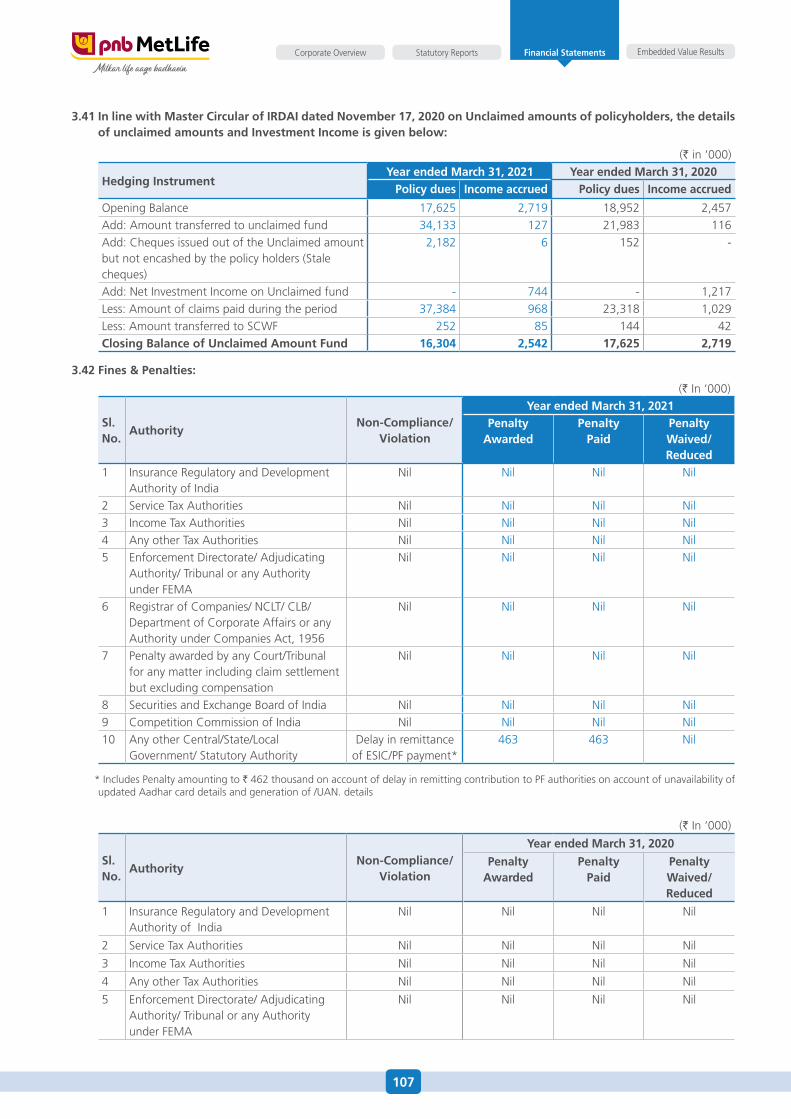
107
Embedded Value ResultsStatutory ReportsCorporate Overview Financial Statements
3.41 in line with master circular of irdai dated november 17, 2020 on unclaimed amounts of policyholders, the details of unclaimed amounts and investment income is given below:
(` in ‘000)
hedging instrumentyear ended march 31, 2021 year ended march 31, 2020
policy dues income accrued policy dues income accrued
opening Balance 17,625 2,719 18,952 2,457add: amount transferred to unclaimed fund 34,133 127 21,983 116add: Cheques issued out of the unclaimed amount but not encashed by the policy holders (stale cheques)
2,182 6 152 -
add: Net Investment Income on unclaimed fund - 744 - 1,217Less: amount of claims paid during the period 37,384 968 23,318 1,029Less: amount transferred to sCWf 252 85 144 42closing Balance of unclaimed amount fund 16,304 2,542 17,625 2,719
3.42 fines & penalties:
(` In ‘000)
Sl. no.
authoritynon-compliance/
Violation
year ended march 31, 2021 penalty
awardedpenalty
paidpenalty waived/ reduced
1 Insurance Regulatory and development authority of India
Nil Nil Nil Nil
2 service Tax authorities Nil Nil Nil Nil3 Income Tax authorities Nil Nil Nil Nil4 any other Tax authorities Nil Nil Nil Nil5 enforcement directorate/ adjudicating
authority/ Tribunal or any authority under feMa
Nil Nil Nil Nil
6 Registrar of Companies/ NCLT/ CLB/ department of Corporate affairs or any authority under Companies act, 1956
Nil Nil Nil Nil
7 Penalty awarded by any Court/Tribunal for any matter including claim settlement but excluding compensation
Nil Nil Nil Nil
8 securities and exchange Board of India Nil Nil Nil Nil9 Competition Commission of India Nil Nil Nil Nil10 any other Central/state/Local
Government/ statutory authoritydelay in remittance
of esIC/Pf payment*463 463 Nil
* Includes Penalty amounting to ` 462 thousand on account of delay in remitting contribution to Pf authorities on account of unavailability of updated aadhar card details and generation of /uaN. details
(` In ‘000)
Sl. no.
authoritynon-compliance/
Violation
year ended march 31, 2020
penalty awarded
penalty paid
penalty waived/ reduced
1 Insurance Regulatory and development authority of India
Nil Nil Nil Nil
2 service Tax authorities Nil Nil Nil Nil
3 Income Tax authorities Nil Nil Nil Nil
4 any other Tax authorities Nil Nil Nil Nil
5 enforcement directorate/ adjudicating authority/ Tribunal or any authority under feMa
Nil Nil Nil Nil
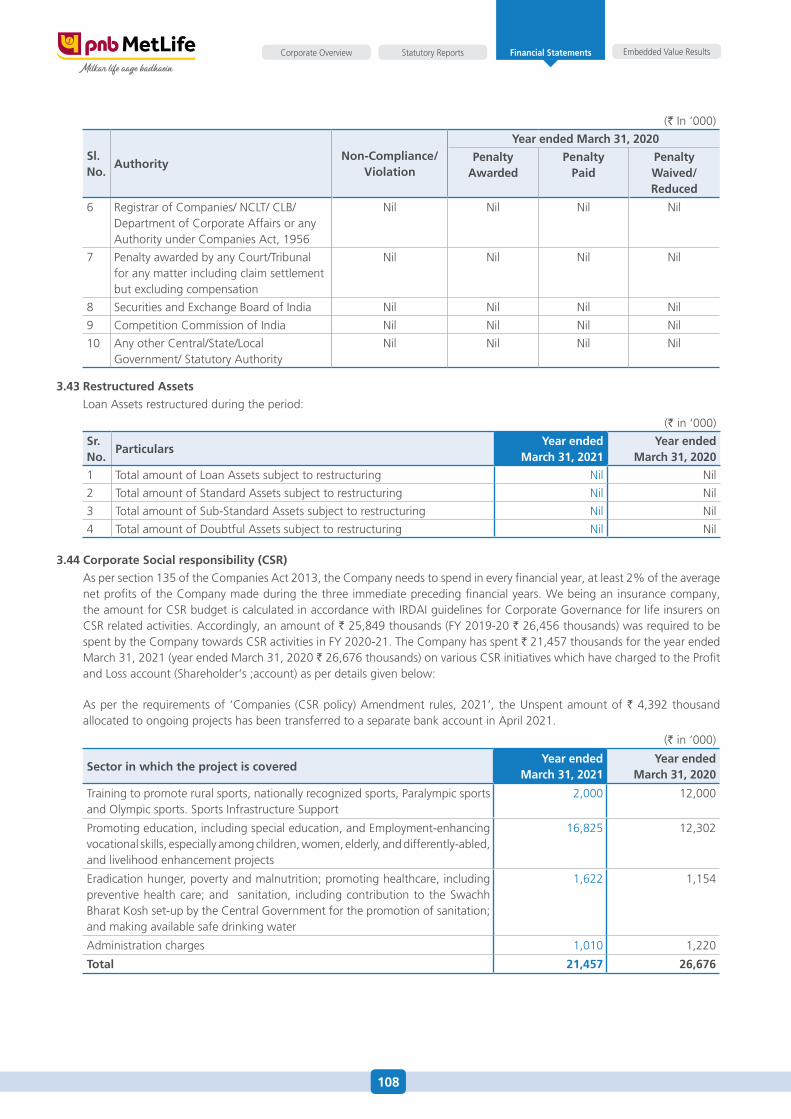
108
Embedded Value ResultsStatutory ReportsCorporate Overview Financial Statements
(` In ‘000)
Sl. no.
authoritynon-compliance/
Violation
year ended march 31, 2020
penalty awarded
penalty paid
penalty waived/ reduced
6 Registrar of Companies/ NCLT/ CLB/ department of Corporate affairs or any authority under Companies act, 1956
Nil Nil Nil Nil
7 Penalty awarded by any Court/Tribunal for any matter including claim settlement but excluding compensation
Nil Nil Nil Nil
8 securities and exchange Board of India Nil Nil Nil Nil
9 Competition Commission of India Nil Nil Nil Nil
10 any other Central/state/Local Government/ statutory authority
Nil Nil Nil Nil
3.43 restructured assets
Loan assets restructured during the period:
(` in ‘000)
Sr. no.
particularsyear ended
march 31, 2021year ended
march 31, 2020
1 Total amount of Loan assets subject to restructuring Nil Nil
2 Total amount of standard assets subject to restructuring Nil Nil
3 Total amount of sub-standard assets subject to restructuring Nil Nil
4 Total amount of doubtful assets subject to restructuring Nil Nil
3.44 corporate Social responsibility (cSr)
as per section 135 of the Companies act 2013, the Company needs to spend in every financial year, at least 2% of the average net profits of the Company made during the three immediate preceding financial years. We being an insurance company, the amount for CsR budget is calculated in accordance with IRdaI guidelines for Corporate Governance for life insurers on CsR related activities. accordingly, an amount of ` 25,849 thousands (fy 2019-20 ` 26,456 thousands) was required to be spent by the Company towards CsR activities in fy 2020-21. The Company has spent ` 21,457 thousands for the year ended March 31, 2021 (year ended March 31, 2020 ` 26,676 thousands) on various CsR initiatives which have charged to the Profit and Loss account (shareholder’s ;account) as per details given below:
as per the requirements of ‘Companies (CsR policy) amendment rules, 2021’, the unspent amount of ` 4,392 thousand allocated to ongoing projects has been transferred to a separate bank account in april 2021.
(` in ‘000)
Sector in which the project is coveredyear ended
march 31, 2021year ended
march 31, 2020
Training to promote rural sports, nationally recognized sports, Paralympic sports and olympic sports. sports Infrastructure support
2,000 12,000
Promoting education, including special education, and employment-enhancing vocational skills, especially among children, women, elderly, and differently-abled, and livelihood enhancement projects
16,825 12,302
eradication hunger, poverty and malnutrition; promoting healthcare, including preventive health care; and sanitation, including contribution to the swachh Bharat Kosh set-up by the Central Government for the promotion of sanitation; and making available safe drinking water
1,622 1,154
administration charges 1,010 1,220
Total 21,457 26,676
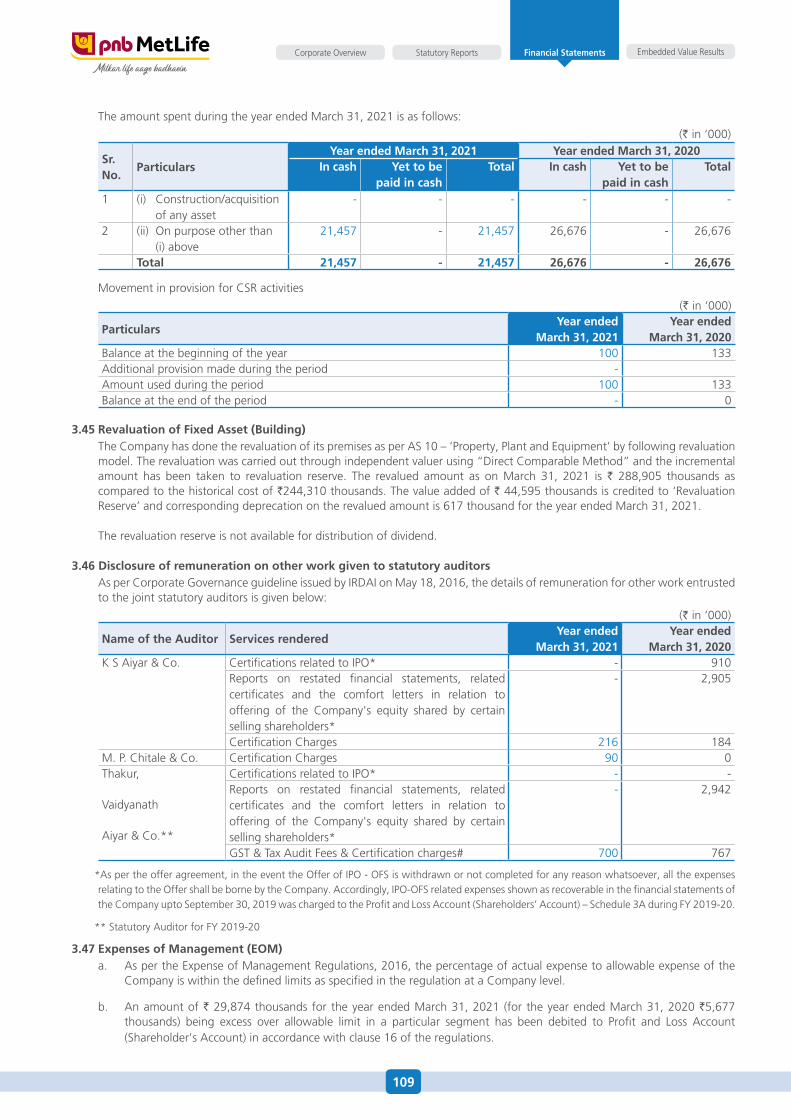
109
Embedded Value ResultsStatutory ReportsCorporate Overview Financial Statements
The amount spent during the year ended March 31, 2021 is as follows:
(` in ‘000)
Sr. no.
particularsyear ended march 31, 2021 year ended march 31, 2020
in cash yet to be paid in cash
Total in cash yet to be paid in cash
Total
1 (i) Construction/acquisition of any asset
- - - - - -
2 (ii) on purpose other than (i) above
21,457 - 21,457 26,676 - 26,676
Total 21,457 - 21,457 26,676 - 26,676
Movement in provision for CsR activities
(` in ‘000)
particularsyear ended
march 31, 2021year ended
march 31, 2020Balance at the beginning of the year 100 133additional provision made during the period -amount used during the period 100 133Balance at the end of the period - 0
3.45 revaluation of fixed asset (Building) The Company has done the revaluation of its premises as per as 10 – ‘Property, Plant and equipment’ by following revaluation
model. The revaluation was carried out through independent valuer using “direct Comparable Method” and the incremental amount has been taken to revaluation reserve. The revalued amount as on March 31, 2021 is ` 288,905 thousands as compared to the historical cost of `244,310 thousands. The value added of ` 44,595 thousands is credited to ‘Revaluation Reserve’ and corresponding deprecation on the revalued amount is 617 thousand for the year ended March 31, 2021.
The revaluation reserve is not available for distribution of dividend.
3.46 disclosure of remuneration on other work given to statutory auditors as per Corporate Governance guideline issued by IRdaI on May 18, 2016, the details of remuneration for other work entrusted
to the joint statutory auditors is given below:
(` in ‘000)
name of the auditor Services renderedyear ended
march 31, 2021year ended
march 31, 2020K s aiyar & Co. Certifications related to IPo* - 910
Reports on restated financial statements, related certificates and the comfort letters in relation to offering of the Company's equity shared by certain selling shareholders*
- 2,905
Certification Charges 216 184M. P. Chitale & Co. Certification Charges 90 0Thakur,
Vaidyanath
aiyar & Co.**
Certifications related to IPo* - -Reports on restated financial statements, related certificates and the comfort letters in relation to offering of the Company's equity shared by certain selling shareholders*
- 2,942
GsT & Tax audit fees & Certification charges# 700 767
*as per the offer agreement, in the event the offer of IPo - ofs is withdrawn or not completed for any reason whatsoever, all the expenses relating to the offer shall be borne by the Company. accordingly, IPo-ofs related expenses shown as recoverable in the financial statements of the Company upto september 30, 2019 was charged to the Profit and Loss account (shareholders’ account) – schedule 3a during fy 2019-20.
** statutory auditor for fy 2019-20
3.47 Expenses of management (EOm)a. as per the expense of Management Regulations, 2016, the percentage of actual expense to allowable expense of the
Company is within the defined limits as specified in the regulation at a Company level.
b. an amount of ` 29,874 thousands for the year ended March 31, 2021 (for the year ended March 31, 2020 `5,677 thousands) being excess over allowable limit in a particular segment has been debited to Profit and Loss account (shareholder’s account) in accordance with clause 16 of the regulations.
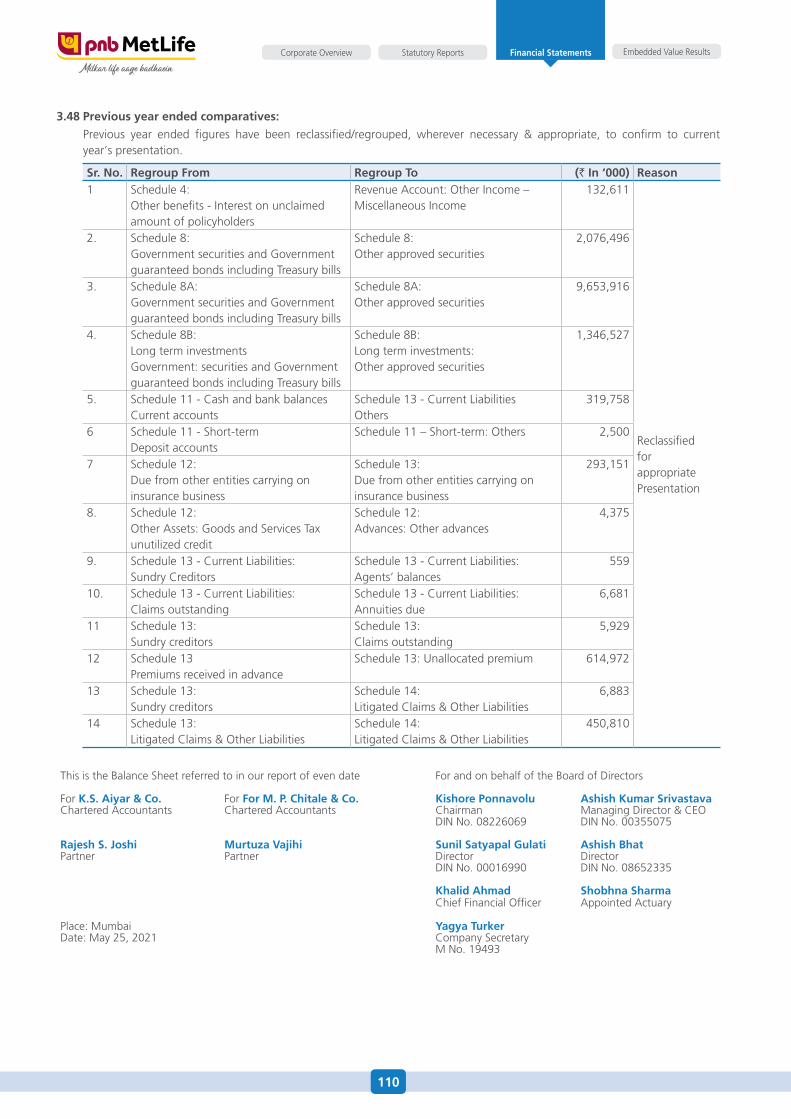
110
Embedded Value ResultsStatutory ReportsCorporate Overview Financial Statements
3.48 previous year ended comparatives:
Previous year ended figures have been reclassified/regrouped, wherever necessary & appropriate, to confirm to current year’s presentation.
Sr. no. regroup from regroup To (` in ‘000) reason1 schedule 4:
other benefits - Interest on unclaimed amount of policyholders
Revenue account: other Income – Miscellaneous Income
132,611
Reclassified for appropriatePresentation
2. schedule 8:Government securities and Government guaranteed bonds including Treasury bills
schedule 8:other approved securities
2,076,496
3. schedule 8a:Government securities and Government guaranteed bonds including Treasury bills
schedule 8a:other approved securities
9,653,916
4. schedule 8B:Long term investmentsGovernment: securities and Government guaranteed bonds including Treasury bills
schedule 8B:Long term investments:other approved securities
1,346,527
5. schedule 11 - Cash and bank balancesCurrent accounts
schedule 13 - Current Liabilitiesothers
319,758
6 schedule 11 - short-term deposit accounts
schedule 11 – short-term: others 2,500
7 schedule 12:due from other entities carrying on insurance business
schedule 13:due from other entities carrying on insurance business
293,151
8. schedule 12:other assets: Goods and services Tax unutilized credit
schedule 12:advances: other advances
4,375
9. schedule 13 - Current Liabilities:sundry Creditors
schedule 13 - Current Liabilities:agents’ balances
559
10. schedule 13 - Current Liabilities:Claims outstanding
schedule 13 - Current Liabilities:annuities due
6,681
11 schedule 13:sundry creditors
schedule 13:Claims outstanding
5,929
12 schedule 13Premiums received in advance
schedule 13: unallocated premium 614,972
13 schedule 13:sundry creditors
schedule 14:Litigated Claims & other Liabilities
6,883
14 schedule 13:Litigated Claims & other Liabilities
schedule 14:Litigated Claims & other Liabilities
450,810
This is the Balance sheet referred to in our report of even date for and on behalf of the Board of directors
for K.S. aiyar & co. for for m. p. chitale & co. Kishore ponnavolu ashish Kumar SrivastavaChartered accountants Chartered accountants Chairman Managing director & Ceo
dIN No. 08226069 dIN No. 00355075
rajesh S. Joshi murtuza Vajihi Sunil Satyapal gulati ashish BhatPartner Partner director director
dIN No. 00016990 dIN No. 08652335
Khalid ahmad Shobhna SharmaChief financial officer appointed actuary
Place: Mumbai yagya Turkerdate: May 25, 2021 Company secretary
M No. 19493
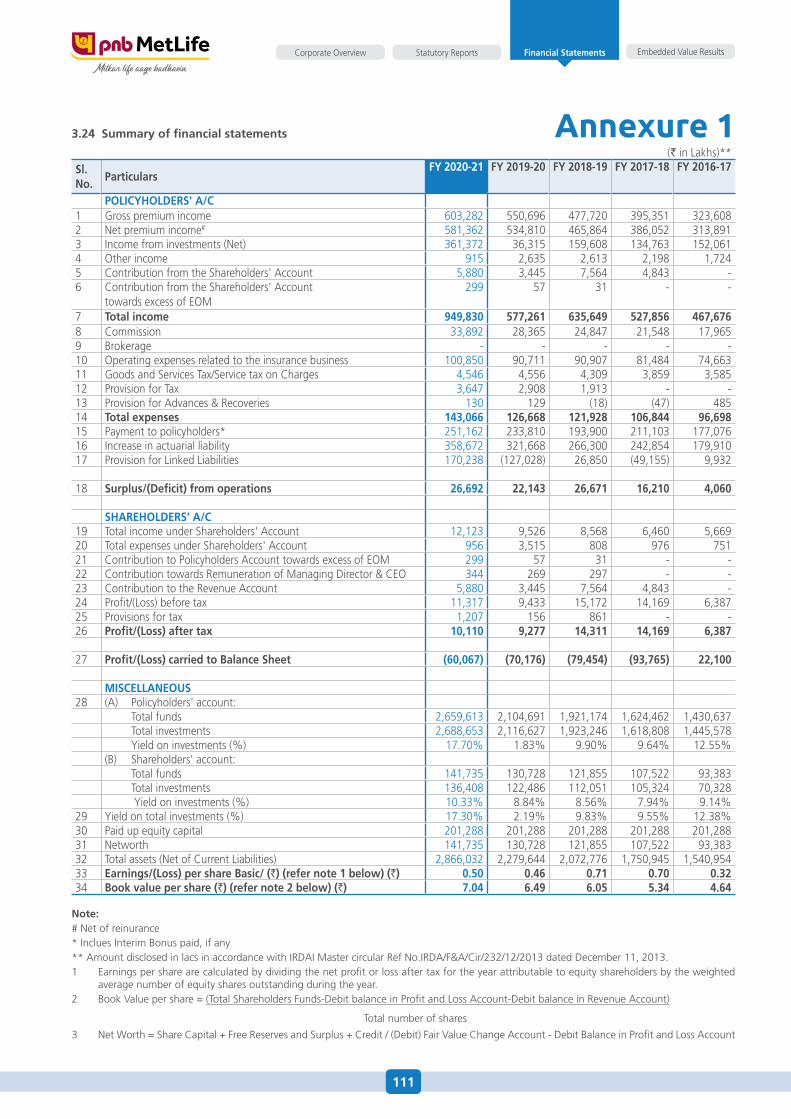
111
Embedded Value ResultsStatutory ReportsCorporate Overview Financial Statements
3.24 Summary of financial statements
(` in Lakhs)** Sl. no.
particularsfy 2020-21 fy 2019-20 fy 2018-19 fy 2017-18 fy 2016-17
pOlicyhOldErS' a/c1 Gross premium income 603,282 550,696 477,720 395,351 323,6082 Net premium income# 581,362 534,810 465,864 386,052 313,8913 Income from investments (Net) 361,372 36,315 159,608 134,763 152,0614 other income 915 2,635 2,613 2,198 1,7245 Contribution from the shareholders' account 5,880 3,445 7,564 4,843 -6 Contribution from the shareholders' account
towards excess of eoM 299 57 31 - -
7 Total income 949,830 577,261 635,649 527,856 467,6768 Commission 33,892 28,365 24,847 21,548 17,9659 Brokerage - - - - -10 operating expenses related to the insurance business 100,850 90,711 90,907 81,484 74,66311 Goods and services Tax/service tax on Charges 4,546 4,556 4,309 3,859 3,58512 Provision for Tax 3,647 2,908 1,913 - -13 Provision for advances & Recoveries 130 129 (18) (47) 48514 Total expenses 143,066 126,668 121,928 106,844 96,69815 Payment to policyholders* 251,162 233,810 193,900 211,103 177,07616 Increase in actuarial liability 358,672 321,668 266,300 242,854 179,91017 Provision for Linked Liabilities 170,238 (127,028) 26,850 (49,155) 9,932
18 Surplus/(deficit) from operations 26,692 22,143 26,671 16,210 4,060
SharEhOldErS' a/c19 Total income under shareholders' account 12,123 9,526 8,568 6,460 5,66920 Total expenses under shareholders' account 956 3,515 808 976 75121 Contribution to Policyholders account towards excess of eoM 299 57 31 - -22 Contribution towards Remuneration of Managing director & Ceo 344 269 297 - -23 Contribution to the Revenue account 5,880 3,445 7,564 4,843 -24 Profit/(Loss) before tax 11,317 9,433 15,172 14,169 6,38725 Provisions for tax 1,207 156 861 - -26 profit/(loss) after tax 10,110 9,277 14,311 14,169 6,387
27 profit/(loss) carried to Balance Sheet (60,067) (70,176) (79,454) (93,765) 22,100
miScEllanEOuS28 (a) Policyholders' account:
Total funds 2,659,613 2,104,691 1,921,174 1,624,462 1,430,637 Total investments 2,688,653 2,116,627 1,923,246 1,618,808 1,445,578 yield on investments (%) 17.70% 1.83% 9.90% 9.64% 12.55%(B) shareholders' account: Total funds 141,735 130,728 121,855 107,522 93,383 Total investments 136,408 122,486 112,051 105,324 70,328 yield on investments (%) 10.33% 8.84% 8.56% 7.94% 9.14%
29 yield on total investments (%) 17.30% 2.19% 9.83% 9.55% 12.38%30 Paid up equity capital 201,288 201,288 201,288 201,288 201,28831 Networth 141,735 130,728 121,855 107,522 93,38332 Total assets (Net of Current Liabilities) 2,866,032 2,279,644 2,072,776 1,750,945 1,540,95433 Earnings/(loss) per share Basic/ (`) (refer note 1 below) (`) 0.50 0.46 0.71 0.70 0.3234 Book value per share (`) (refer note 2 below) (`) 7.04 6.49 6.05 5.34 4.64
note:# Net of reinurance* Inclues Interim Bonus paid, if any** amount disclosed in lacs in accordance with IRdaI Master circular Ref No.IRda/f&a/Cir/232/12/2013 dated december 11, 2013.1 earnings per share are calculated by dividing the net profit or loss after tax for the year attributable to equity shareholders by the weighted
average number of equity shares outstanding during the year.2 Book Value per share = (Total shareholders funds-debit balance in Profit and Loss account-debit balance in Revenue account)
Total number of shares
3 Net Worth = share Capital + free Reserves and surplus + Credit / (debit) fair Value Change account - debit Balance in Profit and Loss account
Annexure 1
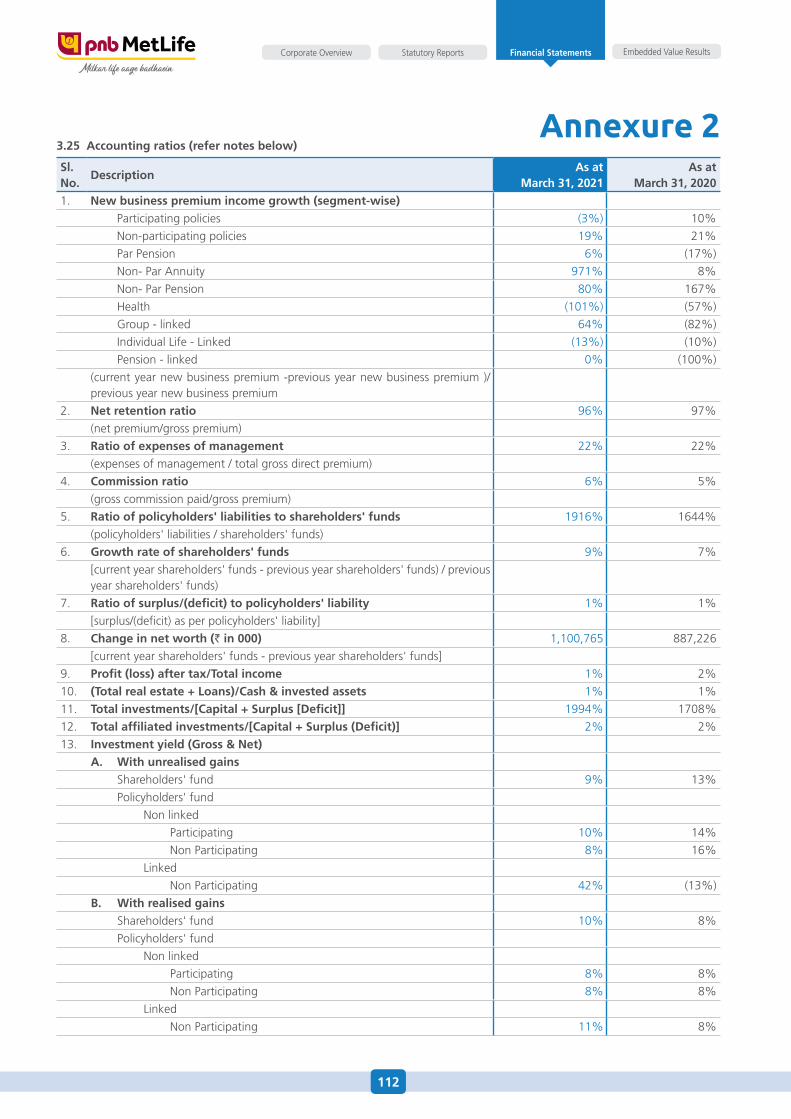
112
Embedded Value ResultsStatutory ReportsCorporate Overview Financial Statements
3.25 accounting ratios (refer notes below)
Sl. no.
descriptionas at
march 31, 2021as at
march 31, 20201. new business premium income growth (segment-wise)
Participating policies (3%) 10%
Non-participating policies 19% 21%
Par Pension 6% (17%)
Non- Par annuity 971% 8%
Non- Par Pension 80% 167%
health (101%) (57%)
Group - linked 64% (82%)
Individual Life - Linked (13%) (10%)
Pension - linked 0% (100%)
(current year new business premium -previous year new business premium )/previous year new business premium
2. net retention ratio 96% 97%
(net premium/gross premium)
3. ratio of expenses of management 22% 22%
(expenses of management / total gross direct premium)
4. commission ratio 6% 5%
(gross commission paid/gross premium)
5. ratio of policyholders' liabilities to shareholders' funds 1916% 1644%
(policyholders' liabilities / shareholders' funds)
6. growth rate of shareholders' funds 9% 7%
[current year shareholders' funds - previous year shareholders' funds) / previous year shareholders' funds)
7. ratio of surplus/(deficit) to policyholders' liability 1% 1%
[surplus/(deficit) as per policyholders' liability]
8. change in net worth (` in 000) 1,100,765 887,226
[current year shareholders' funds - previous year shareholders' funds]
9. profit (loss) after tax/Total income 1% 2%
10. (Total real estate + loans)/cash & invested assets 1% 1%
11. Total investments/[capital + Surplus [deficit]] 1994% 1708%
12. Total affiliated investments/[capital + Surplus (deficit)] 2% 2%
13. investment yield (gross & net)a. with unrealised gains shareholders' fund 9% 13%
Policyholders' fund
Non linked
Participating 10% 14%
Non Participating 8% 16%
Linked
Non Participating 42% (13%)
B. with realised gains shareholders' fund 10% 8%
Policyholders' fund
Non linked
Participating 8% 8%
Non Participating 8% 8%
Linked
Non Participating 11% 8%
Annexure 2

113
Embedded Value ResultsStatutory ReportsCorporate Overview Financial Statements
Sl. no.
descriptionas at
march 31, 2021as at
march 31, 2020
14. conservation ratio Linked 63% 71%
Non Linked 84% 86%
Pension (both Linked and Non Linked) 76% 74%
health 89% 88%
15. persistency ratio (policies)
for 13th month 76% 74%
for 25th month 63% 63%
for 37th month 56% 53%
for 49th Month 50% 45%
for 61st month 39% 31%
Persistency Ratio (premium)
for 13th month 76% 74%
for 25th month 61% 63%
for 37th month 56% 54%
for 49th Month 51% 44%
for 61st month 36% 30%
16. npa ratio
Gross NPa Ratio 0.4% 0.5%
Net NPa Ratio 0.1% 0.3%
note:
1 The above ratios have been calculated based on Revenue account, Profit and Loss account for the year ended March 31, 2021 and for the year ended March 31, 2020 and the Balance sheet as at March 31, 2021 and March 31, 2020.
2 shareholders’ funds are net of accumulated deficit in Profit & loss account, for the purpose of calculating relevant ratios.
3 Persistency Ratios are calculated as per IRdaI circular no. IRda/aCT/CIR/MIsC/035/01/2014 dated January 23, 2014. Persistency ratios for the year have been calculated using policies issued in april to March period, measured as on april 30th of the relevant years.
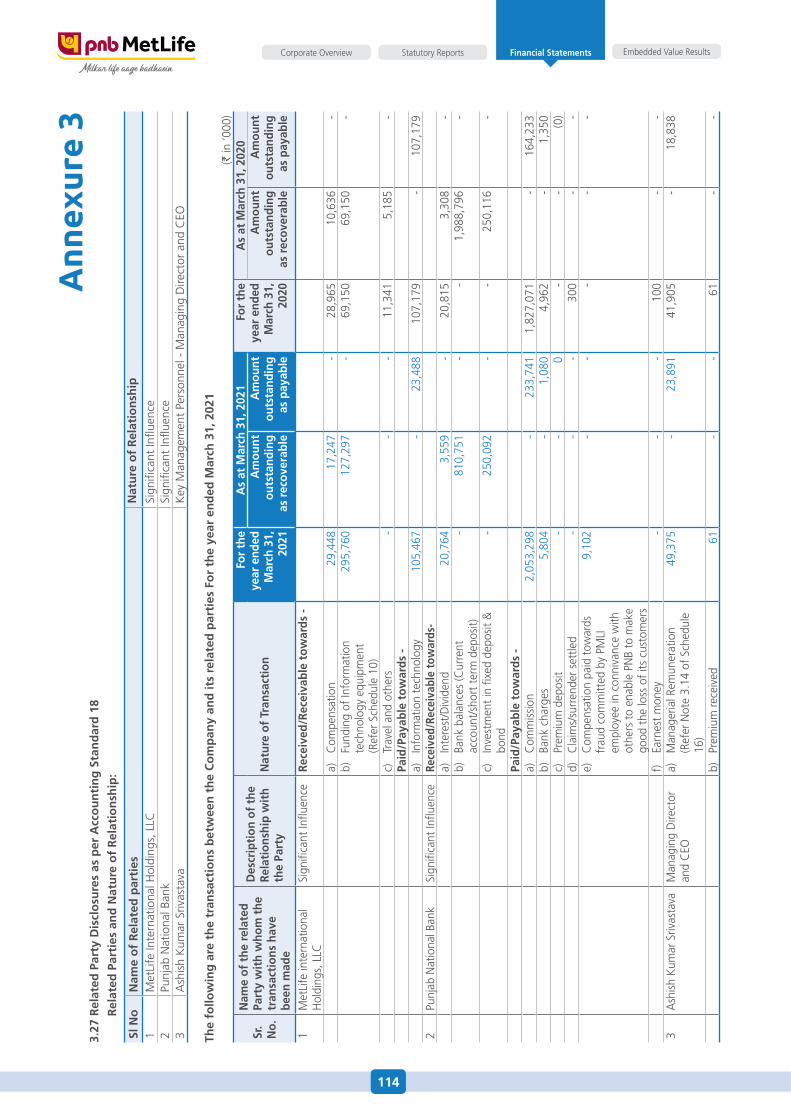
114
Embedded Value ResultsStatutory ReportsCorporate Overview Financial Statements
Ann
exur
e 3
3.27
rel
ated
par
ty d
iscl
osu
res
as p
er a
cco
un
tin
g S
tan
dar
d 1
8
r
elat
ed p
arti
es a
nd
nat
ure
of
rel
atio
nsh
ip:
Sl n
on
ame
of
rel
ated
par
ties
nat
ure
of
rel
atio
nsh
ip
1M
etLi
fe In
tern
atio
nal h
oldi
ngs,
LLC
sign
ifica
nt In
fluen
ce2
Punj
ab N
atio
nal B
ank
sign
ifica
nt In
fluen
ce3
ash
ish
Kum
ar s
rivas
tava
Key
Man
agem
ent
Pers
onne
l - M
anag
ing
dire
ctor
and
Ceo
The
follo
win
g a
re t
he
tran
sact
ion
s b
etw
een
th
e c
om
pan
y an
d it
s re
late
d p
arti
es f
or
the
year
en
ded
mar
ch 3
1, 2
021
(` in
‘000
)
Sr.
no.
nam
e of
the
rel
ated
part
y w
ith
who
m t
hetr
ansa
ctio
ns h
ave
been
mad
e
des
crip
tion
of
the
rela
tion
ship
wit
hth
e pa
rty
nat
ure
of T
rans
acti
on
for
the
year
end
ed
mar
ch 3
1,
2021
as
at m
arch
31,
202
1fo
r th
e ye
ar e
nded
m
arch
31,
20
20
as
at m
arch
31,
202
0a
mou
nt
outs
tand
ing
as r
ecov
erab
le
am
ount
ou
tsta
ndin
g as
pay
able
am
ount
ou
tsta
ndin
g as
rec
over
able
am
ount
ou
tsta
ndin
g as
pay
able
1M
etLi
fe in
tern
atio
nal
hol
ding
s, L
LCsi
gnifi
cant
Influ
ence
rece
ived
/rec
eiva
ble
tow
ards
-
a)
Com
pens
atio
n 2
9,44
8 1
7,24
7 -
28,
965
10,
636
-b)
fu
ndin
g of
Info
rmat
ion
tech
nolo
gy e
quip
men
t (R
efer
sch
edul
e 10
)
295
,760
127
,297
- 6
9,15
0 6
9,15
0 -
c)
Trav
el a
nd o
ther
s -
- -
11,
341
5,1
85 -
paid
/pay
able
tow
ards
-a)
In
form
atio
n te
chno
logy
105
,467
- 2
3,48
8 1
07,1
79 -
107
,179
2Pu
njab
Nat
iona
l Ban
ksi
gnifi
cant
Influ
ence
rece
ived
/rec
eiva
ble
tow
ards
-a)
In
tere
st/d
ivid
end
20,
764
3,5
59 -
20,
815
3,3
08 -
b)
Bank
bal
ance
s (C
urre
nt
acco
unt/s
hort
term
dep
osit)
- 8
10,7
51 -
- 1
,988
,796
-
c)
Inve
stm
ent i
n fix
ed d
epos
it &
bo
nd -
250
,092
- -
250
,116
-
paid
/pay
able
tow
ards
-a)
C
omm
issio
n 2
,053
,298
- 2
33,7
41 1
,827
,071
- 1
64,2
33b)
Ba
nk c
harg
es 5
,804
- 1
,080
4,9
62 -
1,3
50c)
Pr
emiu
m d
epos
it -
- 0
- -
(0)
d)
Cla
ims/
surr
ende
r set
tled
- -
- 3
00 -
-e)
C
ompe
nsat
ion
paid
tow
ards
fr
aud
com
mitt
ed b
y PM
LI
empl
oyee
in c
onni
vanc
e w
ith
othe
rs to
ena
ble
PNB
to m
ake
good
the
loss
of i
ts c
usto
mer
s
9,1
02 -
- -
- -
f) ea
rnes
t mon
ey -
- -
100
- -
3a
shish
Kum
ar s
rivas
tava
Man
agin
g d
irect
or
and
Ceo
a)
Man
ager
ial R
emun
erat
ion
(Ref
er N
ote
3.14
of s
ched
ule
16)
49,
375
- 2
3,89
1 4
1,90
5 -
18,
838
b)
Prem
ium
rece
ived
61
- -
61
- -
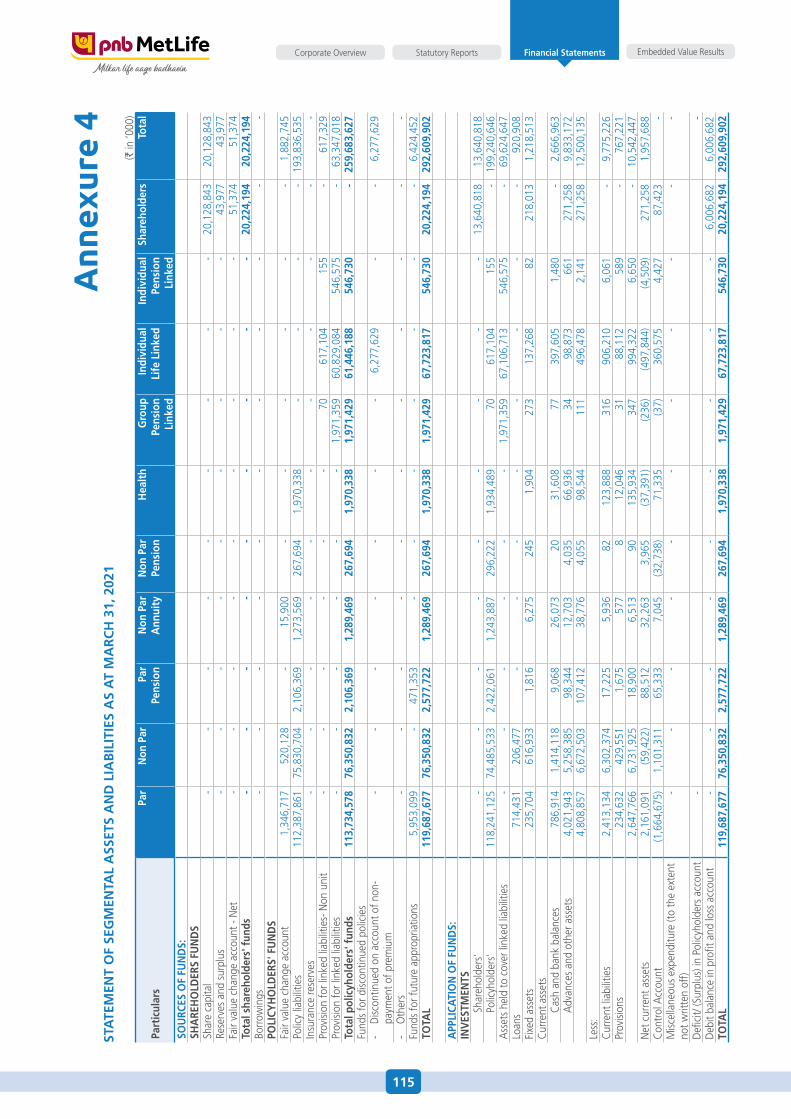
115
Embedded Value ResultsStatutory ReportsCorporate Overview Financial Statements
Ann
exur
e 4
STa
TEm
EnT
Of
SEg
mEn
Tal
aSS
ETS
an
d l
iaB
iliT
iES
aS
aT
ma
rc
h 3
1, 2
021
(` in
‘000
)
part
icul
ars
par
non
par
par
pens
ion
non
par
ann
uity
non
par
pens
ion
hea
lth
gro
uppe
nsio
nli
nked
indi
vidu
alli
fe l
inke
din
divi
dual
pens
ion
link
ed
Shar
ehol
ders
Tota
l
SOu
rcES
Of
fun
dS:
Sha
rEh
Old
ErS
fun
dS
shar
e ca
pita
l -
- -
- -
- -
- -
20,
128,
843
20,
128,
843
Rese
rves
and
sur
plus
- -
- -
- -
- -
- 4
3,97
7 4
3,97
7 fa
ir va
lue
chan
ge a
ccou
nt -
Net
- -
- -
- -
- -
- 5
1,37
4 5
1,37
4 To
tal s
hare
hold
ers'
fun
ds -
- -
- -
- -
- -
20,
224,
194
20,
224,
194
Borr
owin
gs -
- -
- -
- -
- -
- -
pOli
cyh
Old
ErS'
fu
nd
Sfa
ir va
lue
chan
ge a
ccou
nt 1
,346
,717
5
20,1
28
- 1
5,90
0 -
- -
- -
- 1
,882
,745
Po
licy
liabi
litie
s 1
12,3
87,8
61
75,8
30,7
04
2,1
06,3
69
1,2
73,5
69
267
,694
1
,970
,338
-
- -
- 19
3,83
6,53
5 In
sura
nce
rese
rves
- -
- -
- -
- -
- -
- Pr
ovisi
on fo
r lin
ked
liabi
litie
s- N
on u
nit
- -
- -
- -
70
617
,104
1
55
- 6
17,3
29
Prov
ision
for l
inke
d lia
bilit
ies
- -
- -
- -
1,9
71,3
59
60,
829,
084
546
,575
-
63,
347,
018
Tota
l pol
icyh
olde
rs' f
unds
113
,734
,578
76
,350
,832
2
,106
,369
1
,289
,469
2
67,6
94
1,9
70,3
38
1,9
71,4
29
61,
446,
188
546
,730
-
259
,683
,627
fu
nds
for d
iscon
tinue
d po
licie
s-
disc
ontin
ued
on a
ccou
nt o
f non
- pa
ymen
t of p
rem
ium
- -
- -
- -
- 6
,277
,629
-
- 6
,277
,629
- o
ther
s -
- -
- -
- -
- -
- -
fund
s fo
r fut
ure
appr
opria
tions
5,9
53,0
99
- 4
71,3
53
- -
- -
- -
- 6
,424
,452
TO
Tal
119
,687
,677
76
,350
,832
2
,577
,722
1
,289
,469
2
67,6
94
1,9
70,3
38
1,9
71,4
29
67,
723,
817
546
,730
2
0,22
4,19
4 29
2,60
9,90
2
app
lica
TiO
n O
f fu
nd
S:in
VES
TmEn
TS
shar
ehol
ders
' -
- -
- -
- -
- -
13,
640,
818
13,
640,
818
Po
licyh
olde
rs'
118
,241
,125
74
,485
,533
2
,422
,061
1
,243
,887
2
96,2
22
1,9
34,4
89
70
617
,104
1
55
- 19
9,24
0,64
6 a
sset
s he
ld to
cov
er li
nked
liab
ilitie
s -
- -
- -
- 1
,971
,359
6
7,10
6,71
3 5
46,5
75
- 6
9,62
4,64
7 Lo
ans
714
,431
2
06,4
77
- -
- -
- -
- -
920
,908
fi
xed
asse
ts 2
35,7
04
616
,933
1
,816
6
,275
2
45
1,9
04
273
1
37,2
68
82
218
,013
1
,218
,513
C
urre
nt a
sset
s
Cas
h an
d ba
nk b
alan
ces
786
,914
1
,414
,118
9
,068
26,
073
20
31,
608
77
397
,605
1
,480
-
2,6
66,9
63
a
dvan
ces
and
othe
r ass
ets
4,0
21,9
43
5,2
58,3
85
98,
344
12,
703
4,0
35
66,
936
34
98,
873
661
2
71,2
58
9,8
33,1
72
4,8
08,8
57
6,6
72,5
03
107
,412
3
8,77
6 4
,055
9
8,54
4 1
11
496
,478
2
,141
2
71,2
58
12,
500,
135
Less
:C
urre
nt li
abili
ties
2,4
13,1
34
6,3
02,3
74
17,
225
5,9
36
82
123
,888
3
16
906
,210
6
,061
-
9,7
75,2
26
Prov
ision
s 2
34,6
32
429
,551
1
,675
577
8
12,
046
31
88,
112
589
- 7
67,2
21
2,6
47,7
66
6,7
31,9
25
18,
900
6,5
13
90
135
,934
3
47
994
,322
6
,650
-
10,
542,
447
Net
cur
rent
ass
ets
2,1
61,0
91
(59,
422)
88,
512
32,
263
3,9
65
(37,
391)
(236
) (4
97,8
44)
(4,5
09)
271
,258
1
,957
,688
C
ontr
ol a
ccou
nt (1
,664
,675
) 1
,101
,311
6
5,33
3 7
,045
(3
2,73
8) 7
1,33
5 (3
7)36
0,57
5 4
,427
8
7,42
3 -
Misc
ella
neou
s ex
pend
iture
(to
the
exte
nt
not w
ritte
n of
f) -
- -
- -
- -
- -
- -
defi
cit/
(sur
plus
) in
Polic
yhol
ders
acc
ount
- -
deb
it ba
lanc
e in
pro
fit a
nd lo
ss a
ccou
nt -
- -
- -
- -
- -
6,0
06,6
82
6,0
06,6
82
TOTa
l 1
19,6
87,6
77
76,3
50,8
32
2,5
77,7
22
1,2
89,4
69
267
,694
1
,970
,338
1
,971
,429
6
7,72
3,81
7 5
46,7
30
20,
224,
194
292,
609,
902
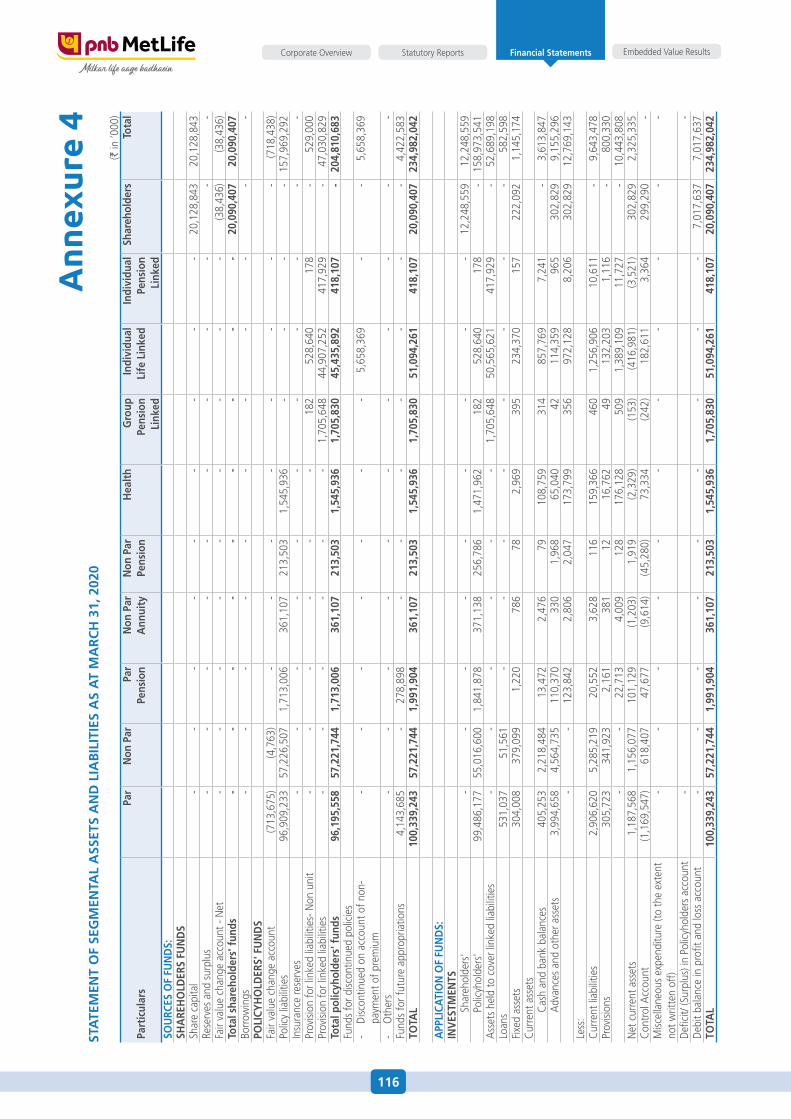
116
Embedded Value ResultsStatutory ReportsCorporate Overview Financial Statements
Ann
exur
e 4
STa
TEm
EnT
Of
SEg
mEn
Tal
aSS
ETS
an
d l
iaB
iliT
iES
aS
aT
ma
rc
h 3
1, 2
020
(` in
‘000
)
part
icul
ars
par
non
par
par
pens
ion
non
par
ann
uity
non
par
pens
ion
hea
lth
gro
uppe
nsio
nli
nked
indi
vidu
alli
fe l
inke
din
divi
dual
pens
ion
link
ed
Shar
ehol
ders
Tota
l
SOu
rcES
Of
fun
dS:
Sha
rEh
Old
ErS
fun
dS
shar
e ca
pita
l -
- -
- -
- -
- -
20,
128,
843
20,
128,
843
Rese
rves
and
sur
plus
- -
- -
- -
- -
- -
- fa
ir va
lue
chan
ge a
ccou
nt -
Net
- -
- -
- -
- -
- (3
8,43
6) (3
8,43
6)To
tal s
hare
hold
ers'
fun
ds -
- -
- -
- -
- -
20,
090,
407
20,
090,
407
Borr
owin
gs -
- -
- -
- -
- -
- -
pOli
cyh
Old
ErS'
fu
nd
Sfa
ir va
lue
chan
ge a
ccou
nt (7
13,6
75)
(4,7
63)
- -
- -
- -
- -
(718
,438
)Po
licy
liabi
litie
s 9
6,90
9,23
3 5
7,22
6,50
7 1
,713
,006
3
61,1
07
213
,503
1
,545
,936
-
- -
- 1
57,9
69,2
92
Insu
ranc
e re
serv
es -
- -
- -
- -
- -
- -
Prov
ision
for l
inke
d lia
bilit
ies-
Non
uni
t -
- -
- -
- 1
82
528
,640
1
78
- 5
29,0
00
Prov
ision
for l
inke
d lia
bilit
ies
- -
- -
- -
1,7
05,6
48
44,
907,
252
417
,929
-
47,
030,
829
Tota
l pol
icyh
olde
rs' f
unds
96,
195,
558
57,
221,
744
1,7
13,0
06
361
,107
2
13,5
03
1,5
45,9
36
1,7
05,8
30
45,
435,
892
418
,107
-
204
,810
,683
fu
nds
for d
iscon
tinue
d po
licie
s-
disc
ontin
ued
on a
ccou
nt o
f non
- pa
ymen
t of p
rem
ium
- -
- -
- -
- 5
,658
,369
-
- 5
,658
,369
- o
ther
s -
- -
- -
- -
- -
- -
fund
s fo
r fut
ure
appr
opria
tions
4,1
43,6
85
- 2
78,8
98
- -
- -
- -
- 4
,422
,583
TO
Tal
100
,339
,243
5
7,22
1,74
4 1
,991
,904
3
61,1
07
213
,503
1
,545
,936
1
,705
,830
5
1,09
4,26
1 4
18,1
07
20,
090,
407
234
,982
,042
app
lica
TiO
n O
f fu
nd
S:in
VES
TmEn
TS
shar
ehol
ders
' -
- -
- -
- -
- -
12,
248,
559
12,
248,
559
Po
licyh
olde
rs'
99,
486,
177
55,
016,
600
1,8
41,8
78
371
,138
2
56,7
86
1,4
71,9
62
182
5
28,6
40
178
-
158
,973
,541
a
sset
s he
ld to
cov
er li
nked
liab
ilitie
s -
- -
- -
- 1
,705
,648
5
0,56
5,62
1 4
17,9
29
- 5
2,68
9,19
8 Lo
ans
531
,037
5
1,56
1 -
- -
- -
- -
- 5
82,5
98
fixe
d as
sets
304
,008
3
79,0
99
1,2
20
786
7
8 2
,969
3
95
234
,370
1
57
222
,092
1
,145
,174
C
urre
nt a
sset
s
Cas
h an
d ba
nk b
alan
ces
405
,253
2
,218
,484
1
3,47
2 2
,476
7
9 1
08,7
59
314
8
57,7
69
7,2
41
- 3
,613
,847
adv
ance
s an
d ot
her a
sset
s 3
,994
,658
4
,564
,735
1
10,3
70
330
1
,968
6
5,04
0 4
2 1
14,3
59
965
3
02,8
29
9,1
55,2
96
- -
123
,842
2
,806
2
,047
1
73,7
99
356
9
72,1
28
8,2
06
302
,829
1
2,76
9,14
3 Le
ss:
Cur
rent
liab
ilitie
s 2
,906
,620
5
,285
,219
2
0,55
2 3
,628
1
16
159
,366
4
60
1,2
56,9
06
10,
611
- 9
,643
,478
Pr
ovisi
ons
305
,723
3
41,9
23
2,1
61
381
1
2 1
6,76
2 4
9 1
32,2
03
1,1
16
- 8
00,3
30
- -
22,
713
4,0
09
128
1
76,1
28
509
1
,389
,109
1
1,72
7 -
10,
443,
808
Net
cur
rent
ass
ets
1,1
87,5
68
1,1
56,0
77
101
,129
(1
,203
) 1
,919
(2
,329
) (1
53)
(416
,981
) (3
,521
) 3
02,8
29
2,3
25,3
35
Con
trol
acc
ount
(1,1
69,5
47)
618
,407
4
7,67
7 (9
,614
) (4
5,28
0) 7
3,33
4 (2
42)
182,
611
3,3
64
299
,290
-
Misc
ella
neou
s ex
pend
iture
(to
the
exte
nt
not w
ritte
n of
f) -
- -
- -
- -
- -
- -
defi
cit/
(sur
plus
) in
Polic
yhol
ders
acc
ount
- -
deb
it ba
lanc
e in
pro
fit a
nd lo
ss a
ccou
nt -
- -
- -
- -
- -
7,0
17,6
37
7,0
17,6
37
TOTa
l 1
00,3
39,2
43
57,
221,
744
1,9
91,9
04
361
,107
2
13,5
03
1,5
45,9
36
1,7
05,8
30
51,
094,
261
418
,107
2
0,09
0,40
7 2
34,9
82,0
42
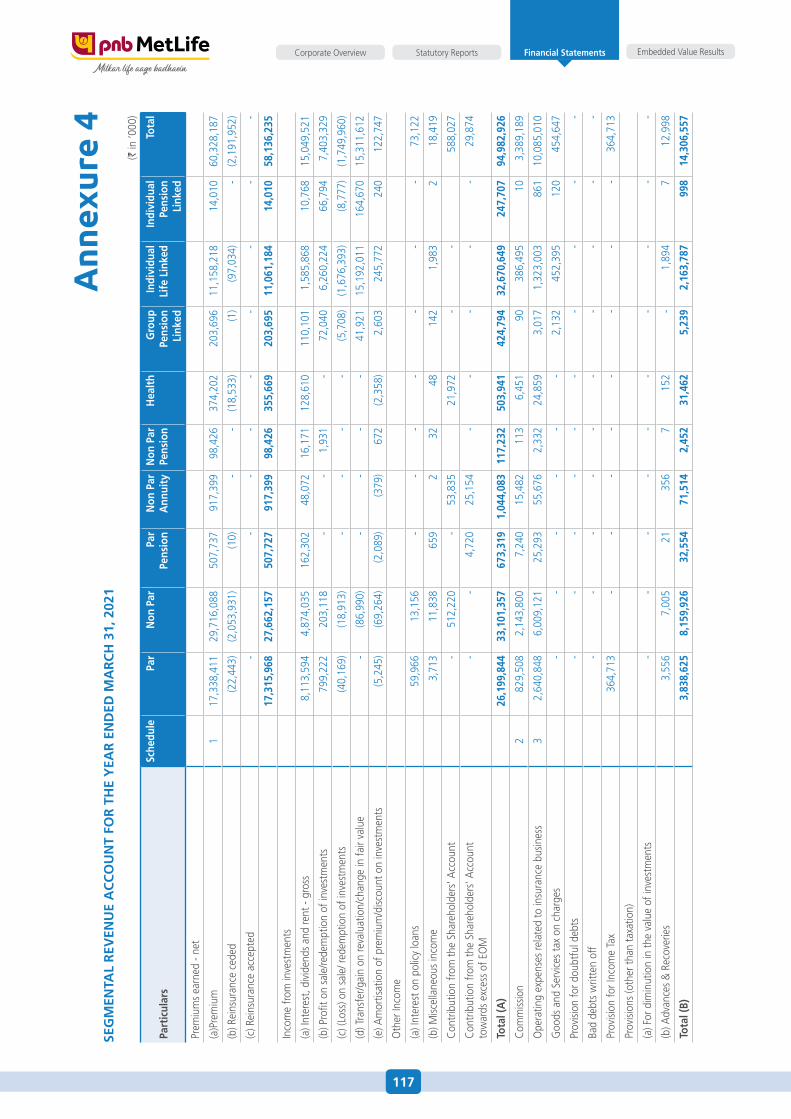
117
Embedded Value ResultsStatutory ReportsCorporate Overview Financial Statements
Ann
exur
e 4
SEg
mEn
Tal
rEV
Enu
E a
cc
Ou
nT
fOr
Th
E y
Ear
En
dEd
ma
rc
h 3
1, 2
021
(` in
‘000
)
part
icul
ars
Sche
dule
par
non
par
par
pens
ion
non
par
ann
uity
non
par
pens
ion
hea
lth
gro
uppe
nsio
nli
nked
indi
vidu
alli
fe l
inke
din
divi
dual
pens
ion
link
ed
Tota
l
Prem
ium
s ea
rned
- ne
t
(a)P
rem
ium
1 1
7,33
8,41
1 29
,716
,088
5
07,7
37
917
,399
9
8,42
6 3
74,2
02
203
,696
1
1,15
8,21
8 1
4,01
0 6
0,32
8,18
7
(b) R
eins
uran
ce c
eded
(22,
443)
(2,0
53,9
31)
(10)
- -
(18,
533)
(1)
(97,
034)
- (2
,191
,952
)
(c) R
eins
uran
ce a
ccep
ted
- -
- -
- -
- -
-
17,
315,
968
27,6
62,1
57
507
,727
9
17,3
99
98,
426
355
,669
2
03,6
95
11,
061,
184
14,
010
58,
136,
235
Inco
me
from
inve
stm
ents
(a) I
nter
est,
divi
dend
s an
d re
nt -
gros
s 8
,113
,594
4
,874
,035
1
62,3
02
48,
072
16,
171
128
,610
1
10,1
01
1,5
85,8
68
10,
768
15,
049,
521
(b) P
rofit
on
sale
/rede
mpt
ion
of in
vest
men
ts 7
99,2
22
203
,118
-
- 1
,931
-
72,
040
6,2
60,2
24
66,
794
7,4
03,3
29
(c) (
Loss
) on
sale
/ red
empt
ion
of in
vest
men
ts (4
0,16
9) (1
8,91
3) -
- -
- (5
,708
) (1
,676
,393
) (8
,777
) (1
,749
,960
)
(d) T
rans
fer/g
ain
on re
valu
atio
n/ch
ange
in fa
ir va
lue
- (8
6,99
0) -
- -
- 4
1,92
1 1
5,19
2,01
1 1
64,6
70
15,
311,
612
(e) a
mor
tisat
ion
of p
rem
ium
/disc
ount
on
inve
stm
ents
(5,2
45)
(69,
264)
(2,0
89)
(379
) 6
72
(2,3
58)
2,6
03
245
,772
2
40
122
,747
oth
er In
com
e
(a) I
nter
est o
n po
licy
loan
s 5
9,96
6 1
3,15
6 -
- -
- -
- -
73,
122
(b) M
iscel
lane
ous
inco
me
3,7
13
11,
838
659
2
3
2 4
8 1
42
1,9
83
2
18,
419
Con
trib
utio
n fr
om th
e sh
areh
olde
rs' a
ccou
nt
- 5
12,2
20
- 5
3,83
5 2
1,97
2 -
- 5
88,0
27
Con
trib
utio
n fr
om th
e sh
areh
olde
rs' a
ccou
nt
tow
ards
exc
ess
of e
oM
- -
4,7
20
25,
154
- -
- -
- 2
9,87
4
Tota
l (a
) 2
6,19
9,84
4 33
,101
,357
6
73,3
19
1,04
4,08
3 11
7,23
2 5
03,9
41
424
,794
3
2,67
0,64
9 2
47,7
07
94,
982,
926
Com
miss
ion
2 8
29,5
08
2,1
43,8
00
7,2
40
15,
482
113
6
,451
9
0 3
86,4
95
10
3,3
89,1
89
ope
ratin
g ex
pens
es re
late
d to
insu
ranc
e bu
sines
s3
2,6
40,8
48
6,0
09,1
21
25,
293
55,
676
2,3
32
24,
859
3,0
17
1,3
23,0
03
861
1
0,08
5,01
0
Goo
ds a
nd s
ervi
ces
tax
on c
harg
es
- -
- -
- -
2,1
32
452
,395
1
20
454
,647
Prov
ision
for d
oubt
ful d
ebts
- -
- -
- -
- -
- -
Bad
debt
s w
ritte
n of
f -
- -
- -
- -
- -
-
Prov
ision
for I
ncom
e Ta
x 3
64,7
13
- -
- -
- -
- -
364
,713
Prov
ision
s (o
ther
than
taxa
tion)
(a) f
or d
imin
utio
n in
the
valu
e of
inve
stm
ents
- -
- -
- -
- -
- -
(b) a
dvan
ces
& R
ecov
erie
s 3
,556
7
,005
2
1 3
56
7
152
-
1,8
94
7
12,9
98
Tota
l (B)
3,8
38,6
25
8,1
59,9
26
32,
554
71,
514
2,4
52
31,
462
5,2
39
2,1
63,7
87
998
1
4,30
6,55
7
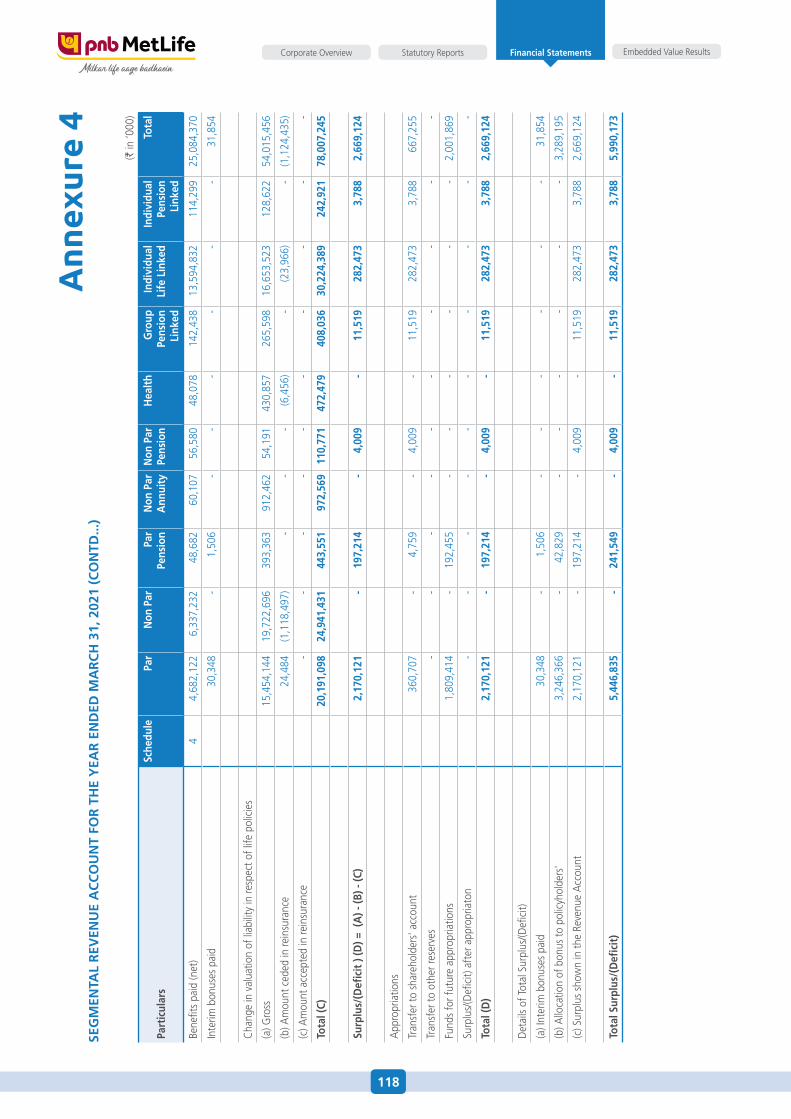
118
Embedded Value ResultsStatutory ReportsCorporate Overview Financial Statements
(` in
‘000
)
part
icul
ars
Sche
dule
par
non
par
par
pens
ion
non
par
ann
uity
non
par
pens
ion
hea
lth
gro
uppe
nsio
nli
nked
indi
vidu
alli
fe l
inke
din
divi
dual
pens
ion
link
ed
Tota
l
Bene
fits
paid
(net
)4
4,6
82,1
22
6,3
37,2
32
48,
682
60,
107
56,
580
48,
078
142
,438
1
3,59
4,83
2 1
14,2
99
25,
084,
370
Inte
rim b
onus
es p
aid
30,
348
- 1
,506
-
- -
- -
- 3
1,85
4
Cha
nge
in v
alua
tion
of li
abili
ty in
resp
ect o
f life
pol
icie
s
(a) G
ross
15,
454,
144
19,
722,
696
393,
363
912
,462
5
4,19
1 4
30,8
57
265
,598
1
6,65
3,52
3 1
28,6
22
54,
015,
456
(b) a
mou
nt c
eded
in re
insu
ranc
e 2
4,48
4 (1
,118
,497
) -
- -
(6,4
56)
- (2
3,96
6) -
(1,1
24,4
35)
(c) a
mou
nt a
ccep
ted
in re
insu
ranc
e -
- -
- -
- -
- -
-
Tota
l (c)
20,
191,
098
24,
941,
431
443
,551
9
72,5
69
110,
771
472
,479
4
08,0
36
30,
224,
389
242
,921
7
8,00
7,24
5
Surp
lus/
(defi
cit
) (d
) = (
a) -
(B) -
(c)
2,1
70,1
21
- 1
97,2
14
- 4
,009
-
11,
519
282
,473
3
,788
2
,669
,124
app
ropr
iatio
ns
Tran
sfer
to s
hare
hold
ers'
acc
ount
3
60,7
07
- 4
,759
-
4,0
09
- 1
1,51
9 2
82,4
73
3,7
88
667
,255
Tran
sfer
to o
ther
rese
rves
- -
- -
- -
- -
- -
fund
s fo
r fut
ure
appr
opria
tions
1,8
09,4
14
- 1
92,4
55
- -
- -
- -
2,0
01,8
69
surp
lus/
(defi
cit)
afte
r app
ropr
iato
n -
- -
- -
- -
- -
-
Tota
l (d
) 2
,170
,121
-
197
,214
-
4,0
09
- 1
1,51
9 2
82,4
73
3,7
88
2,6
69,1
24
det
ails
of T
otal
sur
plus
/(defi
cit)
(a) I
nter
im b
onus
es p
aid
30,
348
- 1
,506
-
- -
- -
- 3
1,85
4
(b) a
lloca
tion
of b
onus
to p
olic
yhol
ders
' 3
,246
,366
-
42,
829
- -
- -
- -
3,2
89,1
95
(c) s
urpl
us s
how
n in
the
Reve
nue
acc
ount
2,1
70,1
21
- 1
97,2
14
- 4
,009
-
11,
519
282
,473
3
,788
2
,669
,124
Tota
l Sur
plus
/(d
efici
t) 5
,446
,835
-
241
,549
-
4,0
09
- 1
1,51
9 2
82,4
73
3,7
88
5,9
90,1
73
Ann
exur
e 4
SEg
mEn
Tal
rEV
Enu
E a
cc
Ou
nT
fOr
Th
E y
Ear
En
dEd
ma
rc
h 3
1, 2
021
(cO
nTd
...)
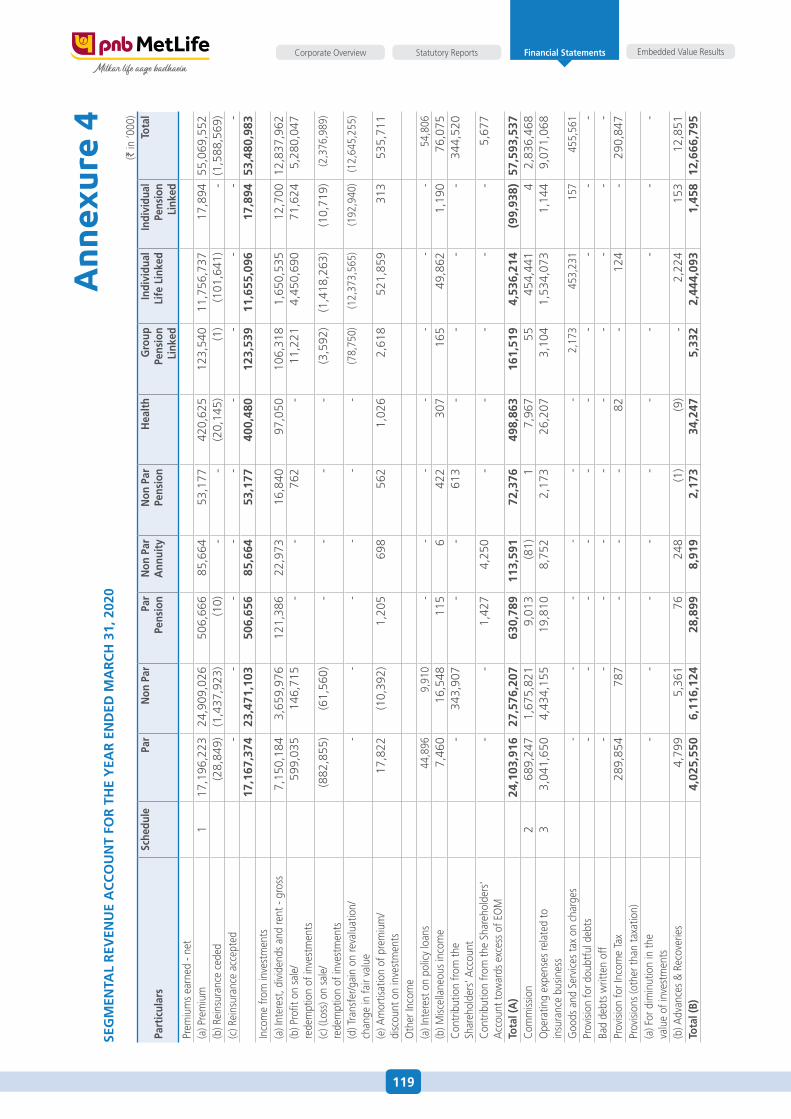
119
Embedded Value ResultsStatutory ReportsCorporate Overview Financial Statements
Ann
exur
e 4
SEg
mEn
Tal
rEV
Enu
E a
cc
Ou
nT
fOr
Th
E y
Ear
En
dEd
ma
rc
h 3
1, 2
020
(` in
‘000
)
part
icul
ars
Sche
dule
par
non
par
par
pens
ion
non
par
ann
uity
non
par
pens
ion
hea
lth
gro
uppe
nsio
nli
nked
indi
vidu
alli
fe l
inke
din
divi
dual
pens
ion
link
ed
Tota
l
Prem
ium
s ea
rned
- ne
t(a
) Pre
miu
m1
17,1
96,2
23
24,
909,
026
506
,666
8
5,66
4 5
3,17
7 4
20,6
25
123
,540
1
1,75
6,73
7 1
7,89
4 55
,069
,552
(b
) Rei
nsur
ance
ced
ed (2
8,84
9) (1
,437
,923
) (1
0) -
-
(2
0,14
5) (1
) (1
01,6
41)
-
(1,5
88,5
69)
(c) R
eins
uran
ce a
ccep
ted
-
-
-
-
-
-
-
-
-
-
17,1
67,3
74
23,
471,
103
506
,656
8
5,66
4 5
3,17
7 4
00,4
80
123
,539
1
1,65
5,09
6 1
7,89
4 53
,480
,983
In
com
e fr
om in
vest
men
ts(a
) Int
eres
t, di
vide
nds
and
rent
- gr
oss
7,1
50,1
84
3,6
59,9
76
121
,386
2
2,97
3 1
6,84
0 9
7,05
0 1
06,3
18
1,6
50,5
35
12,
700
12,8
37,9
62
(b) P
rofit
on
sale
/re
dem
ptio
n of
inve
stm
ents
599
,035
1
46,7
15
-
-
762
-
1
1,22
1 4
,450
,690
7
1,62
4 5
,280
,047
(c) (
Loss
) on
sale
/ re
dem
ptio
n of
inve
stm
ents
(882
,855
) (6
1,56
0) -
-
-
-
(3
,592
) (1
,418
,263
) (1
0,71
9) (2
,376
,989
)
(d) T
rans
fer/g
ain
on re
valu
atio
n/ch
ange
in fa
ir va
lue
- -
- -
- -
(78,
750)
(12,
373,
565)
(192
,940
) (1
2,64
5,25
5)
(e) a
mor
tisat
ion
of p
rem
ium
/di
scou
nt o
n in
vest
men
ts17
,822
(10,
392)
1,2
05
698
5
62
1,0
26
2,6
18
521
,859
3
13
535
,711
oth
er In
com
e(a
) Int
eres
t on
polic
y lo
ans
44,
896
9,9
10
- -
- -
- -
- 5
4,80
6 (b
) Misc
ella
neou
s in
com
e 7
,460
1
6,54
8 1
15
6
422
3
07
165
4
9,86
2 1
,190
7
6,07
5 C
ontr
ibut
ion
from
the
shar
ehol
ders
' acc
ount
-
3
43,9
07
-
-
613
-
-
-
-
3
44,5
20
Con
trib
utio
n fr
om th
e sh
areh
olde
rs'
acc
ount
tow
ards
exc
ess
of e
oM
-
-
1,4
27
4,2
50
-
-
-
-
-
5,6
77
Tota
l (a
)24
,103
,916
2
7,57
6,20
7 6
30,7
89
113
,591
7
2,37
6 4
98,8
63
161
,519
4
,536
,214
(
99,9
38)
57,5
93,5
37
Com
miss
ion
2 6
89,2
47
1,6
75,8
21
9,0
13
(81)
1
7,9
67
55
454
,441
4
2
,836
,468
o
pera
ting
expe
nses
rela
ted
to
insu
ranc
e bu
sines
s3
3,0
41,6
50
4,4
34,1
55
19,
810
8,7
52
2,1
73
26,
207
3,1
04
1,5
34,0
73
1,1
44
9,0
71,0
68
Goo
ds a
nd s
ervi
ces
tax
on c
harg
es
- -
- -
- -
2,1
73
453
,231
1
57
455
,561
Pr
ovisi
on fo
r dou
btfu
l deb
ts -
-
-
-
-
-
-
-
-
-
Ba
d de
bts
writ
ten
off
-
-
-
-
-
-
-
-
-
-
Prov
ision
for I
ncom
e Ta
x 2
89,8
54
787
-
-
-
8
2 -
1
24
-
290
,847
Pr
ovisi
ons
(oth
er th
an ta
xatio
n)(a
) for
dim
inut
ion
in th
e va
lue
of in
vest
men
ts -
-
-
-
-
-
-
-
-
-
(b) a
dvan
ces
& R
ecov
erie
s 4
,799
5
,361
7
6 2
48
(1)
(9)
-
2,2
24
153
12
,851
Tota
l (B)
4,0
25,5
50
6,1
16,1
24
28,
899
8,9
19
2,1
73
34,
247
5,3
32
2,4
44,0
93
1,4
58
12,6
66,7
95
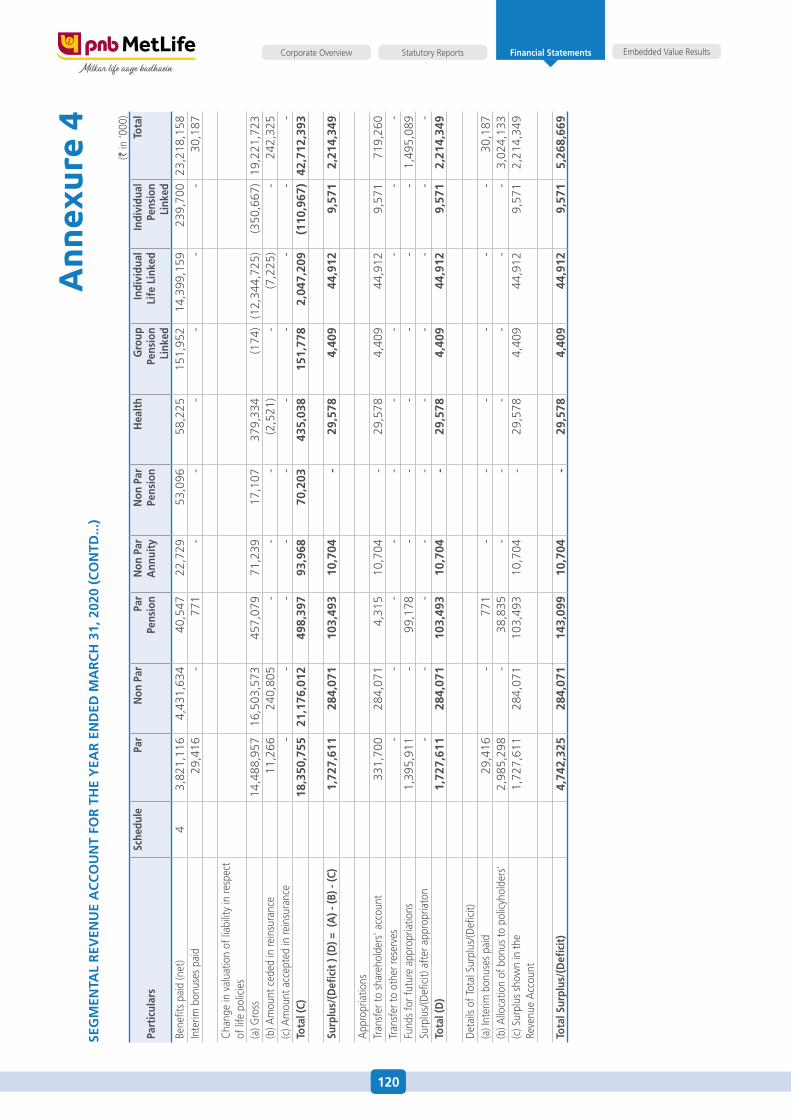
120
Embedded Value ResultsStatutory ReportsCorporate Overview Financial Statements
(` in
‘000
)
part
icul
ars
Sche
dule
par
non
par
par
pens
ion
non
par
ann
uity
non
par
pens
ion
hea
lth
gro
uppe
nsio
nli
nked
indi
vidu
alli
fe l
inke
din
divi
dual
pens
ion
link
ed
Tota
l
Bene
fits
paid
(net
)4
3,8
21,1
16
4,4
31,6
34
40,
547
22,
729
53,
096
58,
225
151
,952
1
4,39
9,15
9 2
39,7
00
23,2
18,1
58
Inte
rim b
onus
es p
aid
29,
416
-
771
-
-
-
-
-
-
3
0,18
7
Cha
nge
in v
alua
tion
of li
abili
ty in
resp
ect
of li
fe p
olic
ies
(a) G
ross
14,4
88,9
57
16,
503,
573
457
,079
7
1,23
9 1
7,10
7 3
79,3
34
(174
)(1
2,34
4,72
5) (3
50,6
67)
19,2
21,7
23
(b) a
mou
nt c
eded
in re
insu
ranc
e 1
1,26
6 2
40,8
05
-
-
-
(2,5
21)
-
(7,2
25)
-
242
,325
(c
) am
ount
acc
epte
d in
rein
sura
nce
-
-
-
-
-
-
-
-
-
-
Tota
l (c)
18,3
50,7
55
21,
176,
012
498
,397
9
3,96
8 7
0,20
3 4
35,0
38
151
,778
2
,047
,209
(
110,
967)
42,7
12,3
93
Surp
lus/
(defi
cit
) (d
) = (
a) -
(B) -
(c)
1,7
27,6
11
284
,071
1
03,4
93
10,
704
-
29,
578
4,4
09
44,
912
9,5
71
2,2
14,3
49
app
ropr
iatio
nsTr
ansf
er to
sha
reho
lder
s' a
ccou
nt
331
,700
2
84,0
71
4,3
15
10,
704
-
29,
578
4,4
09
44,
912
9,5
71
719
,260
Tr
ansf
er to
oth
er re
serv
es -
-
-
-
-
-
-
-
-
-
fu
nds
for f
utur
e ap
prop
riatio
ns 1
,395
,911
-
9
9,17
8 -
-
-
-
-
-
1
,495
,089
su
rplu
s/(d
efici
t) af
ter a
ppro
pria
ton
-
-
-
-
-
-
-
-
-
-
Tota
l (d
) 1
,727
,611
2
84,0
71
103
,493
1
0,70
4 -
2
9,57
8 4
,409
4
4,91
2 9
,571
2
,214
,349
det
ails
of T
otal
sur
plus
/(defi
cit)
(a) I
nter
im b
onus
es p
aid
29,
416
-
771
-
-
-
-
-
-
3
0,18
7 (b
) allo
catio
n of
bon
us to
pol
icyh
olde
rs'
2,9
85,2
98
-
38,
835
-
-
-
-
-
-
3,0
24,1
33
(c) s
urpl
us s
how
n in
the
Reve
nue
acc
ount
1,7
27,6
11
284
,071
1
03,4
93
10,
704
-
29,
578
4,4
09
44,
912
9,5
71
2,2
14,3
49
Tota
l Sur
plus
/(d
efici
t) 4
,742
,325
2
84,0
71
143
,099
1
0,70
4 -
2
9,57
8 4
,409
4
4,91
2 9
,571
5
,268
,669
Ann
exur
e 4
SEg
mEn
Tal
rEV
Enu
E a
cc
Ou
nT
fOr
Th
E y
Ear
En
dEd
ma
rc
h 3
1, 2
020
(cO
nTd
...)
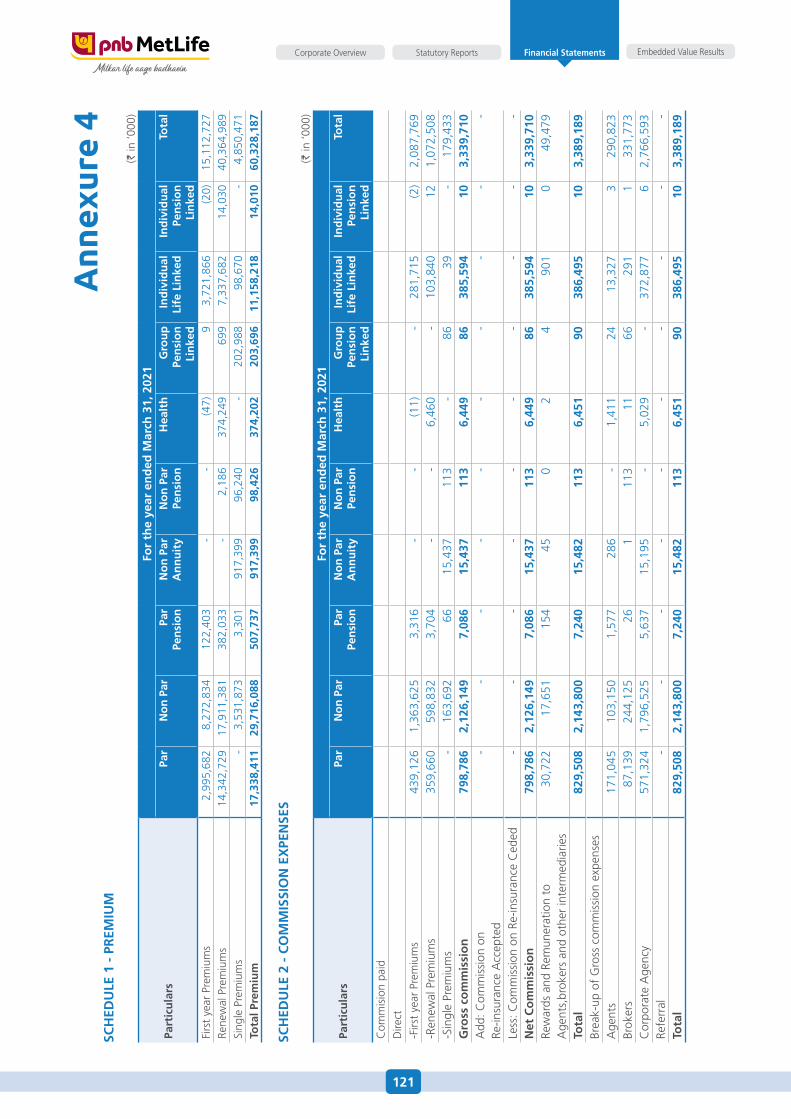
121
Embedded Value ResultsStatutory ReportsCorporate Overview Financial Statements
Ann
exur
e 4
Sch
Edu
lE 1
- p
rEm
ium
(` in
‘000
)
part
icu
lars
for
the
year
en
ded
mar
ch 3
1, 2
021
par
no
n p
ar p
ar
pen
sio
nn
on
par
an
nu
ity
no
n p
arpe
nsi
on
hea
lth
gro
up
pen
sio
nli
nke
d
ind
ivid
ual
life
lin
ked
ind
ivid
ual
pen
sio
nli
nke
d
Tota
l
firs
t ye
ar P
rem
ium
s 2
,995
,682
8
,272
,834
1
22,4
03
-
-
(47)
9
3,7
21,8
66
(20)
15,
112,
727
Rene
wal
Pre
miu
ms
14,
342,
729
17,
911,
381
382
,033
-
2
,186
3
74,2
49
699
7
,337
,682
1
4,03
0 4
0,36
4,98
9 si
ngle
Pre
miu
ms
-
3,5
31,8
73
3,3
01
917
,399
9
6,24
0 -
2
02,9
88
98,
670
-
4,8
50,4
71
Tota
l pre
miu
m 1
7,33
8,41
1 2
9,71
6,08
8 5
07,7
37
917
,399
9
8,42
6 3
74,2
02
203
,696
1
1,15
8,21
8 1
4,01
0 6
0,32
8,18
7
Sch
Edu
lE 2
- c
Om
miS
SiO
n E
xpE
nSE
S
(` in
‘000
)
part
icu
lars
for
the
year
en
ded
mar
ch 3
1, 2
021
par
no
n p
ar p
ar
pen
sio
nn
on
par
an
nu
ity
no
n p
arpe
nsi
on
hea
lth
gro
up
pen
sio
nli
nke
d
ind
ivid
ual
life
lin
ked
ind
ivid
ual
pen
sio
nli
nke
d
Tota
l
Com
mis
ion
paid
dire
ct
- firs
t ye
ar P
rem
ium
s 4
39,1
26 1
,363
,625
3,3
16 -
- (1
1) -
281
,715
(2)
2,0
87,7
69-R
enew
al P
rem
ium
s 3
59,6
60 5
98,8
32 3
,704
- -
6,4
60 -
103
,840
12
1,0
72,5
08-s
ingl
e Pr
emiu
ms
- 1
63,6
92 6
6 1
5,43
7 1
13 -
86
39
- 1
79,4
33g
ross
co
mm
issi
on
798
,786
2,1
26,1
49 7
,086
15,
437
113
6,4
49 8
6 3
85,5
94 1
0 3
,339
,710
add
: Com
mis
sion
on
Re-in
sura
nce
acc
epte
d -
- -
- -
- -
- -
-
Less
: Com
mis
sion
on
Re-in
sura
nce
Ced
ed -
- -
- -
- -
- -
-n
et c
om
mis
sio
n 7
98,7
86 2
,126
,149
7,0
86 1
5,43
7 1
13 6
,449
86
385
,594
10
3,3
39,7
10Re
war
ds a
nd R
emun
erat
ion
to
age
nts,
brok
ers
and
othe
r in
term
edia
ries
30,7
2217
,651
154
450
24
901
049
,479
Tota
l82
9,50
82,
143,
800
7,24
015
,482
113
6,45
190
386,
495
103,
389,
189
Brea
k-up
of
Gro
ss c
omm
issi
on e
xpen
ses
age
nts
171
,045
103
,150
1,5
77 2
86 -
1,4
11 2
4 1
3,32
7 3
290
,823
Brok
ers
87,
139
244
,125
26
1 1
13 1
1 6
6 2
91 1
331
,773
Cor
pora
te a
genc
y 5
71,3
24 1
,796
,525
5,6
37 1
5,19
5 -
5,0
29 -
372
,877
6 2
,766
,593
Refe
rral
- -
- -
- -
- -
- -
Tota
l 8
29,5
08 2
,143
,800
7,2
40 1
5,48
2 1
13 6
,451
90
386
,495
10
3,3
89,1
89
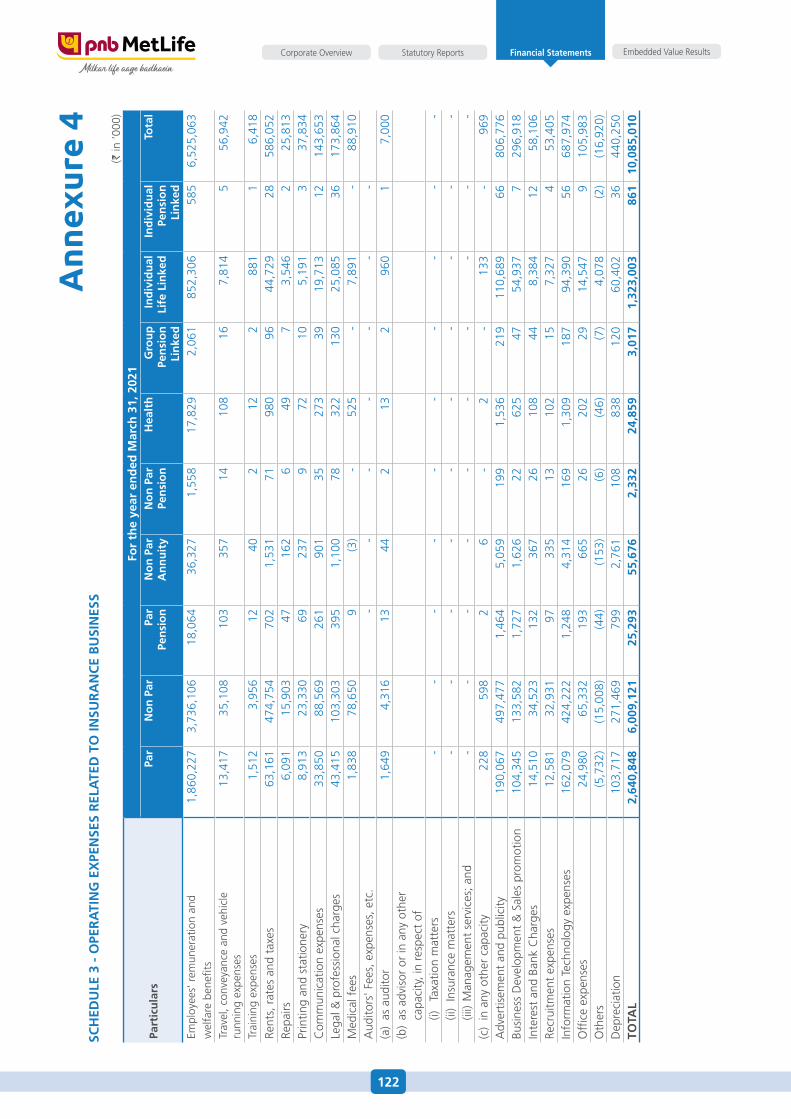
122
Embedded Value ResultsStatutory ReportsCorporate Overview Financial Statements
Ann
exur
e 4
Sch
Edu
lE 3
- O
pEr
aTi
ng
Ex
pEn
SES
rEl
aTE
d T
O in
Sur
an
cE
Bu
Sin
ESS
(` in
‘000
)
part
icu
lars
for
the
year
en
ded
mar
ch 3
1, 2
021
par
no
n p
ar p
ar
pen
sio
nn
on
par
an
nu
ity
no
n p
arpe
nsi
on
hea
lth
gro
up
pen
sio
nli
nke
d
ind
ivid
ual
life
lin
ked
ind
ivid
ual
pen
sio
nli
nke
d
Tota
l
empl
oyee
s' r
emun
erat
ion
and
wel
fare
ben
efits
1,8
60,2
27 3
,736
,106
18,
064
36,
327
1,5
58 1
7,82
9 2
,061
852
,306
585
6,5
25,0
63
Trav
el, c
onve
yanc
e an
d ve
hicl
e ru
nnin
g ex
pens
es 1
3,41
7 3
5,10
8 1
03 3
57 1
4 1
08 1
6 7
,814
5 5
6,94
2
Trai
ning
exp
ense
s 1
,512
3,9
56 1
2 4
0 2
12
2 8
81 1
6,4
18Re
nts,
rat
es a
nd t
axes
63,
161
474
,754
702
1,5
31 7
1 9
80 9
6 4
4,72
9 2
8 5
86,0
52Re
pairs
6,0
91 1
5,90
3 4
7 1
62 6
49
7 3
,546
2 2
5,81
3Pr
intin
g an
d st
atio
nery
8,9
13 2
3,33
0 6
9 2
37 9
72
10
5,1
91 3
37,
834
Com
mun
icat
ion
expe
nses
33,
850
88,
569
261
901
35
273
39
19,
713
12
143
,653
Lega
l & p
rofe
ssio
nal c
harg
es 4
3,41
5 1
03,3
03 3
95 1
,100
78
322
130
25,
085
36
173
,864
Med
ical
fee
s 1
,838
78,
650
9 (3
) -
525
- 7
,891
- 8
8,91
0a
udito
rs' f
ees,
exp
ense
s, e
tc.
- -
- -
- -
-(a
) as
aud
itor
1,6
49 4
,316
13
44
2 1
3 2
960
1 7
,000
(b)
as a
dvis
or o
r in
any
oth
er
capa
city
, in
resp
ect
of(i)
Ta
xatio
n m
atte
rs -
- -
- -
- -
- -
-(ii
) In
sura
nce
mat
ters
- -
- -
- -
- -
- -
(iii)
Man
agem
ent
serv
ices
; and
- -
- -
- -
- -
- -
(c)
in a
ny o
ther
cap
acity
228
598
2 6
- 2
- 1
33 -
969
adv
ertis
emen
t an
d pu
blic
ity 1
90,0
67 4
97,4
77 1
,464
5,0
59 1
99 1
,536
219
110
,689
66
806
,776
Busi
ness
dev
elop
men
t &
sal
es p
rom
otio
n 1
04,3
45 1
33,5
82 1
,727
1,6
26 2
2 6
25 4
7 5
4,93
7 7
296
,918
Inte
rest
and
Ban
k C
harg
es 1
4,51
0 3
4,52
3 1
32 3
67 2
6 1
08 4
4 8
,384
12
58,
106
Recr
uitm
ent
expe
nses
12,
581
32,
931
97
335
13
102
15
7,3
27 4
53,
405
Info
rmat
ion
Tech
nolo
gy e
xpen
ses
162
,079
424
,222
1,2
48 4
,314
169
1,3
09 1
87 9
4,39
0 5
6 6
87,9
74o
ffice
exp
ense
s 2
4,98
0 6
5,33
2 1
93 6
65 2
6 2
02 2
9 1
4,54
7 9
105
,983
oth
ers
(5,7
32)
(15,
008)
(44)
(153
) (6
) (4
6) (7
) 4
,078
(2)
(16,
920)
dep
reci
atio
n 1
03,7
17 2
71,4
69 7
99 2
,761
108
838
120
60,
402
36
440
,250
TOTa
l 2
,640
,848
6,0
09,1
21 2
5,29
3 5
5,67
6 2
,332
24,
859
3,0
17 1
,323
,003
861
10,
085,
010
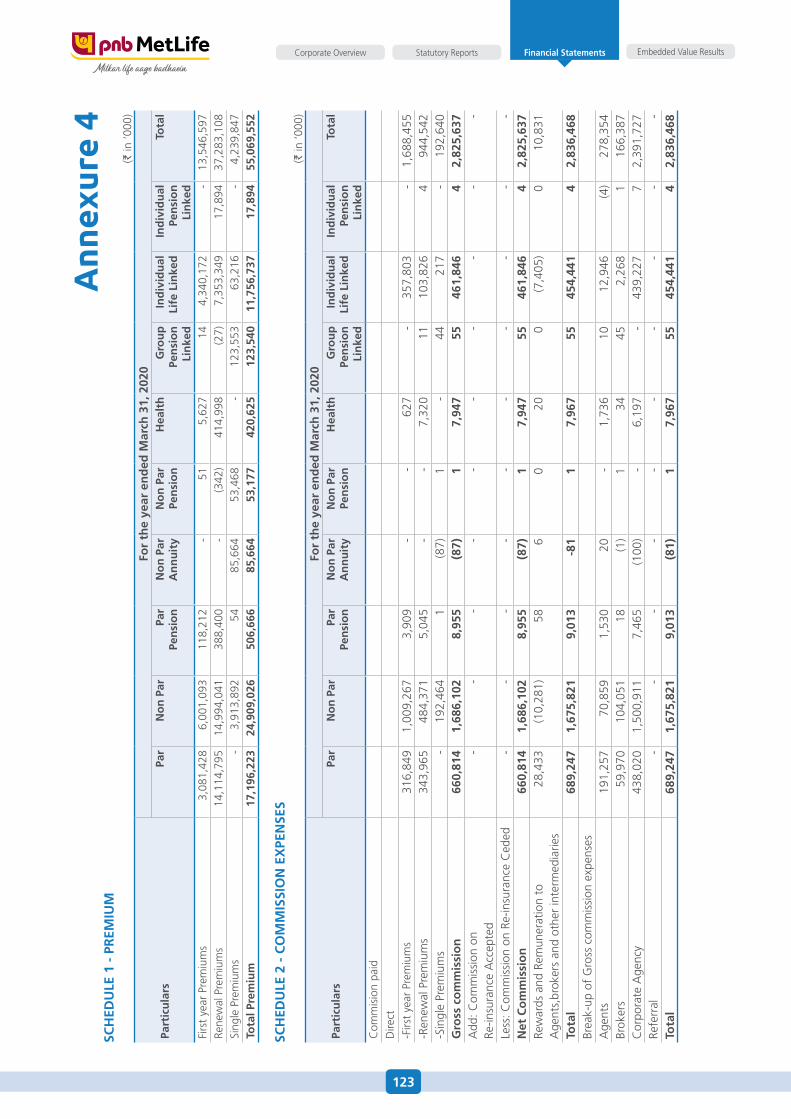
123
Embedded Value ResultsStatutory ReportsCorporate Overview Financial Statements
Ann
exur
e 4
Sch
Edu
lE 1
- p
rEm
ium
(` in
‘000
)
part
icu
lars
for
the
year
en
ded
mar
ch 3
1, 2
020
par
no
n p
ar p
ar
pen
sio
nn
on
par
an
nu
ity
no
n p
arpe
nsi
on
hea
lth
gro
up
pen
sio
nli
nke
d
ind
ivid
ual
life
lin
ked
ind
ivid
ual
pen
sio
nli
nke
d
Tota
l
firs
t ye
ar P
rem
ium
s 3
,081
,428
6
,001
,093
1
18,2
12
-
51
5,6
27
14
4,3
40,1
72
-
13,
546,
597
Rene
wal
Pre
miu
ms
14,
114,
795
14,
994,
041
388
,400
-
(3
42)
414
,998
(2
7) 7
,353
,349
1
7,89
4 3
7,28
3,10
8 si
ngle
Pre
miu
ms
-
3,9
13,8
92
54
85,
664
53,
468
-
123
,553
6
3,21
6 -
4
,239
,847
To
tal p
rem
ium
17,
196,
223
24,
909,
026
506
,666
8
5,66
4 5
3,17
7 4
20,6
25
123
,540
1
1,75
6,73
7 1
7,89
4 5
5,06
9,55
2
Sch
Edu
lE 2
- c
Om
miS
SiO
n E
xpE
nSE
S (`
in ‘0
00)
part
icu
lars
for
the
year
en
ded
mar
ch 3
1, 2
020
par
no
n p
ar p
ar
pen
sio
nn
on
par
an
nu
ity
no
n p
arpe
nsi
on
hea
lth
gro
up
pen
sio
nli
nke
d
ind
ivid
ual
life
lin
ked
ind
ivid
ual
pen
sio
nli
nke
d
Tota
l
Com
mis
ion
paid
dire
ct
-firs
t ye
ar P
rem
ium
s 3
16,8
49 1
,009
,267
3,9
09 -
- 6
27 -
357
,803
- 1
,688
,455
-Ren
ewal
Pre
miu
ms
343
,965
484
,371
5,0
45 -
- 7
,320
11
103
,826
4 9
44,5
42-s
ingl
e Pr
emiu
ms
- 1
92,4
64 1
(87)
1 -
44
217
- 1
92,6
40g
ross
co
mm
issi
on
660
,814
1,6
86,1
02 8
,955
(87
) 1
7,9
47 5
5 4
61,8
46 4
2,8
25,6
37a
dd: C
omm
issi
on o
n Re
-insu
ranc
e a
ccep
ted
- -
- -
- -
- -
- -
Less
: Com
mis
sion
on
Re-in
sura
nce
Ced
ed -
- -
- -
- -
- -
-n
et c
om
mis
sio
n 6
60,8
14 1
,686
,102
8,9
55 (
87)
1 7
,947
55
461
,846
4 2
,825
,637
Rew
ards
and
Rem
uner
atio
n to
a
gent
s,br
oker
s an
d ot
her
inte
rmed
iarie
s28
,433
(10,
281)
586
020
0(7
,405
)0
10,8
31
Tota
l68
9,24
71,
675,
821
9,01
3-8
11
7,96
755
454,
441
42,
836,
468
Brea
k-up
of
Gro
ss c
omm
issi
on e
xpen
ses
age
nts
191,
257
70,
859
1,5
30 2
0 -
1,7
36 1
0 1
2,94
6 (4
) 2
78,3
54Br
oker
s59
,970
104
,051
18
(1)
1 3
4 4
5 2
,268
1 1
66,3
87C
orpo
rate
age
ncy
438,
020
1,5
00,9
11 7
,465
(100
) -
6,1
97 -
439
,227
7 2
,391
,727
Refe
rral
- -
- -
- -
- -
- -
Tota
l 6
89,2
47 1
,675
,821
9,0
13 (
81)
1 7
,967
55
454
,441
4 2
,836
,468
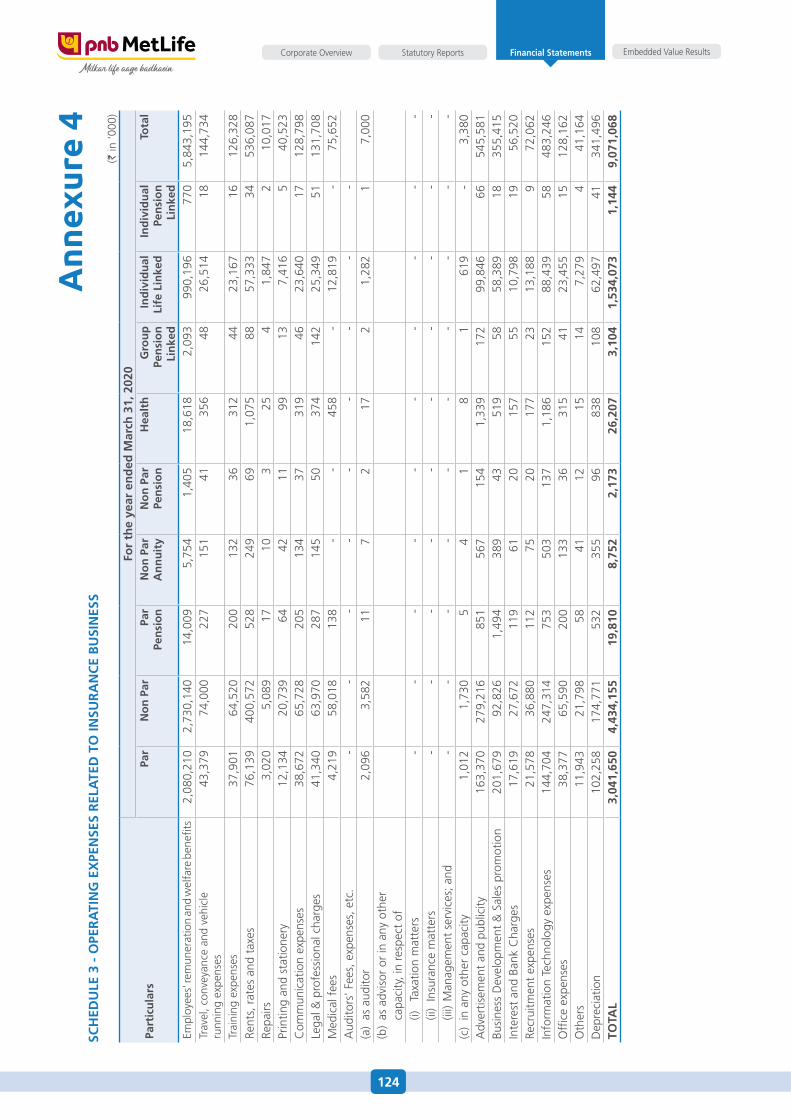
124
Embedded Value ResultsStatutory ReportsCorporate Overview Financial Statements
Ann
exur
e 4
Sch
Edu
lE 3
- O
pEr
aTi
ng
Ex
pEn
SES
rEl
aTE
d T
O in
Sur
an
cE
Bu
Sin
ESS
(` in
‘000
)
part
icu
lars
for
the
year
en
ded
mar
ch 3
1, 2
020
par
no
n p
ar p
ar
pen
sio
nn
on
par
an
nu
ity
no
n p
arpe
nsi
on
hea
lth
gro
up
pen
sio
nli
nke
d
ind
ivid
ual
life
lin
ked
ind
ivid
ual
pen
sio
nli
nke
d
Tota
l
empl
oyee
s' re
mun
erat
ion
and
wel
fare
ben
efits
2,0
80,2
10 2
,730
,140
14,
009
5,7
54 1
,405
18,
618
2,0
93 9
90,1
96 7
70 5
,843
,195
Trav
el, c
onve
yanc
e an
d ve
hicl
e ru
nnin
g ex
pens
es 4
3,37
9 7
4,00
0 2
27 1
51 4
1 3
56 4
8 2
6,51
4 1
8 1
44,7
34
Trai
ning
exp
ense
s 3
7,90
1 6
4,52
0 2
00 1
32 3
6 3
12 4
4 2
3,16
7 1
6 1
26,3
28Re
nts,
rat
es a
nd t
axes
76,
139
400
,572
528
249
69
1,0
75 8
8 5
7,33
3 3
4 5
36,0
87Re
pairs
3,0
20 5
,089
17
10
3 2
5 4
1,8
47 2
10,
017
Prin
ting
and
stat
ione
ry 1
2,13
4 2
0,73
9 6
4 4
2 1
1 9
9 1
3 7
,416
5 4
0,52
3C
omm
unic
atio
n ex
pens
es 3
8,67
2 6
5,72
8 2
05 1
34 3
7 3
19 4
6 2
3,64
0 1
7 1
28,7
98Le
gal &
pro
fess
iona
l cha
rges
41,
340
63,
970
287
145
50
374
142
25,
349
51
131
,708
Med
ical
fee
s 4
,219
58,
018
138
- -
458
- 1
2,81
9 -
75,
652
aud
itors
' fee
s, e
xpen
ses,
etc
. -
- -
- -
- -
- -
(a)
as a
udito
r 2
,096
3,5
82 1
1 7
2 1
7 2
1,2
82 1
7,0
00(b
) as
adv
isor
or
in a
ny o
ther
ca
paci
ty, i
n re
spec
t of
(i)
Taxa
tion
mat
ters
- -
- -
- -
- -
- -
(ii)
Insu
ranc
e m
atte
rs -
- -
- -
- -
- -
-(ii
i) M
anag
emen
t se
rvic
es; a
nd -
- -
- -
- -
- -
-(c
) in
any
oth
er c
apac
ity 1
,012
1,7
30 5
4 1
8 1
619
- 3
,380
adv
ertis
emen
t an
d pu
blic
ity 1
63,3
70 2
79,2
16 8
51 5
67 1
54 1
,339
172
99,
846
66
545
,581
Busi
ness
dev
elop
men
t &
sal
es p
rom
otio
n 2
01,6
79 9
2,82
6 1
,494
389
43
519
58
58,
389
18
355
,415
Inte
rest
and
Ban
k C
harg
es 1
7,61
9 2
7,67
2 1
19 6
1 2
0 1
57 5
5 1
0,79
8 1
9 5
6,52
0Re
crui
tmen
t ex
pens
es 2
1,57
8 3
6,88
0 1
12 7
5 2
0 1
77 2
3 1
3,18
8 9
72,
062
Info
rmat
ion
Tech
nolo
gy e
xpen
ses
144
,704
247
,314
753
503
137
1,1
86 1
52 8
8,43
9 5
8 4
83,2
46o
ffice
exp
ense
s 3
8,37
7 6
5,59
0 2
00 1
33 3
6 3
15 4
1 2
3,45
5 1
5 1
28,1
62o
ther
s 1
1,94
3 2
1,79
8 5
8 4
1 1
2 1
5 1
4 7
,279
4 4
1,16
4d
epre
ciat
ion
102
,258
174
,771
532
355
96
838
108
62,
497
41
341
,496
TOTa
l 3
,041
,650
4,4
34,1
55 1
9,81
0 8
,752
2,1
73 2
6,20
7 3
,104
1,5
34,0
73 1
,144
9,0
71,0
68
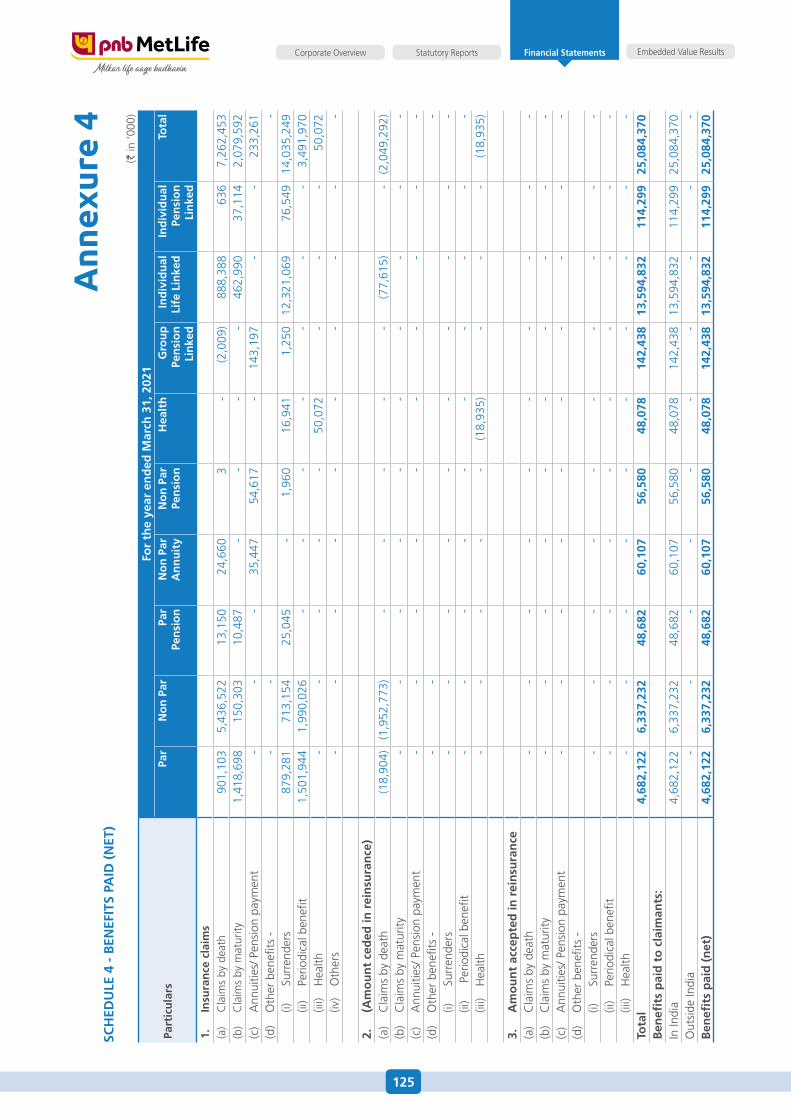
125
Embedded Value ResultsStatutory ReportsCorporate Overview Financial Statements
Ann
exur
e 4
Sch
Edu
lE 4
- B
EnEf
iTS
paid
(n
ET)
(` in
‘000
)
part
icu
lars
for
the
year
en
ded
mar
ch 3
1, 2
021
par
no
n p
ar p
ar
pen
sio
nn
on
par
an
nu
ity
no
n p
arpe
nsi
on
hea
lth
gro
up
pen
sio
nli
nke
d
ind
ivid
ual
life
lin
ked
ind
ivid
ual
pen
sio
nli
nke
d
Tota
l
1.
insu
ran
ce c
laim
s(a
) C
laim
s by
dea
th 9
01,1
03 5
,436
,522
13,
150
24,
660
3 -
(2,0
09)
888
,388
636
7,2
62,4
53(b
) C
laim
s by
mat
urity
1,4
18,6
98 1
50,3
03 1
0,48
7 -
- -
- 4
62,9
90 3
7,11
4 2
,079
,592
(c)
ann
uitie
s/ P
ensi
on p
aym
ent
- -
- 3
5,44
7 5
4,61
7 -
143
,197
- -
233
,261
(d)
oth
er b
enefi
ts -
- -
-
(i)
surr
ende
rs 8
79,2
81 7
13,1
54 2
5,04
5 -
1,9
60 1
6,94
1 1
,250
12,
321,
069
76,
549
14,
035,
249
(ii
) Pe
riodi
cal b
enefi
t 1
,501
,944
1,9
90,0
26 -
- -
- -
- -
3,4
91,9
70
(iii)
h
ealth
- -
- -
- 5
0,07
2 -
- -
50,
072
(iv)
oth
ers
- -
- -
- -
- -
- -
2.
(am
ou
nt
ced
ed in
rei
nsu
ran
ce)
(a)
Cla
ims
by d
eath
(18,
904)
(1,9
52,7
73)
- -
- -
- (7
7,61
5) -
(2,0
49,2
92)
(b)
Cla
ims
by m
atur
ity -
- -
- -
- -
- -
-(c
) a
nnui
ties/
Pen
sion
pay
men
t -
- -
- -
- -
- -
-(d
) o
ther
ben
efits
- -
- -
(i)
su
rren
ders
- -
- -
- -
- -
- -
(ii
) P
erio
dica
l ben
efit
- -
- -
- -
- -
- -
(ii
i) h
ealth
- -
- -
- (1
8,93
5) -
- -
(18,
935)
3.
am
ou
nt
acce
pte
d in
rei
nsu
ran
ce(a
) C
laim
s by
dea
th -
- -
- -
- -
- -
-(b
) C
laim
s by
mat
urity
- -
- -
- -
- -
- -
(c)
ann
uitie
s/ P
ensi
on p
aym
ent
- -
- -
- -
- -
- -
(d)
oth
er b
enefi
ts -
(i)
su
rren
ders
- -
- -
- -
- -
- -
(ii
) Pe
riodi
cal b
enefi
t -
- -
- -
- -
- -
-
(iii)
hea
lth -
- -
- -
- -
- -
-To
tal
4,6
82,1
22 6
,337
,232
48,
682
60,
107
56,
580
48,
078
142
,438
13,
594,
832
114
,299
25,0
84,3
70B
enefi
ts p
aid
to
cla
iman
ts:
In In
dia
4,6
82,1
22 6
,337
,232
48,
682
60,
107
56,
580
48,
078
142
,438
13,
594,
832
114
,299
25,
084,
370
out
side
Indi
a -
- -
- -
- -
- -
-B
enefi
ts p
aid
(n
et)
4,6
82,1
22 6
,337
,232
48,
682
60,
107
56,
580
48,
078
142
,438
13,
594,
832
114
,299
25,
084,
370
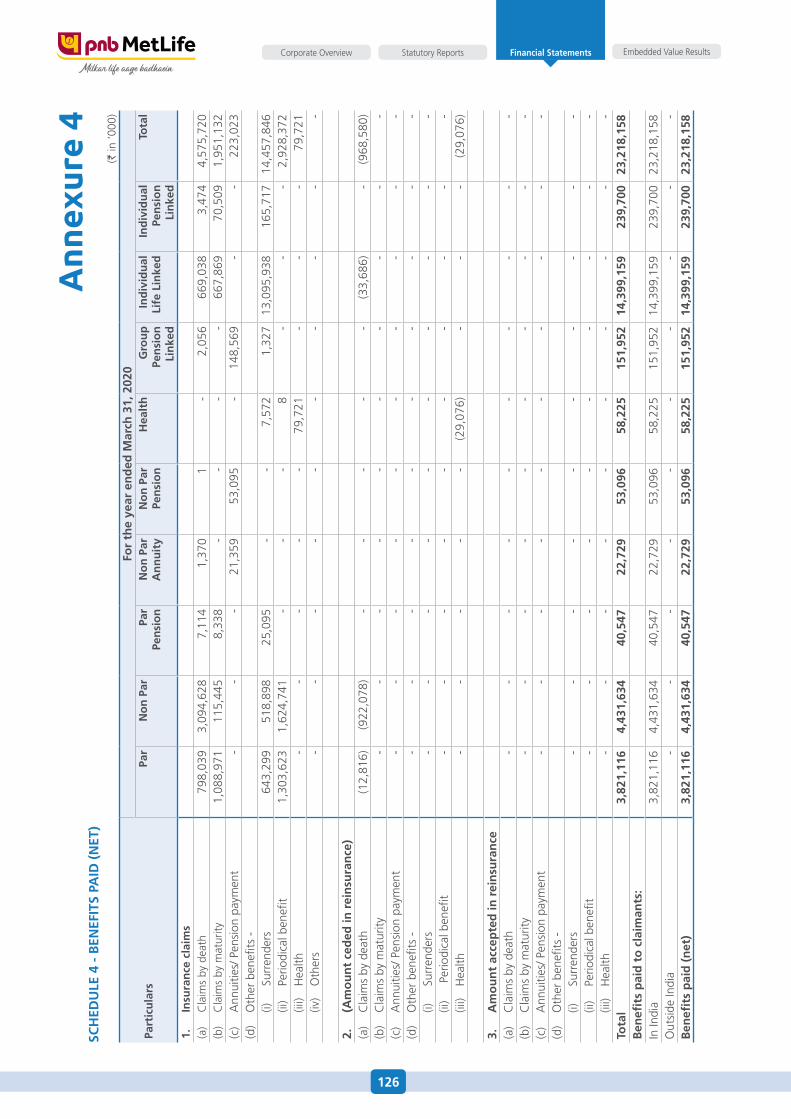
126
Embedded Value ResultsStatutory ReportsCorporate Overview Financial Statements
Ann
exur
e 4
Sch
Edu
lE 4
- B
EnEf
iTS
paid
(n
ET)
(` in
‘000
)
part
icu
lars
for
the
year
en
ded
mar
ch 3
1, 2
020
par
no
n p
ar p
ar
pen
sio
nn
on
par
an
nu
ity
no
n p
arpe
nsi
on
hea
lth
gro
up
pen
sio
nli
nke
d
ind
ivid
ual
life
lin
ked
ind
ivid
ual
pen
sio
nli
nke
d
Tota
l
1.
insu
ran
ce c
laim
s(a
) C
laim
s by
dea
th 7
98,0
39 3
,094
,628
7,1
14 1
,370
1 -
2,0
56 6
69,0
38 3
,474
4,5
75,7
20(b
) C
laim
s by
mat
urity
1,0
88,9
71 1
15,4
45 8
,338
- -
- -
667
,869
70,
509
1,9
51,1
32(c
) a
nnui
ties/
Pen
sion
pay
men
t -
- -
21,
359
53,
095
- 1
48,5
69 -
- 2
23,0
23(d
) o
ther
ben
efits
-
(i)
surr
ende
rs 6
43,2
99 5
18,8
98 2
5,09
5 -
- 7
,572
1,3
27 1
3,09
5,93
8 1
65,7
17 1
4,45
7,84
6
(ii)
Perio
dica
l ben
efit
1,3
03,6
23 1
,624
,741
- -
- 8
- -
- 2
,928
,372
(ii
i)
hea
lth -
- -
- -
79,
721
- -
- 7
9,72
1(iv
) o
ther
s -
- -
- -
- -
- -
-
2.
(am
ou
nt
ced
ed in
rei
nsu
ran
ce)
(a)
Cla
ims
by d
eath
(12,
816)
(922
,078
) -
- -
- -
(33,
686)
- (9
68,5
80)
(b)
Cla
ims
by m
atur
ity -
- -
- -
- -
- -
-(c
) a
nnui
ties/
Pen
sion
pay
men
t -
- -
- -
- -
- -
-(d
) o
ther
ben
efits
- -
- -
- -
- -
- -
-
(i)
surr
ende
rs -
- -
- -
- -
- -
-
(ii)
Per
iodi
cal b
enefi
t -
- -
- -
- -
- -
-
(iii)
hea
lth -
- -
- -
(29,
076)
- -
- (2
9,07
6)
3.
am
ou
nt
acce
pte
d in
rei
nsu
ran
ce(a
) C
laim
s by
dea
th -
- -
- -
- -
- -
-(b
) C
laim
s by
mat
urity
- -
- -
- -
- -
- -
(c)
ann
uitie
s/ P
ensi
on p
aym
ent
- -
- -
- -
- -
- -
(d)
oth
er b
enefi
ts -
(i)
su
rren
ders
- -
- -
- -
- -
- -
(ii
) Pe
riodi
cal b
enefi
t -
- -
- -
- -
- -
-
(iii)
hea
lth -
- -
- -
- -
- -
-To
tal
3,8
21,1
16 4
,431
,634
40,
547
22,
729
53,
096
58,
225
151
,952
14,
399,
159
239
,700
23,2
18,1
58B
enefi
ts p
aid
to
cla
iman
ts:
In In
dia
3,8
21,1
16 4
,431
,634
40,
547
22,
729
53,
096
58,
225
151
,952
14,
399,
159
239
,700
23,
218,
158
out
side
Indi
a -
- -
- -
- -
- -
-B
enefi
ts p
aid
(n
et)
3,8
21,1
16 4
,431
,634
40,
547
22,
729
53,
096
58,
225
151
,952
14,
399,
159
239
,700
23,
218,
158
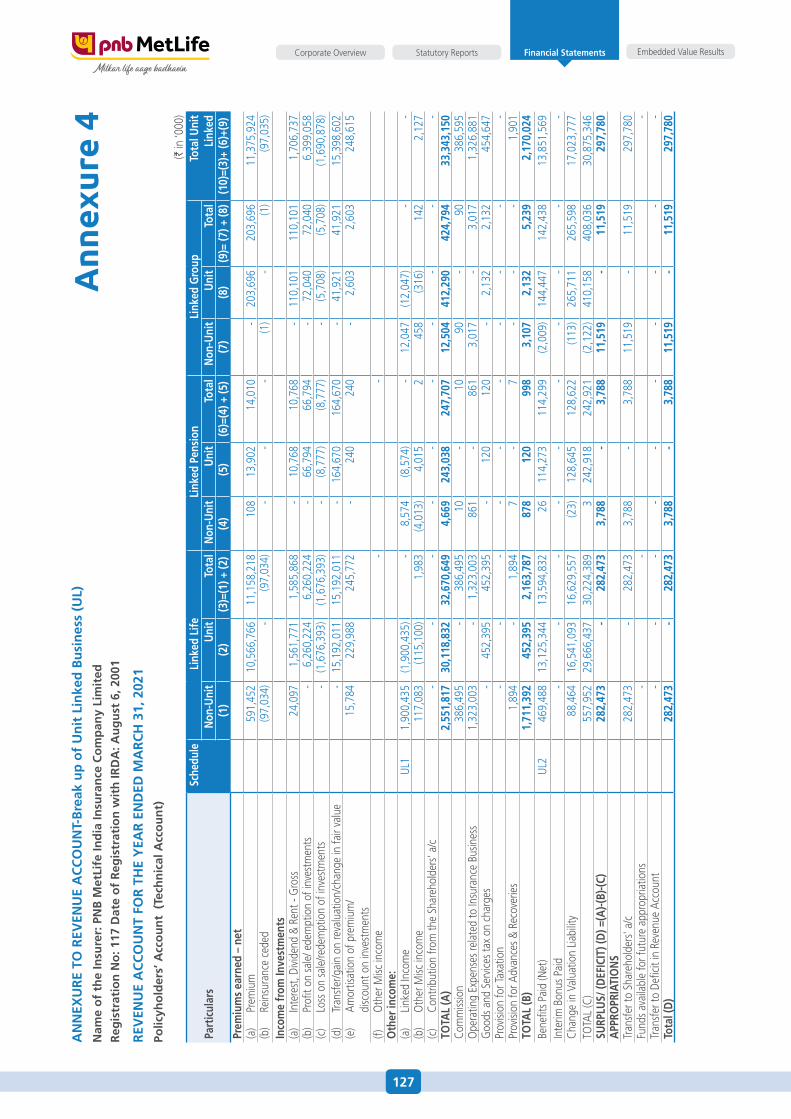
127
Embedded Value ResultsStatutory ReportsCorporate Overview Financial Statements
Ann
exur
e 4
an
nEx
ur
E TO
rEV
Enu
E a
cc
Ou
nT-
Bre
ak u
p o
f u
nit
lin
ked
Bu
sin
ess
(ul)
nam
e o
f th
e in
sure
r: p
nB
met
life
ind
ia in
sura
nce
co
mp
any
lim
ited
reg
istr
atio
n n
o: 1
17 d
ate
of
reg
istr
atio
n w
ith
ird
a: a
ug
ust
6, 2
001
rEV
Enu
E a
cc
Ou
nT
fOr
Th
E y
Ear
En
dEd
ma
rc
h 3
1, 2
021
polic
yho
lder
s’ a
cco
un
t (
Tech
nic
al a
cco
un
t)
(` in
‘000
)
part
icul
ars
Sche
dule
lin
ked
life
lin
ked
pens
ion
lin
ked
gro
upTo
tal u
nit
link
ed n
on-u
nit
uni
tTo
tal
non
-uni
tu
nit
Tota
ln
on-u
nit
uni
tTo
tal
(1)
(2)
(3)=
(1) +
(2)
(4)
(5)
(6)=
(4) +
(5)
(7)
(8)
(9)=
(7) +
(8)
(10)
=(3)
+ (6
)+(9
)pr
emiu
ms
earn
ed –
net
(a)
Prem
ium
591
,452
10,
566,
766
11,
158,
218
108
13,
902
14,
010
- 2
03,6
96 2
03,6
96 1
1,37
5,92
4(b
) Re
insu
ranc
e ce
ded
(97,
034)
- (9
7,03
4) -
- -
(1)
- (1
) (9
7,03
5)in
com
e fr
om in
vest
men
ts(a
) In
tere
st, d
ivide
nd &
Ren
t - G
ross
24,
097
1,5
61,7
71 1
,585
,868
- 1
0,76
8 1
0,76
8 -
110
,101
110
,101
1,7
06,7
37(b
) Pr
ofit o
n sa
le/ e
dem
ptio
n of
inve
stm
ents
- 6
,260
,224
6,2
60,2
24 -
66,
794
66,
794
- 7
2,04
0 7
2,04
0 6
,399
,058
(c)
Loss
on
sale
/rede
mpt
ion
of in
vest
men
ts -
(1,6
76,3
93)
(1,6
76,3
93)
- (8
,777
) (8
,777
) -
(5,7
08)
(5,7
08)
(1,6
90,8
78)
(d)
Tran
sfer
/gai
n on
reva
luat
ion/
chan
ge in
fair
valu
e -
15,
192,
011
15,
192,
011
- 1
64,6
70 1
64,6
70 -
41,
921
41,
921
15,
398,
602
(e)
amor
tisat
ion
of p
rem
ium
/
disc
ount
on
inve
stm
ents
15,
784
229
,988
245
,772
- 2
40 2
40 -
2,6
03 2
,603
248
,615
(f)
oth
er M
isc in
com
e -
-O
ther
inco
me:
(a)
Linke
d In
com
euL
1 1
,900
,435
(1,9
00,4
35)
- 8
,574
(8,5
74)
- 1
2,04
7 (1
2,04
7) -
-(b
) o
ther
Misc
inco
me
117
,083
(115
,100
) 1
,983
(4,0
13)
4,0
15 2
458
(316
) 1
42 2
,127
(c)
Cont
ribut
ion
from
the
shar
ehol
ders
' a/c
- -
- -
- -
- -
- -
TOTa
l (a
) 2
,551
,817
30,
118,
832
32,
670,
649
4,6
69 2
43,0
38 2
47,7
07 1
2,50
4 4
12,2
90 4
24,7
94 3
3,34
3,15
0Co
mm
issio
n 3
86,4
95 -
386
,495
10
- 1
0 9
0 -
90
386
,595
ope
ratin
g ex
pens
es re
late
d to
Insu
ranc
e Bu
sines
s 1
,323
,003
- 1
,323
,003
861
- 8
61 3
,017
- 3
,017
1,3
26,8
81G
oods
and
ser
vices
tax
on c
harg
es -
452
,395
452
,395
- 1
20 1
20 -
2,1
32 2
,132
454
,647
Prov
ision
for T
axat
ion
- -
- -
- -
- -
- -
Prov
ision
for a
dvan
ces &
Rec
over
ies
1,8
94 -
1,8
94 7
- 7
- -
- 1
,901
TOTa
l (B
) 1
,711
,392
452
,395
2,1
63,7
87 8
78 1
20 9
98 3
,107
2,1
32 5
,239
2,1
70,0
24Be
nefit
s Pai
d (N
et)
uL2
469
,488
13,
125,
344
13,
594,
832
26
114
,273
114
,299
(2,0
09)
144
,447
142
,438
13,
851,
569
Inte
rim B
onus
Pai
d -
- -
- -
- -
- -
-Ch
ange
in V
alua
tion
Liabi
lity
88,
464
16,
541,
093
16,
629,
557
(23)
128
,645
128
,622
(113
) 2
65,7
11 2
65,5
98 1
7,02
3,77
7To
TaL
(C)
557
,952
29,
666,
437
30,
224,
389
3 2
42,9
18 2
42,9
21 (2
,122
) 4
10,1
58 4
08,0
36 3
0,87
5,34
6Su
rplu
S/ (d
Efic
iT) (
d) =
(a)-(
B)-(c
) 2
82,4
73 -
282
,473
3,7
88 -
3,7
88 1
1,51
9 -
11,
519
297
,780
app
rOpr
iaTi
On
STr
ansf
er to
sha
reho
lder
s' a/
c 2
82,4
73 -
282
,473
3,7
88 -
3,7
88 1
1,51
9 -
11,
519
297
,780
fund
s ava
ilabl
e fo
r fut
ure
appr
opria
tions
- -
-Tr
ansf
er to
defi
cit in
Rev
enue
acc
ount
- -
- -
- -
- -
- -
Tota
l (d
) 2
82,4
73 -
282
,473
3,7
88 -
3,7
88 1
1,51
9 -
11,
519
297
,780
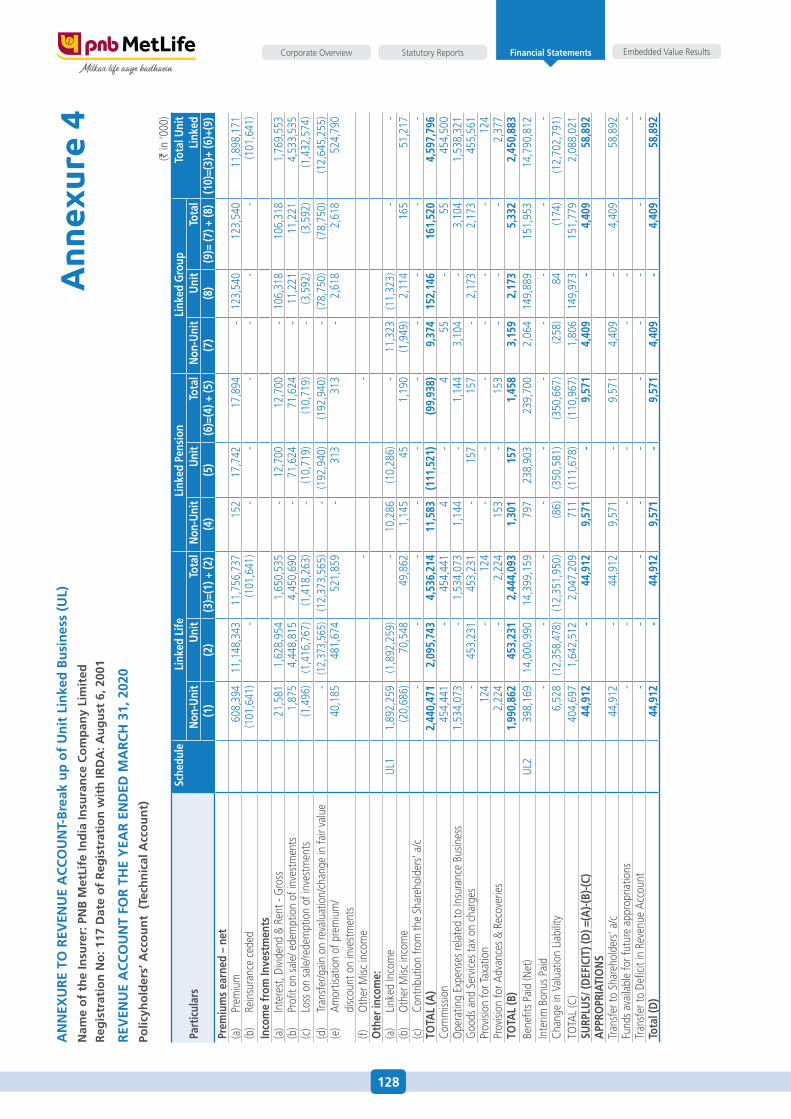
128
Embedded Value ResultsStatutory ReportsCorporate Overview Financial Statements
Ann
exur
e 4
an
nEx
ur
E TO
rEV
Enu
E a
cc
Ou
nT-
Bre
ak u
p o
f u
nit
lin
ked
Bu
sin
ess
(ul)
nam
e o
f th
e in
sure
r: p
nB
met
life
ind
ia in
sura
nce
co
mp
any
lim
ited
reg
istr
atio
n n
o: 1
17 d
ate
of
reg
istr
atio
n w
ith
ird
a: a
ug
ust
6, 2
001
rEV
Enu
E a
cc
Ou
nT
fOr
Th
E y
Ear
En
dEd
ma
rc
h 3
1, 2
020
polic
yho
lder
s’ a
cco
un
t (
Tech
nic
al a
cco
un
t)
(` in
‘000
)
part
icul
ars
Sche
dule
lin
ked
life
lin
ked
pens
ion
lin
ked
gro
upTo
tal u
nit
link
ed n
on-u
nit
uni
tTo
tal
non
-uni
tu
nit
Tota
ln
on-u
nit
uni
tTo
tal
(1)
(2)
(3)=
(1) +
(2)
(4)
(5)
(6)=
(4) +
(5)
(7)
(8)
(9)=
(7) +
(8)
(10)
=(3)
+ (6
)+(9
)pr
emiu
ms
earn
ed –
net
(a)
Prem
ium
608
,394
1
1,14
8,34
3 1
1,75
6,73
7 1
52
17,
742
17,
894
- 1
23,5
40
123
,540
1
1,89
8,17
1 (b
) Re
insu
ranc
e ce
ded
(101
,641
) -
(101
,641
) -
- -
- -
- (1
01,6
41)
inco
me
from
inve
stm
ents
(a)
Inte
rest
, divi
dend
& R
ent -
Gro
ss 2
1,58
1 1
,628
,954
1
,650
,535
-
12,
700
12,
700
- 1
06,3
18
106
,318
1
,769
,553
(b
) Pr
ofit o
n sa
le/ e
dem
ptio
n of
inve
stm
ents
1,8
75
4,4
48,8
15
4,4
50,6
90
- 7
1,62
4 7
1,62
4 -
11,
221
11,
221
4,5
33,5
35
(c)
Loss
on
sale
/rede
mpt
ion
of in
vest
men
ts (1
,496
) (1
,416
,767
) (1
,418
,263
) -
(10,
719)
(10,
719)
- (3
,592
) (3
,592
) (1
,432
,574
)(d
) Tr
ansf
er/g
ain
on re
valu
atio
n/ch
ange
in fa
ir va
lue
- (1
2,37
3,56
5) (1
2,37
3,56
5) -
(192
,940
) (1
92,9
40)
- (7
8,75
0) (7
8,75
0) (1
2,64
5,25
5)(e
) am
ortis
atio
n of
pre
miu
m/
di
scou
nt o
n in
vest
men
ts 4
0,18
5 4
81,6
74
521
,859
-
313
3
13
- 2
,618
2
,618
5
24,7
90
(f)
oth
er M
isc in
com
e -
-O
ther
inco
me:
(a)
Linke
d In
com
euL
1 1
,892
,259
(1
,892
,259
) -
10,
286
(10,
286)
- 1
1,32
3 (1
1,32
3) -
- (b
) o
ther
Misc
inco
me
(20,
686)
70,
548
49,
862
1,1
45
45
1,1
90
(1,9
49)
2,1
14
165
5
1,21
7 (c
) Co
ntrib
utio
n fro
m th
e sh
areh
olde
rs' a
/c -
- -
- -
- -
- -
- TO
Tal
(a)
2,4
40,4
71
2,0
95,7
43
4,5
36,2
14
11,
583
(111
,521
) (9
9,93
8) 9
,374
1
52,1
46
161
,520
4
,597
,796
Co
mm
issio
n 4
54,4
41
- 4
54,4
41
4
- 4
5
5 -
55
454
,500
o
pera
ting
expe
nses
rela
ted
to In
sura
nce
Busin
ess
1,5
34,0
73
- 1
,534
,073
1
,144
-
1,1
44
3,1
04
- 3
,104
1
,538
,321
G
oods
and
ser
vices
tax
on c
harg
es -
453
,231
4
53,2
31
- 1
57
157
-
2,1
73
2,1
73
455
,561
Pr
ovisi
on fo
r Tax
atio
n 1
24
- 1
24
- -
- -
- -
124
Pr
ovisi
on fo
r adv
ance
s & R
ecov
erie
s 2
,224
-
2,2
24
153
-
153
-
- -
2,3
77
TOTa
l (B
) 1
,990
,862
4
53,2
31
2,4
44,0
93
1,3
01
157
1
,458
3
,159
2
,173
5
,332
2
,450
,883
Be
nefit
s Pai
d (N
et)
uL2
398
,169
1
4,00
0,99
0 1
4,39
9,15
9 7
97
238
,903
2
39,7
00
2,0
64
149
,889
1
51,9
53
14,
790,
812
Inte
rim B
onus
Pai
d -
- -
- -
- -
- -
- Ch
ange
in V
alua
tion
Liabi
lity
6,5
28
(12,
358,
478)
(12,
351,
950)
(86)
(350
,581
) (3
50,6
67)
(258
) 8
4 (1
74)
(12,
702,
791)
ToTa
L (C
) 4
04,6
97
1,6
42,5
12
2,0
47,2
09
711
(1
11,6
78)
(110
,967
) 1
,806
1
49,9
73
151
,779
2
,088
,021
Su
rplu
S/ (d
Efic
iT) (
d) =
(a)-(
B)-(c
) 4
4,91
2 -
44,
912
9,5
71
- 9
,571
4
,409
-
4,4
09
58,
892
app
rOpr
iaTi
On
STr
ansf
er to
sha
reho
lder
s' a/
c 4
4,91
2 -
44,
912
9,5
71
- 9
,571
4
,409
-
4,4
09
58,
892
fund
s ava
ilabl
e fo
r fut
ure
appr
opria
tions
- -
- -
- -
- Tr
ansf
er to
defi
cit in
Rev
enue
acc
ount
- -
- -
- -
- -
- -
Tota
l (d
) 4
4,91
2 -
44,
912
9,5
71
- 9
,571
4
,409
-
4,4
09
58,
892
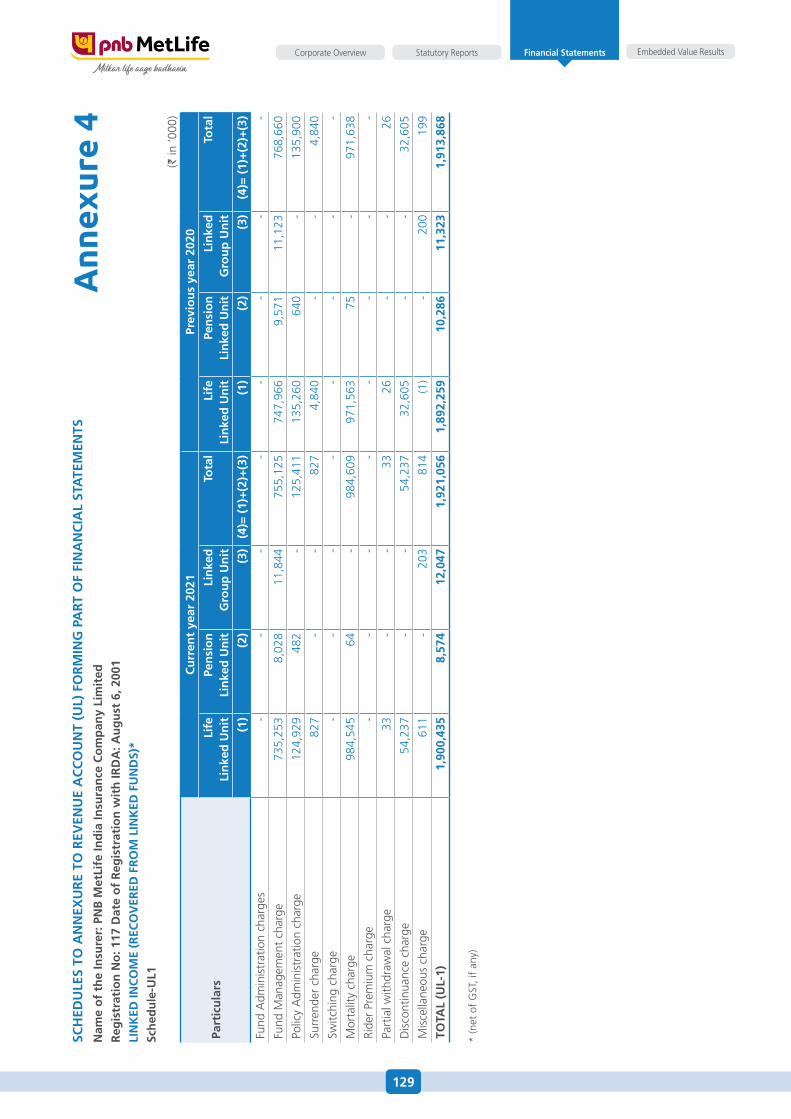
129
Embedded Value ResultsStatutory ReportsCorporate Overview Financial Statements
Ann
exur
e 4
Sch
Edu
lES
TO a
nn
Exu
rE
TO r
EVEn
uE
ac
cO
un
T (u
l) f
Or
min
g p
ar
T O
f fi
na
nc
ial
STa
TEm
EnTS
nam
e o
f th
e in
sure
r: p
nB
met
life
ind
ia in
sura
nce
co
mp
any
lim
ited
reg
istr
atio
n n
o: 1
17 d
ate
of
reg
istr
atio
n w
ith
ird
a: a
ug
ust
6, 2
001
lin
KEd
inc
Om
E (r
EcO
VEr
Ed f
rO
m l
inK
Ed f
un
dS)
*
Sch
edu
le-u
l1
(` in
‘000
)
part
icu
lars
cu
rren
t ye
ar 2
021
prev
iou
s ye
ar 2
020
life
li
nke
d u
nit
pen
sio
n
lin
ked
un
itli
nke
d
gro
up
un
itTo
tal
life
li
nke
d u
nit
pen
sio
n
lin
ked
un
itli
nke
d
gro
up
un
itTo
tal
(1)
(2)
(3)
(4)=
(1)
+(2
)+(3
)(1
)(2
)(3
)(4
)= (
1)+
(2)+
(3)
fund
adm
inis
trat
ion
char
ges
-
-
-
-
-
-
-
-
fund
Man
agem
ent
char
ge 7
35,2
53
8,0
28
11,
844
755
,125
7
47,9
66
9,5
71
11,
123
768
,660
Polic
y a
dmin
istr
atio
n ch
arge
124
,929
4
82
-
125
,411
1
35,2
60
640
-
1
35,9
00
surr
ende
r ch
arge
827
-
-
8
27
4,8
40
-
-
4,8
40
switc
hing
cha
rge
-
-
-
-
-
-
-
-
Mor
talit
y ch
arge
984
,545
6
4 -
9
84,6
09
971
,563
7
5 -
9
71,6
38
Ride
r Pr
emiu
m c
harg
e -
-
-
-
-
-
-
-
Part
ial w
ithdr
awal
cha
rge
33
-
-
33
26
-
-
26
dis
cont
inua
nce
char
ge 5
4,23
7 -
-
5
4,23
7 3
2,60
5 -
-
3
2,60
5
Mis
cella
neou
s ch
arge
611
-
2
03
814
(1
) -
2
00
199
TOTa
l (u
l-1)
1,9
00,4
35
8,5
74
12,
047
1,9
21,0
56
1,8
92,2
59
10,
286
11,
323
1,9
13,8
68
* (n
et o
f G
sT, i
f an
y)
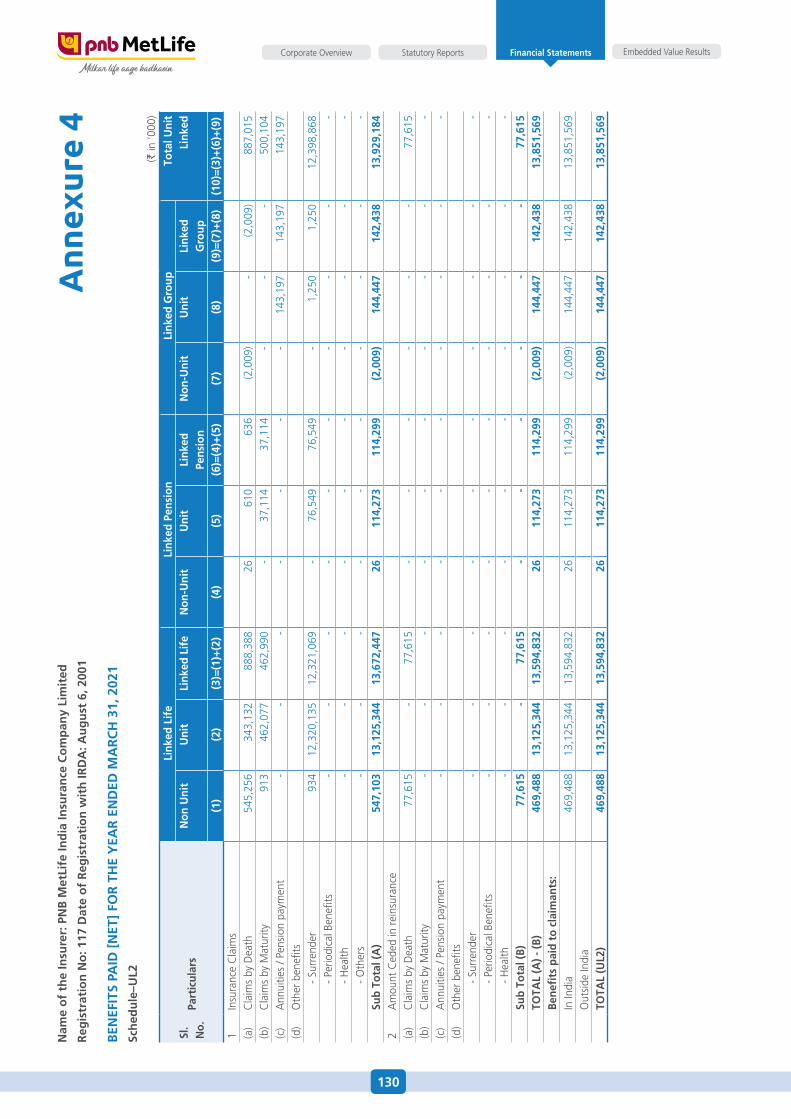
130
Embedded Value ResultsStatutory ReportsCorporate Overview Financial Statements
Ann
exur
e 4
nam
e o
f th
e in
sure
r: p
nB
met
life
ind
ia in
sura
nce
co
mp
any
lim
ited
reg
istr
atio
n n
o: 1
17 d
ate
of
reg
istr
atio
n w
ith
ird
a: a
ug
ust
6, 2
001
BEn
EfiT
S pa
id [
nET
] fO
r T
hE
yEa
r E
nd
Ed m
ar
ch
31,
202
1
Sch
edu
le–u
l2
(` in
‘000
)
Sl.
no.
part
icul
ars
lin
ked
life
lin
ked
pens
ion
lin
ked
gro
upTo
tal u
nit
link
edn
on u
nit
uni
tli
nked
lif
en
on-u
nit
uni
tli
nked
pe
nsio
nn
on-u
nit
uni
tli
nked
g
roup
(1)
(2)
(3)=
(1)+
(2)
(4)
(5)
(6)=
(4)+
(5)
(7)
(8)
(9)=
(7)+
(8)
(10)
=(3)
+(6)
+(9)
1In
sura
nce
Cla
ims
(a)
Cla
ims
by d
eath
545
,256
343
,132
888
,388
26
610
636
(2,0
09)
- (2
,009
) 8
87,0
15(b
)C
laim
s by
Mat
urity
913
462
,077
462
,990
- 3
7,11
4 3
7,11
4 -
- -
500
,104
(c)
ann
uitie
s / P
ensio
n pa
ymen
t -
- -
- -
- -
143,
197
143
,197
143
,197
(d)
oth
er b
enefi
ts
- sur
rend
er 9
3412
,320
,135
12,
321,
069
- 7
6,54
9 7
6,54
9 -
1,2
50 1
,250
12,
398,
868
- P
erio
dica
l Ben
efits
- -
- -
- -
- -
- -
- h
ealth
- -
- -
- -
- -
- -
- o
ther
s -
- -
- -
- -
- -
-Su
b To
tal (
a)
547
,103
13,1
25,3
44 1
3,67
2,44
7 2
6 1
14,2
73 1
14,2
99 (2
,009
)14
4,44
7 1
42,4
38 1
3,92
9,18
42
am
ount
Ced
ed in
rein
sura
nce
(a)
Cla
ims
by d
eath
77,
615
- 7
7,61
5 -
- -
- -
- 7
7,61
5(b
)C
laim
s by
Mat
urity
- -
- -
- -
- -
- -
(c)
ann
uitie
s / P
ensio
n pa
ymen
t -
- -
- -
- -
- -
-(d
)o
ther
ben
efits
- s
urre
nder
- -
- -
- -
- -
- -
- P
erio
dica
l Ben
efits
- -
- -
- -
- -
- -
- h
ealth
- -
- -
- -
- -
- -
Sub
Tota
l (B)
77,
615
- 7
7,61
5 -
- -
- -
- 7
7,61
5TO
T al
(a) -
(B)
469
,488
13,1
25,3
44 1
3,59
4,83
2 2
6 1
14,2
73 1
14,2
99 (2
,009
)14
4,44
7 1
42,4
38 1
3,85
1,56
9Be
nefi
ts p
aid
to c
laim
ants
:In
Indi
a 4
69,4
8813
,125
,344
13,
594,
832
26
114
,273
114
,299
(2,0
09)
144,
447
142
,438
13,
851,
569
out
side
Indi
aTO
Tal
(ul2
) 4
69,4
8813
,125
,344
13,
594,
832
26
114
,273
114
,299
(2,0
09)
144,
447
142
,438
13,
851,
569
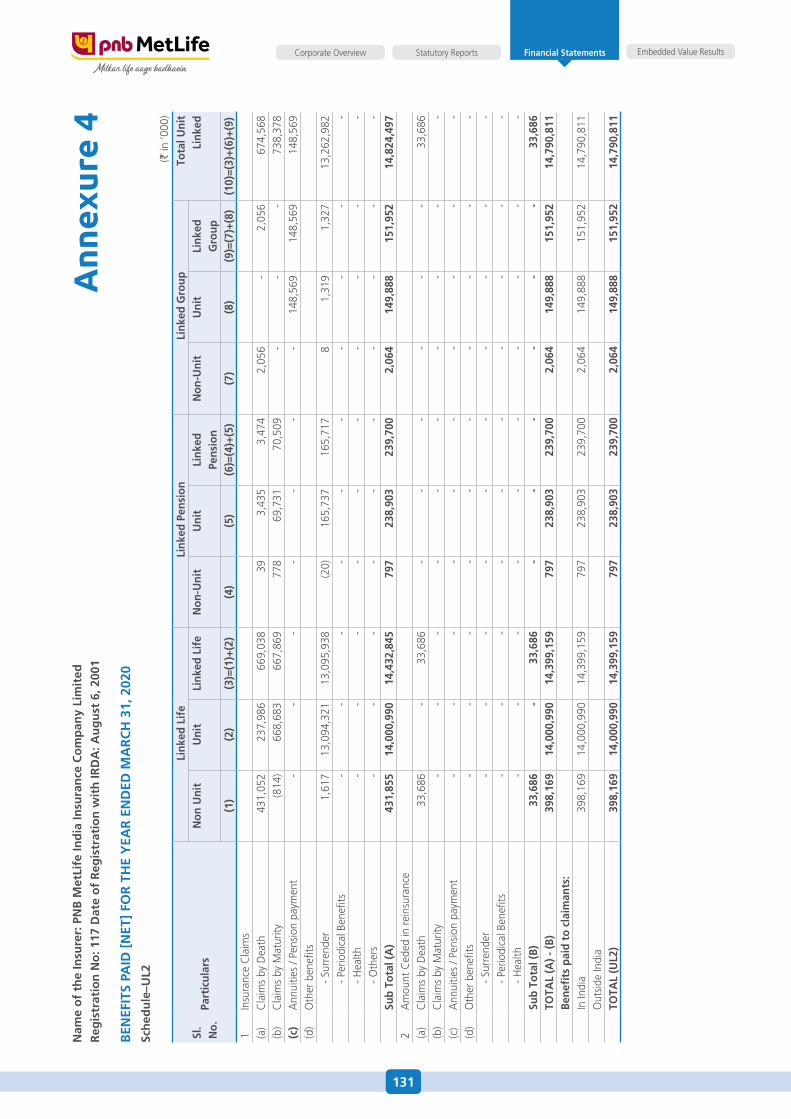
131
Embedded Value ResultsStatutory ReportsCorporate Overview Financial Statements
Ann
exur
e 4
nam
e o
f th
e in
sure
r: p
nB
met
life
ind
ia in
sura
nce
co
mp
any
lim
ited
reg
istr
atio
n n
o: 1
17 d
ate
of
reg
istr
atio
n w
ith
ird
a: a
ug
ust
6, 2
001
BEn
EfiT
S pa
id [
nET
] fO
r T
hE
yEa
r E
nd
Ed m
ar
ch
31,
202
0
Sch
edu
le–u
l2
(` in
‘000
)
Sl.
no.
part
icul
ars
lin
ked
life
lin
ked
pens
ion
lin
ked
gro
upTo
tal u
nit
link
edn
on u
nit
uni
tli
nked
lif
en
on-u
nit
uni
tli
nked
pe
nsio
nn
on-u
nit
uni
tli
nked
g
roup
(1)
(2)
(3)=
(1)+
(2)
(4)
(5)
(6)=
(4)+
(5)
(7)
(8)
(9)=
(7)+
(8)
(10)
=(3)
+(6)
+(9)
1In
sura
nce
Cla
ims
(a)
Cla
ims
by d
eath
431
,052
2
37,9
86
669
,038
3
9 3
,435
3
,474
2
,056
-
2,0
56
674
,568
(b
)C
laim
s by
Mat
urity
(814
) 6
68,6
83 6
67,8
69
778
6
9,73
1 7
0,50
9 -
- -
738
,378
(c
)a
nnui
ties
/ Pen
sion
paym
ent
- -
- -
- -
- 1
48,5
69 1
48,5
69
148
,569
(d
)o
ther
ben
efits
- s
urre
nder
1,6
17
13,
094,
321
13,
095,
938
(20)
165
,737
1
65,7
17
8
1,3
19
1,3
27
13,
262,
982
- P
erio
dica
l Ben
efits
- -
- -
- -
- -
- -
- h
ealth
- -
- -
- -
- -
- -
- o
ther
s -
- -
- -
- -
- -
- Su
b To
tal (
a)
431
,855
1
4,00
0,99
0 1
4,43
2,84
5 7
97
238
,903
2
39,7
00
2,0
64
149
,888
1
51,9
52
14,
824,
497
2a
mou
nt C
eded
in re
insu
ranc
e(a
)C
laim
s by
dea
th 3
3,68
6 -
33,
686
- -
- -
- -
33,
686
(b)
Cla
ims
by M
atur
ity -
- -
- -
- -
- -
- (c
)a
nnui
ties
/ Pen
sion
paym
ent
- -
- -
- -
- -
- -
(d)
oth
er b
enefi
ts -
- -
- -
- -
- -
-
- sur
rend
er -
- -
- -
- -
- -
-
- Per
iodi
cal B
enefi
ts -
- -
- -
- -
- -
-
- hea
lth -
- -
- -
- -
- -
- Su
b To
tal (
B) 3
3,68
6 -
33,
686
- -
- -
- -
33,
686
TOTa
l (a
) - (B
) 3
98,1
69
14,
000,
990
14,
399,
159
797
2
38,9
03
239
,700
2
,064
1
49,8
88
151
,952
1
4,79
0,81
1 Be
nefi
ts p
aid
to c
laim
ants
:In
Indi
a 3
98,1
69
14,
000,
990
14,
399,
159
797
2
38,9
03
239
,700
2
,064
1
49,8
88
151
,952
1
4,79
0,81
1 o
utsid
e In
dia
TOTa
l (u
l2)
398
,169
1
4,00
0,99
0 1
4,39
9,15
9 7
97
238
,903
2
39,7
00
2,0
64
149
,888
1
51,9
52
14,
790,
811
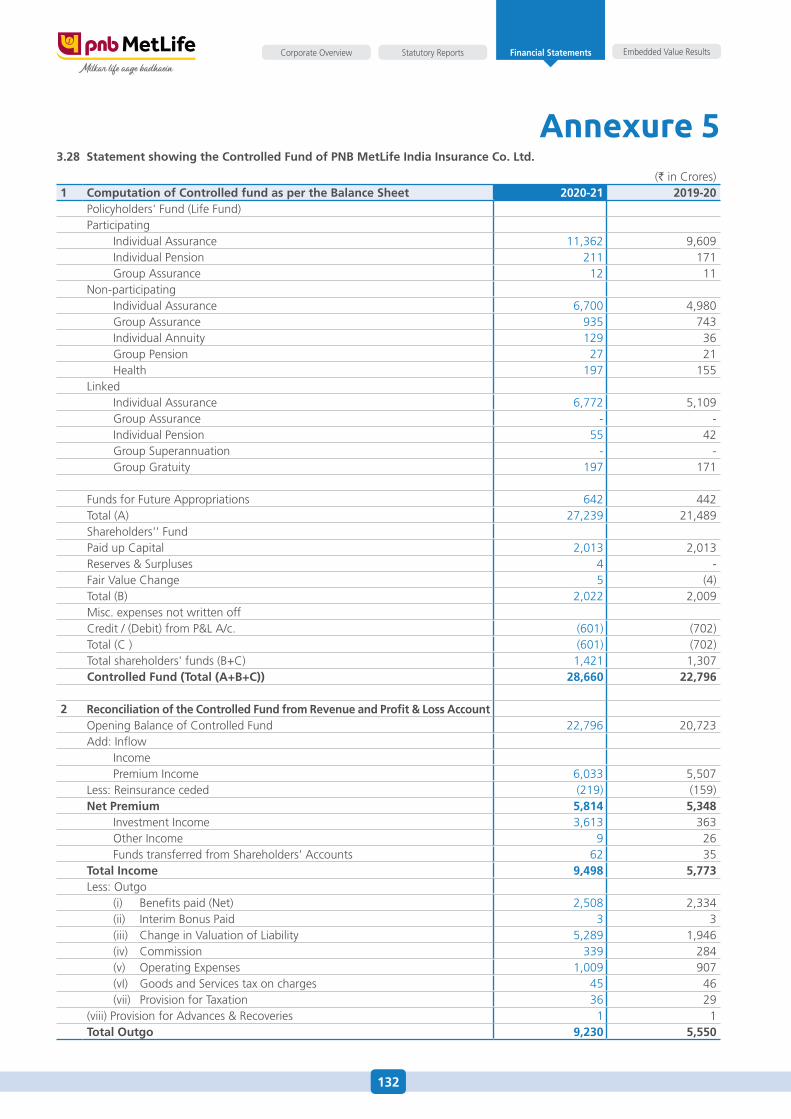
132
Embedded Value ResultsStatutory ReportsCorporate Overview Financial Statements
Annexure 53.28 Statement showing the controlled fund of pnB metlife india insurance co. ltd.
(` in Crores)1 computation of controlled fund as per the Balance Sheet 2020-21 2019-20
Policyholders' fund (Life fund)Participating Individual assurance 11,362 9,609 Individual Pension 211 171 Group assurance 12 11Non-participating Individual assurance 6,700 4,980 Group assurance 935 743 Individual annuity 129 36 Group Pension 27 21 health 197 155Linked Individual assurance 6,772 5,109 Group assurance - - Individual Pension 55 42 Group superannuation - - Group Gratuity 197 171
funds for future appropriations 642 442Total (a) 27,239 21,489shareholders'' fundPaid up Capital 2,013 2,013Reserves & surpluses 4 -fair Value Change 5 (4)Total (B) 2,022 2,009Misc. expenses not written offCredit / (debit) from P&L a/c. (601) (702)Total (C ) (601) (702)Total shareholders' funds (B+C) 1,421 1,307controlled fund (Total (a+B+c)) 28,660 22,796
2 reconciliation of the controlled fund from revenue and profit & loss accountopening Balance of Controlled fund 22,796 20,723add: Inflow Income Premium Income 6,033 5,507Less: Reinsurance ceded (219) (159)net premium 5,814 5,348 Investment Income 3,613 363 other Income 9 26 funds transferred from shareholders' accounts 62 35Total income 9,498 5,773Less: outgo (i) Benefits paid (Net) 2,508 2,334 (ii) Interim Bonus Paid 3 3 (iii) Change in Valuation of Liability 5,289 1,946 (iv) Commission 339 284 (v) operating expenses 1,009 907 (vI) Goods and services tax on charges 45 46 (vii) Provision for Taxation 36 29(viii) Provision for advances & Recoveries 1 1Total Outgo 9,230 5,550
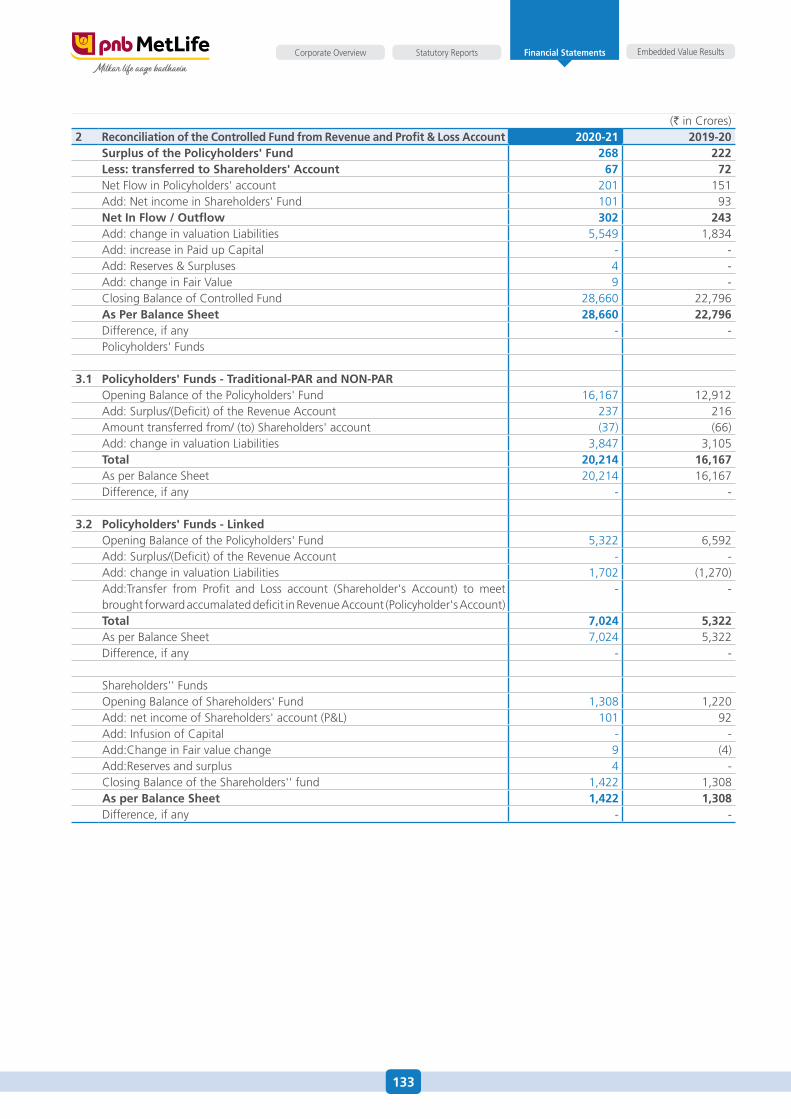
133
Embedded Value ResultsStatutory ReportsCorporate Overview Financial Statements
(` in Crores)2 reconciliation of the controlled fund from revenue and profit & loss account 2020-21 2019-20
Surplus of the policyholders' fund 268 222less: transferred to Shareholders' account 67 72Net flow in Policyholders' account 201 151add: Net income in shareholders' fund 101 93net in flow / Outflow 302 243add: change in valuation Liabilities 5,549 1,834add: increase in Paid up Capital - -add: Reserves & surpluses 4 -add: change in fair Value 9 -Closing Balance of Controlled fund 28,660 22,796as per Balance Sheet 28,660 22,796difference, if any - -Policyholders' funds
3.1 policyholders' funds - Traditional-par and nOn-paropening Balance of the Policyholders' fund 16,167 12,912add: surplus/(deficit) of the Revenue account 237 216amount transferred from/ (to) shareholders' account (37) (66)add: change in valuation Liabilities 3,847 3,105Total 20,214 16,167as per Balance sheet 20,214 16,167difference, if any - -
3.2 policyholders' funds - linkedopening Balance of the Policyholders' fund 5,322 6,592add: surplus/(deficit) of the Revenue account - -add: change in valuation Liabilities 1,702 (1,270)add:Transfer from Profit and Loss account (shareholder's account) to meet brought forward accumalated deficit in Revenue account (Policyholder's account)
- -
Total 7,024 5,322as per Balance sheet 7,024 5,322difference, if any - -
shareholders'' fundsopening Balance of shareholders' fund 1,308 1,220add: net income of shareholders' account (P&L) 101 92add: Infusion of Capital - -add:Change in fair value change 9 (4)add:Reserves and surplus 4 -Closing Balance of the shareholders'' fund 1,422 1,308as per Balance Sheet 1,422 1,308difference, if any - -
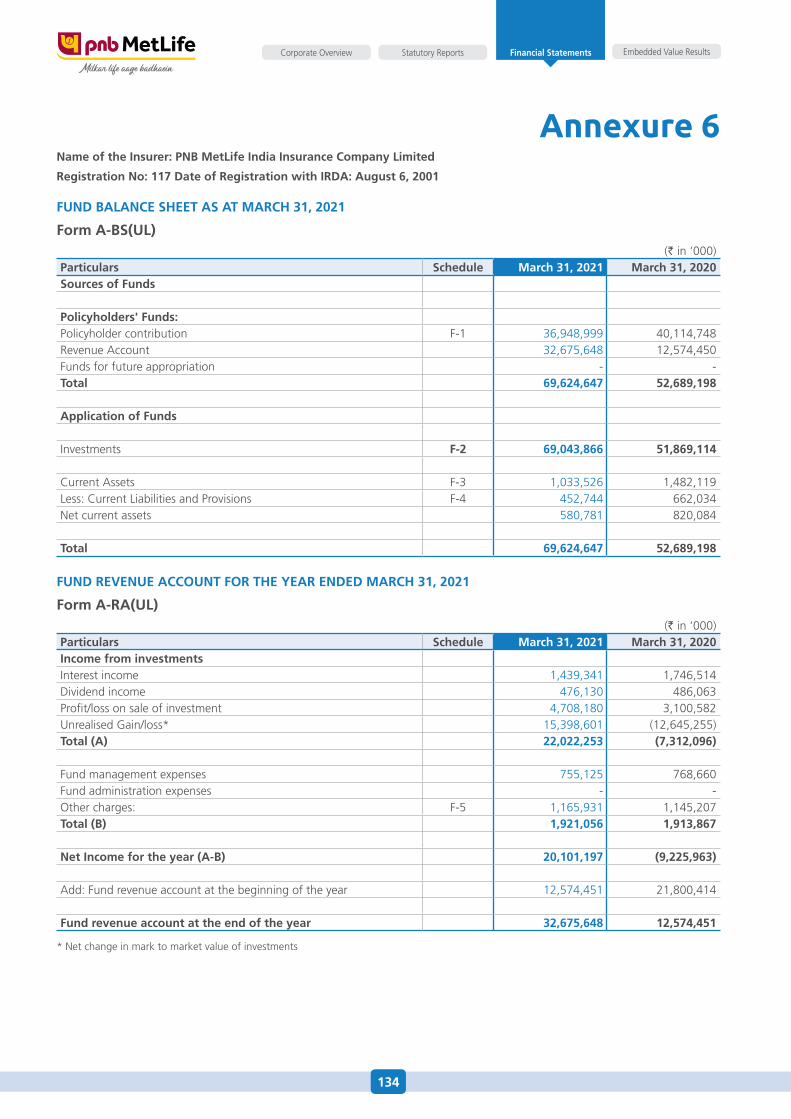
134
Embedded Value ResultsStatutory ReportsCorporate Overview Financial Statements
Annexure 6name of the insurer: pnB metlife india insurance company limited
registration no: 117 date of registration with irda: august 6, 2001
fund BalancE ShEET aS aT march 31, 2021
form a-BS(ul) (` in ‘000)
particulars Schedule march 31, 2021 march 31, 2020Sources of funds
policyholders' funds:Policyholder contribution f-1 36,948,999 40,114,748Revenue account 32,675,648 12,574,450funds for future appropriation - -Total 69,624,647 52,689,198
application of funds
Investments f-2 69,043,866 51,869,114
Current assets f-3 1,033,526 1,482,119Less: Current Liabilities and Provisions f-4 452,744 662,034Net current assets 580,781 820,084
Total 69,624,647 52,689,198
fund rEVEnuE accOunT fOr ThE yEar EndEd march 31, 2021
form a-ra(ul) (` in ‘000)
particulars Schedule march 31, 2021 march 31, 2020income from investmentsInterest income 1,439,341 1,746,514dividend income 476,130 486,063Profit/loss on sale of investment 4,708,180 3,100,582unrealised Gain/loss* 15,398,601 (12,645,255)Total (a) 22,022,253 (7,312,096)
fund management expenses 755,125 768,660fund administration expenses - -other charges: f-5 1,165,931 1,145,207Total (B) 1,921,056 1,913,867
net income for the year (a-B) 20,101,197 (9,225,963)
add: fund revenue account at the beginning of the year 12,574,451 21,800,414
fund revenue account at the end of the year 32,675,648 12,574,451
* Net change in mark to market value of investments
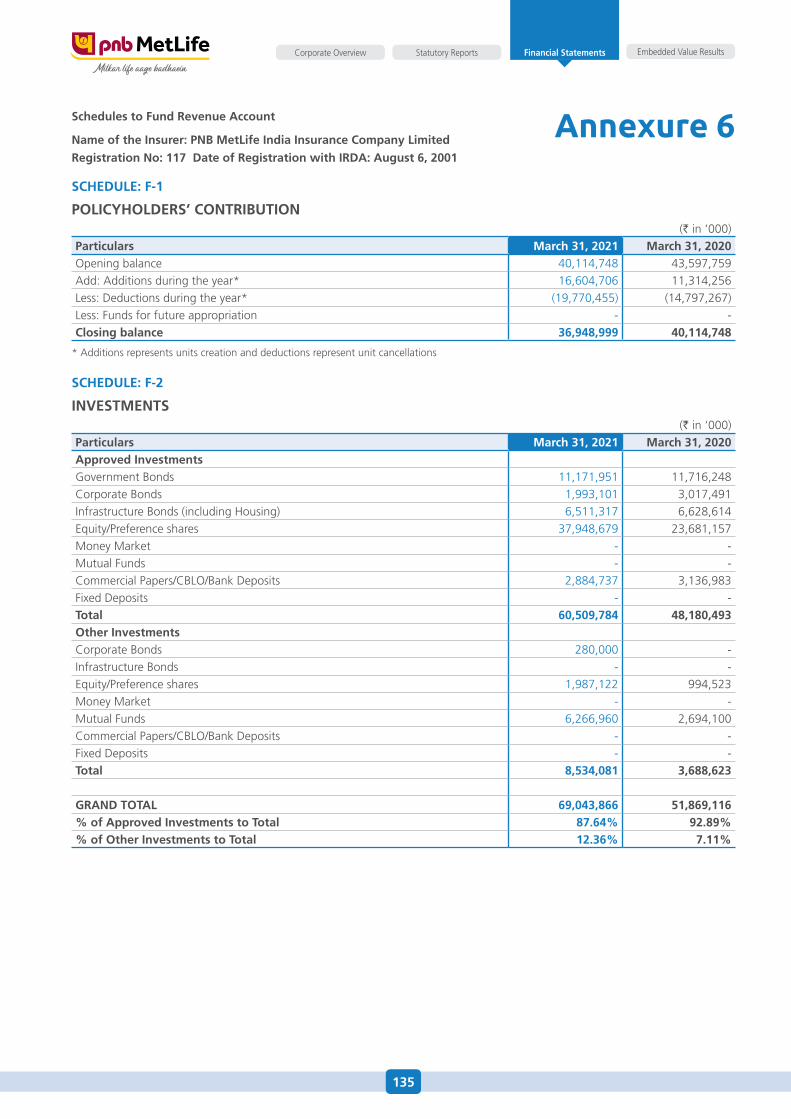
135
Embedded Value ResultsStatutory ReportsCorporate Overview Financial Statements
Schedules to fund revenue account
name of the insurer: pnB metlife india insurance company limited
registration no: 117 date of registration with irda: august 6, 2001
SchEdulE: f-1
pOlicyhOldErS’ cOnTriBuTiOn (` in ‘000)
particulars march 31, 2021 march 31, 2020opening balance 40,114,748 43,597,759 add: additions during the year* 16,604,706 11,314,256 Less: deductions during the year* (19,770,455) (14,797,267)Less: funds for future appropriation - - closing balance 36,948,999 40,114,748
* additions represents units creation and deductions represent unit cancellations
SchEdulE: f-2
inVESTmEnTS (` in ‘000)
particulars march 31, 2021 march 31, 2020approved investmentsGovernment Bonds 11,171,951 11,716,248 Corporate Bonds 1,993,101 3,017,491 Infrastructure Bonds (including housing) 6,511,317 6,628,614 equity/Preference shares 37,948,679 23,681,157 Money Market - - Mutual funds - - Commercial Papers/CBLo/Bank deposits 2,884,737 3,136,983 fixed deposits - - Total 60,509,784 48,180,493 Other investmentsCorporate Bonds 280,000 - Infrastructure Bonds - - equity/Preference shares 1,987,122 994,523 Money Market - - Mutual funds 6,266,960 2,694,100 Commercial Papers/CBLo/Bank deposits - - fixed deposits - - Total 8,534,081 3,688,623
grand TOTal 69,043,866 51,869,116 % of approved investments to Total 87.64% 92.89%% of Other investments to Total 12.36% 7.11%
Annexure 6
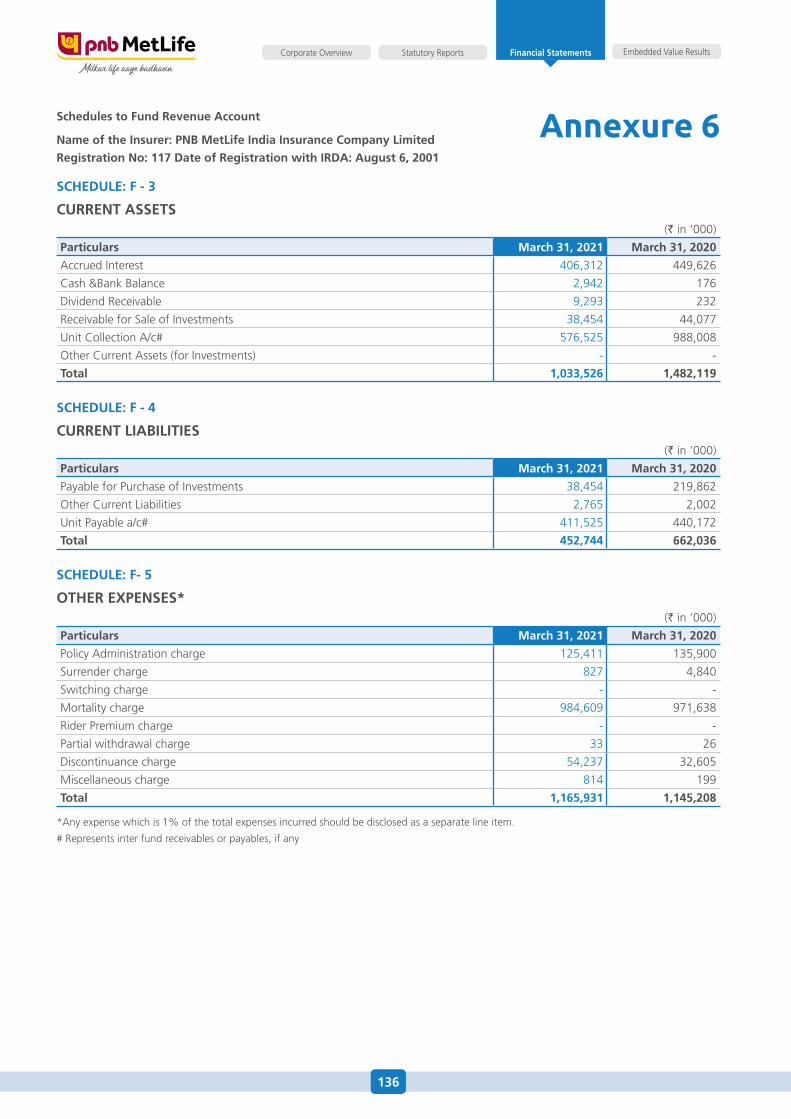
136
Embedded Value ResultsStatutory ReportsCorporate Overview Financial Statements
Schedules to fund revenue account
name of the insurer: pnB metlife india insurance company limited
registration no: 117 date of registration with irda: august 6, 2001
SchEdulE: f - 3
currEnT aSSETS (` in ‘000)
particulars march 31, 2021 march 31, 2020
accrued Interest 406,312 449,626
Cash &Bank Balance 2,942 176
dividend Receivable 9,293 232
Receivable for sale of Investments 38,454 44,077
unit Collection a/c# 576,525 988,008
other Current assets (for Investments) - -
Total 1,033,526 1,482,119
SchEdulE: f - 4
currEnT liaBiliTiES (` in ‘000)
particulars march 31, 2021 march 31, 2020
Payable for Purchase of Investments 38,454 219,862
other Current Liabilities 2,765 2,002
unit Payable a/c# 411,525 440,172
Total 452,744 662,036
SchEdulE: f- 5
OThEr ExpEnSES* (` in ‘000)
particulars march 31, 2021 march 31, 2020
Policy administration charge 125,411 135,900
surrender charge 827 4,840
switching charge - -
Mortality charge 984,609 971,638
Rider Premium charge - -
Partial withdrawal charge 33 26
discontinuance charge 54,237 32,605
Miscellaneous charge 814 199
Total 1,165,931 1,145,208
*any expense which is 1% of the total expenses incurred should be disclosed as a separate line item.
# Represents inter fund receivables or payables, if any
Annexure 6
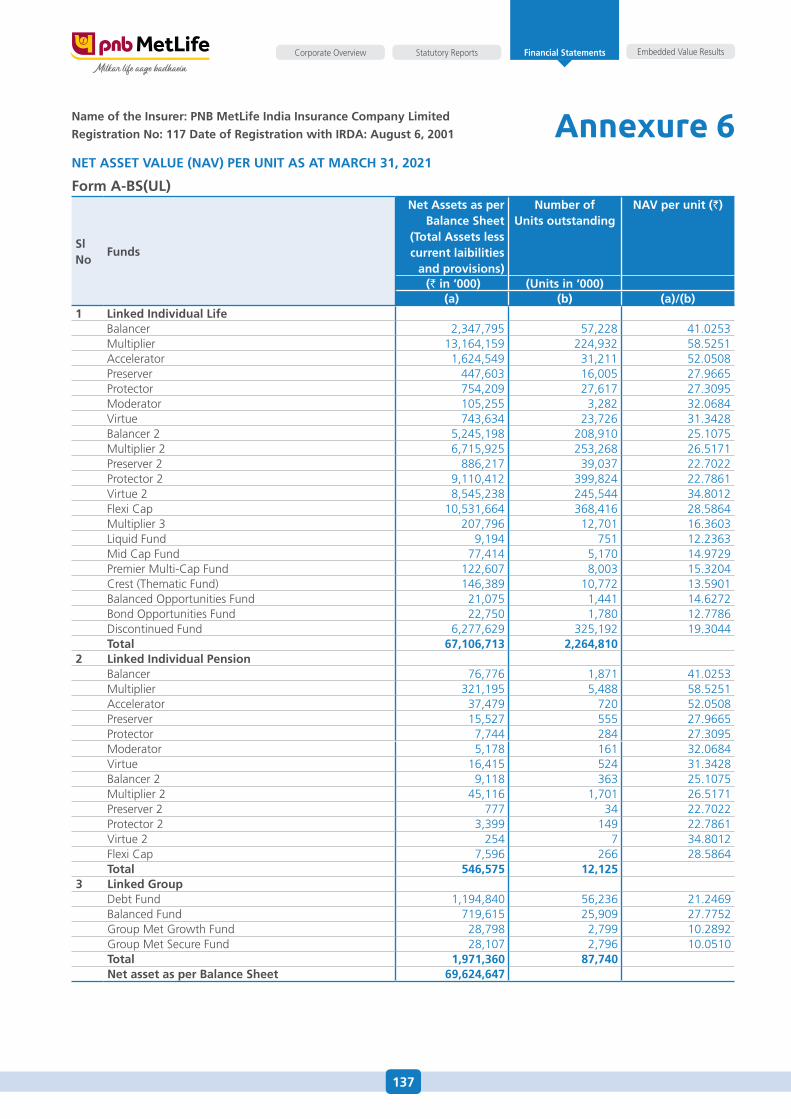
137
Embedded Value ResultsStatutory ReportsCorporate Overview Financial Statements
name of the insurer: pnB metlife india insurance company limited
registration no: 117 date of registration with irda: august 6, 2001
nET aSSET ValuE (naV) pEr uniT aS aT march 31, 2021
form a-BS(ul)
Sl no
funds
net assets as per Balance Sheet
(Total assets less current laibilities
and provisions)
number of units outstanding
naV per unit (`)
(` in ‘000) (units in ‘000) (a) (b) (a)/(b)
1 linked individual lifeBalancer 2,347,795 57,228 41.0253Multiplier 13,164,159 224,932 58.5251accelerator 1,624,549 31,211 52.0508Preserver 447,603 16,005 27.9665Protector 754,209 27,617 27.3095Moderator 105,255 3,282 32.0684Virtue 743,634 23,726 31.3428Balancer 2 5,245,198 208,910 25.1075Multiplier 2 6,715,925 253,268 26.5171Preserver 2 886,217 39,037 22.7022Protector 2 9,110,412 399,824 22.7861Virtue 2 8,545,238 245,544 34.8012flexi Cap 10,531,664 368,416 28.5864Multiplier 3 207,796 12,701 16.3603Liquid fund 9,194 751 12.2363Mid Cap fund 77,414 5,170 14.9729Premier Multi-Cap fund 122,607 8,003 15.3204Crest (Thematic fund) 146,389 10,772 13.5901Balanced opportunities fund 21,075 1,441 14.6272Bond opportunities fund 22,750 1,780 12.7786discontinued fund 6,277,629 325,192 19.3044Total 67,106,713 2,264,810
2 linked individual pensionBalancer 76,776 1,871 41.0253 Multiplier 321,195 5,488 58.5251 accelerator 37,479 720 52.0508 Preserver 15,527 555 27.9665 Protector 7,744 284 27.3095 Moderator 5,178 161 32.0684 Virtue 16,415 524 31.3428 Balancer 2 9,118 363 25.1075 Multiplier 2 45,116 1,701 26.5171 Preserver 2 777 34 22.7022 Protector 2 3,399 149 22.7861 Virtue 2 254 7 34.8012 flexi Cap 7,596 266 28.5864 Total 546,575 12,125
3 linked groupdebt fund 1,194,840 56,236 21.2469 Balanced fund 719,615 25,909 27.7752 Group Met Growth fund 28,798 2,799 10.2892 Group Met secure fund 28,107 2,796 10.0510 Total 1,971,360 87,740 net asset as per Balance Sheet 69,624,647
Annexure 6
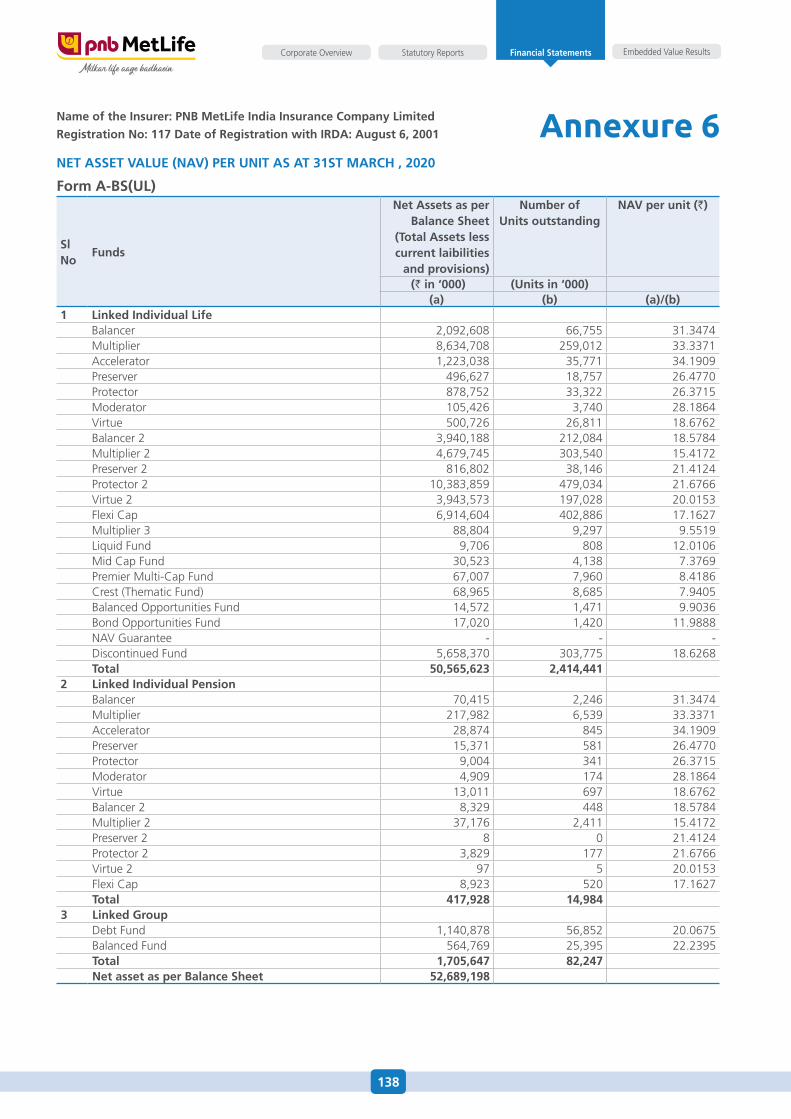
138
Embedded Value ResultsStatutory ReportsCorporate Overview Financial Statements
name of the insurer: pnB metlife india insurance company limited
registration no: 117 date of registration with irda: august 6, 2001
nET aSSET ValuE (naV) pEr uniT aS aT 31ST march , 2020
form a-BS(ul)
Sl no
funds
net assets as per Balance Sheet
(Total assets less current laibilities
and provisions)
number of units outstanding
naV per unit (`)
(` in ‘000) (units in ‘000) (a) (b) (a)/(b)
1 linked individual lifeBalancer 2,092,608 66,755 31.3474 Multiplier 8,634,708 259,012 33.3371 accelerator 1,223,038 35,771 34.1909 Preserver 496,627 18,757 26.4770 Protector 878,752 33,322 26.3715 Moderator 105,426 3,740 28.1864 Virtue 500,726 26,811 18.6762 Balancer 2 3,940,188 212,084 18.5784 Multiplier 2 4,679,745 303,540 15.4172 Preserver 2 816,802 38,146 21.4124 Protector 2 10,383,859 479,034 21.6766 Virtue 2 3,943,573 197,028 20.0153 flexi Cap 6,914,604 402,886 17.1627 Multiplier 3 88,804 9,297 9.5519 Liquid fund 9,706 808 12.0106 Mid Cap fund 30,523 4,138 7.3769 Premier Multi-Cap fund 67,007 7,960 8.4186 Crest (Thematic fund) 68,965 8,685 7.9405 Balanced opportunities fund 14,572 1,471 9.9036 Bond opportunities fund 17,020 1,420 11.9888 NaV Guarantee - - - discontinued fund 5,658,370 303,775 18.6268 Total 50,565,623 2,414,441
2 linked individual pensionBalancer 70,415 2,246 31.3474 Multiplier 217,982 6,539 33.3371 accelerator 28,874 845 34.1909 Preserver 15,371 581 26.4770 Protector 9,004 341 26.3715 Moderator 4,909 174 28.1864 Virtue 13,011 697 18.6762 Balancer 2 8,329 448 18.5784 Multiplier 2 37,176 2,411 15.4172 Preserver 2 8 0 21.4124 Protector 2 3,829 177 21.6766 Virtue 2 97 5 20.0153 flexi Cap 8,923 520 17.1627 Total 417,928 14,984
3 linked groupdebt fund 1,140,878 56,852 20.0675 Balanced fund 564,769 25,395 22.2395 Total 1,705,647 82,247 net asset as per Balance Sheet 52,689,198
Annexure 6
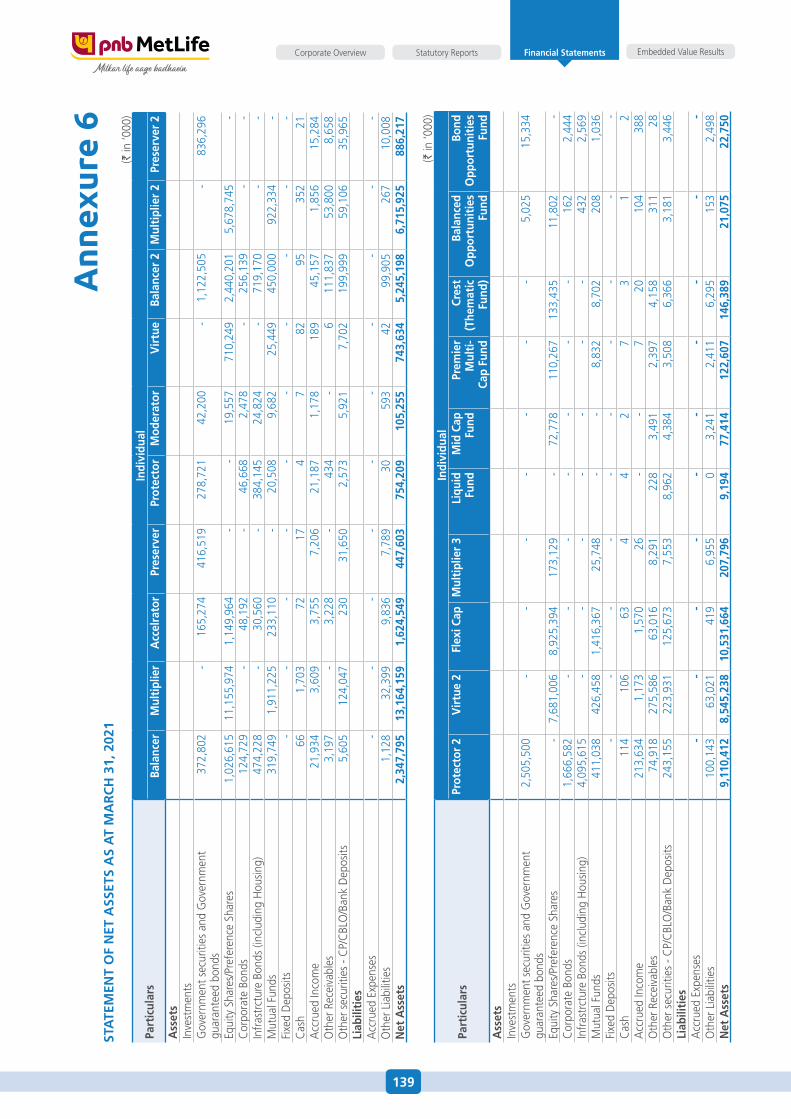
139
Embedded Value ResultsStatutory ReportsCorporate Overview Financial Statements
Ann
exur
e 6
STa
TEm
EnT
Of
nET
aSS
ETS
aS
aT
ma
rc
h 3
1, 2
021
(` in
‘000
)
part
icul
ars
indi
vidu
alBa
lanc
erm
ulti
plie
ra
ccel
rato
rpr
eser
ver
prot
ecto
rm
oder
ator
Vir
tue
Bala
ncer
2m
ulti
plie
r 2
pres
erve
r 2
ass
ets
Inve
stm
ents
Gov
ernm
ent s
ecur
ities
and
Gov
ernm
ent
guar
ante
ed b
onds
372
,802
-
165
,274
4
16,5
19
278
,721
4
2,20
0 -
1,1
22,5
05
- 8
36,2
96
equi
ty s
hare
s/Pr
efer
ence
sha
res
1,0
26,6
15
11,
155,
974
1,1
49,9
64
- -
19,
557
710
,249
2
,440
,201
5
,678
,745
-
Cor
pora
te B
onds
124
,729
-
48,
192
- 4
6,66
8 2
,478
-
256
,139
-
- In
fras
trct
ure
Bond
s (in
clud
ing
hou
sing)
474
,228
-
30,
560
- 3
84,1
45
24,
824
- 7
19,1
70
- -
Mut
ual f
unds
319
,749
1
,911
,225
2
33,1
10
- 2
0,50
8 9
,682
2
5,44
9 4
50,0
00
922
,334
-
fixe
d d
epos
its -
- -
- -
- -
- -
- C
ash
66
1,7
03
72
17
4
7
82
95
352
2
1 a
ccru
ed In
com
e 2
1,93
4 3
,609
3
,755
7
,206
2
1,18
7 1
,178
1
89
45,
157
1,8
56
15,
284
oth
er R
ecei
vabl
es 3
,197
-
3,2
28
- 4
34
- 6
1
11,8
37
53,
800
8,6
58
oth
er s
ecur
ities
- C
P/C
BLo
/Ban
k d
epos
its 5
,605
1
24,0
47
230
3
1,65
0 2
,573
5
,921
7
,702
1
99,9
99
59,
106
35,
965
liab
iliti
esa
ccru
ed e
xpen
ses
- -
- -
- -
- -
- -
oth
er L
iabi
litie
s 1
,128
3
2,39
9 9
,836
7
,789
3
0 5
93
42
99,
905
267
1
0,00
8 n
et a
sset
s 2
,347
,795
1
3,16
4,15
9 1
,624
,549
4
47,6
03
754
,209
1
05,2
55
743
,634
5
,245
,198
6
,715
,925
8
86,2
17
(` in
‘000
)
part
icul
ars
indi
vidu
alpr
otec
tor
2V
irtu
e 2
flex
i cap
mul
tipl
ier
3li
quid
fu
ndm
id c
ap
fund
prem
ier
mul
ti-
cap
fund
cres
t (T
hem
atic
fu
nd)
Bala
nced
O
ppor
tuni
ties
fu
nd
Bond
Opp
ortu
niti
esfu
nda
sset
sIn
vest
men
tsG
over
nmen
t sec
uriti
es a
nd G
over
nmen
t gu
aran
teed
bon
ds 2
,505
,500
-
- -
- -
- -
5,0
25
15,
334
equi
ty s
hare
s/Pr
efer
ence
sha
res
- 7
,681
,006
8
,925
,394
1
73,1
29
- 7
2,77
8 1
10,2
67
133
,435
1
1,80
2 -
Cor
pora
te B
onds
1,6
66,5
82
- -
- -
- -
- 1
62
2,4
44
Infr
astr
ctur
e Bo
nds
(incl
udin
g h
ousin
g) 4
,095
,615
-
- -
- -
- -
432
2
,569
M
utua
l fun
ds 4
11,0
38
426
,458
1
,416
,367
2
5,74
8 -
- 8
,832
8
,702
2
08
1,0
36
fixe
d d
epos
its -
- -
- -
- -
- -
- C
ash
114
1
06
63
4
4
2
7
3
1
2
acc
rued
Inco
me
213
,634
1
,173
1
,570
2
6 -
- 7
2
0 1
04
388
o
ther
Rec
eiva
bles
74,
918
275
,586
6
3,01
6 8
,291
2
28
3,4
91
2,3
97
4,1
58
311
2
8 o
ther
sec
uriti
es -
CP/
CBL
o/B
ank
dep
osits
243
,155
2
23,9
31
125
,673
7
,553
8
,962
4
,384
3
,508
6
,366
3
,181
3
,446
li
abili
ties
acc
rued
exp
ense
s -
-
-
-
-
-
-
-
-
-
o
ther
Lia
bilit
ies
100
,143
6
3,02
1 4
19
6,9
55
0
3,2
41
2,4
11
6,2
95
153
2
,498
n
et a
sset
s 9
,110
,412
8
,545
,238
1
0,53
1,66
4 2
07,7
96
9,1
94
77,
414
122
,607
1
46,3
89
21,
075
22,
750
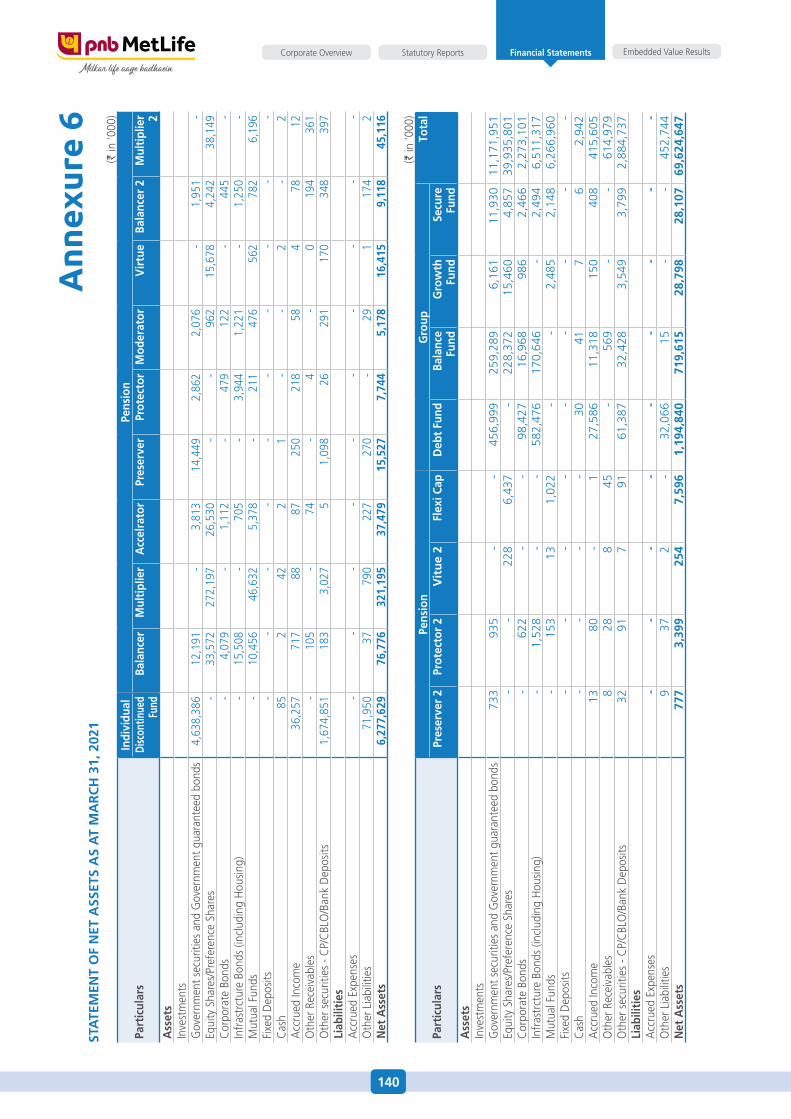
140
Embedded Value ResultsStatutory ReportsCorporate Overview Financial Statements
Ann
exur
e 6
STa
TEm
EnT
Of
nET
aSS
ETS
aS
aT
ma
rc
h 3
1, 2
021
(` in
‘000
)
part
icul
ars
indi
vidu
alpe
nsio
ndi
scon
tinue
dfu
ndBa
lanc
erm
ulti
plie
ra
ccel
rato
rpr
eser
ver
prot
ecto
rm
oder
ator
Vir
tue
Bala
ncer
2m
ulti
plie
r 2a
sset
sIn
vest
men
tsG
over
nmen
t sec
uriti
es a
nd G
over
nmen
t gua
rant
eed
bond
s 4
,638
,386
1
2,19
1 -
3,8
13
14,
449
2,8
62
2,0
76
- 1
,951
-
equi
ty s
hare
s/Pr
efer
ence
sha
res
- 3
3,57
2 2
72,1
97
26,
530
- -
962
1
5,67
8 4
,242
3
8,14
9 C
orpo
rate
Bon
ds -
4,0
79
- 1
,112
-
479
1
22
- 4
45
- In
fras
trct
ure
Bond
s (in
clud
ing
hou
sing)
- 1
5,50
8 -
705
-
3,9
44
1,2
21
- 1
,250
-
Mut
ual f
unds
- 1
0,45
6 4
6,63
2 5
,378
-
211
4
76
562
7
82
6,1
96
fixe
d d
epos
its -
- -
- -
- -
- -
- C
ash
85
2
42
2
1
--
2
- 2
a
ccru
ed In
com
e 3
6,25
7 7
17
88
87
250
2
18
58
4
78
12
oth
er R
ecei
vabl
es -
105
-
74
- 4
-
0
194
3
61
oth
er s
ecur
ities
- C
P/C
BLo
/Ban
k d
epos
its 1
,674
,851
1
83
3,0
27
5
1,0
98
26
291
1
70
348
3
97
liab
iliti
esa
ccru
ed e
xpen
ses
- -
- -
- -
- -
- -
oth
er L
iabi
litie
s 7
1,95
0 3
7 7
90
227
2
70
- 2
9 1
1
74
2
net
ass
ets
6,2
77,6
29
76,
776
321
,195
3
7,47
9 1
5,52
7 7
,744
5
,178
1
6,41
5 9
,118
4
5,11
6
(` in
‘000
)
part
icul
ars
pens
ion
gro
upTo
tal
pres
erve
r 2
prot
ecto
r 2
Vit
ue
2fl
exi c
apd
ebt
fund
Bala
nce
fund
gro
wth
fu
nd S
ecur
e fu
nda
sset
sIn
vest
men
tsG
over
nmen
t sec
uriti
es a
nd G
over
nmen
t gua
rant
eed
bond
s 7
33
935
-
-
4
56,9
99
259
,289
6
,161
1
1,93
0 11
,171
,951
eq
uity
sha
res/
Pref
eren
ce s
hare
s -
-
2
28
6,4
37
-
228
,372
1
5,46
0 4
,857
39
,935
,801
C
orpo
rate
Bon
ds -
6
22
-
-
98,
427
16,
968
986
2
,466
2
,273
,101
In
fras
trct
ure
Bond
s (in
clud
ing
hou
sing)
-
1,5
28
-
-
582
,476
1
70,6
46
-
2,4
94
6,5
11,3
17
Mut
ual f
unds
-
153
1
3 1
,022
-
-
2
,485
2
,148
6
,266
,960
fi
xed
dep
osits
-
-
-
-
-
-
-
-
-
Cas
h -
-
--
30
41
7
6
2,9
42
acc
rued
Inco
me
13
80
- 1
2
7,58
6 1
1,31
8 1
50
408
4
15,6
05
oth
er R
ecei
vabl
es 8
2
8 8
4
5 -
5
69
-
-
614
,979
o
ther
sec
uriti
es -
CP/
CBL
o/B
ank
dep
osits
32
91
7
91
61,
387
32,
428
3,5
49
3,7
99
2,8
84,7
37
liab
iliti
esa
ccru
ed e
xpen
ses
-
-
-
-
-
-
-
-
-
oth
er L
iabi
litie
s 9
3
7 2
-
32,
066
15
-
-
452
,744
n
et a
sset
s 7
77
3,3
99
254
7
,596
1
,194
,840
7
19,6
15
28,
798
28,
107
69,6
24,6
47
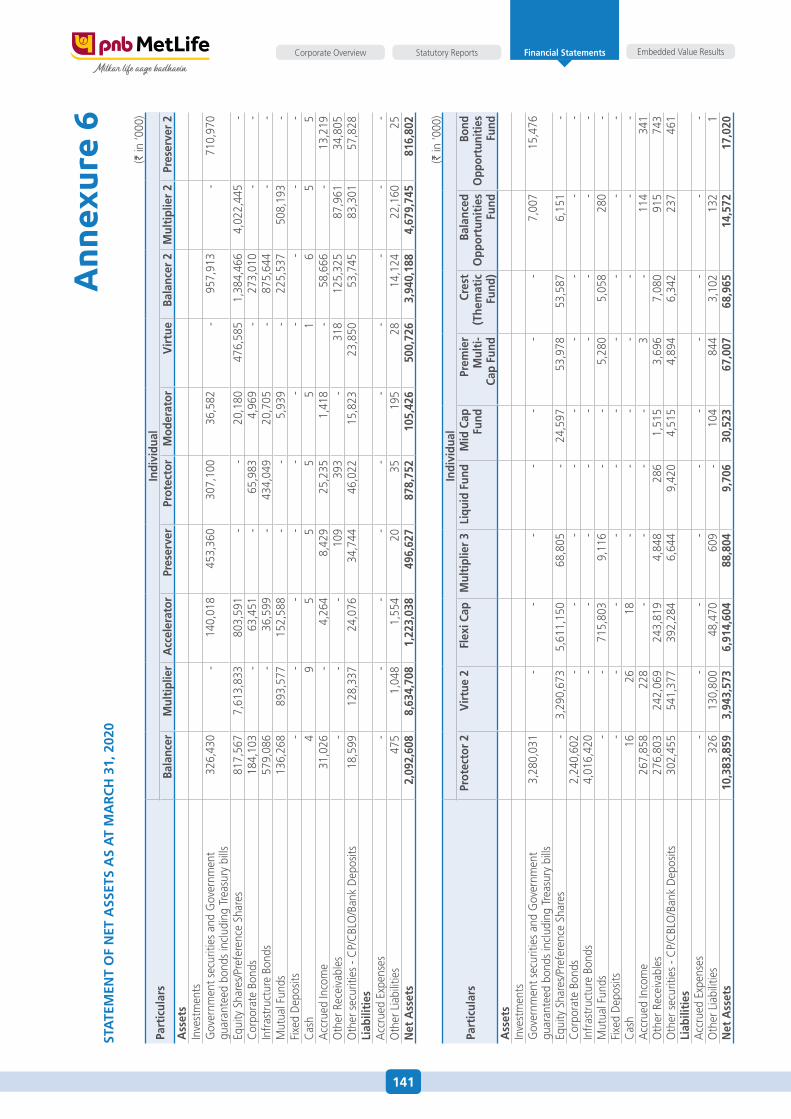
141
Embedded Value ResultsStatutory ReportsCorporate Overview Financial Statements
Ann
exur
e 6
STa
TEm
EnT
Of
nET
aSS
ETS
aS
aT
ma
rc
h 3
1, 2
020
(` in
‘000
)
part
icul
ars
indi
vidu
alBa
lanc
erm
ulti
plie
ra
ccel
erat
orpr
eser
ver
prot
ecto
rm
oder
ator
Vir
tue
Bala
ncer
2m
ulti
plie
r 2
pres
erve
r 2
ass
ets
Inve
stm
ents
Gov
ernm
ent s
ecur
ities
and
Gov
ernm
ent
guar
ante
ed b
onds
incl
udin
g Tr
easu
ry b
ills
326
,430
-
140
,018
4
53,3
60
307
,100
3
6,58
2 -
957
,913
-
710
,970
equi
ty s
hare
s/Pr
efer
ence
sha
res
817
,567
7
,613
,833
8
03,5
91
- -
20,
180
476
,585
1
,384
,466
4
,022
,445
-
Cor
pora
te B
onds
184
,103
-
63,
451
- 6
5,98
3 4
,969
-
273
,010
-
- In
fras
truc
ture
Bon
ds 5
79,0
86
- 3
6,59
9 -
434
,049
2
0,70
5 -
875
,644
-
- M
utua
l fun
ds 1
36,2
68
893
,577
1
52,5
88
- -
5,9
39
- 2
25,5
37
508
,193
-
fixe
d d
epos
its -
- -
- -
- -
- -
- C
ash
4
9
5
5
5
5
1
6
5
5
acc
rued
Inco
me
31,
026
- 4
,264
8
,429
2
5,23
5 1
,418
-
58,
666
- 1
3,21
9 o
ther
Rec
eiva
bles
- -
- 1
09
393
-
318
1
25,3
25
87,
961
34,
805
oth
er s
ecur
ities
- C
P/C
BLo
/Ban
k d
epos
its 1
8,59
9 1
28,3
37
24,
076
34,
744
46,
022
15,
823
23,
850
53,
745
83,
301
57,
828
liab
iliti
esa
ccru
ed e
xpen
ses
- -
- -
- -
- -
- -
oth
er L
iabi
litie
s 4
75
1,0
48
1,5
54
20
35
195
2
8 1
4,12
4 2
2,16
0 2
5 n
et a
sset
s 2
,092
,608
8
,634
,708
1
,223
,038
4
96,6
27
878
,752
1
05,4
26
500
,726
3
,940
,188
4
,679
,745
8
16,8
02
(` in
‘000
)
part
icul
ars
indi
vidu
alpr
otec
tor
2V
irtu
e 2
flex
i cap
mul
tipl
ier
3li
quid
fun
dm
id c
ap
fund
prem
ier
mul
ti-
cap
fund
cres
t(T
hem
atic
fund
)
Bala
nced
Opp
ortu
niti
esfu
nd
Bond
Opp
ortu
nitie
sfu
nda
sset
sIn
vest
men
tsG
over
nmen
t sec
uriti
es a
nd G
over
nmen
t gu
aran
teed
bon
ds in
clud
ing
Trea
sury
bill
s 3
,280
,031
-
- -
- -
- -
7,0
07
15,
476
equi
ty s
hare
s/Pr
efer
ence
sha
res
- 3
,290
,673
5
,611
,150
6
8,80
5 -
24,
597
53,
978
53,
587
6,1
51
- C
orpo
rate
Bon
ds 2
,240
,602
-
- -
- -
- -
- -
Infr
astr
uctu
re B
onds
4,0
16,4
20
- -
- -
- -
- -
- M
utua
l fun
ds -
- 7
15,8
03
9,1
16
- -
5,2
80
5,0
58
280
-
fixe
d d
epos
its -
- -
- -
- -
- -
- C
ash
16
26
18
- -
- -
- -
- a
ccru
ed In
com
e 2
67,8
58
228
-
- -
- 3
-
114
3
41
oth
er R
ecei
vabl
es 2
76,8
03
242
,069
2
43,8
19
4,8
48
286
1
,515
3
,696
7
,080
9
15
743
o
ther
sec
uriti
es -
CP/
CBL
o/B
ank
dep
osits
302
,455
5
41,3
77
392
,284
6
,644
9
,420
4
,515
4
,894
6
,342
2
37
461
li
abili
ties
acc
rued
exp
ense
s -
- -
- -
- -
- -
- o
ther
Lia
bilit
ies
326
1
30,8
00
48,
470
609
-
104
8
44
3,1
02
132
1
n
et a
sset
s 1
0,38
3,85
9 3
,943
,573
6
,914
,604
8
8,80
4 9
,706
3
0,52
3 6
7,00
7 6
8,96
5 1
4,57
2 1
7,02
0
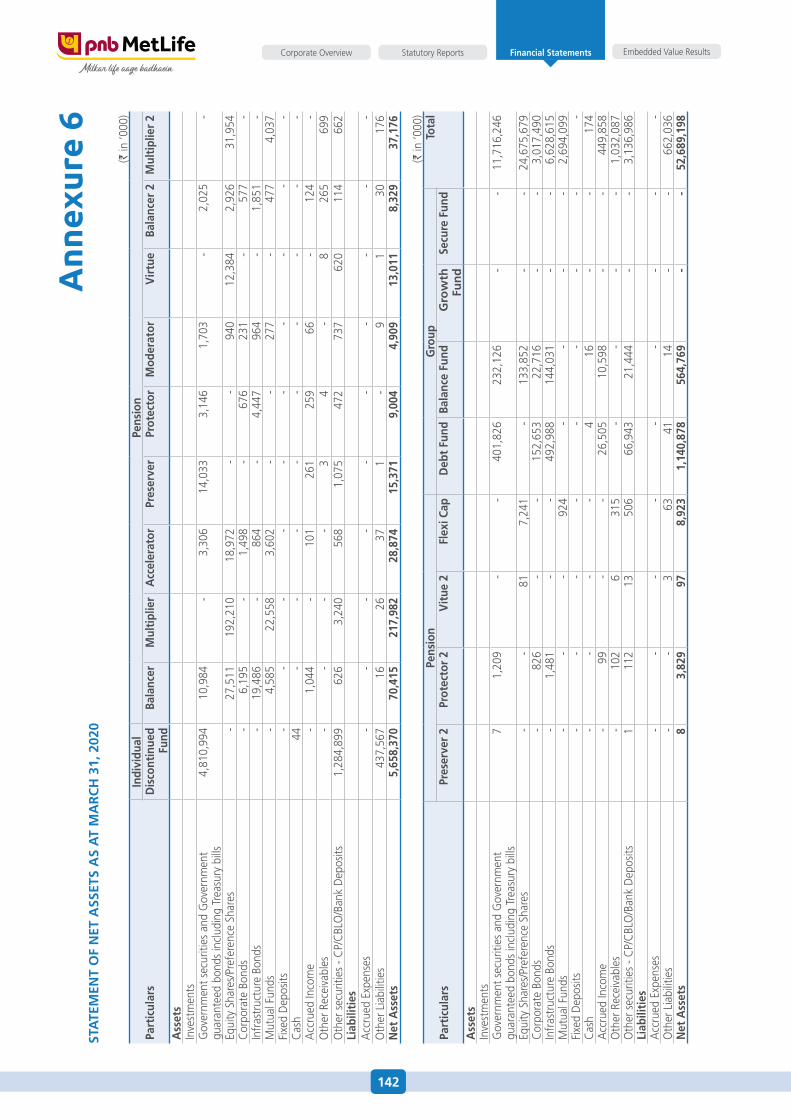
142
Embedded Value ResultsStatutory ReportsCorporate Overview Financial Statements
Ann
exur
e 6
STa
TEm
EnT
Of
nET
aSS
ETS
aS
aT
ma
rc
h 3
1, 2
020
(` in
‘000
)
part
icul
ars
indi
vidu
alpe
nsio
nd
isco
ntin
ued
fund
Bala
ncer
mul
tipl
ier
acc
eler
ator
pres
erve
rpr
otec
tor
mod
erat
orV
irtu
eBa
lanc
er 2
mul
tipl
ier
2
ass
ets
Inve
stm
ents
Gov
ernm
ent s
ecur
ities
and
Gov
ernm
ent
guar
ante
ed b
onds
incl
udin
g Tr
easu
ry b
ills
4,8
10,9
94
10,
984
- 3
,306
1
4,03
3 3
,146
1
,703
-
2,0
25
-
equi
ty s
hare
s/Pr
efer
ence
sha
res
- 2
7,51
1 1
92,2
10
18,
972
- -
940
1
2,38
4 2
,926
3
1,95
4 C
orpo
rate
Bon
ds -
6,1
95
- 1
,498
-
676
2
31
- 5
77
- In
fras
truc
ture
Bon
ds -
19,
486
- 8
64
- 4
,447
9
64
- 1
,851
-
Mut
ual f
unds
- 4
,585
2
2,55
8 3
,602
-
- 2
77
- 4
77
4,0
37
fixe
d d
epos
its -
- -
- -
- -
- -
- C
ash
44
- -
- -
- -
- -
- a
ccru
ed In
com
e -
1,0
44
- 1
01
261
2
59
66
- 1
24
- o
ther
Rec
eiva
bles
- -
- -
3
4
- 8
2
65
699
o
ther
sec
uriti
es -
CP/
CBL
o/B
ank
dep
osits
1,2
84,8
99
626
3
,240
5
68
1,0
75
472
7
37
620
1
14
662
li
abili
ties
acc
rued
exp
ense
s -
- -
- -
- -
- -
- o
ther
Lia
bilit
ies
437
,567
1
6 2
6 3
7 1
-
9
1
30
176
n
et a
sset
s 5
,658
,370
7
0,41
5 2
17,9
82
28,
874
15,
371
9,0
04
4,9
09
13,
011
8,3
29
37,
176
(` in
‘000
)
part
icul
ars
pens
ion
gro
upTo
tal
pres
erve
r 2
prot
ecto
r 2
Vit
ue 2
flex
i cap
deb
t fu
ndBa
lanc
e fu
ndg
row
th
fun
d S
ecur
e fu
nd
ass
ets
Inve
stm
ents
Gov
ernm
ent s
ecur
ities
and
Gov
ernm
ent
guar
ante
ed b
onds
incl
udin
g Tr
easu
ry b
ills
7
1,2
09
- -
401
,826
2
32,1
26
-
- 1
1,71
6,24
6
equi
ty s
hare
s/Pr
efer
ence
sha
res
- -
81
7,2
41
- 1
33,8
52
-
- 2
4,67
5,67
9 C
orpo
rate
Bon
ds -
826
-
- 1
52,6
53
22,
716
-
- 3
,017
,490
In
fras
truc
ture
Bon
ds -
1,4
81
- -
492
,988
1
44,0
31
-
- 6
,628
,615
M
utua
l fun
ds -
- -
924
-
- -
-
2,6
94,0
99
fixe
d d
epos
its -
- -
- -
- -
-
- C
ash
- -
- -
4
16
-
- 1
74
acc
rued
Inco
me
- 9
9 -
- 2
6,50
5 1
0,59
8 -
-
449
,858
o
ther
Rec
eiva
bles
- 1
02
6
315
-
- -
-
1,0
32,0
87
oth
er s
ecur
ities
- C
P/C
BLo
/Ban
k d
epos
its 1
1
12
13
506
6
6,94
3 2
1,44
4 -
-
3,1
36,9
86
liab
iliti
esa
ccru
ed e
xpen
ses
- -
- -
- -
-
- -
oth
er L
iabi
litie
s -
- 3
6
3 4
1 1
4 -
-
662
,036
n
et a
sset
s 8
3
,829
9
7 8
,923
1
,140
,878
5
64,7
69
-
- 5
2,68
9,19
8
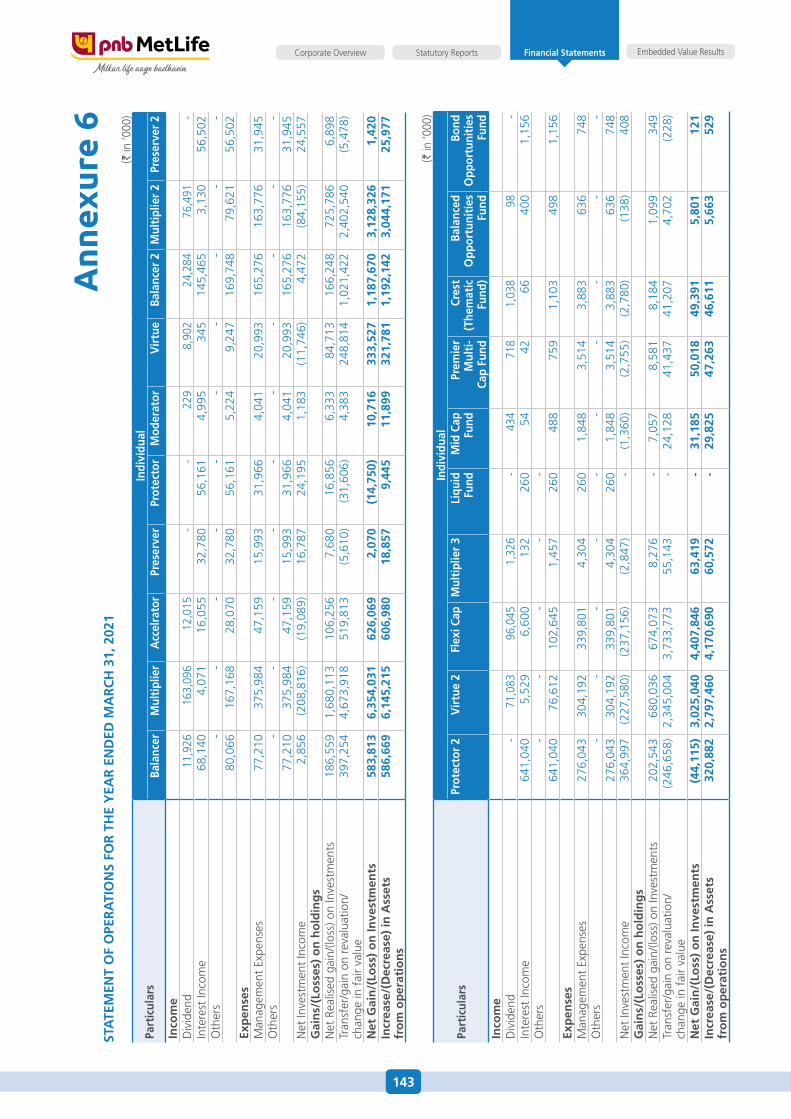
143
Embedded Value ResultsStatutory ReportsCorporate Overview Financial Statements
Ann
exur
e 6
STa
TEm
EnT
Of
OpE
ra
TiO
nS
fOr
Th
E y
Ear
En
dEd
ma
rc
h 3
1, 2
021
(` in
‘000
)
part
icul
ars
indi
vidu
alBa
lanc
erm
ulti
plie
ra
ccel
rato
rpr
eser
ver
prot
ecto
rm
oder
ator
Vir
tue
Bala
ncer
2m
ulti
plie
r 2
pres
erve
r 2
inco
me
div
iden
d 1
1,92
6 1
63,0
96
12,
015
- -
229
8
,902
2
4,28
4 7
6,49
1 -
Inte
rest
Inco
me
68,
140
4,0
71
16,
055
32,
780
56,
161
4,9
95
345
1
45,4
65
3,1
30
56,
502
oth
ers
-
-
-
-
-
-
-
-
-
-
80,
066
167
,168
2
8,07
0 3
2,78
0 5
6,16
1 5
,224
9
,247
1
69,7
48
79,
621
56,
502
Exp
ense
sM
anag
emen
t ex
pens
es 7
7,21
0 3
75,9
84
47,
159
15,
993
31,
966
4,0
41
20,
993
165
,276
1
63,7
76
31,
945
oth
ers
-
-
-
-
-
-
-
-
-
-
77,
210
375
,984
4
7,15
9 1
5,99
3 3
1,96
6 4
,041
2
0,99
3 1
65,2
76
163
,776
3
1,94
5 N
et In
vest
men
t In
com
e 2
,856
(2
08,8
16)
(19,
089)
16,
787
24,
195
1,1
83
(11,
746)
4,4
72
(84,
155)
24,
557
gai
ns/
(lo
sses
) o
n h
old
ing
sN
et R
ealis
ed g
ain/
(loss
) on
Inve
stm
ents
186
,559
1
,680
,113
1
06,2
56
7,6
80
16,
856
6,3
33
84,
713
166
,248
7
25,7
86
6,8
98
Tran
sfer
/gai
n on
rev
alua
tion/
chan
ge in
fai
r va
lue
397
,254
4
,673
,918
5
19,8
13
(5,6
10)
(31,
606)
4,3
83
248
,814
1
,021
,422
2
,402
,540
(5
,478
)
net
gai
n/(
loss
) o
n in
vest
men
ts 5
83,8
13
6,3
54,0
31
626
,069
2
,070
(
14,7
50)
10,
716
333
,527
1
,187
,670
3
,128
,326
1
,420
in
crea
se/(
dec
reas
e) in
ass
ets
fro
m o
per
atio
ns
586
,669
6
,145
,215
6
06,9
80
18,
857
9,4
45
11,
899
321
,781
1
,192
,142
3
,044
,171
2
5,97
7
(` in
‘000
)
part
icul
ars
indi
vidu
alpr
otec
tor
2V
irtu
e 2
flex
i cap
mul
tipl
ier
3li
quid
fu
ndm
id c
ap
fund
prem
ier
mul
ti-
cap
fund
cres
t (T
hem
atic
fu
nd)
Bala
nced
O
ppor
tuni
ties
fu
nd
Bond
Opp
ortu
niti
esfu
ndin
com
ed
ivid
end
- 7
1,08
3 9
6,04
5 1
,326
-
434
7
18
1,0
38
98
- In
tere
st In
com
e 6
41,0
40
5,5
29
6,6
00
132
2
60
54
42
66
400
1
,156
o
ther
s -
-
-
-
-
6
41,0
40
76,
612
102
,645
1
,457
2
60
488
7
59
1,1
03
498
1
,156
Ex
pen
ses
Man
agem
ent
expe
nses
276
,043
3
04,1
92
339
,801
4
,304
2
60
1,8
48
3,5
14
3,8
83
636
7
48
oth
ers
-
-
-
-
-
-
-
-
-
-
276
,043
3
04,1
92
339
,801
4
,304
2
60
1,8
48
3,5
14
3,8
83
636
7
48
Net
Inve
stm
ent
Inco
me
364
,997
(2
27,5
80)
(237
,156
) (2
,847
) -
(1
,360
) (2
,755
) (2
,780
) (1
38)
408
g
ain
s/(l
oss
es)
on
ho
ldin
gs
Net
Rea
lised
gai
n/(lo
ss) o
n In
vest
men
ts 2
02,5
43
680
,036
6
74,0
73
8,2
76
-
7,0
57
8,5
81
8,1
84
1,0
99
349
Tr
ansf
er/g
ain
on r
eval
uatio
n/ch
ange
in f
air
valu
e (2
46,6
58)
2,3
45,0
04
3,7
33,7
73
55,
143
-
24,
128
41,
437
41,
207
4,7
02
(228
)
net
gai
n/(
loss
) o
n in
vest
men
ts (
44,1
15)
3,0
25,0
40
4,4
07,8
46
63,
419
-
31,
185
50,
018
49,
391
5,8
01
121
in
crea
se/(
dec
reas
e) in
ass
ets
fro
m o
per
atio
ns
320
,882
2
,797
,460
4
,170
,690
6
0,57
2 -
2
9,82
5 4
7,26
3 4
6,61
1 5
,663
5
29
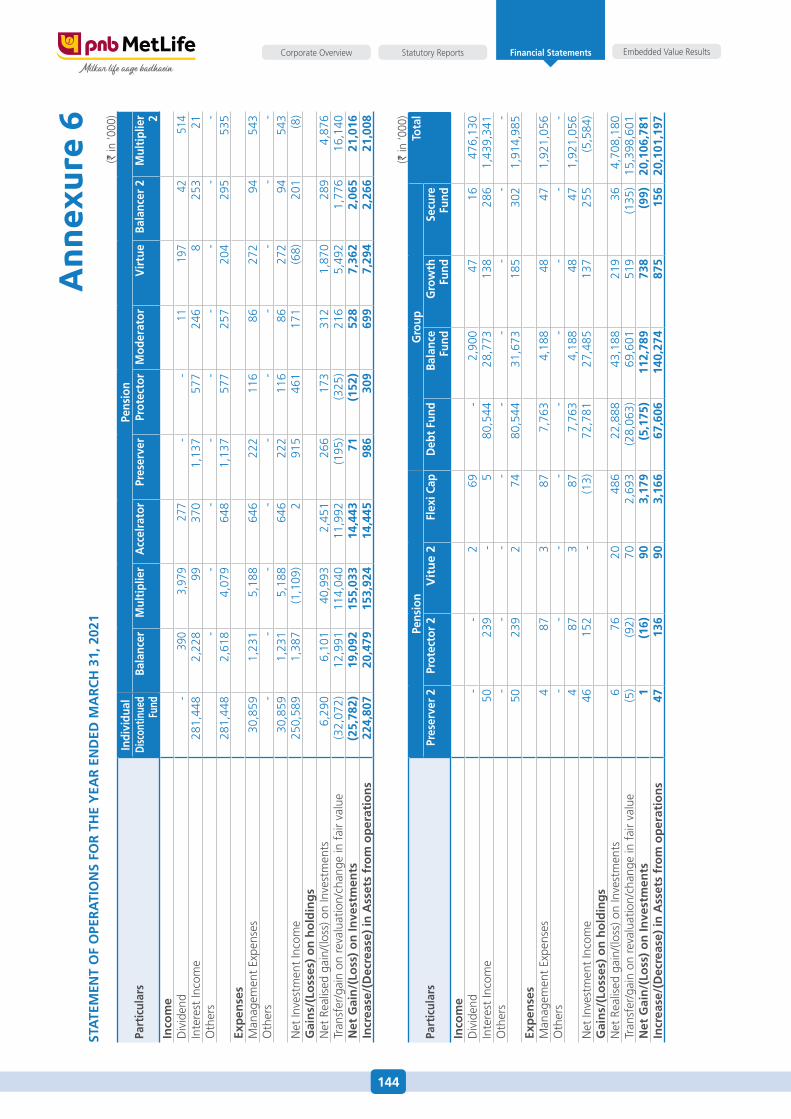
144
Embedded Value ResultsStatutory ReportsCorporate Overview Financial Statements
Ann
exur
e 6
STa
TEm
EnT
Of
OpE
ra
TiO
nS
fOr
Th
E y
Ear
En
dEd
ma
rc
h 3
1, 2
021
(` in
‘000
)
part
icul
ars
indi
vidu
alpe
nsio
ndi
scon
tinue
dfu
ndBa
lanc
erm
ulti
plie
ra
ccel
rato
rpr
eser
ver
prot
ecto
rm
oder
ator
Vir
tue
Bala
ncer
2m
ulti
plie
r 2in
com
ed
ivid
end
- 3
90
3,9
79
277
-
- 1
1 1
97
42
514
In
tere
st In
com
e 2
81,4
48
2,2
28
99
370
1
,137
5
77
246
8
2
53
21
oth
ers
-
-
-
-
-
-
-
-
-
281
,448
2
,618
4
,079
6
48
1,1
37
577
2
57
204
2
95
535
Ex
pen
ses
Man
agem
ent
expe
nses
30,
859
1,2
31
5,1
88
646
2
22
116
8
6 2
72
94
543
o
ther
s -
-
-
-
-
-
-
-
-
-
3
0,85
9 1
,231
5
,188
6
46
222
1
16
86
272
9
4 5
43
Net
Inve
stm
ent
Inco
me
250
,589
1
,387
(1
,109
) 2
9
15
461
1
71
(68)
201
(8
)g
ain
s/(l
oss
es)
on
ho
ldin
gs
Net
Rea
lised
gai
n/(lo
ss) o
n In
vest
men
ts 6
,290
6
,101
4
0,99
3 2
,451
2
66
173
3
12
1,8
70
289
4
,876
Tr
ansf
er/g
ain
on r
eval
uatio
n/ch
ange
in f
air
valu
e (3
2,07
2) 1
2,99
1 1
14,0
40
11,
992
(195
) (3
25)
216
5
,492
1
,776
1
6,14
0 n
et g
ain
/(lo
ss)
on
inve
stm
ents
(25
,782
) 1
9,09
2 1
55,0
33
14,
443
71
(15
2) 5
28
7,3
62
2,0
65
21,
016
incr
ease
/(d
ecre
ase)
in a
sset
s fr
om
op
erat
ion
s 2
24,8
07
20,
479
153
,924
1
4,44
5 9
86
309
6
99
7,2
94
2,2
66
21,
008
(` in
‘000
)
part
icul
ars
pens
ion
gro
upTo
tal
pres
erve
r 2
prot
ecto
r 2
Vit
ue
2fl
exi c
apd
ebt
fund
Bala
nce
fund
gro
wth
fu
nd S
ecur
e fu
ndin
com
ed
ivid
end
-
-
2
69
-
2,9
00
47
16
476
,130
In
tere
st In
com
e 5
0 2
39
- 5
8
0,54
4 2
8,77
3 1
38
286
1
,439
,341
o
ther
s -
-
-
-
-
-
-
-
-
5
0 2
39
2
74
80,
544
31,
673
185
3
02
1,9
14,9
85
Exp
ense
sM
anag
emen
t ex
pens
es 4
8
7 3
8
7 7
,763
4
,188
4
8 4
7 1
,921
,056
o
ther
s -
-
-
-
-
-
-
-
-
4
8
7 3
8
7 7
,763
4
,188
4
8 4
7 1
,921
,056
N
et In
vest
men
t In
com
e 4
6 1
52
- (1
3) 7
2,78
1 2
7,48
5 1
37
255
(5
,584
)g
ain
s/(l
oss
es)
on
ho
ldin
gs
Net
Rea
lised
gai
n/(lo
ss) o
n In
vest
men
ts 6
7
6 2
0 4
86
22,
888
43,
188
219
3
6 4
,708
,180
Tr
ansf
er/g
ain
on r
eval
uatio
n/ch
ange
in f
air
valu
e (5
) (9
2) 7
0 2
,693
(2
8,06
3) 6
9,60
1 5
19
(135
) 1
5,39
8,60
1 n
et g
ain
/(lo
ss)
on
inve
stm
ents
1
(16
) 9
0 3
,179
(
5,17
5) 1
12,7
89
738
(
99)
20,
106,
781
incr
ease
/(d
ecre
ase)
in a
sset
s fr
om
op
erat
ion
s 4
7 1
36
90
3,1
66
67,
606
140
,274
8
75
156
2
0,10
1,19
7
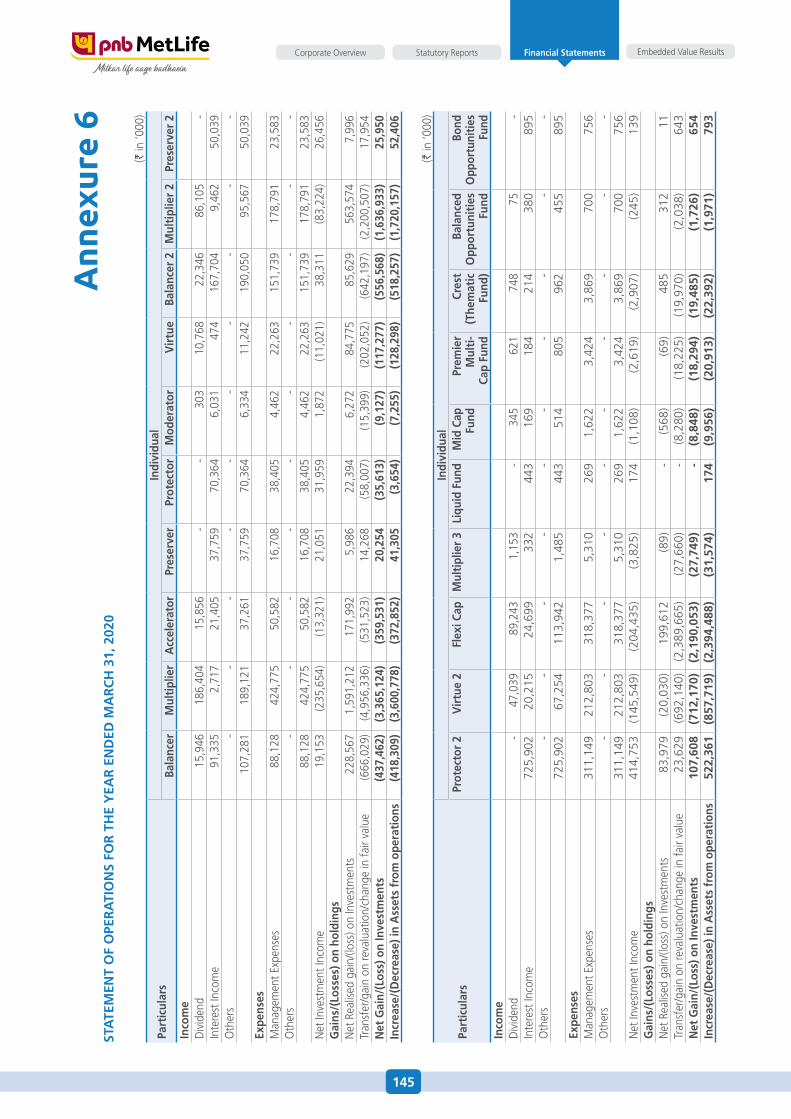
145
Embedded Value ResultsStatutory ReportsCorporate Overview Financial Statements
Ann
exur
e 6
STa
TEm
EnT
Of
OpE
ra
TiO
nS
fOr
Th
E y
Ear
En
dEd
ma
rc
h 3
1, 2
020
(` in
‘000
)
part
icul
ars
indi
vidu
alBa
lanc
erm
ulti
plie
ra
ccel
erat
orpr
eser
ver
prot
ecto
rm
oder
ator
Vir
tue
Bala
ncer
2m
ulti
plie
r 2
pres
erve
r 2
inco
me
div
iden
d 1
5,94
6 1
86,4
04
15,
856
- -
303
1
0,76
8 2
2,34
6 8
6,10
5 -
Inte
rest
Inco
me
91,
335
2,7
17
21,
405
37,
759
70,
364
6,0
31
474
1
67,7
04
9,4
62
50,
039
oth
ers
- -
- -
- -
- -
- -
107
,281
1
89,1
21
37,
261
37,
759
70,
364
6,3
34
11,
242
190
,050
9
5,56
7 5
0,03
9 Ex
pens
esM
anag
emen
t exp
ense
s 8
8,12
8 4
24,7
75
50,
582
16,
708
38,
405
4,4
62
22,
263
151
,739
1
78,7
91
23,
583
oth
ers
- -
- -
- -
- -
- -
88,
128
424
,775
5
0,58
2 1
6,70
8 3
8,40
5 4
,462
2
2,26
3 1
51,7
39
178
,791
2
3,58
3 N
et In
vest
men
t Inc
ome
19,
153
(235
,654
) (1
3,32
1) 2
1,05
1 3
1,95
9 1
,872
(1
1,02
1) 3
8,31
1 (8
3,22
4) 2
6,45
6 g
ains
/(lo
sses
) on
hold
ings
Net
Rea
lised
gai
n/(lo
ss) o
n In
vest
men
ts 2
28,5
67
1,5
91,2
12
171
,992
5
,986
2
2,39
4 6
,272
8
4,77
5 8
5,62
9 5
63,5
74
7,9
96
Tran
sfer
/gai
n on
reva
luat
ion/
chan
ge in
fair
valu
e (6
66,0
29)
(4,9
56,3
36)
(531
,523
) 1
4,26
8 (5
8,00
7) (1
5,39
9) (2
02,0
52)
(642
,197
) (2
,200
,507
) 1
7,95
4 n
et g
ain/
(los
s) o
n in
vest
men
ts (4
37,4
62)
(3,3
65,1
24)
(359
,531
) 2
0,25
4 (3
5,61
3) (9
,127
) (1
17,2
77)
(556
,568
) (1
,636
,933
) 2
5,95
0 in
crea
se/(
dec
reas
e) in
ass
ets
from
ope
rati
ons
(418
,309
) (3
,600
,778
) (3
72,8
52)
41,
305
(3,6
54)
(7,2
55)
(128
,298
) (5
18,2
57)
(1,7
20,1
57)
52,
406
(` in
‘000
)
part
icul
ars
indi
vidu
alpr
otec
tor
2V
irtu
e 2
flex
i cap
mul
tipl
ier
3li
quid
fun
dm
id c
ap
fund
prem
ier
mul
ti-
cap
fund
cres
t(T
hem
atic
fund
)
Bala
nced
Opp
ortu
niti
esfu
nd
Bond
Opp
ortu
nitie
sfu
ndin
com
ed
ivid
end
- 4
7,03
9 8
9,24
3 1
,153
-
345
6
21
748
7
5 -
Inte
rest
Inco
me
725
,902
2
0,21
5 2
4,69
9 3
32
443
1
69
184
2
14
380
8
95
oth
ers
-
-
-
-
-
-
-
-
-
-
725
,902
6
7,25
4 1
13,9
42
1,4
85
443
5
14
805
9
62
455
8
95
Expe
nses
Man
agem
ent e
xpen
ses
311
,149
2
12,8
03
318
,377
5
,310
2
69
1,6
22
3,4
24
3,8
69
700
7
56
oth
ers
-
-
-
-
-
-
-
-
-
-
311
,149
2
12,8
03
318
,377
5
,310
2
69
1,6
22
3,4
24
3,8
69
700
7
56
Net
Inve
stm
ent I
ncom
e 4
14,7
53
(145
,549
) (2
04,4
35)
(3,8
25)
174
(1
,108
) (2
,619
) (2
,907
) (2
45)
139
g
ains
/(lo
sses
) on
hold
ings
Net
Rea
lised
gai
n/(lo
ss) o
n In
vest
men
ts 8
3,97
9 (2
0,03
0) 1
99,6
12
(89)
-
(568
) (6
9) 4
85
312
1
1 Tr
ansf
er/g
ain
on re
valu
atio
n/ch
ange
in fa
ir va
lue
23,
629
(692
,140
)(2
,389
,665
) (2
7,66
0) -
(8
,280
) (1
8,22
5) (1
9,97
0) (2
,038
) 6
43
net
gai
n/(l
oss)
on
inve
stm
ents
107
,608
(
712,
170)
(2,1
90,0
53)
(27
,749
) -
(
8,84
8) (
18,2
94)
(19
,485
) (
1,72
6) 6
54
incr
ease
/(d
ecre
ase)
in a
sset
s fr
om o
pera
tion
s 5
22,3
61
(85
7,71
9)(2
,394
,488
) (
31,5
74)
174
(
9,95
6) (
20,9
13)
(22
,392
) (
1,97
1) 7
93
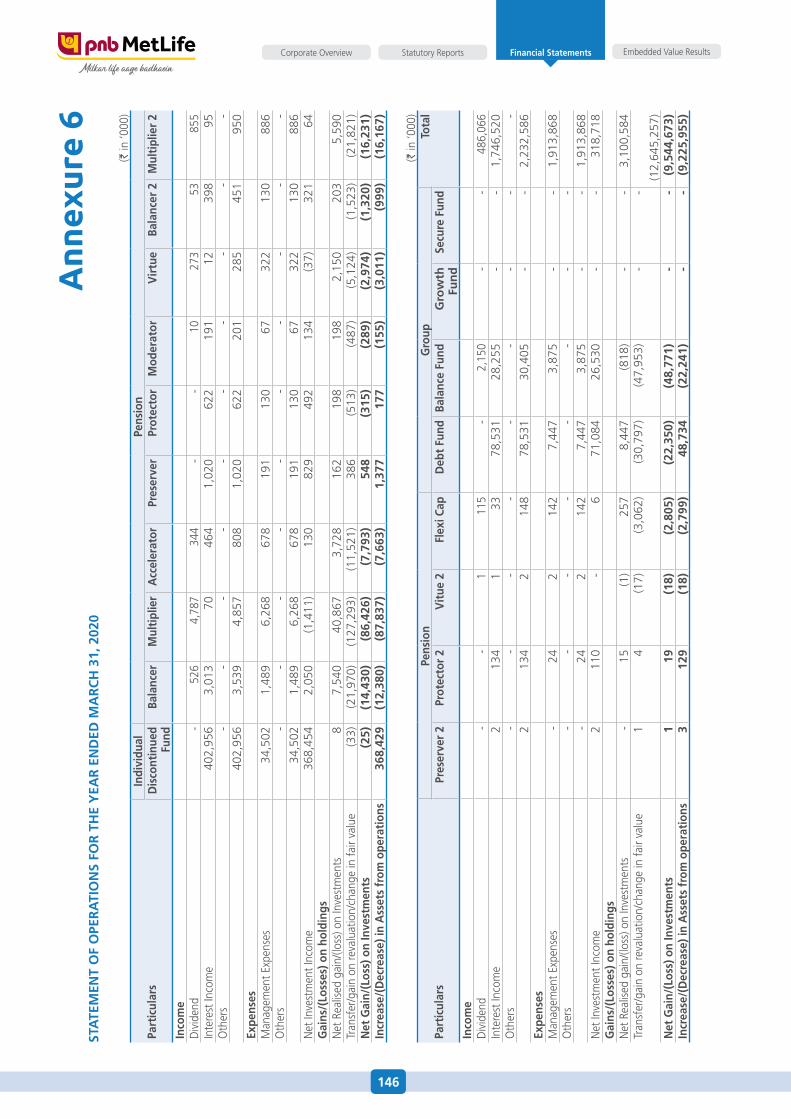
146
Embedded Value ResultsStatutory ReportsCorporate Overview Financial Statements
Ann
exur
e 6
STa
TEm
EnT
Of
OpE
ra
TiO
nS
fOr
Th
E y
Ear
En
dEd
ma
rc
h 3
1, 2
020
(` in
‘000
)
part
icul
ars
indi
vidu
alpe
nsio
nd
isco
ntin
ued
fund
Bala
ncer
mul
tipl
ier
acc
eler
ator
pres
erve
rpr
otec
tor
mod
erat
orV
irtu
eBa
lanc
er 2
mul
tipl
ier
2
inco
me
div
iden
d -
526
4
,787
3
44
- -
10
273
5
3 8
55
Inte
rest
Inco
me
402
,956
3
,013
7
0 4
64
1,0
20
622
1
91
12
398
9
5 o
ther
s -
-
-
-
-
-
-
-
-
-
4
02,9
56
3,5
39
4,8
57
808
1
,020
6
22
201
2
85
451
9
50
Expe
nses
Man
agem
ent e
xpen
ses
34,
502
1,4
89
6,2
68
678
1
91
130
6
7 3
22
130
8
86
oth
ers
-
-
-
-
-
-
-
-
-
-
34,
502
1,4
89
6,2
68
678
1
91
130
6
7 3
22
130
8
86
Net
Inve
stm
ent I
ncom
e 3
68,4
54
2,0
50
(1,4
11)
130
8
29
492
1
34
(37)
321
6
4 g
ains
/(lo
sses
) on
hold
ings
Net
Rea
lised
gai
n/(lo
ss) o
n In
vest
men
ts 8
7
,540
4
0,86
7 3
,728
1
62
198
1
98
2,1
50
203
5
,590
Tr
ansf
er/g
ain
on re
valu
atio
n/ch
ange
in fa
ir va
lue
(33)
(21,
970)
(127
,293
) (1
1,52
1) 3
86
(513
) (4
87)
(5,1
24)
(1,5
23)
(21,
821)
net
gai
n/(l
oss)
on
inve
stm
ents
(25
) (
14,4
30)
(86
,426
) (
7,79
3) 5
48
(31
5) (
289)
(2,
974)
(1,
320)
(16
,231
)in
crea
se/(
dec
reas
e) in
ass
ets
from
ope
rati
ons
368
,429
(
12,3
80)
(87
,837
) (
7,66
3) 1
,377
1
77
(15
5) (
3,01
1) (
999)
(16
,167
)
(` in
‘000
)
part
icul
ars
pens
ion
gro
upTo
tal
pres
erve
r 2
prot
ecto
r 2
Vit
ue 2
flex
i cap
deb
t fu
ndBa
lanc
e fu
ndg
row
th
fun
d S
ecur
e fu
nd
inco
me
div
iden
d -
- 1
1
15
- 2
,150
-
- 4
86,0
66
Inte
rest
Inco
me
2
134
1
3
3 7
8,53
1 2
8,25
5 -
-
1
,746
,520
o
ther
s -
-
-
-
-
-
-
-
-
2
1
34
2
148
7
8,53
1 3
0,40
5 -
-
2
,232
,586
Ex
pens
esM
anag
emen
t exp
ense
s -
2
4 2
1
42
7,4
47
3,8
75
-
-
1,9
13,8
68
oth
ers
-
-
-
-
-
-
-
-
-
24
2
142
7
,447
3
,875
-
-
1
,913
,868
N
et In
vest
men
t Inc
ome
2
110
-
6
7
1,08
4 2
6,53
0 -
-
3
18,7
18
gai
ns/(
loss
es) o
n ho
ldin
gsN
et R
ealis
ed g
ain/
(loss
) on
Inve
stm
ents
-
15
(1)
257
8
,447
(8
18)
-
-
3,1
00,5
84
Tran
sfer
/gai
n on
reva
luat
ion/
chan
ge in
fair
valu
e 1
4
(1
7) (3
,062
) (3
0,79
7) (4
7,95
3) -
-
(12,
645,
257)
net
gai
n/(l
oss)
on
inve
stm
ents
1
19
(18
) (
2,80
5) (
22,3
50)
(48
,771
) -
-
(9
,544
,673
)in
crea
se/(
dec
reas
e) in
ass
ets
from
ope
rati
ons
3
129
(
18)
(2,
799)
48,
734
(22
,241
) -
-
(9
,225
,955
)
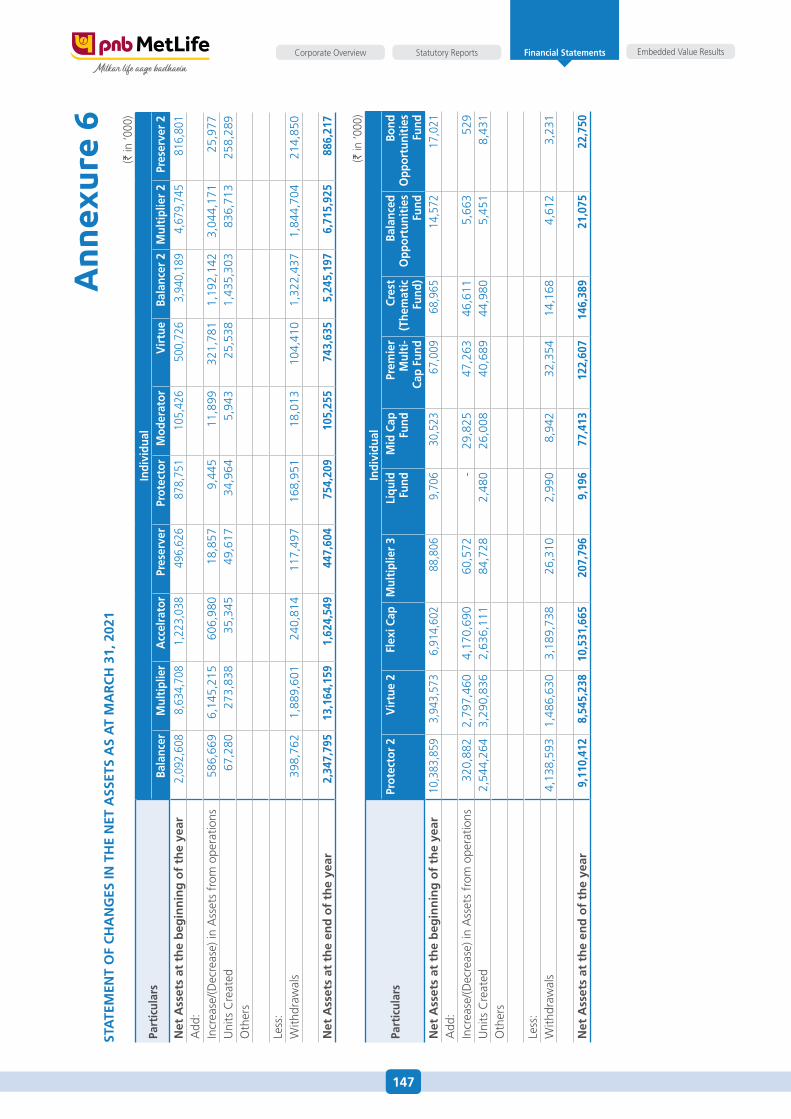
147
Embedded Value ResultsStatutory ReportsCorporate Overview Financial Statements
Ann
exur
e 6
STa
TEm
EnT
Of
ch
an
gES
in T
hE
nET
aSS
ETS
aS
aT
ma
rc
h 3
1, 2
021
(` in
‘000
)
part
icul
ars
indi
vidu
alBa
lanc
erm
ulti
plie
ra
ccel
rato
rpr
eser
ver
prot
ecto
rm
oder
ator
Vir
tue
Bala
ncer
2m
ulti
plie
r 2
pres
erve
r 2
net
ass
ets
at t
he
beg
inn
ing
of
the
year
2,0
92,6
08
8,6
34,7
08
1,2
23,0
38
496
,626
8
78,7
51
105
,426
5
00,7
26
3,9
40,1
89
4,6
79,7
45
816
,801
a
dd:
Incr
ease
/( dec
reas
e) in
ass
ets
from
ope
ratio
ns 5
86,6
69
6,1
45,2
15
606
,980
1
8,85
7 9
,445
1
1,89
9 3
21,7
81
1,1
92,1
42
3,0
44,1
71
25,
977
uni
ts C
reat
ed 6
7,28
0 2
73,8
38
35,
345
49,
617
34,
964
5,9
43
25,
538
1,4
35,3
03
836
,713
2
58,2
89
oth
ers
Less
:W
ithdr
awal
s 3
98,7
62
1,8
89,6
01
240
,814
1
17,4
97
168
,951
1
8,01
3 1
04,4
10
1,3
22,4
37
1,8
44,7
04
214
,850
net
ass
ets
at t
he
end
of
the
year
2,3
47,7
95
13,
164,
159
1,6
24,5
49
447
,604
7
54,2
09
105
,255
7
43,6
35
5,2
45,1
97
6,7
15,9
25
886
,217
(` in
‘000
)
part
icul
ars
indi
vidu
alpr
otec
tor
2V
irtu
e 2
flex
i cap
mul
tipl
ier
3li
quid
fu
ndm
id c
ap
fund
prem
ier
mul
ti-
cap
fund
cres
t (T
hem
atic
fu
nd)
Bala
nced
O
ppor
tuni
ties
fu
nd
Bond
Opp
ortu
niti
esfu
ndn
et a
sset
s at
th
e b
egin
nin
g o
f th
e ye
ar10
,383
,859
3
,943
,573
6
,914
,602
8
8,80
6 9
,706
3
0,52
3 6
7,00
9 6
8,96
5 1
4,57
2 1
7,02
1 a
dd:
Incr
ease
/(dec
reas
e) in
ass
ets
from
ope
ratio
ns 3
20,8
82
2,7
97,4
60
4,1
70,6
90
60,
572
-
29,
825
47,
263
46,
611
5,6
63
529
u
nits
Cre
ated
2,5
44,2
64
3,2
90,8
36
2,6
36,1
11
84,
728
2,4
80
26,
008
40,
689
44,
980
5,4
51
8,4
31
oth
ers
Less
:W
ithdr
awal
s 4
,138
,593
1
,486
,630
3
,189
,738
2
6,31
0 2
,990
8
,942
3
2,35
4 1
4,16
8 4
,612
3
,231
net
ass
ets
at t
he
end
of
the
year
9,1
10,4
12
8,5
45,2
38
10,
531,
665
207
,796
9
,196
7
7,41
3 1
22,6
07
146
,389
2
1,07
5 2
2,75
0
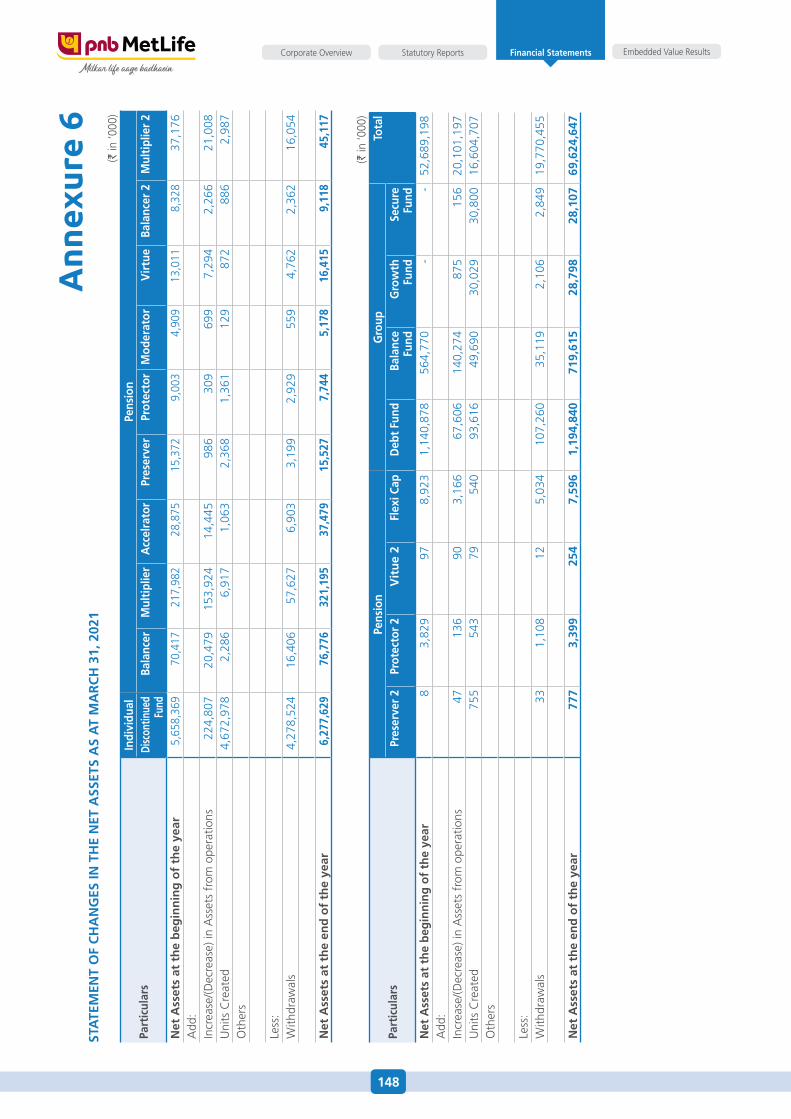
148
Embedded Value ResultsStatutory ReportsCorporate Overview Financial Statements
Ann
exur
e 6
STa
TEm
EnT
Of
ch
an
gES
in T
hE
nET
aSS
ETS
aS
aT
ma
rc
h 3
1, 2
021
(` in
‘000
)
part
icul
ars
indi
vidu
alpe
nsio
ndi
scon
tinue
dfu
ndBa
lanc
erm
ulti
plie
ra
ccel
rato
rpr
eser
ver
prot
ecto
rm
oder
ator
Vir
tue
Bala
ncer
2m
ulti
plie
r 2
net
ass
ets
at t
he
beg
inn
ing
of
the
year
5,6
58,3
69
70,
417
217
,982
2
8,87
5 1
5,37
2 9
,003
4
,909
1
3,01
1 8
,328
3
7,17
6 a
dd:
Incr
ease
/( dec
reas
e) in
ass
ets
from
ope
ratio
ns 2
24,8
07
20,
479
153
,924
1
4,44
5 9
86
309
6
99
7,2
94
2,2
66
21,
008
uni
ts C
reat
ed 4
,672
,978
2
,286
6
,917
1
,063
2
,368
1
,361
1
29
872
8
86
2,9
87
oth
ers
Less
:W
ithdr
awal
s 4
,278
,524
1
6,40
6 5
7,62
7 6
,903
3
,199
2
,929
5
59
4,7
62
2,3
62
16,
054
net
ass
ets
at t
he
end
of
the
year
6,2
77,6
29
76,
776
321
,195
3
7,47
9 1
5,52
7 7
,744
5
,178
1
6,41
5 9
,118
4
5,11
7
(` in
‘000
)
part
icul
ars
pens
ion
gro
upTo
tal
pres
erve
r 2
prot
ecto
r 2
Vit
ue
2fl
exi c
apd
ebt
fund
Bala
nce
fund
gro
wth
fu
nd S
ecur
e fu
ndn
et a
sset
s at
th
e b
egin
nin
g o
f th
e ye
ar 8
3
,829
9
7 8
,923
1
,140
,878
5
64,7
70
-
-
52,
689,
198
add
:In
crea
se/(d
ecre
ase)
in a
sset
s fr
om o
pera
tions
47
136
9
0 3
,166
6
7,60
6 1
40,2
74
875
1
56
20,
101,
197
uni
ts C
reat
ed 7
55
543
7
9 5
40
93,
616
49,
690
30,
029
30,
800
16,
604,
707
oth
ers
Less
:W
ithdr
awal
s 3
3 1
,108
1
2 5
,034
1
07,2
60
35,
119
2,1
06
2,8
49
19,
770,
455
net
ass
ets
at t
he
end
of
the
year
777
3
,399
2
54
7,5
96
1,1
94,8
40
719
,615
2
8,79
8 2
8,10
7 6
9,62
4,64
7
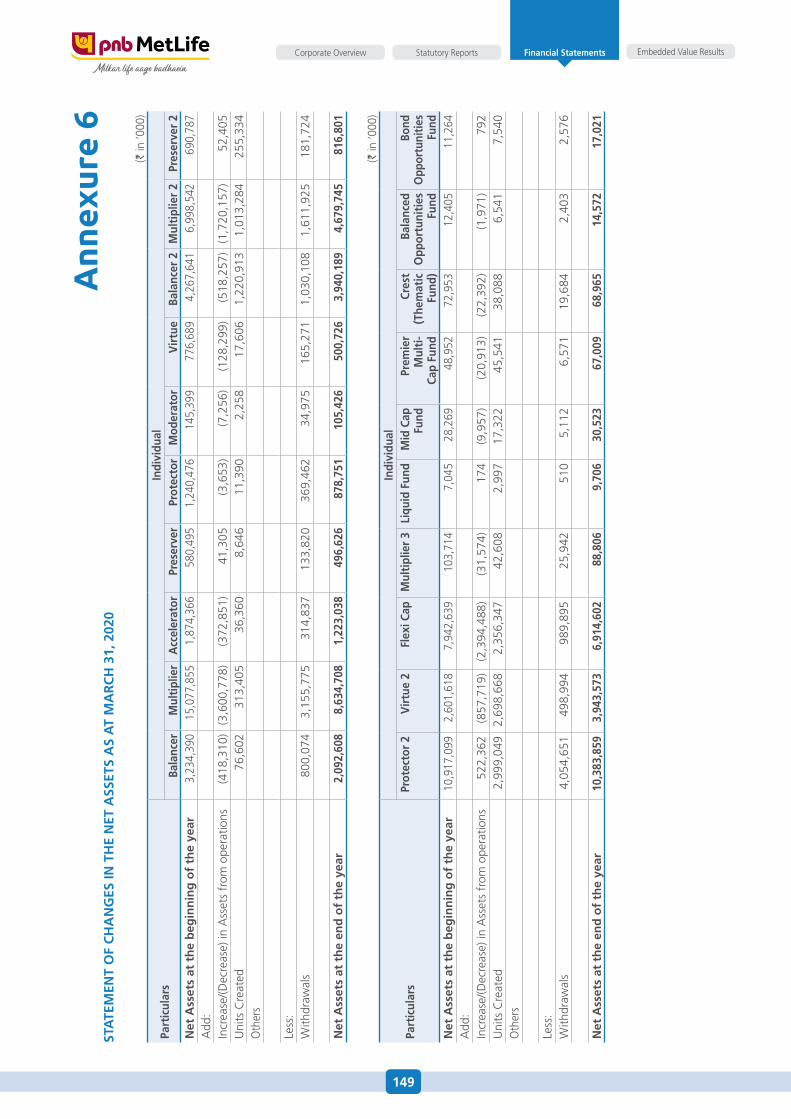
149
Embedded Value ResultsStatutory ReportsCorporate Overview Financial Statements
Ann
exur
e 6
STa
TEm
EnT
Of
ch
an
gES
in T
hE
nET
aSS
ETS
aS
aT
ma
rc
h 3
1, 2
020
(` in
‘000
)
part
icul
ars
indi
vidu
alBa
lanc
erm
ulti
plie
ra
ccel
erat
orpr
eser
ver
prot
ecto
rm
oder
ator
Vir
tue
Bala
ncer
2m
ulti
plie
r 2
pres
erve
r 2
net
ass
ets
at t
he
beg
inn
ing
of
the
year
3,2
34,3
90
15,
077,
855
1,8
74,3
66
580
,495
1
,240
,476
1
45,3
99
776
,689
4
,267
,641
6
,998
,542
6
90,7
87
add
:In
crea
se/(d
ecre
ase)
in a
sset
s fr
om o
pera
tions
(418
,310
)(3
,600
,778
) (3
72,8
51)
41,
305
(3,6
53)
(7,2
56)
(128
,299
) (5
18,2
57)
(1,7
20,1
57)
52,
405
uni
ts C
reat
ed 7
6,60
2 3
13,4
05
36,
360
8,6
46
11,
390
2,2
58
17,
606
1,2
20,9
13
1,0
13,2
84
255
,334
o
ther
s
Less
:W
ithdr
awal
s 8
00,0
74
3,1
55,7
75
314
,837
1
33,8
20
369
,462
3
4,97
5 1
65,2
71
1,0
30,1
08
1,6
11,9
25
181
,724
net
ass
ets
at t
he
end
of
the
year
2,0
92,6
08
8,6
34,7
08
1,2
23,0
38
496
,626
8
78,7
51
105
,426
5
00,7
26
3,9
40,1
89
4,6
79,7
45
816
,801
(` in
‘000
)
part
icul
ars
indi
vidu
alpr
otec
tor
2V
irtu
e 2
flex
i cap
mul
tipl
ier
3li
quid
fun
dm
id c
ap
fund
prem
ier
mul
ti-
cap
fund
cres
t(T
hem
atic
fund
)
Bala
nced
Opp
ortu
niti
esfu
nd
Bond
Opp
ortu
nitie
sfu
ndn
et a
sset
s at
th
e b
egin
nin
g o
f th
e ye
ar 1
0,91
7,09
9 2
,601
,618
7
,942
,639
1
03,7
14
7,0
45
28,
269
48,
952
72,
953
12,
405
11,
264
add
:In
crea
se/(d
ecre
ase)
in a
sset
s fr
om o
pera
tions
522
,362
(8
57,7
19)
(2,3
94,4
88)
(31,
574)
174
(9
,957
) (2
0,91
3) (2
2,39
2) (1
,971
) 7
92
uni
ts C
reat
ed 2
,999
,049
2,
698,
668
2,3
56,3
47
42,
608
2,9
97
17,
322
45,
541
38,
088
6,5
41
7,5
40
oth
ers
Less
:W
ithdr
awal
s 4
,054
,651
4
98,9
94
989
,895
2
5,94
2 5
10
5,1
12
6,5
71
19,
684
2,4
03
2,5
76
net
ass
ets
at t
he
end
of
the
year
10,
383,
859
3,9
43,5
73
6,9
14,6
02
88,
806
9,7
06
30,
523
67,
009
68,
965
14,
572
17,
021
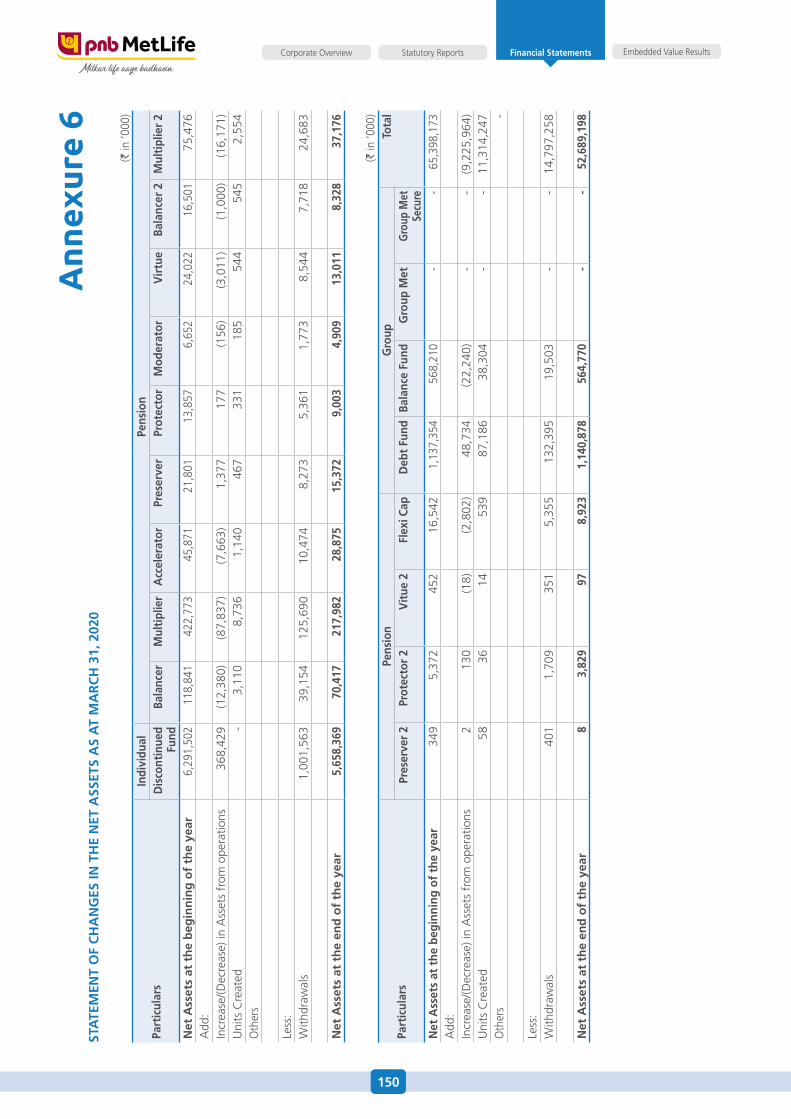
150
Embedded Value ResultsStatutory ReportsCorporate Overview Financial Statements
Ann
exur
e 6
STa
TEm
EnT
Of
ch
an
gES
in T
hE
nET
aSS
ETS
aS
aT
ma
rc
h 3
1, 2
020
(` in
‘000
)
part
icul
ars
indi
vidu
alpe
nsio
nd
isco
ntin
ued
fund
Bala
ncer
mul
tipl
ier
acc
eler
ator
pres
erve
rpr
otec
tor
mod
erat
orV
irtu
eBa
lanc
er 2
mul
tipl
ier
2
net
ass
ets
at t
he
beg
inn
ing
of
the
year
6,2
91,5
02
118
,841
4
22,7
73
45,
871
21,
801
13,
857
6,6
52
24,
022
16,
501
75,
476
add
:In
crea
se/( d
ecre
ase)
in a
sset
s fr
om o
pera
tions
368
,429
(1
2,38
0) (8
7,83
7) (7
,663
) 1
,377
1
77
(156
) (3
,011
) (1
,000
) (1
6,17
1)u
nits
Cre
ated
-
3,1
10
8,7
36
1,1
40
467
3
31
185
5
44
545
2
,554
o
ther
s
Less
:W
ithdr
awal
s 1
,001
,563
3
9,15
4 1
25,6
90
10,
474
8,2
73
5,3
61
1,7
73
8,5
44
7,7
18
24,
683
net
ass
ets
at t
he
end
of
the
year
5,6
58,3
69
70,
417
217
,982
2
8,87
5 1
5,37
2 9
,003
4
,909
1
3,01
1 8
,328
3
7,17
6
(` in
‘000
)
part
icul
ars
pens
ion
gro
upTo
tal
pres
erve
r 2
prot
ecto
r 2
Vit
ue 2
flex
i cap
deb
t fu
ndBa
lanc
e fu
ndg
roup
met
gro
up m
et
Secu
ren
et a
sset
s at
the
beg
inni
ng o
f th
e ye
ar 3
49
5,3
72
452
1
6,54
2 1
,137
,354
5
68,2
10
- -
65,
398,
173
add
:In
crea
se/(d
ecre
ase)
in a
sset
s fr
om o
pera
tions
2
130
(1
8) (2
,802
) 4
8,73
4 (2
2,24
0) -
-
(9
,225
,964
)u
nits
Cre
ated
58
36
14
539
8
7,18
6 3
8,30
4 -
-
1
1,31
4,24
7 o
ther
s -
Less
:W
ithdr
awal
s 4
01
1,7
09
351
5
,355
1
32,3
95
19,
503
-
-
14,
797,
258
net
ass
ets
at t
he
end
of
the
year
8
3,8
29
97
8,9
23
1,1
40,8
78
564
,770
-
- 5
2,68
9,19
8
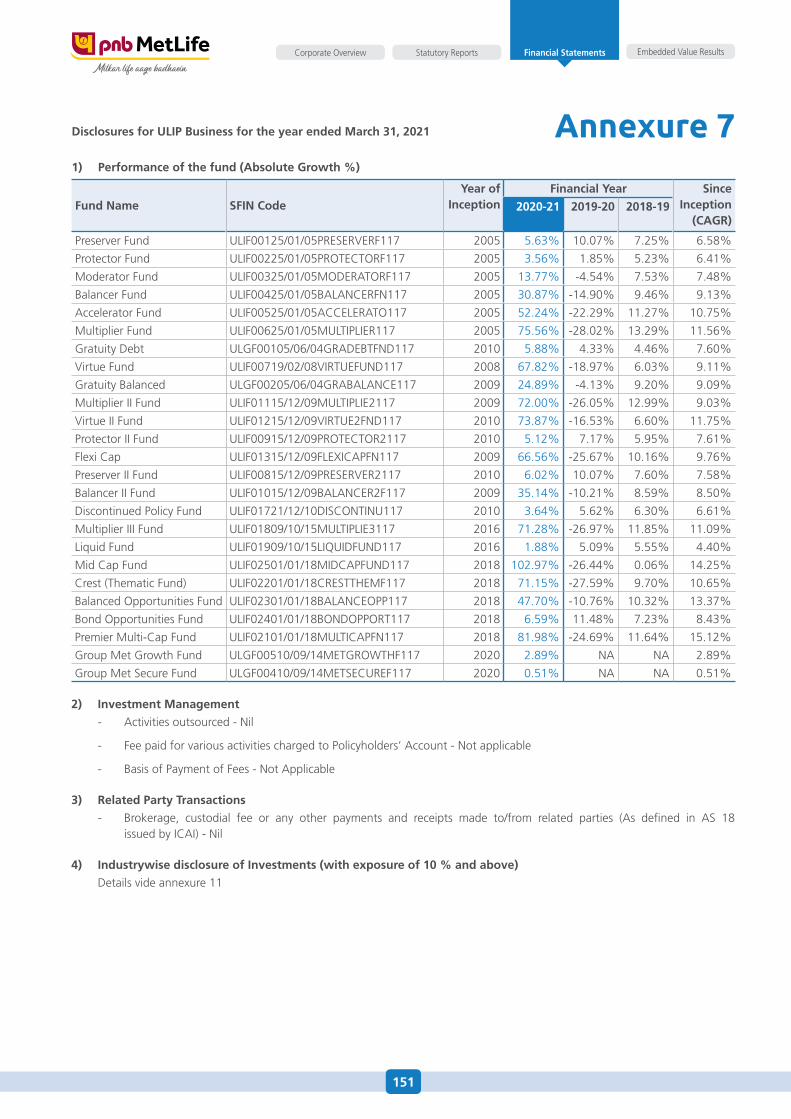
151
Embedded Value ResultsStatutory ReportsCorporate Overview Financial Statements
disclosures for ulip Business for the year ended march 31, 2021
1) performance of the fund (absolute growth %)
fund name Sfin codeyear of
inceptionfinancial year Since
inception (cagr)
2020-21 2019-20 2018-19
Preserver fund uLIf00125/01/05PReseRVeRf117 2005 5.63% 10.07% 7.25% 6.58%
Protector fund uLIf00225/01/05PRoTeCToRf117 2005 3.56% 1.85% 5.23% 6.41%
Moderator fund uLIf00325/01/05ModeRaToRf117 2005 13.77% -4.54% 7.53% 7.48%
Balancer fund uLIf00425/01/05BaLaNCeRfN117 2005 30.87% -14.90% 9.46% 9.13%
accelerator fund uLIf00525/01/05aCCeLeRaTo117 2005 52.24% -22.29% 11.27% 10.75%
Multiplier fund uLIf00625/01/05MuLTIPLIeR117 2005 75.56% -28.02% 13.29% 11.56%
Gratuity debt uLGf00105/06/04GRadeBTfNd117 2010 5.88% 4.33% 4.46% 7.60%
Virtue fund uLIf00719/02/08VIRTuefuNd117 2008 67.82% -18.97% 6.03% 9.11%
Gratuity Balanced uLGf00205/06/04GRaBaLaNCe117 2009 24.89% -4.13% 9.20% 9.09%
Multiplier II fund uLIf01115/12/09MuLTIPLIe2117 2009 72.00% -26.05% 12.99% 9.03%
Virtue II fund uLIf01215/12/09VIRTue2fNd117 2010 73.87% -16.53% 6.60% 11.75%
Protector II fund uLIf00915/12/09PRoTeCToR2117 2010 5.12% 7.17% 5.95% 7.61%
flexi Cap uLIf01315/12/09fLeXICaPfN117 2009 66.56% -25.67% 10.16% 9.76%
Preserver II fund uLIf00815/12/09PReseRVeR2117 2010 6.02% 10.07% 7.60% 7.58%
Balancer II fund uLIf01015/12/09BaLaNCeR2f117 2009 35.14% -10.21% 8.59% 8.50%
discontinued Policy fund uLIf01721/12/10dIsCoNTINu117 2010 3.64% 5.62% 6.30% 6.61%
Multiplier III fund uLIf01809/10/15MuLTIPLIe3117 2016 71.28% -26.97% 11.85% 11.09%
Liquid fund uLIf01909/10/15LIQuIdfuNd117 2016 1.88% 5.09% 5.55% 4.40%
Mid Cap fund uLIf02501/01/18MIdCaPfuNd117 2018 102.97% -26.44% 0.06% 14.25%
Crest (Thematic fund) uLIf02201/01/18CResTTheMf117 2018 71.15% -27.59% 9.70% 10.65%
Balanced opportunities fund uLIf02301/01/18BaLaNCeoPP117 2018 47.70% -10.76% 10.32% 13.37%
Bond opportunities fund uLIf02401/01/18BoNdoPPoRT117 2018 6.59% 11.48% 7.23% 8.43%
Premier Multi-Cap fund uLIf02101/01/18MuLTICaPfN117 2018 81.98% -24.69% 11.64% 15.12%
Group Met Growth fund uLGf00510/09/14MeTGRoWThf117 2020 2.89% Na Na 2.89%
Group Met secure fund uLGf00410/09/14MeTseCuRef117 2020 0.51% Na Na 0.51%
2) investment management
- activities outsourced - Nil
- fee paid for various activities charged to Policyholders’ account - Not applicable
- Basis of Payment of fees - Not applicable
3) related party Transactions
- Brokerage, custodial fee or any other payments and receipts made to/from related parties (as defined in as 18 issued by ICaI) - Nil
4) industrywise disclosure of investments (with exposure of 10 % and above)
details vide annexure 11
Annexure 7
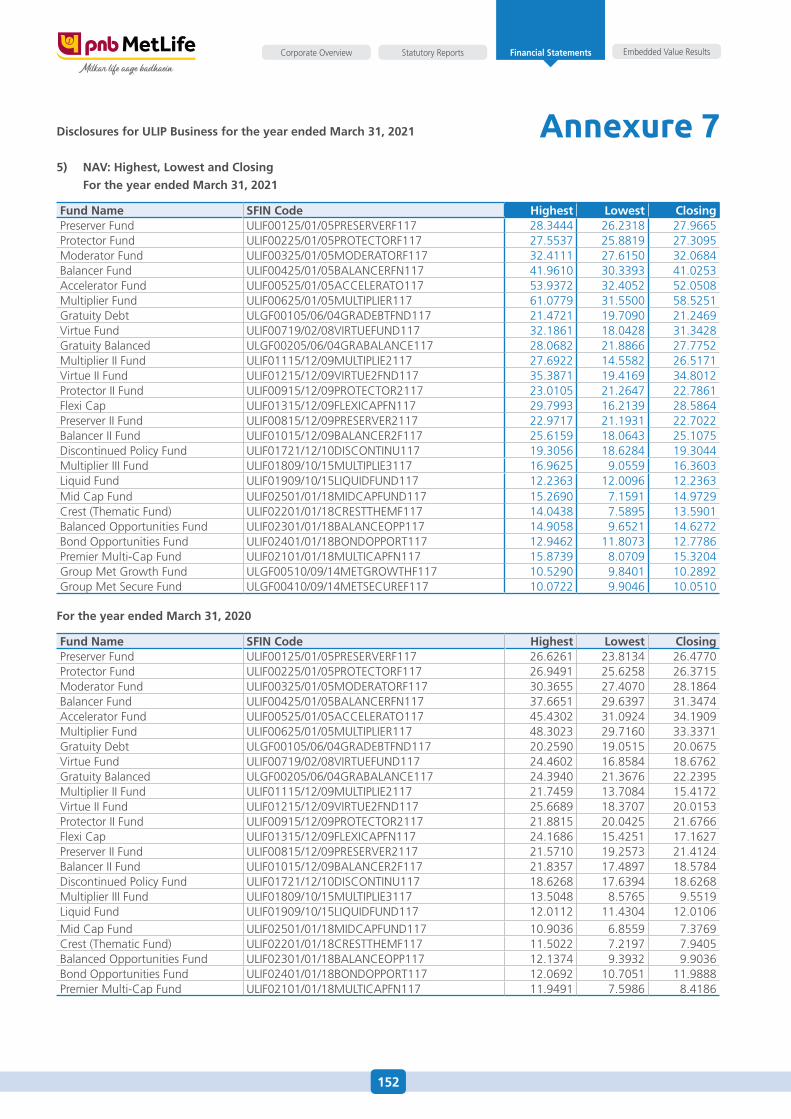
152
Embedded Value ResultsStatutory ReportsCorporate Overview Financial Statements
disclosures for ulip Business for the year ended march 31, 2021
5) naV: highest, lowest and closing
for the year ended march 31, 2021
fund name Sfin code highest lowest closingPreserver fund uLIf00125/01/05PReseRVeRf117 28.3444 26.2318 27.9665 Protector fund uLIf00225/01/05PRoTeCToRf117 27.5537 25.8819 27.3095 Moderator fund uLIf00325/01/05ModeRaToRf117 32.4111 27.6150 32.0684 Balancer fund uLIf00425/01/05BaLaNCeRfN117 41.9610 30.3393 41.0253 accelerator fund uLIf00525/01/05aCCeLeRaTo117 53.9372 32.4052 52.0508 Multiplier fund uLIf00625/01/05MuLTIPLIeR117 61.0779 31.5500 58.5251 Gratuity debt uLGf00105/06/04GRadeBTfNd117 21.4721 19.7090 21.2469 Virtue fund uLIf00719/02/08VIRTuefuNd117 32.1861 18.0428 31.3428 Gratuity Balanced uLGf00205/06/04GRaBaLaNCe117 28.0682 21.8866 27.7752 Multiplier II fund uLIf01115/12/09MuLTIPLIe2117 27.6922 14.5582 26.5171 Virtue II fund uLIf01215/12/09VIRTue2fNd117 35.3871 19.4169 34.8012 Protector II fund uLIf00915/12/09PRoTeCToR2117 23.0105 21.2647 22.7861 flexi Cap uLIf01315/12/09fLeXICaPfN117 29.7993 16.2139 28.5864 Preserver II fund uLIf00815/12/09PReseRVeR2117 22.9717 21.1931 22.7022 Balancer II fund uLIf01015/12/09BaLaNCeR2f117 25.6159 18.0643 25.1075 discontinued Policy fund uLIf01721/12/10dIsCoNTINu117 19.3056 18.6284 19.3044 Multiplier III fund uLIf01809/10/15MuLTIPLIe3117 16.9625 9.0559 16.3603 Liquid fund uLIf01909/10/15LIQuIdfuNd117 12.2363 12.0096 12.2363 Mid Cap fund uLIf02501/01/18MIdCaPfuNd117 15.2690 7.1591 14.9729 Crest (Thematic fund) uLIf02201/01/18CResTTheMf117 14.0438 7.5895 13.5901 Balanced opportunities fund uLIf02301/01/18BaLaNCeoPP117 14.9058 9.6521 14.6272 Bond opportunities fund uLIf02401/01/18BoNdoPPoRT117 12.9462 11.8073 12.7786 Premier Multi-Cap fund uLIf02101/01/18MuLTICaPfN117 15.8739 8.0709 15.3204 Group Met Growth fund uLGf00510/09/14MeTGRoWThf117 10.5290 9.8401 10.2892 Group Met secure fund uLGf00410/09/14MeTseCuRef117 10.0722 9.9046 10.0510
for the year ended march 31, 2020
fund name Sfin code highest lowest closingPreserver fund uLIf00125/01/05PReseRVeRf117 26.6261 23.8134 26.4770 Protector fund uLIf00225/01/05PRoTeCToRf117 26.9491 25.6258 26.3715 Moderator fund uLIf00325/01/05ModeRaToRf117 30.3655 27.4070 28.1864 Balancer fund uLIf00425/01/05BaLaNCeRfN117 37.6651 29.6397 31.3474 accelerator fund uLIf00525/01/05aCCeLeRaTo117 45.4302 31.0924 34.1909 Multiplier fund uLIf00625/01/05MuLTIPLIeR117 48.3023 29.7160 33.3371 Gratuity debt uLGf00105/06/04GRadeBTfNd117 20.2590 19.0515 20.0675 Virtue fund uLIf00719/02/08VIRTuefuNd117 24.4602 16.8584 18.6762 Gratuity Balanced uLGf00205/06/04GRaBaLaNCe117 24.3940 21.3676 22.2395 Multiplier II fund uLIf01115/12/09MuLTIPLIe2117 21.7459 13.7084 15.4172 Virtue II fund uLIf01215/12/09VIRTue2fNd117 25.6689 18.3707 20.0153 Protector II fund uLIf00915/12/09PRoTeCToR2117 21.8815 20.0425 21.6766 flexi Cap uLIf01315/12/09fLeXICaPfN117 24.1686 15.4251 17.1627 Preserver II fund uLIf00815/12/09PReseRVeR2117 21.5710 19.2573 21.4124 Balancer II fund uLIf01015/12/09BaLaNCeR2f117 21.8357 17.4897 18.5784 discontinued Policy fund uLIf01721/12/10dIsCoNTINu117 18.6268 17.6394 18.6268 Multiplier III fund uLIf01809/10/15MuLTIPLIe3117 13.5048 8.5765 9.5519 Liquid fund uLIf01909/10/15LIQuIdfuNd117 12.0112 11.4304 12.0106 Mid Cap fund uLIf02501/01/18MIdCaPfuNd117 10.9036 6.8559 7.3769 Crest (Thematic fund) uLIf02201/01/18CResTTheMf117 11.5022 7.2197 7.9405 Balanced opportunities fund uLIf02301/01/18BaLaNCeoPP117 12.1374 9.3932 9.9036 Bond opportunities fund uLIf02401/01/18BoNdoPPoRT117 12.0692 10.7051 11.9888 Premier Multi-Cap fund uLIf02101/01/18MuLTICaPfN117 11.9491 7.5986 8.4186
Annexure 7
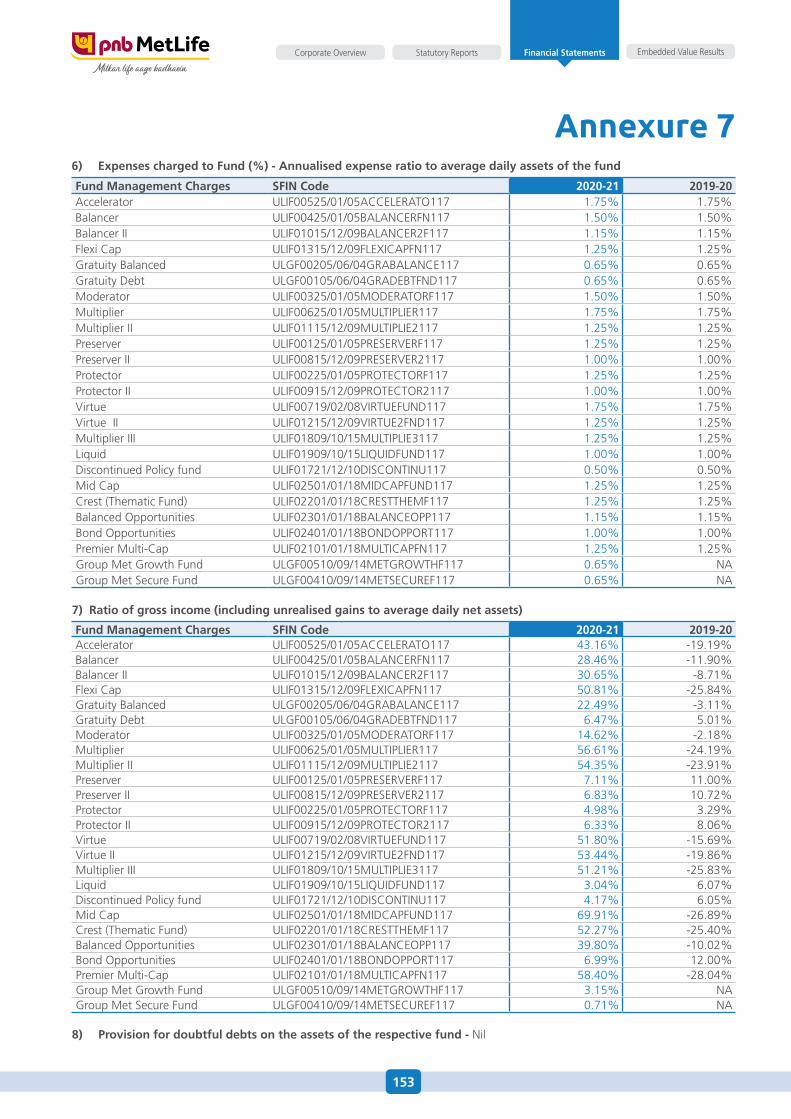
153
Embedded Value ResultsStatutory ReportsCorporate Overview Financial Statements
Annexure 76) Expenses charged to fund (%) - annualised expense ratio to average daily assets of the fund
fund management charges Sfin code 2020-21 2019-20accelerator uLIf00525/01/05aCCeLeRaTo117 1.75% 1.75%Balancer uLIf00425/01/05BaLaNCeRfN117 1.50% 1.50%Balancer II uLIf01015/12/09BaLaNCeR2f117 1.15% 1.15%flexi Cap uLIf01315/12/09fLeXICaPfN117 1.25% 1.25%Gratuity Balanced uLGf00205/06/04GRaBaLaNCe117 0.65% 0.65%Gratuity debt uLGf00105/06/04GRadeBTfNd117 0.65% 0.65%Moderator uLIf00325/01/05ModeRaToRf117 1.50% 1.50%Multiplier uLIf00625/01/05MuLTIPLIeR117 1.75% 1.75%Multiplier II uLIf01115/12/09MuLTIPLIe2117 1.25% 1.25%Preserver uLIf00125/01/05PReseRVeRf117 1.25% 1.25%Preserver II uLIf00815/12/09PReseRVeR2117 1.00% 1.00%Protector uLIf00225/01/05PRoTeCToRf117 1.25% 1.25%Protector II uLIf00915/12/09PRoTeCToR2117 1.00% 1.00%Virtue uLIf00719/02/08VIRTuefuNd117 1.75% 1.75%Virtue II uLIf01215/12/09VIRTue2fNd117 1.25% 1.25%Multiplier III uLIf01809/10/15MuLTIPLIe3117 1.25% 1.25%Liquid uLIf01909/10/15LIQuIdfuNd117 1.00% 1.00%discontinued Policy fund uLIf01721/12/10dIsCoNTINu117 0.50% 0.50%Mid Cap uLIf02501/01/18MIdCaPfuNd117 1.25% 1.25%Crest (Thematic fund) uLIf02201/01/18CResTTheMf117 1.25% 1.25%Balanced opportunities uLIf02301/01/18BaLaNCeoPP117 1.15% 1.15%Bond opportunities uLIf02401/01/18BoNdoPPoRT117 1.00% 1.00%Premier Multi-Cap uLIf02101/01/18MuLTICaPfN117 1.25% 1.25%Group Met Growth fund uLGf00510/09/14MeTGRoWThf117 0.65% NaGroup Met secure fund uLGf00410/09/14MeTseCuRef117 0.65% Na
7) ratio of gross income (including unrealised gains to average daily net assets)
fund management charges Sfin code 2020-21 2019-20accelerator uLIf00525/01/05aCCeLeRaTo117 43.16% -19.19%Balancer uLIf00425/01/05BaLaNCeRfN117 28.46% -11.90%Balancer II uLIf01015/12/09BaLaNCeR2f117 30.65% -8.71%flexi Cap uLIf01315/12/09fLeXICaPfN117 50.81% -25.84%Gratuity Balanced uLGf00205/06/04GRaBaLaNCe117 22.49% -3.11%Gratuity debt uLGf00105/06/04GRadeBTfNd117 6.47% 5.01%Moderator uLIf00325/01/05ModeRaToRf117 14.62% -2.18%Multiplier uLIf00625/01/05MuLTIPLIeR117 56.61% -24.19%Multiplier II uLIf01115/12/09MuLTIPLIe2117 54.35% -23.91%Preserver uLIf00125/01/05PReseRVeRf117 7.11% 11.00%Preserver II uLIf00815/12/09PReseRVeR2117 6.83% 10.72%Protector uLIf00225/01/05PRoTeCToRf117 4.98% 3.29%Protector II uLIf00915/12/09PRoTeCToR2117 6.33% 8.06%Virtue uLIf00719/02/08VIRTuefuNd117 51.80% -15.69%Virtue II uLIf01215/12/09VIRTue2fNd117 53.44% -19.86%Multiplier III uLIf01809/10/15MuLTIPLIe3117 51.21% -25.83%Liquid uLIf01909/10/15LIQuIdfuNd117 3.04% 6.07%discontinued Policy fund uLIf01721/12/10dIsCoNTINu117 4.17% 6.05%Mid Cap uLIf02501/01/18MIdCaPfuNd117 69.91% -26.89%Crest (Thematic fund) uLIf02201/01/18CResTTheMf117 52.27% -25.40%Balanced opportunities uLIf02301/01/18BaLaNCeoPP117 39.80% -10.02%Bond opportunities uLIf02401/01/18BoNdoPPoRT117 6.99% 12.00%Premier Multi-Cap uLIf02101/01/18MuLTICaPfN117 58.40% -28.04%Group Met Growth fund uLGf00510/09/14MeTGRoWThf117 3.15% NaGroup Met secure fund uLGf00410/09/14MeTseCuRef117 0.71% Na
8) provision for doubtful debts on the assets of the respective fund - Nil
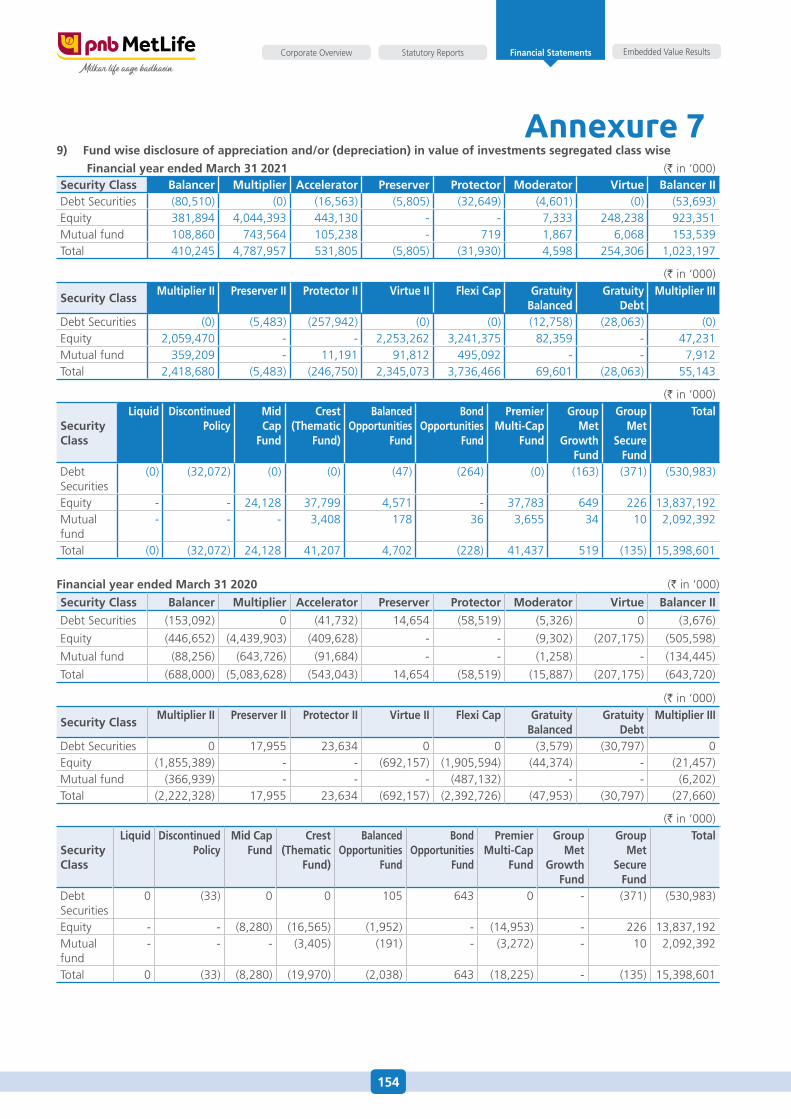
154
Embedded Value ResultsStatutory ReportsCorporate Overview Financial Statements
Annexure 79) fund wise disclosure of appreciation and/or (depreciation) in value of investments segregated class wise
financial year ended march 31 2021 (` in ‘000)Security class Balancer multiplier accelerator preserver protector moderator Virtue Balancer ii debt securities (80,510) (0) (16,563) (5,805) (32,649) (4,601) (0) (53,693)equity 381,894 4,044,393 443,130 - - 7,333 248,238 923,351 Mutual fund 108,860 743,564 105,238 - 719 1,867 6,068 153,539 Total 410,245 4,787,957 531,805 (5,805) (31,930) 4,598 254,306 1,023,197
(` in ‘000)
Security class multiplier ii preserver ii protector ii Virtue ii flexi cap gratuity
Balanced gratuity
debt multiplier iii
debt securities (0) (5,483) (257,942) (0) (0) (12,758) (28,063) (0)equity 2,059,470 - - 2,253,262 3,241,375 82,359 - 47,231 Mutual fund 359,209 - 11,191 91,812 495,092 - - 7,912 Total 2,418,680 (5,483) (246,750) 2,345,073 3,736,466 69,601 (28,063) 55,143
(` in ‘000)
Security class
liquid discontinued policy
mid cap
fund
crest (Thematic
fund)
Balanced Opportunities
fund
Bond Opportunities
fund
premier multi-cap
fund
group met
growth fund
group met
Secure fund
Total
debt securities
(0) (32,072) (0) (0) (47) (264) (0) (163) (371) (530,983)
equity - - 24,128 37,799 4,571 - 37,783 649 226 13,837,192 Mutual fund
- - - 3,408 178 36 3,655 34 10 2,092,392
Total (0) (32,072) 24,128 41,207 4,702 (228) 41,437 519 (135) 15,398,601
financial year ended march 31 2020 (` in ‘000)
Security class Balancer multiplier accelerator preserver protector moderator Virtue Balancer ii
debt securities (153,092) 0 (41,732) 14,654 (58,519) (5,326) 0 (3,676)
equity (446,652) (4,439,903) (409,628) - - (9,302) (207,175) (505,598)
Mutual fund (88,256) (643,726) (91,684) - - (1,258) - (134,445)
Total (688,000) (5,083,628) (543,043) 14,654 (58,519) (15,887) (207,175) (643,720)
(` in ‘000)
Security class multiplier ii preserver ii protector ii Virtue ii flexi cap gratuity
Balanced gratuity
debt multiplier iii
debt securities 0 17,955 23,634 0 0 (3,579) (30,797) 0 equity (1,855,389) - - (692,157) (1,905,594) (44,374) - (21,457)Mutual fund (366,939) - - - (487,132) - - (6,202)Total (2,222,328) 17,955 23,634 (692,157) (2,392,726) (47,953) (30,797) (27,660)
(` in ‘000)
Security class
liquid discontinued policy
mid cap fund
crest (Thematic
fund)
Balanced Opportunities
fund
Bond Opportunities
fund
premier multi-cap
fund
group met
growth fund
group met
Secure fund
Total
debt securities
0 (33) 0 0 105 643 0 - (371) (530,983)
equity - - (8,280) (16,565) (1,952) - (14,953) - 226 13,837,192 Mutual fund
- - - (3,405) (191) - (3,272) - 10 2,092,392
Total 0 (33) (8,280) (19,970) (2,038) 643 (18,225) - (135) 15,398,601
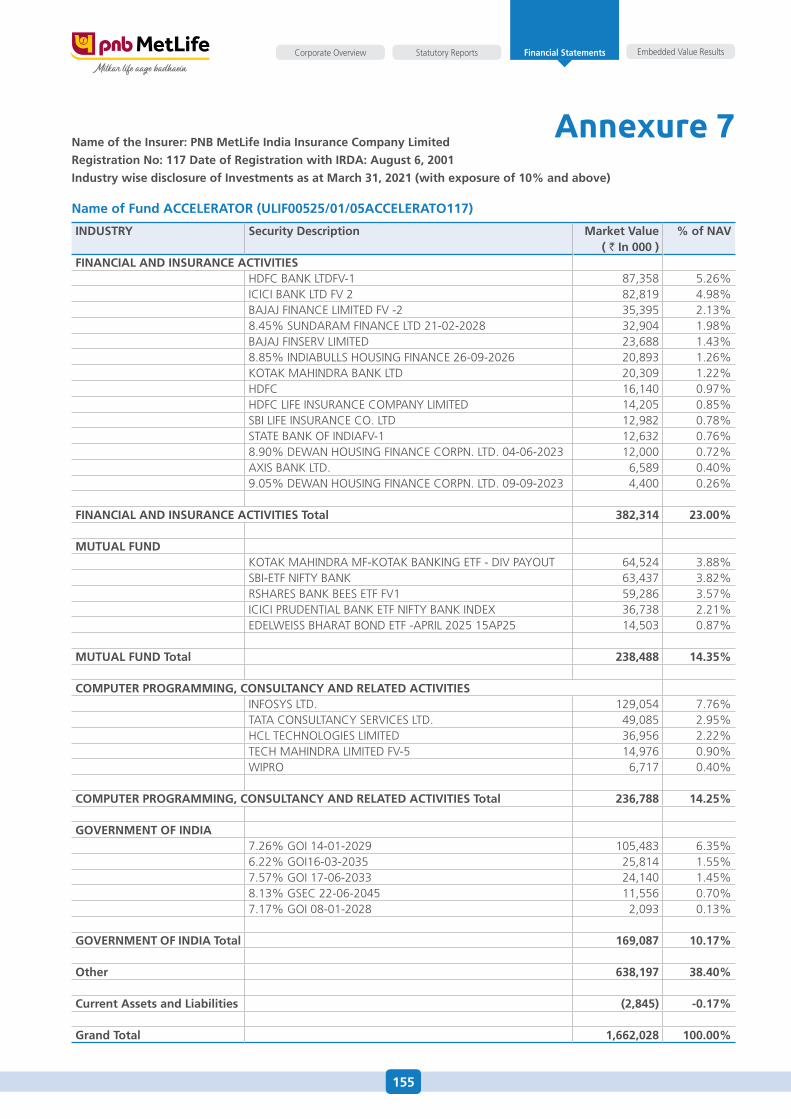
155
Embedded Value ResultsStatutory ReportsCorporate Overview Financial Statements
Annexure 7name of the insurer: pnB metlife india insurance company limited
registration no: 117 date of registration with irda: august 6, 2001
industry wise disclosure of investments as at march 31, 2021 (with exposure of 10% and above)
name of fund accElEraTOr (ulif00525/01/05accElEraTO117)
induSTry Security description market Value ( ` in 000 )
% of naV
financial and inSurancE acTiViTiEShdfC BaNK LTdfV-1 87,358 5.26%ICICI BaNK LTd fV 2 82,819 4.98%BaJaJ fINaNCe LIMITed fV -2 35,395 2.13%8.45% suNdaRaM fINaNCe LTd 21-02-2028 32,904 1.98%BaJaJ fINseRV LIMITed 23,688 1.43%8.85% INdIaBuLLs housING fINaNCe 26-09-2026 20,893 1.26%KoTaK MahINdRa BaNK LTd 20,309 1.22%hdfC 16,140 0.97%hdfC LIfe INsuRaNCe CoMPaNy LIMITed 14,205 0.85%sBI LIfe INsuRaNCe Co. LTd 12,982 0.78%sTaTe BaNK of INdIafV-1 12,632 0.76%8.90% deWaN housING fINaNCe CoRPN. LTd. 04-06-2023 12,000 0.72%aXIs BaNK LTd. 6,589 0.40%9.05% deWaN housING fINaNCe CoRPN. LTd. 09-09-2023 4,400 0.26%
financial and inSurancE acTiViTiES Total 382,314 23.00%
muTual fundKoTaK MahINdRa Mf-KoTaK BaNKING eTf - dIV PayouT 64,524 3.88%sBI-eTf NIfTy BaNK 63,437 3.82%RshaRes BaNK Bees eTf fV1 59,286 3.57%ICICI PRudeNTIaL BaNK eTf NIfTy BaNK INdeX 36,738 2.21%edeLWeIss BhaRaT BoNd eTf -aPRIL 2025 15aP25 14,503 0.87%
muTual fund Total 238,488 14.35%
cOmpuTEr prOgramming, cOnSulTancy and rElaTEd acTiViTiESINfosys LTd. 129,054 7.76%TaTa CoNsuLTaNCy seRVICes LTd. 49,085 2.95%hCL TeChNoLoGIes LIMITed 36,956 2.22%TeCh MahINdRa LIMITed fV-5 14,976 0.90%WIPRo 6,717 0.40%
cOmpuTEr prOgramming, cOnSulTancy and rElaTEd acTiViTiES Total 236,788 14.25%
gOVErnmEnT Of india7.26% GoI 14-01-2029 105,483 6.35%6.22% GoI16-03-2035 25,814 1.55%7.57% GoI 17-06-2033 24,140 1.45%8.13% GseC 22-06-2045 11,556 0.70%7.17% GoI 08-01-2028 2,093 0.13%
gOVErnmEnT Of india Total 169,087 10.17%
Other 638,197 38.40%
current assets and liabilities (2,845) -0.17%
grand Total 1,662,028 100.00%
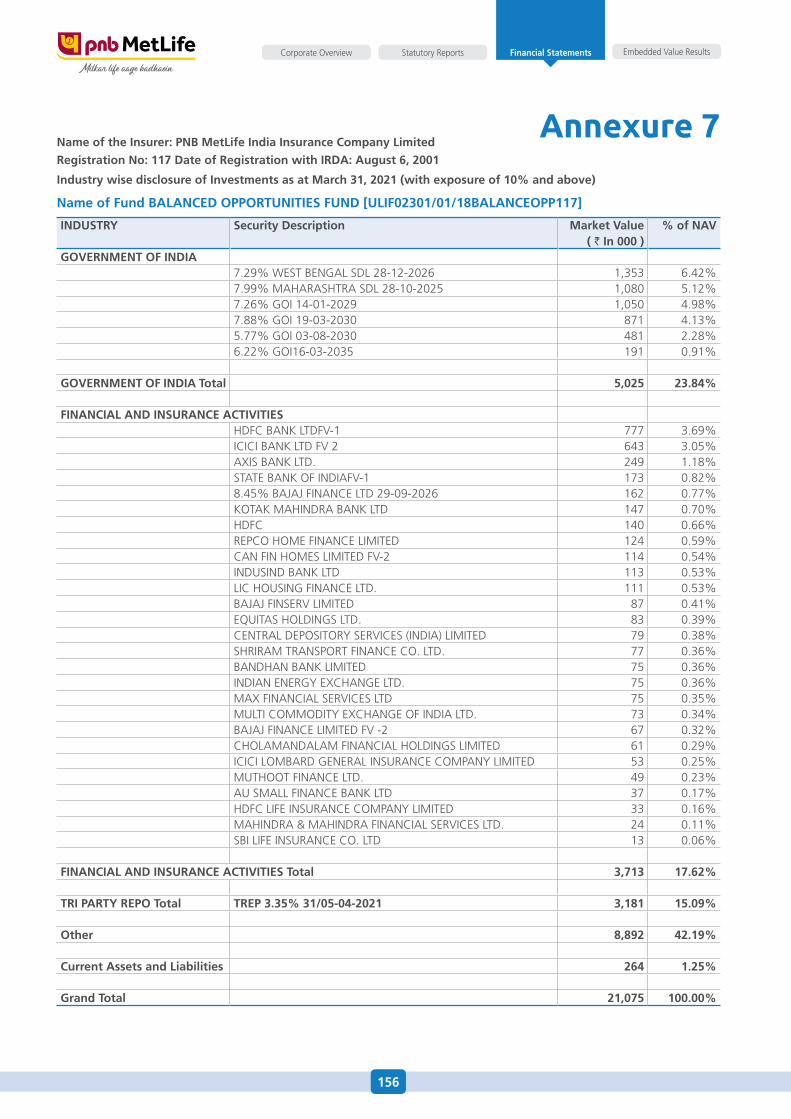
156
Embedded Value ResultsStatutory ReportsCorporate Overview Financial Statements
Annexure 7name of the insurer: pnB metlife india insurance company limited
registration no: 117 date of registration with irda: august 6, 2001
industry wise disclosure of investments as at march 31, 2021 (with exposure of 10% and above)
name of fund BalancEd OppOrTuniTiES fund [ulif02301/01/18BalancEOpp117]
induSTry Security description market Value ( ` in 000 )
% of naV
gOVErnmEnT Of india7.29% WesT BeNGaL sdL 28-12-2026 1,353 6.42%7.99% MahaRashTRa sdL 28-10-2025 1,080 5.12%7.26% GoI 14-01-2029 1,050 4.98%7.88% GoI 19-03-2030 871 4.13%5.77% GoI 03-08-2030 481 2.28%6.22% GoI16-03-2035 191 0.91%
gOVErnmEnT Of india Total 5,025 23.84%
financial and inSurancE acTiViTiEShdfC BaNK LTdfV-1 777 3.69%ICICI BaNK LTd fV 2 643 3.05%aXIs BaNK LTd. 249 1.18%sTaTe BaNK of INdIafV-1 173 0.82%8.45% BaJaJ fINaNCe LTd 29-09-2026 162 0.77%KoTaK MahINdRa BaNK LTd 147 0.70%hdfC 140 0.66%RePCo hoMe fINaNCe LIMITed 124 0.59%CaN fIN hoMes LIMITed fV-2 114 0.54%INdusINd BaNK LTd 113 0.53%LIC housING fINaNCe LTd. 111 0.53%BaJaJ fINseRV LIMITed 87 0.41%eQuITas hoLdINGs LTd. 83 0.39%CeNTRaL dePosIToRy seRVICes (INdIa) LIMITed 79 0.38%shRIRaM TRaNsPoRT fINaNCe Co. LTd. 77 0.36%BaNdhaN BaNK LIMITed 75 0.36%INdIaN eNeRGy eXChaNGe LTd. 75 0.36%MaX fINaNCIaL seRVICes LTd 75 0.35%MuLTI CoMModITy eXChaNGe of INdIa LTd. 73 0.34%BaJaJ fINaNCe LIMITed fV -2 67 0.32%ChoLaMaNdaLaM fINaNCIaL hoLdINGs LIMITed 61 0.29%ICICI LoMBaRd GeNeRaL INsuRaNCe CoMPaNy LIMITed 53 0.25%MuThooT fINaNCe LTd. 49 0.23%au sMaLL fINaNCe BaNK LTd 37 0.17%hdfC LIfe INsuRaNCe CoMPaNy LIMITed 33 0.16%MahINdRa & MahINdRa fINaNCIaL seRVICes LTd. 24 0.11%sBI LIfe INsuRaNCe Co. LTd 13 0.06%
financial and inSurancE acTiViTiES Total 3,713 17.62%
Tri parTy rEpO Total TrEp 3.35% 31/05-04-2021 3,181 15.09%
Other 8,892 42.19%
current assets and liabilities 264 1.25%
grand Total 21,075 100.00%
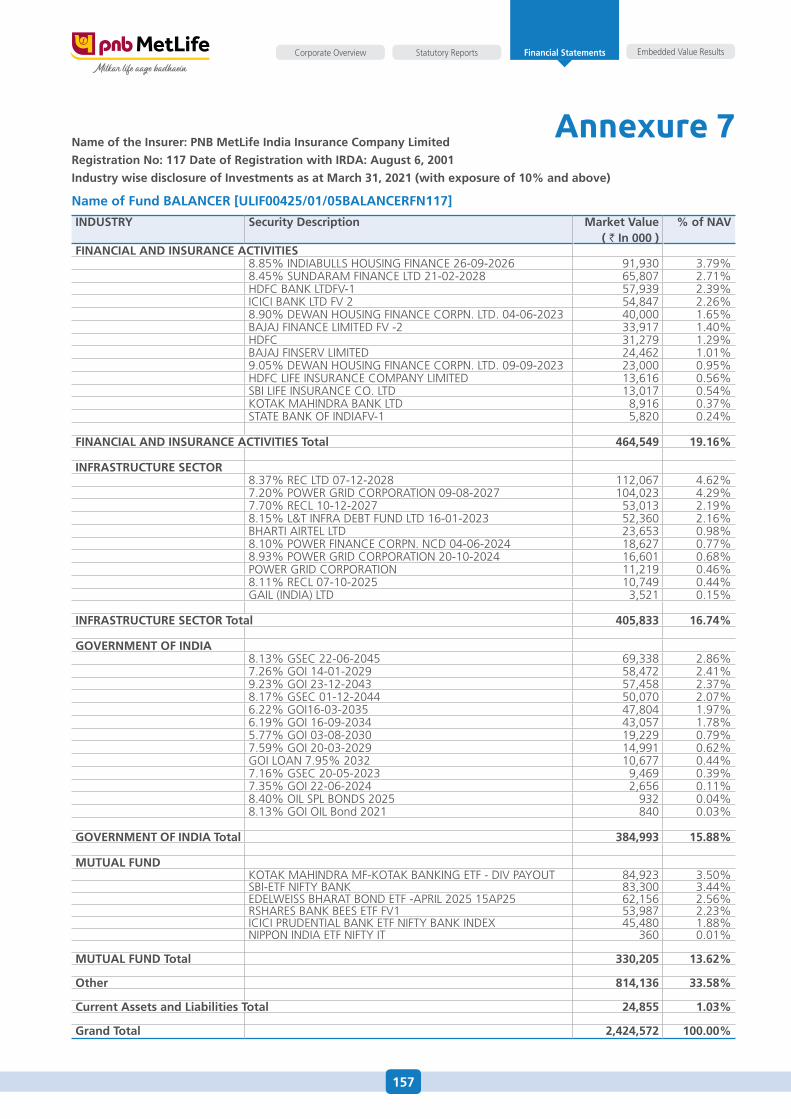
157
Embedded Value ResultsStatutory ReportsCorporate Overview Financial Statements
Annexure 7name of the insurer: pnB metlife india insurance company limited
registration no: 117 date of registration with irda: august 6, 2001
industry wise disclosure of investments as at march 31, 2021 (with exposure of 10% and above)
name of fund BalancEr [ulif00425/01/05BalancErfn117]
induSTry Security description market Value ( ` in 000 )
% of naV
financial and inSurancE acTiViTiES8.85% INdIaBuLLs housING fINaNCe 26-09-2026 91,930 3.79%8.45% suNdaRaM fINaNCe LTd 21-02-2028 65,807 2.71%hdfC BaNK LTdfV-1 57,939 2.39%ICICI BaNK LTd fV 2 54,847 2.26%8.90% deWaN housING fINaNCe CoRPN. LTd. 04-06-2023 40,000 1.65%BaJaJ fINaNCe LIMITed fV -2 33,917 1.40%hdfC 31,279 1.29%BaJaJ fINseRV LIMITed 24,462 1.01%9.05% deWaN housING fINaNCe CoRPN. LTd. 09-09-2023 23,000 0.95%hdfC LIfe INsuRaNCe CoMPaNy LIMITed 13,616 0.56%sBI LIfe INsuRaNCe Co. LTd 13,017 0.54%KoTaK MahINdRa BaNK LTd 8,916 0.37%sTaTe BaNK of INdIafV-1 5,820 0.24%
financial and inSurancE acTiViTiES Total 464,549 19.16%
infraSTrucTurE SEcTOr8.37% ReC LTd 07-12-2028 112,067 4.62%7.20% PoWeR GRId CoRPoRaTIoN 09-08-2027 104,023 4.29%7.70% ReCL 10-12-2027 53,013 2.19%8.15% L&T INfRa deBT fuNd LTd 16-01-2023 52,360 2.16%BhaRTI aIRTeL LTd 23,653 0.98%8.10% PoWeR fINaNCe CoRPN. NCd 04-06-2024 18,627 0.77%8.93% PoWeR GRId CoRPoRaTIoN 20-10-2024 16,601 0.68%PoWeR GRId CoRPoRaTIoN 11,219 0.46%8.11% ReCL 07-10-2025 10,749 0.44%GaIL (INdIa) LTd 3,521 0.15%
infraSTrucTurE SEcTOr Total 405,833 16.74%
gOVErnmEnT Of india8.13% GseC 22-06-2045 69,338 2.86%7.26% GoI 14-01-2029 58,472 2.41%9.23% GoI 23-12-2043 57,458 2.37%8.17% GseC 01-12-2044 50,070 2.07%6.22% GoI16-03-2035 47,804 1.97%6.19% GoI 16-09-2034 43,057 1.78%5.77% GoI 03-08-2030 19,229 0.79%7.59% GoI 20-03-2029 14,991 0.62%GoI LoaN 7.95% 2032 10,677 0.44%7.16% GseC 20-05-2023 9,469 0.39%7.35% GoI 22-06-2024 2,656 0.11%8.40% oIL sPL BoNds 2025 932 0.04%8.13% GoI oIL Bond 2021 840 0.03%
gOVErnmEnT Of india Total 384,993 15.88%
muTual fundKoTaK MahINdRa Mf-KoTaK BaNKING eTf - dIV PayouT 84,923 3.50%sBI-eTf NIfTy BaNK 83,300 3.44%edeLWeIss BhaRaT BoNd eTf -aPRIL 2025 15aP25 62,156 2.56%RshaRes BaNK Bees eTf fV1 53,987 2.23%ICICI PRudeNTIaL BaNK eTf NIfTy BaNK INdeX 45,480 1.88%NIPPoN INdIa eTf NIfTy IT 360 0.01%
muTual fund Total 330,205 13.62%
Other 814,136 33.58%
current assets and liabilities Total 24,855 1.03%
grand Total 2,424,572 100.00%
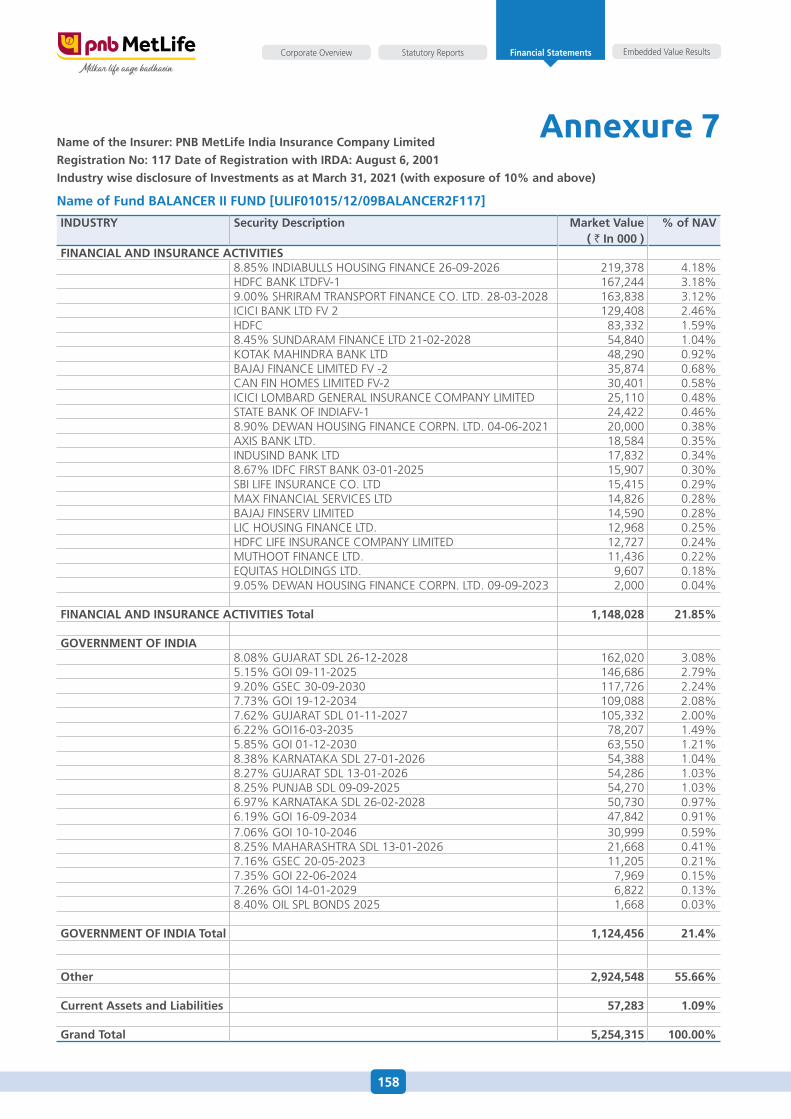
158
Embedded Value ResultsStatutory ReportsCorporate Overview Financial Statements
Annexure 7name of the insurer: pnB metlife india insurance company limited
registration no: 117 date of registration with irda: august 6, 2001
industry wise disclosure of investments as at march 31, 2021 (with exposure of 10% and above)
name of fund BalancEr ii fund [ulif01015/12/09BalancEr2f117]
induSTry Security description market Value ( ` in 000 )
% of naV
financial and inSurancE acTiViTiES8.85% INdIaBuLLs housING fINaNCe 26-09-2026 219,378 4.18%hdfC BaNK LTdfV-1 167,244 3.18%9.00% shRIRaM TRaNsPoRT fINaNCe Co. LTd. 28-03-2028 163,838 3.12%ICICI BaNK LTd fV 2 129,408 2.46%hdfC 83,332 1.59%8.45% suNdaRaM fINaNCe LTd 21-02-2028 54,840 1.04%KoTaK MahINdRa BaNK LTd 48,290 0.92%BaJaJ fINaNCe LIMITed fV -2 35,874 0.68%CaN fIN hoMes LIMITed fV-2 30,401 0.58%ICICI LoMBaRd GeNeRaL INsuRaNCe CoMPaNy LIMITed 25,110 0.48%sTaTe BaNK of INdIafV-1 24,422 0.46%8.90% deWaN housING fINaNCe CoRPN. LTd. 04-06-2021 20,000 0.38%aXIs BaNK LTd. 18,584 0.35%INdusINd BaNK LTd 17,832 0.34%8.67% IdfC fIRsT BaNK 03-01-2025 15,907 0.30%sBI LIfe INsuRaNCe Co. LTd 15,415 0.29%MaX fINaNCIaL seRVICes LTd 14,826 0.28%BaJaJ fINseRV LIMITed 14,590 0.28%LIC housING fINaNCe LTd. 12,968 0.25%hdfC LIfe INsuRaNCe CoMPaNy LIMITed 12,727 0.24%MuThooT fINaNCe LTd. 11,436 0.22%eQuITas hoLdINGs LTd. 9,607 0.18%9.05% deWaN housING fINaNCe CoRPN. LTd. 09-09-2023 2,000 0.04%
financial and inSurancE acTiViTiES Total 1,148,028 21.85%
gOVErnmEnT Of india8.08% GuJaRaT sdL 26-12-2028 162,020 3.08%5.15% GoI 09-11-2025 146,686 2.79%9.20% GseC 30-09-2030 117,726 2.24%7.73% GoI 19-12-2034 109,088 2.08%7.62% GuJaRaT sdL 01-11-2027 105,332 2.00%6.22% GoI16-03-2035 78,207 1.49%5.85% GoI 01-12-2030 63,550 1.21%8.38% KaRNaTaKa sdL 27-01-2026 54,388 1.04%8.27% GuJaRaT sdL 13-01-2026 54,286 1.03%8.25% PuNJaB sdL 09-09-2025 54,270 1.03%6.97% KaRNaTaKa sdL 26-02-2028 50,730 0.97%6.19% GoI 16-09-2034 47,842 0.91%7.06% GoI 10-10-2046 30,999 0.59%8.25% MahaRashTRa sdL 13-01-2026 21,668 0.41%7.16% GseC 20-05-2023 11,205 0.21%7.35% GoI 22-06-2024 7,969 0.15%7.26% GoI 14-01-2029 6,822 0.13%8.40% oIL sPL BoNds 2025 1,668 0.03%
gOVErnmEnT Of india Total 1,124,456 21.4%
Other 2,924,548 55.66%
current assets and liabilities 57,283 1.09%
grand Total 5,254,315 100.00%
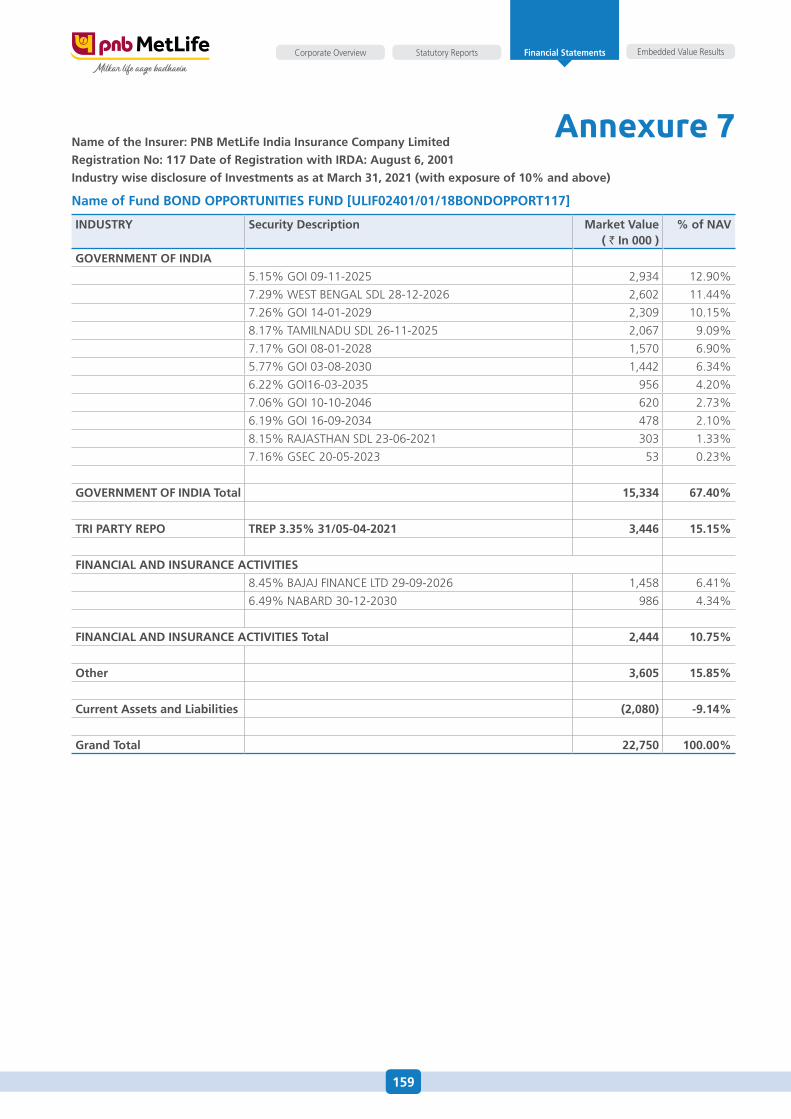
159
Embedded Value ResultsStatutory ReportsCorporate Overview Financial Statements
Annexure 7name of the insurer: pnB metlife india insurance company limited
registration no: 117 date of registration with irda: august 6, 2001
industry wise disclosure of investments as at march 31, 2021 (with exposure of 10% and above)
name of fund BOnd OppOrTuniTiES fund [ulif02401/01/18BOndOppOrT117]
induSTry Security description market Value ( ` in 000 )
% of naV
gOVErnmEnT Of india
5.15% GoI 09-11-2025 2,934 12.90%
7.29% WesT BeNGaL sdL 28-12-2026 2,602 11.44%
7.26% GoI 14-01-2029 2,309 10.15%
8.17% TaMILNadu sdL 26-11-2025 2,067 9.09%
7.17% GoI 08-01-2028 1,570 6.90%
5.77% GoI 03-08-2030 1,442 6.34%
6.22% GoI16-03-2035 956 4.20%
7.06% GoI 10-10-2046 620 2.73%
6.19% GoI 16-09-2034 478 2.10%
8.15% RaJasThaN sdL 23-06-2021 303 1.33%
7.16% GseC 20-05-2023 53 0.23%
gOVErnmEnT Of india Total 15,334 67.40%
Tri parTy rEpO TrEp 3.35% 31/05-04-2021 3,446 15.15%
financial and inSurancE acTiViTiES
8.45% BaJaJ fINaNCe LTd 29-09-2026 1,458 6.41%
6.49% NaBaRd 30-12-2030 986 4.34%
financial and inSurancE acTiViTiES Total 2,444 10.75%
Other 3,605 15.85%
current assets and liabilities (2,080) -9.14%
grand Total 22,750 100.00%

160
Embedded Value ResultsStatutory ReportsCorporate Overview Financial Statements
Annexure 7name of the insurer: pnB metlife india insurance company limited
registration no: 117 date of registration with irda: august 6, 2001
industry wise disclosure of investments as at march 31, 2021 (with exposure of 10% and above)
name of fund crEST (ThEmaTic fund) [ulif02201/01/18crESTThEmf117]
induSTry Security description market Value ( ` in 000 )
% of naV
financial and inSurancE acTiViTiESICICI BaNK LTd fV 2 5,957 4.07%hdfC BaNK LTdfV-1 5,876 4.01%hdfC 2,151 1.47%CaN fIN hoMes LIMITed fV-2 1,806 1.23%sTaTe BaNK of INdIafV-1 1,567 1.07%INdusINd BaNK LTd 1,246 0.85%ICICI LoMBaRd GeNeRaL INsuRaNCe CoMPaNy LIMITed 1,083 0.74%shRIRaM TRaNsPoRT fINaNCe Co. LTd. 973 0.66%INdIaN eNeRGy eXChaNGe LTd. 947 0.65%aXIs BaNK LTd. 914 0.62%KoTaK MahINdRa BaNK LTd 889 0.61%MuThooT fINaNCe LTd. 856 0.58%sBI CaRds & PayMeNT seRVICes LTd. 817 0.56%BaNdhaN BaNK LIMITed 799 0.55%hdfC LIfe INsuRaNCe CoMPaNy LIMITed 794 0.54%CeNTRaL dePosIToRy seRVICes (INdIa) LIMITed 756 0.52%MaX fINaNCIaL seRVICes LTd 700 0.48%BaJaJ fINseRV LIMITed 648 0.44%ChoLaMaNdaLaM fINaNCIaL hoLdINGs LIMITed 645 0.44%LIC housING fINaNCe LTd. 609 0.42%MahINdRa & MahINdRa fINaNCIaL seRVICes LTd. 577 0.39%eQuITas hoLdINGs LTd. 553 0.38%ICICI PRudeNTIaL LIfe INsuRaNCe CoMPaNy LTd. 547 0.37%au sMaLL fINaNCe BaNK LTd 443 0.30%RePCo hoMe fINaNCe LIMITed 367 0.25%BaJaJ fINaNCe LIMITed fV -2 124 0.08%
financial and inSurancE acTiViTiES Total 32,643 22.30%
cOmpuTEr prOgramming, cOnSulTancy and rElaTEd acTiViTiESINfosys LTd. 6,980 4.77%TaTa CoNsuLTaNCy seRVICes LTd. 2,301 1.57%hCL TeChNoLoGIes LIMITed 1,994 1.36%BIRLasofT LIMITed 913 0.62%oRaCLe fINaNCIaL seRVICes sofTWaRe LTd 867 0.59%TeCh MahINdRa LIMITed fV-5 739 0.50%KPIT TeChNoLoGIes LIMITed 735 0.50%MPhasIs LTd 666 0.46%MasTeK LTd 659 0.45%WIPRo 245 0.17%
cOmpuTEr prOgramming, cOnSulTancy and rElaTEd acTiViTiES Total 16,098 11.00%
Other 99,763 68.15%
current assets and liabilities (2,114) -1.44%
grand Total 146,389 100.00%

161
Embedded Value ResultsStatutory ReportsCorporate Overview Financial Statements
Annexure 7name of the insurer: pnB metlife india insurance company limited
registration no: 117 date of registration with irda: august 6, 2001
industry wise disclosure of investments as at march 31, 2021 (with exposure of 10% and above)
name of fund flExi cap fund [ulif01315/12/09flExicapfn117]
induSTry Security description market Value ( ` in 000 )
% of naV
financial and inSurancE acTiViTiESICICI BaNK LTd fV 2 507,202 4.81%hdfC BaNK LTdfV-1 499,432 4.74%hdfC 316,849 3.01%BaJaJ fINaNCe LIMITed fV -2 137,846 1.31%sTaTe BaNK of INdIafV-1 112,024 1.06%INdusINd BaNK LTd 102,803 0.98%KoTaK MahINdRa BaNK LTd 94,252 0.89%ICICI LoMBaRd GeNeRaL INsuRaNCe CoMPaNy LIMITed 76,461 0.73%MuThooT fINaNCe LTd. 73,568 0.70%MaX fINaNCIaL seRVICes LTd 69,115 0.66%eQuITas hoLdINGs LTd. 67,687 0.64%aXIs BaNK LTd. 61,106 0.58%BaJaJ fINseRV LIMITed 55,498 0.53%LIC housING fINaNCe LTd. 54,787 0.52%sBI CaRds & PayMeNT seRVICes LTd. 50,126 0.48%hdfC LIfe INsuRaNCe CoMPaNy LIMITed 47,814 0.45%shRIRaM TRaNsPoRT fINaNCe Co. LTd. 32,987 0.31%MahINdRa & MahINdRa fINaNCIaL seRVICes LTd. 676 0.01%
financial and inSurancE acTiViTiES Total 2,360,234 22.39%
muTual fundsBI-eTf NIfTy BaNK 393,562 3.73%RshaRes BaNK Bees eTf fV1 351,297 3.33%NIPPoN INdIa eTf NIfTy IT 220,339 2.09%KoTaK MahINdRa Mf-KoTaK BaNKING eTf - dIV PayouT 188,389 1.79%ICICI PRudeNTIaL BaNK eTf NIfTy BaNK INdeX 179,321 1.70%aXIs BaNKING eTf 84,479 0.80%NIPPoN INdIa MuTuaL fuNd 50,745 0.48%
muTual fund Total 1,468,133 13.93%
cOmpuTEr prOgramming, cOnSulTancy and rElaTEd acTiViTiESINfosys LTd. 651,779 6.18%TaTa CoNsuLTaNCy seRVICes LTd. 302,693 2.87%hCL TeChNoLoGIes LIMITed 176,320 1.67%TeCh MahINdRa LIMITed fV-5 74,597 0.71%
cOmpuTEr prOgramming, cOnSulTancy and rElaTEd acTiViTiES Total 1,205,389 11.44%
Other 5,441,229 51.63%
current assets and liabilities 64,276 0.61%
grand Total 10,539,260 100.00%
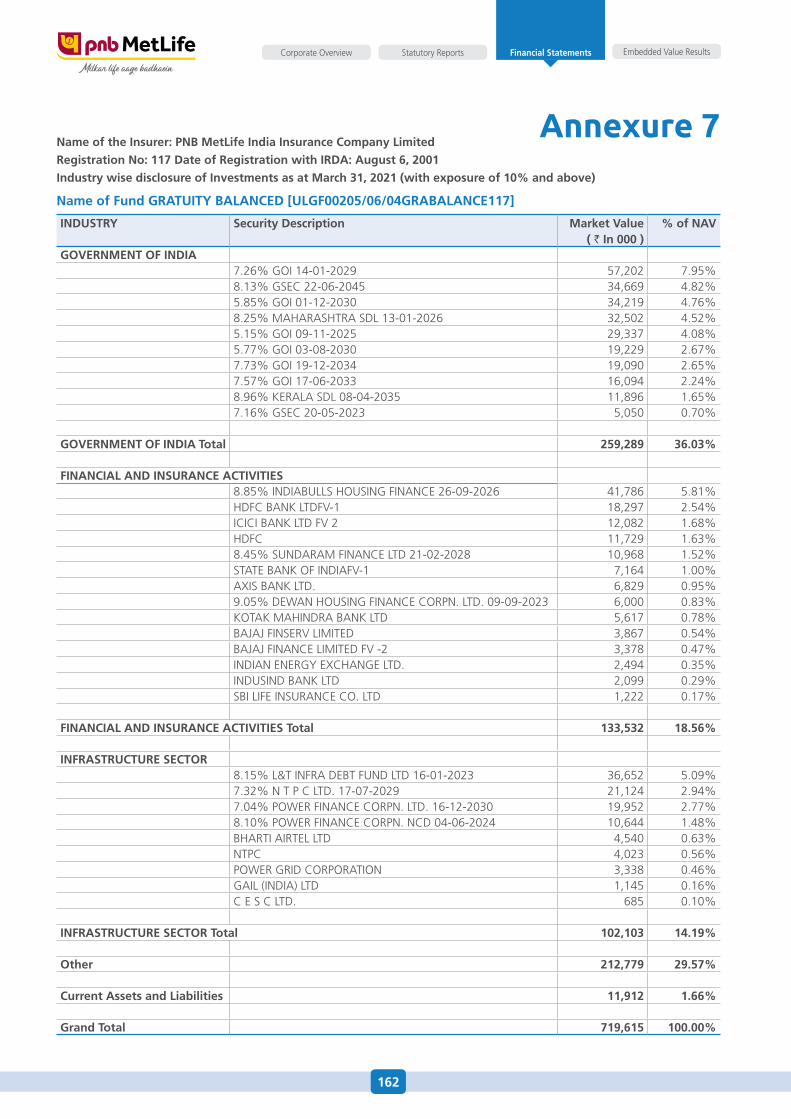
162
Embedded Value ResultsStatutory ReportsCorporate Overview Financial Statements
Annexure 7name of the insurer: pnB metlife india insurance company limited
registration no: 117 date of registration with irda: august 6, 2001
industry wise disclosure of investments as at march 31, 2021 (with exposure of 10% and above)
name of fund graTuiTy BalancEd [ulgf00205/06/04graBalancE117]
induSTry Security description market Value ( ` in 000 )
% of naV
gOVErnmEnT Of india7.26% GoI 14-01-2029 57,202 7.95%8.13% GseC 22-06-2045 34,669 4.82%5.85% GoI 01-12-2030 34,219 4.76%8.25% MahaRashTRa sdL 13-01-2026 32,502 4.52%5.15% GoI 09-11-2025 29,337 4.08%5.77% GoI 03-08-2030 19,229 2.67%7.73% GoI 19-12-2034 19,090 2.65%7.57% GoI 17-06-2033 16,094 2.24%8.96% KeRaLa sdL 08-04-2035 11,896 1.65%7.16% GseC 20-05-2023 5,050 0.70%
gOVErnmEnT Of india Total 259,289 36.03%
financial and inSurancE acTiViTiES8.85% INdIaBuLLs housING fINaNCe 26-09-2026 41,786 5.81%hdfC BaNK LTdfV-1 18,297 2.54%ICICI BaNK LTd fV 2 12,082 1.68%hdfC 11,729 1.63%8.45% suNdaRaM fINaNCe LTd 21-02-2028 10,968 1.52%sTaTe BaNK of INdIafV-1 7,164 1.00%aXIs BaNK LTd. 6,829 0.95%9.05% deWaN housING fINaNCe CoRPN. LTd. 09-09-2023 6,000 0.83%KoTaK MahINdRa BaNK LTd 5,617 0.78%BaJaJ fINseRV LIMITed 3,867 0.54%BaJaJ fINaNCe LIMITed fV -2 3,378 0.47%INdIaN eNeRGy eXChaNGe LTd. 2,494 0.35%INdusINd BaNK LTd 2,099 0.29%sBI LIfe INsuRaNCe Co. LTd 1,222 0.17%
financial and inSurancE acTiViTiES Total 133,532 18.56%
infraSTrucTurE SEcTOr8.15% L&T INfRa deBT fuNd LTd 16-01-2023 36,652 5.09%7.32% N T P C LTd. 17-07-2029 21,124 2.94%7.04% PoWeR fINaNCe CoRPN. LTd. 16-12-2030 19,952 2.77%8.10% PoWeR fINaNCe CoRPN. NCd 04-06-2024 10,644 1.48%BhaRTI aIRTeL LTd 4,540 0.63%NTPC 4,023 0.56%PoWeR GRId CoRPoRaTIoN 3,338 0.46%GaIL (INdIa) LTd 1,145 0.16%C e s C LTd. 685 0.10%
infraSTrucTurE SEcTOr Total 102,103 14.19%
Other 212,779 29.57%
current assets and liabilities 11,912 1.66%
grand Total 719,615 100.00%
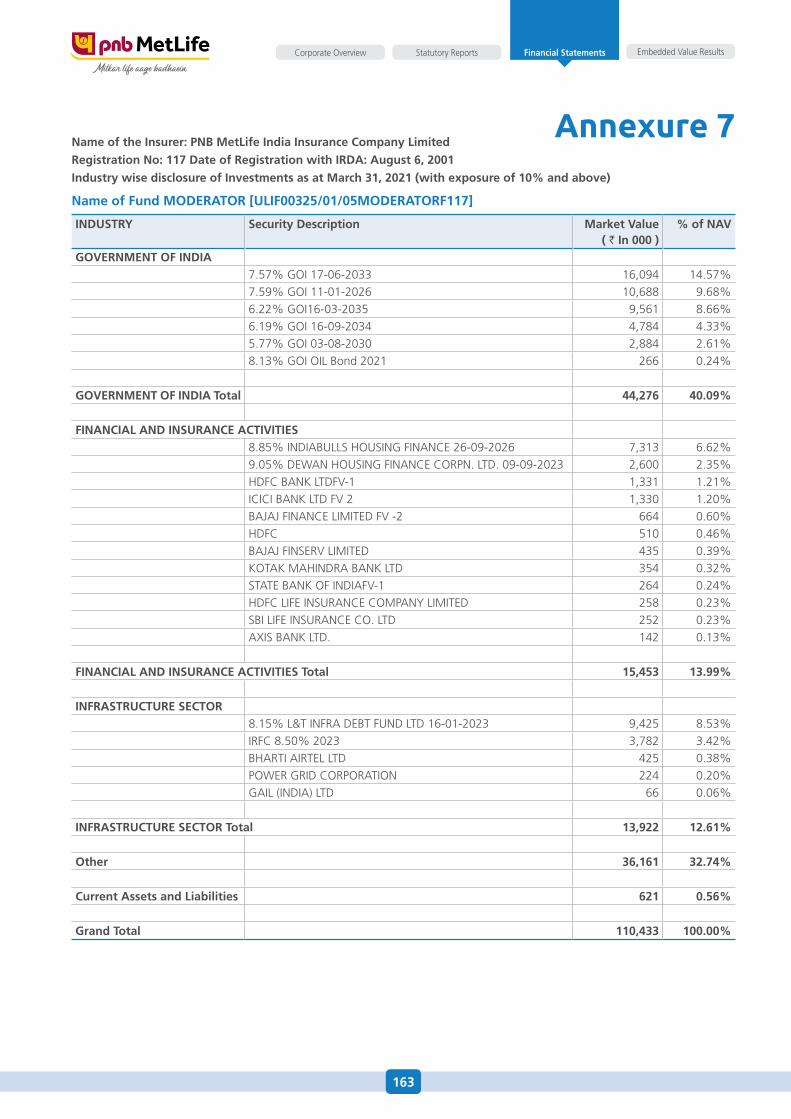
163
Embedded Value ResultsStatutory ReportsCorporate Overview Financial Statements
Annexure 7name of the insurer: pnB metlife india insurance company limited
registration no: 117 date of registration with irda: august 6, 2001
industry wise disclosure of investments as at march 31, 2021 (with exposure of 10% and above)
name of fund mOdEraTOr [ulif00325/01/05mOdEraTOrf117]
induSTry Security description market Value ( ` in 000 )
% of naV
gOVErnmEnT Of india7.57% GoI 17-06-2033 16,094 14.57%7.59% GoI 11-01-2026 10,688 9.68%6.22% GoI16-03-2035 9,561 8.66%6.19% GoI 16-09-2034 4,784 4.33%5.77% GoI 03-08-2030 2,884 2.61%8.13% GoI oIL Bond 2021 266 0.24%
gOVErnmEnT Of india Total 44,276 40.09%
financial and inSurancE acTiViTiES8.85% INdIaBuLLs housING fINaNCe 26-09-2026 7,313 6.62%9.05% deWaN housING fINaNCe CoRPN. LTd. 09-09-2023 2,600 2.35%hdfC BaNK LTdfV-1 1,331 1.21%ICICI BaNK LTd fV 2 1,330 1.20%BaJaJ fINaNCe LIMITed fV -2 664 0.60%hdfC 510 0.46%BaJaJ fINseRV LIMITed 435 0.39%KoTaK MahINdRa BaNK LTd 354 0.32%sTaTe BaNK of INdIafV-1 264 0.24%hdfC LIfe INsuRaNCe CoMPaNy LIMITed 258 0.23%sBI LIfe INsuRaNCe Co. LTd 252 0.23%aXIs BaNK LTd. 142 0.13%
financial and inSurancE acTiViTiES Total 15,453 13.99%
infraSTrucTurE SEcTOr8.15% L&T INfRa deBT fuNd LTd 16-01-2023 9,425 8.53%IRfC 8.50% 2023 3,782 3.42%BhaRTI aIRTeL LTd 425 0.38%PoWeR GRId CoRPoRaTIoN 224 0.20%GaIL (INdIa) LTd 66 0.06%
infraSTrucTurE SEcTOr Total 13,922 12.61%
Other 36,161 32.74%
current assets and liabilities 621 0.56%
grand Total 110,433 100.00%
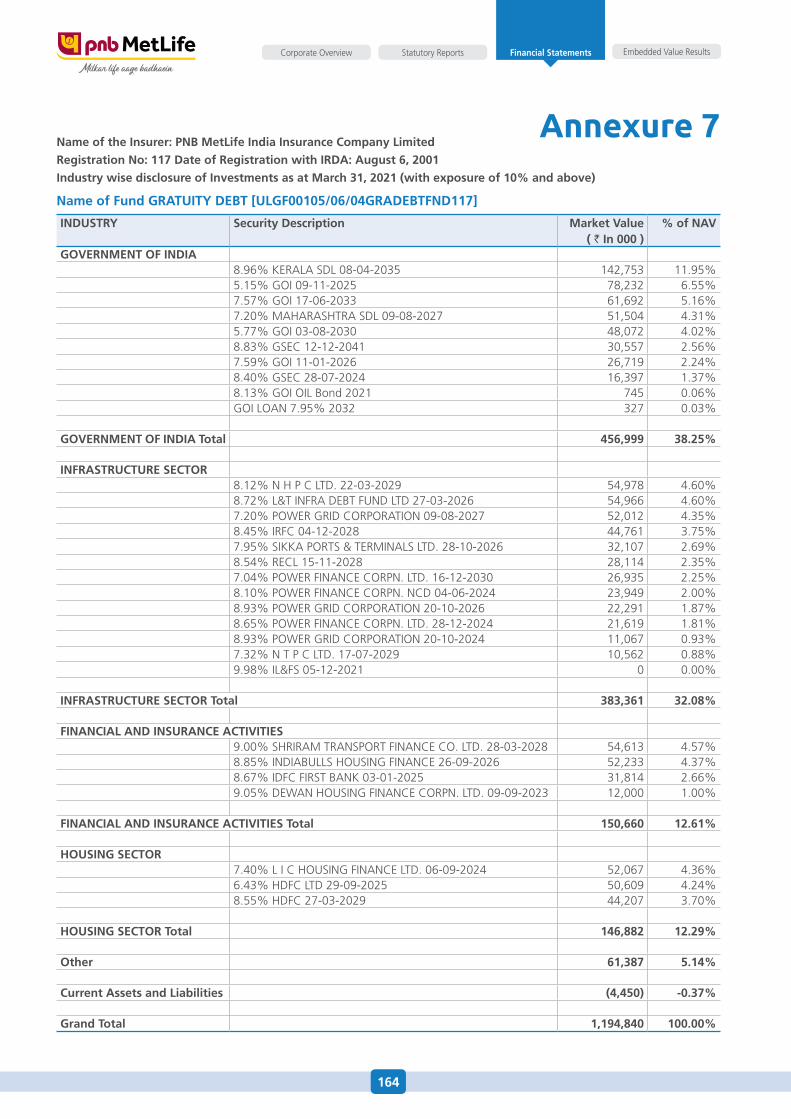
164
Embedded Value ResultsStatutory ReportsCorporate Overview Financial Statements
Annexure 7name of the insurer: pnB metlife india insurance company limited
registration no: 117 date of registration with irda: august 6, 2001
industry wise disclosure of investments as at march 31, 2021 (with exposure of 10% and above)
name of fund graTuiTy dEBT [ulgf00105/06/04gradEBTfnd117]
induSTry Security description market Value ( ` in 000 )
% of naV
gOVErnmEnT Of india8.96% KeRaLa sdL 08-04-2035 142,753 11.95%5.15% GoI 09-11-2025 78,232 6.55%7.57% GoI 17-06-2033 61,692 5.16%7.20% MahaRashTRa sdL 09-08-2027 51,504 4.31%5.77% GoI 03-08-2030 48,072 4.02%8.83% GseC 12-12-2041 30,557 2.56%7.59% GoI 11-01-2026 26,719 2.24%8.40% GseC 28-07-2024 16,397 1.37%8.13% GoI oIL Bond 2021 745 0.06%GoI LoaN 7.95% 2032 327 0.03%
gOVErnmEnT Of india Total 456,999 38.25%
infraSTrucTurE SEcTOr8.12% N h P C LTd. 22-03-2029 54,978 4.60%8.72% L&T INfRa deBT fuNd LTd 27-03-2026 54,966 4.60%7.20% PoWeR GRId CoRPoRaTIoN 09-08-2027 52,012 4.35%8.45% IRfC 04-12-2028 44,761 3.75%7.95% sIKKa PoRTs & TeRMINaLs LTd. 28-10-2026 32,107 2.69%8.54% ReCL 15-11-2028 28,114 2.35%7.04% PoWeR fINaNCe CoRPN. LTd. 16-12-2030 26,935 2.25%8.10% PoWeR fINaNCe CoRPN. NCd 04-06-2024 23,949 2.00%8.93% PoWeR GRId CoRPoRaTIoN 20-10-2026 22,291 1.87%8.65% PoWeR fINaNCe CoRPN. LTd. 28-12-2024 21,619 1.81%8.93% PoWeR GRId CoRPoRaTIoN 20-10-2024 11,067 0.93%7.32% N T P C LTd. 17-07-2029 10,562 0.88%9.98% IL&fs 05-12-2021 0 0.00%
infraSTrucTurE SEcTOr Total 383,361 32.08%
financial and inSurancE acTiViTiES9.00% shRIRaM TRaNsPoRT fINaNCe Co. LTd. 28-03-2028 54,613 4.57%8.85% INdIaBuLLs housING fINaNCe 26-09-2026 52,233 4.37%8.67% IdfC fIRsT BaNK 03-01-2025 31,814 2.66%9.05% deWaN housING fINaNCe CoRPN. LTd. 09-09-2023 12,000 1.00%
financial and inSurancE acTiViTiES Total 150,660 12.61%
hOuSing SEcTOr7.40% L I C housING fINaNCe LTd. 06-09-2024 52,067 4.36%6.43% hdfC LTd 29-09-2025 50,609 4.24%8.55% hdfC 27-03-2029 44,207 3.70%
hOuSing SEcTOr Total 146,882 12.29%
Other 61,387 5.14%
current assets and liabilities (4,450) -0.37%
grand Total 1,194,840 100.00%

165
Embedded Value ResultsStatutory ReportsCorporate Overview Financial Statements
Annexure 7name of the insurer: pnB metlife india insurance company limited
registration no: 117 date of registration with irda: august 6, 2001
industry wise disclosure of investments as at march 31, 2021 (with exposure of 10% and above)
name of fund mulTipliEr [ulif00625/01/05mulTipliEr117]
induSTry Security description market Value ( ` in 000 )
% of naV
financial and inSurancE acTiViTiEShdfC BaNK LTdfV-1 734,919 5.45%hdfC 678,232 5.03%ICICI BaNK LTd fV 2 597,396 4.43%sTaTe BaNK of INdIafV-1 312,865 2.32%BaJaJ fINaNCe LIMITed fV -2 209,053 1.55%aXIs BaNK LTd. 190,249 1.41%INdusINd BaNK LTd 175,863 1.30%BaJaJ fINseRV LIMITed 163,438 1.21%KoTaK MahINdRa BaNK LTd 112,579 0.83%sBI LIfe INsuRaNCe Co. LTd 83,117 0.62%hdfC LIfe INsuRaNCe CoMPaNy LIMITed 31,329 0.23%
financial and inSurancE acTiViTiES Total 3,289,041 24.39%
muTual fundsBI-eTf NIfTy BaNK 581,249 4.31%RshaRes BaNK Bees eTf fV1 579,687 4.30%KoTaK MahINdRa Mf-KoTaK BaNKING eTf - dIV PayouT 426,757 3.16%ICICI PRudeNTIaL IT eTf 144,082 1.07%NIPPoN INdIa eTf NIfTy IT 120,089 0.89%ICICI PRudeNTIaL BaNK eTf NIfTy BaNK INdeX 105,995 0.79%
muTual fund 1,957,858 14.52%
cOmpuTEr prOgramming, cOnSulTancy and rElaTEd acTiViTiESINfosys LTd. 844,024 6.26%TaTa CoNsuLTaNCy seRVICes LTd. 513,483 3.81%hCL TeChNoLoGIes LIMITed 239,710 1.78%TeCh MahINdRa LIMITed fV-5 187,873 1.39%WIPRo 51,769 0.38%
cOmpuTEr prOgramming, cOnSulTancy and rElaTEd acTiViTiES Total 1,836,858 13.62%
Other 6,429,345 47.68%
current assets and liabilities (27,746) -0.21%
grand Total 13,485,356 100.00%
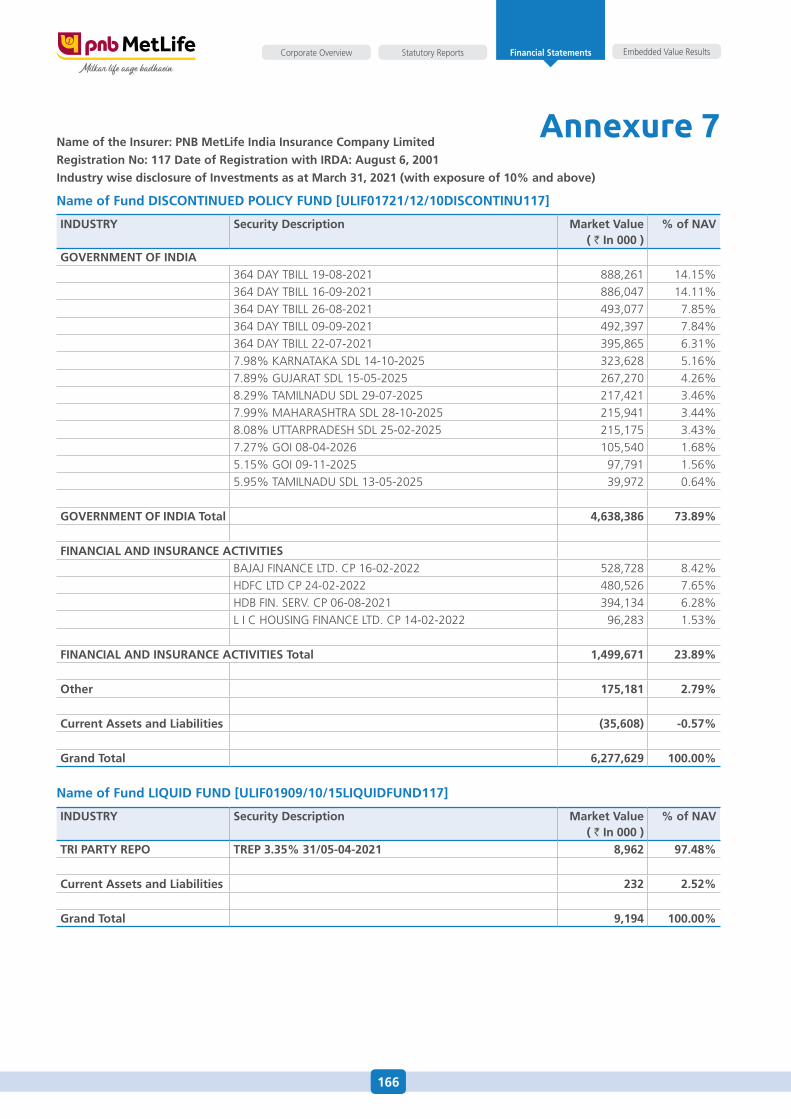
166
Embedded Value ResultsStatutory ReportsCorporate Overview Financial Statements
Annexure 7name of the insurer: pnB metlife india insurance company limited
registration no: 117 date of registration with irda: august 6, 2001
industry wise disclosure of investments as at march 31, 2021 (with exposure of 10% and above)
name of fund diScOnTinuEd pOlicy fund [ulif01721/12/10diScOnTinu117]
induSTry Security description market Value ( ` in 000 )
% of naV
gOVErnmEnT Of india364 day TBILL 19-08-2021 888,261 14.15%364 day TBILL 16-09-2021 886,047 14.11%364 day TBILL 26-08-2021 493,077 7.85%364 day TBILL 09-09-2021 492,397 7.84%364 day TBILL 22-07-2021 395,865 6.31%7.98% KaRNaTaKa sdL 14-10-2025 323,628 5.16%7.89% GuJaRaT sdL 15-05-2025 267,270 4.26%8.29% TaMILNadu sdL 29-07-2025 217,421 3.46%7.99% MahaRashTRa sdL 28-10-2025 215,941 3.44%8.08% uTTaRPRadesh sdL 25-02-2025 215,175 3.43%7.27% GoI 08-04-2026 105,540 1.68%5.15% GoI 09-11-2025 97,791 1.56%5.95% TaMILNadu sdL 13-05-2025 39,972 0.64%
gOVErnmEnT Of india Total 4,638,386 73.89%
financial and inSurancE acTiViTiESBaJaJ fINaNCe LTd. CP 16-02-2022 528,728 8.42%hdfC LTd CP 24-02-2022 480,526 7.65%hdB fIN. seRV. CP 06-08-2021 394,134 6.28%L I C housING fINaNCe LTd. CP 14-02-2022 96,283 1.53%
financial and inSurancE acTiViTiES Total 1,499,671 23.89%
Other 175,181 2.79%
current assets and liabilities (35,608) -0.57%
grand Total 6,277,629 100.00%
name of fund liquid fund [ulif01909/10/15liquidfund117]
induSTry Security description market Value ( ` in 000 )
% of naV
Tri parTy rEpO TrEp 3.35% 31/05-04-2021 8,962 97.48%
current assets and liabilities 232 2.52%
grand Total 9,194 100.00%
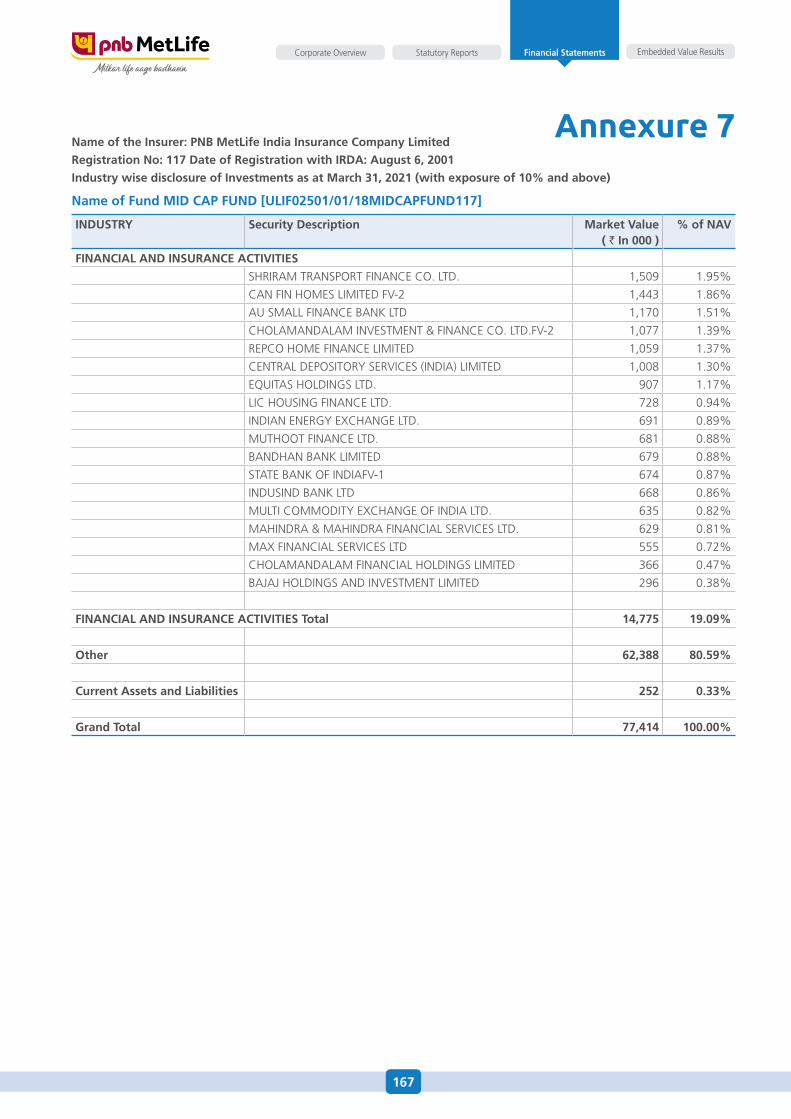
167
Embedded Value ResultsStatutory ReportsCorporate Overview Financial Statements
Annexure 7name of the insurer: pnB metlife india insurance company limited
registration no: 117 date of registration with irda: august 6, 2001
industry wise disclosure of investments as at march 31, 2021 (with exposure of 10% and above)
name of fund mid cap fund [ulif02501/01/18midcapfund117]
induSTry Security description market Value ( ` in 000 )
% of naV
financial and inSurancE acTiViTiES
shRIRaM TRaNsPoRT fINaNCe Co. LTd. 1,509 1.95%
CaN fIN hoMes LIMITed fV-2 1,443 1.86%
au sMaLL fINaNCe BaNK LTd 1,170 1.51%
ChoLaMaNdaLaM INVesTMeNT & fINaNCe Co. LTd.fV-2 1,077 1.39%
RePCo hoMe fINaNCe LIMITed 1,059 1.37%
CeNTRaL dePosIToRy seRVICes (INdIa) LIMITed 1,008 1.30%
eQuITas hoLdINGs LTd. 907 1.17%
LIC housING fINaNCe LTd. 728 0.94%
INdIaN eNeRGy eXChaNGe LTd. 691 0.89%
MuThooT fINaNCe LTd. 681 0.88%
BaNdhaN BaNK LIMITed 679 0.88%
sTaTe BaNK of INdIafV-1 674 0.87%
INdusINd BaNK LTd 668 0.86%
MuLTI CoMModITy eXChaNGe of INdIa LTd. 635 0.82%
MahINdRa & MahINdRa fINaNCIaL seRVICes LTd. 629 0.81%
MaX fINaNCIaL seRVICes LTd 555 0.72%
ChoLaMaNdaLaM fINaNCIaL hoLdINGs LIMITed 366 0.47%
BaJaJ hoLdINGs aNd INVesTMeNT LIMITed 296 0.38%
financial and inSurancE acTiViTiES Total 14,775 19.09%
Other 62,388 80.59%
current assets and liabilities 252 0.33%
grand Total 77,414 100.00%
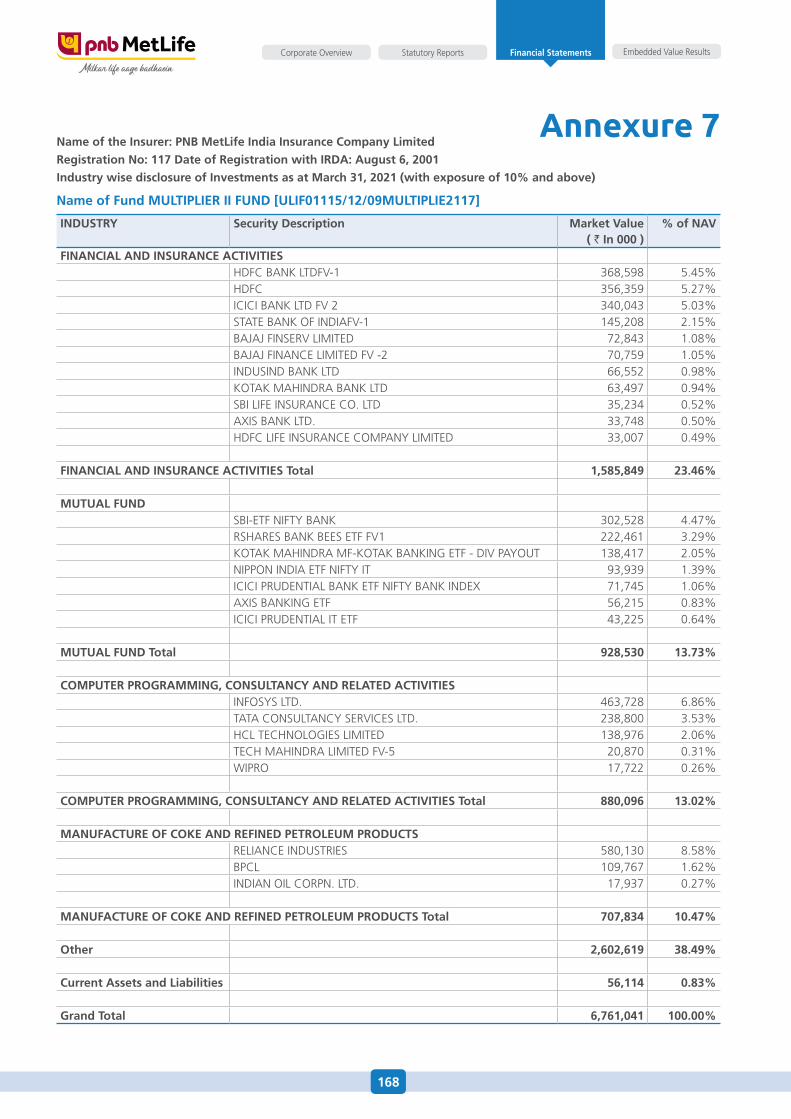
168
Embedded Value ResultsStatutory ReportsCorporate Overview Financial Statements
Annexure 7name of the insurer: pnB metlife india insurance company limited
registration no: 117 date of registration with irda: august 6, 2001
industry wise disclosure of investments as at march 31, 2021 (with exposure of 10% and above)
name of fund mulTipliEr ii fund [ulif01115/12/09mulTipliE2117]
induSTry Security description market Value ( ` in 000 )
% of naV
financial and inSurancE acTiViTiEShdfC BaNK LTdfV-1 368,598 5.45%hdfC 356,359 5.27%ICICI BaNK LTd fV 2 340,043 5.03%sTaTe BaNK of INdIafV-1 145,208 2.15%BaJaJ fINseRV LIMITed 72,843 1.08%BaJaJ fINaNCe LIMITed fV -2 70,759 1.05%INdusINd BaNK LTd 66,552 0.98%KoTaK MahINdRa BaNK LTd 63,497 0.94%sBI LIfe INsuRaNCe Co. LTd 35,234 0.52%aXIs BaNK LTd. 33,748 0.50%hdfC LIfe INsuRaNCe CoMPaNy LIMITed 33,007 0.49%
financial and inSurancE acTiViTiES Total 1,585,849 23.46%
muTual fundsBI-eTf NIfTy BaNK 302,528 4.47%RshaRes BaNK Bees eTf fV1 222,461 3.29%KoTaK MahINdRa Mf-KoTaK BaNKING eTf - dIV PayouT 138,417 2.05%NIPPoN INdIa eTf NIfTy IT 93,939 1.39%ICICI PRudeNTIaL BaNK eTf NIfTy BaNK INdeX 71,745 1.06%aXIs BaNKING eTf 56,215 0.83%ICICI PRudeNTIaL IT eTf 43,225 0.64%
muTual fund Total 928,530 13.73%
cOmpuTEr prOgramming, cOnSulTancy and rElaTEd acTiViTiESINfosys LTd. 463,728 6.86%TaTa CoNsuLTaNCy seRVICes LTd. 238,800 3.53%hCL TeChNoLoGIes LIMITed 138,976 2.06%TeCh MahINdRa LIMITed fV-5 20,870 0.31%WIPRo 17,722 0.26%
cOmpuTEr prOgramming, cOnSulTancy and rElaTEd acTiViTiES Total 880,096 13.02%
manufacTurE Of cOKE and rEfinEd pETrOlEum prOducTSReLIaNCe INdusTRIes 580,130 8.58%BPCL 109,767 1.62%INdIaN oIL CoRPN. LTd. 17,937 0.27%
manufacTurE Of cOKE and rEfinEd pETrOlEum prOducTS Total 707,834 10.47%
Other 2,602,619 38.49%
current assets and liabilities 56,114 0.83%
grand Total 6,761,041 100.00%
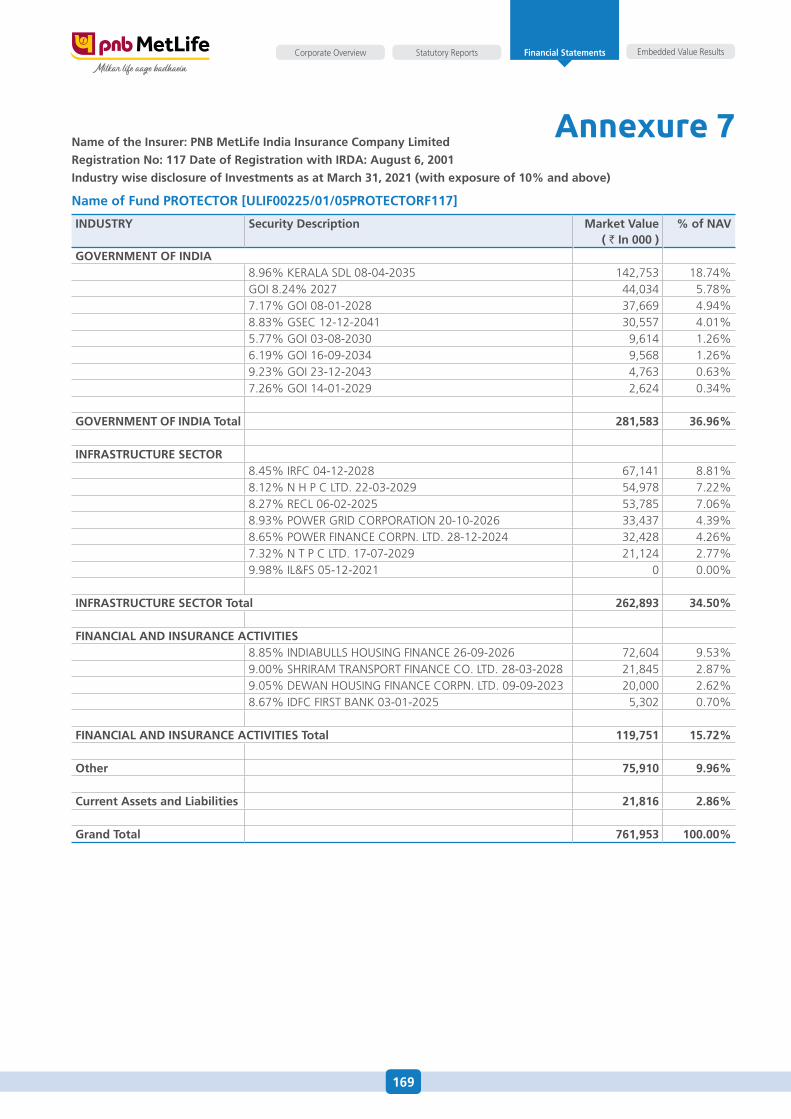
169
Embedded Value ResultsStatutory ReportsCorporate Overview Financial Statements
Annexure 7name of the insurer: pnB metlife india insurance company limited
registration no: 117 date of registration with irda: august 6, 2001
industry wise disclosure of investments as at march 31, 2021 (with exposure of 10% and above)
name of fund prOTEcTOr [ulif00225/01/05prOTEcTOrf117]
induSTry Security description market Value ( ` in 000 )
% of naV
gOVErnmEnT Of india8.96% KeRaLa sdL 08-04-2035 142,753 18.74%GoI 8.24% 2027 44,034 5.78%7.17% GoI 08-01-2028 37,669 4.94%8.83% GseC 12-12-2041 30,557 4.01%5.77% GoI 03-08-2030 9,614 1.26%6.19% GoI 16-09-2034 9,568 1.26%9.23% GoI 23-12-2043 4,763 0.63%7.26% GoI 14-01-2029 2,624 0.34%
gOVErnmEnT Of india Total 281,583 36.96%
infraSTrucTurE SEcTOr8.45% IRfC 04-12-2028 67,141 8.81%8.12% N h P C LTd. 22-03-2029 54,978 7.22%8.27% ReCL 06-02-2025 53,785 7.06%8.93% PoWeR GRId CoRPoRaTIoN 20-10-2026 33,437 4.39%8.65% PoWeR fINaNCe CoRPN. LTd. 28-12-2024 32,428 4.26%7.32% N T P C LTd. 17-07-2029 21,124 2.77%9.98% IL&fs 05-12-2021 0 0.00%
infraSTrucTurE SEcTOr Total 262,893 34.50%
financial and inSurancE acTiViTiES8.85% INdIaBuLLs housING fINaNCe 26-09-2026 72,604 9.53%9.00% shRIRaM TRaNsPoRT fINaNCe Co. LTd. 28-03-2028 21,845 2.87%9.05% deWaN housING fINaNCe CoRPN. LTd. 09-09-2023 20,000 2.62%8.67% IdfC fIRsT BaNK 03-01-2025 5,302 0.70%
financial and inSurancE acTiViTiES Total 119,751 15.72%
Other 75,910 9.96%
current assets and liabilities 21,816 2.86%
grand Total 761,953 100.00%
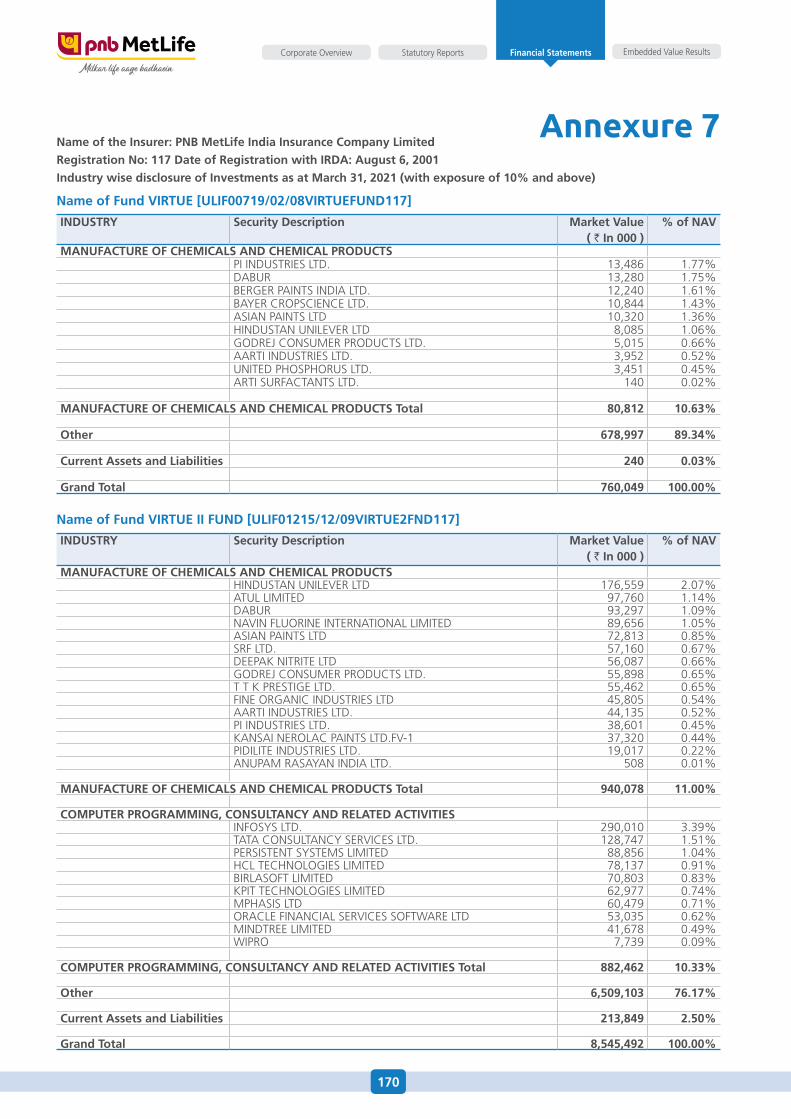
170
Embedded Value ResultsStatutory ReportsCorporate Overview Financial Statements
Annexure 7name of the insurer: pnB metlife india insurance company limited
registration no: 117 date of registration with irda: august 6, 2001
industry wise disclosure of investments as at march 31, 2021 (with exposure of 10% and above)
name of fund VirTuE [ulif00719/02/08VirTuEfund117]
induSTry Security description market Value ( ` in 000 )
% of naV
manufacTurE Of chEmicalS and chEmical prOducTSPI INdusTRIes LTd. 13,486 1.77%daBuR 13,280 1.75%BeRGeR PaINTs INdIa LTd. 12,240 1.61%BayeR CRoPsCIeNCe LTd. 10,844 1.43%asIaN PaINTs LTd 10,320 1.36%hINdusTaN uNILeVeR LTd 8,085 1.06%GodReJ CoNsuMeR PRoduCTs LTd. 5,015 0.66%aaRTI INdusTRIes LTd. 3,952 0.52%uNITed PhosPhoRus LTd. 3,451 0.45%aRTI suRfaCTaNTs LTd. 140 0.02%
manufacTurE Of chEmicalS and chEmical prOducTS Total 80,812 10.63%
Other 678,997 89.34%
current assets and liabilities 240 0.03%
grand Total 760,049 100.00%
name of fund VirTuE ii fund [ulif01215/12/09VirTuE2fnd117]
induSTry Security description market Value ( ` in 000 )
% of naV
manufacTurE Of chEmicalS and chEmical prOducTShINdusTaN uNILeVeR LTd 176,559 2.07%aTuL LIMITed 97,760 1.14%daBuR 93,297 1.09%NaVIN fLuoRINe INTeRNaTIoNaL LIMITed 89,656 1.05%asIaN PaINTs LTd 72,813 0.85%sRf LTd. 57,160 0.67%deePaK NITRITe LTd 56,087 0.66%GodReJ CoNsuMeR PRoduCTs LTd. 55,898 0.65%T T K PResTIGe LTd. 55,462 0.65%fINe oRGaNIC INdusTRIes LTd 45,805 0.54%aaRTI INdusTRIes LTd. 44,135 0.52%PI INdusTRIes LTd. 38,601 0.45%KaNsaI NeRoLaC PaINTs LTd.fV-1 37,320 0.44%PIdILITe INdusTRIes LTd. 19,017 0.22%aNuPaM RasayaN INdIa LTd. 508 0.01%
manufacTurE Of chEmicalS and chEmical prOducTS Total 940,078 11.00%
cOmpuTEr prOgramming, cOnSulTancy and rElaTEd acTiViTiESINfosys LTd. 290,010 3.39%TaTa CoNsuLTaNCy seRVICes LTd. 128,747 1.51%PeRsIsTeNT sysTeMs LIMITed 88,856 1.04%hCL TeChNoLoGIes LIMITed 78,137 0.91%BIRLasofT LIMITed 70,803 0.83%KPIT TeChNoLoGIes LIMITed 62,977 0.74%MPhasIs LTd 60,479 0.71%oRaCLe fINaNCIaL seRVICes sofTWaRe LTd 53,035 0.62%MINdTRee LIMITed 41,678 0.49%WIPRo 7,739 0.09%
cOmpuTEr prOgramming, cOnSulTancy and rElaTEd acTiViTiES Total 882,462 10.33%
Other 6,509,103 76.17%
current assets and liabilities 213,849 2.50%
grand Total 8,545,492 100.00%
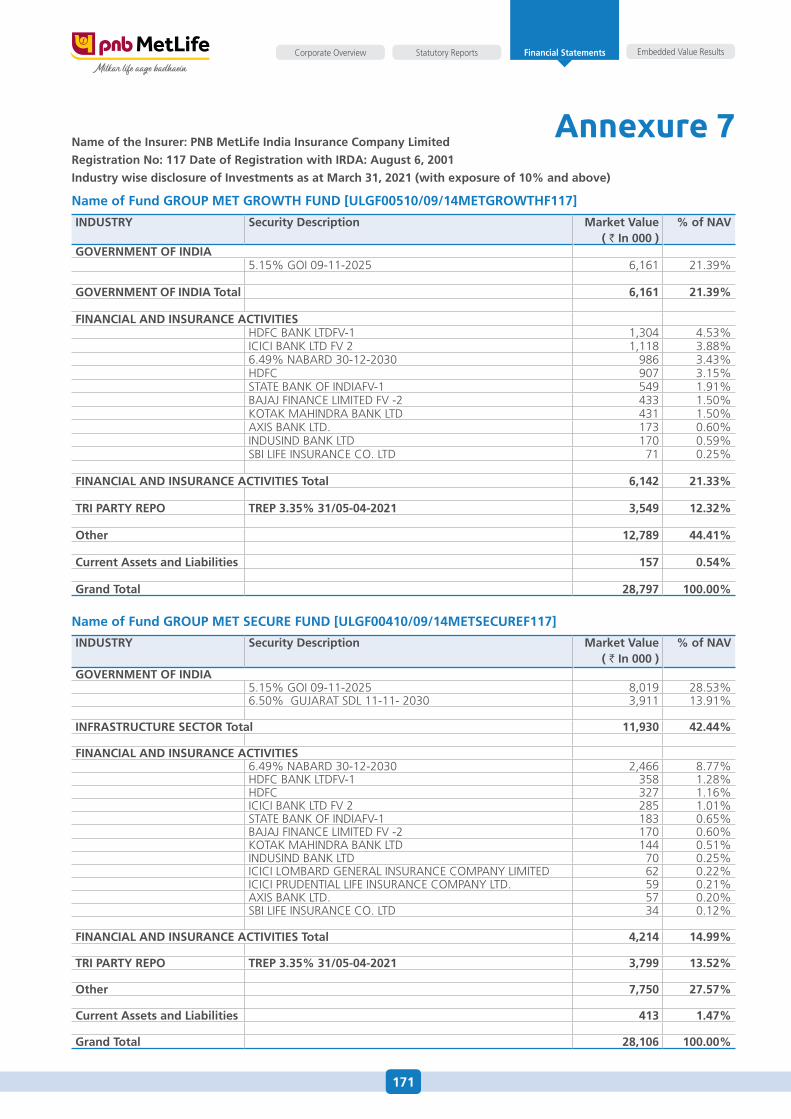
171
Embedded Value ResultsStatutory ReportsCorporate Overview Financial Statements
Annexure 7name of the insurer: pnB metlife india insurance company limited
registration no: 117 date of registration with irda: august 6, 2001
industry wise disclosure of investments as at march 31, 2021 (with exposure of 10% and above)
name of fund grOup mET grOwTh fund [ulgf00510/09/14mETgrOwThf117]
induSTry Security description market Value ( ` in 000 )
% of naV
gOVErnmEnT Of india5.15% GoI 09-11-2025 6,161 21.39%
gOVErnmEnT Of india Total 6,161 21.39%
financial and inSurancE acTiViTiEShdfC BaNK LTdfV-1 1,304 4.53%ICICI BaNK LTd fV 2 1,118 3.88%6.49% NaBaRd 30-12-2030 986 3.43%hdfC 907 3.15%sTaTe BaNK of INdIafV-1 549 1.91%BaJaJ fINaNCe LIMITed fV -2 433 1.50%KoTaK MahINdRa BaNK LTd 431 1.50%aXIs BaNK LTd. 173 0.60%INdusINd BaNK LTd 170 0.59%sBI LIfe INsuRaNCe Co. LTd 71 0.25%
financial and inSurancE acTiViTiES Total 6,142 21.33%
Tri parTy rEpO TrEp 3.35% 31/05-04-2021 3,549 12.32%
Other 12,789 44.41%
current assets and liabilities 157 0.54%
grand Total 28,797 100.00%
name of fund grOup mET SEcurE fund [ulgf00410/09/14mETSEcurEf117]
induSTry Security description market Value ( ` in 000 )
% of naV
gOVErnmEnT Of india5.15% GoI 09-11-2025 8,019 28.53%6.50% GuJaRaT sdL 11-11- 2030 3,911 13.91%
infraSTrucTurE SEcTOr Total 11,930 42.44%
financial and inSurancE acTiViTiES6.49% NaBaRd 30-12-2030 2,466 8.77%hdfC BaNK LTdfV-1 358 1.28%hdfC 327 1.16%ICICI BaNK LTd fV 2 285 1.01%sTaTe BaNK of INdIafV-1 183 0.65%BaJaJ fINaNCe LIMITed fV -2 170 0.60%KoTaK MahINdRa BaNK LTd 144 0.51%INdusINd BaNK LTd 70 0.25%ICICI LoMBaRd GeNeRaL INsuRaNCe CoMPaNy LIMITed 62 0.22%ICICI PRudeNTIaL LIfe INsuRaNCe CoMPaNy LTd. 59 0.21%aXIs BaNK LTd. 57 0.20%sBI LIfe INsuRaNCe Co. LTd 34 0.12%
financial and inSurancE acTiViTiES Total 4,214 14.99%
Tri parTy rEpO TrEp 3.35% 31/05-04-2021 3,799 13.52%
Other 7,750 27.57%
current assets and liabilities 413 1.47%
grand Total 28,106 100.00%
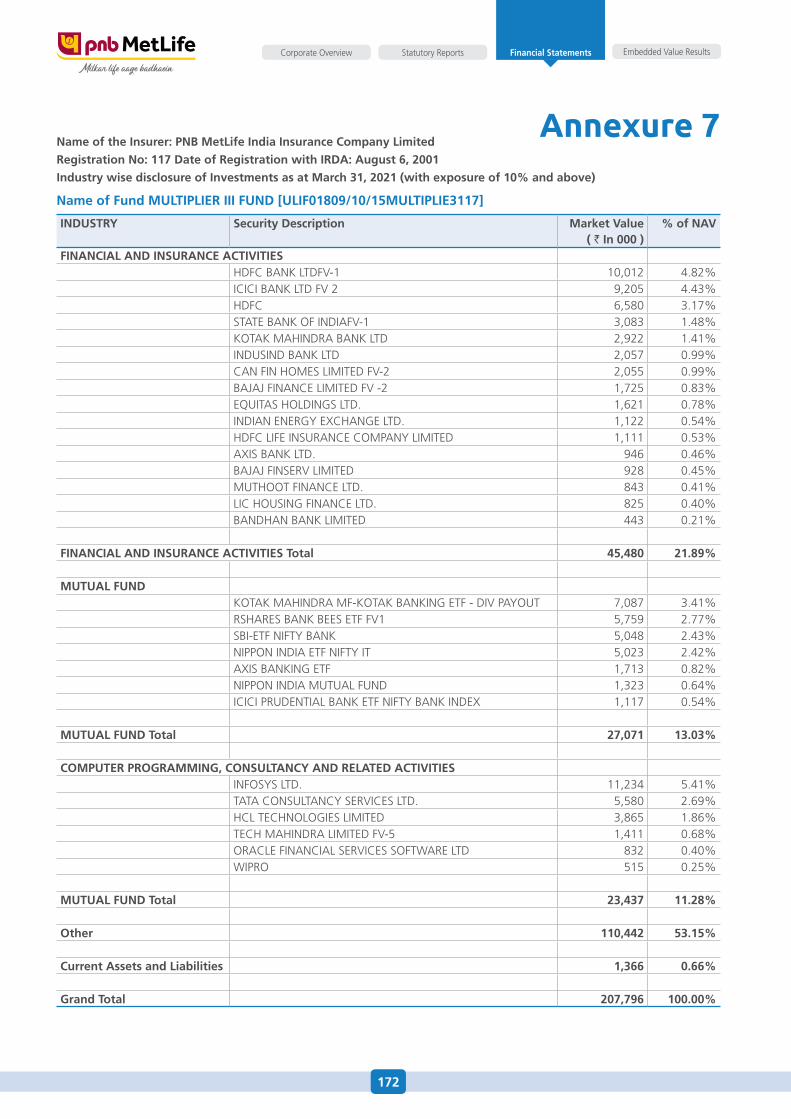
172
Embedded Value ResultsStatutory ReportsCorporate Overview Financial Statements
Annexure 7name of the insurer: pnB metlife india insurance company limited
registration no: 117 date of registration with irda: august 6, 2001
industry wise disclosure of investments as at march 31, 2021 (with exposure of 10% and above)
name of fund mulTipliEr iii fund [ulif01809/10/15mulTipliE3117]
induSTry Security description market Value ( ` in 000 )
% of naV
financial and inSurancE acTiViTiEShdfC BaNK LTdfV-1 10,012 4.82%ICICI BaNK LTd fV 2 9,205 4.43%hdfC 6,580 3.17%sTaTe BaNK of INdIafV-1 3,083 1.48%KoTaK MahINdRa BaNK LTd 2,922 1.41%INdusINd BaNK LTd 2,057 0.99%CaN fIN hoMes LIMITed fV-2 2,055 0.99%BaJaJ fINaNCe LIMITed fV -2 1,725 0.83%eQuITas hoLdINGs LTd. 1,621 0.78%INdIaN eNeRGy eXChaNGe LTd. 1,122 0.54%hdfC LIfe INsuRaNCe CoMPaNy LIMITed 1,111 0.53%aXIs BaNK LTd. 946 0.46%BaJaJ fINseRV LIMITed 928 0.45%MuThooT fINaNCe LTd. 843 0.41%LIC housING fINaNCe LTd. 825 0.40%BaNdhaN BaNK LIMITed 443 0.21%
financial and inSurancE acTiViTiES Total 45,480 21.89%
muTual fundKoTaK MahINdRa Mf-KoTaK BaNKING eTf - dIV PayouT 7,087 3.41%RshaRes BaNK Bees eTf fV1 5,759 2.77%sBI-eTf NIfTy BaNK 5,048 2.43%NIPPoN INdIa eTf NIfTy IT 5,023 2.42%aXIs BaNKING eTf 1,713 0.82%NIPPoN INdIa MuTuaL fuNd 1,323 0.64%ICICI PRudeNTIaL BaNK eTf NIfTy BaNK INdeX 1,117 0.54%
muTual fund Total 27,071 13.03%
cOmpuTEr prOgramming, cOnSulTancy and rElaTEd acTiViTiESINfosys LTd. 11,234 5.41%TaTa CoNsuLTaNCy seRVICes LTd. 5,580 2.69%hCL TeChNoLoGIes LIMITed 3,865 1.86%TeCh MahINdRa LIMITed fV-5 1,411 0.68%oRaCLe fINaNCIaL seRVICes sofTWaRe LTd 832 0.40%WIPRo 515 0.25%
muTual fund Total 23,437 11.28%
Other 110,442 53.15%
current assets and liabilities 1,366 0.66%
grand Total 207,796 100.00%
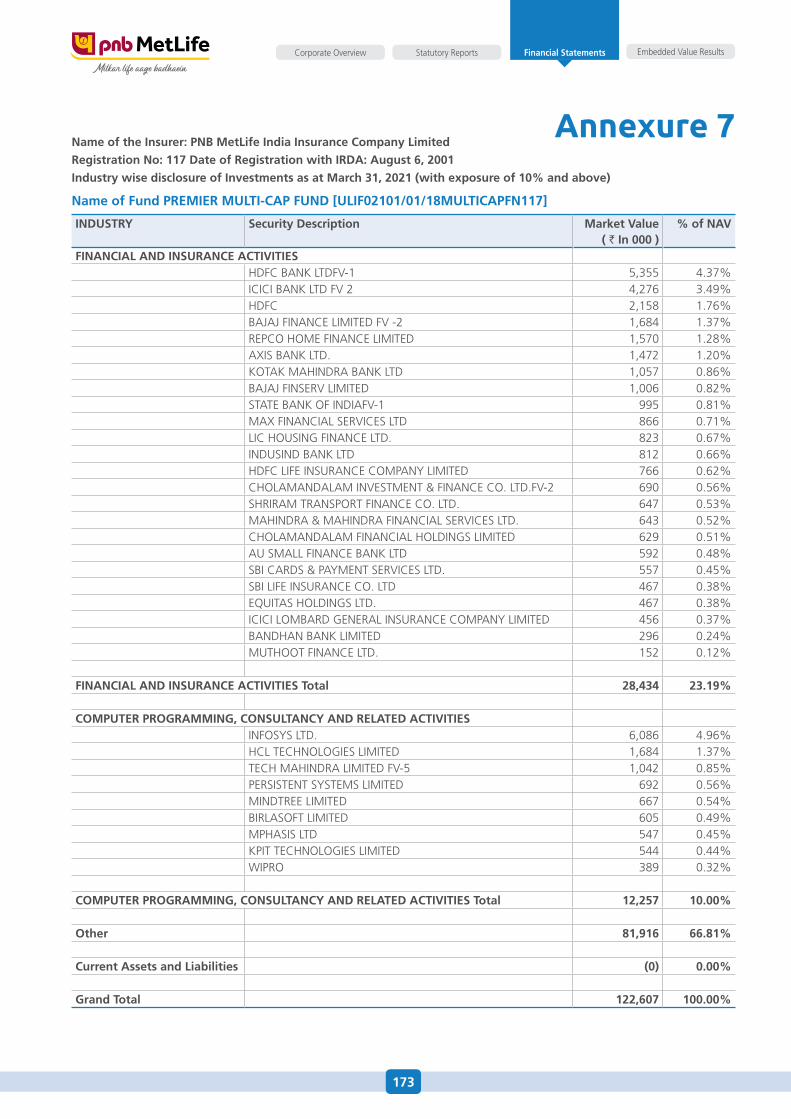
173
Embedded Value ResultsStatutory ReportsCorporate Overview Financial Statements
Annexure 7name of the insurer: pnB metlife india insurance company limited
registration no: 117 date of registration with irda: august 6, 2001
industry wise disclosure of investments as at march 31, 2021 (with exposure of 10% and above)
name of fund prEmiEr mulTi-cap fund [ulif02101/01/18mulTicapfn117]
induSTry Security description market Value ( ` in 000 )
% of naV
financial and inSurancE acTiViTiEShdfC BaNK LTdfV-1 5,355 4.37%ICICI BaNK LTd fV 2 4,276 3.49%hdfC 2,158 1.76%BaJaJ fINaNCe LIMITed fV -2 1,684 1.37%RePCo hoMe fINaNCe LIMITed 1,570 1.28%aXIs BaNK LTd. 1,472 1.20%KoTaK MahINdRa BaNK LTd 1,057 0.86%BaJaJ fINseRV LIMITed 1,006 0.82%sTaTe BaNK of INdIafV-1 995 0.81%MaX fINaNCIaL seRVICes LTd 866 0.71%LIC housING fINaNCe LTd. 823 0.67%INdusINd BaNK LTd 812 0.66%hdfC LIfe INsuRaNCe CoMPaNy LIMITed 766 0.62%ChoLaMaNdaLaM INVesTMeNT & fINaNCe Co. LTd.fV-2 690 0.56%shRIRaM TRaNsPoRT fINaNCe Co. LTd. 647 0.53%MahINdRa & MahINdRa fINaNCIaL seRVICes LTd. 643 0.52%ChoLaMaNdaLaM fINaNCIaL hoLdINGs LIMITed 629 0.51%au sMaLL fINaNCe BaNK LTd 592 0.48%sBI CaRds & PayMeNT seRVICes LTd. 557 0.45%sBI LIfe INsuRaNCe Co. LTd 467 0.38%eQuITas hoLdINGs LTd. 467 0.38%ICICI LoMBaRd GeNeRaL INsuRaNCe CoMPaNy LIMITed 456 0.37%BaNdhaN BaNK LIMITed 296 0.24%MuThooT fINaNCe LTd. 152 0.12%
financial and inSurancE acTiViTiES Total 28,434 23.19%
cOmpuTEr prOgramming, cOnSulTancy and rElaTEd acTiViTiESINfosys LTd. 6,086 4.96%hCL TeChNoLoGIes LIMITed 1,684 1.37%TeCh MahINdRa LIMITed fV-5 1,042 0.85%PeRsIsTeNT sysTeMs LIMITed 692 0.56%MINdTRee LIMITed 667 0.54%BIRLasofT LIMITed 605 0.49%MPhasIs LTd 547 0.45%KPIT TeChNoLoGIes LIMITed 544 0.44%WIPRo 389 0.32%
cOmpuTEr prOgramming, cOnSulTancy and rElaTEd acTiViTiES Total 12,257 10.00%
Other 81,916 66.81%
current assets and liabilities (0) 0.00%
grand Total 122,607 100.00%
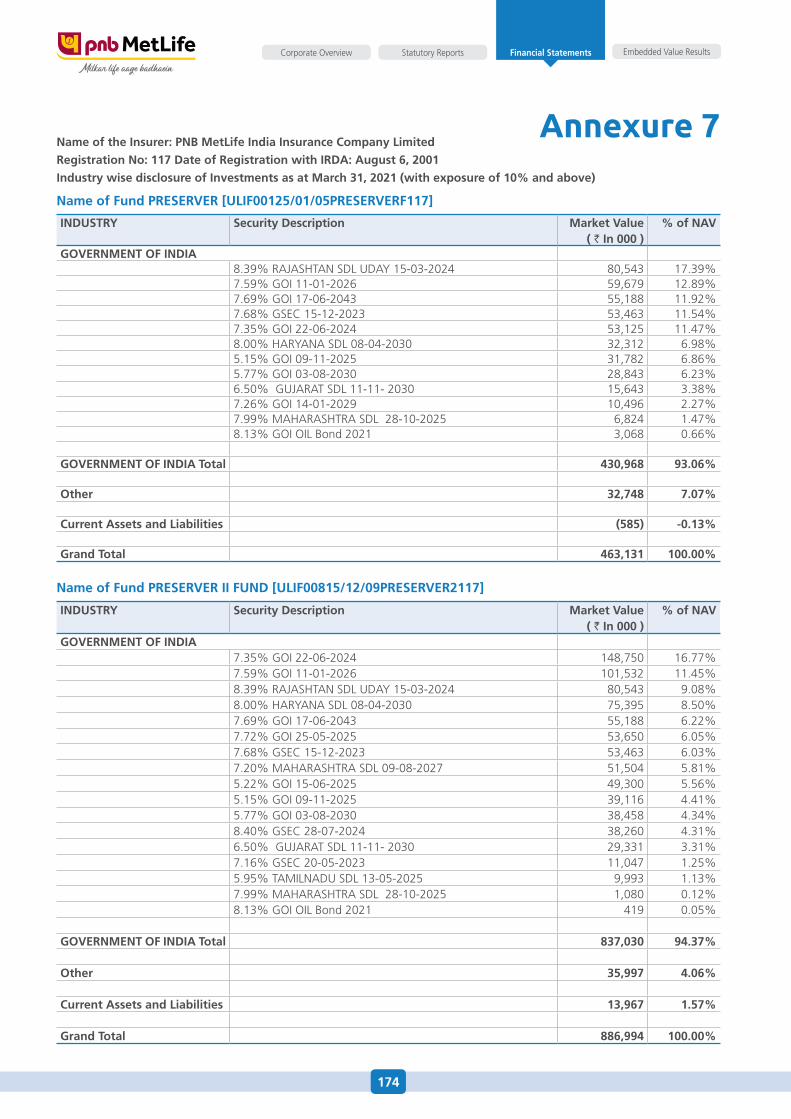
174
Embedded Value ResultsStatutory ReportsCorporate Overview Financial Statements
Annexure 7name of the insurer: pnB metlife india insurance company limited
registration no: 117 date of registration with irda: august 6, 2001
industry wise disclosure of investments as at march 31, 2021 (with exposure of 10% and above)
name of fund prESErVEr [ulif00125/01/05prESErVErf117]
induSTry Security description market Value ( ` in 000 )
% of naV
gOVErnmEnT Of india8.39% RaJashTaN sdL uday 15-03-2024 80,543 17.39%7.59% GoI 11-01-2026 59,679 12.89%7.69% GoI 17-06-2043 55,188 11.92%7.68% GseC 15-12-2023 53,463 11.54%7.35% GoI 22-06-2024 53,125 11.47%8.00% haRyaNa sdL 08-04-2030 32,312 6.98%5.15% GoI 09-11-2025 31,782 6.86%5.77% GoI 03-08-2030 28,843 6.23%6.50% GuJaRaT sdL 11-11- 2030 15,643 3.38%7.26% GoI 14-01-2029 10,496 2.27%7.99% MahaRashTRa sdL 28-10-2025 6,824 1.47%8.13% GoI oIL Bond 2021 3,068 0.66%
gOVErnmEnT Of india Total 430,968 93.06%
Other 32,748 7.07%
current assets and liabilities (585) -0.13%
grand Total 463,131 100.00%
name of fund prESErVEr ii fund [ulif00815/12/09prESErVEr2117]
induSTry Security description market Value ( ` in 000 )
% of naV
gOVErnmEnT Of india7.35% GoI 22-06-2024 148,750 16.77%7.59% GoI 11-01-2026 101,532 11.45%8.39% RaJashTaN sdL uday 15-03-2024 80,543 9.08%8.00% haRyaNa sdL 08-04-2030 75,395 8.50%7.69% GoI 17-06-2043 55,188 6.22%7.72% GoI 25-05-2025 53,650 6.05%7.68% GseC 15-12-2023 53,463 6.03%7.20% MahaRashTRa sdL 09-08-2027 51,504 5.81%5.22% GoI 15-06-2025 49,300 5.56%5.15% GoI 09-11-2025 39,116 4.41%5.77% GoI 03-08-2030 38,458 4.34%8.40% GseC 28-07-2024 38,260 4.31%6.50% GuJaRaT sdL 11-11- 2030 29,331 3.31%7.16% GseC 20-05-2023 11,047 1.25%5.95% TaMILNadu sdL 13-05-2025 9,993 1.13%7.99% MahaRashTRa sdL 28-10-2025 1,080 0.12%8.13% GoI oIL Bond 2021 419 0.05%
gOVErnmEnT Of india Total 837,030 94.37%
Other 35,997 4.06%
current assets and liabilities 13,967 1.57%
grand Total 886,994 100.00%
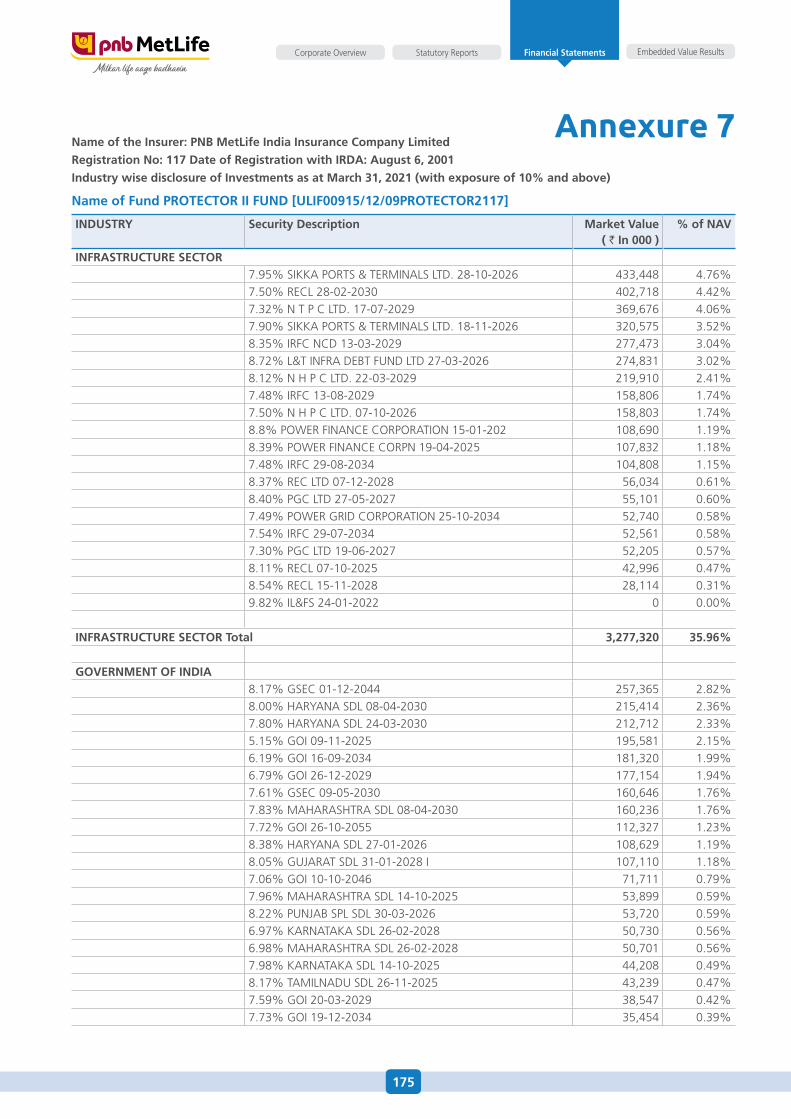
175
Embedded Value ResultsStatutory ReportsCorporate Overview Financial Statements
Annexure 7name of the insurer: pnB metlife india insurance company limited
registration no: 117 date of registration with irda: august 6, 2001
industry wise disclosure of investments as at march 31, 2021 (with exposure of 10% and above)
name of fund prOTEcTOr ii fund [ulif00915/12/09prOTEcTOr2117]
induSTry Security description market Value ( ` in 000 )
% of naV
infraSTrucTurE SEcTOr7.95% sIKKa PoRTs & TeRMINaLs LTd. 28-10-2026 433,448 4.76%7.50% ReCL 28-02-2030 402,718 4.42%7.32% N T P C LTd. 17-07-2029 369,676 4.06%7.90% sIKKa PoRTs & TeRMINaLs LTd. 18-11-2026 320,575 3.52%8.35% IRfC NCd 13-03-2029 277,473 3.04%8.72% L&T INfRa deBT fuNd LTd 27-03-2026 274,831 3.02%8.12% N h P C LTd. 22-03-2029 219,910 2.41%7.48% IRfC 13-08-2029 158,806 1.74%7.50% N h P C LTd. 07-10-2026 158,803 1.74%8.8% PoWeR fINaNCe CoRPoRaTIoN 15-01-202 108,690 1.19%8.39% PoWeR fINaNCe CoRPN 19-04-2025 107,832 1.18%7.48% IRfC 29-08-2034 104,808 1.15%8.37% ReC LTd 07-12-2028 56,034 0.61%8.40% PGC LTd 27-05-2027 55,101 0.60%7.49% PoWeR GRId CoRPoRaTIoN 25-10-2034 52,740 0.58%7.54% IRfC 29-07-2034 52,561 0.58%7.30% PGC LTd 19-06-2027 52,205 0.57%8.11% ReCL 07-10-2025 42,996 0.47%8.54% ReCL 15-11-2028 28,114 0.31%9.82% IL&fs 24-01-2022 0 0.00%
infraSTrucTurE SEcTOr Total 3,277,320 35.96%
gOVErnmEnT Of india8.17% GseC 01-12-2044 257,365 2.82%8.00% haRyaNa sdL 08-04-2030 215,414 2.36%7.80% haRyaNa sdL 24-03-2030 212,712 2.33%5.15% GoI 09-11-2025 195,581 2.15%6.19% GoI 16-09-2034 181,320 1.99%6.79% GoI 26-12-2029 177,154 1.94%7.61% GseC 09-05-2030 160,646 1.76%7.83% MahaRashTRa sdL 08-04-2030 160,236 1.76%7.72% GoI 26-10-2055 112,327 1.23%8.38% haRyaNa sdL 27-01-2026 108,629 1.19%8.05% GuJaRaT sdL 31-01-2028 I 107,110 1.18%7.06% GoI 10-10-2046 71,711 0.79%7.96% MahaRashTRa sdL 14-10-2025 53,899 0.59%8.22% PuNJaB sPL sdL 30-03-2026 53,720 0.59%6.97% KaRNaTaKa sdL 26-02-2028 50,730 0.56%6.98% MahaRashTRa sdL 26-02-2028 50,701 0.56%7.98% KaRNaTaKa sdL 14-10-2025 44,208 0.49%8.17% TaMILNadu sdL 26-11-2025 43,239 0.47%7.59% GoI 20-03-2029 38,547 0.42%7.73% GoI 19-12-2034 35,454 0.39%
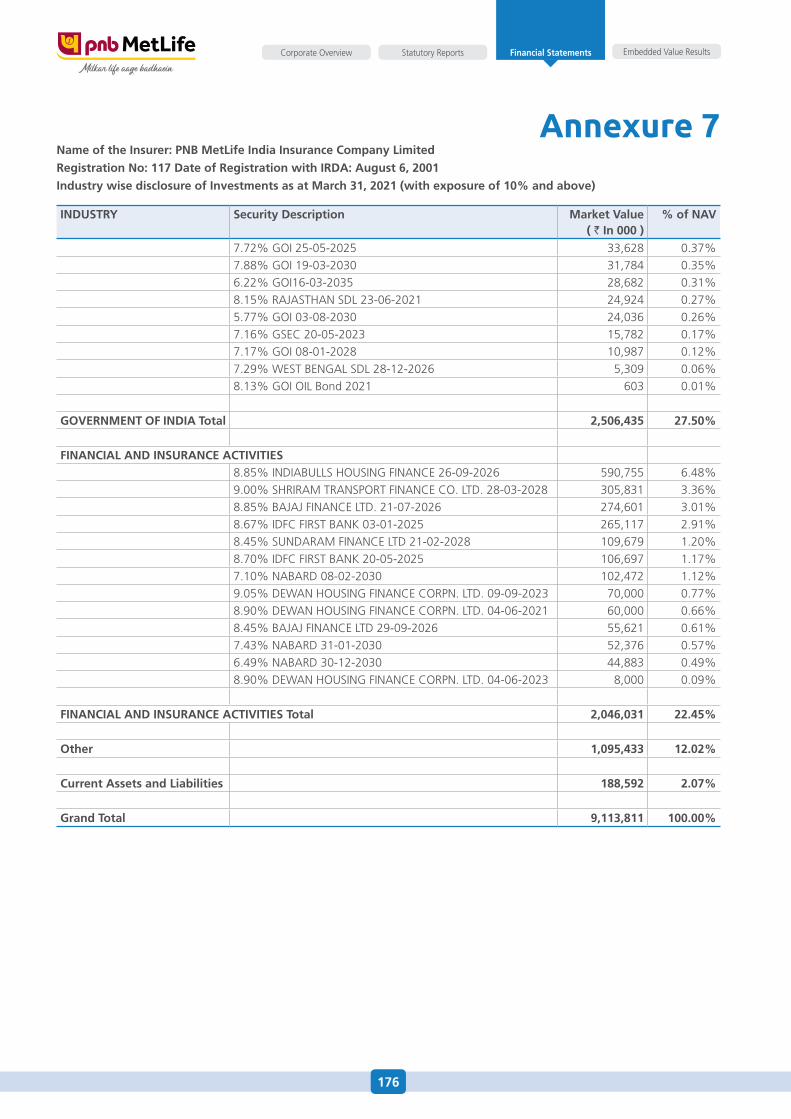
176
Embedded Value ResultsStatutory ReportsCorporate Overview Financial Statements
Annexure 7
induSTry Security description market Value ( ` in 000 )
% of naV
7.72% GoI 25-05-2025 33,628 0.37%7.88% GoI 19-03-2030 31,784 0.35%6.22% GoI16-03-2035 28,682 0.31%8.15% RaJasThaN sdL 23-06-2021 24,924 0.27%5.77% GoI 03-08-2030 24,036 0.26%7.16% GseC 20-05-2023 15,782 0.17%7.17% GoI 08-01-2028 10,987 0.12%7.29% WesT BeNGaL sdL 28-12-2026 5,309 0.06%8.13% GoI oIL Bond 2021 603 0.01%
gOVErnmEnT Of india Total 2,506,435 27.50%
financial and inSurancE acTiViTiES8.85% INdIaBuLLs housING fINaNCe 26-09-2026 590,755 6.48%9.00% shRIRaM TRaNsPoRT fINaNCe Co. LTd. 28-03-2028 305,831 3.36%8.85% BaJaJ fINaNCe LTd. 21-07-2026 274,601 3.01%8.67% IdfC fIRsT BaNK 03-01-2025 265,117 2.91%8.45% suNdaRaM fINaNCe LTd 21-02-2028 109,679 1.20%8.70% IdfC fIRsT BaNK 20-05-2025 106,697 1.17%7.10% NaBaRd 08-02-2030 102,472 1.12%9.05% deWaN housING fINaNCe CoRPN. LTd. 09-09-2023 70,000 0.77%8.90% deWaN housING fINaNCe CoRPN. LTd. 04-06-2021 60,000 0.66%8.45% BaJaJ fINaNCe LTd 29-09-2026 55,621 0.61%7.43% NaBaRd 31-01-2030 52,376 0.57%6.49% NaBaRd 30-12-2030 44,883 0.49%8.90% deWaN housING fINaNCe CoRPN. LTd. 04-06-2023 8,000 0.09%
financial and inSurancE acTiViTiES Total 2,046,031 22.45%
Other 1,095,433 12.02%
current assets and liabilities 188,592 2.07%
grand Total 9,113,811 100.00%
name of the insurer: pnB metlife india insurance company limited
registration no: 117 date of registration with irda: august 6, 2001
industry wise disclosure of investments as at march 31, 2021 (with exposure of 10% and above)
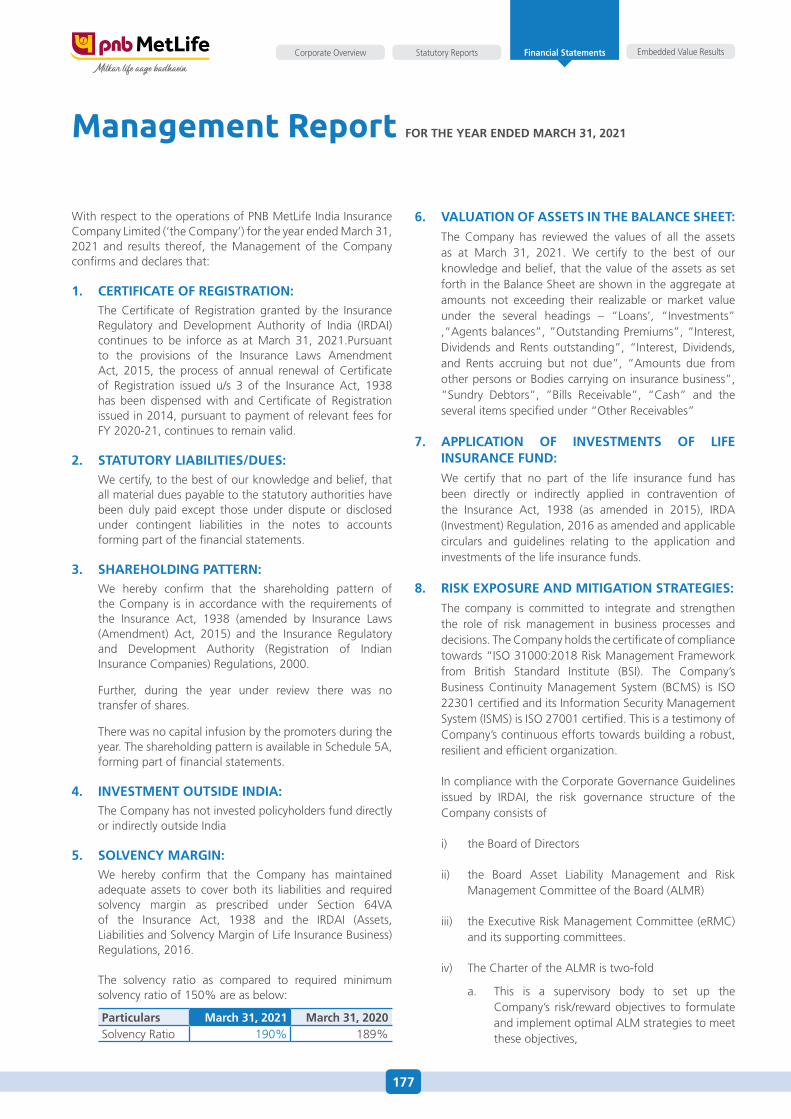
177
Embedded Value ResultsStatutory ReportsCorporate Overview Financial Statements
With respect to the operations of PNB MetLife India Insurance Company Limited (‘the Company’) for the year ended March 31, 2021 and results thereof, the Management of the Company confirms and declares that:
1. cErTificaTE Of rEgiSTraTiOn: The Certificate of Registration granted by the Insurance
Regulatory and development authority of India (IRdaI) continues to be inforce as at March 31, 2021.Pursuant to the provisions of the Insurance Laws amendment act, 2015, the process of annual renewal of Certificate of Registration issued u/s 3 of the Insurance act, 1938 has been dispensed with and Certificate of Registration issued in 2014, pursuant to payment of relevant fees for fy 2020-21, continues to remain valid.
2. STaTuTOry liaBiliTiES/duES: We certify, to the best of our knowledge and belief, that
all material dues payable to the statutory authorities have been duly paid except those under dispute or disclosed under contingent liabilities in the notes to accounts forming part of the financial statements.
3. SharEhOlding paTTErn: We hereby confirm that the shareholding pattern of
the Company is in accordance with the requirements of the Insurance act, 1938 (amended by Insurance Laws (amendment) act, 2015) and the Insurance Regulatory and development authority (Registration of Indian Insurance Companies) Regulations, 2000.
further, during the year under review there was no transfer of shares.
There was no capital infusion by the promoters during the year. The shareholding pattern is available in schedule 5a, forming part of financial statements.
4. inVESTmEnT OuTSidE india: The Company has not invested policyholders fund directly
or indirectly outside India
5. SOlVEncy margin: We hereby confirm that the Company has maintained
adequate assets to cover both its liabilities and required solvency margin as prescribed under section 64Va of the Insurance act, 1938 and the IRdaI (assets, Liabilities and solvency Margin of Life Insurance Business) Regulations, 2016.
The solvency ratio as compared to required minimum solvency ratio of 150% are as below:
particulars march 31, 2021 march 31, 2020solvency Ratio 190% 189%
Management Report fOr ThE yEar EndEd march 31, 2021
6. ValuaTiOn Of aSSETS in ThE BalancE ShEET: The Company has reviewed the values of all the assets
as at March 31, 2021. We certify to the best of our knowledge and belief, that the value of the assets as set forth in the Balance sheet are shown in the aggregate at amounts not exceeding their realizable or market value under the several headings – “Loans’, “Investments” ,“agents balances”, ”outstanding Premiums”, “Interest, dividends and Rents outstanding”, “Interest, dividends, and Rents accruing but not due”, “amounts due from other persons or Bodies carrying on insurance business”, ”sundry debtors”, ”Bills Receivable”, “Cash” and the several items specified under “other Receivables”
7. applicaTiOn Of inVESTmEnTS Of lifE inSurancE fund:
We certify that no part of the life insurance fund has been directly or indirectly applied in contravention of the Insurance act, 1938 (as amended in 2015), IRda (Investment) Regulation, 2016 as amended and applicable circulars and guidelines relating to the application and investments of the life insurance funds.
8. riSK ExpOSurE and miTigaTiOn STraTEgiES: The company is committed to integrate and strengthen
the role of risk management in business processes and decisions. The Company holds the certificate of compliance towards “Iso 31000:2018 Risk Management framework from British standard Institute (BsI). The Company’s Business Continuity Management system (BCMs) is Iso 22301 certified and its Information security Management system (IsMs) is Iso 27001 certified. This is a testimony of Company’s continuous efforts towards building a robust, resilient and efficient organization.
In compliance with the Corporate Governance Guidelines issued by IRdaI, the risk governance structure of the Company consists of
i) the Board of directors
ii) the Board asset Liability Management and Risk Management Committee of the Board (aLMR)
iii) the executive Risk Management Committee (eRMC) and its supporting committees.
iv) The Charter of the aLMR is two-fold
a. This is a supervisory body to set up the Company’s risk/reward objectives to formulate and implement optimal aLM strategies to meet these objectives,
178
Embedded Value ResultsStatutory ReportsCorporate Overview Financial Statements
b. Lay down the Company’s Risk Management strategy
The Board approved enterprise Risk Management policy (“the policy”) & processes support our business to control, manage and effectively mitigate critical risks. The Policy is aligned and in compliance to Iso 31000:2018 Risk Management framework, and covers aspects related to:
i) financial Risk Management: covering market risk, capital risk, credit risk, liquidity risk and insurance risk
ii) operational Risk Management: covering reputational, fraud, legal & regulatory, people, system, cyber, transactional, business execution and business continuity
iii) Risk Identification, analysis, Measurement, and Treatment framework
The key objectives of the Policy are as follows:
• Determining the risk profile of the Company i.e.the aggregate level of risks that the Company has undertaken in pursuit of profitable business.
• Identification, analysis, measuring, managing,treating, monitoring and reporting of risk for the purpose of protecting the interests of key stakeholders.
• Enhancing the Company’s ability to identify andpursue opportunities that offer attractive risk-adjusted returns by providing transparent, accurate and timely risk information.
• Embedding risk-based decision making in keymanagement processes and fostering a culture of risk awareness.
• Limiting the Company’s exposure to adverseoutcomes through risk limits. The Company has formulated a comprehensive Risk appetite statement at the corporate as well as the functional level which are reviewed and monitored by the Board level Risk Management Committee and executive Risk Management Committee respectively.
• Ensuringcompliancewithregulatoryrequirements.
• Focusing on ensuring that theCompany possessesthe appropriate capabilities and experience in managing and transferring risks.
• Minimizingreputationalrisk.
The risk management function is headed by the ‘Chief Risk officer’ and is responsible for establishing sound risk management practices by proactively identifying, measuring, mitigating and monitoring the organization’s risk exposures. The risk management framework of the Company is based on four guiding principles viz. ‘Controlled Risk-Taking’, ‘ownership, accountability & authority’, ‘specialization’ & ‘Change Management’.
The Company’s risk exposure could be in the areas of business continuity in case of disasters / natural calamities including pandemics, adverse claims experience, shortfall in investment performance and high expense levels. Mitigation steps in each of these areas are being taken and monitored on an ongoing basis. from Regulatory standpoint, we continuously monitor new advisories and directives from Central / state / Insurance regulator and authorities, and ensure strict compliance & adherence to the guidelines.
• The Company’s underwriting policy andimplementation of the same are subject to continuous monitoring and review. adequate and suitable reinsurance treaties are in force with Internationally reputed and highly rated reinsurers.
• TheinvestmentsoftheCompanyareinaccordancewith IRdaI guidelines and as per the Investment Policy approved by the Investment Committee (‘IC’) of the Board which stipulates appropriate risk exposures. for achieving the objectives, Credit, Liquidity and Market risks are evaluated on a continuous basis. The assets of the Company are invested in accordance with the requirements prescribed by the IRdaI.
• Expensesarecontinuouslymonitoredtoensurethatthe expense levels are commensurate with the level of operations of the Company.
9. OpEraTiOnS in OThEr cOunTriES: The Company is not operating in any other country and
hence there is no country risk and exposure risk
10. agEing Of claimS: death claims registered and not settled (where all the
documentations have been completed) as on March 31, 2021 is ` 122.55 Lakhs
Trends in death claim settlement time for the last five financial years are given below:
financial year 2020-21 2019-20 2018-19 2017-18 2016-17
average claim settlement period (in days) 5.72 2.69 1.00 2.38 3.14
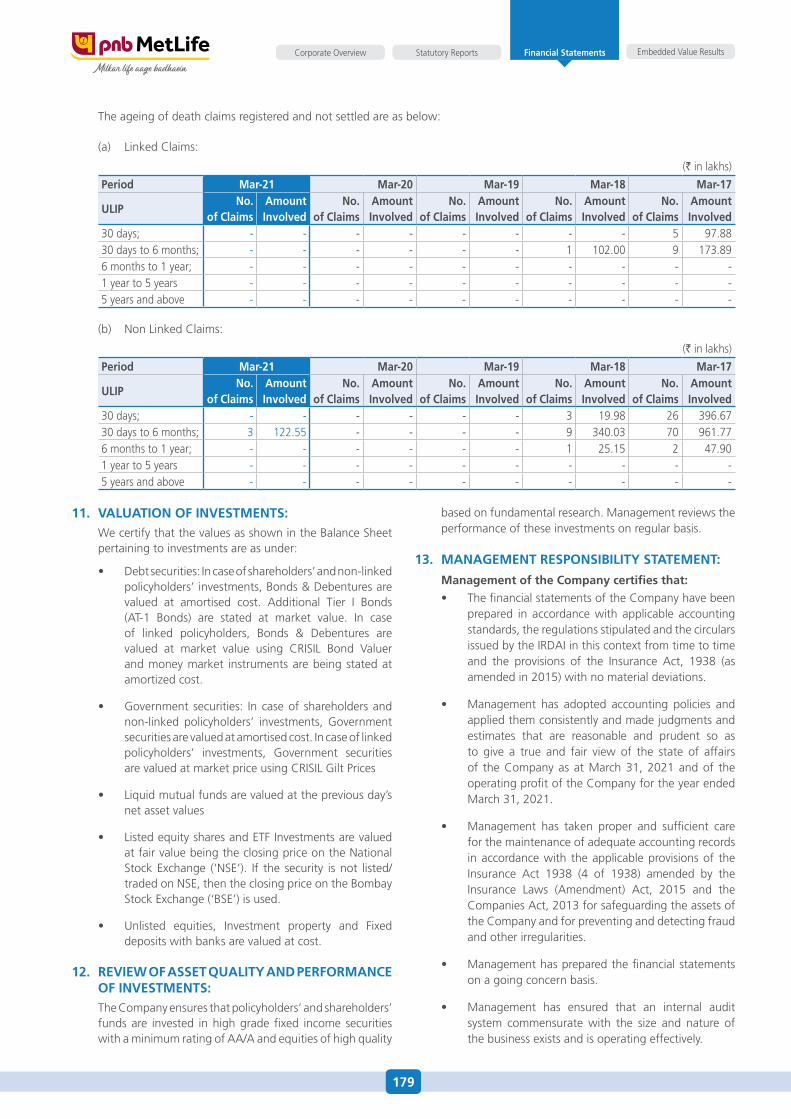
179
Embedded Value ResultsStatutory ReportsCorporate Overview Financial Statements
The ageing of death claims registered and not settled are as below:
(a) Linked Claims:
(` in lakhs)
period mar-21 mar-20 mar-19 mar-18 mar-17
ulipno.
of claimsamount involved
no. of claims
amount involved
no. of claims
amount involved
no. of claims
amount involved
no. of claims
amount involved
30 days; - - - - - - - - 5 97.8830 days to 6 months; - - - - - - 1 102.00 9 173.896 months to 1 year; - - - - - - - - - -1 year to 5 years - - - - - - - - - -5 years and above - - - - - - - - - -
(b) Non Linked Claims:
(` in lakhs)
period mar-21 mar-20 mar-19 mar-18 mar-17
ulipno.
of claimsamount involved
no. of claims
amount involved
no. of claims
amount involved
no. of claims
amount involved
no. of claims
amount involved
30 days; - - - - - - 3 19.98 26 396.6730 days to 6 months; 3 122.55 - - - - 9 340.03 70 961.776 months to 1 year; - - - - - - 1 25.15 2 47.901 year to 5 years - - - - - - - - - -5 years and above - - - - - - - - - -
11. ValuaTiOn Of inVESTmEnTS:We certify that the values as shown in the Balance sheet pertaining to investments are as under:
• Debtsecurities:Incaseofshareholders’andnon-linkedpolicyholders’ investments, Bonds & debentures are valued at amortised cost. additional Tier I Bonds (aT-1 Bonds) are stated at market value. In case of linked policyholders, Bonds & debentures are valued at market value using CRIsIL Bond Valuer and money market instruments are being stated at amortized cost.
• Government securities: Incaseof shareholdersandnon-linked policyholders’ investments, Government securities are valued at amortised cost. In case of linked policyholders’ investments, Government securities are valued at market price using CRIsIL Gilt Prices
• Liquidmutualfundsarevaluedatthepreviousday’snet asset values
• ListedequitysharesandETFInvestmentsarevaluedat fair value being the closing price on the National stock exchange (‘Nse’). If the security is not listed/ traded on Nse, then the closing price on the Bombay stock exchange (‘Bse’) is used.
• Unlisted equities, Investment property and Fixeddeposits with banks are valued at cost.
12. rEViEw Of aSSET qualiTy and pErfOrmancE Of inVESTmEnTS:
The Company ensures that policyholders’ and shareholders’ funds are invested in high grade fixed income securities with a minimum rating of aa/a and equities of high quality
based on fundamental research. Management reviews the performance of these investments on regular basis.
13. managEmEnT rESpOnSiBiliTy STaTEmEnT:
management of the company certifies that:• ThefinancialstatementsoftheCompanyhavebeen
prepared in accordance with applicable accounting standards, the regulations stipulated and the circulars issued by the IRdaI in this context from time to time and the provisions of the Insurance act, 1938 (as amended in 2015) with no material deviations.
• Management has adopted accounting policies andapplied them consistently and made judgments and estimates that are reasonable and prudent so as to give a true and fair view of the state of affairs of the Company as at March 31, 2021 and of the operating profit of the Company for the year ended March 31, 2021.
• Management has taken proper and sufficient carefor the maintenance of adequate accounting records in accordance with the applicable provisions of the Insurance act 1938 (4 of 1938) amended by the Insurance Laws (amendment) act, 2015 and the Companies act, 2013 for safeguarding the assets of the Company and for preventing and detecting fraud and other irregularities.
• Managementhaspreparedthefinancialstatementson a going concern basis.
• Management has ensured that an internal auditsystem commensurate with the size and nature of the business exists and is operating effectively.
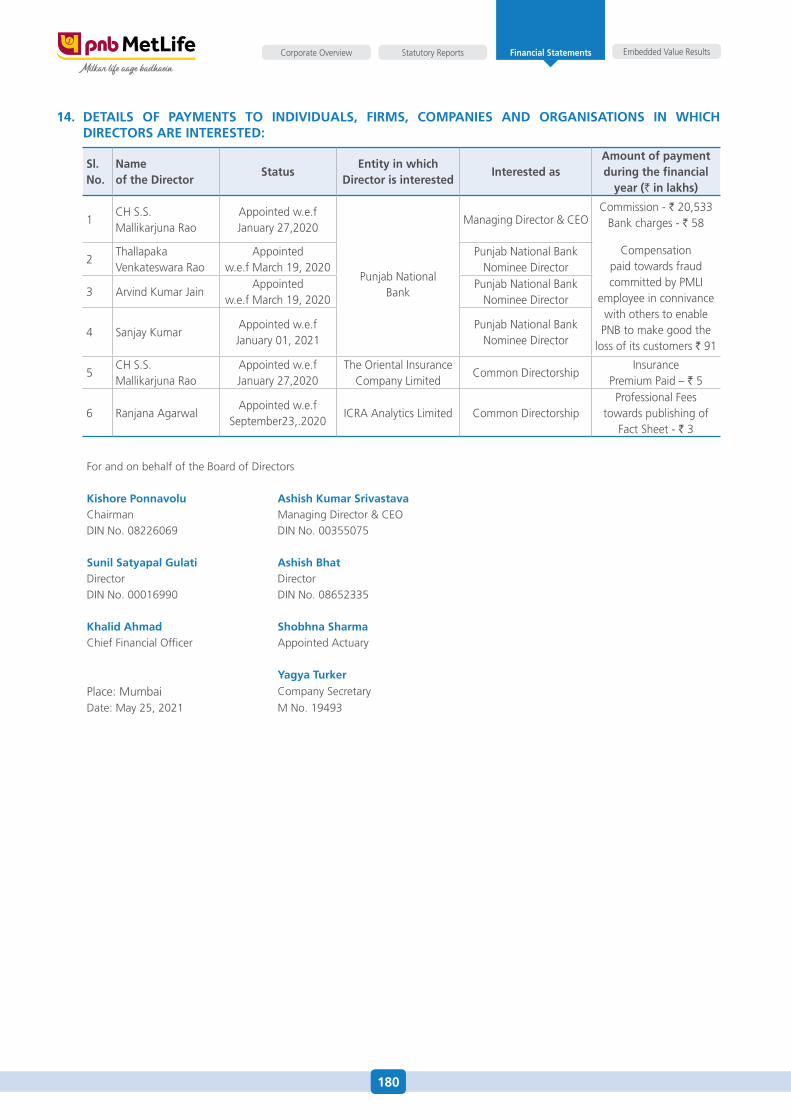
180
Embedded Value ResultsStatutory ReportsCorporate Overview Financial Statements
14. dETailS Of paymEnTS TO indiVidualS, firmS, cOmpaniES and OrganiSaTiOnS in which dirEcTOrS arE inTErESTEd:
Sl. no.
name of the director
StatusEntity in which
director is interestedinterested as
amount of payment during the financial
year (` in lakhs)
1Ch s.s. Mallikarjuna Rao
appointed w.e.f January 27,2020
Punjab NationalBank
Managing director & CeoCommission - ` 20,533
Bank charges - ` 58
Compensation paid towards fraud committed by PMLI
employee in connivance with others to enable
PNB to make good the loss of its customers ` 91
2Thallapaka Venkateswara Rao
appointed w.e.f March 19, 2020
Punjab National Bank Nominee director
3 arvind Kumar Jainappointed
w.e.f March 19, 2020Punjab National Bank
Nominee director
4 sanjay Kumarappointed w.e.fJanuary 01, 2021
Punjab National Bank Nominee director
5Ch s.s. Mallikarjuna Rao
appointed w.e.f January 27,2020
The oriental Insurance Company Limited
Common directorshipInsurance
Premium Paid – ` 5
6 Ranjana agarwalappointed w.e.f
september23,.2020ICRa analytics Limited Common directorship
Professional fees towards publishing of
fact sheet - ` 3
for and on behalf of the Board of directors
Kishore ponnavolu ashish Kumar SrivastavaChairman Managing director & CeodIN No. 08226069 dIN No. 00355075
Sunil Satyapal gulati ashish Bhatdirector directordIN No. 00016990 dIN No. 08652335
Khalid ahmad Shobhna SharmaChief financial officer appointed actuary
yagya Turker
Place: Mumbai Company secretary
date: May 25, 2021 M No. 19493
181
Financial Statements Embedded Value ResultsStatutory ReportsCorporate Overview
This report on embedded Value results as at 31st March 2021 has been prepared by the Company and the results presented in the report have been reviewed by Willis Towers Watson actuarial advisory LLP.
1. BaSiS Of prEparaTiOn
The embedded value is a measure of the consolidated value of shareholders’ interest in the covered life insurance business. The Indian embedded value (IeV) results presented below have been determined by following a market consistent methodology, as per the requirements and principles set forth by the Institute of actuaries of India (IaI) within the actuarial Practice standard 10 (aPs10). a detailed description of the IeV methodology is provided in section 3.
2. KEy rESulTS(Rs. in Crore)
fy 2020-21 fy 2019-20Indian embedded Value (IeV)
5,123 4,304
operating return on eV (eVoP %)(1)
14.4% 15.5%
VNB Margin 21.7% 18.0%Value of New Business (VNB)
347 261
aPe(2) 1,601 1,447
(1) Calculated as annualized eVoP (embedded Value operating Profit) to opening eV.
(2) annualized Premium equivalent is calculated as 100% of annualized regular premium for new business plus 10% of single premium.
3. mEThOdOlOgy
IeV is calculated as the sum of adjusted Net Worth (aNW) and Value of In-force business (VIf).
aNW comprises free surplus (fs) and Required Capital (RC).
VIf consists of the following components:
• Present Value of Future Profits (PVFP) expected toemerge from the covered business;
• Less:FrictionalCostofCapital(FCoC);
• Less: Time Value of Financial Options andGuarantees (TVfoG);
• Less:CostofResidualNon-HedgeableRisks(CRNHR).
3.1. components of anw
free surplus (fs): free surplus represents the market value of any assets in excess of liabilities and Required Capital which is potentially distributable to shareholders
Embedded Value Report – FY 2020-21
immediately. free surplus has been calculated as the excess of aNW over the Required Capital.
Required Capital (RC): Required Capital is the amount of assets attributed to the covered business over and above that required to back liabilities for the covered business, whose distribution to shareholders is restricted. Required Capital has been set at 170% of the Required solvency Margin (RsM), based on the Company’s internal capital target. RsM has been projected by applying the solvency margin factors prescribed by the IRdaI appropriate to each line of business.
3.2. components of Vif
present Value of future profits (pVfp): PVfP represents the present value of future post taxation shareholder cash-flows projected to emerge from the in-force covered business and the assets backing liabilities of the in-force covered business. The PVfP incorporates an allowance for the intrinsic value of financial options and guarantees.
frictional cost of capital (fcoc): fCoC reflects the impact of taxation on investment returns and investment costs on the assets backing required capital. Required Capital is assumed to be maintained throughout the lifetime of the underlying liabilities, at the internal target level of 170% of the RsM, calculated based on the factors prescribed by IRdaI.
Cost of Residual Non-hedgeable Risks (CRNhR): The CRNhR is an allowance for risks to shareholder value to the extent that such risks are not already allowed for in the TVfoG or the PVfP. The CRNhR has been determined using a cost of capital approach. The CRNhR makes allowance for mortality; pandemic and catastrophe; persistency; mass lapse; expense and inflation; and operational risk. for each risk, stand-alone risk capital has been computed to be consistent with a 99.5% confidence level over a one year time horizon using the economic capital model consistent with the eu solvency II standard formula. diversification benefits are considered overall at a Company level. Risk-capital is projected over the lifetime of the underlying risks using appropriate capital drivers.
Time value of financial options and guarantees (TVfOg): The TVfoG reflects the value of the additional cost to shareholders that may arise from embedded financial options and guarantees attaching to the covered business. The intrinsic value of such options and guarantees is reflected in the PVfP.
181
182
Financial Statements Embedded Value ResultsStatutory ReportsCorporate Overview
an assessment for the asymmetric impact on the shareholder value due to any financial options and guarantees within the covered business of the Company has been conducted as at valuation date. Based on the investigations undertaken, the cost of financial options and guarantees, where they arise, have been assessed to be fully allowed within the statutory liabilities of the Company; and hence captured within the aNW without any further release into PVfP considered for such reserves held.
a stochastic approach is used to determine the TVfoG using methods and assumptions consistent with the underlying embedded value.
4. assumptions used
demographic assumptions:
The best estimate assumptions for persistency, mortality and morbidity have been determined by having regard to the past, current and expected future experience for the Company.
commission and Expenses:
The expense assumptions have been derived based on the Company’s actual expenses during fy 2020-21 with no anticipation of productivity gains or cost efficiencies. The fixed renewals are inflated from fy 2021-22 onwards using the best estimate inflation rate.
The commission rates under different products are based on the actual commission payable (if any) to distributors.
Tax rates:
In determining the IeV, allowance has been made for future taxation costs expected to be incurred by the Company. This includes both corporate taxes and Goods and services tax (‘GsT’). Individual pensions and annuities business are considered exempt from taxation.
Economic assumptions:
Investment returns and discount rates are based on reference rates, used as proxy for risk free rates based on zero coupon central government bond yield curve published by fBIL.
183
Financial Statements Embedded Value ResultsStatutory ReportsCorporate Overview
22 May 2021
The Board of directorsPNB MetLife India Insurance Company Limited1st floor, Techniplex 1, Techniplex Complex, off Veer sawarkar flyover Goregaon (West), Mumbai - 400 062
dear sirs,
willis Towers watson Opinion on Embedded Value as at 31 march 2021Willis Towers Watson actuarial advisory LLP (“Willis Towers Watson”, “we”, “us” or “our”) has been engaged by PNB MetLife India Insurance Company Limited (“PNB MetLife” or “the Company”) to review and provide an independent actuarial opinion on the embedded value results prepared by PNB MetLife. The review covered the embedded value as at 31 March 2021 and the value of one year’s new business written during the period 1 april 2020 to 31 March 2021 (together, “embedded value results”).
Scope of work
our scope of work covered:
• Areviewofthemethodologyandassumptionsusedtodeterminetheembeddedvalueresults;
• AreviewoftheresultsofPNBMetLife’scalculationoftheembeddedvalueresults;
• Areviewoftheanalysisofmovementinembeddedvaluefrom31March2020to31March2021;and
• AreviewofselectsensitivitiesasdefinedbytheCompany
OpinionWillis Towers Watson has concluded that the methodology and assumptions used to determine the embedded value results of PNB MetLife comply with the standards issued by the Institute of actuaries of India within the actuarial Practice standard 10 (“Indian embedded Value Principles”), and in particular that:
• theeconomicassumptionsusedareinternallyconsistentandresultintheprojectedcash-flowsbeingvaluedinlinewiththeprices of similar cash-flows that are traded on the capital markets;
• theoperatingassumptionshavebeensetwithappropriateregardtothepast,currentandexpectedfutureexperience;
• theRequiredCapitalhasbeendeterminedandprojectedonthebasisofPNBMetLife’sinternalcapitaltargetof170%oftheRequired solvency Margin and has been assessed from a shareholders’ perspective;
• allowancehasbeenmadefortheCostofResidualNon-HedgeableRisks;and
• forparticipatingbusiness, theassumedbonus rates, andallocationofprofitbetweenpolicyholdersand shareholders, areconsistent with the projection assumptions, established company practice and local market practice.
Willis Towers Watson has also performed a number of checks on the models, processes and results of the calculations performed by PNB MetLife. on the basis of this review, Willis Towers Watson has confirmed that no issues have been discovered that have a material impact on the disclosed embedded value as at 31 March 2021, the value of one year’s new business written during the period 1 april 2020 to 31 March 2021, the analysis of movement in embedded value for fy2020-21 and the sensitivity analysis as at 31 March 2021.
In arriving at these conclusions, Willis Towers Watson has relied on data and information provided by PNB MetLife. This opinion is made solely to PNB MetLife in accordance with the terms of Willis Towers Watson’s engagement letter dated 19 february 2021. To the fullest extent permitted by applicable law, Willis Towers Watson does not accept or assume any responsibility, duty of care or liability to anyone other than PNB MetLife for or in connection with its review work, the opinions it has formed or for any statements set forth in this opinion.
CoVId-19 is an ongoing and continuously evolving issue which has and will continue to have significant effects on global economic activity and insurance claims experience. The actual effects of CoVId-19 could have an unexpected material impact on our findings. The level of uncertainty affecting our conclusions and the underlying volatility of actual outcomes is increased because of the emergence and contingent evolution of CoVId-19.
Vivek Jalan, fiai Kunj Behari maheshwari, fiaiPartner Partner
willis Towers watson actuarial advisory llpRegistered office:a-210, Pioneer urban square sector - 62Golf Course extension Road Gurugram-122003, India

NoTes