Embed Size (px)
Citation preview
UNITED STATESSECURITIES AND EXCHANGE COMMISSION
Washington, DC 20549
FORM 10-Q(Mark one)
x QUARTERLY REPORT PURSUANT TO SECTION 13 OR 15(d) OF THE SECURITIES EXCHANGE ACT OF 1934
For the quarterly period ended June 30, 2016
OR
o TRANSITION REPORT PURSUANT TO SECTION 13 OR 15(d) OF THE SECURITIES EXCHANGE ACT OF 1934
For the transition period from ________________ to __________________
Commission File Number 1-6364
SOUTH JERSEY INDUSTRIES, INC.(Exact name of registrant as specified in its charter)
New Jersey 22-1901645(State of incorporation) (IRS employer identification no.)
1 South Jersey Plaza, Folsom, NJ 08037(Address of principal executive offices, including zip code)
(609) 561-9000(Registrant’s telephone number, including area code)
Common Stock ($1.25 par value per share) New York Stock Exchange
(Title of each class) (Name of exchange on which registered)
Securities registered pursuant to Section 12(g) of the Act: None
Indicate by check mark whether the registrant (1) has filed all reports required to be filed by Section 13 or 15(d) of the Securities Exchange Act of 1934 during thepreceding 12 months (or for such shorter period that the registrant was required to file such reports), and (2) has been subject to such filing requirements for thepast 90 days. Yes x No o
Indicate by check mark whether the registrant has submitted electronically and posted on its corporate Web site, if any, every Interactive Data File required to besubmitted and posted pursuant to Rule 405 of Regulation S-T during the preceding 12 months (or for such shorter period that the registrant was required to submitand post such files). Yes x No o
Indicate by check mark whether the registrant is a large accelerated filer, an accelerated filer, a non-accelerated filer, or a smaller reporting company. See thedefinitions of “large accelerated filer”, “accelerated filer” and “smaller reporting company” in Rule 12b-2 of the Exchange Act.
Large accelerated filer x Accelerated filer oNon-accelerated filer o (Do not check if a smaller reporting company) Smaller reporting company o
Indicate by check mark whether the registrant is a shell company (as defined in Rule 12b-2 of the Exchange Act). Yes o No x
As of August 1, 2016 there were 79,477,822 shares of the registrant’s common stock outstanding.
TABLE OF CONTENTS
PageNo.
PART I FINANCIAL INFORMATION Item 1. Unaudited Condensed Consolidated Financial Statements 1 Condensed Consolidated Statements of Income 1 Condensed Consolidated Statements of Comprehensive Income 3 Condensed Consolidated Statements of Cash Flows 4 Condensed Consolidated Balance Sheets 5 Notes to Unaudited Condensed Consolidated Financial Statements 7 Note 1. Summary of Significant Accounting Policies 7 Note 2. Stock-Based Compensation Plan 10 Note 3. Affiliations and Discontinued Operations 13 Note 4. Common Stock 15 Note 5. Financial Instruments 15 Note 6. Segments of Business 17 Note 7. Rates and Regulatory Actions 21 Note 8. Regulatory Assets & Regulatory Liabilities 22 Note 9. Pension and Other Postretirement Benefits 24 Note 10. Lines of Credit 25 Note 11. Commitments and Contingencies 26 Note 12. Derivative Instruments 26 Note 13. Fair Value of Financial Assets and Financial Liabilities 29 Note 14. Long-Term Debt 31 Note 15. Accumulated Other Comprehensive Loss 32 Note 16. Subsequent Event 33Item 2. Management’s Discussion and Analysis of Financial Condition and Results of Operations 34Item 3. Quantitative and Qualitative Disclosures About Market Risk 51Item 4. Controls and Procedures 54
PART II OTHER INFORMATION Item 1. Legal Proceedings 55Item 1A. Risk Factors 55Item 6. Exhibits 56 Signatures 57
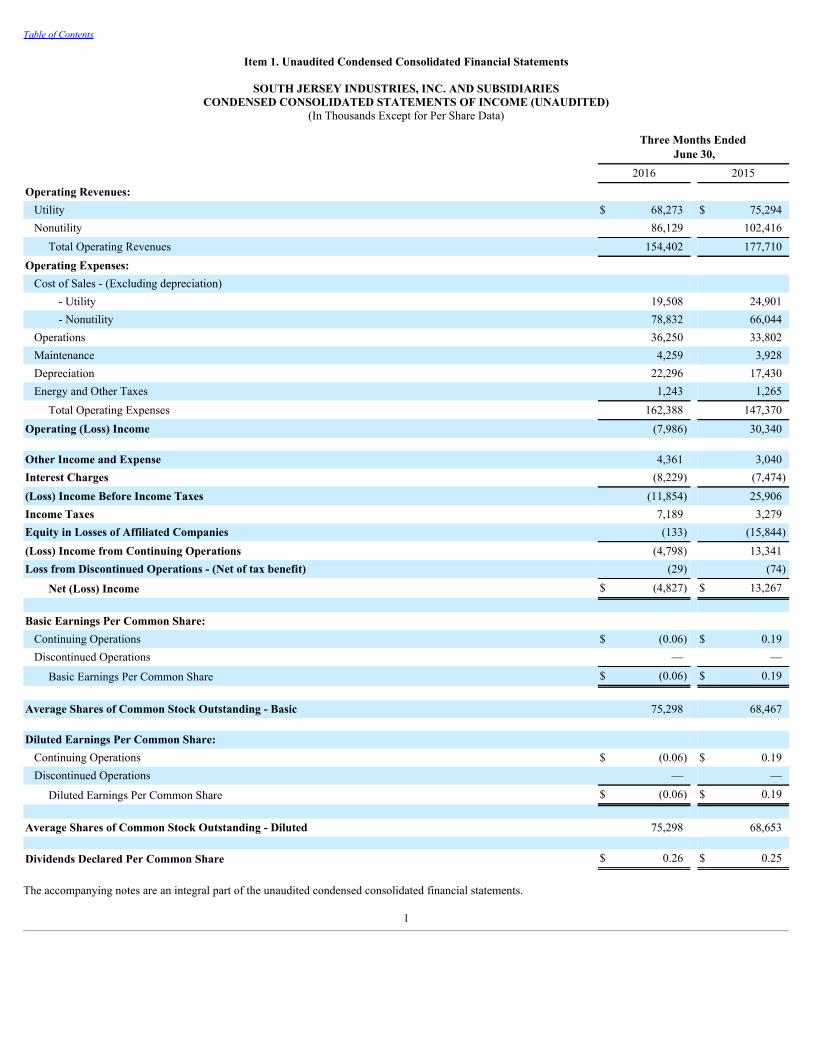
Table of Contents
Item 1. Unaudited Condensed Consolidated Financial Statements
SOUTH JERSEY INDUSTRIES, INC. AND SUBSIDIARIESCONDENSED CONSOLIDATED STATEMENTS OF INCOME (UNAUDITED)
(In Thousands Except for Per Share Data)
Three Months Ended
June 30, 2016 2015Operating Revenues:
Utility $ 68,273 $ 75,294Nonutility 86,129 102,416
Total Operating Revenues 154,402 177,710Operating Expenses:
Cost of Sales - (Excluding depreciation) - Utility 19,508 24,901 - Nonutility 78,832 66,044
Operations 36,250 33,802Maintenance 4,259 3,928Depreciation 22,296 17,430Energy and Other Taxes 1,243 1,265
Total Operating Expenses 162,388 147,370Operating (Loss) Income (7,986) 30,340 Other Income and Expense 4,361 3,040Interest Charges (8,229) (7,474)(Loss) Income Before Income Taxes (11,854) 25,906Income Taxes 7,189 3,279Equity in Losses of Affiliated Companies (133) (15,844)(Loss) Income from Continuing Operations (4,798) 13,341Loss from Discontinued Operations - (Net of tax benefit) (29) (74)
Net (Loss) Income $ (4,827) $ 13,267
Basic Earnings Per Common Share:
Continuing Operations $ (0.06) $ 0.19Discontinued Operations — —
Basic Earnings Per Common Share $ (0.06) $ 0.19
Average Shares of Common Stock Outstanding - Basic 75,298 68,467 Diluted Earnings Per Common Share:
Continuing Operations $ (0.06) $ 0.19Discontinued Operations — —
Diluted Earnings Per Common Share $ (0.06) $ 0.19
Average Shares of Common Stock Outstanding - Diluted 75,298 68,653 Dividends Declared Per Common Share $ 0.26 $ 0.25
The accompanying notes are an integral part of the unaudited condensed consolidated financial statements.
1
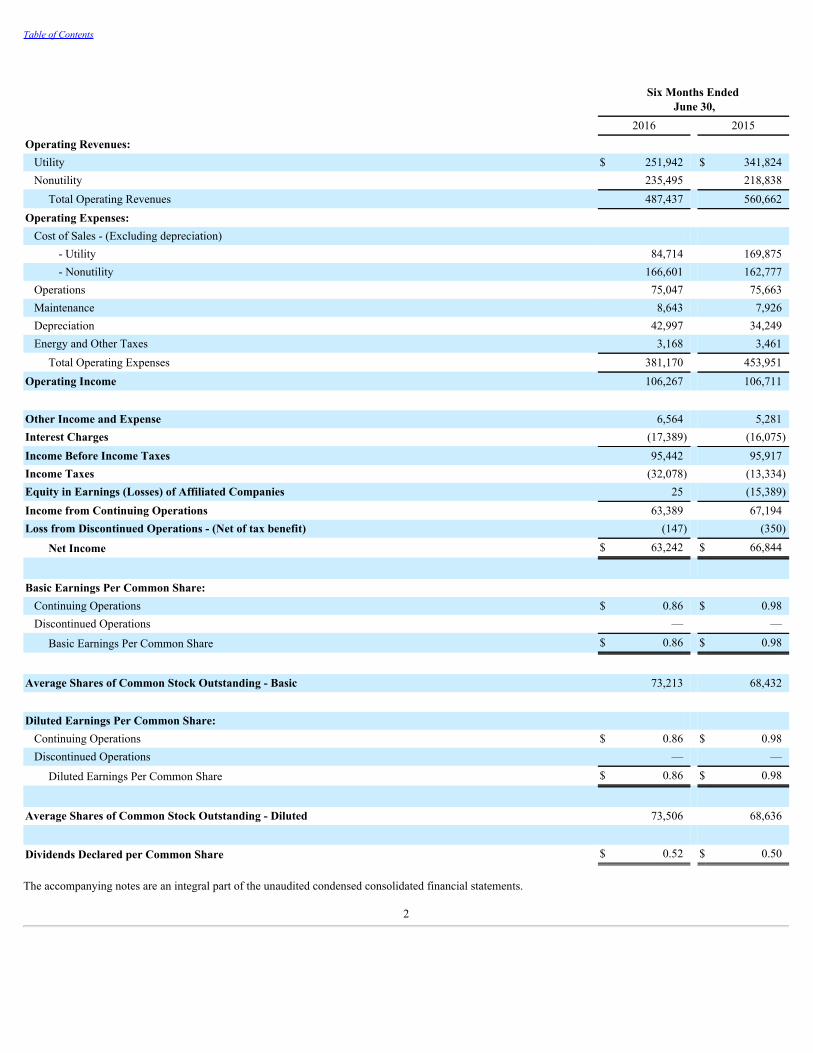
Table of Contents
Six Months Ended
June 30, 2016 2015Operating Revenues:
Utility $ 251,942 $ 341,824Nonutility 235,495 218,838
Total Operating Revenues 487,437 560,662Operating Expenses:
Cost of Sales - (Excluding depreciation) - Utility 84,714 169,875 - Nonutility 166,601 162,777
Operations 75,047 75,663Maintenance 8,643 7,926Depreciation 42,997 34,249Energy and Other Taxes 3,168 3,461
Total Operating Expenses 381,170 453,951Operating Income 106,267 106,711
Other Income and Expense 6,564 5,281Interest Charges (17,389) (16,075)Income Before Income Taxes 95,442 95,917Income Taxes (32,078) (13,334)Equity in Earnings (Losses) of Affiliated Companies 25 (15,389)Income from Continuing Operations 63,389 67,194Loss from Discontinued Operations - (Net of tax benefit) (147) (350)
Net Income $ 63,242 $ 66,844
Basic Earnings Per Common Share: Continuing Operations $ 0.86 $ 0.98Discontinued Operations — —
Basic Earnings Per Common Share $ 0.86 $ 0.98
Average Shares of Common Stock Outstanding - Basic 73,213 68,432
Diluted Earnings Per Common Share: Continuing Operations $ 0.86 $ 0.98Discontinued Operations — —
Diluted Earnings Per Common Share $ 0.86 $ 0.98
Average Shares of Common Stock Outstanding - Diluted 73,506 68,636
Dividends Declared per Common Share $ 0.52 $ 0.50
The accompanying notes are an integral part of the unaudited condensed consolidated financial statements.
2
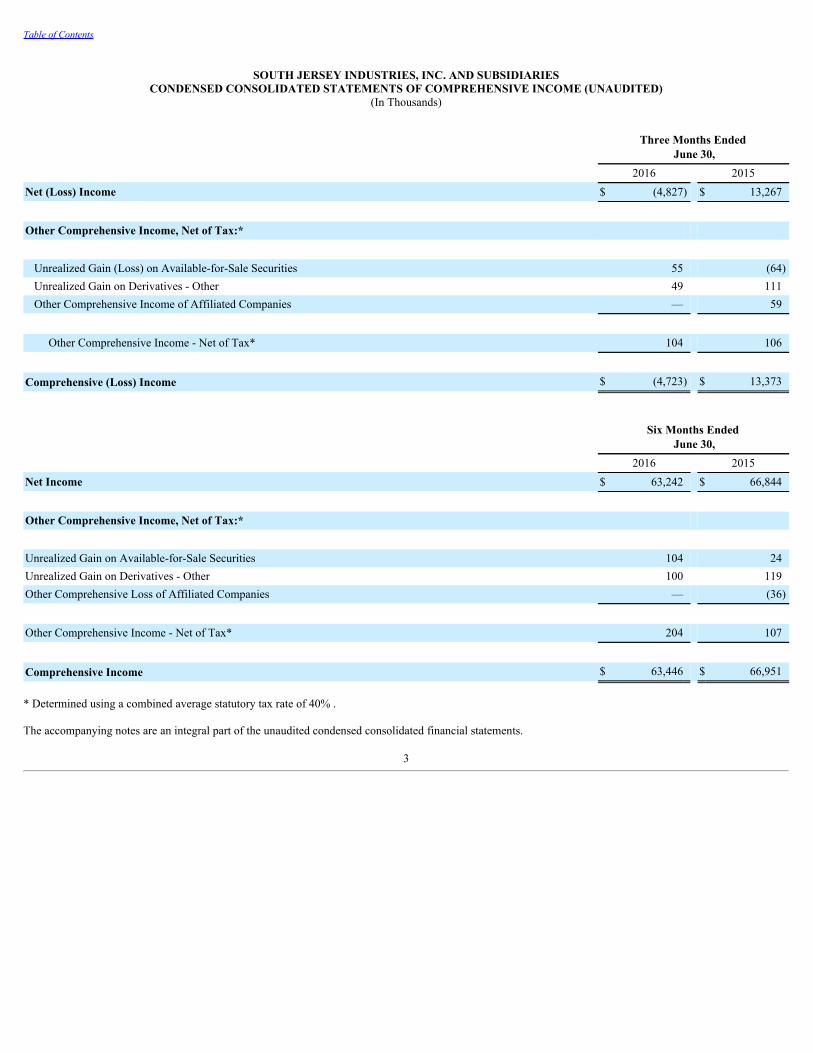
Table of Contents
SOUTH JERSEY INDUSTRIES, INC. AND SUBSIDIARIESCONDENSED CONSOLIDATED STATEMENTS OF COMPREHENSIVE INCOME (UNAUDITED)
(In Thousands)
Three Months Ended
June 30, 2016 2015Net (Loss) Income $ (4,827) $ 13,267
Other Comprehensive Income, Net of Tax:*
Unrealized Gain (Loss) on Available-for-Sale Securities 55 (64)Unrealized Gain on Derivatives - Other 49 111Other Comprehensive Income of Affiliated Companies — 59
Other Comprehensive Income - Net of Tax* 104 106
Comprehensive (Loss) Income $ (4,723) $ 13,373
Six Months Ended
June 30, 2016 2015Net Income $ 63,242 $ 66,844
Other Comprehensive Income, Net of Tax:*
Unrealized Gain on Available-for-Sale Securities 104 24Unrealized Gain on Derivatives - Other 100 119Other Comprehensive Loss of Affiliated Companies — (36)
Other Comprehensive Income - Net of Tax* 204 107
Comprehensive Income $ 63,446 $ 66,951
* Determined using a combined average statutory tax rate of 40% .
The accompanying notes are an integral part of the unaudited condensed consolidated financial statements.
3
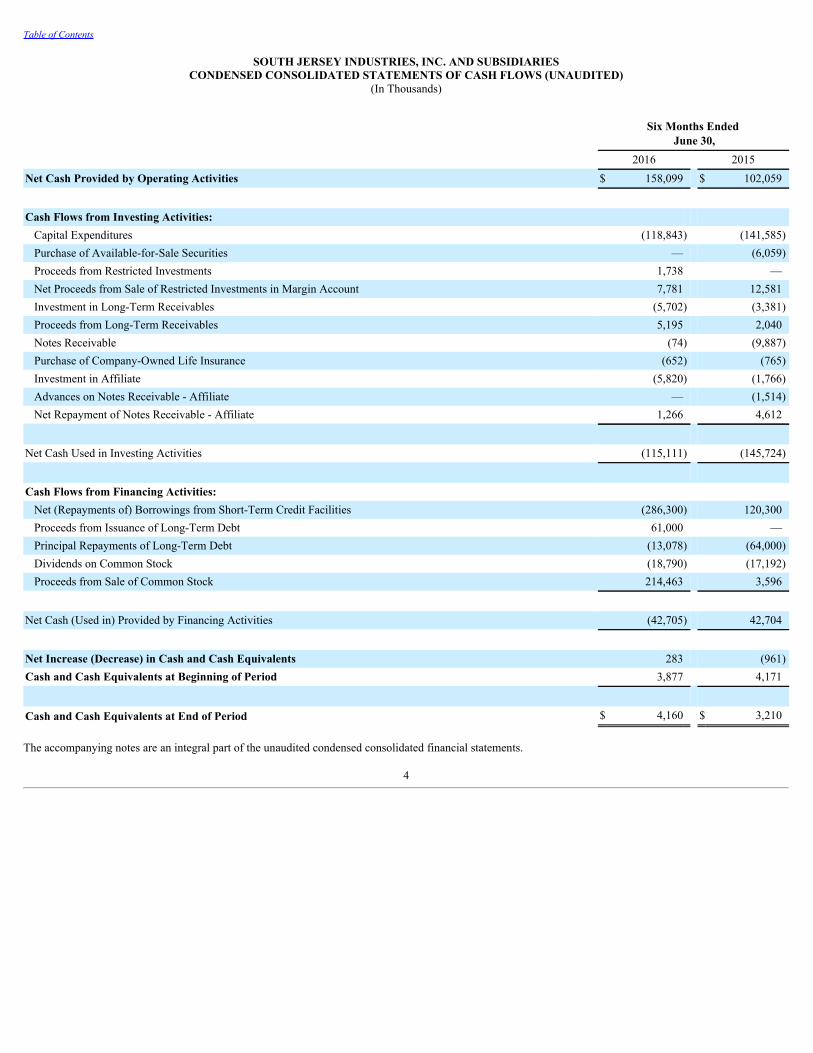
Table of Contents
SOUTH JERSEY INDUSTRIES, INC. AND SUBSIDIARIESCONDENSED CONSOLIDATED STATEMENTS OF CASH FLOWS (UNAUDITED)
(In Thousands)
Six Months Ended
June 30, 2016 2015Net Cash Provided by Operating Activities $ 158,099 $ 102,059
Cash Flows from Investing Activities: Capital Expenditures (118,843) (141,585)Purchase of Available-for-Sale Securities — (6,059)Proceeds from Restricted Investments 1,738 —Net Proceeds from Sale of Restricted Investments in Margin Account 7,781 12,581Investment in Long-Term Receivables (5,702) (3,381)Proceeds from Long-Term Receivables 5,195 2,040Notes Receivable (74) (9,887)Purchase of Company-Owned Life Insurance (652) (765)Investment in Affiliate (5,820) (1,766)Advances on Notes Receivable - Affiliate — (1,514)Net Repayment of Notes Receivable - Affiliate 1,266 4,612
Net Cash Used in Investing Activities (115,111) (145,724)
Cash Flows from Financing Activities: Net (Repayments of) Borrowings from Short-Term Credit Facilities (286,300) 120,300Proceeds from Issuance of Long-Term Debt 61,000 —Principal Repayments of Long-Term Debt (13,078) (64,000)Dividends on Common Stock (18,790) (17,192)Proceeds from Sale of Common Stock 214,463 3,596
Net Cash (Used in) Provided by Financing Activities (42,705) 42,704
Net Increase (Decrease) in Cash and Cash Equivalents 283 (961)Cash and Cash Equivalents at Beginning of Period 3,877 4,171
Cash and Cash Equivalents at End of Period $ 4,160 $ 3,210
The accompanying notes are an integral part of the unaudited condensed consolidated financial statements.
4
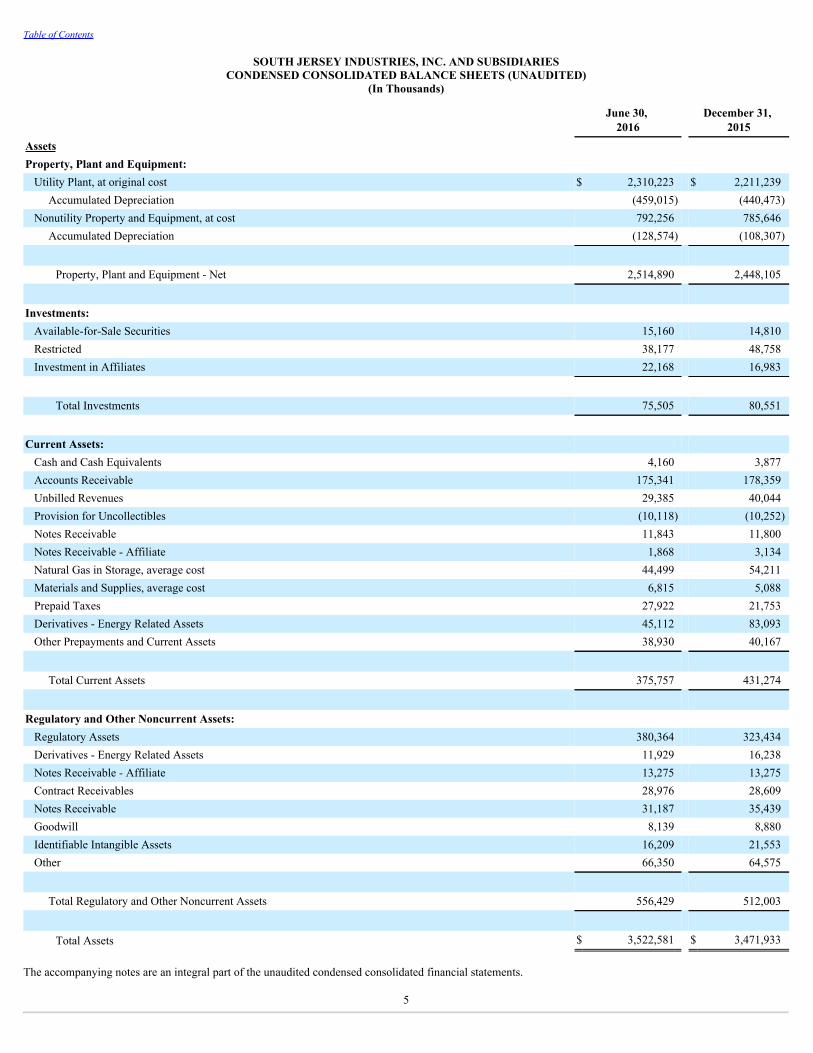
Table of Contents
SOUTH JERSEY INDUSTRIES, INC. AND SUBSIDIARIESCONDENSED CONSOLIDATED BALANCE SHEETS (UNAUDITED)
(In Thousands)
June 30,
2016 December 31,
2015Assets Property, Plant and Equipment:
Utility Plant, at original cost $ 2,310,223 $ 2,211,239Accumulated Depreciation (459,015) (440,473)
Nonutility Property and Equipment, at cost 792,256 785,646Accumulated Depreciation (128,574) (108,307)
Property, Plant and Equipment - Net 2,514,890 2,448,105
Investments: Available-for-Sale Securities 15,160 14,810Restricted 38,177 48,758Investment in Affiliates 22,168 16,983
Total Investments 75,505 80,551
Current Assets: Cash and Cash Equivalents 4,160 3,877Accounts Receivable 175,341 178,359Unbilled Revenues 29,385 40,044Provision for Uncollectibles (10,118) (10,252)Notes Receivable 11,843 11,800Notes Receivable - Affiliate 1,868 3,134Natural Gas in Storage, average cost 44,499 54,211Materials and Supplies, average cost 6,815 5,088Prepaid Taxes 27,922 21,753Derivatives - Energy Related Assets 45,112 83,093Other Prepayments and Current Assets 38,930 40,167
Total Current Assets 375,757 431,274
Regulatory and Other Noncurrent Assets: Regulatory Assets 380,364 323,434Derivatives - Energy Related Assets 11,929 16,238Notes Receivable - Affiliate 13,275 13,275Contract Receivables 28,976 28,609Notes Receivable 31,187 35,439Goodwill 8,139 8,880Identifiable Intangible Assets 16,209 21,553Other 66,350 64,575
Total Regulatory and Other Noncurrent Assets 556,429 512,003
Total Assets $ 3,522,581 $ 3,471,933 The accompanying notes are an integral part of the unaudited condensed consolidated financial statements.
5
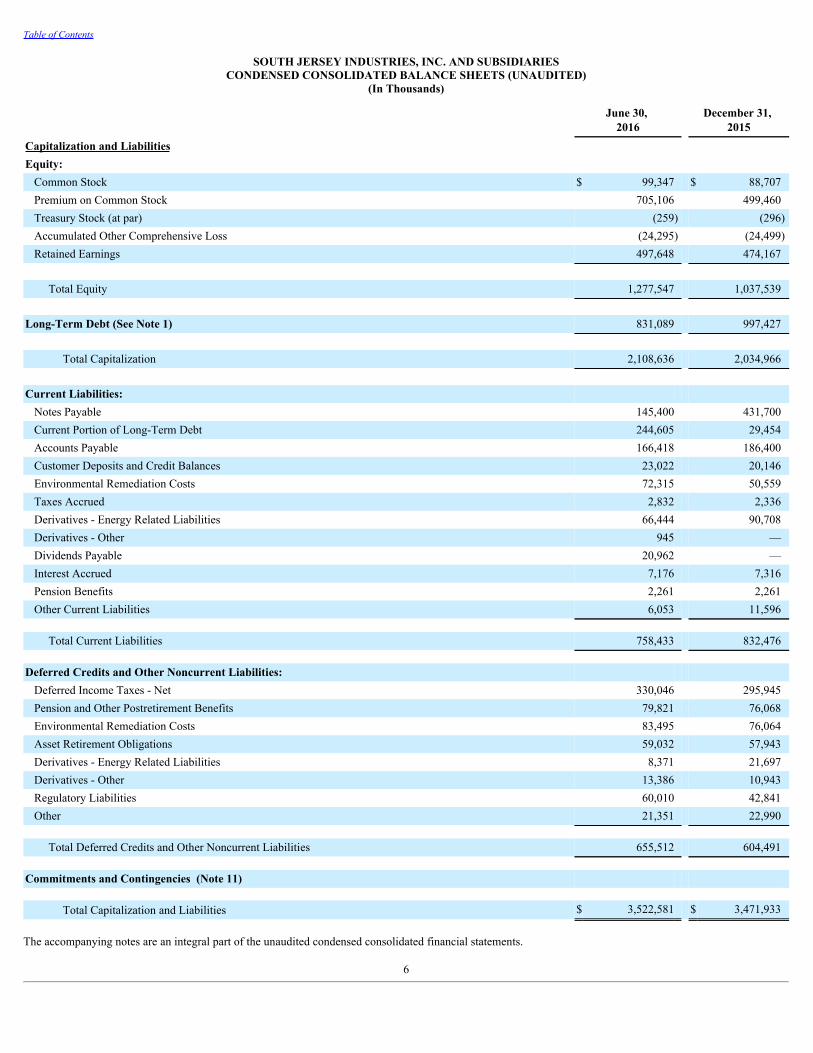
Table of Contents
SOUTH JERSEY INDUSTRIES, INC. AND SUBSIDIARIESCONDENSED CONSOLIDATED BALANCE SHEETS (UNAUDITED)
(In Thousands)
June 30,
2016 December 31,
2015Capitalization and Liabilities Equity:
Common Stock $ 99,347 $ 88,707Premium on Common Stock 705,106 499,460Treasury Stock (at par) (259) (296)Accumulated Other Comprehensive Loss (24,295) (24,499)Retained Earnings 497,648 474,167
Total Equity 1,277,547 1,037,539
Long-Term Debt (See Note 1) 831,089 997,427
Total Capitalization 2,108,636 2,034,966 Current Liabilities:
Notes Payable 145,400 431,700Current Portion of Long-Term Debt 244,605 29,454Accounts Payable 166,418 186,400Customer Deposits and Credit Balances 23,022 20,146Environmental Remediation Costs 72,315 50,559Taxes Accrued 2,832 2,336Derivatives - Energy Related Liabilities 66,444 90,708Derivatives - Other 945 —Dividends Payable 20,962 —Interest Accrued 7,176 7,316Pension Benefits 2,261 2,261Other Current Liabilities 6,053 11,596
Total Current Liabilities 758,433 832,476
Deferred Credits and Other Noncurrent Liabilities:
Deferred Income Taxes - Net 330,046 295,945Pension and Other Postretirement Benefits 79,821 76,068Environmental Remediation Costs 83,495 76,064Asset Retirement Obligations 59,032 57,943Derivatives - Energy Related Liabilities 8,371 21,697Derivatives - Other 13,386 10,943Regulatory Liabilities 60,010 42,841Other 21,351 22,990
Total Deferred Credits and Other Noncurrent Liabilities 655,512 604,491
Commitments and Contingencies (Note 11)
Total Capitalization and Liabilities $ 3,522,581 $ 3,471,933 The accompanying notes are an integral part of the unaudited condensed consolidated financial statements.
6
Table of Contents
Notes to Unaudited Condensed Consolidated Financial Statements
1. SUMMARY OF SIGNIFICANT ACCOUNTING POLICIES:
GENERAL - South Jersey Industries, Inc. (SJI or the Company) currently provides a variety of energy-related products and services primarily through thefollowing wholly-owned subsidiaries:
▪ South Jersey Gas Company (SJG) is a regulated natural gas utility. SJG distributes natural gas in the seven southernmost counties of New Jersey.
▪ South Jersey Energy Company (SJE) acquires and markets natural gas and electricity to retail end users and provides total energy management services tocommercial, industrial and residential customers.
▪ South Jersey Resources Group, LLC (SJRG) markets natural gas storage, commodity and transportation assets along with fuel management services on awholesale basis in the mid-Atlantic, Appalachian and southern states.
▪ South Jersey Exploration, LLC (SJEX) owns oil, gas and mineral rights in the Marcellus Shale region of Pennsylvania.
▪ Marina Energy, LLC (Marina) develops and operates on-site energy-related projects. The following entities are wholly-owned subsidiaries of Marina asof December 31, 2015 (see Note 3):
• ACB Energy Partners, LLC (ACB) owns and operates a natural gas fueled combined heating, cooling and power facility located in AtlanticCity, New Jersey.
• AC Landfill Energy. LLC (ACLE), BC Landfill Energy, LLC (BCLE), SC Landfill Energy, LLC (SCLE) and SX Landfill Energy, LLC(SXLE) own and operate landfill gas-fired electric production facilities in Atlantic, Burlington, Salem and Sussex Counties located in NewJersey.
• MCS Energy Partners, LLC (MCS), NBS Energy Partners, LLC (NBS) and SBS Energy Partners, LLC (SBS) own and operate solar-generation sites located in New Jersey.
▪ South Jersey Energy Service Plus, LLC (SJESP) services residential and small commercial HVAC systems, installs small commercial HVAC systems,provides plumbing services and services appliances under warranty via a subcontractor arrangement as well as on a time and materials basis.
▪ SJI Midstream, LLC was formed in 2014 to invest in infrastructure and other midstream projects, including a current project to build a 100 -mile naturalgas pipeline in Pennsylvania and New Jersey.
BASIS OF PRESENTATION — The condensed consolidated financial statements include the accounts of SJI, its wholly-owned subsidiaries and subsidiaries inwhich SJI has a controlling interest. SJI eliminates all significant intercompany accounts and transactions. In management’s opinion, the condensed consolidatedfinancial statements reflect all normal and recurring adjustments needed to fairly present SJI’s financial position, operating results and cash flows at the dates andfor the periods presented. SJI’s businesses are subject to seasonal fluctuations and, accordingly, this interim financial information should not be the basis forestimating the full year’s operating results. As permitted by the rules and regulations of the Securities and Exchange Commission (SEC), the accompanyingunaudited condensed consolidated financial statements contain certain condensed financial information and exclude certain footnote disclosures normally includedin annual audited consolidated financial statements prepared in accordance with accounting principles generally accepted in the United States of America (GAAP).These financial statements should be read in conjunction with SJI’s 2015 Annual Report on Form 10-K for a more complete discussion of the Company’saccounting policies and certain other information.
Certain reclassifications have been made to the prior period's condensed consolidated balance sheets, as well as the prior period's long-term debt carrying value andprior period's segment disclosures in Notes 5 and 6, respectively, to conform to the current period presentation. The unamortized debt issuance costs previouslyincluded in "Regulatory and Other Noncurrent Assets" on the condensed consolidated balance sheets were reclassified to Long-Term Debt to conform to ASU2015-03, which is described below under "New Accounting Pronouncements." This reclassification caused the prior period long-term debt carrying value in Note 5to be adjusted, along with the prior period unamortized debt issuance costs recorded as Identifiable Assets in the Gas Utility Operations, On-Site EnergyProduction and Corporate and Services segments in Note 6 to be removed.
7
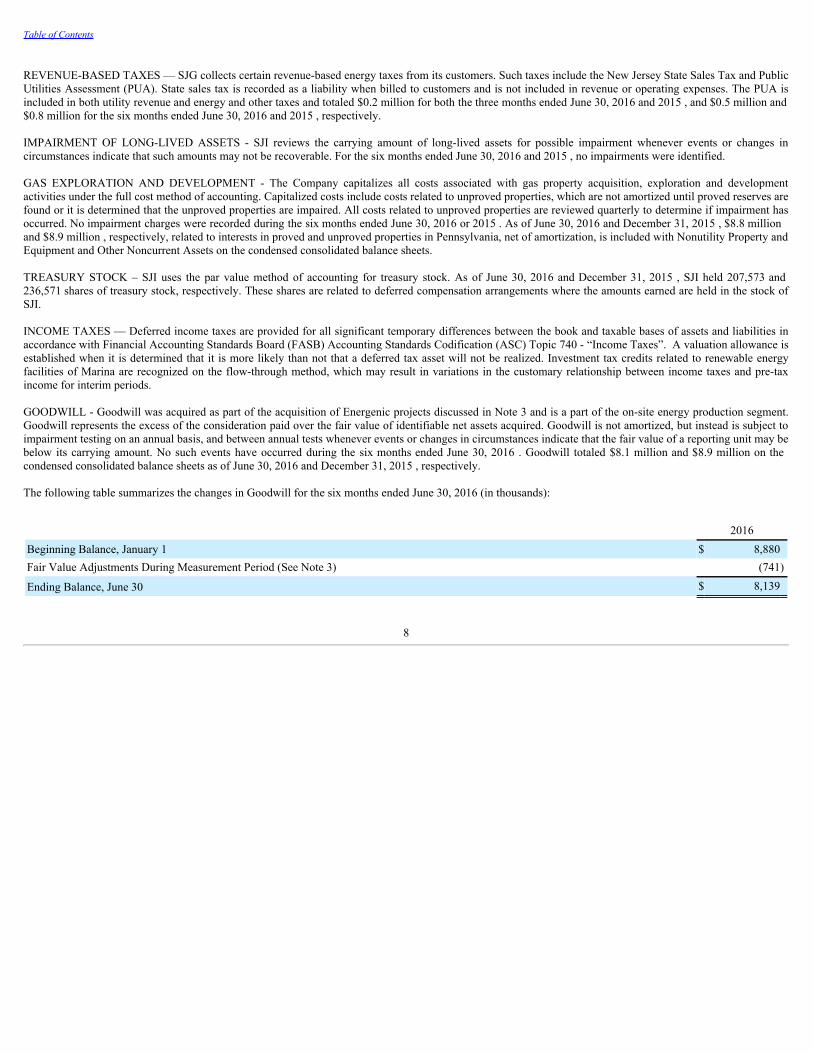
Table of Contents
REVENUE-BASED TAXES — SJG collects certain revenue-based energy taxes from its customers. Such taxes include the New Jersey State Sales Tax and PublicUtilities Assessment (PUA). State sales tax is recorded as a liability when billed to customers and is not included in revenue or operating expenses. The PUA isincluded in both utility revenue and energy and other taxes and totaled $0.2 million for both the three months ended June 30, 2016 and 2015 , and $0.5 million and$0.8 million for the six months ended June 30, 2016 and 2015 , respectively. IMPAIRMENT OF LONG-LIVED ASSETS - SJI reviews the carrying amount of long-lived assets for possible impairment whenever events or changes incircumstances indicate that such amounts may not be recoverable. For the six months ended June 30, 2016 and 2015 , no impairments were identified.
GAS EXPLORATION AND DEVELOPMENT - The Company capitalizes all costs associated with gas property acquisition, exploration and developmentactivities under the full cost method of accounting. Capitalized costs include costs related to unproved properties, which are not amortized until proved reserves arefound or it is determined that the unproved properties are impaired. All costs related to unproved properties are reviewed quarterly to determine if impairment hasoccurred. No impairment charges were recorded during the six months ended June 30, 2016 or 2015 . As of June 30, 2016 and December 31, 2015 , $8.8 millionand $8.9 million , respectively, related to interests in proved and unproved properties in Pennsylvania, net of amortization, is included with Nonutility Property andEquipment and Other Noncurrent Assets on the condensed consolidated balance sheets. TREASURY STOCK – SJI uses the par value method of accounting for treasury stock. As of June 30, 2016 and December 31, 2015 , SJI held 207,573 and236,571 shares of treasury stock, respectively. These shares are related to deferred compensation arrangements where the amounts earned are held in the stock ofSJI.
INCOME TAXES — Deferred income taxes are provided for all significant temporary differences between the book and taxable bases of assets and liabilities inaccordance with Financial Accounting Standards Board (FASB) Accounting Standards Codification (ASC) Topic 740 - “Income Taxes”. A valuation allowance isestablished when it is determined that it is more likely than not that a deferred tax asset will not be realized. Investment tax credits related to renewable energyfacilities of Marina are recognized on the flow-through method, which may result in variations in the customary relationship between income taxes and pre-taxincome for interim periods.
GOODWILL - Goodwill was acquired as part of the acquisition of Energenic projects discussed in Note 3 and is a part of the on-site energy production segment.Goodwill represents the excess of the consideration paid over the fair value of identifiable net assets acquired. Goodwill is not amortized, but instead is subject toimpairment testing on an annual basis, and between annual tests whenever events or changes in circumstances indicate that the fair value of a reporting unit may bebelow its carrying amount. No such events have occurred during the six months ended June 30, 2016 . Goodwill totaled $8.1 million and $8.9 million on thecondensed consolidated balance sheets as of June 30, 2016 and December 31, 2015 , respectively.
The following table summarizes the changes in Goodwill for the six months ended June 30, 2016 (in thousands):
2016Beginning Balance, January 1 $ 8,880Fair Value Adjustments During Measurement Period (See Note 3) (741)
Ending Balance, June 30 $ 8,139
8
Table of Contents
NEW ACCOUNTING PRONOUNCEMENTS — Other than as described below, no new accounting pronouncement issued or effective during 2016 or 2015 had,or are expected to have, a material impact on the condensed consolidated financial statements.
In May 2014, the FASB issued ASU 2014-09, Revenue from Contracts with Customers (Topic 606). This ASU supersedes the revenue recognition requirements inFASB ASC 605, Revenue Recognition , and in most industry-specific topics. The new guidance identifies how and when entities should recognize revenue. Thenew rules establish a core principle requiring the recognition of revenue to depict the transfer of promised goods or services to customers in an amount reflectingthe consideration to which the entity expects to be entitled in exchange for such goods or services. The new guidance is effective for fiscal years, and interimperiods within those years, beginning after December 15, 2017. Management has formed an implementation team that is currently inventorying the contracts withcustomers and evaluating the impact that adoption of this guidance will have on the Company's financial statement results, as well as the transition method theCompany will elect to adopt the guidance.
In August 2014, the FASB issued ASU 2014-15, Presentation of Financial Statements - Going Concern (Subtopic 205-40); Disclosure of Uncertainties about anEntity's Ability to Continue as a Going Concern. The new guidance requires management of a company to evaluate whether there is substantial doubt about thecompany's ability to continue as a going concern. This ASU is effective for the annual reporting period ending after December 15, 2016, and for interim and annualreporting periods thereafter, with early adoption permitted. The Company does not expect this standard to have an impact on its consolidated financial statementsupon adoption.
In April 2015, the FASB issued ASU 2015-03, Interest-Imputation of Interest (Subtopic 835-30): Simplifying the Presentation of Debt Issuance Costs . This ASUrequires debt issuance costs to be presented in the balance sheet as a direct deduction from the associated debt liability. The standard is effective for annual periods,including interim periods within those annual periods, beginning after December 15, 2015. Adoption of this guidance did not have an impact on the Company'sresults of operations; however, balance sheet presentations were modified to conform to this guidance.
In July 2015, the FASB issued ASU 2015-11, Inventory (Topic 330): Simplifying the Measurement of Inventory . This ASU states that inventory for which cost isdetermined using a method other than last-in, first-out (LIFO) or the retail method should be subsequently measured at the lower of cost or net realizable value(NRV), rather than at the lower of cost or market. The standard is effective for annual periods, including interim periods within those annual periods, beginningafter December 15, 2016. Management is currently determining the impact that adoption of this guidance will have on the Company's financial statement results.
In January 2016, the FASB issued ASU 2016-01, Financial Instruments-Overall (Subtopic 825-10): Recognition and Measurement of Financial Assets andFinancial Liabilities , which enhances the reporting model for financial instruments and includes amendments to address aspects of recognition, measurement,presentation and disclosure. The standard is effective for annual periods, including interim periods within those annual periods, beginning after December 15,2017. Early adoption is permitted for only certain portions of the new guidance. Management is currently determining the impact that adoption of this guidancewill have on the Company's financial statement results.
In March 2016, the FASB issued ASU 2016-02, Leases (Topic 842) , which establishes a new lease accounting model for lessees. The new standard requiressubstantially all leases be recognized by lessees on their balance sheet as a right-of-use asset and corresponding lease liability, including leases currently accountedfor as operating leases. The new standard also will result in enhanced quantitative and qualitative disclosures, including significant judgments made bymanagement, to provide greater insight into the extent of revenue and expense recognized and expected to be recognized from existing leases. The accounting forleases by the lessor remains relatively the same. The standard is effective for annual periods, including interim periods within those annual periods, beginning afterDecember 15, 2018, with early adoption permitted. Management is currently determining the impact that adoption of this guidance will have on the Company'sfinancial statement results.
In March 2016, the FASB issued ASU 2016-05, Derivatives and Hedging (Topic 815): Effect of Derivative Contract Novations on Existing Hedge AccountingRelationships . The amendments in this guidance clarify that a change in the counterparty to a derivative instrument that has been designated as a hedginginstrument under Topic 815 does not, in and of itself, require dedesignation of that hedging relationship provided that all other hedge accounting criteria continueto be met. The standard is effective for annual periods, including interim periods within those annual periods, beginning after December 15, 2016, with earlyadoption permitted. Management is currently determining the impact that adoption of this guidance will have on the Company's financial statement results.
9
Table of Contents
In March 2016, the FASB issued ASU 2016-07, Investments- Equity Method and Joint Ventures (Topic 323): Simplifying the Transition to the Equity Method ofAccounting, which eliminates the requirement to apply the equity method of accounting retrospectively when a reporting entity obtains significant influence over apreviously held investment. The standard is effective for annual periods, including interim periods within those annual periods, beginning after December 15, 2016,with early adoption permitted. Management is currently determining the impact that adoption of this guidance will have on the Company's financial statementresults.
In March 2016, the FASB issued ASU 2016-08, Revenue from Contracts with Customers (Topic 606): Principal versus Agent Considerations (Reporting RevenueGross versus Net) . This standard amends ASU 2014-09 (discussed above), to improve the implementation guidance on principal versus agent considerations andwhether an entity reports revenue on a gross or net basis. This standard will have the same effective date and transition requirements as ASU 2014-09.Management is currently determining the impact that adoption of this guidance will have on the Company's financial statement results.
In March 2016, the FASB issued ASU 2016-09, Compensation—Stock Compensation (Topic 718): Improvements to Employee Share-Based Payment Accounting ,which simplifies various aspects of accounting for share-based payment arrangements. The standard is effective for annual periods, including interim periodswithin those annual periods, beginning after December 15, 2016, with early adoption permitted. Management is currently determining the impact that adoption ofthis guidance will have on the Company's financial statement results.
In April 2016, the FASB issued ASU 2016-10, Revenue from Contracts with Customers (Topic 606): Identifying Performance Obligations and Licensing . Thisstandard amends ASU 2014-09 (discussed above) to clarify identifying performance obligations and the licensing implementation guidance. This standard willhave the same effective date and transition requirements as ASU 2014-09. Management is currently determining the impact that adoption of this guidance will haveon the Company's financial statement results.
In May 2016, the FASB issued ASU 2016-12, Revenue from Contracts with Customers (Topic 606): Narrow-Scope Improvements and Practical Expedients . Thisstandard amends ASU 2014-09 (discussed above) to provide additional guidance on (a) the objective of the collectibility criterion, (b) the presentation of sales taxcollected from customers, (c) the measurement date of non-cash consideration received, (d) practical expedients in respect of contract modifications and completedcontracts at transition, and (5) disclosure of the effects of the accounting change in the period of adoption. This standard will have the same effective date andtransition requirements as ASU 2014-09. Management is currently determining the impact that adoption of this guidance will have on the Company's financialstatement results.
2. STOCK-BASED COMPENSATION PLAN:
On April 30, 2015, the shareholders of SJI approved the adoption of the Company's 2015 Omnibus Equity Compensation Plan (Plan), replacing the Amended andRestated 1997 Stock-Based Compensation Plan that had terminated on January 26, 2015. Under the Plan, shares may be issued to SJI’s officers (Officers), non-employee directors (Directors) and other key employees. No options were granted or outstanding during the six months ended June 30, 2016 and 2015 . No stockappreciation rights have been issued under the plans. During the six months ended June 30, 2016 and 2015 , SJI granted 193,184 and 159,416 restricted shares,respectively, to Officers and other key employees under the plans. Performance-based restricted shares vest over a three -year period and are subject to SJIachieving certain market and earnings-based performance targets, which can cause the actual amount of shares that ultimately vest to range from 0% to 200% ofthe original share units granted.
Beginning in 2015, SJI grants time-based shares of restricted stock, one-third of which vest annually over a three -year period and is limited to a 100% payout.Vesting of time-based grants is contingent upon SJI achieving a return on equity (ROE) of at least 7% during the initial year of the grant and meeting the servicerequirement. Provided that the 7% ROE requirement is met in the initial year, payout is solely contingent upon the service requirement being met in years two andthree of the grant. During the six months ended June 30, 2016 and 2015 , Officers and other key employees were granted 57,955 and 47,824 shares of time-basedrestricted stock, which are included in the shares noted above.
Grants containing market-based performance targets use SJI's total shareholder return (TSR) relative to a peer group to measure performance. As TSR-based grantsare contingent upon market and service conditions, SJI is required to measure and recognize stock-based compensation expense based on the fair value at the dateof grant on a straight-line basis over the requisite three-year period of each award. In addition, SJI identifies specific forfeitures of share-based awards, andcompensation expense is adjusted accordingly over the requisite service period. Compensation expense is not adjusted based on the actual achievement ofperformance goals. The fair value of TSR-based restricted stock awards on the date of grant is estimated using a Monte Carlo simulation model.
10
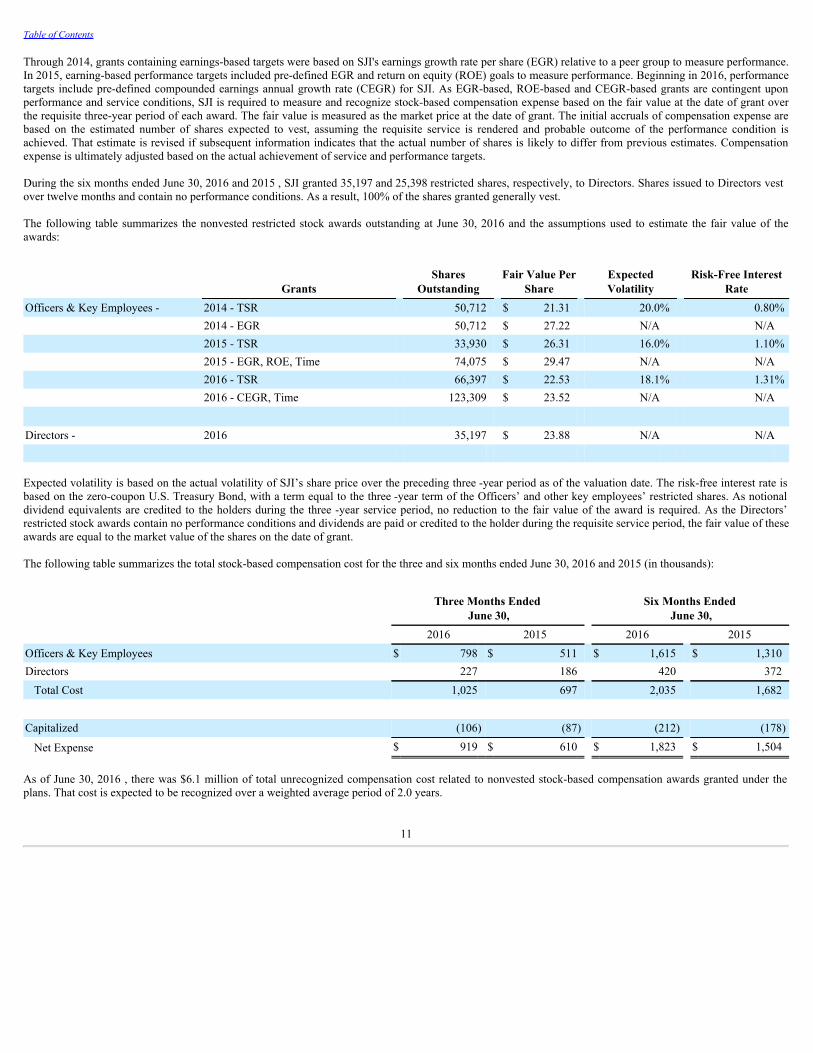
Table of Contents
Through 2014, grants containing earnings-based targets were based on SJI's earnings growth rate per share (EGR) relative to a peer group to measure performance.In 2015, earning-based performance targets included pre-defined EGR and return on equity (ROE) goals to measure performance. Beginning in 2016, performancetargets include pre-defined compounded earnings annual growth rate (CEGR) for SJI. As EGR-based, ROE-based and CEGR-based grants are contingent uponperformance and service conditions, SJI is required to measure and recognize stock-based compensation expense based on the fair value at the date of grant overthe requisite three-year period of each award. The fair value is measured as the market price at the date of grant. The initial accruals of compensation expense arebased on the estimated number of shares expected to vest, assuming the requisite service is rendered and probable outcome of the performance condition isachieved. That estimate is revised if subsequent information indicates that the actual number of shares is likely to differ from previous estimates. Compensationexpense is ultimately adjusted based on the actual achievement of service and performance targets.
During the six months ended June 30, 2016 and 2015 , SJI granted 35,197 and 25,398 restricted shares, respectively, to Directors. Shares issued to Directors vestover twelve months and contain no performance conditions. As a result, 100% of the shares granted generally vest.
The following table summarizes the nonvested restricted stock awards outstanding at June 30, 2016 and the assumptions used to estimate the fair value of theawards:
Grants Shares
Outstanding Fair Value Per
Share ExpectedVolatility
Risk-Free InterestRate
Officers & Key Employees - 2014 - TSR 50,712 $ 21.31 20.0% 0.80% 2014 - EGR 50,712 $ 27.22 N/A N/A 2015 - TSR 33,930 $ 26.31 16.0% 1.10% 2015 - EGR, ROE, Time 74,075 $ 29.47 N/A N/A 2016 - TSR 66,397 $ 22.53 18.1% 1.31% 2016 - CEGR, Time 123,309 $ 23.52 N/A N/A
Directors - 2016 35,197 $ 23.88 N/A N/A
Expected volatility is based on the actual volatility of SJI’s share price over the preceding three -year period as of the valuation date. The risk-free interest rate isbased on the zero-coupon U.S. Treasury Bond, with a term equal to the three -year term of the Officers’ and other key employees’ restricted shares. As notionaldividend equivalents are credited to the holders during the three -year service period, no reduction to the fair value of the award is required. As the Directors’restricted stock awards contain no performance conditions and dividends are paid or credited to the holder during the requisite service period, the fair value of theseawards are equal to the market value of the shares on the date of grant.
The following table summarizes the total stock-based compensation cost for the three and six months ended June 30, 2016 and 2015 (in thousands):
Three Months Ended
June 30, Six Months Ended
June 30, 2016 2015 2016 2015Officers & Key Employees $ 798 $ 511 $ 1,615 $ 1,310Directors 227 186 420 372
Total Cost 1,025 697 2,035 1,682
Capitalized (106) (87) (212) (178)
Net Expense $ 919 $ 610 $ 1,823 $ 1,504
As of June 30, 2016 , there was $6.1 million of total unrecognized compensation cost related to nonvested stock-based compensation awards granted under theplans. That cost is expected to be recognized over a weighted average period of 2.0 years.
11
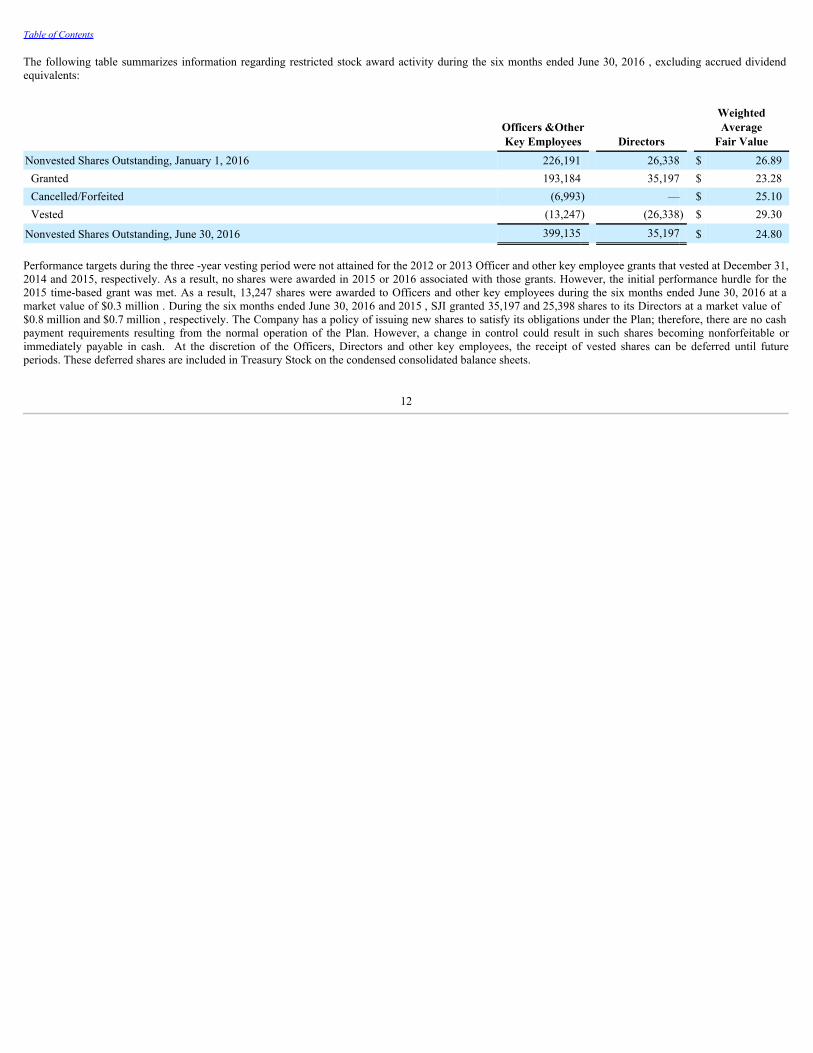
Table of Contents
The following table summarizes information regarding restricted stock award activity during the six months ended June 30, 2016 , excluding accrued dividendequivalents:
Officers &OtherKey Employees Directors
WeightedAverage
Fair ValueNonvested Shares Outstanding, January 1, 2016 226,191 26,338 $ 26.89 Granted 193,184 35,197 $ 23.28 Cancelled/Forfeited (6,993) — $ 25.10 Vested (13,247) (26,338) $ 29.30
Nonvested Shares Outstanding, June 30, 2016 399,135 35,197 $ 24.80
Performance targets during the three -year vesting period were not attained for the 2012 or 2013 Officer and other key employee grants that vested at December 31,2014 and 2015, respectively. As a result, no shares were awarded in 2015 or 2016 associated with those grants. However, the initial performance hurdle for the2015 time-based grant was met. As a result, 13,247 shares were awarded to Officers and other key employees during the six months ended June 30, 2016 at amarket value of $0.3 million . During the six months ended June 30, 2016 and 2015 , SJI granted 35,197 and 25,398 shares to its Directors at a market value of$0.8 million and $0.7 million , respectively. The Company has a policy of issuing new shares to satisfy its obligations under the Plan; therefore, there are no cashpayment requirements resulting from the normal operation of the Plan. However, a change in control could result in such shares becoming nonforfeitable orimmediately payable in cash. At the discretion of the Officers, Directors and other key employees, the receipt of vested shares can be deferred until futureperiods. These deferred shares are included in Treasury Stock on the condensed consolidated balance sheets.
12
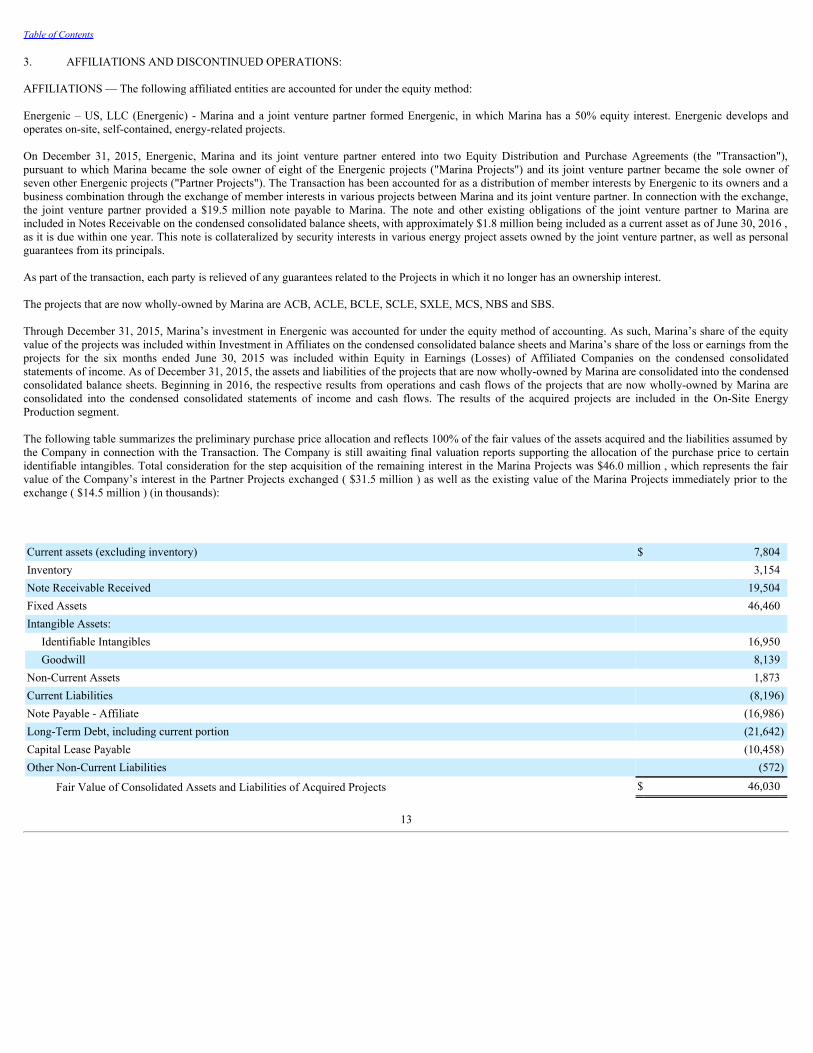
Table of Contents
3. AFFILIATIONS AND DISCONTINUED OPERATIONS:
AFFILIATIONS — The following affiliated entities are accounted for under the equity method:
Energenic – US, LLC (Energenic) - Marina and a joint venture partner formed Energenic, in which Marina has a 50% equity interest. Energenic develops andoperates on-site, self-contained, energy-related projects.
On December 31, 2015, Energenic, Marina and its joint venture partner entered into two Equity Distribution and Purchase Agreements (the "Transaction"),pursuant to which Marina became the sole owner of eight of the Energenic projects ("Marina Projects") and its joint venture partner became the sole owner ofseven other Energenic projects ("Partner Projects"). The Transaction has been accounted for as a distribution of member interests by Energenic to its owners and abusiness combination through the exchange of member interests in various projects between Marina and its joint venture partner. In connection with the exchange,the joint venture partner provided a $19.5 million note payable to Marina. The note and other existing obligations of the joint venture partner to Marina areincluded in Notes Receivable on the condensed consolidated balance sheets, with approximately $1.8 million being included as a current asset as of June 30, 2016 ,as it is due within one year. This note is collateralized by security interests in various energy project assets owned by the joint venture partner, as well as personalguarantees from its principals.
As part of the transaction, each party is relieved of any guarantees related to the Projects in which it no longer has an ownership interest.
The projects that are now wholly-owned by Marina are ACB, ACLE, BCLE, SCLE, SXLE, MCS, NBS and SBS.
Through December 31, 2015, Marina’s investment in Energenic was accounted for under the equity method of accounting. As such, Marina’s share of the equityvalue of the projects was included within Investment in Affiliates on the condensed consolidated balance sheets and Marina’s share of the loss or earnings from theprojects for the six months ended June 30, 2015 was included within Equity in Earnings (Losses) of Affiliated Companies on the condensed consolidatedstatements of income. As of December 31, 2015, the assets and liabilities of the projects that are now wholly-owned by Marina are consolidated into the condensedconsolidated balance sheets. Beginning in 2016, the respective results from operations and cash flows of the projects that are now wholly-owned by Marina areconsolidated into the condensed consolidated statements of income and cash flows. The results of the acquired projects are included in the On-Site EnergyProduction segment.
The following table summarizes the preliminary purchase price allocation and reflects 100% of the fair values of the assets acquired and the liabilities assumed bythe Company in connection with the Transaction. The Company is still awaiting final valuation reports supporting the allocation of the purchase price to certainidentifiable intangibles. Total consideration for the step acquisition of the remaining interest in the Marina Projects was $46.0 million , which represents the fairvalue of the Company’s interest in the Partner Projects exchanged ( $31.5 million ) as well as the existing value of the Marina Projects immediately prior to theexchange ( $14.5 million ) (in thousands):
Current assets (excluding inventory) $ 7,804Inventory 3,154Note Receivable Received 19,504Fixed Assets 46,460Intangible Assets: Identifiable Intangibles 16,950 Goodwill 8,139Non-Current Assets 1,873Current Liabilities (8,196)Note Payable - Affiliate (16,986)Long-Term Debt, including current portion (21,642)Capital Lease Payable (10,458)Other Non-Current Liabilities (572)
Fair Value of Consolidated Assets and Liabilities of Acquired Projects $ 46,030
13
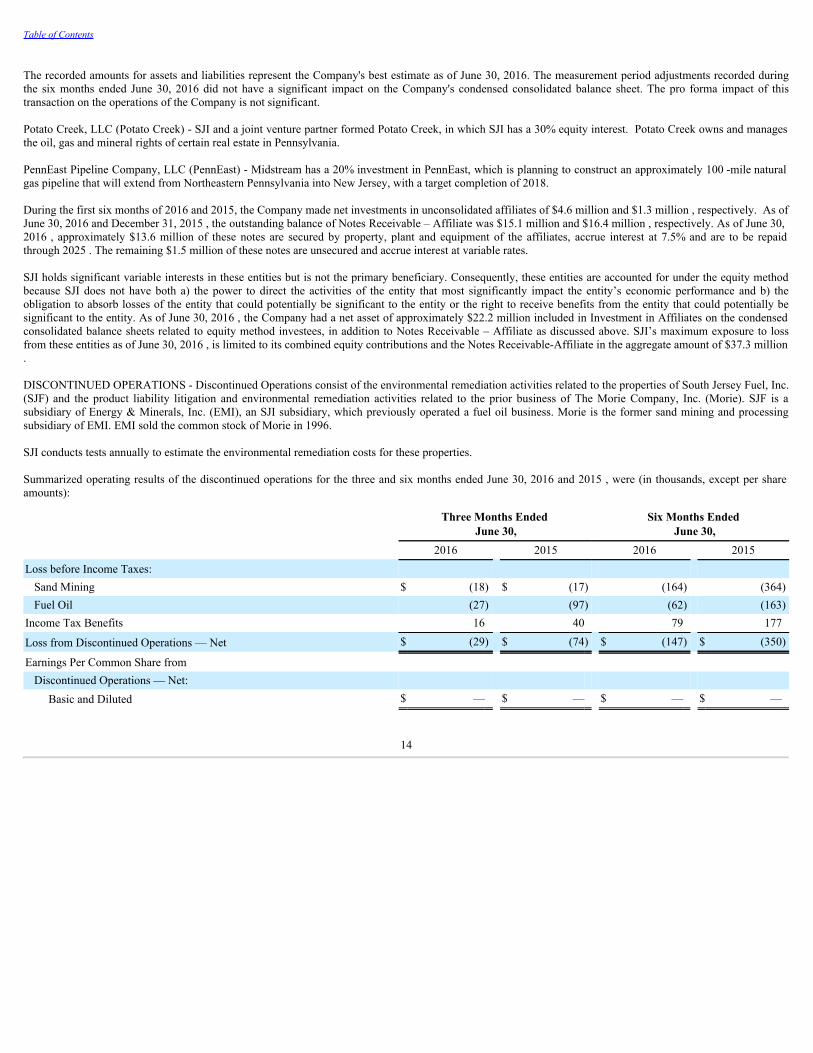
Table of Contents
The recorded amounts for assets and liabilities represent the Company's best estimate as of June 30, 2016. The measurement period adjustments recorded duringthe six months ended June 30, 2016 did not have a significant impact on the Company's condensed consolidated balance sheet. The pro forma impact of thistransaction on the operations of the Company is not significant.
Potato Creek, LLC (Potato Creek) - SJI and a joint venture partner formed Potato Creek, in which SJI has a 30% equity interest. Potato Creek owns and managesthe oil, gas and mineral rights of certain real estate in Pennsylvania.
PennEast Pipeline Company, LLC (PennEast) - Midstream has a 20% investment in PennEast, which is planning to construct an approximately 100 -mile naturalgas pipeline that will extend from Northeastern Pennsylvania into New Jersey, with a target completion of 2018.
During the first six months of 2016 and 2015, the Company made net investments in unconsolidated affiliates of $4.6 million and $1.3 million , respectively. As ofJune 30, 2016 and December 31, 2015 , the outstanding balance of Notes Receivable – Affiliate was $15.1 million and $16.4 million , respectively. As of June 30,2016 , approximately $13.6 million of these notes are secured by property, plant and equipment of the affiliates, accrue interest at 7.5% and are to be repaidthrough 2025 . The remaining $1.5 million of these notes are unsecured and accrue interest at variable rates.
SJI holds significant variable interests in these entities but is not the primary beneficiary. Consequently, these entities are accounted for under the equity methodbecause SJI does not have both a) the power to direct the activities of the entity that most significantly impact the entity’s economic performance and b) theobligation to absorb losses of the entity that could potentially be significant to the entity or the right to receive benefits from the entity that could potentially besignificant to the entity. As of June 30, 2016 , the Company had a net asset of approximately $22.2 million included in Investment in Affiliates on the condensedconsolidated balance sheets related to equity method investees, in addition to Notes Receivable – Affiliate as discussed above. SJI’s maximum exposure to lossfrom these entities as of June 30, 2016 , is limited to its combined equity contributions and the Notes Receivable-Affiliate in the aggregate amount of $37.3 million.
DISCONTINUED OPERATIONS - Discontinued Operations consist of the environmental remediation activities related to the properties of South Jersey Fuel, Inc.(SJF) and the product liability litigation and environmental remediation activities related to the prior business of The Morie Company, Inc. (Morie). SJF is asubsidiary of Energy & Minerals, Inc. (EMI), an SJI subsidiary, which previously operated a fuel oil business. Morie is the former sand mining and processingsubsidiary of EMI. EMI sold the common stock of Morie in 1996.
SJI conducts tests annually to estimate the environmental remediation costs for these properties.
Summarized operating results of the discontinued operations for the three and six months ended June 30, 2016 and 2015 , were (in thousands, except per shareamounts):
Three Months Ended
June 30, Six Months Ended
June 30, 2016 2015 2016 2015Loss before Income Taxes:
Sand Mining $ (18) $ (17) (164) (364)Fuel Oil (27) (97) (62) (163)
Income Tax Benefits 16 40 79 177
Loss from Discontinued Operations — Net $ (29) $ (74) $ (147) $ (350)
Earnings Per Common Share from Discontinued Operations — Net:
Basic and Diluted $ — $ — $ — $ —
14

Table of Contents
4. COMMON STOCK:
The following shares were issued and outstanding:
2016Beginning Balance, January 1 70,965,622New Issuances During the Period:
Dividend Reinvestment Plan 416,862Stock-Based Compensation Plan 45,338
Public Equity Offering 8,050,000
Ending Balance, June 30 79,477,822
The par value ( $1.25 per share) of stock issued was recorded in Common Stock and the net excess over par value of approximately $205.6 million was recorded inPremium on Common Stock.
In May 2016, the Company issued and sold 8,050,000 shares of its common stock, par value $1.25 per share at a public offering, raising net proceeds ofapproximately $203.6 million . The net proceeds from this offering were or will be used for capital expenditures, primarily for regulated businesses, includinginfrastructure investments at its utility business.
EARNINGS PER COMMON SHARE (EPS) - Basic EPS is based on the weighted-average number of common shares outstanding. The incremental sharesrequired for inclusion in the denominator for the diluted EPS calculation were 186,147 for the three months ended June 30, 2015 and 292,782 and 203,455 for thesix months ended June 30, 2016 and 2015 , respectively. For the three months ended June 30, 2016, incremental shares of 297,061 were not included in thedenominator for the diluted EPS calculation because they would have an antidilutive effect on EPS. These additional shares relate to SJI's restricted stock asdiscussed in Note 2.
DIVIDEND REINVESTMENT PLAN (DRP) - The Company offers a DRP which allows participating shareholders to purchase shares of SJI common stock byautomatic reinvestment of dividends or optional purchases. Shares of common stock offered by the DRP have been issued directly by SJI from its authorized butunissued shares of common stock. The Company raised $10.8 million and $3.6 million of equity capital through the DRP during the six months ended June 30,2016 and 2015 , respectively. SJI does not intend to issue any more new equity capital via the DRP in 2016. Effective May 1, 2016, SJI switched to purchasingshares on the open market to fund share purchases by DRP participants.
5. FINANCIAL INSTRUMENTS:
RESTRICTED INVESTMENTS — Marina is required to maintain escrow accounts related to ongoing capital projects as well as unused loan proceeds pendingapproval of construction expenditures. As of June 30, 2016 and December 31, 2015 , the escrowed funds, including interest earned, totaled $2.3 million and $3.4million , respectively.
The Company maintains margin accounts with selected counterparties to support its risk management activities. The balances required to be held in these marginaccounts increase as the net value of the outstanding energy-related contracts with the respective counterparties decrease. As of June 30, 2016 and December 31,2015 , the balances in these accounts totaled $35.9 million and $43.7 million , respectively.
As of December 31, 2015, in accordance with an outstanding loan agreement which ACB had with a third party, ACB was required to maintain control accountswhich included a debt service reserve of $1.7 million . In January 2016, the remaining debt on the loan agreement was paid (see Note 14); as such, there was noreserve as of June 30, 2016 .
The carrying amounts of the Restricted Investments approximate their fair values at June 30, 2016 and December 31, 2015 , which would be included in Level 1 ofthe fair value hierarchy (see Note 13).
INVESTMENT IN AFFILIATES - During 2011, subsidiaries of Energenic, in which Marina has a 50% equity interest, entered into 20 -year contracts to build,own and operate a central energy center and energy distribution system for a new hotel, casino and entertainment complex in Atlantic City, New Jersey. Thecomplex commenced operations in April 2012, and as a result, Energenic subsidiaries began providing full energy services to the complex.
15
Table of Contents
In June 2014, the parent company of the hotel, casino and entertainment complex filed petitions in U.S. Bankruptcy Court to facilitate a sale of substantially all ofits assets. The complex ceased normal business operations in September 2014. Energenic subsidiaries continued to provide limited energy services to the complexduring the shutdown period under a temporary agreement with the trustee. The hotel, casino and entertainment complex was sold in April 2015. As of December31, 2015, the Energenic subsidiaries were providing limited services to the complex under a short-term agreement with the new owner. However, the Energenicsubsidiaries had not been able to secure a permanent or long-term energy services agreement with the new owner.
In 2015 management of the Company and Energenic evaluated the carrying value of the investment in this project and a related note receivable. Based on theinability of the Energenic subsidiaries to secure a permanent or long-term energy services agreement, the Company recorded a $7.7 million (net of tax) non-cashcharge to earnings during the second quarter of 2015 due to the reduction in the carrying value of the investment in this project recorded by Energenic. This chargewas included in Equity in Loss of Affiliated Companies during the second quarter of 2015 on the condensed consolidated statements of income.
The central energy center and energy distribution system owned by the Energenic subsidiaries was financed in part by the issuance of bonds during 2011. Thesebonds were collateralized primarily by certain assets of the central energy center and revenue from the energy services agreement with the hotel, casino andentertainment complex. During 2015, due to the cessation of normal business operations of the complex and the inability of the Energenic subsidiaries to meet itsobligations under the bonds, the trustee for the bondholders filed suit to foreclose on certain assets of the central energy center. In November 2015 duringsettlement discussions, the bondholders alleged, among other things, that they were entitled to recover from Energenic itself, any amounts owed under the bondsthat were not covered by the collateral, including principal, interest and attorney’s fees. The bondholders’ assertion was based on inconsistent language in the bonddocuments. In January 2016, Energenic and certain subsidiaries reached a multi-party settlement with the bondholders. This agreement resolves all outstandinglitigation and transfers ownership of the bondholders’ collateral to the owners of the entertainment complex. The Company’s share of this settlement was $7.5million , which was accrued by Energenic as of December 31, 2015 and paid in 2016. The Company entered into agreements with its insurance carrier and externallegal advisors to recover, net of legal costs, approximately $7.0 million of costs associated with the bondholder settlement discussed above, $2.1 million of whichhas been received as of June 30, 2016 and included in Other Income on the condensed consolidated statements of income. The remaining $4.9 million is expectedto be received and recognized into income prior to the end of the year.
As of June 30, 2016 , the Company, through its investment in Energenic, had a remaining net asset of approximately $1.1 million included in Investment inAffiliates on the condensed consolidated balance sheets related to cogeneration assets for this project. In addition, the Company had approximately $13.6 millionincluded in Notes Receivable - Affiliate on the condensed consolidated balance sheets, due from Energenic, which is secured by those cogeneration assets. Thisnote is subject to a reimbursement agreement that secures reimbursement for the Company, from its joint venture partner, of a proportionate share of any amountsthat are not repaid.
Management will continue to monitor the situation surrounding the complex and will evaluate the carrying value of the investment and the note receivable as futureevents occur.
NOTE RECEIVABLE - In June 2015, SJG advanced $10.0 million to a not-for-profit organization formed to spur economic development in Atlantic City, NewJersey. The note bears interest at 1.0% for an initial term of six months, with the borrower’s option to extend the term for two additional terms of three monthseach. In December 2015 and February 2016, the borrower exercised each option, respectively. SJG holds a first lien security interest on land in Atlantic City ascollateral against this note. The carrying amount of this receivable approximates its fair value at June 30, 2016 and December 31, 2015 , which would be includedin Level 2 of the fair value hierarchy (see Note 13). In July 2016, the note was repaid in full (see Note 16).
LONG-TERM RECEIVABLES — SJG provides financing to customers for the purpose of attracting conversions to natural gas heating systems from competingfuel sources. The terms of these loans call for customers to make monthly payments over a period of up to five to ten years with no interest. The carrying amountsof such loans were $11.0 million and $12.9 million as of June 30, 2016 and December 31, 2015 , respectively. The current portion of these receivables is reflectedin Accounts Receivable and the non-current portion is reflected in Contract Receivables on the condensed consolidated balance sheets. The carrying amounts notedabove are net of unamortized discounts resulting from imputed interest in the amount of $1.1 million and $1.3 million as of June 30, 2016 and December 31, 2015 ,respectively. The annualized amortization to interest is not material to the Company’s condensed consolidated financial statements. The carrying amounts of thesereceivables approximate their fair value at June 30, 2016 and December 31, 2015 , which would be included in Level 2 of the fair value hierarchy (see Note 13).
16
Table of Contents
CREDIT RISK - As of June 30, 2016 , approximately $6.1 million , or 10.8% , of the current and noncurrent Derivatives – Energy Related Assets are transactedwith two counterparties. One counterparty has contracts with a large number of diverse customers which minimizes the concentration of this risk. A portion ofthese contracts may be assigned to SJI in the event of default by the counterparty. The second counterparty is investment-grade rated.
FINANCIAL INSTRUMENTS NOT CARRIED AT FAIR VALUE - The fair value of a financial instrument is the market price to sell an asset or transfer aliability at the measurement date. The carrying amounts of SJI's financial instruments approximate their fair values at June 30, 2016 and December 31, 2015 ,except as noted below.
• For Long-Term Debt, in estimating the fair value, we use the present value of remaining cash flows at the balance sheet date. We based the estimates oninterest rates available to SJI at the end of each period for debt with similar terms and maturities (Level 2 in the fair value hierarchy, see Note 13). Theestimated fair values of SJI's long-term debt, including current maturities, as of June 30, 2016 and December 31, 2015 , were $1,154.2 million and$1,079.0 million , respectively. The carrying amounts of SJI's long-term debt, including current maturities, as of June 30, 2016 and December 31, 2015 ,were $1,075.7 million and $1,026.9 million , respectively. The carrying amounts as of June 30, 2016 and December 31, 2015 are net of unamortized debtissuance costs of $8.1 million and $9.0 million , respectively (see Note 1).
OTHER FINANCIAL INSTRUMENTS - The carrying amounts of SJI's other financial instruments approximate their fair values at June 30, 2016 andDecember 31, 2015 .
6. SEGMENTS OF BUSINESS:
SJI operates in several different reportable operating segments which reflect the financial information regularly evaluated by the chief operating decision maker.These segments are as follows:
• Gas utility operations (SJG) consist primarily of natural gas distribution to residential, commercial and industrial customers.• Wholesale energy operations include the activities of SJRG and SJEX.• SJE is involved in both retail gas and retail electric activities.
◦ Retail gas and other operations include natural gas acquisition and transportation service business lines.◦ Retail electric operations consist of electricity acquisition and transportation to commercial, industrial and residential customers.
• On-site energy production consists of Marina's thermal energy facility and other energy-related projects. Also included in this segment are the activities ofACB, ACLE, BCLE, SCLE, SXLE, MCS, NBS and SBS. These entities became wholly-owned subsidiaries of Marina on December 31, 2015 (see Note3).
• Appliance service operations includes SJESP’s servicing of appliances under warranty via a subcontractor arrangement as well as on a time and materialsbasis.
• The activities of Midstream are a part of the Corporate and Services segment. SJI groups its nonutility operations into two categories: Energy Group and Energy Services. Energy Group includes wholesale energy, retail gas and other, andretail electric operations. Energy Services includes on-site energy production and appliance service operations. The accounting policies of the segments are thesame as those described in the summary of significant accounting policies. Intersegment sales and transfers are treated as if the sales or transfers were to thirdparties at current market prices.
17
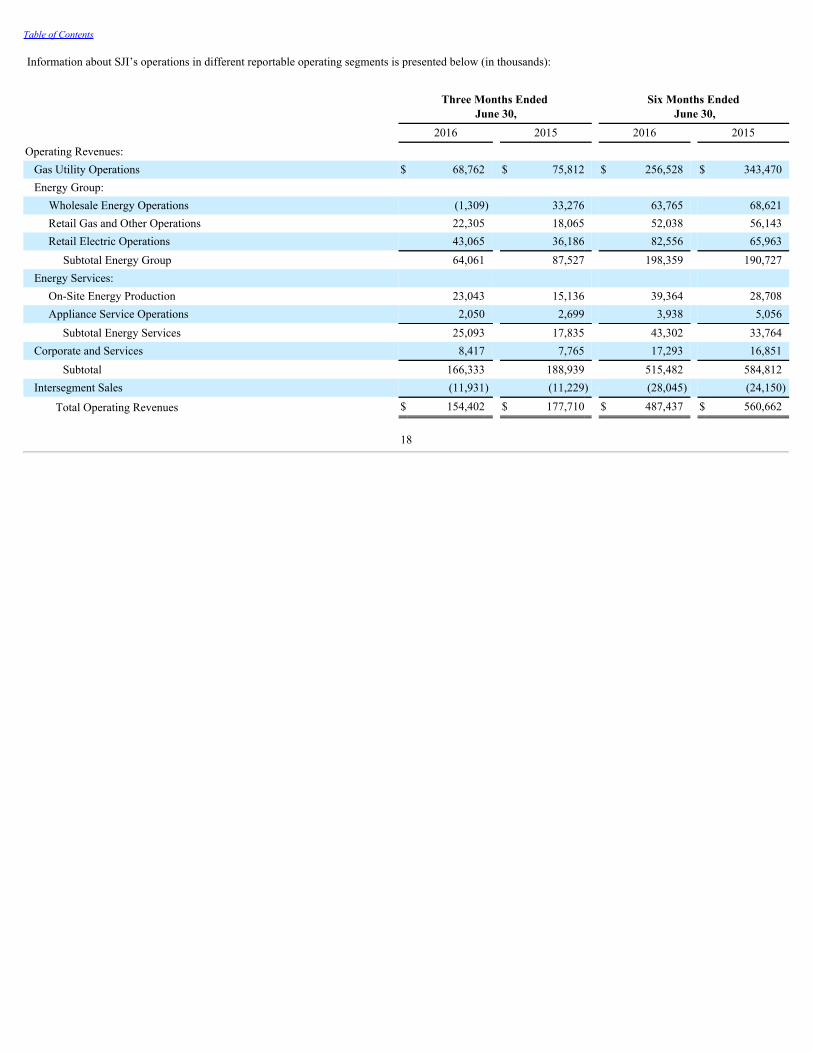
Table of Contents
Information about SJI’s operations in different reportable operating segments is presented below (in thousands):
Three Months Ended
June 30, Six Months Ended
June 30, 2016 2015 2016 2015Operating Revenues:
Gas Utility Operations $ 68,762 $ 75,812 $ 256,528 $ 343,470Energy Group: Wholesale Energy Operations (1,309) 33,276 63,765 68,621
Retail Gas and Other Operations 22,305 18,065 52,038 56,143Retail Electric Operations 43,065 36,186 82,556 65,963 Subtotal Energy Group 64,061 87,527 198,359 190,727
Energy Services: On-Site Energy Production 23,043 15,136 39,364 28,708Appliance Service Operations 2,050 2,699 3,938 5,056
Subtotal Energy Services 25,093 17,835 43,302 33,764Corporate and Services 8,417 7,765 17,293 16,851
Subtotal 166,333 188,939 515,482 584,812Intersegment Sales (11,931) (11,229) (28,045) (24,150)
Total Operating Revenues $ 154,402 $ 177,710 $ 487,437 $ 560,662
18
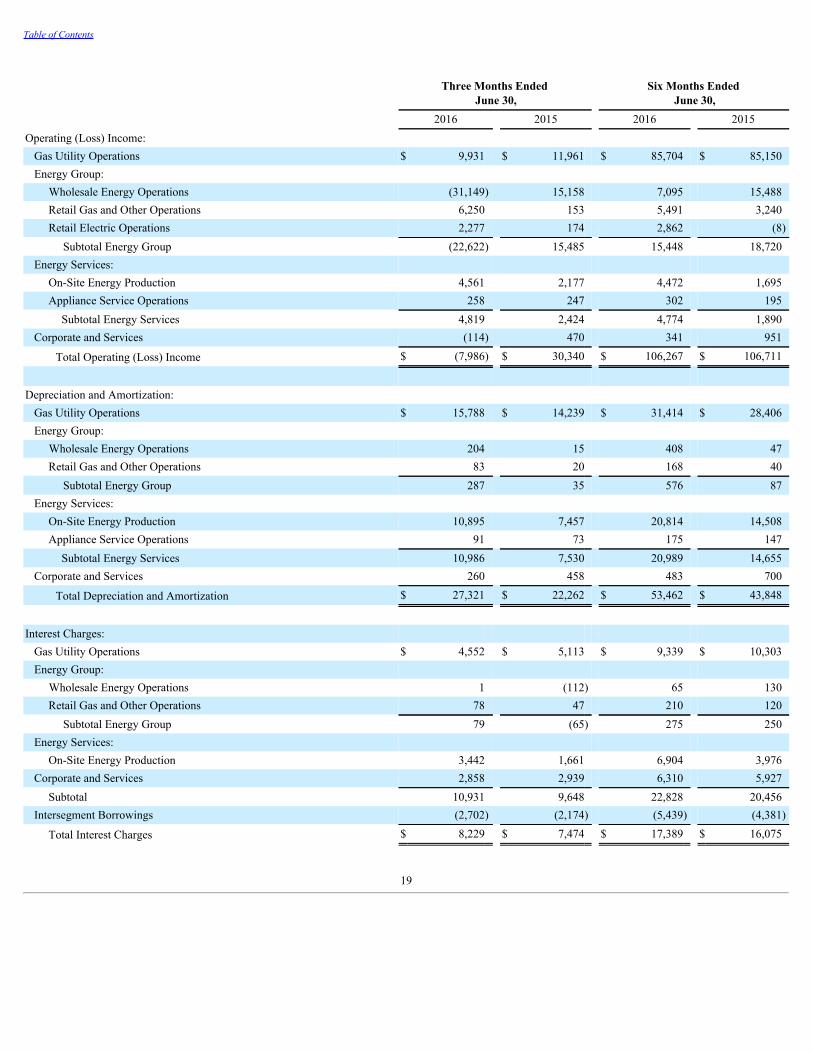
Table of Contents
Three Months Ended
June 30, Six Months Ended
June 30, 2016 2015 2016 2015Operating (Loss) Income:
Gas Utility Operations $ 9,931 $ 11,961 $ 85,704 $ 85,150Energy Group: Wholesale Energy Operations (31,149) 15,158 7,095 15,488
Retail Gas and Other Operations 6,250 153 5,491 3,240Retail Electric Operations 2,277 174 2,862 (8) Subtotal Energy Group (22,622) 15,485 15,448 18,720
Energy Services: On-Site Energy Production 4,561 2,177 4,472 1,695Appliance Service Operations 258 247 302 195
Subtotal Energy Services 4,819 2,424 4,774 1,890Corporate and Services (114) 470 341 951
Total Operating (Loss) Income $ (7,986) $ 30,340 $ 106,267 $ 106,711
Depreciation and Amortization:
Gas Utility Operations $ 15,788 $ 14,239 $ 31,414 $ 28,406Energy Group: Wholesale Energy Operations 204 15 408 47
Retail Gas and Other Operations 83 20 168 40 Subtotal Energy Group 287 35 576 87
Energy Services: On-Site Energy Production 10,895 7,457 20,814 14,508Appliance Service Operations 91 73 175 147
Subtotal Energy Services 10,986 7,530 20,989 14,655Corporate and Services 260 458 483 700
Total Depreciation and Amortization $ 27,321 $ 22,262 $ 53,462 $ 43,848
Interest Charges:
Gas Utility Operations $ 4,552 $ 5,113 $ 9,339 $ 10,303Energy Group: Wholesale Energy Operations 1 (112) 65 130
Retail Gas and Other Operations 78 47 210 120 Subtotal Energy Group 79 (65) 275 250
Energy Services: On-Site Energy Production 3,442 1,661 6,904 3,976
Corporate and Services 2,858 2,939 6,310 5,927Subtotal 10,931 9,648 22,828 20,456
Intersegment Borrowings (2,702) (2,174) (5,439) (4,381)
Total Interest Charges $ 8,229 $ 7,474 $ 17,389 $ 16,075
19
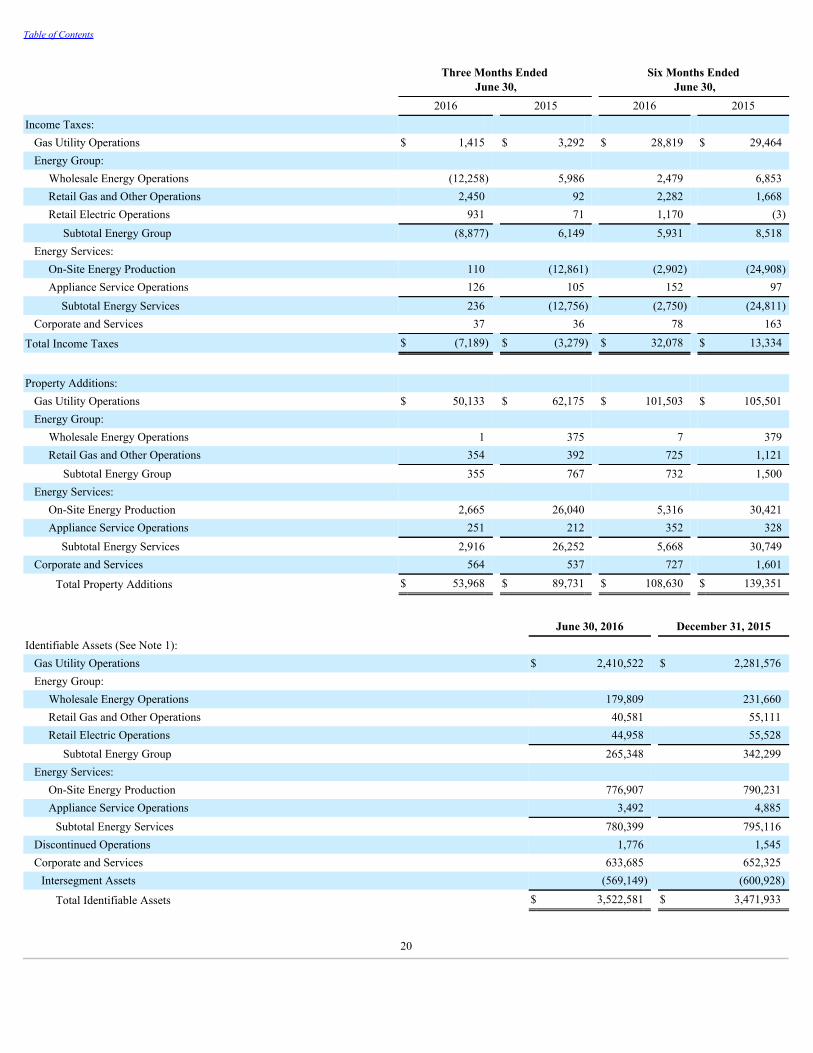
Table of Contents
Three Months Ended
June 30, Six Months Ended
June 30, 2016 2015 2016 2015Income Taxes:
Gas Utility Operations $ 1,415 $ 3,292 $ 28,819 $ 29,464Energy Group: Wholesale Energy Operations (12,258) 5,986 2,479 6,853
Retail Gas and Other Operations 2,450 92 2,282 1,668Retail Electric Operations 931 71 1,170 (3) Subtotal Energy Group (8,877) 6,149 5,931 8,518
Energy Services: On-Site Energy Production 110 (12,861) (2,902) (24,908)Appliance Service Operations 126 105 152 97
Subtotal Energy Services 236 (12,756) (2,750) (24,811)Corporate and Services 37 36 78 163
Total Income Taxes $ (7,189) $ (3,279) $ 32,078 $ 13,334
Property Additions: Gas Utility Operations $ 50,133 $ 62,175 $ 101,503 $ 105,501Energy Group: Wholesale Energy Operations 1 375 7 379
Retail Gas and Other Operations 354 392 725 1,121 Subtotal Energy Group 355 767 732 1,500
Energy Services: On-Site Energy Production 2,665 26,040 5,316 30,421Appliance Service Operations 251 212 352 328
Subtotal Energy Services 2,916 26,252 5,668 30,749Corporate and Services 564 537 727 1,601
Total Property Additions $ 53,968 $ 89,731 $ 108,630 $ 139,351
June 30, 2016 December 31, 2015Identifiable Assets (See Note 1):
Gas Utility Operations $ 2,410,522 $ 2,281,576Energy Group: Wholesale Energy Operations 179,809 231,660
Retail Gas and Other Operations 40,581 55,111Retail Electric Operations 44,958 55,528 Subtotal Energy Group 265,348 342,299
Energy Services: On-Site Energy Production 776,907 790,231Appliance Service Operations 3,492 4,885
Subtotal Energy Services 780,399 795,116Discontinued Operations 1,776 1,545Corporate and Services 633,685 652,325
Intersegment Assets (569,149) (600,928)
Total Identifiable Assets $ 3,522,581 $ 3,471,933
20
Table of Contents
7. RATES AND REGULATORY ACTIONS:
SJG is subject to the rules and regulations of the New Jersey Board of Public Utilities (BPU).
In January 2016, SJG provided a Basic Gas Supply Service (BGSS) bill credit of approximately $20.0 million to its residential and small commercial customers.This credit is in addition to an overall rate reduction of 10.3% that was approved by the BPU and took effect in October 2015. SJG’s ability to offer the BGSS billcredit is a direct result of lower wholesale natural gas prices and the overall management of its gas supply portfolio. The BGSS clause serves as a method to passalong increases or decreases in gas costs to customers; therefore, SJG’s income is not affected by BGSS rate adjustments or bill credits.
In February 2016, SJG filed a petition with the BPU for approval to continue its Accelerated Infrastructure Replacement Program (AIRP), which will expire at theend of 2016. In its petition, SJG has requested approval to continue its AIRP for an additional seven years, with program investments totaling approximately$500.0 million , to retire and replace bare steel and cast iron mains, bare steel services, and other aging infrastructure. The petition proposes to recover the costs of,and a return on, future AIRP investments through annual base rate adjustments. The petition also includes a request to reflect in base rates approximately $76.0million of AIRP investments that will have been made since the conclusion of SJG’s last base rate case in October 2014 through the end 2016. This petition iscurrently pending.
In February 2016, the BPU approved a $7.9 million revenue decrease to SJG’s Energy Efficiency Tracker (EET), which recovers the cost of, and an allowed returnon, investments in Energy Efficiency Programs (EEP). SJG’s original EEPs and its first EEP Extension, approved by the BPU in 2009 and 2013, respectively,ended in July 2013 and August 2015, respectively. The revenue requirements associated with these prior investments decrease over time as they are amortized andrecovered. SJG is continuing to make energy efficiency investments under its most recent EEP Extension, which was approved by the BPU in August 2015, and isrecovering the costs, and the allowed return on, those investments through the EET.
In April 2016, the BPU approved a $2.6 million net decrease, including taxes, in annual revenues collected from SJG customers through the Societal BenefitsClause (SBC) charge and the Transportation Initiation Clause (TIC) charge, comprised of a $5.2 million increase in revenues from the Remediation AdjustmentClause (RAC) component of the SBC, a $7.1 million decrease in revenues from the Clean Energy Program (CLEP) component of the SBC, and a $0.7 milliondecrease in TIC revenues, effective May 7, 2016. The increase in the RAC is driven by an increase in costs associated with the remediation of formerManufactured Gas Plants. The decrease in the CLEP component of the SBC is primarily driven by the accumulation of prior year over-recoveries. The decrease inthe TIC is driven by a decrease in costs. The SBC and TIC allow SJG to recover costs associated with certain State-mandated programs. SJG does not earn anyprofit from these charges.
Also in April 2016, SJG filed a petition requesting to increase annual revenues from base rates by $4.4 million , including taxes, to reflect the roll-in of investmentsmade through June 2016 under its Storm Hardening and Reliability Program (“SHARP”), with rates to become effective on October 1, 2016. This petition iscurrently pending.
In June 2016, SJG filed its annual BGSS and Conservation Incentive Program (CIP) rate adjustment petition, requesting a $0.6 million net decrease in annualrevenues to be implemented on October 1, 2016, comprised of a $47.1 million decrease in BGSS revenues and a $46.5 million increase in CIP revenues, bothincluding taxes. The level of BGSS revenues requested in annual BGSS filings is based on forecasted gas costs and customer usage information for the upcomingBGSS/CIP year, which runs from October to September. SJG’s request for a decrease of BGSS revenues is caused primarily by decreases in forecasted gascommodity costs for the upcoming BGSS/CIP year of October 2016 to September 2017. The level of CIP revenues requested in annual CIP filings is based onhistorical customer usage information, comparing prior CIP year customer usage to normal customer usage. SJG’s request for an increase in CIP revenues iscaused primarily by lower than normal customer usage caused by weather that was 16.4% warmer than normal during the 2015-2016 winter. This petition iscurrently pending.
Also in June 2016, SJG filed its annual EET rate adjustment petition, requesting a $0.8 million decrease in revenues to continue recovering the costs of, and theallowed return on, prior investments associated with energy efficiency programs (EEPs). The EET rate recovers the forecasted revenue requirements for theupcoming EET year of October 2016 to September 2017. The requested revenue decrease is the result of the investments associated with SJG's original EEPs,approved by the BPU in 2009, and its EEP extension, approved by the BPU in 2013, which ended in July 2013 and August 2015, respectively. The revenuerequirements associated with these prior investments decreases over time as they are amortized. This petition is currently pending.
There have been no other significant regulatory actions or changes to SJG's rate structure since December 31, 2015 . See Note 10 to the Consolidated FinancialStatements in Item 8 of SJI's Annual Report on Form 10-K for the year ended December 31, 2015 .
21
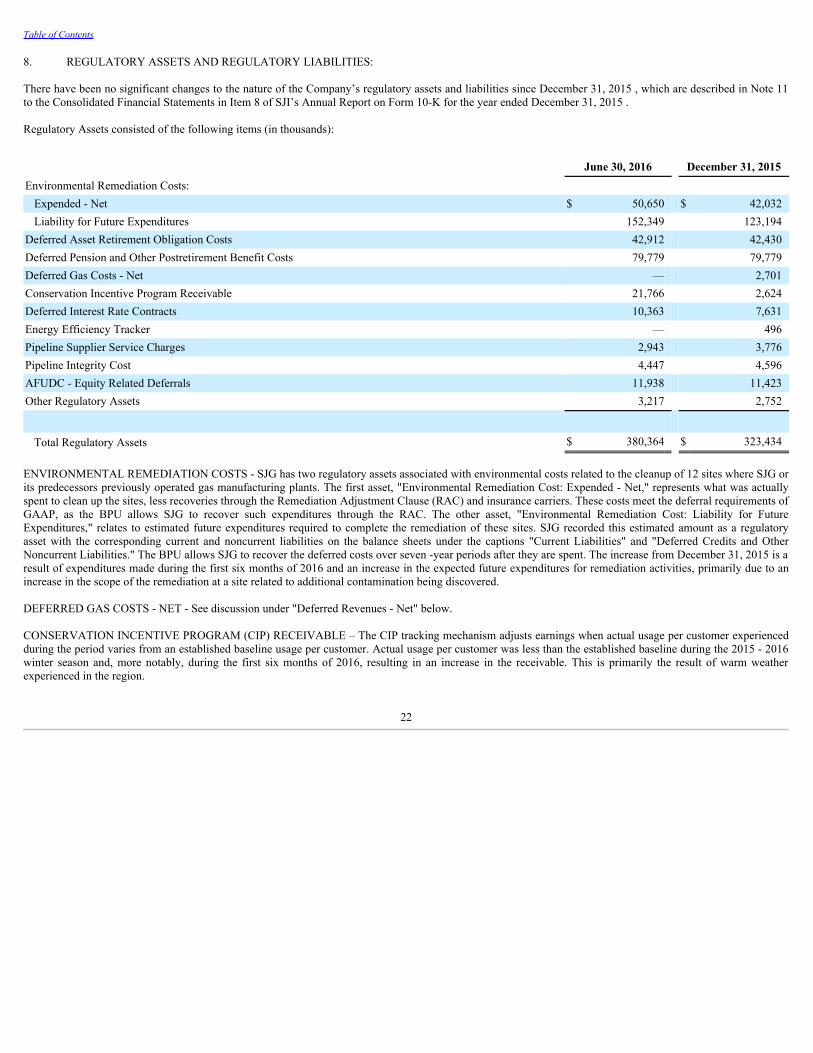
Table of Contents
8. REGULATORY ASSETS AND REGULATORY LIABILITIES:
There have been no significant changes to the nature of the Company’s regulatory assets and liabilities since December 31, 2015 , which are described in Note 11to the Consolidated Financial Statements in Item 8 of SJI’s Annual Report on Form 10-K for the year ended December 31, 2015 .
Regulatory Assets consisted of the following items (in thousands):
June 30, 2016 December 31, 2015Environmental Remediation Costs:
Expended - Net $ 50,650 $ 42,032Liability for Future Expenditures 152,349 123,194
Deferred Asset Retirement Obligation Costs 42,912 42,430Deferred Pension and Other Postretirement Benefit Costs 79,779 79,779Deferred Gas Costs - Net — 2,701Conservation Incentive Program Receivable 21,766 2,624Deferred Interest Rate Contracts 10,363 7,631Energy Efficiency Tracker — 496Pipeline Supplier Service Charges 2,943 3,776Pipeline Integrity Cost 4,447 4,596AFUDC - Equity Related Deferrals 11,938 11,423Other Regulatory Assets 3,217 2,752
Total Regulatory Assets $ 380,364 $ 323,434
ENVIRONMENTAL REMEDIATION COSTS - SJG has two regulatory assets associated with environmental costs related to the cleanup of 12 sites where SJG orits predecessors previously operated gas manufacturing plants. The first asset, "Environmental Remediation Cost: Expended - Net," represents what was actuallyspent to clean up the sites, less recoveries through the Remediation Adjustment Clause (RAC) and insurance carriers. These costs meet the deferral requirements ofGAAP, as the BPU allows SJG to recover such expenditures through the RAC. The other asset, "Environmental Remediation Cost: Liability for FutureExpenditures," relates to estimated future expenditures required to complete the remediation of these sites. SJG recorded this estimated amount as a regulatoryasset with the corresponding current and noncurrent liabilities on the balance sheets under the captions "Current Liabilities" and "Deferred Credits and OtherNoncurrent Liabilities." The BPU allows SJG to recover the deferred costs over seven -year periods after they are spent. The increase from December 31, 2015 is aresult of expenditures made during the first six months of 2016 and an increase in the expected future expenditures for remediation activities, primarily due to anincrease in the scope of the remediation at a site related to additional contamination being discovered.
DEFERRED GAS COSTS - NET - See discussion under "Deferred Revenues - Net" below.
CONSERVATION INCENTIVE PROGRAM (CIP) RECEIVABLE – The CIP tracking mechanism adjusts earnings when actual usage per customer experiencedduring the period varies from an established baseline usage per customer. Actual usage per customer was less than the established baseline during the 2015 - 2016winter season and, more notably, during the first six months of 2016, resulting in an increase in the receivable. This is primarily the result of warm weatherexperienced in the region.
22
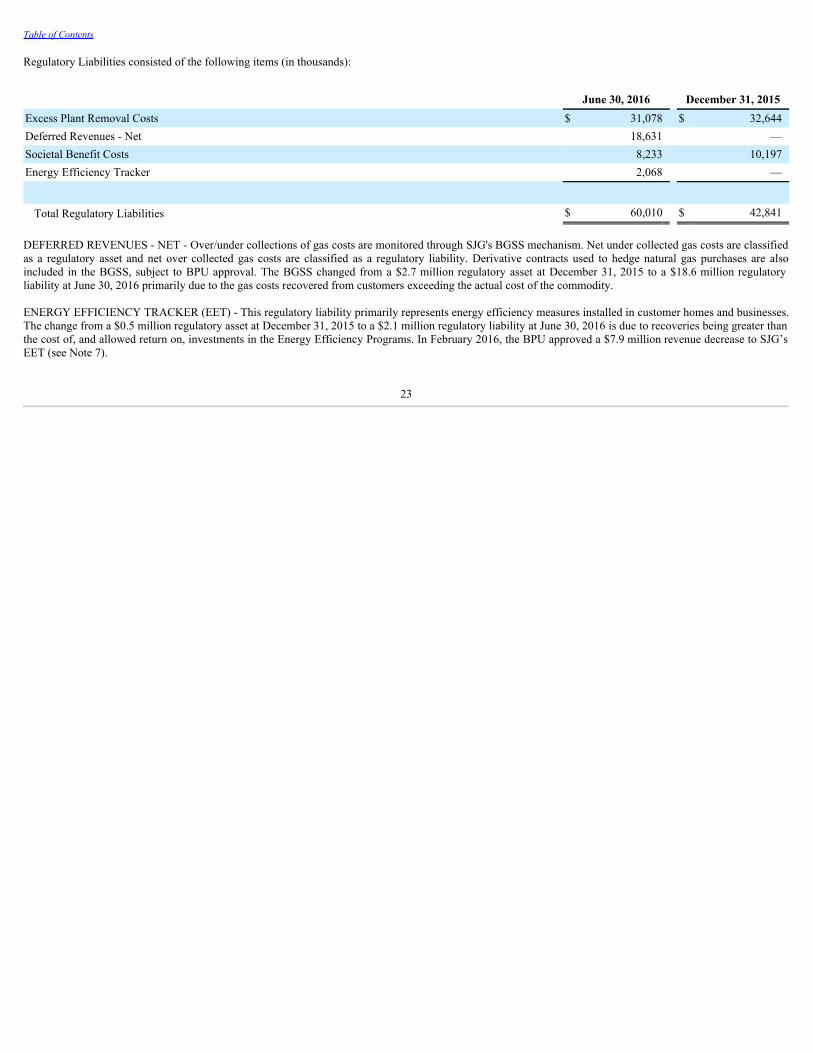
Table of Contents
Regulatory Liabilities consisted of the following items (in thousands):
June 30, 2016 December 31, 2015Excess Plant Removal Costs $ 31,078 $ 32,644Deferred Revenues - Net 18,631 —Societal Benefit Costs 8,233 10,197Energy Efficiency Tracker 2,068 —
Total Regulatory Liabilities $ 60,010 $ 42,841 DEFERRED REVENUES - NET - Over/under collections of gas costs are monitored through SJG's BGSS mechanism. Net under collected gas costs are classifiedas a regulatory asset and net over collected gas costs are classified as a regulatory liability. Derivative contracts used to hedge natural gas purchases are alsoincluded in the BGSS, subject to BPU approval. The BGSS changed from a $2.7 million regulatory asset at December 31, 2015 to a $18.6 million regulatoryliability at June 30, 2016 primarily due to the gas costs recovered from customers exceeding the actual cost of the commodity.
ENERGY EFFICIENCY TRACKER (EET) - This regulatory liability primarily represents energy efficiency measures installed in customer homes and businesses.The change from a $0.5 million regulatory asset at December 31, 2015 to a $2.1 million regulatory liability at June 30, 2016 is due to recoveries being greater thanthe cost of, and allowed return on, investments in the Energy Efficiency Programs. In February 2016, the BPU approved a $7.9 million revenue decrease to SJG’sEET (see Note 7).
23
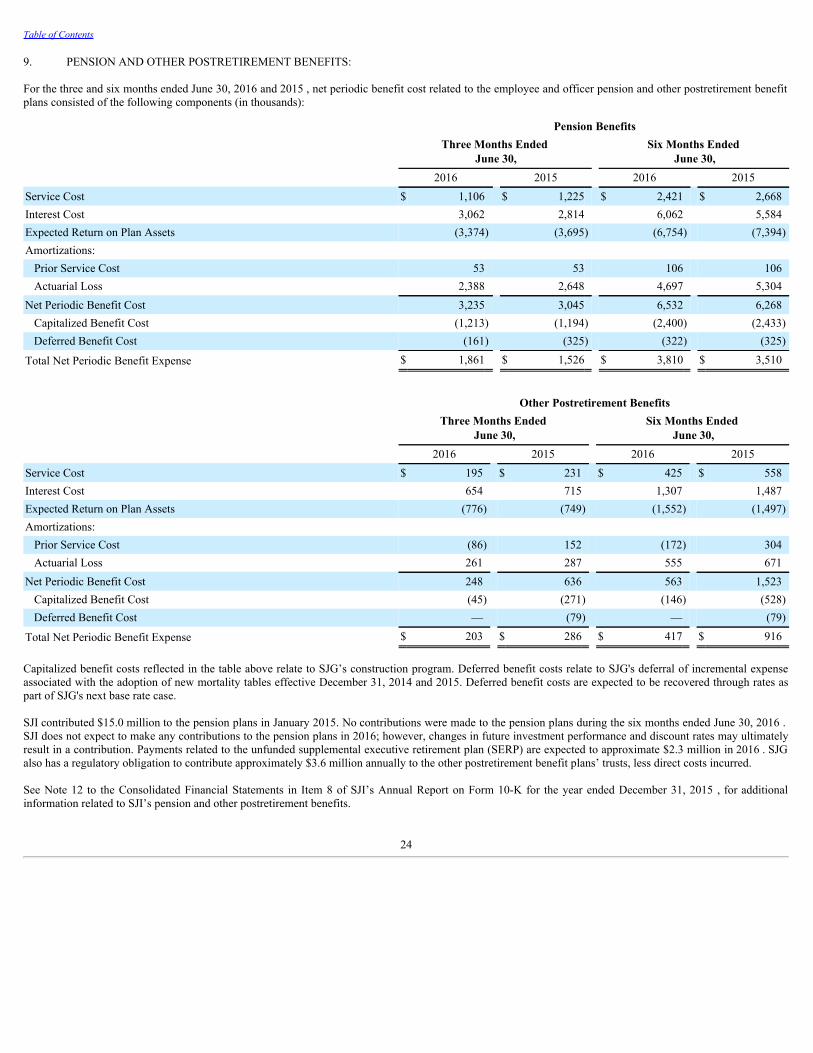
Table of Contents
9. PENSION AND OTHER POSTRETIREMENT BENEFITS:
For the three and six months ended June 30, 2016 and 2015 , net periodic benefit cost related to the employee and officer pension and other postretirement benefitplans consisted of the following components (in thousands):
Pension Benefits
Three Months Ended
June 30, Six Months Ended
June 30, 2016 2015 2016 2015Service Cost $ 1,106 $ 1,225 $ 2,421 $ 2,668Interest Cost 3,062 2,814 6,062 5,584Expected Return on Plan Assets (3,374) (3,695) (6,754) (7,394)Amortizations:
Prior Service Cost 53 53 106 106Actuarial Loss 2,388 2,648 4,697 5,304
Net Periodic Benefit Cost 3,235 3,045 6,532 6,268Capitalized Benefit Cost (1,213) (1,194) (2,400) (2,433)
Deferred Benefit Cost (161) (325) (322) (325)
Total Net Periodic Benefit Expense $ 1,861 $ 1,526 $ 3,810 $ 3,510
Other Postretirement Benefits
Three Months Ended
June 30, Six Months Ended
June 30, 2016 2015 2016 2015Service Cost $ 195 $ 231 $ 425 $ 558Interest Cost 654 715 1,307 1,487Expected Return on Plan Assets (776) (749) (1,552) (1,497)Amortizations:
Prior Service Cost (86) 152 (172) 304Actuarial Loss 261 287 555 671
Net Periodic Benefit Cost 248 636 563 1,523Capitalized Benefit Cost (45) (271) (146) (528)
Deferred Benefit Cost — (79) — (79)
Total Net Periodic Benefit Expense $ 203 $ 286 $ 417 $ 916
Capitalized benefit costs reflected in the table above relate to SJG’s construction program. Deferred benefit costs relate to SJG's deferral of incremental expenseassociated with the adoption of new mortality tables effective December 31, 2014 and 2015. Deferred benefit costs are expected to be recovered through rates aspart of SJG's next base rate case.
SJI contributed $15.0 million to the pension plans in January 2015. No contributions were made to the pension plans during the six months ended June 30, 2016 .SJI does not expect to make any contributions to the pension plans in 2016; however, changes in future investment performance and discount rates may ultimatelyresult in a contribution. Payments related to the unfunded supplemental executive retirement plan (SERP) are expected to approximate $2.3 million in 2016 . SJGalso has a regulatory obligation to contribute approximately $3.6 million annually to the other postretirement benefit plans’ trusts, less direct costs incurred.
See Note 12 to the Consolidated Financial Statements in Item 8 of SJI’s Annual Report on Form 10-K for the year ended December 31, 2015 , for additionalinformation related to SJI’s pension and other postretirement benefits.
24
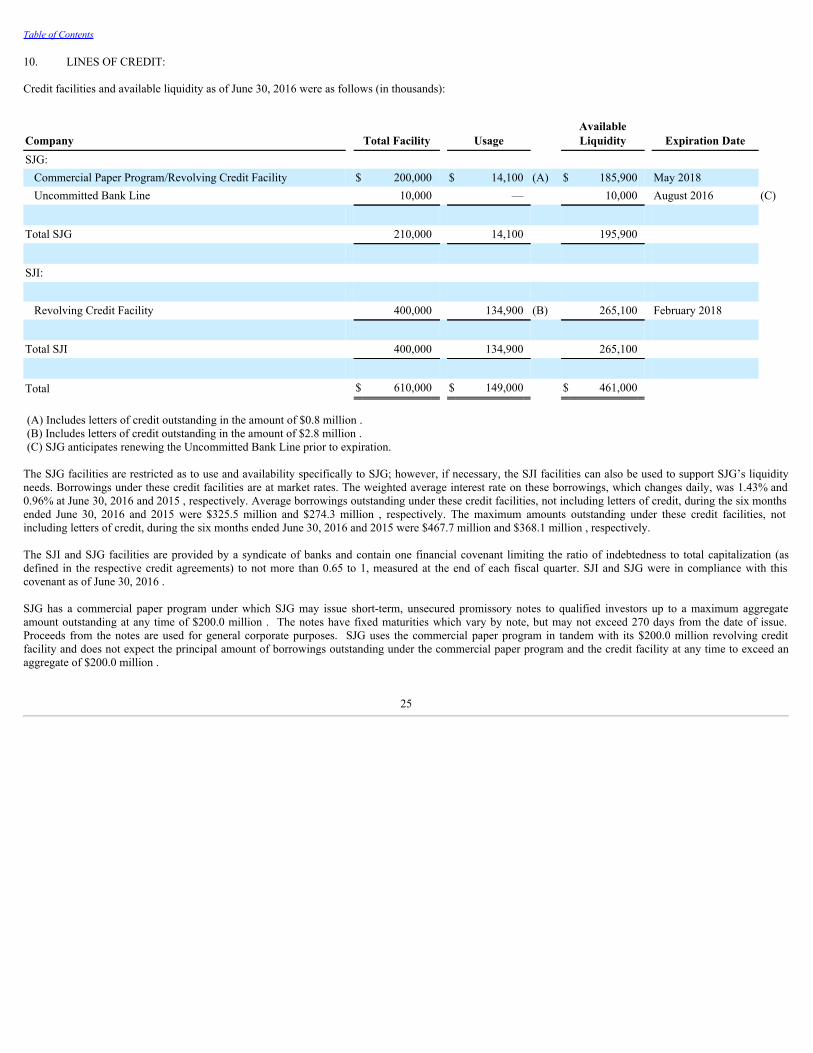
Table of Contents
10. LINES OF CREDIT: Credit facilities and available liquidity as of June 30, 2016 were as follows (in thousands):
Company Total Facility Usage AvailableLiquidity Expiration Date
SJG: Commercial Paper Program/Revolving Credit Facility $ 200,000 $ 14,100 (A) $ 185,900 May 2018 Uncommitted Bank Line 10,000 — 10,000 August 2016 (C)
Total SJG 210,000 14,100 195,900
SJI:
Revolving Credit Facility 400,000 134,900 (B) 265,100 February 2018
Total SJI 400,000 134,900 265,100
Total $ 610,000 $ 149,000 $ 461,000
(A) Includes letters of credit outstanding in the amount of $0.8 million .(B) Includes letters of credit outstanding in the amount of $2.8 million .(C) SJG anticipates renewing the Uncommitted Bank Line prior to expiration.
The SJG facilities are restricted as to use and availability specifically to SJG; however, if necessary, the SJI facilities can also be used to support SJG’s liquidityneeds. Borrowings under these credit facilities are at market rates. The weighted average interest rate on these borrowings, which changes daily, was 1.43% and0.96% at June 30, 2016 and 2015 , respectively. Average borrowings outstanding under these credit facilities, not including letters of credit, during the six monthsended June 30, 2016 and 2015 were $325.5 million and $274.3 million , respectively. The maximum amounts outstanding under these credit facilities, notincluding letters of credit, during the six months ended June 30, 2016 and 2015 were $467.7 million and $368.1 million , respectively.
The SJI and SJG facilities are provided by a syndicate of banks and contain one financial covenant limiting the ratio of indebtedness to total capitalization (asdefined in the respective credit agreements) to not more than 0.65 to 1, measured at the end of each fiscal quarter. SJI and SJG were in compliance with thiscovenant as of June 30, 2016 .
SJG has a commercial paper program under which SJG may issue short-term, unsecured promissory notes to qualified investors up to a maximum aggregateamount outstanding at any time of $200.0 million . The notes have fixed maturities which vary by note, but may not exceed 270 days from the date of issue.Proceeds from the notes are used for general corporate purposes. SJG uses the commercial paper program in tandem with its $200.0 million revolving creditfacility and does not expect the principal amount of borrowings outstanding under the commercial paper program and the credit facility at any time to exceed anaggregate of $200.0 million .
25
Table of Contents
11. COMMITMENTS AND CONTINGENCIES:
GUARANTEES — As part of the Transaction involving the Energenic projects (see Note 3), the Company is relieved of any guarantees from prior periods relatedto the projects in which it no longer has an ownership interest.
As of June 30, 2016 , SJI had issued $5.9 million of parental guarantees on behalf of an unconsolidated subsidiary. These guarantees generally expire within thenext two years and were issued to enable our subsidiary to market retail natural gas.
COLLECTIVE BARGAINING AGREEMENTS — Unionized personnel represent approximately 45% of our workforce at June 30, 2016 . The Company hascollective bargaining agreements with two unions that represent these employees: the International Brotherhood of Electrical Workers (IBEW) Local 1293 and theInternational Association of Machinists and Aerospace Workers (IAM) Local 76. SJG and SJESP employees represented by the IBEW operate under collectivebargaining agreements that run through February 2017. The remaining unionized employees are represented by the IAM and operate under collective bargainingagreements that run through August 2017.
STANDBY LETTERS OF CREDIT — As of June 30, 2016 , SJI provided $2.8 million of standby letters of credit through its revolving credit facility to enableSJE to market retail electricity and for various construction and operating activities. SJG provided a $0.8 million letter of credit under its revolving credit facility tosupport the remediation of environmental conditions at certain locations in SJG's service territory. The Company has also provided $87.5 million of additionalletters of credit under separate facilities outside of the revolving credit facilities to support variable-rate demand bonds issued through the New Jersey EconomicDevelopment Authority (NJEDA) to finance the expansion of SJG’s natural gas distribution system and to finance Marina's initial thermal plant project.
PENDING LITIGATION — The Company is subject to claims arising in the ordinary course of business and other legal proceedings. The Company has beennamed in, among other actions, certain gas supply and capacity management contract disputes and certain product liability claims related to our former sandmining subsidiary. We accrue liabilities related to these claims when we can reasonably estimate the amount or range of amounts of probable settlement costs orother charges for these claims. The Company has accrued approximately $3.1 million and $ 3.2 million related to all claims in the aggregate as of June 30, 2016and December 31, 2015 , respectively. Management does not believe that it is reasonably possible that there will be a material change in the Company's estimatedliability in the near term and does not currently anticipate the disposition of any known claims that would have a material effect on the Company's financialposition, results of operations or cash flows.
ENVIRONMENTAL REMEDIATION COSTS — SJI incurred and recorded costs for environmental cleanup of 12 sites where SJG or its predecessors operatedgas manufacturing plants. SJG stopped manufacturing gas in the 1950s. SJI and some of its nonutility subsidiaries also recorded costs for environmental cleanup ofsites where SJF previously operated a fuel oil business and Morie maintained equipment, fueling stations and storage. Other than the changes discussed in Note 8to the condensed consolidated financial statements, there have been no changes to the status of the Company’s environmental remediation efforts sinceDecember 31, 2015 , as described in Note 15 to the Consolidated Financial Statements in Item 8 of SJI’s Annual Report on Form 10-K for the year endedDecember 31, 2015 .
12. DERIVATIVE INSTRUMENTS:
Certain SJI subsidiaries are involved in buying, selling, transporting and storing natural gas and buying and selling retail electricity for their own accounts as wellas managing these activities for third parties. These subsidiaries are subject to market risk on expected future purchases and sales due to commodity pricefluctuations. The Company uses a variety of derivative instruments to limit this exposure to market risk in accordance with strict corporate guidelines. Thesederivative instruments include forward contracts, swap agreements, options contracts and futures contracts. As of June 30, 2016 , the Company had outstandingderivative contracts intended to limit the exposure to market risk on 64.2 MMdts (1 MMdts = one million decatherms) of expected future purchases of natural gas,71.5 MMdts of expected future sales of natural gas, 2.6 MMmwh (1 MMmwh = one million megawatt hours) of expected future purchases of electricity and 2.4MMmwh of expected future sales of electricity. In addition to these derivative contracts, the Company has basis and index related purchase and sales contractstotaling 148.7 MMdts. These contracts, which have not been designated as hedging instruments under GAAP, are measured at fair value and recorded inDerivatives - Energy Related Assets or Derivatives - Energy Related Liabilities on the condensed consolidated balance sheets. The net unrealized pre-tax gains andlosses for these energy-related commodity contracts are included with realized gains and losses in Operating Revenues – Nonutility.
26
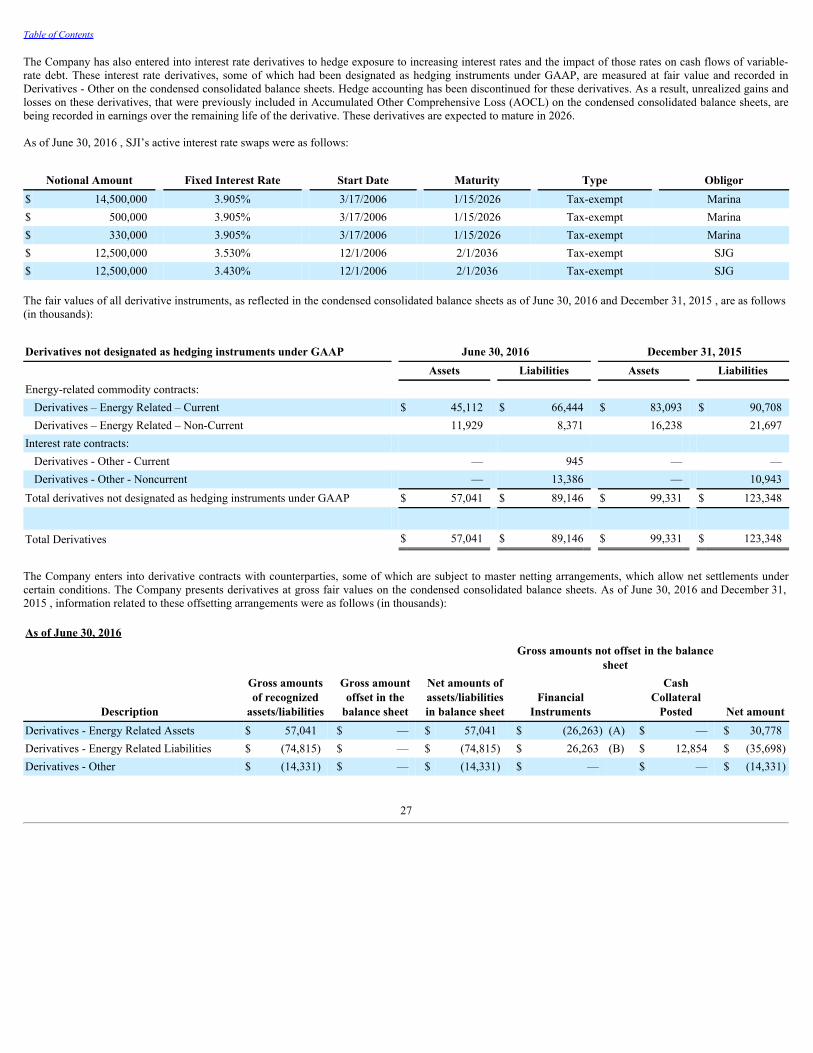
Table of Contents
The Company has also entered into interest rate derivatives to hedge exposure to increasing interest rates and the impact of those rates on cash flows of variable-rate debt. These interest rate derivatives, some of which had been designated as hedging instruments under GAAP, are measured at fair value and recorded inDerivatives - Other on the condensed consolidated balance sheets. Hedge accounting has been discontinued for these derivatives. As a result, unrealized gains andlosses on these derivatives, that were previously included in Accumulated Other Comprehensive Loss (AOCL) on the condensed consolidated balance sheets, arebeing recorded in earnings over the remaining life of the derivative. These derivatives are expected to mature in 2026.
As of June 30, 2016 , SJI’s active interest rate swaps were as follows:
Notional Amount Fixed Interest Rate Start Date Maturity Type Obligor$ 14,500,000 3.905% 3/17/2006 1/15/2026 Tax-exempt Marina$ 500,000 3.905% 3/17/2006 1/15/2026 Tax-exempt Marina$ 330,000 3.905% 3/17/2006 1/15/2026 Tax-exempt Marina$ 12,500,000 3.530% 12/1/2006 2/1/2036 Tax-exempt SJG$ 12,500,000 3.430% 12/1/2006 2/1/2036 Tax-exempt SJG
The fair values of all derivative instruments, as reflected in the condensed consolidated balance sheets as of June 30, 2016 and December 31, 2015 , are as follows(in thousands):
Derivatives not designated as hedging instruments under GAAP June 30, 2016 December 31, 2015 Assets Liabilities Assets LiabilitiesEnergy-related commodity contracts:
Derivatives – Energy Related – Current $ 45,112 $ 66,444 $ 83,093 $ 90,708Derivatives – Energy Related – Non-Current 11,929 8,371 16,238 21,697
Interest rate contracts: Derivatives - Other - Current — 945 — —Derivatives - Other - Noncurrent — 13,386 — 10,943
Total derivatives not designated as hedging instruments under GAAP $ 57,041 $ 89,146 $ 99,331 $ 123,348
Total Derivatives $ 57,041 $ 89,146 $ 99,331 $ 123,348
The Company enters into derivative contracts with counterparties, some of which are subject to master netting arrangements, which allow net settlements undercertain conditions. The Company presents derivatives at gross fair values on the condensed consolidated balance sheets. As of June 30, 2016 and December 31,2015 , information related to these offsetting arrangements were as follows (in thousands):
As of June 30, 2016
Description
Gross amountsof recognized
assets/liabilities
Gross amount
offset in thebalance sheet
Net amounts ofassets/liabilitiesin balance sheet
Gross amounts not offset in the balance
sheet
Net amount Financial
Instruments
CashCollateral
Posted Derivatives - Energy Related Assets $ 57,041 $ — $ 57,041 $ (26,263) (A) $ — $ 30,778Derivatives - Energy Related Liabilities $ (74,815) $ — $ (74,815) $ 26,263 (B) $ 12,854 $ (35,698)Derivatives - Other $ (14,331) $ — $ (14,331) $ — $ — $ (14,331)
27
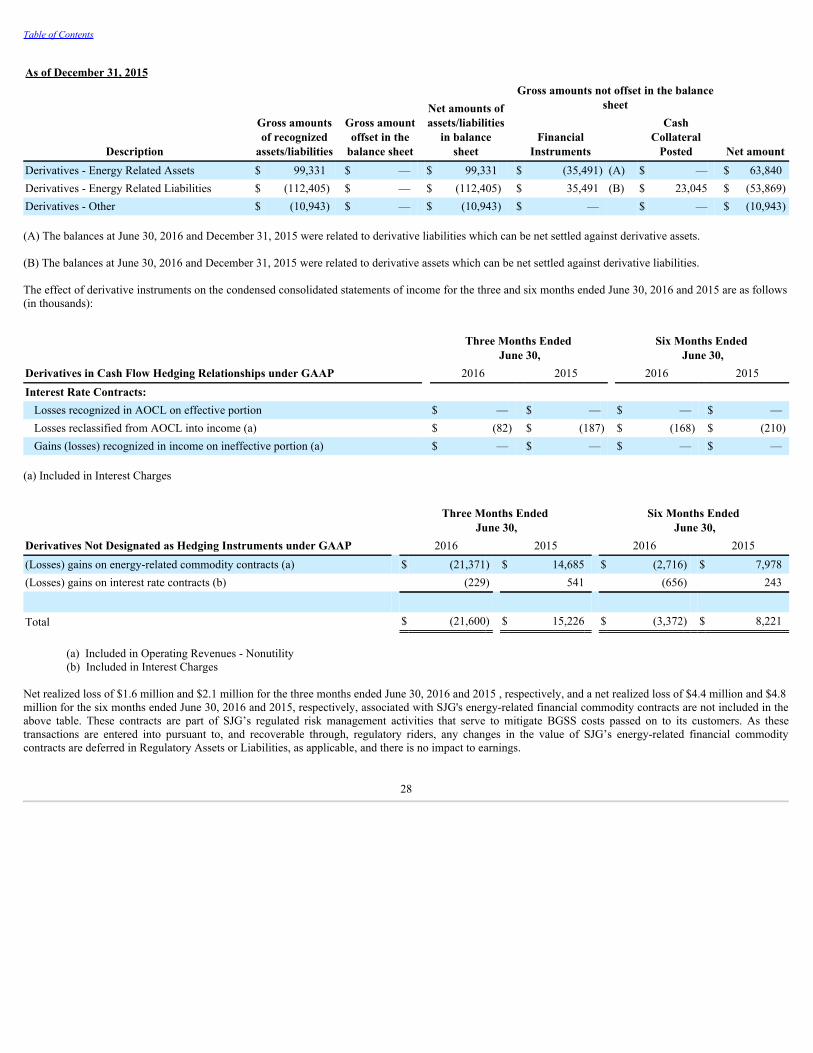
Table of Contents
As of December 31, 2015
Description
Gross amountsof recognized
assets/liabilities
Gross amount
offset in thebalance sheet
Net amounts ofassets/liabilities
in balancesheet
Gross amounts not offset in the balance
sheet
Net amount Financial
Instruments
CashCollateral
Posted Derivatives - Energy Related Assets $ 99,331 $ — $ 99,331 $ (35,491) (A) $ — $ 63,840Derivatives - Energy Related Liabilities $ (112,405) $ — $ (112,405) $ 35,491 (B) $ 23,045 $ (53,869)Derivatives - Other $ (10,943) $ — $ (10,943) $ — $ — $ (10,943)
(A) The balances at June 30, 2016 and December 31, 2015 were related to derivative liabilities which can be net settled against derivative assets.
(B) The balances at June 30, 2016 and December 31, 2015 were related to derivative assets which can be net settled against derivative liabilities.
The effect of derivative instruments on the condensed consolidated statements of income for the three and six months ended June 30, 2016 and 2015 are as follows(in thousands):
Three Months Ended
June 30, Six Months Ended
June 30,Derivatives in Cash Flow Hedging Relationships under GAAP 2016 2015 2016 2015Interest Rate Contracts:
Losses recognized in AOCL on effective portion $ — $ — $ — $ —Losses reclassified from AOCL into income (a) $ (82) $ (187) $ (168) $ (210)Gains (losses) recognized in income on ineffective portion (a) $ — $ — $ — $ —
(a) Included in Interest Charges
Three Months Ended
June 30, Six Months Ended
June 30,Derivatives Not Designated as Hedging Instruments under GAAP 2016 2015 2016 2015(Losses) gains on energy-related commodity contracts (a) $ (21,371) $ 14,685 $ (2,716) $ 7,978(Losses) gains on interest rate contracts (b) (229) 541 (656) 243
Total $ (21,600) $ 15,226 $ (3,372) $ 8,221
(a) Included in Operating Revenues - Nonutility(b) Included in Interest Charges
Net realized loss of $1.6 million and $2.1 million for the three months ended June 30, 2016 and 2015 , respectively, and a net realized loss of $4.4 million and $4.8million for the six months ended June 30, 2016 and 2015, respectively, associated with SJG's energy-related financial commodity contracts are not included in theabove table. These contracts are part of SJG’s regulated risk management activities that serve to mitigate BGSS costs passed on to its customers. As thesetransactions are entered into pursuant to, and recoverable through, regulatory riders, any changes in the value of SJG’s energy-related financial commoditycontracts are deferred in Regulatory Assets or Liabilities, as applicable, and there is no impact to earnings.
28
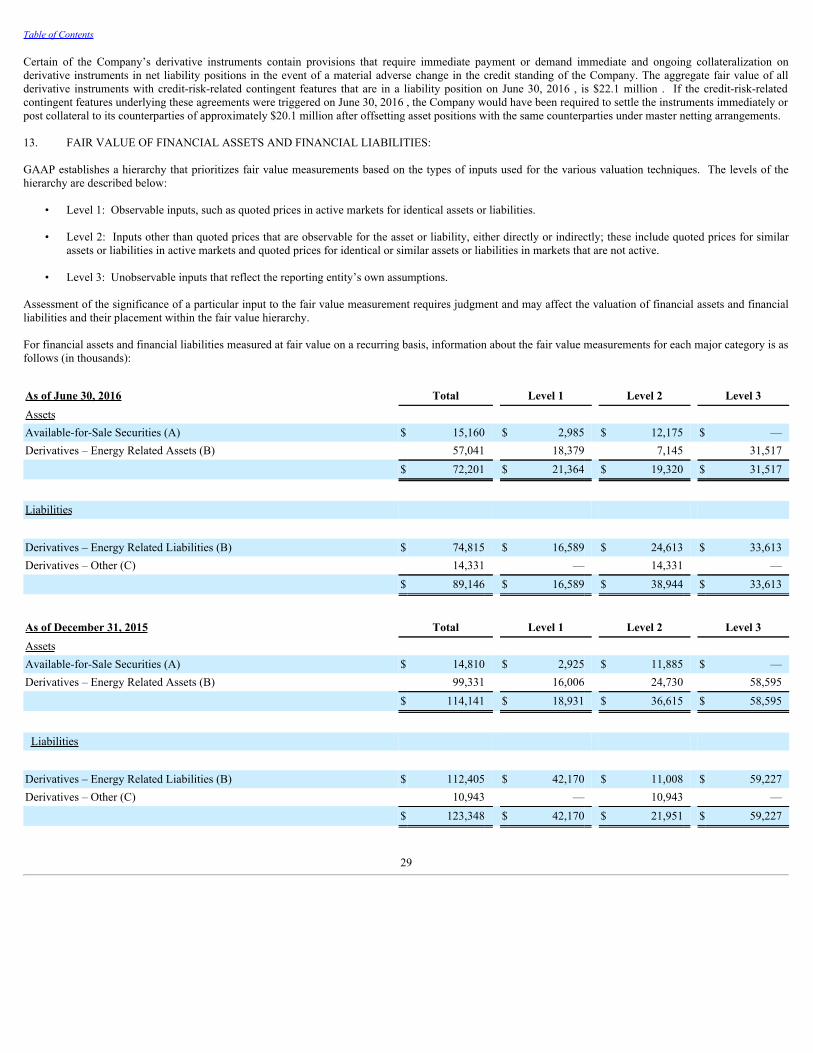
Table of Contents
Certain of the Company’s derivative instruments contain provisions that require immediate payment or demand immediate and ongoing collateralization onderivative instruments in net liability positions in the event of a material adverse change in the credit standing of the Company. The aggregate fair value of allderivative instruments with credit-risk-related contingent features that are in a liability position on June 30, 2016 , is $22.1 million . If the credit-risk-relatedcontingent features underlying these agreements were triggered on June 30, 2016 , the Company would have been required to settle the instruments immediately orpost collateral to its counterparties of approximately $20.1 million after offsetting asset positions with the same counterparties under master netting arrangements.
13. FAIR VALUE OF FINANCIAL ASSETS AND FINANCIAL LIABILITIES:
GAAP establishes a hierarchy that prioritizes fair value measurements based on the types of inputs used for the various valuation techniques. The levels of thehierarchy are described below:
• Level 1: Observable inputs, such as quoted prices in active markets for identical assets or liabilities.
• Level 2: Inputs other than quoted prices that are observable for the asset or liability, either directly or indirectly; these include quoted prices for similarassets or liabilities in active markets and quoted prices for identical or similar assets or liabilities in markets that are not active.
• Level 3: Unobservable inputs that reflect the reporting entity’s own assumptions.
Assessment of the significance of a particular input to the fair value measurement requires judgment and may affect the valuation of financial assets and financialliabilities and their placement within the fair value hierarchy.
For financial assets and financial liabilities measured at fair value on a recurring basis, information about the fair value measurements for each major category is asfollows (in thousands):
As of June 30, 2016 Total Level 1 Level 2 Level 3Assets Available-for-Sale Securities (A) $ 15,160 $ 2,985 $ 12,175 $ —Derivatives – Energy Related Assets (B) 57,041 18,379 7,145 31,517
$ 72,201 $ 21,364 $ 19,320 $ 31,517
Liabilities
Derivatives – Energy Related Liabilities (B) $ 74,815 $ 16,589 $ 24,613 $ 33,613Derivatives – Other (C) 14,331 — 14,331 —
$ 89,146 $ 16,589 $ 38,944 $ 33,613
As of December 31, 2015 Total Level 1 Level 2 Level 3Assets Available-for-Sale Securities (A) $ 14,810 $ 2,925 $ 11,885 $ —Derivatives – Energy Related Assets (B) 99,331 16,006 24,730 58,595
$ 114,141 $ 18,931 $ 36,615 $ 58,595
Liabilities
Derivatives – Energy Related Liabilities (B) $ 112,405 $ 42,170 $ 11,008 $ 59,227Derivatives – Other (C) 10,943 — 10,943 —
$ 123,348 $ 42,170 $ 21,951 $ 59,227
29
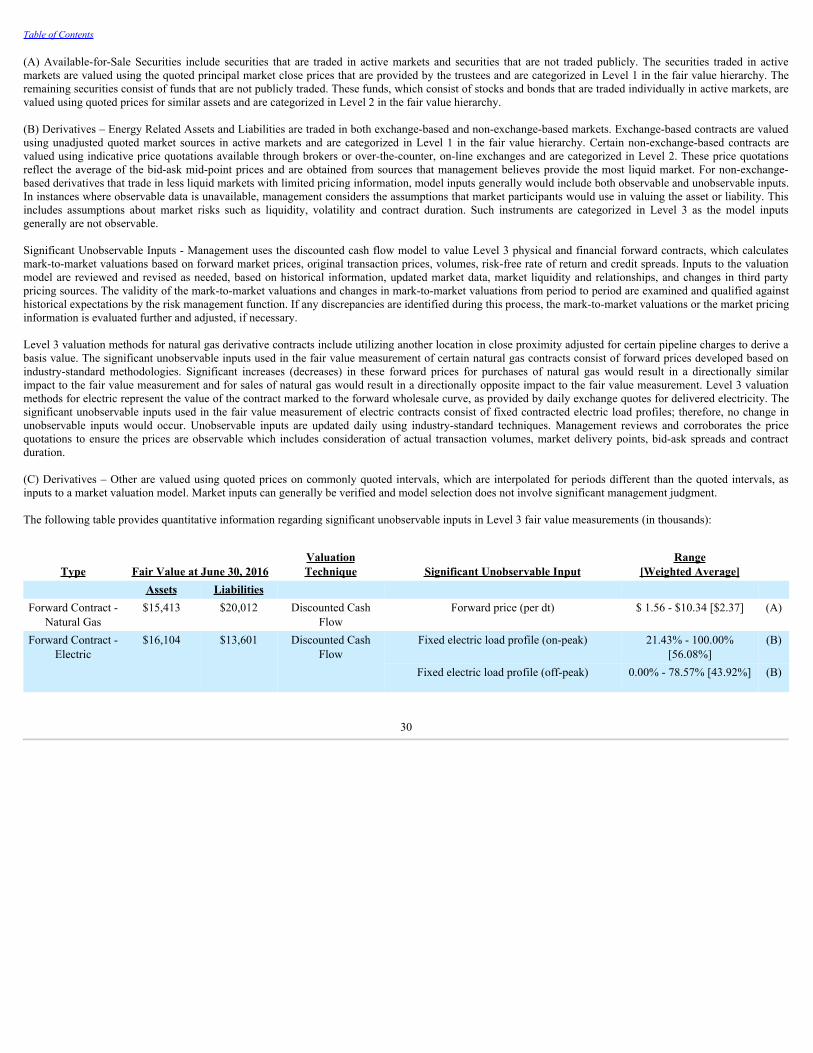
Table of Contents
(A) Available-for-Sale Securities include securities that are traded in active markets and securities that are not traded publicly. The securities traded in activemarkets are valued using the quoted principal market close prices that are provided by the trustees and are categorized in Level 1 in the fair value hierarchy. Theremaining securities consist of funds that are not publicly traded. These funds, which consist of stocks and bonds that are traded individually in active markets, arevalued using quoted prices for similar assets and are categorized in Level 2 in the fair value hierarchy.
(B) Derivatives – Energy Related Assets and Liabilities are traded in both exchange-based and non-exchange-based markets. Exchange-based contracts are valuedusing unadjusted quoted market sources in active markets and are categorized in Level 1 in the fair value hierarchy. Certain non-exchange-based contracts arevalued using indicative price quotations available through brokers or over-the-counter, on-line exchanges and are categorized in Level 2. These price quotationsreflect the average of the bid-ask mid-point prices and are obtained from sources that management believes provide the most liquid market. For non-exchange-based derivatives that trade in less liquid markets with limited pricing information, model inputs generally would include both observable and unobservable inputs.In instances where observable data is unavailable, management considers the assumptions that market participants would use in valuing the asset or liability. Thisincludes assumptions about market risks such as liquidity, volatility and contract duration. Such instruments are categorized in Level 3 as the model inputsgenerally are not observable.
Significant Unobservable Inputs - Management uses the discounted cash flow model to value Level 3 physical and financial forward contracts, which calculatesmark-to-market valuations based on forward market prices, original transaction prices, volumes, risk-free rate of return and credit spreads. Inputs to the valuationmodel are reviewed and revised as needed, based on historical information, updated market data, market liquidity and relationships, and changes in third partypricing sources. The validity of the mark-to-market valuations and changes in mark-to-market valuations from period to period are examined and qualified againsthistorical expectations by the risk management function. If any discrepancies are identified during this process, the mark-to-market valuations or the market pricinginformation is evaluated further and adjusted, if necessary.
Level 3 valuation methods for natural gas derivative contracts include utilizing another location in close proximity adjusted for certain pipeline charges to derive abasis value. The significant unobservable inputs used in the fair value measurement of certain natural gas contracts consist of forward prices developed based onindustry-standard methodologies. Significant increases (decreases) in these forward prices for purchases of natural gas would result in a directionally similarimpact to the fair value measurement and for sales of natural gas would result in a directionally opposite impact to the fair value measurement. Level 3 valuationmethods for electric represent the value of the contract marked to the forward wholesale curve, as provided by daily exchange quotes for delivered electricity. Thesignificant unobservable inputs used in the fair value measurement of electric contracts consist of fixed contracted electric load profiles; therefore, no change inunobservable inputs would occur. Unobservable inputs are updated daily using industry-standard techniques. Management reviews and corroborates the pricequotations to ensure the prices are observable which includes consideration of actual transaction volumes, market delivery points, bid-ask spreads and contractduration.
(C) Derivatives – Other are valued using quoted prices on commonly quoted intervals, which are interpolated for periods different than the quoted intervals, asinputs to a market valuation model. Market inputs can generally be verified and model selection does not involve significant management judgment.
The following table provides quantitative information regarding significant unobservable inputs in Level 3 fair value measurements (in thousands):
Type Fair Value at June 30, 2016ValuationTechnique Significant Unobservable Input
Range[Weighted Average]
Assets Liabilities Forward Contract -
Natural Gas$15,413 $20,012 Discounted Cash
FlowForward price (per dt) $ 1.56 - $10.34 [$2.37] (A)
Forward Contract -Electric
$16,104 $13,601 Discounted CashFlow
Fixed electric load profile (on-peak) 21.43% - 100.00%[56.08%]
(B)
Fixed electric load profile (off-peak) 0.00% - 78.57% [43.92%] (B)
30
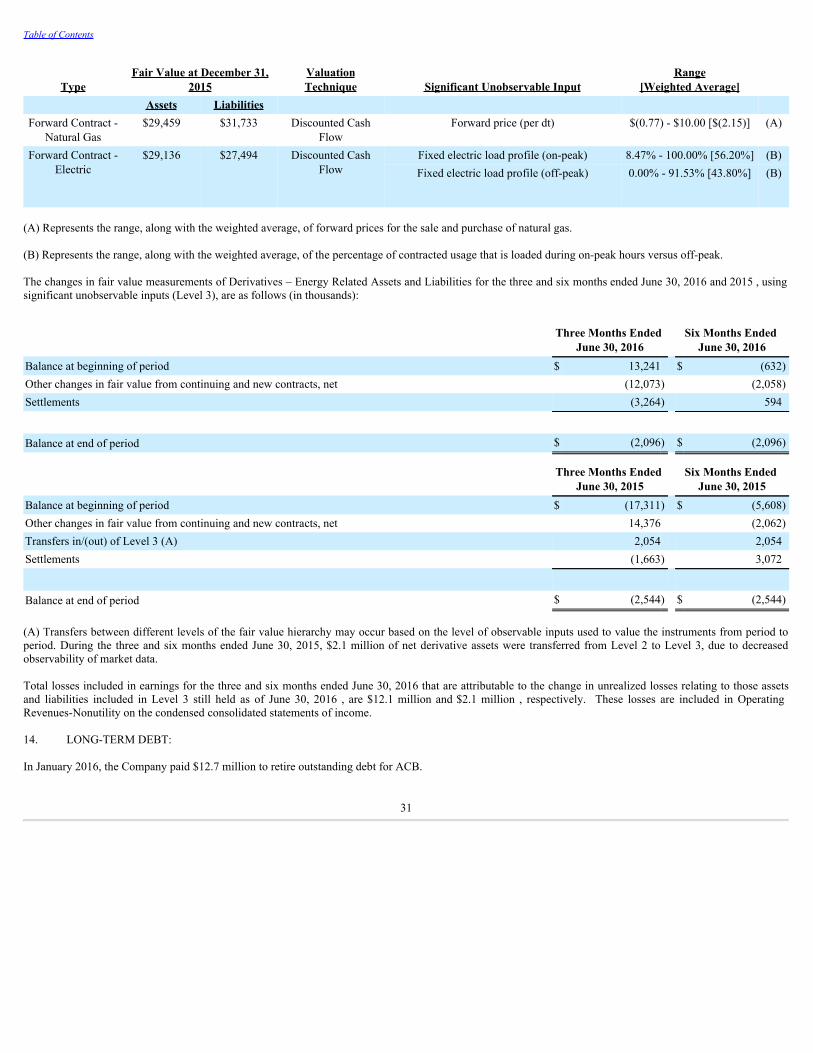
Table of Contents
TypeFair Value at December 31,
2015ValuationTechnique Significant Unobservable Input
Range[Weighted Average]
Assets Liabilities Forward Contract -
Natural Gas$29,459 $31,733 Discounted Cash
FlowForward price (per dt) $(0.77) - $10.00 [$(2.15)] (A)
Forward Contract -Electric
$29,136 $27,494 Discounted CashFlow
Fixed electric load profile (on-peak) 8.47% - 100.00% [56.20%] (B)Fixed electric load profile (off-peak) 0.00% - 91.53% [43.80%] (B)
(A) Represents the range, along with the weighted average, of forward prices for the sale and purchase of natural gas.
(B) Represents the range, along with the weighted average, of the percentage of contracted usage that is loaded during on-peak hours versus off-peak.
The changes in fair value measurements of Derivatives – Energy Related Assets and Liabilities for the three and six months ended June 30, 2016 and 2015 , usingsignificant unobservable inputs (Level 3), are as follows (in thousands):
Three Months Ended
June 30, 2016 Six Months Ended
June 30, 2016Balance at beginning of period $ 13,241 $ (632)Other changes in fair value from continuing and new contracts, net (12,073) (2,058)Settlements (3,264) 594
Balance at end of period $ (2,096) $ (2,096)
Three Months Ended
June 30, 2015 Six Months Ended
June 30, 2015Balance at beginning of period $ (17,311) $ (5,608)Other changes in fair value from continuing and new contracts, net 14,376 (2,062)Transfers in/(out) of Level 3 (A) 2,054 2,054Settlements (1,663) 3,072
Balance at end of period $ (2,544) $ (2,544)
(A) Transfers between different levels of the fair value hierarchy may occur based on the level of observable inputs used to value the instruments from period toperiod. During the three and six months ended June 30, 2015, $2.1 million of net derivative assets were transferred from Level 2 to Level 3, due to decreasedobservability of market data.
Total losses included in earnings for the three and six months ended June 30, 2016 that are attributable to the change in unrealized losses relating to those assetsand liabilities included in Level 3 still held as of June 30, 2016 , are $12.1 million and $2.1 million , respectively. These losses are included in OperatingRevenues-Nonutility on the condensed consolidated statements of income.
14. LONG-TERM DEBT:
In January 2016, the Company paid $12.7 million to retire outstanding debt for ACB.
31
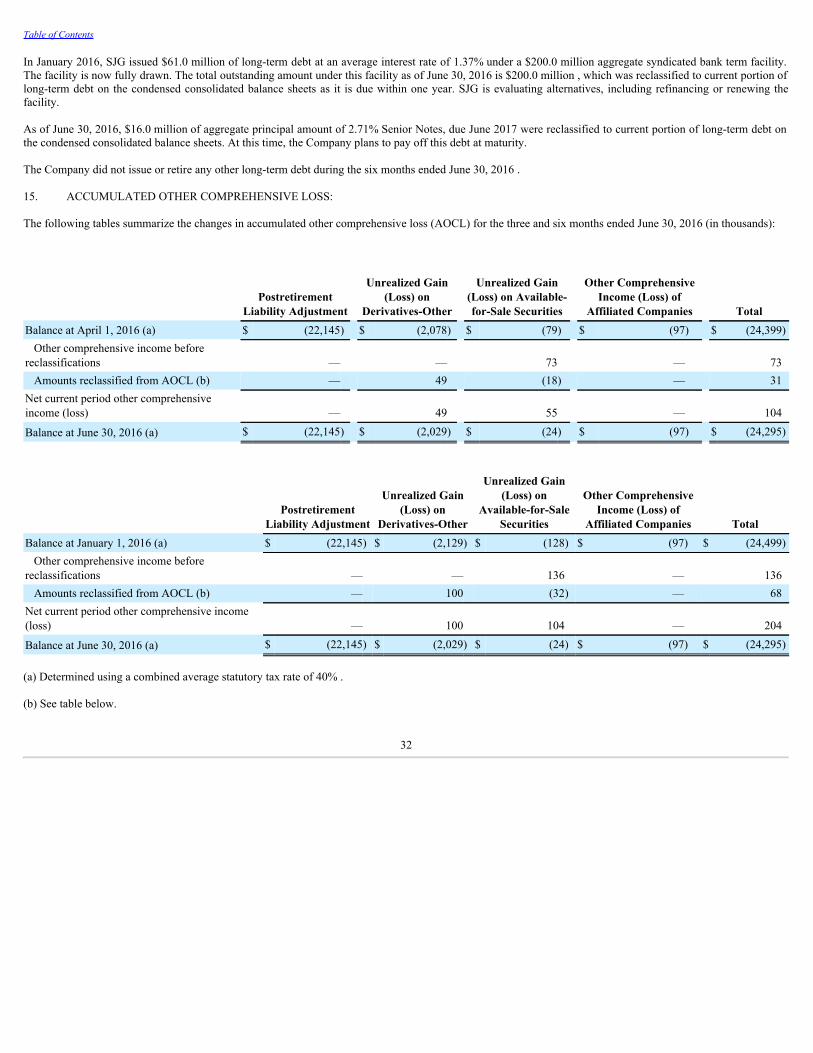
Table of Contents
In January 2016, SJG issued $61.0 million of long-term debt at an average interest rate of 1.37% under a $200.0 million aggregate syndicated bank term facility.The facility is now fully drawn. The total outstanding amount under this facility as of June 30, 2016 is $200.0 million , which was reclassified to current portion oflong-term debt on the condensed consolidated balance sheets as it is due within one year. SJG is evaluating alternatives, including refinancing or renewing thefacility.
As of June 30, 2016, $16.0 million of aggregate principal amount of 2.71% Senior Notes, due June 2017 were reclassified to current portion of long-term debt onthe condensed consolidated balance sheets. At this time, the Company plans to pay off this debt at maturity.
The Company did not issue or retire any other long-term debt during the six months ended June 30, 2016 .
15. ACCUMULATED OTHER COMPREHENSIVE LOSS:
The following tables summarize the changes in accumulated other comprehensive loss (AOCL) for the three and six months ended June 30, 2016 (in thousands):
Postretirement
Liability Adjustment
Unrealized Gain(Loss) on
Derivatives-Other
Unrealized Gain(Loss) on Available-for-Sale Securities
Other ComprehensiveIncome (Loss) of
Affiliated Companies TotalBalance at April 1, 2016 (a) $ (22,145) $ (2,078) $ (79) $ (97) $ (24,399) Other comprehensive income beforereclassifications — — 73 — 73 Amounts reclassified from AOCL (b) — 49 (18) — 31Net current period other comprehensiveincome (loss) — 49 55 — 104
Balance at June 30, 2016 (a) $ (22,145) $ (2,029) $ (24) $ (97) $ (24,295)
Postretirement
Liability Adjustment
Unrealized Gain(Loss) on
Derivatives-Other
Unrealized Gain(Loss) on
Available-for-SaleSecurities
Other ComprehensiveIncome (Loss) of
Affiliated Companies TotalBalance at January 1, 2016 (a) $ (22,145) $ (2,129) $ (128) $ (97) $ (24,499) Other comprehensive income beforereclassifications — — 136 — 136 Amounts reclassified from AOCL (b) — 100 (32) — 68Net current period other comprehensive income(loss) — 100 104 — 204
Balance at June 30, 2016 (a) $ (22,145) $ (2,029) $ (24) $ (97) $ (24,295)
(a) Determined using a combined average statutory tax rate of 40% .
(b) See table below.
32
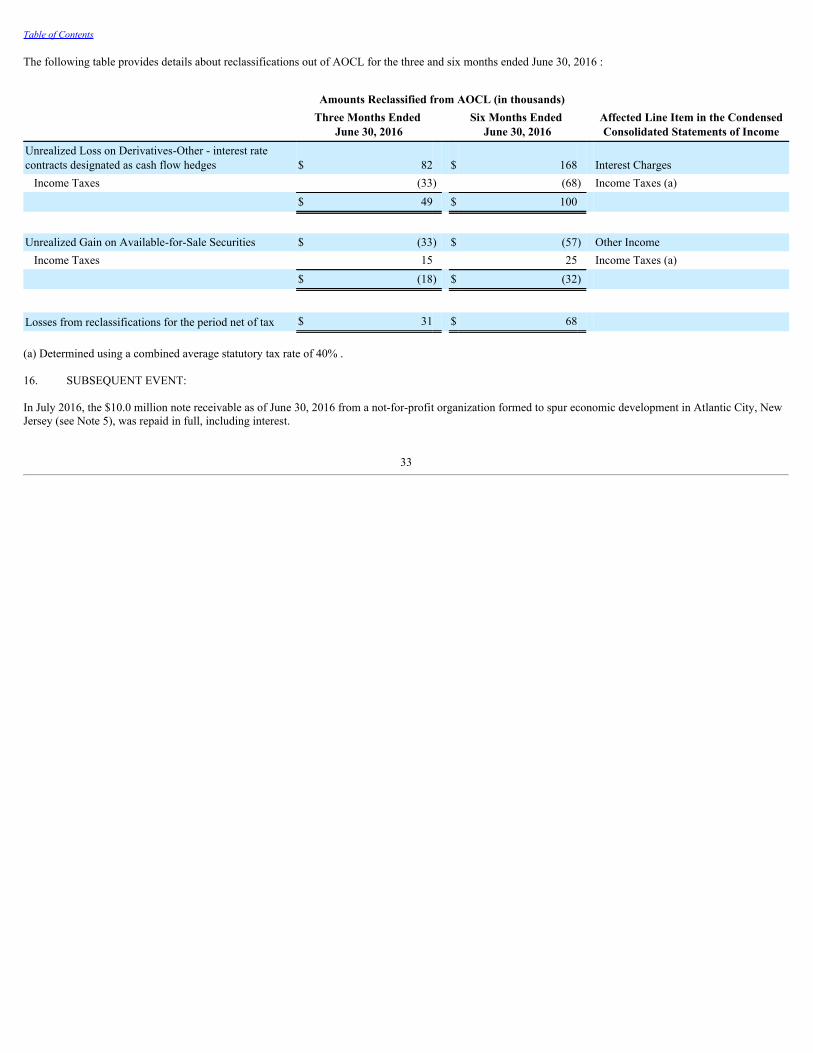
Table of Contents
The following table provides details about reclassifications out of AOCL for the three and six months ended June 30, 2016 :
Amounts Reclassified from AOCL (in thousands) Affected Line Item in the CondensedConsolidated Statements of Income
Three Months Ended June 30, 2016
Six Months Ended June 30, 2016
Unrealized Loss on Derivatives-Other - interest ratecontracts designated as cash flow hedges $ 82 $ 168 Interest Charges Income Taxes (33) (68) Income Taxes (a)
$ 49 $ 100
Unrealized Gain on Available-for-Sale Securities $ (33) $ (57) Other Income Income Taxes 15 25 Income Taxes (a)
$ (18) $ (32)
Losses from reclassifications for the period net of tax $ 31 $ 68
(a) Determined using a combined average statutory tax rate of 40% .
16. SUBSEQUENT EVENT:
In July 2016, the $10.0 million note receivable as of June 30, 2016 from a not-for-profit organization formed to spur economic development in Atlantic City, NewJersey (see Note 5), was repaid in full, including interest.
33

Table of Contents
Item 2. Management’s Discussion and Analysis of Financial Condition and Results of Operations
Forward-Looking Statements and Risk Factors — This Quarterly Report, including information incorporated by reference, contains forward-lookingstatements within the meaning of the U.S. Private Securities Litigation Reform Act of 1995.
All statements other than statements of historical fact, including statements regarding future results of operations or financial position, expected sources ofincremental margin, strategy, financing needs, future capital expenditures and the outcome or effect of ongoing litigation, are forward-looking. This QuarterlyReport uses words such as "anticipate," "believe," "expect," "estimate," "forecast," "goal," "intend," "objective," "plan," "project," "seek," "strategy," "target,""will" and similar expressions to identify forward-looking statements. These forward-looking statements are based on the beliefs and assumptions of managementat the time that these statements were made and are inherently uncertain. Forward-looking statements are subject to risks and uncertainties that could cause actualresults to differ materially from those expressed in the forward-looking statements. These risks and uncertainties include, but are not limited to, general economicconditions on an international, national, state and local level; weather conditions in SJI’s marketing areas; changes in commodity costs; changes in the availabilityof natural gas; “non-routine” or “extraordinary” disruptions in SJI’s distribution system; regulatory, legislative and court decisions; competition; the availabilityand cost of capital; costs and effects of legal proceedings and environmental liabilities; the failure of customers, suppliers or business partners to fulfill theircontractual obligations; and changes in business strategies.
These risks and uncertainties, as well as other risks and uncertainties that could cause actual results to differ materially from those expressed in the forward-lookingstatements, are described in greater detail under the heading “Item 1A. Risk factors” in this Quarterly Report and in SJI’s Annual Report on Form 10-K for the yearended December 31, 2015 and in any other SEC filings incorporated by reference into this Quarterly Report. No assurance can be given that any goal or plan setforth in any forward-looking statement can or will be achieved, and readers are cautioned not to place undue reliance on such statements, which speak only as ofthe date they are made. SJI undertakes no obligation to revise or update any forward-looking statements, whether as a result of new information, future events orotherwise, except as required by law.
Critical Accounting Policies — Estimates and Assumptions — Management must make estimates and assumptions that affect the amounts reported in thecondensed consolidated financial statements and related disclosures. Actual results could differ from those estimates. Five types of transactions presented in ourcondensed consolidated financial statements require a significant amount of judgment and estimation. These relate to regulatory accounting, derivatives,environmental remediation costs, pension and other postretirement employee benefit costs, and revenue recognition. A discussion of these estimates andassumptions may be found in SJI's Annual Report on Form 10-K for the year ended December 31, 2015 .
New Accounting Pronouncements — See detailed discussions concerning New Accounting Pronouncements and their impact on SJI in Note 1 to the condensedconsolidated financial statements.
Regulatory Actions — Other than the changes discussed in Note 7 to the condensed consolidated financial statements, there have been no significant regulatoryactions since December 31, 2015 . See detailed discussion concerning Regulatory Actions in Note 10 to the Consolidated Financial Statements in Item 8 of SJI’sAnnual Report on Form 10-K for the year ended December 31, 2015 .
Environmental Remediation —Other than the changes discussed in Note 8 to the condensed consolidated financial statements, there have been no significantchanges to the status of the Company’s environmental remediation efforts since December 31, 2015 . See detailed discussion concerning EnvironmentalRemediation Costs in Note 15 to the Consolidated Financial Statements in Item 8 of SJI’s Annual Report on Form 10-K for the year ended December 31, 2015 .
34
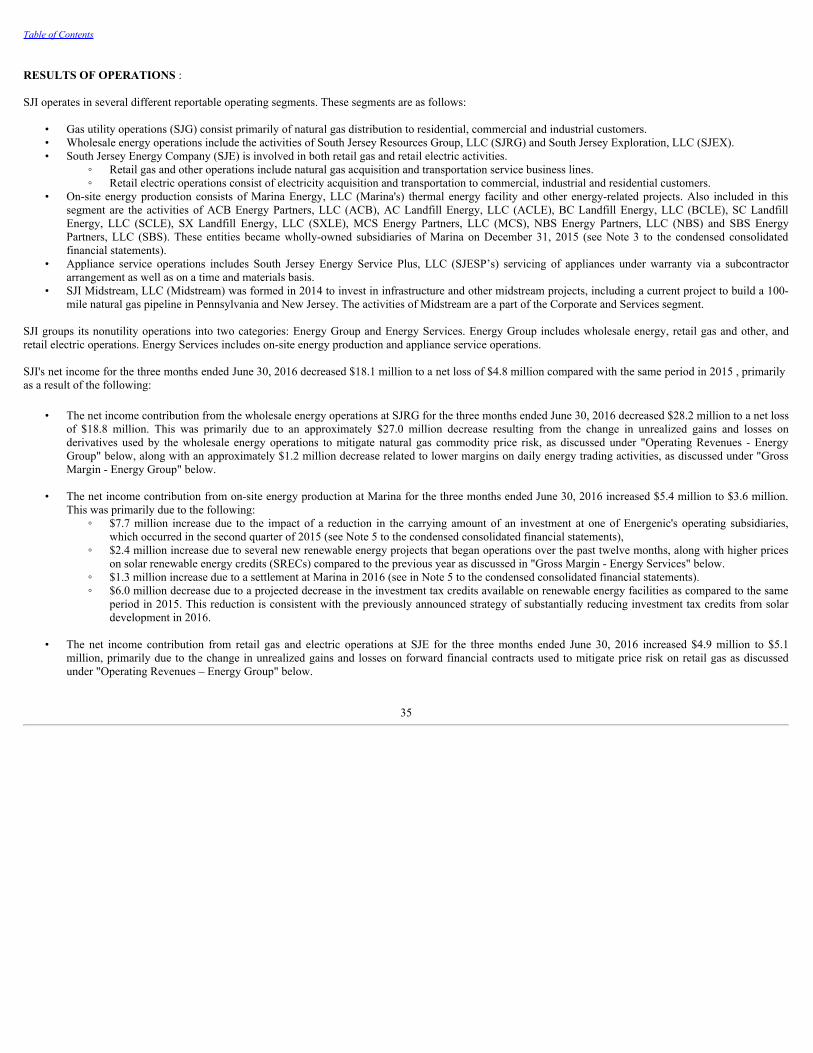
Table of Contents
RESULTS OF OPERATIONS :
SJI operates in several different reportable operating segments. These segments are as follows:
• Gas utility operations (SJG) consist primarily of natural gas distribution to residential, commercial and industrial customers.• Wholesale energy operations include the activities of South Jersey Resources Group, LLC (SJRG) and South Jersey Exploration, LLC (SJEX).• South Jersey Energy Company (SJE) is involved in both retail gas and retail electric activities.
◦ Retail gas and other operations include natural gas acquisition and transportation service business lines.◦ Retail electric operations consist of electricity acquisition and transportation to commercial, industrial and residential customers.
• On-site energy production consists of Marina Energy, LLC (Marina's) thermal energy facility and other energy-related projects. Also included in thissegment are the activities of ACB Energy Partners, LLC (ACB), AC Landfill Energy, LLC (ACLE), BC Landfill Energy, LLC (BCLE), SC LandfillEnergy, LLC (SCLE), SX Landfill Energy, LLC (SXLE), MCS Energy Partners, LLC (MCS), NBS Energy Partners, LLC (NBS) and SBS EnergyPartners, LLC (SBS). These entities became wholly-owned subsidiaries of Marina on December 31, 2015 (see Note 3 to the condensed consolidatedfinancial statements).
• Appliance service operations includes South Jersey Energy Service Plus, LLC (SJESP’s) servicing of appliances under warranty via a subcontractorarrangement as well as on a time and materials basis.
• SJI Midstream, LLC (Midstream) was formed in 2014 to invest in infrastructure and other midstream projects, including a current project to build a 100-mile natural gas pipeline in Pennsylvania and New Jersey. The activities of Midstream are a part of the Corporate and Services segment.
SJI groups its nonutility operations into two categories: Energy Group and Energy Services. Energy Group includes wholesale energy, retail gas and other, andretail electric operations. Energy Services includes on-site energy production and appliance service operations.
SJI's net income for the three months ended June 30, 2016 decreased $18.1 million to a net loss of $4.8 million compared with the same period in 2015 , primarilyas a result of the following:
• The net income contribution from the wholesale energy operations at SJRG for the three months ended June 30, 2016 decreased $28.2 million to a net lossof $18.8 million. This was primarily due to an approximately $27.0 million decrease resulting from the change in unrealized gains and losses onderivatives used by the wholesale energy operations to mitigate natural gas commodity price risk, as discussed under "Operating Revenues - EnergyGroup" below, along with an approximately $1.2 million decrease related to lower margins on daily energy trading activities, as discussed under "GrossMargin - Energy Group" below.
• The net income contribution from on-site energy production at Marina for the three months ended June 30, 2016 increased $5.4 million to $3.6 million.This was primarily due to the following:
◦ $7.7 million increase due to the impact of a reduction in the carrying amount of an investment at one of Energenic's operating subsidiaries,which occurred in the second quarter of 2015 (see Note 5 to the condensed consolidated financial statements),
◦ $2.4 million increase due to several new renewable energy projects that began operations over the past twelve months, along with higher priceson solar renewable energy credits (SRECs) compared to the previous year as discussed in "Gross Margin - Energy Services" below.
◦ $1.3 million increase due to a settlement at Marina in 2016 (see in Note 5 to the condensed consolidated financial statements).◦ $6.0 million decrease due to a projected decrease in the investment tax credits available on renewable energy facilities as compared to the same
period in 2015. This reduction is consistent with the previously announced strategy of substantially reducing investment tax credits from solardevelopment in 2016.
• The net income contribution from retail gas and electric operations at SJE for the three months ended June 30, 2016 increased $4.9 million to $5.1million, primarily due to the change in unrealized gains and losses on forward financial contracts used to mitigate price risk on retail gas as discussedunder "Operating Revenues – Energy Group" below.
35
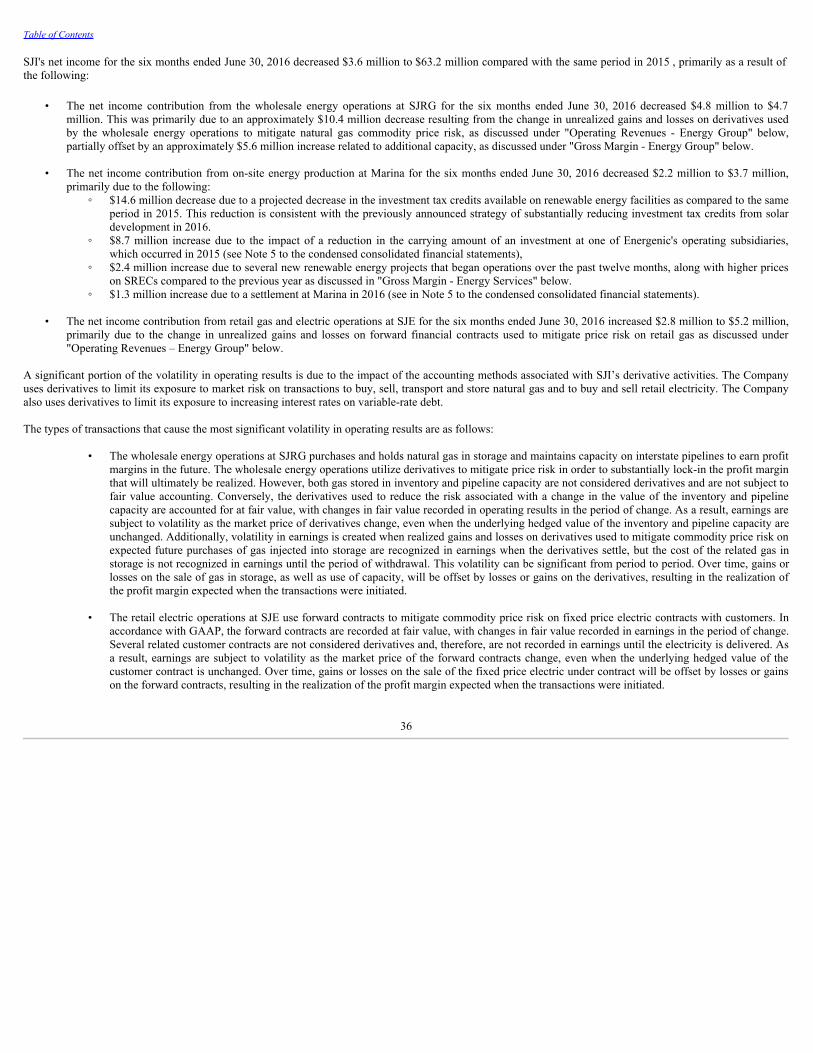
Table of Contents
SJI's net income for the six months ended June 30, 2016 decreased $3.6 million to $63.2 million compared with the same period in 2015 , primarily as a result ofthe following:
• The net income contribution from the wholesale energy operations at SJRG for the six months ended June 30, 2016 decreased $4.8 million to $4.7million. This was primarily due to an approximately $10.4 million decrease resulting from the change in unrealized gains and losses on derivatives usedby the wholesale energy operations to mitigate natural gas commodity price risk, as discussed under "Operating Revenues - Energy Group" below,partially offset by an approximately $5.6 million increase related to additional capacity, as discussed under "Gross Margin - Energy Group" below.
• The net income contribution from on-site energy production at Marina for the six months ended June 30, 2016 decreased $2.2 million to $3.7 million,primarily due to the following:
◦ $14.6 million decrease due to a projected decrease in the investment tax credits available on renewable energy facilities as compared to the sameperiod in 2015. This reduction is consistent with the previously announced strategy of substantially reducing investment tax credits from solardevelopment in 2016.
◦ $8.7 million increase due to the impact of a reduction in the carrying amount of an investment at one of Energenic's operating subsidiaries,which occurred in 2015 (see Note 5 to the condensed consolidated financial statements),
◦ $2.4 million increase due to several new renewable energy projects that began operations over the past twelve months, along with higher priceson SRECs compared to the previous year as discussed in "Gross Margin - Energy Services" below.
◦ $1.3 million increase due to a settlement at Marina in 2016 (see in Note 5 to the condensed consolidated financial statements).
• The net income contribution from retail gas and electric operations at SJE for the six months ended June 30, 2016 increased $2.8 million to $5.2 million,primarily due to the change in unrealized gains and losses on forward financial contracts used to mitigate price risk on retail gas as discussed under"Operating Revenues – Energy Group" below.
A significant portion of the volatility in operating results is due to the impact of the accounting methods associated with SJI’s derivative activities. The Companyuses derivatives to limit its exposure to market risk on transactions to buy, sell, transport and store natural gas and to buy and sell retail electricity. The Companyalso uses derivatives to limit its exposure to increasing interest rates on variable-rate debt.
The types of transactions that cause the most significant volatility in operating results are as follows:
• The wholesale energy operations at SJRG purchases and holds natural gas in storage and maintains capacity on interstate pipelines to earn profitmargins in the future. The wholesale energy operations utilize derivatives to mitigate price risk in order to substantially lock-in the profit marginthat will ultimately be realized. However, both gas stored in inventory and pipeline capacity are not considered derivatives and are not subject tofair value accounting. Conversely, the derivatives used to reduce the risk associated with a change in the value of the inventory and pipelinecapacity are accounted for at fair value, with changes in fair value recorded in operating results in the period of change. As a result, earnings aresubject to volatility as the market price of derivatives change, even when the underlying hedged value of the inventory and pipeline capacity areunchanged. Additionally, volatility in earnings is created when realized gains and losses on derivatives used to mitigate commodity price risk onexpected future purchases of gas injected into storage are recognized in earnings when the derivatives settle, but the cost of the related gas instorage is not recognized in earnings until the period of withdrawal. This volatility can be significant from period to period. Over time, gains orlosses on the sale of gas in storage, as well as use of capacity, will be offset by losses or gains on the derivatives, resulting in the realization ofthe profit margin expected when the transactions were initiated.
• The retail electric operations at SJE use forward contracts to mitigate commodity price risk on fixed price electric contracts with customers. Inaccordance with GAAP, the forward contracts are recorded at fair value, with changes in fair value recorded in earnings in the period of change.Several related customer contracts are not considered derivatives and, therefore, are not recorded in earnings until the electricity is delivered. Asa result, earnings are subject to volatility as the market price of the forward contracts change, even when the underlying hedged value of thecustomer contract is unchanged. Over time, gains or losses on the sale of the fixed price electric under contract will be offset by losses or gainson the forward contracts, resulting in the realization of the profit margin expected when the transactions were initiated.
36
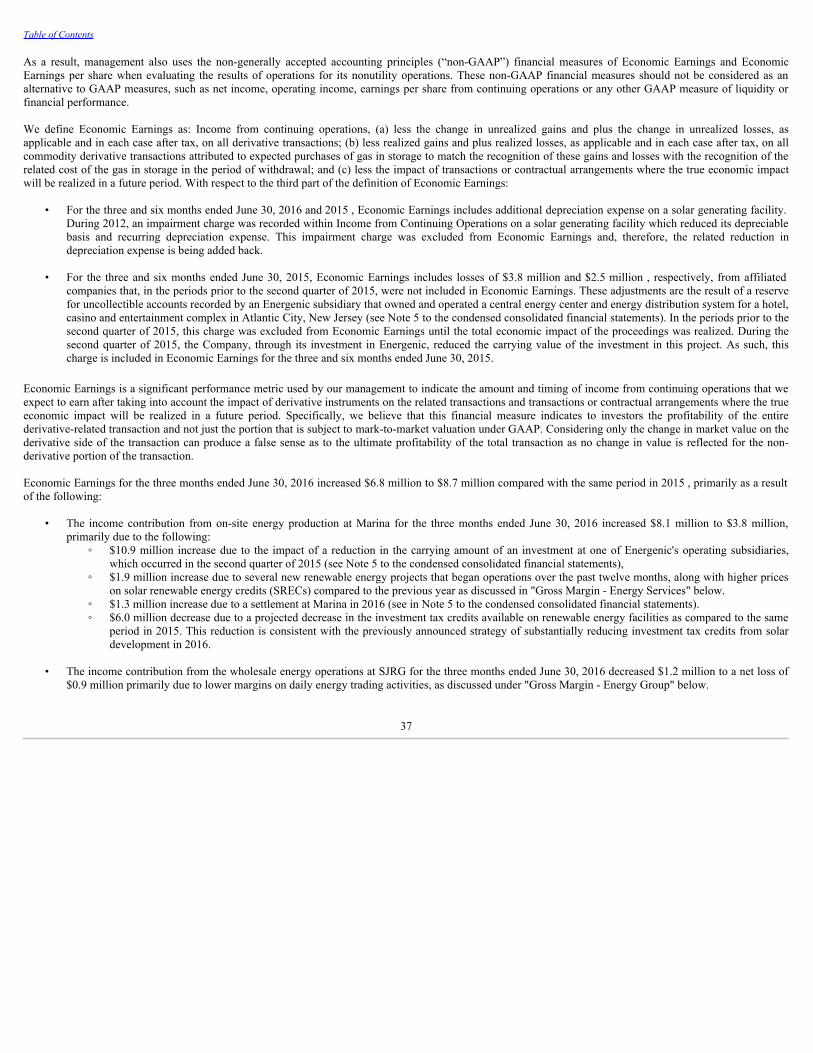
Table of Contents
As a result, management also uses the non-generally accepted accounting principles (“non-GAAP”) financial measures of Economic Earnings and EconomicEarnings per share when evaluating the results of operations for its nonutility operations. These non-GAAP financial measures should not be considered as analternative to GAAP measures, such as net income, operating income, earnings per share from continuing operations or any other GAAP measure of liquidity orfinancial performance.
We define Economic Earnings as: Income from continuing operations, (a) less the change in unrealized gains and plus the change in unrealized losses, asapplicable and in each case after tax, on all derivative transactions; (b) less realized gains and plus realized losses, as applicable and in each case after tax, on allcommodity derivative transactions attributed to expected purchases of gas in storage to match the recognition of these gains and losses with the recognition of therelated cost of the gas in storage in the period of withdrawal; and (c) less the impact of transactions or contractual arrangements where the true economic impactwill be realized in a future period. With respect to the third part of the definition of Economic Earnings:
• For the three and six months ended June 30, 2016 and 2015 , Economic Earnings includes additional depreciation expense on a solar generating facility.During 2012, an impairment charge was recorded within Income from Continuing Operations on a solar generating facility which reduced its depreciablebasis and recurring depreciation expense. This impairment charge was excluded from Economic Earnings and, therefore, the related reduction indepreciation expense is being added back.
• For the three and six months ended June 30, 2015, Economic Earnings includes losses of $3.8 million and $2.5 million , respectively, from affiliatedcompanies that, in the periods prior to the second quarter of 2015, were not included in Economic Earnings. These adjustments are the result of a reservefor uncollectible accounts recorded by an Energenic subsidiary that owned and operated a central energy center and energy distribution system for a hotel,casino and entertainment complex in Atlantic City, New Jersey (see Note 5 to the condensed consolidated financial statements). In the periods prior to thesecond quarter of 2015, this charge was excluded from Economic Earnings until the total economic impact of the proceedings was realized. During thesecond quarter of 2015, the Company, through its investment in Energenic, reduced the carrying value of the investment in this project. As such, thischarge is included in Economic Earnings for the three and six months ended June 30, 2015.
Economic Earnings is a significant performance metric used by our management to indicate the amount and timing of income from continuing operations that weexpect to earn after taking into account the impact of derivative instruments on the related transactions and transactions or contractual arrangements where the trueeconomic impact will be realized in a future period. Specifically, we believe that this financial measure indicates to investors the profitability of the entirederivative-related transaction and not just the portion that is subject to mark-to-market valuation under GAAP. Considering only the change in market value on thederivative side of the transaction can produce a false sense as to the ultimate profitability of the total transaction as no change in value is reflected for the non-derivative portion of the transaction.
Economic Earnings for the three months ended June 30, 2016 increased $6.8 million to $8.7 million compared with the same period in 2015 , primarily as a resultof the following:
• The income contribution from on-site energy production at Marina for the three months ended June 30, 2016 increased $8.1 million to $3.8 million,primarily due to the following:
◦ $10.9 million increase due to the impact of a reduction in the carrying amount of an investment at one of Energenic's operating subsidiaries,which occurred in the second quarter of 2015 (see Note 5 to the condensed consolidated financial statements),
◦ $1.9 million increase due to several new renewable energy projects that began operations over the past twelve months, along with higher priceson solar renewable energy credits (SRECs) compared to the previous year as discussed in "Gross Margin - Energy Services" below.
◦ $1.3 million increase due to a settlement at Marina in 2016 (see in Note 5 to the condensed consolidated financial statements).◦ $6.0 million decrease due to a projected decrease in the investment tax credits available on renewable energy facilities as compared to the same
period in 2015. This reduction is consistent with the previously announced strategy of substantially reducing investment tax credits from solardevelopment in 2016.
• The income contribution from the wholesale energy operations at SJRG for the three months ended June 30, 2016 decreased $1.2 million to a net loss of$0.9 million primarily due to lower margins on daily energy trading activities, as discussed under "Gross Margin - Energy Group" below.
37
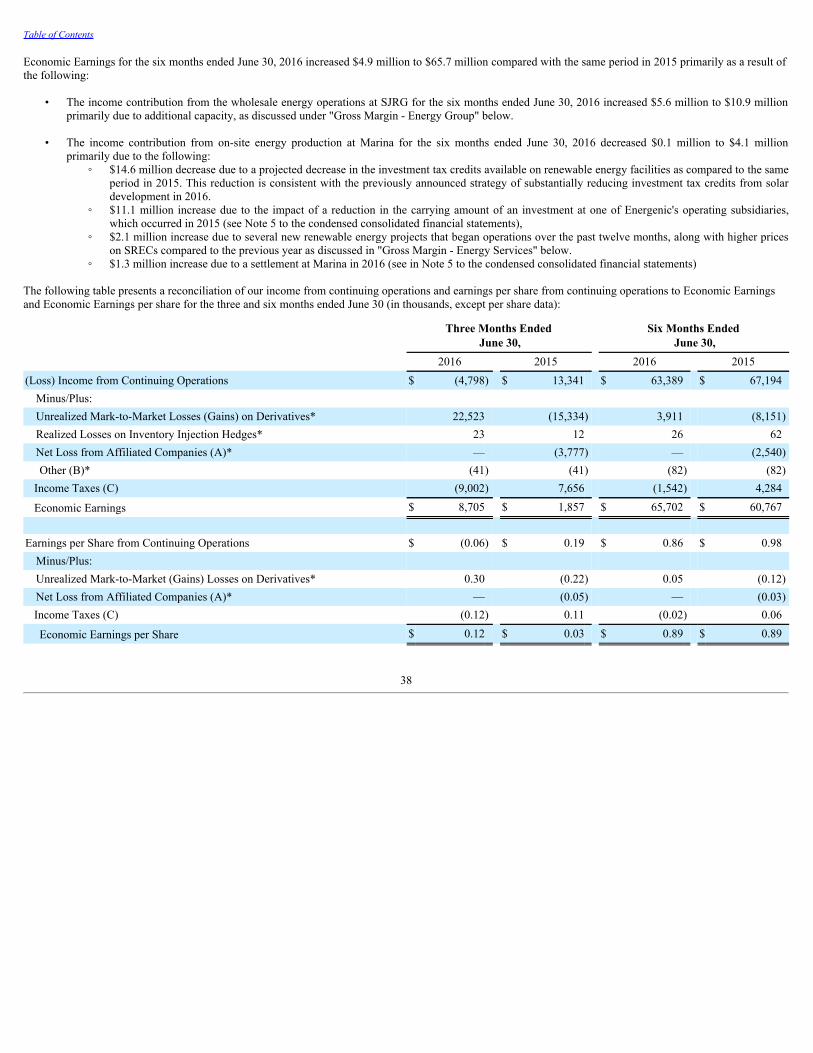
Table of Contents
Economic Earnings for the six months ended June 30, 2016 increased $4.9 million to $65.7 million compared with the same period in 2015 primarily as a result ofthe following:
• The income contribution from the wholesale energy operations at SJRG for the six months ended June 30, 2016 increased $5.6 million to $10.9 millionprimarily due to additional capacity, as discussed under "Gross Margin - Energy Group" below.
• The income contribution from on-site energy production at Marina for the six months ended June 30, 2016 decreased $0.1 million to $4.1 millionprimarily due to the following:
◦ $14.6 million decrease due to a projected decrease in the investment tax credits available on renewable energy facilities as compared to the sameperiod in 2015. This reduction is consistent with the previously announced strategy of substantially reducing investment tax credits from solardevelopment in 2016.
◦ $11.1 million increase due to the impact of a reduction in the carrying amount of an investment at one of Energenic's operating subsidiaries,which occurred in 2015 (see Note 5 to the condensed consolidated financial statements),
◦ $2.1 million increase due to several new renewable energy projects that began operations over the past twelve months, along with higher priceson SRECs compared to the previous year as discussed in "Gross Margin - Energy Services" below.
◦ $1.3 million increase due to a settlement at Marina in 2016 (see in Note 5 to the condensed consolidated financial statements)
The following table presents a reconciliation of our income from continuing operations and earnings per share from continuing operations to Economic Earningsand Economic Earnings per share for the three and six months ended June 30 (in thousands, except per share data):
Three Months Ended
June 30, Six Months Ended
June 30, 2016 2015 2016 2015(Loss) Income from Continuing Operations $ (4,798) $ 13,341 $ 63,389 $ 67,194
Minus/Plus: Unrealized Mark-to-Market Losses (Gains) on Derivatives* 22,523 (15,334) 3,911 (8,151)Realized Losses on Inventory Injection Hedges* 23 12 26 62Net Loss from Affiliated Companies (A)* — (3,777) — (2,540)Other (B)* (41) (41) (82) (82)
Income Taxes (C) (9,002) 7,656 (1,542) 4,284
Economic Earnings $ 8,705 $ 1,857 $ 65,702 $ 60,767
Earnings per Share from Continuing Operations $ (0.06) $ 0.19 $ 0.86 $ 0.98
Minus/Plus: Unrealized Mark-to-Market (Gains) Losses on Derivatives* 0.30 (0.22) 0.05 (0.12)Net Loss from Affiliated Companies (A)* — (0.05) — (0.03)Income Taxes (C) (0.12) 0.11 (0.02) 0.06
Economic Earnings per Share $ 0.12 $ 0.03 $ 0.89 $ 0.89
38
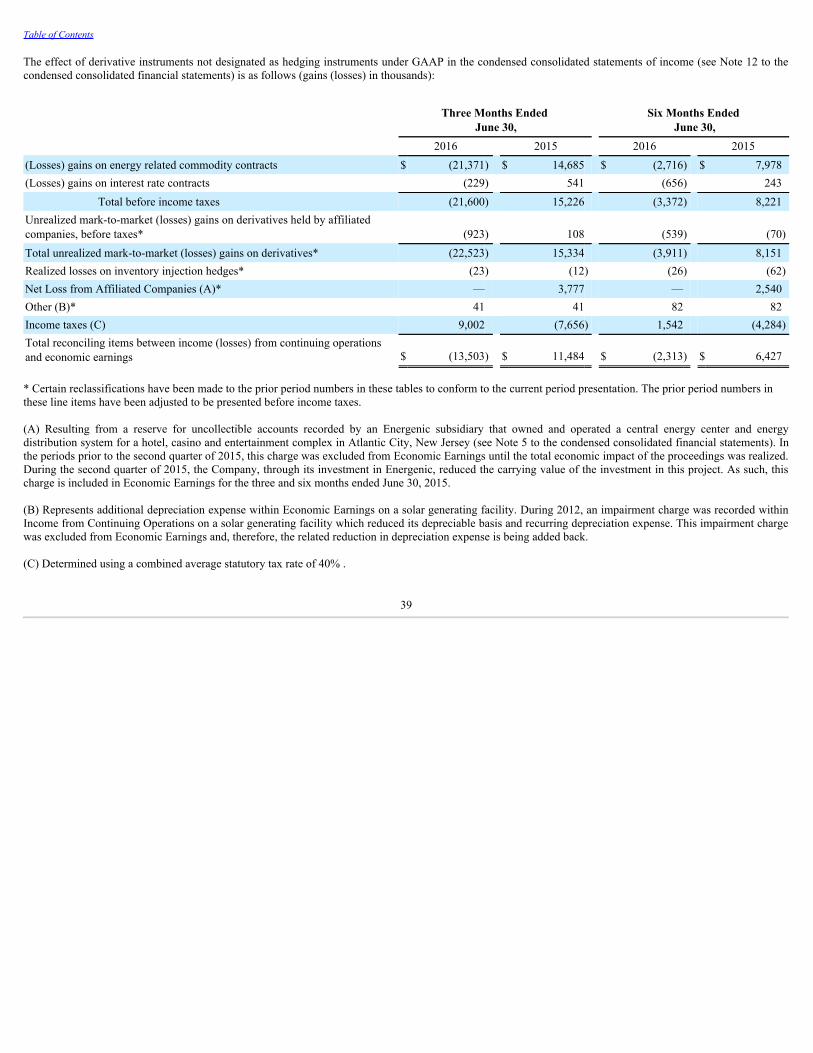
Table of Contents
The effect of derivative instruments not designated as hedging instruments under GAAP in the condensed consolidated statements of income (see Note 12 to thecondensed consolidated financial statements) is as follows (gains (losses) in thousands):
Three Months Ended
June 30, Six Months Ended
June 30, 2016 2015 2016 2015(Losses) gains on energy related commodity contracts $ (21,371) $ 14,685 $ (2,716) $ 7,978(Losses) gains on interest rate contracts (229) 541 (656) 243 Total before income taxes (21,600) 15,226 (3,372) 8,221Unrealized mark-to-market (losses) gains on derivatives held by affiliatedcompanies, before taxes* (923) 108 (539) (70)Total unrealized mark-to-market (losses) gains on derivatives* (22,523) 15,334 (3,911) 8,151Realized losses on inventory injection hedges* (23) (12) (26) (62)Net Loss from Affiliated Companies (A)* — 3,777 — 2,540Other (B)* 41 41 82 82Income taxes (C) 9,002 (7,656) 1,542 (4,284)Total reconciling items between income (losses) from continuing operationsand economic earnings $ (13,503) $ 11,484 $ (2,313) $ 6,427
* Certain reclassifications have been made to the prior period numbers in these tables to conform to the current period presentation. The prior period numbers inthese line items have been adjusted to be presented before income taxes.
(A) Resulting from a reserve for uncollectible accounts recorded by an Energenic subsidiary that owned and operated a central energy center and energydistribution system for a hotel, casino and entertainment complex in Atlantic City, New Jersey (see Note 5 to the condensed consolidated financial statements). Inthe periods prior to the second quarter of 2015, this charge was excluded from Economic Earnings until the total economic impact of the proceedings was realized.During the second quarter of 2015, the Company, through its investment in Energenic, reduced the carrying value of the investment in this project. As such, thischarge is included in Economic Earnings for the three and six months ended June 30, 2015.
(B) Represents additional depreciation expense within Economic Earnings on a solar generating facility. During 2012, an impairment charge was recorded withinIncome from Continuing Operations on a solar generating facility which reduced its depreciable basis and recurring depreciation expense. This impairment chargewas excluded from Economic Earnings and, therefore, the related reduction in depreciation expense is being added back.
(C) Determined using a combined average statutory tax rate of 40% .
39
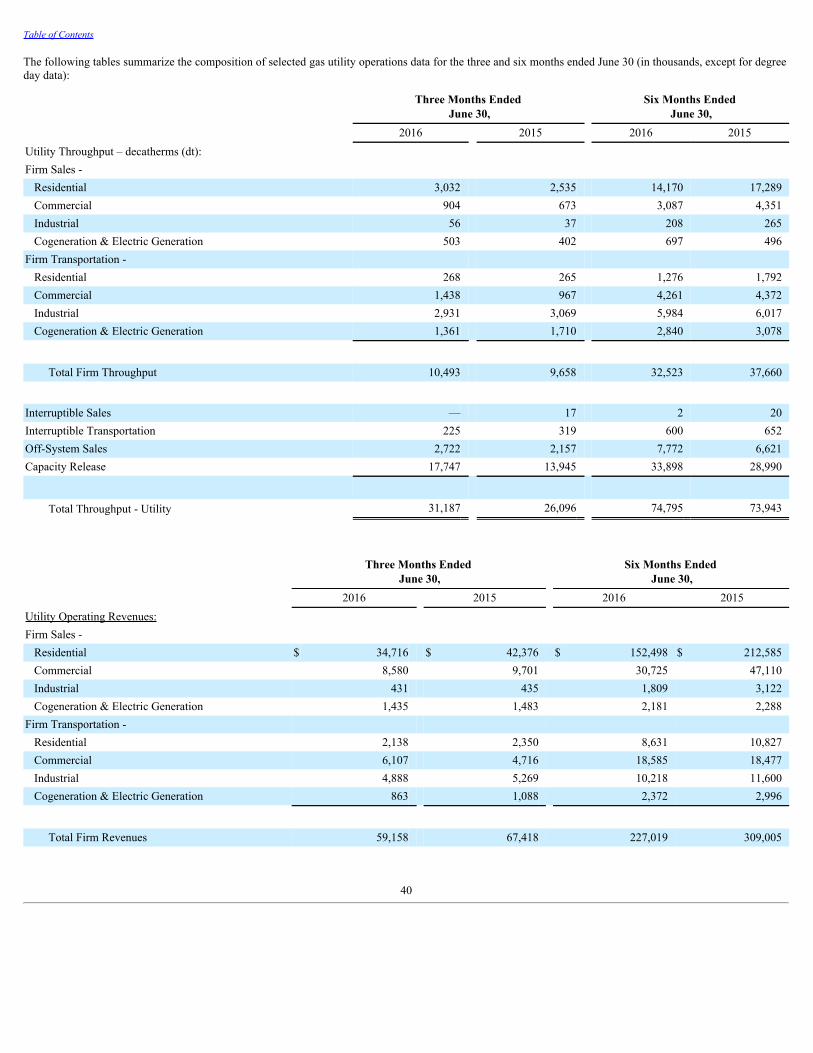
Table of Contents
The following tables summarize the composition of selected gas utility operations data for the three and six months ended June 30 (in thousands, except for degreeday data):
Three Months Ended
June 30, Six Months Ended
June 30, 2016 2015 2016 2015Utility Throughput – decatherms (dt): Firm Sales -
Residential 3,032 2,535 14,170 17,289Commercial 904 673 3,087 4,351Industrial 56 37 208 265Cogeneration & Electric Generation 503 402 697 496
Firm Transportation - Residential 268 265 1,276 1,792Commercial 1,438 967 4,261 4,372Industrial 2,931 3,069 5,984 6,017Cogeneration & Electric Generation 1,361 1,710 2,840 3,078
Total Firm Throughput 10,493 9,658 32,523 37,660
Interruptible Sales — 17 2 20Interruptible Transportation 225 319 600 652Off-System Sales 2,722 2,157 7,772 6,621Capacity Release 17,747 13,945 33,898 28,990
Total Throughput - Utility 31,187 26,096 74,795 73,943
Three Months Ended
June 30, Six Months Ended
June 30, 2016 2015 2016 2015Utility Operating Revenues: Firm Sales -
Residential $ 34,716 $ 42,376 $ 152,498 $ 212,585Commercial 8,580 9,701 30,725 47,110Industrial 431 435 1,809 3,122Cogeneration & Electric Generation 1,435 1,483 2,181 2,288
Firm Transportation - Residential 2,138 2,350 8,631 10,827Commercial 6,107 4,716 18,585 18,477Industrial 4,888 5,269 10,218 11,600Cogeneration & Electric Generation 863 1,088 2,372 2,996
Total Firm Revenues 59,158 67,418 227,019 309,005
40
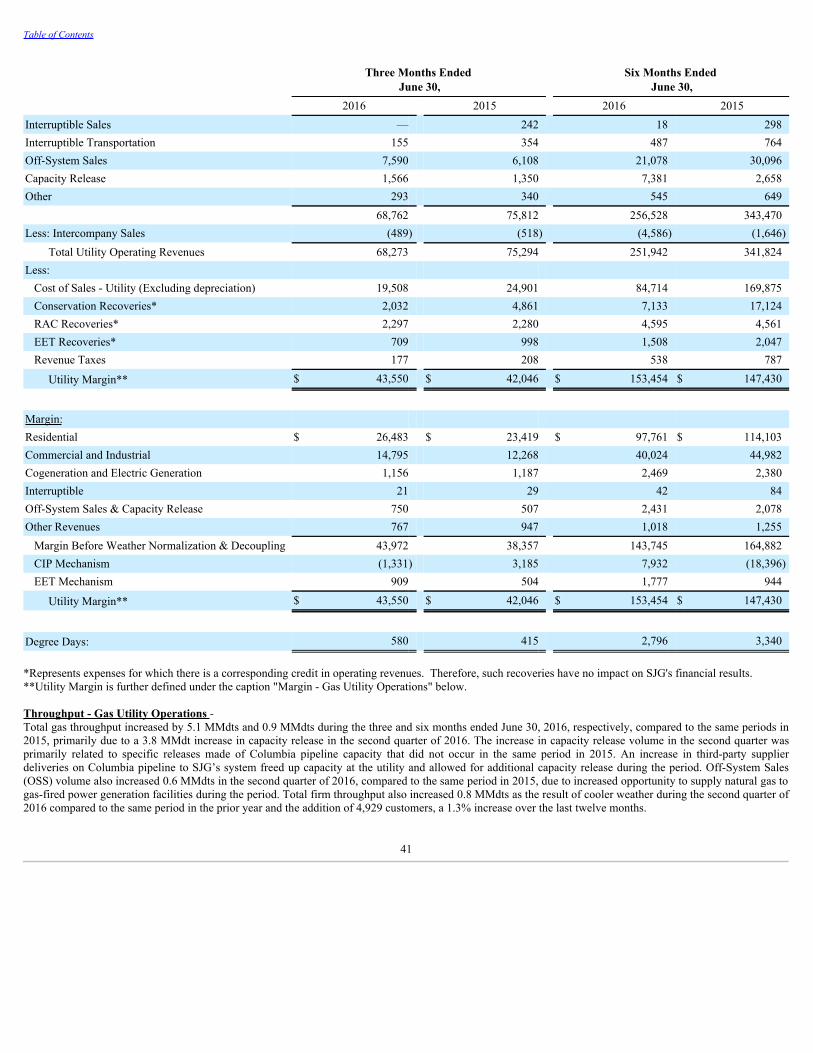
Table of Contents
Three Months Ended
June 30, Six Months Ended
June 30, 2016 2015 2016 2015Interruptible Sales — 242 18 298Interruptible Transportation 155 354 487 764Off-System Sales 7,590 6,108 21,078 30,096Capacity Release 1,566 1,350 7,381 2,658Other 293 340 545 649 68,762 75,812 256,528 343,470Less: Intercompany Sales (489) (518) (4,586) (1,646)
Total Utility Operating Revenues 68,273 75,294 251,942 341,824Less:
Cost of Sales - Utility (Excluding depreciation) 19,508 24,901 84,714 169,875Conservation Recoveries* 2,032 4,861 7,133 17,124RAC Recoveries* 2,297 2,280 4,595 4,561EET Recoveries* 709 998 1,508 2,047Revenue Taxes 177 208 538 787
Utility Margin** $ 43,550 $ 42,046 $ 153,454 $ 147,430
Margin: Residential $ 26,483 $ 23,419 $ 97,761 $ 114,103Commercial and Industrial 14,795 12,268 40,024 44,982Cogeneration and Electric Generation 1,156 1,187 2,469 2,380Interruptible 21 29 42 84Off-System Sales & Capacity Release 750 507 2,431 2,078Other Revenues 767 947 1,018 1,255
Margin Before Weather Normalization & Decoupling 43,972 38,357 143,745 164,882CIP Mechanism (1,331) 3,185 7,932 (18,396)EET Mechanism 909 504 1,777 944
Utility Margin** $ 43,550 $ 42,046 $ 153,454 $ 147,430
Degree Days: 580 415 2,796 3,340
*Represents expenses for which there is a corresponding credit in operating revenues. Therefore, such recoveries have no impact on SJG's financial results.**Utility Margin is further defined under the caption "Margin - Gas Utility Operations" below.
Throughput - Gas Utility Operations -Total gas throughput increased by 5.1 MMdts and 0.9 MMdts during the three and six months ended June 30, 2016, respectively, compared to the same periods in2015, primarily due to a 3.8 MMdt increase in capacity release in the second quarter of 2016. The increase in capacity release volume in the second quarter wasprimarily related to specific releases made of Columbia pipeline capacity that did not occur in the same period in 2015. An increase in third-party supplierdeliveries on Columbia pipeline to SJG’s system freed up capacity at the utility and allowed for additional capacity release during the period. Off-System Sales(OSS) volume also increased 0.6 MMdts in the second quarter of 2016, compared to the same period in 2015, due to increased opportunity to supply natural gas togas-fired power generation facilities during the period. Total firm throughput also increased 0.8 MMdts as the result of cooler weather during the second quarter of2016 compared to the same period in the prior year and the addition of 4,929 customers, a 1.3% increase over the last twelve months.
41
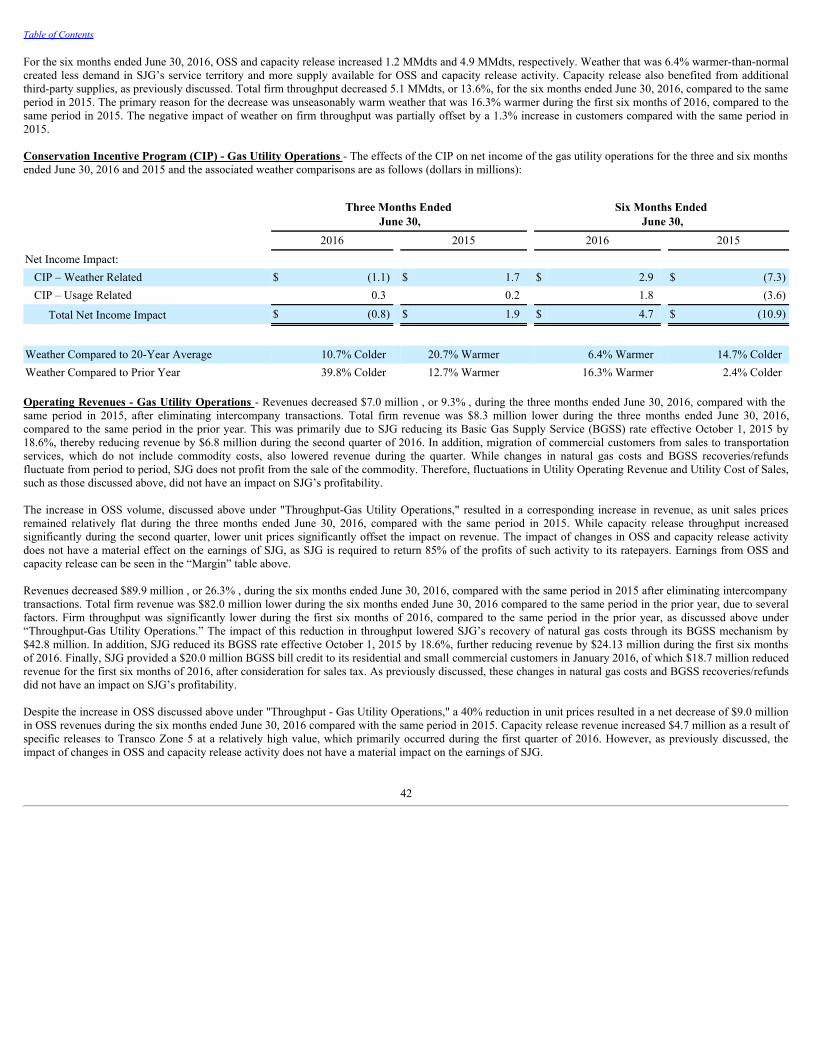
Table of Contents
For the six months ended June 30, 2016, OSS and capacity release increased 1.2 MMdts and 4.9 MMdts, respectively. Weather that was 6.4% warmer-than-normalcreated less demand in SJG’s service territory and more supply available for OSS and capacity release activity. Capacity release also benefited from additionalthird-party supplies, as previously discussed. Total firm throughput decreased 5.1 MMdts, or 13.6%, for the six months ended June 30, 2016, compared to the sameperiod in 2015. The primary reason for the decrease was unseasonably warm weather that was 16.3% warmer during the first six months of 2016, compared to thesame period in 2015. The negative impact of weather on firm throughput was partially offset by a 1.3% increase in customers compared with the same period in2015.
Conservation Incentive Program (CIP) - Gas Utility Operations - The effects of the CIP on net income of the gas utility operations for the three and six monthsended June 30, 2016 and 2015 and the associated weather comparisons are as follows (dollars in millions):
Three Months Ended
June 30, Six Months Ended
June 30, 2016 2015 2016 2015Net Income Impact:
CIP – Weather Related $ (1.1) $ 1.7 $ 2.9 $ (7.3)CIP – Usage Related 0.3 0.2 1.8 (3.6)
Total Net Income Impact $ (0.8) $ 1.9 $ 4.7 $ (10.9)
Weather Compared to 20-Year Average 10.7% Colder 20.7% Warmer 6.4% Warmer 14.7% ColderWeather Compared to Prior Year 39.8% Colder 12.7% Warmer 16.3% Warmer 2.4% Colder
Operating Revenues - Gas Utility Operations - Revenues decreased $7.0 million , or 9.3% , during the three months ended June 30, 2016, compared with thesame period in 2015, after eliminating intercompany transactions. Total firm revenue was $8.3 million lower during the three months ended June 30, 2016,compared to the same period in the prior year. This was primarily due to SJG reducing its Basic Gas Supply Service (BGSS) rate effective October 1, 2015 by18.6%, thereby reducing revenue by $6.8 million during the second quarter of 2016. In addition, migration of commercial customers from sales to transportationservices, which do not include commodity costs, also lowered revenue during the quarter. While changes in natural gas costs and BGSS recoveries/refundsfluctuate from period to period, SJG does not profit from the sale of the commodity. Therefore, fluctuations in Utility Operating Revenue and Utility Cost of Sales,such as those discussed above, did not have an impact on SJG’s profitability.
The increase in OSS volume, discussed above under "Throughput-Gas Utility Operations," resulted in a corresponding increase in revenue, as unit sales pricesremained relatively flat during the three months ended June 30, 2016, compared with the same period in 2015. While capacity release throughput increasedsignificantly during the second quarter, lower unit prices significantly offset the impact on revenue. The impact of changes in OSS and capacity release activitydoes not have a material effect on the earnings of SJG, as SJG is required to return 85% of the profits of such activity to its ratepayers. Earnings from OSS andcapacity release can be seen in the “Margin” table above.
Revenues decreased $89.9 million , or 26.3% , during the six months ended June 30, 2016, compared with the same period in 2015 after eliminating intercompanytransactions. Total firm revenue was $82.0 million lower during the six months ended June 30, 2016 compared to the same period in the prior year, due to severalfactors. Firm throughput was significantly lower during the first six months of 2016, compared to the same period in the prior year, as discussed above under“Throughput-Gas Utility Operations.” The impact of this reduction in throughput lowered SJG’s recovery of natural gas costs through its BGSS mechanism by$42.8 million. In addition, SJG reduced its BGSS rate effective October 1, 2015 by 18.6%, further reducing revenue by $24.13 million during the first six monthsof 2016. Finally, SJG provided a $20.0 million BGSS bill credit to its residential and small commercial customers in January 2016, of which $18.7 million reducedrevenue for the first six months of 2016, after consideration for sales tax. As previously discussed, these changes in natural gas costs and BGSS recoveries/refundsdid not have an impact on SJG’s profitability.
Despite the increase in OSS discussed above under "Throughput - Gas Utility Operations," a 40% reduction in unit prices resulted in a net decrease of $9.0 millionin OSS revenues during the six months ended June 30, 2016 compared with the same period in 2015. Capacity release revenue increased $4.7 million as a result ofspecific releases to Transco Zone 5 at a relatively high value, which primarily occurred during the first quarter of 2016. However, as previously discussed, theimpact of changes in OSS and capacity release activity does not have a material impact on the earnings of SJG.
42
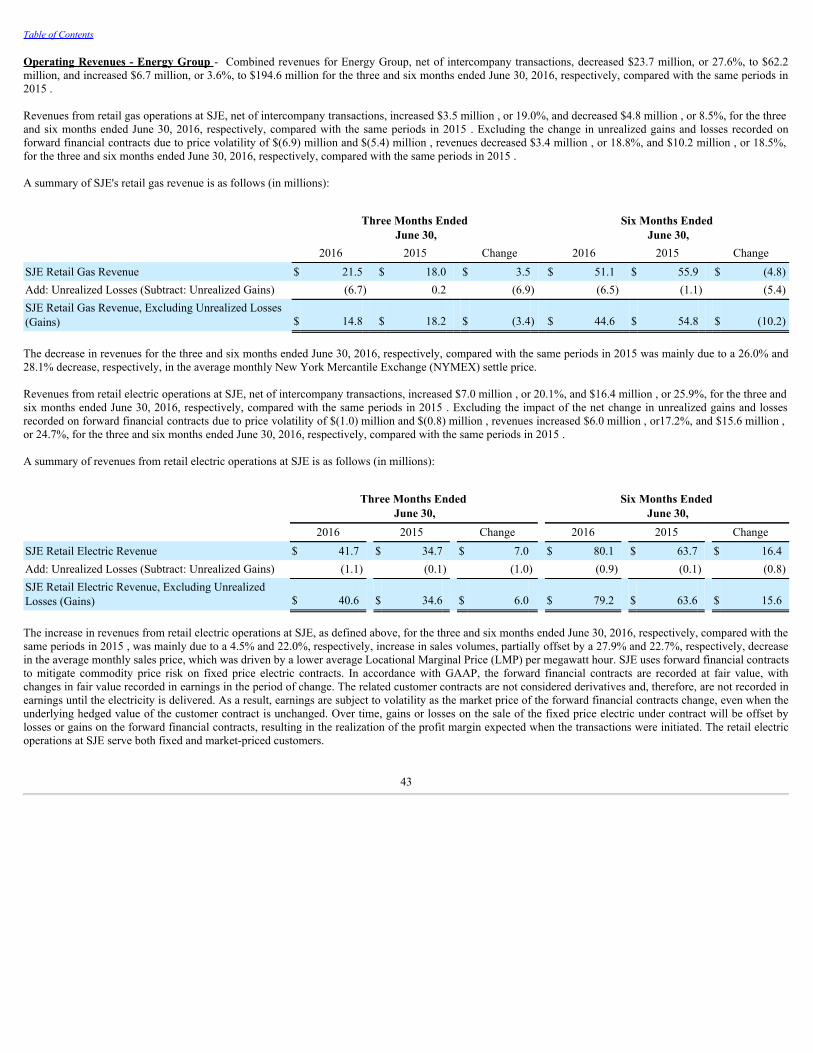
Table of Contents
Operating Revenues - Energy Group - Combined revenues for Energy Group, net of intercompany transactions, decreased $23.7 million, or 27.6%, to $62.2million, and increased $6.7 million, or 3.6%, to $194.6 million for the three and six months ended June 30, 2016, respectively, compared with the same periods in2015 .
Revenues from retail gas operations at SJE, net of intercompany transactions, increased $3.5 million , or 19.0%, and decreased $4.8 million , or 8.5%, for the threeand six months ended June 30, 2016, respectively, compared with the same periods in 2015 . Excluding the change in unrealized gains and losses recorded onforward financial contracts due to price volatility of $(6.9) million and $(5.4) million , revenues decreased $3.4 million , or 18.8%, and $10.2 million , or 18.5%,for the three and six months ended June 30, 2016, respectively, compared with the same periods in 2015 .
A summary of SJE's retail gas revenue is as follows (in millions):
Three Months Ended
June 30, Six Months Ended
June 30, 2016 2015 Change 2016 2015 ChangeSJE Retail Gas Revenue $ 21.5 $ 18.0 $ 3.5 $ 51.1 $ 55.9 $ (4.8)Add: Unrealized Losses (Subtract: Unrealized Gains) (6.7) 0.2 (6.9) (6.5) (1.1) (5.4)SJE Retail Gas Revenue, Excluding Unrealized Losses(Gains) $ 14.8 $ 18.2 $ (3.4) $ 44.6 $ 54.8 $ (10.2)
The decrease in revenues for the three and six months ended June 30, 2016, respectively, compared with the same periods in 2015 was mainly due to a 26.0% and28.1% decrease, respectively, in the average monthly New York Mercantile Exchange (NYMEX) settle price.
Revenues from retail electric operations at SJE, net of intercompany transactions, increased $7.0 million , or 20.1%, and $16.4 million , or 25.9%, for the three andsix months ended June 30, 2016, respectively, compared with the same periods in 2015 . Excluding the impact of the net change in unrealized gains and lossesrecorded on forward financial contracts due to price volatility of $(1.0) million and $(0.8) million , revenues increased $6.0 million , or17.2%, and $15.6 million ,or 24.7%, for the three and six months ended June 30, 2016, respectively, compared with the same periods in 2015 .
A summary of revenues from retail electric operations at SJE is as follows (in millions):
Three Months Ended
June 30, Six Months Ended
June 30, 2016 2015 Change 2016 2015 ChangeSJE Retail Electric Revenue $ 41.7 $ 34.7 $ 7.0 $ 80.1 $ 63.7 $ 16.4Add: Unrealized Losses (Subtract: Unrealized Gains) (1.1) (0.1) (1.0) (0.9) (0.1) (0.8)SJE Retail Electric Revenue, Excluding UnrealizedLosses (Gains) $ 40.6 $ 34.6 $ 6.0 $ 79.2 $ 63.6 $ 15.6
The increase in revenues from retail electric operations at SJE, as defined above, for the three and six months ended June 30, 2016, respectively, compared with thesame periods in 2015 , was mainly due to a 4.5% and 22.0%, respectively, increase in sales volumes, partially offset by a 27.9% and 22.7%, respectively, decreasein the average monthly sales price, which was driven by a lower average Locational Marginal Price (LMP) per megawatt hour. SJE uses forward financial contractsto mitigate commodity price risk on fixed price electric contracts. In accordance with GAAP, the forward financial contracts are recorded at fair value, withchanges in fair value recorded in earnings in the period of change. The related customer contracts are not considered derivatives and, therefore, are not recorded inearnings until the electricity is delivered. As a result, earnings are subject to volatility as the market price of the forward financial contracts change, even when theunderlying hedged value of the customer contract is unchanged. Over time, gains or losses on the sale of the fixed price electric under contract will be offset bylosses or gains on the forward financial contracts, resulting in the realization of the profit margin expected when the transactions were initiated. The retail electricoperations at SJE serve both fixed and market-priced customers.
43
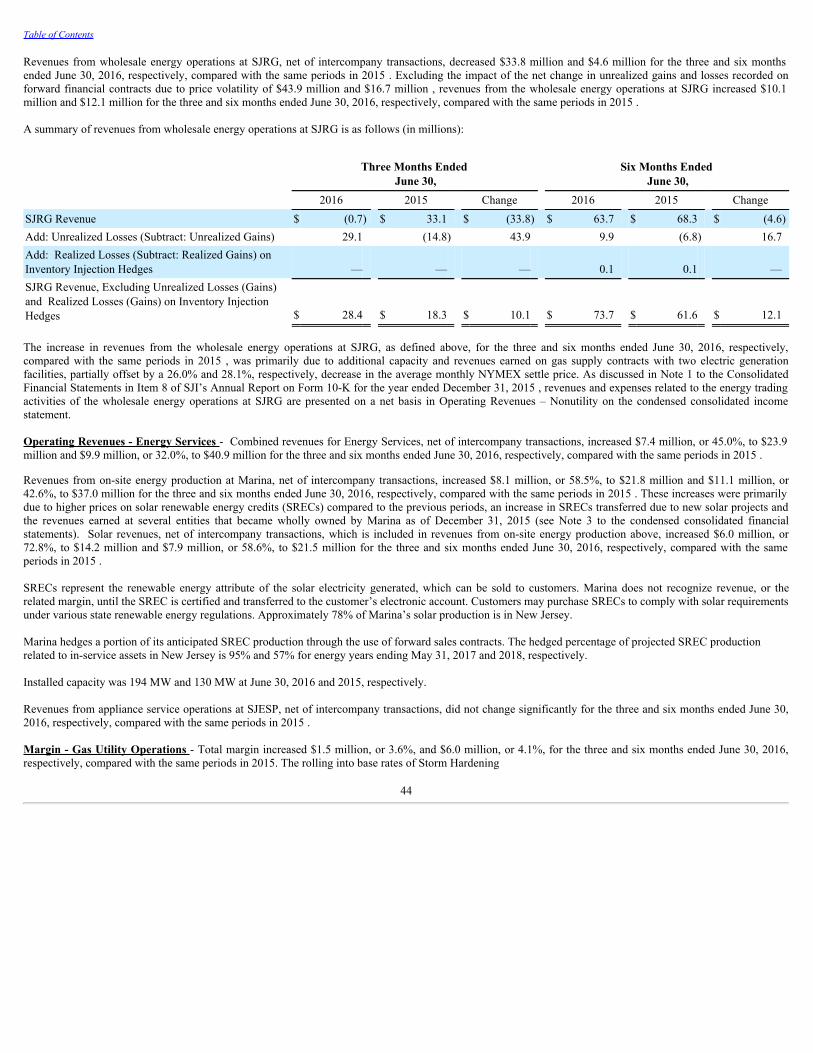
Table of Contents
Revenues from wholesale energy operations at SJRG, net of intercompany transactions, decreased $33.8 million and $4.6 million for the three and six monthsended June 30, 2016, respectively, compared with the same periods in 2015 . Excluding the impact of the net change in unrealized gains and losses recorded onforward financial contracts due to price volatility of $43.9 million and $16.7 million , revenues from the wholesale energy operations at SJRG increased $10.1million and $12.1 million for the three and six months ended June 30, 2016, respectively, compared with the same periods in 2015 .
A summary of revenues from wholesale energy operations at SJRG is as follows (in millions):
Three Months Ended
June 30, Six Months Ended
June 30, 2016 2015 Change 2016 2015 ChangeSJRG Revenue $ (0.7) $ 33.1 $ (33.8) $ 63.7 $ 68.3 $ (4.6)Add: Unrealized Losses (Subtract: Unrealized Gains) 29.1 (14.8) 43.9 9.9 (6.8) 16.7Add: Realized Losses (Subtract: Realized Gains) onInventory Injection Hedges — — — 0.1 0.1 —SJRG Revenue, Excluding Unrealized Losses (Gains)and Realized Losses (Gains) on Inventory InjectionHedges $ 28.4 $ 18.3 $ 10.1 $ 73.7 $ 61.6 $ 12.1
The increase in revenues from the wholesale energy operations at SJRG, as defined above, for the three and six months ended June 30, 2016, respectively,compared with the same periods in 2015 , was primarily due to additional capacity and revenues earned on gas supply contracts with two electric generationfacilities, partially offset by a 26.0% and 28.1%, respectively, decrease in the average monthly NYMEX settle price. As discussed in Note 1 to the ConsolidatedFinancial Statements in Item 8 of SJI’s Annual Report on Form 10-K for the year ended December 31, 2015 , revenues and expenses related to the energy tradingactivities of the wholesale energy operations at SJRG are presented on a net basis in Operating Revenues – Nonutility on the condensed consolidated incomestatement.
Operating Revenues - Energy Services - Combined revenues for Energy Services, net of intercompany transactions, increased $7.4 million, or 45.0%, to $23.9million and $9.9 million, or 32.0%, to $40.9 million for the three and six months ended June 30, 2016, respectively, compared with the same periods in 2015 .
Revenues from on-site energy production at Marina, net of intercompany transactions, increased $8.1 million, or 58.5%, to $21.8 million and $11.1 million, or42.6%, to $37.0 million for the three and six months ended June 30, 2016, respectively, compared with the same periods in 2015 . These increases were primarilydue to higher prices on solar renewable energy credits (SRECs) compared to the previous periods, an increase in SRECs transferred due to new solar projects andthe revenues earned at several entities that became wholly owned by Marina as of December 31, 2015 (see Note 3 to the condensed consolidated financialstatements). Solar revenues, net of intercompany transactions, which is included in revenues from on-site energy production above, increased $6.0 million, or72.8%, to $14.2 million and $7.9 million, or 58.6%, to $21.5 million for the three and six months ended June 30, 2016, respectively, compared with the sameperiods in 2015 .
SRECs represent the renewable energy attribute of the solar electricity generated, which can be sold to customers. Marina does not recognize revenue, or therelated margin, until the SREC is certified and transferred to the customer’s electronic account. Customers may purchase SRECs to comply with solar requirementsunder various state renewable energy regulations. Approximately 78% of Marina’s solar production is in New Jersey.
Marina hedges a portion of its anticipated SREC production through the use of forward sales contracts. The hedged percentage of projected SREC productionrelated to in-service assets in New Jersey is 95% and 57% for energy years ending May 31, 2017 and 2018, respectively.
Installed capacity was 194 MW and 130 MW at June 30, 2016 and 2015, respectively.
Revenues from appliance service operations at SJESP, net of intercompany transactions, did not change significantly for the three and six months ended June 30,2016, respectively, compared with the same periods in 2015 .
Margin - Gas Utility Operations - Total margin increased $1.5 million, or 3.6%, and $6.0 million, or 4.1%, for the three and six months ended June 30, 2016,respectively, compared with the same periods in 2015. The rolling into base rates of Storm Hardening
44
Table of Contents
and Reliability Program (SHARP) investments of approximately $36.6 million on October 1, 2015 contributed approximately $0.8 million and $2.8 million ofadditional margin for the three and six months ended June 30, 2016, respectively, compared with the same period in 2015. In addition, SJG added 4,929 customersover the 12-month period ended June 30, 2016, contributing approximately $0.6 million and $2.7 million in additional margin during the three and six monthsended June 30, 2016, compared with the same periods of 2015, respectively.
The CIP tracking mechanism adjusts earnings when actual usage per customer experienced during the period varies from an established baseline usage percustomer. As reflected in the margin and CIP tables above, the CIP mechanism reduced margin by $1.3 million, or $0.8 million after taxes, for the three monthsended June 30, 2016, primarily due to weather that was colder than average. For the three months ended June 30, 2015, the CIP mechanism protected $3.2 million,or $1.9 million after taxes, that would have been lost due to weather that was warmer than average. The CIP mechanism protected $7.9 million, or $4.7 millionafter taxes, of margin for the six months ended June 30, 2016 that would have been lost due to weather that was warmer than average and lower customer usage.The CIP mechanism reduced margin by $18.4 million, or $10.9 million after taxes, for the six months ended June 30, 2015, primarily due to weather that was muchcolder than normal.
Gross Margin - Nonutility - Gross margin for the nonutility businesses is defined as revenue less all costs that are directly related to the production, sale anddelivery of the Company’s products and services. These costs primarily include natural gas and electric commodity costs as well as certain payroll and relatedbenefits. On the statements of condensed consolidated income, revenue is reflected in Operating Revenues - Nonutility and the costs are reflected in Cost of Sales -Nonutility. As discussed in Note 16 to the Consolidated Financial Statements in Item 8 of SJI’s Annual Report on Form 10-K for the year ended December 31,2015 , revenues and expenses related to the energy trading activities of the wholesale energy operations at SJRG are presented on a net basis in OperatingRevenues - Nonutility on the condensed consolidated income statement.
Gross Margin - Energy Group - Combined gross margins for Energy Group decreased $38.1 million to a loss of $16.7 million and $2.4 million to $27.8 millionfor the three and six months ended June 30, 2016, respectively, compared with the same periods in 2015 . These changes were primarily due to the following:
• Gross margin from SJE’s retail gas and other operations increased $6.8 million to $8.3 million and $3.8 million to $9.6 million for the three and sixmonths ended June 30, 2016, respectively, compared with the same periods in 2015 . Excluding the change in unrealized gains and losses recorded onforward financial contracts due to price volatility of $(6.9) million and $(5.4) million , gross margin decreased $0.1 million and $1.6 million for the threeand six months ended June 30, 2016, respectively, compared with the same periods in 2015 . The three-month comparative period change was notsignificant. The six-month comparative period decrease is primarily due to warmer weather conditions in the first quarter of 2016 compared with the sameperiod in 2015. Excluding the impact of the unrealized gains/losses discussed above, gross margin as a percentage of Operating Revenues did not changesignificantly for the three and six months ended June 30, 2016, respectively, compared with the same periods in 2015 .
• Gross margin from SJE’s retail electric operations increased $1.7 million to $3.2 million and $1.9 million to $4.5 million for the three and six monthsended June 30, 2016, respectively, compared with the same periods in 2015 . Excluding the impact of the net change in unrealized gains and lossesrecorded on forward financial contracts due to price volatility of $(1.0) million and $(0.8) million , gross margin increased $0.7 million and $1.1 millionfor the three and six months ended June 30, 2016, respectively, compared with the same periods in 2015 . These increases are mainly due to increasedsales volumes as discussed in "Operating Revenues - Energy Group" above. Excluding the impact of the unrealized gains/losses discussed above, grossmargin as a percentage of Operating Revenues did not change significantly for the three and six months ended June 30, 2016, respectively, compared withthe same periods in 2015 .
• Gross margin from the wholesale energy operations at SJRG decreased $46.6 million to a loss of $28.2 million and $8.1 million to $13.8 million for thethree and six months ended June 30, 2016, respectively, compared with the same periods in 2015 . Excluding the impact of the net change in unrealizedgains and losses recorded on forward financial contracts due to price volatility of $43.9 million and $16.7 million , gross margin for the wholesale energyoperations at SJRG decreased $2.7 million and increased $8.6 million for the three and six months ended June 30, 2016, respectively, compared with thesame periods in 2015 . The three-month comparative period decrease was primarily due to lower margins on daily energy trading activities. The six-month comparative period increase was due mainly to additional capacity in the first quarter of 2016 compared to the prior year.
The wholesale energy operations at SJRG expect to continue to add incremental margin from marketing and related opportunities in the Marcellus region,capitalizing on its established presence in the area. Future margins could fluctuate significantly due to the volatile nature of wholesale gas prices. As ofJune 30, 2016 , the wholesale energy operations had 9.1 Bcf of storage and 373,253 dts/day of transportation under contract.
45
Table of Contents
Gross Margin - Energy Services - Combined gross margins for Energy Services increased $9.0 million to $24.0 million and $15.2 million to $41.0 million for thethree and six months ended June 30, 2016, respectively, compared with the same periods in 2015 . These changes were primarily due to the following:
• Gross margin from on-site energy production at Marina increased $9.1 million to $22.9 million and $15.5 million to $39.0 million for the three and sixmonths ended June 30, 2016, respectively, compared with the same periods in 2015 . Gross margin as a percentage of Operating Revenues increased 4.7and 14.7 percentage points for the three and six months ended June 30, 2016, respectively, compared with the same periods in 2015 . These increases areprimarily due to several new higher margin renewable energy projects that began operations over the past twelve months, along with higher prices onSRECs compared to the previous year. Also contributing to the increase were margins earned at several entities that became wholly owned by Marina asof December 31, 2015 (see Note 3 to the condensed consolidated financial statements).
• Gross margin from appliance service operations at SJESP did not change significantly for the three and six months ended June 30, 2016, respectively,compared with the same periods in 2015 .
Operating Expenses - A summary of net changes in operations expense for the three and six months ended June 30 , follows (in thousands):
Three Months Ended June30,
2016 vs. 2015 Six Months Ended June 30,
2016 vs. 2015Gas Utility Operations $ (1,414) $ (8,703)Nonutility:
Energy Group: Wholesale Energy Operations (369) 22 Retail Gas and Other Operations 17 214 Retail Electric Operations 248 273 Subtotal Energy Group (104) 509Energy Services: On-Site Energy Production 3,571 7,405 Appliance Service Operations (136) (346)
Subtotal Energy Services 3,435 7,059 Total Nonutility 3,331 7,568
Intercompany Eliminations and Other 531 519
Total Operations Expense $ 2,448 $ (616)
Operations - Gas utility operations expense decreased $1.4 million and $8.7 million for the three and six months ended June 30, 2016, respectively, comparedwith the same periods in 2015 . The decreases primarily resulted from the operation of SJG's New Jersey Clean Energy Program and Energy Efficiency Programs.Such costs are recovered on a dollar-for-dollar basis; therefore, SJG experienced an offsetting decrease in revenue during the three and six months ended June 30,2016, compared with the same periods in the prior year. This was due to a reduction in the approved rates used to recover such costs, as well as lower recoveriesresulting from warmer weather primarily during the first quarter of 2016, as previously discussed under "Throughput-Gas Utility Operations" above.
Nonutility operations expense increased $3.3 million and $7.6 million for the three and six months ended June 30, 2016, respectively, compared with the sameperiods in 2015 , primarily due to operating expenses incurred at several entities that became wholly owned by Marina as of December 31, 2015 (see Note 3 to thecondensed consolidated financial statements) along with operating expenses at several new renewable energy projects that began operations over the past twelvemonths. Also contributing to the increase is additional personnel, governance and compliance costs incurred to support continued growth.
Maintenance - The change in maintenance expense for the three and six months ended June 30, 2016, respectively, compared with the same periods in 2015 , wasnot significant.
46
Table of Contents
Depreciation - Depreciation increased $4.9 million and $8.7 million for the three and six months ended June 30, 2016, respectively, compared with the sameperiods in 2015 , primarily due to the increased investment in property, plant and equipment by the gas utility operations of SJG and on-site energy production atMarina.
Energy and Other Taxes - The change in energy and other taxes for the three and six months ended June 30, 2016, respectively, compared with the same periodsin 2015 , was not significant.
Other Income and Expense - Other income increased $1.3 million for both the three and six months ended June 30, 2016, respectively, compared with the sameperiods in 2015 primarily due to a settlement at Marina in 2016 as discussed in Note 5 to the condensed consolidated financial statements.
Interest Charges – Interest charges increased $0.8 million and $1.3 million for the three and six months ended June 30, 2016, respectively, compared with thesame periods in 2015 primarily due to higher amounts of long-term debt outstanding at SJI and SJG, partially offset by higher capitalization of interest costs onconstruction at the gas utility operations of SJG during 2016. This was a result of accumulating capital investments under SJG's Accelerated InfrastructureReplacement Program (AIRP). AIRP investments are approved by the New Jersey Board of Public Utilities (BPU) to accrue interest on construction until suchtime as they are rolled into base rates.
Income Taxes – Income tax benefit increased $3.9 million for the three months ended June 30, 2016 compared with the same period in 2015 primarily due to aloss before income taxes incurred during the three months ended June 30, 2016 compared to income in the prior period, along with a higher effective tax rate due toa projected decrease in the investment tax credits available on renewable energy facilities at Marina. Income tax expense increased $18.7 million for the six monthsended June 30, 2016 compared with the same period in 2015 primarily due to higher income before income taxes along with a higher effective tax rate due to aprojected decrease in the investment tax credits available on renewable energy facilities at Marina.
Equity in Earnings (Losses) of Affiliated Companies – Equity in losses of affiliated companies decreased $15.7 million for the three months ended June 30,2016 compared with the same period in 2015. Equity in affiliated companies went from a loss of $15.4 million to earnings of less than $0.1 million for the sixmonths ended June 30, 2016 and 2015, respectively. The three and six month comparative period changes were primarily due to the impact of a reduction in thecarrying amount of an investment at one of Energenic's operating subsidiaries, which occurred in the second quarter of 2015 (see Note 5 to the condensedconsolidated financial statements).
Discontinued Operations — The results are primarily comprised of environmental remediation and product liability litigation associated with previously disposedof businesses.
LIQUIDITY AND CAPITAL RESOURCES:
Liquidity needs are driven by factors that include natural gas commodity prices; the impact of weather on customer bills; lags in fully collecting gas costs fromcustomers under the BGSS charge and other regulatory clauses; working capital needs of our energy trading and marketing activities; the timing of constructionand remediation expenditures and related permanent financings; the timing of equity contributions to unconsolidated affiliates; mandated tax payment dates; bothdiscretionary and required repayments of long-term debt; and the amounts and timing of dividend payments.
Cash Flows from Operating Activities — Liquidity needs are first met with net cash provided by operating activities. Net cash provided by operating activitiestotaled $158.1 million and $102.1 million in the first six months of 2016 and 2015 , respectively. Net cash provided by operating activities varies from year-to-yearprimarily due to the impact of weather on customer demand and related gas purchases, customer usage factors related to conservation efforts and the price of thenatural gas commodity, inventory utilization, and gas cost recoveries. Operating activities in the first six months of 2016 produced more net cash than the sameperiod in 2015 , primarily due to improvements in working capital as a result of lower payments for gas purchases driven by warmer weather experienced duringthe first quarter of 2016. Also, SJI did not make a pension payment in 2016. In 2015, SJI made a $15.0 million pension contribution as a result of a decline in thediscount rate and new mortality tables released at the end of 2014, both of which negatively impacted the funding status of its pension plans. The Company strivesto keep its pension plans fully funded. When factors such as lesser than expected asset performance and/or declining discount rates negatively impact the fundingstatus of the plans, the Company increases its contributions to supplant that funding shortfall.
47
Table of Contents
Cash Flows from Investing Activities — SJI has a continuing need for cash resources and capital, primarily to invest in new and replacement facilities andequipment. Net cash outflows from investing activities, which are primarily construction projects, for the first six months of 2016 and 2015 amounted to $115.1million and $145.7 million , respectively. We estimate the net cash outflows for investing activities for fiscal years 2016, 2017 and 2018 at SJI to be approximately$321.9 million , $383.6 million and $221.5 million , respectively. The high level of investing activities for 2016, 2017 and 2018 is due to a combination of theaccelerated infrastructure investment programs and a major pipeline project to support an electric generation facility, both at SJG. Also contributing to the highlevel of investing activities are SJI Midstream investments in 2016 through 2018 and limited solar projects at Marina in 2016. The Company expects to use short-term borrowings under lines of credit from commercial banks and the commercial paper program to finance these investing activities as incurred. From time totime, the Company may refinance the short-term debt with long-term debt.
In support of its risk management activities, the Company is required to maintain margin accounts with selected counterparties as collateral for its forwardcontracts, swap agreements, options contracts and futures contracts. These margin accounts are included in Restricted Investments or Margin Account Liability,depending upon the value of the related contracts (the change in the Margin Account Liability is reflected in cash flows from Operating Activities) on thecondensed consolidated balance sheets. The required amount of restricted investments changes on a daily basis due to fluctuations in the market value of therelated outstanding contracts and is difficult to predict. Margin posted by the Company decreased by $7.8 million in the first six months of 2016 , compared with adecrease of $12.6 million in the same period of 2015 .
During the first six months of 2016 and 2015, the Company made net investments in unconsolidated affiliates of $4.6 million and $1.3 million , respectively.
In June 2015, SJG advanced $10.0 million to a not-for-profit organization formed to spur economic development in Atlantic City, New Jersey. The note bearsinterest at 1.0% for an initial term of six months, with the borrower’s option to extend the term for two additional terms of three months each. In December 2015and February 2016, the borrower exercised each option, respectively. SJG holds a first lien security interest on land in Atlantic City as collateral against this note. In July 2016, the note was repaid in full (see Note 16 to the condensed consolidated financial statements). Cash Flows from Financing Activities — Short-term borrowings from the commercial paper program and lines of credit from commercial banks are used tosupplement cash flows from operations, to support working capital needs and to finance capital expenditures as incurred. From time to time, short-term debtincurred to finance capital expenditures is refinanced with long-term debt.
Credit facilities and available liquidity as of June 30, 2016 were as follows (in thousands):
Company Total Facility Usage AvailableLiquidity Expiration Date
SJG: Commercial Paper Program/Revolving Credit Facility $ 200,000 $ 14,100 (A) $ 185,900 May 2018 Uncommitted Bank Lines 10,000 — 10,000 August 2016 (C)
Total SJG 210,000 14,100 195,900
SJI:
Revolving Credit Facility 400,000 134,900 (B) 265,100 February 2018
Total SJI 400,000 134,900 265,100
Total $ 610,000 $ 149,000 $ 461,000
(A) Includes letters of credit outstanding in the amount of $0.8 million .(B) Includes letters of credit outstanding in the amount of $2.8 million .(C) SJG anticipates renewing the Uncommitted Bank Line prior to expiration.
48
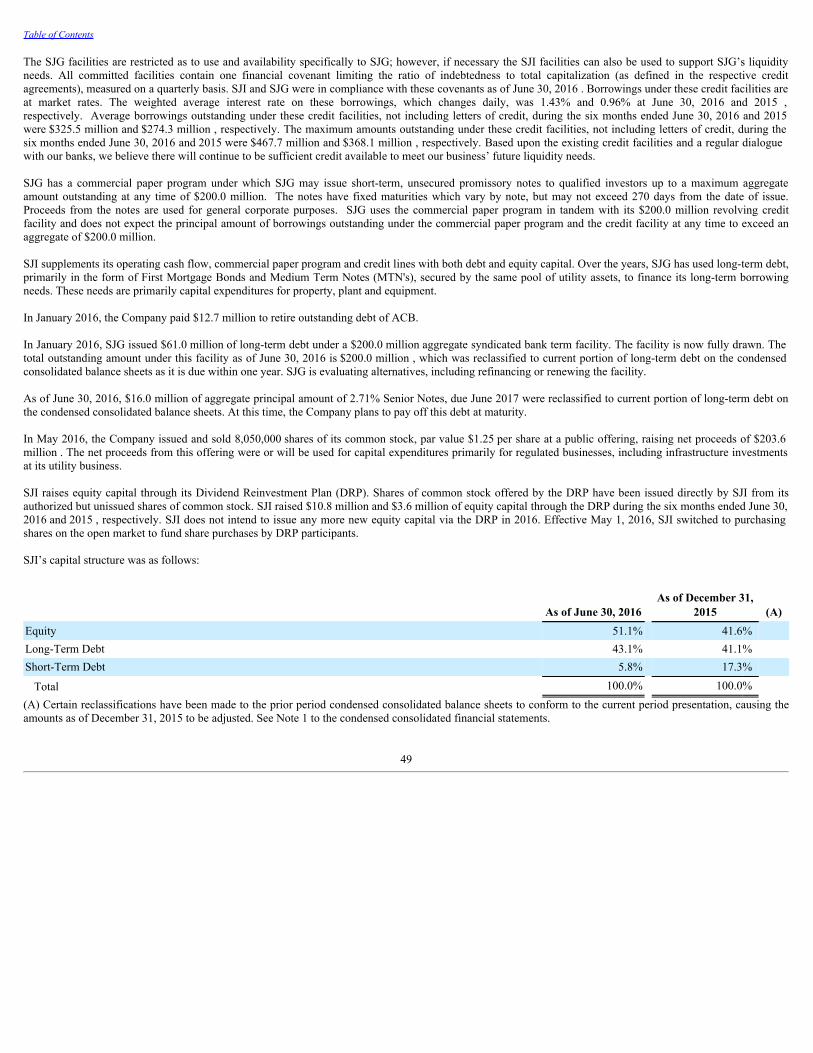
Table of Contents
The SJG facilities are restricted as to use and availability specifically to SJG; however, if necessary the SJI facilities can also be used to support SJG’s liquidityneeds. All committed facilities contain one financial covenant limiting the ratio of indebtedness to total capitalization (as defined in the respective creditagreements), measured on a quarterly basis. SJI and SJG were in compliance with these covenants as of June 30, 2016 . Borrowings under these credit facilities areat market rates. The weighted average interest rate on these borrowings, which changes daily, was 1.43% and 0.96% at June 30, 2016 and 2015 ,respectively. Average borrowings outstanding under these credit facilities, not including letters of credit, during the six months ended June 30, 2016 and 2015were $325.5 million and $274.3 million , respectively. The maximum amounts outstanding under these credit facilities, not including letters of credit, during thesix months ended June 30, 2016 and 2015 were $467.7 million and $368.1 million , respectively. Based upon the existing credit facilities and a regular dialoguewith our banks, we believe there will continue to be sufficient credit available to meet our business’ future liquidity needs.
SJG has a commercial paper program under which SJG may issue short-term, unsecured promissory notes to qualified investors up to a maximum aggregateamount outstanding at any time of $200.0 million. The notes have fixed maturities which vary by note, but may not exceed 270 days from the date of issue.Proceeds from the notes are used for general corporate purposes. SJG uses the commercial paper program in tandem with its $200.0 million revolving creditfacility and does not expect the principal amount of borrowings outstanding under the commercial paper program and the credit facility at any time to exceed anaggregate of $200.0 million.
SJI supplements its operating cash flow, commercial paper program and credit lines with both debt and equity capital. Over the years, SJG has used long-term debt,primarily in the form of First Mortgage Bonds and Medium Term Notes (MTN's), secured by the same pool of utility assets, to finance its long-term borrowingneeds. These needs are primarily capital expenditures for property, plant and equipment.
In January 2016, the Company paid $12.7 million to retire outstanding debt of ACB.
In January 2016, SJG issued $61.0 million of long-term debt under a $200.0 million aggregate syndicated bank term facility. The facility is now fully drawn. Thetotal outstanding amount under this facility as of June 30, 2016 is $200.0 million , which was reclassified to current portion of long-term debt on the condensedconsolidated balance sheets as it is due within one year. SJG is evaluating alternatives, including refinancing or renewing the facility.
As of June 30, 2016, $16.0 million of aggregate principal amount of 2.71% Senior Notes, due June 2017 were reclassified to current portion of long-term debt onthe condensed consolidated balance sheets. At this time, the Company plans to pay off this debt at maturity.
In May 2016, the Company issued and sold 8,050,000 shares of its common stock, par value $1.25 per share at a public offering, raising net proceeds of $203.6million . The net proceeds from this offering were or will be used for capital expenditures primarily for regulated businesses, including infrastructure investmentsat its utility business.
SJI raises equity capital through its Dividend Reinvestment Plan (DRP). Shares of common stock offered by the DRP have been issued directly by SJI from itsauthorized but unissued shares of common stock. SJI raised $10.8 million and $3.6 million of equity capital through the DRP during the six months ended June 30,2016 and 2015 , respectively. SJI does not intend to issue any more new equity capital via the DRP in 2016. Effective May 1, 2016, SJI switched to purchasingshares on the open market to fund share purchases by DRP participants.
SJI’s capital structure was as follows:
As of June 30, 2016 As of December 31,
2015 (A)Equity 51.1% 41.6% Long-Term Debt 43.1% 41.1% Short-Term Debt 5.8% 17.3%
Total 100.0% 100.0% (A) Certain reclassifications have been made to the prior period condensed consolidated balance sheets to conform to the current period presentation, causing theamounts as of December 31, 2015 to be adjusted. See Note 1 to the condensed consolidated financial statements.
49
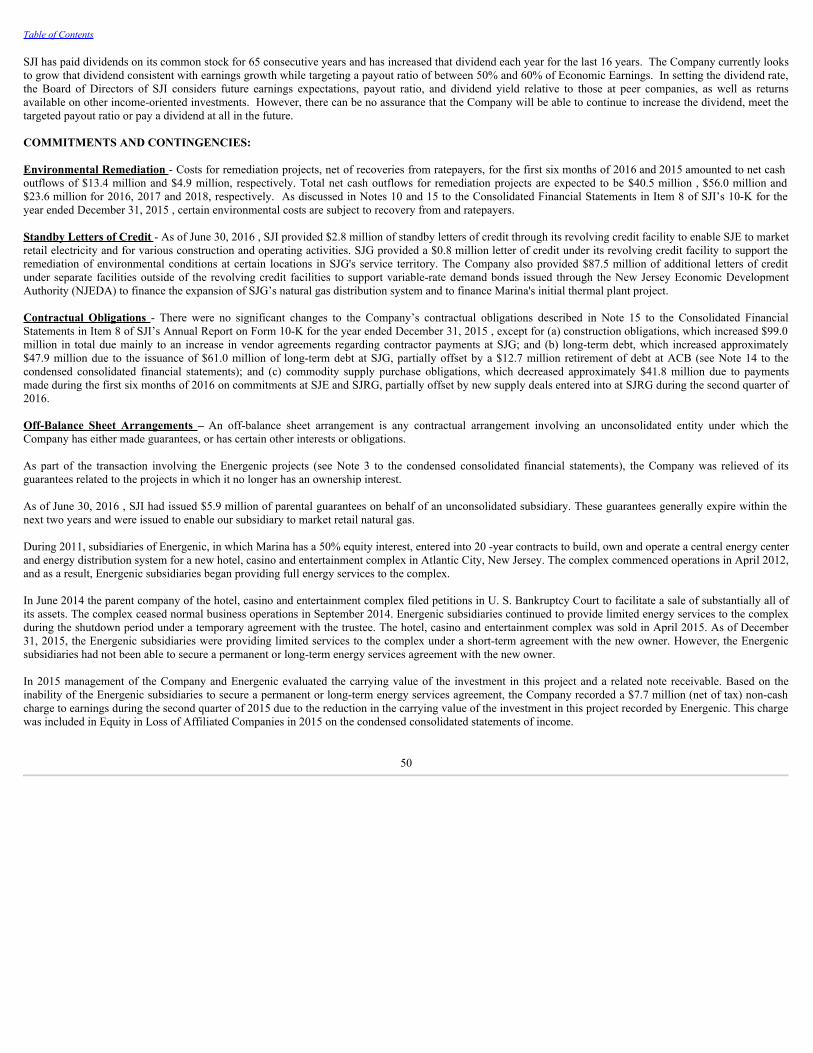
Table of Contents
SJI has paid dividends on its common stock for 65 consecutive years and has increased that dividend each year for the last 16 years. The Company currently looksto grow that dividend consistent with earnings growth while targeting a payout ratio of between 50% and 60% of Economic Earnings. In setting the dividend rate,the Board of Directors of SJI considers future earnings expectations, payout ratio, and dividend yield relative to those at peer companies, as well as returnsavailable on other income-oriented investments. However, there can be no assurance that the Company will be able to continue to increase the dividend, meet thetargeted payout ratio or pay a dividend at all in the future.
COMMITMENTS AND CONTINGENCIES:
Environmental Remediation - Costs for remediation projects, net of recoveries from ratepayers, for the first six months of 2016 and 2015 amounted to net cashoutflows of $13.4 million and $4.9 million, respectively. Total net cash outflows for remediation projects are expected to be $40.5 million , $56.0 million and$23.6 million for 2016, 2017 and 2018, respectively. As discussed in Notes 10 and 15 to the Consolidated Financial Statements in Item 8 of SJI’s 10-K for theyear ended December 31, 2015 , certain environmental costs are subject to recovery from and ratepayers.
Standby Letters of Credit - As of June 30, 2016 , SJI provided $2.8 million of standby letters of credit through its revolving credit facility to enable SJE to marketretail electricity and for various construction and operating activities. SJG provided a $0.8 million letter of credit under its revolving credit facility to support theremediation of environmental conditions at certain locations in SJG's service territory. The Company also provided $87.5 million of additional letters of creditunder separate facilities outside of the revolving credit facilities to support variable-rate demand bonds issued through the New Jersey Economic DevelopmentAuthority (NJEDA) to finance the expansion of SJG’s natural gas distribution system and to finance Marina's initial thermal plant project.
Contractual Obligations - There were no significant changes to the Company’s contractual obligations described in Note 15 to the Consolidated FinancialStatements in Item 8 of SJI’s Annual Report on Form 10-K for the year ended December 31, 2015 , except for (a) construction obligations, which increased $99.0million in total due mainly to an increase in vendor agreements regarding contractor payments at SJG; and (b) long-term debt, which increased approximately$47.9 million due to the issuance of $61.0 million of long-term debt at SJG, partially offset by a $12.7 million retirement of debt at ACB (see Note 14 to thecondensed consolidated financial statements); and (c) commodity supply purchase obligations, which decreased approximately $41.8 million due to paymentsmade during the first six months of 2016 on commitments at SJE and SJRG, partially offset by new supply deals entered into at SJRG during the second quarter of2016.
Off-Balance Sheet Arrangements – An off-balance sheet arrangement is any contractual arrangement involving an unconsolidated entity under which theCompany has either made guarantees, or has certain other interests or obligations.
As part of the transaction involving the Energenic projects (see Note 3 to the condensed consolidated financial statements), the Company was relieved of itsguarantees related to the projects in which it no longer has an ownership interest.
As of June 30, 2016 , SJI had issued $5.9 million of parental guarantees on behalf of an unconsolidated subsidiary. These guarantees generally expire within thenext two years and were issued to enable our subsidiary to market retail natural gas.
During 2011, subsidiaries of Energenic, in which Marina has a 50% equity interest, entered into 20 -year contracts to build, own and operate a central energy centerand energy distribution system for a new hotel, casino and entertainment complex in Atlantic City, New Jersey. The complex commenced operations in April 2012,and as a result, Energenic subsidiaries began providing full energy services to the complex.
In June 2014 the parent company of the hotel, casino and entertainment complex filed petitions in U. S. Bankruptcy Court to facilitate a sale of substantially all ofits assets. The complex ceased normal business operations in September 2014. Energenic subsidiaries continued to provide limited energy services to the complexduring the shutdown period under a temporary agreement with the trustee. The hotel, casino and entertainment complex was sold in April 2015. As of December31, 2015, the Energenic subsidiaries were providing limited services to the complex under a short-term agreement with the new owner. However, the Energenicsubsidiaries had not been able to secure a permanent or long-term energy services agreement with the new owner.
In 2015 management of the Company and Energenic evaluated the carrying value of the investment in this project and a related note receivable. Based on theinability of the Energenic subsidiaries to secure a permanent or long-term energy services agreement, the Company recorded a $7.7 million (net of tax) non-cashcharge to earnings during the second quarter of 2015 due to the reduction in the carrying value of the investment in this project recorded by Energenic. This chargewas included in Equity in Loss of Affiliated Companies in 2015 on the condensed consolidated statements of income.
50

Table of Contents
The central energy center and energy distribution system owned by the Energenic subsidiaries was financed in part by the issuance of bonds during 2011. Thesebonds were collateralized primarily by certain assets of the central energy center and revenue from the energy services agreement with the hotel, casino andentertainment complex. During 2015, due to the cessation of normal business operations of the complex and the inability of the Energenic subsidiaries to meet itsobligations under the bonds, the trustee for the bondholders filed suit to foreclose on certain assets of the central energy center. In November 2015 duringsettlement discussions, the bondholders alleged, among other things, that they were entitled to recover from Energenic itself, any amounts owed under the bondsthat were not covered by the collateral, including principal, interest and attorney’s fees. The bondholders’ assertion was based on inconsistent language in the bonddocuments. In January 2016, Energenic and certain subsidiaries reached a multi-party settlement with the bondholders. This agreement resolves all outstandinglitigation and transfers ownership of the bondholders’ collateral to the owners of the entertainment complex. The Company’s share of this settlement was $7.5million which was accrued by Energenic as of December 31, 2015 and paid in 2016. The Company entered into agreements with its insurance carrier and externallegal advisors to recover, net of legal costs, approximately $7.0 million of costs associated with the bondholder settlement discussed above, $2.1 million of whichhas been received as of June 30, 2016 and included in Other Income on the condensed consolidated statements of income. The remaining $4.9 million is expectedto be received and recognized into income prior to the end of the year.
As of June 30, 2016 , the Company, through its investment in Energenic, had a remaining net asset of approximately $1.1 million included in Investment inAffiliates on the condensed consolidated balance sheets related to cogeneration assets for this project. In addition, the Company had approximately $13.6 millionincluded in Notes Receivable - Affiliate on the condensed consolidated balance sheets, due from Energenic, which is secured by those cogeneration assets. Thisnote is subject to a reimbursement agreement that secures reimbursement for the Company, from its joint venture partner, of a proportionate share of any amountsthat are not repaid.
Management will continue to monitor the situation surrounding the complex and will evaluate the carrying value of the investment and the note receivable as futureevents occur.
Pending Litigation — The Company is subject to claims arising in the ordinary course of business and other legal proceedings. The Company has been namedin, among other actions, certain gas supply and capacity management contract disputes and certain product liability claims related to our former sand miningsubsidiary. We accrue liabilities related to these claims when we can reasonably estimate the amount or range of amounts of probable settlement costs or othercharges for these claims. The Company has accrued approximately $3.1 million and $3.2 million related to all claims in the aggregate as of June 30, 2016 andDecember 31, 2015 , respectively. Management does not believe that it is reasonably possible that there will be a material change in the Company's estimatedliability in the near term and does not currently anticipate the disposition of any known claims that would have a material effect on the Company's financialposition, results of operations or cash flows.
Item 3. Quantitative and Qualitative Disclosures About Market Risk
Commodity Market Risks — Certain regulated and nonregulated SJI subsidiaries are involved in buying, selling, transporting and storing natural gas and buyingand selling retail electricity for their own accounts as well as managing these activities for third parties. These subsidiaries are subject to market risk due to pricefluctuations. To hedge against this risk, we enter into a variety of physical and financial transactions including forward contracts, swaps, futures and optionsagreements. To manage these transactions, SJI has a well-defined risk management policy approved by our Board of Directors that includes volumetric andmonetary limits. Management reviews reports detailing activity daily. Generally, the derivative activities described above are entered into for risk managementpurposes.
As part of its gas purchasing strategy, SJG uses financial contracts to hedge against forward price risk. These contracts are recoverable through SJG’s BGSS,subject to BPU approval.
The retail gas operations of SJE transact commodities on a physical basis and SJE typically does not enter into financial derivative positions directly. SJRGmanages risk in the natural gas markets for SJE as well as for its own portfolio by entering into the types of transactions noted above. The retail electric operationsof SJE use forward physical and financial contracts to mitigate commodity price risk on fixed price electric contracts. It is management's policy, to the extentpractical, within predetermined risk management policy guidelines, to have limited unmatched positions on a deal or portfolio basis while conducting theseactivities. As a result of holding open positions to a minimal level, the economic impact of changes in value of a particular transaction is substantially offset by anopposite change in the related hedge transaction.
51
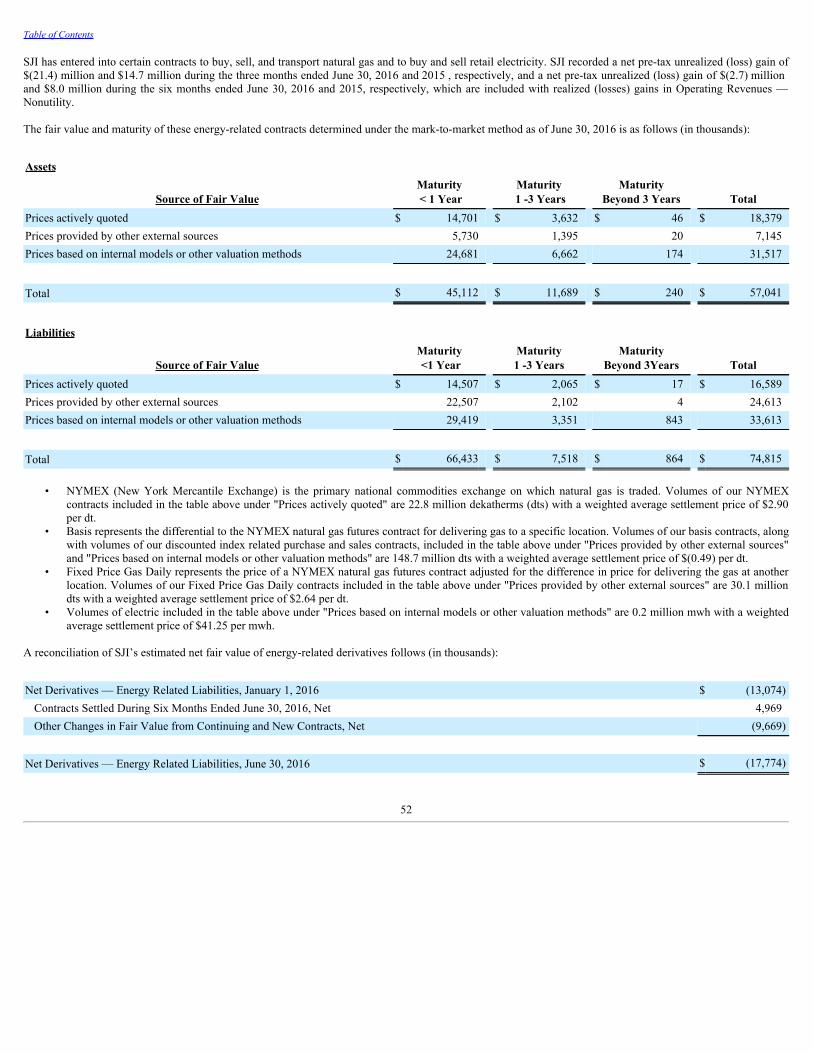
Table of Contents
SJI has entered into certain contracts to buy, sell, and transport natural gas and to buy and sell retail electricity. SJI recorded a net pre-tax unrealized (loss) gain of$(21.4) million and $14.7 million during the three months ended June 30, 2016 and 2015 , respectively, and a net pre-tax unrealized (loss) gain of $(2.7) millionand $8.0 million during the six months ended June 30, 2016 and 2015, respectively, which are included with realized (losses) gains in Operating Revenues —Nonutility.
The fair value and maturity of these energy-related contracts determined under the mark-to-market method as of June 30, 2016 is as follows (in thousands):
Assets
Source of Fair ValueMaturity < 1 Year
Maturity 1 -3 Years
MaturityBeyond 3 Years Total
Prices actively quoted $ 14,701 $ 3,632 $ 46 $ 18,379Prices provided by other external sources 5,730 1,395 20 7,145Prices based on internal models or other valuation methods 24,681 6,662 174 31,517
Total $ 45,112 $ 11,689 $ 240 $ 57,041
Liabilities
Source of Fair ValueMaturity <1 Year
Maturity1 -3 Years
MaturityBeyond 3Years Total
Prices actively quoted $ 14,507 $ 2,065 $ 17 $ 16,589Prices provided by other external sources 22,507 2,102 4 24,613Prices based on internal models or other valuation methods 29,419 3,351 843 33,613
Total $ 66,433 $ 7,518 $ 864 $ 74,815
• NYMEX (New York Mercantile Exchange) is the primary national commodities exchange on which natural gas is traded. Volumes of our NYMEXcontracts included in the table above under "Prices actively quoted" are 22.8 million dekatherms (dts) with a weighted average settlement price of $2.90per dt.
• Basis represents the differential to the NYMEX natural gas futures contract for delivering gas to a specific location. Volumes of our basis contracts, alongwith volumes of our discounted index related purchase and sales contracts, included in the table above under "Prices provided by other external sources"and "Prices based on internal models or other valuation methods" are 148.7 million dts with a weighted average settlement price of $(0.49) per dt.
• Fixed Price Gas Daily represents the price of a NYMEX natural gas futures contract adjusted for the difference in price for delivering the gas at anotherlocation. Volumes of our Fixed Price Gas Daily contracts included in the table above under "Prices provided by other external sources" are 30.1 milliondts with a weighted average settlement price of $2.64 per dt.
• Volumes of electric included in the table above under "Prices based on internal models or other valuation methods" are 0.2 million mwh with a weightedaverage settlement price of $41.25 per mwh.
A reconciliation of SJI’s estimated net fair value of energy-related derivatives follows (in thousands):
Net Derivatives — Energy Related Liabilities, January 1, 2016 $ (13,074)Contracts Settled During Six Months Ended June 30, 2016, Net 4,969Other Changes in Fair Value from Continuing and New Contracts, Net (9,669)
Net Derivatives — Energy Related Liabilities, June 30, 2016 $ (17,774)
52
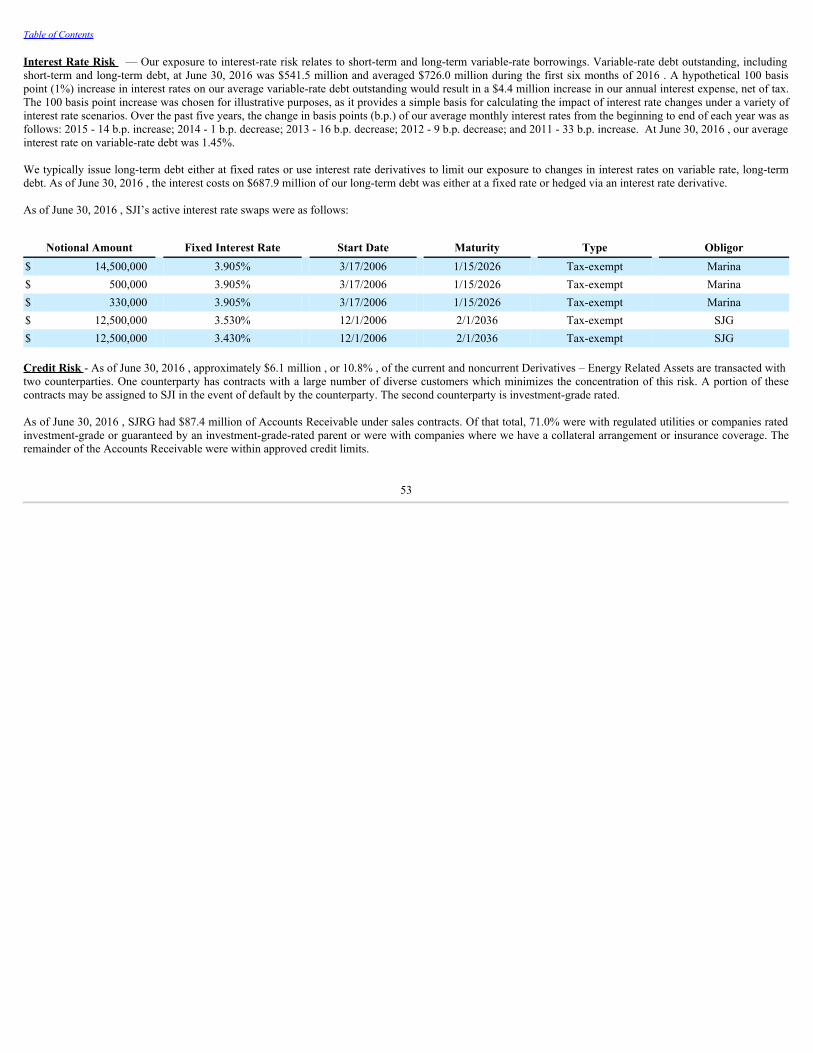
Table of Contents
Interest Rate Risk — Our exposure to interest-rate risk relates to short-term and long-term variable-rate borrowings. Variable-rate debt outstanding, includingshort-term and long-term debt, at June 30, 2016 was $541.5 million and averaged $726.0 million during the first six months of 2016 . A hypothetical 100 basispoint (1%) increase in interest rates on our average variable-rate debt outstanding would result in a $4.4 million increase in our annual interest expense, net of tax.The 100 basis point increase was chosen for illustrative purposes, as it provides a simple basis for calculating the impact of interest rate changes under a variety ofinterest rate scenarios. Over the past five years, the change in basis points (b.p.) of our average monthly interest rates from the beginning to end of each year was asfollows: 2015 - 14 b.p. increase; 2014 - 1 b.p. decrease; 2013 - 16 b.p. decrease; 2012 - 9 b.p. decrease; and 2011 - 33 b.p. increase. At June 30, 2016 , our averageinterest rate on variable-rate debt was 1.45%.
We typically issue long-term debt either at fixed rates or use interest rate derivatives to limit our exposure to changes in interest rates on variable rate, long-termdebt. As of June 30, 2016 , the interest costs on $687.9 million of our long-term debt was either at a fixed rate or hedged via an interest rate derivative.
As of June 30, 2016 , SJI’s active interest rate swaps were as follows:
Notional Amount Fixed Interest Rate Start Date Maturity Type Obligor$ 14,500,000 3.905% 3/17/2006 1/15/2026 Tax-exempt Marina$ 500,000 3.905% 3/17/2006 1/15/2026 Tax-exempt Marina$ 330,000 3.905% 3/17/2006 1/15/2026 Tax-exempt Marina$ 12,500,000 3.530% 12/1/2006 2/1/2036 Tax-exempt SJG$ 12,500,000 3.430% 12/1/2006 2/1/2036 Tax-exempt SJG
Credit Risk - As of June 30, 2016 , approximately $6.1 million , or 10.8% , of the current and noncurrent Derivatives – Energy Related Assets are transacted withtwo counterparties. One counterparty has contracts with a large number of diverse customers which minimizes the concentration of this risk. A portion of thesecontracts may be assigned to SJI in the event of default by the counterparty. The second counterparty is investment-grade rated.
As of June 30, 2016 , SJRG had $87.4 million of Accounts Receivable under sales contracts. Of that total, 71.0% were with regulated utilities or companies ratedinvestment-grade or guaranteed by an investment-grade-rated parent or were with companies where we have a collateral arrangement or insurance coverage. Theremainder of the Accounts Receivable were within approved credit limits.
53

Table of Contents
Item 4. Controls and Procedures
Evaluation of Disclosure Controls and Procedures
The Company’s management, with the participation of its chief executive officer and chief financial officer, evaluated the effectiveness of the design and operationof the Company’s disclosure controls and procedures (as defined in Rule 13a-15(e) under the Exchange Act) as of June 30, 2016 . Based on that evaluation, theCompany’s chief executive officer and chief financial officer concluded that the disclosure controls and procedures employed at the Company are effective.
Changes in Internal Control Over Financial Reporting
There has not been any change in the Company’s internal control over financial reporting as defined in Rule 13a-15(f) under the Exchange Act, during the fiscalquarter ended June 30, 2016 that has materially affected, or is reasonably likely to materially affect, the Company’s internal control over financial reporting.
54
Table of Contents
PART II — OTHER INFORMATION
Item l. Legal Proceedings
Information required by this Item is incorporated by reference to Part I, Item 2, Pending Litigation, beginning on page 51.
Item 1A. Risk Factors
Other than as set forth below, there have been no material changes in our risk factors from those disclosed in Item 1A of the Company’s Annual Report on Form10-K for the year ended December 31, 2015 .
Our stated long-term goals are based on various assumptions and beliefs that may not prove to be accurate, and we may not achieve our stated long-term goalsby 2020 or at all.
Our current long-term goals are to (i) grow Economic Earnings to $150 million by 2020; (ii) improve the quality of our earnings; (iii) strengthen our balance sheet;and (iv) maintain a low-to-moderate risk profile. Management established those goals in conjunction with our board of directors based upon a number of differentinternal and external factors that characterize and influence our current and expected future activities. For example, these long-term goals are based on certainassumptions regarding our participation in a current project to build a 100-mile natural gas pipeline in Pennsylvania and New Jersey. However, construction on thisproject has not yet begun, and this project is subject to a number of regulatory approvals, including approval from the Federal Energy Regulatory Commission,which is not expected until the first quarter of fiscal 2017. The target completion date for this project has been delayed until the second half of 2018, and is subjectto further delay. As a result, no assurance can be given that this project will be completed on time or at all. Further, the economy of Southern New Jersey hasremained depressed relative to other regions, which could cause customer delinquencies or otherwise negatively affect achievement of our long-term earningsgoals. Due to a term limit, the upcoming 2017 New Jersey gubernatorial election will result in a change in administration, which could lead to unfavorable localregulatory changes that could delay approvals, require environmental remediation or capital or other expenditures or otherwise adversely affect our results ofoperations, financial condition or cash flows. Other factors, assumptions and beliefs of management and our board of directors on which our long-term goals werebased may also prove to differ materially from actual future results. Accordingly, we may not achieve our stated long-term goals by 2020 or at all, or our statedlong-term goals may be negatively revised as a result of less than expected progress toward achieving these goals, and you are therefore cautioned not to placeundue reliance on these goals.
Our business could be harmed by cybersecurity threats and related disruptions
We rely extensively on information technology systems to process transactions, transmit and store information and manage our business. Disruption or failure ofour information technology systems could shut down our facilities or otherwise harm our ability to safely deliver natural gas to our customers, serve our customerseffectively, or manage our assets, or otherwise materially disrupt our business.
Cyber threats are constantly evolving, increasing the difficulty of detecting and successfully defending against them. SJI has experienced such attacks in the past;however, based on information currently available to SJI, none have had a material impact on its business, financial condition, results of operations or cash flows.In response, we have invested in expanded cybersecurity systems and procedures designed to ensure the continuous and uninterrupted performance of ourinformation technology systems and protect against unauthorized access. However, all information technology systems are potentially vulnerable to securitythreats, including hacking, viruses, other malicious software, and other unlawful attempts to disrupt or gain access to such systems. There is no guarantee that ourcybersecurity systems and procedures will prevent or detect the unauthorized access by experienced computer programmers, hackers or others. An attack on orfailure of our information technology systems could result in the unauthorized disclosure, theft, misuse or destruction of customer or employee data or business orconfidential information, or disrupt the performance of our information technology systems. These events could expose us to potential liability, litigation,governmental inquiries, investigations or regulatory actions, harm our brand and reputation, diminish customer confidence, disrupt operations, and subject us topayment of fines or other penalties, legal claims by our clients and significant remediation costs.
55

Table of Contents
Item 6. Exhibits(a) Exhibits
Exhibit No. Description 3.1
Bylaws of South Jersey Industries, Inc. as amended and restated through April 29, 2016. (Incorporated by reference from Exhibit 3.2(ii) tothe Registrant's Current Report on Form 8-K filed May 3, 2016).
31.1 Certification of Chief Executive Officer Pursuant to Rule 13a-14(a) of the Exchange Act. 31.2 Certification of Chief Financial Officer Pursuant to Rule 13a-14(a) of the Exchange Act. 32.1
Certification of Chief Executive Officer Pursuant to Rule 13a-14(b) of the Exchange Act as adopted pursuant to Section 906 of theSarbanes-Oxley Act of 2002 (subsections (a) and (b) of Section 1350, Chapter 63 of Title 18, United States Code).
32.2
Certification of Chief Financial Officer Pursuant to Rule 13a-14(b) of the Exchange Act as adopted pursuant to Section 906 of theSarbanes-Oxley Act of 2002 (subsections (a) and (b) of Section 1350, Chapter 63 of Title 18, United States Code).
101
The following financial statements from South Jersey Industries’ Quarterly Report on Form 10-Q for the three and six months ended June30, 2016, filed with the Securities and Exchange Commission on August 5, 2016, formatted in XBRL (eXtensible Business ReportingLanguage): (i) the Condensed Consolidated Statements of Income; (ii) the Condensed Consolidated Statements of Comprehensive Income;(iii) the Condensed Consolidated Statements of Cash Flows; (iv) the Condensed Consolidated Balance Sheets and (v) the Notes toCondensed Consolidated Financial Statements.
56
Table of Contents
SIGNATURES
Pursuant to the requirements of the Securities Exchange Act of 1934, the registrant has duly caused this report to be signed on its behalf by the undersignedthereunto duly authorized
SOUTH JERSEY INDUSTRIES, INC. (Registrant)
Dated: August 5, 2016 By: /s/ Stephen H. Clark Stephen H. Clark Senior Vice President & Chief Financial Officer (Principal Financial Officer)
57

Exhibit 31.1
CERTIFICATION
I, Michael J. Renna, certify that:
1. I have reviewed this Quarterly Report on Form 10-Q for the period ended June 30, 2016 , of South Jersey Industries, Inc.;
2. Based on my knowledge, this report does not contain any untrue statement of a material fact or omit to state a material fact necessary to make the statementsmade, in light of the circumstances under which such statements were made, not misleading with respect to the period covered by this report;
3. Based on my knowledge, the financial statements, and other financial information included in this report, fairly present in all material respects the financialcondition, results of operations and cash flows of the registrant as of, and for, the periods presented in this report;
4. The registrant’s other certifying officer and I are responsible for establishing and maintaining disclosure controls and procedures (as defined in Exchange ActRules 13a-15(e) and 15d-15(e)) and internal control over financial reporting (as defined in Exchange Act Rules 13a-15(f) and 15 d-15(f)) for the registrant andhave:
a) designed such disclosure controls and procedures, or caused such disclosure controls and procedures to be designed under our supervision, to ensurethat material information relating to the registrant, including its consolidated subsidiaries, is made known to us by others within those entities,particularly during the period in which this report is being prepared;
b) designed such internal control over financial reporting, or caused such internal control over financial reporting to be designed under our supervision,to provide reasonable assurance regarding the reliability of financial reporting and the preparation of financial statements for external purposes inaccordance with generally accepted accounting principles;
c) evaluated the effectiveness of the registrant’s disclosure controls and procedures and presented in this report our conclusions about the effectivenessof the disclosure controls and procedures, as of the end of the period covered by this report based on such evaluation; and
d) disclosed in this report any change in the registrant’s internal control over financial reporting that occurred during the registrant’s most recent fiscalquarter (the registrant’s fourth fiscal quarter in the case of an annual report) that has materially affected, or is reasonably likely to materially affect,the registrant’s internal control over financial reporting.
5. The registrant’s other certifying officer and I have disclosed, based on our most recent evaluation of internal control over financial reporting, to the registrant’sauditors and the audit committee of registrant’s board of directors (or persons performing the equivalent function):
a) all significant deficiencies and material weaknesses in the design or operation of internal controls over financial reporting which are reasonably likelyto adversely affect the registrant’s ability to record, process, summarize and report financial information; and
b) any fraud, whether or not material, that involves management or other employees who have a significant role in the registrant’s internal control overfinancial reporting.
South Jersey Industries, Inc.
Date: August 5, 2016 By: /s/ Michael J. Renna Michael J. Renna Chief Executive Officer

Exhibit 31.2
CERTIFICATION I, Stephen H. Clark, certify that:
1. I have reviewed this Quarterly Report on Form 10-Q for the period ended June 30, 2016 , of South Jersey Industries, Inc.;
2. Based on my knowledge, this report does not contain any untrue statement of a material fact or omit to state a material fact necessary to make the statementsmade, in light of the circumstances under which such statements were made, not misleading with respect to the period covered by this report;
3. Based on my knowledge, the financial statements, and other financial information included in this report, fairly present in all material respects the financialcondition, results of operations and cash flows of the registrant as of, and for, the periods presented in this report;
4. The registrant’s other certifying officer and I are responsible for establishing and maintaining disclosure controls and procedures (as defined in Exchange ActRules 13a-15(e) and 15d-15(e)) and internal control over financial reporting (as defined in Exchange Act Rules 13a-15(f) and 15 d-15(f)) for the registrant andhave:
a) designed such disclosure controls and procedures, or caused such disclosure controls and procedures to be designed under our supervision, to ensurethat material information relating to the registrant, including its consolidated subsidiaries, is made known to us by others within those entities,particularly during the period in which this report is being prepared;
b) designed such internal control over financial reporting, or caused such internal control over financial reporting to be designed under our supervision,to provide reasonable assurance regarding the reliability of financial reporting and the preparation of financial statements for external purposes inaccordance with generally accepted accounting principles;
c) evaluated the effectiveness of the registrant’s disclosure controls and procedures and presented in this report our conclusions about the effectivenessof the disclosure controls and procedures, as of the end of the period covered by this report based on such evaluation; and
d) disclosed in this report any change in the registrant’s internal control over financial reporting that occurred during the registrant’s most recent fiscalquarter (the registrant’s fourth fiscal quarter in the case of an annual report) that has materially affected, or is reasonably likely to materially affect,the registrant’s internal control over financial reporting.
5. The registrant’s other certifying officer and I have disclosed, based on our most recent evaluation of internal control over financial reporting, to the registrant’sauditors and the audit committee of registrant’s board of directors (or persons performing the equivalent function):
a) all significant deficiencies and material weaknesses in the design or operation of internal controls over financial reporting which are reasonably likelyto adversely affect the registrant’s ability to record, process, summarize and report financial information; and
b) any fraud, whether or not material, that involves management or other employees who have a significant role in the registrant’s internal control overfinancial reporting.
South Jersey Industries, Inc.
Date: August 5, 2016 By: /s/ Stephen H. Clark Stephen H. Clark Chief Financial Officer

Exhibit 32.1
CERTIFICATION PURSUANT TO 18 U.S.C. SECTION 1350,AS ADOPTED PURSUANT TO SECTION 906 OF
THE SARBANES-OXLEY ACT OF 2002
In connection with the filing of the Quarterly Report on Form 10-Q of South Jersey Industries, Inc. (the “Company”) for the period ended June 30, 2016 ,as filed with the Securities and Exchange Commission on the date hereof (the “Report”), I, Michael J. Renna, Chief Executive Officer of the Company, herebycertify pursuant to 18 U.S.C. Section 1350, as adopted pursuant to Section 906 of the Sarbanes-Oxley Act of 2002, that, to the best of my knowledge:
(1) The Report fully complies with the requirements of Section 13(a) or Section 15(d) of the Securities Exchange Act of 1934; and
(2) The information contained in the Report fairly presents, in all material respects, the financial condition and results of operations of the Company.
/s/ Michael J. Renna Name: Michael J. Renna Title: Chief Executive OfficerAugust 5, 2016
Exhibit 32.2
CERTIFICATION PURSUANT TO 18 U.S.C. SECTION 1350,AS ADOPTED PURSUANT TO SECTION 906 OF
THE SARBANES-OXLEY ACT OF 2002
In connection with the filing of the Quarterly Report on Form 10-Q of South Jersey Industries, Inc. (the “Company”) for the period ended June 30, 2016 ,as filed with the Securities and Exchange Commission on the date hereof (the “Report”), I, Stephen H. Clark, Chief Financial Officer of the Company, herebycertify pursuant to 18 U.S.C. Section 1350, as adopted pursuant to Section 906 of the Sarbanes-Oxley Act of 2002, that, to the best of my knowledge:
(1) The Report fully complies with the requirements of Section 13(a) or Section 15(d) of the Securities Exchange Act of 1934; and
(2) The information contained in the Report fairly presents, in all material respects, the financial condition and results of operations of the Company.
/s/ Stephen H. Clark Name: Stephen H. ClarkTitle: Chief Financial OfficerAugust 5, 2016