Embed Size (px)
Citation preview
Methamphetamine in the United States:
Perceptions and Educational Programming Needs in Extension Education
Dissertation
Presented in Partial Fulfillment of the Requirements for the Degree Doctorate of Philosophy
in the Graduate School of The Ohio State University
By
Amy R. Beaudreault, BS, MS
Graduate Program in Agricultural Education and Extension
The Ohio State University
2009
Dissertation Committee:
Dr. Larry Miller, Advisor
Dr. Joe Donnermeyer
Dr. Scott Scheer

Copyright by
Amy R. Beaudreault
2009
ii
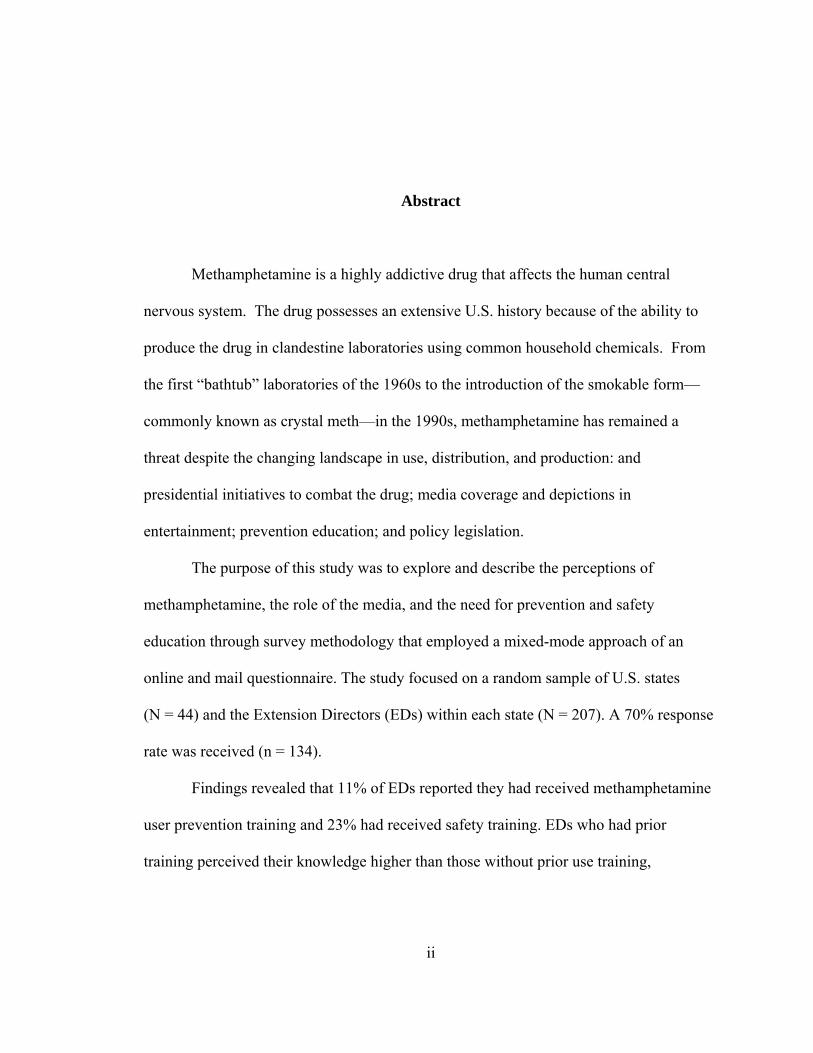
Abstract
Methamphetamine is a highly addictive drug that affects the human central
nervous system. The drug possesses an extensive U.S. history because of the ability to
produce the drug in clandestine laboratories using common household chemicals. From
the first “bathtub” laboratories of the 1960s to the introduction of the smokable form—
commonly known as crystal meth—in the 1990s, methamphetamine has remained a
threat despite the changing landscape in use, distribution, and production: and
presidential initiatives to combat the drug; media coverage and depictions in
entertainment; prevention education; and policy legislation.
The purpose of this study was to explore and describe the perceptions of
methamphetamine, the role of the media, and the need for prevention and safety
education through survey methodology that employed a mixed-mode approach of an
online and mail questionnaire. The study focused on a random sample of U.S. states
(N = 44) and the Extension Directors (EDs) within each state (N = 207). A 70% response
rate was received (n = 134).
Findings revealed that 11% of EDs reported they had received methamphetamine
user prevention training and 23% had received safety training. EDs who had prior
training perceived their knowledge higher than those without prior use training,
iii
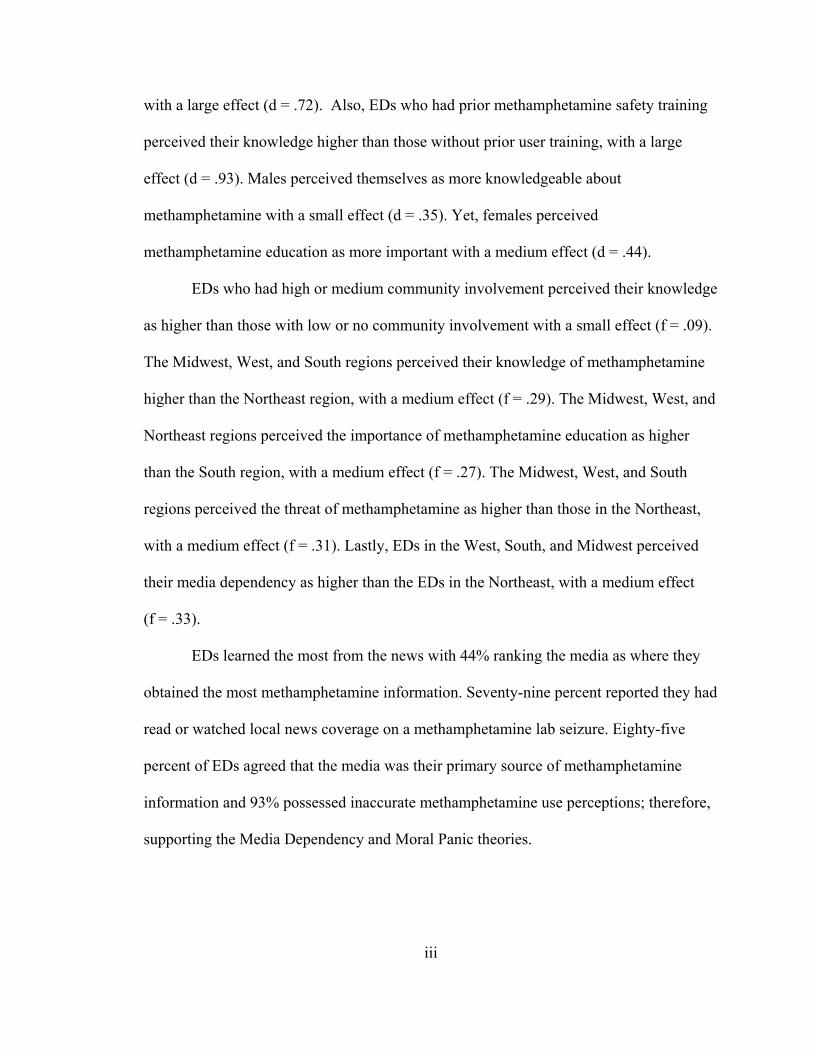
with a large effect (d = .72). Also, EDs who had prior methamphetamine safety training
perceived their knowledge higher than those without prior user training, with a large
effect (d = .93). Males perceived themselves as more knowledgeable about
methamphetamine with a small effect (d = .35). Yet, females perceived
methamphetamine education as more important with a medium effect (d = .44).
EDs who had high or medium community involvement perceived their knowledge
as higher than those with low or no community involvement with a small effect (f = .09).
The Midwest, West, and South regions perceived their knowledge of methamphetamine
higher than the Northeast region, with a medium effect (f = .29). The Midwest, West, and
Northeast regions perceived the importance of methamphetamine education as higher
than the South region, with a medium effect (f = .27). The Midwest, West, and South
regions perceived the threat of methamphetamine as higher than those in the Northeast,
with a medium effect (f = .31). Lastly, EDs in the West, South, and Midwest perceived
their media dependency as higher than the EDs in the Northeast, with a medium effect
(f = .33).
EDs learned the most from the news with 44% ranking the media as where they
obtained the most methamphetamine information. Seventy-nine percent reported they had
read or watched local news coverage on a methamphetamine lab seizure. Eighty-five
percent of EDs agreed that the media was their primary source of methamphetamine
information and 93% possessed inaccurate methamphetamine use perceptions; therefore,
supporting the Media Dependency and Moral Panic theories.
iv
This research is the first national study that evaluated methamphetamine
programming needs related to user prevention and community safety. Results provide
justification for the implementation of methamphetamine education and farm safety
programming. Research also supports the Media Dependency and Moral Panic theories.
However, because of the limited research available, opportunities for additional social
science methamphetamine research exist.

v
Dedication
Dedicated to my loving parents, Linda and Thomas Beaudreault.
vi
Acknowledgments
I thank my advisor, Larry Miller, PhD, for guiding me through this research
process and for the countless hours he spent answering my questions and editing my
drafts. His knowledge, encouragement, and honesty were invaluable resources. His
wisdom will follow me throughout my life. Dr. Miller was an integral part to my decision
to pursue a PhD.
I thank my other committee members, Joe Donnermeyer, PhD, and Scott Scheer,
PhD, for their helpful suggestions and input throughout my studies.
I thank my dear friend, Cub Barrett, MS, and Dr. Larry Miller, Ralph Weisheit,
PhD, and Dr. Joe Donnermeyer, who served as questionnaire validity experts. Their input
influenced and aided in the development of a better instrument.
I also thank my family, friends, and colleagues at The Ohio State University and
Nationwide Children’s Hospital who supported me throughout my studies.
vii
Vita
2001 ....................................................BS, Journalism, Ohio University 2006........................................................... MS, Human and Community Resource
Development, The Ohio State University 2007........................................................... The Ohio State University Lois Simonds
Hungate Scholarship in Extension Education and the George Gist Scholarship in Extension Education
2003-2005 ................................................. Faculty Support, The Ohio State University
Moritz College of Law 2005-2008 ................................................. Program Coordinator, Ohio State University
Extension Agricultural Safety and Health Program
2008-present.............................................. Research Communication Specialist,
Nationwide Children’s Hospital
Publications Beaudreault, A. (2009). Natural: Influences of students’ organic food perceptions.
Journal of Food Products Marketing, 15, 379-391. Beaudreault, A., Jepsen, D., & Dellinger, W. (2009). Designing an agricultural safety
intervention program for Ohio Amish youth. Cases in Public Health Communication and Marketing, 3, 38-58.
Beaudreault, A. (2006). Students’ taste for organic food: A look into perceptions.
(Master’s thesis, The Ohio State University, 2006).
Fields of Study
Major Field: Agricultural Education and Extension
viii
Table of Contents
Abstract ..................................................................................................................................ii Dedication ..............................................................................................................................v Acknowledgements................................................................................................................vi Vita.........................................................................................................................................vii List of Tables .........................................................................................................................xi List of Figures ........................................................................................................................xvi Chapter 1. Introduction ..........................................................................................................1
Purpose of Study ..................................................................................................5 Research Objectives.............................................................................................8 Significance of Study...........................................................................................10 Limitations ...........................................................................................................11 Definition of Terms..............................................................................................12
Chapter 2. Literature Review.................................................................................................14
The History of Methamphetamine .......................................................................14 Methamphetamine and World War II ............................................................14 The Surge of the 1960s ..................................................................................15
The Current State of Methamphetamine in the United States .............................17 Production Trends..........................................................................................17 Use of Methamphetamine ..............................................................................20
Extension Education in the United States............................................................22 Drug Coverage and the Media .............................................................................24
Media Dependency ........................................................................................25 Moral Panic....................................................................................................28
Methamphetamine Safety ....................................................................................30 Methamphetamine Prevention Education ............................................................32
ix
Importance of Subject Characteristics .................................................................34 The Media and Geographic Location, Gender, and Age of Subjects ............35
Summary ..............................................................................................................36 Chapter 3. Methods................................................................................................................38
Research Design...................................................................................................38 Subject Selection..................................................................................................39 Instrument Validity and Reliability .....................................................................40 Conditions of Testing...........................................................................................41 Timeline for Data Collection ...............................................................................43 Controlling Nonresponse Error............................................................................43 Data Analysis .......................................................................................................46
Chapter 4. Results ..................................................................................................................49
Overall Results.....................................................................................................50 Results by Objective ............................................................................................53
Objective 1 .....................................................................................................53 Objective 2 .....................................................................................................57 Objective 3 .....................................................................................................65 Objective 4 .....................................................................................................68 Objective 5 .....................................................................................................70 Objective 6 .....................................................................................................71 Objective 7 .....................................................................................................74 Objective 8 .....................................................................................................77 Objective 9 .....................................................................................................81 Objective 10 ...................................................................................................83
Chapter 5. Discussion ............................................................................................................113
Summary of Conclusions.....................................................................................115 Recommendations and Implications ....................................................................118 Implications to Knowledge ..................................................................................120 Implications for Further Study.............................................................................122
References..............................................................................................................................124 Appendix A. Professional Titles of Sample and Blocking ...................................................131 Appendix B. New York Times Article....................................................................................132 Appendix C. Nebraska Department of Roads Brochure........................................................135 Appendix D. Instrument.........................................................................................................137 Appendix E. Mailed Postcard ................................................................................................149
x
Appendix F. Perceived Knowledge of Methamphetamine ....................................................150 Appendix G. Past Employment of Sample ............................................................................152 Appendix H. Groups that Need Methamphetamine Training................................................155 Appendix I. Initial and Additional Methamphetamine Training Topic.................................156
xi
List of Tables
Table 1. Economic Costs of Methamphetamine in the United States in 2005 ......................10 Table 2. Selected Methamphetamine Headlines in U.S. Media ............................................29 Table 3. Independent Group t-tests on Summated Rating Scales between Early and Late Respondents ......................................................................................................43 Table 4. Magnitude of Correlation.........................................................................................48 Table 5. Age and Years in Current Extension Title...............................................................54 Table 6. Demographic Characteristics of Gender, Education Level, Geographic Information, and Current Community Involvement ........................................................56 Table 7. Personal Experience with Methamphetamine Lab Seizures Nationally..................58 Table 8. Methamphetamine Clandestine Lab Information Sources by Region .....................60 Table 9. Rating (in percent) of Methamphetamine Information Sources ..............................61 Table 10. Other Media Sources of Methamphetamine Information ......................................62 Table 11. Methamphetamine User Prevention and Safety Training Nationally and
Blocked by Region ..........................................................................................................64 Table12. Knowledge of Methamphetamine Production Labs ...............................................65 Table 13: Knowledge of Methamphetamine Physical Effects...............................................65 Table 14. Knowledge of Environmental Effects....................................................................66 Table 15. Knowledge of Methamphetamine Use ..................................................................66 Table 16. Aggregated Responses Blocked as Perceived Low and High Knowledge............67
xii
Table 17. Perceived Threat of Methamphetamine in Area of Extension Directors...............69 Table 18. Perceived Trust and Accuracy of the Media..........................................................72 Table 19. Perceptions of the Media Regarding Stereotypes, Sensationalism, and Emotions ...................................................................................................................74 Table 20. Perceptions of Methamphetamine Safety and Health............................................76 Table 21. Perceived Importance for Others in Methamphetamine Education.......................78 Table 22. Community Groups that Need Methamphetamine Training .................................79 Table 23. Current Methamphetamine Programming in Extension Systems..........................80 Table 24. Association (Cramer’s V Statistic) among Gender, Location of Residence,
Location of Extension Area, U.S. Region, Prior Meth Training with Threat, Media Dependency, Media Portrayal, Safety and Health, Perceived Knowledge, and Perceived Importance.......................................................................................................82
Table 25. Correlation Coefficients for the Relationships among Gender, Location of Residence, Location of Extension Area, U.S. Region, Prior Meth Training with
Threat, Media Dependency, Media Portrayal, Safety and Health, Perceived Knowledge, and Perceived Importance ...........................................................................83
Table 26. Independent Group t-test Between Male and Female Extension Directors...........85 Table 27. Independent Group t-test Between Extension Directors Who Have Had Training in Methamphetamine User Prevention..............................................................86 Table 28. Independent Group t-test Between Extension Directors Who Have
Had Training in Methamphetamine Safety (Including Anhydrous Theft and Lab Detection).........................................................................................................................87
Table 29. ANOVA of Perceived Threat and Mean Scores by Age .......................................88 Table 30. ANOVA of Perceived Media Dependency and Mean Scores by Age ..................88 Table 31. ANOVA of Perceived Media Portrayal and Mean Scores by Age........................89 Table 32. ANOVA of Perceived Safety and Health and Mean Scores by Age .....................89 Table 33. ANOVA of Perceived Knowledge and Mean Scores by Age ...............................90
xiii
Table 34. ANOVA of Perceived Importance and Mean Scores by Age ...............................90 Table 35. ANOVA of Perceived Threat and Mean Scores by Education Level....................91 Table 36. ANOVA of Perceived Media Dependency and Mean Scores by Education Level ..........................................................................................................92 Table 37. ANOVA of Perceived Media Portrayal and Mean Scores by Education Level ....92 Table 38. ANOVA of Perceived Safety and Health and Mean Scores by Education Level .93 Table 39. ANOVA of Perceived Knowledge and Mean Scores by Education Level............93 Table 40. ANOVA of Perceived Importance and Mean Scores by Education Level............94 Table 41. ANOVA of Perceived Threat and Mean Scores by Years in Current Extension Title....................................................................................................95 Table 42. ANOVA of Perceived Media Dependency and Mean Scores by Years in Current Extension Title....................................................................................................95 Table 43. ANOVA of Perceived Media Portrayal and Mean Scores by Years in Current Extension Title....................................................................................................96 Table 44. ANOVA of Perceived Safety and Health and Mean Scores by Years in Current Extension Title....................................................................................................96 Table 45. ANOVA of Perceived Knowledge and Mean Scores by Years in Current Extension Title....................................................................................................97 Table 46. ANOVA of Perceived Importance and Mean Scores by Years in Current Extension Title....................................................................................................97 Table 47. ANOVA of Perceived Threat and Mean Scores of Residence Location Description........................................................................................................98 Table 48. ANOVA of Perceived Media Dependency and Mean Scores of Residence Location Description........................................................................................................99 Table 49. ANOVA of Perceived Media Portrayal and Mean Scores of Residence
Location Description........................................................................................................99 Table 50. ANOVA of Perceived Safety and Health and Mean Scores of Residence Location Description........................................................................................................100
xiv
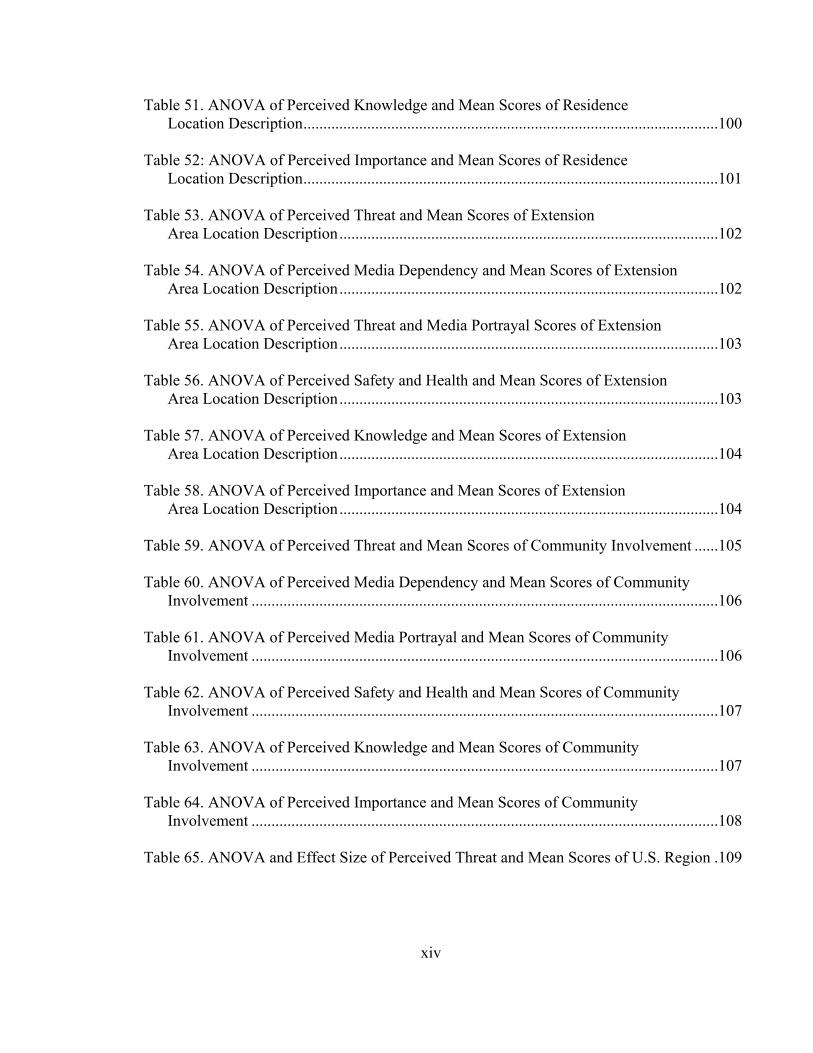
Table 51. ANOVA of Perceived Knowledge and Mean Scores of Residence Location Description........................................................................................................100 Table 52: ANOVA of Perceived Importance and Mean Scores of Residence Location Description........................................................................................................101 Table 53. ANOVA of Perceived Threat and Mean Scores of Extension Area Location Description...............................................................................................102 Table 54. ANOVA of Perceived Media Dependency and Mean Scores of Extension Area Location Description...............................................................................................102 Table 55. ANOVA of Perceived Threat and Media Portrayal Scores of Extension Area Location Description...............................................................................................103 Table 56. ANOVA of Perceived Safety and Health and Mean Scores of Extension
Area Location Description...............................................................................................103 Table 57. ANOVA of Perceived Knowledge and Mean Scores of Extension Area Location Description...............................................................................................104 Table 58. ANOVA of Perceived Importance and Mean Scores of Extension Area Location Description...............................................................................................104 Table 59. ANOVA of Perceived Threat and Mean Scores of Community Involvement ......105 Table 60. ANOVA of Perceived Media Dependency and Mean Scores of Community
Involvement .....................................................................................................................106 Table 61. ANOVA of Perceived Media Portrayal and Mean Scores of Community Involvement .....................................................................................................................106 Table 62. ANOVA of Perceived Safety and Health and Mean Scores of Community Involvement .....................................................................................................................107 Table 63. ANOVA of Perceived Knowledge and Mean Scores of Community Involvement .....................................................................................................................107 Table 64. ANOVA of Perceived Importance and Mean Scores of Community Involvement .....................................................................................................................108 Table 65. ANOVA and Effect Size of Perceived Threat and Mean Scores of U.S. Region .109

xv
Table 66. ANOVA and Effect Size of Perceived Media Dependency and Mean Scores of U.S. Region......................................................................................................................110
Table 67. ANOVA of Perceived Media Coverage and Mean Scores of U.S. Region...........110 Table 68. ANOVA of Perceived Safety and Health and Mean Scores of U.S. Region.........111 Table 69. ANOVA and Effect Size of Perceived Knowledge and Mean Scores of U.S.
Region ..............................................................................................................................111 Table 70. ANOVA and Effect Size of Perceived Importance and Mean Scores of U.S.
Region ..............................................................................................................................112
xvi
List of Figures
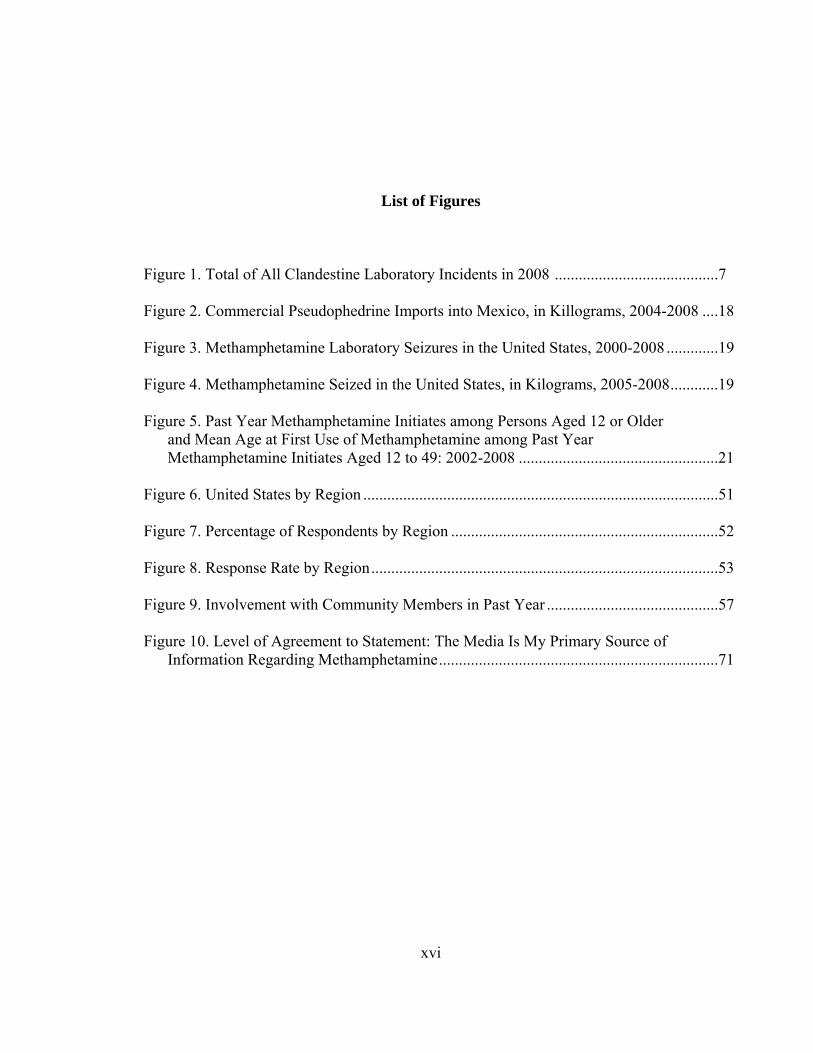
Figure 1. Total of All Clandestine Laboratory Incidents in 2008 .........................................7 Figure 2. Commercial Pseudophedrine Imports into Mexico, in Killograms, 2004-2008 ....18 Figure 3. Methamphetamine Laboratory Seizures in the United States, 2000-2008 .............19
Figure 4. Methamphetamine Seized in the United States, in Kilograms, 2005-2008............19
Figure 5. Past Year Methamphetamine Initiates among Persons Aged 12 or Older and Mean Age at First Use of Methamphetamine among Past Year Methamphetamine Initiates Aged 12 to 49: 2002-2008 ..................................................21
Figure 6. United States by Region .........................................................................................51 Figure 7. Percentage of Respondents by Region ...................................................................52 Figure 8. Response Rate by Region.......................................................................................53 Figure 9. Involvement with Community Members in Past Year ...........................................57 Figure 10. Level of Agreement to Statement: The Media Is My Primary Source of
Information Regarding Methamphetamine......................................................................71
1
Chapter 1: Introduction
The War on Drugs is a war in which most Americans have experienced, whether
directly or indirectly. The drug war, like the War on Terror, is one that has no boundaries
and has the capability of affecting everyone from the rural farmer to the urban housewife.
In recent years, methamphetamine—popularly known as crystal meth or meth—has
emerged as an enemy in that war. Not only does methamphetamine affect the individual
addict, but the drug also compounds environmental, legal, social, and medical problems.
Through presidential drug war declarations, news stories and dramatizations in
entertainment, crime prevention initiatives, education, and policy legislation, the War on
Drugs is one battle that is constant, and one that continually possesses endless enemies.
The United Nations World Drug Report (2006) called methamphetamine the most
abused hard drug on earth, and the number of global methamphetamine addicts—26
million—equals the number of cocaine and heroin users combined. The United States has
an estimated 1.4 million users, and according to a National Association for Counties
survey (2006), 47% of emergency room officials reported that methamphetamine is the
top illicit drug blamed for emergency department visits.
Methamphetamine is a highly addictive drug that affects the human central
nervous system. The drug can be injected, snorted, smoked, or ingested orally. Because

2
of methamphetamine production trends, and the increase in domestic drug distribution by
Mexican and Asian criminal groups in the United States, more potent forms of
methamphetamine are available, creating new challenges for law enforcement officials,
policy-makers, and prevention educators who attempt to decrease methamphetamine drug
use (U.S. Drug Enforcement Administration [DEA], 2007).
President George W. Bush proclaimed November 30, 2006, as National
Methamphetamine Awareness Day. Also, the Bush Administration set goals of a 15%
decrease in methamphetamine use and 25% reduction in the number of domestic
methamphetamine laboratories (labs) by 2009. The Bush Administration budget included
$25 million to implement and continue effective methamphetamine abuse recovery
services and programs (Bush, 2006). The Methamphetamine Epidemic Act of 2005 was
signed, which made manufacturing the drug more difficult and imposed tougher penalties
on those who smuggled or sold the drug.
However, even with an increased amount of legislation, the unique problem with
methamphetamine is ease of production. The Internet offers an ideal location for
directions and for cyber communities to share production ideas and strategies on how to
avoid law enforcement. Methamphetamine production labs are found across the United
States in small towns, rural farms, and cities. Labs even are found on Department of
Interior lands and National Forest Service lands: From 2001 to 2003, labs discovered on
Department of Interior lands increased from 28 to 83, and in 2002, National Forest
Service lands had 187 lab discoveries (National Drug Intelligence Center [NIDA], 2005).
The Combat Methamphetamine Epidemic Act of 2005 is found in Title VII of the
3
USA Patriot Improvement and Reauthorization Act of 2005 (H.R. 3199). The legislation
provides minimum standards for retailers across the United States that sell products
containing ephedrine and pseudoephedrine, commonly used over-the-counter drugs used
for nasal congestion. The law limits sales to 3.6 grams of the base ingredient (the pure
ephedrine or pseudoephedrine) per day and 9 grams per 30 days, and requires that
purchasers provide identification and sign a sales log. Retailers must now keep these
products behind the counter or in a locked case and register online with the U.S. Attorney
General.
Another federal initiative against methamphetamine was the Congressional
Caucus To Fight and Control Methamphetamine that was established to: raise awareness;
advance policies against the manufacture, distribution, and use of methamphetamine;
educate others about the dangers of methamphetamine abuse; involve state and
community leaders, law enforcement, public health professionals, and advocacy groups
in efforts to reduce and prevent methamphetamine use; and, build congressional support
for anti-methamphetamine measures. These new laws make methamphetamine more
difficult to produce, but the laws do not prevent distribution from Mexico or aid
individuals who use or who are indirectly affected by the drug.
A distinct aspect of methamphetamine use is that white males abuse the drug
more than any other demographic group. Data about individuals sentenced to prison
reported that those imprisoned for methamphetamine-related crimes were 59% white and
86% male (Bureau of Justice Statistics, 2005). Although these data imply white males are
the highest population at risk, other populations are now in danger as well.
4
Much of the research regarding methamphetamine has focused on homosexual
and bisexual men because of the drug’s popularity as a party drug that enhances sexual
pleasure (Reback, 1997). Yet, since 2000, the scope of methamphetamine abuse has
encompassed other populations. According to Morgan and Beck (1997), motivation for
methamphetamine use among females centered on weight loss, increased energy for
childrearing and household duties, enhanced self-confidence, and enhanced sexual
pleasure. According to the 2002 National Survey on Drug Use and Health, 12.4 million
adolescents age 12 years and older have tried methamphetamine at least once in their
lifetime. Additionally, methamphetamine use has become a growing trend among
adolescent females, who use the drug as an appetite suppressant and weight-loss aid.
According to the NIDA Monitoring the Future Study (2008), methamphetamine
use in 2008 was reported by 1.2% of eighth graders, 1.5% of tenth graders, and 1.2% of
twelfth graders. The first measurement taken in 1999, use was 3.2%, 4.6%, and 4.7% for
eight, tenth, and twelfth graders. Perceived risk of methamphetamine has increased since
2004 and availability has decreased since 2004. The increase in perceived risk implies
prevention efforts are working.
One of the reasons for the popularity and growth of methamphetamine during the
1990s was because of the production of the smokable form of methamphetamine
commonly referred to as “crystal meth.” Mexico-based trafficking groups began to enter
the methamphetamine market and dominated the trade throughout the 2000s
(Donnermeyer & Tunnell, 2007). Clandestine "mom-and-pop" labs relocated to the
5
Midwest and, thus, geographically expanded the methamphetamine market and
introduced the drug to rural communities.
Purpose of Study
The purpose of this study was to explore and describe the methamphetamine
perceptions, the role of the media, and the need for prevention and safety education. The
study focused on a random sample of U.S. states and the Extension Directors within each
state (see Appendix A for complete list of professional titles sampled). The questionnaire
concentrated on perceived methamphetamine knowledge, the perceived threat of
methamphetamine, media dependency and involvement in methamphetamine
perceptions, methamphetamine safety and health perceptions, and prevention education
needs.
Along with exploring and describing the perceptions through survey
methodology, part of the study also was relational. The relational component identified
correlations among selected characteristics and obtained methamphetamine perceptions.
These relational aspects of the study further examined whether relationships existed
among the characteristics of: geographic area descriptions of the Extension area serviced
and residence of Extension Directors; gender; age; level of education obtained; years in
current Extension title; U.S. state region; and current community involvement.
The population described above was appropriate to be surveyed because
Extension Directors associate with diverse populations at the local level in safety and
health outreach programming, each state possesses an Extension System, and
6
methamphetamine has been identified as a rural problem under President Obama’s Rural
White House Agenda (2009). Extension Directors also work with youth populations, are
active in community engagement in rural areas, and many live in the communities they
service.
Methamphetamine use and production is widespread: Although the drug
originated in the Western region of the United States, clandestine labs are now in the
Midwest. According to the National Clandestine Lab Seizure System (DEA, 2008), the
state with the highest number of labs seizures was Missouri (1,368) and the second
highest was Indiana (701) (Figure 1). Labs relocated to the Midwest from the West Coast
because of the monopoly Mexican traffickers developed to provide the drug during the
2000s (Donnermeyer & Tunnell, 2007). The move east spread methamphetamine across
the United States and also introduced the drug to rural audiences and individuals who
recognized the profitability in methamphetamine production. However, because of recent
laws in Mexico regarding a ban on the importation of ephedrine and pseudoephedrine in
2009, the production of methamphetamine in the United States most likely will change
again.
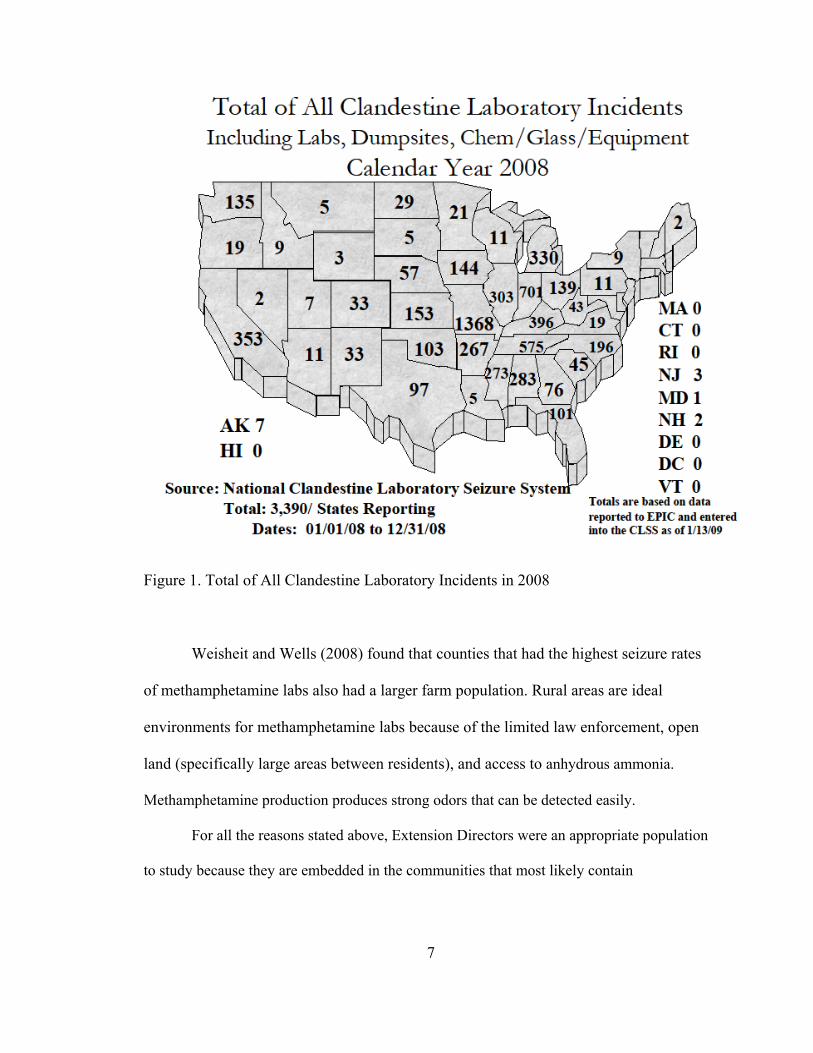
Figure 1. Total of All Clandestine Laboratory Incidents in 2008
Weisheit and Wells (2008) found that counties that had the highest seizure rates
of methamphetamine labs also had a larger farm population. Rural areas are ideal
environments for methamphetamine labs because of the limited law enforcement, open
land (specifically large areas between residents), and access to anhydrous ammonia.
Methamphetamine production produces strong odors that can be detected easily.
For all the reasons stated above, Extension Directors were an appropriate population
to study because they are embedded in the communities that most likely contain
7
8
methamphetamine use and production. Like embedded journalists who are attached to
military units during times of war, Extension Directors are on the frontline of the
methamphetamine drug war.
The results of the study will provide a better understanding of the influence and
power the media has on methamphetamine perceptions and the education needs for
methamphetamine prevention and safety. The findings can be used in Extension
programming, as well as other drug prevention and public health programs. The media
effects findings add to the knowledge base of media dependency and can aid prevention
educators in learning about the role of media in social marketing campaigns.
Research Objectives
The objectives of this study were to determine perceived methamphetamine
knowledge, the perceived threat of methamphetamine, media involvement in
methamphetamine perceptions, methamphetamine safety and health perceptions, and
prevention education needs. The results will assist U.S. educators in the development of a
methamphetamine curriculum as well as help them identify effective communication
channels and target audiences for public health campaigns.
Questionnaire responses can supply an enhanced understanding of the current
state of the problem and needs for prevention education at both aggregate and regional
levels in the United States. Specific objectives (O) of this study included:
O1: To describe Extension Directors in: (a) age, (b) gender, (c) level of education obtained, (d) years in current Extension title, (e) geographic location description of residence, (f) geographic location description of Extension territory, (g) U.S. state geographic description, and (h) current community involvement.
9
O2: To describe the methamphetamine information sources of Extension Directors.
O3: To describe the perceived methamphetamine knowledge of Extension Directors. O4: To describe the threat (related to crime, use, production, and violence) of methamphetamine as perceived by Extension Directors.
O5: To describe the perceived media dependency of Extension Directors for methamphetamine information.
O6: To describe the portrayal of methamphetamine in the media as perceived by Extension Directors. O7: To describe safety and health characteristics with methamphetamine production as perceived by Extension Directors. O8: To describe the perceived needs for methamphetamine prevention education. O9: To describe the relationships among selected demographic characteristics (gender, age, level of education obtained, years of Extension experience, geographic location description of residence and Extension territory, U.S state geographic description, years in current Extension title, and current community involvement) and: perceived methamphetamine threat, perceived media dependency, perceived methamphetamine media portrayal, perceived safety and health characteristics involved with methamphetamine production, and, perceived needs for methamphetamine prevention education.
O10: To identify significant differences in selected demographic characteristics (gender, age, level of education obtained, years of Extension experience, geographic location description of residence and Extension territory, U.S state geographic description, years in current Extension title, and current community involvement) and: perceived methamphetamine threat, perceived media dependency, perceived methamphetamine media portrayal, perceived safety and health characteristics involved with methamphetamine production, and, perceived needs for methamphetamine prevention education.
Significance of Study
Under President Obama’s Rural White House Agenda (2009), methamphetamine
was listed as the first priority under the subhead of “Improve Rural Quality of Life.” The
Agenda stated: “Combat Methamphetamine: Continue the fight to rid our communities of
meth and offer support to help addicts heal.” The reasons for this national emphasis on
methamphetamine included the costs of treatment, methamphetamine-related healthcare,
productivity loss, related crime, child maltreatment and foster care, and overall safety
associated with methamphetamine production and use.
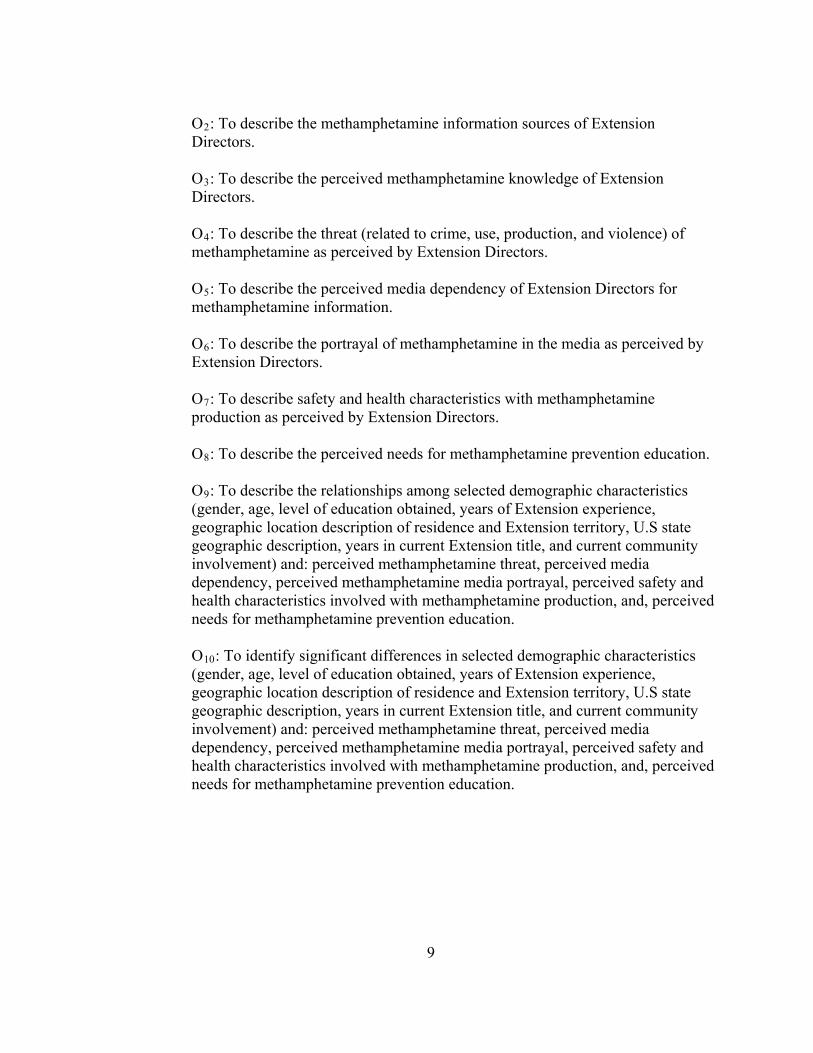
Besides the societal health and safety costs of methamphetamine treatment and
production, methamphetamine has generated a severe economic burden on the already
strained U.S. economy. Nicosia, Pacula, Kilmer, Lundberg, and Chiesa (2009) found that
the economic cost of U.S. methamphetamine use reached $23.4 billion in 2005.
Cost Best Estimate (millions) Drug treatment 545.5 Healthcare 351.3 Intangibles/premature death 16,624.9 Productivity 687.0 Crime and criminal justice 4,209.8 Child endangerment 904.6 Production/environment 61.4 Total 23,384.4 Table 1. Economic Costs of Methamphetamine in the United States in 2005 ($ millions) (Nicosia, Pacula, Kilmer, Lundberg, and Chiesa, 2009)
10
11
Methamphetamine abuse affects all geographic locations, ages, ethnicities, races,
and socioeconomic statuses. Because methamphetamine addiction holds no biases,
research into the perceptions of the current state of the problem, the effects of media on
perceptions, safety and health, and need for education is necessary to develop strategic
prevention and educational programming. Methamphetamine is a drug that places severe
burdens on entire communities and limited research exists in methamphetamine
education.
Limitations
Utilizing survey research inherently has limitations, including memory effect
(Tourangeau, Rips, & Rasinski, 2000), measurement error, and nonattitudes. Also, when
studying media effects, measuring whether the influence was from the media is difficult
to isolate.
Another limitation of the study was the lack of variability within the sample.
Although the sample was nationally representative, the ages of respondents ranged from
32 to 64, with a mean of 53, resulting in a relatively older sample. The sample also was
highly educated. Sixty-five percent of respondents had obtained a Masters in Science or
Arts (MS/MA) and 31% possessed a Doctorate of Philosophy (PhD).
Each state is diverse in their Extension System human resource structure.
Therefore, the number of Extension Directors included in the sample differed for each
state. The Southern region represented 29% of the total sample, the Midwest 41%, the
West 17%, and the Northeast was the least representative with 13%.
12
Definition of Terms (in alphabetical order)
Characteristic: a feature that helps in the identification of a distinguishing trait. Operationally defined as the following:
1. Geographic location description of Extension territory: Operationally defined as location subject reported as rural, suburban, or urban; nominal data. 2. Gender: The state of being male or female (typically used with reference to social and cultural differences rather than biological ones). Operationally defined as subject reported as male or female; nominal data. 3. Age: Operationally defined as subject reported years old; ratio data. 4. State Geographic Location: Operationally defined as the U.S. region state belongs in as West, South, Midwest, and Northeast (U.S. Census Bureau, 2009); nominal data. 5. Geographic location of residence: Operationally defined as location subject reported as rural, suburban, urban, rural/suburban, and suburban/urban; nominal data. 6. Level of education obtained: Operationally defined as amount of education the subject reported as some high school, high school graduate, some college, college graduate, some graduate school, MS/MA, and PhD; ordinal data. 7. Current community involvement: Operationally defined as individual contact with Extension territory community members. Subjects reported as high (weekly), medium (monthly), low (yearly), and none; nominal data. 8. Prior experience with methamphetamine training: Operationally defined as whether the subjects had attended methamphetamine education training; nominal data. 9. Years in current Extension title: Operationally defined as the number of years subject reported as serving in present Extension title; ratio data.
Media: The selected media for this study consisted of: news, fictional television, reality television, and social media; nominal data.
13
Media dependency: Operationally defined as subjects reported media as his or her primary source for methamphetamine information on a six-point Likert scale; interval data. Media portrayal: Operationally defined as a summation of each subject’s answer across items on a six-point Likert scale that measured methamphetamine media accuracy and trust of media; interval data. Media stereotype: Operationally defined as subjects reported agreement or disagreement to statements related to media stereotypes; nominal data. Methamphetamine information sources: The selected methamphetamine information sources for this study consisted of the following community members: media, public school official, law enforcement, state public health employee, Extension colleague, methamphetamine user, and family member or friend of methamphetamine user; nominal data. Method of Methamphetamine Information: Operationally defined as method subjects reported to have received methamphetamine information. Method was defined as on a rating scale including news media, word of mouth, public health campaign, entertainment media, law enforcement, formal education, and Extension education; interval data. Methamphetamine knowledge: Operationally defined as correctly answered items with the possible answers of yes, know, and don’t know; nominal data. Methamphetamine prevention education: Operationally defined as a summation of each subject’s answer on a six-point Likert scale related to the survey subjects’ perceived knowledge and importance of methamphetamine production signs, use, state and federal laws, and prevention and education resources; interval data. Safety and health characteristics of methamphetamine: Operationally defined as a summation of each subject’s answer across items on a six-point Likert scale involving the issues of safety and health methamphetamine programming; interval data. Threat of methamphetamine: Operationally defined as a summation of each subject’s answer across items on a six-point Likert scale involving the issues of crime, use, production, and violence relating to methamphetamine in the area of survey subject; interval data.
14
Chapter 2: Literature Review
Seven sections comprise this literature review. The literature review is divided
into the following sections: (a) history of methamphetamine; (b) methamphetamine in the
United States; (c) Extension education in the United States; (d) drug coverage and the
media (with a focus on Media Dependency and Moral Panic theories); (e)
methamphetamine safety; (f) methamphetamine and prevention education; and (g) the
importance of the characteristics of subjects related to study objectives.
The History of Methamphetamine
Methamphetamine is not a new drug. The active ingredient in amphetamine is
ephedrine and was first synthesized in 1887 by German chemist Lazar Edeleano.
Methamphetamine later was developed in Japan in 1919. In the 1930s, the drug was
introduced in bronchial inhalers and as a tablet known as Benzedrine in the United States.
The drug was legal with a prescription and was used as treatment for conditions such as
fatigue and obesity (Hunt, Kuck, & Truitt, 2006).
Methamphetamine and World War II
Methamphetamine was used by German, Japanese, and American military
throughout World War II for performance enhancement. The Imperial Japanese Armed
15
Forces used methamphetamine, also know as Philloppon, in special operations such as
the kamikaze (Sato, 2008). The drug, in tablet form, was mixed with green tea powder
and stamped with the crest of the emperor. The Armed Forces dispensed the remaining
stockpiles of the drug at the end of the war and use flourished in a devastated Japan.
Twenty-four different types of medication, containing either methamphetamine or
amphetamines existed in Japan (Ikuta, 1951). Several high-profile deaths in Japan from
methamphetamine led to the Stimulant Control Law (1951) and later to the 1954
campaign to eradicate methamphetamine.
In Germany, methamphetamine was manufactured under the name Pervitinor or
Isophan. Between April and July 1940, approximately 35 million tablets were shipped to
the German air force and army (Ulrich, 2005). Under Germany’s Opium Law, the drug
was restricted; however, the law had little effect and in 1941, 10 million tablets were
distributed to the German military.
The U.S. military was no different. An estimated 200 million amphetamine pills
were given to U.S. soldiers during World War II. The United States experienced the same
surge in drug sales after the war when the troops came home (Grinspoon & Hedblom,
1975). Use continued to increase throughout the 1950s and the drug also was used
intravenously (Klee, 1997).
The Surge of the 1960s
The United States experienced a surge in amphetamine and methamphetamine use
during the 1960s in California. The drug subculture that developed in the Haight-Asbury
area in San Francisco welcomed the intravenous use of methamphetamine.
16
Pharmaceutical production demand increased at a rate that far surpassed medical use and
a black market for the drug developed (Klee, 1997).
The Department of Justice took notice and pressured the pharmaceutical
companies to stop production of methamphetamine ampoules. Without a supply, the
beginning of home labs, otherwise known as “bathtub” labs, began. The potency was
much less than the pharmaceutical products; only 30% of street methamphetamine was
truly methamphetamine. However, the potency changed with time. From 1975 to 1983,
street methamphetamine increased from 60% to more than 90% in methamphetamine
content (Lake & Quark, 1984).
The biker subculture was attuned to methamphetamine during the Haight-
Ashbury, San Francisco scene of the 1960s. The high-risk lifestyle of the biker—
unlawful, heavy drinking, and partying—was similar to the lifestyle of methamphetamine
users. Bikers also recognized the financial opportunity in methamphetamine distribution.
The bikers diffused the drug north through Oregon and Washington and south throughout
California.
The Controlled Substances Act of 1970 classified methamphetamine as a
controlled substance, which placed restrictions on the manufacturing and distribution of
amphetamine-related drugs. Criminal sentencing included mandatory-minimum and
quantity-based penalties. For trafficking methamphetamine, mandatory federal sentences
include a minimum of five years in prison and fines of $2 million for individuals and $4
million for more than one individual (Covey, 2007).
17
The Current State of Methamphetamine in the United States
Each year, methamphetamine use and production can change drastically because
of increased law enforcement, government legislation, and prevention education. An
estimated 6,335.66 kilograms of methamphetamine were seized in 2008, according to the
National Drug Threat Assessment (2008). Since 2005, 24,146.93 kilograms of
methamphetamine were seized in the United States. And, according to the National
Clandestine Laboratory Seizure System, 3,390 methamphetamine labs incidents
(including labs, dumpsite, and chemical, glass, and equipment) were reported in 2008
(Figure 1). Lab seizures increased 873 incidents in 2008, compared to 2007 (DEA, 2009).
However, since 1999, 2003 had the most lab seizures with 17,356 reported nationally.
Production Trends
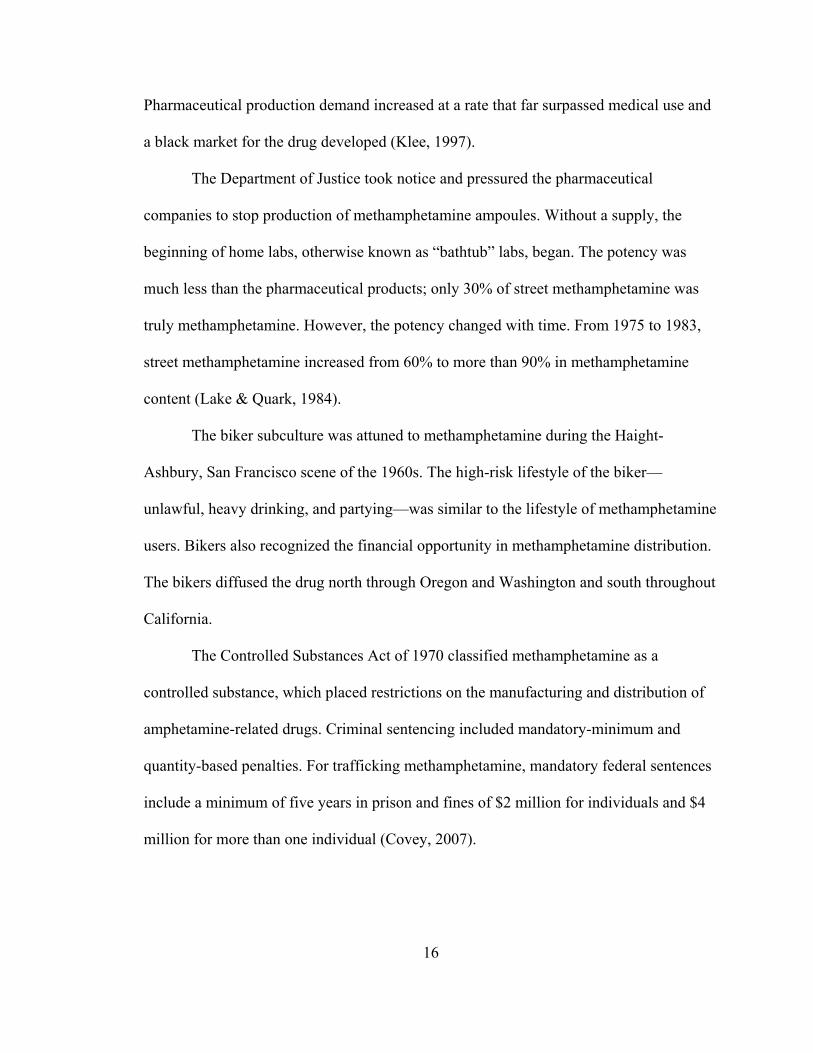
The landscape of methamphetamine production is changing in the United States.
The National Drug Threat Assessment (2008) reported that Mexican methamphetamine
production decreased in 2007 because of the ephedrine and pseudoephedrine import
restrictions the government of Mexico (GOM) introduced (Figure 2). In 2007, the GOM
introduced a ban on ephedrine and pseudoephedrine imports for 2008 and a ban of the
chemicals in 2009. This decrease in Mexican-produced methamphetamine resulted in less
methamphetamine availability in the United States. A slight decrease in use was revealed
in the national drug-prevalence data. Yet, methamphetamine treatment admissions were
stable.
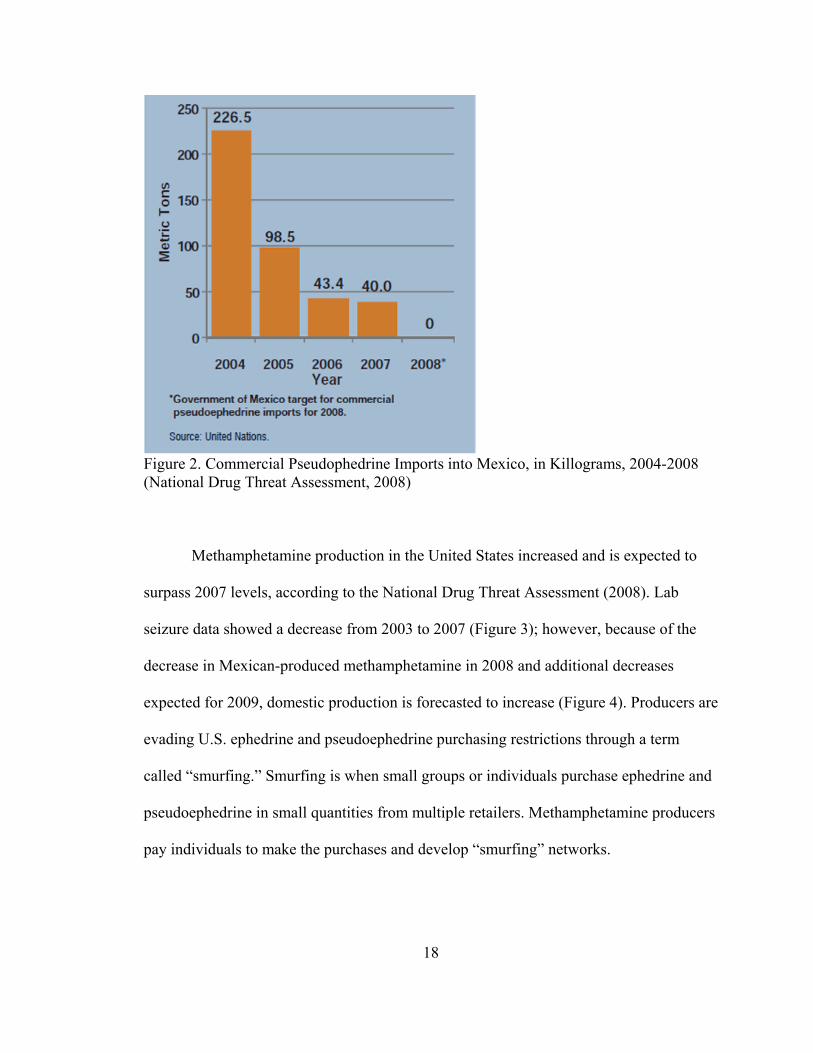
Figure 2. Commercial Pseudophedrine Imports into Mexico, in Killograms, 2004-2008 (National Drug Threat Assessment, 2008)
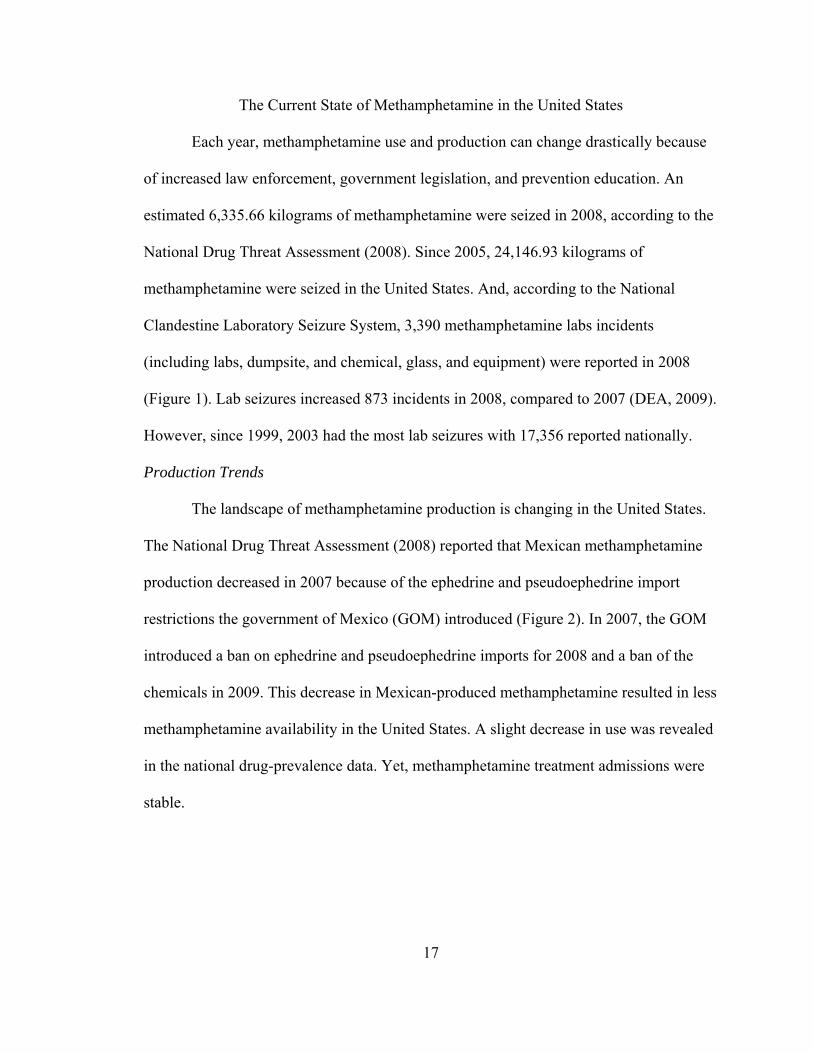
Methamphetamine production in the United States increased and is expected to
surpass 2007 levels, according to the National Drug Threat Assessment (2008). Lab
seizure data showed a decrease from 2003 to 2007 (Figure 3); however, because of the
decrease in Mexican-produced methamphetamine in 2008 and additional decreases
expected for 2009, domestic production is forecasted to increase (Figure 4). Producers are
evading U.S. ephedrine and pseudoephedrine purchasing restrictions through a term
called “smurfing.” Smurfing is when small groups or individuals purchase ephedrine and
pseudoephedrine in small quantities from multiple retailers. Methamphetamine producers
pay individuals to make the purchases and develop “smurfing” networks.
18
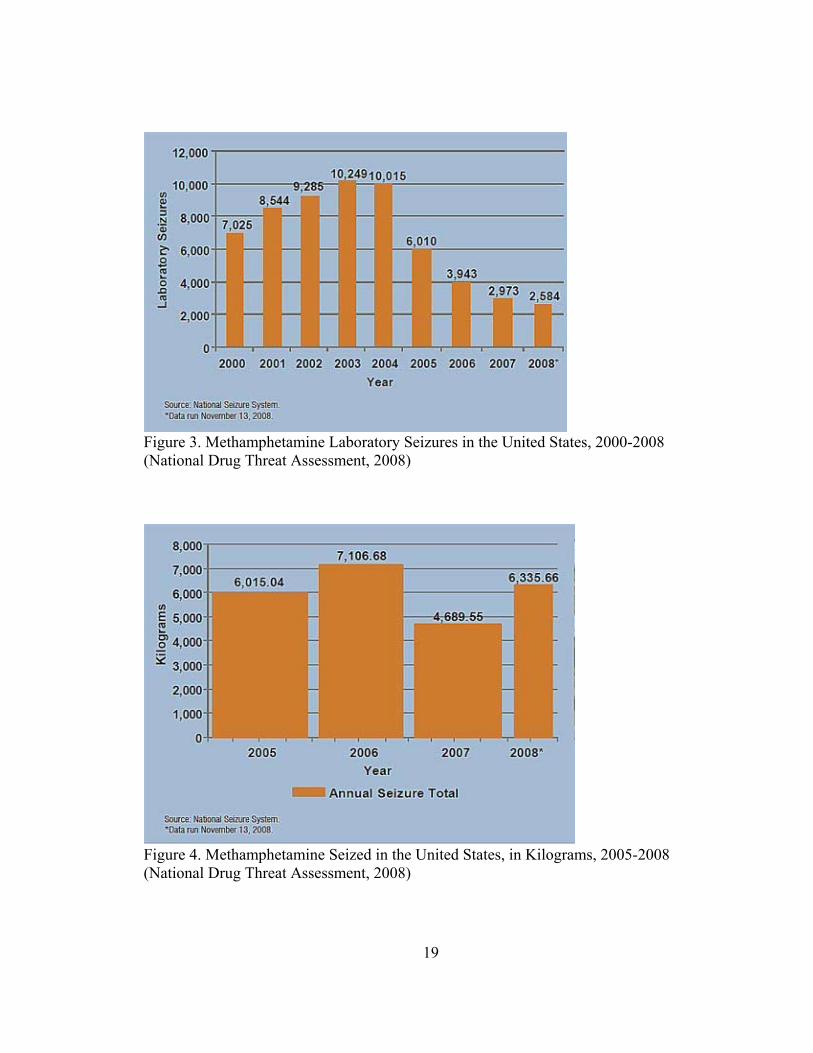
Figure 3. Methamphetamine Laboratory Seizures in the United States, 2000-2008 (National Drug Threat Assessment, 2008)
Figure 4. Methamphetamine Seized in the United States, in Kilograms, 2005-2008 (National Drug Threat Assessment, 2008)
19
20
Also new to methamphetamine producers are novel production methods that are
faster and easier. The one-pot lab, or shake and bake, method uses a combination of
available chemicals to synthesize the anhydrous ammonia (National Drug Intelligence
Center [NDIC], 2008). The one-pot method takes only 30 minutes. The ingredients
usually are mixed in a 2-liter soda bottle. This allows producers to make
methamphetamine literally “on the go” in cars. The waste, which may carry toxic,
explosive, or flammable chemicals, is discarded along roadways.
Use of Methamphetamine According to the 2007 National Meth Use & Attitudes Survey, 24% of
adolescents said it would be “very easy” or “somewhat easy” for them to acquire
methamphetamine and 10% of adolescents have been offered methamphetamine at some
time. Three percent of adolescents admitted to trying methamphetamine: The majority of
those adolescents said they had taken methamphetamine in the past month.
The National Survey on Drug Use and Health (NSDUH) 2008 reported that
95,000 Americans, ages 12 to 49, initiated use of methamphetamine (Figure 5). This is
the lowest estimate since data were first collected in 2002. The average age of first use
was 19.2 years in 2008. However, the first use age ranged from 18.6 to 22.2 since 2002
(Figure 5).

Figure 5. Past Year Methamphetamine Initiates among Persons Aged 12 or Older and Mean Age at First Use of Methamphetamine among Past Year Methamphetamine Initiates Aged 12 to 49: 2002-2008 (NSDUH, 2008)
Overall, NSDUH 2008 findings are positive regarding methamphetamine.
Between 2006 and 2008, the number of past month methamphetamine users decreased by
more than one-half. In 2006, an estimated 731,000 people 12 and older in the United
States were methamphetamine users. In 2008, the estimated number was 314,000. From
2002 to 2008, the past month use of methamphetamine decreased for young adults (from
0.6% to 0.2%). Among adults age 26 and older, .03% use methamphetamine.
Although research identified males as being more likely to be methamphetamine
21

22
users (Bureau of Justice Statistics, 2005), in 2008, males and females had similar rates of
past month use (NSDUH, 2008). However, for adolescents, nonmedical use of
psychotherapeutic drugs among 12- to 17-year-olds was more prevalent among females
(3.3%) than males (2.5%). Psychotherapeutic drugs included prescription-type pain
relievers, tranquilizers, stimulants, or sedatives.
Extension Education in the United States
The United States developed Extension education as the third partner, along with
teaching and research, in the Land-Grant University model to disseminate agricultural
research into practice. Since the U.S. transformation from a predominately rural society
to mostly urban, Extension has placed greater emphasis on health, family, youth, and
community issues rather than solely focusing on agriculture. Unlike large-scale
marketing campaigns, Extension utilizes social marketing philosophies to teach
communities at the grassroots level. Extension now serves individuals in rural, urban, and
suburban settings—allowing the states to be the campuses of the universities.
Extension’s philosophy is grounded in the principles of pragmatism among which
are active, applied learning to fulfill the needs of the participants, and the “workability”
and relevance of the content. In the Extension model, practitioners inform researchers of
their need for new knowledge. Researchers discover the new knowledge that is
appropriate for the practitioner; then the knowledge is translated and delivered through
Extension agents.
23
The Morrill Act was the first initiative to legitimize formal agricultural education
in 1862, and subsequently began the American public university tradition. Before then,
upper-class Americans went to Ivy League institutions of European thought—no other
options for the “common” people existed. These new universities, also known as Land-
Grant Universities, broadened educational opportunities for those who did not have prior
access. The United States divided the 17,430,000 acres of land in the public domain to
finance the Land-Grant Universities (McDowell, 2002) that would emphasize agricultural
and mechanical arts education. These universities also were required to have applied
research, a ROTC program, and a combination of vocational and liberal educational
opportunities. Land-Grant Universities were created for the purposes of serving states and
their people.
Then, in 1887, the Hatch Act added to agricultural education by expanding the
functions of the Morrill Act to include research. The Act created agricultural
experimental stations that were supervised by the United States Department of
Agriculture (USDA). Three years later the second Morrill Act instituted Land-Grant
Universities for black students. The Morrill Act did not change for the next 100 years—
until 1994, when the Improving America’s Schools Act identified 30 Tribunal colleges
and, later in 1998, when Hispanic colleges were added to the original Morrill Act.
The Extension System started in 1914 in the Smith-Lever Act. The Act
established the Cooperative Extension Service and provided federal funds for cooperative
Extension activities. Extension is considered to be the third partner in agricultural
education and the System is an expansive network of non-formal education. The role of
24
the Extension System is to link the research units affiliated with the Land-Grant
Universities to the local communities. The term “Cooperative” is used in the act because
Extension is a partnership between federal, state, and county governments.
Drug Coverage and the Media
Dependency is a part of human nature. Therefore, the construct that humans
become dependent on media for information is not surprising. Like the effects of a drug,
individuals become dependent on the media for their daily doses of information
pertaining to the environment and issues that surround and affect them. Price and Roberts
(1987) explained that the media operates to disseminate information about events, ideas,
and social movements beyond the limits of personal experience and association. The
result is that individuals use the media to assess the broader social implications of the
news. Intuitively, this means the majority of the U.S. population learns about
methamphetamine through the media and would include incorrect stereotypes or
sensational events.
Citizens obtain news through the mediums of print, radio, television, personal
communication, and the Internet. Audience members of the news are exposed to the
decisions of editors and journalists about what makes news, what issues are important,
and how policy debates are portrayed, often referred to in communication research as
agenda setting (McCombs & Shaw, 1972) and framing (Scheufele, 1999). Early research
concluded that the media simply reinforced perceptions (Lazarfeld, Berelson, & Gaudet,
25
1948). However, subsequent research debated that media has greater power and the
ability to select and arrange issues.
Media Dependency
The Media Dependency theory is one formulation that attempts to explain why
the mass media has powerful and direct effects on individuals and societies at the micro
and macro levels. Media dependency relies on the goals and resources of an individual—
under the assumption that individuals rely on the media to meet the goal of being
informed on certain chosen topics (Defleur & Ball-Rokeach, 1989). Mass media makes
information accessible to attain understanding and orientation.
The policy process and the role of the media is a relationship that is based on
needs and goals, and is supported by the Media Dependency theory. Media is an
institution that informs citizens of the political responses to problems. According to
Krivanek (1988), the media depicted the drug problem and focused on consumption
while ignoring other aspects of the story, such as economic, political, and historical
implications of the production and marketing of the drug. Some drug policy researchers
actually included media as a component of the drug problem (Bell, 1982; Fox &
Matthews, 1992).
Part of the difficulty with media portrayal is the use of stereotyping. Bell (1982)
examined the way the media portrayed the drug problem and focused on recurring
language. Much of the stereotyping, Bell concluded, was the identification of victims,
villains, and the proclamation of war on the problem by the government.
Fox and Matthews (1992) strongly disagreed with the media presentation of
26
illegal drugs and how community interaction with the media thwarts policy responses.
Fox and Matthews stated:
The media has been a mirror of society’s attitude towards the drug issue. But it
has been a distorting mirror, giving warped and false images to the public at large.
It has been distorted images that much of society’s views have been based. The
media, in all its forms, has not served the public or governments well by its
largely unchallenging performance (p. 173).
The mass media has been used greatly in drug abuse communication. However,
the drug information campaigns of the 1970s found little evidence that the media
possessed effects on drug prevention (Leshner, 2002). Some believed these campaigns
actually were wasteful because the campaigns introduced children to drugs long before
they would encounter them in their lives. Leshner also concluded that these campaigns,
often times, suggested drug use to be much greater that what was actually occurring.
In the 1990s, research about media effects grew and attention turned to how to
measure the impact of media in preventing substance abuse behaviors. In 1997, the
National Institute on Drug Abuse was asked to evaluate the Office of National Drug
Control Policy (ONDCP) National Youth Anti-Drug Media Campaign. This media
campaign had the goal of eliminating illicit drug use in adolescents and was one of the
most ambitious social intervention campaigns of the time.
Since 2001, the National Youth Anti-Drug Media Campaign has aided in the
27
decline of adolescent drug use. The Media Campaign’s marijuana initiative showed
declines in adolescent marijuana use (Palmgreen, Lorch, Stephenson, Hoyle, &
Donohew, 2007). Research also found that adolescents exposed to the Media Campaign’s
messages, along with an in-school program, were significantly less likely to smoke
marijuana as adolescents exposed to the in-school program alone (Longshore, Ghosh-
Dasidar, & Ellickson, 2005).
The U.S. government and the media form relationships to spread a message and to
set the agenda with the ultimate goal of informing citizens. Yet, if the media is the sole
provider of information to citizens, then that information is the only representation of the
issue. Consequently, the media agenda has effects on not only communities, but
government initiatives and policies.
Although research is limited concerning media dependency and drugs, in
particular methamphetamine, studies do support media dependency in similar social
topics. News dependency elevates during times of intense conflict or change. During
these times, media responds with additional coverage to interest audiences. Research has
found positive relationships between health and other general risk situations and media
exposure (Coleman, 1993; Loges, 1994).
Tucker, Whaley, and Sharp (2006) researched consumer perceptions of food-
related risks and found the media does play a positive role in perceptions. In this study,
the strongest predictor of perceived food risk was biotechnology, yet media dependency
was second. In support of Tucker et al.’s research, Nelkin (1987) stated dependence on
28
the media assists in defining the public’s sense of reality and its perceptions of risks and
benefits.
By extrapolating research findings (Tucker, Whaley, & Sharp, 2006; Nelkin,
1987) to methamphetamine, an assumption would be the perceived risks and description
of a drug user and the drug (i.e., recovery, arrests, and user descriptions) are learned
through the media. If there is a media blitz on methamphetamine-related arrests and lab
seizures, then the public would infer that the current legislation works and the drug is a
threat. Conversely, if the media is not accurately portraying the events and information
about the drug, then individuals dependent on the media are creating their own reality of
the drug threat in the community.
Moral Panic
In 2005, 90 leading doctors, scientists, psychological researchers and treatment
specialists joined together and released a letter requesting the media to stop using the
negative terms such as “ice babies” (Lewis, 2005). The stigmatizing labels lacked
scientific basis. The New York Times methamphetamine story (2004; Appendix B)
provided an example of how law enforcements officials were asked to describe the
effects of methamphetamine exposure to youth rather than a medical expert.
The theory of moral panics began during the 1970s in the sociology of deviance
(Zajdow, 2008). Cohen (1972) identified a moral panic conceptually as when the majority
of society views a social group or activity as threatening to that society. Young (1973)
added to moral panic with deviance amplification spiral theory; when the media becomes
29
involved, public reaction causes deviant behavior to increase, which ultimately amplifies
media attention.
Moral panics assist the news industry in developing emotional appeal to content
(McRobbie & Thornton, 1995). The emotional involvement of an audience intensifies
interest. Many times, Shoemaker and Reese (1996) explained, the more deviant the
content, the more likely the media will pickup the story, and the more likely the content
will be stereotyped. Stereotyping is one way the media connects unrelated events.
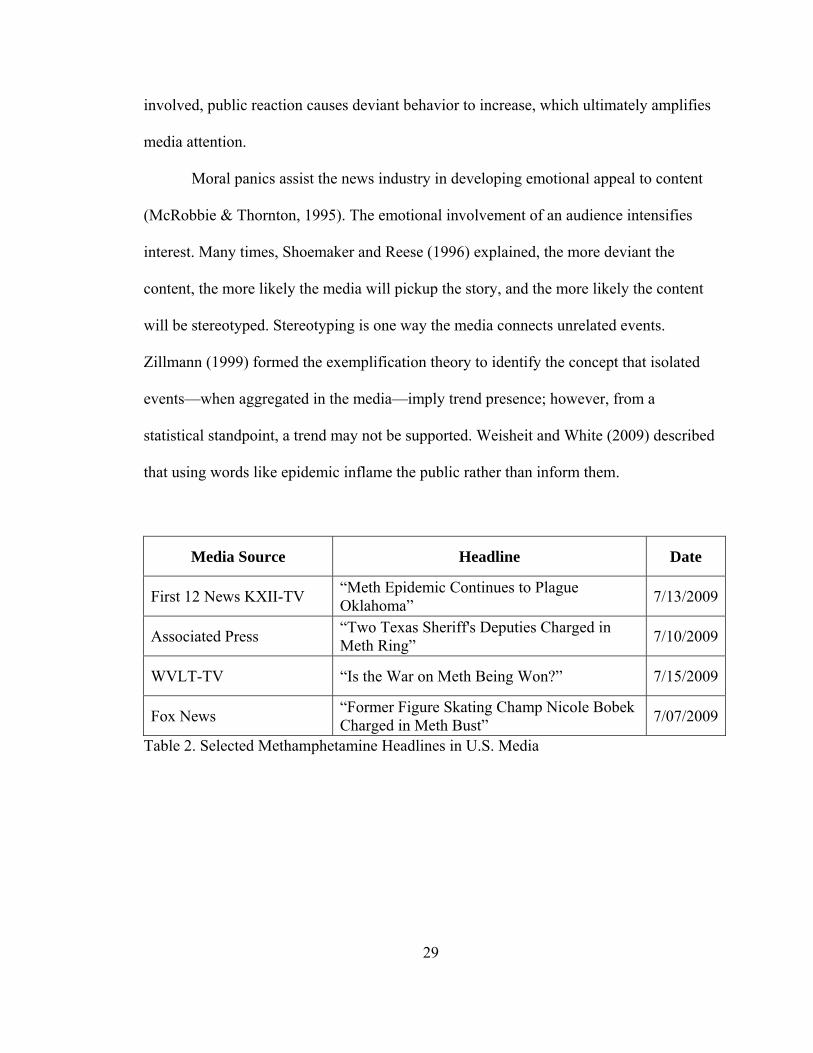
Zillmann (1999) formed the exemplification theory to identify the concept that isolated
events—when aggregated in the media—imply trend presence; however, from a
statistical standpoint, a trend may not be supported. Weisheit and White (2009) described
that using words like epidemic inflame the public rather than inform them.
Media Source Headline Date
First 12 News KXII-TV “Meth Epidemic Continues to Plague Oklahoma”
7/13/2009
Associated Press “Two Texas Sheriff's Deputies Charged in Meth Ring”
7/10/2009
WVLT-TV “Is the War on Meth Being Won?” 7/15/2009
Fox News “Former Figure Skating Champ Nicole Bobek Charged in Meth Bust”
7/07/2009
Table 2. Selected Methamphetamine Headlines in U.S. Media
30
Methamphetamine Safety
The environmental dangers and health risks associated with methamphetamine are
serious, especially to unsuspecting victims such as public safety for first responders and
community members who may accidentally come across a methamphetamine
manufacturing operation. Unlike most drugs, which have to be imported into a region,
methamphetamine can be manufactured in a home operation or mobile lab using regular
household chemicals purchased from pharmacies and hardware stores.
The danger is that the individuals processing the chemical components used in
making methamphetamine are not skilled chemists and thus create a situation with high
potential of explosion and contamination during the manufacturing process. Toxic gas
leaks, chemical fires, and explosions often occur, putting the entire community at risk.
Contaminated ground resulting from a methamphetamine lab is considered so dangerous
that the area is treated as bio-hazardous waste scene.
Methamphetamine can be produced almost anywhere with limited supplies, and
commercial buildings, houses, apartments, hotel rooms, trailers, barns, vans, and storage
units are just some of the structures used for labs. Although many labs are located in rural
areas because the privacy and distance help to hide production smell, labs can be found in
urban and suburban areas as well. Among individuals at risk of exposure are
unsuspecting children, real estate agents, landlords, property managers, prospective
renters and homebuyers, garbage collectors, utility workers, plumbers, social service
agents, law enforcement, and first responders. According to the National Drug Threat

31
Assessment (2008), more than 1,100 children were killed at, removed from, or injured at
a methamphetamine lab from 2007 to September 2008.
Martyny, Arbuckle, McCammon, Esswien, Erb, and Van Dyke (2007) conducted
a study measuring the chemical exposure associated with methamphetamine
manufacturing. The researchers found high concentrations of phosphine, iodine,
anhydrous ammonia, and hydrogen chloride in the lab during the cooking process.
Anhydrous ammonia and hydrogen chloride were detected at levels that exceeded
Immediately Dangerous to Life and Health (IDLH) levels designated by the National
Institutes of Occupational Safety and Health.
Education about the safety concerns involving methamphetamine is necessary to
all community members. Appendix C represents a Nebraska Department of Roads
brochure that focuses on methamphetamine lab litter safety precautions.
The process of methamphetamine lab risk assessment is complicated because
solid research is not available regarding: impact on human health from exposures within
a meth-contaminated structure; absorption by skin or distribution of methamphetamine
throughout the body; levels of methamphetamine in air of former methamphetamine labs
that may be harmful; and, an established safe level for methamphetamine in the
environment. Chemicals used to manufacture methamphetamine vary, based on the
recipe, cooking process used, and availability of ingredients. Labs often contain a variety
of chemicals including (but not limited to) toluene, denatured alcohol, ether, freon,
hydrochloric acid and sodium hydroxide. Other poisons such as mercury and lead also
may be present. Chemicals continue to be a threat after the methamphetamine production
32
has stopped because the toxins permeate the air inside the home and chemical residue
settles on any surface, including walls, carpeting, furniture, and fabric. The chemical
residue remains a toxic hazard long after the methamphetamine lab has been shut down.
An essential strategy in successful law enforcement response to addressing
methamphetamine labs is the involvement and education of the entire community. Law
enforcement needs to take a leadership role in assembling relevant information and
getting the message out to the masses. Collaboration among law enforcement, their
communities, and the mass media is required to combat clandestine drug labs. The
education must implement proactive measures that help identify clandestine lab operators
and methamphetamine trafficking.
Methamphetamine and Prevention Education
The historical function of Extension is to bring research-based knowledge in a
useable form to groups, families, and individuals in local communities. Extension
personnel provide an important bridge between university researchers and community
knowledge-users by being able, first, to identify community needs, and second, to select,
translate, and transmit relevant, research-based information to help address those needs
(Russell, 1991). Extension educators recognized they have a contribution to make in the
drug war and have identified drug education as a high priority. Griner and Parker’s
(2005) study on the attitudes toward both prevention programs serving youth and families
found that 70% of Extension educators sampled perceived a local need for prevention
programs addressing adolescent substance use.
33
Across the United States in state Extension Systems, methamphetamine
prevention education programs are starting. However, no need assessments have been
conducted to identify what types of structure, content, or delivery methods are required or
a national aggregated study on those needs. Many states, like Ohio, have not initiated any
programs, while other states, like Montana and its “Montana Meth Project,” have
extensive campaigns and materials available.
In 2003, Montana recognized the emerging methamphetamine problem in the
state and the Montana Department of Justice provided a grant to Montana State
University (MSU) Extension Housing and Environmental Health (Astroth & Vogel,
2008). The idea for the grant began when MSU Extension faculty received grassroots
input that methamphetamine was impacting young Montanans and the communities in
which they lived. The grant funded a diverse team of Extension agents to develop an
educational PowerPoint program that schoolteachers could use in the classroom. The 10
PowerPoints were included in the Meth Prevention—Tools for Schools CD-ROM.
To date (2008), Extension faculty have conducted 64 school and community workshops
using the toolkit, 4,000 copies of the toolkit have been distributed, and more than 269,000
Montanans have received the methamphetamine education materials.
Another state actively battling methamphetamine is Tennessee. A contributing
factor for the methamphetamine problem in Tennessee is the state borders eight states,
with interstate highways crisscrossing four major Tennessee cities—making interstate
drug trafficking inviting (Weinrauch & Liska, 2006). In 2007, Tennessee Governor Phil
34
Bredesen designated $1 million for after-school programs. The money was given to 17
agencies for three-year installment programs (Meth Destroys, 2006).
Through a 2009 Google Web search, the following Extension Systems had
educational materials posted online regarding methamphetamine: Nebraska, Missouri,
New Hampshire, Wisconsin, Wyoming, Iowa, Indiana, Kentucky, California, West
Virginia, and Michigan. Of the states identified, Wisconsin and Indiana possessed the
most information. Wisconsin posted an online toolkit where visitors would be referred to
other resources available in the state. Purdue Extension developed a lesson plan on
methamphetamine, which is available online. Within the lesson plan, sample news
releases, program outlines, and a teaching preparation guide were included.
According to NIDA, prevention programs can be described by audience:
Universal, selective, and indicated (2007). Through this research project, respondents
identified what audiences are most in need for methamphetamine prevention education.
NIDA also provides three arenas in which prevention education takes place: In the
family, in school, and in the community. The best-suited arena for a prevention education
programs depend on the needs of the community. This exploratory study identified the
needs and also identified where communities currently are receiving information about
methamphetamine.
Importance of Subject Characteristics
The demographics of subjects are important variables when studying perceptions.
The characteristics hypothesized to compare with the study objectives are the gender,
35
age, and geographic area descriptions of the Extension area serviced and residence of
Extension Directors. These characteristics were included because the researcher believed
they would show relationships with the perceptions of methamphetamine safety,
educational needs, and media effects.
The Media and Geographic Location, Gender, and Age of Subjects
Mass media portrayals of rural life are inclined to use convincing stories and
dramatic effects. Since education levels are lower in rural areas (Bushey, 1998),
therefore, according to Alman (1993) and Loges (1994), rural area residents rely more on
the media and the media has more strength effecting perceptions. Implications for this
research involving methamphetamine are that rural residents learn most about
methamphetamine through the media and the effects of the media are stronger on those
citizens than those in urban or suburban areas.
Gender and age also play important roles in media consumption and dependency.
According to The Pew Research Center for the People and the Press (2008), 31% of U.S.
residents under the age of 50 followed crime news, while only 24% older than 50
followed crime. And, 34% of 18- to 24-year-olds have no daily news consumption.
Pew Research (2008) also found that 71% of males follow science and technology
news with 29% of females following the topic. However, 64% of women follow health
news, compared to 36% of men. These demographic statistics are important when
evaluating the perceptions of methamphetamine coverage in the news.
Although methamphetamine abuse is throughout the United States, the
geographic location of the Extension Director was important to identify and analyze
36
because methamphetamine has been characterized as a rural drug. Early outbreaks of the
drug initially began in western states but moved east of the Mississippi River (Rawson,
Gonzales, & Brethen, 2002; Donnermeyer & Tunnell, 2007; Weisheit & White, 2009).
However, because methamphetamine has the capability to affect the environment
as well as those who use the drug, Extension agents who focus on agricultural topics may
also be invested in methamphetamine education, as well as family, consumer, and health
specialties. The environmental impact of methamphetamine use and production currently
is being studied. Chemical residue from home labs remain a toxic hazard and can infect
the ground and nearby water supplies. Research showed that more than one-third of the
children found in a home laboratory tested positive for the drug because of environmental
exposure (Hohman, Oliver, & Wright, 2004).
Summary
Methamphetamine use and production is a drug problem that continuously is
changing. In the past two decades (1990-2009), methamphetamine production evolved
from being produced in clandestine labs in U.S. rural areas, to being supplied by Mexican
drug cartels, to production back in the United States using a new method that is both
quick and easier. Methamphetamine also is one of the rare drugs where the producers of
the drug serve a dual role as trafficker and user.
In many rural areas throughout the United States, Extension personnel are trusted
resources in the communities they serve and often inhabit. Extension personnel also may
discover clandestine labs themselves or notice unusual activity, such as higher traffic on
37
unpopulated roads or disturbances on absentee properties. Farmers may directly call their
agricultural Extension agent concerning anhydrous ammonia theft.
Although methamphetamine use has declined in the United States,
methamphetamine continues to be a problem because of the unique social factors
involved with the drug. Methamphetamine can be made almost anywhere using
household chemicals and the producers of the drug are mostly likely users.
Methamphetamine also affects all individuals exposed both directly and indirectly to the
chemicals. Among individuals at risk of exposure are unsuspecting children, real estate
agents, landlords, property managers, prospective renters and homebuyers, garbage
collectors, utility workers, plumbers, social service agents, law enforcement, and first
responders. According to the National Drug Threat Assessment (2008), more than 1,100
children were killed at, removed from, or injured at a methamphetamine lab from 2007 to
September 2008. The chemical residue from methamphetamine production remains a
toxic hazard long after the methamphetamine lab has been shut down.
Methamphetamine education is necessary because of the negative effects the drug
can impose on entire communities. The drug possesses a long history within the United
States and there are no indications that history methamphetamine use or production will
stop. Additional social science research is necessary to aid efforts in decreasing
methamphetamine use and production.
38
Chapter 3: Method
Chapter 3 provides an overview of the research methods used in this study. Topics
addressed in the chapter are research design, sample selection, instrument validity and
reliability, conditions of testing, timeline for data collection, controlling nonresponse
error, and data analysis. The instrument developed and used is Appendix D.
Research Design
The purpose of this study was to explore and describe the perceived knowledge of
methamphetamine, methamphetamine information sources, the threat of
methamphetamine in communities, media dependency and portrayal of
methamphetamine, and the perceived need for prevention education in the United States
related to prevention and agricultural safety education. The study focused on a random
sample of U.S. states and the Extension Directors within each state (refer to Appendix A
for complete list of Extension titles). The instrument was an online survey that was
disseminated and collected through a mixed-mode approach of U.S. mail and e-mail.
Along with exploring and describing the perceptions, part of the study was
relational. The relational component identified correlations among selected
characteristics and obtained methamphetamine perceptions. These relational aspects of
39
the study were further examined by inferential analysis that identified whether there were
significant differences among the perceived geographic area descriptions of the Extension
area serviced and residence of Extension Directors, years in current Extension title,
geographic region of states sampled, current community involvement of the respondent,
level of education obtained, gender, and age of the subjects. The population described
above was appropriate to be surveyed because Extension Directors associate with diverse
populations at the grassroots level and each state possesses an Extension System.
To ensure the quality of survey research, Dillman, Smyth, and Christian (2009)
identified four errors of survey research: sampling, nonresponse, coverage, and
measurement. Sampling error cannot be eliminated entirely unless a census is conducted.
However, using a large and national random sample of sufficient size, sampling error for
this study was low. Nonresponse error was controlled by utilizing the Dillman’s Tailored
Design Method (Dillman et al., 2009), which is identified in detail following “Timeline
for Data Collection.” Also, a method to control nonrepsonse was to compare early to late
respondents under the assumption that subjects who respond late are similar to those who
do not respond (Miller & Smith, 1983).
Subject Selection
Quantitative research, in the form of a survey, was used to conduct this study. The
study focused on a random sample of U.S. states and the Extension Directors within each
state (refer to Appendix A for complete list of titles). A random sample of 50 states
40
(n = 44) was calculated using Cochran’s formula (1977), with a confidence level of 95%
and risk level of 5%.
Using Microsoft Excel (2008), the 50 U.S. states were listed alphabetically, with a
numerical label of 1 through 50. Using the Excel random number generator tool, 44
numbers were randomly drawn from the 50 and paired to the numerical labels of
coordinating state. Extension Directors were identified through Web searches of each
state Extension Web site (N = 214). However, after the initial contact, the total N
decreased to 207 (because of employment retirements, vacant positions, and leave of
absences). After the selection of District Directors, each subject was given an
identification number for the purpose of preparing for the procedure of data collection
and anonymity. By random sampling the United States, results are nationally
representative.
Instrument Validity and Reliability
According to Groves, Fowler, Couper, Lepkowski, Singer, and Tourangeau,
(2004) the validity of survey research deals with “the extent to which the survey measure
accurately reflects the intended construct” (p. 254). To secure the content validity of the
instrument, a panel of experts (N = 4) reviewed the instrument. One expert in
methodology identified problems with research aspects of the questionnaire; two experts
in methamphetamine and rural crime assessed the methamphetamine-related portion; and
one media expert evaluated the media-related items of the questionnaire. A minimum of

41
three experts was needed to approve each questionnaire item for the instrument to be
considered valid. All four experts approved the questionnaire after several drafts.
Reliability refers to “the degree to which scores obtained with an instrument are
consistent measures of whatever the instrument measures” (Fraenkel & Wallen, 2000).
Reliability is the measurement of variability of answers (Groves, Fowler, Couper,
Lepkowski, Singer, & Tourangeau, 2004). After the expert questionnaire review
established validity, the questionnaire was pilot tested among Ohio State University
Extension agents (N = 24) who were not included in the sample of the study. If the
variance of the response deviations was low and the reliability coefficient approached
1.0, the questionnaire would have high reliability. For the purposes of this study, the
minimum reliability coefficient was established a priori as .7 (Nunnally & Bernstein,
1994) to be considered reliable.
Cronbach’s alpha was used to assess internal consistency of the domain of the
instrument for the items that used Likert-type scales. From the pilot test, the Cronbach’s
alpha yielded values of .92 for methamphetamine perceptions summated items, .80 for
media summated items, .78 for safety summated items, .89 for perceived knowledge
summated items, and .99 for perceived educational need summated items.
Conditions of Testing
In this study, the data were collected through a mixed-mode approach of Web and
U.S. mail questionnaires. The online survey company used was Survey Monkey
(www.surveymonkey.com). Advantages of a mixed-mode approach include lower costs,
42
improved timeliness, reduced coverage error, opportunity for incentive, improved
response rates, and reduced nonresponse error (Dillman, Smyth, & Christian, 2009).
Converse, Wolfe, Huang and Oswald (2008) found that mail followed by e-mail/Web
resulted in an 11.8% higher response rate compared to e-mail/Web followed by mail.
Since multiple contacts have demonstrated to be an effective strategy for higher
response rates by mail and Web surveys (Dillman, Smyth, & Christian, 2009), a series of
five contacts was implemented in the procedure of data collection. Tasks regarding the
five contacts are listed below.
1. First contact—Pre-notice postcard to sample (n = 215), which informed subjects of forthcoming Web questionnaire (sent July 6, 2009).
2. Second contact—Invitation letter sent through Survey Monkey, included
questionnaire instructions and link to Web questionnaire (n = 207; e-mailed July 14, 2009).
3. Third contact—Thank you/reminder e-mail was sent to all nonrespondent
subjects with questionnaire instructions. The additional mode of a paper questionnaire and regular U.S. mail was offered in this contact (e-mailed July 21, 2009.
4. Fourth contact—Second complete e-mail with a new cover letter was sent to
all nonrespondents. Additional mode was offered in this contact (e-mailed July 28, 2009).
5. Fifth and final contact—Reminder e-mail sent to all nonrespondents (e-mailed
August 4, 2009).
An individual identification number was given to each subject. The researcher
was able to use these numbers to follow-up with nonrespondents. To follow regulations
set by the Office of Responsible Research Practice at The Ohio State University, subjects
were informed that their participation was voluntary and their responses would be kept
43
strictly confidential. IRB approval was obtained and the research was concluded exempt
before commencement of the study (OHRP Federalwide Assurance #00006378).
Timeline for Data Collection
The period of data collection for the five contacts lasted approximately seven
weeks (commencing July 6, 2009 and concluding August 21, 2009). Seven days after
sending the initial mailing through U.S. mail (the first contact); an e-mail invitation with
the Survey Monkey Web link (the second contact) was disseminated to all subjects. Eight
days after sending the second contact, a thank you/reminder e-mail (the third contact) was
sent to all subjects (thank you message sent to respondents and reminder message to
nonrespondents). One week after sending the third contact, the second complete e-mail
(the fourth contact) was sent to nonrespondents. Approximately one week after sending
the fourth contact, the final reminder e-mail (the fifth and final contact) was sent to
nonrespondents. To increase the response rate, the data collection period was not held
during major U.S. holidays.
Controlling Nonresponse Error
The basic principle for controlling nonresponse error is to receive a high response
rate. To reach an ideal response rate, Linsky (1975) indicated that multiple follow-ups,
pre-contact with subjects, use of hand-stamped return envelopes, incentive distribution,
and institution sponsorship(s) with the title and signature of the responsible individual(s)
were effective strategies to maximize a survey response. Also, Dillman, Smyth, and
44
Christian (2009) suggested offering a second mode to nonrespondents. In this study, the
effective strategies available to implement were employed in the procedure of data
collection.
1. The pre-notice contact letter (first contact) was mailed to all subjects with the use of USPS commemorative stamps. The letter was in the form of a postcard with one side containing the text and the other side containing a photo and reminder to look for an e-mail from the researcher. (Refer to Appendix X for postcard sample.)
2. The pre-notice contact letter (first contact) contained the incentive of an
individually wrapped teabag. 3. The OSU logo was used in both mode options to represent visually
institutional sponsorship.
4. Each postcard was individually signed and accompanied with the business card of the investigator.
5. Included in Contacts 3 and 5, an additional mode option (U.S. mail) was
offered to complete the questionnaire. 6. The investigator served as the contact person if subjects had any questions
regarding the questionnaire or the study.
Nonresponse error occurs when the values based only on respondent data differ
from those data based on an entire sample (Groves, Fowler, Couper, Lepkowski, Singer,
& Tourangeau, 2004). To control sampling error, frames were complete and a 95%
confidence interval was identified for sampling. Early and late respondents were
compared for significant differences using t-tests for independent groups (Miller &
Smith, 1983). Subjects who returned their questionnaires before or on August 4, 2009
(the date of sending the second e-mail notification) were identified as early respondents.
Subjects were considered late respondents when the investigator received their
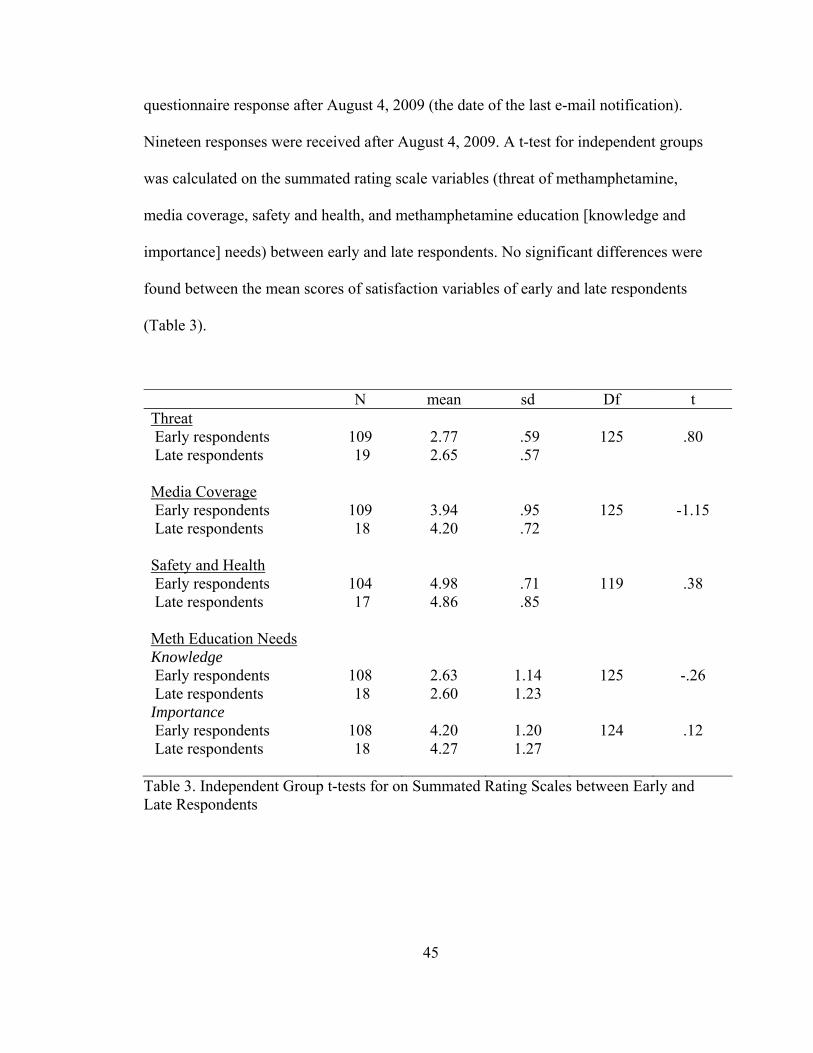
45
questionnaire response after August 4, 2009 (the date of the last e-mail notification).
Nineteen responses were received after August 4, 2009. A t-test for independent groups
was calculated on the summated rating scale variables (threat of methamphetamine,
media coverage, safety and health, and methamphetamine education [knowledge and
importance] needs) between early and late respondents. No significant differences were
found between the mean scores of satisfaction variables of early and late respondents
(Table 3).
N mean sd Df t Threat Early respondents Late respondents Media Coverage Early respondents Late respondents Safety and Health Early respondents Late respondents Meth Education Needs Knowledge Early respondents Late respondents Importance Early respondents Late respondents
109 19
109 18
104 17
108 18
108 18
2.77 2.65
3.94 4.20
4.98 4.86
2.63 2.60
4.20 4.27
.59 .57
.95 .72
.71 .85
1.14 1.23
1.20 1.27
125
125
119
125
124
.80
-1.15
.38
-.26
.12
Table 3. Independent Group t-tests for on Summated Rating Scales between Early and Late Respondents
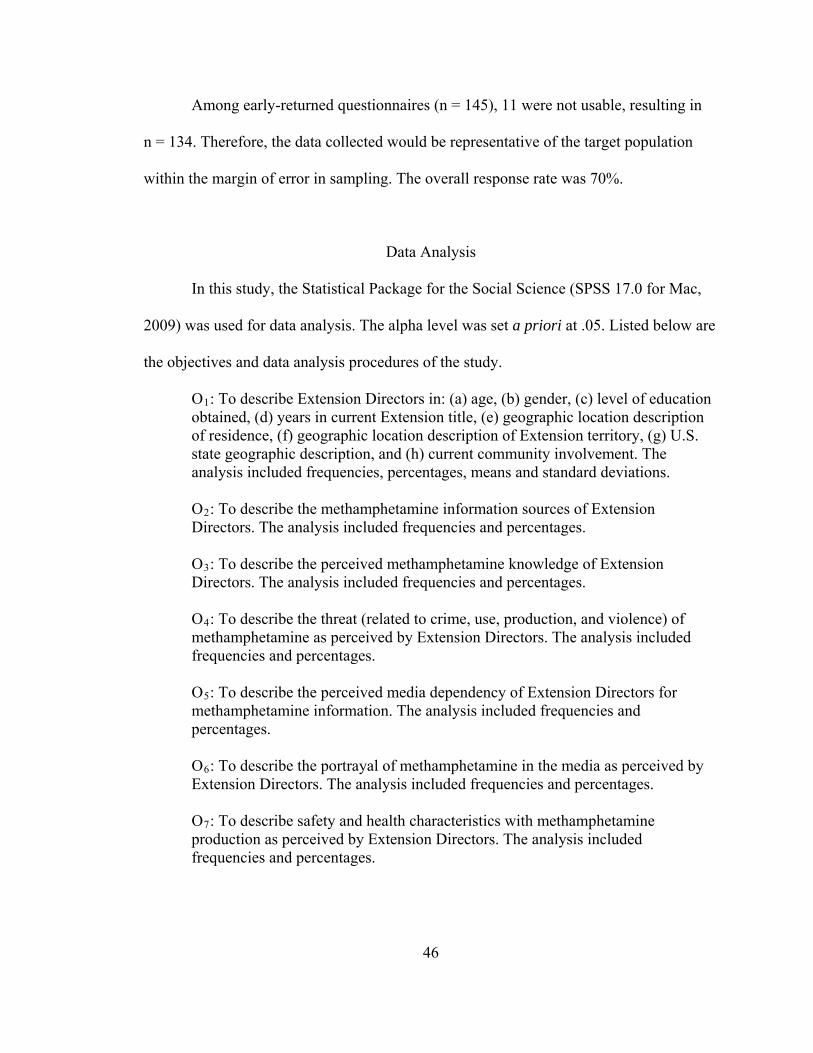
46
Among early-returned questionnaires (n = 145), 11 were not usable, resulting in
n = 134. Therefore, the data collected would be representative of the target population
within the margin of error in sampling. The overall response rate was 70%.
Data Analysis
In this study, the Statistical Package for the Social Science (SPSS 17.0 for Mac,
2009) was used for data analysis. The alpha level was set a priori at .05. Listed below are
the objectives and data analysis procedures of the study.
O1: To describe Extension Directors in: (a) age, (b) gender, (c) level of education obtained, (d) years in current Extension title, (e) geographic location description of residence, (f) geographic location description of Extension territory, (g) U.S. state geographic description, and (h) current community involvement. The analysis included frequencies, percentages, means and standard deviations.
O2: To describe the methamphetamine information sources of Extension Directors. The analysis included frequencies and percentages.
O3: To describe the perceived methamphetamine knowledge of Extension Directors. The analysis included frequencies and percentages. O4: To describe the threat (related to crime, use, production, and violence) of methamphetamine as perceived by Extension Directors. The analysis included frequencies and percentages.
O5: To describe the perceived media dependency of Extension Directors for methamphetamine information. The analysis included frequencies and percentages.
O6: To describe the portrayal of methamphetamine in the media as perceived by Extension Directors. The analysis included frequencies and percentages. O7: To describe safety and health characteristics with methamphetamine production as perceived by Extension Directors. The analysis included frequencies and percentages.
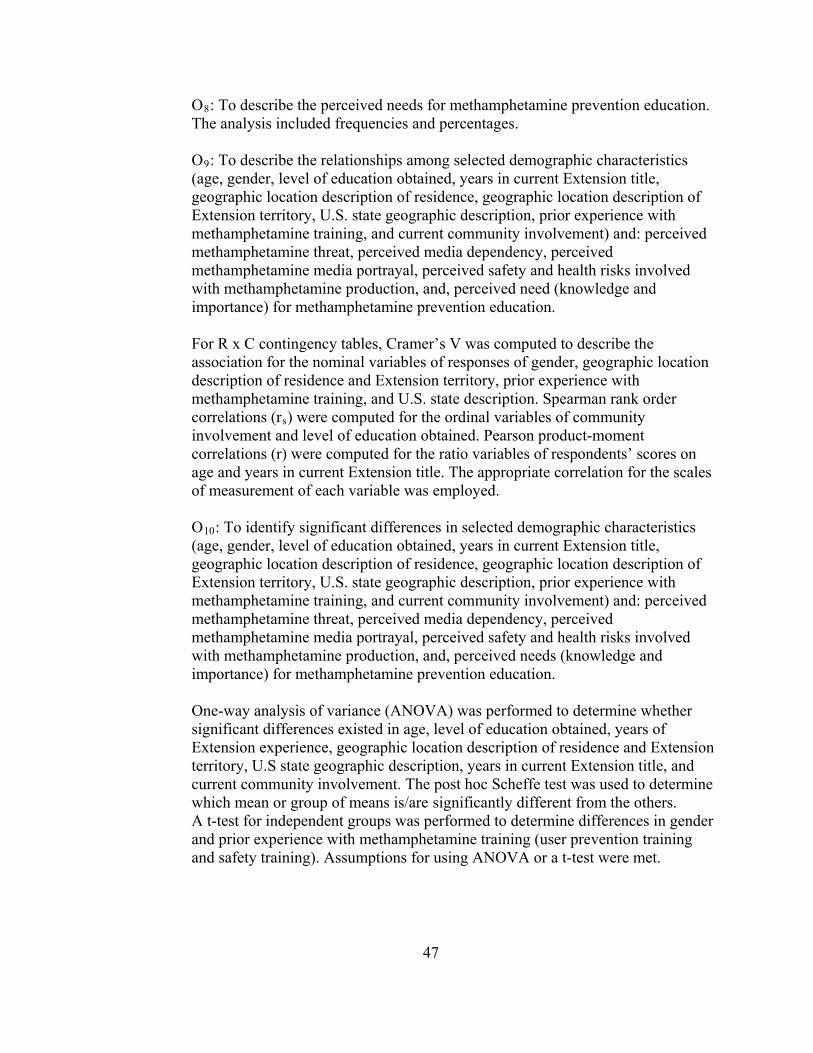
47
O8: To describe the perceived needs for methamphetamine prevention education. The analysis included frequencies and percentages. O9: To describe the relationships among selected demographic characteristics (age, gender, level of education obtained, years in current Extension title, geographic location description of residence, geographic location description of Extension territory, U.S. state geographic description, prior experience with methamphetamine training, and current community involvement) and: perceived methamphetamine threat, perceived media dependency, perceived methamphetamine media portrayal, perceived safety and health risks involved with methamphetamine production, and, perceived need (knowledge and importance) for methamphetamine prevention education. For R x C contingency tables, Cramer’s V was computed to describe the association for the nominal variables of responses of gender, geographic location description of residence and Extension territory, prior experience with methamphetamine training, and U.S. state description. Spearman rank order correlations (rs) were computed for the ordinal variables of community involvement and level of education obtained. Pearson product-moment correlations (r) were computed for the ratio variables of respondents’ scores on age and years in current Extension title. The appropriate correlation for the scales of measurement of each variable was employed.
O10: To identify significant differences in selected demographic characteristics (age, gender, level of education obtained, years in current Extension title, geographic location description of residence, geographic location description of Extension territory, U.S. state geographic description, prior experience with methamphetamine training, and current community involvement) and: perceived methamphetamine threat, perceived media dependency, perceived methamphetamine media portrayal, perceived safety and health risks involved with methamphetamine production, and, perceived needs (knowledge and importance) for methamphetamine prevention education. One-way analysis of variance (ANOVA) was performed to determine whether significant differences existed in age, level of education obtained, years of Extension experience, geographic location description of residence and Extension territory, U.S state geographic description, years in current Extension title, and current community involvement. The post hoc Scheffe test was used to determine which mean or group of means is/are significantly different from the others. A t-test for independent groups was performed to determine differences in gender and prior experience with methamphetamine training (user prevention training and safety training). Assumptions for using ANOVA or a t-test were met.
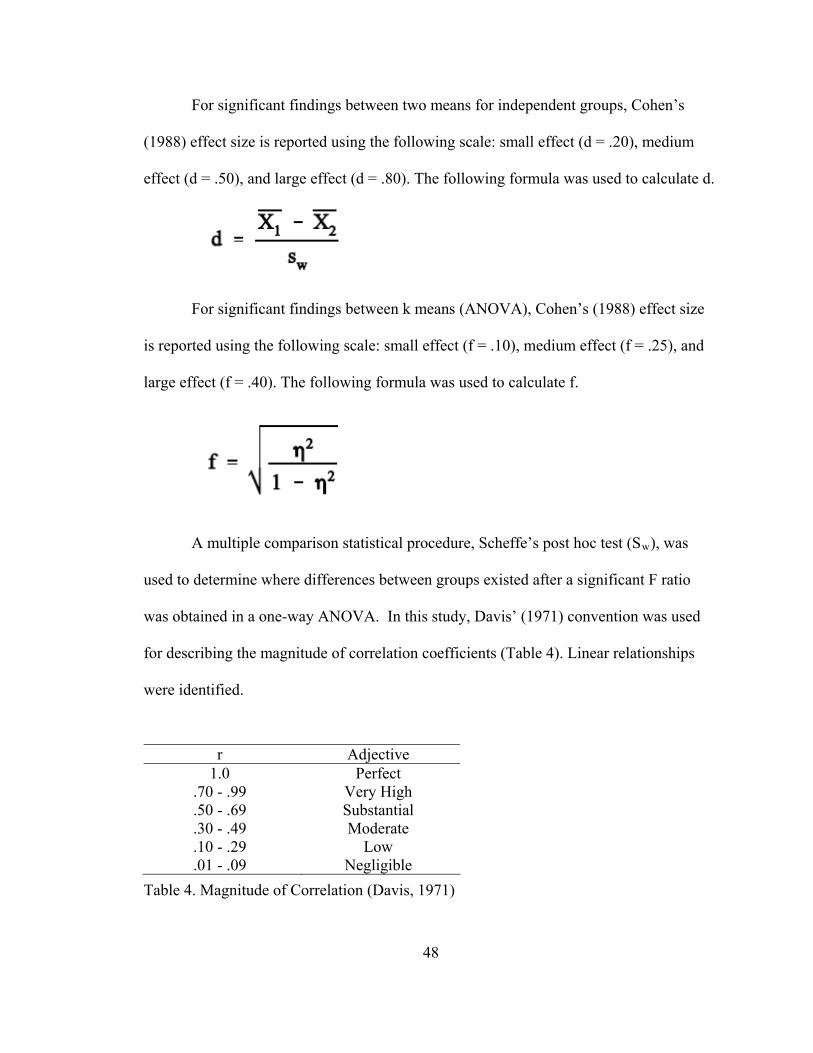
For significant findings between two means for independent groups, Cohen’s
(1988) effect size is reported using the following scale: small effect (d = .20), medium
effect (d = .50), and large effect (d = .80). The following formula was used to calculate d.
For significant findings between k means (ANOVA), Cohen’s (1988) effect size
is reported using the following scale: small effect (f = .10), medium effect (f = .25), and
large effect (f = .40). The following formula was used to calculate f.
A multiple comparison statistical procedure, Scheffe’s post hoc test (Sw), was
used to determine where differences between groups existed after a significant F ratio
was obtained in a one-way ANOVA. In this study, Davis’ (1971) convention was used
for describing the magnitude of correlation coefficients (Table 4). Linear relationships
were identified.
r Adjective 1.0
.70 - .99
.50 - .69
.30 - .49
.10 - .29
.01 - .09
Perfect Very High Substantial Moderate
Low Negligible
Table 4. Magnitude of Correlation (Davis, 1971)
48
49
Chapter 4: Results
The purpose of this study was to explore and describe methamphetamine
perceptions, the role of the media, and need for prevention and safety education among
Extension Directors. The study focused on a random sample of U.S. states and the
Extension Directors (refer to Appendix A for complete list of Extension titles) in the
states sampled. The survey concentrated on perceived methamphetamine knowledge, the
perceived threat of methamphetamine in the area of the Extension Director, media
dependency and portrayal of methamphetamine, methamphetamine safety and health
perceptions, and prevention education needs.
Along with exploring and describing the perceptions through a survey, part of the
study also was relational. The relational component identified correlations among
selected characteristics and obtained methamphetamine perceptions. These relational
aspects of the study further examined whether there were significant differences among
the variables. Chapter 4 presents the results of the data analysis. The findings of the data
analysis are presented in the order of study objectives.
Overall Results
A total of 207 Extension Directors were identified as the accepting sample through
randomly selected U.S. states (n = 44). Data collection lasted seven weeks: July 6, 2009
through August 21, 2009. Among the accepting sample, 145 subjects responded;
however, 11 of the returned questionnaires were not usable reducing the data sample to
134. The response rate was 70% for this study.
Of the randomly sampled 44 states, 42 states were represented with at least one
respondent. The states were blocked by region: West, South, Northeast and Midwest
(U.S. Census, 2009; Figure 6). Among all regions, the Midwest (35%) and the South
(35%) had the highest percentage of respondents (Figure 7).
50
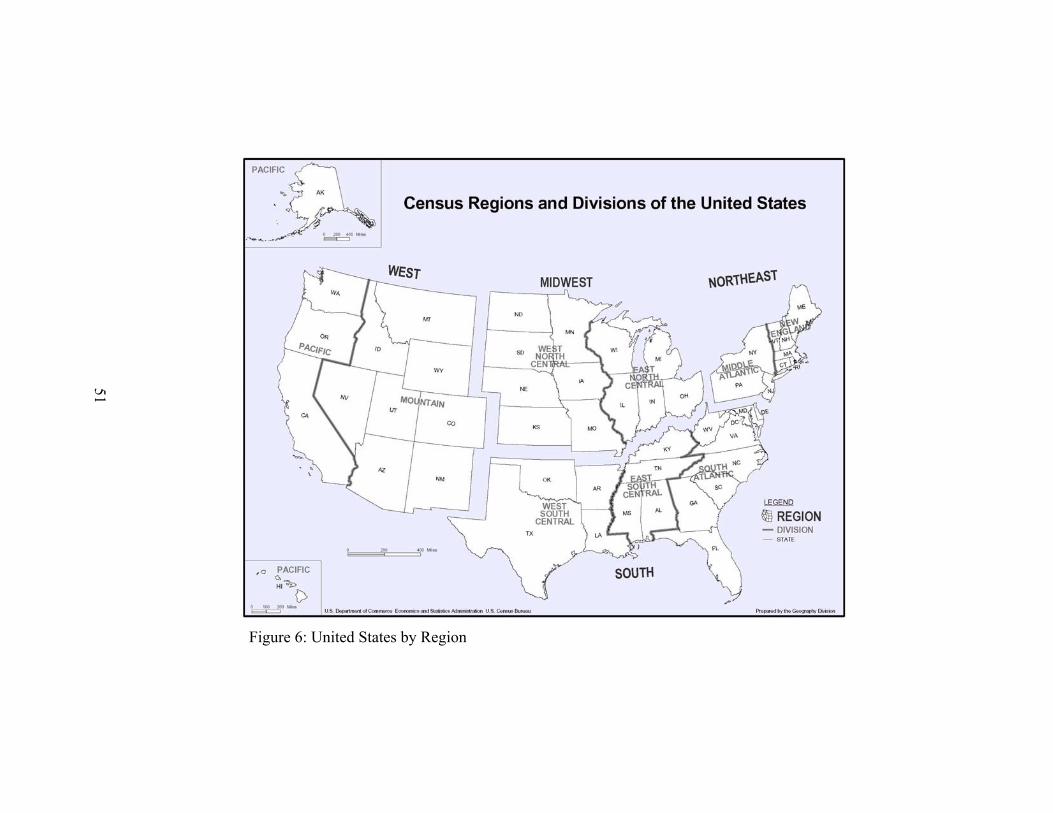
51
Figure 6: United States by Region
51
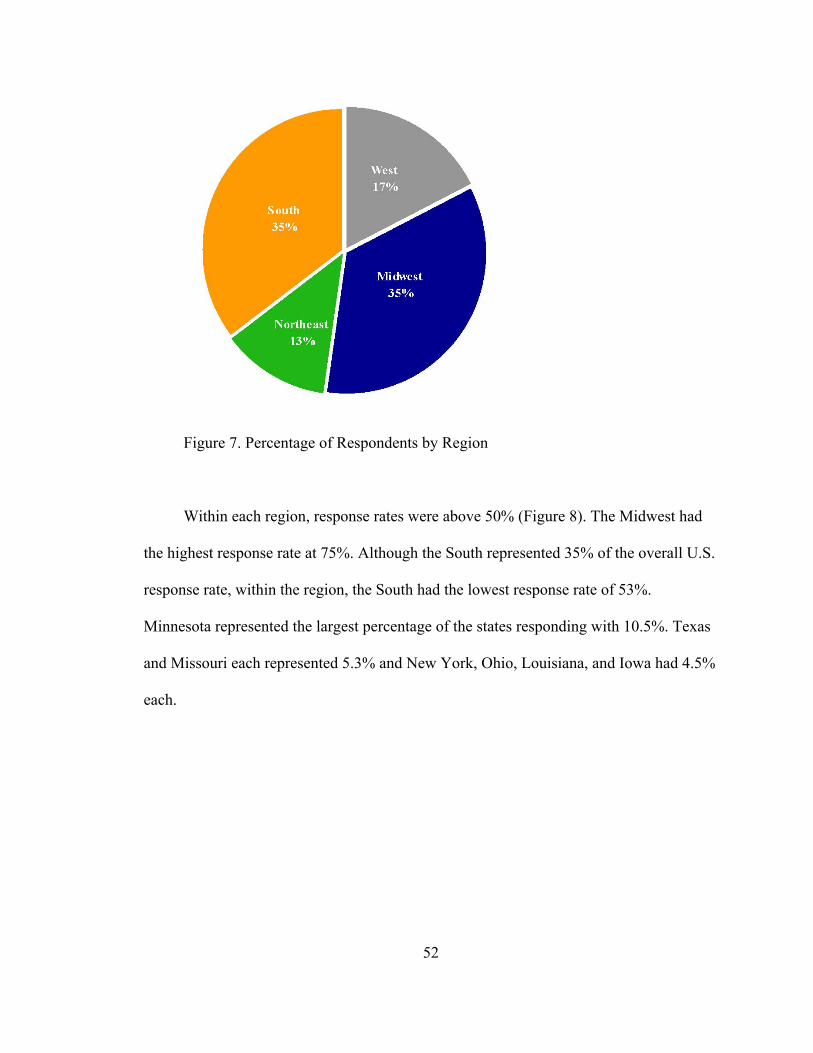
Figure 7. Percentage of Respondents by Region
Within each region, response rates were above 50% (Figure 8). The Midwest had
the highest response rate at 75%. Although the South represented 35% of the overall U.S.
response rate, within the region, the South had the lowest response rate of 53%.
Minnesota represented the largest percentage of the states responding with 10.5%. Texas
and Missouri each represented 5.3% and New York, Ohio, Louisiana, and Iowa had 4.5%
each.
52
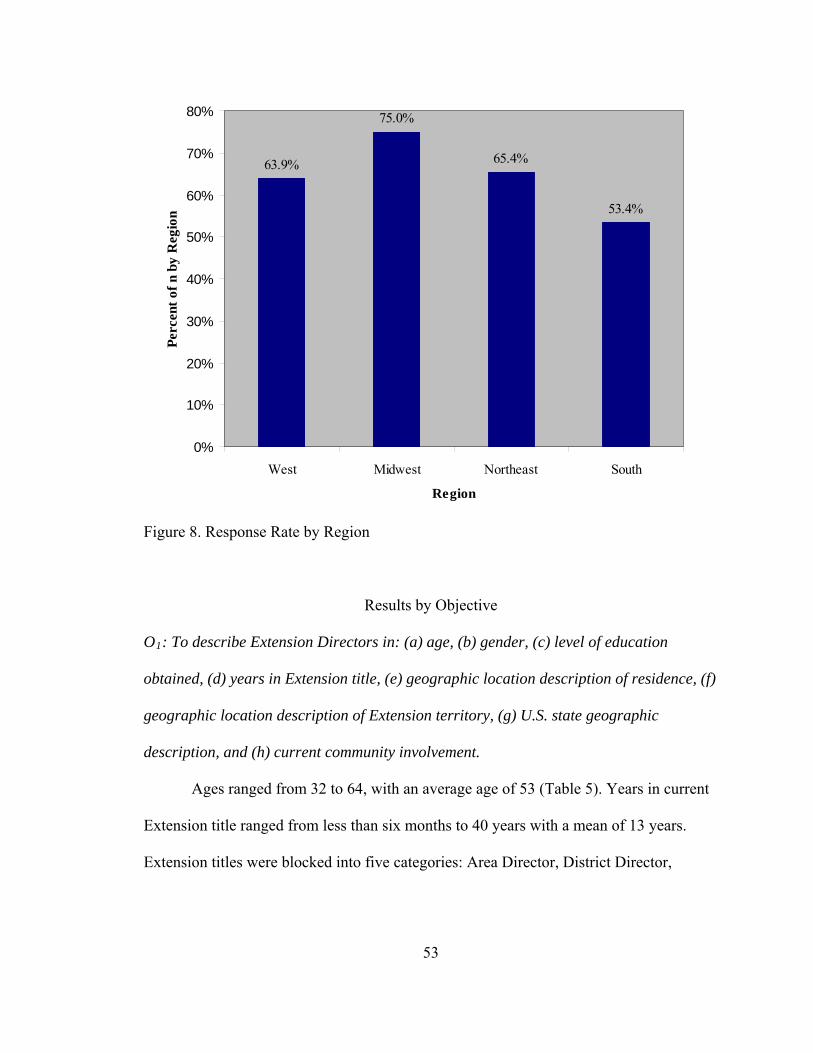
63.9%
75.0%
65.4%
53.4%
0%
10%
20%
30%
40%
50%
60%
70%
80%
West Midwest Northeast South
Region
Per
cent
of
n by
Reg
ion
Figure 8. Response Rate by Region
Results by Objective
O1: To describe Extension Directors in: (a) age, (b) gender, (c) level of education
obtained, (d) years in Extension title, (e) geographic location description of residence, (f)
geographic location description of Extension territory, (g) U.S. state geographic
description, and (h) current community involvement.
Ages ranged from 32 to 64, with an average age of 53 (Table 5). Years in current
Extension title ranged from less than six months to 40 years with a mean of 13 years.
Extension titles were blocked into five categories: Area Director, District Director,
53

Program Director, Regional Director, and Other (Appendix A). The majority of
respondents had “regional” in their job title (42%) and 34% had “district” in their title.
Respondents also were asked their prior employment position and industry (Appendix G).
Mean SD Range Age Year in current Extension title
52.9
13.4
7.0
10.6
33
41
Table 5. Age and Years in Current Extension Title
Of the Extension Directors, 56% were male and 44% were female (Table 6). The
majority of the sample possessed an MS or MA (65%) and 31% had earned a PhD. One
respondent did not possess a college degree (0.8%) and one Extension Director had a BS.
(0.8%).
Approximately 50% of Extension Directors live in a rural area and 34% identified
their Extension territory as rural (Table 6). Thirty-six percent responded that their
Extension territory was rural/suburban, making 80% of the Extension territories either
rural or rural/suburban. Only 16% of Extension Directors lived in an urban area and 5%
served an urban territory.
Although the sample was highly educated and held similar employment titles, the
Extension Directors varied with their individual community involvement. Often times,
Extension Directors are consumed with administrative duties and are not involved with
the daily programming in the communities. The community involvement of the sample
54
was blocked into four categories: high (weekly), medium (monthly), low (yearly), and
none. Twenty-six percent of the respondents had high involvement, which signified
weekly interaction. Medium involvement represented monthly interaction, with 31% of
Extension Directors in this category. The largest percentage, 34%, had low or yearly
involvement. Nine percent of Extension Directors reported no community involvement.
55
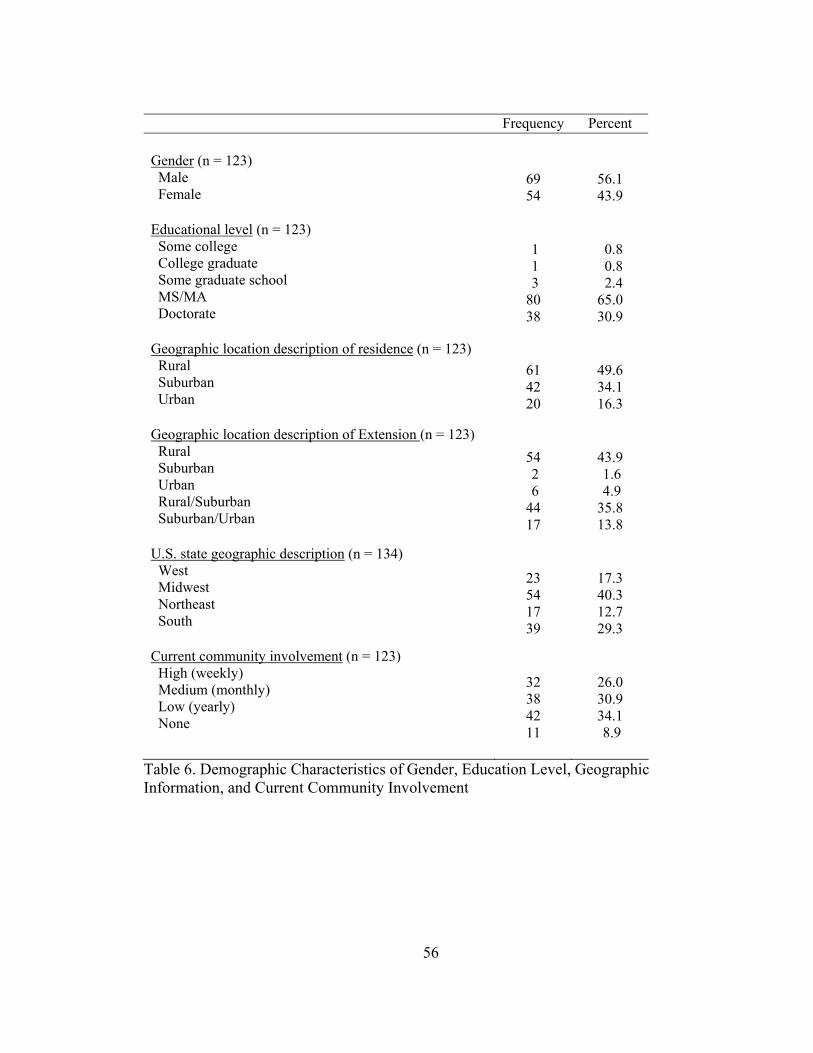
Frequency Percent Gender (n = 123) Male Female Educational level (n = 123) Some college College graduate Some graduate school MS/MA Doctorate Geographic location description of residence (n = 123) Rural Suburban Urban Geographic location description of Extension (n = 123) Rural Suburban Urban Rural/Suburban Suburban/Urban U.S. state geographic description (n = 134) West Midwest Northeast South Current community involvement (n = 123) High (weekly) Medium (monthly) Low (yearly) None
69 54
1 1 3 80 38
61 42 20
54 2 6 44 17
23 54 17 39
32 38 42 11
56.1 43.9
0.8 0.8
2.4 65.0 30.9
49.6 34.1 16.3
43.9 1.6 4.9 35.8 13.8
17.3 40.3 12.7 29.3
26.0 30.9 34.1 8.9
Table 6. Demographic Characteristics of Gender, Education Level, Geographic Information, and Current Community Involvement
56
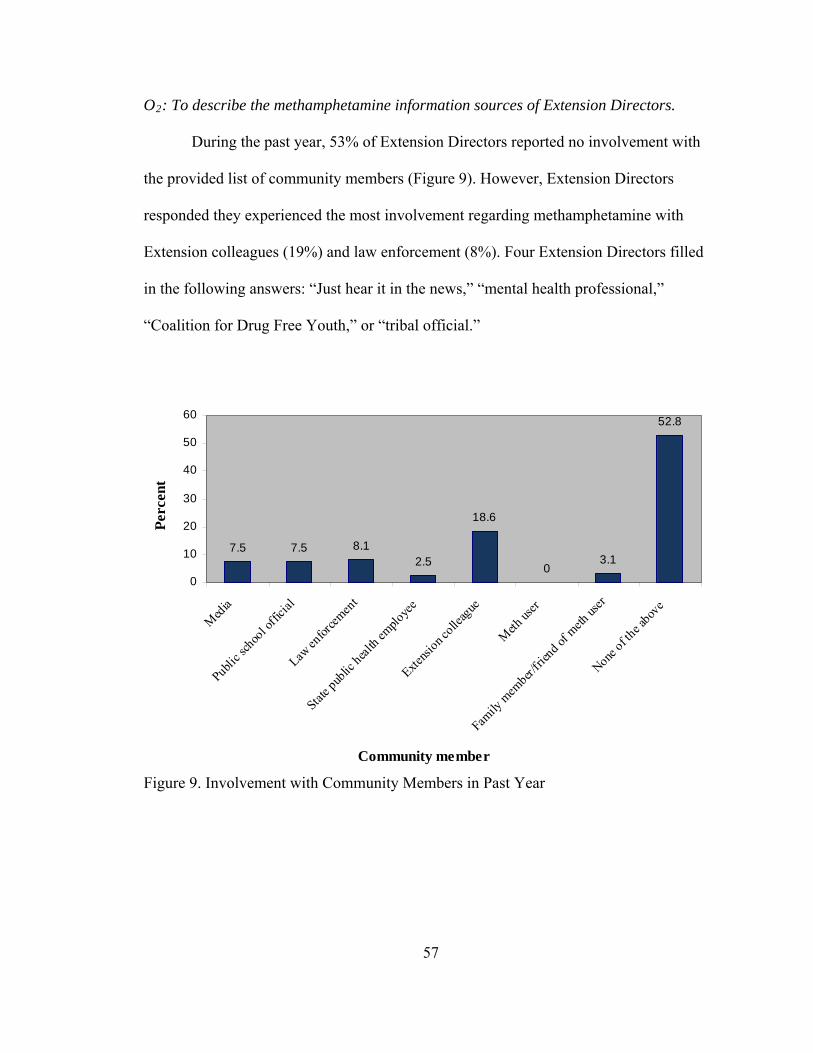
O2: To describe the methamphetamine information sources of Extension Directors.
During the past year, 53% of Extension Directors reported no involvement with
the provided list of community members (Figure 9). However, Extension Directors
responded they experienced the most involvement regarding methamphetamine with
Extension colleagues (19%) and law enforcement (8%). Four Extension Directors filled
in the following answers: “Just hear it in the news,” “mental health professional,”
“Coalition for Drug Free Youth,” or “tribal official.”
7.5 7.5 8.12.5
18.6
03.1
52.8
0
10
20
30
40
50
60
Med
ia
Public s
choo
l offi
cial
Law en
force
ment
State p
ublic
health
emplo
yee
Extens
ion c
olleag
ue
Meth
user
Family
mem
ber/fri
end o
f meth
user
None of t
he abov
e
Community member
Per
cent
Figure 9. Involvement with Community Members in Past Year
57
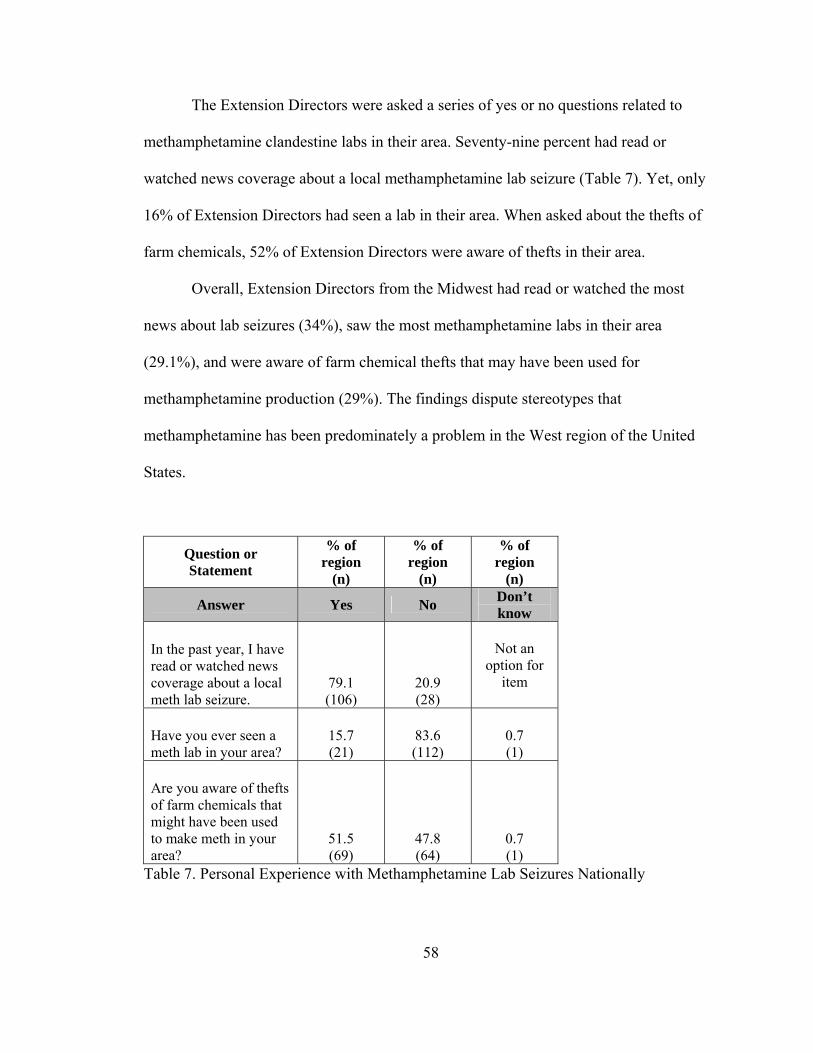
The Extension Directors were asked a series of yes or no questions related to
methamphetamine clandestine labs in their area. Seventy-nine percent had read or
watched news coverage about a local methamphetamine lab seizure (Table 7). Yet, only
16% of Extension Directors had seen a lab in their area. When asked about the thefts of
farm chemicals, 52% of Extension Directors were aware of thefts in their area.
Overall, Extension Directors from the Midwest had read or watched the most
news about lab seizures (34%), saw the most methamphetamine labs in their area
(29.1%), and were aware of farm chemical thefts that may have been used for
methamphetamine production (29%). The findings dispute stereotypes that
methamphetamine has been predominately a problem in the West region of the United
States.
Question or Statement
% of region
(n)
% of region
(n)
% of region
(n)
Answer Yes No Don’t know
In the past year, I have read or watched news coverage about a local meth lab seizure.
79.1 (106)
20.9 (28)
Not an option for
item
Have you ever seen a meth lab in your area?
15.7 (21)
83.6 (112)
0.7 (1)
Are you aware of thefts of farm chemicals that might have been used to make meth in your area?
51.5 (69)
47.8 (64)
0.7 (1)
Table 7. Personal Experience with Methamphetamine Lab Seizures Nationally
58
When responses were blocked by region, the South had the highest frequency
among the regions (87%) regarding if the Extension Directors had read or watched news
coverage about a methamphetamine lab seizure (Table 8). The Extension Directors in the
South had seen the most methamphetamine labs in their area (22%). Yet, Extension
Directors of the Midwest were aware of the most farm chemical thefts that may have
been used to make methamphetamine (72%).
Extension Directors in the Northeast region read or watched the least amount of
news coverage on lab seizures compared to the other U.S. regions. Approximately 41%
of Extension Directors indicated they saw or read about a lab seizure in their local news
(Table 8). Findings were similar with whether Extension Directors had seen a
methamphetamine lab (0%) in their area and if they were aware of thefts of the farm
chemicals used to make methamphetamine (29.4%).
The results also indicate that the news covers lab seizures in such a way that
Extension Directors are able to recall they had seen the topic in the past year. Except for
the Northeast region, the majority of Extension Directors remembered reading or
watching local coverage of a methamphetamine lab seizure. Yet in reality, less than 25%
of Extension Directors had seen a methamphetamine lab. Results are consistent with the
total clandestine lab incidents (National Clandestine Laboratory Seizure System, 2009;
Figure 1).
59
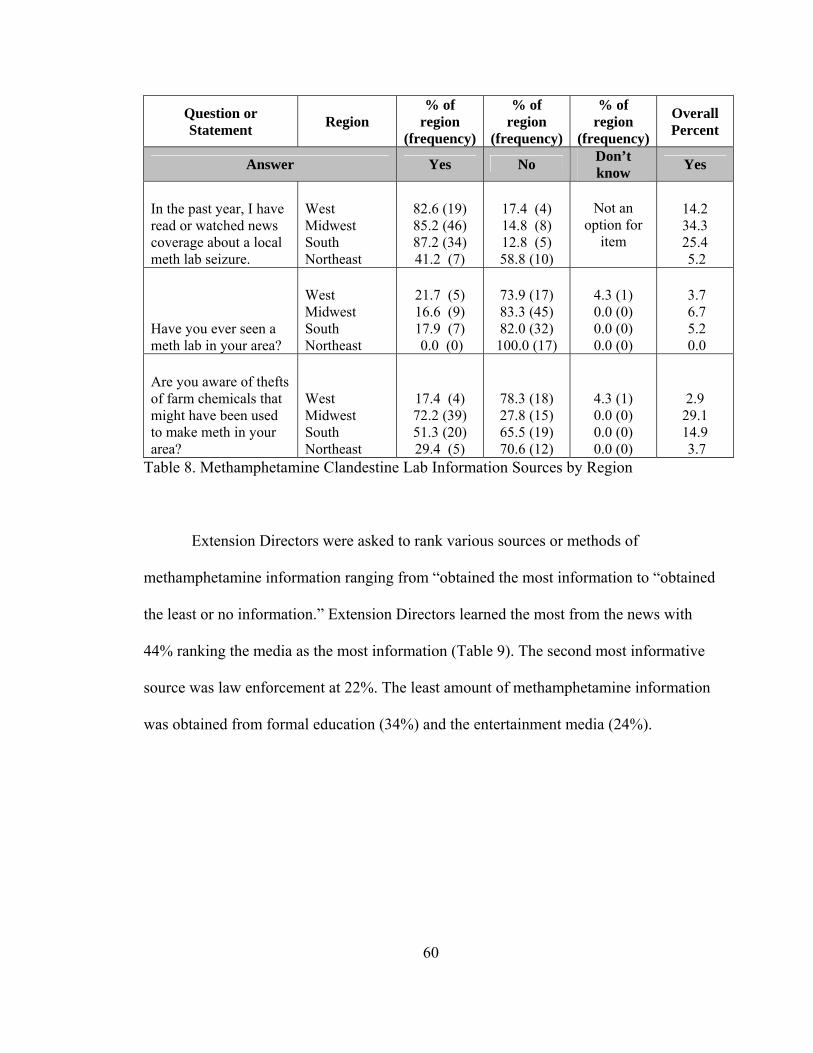
60
Question or Statement Region
% of region
(frequency)
% of region
(frequency)
% of region
(frequency)
Overall Percent
Answer Yes No Don’t know Yes
In the past year, I have read or watched news coverage about a local meth lab seizure.
West Midwest South Northeast
82.6 (19) 85.2 (46) 87.2 (34) 41.2 (7)
17.4 (4) 14.8 (8) 12.8 (5) 58.8 (10)
Not an option for
item
14.2 34.3 25.4 5.2
Have you ever seen a meth lab in your area?
West Midwest South Northeast
21.7 (5) 16.6 (9) 17.9 (7) 0.0 (0)
73.9 (17) 83.3 (45) 82.0 (32)
100.0 (17)
4.3 (1) 0.0 (0) 0.0 (0) 0.0 (0)
3.7 6.7 5.2 0.0
Are you aware of thefts of farm chemicals that might have been used to make meth in your area?
West Midwest South Northeast
17.4 (4) 72.2 (39) 51.3 (20) 29.4 (5)
78.3 (18) 27.8 (15) 65.5 (19) 70.6 (12)
4.3 (1) 0.0 (0) 0.0 (0) 0.0 (0)
2.9
29.1 14.9 3.7
Table 8. Methamphetamine Clandestine Lab Information Sources by Region
Extension Directors were asked to rank various sources or methods of
methamphetamine information ranging from “obtained the most information to “obtained
the least or no information.” Extension Directors learned the most from the news with
44% ranking the media as the most information (Table 9). The second most informative
source was law enforcement at 22%. The least amount of methamphetamine information
was obtained from formal education (34%) and the entertainment media (24%).
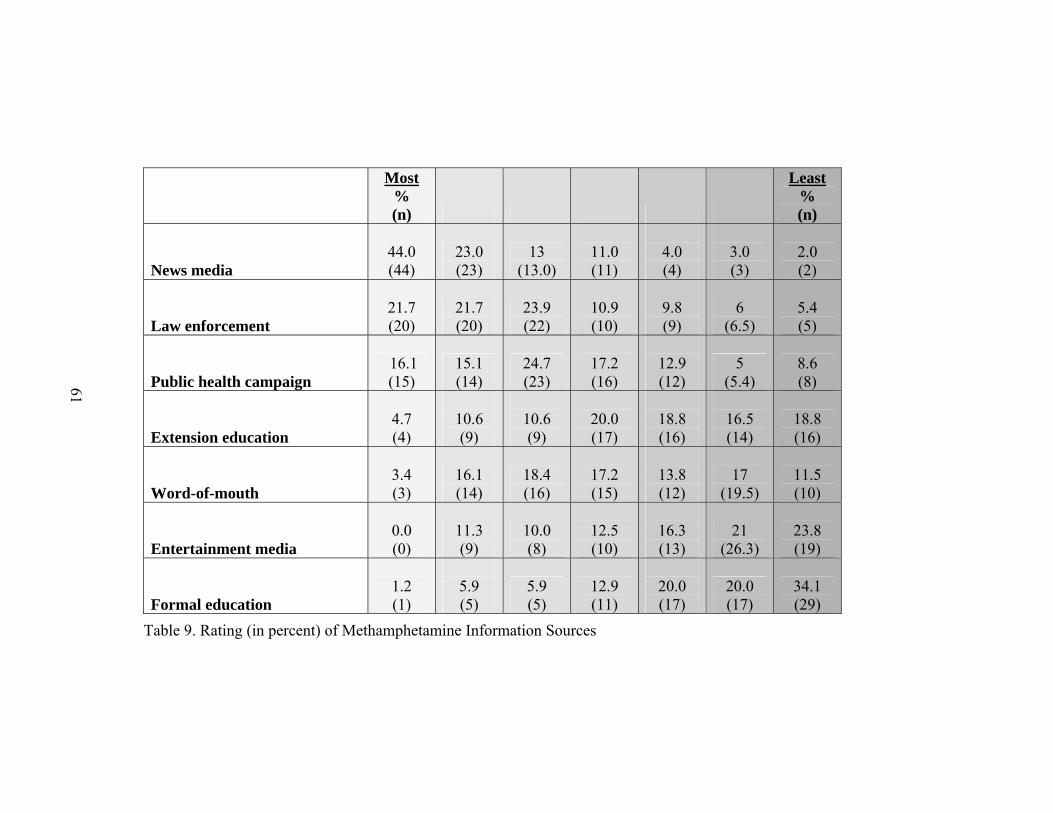
Most
% (n)
Least % (n)
News media
44.0 (44)
23.0 (23)
13 (13.0)
11.0 (11)
4.0 (4)
3.0 (3)
2.0 (2)
Law enforcement
21.7 (20)
21.7 (20)
23.9 (22)
10.9 (10)
9.8 (9)
6 (6.5)
5.4 (5)
Public health campaign 16.1 (15)
15.1 (14)
24.7 (23)
17.2 (16)
12.9 (12)
5 (5.4)
8.6 (8)
Extension education
4.7 (4)
10.6 (9)
10.6 (9)
20.0 (17)
18.8 (16)
16.5 (14)
18.8 (16)
Word-of-mouth 3.4 (3)
16.1 (14)
18.4 (16)
17.2 (15)
13.8 (12)
17 (19.5)
11.5 (10)
Entertainment media
0.0 (0)
11.3 (9)
10.0 (8)
12.5 (10)
16.3 (13)
21 (26.3)
23.8 (19)
Formal education
1.2 (1)
5.9 (5)
5.9 (5)
12.9 (11)
20.0 (17)
20.0 (17)
34.1 (29)
61
Table 9. Rating (in percent) of Methamphetamine Information Sources
61
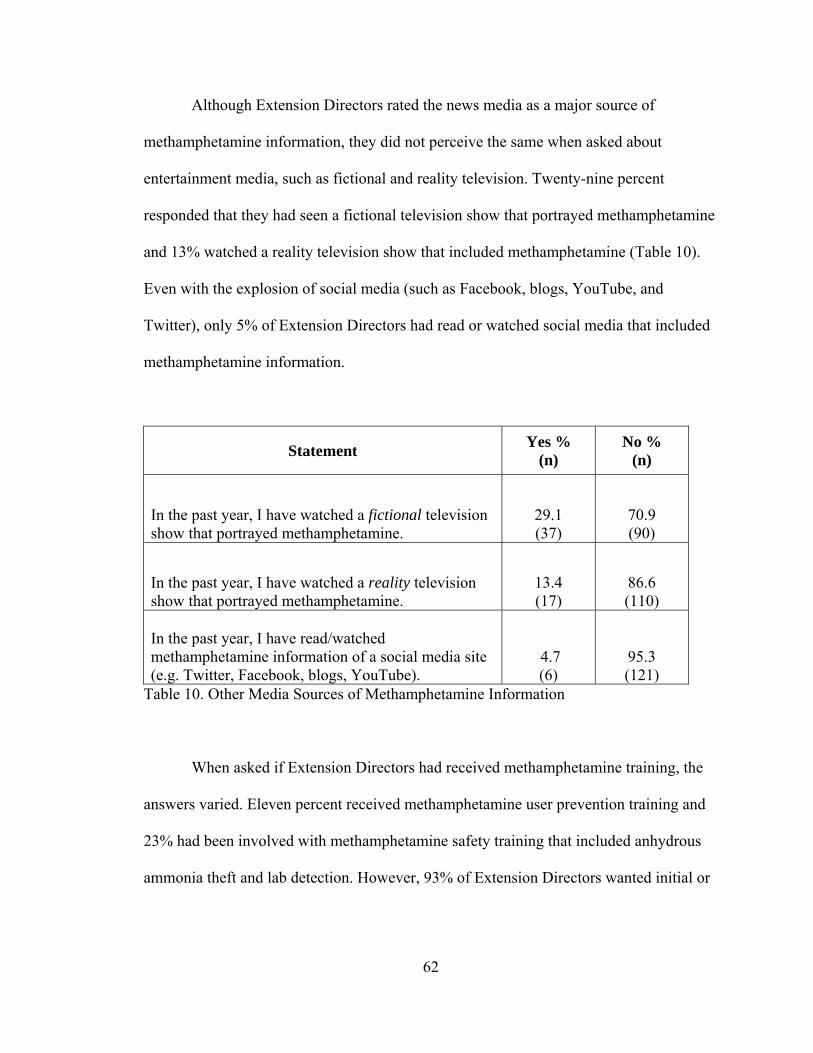
62
Although Extension Directors rated the news media as a major source of
methamphetamine information, they did not perceive the same when asked about
entertainment media, such as fictional and reality television. Twenty-nine percent
responded that they had seen a fictional television show that portrayed methamphetamine
and 13% watched a reality television show that included methamphetamine (Table 10).
Even with the explosion of social media (such as Facebook, blogs, YouTube, and
Twitter), only 5% of Extension Directors had read or watched social media that included
methamphetamine information.
Statement Yes %
(n) No %
(n)
In the past year, I have watched a fictional television show that portrayed methamphetamine.
29.1 (37)
70.9 (90)
In the past year, I have watched a reality television show that portrayed methamphetamine.
13.4 (17)
86.6 (110)
In the past year, I have read/watched methamphetamine information of a social media site (e.g. Twitter, Facebook, blogs, YouTube).
4.7 (6)
95.3 (121)
Table 10. Other Media Sources of Methamphetamine Information When asked if Extension Directors had received methamphetamine training, the
answers varied. Eleven percent received methamphetamine user prevention training and
23% had been involved with methamphetamine safety training that included anhydrous
ammonia theft and lab detection. However, 93% of Extension Directors wanted initial or
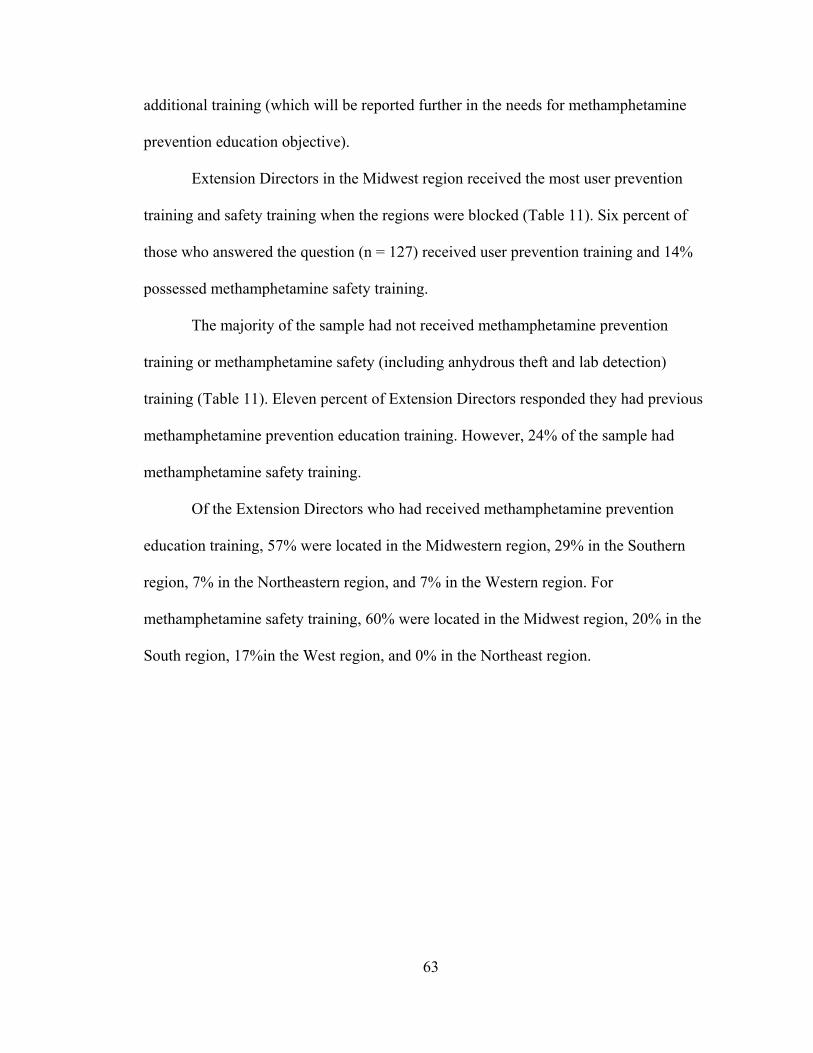
63
additional training (which will be reported further in the needs for methamphetamine
prevention education objective).
Extension Directors in the Midwest region received the most user prevention
training and safety training when the regions were blocked (Table 11). Six percent of
those who answered the question (n = 127) received user prevention training and 14%
possessed methamphetamine safety training.
The majority of the sample had not received methamphetamine prevention
training or methamphetamine safety (including anhydrous theft and lab detection)
training (Table 11). Eleven percent of Extension Directors responded they had previous
methamphetamine prevention education training. However, 24% of the sample had
methamphetamine safety training.
Of the Extension Directors who had received methamphetamine prevention
education training, 57% were located in the Midwestern region, 29% in the Southern
region, 7% in the Northeastern region, and 7% in the Western region. For
methamphetamine safety training, 60% were located in the Midwest region, 20% in the
South region, 17%in the West region, and 0% in the Northeast region.
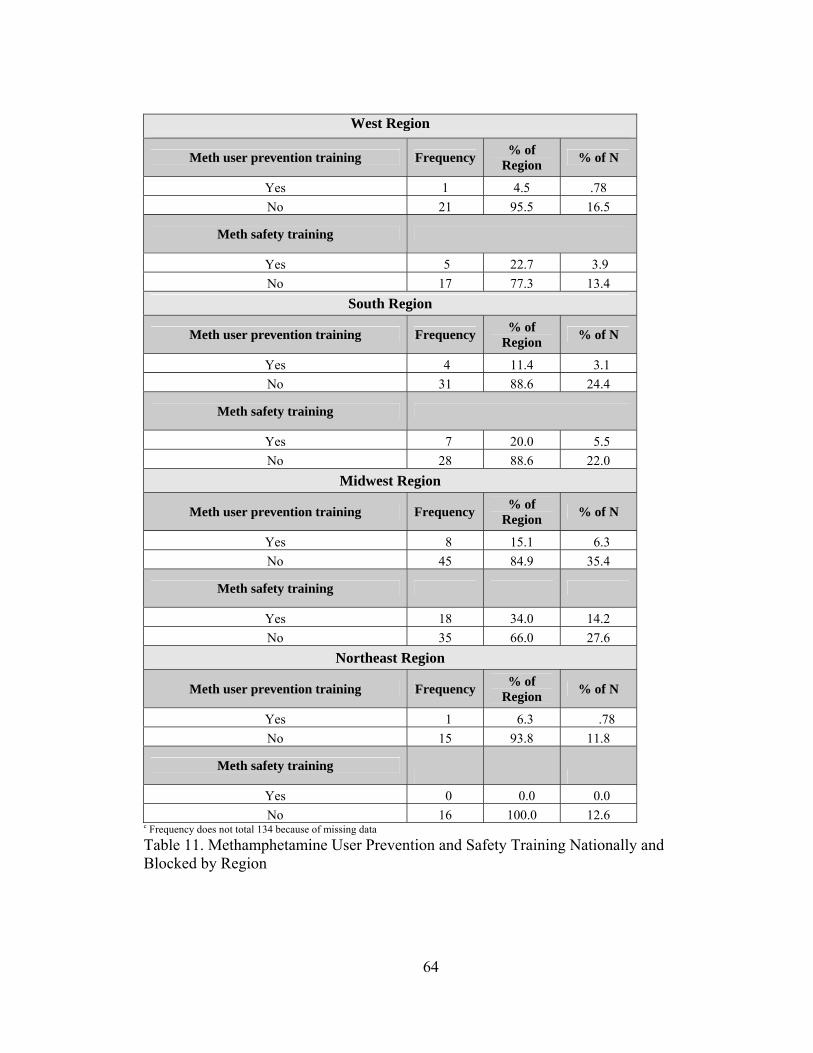
64
West Region
Meth user prevention training Frequency % of
Region % of N
Yes 1 4.5 .78
No 21 95.5 16.5
Meth safety training
Yes 5 22.7 3.9
No 17 77.3 13.4
South Region
Meth user prevention training Frequency % of
Region % of N
Yes 4 11.4 3.1
No 31 88.6 24.4
Meth safety training
Yes 7 20.0 5.5
No 28 88.6 22.0
Midwest Region
Meth user prevention training Frequency % of
Region % of N
Yes 8 15.1 6.3
No 45 84.9 35.4
Meth safety training
Yes 18 34.0 14.2
No 35 66.0 27.6
Northeast Region
Meth user prevention training Frequency % of
Region % of N
Yes 1 6.3 .78
No 15 93.8 11.8
Meth safety training
Yes 0 0.0 0.0
No 16 100.0 12.6 c Frequency does not total 134 because of missing data
Table 11. Methamphetamine User Prevention and Safety Training Nationally and Blocked by Region

65
O3: To describe the perceived methamphetamine knowledge of Extension Directors.
To identify the general understanding of methamphetamine among the sample,
Extension Directors were asked to answer four yes or no items. Fifty-nine percent of
Extension Directors did not know if the majority of methamphetamine in their area was
produced in a U.S. clandestine lab (Table 12). Yet, 36% believed that methamphetamine
is made in clandestine labs in their area.
Statement Frequency Percent The majority of methamphetamine in your area is made in U.S. clandestine labs.
Yes No Don’t know Total
48 7
79 134
35.8 5.2 59.0 100.0
Table 12. Knowledge of Methamphetamine Production Labs
Extension Directors were more knowledgeable of the physical effects of
methamphetamine use (Table 13). Seventy-six percent did answer correctly that some
physical signs of methamphetamine use included rotting teeth, paranoia, scratching of
skin, and decreased appetite. Twenty-one percent did not know the answer.
Statement Frequency Percent Some physical signs of methamphetamine use include: rotting teeth, paranoia, scratching of skin, and decreased appetite.
Yes No Don’t know Total
102 4
28 134
76.1 3.0 20.9 100.0
Table 13: Knowledge of Methamphetamine Physical Effects
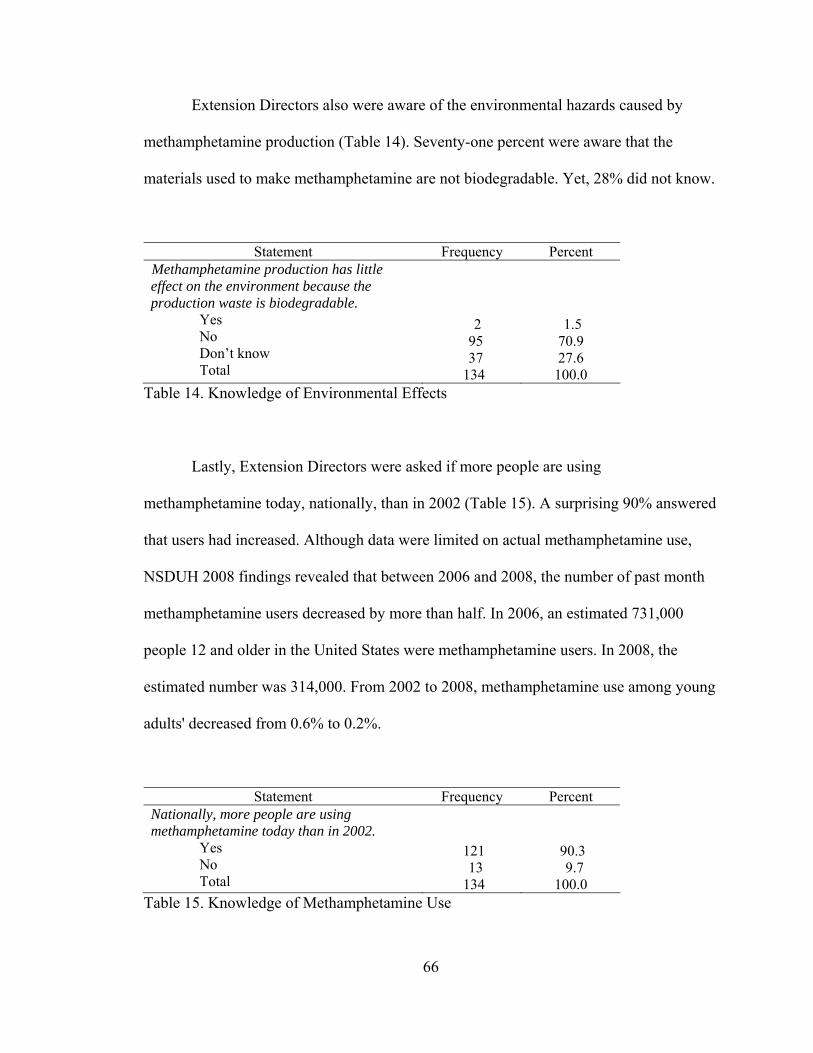
66
Extension Directors also were aware of the environmental hazards caused by
methamphetamine production (Table 14). Seventy-one percent were aware that the
materials used to make methamphetamine are not biodegradable. Yet, 28% did not know.
Statement Frequency Percent Methamphetamine production has little effect on the environment because the production waste is biodegradable.
Yes No Don’t know Total
2 95 37 134
1.5 70.9 27.6
100.0 Table 14. Knowledge of Environmental Effects
Lastly, Extension Directors were asked if more people are using
methamphetamine today, nationally, than in 2002 (Table 15). A surprising 90% answered
that users had increased. Although data were limited on actual methamphetamine use,
NSDUH 2008 findings revealed that between 2006 and 2008, the number of past month
methamphetamine users decreased by more than half. In 2006, an estimated 731,000
people 12 and older in the United States were methamphetamine users. In 2008, the
estimated number was 314,000. From 2002 to 2008, methamphetamine use among young
adults' decreased from 0.6% to 0.2%.
Statement Frequency Percent Nationally, more people are using methamphetamine today than in 2002.
Yes No Total
121 13 134
90.3 9.7
100.0 Table 15. Knowledge of Methamphetamine Use
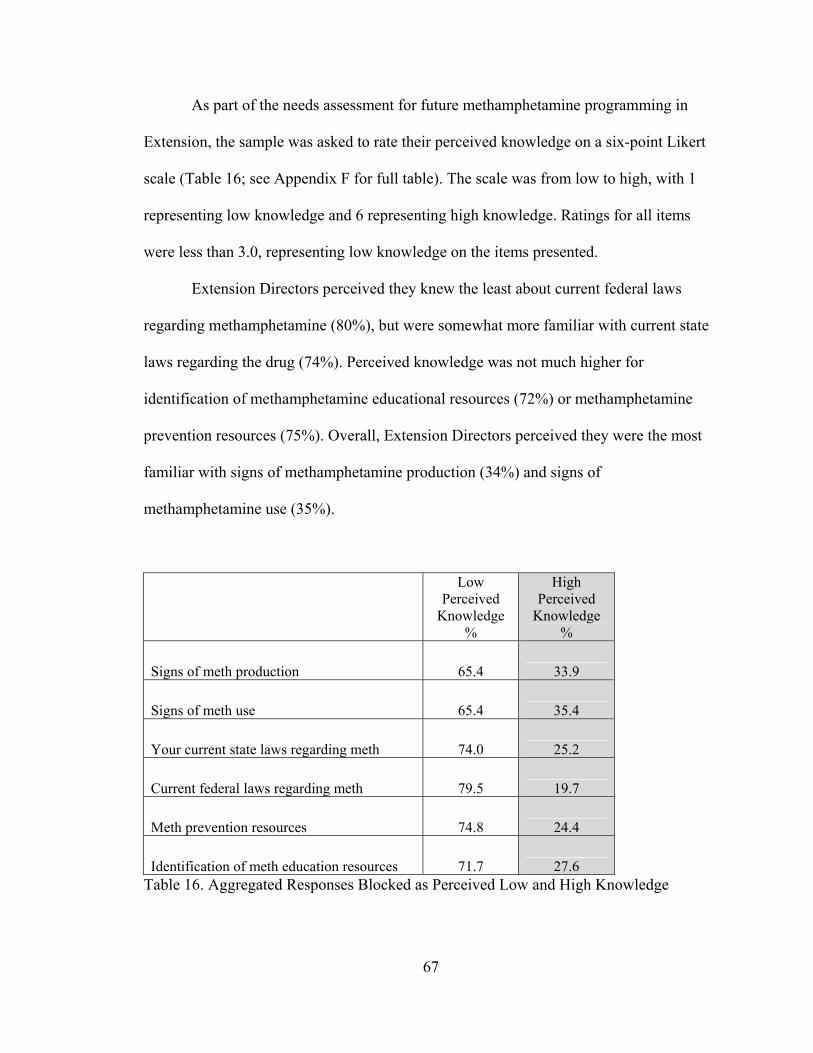
67
As part of the needs assessment for future methamphetamine programming in
Extension, the sample was asked to rate their perceived knowledge on a six-point Likert
scale (Table 16; see Appendix F for full table). The scale was from low to high, with 1
representing low knowledge and 6 representing high knowledge. Ratings for all items
were less than 3.0, representing low knowledge on the items presented.
Extension Directors perceived they knew the least about current federal laws
regarding methamphetamine (80%), but were somewhat more familiar with current state
laws regarding the drug (74%). Perceived knowledge was not much higher for
identification of methamphetamine educational resources (72%) or methamphetamine
prevention resources (75%). Overall, Extension Directors perceived they were the most
familiar with signs of methamphetamine production (34%) and signs of
methamphetamine use (35%).
Low Perceived
Knowledge %
High Perceived
Knowledge %
Signs of meth production 65.4 33.9
Signs of meth use 65.4 35.4
Your current state laws regarding meth 74.0 25.2
Current federal laws regarding meth 79.5 19.7
Meth prevention resources 74.8 24.4 Identification of meth education resources 71.7 27.6
Table 16. Aggregated Responses Blocked as Perceived Low and High Knowledge

68
O4: To describe the threat (related to crime, use, production, and violence) of
methamphetamine as perceived by Extension Directors.
Methamphetamine involves entire communities because of the indirect effects of
the drug. Communities that have methamphetamine may experience violent, property,
and domestic crime increases. Extension Directors were asked to rate various aspects of
methamphetamine in their local area as “no problem,” “minor,” “serious,” or “very
serious” (Table 17).
The majority of Extension Directors responded that methamphetamine use (55%),
production (54%), property crime (49%), domestic violence (47%), and access to
methamphetamine in high schools (43%) were serious problems in their area.
Methamphetamine and violent crime (42%) and methamphetamine-related crime in high
schools (61%) were perceived as minor problems.
Overall, methamphetamine use was perceived as the most threatening aspect of
methamphetamine. Methamphetamine-related crime in high schools was perceived as the
lowest threat. Property crime was perceived as the most serious crime-related issue with
67% of Extension Directors responding that property crime was a serious or very serious
problem.
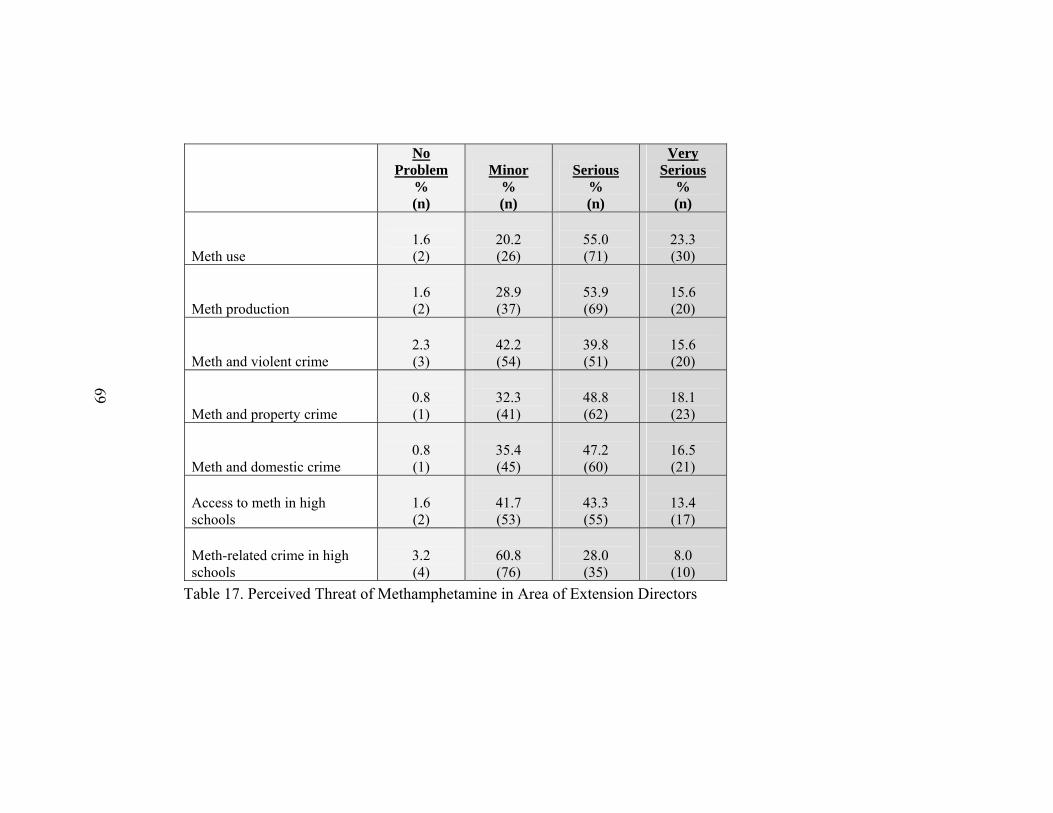
69
No Problem
% (n)
Minor % (n)
Serious % (n)
Very Serious
% (n)
Meth use
1.6 (2)
20.2 (26)
55.0 (71)
23.3 (30)
Meth production 1.6 (2)
28.9 (37)
53.9 (69)
15.6 (20)
Meth and violent crime
2.3 (3)
42.2 (54)
39.8 (51)
15.6 (20)
Meth and property crime
0.8 (1)
32.3 (41)
48.8 (62)
18.1 (23)
Meth and domestic crime 0.8 (1)
35.4 (45)
47.2 (60)
16.5 (21)
Access to meth in high schools
1.6 (2)
41.7 (53)
43.3 (55)
13.4 (17)
Meth-related crime in high schools
3.2 (4)
60.8 (76)
28.0 (35)
8.0 (10)
Table 17. Perceived Threat of Methamphetamine in Area of Extension Directors
69
70
O5: To describe the perceived media dependency of Extension Directors for
methamphetamine information.
The items measuring the dependency on the media for methamphetamine
information were threaded throughout the questionnaire and presented in the findings of
Objective 2. Extension Directors learned the most from the news with 44% ranking the
media as where they obtained the most information about methamphetamine (Figure 10).
Seventy-nine percent of Extension Directors reported they had read or watched local
news coverage on a methamphetamine lab seizure (Table 10). And in the past year, 29%
of Extension Directors reported they had watched a fictional television show that
portrayed methamphetamine; 13% reported they had watched a reality television show
that portrayed methamphetamine; 5% reported they had read or watched
methamphetamine information on social media site.
Extension Directors also were asked their level of agreement on a six-point
Likert scale (from strongly disagree to strongly agree) to the following statement: “The
media is my primary source of information regarding methamphetamine.” Twenty-four
percent of Extension Directors strongly agreed, 39% agreed, and 22% somewhat agreed.
Overall, 85% perceived the media as their primary source of methamphetamine
information.
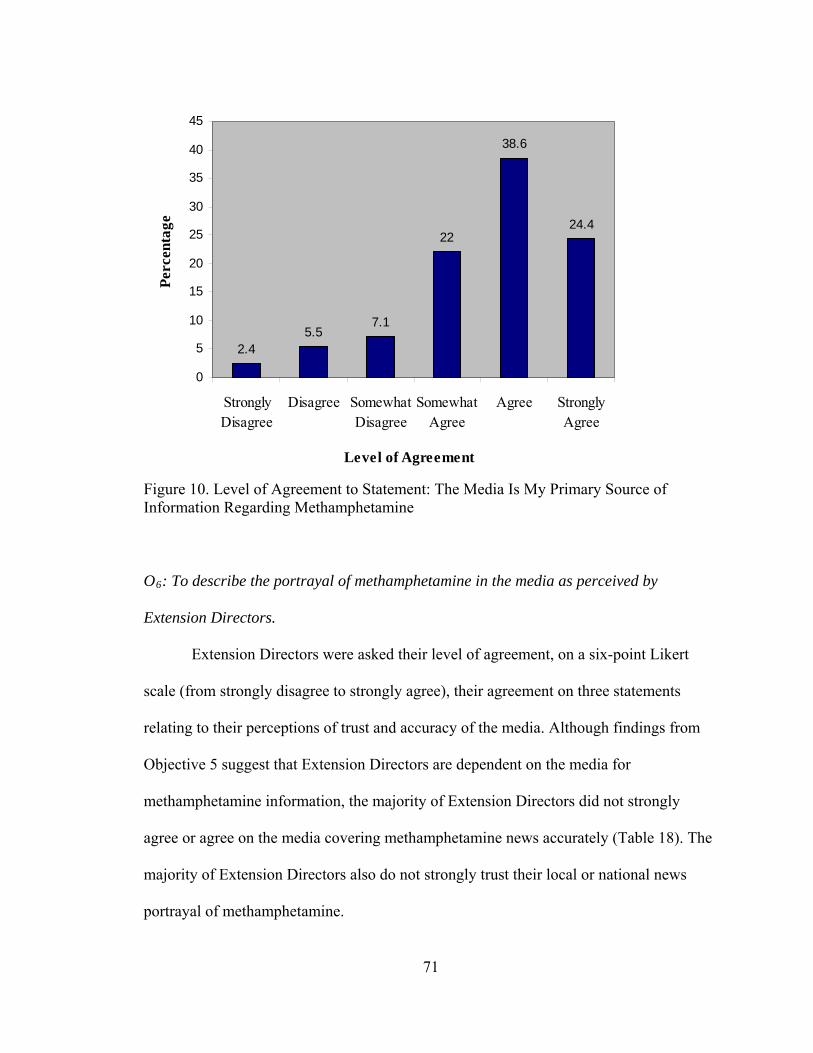
2.45.5
7.1
22
38.6
24.4
0
5
10
15
20
25
30
35
40
45
StronglyDisagree
Disagree SomewhatDisagree
SomewhatAgree
Agree StronglyAgree
Level of Agreement
Per
cent
age
Figure 10. Level of Agreement to Statement: The Media Is My Primary Source of Information Regarding Methamphetamine O6: To describe the portrayal of methamphetamine in the media as perceived by
Extension Directors.
Extension Directors were asked their level of agreement, on a six-point Likert
scale (from strongly disagree to strongly agree), their agreement on three statements
relating to their perceptions of trust and accuracy of the media. Although findings from
Objective 5 suggest that Extension Directors are dependent on the media for
methamphetamine information, the majority of Extension Directors did not strongly
agree or agree on the media covering methamphetamine news accurately (Table 18). The
majority of Extension Directors also do not strongly trust their local or national news
portrayal of methamphetamine.
71
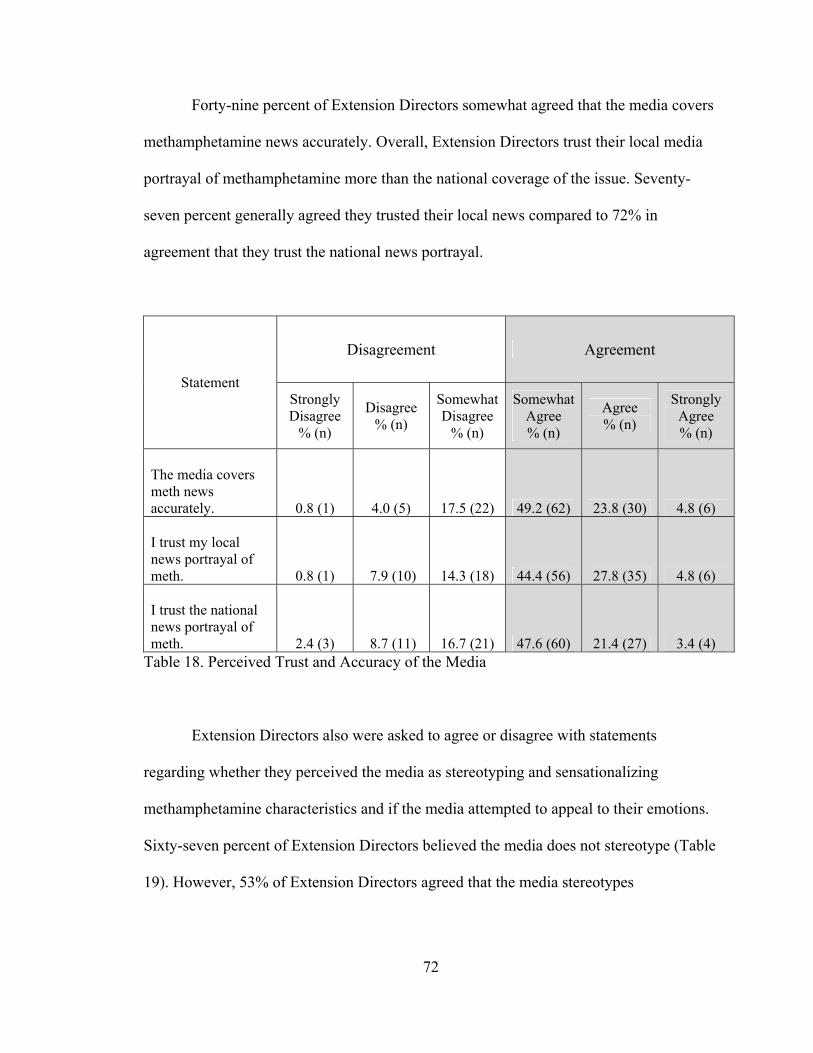
72
Forty-nine percent of Extension Directors somewhat agreed that the media covers
methamphetamine news accurately. Overall, Extension Directors trust their local media
portrayal of methamphetamine more than the national coverage of the issue. Seventy-
seven percent generally agreed they trusted their local news compared to 72% in
agreement that they trust the national news portrayal.
Disagreement Agreement
Statement Strongly Disagree
% (n)
Disagree % (n)
Somewhat Disagree
% (n)
Somewhat Agree % (n)
Agree % (n)
Strongly Agree % (n)
The media covers meth news accurately. 0.8 (1) 4.0 (5) 17.5 (22) 49.2 (62) 23.8 (30) 4.8 (6)
I trust my local news portrayal of meth. 0.8 (1) 7.9 (10) 14.3 (18) 44.4 (56) 27.8 (35) 4.8 (6)
I trust the national news portrayal of meth. 2.4 (3) 8.7 (11) 16.7 (21) 47.6 (60) 21.4 (27) 3.4 (4)
Table 18. Perceived Trust and Accuracy of the Media Extension Directors also were asked to agree or disagree with statements
regarding whether they perceived the media as stereotyping and sensationalizing
methamphetamine characteristics and if the media attempted to appeal to their emotions.
Sixty-seven percent of Extension Directors believed the media does not stereotype (Table
19). However, 53% of Extension Directors agreed that the media stereotypes
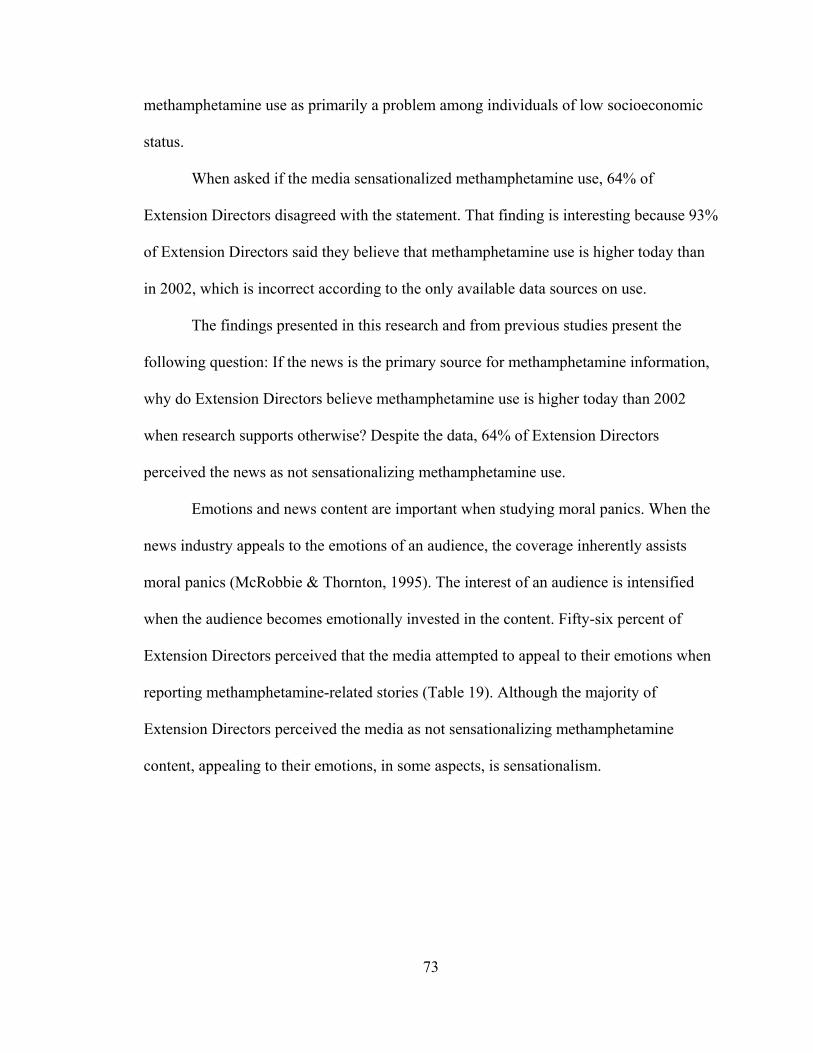
73
methamphetamine use as primarily a problem among individuals of low socioeconomic
status.
When asked if the media sensationalized methamphetamine use, 64% of
Extension Directors disagreed with the statement. That finding is interesting because 93%
of Extension Directors said they believe that methamphetamine use is higher today than
in 2002, which is incorrect according to the only available data sources on use.
The findings presented in this research and from previous studies present the
following question: If the news is the primary source for methamphetamine information,
why do Extension Directors believe methamphetamine use is higher today than 2002
when research supports otherwise? Despite the data, 64% of Extension Directors
perceived the news as not sensationalizing methamphetamine use.
Emotions and news content are important when studying moral panics. When the
news industry appeals to the emotions of an audience, the coverage inherently assists
moral panics (McRobbie & Thornton, 1995). The interest of an audience is intensified
when the audience becomes emotionally invested in the content. Fifty-six percent of
Extension Directors perceived that the media attempted to appeal to their emotions when
reporting methamphetamine-related stories (Table 19). Although the majority of
Extension Directors perceived the media as not sensationalizing methamphetamine
content, appealing to their emotions, in some aspects, is sensationalism.
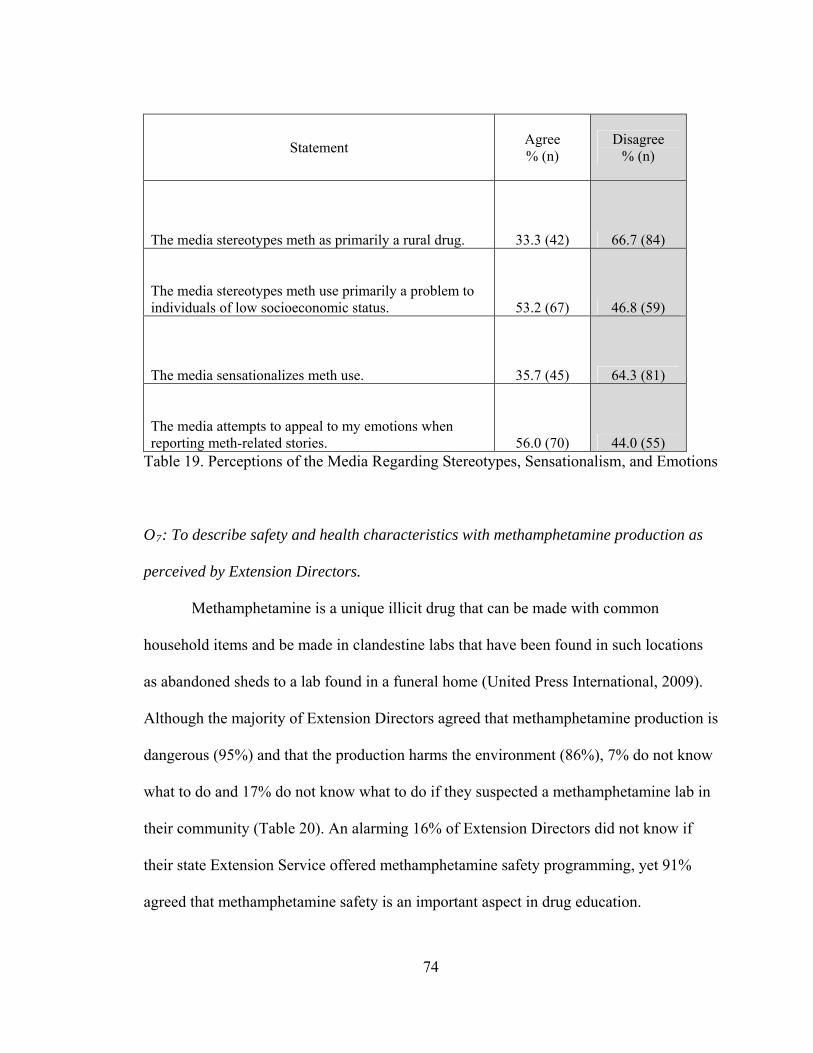
74
Statement Agree % (n)
Disagree % (n)
The media stereotypes meth as primarily a rural drug. 33.3 (42) 66.7 (84)
The media stereotypes meth use primarily a problem to individuals of low socioeconomic status. 53.2 (67) 46.8 (59)
The media sensationalizes meth use. 35.7 (45) 64.3 (81)
The media attempts to appeal to my emotions when reporting meth-related stories. 56.0 (70) 44.0 (55)
Table 19. Perceptions of the Media Regarding Stereotypes, Sensationalism, and Emotions
O7: To describe safety and health characteristics with methamphetamine production as
perceived by Extension Directors.
Methamphetamine is a unique illicit drug that can be made with common
household items and be made in clandestine labs that have been found in such locations
as abandoned sheds to a lab found in a funeral home (United Press International, 2009).
Although the majority of Extension Directors agreed that methamphetamine production is
dangerous (95%) and that the production harms the environment (86%), 7% do not know
what to do and 17% do not know what to do if they suspected a methamphetamine lab in
their community (Table 20). An alarming 16% of Extension Directors did not know if
their state Extension Service offered methamphetamine safety programming, yet 91%
agreed that methamphetamine safety is an important aspect in drug education.

75
Another interesting finding involving the media was that 67% of Extension
Directors agreed that methamphetamine safety is not covered enough in the media. This
is important because as presented earlier, 79% had read or watched news coverage about
a local methamphetamine lab seizure. And, 85% agreed that the media is their primary
source of information regarding methamphetamine.
This section also concluded that farmers should be a primary audience for
methamphetamine safety programming (Table 20). Eighty-eight percent of Extension
Directors agreed farmers should be an audience and 87% agreed methamphetamine
safety should be taught in farm safety programs. At this time, more than one-half of
Extension Directors (58%) did not believe their state offered methamphetamine safety
programming.
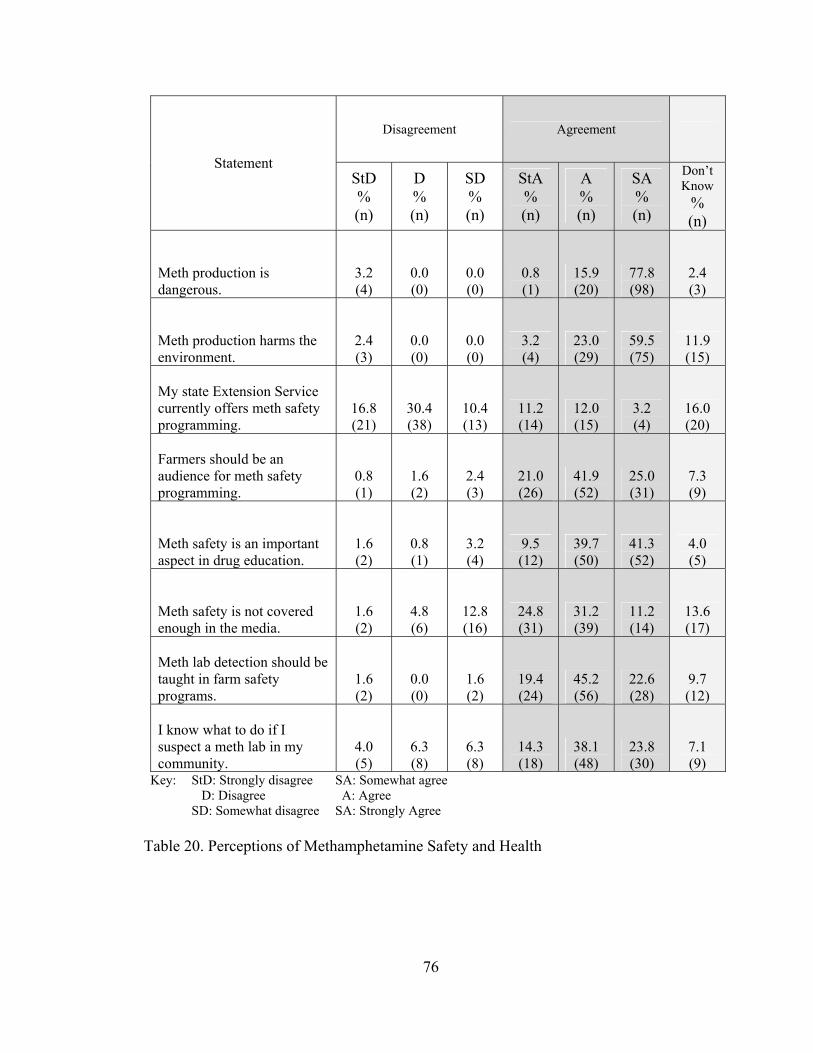
Key: StD: Strongly disagree SA: Somewhat agree
Disagreement Agreement
Statement StD % (n)
D % (n)
SD % (n)
StA % (n)
A % (n)
SA % (n)
Don’t Know
% (n)
Meth production is dangerous.
3.2 (4)
0.0 (0)
0.0 (0)
0.8 (1)
15.9 (20)
77.8 (98)
2.4 (3)
Meth production harms the environment.
2.4 (3)
0.0 (0)
0.0 (0)
3.2 (4)
23.0 (29)
59.5 (75)
11.9 (15)
My state Extension Service currently offers meth safety programming.
16.8 (21)
30.4 (38)
10.4 (13)
11.2 (14)
12.0 (15)
3.2 (4)
16.0 (20)
Farmers should be an audience for meth safety programming.
0.8 (1)
1.6 (2)
2.4 (3)
21.0 (26)
41.9 (52)
25.0 (31)
7.3 (9)
Meth safety is an important aspect in drug education.
1.6 (2)
0.8 (1)
3.2 (4)
9.5 (12)
39.7 (50)
41.3 (52)
4.0 (5)
Meth safety is not covered enough in the media.
1.6 (2)
4.8 (6)
12.8 (16)
24.8 (31)
31.2 (39)
11.2 (14)
13.6 (17)
Meth lab detection should be taught in farm safety programs.
1.6 (2)
0.0 (0)
1.6 (2)
19.4 (24)
45.2 (56)
22.6 (28)
9.7 (12)
I know what to do if I suspect a meth lab in my community.
4.0 (5)
6.3 (8)
6.3 (8)
14.3 (18)
38.1 (48)
23.8 (30)
7.1 (9)
D: Disagree A: Agree SD: Somewhat disagree SA: Strongly Agree Table 20. Perceptions of Methamphetamine Safety and Health
76
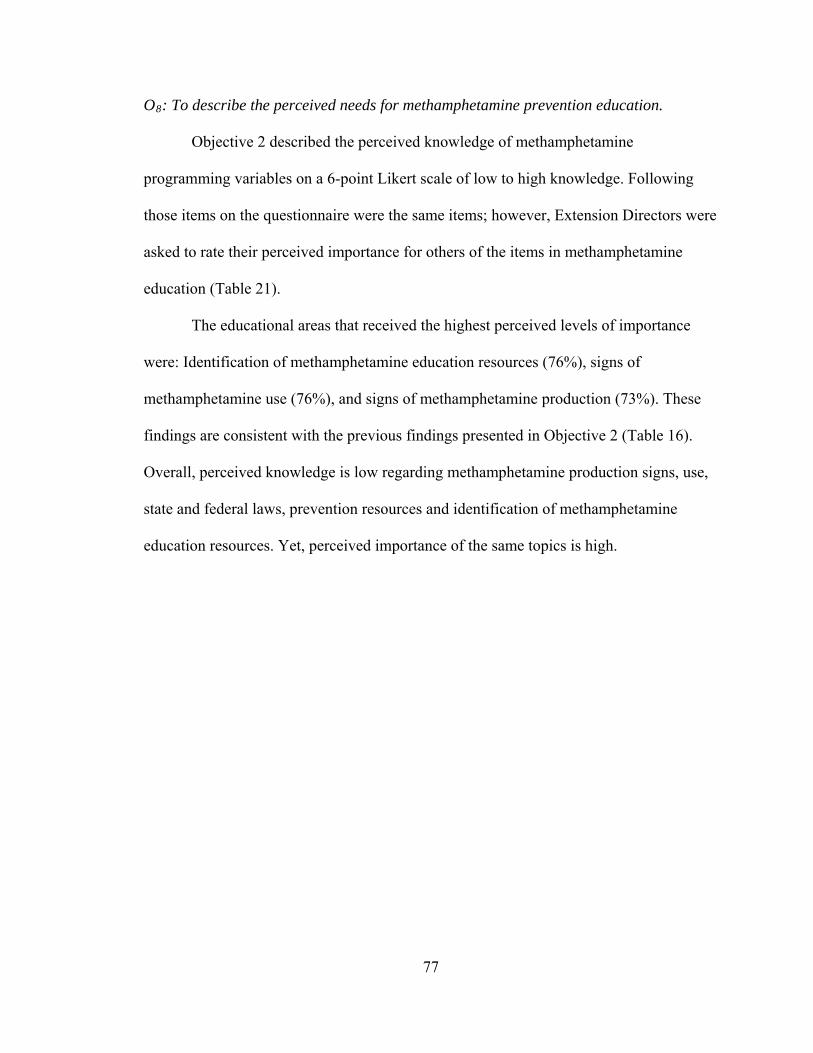
77
O8: To describe the perceived needs for methamphetamine prevention education.
Objective 2 described the perceived knowledge of methamphetamine
programming variables on a 6-point Likert scale of low to high knowledge. Following
those items on the questionnaire were the same items; however, Extension Directors were
asked to rate their perceived importance for others of the items in methamphetamine
education (Table 21).
The educational areas that received the highest perceived levels of importance
were: Identification of methamphetamine education resources (76%), signs of
methamphetamine use (76%), and signs of methamphetamine production (73%). These
findings are consistent with the previous findings presented in Objective 2 (Table 16).
Overall, perceived knowledge is low regarding methamphetamine production signs, use,
state and federal laws, prevention resources and identification of methamphetamine
education resources. Yet, perceived importance of the same topics is high.

Low
n (%)
Highn
(%)
Signs of meth production 2.4 (3)
8.7 (11)
15.9 (20)
27.0 (34)
25.4 (32)
20.6 (26)
Signs of meth use 2.4 (3)
7.1 (9)
14.3 (18)
25.4 (32)
31.0 (39)
19.8 (25)
Your current state laws regarding meth 1.6 (2)
13.6 (17)
18.4 (23)
32.0 (40)
22.4 (28)
12.0 (15)
Current federal laws regarding meth 3.2 (4)
12.7 (16)
21.4 (27)
27.8 (35)
23.8 (30)
11.1 (14)
Meth prevention resources 3.2 (4)
7.2 (9)
14.4 (18)
26.4 (33)
30.4 (38)
18.4 (23)
Identification of meth education resources
4.0 (5)
7.9 (10)
11.9 (15)
27.0 (34)
29.4 (37)
19.8 (25)
78
78
Table 21. Perceived Importance for Others in Methamphetamine Education
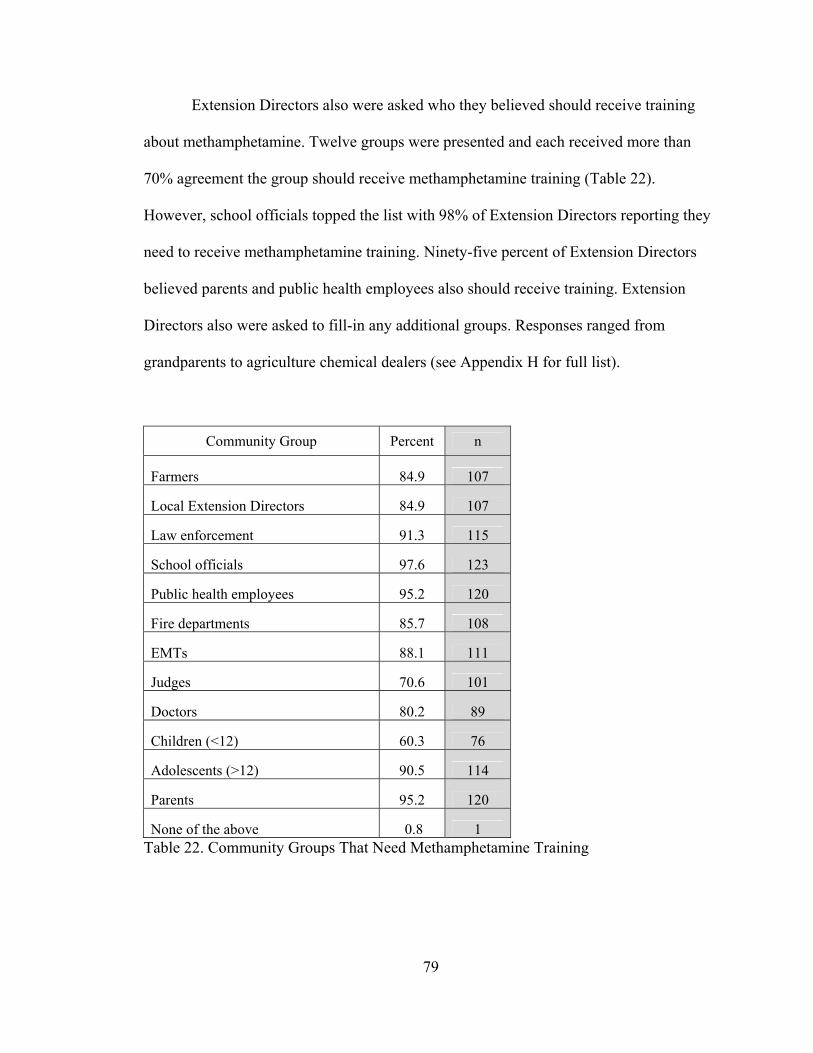
79
Extension Directors also were asked who they believed should receive training
about methamphetamine. Twelve groups were presented and each received more than
70% agreement the group should receive methamphetamine training (Table 22).
However, school officials topped the list with 98% of Extension Directors reporting they
need to receive methamphetamine training. Ninety-five percent of Extension Directors
believed parents and public health employees also should receive training. Extension
Directors also were asked to fill-in any additional groups. Responses ranged from
grandparents to agriculture chemical dealers (see Appendix H for full list).
Community Group Percent n
Farmers 84.9 107
Local Extension Directors 84.9 107
Law enforcement 91.3 115
School officials 97.6 123
Public health employees 95.2 120
Fire departments 85.7 108
EMTs 88.1 111
Judges 70.6 101
Doctors 80.2 89
Children (<12) 60.3 76
Adolescents (>12) 90.5 114
Parents 95.2 120
None of the above 0.8 1 Table 22. Community Groups That Need Methamphetamine Training
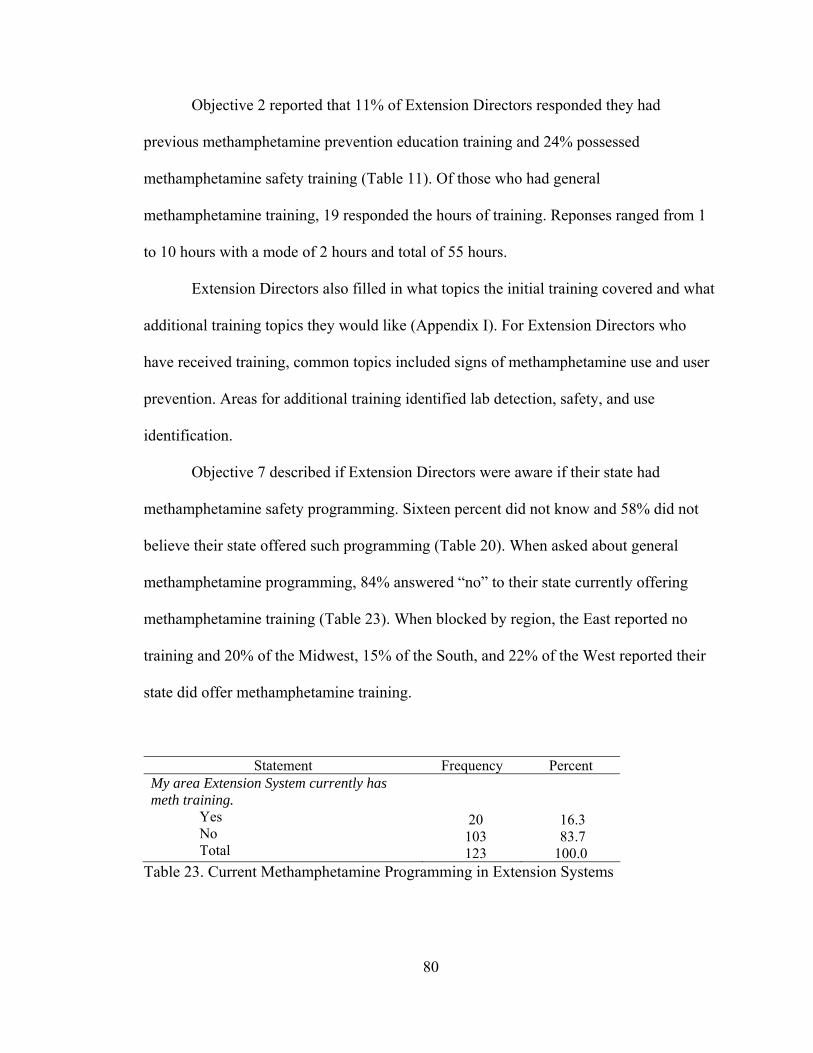
80
Objective 2 reported that 11% of Extension Directors responded they had
previous methamphetamine prevention education training and 24% possessed
methamphetamine safety training (Table 11). Of those who had general
methamphetamine training, 19 responded the hours of training. Reponses ranged from 1
to 10 hours with a mode of 2 hours and total of 55 hours.
Extension Directors also filled in what topics the initial training covered and what
additional training topics they would like (Appendix I). For Extension Directors who
have received training, common topics included signs of methamphetamine use and user
prevention. Areas for additional training identified lab detection, safety, and use
identification.
Objective 7 described if Extension Directors were aware if their state had
methamphetamine safety programming. Sixteen percent did not know and 58% did not
believe their state offered such programming (Table 20). When asked about general
methamphetamine programming, 84% answered “no” to their state currently offering
methamphetamine training (Table 23). When blocked by region, the East reported no
training and 20% of the Midwest, 15% of the South, and 22% of the West reported their
state did offer methamphetamine training.
Statement Frequency Percent My area Extension System currently has meth training.
Yes No Total
20 103 123
16.3 83.7 100.0
Table 23. Current Methamphetamine Programming in Extension Systems

81
O9: To describe the relationships among selected demographic characteristics (gender,
age, level of education obtained, years of Extension experience, geographic location
description of residence and Extension territory, U.S state geographic description, years
in current Extension title, and current community involvement) and: perceived
methamphetamine threat, perceived media dependency, perceived methamphetamine
media portrayal, perceived safety and health characteristics involved with
methamphetamine production, and, perceived needs for methamphetamine prevention
education.
Table 24 summarizes the associations found among gender, location of residence,
location of Extension area, U.S. region, prior methamphetamine training with perception
variables (i.e., threat, media dependency, media portrayal, safety and health, perceived
knowledge and perceived importance). For R x C contingency tables, Cramer’s V was
computed to describe the association for the nominal variables of responses of gender,
geographic location description of residence and Extension territory, prior experience
with methamphetamine training, and U.S. state description. Spearman rank order
correlations (rs) were computed for the ordinal variables of community involvement and
level of education obtained. Pearson product-moment correlations (r) were computed for
the ratio variables of respondents’ scores on age and years in current Extension title. The
appropriate correlation for the scales of measurement of each variable was employed.
The majority of the Cramer’s V values found moderate associations among
variables (values of .20 and less than .40). However, according to Davis (1971), gender
and perceived knowledge had a substantial association ( = .54); location of Extension
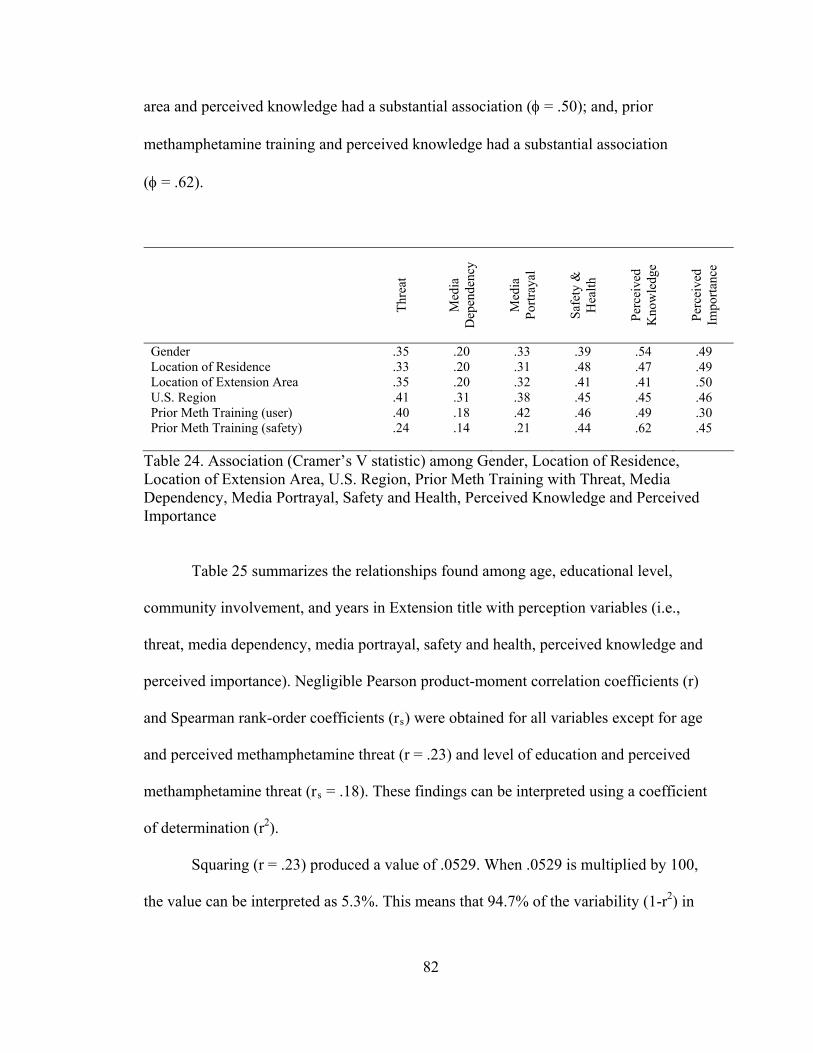
82
area and perceived knowledge had a substantial association ( = .50); and, prior
methamphetamine training and perceived knowledge had a substantial association
( = .62).
Thr
eat
Med
ia
Dep
ende
ncy
Med
ia
Por
tray
al
Saf
ety
&
Hea
lth
Per
ceiv
ed
Kno
wle
dge
Per
ceiv
ed
Impo
rtan
ce
Gender Location of Residence Location of Extension Area U.S. Region Prior Meth Training (user) Prior Meth Training (safety)
.35
.33
.35
.41
.40
.24
.20
.20
.20
.31
.18
.14
.33
.31
.32
.38
.42
.21
.39
.48
.41
.45
.46
.44
.54
.47
.41
.45
.49
.62
.49
.49
.50
.46
.30
.45
Table 24. Association (Cramer’s V statistic) among Gender, Location of Residence, Location of Extension Area, U.S. Region, Prior Meth Training with Threat, Media Dependency, Media Portrayal, Safety and Health, Perceived Knowledge and Perceived Importance
Table 25 summarizes the relationships found among age, educational level,
community involvement, and years in Extension title with perception variables (i.e.,
threat, media dependency, media portrayal, safety and health, perceived knowledge and
perceived importance). Negligible Pearson product-moment correlation coefficients (r)
and Spearman rank-order coefficients (rs) were obtained for all variables except for age
and perceived methamphetamine threat (r = .23) and level of education and perceived
methamphetamine threat (rs = .18). These findings can be interpreted using a coefficient
of determination (r2).
Squaring (r = .23) produced a value of .0529. When .0529 is multiplied by 100,
the value can be interpreted as 5.3%. This means that 94.7% of the variability (1-r2) in
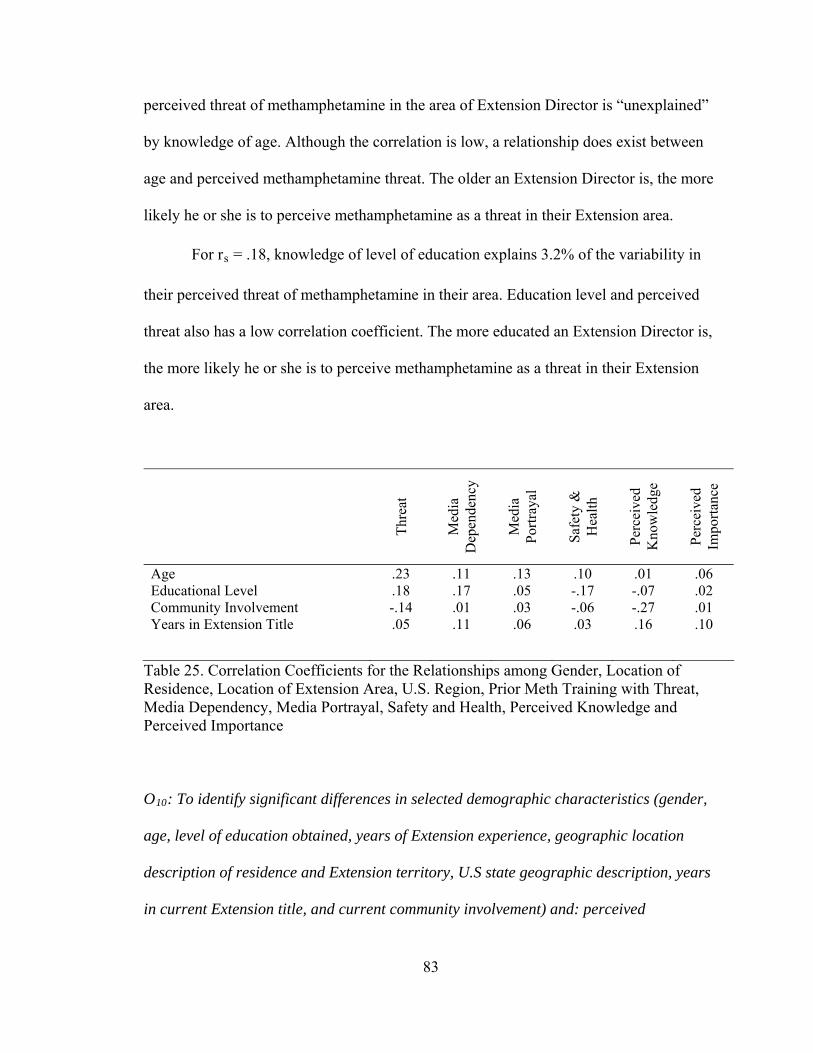
83
perceived threat of methamphetamine in the area of Extension Director is “unexplained”
by knowledge of age. Although the correlation is low, a relationship does exist between
age and perceived methamphetamine threat. The older an Extension Director is, the more
likely he or she is to perceive methamphetamine as a threat in their Extension area.
For rs = .18, knowledge of level of education explains 3.2% of the variability in
their perceived threat of methamphetamine in their area. Education level and perceived
threat also has a low correlation coefficient. The more educated an Extension Director is,
the more likely he or she is to perceive methamphetamine as a threat in their Extension
area.
Thr
eat
Med
ia
Dep
ende
ncy
Med
ia
Por
tray
al
Saf
ety
&
Hea
lth
Per
ceiv
ed
Kno
wle
dge
Per
ceiv
ed
Impo
rtan
ce
Age Educational Level Community Involvement Years in Extension Title
.23
.18 -.14 .05
.11
.17
.01
.11
.13
.05
.03
.06
.10 -.17 -.06 .03
.01 -.07 -.27 .16
.06
.02
.01
.10
Table 25. Correlation Coefficients for the Relationships among Gender, Location of Residence, Location of Extension Area, U.S. Region, Prior Meth Training with Threat, Media Dependency, Media Portrayal, Safety and Health, Perceived Knowledge and Perceived Importance
O10: To identify significant differences in selected demographic characteristics (gender,
age, level of education obtained, years of Extension experience, geographic location
description of residence and Extension territory, U.S state geographic description, years
in current Extension title, and current community involvement) and: perceived
84
methamphetamine threat, perceived media dependency, perceived methamphetamine
media portrayal, perceived safety and health characteristics involved with
methamphetamine production, and perceived needs for methamphetamine prevention
education.
Independent group t-tests and One-Way Analysis of Variances (ANOVAs) were
performed to identify significant differences among dichotomous nominal variables (i.e.,
gender and prior methamphetamine user and safety training), multichotomous nominal
variables (i.e.,age, level of education obtained, years of Extension experience, geographic
location description of residence and Extension territory, U.S state geographic
description, years in Extension, and current community involvement), and the dependent
variables (perceived methamphetamine threat, perceived media dependency, perceived
methamphetamine media portrayal, perceived safety and health characteristics involved
with methamphetamine production, and, perceived needs for methamphetamine
prevention education.
A Likert scale, otherwise referred to as a summated rating scale, was used to
generate means summed across items. The sums are assumed to be internal in scale of
measurement. An alpha level of .05 was appropriate and is commonly used in social
sciences.
Gender
Table 26 presents the t-tests for the independent groups of male and female
Extension Directors and perception variables. No significant differences were found
among the mean scores of threat, media dependency, media portrayal, and safety and
health. Significant differences were found between perceived knowledge and perceived
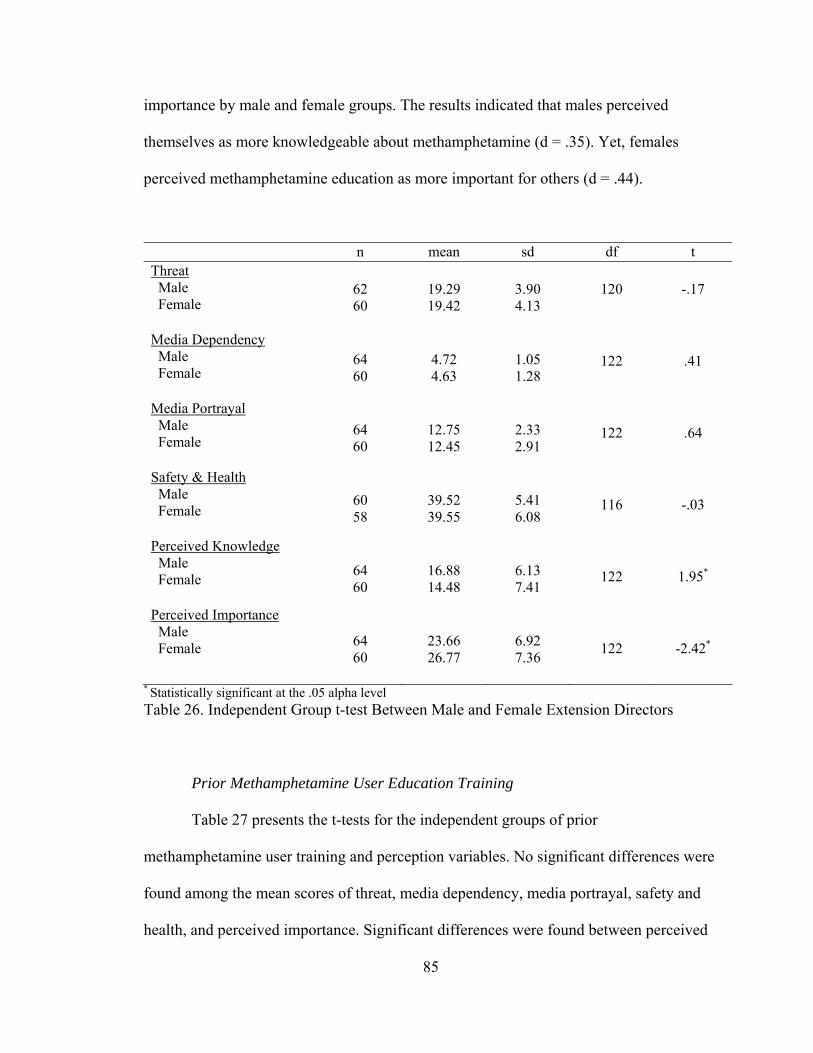
85
importance by male and female groups. The results indicated that males perceived
themselves as more knowledgeable about methamphetamine (d = .35). Yet, females
perceived methamphetamine education as more important for others (d = .44).
n mean sd df t Threat Male Female Media Dependency Male Female Media Portrayal Male Female Safety & Health Male Female Perceived Knowledge Male Female Perceived Importance Male Female
62 60
64 60
64 60
60 58
64 60
64 60
19.29 19.42
4.72 4.63
12.75 12.45
39.52 39.55
16.88 14.48
23.66 26.77
3.90 4.13
1.05 1.28
2.33 2.91
5.41 6.08
6.13 7.41
6.92 7.36
120
122
122
116
122
122
-.17
.41
.64
-.03
1.95*
-2.42*
* Statistically significant at the .05 alpha level Table 26. Independent Group t-test Between Male and Female Extension Directors
Prior Methamphetamine User Education Training
Table 27 presents the t-tests for the independent groups of prior
methamphetamine user training and perception variables. No significant differences were
found among the mean scores of threat, media dependency, media portrayal, safety and
health, and perceived importance. Significant differences were found between perceived

86
knowledge and Extension Directors who had prior methamphetamine user training.
Results found those who had prior training perceived their knowledge significantly
higher than those Extension Directors without prior user training (d = .72)
n mean sd df t
Threat Training No Training Media Dependency Training No Training Media Coverage Training No Training Safety & Health Training No Training Perceived Knowledge Training No Training Perceived Importance Training No Training
14 111
14 113
14 113
14 107
14 113
14 112
20.00 19.22
4.57 4.66
12.14 12.58
37.71 39.93
22.29 14.92
24.79 25.24
5.13 4.00
1.34 1.17
4.04 2.48
7.04 5.66
5.51 6.59
6.70 7.33
123
125
125
119
125
124
.69
-.27
-.58
-1.34
4.00*
-.22
* Statistically significant at the .05 alpha level Table 27. Independent group t-test Between Extension Directors Who Have Had Training in Methamphetamine User Prevention
Prior Methamphetamine Safety Education Training Table 28 presents the t-tests for the independent groups of prior
methamphetamine safety training and perception variables. No significant differences
were found among the mean scores of threat, media dependency, media portrayal, safety
and health, and perceived importance. Significant differences were found between
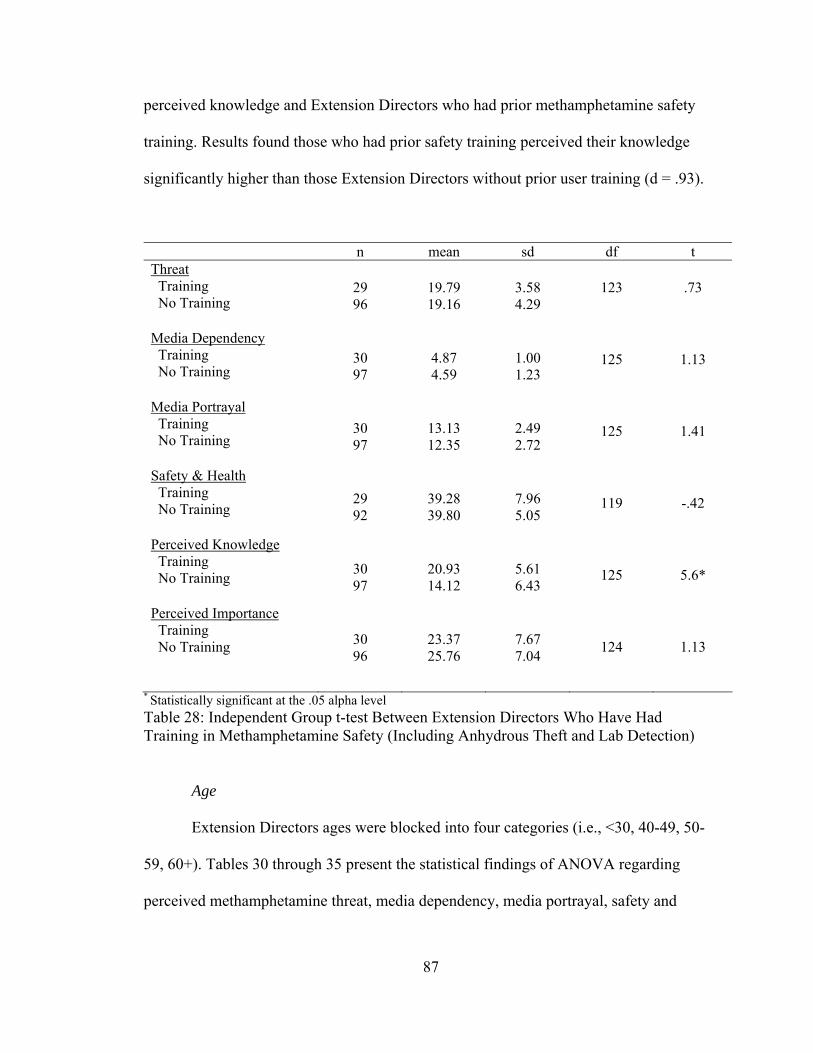
87
perceived knowledge and Extension Directors who had prior methamphetamine safety
training. Results found those who had prior safety training perceived their knowledge
significantly higher than those Extension Directors without prior user training (d = .93).
n mean sd df t Threat Training No Training Media Dependency Training No Training Media Portrayal Training No Training Safety & Health Training No Training Perceived Knowledge Training No Training Perceived Importance Training No Training
29 96
30 97
30 97
29 92
30 97
30 96
19.79 19.16
4.87 4.59
13.13 12.35
39.28 39.80
20.93 14.12
23.37 25.76
3.58 4.29
1.00 1.23
2.49 2.72
7.96 5.05
5.61 6.43
7.67 7.04
123
125
125
119
125
124
.73
1.13
1.41
-.42
5.6*
1.13
* Statistically significant at the .05 alpha level Table 28: Independent Group t-test Between Extension Directors Who Have Had Training in Methamphetamine Safety (Including Anhydrous Theft and Lab Detection)
Age
Extension Directors ages were blocked into four categories (i.e., <30, 40-49, 50-
59, 60+). Tables 30 through 35 present the statistical findings of ANOVA regarding
perceived methamphetamine threat, media dependency, media portrayal, safety and
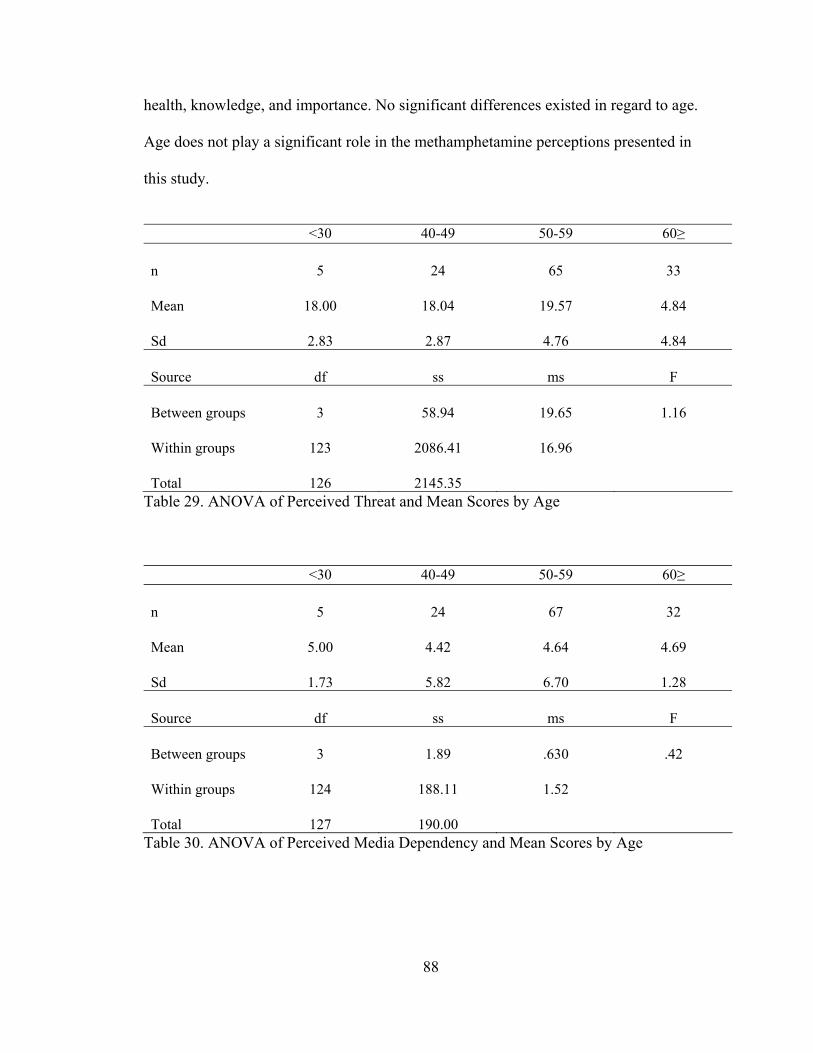
88
health, knowledge, and importance. No significant differences existed in regard to age.
Age does not play a significant role in the methamphetamine perceptions presented in
this study.
<30 40-49 50-59 60≥ n Mean Sd
5
18.00
2.83
24
18.04
2.87
65
19.57
4.76
33
4.84
4.84 Source
df
ss
ms
F
Between groups Within groups Total
3
123
126
58.94
2086.41
2145.35
19.65
16.96
1.16
Table 29. ANOVA of Perceived Threat and Mean Scores by Age <30 40-49 50-59 60≥ n Mean Sd
5
5.00
1.73
24
4.42
5.82
67
4.64
6.70
32
4.69
1.28 Source
df
ss
ms
F
Between groups Within groups Total
3
124
127
1.89
188.11
190.00
.630
1.52
.42
Table 30. ANOVA of Perceived Media Dependency and Mean Scores by Age
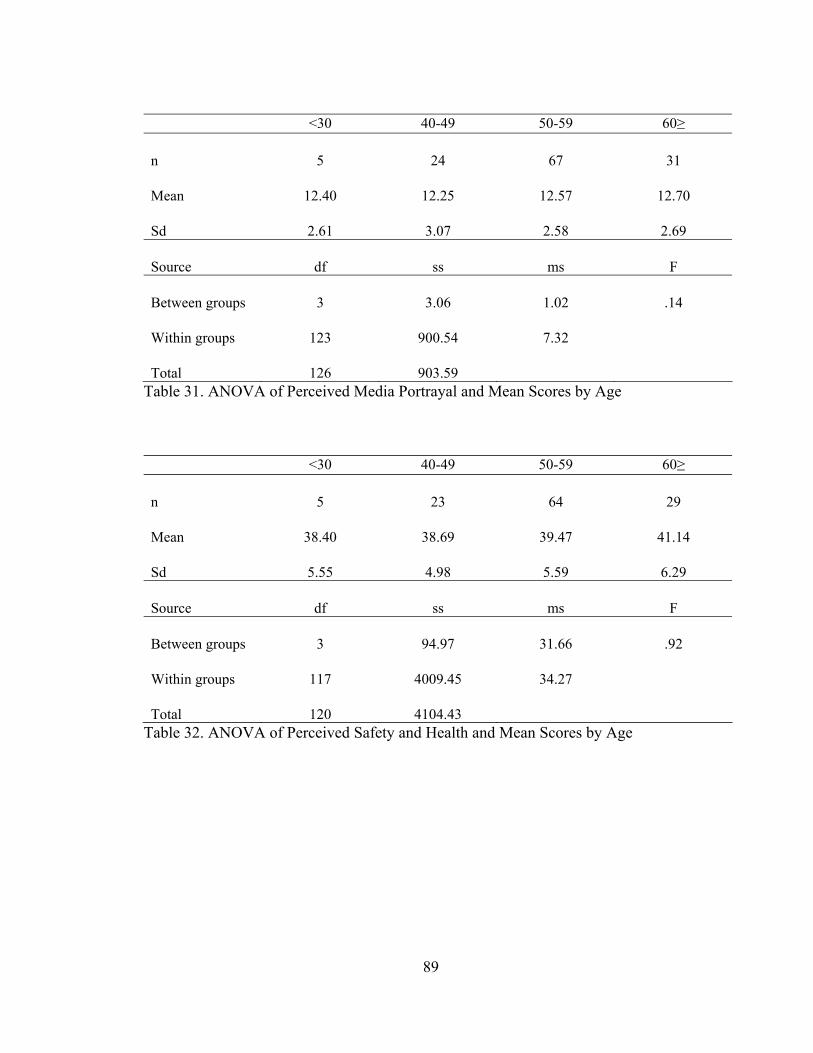
89
<30 40-49 50-59 60≥ n Mean Sd
5
12.40
2.61
24
12.25
3.07
67
12.57
2.58
31
12.70
2.69 Source
df
ss
ms
F
Between groups Within groups Total
3
123
126
3.06
900.54
903.59
1.02
7.32
.14
Table 31. ANOVA of Perceived Media Portrayal and Mean Scores by Age <30 40-49 50-59 60≥ n Mean Sd
5
38.40
5.55
23
38.69
4.98
64
39.47
5.59
29
41.14
6.29 Source
df
ss
ms
F
Between groups Within groups Total
3
117
120
94.97
4009.45
4104.43
31.66
34.27
.92
Table 32. ANOVA of Perceived Safety and Health and Mean Scores by Age

90
<30 40-49 50-59 60≥ n Mean Sd
5
17.20
5.67
24
14.21
5.82
67
16.18
6.70
30
15.71
8.16 Source
df
ss
ms
F
Between groups Within groups Total
3
123
126
79.90
5868.99
5948.89
26.63
47.72
.59
Table 33. ANOVA of Perceived Knowledge and Mean Scores by Age <30 40-49 50-59 60≥ n Mean Sd
5
23.60
5.13
24
23.63
6.38
67
26.02
7.20
31
24.83
8.22 Source
df
ss
ms
F
Between groups Within groups Total
3
122
125
122.49
6424.93
6547.43
40.83
52.66
.78
Table 34. ANOVA of Perceived Importance and Mean Scores by Age

91
Level of Education
The level of education obtained of Extension Directors is represented in five
categories; the categories of “some college,” “college graduate,” and “some graduate
school” were collapsed into <PhD. Tables 35 through 40 present the statistical findings of
ANOVA regarding perceived methamphetamine threat, media dependency, media
portrayal, safety and health, knowledge, and importance. No significant differences
existed in regard to education level. Education level does not play a significant role in the
methamphetamine perceptions presented in this study.
<PhD PhD n Mean sd
83
18.92
3.76
38
20.39
4.00
Source
df
ss
ms
F
Between groups Within groups Total
1
119
120
57.02
1869.50
1926.51
57.02
15.71
3.63
Table 35. ANOVA of Perceived Threat and Mean Scores by Education Level
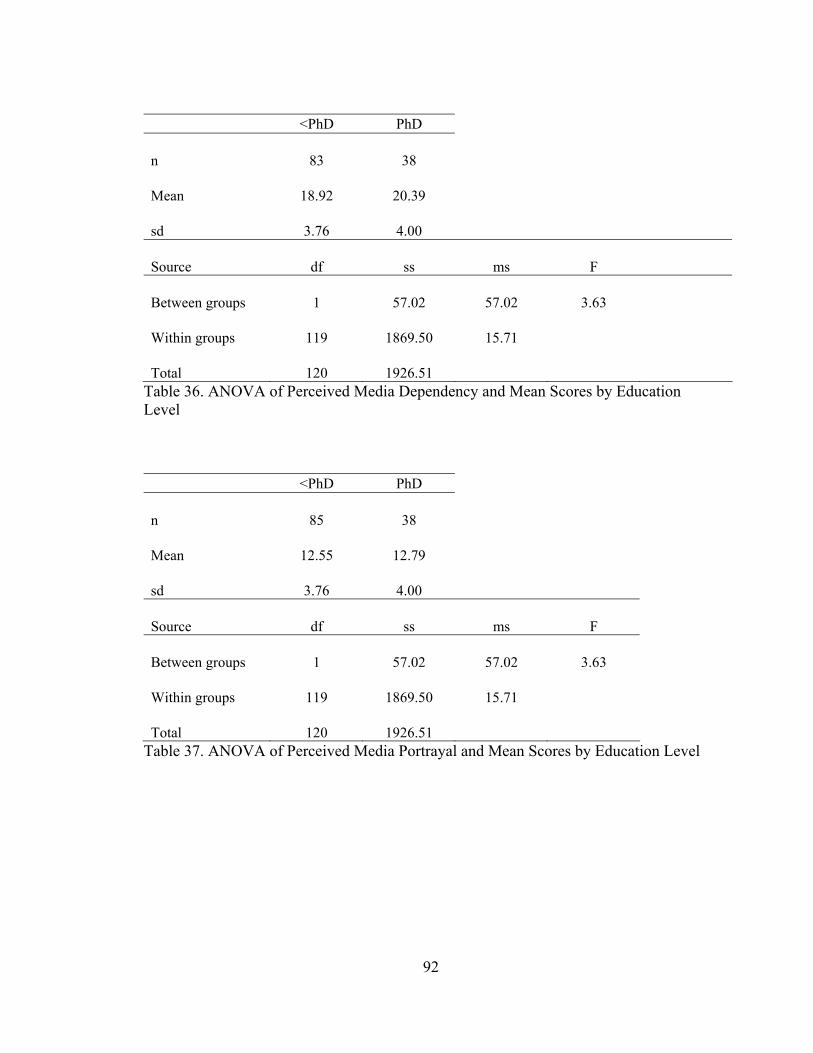
92
<PhD PhD n Mean sd
83
18.92
3.76
38
20.39
4.00
Source
df
ss
ms
F
Between groups Within groups Total
1
119
120
57.02
1869.50
1926.51
57.02
15.71
3.63
Table 36. ANOVA of Perceived Media Dependency and Mean Scores by Education Level <PhD PhD n Mean sd
85
12.55
3.76
38
12.79
4.00
Source
df
ss
ms
F
Between groups Within groups Total
1
119
120
57.02
1869.50
1926.51
57.02
15.71
3.63
Table 37. ANOVA of Perceived Media Portrayal and Mean Scores by Education Level

93
<PhD PhD n Mean sd
81
39.90
6.33
36
38.67
4.09
Source
df
ss
ms
F
Between groups Within groups Total
1
115
116
37.99
3793.21
3831.20
37.99
32.98
3.63
Table 38. ANOVA of Perceived Safety and Health and Mean Scores by Education Level <PhD PhD n Mean sd
85
16.07
7.09
38
15.05
6.38
Source
df
ss
ms
F
Between groups Within groups Total
1
121
122
35.45
5733.47
5760.68
27.21
47.38
.57
Table 39. ANOVA of Perceived Knowledge and Mean Scores by Education Level
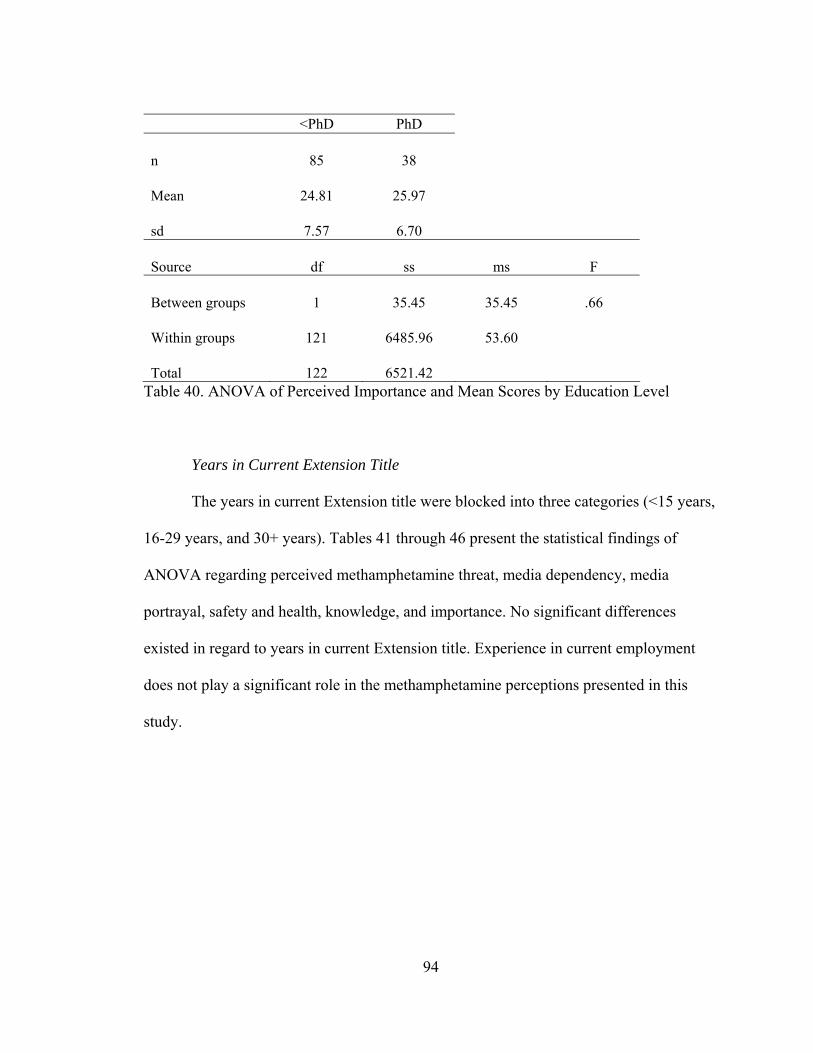
94
<PhD PhD n Mean sd
85
24.81
7.57
38
25.97
6.70
Source
df
ss
ms
F
Between groups Within groups Total
1
121
122
35.45
6485.96
6521.42
35.45
53.60
.66
Table 40. ANOVA of Perceived Importance and Mean Scores by Education Level
Years in Current Extension Title
The years in current Extension title were blocked into three categories (<15 years,
16-29 years, and 30+ years). Tables 41 through 46 present the statistical findings of
ANOVA regarding perceived methamphetamine threat, media dependency, media
portrayal, safety and health, knowledge, and importance. No significant differences
existed in regard to years in current Extension title. Experience in current employment
does not play a significant role in the methamphetamine perceptions presented in this
study.
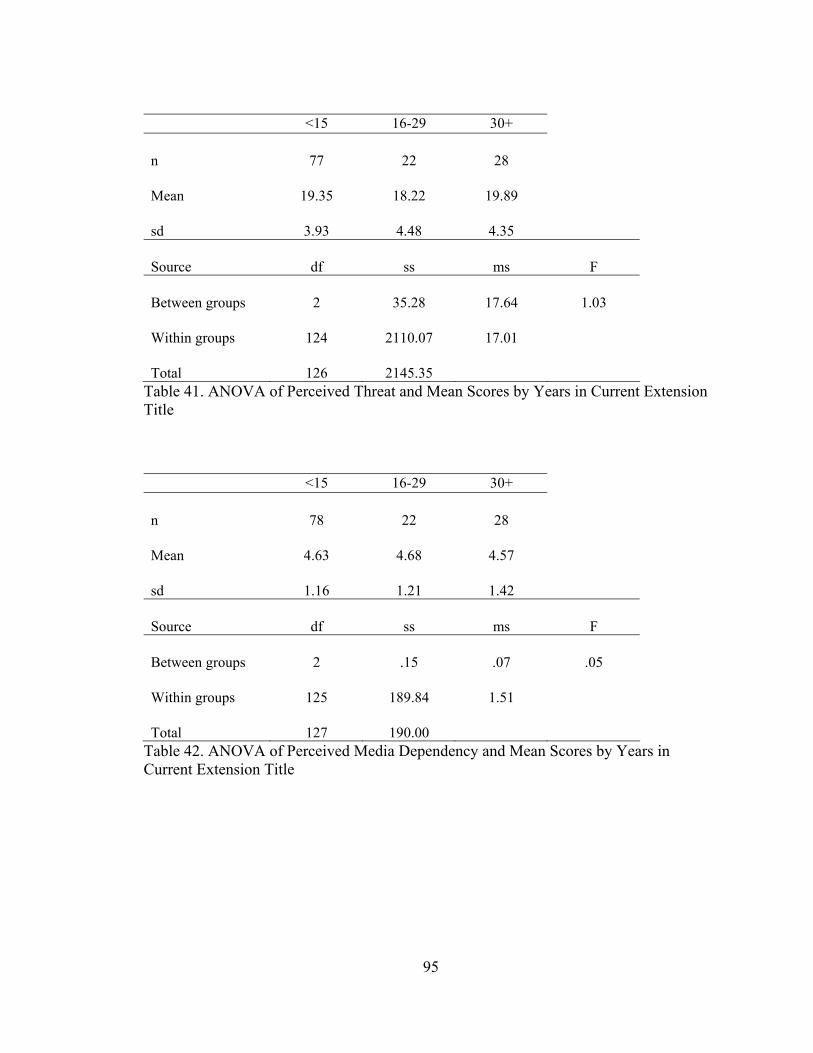
95
<15 16-29 30+ n Mean sd
77
19.35
3.93
22
18.22
4.48
28
19.89
4.35
Source
df
ss
ms
F
Between groups Within groups Total
2
124
126
35.28
2110.07
2145.35
17.64
17.01
1.03
Table 41. ANOVA of Perceived Threat and Mean Scores by Years in Current Extension Title <15 16-29 30+ n Mean sd
78
4.63
1.16
22
4.68
1.21
28
4.57
1.42
Source
df
ss
ms
F
Between groups Within groups Total
2
125
127
.15
189.84
190.00
.07
1.51
.05
Table 42. ANOVA of Perceived Media Dependency and Mean Scores by Years in Current Extension Title
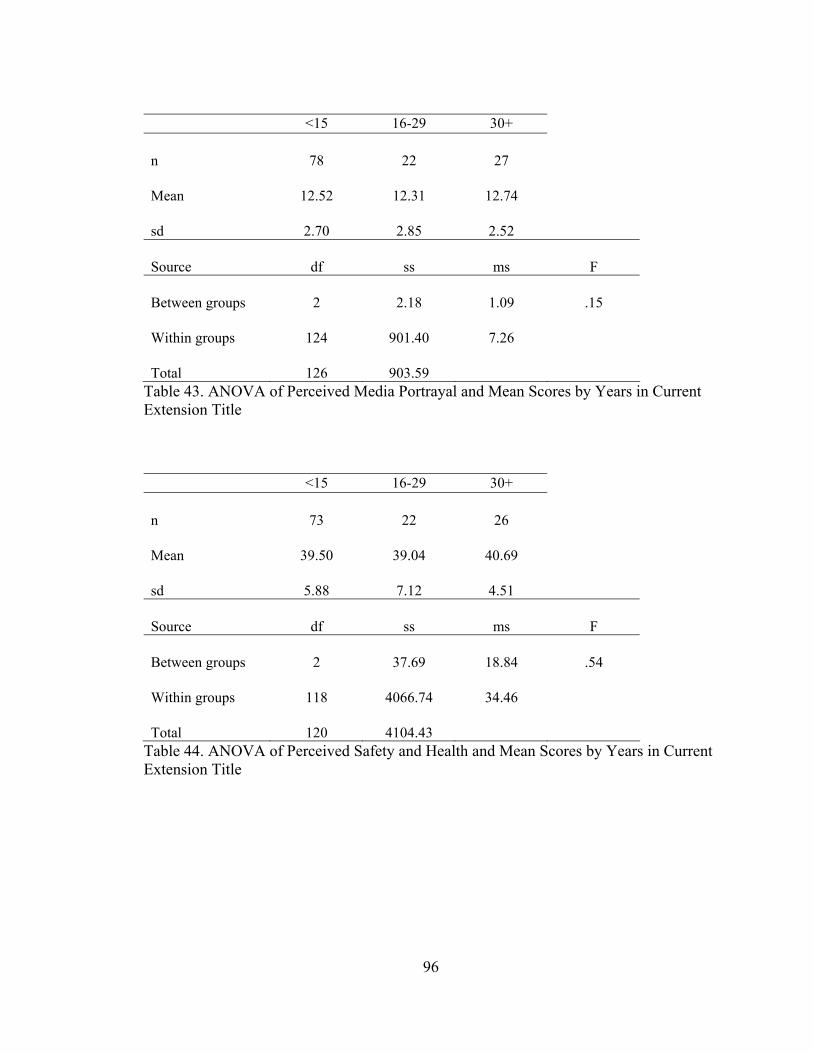
96
<15 16-29 30+ n Mean sd
78
12.52
2.70
22
12.31
2.85
27
12.74
2.52
Source
df
ss
ms
F
Between groups Within groups Total
2
124
126
2.18
901.40
903.59
1.09
7.26
.15
Table 43. ANOVA of Perceived Media Portrayal and Mean Scores by Years in Current Extension Title <15 16-29 30+ n Mean sd
73
39.50
5.88
22
39.04
7.12
26
40.69
4.51
Source
df
ss
ms
F
Between groups Within groups Total
2
118
120
37.69
4066.74
4104.43
18.84
34.46
.54
Table 44. ANOVA of Perceived Safety and Health and Mean Scores by Years in Current Extension Title
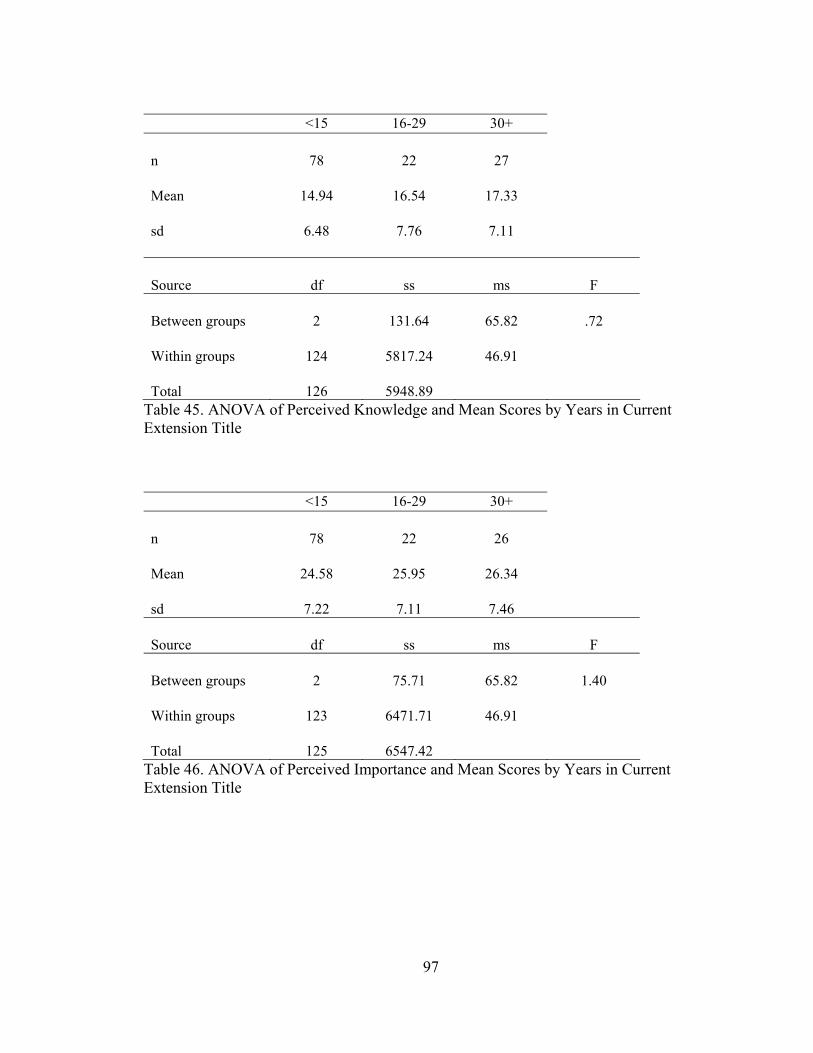
97
<15 16-29 30+ n Mean sd
78
14.94
6.48
22
16.54
7.76
27
17.33
7.11
Source
df
ss
ms
F
Between groups Within groups Total
2
124
126
131.64
5817.24
5948.89
65.82
46.91
.72
Table 45. ANOVA of Perceived Knowledge and Mean Scores by Years in Current Extension Title <15 16-29 30+ n Mean sd
78
24.58
7.22
22
25.95
7.11
26
26.34
7.46
Source
df
ss
ms
F
Between groups Within groups Total
2
123
125
75.71
6471.71
6547.42
65.82
46.91
1.40
Table 46. ANOVA of Perceived Importance and Mean Scores by Years in Current Extension Title
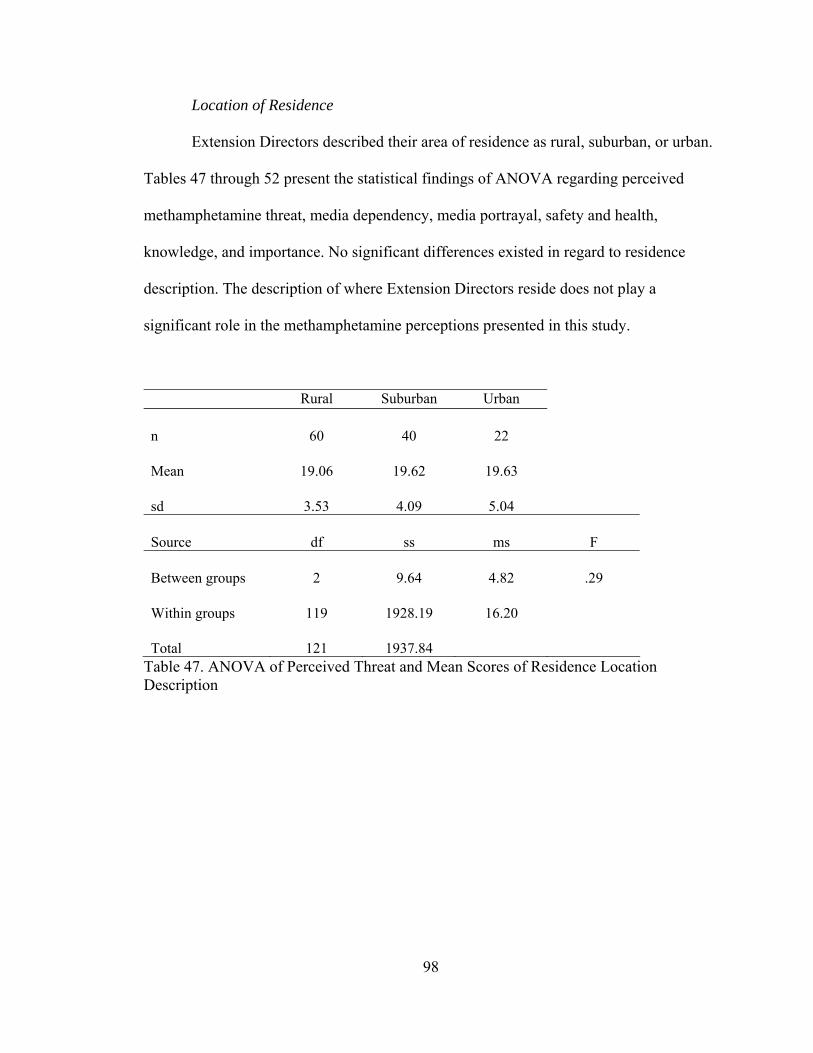
98
Location of Residence
Extension Directors described their area of residence as rural, suburban, or urban.
Tables 47 through 52 present the statistical findings of ANOVA regarding perceived
methamphetamine threat, media dependency, media portrayal, safety and health,
knowledge, and importance. No significant differences existed in regard to residence
description. The description of where Extension Directors reside does not play a
significant role in the methamphetamine perceptions presented in this study.
Rural Suburban Urban n Mean sd
60
19.06
3.53
40
19.62
4.09
22
19.63
5.04
Source
df
ss
ms
F
Between groups Within groups Total
2
119
121
9.64
1928.19
1937.84
4.82
16.20
.29
Table 47. ANOVA of Perceived Threat and Mean Scores of Residence Location Description
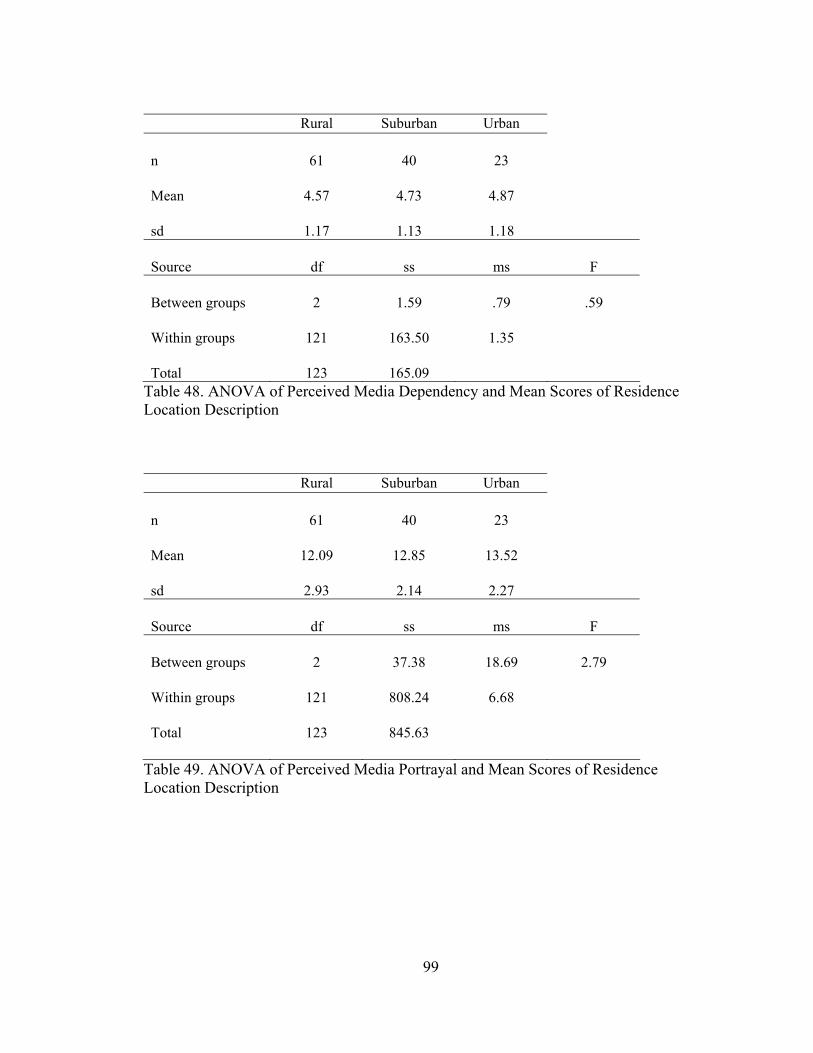
99
Rural Suburban Urban n Mean sd
61
4.57
1.17
40
4.73
1.13
23
4.87
1.18
Source
df
ss
ms
F
Between groups Within groups Total
2
121
123
1.59
163.50
165.09
.79
1.35
.59
Table 48. ANOVA of Perceived Media Dependency and Mean Scores of Residence Location Description Rural Suburban Urban n Mean sd
61
12.09
2.93
40
12.85
2.14
23
13.52
2.27
Source
df
ss
ms
F
Between groups Within groups Total
2
121
123
37.38
808.24
845.63
18.69
6.68
2.79
Table 49. ANOVA of Perceived Media Portrayal and Mean Scores of Residence Location Description
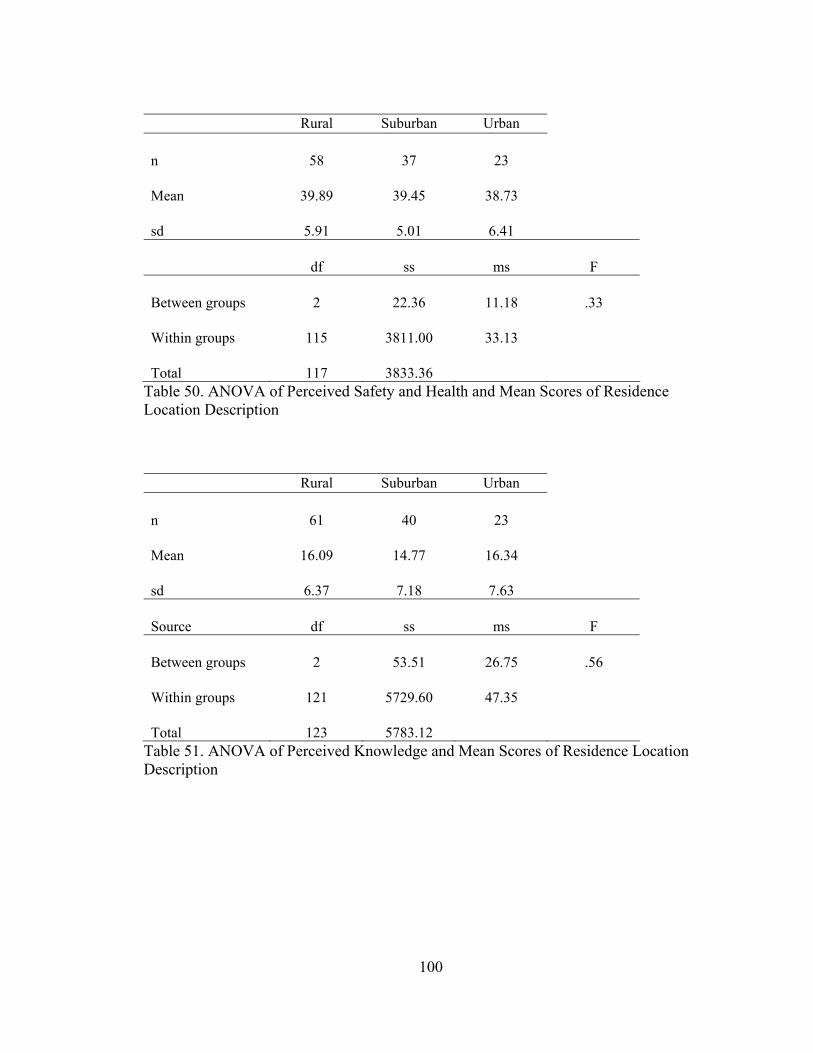
100
Rural Suburban Urban n Mean sd
58
39.89
5.91
37
39.45
5.01
23
38.73
6.41
df
ss
ms
F
Between groups Within groups Total
2
115
117
22.36
3811.00
3833.36
11.18
33.13
.33
Table 50. ANOVA of Perceived Safety and Health and Mean Scores of Residence Location Description Rural Suburban Urban n Mean sd
61
16.09
6.37
40
14.77
7.18
23
16.34
7.63
Source
df
ss
ms
F
Between groups Within groups Total
2
121
123
53.51
5729.60
5783.12
26.75
47.35
.56
Table 51. ANOVA of Perceived Knowledge and Mean Scores of Residence Location Description
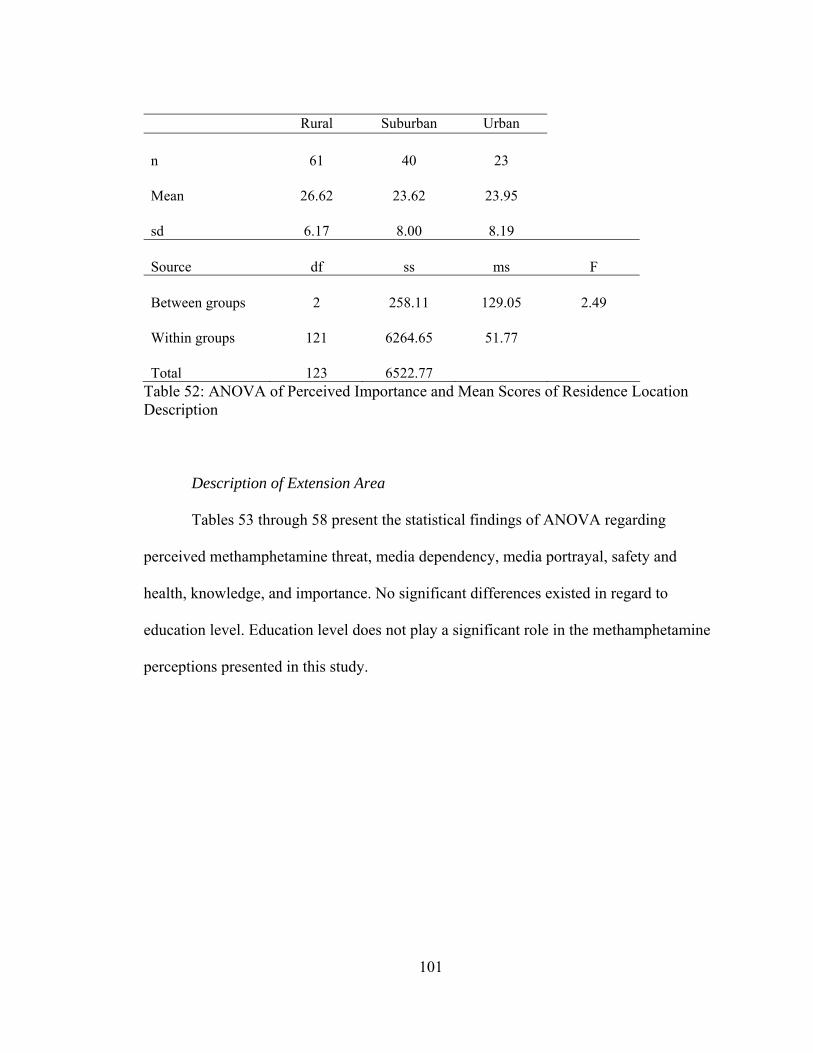
101
Rural Suburban Urban n Mean sd
61
26.62
6.17
40
23.62
8.00
23
23.95
8.19
Source
df
ss
ms
F
Between groups Within groups Total
2
121
123
258.11
6264.65
6522.77
129.05
51.77
2.49
Table 52: ANOVA of Perceived Importance and Mean Scores of Residence Location Description
Description of Extension Area
Tables 53 through 58 present the statistical findings of ANOVA regarding
perceived methamphetamine threat, media dependency, media portrayal, safety and
health, knowledge, and importance. No significant differences existed in regard to
education level. Education level does not play a significant role in the methamphetamine
perceptions presented in this study.

102
Rural Suburban Urban Rural/
Suburban Suburban/
Urban n Mean sd
51
19.47
3.51
2
23.50
6.36
7
19.00
3.05
47
19.23
4.07
15
18.93
5.48 Source
df
ss
ms
F
Between groups Within groups Total
4
117
121
39.28
1898.56
1937.84
9.82
16.22
.60
Table 53. ANOVA of Perceived Threat and Mean Scores of Extension Area Location Description Rural Suburban Urban Rural/
Suburban Suburban/
Urban n Mean sd
53
4.75
.97
2
4.00
2.82
7
4.71
1.11
47
4.51
1.34
15
5.00
.92 Source
df
ss
ms
F
Between groups Within groups Total
4
119
123
4.11
160.98
165.09
1.02
1.35
.76
Table 54. ANOVA of Perceived Media Dependency and Mean Scores of Extension Area Location Description
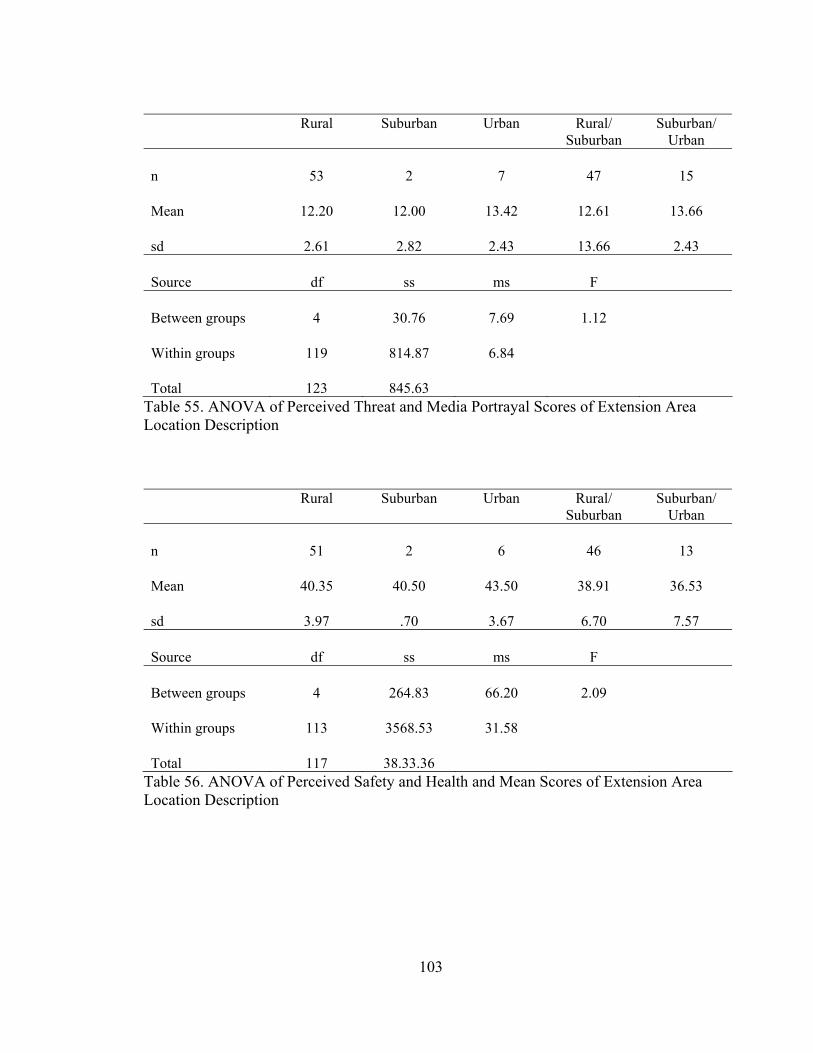
103
Rural Suburban Urban Rural/
Suburban Suburban/
Urban n Mean sd
53
12.20
2.61
2
12.00
2.82
7
13.42
2.43
47
12.61
13.66
15
13.66
2.43 Source
df
ss
ms
F
Between groups Within groups Total
4
119
123
30.76
814.87
845.63
7.69
6.84
1.12
Table 55. ANOVA of Perceived Threat and Media Portrayal Scores of Extension Area Location Description Rural Suburban Urban Rural/
Suburban Suburban/
Urban n Mean sd
51
40.35
3.97
2
40.50
.70
6
43.50
3.67
46
38.91
6.70
13
36.53
7.57 Source
df
ss
ms
F
Between groups Within groups Total
4
113
117
264.83
3568.53
38.33.36
66.20
31.58
2.09
Table 56. ANOVA of Perceived Safety and Health and Mean Scores of Extension Area Location Description
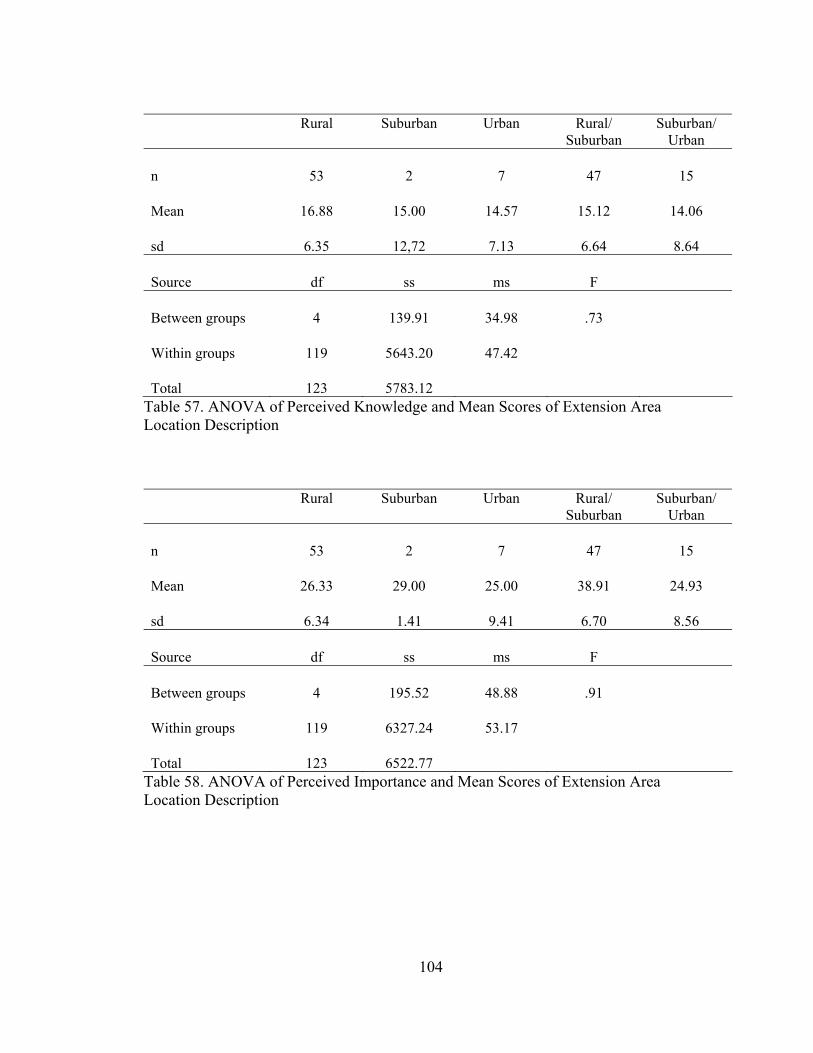
104
Rural Suburban Urban Rural/
Suburban Suburban/
Urban n Mean sd
53
16.88
6.35
2
15.00
12,72
7
14.57
7.13
47
15.12
6.64
15
14.06
8.64 Source
df
ss
ms
F
Between groups Within groups Total
4
119
123
139.91
5643.20
5783.12
34.98
47.42
.73
Table 57. ANOVA of Perceived Knowledge and Mean Scores of Extension Area Location Description Rural Suburban Urban Rural/
Suburban Suburban/
Urban n Mean sd
53
26.33
6.34
2
29.00
1.41
7
25.00
9.41
47
38.91
6.70
15
24.93
8.56 Source
df
ss
ms
F
Between groups Within groups Total
4
119
123
195.52
6327.24
6522.77
48.88
53.17
.91
Table 58. ANOVA of Perceived Importance and Mean Scores of Extension Area Location Description
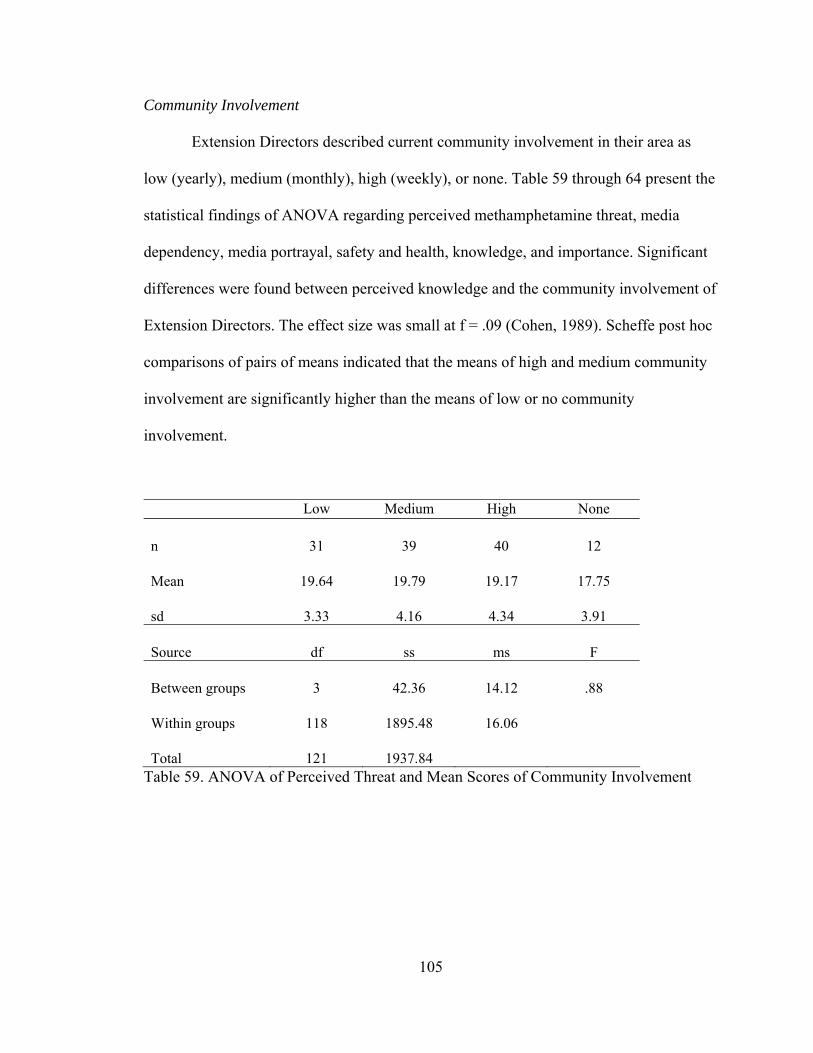
105
Community Involvement
Extension Directors described current community involvement in their area as
low (yearly), medium (monthly), high (weekly), or none. Table 59 through 64 present the
statistical findings of ANOVA regarding perceived methamphetamine threat, media
dependency, media portrayal, safety and health, knowledge, and importance. Significant
differences were found between perceived knowledge and the community involvement of
Extension Directors. The effect size was small at f = .09 (Cohen, 1989). Scheffe post hoc
comparisons of pairs of means indicated that the means of high and medium community
involvement are significantly higher than the means of low or no community
involvement.
Low Medium High None n Mean sd
31
19.64
3.33
39
19.79
4.16
40
19.17
4.34
12
17.75
3.91 Source
df
ss
ms
F
Between groups Within groups Total
3
118
121
42.36
1895.48
1937.84
14.12
16.06
.88
Table 59. ANOVA of Perceived Threat and Mean Scores of Community Involvement
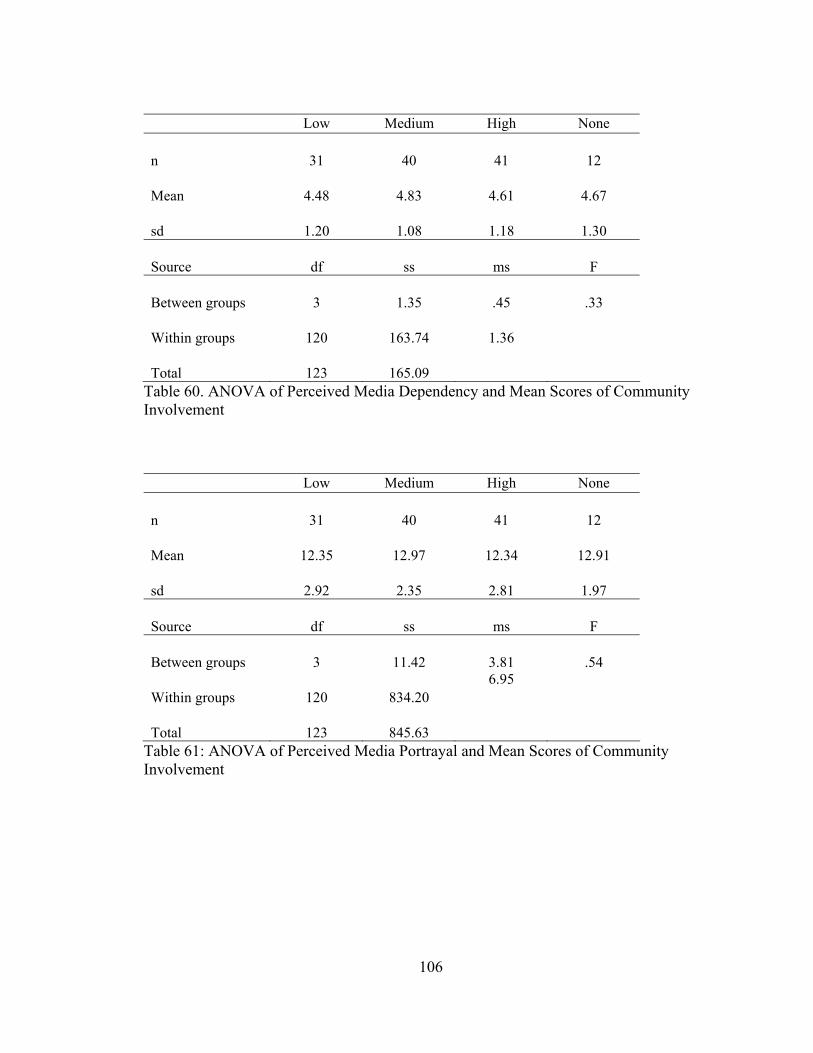
106
Low Medium High None n Mean sd
31
4.48
1.20
40
4.83
1.08
41
4.61
1.18
12
4.67
1.30 Source
df
ss
ms
F
Between groups Within groups Total
3
120
123
1.35
163.74
165.09
.45
1.36
.33
Table 60. ANOVA of Perceived Media Dependency and Mean Scores of Community Involvement Low Medium High None n Mean sd
31
12.35
2.92
40
12.97
2.35
41
12.34
2.81
12
12.91
1.97 Source
df
ss
ms
F
Between groups Within groups Total
3
120
123
11.42
834.20
845.63
3.81 6.95
.54
Table 61: ANOVA of Perceived Media Portrayal and Mean Scores of Community Involvement

107
Low Medium High None n Mean sd
30
40.06
5.48
37
39.89
4.93
40
38.32
6.80
11
39.53
5.72 Source
df
ss
ms
F
Between groups Within groups Total
3
114
117
104.97
3728.39
3833.36
34.99
32.70
1.07
Table 62: ANOVA of Perceived Safety and Health and Mean Scores of Community Involvement Low Medium High None n Mean sd
31
18.74
7.53
40
15.45
6.06
41
14.76
6.55
12
12.08
6.35 Source
df
ss
ms
F
Between groups Within groups Total
3
120
123
482.80
5300.31
5783.12
160.93
44.16
3.64*
* Statistically significant at the .05 alpha level; effect size (f = .09) Table 63: ANOVA and Effect Size of Perceived Knowledge and Mean Scores of Community Involvement

108
Low Medium High None n Mean sd
31
25.70
8.25
40
24.32
6.39
41
25.14
7.24
12
26.58
7.28 Source
df
ss
ms
F
Between groups Within groups Total
3
120
123
61.57
6461.20
6522.77
20.52
53.84
.38
Table 64: ANOVA of Perceived Importance and Mean Scores of Community Involvement U.S. Region
The states Extension Directors were divided by region. Tables 65 through 70
present the statistical findings of ANOVA regarding perceived methamphetamine threat,
media dependency, media portrayal, safety and health, knowledge, and importance.
Significant differences were found among perceived threat, media dependency,
knowledge, and importance and the U.S. region of Extension Directors. Scheffe post hoc
comparisons of pairs of means indicate that the means of Midwest, West, and South
regions in perceived knowledge of methamphetamine are significantly higher than the
mean of the Northeast region, with a medium effect (f = .29). Scheffe post hoc
comparisons of pairs of means indicate that the means of Midwest, West, and Northeast
regions in perceived importance of methamphetamine education are significantly higher
than the mean of the South region, with a medium effect size (f = .27). Scheffe post hoc
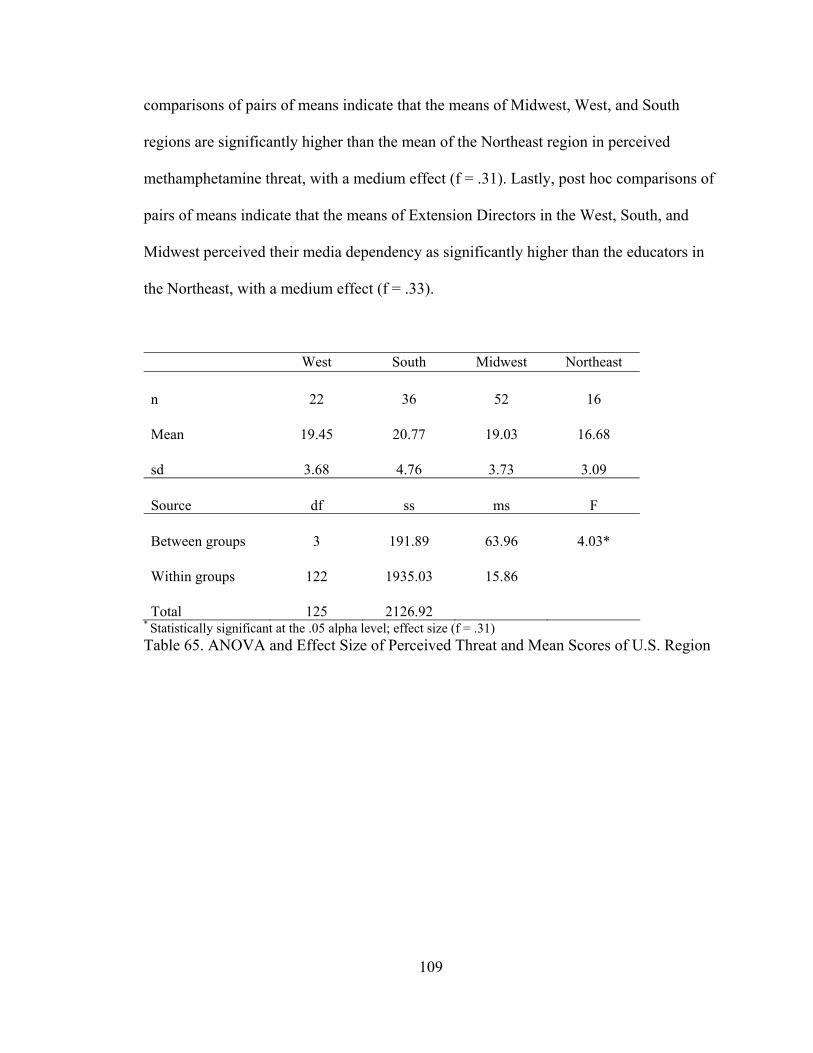
109
comparisons of pairs of means indicate that the means of Midwest, West, and South
regions are significantly higher than the mean of the Northeast region in perceived
methamphetamine threat, with a medium effect (f = .31). Lastly, post hoc comparisons of
pairs of means indicate that the means of Extension Directors in the West, South, and
Midwest perceived their media dependency as significantly higher than the educators in
the Northeast, with a medium effect (f = .33).
West South Midwest Northeast n Mean sd
22
19.45
3.68
36
20.77
4.76
52
19.03
3.73
16
16.68
3.09 Source
df
ss
ms
F
Between groups Within groups Total
3
122
125
191.89
1935.03
2126.92
63.96
15.86
4.03*
* Statistically significant at the .05 alpha level; effect size (f = .31) Table 65. ANOVA and Effect Size of Perceived Threat and Mean Scores of U.S. Region
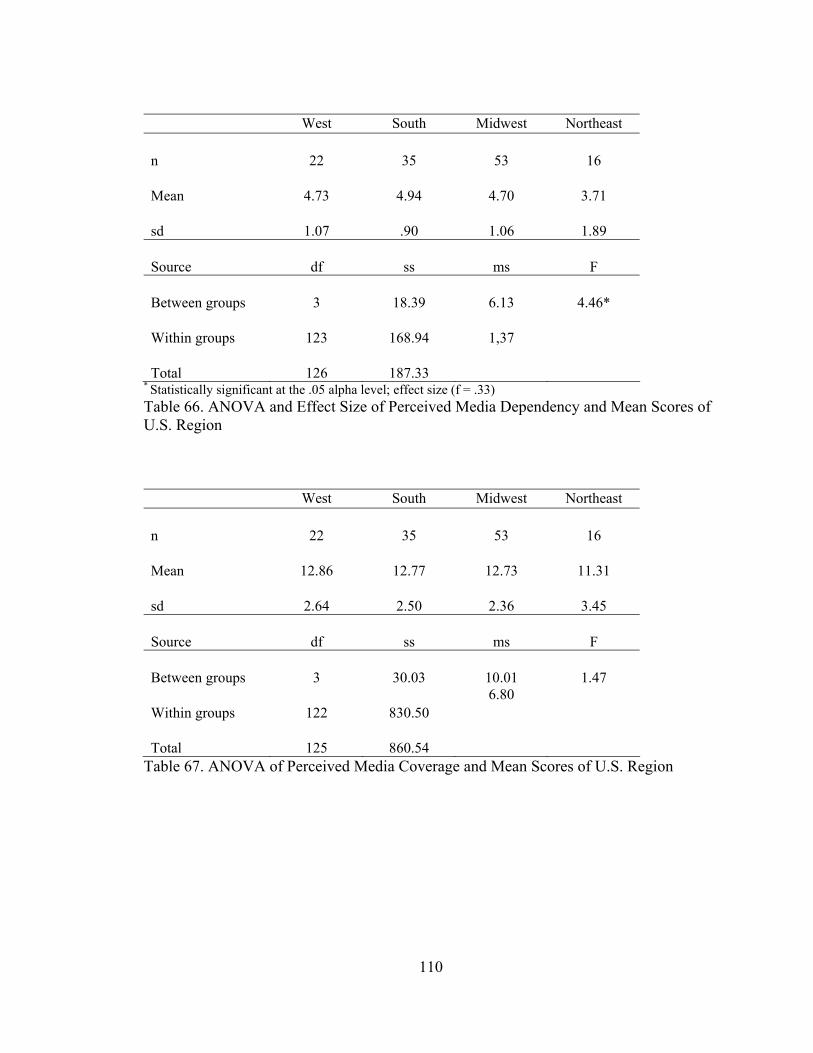
110
West South Midwest Northeast n Mean sd
22
4.73
1.07
35
4.94
.90
53
4.70
1.06
16
3.71
1.89 Source
df
ss
ms
F
Between groups Within groups Total
3
123
126
18.39
168.94
187.33
6.13
1,37
4.46*
* Statistically significant at the .05 alpha level; effect size (f = .33) Table 66. ANOVA and Effect Size of Perceived Media Dependency and Mean Scores of U.S. Region West South Midwest Northeast n Mean sd
22
12.86
2.64
35
12.77
2.50
53
12.73
2.36
16
11.31
3.45 Source
df
ss
ms
F
Between groups Within groups Total
3
122
125
30.03
830.50
860.54
10.01 6.80
1.47
Table 67. ANOVA of Perceived Media Coverage and Mean Scores of U.S. Region
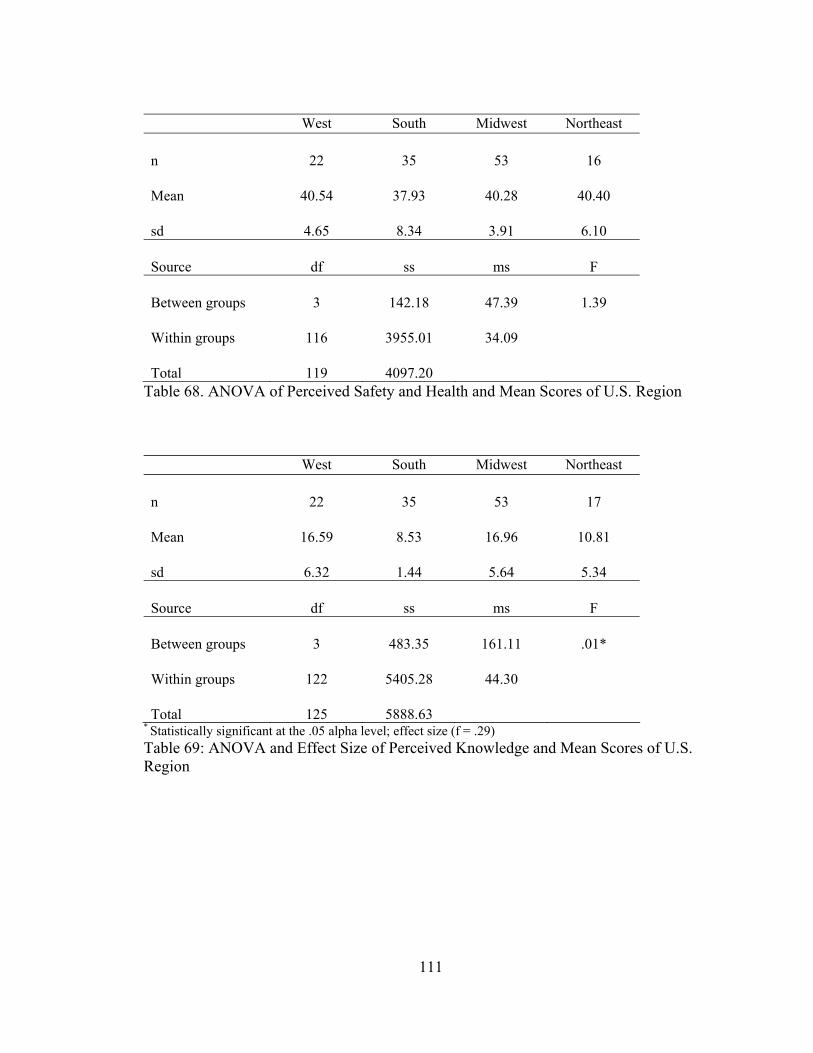
111
West South Midwest Northeast n Mean sd
22
40.54
4.65
35
37.93
8.34
53
40.28
3.91
16
40.40
6.10 Source
df
ss
ms
F
Between groups Within groups Total
3
116
119
142.18
3955.01
4097.20
47.39
34.09
1.39
Table 68. ANOVA of Perceived Safety and Health and Mean Scores of U.S. Region West South Midwest Northeast n Mean sd
22
16.59
6.32
35
8.53
1.44
53
16.96
5.64
17
10.81
5.34 Source
df
ss
ms
F
Between groups Within groups Total
3
122
125
483.35
5405.28
5888.63
161.11
44.30
.01*
* Statistically significant at the .05 alpha level; effect size (f = .29) Table 69: ANOVA and Effect Size of Perceived Knowledge and Mean Scores of U.S. Region

112
West South Midwest Northeast n Mean sd
22
22.04
8.00
34
27.76
6.61
53
24.77
6.79
16
25.50
7.74 Source
df
ss
ms
F
Between groups Within groups Total
3
121
124
453.64
6092.35
6546.00
151.21 50.35
3.00*
* Statistically significant at the .05 alpha level; effect size (f = .27) Table 70: ANOVA and Effect Size of Perceived Importance and Mean Scores of U.S. Region
113
Chapter 5: Discussion
Methamphetamine is a drug that places severe burdens on entire communities and
limited research exists in methamphetamine education. Not only does methamphetamine
affect the individual addict, but the drug also compounds environmental, legal, social,
and medical problems. Since 2005, 24,146.93 kilograms of methamphetamine have been
seized in the United States. And, according to the National Clandestine Laboratory
Seizure System, 3,390 methamphetamine lab incidents (including labs, dumpsite, and
chemical, glass, and equipment) were reported in 2008 (Figure 1).
The purpose of this study was to explore and describe the methamphetamine
perceptions, the role of the media, and the need for prevention and safety education. The
study focused on a random sample of U.S. states (N = 44) and the U.S. Extension
Directors within each state (N = 207; n = 134). The questionnaire concentrated on
perceived methamphetamine knowledge, the perceived threat of methamphetamine,
media involvement in methamphetamine perceptions, methamphetamine safety and
health perceptions, and prevention education needs.
Questionnaire responses supplied an enhanced understanding of the current state
of the problem and the needs for prevention education at both aggregate and regional
levels in the United States. Specific objectives (O) of this study included:
O1: To describe Extension Directors in: (a) age, (b) gender, (c) level of education obtained, (d) years in current Extension title, (e) geographic location description
114
of residence, (f) geographic location description of Extension territory, (g) U.S. state geographic description, and (h) current community involvement.
O2: To describe the methamphetamine information sources of Extension Directors.
O3: To describe the perceived methamphetamine knowledge of Extension Directors. O4: To describe the threat (related to crime, use, production, and violence) of methamphetamine as perceived by Extension Directors.
O5: To describe the perceived media dependency of Extension Directors for methamphetamine information.
O6: To describe the portrayal of methamphetamine in the media as perceived by Extension Directors. O7: To describe safety and health characteristics with methamphetamine production as perceived by Extension Directors. O8: To describe the perceived needs for methamphetamine prevention education. O9: To describe the relationships among selected demographic characteristics (gender, age, level of education obtained, years of Extension experience, geographic location description of residence and Extension territory, U.S state geographic description, years in current Extension title, and current community involvement) and: perceived methamphetamine threat, perceived media dependency, perceived methamphetamine media portrayal, perceived safety and health characteristics involved with methamphetamine production, and, perceived needs for methamphetamine prevention education.
O10: To identify significant differences in selected demographic characteristics (gender, age, level of education obtained, years of Extension experience, geographic location description of residence and Extension territory, U.S state geographic description, years in current Extension title, and current community involvement) and: perceived methamphetamine threat, perceived media dependency, perceived methamphetamine media portrayal, perceived safety and health characteristics involved with methamphetamine production, and, perceived needs for methamphetamine prevention education.
115
Summary of Conclusions
The average age of Extension Directors was 53 and years in current Extension title
ranged from less than six months to 40 years, with a mean of 13 years (Table 6). Fifty-six
percent of Extension Directors were male and 44% female. The majority possessed an
MS or MA (65%) and 31% had earned a PhD. Approximately 50% of Extension
Directors lived in rural areas and 44% identified their Extension territory as rural.
Community involvement was spread across weekly (26%), monthly (31%), yearly (31%),
and no involvement (9%).
Seventy-nine percent of Extension Directors had read or watched news coverage
about a local methamphetamine lab seizure (Table 7). Yet, only 16% of Extension
Directors had seen a lab in their area. When asked about the thefts of farm chemicals,
52% of Extension Directors were aware of thefts in their area.
Methamphetamine training among Extension Directors was limited. Eleven percent
reported they had received methamphetamine user prevention training. Twenty-three
percent responded they had received safety training that included anhydrous ammonia
theft and lab detection (Table 11).
Extension Directors are dependent on the media for methamphetamine information.
Eighty-five percent strongly agreed, agreed, or somewhat agreed that the media was their
primary source of methamphetamine information (Figure 10). Extension Directors also
reported they learned the most information about methamphetamine from the media
(44%) (Table 9).
According to 49% of Extension Directors, the media covers methamphetamine
news accurately (Table 18). Extension Directors also trust their local news (77%) and
116
national news (72%). Sixty-seven percent reported they do not believe the media
stereotypes methamphetamine as a rural drug and 64% do not believe the media
sensationalizes methamphetamine use. However, 56% of Extension Directors do believe
the media attempts to appeal to their emotions when report meth-related stories. Sixty-
seven percent of Extension Directors reported that the media does not cover
methamphetamine safety enough (Table 19).
Seventy-nine percent of Extension Directors strongly agreed that
methamphetamine production is dangerous and 88% reported that farmers should be an
audience for methamphetamine safety programming (Table 20). Ninety-one percent of
Extension Directors also agreed that methamphetamine safety is an important aspect in
drug education. An alarming 24% reported they did not know what to do if they
suspected a methamphetamine lab in their community.
Perceived knowledge of methamphetamine topics was low (Table 16). Extension
Directors reported they knew the least about current federal laws regarding
methamphetamine (80%) and methamphetamine prevention resources (75%). Topics that
Extension Directors reported as high importance were signs of methamphetamine use
(96%) and methamphetamine production (73%) (Table 21).
According to Davis (1971), gender and perceived knowledge had a substantial
association ( = .54); location of Extension area and perceived knowledge had a
substantial association (( = .50); and, prior methamphetamine training and perceived
knowledge had a substantial association ( = .62) (Table 24). Negligible Pearson product-
moment correlation coefficients (r) and Spearman rank-order coefficients (rs) were
obtained for all variables except for age and perceived methamphetamine threat (r = .23)

117
and level of education and perceived methamphetamine threat (rs = .18) (Table 25).
These findings can be interpreted using a coefficient of determination (r2).
Significant differences were found between perceived knowledge and perceived
importance by male and female groups (Table 26). The results indicated that males
perceived themselves as more knowledgeable about methamphetamine with a small
effect size of d = .35. Yet, females perceived methamphetamine education as more
important for others with a medium effect size of d = .44. Significant differences were
found between perceived knowledge and Extension Directors who had prior
methamphetamine user training. Results found those who had prior training perceived
their knowledge significantly higher than those Extension Directors without prior user
training with a large effect size of d = .72. Significant differences were found between
perceived knowledge and Extension Directors who had prior methamphetamine safety
training. Results found those who had prior safety training perceived their knowledge
significantly higher than those Extension Directors without prior user training with a
large effect size of d = .93.
Significant differences were found between perceived knowledge and the
community involvement of Extension Directors (Table 27). Results found those who had
high or medium community involvement perceived their knowledge significantly higher
than those Extension Directors with low or no community involvement. The effect size
was small at f = .09 (Table 59).
Results found Extension Directors in the Midwest region perceived their
knowledge of methamphetamine significantly higher than those in other regions with a
medium effect (f = .29) (Table 68). The South and Midwest regions perceived
118
methamphetamine education as more significantly important than other regions with a
medium effect size (f = .27) (Table 70). The West, South, and Midwest Extension
Directors perceived methamphetamine as a significantly greater threat in their areas than
the Northeast with medium effect (f = .31) (Table 65). Lastly, Extension Directors in the
West, South, and Midwest perceived their media dependency as significantly higher than
the educators in the Northeast with a medium effect (f = .33) (Table 66).
No significant difference existed in regard to age, education level, years in current
Extension title, residence description, and description of Extension area. These variables
do not play a significant role in the methamphetamine perceptions presented in this study.
Recommendations and Implications
The findings presented revealed a strong need for methamphetamine training in
Extension education. Extension Directors perceived their knowledge as low and their
perceived need for that knowledge as high (Tables 16 and 21). Also, only 11% of
Extension Directors have received methamphetamine prevention education training and
23% reported they had received methamphetamine safety training (Table 11). New
methods of making methamphetamine, such as the “Shake and Bake” or the “One-Pot”
method have made methamphetamine production easier. Additionally, the 2009 ban in
Mexico on the importation of ephedrine and pseudoephedrine will inevitably change the
U.S. production trends.
The initial step in methamphetamine programming is training the Extension
personnel. Rural crime researchers or law enforcement should train Extension personnel
in all aspects of methamphetamine use and production. Training could be achieved
119
through a one-day conference or through videos, podcasts, or written materials accessible
through the Web.
Methamphetamine also is one of the rare drugs where the producers of the drug
serve a dual role as trafficker and user. In many rural areas throughout the United States,
Extension personnel are trusted resources in the communities they serve and often
inhabit. Extension personal also may discover clandestine labs themselves or notice
unusual activity, such as higher traffic on unpopulated roads or disturbances on absentee
properties. Farmers may directly call their agricultural Extension agent when anhydrous
ammonia is stolen.
Although a need for methamphetamine programming exists, each state and region
within larger states should evaluate the educational needs of their publics. The findings
in this study support prior research that methamphetamine is not a homogenous problem
geographically. Also, in an era of increased technology and limited financial and human
resources at the federal and state levels in Extension, state Extension Systems should
evaluate their current programming to identify if methamphetamine can be incorporated
into existing educational efforts.
Offering resources on the Web, holding seminars in pre-existing conferences, and
incorporating methamphetamine into successful drug prevention or agricultural safety
programming are low-cost tactics to increase methamphetamine awareness among
varying audiences. Extension personnel can tap into already-established community and
youth groups such as the Girl Scouts, Senior Citizen Centers, and agricultural groups
(i.e., Pork Producers Associations, 4-H, County Fair committees, Master Gardeners), and
offer to be a guest presenter at meetings.

120
Extension Directors trust their local and national media portrayals of
methamphetamine use. Also, Extension Directors received the most information about
methamphetamine from the media. Therefore, the prevention education initiatives should
partner with the media in disseminating education and messages. The media is a free
outlet for prevention messaging. Extension personnel should approach local radio and
television stations offering expertise on methamphetamine safety and prevention
education. Extension personnel also can approach local print and online publications
with safety tips for feature stories on detecting methamphetamine labs.
Extension personnel also could partner with local media or journalism college
students to produce educational videos that could be posted on YouTube. Today, low-
budget films are popular because of their easy production and quick turnaround. In 2009,
the necessary equipment to create a video is a flip video camera and a computer with
Internet access. A possible topic for a short educational video would be the signs of a
clandestine methamphetamine lab.
Implications to Knowledge
The findings of this research give justification for the implementation of
methamphetamine education programming. This study is the first research to evaluate
programming needs in regard to methamphetamine user prevention and safety. Because
of the national scope of the research, strategic education and messaging can be developed
to target areas that are most in need.
Findings support the media dependency theory (Defleur & Ball-Rokeach, 1989)
in that Extension Directors rely on the media to meet their goal of being informed about
121
methamphetamine. News dependency increases during times of change and the responds
with additional coverage. This research found that 81% of Extension Directors recalled
reading or watching news coverage about a local methamphetamine lab seizure, while
only 14% reported that they actually had seen a methamphetamine lab in their area.
These findings support prior research that found positive relationships between health
and other general risk situations and media exposure (Coleman, 1993; Loges, 1994).
When discussing moral panic, the media coverage of methamphetamine supports
prior research. The news industry develops emotional-appeal content (McRobbie &
Thornton, 1995) and the resulting emotional involvement of an audience intensifies
interest. Fifty-six percent of Extension Directors agreed that the media attempts to appeal
to their emotions when reporting methamphetamine-related stories.
Stereotyping is one way the media connects unrelated events. Zillmann (1999)
formed the exemplification theory to identify the concept that isolated events—when
aggregated in the media—imply trend presence; yet, from a statistical standpoint, a trend
may not be supported. More than one-half (53%) of Extension Directors agreed that the
media stereotyped methamphetamine use primarily as a problem to individuals of low
socioeconomic status.
Ninety-three percent of Extension Directors reported that methamphetamine use
is higher today than in 2002, which is inaccurate. NSDUH (2008) reported that 95,000
Americans, ages 12 to 49, initiated use of methamphetamine (Figure 5). This estimate is
the lowest since data were first collected in 2002. From 2002 to 2008, the past month use
of methamphetamine decreased for young adults from 0.6% to 0.2%. Since 85% of
Extension Directors agreed that the media is their primary source of information

122
regarding methamphetamine and 93% possessed inaccurate methamphetamine use
perceptions, then the portrayal of methamphetamine in the U.S. media supports the moral
panic theory.
Implications for Further Study
Further study on methamphetamine is necessary. Limited research exists,
especially in the social sciences. This study can be replicated by using a different target
population, such as public health workers, drug prevention specialists, and law
enforcement.
The DEA tracks methamphetamine lab incidents and data are categorized by state
and county. The data collected in this research could be correlated at the county level to
further describe perceptions. The lab seizure data also could be compared with a content
analysis of media coverage on lab seizures.
Further research also could include an analysis of current methamphetamine
programming. Many of the educational resources available are accessible through the
Web. Web analytics would identify what about methamphetamine is being most
searched on the Web—for example, what keywords people are searching on Google
involving methamphetamine. Web analytics also would identify the geography of the
searches and give quantitative descriptions such as time spent on specific Web pages and
number of page views.
Within media studies, content analyses should be conducted for methamphetamine
media coverage. For media on the Web, web analytics could provide useful quantitative
123
data on how many people viewed the news story and how many posted the story to social
networking sites such as Facebook.
In criminology studies, rate of crime could be compared to state and/or county lab
seizure data. Treatment admissions also could be correlated to crime data. Law
enforcement, like Extension Directors, is a population that is embedded in local
communities. However, unlike Extension personnel, law enforcement officials most
likely experience methamphetamine issues first-hand.
Because methamphetamine research is limited or non-existent in many academic
disciplines, the opportunity for further research is endless. Methamphetamine use,
production, perceptions, treatment, legislation, and education cross both the soft and the
hard sciences. Methamphetamine has been a part of the American drug culture since the
early 1900s and will continue to have a presence and be a topic for further research
indefinitely.
124
References Alman, K. C. (1993). The role of television advertising in acculturation: A media systems
dependency approach. Dissertation Abstracts International, 55, AAT 9417950. Astroth, K. A., & Vogel, M. Methamphetamine prevention education: Extension
responds to a national issue. Journal of Extension, 46. Bell, P (1982). Headlining drugs: An analysis of newspaper reports of drug-related
issues in the NSW Press. Sydney: Drug and Alcohol Education and Information Centre.
Bureau of Justice Statistics. (2005). Compendium of Federal Justice Statistics, 2003. Bush, G. W. (November 28, 2006). National Methamphetamine Awareness Day, 2006.
Press release. Retrieved on January 4, 2007, from http://www.whitehouse.gov/news/releases/2006/11/20061128.html.
Bushey, A. (1998). Health issue of women in rural environments: An overview. Journal
of the American Medical Association, 53, 53-56. Cochran, W. G. (1977). Sampling techniques. New York: John Wiley & Sons. Cohen, J. (1969). Statistical Power Analysis for the Behavioral Sciences. New York:
Academic Press. Cohen, S. (1972). Folk devil and moral panics: Creation of mods and rockers. New
York: MacGibbon and Key Ltd. Coleman, C. (1993). The influence of mass media and interpersonal communication on
societal and personal risk judgments. Communication Research, 20, 611-628. Converse, P. D., Wolfe, E. W., Huang, Z., & Oswald, F. L. (2008). Response rates for
mixed-mode surveys using mail and e-mail/Web. American Journal of Evaluation, 29, 99-107.
Covey, H. C., (2007) The Methamphetamine Crisis: Strategies to Save Addicts, Families,
and Communities. Westport, CT: Praeger Publishers.
125
Davis, J. A. (1971). Elementary survey analysis. Englewood, NJ: Prentice Hall. DEA Congressional Testimony. (2006). Retrieved on June 8, 2007, from
http://www.usdoj.gov/dea/pubs/cngrtest/ct040506_attach.html Defleur, M. L., & Ball-Rokeach, S. (1989). Theories of Mass Communication, 5th ed.
(Pp. 297-326). White Plains, NY: Longman. Dillman, D. A. (2000). Mail and internet surveys: The tailored design method. New
York: John Wiley & Sons, Inc. Dillman, D. A., Smyth, J. D., & Christian, L. M. (2009). Internet, Mail, and
Mixed-Mode Surveys: The Tailored Design Method. 3rd ed. New York: John Wiley.
Donnermeyer, J. F., & Tunnel, K. (2007). In our own backyard: The
danger of methamphetamine to rural communities. Rural Realities, 2, 1-12. Flynn, J., Slovic, P., &Mertz, C. K. (1994). Gender, race, and perception of
environmental health risks. Risk Analysis, 14, 1101-1108. Fox, R., & Matthews, I. (1992). Drugs policy: Fact, fiction, and the future. Sydney: The
Federation Press. Fraenkel, J. R., & Wallen, N. E. (2000). How to design and evaluate research in
education. Boston, MA: The McGraw-Hill Companies. Griner, L., & Parker, L. A. (2005). Extension as a delivery system for prevention
programming: Capacity, barriers, and opportunities. Journal of Extension. Retrieved on June 7, 2007, from http://www.joe.org/joe/2005february/a1.shtml
Grinspoon, L., & Hedblom, P. (1975). Speed Culture: Amphetamine Use and Abuse in
America. Cambridge: Harvard University Press. Groves, R. M., Fowler, F. J., Couper, M. P., Lepkowski, J. M., Singer, E., & Tourangeau,
R. (2004). Survey methodology. Hoboken, NJ: Wiley-Interscience. Hohman, M., Oliver, R., & Wright, W. (2004). Methamphetamine abuse and
manufacture: The child welfare response. Social Work, 49, 373-382. Hunt, D., Kuck, S., & Truitt, L. (2006). Methamphetamine Use: Lessons Learned.
Cambridge, MA: Abt Associates, Inc, Analytic Support Program Contract, 99-C-008.
126
Ikuta, B. (1951). On stimulants. The Science and Crime Detection, 4, 28-53. Klee, H. (1997) Amphetamine misuse: international perspectives on current trends.
Amsterdam: Harwood Academic Publishers. Krivanek, J. (1988). Heroin: Myth and Reality. Boston: Allen & Unwin. Lake, C. & Quirk, R.. (1984) Stimulants and look-alike drugs. Psychiatric Clinics of
North America, 7, 689-701. Lazarfeld, P, Bernard, B., & Gaudet, H. (1948). The People’s Choice, 2d ed. New York:
Columbia University Press. Leshner, A. I. (2002). Foreword. Pp. ix-xii in Crano, W. D., & Burgoon, M. (2002). Mass
media and drug prevention: Classic and contemporary theories and research. Mahwah, NJ: Lawrence Erlbaum Associates.
Lewis, D. (2005). Meth science not stigma: Open letter to the media. The National Center
on Addiction and Substance Abuse at Columbia University. Retrieved on November 25, 2009, from http://www.jointogether.org/news/yourturn/commentary/2005/meth-science-not-stigma-open.html
Linsky, A. S. (1975). Stimulating responses to mailed questionnaires: A review. Public
Opinion Quarterly, 39, 82-101. Loges, W. E. (1994). Canaries in the coal mine: Perceptions of threat and media system
dependency relations. Communication Research, 21, 5-23. Longshore, D., Ghosh-Dasidar, B., & Ellickson, P. L. (2005). National Youth Anti-Drug
Media Campaign and school-based drug prevention: Evidence for a synergistic effect in ALERT Plus. Addictive Behaviors, 31, 496-508.
Martyny, J. W., Arbuckle, S. L., McCammon, C. S., Jr., Esswein, E. J., Erb, N., & Van
Dyke, M. (2007). Chemical concentrations and contamination associated with clandestine methamphetamine laboratories. Journal of Chemical Health and Safety, 14, 40-52.
McCampbell, M. S. (2003). Clandestine laboratories: Lessons learned and
recommendations from the field. COPS National Clandestine Laboratory Training Project. Retrieved on June 8, 2007, from http://www.circsol.com/clanlab/articles/article1.htm
McCombs, M. E., & Shaw, D. L. (1972). The agenda-setting function of mass media.
Public Opinion Quarterly, 36, 176-187.

127
McDowell, G. (2002, May 13-15). Land-Grant Universities and Extension into the 21st
Century: Taking back the system. Paper presented at the 2002 North Central Administrative Leadership Conference, East Lansing, MI.
McRobbie, A., & Thornton, S. L. (1995). Rethinking ‘Moral Panic’ for multi-mediated
social worlds. British Journal of Sociology, 46, 559-574. Meth Destroys. (2006). Tennessee District Attorneys General Conference. Retrieved on
November 25, 2009, from http://methfreetn.org/ Miller, L. E., & Smith, K. L. (1983). Handling non-response issues. Journal of Extension,
Sept./Oct., 45-50.
Monitoring the Future Study. (2008). National Institute on Drug Abuse. Retrieved on November 25, 2009, from http://www.drugabuse.gov/PDF/overview2008.pdf
Morgan, P., & Beck, J. E. (1997). The legacy and the paradox: Hidden contexts of
methamphetamine use in the United States. In Amphetamine misuse: International perspectives on current trends, ed, H. Klee 135-162. Amsterdam, The Netherlands: Harwood Academic Publishers.
National Association of Counties. (2006). The meth epidemic in America. Retrieved on
January 19, 2007, from http://www.naco.org/Template.cfm?Section = Surveys&template = /ContentManagement/ContentDisplay.cfm&ContentID = 24797.
National Drug Threat Assessment. (2008). National Drug Intelligence Center. U.S.
Department of Justice. Document ID: 2008-Q0317-005 National Drug Intelligence Center. (2005). Marijuana and methamphetamine trafficking
on federal lands threat assessment. Retrieved on February 15, 2007, from http://www.usdoj.gov/ndic/pubs10/10402/index.htm
National Institute on Drug Abuse (2007). What is methamphetamine? Retrieved on
January 22, 2007, from http://www.nida.nih.gov/ResearchReports/methamph/methamph2.html.
National Institute on Drug Abuse (2006). Monitoring the future. Retrieved on June 8,
2007, from http://www.monitoringthefuture.org/pubs/monographs/overview2006.pdf.
Nelkin, D. 1987. Selling Science: How the Press Covers Science and Technology. W.H.
Freeman and Company. New York.
128
Nicosia, N., Pacula, R. L., Kilmer, B., Lundberg, R., & Chiesa, J. (2009). The Costs of
Methamphetamine Use: A National Estimate (RB-9438-MPF/NIDA). Santa Monica, CA: RAND Corporation.
Nunnally, J. C., & Bernstein, I. H. (1994). Psychometric Theory, 3rd Ed., New York:
McGraw-Hill. Palmgreen, P., Lorch, E. P., Stephenson, M. T., Hoyle, R. H., & Donohew, L. (2007).
Effects of the Office of National Drug Control Policy’s Marijuana Initiative Campaign on high-sensation-seeking adolescents. American Journal of Public Health, 97, 1644-1649.
Pew Research Center for the People and Press. (2008). Pew Research Center Biennial
News Consumption Survey. Washington, DC: The Pew Research Center. Price, V., & Roberts, D. F. (1987). Public opinion process (pp. 781-816) in C. R. Berger
and S. H. Chaffee (eds): Handbook of Communication Science. Newbury Park, CA: Sage.
Police find meth lab in funeral home. (2009, Jan. 9). United Press International.
Retrieved on October 26, 2009, from http://www.upi.com/Odd_News/2009/01/09/Police-find-meth-lab-in-funeral-home/UPI-14901231547868/
Rawson, R. A., Gonzales R., & Brethen, P. (2002). Treatment of methamphetamine use
disorders: an update. Journal of Substance Abuse Treatment. 23, 145-50. Reback, C. J. (1997), The Social Construction of a Gay Drug: Methamphetamine Use
among Gay and Bisexual Males in Los Angeles. Los Angeles: City of Los Angeles, AIDS Coordinator’s Office.
Russell, M. M. (1991). Cooperative Extension and the land-grant university: A futures
history. Journal of Extension, 29. Sato, A. (2008).Methamphetamine use in Japan after the Second World War:
Transformation of narratives. Contemporary Drug Problem, 35, 717-745. Scheufele, D. A. (1999). Framing as a theory of media effects. Journal of
Communication, 49, 101-120. Shoemaker, P. J., & Reese, S. D. (1989). Mediating the message: Theories of influences
on mass media content. New York: Longman.
129
Tourangeau, R., Rips, L. J., & Rasinski, K. (2000). The psychology of survey response. Cambridge, United Kingdom: Cambridge University Press.
Tucker, M., Whaley, S. R., & Sharp, J. S. (2006). Consumer perceptions of food-related
risks. International Journal of Food Science and Technology, 41, 135-146. Ulrich, A. (2005). Hitler’s drugged soldiers. Speigal, May 6. U.N. World Drug Report (2006). Retrieved on February 15, 2007, from
http://www.unodc.org/unodc/world_drug_report.html U.S. Census Bureau. (2009). Census Regions and Divisions of the United States.
Retrieved on October 26, 2009, from http://www.census.gov/geo/www/us_regdiv.pdf
U.S. Department of Health & Human Services. (2008). National Survey on Drug Use &
Health. Retrieved on November 25, 2009, from http://www.oas.samhsa.gov/NSDUHlatest.htm
U.S. Drug Enforcement Administration. (2009). Maps of Methamphetamine Lab
Incidents. Retrieved on October 26, 2009, from http://www.usdoj.gov/dea/concern/map_lab_seizures.html.
U.S. Drug Enforcement Administration. (2005). National Drug Threat Assessment 2005.
Retrieved on February 15, 2007, from http://www.usdoj.gov/ndic/pubs11/12620/ U.S. Drug Enforcement Administration. (2007). National Drug Threat Assessment 2007.
Retrieved on February 15, 2007, from http://www.dea.gov/concern/18862/index.htm#Summary.
Young, J. (1973). The drugtakers: The social meaning of drug use. London, Paladin. Weinrauch, D. J. (2006). A social entrepreneurial and educational venture: a creative and
collaborative approach to address the methamphetamine epidemic. Academy of Healthcare Management Journal, 2, 51-74.
Weisheit, R., & Wells, E. L. Wells. (2008). Methamphetamine Laboratories: The
Geography of Drug Production. Presented at the 2008 annual meeting of the American Society of Criminology in St. Louis, MO.
Weisheit, R., & White, W. L. (2009). Methamphetamine: Its history, pharmacology, and
treatment. Center City, MN: Hazelden. The White House. (2009). The Rural Agenda. Retrieved on January 18, 2009, from
http://www.whitehouse.gov/issues/Rural
130
Zajdow, G. (2008). Moral panics: The old and the new. Deviant Behavior, 29, 640-664. Zillman, D. (1999). Exemplification theory: Judging the whole by the sum of its parts.
Media Psychology, 1, 69-94.

131
Appendix A: Professional Titles of Sample and Blocking
Area Directors Area Director Area Extension Director Area Extension Education Director District Directors District Director District Extension Administrator District Extension Director Associate District Director Program Directors Program Administrator Program Chair Program Director Regional Director Region Director Region Head Regional Chair Regional Director Extension District Director Extension Regional Director Associate Regional Director Other Senior Extension Director Assistant Director Associate Director Extension Center Coordinator County Director County Administrator
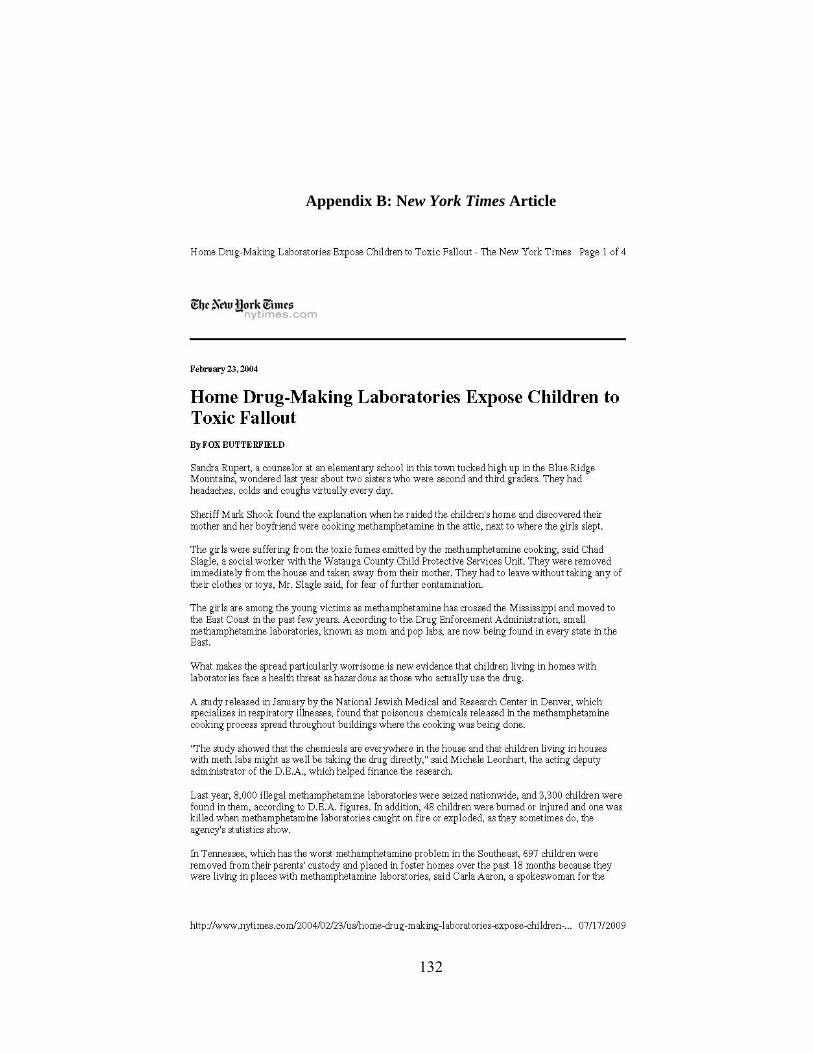
Appendix B: New York Times Article
132
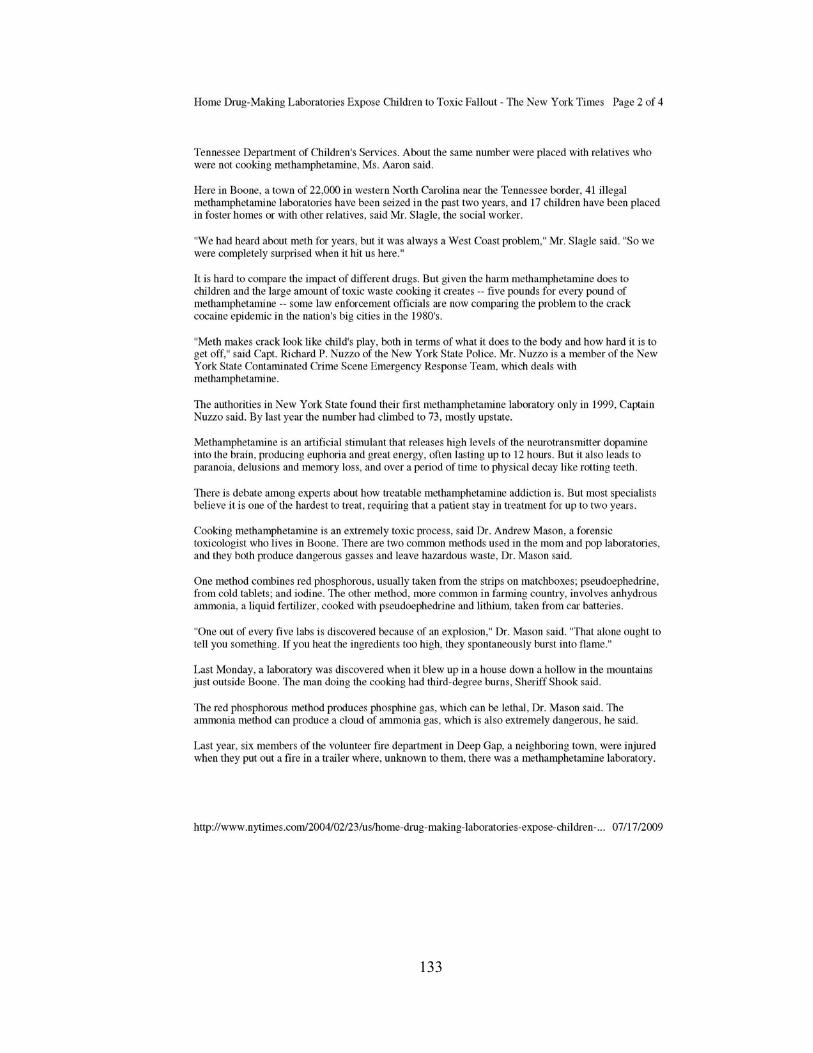
133

134
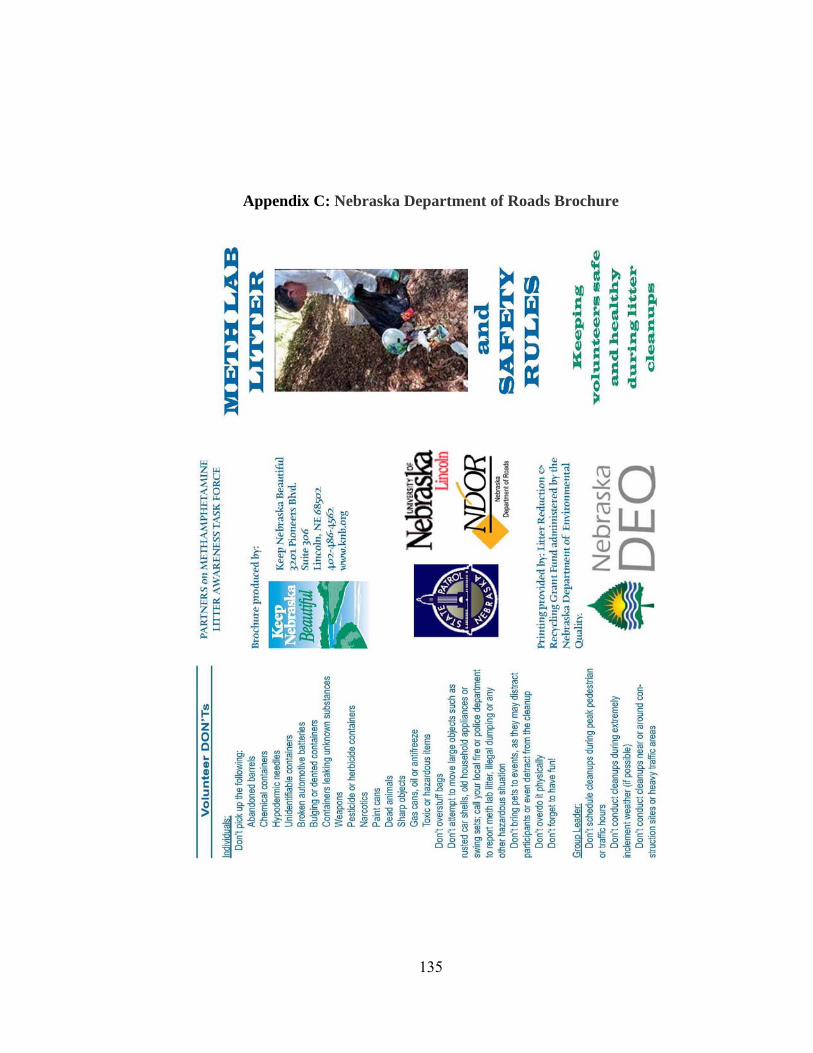
Appendix C: Nebraska Department of Roads Brochure
135
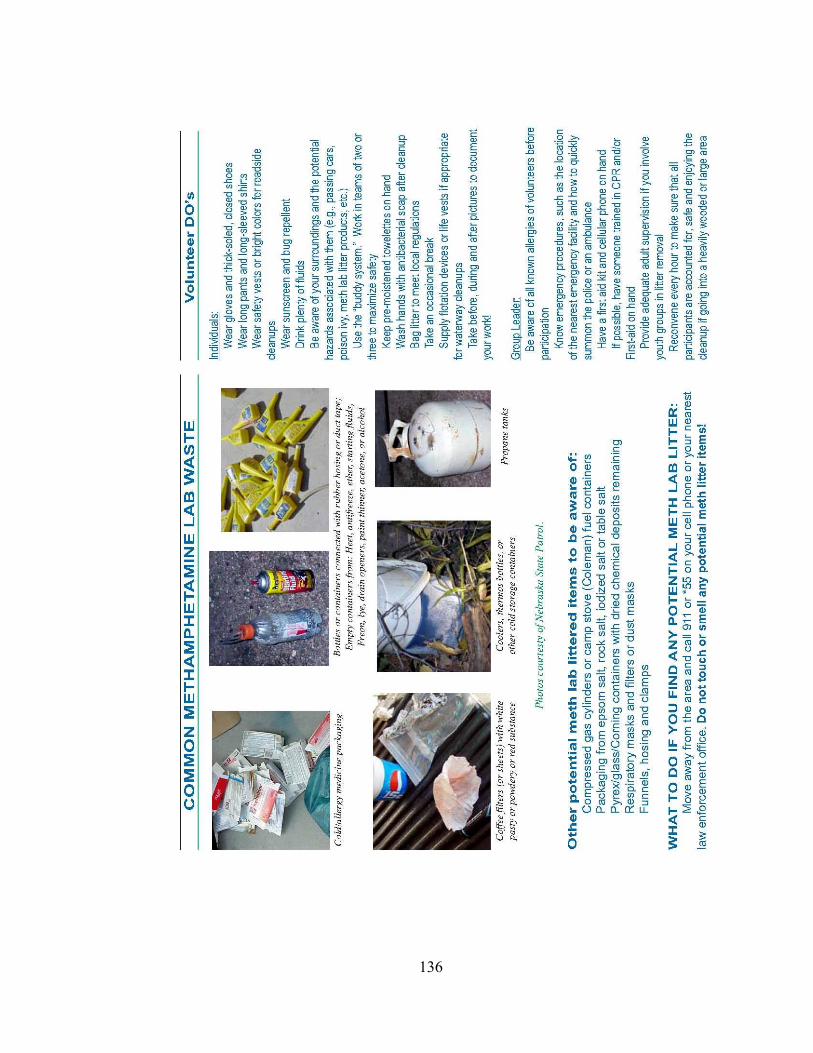
136

Appendix D: Instrument
137

138
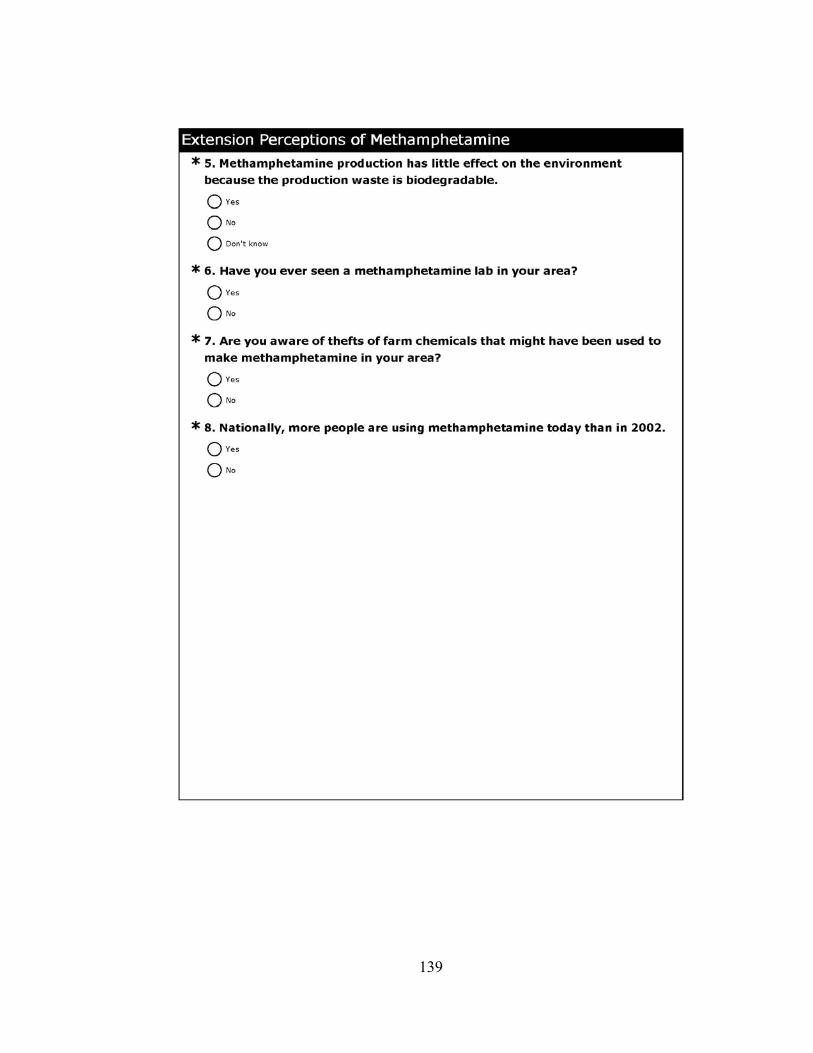
139
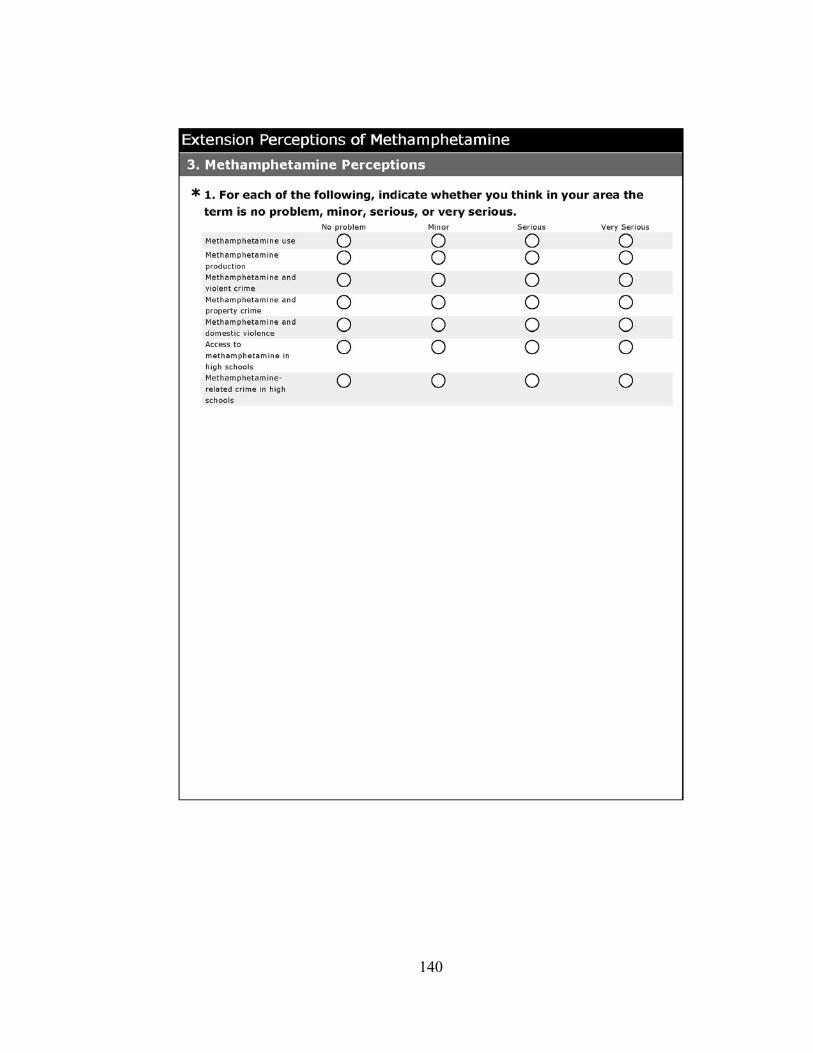
140
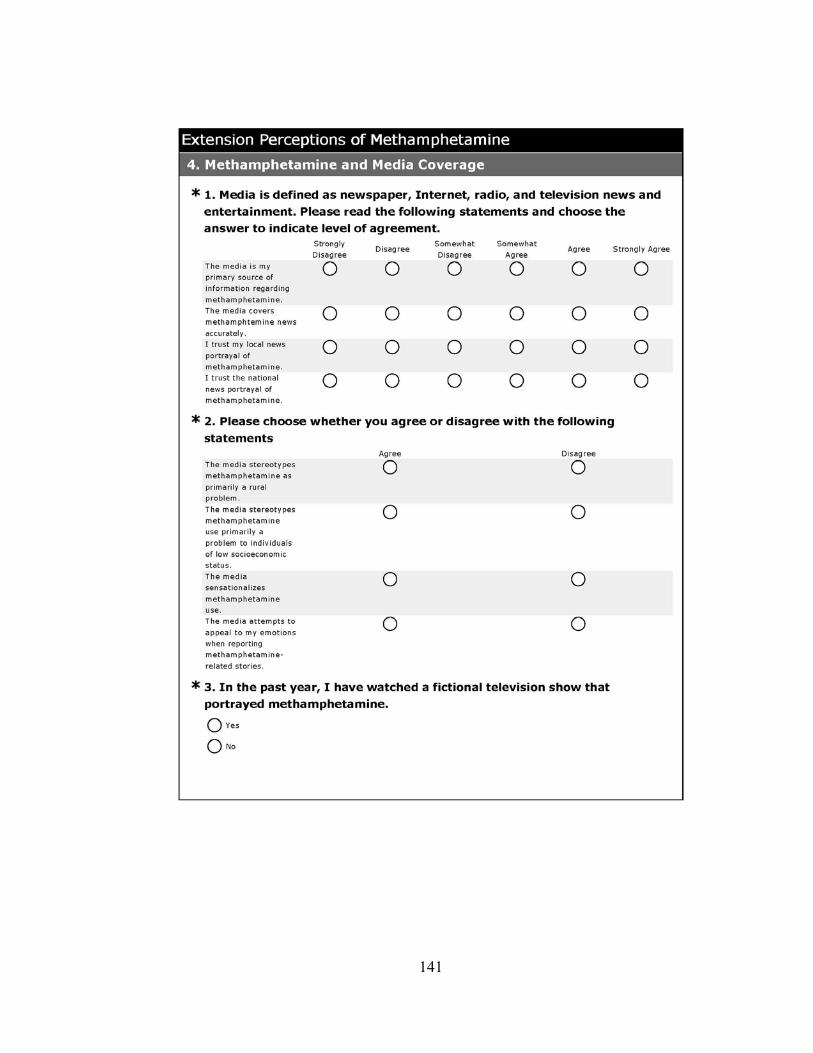
141
142
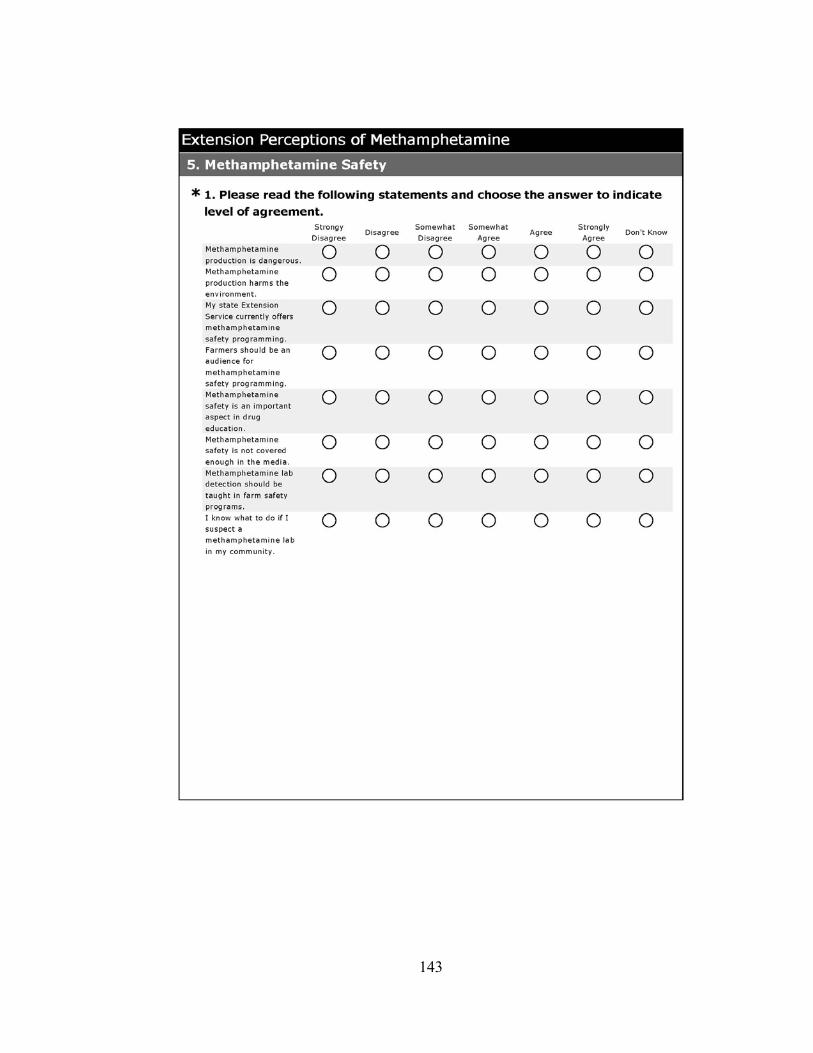
143

144
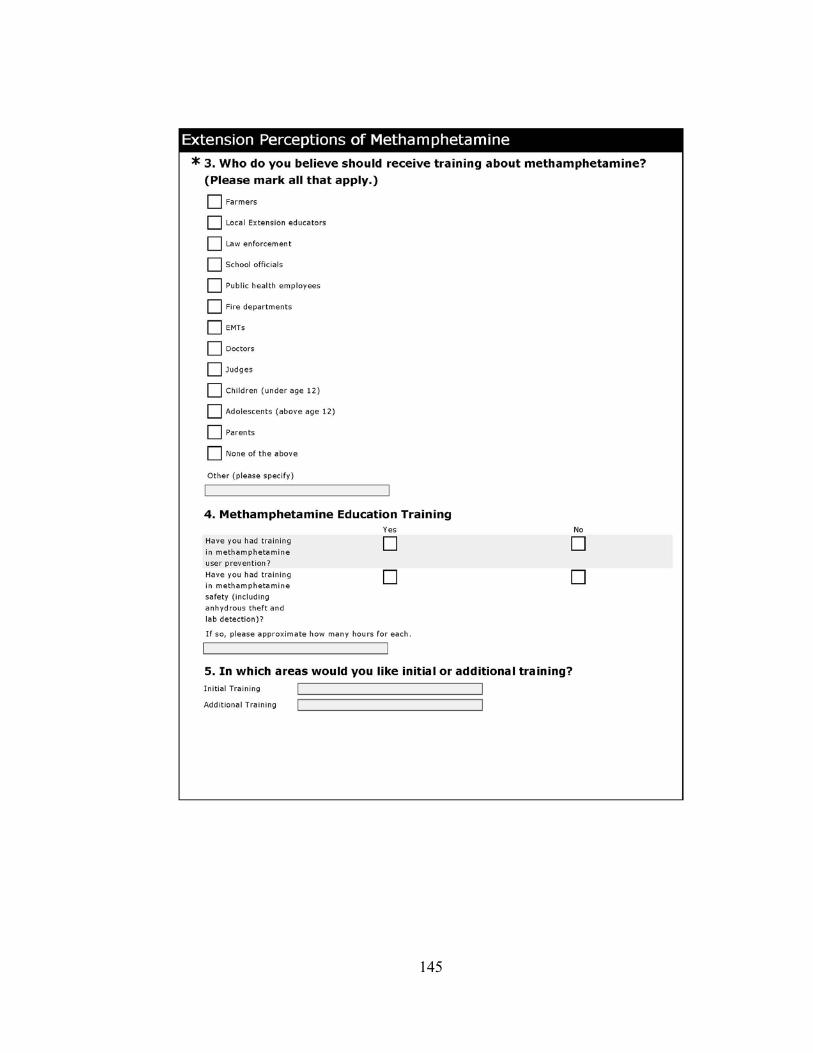
145
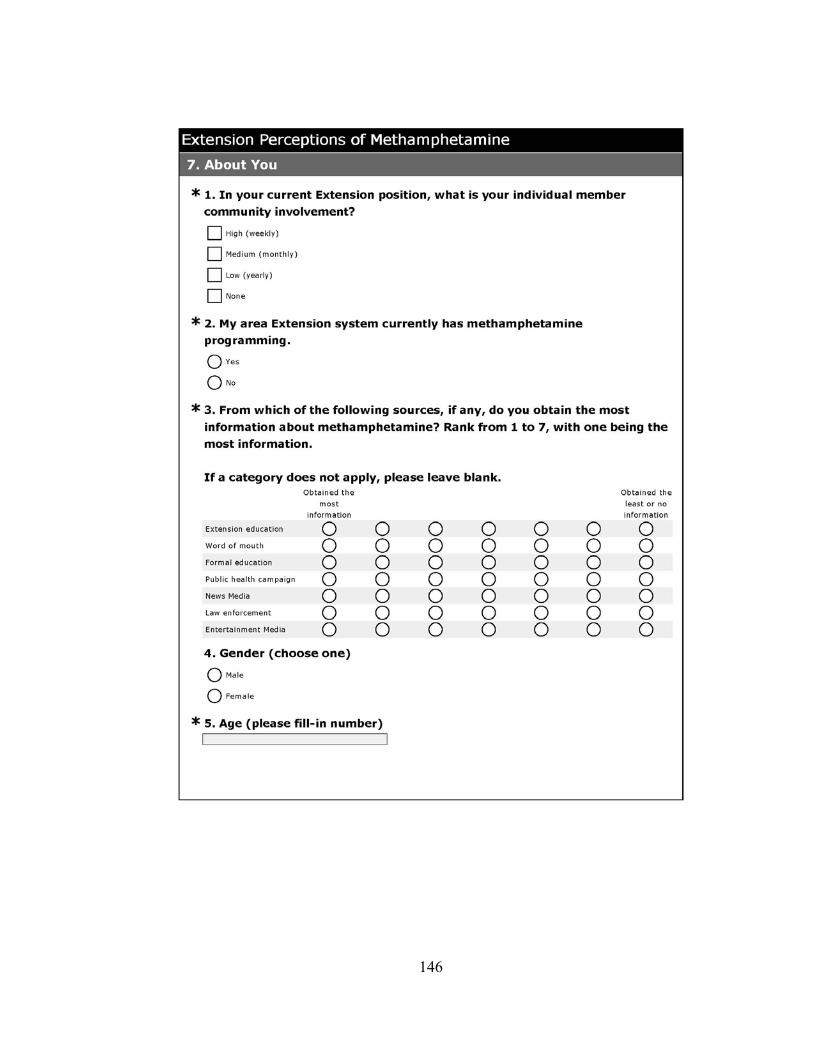
146
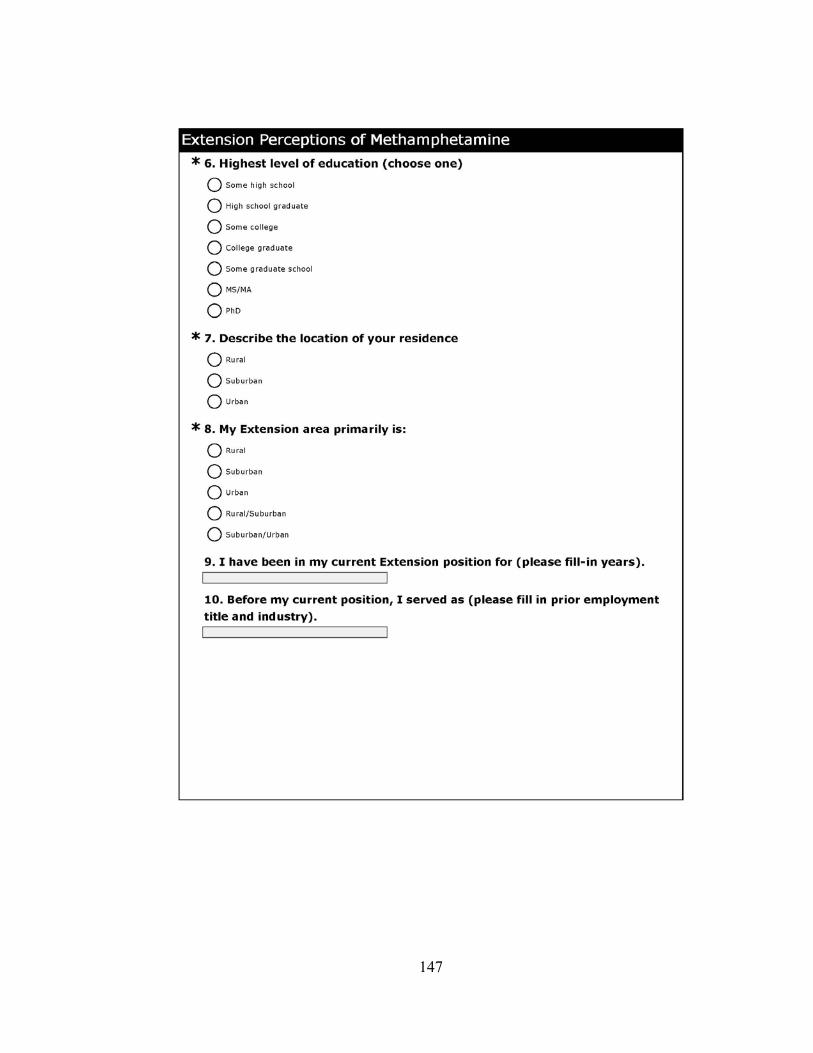
147

148

Appendix E: Mailed Postcard
149
150
Appendix F: Perceived Knowledge of Methamphetamine
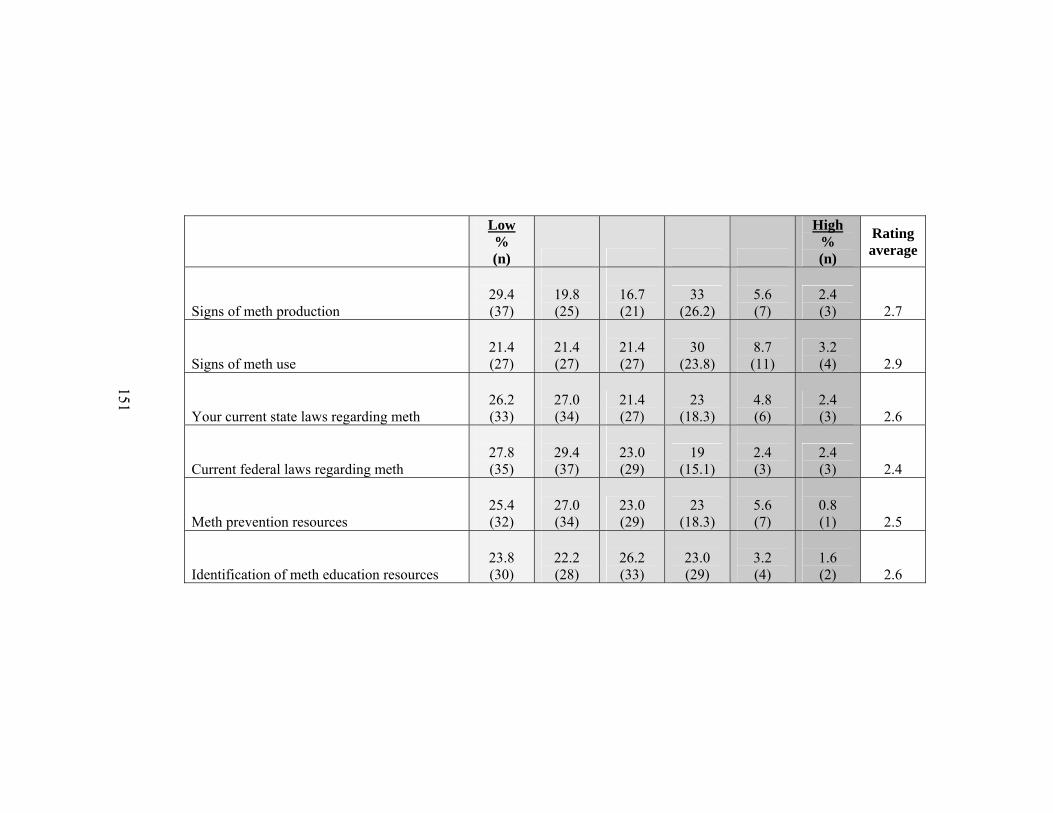
151
Low % (n)
High% (n)
Rating average
Signs of meth production
29.4 (37)
19.8 (25)
16.7 (21)
33 (26.2)
5.6 (7)
2.4 (3) 2.7
Signs of meth use
21.4 (27)
21.4 (27)
21.4 (27)
30 (23.8)
8.7 (11)
3.2 (4) 2.9
Your current state laws regarding meth
26.2 (33)
27.0 (34)
21.4 (27)
23 (18.3)
4.8 (6)
2.4 (3) 2.6
Current federal laws regarding meth
27.8 (35)
29.4 (37)
23.0 (29)
19 (15.1)
2.4 (3)
2.4 (3) 2.4
Meth prevention resources
25.4 (32)
27.0 (34)
23.0 (29)
23 (18.3)
5.6 (7)
0.8 (1) 2.5
Identification of meth education resources
23.8 (30)
22.2 (28)
26.2 (33)
23.0 (29)
3.2 (4)
1.6 (2) 2.6
151
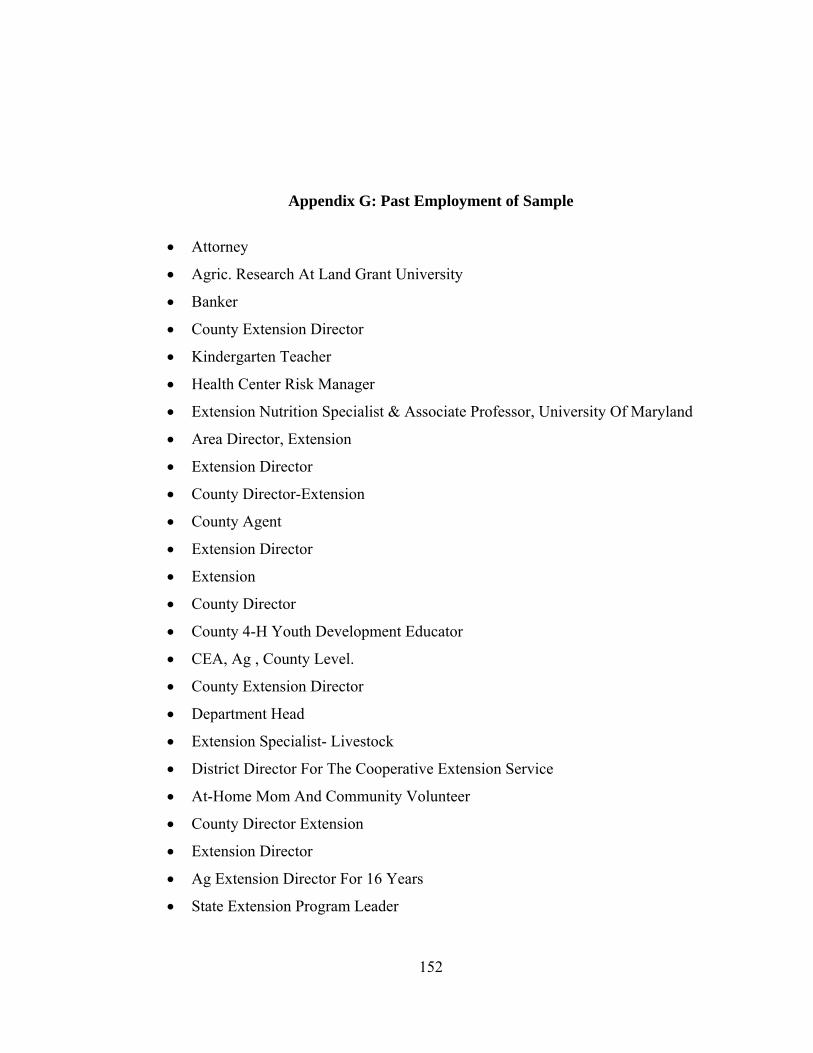
152
Appendix G: Past Employment of Sample
Attorney
Agric. Research At Land Grant University
Banker
County Extension Director
Kindergarten Teacher
Health Center Risk Manager
Extension Nutrition Specialist & Associate Professor, University Of Maryland
Area Director, Extension
Extension Director
County Director-Extension
County Agent
Extension Director
Extension
County Director
County 4-H Youth Development Educator
CEA, Ag , County Level.
County Extension Director
Department Head
Extension Specialist- Livestock
District Director For The Cooperative Extension Service
At-Home Mom And Community Volunteer
County Director Extension
Extension Director
Ag Extension Director For 16 Years
State Extension Program Leader
153
21 Years - Administrative Assistant
Extension Director -4-H Youth Development; Univ. Of KY•
Extension Beef Specialist
Head Start Services Manager
County Extension Agent Family & Consumer Sciences
19 Years In The Field
Extension Director
Middle School Teacher
County Extension Agent
County Extension Director
High School Teacher
Environmental Educator
County Extension Executive Director
Extension County Director
Education, Secondary Teaching
CD Educator
Farmer
Extension Administration
Agent In Another State--14 Years Prior
Farm Owner/Operator
Extension Specialist
Extension Director - County Based
Nutrition Consultant
Extension Agronomy Specialist
Area Extension Director
Professional Development
Extension Ag Agent
County Extension Agent
State Nutrition Specialist
Program Leader, UT Extension
154
Teacher
Other Extension Positions (total 27 years)
District Extension Administrator
High School Teacher
County Extension Agent - 30 Years
County Extension Agent
Business & Industry Specialist 16 Years
University Administrator - Not Extension
County Extension Director, In Another Location
County Extension Agent
Grad School
17 Years In Field Work With Extension
Extension Director
District Director In Another State
Extension Director/ANR/CED, Extension Director/4-H Youth
24 County Field Staff
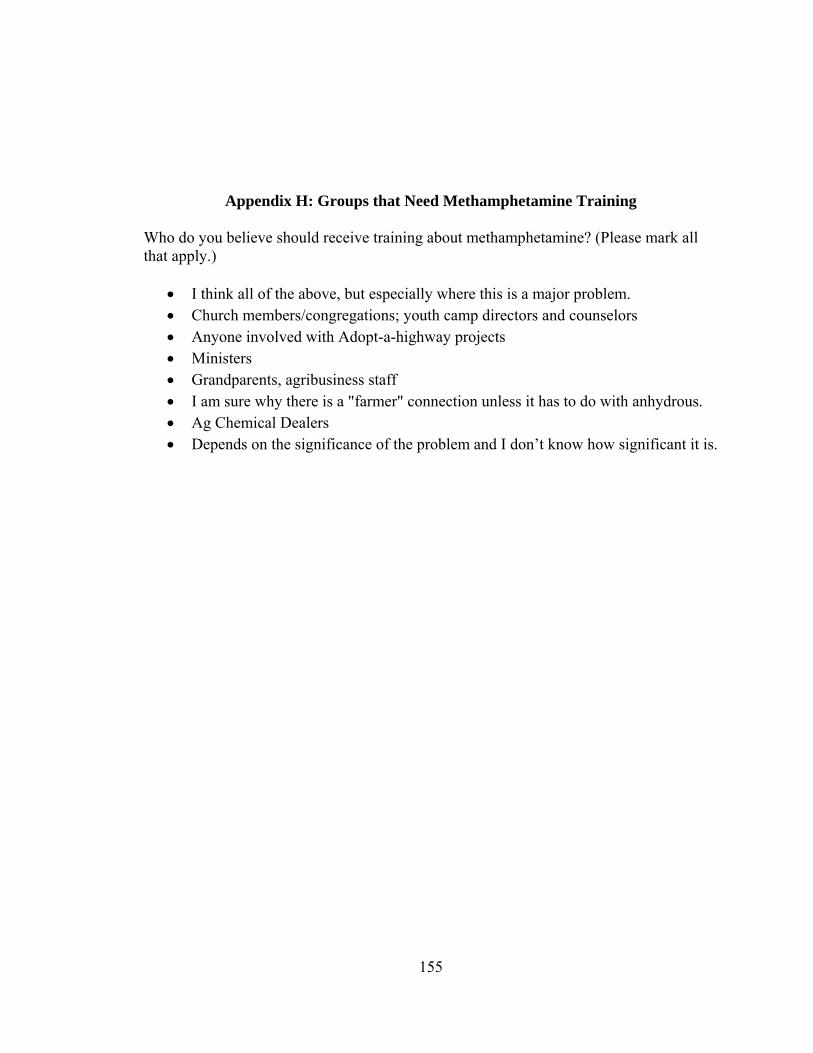
155
Appendix H: Groups that Need Methamphetamine Training
Who do you believe should receive training about methamphetamine? (Please mark all that apply.)
I think all of the above, but especially where this is a major problem. Church members/congregations; youth camp directors and counselors Anyone involved with Adopt-a-highway projects Ministers Grandparents, agribusiness staff I am sure why there is a "farmer" connection unless it has to do with anhydrous. Ag Chemical Dealers Depends on the significance of the problem and I don’t know how significant it is.
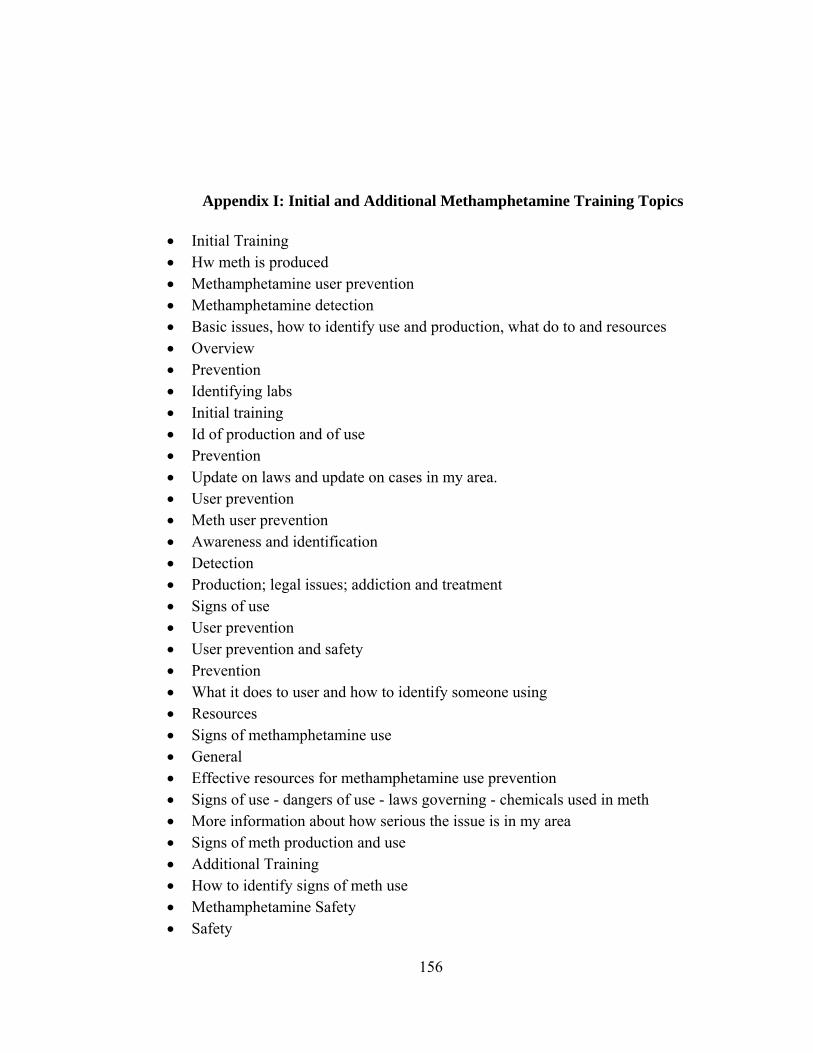
156
Appendix I: Initial and Additional Methamphetamine Training Topics
Initial Training Hw meth is produced Methamphetamine user prevention Methamphetamine detection Basic issues, how to identify use and production, what do to and resources Overview Prevention Identifying labs Initial training Id of production and of use Prevention Update on laws and update on cases in my area. User prevention Meth user prevention Awareness and identification Detection Production; legal issues; addiction and treatment Signs of use User prevention User prevention and safety Prevention What it does to user and how to identify someone using Resources Signs of methamphetamine use General Effective resources for methamphetamine use prevention Signs of use - dangers of use - laws governing - chemicals used in meth More information about how serious the issue is in my area Signs of meth production and use Additional Training How to identify signs of meth use Methamphetamine Safety Safety
157
Need a review; it has been a couple years since training Identifying use How to recognize signs that someone is using it More on safety Safety Prevention and intervention strategies Laws and reporting problems Detection of use; lab detection How it is made and what resources for education are available Signs of Methamphetamine production Same Preventative measures Meth education resources


