Embed Size (px)
Citation preview
See discussions, stats, and author profiles for this publication at: https://www.researchgate.net/publication/344095977
Mergers in the Digital Economy
Article in Information Economics and Policy · September 2020
DOI: 10.1016/j.infoecopol.2020.100890
CITATIONS
9READS
907
2 authors, including:
Axel Gautier
University of Liège
82 PUBLICATIONS 512 CITATIONS
SEE PROFILE
All content following this page was uploaded by Axel Gautier on 09 September 2020.
The user has requested enhancement of the downloaded file.
Mergers in the Digital Economy∗
Axel Gautier †& Joe Lamesch ‡
June 2, 2020
Abstract
Over the period 2015-2017, the five giant technologically leading firms, Google, Amazon,Facebook, Apple and Microsoft (GAFAM) acquired 175 companies, from small startups tobillion dollar deals. In this paper, we provide detailed information and statistics on themerger activity of the GAFAM and on the characteristics of the firms they acquire. Oneof the most intriguing features of these acquisitions is that, in the majority of cases, theproduct of the target is discontinued under its original brand name post acquisition andthis is especially true for the youngest firms. There are three reasons to discontinue aproduct post acquisition: the product is not as successful as expected, the acquisition wasnot motivated by the product itself but by the target’s assets or R&D effort, or by theelimination of a potential competitive threat. While our data does not enable us to screenbetween these explanations, the present analysis shows that most of the startups are killedin their infancy. This important phenomenon calls for tighter intervention by competitionauthorities in merger cases involving big techs.
Keywords: Mergers, GAFAM, platform, digital markets, competition policy, killer acquisitionJEL Codes: D43, K21, L40, L86, G34
∗The authors would like to thank P. Bougette, M. Bourreau, N. Durr, L. Madio, N. Petit, I. Salem, the editorsY. Spiegel and J. Waldfogel and the referee for their useful comments and suggestions and I. Peere for editingassistance. This research was funded through the ARC grant for Concerted Research Actions, financed by theFrench speaking Community of Belgium.†HEC Liege Management School, University of Liege, LCII. Other affiliations: CORE and CESifo. Email:
[email protected]‡Luxembourg Competition Authority and HEC Liege Management School, University of Liege, LCII. Email:
1
1 Introduction
The five largest tech giants, Apple, Alphabet (Google), Amazon, Facebook and Microsoft,known as GAFAM, are among the largest market capitalization firms worldwide. Operating asmulti-sided platforms, they have created a large ecosystem of products, applications, services,content and users. They generate value by offering services to the various user groups gravitatingaround the platform and by enabling interaction between and within them.
The GAFAM have known tremendous internal and external growth over the last two decades.Their investment in research and development is huge with a cumulated investment of over $ 71billion for the year 2017. In addition to these important investments, they have an extremelyintense mergers and acquisitions (M&A) activity. In 2017, for instance, they made 55 (different)acquisitions altogether, most of which were young and innovative startups.1
There are several reasons for one of the GAFAM platforms to acquire an innovative startup.First, the platform might be interested in the products developed by the startup. The GAFAMhave developed a large ecosystem of products and services and are increasingly competing forattention, i.e. to retain consumers on their platform. In this context, adding new products orfunctionalities is part of the competitive process, acquisition therefore is one way of developingthe firm’s ecosystem. Second, the platform might be interested in the startup’s inputs. They,indeed, have valuable assets (innovation, patent, engineer, talent2, customer base) that couldbe of interest to the platform. Last, acquisition may be a way of restricting competition andconsolidating the platform’s position on the market. As, in the digital economy, an importantsource of value comes from network effects, a firm with a substantial user base can eventuallyturn into a competitor of the incumbent network even if at the time of its acquisition there wasno product overlap. . Hence, the preemptive acquisition of a small and promising startup canbe used to restrict potential competition on the market. Nowadays, there are growing fears thatthe GAFAM acquire startups to protect their already strong market position.
Despite their intense merger activities and the vivid debates they generate, little is knownabout the the GAFAM’s merger strategies. The present research ambitions to fill this gap. Tothis end, we have collected detailed information on the acquisitions of the GAFAM over the years2015-2017 and on the GAFAM themselves. We have extracted all the necessary informationfrom the firms’ 10-k files3 and the Crunchbase database4.
In this paper, we provide detailed information and statistics on the GAFAM’s merger activityand on the characteristics of the firms they acquire. We focus in particular on the age, thefunding and the origin of the target. We also identify the products they offer. To that end, weclassify products in segments broadly defined according to the group of customers targeted. Sixdifferent user segments are identified: products offered to advertisers, businesses, consumers,merchants, content editors and platform products (mainly hardware and operating systems).
This product classification is used to identify the main segments of the platforms and theirmain income source. Given their multi-sided nature, some segments do not directly generate
1This paper focuses on the five largest tech companies by market capitalization, Google, Amazon, Facebook,Apple and Microsoft. We have two reasons for focusing on these five firms. The first one is that they are themost active tech firms in terms of acquisition: over the years 2015-2017, they acquired a total of 175 firms (ofthe five, though, Facebook proved the least active with just 20 acquisitions.) The other tech firms appear to beless inclined to rely on such transactions. Over the same period, Twitter undertook 11 acquisitions, AirBnB 10,Uber 5 and Netflix only 1. The same holds for Asian tech companies: Alibaba acquired 12, Rakuten 6, Tencent5 and Baidu 4. The second reason for focusing on the GAFAM is that acquisitions made by them received muchmore attention given their strong market position and growing fears that they would use mergers to strengthentheir market power.
2The word acqui-hire is used to qualify an acquisition made with the purpose of recruiting the target’semployees and talents. Kim (2018) and Ng and Stuart (2019) however show that this recruitment strategy is notnecessarily effective.
3https://www.sec.gov/fast-answers/answersreada10khtm.html4https://www.crunchbase.com/
2
revenues for the platform. This is particularly true for social media, Facebook and Google, forwhich users are extremely important. However, matching revenue with segments is important toidentify the money side of the platform. For all the GAFAM, the revenue streams are extremelyconcentrated with most of the revenues coming from one or two segments: platform products(devices) for Apple, merchants for Amazon, advertising for Facebook and Google, business andplatform products for Microsoft.
In a second step, we classify acquisitions and allocate each to one of the six business segments.Unsurprisingly, we observe that the firms acquire a lot in their main income segment. Forinstance, Microsoft used acquisitions to reinforce its business offers with 65% of the acquisitionsin this segment. We also observe that there are two segments where the merger activity is quiteintense: the digital content segment with 26% of all acquisitions and all firms being extremelyactive and, the business segment, where all firms, except Facebook and to a lesser extent Apple,make a lot of acquisitions. The intense merger activity in these two segments could be a signof increasing rivalry for business customers and for digital content.
We further analyze the acquisition strategies of the GAFAM firms by looking at the evolutionof the target post-acquisition. We observe that in the vast majority of cases, the acquirerdiscontinues the acquired brands. A product is considered to be discontinued if it is no longersupplied, maintained or upgraded under its original brand name. This practice is far from beingsystematic in the digital world and there are plenty of examples of products which continue to besupplied under their original name after an acquisition by one of the GAFAM.5 In our sample,we observe that in more than 60% of the acquisitions, the acquired products were discontinued.Apple and Facebook seem to have a more systematic discontinuation policy than the otherfirms.
There are three main reasons to discontinue a product post-acquisition. First, the productmay not be as successful as expected and the acquirer gives up the project. Second, themotivation for the acquisition was not the product or the brand in itself but the assets of thecompany or its innovation effort. Following the acquisition, the targeted assets are transferredto the acquirer and the target is shut down. Puranam and Srikanthfor (2007) explains thatwhen acquisition is motivated by asset acquisition, the target is more likely to be integratedwith the acquirer while when it is motivated by product acquisition, the target is more likely tobe kept independent. Last, the product may be discontinued to protect the acquirer’s marketposition. Such a merger followed by the disappearance of the acquired firm is now referred toas a killer merger. The firm acquires a target which develops a technology that can be used tocompete with its own products in the future and the acquisition kills the competitive threat.6
Killing rather than continuing a project competing with the acquirer’s own product depends onthe existence of demand and supply side complementarities. With strong complementarities,the acquirer is better off if it continues to develop the acquired project and supplies it alongwith its own product. Otherwise, the acquirer is better off killing the project and only developsits own version of the product.
We run Probit regressions to better understand the determinants of product discontinu-ation. In our estimation, the age of the target appears to be an important determinant ofproduct discontinuation: younger firms are more likely to be discontinued. We also find thatacquisitions in the platform’s core segment, defined as the main income segment plus the usersegment for the social medias, are more likely to be discontinued than acquisitions in the othersegments. This suggests that products which are more closely related to the (broadly defined)main products of the platform are more likely to be discontinued. However, from our data, wecannot screen between the two explanations for product discontinuation: technology acquisition
5YouTube, Android, Instagram, WhatsApp, Shazam, LikedIn to cite a few.6Cunningham et al. (2018) collect data on acquisitions in the pharmaceutical industry. They document that
6% of acquisitions are killer acquisitions, where the acquiring firm buys a target developing a drug similar to itsown and later stops the development of the target’s product.
3
or the elimination of a potential rival. A more detailed analysis, product by product, shouldbe carried on to understand the motivations for the merger. But our paper shows that mostof the startups are killed in their infancy and this important phenomenon calls for a tighterintervention by competition authorities in merger cases involving big techs.
In the literature, there is, to our knowledge, no systematic analysis of the merger activity ofthe main digital platforms, Argentesi et al. (2019a, 2019b) being exceptions. Both papers makea critical assessment of several merger decisions taken by the Competition Market Authority(UK) in the digital economy, and suggests reforms to take better account of the specificitiesof digital markets. Furthermore Argentesi et al. (2019b) systematically review the mergers ofGoogle, Amazon and Facebook (GAF) for the period 2008-2018. They classify mergers into eightsegments, not according to the targeted user group as we did, but according to the products’purpose or functionality. They observe an intense acquisition activity in the AI, data scienceand analytics segments which raise concerns as data analytics technology combined with thehuge amount of data collected by the GAF may constitute a barrier to entry for competitors.Finally, their analysis converge with ours in noticing that Google has a more intense and morediversified acquisition strategy than Amazon and Facebook who have a more focused acquisitionpattern.
Few papers explicitly consider the striking features of the digital economy in a merger model.Motta and Peitz (2020) develop a model of acquisition by big tech firms. In their set-up, thestartup (the target) is potentially financially constrained and may lack of the necessary resourcesto complete its innovative project. Acquisition by a less financially constrained big tech mayremove this financially constraint and brings the new project to an end. Acquisition, however,has two drawbacks. First, the big tech may acquire the startup and stop the project (a killeracquisition). Second, acquisition could occur despite the fact that the startup has enoughressource. In this case, the innovative project would be developed when the startup remainsindependent and acquisition only reduces competition on the market. Finally, on the basis oftheir modeling, Motta and Peitz develop theories of harm that integrate specific features of thedigital economy like zero-price products or network effects.
Prat and Valletti (2019) develop a model of attention oligopoly in which platforms thatmay a priori look like different are competing for the attention of the targeted consumers,attention that will be sold to the advertisers and retailers. In this context, they consider amerger between two competing networks and show that the larger the overlap between theuser bases, the larger the welfare losses resulting from the merger. Indeed, a merger betweenoverlapping networks is more detrimental than a merger from dissociated networks. Hence, amerger between two networks offering different products to the same user groups can be usedto substantially restrict competition on the market, even if the products offered to captureconsumer attention are different.
Recently, the literature has considered the impact of a merger on innovation efforts.7 Cabral(2018) develops a model where tech giants are competing with fringe firms. The focus of themodel is on innovation and the impact of mergers on incentives to innovate. He distinguishesbetween radical and incremental innovations, showing that mergers decrease the former butfavor the latter. The idea is that incremental innovation has more value if it is transferred tothe dominant firm, as is the case of a merger. Anticipating a transfer, the startup partiallyinternalizes the full benefit of its innovation and has more incentives to invest. On the contrary,startups have fewer incentives to invest in radical innovations that would allow them to replacethe dominant firm. The reason is that increasing the benefit of incremental innovation also in-creases the opportunity cost of a radical innovation. Therefore, a merger may boost investmentyet also reinforce the incumbent’s dominance. Bryan and Hovenkamp (2020) reach a similar
7A merger changes the incentives to innovate of both insiders and outsiders to the merger. Several recentpapers focus on the impact of mergers on innovation incentives (see for instance Motta and Tarentino, 2017;Federico et al., 2018; Bourreau and Jullien, 2018).
4
conclusion. They develop a model of startup acquisitions by dominant firms where startupsinnovate and develop components to be used by a tech giant. They show that technologicalleaders have more incentives to buy the startups to maintain their leadership and that this per-sistence of leadership through acquisition may not be welfare improving. Furthermore, startupsmay bias their research efforts towards the improvement of the technological leader, and in sodoing reinforce its leadership.
Complementarities are important in the digital economy as many startups develop productsor features that are complements to the platform’s ecosystem. Wen and Zhu (2019) showthat the entry threat of the platform in a complementary market changes the incentives toinnovate and the complementor’s pricing strategy. Rather than entry, a platform can buythe complementor to expand its ecosystem. Etro (2019) shows that such a merger betweencomplements increases the innovation effort, as it solves the Cournot complement problem butrestricts competition by making entry less likely.
The paper is organized as follows. In Section 2, we present the platform’s business model,the users group gravitating around it and the main revenue sources. In Section 3, we providedetailed information on the GAFAM firms’ merger activities over 2015-2017. In Section 4, weanalyze the product continuation decision and we conclude in Section 5. In the appendices, wedescribe the data source in greater detail (Appendix A), provide a list of acquisitions (AppendixB) and additional statistics (Appendix C).
2 The GAFAM firms
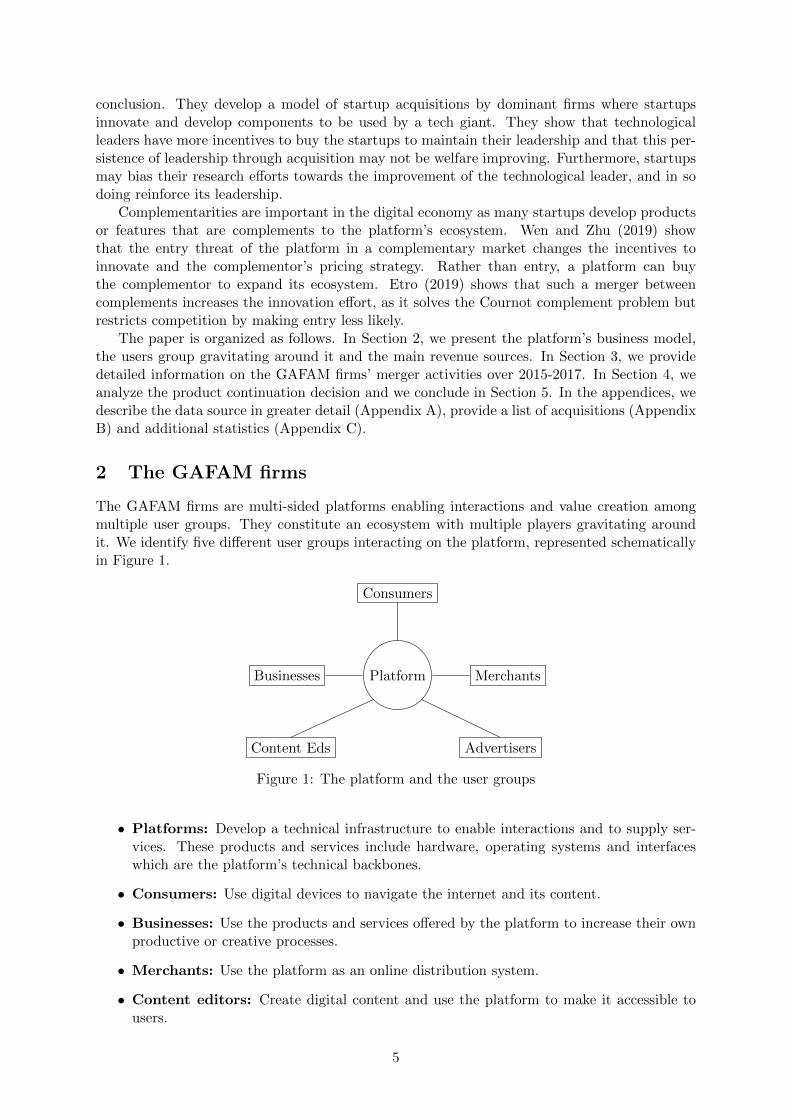
The GAFAM firms are multi-sided platforms enabling interactions and value creation amongmultiple user groups. They constitute an ecosystem with multiple players gravitating aroundit. We identify five different user groups interacting on the platform, represented schematicallyin Figure 1.
Platform
Consumers
Businesses Merchants
AdvertisersContent Eds
Figure 1: The platform and the user groups
• Platforms: Develop a technical infrastructure to enable interactions and to supply ser-vices. These products and services include hardware, operating systems and interfaceswhich are the platform’s technical backbones.
• Consumers: Use digital devices to navigate the internet and its content.
• Businesses: Use the products and services offered by the platform to increase their ownproductive or creative processes.
• Merchants: Use the platform as an online distribution system.
• Content editors: Create digital content and use the platform to make it accessible tousers.
5
• Advertisers: Use the platform to place online advertising to reach potential clients.
2.1 A classification of activities by user groups
Platforms create value by offering products and services to each user category. Our objectiveis to have a schematic view of the platforms by identifying the groups they serve and the revenuesgenerated by each user category. To do so, we proceed in three steps.
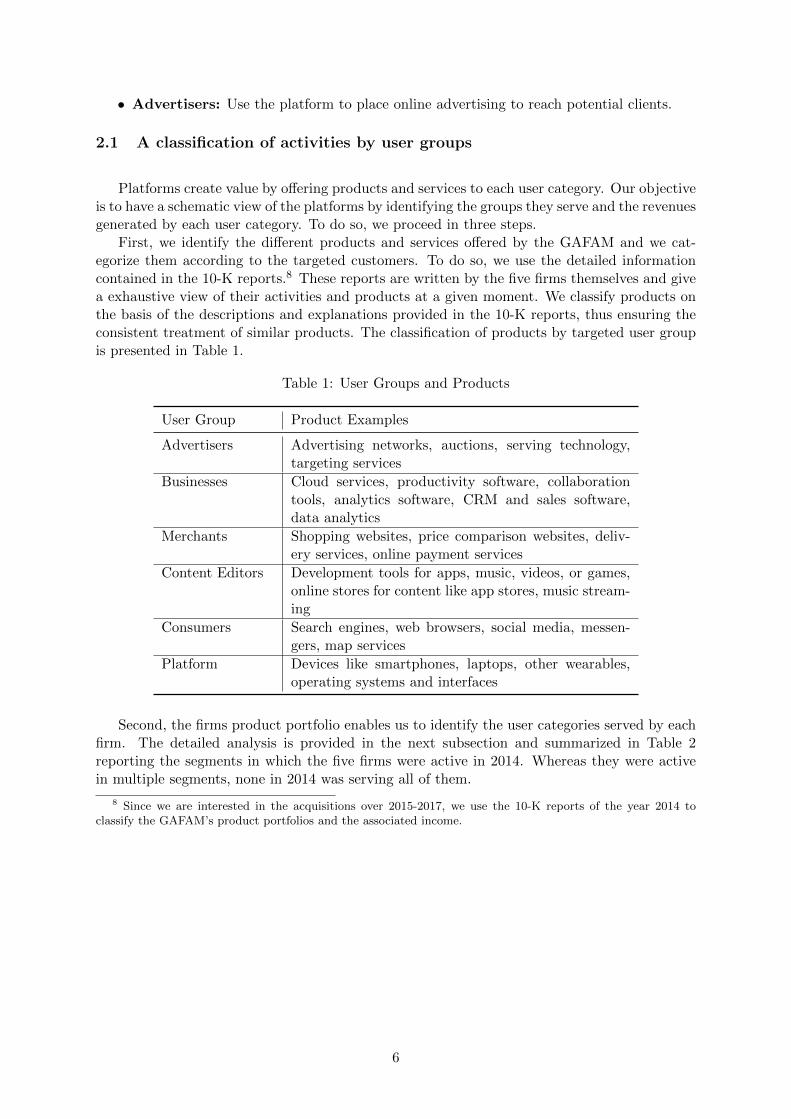
First, we identify the different products and services offered by the GAFAM and we cat-egorize them according to the targeted customers. To do so, we use the detailed informationcontained in the 10-K reports.8 These reports are written by the five firms themselves and givea exhaustive view of their activities and products at a given moment. We classify products onthe basis of the descriptions and explanations provided in the 10-K reports, thus ensuring theconsistent treatment of similar products. The classification of products by targeted user groupis presented in Table 1.
Table 1: User Groups and Products
User Group Product Examples
Advertisers Advertising networks, auctions, serving technology,targeting services
Businesses Cloud services, productivity software, collaborationtools, analytics software, CRM and sales software,data analytics
Merchants Shopping websites, price comparison websites, deliv-ery services, online payment services
Content Editors Development tools for apps, music, videos, or games,online stores for content like app stores, music stream-ing
Consumers Search engines, web browsers, social media, messen-gers, map services
Platform Devices like smartphones, laptops, other wearables,operating systems and interfaces
Second, the firms product portfolio enables us to identify the user categories served by eachfirm. The detailed analysis is provided in the next subsection and summarized in Table 2reporting the segments in which the five firms were active in 2014. Whereas they were activein multiple segments, none in 2014 was serving all of them.
8 Since we are interested in the acquisitions over 2015-2017, we use the 10-K reports of the year 2014 toclassify the GAFAM’s product portfolios and the associated income.
6
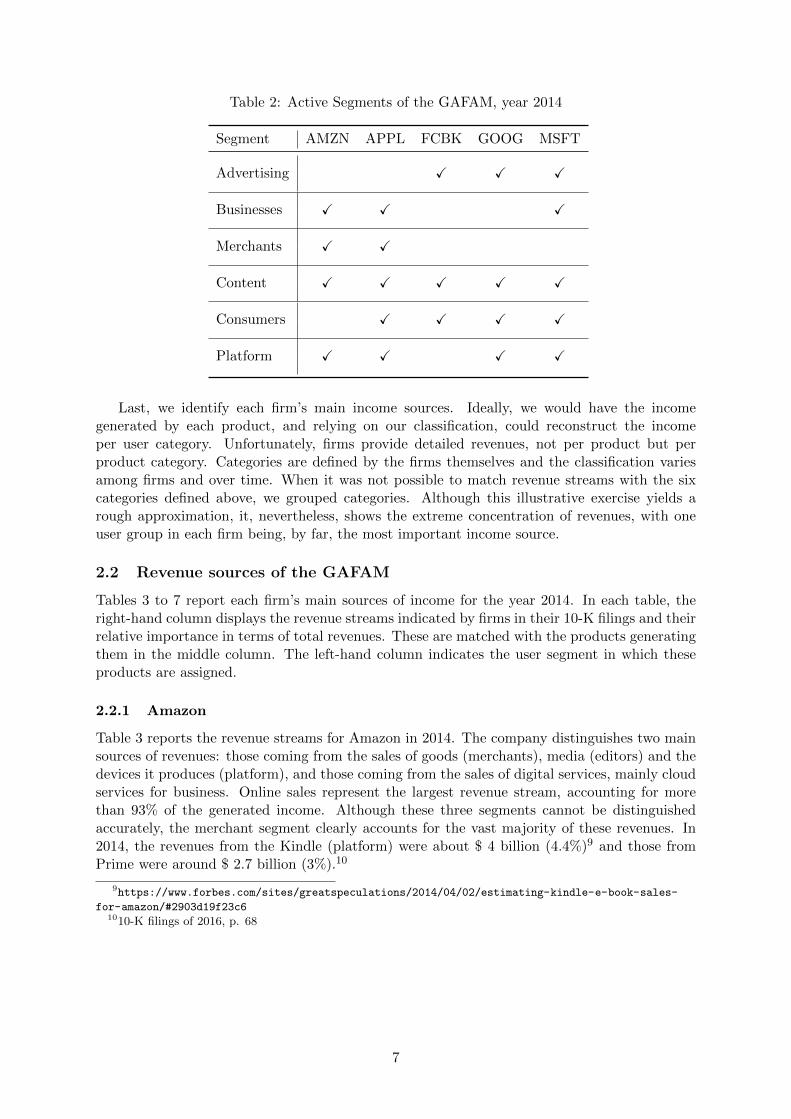
Table 2: Active Segments of the GAFAM, year 2014
Segment AMZN APPL FCBK GOOG MSFT
Advertising X X X
Businesses X X X
Merchants X X
Content X X X X X
Consumers X X X X
Platform X X X X
Last, we identify each firm’s main income sources. Ideally, we would have the incomegenerated by each product, and relying on our classification, could reconstruct the incomeper user category. Unfortunately, firms provide detailed revenues, not per product but perproduct category. Categories are defined by the firms themselves and the classification variesamong firms and over time. When it was not possible to match revenue streams with the sixcategories defined above, we grouped categories. Although this illustrative exercise yields arough approximation, it, nevertheless, shows the extreme concentration of revenues, with oneuser group in each firm being, by far, the most important income source.
2.2 Revenue sources of the GAFAM
Tables 3 to 7 report each firm’s main sources of income for the year 2014. In each table, theright-hand column displays the revenue streams indicated by firms in their 10-K filings and theirrelative importance in terms of total revenues. These are matched with the products generatingthem in the middle column. The left-hand column indicates the user segment in which theseproducts are assigned.
2.2.1 Amazon
Table 3 reports the revenue streams for Amazon in 2014. The company distinguishes two mainsources of revenues: those coming from the sales of goods (merchants), media (editors) and thedevices it produces (platform), and those coming from the sales of digital services, mainly cloudservices for business. Online sales represent the largest revenue stream, accounting for morethan 93% of the generated income. Although these three segments cannot be distinguishedaccurately, the merchant segment clearly accounts for the vast majority of these revenues. In2014, the revenues from the Kindle (platform) were about $ 4 billion (4.4%)9 and those fromPrime were around $ 2.7 billion (3%).10
9https://www.forbes.com/sites/greatspeculations/2014/04/02/estimating-kindle-e-book-sales-
for-amazon/#2903d19f23c61010-K filings of 2016, p. 68
7
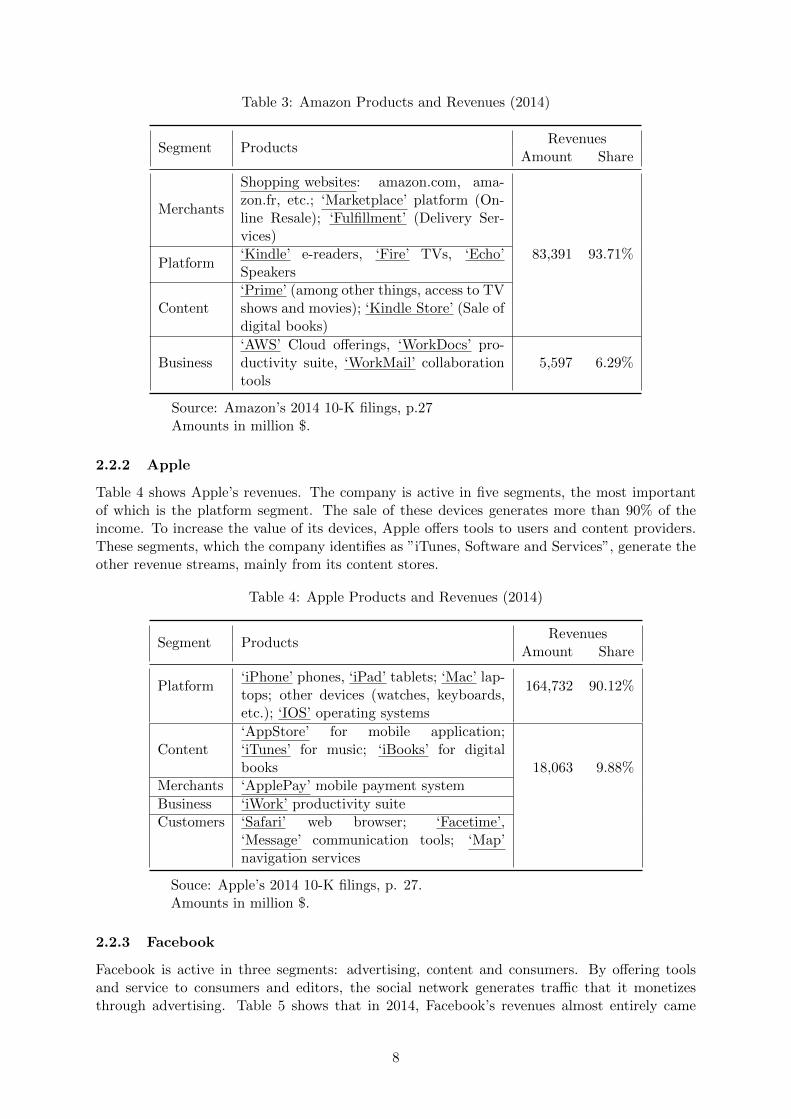
Table 3: Amazon Products and Revenues (2014)
Segment ProductsRevenues
Amount Share
Merchants
Shopping websites: amazon.com, ama-zon.fr, etc.; ‘Marketplace’ platform (On-line Resale); ‘Fulfillment’ (Delivery Ser-vices)
83,391 93.71%Platform
‘Kindle’ e-readers, ‘Fire’ TVs, ‘Echo’Speakers
Content‘Prime’ (among other things, access to TVshows and movies); ‘Kindle Store’ (Sale ofdigital books)
Business‘AWS’ Cloud offerings, ‘WorkDocs’ pro-ductivity suite, ‘WorkMail’ collaborationtools
5,597 6.29%
Source: Amazon’s 2014 10-K filings, p.27Amounts in million $.
2.2.2 Apple
Table 4 shows Apple’s revenues. The company is active in five segments, the most importantof which is the platform segment. The sale of these devices generates more than 90% of theincome. To increase the value of its devices, Apple offers tools to users and content providers.These segments, which the company identifies as ”iTunes, Software and Services”, generate theother revenue streams, mainly from its content stores.
Table 4: Apple Products and Revenues (2014)
Segment ProductsRevenues
Amount Share
Platform‘iPhone’ phones, ‘iPad’ tablets; ‘Mac’ lap-tops; other devices (watches, keyboards,etc.); ‘IOS’ operating systems
164,732 90.12%
Content‘AppStore’ for mobile application;‘iTunes’ for music; ‘iBooks’ for digitalbooks 18,063 9.88%
Merchants ‘ApplePay’ mobile payment system
Business ‘iWork’ productivity suiteCustomers ‘Safari’ web browser; ‘Facetime’,
‘Message’ communication tools; ‘Map’navigation services
Souce: Apple’s 2014 10-K filings, p. 27.Amounts in million $.
2.2.3 Facebook
Facebook is active in three segments: advertising, content and consumers. By offering toolsand service to consumers and editors, the social network generates traffic that it monetizesthrough advertising. Table 5 shows that in 2014, Facebook’s revenues almost entirely came
8
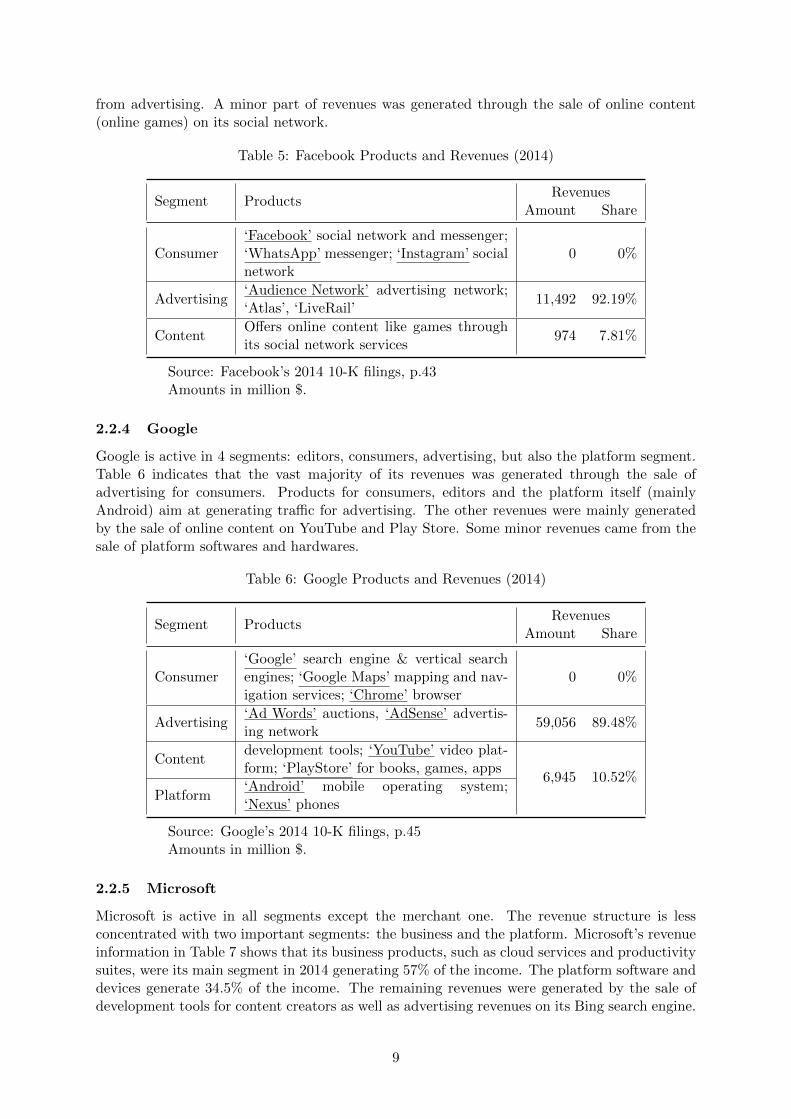
from advertising. A minor part of revenues was generated through the sale of online content(online games) on its social network.
Table 5: Facebook Products and Revenues (2014)
Segment ProductsRevenues
Amount Share
Consumer‘Facebook’ social network and messenger;‘WhatsApp’ messenger; ‘Instagram’ socialnetwork
0 0%
Advertising‘Audience Network’ advertising network;‘Atlas’, ‘LiveRail’
11,492 92.19%
ContentOffers online content like games throughits social network services
974 7.81%
Source: Facebook’s 2014 10-K filings, p.43Amounts in million $.
2.2.4 Google
Google is active in 4 segments: editors, consumers, advertising, but also the platform segment.Table 6 indicates that the vast majority of its revenues was generated through the sale ofadvertising for consumers. Products for consumers, editors and the platform itself (mainlyAndroid) aim at generating traffic for advertising. The other revenues were mainly generatedby the sale of online content on YouTube and Play Store. Some minor revenues came from thesale of platform softwares and hardwares.
Table 6: Google Products and Revenues (2014)
Segment ProductsRevenues
Amount Share
Consumer‘Google’ search engine & vertical searchengines; ‘Google Maps’ mapping and nav-igation services; ‘Chrome’ browser
0 0%
Advertising‘Ad Words’ auctions, ‘AdSense’ advertis-ing network
59,056 89.48%
Contentdevelopment tools; ‘YouTube’ video plat-form; ‘PlayStore’ for books, games, apps
6,945 10.52%
Platform‘Android’ mobile operating system;‘Nexus’ phones
Source: Google’s 2014 10-K filings, p.45Amounts in million $.
2.2.5 Microsoft
Microsoft is active in all segments except the merchant one. The revenue structure is lessconcentrated with two important segments: the business and the platform. Microsoft’s revenueinformation in Table 7 shows that its business products, such as cloud services and productivitysuites, were its main segment in 2014 generating 57% of the income. The platform software anddevices generate 34.5% of the income. The remaining revenues were generated by the sale ofdevelopment tools for content creators as well as advertising revenues on its Bing search engine.
9
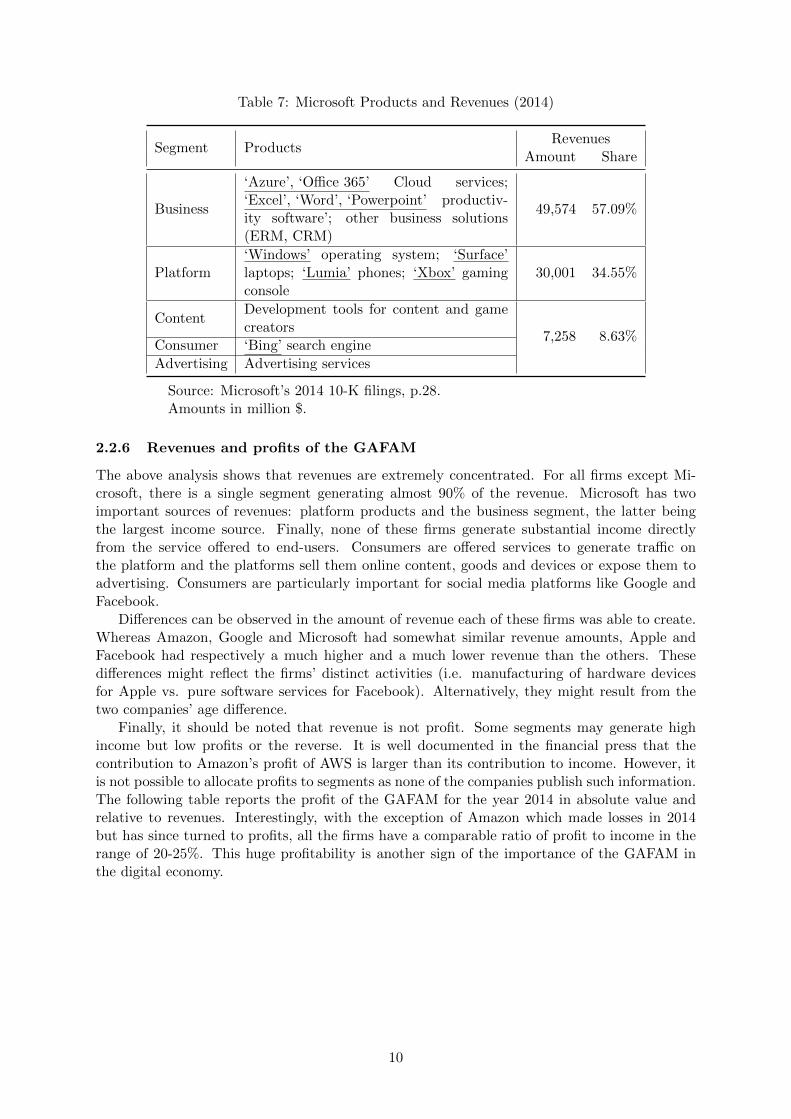
Table 7: Microsoft Products and Revenues (2014)
Segment ProductsRevenues
Amount Share
Business
‘Azure’, ‘Office 365’ Cloud services;‘Excel’, ‘Word’, ‘Powerpoint’ productiv-ity software’; other business solutions(ERM, CRM)
49,574 57.09%
Platform‘Windows’ operating system; ‘Surface’laptops; ‘Lumia’ phones; ‘Xbox’ gamingconsole
30,001 34.55%
ContentDevelopment tools for content and gamecreators
7,258 8.63%Consumer ‘Bing’ search engine
Advertising Advertising services
Source: Microsoft’s 2014 10-K filings, p.28.Amounts in million $.
2.2.6 Revenues and profits of the GAFAM
The above analysis shows that revenues are extremely concentrated. For all firms except Mi-crosoft, there is a single segment generating almost 90% of the revenue. Microsoft has twoimportant sources of revenues: platform products and the business segment, the latter beingthe largest income source. Finally, none of these firms generate substantial income directlyfrom the service offered to end-users. Consumers are offered services to generate traffic onthe platform and the platforms sell them online content, goods and devices or expose them toadvertising. Consumers are particularly important for social media platforms like Google andFacebook.
Differences can be observed in the amount of revenue each of these firms was able to create.Whereas Amazon, Google and Microsoft had somewhat similar revenue amounts, Apple andFacebook had respectively a much higher and a much lower revenue than the others. Thesedifferences might reflect the firms’ distinct activities (i.e. manufacturing of hardware devicesfor Apple vs. pure software services for Facebook). Alternatively, they might result from thetwo companies’ age difference.
Finally, it should be noted that revenue is not profit. Some segments may generate highincome but low profits or the reverse. It is well documented in the financial press that thecontribution to Amazon’s profit of AWS is larger than its contribution to income. However, itis not possible to allocate profits to segments as none of the companies publish such information.The following table reports the profit of the GAFAM for the year 2014 in absolute value andrelative to revenues. Interestingly, with the exception of Amazon which made losses in 2014but has since turned to profits, all the firms have a comparable ratio of profit to income in therange of 20-25%. This huge profitability is another sign of the importance of the GAFAM inthe digital economy.
10
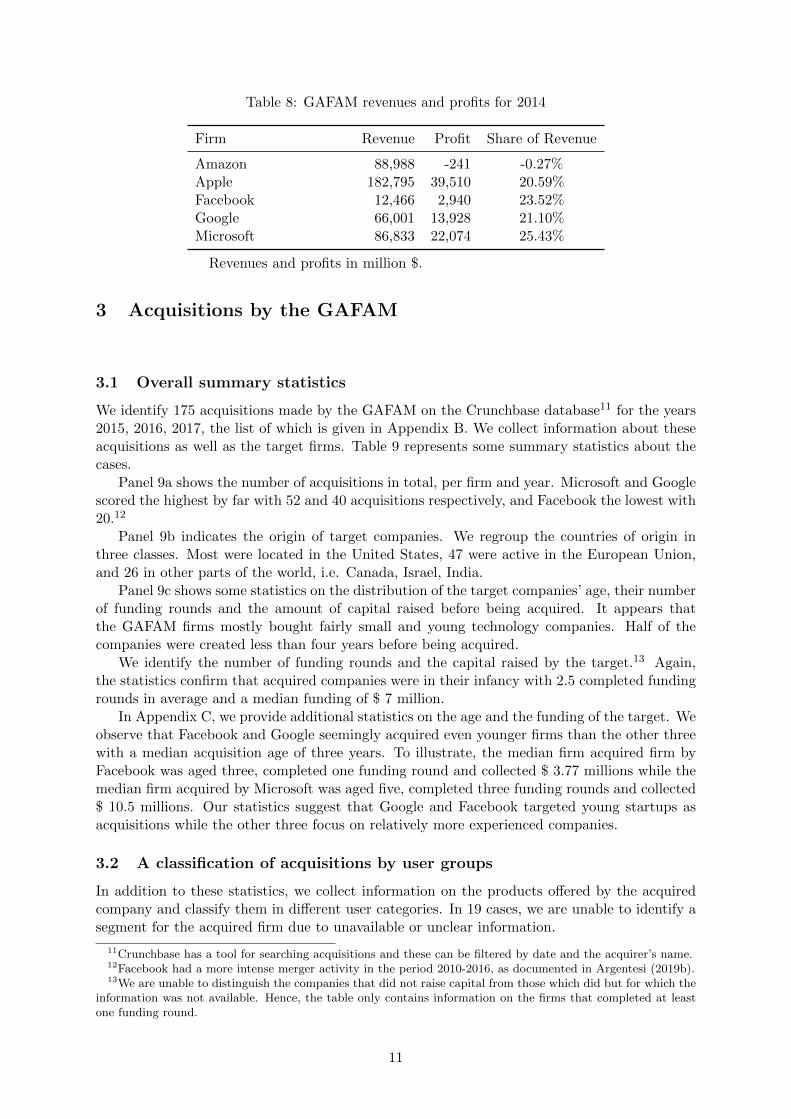
Table 8: GAFAM revenues and profits for 2014
Firm Revenue Profit Share of Revenue
Amazon 88,988 -241 -0.27%Apple 182,795 39,510 20.59%Facebook 12,466 2,940 23.52%Google 66,001 13,928 21.10%Microsoft 86,833 22,074 25.43%
Revenues and profits in million $.
3 Acquisitions by the GAFAM
3.1 Overall summary statistics
We identify 175 acquisitions made by the GAFAM on the Crunchbase database11 for the years2015, 2016, 2017, the list of which is given in Appendix B. We collect information about theseacquisitions as well as the target firms. Table 9 represents some summary statistics about thecases.
Panel 9a shows the number of acquisitions in total, per firm and year. Microsoft and Googlescored the highest by far with 52 and 40 acquisitions respectively, and Facebook the lowest with20.12
Panel 9b indicates the origin of target companies. We regroup the countries of origin inthree classes. Most were located in the United States, 47 were active in the European Union,and 26 in other parts of the world, i.e. Canada, Israel, India.
Panel 9c shows some statistics on the distribution of the target companies’ age, their numberof funding rounds and the amount of capital raised before being acquired. It appears thatthe GAFAM firms mostly bought fairly small and young technology companies. Half of thecompanies were created less than four years before being acquired.
We identify the number of funding rounds and the capital raised by the target.13 Again,the statistics confirm that acquired companies were in their infancy with 2.5 completed fundingrounds in average and a median funding of $ 7 million.
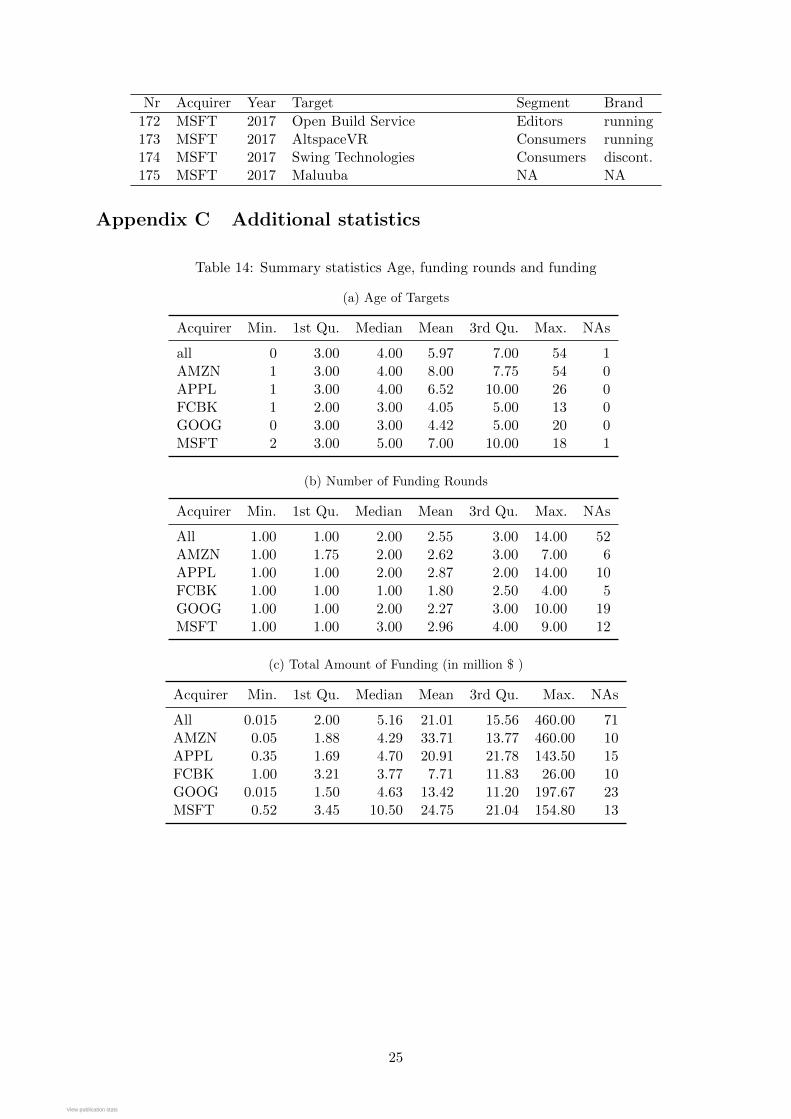
In Appendix C, we provide additional statistics on the age and the funding of the target. Weobserve that Facebook and Google seemingly acquired even younger firms than the other threewith a median acquisition age of three years. To illustrate, the median firm acquired firm byFacebook was aged three, completed one funding round and collected $ 3.77 millions while themedian firm acquired by Microsoft was aged five, completed three funding rounds and collected$ 10.5 millions. Our statistics suggest that Google and Facebook targeted young startups asacquisitions while the other three focus on relatively more experienced companies.
3.2 A classification of acquisitions by user groups
In addition to these statistics, we collect information on the products offered by the acquiredcompany and classify them in different user categories. In 19 cases, we are unable to identify asegment for the acquired firm due to unavailable or unclear information.
11Crunchbase has a tool for searching acquisitions and these can be filtered by date and the acquirer’s name.12Facebook had a more intense merger activity in the period 2010-2016, as documented in Argentesi (2019b).13We are unable to distinguish the companies that did not raise capital from those which did but for which the
information was not available. Hence, the table only contains information on the firms that completed at leastone funding round.
11
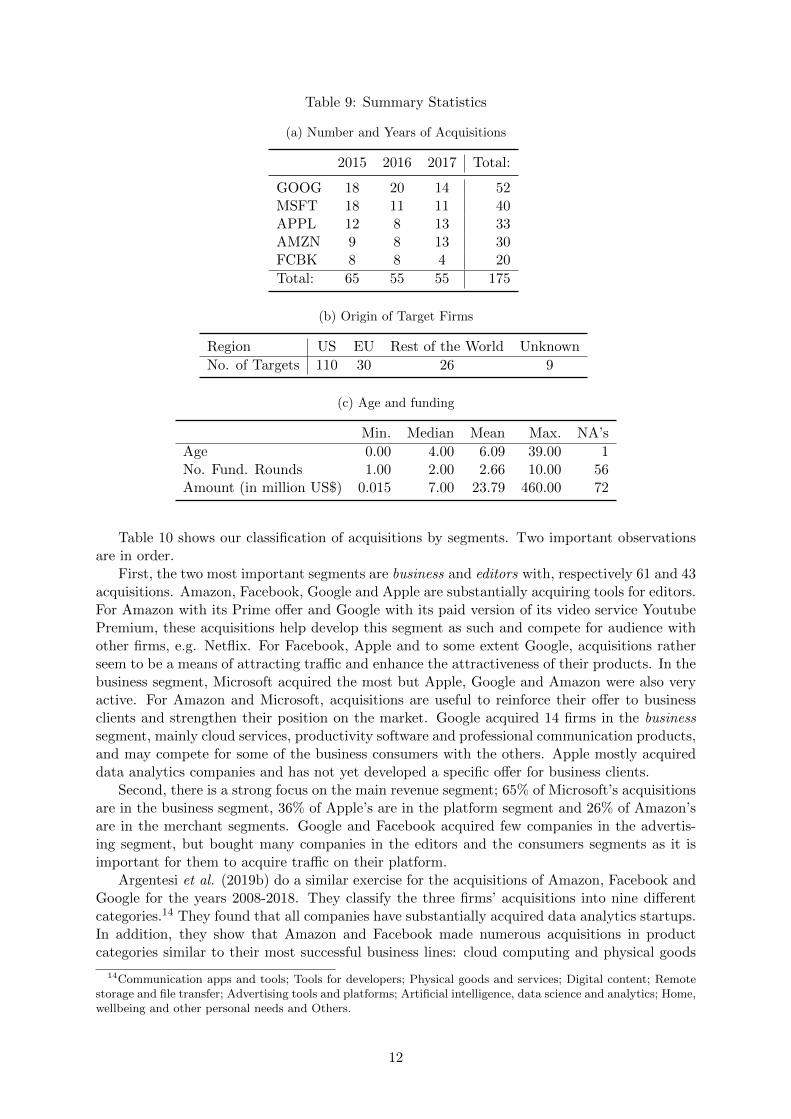
Table 9: Summary Statistics
(a) Number and Years of Acquisitions
2015 2016 2017 Total:
GOOG 18 20 14 52MSFT 18 11 11 40APPL 12 8 13 33AMZN 9 8 13 30FCBK 8 8 4 20
Total: 65 55 55 175
(b) Origin of Target Firms
Region US EU Rest of the World Unknown
No. of Targets 110 30 26 9
(c) Age and funding
Min. Median Mean Max. NA’s
Age 0.00 4.00 6.09 39.00 1No. Fund. Rounds 1.00 2.00 2.66 10.00 56Amount (in million US$) 0.015 7.00 23.79 460.00 72
Table 10 shows our classification of acquisitions by segments. Two important observationsare in order.
First, the two most important segments are business and editors with, respectively 61 and 43acquisitions. Amazon, Facebook, Google and Apple are substantially acquiring tools for editors.For Amazon with its Prime offer and Google with its paid version of its video service YoutubePremium, these acquisitions help develop this segment as such and compete for audience withother firms, e.g. Netflix. For Facebook, Apple and to some extent Google, acquisitions ratherseem to be a means of attracting traffic and enhance the attractiveness of their products. In thebusiness segment, Microsoft acquired the most but Apple, Google and Amazon were also veryactive. For Amazon and Microsoft, acquisitions are useful to reinforce their offer to businessclients and strengthen their position on the market. Google acquired 14 firms in the businesssegment, mainly cloud services, productivity software and professional communication products,and may compete for some of the business consumers with the others. Apple mostly acquireddata analytics companies and has not yet developed a specific offer for business clients.
Second, there is a strong focus on the main revenue segment; 65% of Microsoft’s acquisitionsare in the business segment, 36% of Apple’s are in the platform segment and 26% of Amazon’sare in the merchant segments. Google and Facebook acquired few companies in the advertis-ing segment, but bought many companies in the editors and the consumers segments as it isimportant for them to acquire traffic on their platform.
Argentesi et al. (2019b) do a similar exercise for the acquisitions of Amazon, Facebook andGoogle for the years 2008-2018. They classify the three firms’ acquisitions into nine differentcategories.14 They found that all companies have substantially acquired data analytics startups.In addition, they show that Amazon and Facebook made numerous acquisitions in productcategories similar to their most successful business lines: cloud computing and physical goods
14Communication apps and tools; Tools for developers; Physical goods and services; Digital content; Remotestorage and file transfer; Advertising tools and platforms; Artificial intelligence, data science and analytics; Home,wellbeing and other personal needs and Others.
12
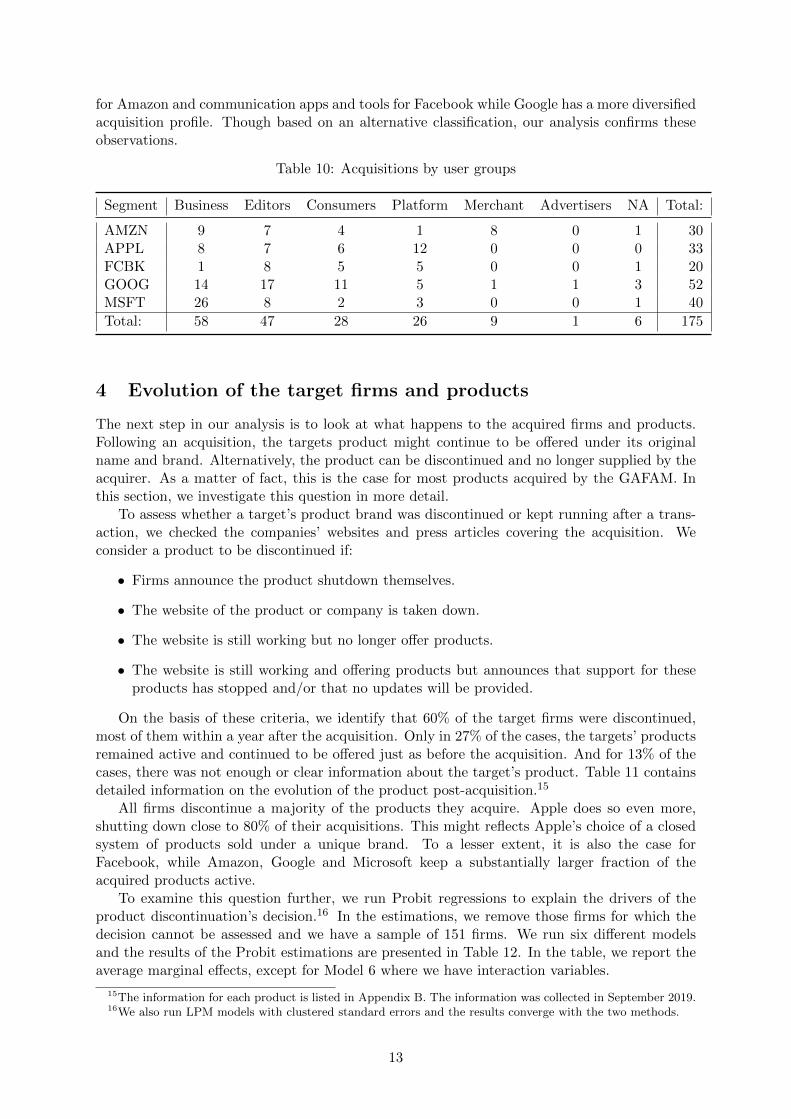
for Amazon and communication apps and tools for Facebook while Google has a more diversifiedacquisition profile. Though based on an alternative classification, our analysis confirms theseobservations.
Table 10: Acquisitions by user groups
Segment Business Editors Consumers Platform Merchant Advertisers NA Total:
AMZN 9 7 4 1 8 0 1 30APPL 8 7 6 12 0 0 0 33FCBK 1 8 5 5 0 0 1 20GOOG 14 17 11 5 1 1 3 52MSFT 26 8 2 3 0 0 1 40
Total: 58 47 28 26 9 1 6 175
4 Evolution of the target firms and products
The next step in our analysis is to look at what happens to the acquired firms and products.Following an acquisition, the targets product might continue to be offered under its originalname and brand. Alternatively, the product can be discontinued and no longer supplied by theacquirer. As a matter of fact, this is the case for most products acquired by the GAFAM. Inthis section, we investigate this question in more detail.
To assess whether a target’s product brand was discontinued or kept running after a trans-action, we checked the companies’ websites and press articles covering the acquisition. Weconsider a product to be discontinued if:
• Firms announce the product shutdown themselves.
• The website of the product or company is taken down.
• The website is still working but no longer offer products.
• The website is still working and offering products but announces that support for theseproducts has stopped and/or that no updates will be provided.
On the basis of these criteria, we identify that 60% of the target firms were discontinued,most of them within a year after the acquisition. Only in 27% of the cases, the targets’ productsremained active and continued to be offered just as before the acquisition. And for 13% of thecases, there was not enough or clear information about the target’s product. Table 11 containsdetailed information on the evolution of the product post-acquisition.15
All firms discontinue a majority of the products they acquire. Apple does so even more,shutting down close to 80% of their acquisitions. This might reflects Apple’s choice of a closedsystem of products sold under a unique brand. To a lesser extent, it is also the case forFacebook, while Amazon, Google and Microsoft keep a substantially larger fraction of theacquired products active.
To examine this question further, we run Probit regressions to explain the drivers of theproduct discontinuation’s decision.16 In the estimations, we remove those firms for which thedecision cannot be assessed and we have a sample of 151 firms. We run six different modelsand the results of the Probit estimations are presented in Table 12. In the table, we report theaverage marginal effects, except for Model 6 where we have interaction variables.
15The information for each product is listed in Appendix B. The information was collected in September 2019.16We also run LPM models with clustered standard errors and the results converge with the two methods.
13
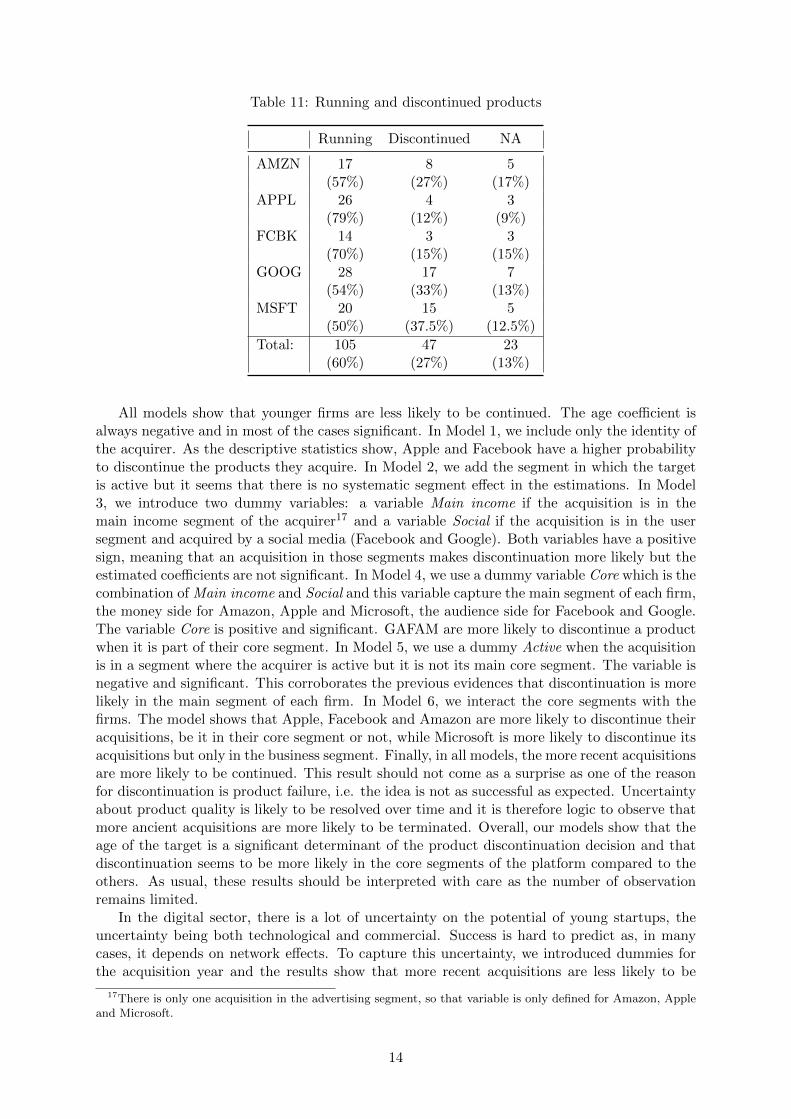
Table 11: Running and discontinued products
Running Discontinued NA
AMZN 17 8 5(57%) (27%) (17%)
APPL 26 4 3(79%) (12%) (9%)
FCBK 14 3 3(70%) (15%) (15%)
GOOG 28 17 7(54%) (33%) (13%)
MSFT 20 15 5(50%) (37.5%) (12.5%)
Total: 105 47 23(60%) (27%) (13%)
All models show that younger firms are less likely to be continued. The age coefficient isalways negative and in most of the cases significant. In Model 1, we include only the identity ofthe acquirer. As the descriptive statistics show, Apple and Facebook have a higher probabilityto discontinue the products they acquire. In Model 2, we add the segment in which the targetis active but it seems that there is no systematic segment effect in the estimations. In Model3, we introduce two dummy variables: a variable Main income if the acquisition is in themain income segment of the acquirer17 and a variable Social if the acquisition is in the usersegment and acquired by a social media (Facebook and Google). Both variables have a positivesign, meaning that an acquisition in those segments makes discontinuation more likely but theestimated coefficients are not significant. In Model 4, we use a dummy variable Core which is thecombination of Main income and Social and this variable capture the main segment of each firm,the money side for Amazon, Apple and Microsoft, the audience side for Facebook and Google.The variable Core is positive and significant. GAFAM are more likely to discontinue a productwhen it is part of their core segment. In Model 5, we use a dummy Active when the acquisitionis in a segment where the acquirer is active but it is not its main core segment. The variable isnegative and significant. This corroborates the previous evidences that discontinuation is morelikely in the main segment of each firm. In Model 6, we interact the core segments with thefirms. The model shows that Apple, Facebook and Amazon are more likely to discontinue theiracquisitions, be it in their core segment or not, while Microsoft is more likely to discontinue itsacquisitions but only in the business segment. Finally, in all models, the more recent acquisitionsare more likely to be continued. This result should not come as a surprise as one of the reasonfor discontinuation is product failure, i.e. the idea is not as successful as expected. Uncertaintyabout product quality is likely to be resolved over time and it is therefore logic to observe thatmore ancient acquisitions are more likely to be terminated. Overall, our models show that theage of the target is a significant determinant of the product discontinuation decision and thatdiscontinuation seems to be more likely in the core segments of the platform compared to theothers. As usual, these results should be interpreted with care as the number of observationremains limited.
In the digital sector, there is a lot of uncertainty on the potential of young startups, theuncertainty being both technological and commercial. Success is hard to predict as, in manycases, it depends on network effects. To capture this uncertainty, we introduced dummies forthe acquisition year and the results show that more recent acquisitions are less likely to be
17There is only one acquisition in the advertising segment, so that variable is only defined for Amazon, Appleand Microsoft.
14
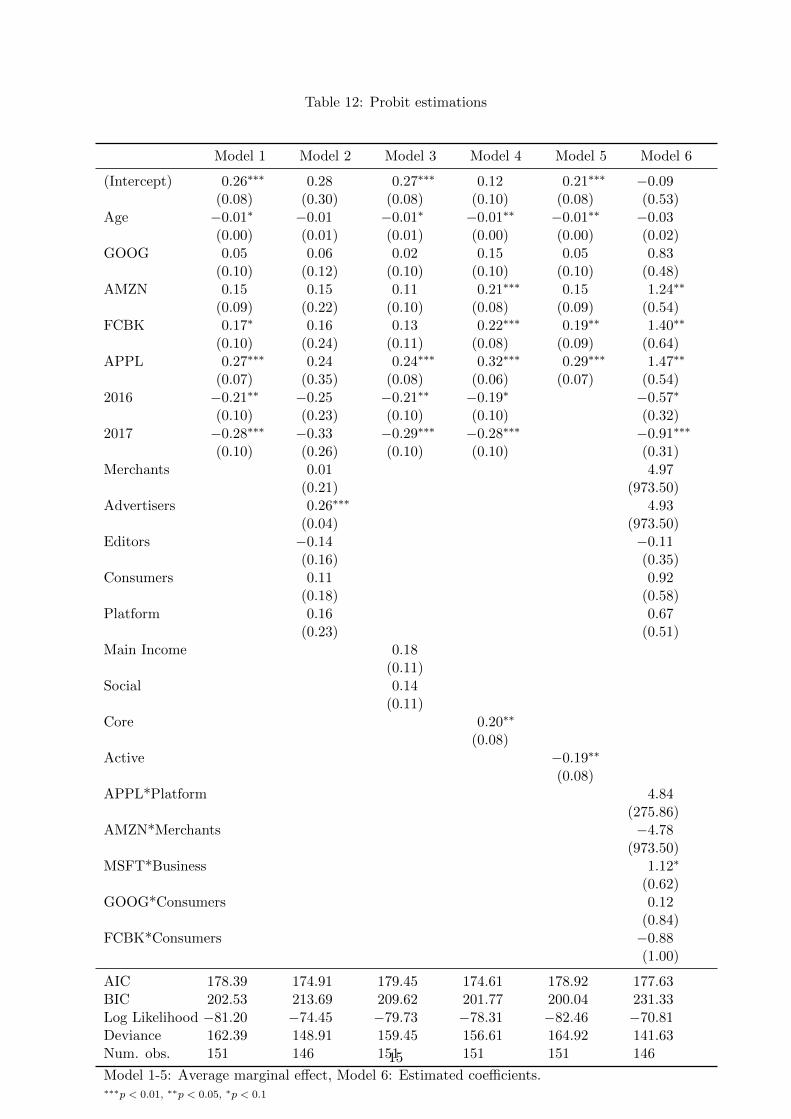
Table 12: Probit estimations
Model 1 Model 2 Model 3 Model 4 Model 5 Model 6
(Intercept) 0.26∗∗∗ 0.28 0.27∗∗∗ 0.12 0.21∗∗∗ −0.09(0.08) (0.30) (0.08) (0.10) (0.08) (0.53)
Age −0.01∗ −0.01 −0.01∗ −0.01∗∗ −0.01∗∗ −0.03(0.00) (0.01) (0.01) (0.00) (0.00) (0.02)
GOOG 0.05 0.06 0.02 0.15 0.05 0.83(0.10) (0.12) (0.10) (0.10) (0.10) (0.48)
AMZN 0.15 0.15 0.11 0.21∗∗∗ 0.15 1.24∗∗
(0.09) (0.22) (0.10) (0.08) (0.09) (0.54)FCBK 0.17∗ 0.16 0.13 0.22∗∗∗ 0.19∗∗ 1.40∗∗
(0.10) (0.24) (0.11) (0.08) (0.09) (0.64)APPL 0.27∗∗∗ 0.24 0.24∗∗∗ 0.32∗∗∗ 0.29∗∗∗ 1.47∗∗
(0.07) (0.35) (0.08) (0.06) (0.07) (0.54)2016 −0.21∗∗ −0.25 −0.21∗∗ −0.19∗ −0.57∗
(0.10) (0.23) (0.10) (0.10) (0.32)2017 −0.28∗∗∗ −0.33 −0.29∗∗∗ −0.28∗∗∗ −0.91∗∗∗
(0.10) (0.26) (0.10) (0.10) (0.31)Merchants 0.01 4.97
(0.21) (973.50)Advertisers 0.26∗∗∗ 4.93
(0.04) (973.50)Editors −0.14 −0.11
(0.16) (0.35)Consumers 0.11 0.92
(0.18) (0.58)Platform 0.16 0.67
(0.23) (0.51)Main Income 0.18
(0.11)Social 0.14
(0.11)Core 0.20∗∗
(0.08)Active −0.19∗∗
(0.08)APPL*Platform 4.84
(275.86)AMZN*Merchants −4.78
(973.50)MSFT*Business 1.12∗
(0.62)GOOG*Consumers 0.12
(0.84)FCBK*Consumers −0.88
(1.00)
AIC 178.39 174.91 179.45 174.61 178.92 177.63BIC 202.53 213.69 209.62 201.77 200.04 231.33Log Likelihood −81.20 −74.45 −79.73 −78.31 −82.46 −70.81Deviance 162.39 148.91 159.45 156.61 164.92 141.63Num. obs. 151 146 151 151 151 146
Model 1-5: Average marginal effect, Model 6: Estimated coefficients.∗∗∗p < 0.01, ∗∗p < 0.05, ∗p < 0.1
15
discontinued. An acquisition made in 2016 has 20% fewer chances to be discontinued than anacquisition made in 2015; an acquisition made in 2017 has almost 30% fewer chances to bediscontinued. Uncertainty, then, may explain some of the closure decisions but certainly notall.
When a product and its brand disappear or is integrated into the firm’s ecosystem, variouspossible motivations are conceivable. The acquiring firm could have wanted to add some func-tionality of the acquired product for its own products. In this case, the product might continueto exist, but under a different brand, name and layout. The acquirer may also decide to sell theproduct under its own brand, which has an established reputation and a higher potential forgrowth. Additionally, intellectual property or other technological know-how might have beenthe driver of the acquisition.18 Or, the transaction could be qualified as a so-called acqui-hire,if the main objective was to add engineers, programmers or other high-quality employees to thecompany. In all these cases, the acquisition strengthen the acquirer’s position on the marketand, it does not come as a surprise that discontinuation is more likely in the segments wherethe acquirer is already strong, i.e acquisitions in the core segments are more likely to be discon-tinued as our model shows. According to this, technology acquisition is the main driver of theintense merger activity. As a matter of fact, this explanation is often advanced by the GAFAMto justify their numerous acquisitions.
Yet, there is another competing explanation. Acquisitions (or at least some of them) aremotivated by the elimination of potential competitors. A young startup which develops asuccessful product and manages to acquire a sufficient large user base (or which has the potentialto do so) can be a competitive threat for an incumbent platform. Acquisition at an early stage,then, is a means of preventing the development of future competition and to reinforce theacquirer’s market power. In the digital sector, there is a growing fear that mergers are killermergers aiming at eliminating potential competition. The data and the evidence we show areperfectly compatible with this explanation. The GAFAM are acquiring intensively, mostly intheir core segments and our evidence shows that most of these products are no longer developedas independent products, and this is particularly true for young startups. Our paper adds tothis debate by showing the importance of discontinuations in the digital sector. These facts canjustify the fears that killing mergers are potentially important in the sector.
Unfortunately, our data does not enable us to screen between the two competing explana-tions for discontinuation, technology acquisition or killer merger. In the pharmaceutical sector,Cunningham et al. (2018) can track the development steps of the young startups (patent, clini-cal trials, etc.) acquired by the big pharmas and the proximity with the existing drug portfolioof the acquirer; they can therefore identify correctly killer mergers. As our data do not enableus to do so likewise, we cannot conclude that these discontinued acquisitions are killer acquisi-tions, nor that they aim at reducing competition on the market Additional data on the productdevelopment and on the relative importance of the competitive threat exerted by the startupare needed, but they are not easy to find. However, our evidence shows that there is a concernand that some, if not all, of these mergers may be intended to restrict competition.
Finally, notice that the fact that a product is continued does not eliminate competitionconcerns. Instagram, WhatsApp and Waze, which are referred to as potential examples of killermergers, continue to operate under their original brand name after having been acquired byFacebook and Google respectively. The decision to continue the development of the target’sproduct or to kill it depends on complementarities between products. With strong complemen-tarities, the acquirer prefers to continue the product rather than killing it.
18Puranam and Srikanthfor (2007) argue that acquiring firms can be interested in target companies either for”what they know or for what they do”. If acquirers are mainly motivated by the knowledge stock (technology, IPor human resources) of a target i.e. what they know, they will fully integrate it into their own processes. On theother hand, if the acquirer wants to use the target as an additional source of innovation i.e. what they do, it willkeep it running as a separate entity.
16
5 Conclusion
In this paper, we show that most of the acquisitions do not survive and that the product sup-plied disappears in its original form after acquisition by one of the GAFAM. This should bringthe attention of competition authorities. They indeed have the power to block an anticompet-itive merger. Yet, despite their intense merger activities, only few GAFAM acquisitions werescrutinized by antitrust authorities. Currently, there are growing fears that anti-competitivemergers fly under the antitrust radar. This is particularly problematic for the acquisitions bythe GAFAM who enjoy an already strong market position.
Two main reasons account for such fears. First, the target firm is often too small andits revenue usually falls below the usual threshold for investigation.19 There are exceptionsthough. For instance, the mergers between Apple/Shazam (2018) Microsoft/LinkedIn (2016),Facebook/WhatsApp (2014) and Google/Doubleclick (2008) were all approved by the EuropeanCommission, and so were the mergers between Facebook/Instagram (2012) and Google/Waze(2013) by the OFT. Nevertheless, most GAFAM acquisitions are not scrutinized by competitionauthorities and none of them have been blocked.20
Second, the acquired start-ups develop products and services that do not overlap with thenarrowly defined market in which the acquiring firm has a dominant position. For this rea-son, most acquisitions could be classified as conglomerate mergers and, as such, raise fewercompetitive concerns. However, a successful start-up may rapidly turn into a competitor ofthe dominant platform. This is particularly true if the firm has managed to rapidly acquirea large user base. Indeed, even if there is no obvious overlapping between products, the firmcan extend its products bundle and, with a sizable user group, turn into a significant competi-tor of the installed platform. In this case, the acquisition of the firm by the dominant firmmay substantially reduce (potential) competition on the market. However, as there is a lotof uncertainty surrounding the startup’s competitive potential, the anticompetitive effects of aproposed merger might be difficult to assess ex-ante as it is notably complicated to construct anappropriate counterfactual against which the effects of the merger should be appreciated. Thereis the risk of a false negative (clearing an anticompetitive merger). Several scholars considerthat competition authorities have underestimated that risk in their assessments (see Argentesiet al., 2019a) and that not only the risk but the cost of a type-II error should be considered(Bourreau and de Streel, 2019).
For these reasons, several recent high-profile reports from both sides of the Atlantic21 proposereforms of the merger assessment procedure. The possible reforms include firstly, a revision ofthe notification thresholds to be taken into account, e.g. the transaction value, the numberof affiliated users or other criteria. A change in the notification threshold is necessary to givecompetition authorities the opportunity to scrutinize the acquisition by a large platform of asmall startup.22 Secondly, they propose to change the balance of risk to give more importance tothe potential competition exerted by the target on the acquiring platform, even if there is a lot ofuncertainty surrounding future market evolutions. For the moment, a highly uncertain potentialcompetition is balanced with the most likely efficiency effects. In the merger assessment, it isproposed to give more importance to the former and less importance to the latter. Last, areversal of the burden of proof is suggested. In this case and in specific circumstances, it is upto the acquiring firm to demonstrate that the proposed acquisition has pro-competitive effects
19Germany and Austria have recently modified their notification thresholds, including a reference to the valueof the transaction.
20In August 2019, the FTC started to investigate Facebook’s motivations for acquiring Instagram and What-sApp.
21Argentesi et al. (2019a), Bourreau and de Streel (2019, 2020), Cremer et al. (2019), Scott-Morton et al.(2019)
22Wollmann (2019) shows that higher thresholds are detrimental to competition as they lead to a substantialincrease in (unscrutinized) mergers, especially horizontal ones between competitors.
17
rather than to the competition authority to demonstrate that the mergers have a negativeimpact on the market.
With 60% of the products discontinued, the possibility of killing acquisitions cannot beleaved aside and it is important that competition authorities take into account the competitivepotential of these young startups.23 The analysis and the data we provide in this paper show thatcompetition authorities should more closely scrutinize the merger activities of the technologicalgiants.
23Pellegrino (2020) documents that the increasing number of startup acquisitions leads to an increase in industryconcentration and markups.
18
References
[1] Argentesi, E., P. Buccirossi, E. Calvano, T. Duso, A. Marrazzo and S. Nava (2019a). Ex-post assessment of merger control decisions in digital markets, Report to the CompetitionMarket Authority.
[2] Argentesi, E., P. Buccirossi, E. Calvano, T. Duso, A. Marrazzo and S. Nava (2019b).Merger Policy in Digital Markets: An Ex-Post Assessment, Working paper DIW Berlin.
[3] Bourreau, M. and A. de Streel (2019). Digital conglomerates and EU competition Policy,report to the CERRE.
[4] Bourreau, M. and A. de Streel (2020). Big tech acquisitions, competition & innovationeffects and EU merger control, report to the CERRE.
[5] Bourreau M. and B. Jullien (2018) Mergers, investments and demand expansion, EconomicsLetters 167, 136-141.
[6] Bryan, K. and E. Hovenkamp (2020). Antitrust limits on startup acquisitions, Review ofIndustrial Organization 56, 615-636.
[7] Cabral, L. (2018). Standing on the shoulders of dwarfs: Dominant firms and innovationincentives, Working paper.
[8] Cunningham, C., F. Ederer and S. Ma (2018). Killer acquisitions, Working paper.
[9] Cremer, J., Y.-A. de Montjoye and H. Schweitzer (2019). Competition policy for the digitalera, Report to the European Commission.
[10] Etro, F. (2019). Mergers of complements and entry in innovative industries, InternationalJournal of Industrial organisation 65, 302-326.
[11] Federico, G., F. Langus and T. Valletti (2018). Horizontal mergers and product innovation,International Journal of Industrial Organization, 59, 1-23.
[12] Kim, D. (2018) Predictable Exodus: Startup Acquisitions and Employee Departures, Work-ing paper.
[13] Motta, M., Tarantino, E. (2017). The effect of horizontal mergers, when firms compete inprices and investments. Working Paper.
[14] Motta, M. and M. Peitz (2020). Big tech merger, Working paper.
[15] Ng, W. and T. Stuart(2020). Acquihired: Retained or turned over?, Working paper.
[16] Pellegrino, B. (2020). Product differentiation, oligopoly, and resource allocation, Workingpaper.
[17] Prat, A. and T. Valletti (2019). Attention oligopoly, Working paper.
[18] Puranam, P. and K. Srikanth (2007). What they know vs. what they do: How acquirersleverage technology acquisitions, Strategic Management Journal 28, 805-825.
[19] Scott Morton, F., P. Bouvier, A. Ezrachi, B. Jullien, R. Katz, G. Kimmelman, A.D.Melamed, and J. Morgenstern. (2019). Committee for the study of digital platforms: Mar-ket structure and antitrust subcommittee report, Chicago: Stigler Center for the Study ofthe Economy and the State, University of Chicago Booth School of Business.
19
[20] Wen, W. and F. Zhu, (2018). Threat of platform-owner entry and complementor responses:Evidence from the mobile app market, Strategic Management Journal 40(9), 1336-1367.
[21] Wollmann (2019) Stealth Consolidation: Evidence from an Amendment to the Hart-Scott-Rodino Act, AER: Insights, 1(1), 77-94.
20
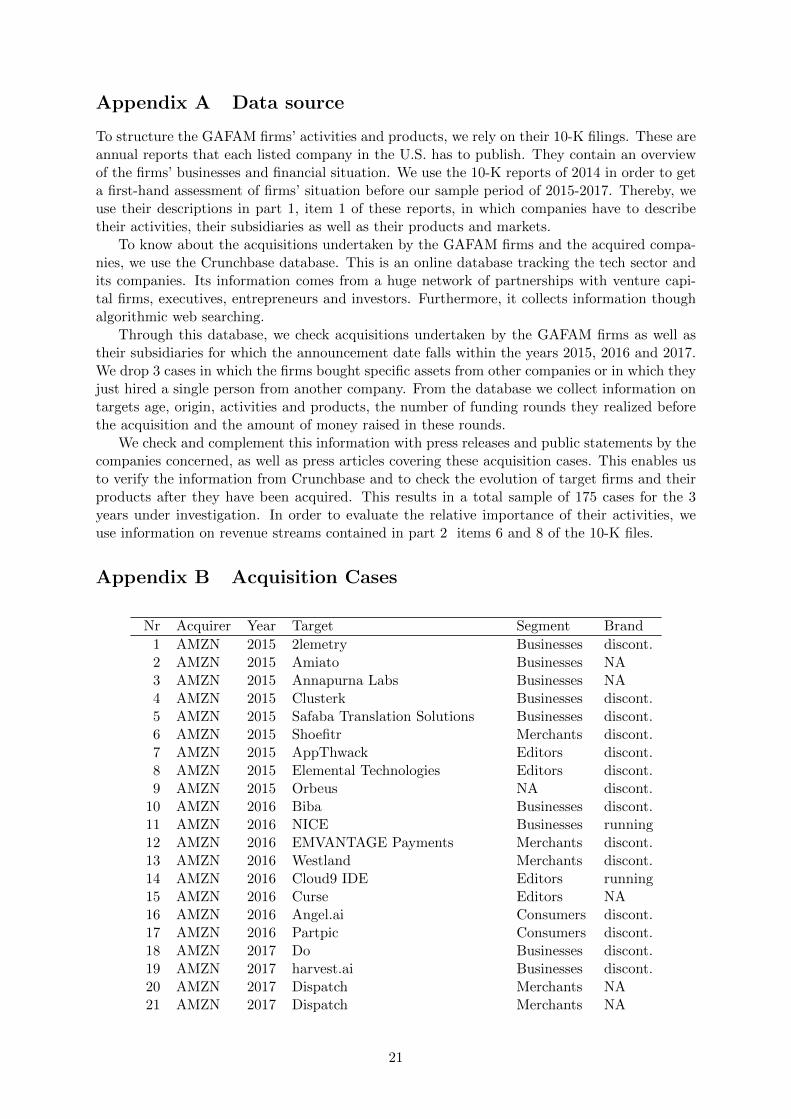
Appendix A Data source
To structure the GAFAM firms’ activities and products, we rely on their 10-K filings. These areannual reports that each listed company in the U.S. has to publish. They contain an overviewof the firms’ businesses and financial situation. We use the 10-K reports of 2014 in order to geta first-hand assessment of firms’ situation before our sample period of 2015-2017. Thereby, weuse their descriptions in part 1, item 1 of these reports, in which companies have to describetheir activities, their subsidiaries as well as their products and markets.
To know about the acquisitions undertaken by the GAFAM firms and the acquired compa-nies, we use the Crunchbase database. This is an online database tracking the tech sector andits companies. Its information comes from a huge network of partnerships with venture capi-tal firms, executives, entrepreneurs and investors. Furthermore, it collects information thoughalgorithmic web searching.
Through this database, we check acquisitions undertaken by the GAFAM firms as well astheir subsidiaries for which the announcement date falls within the years 2015, 2016 and 2017.We drop 3 cases in which the firms bought specific assets from other companies or in which theyjust hired a single person from another company. From the database we collect information ontargets age, origin, activities and products, the number of funding rounds they realized beforethe acquisition and the amount of money raised in these rounds.
We check and complement this information with press releases and public statements by thecompanies concerned, as well as press articles covering these acquisition cases. This enables usto verify the information from Crunchbase and to check the evolution of target firms and theirproducts after they have been acquired. This results in a total sample of 175 cases for the 3years under investigation. In order to evaluate the relative importance of their activities, weuse information on revenue streams contained in part 2 items 6 and 8 of the 10-K files.
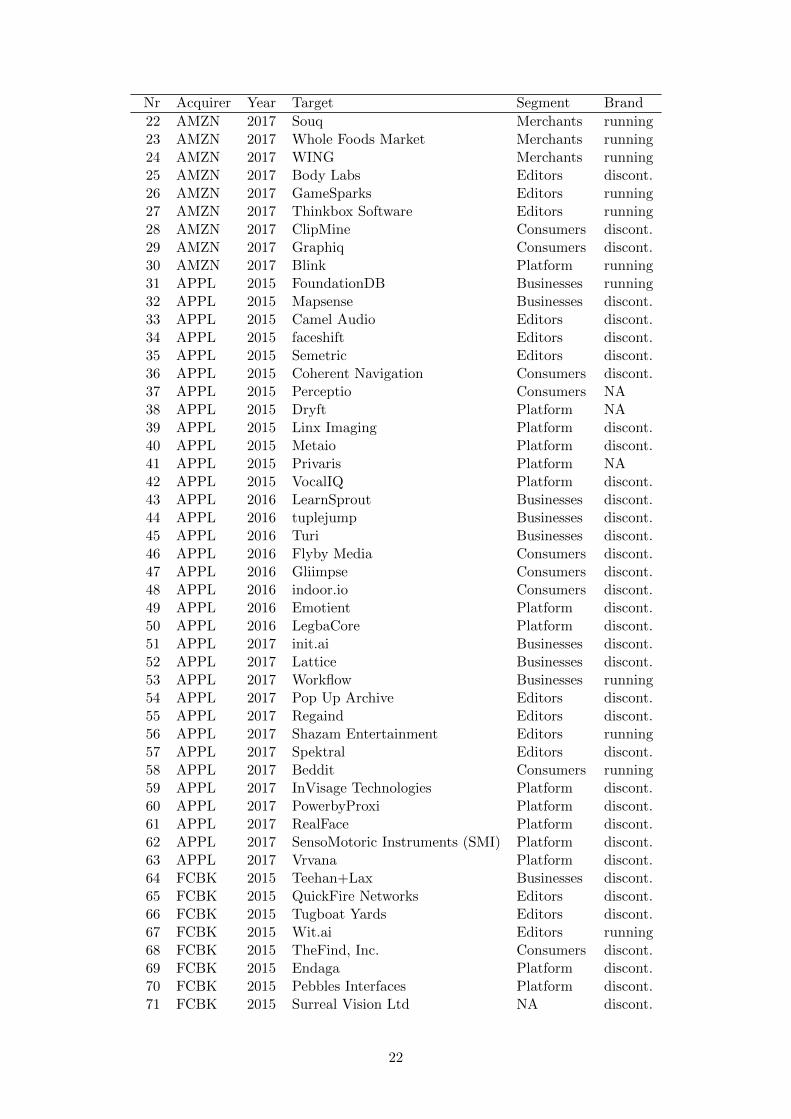
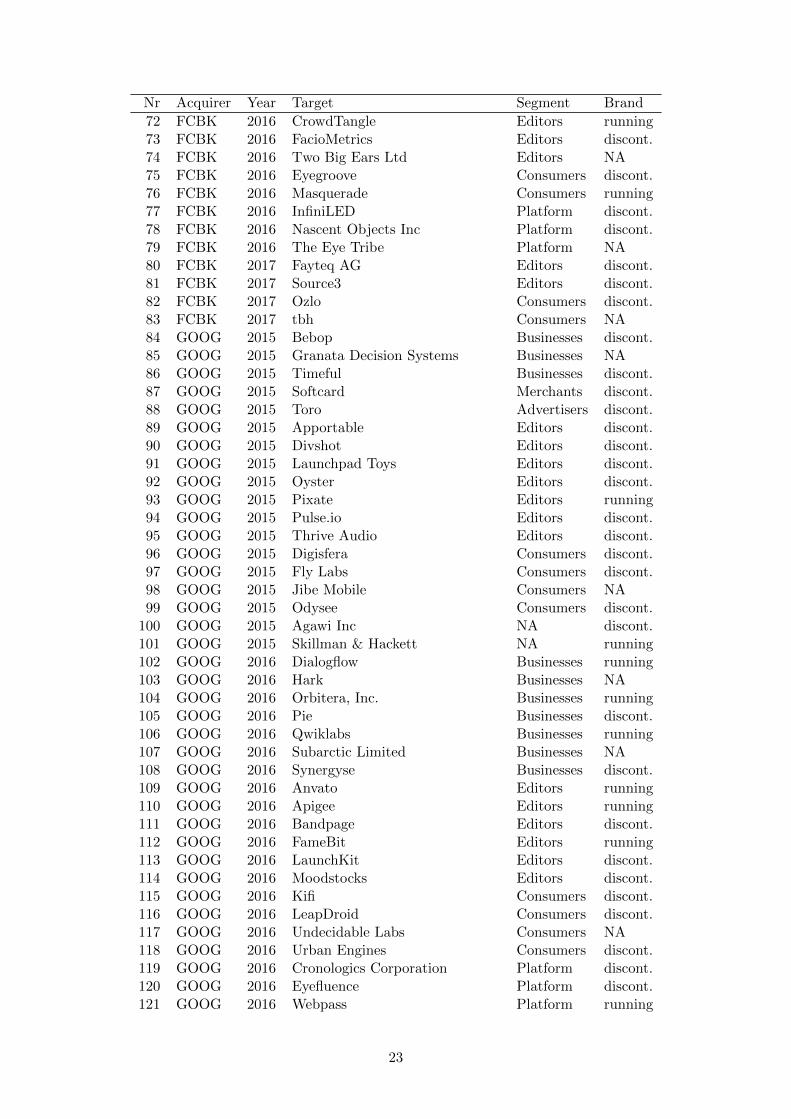
Appendix B Acquisition Cases
Nr Acquirer Year Target Segment Brand
1 AMZN 2015 2lemetry Businesses discont.2 AMZN 2015 Amiato Businesses NA3 AMZN 2015 Annapurna Labs Businesses NA4 AMZN 2015 Clusterk Businesses discont.5 AMZN 2015 Safaba Translation Solutions Businesses discont.6 AMZN 2015 Shoefitr Merchants discont.7 AMZN 2015 AppThwack Editors discont.8 AMZN 2015 Elemental Technologies Editors discont.9 AMZN 2015 Orbeus NA discont.
10 AMZN 2016 Biba Businesses discont.11 AMZN 2016 NICE Businesses running12 AMZN 2016 EMVANTAGE Payments Merchants discont.13 AMZN 2016 Westland Merchants discont.14 AMZN 2016 Cloud9 IDE Editors running15 AMZN 2016 Curse Editors NA16 AMZN 2016 Angel.ai Consumers discont.17 AMZN 2016 Partpic Consumers discont.18 AMZN 2017 Do Businesses discont.19 AMZN 2017 harvest.ai Businesses discont.20 AMZN 2017 Dispatch Merchants NA21 AMZN 2017 Dispatch Merchants NA
21
Nr Acquirer Year Target Segment Brand
22 AMZN 2017 Souq Merchants running23 AMZN 2017 Whole Foods Market Merchants running24 AMZN 2017 WING Merchants running25 AMZN 2017 Body Labs Editors discont.26 AMZN 2017 GameSparks Editors running27 AMZN 2017 Thinkbox Software Editors running28 AMZN 2017 ClipMine Consumers discont.29 AMZN 2017 Graphiq Consumers discont.30 AMZN 2017 Blink Platform running31 APPL 2015 FoundationDB Businesses running32 APPL 2015 Mapsense Businesses discont.33 APPL 2015 Camel Audio Editors discont.34 APPL 2015 faceshift Editors discont.35 APPL 2015 Semetric Editors discont.36 APPL 2015 Coherent Navigation Consumers discont.37 APPL 2015 Perceptio Consumers NA38 APPL 2015 Dryft Platform NA39 APPL 2015 Linx Imaging Platform discont.40 APPL 2015 Metaio Platform discont.41 APPL 2015 Privaris Platform NA42 APPL 2015 VocalIQ Platform discont.43 APPL 2016 LearnSprout Businesses discont.44 APPL 2016 tuplejump Businesses discont.45 APPL 2016 Turi Businesses discont.46 APPL 2016 Flyby Media Consumers discont.47 APPL 2016 Gliimpse Consumers discont.48 APPL 2016 indoor.io Consumers discont.49 APPL 2016 Emotient Platform discont.50 APPL 2016 LegbaCore Platform discont.51 APPL 2017 init.ai Businesses discont.52 APPL 2017 Lattice Businesses discont.53 APPL 2017 Workflow Businesses running54 APPL 2017 Pop Up Archive Editors discont.55 APPL 2017 Regaind Editors discont.56 APPL 2017 Shazam Entertainment Editors running57 APPL 2017 Spektral Editors discont.58 APPL 2017 Beddit Consumers running59 APPL 2017 InVisage Technologies Platform discont.60 APPL 2017 PowerbyProxi Platform discont.61 APPL 2017 RealFace Platform discont.62 APPL 2017 SensoMotoric Instruments (SMI) Platform discont.63 APPL 2017 Vrvana Platform discont.64 FCBK 2015 Teehan+Lax Businesses discont.65 FCBK 2015 QuickFire Networks Editors discont.66 FCBK 2015 Tugboat Yards Editors discont.67 FCBK 2015 Wit.ai Editors running68 FCBK 2015 TheFind, Inc. Consumers discont.69 FCBK 2015 Endaga Platform discont.70 FCBK 2015 Pebbles Interfaces Platform discont.71 FCBK 2015 Surreal Vision Ltd NA discont.
22
Nr Acquirer Year Target Segment Brand
72 FCBK 2016 CrowdTangle Editors running73 FCBK 2016 FacioMetrics Editors discont.74 FCBK 2016 Two Big Ears Ltd Editors NA75 FCBK 2016 Eyegroove Consumers discont.76 FCBK 2016 Masquerade Consumers running77 FCBK 2016 InfiniLED Platform discont.78 FCBK 2016 Nascent Objects Inc Platform discont.79 FCBK 2016 The Eye Tribe Platform NA80 FCBK 2017 Fayteq AG Editors discont.81 FCBK 2017 Source3 Editors discont.82 FCBK 2017 Ozlo Consumers discont.83 FCBK 2017 tbh Consumers NA84 GOOG 2015 Bebop Businesses discont.85 GOOG 2015 Granata Decision Systems Businesses NA86 GOOG 2015 Timeful Businesses discont.87 GOOG 2015 Softcard Merchants discont.88 GOOG 2015 Toro Advertisers discont.89 GOOG 2015 Apportable Editors discont.90 GOOG 2015 Divshot Editors discont.91 GOOG 2015 Launchpad Toys Editors discont.92 GOOG 2015 Oyster Editors discont.93 GOOG 2015 Pixate Editors running94 GOOG 2015 Pulse.io Editors discont.95 GOOG 2015 Thrive Audio Editors discont.96 GOOG 2015 Digisfera Consumers discont.97 GOOG 2015 Fly Labs Consumers discont.98 GOOG 2015 Jibe Mobile Consumers NA99 GOOG 2015 Odysee Consumers discont.
100 GOOG 2015 Agawi Inc NA discont.101 GOOG 2015 Skillman & Hackett NA running102 GOOG 2016 Dialogflow Businesses running103 GOOG 2016 Hark Businesses NA104 GOOG 2016 Orbitera, Inc. Businesses running105 GOOG 2016 Pie Businesses discont.106 GOOG 2016 Qwiklabs Businesses running107 GOOG 2016 Subarctic Limited Businesses NA108 GOOG 2016 Synergyse Businesses discont.109 GOOG 2016 Anvato Editors running110 GOOG 2016 Apigee Editors running111 GOOG 2016 Bandpage Editors discont.112 GOOG 2016 FameBit Editors running113 GOOG 2016 LaunchKit Editors discont.114 GOOG 2016 Moodstocks Editors discont.115 GOOG 2016 Kifi Consumers discont.116 GOOG 2016 LeapDroid Consumers discont.117 GOOG 2016 Undecidable Labs Consumers NA118 GOOG 2016 Urban Engines Consumers discont.119 GOOG 2016 Cronologics Corporation Platform discont.120 GOOG 2016 Eyefluence Platform discont.121 GOOG 2016 Webpass Platform running
23
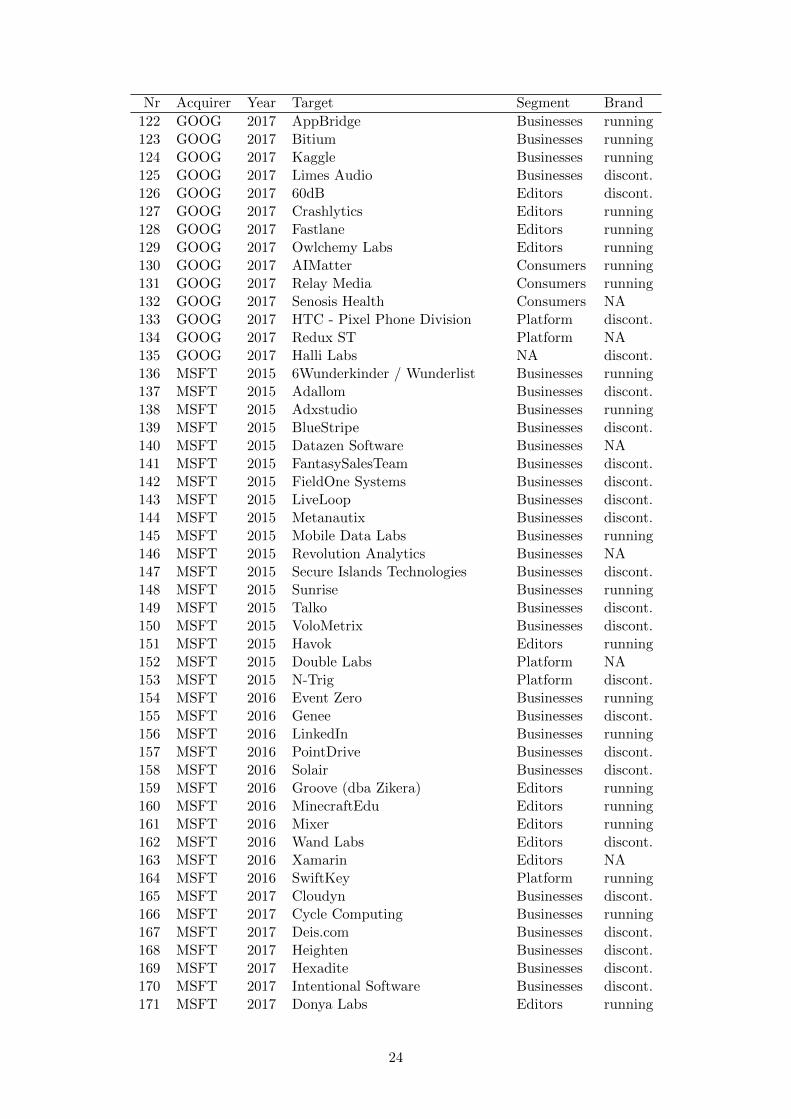
Nr Acquirer Year Target Segment Brand
122 GOOG 2017 AppBridge Businesses running123 GOOG 2017 Bitium Businesses running124 GOOG 2017 Kaggle Businesses running125 GOOG 2017 Limes Audio Businesses discont.126 GOOG 2017 60dB Editors discont.127 GOOG 2017 Crashlytics Editors running128 GOOG 2017 Fastlane Editors running129 GOOG 2017 Owlchemy Labs Editors running130 GOOG 2017 AIMatter Consumers running131 GOOG 2017 Relay Media Consumers running132 GOOG 2017 Senosis Health Consumers NA133 GOOG 2017 HTC - Pixel Phone Division Platform discont.134 GOOG 2017 Redux ST Platform NA135 GOOG 2017 Halli Labs NA discont.136 MSFT 2015 6Wunderkinder / Wunderlist Businesses running137 MSFT 2015 Adallom Businesses discont.138 MSFT 2015 Adxstudio Businesses running139 MSFT 2015 BlueStripe Businesses discont.140 MSFT 2015 Datazen Software Businesses NA141 MSFT 2015 FantasySalesTeam Businesses discont.142 MSFT 2015 FieldOne Systems Businesses discont.143 MSFT 2015 LiveLoop Businesses discont.144 MSFT 2015 Metanautix Businesses discont.145 MSFT 2015 Mobile Data Labs Businesses running146 MSFT 2015 Revolution Analytics Businesses NA147 MSFT 2015 Secure Islands Technologies Businesses discont.148 MSFT 2015 Sunrise Businesses running149 MSFT 2015 Talko Businesses discont.150 MSFT 2015 VoloMetrix Businesses discont.151 MSFT 2015 Havok Editors running152 MSFT 2015 Double Labs Platform NA153 MSFT 2015 N-Trig Platform discont.154 MSFT 2016 Event Zero Businesses running155 MSFT 2016 Genee Businesses discont.156 MSFT 2016 LinkedIn Businesses running157 MSFT 2016 PointDrive Businesses discont.158 MSFT 2016 Solair Businesses discont.159 MSFT 2016 Groove (dba Zikera) Editors running160 MSFT 2016 MinecraftEdu Editors running161 MSFT 2016 Mixer Editors running162 MSFT 2016 Wand Labs Editors discont.163 MSFT 2016 Xamarin Editors NA164 MSFT 2016 SwiftKey Platform running165 MSFT 2017 Cloudyn Businesses discont.166 MSFT 2017 Cycle Computing Businesses running167 MSFT 2017 Deis.com Businesses discont.168 MSFT 2017 Heighten Businesses discont.169 MSFT 2017 Hexadite Businesses discont.170 MSFT 2017 Intentional Software Businesses discont.171 MSFT 2017 Donya Labs Editors running
24
Nr Acquirer Year Target Segment Brand
172 MSFT 2017 Open Build Service Editors running173 MSFT 2017 AltspaceVR Consumers running174 MSFT 2017 Swing Technologies Consumers discont.175 MSFT 2017 Maluuba NA NA
Appendix C Additional statistics
Table 14: Summary statistics Age, funding rounds and funding
(a) Age of Targets
Acquirer Min. 1st Qu. Median Mean 3rd Qu. Max. NAs
all 0 3.00 4.00 5.97 7.00 54 1AMZN 1 3.00 4.00 8.00 7.75 54 0APPL 1 3.00 4.00 6.52 10.00 26 0FCBK 1 2.00 3.00 4.05 5.00 13 0GOOG 0 3.00 3.00 4.42 5.00 20 0MSFT 2 3.00 5.00 7.00 10.00 18 1
(b) Number of Funding Rounds
Acquirer Min. 1st Qu. Median Mean 3rd Qu. Max. NAs
All 1.00 1.00 2.00 2.55 3.00 14.00 52AMZN 1.00 1.75 2.00 2.62 3.00 7.00 6APPL 1.00 1.00 2.00 2.87 2.00 14.00 10FCBK 1.00 1.00 1.00 1.80 2.50 4.00 5GOOG 1.00 1.00 2.00 2.27 3.00 10.00 19MSFT 1.00 1.00 3.00 2.96 4.00 9.00 12
(c) Total Amount of Funding (in million $ )
Acquirer Min. 1st Qu. Median Mean 3rd Qu. Max. NAs
All 0.015 2.00 5.16 21.01 15.56 460.00 71AMZN 0.05 1.88 4.29 33.71 13.77 460.00 10APPL 0.35 1.69 4.70 20.91 21.78 143.50 15FCBK 1.00 3.21 3.77 7.71 11.83 26.00 10GOOG 0.015 1.50 4.63 13.42 11.20 197.67 23MSFT 0.52 3.45 10.50 24.75 21.04 154.80 13
25
View publication statsView publication stats


