Embed Size (px)
Citation preview
The Effects of Mergers and Acquisitions in thePharmaceutical Industry
By
Matthew David Lamb
Union College
March 14, 2014
1
1: Abstract
Corporate management strives to maximize and sustain
revenue and earnings growth, in order to drive shareholder’s
profits. Two key factors in providing long-term growth are
producing new products and possessing strong core operation
activities. The creation of new products primarily derives
from two options, either internal research and development,
or merger acquisition activity. Corporate mergers and
acquisitions (M&A) are a tempting option for senior managers
and board members. The potential to obtain rights to the
next “Blockbuster drug” helps drive demand. Internal
research and development (R&D) has a tendency to be a
sluggish process that does not guarantee to come to fruition
(Wang 2007). Mergers and acquisitions can help companies
obtain current high revenue generating drugs and can help
companies increase efficiency by reducing overhead. Mergers
2
and acquisitions can be used as a tool to help protect a
firm from competition.
The nature of the pharmaceutical industry makes it
extremely susceptible to globalization and industry
competition. In the 20th century, pharmaceutical companies
endured a slight change in development preference. A strong
trend of M&A activity swept across the industry and in 2000
firms spent roughly 1.6 trillion dollars in M&As. Compared
to the 300 billion dollars that firms spent in 1991, 2000’s
M&A activity rate is astronomically high (Hill and Jones
2004). This begs the question why? Have pharmaceutical firms
discovered the secret to rapid corporate growth? Or, are
firms following the industry’s herd mentality in the hopes
of achieving similar returns from particular firm’s M&As?
The long-term demand for M&A’s will be determined by the
success of transactions. In this paper I will be analyzing
the short-term and long-term realized abnormal returns in an
effort to determine if M&A’s increase the firms ability to
generate profit from its assets and increase its operational
efficiency.
3
The analysis will focus on companies in the
pharmaceutical sector, and more specially, the top companies
competing in the Pharmaceutical Preparation Manufacturing
industry (NAICS 325412); according to MergentsOnline. The
data was collected from 1982 to 2013; company’s dates range
due to their availability on MergentOnline. This study will
use a multi prong approach, both looking at four-years
performance pre and post-merger and acquisitions, while
compared to industry weighted averages, among other
benchmarks. This study will be focusing on both horizontal
and cross-sectional M&A activity.
There has been numerous studies on the performance of
M&A activity in the pharmaceutical industry. However, many
economic studies report conflicting results. Wang reports
evidence of both long and short-run abnormal returns for
acquisitions, but not for mergers. There has been no
evidence that mergers produce positive abnormal return,
although one study indicates that mergers do produce some
operational efficiency. The study reports that both return
on assets and cash flows improve post mergers (Wang 2007).
4
Across academic papers today the results are volatile, which
suggests that the effect of M&A activity is still a valid
and debated topic.
Table of Contents
Chapter One: Introduction5
A. Motivation to Participate in Mergers & Acquisitions6
B. Why the Pharmaceutical Manufacturing Industry8
Chapter Two: Literature Review
10
Chapter Three: Data and Methods18
A. Data Description18
5
B. Regression Methods22
Chapter Four: Empirical Results25
A. Event window results for Return on Equity 26
B. Event window results for Gross Profit Margin31
C. Event window results for Return on Investment
37
Chapter Five: Conclusion
42
Chapter One
6
1: Introduction
The overriding goal for a merger is to strengthen a
firm’s share value, generating increases in shareholders’
wealth. However, there is an on going debate between
academic researchers on what effect acquiring companies has
on shareholders’ wealth. There has been a plethora of
studies performed on mergers and acquisitions, indicating
both positive and negative effects on shareholder wealth. A
study by Agrawal reports a statistically significant
decrease in wealth of 10 percent following the merger’s
completion (Agrawal 1992). This study hypothesizes that the
market is slow to adjust to the effect of the merger. Firth
in 1980 reported that mergers and acquisitions do create
value (Firth 1980). Chatterjee’s 1986 study, reports that
acquiring firms indeed creates company value, but not
through the traditional notation of synergies. He indicates
that the value creation stems from unexplored opportunities
within the targeted company, which have either been
previously ignored or were unable to be performed because
the target firm was incapable of such activities (Chatterjee
7
1986). Due to the vast discrepancies in the results on the
firm’s post-performance after a merger and acquisition,
there remains to be unanswered questions. My analysis will
focus on the long-term pre and post-performance effects of
mergers and acquisitions (M&A) in the Pharmaceutical
Preparation Manufacturing industry (NAICS 325412), defined
by MerchantOnline.
The pharmaceutical industry is an attractive setting to
study M&A performance, due to the volume of M&A activity and
the susceptibility for high abnormal returns. This is
because newly invented brand name drugs can generate
substantial revenue. In this analysis we focus on abnormal
returns based on a firm’s return on investment, return on
equity, and gross profit margin.
This section will indicate the quintessential topic
discussed in the paper. The third section will indicate the
motivations behind why these firms will participate in
merger and acquisition activity. The fourth section will
discuss the rationale behind why pharmaceutical industries
are enticing to analyze. The fifth section will discuss the
8
relevant studies previously done in this subject matter. The
sixth section will divulge my data sources. The seventh
section will describe what type of regression methods are
used and how abnormal returns are generated. The eighth
section will consist of the findings from my research and
the analysis of the findings and the final section will
include a conclusion of the results and a discussion of
their limitations.
2: Motivation to Participate in Mergers & Acquisitions
Section two will describe the potential reasons firm part-
take in merger and acquisitions.
In order to have a comprehensive understanding of what
effect M&A’s have on shareholder value and why they have
that effect, it is important to acknowledge what motivates
acquiring firms to participate in M&A activity. “The
overriding goal for merging is maximization of owners’
wealth as reflected in the acquirer’s share price” (Krueger,
2010). However, often mergers are performed for other
9
reasons. According to Principles of Managerial Finance there are two
types of reasons for mergers and acquisitions, strategic and
financial.
In a strategic M&A the operations of the acquiring firm
and target firm are combined to achieve synergies. The
generated synergy or economies of scale result from the
merged firms lowering of overhead by the elimination of
redundant functions and employees. This is most clearly
identifiable when companies merge with other companies in
the industry. M&A’s can also provide rapid growth in size
and diversification of product line. The acquiring firm may
buy a target firm for their new developments, patents, or
the current drugs they produce. This type of merger would
allow them to expand product lines without incurring the
risks associated with designing, manufacturing, and selling
new or additional products. Many companies find M&A a more
cost effective alternative for growth, compared to “organic
growth” through internal research and development funding.
Lastly, strategic M&A activity can increase both managerial
and technological skills. Often companies cannot fulfill
10
their full potential due to insufficiency in particular
aspects of management, or the lack of necessary product
and/or technology (Krueger, 2010).
The motivation for financial M&A activity is that
acquiring companies believe they can restructure the
companies' cash flows, to reveal their untapped potential.
The acquiring company achieves this by cutting costs and
selling off unproductive assets, among other things.
Companies also participate in financial M&As for tax
benefits. This normally takes place when one company has a
tax loss carry-forward. When a merger occurs with a firm
that has a tax loss carry-forward, the company can apply
that tax loss to future earnings to reduce the other
company’s taxable income. The final motivation behind
financial M&A activity is to increase the firm’s ability to
fundraise. In this case a company may acquire a “cash rich”
company (high liquid assets and low liabilities,) to
increase its borrowing power by reducing its financial
leverage. By decreasing financial leverage, the company is
11
able to externally borrow funds at a lower cost (Krueger,
2010).
3: Why the Pharmaceutical Manufacturing Industry
Section three will discuss the rationale on why I chose
the pharmaceutical industry
The Pharmaceutical Industry has been highly influenced
by globalization due to the nature of its products. The
industry is particularly attractive due to the mass quantity
of mergers and acquisition activities. The pharmaceutical
industry has a rich history dating back to the late 19th
Century (Surrey 2005). Early characteristics of this
industry were centered on strong internal research and
developmental, and patent protection. Competition was based
on new product development and not price of certain drugs.
In a study conducted by Hill and Jones they said “The most
recent wave of mergers and acquisitions peaked in 2000 when
US firms spent some $1.6 trillion on 11,000 mergers and
acquisitions up from $300 billion in 1991. (Hill and Jones
12
2004)” It would seem that pharmaceutical firms have adverted
from the early practices to an increasingly preferred system
of mergers and acquisitions. In 1990 the top 10 companies in
this industry represented only 28 percent of the total
market. After an eight-year window, the largest ten
companies increased their market share to 36 percent (Marron
2006). Why has this change occurred? Some point to stricter
regulations on clinical trials by increasing time-to-market
and other development costs. However, the most significant
change may have stemmed from the implementation of a fixed
period on patent protection. For example, sales in Prozac
fell by 22 percent in the first year alone after the patent
expired (Marron 2006).
The drug manufacturing industry is unique in that it
has a high cost of drug development paired with an
incredibly low rate of success. In a study performed on the
top 50 largest pharmaceutical firms by sales, it was
reported that only one sixth of the self-originated drugs
that first entered clinical trials between 1993-2004 and
were observed in June 2009 were approved for retail (DiMasi
13
2010). This trend continued to fall; in a study of
pharmaceutical firms between 2004-2010, only one out of
every ten drugs entered the first phase of clinical trials
received FDA approval (Berkrot 2011). It’s very important to
note that many of the projects these companies fund fail
before they can even enter the first phase of clinical
trials. Pharmaceutical companies inherently understand these
statistics and therefore have an incentive to partake in M&A
activity either to supplement or outsource early stage
research.
In order to indicate the success of the M&A, this study
will be focusing on changes in efficiencies, accounting
ratios and abnormal returns in the firm’s short and long
run. Changes in these categories should “reflect the
synergies claimed in the company’s explanations of their
reasons for merging” (Wang 2007). According to Hassan and
Wang (2007) the pharmaceutical industry has predisposition
to incite M&A activity with firms that have potential
billion-dollar revenue power, referred to as “blockbuster
drugs. ” A prevalent example of this can be seen with the
14
company AstraZeneca. The company, based in London, was
formed in 1999 from Astra AB of Sweden merging with Zeneca
Group PLC of the UK. Two major blockbuster drugs were
developed due to this merger, Prilosec and Nexium. Prilosec,
despite losing its patent protect in 2002 generated 946
million dollars in 2009, while in 2009, still patented,
raked in $4.96 billion as AstraZeneca’s top seller (Berndt
2001). As certain companies exemplified, there is
particularly strong potential for high returns for these
types of M&A activity, leading many firms to correlate M&As
with increases in wealth. However, many studies on this
topic have not been able to conclude this effect. Once a
pharmaceutical company has patent on a new drug, they have
monopoly or oligopoly structure on that particular product-
market. Over this patent-protected period, abnormal returns
stemming from the M&A can be readily observed. In a 2001
study by Berndt, he reports that 80 percent of revenue is
lost after the expiration of the patent period (Berndt
2001). Due to all of the reasons listed, this study will
base its regressions on companies in the pharmaceutical
15
industry.
4: Literature Review
Section four will describe and discuss the finding of
economic studies similar to this study.
The majority of recent publishing on comprehensive
performance valuations for mergers and acquisitions have
been event studies. Event studies measure the statistical
effects of a merger and acquisition on a firm’s value.
Current findings have produced conflicting results depending
on which company the study is focused on: the acquiring or
targets company. Conclusive abnormal return results are
difficult to achieve because studies vary by time periods,
benchmarks, abnormal returns equations, and weighting
methodologies (Wang 2007). An inconsistency among previous
studies' variables makes comparisons difficult as well. Wang
in 2007 analyzed 405 mergers and acquisitions, 78 percent US
based targets and 22 percent foreign-based targets, between
the years of 1981-2004. Wang found no abnormal returns in
16
both short and long run mergers of both US and foreign based
acquiring companies (Wang 2007). Firth in 1980 investigated
434 takeovers (mergers) between the periods of 1969 to 1975.
He uses a market model to measure the effect takeovers have
on shareholder returns. Though the results were
insignificant, identified positive abnormal returns for
acquiring firms after 36 months following the takeover
(Firth 1980). Agrawal in1992 researched post-merger
performance in acquiring firms; he determined that acquiring
firms exhibited significant underperformance after a merger
(Agrawal 1992). Agrawal’s findings were consistent with
other works like Loughran and Vijh (1997), Asquith et al.
(1983) and Andre ́ et al. (2004).
To measure the performance of mergers and acquisitions,
an overwhelming number of studies focus on abnormal returns.
The idea of abnormal returns runs in contrast with the
efficient market hypothesis (EMH), which describes the
market as “perfect”: expected returns are equal to required
returns, prices react swiftly to new information, and stocks
17
are fully and fair priced. If EMH theory were correct,
abnormal returns would not exist ("Efficient Market
Hypothesis"). Abnormal returns are actual returns greater
than average market returns. These are often triggered by an
event. Recent studies have used M&A activity during a time
period as an event to see if there have been changes in
abnormal returns. Wang study uses cumulative abnormal
returns after an event (M&A activity) to see what the long
and short-term effects are (Wang 2007). Wang reports no
abnormal returns for acquiring companies post M&A in both
the short and long run. Sorescu in 2002 identified abnormal
returns on stock price created by M&As in the pharmaceutical
industry. Sorescu uses two methodologies to measure post-
event abnormal returns: the Fama and French three-factor
model and the mean monthly calendar time approach. His data
included 1414 acquisitions for eleven years between 1992 and
2002. Sorescu found that long run abnormal returns were not
statistically significantly, claiming the M&A activity had
no long run effect. Sorescu also analyzed short term effects
for acquiring companies and found a -1 percent return for
18
the three and five day window surrounding the announcement
of the acquisition (Sorescu 2002).
Previous and recent reports on a long-term acquiring
firm’s performance are mixed, but consensus is pointing to
negative post-merger performance. Andre in 2004 did a study
on 267 Canadian mergers and acquisitions between the years
of 1980 to 2000. The study focuses on completed M&A deals
with a minimum value of 10 million US dollars. Andre also
includes companies that performed numerous M&A deals during
this time period, similar to my study. To measure average
long run abnormal returns Andre construction monthly
portfolios in calendar time. He uses this method over an
event time approach because monthly returns are less
subjected to “the bad model problem. (Andre 2004)” Monthly
returns allow cross-correlation examination between the
companies in the sample size. In this model each month’s
returns are calculated from the portfolio of companies that
undertook M&A activity during month k of the calendar month
t. The dependent variable is excess returns, which is derived
19
from given month t’s return on portfolio minus the calculated
risk free rate. Andre found that mergers underperformed
significantly in both the long run and three-year horizon.
The three-year post-acquisition average abnormal returns for
the portfolio of Canadian acquiring firms resulted in a
statistically significant negative return of -0.523% per
month. Over a twelve-month period, that is a negative
abnormal return of -6.28 percent (Andre 2004). Andre was
unable to find significant positive results post M&A
activity.
Loughran and Vijh results indicate similar findings to
Andre (2004). Loughran and Vijh in 1997 collected annual
data and aggregate market value for 947 acquisitions by 639
firms, between the years of 1970-1989. Loughran and Vijh
only includes operating firms found on the NYSE, AMEX, or
Nasdaq, and excludes all ADRs, closed-end funds, and REITs.
To measure long run abnormal returns, the study ran an
annual regression of one-year buy and hold returns. Their
regression was run to find abnormal returns in the company’s
20
stock price. A regression run for the overall sample average
of 947 acquisitions for a five-year buy and hold period
indicated a return of 88.2 percent. The average acquisition
returns were 6.5% lower than that of competing non-
acquisition peers, and were statistically significant.
Loughran and Vijh ran an independent regression for firms
that participated in mergers. The returns indicated mergers
performed even worse. Firms that participated in a merger in
a five-year buy and hold model experienced an
underperformance of 15.9 percent compared to matching firms
(Loughran and Vijh 1997).
The majority of event studies and economic papers focus
on the creation of abnormal returns from the company’s stock
price. Healy study decided to use post-merger cash flow to
find abnormal returns instead of stock price. He says “Our
research is motivated by the inability of stock price
performance studies to determine whether takeovers create
real economic gains (Healy 1992).” One of the major causes
of the inability of stock price studies to successfully
21
determine the effect of M&A is market inefficiencies. A
possible explanation on why a stock price study may produce
positive abnormal returns is the market overvaluing the
equity (Healy 1992). The overvaluation of equities happens
on a day-to-day basis. By using a firm’s post and pre merger
accounting data to find real economic gains in M&A activity,
market inefficiency risk can be mitigated. Healy in 1992
collected data from the 50 largest target firms'
acquisitions between the years of 1979 to 1983. Healy
reports that merger firms have significantly greater return
on operating cash flows, due to greater asset productivity
in comparison to industry average (Healy 1992). Ravenscraft
and Scherer in 1987 also analyzed earnings performance after
takeovers. Their results contradicted Healy’s. They were not
able to identify any post takeover operational improvements
(Healy 1992).
Recent and historical academic literature has also used
operational efficiencies and financial ratios to measure
post M&A performance. Demirbag in 2007 states that value
22
creation and performance of M&A are created by changes in
cost-based and revenue-based synergies. His case study is a
comparative analysis of pharmaceutical companies pre M&A
during the years of 1995 to 1999 and post M&A for the years
of 2000 to 2004. The case study compares six companies,
three large pharmaceutical firms and three similar
pharmaceutical firms that operated through organic growth,
instead of M&A. The variables the study compares are
research productivity, return on investment (ROI), and
profit margin. Demirbag found that research productivity
pre-M&A was significantly higher at 78.7, than post-M&A at
only 12 (Demirbag, 2007). R&D based pharmaceutical firms saw
a similar decline during the same period for research
production, but operated at a higher level between 2000-2004
compared to M&A firms. For ROI post-M&A firms on average
performed better at 20.6 percent than non-M&A firm at 17.3
percent. Results for marginal profit were higher post-M&A
than pre-M&A, but only by a small amount (Demirbag, 2007).
Trivedi in 2013 performed a case study on the effect of
23
M&As on operational performance and shareholder wealth in
the short-run. Trivedi found inconsistencies on the effect
of earnings per share (EPS). The research shows examples of
firms both increasing post-M&A and firms EPS dropping by
half post-M&A. The research concluded that in the short run
post M&A firms endured significant reductions in Return on
Net Worth, Return on Capital Employed, Gross Margin, and Net
Margin. Trivedi notes that in the long run more synergies
may arise to help cope with competition, cut costs, and
increase a company’s market reach (Trivedi 2013).
To complement the first half of Wang's study on
abnormal returns in stock price, Wang also investigated
abnormal returns in operational efficiencies. The study
focused on pre-tax operational cash flows (ORET), Return on
Assets (ROA), and Return on Equity, pre and post-M&A. Wang’s
results indicate that post M&A firms have higher ROA ratios
than pre-M&A. Further, operating cash flows also improved,
but many of the positive returns were insignificant.
However, ROE does not improve post M&A, indicating that
24
larger mergers may not create value (Wang 2007).
Researchers have also analyzed cross-border mergers and
acquisitions. The results are mixed but predominantly
negative. Danzon in 2004 found positive abnormal returns
from both large horizontal and cross-border mergers. This
indicates that shareholders should expect positive value
creation from these types of mergers (Danzon 2004). Black in
2001 also analyzed cross-border M&As. His sample included
361 M&A transactions over the period of 1985 to 1995. Black
focused on abnormal returns to measure M&A performance. In a
three and five year regression of abnormal returns, which
the researchers considered to indicate the long run effects,
Black found negatively significant returns. The study
reports that 53 percent of cross-border M&As resulted in
lower shareholder value one year after M&A (Black 2001). The
negative returns for cross-border firms post M&A in both
three and five-year regressions are consistent with the
domestic findings of both Agrawal and Loughran & Vijh. Conn
in 2001 performed a study comparing domestic and cross-
25
border acquisitions between the years of 1984 to 2000. Conn
concluded that domestic acquisitions did produce negative,
but not cross-border acquisitions. Conn’s regressions showed
significant neutral long-term returns post takeover of
cross-border firms. Their research shows there was no
difference in abnormal returns between domestic and cross-
border M&A’s, in the second and third years (Conn 2001).
With research merger and acquisition performance, there
is a plethora of benchmarks and variables that can alter
findings. In multiple recent academic studies researchers
employ controls for firm size. Andre, Barber and Lyon, and
Kothari and Warner used reference portfolios to control for
firm size (Wang 2007). To construct the size control
portfolio, Andre each month ranked the securities he was
researching by market capitalization. In addition to
controlling for size, recent merger and acquisition studies
on measuring performance also control for book-to-market
ratio. Loughran and Vijh make the connection between book-
to-market ratio and method of payment (Loughran and Vijh
26
1997). Andre’s results show that companies that participated
in M&A activity with target firms with a low book-to-market
ratio outperformed companies that purchased target firms
with high book-to-market ratios, but these results were
insignificant in the long run. Similar to Andre, and
Loughran and Vijh control for market-to-book ratio, Asquith
in 1983 controls for method of payment. Asquith reported
discrepancies on post M&A returns when the form of payment
differs. The study indicated positive returns when M&A
activity was paid in cash, and negative returns for
acquiring companies post M&A that completed the transaction
through stock offering (Asquith 1983).
In order to generate an abnormal return, a benchmark
needs to be incorporated to provide a basis to compare to.
Studies that use stock price to generate abnormal returns
will frequently use tailored industry indexes as a
benchmark. For abnormal returns that focus on accounting
data, indexes will not provide a useful benchmark. Instead
industry averages will be used. Agrawal controlled for
27
changes in company risk or beta on a month-to-month basis.
“When investigating long-run returns over several years,
Dimson and Marsh (1986, especially Fig. 1) present
persuasive evidence that measured performance can be
significantly affected by the firm size effect (Agrawal
1992)” However, Agrawal found that acquiring firms lost 10
percent, five-years post merger. This finding was not
affected by changes in a firm’s beta (Agrawal 1992).
Limited academic research has investigated the various
effects of M&A in the pharmaceutical industry. There is an
abundance of different methods available to measure M&A
performance in the pharmaceutical industry. Because of these
varying methodologies, differentiating time frames, and
changes in the industry regulations, comparison among
different studies proves to be difficult. Danzon (2004)
controls for propensity to merger due to patent expiration,
depleted drug production, and visible firm characteristics.
Danzon (2004) concludes that firms with high propensity to
merge have low internal R&D growth. He further concludes
28
that mergers have a negative effect on internal sales and
R&D growth (Danzon 2004).
My paper will focus on the long and short run effects
of pre & post-M&A for acquiring firms. The methodology this
paper for calculating abnormal returns will use the
traditional market model and abnormal returns equation. We
will be regressing profitability ratios to identify a firm’s
abnormal returns over a period of time. To adjust for cross-
sectional dependency, my study will be weighted according to
size and income generating ability to minimize redundant
detection of long run abnormal returns. To avoid other
potential biases, this analysis will also control for beta,
and firm size. The approaches this paper will participate in
are described in more detail in the proceeding paragraphs.
5: Data and Methods
Section five will present and describe the data I collected and the regression methods used.
Data Description
The data pertaining to the dates of mergers and
29
acquisitions activity is gathered from MergentOnlines and
LexisNexis Company Profiles. MergentOnline gives members
access to all publicly traded company information, which
includes a detailed list of the company’s historic
activities. To reinforce the validity of the collected data,
this analysis fact checked using the LexisNexis resources.
LexisNexis uses the resources of Experian Corpfin, SDC
Mergers and acquisitions, and Mergerstat M&A database, which
display the effective date, the quantitative amount, and
synopsis of the merger or acquisition.
The data includes both United States and foreign
companies merger and acquisition activity on the New York
Stock Exchange. The date of the completion of the merger and
acquisition activity or “effective date” is used to
differentiate the company’s post and pre performance. For
example, if Merck were to acquire Pfizer and the effective
date was June 2005, then 2000 to 2005 would constitute five
years pre merger and 2006 to 2010 would represent five years
post merger. The data collected in this study is considered
30
to be panel data or longitudinal data. Panel data contains
observations where multiple cases (in our case firms) will
be observed multiple times at different time periods. Panel
data is unique because it can provide two types of
information. It can show the difference in performance
between two or more firms, and how the firms performed over
time.
As Healy (1992) states, the use of stock price to
measure the true economic gain of merger and acquisition
activity may not be the best indication of the firm’s
performance. Unlike Loughran and Vijh and Andre who used a
stock price variable to find abnormal returns, this study
uses accounting profitability measures as variables to
generate abnormal returns. Unlike stock price, which is
susceptible to human error and volatile fluctuations,
profitability measures reflect the overall performance of
the company (Healy 1992). If synergies are achieved, then
those synergies should be reflected by an increase in the
company’s profitability. According to investment
31
professionals, the listed measurements are critical in
determining the health and future of the company. The
variables I chose to measure each firm’s profitability were
return on investment, gross profit margin, and return on
equity. The advantage of using profitability ratios is that
inflation does not affect the accounting ratios. This is
because accounting ratios are calculated in the current
fiscal year. The percentage calculated is therefore not
affected by inflation.
The most significant limitation of my data is its
ability to capture the entire effect of M&A activity. In our
estimation we are expecting to be able to identify changes
in the company’s performance within a ten-year window.
However, some firms may take ten years post merger for the
company to be able to benefit from the M&A activity. In
certain situations the beginning M&A activity can produce
negative abnormal returns due to possible redundancies in
operations. In fact, there is not a defined time period when
companies always are able to fully benefit from their
32
acquisition. Our study may not accurately identify all of
the abnormal returns because some of the benefits from the
M&A activity could come to fruition a decade after the
activity took place.
The sample size used in this paper consists of twenty
companies that participated in at least one or more merger
and/or acquisitions, between 1982 and 2013. After omitting
companies with incomplete data on MergentsOnline, or
suspicious merger and acquisition dates, the number of
mergers and acquisitions for gross profit margin (GPM) and
return on equity (ROE) dependent variables is forty-nine.
Return on investment has fifty M&A activity observations,
because there was more historic information on MergentOnline
for this variable. The profitability ratios are calculated
using the firm’s annual fiscal year accounting information.
As stated before, all companies participating in the
following regressions are constituted as operating in the
Pharmaceutical Preparation Manufacturing industry (NAICS
325412). The fiscal year for the majority of the sample
33
companies expires at the same time.
Table 1: Summary Statistics
Variable
Obs Mean
Std. Dev. Min Max
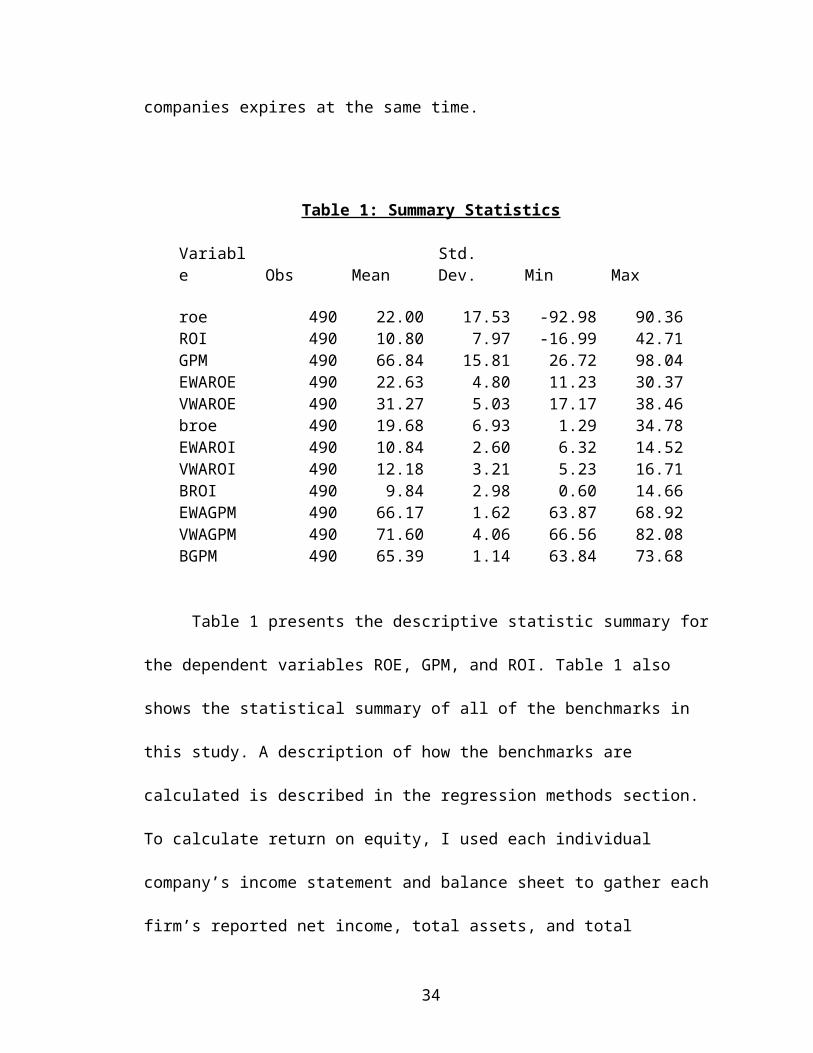
roe 490 22.00 17.53 -92.98 90.36ROI 490 10.80 7.97 -16.99 42.71GPM 490 66.84 15.81 26.72 98.04EWAROE 490 22.63 4.80 11.23 30.37VWAROE 490 31.27 5.03 17.17 38.46broe 490 19.68 6.93 1.29 34.78EWAROI 490 10.84 2.60 6.32 14.52VWAROI 490 12.18 3.21 5.23 16.71BROI 490 9.84 2.98 0.60 14.66EWAGPM 490 66.17 1.62 63.87 68.92VWAGPM 490 71.60 4.06 66.56 82.08BGPM 490 65.39 1.14 63.84 73.68
Table 1 presents the descriptive statistic summary for
the dependent variables ROE, GPM, and ROI. Table 1 also
shows the statistical summary of all of the benchmarks in
this study. A description of how the benchmarks are
calculated is described in the regression methods section.
To calculate return on equity, I used each individual
company’s income statement and balance sheet to gather each
firm’s reported net income, total assets, and total
34
liabilities. This information was collected through the
MergentOnline database. Return on equity is calculated by
net income over average common shareholders’ equity, where
average common shareholders equity is derived from
difference between total assets and total liabilities, then
averaged with the previous years common shareholders equity.
The number of observations for ROE is 500. ROE had a mean of
22%, and a standard deviation of 17.52; this is the largest
out of all of the dependent variables.
The profitability measures return on investment and
gross profit margin were calculated using MergentOnline
resources, these dependent variables included 490
observations. Return on investment can be calculated in
numerous ways but due to some limitations of the data,
return on investment is calculated in the following way:
dividing net income over average total asset, where average
total assets is the average of the current year’s total
assets and the previous year’s total assets. ROI showed the
smallest standard deviation value, suggesting its sample
35
size has the least variation from the mean. Gross profit
margin indicates the firm’s ability to generate profits
through its core operations. This ratio represents the
percentage of each sales dollar remaining after the cost of
goods sold. Gross profit margin is derived by dividing the
difference between revenue and cost of goods sold over
revenue. GPM had a mean of 66.84%, suggesting on average
over the entire time period firms have the ability to retain
66.84 cents per dollar of goods sold. No firm in this sample
size produced a negative GPM.
7: Regression Methods
The following regression is an event study, because it
uses statistical methods to identify the impact of mergers
and acquisitions on firm performance. The data analysis and
statistical software used to perform this event study was
Stata. The event study approach is used to analyze the
reaction of profitability ratios after the completion of a
major merger and/or acquisition. The regression model used
was the random effect model. The random effect model is used
36
because we are assuming that the independent variables are
random and not fixed. The variables in this regression are
random variables because these twenty companies are intended
to help generalize the pharmaceutical market as a whole
(Portland State School, 2006). Similar to Wang, often time
firms would have overlapping mergers, meaning that companies
would perform more than one merger in a five-year span.
Overlapping mergers can cause a cross-sectional dependency
problem (Wang 2007). To control for this, I isolated each
merger as its own individual firm. For example, if Merck
bought Johnson and Johnson in 2000, and Aetna in 2002, the
firm name for the first merger would be Merck and the firm
name for the second merger would be Merck1. In order to run
the regression that corresponded with merger and acquisition
activity, a specific date had to be selected, and estimated
parameters needed to be constructed. To illustrate this,
suppose a company’s effective date for a merger is September
30th 2008. An estimated event window is then constructed for
two defined periods per-merger years (-4, 0) to represent
five year prior to merger, and post-merger years (1, 5) to
37
represent five years performance post merger. In order to
analyze the effect of abnormal return over time, I adjusted
the estimated window range from a ten-year window to smaller
ranges. This allows me to compare the effect of abnormal
returns in both the long and short-run.
To adjust for size bias and to estimate abnormal
returns, I used a market model with three different
benchmarks. The first benchmarked used, BROE, was computed
using the ratios from the firms included in the study plus
twenty companies operating on different exchanges. These
additional companies are classified as working in the
pharmaceutical sector of the market. Additionally, according
to the experts at MergentOnline, all companies added into
the benchmark were characterized as competitors to the
majority companies in the pharmaceutical preparation and
manufacturing industry. The next benchmark I created was an
equally weighted average of each company’s profitability
ratio per year. This benchmark was created by averaging the
ratios of each company equally, implying that each firm’s
38
ratios have the same effect on the average. The last
benchmark used in this analysis was a value weighted
average. The value-weighted benchmark was valued by the
firm’s ability to generate income. For the dependent
variables ROE and ROI net income was used to determine the
company’s impact on the average. The more net income a
company had, the greater impact their ratio has on the
average. For GPM the value of the firm’s ratio on the
benchmark average is determined by the amount of revenue the
company generates. The reason we used value-weighted average
is that larger companies are traditionally viewed as less
volatile and a better indicator of industry performance. The
equally weighted and value weighted benchmark were
calculated using only the companies included directly in the
study. The use of three different benchmarks will help
support the validity of my findings.
The traditional market model to generate estimated
abnormal returns is calculated by:
R i, t = α + Benchmark + ε i, t
39
(1)
Where Ri,t is the return on company i during year t, α is
alpha. The traditional market model only calculates the
firm’s return for a certain time period. The traditional
model helps us generate the predicted return for a certain
time period. To determine if a company benefited or
suffered from M&A activity, we examine each firm’s abnormal
returns over a single time period. To identify a firm’s
abnormal return per year, we used the following equation:
ARi,t = R i, t – predicted return
(2)
The methodology behind finding abnormal returns will be
described in this section. Predicted return is calculated
using the company’s historic performance and industry
benchmarks and previous performance as a tool to estimate
how the company should be performing. The estimated model
implies that a company will continue on its historic trend
within the parameters of the industry as a whole. The actual
40
predicted value was generated using the Stata. When
calculating the difference between the company’s actual
performance and its predicted performance, we are able to
identify if the company has experienced a change in its
trends. If the company continues on its historical trend
then abnormal returns will be zero. If the abnormal return
is a positive number, this indicates that the company,
because of the merger and acquisition activity, was able to
improve on its traditional and expected growth trend. If the
abnormal return is a negative number, then this means that
the M&A activity actually had a negative impact on the
company’s growth trend. The abnormal return will be
statistically important only if the data comes to be
statistically significant, meaning P values are less
than .05. Once the abnormal returns are achieved, averages
are computed for each year across all firms.
8: Empirical Results
In this section we present and discuss our empirical
findings using the model discussed above.
41
Event window results for Return on Equity
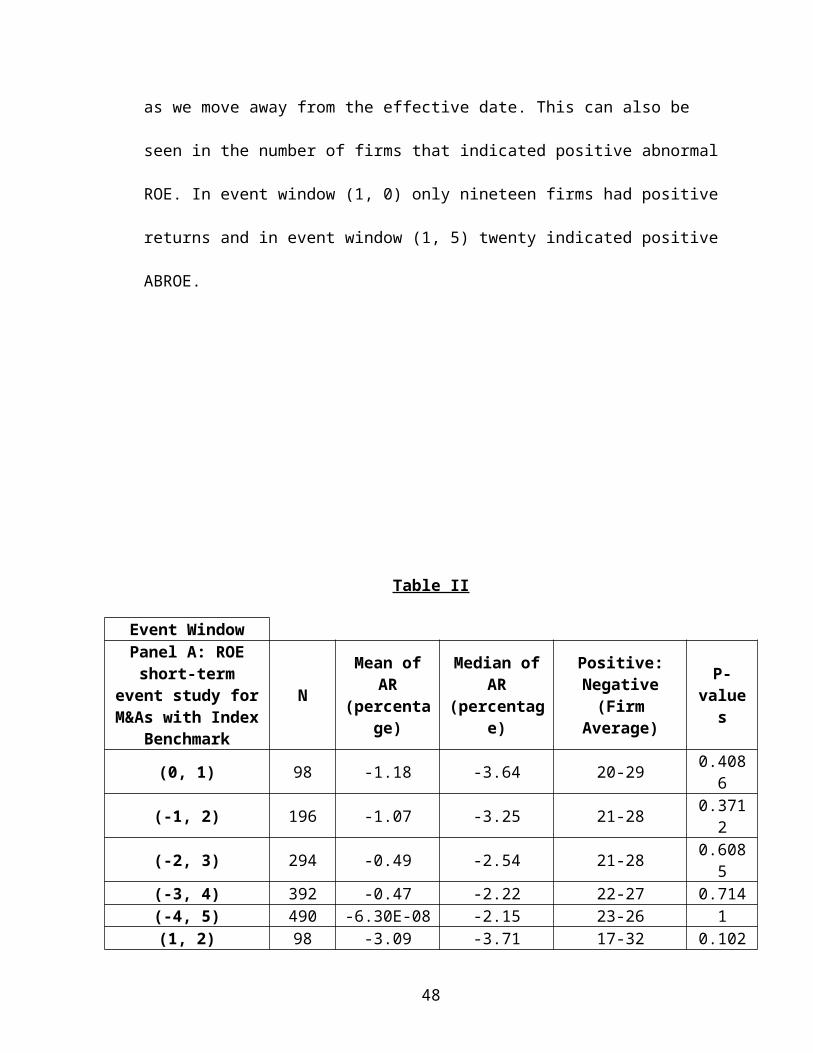
Table II shows the results of the horizon short-term
event study based on return on equity, using the traditional
market model and our abnormal returns equation. Panel A
reports the profitability performance results for M&A
activity based on the company’s return on equity. The
benchmark that Panel A incorporates uses multiple
competitors not located on the New York Stock Exchange; this
provides more broad exposure to the overall performance of
the pharmaceutical industry. Panel B reports the results of
the same information as Panel A; however, Panel B uses the
equally weighted averages as the benchmark. Panel C
integrates the same event windows as both Panels A and B,
while using a different benchmark of value weighted average.
In the preceding tables N represents the number of
observations, and the mean and median are represented as a
percentage. The column Positive: Negative represents the
number of firms that had either a negative or positive mean.
42
The results in Panel A indicate that after a merger or
acquisition occurs, the company’s return on equity ratio is
reduced. The average drop in a company’s ROE two years post
M&A activity is -3.08 percent. Excluding event window (1,
4), which represents the average abnormal ROE four years
post merger, year-over-year the value of ROE increases. The
value of abnormal ROE from two years post merger to five
years post merger increased by thirty percentage points.
Event windows (1, 3), (1, 4), and (1, 5) are all
statistically significant values at alpha .05. This
indicates that our results show with 95% confidents that on
average firms participating in M&A activity three, four, and
five years post merger will produce negative returns.
What is interesting about Panel A’s results is the
trend of how much abnormal ROE has dropped year after year.
Event window (0, 1), which illustrates the abnormal return
on equity for one year post and pre-merger, has a negative
abnormal ROE of -1.18%. Though this number is not
statistically significant, the value is what we would have
predicted. In the first year post and pre merger, the
43
companies produced the worst median and mean abnormal
return. As the study begins to incorporate more years after
and before the “effective date,” the abnormal ROE begins to
increase in value. This can be seen in event windows (-1,
2), (-2, 3), and (-3, 4); the average abnormal ROE increases
by .11 percentage points when expanding the post and pre
merger to a total span of four years. This trend continues
in the six-year (-2, 3) window where the abnormal ROE
increased by .69 percentage points. After the window
incorporates eight years, the average AR increased by .70
percentage points.
Congruent with the increases of mean of abnormal
return, the median abnormal return on equity also increased
as the study incorporates more years after and before the
merger’s effective date. Despite the increase of abnormal
ROE year-over-year, the mean and median abnormal return on
equity four-years pre and post-merger is still negative. It
is also worth noting that as our event windows include more
years, the P values also increase in significance, except
for in event window (-1, 2).
44
Panel B compares the sample size companies’ return on
equity while using the equally weighted benchmark. Similar
to our index benchmark, no positive mean or median abnormal
return on equity was identified in any of the event windows.
Panel B signifies that as we incorporate more years post and
pre merger, the average value of abnormal ROE increases. In
the first year pre and post M&A completion, only twenty-one
companies out of forty-nine produced positive abnormal
returns. However, in event window (-3, 4), which included a
regression of eight years (four pre, and four post), twenty-
five companies were identified as generating a positive
abnormal return on equity. Panel B also displays the fact
that as we expanded our event window period, the P-value
increases. Panel B, in comparison to Panel A, has
significantly lower mean and median abnormal ROE. This may
suggest that the included pharmaceutical companies have
produced higher levels of ROE over the same period than the
companies directly included in this study.
Panel B displays statistically significant results from
event windows (1, 3) and (1, 4) at alpha .05. This
45
indicates that we are 95% confident that on average abnormal
return on equity will be -3.17% three years post merger, and
-3.03% four years post merger. When comparing firms’ average
abnormal return on equity one-year post merger to five years
post merger, the average abnormal return increases by .38
percentage points. This suggests that as firms move away
from the completion date of M&A activity, the average
abnormal return on equity percentage increases. This is
supported by the increase in the number of firms that were
identified with positive mean abnormal ROE. After the first
year post merger, only twenty-one firms produced a positive
mean abnormal ROE. This number increases to twenty-three
firms after a five-year period post M&A activity.
Panel C differs from the other two Panels because it
uses a value weighted index. Despite the different
benchmarks, the trend of the numbers is quite similar to the
other Panels. The results in event window (0, 1) produced
the greatest mean and median negative abnormal return on
equity (ABROE). Again as we include more post and pre M&A
activity years, the mean and median abnormal ROE increases
46
in value. This trend can be supported when looking at the
number of companies that had a negative abnormal ROE one-
year post & pre merger versus four years post & pre merger.
In event window (0, 1) twenty-seven companies were
identified as having a negative abnormal ROE. In event
window (-3, 4) the number of companies experiencing negative
ABROE decreased to twenty-six. The trend of increasing mean
and median ABROE is consistent within A, B, and C Panels.
Panel C also displays the abnormal return on equity
just for years after merger. Only event windows (1, 3), and
(1, 4), representing three and four years post merger, are
statistically significant at alpha .05. For three-year post
M&A activity, firms on average produced -3.13% less abnormal
return on equity. In a four-year period post M&A completion
date, firms had an average 3.35% less abnormal return on
equity. Isolating all of the event windows that strictly
obtain post M&A activity years, the largest percentage
decrease in ABROE was (1, 2), and the smallest decrease in
ABROE was in (1, 5). This is similar to the trend discussed
above where the value of abnormal return on equity increases
47
as we move away from the effective date. This can also be
seen in the number of firms that indicated positive abnormal
ROE. In event window (1, 0) only nineteen firms had positive
returns and in event window (1, 5) twenty indicated positive
ABROE.
Table II
Event WindowPanel A: ROEshort-term
event study forM&As with Index
Benchmark
N
Mean ofAR
(percentage)
Median ofAR
(percentage)
Positive:Negative(Firm
Average)
P-value
s
(0, 1) 98 -1.18 -3.64 20-29 0.4086
(-1, 2) 196 -1.07 -3.25 21-28 0.3712
(-2, 3) 294 -0.49 -2.54 21-28 0.6085
(-3, 4) 392 -0.47 -2.22 22-27 0.714(-4, 5) 490 -6.30E-08 -2.15 23-26 1(1, 2) 98 -3.09 -3.71 17-32 0.102
48
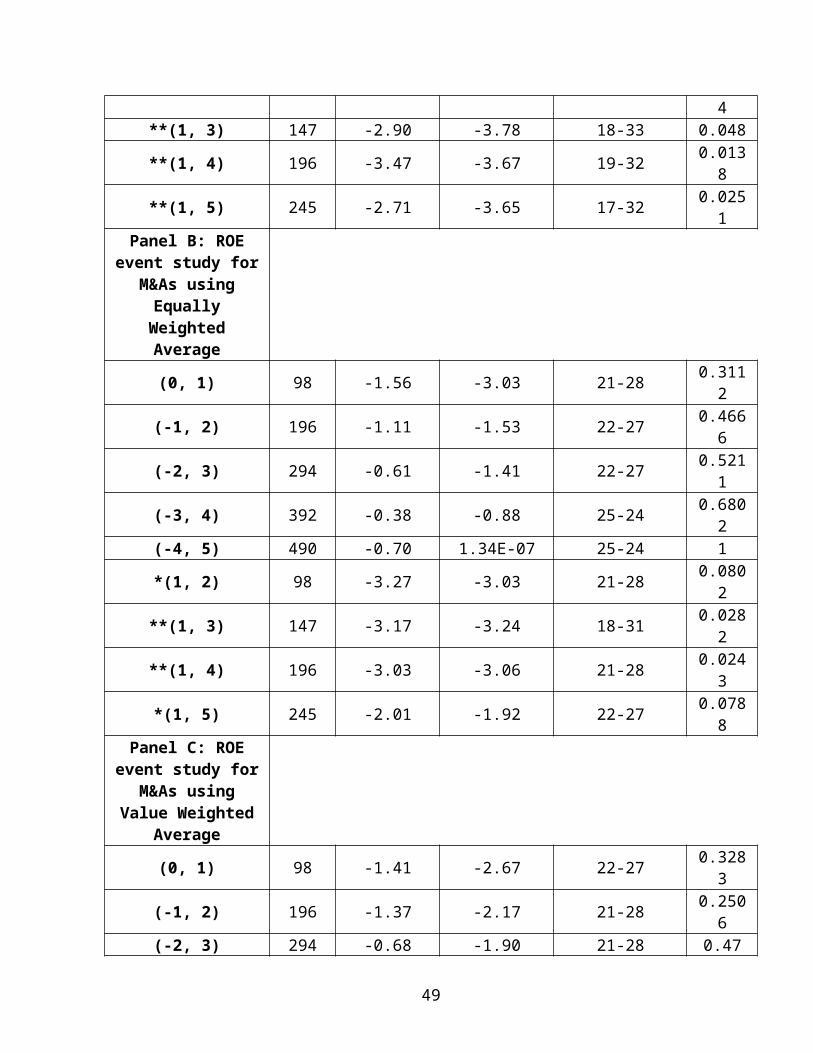
4**(1, 3) 147 -2.90 -3.78 18-33 0.048
**(1, 4) 196 -3.47 -3.67 19-32 0.0138
**(1, 5) 245 -2.71 -3.65 17-32 0.0251
Panel B: ROEevent study for
M&As usingEquallyWeightedAverage
(0, 1) 98 -1.56 -3.03 21-28 0.3112
(-1, 2) 196 -1.11 -1.53 22-27 0.4666
(-2, 3) 294 -0.61 -1.41 22-27 0.5211
(-3, 4) 392 -0.38 -0.88 25-24 0.6802
(-4, 5) 490 -0.70 1.34E-07 25-24 1
*(1, 2) 98 -3.27 -3.03 21-28 0.0802
**(1, 3) 147 -3.17 -3.24 18-31 0.0282
**(1, 4) 196 -3.03 -3.06 21-28 0.0243
*(1, 5) 245 -2.01 -1.92 22-27 0.0788
Panel C: ROEevent study for
M&As usingValue Weighted
Average
(0, 1) 98 -1.41 -2.67 22-27 0.3283
(-1, 2) 196 -1.37 -2.17 21-28 0.2506
(-2, 3) 294 -0.68 -1.90 21-28 0.47
49
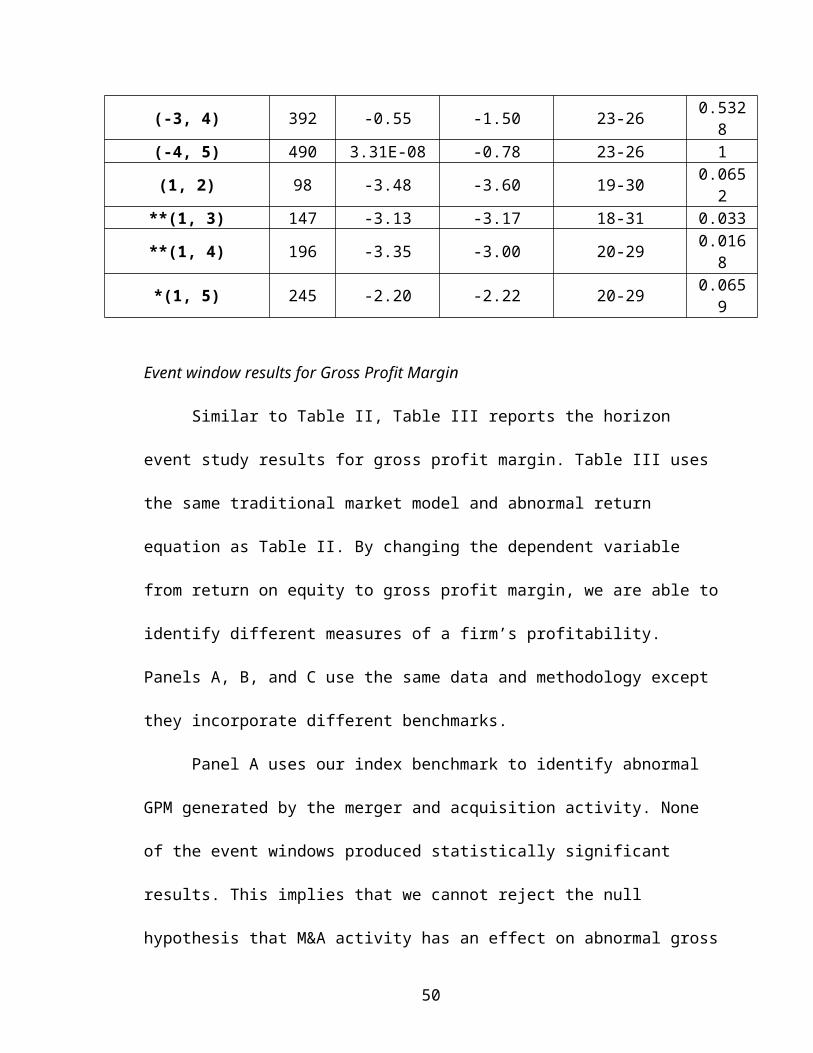
(-3, 4) 392 -0.55 -1.50 23-26 0.5328
(-4, 5) 490 3.31E-08 -0.78 23-26 1
(1, 2) 98 -3.48 -3.60 19-30 0.0652
**(1, 3) 147 -3.13 -3.17 18-31 0.033
**(1, 4) 196 -3.35 -3.00 20-29 0.0168
*(1, 5) 245 -2.20 -2.22 20-29 0.0659
Event window results for Gross Profit Margin
Similar to Table II, Table III reports the horizon
event study results for gross profit margin. Table III uses
the same traditional market model and abnormal return
equation as Table II. By changing the dependent variable
from return on equity to gross profit margin, we are able to
identify different measures of a firm’s profitability.
Panels A, B, and C use the same data and methodology except
they incorporate different benchmarks.
Panel A uses our index benchmark to identify abnormal
GPM generated by the merger and acquisition activity. None
of the event windows produced statistically significant
results. This implies that we cannot reject the null
hypothesis that M&A activity has an effect on abnormal gross
50
profit margin. Event window (0, 1) includes the first year
pre and post merger and acquisition activity. Parallel to
the findings in return on equity, from event windows (1, 0)
to (-3, 4) the mean abnormal GPM value increases. Event
window (-2, 3) had a mean abnormal gross profit margin of
0.04%, while event window (-3,4) had a mean abnormal return
of 0.13% percentage points. Between event windows (1, 0) and
(-3, 4), the mean abnormal return increased by 0.46
percentage points. This helps support the trend that as
mergers and acquisitions over time generates a greater mean
abnormal gross profit margin.
The median abnormal GPM has been predominately
positive. When separating the high values and low values,
the median abnormal gross profit margin overall of the event
windows hovered around 5, when including year’s post and pre
M&A activity. This indicates that more companies saw a
positive abnormal GPM than negative, suggesting that our
mean values may be skewed by disproportionately large
negative abnormal GPM. In event window (0, 1) the number of
firms that had a positive abnormal GPM one-year pre and post
51
effective date is thirty-two. Event window (-3, 4) includes
three more pre and post M&A years. The results report that
over the additional three years post & pre M&A activity, two
additional firms were able to generate a mean positive
abnormal gross profit margin.
When isolating just the performance years post merger,
the mean abnormal gross profit margin is significantly less
than the event windows including pre & post M&A activity
dates. Congruent with the above statement, the mean abnormal
gross profit margin is also significantly less; the average
value hovers around 3.6. Similar to the results for abnormal
ROE, the mean abnormal GPM one-year post merger is the
smallest percentage at -0.72. Event window (1, 5)
representing five years post effective date endured a mean
abnormal GPM increase of .28 percentage points. This is in
line with the trend we identified in return on equity.
However, in contradiction to that trend, the median abnormal
gross profit margin decreases as the study includes more
years post merger. Event window (1, 2) results indicated
highest value median abnormal GPM. The lowest abnormal
52
median gross profit margin was found in event windows (1, 3)
and (1, 5). The decreasing trend of abnormal GPM is also
represented by the number of firms that indicated positive
abnormal GPM. One-year post merger, thirty-four companies
produced positive abnormal GPM; that number decreased by
three firms when including five years post merger.
Panel B uses the same gross profit margin dependent
variable as Panel A, but instead of using the Index
benchmark it uses our equally weighted average benchmark.
Panel B’s mean abnormal gross profit margin reports similar
results to those found in Panel A. Panel B does not include
any statistically significant results. The mean abnormal GPM
in event window (1, 0) is -0.5%. As the event windows
expand, the mean abnormal gross profit margin increases from
a negative to a positive value at (-3, 4). Comparing event
windows (1, 0) through (-4, 5), the number of companies that
were able to obtain positive abnormal gross profit margins
increased from thirty firms to thirty-four firms. This
indicates that the more years companies have post and pre
M&A activity, the more abnormal returns they are able to
53
obtain. Panel B’s median abnormal return is overwhelmingly
positive, similar to Panel A’s. The average median abnormal
GPM over all event windows including pre and post M&A
activity date is 4.82%. This indicates that firms who
participated in M&A activity were able to see more positive
abnormal returns than negative. As I have stated before,
this may indicate that mean abnormal GPM for the event
windows is slanted due to larger negative abnormal returns.
Counter to the trend of mean abnormal GPM, though only
miniscule, the trend of median abnormal GPM between event
windows (0, 1) and (-3, 4) is decreasing. As we incorporate
more years pre and post M&A effective date, the smaller the
median abnormal GPM becomes. This can also be seen in Panel
A.
The trend of increasing mean abnormal GPM can also be
seen when strictly looking at post M&A performance data.
This constitutes only event windows (1, 2), (1, 3), (1, 4),
and (1, 5). In the first year post merger (1, 0), the mean
abnormal GPM was -0.69%. The result was the
greatest underperformance out of all post M&A activity event
54
windows. This makes sense because it takes time for a
company to be able to identify and create synergies. As we
include more post M&A years, the value of the mean abnormal
GPM increases. Though the mean is still negative at -.22%
five years post merger, the mean abnormal GPM increases
by .47 percentage points. This is congruent with the number
of firms that identified positive abnormal GPM. Between
event windows (1, 2) and (1, 5) two additional firms saw
positive mean abnormal return. In contradiction to mean
abnormal GPM, median abnormal GPM decreases as we include
more years post merger.
Panel C uses the value-weighted average benchmark when
regressing the dependent variable gross profit margin. As
the event windows move from the results of the short-term
performance (0, 1) and (-1,2) to a more long-term view (-2,
3) through (-4, 5), the mean abnormal GPM goes from a
negative to positive. Between event windows (0, 1) to (-3,
4) the mean abnormal return increased by .61 percentage
points. This supports the trend we have been able to
identify, that as we expand to include more post and pre M&A
55
activity years, the mean abnormal GPM increases. One factor
supporting this trend’s theory is the number of companies
that produced positive abnormal gross profit margin between
(1, 0) and (-4, 5). In event window (1, 0) thirty companies
saw a positive abnormal GPM while nineteen companies endured
negative abnormal GPM. As we expand the event window to (-4,
5) to include a total of ten years pre and post merger,
three additional companies went from a negative to a
positive abnormal return. Similar to both Panel A & B, Panel
C also reported a declining trend in median abnormal GPM.
The declining median abnormal return deviates less than
Panel B’s; this is because larger companies tend to be less
volatile than smaller ones.
Panel C also displays the results of abnormal GPM
returns solely for post M&A activity; these event windows
are (1, 2,), (1, 3), (1, 4), and (1, 5). All of the event
windows representing post M&A activity indicate negative
mean abnormal GPM. However, an increasing trend over time
can be identified in both mean and median abnormal GPM. For
both mean and median abnormal GPM, the lowest percentage
56
value presented is located in event window (1, 2). As we
include more years by expanding the event window, the
negative mean and median abnormal GPM increases. The trend
is supported by the number of firms that produced positive
abnormal GPM; in (1, 2) twenty-eight firms had positive
abnormal GPM. That number increases to thirty-two firms when
the study moves from one-year post merger to five-years post
merger. Additionally as we expanded the event window to
include more post M&A years, the P-value also increases,
suggesting less and less significant results.
All of the gross profit margin results in Panel A, B,
and C were not statistically significant. This means we are
not confident that we can reject the null hypothesis that
M&A activity does affect abnormal GPM. The trends in Panel
A, B, C are all consistent; the results indicate that in
event windows (0, 1) and (-1, 2), mean gross profit margin
on average will suffer from a negative abnormal return.
However, when expanding the study to four years post and pre
effective date, the abnormal GPM will increase in value.
57
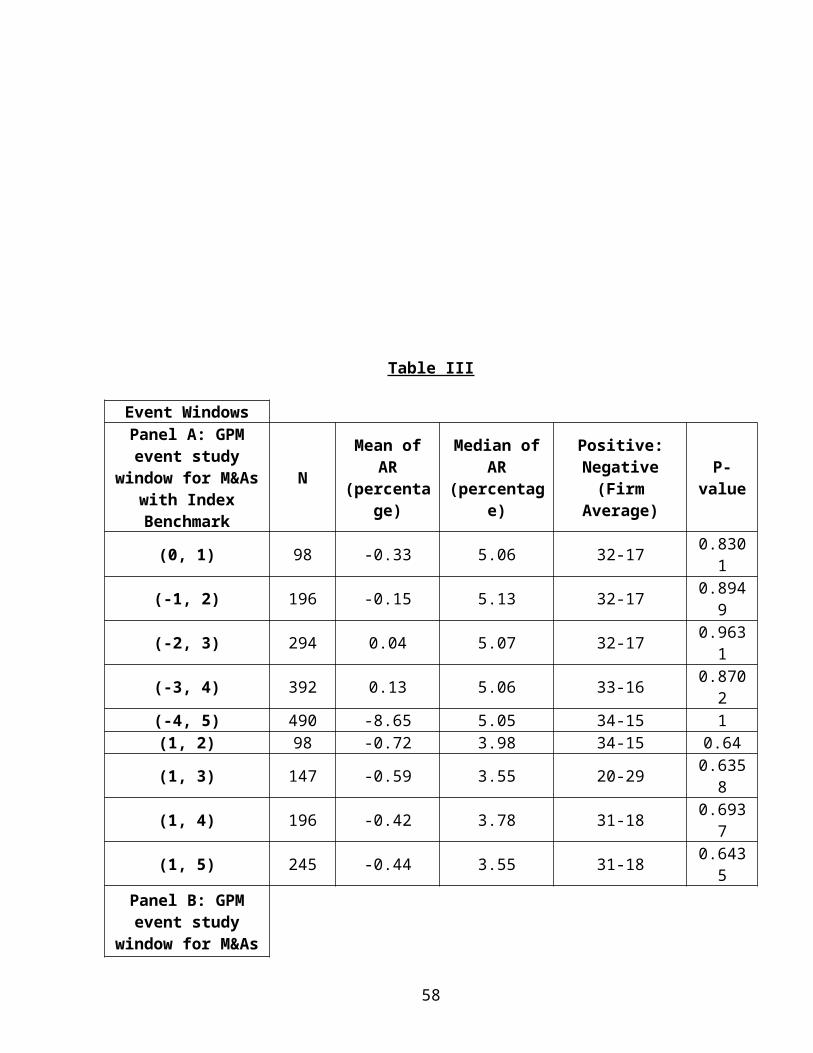
Table III
Event WindowsPanel A: GPMevent study
window for M&Aswith IndexBenchmark
N
Mean ofAR
(percentage)
Median ofAR
(percentage)
Positive:Negative(Firm
Average)
P-value
(0, 1) 98 -0.33 5.06 32-17 0.8301
(-1, 2) 196 -0.15 5.13 32-17 0.8949
(-2, 3) 294 0.04 5.07 32-17 0.9631
(-3, 4) 392 0.13 5.06 33-16 0.8702
(-4, 5) 490 -8.65 5.05 34-15 1(1, 2) 98 -0.72 3.98 34-15 0.64
(1, 3) 147 -0.59 3.55 20-29 0.6358
(1, 4) 196 -0.42 3.78 31-18 0.6937
(1, 5) 245 -0.44 3.55 31-18 0.6435
Panel B: GPMevent study
window for M&As
58
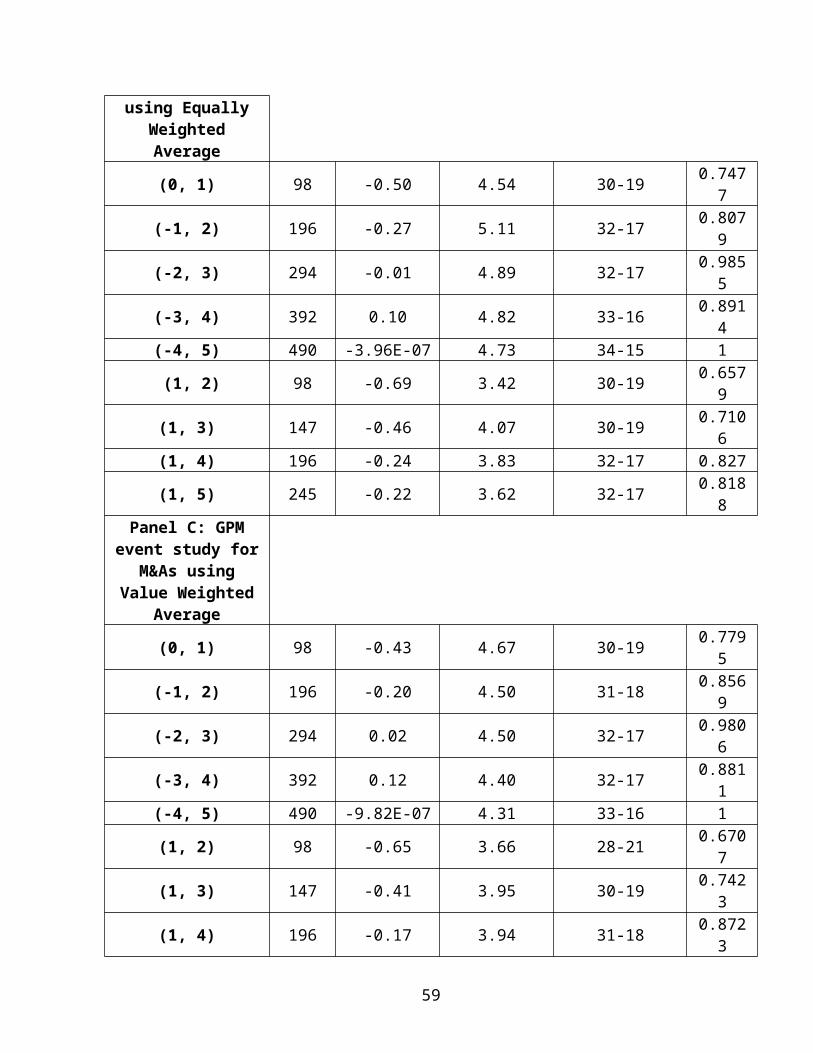
using EquallyWeightedAverage
(0, 1) 98 -0.50 4.54 30-19 0.7477
(-1, 2) 196 -0.27 5.11 32-17 0.8079
(-2, 3) 294 -0.01 4.89 32-17 0.9855
(-3, 4) 392 0.10 4.82 33-16 0.8914
(-4, 5) 490 -3.96E-07 4.73 34-15 1
(1, 2) 98 -0.69 3.42 30-19 0.6579
(1, 3) 147 -0.46 4.07 30-19 0.7106
(1, 4) 196 -0.24 3.83 32-17 0.827
(1, 5) 245 -0.22 3.62 32-17 0.8188
Panel C: GPMevent study for
M&As usingValue Weighted
Average
(0, 1) 98 -0.43 4.67 30-19 0.7795
(-1, 2) 196 -0.20 4.50 31-18 0.8569
(-2, 3) 294 0.02 4.50 32-17 0.9806
(-3, 4) 392 0.12 4.40 32-17 0.8811
(-4, 5) 490 -9.82E-07 4.31 33-16 1
(1, 2) 98 -0.65 3.66 28-21 0.6707
(1, 3) 147 -0.41 3.95 30-19 0.7423
(1, 4) 196 -0.17 3.94 31-18 0.8723
59
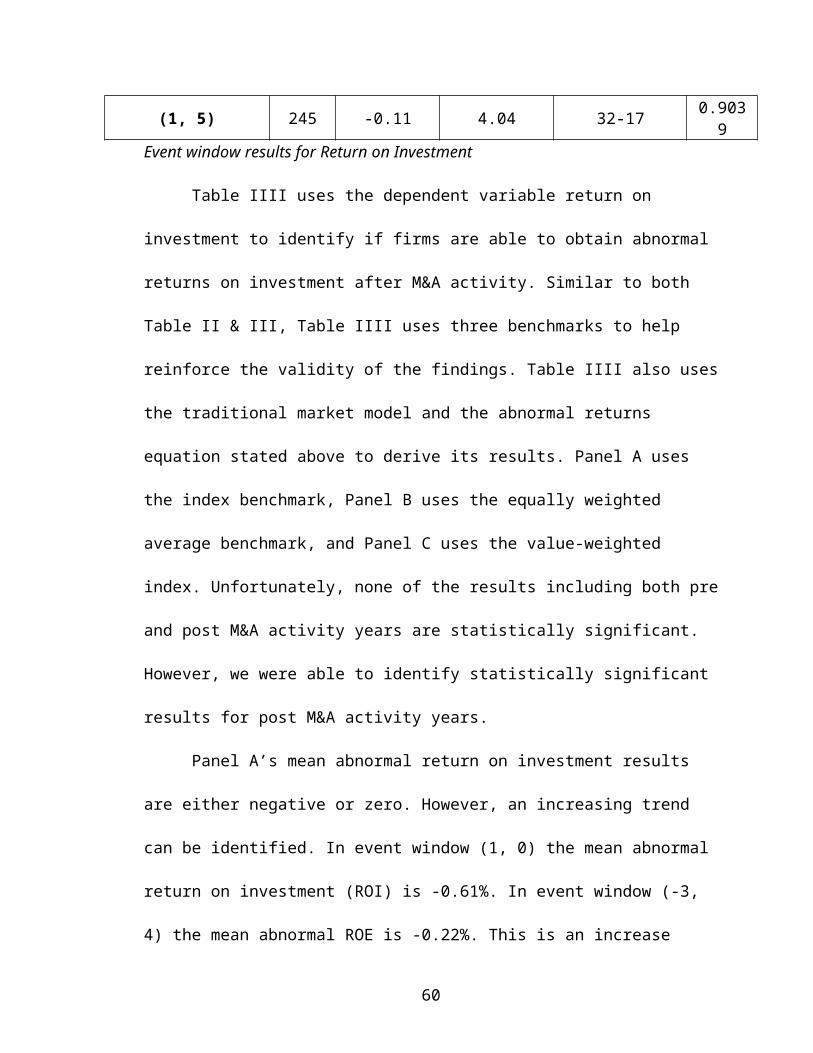
(1, 5) 245 -0.11 4.04 32-17 0.9039
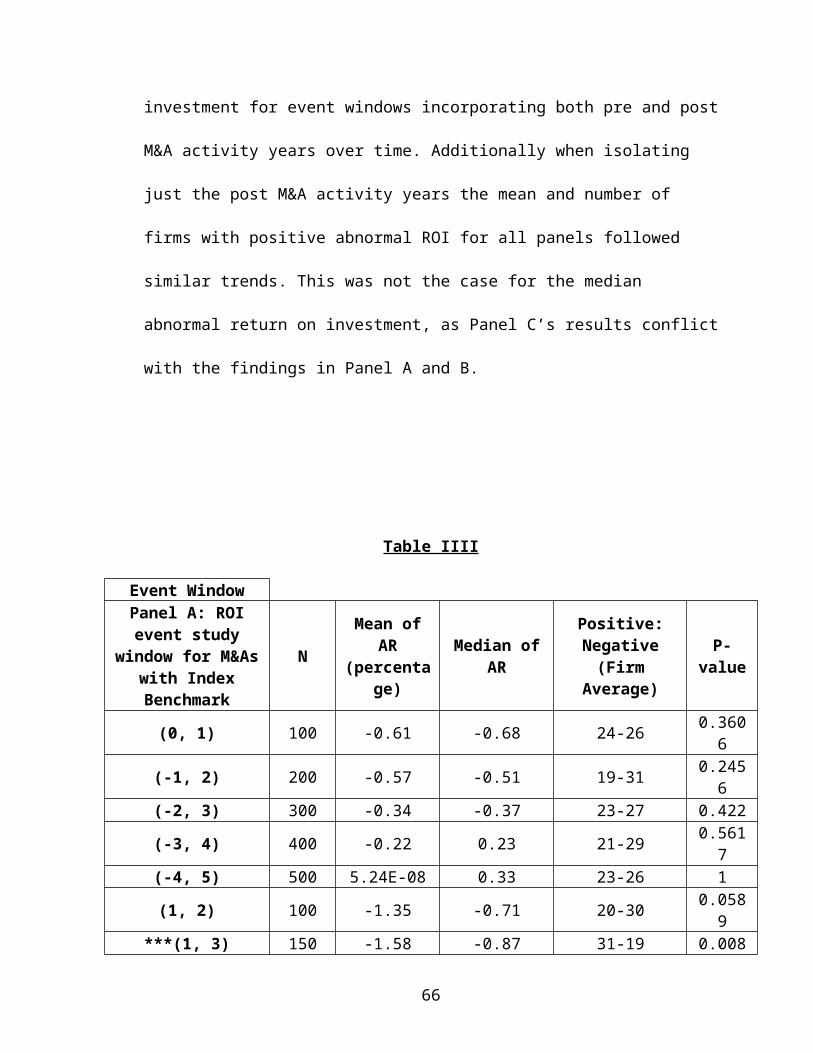
Event window results for Return on Investment
Table IIII uses the dependent variable return on
investment to identify if firms are able to obtain abnormal
returns on investment after M&A activity. Similar to both
Table II & III, Table IIII uses three benchmarks to help
reinforce the validity of the findings. Table IIII also uses
the traditional market model and the abnormal returns
equation stated above to derive its results. Panel A uses
the index benchmark, Panel B uses the equally weighted
average benchmark, and Panel C uses the value-weighted
index. Unfortunately, none of the results including both pre
and post M&A activity years are statistically significant.
However, we were able to identify statistically significant
results for post M&A activity years.
Panel A’s mean abnormal return on investment results
are either negative or zero. However, an increasing trend
can be identified. In event window (1, 0) the mean abnormal
return on investment (ROI) is -0.61%. In event window (-3,
4) the mean abnormal ROE is -0.22%. This is an increase
60
of .39 percentage points. This trend is congruent with the
trends identified in both ROE and GPM. Like the trend of
mean abnormal returns, Panel A shows that as we incorporate
more post and pre M&A activity years, the greater the median
abnormal ROI is. In fact, the median abnormal ROI is
positive 0.23% when the study includes a total of eight
years. However, unlike the results from ROE and GPM, the
number of firms that had a positive abnormal ROI at event
window (0, 1) decreased in comparison to event window (-3,
4). The number of firms with a positive abnormal return went
from twenty-four one-year post & pre mergers to twenty-one
four-years post & pre merger. This trend primarily
contradicts what we found in Table II and III.
Two years after the effective date, firms on average
produced the highest percentage of abnormal ROI on
investment at -1.35%. As the event window expands to include
more years after the effective date, the mean abnormal
return on investment decreases. Though more volatile, the
median abnormal return on investment follows a similar trend
as the mean. Event windows (1, 3), (1, 4), and (1, 5) are
61
all statistically significant at alpha 0.01, indicating that
we are 99% confident that firms on average will produce
negative abnormal return on investment three, four, and five
years post M&A activity.
Panel B uses the equally weighted benchmark to help
generate the predicted abnormal returns. Parallel to the
findings in Panel A, the mean abnormal ROI were either
negative or zero. Additionally, the mean abnormal ROI
increases in value as more years are included in the event
window. The highest percentage abnormal return on investment
occurred in event window (-3, 4) where it produced a value
of -0.16%. Between event windows (1, 0) and (-3, 4) the mean
abnormal return on investment value increased by 0.59
percentage points. Panel B’s first three event windows
produce a negative median abnormal ROI similar to that of
Panel A’s. For return on investment, Panel B presents the
strongest evidence that over time firms are able to generate
the positive abnormal returns, when including both pre and
post M&A activity data. In event window (0, 1) the number of
firms that had a positive abnormal return was only twenty-
62
two, which is less than half of our sample size. However, in
event window (-4, 5), our largest event window, the number
of firms with positive abnormal returns was twenty-nine,
more than half our sample size. This indicates that when
comparing one-year post and post merger versus four-years
pre and post merger, seven additional companies were able to
obtain positive mean abnormal returns.
Panel B also includes event windows that only
incorporate post M&A activity performance data. The three
statistically significant results identified stem from event
window (1, 3), (1, 4), and (1, 5). Event windows (1, 3), and
(1, 4) are statistically significant at alpha 0.01, and
event window (1, 5) is statistically significant at alpha
0.05. These event windows suggest that we can reject the
null hypothesis that M&A activity does not have an effect on
abnormal return on investment ratios. All the significant
event windows produced negative abnormal return on
investment. Between three and five years post M&A activity,
the mean abnormal return on investment increased by 1.06
percentage points. The median abnormal ROI did not follow
63
the same trend as the mean, but between the same time
periods an additional two firms were identified with
positive abnormal ROI.
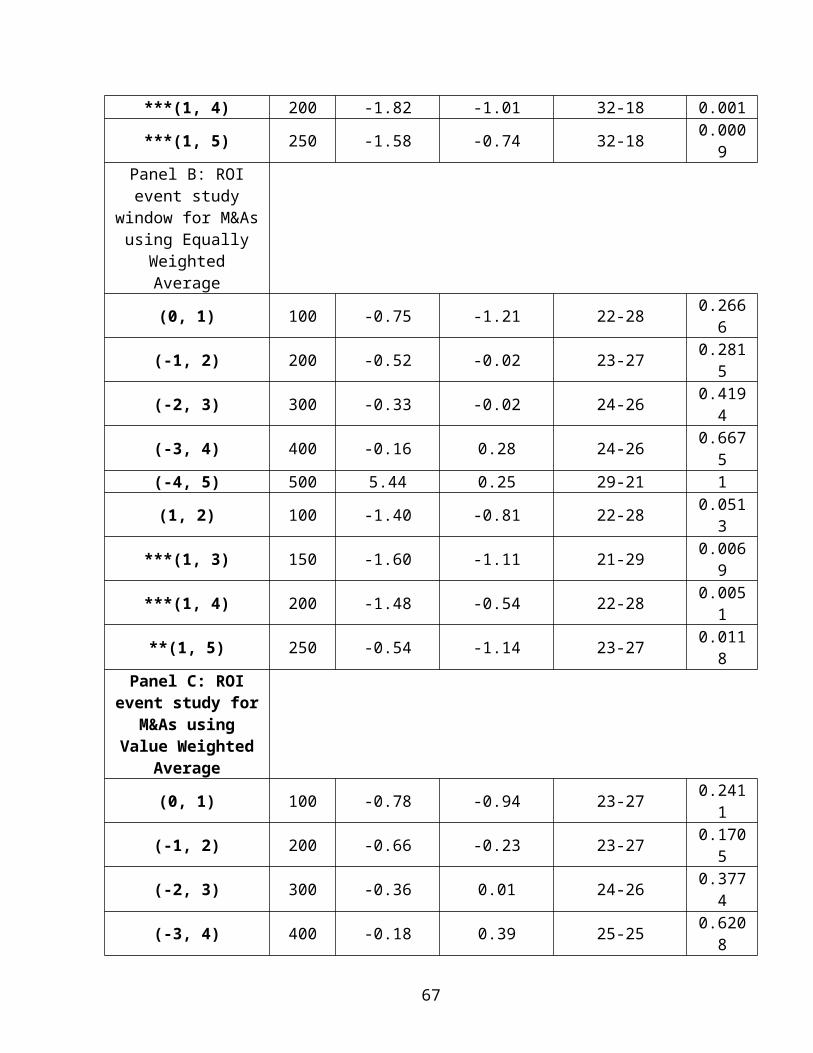
Panel C uses our value-weighted benchmark to produce
abnormal return results. Consistent with both Panels A and
B, Panel C had all negative mean abnormal ROI. Additionally,
the trend of increasing mean abnormal ROI for event windows
incorporating both pre and post M&A years is also present in
Panel C. From event windows (0, 1) to (-3, 4) the mean
abnormal return on investment increased by 0.60 percentage
points. Unlike the mean abnormal ROI values, the abnormal
ROI median is positive for three event windows: (-2, 3), (-
3, 4), and (-4, 5). Similar to the findings in mean abnormal
ROI, the median abnormal ROI increases as the event windows
expand. This is found in all three of the Panels in Table
IIII. This can also be seen in the number of firms that have
experienced the positive abnormal ROI. In event window (0,1)
only twenty-three companies were identified with positive
abnormal ROI; the number increases to twenty-eight firms in
(-4, 5).
64
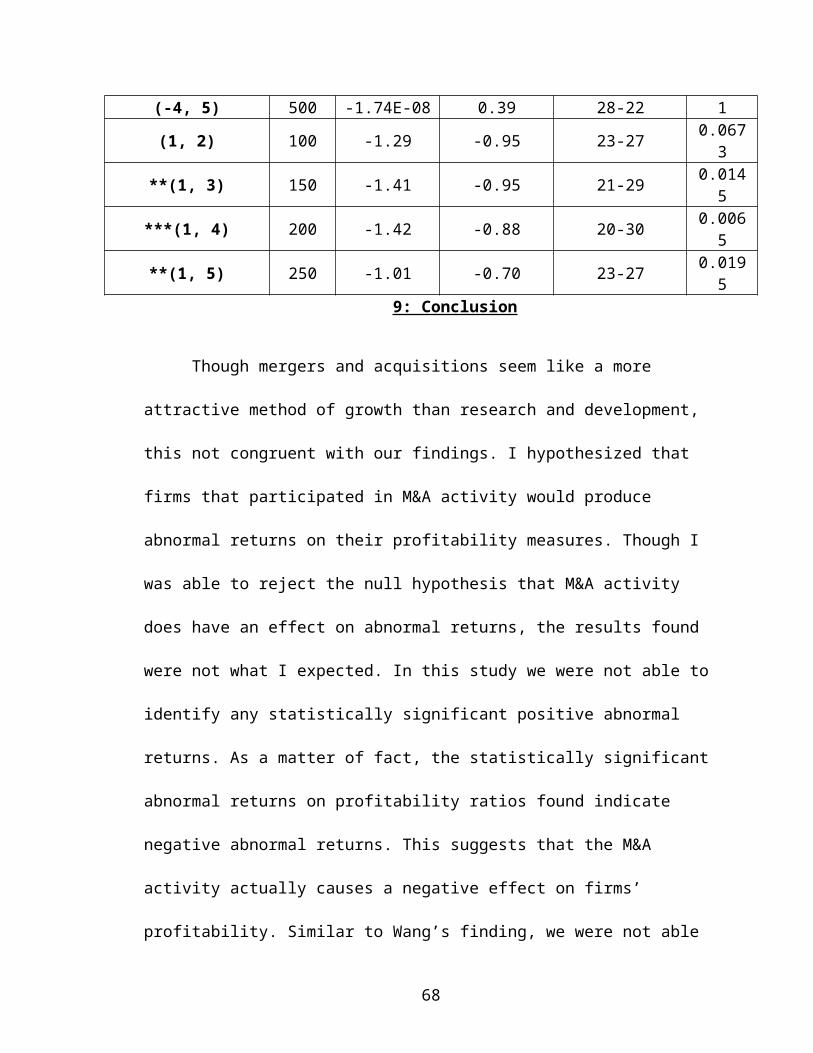
Parallel to the finding in Panel B, Panel C’s
significant event windows display increasing abnormal ROI as
the event windows incorporate more years post merger. Both
the mean and median are at their highest value, though still
negative, when we incorporate our greatest sample size of
five years post M&A activity. Event windows (1, 3) and (1,
5) are statistically significant at alpha .05, suggesting
that we are 95% confident that on average firms three and
five years post M&A activity will produce a negative
abnormal return on investment. Event window (1, 4) is
statistically significant at alpha .01, meaning that we can
both reject the null hypothesis and we are 99% confident
that firms on average will produce a negative abnormal
return on investment four years post the effective date.
Unlike the findings in Panels A and B, Panel C median and
mean abnormal ROI for post M&A years follows a correlating
increasing trends.
Overall, Panels A, B, and C all produced similar
results and trends of increased abnormal return on
65
investment for event windows incorporating both pre and post
M&A activity years over time. Additionally when isolating
just the post M&A activity years the mean and number of
firms with positive abnormal ROI for all panels followed
similar trends. This was not the case for the median
abnormal return on investment, as Panel C’s results conflict
with the findings in Panel A and B.
Table IIII
Event WindowPanel A: ROIevent study
window for M&Aswith IndexBenchmark
N
Mean ofAR
(percentage)
Median ofAR
Positive:Negative(Firm
Average)
P-value
(0, 1) 100 -0.61 -0.68 24-26 0.3606
(-1, 2) 200 -0.57 -0.51 19-31 0.2456
(-2, 3) 300 -0.34 -0.37 23-27 0.422
(-3, 4) 400 -0.22 0.23 21-29 0.5617
(-4, 5) 500 5.24E-08 0.33 23-26 1
(1, 2) 100 -1.35 -0.71 20-30 0.0589
***(1, 3) 150 -1.58 -0.87 31-19 0.008
66
***(1, 4) 200 -1.82 -1.01 32-18 0.001
***(1, 5) 250 -1.58 -0.74 32-18 0.0009
Panel B: ROIevent study
window for M&Asusing Equally
WeightedAverage
(0, 1) 100 -0.75 -1.21 22-28 0.2666
(-1, 2) 200 -0.52 -0.02 23-27 0.2815
(-2, 3) 300 -0.33 -0.02 24-26 0.4194
(-3, 4) 400 -0.16 0.28 24-26 0.6675
(-4, 5) 500 5.44 0.25 29-21 1
(1, 2) 100 -1.40 -0.81 22-28 0.0513
***(1, 3) 150 -1.60 -1.11 21-29 0.0069
***(1, 4) 200 -1.48 -0.54 22-28 0.0051
**(1, 5) 250 -0.54 -1.14 23-27 0.0118
Panel C: ROIevent study for
M&As usingValue Weighted
Average
(0, 1) 100 -0.78 -0.94 23-27 0.2411
(-1, 2) 200 -0.66 -0.23 23-27 0.1705
(-2, 3) 300 -0.36 0.01 24-26 0.3774
(-3, 4) 400 -0.18 0.39 25-25 0.6208
67
(-4, 5) 500 -1.74E-08 0.39 28-22 1
(1, 2) 100 -1.29 -0.95 23-27 0.0673
**(1, 3) 150 -1.41 -0.95 21-29 0.0145
***(1, 4) 200 -1.42 -0.88 20-30 0.0065
**(1, 5) 250 -1.01 -0.70 23-27 0.0195
9: Conclusion
Though mergers and acquisitions seem like a more
attractive method of growth than research and development,
this not congruent with our findings. I hypothesized that
firms that participated in M&A activity would produce
abnormal returns on their profitability measures. Though I
was able to reject the null hypothesis that M&A activity
does have an effect on abnormal returns, the results found
were not what I expected. In this study we were not able to
identify any statistically significant positive abnormal
returns. As a matter of fact, the statistically significant
abnormal returns on profitability ratios found indicate
negative abnormal returns. This suggests that the M&A
activity actually causes a negative effect on firms’
profitability. Similar to Wang’s finding, we were not able
68
to identify any improvement in firms’ ROE.
The results from the predominately negative dependent
profitability variables should make readers question the
efficiency of M&A activity. The statistically significant
results for mean and median ROE and ROI post merger indicate
that firms have worse profitability measures than if they
did not partake in the activity. The reason we included the
pre and post M&A event windows is to compare these windows
to the post M&A activity event windows. When comparing the
mean and median abnormal ROI and ROE, the pre and post event
windows significantly outperform. This suggests that on
average firm’s historical profitability trends pre effective
date would predict higher rates than their real
profitability rates post M&A. In our prediction we would
expect that due to synergies and the growth of the
companies, the firms would experience increases in all three
profitability measures. The biggest surprise was that the
dependent variable gross profit margin did not produce an
overwhelmingly positive and significant abnormal return. I
69
would not automatically assume that M&A would cause an
increase in revenues; however, I would expect that GPM would
increase due to a reduction in the cost of goods sold.
The study results beg the question why did M&A activity
cause profitability measure to reduce? Our findings suggest
that target companies are not as easily incorporated as the
acquiring company might have thought. The combining of two
companies is an enormous task, even in horizontal M&A’s each
company is different. Difficulties can arise from
conflicting company cultures, incompatible infrastructures,
and languages. The acquiring company’s management also might
not be effective enough to efficiently incorporate the
assets that they have acquired. Additionally, the post M&A
performance data might be skewed if the acquiring company
and the target company use different account policies, like
FIFO and LIFO.
Despite the strictly negative statistically significant
returns our results indicated M&A activity might not be all-
bad. Discussed in the empirical results section, we were
70
able to identify a trend of increasing abnormal ROI (Panels
B & C) and ROE as we expand the event window. As the study
included more post years the negative abnormal returns
increase in value. This may suggest that M&A do in fact
create positive returns, however it may take the acquiring
company more than five years to achieve.
The question still remains why would pharmaceutical
firms continue to partake in M&A activity when they produce
negative results? Our study’s finding expect that as firms
begin to realize that these activities are actually creating
negative returns, their development preferences will change.
It will be interesting to see if the industries preference
will change, and revert back to heavy dependence on internal
development. Wang suggests that if this preference doesn’t
change, that firm performing M&As knowing that the majority
of them will fail, but the ones that due succeed will makeup
for the ones that don’t (Wang 2007). Additional studies
should be preformed with larger post M&A activity event
windows. If these studies do not on average produce positive
71

abnormal returns, than economists should reevaluate firms’
motivation to perform mergers and acquisitions.
Citations
AGRAWAL, A, Jay JAFFE, and G MANDELKER. The Journal of Finance, "The Post-Merger Performance of Acquiring Firms: A Re-examination of an Anomaly." Last modified
72
1992. Accessed September 2013. http://bama.ua.edu/~aagrawal/postmer.pdf.
André, Paul. The Long-Run Performance of Mergers and Acquisitions: Evidence from the Canadian Stock Market. working paper., Financial Management Association International, 2004. Jstor
Berkrot, Bill. Reuters, "Success Rates for Experimental Drugs Falls: Study." Last modified 2011. Accessed September 2013. http://www.reuters.com/article/2011/02/14/us-pharmaceuticals-success-idUSTRE71D2U920110214.
Berndt, Ernest. Health Affairs, "The US pharmaceutical industry: why major growth in times of cost containment." Last modified 2001. Accessed October 2013.http://www.econ.canterbury.ac.nz/personal_pages/john_fountain/econ337/reading/HABerndtRx.pdf.
Black, E, T Carnes, and T Jandik. SSRN working paper , "The Long-Term Success of Cross-Border Mergers andAcquisitions." Last Modified 2001. Accessed November2013. http://papers.ssrn.com/sol3/papers.cfm?abstract_id=270288.
Chatterjee, Sayan. Jstor, "Types of synergy and economic value: The impact of acquisitions on merging and rival firms." Last modified 1986. Accessed October 2013.
Conn, Rodney, and A Hughes. ESRC Center for BusinessResearch, "Improved Methods for Tests of Long-RunAbnormal Stock Returns." Last modified 1999. AccessedNovember 2013.
Danzon, P, A Epstein, and S Nicholson. NATIONAL BUREAU OF ECONOMIC RESEARCH, "Mergers Acquisitions in the Pharmaceutical and Biotech Industries." Last modified 2004. Accessed September 2013. http://www.nber.org/papers/w10536.pdf?new_window=1.
DiMasi, JA, A Feldman, Seckler, and A Wilson. Tufts University, "Trends in Risks Associated with New Drug
73
Development: Success Rates for Investigational Drugs." Last modified 2010.
"Distinguishing Between Random and Fixed: Variables, Effects, and Coefficients." Portland State School of CommunityHealth: Institute on Aging | Home. Portland State School of Community Health, n.d. Web. 13 Jan. 2014. <http://www.upa.pdx.edu/IOA/.../ho_randf
Donald, Marron. Congressional Budget Office, "Research and Development in the Pharmaceutical Industry." Last modified October 2007. Accessed September 2013.
Firth, Michael. Oxford University Press, "Takeovers, Shareholder Returns, and the Theory of the Firm." Last modified 1980. Accessed September 2013. http://www.jstor.org/stable/1884539.
Healy, Palepu, and Rodney Ruback. Journal of Financial Economics, "Does Corporate performance improve after mergers." Last modified 1992. Accessed October 2013.
Hill, C, and G Jones. Strategic Management Theory an Integrated Approach. Houghton Miffin Company , 2004.
Investopedia. "Efficient Market Hypothesis (EMH) Definition." Accessed January 14, 2014. http://www.investopedia.com/terms/e/efficientmarkethypothesis.asp.
Krueger, Thomas M., Lawrence J. Gitman, and Anthony D. Plath. Study guide to accompany Gitman Principles of managerial finance. 13th ed. New York, N.Y.: HarperCollins Publishers, 2010. Print.
Loughran, T, and A Vijh. Journal of Finance, "Do Long-run Shareholders Benefit from Corporate acquisitions?." Lastmodified 1997. Accessed October 2013. http://www.jstor.org/stable/2329464.
Lyon, Barber, and C Tsai. Journal of Finance, "ImprovedMethods for Tests of Long-Run Abnormal Stock Returns."
74
Last modified 1999. Accessed October 2013.http://www.jstor.org/stable/222413.
Nicholson, S, and J MCullough. NBER working paper, "Biotech-Pharmaceutical Alliances as a Signal of Asset and FirmQuality." Last modified 2002. Accessed September 2013.
Surrey, Pamala. prmrinc.net, "Mergers and Acquisitions in the Pharmaceutical Industry." Last modified 2013. Accessed September 2013. http://www.prmrinc.net/wp-
Sorin, Sorescu, and Rodney Boehme. The Journal of Finance , "The Long-Run Performance Following Dividend Initiationsand Resumptions: Underreaction or Product of Chance?." Last modified 2002. Accessed November 2013. http://www.jstor.org/stable/2697761.
Trivedi, Arti, and Jay Desai. Shri Chimanbhai Patel Institutes Working Paper, "A Study on Mergers & Acquisitions in Oil & Gas Sector in India and Their Impact on the Operating Performance and Shareholders’ Wealth." Last modified January 13, 2013. http://papers.ssrn.com/sol3/papers.cfm?abstract_id=2202333.
Wang, Xiaoli. International Journal of Pharmaceutical and Healthcare Marketing, "Do mergers and acquisitions create shareholder wealth in the pharmaceutical industry?." Last modified 2007. Accessed October 2013. pbfea2005.rutgers.edu/2007/.../052-Pharma Merger Paper.doc.
75


