Embed Size (px)
Citation preview

1
Membrane Potential Fluctuations in Chara australis: a Characteristic Signature of High External Sodium. Sabah Al Khazaaly, N Alan Walker, Mary J Beilby & Virginia A Shepherd Plant Membrane Biophysics Group School of Physics University of NSW Sydney, NSW 2052 Australia Corresponding authors: N A Walker e-mail: [email protected] M J Beilby e-mail: [email protected]
2
Abstract We have studied fluctuations in membrane PD in Chara australis at frequencies between 1 and 500 mHz, by classical noise analysis and by inspection of the PD time-course. The former shows (1) a quasi-Lorentzian (1/f2) rise of noise power as frequency falls, and (2) a marked increase in noise power when the cell is exposed to high salinity (Chara australis is a salt-sensitive species). The latter shows that as well as initiating depolarisation, exposure to 50 mM Na as either chloride or sulfate usually initiates a continuous but random series of small depolarisations which gives rise to the increase in noise and whose mechanism is discussed. Key words: membrane potential difference, fluctuations, salinity stress, charophytes, Fourier transform, proton or hydroxyl channels Introduction Many investigators have studied electrical potential difference (PD) fluctuations across charophyte cell membranes, including both periodic oscillations and random noise, in the milliHertz range. They have produced interesting suggestions, but perhaps no great certainty, about the mechanisms producing PD fluctuations at frequencies below 1 Hz. Deterministic oscillations. Hill & Osterhout (1938) and Kishimoto (1966) found that, in high Na concentrations, stimulating an action potential (AP) induced repetitive PD spikes in Nitella flexilis with a frequency around 1 Hz. Sustained oscillations in membrane PD with a smaller amplitude and a definite period were reported in charophyte cells by Hayashi & Hirakawa (1979, 1980) who induced oscillations at around 40 mHz in Nitella axilliformis by a ramp of depolarizing current that caused the membrane PD to approach the AP threshold. Free-running oscillations have been reported in Nitella under some conditions (Hansen, 1978; Fisahn et al., 1986) at about 0.3 mHz (period ≈ 1 hr) and at about 1 mHz (period ≈ 15 min). The 0.3 mHz oscillations could be evoked by depolarizing current, by changes in light intensity or by exposure to butyrate. By measuring both PD and membrane resistance the authors showed that these PD oscillations were often not accompanied by a corresponding oscillation in resistance. The authors suggested that these were oscillations in a transport process far from equilibrium and so acting as a current source. At membrane PDs between -180 and -100 mV, the flow of protons through the proton pump would perhaps fit this description. The 1 mHz PD oscillations were accompanied by resistance oscillations, as expected for a process near its equilibrium, such as flow of ions through a channel population. These oscillations were therefore thought to be due to K-channels.

3
Random Noise. Hayashi & Hirakawa (1979, 1980) obtained power spectra for membrane PD fluctuations in Nitella axilliformis that showed a continuous noise spectrum with power increasing from 50 Hz down to 3 mHz. They attributed a convex bulge (change of slope) in the spectrum at around 40 mHz to the activity of 'the K-channel', but did not offer direct supporting evidence. Korff et al. (1980), in a brief description of a conference poster, showed a noise spectrum for Nitella with a peak at 0.3 mHz and a slope of -2 at frequencies above that. They attributed the noise to the proton pump and one or more of its control systems (Hansen, 1978), but seem not to have formally published this work. Ogata et al. (1983) measured membrane PD noise in Chara australis in both acid and alkaline bands (cf. Spear et al., 1969), showing power spectra between about 0.2 mHz and 0.5 Hz. The power spectra had no peak and had similar magnitudes and similar slopes of -2 except for the alkaline band spectrum below 10 mHz where in some cells the slope was -2.7. This increase in slope as frequency falls is opposite to that of Hayashi & Hirakawa (1979). Ferrier et al. (1979) studied Chara membrane PD noise largely at frequencies above 1 Hz, and Ross & Dainty (1985, 1986) showed power spectra down to 20 mHz for Chara corallina. The latter found that raising the pH to 11 or inhibiting ATPase activity with dicyclohexylcarbodiimide (DCCD) reduced the noise above 100 mHz so that they attributed this noise to the proton pump. We note here that there is a general similarity between the spectra obtained by different authors, i.e. milliHertz noise power depending on frequency to a power of about -2, but little agreement in detail. Since the burst of charophyte membrane noise research activity in the 1980s there appears to have been little or no follow-up work to test possible mechanisms. Present Work. We have a long in-term interest in the mechanisms by which salinity affects plant cells. One of us, VAS, first noticed increased PD fluctuations while studying the effect of 100 mM NaCl on mechanoperception in the salt-sensitive charophyte, Chara australis (Shepherd et al., 2008). In the present paper we present power spectra for PD fluctuations from below 1 mHz to about 500 mHz, and discuss the interpretation of these spectra. We show here the effects of an increase in external osmotic pressure, ionic strength and external sodium concentration. These considerations lead to suggestions about mechanism, which will be further explored.
Materials and Methods
Chara australis RBr was collected from a concrete tank at the School of Biological Sciences, University of Sydney, and kept in its native medium under 80 μmol m-2 s-1 of photosynthetically active radiation, from cool white and Sylvania Gro-Lux fluorescent lamps in equal numbers, on a 10/14 hr day/night cycle.

4
Subapical internodes 15-20 mm long and 0.6-1.2 mm diameter were selected 3 days before use and kept in buffered APW: o.1 mM KCl, 1.0 mM NaCl. 0.1 mM CaCl2, 2 mM HEPES/1 mM NaOH, pH 6.8 – 7.1. Experimental solutions were: APW: buffered APW, pH 7.1 Sorbitol-APW: buffered APW + 90 mM sorbitol at pH 7.1 Saline-APW: buffered APW + 50 mM NaCl at pH 7.1 Sulfate-APW: buffered APW + 25 mM Na2SO4 at pH 7.1 PDs and Estimated Spectra. A 5 mm central section of the internodal cell was isolated electrically by silicone grease barriers. The membrane PD in this section was measured as vacuolar PD by a deeply inserted microelectrode, with a similar electrode in the bathing medium as reference. The microelectrodes were filled with 0.5 M KCl. The bathing medium flowed continuously at about 1 ml per minute. The PD, after 10 x amplification, was filtered by a simple RC filter attenuating by 3 dB at 1 Hz or by a 5-pole elliptical filter with a sharp cutoff at 1 Hz. Earlier experiments with no Nyquist filtering did not give significantly different results (cf. Ogata et al., 1983, whose filtering was done after digitization, and so did not satisfy the Nyquist criterion). The filtered PD was sampled, normally at 10 Hz, by a Data Translation DT2801A 12-bit AD/DA board in a computer running Data Translation Notebook software under MS-DOS. Estimates of the power spectrum were computed with Matllab 7.5 by applying the discrete Fourier transform (Matlab function fft) to the raw PD record: values of the transform were divided by number of data points (N) and squared to give power in V2. This conforms to the scaling in eqn. 2.20 of Kay & Marple (1980) and to the result given by Mathematica with fft options set at [-1 1]. The power so obtained is not power spectral density (in V2 /Hz) but power per ordinate (in V2). This means that total power in a frequency interval is not obtained as the area under the spectral curve in that interval, but as the sum of the ordinates in that interval. The raw estimated spectra thus obtained showed the inevitable high variance (cf. Kay & Marple, 1981). They were smoothed by a running-average filter using a trapezoidal 7-point Daniell window (Bloomfield, 2000) and 95 % confidence limits were calculated. Stationarity. In what follows it is important to be clear that the cells are not necessarily in a steady state, particularly at the most interesting time in the experiment. The protocol allows time for ‘settling down’ after microelectrode insertion, and again after turgor change, in the hope of achieving a steady or at least a slowly-varying state, but we did not select cells e.g. for constancy of membrane PD. After cells are put into Saline-APW they change in various ways including in membrane PD and membrane PD noise, leading eventually to death, and we are explicitly interested in these changes. Thus we do not claim to have investigated cells under stationary conditions, or to have obtained spectra that are invariant in time. In dealing with these spectra we followed common practice:

5
when the PD appeared to vary slowly, we used longer runs of data containing 5,000 – 15,000 points, and under clearly nonstationary conditions or to study the effects of anomalies in the PD record we used successive data sets of 1,000 – 5,000 points, carefully inspecting the PD record alongside each smoothed power spectrum. Most data sets selected for further study and publication had lengths of 5,000 consecutive points, chosen so as to omit PD anomalies such as artifactual spikes and action potentials.
We did not ‘detrend’ the data before applying the transform, but – what amounts to the same thing – we omitted the zero-frequency point from each fft result. After various trial runs with many cells, 7 cells (11/11 to 10/12) were subject to the following protocol: after microelectrode insertion, PD was recorded for ½ to 1 hr in APW, ½ to 1 hr in Sorbitol-APW and then for 1 hr or more in Saline-APW. The records were analysed sequentially as described above. Similar protocols were used to control for the effects of Cl- using Sulfate-APW. Which Membrane? These studies refer to the total PD of the plasmalemma and tonoplast in series. Although the plasmalemma PD is much larger than the tonoplast PD (Findlay & Hope, 1964), it does not follow that all or most of the PD fluctuation comes from the plasmalemma. This however seems to have been the general assumption made by earlier workers and it is one which we share.
Results Membrane PDs. Though it is not a new observation, we note that the median resting potential of the 7 cells reported on here underwent the changes summarised in Table 1 when the external solution was changed.
[Table 1 here]
Saline-APW caused relatively quick depolarization, and usually led to a continuing slow depolarization and eventual death.
The Estimated Power Spectrum. Fig. 1 shows a typical estimated power spectrum of the membrane PD of a Chara cell (cell 13/11) in APW recorded for 15,000 points (1,500 s). The estimate has been smoothed by a 7-point moving-average and is accompanied by calculated 95 % confidence limits. It shows (1) above about 0.5 Hz, a featureless ‘white noise’ largely of instrumental (post-filter) origin, (2) below o.5 Hz a region of ‘red noise’ with a slope of roughly -2 and a width of several decades and (3) a leveling off at frequencies below 3 mHz which may indicate a Lorentzian corner frequency. The line represents a least-squares fit to the data between 10 & 100 mHz. All our power spectra show this rise in power at lower frequencies with a slope of -1.4 to -2.7 as discussed below.

6
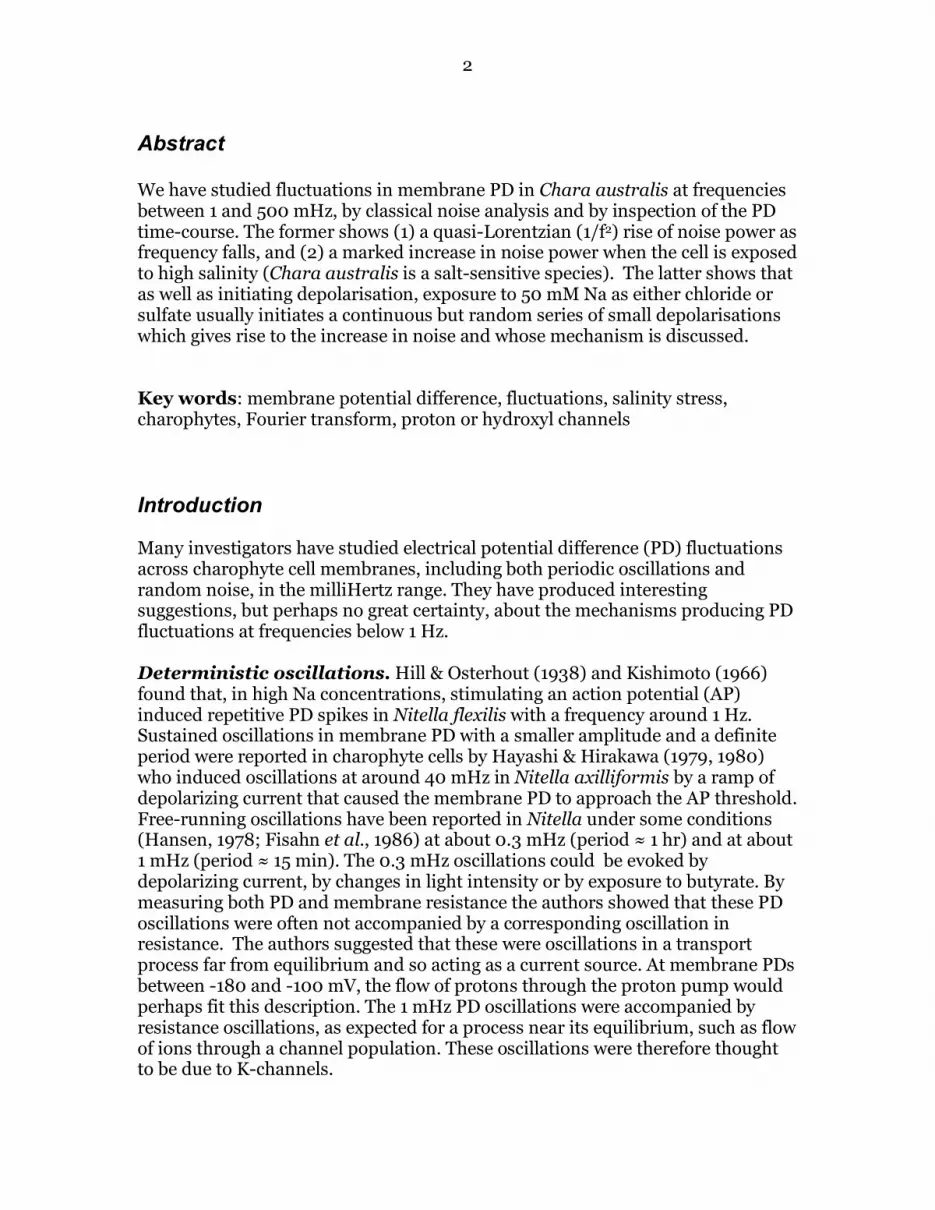
In a true Lorentzian the exponent would be precisely -2. The leveling off at the lowest frequencies is not always apparent, even in long data sets, in which case the parameters of a Lorentzian cannot be determined by fitting to the data. Even when there seems to be a leveling off, as in Fig. 1, the corner frequency and low-frequency limit are not well defined by the data. For this reason we have routinely fitted straight lines to the power spectra between 10 & 100 mHz, and also between 100 & 500 mHz, and we compare spectra in terms of the regression slopes and the total power in those intervals, obtained by summing of the ordinates in each interval. Effects of turgor and salinity. Fig. 2 shows the last 5000–point estimated power spectrum for cell 11/11 in APW and then the first such in Sorbitol-APW. This solution has a higher osmotic pressure due to its added impermeant solute, and will therefore have reduced the cell turgor pressure by 0.224 MPa (temperature taken as 300 K). Fig. 3 shows power spectra for cell 25/11, the last in Sorbitol-APW and then the first in Saline-APW. This medium has a higher salinity than Sorbitol-APW but closely similar osmotic pressure. Both figures show results that are typical of such transitions. It is apparent that the fall in turgor pressure of about 0.224 MPa (Fig. 2) has had little effect on the power spectrum, while the transition from 2 mM to 52 mM Na (Fig. 3) has had a marked effect, increasing the signal power in both intervals of frequency. Data on these effects for the 7 cells 11/11 – 10/12 are gathered in Table 2,
[Table 2 here] which shows that the increase in turgor pressure caused by the transition from APW to Sorbitol-APW has produced no significant effect on the parameters of the noise spectrum, while the increase in salinity from 2 to 52 mM has not changed the slope but has significantly increased the power in the spectrum. Data for the interval 100 to 500 mHz (not shown) leads to the same conclusions. In 7 trials on 3 cells substitution of Sulfate-APW for Saline-APW caused no consistent change in noise power (data not shown). PD Fluctuations. Examining the PD fluctuations themselves shows the nature of the noise set off by the high external salinity (Fig. 4A, 4B). We find a characteristic signature in Saline-APW, with the PD subject to a random series of depolarisations, often rapid, each followed by repolarisation, often much slower. Shapes vary, but the time course of each depolarisation is often sigmoid, that of the repolarisation often seems asymptotic, though to what PD is not easily determined. Table 3 gives details of the median amplitude and frequency of these spikes for 6 of the 7 cells in Table 1.
[Table 3 here] It is noticeable that the rate of occurrence of the spikes and hence their duration seem relatively consistent from cell to cell, the amplitude of depolarisation depending more on its rate than on its duration. In spite of this consistency, not all cells show these depolarising spikes: 13/11 does not, although it depolarises in Saline-APW. The spikiness of the record varies from cell to cell (Table 3), and it also declines with time in high [Na].
7
Discussion
Interpretation of the Power Spectra. We began this investigation in the expectation of observing periodic or quasi-periodic oscillations at frequencies in the milliHertz range, an expectation based on the oscillations sometimes observed in charophyte cell PDs as well as those reported in land plant ion fluxes by Shabala et al. (2006). Such oscillations have been attributed to interactions between membrane transport processes via membrane PD, substrate concentrations and biochemical control systems (Gradmann, 2001).
Deterministic oscillations? Plotting the raw unsmoothed estimated power spectra on linear scales can suggest the presence of low-frequency peaks, suggesting deterministic oscillations of defined period such as we expected to find, but a careful study of these peaks showed that their number varied from one data set to another and their position ranged from 0.5 to 10 mHz, in a way seemingly unconnected with the identity of the cell or the experimental conditions. These peaks vanish when the estimated spectrum is lightly smoothed (Figs. 1 - 3). When the smoothed spectrum is plotted as usual on a log-log plot,
the apparent peaks vanish into a roughly 1/f2 slope, particularly when care is taken not to include PD artifacts in the analysis. We therefore view the spectra we have obtained as the product of random processes whose variance can give the appearance of peaks in the raw spectrum at low frequencies. This can be confirmed by studying random sequences of numbers representing 1/f2 noise, which resemble our time-courses and give similar spectra (data not shown). A Noise Spectrum. Thus under the conditions of the experiments reported here we have not observed sustained periodic or quasi-periodic oscillations but rather we have obtained continuous noise spectra, characteristic of random rather than deterministic processes. Some of the longer-run spectra resemble a Lorentzian, with slopes near -2 and apparent corner frequencies from 10 Hz to below 1 mHz, but these ‘corner frequencies’ are not consistent visually and even when seen are not well defined by the data. We have seen no significant consistent peaks in the power spectrum, judging from the lightly smoothed spectra with their 95 % confidence limits, and we believe that such spectra give a reliable picture of the situation.
Slope of the Spectrum. It is noticeable that the slopes of our estimated power spectra range from -1.4 to -2.7 depending on the cell and the experimental conditions, however the grand median of the medians in Table 2 is just -2.04, not significantly different from -2. We note here that our plotted power spectra do
not represent physical power, since they give only the value of E2 in the equation for electrical power:
P = E2/R … (1) where R is the resistive impedance across which the potential difference E is

8
applied. Since R may vary with frequency in this range this would need to be studied in order to estimate the true power.
We note that in Nitella in this region Korff et al. (1980) found 1/f noise, with 1/f3 at higher frequencies. This contrasts with the result of Hayashi and Hiragawa, who found a steeper slope at higher frequencies (above 40 mHz) than at lower. Much further evidence would be required before these slopes could be accepted as reliable.
The ‘Lorentzian’ Process in APW. All previous workers have observed the strong rise in power at low frequencies reported here, in both Chara and Nitella, and there is some general agreement as to the likely mechanism/s producing this square-law rise. Korff et al. (1980) say that their spectrum agrees with the Hansen model (Hansen, 1978) for light effects on the proton pump via several control systems, and this agrees broadly with the results of Ross & Dainty, who also suggest the proton pump on the basis of effects of the inhibitor DCCD. If we accept it as probable that the proton pump control systems are responsible for the major low-frequency feature of the spectrum in APW or in Sorbitol-APW, it is reasonable to ask whether in Saline-APW that same process is at work or a new noise source is involved.
A Noise Source in High [Na]. There is a striking difference in power represented by the Sorbitol-APW and the Saline-APW spectra, associated with the presence of 52 mM Na+. This is illuminated by the difference in character of their time courses of PD, shown in Fig. 4. The new element is the random series of depolarizing events interspersed between periods of recovery. Cell 13/11, with no spikes in the time-course under saline, also shows the smallest noise under saline, suggesting that the noise under saline conditions is largely the result of the spiky time-course. Crudely modeled time-courses of similar spiky noise show similar noise powers (data not shown).
It was tempting to think that the depolarizing spikes represent the process causing the general depolarisation in Saline-APW (Table 1). However they are not apparent in the time-course of cell 13/11, which showed instead a smooth (depolarized) PD time-course with APs, nor in cell 10/12, which showed frequent fast hyperpolarising spikes and fast returns with overshoot as its characteristic noise. The electrical time-constant of the plasmalemma, though not precisely definable, is of the order of 10 ms (Coster & Smith, 1977), so that the recovery (hyperpolarising) events cannot be simply electrical – i.e. the recharging of the membrane capacitance after a brief depolarisimg event.
It seems that the time-course of the individual event represents the time-course of a depolarising current, which might be an influx of positive or efflux of negative ions through channels or even an inhibition of efflux of positive ions through the proton pump. Candidates for the ions involved include Na+, H+, OH-

9
and Cl- and Ca++. Much further work is needed to sort out these possibilities, but meanwhile some hypotheses are worth considering.
As the latter stages of salinity stress involve spontaneous action potentials (APs , Shepherd et al., 2008), we considered a possible role of the AP mechanism in the salinity-induced noise. The AP in charophytes is stimulated by the membrane PD depolarizing to the threshold level (near -100 mV), which produces IP3 (inositol triphosphate). At a critical concentration IP3 liberates Ca2+ from internal stores. The rise in [Ca] in the cytoplasm opens Cl- channels (Wacke and Thiel, 2001; Wacke et al., 2003). Comparison of the noise pulses and APs shows substantial differences: (1) noise appears seconds after the cell is exposed to Saline APW and the resting PD is still quite negative compared to AP threshold (see Fig. 4B), (2) the depolarizing pulses are small compared to AP amplitude, (3) the pulse amplitude is variable (not all or none), (4) the cytoplasmic streaming does not stop. Thus it is unlikely that Ca2+-activated Cl- channels are involved in the noise.
The effects of high external [Na] are opposed by high external [Ca] (Osterhout 1917, Cramer 2002, Shepherd et al 2008), making calcium entry an unlikely candidate. Also the argument (4) above applies here.
The relatively slow recovery in each noise pulse may be due to a change in concentration of a cytoplasmic solute, implying that the depolarising events may be caused by the cross-membrane movement of pulses of this solute, causing steps in concentration and so in PD. A possible solute would be sodium, which might depolarise the membrane by inhibiting the proton pump, so pulses of sodium entry cannot be ruled out as the cause at this stage.
Alternatively the profiles of depolarisation and hyperpolarisation may represent profiles of opening and closing of groups of channels which act cooperatively, in the way proposed for H+/OH- channels (Bisson & Walker, 1980; Toko et al, 1984). Each depolarisation might in this case represent the spread in space of a cluster of open H+/OH- channels, followed by its slow 'evaporation'.
Entry of H+ through H+/OH- channels is known to depolarise Chara longifolia in high [Na] (Yao & Bisson, 1993) and there is current-voltage (I/V) evidence that high salinity opens H+/OH- channels in Chara australis (Beilby & Al Khazaaly, 2009). Similarly to the noise pulses, this putative H+/OH- current is also insensitive to changes of medium from NaCl to Na2SO4. Further, the current decreases as membrane PD becomes more negative, producing the typical upwardly concave I/V characteristics. The half-activation PD shifts from ~ -100 mV at early exposure to Saline APW to ~-200 mV after exposures for 60 min or more (Beilby & Al Khazaaly, 2009). The negative PDs at the early times of exposure to Saline APW might be the cause of transient H+/OH- channel opening. The involvement of H+/OH- channels in salinity stress may extend to land plants, as Tyerman et al (1997) observed inward currents at membrane PDs more

10
positive than EK and ECl, as well as salinity-induced noise, in salt stressed wheat root protoplasts.
References
Beilby MJ, Al Khazaaly S (2009) The role of H+/OH- channels in salt stress response of Chara australis. In preparation.
Bloomfield P (2000) Fourier Analysis of Time Series: an Introduction. John Wiley & Sons, NY. Bisson MA, Walker NA (1980) The Chara plasmalemma at high pH. Electrical measurements show rapid specific passive uniport of H+ or OH-. J Membrane Biol 56: 1-7 Coster HGL, Smith JR (1977) Low-frequency Impedance of Chara corallina: simultaneous measurements of the separate plasmalemma and tonoplast capacitance and conductance. Aust J Plant Physiol 4: 667-674 Cramer GR (2002) Sodium-calcium interactions under salinity stress. In: A. Lauchli A, Luttge V (eds) Salinity: Environment–Plants–Molecules, Kluwer Dordrecht, the Netherlands, pp 205–227 Ferrier JM, Morvan C, Lucas, WJ, Dainty J (1979) Plasmalemma voltage noise in Chara corallina. Plant Physiol 63: 709-714 Findlay GP, Hope AB (1964) Ionic relations of cells of Chara australis: VII. The separate electrical characteristics of the plasmalemma and tonoplast. Aust J Biol Sci 17: 62 - 77 Fisahn J, Mikschl E, Hansen U-P (1986) Separate oscillations of the electrogenic
pump and of a K+ channel in Nitella as revealed by simultaneous measurement of membrane potential and of resistance. J Exp Bot 37: 34-47 Gradmann D (2001) Models for oscillations in plants. Aust J Plant Physiol 28: 577-590 Hansen U-P (1978) Do light-induced changes in the membrane potential of Nitella reflect the feed-back regulation of a cytoplasmic parameter? J Membrane Biol 41: 197-224

11
Hayashi H, Hirakawa K (1979) The instability in the membrane potential of the Nitella internodal cell. J Phys Soc Japan 47: 345-346 Hayashi H, Hirakawa K (1980) Nitella fluctuation and instability in the membrane potential near threshold. Biophys J 31: 31-44 Hill SE, Osterhout WJV (1938) Nature of the action current in Nitella. IV. Production of quick action currents by exposure to NaCl. J Gen Physiol 22: 91-106 Kay SM, Marple, SL (1981) Spectrum analysis - a modern perspective Proc IEEE 69: 1380-1419 Kishimoto U (1966) Repetitive action potentials in Nitella internodes. Plant Cell Physiol 7: 547-558 Korff H-M, Grahn J, Warncke J, Hansen U-P (1980) The noise spectrum of the membrane potential in Nitella. In: Spanswick RM, Lucas WJ, Dainty J (eds) Plant Membrane Transport: Current Conceptual Issues, Elesvier/North Holland, Amsterdam, pp 605-606 Ogata K, Kishimoto U (1976) Rhythmic change of membrane potential and cyclosis of Nitella internode. Plant Cell Physiol 17: 201-207 Ogata K, Chilcott TC, Coster HGL (1983) Spatial variation of the electrical properties of Chara australis. I. External potentials and membrane conductance. Aust J Plant Physiol 10: 339-351 Osterhout WJV (1917) Antagonism and permeability. Science 45:1153-1197 Roa RL, Pickard WF (1976) The use of membrane electrical noise in the study of Characean electrophysiology. J Exp Bot 27: 460-472 Roa RL, Pickard WF (1977) Further experiments on the low frequency excess noise in the vacuolar resting potential of Chara braunii. J Exp Bot 28: 1-16 Ross S, Dainty J (1985) Membrane electrical noise in Chara corallina, I. A low frequency spectral component. Plant Physiol 79: 1021-1025 Ross S, Dainty J (1986) Membrane electrical noise in Chara corallina, II. Effects of inhibitors on the low frequency spectral component. Plant Physiol 81: 758-761 Shabala S, Shabala L, Gradmann D, Chen Z-H, Newman I, Mancuso S (2006) Oscillations in plant membrane transport: model predictions, experimental validation and physiological implications. J Exp Bot 57: 171-184

12
Shepherd VA, Beilby MJ, Al Khazaaly S, Shimmen T (2008) Mechano-perception in Chara cells: the influence of salinity and calcium on touch-activated receptor potentials, action potentials and ion transport. Plant Cell Environ 31: 1575–1591 Spear DG, Barr, JK, Barr GE (1969) Localization of hydrogen ion and chloride ion fluxes in Nitella. J Gen Physiol 54: 397-414 Toko K, Iiyama S, Yamafuji K (1984) Band-type dissipative structure in ion transport systems with cylindrical shape. J Phys Soc Japan 53: 4070-4082 Tyerman SD, Skerrett M, Garrill A, Findlay GP, Leigh RA (1997) Pathways for the permeation of Na+, and Cl- into protoplasts derived from the cortex of wheat roots. Journal of Experimental Botany 48: 459 - 480 Wacke M, Thiel G (2001) Electrically triggered all-or-none Ca2+ liberation during action potential in the giant alga Chara. J. Gen. Physiol. 118: 11 – 21 Wacke M, Thiel G, Hutt M-T (2003) Ca2+ dynamics during membrane excitation of green alga Chara: Model simulations and experimental data. J. Membrane Biol. 191: 179 - 192 Yao X, Bisson MA (1993) Passive proton conductance is the major reason for membrane depolarization and conductance increase in Chara buckellii in high-salt conditions. Plant Physiol 103: 197-203
Figure Legends
Figure 1. A typical power spectrum for membrane PD fluctuations in a Chara cell (cell 13/11) in APW, smoothed by a 7-point moving average filter and accompanied by its 95 % confidence limits. The power spectrum is obtained from a run of 15,000 points taken at 10 Hz. It shows (a) a region of ‘white noise’ at frequencies above 1 Hz, (b) below 0.5 Hz a region of ‘red noise’ with a slope of about -2 and a width of several decades and (c) a tendency to level off at frequencies below 3 mHz. The line represents a least-squares fit of a straight line to the power in the interval 10 to 100 mHz.
Figure 2. Power spectrum for membrane PD fluctuations in cell 11/11. (A) the last in APW and then (B) the first in Sorbitol-APW. Both spectra obtained from runs of 5000 points at 10 Hz and smoothed as Fig. 1.

13
Figure 3. Power spectrum for membrane PD fluctuations in cell 25/11. (A) the last in Sorbitol-APW and then (B) the first in Saline-APW. Both spectra obtained from runs of 5000 points at 10 Hz and smoothed as Fig. 1. Figure 4. Time-course of membrane PD fluctuations in cell 25/11 in: (A) Sorbitol-APW (B) Saline-APW These plots are typical of 5 out of the 7 cells discussed.

14
Tables Table 1. Membrane PD/mV of Chara australis cells before and after solution changes.
Solution Change: APW to Sorbitol-APW Sorbitol-APW to Saline-APW Cell Before After Before After 11/11 -255 -255 -231 -155 13/11 -196 -195 -200 -81 25/11 -223 -216 -235 -182 1/12 -191 -181 -225 -140 5/12† -203 -185 -131 -38 9/12 -228 -216 -213 -162 10/12 -171 -180 -193 -78
Median -203 -195 -213 -140 † This cell appears to have been in poor condition during and after exposure to Sorbitol-APW and its viability is questionable.
Table 2. Change in slope of noise spectrum and net noise power between 10 and 100 mHz resulting from solution changes.
Change: APW to Sorbitol-APW Sorbitol-APW to Saline-APW Change in: Slope * Power* Slope * Power* 11/11 0.25 3.5× -0.48 99× 13/11 0.06 1.0× -0.61 3.6x 25/11 -0.03 1.3× 0.15 858× 1/12 -0.03 1.1× 0.56 65× 5/12 -0.22 1.9× -0.05 9.6× 9/12 0.19 0.8× -0.06 7.7× 10/12 -0.04 1.4× -0.27 26× Median -0.03 1.3× -0.06 26×
98 % c.l. -0.22, 0.25 0.8×, 3.5× -0.61, 0.56 3.6×, 858×

15
Table 3. Parmeters of random depolarizing events n Saline-APW.
Depolarizations: Cell Mean Ampl. Mean Duration Mean Rate Mean Freq. mV s mV/s Hz 11/11 0.91 1.56 0.58 0.17 25/11 6.15 0.99 5.64 0.18 1/12 2.64 1.45 2.06 0.22 5/12 0.62 0.94 0.93 0.17 9/12 5.55 1.51 5.28 0.20 10/12* 1.52 2.23 1.98 0.32 Median 2.08 1.48 2.02 0.19
Repolarizations: Cell Mean Rate mV/s 11/11 -0.33 25/11 -1.36 1/12 -0.86 5/12 -0.52 9/12 -1.77 10/12* -nd- Median -0.86 * This cell showed frequent fast hyperpolarising spikes & fast returns with overshoot as its characteristic noise.

16
17

18

19


