Embed Size (px)
Citation preview

The Role of H+/OH2 Channels in the Salt Stress Responseof Chara australis
Mary J. Beilby Æ Sabah Al Khazaaly
Received: 9 April 2009 / Accepted: 2 June 2009 / Published online: 17 July 2009
� Springer Science+Business Media, LLC 2009
Abstract We investigate the electrophysiological salt
stress response of the salt-sensitive charophyte Chara
australis as a function of time in saline artificial pond water
(saline APW) containing 50 mM NaCl and 0.1 mM CaCl2.
The effects are due to an increase in Na? concentration
rather than an increase in Cl- concentration or medium
osmolarity. A previous paper (Shepherd et al. Plant Cell
Environ 31:1575–1591, 2008) described the rise in the
background conductance and inhibition of proton pumping
in saline APW in the first 60 min. Here we investigate the
shift of membrane potential difference (PD) to levels above
-100 mV and the change of shape of the current–voltage
(I/V) profiles to upwardly concave. Arguing from ther-
modynamics, the I/V characteristics can be modeled by
channels that conduct H? or OH-. OH- was chosen, as H?
required an unrealistic increase in the number/permeability
of the channels at higher pH levels. Prolonged exposure to
saline APW stimulated opening of more OH- channels.
Recovery was still possible even at a PD near -50 mV,
with partial return of proton pumping and a decrease in
OH- current following APW wash. Upon change of pH
from 7 to 9, the response was consistent with previously
observed I/V characteristics of OH- channels. For a pH
change to 6, the response was transient before channel
closure but could still be modeled. The consequences of
opening of H? or OH- channels while the cell is under salt
stress are discussed.
Keywords Salt stress � Charophytes H?/OH- channels �Current-voltage analysis
The experiments described in this paper are a part of a
larger investigation that compares the electrophysiology of
salt-sensitive and salt-tolerant charophytes challenged by
saline stress. To gain a full understanding of the ability of
salt-tolerant plants to survive in saline media, it is also
necessary to study the pathology of salt stress in their salt-
sensitive relatives. The salt-tolerant charophyte Lampro-
thamnium thrives in brackish coastal lakes where salinity
can be higher than that of seawater at the time of drought
(Shepherd et al. 1999). The salt-sensitive Chara australis
dies within 6 days in media with 50 mM NaCl and 0.1 mM
Ca2?. Thus comparing the electrophysiological responses
to salinity of these closely related plants of ancient lineage
is likely to identify a minimal ensemble of factors that
influence salt tolerance (Tester and Davenport 2003).
In plant cells proton ATPase at the plasma membrane
pumps protons out of the cytoplasm. The resulting negative
membrane potential difference (PD) energizes the import of
nutrients and export of undesirable ions, such as Na?. The
proton pump in Lamprothamnium is stimulated by both a
decrease in internal pressure (increase in medium osmo-
larity) and an increase in medium salinity (Al Khazaaly and
Beilby 2007). The proton pump in Chara australis, on the
other hand, is insensitive to a decrease in internal pressure
and becomes inhibited by salinity, especially if the calcium
ion in the medium is low. In a previous paper we modeled
the decline of the proton pump toward the passive back-
ground state with a resting PD near -100 mV and docu-
mented an increase in the background conductance and
onset of repetitive spontaneous action potentials (APs) in
the first 60 min of salinity stress (Shepherd et al. 2008).
M. J. Beilby (&) � S. Al Khazaaly
Department of Biophysics, School of Physics, The University of
New South Wales, Sydney, NSW 2052, Australia
e-mail: [email protected]
123
J Membrane Biol (2009) 230:21–34
DOI 10.1007/s00232-009-9182-4

In this paper we follow further development of electrical
characteristics of Chara cells after longer exposure to
salinity stress. Cells were pretreated with sorbitol APW
(artificial pond water). The I/V characteristics were pump
current-dominated (see Fig. 1a, open squares, and Fig. 1c
and d, heavy solid lines). After exposure to saline APW of
the same osmolarity the membrane PD moved toward
-100 mV and the shape of the I/V profile transformed
close to linear—the background state (Fig. 1a, triangles,
and Fig. 1c and d, short-dashed lines). In this case there is
still a low pump current component present. With further
exposure to saline APW the I/V characteristics became
upwardly concave (Fig. 1a, diamonds, and Fig. 1c and d,
long-dashed lines). Such I/V characteristics suggest the
contribution of a negative current (outflow of negative
charge or inflow of positive charge) with a reversal PD at 0
or positive PDs. The ions with the appropriate inside and
outside concentrations are Cl-, Ca2?, and proton (H?) or
hydroxyl (OH-). Large currents of Ca2? are unlikely and
would result in stoppage of cytoplasmic streaming (Ka-
miya 1959), which was not observed. Cl- was eliminated,
as replacement of NaCl by Na2SO4 in the saline APW did
not shift the reversal PD or change the shape of the I/V
characteristics. The change of medium pH shifted the
membrane PD in the right direction and affected the shape
of the I/V characteristics. Consequently, we modeled the
negative current as inflow of H? or outflow of OH-,
employing the Goldman-Hodgkin-Katz (GHK) equation.
The H?/OH- channels are well documented in charo-
phytes. The discovery of acid and alkaline bands along the
surface of charophyte cells (Spear et al. 1969; Lucas and
Smith 1973) was one of the starting points for research into
Fig. 1 a A typical trend in the I/V characteristics from the pump-
dominated profile (empty rectangles) in sorbitol APW to the
background current-dominated profile after 67 min of saline APW
(filled triangles). After 117 min of saline APW the membrane PD
depolarized further and the profile exhibited an upward bend (filleddiamonds). Experimental data are simulated by background current
and pump (solid line; model parameters—background current
gbkg = 0.2 S m-2, Vbkg = -110 mV; pump parameters—k0io ¼
7200 s�1; k0oi ¼ 2:9 s�1; jio ¼ 0:5 s�1; jio ¼ 138 s�1); by back-
ground current, declining pump, and inward rectifier current (short-dashed line; model parameters—background current gbkg =
1.36 S m-2, Vbkg = -110 mV; pump parameters—k0io ¼ 100 s�1;
k0oi ¼ 0:1 s�1; jio ¼ 0:5 s�1; joi ¼ 55 s�1; inward rectifier para-
meters—NKPK = 40 9 10-7 m s-1, V50 = -258 mV, zg = 3.5);
and by background current, OH- channels, and inward rectifier
current (long-dashed line; model parameters—background current
gbkg = 1.3 S m-2, Vbkg = -110 mV; OH- channel parameters—
NOHPOH = 35 9 10-4 m s-1, V50- = -130 mV, zg- = 0.6; inward
rectifier parameters—NKPK = 40 9 10-7 m s-1, V50 = -174 mV,
zg = 4, pHi = 6.98). b Total conductance-voltage profiles, with the
resting PD indicated on each curve by a point of the same type as in a. cPump currents and OH- current. d Background currents and inward
rectifier currents. The thin solid lines in b–d show extrapolation of the
models beyond the PD window delimited by the data
22 M. J. Beilby, S. Al Khazaaly: The Role of H?/OH- Channels
123

the localized transporter operation and external currents
flowing between these specialized cell zones (Walker and
Smith 1977; Lucas and Nuccitelli 1980). The transporter
active in the acid zone is the proton pump creating the H?
efflux, while the alkaline zones facilitate opening of channels
conducting H? or OH- (Bisson and Walker 1980; Lucas
1982). While it is clear that the banding system helps cells
assimilate carbon, different schemes have been proposed
involving CO2 or HCO3- transport (Walker et al. 1980;
Lucas 1982).
Speculation about whether the channels conduct H? or
OH- has remained unresolved for almost 40 years. OH- is
the favored ion, as the concentration of H? is very low in the
alkaline bands, where the pH rises up to 10.5. Bisson and
Walker (1980), Smith and Walker (1983), and Beilby and
Bisson (1992) measured conductances of up to10 S/m2,
which would be difficult to sustain with so few H? ions in
the vicinity of the membrane, unless there is water splitting
in the membrane due to high electric fields (Simons 1979).
Lucas (1979) also argued for OH- to be the transported ion.
However, the definitive experiment is yet to be designed
and so we continue to refer to the channels as H?/OH-.
Under normal nonsaline conditions Chara H?/OH-
channels are activated at a high external pH, C9.0 (Bisson
and Walker 1980). It is not yet known why saline APW
opens the H?/OH- channels at a neutral medium pH.
However, this new aspect of salinity stress contributes to
cell deterioration, as the proton electrochemical gradient is
dissipated and the cytoplasm becomes more acid.
Extant Charales are a sister group to the ancestors of all
land plants (Karol et al. 2001) and their cellular responses
to salinity are likely to reveal fundamental mechanisms
with wider applications. Acid and alkaline zones were
found in aquatic angiosperms (Prins et al. 1980). Raven
(1991) surveyed rhizophytes from many habitats, exhibit-
ing H? (or OH-) currents in root tips that assist with
nutrient acquisition. The similarity between salt-sensitive
charophytes and roots of crops is discussed.
Materials and Methods
Cell Culture
Chara australis Brown (Garcia and Chivas 2006) was
collected from a golf course lake at Little Bay, Sydney, and
planted in round containers on a bed of autoclaved garden
soil, covered with rainwater, with a handful of rotting
leaves added. C. australis was cultured under equal num-
bers of Sylvania Gro-Lux fluorescent tubes (Sylvania
Australasia, Pty. Ltd.) and cool white fluorescent
tubes, providing photosynthetically active radiation of
80 lmol m-2 s-1, on a cycle of 10 h light and 14 h
darkness. Young subapical internodal cells, 7–15 mm long
and between 0.6 and 0.7 mm in diameter, were trimmed
from healthy plants and left to recover in artificial pond
water (APW) for at least 3 days. Experiments were con-
ducted at room temperature (25�C).
Electrophysiology
The internal microelectrode was placed in the large vacuolar
compartment. Thus the PD was measured across both the
plasma membrane and the tonoplast. However, the plasma
membrane I/V characteristics dominate under most condi-
tions because of the high tonoplast conductance (Beilby
1990). Cells were placed in a three-compartment holder, with
each compartment insulated by grease. The voltage-clamp
was achieved by passing current between Ag/AgCl wire
electrodes in the outside and middle compartments (Beilby
1989; Beilby and Shepherd 1996). We measured current-
voltage (I/V) characteristics using a bipolar staircase voltage
command, with pulses of width between 60 and 100 ms,
separated by 120–250 ms, at the resting PD. The data-log-
ging rate was one measurement per millisecond (Beilby and
Beilby 1983). The resting PD was data-logged separately at a
rate of one PD measurement every 10 s in early experiments
and at 10 points per second in later experiments.
Experimental Protocol and Media
In the experimental protocol the cells were inserted into the
apparatus and left to recover in the APW for about 1 h.
Sorbitol APW was then introduced into the chamber for
another hour. I/V characteristics were monitored in both
APW and sorbitol APW. Finally, sorbitol APW was
exchanged for saline APW and a series of I/V character-
istics was recorded. Thus the effects measured were due to
salinity stress, as distinct from a decrease in turgor. Some
cells were returned to APW and the electrophysiology of
the recovery was recorded. To maintain the composition
constant the bathing medium was often refreshed by hand.
The pH changes of the saline APW were performed
quickly, as the electrophysiology of the cells was changing
slowly as a function of time in saline APW.
APW consisted of (mM) 0.1 KCl, 1.0 NaCl, 0.1 CaCl2, 2.0
HEPES [4-(2-hydroxyethyl)-1-piperazineethanesulfonic
acid], pH 7. Sorbitol APW was made from APW by adding
90 mM sorbitol to match the osmolarity of saline APW.
Saline APW was made from APW by adding 50 mM NaCl.
For saline APW of pH 9, HEPES was replaced with AMPSO
[N-(1,1-dimethyl-2-hydroxyethyl)-3-amino-2-hydroxypro-
panesulfonic acid] at the same concentration. For saline
APW of pH 6, the buffer was MES [2-(N-morpholino)eth-
anesulfonic acid]. The buffer concentration was increased to
5.0 mM in saline APW.
M. J. Beilby, S. Al Khazaaly: The Role of H?/OH- Channels 23
123

Modeling
The total clamp current was resolved into contributions
made by parallel populations of ion transporters. The proton
pump current Ip was modeled by the two-state Hansen et al.
(1981) model. This model has been used extensively to
model chloride or proton ATPases in Acetabularia, charo-
phytes, guard cells, and wheat root protoplasts (Gradmann
1989; Beilby 1984; Blatt 1987; Tyerman et al. 2001).
Ip ¼ zpFNkiojoi � koijio
kio þ koi þ jio þ joi
ð1Þ
kio ¼ koioe
zFV2RT ð2Þ
koi ¼ kooie�zFV
2RT ð3Þ
where F, R, and T have their usual meanings, and zp is the
pump stoichiometry, which has been set to 1. N is a scaling
factor (2 9 10-8) and V is the PD across the membrane(s).
The number of carrier states was reduced to two with a pair
of PD-dependent constants, kio and koi, with a symmetric
Eyring barrier and two PD-independent rate constants, jio
and joi. These constants are fitted to the data.
The background current was fitted by an empirical
equation:
Ibkg ¼ gbkg V � Vbkg
� �ð4Þ
The channels passing Ibkg are thought to be the
equivalent of nonselective cation-permeable channels
(NCCs) found in land plants (Shepherd et al. 2002;
Demidchik and Maathuis 2007; Demidchik et al. 2002).
The reasons for choosing this form of the background
current are explained in the Discussion.
The inward and outward rectifiers (with K? as the per-
meant ion) and H?/OH- channels were fitted by the GHK
equation, with the channel number/permeability as the
single parameter (Eq. 5). The moderate PD dependence of
the GHK model was supplemented by multiplying by the
Boltzmann distribution of open probabilities Po- (Eq. 6) for
the inward rectifier, Iirc, Po? (Eq. 7) for the outward recti-
fier, Iorc, and both probabilities for the OH- current, IOH.
IX ¼ PoþPo�NXPXðzFÞ2Vð½X�i � ½X�oe�
zFVRT Þ
RTð1� e�zFVRT Þ
" #
ð5Þ
Po� ¼ 1� 1
1þ e�zgFðV�V50Þ
RT
ð6Þ
Poþ ¼1
1þ e�zgFðV�V50Þ
RT
ð7Þ
where z is the valence of the transported ion, and [X]o and
[X]i are the ion concentrations in the medium and in the
cytoplasm, respectively. NXPX stands for the number of X
ion channels and their permeability treated as a single
parameter; zg is the number of gating charges, and V50- and
V50? are the half activation potentials, V50, at the negative
and positive PDs of channel closure (Amtmann and
Sanders 1999; Beilby and Shepherd, 2001).
I/V profiles were fitted by eye. Due to the large number
of parameters, a good fit could be achieved with several
parameter combinations. Some parameters were con-
strained by additional information, as outlined in the Dis-
cussion. Families of I/V profiles were fitted with minimal
parameter changes. The main goal was to visualize the
components of the total clamp current and their evolution
as a function of exposure to salinity. Conductance-voltage
(G/V) characteristics were calculated by differentiating the
modeled I/V profiles. G/V profiles sometimes aid inter-
pretation, as parallel conductances of channel and pump
populations are directly additive.
Results
Membrane PD and I/V Characteristics as a Function of
Time in Saline APW
More than 50 cells were exposed to APW, sorbitol APW,
and then saline APW at neutral pH. The membrane PD
depolarized in all cells in saline APW, whether they were
subjected to repeated voltage-clamping protocol to obtain
I/V characteristics or the membrane PD was allowed to
vary spontaneously while the salinity noise was measured
(Al Khazaaly et al. 2009). However, the time course of the
depolarization varied from cell to cell. This effect mani-
fested as large scatter in the statistics for four voltage-
clamped cells after 1 h in saline APW (Shepherd et al.
2008). The complexity of the response to low-Ca2? saline
APW is due to several mechanisms activated (or inacti-
vated) by salinity: (i) increased background conductance,
(ii) salinity-induced noise, (iii) pump inhibition, (iv) acti-
vation of negative currents, (v) spontaneous and prolonged
action potentials, and (vi) activation of the outward rectifier
current. In this paper we investigate mechanism iv in more
detail.
Twelve cells were subjected to I/V analysis as a function
of time in saline APW. All exhibited depolarization of the
membrane PD to levels above -100 mV and upwardly
concave I/V characteristics. The pH of the medium was
changed in four of these cells. Another four cells were
tested for changes of NaCl to Na2SO4: neither membrane
PD nor I/V characteristics were affected by this change
(results not shown). Thus we could eliminate chloride as a
possible carrier of the depolarizing negative currents.
A typical change from the pump-dominated I/V char-
acteristics (open rectangles) in sorbitol APW to the back-
ground current-dominated I/V profile after 67 min of saline
24 M. J. Beilby, S. Al Khazaaly: The Role of H?/OH- Channels
123
APW (filled triangles) and to the upwardly concave I/V
characteristics after 117 min of saline APW (diamonds) is
shown in Fig. 1a. The pump-dominated I/V characteristics
are curved and the resting PD can be more negative than
-200 mV. The G/V profile exhibits a maximum near
-200 mV, attributed to the proton pump. In the back-
ground current-dominated state, the I/V profile is close to
linear. Note also the increase in the background conduc-
tance in saline APW (Fig. 1d). After 117 min of saline
APW the membrane PD depolarized further and the profile
exhibited an upward bend (filled diamonds). The modeled
components of each I/V profile and the fit parameters are
listed in the caption to Fig. 1. The total conductance-
voltage profiles are shown in Fig. 1b. The resting con-
ductance (shown in Fig. 1b by symbols on each curve)
increased with the time in saline APW.
Development of the H?/OH- state with time in saline
APW is documented in Fig. 2. At the beginning of this
experiment the cell was left to recover from handling and
microelectrode insertion for more than an hour in APW and
then exposed to sorbitol APW for more than an hour (not
shown). I/V characteristics were measured several times.
An I/V profile in sorbitol APW that is typical for this cell is
shown as black points in Fig. 2b. Figure 2a shows the
membrane PD response after the cell was exposed to saline
APW (thin vertical line). The membrane PD exhibited a
fast shift to -120 mV, followed by a slower trend to levels
more positive than -100 mV. I/V scans were performed at
21 min (violet line), 60 min (light-green line), 66 min
(blue line), and 74 min (pink line) after the saline APW
challenge. The membrane PD moved to -50 mV after the
last I/V scan. In a preliminary recovery experiment saline
APW was replaced with APW. The sorbitol APW step was
omitted to save time and to return the cell to full turgor.
To our surprise, the membrane PD returned rapidly to
-100 mV and gradually became more negative. I/V
characteristics after 33 min of APW (orange line) were
recorded.
I/V characteristics in sorbitol APW were fitted by the
pump model (Fig. 2d), the background current, and the
inward rectifier models (Fig. 2e). I/V characteristics in
saline APW were modeled by the background current, the
inward rectifier (Fig. 2e), and the OH- channels (Fig. 2d).
The recovery I/V characteristics in APW required both the
OH- channel and pump model (Fig. 2d) and the back-
ground current and inward rectifier models (Fig. 2e). The
fit parameters are listed in Table 1.
Response to pH Change of Saline APW
To test if H?/OH- channels indeed participate in salinity
stress, we exposed four cells (cells 5–8) to the same
sequence of APW, sorbitol APW, and saline APW. When
the cells exhibited upwardly concave I/V characteristics
that we consider typical of H?/OH- channels (see Figs. 1a
and 2b), the pH of the saline APW was changed to either
more alkaline or more acidic values.
Figure 3a shows the membrane PD of cell 5, which was
exposed to saline APW (pH 7) for 106 min. The medium
pH was increased to 9. The cell responded with two action
potentials (APs) and a prompt negative shift of the mem-
brane PD of about 20 mV. Better fits of the data were
obtained when the pHi was increased, especially for the
second I/V curve, after about 5 min in alkaline saline APW
(see Table 2). For the hydroxyl to flow into the cell, EOH
has to be negative of Vbkg. In this case both reversal PDs
were close. As the resting PD settled close to -90 mV, we
set Vbkg as -90 mV in alkaline saline APW. To fit the
hydroxyl current at pH 9, the NOHPOH parameter decreased
slightly. The current started to inactivate at PDs positive of
EOH, but no inactivation was seen at negative PDs (see
Table 2 for parameters). To obtain an equivalent fit of the
data at pH 9 using H? channels, the parameter NHPH had to
be increased to 1400 m/s. Such a large increase seemed
unrealistic and all the data were modeled with OH-
channels. The cells were excitable at this stage of saline
stress (Shepherd et al. 2008) and thus APs are often
observed upon change of media or after the I/V protocol.
The I/V data were discarded if an AP occurred at the time
of the I/V scan.
A change from neutral to low pH elicited a positive-
going transient in the resting PD. Figure 4a shows the
resting PD of cell 7 upon change from pH 9 to pH 6 (see
also Table 3). This larger change in pH caused a larger
transient, and I/V scans could be performed before the
membrane PD repolarized. The cell was exposed to neu-
tral-pH saline APW for 191 min. Upon exposure to pH 9,
the membrane PD shifted in a negative direction in a
similar fashion to cell 5 (Fig. 3a). The shape of the I/V
curves was also similar (Fig. 4b). A change to pH 6
resulted in a positive-going transient of about 76 mV. The
I/V scan was run 100 s after the pH decrease. The mem-
brane was left clamped and another I/V scan was run over a
greater PD range (see Fig. 4b). Once the membrane PD
was free, it continued to move back to negative levels.
Another I/V scan was performed. The modeling confirmed
that the low pH was closing the hydroxyl channels, and the
last I/V curve at pH 6 was fitted by the background current
and rectifiers only. The closure of hydroxyl channels
caused the membrane PD to tend to Vbkg. The PD level at
pH 6 approached -88 mV.
Figure 5 shows statistics of the response to pH change
for cells 5–8 (see also Table 4). The I/V scans at low pH
were done as soon as possible after medium change. The
average immediate negative step upon increasing the pH
from 7 to 9 was 27 mV (five changes in four cells), with a
M. J. Beilby, S. Al Khazaaly: The Role of H?/OH- Channels 25
123
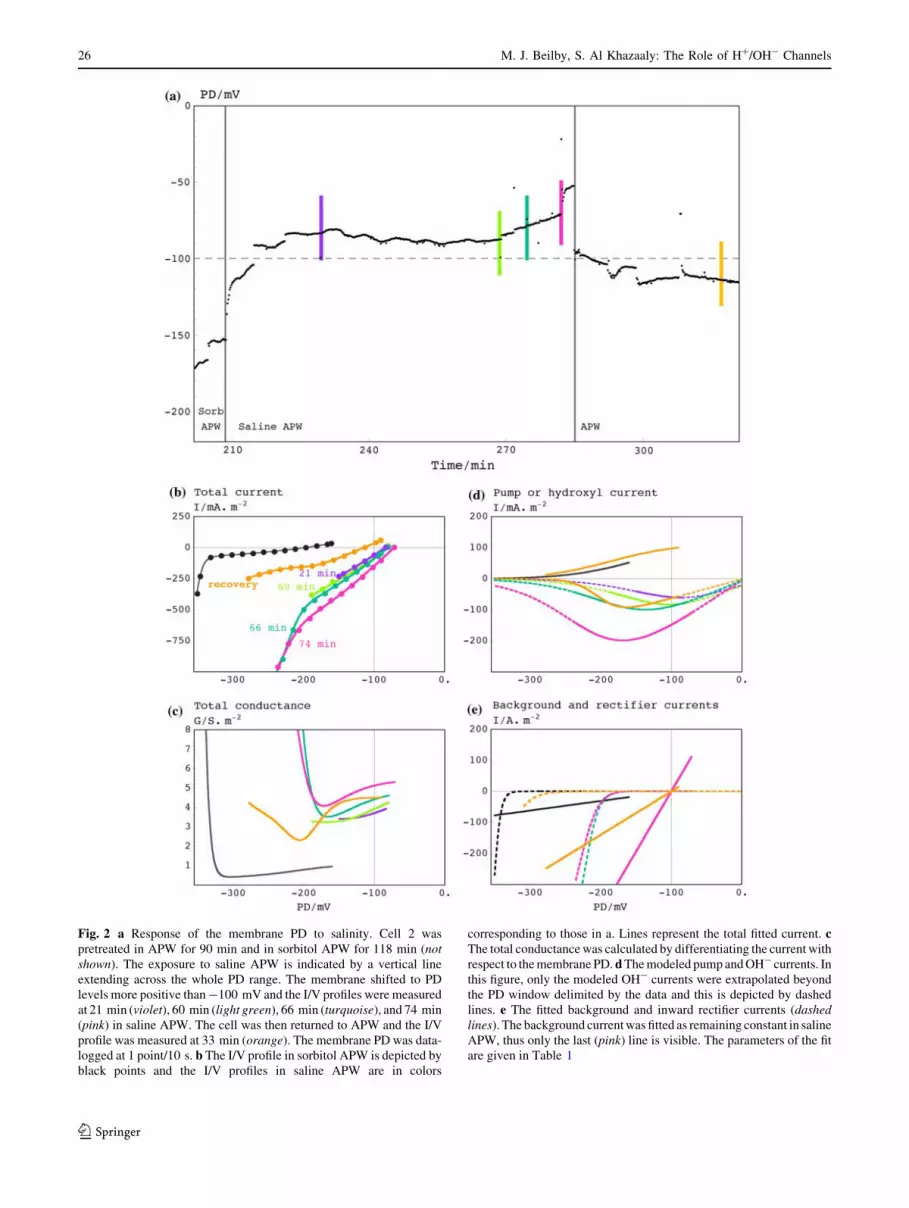
Fig. 2 a Response of the membrane PD to salinity. Cell 2 was
pretreated in APW for 90 min and in sorbitol APW for 118 min (notshown). The exposure to saline APW is indicated by a vertical line
extending across the whole PD range. The membrane shifted to PD
levels more positive than -100 mV and the I/V profiles were measured
at 21 min (violet), 60 min (light green), 66 min (turquoise), and 74 min
(pink) in saline APW. The cell was then returned to APW and the I/V
profile was measured at 33 min (orange). The membrane PD was data-
logged at 1 point/10 s. b The I/V profile in sorbitol APW is depicted by
black points and the I/V profiles in saline APW are in colors
corresponding to those in a. Lines represent the total fitted current. cThe total conductance was calculated by differentiating the current with
respect to the membrane PD. d The modeled pump and OH- currents. In
this figure, only the modeled OH- currents were extrapolated beyond
the PD window delimited by the data and this is depicted by dashed
lines. e The fitted background and inward rectifier currents (dashedlines). The background current was fitted as remaining constant in saline
APW, thus only the last (pink) line is visible. The parameters of the fit
are given in Table 1
26 M. J. Beilby, S. Al Khazaaly: The Role of H?/OH- Channels
123
large range, from 8 to 53 mV. A repeated increase in cell 4
produced a negative-going change of 27 mV upon the first
exposure but only 8 mV upon the second exposure. The
change from pH 9 to pH 6 produced an average positive-
going transient of 59 mV (three changes in three cells),
with a range of 43 to 76 mV.
Discussion
Modeling Strategies and Insights
The Background State
Figures 1 and 2 show that salinity stress is yet another
condition that induces Chara cells to enter, in this case
transiently, the ‘‘background state.’’ This state is charac-
terized by near-linear I/V characteristics in the PD window
delimited by inward and outward rectifiers, Iirc and Iorc,
which are modeled as separate transporter populations
mainly permeable to K?. The reversal PD for background
current, Vbkg, is -100 mV (± 30 mV). There is an abun-
dance of experimental data indicating that the background
state underpins all the other PD states. Proton pump inhi-
bition by different types of inhibitors (DES, Azide, Vana-
date) and withdrawal of ATP in perfused cells yields very
similar background states in Chara australis and longifolia
(Beilby 1984; Yao et al. 1992; Beilby and Walker 1996).
Closure of the high-conductance K? channels by a blocker
such as TEA, Ba2?, Na?, or Cs?, a high concentration of
Ca2?, or a low concentration of K? again reveals similar
background states (Beilby 1985, 1986a, b; Tester 1988a, b).
Cells of the salt-tolerant charophyte Lamprothamnium
are often found in the background state (Beilby and
Shepherd 1996). Comparison of I/V characteristics of
Lamprothamnium cells acclimated to a range of salinities
revealed that the background conductance increases with
salinity, but the reversal PD remains near -100 mV
(Beilby and Shepherd 2001). A similar increase in con-
ductance is found in Chara (Beilby and Shepherd 2006;
Shepherd et al. 2008) (Figs. 1 and 2). We are assuming that
the background current flows through nonselective chan-
nels (Demidchik and Mathuis 2007) and that these chan-
nels are the main pathways for Na? into the cell. While the
nonzero reversal PD, which seems relatively insensitive to
changes in most ionic concentrations, is yet to be
explained, the background currents are well documented
not only in charophytes but also in many land plant cells.
For instance, a bimodal distribution of membrane PDs and
I/V characteristics is observed in guard cells (Thiel et al.
1992). In wheat root protoplasts, linear background cur-
rents with nonzero reversal PDs had to be included to
match the measured proton fluxes with the measured total
currents (Tyerman et al. 2001).
Modeling H?/OH- Channels
The early I/V characteristics in saline APW (violet and
green I/V curves; Fig. 2b) exhibit reversal PDs only
slightly positive with respect to -100 mV (reversal PD for
the background current). The profiles are nearly linear,
with only a hint of curvature, as the contribution of the
negative current is small. However, with time in saline
APW, the membrane PD becomes less negative and the
upwardly concave shape more pronounced (blue and pink
I/V curves; Fig. 2b). We model this development by
increasing the combined parameter for hydroxyl channel
number and permeability, NOHPOH (see Fig. 2d and
Table 1). The upwardly concave shape arises from the PD
dependence of the hydroxyl current. The current decreases
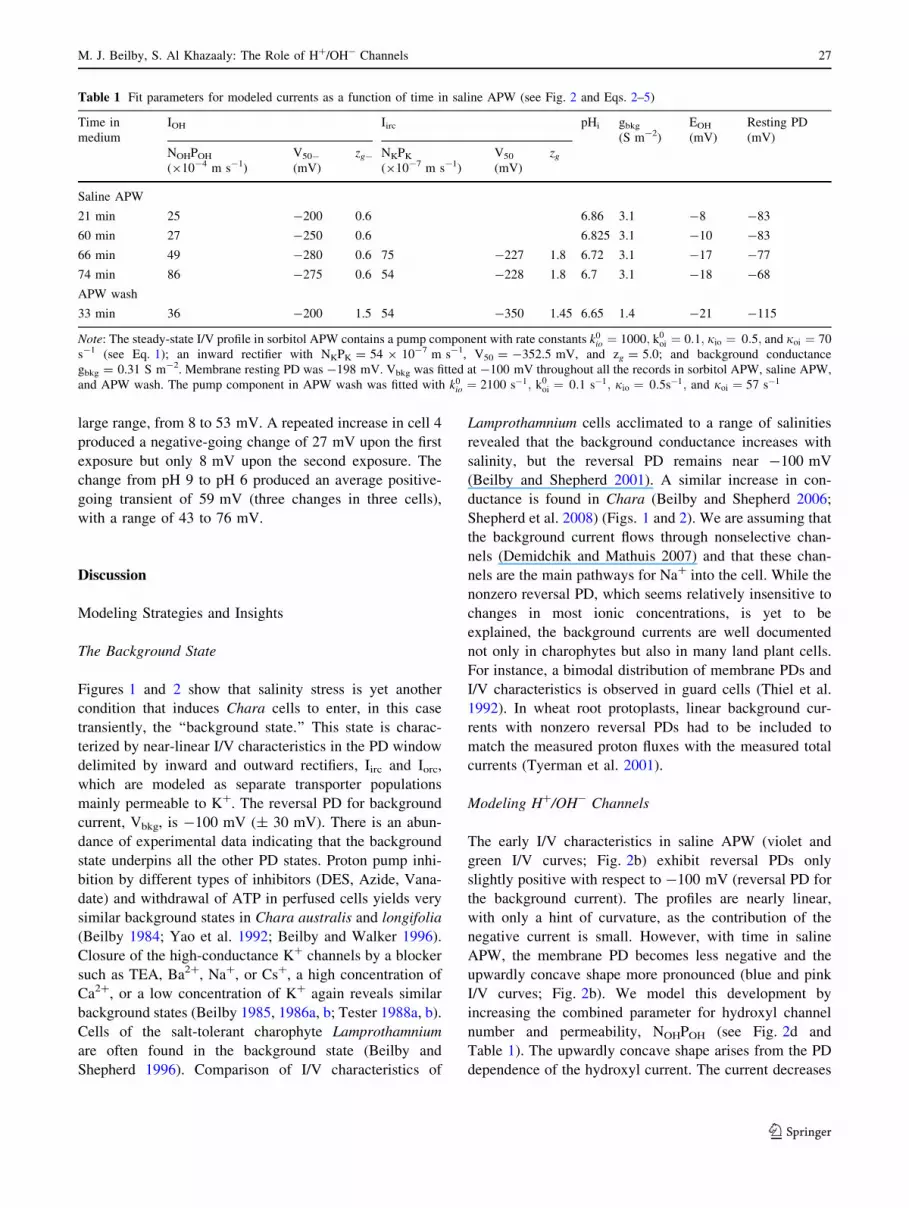
Table 1 Fit parameters for modeled currents as a function of time in saline APW (see Fig. 2 and Eqs. 2–5)
Time in
medium
IOH Iirc pHi gbkg
(S m-2)
EOH
(mV)
Resting PD
(mV)
NOHPOH
(910-4 m s-1)
V50-
(mV)
zg- NKPK
(910-7 m s-1)
V50
(mV)
zg
Saline APW
21 min 25 -200 0.6 6.86 3.1 -8 -83
60 min 27 -250 0.6 6.825 3.1 -10 -83
66 min 49 -280 0.6 75 -227 1.8 6.72 3.1 -17 -77
74 min 86 -275 0.6 54 -228 1.8 6.7 3.1 -18 -68
APW wash
33 min 36 -200 1.5 54 -350 1.45 6.65 1.4 -21 -115
Note: The steady-state I/V profile in sorbitol APW contains a pump component with rate constants k0io ¼ 1000; k0
oi ¼ 0:1; jio ¼ 0:5; and joi ¼ 70
s-1 (see Eq. 1); an inward rectifier with NKPK = 54 9 10-7 m s-1, V50 = -352.5 mV, and zg = 5.0; and background conductance
gbkg = 0.31 S m-2. Membrane resting PD was -198 mV. Vbkg was fitted at -100 mV throughout all the records in sorbitol APW, saline APW,
and APW wash. The pump component in APW wash was fitted with k0io ¼ 2100 s�1; k0
oi ¼ 0:1 s�1; jio ¼ 0:5s�1; and joi ¼ 57 s�1
M. J. Beilby, S. Al Khazaaly: The Role of H?/OH- Channels 27
123

Fig. 3 a Response of the membrane PD in saline APW to a change in
pH from 7 to 9 (cell 5). The membrane PD was data-logged at the
faster rate of 10 points/s. The horizontal axis shows the time from the
start of the experiment, with the cell exposed to saline APW at 152
min. At this data-logging speed and the scale of the time axis, the I/V
staircases appear as thick vertical bars. These are designated by
different symbols (full square, open triangle, and open diamond). The
change to pH 9 is indicated by an arrow. Action potentials can be seen
after the first and third I/V data collection and upon change of saline
APW. b The I/V profiles are shown as points using the same symbols
as in a. The data are modeled (solid line for pH 7, short-dashed line
for the first I/V curve at pH 9, long-dashed line for the second I/V
curve at pH 9. The modeling parameters are given in Table 2. c G/V
profiles are obtained by differentiation of the I/V profiles. d OH-
currents. The thin solid lines show extrapolation of the model beyond
the PD window delimited by the data. e Background and rectifier
currents. The background current was fitted as remaining constant at
pH 9. The same types of lines are used in b–e
28 M. J. Beilby, S. Al Khazaaly: The Role of H?/OH- Channels
123

in amplitude as the membrane PD becomes more negative
(see Fig. 1d). A similar PD dependence of H?/OH-
channels was calculated from flux measurements in wheat
root protoplasts (Tyerman et al. 2001). The half-activation
potential, V50- (see Table 1) becomes progressively more
negative with time in saline APW. This tendency for H?/
OH- channels to close at PDs more negative than
-100 mV in early exposure to saline APW is a probable
cause of the membrane PD noise (Al Khazaaly et al. 2009):
we postulate that groups of H?/OH- channels open and
close spontaneously as the proton pump still maintains a
negative membrane PD. The PD noise is no longer
observed once the I/V characteristics indicate that the H?/
OH- state has become dominant. The gating charge zg-
remains constant with time in saline APW. The fractional
value is taken to indicate partial movement of the charged
structural elements of the channel. The low value indicates
relatively weak PD dependence.
The resting PD is determined by the balance between
the hydroxyl current (Fig. 2d) and the background current
(Fig. 2e). Consequently, as the hydroxyl current increases,
the membrane PD tends toward EOH (see Table 2). The
cytoplasmic pH, pHi, for Chara, Nitella, and Nitellopsis
was found to be in the range of 7.2–7.8 in their native
media (Walker and Smith 1975; Smith and Raven 1979;
Katsuhara et al. 1989), providing a starting value for pHi in
the modeling. However, better fits of our data were
obtained with pHi becoming more acidic with time in
saline APW (see Table 1). This finding is reasonable, as
the presence of the background state maintains the mem-
brane PD negative of EOH, causing outflow of OH- out of
or inflow of H? into the cytoplasm. This trend is supported
by NMR measurements made by Katsuhara et al. (1989),
who found that the cytoplasmic pH in Nitellopsis obtusa
decreased to 6.9 in 2 h of exposure to saline APW.
The inward rectifier channels open at more positive PDs
in saline APW (Fig. 2e). A positive shift in half-activation
PD was found in the salt-tolerant charophyte Lampro-
thamnium (Al Khazaaly and Beilby, 2007). However, in
Chara the resting PD is located too far in the positive
direction to allow any K? inflow. The [K?]i was set to 40
or 30 mM for modeling I/V characteristics of cells exposed
to saline APW for more than 60 min. These values are
supported by measurements made by Katsuhara and Taz-
awa (1986).
The background conductance, which increased by up to
an order of magnitude in saline APW, was reduced by the
APW wash. The lower background current can be seen as
the orange line in Fig. 2e (see also Table 1 for fit parame-
ters). The half-activation potential for the inward rectifier
returned to a more negative PD. The I/V curve displayed an
unusual shape, with both upward and downward curvature.
Table 2 Parameters for modeled currents to fit data from saline APW of pH 7 and 9 (see Fig. 3 and Eqs. 2–5)
pHo IOH Iirc Iorc pHi gbkg
(S m-2)
EOH
(mV)
Resting PD
(mV)NOHPOH
(910-4
m s-1)
V50- zg- V50? zg? NKPK
(910-7 m s-1)
V50
(mV)
zg NKPK
(910-7 m s-1)
V50
(mV)
zg
7 11 -185 0.6 50 -181 2.5 7.25 1.05 9 -60
9 9 -117 0.6 7.32 1.05 -100 -95
9 9.5 -139 0.6 50 -220 2.5 6.5 105 1.0 7.5 1.05 -89 -90
Note: Vbkg was set at -100 mV for pH 7 but was modeled at -90 mV for pH 9. The internal K? concentration was set at 40 mM for all three I/V
curves
Table 3 Parameters for modeled currents to fit data from saline APW of pH 9 and 6 (see Fig. 4 and Eqs. 2–5)
pHo IOH Iirc Iorc pHi gbkg
(S m-2)
EOH
(mV)
Resting PD
(mV)NOHPOH
(910-4
m s-1)
V50- zg- V50? zg? NKPK
(910-7 m s-1)
V50
(mV)
zg NKPK
(910-7 m s-1)
V50
(mV)
zg
9 5.0 -190 0.6 -115 0.6 50 -220 2.8 6.5 32 2.8 7.1 0.5 -113 -101
9 5.0 -180 0.6 -115 0.6 6.5 32 2.8 7.27 0.5 -103 -97
6 14.0 -140 0.8 -50 0.6 7.2 0.85 ?81 -51
6 12.0 -145 0.8 -50 0.6 6.5 32 2.8 7.2 0.85 ?81 -59
6 50 -198 2.8 6.5 39 2.8 0.82 -87
Note. Vbkg was set at -90 mV for pH 9 and -88 mV for pH 6
M. J. Beilby, S. Al Khazaaly: The Role of H?/OH- Channels 29
123

Fig. 4 a Response of the membrane PD in saline APW to a change in
pH from 7 to 9 and to 6. The membrane PD was data-logged at the
faster rate of 10 points/s. The horizontal axis shows the time from the
start of the experiment with the cell exposed to saline APW at 136
min. I/V curves appear as vertical lines and are designated by
different symbols (open square, open triangle, filled triangle, filleddiamond, and star). The changes to pH 9 and pH 6 are indicated by
arrows. The membrane PD drift seen before the change to pH 9 is
typical of fluctuations observed at this stage of exposure to saline. b I/
V profiles are shown as points using same symbols as in a. Modeled
currents are shown by the solid line for pH 9, the short-dashed line for
the first I/V curve at pH 6, the long-dashed line for the second I/V
curve at pH 6, and the dashed-dotted line for the third I/V curve at pH
6. The membrane PD was clamped at -45 mV between the first two
I/Vs at pH 6. The modeling parameters are given in Table 3. c G/V
profiles obtained by differentiation of the I/V profiles. d OH-
currents. The thin solid lines show extrapolation of the model beyond
the PD window delimited by the data. e Background and rectifier
currents. The same types of lines are employed in b–e
30 M. J. Beilby, S. Al Khazaaly: The Role of H?/OH- Channels
123

This shape can be obtained by a simultaneous fit of both
proton pump and hydroxyl channels. The recovery of the
proton pumping and gradual closure of the H?/OH- chan-
nels (see Fig. 2d) suggest that the cell can make a full
recovery in APW. This recovery can be slow, as docu-
mented for pump recovery from the K? state (Beilby 1985).
The pH change experiments support our hypothesis that
the H?/OH- channels are involved in salinity stress. The
membrane PD moved in the right direction in each case. In
medium of pH 7, the EOH was in the range of ?30 to 0 mV,
depending on the internal pH. In medium of pH 9, the EOH
was near -100 mV. In medium of pH 6, the EOH moved to
between ?50 and ?80 mV. The membrane PD settled
between EOH and Vbkg at pH 9 or 7. At pH 6 there was a
positive-going transient and then H?/OH- channels closed.
The shape of the I/V profiles at pH 9 in Fig. 3 is similar to
that observed by Beilby and Bisson (1992). In APW the
H?/OH- channels close at pH levels \ 9 (Beilby and
Fig. 5 a Statistics of the response of the I/V characteristics in saline
APW to pH change. At pH 7, cells 4–8 (four I/V profiles), filledrectangles, solid line; at pH 9, cells 7 and 8 (four I/V profiles), opentriangles, long-dashed line; at pH 6, cells 7 and 8 (four I/V profiles),
stars, short-dashed line. Data were sorted into 15-mV slots (horizontalerror bars), with the standard error for each slot given as the vertical
error bar. The fitted parameters are given in Table 4. b G/V profiles.
c Fitted OH- currents. d Background and rectifier currents. The line
types are the same as in a–d. The thin solid lines in d show
extrapolation of the model beyond the PD window delimited by the
data
Table 4 Fitted parameters to statistics for the response of I/V characteristics to pH change (see Fig. 5 and Eqs. 2–5)
pHo OH- current Iirc Iorc pHi gbkg (S
m-2)
EOH
(mV)
Resting PD
(mV)NOHPOH
(910-4 m s-1)
V50- zg- V50? zg? NKPK
(910-7 m s-1)
V50
(mV)
zg NKPK
(910-7 m s-1)
V50
(mV)
zg
7 5.5 -230 0.6 30 -160 2.1 7.1 0.6 0 -70
9 6.0 -200 0.6 -100 0.6 30 -205 2.1 6.5 25 2.8 7.4 0.6 -95 -97
6 45.0 -240 0.6 6.5 20 2.5 6.9 1.3 53 -46
Note: Cells 4–8 (four I/V profiles) at pH 7, cells 4–7 (four I/V profiles) at pH 9, cells 7 and 8 (4 I/V profiles) at pH 6. Vbkg was fitted at -100 mV
for pH 7, -90 mV for pH 9, and -100 for pH 6. [K?]i was set at 30 mM throughout
M. J. Beilby, S. Al Khazaaly: The Role of H?/OH- Channels 31
123
Bisson 1992), while in saline APW this threshold pH is
lowered to values between 7 and 6. It will be interesting to
investigate if the lowering of the pH threshold for channel
opening depends on the Na? concentration of the saline
APW.
The Role of H?/OH- Channels in Salt Stress in Chara
australis
Bisson and Walker (1980) found that if the external pH of
APW is increased to a threshold value (near pH 9), the
surface of the whole cell becomes an alkaline band. Beilby
and Bisson (1992) measured the I/V profiles of this high pH
state and found that both the conductance and the reversal
PD were rather variable. However, the membrane has
always reverted to a proton pump-dominated state below
pH 9. Thus, finding activation of these channels at pH 7 in
saline APW is rather surprising. While the opening of the
H?/OH- channels in the alkaline band is beneficial for the
cell in native pond water, the circumstances are very dif-
ferent under salinity stress. The negative H?/OH- current
implies outflow of OH- or inflow of H?, acidifying the
cytoplasm. The proton pump is inactivated (Shepherd et al.
2008) and the buffering capacity of the cytoplasm is finite.
The membrane PD continues to move to more positive
levels, reaching the activation threshold for the outward
rectifier (about -50 mV), where the cell will lose more
K?. The balance of K? to Na?, important for normal
metabolism (Maathuis and Amtmann 1999), will be further
disrupted. Finally, the increased permeability to H?/OH-
dissipates some of the proton electrochemical gradient that
is needed for 2H?/Cl- symport and H?/Na? antiport. And,
of course, the cell cannot band without the pump to provide
the acid regions. The mechanism that increases carbon
assimilation is sabotaged. The cell is doomed if it remains
in the saline medium. The high Na? concentration and
Na?/Ca2? ratio of the medium are clearly the cause of the
proton pump inactivation, large background conductance,
and H?/OH- channel activation, as once the cell is
returned to APW, all these effects are gradually reversed
(orange curve in Fig. 2b–e).
What happens in salt-tolerant charophytes? Yao and
Bisson (1993) found that the alkaline bands in salt-tolerant
Chara buckellii (longifolia) cover more surface area in
saline APW than in APW. They observed an increase in
membrane conductance and assumed that it is due to
activation of H?/OH- channels. The key difference from
salt-sensitive Chara australis is the salinity-activated
increase in proton pumping. Thus Chara longifolia is able
to maintain a negative membrane PD and the banding
system. Another salt-tolerant charophyte, Lamprothamni-
um, also exhibits progressively greater membrane con-
ductance as the medium salinity is increased (Beilby and
Shepherd 2001). However, modeling of the I/V character-
istics suggests that it is the background conductance that
increases (Beilby and Shepherd 2001; Al Khazaaly and
Beilby 2007). Lamprothamnium has not been observed to
band in saline media but does exhibit the high-pH state in
alkaline media (Bisson and Kirst 1983). Neither Chara
longifolia nor Lamprothamnium exhibits the sodium-
induced noise observed in Chara australis (Al Khazaaly
et al. 2009).
H?/OH- Channels in Roots
Roots of land plants have a system similar to charophyte
banding, with proton (or hydroxyl) channels activated at the
root tip and proton pumping in the subapical zone of the
root (Raven 1991). Wheat root protoplasts were observed to
oscillate from a pump-dominated state with H? efflux to a
state with channel-mediated H? influx (Tyerman et al.
2001). If salinity inactivates the pump and opens the proton
(or hydroxyl) channels in the subapical zone of roots, this
will lead to major disruption of the normal root function
(Raven 1991). Tyerman et al. (1997) observed inward
currents at membrane PDs more positive than EK and ECl, as
well as salinity-induced noise, in salt-stressed wheat root
protoplasts. Consequently, the role of H?/OH- channels in
salinity stress may extend to many salt-sensitive land plants.
Conclusion
While pH changes can affect various transporters and more
experiments are necessary for final identification, we pres-
ent strong evidence that H?/OH- channels open in the latter
stages of salinity stress in Chara australis. In native pond
water these channels are part of the banding mechanism that
enhances the cell’s carbon assimilation in nonsaline pond
media and are closed at pH levels below 9. The activation at
neutral pH in saline APW is thus rather unexpected. Under
salinity stress the opening of these channels causes a posi-
tive-going shift of the membrane PD and possible acidifi-
cation of the cytoplasm. The electrochemical gradient for
H? is progressively dissipated, so there is less motive force
for H?/Na? antiport and 2H?/Cl- symport. The membrane
PD becomes more positive and outward K? rectifier chan-
nels are activated, depleting the cell of more K?.
References
Al Khazaaly S, Beilby MJ (2007) Modelling ion transporters at the
time of hypertonic regulation in Lamprothamnium succinctum.
Charophytes 1:28–47
32 M. J. Beilby, S. Al Khazaaly: The Role of H?/OH- Channels
123
Al Khazaaly S, Walker NA, Beilby MJ, Shepherd VA (2009)
Membrane potential fluctuations in Chara australis: the charac-
teristic signature of high external sodium. Eur Biophy J (in press)
Amtmann A, Sanders D (1999) Mechanisms of Na? uptake by plant
cells. Adv Bot Res 29:75–112
Beilby MJ (1984) Current-voltage characteristics of the proton pump
at Chara plasmalemma. J Membr Biol 81:113–125
Beilby MJ (1985) Potassium channels at Chara plasmalemma. J Exp
Bot 36:228–239
Beilby MJ (1986a) Factors controlling the K? conductance in Chara.
J Membr Biol 93:187–193
Beilby MJ (1986b) Potassium channels and different states of Charaplasmalemma. J Membr Biol 89:241–249
Beilby MJ (1989) Electrophysiology of giant algal cells. Methods
Enzymol 174:403–443
Beilby MJ (1990) Current/voltage curves for plant membrane studies:
a critical analysis of the method. J Exp Bot 41:165–182
Beilby MJ, Beilby BN (1983) Potential dependence of the admittance
of Chara plasmalemma. J Membr Biol 74:229–245
Beilby MJ, Bisson MA (1992) Chara plasmalemma at high pH:
voltage dependence of the conductance at rest and during
excitation. J Membr Biol 125:25–39
Beilby MJ, Shepherd VA (1996) Turgor regulation in Lamprotham-nium papulosum. 1. I/V analysis and pharmacological dissection
of the hypotonic effect. Plant Cell Environ 19:837–847
Beilby MJ, Shepherd VA (2001) Modeling the current-voltage
characteristics of charophyte membranes. II. The effect of
salinity on membranes of Lamprothamnium papulosum. J
Membr Biol 181:77–89
Beilby MJ, Shepherd VA (2006) The electrophysiology of salt
tolerance in charophytes. Cryptogamie Algologie 27:403–417
Beilby MJ, Walker NA (1996) Modeling the current-voltage charac-
teristics of Chara membranes: I. The effect of ATP removal and
zero turgor. J Membr Biol 149:89–101
Bisson MA, Kirst GO (1983) Osmotic adaptations of charophyte
algae in the Coorong, South Australia and other Australian lakes.
Hydrobiologia 105:45–51
Bisson MA, Walker NA (1980) The Chara plasmalemma at high pH.
Electrical measurements show rapid specific passive uniport of
H? or OH–. J Membr Biol 56:1–7
Blatt M (1987) Electrical characteristics of stomatal guard cells: the
contribution of ATP-dependent, ‘‘electrogenic’’ transport
revealed by current-voltage and difference-current–voltage anal-
ysis. J Membr Biol 98:257–274
Demidchik V, Maathuis FJM (2007) Physiological roles of nonse-
lective cation channels in plants: from stress to signaling and
development. New Phytol 175:387–404
Demidchik VV, Tester M (2002) Sodium fluxes through nonselective
cation channels in plasma membrane of protoplasts from
Arabidopsis roots. Plant Physiol 128:379–387
Demidchik VV, Bowen HC, Maathuis FJM, Shabala SN, Tester M,
White PJ, Davies JM (2002) Arabidopsis thaliana root non-
selective cation channels mediate calcium uptake and are
involved in growth. Plant J 32:799–808
Garcia A, Chivas AR (2006) Diversity and ecology of extant and
Quaternary Australian charophytes (Charales). Cryptogamie
Algologie 27:323–340
Gradmann D (1989) ATP-driven chloride pump in giant alga
Acetabularia. Methods Enzymol 174:490–504
Hansen U-P, Gradmann D, Sanders D, Slayman CL (1981) Interpre-
tation of current-voltage relationship for ‘‘active’’ ion transport
systems: I. steady-state reaction-kinetic analysis of class I
mechanisms. J Membr Biol 63:165–190
Kamiya N (1959) Protoplasmic streaming. Protoplasmatologia.
Handbuch der Protoplasma-forshung VIII/3 a. Springer, Wien
Karol KG, McCourt RM, Cimino MT, Delwiche CF (2001) The
closest living relatives of land plants. Science 294:2351–2353
Katsuhara M, Tazawa M (1986) Salt tolerance in Nitellopsis obtusa.
Protoplasma 135:155–161
Katsuhara M, Kuchitsu K, Takeshige K, Tazawa M (1989) Salt stress-
induced cytoplasmic acidification and vacuolar alkalization in
Nitellopsis obtusa cells. In vivo 31P-nuclear magnetic resonance
study. Plant Physiol 90:1102–1107
Lucas WJ (1979) Alkaline band formation in Chara corallina. Due to
OH– efflux or H? influx? Plant Physiol 63:248–254
Lucas WJ (1982) Mechanism of acquisition of exogeneous bicarbon-
ate by internodal cells of Chara corallina. Planta 156:181–192
Lucas WJ, Nuccitelli R (1980) HCO3– and OH– transport across the
plasmalemma of Chara corallina: spatial resolution obtained
using extraceltular vibrating probe. Planta 150:120–131
Lucas WJ, Smith FA (1973) The formation of alkaline and acid
regions at the surface of Chara corallina cells. J Exp Bot 24:1–14
Maathuis FJM, Amtmann A (1999) K? nutrition and Na? toxicity: the
basis of cellular K?/Na? ratios. Ann Bot 84:123–133
Prins HBA, Snel JFH, Helder RJ, Zanstra PE (1980) Photosynthetic
HCO3– utilization and OH– excretion in aquatic angiosperms.
Plant Physiol 66:818–822
Raven JA (1991) Terrestrial rhizophytes and and H? currents
circulating over at least a millimeter: an obligate relationship?
New Phytol 117:177–185
Shepherd VA, Beilby MJ, Heslop D (1999) Ecophysiology of the
hypotonic response in the salt-tolerant alga Lamprothamniumpapulosum. Plant Cell Environ 22:333–346
Shepherd VA, Beilby MJ, Shimmen T (2002) Mechanosensory ion
channels in charophyte cells: the response to touch and salinity
stress. Eur Biophys J 31:341–355
Shepherd VA, Beilby MJ, Al Khazaaly S, Shimmen T (2008)
Mechano-perception in Chara cells: the influence of salinity and
calcium on touch-activated receptor potentials, action potentials
and ion transport. Plant Cell Environ 31:1575–1591
Simons R (1979) Strong electric field effects on transfer between
membrane-bound amines and water. Nature 280:824–826
Smith FA, Raven JA (1979) Intracellular pH and its regulation. Ann
Rev Plant Physiol 30:289–311
Smith JR, Walker NA (1983) Membrane conductance of Charameasured in the acid and basic zones. J Membr Biol 73:193–202
Spear DG, Barr JK, Barr CE (1969) Localization of hydrogen ion and
chloride ion fluxes in Nitella. J Gen Physiol 54:397–414
Tester M (1988a) Pharmacology of K? channels in the plasmalemma
of the green alga Chara corallina. J Membr Biol 103:159–169
Tester M (1988b) Blockade of potassium channels in the plasma-
lemma of Chara corallina by tetraethylammonium, Ba2?, Na?,
and Cs?. J Membr Biol 105:77–85
Tester M, Davenport R (2003) Na? tolerance and Na? transport in
higher plants. Ann Bot 91:503–527
Thiel G, MacRobbie EAC, Blatt MR (1992) Membrane transport in
stomatal guard cells: the importance of voltage control. J Membr
Biol 126:1–18
Tyerman SD, Skerrett M, Garrill A, Findlay GP, Leigh RA (1997)
Pathways for the permeation of Na?, and Cl– into protoplasts
derived from the cortex of wheat roots. J Exp Bot 48:459–480
Tyerman SD, Beilby MJ, Whittington J, Juswono U, Newman I,
Shabala S (2001) Oscillations in proton transport revealed from
simultaneous measurements of net current and net proton fluxes
from isolated root protoplasts: MIFE meets patch-clamp. Aust J
Plant Physiol 28:591–604
Walker NA (1983) The uptake of inorganic carbon by freshwater
plants. Plant Cell Environ 6:323–328
Walker NA, Smith FA (1975) Intracellular pH in Chara corallinameasured by DMO distribution. Plant Sci Lett 4:125–132
M. J. Beilby, S. Al Khazaaly: The Role of H?/OH- Channels 33
123

Walker NA, Smith FA (1977) Circulating electric currents between
acid and alkaline zones associated with HCO3– assimilation in
Chara. J Exp Bot 28:1190–1206
Walker NA, Smith FA, Cathers IR (1980) Bicarbonate assimilation
by freshwater charophytes and higher plants: I. membrane
transport of bicarbonate ions is not proven. J Membr Biol
57:51–58
Yao X, Bisson MA (1993) Passive proton conductance is the major
reason for membrane depolarization and conductance increase in
Chara buckellii in high-salt conditions. Plant Physiol 103:197–
203
Yao X, Bisson MA, Brzezicki LJ (1992) ATP-driven proton pumping
in two species of Chara differing in salt tolerance. Plant Cell
Environ 15:199–210
34 M. J. Beilby, S. Al Khazaaly: The Role of H?/OH- Channels
123


