Embed Size (px)
Citation preview
COLOR CHARACTERISTIC OF BUTTERFLY PEA
(Clitoria ternatea L.) ANTHOCYANIN EXTRACTS
AND BRILLIANT BLUE
CORAZON NIKIJULUW
DEPARTMENT OF FOOD SCIENCE AND TECHNOLOGY
FACULTY OF AGRICULTURAL TECHNOLOGY
BOGOR AGRICULTURAL UNIVERSITY
BOGOR
2013
STATEMENT OF BACHELOR THESIS, INTELLECTUAL
PROPERTY AND INFORMATION SOURCE*
Hereby, I certify that this bachelor thesis entitled Color Characteristic of
Butterfly Pea (Clitoria ternatea L.) Anthocyanin Extracts and Brilliant Blue is an
authentic work of mine under supervision of academic advisor and never been
submitted in any form to any university. All of the information cited from
published or unpublished works of other authors had been mentioned in the text
and attached in the reference part at the end of this bachelor thesis. I give my
bachelor thesis copyright to Bogor Agricultural University.
Bogor, October 2013
Corazon Nikijuluw
F24090009
ABSTRACT
CORAZON NIKIJULUW. Color Characteristic of Butterfly Pea (Clitoria
ternatea L.) Anthocyanin Extracts and Brilliant Blue. Supervised by NURI
ANDARWULAN.
Butterfly pea (Clitoria ternatea L.) is one of potential anthocyanin sources
which can be use as a food colorant. Anthocyanin extracts of butterfly pea was
evaluated under different concentration, pH, tinctorial strength, and storage
conditions and compared to synthetic colorant, brilliant blue. The structure of the
largest molecule of anthocyanin in butterfly pea extracts, ternatin A1, made the
extracts had a wide range of color spectrum from red in pH 1-2, purple to blue in
pH 3-7, and yellow green in pH 8-14. The color of brilliant blue solution showed
high stability from pH 1-12. The good stability of brilliant blue was also showed
by the score of color density and degradation index.Chromaticity parameters of
the samples were evaluated with the score of lightness, chroma, and hue. The hue
score of anthocyanin extracts of butterfly pea at pH 4,5 and 7 showed blue to
purple while brilliant blue showed blue color at same pH. When both of them
were added to yogurt drink (pH 4,5) and rice (pH 7), the food added with
anthocyanin extracts became blue-purple and brilliant blue gave bright blue color
to the food.
Keywords: anthocyanin extract, brilliant blue, pH, tinctorial strength, chromaticity
parameters.
Bachelor Thesis
as the partial fulfillment for the degree of
Bachelor of Agricultural Technology
at
Department of Food Science and Technology
COLOR CHARACTERISTIC OF BUTTERFLY PEA
(Clitoria ternatea L.) ANTHOCYANIN EXTRACTS
AND BRILLIANT BLUE
CORAZON NIKIJULUW
DEPARTMENT OF FOOD SCIENCE AND TECHNOLOGY
FACULTY OF AGRICULTURAL TECHNOLOGY
BOGOR AGRICULTURAL UNIVERSITY
BOGOR
2013

Title of Bachelor Thesis : Color Characteristic of Butterfly Pea (elitaria ternatea L.) Anthocyanin Extracts and Brilliant Blue
Name : Corazon Nikijuluw Student ID : F24090009
Approved by
M.Si
Date of Graduate: 2 4 OCT 2013 '
Title of Bachelor Thesis : Color Characteristic of Butterfly Pea (Clitoria
ternatea L.) Anthocyanin Extracts and Brilliant
Blue
Name : Corazon Nikijuluw
Student ID : F24090009
Approved by
Prof. Dr. Ir. Nuri Andarwulan, M.Si
Academic Advisor
Acknowledged
Dr. Ir. Feri Kusnandar, M. Sc
Head of Department
Date of Graduate:
ACKNOWLEDGEMENT
All gratitude may be praised only to Jesus Christ which always leads me in
a wonderful way to complete my bachelor degree through final thesis entitled
Color Characteristic of Butterfly Pea (Clitoria ternatea L.) Anthocyanin Extracts
and Brilliant Blue. Lot of thanks and appreciation may be uttered to everyone who
took part on finishing this final bachelor thesis, especially to:
1. My supportive and warm family; my parents Victor P.H. Nikijuluw and
Dewi Budiastuti, also my lovely sister, Ruth Nikijuluw for all the pray
and support.
2. My lovely academic advisor, Mrs. Nuri Andarwulan. Thanks a million
for every guidance, advice, and encouragement.
3. My final paper examiner, Mrs. Didah Nur Faridah and Mrs. Dias
Indrasti. Thanks for every guidance and advice.
4. My great small group: Kak Lenny, Fascah, Bonita, Lourenza, Evi, Sinta,
Krisye, Mega, and Desi. Thanks for your helps and supports.
5. Family of ITP 46, especially to Irene, Lina, Kyo, Ayu, and Dea. The
friendship and support has meant more than I could ever express.
Thanks for every great journey we had shared together.
6. Family of Profession Division 2012: Dini, Yonas, Florentina, Ditya,
Dimas, and Khalid. Each of you have differrent story written in my
heart.
7. Family of PMK IPB especially KPP. Thanks for the great moment with
you all.
8. Family of PT GPIB Zebaoth Bogor for every lesson taught.
The author hopes that this script can bring nothing but knowledge and good,
especially in food science and technology, to every reader.
Bogor, October 2013
Corazon Nikijuluw
TABLE OF CONTENT
LIST OF TABLES vi
LIST OF FIGURES vi
LIST OF APPENDICES vi
INTRODUCTION 1
Background 1
Problem Formulation 1
Research Objective 2
Research Benefit 2
METHOD 2
Materials 2
Instruments 2
Research Method 2
Results and Discussion 5
Butterfly Pea Anthocyanin Extraction Process and Its Content 5
Color Spectrum of Butterfly Pea Anthocyanin Extracts and Brilliant Blue at
Many Concentrations 6
Color Spectrum of Butterfly Pea Anthocyanin Extracts and Brilliant Blue at
pH 1 - 14 7
Chromaticity Measurement 11
Color Density, Polymeric Color, and Degradation Index 14
Application of Butterfly Anthocyanin Extracts and Brilliant Blue as Food
Colorant 14
Conclusion and Recommendations 15
Conclusion 15
Recommendations 16
REFERENCES 16
APPENDIX 19
AUTHOR BIOGRAPHY 21
LIST OF TABLES
1 Anthocyanin extracts from butterfly pea 6 2 Color description based on hue 13 3 Color density, % polymeric color, and degradation index at pH 1, 4,5,
and 7 before and after 40C storage 14
LIST OF FIGURES
1 Butterfly pea anthocyanin extraction process 3 2 Spectrum charts of butterfly pea anthocyanin extracts at pH 4,5 and
brilliant blue pH 4,5 at many concentrations 7 3 Spectrum charts of butterfly pea anthocyanin extracts pH 4,5 and
brilliant blue pH 4,5 at chosen concentrations 7 4 Color of butterfly pea anthocyanin extracts at 0,0004 mg/mL at pH 1-14 8 5 Spectrum charts of butterfly pea anthocyanin extracts at 0,0004 mg
anthocyanin/mL at pH 1-7 8 6 Spectrum charts of butterfly pea anthocyanin extracts at 0,0004 mg/mL
at pH 8-14 9 7 Color of brilliant blue at 0,010 mg/mL at pH 1-14 9 8 Brilliant blue structure 9 9 Hypothesis of ternatin A1 (Terahara et al. 1990) structure changes at
different pH 10 10 Spectrum charts of brilliant blue at 0,010 mg/mL at pH 1-7 11 11 Spectrum charts of brilliant blue at 0,010 mg/mL at pH 1-7 11 12 The L* value at (a) pH 1, (b) pH 4,5, and (c) pH 7 of butterfly pea
anthocyanin extracts and brilliant blue 12 13 The C* value at (a) pH 1, (b) pH 4,5, and (c) pH 7 of butterfly pea
anthocyanin extracts and brilliant blue 12
14 The hue value at (a) pH 1, (b) pH 4,5, and (c) pH 7 of butterfly pea
anthocyanin extracts and brilliant blue 13 15 Butterfly pea anthocyanin extracts at pH 4,5 in yogurt drink (left),
control (centre), and brilliant blue at pH 4,5 in yogurt drink (right) 15 16 Butterfly pea anthocyanin extracts at pH 7 in rice (left), control (centre),
and brilliant blue at pH 7 in rice (right) 15
LIST OF APPENDICES
1 Absorbance used in monomeric anthocyanin content analysis 19
2 Chromaticity parameter of butterfly pea anthocyanin extracts and
brilliant blue at pH 1, 4,5, and 7 20
1
INTRODUCTION
Background
Color is an important attribute related to the visual appeal in food
products (Reyes and Cisneros-Zevallos 2007). One of the source of color in
food products comes from food colorant which can be natural or synthetic.
Nowadays, the use of natural food colorant to replace synthetic offers a
challenge due to the lower stability of natural food colorant.
Anthocyanin has a high potential for use as natural food colorants due
to their attractive colors (Cevallos-Casals and Cisneros-Zevallos 2004).
There are more than 540 types of anthocyanins that had been identified
(Anderson & Francis 2004 in Wrolstad et al. 2005). Anthocyanin is the
biggest pigment in plants which dissolves in water. The use of this pigment
as food colorant is still lack although it has been reported that anthocyanin is
safe to human health (Vankar and Srivastava 2010). One of the potential
source of anthocyanin is butterfly pea (Clitoria ternatea L.) petal. Vankar
and Srivastava research (2010) reported 15 types of flowers which had
anthocyanin content. This research also reported that anthocyanin content in
butterfly pea was 227,42 mg/kg flower. Anthocyanin content in this flower
make the variation color of the extracts including red until purple at acid
condition, blue at neutral condition, and green until yellow in base condition.
Wide color spectrum of butterfly pea anthocyanin extracts make it is
possible to use as natural food colorant especially for replacing synthetic
colorant. Nowadays, natural food colorants have been in high demand. This
need has come from consumer concern against synthetic food colorant
(Cevallos-Casals and Cisneros-Zevallos 2004). The high demand of natural
food colorant due to its functional properties. On the other side, some
synthetic food colorants have bad effect to human health. Brilliant blue is
common synthetic colorant use in food products. This colorant is dissolve in
water and slightly dissolve in ethanol. The value of ADI (Acceptable Daily
Intake) of brillaint blue is 6 mg/kg body weight/day (EFSA 2010). The
greatest use of brilliant blue is at dairy products (80%), cake, and
confectionary (Flury and Fluhler 1994). Brilliant blue is also use in
beverages within the concentration at 0,5, 1, and 15 mg/L (Noonan and
Meggos 1980 in Flury and Fluhler 1994). European Food Safety Authority
(2010) stated that the use of brilliant blue was permitted at 20-500 mg/kg for
food products and maximum 200 mg/L for beverages.
Problem Formulation
Brilliant blue is common blue food colorant use in food products.
Butterfly pea anthocyanin extracts is natural food colorant which has wide
color spectrum including blue. Therefore, color parameter of butterfly pea
anthocyanin extracts and brilliant blue need to be compared each other for
development of butterfly pea anthocyanin extracts as blue colorant in food
products.
2
Research Objective
The overall goal of this research was to characterize the color of
butterfly pea anthocyanin extracts and brilliant blue.
Research Benefit
This research was expected to get color characteristic from butterfly
pea anthocyanin extracts and brilliant blue. Thus, the results of this research
can be a part of the effort to use anthocyanin extracts as blue colorant in
food products.
METHOD
Materials
Materials used in this research were butterfly pea (Clitoria ternatea
L.) which is cultivated at Cikarawang Bogor, brilliant blue FCF E133 from
CV Bukit Warna Abadi, yogurt drink Biokul plain, rice, KCl (CICA),
CH3COONa (CICA), HCl (Merck), NaOH (Merck), K2S2O5 (Merck), and
H2O.
Instruments
Instruments used in this research were glasswares, hot plate
Thermolyne Cimarec®
3, double beam spectrophotometer UV 1800
Shimadzu, water bath shaker GFL Typ 1083, pH-meter Eutech Instruments
pH 700, and chromameter Minolta CR 310.
Research Method
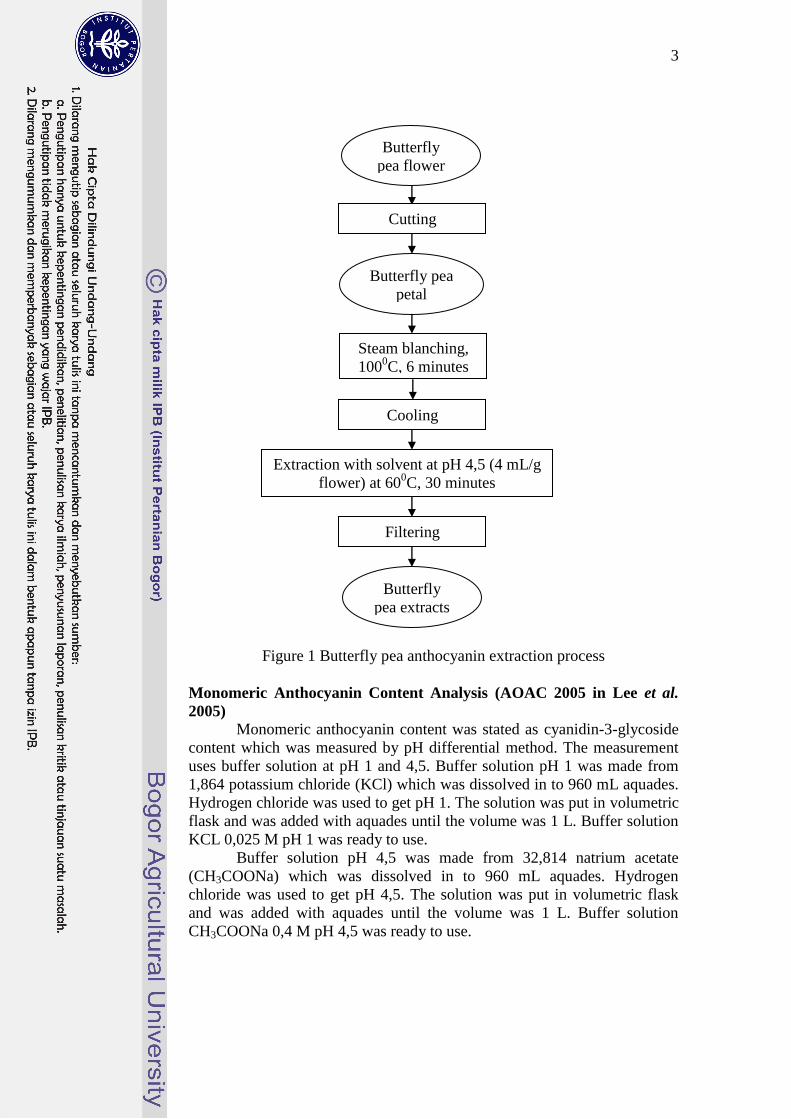
Butterfly Pea Anthocyanin Extraction (Marpaung 2012)
Weight of butterfly pea flowers were measured. The flowers petal
were collected to be measured due to determination of solvent volume. Ten
grams of butterfly pea flowers petal were put in HDPE plastic. The plastic
was sealed by hot. The petals were steam blanched at 1000C for 6 minutes.
After that, it was cooled in ice.
The petals were put in erlenmeyer which covered with aluminium
foil. The solvent was set at pH 4,5. Extraction process was held on water
bath shaker at 600C for 30 minutes. The extracts were filtered using
Whatman paper and put in erlenmeyer covered by aluminium foil.
Extraction process diagram was showed in Figure 1.
3
Figure 1 Butterfly pea anthocyanin extraction process
Monomeric Anthocyanin Content Analysis (AOAC 2005 in Lee et al.
2005)
Monomeric anthocyanin content was stated as cyanidin-3-glycoside
content which was measured by pH differential method. The measurement
uses buffer solution at pH 1 and 4,5. Buffer solution pH 1 was made from
1,864 potassium chloride (KCl) which was dissolved in to 960 mL aquades.
Hydrogen chloride was used to get pH 1. The solution was put in volumetric
flask and was added with aquades until the volume was 1 L. Buffer solution
KCL 0,025 M pH 1 was ready to use.
Buffer solution pH 4,5 was made from 32,814 natrium acetate
(CH3COONa) which was dissolved in to 960 mL aquades. Hydrogen
chloride was used to get pH 4,5. The solution was put in volumetric flask
and was added with aquades until the volume was 1 L. Buffer solution
CH3COONa 0,4 M pH 4,5 was ready to use.
Butterfly
pea flower
Cutting
Butterfly pea
petal
Steam blanching,
1000C, 6 minutes
Cooling
Extraction with solvent at pH 4,5 (4 mL/g
flower) at 600C, 30 minutes
Filtering
Butterfly
pea extracts
4
Extracts of 0,2 mL were mixed with 1,8 mL buffer solution pH 1 and
4,5. The absorbance of each solution was measured in 510 nm and 700 nm,
then was calculated using formula below:
A = (A510 – A700)pH 1,0 - (A510 – A700)pH 4,5
Monomeric anthocyanin content (cyanidin-3-glucoside equivalents
in mg/L) was get from:
(A x MW x DF x 1000)/(ε x 1)
MW is molecular weight of cyanidin-3-glucoside (449,2 g/mol). DF
is dilution factor, ε is molar absorptivity from cyanidin-3-glucoside (26900),
and 1 is cuvette width (1 cm).
Spectrum Measurement of Butterfly Pea Anthocyanin Extracts and
Brilliant Blue at Many Concentrations
Butterfly pea anthocyanin extracts at pH 4,5 was set at 4
concentrations (0,0001 mg anthocyanin/mL – 0,0004 mg anthocyanin/mL).
Brilliant blue at pH 4,5 was set at 5 concentrations (0,002 mg/mL – 0,01
mg/mL). Each solution was measured with spectrophotometer at 250 nm –
700 nm.
Spectrum and Maximum Absorbance Measurement of Butterfly Pea
Anthocyanin Extracts and Brilliant Blue (Marpaung 2012)
Each pH was adjusted with HCl or NaOH to get pH 1-14.
Anthocyanin extracts of 10 mL at 0,0004 mg anthocyanin/mL and brilliant
blue at 0,01 mg/mL were each mixed with 90 mL pH solution from 1 until
14. Each solution solution was measured with spectrophotometer at 250 nm
– 700 nm.
Sample Preparation at Different Tinctorial Strength (Cevallos-Casals
and Cisneros-Zevallos 2004)
The effect of pH on chromaticity was determined in sample at pH 1,
4,5 and 7 which were prepared at different tinctorial strength. Butterfly pea
anthocyanin extracts which used were 0,000003 mg anthocyanin/mL –
0,0005 mg anthocyanin/mL. Brilliant blue concentrations were from 0,0001
mg/mL until 0,075 mg/mL. Tinctorial strength was determined by
Aλmax x dilution factor
Both samples were prepared at 4 different tinctorial strength ranging
from 4-21.
Color Characteristic Measurement with Chromameter
Chromaticity of butterfly pea anthocyanin extracts and brilliant blue
was characterized with a Minolta CR 310 chromameter. Lightness (L*),
chroma (C*) and hue (H0) were analyzed.
5
Determination of Color Density, Polymeric Color, and Degradation
Index (Wrolstad 1993) Solution of 0,2 mL of 20% potassium metabisulfite is added to a 3
mL sample and 0,2 mL aquades is added to a second 3,0 mL control sample.
Samples used were 0,0006 mg anthocyanin/mL butterfly pea anthocyanin
extracts and 0,01 mg/mL brilliant blue. The visible absorption spectrum of
each solution is recorded from 250 nm – 700 nm. The absorbance at 420 nm,
at the λmax, and 700 nm is recorded.
The color density can be determined by summing the absorbance of
the control sample at 420 nm and at the anthocyanin λmax. Turbidity can be
corrected for by subtracting any absorbance at 700 nm. If the sample was
diluted, the sum is multiplied by the dilution factor.
Color density = ((A420nm – A700nm) + (Aλmax– A700nm)) x DF
A measure of polymeric color can be calculated by subtracting the
absorbance of the bisulfite treated sample at λmax and at 420 nm.
Polymeric color = ((Aλmax – A700nm) - (A420nm– A700nm)) x DF
Polymeric color was determined as percent of color density.
Method of measuring degradation index would be to determine the
ratio of the absorbance at 420 nm and at λmax.
The Use of Butterfly Pea Anthocyanin Extracts and Brilliant Blue at
Yogurt Drink and Rice
Butterfly pea anthocyanin extracts pH 4,5 at 0,0006 mg
anthocyanin/mL and brilliant blue pH 4,5 at 0,1 mg/mL were prepared.
Samples were added to 30 mL yogurt drink. Application of butterfly pea
anthocyanin extracts and brilliant blue to rice was done by cooking rice with
50 mL sample. Samples were butterfly pea anthocyanin extracts pH 7 at
0,0001 mg anthocyanin/mL and brilliant blue pH 7 at 0,002 mg/mL. Yogurt
drink and rice which had been added with samples will be observed visually.
RESULTS AND DISCUSSION
Butterfly Pea Anthocyanin Extraction Process and Its Content
Butterfly pea extraction process was done at fresh condition. The aim
of extraction process was to take one or more active compound from the
plant using solvent. One process step before extraction was blanching. This
process was due to inactivate anthocyanin degradation enzyme like
peroxidase, phenoloxidase, and polyphenoloxidase (Rein 2005). Rossi et al.
(2003) showed anthocyanin content at bluberry juice which had blanched
first was 200% higher than the one which had not blanched. High
anthocyanin content in the blanched juice was due to inactivate
polyphenoloxidase which responsible to anthocyanin degradation.
6
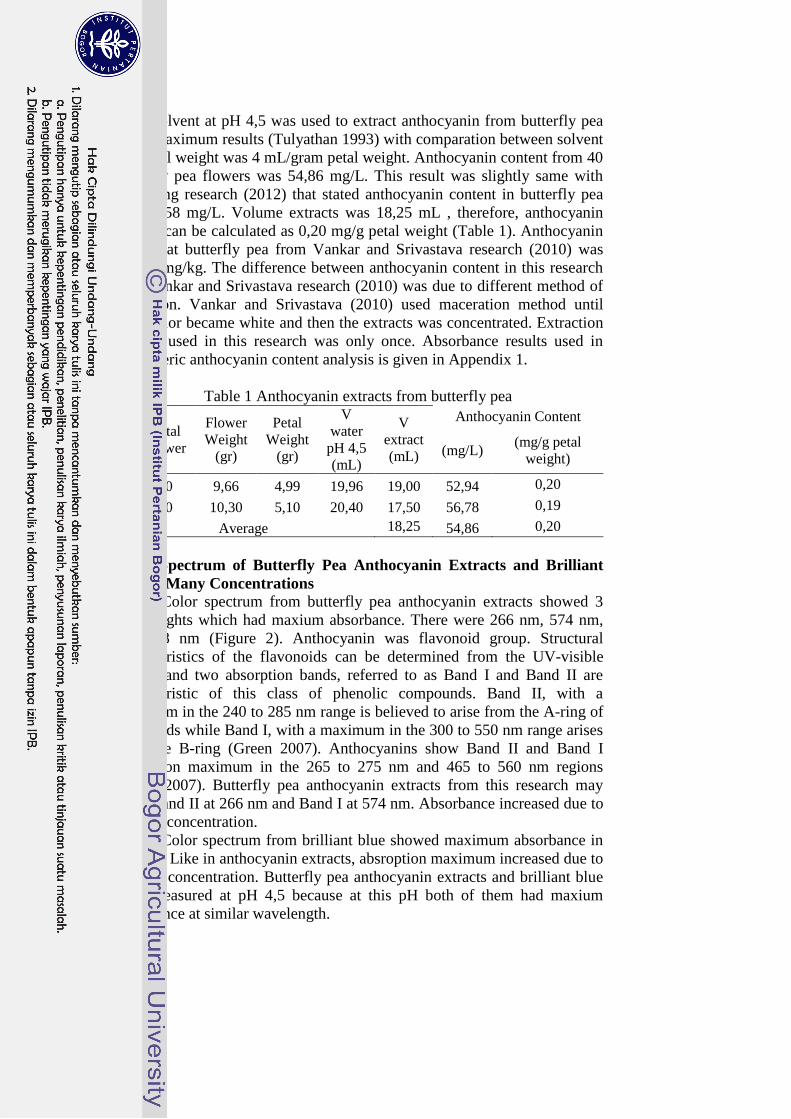
Solvent at pH 4,5 was used to extract anthocyanin from butterfly pea
to get maximum results (Tulyathan 1993) with comparation between solvent
and petal weight was 4 mL/gram petal weight. Anthocyanin content from 40
butterfly pea flowers was 54,86 mg/L. This result was slightly same with
Marpaung research (2012) that stated anthocyanin content in butterfly pea
was 40,58 mg/L. Volume extracts was 18,25 mL , therefore, anthocyanin
content can be calculated as 0,20 mg/g petal weight (Table 1). Anthocyanin
content at butterfly pea from Vankar and Srivastava research (2010) was
227,42 mg/kg. The difference between anthocyanin content in this research
with Vankar and Srivastava research (2010) was due to different method of
extraction. Vankar and Srivastava (2010) used maceration method until
petal color became white and then the extracts was concentrated. Extraction
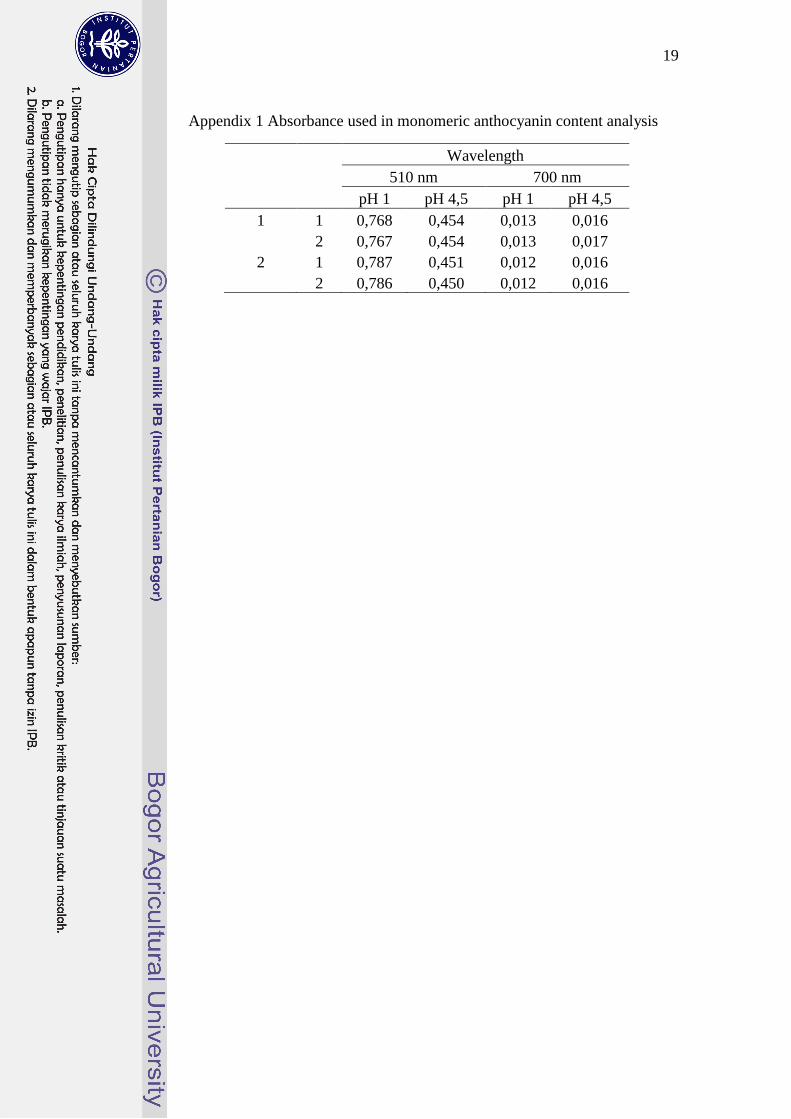
method used in this research was only once. Absorbance results used in
monomeric anthocyanin content analysis is given in Appendix 1.
Table 1 Anthocyanin extracts from butterfly pea
Total
Flower
Flower Weight
(gr)
Petal
Weight (gr)
V
water
pH 4,5 (mL)
V
extract
(mL)
Anthocyanin Content
(mg/L) (mg/g petal
weight)
1 40 9,66 4,99 19,96 19,00 52,94 0,20
2 40 10,30 5,10 20,40 17,50 56,78 0,19
Average 18,25 54,86 0,20
Color Spectrum of Butterfly Pea Anthocyanin Extracts and Brilliant
Blue at Many Concentrations
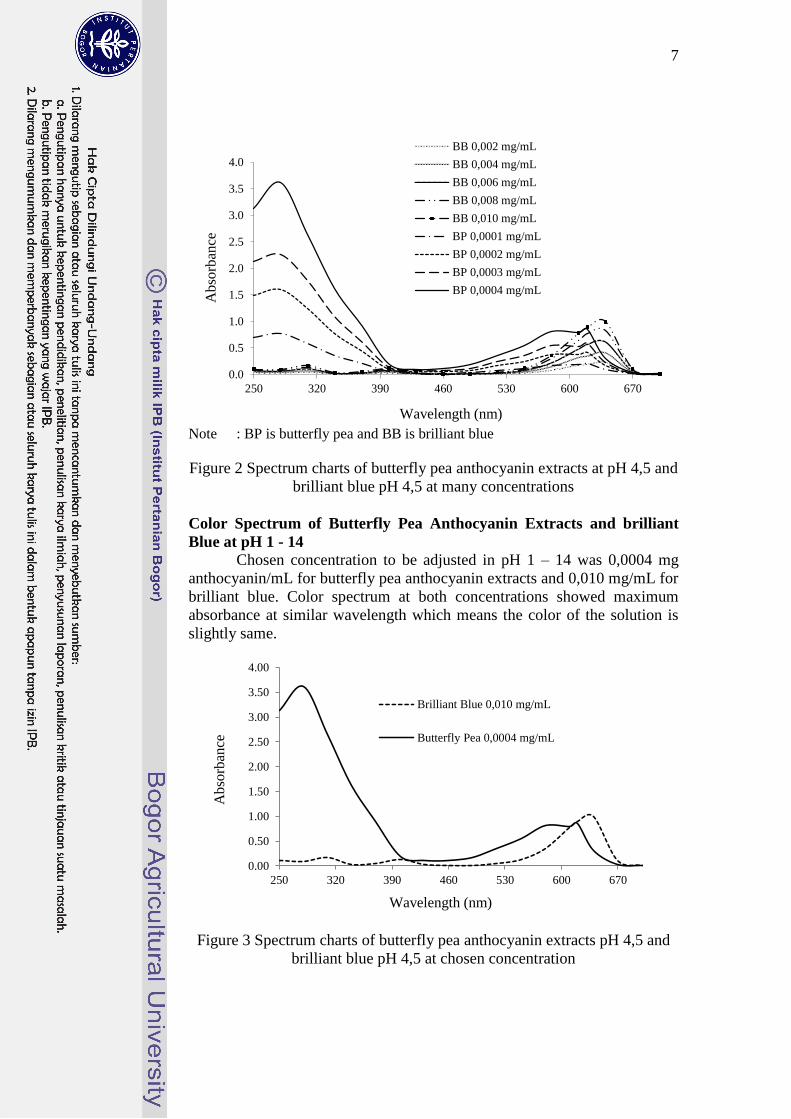
Color spectrum from butterfly pea anthocyanin extracts showed 3
wavelenghts which had maxium absorbance. There were 266 nm, 574 nm,
and 618 nm (Figure 2). Anthocyanin was flavonoid group. Structural
characteristics of the flavonoids can be determined from the UV-visible
spectra and two absorption bands, referred to as Band I and Band II are
characteristic of this class of phenolic compounds. Band II, with a
maximum in the 240 to 285 nm range is believed to arise from the A-ring of
flavonoids while Band I, with a maximum in the 300 to 550 nm range arises
from the B-ring (Green 2007). Anthocyanins show Band II and Band I
absorption maximum in the 265 to 275 nm and 465 to 560 nm regions
(Green 2007). Butterfly pea anthocyanin extracts from this research may
show Band II at 266 nm and Band I at 574 nm. Absorbance increased due to
extracts concentration.
Color spectrum from brilliant blue showed maximum absorbance in
629 nm. Like in anthocyanin extracts, absroption maximum increased due to
extracts concentration. Butterfly pea anthocyanin extracts and brilliant blue
were measured at pH 4,5 because at this pH both of them had maxium
absorbance at similar wavelength.
7
Note : BP is butterfly pea and BB is brilliant blue
Figure 2 Spectrum charts of butterfly pea anthocyanin extracts at pH 4,5 and
brilliant blue pH 4,5 at many concentrations
Color Spectrum of Butterfly Pea Anthocyanin Extracts and brilliant
Blue at pH 1 - 14
Chosen concentration to be adjusted in pH 1 – 14 was 0,0004 mg
anthocyanin/mL for butterfly pea anthocyanin extracts and 0,010 mg/mL for
brilliant blue. Color spectrum at both concentrations showed maximum
absorbance at similar wavelength which means the color of the solution is
slightly same.
Figure 3 Spectrum charts of butterfly pea anthocyanin extracts pH 4,5 and
brilliant blue pH 4,5 at chosen concentration
0.0
0.5
1.0
1.5
2.0
2.5
3.0
3.5
4.0
250 320 390 460 530 600 670
Ab
sorb
ance
Wavelength (nm)
BB 0,002 mg/mL
BB 0,004 mg/mL
BB 0,006 mg/mL
BB 0,008 mg/mL
BB 0,010 mg/mL
BP 0,0001 mg/mL
BP 0,0002 mg/mL
BP 0,0003 mg/mL
BP 0,0004 mg/mL
0.00
0.50
1.00
1.50
2.00
2.50
3.00
3.50
4.00
250 320 390 460 530 600 670
Ab
sorb
ance
Wavelength (nm)
Brilliant Blue 0,010 mg/mL
Butterfly Pea 0,0004 mg/mL
8
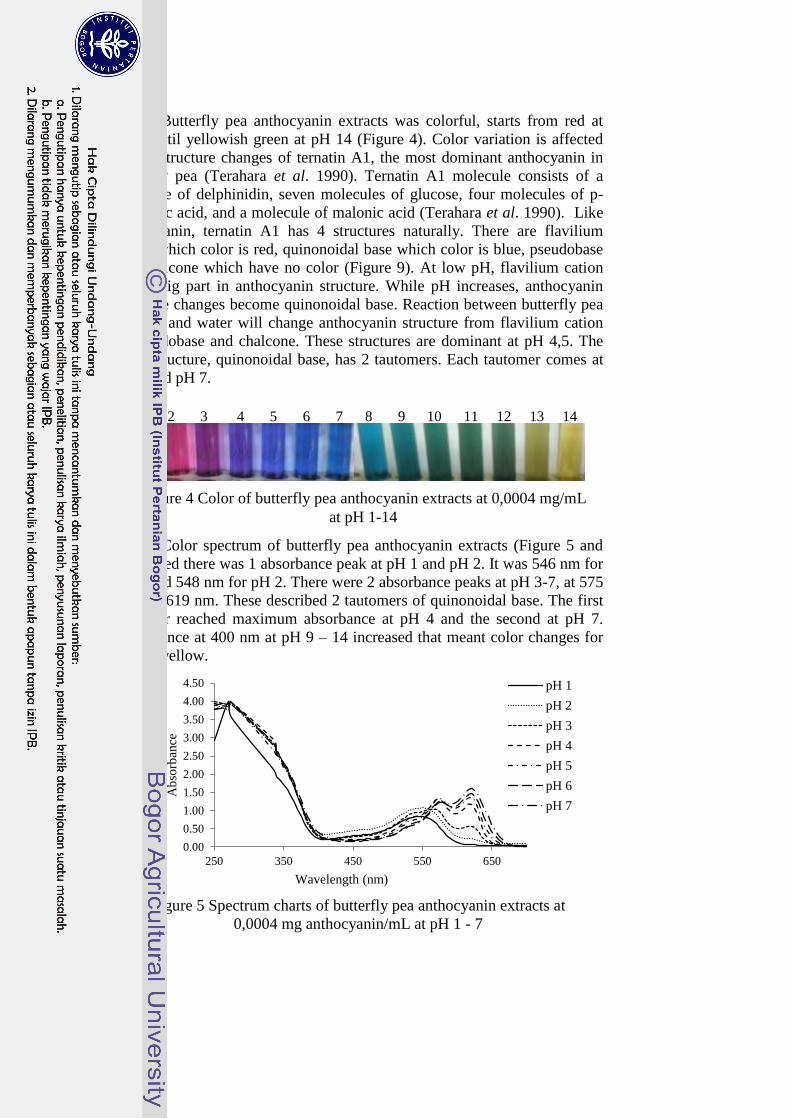
pH 1 2 3 4 5 6 7 8 9 10 11 12 13 14
Figure 4 Color of butterfly pea anthocyanin extracts at 0,0004 mg/mL
at pH 1-14
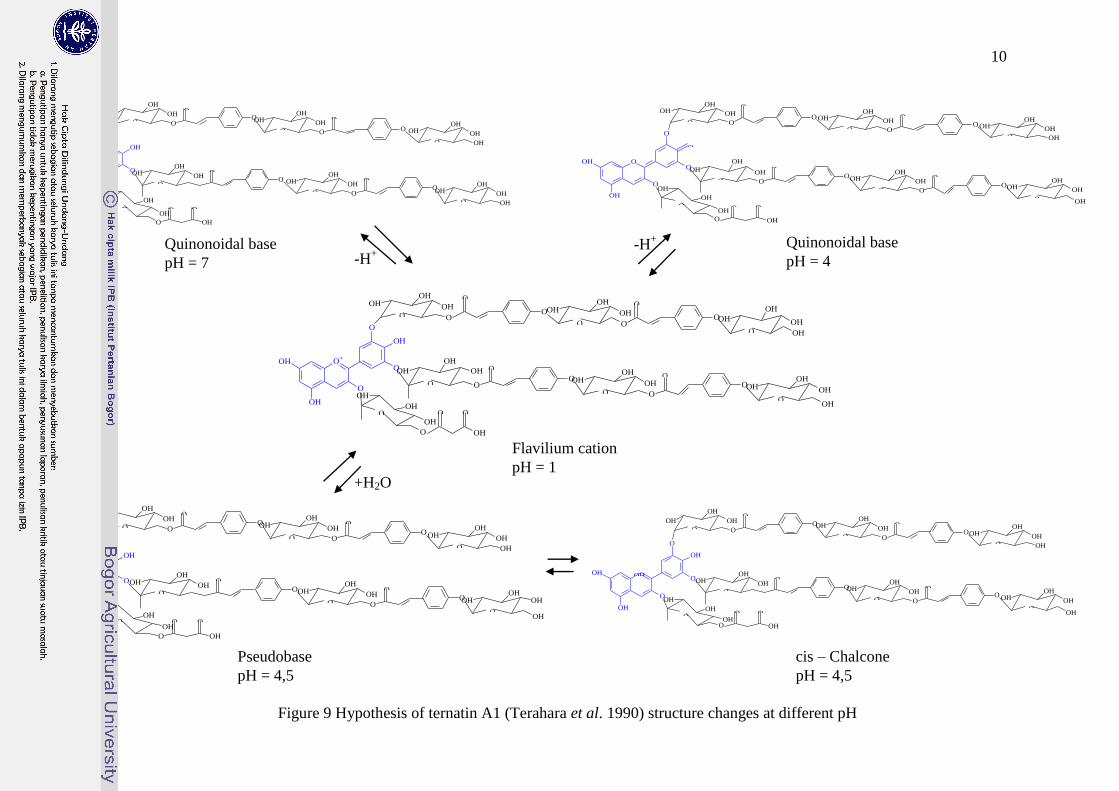
Butterfly pea anthocyanin extracts was colorful, starts from red at
pH 1 until yellowish green at pH 14 (Figure 4). Color variation is affected
due to structure changes of ternatin A1, the most dominant anthocyanin in
butterfly pea (Terahara et al. 1990). Ternatin A1 molecule consists of a
molecule of delphinidin, seven molecules of glucose, four molecules of p-
coumaric acid, and a molecule of malonic acid (Terahara et al. 1990). Like
anthocyanin, ternatin A1 has 4 structures naturally. There are flavilium
cation which color is red, quinonoidal base which color is blue, pseudobase
and chalcone which have no color (Figure 9). At low pH, flavilium cation
take a big part in anthocyanin structure. While pH increases, anthocyanin
structure changes become quinonoidal base. Reaction between butterfly pea
extracts and water will change anthocyanin structure from flavilium cation
to pseudobase and chalcone. These structures are dominant at pH 4,5. The
other structure, quinonoidal base, has 2 tautomers. Each tautomer comes at
pH 4 and pH 7.
Color spectrum of butterfly pea anthocyanin extracts (Figure 5 and
6) showed there was 1 absorbance peak at pH 1 and pH 2. It was 546 nm for
pH 1 and 548 nm for pH 2. There were 2 absorbance peaks at pH 3-7, at 575
nm and 619 nm. These described 2 tautomers of quinonoidal base. The first
tautomer reached maximum absorbance at pH 4 and the second at pH 7.
Absorbance at 400 nm at pH 9 – 14 increased that meant color changes for
blue to yellow.
Figure 5 Spectrum charts of butterfly pea anthocyanin extracts at
0,0004 mg anthocyanin/mL at pH 1 - 7
0.00
0.50
1.00
1.50
2.00
2.50
3.00
3.50
4.00
4.50
250 350 450 550 650
Ab
sorb
ance
Wavelength (nm)
pH 1
pH 2
pH 3
pH 4
pH 5
pH 6
pH 7
9
pH 1 2 3 4 5 6 7 8 9 10 11 12 13 14
Figure 7 Color of brilliant blue at 0,010 mg/mL at pH 1-14
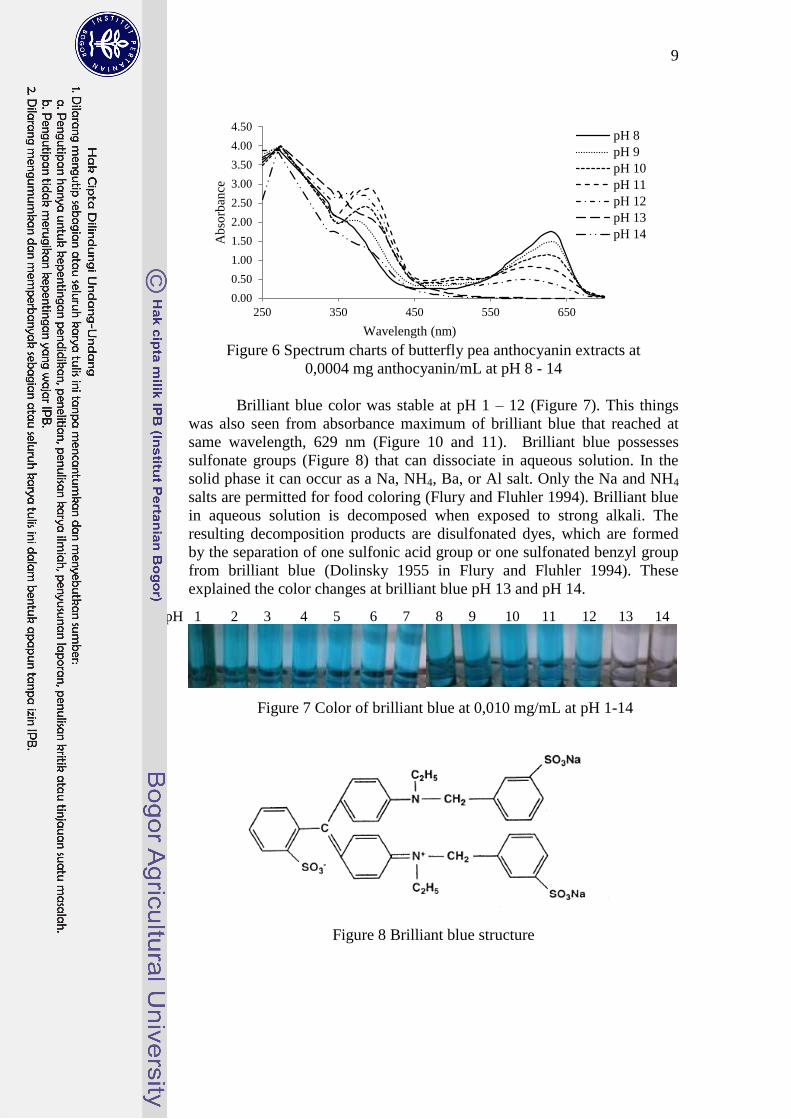
Figure 6 Spectrum charts of butterfly pea anthocyanin extracts at
0,0004 mg anthocyanin/mL at pH 8 - 14
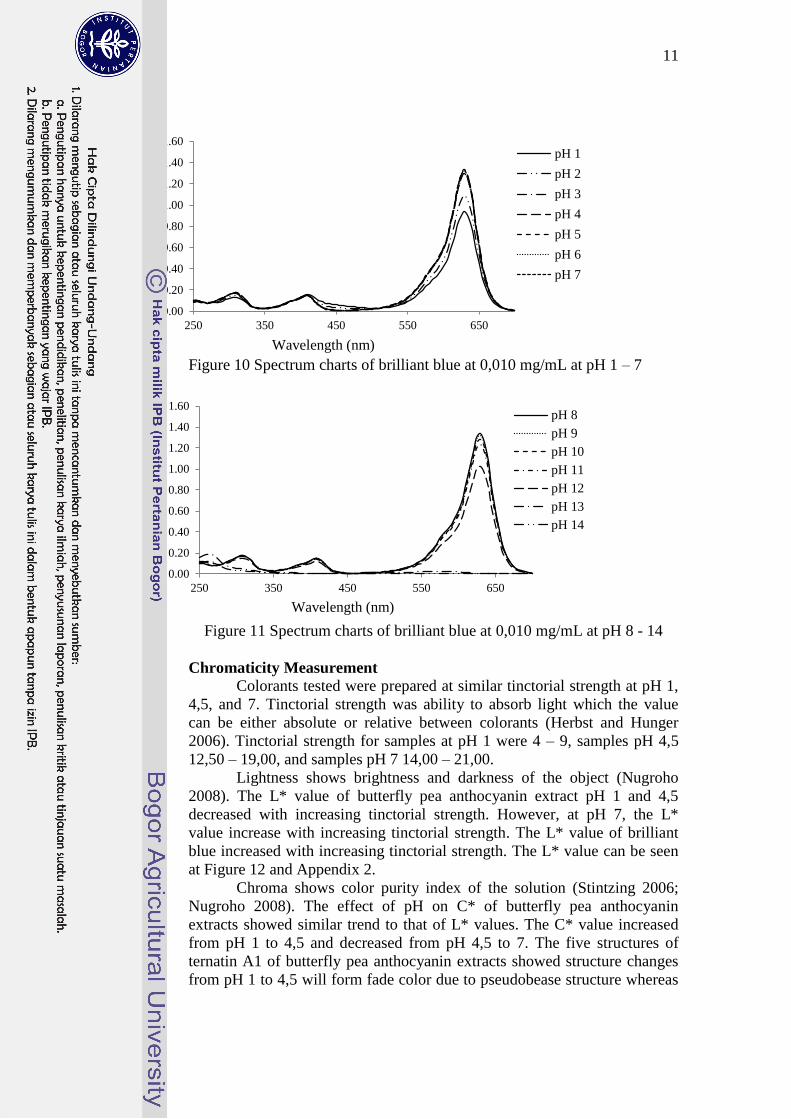
Brilliant blue color was stable at pH 1 – 12 (Figure 7). This things
was also seen from absorbance maximum of brilliant blue that reached at
same wavelength, 629 nm (Figure 10 and 11). Brilliant blue possesses
sulfonate groups (Figure 8) that can dissociate in aqueous solution. In the
solid phase it can occur as a Na, NH4, Ba, or Al salt. Only the Na and NH4
salts are permitted for food coloring (Flury and Fluhler 1994). Brilliant blue
in aqueous solution is decomposed when exposed to strong alkali. The
resulting decomposition products are disulfonated dyes, which are formed
by the separation of one sulfonic acid group or one sulfonated benzyl group
from brilliant blue (Dolinsky 1955 in Flury and Fluhler 1994). These
explained the color changes at brilliant blue pH 13 and pH 14.
Figure 8 Brilliant blue structure
0.00
0.50
1.00
1.50
2.00
2.50
3.00
3.50
4.00
4.50
250 350 450 550 650
Ab
sorb
ance
Wavelength (nm)
pH 8
pH 9
pH 10
pH 11
pH 12
pH 13
pH 14

10
OH
OH
OH
O+
O
OH
OH
O OH
OHOOH
OH
OOHO
OH
OH
OH
OH
O
OH
OOH
OH
O
OHOH
OH
OOHO
OH
OH
OOHO
OH
OH
OH
O
O O
O
O O
O
O O
O O
O O
OH
OHOOH
OH
OOHO
OH
OH
OH
OH
OH
OH
OH
OH
O
O
O
O
OH
OH
O
OH
OH
O
OH
OH
OOHO
OH
OH
OOHO
OH
OH
OH
O
O
O O
O O
O
O O
O O
O
O
O
OH
O
OH
O
OH
OH
O OH
OHOOH
OH
O OHO
OH
OH
OH
OH
O
OH
OOH
OH
OH
OH
OH
OOHO
OH
OH
O OHOOH
OH
OH
O
O O
O
O O
O
O O
O O
O O
O
OH
OH
OH
OOH
O
OH
OH
O OH
OHOOH
OH
OOH OHO
OH
OH
OH
O
OH
OOH
OH
OH
OH
OH
OOHO
OH
OH
O OHOOH
OH
OH
O
O
O
O
O
O
O
O O
O O
O
O
OH
OH
OH
O
OH
OHO OH
OHOOH
OH
OOH
OH
OHO
OH
OH
OH
OH
OHOH
OH
O
O
OH
OOH
OH
OHO
OOH
OH
OHO
OH
O
O O
O
O O
O
O O
O O
O O
OH
O
-H+
-H+
+H2O
Quinonoidal base
pH = 4 Quinonoidal base
pH = 7
Flavilium cation
pH = 1
cis – Chalcone
pH = 4,5
Pseudobase
pH = 4,5
Figure 9 Hypothesis of ternatin A1 (Terahara et al. 1990) structure changes at different pH

11
Figure 10 Spectrum charts of brilliant blue at 0,010 mg/mL at pH 1 – 7
Figure 11 Spectrum charts of brilliant blue at 0,010 mg/mL at pH 8 - 14
Chromaticity Measurement
Colorants tested were prepared at similar tinctorial strength at pH 1,
4,5, and 7. Tinctorial strength was ability to absorb light which the value
can be either absolute or relative between colorants (Herbst and Hunger
2006). Tinctorial strength for samples at pH 1 were 4 – 9, samples pH 4,5
12,50 – 19,00, and samples pH 7 14,00 – 21,00.
Lightness shows brightness and darkness of the object (Nugroho
2008). The L* value of butterfly pea anthocyanin extract pH 1 and 4,5
decreased with increasing tinctorial strength. However, at pH 7, the L*
value increase with increasing tinctorial strength. The L* value of brilliant
blue increased with increasing tinctorial strength. The L* value can be seen
at Figure 12 and Appendix 2.
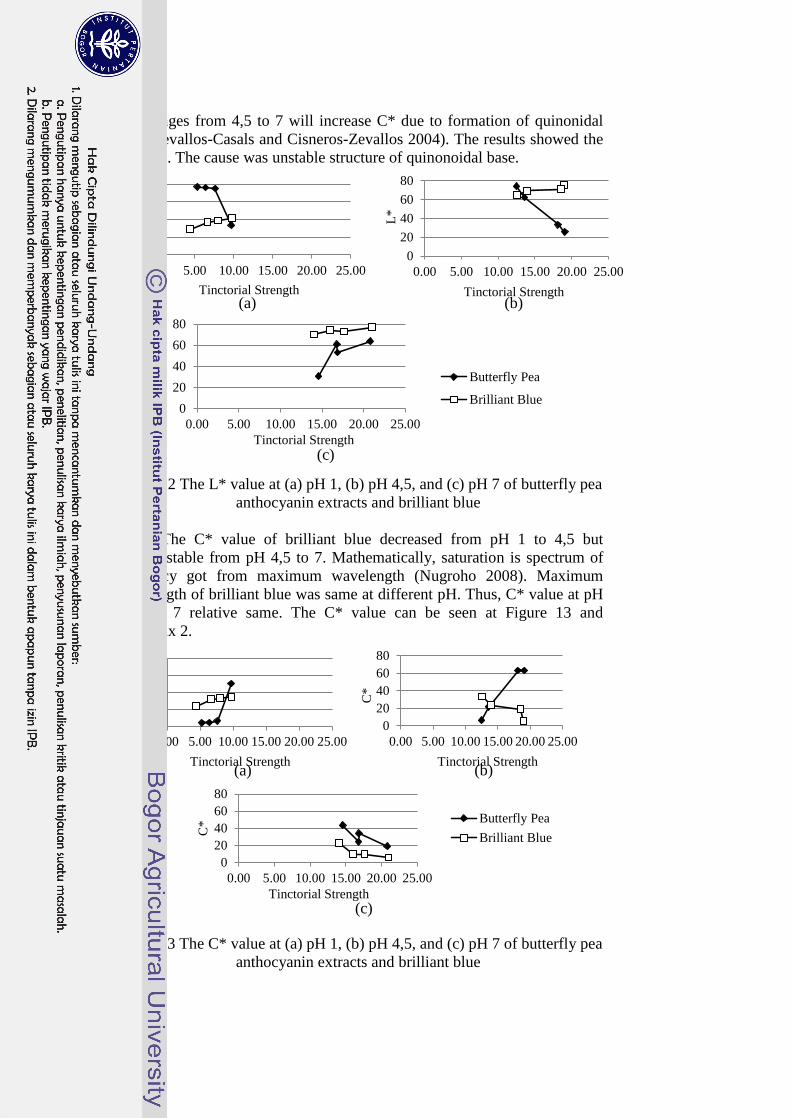
Chroma shows color purity index of the solution (Stintzing 2006;
Nugroho 2008). The effect of pH on C* of butterfly pea anthocyanin
extracts showed similar trend to that of L* values. The C* value increased
from pH 1 to 4,5 and decreased from pH 4,5 to 7. The five structures of
ternatin A1 of butterfly pea anthocyanin extracts showed structure changes
from pH 1 to 4,5 will form fade color due to pseudobease structure whereas
10
0.00
0.20
0.40
0.60
0.80
1.00
1.20
1.40
1.60
250 350 450 550 650
Ab
sorb
ance
Wavelength (nm)
pH 1
pH 2
pH 3
pH 4
pH 5
pH 6
pH 7
0.00
0.20
0.40
0.60
0.80
1.00
1.20
1.40
1.60
250 350 450 550 650
Ab
sorb
ance
Wavelength (nm)
pH 8
pH 9
pH 10
pH 11
pH 12
pH 13
pH 14
12
pH changes from 4,5 to 7 will increase C* due to formation of quinonidal
base (Cevallos-Casals and Cisneros-Zevallos 2004). The results showed the
opposite. The cause was unstable structure of quinonoidal base.
Figure 12 The L* value at (a) pH 1, (b) pH 4,5, and (c) pH 7 of butterfly pea
anthocyanin extracts and brilliant blue
The C* value of brilliant blue decreased from pH 1 to 4,5 but
relative stable from pH 4,5 to 7. Mathematically, saturation is spectrum of
frequency got from maximum wavelength (Nugroho 2008). Maximum
wavelength of brilliant blue was same at different pH. Thus, C* value at pH
4,5 and 7 relative same. The C* value can be seen at Figure 13 and
Appendix 2.
Figure 13 The C* value at (a) pH 1, (b) pH 4,5, and (c) pH 7 of butterfly pea
anthocyanin extracts and brilliant blue
0
20
40
60
80
0.00 5.00 10.00 15.00 20.00 25.00
L*
Tinctorial Strength
0
20
40
60
80
0.00 5.00 10.00 15.00 20.00 25.00
L*
Tinctorial Strength (a) (b)
0
20
40
60
80
0.00 5.00 10.00 15.00 20.00 25.00
L*
Tinctorial Strength
Butterfly Pea
Brilliant Blue
(c)
0
20
40
60
80
0.00 5.00 10.00 15.00 20.00 25.00
C*
Tinctorial Strength
0
20
40
60
80
0.00 5.00 10.00 15.00 20.00 25.00
C*
Tinctorial Strength
(a)
(b)
0
20
40
60
80
0.00 5.00 10.00 15.00 20.00 25.00
C*
Tinctorial Strength
Butterfly Pea
Brilliant Blue
(c)
(a)
(c)
(b)
13
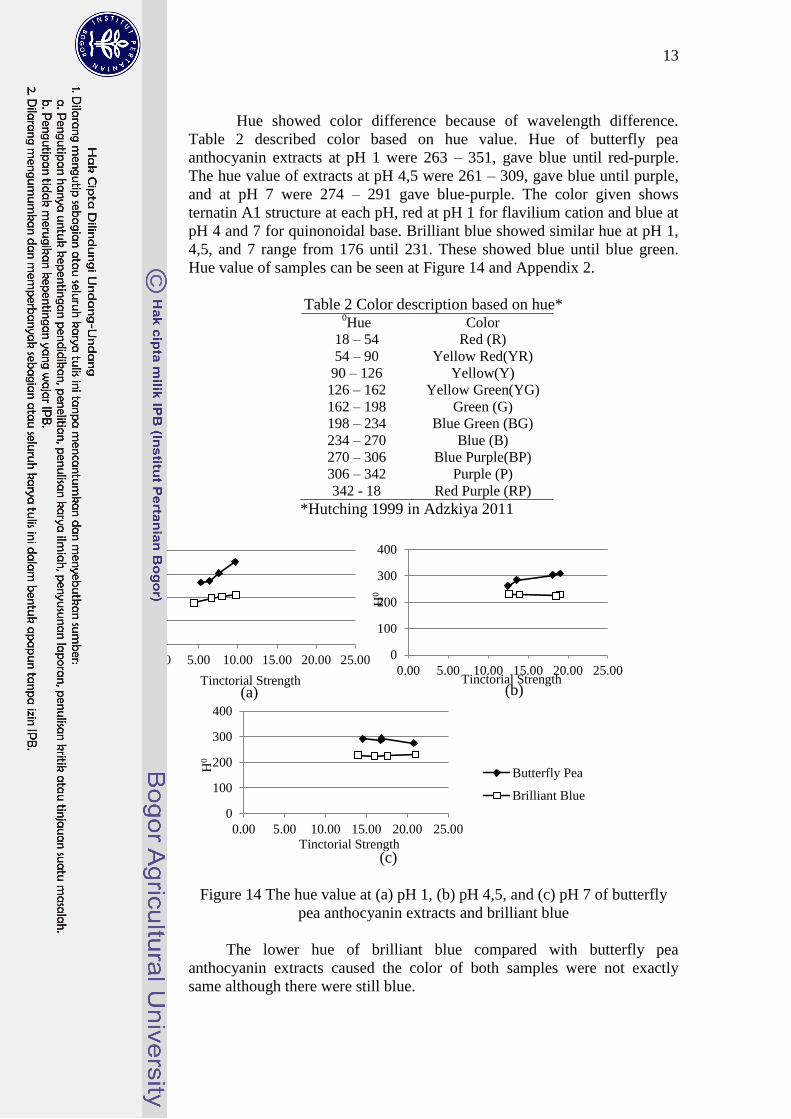
Hue showed color difference because of wavelength difference.
Table 2 described color based on hue value. Hue of butterfly pea
anthocyanin extracts at pH 1 were 263 – 351, gave blue until red-purple.
The hue value of extracts at pH 4,5 were 261 – 309, gave blue until purple,
and at pH 7 were 274 – 291 gave blue-purple. The color given shows
ternatin A1 structure at each pH, red at pH 1 for flavilium cation and blue at
pH 4 and 7 for quinonoidal base. Brilliant blue showed similar hue at pH 1,
4,5, and 7 range from 176 until 231. These showed blue until blue green.
Hue value of samples can be seen at Figure 14 and Appendix 2.
Table 2 Color description based on hue* 0Hue Color
18 – 54 Red (R)
54 – 90 Yellow Red(YR)
90 – 126 Yellow(Y)
126 – 162 Yellow Green(YG)
162 – 198 Green (G)
198 – 234 Blue Green (BG)
234 – 270 Blue (B)
270 – 306 Blue Purple(BP)
306 – 342 Purple (P)
342 - 18 Red Purple (RP)
*Hutching 1999 in Adzkiya 2011
Figure 14 The hue value at (a) pH 1, (b) pH 4,5, and (c) pH 7 of butterfly
pea anthocyanin extracts and brilliant blue
The lower hue of brilliant blue compared with butterfly pea
anthocyanin extracts caused the color of both samples were not exactly
same although there were still blue.
0
100
200
300
400
0.00 5.00 10.00 15.00 20.00 25.00
H0
Tinctorial Strength
0
100
200
300
400
0.00 5.00 10.00 15.00 20.00 25.00
H0
Tinctorial Strength (a) (b)
0
100
200
300
400
0.00 5.00 10.00 15.00 20.00 25.00
H0
Tinctorial Strength
Butterfly Pea
Brilliant Blue
(c)
(b)
(c)
14
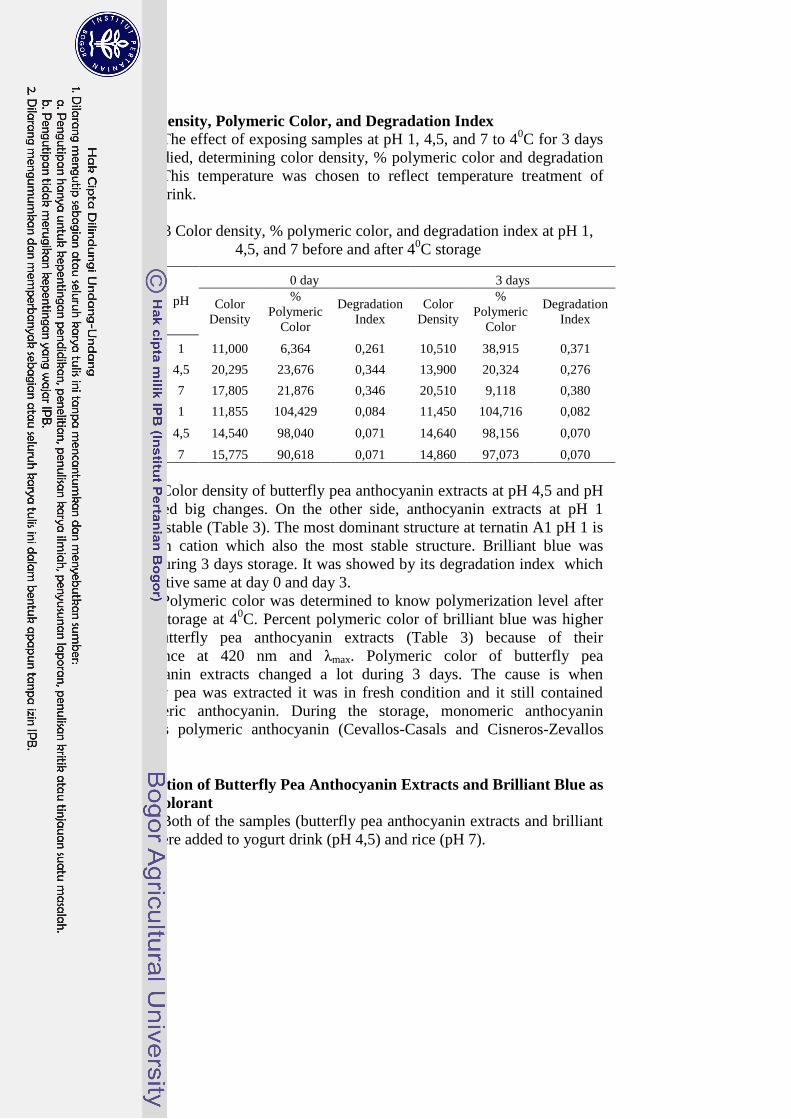
Color Density, Polymeric Color, and Degradation Index The effect of exposing samples at pH 1, 4,5, and 7 to 4
0C for 3 days
was studied, determining color density, % polymeric color and degradation
index. This temperature was chosen to reflect temperature treatment of
yogurt drink.
Table 3 Color density, % polymeric color, and degradation index at pH 1,
4,5, and 7 before and after 40C storage
Color density of butterfly pea anthocyanin extracts at pH 4,5 and pH
7 showed big changes. On the other side, anthocyanin extracts at pH 1
relative stable (Table 3). The most dominant structure at ternatin A1 pH 1 is
flavilium cation which also the most stable structure. Brilliant blue was
stable during 3 days storage. It was showed by its degradation index which
was relative same at day 0 and day 3.
Polymeric color was determined to know polymerization level after
3 days storage at 40C. Percent polymeric color of brilliant blue was higher
than butterfly pea anthocyanin extracts (Table 3) because of their
absorbance at 420 nm and λmax. Polymeric color of butterfly pea
anthocyanin extracts changed a lot during 3 days. The cause is when
butterfly pea was extracted it was in fresh condition and it still contained
monomeric anthocyanin. During the storage, monomeric anthocyanin
becomes polymeric anthocyanin (Cevallos-Casals and Cisneros-Zevallos
2004).
Application of Butterfly Pea Anthocyanin Extracts and Brilliant Blue as
Food Colorant
Both of the samples (butterfly pea anthocyanin extracts and brilliant
blue) were added to yogurt drink (pH 4,5) and rice (pH 7).
Colorant pH
0 day 3 days
Color
Density
%
Polymeric
Color
Degradation
Index
Color
Density
%
Polymeric
Color
Degradation
Index
Butterfly
Pea
1 11,000 6,364 0,261 10,510 38,915 0,371
4,5 20,295 23,676 0,344 13,900 20,324 0,276
7 17,805 21,876 0,346 20,510 9,118 0,380
Brilliant
Blue
1 11,855 104,429 0,084 11,450 104,716 0,082
4,5 14,540 98,040 0,071 14,640 98,156 0,070
7 15,775 90,618 0,071 14,860 97,073 0,070
15
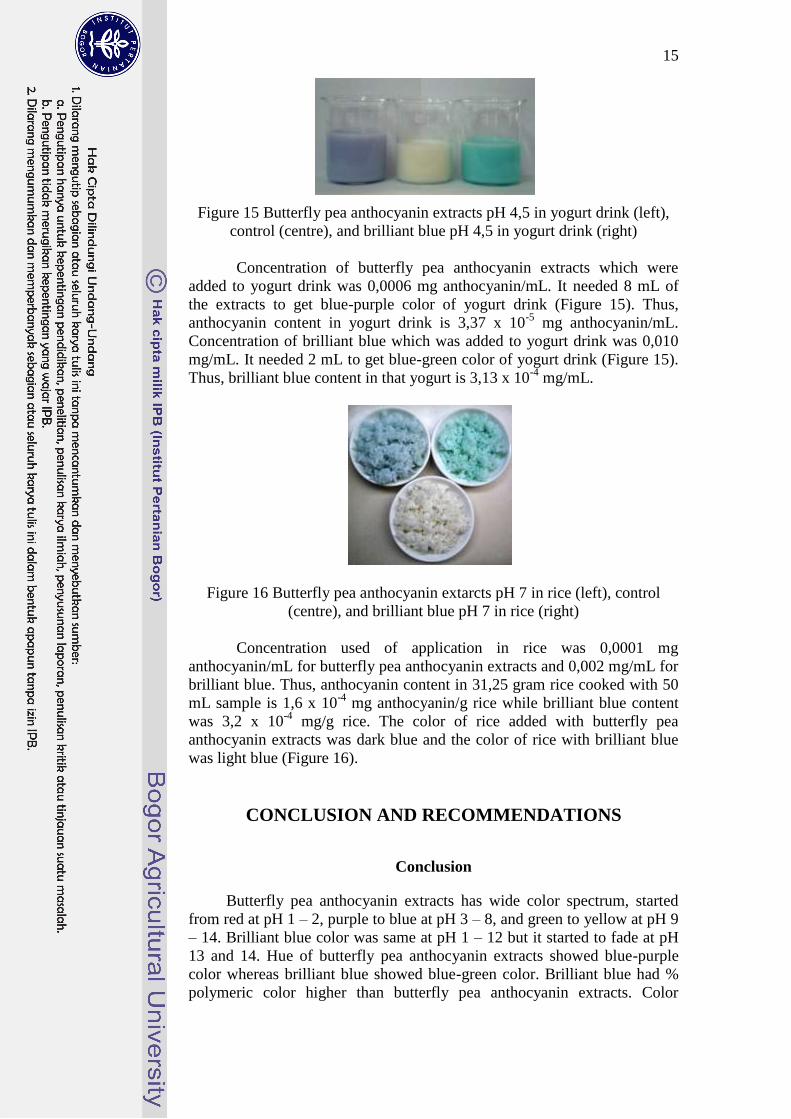
Figure 15 Butterfly pea anthocyanin extracts pH 4,5 in yogurt drink (left),
control (centre), and brilliant blue pH 4,5 in yogurt drink (right)
Concentration of butterfly pea anthocyanin extracts which were
added to yogurt drink was 0,0006 mg anthocyanin/mL. It needed 8 mL of
the extracts to get blue-purple color of yogurt drink (Figure 15). Thus,
anthocyanin content in yogurt drink is 3,37 x 10⁻⁵
mg anthocyanin/mL.
Concentration of brilliant blue which was added to yogurt drink was 0,010
mg/mL. It needed 2 mL to get blue-green color of yogurt drink (Figure 15).
Thus, brilliant blue content in that yogurt is 3,13 x 10⁻⁴
mg/mL.
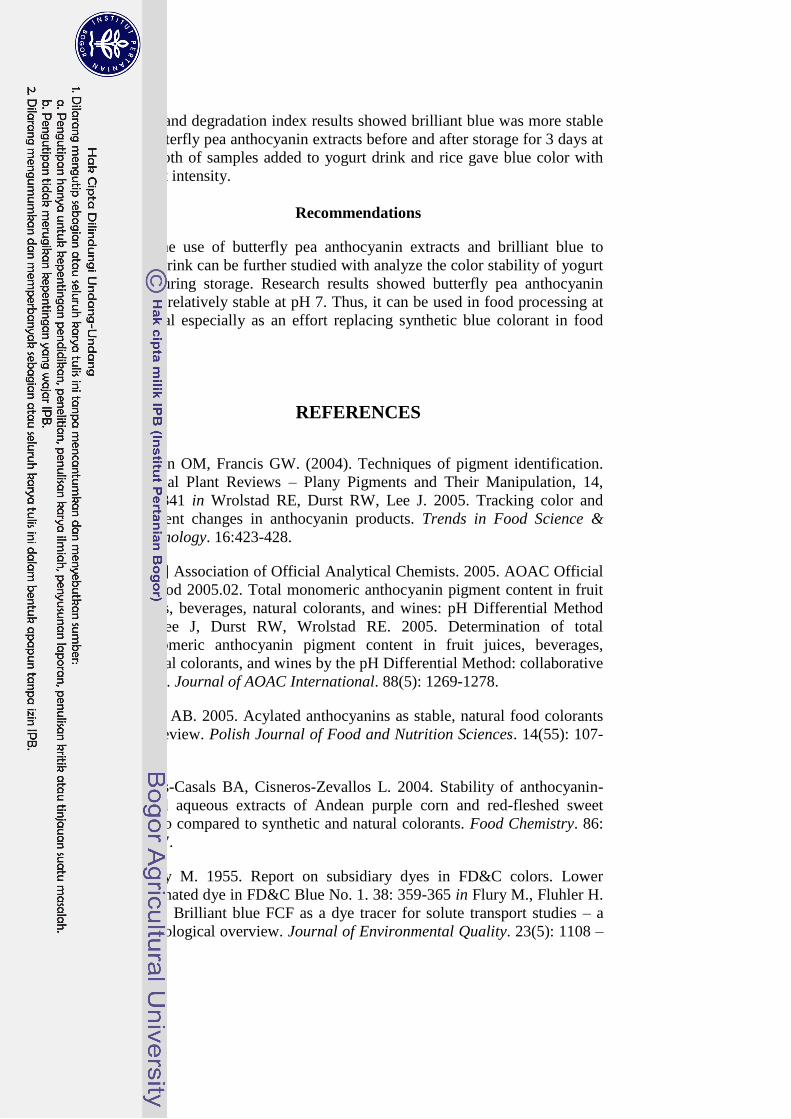
Figure 16 Butterfly pea anthocyanin extarcts pH 7 in rice (left), control
(centre), and brilliant blue pH 7 in rice (right)
Concentration used of application in rice was 0,0001 mg
anthocyanin/mL for butterfly pea anthocyanin extracts and 0,002 mg/mL for
brilliant blue. Thus, anthocyanin content in 31,25 gram rice cooked with 50
mL sample is 1,6 x 10⁻⁴
mg anthocyanin/g rice while brilliant blue content
was 3,2 x 10⁻⁴
mg/g rice. The color of rice added with butterfly pea
anthocyanin extracts was dark blue and the color of rice with brilliant blue
was light blue (Figure 16).
CONCLUSION AND RECOMMENDATIONS
Conclusion
Butterfly pea anthocyanin extracts has wide color spectrum, started
from red at pH 1 – 2, purple to blue at pH 3 – 8, and green to yellow at pH 9
– 14. Brilliant blue color was same at pH 1 – 12 but it started to fade at pH
13 and 14. Hue of butterfly pea anthocyanin extracts showed blue-purple
color whereas brilliant blue showed blue-green color. Brilliant blue had %
polymeric color higher than butterfly pea anthocyanin extracts. Color
16
density and degradation index results showed brilliant blue was more stable
than butterfly pea anthocyanin extracts before and after storage for 3 days at
40C. Both of samples added to yogurt drink and rice gave blue color with
different intensity.
Recommendations
The use of butterfly pea anthocyanin extracts and brilliant blue to
yogurt drink can be further studied with analyze the color stability of yogurt
drink during storage. Research results showed butterfly pea anthocyanin
extracts relatively stable at pH 7. Thus, it can be used in food processing at
pH netral especially as an effort replacing synthetic blue colorant in food
product.
REFERENCES
Anderson OM, Francis GW. (2004). Techniques of pigment identification.
Annual Plant Reviews – Plany Pigments and Their Manipulation, 14,
293-341 in Wrolstad RE, Durst RW, Lee J. 2005. Tracking color and
pigment changes in anthocyanin products. Trends in Food Science &
Technology. 16:423-428.
[AOAC] Association of Official Analytical Chemists. 2005. AOAC Official
Method 2005.02. Total monomeric anthocyanin pigment content in fruit
juices, beverages, natural colorants, and wines: pH Differential Method
in Lee J, Durst RW, Wrolstad RE. 2005. Determination of total
monomeric anthocyanin pigment content in fruit juices, beverages,
natural colorants, and wines by the pH Differential Method: collaborative
study. Journal of AOAC International. 88(5): 1269-1278.
Barczak AB. 2005. Acylated anthocyanins as stable, natural food colorants
– a review. Polish Journal of Food and Nutrition Sciences. 14(55): 107-
116.
Cevallos-Casals BA, Cisneros-Zevallos L. 2004. Stability of anthocyanin-
based aqueous extracts of Andean purple corn and red-fleshed sweet
potato compared to synthetic and natural colorants. Food Chemistry. 86:
69-77.
Dolinsky M. 1955. Report on subsidiary dyes in FD&C colors. Lower
sulfonated dye in FD&C Blue No. 1. 38: 359-365 in Flury M., Fluhler H.
1994. Brilliant blue FCF as a dye tracer for solute transport studies – a
toxicological overview. Journal of Environmental Quality. 23(5): 1108 –
1112.
17
[EFSA] European Food Safety Authority. 2010. Scientific opinion on the re-
evaluation of brilliant blue FCF (E 133) as a food additive. EFSA Journal.
8(11): 1853.
Flury M, Fluhler H. 1994. Brilliant blue FCF as a dye tracer for solute
transport studies – a toxicological overview. Journal of Environmental
Quality. 23(5): 1108–1112.
Green RC. 2007. Physicochemical properties and phenolic composition of
selected saskatchewan fruits: buffaloberry, chokecherry and sea
buckthorn [thesis]. Saskatchewan(Canada): University of Saskatchewan.
Herbst W, Hunger K. 2006. Industrial Organic Pigments: Production,
Properties, Applications. New Jersey: Wiley.
Hutching JB. 1999. Food Color and Appearance, Chapman and Hall Food
Science Book. Gaithersburg Maryland: Aspen Publishers Inc. in Adzkiya
MAZ. 2011. Kajian potensi antioksidan beras merah dan pemanfaatannya
pada minuman beras kencur [thesis]. Bogor (ID): Institut Pertanian
Bogor.
Marpaung AM, 2012. Optimasi proses ekstraksi antosianin pada bunga
teleng (Clitoria ternatea L.) dengan metode permukaan tanggap [thesis].
Bogor(ID): Institut Pertanian Bogor.
Noonan JE, Meggos H. 1980 Synthetic colors. P. 339-383 dalam Flury M,
Fluhler H. 1994. Brilliant blue FCF as a dye tracer for solute transport
studies – a toxicological overview. Journal of Environmental Quality.
23(5): 1108–1112.
Nugroho E. 2008. Pengenalan Teori Warna. Yogyakarta(ID): Penerbit
ANDI.
Rein M. 2005. Copigmentation reactions and color stability of berry
anthocyanins [dissertation]. Viikki(FI): University of Helsinki.
Reyes LF, Cisneros-Zevallos L. 2007. Degradation kinetics and colour of
anthocyanins in aqueous extracts of purple- and red-flesh potatoes
(Solanum tuberosum L.). Food Chemistry. 100: 885-894.
Rossi M, Giussani E, Morelli R, Lo Scalzo R, Nani RC, Torreggiani D.
2003. Effect of fruit blanching on phenolics and radical scavenging of
highbush blueberry juice. International Food Research Journal. 36: 999-
1005 in Marpaung AM, 2012. Optimasi proses ekstraksi antosianin pada
bunga teleng (Clitoria ternatea L.) dengan metode permukaan tanggap
[thesis]. Bogor(ID): Institut Pertanian Bogor.
Stintzing FC, Trichterborn J, Carle R. 2006. Characterisation of
anthocyanin-betalain mixtures for food colouring by chromatic and
HPLC-DAD-MS analyses. Food Chemistry. 94: 296-309.
18
Suzuki H, Nishino T, Nakayama T. 2007. Anthocyanin acyltransferase
engineered for the synthesis of a novel polyacylated anthocyanin. Plant
Biotechnology. 24: 495-501.
Terahara N, Saito N, Honda T, Toki K, Osajima Y. 1990. Structure of
ternatin A1, the largest ternatin in the major blue anthocyanins from
Clitoria ternatea flowers. Tetrahedron Letters. 31(20): 2921-2924.
Tulyathan V, Duangmai K, Thunpittayakul C. 1993. Anthocyanin extraction
from blue pea flowers [Abstract]. Thai Journal of Agricultural Science.
26(2): 171-183.
Vankar PS, Srivastava J. 2010. Evaluation of anthocyanin content in red and
blue flowers. International Journal of Food Engineering. 6(4): 1-11.
Wrolstad RE. 1993. Color and pigment analysis in fruit products.
Agricultural Experiment Station, Station Bulletin. 624: 1-17.
19
Appendix 1 Absorbance used in monomeric anthocyanin content analysis
Wavelength
510 nm 700 nm
pH 1 pH 4,5 pH 1 pH 4,5
1 1 0,768 0,454 0,013 0,016
2 0,767 0,454 0,013 0,017
2 1 0,787 0,451 0,012 0,016
2 0,786 0,450 0,012 0,016
20
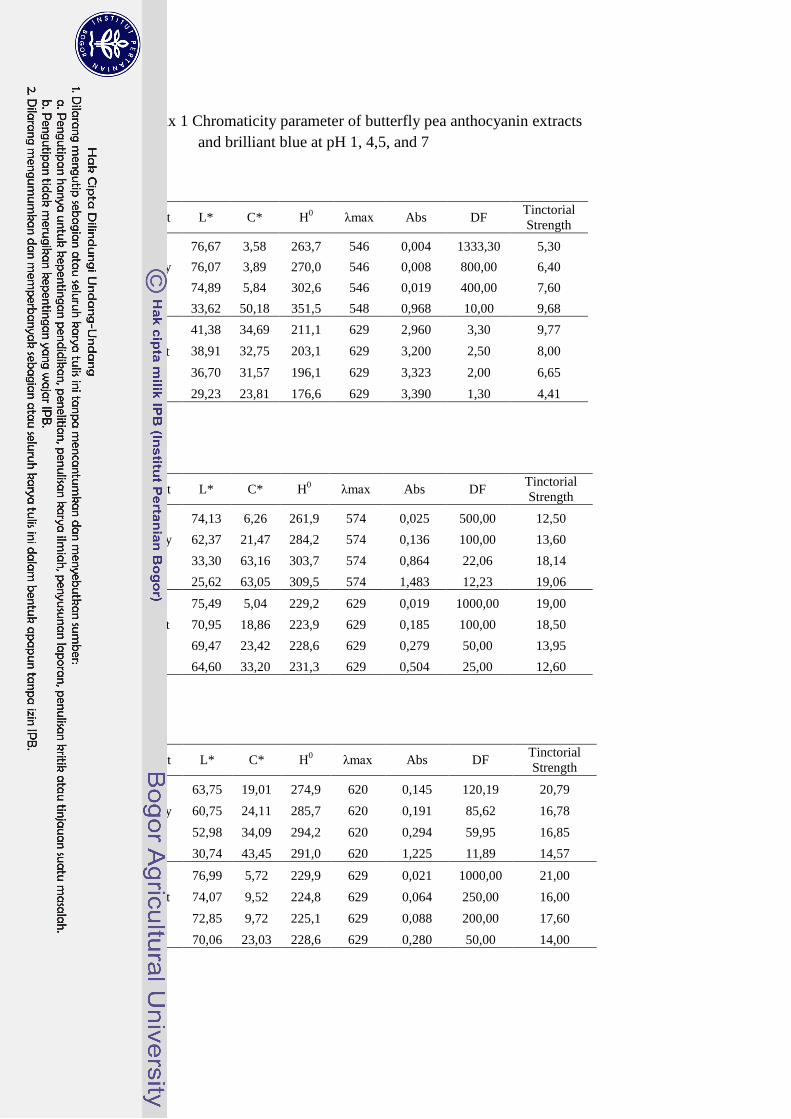
Appendix 1 Chromaticity parameter of butterfly pea anthocyanin extracts
and brilliant blue at pH 1, 4,5, and 7
pH 1
Colorant L* C* H0 λmax Abs DF
Tinctorial
Strength
Butterfly
Pea
76,67 3,58 263,7 546 0,004 1333,30 5,30
76,07 3,89 270,0 546 0,008 800,00 6,40
74,89 5,84 302,6 546 0,019 400,00 7,60
33,62 50,18 351,5 548 0,968 10,00 9,68
Brilliant
Blue
41,38 34,69 211,1 629 2,960 3,30 9,77
38,91 32,75 203,1 629 3,200 2,50 8,00
36,70 31,57 196,1 629 3,323 2,00 6,65
29,23 23,81 176,6 629 3,390 1,30 4,41
pH 4,5
Colorant L* C* H0 λmax Abs DF
Tinctorial
Strength
Butterfly
Pea
74,13 6,26 261,9 574 0,025 500,00 12,50
62,37 21,47 284,2 574 0,136 100,00 13,60
33,30 63,16 303,7 574 0,864 22,06 18,14
25,62 63,05 309,5 574 1,483 12,23 19,06
Brilliant
Blue
75,49 5,04 229,2 629 0,019 1000,00 19,00
70,95 18,86 223,9 629 0,185 100,00 18,50
69,47 23,42 228,6 629 0,279 50,00 13,95
64,60 33,20 231,3 629 0,504 25,00 12,60
pH 7
Colorant L* C* H0 λmax Abs DF
Tinctorial
Strength
Butterfly
Pea
63,75 19,01 274,9 620 0,145 120,19 20,79
60,75 24,11 285,7 620 0,191 85,62 16,78
52,98 34,09 294,2 620 0,294 59,95 16,85
30,74 43,45 291,0 620 1,225 11,89 14,57
Brilliant
Blue
76,99 5,72 229,9 629 0,021 1000,00 21,00
74,07 9,52 224,8 629 0,064 250,00 16,00
72,85 9,72 225,1 629 0,088 200,00 17,60
70,06 23,03 228,6 629 0,280 50,00 14,00
21
AUTHOR BIOGRAPHY
Corazon Nikijuluw was born in Los Banos, Manila,
Philipina, October 21st, 1991, from parent Victor P. H.
Nikijuluw and Dewi Budiastuti as the second daughter of the
family.
On 2009, the author graduated from SMAN 1 Bogor
and had been approved in Bogor Agricultural University
majoring in Food Science and Technology.
During college, the author participated in several
extracurricular activities, including student organizations and committees.
The author participated as staff of Profession Division (2011) and head of
Proffesion Division (2012) in Himitepa Fateta IPB also head of Discipleship
Development Divison in PMK IPB (2011), as well as several committees
such as Suksesi Himitepa 2010, HACCP Seminar and Training held by
Himitepa Fateta IPB (2011), Indonesian Food Expo (2012), and New
Christian Student Retreat (2010 and 2012).
In academic activities, the author had been an assistant of Protestant
discussion course (2010 and 2012), Food Chemistry and Biochemistry
laboratory course (2012), Sensory Evaluation laboratory course (2012) and
Principles of Food Technology laboratory course (2013). Several
achievements also had been achieved including the receiver of PKM funds
in entrepreneurship and research (2011 and 2012).


