Embed Size (px)
Citation preview
Published by
MCSER - Mediterranean Center of Social and Educational Research
in cooperation with
Mediterranean Journal of Social Sciences
Vol. 4, No. 1, January 2013
Rome, Italy 2013
Mediterranean Journal of Social Sciences
Editor in Chief
Dr. Andrea Carteny
Executive Director, MCSER Prof. Antonello Biagini Editing Dr. Antonello Battaglia Editorial Assistant Dr. Giuseppe Motta
Scientific Coordinator Prof. Giovanna Motta Graphic Design Dr. Gabriele Natalizia Editorial Managing Dr. Igor Baglioni
Copyright 2013 MCSER – Mediterranean Center of Social and Educational Research CEMAS – Sapienza University of Rome, Italy
ISSN 2039-9340 (print) ISSN 2039-2117 (online)
Index Copernicus Year 2011 Impact Factor 3.77
Doi:10.5901/mjss.2013.v4n1
Vol. 4, No. 1, January 2013
Publisher
MCSER – Mediterranean Center of Social and Educational Research
CEMAS – Sapienza University of Rome, Italy Piazzale Aldo Moro, 5, Cap. 00186, Rome, Italy
Tel/Fax: 039/0692913868 E-mail: [email protected]
Web: http://www.mcser.org
This journal is printed by Gruppo Atena.net Srl
Via del Lavoro, 22, 36040, Grisignano VI, Italy
Tel: 0039/0444613696 Web: http://www.atena.net
Mediterranean Journal of Social Sciences
Vol. 4, No. 1, January 2013
ISSN: 2039-9340 (print) ISSN: 2039-2117 (online)
About the Journal
Mediterranean Journal of Social Sciences (MJSS) is a double blind peer-reviewed journal, published three times a year, by Mediterranean Center of Social and Educational Research. The journal publishes research papers in the fields of Mediterranean and World Culture, Sociology, Philosophy, Linguistics, Education, History, History of Religions, Anthropology, Statistics, Politics, Laws, Psychology and Economics. MJSS is open for the academic world and research institutes, academic and departmental libraries, graduate students and PhD candidates, academic and non-academic researchers and research teams. Specifically, MJSS is positioned as a vehicle for academics and practitioners to share field research. In addition to scientific studies, we will also consider letters to the editor, guest editorials, and book reviews. Our goal is to provide original, relevant, and timely information from diverse sources; to write and publish with absolute integrity; and to serve as effectively as possible the needs of those involved in all social areas. If your research will help us achieve these goals, we would like to hear from you. MJSS provides immediate open access to its content on the principle that making research freely available to the public supporting a greater global exchange of knowledge. All manuscripts are subject to a double blind peer review by the members of the editorial board who are noted experts in the appropriate subject area.
Editor in Chief, Andrea Carteny
Sapienza University of Rome, Italy
Indexing/Abstracting/Library
Mediterranean Journal of Social Sciences is included on the following index/abstracting/library
• IBSS - International Bibliography of the Social Sciences
• ProQuest – Social Sciences Index • ProQuest Political Sciences • Sociological Abstract – ProQuest • DOAJ – Directory of Open Access
Journals • EBSCOhost • EBSCO Publishing • Index Copernicus International • Cabell’s Publishing – Directories of
Academic Journals • Ulrichsweb – Global Serials Directory • Socol@r Index • E-Journals.org • World Wide Web Virtual Library • Genamics JournalSeek • Kaohsiung Medical University Library • PsycINFO – Bibliographic Database of
the American Psychological Association • MLA Index – International Bibliography
of the Modern Language Association
• Georgetown University Library • Scirus Index • Open J. Gate Index • Ohio Library and Information Network –
OhioLINK • Academic Journals Database • Indiana University Libraries • California State Monterey Bay Library –
CSUMB • University of Saskatchwean Library • San José State University – Electronic Journal
Index • University of Ottawa Library • Birmingham Public Library • Exlibris Index, The Bridge of Knowledge • Shenzen University Library • WZB Library • Colorado States University Libraries • Berlin State Library • University of Washington Libraries • University Library of Regensburg • Digital Library of Wroclaw University • Shenzen University Library

Mediterranean Journal of Social Sciences
Editor in chief Dr. Andrea Carteny Sapienza University of Rome, Italy
International Editorial Board
Vincent Hoffmann-Martinot University of Bordeaux, France Dimitri A. Sotiropoulos University of Athens, Greece Giuseppe Motta Sapienza University of Rome, Italy Sibylle Heilbrunn Ruppin Academic Center, Emek-Hefer, Israel Anne Cross Metropolitan State University, USA Marco Cilento Sapienza University of Rome, Italy Werner J. Patzelt University of Dresden Germany Mohamed Ben Aissa University of Tunis, Tunisia Emanuele Santi African Development Bank, Tunis, Tunisia Arda Arikan Akdeniz University, Antalya, Turkey Alessandro Vagnini Sapienza University of Rome, Italy Godfrey Baldacchino University of Malta, Malta Kamaruzaman Jusoff Universiti Putra Malaysia Daniel Pommier Vincelli Sapienza University of Rome, Italy Hossein Vahid Dastjerdi University of Isfahan, Isfahan, Iran Gabriele Natalizia Sapienza University of Rome, Italy Francisco J. Ramos Universidad de Castilla-La Mancha, Spain Igor Baglioni Sapienza University of Rome, Italy Tarau Virgiliu Leon Babes-Bolyai University, Cluj-Napoca, Romania
José Sánchez-Santamaría University of Castilla-La Mancha, Spain Dorina Orzac Babes-Bolyai University, Cluj-Napoca, Romania
Marian Zlotea Sapienza University of Rome / Government Agency, Romania Petar Jordanoski Sapienza University / University of Skopje Slavko Burzanovic University of Montenegro, Montenegro Martina Bitunjac Humboldt University of Berlin, Germany Aranit Shkurti CIRPS Sapienza University / CIT University, Albania Francesco Randazzo University of Perugia, Italy Gulap Shahzada University of Science and Tecnology, Pakistan Nanjunda D C Universiy of Mysore, Karnataka, India Nkasiobi S.Oguzor Federal College of Education (Technical), Omoku- Nigeria Shobana Nelasco Fatima College, Madurai-India Jacinta A. Opara Universidad Azteca, Mexico Fernando A. Ferreira Polytechnic Institute of Santarem, Portugal Hassan Danial Aslam Human Resource Management Research Society, Pakistan Asoluka C. Njoku Alvan Ikoku Federal College of Education, Owerri-Nigeria
Alice Kagoda Makerere University, Kampala-Uganda B.V. Toshev University of Sofia, Bulgaria Benedicta Egbo University of Windsor, Ontario-Canada Adriana Vizental University Aurel Vlaicu, Romania Florica Bodistean University Aurel Vlaicu, Romania Bassey Ubong Federal College of Education (Technical), Omoku-Nigeria Tutku Akter Girne American University, Northern Cyprus A. C. Nwokocha Michael Okpara University of Agriculture, Umudike-Umuahia, Nigeria Murthy CSHN Tezpur University Napaam Assam India Femi Quadri Federal College of Education (Technical), Omoku-Nigeria Abraham I. Oba Niger Delta Development Commission, Nigeria Fouzia Naeem Khan Shaheed Zulfikar Ali Bhutto Institute of Science and Technology, Pakistan Marcel Pikhart University Hradec Kralove, Czech Republic Sodienye A. Abere Rivers State University of Science and Technology, Port Harcourt, Nigeria Luiela-Magdalena Csorba University Aurel Vlaicu, Romania
Joan Garcia Garriga Institut de Paleoecologia Humana i Evolució Social (IPHES) / Universitat Oberta de Catalunya (UOC), Spain
Georgios A. Antonopoulos Teesside University Middlesbrough, UK
Vennila Gopal Bharathiar University, Coimbatore, India Eddie Blass Swinburne University of Technology, Australia Hanna David Tel Aviv University, Jerusalem-Israel Raphael C. Njoku University of Louisville, USA Ali Simek Anadolu University, Turkey Austin N. Nosike The Granada Management Institute, Spain Gerhard Berchtold Universidad Azteca, Mexico Samir Mohamed Alredaisy University of Khartoum, Sudan Lawrence Ogbo Ugwuanyi University of Abuja, Abuja-Nigeria Oby C. Okonkwor Nnamdi Azikiwe University, Awka-Nigeria Ridvan Peshkopia American Unievrsity of Tirana, Albania George Aspridis Technological Educational Institute of Larissa, Greece Talat Islam University of the Punjab, Lahore, Pakistan Sokol Paçukaj Aleksander Moisiu University, Albania Federico Niglia Libera Università Internazionale degli Studi Sociali (LUISS) “Guido Carli”, Italy Isara Tongsamsi Songkhla Rajabhat University, Thailand S.E. Onuebunwa Federal College of Education (Technical), Omoku-Nigeria
ISSN 2039-9340 Mediterranean Journal of Social Sciences Vol. 4 (1) January 2013
7
TABLE OF CONTENTS Articles Communication Research in the EFL Context: Challenges and Directions 11 Nan Zhou Effectiveness of Cognitive-Attribution Therapy on Shame and Guilt Feelings of Women Exposed to Spousal Rejection in Nigeria 21 Adeola Shobola Social Networking Websites and Their Effect in Contemporary Human Resource Management – A Research Approach 29 G. Aspridis, V. Kazantzi, D. Kyriakou The Advantages of Administrative Reforms in Judicial System, Democracy Transparence and the Rule of Law Comparative Analyze in Albanian Legal Case Study 47 Alba Robert Dumi,Neshet Ngucaj Wetland Ecosystem Conflict: Implication for Agricultural Productivity and Food Security in Mbiabo, Odukpani, Cross River State, Nigeria. 55 Okpiliya F.I, Ekong A.E, Imoke Eni Pakistan: On the Way to be Failed State? 63 Md. Matiul Hoque Masud, Helal Uddin Ahmmed, Anwar Hossain Choudhury,Muhammad Ridwan Mostafa Edgar Allan Poe’s Narrative Use of Literary Doubling 71 Miriam Fernández-Santiago Private Sector Creditand Economic Growth Nexus in Nigeria: An Autoregressive Distributed Lag Bound Approach 83 Haruna Mohammed Aliero, Yahya Zakari Abdullahi, Nasiru Adamu The Evolving Role of the Press in Contemporary Vietnam 91 Le Mai Huong The Challenges of Saving Mothers from Childbirth-Related Injuries and Deaths in Nigeria 97 Godswill James Measuring Work Related Quality of Life and Affective Well-being in Turkey 105 Emin Cihan Duyan, Serpil Aytaç, Neslihan Akyıldız, Darren Van Laar The Case of Lisbon Treaty; An Elitist Analysis of the State of Democracy in the EU 117 Aida Goga The Social Construction of sub-Saharan Women’s Status through African Proverbs 123 Lewis Asimeng-Boahene Conceptual Model for Effective Implementation of Industrial Symbiosis: A Case Study of Mab-Ta-Phut Industrial Estate 133 Paitoon Termsinvanich, Suwattana Thadaniti, Dawan Wiwattanadate Development Strategy for Health Behavior of the Elderly 141 Pagapan Hantrakul, Suchat Saengthong, Supawan Vongkamjan Determinants of the Food Security Status of Households Receiving Government Grants in Kwakwatsi, South Africa 147 Tshediso Joseph Sekhampu
ISSN 2039-9340 Mediterranean Journal of Social Sciences Vol. 4 (1) January 2013
8
Uncertainty and Foreign Direct Investment: A Case of Agriculture in Nigeria 155 S. Ajuwon, F. O. Ogwumike The Business Process Outsourcing Sector in the Philippines: A Defiant Trend 167 Burak Herguner Mandatory Adoption of International Financial Reporting Standards (IFRS) in Nigeria: The Unresolved Institutional Question 175 P.A. Isenmila, Adeyemo, Kingsley Aderemi Is There a Unique or Non Unique Value Profile for Albanian Social Actors? (The Study Case of Tirana Electorate in 2003, 2008, 2010 and 2011) 185 Aleksandër Kocani The Effects of Cooperative versus Competitive Word Games on EFL Learners` Vocabulary Gain, Motivation, and Class Atmosphere 189 Zahra Fotovatnia, Maryam Namjoo Classroom Activities as Measure of Academic Performance of Senior Secondary School Students in Core Science Subjects 209 M.F Omodara, E.B Kolawole, J.A Oluwatayo The Development Strategy of Local Shop to Promote the Economic Strength of the Community 215 Suwan Ronnahong-sa, Chaloi Buripakdee, Suchart Saengthong Health Care Financing in Nigeria: Prospects And Challenges 221 S.A.J. Obansa, Akinnagbe Orimisan The Examination of the Effect of Participation in Entrepreneurial Development Programmes on Enterprise Performance: A Case of Small-Scale Business in Nigeria 237 Aribaba Foluso Olugbenga Relative Contributions of Selected Teachers’ Variables and Students’ Attitudes Toward Academic Achievement in Biology Among Senior Secondary School Students in Ondo State, Nigeria 243 Gbore, L.O. Time Series and Trend Analysis of Fatalities from Road Traffic Accident in Lagos State, Nigeria 251 Atubi, Augustus .O. Globalization of Localized Social Integration: Disembodied ‘Selves’, New Form of Social Interaction and Re-Identification of ‘Who We Are’ in a Virtual Environment 261 Tutku Akter Censorship, Resistance and Transformation in Modern Indonesian Literature 269 Ferdinal Ferdinal Exploring the Mismatch Between Teacher Demand-Supply in Sub-Sahara Africa: Ghana as Case Study 273 Stephen Ntim Needs Analysis Regarding Residents of Environmentally Affected Areas. Patos - Marinza Case 285 Marilda Jance Corruption Reduction in Nigerian: Appraisal of the Role of Music 291 Ogunrinade D. O. A. Politics of Economy: The Case of China's Involvement in Africa 299 Md. Matiul Hoque Masud, Helal Uddin Ahmmed, Muhammad Ridwan Mostafa, Anwar Hossain Choudhur Spiritual Well-Being and Fulfilment, or Exploitation by a Few Smart Ones? The Proliferation of Christian Churches in West African Immigrant Communities in Canada 305 Michael Baffoe Strategy for Developing a Body of Knowledge on Graduate Entrepreneurship 317 Pimchanok Sangkaew, Suphawan Vongkamjan, Somkiat Chaipiboon Nonprofit Organizations: The Impact of Advertising in Fundraising 323 Xhiliola Agaraj (Shehu), Elenica Pjero, Ylldes Sokoli, Aurela Ramaj
ISSN 2039-9340 Mediterranean Journal of Social Sciences Vol. 4 (1) January 2013
9
Assessment of the Administration and Practice of Juvenile Justice System in Abuja, Nigeria 331 Godswill James The Missing Third Question 339 Aleksandër Kocani McDonaldization of Nigerian Banking Industry in the Post-consolidated Era: An Exploration of the Unavoidable Consequences 343 Emeka W. Dumbili The Effect of Using MoodleReader as an Extensive Reading Tool on Learners’ Awareness of Affective Dimensions of Deep Vocabulary Knowledge 353 Ramin Vaezi, Somayeh Nilforooshan The Education Effects in Personal Finance Management 361 Sanie Doda Global Marketing of Agricultural and Mineral Products, Pre-Requisite for Africa’s Economic Development 369 O.S. Ibidunni An Analysis of the Offences Committed by Youths in Selected Remand Homes in South West Nigeria, Implication for School Administrators 375 O. A. Adegun A Synopsis of Factors of Injuries in Road Traffic Accidents in Lagos, Nigeria 383 Atubi, Augustus .O. Constructivists’ Didactics in Teaching Technology Education in Ethiopian Technology Universty- Practices and Challenges (The Case of Adama Science and Technology University) 391 Ziyn Engdasew An Investigation of the Performance of Cooperative Thrift and Credit Societies in Financing Small-Scale Businesses in Nigeria 401 Aribaba, Foluso Olugbenga Fier By-Pass and its Role in the Socio-Economic Development of Fier Region 407 Nevila Çinaj, Jostina Dhimitri Alcohol Abuse as a Cause of Poor Academic Performance among Social Science Students of the University of Calabar, Nigeria 413 Ukwayi, Joseph K., Lucy Ambekeh U., Chibuzo, C. Uwanede, Undelikwo, Veronica. A Corruption as a Social Problem and its Implication on Nigerian Society: A Review of Anticorrupt Policies 423 Bassey, Antigha Okon, Abia, Raphael Pius, Attah Frank Bassey, Umo Antigha An Analysis about Albanian Politics and Constitutional Changes of 2008 431 Elda Zotaj The Rights of Albanian Nationals under the Stabilization and Association Agreement Between Albania and the European Communities 439 Anduena Gjevori Competition in Marketing: Survival Yardstick for Small and Medium Enterprises in Nigeria 447 O.S. Ibidunni, O . J . K . Ogundele The Impact of Direct and Indirect Experience of Insurance Services on Customer-Based Brand Equity: Some Research Questions and Implications 459 Hassan, Ghorbani, Seyedeh Masoomeh, Abdollahi Mohammad Reza, Dalvi Esfahan Constructing America’s “New Blacks:” Post 9/11 Social Policies and their Impacts on and Implications for the Lived Experiences of Muslims, Arabs and “Others.” 469 Buster C. Ogbuagu A Qualitative Study Exploring Factors Contributing to Gender Inequality in Rural Ghana 481 Mavis Dako-Gyeke and Prince Owusu Implementation of National Accounting Standards Focused in Albanian Reality 491 Shqipe Xhaferri
ISSN 2039-9340 Mediterranean Journal of Social Sciences Vol. 4 (1) January 2013
10
Patterns in Agricultural Loans under the Agricultural Credit Guarantee Scheme in Nigeria 497 R.A. Isiorhovoja The Convergence of Accounting Treatment for Intangible Assets in Albania 503 Shqipe Xhaferri Socioeconomic Factors as Predictors of Entrepreneurial Behaviour in Poultry Farm 511 R.A. Isiorhovoja Basic Psychological Needs at Work of Mental Health Professionals in Albania 519 Lediana Xhakollari The Impact of Joseph Heller Post-Modernist Features in the Recent Scientific Studies 525 Anita Neziri Quality of Work Life of Mental Health Professionals in Albania 529 Lediana Xhakollari Impact of Age and Level of Experience on Occupational Stress of Academic Managers at Higher Educational Level 535 Azhar Mahmood, Shazia Zamir, Qurat-ul-Ain, Saira Nudrat, Fatima Zahoor Gender Differences in Participation and Achievement in Science: Implications and Intervention Strategies for Scientific and Technological Development in the Caribbean 543 Babalola J. Ogunkola, Leah Garner – O’Neale Development Strategy the Balance of Environment against Green Factory of the Infectious Garbage Displacement Nakhon Sawan Province 553 Pinyapat Somboonkittikorn, Direk Lerkrai, Supawan Wongkamjan Development of Flood Disaster Model through PAIC Process 559 Cherdpong Mongkonsin, Nongnapas Thiengkamol Tanarat Thiengkamol Democracy and Development in Africa: The Nigerian Experience 569 S.M. Omodia Multidimensional Determinants of foreign Direct Investment in Central Africa: A Modified Gravity GMM Panel Approach 575 Ibrahim Ngouhouo Causal Relationship Model of Flood Response Behavior 587 Cherdpong Mongkonsin, Nongnapas Thiengkamol, Tanarat Thiengkamol Analyzing the Determinants of Export Trade in Cameroon (1970 – 2008) 599 Ibrahim Ngouhouo, Alex Audrin Makolle A Study of Errors in Bilingual Road, Street and Shop Signs in Iran 607 Alireza Hojati
Note from the Editor, Retraction and Apology ………………………………………………………………………………612
ISSN 2039-9340 Mediterranean Journal of Social Sciences Vol. 4 (1) January 2013
11
Communication Research in the EFL Context: Challenges and Directions
Nan Zhou
Shenyang Normal University, China E-mail: [email protected]
Doi:10.5901/mjss.2013.v4n1p11
Abstract
The purpose of this study is to explore the challenges of the existing research on learners’communication behaviors in the English-as-a-foreign-language (EFL), mainly Asian context, and identify the fields which need to be further explored. By reviewing the research investigating factors influencing EFL learners’ willingness to communicate, this paper argues that though learners’ use of English in communication has become the common interest in EFL education research and factors influencing their oral participation have been widely documented, there are limitations.This paper suggests that it is necessary to conceptualize the communication behaviors of EFL learners in English in terms of situational-specific practices, and to identify the underlying causes of student self-exclusion from oral tasks, by examining the context in which these students are located. In light of the review of the literature, this paper also identifies some variables which need to be taken into consideration in future research, such as identity negotiation, investment in English learning, international posture and imagined community.It is hoped that this paper will inform the development of L2 communication research.
Key words:second language communication, EFL context, challenges and directions
1. Introduction The idea that some people have difficulty communicating across a range of situations is first introduced by Phillips in 1965 with the publication of his paper on reticence (Keaten & Kelly, 2000). Originally, reticence is defined by Phillips (1965) as a personality-based anxiety disorder. Most studies focus on the effects of individual characteristics.The communication concept is mainly conceptualized as a trait-like and personality-based predisposition, rather than as a situation-based variable (McCroskey & Baer, 1985). Then after realizing that second language (L2) learners’ willingness to communicate (WTC) is not a simple manifestation of L1 WTC, growing attention has been drawn to the study of English-as-a-second-language (ESL) 1
English-as-a-foreign-language (EFL)
learners’ willingness to communicate in the target language.Communication research in the ESL context has moved from the idea of WTC as personality-based predisposition, to include also situation-specific practices. ESL learners’ communication behaviors are seen as jointly influenced by personal and situational variables.
2
1ESL=English as a Second Language. In the present paper, second language refers to the language learned after the first language or mother tongue in the context that the target language is the main language for communication. 2EFL=English as a Foreign Language. In the present paper, foreign language refers to the language being learned in a context where that language is not generally used.
learners are different from L1 and ESL learners, in that the target language is hardly used outside the classroom (Fushino, 2010). Differences in the extent of involvement in English language communities, and in the opportunity to use English in communication, might affect the factors underlying their communication behaviors. This suggests it is unwise to directly apply theories and findings derived from L1 and ESL contexts to understandings of EFL learners. The field of EFL learners’ communication research needs its own distinctive research. To examine the factors influencingEFL learners’use of English in oral communication,scholars from various cultures have attempted to transfer into EFL learning contexts, variables found to have influenced L1 and ESL WTC and communication behaviors (e.g. Wen &Clément, 2003; Yashima, 2002; Yashima et al., 2004; Liu, 2005; Yashima &Zenuk-Nishide, 2008; Fushino, 2010; Peng & Woodrow, 2010). The purpose of this study is to examine the challenges of the existing research and identify the fields which need to be further explored in the field of EFL communication research. Based on a review of the research on learners’communication behaviors in the EFL, mainly Asian context, this paperwill argue that though learners’ use of English in communication has become the common interest in EFL education research, there are limitations.This paper suggests that it is necessary to conceptualize the communication behaviors of
ISSN 2039-9340 Mediterranean Journal of Social Sciences Vol. 4 (1) January 2013
12
L2 learners in English in terms of situational-specific practices, and to identify the underlying causes of student self-exclusion from oral tasks, by examining the context in which these students are located. In light of the review of the literature, this paper also suggests some variables which need to be taken into consideration in future research, such as identity negotiation, investment in English learning, international posture and imagined community.It is hoped that this paper will inform the development of L2 communication research. 2. Communication research in the EFL context Asian students have long been described as reticent and passive in EFL class (Chen, 2003; Liu, 2005; Fushino, 2010). Some scholars attribute this to cultural attributes of Asian societies (e.g. Flowerdew& Miller, 1995; Ferris &Tagg, 1996; Jones, 1999). Flowerdew and Miller (1995) believe that Chinese students adopt a negative attitude to participation due to the impact on those students of local and academic cultures, especially teacher-centred primary and secondary education. Song (1995) notes, in relation to teaching East Asian students in an American University, that some students are uneasy and anxious in group discussions, even at the thought of asking questions in class. She too attributes reticent behaviors to cultural factors and previous educational experiences. Some scholars (e.g. Jones, 1999) maintain that students’ silence may be caused by Asian culture as by shyness or language difficulties.
However, the assertion that Chinese students have negative attitudes toward participation due to the influence of cultural attributes is challenged by Liu and Littlewood (1997), in a paper reporting the findings of two large-scale surveys conducted among the teachers and students at the University of Hong Kong. They critique the tendency of some studies to attribute observed behavioral traits to Asian culture and values. They state that most Chinese students prefer an active speech role in class. A large majority of students are willing to participate in interpersonal conversations. Some feel uncomfortable speaking English simply because they do not practice it frequently. Littlewood (1999) further reports, in relation to studies conducted in China, that most students are not satisfied with their teachers because the teachers do not provide enough discussion opportunities in class. Cheng (2000) asserts it is an over-generalization to allege that cultural attributes are causal factors of students’ passive participation, arguing that the explanation may lie in the specific situation. Students’ English language proficiency (ELP) and teaching strategies may affect patterns of participation.
In addition to cultural elements, some scholars attribute differences in students’ learning to personality factors. Liang and Tan (1999) investigate the relations between introverted/extroverted personality and students’ English learning, based on questionnaires collected from 263 non-English major undergraduates in Mainland China. They find that students with extroverted personalities tend to perform better in English speaking communication and are more active in English class than are introverted students. Exploring the factors influencing Chinese tertiary students’ participation patterns in classroom activities, Zhang and Zhou (2004) report on a questionnaire survey that examined the correlations between students’ participation in classroom activities, learning outcomes and personality factors. They find that students’ patterns of verbal class participation are mainly determined by their personalities.
Liu and Littlewood (1997) maintain that students’ English communication confidence and oral English proficiency are affected by the frequency of opportunities to speak English. The more students speak English, the more confidence they are in their own English speaking competence and vice versa. Also some students do not evaluate their own English oral competence positively, even though their oral performances might be regarded as adequate by their peers or teachers. Liu and Littlewood attribute this to “uncertainty avoidance” (Hofstede, 1986). For some students, speaking in front of a group is a high risky behavior, especially when they are not confident in their English. Many students choose to avoid oral participation, which they perceiveas uncertain, in case they lose face or make fool of themselves. Liu and Littlewood (1997) also find that student silence in class can also be affected by mismatches between teacher and student perceptions of the role of learners and the nature of tertiary English learning. In a questionnaire survey of 997 tertiary students and 50 English teachers at a Hong Kong university, Spratt (1999) also reports on discrepancies between teachers and students in their perceptions of English learning. Spratt investigates 48 possible classroom activities, finding a considerable difference between the classroom activities preferred by learners, and those activities identified by teachers as being preferred by learners.
Yashima (2002) reports a study conducted among 389 first-grade Japanese students majoring in Information Science at a coeducational university in Osaka. The questionnaire survey investigated the influence of L2 communication confidence, L2 proficiency, L2 learning motivation and international posture on L2 communication in the EFL context. Yashima used the concept of “international posture” to refer to the learners’ general attitude toward the international community, said to influence English learning and communication among EFL learners (p. 62-63). According to Yashima, international posture includes an interest in international affairs, willingness to go overseas to stay or work, readiness to interact with intercultural partners, and openness toward different cultures (2002, p. 57). A socioeducational model (relationships between attitudes, motivation, and achievement) and WTC model are used as a framework for examining
ISSN 2039-9340 Mediterranean Journal of Social Sciences Vol. 4 (1) January 2013
13
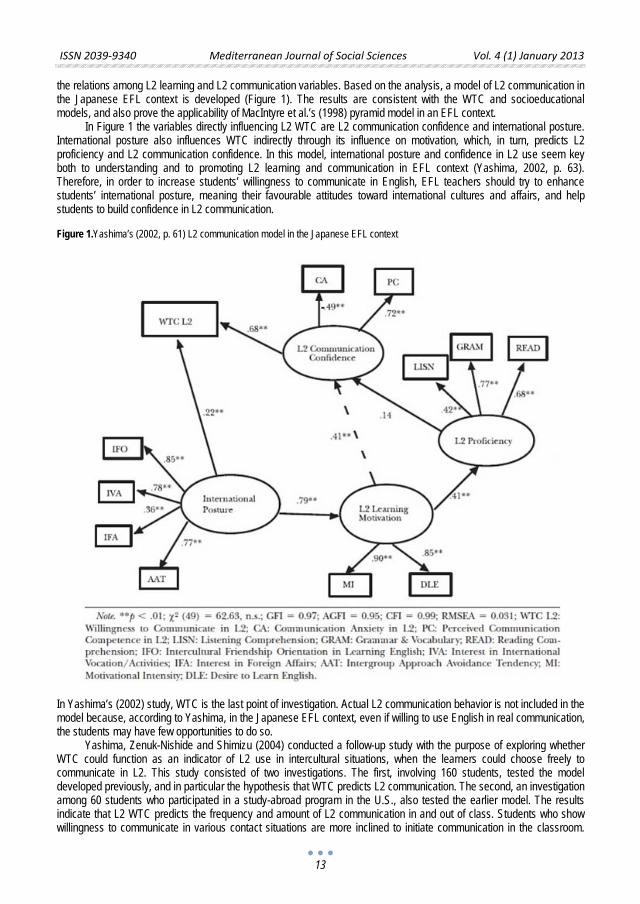
the relations among L2 learning and L2 communication variables. Based on the analysis, a model of L2 communication in the Japanese EFL context is developed (Figure 1). The results are consistent with the WTC and socioeducational models, and also prove the applicability of MacIntyre et al.’s (1998) pyramid model in an EFL context.
In Figure 1 the variables directly influencing L2 WTC are L2 communication confidence and international posture. International posture also influences WTC indirectly through its influence on motivation, which, in turn, predicts L2 proficiency and L2 communication confidence. In this model, international posture and confidence in L2 use seem key both to understanding and to promoting L2 learning and communication in EFL context (Yashima, 2002, p. 63). Therefore, in order to increase students’ willingness to communicate in English, EFL teachers should try to enhance students’ international posture, meaning their favourable attitudes toward international cultures and affairs, and help students to build confidence in L2 communication.
Figure 1.Yashima’s (2002, p. 61) L2 communication model in the Japanese EFL context
In Yashima’s (2002) study, WTC is the last point of investigation. Actual L2 communication behavior is not included in the model because, according to Yashima, in the Japanese EFL context, even if willing to use English in real communication, the students may have few opportunities to do so.
Yashima, Zenuk-Nishide and Shimizu (2004) conducted a follow-up study with the purpose of exploring whether WTC could function as an indicator of L2 use in intercultural situations, when the learners could choose freely to communicate in L2. This study consisted of two investigations. The first, involving 160 students, tested the model developed previously, and in particular the hypothesis that WTC predicts L2 communication. The second, an investigation among 60 students who participated in a study-abroad program in the U.S., also tested the earlier model. The results indicate that L2 WTC predicts the frequency and amount of L2 communication in and out of class. Students who show willingness to communicate in various contact situations are more inclined to initiate communication in the classroom.
ISSN 2039-9340 Mediterranean Journal of Social Sciences Vol. 4 (1) January 2013
14
Among the examined variables, students’ self-perceived L2 competence seems to exert the strongest impact on L2 WTC. As in Yashima’s (2002) study, it is found that students’ self-confidence in L2 communicative competence is crucial for their willingness to be involved in L2 communication. In addition, students who show greater interest in international affairs, occupations and activities tend to be more actively involved in L2 communication.
Because the previous two studies were mostly cross-sectional and did not reflect the developmental aspect of WTC or international posture, Yashima and Zenuk-Nishide (2008) conducted a study that followed up the Yashima et al. (2004) research. The new study compared 165 Japanese high school students in two different English learning contexts. The study found that when individual learners engage more actively in the community of practice, whether actual community or imagined community, they are more successful in gaining the knowledge and experience encouraged by that community. The findings of Yashima and Zenuk-Nishide (2008) are important for EFL teaching. Though most EFL students cannot participate in an actual L2 community, the teachers can provide teaching contexts in which a positive imagined community is created.
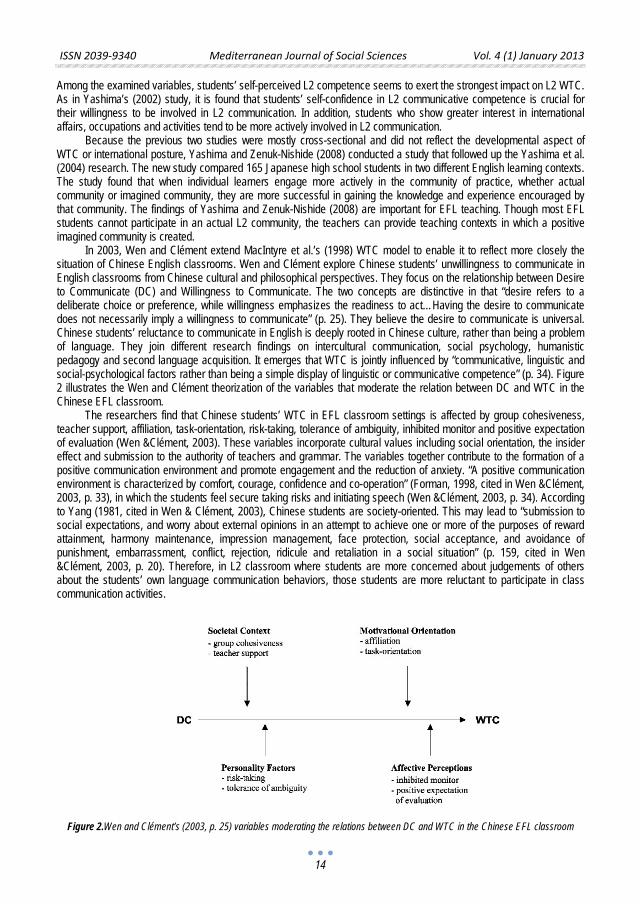
In 2003, Wen and Clément extend MacIntyre et al.’s (1998) WTC model to enable it to reflect more closely the situation of Chinese English classrooms. Wen and Clément explore Chinese students’ unwillingness to communicate in English classrooms from Chinese cultural and philosophical perspectives. They focus on the relationship between Desire to Communicate (DC) and Willingness to Communicate. The two concepts are distinctive in that “desire refers to a deliberate choice or preference, while willingness emphasizes the readiness to act…Having the desire to communicate does not necessarily imply a willingness to communicate” (p. 25). They believe the desire to communicate is universal. Chinese students’ reluctance to communicate in English is deeply rooted in Chinese culture, rather than being a problem of language. They join different research findings on intercultural communication, social psychology, humanistic pedagogy and second language acquisition. It emerges that WTC is jointly influenced by “communicative, linguistic and social-psychological factors rather than being a simple display of linguistic or communicative competence” (p. 34). Figure 2 illustrates the Wen and Clément theorization of the variables that moderate the relation between DC and WTC in the Chinese EFL classroom.
The researchers find that Chinese students’ WTC in EFL classroom settings is affected by group cohesiveness, teacher support, affiliation, task-orientation, risk-taking, tolerance of ambiguity, inhibited monitor and positive expectation of evaluation (Wen &Clément, 2003). These variables incorporate cultural values including social orientation, the insider effect and submission to the authority of teachers and grammar. The variables together contribute to the formation of a positive communication environment and promote engagement and the reduction of anxiety. “A positive communication environment is characterized by comfort, courage, confidence and co-operation” (Forman, 1998, cited in Wen &Clément, 2003, p. 33), in which the students feel secure taking risks and initiating speech (Wen &Clément, 2003, p. 34). According to Yang (1981, cited in Wen & Clément, 2003), Chinese students are society-oriented. This may lead to “submission to social expectations, and worry about external opinions in an attempt to achieve one or more of the purposes of reward attainment, harmony maintenance, impression management, face protection, social acceptance, and avoidance of punishment, embarrassment, conflict, rejection, ridicule and retaliation in a social situation” (p. 159, cited in Wen &Clément, 2003, p. 20). Therefore, in L2 classroom where students are more concerned about judgements of others about the students’ own language communication behaviors, those students are more reluctant to participate in class communication activities.
Figure 2.Wen and Clément’s (2003, p. 25) variables moderating the relations between DC and WTC in the Chinese EFL classroom
ISSN 2039-9340 Mediterranean Journal of Social Sciences Vol. 4 (1) January 2013
15
Wen and Clément’s (2003) study is significant because of their identification of proposed variables constituting the positive communication environment. Nevertheless, their study is also limited, in that they propose a theoretical framework without the support of empirical research, the variables they identify are positioned in the different positions along the axis in Figure 2, and they do not indicate the temporal sequence of the influence of those variables on Chinese students’ willingness to communicate in EFL classroom settings (Wen and Clément, 2003).
Communication apprehension is frequently cited as a factor that contributes to an individual’s unwillingness to communicate, in both in L1 and ESL contexts (Keaten et al., 2000; Hashimoto, 2002). Originally, communication apprehension referred to first language anxiety. Later it became widely used in L2 communication research in relation to anxiety about communication. Its negative effect on students’ interaction and communication behaviors has also been explored in the EFL classroom setting (Liu, 2005; Peng & Woodrow, 2010). Communication apprehension is defined as ‘‘fear or anxiety associated with real or anticipated communication with another person or persons’’ (McCroskey, 1977, p. 78).
The PhD thesis by Liu (2005) investigates Chinese university students’ reticence and communication apprehension in EFL oral classes and testing situations, using both qualitative and quantitative approaches. The research included 527 questionnaires among first year undergraduate non-English majors at three different ELP levels at Tsinghua University. Subsequently the researcher conducted a case study among three EFL classes (one from each ELP level) over the full term. The study used data from students’ reflective journals, class observations, semi-structured interviews and oral test results to explore students’ reticence and anxiety during oral English lessons and tests, and to identify the underlying factors and students’ coping strategies. Liu finds that reticence and nervousness in oral EFL classes and tests are widespread. Reticence is positively related to the anxiety experienced by the students in oral EFL lessons and tests. Reticence and anxiety negatively impacted students’ oral EFL performances. Students with higher ELP tended to be less anxious and reticent. Reticence and anxiety were not permanent and changed from activity to activity. Reticence and anxiety were caused by multiple factors and interacted with each other.
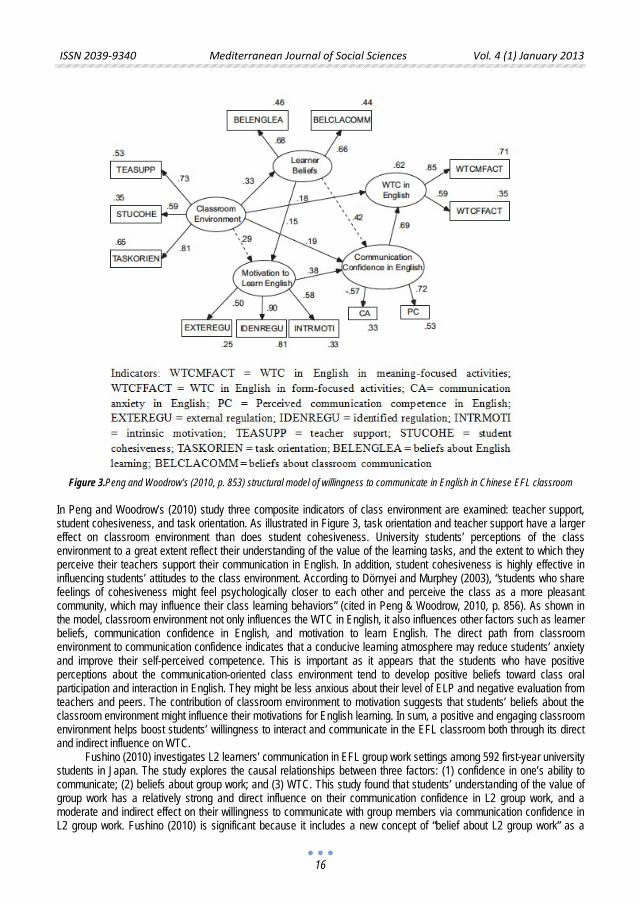
Peng and Woodrow (2010) report a quantitative study among 579 students from eight universities in Eastern China. They investigate Chinese tertiary students’ willingness to use English in classroom communication, from an ecological perspective in relation to classroom dynamics. In light of the previous studies, six scales are included in the questionnaires. They are students’ willingness to communicate in English, communication anxiety in English, their self-perceived English communicative competence, English learning motivation, learner beliefs and classroom environment. Based on the data analysis, a structural model of willingness to communicate in English in Chinese EFL classroom is developed (Figure 3).
As illustrated in Peng and Woodrow’s model, students’ willingness to communicate in English in EFL classroom setting is influenced both directly and indirectly by the joint effect of communication confidence in English, learner beliefs, classroom environment and motivation to learn English. Communication confidence in English exerts a strong and direct influence on students’ willingness to communicate in English in EFL classroom. This result is consistent with MacIntyre et al.’s (1998) L2 WTC model and the empirical cross-cultural studies on the basis of it (Yashima, 2002; Clément et al., 2003). It seems to support the claim that communication confidence is a primary and universal precursor to L2 WTC regardless of the diversities of cultures and contexts (Peng & Woodrow, 2010, p. 855). At the same time, communication confidence in English is influenced by the other three factors: learner beliefs, classroom environment and English learning motivation.
Figure 3 shows how English learning motivation influences WTC in English indirectly via English communication confidence. Though motivation is regarded as closely related to L2 WTC (also see Yashima, 2002), higher motivation in English learning does not necessarily lead to more willingness to communicate in English in the EFL classroom. Peng and Woodrow attribute this to Chinese EFL students’ tendency to focus on test-related skills like vocabulary, reading and writing, rather than speaking. However, the significant path from motivation to communication confidence in English implies that higher motivated students tend to have higher communicative competence and lower communication anxiety. The significant paths from learner beliefs to motivation and communication confidence indicate that learner beliefs shape L2 learning motivation and communication confidence. In this study, learner beliefs are associated with Chinese sociocultural influences (Peng & Woodrow, 2010, p. 850), which are seen as especially relevant and powerful in shaping learners’ L2 learning behaviors. If the students believe that active participation in class communication does not conform to social norms or expectations, they may experience anxiety and lack of confidence before or during speaking up and less motivated to engage in oral activities.
ISSN 2039-9340 Mediterranean Journal of Social Sciences Vol. 4 (1) January 2013
16
Figure 3.Peng and Woodrow’s (2010, p. 853) structural model of willingness to communicate in English in Chinese EFL classroom
In Peng and Woodrow’s (2010) study three composite indicators of class environment are examined: teacher support, student cohesiveness, and task orientation. As illustrated in Figure 3, task orientation and teacher support have a larger effect on classroom environment than does student cohesiveness. University students’ perceptions of the class environment to a great extent reflect their understanding of the value of the learning tasks, and the extent to which they perceive their teachers support their communication in English. In addition, student cohesiveness is highly effective in influencing students’ attitudes to the class environment. According to Dörnyei and Murphey (2003), “students who share feelings of cohesiveness might feel psychologically closer to each other and perceive the class as a more pleasant community, which may influence their class learning behaviors” (cited in Peng & Woodrow, 2010, p. 856). As shown in the model, classroom environment not only influences the WTC in English, it also influences other factors such as learner beliefs, communication confidence in English, and motivation to learn English. The direct path from classroom environment to communication confidence indicates that a conducive learning atmosphere may reduce students’ anxiety and improve their self-perceived competence. This is important as it appears that the students who have positive perceptions about the communication-oriented class environment tend to develop positive beliefs toward class oral participation and interaction in English. They might be less anxious about their level of ELP and negative evaluation from teachers and peers. The contribution of classroom environment to motivation suggests that students’ beliefs about the classroom environment might influence their motivations for English learning. In sum, a positive and engaging classroom environment helps boost students’ willingness to interact and communicate in the EFL classroom both through its direct and indirect influence on WTC.
Fushino (2010) investigates L2 learners’ communication in EFL group work settings among 592 first-year university students in Japan. The study explores the causal relationships between three factors: (1) confidence in one’s ability to communicate; (2) beliefs about group work; and (3) WTC. This study found that students’ understanding of the value of group work has a relatively strong and direct influence on their communication confidence in L2 group work, and a moderate and indirect effect on their willingness to communicate with group members via communication confidence in L2 group work. Fushino (2010) is significant because it includes a new concept of “belief about L2 group work” as a
ISSN 2039-9340 Mediterranean Journal of Social Sciences Vol. 4 (1) January 2013
17
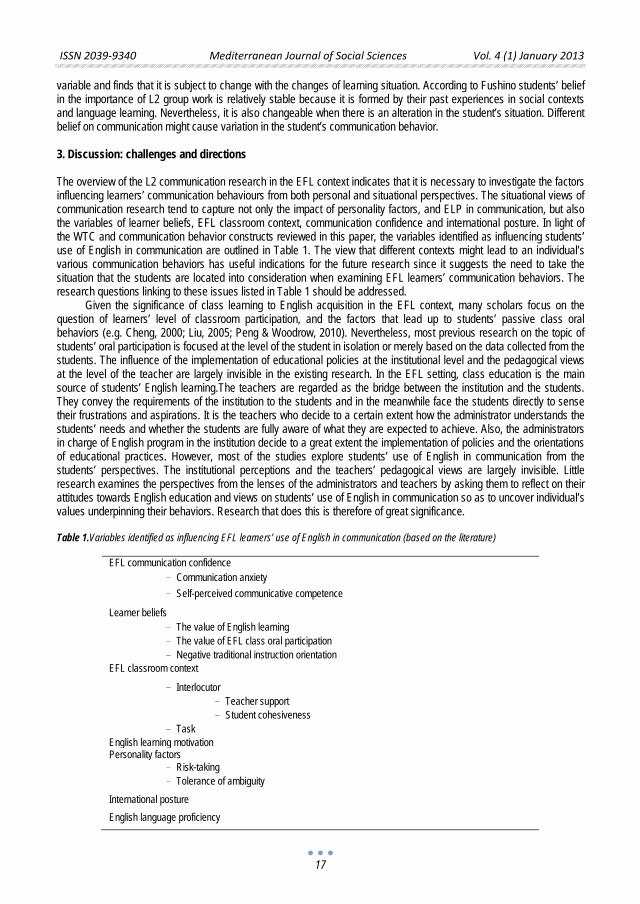
variable and finds that it is subject to change with the changes of learning situation. According to Fushino students’ belief in the importance of L2 group work is relatively stable because it is formed by their past experiences in social contexts and language learning. Nevertheless, it is also changeable when there is an alteration in the student’s situation. Different belief on communication might cause variation in the student’s communication behavior. 3. Discussion: challenges and directions The overview of the L2 communication research in the EFL context indicates that it is necessary to investigate the factors influencing learners’ communication behaviours from both personal and situational perspectives. The situational views of communication research tend to capture not only the impact of personality factors, and ELP in communication, but also the variables of learner beliefs, EFL classroom context, communication confidence and international posture. In light of the WTC and communication behavior constructs reviewed in this paper, the variables identified as influencing students’ use of English in communication are outlined in Table 1. The view that different contexts might lead to an individual’s various communication behaviors has useful indications for the future research since it suggests the need to take the situation that the students are located into consideration when examining EFL learners’ communication behaviors. The research questions linking to these issues listed in Table 1 should be addressed.
Given the significance of class learning to English acquisition in the EFL context, many scholars focus on the question of learners’ level of classroom participation, and the factors that lead up to students’ passive class oral behaviors (e.g. Cheng, 2000; Liu, 2005; Peng & Woodrow, 2010). Nevertheless, most previous research on the topic of students’ oral participation is focused at the level of the student in isolation or merely based on the data collected from the students. The influence of the implementation of educational policies at the institutional level and the pedagogical views at the level of the teacher are largely invisible in the existing research. In the EFL setting, class education is the main source of students’ English learning.The teachers are regarded as the bridge between the institution and the students. They convey the requirements of the institution to the students and in the meanwhile face the students directly to sense their frustrations and aspirations. It is the teachers who decide to a certain extent how the administrator understands the students’ needs and whether the students are fully aware of what they are expected to achieve. Also, the administrators in charge of English program in the institution decide to a great extent the implementation of policies and the orientations of educational practices. However, most of the studies explore students’ use of English in communication from the students’ perspectives. The institutional perceptions and the teachers’ pedagogical views are largely invisible. Little research examines the perspectives from the lenses of the administrators and teachers by asking them to reflect on their attitudes towards English education and views on students’ use of English in communication so as to uncover individual’s values underpinning their behaviors. Research that does this is therefore of great significance. Table 1.Variables identified as influencing EFL learners’ use of English in communication (based on the literature)
EFL communication confidence ﹣Communication anxiety ﹣Self-perceived communicative competence
Learner beliefs ﹣The value of English learning ﹣The value of EFL class oral participation ﹣Negative traditional instruction orientation
EFL classroom context
﹣Interlocutor ﹣Teacher support ﹣Student cohesiveness
﹣Task English learning motivation Personality factors
﹣Risk-taking ﹣Tolerance of ambiguity
International posture English language proficiency
ISSN 2039-9340 Mediterranean Journal of Social Sciences Vol. 4 (1) January 2013
18
Research indicates that students’ learning approaches are not stable and their academic practices might change across educational contexts (Wen &Clément, 2003; Peng & Woodrow, 2010). Also, classroom is a place where people with different socio-educational background meet. Before entering university, the students have already had years of experience in learning English language. It is assumed that they have acquired their own understanding and aspirations for English learning. Most students will attempt to behave in accordance with their interpretation on the disciplinary requirements and the academic practices that they thought of as being valued. In the course of participating in English oral activities, students may constantly negotiate their identities as English learners and adjust their learning behaviors, which may in turn impact their willingness to use English in communication (Norton, 2000). However, there seems to be insufficient information on how students actually adapt to their English learning. In response to this gap, the study attempting to explore how the EFL students negotiate their identities and change their English communication behaviors through the course may help understand the reasons causing students’ reticence in English communication.
Gardner and Lambert (1972) introduce the notions of instrumental and integrative motivation in L2 acquisition. Later, Norton (1995) challenges the notion of motivation and argues that the theory advocated by Gardner and Lambert is inconsistent with her (Norton’s) research findings. Inspired by Bourdieu’s (1977) economic metaphors, Norton (2000) extends the notion of motivation to the concept of investment; and sees language learners as “individuals with complex social histories and multiple desires” (p. 11), rather than as “unitary, fixed, and ahistorical individuals” (p. 10) as suggested by the concept of motivation. Using the term “investment” differently to its traditional economic sense, Norton’s term signals the “socially and historically constructed relationship of learners to the target language, and their often ambivalent desire to learn and practice it” (2000, p. 10). Learning a language is a form of investment (Kubota, 2011). When language learners invest in a certain language, they expect to get a good return (Norton, 1995). In EFL classes, teachers and students draw on their past and present experience, and their visions for the future, to organize and reorganize a sense of who they are and how they relate to the social world. This determines how much they invest in English communication. However, the influence of students’ investment in EFL learning on their use of English in communication has been little documented. Therefore, the study whichtakes EFL learners’ investment in English learning into consideration when examining factors influencing students’ communication behaviors may contribute to the efforts to improve students’ willingness to communicate in English.
The term “imagined community” was first coined by Benedict Anderson (1991) to refer to communities that only exist in people’s imagination. Norton (2001) has adapted this term in L2 learning research and asserted that language learners’ imagined membership of the L2 community exerts great influence on their present language learning practices. In the past decade, imagined community has become a prominent topic in L2 educational research (e.g. Kanno& Norton, 2003; Pavlenko& Norton, 2007). In the educational context, what students expect and imagine about the future can strongly influence their ongoing activities (Norton, 2000). For example, when a learner learns in class, he/she not only invests in the classroom community, he/she also invests in the community that he/she expects to enter after leaving the classroom. Normally this future community is much more significant. In educational context, learners’ imagined communities shadow their relationships with English (Gu, 2009) and influence their investment in English learning. Some students view English language learning as a task they must perform, focusing solely on passing exams. Others are interested in the language and the culture of English-speaking communities and view English learning as fun. These different views are associated with very different perspectives on English learning and English oral activities. These differences in turn may lead to variations in English learning behaviors and involvement in communication. Understanding students’ imagined communities can help in understanding their ongoing behaviors involving English communication. If teachers neglect learners’ imagined communities, learners may refuse to participate in learning activities (Norton, 2000). Though the variable of “imagined community” has been identified by scholars (e.g. Yashima and Zenuk-Nishide, 2004) as one of the influential factors on students’ willingness to communicate in English, the research on to what extent it may impact students’ communication behaviors and what the teachers should do to make learner’s imagined community concrete, tangible and accessible (Kanno& Norton, 2003)are largely invisible in the existing research.
As discussed above, Yashima (2002), Yashima et al. (2004) and Yashima and Zenuk-Nishide (2008) conducted a series of studies on L2 communication research among Japanese EFL learners and introduce the term of “international posture”. According to Yashima, international posture exerts direct influence on learners’ L2 WTC. This variable is new in L2 communication research. Whether it influences L2 learners’ communication in other EFL contexts, such as China and other Asian countries, and to what extent it may influence students’ willingness to communicate in English need further exploration.
ISSN 2039-9340 Mediterranean Journal of Social Sciences Vol. 4 (1) January 2013
19
4. Conclusion This paper explores the challenges and directions for further L2 communication research in the EFL context by reviewing the literature in this field. The finding of this study indicates that while learners’ use of English in communication has become the common interest in L2 education and factors influencing their oral participation have been widely documented, there are limitations.Students’ class oral participation is by no means an individual endeavour.Further research could exceed the scope of previous research on the topic of students’ oral participation, which mainly focuses at the level of the student in isolation or merely based on the data collected from the students by also examining the pedagogical perspectives and teaching practices from the lenses of the administrators and teachers. In addition, future research should take some variables, such as identity negotiation, investment in English learning, imagined community, and international posture, into account when examining factors influencing EFL learners’ English communication behaviors. Acknowledgement This paper is part of a large-scale PhD research, which is funded by the University of Melbourne. References Anderson, B. (1991). Imagined communities: Reflections on the origins and spread of nationalism (Rev. ed.). London: Verso. Bourdieu, P. (1977). The economics of linguistic exchanges.Social Science Information, 16(6), 645-668. Cheng, X. T. (2000). Asian students’ reticence revisited. System, 28(3), 435-446. Clément, R., Baker, S. C., & MacIntyre, P. D. (2003). Willingness to communicate in a second language: The effects of context, norms,
and vitality. Journal of Language and Social Psychology, 22(2), 190-209. Dörnyei, Z., &Murphey, T. (2003).Group dynamics in the language classroom.Cambridge: Cambridge University Press. Ferris, D.,&Tagg, T. (1996). Academic listening/speaking tasks for ESL students: Problems, suggestions, and implications. TESOL
Quarterly, 30(2), 297-317. Flowerdew, J.,& Miller, L. (1995). On the notion of culture in L2 lectures. TESOL Quarterly, 29(2), 345-373. Fushino, K. (2010). Causal relationships between communication confidence, beliefs about group work, and willingness to communicate
in foreign language group work. TESOL Quarterly, 44(4), 700-724. Gardner, R. C., & Lambert, W. E. (1972).Attitudes and motivation in second-language learning. Rowley, Mass.: Newbury House. Gu, M. Y. (2009).College English learners’ discursive motivation construction in China.System, 37(2), 300-312. Hashimoto, Y. (2002). Motivation and willingness to communicate as predictors of reported L2 use: The Japanese ESL context. Second
Language Studies, 20(2), 29-70. Hofstede, G. (1986). Cultural differences in teaching and learning.International Journal of International Relations, 10(3), 301-320. Jones, J. F. (1999). From silence to talk: Cross-cultural ideas on students’ participation in academic group discussion. English for
Specific Purposes, 18(3), 243-259. Kanno, Y., & Norton, B. (2003).Imagined communities and educational possibilities: Introduction.Journal of Language, Identity &
Education, 2(4), 241-249. Keaten, J. A., & Kelly, L. (2000). Reticence: An affirmation and revision. Communication Education, 49(2), 165-177. Keaten, J.A., Kelly, L., & Finch, C. (2000). Effectiveness of the Penn State Program in changing beliefs associated with reticence.
Communication Education, 49(2), 134–145. Kubota, R. (2011). Learning a foreign language as leisure and consumption: Enjoyment, desire, and the business of
eikaiwa.International Journal of Bilingual Education and Bilingualism, 14(4), 473-488. Liang, X. B., & Tan, J. L. (1999).Introverted/Extroverted personality and English learning.Journal of PLA Foreign Languages University,
22(4), 68-71.[In Chinese] Littlewood, W. (1999).Defining and developing autonomy in East Asian contexts. Applied Linguistics, 20(1), 71-94. Liu, M. H. (2005) Reticence, anxiety and performance of Chinese university students in oral English lessons and tests.Ph.D. Thesis, The
Chinese University of Hong Kong. Liu, N.,&Littlewood, W. (1997). Why do Many Students Appear Reluctant to Participate in Classroom Learning Discourse? System,
25(3), 371-384. Pavlenko, A., & Norton, B. (2007).Imagined communities, identity, and English language learning.In J. Cummins & C. Davison (Eds.),
International Handbook of English Language Teaching (pp. 669-680). Dordrecht, Netherlands: Springer. Peng, J. E., & Woodrow, L. (2010). Willingness to communicate in English: A model in the Chinese EFL classroom context. Language
learning, 60(4), 834-876. Phillips, G. M. (1965). The problem of reticence.Pennsylvania Speech Annual, 22, 22-38. MacIntyre, P. D., Dornyei, Z., Clement, R., Dornyei, Z., & Noels, K. A. (1998).Conceptualizing willingness to communicate in a L2: A
situational model of L2 confidence and affiliation.The Modern Language Journal, 82(4), 545-562.
ISSN 2039-9340 Mediterranean Journal of Social Sciences Vol. 4 (1) January 2013
20
McCroskey, J. C. (1977). Oral Communication Apprehension: A Summary of Recent Theory and Research. Human Communication Research, 4(1), 78-96.
McCroskey, J.C.,& Baer, J. E. (1985) Willingness to communicate: The construct and its measurement. Paper presented at the annual convention of the Speech Communication Association, Denver.
Norton, B. (1995). Social identity, investment, and language learning.TESOL Quarterly, 29(1), 9-31. Norton, B. (2000). Identity and language learning: gender, ethnicity and educational change. Harlow: Longman. Norton, B. (2001). Non-participation, imagined communities and the language classroom. In M. P. Breen (Ed.), Learner contributions to
language learning: New directions in research (pp. 159-171). New York: Pearson Education. Song, B. (1995). What does reading mean for East Asian students? College ESL, 5(2), 35-48. Spratt, M. (1999). How good are we at knowing what learners like? System, 27(2), 141-155. Wen, W. P., &Clément, R. (2003).A Chinese conceptualisation of willingness to communicate in ESL.Language, Culture and Curriculum,
16(1), 18-38. Wenger, E. (1998). Communities of practice: learning, meaning and identity. Cambridge: Cambridge University Press. Yashima, T. (2002). Willingness to communicate in a second language: The Japanese EFL context. The Modern Language Journal,
86(1), 54-66. Yashima, T., &Zenuk-Nishide, L. (2008). The impact of learning contexts on proficiency, attitudes, and L2 communication: Creating an
imagined international community. System, 36(4), 566-585. Yashima, T., Zenuk-Nishide, L., & Shimizu, K. (2004).The influence of attitudes and affect on willingness to communicate and second
language communication.Language learning, 54(1), 119-152. Zhang, Y., & Zhou, D. J. (2004).A study on tertiary students’ EFL class participation pattern.Foreign Language World, 6, 28-33. [In
Chinese]
ISSN 2039-9340 Mediterranean Journal of Social Sciences Vol. 4 (1) January 2013
21
Effectiveness of Cognitive-Attribution Therapy on Shame and Guilt Feelings of
Women Exposed to Spousal Rejection in Nigeria
Adeola Shobola
Educational Foundations and Counselling Faculty of Education
Obafemi Awolowo University, Ile-Ife Nigeria [email protected]
Doi:10.5901/mjss.2013.v4n1p21 Abstract
Nowadays, one of the ways to reject a woman in Africa especially Nigeria is when the spouse elopes with a lady in the Western state in the guise of seeking greener pastures. Economic depression, lack of job and general insecurity, political instability and lack of social amenities have been attributed to reasons many men leave their home country for the Western world for better living for self and the family; but the current trend has been abandon, neglect and eventual divorce of the women with their children. This has brought shame and guilt to many women because of the perception of many Africans towards divorce. This empirical study involved twenty-five women whose husbands have been overseas in the last five to ten years and waiting to be invited over; but were later divorced. It was established that these women were suffering from guilt and shame. The twenty-five volunteer women were subjected to twelve weeks counseling using self-developed scales that were patterned after Cognitive-Attribution Therapy of Lewis (1993), and Shame and Guilt of Barrett (1995). The prognosis revealed that the level of shame and guilt of the women were reduced; some of them concluded to move forward by remarrying, while others concluded to take the incidence as fate and continue to take care of self and children. It was concluded that many people inflict self pain on self for not being responsible for a particular occurrence, but psychological therapies such as Cognitive-Attribution can be applied to help such individuals.
Key Words: Cognitive-Attribution Therapy, Shame, Guilt, Women, Spousal Rejection, Nigeria
1. Introduction Marriage in Africa especially Nigeria is one of the most respected social institutions. In the time past, marriage was prescribed, initiated and instituted by the family members; giving the reasons for family’s involvement whenever things go wrong between the couple. Marriage is defined by Olson and DeFrain (2003) as the emotional and legal commitment of two people to share emotional and physical intimacy, various tasks, and economic resources. Arising from this, people marry for different reasons which may include; forming a family unit, to strengthen social and economic stability, and to nurture and educate offspring (Maggie 2002, Alexander, Schill and Dukeminier 2006). Some claim that marriage improves the health and longevity of men and women; gives them access to a more active and satisfying sex life; increases wealth and assets; boosts children's chances for success; and enhances men's performance at work and their earnings (Cherlin 2005 ). It suffices to say therefore that marriage typically provides important and substantial benefits to individuals as well as society.
In Africa, Nigeria inclusive, man is regarded as the breadwinner of the family, who is required to support the family especially financially: footing all the bills ranging from shelter to children’s school fees, feeding, electricity and phone bills etc (Shobola 2010). While the woman is obligated to keep the house, nurture the children and provide sex (Phanjaruniti 1994). Though it is becoming a common practice for man and woman not to live together as a result of job location; and in most cases some spouses are on job transfers especially men, while the women are left behind to take care of the children and the entire family as the husbands visit weekly or monthly or as otherwise arranged by both parties.
During the 1980s in Nigeria, a large number of agile and virile professional and middle-class individuals especially men exited the country for the Western world (Europe, America, etc) in search of better living (Shobola 2010). This sometimes eventually makes the men abandon their families back home in Nigeria; as some of them send home divorce particulars without any prior discussion or compensation for doing so (Personal Communication).
ISSN 2039-9340 Mediterranean Journal of Social Sciences Vol. 4 (1) January 2013
22
2. Effects of Spousal Rejection Among several effects of spousal rejection is shame and guilt which forms part of the psychological feelings the victims go through. Shame and guilt feeling is part of the emotional trauma a Nigerian woman goes through when her spouse who has denied her physical presence and finally divorce goes through. Shame and guilt is expressed when the woman feels that the entire society is aware of her divorce situation and there is nothing she can do to salvage the situation.
This is evident because of the way marriage is held in Africa. One, marriage is a relationship between two families but with a representation of two individuals, and in most cases the marriage ceremony is usually elaborate and in the process, when things go wrong, the family members are involved which makes it more devastating for the woman to bear. Two, it is believed that woman is always at fault when marriage breaks up. Three, as a result of economic hardship in Nigeria, some families rely and live on the money that is remitted to them by their son or husband that is overseas which gives them some psychological fulfillment and it makes them feel above their contemporaries here at home. Four, marriage in Africa is perceived as an indicator of success, responsibility and height of acceptance in the society. In the same manner, one is rejected when her marriage breaks up.
Therefore, when this marital relationship ends in an abrupt manner it does not only bring a feeling of rejection and immense shame to a person, but it can also lead to mental illness (Moison, 2009, Hall, 2011). Earlier, Brown and Harris (1989), gave the report of U.S. Surgeon General that about 30 to 40% of those undergoing divorce reported a significant increase in symptoms of depression and anxiety. Being subjected to continual indignities may lead to low self-esteem and can cause psychological imbalances. Whisman (2001) summarized these marital stressors as the leading cause for depression among women generally. 3. Conceptual Framework This study is guided by the principles of reality theory otherwise known as choice theory. Reality theory of Glasser posits that man’s behavior is driven by five genetically needs which are patterned after Abraham Maslow’s. The needs are:
• Physiological/Survival • Belongingness/Love/Connecting • Power/Competence/Significance • Freedom/Responsibility • Fun/Learning
One of the core principles of Reality Theory is that, whether one is aware of it or not, one is at all times acting to meet these needs, but our inability to successfully achieve this may degenerate into psychological challenges. Socializing with people or being in a relationship is one of the effective ways to meet our need for belonging. When we get disappointed from such relationship we may decide to mourn that experience and if possible decide not to enter into another relationship. Or we might allow it to affect our entire whole being. This is generally an ineffective way of meeting that need – though it may work for a while, but it is painful and it is detrimental to self and others. So if life is unsatisfactory or we are distressed or in trouble, one basic thing to check is whether we are succeeding in meeting our basic psychological needs for survival, power, belonging, freedom and fun. The choice for this theory in this study is for the fact that these participants are already dysfunctional in the five construct areas of Reality Theory. It is typical of Nigerian women to depend on their husbands for the provision of their needs to survive and by extension of this, it makes them fulfill other psychological needs, but when these are thwarted by divorce, it will expose them to some emotional trauma of which is shame and guilt. Reality theory therefore is applied to assist the participants shift from the zone of thinking (mourning) of the past by way of feeling shame and guilt to what needs to be done at present to make the individual happy and functional once again. In effect, the clients with expression of unhappiness and gloominess are able to learn how to choose alternate behaviors that will result in positive and greater satisfaction. 4. Shame and Guilt Feelings
Shame is a type of negative evaluation of oneself as a whole person, while guilt is a feeling that one has acted in a way that is different from a social or moral expectation. Shame and unresolved guilt are associated with greater distress and could also impact both physiological and psychological feelings in ways that might weaken a body’s ability to respond well to stress and relationship activity. Women that are going through spousal rejection may experience shame due to the abandonment from husbands, gossips about them, inability to satisfy their daily needs because of husbands’ refusal to financially support them, they may also view themselves unlucky, or inability to run a successful marital home.
ISSN 2039-9340 Mediterranean Journal of Social Sciences Vol. 4 (1) January 2013
23
Women may also feel guilt having conceded to their husbands going overseas for better living for the entire family, mistakenly believing that they have caused the divorce because they have not been pestering their men to invite them over. Some even feel that they have trusted their men so much that when they say things are not easy with them overseas, or they are working on their ‘stay papers’ and will invite them over when they are comfortable, think that they wouldn’t have been that devastated if they were already in a new relationship as soon as their husbands left Nigeria, and all kinds of expression of guilt make them not to forgive themselves. 5. Cognitive-Attribution Therapy (CAT) Cognitive theory is concerned with the development of a person's thought processes. It also looks at how these thought processes influence how we understand and interact with the world. While attribution theory is concerned with the ways in which people explain (or attribute) the behavior of self and others. It explores how individuals attribute causes to events and how this cognitive perception affects their motivation. In effect, cognitive is about encoding and decoding information that is gathered through the cognition channels and attribution affiliates it to the accessible objects.
Attribution theory seeks to explain the cognitive process whereby individuals make explanatory inferences regarding the causes of events. Heider (1958) distinguished between two general categories of explanation, internal and external. Internal attributions implicate characteristics of the individual (such as ability, attitudes, personality, mood, and effort) for having caused a particular behavior, whereas external attributions implicate external factors (such as the task, other people, or luck) for causing an event or outcome to occur. 6. The Problem This study seeks to assist women whose husbands left for overseas for better living and eventually got their wives divorced back home in Nigeria. The aftermath of this divorce brings the feelings of shame and guilt to the women; and in effect it affects their emotional and psychological feelings. 7. Research Hypotheses The following hypotheses are raised for this study:
There will be a significant relationship between spousal rejection of the women and shame feeling There will be a significant relationship between spousal rejection of the women and guilt feeling There will be a significant difference in shame and guilt feelings of the spousal rejected women before and after
cognitive-attribution therapy. 8. Methodology 8.1 Research Objectives There are two basic objectives for this study. One, it examines the relationship between spousal rejection and shame feeling on one hand; and guilt feeling on the other. Two, the study investigates the effectiveness of cognitive-attribution treatment on shame and guilt feelings of the women as a result of spousal rejection. 8.2 Participants The participants for this study were drawn from two churches in Southwestern Nigeria. There was a Christian program targeted at divorced women in the two churches; the program was titled: “Divorce and the Christian Women in Nigeria”. Out of six hundred and fifty women in the two churches; forty-seven of them are divorcees, out of which twenty-five women who volunteered to come for counseling reported shame and guilt feelings. To qualify for the experimental study, the participants were confirmed legally married and husbands have been overseas for not less than ten years ago; the women have been divorced by their husbands in the last one year before this study, and the divorce took place with husband being overseas and wife in Nigeria. The participants are between the ages of 30 and 50 years.

ISSN 2039-9340 Mediterranean Journal of Social Sciences Vol. 4 (1) January 2013
24
8.3 Instruments A self-developed scale tagged ‘Shame and Guilt Feelings of Divorced Women’ patterned after Barrett (1995) was used. It has three sections; section A consisted the bio-data and information on the participants’ divorce experience, sections B and C are on Shame and Guilt feelings respectively. The treatment properties were carefully selected from the participants’ reported style of thought and attributable objects which were derived from the work of Lewis (1993). 8.4 Design This study made use of pre and post test of dependent group. 8.5 Procedure Through a self-constructed questionnaire, the participants were confirmed to express shame and guilt feelings as a result of spousal rejection through divorce. It was also confirmed that this feeling has made the participants to live a solitary life, refusal to begin a new relationship and inability to discuss the divorce experience with people, including close relations and friends. Willingness to participate in the study was sought from the participants and confidentiality was assured. The participants were put together as experimental group. A sample of Cognitive-Attribution statements that were applied during the training is presented as thus:
• Divorce has taken place; what do you want to do next? • Since divorce, and you have been feeling this way; has anything changed? • Whether you blamed yourself for this divorce or not, your partner is not around to pity your situation • If you develop any medical complications how would you cope? • Don’t think of how people would make jest of you only, but the social support you stand to enjoy from them by
discussing your experience with them etc. The participants and the researcher arrived at some other logical statements that they can use each time the thought of divorce and the negative behaviour was to be expressed. For instance:
• I am not the first person to experience divorce • My life is not solely tied to marriage • There are more agonizing marital situations than divorce etc.
The group members were given a copy of the questionnaire each to establish shame and guilt feelings as a result of spousal rejection. The group was made to go through the training once in a week for twelve weeks. They were given assignment weekly; to record their thought patterns, instances that remind them of their husbands and their feelings, and the counter thoughts. They were also asked to record some steps they have taken such as discussing the divorce case with people, readiness to start a new relationship etc. At the end of the twelfth week, the questionnaire was re-administered measuring the present level of shame and guilt of the participants. 9. Results The data generated at both pre and post tests are analyzed along the hypotheses tested and the following results are presented: Hypothesis 1: There is a significant relationship between spousal rejection of the women and shame feeling. Table 1: Correlation coefficient summary of relationship between spousal rejection and shame feeling of the women
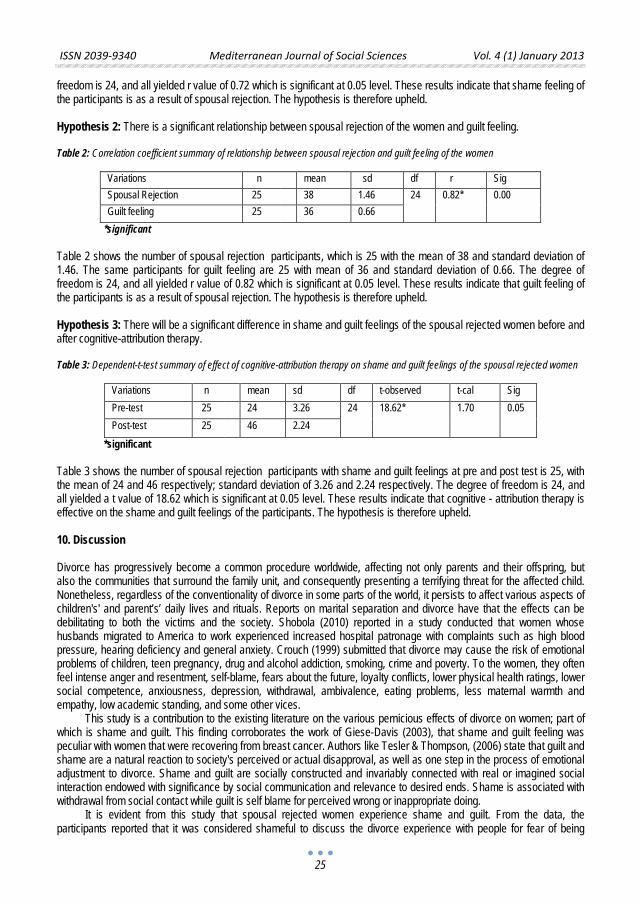
Variations n mean sd df r Sig Spousal Rejection 25 38 1.46 24 0.72* 0.00 Shame feeling 25 22 0.68
*significant Table 1 shows the number of spousal rejection participants, which is 25 with the mean of 38 and standard deviation of 1.46. The same participants for shame feeling are 25 with mean of 22 and standard deviation of 0.68. The degree of
ISSN 2039-9340 Mediterranean Journal of Social Sciences Vol. 4 (1) January 2013
25
freedom is 24, and all yielded r value of 0.72 which is significant at 0.05 level. These results indicate that shame feeling of the participants is as a result of spousal rejection. The hypothesis is therefore upheld. Hypothesis 2: There is a significant relationship between spousal rejection of the women and guilt feeling. Table 2: Correlation coefficient summary of relationship between spousal rejection and guilt feeling of the women
Variations n mean sd df r Sig Spousal Rejection 25 38 1.46 24 0.82* 0.00 Guilt feeling 25 36 0.66
*significant Table 2 shows the number of spousal rejection participants, which is 25 with the mean of 38 and standard deviation of 1.46. The same participants for guilt feeling are 25 with mean of 36 and standard deviation of 0.66. The degree of freedom is 24, and all yielded r value of 0.82 which is significant at 0.05 level. These results indicate that guilt feeling of the participants is as a result of spousal rejection. The hypothesis is therefore upheld. Hypothesis 3: There will be a significant difference in shame and guilt feelings of the spousal rejected women before and after cognitive-attribution therapy. Table 3: Dependent-t-test summary of effect of cognitive-attribution therapy on shame and guilt feelings of the spousal rejected women
Variations n mean sd df t-observed t-cal Sig Pre-test 25 24 3.26 24 18.62* 1.70 0.05 Post-test 25 46 2.24
*significant Table 3 shows the number of spousal rejection participants with shame and guilt feelings at pre and post test is 25, with the mean of 24 and 46 respectively; standard deviation of 3.26 and 2.24 respectively. The degree of freedom is 24, and all yielded a t value of 18.62 which is significant at 0.05 level. These results indicate that cognitive - attribution therapy is effective on the shame and guilt feelings of the participants. The hypothesis is therefore upheld. 10. Discussion Divorce has progressively become a common procedure worldwide, affecting not only parents and their offspring, but also the communities that surround the family unit, and consequently presenting a terrifying threat for the affected child. Nonetheless, regardless of the conventionality of divorce in some parts of the world, it persists to affect various aspects of children's' and parent’s’ daily lives and rituals. Reports on marital separation and divorce have that the effects can be debilitating to both the victims and the society. Shobola (2010) reported in a study conducted that women whose husbands migrated to America to work experienced increased hospital patronage with complaints such as high blood pressure, hearing deficiency and general anxiety. Crouch (1999) submitted that divorce may cause the risk of emotional problems of children, teen pregnancy, drug and alcohol addiction, smoking, crime and poverty. To the women, they often feel intense anger and resentment, self-blame, fears about the future, loyalty conflicts, lower physical health ratings, lower social competence, anxiousness, depression, withdrawal, ambivalence, eating problems, less maternal warmth and empathy, low academic standing, and some other vices.
This study is a contribution to the existing literature on the various pernicious effects of divorce on women; part of which is shame and guilt. This finding corroborates the work of Giese-Davis (2003), that shame and guilt feeling was peculiar with women that were recovering from breast cancer. Authors like Tesler & Thompson, (2006) state that guilt and shame are a natural reaction to society's perceived or actual disapproval, as well as one step in the process of emotional adjustment to divorce. Shame and guilt are socially constructed and invariably connected with real or imagined social interaction endowed with significance by social communication and relevance to desired ends. Shame is associated with withdrawal from social contact while guilt is self blame for perceived wrong or inappropriate doing.
It is evident from this study that spousal rejected women experience shame and guilt. From the data, the participants reported that it was considered shameful to discuss the divorce experience with people for fear of being
ISSN 2039-9340 Mediterranean Journal of Social Sciences Vol. 4 (1) January 2013
26
mocked, or being gossiped about. The participants also felt the shame more when their spouses blocked every means of communication against them which made it so difficult to venture into any means of negotiation or resolution. They also reported a psychological feeling of ‘being used and dumped’ by their spouses. This is rationalized from the fact that since their spouses left Nigeria, there had been promises of being invited over to live together as a family which never came to be. However, seven out of the twenty-five women whose husbands left between eight and ten years ago; assist them financially, and communicate regularly express shame feeling more when compared with those whose husbands left between five and seven years; rarely assist them financially, and communicate occasionally.
The guilt feeling reports from the participants were as a result of the dimension of the divorce process. Twenty-two of the participants reported a ‘no fault divorce’ type of situation. In some of the divorce papers that were sent to them, their husbands’ excuse was given as long years of living separately of which in the Western world, it is tantamount to separation which is a symptom of a broken marriage. In effect, the women still feel that they must have gone wrong somewhere and their husbands are neither ready to disclose this to them nor the legal sector. Some of the participants also reported that they financed the travelling of their husbands overseas, and they have been responsible for the upkeep of the family which they regret when the divorce matter came up.
Cognitive-attribution therapy explores how individuals attribute or affiliate causes to events and how this cognitive perception affects their motivation. This study demonstrates how the participants attribute their shame and guilt feelings to spousal rejection. Cognitive-attribution therapy has been applied to several psychological challenges. Roesch and Amirkham (1997) found that more experienced athletes made less self-serving external attributions, leading them to find and address real causes and hence were better able to improve their performance. Stage, Patricia, Jillian, and Ada (1998) in their study concluded that when students can connect outcomes to their causes using cognitive-attribution therapy, they can reduce the stress associated with uncertainty and can understand themselves better. During the treatment, participants in a group session were encouraged to narrate their divorce ordeal, and they were encouraged to feel free to share the experience with whom they wished outside the group. Some of the faulty thought patterns that were presented by the participants were analyzed with them both at group and one-on-one counseling sessions, and these were jointly reconstructed. Within the 12 weeks of the treatment, 15 participants were able to discuss their divorce experience with some relations and friends. All the participants reported forgiving self and their former spouses, and twelve of them after several attempts communicated with their former husbands. It was also observed that the participants were appearing cheerful and happy as the treatment period went by.
However, five of the participants though appeared forgiving and reconciliatory but they were not motivated to discuss their divorce case with any in-laws, relations and friends. From the data, these five women possessed the highest educational qualifications and they hold high positions in their various places of work. It suffices to say therefore that financial independence can help to ameliorate the level of financial denial from spouse.
The implication of this study is that cognitive-attribution therapy is effective in treating shame and guilt feeling of spousal rejected people. The effectiveness may be due to the fact that the therapy is user-friendly, interactive in nature and cost effective. Therefore, the therapy can be applied to other related psychological challenges. This study appears the first to apply cognitive-attribution therapy in the treatment of shame and guilt feeling among the spousal rejected women in this dimension; reasons for dearth literature.
It is recommended therefore that cognitive-attribution therapy can be applied to more marital challenges to generate more literature within the field. It is suggested also that this study can be replicated in another part of Africa, and larger population may be considered. References Alexander, G.S, Schill, M.H., and Dukeminier, J. (2006). Property. Aspen Publishers. Barrett, K.C. (1995) “A Functionalist Approach to Shame and Guilt”, in Self Conscious Emotions, The Psychology of Shame, Guilt,
Embarrassment, and Pride, (1995), ed. June. Brown, G.W. and Harris, T.O. (1989). Life Events and Illness. London: The Guildford Press. Cherlin, A.J. (2005). Public and Private Families. McGraw Hill, USA. Crouch, J. (1999). The marriage Movement: An Introduction to Divorce Reform and other Marriage
Issues. www.divorcereform.org/mmo.html retrieved 05-5-2011. Giese-Davis, .J. (2003). Assessing the Impact of Shame and Guilt in Recovery. http://cbcrp.org.127.seekdotnet.com/research/byTitle.asp
retrieved 11-4-2011. Hall, P. (2011). Having a Healthy Divorce. www.nhs.usc/Livewell/mentalhealth/Pages/healthydivorce.aspx. Retrieved 20-4-2012. Heider, F. (1958). "The Psychology of Interpersonal Relations". New York: John Wiley & Sons. ISBN 0-471-36833-4. Lewis, M. (1993). “Self-conscious emotions: embarrassment, pride, shame, and guilt,”Handbook of emotions, ed. Michael Lewis and
Jeanette M. Haviland. New York: The Guilford Press.

ISSN 2039-9340 Mediterranean Journal of Social Sciences Vol. 4 (1) January 2013
27
Maggie, P. (2002). What is Marriage for? The Public Purposes of Married Law. Louisiana Law Review. Moison, L. (2009). Is Divorce Causing Anxiety, Panic? http://www.divorce360.com/divorcearticles/he. Retrieved 20-4-2012. Olson, D.H. and DeFrain, J. (2003). Marriages and Families: Intimacy, Diversity, and Strengths. Fourth Edition, McGraw Hill, USA. Phanjaruniti, S. (1994). Traditional Child Rearing Practices among Different Ethnic Groups in Houphan Province, Lao People’s
Democratic Republic, UNICEF, Vientiane. Roesch, S. C. and Amirkham, J. H. (1997). Boundary conditions for self-serving attributions: Another look at the sports pages. Journal of
Applied Social Psychology, 27, 245-261. Shobola, A.A (2010). Scrambling for Greener Pastures and Family Disintegration in Nigeria.Ifepsychologia, vol. 18, no. 1. Stage, F. K., Patricia, A. M, Jillian, K. and Ada, S. (1998). Creating Learning Centered Classrooms. Washington, D.C.: George
Washington University. Tesler, P. and Thompson, P. (2006). In Collaborative Divorce. Regan Books, USA. Whisman, M. A. (2001). Marital Adjustment and Outcome Following Treatments for Depression. Journal of Consulting and Clinical
Psychology, 69, 125-129.

ISSN 2039-9340 Mediterranean Journal of Social Sciences Vol. 4 (1) January 2013
29
Social Networking Websites and Their Effect in Contemporary Human
Resource Management - A Research Approach
G. Aspridis
Assistant Professor, Department of Project Management,
TEI of Larissa, 41 110 Larissa, Greece, email: [email protected].
V. Kazantzi
Assistant Professor, Department of Project Management, TEI of Larissa, 41 110 Larissa, Greece, email: [email protected].
D. Kyriakou
BSc, MBA (Finance, University of Liverpool),
MSc (Tourism Management, University of Surrey), email: [email protected]. Doi:10.5901/mjss.2013.v4n1p29 Abstract
Social Media, the new term that has invaded our daily lives in high velocity, consists of social networking, playing interactive games, making international friendships and communicating, in general, worldwide. On the other hand, Human Resources are occupied with terms such as recruitment, career advancement, motivation, employability, evaluation. Those two seem so different and diverse but nowadays a correlation and a parallel walk is occurring. Social Media sites such as Facebook, Linkedin, Twitter etc are currently being utilised as a company promotion tool under their will to reach in a personal way each 'user' or as a possible employability entrance, and, in same recent cases, reason for dismissal. But how these two actually combine or better correlate? This latter in addition, firstly, to the way this relation is widely perceived by potential and current employees as well as companies' Human Resources departments and secondly, the emergence and application of all these in the case of Greece, will be the research scope of this paper presenting the traditional way of recruitment and selection as well as career advancement and evaluation through the basic principles of Human Resources Theory and practical experience, in correlation with the will to explore and investigate the opportunity or not to utilise social media as an additional tool in order to advance in a modern world of Human Resources.
Keywords: “Social Media”, “Recruitment”, “Human Resources Evaluation”, “Employability”, “Modern Technologies”
Everyone has the right to participate in the Society of Information. Easy access to electronic transmitted information as well their production, exchange and spread consists of an obligation of the State.
Hellenic Constitution 1975/1986/2001/2008, article 5Α, 2 1. Introduction Over the past few years it has become inevitable to be familiar with most of the problems faced by industries worldwide. The ongoing recession has as cost dramatic changes in the business world. Words such as bankruptcy, layoffs and cost reduction have become increasingly familiar and common. Human resource management has also taken its share of these cuts. One area where companies want to find more efficient and effective as well as cost-effective ways to act is recruitment. There is always the need for recruitment in the business world and companies spend fortunes on it. It is also clear that the hiring process is all the time a thought about new prospects.
All the time companies are trying to find more conventional ways to recruit more people and companies have discovered that web-based hiring is more efficient than the traditional ways, such as advertisements in newspapers. Internet advertising has longer lifetime cycle and in many cases it is also free, or at least cheaper than advertising in newspapers. Nowadays, people that are seeking work are based on the Internet, for example in social media websites where thousands of new job ads are posted and advertised daily.
ISSN 2039-9340 Mediterranean Journal of Social Sciences Vol. 4 (1) January 2013
30
Furthermore, during these years, a new phenomenon called social media has surfaced in our society and has become a hot topic around the world. All media are full of articles about social media. Social networking sites quickly became very popular presenting and magnifying every day millions of users around the world. Companies have realized that explosion. As the core idea of social media is based on free and no cost access, companies seem to resort to social media like Facebook, Linkedin. Companies want to have as many fans as possible and their own profile but they do not even think about how to use them.
Suddenly everyone is talking about hiring through social media, without really knowing what to do there, either on the part of companies or the side of job seekers. In Greece, many seem to discuss the possibilities of social media in recruitment, but results are still missing. Companies can succeed in recruiting through social media; Jobseekers via social media can be assured of their reliability or being hired without the traditional recruitment? In what ways can social media be used for recruitment and are these methods effective? 2. Human Resource Management Human resource management (HRM), in a professional context, consists of the "effective and efficient management of employees of an organization (human resources) to achieve the desired objectives'' (Beardwell et al, 2004). HRM has replaced its predecessors, such as personnel administration and personnel management, incorporating traditional elements of management - human resource development, job design, recruitment and selection, compensation, career management, with company's strategic objectives (and Buchanan and Huczynski, 2004). HRM perceives employees similar to other resources such as finance and technology as it must be effectively managed to ensure the best performance for the entire company (Compton et al., 2009). 2.1. Recruitment and Selection There will always be a need for hiring new employees, and finding effective ways to recruit people is a key issue for the business world of today. This is the key issue and the driving force behind recruitment around the world as it is vital to survival and development in modern business world (Bourandas, 2005). "Organizations recognize the important role of their people in achieving and maintaining a competitive advantage, and that, therefore, are aware of the need to attract better caliber people'' (Foot & Hook, 2008).
As recruitment are described «the practices and activities carried out by the organisation with principal aim to identify and attract potential employees» (Breaugh & Starke, 2000, according to Parry & Wilson 2009). The intake is designed to attract applicants and to fill vacancies in order to maintain proper levels of staff to match the strategy of an organization. Due to the competitive labor market, the company must also "sell" itself and the vacancy to potential candidates presenting their work benefits. (Compton et al. 2009)
According to Foot and Hook (2008), the recruitment process is not a simple process and should always be considered from three different perspectives: legal, ethical and business. It is very important to remember all these three points to avoid potential problems on the course and achievement of process objectives. It should also be remembered that the whole process is in line with the human resources strategy of the organization (Boyall and Purcell, 2003).
2.2. Job description and personal traits Usually, it is recommended that the next step of the process is to make the job description and set personal standards for applicants (Emerald, 2005). This means that the company lists a number of specific features and capabilities they want from prospective employees, but also list the key elements of the job they want to pay. One common way to do this is to break the job description into smaller parts to find the job's main objectives (Torrington et al., 2008). 2.3. Job advertising When the company has chosen the way of recruitment and has determined the vacancy and what is required by the applicant, it is time to choose how to promote employment. The company should choose the best way to inform people about the job, taking into account the specific vacancy (Kessler, 2006). There are of course several ways to promote the job, some of which are for example the newspaper, employment agencies, the company's website, recruitment websites on the internet, radio or television and contact with local schools and universities (Russo et al, 1995). Also, if the company wants to fill the vacancy through internal company network (Intranet) or other internal sites are usually the most effective way to promote employment (Whiddett & Kandola, 2000).
ISSN 2039-9340 Mediterranean Journal of Social Sciences Vol. 4 (1) January 2013
31
There are several aspects to consider when choosing the right method of advertising. Following the terms of Whiddett & Kandola (2000) the main factor to consider is of course the chance to find the right candidate from this way of advertising. Some other issues to consider for example is the cost of advertising.
One aspect is also the life cycle of the mass media instrument. On the Internet, the life cycle is of course longer and allows the display of the duration of the advertisement (Valvis, 2005). Markkanen (2002) reported that is studied that for active job seekers, the ad is "hot" only for ten days and, if the ad is displayed for too long can actually make it unattractive to candidates, creating questions about what is wrong with the company since it is so difficult to find workers. 2.4. Pre-selection of candidates After time has expired for applications, is time for applications to be checked out and find the best candidates. If the pre-recruitment procedures are performed properly, it is much easier for the first inspection (screening) of applications to be realised (Fish and Macklin, 2004). For example, if the job description requires a specific educational or professional background is easy to control and to categorize the entries under these conditions (Österberg, 2009). The company should reflect the candidacy in various aspects that are needed and desired by the prospective employee (Vaxevanidou, Rekleitis, 2008). These aspects may be, for example how the person fits within the company? How the person fits the operating team and of course the person should be evaluated beyond the specific job criteria listed in the job description and personal characteristics. (Emerald, 2008; Torrington et al. 2008)
2.5. The interview After the first steps of the pre-selection process, companies often choose to use interviews to distinguish the right candidate and to really explore what kind of personalities behind the application forms are hidden. A typical interview is that of face to face (Galanaki, 2002). Telephone interviews are also widely used in cases where for example is not geographically possible to have face to face interviews. Interviews can also be made through recruitment agencies or local work centers, but usually companies refuse to hire people if they have not met with them personally (Marler, 2009; Foot & Hook, 2008).
According to Woodall et al (2009) and Foot & Cook (2008) interviews are still the most common way to select the best candidate even though studies show that the performance in the interview does not really reflect the future performance of the employee. Therefore, it is important that the interview should be conducted thoroughly and the person who assumes it to know what to do. There are several cases of errors occurring through the interview process, and it is important to know how to avoid and how to conduct a good interview process to test the reality of future job performance. 3. Social Media
Facebook allows people to be self-promoted, changing their profile and pictures, demonstrating how many hundreds of friends they have. I know some that have over 1000.1
Carol Craig
2
If Facebook is becoming a place where people go to "repair" their ego and find social acceptance is crucial to discover the negative elements and the kinds of people likely to adopt.
3
Christopher Carpenter
4
1From website
The term social media refers to the use of technologies based on Internet communication and make communication an interactive dialogue (Calvo-Armengol and Jackson, 2004). Kaplan and Haenlein (2010) define social media as "a group of web based applications that build the ideological and technological foundations of Web 2.0 and allows the creation and exchange of data by users." Social media is a means for social interaction, as a superset beyond the natural social communication. As enabled by the existing and expanding communication techniques, social media have changed substantially communication between both organizations and individuals (Kietzman et al, 2011; Henricks, 2009).
http://tvxs.gr/news/internet-mme/facebook-mas-kanei-narkissistes (accessed on 25/3/2012). 2Social scientist, CEO of British Centre for Confidence and Well-being. 3From website http://tvxs.gr/news/internet-mme/facebook-mas-kanei-narkissistes (accessed on 25/3/2012). 4Researcher at Western Illinois University.
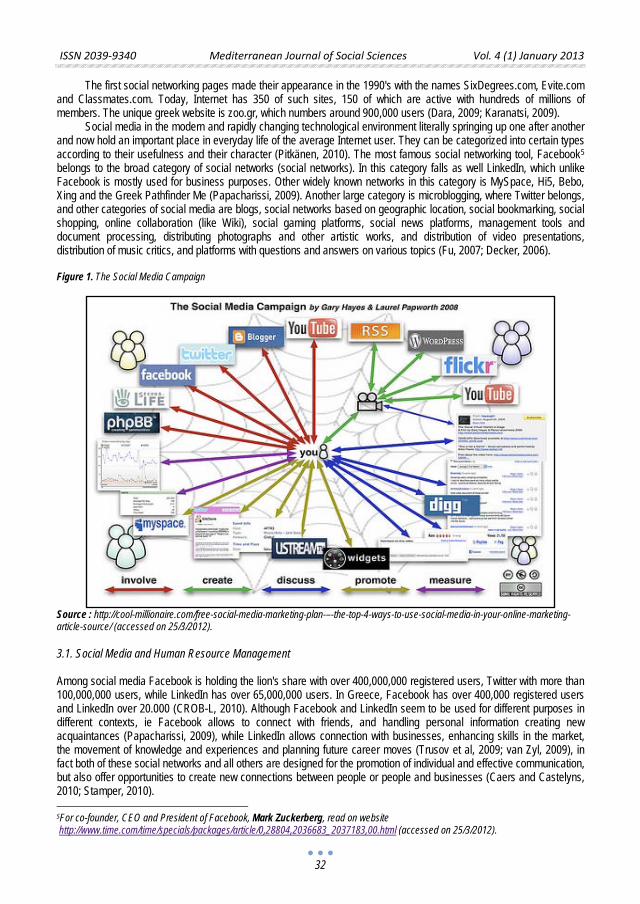
ISSN 2039-9340 Mediterranean Journal of Social Sciences Vol. 4 (1) January 2013
32
The first social networking pages made their appearance in the 1990's with the names SixDegrees.com, Evite.com and Classmates.com. Today, Internet has 350 of such sites, 150 of which are active with hundreds of millions of members. The unique greek website is zoo.gr, which numbers around 900,000 users (Dara, 2009; Karanatsi, 2009).
Social media in the modern and rapidly changing technological environment literally springing up one after another and now hold an important place in everyday life of the average Internet user. They can be categorized into certain types according to their usefulness and their character (Pitkänen, 2010). The most famous social networking tool, Facebook5
Source : http://cool-millionaire.com/free-social-media-marketing-plan-–-the-top-4-ways-to-use-social-media-in-your-online-marketing-article-source/ (accessed on 25/3/2012). 3.1. Social Media and Human Resource Management Among social media Facebook is holding the lion's share with over 400,000,000 registered users, Twitter with more than 100,000,000 users, while LinkedIn has over 65,000,000 users. In Greece, Facebook has over 400,000 registered users and LinkedIn over 20.000 (CROB-L, 2010). Although Facebook and LinkedIn seem to be used for different purposes in different contexts, ie Facebook allows to connect with friends, and handling personal information creating new acquaintances (Papacharissi, 2009), while LinkedIn allows connection with businesses, enhancing skills in the market, the movement of knowledge and experiences and planning future career moves (Trusov et al, 2009; van Zyl, 2009), in fact both of these social networks and all others are designed for the promotion of individual and effective communication, but also offer opportunities to create new connections between people or people and businesses (Caers and Castelyns, 2010; Stamper, 2010).
belongs to the broad category of social networks (social networks). In this category falls as well LinkedIn, which unlike Facebook is mostly used for business purposes. Other widely known networks in this category is MySpace, Hi5, Bebo, Xing and the Greek Pathfinder Me (Papacharissi, 2009). Another large category is microblogging, where Twitter belongs, and other categories of social media are blogs, social networks based on geographic location, social bookmarking, social shopping, online collaboration (like Wiki), social gaming platforms, social news platforms, management tools and document processing, distributing photographs and other artistic works, and distribution of video presentations, distribution of music critics, and platforms with questions and answers on various topics (Fu, 2007; Decker, 2006). Figure 1. The Social Media Campaign
5For co-founder, CEO and President of Facebook, Mark Ζuckerberg, read on website http://www.time.com/time/specials/packages/article/0,28804,2036683_2037183,00.html (accessed on 25/3/2012).
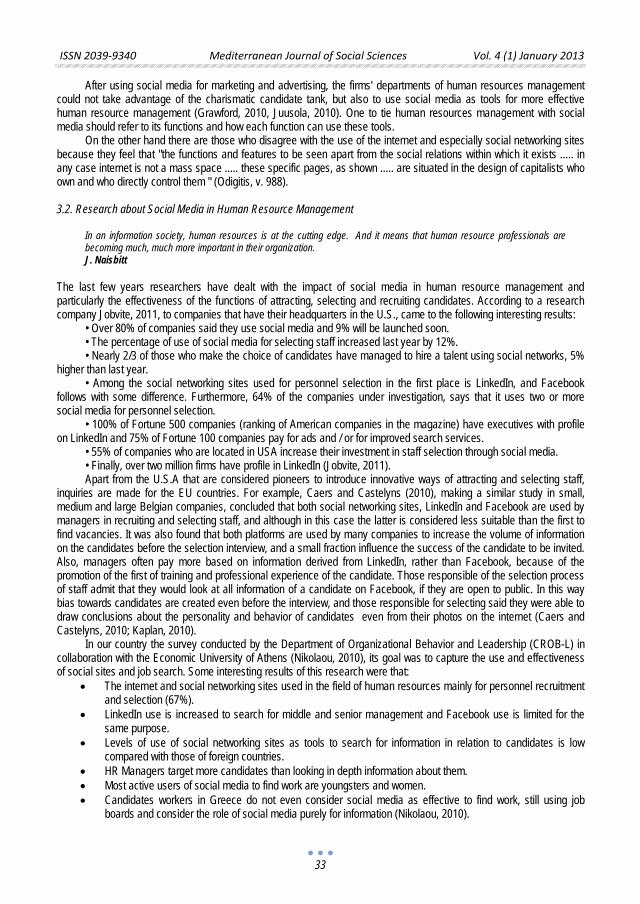
ISSN 2039-9340 Mediterranean Journal of Social Sciences Vol. 4 (1) January 2013
33
After using social media for marketing and advertising, the firms' departments of human resources management could not take advantage of the charismatic candidate tank, but also to use social media as tools for more effective human resource management (Grawford, 2010, Juusola, 2010). One to tie human resources management with social media should refer to its functions and how each function can use these tools.
On the other hand there are those who disagree with the use of the internet and especially social networking sites because they feel that "the functions and features to be seen apart from the social relations within which it exists ..... in any case internet is not a mass space ..... these specific pages, as shown ..... are situated in the design of capitalists who own and who directly control them " (Odigitis, v. 988). 3.2. Research about Social Media in Human Resource Management
In an information society, human resources is at the cutting edge. And it means that human resource professionals are becoming much, much more important in their organization. J. Naisbitt
The last few years researchers have dealt with the impact of social media in human resource management and particularly the effectiveness of the functions of attracting, selecting and recruiting candidates. According to a research company Jobvite, 2011, to companies that have their headquarters in the U.S., came to the following interesting results:
• Over 80% of companies said they use social media and 9% will be launched soon. • The percentage of use of social media for selecting staff increased last year by 12%. • Nearly 2/3 of those who make the choice of candidates have managed to hire a talent using social networks, 5%
higher than last year. • Among the social networking sites used for personnel selection in the first place is LinkedIn, and Facebook
follows with some difference. Furthermore, 64% of the companies under investigation, says that it uses two or more social media for personnel selection.
• 100% of Fortune 500 companies (ranking of American companies in the magazine) have executives with profile on LinkedIn and 75% of Fortune 100 companies pay for ads and / or for improved search services.
• 55% of companies who are located in USA increase their investment in staff selection through social media. • Finally, over two million firms have profile in LinkedIn (Jobvite, 2011). Apart from the U.S.A that are considered pioneers to introduce innovative ways of attracting and selecting staff,
inquiries are made for the EU countries. For example, Caers and Castelyns (2010), making a similar study in small, medium and large Belgian companies, concluded that both social networking sites, LinkedIn and Facebook are used by managers in recruiting and selecting staff, and although in this case the latter is considered less suitable than the first to find vacancies. It was also found that both platforms are used by many companies to increase the volume of information on the candidates before the selection interview, and a small fraction influence the success of the candidate to be invited. Also, managers often pay more based on information derived from LinkedIn, rather than Facebook, because of the promotion of the first of training and professional experience of the candidate. Those responsible of the selection process of staff admit that they would look at all information of a candidate on Facebook, if they are open to public. In this way bias towards candidates are created even before the interview, and those responsible for selecting said they were able to draw conclusions about the personality and behavior of candidates even from their photos on the internet (Caers and Castelyns, 2010; Kaplan, 2010).
In our country the survey conducted by the Department of Organizational Behavior and Leadership (CROB-L) in collaboration with the Economic University of Athens (Nikolaou, 2010), its goal was to capture the use and effectiveness of social sites and job search. Some interesting results of this research were that:
• The internet and social networking sites used in the field of human resources mainly for personnel recruitment and selection (67%).
• LinkedIn use is increased to search for middle and senior management and Facebook use is limited for the same purpose.
• Levels of use of social networking sites as tools to search for information in relation to candidates is low compared with those of foreign countries.
• HR Managers target more candidates than looking in depth information about them. • Most active users of social media to find work are youngsters and women. • Candidates workers in Greece do not even consider social media as effective to find work, still using job
boards and consider the role of social media purely for information (Nikolaou, 2010).
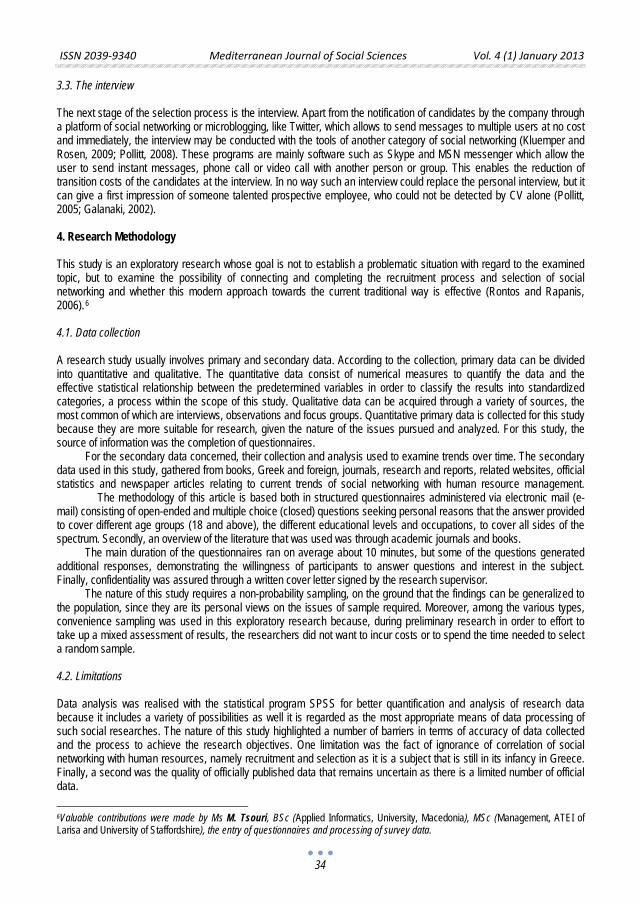
ISSN 2039-9340 Mediterranean Journal of Social Sciences Vol. 4 (1) January 2013
34
3.3. The interview The next stage of the selection process is the interview. Apart from the notification of candidates by the company through a platform of social networking or microblogging, like Twitter, which allows to send messages to multiple users at no cost and immediately, the interview may be conducted with the tools of another category of social networking (Kluemper and Rosen, 2009; Pollitt, 2008). These programs are mainly software such as Skype and MSN messenger which allow the user to send instant messages, phone call or video call with another person or group. This enables the reduction of transition costs of the candidates at the interview. In no way such an interview could replace the personal interview, but it can give a first impression of someone talented prospective employee, who could not be detected by CV alone (Pollitt, 2005; Galanaki, 2002). 4. Research Methodology This study is an exploratory research whose goal is not to establish a problematic situation with regard to the examined topic, but to examine the possibility of connecting and completing the recruitment process and selection of social networking and whether this modern approach towards the current traditional way is effective (Rontos and Rapanis, 2006).6
6Valuable contributions were made by Ms M. Tsouri, BSc (Applied Informatics, University, Macedonia), MSc (Management, ATEI of Larisa and University of Staffordshire), the entry of questionnaires and processing of survey data.
4.1. Data collection A research study usually involves primary and secondary data. According to the collection, primary data can be divided into quantitative and qualitative. The quantitative data consist of numerical measures to quantify the data and the effective statistical relationship between the predetermined variables in order to classify the results into standardized categories, a process within the scope of this study. Qualitative data can be acquired through a variety of sources, the most common of which are interviews, observations and focus groups. Quantitative primary data is collected for this study because they are more suitable for research, given the nature of the issues pursued and analyzed. For this study, the source of information was the completion of questionnaires.
For the secondary data concerned, their collection and analysis used to examine trends over time. The secondary data used in this study, gathered from books, Greek and foreign, journals, research and reports, related websites, official statistics and newspaper articles relating to current trends of social networking with human resource management. The methodology of this article is based both in structured questionnaires administered via electronic mail (e-mail) consisting of open-ended and multiple choice (closed) questions seeking personal reasons that the answer provided to cover different age groups (18 and above), the different educational levels and occupations, to cover all sides of the spectrum. Secondly, an overview of the literature that was used was through academic journals and books.
The main duration of the questionnaires ran on average about 10 minutes, but some of the questions generated additional responses, demonstrating the willingness of participants to answer questions and interest in the subject. Finally, confidentiality was assured through a written cover letter signed by the research supervisor.
The nature of this study requires a non-probability sampling, on the ground that the findings can be generalized to the population, since they are its personal views on the issues of sample required. Moreover, among the various types, convenience sampling was used in this exploratory research because, during preliminary research in order to effort to take up a mixed assessment of results, the researchers did not want to incur costs or to spend the time needed to select a random sample. 4.2. Limitations Data analysis was realised with the statistical program SPSS for better quantification and analysis of research data because it includes a variety of possibilities as well it is regarded as the most appropriate means of data processing of such social researches. The nature of this study highlighted a number of barriers in terms of accuracy of data collected and the process to achieve the research objectives. One limitation was the fact of ignorance of correlation of social networking with human resources, namely recruitment and selection as it is a subject that is still in its infancy in Greece. Finally, a second was the quality of officially published data that remains uncertain as there is a limited number of official data.
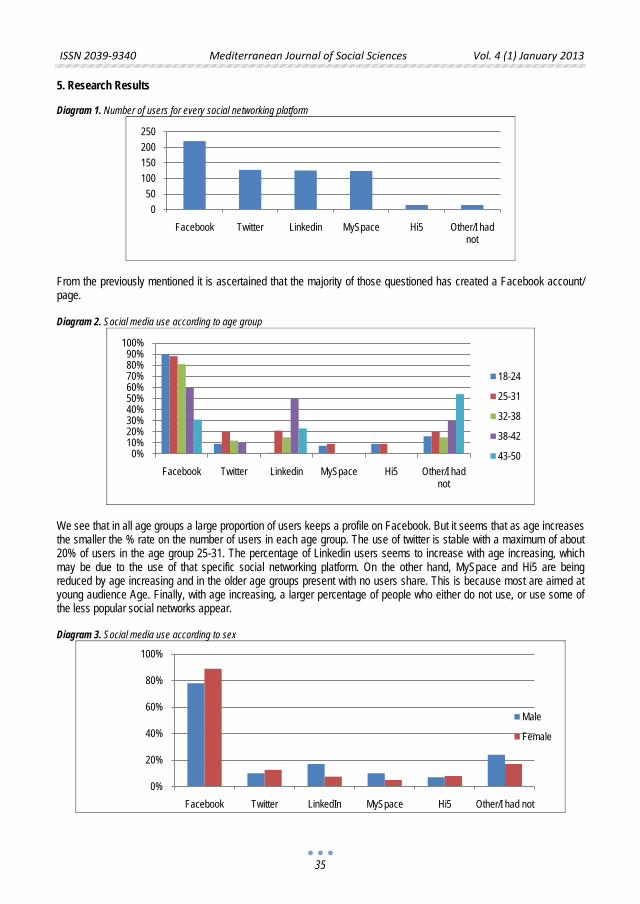
ISSN 2039-9340 Mediterranean Journal of Social Sciences Vol. 4 (1) January 2013
35
5. Research Results
Diagram 1. Number of users for every social networking platform
From the previously mentioned it is ascertained that the majority of those questioned has created a Facebook account/ page. Diagram 2. Social media use according to age group
We see that in all age groups a large proportion of users keeps a profile on Facebook. But it seems that as age increases the smaller the % rate on the number of users in each age group. The use of twitter is stable with a maximum of about 20% of users in the age group 25-31. The percentage of Linkedin users seems to increase with age increasing, which may be due to the use of that specific social networking platform. On the other hand, MySpace and Hi5 are being reduced by age increasing and in the older age groups present with no users share. This is because most are aimed at young audience Age. Finally, with age increasing, a larger percentage of people who either do not use, or use some of the less popular social networks appear. Diagram 3. Social media use according to sex
050
100150200250
Facebook Twitter Linkedin MySpace Hi5 Other/I had not
0%10%20%30%40%50%60%70%80%90%
100%
Facebook Twitter Linkedin MySpace Hi5 Other/I had not
18-24
25-31
32-38
38-42
43-50
0%
20%
40%
60%
80%
100%
Facebook Twitter LinkedIn MySpace Hi5 Other/I had not
Male
Female
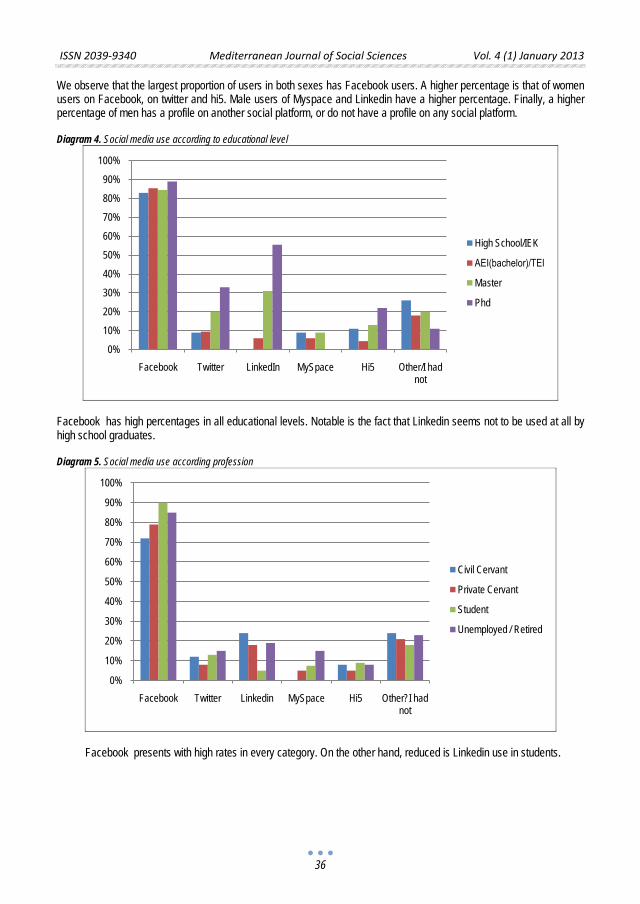
ISSN 2039-9340 Mediterranean Journal of Social Sciences Vol. 4 (1) January 2013
36
We observe that the largest proportion of users in both sexes has Facebook users. A higher percentage is that of women users on Facebook, on twitter and hi5. Male users of Myspace and Linkedin have a higher percentage. Finally, a higher percentage of men has a profile on another social platform, or do not have a profile on any social platform. Diagram 4. Social media use according to educational level
Facebook has high percentages in all educational levels. Notable is the fact that Linkedin seems not to be used at all by high school graduates. Diagram 5. Social media use according profession
Facebook presents with high rates in every category. On the other hand, reduced is Linkedin use in students.
0%
10%
20%
30%
40%
50%
60%
70%
80%
90%
100%
Facebook Twitter LinkedIn MySpace Hi5 Other/I had not
High School/IEK
ΑEI(bachelor)/ΤΕΙ
Master
Phd
0%
10%
20%
30%
40%
50%
60%
70%
80%
90%
100%
Facebook Twitter Linkedin MySpace Hi5 Other?I had not
Civil Cervant
Private Cervant
Student
Unemployed / Retired
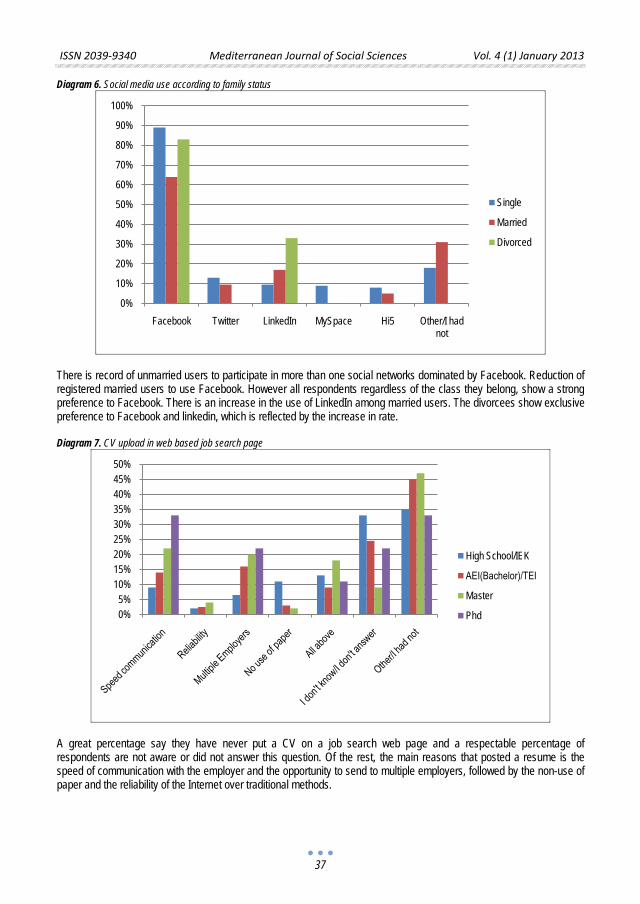
ISSN 2039-9340 Mediterranean Journal of Social Sciences Vol. 4 (1) January 2013
37
Diagram 6. Social media use according to family status
There is record of unmarried users to participate in more than one social networks dominated by Facebook. Reduction of registered married users to use Facebook. However all respondents regardless of the class they belong, show a strong preference to Facebook. There is an increase in the use of LinkedIn among married users. The divorcees show exclusive preference to Facebook and linkedin, which is reflected by the increase in rate. Diagram 7. CV upload in web based job search page
A great percentage say they have never put a CV on a job search web page and a respectable percentage of respondents are not aware or did not answer this question. Of the rest, the main reasons that posted a resume is the speed of communication with the employer and the opportunity to send to multiple employers, followed by the non-use of paper and the reliability of the Internet over traditional methods.
0%
10%
20%
30%
40%
50%
60%
70%
80%
90%
100%
Facebook Twitter LinkedIn MySpace Hi5 Other/I had not
Single
Married
Divorced
0%5%
10%15%20%25%30%35%40%45%50%
High School/IEK
ΑΕΙ(Bachelor)/ΤΕΙ
Master
Phd

ISSN 2039-9340 Mediterranean Journal of Social Sciences Vol. 4 (1) January 2013
38
Diagram 8a. Internet CV deposit according to age group
Diagram 8b. Internet CV deposit according to sex
Diagram 8c. Internet CV deposit according to educational level
0%10%20%30%40%50%60%70%
18-24
25-31
32-38
38-42
43-50
0%10%20%30%40%50%60%
Male
Female
0%5%
10%15%20%25%30%35%40%45%50%
High School/IEK
ΑΕΙ(Bachelor)/ΤΕΙ
Master
Phd
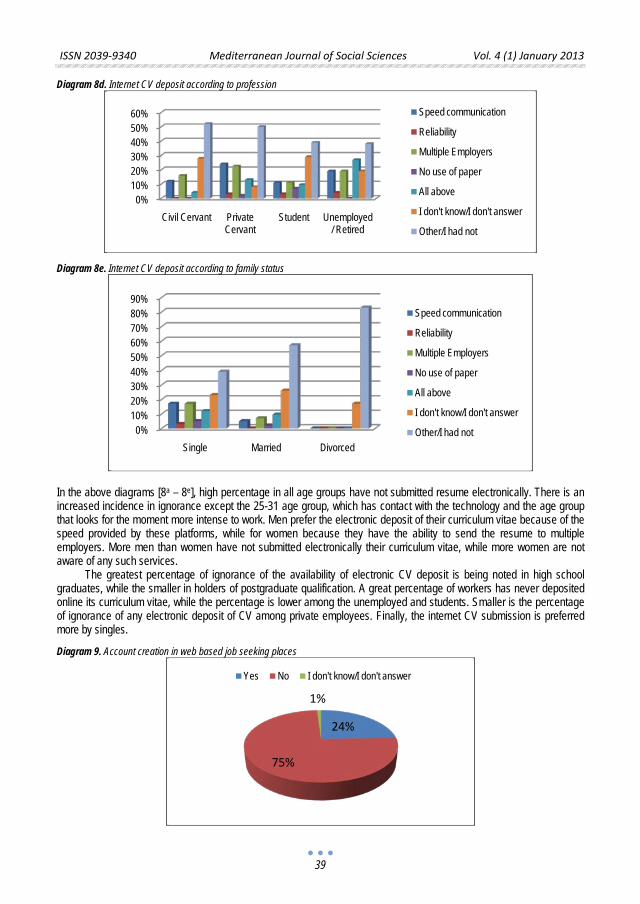
ISSN 2039-9340 Mediterranean Journal of Social Sciences Vol. 4 (1) January 2013
39
Diagram 8d. Internet CV deposit according to profession
Diagram 8e. Internet CV deposit according to family status
In the above diagrams [8a – 8e], high percentage in all age groups have not submitted resume electronically. There is an increased incidence in ignorance except the 25-31 age group, which has contact with the technology and the age group that looks for the moment more intense to work. Men prefer the electronic deposit of their curriculum vitae because of the speed provided by these platforms, while for women because they have the ability to send the resume to multiple employers. More men than women have not submitted electronically their curriculum vitae, while more women are not aware of any such services.
The greatest percentage of ignorance of the availability of electronic CV deposit is being noted in high school graduates, while the smaller in holders of postgraduate qualification. A great percentage of workers has never deposited online its curriculum vitae, while the percentage is lower among the unemployed and students. Smaller is the percentage of ignorance of any electronic deposit of CV among private employees. Finally, the internet CV submission is preferred more by singles. Diagram 9. Account creation in web based job seeking places
0%10%20%30%40%50%60%
Civil Cervant Private Cervant
Student Unemployed / Retired
Speed communication
Reliability
Multiple Employers
No use of paper
All above
I don't know/I don't answer
Other/I had not
0%10%20%30%40%50%60%70%80%90%
Single Married Divorced
Speed communication
Reliability
Multiple Employers
No use of paper
All above
I don't know/I don't answer
Other/I had not
24%
75%
1%
Yes No I don't know/I don't answer
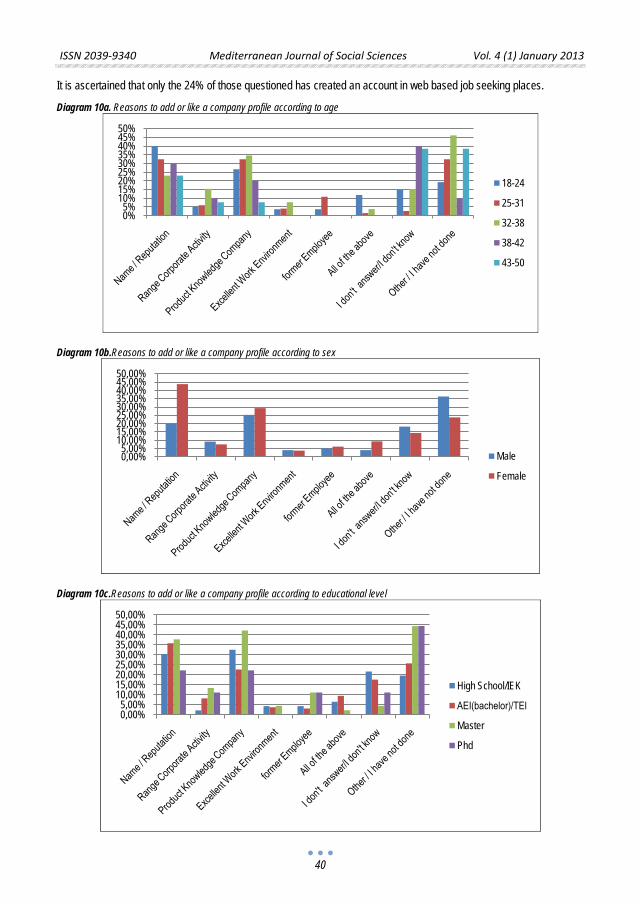
ISSN 2039-9340 Mediterranean Journal of Social Sciences Vol. 4 (1) January 2013
40
It is ascertained that only the 24% of those questioned has created an account in web based job seeking places. Diagram 10a. Reasons to add or like a company profile according to age
Diagram 10b.Reasons to add or like a company profile according to sex
Diagram 10c.Reasons to add or like a company profile according to educational level
0%5%
10%15%20%25%30%35%40%45%50%
18-24
25-31
32-38
38-42
43-50
0,00%5,00%
10,00%15,00%20,00%25,00%30,00%35,00%40,00%45,00%50,00%
Male
Female
0,00%5,00%
10,00%15,00%20,00%25,00%30,00%35,00%40,00%45,00%50,00%
High School/IEK
ΑΕΙ(bachelor)/ΤΕΙ
Master
Phd
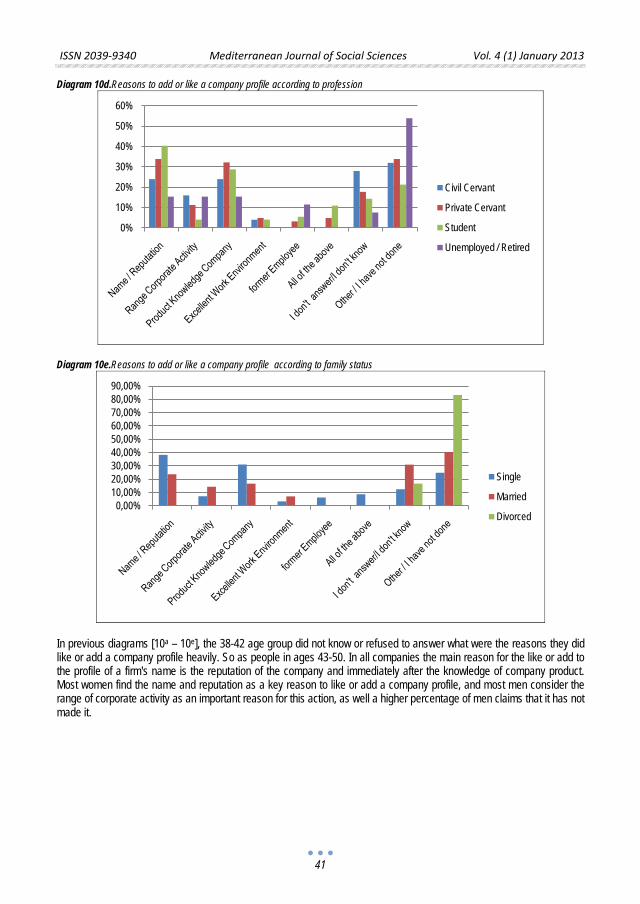
ISSN 2039-9340 Mediterranean Journal of Social Sciences Vol. 4 (1) January 2013
41
Diagram 10d.Reasons to add or like a company profile according to profession
Diagram 10e.Reasons to add or like a company profile according to family status
In previous diagrams [10a – 10e], the 38-42 age group did not know or refused to answer what were the reasons they did like or add a company profile heavily. So as people in ages 43-50. In all companies the main reason for the like or add to the profile of a firm's name is the reputation of the company and immediately after the knowledge of company product. Most women find the name and reputation as a key reason to like or add a company profile, and most men consider the range of corporate activity as an important reason for this action, as well a higher percentage of men claims that it has not made it.
0%
10%
20%
30%
40%
50%
60%
Civil Cervant
Private Cervant
Student
Unemployed / Retired
0,00%10,00%20,00%30,00%40,00%50,00%60,00%70,00%80,00%90,00%
Single
Married
Divorced
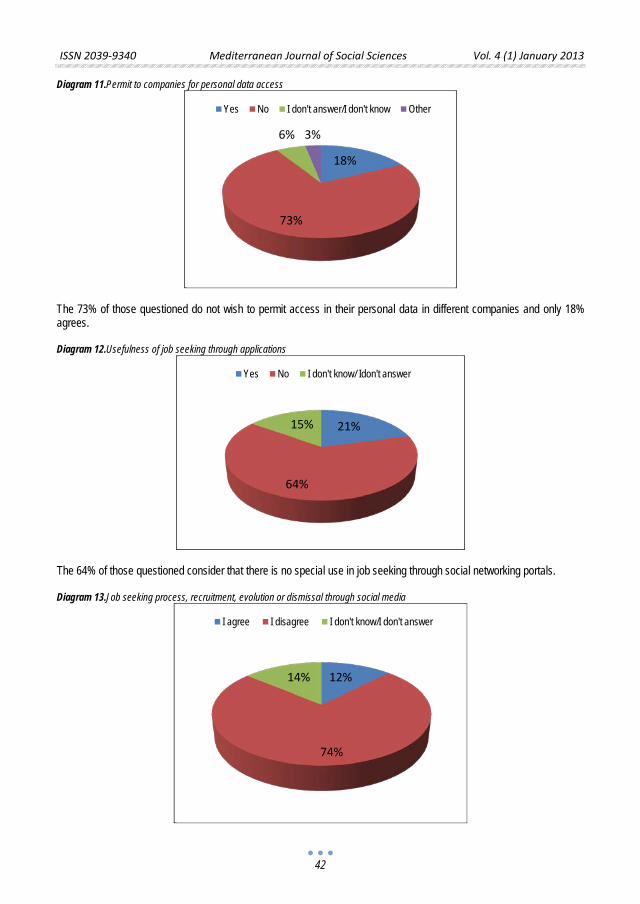
ISSN 2039-9340 Mediterranean Journal of Social Sciences Vol. 4 (1) January 2013
42
Diagram 11.Permit to companies for personal data access
The 73% of those questioned do not wish to permit access in their personal data in different companies and only 18% agrees. Diagram 12.Usefulness of job seeking through applications
Τhe 64% of those questioned consider that there is no special use in job seeking through social networking portals. Diagram 13.Job seeking process, recruitment, evolution or dismissal through social media
18%
73%
6% 3%
Yes No I don't answer/I don't know Other
21%
64%
15%
Yes No I don't know/ Idon't answer
12%
74%
14%
I agree I disagree I don't know/I don't answer
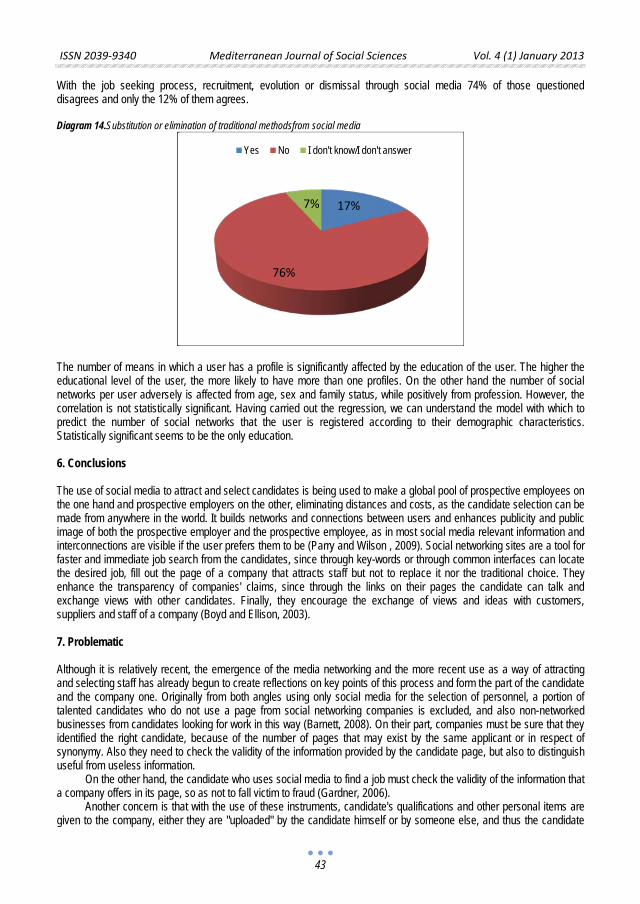
ISSN 2039-9340 Mediterranean Journal of Social Sciences Vol. 4 (1) January 2013
43
With the job seeking process, recruitment, evolution or dismissal through social media 74% of those questioned disagrees and only the 12% of them agrees. Diagram 14.Substitution or elimination of traditional methodsfrom social media
The number of means in which a user has a profile is significantly affected by the education of the user. The higher the educational level of the user, the more likely to have more than one profiles. On the other hand the number of social networks per user adversely is affected from age, sex and family status, while positively from profession. However, the correlation is not statistically significant. Having carried out the regression, we can understand the model with which to predict the number of social networks that the user is registered according to their demographic characteristics. Statistically significant seems to be the only education. 6. Conclusions The use of social media to attract and select candidates is being used to make a global pool of prospective employees on the one hand and prospective employers on the other, eliminating distances and costs, as the candidate selection can be made from anywhere in the world. It builds networks and connections between users and enhances publicity and public image of both the prospective employer and the prospective employee, as in most social media relevant information and interconnections are visible if the user prefers them to be (Parry and Wilson , 2009). Social networking sites are a tool for faster and immediate job search from the candidates, since through key-words or through common interfaces can locate the desired job, fill out the page of a company that attracts staff but not to replace it nor the traditional choice. They enhance the transparency of companies' claims, since through the links on their pages the candidate can talk and exchange views with other candidates. Finally, they encourage the exchange of views and ideas with customers, suppliers and staff of a company (Boyd and Ellison, 2003). 7. Problematic Although it is relatively recent, the emergence of the media networking and the more recent use as a way of attracting and selecting staff has already begun to create reflections on key points of this process and form the part of the candidate and the company one. Originally from both angles using only social media for the selection of personnel, a portion of talented candidates who do not use a page from social networking companies is excluded, and also non-networked businesses from candidates looking for work in this way (Barnett, 2008). On their part, companies must be sure that they identified the right candidate, because of the number of pages that may exist by the same applicant or in respect of synonymy. Also they need to check the validity of the information provided by the candidate page, but also to distinguish useful from useless information.
On the other hand, the candidate who uses social media to find a job must check the validity of the information that a company offers in its page, so as not to fall victim to fraud (Gardner, 2006).
Another concern is that with the use of these instruments, candidate's qualifications and other personal items are given to the company, either they are "uploaded" by the candidate himself or by someone else, and thus the candidate
17%
76%
7%
Yes No I don't know/I don't answer
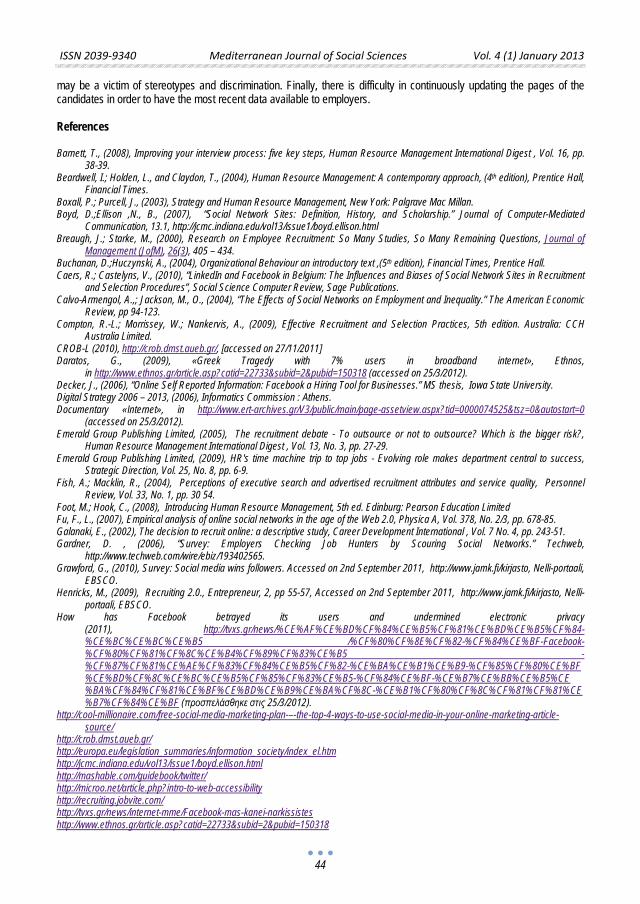
ISSN 2039-9340 Mediterranean Journal of Social Sciences Vol. 4 (1) January 2013
44
may be a victim of stereotypes and discrimination. Finally, there is difficulty in continuously updating the pages of the candidates in order to have the most recent data available to employers. References Barnett, T., (2008), Improving your interview process: five key steps, Human Resource Management International Digest , Vol. 16, pp.
38-39. Beardwell, I.; Holden, L., and Claydon, T., (2004), Human Resource Management: A contemporary approach, (4th edition), Prentice Hall,
Financial Times. Boxall, P.; Purcell, J., (2003), Strategy and Human Resource Management, New York: Palgrave Mac Millan. Boyd, D.;Ellison ,N., B., (2007), “Social Network Sites: Definition, History, and Scholarship.” Journal of Computer-Mediated
Communication, 13.1, http://jcmc.indiana.edu/vol13/issue1/boyd.ellison.html Breaugh, J.; Starke, M., (2000), Research on Employee Recruitment: So Many Studies, So Many Remaining Questions, Journal of
Management (JofM), 26(3), 405 – 434. Buchanan, D.;Huczynski, A., (2004), Organizational Behaviour an introductory text ,(5th edition), Financial Times, Prentice Hall. Caers, R.; Castelyns, V., (2010), “LinkedIn and Facebook in Belgium: The Influences and Biases of Social Network Sites in Recruitment
and Selection Procedures”, Social Science Computer Review, Sage Publications. Calvo-Armengol, A.,; Jackson, M., O., (2004), “The Effects of Social Networks on Employment and Inequality.” The American Economic
Review, pp 94-123. Compton, R.-L.; Morrissey, W.; Nankervis, A., (2009), Effective Recruitment and Selection Practices, 5th edition. Australia: CCH
Australia Limited. CROB-L (2010), http://crob.dmst.aueb.gr/, [accessed on 27/11/2011] Daratos, G., (2009), «Greek Tragedy with 7% users in broadband internet», Ethnos,
in http://www.ethnos.gr/article.asp?catid=22733&subid=2&pubid=150318 (accessed on 25/3/2012). Decker, J., (2006), “Online Self Reported Information: Facebook a Hiring Tool for Businesses.” MS thesis, Iowa State University. Digital Strategy 2006 – 2013, (2006), Informatics Commission : Αthens. Documentary «Ιnternet», in http://www.ert-archives.gr/V3/public/main/page-assetview.aspx?tid=0000074525&tsz=0&autostart=0
(accessed on 25/3/2012). Emerald Group Publishing Limited, (2005), The recruitment debate - To outsource or not to outsource? Which is the bigger risk?,
Human Resource Management International Digest , Vol. 13, No. 3, pp. 27-29. Emerald Group Publishing Limited, (2009), HR's time machine trip to top jobs - Evolving role makes department central to success,
Strategic Direction, Vol. 25, No. 8, pp. 6-9. Fish, A.; Macklin, R., (2004), Perceptions of executive search and advertised recruitment attributes and service quality, Personnel
Review, Vol. 33, No. 1, pp. 30 54. Foot, M.; Hook, C., (2008), Introducing Human Resource Management, 5th ed. Edinburg: Pearson Education Limited Fu, F., L., (2007), Empirical analysis of online social networks in the age of the Web 2.0, Physica A, Vol. 378, No. 2/3, pp. 678-85. Galanaki, E., (2002), The decision to recruit online: a descriptive study, Career Development International , Vol. 7 No. 4, pp. 243-51. Gardner, D. , (2006), “Survey: Employers Checking Job Hunters by Scouring Social Networks.” Techweb,
http://www.techweb.com/wire/ebiz/193402565. Grawford, G., (2010), Survey: Social media wins followers. Accessed on 2nd September 2011, http://www.jamk.fi/kirjasto, Nelli-portaali,
EBSCO. Henricks, M., (2009), Recruiting 2.0., Entrepreneur, 2, pp 55-57, Accessed on 2nd September 2011, http://www.jamk.fi/kirjasto, Nelli-
portaali, EBSCO. How has Facebook betrayed its users and undermined electronic privacy
(2011), http://tvxs.gr/news/%CE%AF%CE%BD%CF%84%CE%B5%CF%81%CE%BD%CE%B5%CF%84-%CE%BC%CE%BC%CE%B5 /%CF%80%CF%8E%CF%82-%CF%84%CE%BF-Facebook-%CF%80%CF%81%CF%8C%CE%B4%CF%89%CF%83%CE%B5 -%CF%87%CF%81%CE%AE%CF%83%CF%84%CE%B5%CF%82-%CE%BA%CE%B1%CE%B9-%CF%85%CF%80%CE%BF %CE%BD%CF%8C%CE%BC%CE%B5%CF%85%CF%83%CE%B5-%CF%84%CE%BF-%CE%B7%CE%BB%CE%B5%CE %BA%CF%84%CF%81%CE%BF%CE%BD%CE%B9%CE%BA%CF%8C-%CE%B1%CF%80%CF%8C%CF%81%CF%81%CE %B7%CF%84%CE%BF (προσπελάσθηκε στις 25/3/2012).
http://cool-millionaire.com/free-social-media-marketing-plan-–-the-top-4-ways-to-use-social-media-in-your-online-marketing-article-source/
http://crob.dmst.aueb.gr/ http://europa.eu/legislation_summaries/information_society/index_el.htm http://jcmc.indiana.edu/vol13/issue1/boyd.ellison.html http://mashable.com/guidebook/twitter/ http://microo.net/article.php?intro-to-web-accessibility http://recruiting.jobvite.com/ http://tvxs.gr/news/internet-mme/Facebook-mas-kanei-narkissistes http://www.ethnos.gr/article.asp?catid=22733&subid=2&pubid=150318
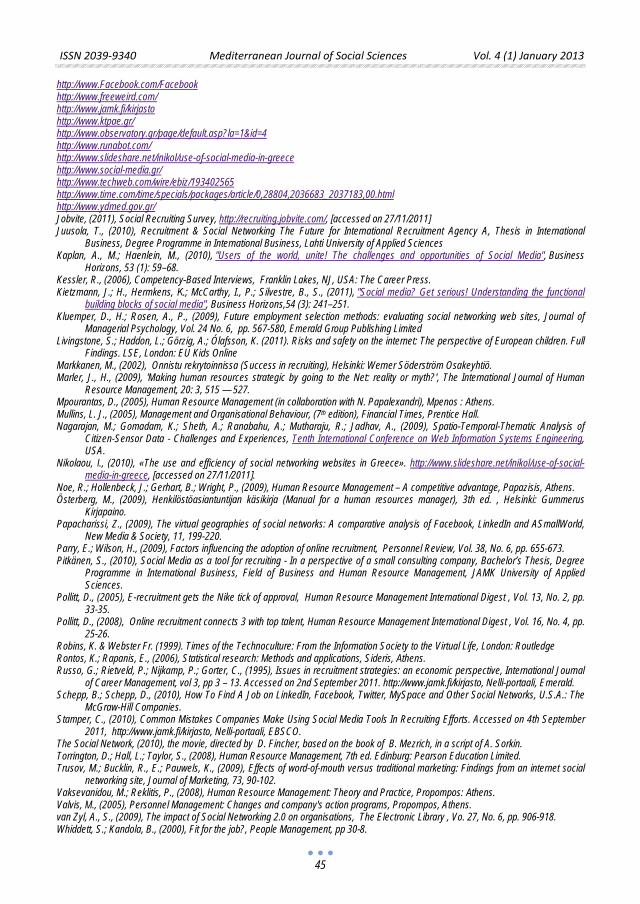
ISSN 2039-9340 Mediterranean Journal of Social Sciences Vol. 4 (1) January 2013
45
http://www.Facebook.com/Facebook http://www.freeweird.com/ http://www.jamk.fi/kirjasto http://www.ktpae.gr/ http://www.observatory.gr/page/default.asp?la=1&id=4 http://www.runabot.com/ http://www.slideshare.net/inikol/use-of-social-media-in-greece http://www.social-media.gr/ http://www.techweb.com/wire/ebiz/193402565 http://www.time.com/time/specials/packages/article/0,28804,2036683_2037183,00.html http://www.ydmed.gov.gr/ Jobvite, (2011), Social Recruiting Survey, http://recruiting.jobvite.com/, [accessed on 27/11/2011] Juusola, T., (2010), Recruitment & Social Networking The Future for International Recruitment Agency A, Thesis in International
Business, Degree Programme in International Business, Lahti University of Applied Sciences Kaplan, A., M.; Haenlein, M., (2010), "Users of the world, unite! The challenges and opportunities of Social Media", Business
Horizons, 53 (1): 59–68. Kessler, R., (2006), Competency-Based Interviews, Franklin Lakes, NJ, USA: The Career Press. Kietzmann, J.; H., Hermkens, Κ.; McCarthy, I., P.; Silvestre, B., S., (2011), "Social media? Get serious! Understanding the functional
building blocks of social media", Business Horizons,54 (3): 241–251. Kluemper, D., H.; Rosen, A., P., (2009), Future employment selection methods: evaluating social networking web sites, Journal of
Managerial Psychology, Vol. 24 No. 6, pp. 567-580, Emerald Group Publishing Limited Livingstone, S.; Haddon, L.; Görzig, A.; Ólafsson, K. (2011). Risks and safety on the internet: The perspective of European children. Full
Findings. LSE, London: EU Kids Online Markkanen, M., (2002), Onnistu rekrytoinnissa (Success in recruiting), Helsinki: Werner Söderström Osakeyhtiö. Marler, J., H., (2009), 'Making human resources strategic by going to the Net: reality or myth?', The International Journal of Human
Resource Management, 20: 3, 515 — 527. Mpourantas, D., (2005), Human Resource Management (in collaboration with N. Papalexandri), Μpenos : Αthens. Mullins, L. J., (2005), Management and Organisational Behaviour, (7th edition), Financial Times, Prentice Hall. Nagarajan, M.; Gomadam, K.; Sheth, A.; Ranabahu, A.; Mutharaju, R.; Jadhav, A., (2009), Spatio-Temporal-Thematic Analysis of
Citizen-Sensor Data - Challenges and Experiences, Tenth International Conference on Web Information Systems Engineering, USA.
Nikolaou, Ι., (2010), «The use and efficiency of social networking websites in Greece». http://www.slideshare.net/inikol/use-of-social-media-in-greece, [accessed on 27/11/2011].
Noe, R.; Hollenbeck, J.; Gerhart, B.; Wright, P., (2009), Human Resource Management – A competitive advantage, Papazisis, Αthens. Österberg, M., (2009), Henkilöstöasiantuntijan käsikirja (Manual for a human resources manager), 3th ed. , Helsinki: Gummerus
Kirjapaino. Papacharissi, Z., (2009), The virtual geographies of social networks: A comparative analysis of Facebook, LinkedIn and ASmallWorld,
New Media & Society, 11, 199-220. Parry, E.; Wilson, H., (2009), Factors influencing the adoption of online recruitment, Personnel Review, Vol. 38, No. 6, pp. 655-673. Pitkänen, S., (2010), Social Media as a tool for recruiting - In a perspective of a small consulting company, Bachelor’s Thesis, Degree
Programme in International Business, Field of Business and Human Resource Management, JAMK University of Applied Sciences.
Pollitt, D., (2005), E-recruitment gets the Nike tick of approval, Human Resource Management International Digest , Vol. 13, No. 2, pp. 33-35.
Pollitt, D., (2008), Online recruitment connects 3 with top talent, Human Resource Management International Digest , Vol. 16, No. 4, pp. 25-26.
Robins, K. & Webster Fr. (1999). Times of the Technoculture: From the Information Society to the Virtual Life, London: Routledge Rontos, K.; Rapanis, E., (2006), Statistical research: Μethods and applications, Sideris, Αthens. Russo, G.; Rietveld, P.; Nijkamp, P.; Gorter, C., (1995), Issues in recruitment strategies: an economic perspective, International Journal
of Career Management, vol 3, pp 3 – 13. Accessed on 2nd September 2011. http://www.jamk.fi/kirjasto, Nelli-portaali, Emerald. Schepp, B.; Schepp, D., (2010), How To Find A Job on LinkedIn, Facebook, Twitter, MySpace and Other Social Networks, U.S.A.: The
McGraw-Hill Companies. Stamper, C., (2010), Common Mistakes Companies Make Using Social Media Tools In Recruiting Efforts. Accessed on 4th September
2011, http://www.jamk.fi/kirjasto, Nelli-portaali, EBSCO. The Social Network, (2010), the movie, directed by D. Fincher, based on the book of B. Mezrich, in a script of A. Sorkin. Torrington, D.; Hall, L.; Taylor, S., (2008), Human Resource Management, 7th ed. Edinburg: Pearson Education Limited. Trusov, M.; Bucklin, R., E.; Pauwels, K., (2009), Effects of word-of-mouth versus traditional marketing: Findings from an internet social
networking site, Journal of Marketing, 73, 90-102. Vaksevanidou, M.; Reklitis, P., (2008), Human Resource Management: Theory and Practice, Propompos: Αthens. Valvis, Μ., (2005), Personnel Management: Changes and company's action programs, Propompos, Athens. van Zyl, A., S., (2009), The impact of Social Networking 2.0 on organisations, The Electronic Library , Vo. 27, No. 6, pp. 906-918. Whiddett, S.; Kandola, B., (2000), Fit for the job?, People Management, pp 30-8.
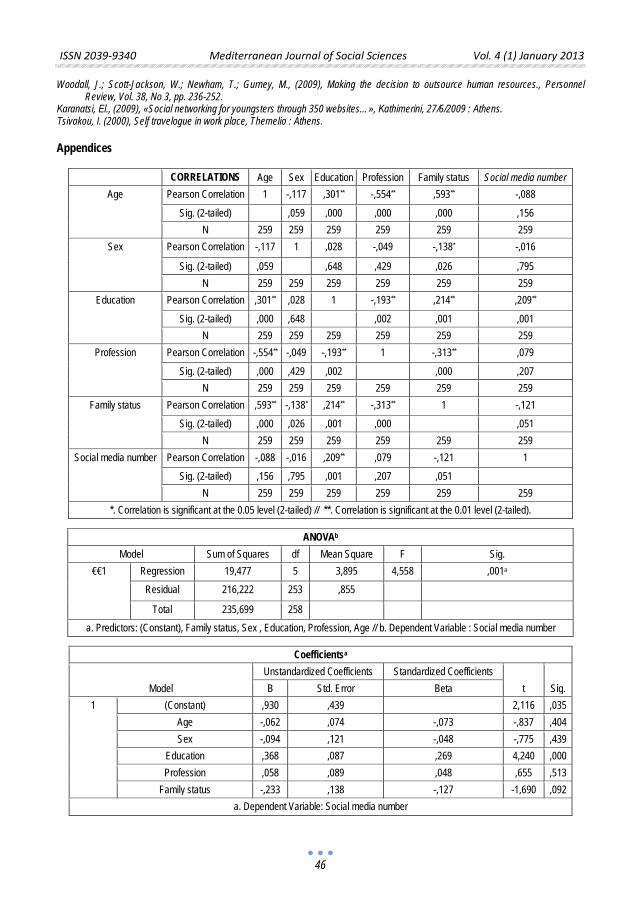
ISSN 2039-9340 Mediterranean Journal of Social Sciences Vol. 4 (1) January 2013
46
Woodall, J.; Scott-Jackson, W.; Newham, T.; Gurney, M., (2009), Making the decision to outsource human resources., Personnel Review, Vol. 38, No 3, pp. 236-252.
Κaranatsi, Εl., (2009), «Social networking for youngsters through 350 websites…», Κathimerini, 27/6/2009 : Αthens. Τsivakou, Ι. (2000), Self travelogue in work place, Themelio : Αthens. Appendices
CORRELATIONS Age Sex Education Profession Family status Social media number Age Pearson Correlation 1 -,117 ,301** -,554** ,593** -,088
Sig. (2-tailed) ,059 ,000 ,000 ,000 ,156 N 259 259 259 259 259 259
Sex Pearson Correlation -,117 1 ,028 -,049 -,138* -,016
Sig. (2-tailed) ,059 ,648 ,429 ,026 ,795 N 259 259 259 259 259 259
Education Pearson Correlation ,301** ,028 1 -,193** ,214** ,209**
Sig. (2-tailed) ,000 ,648 ,002 ,001 ,001 N 259 259 259 259 259 259
Profession Pearson Correlation -,554** -,049 -,193** 1 -,313** ,079
Sig. (2-tailed) ,000 ,429 ,002 ,000 ,207 N 259 259 259 259 259 259
Family status Pearson Correlation ,593** -,138* ,214** -,313** 1 -,121
Sig. (2-tailed) ,000 ,026 ,001 ,000 ,051 N 259 259 259 259 259 259
Social media number Pearson Correlation -,088 -,016 ,209** ,079 -,121 1
Sig. (2-tailed) ,156 ,795 ,001 ,207 ,051 N 259 259 259 259 259 259
*. Correlation is significant at the 0.05 level (2-tailed) // **. Correlation is significant at the 0.01 level (2-tailed).
ANOVAb Model Sum of Squares df Mean Square F Sig.
€€1 Regression 19,477 5 3,895 4,558 ,001a Residual 216,222 253 ,855
Total 235,699 258 a. Predictors: (Constant), Family status, Sex , Education, Profession, Age // b. Dependent Variable : Social media number
Coefficientsa
Model Unstandardized Coefficients Standardized Coefficients
t Sig. B Std. Error Beta 1 (Constant) ,930 ,439 2,116 ,035
Age -,062 ,074 -,073 -,837 ,404 Sex -,094 ,121 -,048 -,775 ,439
Education ,368 ,087 ,269 4,240 ,000 Profession ,058 ,089 ,048 ,655 ,513
Family status -,233 ,138 -,127 -1,690 ,092 a. Dependent Variable: Social media number
ISSN 2039-9340 Mediterranean Journal of Social Sciences Vol. 4 (1) January 2013
47
The Advantages of Administrative Reforms in Judicial System, Democracy
Transparence and the Rule of Law (Comparative Analyze in Albanian Legal Case Study)
Prof Ass Dr. Alba Robert Dumi
Prof As Dr, Dean of Graduated School”Ismail Qemali” Vlora University Albania,
Management Department Management Department, Economy Faculty, Tirana University
Email:[email protected]
PhD Neshet Ngucaj
Private Lawyer, Court of Vlora member Email:[email protected]
Doi:10.5901/mjss.2013.v4n1p47 Abstract
The European Union has offered autonomous trade concessions to the Balkan countries. All industrial products and most agricultural products have duty and quota free access. “Autonomous” means that the European Union immediately opens the internal market, while a longer period of transition is conceded to the Balkan countries before opening up their markets to EU competition. Albanian economic performances have improved recently. But encouraging signs of economic development are being at risk by various uncertainties and deficiencies in the Albanian development system. Electricity shortage is a major handicap of the country. Many working hours are getting lost when electricity is switched of. This increases costs of production and business management. Infrastructure - traffic and transportation - is a problem, which particularly impedes economic development and investment in the more remote and rural regions. Regional development is considered a high priority objective by most experts. There has been moderate progress in judicial reform, which is a key priority of the Opinion. This article presents a summary of the influences of technical assistance and administrative capacity in development of Albanian government. In the centre of this study we are using the concepts and innovations of the E-Learning, which is gaining significant interest in distance education, including reforming political, social and economical developing in Albanian government reforms and other details.
Key words: Association Agreement, Stabilisation and Association Process, Judicial strategy, Policy makers, Law force.
1. Introduction 1.1 Albania is participating in the Stabilization and Association Process. The Stability and Association process entails commitments on both sides. The Union offers a prospect of accession, an assistance program to support that ambition, and preferential access to the EU internal market. (Bregu M 2012) The candidates, in return, undertake to abide by the Union’s conditionality and participate fully in the Stabilization and Association process. Performances are monitored in annual assessment reports. Point of reference is the so-called Copenhagen criteria. Trade preferences and the EU assistance program carts are the key instruments of SAP. Overall, Albania has been implementing its obligations under the Stabilization and Association Agreement (SAA) well. (Adellen G 2011)
Implementation of the July 2011 cross-cutting Judicial Reform Strategy and the relevant Action Plan, revised in March 2012, has started. There are concerns over reform cooperation, budget allocations, budget planning, and the level of human resources in this sector. Albania needs to further accelerate the implementation of the judicial reform strategy in order to ensure the independence, efficiency and accountability of its judicial institutions. (Codlak S 2008)
ISSN 2039-9340 Mediterranean Journal of Social Sciences Vol. 4 (1) January 2013
48
1.2 The influences of technical assistance and administrative capacity in new methodology organization Technical assistance is provided throughout the country to increase the fiscal autonomy and administrative capacity of local governments. With regional offices in four Albanian cities, USAID and its partners can work directly with local governments through targeted training and technical assistance aimed at improving local service delivery based on priorities and budgets developed in response to local preferences. It also seeks to reduce corruption and increase opportunities for citizen participation in local governance. (E Brown, P Holmes, 2006) 1.2.1 The political influences and the dialogue with EU It participated in the regular political and economic dialogue between the EU and the country through the SAA structures and contributed to the smooth functioning of the various joint institutions. Meetings of the Stabilization and Association Committee and Council were held in March and May 2012 respectively. (Saldenn A, 2009) Six subcommittee meetings were held in the reporting period. Furthermore, the SA Council agreed to set up a special group on Public Administration Reform within the SAA structures. Multilateral economic dialogue between the Commission, EU Member States and potential candidate countries in the context of pre-accession fiscal surveillance took place at an expert meeting in May 2012.
The European political opinion often refer to the fact that unlike other countries of the region, no political grouping in Albania. But, is this enough to bring to life the European dream of Albanians? (Progress report 2011, pp 8)
Of course not! The political consensus should be developed though a real cooperation between the ruling parties and the opposition on the main development and transformation challenges the country faces, these being essential challenges for the European integration. 1.3 The mandate to promote integration at EU level The EU’s mandate to promote integration derives from the following: 1).Treaties 2).European Council multiannual Program 3).Europe 2020 Strategy: Article 13, which enables the Council to take appropriate action to combat discrimination based on sex, racial or ethnic origin, religion or belief, disability, age or sexual orientation. Article 73k, requests the Council to adopt measures on immigration policy regarding, among others, "conditions of entry and residence, and standards on procedures for the issue by Member States of long term visas and residence permits, including those for the purpose of family reunion". (Progress report 2011, pp 28)
The Council is also requested to adopt "measures defining the rights and conditions under which nationals of third countries who are legally resident in a Member State may reside in other Member States."
The Treaty of Lisbon was adopted in 2007 and entered into force in 2009. For the first time, the Treaty provides a legal basis for the promotion of integration at EU level: Article 79.4 states: "The European Parliament and the Council, acting in accordance with the ordinary legislative procedure, may establish measures to provide incentives and support for the action of Member States with a view to promoting the integration of third-country nationals residing legally in their territories, excluding any harmonization of the laws and regulations of the Member States."(Kottler V, 2009) 1.4 Charter of Fundamental Rights The Charter of Fundamental Rights was solemnly proclaimed in 2000 and became legally binding in 2009 with the entry into force of the Treaty of Lisbon. The Charter is addressed to the institutions, bodies, offices and agencies of the Union. It is also addressed to Member States, but only when they are implementing EU law. For example, the Charter applies when Member States adopt or apply a national law implementing an EU directive or when their authorities apply directly an EU regulation. In those cases in which the Charter does not apply, fundamental rights are guaranteed under the constitutions of Member States. (Progress report 2010, pp 14)
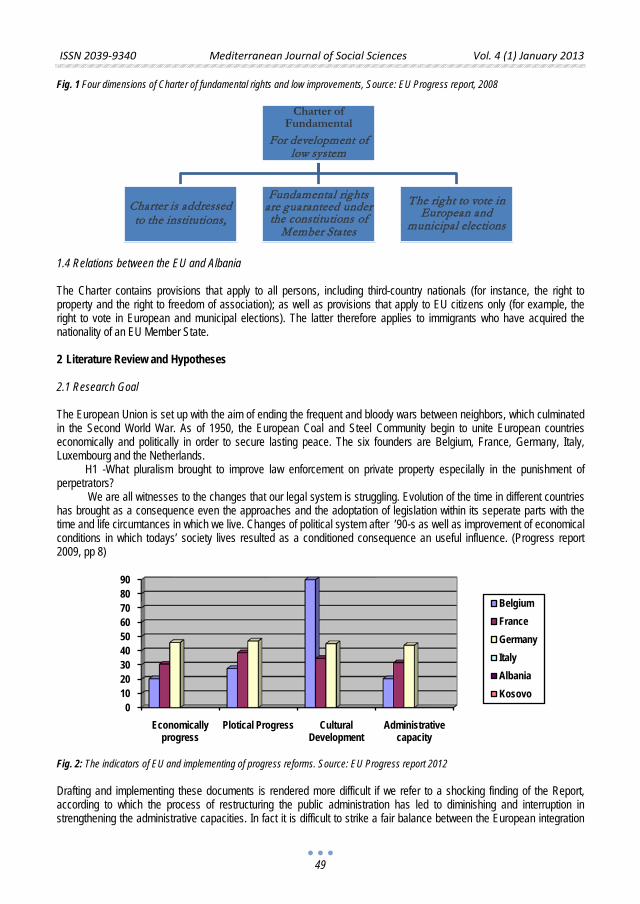
ISSN 2039-9340 Mediterranean Journal of Social Sciences Vol. 4 (1) January 2013
49
Fig. 1 Four dimensions of Charter of fundamental rights and low improvements, Source: EU Progress report, 2008
1.4 Relations between the EU and Albania The Charter contains provisions that apply to all persons, including third-country nationals (for instance, the right to property and the right to freedom of association); as well as provisions that apply to EU citizens only (for example, the right to vote in European and municipal elections). The latter therefore applies to immigrants who have acquired the nationality of an EU Member State. 2 Literature Review and Hypotheses
2.1 Research Goal
The European Union is set up with the aim of ending the frequent and bloody wars between neighbors, which culminated in the Second World War. As of 1950, the European Coal and Steel Community begin to unite European countries economically and politically in order to secure lasting peace. The six founders are Belgium, France, Germany, Italy, Luxembourg and the Netherlands.
H1 -What pluralism brought to improve law enforcement on private property especilally in the punishment of perpetrators?
We are all witnesses to the changes that our legal system is struggling. Evolution of the time in different countries has brought as a consequence even the approaches and the adoptation of legislation within its seperate parts with the time and life circumtances in which we live. Changes of political system after ’90-s as well as improvement of economical conditions in which todays’ society lives resulted as a conditioned consequence an useful influence. (Progress report 2009, pp 8)
Fig. 2: The indicators of EU and implementing of progress reforms. Source: EU Progress report 2012 Drafting and implementing these documents is rendered more difficult if we refer to a shocking finding of the Report, according to which the process of restructuring the public administration has led to diminishing and interruption in strengthening the administrative capacities. In fact it is difficult to strike a fair balance between the European integration
Charter of Fundamental
For development of low system
Charter is addressed to the institutions,
Fundamental rights are guaranteed under the constitutions of
Member States
The right to vote in European and
municipal elections
0102030405060708090
Economically progress
Plotical Progress Cultural Development
Administrative capacity
BelgiumFranceGermanyItalyAlbaniaKosovo
ISSN 2039-9340 Mediterranean Journal of Social Sciences Vol. 4 (1) January 2013
50
process requirements for a stronger and more efficient administration and the Government on a diet. Also, it is even more difficult to measure the political willingness of a Government to carry on with reforms for Europeanizing the country where the governance willingness is not focused on strengthening the public administration, while observing the constitutional principles and the law on the basis of which, like the ADN of a modern society, the public administration should function. 2.2 Democracy and the rule of law, an important key of political reform The ruling majority and opposition reached a political agreement in November 2011 which marked the end of the political stalemate stemming from the 2009 parliamentary elections. This agreement established a plan and timetable for carrying out electoral reform, for improving the parliament’s rules of procedure and for adopting all pending laws requiring reinforced majority. The ruling majority and opposition remained generally committed to the key political reforms stemming from this agreement and political dialogue has improved considerably ever since. The process of working on the implementation of the 12 key priorities has, overall, been an inclusive one. 2.2.1 The High Council investigation Yet there were short periods of confrontational rhetoric between government, opposition and other state institutions, notably in relation to investigations into the events of 21 January 2011 and to the nomination by parliament of a member of the High Council of Justice. Since November 2011, significant progress has been made by adopting pending reinforced majority laws, appointing an Ombudsman, adopting amendments to the electoral code, and towards revising parliamentary rules of procedure. (Adenn E 2011, pp 13)
2.3 The climate of cooperation and needs of forced the LAC (Low Administrative Courts) This created a climate of cross party cooperation, which enabled reform progress also in other areas under the political criteria. Adoption of these laws requires a reinforced majority vote in parliament. The Law on Administrative Courts was adopted in May for implementation next year, and the Laws on the National Judicial Conference and the Profession of Lawyer were adopted in July and September respectively. The Law on Administrative Courts provides for first instance administrative courts to be set up at central and regional level, and for a court of appeal and a dedicated chamber in the High Court. This should ease the case burden of other courts and allow specialized judges to deal with administrative cases.
H2: The EU, which is based on a corpus of values, laws, standards and democratic institutions inspired by the constitutional traditions of the Member States, identifies in its legal documents and strategy the unique role of the justice system in general and that of the judicial power in particular in terms of safeguarding and enriching these values 3 Methodology of this paper research
3.1 Research Goal In this survey we aim to identify the mediating effect of strategic developing of economical system in Albania. Nowadays people enjoy a greater sphere of rights reffered to the right enjoyed by the individuals before ’90-s,eventhough some rights recognized by law of that time could not find application in everyday life. Another remarkable difference is that today people enjoy several colateral rights that were not recognized by the law of that time. The factors that have brought the evolution of the law-right & justice are different regarding to economic ones,political as well as demographic etc.Another question that evidently comes out is: “ Have these changes been effective for todays’ society?( Garrett, N., Abbott, M. Cheung, V and De Souza, R. (2007)
3.2 An integration of Eastern Europe countries in E U without frontiers With the collapse of communism across central, Eastern Europe, Europeans become closer neighbors. In 1993 the Single Market is completed with the 'four freedoms' of: movement of goods, services, people and money. The 1990s is also the decade of two treaties, the ‘Maastricht’ Treaty on European Union in 1993 and the Treaty of Amsterdam in 1999. People are concerned about how to protect the environment and also how Europeans can act together when it comes to security and defense matters. Good progress has been made in combating corruption within the judiciary through the adoption of constitutional amendments limiting the immunity of judges.
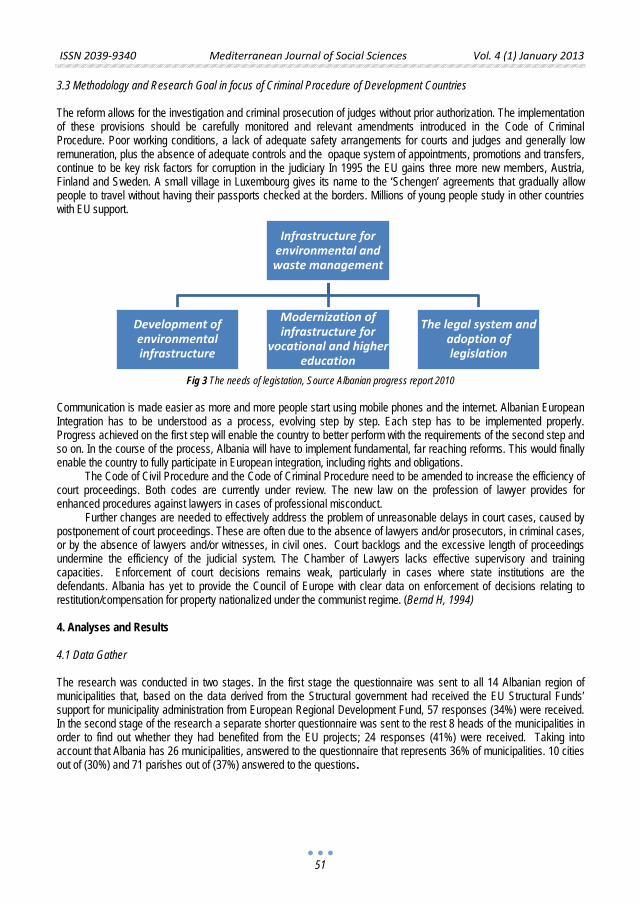
ISSN 2039-9340 Mediterranean Journal of Social Sciences Vol. 4 (1) January 2013
51
3.3 Methodology and Research Goal in focus of Criminal Procedure of Development Countries The reform allows for the investigation and criminal prosecution of judges without prior authorization. The implementation of these provisions should be carefully monitored and relevant amendments introduced in the Code of Criminal Procedure. Poor working conditions, a lack of adequate safety arrangements for courts and judges and generally low remuneration, plus the absence of adequate controls and the opaque system of appointments, promotions and transfers, continue to be key risk factors for corruption in the judiciary In 1995 the EU gains three more new members, Austria, Finland and Sweden. A small village in Luxembourg gives its name to the ‘Schengen’ agreements that gradually allow people to travel without having their passports checked at the borders. Millions of young people study in other countries with EU support.
Fig 3 The needs of legistation, Source Albanian progress report 2010
Communication is made easier as more and more people start using mobile phones and the internet. Albanian European Integration has to be understood as a process, evolving step by step. Each step has to be implemented properly. Progress achieved on the first step will enable the country to better perform with the requirements of the second step and so on. In the course of the process, Albania will have to implement fundamental, far reaching reforms. This would finally enable the country to fully participate in European integration, including rights and obligations.
The Code of Civil Procedure and the Code of Criminal Procedure need to be amended to increase the efficiency of court proceedings. Both codes are currently under review. The new law on the profession of lawyer provides for enhanced procedures against lawyers in cases of professional misconduct.
Further changes are needed to effectively address the problem of unreasonable delays in court cases, caused by postponement of court proceedings. These are often due to the absence of lawyers and/or prosecutors, in criminal cases, or by the absence of lawyers and/or witnesses, in civil ones. Court backlogs and the excessive length of proceedings undermine the efficiency of the judicial system. The Chamber of Lawyers lacks effective supervisory and training capacities. Enforcement of court decisions remains weak, particularly in cases where state institutions are the defendants. Albania has yet to provide the Council of Europe with clear data on enforcement of decisions relating to restitution/compensation for property nationalized under the communist regime. (Bernd H, 1994)
4. Analyses and Results 4.1 Data Gather The research was conducted in two stages. In the first stage the questionnaire was sent to all 14 Albanian region of municipalities that, based on the data derived from the Structural government had received the EU Structural Funds’ support for municipality administration from European Regional Development Fund, 57 responses (34%) were received. In the second stage of the research a separate shorter questionnaire was sent to the rest 8 heads of the municipalities in order to find out whether they had benefited from the EU projects; 24 responses (41%) were received. Taking into account that Albania has 26 municipalities, answered to the questionnaire that represents 36% of municipalities. 10 cities out of (30%) and 71 parishes out of (37%) answered to the questions.
Infrastructure for environmental and waste management
Development of environmental infrastructure
Modernization of infrastructure for
vocational and higher education
The legal system and adoption of legislation
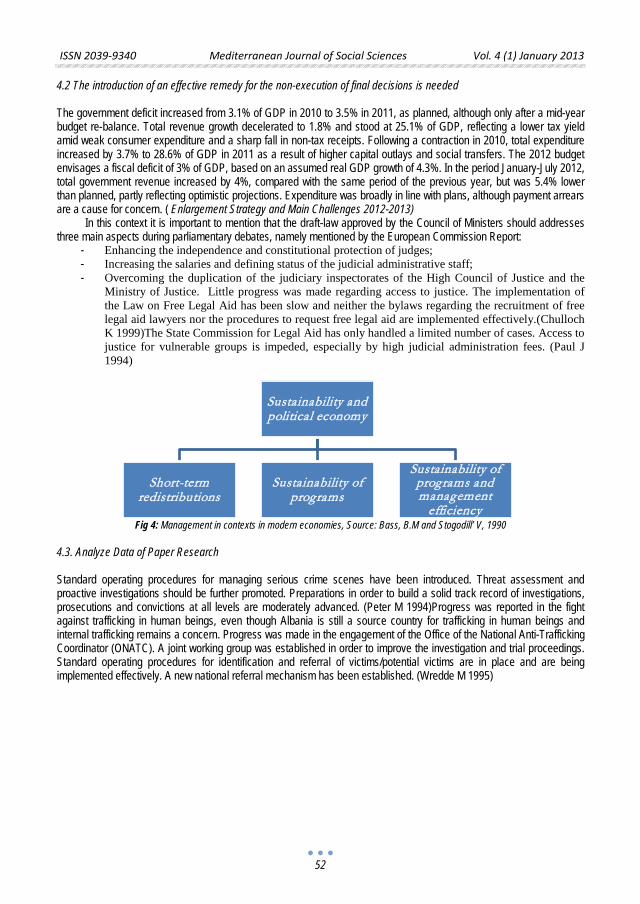
ISSN 2039-9340 Mediterranean Journal of Social Sciences Vol. 4 (1) January 2013
52
4.2 The introduction of an effective remedy for the non-execution of final decisions is needed
The government deficit increased from 3.1% of GDP in 2010 to 3.5% in 2011, as planned, although only after a mid-year budget re-balance. Total revenue growth decelerated to 1.8% and stood at 25.1% of GDP, reflecting a lower tax yield amid weak consumer expenditure and a sharp fall in non-tax receipts. Following a contraction in 2010, total expenditure increased by 3.7% to 28.6% of GDP in 2011 as a result of higher capital outlays and social transfers. The 2012 budget envisages a fiscal deficit of 3% of GDP, based on an assumed real GDP growth of 4.3%. In the period January-July 2012, total government revenue increased by 4%, compared with the same period of the previous year, but was 5.4% lower than planned, partly reflecting optimistic projections. Expenditure was broadly in line with plans, although payment arrears are a cause for concern. ( Enlargement Strategy and Main Challenges 2012-2013)
In this context it is important to mention that the draft-law approved by the Council of Ministers should addresses three main aspects during parliamentary debates, namely mentioned by the European Commission Report:
- Enhancing the independence and constitutional protection of judges; - Increasing the salaries and defining status of the judicial administrative staff; - Overcoming the duplication of the judiciary inspectorates of the High Council of Justice and the
Ministry of Justice. Little progress was made regarding access to justice. The implementation of the Law on Free Legal Aid has been slow and neither the bylaws regarding the recruitment of free legal aid lawyers nor the procedures to request free legal aid are implemented effectively.(Chulloch K 1999)The State Commission for Legal Aid has only handled a limited number of cases. Access to justice for vulnerable groups is impeded, especially by high judicial administration fees. (Paul J 1994)
Fig 4: Management in contexts in modern economies, Source: Bass, B.M and Stogodill’ V, 1990
4.3. Analyze Data of Paper Research Standard operating procedures for managing serious crime scenes have been introduced. Threat assessment and proactive investigations should be further promoted. Preparations in order to build a solid track record of investigations, prosecutions and convictions at all levels are moderately advanced. (Peter M 1994)Progress was reported in the fight against trafficking in human beings, even though Albania is still a source country for trafficking in human beings and internal trafficking remains a concern. Progress was made in the engagement of the Office of the National Anti-Trafficking Coordinator (ONATC). A joint working group was established in order to improve the investigation and trial proceedings. Standard operating procedures for identification and referral of victims/potential victims are in place and are being implemented effectively. A new national referral mechanism has been established. (Wredde M 1995)
Sustainability and political economy
Short-term redistributions
Sustainability of programs
Sustainability of programs and management
efficiency
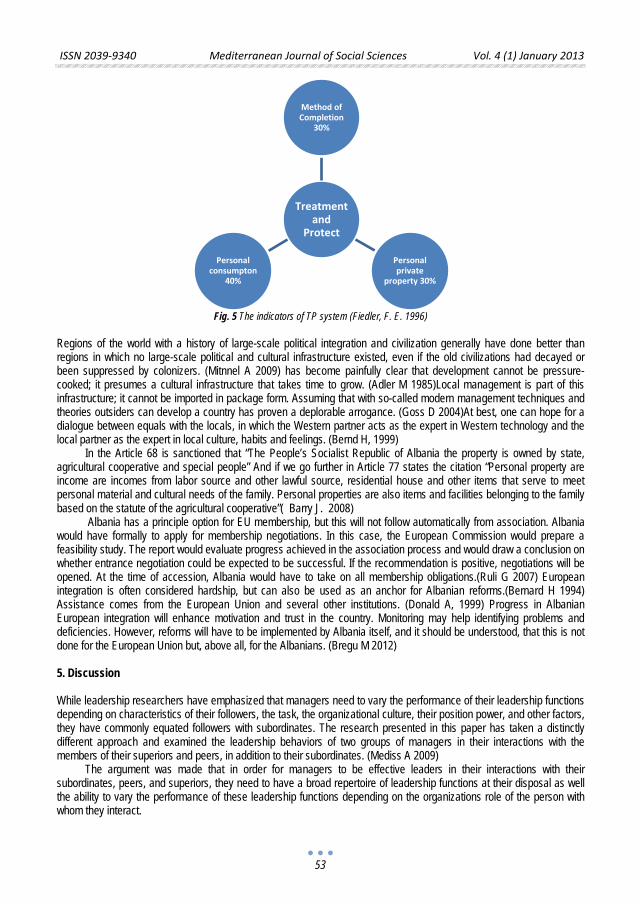
ISSN 2039-9340 Mediterranean Journal of Social Sciences Vol. 4 (1) January 2013
53
Fig. 5 The indicators of TP system (Fiedler, F. E. 1996)
Regions of the world with a history of large-scale political integration and civilization generally have done better than regions in which no large-scale political and cultural infrastructure existed, even if the old civilizations had decayed or been suppressed by colonizers. (Mitnnel A 2009) has become painfully clear that development cannot be pressure-cooked; it presumes a cultural infrastructure that takes time to grow. (Adler M 1985)Local management is part of this infrastructure; it cannot be imported in package form. Assuming that with so-called modern management techniques and theories outsiders can develop a country has proven a deplorable arrogance. (Goss D 2004)At best, one can hope for a dialogue between equals with the locals, in which the Western partner acts as the expert in Western technology and the local partner as the expert in local culture, habits and feelings. (Bernd H, 1999)
In the Article 68 is sanctioned that “The People’s Socialist Republic of Albania the property is owned by state, agricultural cooperative and special people” And if we go further in Article 77 states the citation “Personal property are income are incomes from labor source and other lawful source, residential house and other items that serve to meet personal material and cultural needs of the family. Personal properties are also items and facilities belonging to the family based on the statute of the agricultural cooperative”( Barry J. 2008)
Albania has a principle option for EU membership, but this will not follow automatically from association. Albania would have formally to apply for membership negotiations. In this case, the European Commission would prepare a feasibility study. The report would evaluate progress achieved in the association process and would draw a conclusion on whether entrance negotiation could be expected to be successful. If the recommendation is positive, negotiations will be opened. At the time of accession, Albania would have to take on all membership obligations.(Ruli G 2007) European integration is often considered hardship, but can also be used as an anchor for Albanian reforms.(Bernard H 1994) Assistance comes from the European Union and several other institutions. (Donald A, 1999) Progress in Albanian European integration will enhance motivation and trust in the country. Monitoring may help identifying problems and deficiencies. However, reforms will have to be implemented by Albania itself, and it should be understood, that this is not done for the European Union but, above all, for the Albanians. (Bregu M 2012) 5. Discussion While leadership researchers have emphasized that managers need to vary the performance of their leadership functions depending on characteristics of their followers, the task, the organizational culture, their position power, and other factors, they have commonly equated followers with subordinates. The research presented in this paper has taken a distinctly different approach and examined the leadership behaviors of two groups of managers in their interactions with the members of their superiors and peers, in addition to their subordinates. (Mediss A 2009)
The argument was made that in order for managers to be effective leaders in their interactions with their subordinates, peers, and superiors, they need to have a broad repertoire of leadership functions at their disposal as well the ability to vary the performance of these leadership functions depending on the organizations role of the person with whom they interact.
Treatment and
Protect
Method of Completion
30%
Personal private
property 30%
Personal consumpton
40%
ISSN 2039-9340 Mediterranean Journal of Social Sciences Vol. 4 (1) January 2013
54
The results of this study show that behavioral repertoire has strong positive effects on subordinate, peer, and superior perceptions of effectiveness. These results indicate that to be effective it is important for managers to not only perform their leadership functions frequently in interactions with their subordinates, but also in their interactions with their peers and superiors. Having a broad portfolio of leadership functions at one’s disposal will increase the likelihood that one can effectively meet the demands of the member of one’s organizational role-set.(Bernard H 1994) References Bernd Hayo, Testing Wagner`s Law for Germany from 1960 to 1993, July 1994 Bernd Hayo and Matthias Wrede, Fiscal Policy in a Keynesian Model of a Closed Monetary Union, October 1994 Donald A. Ball, Wendell H. McCulloch, ˝ International Business – The challenge of Global Competition˝, New York, 1999 D. Gros and A. Steinherr, Economic Transition in Central and Eastern Europe, 2nd edition, chapter 9, Cambridge: Cambridge University
Press, 2004. Donald A. Ball, Wendell H. McCulloch, Jr. Paul L. Frantz, J. Michael Geringer, Michael S. Minor, ˝ International Business – The
challenge of Global Competition˝, New York, 2004,pp 23,56,78 Michael Betten, Heinz-Dieter Wenzel, and Matthias Wrede, Why Income Taxation Need Not Harm Growth, October 1994 Heinz-Dieter
Wenzel (Editor), Problems and Perspectives of the Transformation Process in Eastern Europe, August 1995 Matthias Wrede, Vertical and horizontal tax competition: Will uncoordinated Leviathans end up on the wrong side of the Laffer curve?
December 1995 Just what is this ‘absorption capacity’ of the European Union? Policy Brief No. 113, Center for European Policy Studies, www.ceps.be In
search of a realistic agenda of Albania’s EU Integration, Policy Brief 1, AGENDA Institute, www.agendainstitute.org Peter Meister and Heinz-Dieter Wenzel, Budgetfinanzierung in einem föderalen System, October 1994 World Economic Forum, The Global Competitiveness Index: Identifying the Key Elements of Sustainable Growth, p. 4 (2006) Lisbon
Agenda, www.ec.europa.eu Stabilization and Association Agreement,EU-Albania (2006).Regulations of the Council of EU1763/99 and 2820/98.
ISSN 2039-9340 Mediterranean Journal of Social Sciences Vol. 4 (1) January 2013
55
Wetland Ecosystem Conflict: Implication for Agricultural Productivity and
Food Security in Mbiabo, Odukpani, Cross River State, Nigeria.
Okpiliya F. I Ekong A. E Imoke Eni
Department of Geography and Environmental ScienceUniversity of Calabar, Calabar.
E-mail: [email protected] Doi:10.5901/mjss.2013.v4n1p55 Abstract
Conflict is a common daily occurrence in individuals, groups, communities and nation states. This study examined the consequences of communal conflict of 2010 on peasant agricultural productivities in Mbiabo wetland of Odukpani Local Government Area, Cross River State. The data for this was generated through questionnaire administration, participatory rural appraisal and on the spot observation of the area. The population of farmers were drawn from six villages out of ten in the two communities. A total of 426 household heads form the sample size. The Likert scale which has the attributes Strongly Agreed (SA), Agree (A), Disagree (D), Undecided (U) and Strongly Disagree (SD) was used to analyse the causes of the conflict while the analysis of variance was used to test for the variation in crops productivity before and after the conflict in the area. At 0.05 level of significance, the calculated value of 3.08 was greater than the table value of 2.23. This led to the rejection of the null hypothesis, that there is no significant variation in agriculture productivity before and after the conflict and accepting the alternate one. The work revealed that conflict affected the utilization of wetland for farming thereby reducing the income generated from farming and also reduced the quantity of crops harvested by approximately more than 50 per cent with overriding influence on the quality of life of the people in the study area and the environs.
Key words: wetland, Ecosystem, Productivity, food, security, conflict, agriculture
1. Introduction Man depends on the environment for his basic needs. The environment consist of materials human beings transform into resources capable of satisfying man’s need of food, shelter, warmth, clothing, health, wealth, possessions, etc. Such resources include, water, soil, wildlife forests, minerals, a variety of plants and animals species.
Increase in human population without corresponding increase in resource availability has become the greatest problem facing man in recent times. The non availability of resources to meet the demand of the population, according to Karl Max (1798), breeds conflict because there is bound to be struggle over the scarce resources. Himes (1980) defines conflict as purposeful struggle between collective actors who use social power to defeat or remove opponents and to gain status, power, resources and other scarce values. Aja (2007) observed that conflict involves two or more parties in opposition to interest, principles, practice or strategies. In other words, conflict reflects a clash of interest or goal between parties, which may be individuals or group of individuals, ethnic groups or states (Burton, 1990). Conflict reflects a determined action or struggle over a goal, which may be overt or subtle, manifest or imaginary. In behavioural terms, Deutsch (1993) viewed conflict as an action, which prevents or obstructs, interferes, with, injure or renders ineffective another action with which it is incompatible. In a similar manner, Ortiz (1999) is of the view that conflict is a struggle involving ideas, values and or limited resources. Hence, it is not out of place to view the Ikot Offiong and Oku Iboku communal conflict on the Mbiabo wetland in line with their views as conflict arising from the struggle for scarce resources of which has to with scarcity of land for agriculture.
Throughout the world and the beginning of human history, people have turned to wetland to sustain their lives (Ramsal convention, 1971). According to Scones (1992) Wetlands are areas where shallow water dominates the environment. This may be because the water table is at or near the land surface, or because the land is covered by shallow water which makes it readily available for human confusion. Wetlands water may be fresh, brackish, or salty, including areas of marine water whose depth at low tide does not exceed 6m (Cowardin, 1979). Wetlands occur in many countries and are estimated to cover about 6 per cent of the earth’s land surface, about 570 million hectares or 5.7 million
ISSN 2039-9340 Mediterranean Journal of Social Sciences Vol. 4 (1) January 2013
56
sq km (UNEP, 1993). About 30 per cent are peat lands (or bogs), 26 per cent marshlands (or fens), 20 per cent swamps, 15 per cent flood plain and 2 per cent lakes. Mangroves cover some 240, 000 sq km of tropical coast, while coral reefs extent over an estimated 600,000 sq km world wide Scones (1992). Wetlands are among the most productive ecosystems in the world. Frazier (1996) classified wetland into five basic categories namely: lacustrine, riverine, palustrine, marine and esuarine. In Nigeria, estuarine wetlands are found in the Lagos – lekki lagoons, stubs creek forest reserve (Akwa Ibom State) Bakassi peninsula Cross River State) the Hadejia Nguru and Lake Chad are examples of lacustrine wetlands while the Niger Delta marshes and artificial wetlands in FESTAC town in Lagos are palustrine wetlands.
Conflict is inevitable in human life. Man has been struggling to improve his sustenance level by seeking a change from his present status to a higher one. The struggle towards this improvement revolves around resources and value -based needs. Albert (2001) and Aja (2007) described the cause of social conflict to be competition for inadequate (or perceived inadequate) resources, contradicting value systems (religious, beliefs, ideological position and general worldview), and psychological needs of groups and individuals.
Communal conflict in Africa and Nigeria in particular has been a great obstacle to peasant agricultural development. In rural areas, more than 90 percent depend on farming as a major source of livelihood. Incessant dispute over fertile land has not only brought untold hardship but also destruction of lives and properties. The Ikot Offiong – Oku Iboku war experienced in (2001) showed that the resultant carnage devoured not only men but women and children, as well as their properties. The Mbiabo community was also severely affected where market and houses were demolished, farmland destroyed and the wetland was abandoned due to tension from the conflict and subsequent displacement and relocation of some people to Calabar and others in Diaspora hereby increasing the population of Calabar and other villages in Odukpani and Itu Local Government Areas. Wetland has been a rich base for agricultural products such as Okro, pepper, cassava, cocoyam, water yam, pumpkins, garden egg and other benefits such as fish, timber, bush meat and palm wine. With the conflict, the production of crops and other materials have reduced and have also affected the nearby urban markets (Calabar and Aba) that depend on the communities for food and other resources.
The conflict had its effect on the revenue generating capacity of Itu Local Government Council as greater part of its income was from taxes, market tolls and revenues. Also vehicles travelling along the Calabar - Itu high way were set ablaze and houses razed down. The vanguard newspapers of December 25th 2001 confirm that no fewer than fifty cars were burnt and about 42 houses were razed down. At the time of this study, economic activities such as farming, fishing, harvesting of non timber forest products from the wetland were at their minimum due to tension and fear.
Most studies concentrated on social and economic effect without considering the land resource base on which the population is dependent. This study examined the effects of conflict on the utilization and productivity of the community’s natural resources base which is abandoned by the people because of the communal conflict. 2. Objectives of the Study
1. To examine the causes of the communal conflict in the study area. 2. To examine the effect of the conflict on crop productivity and food security. 3. To recommend possible solutions to the conflict.
3. Research Hypothesis There is no significant variation in agricultural productivity in the area as a result of conflict over the wetland. 4. Study Area 4.1 Location The study areas are in the Mbiabo communities along Odukpani – Itu Bridge in Cross River States. The portion is located on latitudes 5000N and 50151N and longitudes 80001E, and 80151. The area is bounded to the North by Biase Local Government Area, to the South by Calabar Municipal, to the East by Akamkpa Local Government Area and to the West by Itu Local Government.
The area falls within the equatorial region with a mean annual rainfall of 2,558mm. The wet season begins in April and last till October. The dry season commences in the middle of November and ends in March.
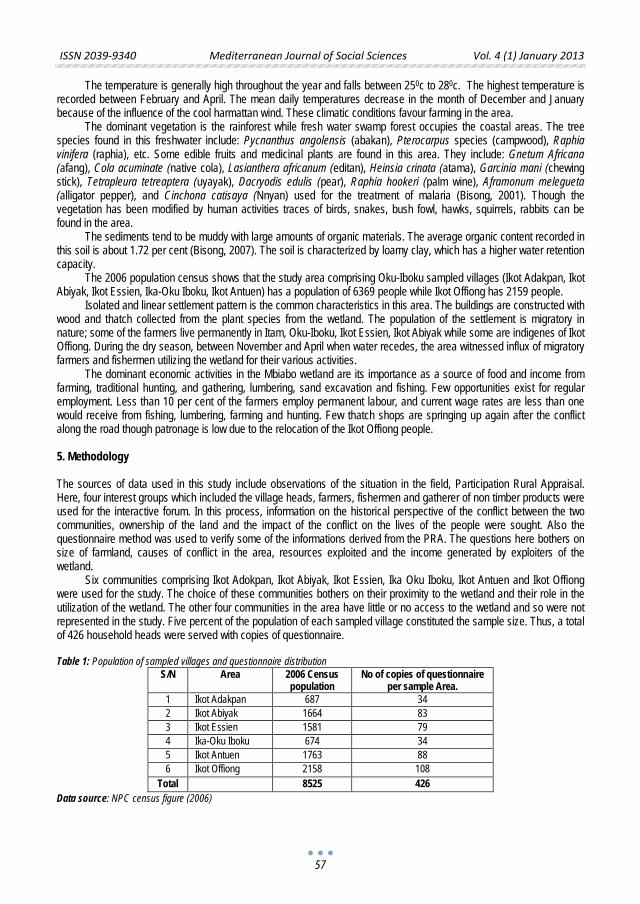
ISSN 2039-9340 Mediterranean Journal of Social Sciences Vol. 4 (1) January 2013
57
The temperature is generally high throughout the year and falls between 250c to 280c. The highest temperature is recorded between February and April. The mean daily temperatures decrease in the month of December and January because of the influence of the cool harmattan wind. These climatic conditions favour farming in the area.
The dominant vegetation is the rainforest while fresh water swamp forest occupies the coastal areas. The tree species found in this freshwater include: Pycnanthus angolensis (abakan), Pterocarpus species (campwood), Raphia vinifera (raphia), etc. Some edible fruits and medicinal plants are found in this area. They include: Gnetum Africana (afang), Cola acuminate (native cola), Lasianthera africanum (editan), Heinsia crinata (atama), Garcinia mani (chewing stick), Tetrapleura tetreaptera (uyayak), Dacryodis edulis (pear), Raphia hookeri (palm wine), Aframonum melegueta (alligator pepper), and Cinchona catisaya (Nnyan) used for the treatment of malaria (Bisong, 2001). Though the vegetation has been modified by human activities traces of birds, snakes, bush fowl, hawks, squirrels, rabbits can be found in the area.
The sediments tend to be muddy with large amounts of organic materials. The average organic content recorded in this soil is about 1.72 per cent (Bisong, 2007). The soil is characterized by loamy clay, which has a higher water retention capacity.
The 2006 population census shows that the study area comprising Oku-Iboku sampled villages (Ikot Adakpan, Ikot Abiyak, Ikot Essien, Ika-Oku Iboku, Ikot Antuen) has a population of 6369 people while Ikot Offiong has 2159 people.
Isolated and linear settlement pattern is the common characteristics in this area. The buildings are constructed with wood and thatch collected from the plant species from the wetland. The population of the settlement is migratory in nature; some of the farmers live permanently in Itam, Oku-Iboku, Ikot Essien, Ikot Abiyak while some are indigenes of Ikot Offiong. During the dry season, between November and April when water recedes, the area witnessed influx of migratory farmers and fishermen utilizing the wetland for their various activities.
The dominant economic activities in the Mbiabo wetland are its importance as a source of food and income from farming, traditional hunting, and gathering, lumbering, sand excavation and fishing. Few opportunities exist for regular employment. Less than 10 per cent of the farmers employ permanent labour, and current wage rates are less than one would receive from fishing, lumbering, farming and hunting. Few thatch shops are springing up again after the conflict along the road though patronage is low due to the relocation of the Ikot Offiong people. 5. Methodology The sources of data used in this study include observations of the situation in the field, Participation Rural Appraisal. Here, four interest groups which included the village heads, farmers, fishermen and gatherer of non timber products were used for the interactive forum. In this process, information on the historical perspective of the conflict between the two communities, ownership of the land and the impact of the conflict on the lives of the people were sought. Also the questionnaire method was used to verify some of the informations derived from the PRA. The questions here bothers on size of farmland, causes of conflict in the area, resources exploited and the income generated by exploiters of the wetland.
Six communities comprising Ikot Adokpan, Ikot Abiyak, Ikot Essien, Ika Oku Iboku, Ikot Antuen and Ikot Offiong were used for the study. The choice of these communities bothers on their proximity to the wetland and their role in the utilization of the wetland. The other four communities in the area have little or no access to the wetland and so were not represented in the study. Five percent of the population of each sampled village constituted the sample size. Thus, a total of 426 household heads were served with copies of questionnaire. Table 1: Population of sampled villages and questionnaire distribution
S/N Area 2006 Census population
No of copies of questionnaire per sample Area.
1 Ikot Adakpan 687 34 2 Ikot Abiyak 1664 83 3 Ikot Essien 1581 79 4 Ika-Oku Iboku 674 34 5 Ikot Antuen 1763 88 6 Ikot Offiong 2158 108
Total 8525 426 Data source: NPC census figure (2006)
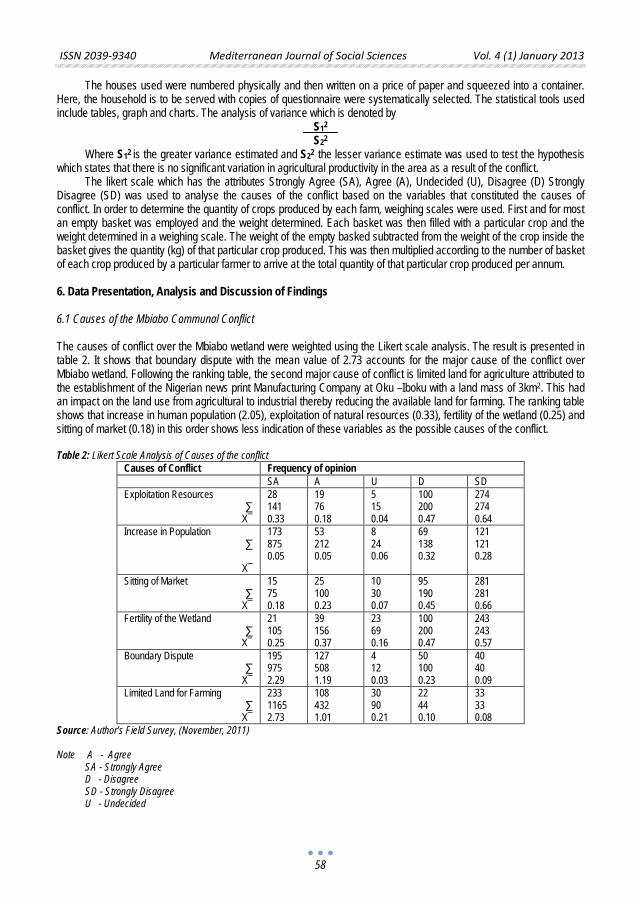
ISSN 2039-9340 Mediterranean Journal of Social Sciences Vol. 4 (1) January 2013
58
The houses used were numbered physically and then written on a price of paper and squeezed into a container. Here, the household is to be served with copies of questionnaire were systematically selected. The statistical tools used include tables, graph and charts. The analysis of variance which is denoted by
S12 S22
Where S12 is the greater variance estimated and S22 the lesser variance estimate was used to test the hypothesis which states that there is no significant variation in agricultural productivity in the area as a result of the conflict.
The likert scale which has the attributes Strongly Agree (SA), Agree (A), Undecided (U), Disagree (D) Strongly Disagree (SD) was used to analyse the causes of the conflict based on the variables that constituted the causes of conflict. In order to determine the quantity of crops produced by each farm, weighing scales were used. First and for most an empty basket was employed and the weight determined. Each basket was then filled with a particular crop and the weight determined in a weighing scale. The weight of the empty basked subtracted from the weight of the crop inside the basket gives the quantity (kg) of that particular crop produced. This was then multiplied according to the number of basket of each crop produced by a particular farmer to arrive at the total quantity of that particular crop produced per annum. 6. Data Presentation, Analysis and Discussion of Findings 6.1 Causes of the Mbiabo Communal Conflict The causes of conflict over the Mbiabo wetland were weighted using the Likert scale analysis. The result is presented in table 2. It shows that boundary dispute with the mean value of 2.73 accounts for the major cause of the conflict over Mbiabo wetland. Following the ranking table, the second major cause of conflict is limited land for agriculture attributed to the establishment of the Nigerian news print Manufacturing Company at Oku –Iboku with a land mass of 3km2. This had an impact on the land use from agricultural to industrial thereby reducing the available land for farming. The ranking table shows that increase in human population (2.05), exploitation of natural resources (0.33), fertility of the wetland (0.25) and sitting of market (0.18) in this order shows less indication of these variables as the possible causes of the conflict. Table 2: Likert Scale Analysis of Causes of the conflict
Causes of Conflict Frequency of opinion SA A U D SD Exploitation Resources
∑ Х¯
28 141 0.33
19 76 0.18
5 15 0.04
100 200 0.47
274 274 0.64
Increase in Population ∑
Х¯
173 875 0.05
53 212 0.05
8 24 0.06
69 138 0.32
121 121 0.28
Sitting of Market ∑
Х¯
15 75 0.18
25 100 0.23
10 30 0.07
95 190 0.45
281 281 0.66
Fertility of the Wetland ∑
Х¯
21 105 0.25
39 156 0.37
23 69 0.16
100 200 0.47
243 243 0.57
Boundary Dispute ∑
Х¯
195 975 2.29
127 508 1.19
4 12 0.03
50 100 0.23
40 40 0.09
Limited Land for Farming ∑
Х¯
233 1165 2.73
108 432 1.01
30 90 0.21
22 44 0.10
33 33 0.08
Source: Author’s Field Survey, (November, 2011)
Note A - Agree SA - Strongly Agree D - Disagree SD - Strongly Disagree U - Undecided
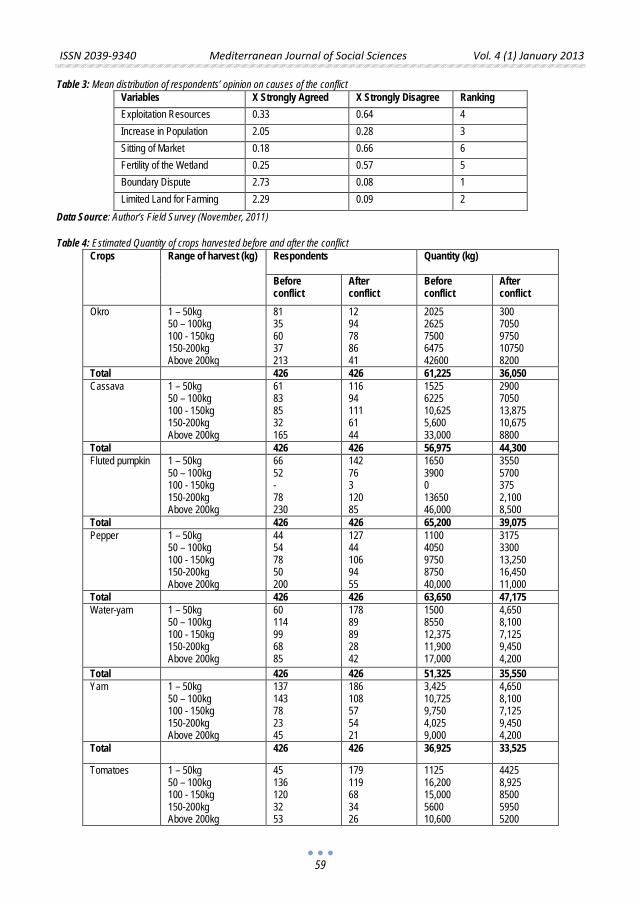
ISSN 2039-9340 Mediterranean Journal of Social Sciences Vol. 4 (1) January 2013
59
Table 3: Mean distribution of respondents’ opinion on causes of the conflict Variables X Strongly Agreed X Strongly Disagree Ranking Exploitation Resources 0.33 0.64 4 Increase in Population 2.05 0.28 3 Sitting of Market 0.18 0.66 6 Fertility of the Wetland 0.25 0.57 5 Boundary Dispute 2.73 0.08 1 Limited Land for Farming 2.29 0.09 2
Data Source: Author’s Field Survey (November, 2011) Table 4: Estimated Quantity of crops harvested before and after the conflict
Crops Range of harvest (kg) Respondents Quantity (kg)
Before conflict
After conflict
Before conflict
After conflict
Okro 1 – 50kg 50 – 100kg 100 - 150kg 150-200kg Above 200kg
81 35 60 37 213
12 94 78 86 41
2025 2625 7500 6475 42600
300 7050 9750 10750 8200
Total 426 426 61,225 36,050 Cassava 1 – 50kg
50 – 100kg 100 - 150kg 150-200kg Above 200kg
61 83 85 32 165
116 94 111 61 44
1525 6225 10,625 5,600 33,000
2900 7050 13,875 10,675 8800
Total 426 426 56,975 44,300 Fluted pumpkin 1 – 50kg
50 – 100kg 100 - 150kg 150-200kg Above 200kg
66 52 - 78 230
142 76 3 120 85
1650 3900 0 13650 46,000
3550 5700 375 2,100 8,500
Total 426 426 65,200 39,075 Pepper 1 – 50kg
50 – 100kg 100 - 150kg 150-200kg Above 200kg
44 54 78 50 200
127 44 106 94 55
1100 4050 9750 8750 40,000
3175 3300 13,250 16,450 11,000
Total 426 426 63,650 47,175 Water-yam 1 – 50kg
50 – 100kg 100 - 150kg 150-200kg Above 200kg
60 114 99 68 85
178 89 89 28 42
1500 8550 12,375 11,900 17,000
4,650 8,100 7,125 9,450 4,200
Total 426 426 51,325 35,550 Yam 1 – 50kg
50 – 100kg 100 - 150kg 150-200kg Above 200kg
137 143 78 23 45
186 108 57 54 21
3,425 10,725 9,750 4,025 9,000
4,650 8,100 7,125 9,450 4,200
Total 426 426 36,925 33,525
Tomatoes 1 – 50kg 50 – 100kg 100 - 150kg 150-200kg Above 200kg
45 136 120 32 53
179 119 68 34 26
1125 16,200 15,000 5600 10,600
4425 8,925 8500 5950 5200
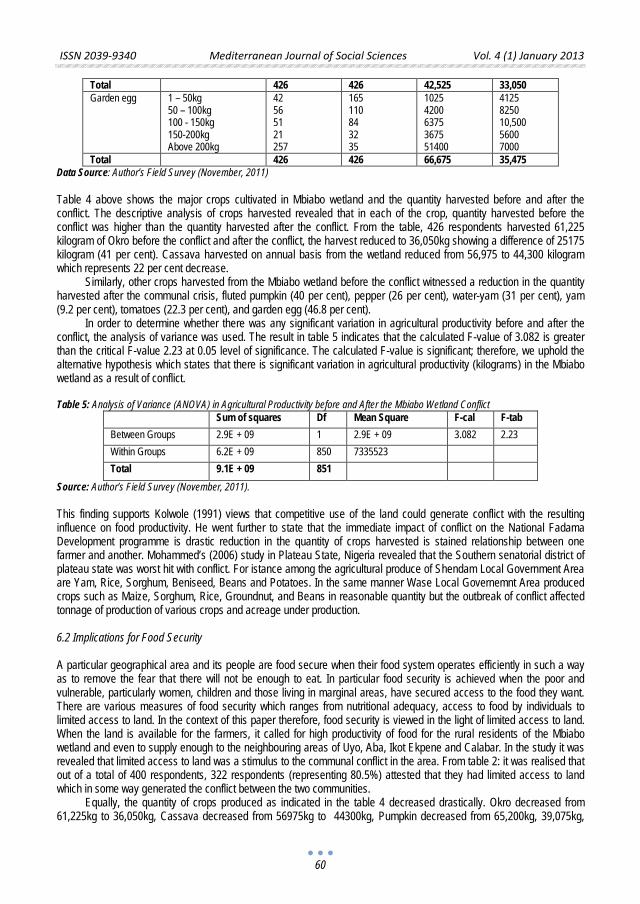
ISSN 2039-9340 Mediterranean Journal of Social Sciences Vol. 4 (1) January 2013
60
Total 426 426 42,525 33,050 Garden egg 1 – 50kg
50 – 100kg 100 - 150kg 150-200kg Above 200kg
42 56 51 21 257
165 110 84 32 35
1025 4200 6375 3675 51400
4125 8250 10,500 5600 7000
Total 426 426 66,675 35,475 Data Source: Author’s Field Survey (November, 2011) Table 4 above shows the major crops cultivated in Mbiabo wetland and the quantity harvested before and after the conflict. The descriptive analysis of crops harvested revealed that in each of the crop, quantity harvested before the conflict was higher than the quantity harvested after the conflict. From the table, 426 respondents harvested 61,225 kilogram of Okro before the conflict and after the conflict, the harvest reduced to 36,050kg showing a difference of 25175 kilogram (41 per cent). Cassava harvested on annual basis from the wetland reduced from 56,975 to 44,300 kilogram which represents 22 per cent decrease.
Similarly, other crops harvested from the Mbiabo wetland before the conflict witnessed a reduction in the quantity harvested after the communal crisis, fluted pumpkin (40 per cent), pepper (26 per cent), water-yam (31 per cent), yam (9.2 per cent), tomatoes (22.3 per cent), and garden egg (46.8 per cent).
In order to determine whether there was any significant variation in agricultural productivity before and after the conflict, the analysis of variance was used. The result in table 5 indicates that the calculated F-value of 3.082 is greater than the critical F-value 2.23 at 0.05 level of significance. The calculated F-value is significant; therefore, we uphold the alternative hypothesis which states that there is significant variation in agricultural productivity (kilograms) in the Mbiabo wetland as a result of conflict. Table 5: Analysis of Variance (ANOVA) in Agricultural Productivity before and After the Mbiabo Wetland Conflict
Sum of squares Df Mean Square F-cal F-tab Between Groups 2.9E + 09 1 2.9E + 09 3.082 2.23 Within Groups 6.2E + 09 850 7335523 Total 9.1E + 09 851
Source: Author’s Field Survey (November, 2011). This finding supports Kolwole (1991) views that competitive use of the land could generate conflict with the resulting influence on food productivity. He went further to state that the immediate impact of conflict on the National Fadama Development programme is drastic reduction in the quantity of crops harvested is stained relationship between one farmer and another. Mohammed’s (2006) study in Plateau State, Nigeria revealed that the Southern senatorial district of plateau state was worst hit with conflict. For istance among the agricultural produce of Shendam Local Government Area are Yam, Rice, Sorghum, Beniseed, Beans and Potatoes. In the same manner Wase Local Governemnt Area produced crops such as Maize, Sorghum, Rice, Groundnut, and Beans in reasonable quantity but the outbreak of conflict affected tonnage of production of various crops and acreage under production. 6.2 Implications for Food Security A particular geographical area and its people are food secure when their food system operates efficiently in such a way as to remove the fear that there will not be enough to eat. In particular food security is achieved when the poor and vulnerable, particularly women, children and those living in marginal areas, have secured access to the food they want. There are various measures of food security which ranges from nutritional adequacy, access to food by individuals to limited access to land. In the context of this paper therefore, food security is viewed in the light of limited access to land. When the land is available for the farmers, it called for high productivity of food for the rural residents of the Mbiabo wetland and even to supply enough to the neighbouring areas of Uyo, Aba, Ikot Ekpene and Calabar. In the study it was revealed that limited access to land was a stimulus to the communal conflict in the area. From table 2: it was realised that out of a total of 400 respondents, 322 respondents (representing 80.5%) attested that they had limited access to land which in some way generated the conflict between the two communities.
Equally, the quantity of crops produced as indicated in the table 4 decreased drastically. Okro decreased from 61,225kg to 36,050kg, Cassava decreased from 56975kg to 44300kg, Pumpkin decreased from 65,200kg, 39,075kg,
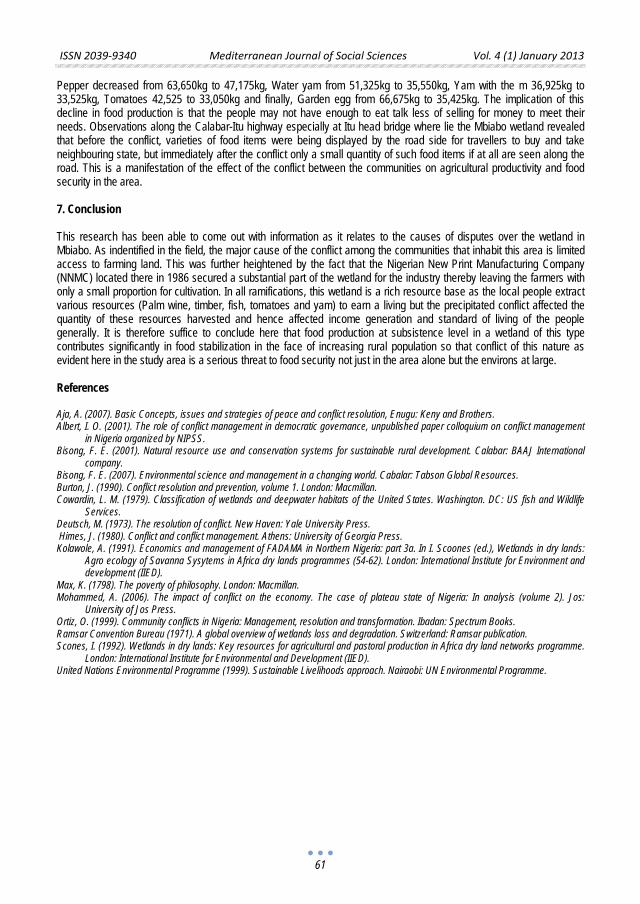
ISSN 2039-9340 Mediterranean Journal of Social Sciences Vol. 4 (1) January 2013
61
Pepper decreased from 63,650kg to 47,175kg, Water yam from 51,325kg to 35,550kg, Yam with the m 36,925kg to 33,525kg, Tomatoes 42,525 to 33,050kg and finally, Garden egg from 66,675kg to 35,425kg. The implication of this decline in food production is that the people may not have enough to eat talk less of selling for money to meet their needs. Observations along the Calabar-Itu highway especially at Itu head bridge where lie the Mbiabo wetland revealed that before the conflict, varieties of food items were being displayed by the road side for travellers to buy and take neighbouring state, but immediately after the conflict only a small quantity of such food items if at all are seen along the road. This is a manifestation of the effect of the conflict between the communities on agricultural productivity and food security in the area. 7. Conclusion This research has been able to come out with information as it relates to the causes of disputes over the wetland in Mbiabo. As indentified in the field, the major cause of the conflict among the communities that inhabit this area is limited access to farming land. This was further heightened by the fact that the Nigerian New Print Manufacturing Company (NNMC) located there in 1986 secured a substantial part of the wetland for the industry thereby leaving the farmers with only a small proportion for cultivation. In all ramifications, this wetland is a rich resource base as the local people extract various resources (Palm wine, timber, fish, tomatoes and yam) to earn a living but the precipitated conflict affected the quantity of these resources harvested and hence affected income generation and standard of living of the people generally. It is therefore suffice to conclude here that food production at subsistence level in a wetland of this type contributes significantly in food stabilization in the face of increasing rural population so that conflict of this nature as evident here in the study area is a serious threat to food security not just in the area alone but the environs at large. References Aja, A. (2007). Basic Concepts, issues and strategies of peace and conflict resolution, Enugu: Keny and Brothers. Albert, I. O. (2001). The role of conflict management in democratic governance, unpublished paper colloquium on conflict management
in Nigeria organized by NIPSS. Bisong, F. E. (2001). Natural resource use and conservation systems for sustainable rural development. Calabar: BAAJ International
company. Bisong, F. E. (2007). Environmental science and management in a changing world. Cabalar: Tabson Global Resources. Burton, J. (1990). Conflict resolution and prevention, volume 1. London: Macmillan. Cowardin, L. M. (1979). Classification of wetlands and deepwater habitats of the United States. Washington. DC: US fish and Wildlife
Services. Deutsch, M. (1973). The resolution of conflict. New Haven: Yale University Press. Himes, J. (1980). Conflict and conflict management. Athens: University of Georgia Press. Kolawole, A. (1991). Economics and management of FADAMA in Northern Nigeria: part 3a. In I. Scoones (ed.), Wetlands in dry lands:
Agro ecology of Savanna Sysytems in Africa dry lands programmes (54-62). London: International Institute for Environment and development (IIED).
Max, K. (1798). The poverty of philosophy. London: Macmillan. Mohammed, A. (2006). The impact of conflict on the economy. The case of plateau state of Nigeria: In analysis (volume 2). Jos:
University of Jos Press. Ortiz, O. (1999). Community conflicts in Nigeria: Management, resolution and transformation. Ibadan: Spectrum Books. Ramsar Convention Bureau (1971). A global overview of wetlands loss and degradation. Switzerland: Ramsar publication. Scones, I. (1992). Wetlands in dry lands: Key resources for agricultural and pastoral production in Africa dry land networks programme.
London: International Institute for Environmental and Development (IIED). United Nations Environmental Programme (1999). Sustainable Livelihoods approach. Nairaobi: UN Environmental Programme.

ISSN 2039-9340 Mediterranean Journal of Social Sciences Vol. 4 (1) January 2013
63
Pakistan: On the Way to be Failed State?
Md. Matiul Hoque Masud
Lecturer, Department of International Relations
The University of Chittagong, Chittagong-4331, Bangladesh. Email: [email protected]
Helal Uddin Ahmmed
Lecturer, Department of International Relations
The University of Chittagong, Chittagong-4331, Bangladesh. Email: [email protected]
Anwar Hossain Choudhury
Lecturer, Department of Sociology,
The University of Chittagong, Chittagong-4331. Email: [email protected]
Muhammad Ridwan Mostafa
Lecturer, Department of Sociology,
The University of Chittagong, Chittagong-4331. Email: [email protected]
Doi:10.5901/mjss.2013.v4n1p63 Abstract
Vibrant political situation and unstable foreign policy has raised the question –whether Pakistan a “failed state” or not- more strongly. Its dependence on major powers for security and absence of specific sphere of nationalism has made Pakistan more exposed. Over the last few years Pakistan is going to be considered a “failed state” because the indicators of a “failed state” have harmonized with the real impasse of Pakistan. Pakistan’s failure as state would have an international and regional ramification. Pakistan backed “war on terrorism” and ‘balance in South Asia’ would be more inconsistent if Pakistan failed. International community always would like to solve crisis related to Pakistan to fix up a “men” not by implementing a “system”. Pakistan was used as spring board by big powers for their own interest. If Pakistan failed it would be the first state which is not ‘weak’ but ‘failed’. The paper will discuss the dubious position of Pakistan as failed state; of course, without denying its internal dynamics and imminent tribulations related to its malfunction. The paper at last will propose some guiding principles to solve the setback.
Key Words: Failed State, Democracy, Intervention, Foreign Policy.
1. Introduction Internationally Pakistan’s position is always dubious, questionable and unpredictable. Absence of democracy, religious politics, separatist movement and dependent foreign policy has been the symbol of Pakistan since its independence. Geo-strategically important Pakistan in the middle of India, China and Iran usually used by every major powers as playground. Mutuality of interest got preference in Pakistan’s foreign policy in dealing with major big powers. Frequent disputes, absence of confidence building measures, uneven development and big power’s imbalance in assistance have made Pakistan more hostile to India. Building symmetry in power and getting international preference to India pushed Pakistan to change its allies that’s why its foreign policy was not stable and independent.
ISSN 2039-9340 Mediterranean Journal of Social Sciences Vol. 4 (1) January 2013
64
Internal dynamics and mutual mistrust has made the state ‘a difficult country to govern’.1 According to Newsweek it is the most dangerous nation.2
As strategically important de facto nuclear state and engaged in solving various common security problems of the world community, Pakistan’s failure as state will be fur reaching and devastating. But still we notice a ray of hope at the end of the tunnel that cannot be overlooked. Many argue that both the ‘failed state’ theory (like many other analysts Stewart Patrick feels that ‘failed states’ concept is not analytically reliable)
However, Most of the indicators essential to be ‘failed state’ have found in Pakistan.
3
The word “Failed” does not mean ‘weak’ or unstable state. In the phrase “Failed State”, the word ‘State’ is as important as ‘Failed’. State is not similar to nation. A state can be described as a group of people who share a common territory, history, culture, ethnic origin and language. A state is a set of institutions that possess the authority to govern the people.
and Pakistan’s position as ‘failed states’ are questionable. Last election in 2008 has opened a way to democracy after a bitter brutal autocratic background. Truly, every allies wanted to hold a titular men that serve well as their own interest as President of Pakistan. They never tried to nurture a stable and sound form of government. They never thought about the system which will be better suited in case of Pakistan. The US led ‘war on terrorism’ gave Pakistan an international presence but took away its acceptance. By the name of combating terrorism, frequent drone attack on Pakistan’s territory without its approval compelled Pakistan to review its relations with the US. China can come forward to get to the bottom of political impasse that has risen from internal and external mistrust. 2. Failed state: Definition and Indicators
4
In 2006 Noam Chomsky in his book ‘Failed States: The abuse of Power and the assault on democracy’ used the phrase and gave some indicators and elements essential to be considered “failed state”. He has indicated failed state to those states have lost their physical control over their territory; their legitimate authority has increasingly minor; public services have lessen; totally unable to interact with other states with trust; internationally which position is dubious. State failure suggests that the government – if one exists – is completely unable to maintain public services, institutions, or authority, and that central control over territory does not exist. State failure implies that central state authority and control do not de facto exist. Failed States refers to states in which institutions and law and order have totally or partially collapsed. Geographically, failed states are essentially associated with internal problem that have cross-border impacts they may face disintegration movement from their underdeveloped and exploited areas. Politically, collapse of law and order may fragment state authority that leads to civil war among paramilitary groups; they are unable to protect their citizens from violence.
It is the organization that has monopolistic power on the legitimate use of physical force within a given territory. It thus includes such institutions as the armed forces, civil service or state bureaucracy, courts, and the police. State means a sum of institutions that works together for the welfare of the people. It is not necessary to include a territory or heritage. State includes its government, military, public services etc.
5 Internationally, there will be no body representing the state to negotiate and enforce in world level without the outsiders influence. Historically, its history may rise in colonial regimes that destroyed its own local social traditions that’s why unable to get an effective identity and nationalism. 6Some of them may face partiality in nation building process. Sociologically, in such states the police, judiciary and other bodies serving to maintain law and order may no longer able to operate. Democratically, they suffer from a serious ‘democratic deficit’ that causes gradual destroy of formal democratic institutions. Its writ of government is challenged by militant groups.7 failed state Legally, the term ‘ s’ is often used to describe a state can no longer perform its basic security and development functions and that has no effective control over its territory and border.
Since 2005, the USA based think tank ‘Fund for Peace’ and well-known magazine ‘Foreign Policy’ has been publishing ‘Failed States Index’. The index shows five types of failed State in terms of their intensity-alert (if index is 90+
), warning (if index is 60+), dependent territory, moderate (if index is 30+), sustainable. Ranking is based on the total scores of the 12 indicators. For each indicator, the ratings are placed on a scale of 0(low intensity) to 10(high intensity).
1 Husain Haqqani, The Role of Islam in Pakistan’s Future, The Washington Quarterly, 28:1 Winter 2004-05, p-87 2 Nizar Diamond Ali, Is Pakistan a failed state? Daily Dawn, July 20, 2010.( The writer criticized The Newsweek Magazine in his writing for covering Pakistani nation negatively) 3 Stewart Patrick, ‘Weak States and Global Threats: Fact or Fiction?’,The Washington Quarterly, Vol.29, No.2 (Spring 2006), pp. 27–53; 4 Ali Hashmi, Is Pakistan a failed state? The Daily Times Wednesday, August 04, 2010 5 Noam Chomsky, Superpower and Failed States, Khaleej Times, April 5, 2006 6 Daniel Thürer, The "failed State" and international law International Review of the Red Cross, No. 836, 31-12-1999. 7 Dr Shabir Choudhry, Is Pakistan A Failed State? Countercurrents.org
ISSN 2039-9340 Mediterranean Journal of Social Sciences Vol. 4 (1) January 2013
65
So, total scores will be 0 to 120. In 2011, 177 states were included in the list, of which 35 were classified as "alert", 88 as "warning", 40 as "moderate", and 11 as "sustainable".8
The Failed State Index consider some indicators essential for being ‘failed state’- There are twelve indicators which demonstrate state’s failure.
9
1. Demographic Pressures – high density in population in comparison to supply of food and other complementary resources, reserved ownership of land and transport; and religious and historical sites under strict national control etc;
Out of twelve indicators four are social, two economic and six political. 2.1 Social indicators
2. Humanitarian and Social Security problems- massive movement of Refugees and Internally Displaced Peoples (IDPs) by forced uprooting of large communities or ethnic groups
3. Social Identification-atrocities committed with impunity against communal groups or specific groups, institutionalized political and communal identity over nationality;
4. Continual Human Flight - both the ‘brain drain’ of professionals, intellectuals and political dissidents and intentional emigration of the middle class, ethnic populace to other places of the state or any other state.
2.2 Economic indicators
1. Imbalance in Economic Development– inequality and injustice against a group or a tribe in education, jobs, and economic status according to their communal or religious identity.
2. Stern Economic Decline –high rate in inflation, fall in foreign investment, debt payments, deflation of the national currency and a growth in drug trade, smuggling.
2.3 Political indicators
1. Lack of Transparency–widespread corruption and political elites use their positions to oppose transparency, accountability.
2. Lack in Public Services –state become useless and fail to defend citizens from terrorism and violence; and fail to provide crucial services, such as health, education, sanitation, public transportation and essential commodities.
3. Violation of Human Rights through Politicization- widespread abuse of legal, political and social rights, including those of individuals, politicization of the judiciary, internal use of military for political ends
4. ‘State within a State’- State-sponsored or state-supported private or religious militias will increase terrorism and religious riot. This ‘army within an army’ will protect and promote the interests of the dominant military, religious or political elite.
5. Rise of Political Elites – continuous conflict between the ruling elites and state institutions, national decision will be taken in lines with religious, tribal or nationalistic or sub nationalistic identity
6. Foreign Intervention – receive free interference in internal affairs through military and economic assistance in accordance with foreign interest.
3. Questionable Position of Pakistan According to the latest (2011) index scores, Pakistan ranks 12th out of 177 countries examined.10 In both 2009 and 2010, Pakistan took the number 10 spot on this index, whereas in 2008 it was ranked number nine. Looking at the indicators used for the ranking, Pakistan’s worst scoring categories were: Refugees and Internally Displaced Persons (9.2), Group Grievance (9.3), Security Apparatus (9.4), External Interventions (9.3), Legitimacy of the State (8.6), and Uneven Economic Development (8.5).11
8 See for details-Failed State Index-2011. 9 Shabir Choudhry, Op,cit.
In line with the above mentioned indicators of Failed States we have no other to defy Pakistan from the Failed States list:
10 Charles Bara, Pakistan: A Failed State? ISN Special Feature, on Thursday, 14 July 2011 11 ibid
ISSN 2039-9340 Mediterranean Journal of Social Sciences Vol. 4 (1) January 2013
66
• With a population exceeding 170 million people, it is the sixth most populous country in the world and as the second largest Muslim population after Indonesia. Its demographic pressure is increasing at large extent. At 2.03% it has the highest population growth rate among the SAARC countries, resulting in an annual addition of 3.6 million people. The population is projected to reach 210.13 million by the year 2020 and would double in next 34 years.12
• Diversity in unity in communal affairs is an ever emerging crisis in Pakistan. Communal identities get preference in nation matters. Panjabi, Pashto, and Mohajir identities are considered superior than others. So belonging to any high profiled community is recognized as compulsory in Pakistan. The major threat to Pakistan is that the populace of periphery area considers the law and regulations ordered by their communal leader are more legal and social oriented than state proposed laws. Religious identity is critical in Pakistan. Muslim of Pakistan believes them as real Muslim and different from other South Asian semi-Muslims, they think them more similar to Arabian Muslim. Mainly identity in Pakistan is socially constructed from upward. Institutionalizing the communal political identity creates atrocities in different area.
• For various reasons, Pakistani skilled professionals are gradually crossing the national border for better and secure life. Political impasse and insecure future is largely contributed to the skilled human flight to other states from Pakistan. According to official estimates of Pakistan’s Overseas Employment Corporation, near about 36000 professionals, including doctors, engineers and teachers, have migrated to other countries in last 30 years.13
• Uneven development and imbalance in national social services causes mistrust to state authority. In 2011, 57.7% of adult Pakistanis were literate. While female literacy was 45.2% but in tribal areas this rate was 3% (Human Development Report, 2011). Pakistan hosts more refugees than any other country in the world including 1.7 million Afghan refugees from neighboring Afghanistan (UNHCR). Refugees and IDPs in major times take part in separatist and religious movement and causes insurgency to draw attention of the world community for their survival. Displacement is a key problem, by mid-July 2009; Pakistan’s National Database and Registration Authority (NADRA) put the total of Internally Displaced People (IDPs) at just over 2m, while unofficial figures are as high as 3.5m.
• Economic situation is not well solving. Dependency on foreign debt and investment is the major setback of Pakistan’s economy. Necessary commodities are not available for all. The inflation rate for the fiscal year 2010-11 was 14.1% Approximately 19% of the population and 30% of children under age of five are malnourished. About 20% of the population lives below the international poverty line of US$1.25 a day.14
• Economic status of Pakistan is not in first-rate. The rate of unemployment is 25% in 2011.
15
• Lack of democracy within Party and the state give the social acceptance to wide spread corruption by political elites. Public services are useless. Political rights in Pakistan are very narrow, for example, The 2009 Freedom in the World report by Freedom House gave Pakistan a political rights rating of 4 (1 representing free and 7 representing not free), and a civil liberties rating of 5, earning it the designation of partly free .
According to Finance Ministry of Pakistan, the foreign exchange reserves had declined by $10 billion. Devaluation of currency is daily news now in Pakistan. In 2006, Pakistani Rupees per dollar was 60.35 and in 2010 it soar up to 85.27. The volume of external debt in December 2010 is around $56 billion which consumes 50.6% of GDP (Ministry of Finance, Pakistan).
16
• Throughout the country, there is an almost complete absence of legitimate authority and institutional mechanisms for decision-making. Most decisions are made by the President himself who also tends to personally conduct Pakistani diplomacy. Coordination between different branches of government is also virtually non-existent.
• Pakistan does not provide reasonable public services to all or at least most of its citizens (which flows directly from its lack of territorial control). Even in Karachi, the country’s biggest city, the authorities are unable to provide even a minimum of personal security, with an average of 4.7 murders in the city every night– most of
12 Lecture delivered to the participants of the Command and Staff Course at Command and Staff College Quetta on September 4, 2009, available at: http://www.iba.edu.pk/News/speechesarticles_drishrat/Pakistan_Economy_Challenges_Prospects.pdf 13 Info available at :http://www.yespakistan.com/education/brain_drain.asp 14Economic Watch, 29th May, 2010, available at http://www.economywatch.com/world_economy/pakistan/ 15 ibid 16 Economic Watch, 29th May, 2010, available at: http://www.economywatch.com/world_economy/pakistan/
ISSN 2039-9340 Mediterranean Journal of Social Sciences Vol. 4 (1) January 2013
67
which are politically motivated.17
• Violation of Human rights in every sector is common and legally accepted. Communal leaders are countered by using state force. Even, Political and military interests have been prioritized over humanitarian considerations in their offensives against the Taliban. Some popular, legal and recognized culture is not globally accepted like Blasphemies law.
And due to ongoing military operations and militant activities in the Federally Administered Tribal Areas (FATA) in north-west Pakistan, there has been enormous internal displacement of persons.
• Pakistan is unable to control its territory physically. In the North-west, along the border with Afghanistan, tribal militants and the Taliban are actively challenging the government’s physical control. In the south-west, Pakistan is close to losing one of its biggest provinces − Baluchistan – to a bloody insurgency that openly seeks independence under separatist movement. And while one tends to think of Pakistan’s military as a more professional, secular organization, the evidence now clearly shows that it has been infiltrated by violent Islamist, insurgent and terrorist groups at basically all levels.
• Pakistan faces many challenges. Since 9/11, 35,000 Pakistanis have died in suicide bombings, with an average of more than one such bombing a week (BBC News, 7th May, 2011). Since 9/11 the US led NATO forces ran drone operation over 120 times, without approval from authority, which is clearly a threat to Pakistani sovereignty. Interference in internal affairs has increased.
4. A State without an Independent Foreign Policy Under the flag of friendliness and goodwill towards the nations of the world Pakistan distinguished herself as moderate Muslim country. Security problem with India and Afghanistan pushed Pakistan towards alignments with the USA. Continuing developed relations between the USA and India pressurized Pakistan to ally with Socialist world namely the USSR and China. Pakistan withdrew from the SEATO, CENTO and joined in NAM to secure its interest. To deter secret enrichment of uranium by Pakistan the USA cut all security assistance. The Soviet military intervention in Afghanistan allowed Pakistan and the US to get involved in a marriage of convenience. The USA opened again it’s all assistance after 9/11. The US led war on terrorism made Pakistan more vulnerable it found itself in the middle of cross-fire. The US nuclear deal with India and mistrust in case of terrorism has posed Pakistan to get ally with China. From its independence, Pakistan had no stable foreign policy. It took alignment, non-alignment, bilateralism, anti-indianism, isolationist foreign policy in the phase of history.
Religion based social and political tradition has made Pakistan compelled to take Anti-Indian foreign policy. Then to present two nations have fought four wars between them. To counter India searching security allies was the foremost policy of Pakistan. Immediate aftermath of independence, Pakistan faced territorial boundary disputes from two sides with India and Afghanistan. First Kashmir war (1947-48) made Pakistan bound to explore allies. On the other side Afghanistan claimed its sovereignty over North West Frontier Province (NWFP) and Baluchistan.18
17 ibid 18 Dr.Hasan-Askari Rizvi, Pakistan’s Foreign Policy: An Overview 1947-2004, Pildat Briefing Paper,p-10
India and the USSR gave support to Afghanistan. In May 1954, Pakistan signed a Mutual Defense Assistance Agreement with the US. In September 1954, Pakistan joined the South East Asia Treaty Organization (SEATO) though it was not East Asian states. In September 1955, Pakistan joined the CENTO that helps Pakistan to get ally with Muslim states. A Bilateral Agreement of Cooperation was signed in March 1959. Though all treaties have signed but Pakistan’s security ambition (to counter India) was not fulfilled because the US agreed to use its assistance against Communism. On the other hand most of the Middle Eastern states responded negatively to Pakistan’s security ties with the West. The USSR extended its support to India. Pakistan has lost its ground in NAM. Without any security commitments in return for arms transfer the US rushed military equipments to India in October 1962 to counter China. Pakistan began to review their alignment with the US. Pakistan decided to improve its relations with the USSR and China. The USSR adopted a balanced approach towards Indo-Pak disputes in 1965 and maintained neutrality in signing Tashkent Declaration in January 1966. Pakistan began to plead for the seating for China in the UNSC. China stood by Pakistan during 2nd Indo-Pak war. China was it’s the most important source of supply of weapons when the US imposed an arms embargo on the South Asia in the post 1965 war period. At the time of a widen rift between China and the USSR in 1969, Pakistan did not endorse Asian Collective Security System advocated by the USSR. The Soviets were disappointed by Pakistan’s role in Sino-American rapprochement. Concrete Soviet support (military support and action in UNSC) to India through Treaty of Friendship and Cooperation strengthened India’s interfering policies in East Pakistan. As a result of American limited help and arms embargos, Pakistan withdrew from the Commonwealth (returned in 1989) the SEATO, and the CENTO. After the
ISSN 2039-9340 Mediterranean Journal of Social Sciences Vol. 4 (1) January 2013
68
independence of Bangladesh, Pakistan took independent approach to world affairs that helped to normalize its relations with India by signing Simla Peace Agreement in 1972. In 1974, when India exploded (peaceful) its first nuclear bomb, Pakistan was secretly working on setting up uranium experiment.
The Soviet military intervention in December 1979 was a turning point for the US-Pak relations. Mutuality of interest has fulfilled. The US gave $ 7.4 billion assistance package between 1981 and 1993.19
At present ‘failed states’ are the single most security threat to liberal democratic states. According to Jack Straw, ‘Terrorists are strongest where states are weakest’, and weak or failed states provide a ‘breeding ground’ or ‘sanctuary’ for terrorism.
After the completion of Soviet withdrawal from Afghanistan in 1989, Pakistan made various attempts to install to new government in Kabul comprising pro-Pakistani mujahedeen groups. The US shifted its interest and imposed sanctions against Pakistan for its secret nuclear project under the Pressler Amendment in the Foreign Assistance Act. Pakistan had lost its strategic relevance for the US after Soviet collapse. Pakistan gave support to the Taliban regime in Afghanistan (1996-2001). It adversely affected Pakistan’s reputation at the international level. India took the chance and suspected that Pakistan armies and intelligences sponsored Islamic militant groups in Indian administered Kashmir. The two states engaged in a limited war in Kargil region of Kashmir in 1999. To overthrow nuclear imbalance and show ‘minimum credible deterrence’, Pakistan exploded its first nuclear bomb in 1998. After the ground breaking event of 9/11 Pakistan got focus because the US identified the Al-Qaeda movement of Osama bin laden based in Afghanistan was the main culprit of the event. As Pakistan supported the Taliban regime and shared a long border with Afghanistan, its support to the US led war on terrorism was important. Both states gave immense strategic support. Pakistan was concerned like the past after the overthrow of Taliban government from Afghanistan Pak- US relations might not continue for a long time; the US would abandon Pakistan when its strategic interest shift away from in or around Pakistan. It happened. After the death of Osama bin laden, Pakistan has lost its significance for the US interest. So, foreign policy of Pakistan is not independent. It varies if foreign policy of others changes. There is no basic foundation of Pakistan’s foreign policy. 5. Pakistan’s Failure: Regional and International Ramification
20 According to Fukuyama, ‘weak and failing states have arguably become the single most important problem for international order’.21 If Pakistan fails, it will be a safe haven for Islamic militants. The state may misplace its nuclear project and clue to the militants. Weak and failing states are vulnerable to all forms of smuggling, including trafficking in small arms and light weapons. 22
19 Ibid, p-19 20 Jack Straw, Reordering the World: The Long-Term Implications of September 11 (London: Foreign Policy Research Centre, 2002). 21 Francis Fukuyama, State-Building: Governance and World Order in the 21st Century (Ithaca, NY:Cornell University Press, 2004),p.92. 22 Edward Newman, Failed State and International Order, Contemporary Security Policy, Vol.30, No.3 (December 2009), pp.429.
It will create security concern in regional and international arena. Whole South Asia will lose its balance of power. Imbalance in power and uneven development in a region may raise security mistrust among neighboring states. Regional organization likewise SAARC will mislay a state that has leading power. Refugee flow from the failed states may create insurgency in neighboring states. Major Powers will start their great game to increase their sphere of influence in the region. Common security threat like- terrorism, drug trafficking, arms trade, nuclear proliferation will be difficult to tackle without the assistance from Pakistan. 6. Ever present Challenges ahead of Pakistan Since independence to 1956, Pakistan has been a dominion in the Commonwealth of Nations and it became a notable Islamic Parliamentary Republic in 1956. The civilian rule was caught up by a coup d’état by Army Commander-in-Chief General Ayub Khan, who was the first Chief Martial Law Administrator and also the President during 1958–69. Ayub Khan's descendant, General Yahya Khan (1969–71), also an Army Commander, General Yahya Khan surrendered his authority to Zulfikar Ali Bhutto, who became the first and to-date the only civilian Chief Martial Law Administrator. Civilian rule resumed in Pakistan from 1972 to 1977. Bhutto was removed by a coup d'état and in 1979, General Zia-ul-Haq became the third military president and fourth Chief Martial Law Administrator. Military government lasted until 1988. When Zia died in a plane crash in 1988, Benazir Bhutto, daughter of Zulfikar Ali Bhutto, was elected as the first female Prime Minister of Pakistan. She was followed by Nawaz Sharif and over the next ten years the two leaders fought for power and alternated as the country's situation worsened. Military tension in the Kargil with India was followed by Kargil War, after which General Pervez Musharraf took over through a Bloodless coup d'état and captured vast executive powers.
ISSN 2039-9340 Mediterranean Journal of Social Sciences Vol. 4 (1) January 2013
69
General Musharraf ruled Pakistan as head of state from 1999–2001 and as President from 2001-08. On 15 November 2007, Pakistan's National Assembly completed tenure for the first time in its history when a new election was called. In the 2008 elections, Bhutto's Pakistan People’s Party (PPP) obtained the largest number of seats and its member Yousaf Raza Gillani was sworn in as Prime Minister. Musharraf resigned from the presidency when threatened with impeachment on 18 August 2008, and was succeeded by current president; Asif Ali Zardari. The first Constitution of Pakistan was adopted in 1956, but was suspended in 1958 by General Ayub Khan. The Constitution of 1973 – suspended in 1977, by Zia-ul-Haq, but re-instated in 1985 – is the country's most important document, laying the foundations of the current government.
The Pakistani military establishment has played an influential role in mainstream politics throughout Pakistan's political history, with military presidents ruling from 1958–1971, 1977–1988 and 1999–2008. The election of 2008, despite a difficult start with voter registration and manipulation of electoral rules, was reasonably air and peaceful, despite Taliban threats to disrupt the process. That election saw the peaceful and democratic transfer of power which brought President Asif Ali Zardari and Prime Minister Yousaf Raza Gilani into office. Despite the problems with President Zardari, who is widely viewed as corrupt, an important shift has taken place politically. Perhaps under Army pressure, Zardari began relinquishing the sweeping presidential powers he inherited from Musharraf. In April 2010, Zardari signed the 18thAmendment which returned Pakistan to a parliamentary democracy more in line with its 1973 Constitution, which remains the lodestone of democratic legitimacy in Pakistan. This is the first time in recent history when a president "willingly" ceded power to a prime minister. Democracy deficit, military intervention in politics, disputes in cabinet, failure in national integration and state within state are leading internal challenges ahead of Pakistan. Democracy is still not well practiced and well established. After its independence as sovereign and democratic state it took nearly a decade to frame a constitution. Since 1958-73, 1977-88, 1999-2008, there was not democratically elected government in Pakistan. Democracy and the rule of law were not nurtured. When military think that the civilian government is not capable to run the state and serve the nation, it upholds the state power from democratically elected government.
Dispute within Cabinet between Prime Minister and President is not historically rare in Pakistan. Constitution gave Prime Minister the power to overthrow President. Governor General Malik Ghulam Muhammed misplaced public council trice between 1953 and 1955. Then, being President Iskander Mirza announced martial law and made Muhammad Ayub Khan Commander In Chief but Ayub Khan in 1958 disposed Iskander Mirza and took legal power of Presidency in 1960. General Zia took power in 1977 and sentenced death to Bhutto in 1979. After death of General Zia, Benazir Bhutto crowned power in 1988 but overthrown by Ghulam Ishaq Khan in 1990. Mian Mohammad Nawaz Sharif reached power in 1990 and overthrown in 1993. In 1996 President Farooq Leghari overthrew Benazir. In 1999 Musharraf overthrew government under a coup. The nation got sound democracy after 2008.
Creation of Bangladesh in 1971 as independent nation was considered a failure of Pakistan’s national integration. Baluchistan may follow the so. Pakistan may break into pieces. The Baluchistan problem was potentially serious in that it sought to generate separatist and nationalist sentiment within a culturally distinct ethno-linguistic group that had its own autonomous history. The Baluchis were accustomed to having arms and historically overlapped with Iran as well as Afghanistan. Within Pakistan, the Baluchistan area made up 42 per cent of the entire country. Baluchi separatism was perceived as a threat to the state of Pakistan. The Sindhudesh or Sindhi nationalist problem was probably the most significant potential base of separatism in Pakistan because of the long history of Sindhi states prior to British rule, the highly developed language, and the relative size and territorial compactness of the Sindhi population in Sindh province. It was geographically an ominous threat too because Sindhi independence could turn northern Pakistan into a landlocked country.
Olama mashaek (Islamic leaders) and Islamic militants have raised themselves as third party in the disputes between military and civilian government. State may lose its nuclear secrecy to these third parties. Pakistan has taken the challenge of defeating the Pakistani Taliban seriously.23
23 C. Christine Fair, Is Pakistan a failed state? No. in Foreign Policy Magazine June 24, 2010
Pakistan has made significant strides in securing its nuclear arsenal through the establishment of the National Command Authority and the Strategic Plans Directorate.
The new type of clash is ongoing between Supreme Court and Government of Pakistan. Recently Pakistani Prime Minister Yousaf Raza Gilani has been dismissed. The scene behind the curtain is, since 2009 Mr. Zardari opposed Justice Chaudhry’s restoration. Mr. Gilani’s dismissal stemmed directly from his refusal to heed court orders to pursue a corruption inquiry against the president. The ultimate target of Chief Justice Iftikhar Chaudhry’s order may have been President Zardari. The new prime minister Raja Pervaiz Ashraf has embroiled in the same legal battle as Gilani, as the supreme court reissues its demands for the prime minister to pursue money laundering allegations against Zardari within two weeks. Basically, being used to overthrow so many civilian Presidents in the history of Pakistan, the judiciary and military view this periodical coup as their duty. Some described Gilani's ousting as a "judicial coup".
ISSN 2039-9340 Mediterranean Journal of Social Sciences Vol. 4 (1) January 2013
70
7. What would be the Solution: The System or Men? State failure can only be countered through democracy, reform in governance and positive international response in time. Pakistan has to give up its longstanding ties with radical Islam and share intelligence with the US to remove mistrust. Pakistan has the potentialities to frustrate antiterrorism operation and radicalize key segments of Islamic world. The military’s political ambition could not be encouraged. Pakistan’s excess focus on religious ideology, military capability and external alliance has weakened it internally that leads state governed institutions in decline. Pakistan should give more emphasis on developing own economy. It should remove its intersecting fault lines between civilians and the military, among different ethnic and provincial groups, and between Islamists and secularists. These countering measures can only tackle state falling. The US should not use its aid (Since 9/11 the US has provided Pakistan - or more accurately the Pakistani military - with more than $20bn in aid) 24
Charles Bara, 2011,
as leverage to influence in Pakistan’s internal politics. Independent foreign policy will pave the way for Pakistan to solve common security problems. It may be difficult for the world community to force an end to Pakistan’s status as an Islamic ideological state. The world should demand reform in Pakistan’s governance. Military of Pakistan should not nurture Islamic militancy in home land and may give up national objectives like building pro-Pakistani government in Afghanistan or sponsoring terrorism in Indian Kashmir. It should give more emphasis on economic prosperity and popular participation in governance. There should be a balance in spending between military and social services. Establishing democracy, strengthening civil society and building secular political parties can contain its falling. References
Ali Hashmi, 2010, Is Pakistan a failed state? The Daily Times Wednesday, August 04, 2010 C. Christine Fair,2010 Is Pakistan a failed state? No. in Foreign Policy Magazine June 24, 2010
Pakistan: A Failed State? ISN Special Feature, on Thursday, 14 July 2011 Daniel Thürer, 1999, The "failed State" and international law International Review of the Red Cross, No. 836, 31-12-1999. Edward Newman,2009, Failed State and International Order, Contemporary Security Policy, Vol.30, No.3 pp.429. Francis Fukuyama, 2004, State-Building: Governance and World Order in the 21st Century, Ithaca, NY:Cornell University Press,p.92. Hasan-Askari Rizvi, Pakistan’s Foreign Policy: An Overview 1947-2004, Pildat Briefing Paper,p-10 Husain Haqqani, 2005, The Role of Islam in Pakistan’s Future, The Washington Quarterly, 28:1 p-87 Jack Straw, 2002, Reordering the World: The Long-Term Implications of September 11, London: Foreign Policy Research Centre, Lecture delivered to the participants of the Command and Staff Course at Command and Staff College Quetta on September 4, 2009,
available at: http://www.iba.edu.pk/News/speechesarticles_drishrat/Pakistan_Economy_Challenges_Prospects.pdf Nizar Diamond Ali, 2010, Is Pakistan a failed state? Daily Dawn, The writer criticized The Newsweek Magazine in his writing for covering
Pakistani nation negatively Noam Chomsky,2006, Superpower and Failed States, Khaleej Times, Owen Bennett-Jones, 2011, Pakistan: A failed state or a clever gambler? BBC News, Islamabad on 17th May 2011. Shabir Choudhry, Is Pakistan A Failed State? Countercurrents.org Stewart Patrick, 2006, ‘Weak States and Global Threats: Fact or Fiction?’,The Washington Quarterly, Vol.29, No.2, pp. 27–53; Website http://www.yespakistan.com/education/brain_drain.asp http://www.economywatch.com/world_economy/pakistan
24 Owen Bennett-Jones, Pakistan: A failed state or a clever gambler? BBC News, Islamabad on 17th May 2011.
ISSN 2039-9340 Mediterranean Journal of Social Sciences Vol. 4 (1) January 2013
71
Edgar Allan Poe’s Narrative Use of Literary Doubling
Miriam Fernández-Santiago, PhD.
University of Granada, Spain.
Email: [email protected] Doi:10.5901/mjss.2013.v4n1p71 Abstract
The present article analyzes the incidence of the literary tradition of doubling in the short narratives of Edgar Allan Poe. It presents an analysis of doubling in Poe’s short narratives from the different critical perspectives of previous research on literary and non-literary doubling, and also from Poe’s own views as a literary critic. It contends that Poe’s compliant and subversive use of traditional literary doubling corresponds with his critical views on the compositional unity of effect as he developed them in “The Philosophy of Composition.”
Key Words: Literary Doubling, Short Narrative, Aesthetic Effect.
“Since the world began there have been two Jeremys”1
1. Introduction
The theme of the double in literature has been subject to extensive critical analysis both from the literary and non-literary perspectives, including Psychoanalytic elaboration, sociological connections, and mythological, religious or anthropological approaches. In this article, I would like to analyse the literary convention of the double in the narrative fiction of Edgar Allan Poe. In my analysis, the convention of the literary double is extended from its classical constriction to characterization into a wider concept including elements from the literary fabric such as setting construction and implied criticism. The purpose underlying such extension is to establish a basis for literary analysis that considers Poe’s own critical vision relating to the compositional requirements of textual effect. I contend that Poe’s use (compliant and subversive) of the literary convention of the double might transcend the merely Gothic use of psychologically unbalanced characters to become an artistic statement on compositional harmony in terms of unity and balance, and also a critical reflection on the nature of art as mimesis. 2. Defining the Literary Double Within the Psychoanalytic tradition that approves of making paradigmatic use of literature (fictional or else) for the study of the human psyche, Eder associates the origin of the double to ethnological and mythological sources that situate the first appearance of the double “in physical images of the self, such as shadows and reflections, and in psychic projections of the self, such as gods and devils, guardian angels and familiar” and connects it to allegorical representations of “a struggle between personified virtues and vices” such as can be found in medieval morality plays.2 Herdman affirms that this “theology of the moral conflict between the opposing wills in man, natural and spiritual, was developed by St Paul,” and he traces it back to the Calvinist doctrine of election through Gnosticism, Manichaeism and St. Augustine’s Confessions. At the end of the 18th century, a growing corpus of literature describing the native cultures of newly colonised peoples produces an alteration in the literary tradition of the double, causing that “[t]he concept of moral evil became associated with the primitive, the savage and the untamed in the human spirit” typical of Romanticism.3
The theme of identity is central to the literary double, but according to Dryden, it becomes more pressing for nineteenth-century subjects, who have to face the dilution of their individuality into the emergent mass of people gathering in expanding metropolis.
4
1 Poe, Edgar Allan. The Works of the Late Edgar Allan Poe (The Griswold Edition, 1850-1856), 4: 267. http://www.eapoe.org/works. 2 Eder, Doris L. “The Idea of the Double.” Psychoanalitic Review, 65.4 (1978): 579-614, 580, 582. 3 Herdman, John. The Double in Nineteenth-Century Fiction (London: MacMillan, 1990), 4-9, 11. 4 Dryden, Linda. Modern Gothic and Literary Doubles. Stevenson, Wilde and Wells (New York: Palgrave Macmillan, 2003), 16.
The special interest in the theme of the double during the nineteenth-century has
ISSN 2039-9340 Mediterranean Journal of Social Sciences Vol. 4 (1) January 2013
72
also been explained in relation with the rise of Psychology and the theories of dual consciousness developed by Mesmer, Schubert, Charcot, Binet and Janet.5
The coinage of the term doppelgänger is attributed to Jean Paul Richter,
The figure of the double would later develop into the Freudian unconscious; a subdivision of the human psyche that stages the moral struggle between good and evil—or primitive appetite and its civilized constriction—within the individual’s own mind.
6 but it was Hoffman who in the early 19th century, would relate the figure of the literary double with a part of the personality and spread enthusiasm for duality to the rest of Europe.7
The literary double “has been apt to take a comic turn—to turn, for instance, in a manner prefigured by Shakespearean duality, into a comedy of errors and impostures.”
But the theme of the literary double is much older than that. In Western culture, some of its variants can at least be found in both the ancient Greek (mythological, dramatic or epic texts), and Judaeo-Christian traditions. Although the Gothic development of the literary double into the figure of the doppelganger is often the best known and more thoroughly analyzed version of the theme of the literary double, there is also a long literary tradition of doubling in comedy.
8 In fact, doubling has been described as intrinsic to humor in general. Willeford notices how “[t]he fool often appropriates or replaces the image of someone else” and analyses classical representations of the Fool’s bauble as an elaboration of a mirror-image that sticks out its tongue to the mirror holder (33).9 Also, the doubling nature of the jester as Harlequin is present in its patched costume and masked identity, and its often numinous nature.10
Alter makes an interesting distinction between two types of doppelgangers; the split and the double proper. To him, the split would portray a “self divided inwardly in a kind of moral meiosis”
11 that addresses a contradictory difference within the self and that connects with Herdman’s historical account of the double. Alter’s distinction of the figure of the split clarifies the reason underlying Herdman’s description of the double and its host as a pair that “reflect hostility and conflict, yet at the same time mutual dependence and interlocked destinies” 12
To Alter, the double proper, “encounters a disturbing mirror-image in the external world” and would therefore be closer to Eder’s ethnological and mythological account of the origin of the double. “The double [proper]” Alter explains, “draws on a background of folktales about confrontations with demonic figures who exercise a maddening ability to mime the self, generally as part of a scheme to destroy it.”
and is reminiscent of the Freudian Unheimlich.
13 Eder’s psychoanalytical dissection of the literary theme of the double distinguishes several categories of doubles such as mirror images (very similar to Alter’s split), manifest or latent doubles (both complementary and oppositional), foils and multiple personalities. She also distinguishes between subjective and objective doubling, and detects an underlying “psychomachia between the forces of Eros and Thanatos” in most double fiction.14
The figure of the double also seems to be related to a Romantic anxiety for (moral) freedom that is often represented in contrast with the threat of imprisonment.
15 This moral constraint that seems to repress the Romantic double is sometimes represented as claustrophobic projections of the self (host) into Gothic settings. But for the romantics, the self’s impossibility to escape his/her own dark nature also takes the literary expression of fate. Romantic protagonists, Herdman argues, “attribute their possession to the inscrutable workings of a destiny which they are powerless to evade,”16
This moral tincture in the construction of the literary double is retained in the Psychoanalytic readings that view the double as a possible expression of unconscious, repressed desires of doppelganger hosts that (rather liberally) include forms of “consciousness” as diverse as authors, narrative voices or other characters. The literary expression of the double thus transforms fiction into the discourse of freedom from social constraints (including the Jungian Signifier).
which is directly linked to the idea of predestination.
5 Eder, “The Idea,” 580. 6 Eder, “The Idea,” 580. 7 Miller, Karl. Doubles. Studies in Literary History (Oxford & New York: Oxford UP, 1987), 49. 8 Herdman, The Double, 88. 9 More precisely, one of Holbein’s illustrations to Erasmus’ Praise of Folly, based on an illustration to Brant’s Narrenschiff. Willeford, William. The Fool and His Scepter: A Study in Clowns and Jesters and Their Audience, (London: Edward Arnold (Publishers) Ltd., 1977), 33-4 10 Zucker, Wolfgang M. “The Image of the Clown,” The Journal of Aesthetics and Art Criticism, 12.3 (1954): 310-317, 311-312. 11 Alter, Robert. “Playing host to the Doppelgänger” Times Literary Supplement, 24 (1985), 1190. 12 Herdman, The Double, 15. 13 Alter, “Playing host,” 1190. 14 Eder, “The Idea,” 582, 598. 15 Dryden, Modern Gothic, 87; Alter “Playing Host,” 1190; Miller, Doubles, 157. 16 Herdman, The Double, 12.
ISSN 2039-9340 Mediterranean Journal of Social Sciences Vol. 4 (1) January 2013
73
Moreover, the heavy sexual load of Psychoanalysis turns attention to gender roles and power relations that become apparent in the tension of literary dualism. Of special relevance in this direction are Queer Studies on the literary double as either extensions or contestations of the Psychoanalytic reading of the myth of Narcissus.
I would like to finish this introduction to the idea of the literary double with Alter’s illustrative sketch of the social profile of the figure that becomes hosts to the doppelganger. In it, he includes details like the host’s gender (male), sociability (single, without friends or visible relatives), financial means (ample), and literacy (educated and intelligent). “Sterility,” Alter adds, “disconnection, the displacement of personal by professional life, a developed mind with the leisure to exercise it, are the general fate of the Doppelgänger host.”17
3. The literary Double in Poe: Characterization
Most of these features, which are currently associated with the literary figure of the double, are liable to provide
critical clues to Poe’s often cryptic work. The moral dimension; the numinous, demonic character of the double as shadow; the issue of identity; the notion of fate; the Icarian contestation to social or mental imprisonment, the threat of mental imbalance, the humorous distancing and the gender perspective are useful tools for the analysis of double characters. Still, doubling is also a characteristic of the textual fabric that can shed light on the compositional techniques and critical positions that are present in Poe’s narratives.
A.- Homodiegesis. A most pervading manifestation of doubling in Poe’s narratives is the presence of a homodiegetic narrative voice. It could be argued that ninety-eight per cent of Poe’s prose fiction is homodiegetic. Homodiegesis signals an internal dualism that splits the narrative voice into speaking subject and spoken object. This double quality of the narrative voice often takes the form of some “duality of mood” in the homodiegetic character, “which sometimes manifests itself in fluctuations of tone.”18
In “The Tell Tale Heart,” the narrator asks readers to bear witness of his sanity; “observe how healthily – how calmly I can tell you the whole story.” However, in the following paragraph, he suggests that he might have killed the old man he loved, and who had never wronged him, because “[o]ne of his eyes resembled one of a vulture;” which is suggestive of his mental imbalance. As it often occurs in Poe’s narrative, and despite the fact that he does narrate the story, the narrator of “The Tell Tale Heart” accepts his impotence to make meaning out of it: “It is impossible to say how first the idea entered my brain.”
Poe’s homodiegetic voices frequently get so fluctuant in tone that they make readers distrustful of character consistency. Although mental imbalance (usually a family legacy) and drug or alcohol abuse often provide an acceptable explanation in terms of Aristotelian standards of mimetic probability, the account that Poe’s homodiegetic narrative “voice-as-subject” gives of its behaviour as “voice-as-object” is often relegated to the unutterable.
19
In Poe’s fiction, the homodiegetic double might appear as both an internal division of a diseased or intoxicated mind (the split), or as the external impersonation of some haunting demon (the double proper). The narrator’s alcoholic intoxication in “The Angel of the Odd” is embodied in a “genius who presided over the contre temps of mankind”
The fact that the narrator seems to be “absent” from the reasons that lead his own actions, together with narrative inconsistency or fluctuation in tone, point at doubling as the structural frame of the narrative voice.
20
I bethought me of looking immediately before my nose, and there, sure enough, confronting me at the table sat a personage nondescript, although not altogether indescribable. His body was a wine-pipe or a rum-puncheon [. . .] two kegs, which seemed to answer all the purposes of two legs. For arms there dangled [. . .] two tolerably long bottles, [. . .] All the head that I saw the monster
and whose negative influence on the disastrous fate of the narrator is presented as the natural consequence of the narrator’s actions. When the Angel of the Odd is first described, he appears as a mirroring image facing the homodiegetic narrator, but also as an outer being that is referred to as “monster” and “creature:”
21 possessed of was one of those Hessian canteens [. . .].22
17 Alter, “Playing host,” 1190. 18 Herdman, The Double, 22. 19 (1:382). 20 (4:282). 21 Emphasis added. 22 (4:279-280).
The Angel-double has elements of the undecidable in the narrator’s difficulty to describe it and in the reader’s
difficulty to follow its speech, which is a transcription of the phonetic distortions of a drunkard’s (more specifically the narrator, whom the Angel doubles).
ISSN 2039-9340 Mediterranean Journal of Social Sciences Vol. 4 (1) January 2013
74
The open acknowledgement or underlying suggestion of madness in the homodiegetic narrative voice does not only account for the presence of the double within such voice as character. It might also render the narrative voice as the double of a host long lost in textual ambiguity, which opens up the question of usurped identity that is typical of literary doubling. The signer of the homodiegetic adventures of Hans Pfaall, introduces himself in the following terms: “I, the writer of this communication, am the identical Hans Pfaall himself.”23 His emphasis on similarity rather than identity (but also including the pun in “identical”) adds to a lunacy that is suggested by his voyage to the Moon as much as acknowledged by Pfaall himself “lest I should be supposed more of a madman than I actually am.”24 In Poe’s narrative, the reader often faces the uncanniness of suspecting the double’s actual usurpation of the narrative perspective, which traditionally belongs to the host-subject. The Angel of the Odd, The Imp of the Perverse, and William Wilson incarnate the voices of a good consciousness that haunt a depraved host; a reversal of the double types that makes suspicion turn to the narrative voice as the true wicked double of the moral pair.25
In accordance with Alter’s social profile of the host to the doppelganger, most of Poe’s double characters are male, which has often caused that some critics see a projection of his own internal division on his characters.
Poe’s use of narrative homodiegesis is inscribed within the tradition of literary doubling through fluctuations in tone,
character inconsistency and shifts of narrative perspective. The effect of a double voicing in Poe’s short stories does not only create a narrative tension that adds to plot development, but also causes a certain metafictional discomfort in readers by continuously undermining suspension of disbelief. Still, other issues related to character doubling should be addressed before analysing the implications of doubling in the textual dimension. B. Reading Queer
26 More recently, Queer Studies have developed a double direction in a Queer reading of Poe’s doubling that renders him either homophobic,27 or an advocate of sexual ambiguity.28
The contradiction existing between Dupin’s objective “investigative method” and his “subjective implication” with his object (subject) of study in “The Purloined Letter” is interpreted by Person as Poe’s “homophobic repressions of erotic identification between men.”
Notwithstanding the cultural, social and biographical interest of this approach, I would rather consider the development of double characters in Poe’s texts as evidence of his interest in artistic composition as an intertext of the scientific discourse of his time.
29 However, Dupin himself describes it as “an identification of the reasoner’s intellect with that of his opponent,” and he lectures the narrator on the subject: “This response [. . .] lies at the bottom of all the spurious profundity which has been attributed to Rochefoucauld, to La Bougive, to Machiavelli, and to Campanella.”30 As he observes Monsieur Dupin, his roommate and literary double, the narrator of “The Murders of the Rue Morgue” dwells “meditatively upon the old philosophy of the Bi-Part Soul, and amuse[s him]self with the fancy of a double Dupin — the creative and the resolvent.”31
The nineteenth-century criminalization of same-sex desire has also been considered an expression of the Gothic potential of the doppelganger as an incarnation of the demonic shadow that haunts the individual’s moral, social and identity status. To nineteenth-century readers, homosexuality is suggestive of a perverse psychology
As it is expressed, Poe’s elaboration of the idea of doubling in Dupin would be much more justifiably seen as a dialogue between the literary tradition of the double and the nineteenth-century philosophical/scientific interest in theories of double consciousness, than to the gender issue—notwithstanding the terms used by the narrator to describe their relationship.
32 as much as murder or theft. Person and Bradley33
23(1:5). Emphasis added. 24 (1:15). 25 Particularly illustrating in this respect is Bate’s analysis of character reversal in “William Wilson.” Bate, Nancy Berkovitz. “I Think, but I am Not: The Nightmare of William Wilson” Poe Studies, 30 (1997): 27-38. 26 Buranelli, Vincent. Edgar Allan Poe (Boston: G.K. Hall&Co., 1977), 34. 27 Stadler, Gustavus T. “Poe and Queer Studies.” Poe Studies, 33 (2000): 19-22, 19. 28 Person, Leland S. “Queer Poe: The Tell-Tale Heart of His Fiction.” Poe Studies, 41.1 (2008): 7-30, 8. Lint, Brad. “The Hermaphrodite in the Abyss: Queering Poe’s Pym.” The Edgar Allan Poe Review, 7.1 (2006):49-60, 51. 29 Person, “Queer Poe,” 9. 30 (1: 272). 31 Emphasis added, (1: 183). 32 Lemay, Leo. “The Psychology of ‘The Murders in the Rue Morgue,’” American Literature, 54.2 (1982): 165-188, 172. 33 Bradley, Jaqueline. “Character Doubles and Barrier Imagery in Poe’s Work,” The Edgar Allan Poe Review, 9.2 (2008): 55-66. Person, “Queer Poe.”
make a similar approach to the queerness in “The Tell-Tale Heart,” “The Man of the Crowd” and “The Cask of Amontillado.” Despite his Queer approach to The Narrative of Arthur Gordon Pym, Lint
ISSN 2039-9340 Mediterranean Journal of Social Sciences Vol. 4 (1) January 2013
75
acknowledges that Fiedler’s interpretation of homoerotic desire in Pym as a Gothic element might make a plausible reading. “[T]he language of horror,” Fiedler notices, “becomes that of eroticism, the [. . .] longing to fall and the desire for the dark spouse are one, a single perverseness.”34 Lint does not fail to see that it is precisely the ambiguity in Poe’s representations of suggested, homosocial behaviour what might justify a Queer reading of doubling in his texts as resistance to normality. 35 Still, ambiguity is not only characteristic of doubling by itself—with no need to refer to homosocial behaviour for its interpretation—but also of the Gothic Sublime, and even (possibly) of Poe’s critical conception of art as mimesis. Thus, Stadler’s reading of “The Man of the Crowd” where “er lasst sich nicht lessen” is interpreted as a suggestion of homoeroticism,36
Although the host to the doppelganger might typically be male, being a shadow of demonic tradition, the double can in fact take many shapes. Poe has represented it as the Imp of the Perverse (split) and as a Black Cat or a Fay (double proper). But when it is not a man, the most common form of the double in Poe’s tales is a female one. In fact, the male-female doubling is also an important representation of doubling in literary tradition that can be traced back to the Adam/Eve pair in Genesis or to the androgynous primeval man of Aristophanes’ speech in Plato’s Symposium: “Man and wife are among the most compelling of all dualities—opposites of a sort, a pair who may become the parents of a pair of opposing subsidiary selves.”
might find a more plausible reading as an expression of Poe’s vision of literature as imitation. C.- Male-Female pairs
37
Bradley sees “Berenice as the narrator’s double in that what happens to one invariably affects the other,”
Although Poe’s female characters have often been analysed as the victims of an often mentally disturbed male characters, they so obviously parallel and oppose their male partners that their analysis as literary doubles is more than justified. They are usually twin souls or close relatives of the narrator/host (Madeline Usher, Ligeia, Berenice, Morella, Eleonora); but they are also shadows or ghosts (also the wife of the narrator in “The Back Cat”) in an uncertain, threatening way (even sweet Eleonora as the guarantor of an oath) that makes them dangerous for their male hosts. Thus, the female double must be destroyed for her host to survive in terms unaffected by her existence.
38 but also as the narrator’s “phallusized competitor double,” which leads him to bury her alive to preserve his sense of power.39
One of the most obvious cases of female doubling in Poe’s tales is that of Ligeia, where the spirit of dark, mysterious Lady Ligeia (double) possesses the body of blonde, innocent Lady Rowena (host) as the latter dies. Lady Ligeia is characterized by her strong will--which is the key to the tale, as indicates the epigraph by Glanvill—a psychoanalytical reading of which leads to the typical psychomachia between the doubling vicious id and its hosting virtuous ego.
A similar approach is found in “The Fall of the House of Usher,” where Roderick buries his sister alive in the house’s dungeon. In this case, like in “William Wilson,” the doubles are so close that the destruction of Madeleine (female double) implies the destruction of her brother (male host). Also like in Wilson’s case (and “Angel of the Odd” or “The Imp of the Perverse” mentioned above), the literary tradition of the female doppelganger (represented by the Eve/Adam, Mcbeth/Lady Mcbeth pattern) is subverted by having the (female) double be the good (instead of the bad) half of the doubling pair. Poe’s female doubles are extremely beautiful, intelligent and noble by nature, whereas their male counterparts are perverse in a way that suggests the later are rather the wicked doubles of a female host. Although the painting in “The Oval Portrait” has been analyzed as a double that replicates/substitutes the painter’s wife, the image of the painter in the act of painting is suggestive of his looking at himself on a mirror that reflects his own (perverse, murderous) image rather than his wife’s. But female doubles also replicate themselves as black cats do (which often indicates their indestructibility), or their re-appearance as resurrections that continue as long as the host lives; since they belong to the host and cannot be separated from him. D. Female pairs:
40 Although the character of Morella in the eponymous tale (where a epigraph from Plato’s Symposium is illustratively included) is described as the “shadow,” and “the forbidden spirit enkindling within” the narrator;41
34 Lint, “The Hermaphrodite,” 53. 35 Lint, “The Hermaphrodite,” 57. 36 Stadler, “Poe and Queer,” 21. 37 Herdman, The Double, 24. 38 Bradley, “Character Doubles,” 60. 39 Bradley, “Character Doubles,” 61. 40 Eder, “The Idea,” 582. 41 (1:469).
she is herself doubled

ISSN 2039-9340 Mediterranean Journal of Social Sciences Vol. 4 (1) January 2013
76
by her daughter-twin, “the perfect resemblance of her who had departed,”42
The narrator’s loving wife and cousin Eleonora reads like a redeeming double to vengeful Morella. She is also a dead wife, but contrary to Morella; she does not wish to be replaced by any double, which creates the narrative tension that sustains the interest in the tale. Ermengade, who finally replaces her in the narrator’s heart, is described with the epithet “ethereal,” and identified with a “seraph,”
who would finally answer to her mother’s name and whose corpse would fill the absence of her mother’s in the grave. But the second Morella has a characteristic of the literary double that her mother lacked; the Unheimlich. Thus, she will be as attractive as repulsive, as familiar as disgusting, as close as distant; and therefore, the love the narrator feels for her is as legitimate as suggestively (incestuously) forbidden.
43 which endows her with the shadowy qualities of the double. Identification of the two women is not only justified by the alliterative assimilation of their names, but also by the narrator’s ambiguous use of the object pronoun in italics: “Oh, divine was the angel Ermengade! and as I looked into the depths of her memorial eyes, I thought only of them—and of her.” 44 In fact, the narrator’s final absolution from his vow of faithfulness can only make sense if Ermengade and Eleonora are two versions of the same woman.45
The death of the painter’s wife in “The Oval Portrait” seems to be caused not only because “he would not see that the light which fell so ghastlily in that lone turret withered the health and the spirits of his bride,”
46 but by “the exactitude of the conveyance of life into art.”47 Art, which is considered as “her rival” is the only thing that the artist’s wife, who is “all light and smiles,”48 hates. As the perfect double that would finally replace her, the portrait comes to life as the painter’s wife dies. But the relevance of “The Oval Portrait” in relation with the tradition of literary doubling lays not so much in its transgression of the male-male/male-female character pattern of the double, but in that doubling is transferred from character to the concept of mimesis itself as a double that competes with and can replace life. To Freeman, the issue in “The Oval Portrait” is both aesthetic and moral: “The implication of the parasitic relationship of art and reality is that art feeds on nature [. . .] in effect destroying it in the act of converting it to art. Transformation [. . .] of life into art, is inevitably a form of murder.”49
Alter, Dryden and Mills find doubling to be usually accompanied by the anguish of imprisonment and the impulse of flight.
E. Echoing the Double: Settings.
50 The typically repressed double that fights for individual freedom from social and moral imprisonment is a threat for the socially integrated identity of the host who represses him. Thus, it is not uncommon to have literary doubles involved in actions occurring in claustrophobic settings that intensify the double’s anguish of imprisonment by somehow replicating it.51
Paradigmatic of this replication is the case of “The Fall of the House of Usher,” where the term “house” stands for both the building and its inhabitants, whose fate and nature are so closely linked to the building that when it breaks in two and sinks within the dark tarn that reflects its inverted image, the Usher siblings sink with it. The building itself has human-like features such as “eye-like windows”
52 and the impression it produces on its host is typical of the double: “He [Roderick] was enchained53
42 (1:472). 43 (1:451). 44 (1:451). 45 Although Silverman argues that Eleonora “returns, but not in another body,” the epigraph by Lully at the beginning of the tale rather suggests the opposite: “Sub conservatione formae specificae salva anima,” the soul is saved through preservation of a specific form (1:446). Silverman, Ken. Edgar A. Poe: Mournful and Never-ending Remembrance. (New York: Harper Collins, 1992), 170. 46 (1:368). 47 Freedman, William. “Poe’s Oval Portrait of ‘The Oval Portrait.’” Dark Romanticism: History, Theory, Interpretation, 34.1&2 (2001): 7-12, 8. 48 (1:368). 49 Freedman, “Poe’s Oval Portrait, 8. 50 Alter, “Playing Host,” 1190; Dryden, Modern Gothic, 87, 102; Mills, Bruce. Poe, Fuller, and the Mesmeric Arts: Transition States in the American Renaissance (Columbia, MO, USA: University of Missouri Press, 2005), 85-101. 51 Buranelli contends that Poe uses atmosphere to reinforce the description of his characters’ mental state (Buranelli, Edgar Allan, 79). A study of the use of chromatic references in his narrative shows a clear predilection for black and white, weak illumination, obscurity and a nightly atmosphere; which are meant to reflect not only dark deeds, but also crooked minds. Castillo, Debra A. "Borges and Pynchon: The Tenuous Symmetries of Art," New Essays on “The Crying of Lot 49.” Patrick O'Donnell, ed. (Cambridge: Cambridge University Press, 1991), 21-46, 45-46. 52 (1:291). 53 Emphasis added.
by certain superstitious impressions in regard to the dwelling which he tenanted [. . .] an
ISSN 2039-9340 Mediterranean Journal of Social Sciences Vol. 4 (1) January 2013
77
influence which some peculiarities in the form and substance of his family mansion, had [. . .] obtained over his spirit.”54
To Cagliero, “Poe’s interiors are always a Haunted House of thought”
The Ushers are not only doubled by a (their) house that mirrors them and is called like them, they are also imprisoned within their house in the two senses of the word; as the decaying building that would bury them and also as a family lineage limited by the biological legacy of their mental illness.
55 that reflects or doubles the nature or mental state of his characters. The decoration of Lady Rowena’s bridal chamber in “Ligeia” is presented as a reflection of the “incipient madness” of its narrator, whose description ends with the “hideous and uneasy animation” of the chamber as a phantasmagoric product of his own mind that somehow seems to contribute to her progressive decay. The location of the eccentric bridal chamber being “a high turret of a castellated abbey” is also suggestive of physical and mental imprisonment between the fairy tale and the lunatic asylum.56
Bate’s argument that the narrator of “William Wilson” might in fact be the double of a subject who dreams him is based on her identification of the narrator and his environment.
57 In fact, the narrator’s double Wilson is first introduced after the description in binary terms of the boarding school where the narrator passed from childhood to adolescence. The two-story school is an Elizabethan “prison-like” building with an impossible interior design that is claustrophobically labyrinthine. The desolate play-ground at the rear of the building and the green front exit are separated by a “sacred division.”58 The narrator even suggests that the existence of his double might be caused by his seclusion in the school: “Encompassed by the massy walls of this venerable academy, I passed [. . .] the years of the third lustrum of my life. The teeming brain of childhood requires no external world of incident [. . .] I must believe that my first mental development had in it much of the uncommon — even much of the outré.”59
According to Dryden, dichotomist oppositions in elements that depict a setting “like day and night, light and dark, upper worlds and lower worlds” are characteristic of “tales of Gothic duality.”
If, as Bate argues, the narrator is the double who calls himself “William Wilson” although such is not his real name, he seems to be the product of a repressive institution he needs to flee. The boarding-school as a repressive instrument doubles Wilson’s good host-conscience as much as the narrator does, in a way that identifies character and setting as mutual doubles and doubles of an original host.
60
The doublings of the narrator and the old man in “The Tell-Tale Heart,” and of Montressor and Fortunato in “The Cask of Amontillado”
The horizontal double settings of Poe’s tales described so far are sometimes doubled by a vertical doubling that by distinguishing between the upper and lower halves of a setting, echoes the division of character identity between an upper-conscious literary host and its lower-subconscious double. The inside-outside distinction of the prison-like horizontal setting is also reinforced by the vertical double setting, whose claustrophobic atmosphere is suggestive of entombment.
61 is reflected in both the vertical division between the upper world and the underworld and the repressive entombment of the literary double. The old man’s “evil eye” (I) that watches and threatens the narrator of “The Tell-Tale Heart” and the usurper Fortunato of “The Cask of Amontillado” are respectively walled up and buried alive (or at least beating) underground so that their hosts can be freed from them. 62
The underworld in “A Descent into the Maelström” with its incredible destructive potential serves as setting for the struggle for survival of two brothers. The surviving one narrates the story—significantly—from the top of a mountain. In “The Assignation,” the silent waters both hide the secrets below their surface and reflect the characters above. Cole argues that the initial description of the waters “creates a surface/depth dichotomy, which presupposes the possibility of disclosing ‘secrets,’ of enacting a hermeneutic operation that would comprehend a mystery.”
.
63 Such secrets involve the couple formed by the Marchessa di Mentoni and “the stranger”64
54 (1:297). 55 Cagliero, Roberto. “Poe’s Interiors: The Theme of Usurpation in ‘The Cask of Amontillado.’ ” The Edgar Allan Poe Review 2.1 (2001): 30-36, 30. 56 (1:461-462). 57 Bate, “I Think,” 27. 58 (1:419-420). 59 (1:421). 60 Dryden, Modern Gothic, 17.
who rescues her son from his liquid prison, and suggest
61 In the case of “The Cask of Amontillado,” doubling is also replicated by the carnival masks and disguises that characterize harlequin as Herllekin (the leader of a troop of demons who rode the night air on horses. Online Etymology Dictionary, at http://www.etymonline.com, retrieved 01/26/2011). 62 Notwithstanding the fluctuant identity of host and double in these tales, the vertical division of the settings mirrors and reinforces their doubling. 63 Cole, Merril. “The Purloined Mirror.” Literature Interpretation Theory, 8.2 (1997): 135-151, 139. 64 (1:374). It must be noted that the name of the stranger is not revealed and that he first appears out of a niche in the prison of the Old Republic that is most conveniently “right opposite her chamber window” (1: 372). The stranger has thus all the features of the literary double; eschatological elements that suggest his being a (phantom) shadow, a nature that is opposite and complementary to the
ISSN 2039-9340 Mediterranean Journal of Social Sciences Vol. 4 (1) January 2013
78
they lead a double secret life as lovers. The existence of this double reality (the apparent above and the real below) also produces the narrative tension that leads the plot to its climax at the end of the tale.
Finally, Hans Pfaal’s doubling into his comic doppelganger is most illustratively doubled by the setting where action develops: “Hans’s pflight and possible Pfaal are several things at once: [. . .] a scientific experiment, and an exercise of poetic fancy [. . .] in a vehicle both ramshackle and precisely calibrated.”65
Since the threat of doubling resides in the possible replacement of the original host, echoing double characters with other types of doubling should increase the reader’s response of terror to the tale, and imply strengthening the tale’s unity of effect. Poe’s use of the doubling literary tradition is subversive in several ways that include gender reversals of the pattern and the personification of settings as character doubles, but its most significant subversion is that he often presents the double’s perspective instead of the host’s. This doubles the effect of awe and terror in readers since it suggests the most dreadful conclusion that the reader has been led to identify not with the host, but with his evil usurper. In mimetic terms, this means that the imitation or doubling of a character claims for an identity and status prior to the “natural” item it imitates. Although in Poe’s—like in Cervantes’—times, this is as much as being mentally disturbed, a late twentieth-century perspective would see it as the precession of simulacra.
Pfaal ascends and descends from and to the Moon and the Earth in his attempt to escape and return to his being Hans Pfaal. As the tale’s epigraph suggests with the reference to Tom O’Bedlam, Pfaal’s is a phantom doubling; but a doubling that follows many conventions of the literary tradition, including the urge to escape and the Gothic development of the literary double as a mental fabrication of his host.
66
A similar argument is defended by Bate when he affirms that “Edgar Allan Poe’s ‘William Wilson’ presents a cosmos that foists upon the timorous reader the possibility that the universe itself is a dream or a fiction: “[r]esembling a ‘dream within a dream,’ this tale blurs the boundary dividing the ‘real’ world from the dreamscape, that fictive cosmos inhabited by the artist.”
F.The Textual Exegesis of Mimesis as Doubling.
67 Eder considers the theme of the double to be of an intrinsic interest to artistic production: “It is easy to understand the attraction the idea of the double has for the writer, whose consciousness is, by the very nature of his task as creator-observer and participant in the world he imagines, sharply dual. Self-consciousness always implies duality—the subject reflecting on himself as object.”68 However, her focus on identity makes her miss the implications of the theme of the double for the idea of mimesis as an artistic construct. A more subtle connection between doubling and artistic representation is described by Herdman when he affirms: “Psychic duplication and division, on the one hand, and the open mind, on the other, are conceptions which are kept apart by historians of Romanticism: but they were pursued at the same early point in its history, [. . .] They are conceptions which predict, and participate in, the young idea of the following century—the Modernist view of art’s impersonality, of the artist’s need to be absent from his creations.”69
In Poe’s tales, it is not unusual to see doubling extended from the merely fictional to the metafictional level in a way that unites literature and literary criticism as it questions the primacy of the real over the artistic. Like the portrait of Dorian Gray, which would finally become the real term in the artistic doubling of its host while the physical Dorian tried “to realize an aesthetic ideal in his life,”
70 the portrait of the artist’s wife in “The Oval Portrait” exchanges places with its original and comes to life as she dies. The portrait itself becomes the original of “a small volume which [. . .] purported to criticise and describe [it],”71 and the volume itself is also described and commented by the narrator of the tale. The reader that intends to follow the series would unavoidably reach the conclusion that this narrator must be doubled by other narratives that take it as their original. To this argument, Freedman adds that the awe-inspiring perfection of lifelikeness of the portrait “is achieved not by studious attention of the life it renders but by an ardor for the labor that refuses to perceive it”72
Marchessa, and the impulse to flee his imprisonment. The image reflected by the channel is therefore the doubling of character doubling. 65 Herdman, The Double, 161-162. 66 Baudrillard, Jean. “The Precession of Simulacra” in Simulations, Paul Foss, Paul Patton and Philip Beitchman, trans. (New York: Semiotext(e) 1983), 1-75. 67 Bate, “I Think,” 27. 68 Eder, “The Idea,” 580. 69 Herdman, The Double, 22. 70 Dryden, Modern Gothic, 122. 71 1:366. 72 Freedman, “Poe’s Oval,” 9.
because the artist “turned his eyes from the canvass rarely even to regard the countenance of his
ISSN 2039-9340 Mediterranean Journal of Social Sciences Vol. 4 (1) January 2013
79
wife.”73
To Freedman, “Poe often demands [from his readers] the reluctant simultaneous suspension of belief and disbelief alike”
The “labor” that is added to the artistic double accounts for the unfamiliar tincture of uncanniness typical of doubling and that is absent from the natural host. A similar deferral of the original is found in the falsifications of “The Purloined Letter,” where the purloined original seems to be fatefully doomed to be replaced by a double that is never overtly acknowledged to be anything but an original by its holder.
74 that in “The Oval Portrait,” is a consequence of the tale’s concern “with the entangled relationship between carnal reality and the art that rejects, transcend, and yet unavoidably includes it.”75 The fact that most of Poe’s tales that incorporate doubling among their themes are narrated by the homodiegetic characters that are suspicious of doubling their hosts makes their narratives equally unreliable as mimetic representations of the supposedly original narratives that would have been replaced by Poe’s tales. Poe creates doppelgangers of his narratives that mirror (and subvert) the tradition of the literary doubling of characters. In his paradigmatic tale on doubling, the narrator Wilson recalls how difficult it was to ascertain in which of the two stories of the boarding school “one happened to be,” given “its incomprehensible subdivisions,”76 which can be read as a pun on two possible readings of that would question which Wilson is the host and which the double in the eponymous tale. Cole argues that the ambiguity pervading Poe’s tales is achieved by means of narrative doubling; “the text’s mirror chamber, where every viewpoint is immediately doubled and reversed, every stance creates its opposite, and the play of reflection recedes into the endless abyss of opposing mirrors.”77 Ware sees this ambiguity as possibly resulting from the irreducible dualism of the allegorical and the fantastic levels of the tale.78
As the undecidedness of character identity in literary doubling is often expressed by either having two characters share the same name/initial (Usher, Wilson, D.), or by leaving them unnamed (the stranger in “The Assignation,” the artist’s wife in “The Oval Portrait,” “The Man of the Crowd”), the ambiguity of the double text is often expressed in Poe as the problem of naming. His narratives are endemically affected by the impossibility of expression: dates are usually incomplete; characters’ family names and places of birth, impossible to remember; the means of thought, inscrutable; character behaviour, absurdly incomprehensible. To Stadler, the undecidability caused by doubling in “The Man of the Crowd” produces the narrative action that constitutes the tale,
79 which might point to undecidability as the possible key to interpret the tale. Similarly, Cole considers that character doubling parallels the notion of text as mimesis when he argues that: “Just as the narrator’s journey within the past time of the narrative is a quest for knowledge that never succeeds fully, so is the quest of the implicit reader.”80 In the same sense, Ware defends that “the narrator’s [William Wilson’s] interpretive hesitations are a thematization of an appropriate reader response.”81 Or to put it in terms more in tune with Poe’s critical views, resolving ambiguity in Poe’s tales of duality “would be to suck the lifeblood out of the aesthetic effect,”82
Miller sees Derrida’s famous contribution to the twentieth-century discussion of “The Purloined Letter” to have a “place in the long history of duality” since Derrida attributes Poe’s literary uncertainty to his “employment of words with a double and undecidable meaning.”
which is the same as saying that narrative doubling is intentionally designed to contribute to the achievement of the tales’ final effect. G. The Tale is Doubled by its Frame.
83 To Derrida, “[t]he fictional structure [of the tale] is reduced as soon as it is related to the condition of its truth.”84 He argues that it is “possible to read the whole thing [the tale] as a matter of writing, and of writing off its course, in a writing space unboundedly open to grafting onto other writing.”85
73 (1:368). 74 Freedman, “Poe’s Oval,” 7. 75 Freedman, “Poe’s Oval,” 10. 76 (1:420). 77 Cole, “The Purloined Mirror,” 136. 78 Ware, Tracy. “The Two Stories of ‘William Wilson.’ Studies in Short Fiction, 26:1 (1989): 43-48, 47. 79 Stadler, “Poe and Queer,” 21. 80 Cole, “The Purloined,” 137. 81 Ware, “The Two Stories,” 47. 82 Moores, D.J. “ ‘Oh Gigantic Paradox:’ Poe’s ‘William Wilson’ and the Jungian Self.” Edgar Allan Poe Review, 7.1 (2006): 31-48, 46. 46. Emphasis added. 83 Miller, Doubles, 22. In fact, although Miller speaks of Derrida’s work in more general terms, Derrida’s description of the purloined letter in Poe’s eponymous tale as undecidable and in terms of doubling makes Miller’s reference to “The Purveyor of Truth” quite obvious. 84 Derrida, Jacques. “The Purveyor of Truth.” Yale French Studies, 52 (1975): 31-113, 53. 85 Derrida, “The Purveyor,” 102.
He not only finds the analogy
ISSN 2039-9340 Mediterranean Journal of Social Sciences Vol. 4 (1) January 2013
80
between “The Purloined Letter” and the “two other stories to which ‘this one’ is grafted”86 to be the core of the tale, but the text to be framed by settings that work as intertextual hosts or doubles to the tale by means of analogy. A similar procedure is followed in “The Murders in Rue Morgue,” where what Derrida calls the tale’s frame and its preface exchange places87 as both terms of textual doubling (what could be called the host and the double text). Doubling at multiple levels, Derrida argues, “imprint[s] the purloined letter with an incorrigible indirection.”88
Just like double characters are often recognized in the text by their “act[ing] out of character,”
89 Poe’s tales on doubling also “act out of text.” Such is the case of “The Mystery of Marie Rôget,” a pastiche of periodical publications that double each other as they double a supposedly original plot that is finally narrated by the text that reproduces them (the tale). The same narrative frame is provided for “Von Kempelen and His Discovery,” which does not only build the story on allusions to personal and journalistic texts that also (mis)translate and copy each other, but overtly expresses its intention to speculate on “the results of the discovery”90 and ends with a reflection on “Speculation.”91 Finally, Hans Pfaall escapes Rotterdam on “a balloon manufactured entirely of dirty newspapers;”92
Stadler’s homoerotic reading of “The Man of the Crowd” and “The Facts in the Case of M. Valdemar” leads him to find in the supposedly liminal representation of male characters and Poe’s fascination with the irrational, an “instance of his proto-poststructuralism.”
which makes a perfect allegory of the “volatile” nature of journalistic textuality as it shifts into narrative fiction. In all of these cases, ambiguity relating the nature of text and frame as either host or doubling text, contributes to exegetical uncertainty.
93 Be it that Poe advanced Post-structuralism (as he would have also advanced Symbolism), or that post-structuralist readings of Poe’s texts are putting forward different interpretive possibilities (as his reading by the French Symbolists did), Poe’s narratives seem to show a series of features that make them specially sensitive to a post-structuralist approach; and that are somehow related to doubling as literary technique that affects both means (mimesis) and content (characters, settings and plot), and to textual uncertainty as its consequent literary effect.94
4. Conclusion. The Artist and the Critic
Finally, I must be allowed the concession of one more analogy to be able to argue that the artistic and the critical facets of Poe do also partake of the traditional elements of doubling. This is not only because his critical reviews often present the tone and rhetorical elaboration of his literary texts, but also because the later also give overt and implied expression to his critical opinions on artistic composition. In his analysis of the character of Dupin, Kelly proposes a reading of Poe’s detective stories that may “connect [Poe’s] attitudes as a reviewer and [his] practices as a creative writer,” arguing that “those attitudes evident in [his] critical work may appear in his creative practices at levels of technique and content.”95
86 Derrida, “The Purveyor,” 101. 87 Derrida, “The Purveyor,” 103. 88 Derrida, “The Purveyor,” 110. 89 Moores, “ ‘Oh Gigantic Paradox,’ ” 43. 90 1: 102. 91 1: 108-109. 92 1: 2. 93 Stadler, “Poe and Queer,” 20. 94 Although I might feel particularly critical with readings that anachronically find post-structuralist elements in early nineteenth-century literature, I have to accept that Poe’s own aesthetic views are often presented in a form that requires little commentary (or perhaps too much) when contrasted with post-structuralist views. Consider the following extract from “The Philosophy of Composition.” Since Poe italizes, I have underlined for emphasis: “I prefer commencing with the consideration of an effect. Keeping originality always in view — for he is false to himself who ventures to dispense with so obvious and so easily attainable a source of interest — I say to myself, in the first place, “Of the innumerable effects, or impressions, of which the heart, the intellect, or (more generally) the soul is susceptible, what one shall I, on the present occasion, select?” Having chosen a novel, first, and secondly a vivid effect, I consider whether it can best be wrought by incident or tone — whether by ordinary incidents and peculiar tone, or the converse, or by peculiarity both of incident and tone — afterward looking about me (or rather within) for such combinations of event, or tone, as shall best aid me in the construction of the effect” (1:259-260). The text is not only philosophically ambiguous, but even funny in a silly way that must/might have delighted Derrida. 95 Kelly, Warren Hill. “Detecting the Critic: The Presence of Poe’s Critical Voice in His Stories of Dupin.” Edgar Allan Poe Review, 4.2 (2003): 77-86, 77.
The interest of such an approach would not only lie in the intertextual doubling of author and character proposed by Kelly, but also in the possibility of establishing an intertextual dialogue between Poe’s literary and critical work that might render a plausible interpretation of Poe’s literary work from his own critical perspective.
ISSN 2039-9340 Mediterranean Journal of Social Sciences Vol. 4 (1) January 2013
81
To Kelly, the content of the Dupin stories “comment on the proposed purpose of the narrative technique,” which to him would be “that of exposing readers’ insensitivity.”96 Notwithstanding Poe’s collusive inclination to tease the readers of his narratives, he expressed his critical concern for the response of his readers towards (his) literary work more overtly in relation with the unity of effect in art. In “The Philosophy of Composition,” he argues that “it is an obvious rule of Art that effects should be made to spring from direct causes-that objects should be attained through means best adapted for their attainment.”97 Although the intended effect of Poe’s tales may differ from each other, that they are concerned with truth and passions rather than beauty (which according to Poe is the main purpose of poetry) would indicate that both the intellect and the heart should be involved in it.98
If Beauty, as Poe argues in “The Philosophy of Composition,”
As has been showed above, the effect of doubling often involves both raising certain the passions in readers (terror in the Gothic tales, hilariousness in the humorous ones) and questioning identity, fiction and narrative as objective truths (confusion, uncertainty, undecidability), which makes of it a useful literary technique.
Aware as he certainly was of its potential, Poe makes doubling permeate all of the layers of his tales. Doubling (double characters) makes the incident that builds the thesis of the story, and draws the setting where it happens. The effect of awe that is usually intended for the Gothic tales is achieved by the combination of the fear (passion) and wonder (intellect) elicited by the uncanny quality of doubling. Doubling also serves the purposes of humorous tales as its effects also include surprise and hilariousness in its appeal to both the intellect and passions. Literary doubling provides the two opposing poles the tension between which allows building plot to its climax. And finally it gives an appropriate tone for the incident (uncertainty) by means of unreliable homodiegesis at the level of narrative voice, of metafictional ambivalence between the natural and the mimetic aspects of the literary work, and of metacritical undecidability by means of intertextual deferral of literary sources.
99 is the effect (elevation of the soul) “experienced in consequence of contemplating ‘the beautiful,’ then Truth and Passion must be the effects (elevation of intellect and heart) of the contemplation of “the true” and “the passionate.” The reader of Poe’s tales on doubling appeal to the intellect and the heart at so many levels of the narrative composition that contemplation of doubling in them is a holistic experience that constitutes an act of doubling itself. “One result of this too-neat duplication,” Lemay argues, “is an aesthetic pleasure in the extraordinary unity of the tale’s formal motifs and plot.”100
Poe’s intended unity of effect is achieved in many of his tales by means of literary doubling, a technique he used as he inherited it from the previous literary tradition and that he also manipulated, transformed and subverted to transcend the merely thematic and intertwine with the technical aspects of short narrative. Although Cagliero argues that the reference to “Arabesque” in Eureka shows Poe’s preference for the “metaphysical unity of the many in contrast with the monstrous uniformity of the double created by the mirror”
Although Lemay misses the critical aspects of doubling in the metafictional and metacritical traits of Poe’s tales, he still perceives the aesthetic dimension achieved through them.
101 and in spite of the fact that he is discussing poetry, the possible influence of Victor Hugo’s theory of the grotesque in art (the union of les qualities les plus opposées) on Poe’s aesthetic paradigm102
His originality with respect to this, “demands in its attainment less of invention than negation” might gain a new dimension when applied to doubling.
103
96 Kelly, “Detecting the Critic,” 80. 97 2: 262. 98 2:262-263. 99 1:262. 100 Lemay, “The Psychology,” 171. 101 Cagliero, “Poe’s Interiors,” 31. 102 Pollin, Burton R. Discoveries in Poe (London, Notre Dame: University of Notre Dame Press, 1970), 5, 23. 103 “The Philosophy of Composition,” 1:266.
since both the effects of Awe (as it appeals to both intellect and heart) and Beauty (as the elevation of the soul) share the ineffable as a means for achievement in the literary work. But as negation is paradoxically founded on the “original” term it negates, also does literary expression find the ineffable as its basis, as do the two mirroring terms of literary doubling. References Alter, Robert 1985, “Playing host to the Doppelgänger” Times Literary Supplement, 24, 1190. Bate, Nancy Berkovitz. 1997, “I Think, but I am Not: The Nightmare of William Wilson” Poe Studies, 30, 27-38. Baudrillard, Jean. 1983, “The Precession of Simulacra” in Simulations, Paul Foss, Paul Patton and Philip Beitchman, trans. New York:
Semiotext(e), 1-75.
ISSN 2039-9340 Mediterranean Journal of Social Sciences Vol. 4 (1) January 2013
82
Bradley, Jaqueline. 2008, “Character Doubles and Barrier Imagery in Poe’s Work,” The Edgar Allan Poe Review, 9.2: 55-66. Person, “Queer Poe.”
Buranelli, Vincent. 1977, Edgar Allan Poe, Boston: G.K. Hall&Co., 34. Cagliero, Roberto. 2001, “Poe’s Interiors: The Theme of Usurpation in ‘The Cask of Amontillado.’ ” The Edgar Allan Poe Review 2.1 30-
36, 30. Castillo, Debra A. 1991, "Borges and Pynchon: The Tenuous Symmetries of Art," New Essays on “The Crying of Lot 49.” Patrick Cole, Merril. 1997, “The Purloined Mirror.” Literature Interpretation Theory, 8.2: 135-151, 139. Derrida, Jacques. 1975, “The Purveyor of Truth.” Yale French Studies, 52, 31-113, 53. Dryden, Linda. 2003, Modern Gothic and Literary Doubles. Stevenson, Wilde and Wells (New York: Palgrave Macmillan, 2003), 16. Eder, Doris L. 1978, “The Idea of the Double.” Psychoanalitic Review, 65.4 (1978): 579-614, 580, 582. Freedman, William. 2001,“Poe’s Oval Portrait of ‘The Oval Portrait.’” Dark Romanticism: History, Theory, Interpretation, 34.1&2: 7-12, 8. Herdman, John. 1990, The Double in Nineteenth-Century Fiction, London: MacMillan, 4-9, 11. Kelly, Warren Hill. 2003, “Detecting the Critic: The Presence of Poe’s Critical Voice in His Stories of Dupin.” Edgar Allan Poe Review,
4.2, 77-86, 77. Lemay, Leo. 1982, “The Psychology of ‘The Murders in the Rue Morgue,’” American Literature, 54.2: 165-188, 172. Lint, Brad. 2006, “The Hermaphrodite in the Abyss: Queering Poe’s Pym.” The Edgar Allan Poe Review, 7.1: 49-60, 51. Miller, Karl. Doubles.1987, Studies in Literary History, Oxford & New York: Oxford UP, 49. Moores, D.J., 2006,. “ ‘Oh Gigantic Paradox:’ Poe’s ‘William Wilson’ and the Jungian Self.” Edgar Allan Poe Review, 7.1: 31-48, 46. O'Donnell, ed., Cambridge: Cambridge University Press, 21-46, 45-46. Person, Leland S. 2008, “Queer Poe: The Tell-Tale Heart of His Fiction.” Poe Studies, 41.1: 7-30, 8. Poe, Edgar Allan. The Works of the Late Edgar Allan Poe (The Griswold Edition, 1850-1856), 4: 267 Pollin, Burton R. 1970, Discoveries in Poe , London, Notre Dame: University of Notre Dame Press, 5, 23. Silverman, Ken. 1992, Edgar A. Poe: Mournful and Never-ending Remembrance. New York: Harper Collins, 170. Stadler, Gustavus T. 2000, “Poe and Queer Studies.” Poe Studies, 33, 19-22, 19. Ware, Tracy. 1989, “The Two Stories of ‘William Wilson.’ Studies in Short Fiction, 26:1: 43-48, 47. Willeford, William. 1977, The Fool and His Scepter: A Study in Clowns and Jesters and Their Audience, London: Edward Arnold
Publishers Ltd., 33-4 Zucker, Wolfgang M. 1954, “The Image of the Clown,” The Journal of Aesthetics and Art Criticism, 310-317, 311-312. Website http://www.eapoe.org/works. http://www.etymonline.com,
ISSN 2039-9340 Mediterranean Journal of Social Sciences Vol. 4 (1) January 2013
83
Private Sector Creditand Economic Growth Nexus in Nigeria:
An Autoregressive Distributed Lag Bound Approach
Haruna Mohammed Aliero PhD
Department of Economics Usmanu Danfodiyo University, Sokoto
Mobile: +234-8135219790, Email: [email protected]
Yahya Zakari Abdullahi PhD
Department of Economics Usmanu Danfodiyo University, Sokoto
Mobile: 07031538760, E-mail: [email protected]
Nasiru Adamu
Department of Economics Isa Kaita College Of Education, Dutsin-Ma , Katsina State
Mobile: 08038213942, Email: [email protected]
Doi:10.5901/mjss.2013.v4n1p83 Abstract
This paper analyses the relationship between private sector credit and economic growth in Nigeria, using time series data for the period of thirty-seven (37) years (1974-2010). In analyzing the data the paper used Autoregressive Distributed Lag (ARLD) bound F-test for cointegration. The results indicated that a long run equilibrium relationship exists between private sector credit and economic growth, when private sector credit was used as dependent variable. However, causality results indicate that there is no causal relationship between private sector and economic growth in Nigeria. Therefore the empirical findings of this research implied that while “demand following hypothesis” prevailed in the long run relationship between private sector credit and economic growth in Nigeria, non-causal impact between private sector and economic growth on the other hand indicates the prevalence of the Schumpeterian “independent hypothesis” on the Nigerian economy. Finally, the study recommends long-term investment loan to the productive private sector in addition to the need for comprehensive policies and strong legal framework for easy disbursement and quick recovery of private sector credit.
Keywords: ARDL, Private Sector Credit, Co-integration, Causality, Economic Growth.
1. Introduction Economic growth from whatever angle it is viewed indicates the ability of an economy to increase production of goods and services over a certain period of time using the stock of capital and other factors of production within the economy (Popkova et-al, 2008). However, theoretical discussions on the importance of finance and economic growth have occupied a key position in the financial economics literature. The theoretical benchmark of the early studies on the relationship between finance and economic growth may be traceable to Schumpeter (1934), Mckinnon (1937) and Shaw (1973). They strongly emphasized on the critical role of finance in economic growth. Their argument is centered on the role of banks in facilitating technological innovation through its intermediary role. This role according to them is performed through the process of channeling funds in the form of credit or loan for investment to those economic agents who need them and can put them into the most productive use. Thus, credit which is defined in this context, as the link through which resources are transferred for capital formation, facilitates investment which leads to economic growth.
There has been a renewed interest globally into the study of credit to private sector and its ability to generate economic growth. These studies stressed that firms that are able to generate external finance are more likely to grow than those limited to internal finance (Levine 2002; Beck, Rioja and Valen 2009). Moreover, recent empirical findings provided support for the existence of finance and economic growth relationship. These includes the works of Eatzaz and
ISSN 2039-9340 Mediterranean Journal of Social Sciences Vol. 4 (1) January 2013
84
Malik (2009) who undertake an empirical study of 35 developing countries over the periods of 33 years (1970-2003) on financial sector development and economic growth, their studies reported that domestic credit to private sector is instrumental in increasing per worker output and hence promoting economic growth in the long run. Their findings also explore the possible means through which domestic credit to private sector can contribute to the growth of the economy.
Specific research works on the nexus between private sector credit and economic growth in Nigeria have not been able to employ the use of a rigorous econometric analysis (Oluitan, 2008 and Josephine, 2008) and no research work on the relationship between private sector credit and economic growth have adopted the recently developed Autoregressive Distributed Lag (ARDL) bound test approach to the best knowledge of the authors. These reasons justify the relevance of carrying out this study which attempts to examine the relationship between private sector credit and economic growth in Nigeria, as well as to examine the direction of the relationship between private sector credit and economic growth in order to provide additional empirical evidence on the relationship between private sector credit and economic growth in Nigeria. This study seeks to contribute to the debate on finance-economic growth nexus which contains empirical gap, especially in the developing economies, that need to be filled.
The aim of this paper is to examine the relationship between private sector credit and economic growth in Nigeria using the recently developed Autoregressive Distributed Lag (ARLD) bound F-test for cointegration. The paper is divided into six sections. Section 1 is this introduction. Section 2 discusses theoretical and conceptual issues. Section 3 reviews related empirical studies. Section 4 presents our econometric models and methodology. Section 5 presents and discuses our empirical results. Finally, section 6 draws conclusion and offers policy recommendations. 2. Theoretical and conceptual issues Theoretical propositions on the finance and economic growth relationship is traceable to the earlier Schumpeterian hypothesis which is categorized into supply-leading and demand following hypotheses. While supply-leading hypothesis suggested that financial institutions serve as a useful tool for increasing the productive capacity of the economy, the latter assumed banks as not a direct cause for economic growth, rather the growth of the real sector increases demand for financial services which stimulates the financial sector. Thus, “where enterprise leads, finance follows” (Schumpeter, 1934).
It is widely accepted that financial development is a multidimensional concept which constitutes an important mechanism for a long-run economic growth (Coricelli, 2008). The argument on whether finance causes economic growth dates back to Schumpeterian “supply-leading hypothesis” which believed that activities of financial intermediation serve as a useful tool for increasing the productive capacity of the economy. The theory presupposes that efficient allocation of savings through the identification and the extension of credit to entrepreneurs with the best chance of successfully implementing innovative products and production process increases national output and hence accelerates economic growth in the long-run (Schumpeter, 1934). This was further supported by the theoretical evidence established by Goldsmith (1969), Shaw (1973), McKinnon (1937); their works theorized that finance is a very essential and prime requirement for both short and long-run economic growth.
More recently, several theoretical and empirical studies further strive to investigate the validity of the theoretical assertions on finance and economic growth. These includes the works of Johannes et.al (2011), Levine (2002), Olofin and Afangideh (2006) and Beck, Riojan and Valen (2009), they all opined that a big, liquid and a well functioning financial market can accelerate and foster economic growth and profit incentives, enhance corporate governance and facilitates risk management. They further expressed that each of these financial functions effect economic growth through capital accumulation and technological innovation. Their argument is further supported by Coricelli (2008), who confirmed financial sector as a ‘shock absorber’ to economic growth and theorized that the underdevelopment of the financial sector is one of the reasons why poorer countries tend to show much larger falls in output than more advanced countries.
Alternative views on the link between private sector credit and economic growth focus on the key function of financial sector in saving-investment-growth relationship. These according to Azigkpono (2003) includes acting as an effective conduit, first, for channeling funds from surplus to deficit unit by mobilizing resources and ensuring an efficient transformation of funds into real productive capital and second, financial intermediation transform maturity of the portfolio savers and investors, while producing sufficient liquidity to the system as the need arises.
The specific role of bank credit to private sector in stimulating economic growth is opined by Ngai (2005), who reported that bank credit to private sector is the most important source of financing for firms, especially in countries where capital markets are not fully developed. Bank credit according to Josephine (2009) is one of the important aspects of financial intermediation that provide funds to economic entities that can put them to the most productive investment. Emphasizing on the relevance of bank credit to business firms, Plamen and Khamis (2009) opined that credit availability enables firms to undertake investments that they could not have otherwise made out of their own funds. They further
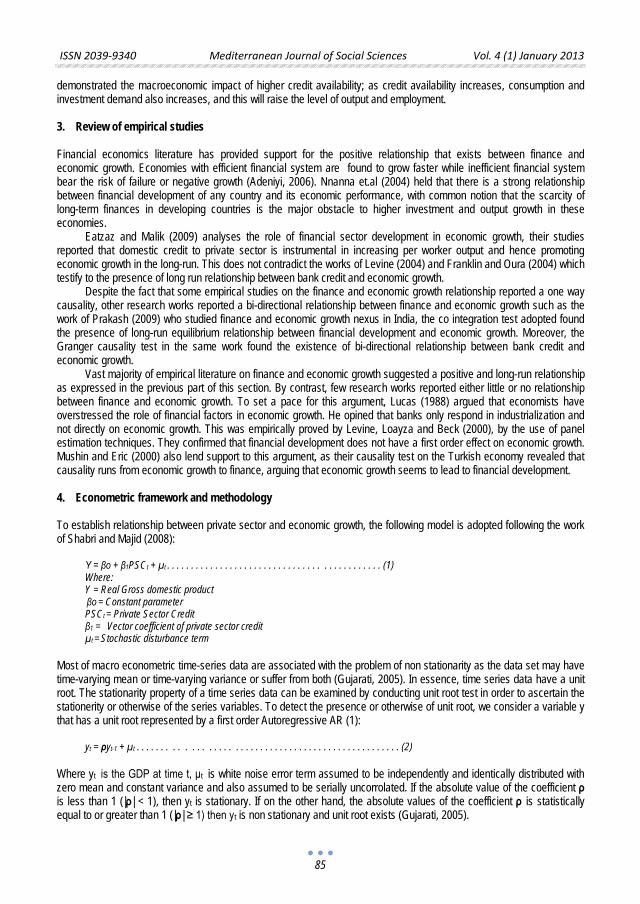
ISSN 2039-9340 Mediterranean Journal of Social Sciences Vol. 4 (1) January 2013
85
demonstrated the macroeconomic impact of higher credit availability; as credit availability increases, consumption and investment demand also increases, and this will raise the level of output and employment. 3. Review of empirical studies Financial economics literature has provided support for the positive relationship that exists between finance and economic growth. Economies with efficient financial system are found to grow faster while inefficient financial system bear the risk of failure or negative growth (Adeniyi, 2006). Nnanna et.al (2004) held that there is a strong relationship between financial development of any country and its economic performance, with common notion that the scarcity of long-term finances in developing countries is the major obstacle to higher investment and output growth in these economies.
Eatzaz and Malik (2009) analyses the role of financial sector development in economic growth, their studies reported that domestic credit to private sector is instrumental in increasing per worker output and hence promoting economic growth in the long-run. This does not contradict the works of Levine (2004) and Franklin and Oura (2004) which testify to the presence of long run relationship between bank credit and economic growth.
Despite the fact that some empirical studies on the finance and economic growth relationship reported a one way causality, other research works reported a bi-directional relationship between finance and economic growth such as the work of Prakash (2009) who studied finance and economic growth nexus in India, the co integration test adopted found the presence of long-run equilibrium relationship between financial development and economic growth. Moreover, the Granger causality test in the same work found the existence of bi-directional relationship between bank credit and economic growth.
Vast majority of empirical literature on finance and economic growth suggested a positive and long-run relationship as expressed in the previous part of this section. By contrast, few research works reported either little or no relationship between finance and economic growth. To set a pace for this argument, Lucas (1988) argued that economists have overstressed the role of financial factors in economic growth. He opined that banks only respond in industrialization and not directly on economic growth. This was empirically proved by Levine, Loayza and Beck (2000), by the use of panel estimation techniques. They confirmed that financial development does not have a first order effect on economic growth. Mushin and Eric (2000) also lend support to this argument, as their causality test on the Turkish economy revealed that causality runs from economic growth to finance, arguing that economic growth seems to lead to financial development. 4. Econometric framework and methodology To establish relationship between private sector and economic growth, the following model is adopted following the work of Shabri and Majid (2008):
Y = βo + β1PSCt + μt . . . . . . . . . . . . . . . . . . . . . . . . . . . . . . . . . . . . . . . . . . . . (1) Where: Y = Real Gross domestic product βo = Constant parameter PSCt = Private Sector Credit β1 = Vector coefficient of private sector credit μt = Stochastic disturbance term
Most of macro econometric time-series data are associated with the problem of non stationarity as the data set may have time-varying mean or time-varying variance or suffer from both (Gujarati, 2005). In essence, time series data have a unit root. The stationarity property of a time series data can be examined by conducting unit root test in order to ascertain the stationerity or otherwise of the series variables. To detect the presence or otherwise of unit root, we consider a variable y that has a unit root represented by a first order Autoregressive AR (1):
yt = ρyt-1 + μt . . . . . . . . . . . . . . . . . . . . . . . . . . . . . . . . . . . . . . . . . . . . . . . . . . . . (2)
Where yt is the GDP at time t, μt is white noise error term assumed to be independently and identically distributed with zero mean and constant variance and also assumed to be serially uncorrolated. If the absolute value of the coefficient ρ is less than 1 (|ρ| < 1), then yt is stationary. If on the other hand, the absolute values of the coefficient ρ is statistically equal to or greater than 1 (|ρ| ≥ 1) then yt is non stationary and unit root exists (Gujarati, 2005).
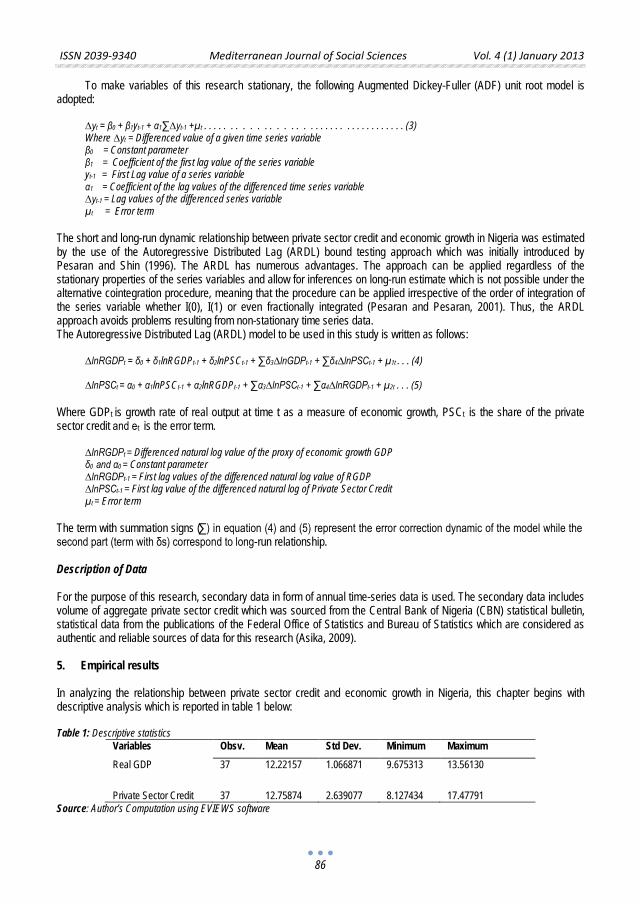
ISSN 2039-9340 Mediterranean Journal of Social Sciences Vol. 4 (1) January 2013
86
To make variables of this research stationary, the following Augmented Dickey-Fuller (ADF) unit root model is adopted:
∆yt = β0 + β1yt-1 + α1∑∆yt-1 +μt . . . . . . . . . . . . . . . . . . . . . . . . . . . . . . . . . . . . (3) Where ∆yt = Differenced value of a given time series variable β0 = Constant parameter β1 = Coefficient of the first lag value of the series variable yt-1 = First Lag value of a series variable α1 = Coefficient of the lag values of the differenced time series variable ∆yt-1 = Lag values of the differenced series variable μt = Error term
The short and long-run dynamic relationship between private sector credit and economic growth in Nigeria was estimated by the use of the Autoregressive Distributed Lag (ARDL) bound testing approach which was initially introduced by Pesaran and Shin (1996). The ARDL has numerous advantages. The approach can be applied regardless of the stationary properties of the series variables and allow for inferences on long-run estimate which is not possible under the alternative cointegration procedure, meaning that the procedure can be applied irrespective of the order of integration of the series variable whether I(0), I(1) or even fractionally integrated (Pesaran and Pesaran, 2001). Thus, the ARDL approach avoids problems resulting from non-stationary time series data. The Autoregressive Distributed Lag (ARDL) model to be used in this study is written as follows:
∆lnRGDPt = δ0 + δ1lnRGDPt-1 + δ2lnPSCt-1 + ∑δ3∆lnGDPt-1 + ∑δ4∆lnPSCt-1 + μ1t . . . (4) ∆lnPSCt = α0 + α1lnPSCt-1 + α2lnRGDPt-1 + ∑α3∆lnPSCt-1 + ∑α4∆lnRGDPt-1 + μ2t . . . (5)
Where GDPt is growth rate of real output at time t as a measure of economic growth, PSCt is the share of the private sector credit and еt is the error term.
∆lnRGDPt = Differenced natural log value of the proxy of economic growth GDP δ0 and α0 = Constant parameter ∆lnRGDPt-1 = First lag values of the differenced natural log value of RGDP ∆lnPSCt-1 = First lag value of the differenced natural log of Private Sector Credit μt = Error term
The term with summation signs (∑) in equation (4) and (5) represent the error correction dynamic of the model while the second part (term with δs) correspond to long-run relationship. Description of Data For the purpose of this research, secondary data in form of annual time-series data is used. The secondary data includes volume of aggregate private sector credit which was sourced from the Central Bank of Nigeria (CBN) statistical bulletin, statistical data from the publications of the Federal Office of Statistics and Bureau of Statistics which are considered as authentic and reliable sources of data for this research (Asika, 2009). 5. Empirical results In analyzing the relationship between private sector credit and economic growth in Nigeria, this chapter begins with descriptive analysis which is reported in table 1 below: Table 1: Descriptive statistics
Variables Obsv. Mean Std Dev. Minimum Maximum Real GDP 37 12.22157 1.066871 9.675313 13.56130
Private Sector Credit 37 12.75874 2.639077 8.127434 17.47791 Source: Author’s Computation using EVIEWS software
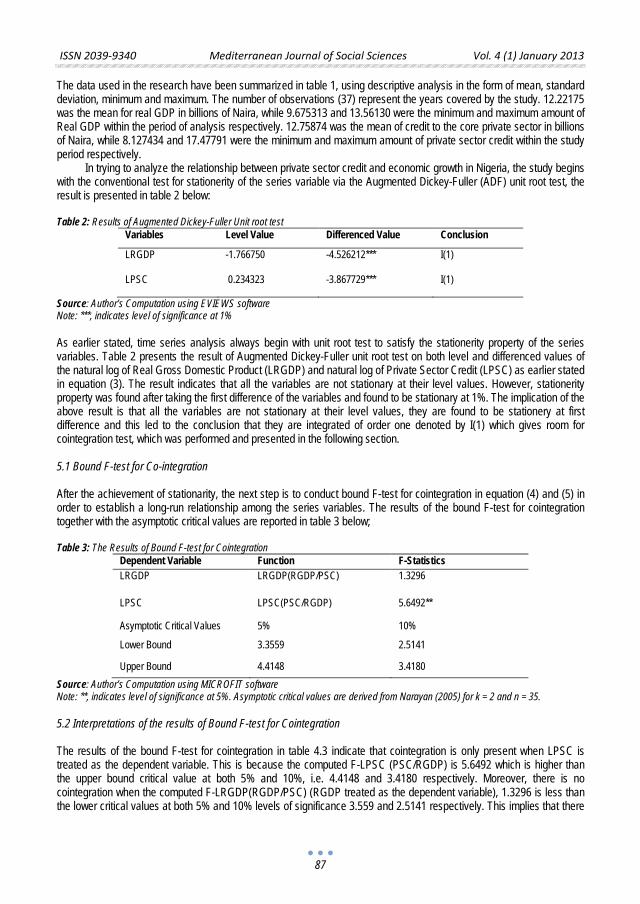
ISSN 2039-9340 Mediterranean Journal of Social Sciences Vol. 4 (1) January 2013
87
The data used in the research have been summarized in table 1, using descriptive analysis in the form of mean, standard deviation, minimum and maximum. The number of observations (37) represent the years covered by the study. 12.22175 was the mean for real GDP in billions of Naira, while 9.675313 and 13.56130 were the minimum and maximum amount of Real GDP within the period of analysis respectively. 12.75874 was the mean of credit to the core private sector in billions of Naira, while 8.127434 and 17.47791 were the minimum and maximum amount of private sector credit within the study period respectively.
In trying to analyze the relationship between private sector credit and economic growth in Nigeria, the study begins with the conventional test for stationerity of the series variable via the Augmented Dickey-Fuller (ADF) unit root test, the result is presented in table 2 below: Table 2: Results of Augmented Dickey-Fuller Unit root test
Variables Level Value Differenced Value Conclusion
LRGDP -1.766750 -4.526212*** I(1)
LPSC 0.234323 -3.867729*** I(1)
Source: Author’s Computation using EVIEWS software Note: ***, indicates level of significance at 1% As earlier stated, time series analysis always begin with unit root test to satisfy the stationerity property of the series variables. Table 2 presents the result of Augmented Dickey-Fuller unit root test on both level and differenced values of the natural log of Real Gross Domestic Product (LRGDP) and natural log of Private Sector Credit (LPSC) as earlier stated in equation (3). The result indicates that all the variables are not stationary at their level values. However, stationerity property was found after taking the first difference of the variables and found to be stationary at 1%. The implication of the above result is that all the variables are not stationary at their level values, they are found to be stationery at first difference and this led to the conclusion that they are integrated of order one denoted by I(1) which gives room for cointegration test, which was performed and presented in the following section. 5.1 Bound F-test for Co-integration After the achievement of stationarity, the next step is to conduct bound F-test for cointegration in equation (4) and (5) in order to establish a long-run relationship among the series variables. The results of the bound F-test for cointegration together with the asymptotic critical values are reported in table 3 below; Table 3: The Results of Bound F-test for Cointegration
Dependent Variable Function F-Statistics LRGDP LRGDP(RGDP/PSC) 1.3296
LPSC LPSC(PSC/RGDP) 5.6492**
Asymptotic Critical Values 5% 10%
Lower Bound 3.3559 2.5141
Upper Bound 4.4148 3.4180 Source: Author’s Computation using MICROFIT software Note: **, indicates level of significance at 5%. Asymptotic critical values are derived from Narayan (2005) for k = 2 and n = 35. 5.2 Interpretations of the results of Bound F-test for Cointegration The results of the bound F-test for cointegration in table 4.3 indicate that cointegration is only present when LPSC is treated as the dependent variable. This is because the computed F-LPSC (PSC/RGDP) is 5.6492 which is higher than the upper bound critical value at both 5% and 10%, i.e. 4.4148 and 3.4180 respectively. Moreover, there is no cointegration when the computed F-LRGDP(RGDP/PSC) (RGDP treated as the dependent variable), 1.3296 is less than the lower critical values at both 5% and 10% levels of significance 3.559 and 2.5141 respectively. This implies that there
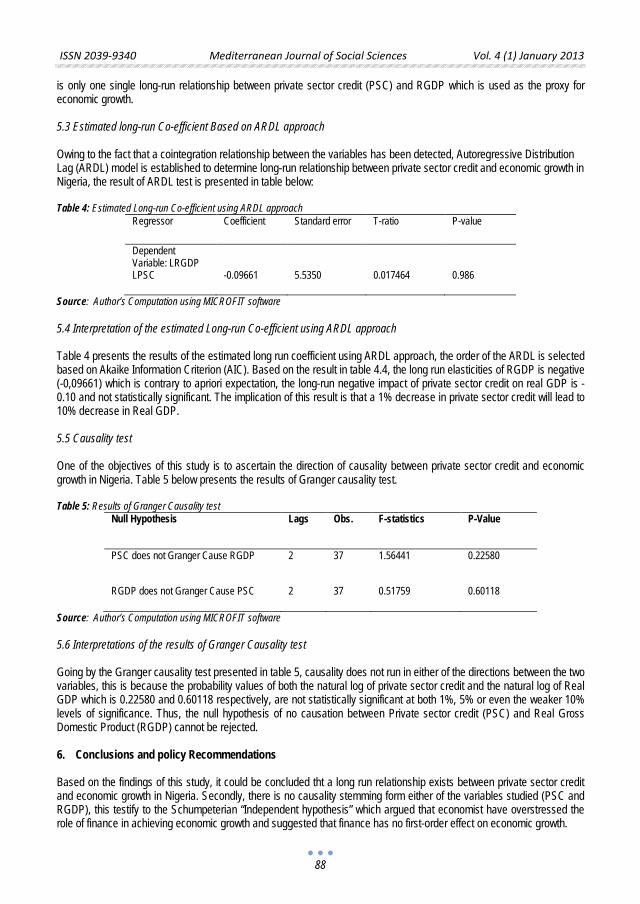
ISSN 2039-9340 Mediterranean Journal of Social Sciences Vol. 4 (1) January 2013
88
is only one single long-run relationship between private sector credit (PSC) and RGDP which is used as the proxy for economic growth. 5.3 Estimated long-run Co-efficient Based on ARDL approach Owing to the fact that a cointegration relationship between the variables has been detected, Autoregressive Distribution Lag (ARDL) model is established to determine long-run relationship between private sector credit and economic growth in Nigeria, the result of ARDL test is presented in table below: Table 4: Estimated Long-run Co-efficient using ARDL approach
Regressor Coefficient Standard error T-ratio P-value
Dependent Variable: LRGDP
LPSC -0.09661 5.5350 0.017464 0.986
Source: Author’s Computation using MICROFIT software 5.4 Interpretation of the estimated Long-run Co-efficient using ARDL approach Table 4 presents the results of the estimated long run coefficient using ARDL approach, the order of the ARDL is selected based on Akaike Information Criterion (AIC). Based on the result in table 4.4, the long run elasticities of RGDP is negative (-0,09661) which is contrary to apriori expectation, the long-run negative impact of private sector credit on real GDP is -0.10 and not statistically significant. The implication of this result is that a 1% decrease in private sector credit will lead to 10% decrease in Real GDP. 5.5 Causality test One of the objectives of this study is to ascertain the direction of causality between private sector credit and economic growth in Nigeria. Table 5 below presents the results of Granger causality test. Table 5: Results of Granger Causality test
Null Hypothesis Lags Obs. F-statistics P-Value
PSC does not Granger Cause RGDP 2 37 1.56441
0.22580
RGDP does not Granger Cause PSC 2 37 0.51759 0.60118
Source: Author’s Computation using MICROFIT software 5.6 Interpretations of the results of Granger Causality test Going by the Granger causality test presented in table 5, causality does not run in either of the directions between the two variables, this is because the probability values of both the natural log of private sector credit and the natural log of Real GDP which is 0.22580 and 0.60118 respectively, are not statistically significant at both 1%, 5% or even the weaker 10% levels of significance. Thus, the null hypothesis of no causation between Private sector credit (PSC) and Real Gross Domestic Product (RGDP) cannot be rejected. 6. Conclusions and policy Recommendations Based on the findings of this study, it could be concluded tht a long run relationship exists between private sector credit and economic growth in Nigeria. Secondly, there is no causality stemming form either of the variables studied (PSC and RGDP), this testify to the Schumpeterian “Independent hypothesis” which argued that economist have overstressed the role of finance in achieving economic growth and suggested that finance has no first-order effect on economic growth.
ISSN 2039-9340 Mediterranean Journal of Social Sciences Vol. 4 (1) January 2013
89
We therefore recommend that, since a long run equilibrium relationship between private sector credit and economic growth has been established, this implies that promoting economic growth in Nigeria in the long run calls for the provision of long-term investment loans to the productive private sector. This is because private sector credit is identified as one of the forcing variables for achieving economic growth in the long run.
Secondly, as the two variables studied (PSC and RGDP) were reported to have no causal impact, Nigerian banks are burdened with excess liquidity and these banks are very cautious in providing credit to the private sector (See Adeniyi, 2006), this research recommends for comprehensive policies and strong legal frame-work that will facilitate the disbursement and recovery of private sector credit, especially to the preferred agricultural and manufacturing sectors of the Nigerian economy. References Adeniyi, O. M. (2006), ‘Bank Credit and Economic Development in Nigeria: A Case of Deposit Money Banks’ Jos Journal of Economics. Asika, N. (2009), ‘Research Methodology in the Behavioural Sciences’ Ikeja lagos, Longman Nigeria Plc Aziokpono, M. (2003), ‘Financial intermediation and economic growth in economic intergration: A case of South African Custom Union
SACU’ retrieved on 7/7/2011 from www.google.com Beck, T., Rioji, F. and Valen, N. (2009), ‘Who Gets the Credit? And does it Matter?’ European Banking Center Discussion Paper No.
2009-12 Coricelli, F. (2008), ‘Finance and Growth: When does Credit Really Matter?’ Vol. X; Research-based Policy Analysis and Commentary
from Leading Economist; Retrieved on 5/7/2011 from http://www.voxeu.org/index Eatzaz, A. and Malik, A. (2009), ‘Financial Sector and Economic Growth: An Empirical Analysis of Developing Countries’ Journal of
Economic Cooperation and Development Vol. 30, 1, 17-40. Franklin, A. and Oura, H. (2004), ‘Sustained Economic Growth and the Financial System’; Institute for Monetary and Economic Research
(IMES), Bank of Japan, Discussion paper No. E-17 also available at http://www.imes.boj.or.jp Goldsmith, R. W. (1969), ‘Financial Structure and Development’ Yale University Press, New Haves City Gujarati, D. N. (2005), ‘Basic Econometrics’ Fifth Reprint, New Delhi, Tata McGraw-Hill, India Pp 801-820 Johannes, T. A., Njong, A. M. and Cletus, N. N. (2011), ‘Financial Development and Economic Growth’ Journal of Economics and
International Finance; Vol. 3 (6) Pp 367-375 Josephine, N. O. (2009), ‘Analysis of Bank Credit on the Nigerian Economic Growth (1992-2008). Jos Journal of Economics, Vol. 4,
NO.1, Pp 43-58 Levine, R. (1997), ‘Financial Development and Economic Growth: Views and Agenda” Journal of Economic Literature, 35(2) 688-726. Levine, R. (2002), ‘Bank-based or Market-based Financial System: Which is better’ Journal of Financial Intermediation, 11 (4) 398-428 Levine, R. (2004), ‘Finance and Growth: Theory and Evidence’ NBER Working Paper NO.10766 Levine, R., Loayza, N. and Beck, T. (2000), ‘Financial Intermediation and Economic Growth: Causes and Causality’ Journal of Monetary
Economics No. 46, Pp 31-77. Lucas, R. (1988), ‘On the Mechanic of Economic Development’ Journal of Monetary Economics Vol.22 Pp 2-42 Mckinnon, R. (1937), ‘Money and Capital in Economic Development’; Washington, Brookings institute Muhsin, K. and Eric, J. P. (2000), ‘Financial Development and Economic Growth in Turkey: Further Evidence on the Causality Issue’
Centre for International, Financial and Economic Research. Department of Economics, Loughborough University Narayan, P. K. (2004), ‘Reformulating Critical Values for the Bounds F-statistics Approach to Cointegration: An Application to the
Tourism Demand Model for Fiji’; Discussion Paper 02/04, Department of Business Economics, Monash University, Australia. Nnanna, O. J., Englama, A. and Odoko, F. O.(2004), ‘Finance, Investment and Growth in Nigeria’ A Central Bank of Nigeria Publication,
Kas Arts Services. Also available at www.centbank.org Ngai, H.(2005), ‘Bank Credit and Economic Growth in Macao’ Monetary Authority of Macao. Retrieved on 21/05/2011 from
www.amcm.gov.mo/publication Olofin, S. O. and Afangideh, U. J. (2006), ‘Financial Structure and Economic Growth in Nigeria: A Macro Econometric Approach’ Ibadan,
Centre for Econometric and Allied Research. Retrieved on 02/05/2011 from http//:www.cear.ng.org Oluitan, R. (2007), ‘Bank Credit and Economic Growth: The Nigerian Experience’ retrieved on 12/04/2011 from www.google.com Plamen, K. and Khamis, A. (2009), ‘Credit Growth in Sub-Saharan Africa: Sources, Risks and Policy Response’ IMF Working Paper
wp/09/180 Pesaran, H. M. and Shin, Y. (1996), ‘Autoregressive Distributed Lag Modeling to Cointegration Analysis’ DAE Working Paper Series, No.
9514, Department of Applied Economics, University of Cambridge. Retrieved on 14th December 2011 from www.eprg.org.uk/faculty/pesaran/ardl.pdf
Pesaran, H. M., and Pesaran (2001), ‘Bound Testing Approach to the Analysis of Level Relationships’; Journal of Applied Econometrics 16, 284-326
Popkova, E. G., Shakhovskaya, L. S., Mitrakhovich, T. N. (2008), ‘New Quality of Economic Growth Concept’; International Journal of Economic Policy Studies; Pp 01-10
Prakash, P. R. (2009), ‘The Nexus between Financial Development and Economic Growth in India: Evidence from Multivariate VAR Model’; International Journal of Research and Reviews in Applied Sciences. Vol. 1, Issue 2

ISSN 2039-9340 Mediterranean Journal of Social Sciences Vol. 4 (1) January 2013
90
Rodriguez, F. and Rodrik, D. (1999), ‘Trade Policy and Economic Growth: A Skeptic’s Guide to Cross-national Evidence’ NBER Working Paper 7081
Schumpeter, J. A. (1934), ‘The Theory of Economic Development’; Cambridge Mass. Harvard University Press Shabri, M. and Majid, A. (2008), ‘Does Financial Development Matter for Economic Growth in Malaysia: An ARDL Bound Testing
Approach’; Journal of Economic Cooperation 29, 61- 82 Shaw, E. S. (1973), ‘Financial Deepening in Economic Growth’; New York, Oxford University Press
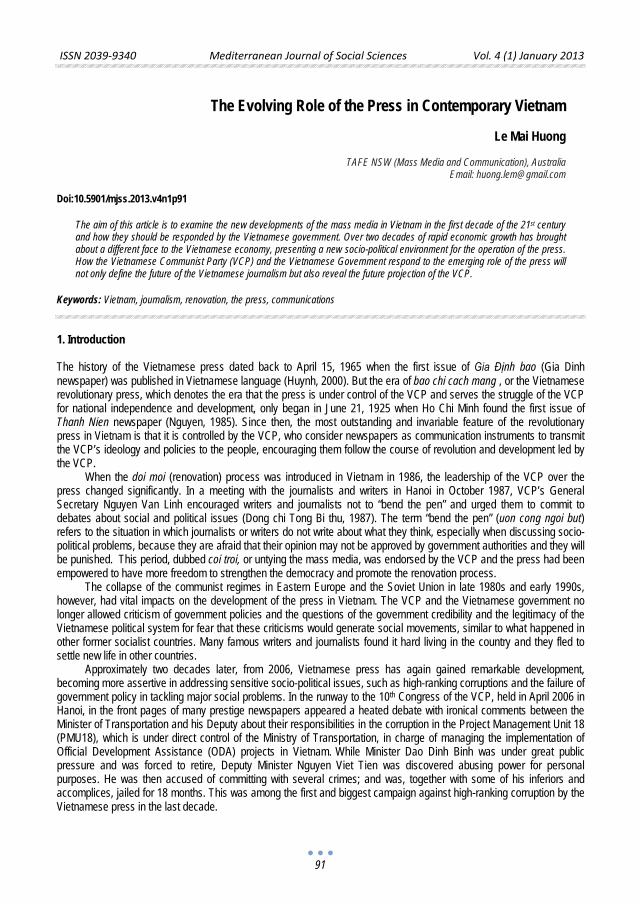
ISSN 2039-9340 Mediterranean Journal of Social Sciences Vol. 4 (1) January 2013
91
The Evolving Role of the Press in Contemporary Vietnam
Le Mai Huong
TAFE NSW (Mass Media and Communication), Australia
Email: [email protected] Doi:10.5901/mjss.2013.v4n1p91
The aim of this article is to examine the new developments of the mass media in Vietnam in the first decade of the 21st century and how they should be responded by the Vietnamese government. Over two decades of rapid economic growth has brought about a different face to the Vietnamese economy, presenting a new socio-political environment for the operation of the press. How the Vietnamese Communist Party (VCP) and the Vietnamese Government respond to the emerging role of the press will not only define the future of the Vietnamese journalism but also reveal the future projection of the VCP.
Keywords: Vietnam, journalism, renovation, the press, communications
1. Introduction The history of the Vietnamese press dated back to April 15, 1965 when the first issue of Gia Định bao (Gia Dinh newspaper) was published in Vietnamese language (Huynh, 2000). But the era of bao chi cach mang , or the Vietnamese revolutionary press, which denotes the era that the press is under control of the VCP and serves the struggle of the VCP for national independence and development, only began in June 21, 1925 when Ho Chi Minh found the first issue of Thanh Nien newspaper (Nguyen, 1985). Since then, the most outstanding and invariable feature of the revolutionary press in Vietnam is that it is controlled by the VCP, who consider newspapers as communication instruments to transmit the VCP’s ideology and policies to the people, encouraging them follow the course of revolution and development led by the VCP.
When the doi moi (renovation) process was introduced in Vietnam in 1986, the leadership of the VCP over the press changed significantly. In a meeting with the journalists and writers in Hanoi in October 1987, VCP’s General Secretary Nguyen Van Linh encouraged writers and journalists not to “bend the pen” and urged them to commit to debates about social and political issues (Dong chi Tong Bi thu, 1987). The term “bend the pen” (uon cong ngoi but) refers to the situation in which journalists or writers do not write about what they think, especially when discussing socio-political problems, because they are afraid that their opinion may not be approved by government authorities and they will be punished. This period, dubbed coi troi, or untying the mass media, was endorsed by the VCP and the press had been empowered to have more freedom to strengthen the democracy and promote the renovation process.
The collapse of the communist regimes in Eastern Europe and the Soviet Union in late 1980s and early 1990s, however, had vital impacts on the development of the press in Vietnam. The VCP and the Vietnamese government no longer allowed criticism of government policies and the questions of the government credibility and the legitimacy of the Vietnamese political system for fear that these criticisms would generate social movements, similar to what happened in other former socialist countries. Many famous writers and journalists found it hard living in the country and they fled to settle new life in other countries.
Approximately two decades later, from 2006, Vietnamese press has again gained remarkable development, becoming more assertive in addressing sensitive socio-political issues, such as high-ranking corruptions and the failure of government policy in tackling major social problems. In the runway to the 10th Congress of the VCP, held in April 2006 in Hanoi, in the front pages of many prestige newspapers appeared a heated debate with ironical comments between the Minister of Transportation and his Deputy about their responsibilities in the corruption in the Project Management Unit 18 (PMU18), which is under direct control of the Ministry of Transportation, in charge of managing the implementation of Official Development Assistance (ODA) projects in Vietnam. While Minister Dao Dinh Binh was under great public pressure and was forced to retire, Deputy Minister Nguyen Viet Tien was discovered abusing power for personal purposes. He was then accused of committing with several crimes; and was, together with some of his inferiors and accomplices, jailed for 18 months. This was among the first and biggest campaign against high-ranking corruption by the Vietnamese press in the last decade.
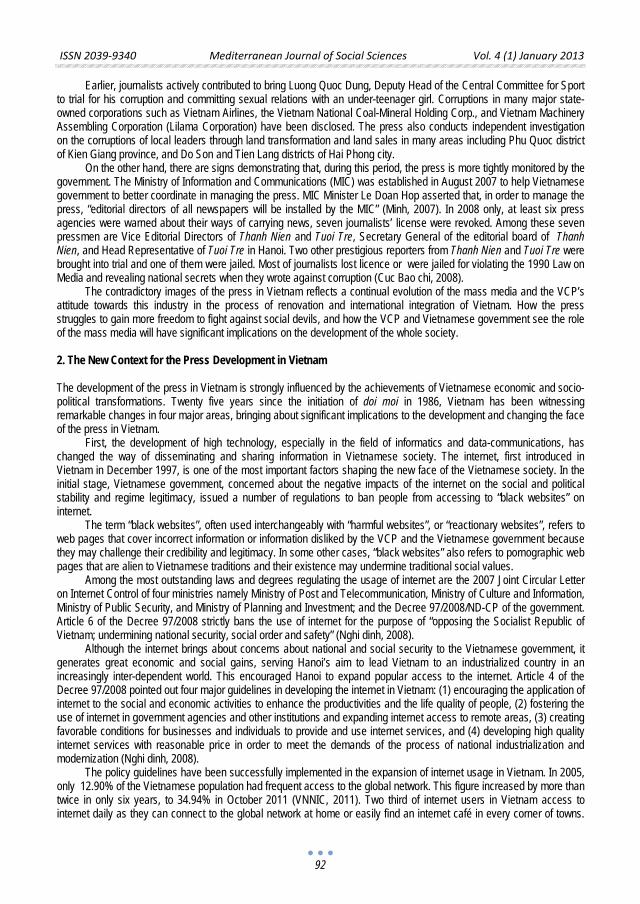
ISSN 2039-9340 Mediterranean Journal of Social Sciences Vol. 4 (1) January 2013
92
Earlier, journalists actively contributed to bring Luong Quoc Dung, Deputy Head of the Central Committee for Sport to trial for his corruption and committing sexual relations with an under-teenager girl. Corruptions in many major state-owned corporations such as Vietnam Airlines, the Vietnam National Coal-Mineral Holding Corp., and Vietnam Machinery Assembling Corporation (Lilama Corporation) have been disclosed. The press also conducts independent investigation on the corruptions of local leaders through land transformation and land sales in many areas including Phu Quoc district of Kien Giang province, and Do Son and Tien Lang districts of Hai Phong city.
On the other hand, there are signs demonstrating that, during this period, the press is more tightly monitored by the government. The Ministry of Information and Communications (MIC) was established in August 2007 to help Vietnamese government to better coordinate in managing the press. MIC Minister Le Doan Hop asserted that, in order to manage the press, “editorial directors of all newspapers will be installed by the MIC” (Minh, 2007). In 2008 only, at least six press agencies were warned about their ways of carrying news, seven journalists’ license were revoked. Among these seven pressmen are Vice Editorial Directors of Thanh Nien and Tuoi Tre, Secretary General of the editorial board of Thanh Nien, and Head Representative of Tuoi Tre in Hanoi. Two other prestigious reporters from Thanh Nien and Tuoi Tre were brought into trial and one of them were jailed. Most of journalists lost licence or were jailed for violating the 1990 Law on Media and revealing national secrets when they wrote against corruption (Cuc Bao chi, 2008).
The contradictory images of the press in Vietnam reflects a continual evolution of the mass media and the VCP’s attitude towards this industry in the process of renovation and international integration of Vietnam. How the press struggles to gain more freedom to fight against social devils, and how the VCP and Vietnamese government see the role of the mass media will have significant implications on the development of the whole society. 2. The New Context for the Press Development in Vietnam The development of the press in Vietnam is strongly influenced by the achievements of Vietnamese economic and socio-political transformations. Twenty five years since the initiation of doi moi in 1986, Vietnam has been witnessing remarkable changes in four major areas, bringing about significant implications to the development and changing the face of the press in Vietnam.
First, the development of high technology, especially in the field of informatics and data-communications, has changed the way of disseminating and sharing information in Vietnamese society. The internet, first introduced in Vietnam in December 1997, is one of the most important factors shaping the new face of the Vietnamese society. In the initial stage, Vietnamese government, concerned about the negative impacts of the internet on the social and political stability and regime legitimacy, issued a number of regulations to ban people from accessing to “black websites” on internet.
The term “black websites”, often used interchangeably with “harmful websites”, or “reactionary websites”, refers to web pages that cover incorrect information or information disliked by the VCP and the Vietnamese government because they may challenge their credibility and legitimacy. In some other cases, “black websites” also refers to pornographic web pages that are alien to Vietnamese traditions and their existence may undermine traditional social values.
Among the most outstanding laws and degrees regulating the usage of internet are the 2007 Joint Circular Letter on Internet Control of four ministries namely Ministry of Post and Telecommunication, Ministry of Culture and Information, Ministry of Public Security, and Ministry of Planning and Investment; and the Decree 97/2008/ND-CP of the government. Article 6 of the Decree 97/2008 strictly bans the use of internet for the purpose of “opposing the Socialist Republic of Vietnam; undermining national security, social order and safety” (Nghi dinh, 2008).
Although the internet brings about concerns about national and social security to the Vietnamese government, it generates great economic and social gains, serving Hanoi’s aim to lead Vietnam to an industrialized country in an increasingly inter-dependent world. This encouraged Hanoi to expand popular access to the internet. Article 4 of the Decree 97/2008 pointed out four major guidelines in developing the internet in Vietnam: (1) encouraging the application of internet to the social and economic activities to enhance the productivities and the life quality of people, (2) fostering the use of internet in government agencies and other institutions and expanding internet access to remote areas, (3) creating favorable conditions for businesses and individuals to provide and use internet services, and (4) developing high quality internet services with reasonable price in order to meet the demands of the process of national industrialization and modernization (Nghi dinh, 2008).
The policy guidelines have been successfully implemented in the expansion of internet usage in Vietnam. In 2005, only 12.90% of the Vietnamese population had frequent access to the global network. This figure increased by more than twice in only six years, to 34.94% in October 2011 (VNNIC, 2011). Two third of internet users in Vietnam access to internet daily as they can connect to the global network at home or easily find an internet café in every corner of towns.
ISSN 2039-9340 Mediterranean Journal of Social Sciences Vol. 4 (1) January 2013
93
About 40-45% of Vietnamese internet users have personal accounts in forums, blogs, and social network sites (Cimigo, 2010). Internet has become an indispensable part of many young people in big cities.
The global internet flourishing makes it impossible for any government to rely on administrative and technological tools to control the flow of online information, unless all internet connection to the country is shut down. Hanoi may understand that it is not pragmatic to try blocking all “black websites”, or even censor online information. For that reason, apart from using firewall to intercept certain websites, it pursues a two-dimensional approach. One is to foster registered websites to provide people with official information about the policies and instruction for administrative services. The other dimension is to trace the owners of websites that carry information prejudicial to the political system. According to the Reporters without Borders, in 2011 alone, 17 netizens, including some famous bloggers, were arrested (Reporters without Borders, 2011). Rumors also spread that the Vietnamese authorities used virus and other technological tactics to attack harmful websites (BBC, 2010; Reporters without Borders, 2011), but Vietnam officially rejected that accusation (Vietnam Ministry of Foreign Affairs, 2010).
Second, the shift from a central-planned economy to a market oriented one and Vietnam’s remarkable economic performance for over two decades have created a new social environment that contributes to change readers’ reading interests as well as the fundamental way in which the press runs in Vietnam. The market economy in Vietnam has widened social gaps, inequity, and created more social evils, which has subsequently brought about social disputes and conflicts. At the same time, higher living standards of ordinary people have lead to their higher demands for entertainment and more concerns over social issues.
The economic development has spilled over to the mass media, bringing about a flourishing of this industry. Hundreds of printed and online newspaper editorial offices have been newly established since 1986. Statistics from Vietnamese Ministry of Information and Communications showed that, by June 2012, Vietnam has 748 printed news agencies, 62 online newspapers, and 1024 licensed news websites (Vietnam Ministry of Information and Communications, 2012). Besides, several pay-television stations have been established. In April 2003, Vietnam introduced the first ever cable television station, Vietnam Cable Television (VCTV), of which subscribers must pay a monthly fee to have access to the cabled channels. VCTV was then competed by other cable television stations such as HCTV and SCTV. Other forms of pay-TV such as satellite TV and digital TV are also introduced in Vietnam.
The market economy has also had substantial impacts on the way the news agencies run business in Vietnam. The press, still controlled by the government, is forced to generate their own income through advertisement sales and, for printed newspapers, high circulation. This means that newspapers now operate in a very much higher competitive environment in which they have to win the readers. This task is only achieved through breaking renovation in both the design and the content of the press. More interactive tools such as feedbacks and readers’ opinions have been introduced in modern designs of printed newspapers such as Tien Phong, Lao Dong, Thanh Nien, and Tuoi Tre. Regarding the issues carried by the press, social problems, comments on government’s policies, and the struggles against corruptions, which are of the readers’ main interests, more frequently appeared in the press.
Third, Vietnam is increasingly integrated into the world in all aspects and the country is increasingly exposed to international customs, laws, and practices. Vietnamese government and the whole society are learning, absorbing, and accommodating to the new rules and values from the international community. Hanoi opened its foreign relations with the world since early 1990s with the diplomatic normalization with China in 1991. After that, Vietnam’s foreign relations have quickly been broadened. In 1995, the country made diplomatic breakthroughs with the accession to the Association of Southeast Asian Nations (ASEAN) and the diplomatic normalization with the United States and the European Union. Since then, Hanoi has been very proactive in its foreign policy as it enters various bilateral and multilateral negotiations in political and economic issues. Vietnam accessed to the World Trade Organization (WTO) in 2006 and became a non-permanent member of the United Nation’s Security Council for the two year rotation in 2008 and 2009.
Today, Vietnamese economy is strongly connected with the global partners. The country’s economic growth is strongly assisted by foreign investment and trade. By 2011, Vietnam had registered approximately USD 198 billion from over 13,600 foreign direct investment (FDI) projects, “outweighing the growth rates of other developing country recipients of FDI” (UNIDO&MPI, 2012). Vietnamese foreign trade in 2011 reached USD 108.1 billion, equating to 160% of Vietnamese GDP (HSBC, 2012; Tinh, 2012).
Economic and diplomatic integrations to the world have led to the introduction of international customs and practices to Vietnam. Foreign television programs, movies, business links, international laws, personal contacts, etc., have changed the habit and thinking of Vietnamese people. Western style entertainment complexes have been built in big cities, big corporations have been listing in the stock markets. By 2011, the number of foreign tourists coming to Vietnam reached over 6 billion, equal to around 7.5% Vietnamese population (Vietnam National Administration of Tourism, 2011). Vietnamese pay-TV packages include all major world’s famous channels such as BBC, CNN, ABC, Discovery, Star Movies, HBO, Star Sport, and ESPN. Both governmental dialogues and people to people relations help to
ISSN 2039-9340 Mediterranean Journal of Social Sciences Vol. 4 (1) January 2013
94
introduce relatively new concepts and perceptions such as intellectual property rights, human security, and civil society into Vietnam. They have gradually made impacts on individuals’ minds and contributed to shape the way the society operate in the new era.
Lastly, a growing number of western-educated Vietnamese intellectuals are contributing to thinking and habitual changes of both the society and the government. Each year, hundreds of Vietnamese students are sent to high quality education systems such as those in the US, European countries, Australia, and Singapore, to study under the government scholarship programs. Foreign governments such as those of Australia, Japan, China, and New Zealand also provide totally some hundreds of scholarships annually for Vietnamese students, most of whom are from governmental sectors. Besides, each year, thousands of Vietnamese students pays for themselves to study abroad.
This helps increase the total number of Vietnamese students studying overseas. For example, according to the Institute of International Education (IIE), in the 2010-11 academic years, nearly 15,000 Vietnamese students registered to US educational institutions, making Vietnam the 8th among countries sending students to the US (IIE, 2012). The number of Vietnamese students in Australia in the same year was over 23,000 (Australian Department of Foreign Affairs and Trade, n.d.). Many foreign-educated students have come back to work in Vietnam in different sectors such as government officers, university lecturers, journalists, and businessmen. They contribute to change the face of the society and the press through contribution to the policy making process, teaching, or working in the mass media industry. 3. A new role for the Press in Vietnam The VCP has always considered newspapers a tool to better manage the country because it serves as a channel to explain the government and party’s policies and to enable ordinary people to have a saying in national affairs. Officials’ perceptions towards the press, however, are diverse. Some see the opening of the press is good, while others are concerned that if the press is not controlled, they will be disoriented and will not serve the course of national development. Against this backdrop, the willingness of the VCP and Vietnamese government to empower the press to address socio-political problems will significantly determine its role in the society.
In the most basic explanation of a country’s politics, there are three broad types of politics. Official politics deals with government duties, including the making and implementation of policies. People’s politics refers to the influence of ordinary people to politics through the way they live and behavior. Advocacy politics involves direct efforts to support, criticize, or oppose authorities, programs, policies, or the entire way the resources are produced and distributed (Kerkvliet, 2005). Placing the press into this category division, it often functions as a part of the advocacy group.
In the Vietnamese political system, however, the press is under control of the VCP and government. Article 6 of the Law on Media of Vietnam noted that the media has the responsibility “to disseminate, publicize and contribute to the establishment and protection of the strategies and policies of the Party….; to establish and develop socialist democracy; … to strengthen and protect the Socialist Vietnam Fatherland” (Law on Media, 1990). The VCP also stated it clearly, considering newspapers as communication instruments to transmit the VCP’s ideology and policies to the people, encouraging them follow the course of revolution and development led by the VCP (Van kien, 1982).
Although the press is under control of the VCP and the Vietnamese government, it in fact is granted a certain level of independence as a power check of the making and implementation of the government’s policies. This new openness in this time, however, differs from the one in 1988-1989 in two aspects.
First, in 1988-1989, the openness of the press was for a small group of intellectuals, who advocated for a freedom of expression and speech to tackle social and public issues. The openness policy towards the press was influenced by liberal Party leaders and the intellectuals in a domestic context of extreme social, economic, and political difficulties. The current re-emerging role of the press in Vietnam occurred in the context of high national economic growth and the living standards of people are increased. The mass media currently imparts the aspiration and reaction of ordinary people to the government’s policies and implementations as well as to changes which affect their daily lives.
Examples are abundant. In recent years, general meetings of the National Assembly have always been broadcasted live in national television channels so that people can easily follow discussions and Q&A sessions between members of the National Assembly and Ministers of the government. In the same pattern, general meetings of the People’s Council at provincial level in Hanoi and Ho Chi Minh city, Vietnam’s two biggest cities, also have live coverage in local televisions. The press also reflected people’s expectations and criticized many poor quality policies and regulations, thus putting pressure on government authorities to remove them. For example, the policy of stopping vehicle registration as a means to reduce traffic jam in Hanoi in September 2003 was strongly criticized by the press. Many newspapers, such as Tuoi Tre and Tien Phong commented that this policy violated the right of ownership written in the Constitution. This policy hence was removed in 2006. In another case, the national electricity corporation of Vietnam (EVN), which de factor enjoys a monopoly status in providing electricity in Vietnam, has always been challenged by the press when it
ISSN 2039-9340 Mediterranean Journal of Social Sciences Vol. 4 (1) January 2013
95
attempts to increase electricity price. Social spirit is reflected in the press, resulting in the government’s decision to open the electricity market for competition from July 2012.
Second, the opening of the press in this time is a gradual process, focusing more on the struggle against the socio-political problems, including corruption, in an established political system. It is different from the period of 1988-89 when the intellectuals demanded immediate and radical changes at doctrinal level. A common explanation for the sudden death of the openness in the period of 1988-89 was that it occurred in a high speed and broad scale so that the VCP feel that the revolution would undermine its legitimacy.
In addition, comparing with the social and political context in late 1980s, the VCP now enjoys higher level of credibility and legitimacy thanks to the country’s lasting economic growth in the last two decades, so it has more confidence in allowing criticisms from the intellectuals. The current development of mass media in Vietnam is, therefore, expected to be a stable process.
It would be a critical shortcoming, however, if we conclude that the press in Vietnam today is playing a role of an independent group at advocacy politics level. The VCP has always asserted its control over the press explicitly and implicitly. Editors in Chief of newspapers must be members of the VCP, and they gather frequently to hear direction for their jobs from the Department for Propaganda and Ideology of the VCP. The evolution towards a more freedom from government of the mass media in Vietnam, therefore, will possibly experience some fluctuations. But as the Vietnamese domestic context has changed, in the long run, this trend is unlikely to be reversed. Reference Australian Department of Foreign Affairs and Trade. (n.d.). Vietnam Country Brief. Retrieved August 30, 2012,
from http://www.dfat.gov.au/geo/vietnam/vietnam_brief.html BBC. (2010). Google cao giac ve “tin tac chinh tri” VN [Google denounces “political hackers” in Vietnam]. Retrieved June 03, 2012,
from: http://www.bbc.co.uk/vietnamese/vietnam/2010/03/100331_google_vietnam.shtml Cimigo. (2010). Vietnam NetCitizens Report: Internet Usage and Development in Vietnam. Available from Cimogo
website: http://www.cimigo.vn Cuc bao chi giai thich ly do thu the 7 nha bao [Authority of Press Explains reason to withdraw licence of 7 journalists]. (2008). Retrieved
July 30, 2012 from http://vnexpress.net/gl/xa-hoi/2008/08/3ba05c78/. Dong chi Tong Bi thu noi chuyen voi Van Nghe sy [General Secretary Talks to Journalists and Writers]. (1987, October 17). Van Nghe.
42. HSBC. (2012). Vietnam: Country Guide. Available from http://globalconnections.hsbc.com/countries/vietnam IIE. (2012). Office at a Glance. Retrieved July 23, 2012 from http://www.iie.org/Offices/Hanoi Kerkvliet, Benedict J. (2005). The power of Everyday Politics: How Vietnamese Peasants Transformed National policy. Ithaca and
London: Cornell University Press. Law on Media 1990. Minh, Bao. (2007). Bo truong Bo Thong tin va Truyen thong Le Doan Hop: Tiep can cai moi de dua dat nuoc di len [Minister of
Information and Communications: Approaching new things to develop our country]”. Retrieved June 02, 2012, from Sai Gon Giai Phong Online: http://www.sggp.org.vn/chinhtri/2007/8/113880/
Nghi dinh ve Quan ly, cung cap, su dung dich vu Internet va thong tin dien tu tren Internet 97/2008/ND-CP. [Government Decree on the management of internet, internet service provision, and internet usage 97/2008/ND-CP]. (2008).
Reporters without Borders. (2011). Internet Enemies: Vietnam. Retrieved June 05, 2012 from http://en.rsf.org/internet-enemie-vietnam,39763.html
Thanh, Nguyen. (1984). Bao chi Cach mang Viet Nam: 1925-1945 [The Vietnamese Revolutionary Press: 1925-1945]. Hanoi: Social Sciences Publisher.
Tinh, Le Dinh. (2012). Vietnam: New Thinking, New Risks, New Opportunities. PacNet. Vol.15. Tong, Huynh Van. (2000). Bao chi Viet Nam tu khoi thuy den 1945 [The Vietnamese Press from the Beginning to 1945]. Ho Chi Minh
City: HCM City Publishing House. UNIDO&MPI. (2012). Vietnam Industrial Investment Report 2011. Retrieved August 20, 2012,
from http://www.un.org.vn/vi/publications/publications-by-agency/doc_details/293-viet-nam-industrial-investment-report-2011.html Van Kien Dai hoi Dang Cong San Viet Nam lan thu V [The Documents of the 5th General Congress of the VCP]. (1982). Hanoi: Su That
Publisher. Vietnam Ministry of Foreign Affairs. (2010). Nhung y kien ve cac phan mem gay hai nham vao nguoi su dung may tinh co cai dat tieng
Viet la khong co co so [Suggestions that harmful software targets computer users using Vietnamese font are baseless]. Retrieved June 20, 2012, from: http://www.mofa.gov.vn/vi/tt_baochi/pbnfn/ns100405185715
Vietnam Ministry of Information and Communications. (2012). Tinh hinh phat trien linh vuc bao chi 6 thang nam 2012 [The Press in the first 6 months of 2012]. Retrieved September, 2012, from http://mic.gov.vn/solieubaocao/solieuthongke/baochi/ Trang/T%C3%ACnhh%C3%ACnhph%C3%A1ttri%E1%BB%83n.aspx

ISSN 2039-9340 Mediterranean Journal of Social Sciences Vol. 4 (1) January 2013
96
Vietnam National Administration of Tourism. (2011). International visitors to Vietnam in December and 12 months of 2011. Retrieved August 03, 2012, from http://www.vietnamtourism.gov.vn/english/index.php?cat=012040&itemid=5143
VNNIC. (2011). Thong ke Internet [Internet Statistics]. Retrieve June 05, 2012, from http://www.thongkeinternet.vn/
ISSN 2039-9340 Mediterranean Journal of Social Sciences Vol. 4 (1) January 2013
97
The Challenges of Saving Mothers from Childbirth-Related Injuries
and Deaths in Nigeria
Dr Godswill James
Department of Sociology, Kaduna State University, Kaduna, Nigeria E-mail: [email protected]
Doi:10.5901/mjss.2013.v4n1p97 Abstract
Nigeria’s national maternal mortality rate is estimated at 545 per 100,000 live births in 2008. Despite the decrease compared to previous rate of 800 per 100,000 live births in 2005 it is still high, and presents a picture of maternal health status of the country. Nigerian government has embarked on programmes to reduce maternal mortality such as, Midwife Service Scheme (MSS) aimed at achieving the fifth Millennium Development Goals (MDG) for increased maternal health and survival. However, the achievement made so far is low as annual percentage decline in maternal mortality ratio from 1990-2008 was 1.5% compared to the targeted 5.5%. In addition, maternal deaths and lifetime risk is high as a woman’s chance of dying from pregnancy and childbirth in Nigeria is 1 in 13, while it is 1 in 5000 in developed nations. Against the backdrop of the worsening state of maternal health in Nigeria, this paper examines the crucial challenges militating against efforts at saving mothers from childbirth-related injuries and death in Nigeria. Relying mainly on secondary data, the author contends that maternal health is a function of significant and complex underlying interaction of socio-cultural and environmental factors. It is argued that socio-cultural context within which Nigerian people live affects their ideas, decisions and behavior concerning maternal deaths; it affects what people know about pregnancy and delivery, what preparations they make and what they do about life-threatening complications and it ultimately poses challenges on maternal health in Nigeria.
Key Words: Maternal Health, Injuries, Deaths, Challenges, Nigeria, Maternal mortality and morbidity
1. Introduction Conceptually, maternal mortality refers to the death of a woman while pregnant or within 42 days of termination of pregnancy from any cause related to or aggravated by the pregnancy or its management but not from accidental or incidental causes. It includes deaths resulting from complications of pregnancy or childbearing as well as deaths due to complications of spontaneous or induced abortions. Mortality ratios range from lows of 6 to 12 maternal deaths per 100,000 live births in developed countries such as Norway, Canada, Britain, and the United States, to ratios higher than 870 maternal deaths per 100,000 live births in Africa (WHO, 1996). Although between 600,000 and one million women die each year from childbirth-related causes, only 1 percent of these deaths occur in industrialized countries (Abou-Zahr and Royston, 1991; WHO, 1996; Weinstein, 1997). The vast majority of maternal deaths take place in the cultures of tropical poverty, particularly in Africa; this continent account for 40 percent of the world’s maternal deaths. The lifetime risk of a woman dying in childbirth in Scandinavia has been estimated to be as low as one in 25,000; in rural Africa, however, the risk may be as high as one in eight due to the combination of high fertility, complicated pregnancies, and poor access to health care (Abou-Zahr and Royston, 1991; WHO, 1996).
The International Conference on Population and Development (ICPD), held in Cairo in 1994, the Fourth World Conference on Women (Beijing, 1995) and the Safe Motherhood Technical Consultation (Colombo, 1997) have helped to focus international attention on the need for accelerated action to reduce maternal mortality, which can be achieved with relatively small investments. These conferences repeated the World Summit for Children (WSC) call to reduce maternal mortality by half.
National Demographic and Health Survey (NDHS), 2008 estimated the national maternal mortality rate at 545 per 100,000 live births. Despite the decrease compared to previous rate of 800 per 100,000 live births in 2005 it is still high, and presents a picture of maternal health status of Nigeria. Nigerian government embarked on programmes to reduce maternal mortality such as, Midwife Service Scheme (MSS) aimed at achieving the fifth Millennium Development Goals (MDG) for increased maternal health and survival. However, the achievement made so far is low as annual percentage decline in maternal mortality ratio from 1990-2008 was 1.5% compared to the targeted 5.5%. In addition, maternal deaths and lifetime risk is high as a woman’s chance of dying from pregnancy and childbirth in Nigeria is 1 in 13, while it is 1 in
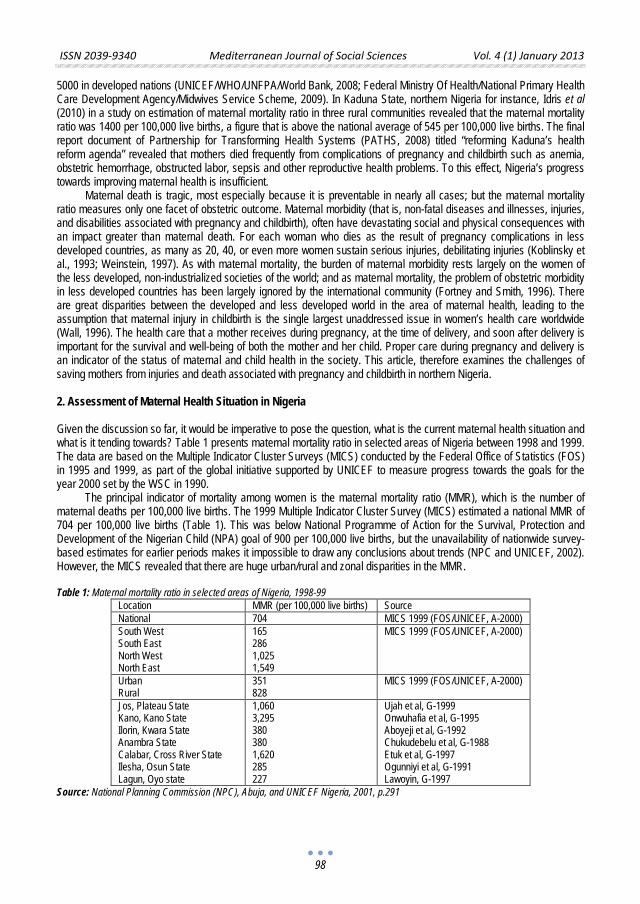
ISSN 2039-9340 Mediterranean Journal of Social Sciences Vol. 4 (1) January 2013
98
5000 in developed nations (UNICEF/WHO/UNFPA/World Bank, 2008; Federal Ministry Of Health/National Primary Health Care Development Agency/Midwives Service Scheme, 2009). In Kaduna State, northern Nigeria for instance, Idris et al (2010) in a study on estimation of maternal mortality ratio in three rural communities revealed that the maternal mortality ratio was 1400 per 100,000 live births, a figure that is above the national average of 545 per 100,000 live births. The final report document of Partnership for Transforming Health Systems (PATHS, 2008) titled “reforming Kaduna’s health reform agenda” revealed that mothers died frequently from complications of pregnancy and childbirth such as anemia, obstetric hemorrhage, obstructed labor, sepsis and other reproductive health problems. To this effect, Nigeria’s progress towards improving maternal health is insufficient.
Maternal death is tragic, most especially because it is preventable in nearly all cases; but the maternal mortality ratio measures only one facet of obstetric outcome. Maternal morbidity (that is, non-fatal diseases and illnesses, injuries, and disabilities associated with pregnancy and childbirth), often have devastating social and physical consequences with an impact greater than maternal death. For each woman who dies as the result of pregnancy complications in less developed countries, as many as 20, 40, or even more women sustain serious injuries, debilitating injuries (Koblinsky et al., 1993; Weinstein, 1997). As with maternal mortality, the burden of maternal morbidity rests largely on the women of the less developed, non-industrialized societies of the world; and as maternal mortality, the problem of obstetric morbidity in less developed countries has been largely ignored by the international community (Fortney and Smith, 1996). There are great disparities between the developed and less developed world in the area of maternal health, leading to the assumption that maternal injury in childbirth is the single largest unaddressed issue in women’s health care worldwide (Wall, 1996). The health care that a mother receives during pregnancy, at the time of delivery, and soon after delivery is important for the survival and well-being of both the mother and her child. Proper care during pregnancy and delivery is an indicator of the status of maternal and child health in the society. This article, therefore examines the challenges of saving mothers from injuries and death associated with pregnancy and childbirth in northern Nigeria. 2. Assessment of Maternal Health Situation in Nigeria Given the discussion so far, it would be imperative to pose the question, what is the current maternal health situation and what is it tending towards? Table 1 presents maternal mortality ratio in selected areas of Nigeria between 1998 and 1999. The data are based on the Multiple Indicator Cluster Surveys (MICS) conducted by the Federal Office of Statistics (FOS) in 1995 and 1999, as part of the global initiative supported by UNICEF to measure progress towards the goals for the year 2000 set by the WSC in 1990.
The principal indicator of mortality among women is the maternal mortality ratio (MMR), which is the number of maternal deaths per 100,000 live births. The 1999 Multiple Indicator Cluster Survey (MICS) estimated a national MMR of 704 per 100,000 live births (Table 1). This was below National Programme of Action for the Survival, Protection and Development of the Nigerian Child (NPA) goal of 900 per 100,000 live births, but the unavailability of nationwide survey-based estimates for earlier periods makes it impossible to draw any conclusions about trends (NPC and UNICEF, 2002). However, the MICS revealed that there are huge urban/rural and zonal disparities in the MMR. Table 1: Maternal mortality ratio in selected areas of Nigeria, 1998-99
Location MMR (per 100,000 live births) Source National 704 MICS 1999 (FOS/UNICEF, A-2000) South West South East North West North East
165 286 1,025 1,549
MICS 1999 (FOS/UNICEF, A-2000)
Urban Rural
351 828
MICS 1999 (FOS/UNICEF, A-2000)
Jos, Plateau State Kano, Kano State Ilorin, Kwara State Anambra State Calabar, Cross River State Ilesha, Osun State Lagun, Oyo state
1,060 3,295 380 380 1,620 285 227
Ujah et al, G-1999 Onwuhafia et al, G-1995 Aboyeji et al, G-1992 Chukudebelu et al, G-1988 Etuk et al, G-1997 Ogunniyi et al, G-1991 Lawoyin, G-1997
Source: National Planning Commission (NPC), Abuja, and UNICEF Nigeria, 2001, p.291
ISSN 2039-9340 Mediterranean Journal of Social Sciences Vol. 4 (1) January 2013
99
As Table 1 shows, maternal mortality is more than twice as high in the rural areas (828 per 100,000 live births) than in the urban areas (351 per 100,000 live births). The North East is the zone with the highest MMR (1,549 per 100,000 live births), which is almost ten times higher than in the South West. The rate in the North West (1,025 per 100,000 live births) is six times higher than in the South West.
Since 1974, a number of programmes aimed at improving the health of mothers and children in the world and Africa in particular have been established. In 1974 the Expanded Programme on Immunization (EPI) was put in place to immunize children against six preventable childhood killer diseases and later extended to pregnant women. This was closely followed by the Primary Health Care (WHO, 1978) strategy for the development of health care. This scheme has as one of its focus, maternal and child health which is to be executed at the local (primary) level. The MCH focus under this scheme is due to the realization of the enormous health implication which children entails and the death toll attendant in an environment where little or no facilities are available for the maintenance of mothers and their newborns (Turmen, 1993; Ching-Li, 1993). Other programmes worthy of mention are the Safe Motherhood Baby Package (1987) and the baby-friendly hospital initiative (1991).
Evidently, efforts have been made in Nigeria but the spirit or the governing ethos is shrouded by health development. The structure and the development pattern initiated under the colonial masters have largely remained while the obvious fact of the inevitable utility of the traditional structures is becoming manifest. This can be buttressed by the fact that traditional health care practices that were discredited previously are now being adopted and is playing a significant role in maternal and child health in Nigeria. The WHO (1976) has recognized and promoted the idea of the training of traditional medicine men as an effective means of extending the frontiers of health care and the cornerstone of PHC in the developing world. The baby-friendly hospital initiative is also another case in point, which suggests the African depending syndrome. Not until any subject is promoted by the developed world, African elite and government do not take it seriously due largely to the fact that these programmes have foreign aids tied to them which are of interest to African elite and government (Donahue and Mcquire, 1995).
Obviously, the international agencies, on the average, have contributed tremendously to the improvement and the quality of MCH in Nigeria and many other African countries. However, significant as these improvements may appear, they are still a long way from what obtains in the developed world, where under five mortality rate is put at 9 per 1000 while maternal mortality is 7 per 100, 000 (UNICEF, 1996).
Generally, modern health care during pregnancy, delivery, and in the period after the baby is born includes antenatal care, assistance during delivery, and postnatal care. 2.1. Antenatal Care The newest or updated WHO approach to promote safe pregnancies, called Focused Antenatal Care (FANC), recommends at least four ANC visits for women without complications, and emphasizes quality of care during each visit instead of focusing on the number of visits. The major objective of antenatal care is to ensure optimal health outcomes for the mother and the baby. Early detection of problems during pregnancy leads to more timely treatment and referrals in the case of complications. This is particularly important in less developed countries where physical barriers are a challenge to the health care delivery system. Antenatal care from a trained or skilled health worker or provider is important to monitor the pregnancy and reduce morbidity risks for the mother and child during pregnancy and delivery.
Antenatal care provided by a skilled health worker enables: 1) early detection of complications and prompt treatment (for example, detection and treatment of sexually transmitted infections); 2) prevention of diseases through immunization and micronutrient supplementation; 3) birth preparedness and complication readiness; and 4) health promotion and disease prevention through health messages and counseling of pregnant women (NPC and ICF Macro, 2009).
According to the World Health Organization (WHO), a skilled health worker is “an accredited health professional, such as a midwife, doctor, or nurse, who has been educated and trained to proficiency in the skills needed to manage normal (uncomplicated) pregnancies, child births and the immediate post-partum period, and in the identification, management, and referral of complications in women and newborns” (WHO, 2008).
However, the NDHS 2008 reported that 58% of women age 15-49 received antenatal care (ANC) from a skilled provider (doctor, nurse/midwife, or auxiliary nurse/midwife) during their last pregnancy, implying that a large proportion of women in Nigeria are either receiving ANC services from unskilled providers or not receiving at all. Moreover, tetanus toxoid injections are given during pregnancy to prevent neonatal tetanus. Overall, less than half (48%) of last births in Nigeria were protected against neonatal tetanus (NPC and ICF Macro, 2009).
ISSN 2039-9340 Mediterranean Journal of Social Sciences Vol. 4 (1) January 2013
100
2.2. Assistance during Delivery An important factor in reducing maternal death and morbidity is increasing the number of births delivered in health facilities. The expectation is that if a complication arises during delivery, a skilled health worker can manage the complication or refer the mother to the next level of care. In addition to place of birth, assistance during childbirth is an important variable influencing the birth outcome and the health of the mother and infant (NPC and ICF Macro, 2009). The skills and performance of the person providing assistance during delivery determine whether complications are managed and hygienic practices are observed. Again, the report of NDHS 2008 indicated that only 39% of births in the five years preceding the survey were assisted by a skilled health worker (doctor, nurse, midwife, or auxiliary nurse/midwife). In the absence of a skilled health worker, a traditional birth attendant (TBA) was the next most common person assisting a delivery. Slightly more than one-third of births in the five years before the survey were delivered in a health facility (35%); almost two-thirds (62%) of births occurred at home, 22% of which were assisted by a traditional birth attendant (TBA) and 19% by a relative. About 19% of births had no assistance at all (NPC and ICF Macro, 2009). 2.3. Postnatal Care A large proportion of maternal and neonatal deaths occur during the first 24 hours after delivery. It follows that prompt postnatal care is important for both the mother and the child to treat complications arising from the delivery, as well as to provide the mother with important information on how to care for herself and her child. It is recommended that all women receive a health check within three days of giving birth. Generally, the practice of postnatal care is reportedly poor and far from expectation because very few mothers visit health facilities after delivery especially in rural areas. A lot of mothers still consider a return to clinics after safe delivery unnecessary. For instance, the NDHS 2008 report showed that less than half (42%) of mothers received a postnatal check-up for the most recent birth in the five years preceding the survey, with 38% having the check-up within the critical 48 hours after delivery. This implies that a large proportion of women do not receive any postnatal care in Nigeria. 3. Socio-Cultural Challenges of Maternal Health in Nigeria The socio-cultural context within which Nigerian people live affects their ideas, decisions and behavior concerning maternal deaths. It affects what people know about pregnancy and delivery, what preparations they make and what they do about life-threatening complications. The available opportunities, the role models, the reinforcement contingencies that further shape behaviors, the social norms, the perceptions, the beliefs, attitudes and values of an individual are most influenced by his social environment, which affects his/her behavior. 3.1. Beliefs and Values Within the boundary of Nigeria, there are many social groups with distinct cultural traits, which are reflected in the diverse behaviors of people. For instance, in northern Nigeria, particularly among the Hausa-Fulani, childbirth is associated with kunya, a custom which implies a complex feeling of shy and modest behaviors pertaining to pregnancy and childbirth, and avoidance of relations between prescribed categories of kin. Kunya prescribes that one disguises signs of pregnancy and labor pains. This behavior may result in problems if the woman in labor has complications as in the case of prolonged labor which could deteriorate if there is no medical intervention. Furthermore, in parts of southern Nigeria, prolonged or obstructed labor is taken to be a sign of the woman’s infidelity. Obstructed labor is thus interpreted as punishments for adultery and not recognized as medical problem. Culture demands that such a woman must “confess her sins” so that delivery may progress smoothly and safely, thus preclude the decision to seek medical care for the complications.
Generally in Nigeria, some culture expect women to deliver in solitude and to show stoicism during labor; when she is in labor she goes into a room herself, and manages to deliver without calling for assistance until the baby is born. Such a woman is especially esteemed. Childbirth, thus, represents a rare opportunity for a woman to demonstrate courage and bring honor to both her family and that of her husband by stoic demeanor during labor and delivery. Hospital delivery on the other hand, denies a woman privacy and opportunity to demonstrate courage, as well as prevents her from choosing delivery position. These explain partly low proportion of delivery in health facilities and assisted by skilled health worker.
ISSN 2039-9340 Mediterranean Journal of Social Sciences Vol. 4 (1) January 2013
101
3.2. Status of Women Essentially, the status of women in Nigerian society is low and this, to some extent, has implications for maternal mortality. Women’s status is a composite indicator of the educational, cultural, economic, legal and political position of women in a given society. In Nigeria, women do not decide on their own to seek care, the decision belongs to a spouse or to senior members of the family. Furthermore, women’s mobility is limited in certain areas because they must be permitted to travel. Often, this permission must be granted by the spouse or the mother-in-law. In northern Nigeria in particular, women are required to live in seclusion (Purdah) and are not allowed to leave the confines of the family compound. These compounds are surrounded by high walls which block out even the neighbors. When labor or complication arises, permission from the husbands has to be obtained in order to seek care. In fact in some cases, no matter how obvious the need for hospital management becomes for the girl who develops obstructed labor, permission to leave home for hospital can usually be given only by the husband, if he happens to be away from home, those present are often unwilling to accept such responsibility.
Nigerian society also expects and demands women to produce children (and as many as possible), bear sole responsibility for the household chores and help in farm work. This makes women to overwork and over work affects health of pregnant women. Related to this is the societal permissiveness of wife battery. Studies confirm that violence during pregnancy leads to miscarriages (i.e. spontaneous abortion), low birth weight, infant and maternal morbidity; women who suffered violence during pregnancy were two times more likely than other women to have spontaneous abortion and four times much likely to give birth to a baby of low weight (Jejeebhoy, 1998). 3.3. Socio-cultural Practices Some socio-cultural practices with negative consequences on maternal mortality and morbidity in Nigeria include early marriage and female circumcision otherwise known as female genital mutilation. The risk of dying from pregnancy and childbirth related causes is very high for adolescent girls. Maternal rates for women ages 15 to 19 years are twice as high as women in their 20s. This is because young adolescent girls are not well developed physically (have not reached their full height or achieved their full pelvic size), neither are they prepared emotionally and mentally for the responsibility and realities of life. In spite of this, in some Nigerian communities, young girls are betrothed and married at very young ages (ranging from birth to fourteen years) and taken to live with their husbands who are usually older men (James, 2010). When these girls become pregnant, they are faced with reproductive health problems associated with the immature development of the reproductive organs, such as ruptured uterus, obstructed labor, Vesico Virginal Fistulae (VVF), Rector Vaginal Fistulae (RUF). All these have implications for the physical, mental and social health of the girls (CONNOHPD, 1993).
On the other hand, female circumcision, the traditional practices in which part or whole of the female genital are cut or scrapped, can also endanger women’s reproductive health and lead to maternal death. The practice which sometimes involves the stitching together of the vulva, usually by unskilled person, has four operations, namely (i) Circumcision, (ii) Excision, (iii) Infibulations, and (iv) Introcision, all of which involve the removal of part of the genetalia. The health problems associated with female genital mutilation which may occur during pregnancy or soon after delivery include shock, infection, tetanus, septicemia (blood poisoning), and hemorrhage and urine retention, which are capable of leading to obstructed labor and death. 3.4. Attitudinal Factors Attitude toward operative delivery in Nigeria is very low and this has implications for maternal mortality. Every pregnant Nigerian woman wants to have a baby delivered normally. Even when things go wrong and operative delivery becomes necessary to save their lives, the extent to which some of our women will go to avoid operative delivery is truly astonishing. Permission for such operation will be deliberately delayed with the hope that during the period of delay, normal delivery will take place, making operative delivery unnecessary. Persuading some women to accept operative delivery at times takes a whole day or even more, thus risking her life and the baby’s life as well. This explains why only 2% of births in Nigeria are delivered by a caesarean section (NPC and ICF Macro, 2009). 3.5. Socio-economic and Health Status Maternal mortality rates are higher among groups of low economic status. Economic status is defined and measured in a variety of ways and it commonly includes income and occupation. Income constraints and characteristics of the health
ISSN 2039-9340 Mediterranean Journal of Social Sciences Vol. 4 (1) January 2013
102
care facilities serving the poor may discourage use, including poor quality of care, physical and institutional accessibility barrier. Indeed, multiple socio-economic factors lead to the death of many mothers in Nigeria. Many women dying in childbirth started on the “Road to Death” from early childhood, having been born into a socially disadvantaged family and community. They then progress along the road by engaging in uncontrolled fertility including high-risk pregnancies. They developed life-threatening complications which were inadequately addressed by community-based services or the referral hospital, and so they died. Such deaths are not unconnected with their low status in society. In essence, a woman does not die just because she has a post-partum hemorrhage, for example. She dies because she does not receive adequate or timely medical treatment of the hemorrhage. To go further back, the hemorrhage may have been caused by having had too many children. In turn, she may have wished to stop childbearing but either not known about modern contraception or not had access to family planning services. Finally, her lack of knowledge about or access to family planning and medical services may have been due to the fact that she was illiterate and lived in a poor, rural area with few roads. Furthermore, a woman dies not only due to the bleeding from placenta previa she had, but because the health facilities where she was taken to did not have sufficient blood (or bank) for transfusion. The clinician was not there when she arrived so she had to wait for surgery after she had traveled for hours to reach the hospital. An efficient communication and transportation system, fully equipped, efficient and well staffed hospital could have averted this tragedy. Indeed, this is the tragedy of many women in Nigeria society.
Similarly, maternal mortality rates are higher among those of low educational status. Education status may be measured by the levels of formal educational attainment namely primary, secondary, and tertiary as well as knowledge of basic health education. The importance of education to maternal health cannot be overemphasized. For instance, education of women during prenatal care is intended to give pregnant women the knowledge to help themselves have a successful and healthy pregnancy. Dietary advice, for example, is intended to include anemia, education about hygiene to reduce exogenous infection, and education about danger signals during pregnancy to encourage prompt treatment of developing complications. Furthermore, education increases self-confidence and imparts respect and influence. Thus, educated women can successfully challenge traditional authority structure, and introduce innovative health concepts and practices. Educated women’s experience with the staff at a health facility may be more favorable than that of the uneducated women as health providers tend to treat educated women with more consideration.
From feminist perspective, maternal mortality is associated with continuous gender bias and inequality in the design and implementation of social policies. This has been termed “apartheid of gender”, which is explained as systematic marginalization of women’s low status in all sphere of life leading to deprivation of their full potentials. They include such issues as access to education, non-participation in decision making in and out of the household, as well as poor feeding which is responsible for the high prevalence of anemia especially during pregnancy. Furthermore, there is lack of autonomy in sexual relationship, poor access to health facilities, limited access to paid employment and progressive traditional practices such as early marriage and genital mutilation, etc. All these expose women to higher risk during pregnancy in Nigeria. 4. Conclusion It is obvious from the foregoing that there are myriads of crucial challenges militating against efforts at saving mothers from childbirth-related injuries and death. Indeed, maternal health is a function of significant and complex underlying interaction of socio-cultural and environmental factors. Thus any interventions or policies aimed at improving maternal and child health in Nigeria must recognize the crucial role of socio-cultural factors. 5. Recommendations
Innovative engagement with political, religious leaders and community groups needs to be fostered through sensitization and sustained advocacy to remove constraints and barriers to accessibility of maternal health care in Nigeria. This may also include greater engagement of civil society organization and the private sector.
There is also the need to engage in aggressive public enlightenment on the rights of women and children, and the advantages to be derived thereof.
ISSN 2039-9340 Mediterranean Journal of Social Sciences Vol. 4 (1) January 2013
103
References Abou-Zahr, C. and E. Royston. 1991. Maternal Mortality: A Global Factbook. Geneva: World Health Organization. Aboyeyi, A.p., and O.O. Fakoye (G-1992), “Avoidable Factors in Maternal Mortality in Ilorin”, Nigerian Medical Practitioner, vol. 29,
No.12. Ching-Li, Hu (1993). “Child Health in the World: Update status”, International Child Health: A Digest of Current Information. An
International Paediatric Association Publication in collaboration with UNICEF and WHO, vol. IV, no.1 Chukudebelu, W.O., and B.C. Ozumba (G-1988), “Maternal Mortality in Anambra State of Nigeria,” International Journal of Gynacology
and Obstetrics, vol. 27, No.3. CONNOHPD (1993). Voices from Below, Coalition of the Nigerian Non-Government Organizations on Health, Population and
Development, Lagos. Donahue, J. and S. Mcquire (1995). “The Political Economy of Responsibility in Health and Illness.” International Journal of Social
Science and Medicine Volume 40, Number 1. Etuk, S.J., and E.E. Asuquo (G-1997), “Maternal Mortality Following Post Partum Haemorrhage in Calabar: A 6 Year Review”, West
African Journal of Medicine, vol. 17, No.13. Federal Ministry of Health and National Primary Health Care Development Agency (NPHCDA) Midwives Service Scheme (2009).
Accelerating Reduction in Maternal, Newborn and Child Mortality through Improved Access to Skilled Birth Attendants Pp 3, 5. Retrieved 25 May, 2011 www.nphcda.gov ng/.../MSS_HARMONIZED_CONCEPT_FINAL_AT-REIZ-HTL.doc
Fortney, J.A. and J.B. Smith (eds.). 1996. The Base of the Iceberg: Prevalence and Perceptions of Maternal Morbidity in Four Developing countries. Research Triangle Park, NC: Family Health International.
FOS/UNICEF (A-2000), Multiple Indicator Cluster Survey 1999, Draft Tables, Federal Office of Statistics and UNICEF, Lagos. Idris,H.Tyoden,C. Ejembi,C. and Taylor,K. (2010). Estimation of Maternal Mortality Using the Indirect Sisterhood Method in Three Communities in Kaduna State, Northern Nigeria. African Journal of Reproductive Health.Vol.14 N0.3.P.79.
James, G. (2010). “Socio-cultural Context of Adolescents’ Motivations for Marriage and Childbearing in Northwestern Nigeria: A Qualitative Approach.” Current Research Journal of Social Sciences, volume 2, No. 5, pp. 269-275
Jejeebhoy, S.J. (1998). Association between wife-beating and fetal and infant death: Impressions from a survey in rural India. Studies in Family Planning 29(3): 300-308.
Koblinsky, M.A., Oona M.R. Campbell, and S.D. Harlow (1993) “Mother and more: A broader perspective on women’s health.” In The Health of Women: A Global Perspective. Eds. Marjorie A. Koblinsky, J. Timyan, and J. Gay. Boulder, CO: Westview Press.
Ladipo, O. A. (2008). Delivery of an Effective Maternal and Child Health Services in Nigeria Retrieved May 20, 2011 from www.ngnhc.org/.../delivery%20of20%effective%20materna
Lawoyin, T. (G-1997), “Risk factors for Maternal Mortality”, Nigerian Medicine Journal, vol. 32, No.1 National Population Commission (NPC) [Nigeria] and ICF Macro (2009). Nigeria Demographic and Health Survey 2008. Abuja, Nigeria:
National Population Commission and ICF Macro. National Planning Commission (NPC) Abuja, and UNICEF Nigeria (2001), Children’s and women’s Rights in Nigeria: A Wake-up Call:
Situation Assessment and Analysis 2001, Nigeria: NPC/UNICEF. National Population Commission (NPC) [Nigeria] and ORC Macro. (2004). Nigeria Demographic and Health Survey 2003. Calverton,
Maryland: National Population Commission and ORC Macro. Ogunniyi, S.O., and B.L Faleyimu (G-1991), “Trends in Maternal Deaths in Ilesha, Nigeria, 1977 – 1988”, West African Journal of
Medicine, vol. 10. Onwuhafia, P.I., and A. Onwulafia (G-1995)”Maternal Mortality; A Continuing Challenge in Tropical Obstetric Practice: A Report from
Kano, Northern Nigeria”, in United Nations Population Fund Studies in Reproductive Health in Nigeria, UNFPA, Lagos. Partnership for Transforming Health System (PATHS, 2008). Supporting Kaduna’s Health Reform Agenda. Retrieved August 30, 2011
from http://www.healthpartners.int.co.uk/our_project/document/kadunapathsreport Turmen, T. (1993). "Introduction to Workshop Theme,” International Child health: A Digest of Current Information, An International
Paediatric Association Publication in collaboration with UNICEF and WHO, vol. IV, no.1 Ujah, A.O., V.E. Uguru, A.O. Aisien, S.A. Sagay and J.A.M. Otubu (G-1999), “How safe is Motherhood: The Trend of Material Mortality in
a Tertiary Health Institution”, East Africa Medical Journal, vol. 76, No.8. UNICEF (A-2000) “National Report on the follow up of the World Summit for Children, Technical Guidelines for Statistical Appendix”,
UNICEF, New York. UNICEF/WHO/UNFPA/World Bank (2008).Trends in Maternal Mortality. Retrieved March 15, 2011 from www.whqlibdoc.who.int/publications/2010 United Nations Children’s' Fund (UNICEF). (1996). The State of the World's Children 50th Anniversary, UNICEF. United Nations Children's Fund (UNICEF). (2004). The State of the World's Children 2005: Childhood Under Threat, New York: UNICEF. Wall, L.L. 1996. “Obstetric fistulas in Africa and the developing world: New efforts to solve an age-old problem.” Women’s Health Issues
6: 229-234. Weinstein, D. 1997. “Maternal mortality and the world in the year 2000.”Paper presented at the First World Congress on Maternal
Mortality, World Society of Labor and Delivery, Marrakech, Morocco, 10 March. World Health Organization (WHO). 2008. Making Pregnancy Safer. Geneva: World Health Organization. World Health Organization (2005). World Health Report: Make every mother and child count. Geneva: The World Health Organization.

ISSN 2039-9340 Mediterranean Journal of Social Sciences Vol. 4 (1) January 2013
104
World Health Organization (WHO). 1996. Revised 1990 Estimates of Maternal Mortality: A New Approach by WHO and UNICEF. Geneva: World Health Organization.
World Health Organization (1996). "Maternal Health and Safe Motherhood Programme," Perinatal Mortality, Family and Reproductive Health, Geneva.
World Health Organization (1994) Safe Motherhood Mother-Baby Package: Implementing Safe Motherhood in Countries. WHO Geneva. World Health Organization (1978). Primary Health Care, Report of the International Conference on Primary Health Care. Alma Ata,
USSR 6-12 September, Geneva. World Health Organization (WHO) 1976. "African Traditional Medicine," AFRD Technical Report Series, no.1.
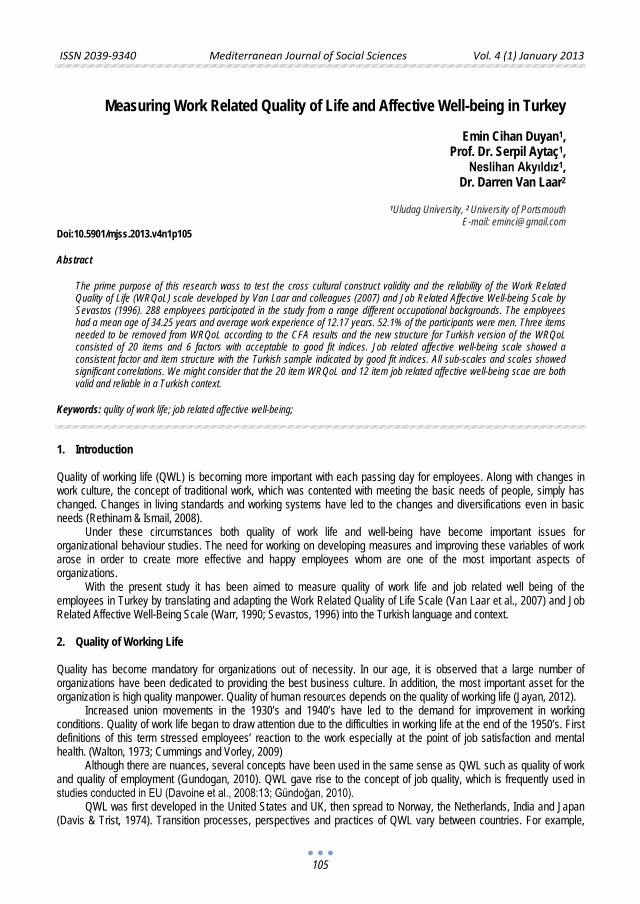
ISSN 2039-9340 Mediterranean Journal of Social Sciences Vol. 4 (1) January 2013
105
Measuring Work Related Quality of Life and Affective Well-being in Turkey
Emin Cihan Duyan1,
Prof. Dr. Serpil Aytaç1, Neslihan Akyıldız1,
Dr. Darren Van Laar2
1Uludag University, 2 University of Portsmouth E-mail: [email protected]
Doi:10.5901/mjss.2013.v4n1p105 Abstract
The prime purpose of this research wass to test the cross cultural construct validity and the reliability of the Work Related Quality of Life (WRQoL) scale developed by Van Laar and colleagues (2007) and Job Related Affective Well-being Scale by Sevastos (1996). 288 employees participated in the study from a range different occupational backgrounds. The employees had a mean age of 34.25 years and average work experience of 12.17 years. 52.1% of the participants were men. Three items needed to be removed from WRQoL according to the CFA results and the new structure for Turkish version of the WRQoL consisted of 20 items and 6 factors with acceptable to good fit indices. Job related affective well-being scale showed a consistent factor and item structure with the Turkish sample indicated by good fit indices. All sub-scales and scales showed significant correlations. We might consider that the 20 item WRQoL and 12 item job related affective well-being scae are both valid and reliable in a Turkish context.
Keywords: qulity of work life; job related affective well-being;
1. Introduction Quality of working life (QWL) is becoming more important with each passing day for employees. Along with changes in work culture, the concept of traditional work, which was contented with meeting the basic needs of people, simply has changed. Changes in living standards and working systems have led to the changes and diversifications even in basic needs (Rethinam & Ismail, 2008).
Under these circumstances both quality of work life and well-being have become important issues for organizational behaviour studies. The need for working on developing measures and improving these variables of work arose in order to create more effective and happy employees whom are one of the most important aspects of organizations.
With the present study it has been aimed to measure quality of work life and job related well being of the employees in Turkey by translating and adapting the Work Related Quality of Life Scale (Van Laar et al., 2007) and Job Related Affective Well-Being Scale (Warr, 1990; Sevastos, 1996) into the Turkish language and context. 2. Quality of Working Life Quality has become mandatory for organizations out of necessity. In our age, it is observed that a large number of organizations have been dedicated to providing the best business culture. In addition, the most important asset for the organization is high quality manpower. Quality of human resources depends on the quality of working life (Jayan, 2012).
Increased union movements in the 1930’s and 1940’s have led to the demand for improvement in working conditions. Quality of work life began to draw attention due to the difficulties in working life at the end of the 1950’s. First definitions of this term stressed employees’ reaction to the work especially at the point of job satisfaction and mental health. (Walton, 1973; Cummings and Vorley, 2009)
Although there are nuances, several concepts have been used in the same sense as QWL such as quality of work and quality of employment (Gundogan, 2010). QWL gave rise to the concept of job quality, which is frequently used in studies conducted in EU (Davoine et al., 2008:13; Gündoğan, 2010).
QWL was first developed in the United States and UK, then spread to Norway, the Netherlands, India and Japan (Davis & Trist, 1974). Transition processes, perspectives and practices of QWL vary between countries. For example,
ISSN 2039-9340 Mediterranean Journal of Social Sciences Vol. 4 (1) January 2013
106
leading countries in Europe are Norway with its "industrial democracy" program, Sweden on the subject of “ the democratization of the institutions within the framework of employer-employee-union”, UK on theoretical area (Kaymaz, 2003). The concept of QWL is associated with the improvement of working conditions in France, with humanization of work in Germany and with employee protection in Eastern European Countries, (Huzzard, 2003). North America, Europe and Japan not only consider QWL as a tool of efficiency but have also discussed/examined it in terms of democracy and humanization of the working environment (Wyatt & Wah, 2001).
QWL is related to employee's mental, physical, psychological and spiritual needs (Schulze, 1998 and QWL is based on a management philosophy which seeks to increase the level of physical and psychological well-being and reputation of employees and to change organizational culture (Ivancevich & Matteson, 1996).
Definitions of QWL put emphasis on different points. Some researchers have focused on the relationship between work environment and work performance while others have concentrated on well-being (Huzzard, 2003).
Newstorm and Davis (1997) defined QWL as the degree which employees meet their important personal needs through work. According to this, QWL covers all topics related to workplace, not only favourable subjects as job satisfaction, development of employee skills, wages, health, safety and the improvement of the physical conditions but also issues such as stress, burnout which are unfavourable for employees.
Robbins (1989:207) defined QWL as "a process by which an organization responds to employee needs by developing mechanisms to allow them to share fully in making the decisions that design their lives at work”.
Sirgy et al. (2001) defined QWL as the individual's job satisfaction of work life. Carayon et al. (2003) considered the human dimension and described QWL as the quality of the relationship between employees and their work environment in addition to the technical and economic aspects. Serey (2006)'s definition of QWL emphasized the need for meaningful and satisfying work.
The European Foundation for the Improvement of Living and Working Conditions (2002) related QWL to job satisfaction, job acceptance, motivation, health, security, safety, productivity, job security, skill development, well-being and balance between work and non-work life. Studies on QWL mostly try to explain the status of employees in their work environment (Limongi-Franca, 2004).
According to (Can, 1991) QWL is a concept covering factors as wages and other benefits, working environment and conditions, work structure, work organization, management and organization of work, technology, employee satisfaction and motivation, industrial relations, participation, employment security, social justice and social security, demographic structure and continuing education.
In its original form, the concept of QWL shows the relationship between the employee and the work environment stressing the human dimension (Erdem, 2010). Originally QWL was been said to focus on the individual, perhaps one who has been pushed aside, despised/ill-treated and alienated, especially because of the development of new technology (Davis & Trist, 1974).
Runcie (1980), stated that employees with positive opinion regarding the quality of working life would strive for better working conditions, productivity and products. Growing efficiency is the by-product of development in the quality of work life (Reena & Jayan, 2012).
QWL is a concept consisting of a large number of inter-related elements (Rethinam & Ismail, 2008). Potential QWL-related elements would form a long list. Elements on which majority of QWL studies appear to agree on (Walton, 1972, 1973; Beach, 1980, Cummings and Worley, 1997; Bowditch and Buono, 1994, Solmus, 2000; Dikmetas, 2006) include the following:
- Appropriate, adequate and fair compensation: Includes elements such as compensation to meet standards, to be sufficient, internal and external fairness, to have similar wages to those of other employees doing the same work, fringe benefits and payments, employee rights, retirement.
- Safe and healthy working environment: Factors such as physical working conditions (cleanliness, lighting, temperature, colours used), ergonomics, workplace security and working hours.
- Developing individual capacity: auto-control, autonomy, providing the opportunity for development and use of capacity and capability, business planning and providing employees information about the process, ability to follow work-related innovations, management support.
- Development and security opportunities: Personal and professional development of individual, career, promotion and advancement opportunities, job security.
- Social integration: Cooperation, organizational trust, sense of belonging and organizational commitment, teamwork, communication, prejudices and conflicts, interpersonal communication and distance are included in this group.
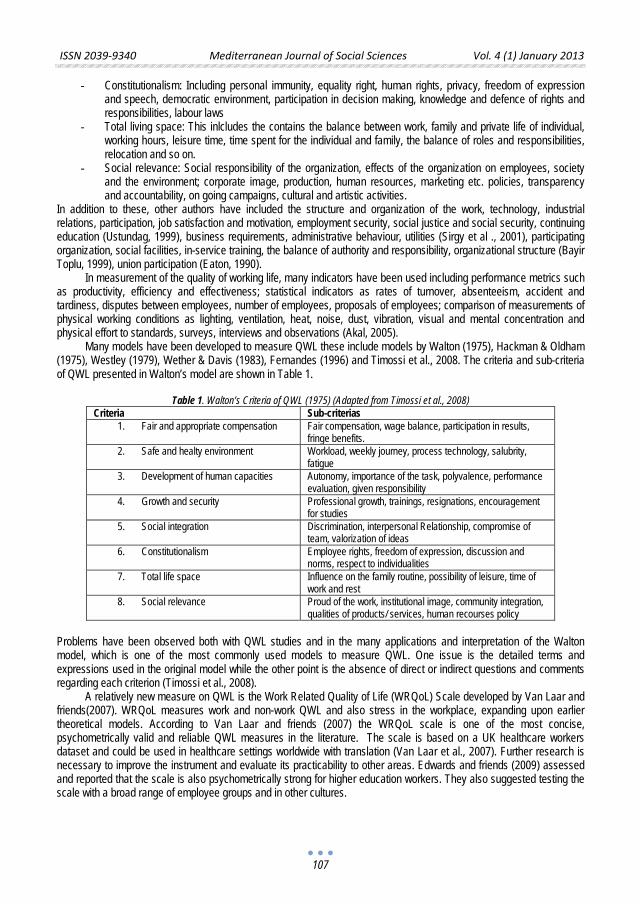
ISSN 2039-9340 Mediterranean Journal of Social Sciences Vol. 4 (1) January 2013
107
- Constitutionalism: Including personal immunity, equality right, human rights, privacy, freedom of expression and speech, democratic environment, participation in decision making, knowledge and defence of rights and responsibilities, labour laws
- Total living space: This inlcludes the contains the balance between work, family and private life of individual, working hours, leisure time, time spent for the individual and family, the balance of roles and responsibilities, relocation and so on.
- Social relevance: Social responsibility of the organization, effects of the organization on employees, society and the environment; corporate image, production, human resources, marketing etc. policies, transparency and accountability, on going campaigns, cultural and artistic activities.
In addition to these, other authors have included the structure and organization of the work, technology, industrial relations, participation, job satisfaction and motivation, employment security, social justice and social security, continuing education (Ustundag, 1999), business requirements, administrative behaviour, utilities (Sirgy et al ., 2001), participating organization, social facilities, in-service training, the balance of authority and responsibility, organizational structure (Bayir Toplu, 1999), union participation (Eaton, 1990).
In measurement of the quality of working life, many indicators have been used including performance metrics such as productivity, efficiency and effectiveness; statistical indicators as rates of turnover, absenteeism, accident and tardiness, disputes between employees, number of employees, proposals of employees; comparison of measurements of physical working conditions as lighting, ventilation, heat, noise, dust, vibration, visual and mental concentration and physical effort to standards, surveys, interviews and observations (Akal, 2005).
Many models have been developed to measure QWL these include models by Walton (1975), Hackman & Oldham (1975), Westley (1979), Wether & Davis (1983), Fernandes (1996) and Timossi et al., 2008. The criteria and sub-criteria of QWL presented in Walton’s model are shown in Table 1.
Table 1. Walton’s Criteria of QWL (1975) (Adapted from Timossi et al., 2008) Criteria Sub-criterias
1. Fair and appropriate compensation Fair compensation, wage balance, participation in results, fringe benefits.
2. Safe and healty environment Workload, weekly journey, process technology, salubrity, fatigue
3. Development of human capacities
Autonomy, importance of the task, polyvalence, performance evaluation, given responsibility
4. Growth and security
Professional growth, trainings, resignations, encouragement for studies
5. Social integration Discrimination, interpersonal Relationship, compromise of team, valorization of ideas
6. Constitutionalism
Employee rights, freedom of expression, discussion and norms, respect to individualities
7. Total life space Influence on the family routine, possibility of leisure, time of work and rest
8. Social relevance Proud of the work, institutional image, community integration, qualities of products/ services, human recourses policy
Problems have been observed both with QWL studies and in the many applications and interpretation of the Walton model, which is one of the most commonly used models to measure QWL. One issue is the detailed terms and expressions used in the original model while the other point is the absence of direct or indirect questions and comments regarding each criterion (Timossi et al., 2008).
A relatively new measure on QWL is the Work Related Quality of Life (WRQoL) Scale developed by Van Laar and friends(2007). WRQoL measures work and non-work QWL and also stress in the workplace, expanding upon earlier theoretical models. According to Van Laar and friends (2007) the WRQoL scale is one of the most concise, psychometrically valid and reliable QWL measures in the literature. The scale is based on a UK healthcare workers dataset and could be used in healthcare settings worldwide with translation (Van Laar et al., 2007). Further research is necessary to improve the instrument and evaluate its practicability to other areas. Edwards and friends (2009) assessed and reported that the scale is also psychometrically strong for higher education workers. They also suggested testing the scale with a broad range of employee groups and in other cultures.
ISSN 2039-9340 Mediterranean Journal of Social Sciences Vol. 4 (1) January 2013
108
Job Related Affective Well-Being There are many notions related to well-being in the literature. Pleasure, satisfaction, social well-being, subjective well-being, psychological well-being and quality of life are among those notions (Bayram et al., 2004).
Diener and friends (1999:277) suggest subjective well-being to be “a broad category of phenomena that includes people’s emotional responses, domain satisfactions, and global judgments of life satisfaction”. We might consider the term as people’s evaluations of their own lives (Aytac, 2006).
Psychological well-being is defined by Robertson and Cooper (2011:54) as the “affective and purposive psychological state that people experience while they are at work”. They suggest that psychological well-being has two major components. First one is hedonic, about feeling good. The second one is eudemonic, which is related to the meaning and purpose that we associate with our work (Robertson and Cooper, 2011).
Obstacles may occur while measuring psychological well-being. Some of the measures may confound well-being with cognitive processes that influence well-being. Also job related psychological well-being might be limited by being used as job satisfaction only (Daniels, 2000). To overcome these obstacles as one of the most important indicators of psychological well-being, affective well-being needs to be assessed (Diener & Larsen, 1993; Warr, 1994).
Affective well-being includes the frequent experience of positive affects and occasional experience of negative affects (Diener & Larsen, 1993). Affective well-being can be separated from attitudinal factors of psychological well-being which includes affective and cognitive elements like job satisfaction (Diener & Larsen, 1993; Warr, 1990). Unlike uni-dimensional measures, multi-dimensional affective well-being is capable of capturing subtleties, complexities and changes in the experience of work (Briner, 1997).
Adopting affective well-being into work and employees was Warr’s (1987, 1990) idea in the first place. In practice affective psychological state indicates whether people feel good or not at work (Robertson and Cooper, 2011). Warr (1990) developed a two dimensional model based on emotional states and originated from Russel’s (1980) work. The first factor was anxiety-contentment represented by tense, uneasy, worried, calm, contented and relaxed items. Warr (1992, 1994) renamed this factor as anxiety-comfort after Sevastos and friends’(1992) study. Depressed, gloomy, miserable, cheerful, enthusiastic and optimistic items were representing depression-enthusiasm as the second factor (Warr, 1990).
Sevastos (1996) hypothesized the two bipolar scale of Warr (1990) needs to evolved into a four mono polar scale and proved it with a large sample in his doctoral dissertation. The items of Sevastos (1996) were as follows; Gloomy, Calm, Anxious, Enthusiastic, Motivated, Worried, Restful, Tense, Depressed, Optimistic, Relaxed and Miserable.
Katwyk and friends (2000) developed the Job-Related Affective Well-Being Scale (JAWS) which describes an individual’s affective states in the context of the workplace which Bayram and
colleagues (2004) adapted le into Turkish. According to the study Job-Related Affective Well-Being consists of four dimensions: High Pleasure High Arousal (HPHA), High Pleasure Low Arousal (HPLA), Low Pleasure High Arousal (LPHA) and Low Pleasure Low Arousal (LPLA). Four dimensions lay on two main axes named low-high pleasure and low-high arousal (Katwyk et al., 2000).
In order to assess job related affective well-being in Turkey, Sevastos’ (1996) scale is preferred in this study due to its concise and easy to understand nature with one word items. 3. Research methodology 3.1. Objectives The aim of this study is to test the cross cultural construct validity and the reliability of the Work Related Quality of Life (WRQoL) scale developed by Van Laar and colleagues (2007) and Job Related Affective Well-being Scale (Warr, 1990; Sevastos, 1996). We are also interested in investigating the relationships between the Work Related Quality of Life scale and Job Related Affective Well-being in all dimensions. 3.2 Method The Work Related Quality of Life (WRQoL) scale and Job Related Affective Well-being Scale were translated from English into Turkish according to the back-translation procedure (Brislin, 1986), in which a bilingual person translates the scale from its original language to the language under study. Another bilingual individual, who is unfamiliar with the original scale, re-translates this version back to the original language.
Then in order to do the final adjustments and controls a committee has been composed among the academics at Uludag University. The committee was consisted of 4 academics from different departments such as: English Language
ISSN 2039-9340 Mediterranean Journal of Social Sciences Vol. 4 (1) January 2013
109
Department, Turkish Language Department, Work Psychology Department and Business Administration Department. Then the original authors checked the latest version of the translations. To take the feedbacks from the participants survey has been conducted among 30 academics first. The preliminary analysis and the feedbacks were also considered by the committee and after very minor changes the survey was ready to go. 3.3 Participants The Survey has been distributed in Bursa-Turkey. Data have been collected from 288 employees (48% response rate after the removal of the cases with missing data) with different occupational backgrounds. The sample consisted of 150 men (52.1%) and 126 women (43.8%) (Missing data: 12). Their mean age was 34.25 years (SD = 8.96), ranging from 16 to 65 years old. Average work experience was 12.17 years (SD = 9.31). 163 of the participants were married (56.6%). Average weekly working hours were found 51.55 (SD = 10.46). 3.4 Measures The Work Related Quality of Life (WRQoL) scale has six dimensions within 23 items and all of the items were measured on a five-point (1 = Strongly Agree through to Strongly Disagree = 5) Likert scale (Van Laar et al., 2007). Three reversed items were recoded while computing the overall WRQoL. The scale is partly based on the study of Sirgy and friends (2001). To evaluate the internal and external factors the Van Laar and friends (2007) made use of Loscocco and Roschelle’s (1991) work. WRQoL is based on the idea that the many facets of work experience can’t be effectively explained separately, and need to be considered together (Edwards et al., 2009).
- General Well-Being (GWB) -six items-: Items are related to happiness and life satisfaction: e.g. “Generally things work out well for me”.
- Home–Work Interface (HWI) -three items-: Items are related to issues of accommodating family and work commitments, e.g. “My current working hours/patterns suit my personal circumstances”
- Job and Career Satisfaction (JCS) -six items- e.g. “I am satisfied with the career opportunities available to me at the organization”
- Control at Work (CAW) (three items): Items are related to being able to have control over decisions, e.g. “I am involved in decisions that affect me in my own area of work”
- Working Conditions (WCS) -three items-: Items are related to the physical working environment: e.g. “The working conditions are satisfactory”.
- Stress at Work (SAW) -two items-: Items are related to demands. e.g. “I often feel under pressure at work” The Job Related Affective Well-Being Scale has four dimensions (Enthusiasm, Anxiety, Depression, Relaxation) within 12 items and all of the items were measured on a 6-point scale (1 = Never, 2 = Occasionally, 3 = Some of The Time, 4 = Much of The Time, 5 = Most of The Time, 6 = All of The Time). Sevastos (1996) converted the two bipolar scale of Warr (1990) into four monopolar scale in his doctoral dissertation. The scale is concerned with how their job has been making the participants feel over the past few weeks (Sevastos, 1996). 12 items are Gloomy, Calm, Anxious, Enthusiastic, Motivated, Worried, Restful, Tense, Depressed, Optimistic, Relaxed and Miserable respectively. Six negative items were recoded while computing overall job related affective well-being. 4. Results The scores of all items were recorded and the distributions checked. Skewness and kurtosis for almost all of the WRQoL and Job Related Affective Well-Being Scale items fell between –1.00 and +1.00 with few minor exceptions. KMO value was 0.94, which is greater than expected 0.90, and a significant Barlett’s test (p<0.05) demonstrated that the data set was appropriate for factor analysis.
Because we were testing existing measures with solid conceptual models we ran both first order and second order Confirmatory Factor Analyses (CFA) by using Lisrel software versions 8.51 and 8.80. Fit indices were evaluated according to following criterion. 0 ≤ χ2 ≤ 2df good fit, 0 ≤ χ2 ≤ 3df acceptable fit, 0.90 ≤ CFI ≤ 0.95 acceptable fit, 0.9 5 ≤ CFI ≤ 1.00 good fit , 0.05 ≤ SRMR ≤ 0.10 acceptable fit, 0 ≤ SRMR ≤ 0.05 good fit, 0.05 ≤ RMSEA ≤ 0.08 acceptable fit, 0 ≤ RMSEA ≤ 0.05 good fit , 0.90 ≤ GFI ≤ 0.95 acceptable fit, 0.95 ≤ GFI ≤ 1.00 good fit , 0.85 ≤ AGFI ≤ 0.90 acceptable fit, 0.90 ≤ AGFI ≤ 1.00 good fit (B ayram, 2010; Hu & Bentler, 1999; Jöreskog & Sörbom, 1993; Bentler, 1990; Dunn et al., 1993).
The original structure of the WRQoL scale consisted of 6 factors and it was tested several times by Van Laar and friends and statistics showed a good fit model in each study (Van Laar et al., 2007; Edwards et al., 2009). Due to this fact
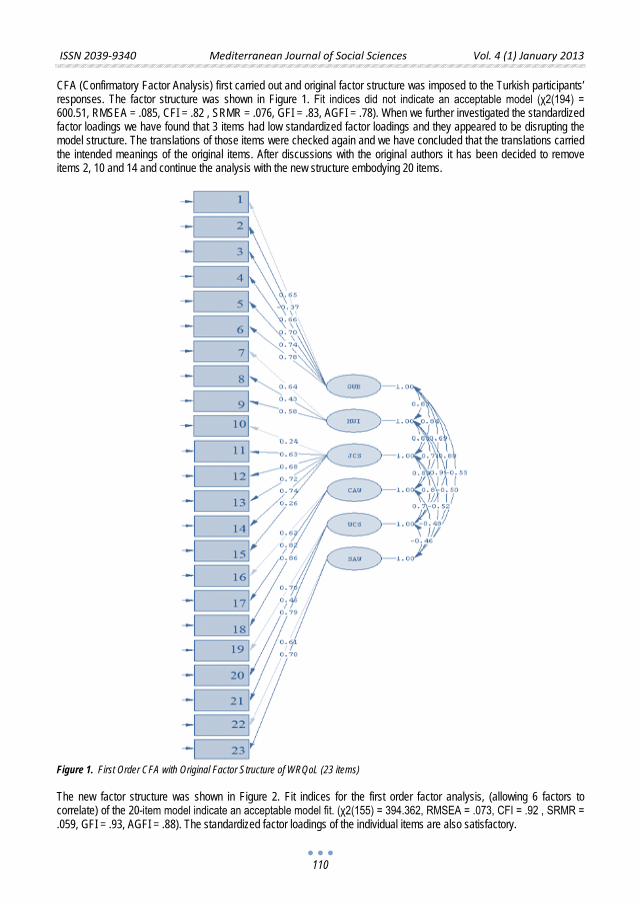
ISSN 2039-9340 Mediterranean Journal of Social Sciences Vol. 4 (1) January 2013
110
CFA (Confirmatory Factor Analysis) first carried out and original factor structure was imposed to the Turkish participants’ responses. The factor structure was shown in Figure 1. Fit indices did not indicate an acceptable model (χ2(194) = 600.51, RMSEA = .085, CFI = .82 , SRMR = .076, GFI = .83, AGFI = .78). When we further investigated the standardized factor loadings we have found that 3 items had low standardized factor loadings and they appeared to be disrupting the model structure. The translations of those items were checked again and we have concluded that the translations carried the intended meanings of the original items. After discussions with the original authors it has been decided to remove items 2, 10 and 14 and continue the analysis with the new structure embodying 20 items.
Figure 1. First Order CFA with Original Factor Structure of WRQoL (23 items)
The new factor structure was shown in Figure 2. Fit indices for the first order factor analysis, (allowing 6 factors to correlate) of the 20-item model indicate an acceptable model fit. (χ2(155) = 394.362, RMSEA = .073, CFI = .92 , SRMR = .059, GFI = .93, AGFI = .88). The standardized factor loadings of the individual items are also satisfactory.
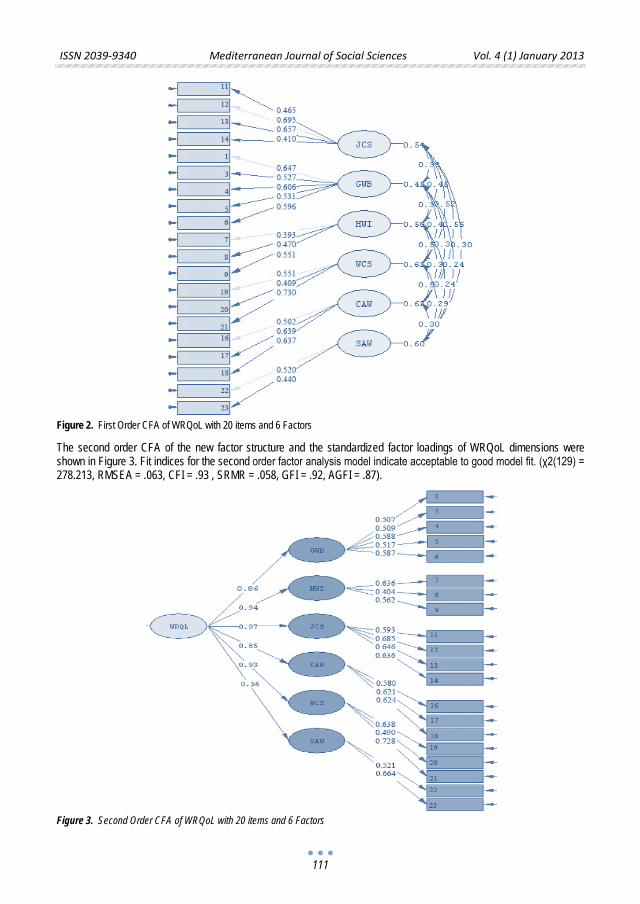
ISSN 2039-9340 Mediterranean Journal of Social Sciences Vol. 4 (1) January 2013
111
Figure 2. First Order CFA of WRQoL with 20 items and 6 Factors The second order CFA of the new factor structure and the standardized factor loadings of WRQoL dimensions were shown in Figure 3. Fit indices for the second order factor analysis model indicate acceptable to good model fit. (χ2(129) = 278.213, RMSEA = .063, CFI = .93 , SRMR = .058, GFI = .92, AGFI = .87).
Figure 3. Second Order CFA of WRQoL with 20 items and 6 Factors
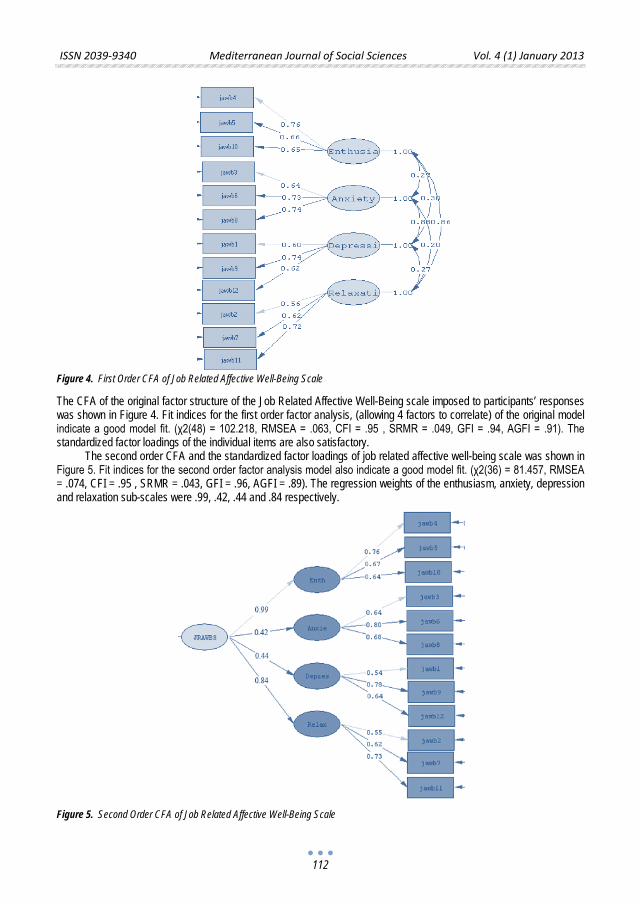
ISSN 2039-9340 Mediterranean Journal of Social Sciences Vol. 4 (1) January 2013
112
Figure 4. First Order CFA of Job Related Affective Well-Being Scale The CFA of the original factor structure of the Job Related Affective Well-Being scale imposed to participants’ responses was shown in Figure 4. Fit indices for the first order factor analysis, (allowing 4 factors to correlate) of the original model indicate a good model fit. (χ2(48) = 102.218, RMSEA = .063, CFI = .95 , SRMR = .049, GFI = .94, AGFI = .91). The standardized factor loadings of the individual items are also satisfactory.
The second order CFA and the standardized factor loadings of job related affective well-being scale was shown in Figure 5. Fit indices for the second order factor analysis model also indicate a good model fit. (χ2(36) = 81.457, RMSEA = .074, CFI = .95 , SRMR = .043, GFI = .96, AGFI = .89). The regression weights of the enthusiasm, anxiety, depression and relaxation sub-scales were .99, .42, .44 and .84 respectively.
Figure 5. Second Order CFA of Job Related Affective Well-Being Scale
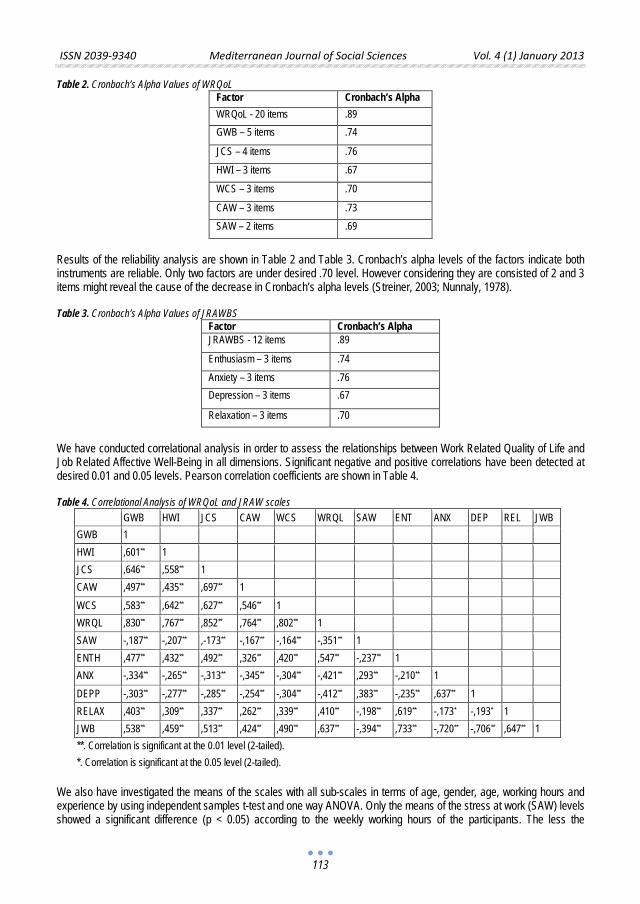
ISSN 2039-9340 Mediterranean Journal of Social Sciences Vol. 4 (1) January 2013
113
Table 2. Cronbach’s Alpha Values of WRQoL Factor Cronbach’s Alpha WRQoL - 20 items .89 GWB – 5 items .74
JCS – 4 items .76 HWI – 3 items .67
WCS – 3 items .70
CAW – 3 items .73 SAW – 2 items .69
Results of the reliability analysis are shown in Table 2 and Table 3. Cronbach’s alpha levels of the factors indicate both instruments are reliable. Only two factors are under desired .70 level. However considering they are consisted of 2 and 3 items might reveal the cause of the decrease in Cronbach’s alpha levels (Streiner, 2003; Nunnaly, 1978). Table 3. Cronbach’s Alpha Values of JRAWBS
Factor Cronbach’s Alpha JRAWBS - 12 items .89
Enthusiasm – 3 items .74 Anxiety – 3 items .76 Depression – 3 items .67
Relaxation – 3 items .70
We have conducted correlational analysis in order to assess the relationships between Work Related Quality of Life and Job Related Affective Well-Being in all dimensions. Significant negative and positive correlations have been detected at desired 0.01 and 0.05 levels. Pearson correlation coefficients are shown in Table 4. Table 4. Correlational Analysis of WRQoL and JRAW scales
GWB HWI JCS CAW WCS WRQL SAW ENT ANX DEP REL JWB GWB 1 HWI ,601** 1 JCS ,646** ,558** 1 CAW ,497** ,435** ,697** 1 WCS ,583** ,642** ,627** ,546** 1 WRQL ,830** ,767** ,852** ,764** ,802** 1 SAW -,187** -,207** ,-173** -,167** -,164** -,351** 1 ENTH ,477** ,432** ,492** ,326** ,420** ,547** -,237** 1 ANX -,334** -,265** -,313** -,345** -,304** -,421** ,293** -,210** 1 DEPP -,303** -,277** -,285** -,254** -,304** -,412** ,383** -,235** ,637** 1 RELAX ,403** ,309** ,337** ,262** ,339** ,410** -,198** ,619** -,173* -,193* 1 JWB ,538** ,459** ,513** ,424** ,490** ,637** -,394** ,733** -,720** -,706** ,647** 1 **. Correlation is significant at the 0.01 level (2-tailed). *. Correlation is significant at the 0.05 level (2-tailed).
We also have investigated the means of the scales with all sub-scales in terms of age, gender, age, working hours and experience by using independent samples t-test and one way ANOVA. Only the means of the stress at work (SAW) levels showed a significant difference (p < 0.05) according to the weekly working hours of the participants. The less the
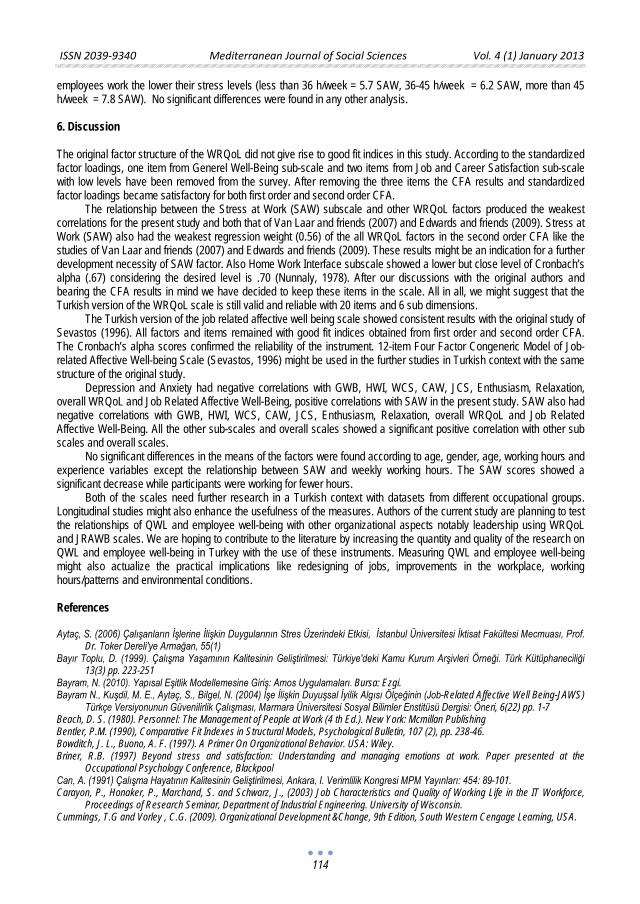
ISSN 2039-9340 Mediterranean Journal of Social Sciences Vol. 4 (1) January 2013
114
employees work the lower their stress levels (less than 36 h/week = 5.7 SAW, 36-45 h/week = 6.2 SAW, more than 45 h/week = 7.8 SAW). No significant differences were found in any other analysis. 6. Discussion The original factor structure of the WRQoL did not give rise to good fit indices in this study. According to the standardized factor loadings, one item from Generel Well-Being sub-scale and two items from Job and Career Satisfaction sub-scale with low levels have been removed from the survey. After removing the three items the CFA results and standardized factor loadings became satisfactory for both first order and second order CFA.
The relationship between the Stress at Work (SAW) subscale and other WRQoL factors produced the weakest correlations for the present study and both that of Van Laar and friends (2007) and Edwards and friends (2009). Stress at Work (SAW) also had the weakest regression weight (0.56) of the all WRQoL factors in the second order CFA like the studies of Van Laar and friends (2007) and Edwards and friends (2009). These results might be an indication for a further development necessity of SAW factor. Also Home Work Interface subscale showed a lower but close level of Cronbach’s alpha (.67) considering the desired level is .70 (Nunnaly, 1978). After our discussions with the original authors and bearing the CFA results in mind we have decided to keep these items in the scale. All in all, we might suggest that the Turkish version of the WRQoL scale is still valid and reliable with 20 items and 6 sub dimensions.
The Turkish version of the job related affective well being scale showed consistent results with the original study of Sevastos (1996). All factors and items remained with good fit indices obtained from first order and second order CFA. The Cronbach’s alpha scores confirmed the reliability of the instrument. 12-item Four Factor Congeneric Model of Job-related Affective Well-being Scale (Sevastos, 1996) might be used in the further studies in Turkish context with the same structure of the original study.
Depression and Anxiety had negative correlations with GWB, HWI, WCS, CAW, JCS, Enthusiasm, Relaxation, overall WRQoL and Job Related Affective Well-Being, positive correlations with SAW in the present study. SAW also had negative correlations with GWB, HWI, WCS, CAW, JCS, Enthusiasm, Relaxation, overall WRQoL and Job Related Affective Well-Being. All the other sub-scales and overall scales showed a significant positive correlation with other sub scales and overall scales.
No significant differences in the means of the factors were found according to age, gender, age, working hours and experience variables except the relationship between SAW and weekly working hours. The SAW scores showed a significant decrease while participants were working for fewer hours.
Both of the scales need further research in a Turkish context with datasets from different occupational groups. Longitudinal studies might also enhance the usefulness of the measures. Authors of the current study are planning to test the relationships of QWL and employee well-being with other organizational aspects notably leadership using WRQoL and JRAWB scales. We are hoping to contribute to the literature by increasing the quantity and quality of the research on QWL and employee well-being in Turkey with the use of these instruments. Measuring QWL and employee well-being might also actualize the practical implications like redesigning of jobs, improvements in the workplace, working hours/patterns and environmental conditions. References Aytaç, S. (2006) Çalışanların İşlerine İlişkin Duygularının Stres Üzerindeki Etkisi, İstanbul Üniversitesi İktisat Fakültesi Mecmuası, Prof.
Dr. Toker Dereli'ye Armağan, 55(1) Bayır Toplu, D. (1999). Çalışma Yaşamının Kalitesinin Geliştirilmesi: Türkiye'deki Kamu Kurum Arşivleri Örneği. Türk Kütüphaneciliği
13(3) pp. 223-251 Bayram, N. (2010). Yapısal Eşitlik Modellemesine Giriş: Amos Uygulamaları. Bursa: Ezgi. Bayram N., Kuşdil, M. E., Aytaç, S., Bilgel, N. (2004) İşe İlişkin Duyuşsal İyilik Algısı Ölçeğinin (Job-Related Affective Well Being-JAWS)
Türkçe Versiyonunun Güvenilirlik Çalışması, Marmara Üniversitesi Sosyal Bilimler Enstitüsü Dergisi: Öneri, 6(22) pp. 1-7 Beach, D. S. (1980). Personnel: The Management of People at Work (4 th Ed.). New York: Mcmillan Publishing Bentler, P.M. (1990), Comparative Fit Indexes in Structural Models, Psychological Bulletin, 107 (2), pp. 238-46. Bowditch, J. L., Buono, A. F. (1997). A Primer On Organizational Behavior. USA: Wiley. Briner, R.B. (1997) Beyond stress and satisfaction: Understanding and managing emotions at work. Paper presented at the
Occupational Psychology Conference, Blackpool Can, A. (1991) Çalışma Hayatının Kalitesinin Geliştirilmesi, Ankara, I. Verimlilik Kongresi MPM Yayınları: 454: 89-101. Carayon, P., Honaker, P., Marchand, S. and Schwarz, J., (2003) Job Characteristics and Quality of Working Life in the IT Workforce,
Proceedings of Research Seminar, Department of Industrial Engineering. University of Wisconsin. Cummings, T.G and Vorley , C.G. (2009). Organizational Development &Change, 9th Edition, South Western Cengage Learning, USA.
ISSN 2039-9340 Mediterranean Journal of Social Sciences Vol. 4 (1) January 2013
115
Daniels, K. (2000) Measures of five aspects of affective well-being at workMeasures of five aspects of affective well-being at work, Human Relations 53(2): 275–294
Davoine L., Erhel, C., Guergoat-Lariviere, M. (2008), A Taxonomy of European Labour Markets Using Quality Indicators, Centre D’etudes De L’emploi, Mai 2008, No.45.
Davis, L. E., Trist, E. L. (1974). Improving The Quality Of Working Life: Sociotechnical Case Studies. in James O’toole (Edt.) Work And The Quality Of Life Resource Papers For Work In America (p.246- 279). MIT Pres.
Diener, E. & Larsen, R.J. (1993) The experience of emotional well-being. In M.Lewis and J.M. Havilland (Eds), Handbook of emotions. New York: Guildford Press
Diener, E.; Lucas, R.E.; Smith, H.L.; Suh, E.M. (1999) Subjective Well-Being: Three Decades of Progress. Psychological Bulletin 175(2) pp. 276-302
Dikmetaş, E. (2006). Hastane Personelinin Çalışma / İş Yaşam Kalitesine Yönelik Bir Araştırma. Ç.Ü. Sosyal Bilimler Enstitüsü Dergisi, 15(2) pp.169-182
Dunn, G., Everitt, B. & Pickles, A.(1993) Modelling covariances and latent variables using EQS. London: Chapman & Hall,. Eaton, A. E. (1990). The Extent and Determinants of Local Union Control of Participative Programs. Industrial and Labor Relations
Review, 43(5), pp. 604–620. Edwards, J.A.,Van Laar, D. ve Easton, S. (2009). “The Work-Related Quality of Life (WRQoL) scale for higher education employees”.
Quality in Higher Education, 15(3), pp. 207–219 Erdem, M. (2010). Öğretmen Algılarına Göre Liselerde İş Yaşamı Kalitesi ve Örgütsel Bağlılıkla İlişkisi. Educational Administration:
Theory and Practice, 16(4) pp. 511-536 European Foundation for the Improvement of Living and Working Conditions (2002) [Online]
Available: http://www.eurofound.europa.eu/pubdocs/2002/12/en/1/ef0212en.pdf (July, 15 2012) Fernandes, E. C. (1996). Qualidade de vida no trabalho: como medir para melhorar. Salvador, BA : Casa da Qualidade. Gundogan, N. (2010). “İstihdam Politikalarının Bir Hedefi Olarak İş Kalitesi ve Uluslararası Kuruluşların Bu Konudaki Yaklaşımları”,
Çimento-İşveren Dergisi, Ocak 2010. Hackman, J.R., ve Oldham, G.R.. (1980). Work redesign. Reading. M.A: Addison-Wesley. Hu, L.T. ; Bentler, P.M. (1999), Cutoff Criteria for Fit Indexes in Covariance Structure Analysis: Conventional Criteria Versus New
Alternatives, Structural Equation Modeling, 6 (1), 1-55. Huzzard, T. (2003). The Convergence of the Quality of Working Life and Competitiveness, Arbetsliv –Omvandling. National Institute for
Working Life. Sweden. Ivancevich, J. M., & Matteson, M. T. (1996). Organizational Behaviour and Management (4th ed.). Chicago, IL: Irwin Jöreskog, K. and Sörbom, D. (1993), LISREL 8: Structural Equation Modeling with the SIMPLIS Command Language. Chicago, IL:
Scientific Software International Inc Van Katwyk, P. T., Fox, S., Spector, P. E., & Kelloway, E. K. (2000). Using the Jobrelated Affective Well-being Scale (JAWS) to
investigate affective responses to work stressors. Journal of Occupational Health Psychology, 5, 219-230 Kaymaz, K. (2003). Çalışma Yaşamında Kalite. İş, Güç Endüstri İlişkileri ve İnsan Kaynakları Dergisi. 5(1) Limongi-França, A. C. (2004). Qualidade De Vida No Trabalho: Conceitos E Práticas Na Sociedade Pósindustrial. Atlas. São Paulo. Newstrom, J. W. & Davis, K. (1997). Organizational Behavior Human Behavior at Work (10th Ed.). Mcgraw-Hill. Nunnaly, J. (1978). Psychometric theory. New York: McGraw-Hill Reena, G., Jayan, C. (2012). Role Of Quality of Work Life on The Job Attitude and Personal Effectiveness of Engineering College
Teachers, South Asian Academic Research Journals, Academicia 2(6) Rethinam, G.N & Ismail, M. (2008). Constructs of Quality of Work Life: A Perspective of Information and Technology Professionals,
European Journal of Social Sciences, 7(1) Runcie, J. F. (1980). Dynamic Systems and the Quality of Work Life. Personnel. 57(6) pp. 13–24. Robbins, S. P. (1989). Organizational Behavior: Concepts, Controversies, and Applications. NJ: Prentice Hall. Robertson, I. & Cooper, C. (2011) Well-being: Productivity and Happiness at Work, Eastbourne, Palgrave Macmillan Russell, J.A. (1980) Affective space is bipolar. Journal of Personality and Social Psychology, 39, 1152–68. Schulze, N. (1998). Yaşam Kalitesini Yükselten Temel Unsur Olarak İşin İnsancıllaştırılması, 6. Ergonomi Kongresi, M.P.M. Yayınları
No:622, Ankara, 1998. Sevastos, P., Smith, L. & Cordery, J.L. (1992) Evidence on the reliability and construct validity of Warr’s (1990) measures of well-being
and mental health measures. Journal of Occupational Psychology, 65, pp. 33–50. Sevastos, P.P. (1996). Job-Related Affective Well-Being and Its Relation to Intrinsic Job Satisfaction. Unpublished PhD Thesis, Curtin
University, Perth, Australia Serey, T.T. (2006). Choosing a Robust Quality of Work Life, Business Forum, 27(2), pp. 7-10. Sirgy, M.J., Efraty, D., Siegel, P., & Lee, D.J. (2001). A New Measure Of Quality Of Work Life (QWL) Based On Need Satisfaction and
Spillover Theory. Social Indicators Research, 55 (3), pp. 241–302. Solmuş, T. (2000). İş Yaşamında Kalite ve Kaliteyi Arttırmaya Yönelik Program. Türk Psikoloji Bülteni, 18 Streıner D. (2003) Starting at the beginning: an introduction to coefficient alpha and internal consistency. Journal of personality
assessment. 80 pp. 99-103. Timossi,L., Pedroso, B., Francisco, A., Pilatti, L. (2008). Evaluation of QWL: An Adaptation from the Walton’s QWL Model. XIV
International Conference On Industrial Engineering and Operations Management. Rio de Janeiro. Brazil Ustundag; N. (1999) Akıllı binaların tesis yönetimi ve iş yaşamı kalitesi üzerindeki etkileri. Unpublished PhD Thesis, İstanbul Üniversitesi,
Sosyal Bilimler Enstitüsü, İstanbul.

ISSN 2039-9340 Mediterranean Journal of Social Sciences Vol. 4 (1) January 2013
116
Van Laar, D. L., Edwards, J. A. & Easton, S. (2007). The Work-Related Quality of Life (QoWL) scale for Healthcare Workers. Journal of Advanced Nursing. 60(3), 325–333.
Walton, R. E. (1972). How to Counter Alienation in the Plant. Harvard Business Review, 50(6), pp. 70-81. Walton, R. E. (1973). Quality of working life: what is it?. Sloan Management Review. 15(1) pp. 11-21. Warr, P. (1990a) The measurement of well-being and other aspects of mental health. Journal of Occupational Psychology, 63, pp.193–
210. Warr, P. (1990b) Decision latitude, job demands, and employee well-being. Work & Stress, 4, pp.285–294. Warr, P. (1992) Age and occupational well-being. Psychology and Aging, 7, pp. 37–45. Warr, P. (1994) A conceptual study for the work and mental health. Work & Stress, 8, pp. 84–97. Wyatt, T. A. & Wah, C. Y. (2001). Perceptions of QWL: A study of Singaporean employees development. Research and Practice in
Human Resource Management, 9(2), pp. 59-76.
ISSN 2039-9340 Mediterranean Journal of Social Sciences Vol. 4 (1) January 2013
117
The Case of Lisbon Treaty;
An Elitist Analysis of the State of Democracy in the EU
Aida Goga
PhD Candidate Albanian Institute of European Studies
Doi:10.5901/mjss.2013.v4n1p117 Abstract
The gap separating elite and popular opinion on the path and finality of the European Union was never as visible as it became after the negative referendums on the Constitutional Treaty followed by the introduction of Lisbon Treaty. This paper tries to analyse this issue in the light of an elitist theory and it is organized as follows: In the first section the problem will be characterized by means of some theoretical considerations. The following section discusses the key facts from the birth of the Constitution to the birth of the Lisbon Treaty. It is followed by some facts that show that the Lisbon Treaty maintains almost the same content as the rejected Constitution, concluding with some final observations. In more specific terms, this essay will focus on the introduction of Lisbon Treaty after the failure of the European Constitution in the referenda during 2005. The relevant dynamic is not the formulation of a Treaty per se but the important dynamic that will be discussed relates to the particularities that associate this specific Treaty. The analysis of the introduction of Lisbon Treaty will be under the light of an elitist conception of democracy which constitutes the theoretical framework of the paper. The direct link between the theoretical basis and the Lisbon Treaty as a case study is the process of transition -from the failure of the European Constitution derived by a referenda -to a new “imposed” Treaty that substantially maintains the same content. According to this approach, democracy in the EU can be seen mainly as a means to change the governing elites and not as the rule of the “people”. In relation to this, Lisbon Treaty is just a subsequent elitist project sharpening further the gap between “people” and the ruling elites.
Key words: European Union, Lisbon Treaty, Referenda, Constitution, Democracy, Elitist Theories, Euro-Elites.
1. Introduction Actually, there are substantial differences within the elitist ‘school of thought’ that vary from moderate to radical. The main theorists in this field are:
- Vilfredo Pareto (1848-1923) - Charles Wright Mills - Gaetano Mosca (1858-1941) - Talcott Parsons (1902-1979) - Roberto Michels (1876-1936) - Robert Dahl - Joseph Schumpeter (1883-1950) - Karl Manheim (1893-1947) - Neo-Marxist Representatives
In regards to democracy, the relevant theoretical conception discussed in this paper is the minimalist model of democracy which is nearest to a Schumpeterian vision. It differs in the point that it is not an attempt to make any normative evaluation, approach that these theories usually take. From this point of view, “elites are seen as relatively a small groups in any society which dispose of disproportionate power; this power originates from the fact that they are occupying specific power-conferring positions or dispose of particularly useful resources”(Haller, 2008,p 8).
According to Schumpeter’s model of democracy citizens are only consumers of politics. His theory identifies democracy with a method of electoral competition whereby political leaders are selected by those over whom they rule (Medearis 2001, p.805). Citizens do not take decisions on anything else except of the decision about which party or individual is going to take decisions for them. As a result of the elections, citizens give “a credit” to the politicians that they elect. Politicians use it in order to formulate and implement their policies until the next elections. If they “consume the credit”, all that citizens can do is vote them down in the next elections. In reality this is the power that they have. “Democracy is only a method, of no intrinsic value, its sole function is to select leaders, according to Schumpeter. Leaders impose their views, and are not controlled by voters” (Mackie, 2009, p. 128). There is also the risk that citizens might be manipulated by elites in the same way that consumers can be manipulated by publicity. Elites are able to bargain, trade votes and coordinate their moves.
ISSN 2039-9340 Mediterranean Journal of Social Sciences Vol. 4 (1) January 2013
118
In early elite theories (Pareto, Mosca, Michels) we find a differentiation between political elites who possess the political power, economic elites who possess ownership of the means of production and economic wealth, and bureaucratic elites who hold top positions in public administration. Elites in earlier elite theories were defined as egoistic, per se power-driven, or even corrupted. Actually, no matter how you define elites, the important thing stressed here is the fact that they are a smaller group in relation to masses and elites are the real decision-makers. There are different explanations how this split elite-“people” in EU came about. One set of arguments might be derived since from the foundation of the EEC/EU seen as a wholly elitist project. Another explanation is that the split came with time.
In relation with the decision-making process in European level, one factor that leads to the empowerment of Euro-elites comparing to weaker masses is the level of competence of masses in different issues. Citizens in large scale are not very informed and not very competent in political, economical and legal issues.
This might be a result of two different reasons. It might be a rational choice or it might be just a sad truth. However, the result is that this dynamic leads to an elitist domination of decision-making.
According to Downs the cost of being informed about the details of political issues generally outweighs the benefits to be derived from voting on an informed basis. This happens because of a set of reasons. “The cost of being informed is a sum of the costs of gathering and selecting data with the undertaking a factual analysis of these data. Rational voters need also to invest time and resources in order to become politically informed. Because such a complex procedure, rational voters have strong incentives to try to avoid the high costs of information acquisition. They act according to some rules that allow voters to make political decisions and form political preferences without being fully informed about the content and details of political issues” (Downs 1957, p. 217).
On the other hand, different analysis and surveys are a strong proof of the low level of competence of voters in European level. The above presented table shows the perceived level of understanding of issues involved in the Nice Referendums and the Lisbon Referendum (%):
Lisbon Treaty Referendum Research Findings (taken from Quinlan, 2009, p.117)
So, no matter if voters choose not to be informed or they are irrationally not informed, the result is that elites are
empowered from this dynamic and there is a gap that divides them from masses. Elites are also seen as those who mainly benefit from the integration and further deepening process. The
population at large is politically alienated and marginalised. Moreover, political scientists symbolically doubt whether politicians responsible for issues in European level live in the same Europe as the people they are supposed to represent.
Actually, doubts about consulting public opinion have been raised times before the French, Dutch and Irish referendums about the European Constitution. As already explained, one of the main arguments against ratification of EU set of rules by popular referendum is that voters cannot be expected to understand technically complex texts of hundreds of pages. It may be also argued that further deepening of European integration brings more advantages to the powerful “Eurocratic” elites and the gains for the population are less obvious and may be hardly perceived. This division is very problematic for the legitimacy of the European Union.
The gap between elites and citizens is there may be since forever but the rejection of the European Constitution by popular vote in 2005 and the introduction of the same content by Lisbon Treaty is only the latest and most sharp event in this regard.
On the other hand, there are also “structural” or institutional reasons why citizens can only indirectly co-determine politics at the level of the European Union.
Although the European Parliament is directly elected it still does not have the main competences of a democratic parliament. The fact that the European Union suffers from a serious democratic deficit highlights the fact that “a majority, in the strict sense, is not required to make policy” (taken from Majone, 2009, p.11). This is not a normative evaluation but actually it is more an empiric observation.
Level of understanding Nice I Nice II Lisbon
Good understanding of what the Treaty is all about 8 22 9
Understood some of the issues but not all 28 39 31
Only vaguely aware of the issues involved 28 25 30
Did not know what the Treaty was about at all 36 14 30
ISSN 2039-9340 Mediterranean Journal of Social Sciences Vol. 4 (1) January 2013
119
2. Actualizing the theoretical approach 2.1 From the European Constitution to the Lisbon Treaty The signing of the European Constitution in October 2004 was seen as a significant step forward for the EU. However, in France was decided to hold a referendum about the Constitution.
“A very high turnout rate of 70% characterized the referendum. The Constitution was rejected by a clear majority of 54.8% of the voters – in spite of the fact that all large and governing parties and politicians had supported it. Only three days later, the Dutch people rejected the Constitution with an even larger majority, 61.6%”(Haller, 2008, p.3). Also in this country, the ruling economic and political elites had strongly advocated its acceptation. These results were a big disappointment for the European establishment. The lack of enthusiasm for the proposed constitution among the Europeans surprised the political elite of Europe but it did not stop them.
Voting for the Constitutional Treaty turned out to be more a symbolic act because elites found the way to move forward even with a public “No” in the referendums in France and in the Netherlands. They moved forward by introducing Lisbon treaty.
Chronologically, the key facts from the birth of the Constitution to the birth of the Lisbon Treaty are (Treaty of Lisbon key facts, n.d):
- In October 2004, EU leaders signed The European Constitution. This Constitution was designed to replace The Maastricht Treaty and The Treaty Establishing the European Community as amended by the Treaty of Nice.
- In May and June 2005, people of the Netherlands and France rejected the Constitution in referendums. The Constitution failed.
- In June 2005, EU leaders announced a "period of reflection" - In 2006, EU leaders announced that the "period of reflection" would come to an end by June 2008. Citizen’s
debates on different issues took place in only three or four member states. - In January 2007, the German Chancellor, Angela Merkel was determined to get something settled to replace
the Constitution (when Germany took over the EU presidency). - In June 2007, the German team came up with a plan to replace the Constitution. Angela Merkel presented the
text of a set of instructions for re-writing the previous texts. The document was called the "Draft IGC Mandate". This was in fact an instruction for writing The Reform Treaty.
- In October 2007, a refined version of "The Reform Treaty" was agreed by EU leaders. - In December 2007, "The Reform Treaty" was renamed "The Treaty of Lisbon" and was signed by the 27 EU
leaders in Lisbon. The new Treaty could be ratified by national parliaments, thus overcoming the difficulties and uncertainties of referendums, since the citizens are considered inadequately prepared to evaluate the legal and technical matters presented by the document. In part, that is why it is considered a mechanism organized by eurocrates behind “citizens backs”.
This perception is reinforced by the fact that Lisbon Treaty looks a lot like the rejected constitution. It is billed as an adjustment of existing documents. It resembles the old document in many points and maintains the same content of a number of articles presented in the constitution.
According to Nicholas Moussis’ findings in analysing both Lisbon Treaty and the rejected Constitution there is a large percentage of “congruency” between the two documents. Some of the main points introduced by Lisbon Treaty as the same points previously introduced by the Constitution, are listed below.
- Lisbon Treaty reshapes European institutions and changes voting procedures suggesting a merge of the Community and the Union doing away with the ''three pillars'' of the Union.The European Union will have a single legal personality under which it will sign and implement external commitments, negotiate policies and activities.
- The powers of the European Parliament are increased considerably. The ''co-decision procedure'' is renamed ''ordinary legislative procedure'' and it is extended to a number of new fields.
- Decisions in the Council of Ministers need the support of 55% of Member States representing a minimum of 65% of the EU's population, facilitating the decision-making process in the enlarged Union.
- The composition of the European Parliament is adapted to the new circumstances of the enlarged Union. - Concerning the budget, it is called the ''Union budget''. The distinction between ''compulsory'' expenditure and
''non-compulsory'' expenditure is abolished and the Parliament and the Council have equal powers in relation to the whole budget.
ISSN 2039-9340 Mediterranean Journal of Social Sciences Vol. 4 (1) January 2013
120
- The Treaty of Lisbon, same as the constitution contains many elements concerning democratisation of the Union. It reinforces the values and objectives on which the Union is built.
- It gives to the citizens the possibility to participate in the policies of the Union through the citizen’s initiative. - In relation to the integration it explicitly recognise the possibility for a Member State to withdraw from the
Union.
Transposing what above listed in technical language: ''-Article 9 A, Lisbon = article I-20, Constitution. -Article 9 C(4), Lisbon = Article I-25, Constitution. -Article 9 A(2), Lisbon = Article I-20, Constitution -Article 25b, Lisbon = article I-53, Constitution -Article 1a, Lisbon, Article I-2, Constitution. -Articles 8 A et 8 B, Lisbon = Articles I-46 and I-47, Constitution. -Article 49 A, Lisbon = Article I-60, Constitution.'' (Europedia, n.d) However, the scale of similarities is larger. This is only a brief set of facts that illustrate the principle behind the
argumentation. According to the former Irish Prime Minister, “...most of the changes are presentational changes that have no practical effect. They have simply been designed to enable certain heads of government to sell to their people the idea of ratification by parliamentary action rather than by referendum.” (Bonde, 2007, p.27) Apparently, parliamentary ratification does not pose a serious risk because majority parties as national elites, usually tend to find an agreement on European issues.
Moreover the Irish “No” to Lisbon Treaty did not stop it. Similarly, the Treaty of Nice was also rejected by the Irish in 2001, but was later passed after changes were made. Most European leaders expressed grave disappointment with the Irish result but actually the process went on. “The President of the European Commission, Jose Manuel Barroso, said he respected the outcome but called for ratification of the Treaty to continue in other member states, sentiments echoed by French President Nicolas Sarkozy and German Chancellor Angela Merkel (Smyth, 2008). However, other European politicians were not as polite and could hardly contain their annoyance. The French Minister for Europe, Jean-Pierre Jouyet, issued a stark warning that, in spite of the Irish rejection, under no circumstances was renegotiation of the Treaty an option.” (Quinlan,2009, p.117).
Elites “reworked” the Constitution reintroducing it as the Lisbon Treaty and they can rework the new Treaty itself in order to address the specific concerns about it. It is sure that they will find a way to fulfil their will but the lesson that leaders seem to have learned from the failure of the Constitutional Treaty appears to be “No more referenda”. The ambition “to bring the European institutions closer to the citizens” seems in some ways distorted. On one hand, the Treaty of Lisbon does contain certain elements to increase citizens’ interest in EU decision-making. On the other hand, the process of introducing it is far from this aim. Some democratic theorists counter-attack elite theory conceptions because their understandings of democracy. The elitist and neo-elitist approach is very questionable and in many critics it is argued that although neo-elitists may appear to be more sympathetic to democracy than “old” elitist were in fact their work has a big tendency to give democratic forms an oligarchic content. However, a great number of elements can be seen in the light of the elitist conception and sustained because of concrete facts as above presented .
Summarizing - Euro-elites propose a step forward for the European Union through working out a Constitution. They suggest a referendum which fails to pass the document. Failure…? -They bring the same content in a different format avoiding referendums. Euro-elites choose problem-solving effectiveness in relation to the alternative of following the will of people, expressed through direct democracy means. They choose output legitimacy comparing to input legitimacy. Euro-elites perpetuate their power and the pursued European democracy actually turns to be elusive. Bibliography Bonde.J,P.(n.d). From EU Constitution to Lisbon Treaty. Retrieved on April 9, 2009 from www.bonde.com Crum,B.(2005).Tailoring Representative Democracy to the European Union: Does the European Constitution Reduce the Democratic
Deficit? European Law Journal, 11(4), 452–467. Coe,R,D, Wilber,Ch.(1985). Capitalism and Democracy, Schumpeter Revisited. Indiana. University of Notre Dame Press De Burca,G. (2008). Reflections on the EU’s Path from the Constitutional Treaty to the Lisbon Treaty. Retrieved on April 15, 2009
from http://ssrn.com/abstract=1124586 Downs, A. (1957). An Economic Theory of Democracy. New York: Harper&Row. Dunleavy,P, O’Leavy,B.(1987) Theories of the State, the Politics of Liberal Democracy. Hampshire. Palgrave McMillan Duff,A.(n.d).True Guide to the treaty of Lisbon . Retrieved on April 10, 2009 from www.alde.eu/fileadmin/files/Download/True-Guide-
NEW.pdf
ISSN 2039-9340 Mediterranean Journal of Social Sciences Vol. 4 (1) January 2013
121
Haller,M.(2008). Divisions on Europe between elites and citizens.“European Union and World Politics”, Retrieved on April 10, 2009 from www.akademiai.com/index/6954857477276RR2.pdf
Katz,S,R.(2001). European Union Models of Democracy: Elite Attitudes and the Democratic Deficit in the European Union Politics . Retrieved on 14 April 2009 from http://eup.sagepub.com/cgi/content/abstract/2/1/53
Kreidman,A. (2008) Correcting Past Mistakes: The Failure of the European Constitution and its Resurrection as the Lisbon Treaty. European Union Center of Excellence . 5 (12)
Lippman,W.(2007).Public Opinion. UK. Filiquarian Publishing.LLC Mackie,G. (2009). Schumpeter's Leadership Democracy. Political Theory. 37 (1), 128-153 Majone,G.(2009).The “Referendum Threat”, The Rationally Ignorant Voter, And the political culture of the EU. UCD Working Papers in
Law, Criminology & Socio-Legal Studies Research Paper No. 04/2009 Magnette,P.(2003). European Governance and Civic Participation: Beyond Elitist Citizenship? Political Studies Association, 51, 1–17 Medding,P,Y .(1969). "Elitist" Democracy: An Unsuccessful Critique of a Misunderstood Theory. [Electronic version].The Journal of
Politics, 31(3). 641-654 Retrieved March on 22, 2009 from JSTOR database Medearis,J (2001). Joseph Schumpeter's Two Theories of Democracy. American Political Science Review. 96 (4) Moussis,N. (n.d). The Treaty of Lisbon: a Constitution without title. Retrieved on April 05, 2009
from http://www.europedia.moussis.eu/books/Book_2/2/2/5/index.tkl?all=1&pos=23 Quinlan,S.(2009).The Lisbon Treaty Referendum 2008. [Electronic version].Irish Political Studies, 24(1),107 — 121 Schmidt, A,V. (n.d). European Elites on the European Union ;What vision for the future? Retrieved on April 1, 2009 from http://people.bu.edu/vschmidt Tsakatika, M. (2007).Governance vs. politics: the European Union’s constitutive ‘democratic deficit’. Journal of European Public Policy
14(6) .867–885 Treaty of Lisbon / Reform Treaty. How it came to be written. Retrieved on April 03, 2009, Treaty of Lisbon Key Facts Web:
http://www.saxonbooks.co.uk/treaty_of_lisbon.htm The Treaty of Lisbon: An impact assessment. House of Lords. European Union Committee 10th Report of Session 2007–08.(I): Report
13 March 2008 Young,I,M.(2000). Inclusion and Democracy. Oxford. Oxford University Press Zowislo-Grünewald,N. (n.d) .On Europe’s Representation: A Symbolic Interpretation of Rejecting the Constitution. Retrieved on April 12,
2009 from www.apsanet.org

ISSN 2039-9340 Mediterranean Journal of Social Sciences Vol. 4 (1) January 2013
123
The Social Construction of sub-Saharan Women’s Status
through African Proverbs
Lewis Asimeng-Boahene, Ph.D
Associate Prof. of Social Studies Education Penn State University-Harrisburg, 777 West Harrisburg Pike
Middletown, PA, 17057 , USA Tel: 717-948-6348 , Fax; 717-948-6681, E-mail: [email protected]
Doi:10.5901/mjss.2013.v4n1p123 Abstract
The continent of Africa, especially the sub-Saharan Africa, is known for its rich oral traditions and practices. Proverbs are the most widely used in this genre of oral arts and practices, and thus their influence is so strong to the point that even the concept of social construction of women is so persistently carved from it. This paper examines how proverbs serve as storylines between the ways proverbs represent the roles, statuses, and identity of women in traditional sub-Saharan Africa. The paper focuses on the social construction and patriarchy as conceptsand uses critical discourse asa theoretical framework explaining the status of women. The study also employed qualitative and the interpretive methods, which underscores the importance of the narratives on the lived experiences of the respondents.
Key words: social construction, African proverbs, Sub-Saharan Africa, women, status
If you educate a man, you educate an individual; but if you educate a woman, you educate a nation… KwegyirAggrey
1. Introduction The African continent is culturally complex and fluid with diverse cultures, natural environment and different ways of living, but sub-Saharan Africa is generally known for its rich oral traditions and proverbs which are the most widely and commonly used in this tradition of oral arts (Asimeng-Boahene, 2010; Grant &Asimeng-Boahene, 2004). African proverbs are the foundation of social and cultural wisdom and therefore serve as the basis for formulating concepts that govern social relations (Asimeng-Boahene, 2009). However,largely due to the well-entrenched patrician system of organization in the sub-Saharan Africa (Tamale, 2005), and just like some societies of the world, the subordination of women has been prominently expressed in proverbs, which has further exacerbated the disadvantaged conditions of women. The use of proverbs permeates the entire African society, and it is the foundation of social and cultural wisdom (Finnegan, 1970).The influence of proverbs on African thought is so strong that even the concept of social construction of African women is persistently sculpted from it as they are coined to condition the female into accepting her position as subordinate. Thus, according to Fasiku (2006), proverbs serve as “a powerful rhetorical device for the shaping of moral consciousness, opinions, and beliefs” (p.51). No wonder thatthe Zulu of South Africa say, “Without them, the language would be but skeleton without a flesh, a body without soul” (Finnegan, 1970, p. 475). Thus, Finnegan (1970) is right when she posits that “in many African cultures a feeling for language, for imagery, and for the expression of abstract ideas through compressed and allusive phraseology comes out particularly in proverbs” (p. 390).Thus it can be argued that though Africa is a conglomeration of multicultural societies, in the study of African paroemiography, what is true of a particular ethnicity, may also be true in other sub-Saharan African countries.
The above suppositions clearly demonstrate the important place of proverbs in sub-Saharan African oral art. In this paper, I examine how through rationalization, institutionalization, and formalization, and even sometimes nullification of their total humankind, African proverbs have been used to situate or socially construct African women in both matriarchal and patriarchal systems in Africa. I open the discussion by examining the theoretical framework in the form of the concepts of social construction and African feminism, which serve as epistemological constructs that underlie how proverbs place the roles, statuses, and identity of women in Africa. The next discussion highlights the methods, and findings from the study are presented, and the emergent themes are discussed. Finally, it concludes with recommendations on how the problems could be addressed.
ISSN 2039-9340 Mediterranean Journal of Social Sciences Vol. 4 (1) January 2013
124
2. African Proverbs Proverbs are interactive communication systems whereby the vast array of available sociocultural knowledge artifacts can be mined for information which can be visualized, measured, and explored over time. By and large, proverbs are universal phenomena. They open access to knowledge creation and consumption to the wider public. African proverbs are expressed not only in words, but also in the language of the drums and even in the patterns woven in cloth (Asimeng-Boahene, 2009; Asimeng-Boahene, 2010; Korem&Abissath, 2004). Almost everywhere in sub- Saharan Africa, the storytellers use stories, proverbs, and myths as teaching tools as they have authority and prestige in shaping social perception and behavior (Finnegan, 1970; Gyekye, 1996; Korem&Abissath, 2004; Reagan, 2005; Rosenfeld & Geller, 1987; Sarpong, 1974).Accordingly, African proverbs, being accumulated treasure, serve as a way of looking at things differently, as they draw on observations, knowledge, and the wisdom of ancestors who use short, witty phrases that could be transmitted from generation to generation (Makinde, 1986). Consequently, because they are the ore from which Africans mine the meaning of their past, present and future of their cultural beliefs, and practices,African proverbs have facilitated the transmission of knowledge and conventions which socially construct women’s position in the society(Dogbevi, 2011; Gyekye, 1996).The above assertions about African proverbs set the tone for the study of how proverbs have defined women’s status in sub-Saharan Africa. 3. Theoretical Framework This article uses the lenses of critical discourse, which according to Lewis (2006), is “both a theory and a method that examines how social and power relations, identities and knowledge are constructed through written, visual, and spoken text and their production and consumption” (p. 374) as the epistemological framework for examining how African women have beensocially engineered and constructed. Furthermore, critical discourse analyses help guide my quest because they address issues such as how one’s own racial, ethnic, and cultural backgrounds shape the nature of his or her conversation (Lindsey, 2005). Also included in the theoretical framework are radical feminist concepts, which are concerned with how patriarchy spread its tentacles in society to situate women as being held down as a result of their unequal standing in both the workplace and domestic sphere, and thus, as a result of their economic dependence, domestic work, childcare, and marriage are all seen as ways in which women are exploited by a patriarchal system that devalues women and the substantial work that they do (Lindsey, 2005).
Although patriarchy is defined differently, it simply refers to power relations in which women’s interests are subordinated to the interests of men (Jenainati& Groves, 2010). These power relations take many forms, from the sexual division of labor and the social organization of procreation to the internalized norms of femininity by which women live. In terms of patriarchal tendencies, this discourse opines that women’s oppression and domination by men is the fundamental oppression and at the root of other isms. Thus, it identifies suppression of distinctive different female qualities, experiences, and values as the primary cause of women’s subordination.
Consequently, critiquing patriarchal structures through the context of critical analysis explains why some men use proverbs to justify and foster their hegemonic masculinity and practices in terms of legitimization of the oppression of women through political, social, economic, legal, cultural, religious, and military institutions. Men’s access to and control over resources and rewards within the private and public spheres derive legitimacy from the ideology of male dominance. The understanding of patriarchy is crucial because it provides a framework within which to express the totality of exploitative relations which affect African women. Patriarchal structures privilege men over women; whether demonstrated through direct or indirect violence against women, political and economic dominance over women, or by severely restricting women’s movement, education, and development, traditional patriarchal structuresshow great resistance to change (Beneria, 2003). Thus, social construction denotes those processes and agencies planned or unplanned, by which individuals are taught, persuaded, or compelled to conform to the usages and life values of the groups to which they belong. The ultimate aim of such an agenda is woman’s “passive acceptance and respect for male domination” (Gilbert & Taylor, 1992, p. 81). Consequently, with the emphasis on normative male-dominated African society, women’s roles are limited as stereotyped in the traditional narrative/literature. This epitomizes the successful construction of patriarchy and male chauvinism that continues to define the African world.
Thus using proverbs as agents of social construction/control, Peter Berger (as cited in Charon, 1993) reminds us that “every society has its cognitive policemen who administer the ‘official’ definition of reality”(p. 432).In their respective cases, the agents of social control (in this case it could be proverbs) provide informal and formal punitive measures that are meant to keep men and women away from behavior that disrupts the normative structure of the society. The end result is the assurance of greater conformity and order, as opposed to deviance and disorder.
ISSN 2039-9340 Mediterranean Journal of Social Sciences Vol. 4 (1) January 2013
125
Aristotle around the 4th century BC declared that “women were women by virtue of a certain lack of qualities” (cited in Jenainati & Groves, 2010, p.5). Thus, early thinking about the difference between women and men was based on essentialist ideas about gender, which maintained that women’s and men’s differences are as result of biology. The belief that biology is destiny suggests that, in comparable situations, men exhibit masculine psychological traits, such as aggression, rationality and assertiveness, whereas women will exhibit feminine traits such as gentleness, intuitiveness, and sensibility (Jenainati& Groves, 2010). 4. Methodology This study employedqualitativeresearch and the interpretive method. The qualitative approach was accentuated because it allows the researcher to gain insight into the organizational structures and settings, social processes, and more poignantly underscores the importance of personal interviews and narratives on the lived experiences of the respondents (Strauss and Corbin, 1994).In addition, it also privileges the perceptions of the participants and allows for the development of a rich and in-depth understanding of the community from the viewpoint of its members (Maxwell, 2005). By giving precedence to the voices of the participants through their lived experiences, the researcher was better placed to develop a better understanding of individual and group experiences of the research participants. Thus, the essence of this methodology, according to Strauss and Corbin (1999) is its holistic characteristics in evaluating research, as well as its ability to resist standardized categories that have been prearranged. I found the qualitative research method suitable for the design of the study because of itsinductive property of flexibility and amenability,which falls in tandem with the dynamics of thenatural settings for the study. 4.1 Constellation of Research Participants The participants included both Western-educated and non-Western-educatedwomen with traditional beliefs to find out whether or not Western education has influenced African women’s views about traditional proverbs dealing with perception and suppositions of women’spositions in the traditional cultural landscape. This enabled me to gain insight into the historical, cultural, and contemporary significance of African, particularly (Akan of Ghana) oral literature in terms of proverbs. As repositories of traditional oral wisdom, I interviewed about 200 Akan women between the ages of 45-70 and of different sociocultural beliefs, educational levels, and religious backgrounds. They comprised 50 non-Western-educated women and 50 Western-educated women based in the Ashanti, Eastern, and Central Regions of Ghana. Also includedwere25 Western-educated foreign-based women (mostly UK, USA, and Canada) and 25 foreign-based non-Western-educated women (Canada, USA, and UK).I employed a purposeful sample asthis is the most common sampling technique, which enables the researcher to identify and actively select the most productive sample that provides in-depth information that would help to answer the research questions (Burgess, 1989; Frenkel & Wallen, 2000; Marshall, 1996).Potential participants were informed that pseudonyms would be used to protect their confidentiality and anonymity. Also, the participants’selection was based mainly on their expressed interest and availability to be part of the study. 4.2 Research Questions The study sought to find answers to the following research questions:
1. What do you think about proverbs in general? 2. Do you think some proverbs devalue women? Why? 3. Who do you blame for some of the negative portrayal of women in proverbs? And why? 4. How do these proverbs that devalue women perpetuate patriarchal tendencies in African cultural heritage?
4.3 Data Collection Process Contacts and solicitations for participation were made through telephone calls, home visits, and introduction by other participants resulting in one-on-one interviews. The one on one interviews were complemented by three focus groups meetings in Ghana. The first focus group was comprised of non-Western-educated participants. The second consisted of Western-educated, and the third a combination of both Western and non-Western-educated participants.The focus group process was tape recorded, and the focus groups deliberations were used to evaluate and make comparisons with the responses captured from the one-on-one interviews that had earlier been conducted. The data so collected from the interviews and the focus groups provided materials for highlighting and providing emerging common themes for
ISSN 2039-9340 Mediterranean Journal of Social Sciences Vol. 4 (1) January 2013
126
analysis.It also provided a rich opportunity for both the participants and the researcher to gauge how the individual responses during the discussion differ from or underpin those of colleagues.
In addition, data collection of existing literature was conducted to gain insights into conceptual, cultural, historical, and contemporary issues concerning the topic. Ethical issues in a research study of this nature are extremely critical. The fact that I am an African male did nothing to mitigate the ethical dilemma. My ethnic backgroundand the prior knowledge of the area where I conducted the study gave me a considerable advantageand access and made my work easier than if I were a foreign researcheras I speak the same language and share the same culture with the participants. I did not hide my status as a researcher, and in spite of the nature of the topic under investigation, most participants spoke freely and fully. 4.4 Limitations I began this study with a realization of the existent inherent limitations a study of such a nature with data collected across a vast area of the country (Ghana). The limitations may result from such things as techniques of sample determination, e.g., focusing mostlyon the women in the Akan- speaking areas of Ghana, which may have created problems of certain biases and generalization of findings throughout Africa. Other non-controllable factors that may have affected the research were the psychological set of the minds of the respondents at the time of my interview. 5. Analysis of findings This study is informed by grounded theory techniques for data analysis (Strauss& Corbin, 1994), which involved making sense of what the researcher has seen, heard, and read. It also involves analyzing, categorizing, searching for patterns, and interpreting the data (Glesne, 1999).The significant themes that emerged from the interviews and focus groups, which were applied in analyzing and understanding the study, are discussed below. 5.1 Patriarchy and Male Chauvinism: Proverbs as a Tool for Objectifying Women As indicated by the respondents, a lot of underlying sociocultural conditions produce images of women as “commodities.” Women struggle to gain ownership of their bodies, which are continually discussed and objectified by traditional stereotypes of femininitythrough proverbs, which help internalize gender identity.
The analysis of the findings revealed that the use of proverbs has become the tool through which men control positions of social and economic influence by limiting women’s participation to domestic spheres.The non-recognition of women’s labor reinforces the perception that they are nonproductive “dependents” and subjects them to circumstances that exacerbate their material poverty and weaken their bargaining positions, both within the household and in society at large. For instance, traditionally, the Akan (Ghana) society functions on male dominance over women. This position is amplified and legitimized by the belief systems of the society. Most of the belief systems in the Akan ethnic group in Ghana are woven around proverbs. For example, there is a proverb that says, “Woe betide you if you have no male figure in your family.” The meaning is that the family is only “whole” when there is a male figure.
One of the most patriarchal and chauvinist arrangements in Ghana’s Akan society is the fact that childbearing and childrearing are regarded as the sole responsibility of women. There is an Akan proverb, “Obaaanuonyamne se wa ware” (only a married woman commands respect). This high value placed on fertility means that girls, even in their teens, are under tremendous pressure to marry and bear children. Thus, young women often hold the culturally centered belief that their worth is tied to their fertility (Population Report, 1995). The woman who is not married has a limited role in society in the African (Akan) traditional world view as it is expected that all women get married. So a proverb states: “An ugly girl does not become old at home.” It means that the looks of a girl should not stop her from getting married. Otherwise this would deny her the role of womanhood (Mbiti, 1988). This thought is bound up with the value of bearing children. The childless woman goes through deep sorrows in African society. So it is said, for example, “The woman who has children does not desert home” (Dalfovo, cited in Mbiti, 1988). This means that bearing children gives the woman the security and joy of a society. So “the woman whose sons have died is richer than a barren woman” (Barro, as cited in Mbiti, 1988). The above is intended to say that people will excuse a woman for losing her children through death, but the one who does not bear is hardly “excused.” Consequently, people say, “A barren woman never gives thanks.” Nothing else is as valuable as children.
Thus, if a woman has everything else except children, she would have no cause or joy to give thanks. So the Ghanaians say, “A serviceable wife is often blessed with the birth of a 10th child.” It is therefore not surprising that when a woman bears a 10th child, her family is expected to buy a sheep to present to the husband as their appreciation for

ISSN 2039-9340 Mediterranean Journal of Social Sciences Vol. 4 (1) January 2013
127
increasing their family with more children. The effort, pain, and all the work the woman has undergone in bearing and raising 10 children is not recognized. 5.2 The Cult of Domesticity: Gendering of the Proverbs The analysis of the findings revealed that the Akan of Ghana also have a situation in which females are regarded with little respect when it comes to assigning negative traits. The gender issues (demeaning females) are represented by the following proverbs:
Table 1: The cult of domesticity African Proverb Meaning If you marry a woman in a pub, you divorce her at a pub. The determining factor for a marriage is the environment
where you meet the women.
A women sells egg plant not gunpowder (Obaa ton nyaadoanaontonatuduro).
Women should do what is appropriate to them and not to interfere in men’s affairs.
Obaa to etuo a etwereobarimadan mu (If a woman buys a gun, she keeps it in a man’s room).
Whatever a woman may do, she needs a man.
Obaawompempem a, obarimanaohwe ne so (If a woman has thousands and thousands, it is a man that looks after her).
Whatever a woman may do or have, she needs a man.
From the above proverbs, it is not difficult for one to establish the mindset of the African male. That males sought to belittle their female counterparts should not be surprising because in the traditional African society, the male has always been on top of things. This mindset is exposed by the gendering that occurs in these proverbs. 5.3 Proverb as Tool for Social Engineering: Marriage and Sexual Practices
These findings revealed how proverbs have served as tools for social engineering in terms of marriage and sexual practices. This notion of control is reflected in the practice of female genital mutilation (FGM)insome ethnic communities. The idea is to deny women the ability to have sexual pleasurebecause the woman is thoroughly an object of a man’s pleasure. Women do not even have the right to their own sexuality. Women, especially wives, are socially engineered and not supposed to express their satisfaction or otherwise during sex as this expression is frowned upon. A woman who does so is regarded as sexual maniac or prostitute. Consequently, sexual politics in terms of inequality, oppression, or behaviorthat have been imposed on African (Akan) women by social custom in terms of patriarchy’s sex/gender system denies the woman her right to sexual pleasure and should not be seen as a natural consequence of her biology. Thus marriage practices in some African societies undermine women’s autonomy, increase women’s exploitation, and exacerbate their vulnerability to different risks in terms of sexuality. 5.4 Narratives When asked to comment on the proverb, “If a woman is going to commit adultery, it does not matter that she has a good marriage.” the response was that if a woman is not sexually satisfied in her marriage life, she might seek it outside or may stay in the marriage because of her children for security and economic reasons(a common statement from both the Western and non- Western-educated participants). 5.5 A Penology of Servants: Female Subordination and Subservience Another finding from the analysis reveals female subordination and subservience. A Ghanaian proverb says, “If a woman buys a gun, it should be kept in a man’s room,” which means that a woman is not capable of taking care of precious items. Society, therefore, does not look kindly on women who are wealthy. This is regarded as outside the norm, which reinforces male dominance and female subordination.
Again, traditionally, most African societies, especially the Akan of Ghana, do not take kindly to women who are assertive. When a woman is assertive or portrays confidence and independence, she is stigmatized and given all sorts of
ISSN 2039-9340 Mediterranean Journal of Social Sciences Vol. 4 (1) January 2013
128
derogatory names like “obaaakokonini” (a woman cock), “Obaabarima” (woman man), “odeenden” (tough cookie). All these are designed to keep women in their subordinate and subservient roles. Again, in terms of subordination, one should be remindedthatevery society has its cognitive policemen who administer the official “definition of reality”(Assimeng, 2006, p. 59). In other words, their role is principally the defense of societal norms. Thus, the way African proverbs and other oral traditions are used to legitimize inequalities can be explained using Michel Foucalt’s (1980) “Regime of truth”:
Each society has its regime of truth, its “general politics” of truth: That is, the types of discourse which it accepts and makes function as true; the mechanisms and instances which enable one to distinguishtrue and false statements, the means by which each is sanctioned; the techniques and procedures accorded value in the acquisition of truth;that status of those who are charged with saying what counts as true. (p. 131)
From the above, one can argue that African proverbs as obviously discursive habits in the patriarchal system have been created and recreated to reinforce the myth of male superiority.
A proverb like “the hen says, I have a voice to declare daybreak, but I listen to my husband” (Ewe of Ghana) further establishes men’s prerogative to the allegiance and subservience of women and legitimizes men to exercise their power over women to sustain the latter’s subordination and marginalization (Dogbevi, 2007). Narratives:To comment on “Tears do not shy away from a woman’s face,” most respondents agreed with the proverb “because by nature women are more emotional than men.” 5.6 Sense and Sensibility: Women and Intelligence/Education This theme from the analysis deals with femininity and its insistence on equating men with “mind” and women with nature and “body.”
Well-educated African (Akan)womenare/were normallynot the norm. Some members of the society frown on women who have more or higher education. Highly educated women are sometimes mocked with derogatory jokes and through proverbs like “Go andmarry your books” or “a woman’s place is not the classroom. It is in the kitchen.”
According to Oboler(1985, ascited in Bullow, 1993), traditionally in patriarchal Africa,men are believed to be more intelligent than women. Women are thought particularly to be incapable of foresight and lack the ability to make and carry through sensible and realistic plans. For this reason, it is generally agreed that husbands should administer the family estate and wives for the most part must concur with the husbands’ plans. An Akan proverb entrenches this idea when it says, “When a woman buys a gun, it is kept in a man’s room.” This proverb shows that women do not have the capacity and ability to manage valuable property, an indication that they must play insignificant and subordinate roles to men with regard to property ownership.
Another Akan proverb says, “The man is the woman’s honor.” Therefore, if a woman marries a man who is poor and owns no property and she, on the other hand, is materially endowed, she would have to pretend that all the wealth belongs to the husband because it is the only way the man could become her symbol of honor. Consequently, the roles and responsibilities, constraints, opportunities, and the needs of men and women in some African societies have largely been identified and established through proverbs. 5.7 Narrative: When asked to comment on the proverb “Women are like goats, feeding makes them immune to abuse,” a respondent stated it is true because women want security, so there is the tendency to overlook the abuse and stay in the marriage/relationship.
Another opined, “It is true because if you get a well-to-do husband and gets used to the lifestyle, you would not go anywhere even if you’re being abused.” 5.8 African proverbs depict women in terms of biology (Biology of Destiny: sexism) The sexist proverbs not only marginalize women’s role, they also communicate the perception that women are difficult to manage/understand. This is illustrated by the following proverb: “A wife is like a woolen blanket; if you cover yourself with it, it irritates you; if you take it away, you feel cold” (Akan, Ghana). According to this proverb, women are difficult to manage, first and foremost, because they are not endowed with the faculty to manage themselves.
ISSN 2039-9340 Mediterranean Journal of Social Sciences Vol. 4 (1) January 2013
129
5.9 Narrative: Commenting on the proverb “A woman’s worth is determined by her marital status,” a respondent stated, “I don’t believe that; it depends on the way you carry yourself” (Western-educated).
Another comment from a non-Western-educated respondent: “This is true because in our society if you’re a woman without husband, you do not command respect. Anyone can say anything to you and get away with it.” 5.10 Distrust/Opportunists “Emaapeneaadeewo” (Akan),literally means“Where gold dust is, that is where women like to be.” In patriarchal societies, women are not trusted, even when they reflect the most fundamental and highly valued social behavior or standards of life: men are thus advised not to forget themselves with their womenfolk. Such a view is clear in the following proverb, which portrays women as a group with moral laxity:“When women say to you, ‘You are a handsome fellow,’ it means you are going to run into debt” (“Yeekanfowahoofe, nayeekanfowakyakya”). The tone of this proverb is reiterated with equal strength in the following Ethiopian proverb: “Women, their heart swing like their breast” (Hussain, 2009). Akans (Ghana) say,“Obaampewo a ompewoka”(women tend to be spendthrift) because “emaampehyia”(women don’t like poverty)as if men do?Women proverb: “A lazy wife will bring you bankruptcy.”
Commenting on “If a woman gets a fortune, no one hears of it; if she has trouble, then, a man has trouble,” a respondent stated: Yes, it is the man’s responsibility to take care of me, not vice versa (Non-Western educated participant). Another responded, “No! This is not true because African woman who goes into marriage goes with the intention of
helping the man to be successful. A woman may only do that if she detects that the man is hiding some things from her or if there is no understanding in the marriage.” 5.11 Positive Proverbs However, there are some the other proverbs in African oral traditionsthat reflect womenas warm and all-nourishing symbols. Hard working: Women are extremely valuable in the sight of society. Not only do they bear life, but they nurse, they cherish, they give warmth, they care for life since all human life passes though their bodies. The following proverbs bring these points out clearly:“Wives and oxen have no friends.” This indicates that a wife is so valuable that she cannot be given over to even the best friends. For that reason, another proverb reminds us that “a woman must not be killed.” She is the mother of life, and to kill the woman is to kill children.
Thus, ironically, though, a woman, in spite of her perceived “weakness.” is supposed to be very hard-working. Her role in subsistence farming is crucial in the sustenance of the husband and the family. Thus, a woman is an economic asset in terms of supporting her menfolk in manual farm chores.In Ghana, elderly women are much revered, hence the popular Akan (Ghana) notion of consulting the “old woman” (“yenkobisananaaberewa”) for counsel anytime there is a deadlock or difficulty in making a decision.
The perceived weakness of women is further debunked if one considers the following by a renowned Ghanaian sociologist when he opines:
A significant aspect of economic activity, especially in West Africa, involves the status and role of women. While a large number of women still operate on subsistence farms in villages in support of their menfolk in farming and fishing, the pattern in urban communities is different. From the urban centers of Cameroon to Senegal, women are “famously prominent” as market mammies. These shrewd traders, largely illiterate, deal in merchandise ranging from foodstuff, to textile, to beverages. A visit to an Accra Central market, such as Makola, will challenge any assertion that women in Ghana are an inferior, marginalized group, especially in the economic sphere. (Assimeng, 2006, p. 43)
The above statement establishes the fact that before the patriarchal predispositions about women of being weak and subservient become self-fulfilling prophesy, women can show their true colors if given the opportunity. This argument gains a stronger currency if one considers the fact that African women’s participation in the struggle against European domination went unnoticed despite their actual leadership in some of the emancipation struggles. A classical example was the initiation of wars of resistance against colonialism. One of the most noteworthy examples is the 19th century queen mother of Ejisu- Asante, (Ghana), YaaAsantewaa’s role in leading the Asante Kingdom against British colonizers in 1900, one of the Anglo-Asante Wars (Boahen, 2000). The Aba women’s riots against some of colonialist Britain’s policies in Nigeria also illustrates African women’s role in resistance to colonial rule (Boahen, 1987).
ISSN 2039-9340 Mediterranean Journal of Social Sciences Vol. 4 (1) January 2013
130
6. Discussion An interesting issue that emerged from the study is the fact thatthe use of proverbs as tools for socially positioning women in society is central to the cultural norms of some African societies. Also, it disputes and challenges some of the Western notions that African women have been passive and overwhelmed by their cultural landscape.The findings from the study confirmthat Western-educated women participants tended to refute the proverbs while non-Western ones tended to affirm the statements. We can therefore conclude that the more an African woman becomes Western-educated, the greater the tendency for her to refute the patriarchal-oriented proverbs in Africa. 7. Recommendations Based on the analyses of the interviews and focus group deliberations, the following views are recommended:
1. There is the need to create an androgynous society in which men and women lead equal lives. This involves rethinking and revising language so that male definitions of the world can be appropriated to reflect women’s experience and participation in it.
2. Oppressive practices made sacrosanct by culture can be interrogated and transformed by both insiders and outsiders working separately and together in a range of sectors.
3. Atransformational process can be accomplished through educational, legal, political, and cultural approaches, and by organizations set up to advance gender equity and healthy communities. The first step is to recognize the attitudes, beliefs, and practices of a society and their consequences on gender equality. The second is to recognize that culture changes and evolves as individuals and communities evolve. As such, it can be molded in ways that enhance gender equity.
4. Stake holders need to ensure the ongoing commitment from government to spearhead educational, legal, and economic policies that explicitly empower women as equal citizens with full rights, including equal protection under the law and property ownership.
5. There should be national sensitivity exercisesdirected toward the articulation that women’s cultural role, status, positions, and dealingsas projected through African proverbs, which more often than notassign inferior or lesser identities to women, have no biological basis and are, instead, the product of socially constructed beliefs.
8. Conclusion It is quite evident from this study thatthanks to cultural enhancers like proverbs, patriarchy as a social system has held firm in the African cultural landscape for ages. It can also be deduced from the analysis and the narratives that the interpretations and the acceptance or otherwise of the proverbs depend on the level of Western education of African women asthe modeof thinking can be influenced by the educational systems and values.The changes in African societies have affected the meanings and interpretations of some proverbs with regard to the role of women in some African societies. These days, women in some African societies who hitherto had no right to own property and assume leadership roles have taken up such roles with ease and immense success. Thus, one may argue that the unflattering identities African proverbs mostly assign to women may have no biological basis and are instead the product of socially constructed beliefs. References Appiah, P. et al. (2007) Bu me be: Proverbs of the Akans. Boulder, CO: Lynne Rienner Publishers, Inc. Appiah-Kubi, K. (1999). The Akan of Ghana, West Africa: A cultural handbook forreference. Bloomfield, CT: Cowhide Press. Asimeng-Boahene, L(2009). Educational wisdom of African oral literature: African proverbs as vehicles for enhancing critical thinking
skills. International Journal of Pedagogies and Learning, 5(3), 59-69. Asimeng-Boahene, L. (2010)Counter storytelling with African proverbs. A vehicle for teaching social justice and global understanding in
urban, U.S. Schools. Equity & Excellence in Education, 43(4), 434-445. Assimeng, M. (2006). Understanding society: An introduction to sociology for African students. Accra, Ghana: Woeli. Beneria, L. (2003). Gender, development, and globalization: Economics as if peoplemattered. New York, NY: Routledge. Boahen, A. Adu (1987). African perspectives on colonialism. Baltimore, MD: The Johns HopkinsUniversity Press. Boahen, A. A. (2000). Yaa Asantewa in the Yaa Asantewa War of 1900: Military leader or symbolic head? Ghana Studies.3, 111-135. Bullow, D. V. (1993).Bigger than men? Gender relations and their changing meaning in Kipsigis society, Kenya. .Africa.62(4), 523-546. Burgess, R. G. (Ed.). (1989). Field research: A sourcebook and manual. London, England: Routledge.
ISSN 2039-9340 Mediterranean Journal of Social Sciences Vol. 4 (1) January 2013
131
Charon, J. M. (Ed.). (1993). The meaning of sociology: A Reader. (4th ed). Englewood Cliffs, NJ: Prentice Hall, p. 432. Dei, G. J. S. (2000).Rethinking the role of indigenous knowledge in the academy.International Journal of Inclusive Education,4(2), 111-
132. Dogbevi, E. K. (2007). Gender construction in African proverbs: an analysis. www.myjoyline.com/tools/printnews.asp? (Retrieved
7/31/2012). Dogbevi, E. K. (2011). African proverbs and gender construction: Perspective on women. [Web log post]. Retrieved
from http://emmanuelwites.blogspot.com/2011/03/african-proverbs-and-gender.html. Dzobo, N. K. (2006). African Proverbs: A guide to conduct(3rded). Accra, Ghana: Woeli Publishing services. Fasiku, G. (2006). Yoruba proverbs, names and national consciousness. TheJournal of Pan African Studies, 1.4, 50-63. Finnegan, R. (1970). Oral literature in Africa. Oxford, England: UP. Foucault, M. (1980). Power/knowledge; selected interviews and other writings of 1977-1984. New York: Routledge. Frankel, J. R. & Wallen, N. E. (2000). How to design and evaluate research in education (2nded.). New York, NY: McGraw-Hill. Gilbert, P., & Taylor, S. (1992). Fashioning the feminine: Girls, popular culture and Schooling. North Sydney: Allen and Unwin. Glesne, C. (1999). Becoming qualitative researchers: an introduction (2nded.) New York: Pearson. Grant, R. & Asimeng-Boahene, L (2004). “Culturally Responsive Pedagogy in Citizenship Education: Using African Proverbs as Tools
for Teaching in Urban Schools.” Multicultural Perspectives, 8(4), 17-24. Gyekye, K. (1996). African cultural values: An introduction. Philadelphia, PA: Sankofa Publishing Co. Hagan, J., Shedd, C. & Payne, M. R. (2005). Race, ethnicity, and youth perceptions of criminal injustice. American Sociological Review,
70: 381-407. Hobbs, J. J. (2010). Fundamentals of world regional geography (2nded.). Belmont,CA: Brooks/Cole. Jenainati, C & Groves, J. (2010).Introducing feminism: A graphic guide. London, UK: Icon BookLtd. Koening, B. A., Back, A. I., & Crowley, L. M. (2003). Qualitative methods in end of life research-recommendations to enhance the
protection of human subjects. Journal of Pain and Symptom Management, 25(4), 43-52. Korem, A. K., &Abissath, M. K. (2004). Traditional wisdom in Africa: 1915 proverbs from 41 African countries.Accra, Ghana: Publishing
Trends. Lewis C. (2006) At Last “What’s discourse got to do with it?” A meditation on critical discourse analysis in literacy. Research in the
Teaching of English.40(3), 373-379. Lindsey, L. L. (2005). Gender Roles: Sociological Perspectives. London: Prentice Hall. Marshall, M. N. (1996). Sampling for qualitative research.Family Practice, 13: 522-525. Maxwell, J. A. (2005). Qualitative research design: An interpretive approach. Thousand Oak: Sage. Makinde, O. (1986). Cultural resources for integrated counseling in Nigeria.Paper presented at a conference in University of Ilorin,
Nigeria. Mbiti, J. (1988). The role of women in African traditional religion.Cahiers des Religions Africaines, 22, 69-82. Mikell, G. (1997). African feminism: The politics of survival in Sub-Saharan Africa.Philadelphia: University of Pennsylvania Press. Oha, O. (1999). The semantics of female devaluation in Igbo proverbs.African Study Monographs, 19.2, 87-102. Population Report. (1995). Health risks of early pregnancy. Population Information Program Center. Baltimore: John Hopkins School of
Public Health. Reagan, T. (2005). Non-western educational traditions: indigenous approaches to educational thought and practice (3rd). Mahweh, NJ:
Lawrence Erlbaum Associates, Publishers. Rosenfeld, E., & Geller, H. (1987).Global studies: A vivid survey of the world’s people and cultures. New York, NY: Barron’s. Sarpong, P. (1974). Ghana in Retrospect: Some aspects of Ghanaian culture. Accra,Ghana: Ghana Publishing Corp. Ssetuba, I. (2002). The hold of patriarchy: An appraisal of the Ganada proverb in the light of modern gender relations. Paper presented
at Gender Symposium by CODESRIA/ARC, Cairo 7th-10th April. Strauss, A. L. & Corbin, J. (1994). Grounded theory methodology: An overview. In N. K. Denzin and Y. S. Lincoln (Eds.).A handbook of
qualitative research, pp. 286-323. Thousand Oaks, CA: Sage. Strauss, A. L. & J. Corbin (1999). Basics of qualitative research; Basics of qualitative research: grounded theory procedures and
techniques (17th Ed.). Sage, Newbury Park, CA. pp. 270 Tamale, S. (2005). Eroticism, sensuality and ‘women’s secrets’ among the Buganda:A critical analysis.Feminist Africa: Sexual Cultures,
5.

ISSN 2039-9340 Mediterranean Journal of Social Sciences Vol. 4 (1) January 2013
133
Conceptual Model for Effective Implementation of Industrial Symbiosis:
A Case Study of Mab-Ta-Phut Industrial Estate
Paitoon Termsinvanich
Environment, Development and Sustainability Program, Graduate School, Chulalongkorn University, Bangkok, Thailand
E-mail: [email protected]
Suwattana Thadaniti
Social and Human Development Program, Graduate school,Chulalongkorn University, Bangkok, Thailand
Dawan Wiwattanadate
Faculty of Engineering,
Chulalongkorn University, Bangkok, Thailand
Doi:10.5901/mjss.2013.v4n1p133 Abstract
This paper illustrates effective factors as well as a model for effective implementation of industrial symbiosis (IS) in Mab-Ta-Phut Industrial Estate that was used (MTBIE) as a case study. The study was carried out using questionnaires, in-depth interview, and site survey both factories in MTBIE and waste processor plants in Saraburi Province. Information from the study indicates that policy (on zero discharge, zero waste to landfill and willingness to adjust process), initiator, information (on waste generation), and financial mechanisms are effective factors influencing IS implementation, while technology and public participation are not as effective for the case of factories in the industrial estate. Therefore, a model for effective implementation of industrial symbiosis in industrial estate is proposed and presented in this paper.
Keywords: Industrial symbiosis; Eco-Industrial Park; Waste generator; Waste processor
1. Introduction Impacts of industrialization and population growth on environment have been an issue of public concerns world-wide for several decades, especially in developed countries. In the past, industries could be located in any areas and individually emitted pollutants to environment causing difficulty in pollution control. Thus, an industrial park concept has been introduced to set up community of industries which are grouped to obtain advantages of arranging common services (Barrie, 1992) and controlling emissions in the standard level. However, many countries still confront the environmental problem due to accumulation of the impacts. Hence, a concept of Eco-Industrial Park (EIP) as well as Industrial Symbiosis (IS) that aim to create materials and energy interchanging networks among companies had been initiated to provide benefits for both environment and economy for the participating industries and societies (Graedel, Allenby, 2003).
Map-Ta-Phut Industrial Estate (MTPIE) is located in Rayong province, eastern Thailand. It was developed in 1989 by the state enterprise, Industrial Estate Authority of Thailand. Although most industries in MTPIE have been continuously developing and implementing environmental management system in accordance to ISO14001 and trying to control their emissions within emission standard, the accumulated emissions still exhibit environmental problem. This means that the current environmental management method is not sufficient to develop industries in a sustainable way. Industrial production is a dynamic system, and wastes generated from the industries are dynamic as well. Therefore, managing and addressing these wastes have to be dynamic too. Hence, this study aims to find factors effective for implementation of industrial symbiosis and to propose a model for effective implementation of the industrial symbiosis in an industrial estate.
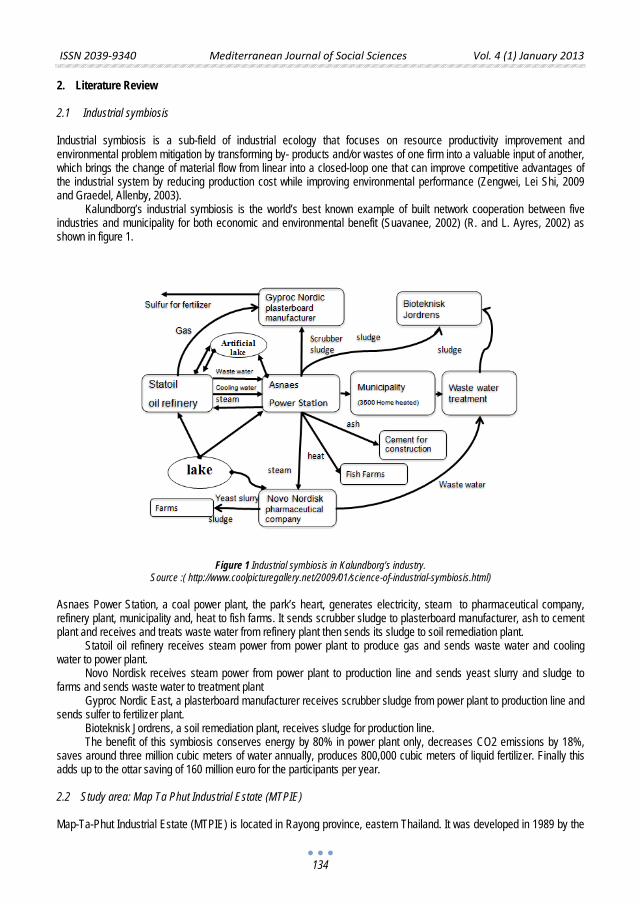
ISSN 2039-9340 Mediterranean Journal of Social Sciences Vol. 4 (1) January 2013
134
2. Literature Review 2.1 Industrial symbiosis Industrial symbiosis is a sub-field of industrial ecology that focuses on resource productivity improvement and environmental problem mitigation by transforming by- products and/or wastes of one firm into a valuable input of another, which brings the change of material flow from linear into a closed-loop one that can improve competitive advantages of the industrial system by reducing production cost while improving environmental performance (Zengwei, Lei Shi, 2009 and Graedel, Allenby, 2003).
Kalundborg’s industrial symbiosis is the world’s best known example of built network cooperation between five industries and municipality for both economic and environmental benefit (Suavanee, 2002) (R. and L. Ayres, 2002) as shown in figure 1.
Figure 1 Industrial symbiosis in Kalundborg’s industry.
Source :( http://www.coolpicturegallery.net/2009/01/science-of-industrial-symbiosis.html) Asnaes Power Station, a coal power plant, the park’s heart, generates electricity, steam to pharmaceutical company, refinery plant, municipality and, heat to fish farms. It sends scrubber sludge to plasterboard manufacturer, ash to cement plant and receives and treats waste water from refinery plant then sends its sludge to soil remediation plant.
Statoil oil refinery receives steam power from power plant to produce gas and sends waste water and cooling water to power plant.
Novo Nordisk receives steam power from power plant to production line and sends yeast slurry and sludge to farms and sends waste water to treatment plant
Gyproc Nordic East, a plasterboard manufacturer receives scrubber sludge from power plant to production line and sends sulfer to fertilizer plant.
Bioteknisk Jordrens, a soil remediation plant, receives sludge for production line. The benefit of this symbiosis conserves energy by 80% in power plant only, decreases CO2 emissions by 18%,
saves around three million cubic meters of water annually, produces 800,000 cubic meters of liquid fertilizer. Finally this adds up to the ottar saving of 160 million euro for the participants per year. 2.2 Study area: Map Ta Phut Industrial Estate (MTPIE) Map-Ta-Phut Industrial Estate (MTPIE) is located in Rayong province, eastern Thailand. It was developed in 1989 by the
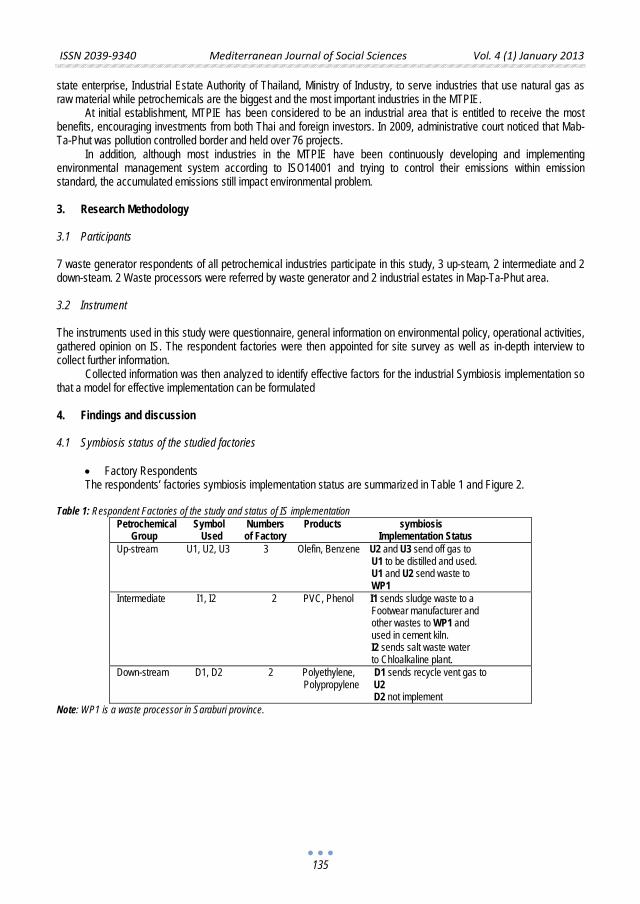
ISSN 2039-9340 Mediterranean Journal of Social Sciences Vol. 4 (1) January 2013
135
state enterprise, Industrial Estate Authority of Thailand, Ministry of Industry, to serve industries that use natural gas as raw material while petrochemicals are the biggest and the most important industries in the MTPIE.
At initial establishment, MTPIE has been considered to be an industrial area that is entitled to receive the most benefits, encouraging investments from both Thai and foreign investors. In 2009, administrative court noticed that Mab-Ta-Phut was pollution controlled border and held over 76 projects.
In addition, although most industries in the MTPIE have been continuously developing and implementing environmental management system according to ISO14001 and trying to control their emissions within emission standard, the accumulated emissions still impact environmental problem. 3. Research Methodology 3.1 Participants 7 waste generator respondents of all petrochemical industries participate in this study, 3 up-steam, 2 intermediate and 2 down-steam. 2 Waste processors were referred by waste generator and 2 industrial estates in Map-Ta-Phut area. 3.2 Instrument The instruments used in this study were questionnaire, general information on environmental policy, operational activities, gathered opinion on IS. The respondent factories were then appointed for site survey as well as in-depth interview to collect further information.
Collected information was then analyzed to identify effective factors for the industrial Symbiosis implementation so that a model for effective implementation can be formulated 4. Findings and discussion 4.1 Symbiosis status of the studied factories
• Factory Respondents The respondents’ factories symbiosis implementation status are summarized in Table 1 and Figure 2.
Table 1: Respondent Factories of the study and status of IS implementation
Petrochemical Symbol Numbers Products symbiosis Group Used of Factory Implementation Status Up-stream U1, U2, U3 3 Olefin, Benzene U2 and U3 send off gas to U1 to be distilled and used. U1 and U2 send waste to WP1 Intermediate I1, I2 2 PVC, Phenol I1 sends sludge waste to a Footwear manufacturer and other wastes to WP1 and used in cement kiln. I2 sends salt waste water to Chloalkaline plant. Down-stream D1, D2 2 Polyethylene, D1 sends recycle vent gas to Polypropylene U2 D2 not implement
Note: WP1 is a waste processor in Saraburi province.
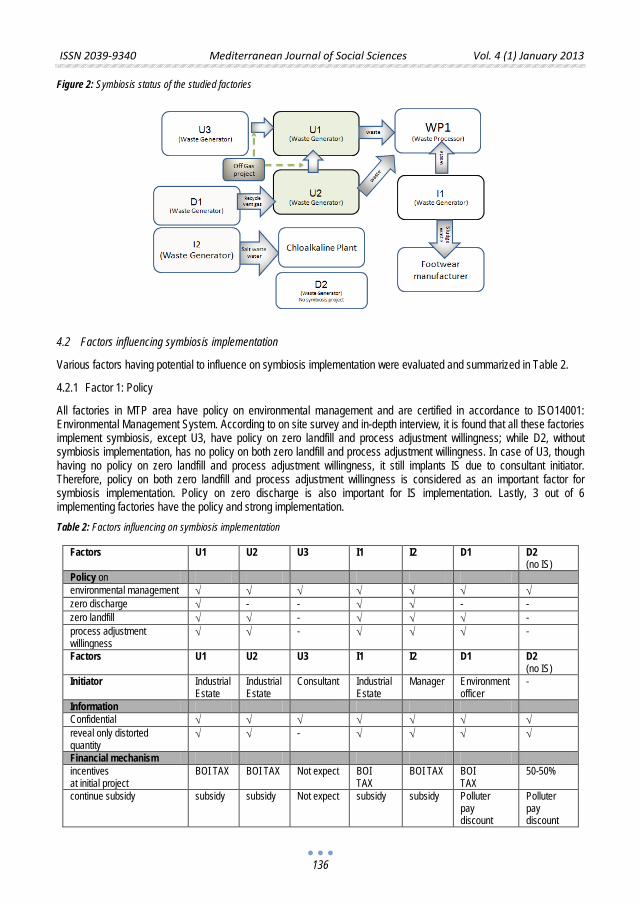
ISSN 2039-9340 Mediterranean Journal of Social Sciences Vol. 4 (1) January 2013
136
Figure 2: Symbiosis status of the studied factories
4.2 Factors influencing symbiosis implementation Various factors having potential to influence on symbiosis implementation were evaluated and summarized in Table 2. 4.2.1 Factor 1: Policy All factories in MTP area have policy on environmental management and are certified in accordance to ISO14001: Environmental Management System. According to on site survey and in-depth interview, it is found that all these factories implement symbiosis, except U3, have policy on zero landfill and process adjustment willingness; while D2, without symbiosis implementation, has no policy on both zero landfill and process adjustment willingness. In case of U3, though having no policy on zero landfill and process adjustment willingness, it still implants IS due to consultant initiator. Therefore, policy on both zero landfill and process adjustment willingness is considered as an important factor for symbiosis implementation. Policy on zero discharge is also important for IS implementation. Lastly, 3 out of 6 implementing factories have the policy and strong implementation. Table 2: Factors influencing on symbiosis implementation
Factors U1 U2 U3 I1 I2 D1 D2 (no IS)
Policy on environmental management √ √ √ √ √ √ √ zero discharge √ - - √ √ - - zero landfill √ √ - √ √ √ - process adjustment willingness
√ √ - √ √ √ -
Factors U1 U2 U3 I1 I2 D1 D2 (no IS)
Initiator Industrial Estate
Industrial Estate
Consultant Industrial Estate
Manager Environment officer
-
Information Confidential √ √ √ √ √ √ √ reveal only distorted quantity
√ √ - √ √ √ √
Financial mechanism incentives at initial project
BOI TAX BOI TAX Not expect
BOI TAX
BOI TAX BOI TAX
50-50%
continue subsidy subsidy subsidy Not expect
subsidy subsidy Polluter pay discount
Polluter pay discount
ISSN 2039-9340 Mediterranean Journal of Social Sciences Vol. 4 (1) January 2013
137
Note: √ represent answer yes
4.2.2 Factor 2: Initiator According to on site survey and in-depth interview, it is found that all implementing factories did not initiate the project by themselves, but having an initiator; 3 out of 6 implementing factories were initiated by industrial estates and 1 out of 6 was initiated by the manager, another 1 out of 6 was initiated by consultant, and another one was initiated by environmental office. Therefore, initiator is considered as a more crucial factor for symbiosis implementation. 4.2.3 Factor 3: Information on Waste Generation According to on site survey and in-depth interview, all 7 factories agree that information on waste generation in each factory is extremely important for symbiosis implementation, but also confidential and can only be revealed if quantity is distorted or they have contract with each other 4.2.4 Factor 4: Financial Mechanism According to on site survey and in-depth interview, it is found that 6 out of 7 factories need financial supports or incentives like BOI Tax exemption at the initial project, and also the continuing subsidy during project operation. However, one of them 7 factories does not expect incentive from government. Therefore, financial mechanism is considered as one important factor for symbiosis implementation 4.2.5 Factor 5: Technology Assistant According to on site survey and in-depth interview, it is found that all of 7 factories have no problem in regards to technology, in other words, technology is not a barrier for symbiosis implementation. Therefore, technology assistant is not an important factor for symbiosis implementation in MTPIE. . 4.2.6 Factor 6: Public Participation According to on site survey and in-depth interview, all of 7 factories agree that stakeholder participation, especially community participation, is not an important factor for symbiosis implementation. However, 3 of them found that government participation is still important for symbiosis implementation. 5. Concluding remarks The only different between implementing and non-implementing factory is policy on zero discharge, zero landfill, and willingness to adjust process. This is the first effective factor for symbiosis implementation.
The symbiosis will not be implemented without initiator. Monthly meeting among executive or managers of all factories addressed by estate owners is extremely important for information exchange. Government agency should involve in the monthly meeting and participate as part of initiator to help solving regulation issues or obstruction of the symbiosis implementation.
Financial mechanism, both incentives at the initial project and the continuing subsidy, is necessary for all factory respondents; while public participation and technology assistant are not significantly important factors for the symbiosis implementation. Hence, a model for effective implementation of industrial symbiosis in industrial estate is proposed as shown in Figure 3.
Technology Assistant no technology problem √ √ √ √ √ √ √ Stakeholder Participation
government involve √ √ - √ - √ - communities involve
- - - - - - -
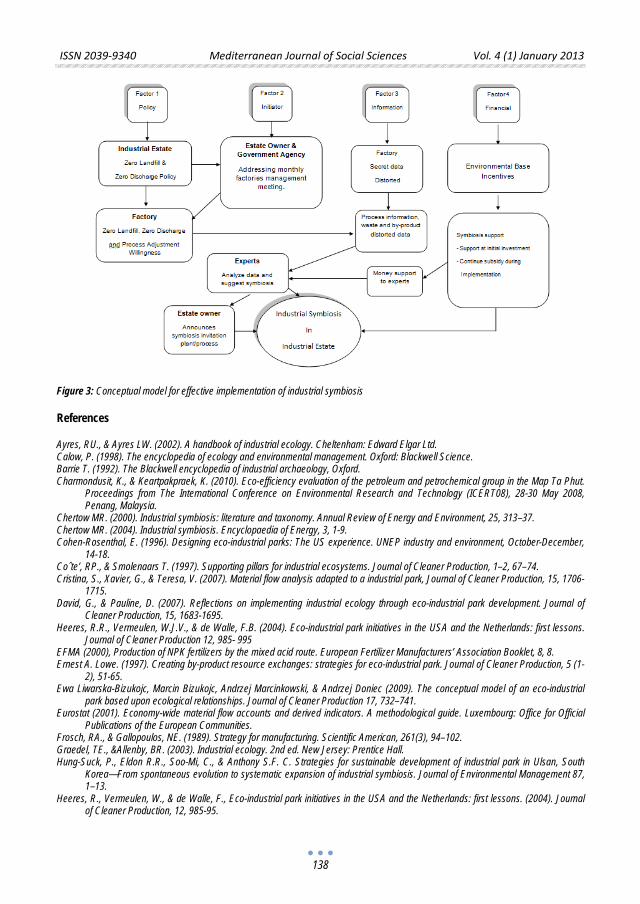
ISSN 2039-9340 Mediterranean Journal of Social Sciences Vol. 4 (1) January 2013
138
Figure 3: Conceptual model for effective implementation of industrial symbiosis References Ayres, RU., & Ayres LW. (2002). A handbook of industrial ecology. Cheltenham: Edward Elgar Ltd. Calow, P. (1998). The encyclopedia of ecology and environmental management. Oxford: Blackwell Science. Barrie T. (1992). The Blackwell encyclopedia of industrial archaeology, Oxford. Charmondusit, K., & Keartpakpraek, K. (2010). Eco-efficiency evaluation of the petroleum and petrochemical group in the Map Ta Phut.
Proceedings from The International Conference on Environmental Research and Technology (ICERT08), 28-30 May 2008, Penang, Malaysia.
Chertow MR. (2000). Industrial symbiosis: literature and taxonomy. Annual Review of Energy and Environment, 25, 313–37. Chertow MR. (2004). Industrial symbiosis. Encyclopaedia of Energy, 3, 1-9. Cohen-Rosenthal, E. (1996). Designing eco-industrial parks: The US experience. UNEP industry and environment, October-December,
14-18. Coˆte’, RP., & Smolenaars T. (1997). Supporting pillars for industrial ecosystems. Journal of Cleaner Production, 1–2, 67–74. Cristina, S., Xavier, G., & Teresa, V. (2007). Material flow analysis adapted to a industrial park, Journal of Cleaner Production, 15, 1706-
1715. David, G., & Pauline, D. (2007). Reflections on implementing industrial ecology through eco-industrial park development. Journal of
Cleaner Production, 15, 1683-1695. Heeres, R.R., Vermeulen, W.J.V., & de Walle, F.B. (2004). Eco-industrial park initiatives in the USA and the Netherlands: first lessons.
Journal of Cleaner Production 12, 985- 995 EFMA (2000), Production of NPK fertilizers by the mixed acid route. European Fertilizer Manufacturers’ Association Booklet, 8, 8. Ernest A. Lowe. (1997). Creating by-product resource exchanges: strategies for eco-industrial park. Journal of Cleaner Production, 5 (1-
2), 51-65. Ewa Liwarska-Bizukojc, Marcin Bizukojc, Andrzej Marcinkowski, & Andrzej Doniec (2009). The conceptual model of an eco-industrial
park based upon ecological relationships. Journal of Cleaner Production 17, 732–741. Eurostat (2001). Economy-wide material flow accounts and derived indicators. A methodological guide. Luxembourg: Office for Official
Publications of the European Communities. Frosch, RA., & Gallopoulos, NE. (1989). Strategy for manufacturing. Scientific American, 261(3), 94–102. Graedel, TE., &Allenby, BR. (2003). Industrial ecology. 2nd ed. New Jersey: Prentice Hall. Hung-Suck, P., Eldon R.R., Soo-Mi, C., & Anthony S.F. C. Strategies for sustainable development of industrial park in Ulsan, South
Korea—From spontaneous evolution to systematic expansion of industrial symbiosis. Journal of Environmental Management 87, 1–13.
Heeres, R., Vermeulen, W., & de Walle, F., Eco-industrial park initiatives in the USA and the Netherlands: first lessons. (2004). Journal of Cleaner Production, 12, 985-95.
ISSN 2039-9340 Mediterranean Journal of Social Sciences Vol. 4 (1) January 2013
139
Lilian, B., Elabras, V., & Alessandra, M. (2009). Eco-industrial park development in Rio de Janeiro, Brazil: a tool for sustainable development. Journal of Cleaner Production 17, 653–661.
Lowe, E. (2001). Handbook for development of eco-industrial parks, indigo development, USA. Retreived from: http://indigodev.com Magnus, K., & Anna, W. (2008). Using an optimization model to evaluate the economic benefits of industrial symbiosis in the forest
industry. Journal of Cleaner Production 16, 1536-1544. Kaosa-ard M., & Rayanakorn K. (2009). Economic tool for environment management Policy knowledge. Logdesingwork. Kaewtap, K., & Kutiyos, P. (1998). Economic tool for environment management Environmental Journal, 7, 1-19. Olli, S. (2007). Eco-efficiency and industrial symbiosis – a counterfactual analysis of a mining community. Journal of Cleaner Production
15, 1696-1705. Roberts, B.H. (2004). The application of industrial ecology principles and planning guidelines for the development of eco-industrial parks:
an Australian case study. Journal of Cleaner Production 12, 997–1010. Sokka, L., Pakarinen, S., & Melanen, M. (2009). Industrial symbiosis contributing to more sustainable energy use – an example from
forest industry in Kymenlaakso, Finland. Journal of Cleaner Production. Suavanee V. (2002). Environmental management by eco-industrial estate principle. Master’s Dissertation. Inter-Departmental Program in
Environmental Management, Graduate School, Chulalongkorn University. United Nation Division for Sustainable Development (2001). Environmental management accounting principle and procedures. New
York: United Nations. Wang, C., Zhang, G., & Wang, W (2009). Research on industrial symbiosis supporting system of Eco-industrial Park. Chinese Journal of
Population, Research and Environment, 7 (3), 61. World commission on environment and development, our common future (1987). Oxford University Press, Oxford. Welford, R. (1995). Environmental strategy and sustainable development. The Corporate Challenge for the 21st Century. Routledge,
London. Zengwei, Y., & Lei, S. (2009). Improving enterprise competitive advantage with industrial symbiosis: case study of a smeltery in China.
Journal of Cleaner Production 17, 1295–1302. Electronic media Department of Pollution control, available from Economic instruments for environment management available from
www.pcd.go.th, 10/09/2010 http://www.idis.ru.ac.th/report/index.php?topic=5972.0 29/06/2012

ISSN 2039-9340 Mediterranean Journal of Social Sciences Vol. 4 (1) January 2013
141
Development Strategy for Health Behavior of the Elderly
Pagapan Hantrakul
Ph.D. Candidate Student of Development Strategy Program,
Nakhon Sawan Rajabhat University.
Assoc. Professor Dr. Suchat Saengthong
Major Advisor, Development Strategy Program, Nakhon Sawan Rajabhat University.
Asst. Prof. Dr. Supawan Vongkamjan
Co-Advisor, Development Strategy Program,
Nakhon Sawan Rajabhat University. Doi:10.5901/mjss.2013.v4n1p141 Abstract
The research objectives were 1) to examine the health problems of elderly people who resided in urban community around the Development Strategy Practice Centre in Nakhon Sawan Municipality, 2) to construct development strategy of strategies for enhancing health behaviour of the elderly people, and 3) to experiment the strategies with the target group of elderly people. The research design was mixed methods of quantitative and qualitative approaches. The population comprises 897 elderly peoples who live around the Centre. The purposive sampling was used for sample selection of 30 elderly who were voluntarily assigned as an experimental group. The research tools used are a structured in-depth interview, a self-administered questionnaire, participation observation, and a test of knowledge, skills and attitudes of health behavior. The findings revealed that the elderly peoples suffered from the following problems: non-exercise, malnutrition, anxiety, and illness resulting from afore mentioned. Therefore, the constructed development strategy for solving the health behavior problems of the elderly people based on food, drinking water, fresh air, emotion, Thai massage, and music (singing, listening, and playing). The instrument for data collection was a Likert-scale questionnaire. The finding revealed that 30 elderly peoples before training and at the twelfth week about weight, body index, upper blood pressure, lower blood pressure, heart rate, waistline, and blood sugar level were different with statistical significance at .001.
Key Words: Development Strategy /Health Behavior / Elderly People
1. Introduction
Thailand has entered into elderly society since 2004 and it will completely in the next 20 years of in 2024. However, the Tenth Economic and Social Development Plan (2007-2011) was established based on the promotion of capital creation of country in terms of social capital, economic and natural resources and environment in to order to incessantly strengthen by accepting the self-sufficiency economy to be guideline for practice with people centered of development (The National Economic Development Board Office of the Prime Minister, 2007).
The government has realized the importance of elderly thoroughly because they are valuable people who gained a great number of life experiences, therefore the government had established National Elderly Committee second copy (B.E. 2545-2564) under the agreement of Ministerial Committee when the fifth July, 2002 with statement that it must to promote elderly peoples to have better life quality (National Elderly Committee, Ministry of Social Development and Human Security, 2012).
International academic conference with the drive of World Health Organization (WHO) mentioned to the new trend of health promotion at Ottava city, Canada in 1986 about the objective Health for All (HFA) within 2000 (Health for all for the year 2000) with composing of public policy that support for health and build the environment to effect to good health promotion together with creation community activities to strengthen the community in order to develop personal skill to be aware and to take responsibility to build health by adjusting system of public health service and by emphasizing on health
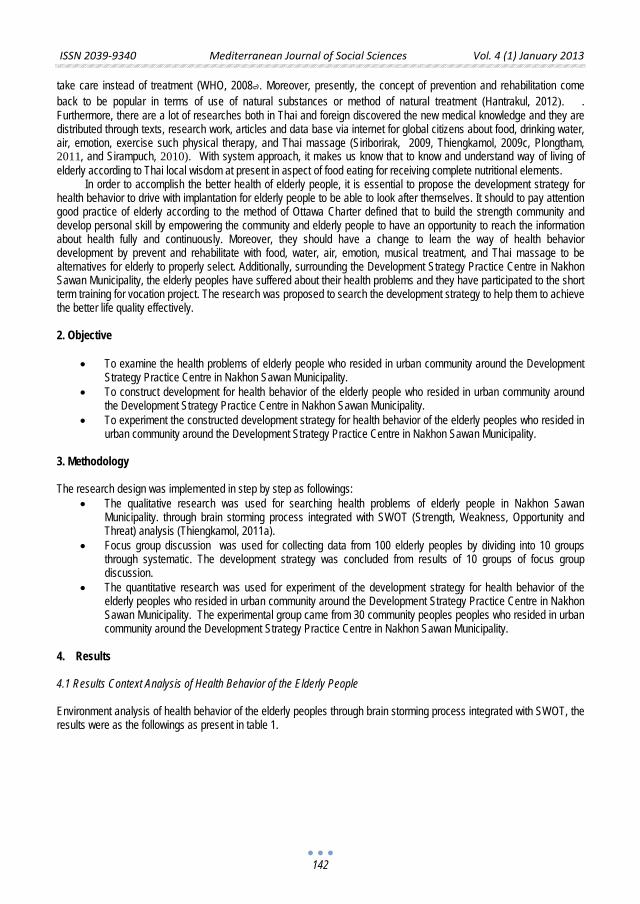
ISSN 2039-9340 Mediterranean Journal of Social Sciences Vol. 4 (1) January 2013
142
take care instead of treatment (WHO, 2008๗. Moreover, presently, the concept of prevention and rehabilitation come back to be popular in terms of use of natural substances or method of natural treatment (Hantrakul, 2012). . Furthermore, there are a lot of researches both in Thai and foreign discovered the new medical knowledge and they are distributed through texts, research work, articles and data base via internet for global citizens about food, drinking water, air, emotion, exercise such physical therapy, and Thai massage (Siriborirak, 2009, Thiengkamol, 2009c, Plongtham, 2011, and Sirampuch, 2010). With system approach, it makes us know that to know and understand way of living of elderly according to Thai local wisdom at present in aspect of food eating for receiving complete nutritional elements.
In order to accomplish the better health of elderly people, it is essential to propose the development strategy for health behavior to drive with implantation for elderly people to be able to look after themselves. It should to pay attention good practice of elderly according to the method of Ottawa Charter defined that to build the strength community and develop personal skill by empowering the community and elderly people to have an opportunity to reach the information about health fully and continuously. Moreover, they should have a change to learn the way of health behavior development by prevent and rehabilitate with food, water, air, emotion, musical treatment, and Thai massage to be alternatives for elderly to properly select. Additionally, surrounding the Development Strategy Practice Centre in Nakhon Sawan Municipality, the elderly peoples have suffered about their health problems and they have participated to the short term training for vocation project. The research was proposed to search the development strategy to help them to achieve the better life quality effectively. 2. Objective
• To examine the health problems of elderly people who resided in urban community around the Development Strategy Practice Centre in Nakhon Sawan Municipality.
• To construct development for health behavior of the elderly people who resided in urban community around the Development Strategy Practice Centre in Nakhon Sawan Municipality.
• To experiment the constructed development strategy for health behavior of the elderly peoples who resided in urban community around the Development Strategy Practice Centre in Nakhon Sawan Municipality.
3. Methodology The research design was implemented in step by step as followings:
• The qualitative research was used for searching health problems of elderly people in Nakhon Sawan Municipality. through brain storming process integrated with SWOT (Strength, Weakness, Opportunity and Threat) analysis (Thiengkamol, 2011a).
• Focus group discussion was used for collecting data from 100 elderly peoples by dividing into 10 groups through systematic. The development strategy was concluded from results of 10 groups of focus group discussion.
• The quantitative research was used for experiment of the development strategy for health behavior of the elderly peoples who resided in urban community around the Development Strategy Practice Centre in Nakhon Sawan Municipality. The experimental group came from 30 community peoples peoples who resided in urban community around the Development Strategy Practice Centre in Nakhon Sawan Municipality.
4. Results 4.1 Results Context Analysis of Health Behavior of the Elderly People Environment analysis of health behavior of the elderly peoples through brain storming process integrated with SWOT, the results were as the followings as present in table 1.
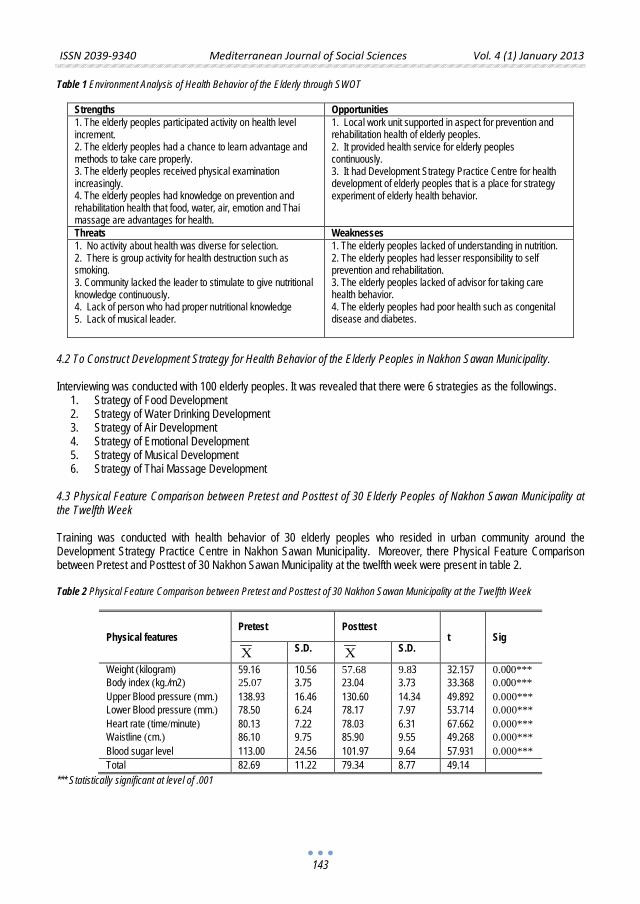
ISSN 2039-9340 Mediterranean Journal of Social Sciences Vol. 4 (1) January 2013
143
Table 1 Environment Analysis of Health Behavior of the Elderly through SWOT
Strengths Opportunities 1. The elderly peoples participated activity on health level increment. 2. The elderly peoples had a chance to learn advantage and methods to take care properly. 3. The elderly peoples received physical examination increasingly. 4. The elderly peoples had knowledge on prevention and rehabilitation health that food, water, air, emotion and Thai massage are advantages for health.
1. Local work unit supported in aspect for prevention and rehabilitation health of elderly peoples. 2. It provided health service for elderly peoples continuously. 3. It had Development Strategy Practice Centre for health development of elderly peoples that is a place for strategy experiment of elderly health behavior.
Threats Weaknesses 1. No activity about health was diverse for selection. 2. There is group activity for health destruction such as smoking. 3. Community lacked the leader to stimulate to give nutritional knowledge continuously. 4. Lack of person who had proper nutritional knowledge 5. Lack of musical leader.
1. The elderly peoples lacked of understanding in nutrition. 2. The elderly peoples had lesser responsibility to self prevention and rehabilitation. 3. The elderly peoples lacked of advisor for taking care health behavior. 4. The elderly peoples had poor health such as congenital disease and diabetes.
4.2 To Construct Development Strategy for Health Behavior of the Elderly Peoples in Nakhon Sawan Municipality. Interviewing was conducted with 100 elderly peoples. It was revealed that there were 6 strategies as the followings.
1. Strategy of Food Development 2. Strategy of Water Drinking Development 3. Strategy of Air Development 4. Strategy of Emotional Development 5. Strategy of Musical Development 6. Strategy of Thai Massage Development
4.3 Physical Feature Comparison between Pretest and Posttest of 30 Elderly Peoples of Nakhon Sawan Municipality at the Twelfth Week Training was conducted with health behavior of 30 elderly peoples who resided in urban community around the Development Strategy Practice Centre in Nakhon Sawan Municipality. Moreover, there Physical Feature Comparison between Pretest and Posttest of 30 Nakhon Sawan Municipality at the twelfth week were present in table 2. Table 2 Physical Feature Comparison between Pretest and Posttest of 30 Nakhon Sawan Municipality at the Twelfth Week
Physical features Pretest Posttest
t Sig X
S.D. X S.D.
Weight (kilogram) 59.16 10.56 57.68 9.83 32.157 0.000*** Body index (kg./m2) 25.07 3.75 23.04 3.73 33.368 0.000*** Upper Blood pressure (mm.) 138.93 16.46 130.60 14.34 49.892 0.000*** Lower Blood pressure (mm.) 78.50 6.24 78.17 7.97 53.714 0.000*** Heart rate (time/minute) 80.13 7.22 78.03 6.31 67.662 0.000*** Waistline (cm.) 86.10 9.75 85.90 9.55 49.268 0.000*** Blood sugar level 113.00 24.56 101.97 9.64 57.931 0.000*** Total 82.69 11.22 79.34 8.77 49.14
*** Statistically significant at level of .001
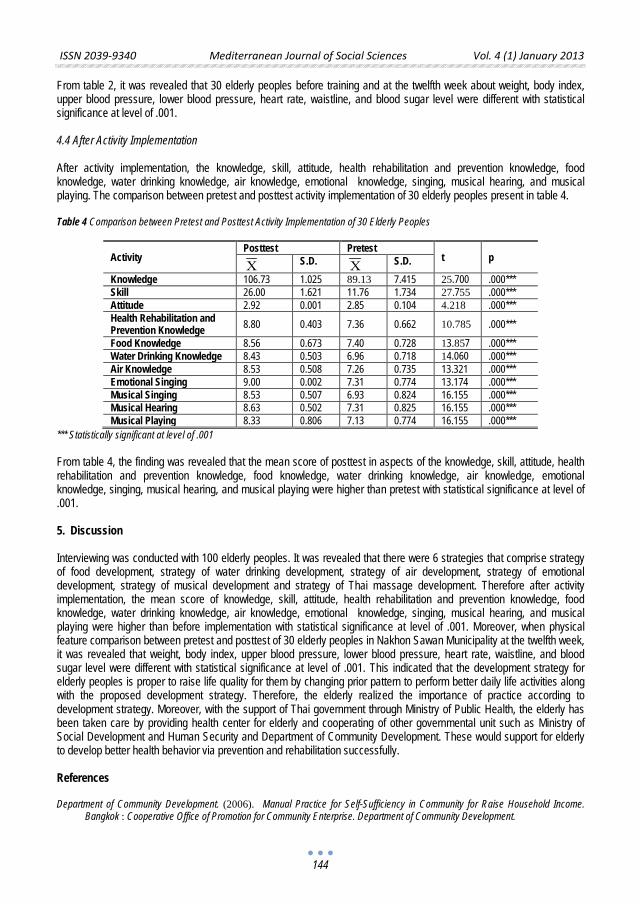
ISSN 2039-9340 Mediterranean Journal of Social Sciences Vol. 4 (1) January 2013
144
From table 2, it was revealed that 30 elderly peoples before training and at the twelfth week about weight, body index, upper blood pressure, lower blood pressure, heart rate, waistline, and blood sugar level were different with statistical significance at level of .001. 4.4 After Activity Implementation After activity implementation, the knowledge, skill, attitude, health rehabilitation and prevention knowledge, food knowledge, water drinking knowledge, air knowledge, emotional knowledge, singing, musical hearing, and musical playing. The comparison between pretest and posttest activity implementation of 30 elderly peoples present in table 4. Table 4 Comparison between Pretest and Posttest Activity Implementation of 30 Elderly Peoples
Activity Posttest Pretest
t p X
S.D. X S.D.
Knowledge 106.73 1.025 89.13 7.415 25.700 .000*** Skill 26.00 1.621 11.76 1.734 27.755 .000*** Attitude 2.92 0.001 2.85 0.104 4.218 .000*** Health Rehabilitation and Prevention Knowledge 8.80 0.403 7.36 0.662 10.785 .000***
Food Knowledge 8.56 0.673 7.40 0.728 13.857 .000*** Water Drinking Knowledge 8.43 0.503 6.96 0.718 14.060 .000*** Air Knowledge 8.53 0.508 7.26 0.735 13.321 .000*** Emotional Singing 9.00 0.002 7.31 0.774 13.174 .000*** Musical Singing 8.53 0.507 6.93 0.824 16.155 .000*** Musical Hearing 8.63 0.502 7.31 0.825 16.155 .000*** Musical Playing 8.33 0.806 7.13 0.774 16.155 .000***
*** Statistically significant at level of .001 From table 4, the finding was revealed that the mean score of posttest in aspects of the knowledge, skill, attitude, health rehabilitation and prevention knowledge, food knowledge, water drinking knowledge, air knowledge, emotional knowledge, singing, musical hearing, and musical playing were higher than pretest with statistical significance at level of .001. 5. Discussion Interviewing was conducted with 100 elderly peoples. It was revealed that there were 6 strategies that comprise strategy of food development, strategy of water drinking development, strategy of air development, strategy of emotional development, strategy of musical development and strategy of Thai massage development. Therefore after activity implementation, the mean score of knowledge, skill, attitude, health rehabilitation and prevention knowledge, food knowledge, water drinking knowledge, air knowledge, emotional knowledge, singing, musical hearing, and musical playing were higher than before implementation with statistical significance at level of .001. Moreover, when physical feature comparison between pretest and posttest of 30 elderly peoples in Nakhon Sawan Municipality at the twelfth week, it was revealed that weight, body index, upper blood pressure, lower blood pressure, heart rate, waistline, and blood sugar level were different with statistical significance at level of .001. This indicated that the development strategy for elderly peoples is proper to raise life quality for them by changing prior pattern to perform better daily life activities along with the proposed development strategy. Therefore, the elderly realized the importance of practice according to development strategy. Moreover, with the support of Thai government through Ministry of Public Health, the elderly has been taken care by providing health center for elderly and cooperating of other governmental unit such as Ministry of Social Development and Human Security and Department of Community Development. These would support for elderly to develop better health behavior via prevention and rehabilitation successfully. References Department of Community Development. (2006). Manual Practice for Self-Sufficiency in Community for Raise Household Income.
Bangkok : Cooperative Office of Promotion for Community Enterprise. Department of Community Development.
ISSN 2039-9340 Mediterranean Journal of Social Sciences Vol. 4 (1) January 2013
145
Hantrakul, K. ( 2012). Prevention for Health Rehabilitation of Elderly. ( Teaching Manual for take Care of Elderly at Center Development Strategy of Nakorn Sawan Province). Nakorn Sawan : Rimping Publishing.
Hutapataya, K. ( 2011). Fund for Supporting Activity of Text Development Project. Foundation of Thai Medicine Self-Development. Bangkok : Public Health Foundation for Development and Local Doctor Foundation.
National Elderly Committee, Ministry of Social Development and Human Security. (2010). National Elderly Plan (B.E. 2545-2564). Revised the First Copy in 2009. Bangkok: Theppenvanich.
Pityapong, J. (2011). Community Health Development. Uttaradit : Uttaradit Rajabhat University. Plongtham, J. (2011). Miracle of Weed Plant. Bangkok : Pailin. Sakulsak, J. (2002). Yoka train mind to conquer diseases. Bangkok: Judthong. Sirampuch, K. ( 2010). Physic above Mind above Time: Secret of Age Slow down with medical sciences. Bangkok : Thammasart
University. Siriborirak, S. (2009). Wonderful Power of Food. Bangkok: Se-Education. The National Economic Development Board Office of the Prime Minister. (2007). The Tenth Economic and Social Development Plan
(2007-2011). Retrieved from http://www.nesdb.go.th/Default.aspx?tabid=402 Thiengkamol, N. (2009c). Environment and Development Book 2: Food Security.Bangkok: Chulalongkorn University Press. Thiengkamol, N. (2011a). Holistically Integrative Research. (2nd Edition). Bangkok: Chulalongkorn Press. World Health Organization. (2008). Action plan for the global strategy for the prevention and control of noncommunicable
diseases 2008-2013. 20 Avenue Appia, 1211 Geneva 27. Switzerland.


ISSN 2039-9340 Mediterranean Journal of Social Sciences Vol. 4 (1) January 2013
147
Determinants of the Food Security Status of Households Receiving
Government Grants in Kwakwatsi, South Africa
Tshediso Joseph Sekhampu
North-West University, South Africa E-mail: [email protected]
Doi:10.5901/mjss.2013.v4n1p147 Abstract
This study attempts to estimate the food security status and identify the determinants of food security among households receiving government grants in a township of Kwakwatsi, South Africa. The results are based on a household survey using questionnaires. A Logistic regression model was estimated based on this data with the household food security status (that is food secure and insecure) as the dependent variable and a set of demographic variables as explanatory variables. It was found that about 38 per cent of the sampled households are food secure. The results of the regression analysis showed total householdincome, household size, employment and marital status of the household head, employment status of the spouse as important determinants of food security in the area. Household size and the marital status of the head of household were negatively associated with household food security. The age, gender and educational attainment of the household head were not significant predictors of household food security status. This study makes a contribution to the understanding of the dynamics of households dependent on government grants by modelling the factors which determine food security and may act as reference source for policy planning purposes.
Keywords: Food security,government grants, township, South Africa.
1. Introduction Food security is a broad concept that includes issues related to the nature, quality, food access and security of the food supply. Food security can be defined as access by all people at all times to the food needed for a healthy life. The concept addresses people’s risks of not having access to the required food (Von Braun et al., 1992: 2). Food security is a concept that has evolved considerably over time and there is much literature on potential household food security indicators. There are multiple definitions and indicators of food security. Maxwell and Frankenberger (1992) list 25 broadly defined indicators. Riley and Moock (1995) list 73 such indicators used in understanding food security. Despite the wide ranging views on the topic, a general agreement is that food security exists when all people, at all times, have physical, social and economic access to sufficient, safe and nutritious food which meets their dietary needs and food preferences for an active and healthy life. Household food security is the application of this concept to the family level, with individuals within households as the focus of concern (Faridi&Wadood, 2010: 101).
The continuing evolution of food security as an operational concept in publicpolicy has reflected the wider recognition of the complexities of the technical andpolicy issues involved.Food security is part of the section 27 Constitutional Rights in South Africa. The Constitution states that every citizen has the right to have access to sufficient food and water (RSA, 1996). The Reconstruction and Development Programme (RDP) drafted in 1994 identified food security as a priority policy objective. As a result, the Government reprioritized public spending to focus on improving the food security conditions of historically disadvantaged people. The policy resulted in increased spending on social programs in all spheres of government, such as school feeding schemes, child support grants, free health services for children between 0-6 years, for pregnant and lactating women, pension funds for the elderly, working for water, and community public works programs (ANC, 1994). The efforts to address food security culminated in the compilation of the Integrated Food Security Strategy in 2002. The vision of the Integrated Food Security Strategy is to attain universal physical, social and economic access to sufficient, safe and nutritious food by all South Africans at all times to meet their dietary and food preferences for an active and healthy life (Department of Agriculture, 2002).
Altman et al (2010: 349) notes that a large proportion of South African households are food insecure, and that it is currently not possible to monitor progress towards greater food security. Despite numerous indicators of food security status evident in various national datasets, sampling and methodological constraints render cross-dataset comparisons
ISSN 2039-9340 Mediterranean Journal of Social Sciences Vol. 4 (1) January 2013
148
unworkable.A study by Jacobs (2009) concluded that approximately 80% of households could not afford to buy a basic nutritional basket of food costing an average of R 262 per person per month (at 2005 prices).Hendriks(2005) cites that South Africa is nationally food secure but suggests that between 58.5 and 73 percent of South African households experience food insecurity. Devereux & Maxwell (2001) notes that food insecurity is no longer seen as a failure of food production at the nationallevel but as livelihood failure.This shift in perspective away from emphasis onnational food production and the increasing awareness that sustainable livelihoods arecrucial elements in future food self-sufficiency that lead to a number of progressivedevelopments towards more household-focused food security measurement methodologies (Hendricks, 2005: 104).
South Africa’s social security system is the government’s chief initiative in tackling some of these problems. It has two main objectives. The first is to immediately reduce poverty among groups who are not expected to participate fully in the labour market, and therefore vulnerable to low income; the elderly, those with disabilities, and children. The second objective is to increase investment in health, education and nutrition, so as to increase economic growth and development (Samson et al., 2005). While Government’s spending on the social grants has increased significantly in recent years, research indicates that this has not reversed the drift into poverty by the majority of the recipients. Social grants are generally not regarded as pension as they bear no relationship to the income the recipient earned when they worked. They are seen as an attempt by the government to ameliorate the plight of the poor and marginalised (Van Driel, 2009:139). The state’s old-age pension grant is the largest grant when it comes to the monetary cost to the national government. Expenditure on social protection has increased from R72.3 billion in 2005/06 (4.6 per cent of the GDP) to a projected R118.1 billion in 2009/10 (National Treasury, 2009).Gordan (2012) indicates that social assistance spending is projected to rise from R111.2-billion in 2012/12 to R129-billion in 2015.With the current problem of unemployment and poverty in South Africa, it can be expected that the demand for social grants will continue to increase. This calls for an investigation into the intricacies of households receiving grants in order to inform policy directions.
This article makes a contribution to the understanding of households receiving government grants and their socio-economic conditions. A survey was undertaken to collect household information from households in Kwakwatsi who rely government grants as their source of income. The study reported here investigated the food security status of these households and continues to analyse the socio-economic and demographic factors determining the food security status. For this study, food security is defined as the ability of a household to secure enough food to ensure adequate dietary for all its members. The South African National Department of Agriculture’s proxy food poverty line was used as a measure of the food security status of a household. The next section provides a brief discussion of government grants in South Africa. The research methodology followed in the study is explained in section 3. Following that will be the presentation of the empirical findings. The final section will conclude the study and provide recommendations stemming from the findings of the study. 2. Government Grants in Perspective South Africa’s social security system is at the heart of the government’s poverty alleviation strategy. The current system was implemented and reformed in stages, adapted from the legacy of programmes inherited by the post-apartheid government. There are currently five main types of social grants. The first is the State Old-Age Pension (SOAP), which provides support to men from the age of 62 and upwards and to women aged 60 and upwards. The second is the Disability Grant (DG), which provides support to adults with disabilities. The third is the Child Support Grant (CSG), which provides support to families with children under the age of 14. The fourth is the Foster Child Grant, which provides support to families with children, below the age of 18, in foster care. The fifth is the Care Dependency Grant, which provides additional support to families with children, below the age of 18, with disabilities (Stats SA, 2009).The social-pension programme was introduced in 1928 to provide basic income to white and coloured older persons who lacked an occupational pension (Devereux 2001; Van der Berg, 1998). With the enactment of the Pension Laws Amendment Bill in 1944, its benefits were extended to blacks, but for the following 65 years, differential payments were made to beneficiaries in the different racial groups: whites received four times the amount that blacks received, while coloured and Asian beneficiaries received approximately twice the benefit paid to blacks. From the late-1980s, political pressure and the fight to topple apartheid brought about a gradual reduction in these disparities, and in 1993 parity in the payments was achieved (Van der Berg, 1998).
It is widely acknowledged that the social security programme significantly redistributes income, which many contend makes a substantial contribution to the country’s development. More specifically, it is argued that social-pension beneficiaries provide important economic support to their communities and local economies through pension sharing and their own expenditure (Duflo, 2000; SASSA, 2010). However, there is limited understanding of the dynamics of government grant recipients and their food security status. As Hendriks (2005: 2) notes, there are few studies in
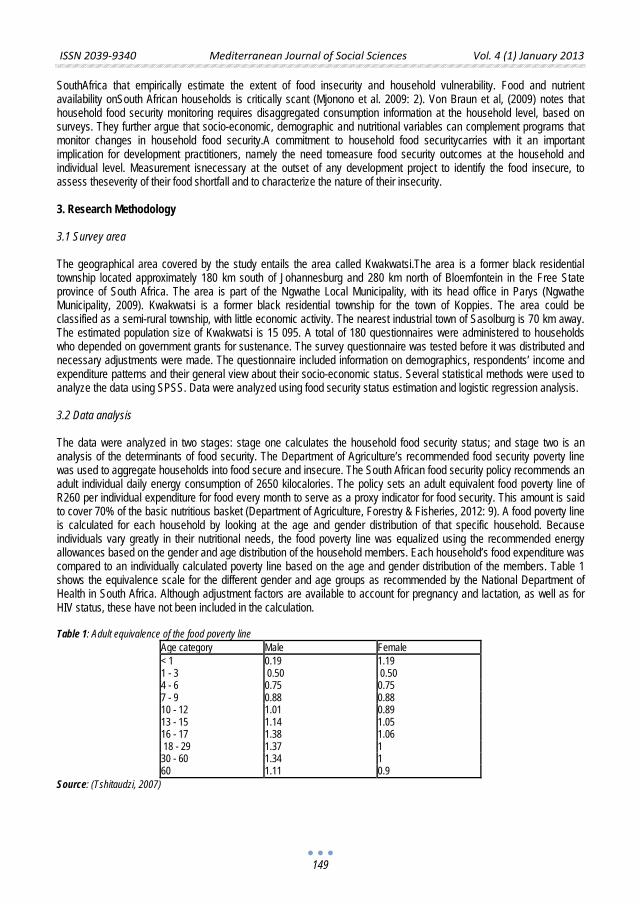
ISSN 2039-9340 Mediterranean Journal of Social Sciences Vol. 4 (1) January 2013
149
SouthAfrica that empirically estimate the extent of food insecurity and household vulnerability. Food and nutrient availability onSouth African households is critically scant (Mjonono et al. 2009: 2). Von Braun et al, (2009) notes that household food security monitoring requires disaggregated consumption information at the household level, based on surveys. They further argue that socio-economic, demographic and nutritional variables can complement programs that monitor changes in household food security.A commitment to household food securitycarries with it an important implication for development practitioners, namely the need tomeasure food security outcomes at the household and individual level. Measurement isnecessary at the outset of any development project to identify the food insecure, to assess theseverity of their food shortfall and to characterize the nature of their insecurity. 3. Research Methodology 3.1 Survey area The geographical area covered by the study entails the area called Kwakwatsi.The area is a former black residential township located approximately 180 km south of Johannesburg and 280 km north of Bloemfontein in the Free State province of South Africa. The area is part of the Ngwathe Local Municipality, with its head office in Parys (Ngwathe Municipality, 2009). Kwakwatsi is a former black residential township for the town of Koppies. The area could be classified as a semi-rural township, with little economic activity. The nearest industrial town of Sasolburg is 70 km away. The estimated population size of Kwakwatsi is 15 095. A total of 180 questionnaires were administered to households who depended on government grants for sustenance. The survey questionnaire was tested before it was distributed and necessary adjustments were made. The questionnaire included information on demographics, respondents’ income and expenditure patterns and their general view about their socio-economic status. Several statistical methods were used to analyze the data using SPSS. Data were analyzed using food security status estimation and logistic regression analysis. 3.2 Data analysis The data were analyzed in two stages: stage one calculates the household food security status; and stage two is an analysis of the determinants of food security. The Department of Agriculture’s recommended food security poverty line was used to aggregate households into food secure and insecure. The South African food security policy recommends an adult individual daily energy consumption of 2650 kilocalories. The policy sets an adult equivalent food poverty line of R260 per individual expenditure for food every month to serve as a proxy indicator for food security. This amount is said to cover 70% of the basic nutritious basket (Department of Agriculture, Forestry & Fisheries, 2012: 9). A food poverty line is calculated for each household by looking at the age and gender distribution of that specific household. Because individuals vary greatly in their nutritional needs, the food poverty line was equalized using the recommended energy allowances based on the gender and age distribution of the household members. Each household’s food expenditure was compared to an individually calculated poverty line based on the age and gender distribution of the members. Table 1 shows the equivalence scale for the different gender and age groups as recommended by the National Department of Health in South Africa. Although adjustment factors are available to account for pregnancy and lactation, as well as for HIV status, these have not been included in the calculation. Table 1: Adult equivalence of the food poverty line
Age category Male Female < 1 0.19 1.19 1 - 3 0.50 0.50 4 - 6 0.75 0.75 7 - 9 0.88 0.88 10 - 12 1.01 0.89 13 - 15 1.14 1.05 16 - 17 1.38 1.06 18 - 29 1.37 1 30 - 60 1.34 1 60 1.11 0.9
Source: (Tshitaudzi, 2007)
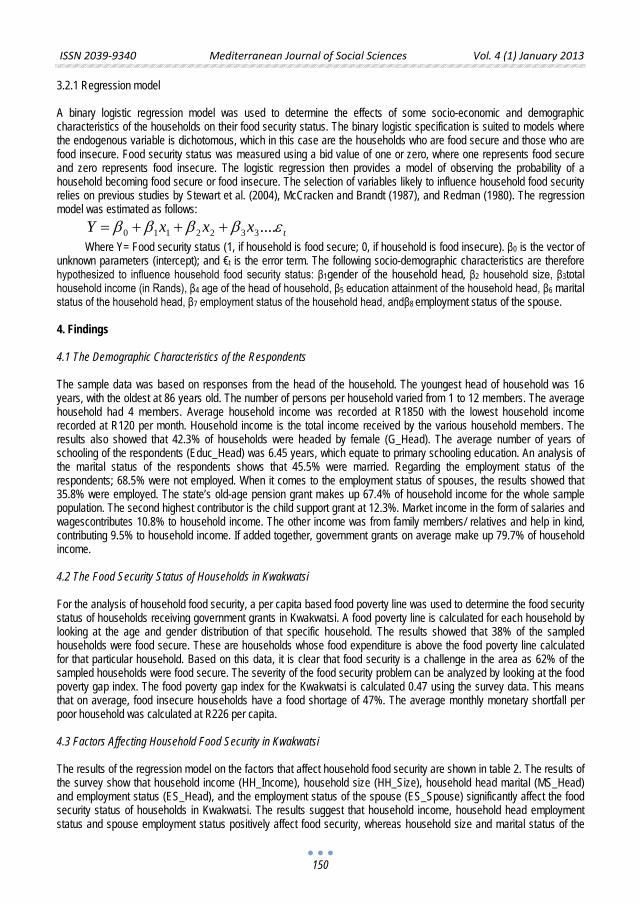
ISSN 2039-9340 Mediterranean Journal of Social Sciences Vol. 4 (1) January 2013
150
3.2.1 Regression model A binary logistic regression model was used to determine the effects of some socio-economic and demographic characteristics of the households on their food security status. The binary logistic specification is suited to models where the endogenous variable is dichotomous, which in this case are the households who are food secure and those who are food insecure. Food security status was measured using a bid value of one or zero, where one represents food secure and zero represents food insecure. The logistic regression then provides a model of observing the probability of a household becoming food secure or food insecure. The selection of variables likely to influence household food security relies on previous studies by Stewart et al. (2004), McCracken and Brandt (1987), and Redman (1980). The regression model was estimated as follows:
txxxY εββββ ....3322110 +++= Where Y= Food security status (1, if household is food secure; 0, if household is food insecure). β0 is the vector of
unknown parameters (intercept); and €t is the error term. The following socio-demographic characteristics are therefore hypothesized to influence household food security status: β1gender of the household head, β2 household size, β3total household income (in Rands), β4 age of the head of household, β5 education attainment of the household head, β6 marital status of the household head, β7 employment status of the household head, andβ8 employment status of the spouse. 4. Findings 4.1 The Demographic Characteristics of the Respondents The sample data was based on responses from the head of the household. The youngest head of household was 16 years, with the oldest at 86 years old. The number of persons per household varied from 1 to 12 members. The average household had 4 members. Average household income was recorded at R1850 with the lowest household income recorded at R120 per month. Household income is the total income received by the various household members. The results also showed that 42.3% of households were headed by female (G_Head). The average number of years of schooling of the respondents (Educ_Head) was 6.45 years, which equate to primary schooling education. An analysis of the marital status of the respondents shows that 45.5% were married. Regarding the employment status of the respondents; 68.5% were not employed. When it comes to the employment status of spouses, the results showed that 35.8% were employed. The state’s old-age pension grant makes up 67.4% of household income for the whole sample population. The second highest contributor is the child support grant at 12.3%. Market income in the form of salaries and wagescontributes 10.8% to household income. The other income was from family members/ relatives and help in kind, contributing 9.5% to household income. If added together, government grants on average make up 79.7% of household income. 4.2 The Food Security Status of Households in Kwakwatsi For the analysis of household food security, a per capita based food poverty line was used to determine the food security status of households receiving government grants in Kwakwatsi. A food poverty line is calculated for each household by looking at the age and gender distribution of that specific household. The results showed that 38% of the sampled households were food secure. These are households whose food expenditure is above the food poverty line calculated for that particular household. Based on this data, it is clear that food security is a challenge in the area as 62% of the sampled households were food secure. The severity of the food security problem can be analyzed by looking at the food poverty gap index. The food poverty gap index for the Kwakwatsi is calculated 0.47 using the survey data. This means that on average, food insecure households have a food shortage of 47%. The average monthly monetary shortfall per poor household was calculated at R226 per capita. 4.3 Factors Affecting Household Food Security in Kwakwatsi The results of the regression model on the factors that affect household food security are shown in table 2. The results of the survey show that household income (HH_Income), household size (HH_Size), household head marital (MS_Head) and employment status (ES_Head), and the employment status of the spouse (ES_Spouse) significantly affect the food security status of households in Kwakwatsi. The results suggest that household income, household head employment status and spouse employment status positively affect food security, whereas household size and marital status of the
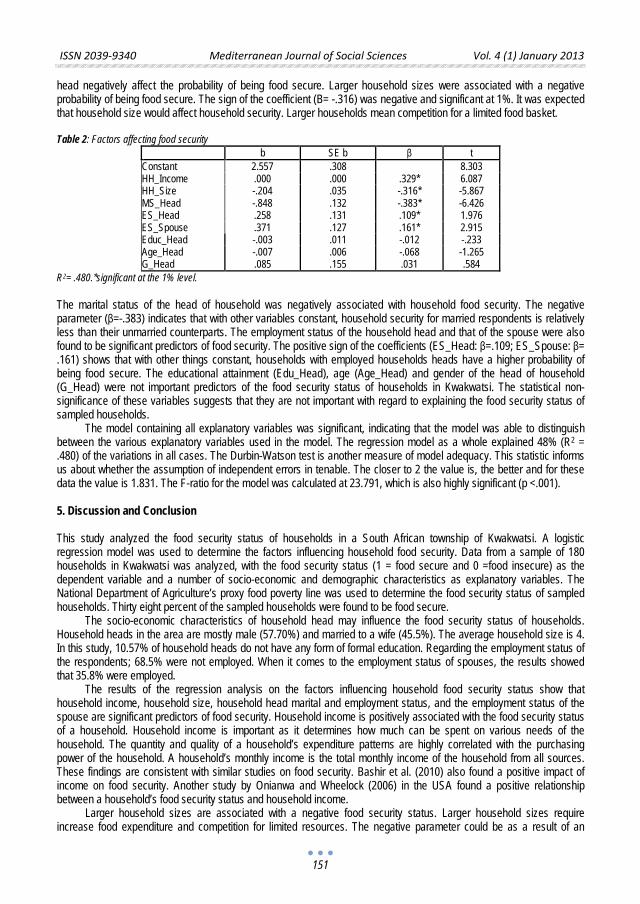
ISSN 2039-9340 Mediterranean Journal of Social Sciences Vol. 4 (1) January 2013
151
head negatively affect the probability of being food secure. Larger household sizes were associated with a negative probability of being food secure. The sign of the coefficient (B= -.316) was negative and significant at 1%. It was expected that household size would affect household security. Larger households mean competition for a limited food basket. Table 2: Factors affecting food security
b SE b β t Constant 2.557 .308 8.303 HH_Income .000 .000 .329* 6.087 HH_Size -.204 .035 -.316* -5.867 MS_Head -.848 .132 -.383* -6.426 ES_Head .258 .131 .109* 1.976 ES_Spouse .371 .127 .161* 2.915 Educ_Head -.003 .011 -.012 -.233 Age_Head -.007 .006 -.068 -1.265 G_Head .085 .155 .031 .584
R2= .480.*significant at the 1% level. The marital status of the head of household was negatively associated with household food security. The negative parameter (β=-.383) indicates that with other variables constant, household security for married respondents is relatively less than their unmarried counterparts. The employment status of the household head and that of the spouse were also found to be significant predictors of food security. The positive sign of the coefficients (ES_Head: β=.109; ES_Spouse: β= .161) shows that with other things constant, households with employed households heads have a higher probability of being food secure. The educational attainment (Edu_Head), age (Age_Head) and gender of the head of household (G_Head) were not important predictors of the food security status of households in Kwakwatsi. The statistical non-significance of these variables suggests that they are not important with regard to explaining the food security status of sampled households.
The model containing all explanatory variables was significant, indicating that the model was able to distinguish between the various explanatory variables used in the model. The regression model as a whole explained 48% (R2 = .480) of the variations in all cases. The Durbin-Watson test is another measure of model adequacy. This statistic informs us about whether the assumption of independent errors in tenable. The closer to 2 the value is, the better and for these data the value is 1.831. The F-ratio for the model was calculated at 23.791, which is also highly significant (p <.001). 5. Discussion and Conclusion This study analyzed the food security status of households in a South African township of Kwakwatsi. A logistic regression model was used to determine the factors influencing household food security. Data from a sample of 180 households in Kwakwatsi was analyzed, with the food security status (1 = food secure and 0 =food insecure) as the dependent variable and a number of socio-economic and demographic characteristics as explanatory variables. The National Department of Agriculture’s proxy food poverty line was used to determine the food security status of sampled households. Thirty eight percent of the sampled households were found to be food secure.
The socio-economic characteristics of household head may influence the food security status of households. Household heads in the area are mostly male (57.70%) and married to a wife (45.5%). The average household size is 4. In this study, 10.57% of household heads do not have any form of formal education. Regarding the employment status of the respondents; 68.5% were not employed. When it comes to the employment status of spouses, the results showed that 35.8% were employed.
The results of the regression analysis on the factors influencing household food security status show that household income, household size, household head marital and employment status, and the employment status of the spouse are significant predictors of food security. Household income is positively associated with the food security status of a household. Household income is important as it determines how much can be spent on various needs of the household. The quantity and quality of a household’s expenditure patterns are highly correlated with the purchasing power of the household. A household’s monthly income is the total monthly income of the household from all sources. These findings are consistent with similar studies on food security. Bashir et al. (2010) also found a positive impact of income on food security. Another study by Onianwa and Wheelock (2006) in the USA found a positive relationship between a household’s food security status and household income.
Larger household sizes are associated with a negative food security status. Larger household sizes require increase food expenditure and competition for limited resources. The negative parameter could be as a result of an
ISSN 2039-9340 Mediterranean Journal of Social Sciences Vol. 4 (1) January 2013
152
increase in the dependency ratio in larger households. A study by Babatunde et al. (2007) concluded that larger household sizes are more likely to be food insecure than smaller size households. Of interest is that the marital status of the household head is negatively associated with spending on food. The coefficient for the variable (MS_Head: -.848) was significant at 1%. This might be due to an increased household size due to a spouse in households were the head is married. Elijah (2010) concluded that households with unmarried heads were more food secure than the married, possibly as a result of limited number of people that such have to feed. A study by Kaloiet al (2005) concluded that married couples were likely to be more food secure than single headed households.
The age of the household head was not significant, although it had a negative sign. The older the household head less food secure the household was likely to be. Older people might not have the ability to work, thus ensuring increasing strain of the food acquisition of a household. The average age of the respondents was 45. Older people is South Africa (>60 years) and in need, are eligible for the state’s old-age pension grant. This grant is seen a source of sustenance for many poor urban residents. The aim of the grant is to reduce poverty among groups who are not expected to participate fully in the labour market, and therefore vulnerable to low income due to old age (Meth, 2002). This finding is consistent with similar studies on the topic. In a related study, Bashir et al. (2012) found that an increase of one year in the age of household head decreases the chances of a household to become food secure. A study by Omonoma&Agoi (2007) in Nigeria found an inverse relationship between the age of household head and food security. Arene and Anyaeji (2010) concluded that the age of household head has a positive effect on food security status.
The educational attainment of the head of the household was not important in explaining the variations in household food security. This might be due to the high unemployment rate (68.5%) among the respondents, resulting in lower returns for education in the market. As a result, education does not help much to improve the food security status of households. The problems to urban residents in achieving food security include unemployment, poor health and nutrition, scarcity of land, and high population density. Unemployment rate is considerably high in many urban areas. This calls for employment opportunities among urban residents in order to ensure food security. Specific programmes should be developed and targeted at reducing urban food insecurity. In view of the negative impact of large family size on the food security situation of rural households in the study areas, households should be educated on the need to adopt family planning techniques. This study may serve as a reference source when planning interventions related to government grants recipients.The study propagates an investigation into additional measures to ameliorate the impact of food insecurity amongst these households. References Altman, M., & Jacobs, P. (2010). Household food security in South Africa. Agrekon, 48(4), 345- 361. ANC (African National Congress). (1994). The Reconstruction and Development Programme. Johannesburg: African National Congress. Arene, C., & Anyaeji, C. (2010). Determinants of Food Security among Households in Nsukka Metropolis of Enugu State, Nigeria.
Pakistan Journal of Social Sciences, 30(1), 9-16. Babatunde, R., Omotesho, O., & Sholotan, O. (2007). Socio-economic characteristics and food security of farming households in Kwara
State, North-Central Nigeria. Pakistan Journal of Nutrition, 6(1), 41- 58. Bashir, M., Schilizzi, S., & Pandit, R. (2012). The Determinants of Rural Food Security: the case of Landless Households of the Punjab,
Pakistan. Crawley: aSchool of Agricultural and Resource Economics, The University of Western Australia. Department of Agriculture. (2002). The Integrated Food Security Strategy of South Africa. Pretoria: Government Printer. Department of Agriculture, Forestry and Fisheries. (2012). Food Security Policy of the Republic of South Africa. Government Printer:
Pretoria. Devereux, S. (2001). Social Pensions in Namibia and South Africa. Falmer: IDS, University of Sussex. Devereux, S., & Maxwell, S. (Eds.). (2001). Food Security in Sub-Saharan Africa. Pietermaritzburg: ITDG Publishing. Duflo, E. (2001). Grandmothers and Granddaughters: Old-Age Pension and Intra-household Allocation in South Africa. Pretoria: National
Bureau of Economic Research. Elijah, O. (2010). Classification of households into food security status in the North-Central Region of Nigeria: an application of Rasch
Measurement Model. ARPN Journal of Agricultural and Biological Science, 5(3), 26-41. Estelle, E. (2003). Poverty Shocker for Cape Townships. Retrieved Oct 2012, from www.101.co.za/news/south.africa/poverty-shocker-
for-cape-townships-1,1150710 Faridi, R., & Wadood, S. (2010). An Econometric Assessment of Household Food Security in Bangladesh. The Bangladesh
Development Studies, 33(3), 97- 111. Frankenberger, T. (1992). Indicators and data collection methods forassessing household food security. In S. Maxwell &
T.Frankenberger, eds. Household food security: concepts, indicators and measurements: a technical review. New York: UNICEF. Gordhan, P. (2012). The 2012 budget statement. Pretoria: Government Printer. Hendriks, S. (2005). The Challenges facing Empirical Estimation of food (in)security in South Africa. Development Southern Africa,
22(1), 1- 21.
ISSN 2039-9340 Mediterranean Journal of Social Sciences Vol. 4 (1) January 2013
153
Jacobs, P. (2009). Identifying Targets for Household Food Security in South Africa. Pretoria: Centre for Poverty, Employment and Growth, Human Science Research Council.
Kaloi, E., Tayebwa, E., & Bashaasha, B. (2005). Food security status of households in Mwingi district, Kenya. The 7th African Crop Science Society Conference, 5–9 December. Kampala, Uganda.
Maxwell, S., & Frankenberger, T. (1992). Household Food Security Concepts, Indicators and Measurements. New York: UNICEF. McCracken, V., & Brandt, J. (1987). Household Consumption of Food Away from Home: total expenditure and by type o f food facility.
American Journal of Agricultural Economics, 69(3), 274-284. Mjonono, M., Ngidi, M., & Hendriks, S. (2012). Investigating Household Food Insecurity Coping Strategiess and the Impact of Crop
Production on Food Security using Coping Strategy Index (CSI). 17th International Farm Management Congress, (pp. 312- 326). Bloomington, Illinois.
National Treasury. (2009). The 2009 budget review. Pretoria: Government Printer. Ngwathe Municipality. (2009). Integrated Development Plan Review 2009-2010. Parys: Ngwathe Municipality. Omonoma , B., & Agoi , G. (2007). An analysis of food security situation among Nigerian urban households: evidence from Lagos State,
Nigeria. Journal of Central Europena Agriculture, 8(3), 307-406. Onianwa , O., & Wheelock , G. (2006). An analysis of the determinants of food insecurity with severe hunger in selected southern states.
Southern Rural Sociology, 21, 80-96. Redman, B. (1980). The Impact of Women’s Time Allocation on Expenditure for Meals Away From Home and Prepared Foods.
American Journal of Agricultural Economics, 62, 234-237. Riley, F., & Moock, N. (1995). Inventory of Food Security Impact Indicators: Food Security Indicators and Framework. In: A Handbook for
Monitoring and Evaluation of Food aid Programs. Arlington, VA: IMPACT. RSA (Republic of South Africa). (1996). Constitution of the Republic of South Africa, 1996, No 108 of 1996. Pretoria: Government
Printer. Samson, M., & MacQuene, K. (2005). Social grants – policy brief 1. London: Overseas Development Institute. SASSA (South Africa Social Security Agency). (2010). Statistical report on social grants. Report no. 26. Pretoria: Government Printer. Stats SA (Statistics South Africa). (2009). Social profile of South Africa, 2002–2009. Pretoria: Government Printer. Steward, H., Blisard, N., Byuyan, S., & Nayga, R. (2004). The Demand for Food from Home: Full-Service or Fast Food. United States:
Economic Research Service, US Department of Agriculture. Tshitaudzi, G. (2007). Nutritional Requirements for Individuals. Government Printer: Department of Health. Van Der Berg, S. (1998). South African Social Security under Apartheid and Beyond. Development Southern Africa, 14 (4), 481–503. Van Driel, M. (2009). The social grants and black women in South Africa: a case of Bophelong Township in Gauteng. Journal of
International Women’s Studies, 10(4). Von Braun, J., Buis, H., Kumar, S., & Pandya-Lorch, N. (1992). Improving food security of the poor: concept, policy and programs.
Washington: International Food Policy Research Institute

ISSN 2039-9340 Mediterranean Journal of Social Sciences Vol. 4 (1) January 2013
155
Uncertainty and Foreign Direct Investment: A Case of Agriculture in Nigeria
O. S. Ajuwon
Department of Economics,
University of Lagos, Nigeria Email: [email protected]
F. O. Ogwumike, Ph.D
Department of Economics University of Ibadan, Nigeria.
Corresponding Author Email: [email protected] Doi:10.5901/mjss.2013.v4n1p155 Abstract
Premised on economic uncertainty and political instability indicators, this paper examined the role of uncertainty as they affected the inflow of FDI into the agricultural subsector of the Nigerian economy given that such empirical work are limited. Employing secondary time series data which spanned 1970 to 2008, on an investment-cointegrated Error Correction Model, this study attempted to fill the gap. Following ADF test for stationarity and a Johenson cointegration test, we found a cointegrating relationship among the variables as affirmed by the error correction mechanism parameter. It was revealed that FDI positively impacted on agriculture not only in the short run but also in the long run. This will also engender domestic income diversification which will boost agricultural sector and stem the erstwhile neglect of the sector. Further, political instability adversely affected agricultural investments in the long run. An enabling environment should be provided to attract investment on short and long term basis. Also exchange rate fluctuation, high lending and inflation rates problems should be addressed.
Key words: Foreign Direct Investment, Economic Uncertainty, Political stability, Agriculture and Nigeria
1. Introduction Nigeria faces serious poverty challenges. Nearly seven out of every ten Nigerians live below the poverty line of $1 per day (National Bureau of Statistics 2012). Poverty in Nigeria is concentrated in rural areas which accounts for more than two-third of the nation’s poor. Development indicators of rural areas lag behind those of urban areas: incomes are lower, infant mortality rates are higher, life expectancy is shorter, illiteracy is more widespread, malnutrition is more prevalent and greater proportion of people lack access to clean water and improved sanitation services.
Endowed with abundant land and water resources, Nigeria’s agricultural sector has potential for growth, especially, if the value chain of major commodities is fully exploited to remove all forms of wastes and eliminate glut in supply. Despite the huge potential of agriculture in Nigeria, the impact of the sector on poverty reduction through ensuring food security and self-sufficiency is still very low. Although several reasons could be deduced for this development, prominent among them are poor private investments in agriculture, inequitable access to assets and resources, and poor technology (including absence of processing, storage and marketing facilities) as well as inadequate electricity supply.
Further, productivity is low and in some cases stagnant. Farming system, mostly small scale, is still predominantly subsistence-based and for the most part depends on weather vagaries. The country vast irrigation potential remains largely unexploited. Most farmers produce mainly food crops using traditional extensive cultivation methods while commercial agriculture based on modern technologies remains underdeveloped; and the most limiting factor is access to investible fund. Investing in agriculture can be transformative, especially as agriculture is still the single largest employer of labour in Nigeria today and holds the promise of sustainable reduction in poverty. Further, the World Bank estimates that growth in the agriculture sector is twice as effective at reducing poverty compared to growth in other sectors. This enormous potential of agriculture can be harnessed to alleviate poverty among Nigerians through the provision of food,
ISSN 2039-9340 Mediterranean Journal of Social Sciences Vol. 4 (1) January 2013
156
incomes to the farmers, raw materials for industries, and generation of foreign exchange for the country. In addition to fuelling economic growth, investment in agriculture will also enable the country to withstand future shocks from changing global commodity prices, weather patterns, and financial crises.
Nigeria as a country, given her natural resource base and large market size (a population of about 160 million), qualifies to be a major recipient of FDI in Africa and indeed, is one of the top three leading African countries that consistently received FDI in the past decade. However, the level of FDI attracted especially to agriculture is small compared to the resource base and potential need. Nigeria’s share of FDI inflow to Africa averaged around 20.68% between 1976 and 2007. The percentage of FDI inflow to the agricultural sector in Nigeria during the same period is less than 1%. Between 1980 and 1984, it was 2.46% which was the highest and stood at 0.37% in 2007.
While there are many factors influencing FDI inflow into a country, frequent political and macroeconomic instability, bureaucratic bottlenecks and corruption forestall FDI inflows. This study attempts to answer the following questions:
• What is the relationship between economic uncertainty and inflow of FDI into the agricultural sector in Nigeria? • What is the relationship between political stability and inflow of FDI into the agricultural sector of the Nigerian
economy? 2. Literature Review Theoretically, two main approaches have been used to assess FDI inflows: location theory, which deals with the reasons underlying the choice of host country for foreign investment, and industrial organisation theory concerned with successful competition between domestic producers and foreign firms. Hymer (1976) study provides insight into the role of multinational corporations (MNCs) as global industrial organisations. He argues that FDI is more than a process by which assets are exchanged internationally. It also involves international production. His submission is that FDI represents not simply a transfer of capital, but the transfer of a “package” in which capital, superior managerial, administrative and marketing skills, new and advanced technology, access to low-cost funding and research and development capabilities are all combined. This theory was earlier addressed by Caves (1971, 1974) and deepened by Kindleberger (1984).
Several studies have sought to grasp the existing link between FDI inflows and economic and political stability. For example, Wheeler and Mody (1992) used country risk indices to demonstrate that there exists a strong correlation between economic and political stability, and investment inflows. Sachs and Sievers (1998) study, point to political stability as one of the most important determinants of FDI distribution. According to Singh and Jun (1996), socio-political instability is a complex phenomenon whose effect is difficult to define, since the determination of the link between political instability and FDI most often vary with the political risk indicators used.
The effect of legal and regulatory environment on FDI is another issue. Crucial to inflow of FDI is a well functioning legal and regulatory framework where the rule of law prevails as well as transparency and consistency in enforcement. Also, physical infrastructure (electricity, roads and water supply) is important in attracting domestic and foreign investments. In addition, human capital is another key factor that encourages inflow of FDI.
Blomstrom et al (1994) observe that FDI inflows had a significant positive effect on the average growth rate of per capita income (PCI) for a sample of 78 developing and 23 developed countries. However, when the sample of developing countries was split between two groups based on level of PCI, the effect of FDI on growth of lower income developing countries was not statistically significant although it still has a positive sign. They argue that least developed countries gain marginally from multinational enterprises (MNEs) because domestic enterprises are too far behind technologically to be either imitators or suppliers to MNEs.
While there seems to be some agreement on the determinants of investments in both developing and developed countries, the literature identifies some additional risk and uncertainty factors that constrain investment in developing countries. These include inflation (Dornbusch and Reynoso, 1989; Serven and Solimano, 1993 and Oshikoya, 1994), large external debt (Borensztein, 1990; Faruqee, 1992), ownership, location, and internalization (Rivoli and Salorio, 1996), credibility of policy changes during macroeconomic adjustment (Rodrik, 1989), level and variability of the real exchange rate (Faruqee, 1992; Serven, 1998, Jenkins and Thomas, 2002), terms of trade effect (Oshikoya, 1994) and political instability (Bleaney, 1993; Garner, 1993; Root and Ahmed, 1979, Schneider and Fry, 1985); and infrastructure and institutions (Asiedu, 2002, and Ajayi, 2004).
There are a couple of survey-based studies of FDI in Africa mostly identifying the same set of obstacles constraining FDI inflow in the region. For instance, Hess (2000) assesses the investment climate in each of the SADC economies and highlights the most common factors constraining investment in this area. Among the prominent factors he identifies are unstable political and economic environment; lack of transparency; inadequate infrastructure; inefficient and cumbersome bureaucracy which breed corruption; underdeveloped financial sectors; and low productivity. He affirms that
ISSN 2039-9340 Mediterranean Journal of Social Sciences Vol. 4 (1) January 2013
157
the most important factor in attracting significant levels of FDI is a stable macroeconomic and political environment. He notes that investors require as much certainty as possible about an economy for them to be willing to invest in it.
Ngowi (2001) points out that it is difficult to determine the exact quantity and quality of each of the determinants of FDI in a location to attract a given level of FDI inflow. With respect to African countries, the study identifies high risk characterised by a lack of political, institutional and policy stability as well as predictability, poor access to world markets, price instability, high levels of corruption, small and stagnant markets and poor infrastructure as some of the important factors hindering FDI in Africa.
As indicated by Thomas and Worral (1994), other forms of uncertainty emanate from risk of expropriation, and can be guaranteed only through signing bilateral and/or multilateral investment guarantees to protect foreign investors. Baker (1999) affirms the role played by the Multinational Investment Guarantee Agency to increase flow of FDI. The level of exchange rate becomes a determining factor, as indicated by Campa (1993), for the case of FDI inflow to USA, and also by Bacek and Okawa (2001) for Japanese FDI in Asia.
The expected sign for the measure of uncertainty is not clear from economic theory. Positive sign implies that firms invest more in a foreign market to diversify production, use a market as a shock absorber, or to compete with rival competitor, which is a strategic motive. Cushman (1985) argues that uncertainty affects FDI positively, as multinational firms tend to serve foreign market through FDI than through export when investors start to worry about uncertainty. On the other hand, the theory of investment and option value implies that firms lower investment when there is uncertainty, due to high sunk cost which further delays investment.
In Nigeria, significant scholarly effort has gone into the study of the role of foreign direct investment in the Nigerian economy. Oyaide (1979), Dinda (2009), and Abu (2010) provide an excellent documentation of works conducted under the aegis of the Nigerian Economic Society. However, previous empirical works have not addressed the roles of some of these uncertainty indicators and policies. The present study therefore, intends to fill this gap by focusing on uncertainty and FDI into agricultural sector in Nigeria. 3. Materials and Methods 3.1 Data This study is carried out in the context of Nigeria, for the period 1970-2008. Foreign direct investment into agriculture is measured by the ratio of net foreign direct investment into agriculture, forestry and fisheries to GDP (RAGRIC). Economic uncertainty indicators consist of the annual variability in consumer price index (INF) and the annual volatility in exchange rate of dollar (VRER). Political uncertainty indicators include Political freedom (POLI) and government commitment to bilateral and multi-lateral agreements proxy by the total number of Bilateral Investment Treaties signed by a host country and membership in Multilateral Investment Guarantee Agency (TBMAS). Other variables include investors’ confidence proxy by the ratio of total external debt servicing of a host country to total export value (EDSEXP) and the size of non-oil export sector measured as the ratio of value of total non-oil export of goods and services to total export (NOEXP). Further, domestic market size, cost of capital, technology and infrastructure are proxy by GDP per capita (GDPPC) and real lending rate (RLR) measured as nominal lending rate minus inflation. Average rainfall (AVGRAIN) is included given the uncertainty associated with rain fed agriculture especially in poorly irrigated countries.
Data on GDP, net FDI into agric, INF, VRER, RLR, and rainfall were sourced from the Central Bank of Nigeria Statistical Bulletin. Data on political freedom was sourced from Freedom House website, while data on bilateral and multi-lateral agreements were sourced from Washington CIA data centre and MIGA respectively. 3.2 Model Specification In the traditional investment model, the desired capital stock (Kit) depends on output (Yit) and real user cost of capital (IRit) in the host country. Kit = f (Yit, IRit) (1) However, a multinational firms’ investment is affected by other host country characteristics, which alter exchange rate, and demand. Therefore, this model is augmented based on the premise that both revenue and cost functions are subject to host country uncertainties and instabilities. Following the model developed by Goldberg and Kolstad (1995) [as contained in the work of Lemi and Asefa (2001); and Lemi et al (2002) ], which incorporates both the exchange rate and demand uncertainty, this study adapts the model by augmenting it with the Nigerian economy characteristics.
ISSN 2039-9340 Mediterranean Journal of Social Sciences Vol. 4 (1) January 2013
158
Foreign investors divide their production capacity across borders according to the distributions and correlations of exchange rate and demand shocks. The profit function of a source country firm that produces only for a foreign market, with a combination of domestic capacity and foreign capacity is given by: Π(qd, qf, e, σ) = e (p (q) + δ) q – qd – eqf (2)
Where: p (q) = Total demand in the host country for the product of affiliate firm qd = Home capacity costs qf = Foreign capacity costs δ = Demand shock e = Exchange rate
Typically, the firm decides the level of production both in the domestic market and abroad before uncertainty is resolved. However, the model becomes more complex when other factors are taken into account. For example, foreign firms invest in a given host country not only to produce and sell products in the host country market, but also to export products either back to the parent firm’s country or to neighbouring countries. In that case, expected profit is a function of exchange rate and demand shock uncertainty and the correlation between the two. Therefore, level of production in the domestic market and abroad is a function of demand (price) and exchange rate uncertainties. As foreign firms cross boundaries, other factors pertinent for foreign investors include political instability and host country government policies; these factors are important because, in most cases, they treat foreign firms differently.
Other macroeconomic determinants of investment, such as total and skilled labour force, market size and potential, cost of capital, productivity (technology), infrastructure, size of export sector, investors’ confidence, and image of a host country in the international business community are commonly used control variables for the study of investment behaviour of multinational firms.
In assessing the role of economic uncertainty and political instability on FDI inflow to the agricultural subsector of the Nigerian economy; the rate of inflation and the exchange rate uncertainty, as well as political instability are expected to impede FDI inflow. Apart from these uncertainty indicators, host country economic policy parameters, investors’ confidence, market size and potential size of export sector, labour force availability and infrastructure facilities are factors in deciding whether to invest or not in a country. These control variables are expected to impact the inflow of FDI. Studies show that the inflow of FDI to African economies is enhanced by cheap labour and a large export sector (mainly to extract resources) (Nnadozie, 2000; Allaoua and Atkin, 1993). It is evident from similar studies that the role of communication infrastructure, and suitable policy environment is critical. By using proxy variables for the uncertainty indicators and other control variables, this study estimates FDI model for the agricultural subsector of the Nigerian economy as shown in equation 3.
t 0 1 t 2 t 3 t 4 t 5 t 6 t 7 t 8 9 t tRAGRIC = + INF + VRER + POLI + TBMAS + AVGRAIN + GDPPC + RLR + EDSEXP + NOEXP + -----------(3)tβ β β β β β β β β β ε Where:
RAGRIC = Ratio of net FDI into agriculture (including forestry and fisheries) to GDP INF = Annual variability in consumer price index VRER = Volatility in exchange rate of dollar POLI = Political freedom indicator TBMAS = Total Bilateral Investment Treaties and Membership in Multilateral Investment Guarantee Signed AVGRAIN = Average rainfall. GDPPC = GDP per capita RLR = Real lending rate defined as nominal lending rate minus inflation. EDSEXP = Ratio of total external debt servicing to total export. NOEXP = Ratio of non-oil export of goods and services to total export. β0, β1, β2, β3, β4, β5, β6, β7, β8, β9 are the intercept and relevant elasticities; and ε is the error term.
The a priori expectation for the variables are that GDPPC, TBMAS, NOEXP, AVGRAIN and POLI are expected to be positively related to foreign direct investment in agriculture while INF, VRER, RLR, and EDSEXP are expected to be negatively related to FDI inflow into agriculture. However, there is possibility of EDSEXP being positively related to inflow of FDI into agriculture if debt are injected optimally into the sector.
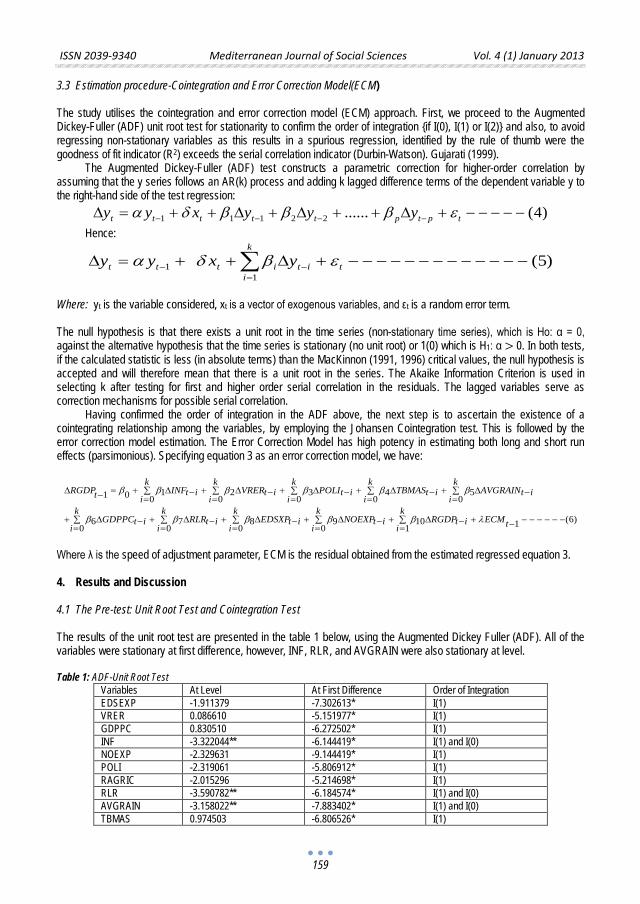
ISSN 2039-9340 Mediterranean Journal of Social Sciences Vol. 4 (1) January 2013
159
3.3 Estimation procedure-Cointegration and Error Correction Model(ECM) The study utilises the cointegration and error correction model (ECM) approach. First, we proceed to the Augmented Dickey-Fuller (ADF) unit root test for stationarity to confirm the order of integration {if I(0), I(1) or I(2)} and also, to avoid regressing non-stationary variables as this results in a spurious regression, identified by the rule of thumb were the goodness of fit indicator (R2) exceeds the serial correlation indicator (Durbin-Watson). Gujarati (1999).
The Augmented Dickey-Fuller (ADF) test constructs a parametric correction for higher-order correlation by assuming that the y series follows an AR(k) process and adding k lagged difference terms of the dependent variable y to the right-hand side of the test regression:
1 1 1 2 2 ...... (4)t t t t t p t p ty y x y y yα δ β β β ε− − − −∆ = + + ∆ + ∆ + + ∆ + − − − − −
Hence:
11
(5)k
t t t i t i ti
y y x yα δ β ε− −=
∆ = + + ∆ + − − − − − − − − − − − − −∑
Where: yt is the variable considered, xt is a vector of exogenous variables, and εt is a random error term. The null hypothesis is that there exists a unit root in the time series (non-stationary time series), which is Ho: α = 0, against the alternative hypothesis that the time series is stationary (no unit root) or 1(0) which is H1: α > 0. In both tests, if the calculated statistic is less (in absolute terms) than the MacKinnon (1991, 1996) critical values, the null hypothesis is accepted and will therefore mean that there is a unit root in the series. The Akaike Information Criterion is used in selecting k after testing for first and higher order serial correlation in the residuals. The lagged variables serve as correction mechanisms for possible serial correlation.
Having confirmed the order of integration in the ADF above, the next step is to ascertain the existence of a cointegrating relationship among the variables, by employing the Johansen Cointegration test. This is followed by the error correction model estimation. The Error Correction Model has high potency in estimating both long and short run effects (parsimonious). Specifying equation 3 as an error correction model, we have:
1 2 3 4 51 0 0 0 0 0 0
(6)6 7 8 9 10 10 0 0 0 1
k k k k kRGDP INF VRER POLI TBMAS AVGRAINt i t i t i t i t it i i i i ik k k k k
GDPPC RLR EDSXP NOEXP RGDP ECMt i t i t i t i t i ti i i i i
β β β β β β
β β β β β λ
∆ = + ∆ + ∆ + ∆ + ∆ + ∆∑ ∑ ∑ ∑ ∑− − − − −− = = = = =
+ ∆ + ∆ + ∆ + ∆ + ∆ + − − − − − −∑ ∑ ∑ ∑ ∑− − − − − −= = = = = Where λ is the speed of adjustment parameter, ECM is the residual obtained from the estimated regressed equation 3. 4. Results and Discussion 4.1 The Pre-test: Unit Root Test and Cointegration Test The results of the unit root test are presented in the table 1 below, using the Augmented Dickey Fuller (ADF). All of the variables were stationary at first difference, however, INF, RLR, and AVGRAIN were also stationary at level. Table 1: ADF-Unit Root Test
Variables At Level At First Difference Order of Integration EDSEXP -1.911379 -7.302613* I(1) VRER 0.086610 -5.151977* I(1) GDPPC 0.830510 -6.272502* I(1) INF -3.322044** -6.144419* I(1) and I(0) NOEXP -2.329631 -9.144419* I(1) POLI -2.319061 -5.806912* I(1) RAGRIC -2.015296 -5.214698* I(1) RLR -3.590782** -6.184574* I(1) and I(0) AVGRAIN -3.158022** -7.883402* I(1) and I(0) TBMAS 0.974503 -6.806526* I(1)
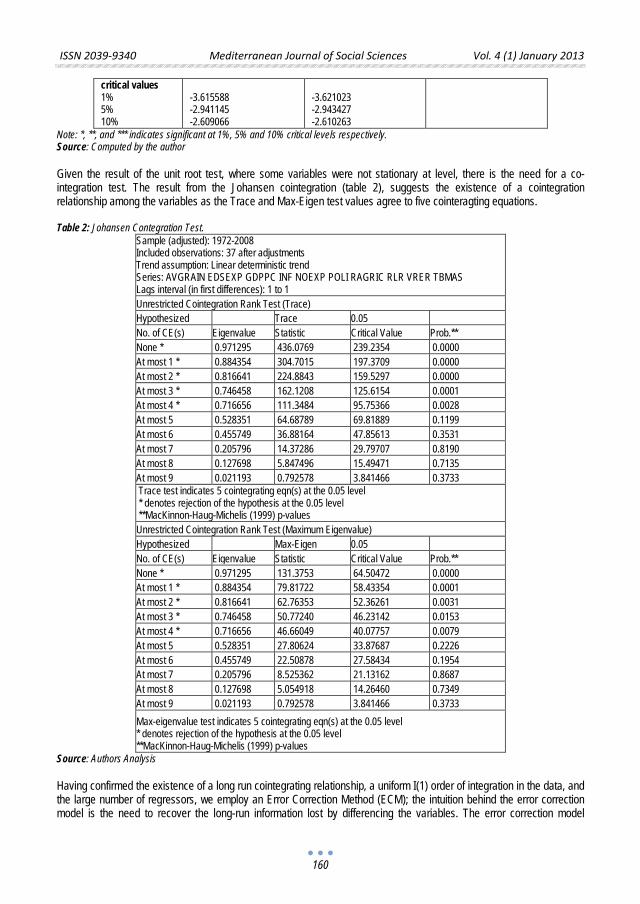
ISSN 2039-9340 Mediterranean Journal of Social Sciences Vol. 4 (1) January 2013
160
critical values 1% 5% 10%
-3.615588 -2.941145 -2.609066
-3.621023 -2.943427 -2.610263
Note: *, **, and *** indicates significant at 1%, 5% and 10% critical levels respectively. Source: Computed by the author Given the result of the unit root test, where some variables were not stationary at level, there is the need for a co-integration test. The result from the Johansen cointegration (table 2), suggests the existence of a cointegration relationship among the variables as the Trace and Max-Eigen test values agree to five cointeragting equations. Table 2: Johansen Contegration Test.
Sample (adjusted): 1972-2008 Included observations: 37 after adjustments Trend assumption: Linear deterministic trend Series: AVGRAIN EDSEXP GDPPC INF NOEXP POLI RAGRIC RLR VRER TBMAS Lags interval (in first differences): 1 to 1 Unrestricted Cointegration Rank Test (Trace) Hypothesized Trace 0.05 No. of CE(s) Eigenvalue Statistic Critical Value Prob.** None * 0.971295 436.0769 239.2354 0.0000 At most 1 * 0.884354 304.7015 197.3709 0.0000 At most 2 * 0.816641 224.8843 159.5297 0.0000 At most 3 * 0.746458 162.1208 125.6154 0.0001 At most 4 * 0.716656 111.3484 95.75366 0.0028 At most 5 0.528351 64.68789 69.81889 0.1199 At most 6 0.455749 36.88164 47.85613 0.3531 At most 7 0.205796 14.37286 29.79707 0.8190 At most 8 0.127698 5.847496 15.49471 0.7135 At most 9 0.021193 0.792578 3.841466 0.3733 Trace test indicates 5 cointegrating eqn(s) at the 0.05 level * denotes rejection of the hypothesis at the 0.05 level **MacKinnon-Haug-Michelis (1999) p-values Unrestricted Cointegration Rank Test (Maximum Eigenvalue) Hypothesized Max-Eigen 0.05 No. of CE(s) Eigenvalue Statistic Critical Value Prob.** None * 0.971295 131.3753 64.50472 0.0000 At most 1 * 0.884354 79.81722 58.43354 0.0001 At most 2 * 0.816641 62.76353 52.36261 0.0031 At most 3 * 0.746458 50.77240 46.23142 0.0153 At most 4 * 0.716656 46.66049 40.07757 0.0079 At most 5 0.528351 27.80624 33.87687 0.2226 At most 6 0.455749 22.50878 27.58434 0.1954 At most 7 0.205796 8.525362 21.13162 0.8687 At most 8 0.127698 5.054918 14.26460 0.7349 At most 9 0.021193 0.792578 3.841466 0.3733 Max-eigenvalue test indicates 5 cointegrating eqn(s) at the 0.05 level * denotes rejection of the hypothesis at the 0.05 level **MacKinnon-Haug-Michelis (1999) p-values
Source: Authors Analysis
Having confirmed the existence of a long run cointegrating relationship, a uniform I(1) order of integration in the data, and the large number of regressors, we employ an Error Correction Method (ECM); the intuition behind the error correction model is the need to recover the long-run information lost by differencing the variables. The error correction model
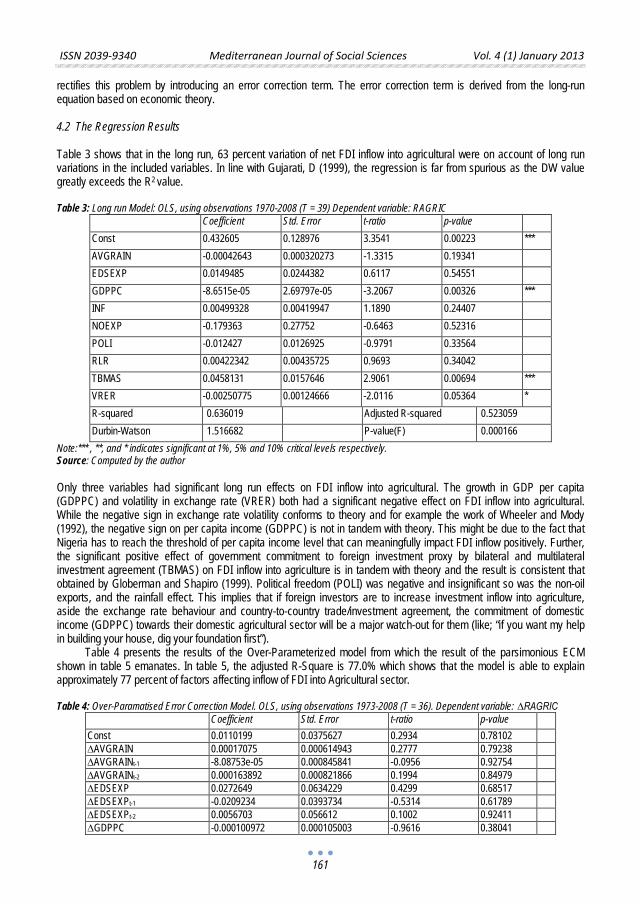
ISSN 2039-9340 Mediterranean Journal of Social Sciences Vol. 4 (1) January 2013
161
rectifies this problem by introducing an error correction term. The error correction term is derived from the long-run equation based on economic theory. 4.2 The Regression Results Table 3 shows that in the long run, 63 percent variation of net FDI inflow into agricultural were on account of long run variations in the included variables. In line with Gujarati, D (1999), the regression is far from spurious as the DW value greatly exceeds the R2 value. Table 3: Long run Model: OLS, using observations 1970-2008 (T = 39) Dependent variable: RAGRIC
Coefficient Std. Error t-ratio p-value Const 0.432605 0.128976 3.3541 0.00223 *** AVGRAIN -0.00042643 0.000320273 -1.3315 0.19341 EDSEXP 0.0149485 0.0244382 0.6117 0.54551 GDPPC -8.6515e-05 2.69797e-05 -3.2067 0.00326 *** INF 0.00499328 0.00419947 1.1890 0.24407 NOEXP -0.179363 0.27752 -0.6463 0.52316 POLI -0.012427 0.0126925 -0.9791 0.33564 RLR 0.00422342 0.00435725 0.9693 0.34042 TBMAS 0.0458131 0.0157646 2.9061 0.00694 *** VRER -0.00250775 0.00124666 -2.0116 0.05364 * R-squared 0.636019 Adjusted R-squared 0.523059 Durbin-Watson 1.516682 P-value(F) 0.000166
Note:*** , **, and * indicates significant at 1%, 5% and 10% critical levels respectively. Source: Computed by the author Only three variables had significant long run effects on FDI inflow into agricultural. The growth in GDP per capita (GDPPC) and volatility in exchange rate (VRER) both had a significant negative effect on FDI inflow into agricultural. While the negative sign in exchange rate volatility conforms to theory and for example the work of Wheeler and Mody (1992), the negative sign on per capita income (GDPPC) is not in tandem with theory. This might be due to the fact that Nigeria has to reach the threshold of per capita income level that can meaningfully impact FDI inflow positively. Further, the significant positive effect of government commitment to foreign investment proxy by bilateral and multilateral investment agreement (TBMAS) on FDI inflow into agriculture is in tandem with theory and the result is consistent that obtained by Globerman and Shapiro (1999). Political freedom (POLI) was negative and insignificant so was the non-oil exports, and the rainfall effect. This implies that if foreign investors are to increase investment inflow into agriculture, aside the exchange rate behaviour and country-to-country trade/investment agreement, the commitment of domestic income (GDPPC) towards their domestic agricultural sector will be a major watch-out for them (like; “if you want my help in building your house, dig your foundation first”).
Table 4 presents the results of the Over-Parameterized model from which the result of the parsimonious ECM shown in table 5 emanates. In table 5, the adjusted R-Square is 77.0% which shows that the model is able to explain approximately 77 percent of factors affecting inflow of FDI into Agricultural sector. Table 4: Over-Paramatised Error Correction Model. OLS, using observations 1973-2008 (T = 36). Dependent variable: ∆RAGRIC
Coefficient Std. Error t-ratio p-value Const 0.0110199 0.0375627 0.2934 0.78102 ∆AVGRAIN 0.00017075 0.000614943 0.2777 0.79238 ∆AVGRAINt-1 -8.08753e-05 0.000845841 -0.0956 0.92754 ∆AVGRAINt-2 0.000163892 0.000821866 0.1994 0.84979 ∆EDSEXP 0.0272649 0.0634229 0.4299 0.68517 ∆EDSEXPt-1 -0.0209234 0.0393734 -0.5314 0.61789 ∆EDSEXPt-2 0.0056703 0.056612 0.1002 0.92411 ∆GDPPC -0.000100972 0.000105003 -0.9616 0.38041
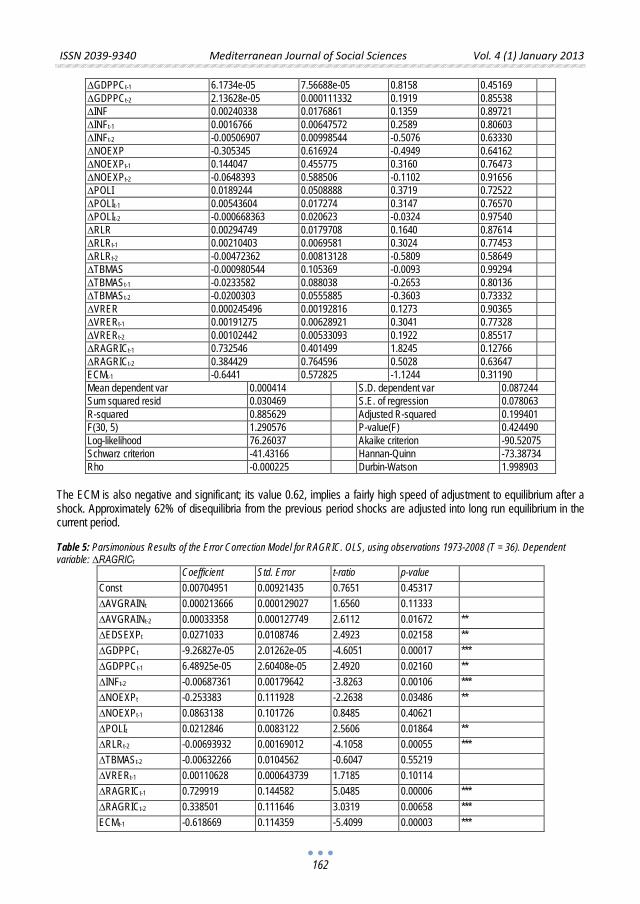
ISSN 2039-9340 Mediterranean Journal of Social Sciences Vol. 4 (1) January 2013
162
∆GDPPCt-1 6.1734e-05 7.56688e-05 0.8158 0.45169 ∆GDPPCt-2 2.13628e-05 0.000111332 0.1919 0.85538 ∆INF 0.00240338 0.0176861 0.1359 0.89721 ∆INFt-1 0.0016766 0.00647572 0.2589 0.80603 ∆INFt-2 -0.00506907 0.00998544 -0.5076 0.63330 ∆NOEXP -0.305345 0.616924 -0.4949 0.64162 ∆NOEXPt-1 0.144047 0.455775 0.3160 0.76473 ∆NOEXPt-2 -0.0648393 0.588506 -0.1102 0.91656 ∆POLI 0.0189244 0.0508888 0.3719 0.72522 ∆POLIt-1 0.00543604 0.017274 0.3147 0.76570 ∆POLIt-2 -0.000668363 0.020623 -0.0324 0.97540 ∆RLR 0.00294749 0.0179708 0.1640 0.87614 ∆RLRt-1 0.00210403 0.0069581 0.3024 0.77453 ∆RLRt-2 -0.00472362 0.00813128 -0.5809 0.58649 ∆TBMAS -0.000980544 0.105369 -0.0093 0.99294 ∆TBMASt-1 -0.0233582 0.088038 -0.2653 0.80136 ∆TBMASt-2 -0.0200303 0.0555885 -0.3603 0.73332 ∆VRER 0.000245496 0.00192816 0.1273 0.90365 ∆VRERt-1 0.00191275 0.00628921 0.3041 0.77328 ∆VRERt-2 0.00102442 0.00533093 0.1922 0.85517 ∆RAGRICt-1 0.732546 0.401499 1.8245 0.12766 ∆RAGRICt-2 0.384429 0.764596 0.5028 0.63647 ECMt-1 -0.6441 0.572825 -1.1244 0.31190 Mean dependent var 0.000414 S.D. dependent var 0.087244 Sum squared resid 0.030469 S.E. of regression 0.078063 R-squared 0.885629 Adjusted R-squared 0.199401 F(30, 5) 1.290576 P-value(F) 0.424490 Log-likelihood 76.26037 Akaike criterion -90.52075 Schwarz criterion -41.43166 Hannan-Quinn -73.38734 Rho -0.000225 Durbin-Watson 1.998903
The ECM is also negative and significant; its value 0.62, implies a fairly high speed of adjustment to equilibrium after a shock. Approximately 62% of disequilibria from the previous period shocks are adjusted into long run equilibrium in the current period.
Table 5: Parsimonious Results of the Error Correction Model for RAGRIC. OLS, using observations 1973-2008 (T = 36). Dependent variable: ∆RAGRICt
Coefficient Std. Error t-ratio p-value Const 0.00704951 0.00921435 0.7651 0.45317 ∆AVGRAINt 0.000213666 0.000129027 1.6560 0.11333 ∆AVGRAINt-2 0.00033358 0.000127749 2.6112 0.01672 ** ∆EDSEXPt 0.0271033 0.0108746 2.4923 0.02158 ** ∆GDPPCt -9.26827e-05 2.01262e-05 -4.6051 0.00017 *** ∆GDPPCt-1 6.48925e-05 2.60408e-05 2.4920 0.02160 ** ∆INFt-2 -0.00687361 0.00179642 -3.8263 0.00106 *** ∆NOEXPt -0.253383 0.111928 -2.2638 0.03486 ** ∆NOEXPt-1 0.0863138 0.101726 0.8485 0.40621 ∆POLIt 0.0212846 0.0083122 2.5606 0.01864 ** ∆RLRt-2 -0.00693932 0.00169012 -4.1058 0.00055 *** ∆TBMASt-2 -0.00632266 0.0104562 -0.6047 0.55219 ∆VRERt-1 0.00110628 0.000643739 1.7185 0.10114 ∆RAGRICt-1 0.729919 0.144582 5.0485 0.00006 *** ∆RAGRICt-2 0.338501 0.111646 3.0319 0.00658 *** ECMt-1 -0.618669 0.114359 -5.4099 0.00003 ***
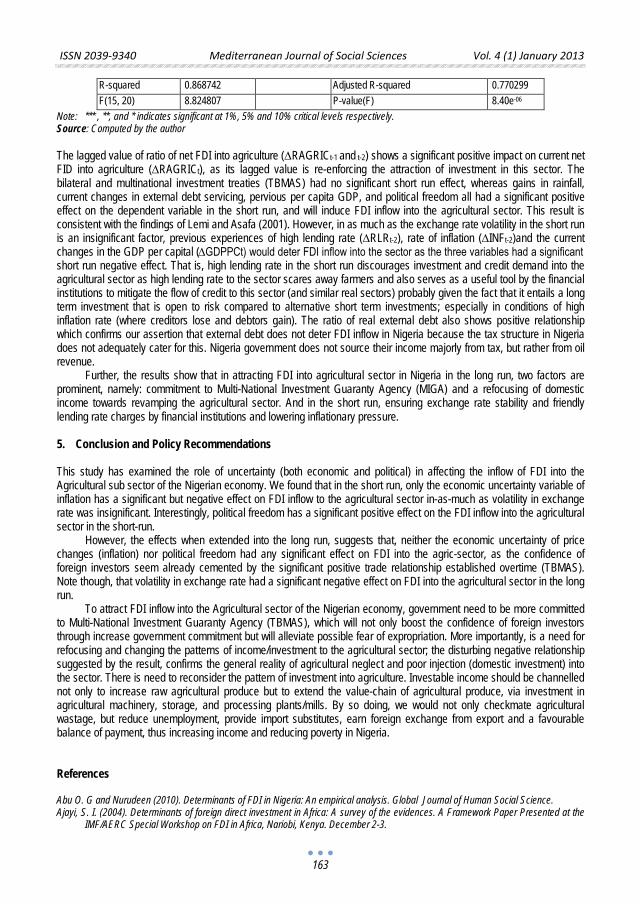
ISSN 2039-9340 Mediterranean Journal of Social Sciences Vol. 4 (1) January 2013
163
R-squared 0.868742 Adjusted R-squared 0.770299 F(15, 20) 8.824807 P-value(F) 8.40e-06
Note: *** , **, and * indicates significant at 1%, 5% and 10% critical levels respectively. Source: Computed by the author The lagged value of ratio of net FDI into agriculture (∆RAGRICt-1 and t-2) shows a significant positive impact on current net FID into agriculture (∆RAGRICt), as its lagged value is re-enforcing the attraction of investment in this sector. The bilateral and multinational investment treaties (TBMAS) had no significant short run effect, whereas gains in rainfall, current changes in external debt servicing, pervious per capita GDP, and political freedom all had a significant positive effect on the dependent variable in the short run, and will induce FDI inflow into the agricultural sector. This result is consistent with the findings of Lemi and Asafa (2001). However, in as much as the exchange rate volatility in the short run is an insignificant factor, previous experiences of high lending rate (∆RLRt-2), rate of inflation (∆INFt-2)and the current changes in the GDP per capital (∆GDPPCt) would deter FDI inflow into the sector as the three variables had a significant short run negative effect. That is, high lending rate in the short run discourages investment and credit demand into the agricultural sector as high lending rate to the sector scares away farmers and also serves as a useful tool by the financial institutions to mitigate the flow of credit to this sector (and similar real sectors) probably given the fact that it entails a long term investment that is open to risk compared to alternative short term investments; especially in conditions of high inflation rate (where creditors lose and debtors gain). The ratio of real external debt also shows positive relationship which confirms our assertion that external debt does not deter FDI inflow in Nigeria because the tax structure in Nigeria does not adequately cater for this. Nigeria government does not source their income majorly from tax, but rather from oil revenue.
Further, the results show that in attracting FDI into agricultural sector in Nigeria in the long run, two factors are prominent, namely: commitment to Multi-National Investment Guaranty Agency (MIGA) and a refocusing of domestic income towards revamping the agricultural sector. And in the short run, ensuring exchange rate stability and friendly lending rate charges by financial institutions and lowering inflationary pressure. 5. Conclusion and Policy Recommendations This study has examined the role of uncertainty (both economic and political) in affecting the inflow of FDI into the Agricultural sub sector of the Nigerian economy. We found that in the short run, only the economic uncertainty variable of inflation has a significant but negative effect on FDI inflow to the agricultural sector in-as-much as volatility in exchange rate was insignificant. Interestingly, political freedom has a significant positive effect on the FDI inflow into the agricultural sector in the short-run.
However, the effects when extended into the long run, suggests that, neither the economic uncertainty of price changes (inflation) nor political freedom had any significant effect on FDI into the agric-sector, as the confidence of foreign investors seem already cemented by the significant positive trade relationship established overtime (TBMAS). Note though, that volatility in exchange rate had a significant negative effect on FDI into the agricultural sector in the long run.
To attract FDI inflow into the Agricultural sector of the Nigerian economy, government need to be more committed to Multi-National Investment Guaranty Agency (TBMAS), which will not only boost the confidence of foreign investors through increase government commitment but will alleviate possible fear of expropriation. More importantly, is a need for refocusing and changing the patterns of income/investment to the agricultural sector; the disturbing negative relationship suggested by the result, confirms the general reality of agricultural neglect and poor injection (domestic investment) into the sector. There is need to reconsider the pattern of investment into agriculture. Investable income should be channelled not only to increase raw agricultural produce but to extend the value-chain of agricultural produce, via investment in agricultural machinery, storage, and processing plants/mills. By so doing, we would not only checkmate agricultural wastage, but reduce unemployment, provide import substitutes, earn foreign exchange from export and a favourable balance of payment, thus increasing income and reducing poverty in Nigeria. References Abu O. G and Nurudeen (2010). Determinants of FDI in Nigeria: An empirical analysis. Global Journal of Human Social Science. Ajayi, S. I. (2004). Determinants of foreign direct investment in Africa: A survey of the evidences. A Framework Paper Presented at the
IMF/AERC Special Workshop on FDI in Africa, Nariobi, Kenya. December 2-3.
ISSN 2039-9340 Mediterranean Journal of Social Sciences Vol. 4 (1) January 2013
164
Allaoua, Abdelkader and Atkin, Micheal (1993). FDI in Africa: Trends, constraints and challenges. Economic Commission for Africa (ECA), Addis Ababa, Ethiopia.
Asiedu, E. (2002). On the determinant of FDI to developing countries: Is Africa different? World Development, vol. 30, No.1. Baek, In-Mee and Okawa, Tamami (2001). Foreign exchange rates and Japanese foreign direct Investment in Asia. Journal of Economic
and Business, vol. 53, pp. 69-84. Baker, C. James (1999). Foreign direct investment in less developed countries: The role of ICSID and MIGA. (Boston: Quorum Books). Bleaney, M. (1993). Political uncertainty and private investment in South Africa. CREDIT Research Paper No.93/15, University of
Nottingham. Blomström, M., Kokko, A. and Zejan, M. (1994). Host country competition and technology transfer by multinationals. Weltwirtschaftliches
Archiv, Band 130, pp 521-533. Borensztein, E et al (1995). How does foreign direct investment affects economic growth? Working Paper No 5057; Cambridge M.A;
National Bureau of Economic Research Campa, J. (1993). Entry by foreign firms in the US under exchange-rate uncertainty. Review of Economics and Statistics, vol 75, (4), pp.
614-622. Caves, R. E. (1971). International corporations: The industrial economics of foreign investment. Economica, February, pp.1-27. Caves, R. E. (1974). Multinational firms, competition and productivity in host-country markets. Economica, vol. 32, pp. 176-193. Cushman, D. (1985). Real exchange rate risk, expectations, and the level of direct investment. The Review of Economics and Statistics,
vol. 67, pp. 297-308. Dinda. S (2009). Factors attracting FDI to Nigeria: An empirical investigation. Madras School of Economics, Tamil Nadi, India. Dornbusch, R and Reynoso, A. (1989). Financial factors in economics development. American Economic Review Papers and
Proceedings, vol.79, pp. 204-209. Faruqee, R. (1992). Private investment in Sub-Saharan Africa: An exploratory analysis. Internal Discussion Paper (Africa regional
series), World Bank. Freedom House (various issues) Annual Survey of Freedom Country ratings 1972-73 to 2007-08, 2008. Garner, J (1993). Determinants of recent direct investment flows to South Africa. Research Paper No.8, London School of Economics:
Centre for the Study of the South African Economy and International Finance. Globerman, S and Shapiro, D. M (1999), ‘The impact of government policies on foreign direct investment: the Canadian experience,’
Journal of International Business Studies, 30 (3), 513-532. Globerman, S and Sharpiro, D. M (2003). Governance infrastructure and US foreign direct investment. Journal of International Business
Studies, vol. 34, (1): pp 19-39. Goldberg, L. and Kolstad, C. (1995). Foreign direct investment, exchange rate variability and demand uncertainty. International
Economic Review, vol 36(4). Gujarati Damodar (1999). Essentials of Econometrics (2nd Edition) McGraw-Hill International Edition. Economics Series. Page 442, 461. Hess, R. (2000). Constraints on foreign direct investment. In Jenkins, C., Leape, J. and Thomas, L. (Eds), Gaining from Trade in
Southern Africa: Complementary Policies to Underpin the SADC Free Trade Area, Macmillan/Commonwealth Secretariat. Hymer, S (1976). The international operations of national firms: A study of foreign direct investment, MIT Press. Jenkins, C. and Lynne Thomas (2002). Foreign direct investment in Southern Africa: Determinants, characteristics and implications for
economic growth and poverty alleviation. A Research on Globalization and Poverty, Funded by DFID. Kindleberger, C. P. (1984). Multinational excursions. Cambridge: MIT Press. Lemi, A and Asefa, S (2001). Foreign direct investment and uncertainty: The case of African economies. Proceedings of the International
Business and Economics Research Conference, October 8-12, 2001, Reno, Nevada. Lemi, A, Asefa, S and Varangis, P (2002). Foreign direct investment and uncertainty: Empirical evidence from Africa. Centre for
Economic Research on Africa (CERAF), School of Business, Montclair State University, Upper Montclair, New Jersey. Paper Pthe Allied Social Science Association Annual Meeting That held in Atlanta, GA January 4-6, 2002.
MacKinnon, James G. (1991). “Critical Values for Cointegration Tests,” Chapter 13 in R. F. Engle and C. W. J . Granger (eds.), Long-run Economic Relationships: Readings in Cointegration, Oxford: Oxford University Press.
MacKinnon, James G. (1996). “Numerical Distribution Functions for Unit Root and Cointegration Tests,” Journal of Applied Econometrics, 11, 601-618.
National Bureau of Statistics (2012). Poverty Profile for Nigeria. Abuja: NBS Ngowi, H. P, (2001). Can Africa increase its global share of foreign direct investment (FDI). West Africa Review, vol 2(2). Nnadozie, Emmanuel, (2000). What determines US direct investment in African countries?’ Truman State University, Mimeo. Oshikoya, T. (1994). Macroeconomic determinants of domestic private investment in Africa: An empirical analysis. Economic
Development and Cultural Change, vol 42(3), pp.573-596. Oyaide, W. J. (1979). Twenty years of the Nigerian Economic Society and foreign investment in Nigeria. Nigerian Journal of Economic
and Social Studies 21(1-3) Special Issue: 57-66. Rivoli, P and Salorio, E. (1996). Foreign direct investment and investment under uncertainty. Journal of International Business Studies,
Second Quarter. Rodrik, D. (1989). Policy uncertainty and private investment in developing countries. NBER Working Paper 2999. Root, F. and Ahmed, A. (1979). Empirical determinants of manufacturing direct foreign investment in developing countries. Economic
Development and Cultural Change, vol 27, pp.751-767. Sachs, J. and Sievers, S. (1998). FDI in Africa. Africa Competitive Report. 1998, Geneva: World Economic Forum.

ISSN 2039-9340 Mediterranean Journal of Social Sciences Vol. 4 (1) January 2013
165
Schneider, F. and Fry, B. (1985). Economic and political determinants of foreign direct investment. World Development, vol 13(2), pp. 161-175.
Serven, L. and Solimano, A. (1993). Debt crisis, adjustment policies and capital formation in developing countries: Where do we stand? World Development, vol 21(1), pp.127-140.
Serven, Luis. (1998). Macroeconomic uncertainty and private investment in LDCs: An empirical investigation. The World Bank. Singh H. and Jun, K. W. (1996). The determinants of foreign direct investment in developing countries. Transnational Corporations, vol
5, (2), August. Thomas, Jonathan and Worral, Tim (1994). Foreign direct investment and the risk of expropriation. Review of Economics Studies vol. 61. Wheeler, D. and Mody, A. (1992). International investment location decisions: The case of U.S. firms. Journal of International
Economics, vol 33, pp. 57-76.

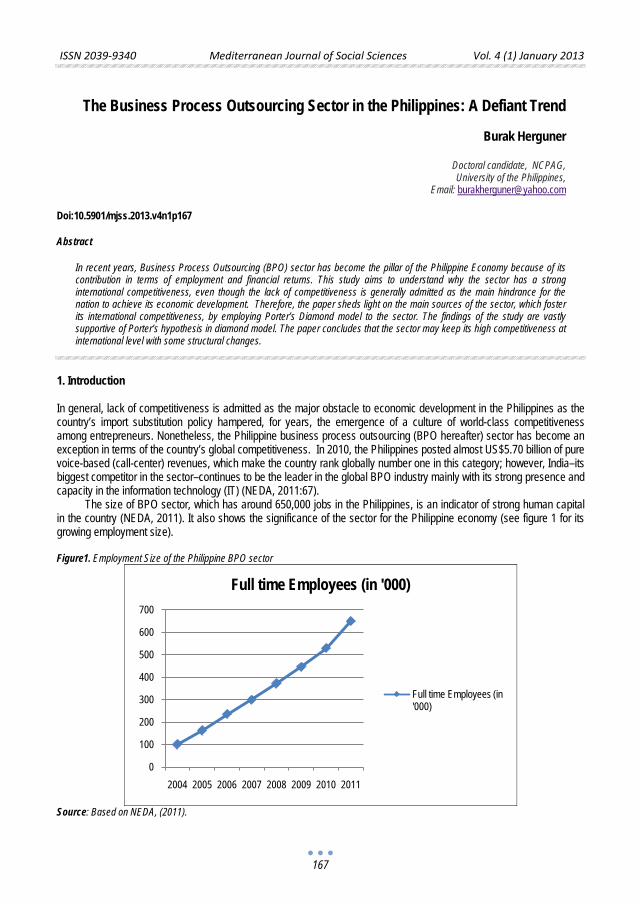
ISSN 2039-9340 Mediterranean Journal of Social Sciences Vol. 4 (1) January 2013
167
The Business Process Outsourcing Sector in the Philippines: A Defiant Trend
Burak Herguner
Doctoral candidate, NCPAG, University of the Philippines,
Email: [email protected] Doi:10.5901/mjss.2013.v4n1p167 Abstract
In recent years, Business Process Outsourcing (BPO) sector has become the pillar of the Philippine Economy because of its contribution in terms of employment and financial returns. This study aims to understand why the sector has a strong international competitiveness, even though the lack of competitiveness is generally admitted as the main hindrance for the nation to achieve its economic development. Therefore, the paper sheds light on the main sources of the sector, which foster its international competitiveness, by employing Porter’s Diamond model to the sector. The findings of the study are vastly supportive of Porter’s hypothesis in diamond model. The paper concludes that the sector may keep its high competitiveness at international level with some structural changes.
1. Introduction In general, lack of competitiveness is admitted as the major obstacle to economic development in the Philippines as the country’s import substitution policy hampered, for years, the emergence of a culture of world-class competitiveness among entrepreneurs. Nonetheless, the Philippine business process outsourcing (BPO hereafter) sector has become an exception in terms of the country’s global competitiveness. In 2010, the Philippines posted almost US$5.70 billion of pure voice-based (call-center) revenues, which make the country rank globally number one in this category; however, India–its biggest competitor in the sector–continues to be the leader in the global BPO industry mainly with its strong presence and capacity in the information technology (IT) (NEDA, 2011:67).
The size of BPO sector, which has around 650,000 jobs in the Philippines, is an indicator of strong human capital in the country (NEDA, 2011). It also shows the significance of the sector for the Philippine economy (see figure 1 for its growing employment size).
Figure1. Employment Size of the Philippine BPO sector
Source: Based on NEDA, (2011).
0
100
200
300
400
500
600
700
2004 2005 2006 2007 2008 2009 2010 2011
Full time Employees (in '000)
Full time Employees (in '000)
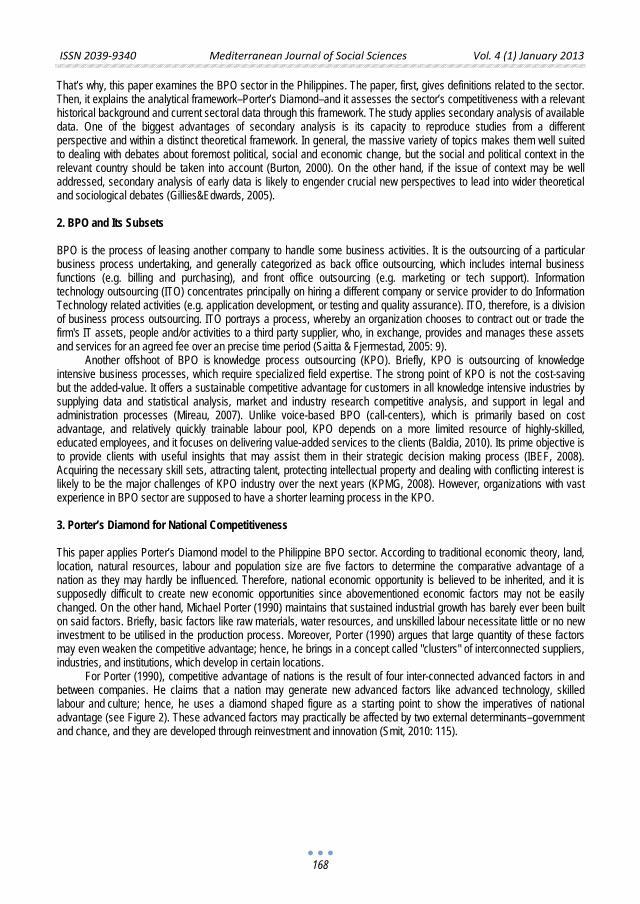
ISSN 2039-9340 Mediterranean Journal of Social Sciences Vol. 4 (1) January 2013
168
That’s why, this paper examines the BPO sector in the Philippines. The paper, first, gives definitions related to the sector. Then, it explains the analytical framework–Porter’s Diamond–and it assesses the sector’s competitiveness with a relevant historical background and current sectoral data through this framework. The study applies secondary analysis of available data. One of the biggest advantages of secondary analysis is its capacity to reproduce studies from a different perspective and within a distinct theoretical framework. In general, the massive variety of topics makes them well suited to dealing with debates about foremost political, social and economic change, but the social and political context in the relevant country should be taken into account (Burton, 2000). On the other hand, if the issue of context may be well addressed, secondary analysis of early data is likely to engender crucial new perspectives to lead into wider theoretical and sociological debates (Gillies&Edwards, 2005). 2. BPO and Its Subsets BPO is the process of leasing another company to handle some business activities. It is the outsourcing of a particular business process undertaking, and generally categorized as back office outsourcing, which includes internal business functions (e.g. billing and purchasing), and front office outsourcing (e.g. marketing or tech support). Information technology outsourcing (ITO) concentrates principally on hiring a different company or service provider to do Information Technology related activities (e.g. application development, or testing and quality assurance). ITO, therefore, is a division of business process outsourcing. ITO portrays a process, whereby an organization chooses to contract out or trade the firm's IT assets, people and/or activities to a third party supplier, who, in exchange, provides and manages these assets and services for an agreed fee over an precise time period (Saitta & Fjermestad, 2005: 9).
Another offshoot of BPO is knowledge process outsourcing (KPO). Briefly, KPO is outsourcing of knowledge intensive business processes, which require specialized field expertise. The strong point of KPO is not the cost-saving but the added-value. It offers a sustainable competitive advantage for customers in all knowledge intensive industries by supplying data and statistical analysis, market and industry research competitive analysis, and support in legal and administration processes (Mireau, 2007). Unlike voice-based BPO (call-centers), which is primarily based on cost advantage, and relatively quickly trainable labour pool, KPO depends on a more limited resource of highly-skilled, educated employees, and it focuses on delivering value-added services to the clients (Baldia, 2010). Its prime objective is to provide clients with useful insights that may assist them in their strategic decision making process (IBEF, 2008). Acquiring the necessary skill sets, attracting talent, protecting intellectual property and dealing with conflicting interest is likely to be the major challenges of KPO industry over the next years (KPMG, 2008). However, organizations with vast experience in BPO sector are supposed to have a shorter learning process in the KPO. 3. Porter’s Diamond for National Competitiveness This paper applies Porter’s Diamond model to the Philippine BPO sector. According to traditional economic theory, land, location, natural resources, labour and population size are five factors to determine the comparative advantage of a nation as they may hardly be influenced. Therefore, national economic opportunity is believed to be inherited, and it is supposedly difficult to create new economic opportunities since abovementioned economic factors may not be easily changed. On the other hand, Michael Porter (1990) maintains that sustained industrial growth has barely ever been built on said factors. Briefly, basic factors like raw materials, water resources, and unskilled labour necessitate little or no new investment to be utilised in the production process. Moreover, Porter (1990) argues that large quantity of these factors may even weaken the competitive advantage; hence, he brings in a concept called "clusters" of interconnected suppliers, industries, and institutions, which develop in certain locations.
For Porter (1990), competitive advantage of nations is the result of four inter-connected advanced factors in and between companies. He claims that a nation may generate new advanced factors like advanced technology, skilled labour and culture; hence, he uses a diamond shaped figure as a starting point to show the imperatives of national advantage (see Figure 2). These advanced factors may practically be affected by two external determinants–government and chance, and they are developed through reinvestment and innovation (Smit, 2010: 115).
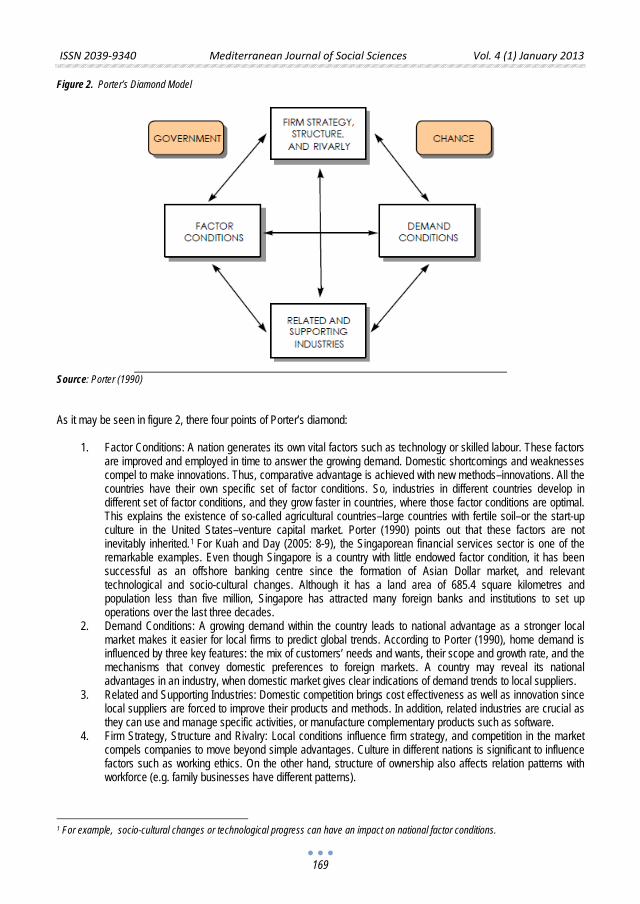
ISSN 2039-9340 Mediterranean Journal of Social Sciences Vol. 4 (1) January 2013
169
Figure 2. Porter’s Diamond Model
1. Factor Conditions: A nation generates its own vital factors such as technology or skilled labour. These factors are improved and employed in time to answer the growing demand. Domestic shortcomings and weaknesses compel to make innovations. Thus, comparative advantage is achieved with new methods–innovations. All the countries have their own specific set of factor conditions. So, industries in different countries develop in different set of factor conditions, and they grow faster in countries, where those factor conditions are optimal. This explains the existence of so-called agricultural countries–large countries with fertile soil–or the start-up culture in the United States–venture capital market. Porter (1990) points out that these factors are not inevitably inherited.
Source: Porter (1990) As it may be seen in figure 2, there four points of Porter’s diamond:
1
2. Demand Conditions: A growing demand within the country leads to national advantage as a stronger local market makes it easier for local firms to predict global trends. According to Porter (1990), home demand is influenced by three key features: the mix of customers’ needs and wants, their scope and growth rate, and the mechanisms that convey domestic preferences to foreign markets. A country may reveal its national advantages in an industry, when domestic market gives clear indications of demand trends to local suppliers.
For Kuah and Day (2005: 8-9), the Singaporean financial services sector is one of the remarkable examples. Even though Singapore is a country with little endowed factor condition, it has been successful as an offshore banking centre since the formation of Asian Dollar market, and relevant technological and socio-cultural changes. Although it has a land area of 685.4 square kilometres and population less than five million, Singapore has attracted many foreign banks and institutions to set up operations over the last three decades.
3. Related and Supporting Industries: Domestic competition brings cost effectiveness as well as innovation since local suppliers are forced to improve their products and methods. In addition, related industries are crucial as they can use and manage specific activities, or manufacture complementary products such as software.
4. Firm Strategy, Structure and Rivalry: Local conditions influence firm strategy, and competition in the market compels companies to move beyond simple advantages. Culture in different nations is significant to influence factors such as working ethics. On the other hand, structure of ownership also affects relation patterns with workforce (e.g. family businesses have different patterns).
1 For example, socio-cultural changes or technological progress can have an impact on national factor conditions.
ISSN 2039-9340 Mediterranean Journal of Social Sciences Vol. 4 (1) January 2013
170
Finally, although not illustrated as one of the four factors in the Diamond model, Porter (1990) acknowledges the role of governmental forces and chance for the national competitive advantage. Governments’ expected duty in the Diamond Model is principally to assist in creating growth for industries, and to give confidence. Furthermore, for him, national governments should establish policies to breed national advantages for industries in the country to develop a strong competitive position at global scale.
For Wickham (2005), one of the major problems regarding the implementation of Porter’s model by policy makers is the replication of successful models such as Silicon Valley without examining the context. Likewise, some research projects underscore the necessity for amendments in the model to better evaluate the distinct circumstances.2
On the other hand, for a successful shift from a voice-based BPO sector to stronger ITO and KTO for a sustainable growth, the Philippines should solve its two main problems (i.e. human resources and capital).
On the other hand, Moon et al. (1998) argue that governments’ role is the most crucial factor, especially for smaller
economies, to determine the competitiveness in a given industry. In addition, there are views considering the role of government as a fifth determinant in the diamond model (Oz, 2002; Wickham, 2005). Porter’s model, however, provides no reliable guide for governments with respect to appropriate policies to engage in. Especially, developing countries are given extensive encouragement to pursue policies which may actually be detrimental (Wickham, 2005; Davies and Ellis, 2000; Jackson, 2006). The role of the Multinationals is allegedly overlooked in Porter’s model as well (Kim and Wicks, 2010; Oz, 2002; Moon et al, 1998). In the face of these critics, Porter’s model has continued to attract interest and it was further developed by a number of economists under various names such as the Generalized Double Diamond to include human factor (Moon et al, 1995, 1998), or the Nine-Factor Model to add the role of Multinationals (Cho 1994; Cho and Moon, 2000, 2005). 4. Assessing the Competitiveness of the BPO sector in the Philippines 4.1 Factor Conditions First element of Porter’s diamond model is factor conditions. According to the hypothesis of Porter (1990), more advanced factor conditions create stronger international competitiveness in a given sector, and pertinent factors are knowledge resources, capital resources, physical resources, human resources and infrastructure.
Currently, voice-based outsourcing is the Philippine’s strongest business outsourcing activity, and its strength is deeply related to recent infrastructural developments. In 2002-2003, the Philippines had significant telecom advantages over other countries (e.g. available international direct dial services, lower prices, and diversity in the number of major or trunk lines). Later, a significant part of the wiring became comprised of fibre optics. A standard E1 (high bandwidth) telephone line was about two to three times cheaper in the Philippines than in India–its major competitor. These infrastructural advantages were the reasons behind the boost in the voice-based BPO (Tschang, 2005).
In terms of human resources, because of its relatively higher labour costs, the country lost its comparative advantage in unskilled labour-intensive production to the countries such as China. Nonetheless, it still has a comparative advantage in semi-skilled recruitment thanks to its English language based educational system (Abinales &Amoroso, 2005: 247). This is the main reason in the strength of the nation in voice-based BPO. In recent years, its success attracted interest in other countries as well (e.g. for researches to emulate the Philippine model on Bangladesh, see Carana Corporation, 2002).
3
Demand Conditions are related to domestic interest and demand for the products or service of a firm, and they are connected with both the quantity and the quality of consumers. Hence, the population characteristics and economic development level of a given country are significant determinants. Simply, if there is no current home demand for any
In the Philippines, about 400,000 students graduate from colleges per year, and more than 20 per cent are in Engineering and IT departments. In addition, Western based curriculum and high literacy rate are all promising for the sector (NSO, 2012). Nonetheless, the quality of education in the relevant departments should be increased with more financial support and cooperation of the firms as software development firms are concerned about the competency of labour pool in dealing with software processes. 4.2 Demand conditions
2 See Magdelena and Federico (2011) for a discussion on the necessity of amendment in the model. 3 For example, Filipino software development has some disadvantages, whereas several Indian firms are already of a noteworthy size and capability, and firms in other countries such as China are also in search of entering the software services market.
ISSN 2039-9340 Mediterranean Journal of Social Sciences Vol. 4 (1) January 2013
171
specific service or products, and there is not any prospect for future demand, it is impossible for an industry to achieve international competition advantage (Porter, 1990).
Drawing on the hypothesis of Porter about demand conditions (i.e. more demanding homeland customers create stronger international competitiveness), we should first analyse the population of the country. According to the demographic indicators of the United Nations Population Fund (2010), total population of the Philippines was 93.6 millions in 2010, and it is projected that the population will reach 146.2 million by 2050; thus, the Philippines is likely to remain as the second most populated country of the South-Eastern Asia region after Indonesia. According to a report of National Statistics of Office (2012), the ratio of elderly people in the country in 2007 was only 4.1 per cent. In addition, the projections regarding the population of the country made by United Nations Population Fund (UNFPA) (2007; 2010) the state of world population reports confirm that the Philippines is expected to keep its young population in the future. Nonetheless, in terms of GDP growing and GDP per capita indicators, the country lagged behind its neighbours due to its boom-and-bust cycle economy which made it classified among low-middle level income countries (Aldaba, 2000: Gonzales and Manasan, 2002: Virola et al, 2010).
On the other hand, naturally, the size of population and per capita income are not adequate to gauge home demand. Apart from said macro indicators, key indicators concerning a sector to determine home demand for its service or products are interest and affinity of the people. However, home demand is the most intriguing issue in applying the Porter’s Diamond for the BPO sector as the chief rationale of the sector is to gain offshore cost advantages. Therefore, in this sense, it is difficult to talk about a strong home market, but rather we may link the issue with successful internationalization of the home market with cultural affinity as mentioned by Porter (1990). In the BPO sector, strong cultural affinity of the Philippine people with English speaking nations thanks to similar educational syllabus and life-style in the big cities makes the country a preferable BPO destination abroad. Thus, we may argue that keeping and enforcing cultural similarities act the part of strong local market for the application of Porter’s diamond into the BPO sector.4
In the BPO sector, a different way to increase opportunities is to provide business opportunities to domestic firms. In the Philippines, some multinationals in the sector such as Accenture and RCG have started to develop relations or to use the work force of the smaller local software firms, which have capability in technical areas to complement the larger firms’ ability. Similarly, e-commerce firm ABM Global-Bayan Trade has been developing the auction market for local suppliers and buyers to transact with each other. By doing so, it assists local industries become more efficient. On the other hand, local industry associations are important in promoting the potential of an industry.
4.3 Related and Supporting Industries Third constituent of Porter’s diamond is related and supporting industries. Especially, behind any industrial development path–whether it is about manufacturing, software, or services–there is a particular supportive economic mechanism including supplier networks, industrial or agglomerative clusters, resource pools, and institutions (neoIT, 2005). Development of competitive economy takes time as efforts to transform the economic base give positive results in the long term. On the other hand, industry clustering has eventually become more popular among economic development professionals all over the world since it is largely believed in our day that the competitiveness of a nation stands on the industrial ability to form networks, which sustain geographic concentrations of institutions, customers and firms. Whereas a sector may be identical with a cluster in some cases, a cluster is broader than a single sector. Clusters are industries that are connected by the flow of goods and services (Smith, 2003). On the other hand, the firms in a cluster may be both cooperative and competitive. They may be in direct competition with other members in the cluster; they may purchase inputs from other cluster members, or rely on the services of other firms in the operation of their business. A cluster also differs from a trade association, which generally has a more limited membership and focus. A trade association in general includes the members of a single industry and focus overwhelmingly on lobbying (UMES, 1999). Nevertheless, as the BPO is a service industry, it does not need supply chains like those of the manufacturing sector. BPO firms do not automatically have the same kinds of linkages that some clusters have between industries and universities, or between firms.
5
4 Here, we should take account of the limitation of the study. This issue, as expected, should be widely discussed in connection with the Philippine local cultures and its other potential implications. 5 For example, India’s software association–NASSCOM–plays a pivotal role for the Indian software industry to promote it abroad, and to assist in preparing useful industrial solutions.
In the Philippines, Business Process Association of the Philippines (BPAP), which represents entire BPO industry including call centers and ITO firms, try to play a significant role (Tschang, 2005). The BPO Services Association Unlimited (BSA/U), and Contact Center Association of the Philippines (CCAP) are another important associations in the sector to unite the collective
ISSN 2039-9340 Mediterranean Journal of Social Sciences Vol. 4 (1) January 2013
172
interests of the BPO firms. Nonetheless, the Philippines, in general, is still lagging behind its competitors in building strong institutions to help its industries.
4.4 Firm strategy, Structure and Rivalry Firm strategy, structure and rivalry are the fourth element in the Porter’s model. Growth strategies are linked with higher competitiveness as the growth is highly related to overall business health. Greater competition in an industry paves the way for a firm to reach a higher level of competitiveness in comparison with its global competitors. However, in the Philippines, there is a need for structural change to achieve sustainable growth. The main problem of the country has hitherto been the inefficient or ailing institutions. During Marcos presidency, with the declaration of Martial law in 1972, existing legislative, executive and judiciary institutions were weakened. Marcos regime ended aftermath of EDSA uprising in 1986 with the help of some political elites, who were once close to him. The assistance of these elites including some high ranked Army officers prevented succeeding Corazon Aquino administration from establishing new institutions as well. The main objective of Ferdinand Marcos was to thwart oligarchs by supporting his cronies, and to establish a technocratic system to provide economic growth; hence, he appointed western educated economists, who had no political motivations. As a result, he kept good relations with international finance institutions–mainly with IMF and World Bank–and said institutions provided large amount of loans to the country. Nonetheless, the Philippines invested in wrong areas–capital intensive industries–instead of using its comparative labour advantage; therefore, its economy grew less than its neighbours (Root, 1996: 114-138).
On the other hand, main reasons to outsource to the Philippines are Filipinos’ cultural affinity to the West, highly motivated labour pool, and the work ethics of Filipino agents causing relatively lower labour problems compared to western countries. Besides, English is the basic communication medium in business, government and schools. These advantages have made the Philippines a major call center destination. 6
In the Philippines, although there are extensive efforts to develop new outsourcing destinations in different cities, metro Manila is, by far, the most popular outsourcing destination. The biggest advantage of the city as a global centre of outsourcing is its huge skilful workforce pool with English language proficiency, cultural affinity with the English-speaking nations, good telecommunication infrastructure, and an attractive cost structure offering big savings for both outsourcing firms and their customers. Nevertheless, overall talent pool of its major rivals such as China and India are greater than the Philippines. Therefore, there is a need for a profound structural change, and a shift of priority in BPO subsectors (i.e. from voice-based to ITO and KPO). For now, KPO seems to be the new trend of global outsourcing market. Especially, India is in pursuit of producing policies to benefit more from the global market in this emerging sector. In the Philippines, although a remarkable growth in KPO
In addition, the sector expects to continue posting double digit growth, mostly owing to diversification and expansion of major clients abroad (BOI, 2011). Nonetheless, there is a growing tendency among industry leaders for a change from call center intensified employment and focus to higher value-added employment and businesses like outsourced animation and IT services.
7
Currently, the BPO industry has the full support of the incumbent Benigno S. Aquino III administration, which plans to generate additional jobs for nearly 1.3 million Filipinos in the BPO centres, and to increase total revenues to around $25 billion by 2016. These plans came amid a backlash in the United States against the outsourcing by large corporations of back office work to cheaper locations like the Philippines and India in the midst of the high unemployment rate in the US mainland. However, it is not yet obvious whether this sentiment is translated into a lower degree of outsourcing through legislations or voluntary withdrawal from outsourcing. Therefore, the Philippine officials are still optimistic about the prospects for long-run growth of the sector thanks to high amount of English-speaking college graduates in the country, who are paid much lesser than their counterparts in the US and somewhere else for getting the same output. It is evident that advanced countries have better business infrastructures. In general, the Philippine government is quite supportive and it makes necessary amendments and official regulations to boost its local industries.
with more than two-fold growth in revenues from US$400 million to US$830 million between 2007 and 2008, there are some disadvantages of the country in talent pool availability, and cost arbitrage (NEDA, 2011). 4.5 Government Policies and Chance Along with the aforementioned four main components of Porter’s diamond, Government policies and chance also play an essential role in developing the competitiveness of the nation.
6 In 2010, over 60 percent of the total BPO workforce of 530,000 was employed in call center facilities (NEDA, 2011). 7 Mainly in research, analytics and legal services.
ISSN 2039-9340 Mediterranean Journal of Social Sciences Vol. 4 (1) January 2013
173
However, enforcement of laws is still problematic, and it should be one of the priorities of the national government in the coming years. Cost of doing business, time to start a business, or copyright and patent arrangements play a vital role in thriving of businesses. In recent years, the Philippine governments made several amendments, but there is still need for further improvements (e.g., time to start a business is 52 days in the Philippines, three days in Singapore, and six days in Hong Kong see NEDA, 2011).
On the other hand, The Philippine government has plans to develop alternative, smaller cities to sustain the growth in the BPO sector. Therefore, initially, eight cities were identified as the most favourable alternate destinations. These cities are Davao, Cebu, Clark, Cagayan de Oro, Iloilo, Baguio, Bacalod and Dumaguete, and they are called as second-tier emerging Filipino cities. Local governments in the aforementioned cities diligently promote their cities as an alternate outsourcing destination of the country as well. Although metro Manila is likely to keep its primary destination status in coming years, these cities have significant advantages compared with metro Manila especially in terms of cost of living and cost of real estate. Increasing cost of doing business mainly because of rising price of class A prime properties in Manila in comparison with relatively untapped outsourcing markets offering lower operational costs in the said smaller cities pave the way for emerging cities to boost their BPO industry (NeoIT, 2005; NEDA, 2011).
For Porter (1990), chance factor consists of positive or negative impacts of several external incidents such as war, or policy changes in other countries. For the BPO sector, a prospect policy change of the US administration to bring the offshore jobs back to the country may have a negative impact as the US firms are the leading client of the Philippine BPO industry. On the other hand, the Philippines is in a relatively more business friendly and stable region, which gives any thriving sector in the Philippines to find market for its services or products outside home market. However, chance alone is not enough to boost any industry and it should be wisely used by the firms in the sector as well as governments. 5. Concluding Remarks This paper has discussed the Philippine BPO sector, which is currently one of the most vital sectors for the Philippine economy, and it has applied Porter’s diamond model for the sector. When Porter’s diamond model was applied to the Philippine BPO sector, it was observed that the industry’s competitive advantage lies more in human factor. Drawing on the findings, this study suggests a structural change in the sector, enforcement of related laws and regulations, and better planned education policy by the government to sustain the growth in the sector. In the short term, a shift from voice based sector to KPO may be beneficial for the continuity of growth in the BPO sector.
Even if, as mentioned earlier, there are some critics of the model for its insufficient analysis on the role of multinationals or human factor, the results of the study, which are highly supportive of Porter’s diamond model, may encourage the applicability of the framework to uncompetitive industries by designing relevant policies to boost their competitiveness at international level. To sum up, the BPO industry in the Philippines may keep its competitiveness with successful strategies on the basis of restructuration as discussed in this study. References Abinales, P. N., & Amoroso, D.J. (2005). State and Society in the Philippines. Pasig City: Anvil Publishing. Aldaba, F. T. (2000). Globalisation and social development in the Philippines: socio economic impact of the East Asian crisis. CAS
Discussion paper No 27, Centre for ASEAN Studies, University of Antwerp, Antwerp. Baldia, S. (2010). Thinking Outside the BPO: Knowledge Process Outsourcing to India. Accessed
at www.mayerbrownrowe.com/businesstechnologysourcing BOI (2011). Customer Relations Management (CRM) / VOICE BPO. Accessed at http://www.boi.gov.ph/pdf/industryprofiles/
IT%20and%20BPO/Call%20Center.pdf Burton, D. (2000). Secondary Data Analysis. In: Burton D. (eds.) Research Training for Social Scientists: A Handbook for Postgraduate
Researchers (Ch.24). London: Sage Publications. Carana Corporation. (2002). Elements of a National Strategy for Development of an Information Technology Enabled Services Sector in
Bangladesh. USAID Bangladesh IT Enabled Services Project. Cho, D.S. (1994). A Dynamic Approach to International Competitiveness: The Case of Korea. Journal of Far Eastern Business, 1(1) 17-
36. Cho, D.S., & Moon, H.C. (2000). From Adam Smith to Michael Porter. Singapore: World Scientific Publication. Cho, D.S., & Moon, H.C. (2005). National Competitiveness: Implications for Different Groups and Strategies. International Journal of
Global Business and Competitiveness, 1(1), 1-11. Davies, H., & Ellis, P.D. (2000). “Porter’s ‘Competitive Advantage of Nations’: Time for a final judgment? Journal of Management
Studies, 37(8), 1189-1213.
ISSN 2039-9340 Mediterranean Journal of Social Sciences Vol. 4 (1) January 2013
174
Federico, G. T. B., & Magdalena, M. G. T. (2011). Is Porter’s diamond applicable to developing countries? A case study of the broiler industry in Uruguay. International Journal of Business and Social Science, 2(6), 17-28.
Gillies, V., & Edwards, R. (2005). Secondary Analysis in Exploring Family and Social Change: Addressing the Issue of Context, 6(1), Art. 44.
Gonzalez, E., & Manasan, R. (2002). Social Protection in the Philippines. In: Adam, E., vonHuff, M. and John, M. (Eds.), Social Protection in Southeast and EastAsia (pp. 180-229). Singapore: Friedrich Ebert Stiftung.
IBEF (2008). Knowledge Process Outsourcing: Market & Opportunities. Accessed at www.tpi.net/pdf/researchreports/KPO ResearchReport_july07.pdf
Jackson, J. (2006). Developing regional tourism in China: The potential for activating business clusters in a socialist market economy, Tourism Management, 27. 695 - 706.
Kim, N., & Wicks, B. E. (2010). Rethinking Tourism Cluster Development Models for Global Competitiveness. International CHRIE Conference Working paper, University of Massachusetts, Amherst.
KPMG (2008). Knowledge Process Outsourcing: Unlocking top-line growth by oursourcing “the core”. Accessed at http://www.kpmg.com/Global/en/IssuesAndInsights/ArticlesPublications/Documents/Knowledge-Process-Outsourcing.pdf
Kuah, A. & Day, J. (2005). Revisiting the Porter Diamond: Applying Importance Performance Matrix to the Singaporean Financial Cluster. Working Paper No 05/39, Bradford University, School of Management.
Mierau, A. (2007). Strategic Importance of Knowledge Process Outsourcing. Accessed at http://www.hrotoday.com/pdf/white-papers/Strategic-Implications-of-KPO.pdf
Moon, H.C., Rugman, A.M., & Verbeke, A. (1998) A generalized double diamond approach to the global competitiveness of Korea and Singapore. International Business Review, (7), 135–150.
Moon, H.C., Rugman, A.M., & Verbeke, A. (1995). The generalized double diamond approach to international competitiveness. In: A. Rugman, J. Van Den Broeck & A. Verbeke (Eds.), Research in global strategic management: Volume 5: Beyond the diamond (pp. 97–114). Greenwich, CT: JAI Press.
NEDA (2011). The Philippine Development Plan (PDP) 2011-2016: Social Contract with Whom? Manila: NEDA. neoIT (2005). Outsourcing to the Philippines: Metro Manila and Beyond, Offshore Insights Market Reports Series, 3(9). NSO (2012). The Philippines in Figures 2012. Metro Manila: NSO. Oz, O. (2002). Assessing Porter’s framework for national advantage: the case of Turkey. Journal of Business Research, 55, 509– 515. Porter, M.E. (1990). The Competitive Advantages of Nations. New York: The Free Press. Root, H. L. (1996). Small Countries, Big Lessons: Governance and the rise of East Asia. Hong Kong: Oxford University Press. Saitta, J.A., & Fjermestad, J.F. (2005). A Basic Model for Information Technology Outsourcing. Journal of Information Science and
Technology, 2(4), 7-29. Smit, A.J. (2010). the competitive advantage of nations: is Porter’s Diamond Framework a new theory that explains the international
competitiveness of countries? Southern African Business Review, 14(1), 105-130. Smith, R.V. (2003). Industry Cluster Analysis: Inspiring a Common Strategy for Community Development. Accessed
at http://extension.psu.edu/workforce/briefs/indclustanal.pdf Tschang, F. T. (2005). The Philippines IT-Enabled Services Industry, report for the Foreign Investment Advisory Service (World Bank)
and the Government of the Philippines. UMES (1999). Industry Clusters: An Economic Development Strategy for Minnesota. Accessed at http://www.hhh.umn.edu/centers/slp
/economic_development/documents/econdev_strategy_mn_industry_cluster.pdf UNFPA (2007). the State of World Population 2007. New York: UNFPA. UNFPA (2010). the State of World Population 2010. New York: UNFPA. Virola, R.A., Astrologo, C.J., & Rivera P.A.L. (2010). Disturbing Statistics: The Philippines Compared to Our ASEAN Neighbors. 11th
National Convention on Statistics (NCS) working paper, Manila. Wickham, M. (2005). Reconceptualising Porter's Diamond for the Australian Context. Journal of New Business Ideas and Trends, 3 (2).
40-48.
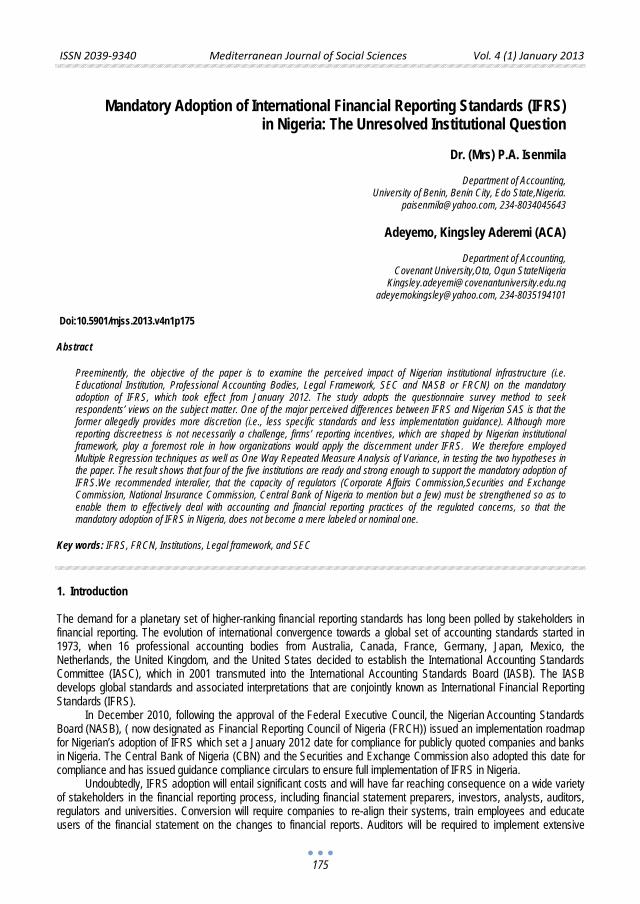
ISSN 2039-9340 Mediterranean Journal of Social Sciences Vol. 4 (1) January 2013
175
Mandatory Adoption of International Financial Reporting Standards (IFRS)
in Nigeria: The Unresolved Institutional Question
Dr. (Mrs) P.A. Isenmila
Department of Accounting, University of Benin, Benin City, Edo State,Nigeria.
[email protected], 234-8034045643
Adeyemo, Kingsley Aderemi (ACA)
Department of Accounting, Covenant University,Ota, Ogun StateNigeria
[email protected] [email protected], 234-8035194101
Doi:10.5901/mjss.2013.v4n1p175 Abstract
Preeminently, the objective of the paper is to examine the perceived impact of Nigerian institutional infrastructure (i.e. Educational Institution, Professional Accounting Bodies, Legal Framework, SEC and NASB or FRCN) on the mandatory adoption of IFRS, which took effect from January 2012. The study adopts the questionnaire survey method to seek respondents’ views on the subject matter. One of the major perceived differences between IFRS and Nigerian SAS is that the former allegedly provides more discretion (i.e., less specific standards and less implementation guidance). Although more reporting discreetness is not necessarily a challenge, firms’ reporting incentives, which are shaped by Nigerian institutional framework, play a foremost role in how organizations would apply the discernment under IFRS. We therefore employed Multiple Regression techniques as well as One Way Repeated Measure Analysis of Variance, in testing the two hypotheses in the paper. The result shows that four of the five institutions are ready and strong enough to support the mandatory adoption of IFRS.We recommended interalier, that the capacity of regulators (Corporate Affairs Commission,Securities and Exchange Commission, National Insurance Commission, Central Bank of Nigeria to mention but a few) must be strengthened so as to enable them to effectively deal with accounting and financial reporting practices of the regulated concerns, so that the mandatory adoption of IFRS in Nigeria, does not become a mere labeled or nominal one.
Key words: IFRS, FRCN, Institutions, Legal framework, and SEC 1. Introduction The demand for a planetary set of higher-ranking financial reporting standards has long been polled by stakeholders in financial reporting. The evolution of international convergence towards a global set of accounting standards started in 1973, when 16 professional accounting bodies from Australia, Canada, France, Germany, Japan, Mexico, the Netherlands, the United Kingdom, and the United States decided to establish the International Accounting Standards Committee (IASC), which in 2001 transmuted into the International Accounting Standards Board (IASB). The IASB develops global standards and associated interpretations that are conjointly known as International Financial Reporting Standards (IFRS).
In December 2010, following the approval of the Federal Executive Council, the Nigerian Accounting Standards Board (NASB), ( now designated as Financial Reporting Council of Nigeria (FRCH)) issued an implementation roadmap for Nigerian’s adoption of IFRS which set a January 2012 date for compliance for publicly quoted companies and banks in Nigeria. The Central Bank of Nigeria (CBN) and the Securities and Exchange Commission also adopted this date for compliance and has issued guidance compliance circulars to ensure full implementation of IFRS in Nigeria.
Undoubtedly, IFRS adoption will entail significant costs and will have far reaching consequence on a wide variety of stakeholders in the financial reporting process, including financial statement preparers, investors, analysts, auditors, regulators and universities. Conversion will require companies to re-align their systems, train employees and educate users of the financial statement on the changes to financial reports. Auditors will be required to implement extensive
ISSN 2039-9340 Mediterranean Journal of Social Sciences Vol. 4 (1) January 2013
176
training programs and build appropriate infrastructure to ensure that audit engagement teams are equipped to audit IFRS accounts. Polytechnics and universities will need to revamp curriculum materials to ensure that future accounting professionals receive a substantial amount of IFRS education.
The major concern in Nigeria today (in the face of these copious associated challenges) is, would ‘de jure’ synchronization of accounting standards (i.e. IFRS) in Nigeria lead to ‘de facto’ harmonization of financial reporting practices? In view of the obvious fact that reported accounting numbers are shaped by the historical, economical and institutional structure in the locale where firms are domicile.Soderstrom and Sun ( 2007) argue that cross – country differences in accounting quality are likely to remain, sequel to IFRS adoption, because accounting quality is a function of the firm’s overall institutional infrastructure (or setting), including the legal and political system of the country where they reside.
To address this concern (i.e. IFRS adoption and institutions), we adopted the survey research approach. We thus administered questionnaire to four relevant stakeholders in financial reporting in Nigeria, namely: Preparers of Financial Reports, Auditors, Capital Market Operators, and Trainers of accounting students. The questionnaire was aimed at eliciting the strength and preparedness of five Nigerian institutions (i.e. Educational Institution, Professional Accounting Bodies, Legal Framework, SEC and NASB or FRCN), in meeting the demands of the ongoing mandatory adoption of IFRS. 1.1 Objectives of the Study and Hypotheses 1.1.1 Objectives of Study The main objective of this study is to examine the perceived impact of Nigerian institutional infrastructure (i.e. Educational Institution, Professional Accounting Bodies, Legal Framework, SEC and NASB or FRCN) on the mandatory adoption of IFRS. Other specific objectives are to:
a) examine whether Nigerian Institutional Infrastructure have the capacity to support the mandatory adoption of IFRS;
b) determine whether there is any significant difference in the perception of stakeholders concerning the capacity of Nigerian Institutional Infrastructure to support the adoption of IFRS;
1.1.2 The Research Hypotheses For the purpose of resolving the research questions articulated above, the following hypotheses will be tested in the course of the study.
H1: Nigerian Institutional Infrastructures are not significantly developed to support the mandatory adoption of IFRS. H2: There is no significant difference in the perception of the stakeholders about the readiness of Nigerian
Institutional Infrastructures to support the proposed mandatory adoption of IFRS. 2. Literature Review There are presently two principal schools of thought in the debate on International Financial Reporting Standards (IFRS) and accounting harmonization or convergence. The First is the argument that a single global set of accounting standards helps to reduce information dissymmetry or imbalance, lowers the cost of capital, and enhances capital flow across borders. The opponents of this school of thought argue that the characteristics of local business environments and institutional frameworks mould the course and substance of accounting standards. Few of such studies are reviewed below.
Armstrong, Barth, Jagolizer and Riedl (2008) did a study titled “Market Reaction to Events Surrounding the Adoption of IFRS in Europe”, with the object of unraveling European stock market reaction to events associated with the adoption of IFRS in Europe. A sample of 3,265 European firms was employed over the period 2002 and 2005. The result of the study revealed that Investors in European firms noticed that the expected benefits associated with IFRS adoption will outweigh the expected costs. The study left it to further research to determine whether the expectations were fulfilled. Similarly, Barth, Landsman, and Land (2008) conducted a study on “International Accounting Standards and Accounting Quality”. The intent of the study was, to determine whether IAS was affiliated with financial reporting quality. A sample of 21 countries over a period 1994 and 2003 were engaged. The result evinced that companies that apply IAS were of higher quality than non US companies that do not.
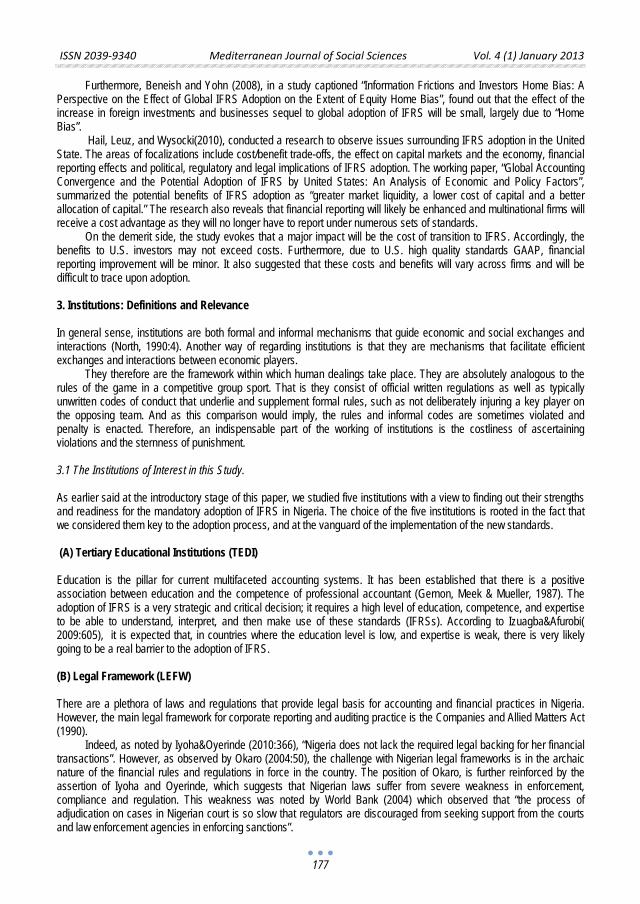
ISSN 2039-9340 Mediterranean Journal of Social Sciences Vol. 4 (1) January 2013
177
Furthermore, Beneish and Yohn (2008), in a study captioned “Information Frictions and Investors Home Bias: A Perspective on the Effect of Global IFRS Adoption on the Extent of Equity Home Bias”, found out that the effect of the increase in foreign investments and businesses sequel to global adoption of IFRS will be small, largely due to “Home Bias”.
Hail, Leuz, and Wysocki(2010), conducted a research to observe issues surrounding IFRS adoption in the United State. The areas of focalizations include cost/benefit trade-offs, the effect on capital markets and the economy, financial reporting effects and political, regulatory and legal implications of IFRS adoption. The working paper, “Global Accounting Convergence and the Potential Adoption of IFRS by United States: An Analysis of Economic and Policy Factors”, summarized the potential benefits of IFRS adoption as “greater market liquidity, a lower cost of capital and a better allocation of capital.” The research also reveals that financial reporting will likely be enhanced and multinational firms will receive a cost advantage as they will no longer have to report under numerous sets of standards.
On the demerit side, the study evokes that a major impact will be the cost of transition to IFRS. Accordingly, the benefits to U.S. investors may not exceed costs. Furthermore, due to U.S. high quality standards GAAP, financial reporting improvement will be minor. It also suggested that these costs and benefits will vary across firms and will be difficult to trace upon adoption. 3. Institutions: Definitions and Relevance In general sense, institutions are both formal and informal mechanisms that guide economic and social exchanges and interactions (North, 1990:4). Another way of regarding institutions is that they are mechanisms that facilitate efficient exchanges and interactions between economic players.
They therefore are the framework within which human dealings take place. They are absolutely analogous to the rules of the game in a competitive group sport. That is they consist of official written regulations as well as typically unwritten codes of conduct that underlie and supplement formal rules, such as not deliberately injuring a key player on the opposing team. And as this comparison would imply, the rules and informal codes are sometimes violated and penalty is enacted. Therefore, an indispensable part of the working of institutions is the costliness of ascertaining violations and the sternness of punishment. 3.1 The Institutions of Interest in this Study. As earlier said at the introductory stage of this paper, we studied five institutions with a view to finding out their strengths and readiness for the mandatory adoption of IFRS in Nigeria. The choice of the five institutions is rooted in the fact that we considered them key to the adoption process, and at the vanguard of the implementation of the new standards. (A) Tertiary Educational Institutions (TEDI) Education is the pillar for current multifaceted accounting systems. It has been established that there is a positive association between education and the competence of professional accountant (Gernon, Meek & Mueller, 1987). The adoption of IFRS is a very strategic and critical decision; it requires a high level of education, competence, and expertise to be able to understand, interpret, and then make use of these standards (IFRSs). According to Izuagba&Afurobi( 2009:605), it is expected that, in countries where the education level is low, and expertise is weak, there is very likely going to be a real barrier to the adoption of IFRS. (B) Legal Framework (LEFW) There are a plethora of laws and regulations that provide legal basis for accounting and financial practices in Nigeria. However, the main legal framework for corporate reporting and auditing practice is the Companies and Allied Matters Act (1990).
Indeed, as noted by Iyoha&Oyerinde (2010:366), “Nigeria does not lack the required legal backing for her financial transactions”. However, as observed by Okaro (2004:50), the challenge with Nigerian legal frameworks is in the archaic nature of the financial rules and regulations in force in the country. The position of Okaro, is further reinforced by the assertion of Iyoha and Oyerinde, which suggests that Nigerian laws suffer from severe weakness in enforcement, compliance and regulation. This weakness was noted by World Bank (2004) which observed that “the process of adjudication on cases in Nigerian court is so slow that regulators are discouraged from seeking support from the courts and law enforcement agencies in enforcing sanctions”.
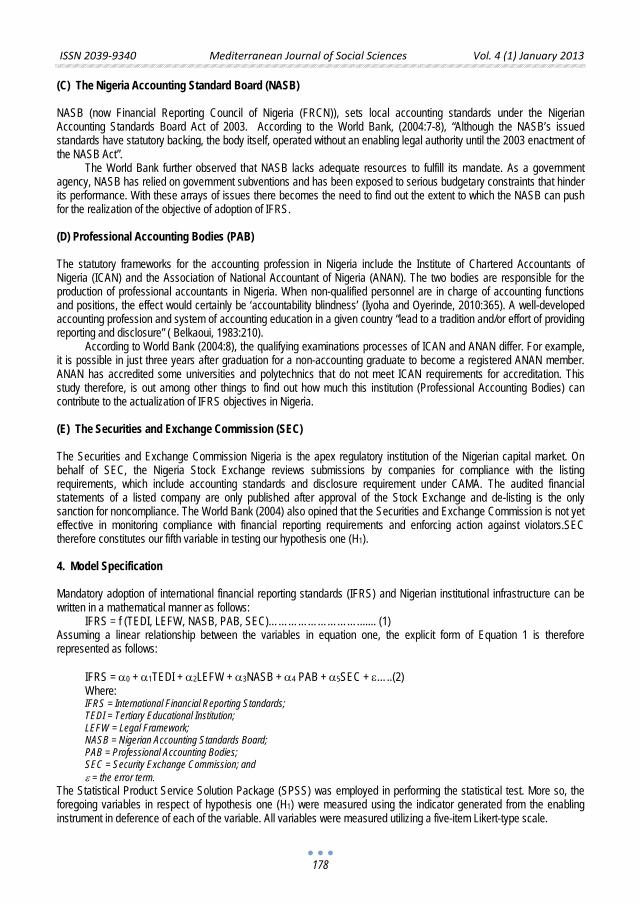
ISSN 2039-9340 Mediterranean Journal of Social Sciences Vol. 4 (1) January 2013
178
(C) The Nigeria Accounting Standard Board (NASB) NASB (now Financial Reporting Council of Nigeria (FRCN)), sets local accounting standards under the Nigerian Accounting Standards Board Act of 2003. According to the World Bank, (2004:7-8), “Although the NASB’s issued standards have statutory backing, the body itself, operated without an enabling legal authority until the 2003 enactment of the NASB Act”.
The World Bank further observed that NASB lacks adequate resources to fulfill its mandate. As a government agency, NASB has relied on government subventions and has been exposed to serious budgetary constraints that hinder its performance. With these arrays of issues there becomes the need to find out the extent to which the NASB can push for the realization of the objective of adoption of IFRS. (D) Professional Accounting Bodies (PAB) The statutory frameworks for the accounting profession in Nigeria include the Institute of Chartered Accountants of Nigeria (ICAN) and the Association of National Accountant of Nigeria (ANAN). The two bodies are responsible for the production of professional accountants in Nigeria. When non-qualified personnel are in charge of accounting functions and positions, the effect would certainly be ‘accountability blindness’ (Iyoha and Oyerinde, 2010:365). A well-developed accounting profession and system of accounting education in a given country “lead to a tradition and/or effort of providing reporting and disclosure” ( Belkaoui, 1983:210).
According to World Bank (2004:8), the qualifying examinations processes of ICAN and ANAN differ. For example, it is possible in just three years after graduation for a non-accounting graduate to become a registered ANAN member. ANAN has accredited some universities and polytechnics that do not meet ICAN requirements for accreditation. This study therefore, is out among other things to find out how much this institution (Professional Accounting Bodies) can contribute to the actualization of IFRS objectives in Nigeria. (E) The Securities and Exchange Commission (SEC) The Securities and Exchange Commission Nigeria is the apex regulatory institution of the Nigerian capital market. On behalf of SEC, the Nigeria Stock Exchange reviews submissions by companies for compliance with the listing requirements, which include accounting standards and disclosure requirement under CAMA. The audited financial statements of a listed company are only published after approval of the Stock Exchange and de-listing is the only sanction for noncompliance. The World Bank (2004) also opined that the Securities and Exchange Commission is not yet effective in monitoring compliance with financial reporting requirements and enforcing action against violators.SEC therefore constitutes our fifth variable in testing our hypothesis one (H1). 4. Model Specification Mandatory adoption of international financial reporting standards (IFRS) and Nigerian institutional infrastructure can be written in a mathematical manner as follows:
IFRS = f (TEDI, LEFW, NASB, PAB, SEC)………………………....... (1) Assuming a linear relationship between the variables in equation one, the explicit form of Equation 1 is therefore represented as follows:
IFRS = α0 + α1TEDI + α2LEFW + α3NASB + α4 PAB + α5SEC + ε…..(2) Where: IFRS = International Financial Reporting Standards; TEDI = Tertiary Educational Institution; LEFW = Legal Framework; NASB = Nigerian Accounting Standards Board; PAB = Professional Accounting Bodies; SEC = Security Exchange Commission; and ε = the error term.
The Statistical Product Service Solution Package (SPSS) was employed in performing the statistical test. More so, the foregoing variables in respect of hypothesis one (H1) were measured using the indicator generated from the enabling instrument in deference of each of the variable. All variables were measured utilizing a five-item Likert-type scale.
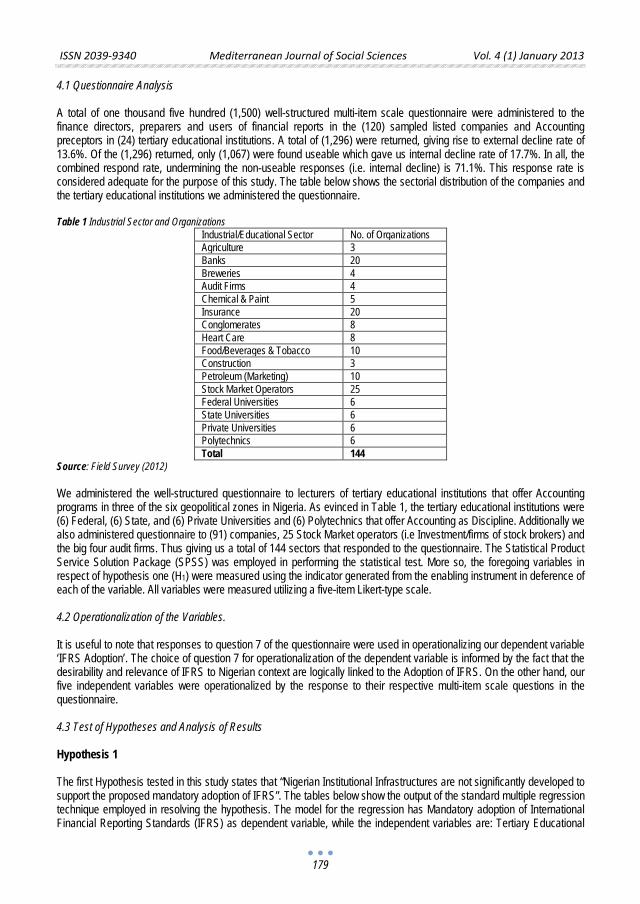
ISSN 2039-9340 Mediterranean Journal of Social Sciences Vol. 4 (1) January 2013
179
4.1 Questionnaire Analysis A total of one thousand five hundred (1,500) well-structured multi-item scale questionnaire were administered to the finance directors, preparers and users of financial reports in the (120) sampled listed companies and Accounting preceptors in (24) tertiary educational institutions. A total of (1,296) were returned, giving rise to external decline rate of 13.6%. Of the (1,296) returned, only (1,067) were found useable which gave us internal decline rate of 17.7%. In all, the combined respond rate, undermining the non-useable responses (i.e. internal decline) is 71.1%. This response rate is considered adequate for the purpose of this study. The table below shows the sectorial distribution of the companies and the tertiary educational institutions we administered the questionnaire. Table 1 Industrial Sector and Organizations
Industrial/Educational Sector No. of Organizations Agriculture 3 Banks 20 Breweries 4 Audit Firms 4 Chemical & Paint 5 Insurance 20 Conglomerates 8 Heart Care 8 Food/Beverages & Tobacco 10 Construction 3 Petroleum (Marketing) 10 Stock Market Operators 25 Federal Universities 6 State Universities 6 Private Universities 6 Polytechnics 6 Total 144
Source: Field Survey (2012) We administered the well-structured questionnaire to lecturers of tertiary educational institutions that offer Accounting programs in three of the six geopolitical zones in Nigeria. As evinced in Table 1, the tertiary educational institutions were (6) Federal, (6) State, and (6) Private Universities and (6) Polytechnics that offer Accounting as Discipline. Additionally we also administered questionnaire to (91) companies, 25 Stock Market operators (i.e Investment/firms of stock brokers) and the big four audit firms. Thus giving us a total of 144 sectors that responded to the questionnaire. The Statistical Product Service Solution Package (SPSS) was employed in performing the statistical test. More so, the foregoing variables in respect of hypothesis one (H1) were measured using the indicator generated from the enabling instrument in deference of each of the variable. All variables were measured utilizing a five-item Likert-type scale. 4.2 Operationalization of the Variables. It is useful to note that responses to question 7 of the questionnaire were used in operationalizing our dependent variable ‘IFRS Adoption’. The choice of question 7 for operationalization of the dependent variable is informed by the fact that the desirability and relevance of IFRS to Nigerian context are logically linked to the Adoption of IFRS. On the other hand, our five independent variables were operationalized by the response to their respective multi-item scale questions in the questionnaire. 4.3 Test of Hypotheses and Analysis of Results Hypothesis 1 The first Hypothesis tested in this study states that “Nigerian Institutional Infrastructures are not significantly developed to support the proposed mandatory adoption of IFRS”. The tables below show the output of the standard multiple regression technique employed in resolving the hypothesis. The model for the regression has Mandatory adoption of International Financial Reporting Standards (IFRS) as dependent variable, while the independent variables are: Tertiary Educational
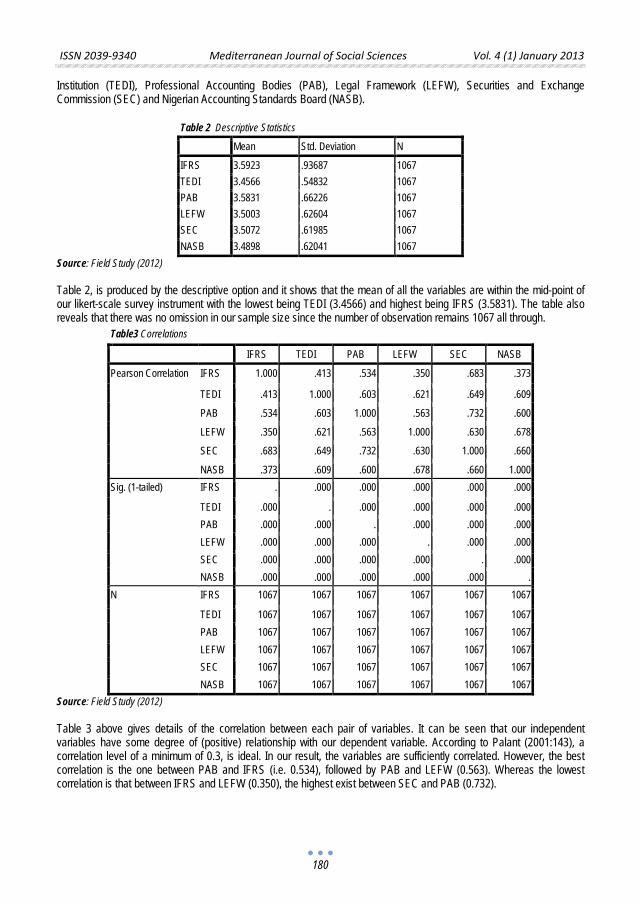
ISSN 2039-9340 Mediterranean Journal of Social Sciences Vol. 4 (1) January 2013
180
Institution (TEDI), Professional Accounting Bodies (PAB), Legal Framework (LEFW), Securities and Exchange Commission (SEC) and Nigerian Accounting Standards Board (NASB).
Table 2 Descriptive Statistics
Mean Std. Deviation N
IFRS 3.5923 .93687 1067 TEDI 3.4566 .54832 1067 PAB 3.5831 .66226 1067 LEFW 3.5003 .62604 1067 SEC 3.5072 .61985 1067 NASB 3.4898 .62041 1067
Source: Field Study (2012) Table 2, is produced by the descriptive option and it shows that the mean of all the variables are within the mid-point of our likert-scale survey instrument with the lowest being TEDI (3.4566) and highest being IFRS (3.5831). The table also reveals that there was no omission in our sample size since the number of observation remains 1067 all through.
Table3 Correlations
IFRS TEDI PAB LEFW SEC NASB
Pearson Correlation IFRS 1.000 .413 .534 .350 .683 .373
TEDI .413 1.000 .603 .621 .649 .609
PAB .534 .603 1.000 .563 .732 .600
LEFW .350 .621 .563 1.000 .630 .678
SEC .683 .649 .732 .630 1.000 .660
NASB .373 .609 .600 .678 .660 1.000 Sig. (1-tailed) IFRS . .000 .000 .000 .000 .000
TEDI .000 . .000 .000 .000 .000 PAB .000 .000 . .000 .000 .000 LEFW .000 .000 .000 . .000 .000 SEC .000 .000 .000 .000 . .000 NASB .000 .000 .000 .000 .000 .
N IFRS 1067 1067 1067 1067 1067 1067
TEDI 1067 1067 1067 1067 1067 1067 PAB 1067 1067 1067 1067 1067 1067 LEFW 1067 1067 1067 1067 1067 1067 SEC 1067 1067 1067 1067 1067 1067 NASB 1067 1067 1067 1067 1067 1067
Source: Field Study (2012)
Table 3 above gives details of the correlation between each pair of variables. It can be seen that our independent variables have some degree of (positive) relationship with our dependent variable. According to Palant (2001:143), a correlation level of a minimum of 0.3, is ideal. In our result, the variables are sufficiently correlated. However, the best correlation is the one between PAB and IFRS (i.e. 0.534), followed by PAB and LEFW (0.563). Whereas the lowest correlation is that between IFRS and LEFW (0.350), the highest exist between SEC and PAB (0.732).
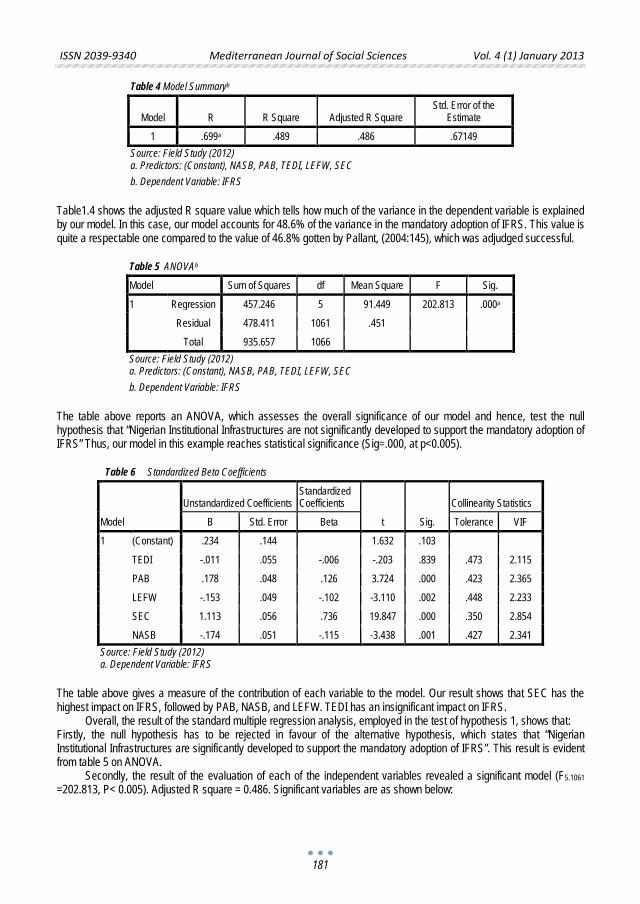
ISSN 2039-9340 Mediterranean Journal of Social Sciences Vol. 4 (1) January 2013
181
Table 4 Model Summaryb
Model R R Square Adjusted R Square Std. Error of the
Estimate
1 .699a .489 .486 .67149 Source: Field Study (2012) a. Predictors: (Constant), NASB, PAB, TEDI, LEFW, SEC b. Dependent Variable: IFRS
Table1.4 shows the adjusted R square value which tells how much of the variance in the dependent variable is explained by our model. In this case, our model accounts for 48.6% of the variance in the mandatory adoption of IFRS. This value is quite a respectable one compared to the value of 46.8% gotten by Pallant, (2004:145), which was adjudged successful.
Table 5 ANOVAb
Model Sum of Squares df Mean Square F Sig.
1 Regression 457.246 5 91.449 202.813 .000a
Residual 478.411 1061 .451
Total 935.657 1066 Source: Field Study (2012) a. Predictors: (Constant), NASB, PAB, TEDI, LEFW, SEC b. Dependent Variable: IFRS
The table above reports an ANOVA, which assesses the overall significance of our model and hence, test the null hypothesis that “Nigerian Institutional Infrastructures are not significantly developed to support the mandatory adoption of IFRS” Thus, our model in this example reaches statistical significance (Sig=.000, at p<0.005).
Table 6 Standardized Beta Coefficients
Model
Unstandardized Coefficients Standardized Coefficients
t Sig.
Collinearity Statistics
B Std. Error Beta Tolerance VIF
1 (Constant) .234 .144 1.632 .103
TEDI -.011 .055 -.006 -.203 .839 .473 2.115
PAB .178 .048 .126 3.724 .000 .423 2.365
LEFW -.153 .049 -.102 -3.110 .002 .448 2.233
SEC 1.113 .056 .736 19.847 .000 .350 2.854
NASB -.174 .051 -.115 -3.438 .001 .427 2.341 Source: Field Study (2012) a. Dependent Variable: IFRS
The table above gives a measure of the contribution of each variable to the model. Our result shows that SEC has the highest impact on IFRS, followed by PAB, NASB, and LEFW. TEDI has an insignificant impact on IFRS.
Overall, the result of the standard multiple regression analysis, employed in the test of hypothesis 1, shows that: Firstly, the null hypothesis has to be rejected in favour of the alternative hypothesis, which states that “Nigerian Institutional Infrastructures are significantly developed to support the mandatory adoption of IFRS”. This result is evident from table 5 on ANOVA.
Secondly, the result of the evaluation of each of the independent variables revealed a significant model (F5.1061 =202.813, P< 0.005). Adjusted R square = 0.486. Significant variables are as shown below:
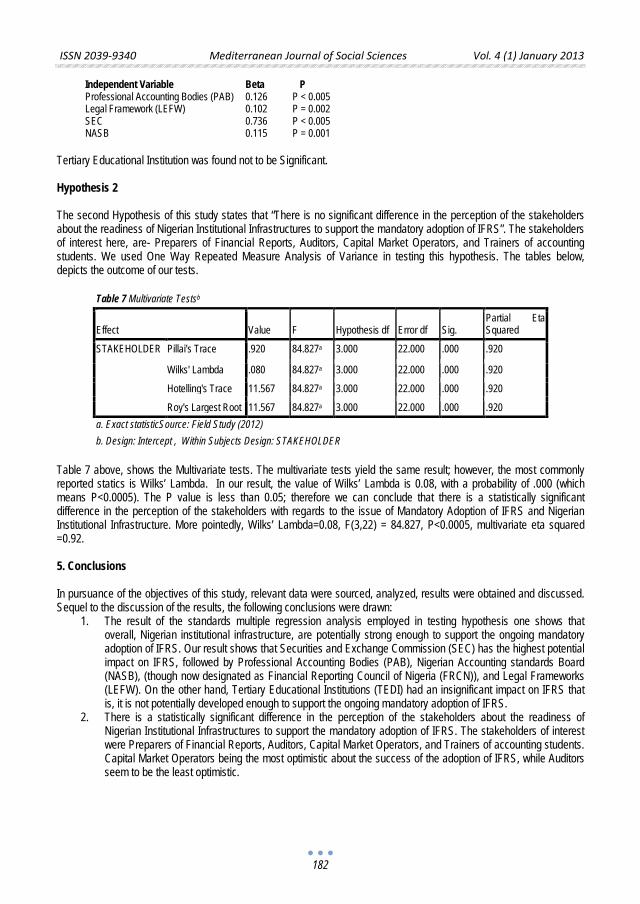
ISSN 2039-9340 Mediterranean Journal of Social Sciences Vol. 4 (1) January 2013
182
Independent Variable Beta P Professional Accounting Bodies (PAB) 0.126 P < 0.005 Legal Framework (LEFW) 0.102 P = 0.002 SEC 0.736 P < 0.005 NASB 0.115 P = 0.001
Tertiary Educational Institution was found not to be Significant. Hypothesis 2 The second Hypothesis of this study states that “There is no significant difference in the perception of the stakeholders about the readiness of Nigerian Institutional Infrastructures to support the mandatory adoption of IFRS”. The stakeholders of interest here, are- Preparers of Financial Reports, Auditors, Capital Market Operators, and Trainers of accounting students. We used One Way Repeated Measure Analysis of Variance in testing this hypothesis. The tables below, depicts the outcome of our tests.
Table 7 Multivariate Testsb
Effect Value F Hypothesis df Error df Sig. Partial Eta Squared
STAKEHOLDER Pillai's Trace .920 84.827a 3.000 22.000 .000 .920
Wilks' Lambda .080 84.827a 3.000 22.000 .000 .920
Hotelling's Trace 11.567 84.827a 3.000 22.000 .000 .920
Roy's Largest Root 11.567 84.827a 3.000 22.000 .000 .920 a. Exact statisticSource: Field Study (2012) b. Design: Intercept , Within Subjects Design: STAKEHOLDER
Table 7 above, shows the Multivariate tests. The multivariate tests yield the same result; however, the most commonly reported statics is Wilks’ Lambda. In our result, the value of Wilks’ Lambda is 0.08, with a probability of .000 (which means P<0.0005). The P value is less than 0.05; therefore we can conclude that there is a statistically significant difference in the perception of the stakeholders with regards to the issue of Mandatory Adoption of IFRS and Nigerian Institutional Infrastructure. More pointedly, Wilks’ Lambda=0.08, F(3,22) = 84.827, P<0.0005, multivariate eta squared =0.92. 5. Conclusions In pursuance of the objectives of this study, relevant data were sourced, analyzed, results were obtained and discussed. Sequel to the discussion of the results, the following conclusions were drawn:
1. The result of the standards multiple regression analysis employed in testing hypothesis one shows that overall, Nigerian institutional infrastructure, are potentially strong enough to support the ongoing mandatory adoption of IFRS. Our result shows that Securities and Exchange Commission (SEC) has the highest potential impact on IFRS, followed by Professional Accounting Bodies (PAB), Nigerian Accounting standards Board (NASB), (though now designated as Financial Reporting Council of Nigeria (FRCN)), and Legal Frameworks (LEFW). On the other hand, Tertiary Educational Institutions (TEDI) had an insignificant impact on IFRS that is, it is not potentially developed enough to support the ongoing mandatory adoption of IFRS.
2. There is a statistically significant difference in the perception of the stakeholders about the readiness of Nigerian Institutional Infrastructures to support the mandatory adoption of IFRS. The stakeholders of interest were Preparers of Financial Reports, Auditors, Capital Market Operators, and Trainers of accounting students. Capital Market Operators being the most optimistic about the success of the adoption of IFRS, while Auditors seem to be the least optimistic.
ISSN 2039-9340 Mediterranean Journal of Social Sciences Vol. 4 (1) January 2013
183
6. Recommendations The recommendations that emanates from this study which are likely to be very useful to Government, Capital Market Operators, Professional Accounting Bodies, Auditors, the ministry of Education, NASB, Central Bank of Nigeria and a host of other stakeholders in financial reporting in Nigeria are presented hereunder.
What is important is not just reporting under IFRS, but the firmness of purpose and the integrity of the financial statements, prepared for the benefits of both local and international communities. To this end, regulators of financial reporting in Nigeria must wake up to their responsibility so as to ensure that the ongoing efforts at mandatory adoption of IFRS do not become a mere “LABEL or NOMINAL” adoption. More pointedly, the capacity of regulators (Corporate Affairs Commission,Securities and Exchange Commission, National Insurance Commission, Central Bank of Nigeria to mention but a few) must be strengthened so as to enable them to effectively deal with accounting and financial reporting practices of the regulated concerns.
IFRS must as a matter of urgency, be incorporated into universities, polytechnics and Professional Accounting institutions’ curricula so as to build human capacity that will support
the preparation of IFRS financial reports in the organizations. Much more, the preceptors in these institutions must firstly be schooled in the dynamics of IFRS, since the blind has never to been known to successful lead the blind.
Steps must be taken to improve the statutory framework of accounting and auditing practice in Nigeria, to make it oriented towards the protection of public interest and outdated and obsolete sections should be obliterated. Essentially, the various laws and regulations should be harmonized to conform to the demands of IFRS.
Besides International Financial Reporting Standards, the other global accounting and financial reporting features that are equally imperative to the economic development of Nigeria are:
I. High quality auditing standards; II. Effective Quality Assurance (i.e. audit firms and profession-wide); III. Sound Corporate Governance; and IV. Robust Regulatory Oversight.
These factors must be pursued with the same zest Nigeria is pursuing the adoption of IFRS. Otherwise the promised or anticipated benefits of IFRS will be a mirage.
The proposal of adopting IFRSs seems to be driven by the big four audit firms. Literature documents their strong participation in the setting of IFRSs. The real issue in the case of Nigeria is that, our local accounting firms lack the expertise to foster the smooth transition to IFRS. What this means therefore is that organizations are to continue to hire the services of the big four audit firms, at overpriced cost. To address this challenge, the 94 small indigenous accounting firms should go into merger arrangements so as to be able to reasonably compete with the big four. References Ampofo, A.A. and Sellani, R.J. (2005).Examining the differences between United States Generally Accepted Accounting Principles (U.S.
GAAP) and International Accounting Armstrong, C., Barth, M.E., Jagolinzer, A. andRiedl, E.J. (2008). Market reaction to the adoption of IFRS in Europe. Unpublished
research paper, Stanford University, June 2007 Available: http://www.hbs.edu/research/pdf/09-032.pdf Accessed 10th July 2010 Belkaoui, A. 1983. Economic, political, and civil indicators and reporting and disclosure adequacy: Empirical investigation. Journal of
Accounting and Public Policy (Fall): 207-219. Ball R., (2006). International Financial Reporting Standards (IFRS): pros and cons for investors, Accounting and Business
Research.International Accounting Policy Forum, p.5-27 Barth, M., Landsman, W.R. and Lang, M. (2008).International accounting standards and accounting quality. Journal of Accounting
Research, (46), 467- 498. Beneish, M. D., and T. Yohn. (2008). Information friction and investor home bias: A perspective on the effect of global IFRS adoption on
the extent of equity home bias. Journal of Accounting and Public Policy27 (6) 433-443. Chand, P. (2005). Impetus to the success of harmonization: the case of South Pacific Island Nations.Critical Perspective on Accounting,
16 (3) 209-226. Daske, H., Hail, L., Leuz, C., and Verdi, R. (2007). Mandatory IFRS Reporting Around the World: Early Evidence on the Economic
Consequences. Working paper, University of Chicago. Douglas, M. (1986).How institutions think. Syracuse University Press: Syracuse. Evans, L. (2004). Language, translation and the problem of international accounting communication.Accounting, Auditing and
Accounting Journal, 17(2), 210 -248. Gernon, H., Meek, G., & Mueller, G. (1987).Accounting: An International Perspective Homewood, II: Irwin.
ISSN 2039-9340 Mediterranean Journal of Social Sciences Vol. 4 (1) January 2013
184
Hail, L., Leuz, C., Wysocki, P. (2010), Global accounting convergence and the potential adoption of IFRS by the United States: an analysis of Economic and policy factors .Working paper. Available: http://ssrn.com/abstract=1357331S. Accessed on 10th July 2010.
IASB,2006. “Statement of Best Practice: working relationships between the IASB and other Accounting Standard-Setters” February.Available online at http://www.iasb.org/uploaded files/documents/8 1500 SOBPFebruary2006final.pdf Accessed on 19th July 2012.
Iyoha, F. O. &Oyerinde, D. (2010). Accounting infrastructure and accountability in the management of public expenditure in developing countries: A focus on Nigeria. Critical Perspective on Accounting,( 21) 361-373
Izuagba, A. C. &Afurobi, A. O. (2009). Quality Education through innovation: Examples of Tertiary Institutions in Nigeria. European Journal of Social Sciences, 10 (4), 605-613.
Land, J, and M. Lang (2002).Empirical evidence on evolution of International earnings.The Accounting Review, 77(supplement), 115-133.
North, D. (1990), Institutions, institutional change and economic performance Cambridge: Cambridge University Press. Available online at http://www.usmsl.edu/∼mk6c3/paper/reviewnorth.pdf
UNCTAD,( 2005), “Review of practical Implementation Issues of International Financial Reporting Standards”.Available at
Accessed on 12 June 2010 Okaro, S., (2004). Bank failure in Nigeria: an early warning models of corporate distress. The Nigeran Accountant, 37(4) Pallant, J (2005) SPSS Survival Manual: A Step By Step Guide to Data Analysis Using SPSS Version 12. Berkshire: Open University
Press Soderstrom, n., and Sun K.(2007). “IFRS adoption and accounting quality: a review.” European Accounting Review,(16),675-702.
http://www.iasplus.com/resource/0511 unctad.pdf.Accessed 18th July 2012. World Bank (2004). Report on the Observance of Standards and Codes (ROSC) Nigeria, Accounting and Auditing.Retrieved May 1,
2012, from http://www.worldbank.org/ifa/rosc_aa_nga.pdf.
ISSN 2039-9340 Mediterranean Journal of Social Sciences Vol. 4 (1) January 2013
185
Is there a Unique or non Unique Value Profile for Albanian Social Actors?
(The Study Case of Tirana Electorate in 2003, 2008, 2010 and 2011)
Prof. As. Dr. Aleksandër Kocani
Departament of Political Sciences, Faculty of Social Sciences at Tirana University E-mail: [email protected]
Doi:10.5901/mjss.2013.v4n1p185 Abstract
This paper shows the results of an empirique panel study carried out in 2003, 2008, 2010 and 2010. The start point for this paper was the notice of C.Brooks and J.Manza about the possibility for reaching opposite results if you repeat the Inglehart’s interviews by other methods. Here one may ask: Is there a indicator of the problem related with the value’s profile nature of social actors. In this case, you may consider two alternatives: 1) the social actor has only one value profile, or on the contrary 2) he does not has such a value profile. The last one may be separated into two cases: a) or there is not a value profile, but it is created by interaction between knowledge subject and object ; or b) there are two opposite value profile which are selected occasionally. The empirical testing is possible if one may find or not the influence upon the respondents during the intreviews. If there is only one value profile you can not find possible influencies. On the contrary you have to consider there is not one value profile.
Key words: unique value profile, social actors.
1. Introduction When R.Inglehart, one of the most knowned researcher in the values studies fild, trays to depicte the cross-cultural variation of the basic values, he refers to an explaining model with two major dimension: (1) Traditional/Secular-rational and (2) Survival/Self-expression values. By his opininion, “these two dimensions explain more than 70 percent of the cross-national variance on key variables, and each dimension is strongly correlated with scores of other important attitudes. The global cultural map shows how scores of societies are located on these two dimensions: moving from south to north reflects the shift from Traditional to Secularrational values; moving from west to east reflects the shift from Survival values to Selfexpressional values”1. Here we are in an “updated” expression of the old term “materialistic values”, “post materialistic values” and “modern values”, “postmodern values” used in the past by R.Inglehart 2. The Inglehart’s concerns related with the explaining how and why moving from industrial societies to post industrial one’s is accompagned with the shift of basic values system from traditional (former “modern”) to secular-rational (former “postmodern”) and from survival (former “materialistic”) to self-expression (former “post-materialistic”) values. And how this process is closely correlated with the human development and the raising of democracy3
Our concerns differ from one’s choosed by R.Inglehart. It is based on the old philosophical problem about unique or multiple nature of beeing. The point of view wich hold the unique nature of beeing, as is largely known, has suported by old greek philosopher Parmenides
.
4
1 Values change the world. World values survey. Brochure,
. By him the beeing as whole is unique and in a rest situation. While the most of other old greek philosophers suported the multiple point of view for the nature of beeing, which is in opposite with Parmenides’ point of view. For them the beeing is something not unique, but multiple. In this conceptual frame, we want to know if it is possible for the basic values of a social actor to be structured insight him as a system which one may depicte with terms of “survival” (“materialistic”) values system or “self-expression” (“post-materialistic”) values system. And if this structuration as system is an intrisic (or, principal) feature for each social actor. Or, there is no values system
www.worldvaluessurvey.org, p.6. [Notice: perhaps here it is needed to substitude the term “west” with the term “est”- A.K.] 2 Inglehart, R., “Globalisation and postmodern values”, The Washington Quaterly 23.1 (2000), p.222. 3 Idem, p.225-226; Values change the world. World values survey. Brochure, www.worldvaluessurvey.org, p.7-9. 4 Vergely, B., La Philosophie, Les Essentiels, Milan, 1996, p.26; Parmenides (Internet Encyclopedia of Philosophy), http://www.utm.edu/research/iep/p/parmenid.htm (1 of 3) [4/21/2000 8:56:30 AM].
ISSN 2039-9340 Mediterranean Journal of Social Sciences Vol. 4 (1) January 2013
186
as intrisic feature (or values profile) for the social actor and, if you find it, this is because of interaction process between knowledge subject and object. That means there are two possibility: (1) there are no basic values structured system insight social actors. This system emerge as production after interaction knowledge subject – object. (2) There are two such a opposite systems insight each social actor and the mentioned interaction, as an “osmosa” process, “give permission” for being exhibited to only one.
Historically as the start point for this paper was the notice of C.Brooks and J.Manza about the possibility for reaching oposite results if you repeat the Inglehart’s interviews by other methods5
5 “Raisons de vivre.Raisons d’agir”. Sciences Humaines, Nº79, 1998, p.32.
. By them, in the most of cases one can observes at the same person a mix of materialistic values with post materialistic one’s. That means where Inglehart finds survival values, you can also find self-expression one’s. Here one may ask: Is there a indicator of the "consistency" or "repeatability" (i.d., reliability) problem of your measures? Or the problem here doesn’t related with the violation of measure rules, but with the value’s profile nature of social actors. I.e. a problem of unique or non unique value system beeing for a social actor. In other words, can’t we provide a sufficient secure measure process, or the value’s profile of the social actors isn’t unique one’s? This is the point.
An experiment made upon the Tirana electorate tried for times (years 2003, 2008, 2010 and 2011) to test empirically a hypothetical proposition about the existence of a non unique value’s profile at the social actors. Pratically it was considered impossible to distinguish insight of a non unique value’s model the case of value’s system absence from one’s considering a dyhotomic situation. That means, the existence insight of social actor of two opposite value’s system (“survival” and “self-expression”). So it was decided to focus on the empirical test of proposition which states being a non unique value’s profile for social actors. Each of the two first times (years 2003 and 2008) the empirical test consisted by two survey procedures. One was focused on the ordinary electorate of Tirana city and the other concerns only the opinions of student part of this electorate. The principal idea of this empirical test was the possibility to influence, in case of existing a non unique value’s profile for social actors, the answers of respondents by the questionnaire using the mechanisme of comformism. I.d. it was calculated as reasonable to use the aspiration expressed by albanian population since 1991 to be like europian people to influence on shifting their worldviews, attitudes and beliefs towards europian one’s. For this purpose the questionnaire was structured into two different parts. The first part, following the ordinary rules, was composed with the aim to avoid as much as possible the interviewee s’ influence upon the respondent. While the second part, using in essence the same questions, on the contrary was structured to provide the maximum of influence by mean of a ingoing context puted in almost every question and emphasizing how react, comport and think individuals in europian countries about the concerned problem. The questions was drawed folloing the Inglehart’s indicators of “survival” and “self-expression” value system. The basic assumption predicts (as implication) an statistical attendance between couples of similar questions at the same questionnaire in case of unique value’s profile and the absence of this attendence in opposite case. In 2003 from questioners was choosed 22 couples as signifiants for empirical test of hypothesis, while in 2008 the selection was for 20 such a couples and in 2010 and 2011 – the same (22 such a couples).
The results of statistical elaboration of data for both surveys made in 2003 (with electorate and students) indicate in a size of 85% the cases of statistical attendance belonging moderate, strong and very strong level. Regarding the significance at level 0.01, you may conclude there are statistical attendance between choosed couples as empirical fact. So it is possible to accept this empirical fact as an falsification testimony of model assumpting a non unique value’s profile for social actors and reject it. I.d. as acceptability of unique model for value’s profile of social actors.
Analysis of the data belonging the two surveys carried out at 2008 reveals that crosstab of 20 couples choosed as potentially influenciables show a statistical attendance significant at an acceptable level by Phi and Cramer’s indicators. Again empirical test is in favor of model assumpting an unique value’s profile for social actor.
The results of survey made in 2010 and 2011 for 22 couples choosed as potentially influenciables show in a size of 100% the cases a statistical attendance significant at an acceptable level by Phi and Cramer’s indicators.
Now the problem is to discuss if the conlusion about an unique value’s profile for social actors (Tirana ‘s electorate) is acceptable or it is needed to consider another option. Shortly, to consider as the meaning of C.Brooks and J.Manza’s mentioned notice not the existence of an unique value’s profile for social actor, but the existence of a reliability problem. I.d. the problem of non consistency of results if you repeat the surveys changing a little the questionnaire. In this case one may expect to have different results by two surveys carried out in 2003 on the Tirana city electorate and on Tirana city students electorate, because there was a repeat of survey and the questionnaire was changed a little. The same expectation is possible for the results of two surveys made in 2008 on the similar population. Again was made same questionnnaire changes in rapport of them belonging surveys made in 2003. This situation did not change for the survey carried out in 2010 and 2011.

ISSN 2039-9340 Mediterranean Journal of Social Sciences Vol. 4 (1) January 2013
187
Against these expectations the results of two surveys groups show a evident similarity in the values of statistical attemption regardless of repeat in defferent sample and time. So you may conlude here there is no a reliability problem, but only a value’s profile nature problem for social actors. Sources Inglehart, R., Baker, W. E., Modernization, Cultural Change, and the Persistence of Traditional Values American Sociological Review,
2000,Vol.65 (February) ; Inglehart, R., Globalization and Postmodern Values, Washington Quarterly 23.1 (2000) ; Lecomte, L., Raisons de vivre. Raisons d’agir, Sciences Humaines, No 79, 1998; Values change the world. World values survey. Brochure, www.worldvaluessurvey.org.

ISSN 2039-9340 Mediterranean Journal of Social Sciences Vol. 4 (1) January 2013
189
The Effects of Cooperative versus Competitive Word Games on EFL Learners`
Vocabulary Gain, Motivation, and Class Atmosphere
Zahra Fotovatnia, P.HD
English Department, Najafabad Branch, Islamic Azad University, Najafabad, Iran
Maryam Namjoo
English Department, Najafabad Branch,
Islamic Azad University, Najafabad, Iran. Email: [email protected]
Doi:10.5901/mjss.2013.v4n1p189 Abstract
English vocabulary is considered difficult to learn and use in real life situations by most Iranian learners. In addition, many of them feel bored in vocabulary classes since they do not have the opportunity to take part in learning process, therefore, they lack necessary motivation to be pushed forward. Besides, they have not changed their learning habits, such as writing words on paper, trying to learn by heart or learning passively through teachers` explanations. The reason must be that the main techniques used to practice in memorization while the features like fun, motivation and effort are ignored in almost all English classes. To help learners find language classes, especially vocabulary lessons more interesting, and to achieve more, the researcher used word games, which are generally engaged as a source of entertainment to serve an educational purpose, as instructional tools in practicing newly taught words. Moreover, the researcher compared the effects of two types of word games (cooperative versus competitive) on learners` motivation, attitudes toward their teacher, class atmosphere, and vocabulary achievement, in order to investigate which game type was more successful in this field. In order to achieve this goal, this study has been done on 60 male English learners with the age range of 17-19 years old. Among these learners, 40 were considered as the experimental (in 2 different experimental groups), and the other 20 learners as the control. To gather data, these instruments have been used: a motivation questionnaire, a questionnaire about word games, a classroom atmosphere questionnaire, vocabulary tests, and teacher`s interview. Besides, 2 different categories of word games (cooperative versus competitive games) were used in this study to compare their effects on EFL vocabulary learning. The results show that both types of word games affect learners` vocabulary learning, increase their motivation, change their attitudes toward their teacher, and also create a positive atmosphere in their classroom. Moreover, through comparing effects of these games, the researcher found out that for some learners, cooperative word games could affect their vocabulary learning by increasing their motivation and providing a positive atmosphere in their classroom, while for some others, competitive word games were more effective. Consequently, it cannot be stated exactly which type of these games were more successful in this study. Curriculum designers, English textbook authors, and those who train EFL teachers can use these findings and improve English education and learning in words in English classes in Iran. It other words, it is suggested to use word games in English classes to increase learners` motivation, vocabulary learning, and also to provide a more positive atmosphere in the classroom.
Keywords: word games, cooperative games, competitive games, motivation, and class atmosphere.
1. Introduction 1.1. Background and Rationale Foreign language learning is a hard task and a lot of effort is required every moment and over a long period of time to manipulate, understand, and produce the target language. For years, it has been supposed that differences which exist among people have an effect on the way they learn a language (Ojeda, 2004). For instance, different people have different learning styles and understanding these differences may bring variety into the classroom. There is no doubt about it, but the most important challenge for language teacher is to make EFL classroom more interesting (Yu, 2005). In learning a foreign language, vocabulary plays an important role. It is one element that links the four skills of speaking, listening, reading, and writing all together. However, most vocabulary lessons, conversation practice and even grammar
ISSN 2039-9340 Mediterranean Journal of Social Sciences Vol. 4 (1) January 2013
190
learning do not always attract learners` attention. Therefore, learners do not learn in accordance with the teachers’ expectations and this may hinder their progress. One solution for this problem is to use more than one way to teach language and add more fun and enjoyment to language activities. One of the most useful techniques to achieve this is to use games since games are effective and cost-saving method in language education.
Moreover, Vocabulary is considered not only as one of the language elements many learners find problematic to learn, but also as a boring part of language learning (Ojeda, 2004). In Iran, the situation is getting worse since in most English classes, traditional methods which bring little or no interaction between learners and their teacher and even among learners themselves, are being used in teaching vocabulary items. For this reason, English vocabulary learning in classes is often teacher-centered and learners have no active role in this process. Hence, many researchers who study learning process, mostly look for learner-centered approaches since in these approaches (i.e., task-based instruction (TBI)), learners have the opportunity to actively participate in the process of learning (Carris et al., 2002).
Yu (2005) mentions that the most important point that must be considered in vocabulary learning process is that in language classrooms, learners must have the opportunity to use what they have learnt in a communicative context (Ellis, 1997; Li, 2003; Sysoyev, 1991; Yen, 2002). Using some types of word games in the second language (SL) classroom may effectively implement this strategy. By implementing certain types of words games in the SL classroom, the language instructor can provide implicit word instruction veiled in the format of recurrent attempts at play. This is particularly true when specific target words are required in obligatory environments. In turn, this process may lead to automatization of specific words (Ojeda, 2004; Yu, 2005). The redundancy inherent in the taking of turns is instrumental in comprehension, particularly in the case of semantic repetition (Doughty 1991). Practice, while repeating tasks in the classroom, has been shown to increase language accuracy, fluency, and complexity (Bygate 1996; Robinson 2001). In word games, teachers have the option of structuring lessons competitively, individualistically, or cooperatively. The decisions teachers make in structuring lessons can influence students' interactions with others, knowledge, and attitudes (Carson, 1990; Johnson & Johnson, 1987). In a competitively structured classroom, students engage in a win-lose struggle in an effort to determine who is best (Johnson & Johnson, 1991). In competitive classrooms students perceive that they can obtain their goals only if other students in the class fail to obtain their own goals (Johnson, Johnson, & Holubec, 1986). Students in independently structured classrooms work by themselves to accomplish goals unrelated to those of the other students (Johnson & Johnson 1991). In a cooperative learning classroom, students work together to attain group goals that cannot be obtained by working alone or competitively. In this classroom structure, students discuss subject matter, help each other learn, and provide encouragement for members of the group (Johnson, Johnson, & Holubec, 1986). 1.2. Definitions of the Related Terms Some terms and phrases have been used throughout the study. To help the reader to understand them, brief definition of each is given below.
Task: an activity designed to help achieve a particular learning goal (Richard, Platt, & Platt, 1992). Language games: games which focus on using elements of language in order to arrive at a particular solution,
or to win a competition (Ojeda, 2004). Word games: these games are computer or non-computer games used as an instructional tol in learning new
words, and generally engaged as a source of entertainment, but have been found to serve an educational purpose (in learning words) as well (Allery, 2004).
Traditional methods of language instruction: teaching methods which follow behaviorist approach to foreign and second language teaching and learning. In these methods, learners do not have the opportunity to take part in learning process (Ojeda, 2004).
Motivation: the factors that determine a person`s desire to do something (Richard, Platt, & Platt, 1995). Class atmosphere: it is feelings of learners toward their teacher, subject matter, and the classroom itself which
have positive or negative effect on learners` learning process (Yu, 2005). Cooperative game: a game where groups of players may enforce cooperative behavior, hence the game is a
competition between groups of players not among individuals (Hadfield, 1994). Competitive game: a game in which different individual players participate, not different groups (Hadfield,
1996). 1.3. Word Games In order to compare the effect of both types of word games on Iranian EFL learners` vocabulary learning, motivation,
ISSN 2039-9340 Mediterranean Journal of Social Sciences Vol. 4 (1) January 2013
191
attitudes toward their teacher, and classroom atmosphere, four word games (two cooperative games and two competitive games) were used in this study. In order to achieve this goal, in the first week of the study, the researcher used two cooperative games in the first experimental groups while the second experimental group played two competitive games. However, during the second week, learners in the first experimental group played competitive games whereas the second experimental group used two cooperative word games as instructional tools in practicing the newly taught words. The aim of each word game was to reinforce the words the learners had learnt. All these four games were selected based on the characteristics of good instructional games which are
1. Level of the game compatible with learners` level of language proficiency: all of the word games used in this study was in accordance with learners` level of language proficiency. In order to check this, one OPT test consisting of 60 grammatical items were given to the learners before the study.
1.3.1. Cooperative Word Games As mentioned earlier, after teaching the new words, the researcher asked learners in both experimental groups to practice these words through the use of two cooperative word games, in which the learners needed to cooperate with each other rather than compete. These games were as the followings.
1. Contact Game: In this game the teacher put the learners (of each experimental group) into 4 groups (consisting of 5 individuals). Then, the teacher or one of the other groups-called the “word master” or the “target person” should think of one of the words they`ve just learnt-called the “target word”, and the other learners in other groups should guess that target word, one letter at a time, by giving clues hard enough to stump the word-master but easy enough to enable other players “make contact” with the clue. Some amount of cooperation is needed among the players within groups since a guess must be scored by the other players by stating “Contact!” in order to be challenged by the word master. These clues can be the word`s synonym or antonym or just a brief explanation about it.
2. Jotto (Gitto): This game is a logic-oriented word game in which the teacher picks one secret word from among the newly taught words, with the purpose for the learners to guess the word. The score for this game is the number of letters containing in the guessed word. And the game continues till one group can guess the correct secret word. For example, if the secret word is “purchase”, and the first group guess “penmanship”, the score is 5 for the letters p, e, a, s, and h.
1.3.2. Competitive Word Games After teaching the new words, the researcher asked learners in both experimental groups to practice these words through the use of two competitive word games, in which the learners needed to compete with each other rather than cooperate. These games were as the followings
1. Crossword: In this game, learners were given one identical crossword, and the teacher asked them to fill the cells of the crosswords through the use of the words they had newly learnt in the class.
2. Matching: In this word game, again, learners were given a sheet of paper containing 2 columns; synonyms and antonyms of the words they have just learnt, and the teacher asked them to match the correct words.
1.4. Significance of the Study Nowadays, in Iran as well as in many other educational settings, there exists an emphasis on communicative language teaching; however, few practical attempts have been made to actualize the requirements and conditions suggested by this type of teaching and to see the reacts of those involved in educational settings to find out if common language teaching really promoted language learning.
Besides, the most important factors which can boost learners` ability in learning a foreign language are motivation, and learners` attitudes toward teaching methods as well as their teacher (Ellis, 2006; Macedonia, 2005; Ojeda, 2004; Yu, 2005). However, in Iran, little study has been done about the influence of word games on these four important factors. Consequently, this study aimed at investigating the impact of word games on EFL learners` motivation, attitudes toward their teacher, and class atmosphere. 1.5. Objectives of the Study Although vocabulary is considered as an important part of foreign language learning, learning vocabulary has a bad
ISSN 2039-9340 Mediterranean Journal of Social Sciences Vol. 4 (1) January 2013
192
reputation Yu (2005). According to him, the word “vocabulary” often freezes the heart of language learners. Moreover, many second and foreign language learners complain that vocabulary learning is a negative experience for them (Ojeda, 2004). In this way, word games are considered as particular tasks and activities which can promote the learning process as well as learners` motivation. Besides, they make classrooms more learner-centered and, as a result, they can not only improve learner-teacher relationships but also create a positive classroom environment in which learners are not anxious and are eager to participate in classroom learning activities.
However, few studies have been done on the effect of vocabulary games in English classrooms, so the aim of this study is to find out cognitive as well as socio-affective advantages of using word games and to compare two types of word games (competitive versus cooperative games) and see whether playing word games is an effective tool in learning new words, motivating learners, and providing a positive atmosphere in the classroom or not; if yes, which one can promote learners` vocabulary achievement and motivation more. Also the aim is to investigate which game type can change learners` attitudes toward their teacher and provide more positive atmosphere in the class more. 1.6. Research Questions In order for the researcher to achieve these goals, the following questions are investigated:
1. Is there any difference in learners` vocabulary gains practiced through the use of word games versus those practiced textbook exercises?
2. Is there any difference in the learning of new words practiced through the use of cooperative games versus competitive games?
3. Is there any difference in learners` motivation practiced the newly learnt words through the use of cooperative games versus competitive games?
4. Is there any difference in providing a positive atmosphere in classes where learners made use of cooperative games as instructional tools in practicing newly learnt words versus competitive games?
1.7. Research Hypothesis:
Based on the research questions, the following null hypotheses were formed: HO1. There is no difference in the achievement of new words which are practiced through playing word games
versus those practiced textbook exercises. HO2. There is no difference in the achievement of new words which are practiced through playing cooperative
games versus those practiced by competitive games. HO3. There is no difference in learners` motivation who used cooperative games versus those used competitive
games for the purpose of practicing newly taught words. HO4. There is no difference in providing a positive atmosphere in classes where learners are taught by cooperative
games versus those taught by competitive games. The effect and also the result is the same. 2. Review of Literature There is controversy over using games in language classes. Some teachers believe that learning must be serious in nature and having fun in the classroom does not lead to real learning. Some other think that using games in language classes is a waste of time, so they do not make use of them since, based on their belief, games have only one element, which is fun (Ojeda, 2004). In spite of all of these beliefs and misconceptions, games have become popular over the past decade (Fletcher and Tobias, 2006). Language games not only encourage learners, but also help teachers provide a context in which language is used meaningfully. Furthermore, games are amusing, challenging and encourage and increase cooperation among learners.
Dalton E. (2005), in her study “Language Learning Games” tries to invent or discover instructional strategies that reduce the intense stress learners experience in formal language learning situations, e.g., EFL classes. She states that games can help with motivation, particularly cooperative games, and are also a way to be sure that all learners are included in the learning effort. She also mentions that not all language learning games are equivalent. Some are helpful in practicing individual vocabulary words such as Matching, while others involve the learners in complex discourse like Simulation.
So, in the process of developing in-class activities, the author has found that games and language activities are both highly useful not only for learning isolated vocabulary, but also for expanding into the realms of sentences and discourse, depending on the design of the game in question. Simple vocabulary games like Bingo and Concentration help
ISSN 2039-9340 Mediterranean Journal of Social Sciences Vol. 4 (1) January 2013
193
learners with isolated vocabulary, but do not increase overall communicative competence in themselves. More sophisticated “memory chain” games in which each learner adds to the sentence of the learner previous can help build sentence competence, but the more subtle elements of discourse are not addressed. Finally, in elaborate role plays and “jigsaw” games, in which the learners either compete or work cooperatively to solve a language task such as constructing dialogue for an everyday situation or resolving a more structured mystery with clues, true discourse elements such as greetings, politeness phrases and idioms can be incorporated. Our goal needs to be to find games and learning activities which address all three levels of learning.
Hajdu, J. (2000) has committed a study in which he provides an evaluation Checklist for computer games used for EFL vocabulary learning practice, called “Vocaword “. In this paper, Uzun follows three purposes: to draw attention to the use of games in EFL teaching and learning, to present a vocabulary learning game which can be used as supplementary material in CALL and/or traditional language classes in any language, and to compare it with two other widely used games in FLT. A criteria checklist for CALL systems and more specifically for vocabulary learning software is offered and applied to the evaluation of one game, namely VocaWord. He concludes that the checklist’s application to the game, used in this study, shows that the weakness of the game is half as much, and the strengths might be twice as much compared to Scrabble and Taboo, which are commercially oriented games widely used by teachers and foreign language learners. According to him, these results suggest that VocaWord is a promising game that has the potential to be quite effective.
Carolyn Hildebrandt (2002) who is interested in “cooperative and competitive games in constructivist classrooms” reports the results of three analyses of first graders’ social behavior in constructivist classrooms during cooperative and competitive games. The first analysis involved time sampling of aggressive and cooperative behaviors; the second focused on enacted interpersonal understanding (negotiation strategies and shared experiences); and the third on turn taking and rule following.
This study, also, captured the attention of one of Carolyn’s graduate learners, Taunjah Bell, and together they designed a study to replicate it in two constructivist classrooms. They hypothesized that in constructivist classrooms, where mutual respect is practiced between teachers and children and between children themselves, there would be no difference between the way children play cooperative and competitive games.
At the end of their research, they mention that results of these three analyses suggest both cooperative and competitive games have value in constructivist classrooms. They argue that in classrooms characterized by high levels of cooperation, children’s interactions are cooperative, regardless of the type of game. Based on this research, the significant differences in children’s reciprocal negotiation strategies and shared experience suggest that developmentally appropriate early childhood teachers should take a closer look at cooperative games and consider adding them to their collection of group games, but they should not discard their competitive games. 3. Research Methodology 3.1. Participants This study was conducted with 60 male learners with the age range of 17 - 19, who were studying at three different EFL (intermediate) Reading classes. The main reason for selecting them was that they had the same proficiency level (based on an OPT Test they have received), the same teacher (to teach the course and play the word games in the class), the same environment (English Reading private classes) and instructional materials (Select Reading II). So, three groups of learners - each consisting of 20 learners- have been involved, one served as the control group and the other two as the experimental groups. 3.2. Materials In the current study, one proficiency test, two vocabulary tests, three questionnaires, and one interview were used at the end of each week to gather both qualitative and quantitative data and give information about the effect of cooperative as well as competitive word games on learners` vocabulary gains, motivation, attitudes toward their teacher, and class atmosphere. 3.3. Procedures As mentioned before, the aim of this study was to investigate and compare the effects of two types of word games (cooperative versus competitive) on EFL learners` vocabulary learning, motivation, attitudes toward their teacher, and
ISSN 2039-9340 Mediterranean Journal of Social Sciences Vol. 4 (1) January 2013
194
classroom atmosphere. To achieve this goal, the researcher selected 60 learners and put them randomly in three group; each group consisting of 20 learners, and asked them to take part in this study. From among these three groups, two served as the experimental and one as the control. These 60 learners were given the same materials having the same teacher, and in the experimental groups, playing the same types of word games, while no game was used in the control group. Besides, in order for the researcher to make sure that all learners in both experimental and control groups were comparable, before the experiment, a test of OPT was given to them. This test consisted of 60 multiple choice grammatical items and learners were supposed to answer them in 60 minutes (the standard time for answering multiple choice items is one question per one minute). Moreover, in order to do a comparative study, the researcher divided the procedure into two identical phases: 3.3.1. The First Phase Week one: During this week, learners were taught 10 new English words accompanied by their families such as noun, verb, adjective, adverb, and etc., and their individual meanings. This strategy, which is called “family group”, is used in all three groups. Week two: During this week, the teacher asked learners to practice these newly taught words; learners in the control group were required to practice these words by doing some textbook drills. Since the aim of this study was to compare the effects of two types of word games on EFL learners, no questionnaire was given to this group. However, learners in the first experimental group played two cooperative word games (Contact and Jotto) in order to practice the new words they had been taught in the previous week. After practicing, in order for the researcher to gather quantitative data for the study, the teacher gave them three questionnaires; a motivation questionnaire to see whether these games could increase their motivation, a word game questionnaire to investigate their attitudes toward the games they had played as well as their attitudes toward their teacher, a classroom atmosphere questionnaire to discover whether playing these games could provide a more positive atmosphere in the class. Finally, in order for the researcher to gather qualitative data for the study, two learners were selected randomly by the teacher to take part in the interview and express their feelings and opinions about using cooperative games as instructional tools for practicing the new words in the class. The same procedure was followed in the second experimental group, but the games they used for practicing the newly taught words were different; they were asked to play two competitive word games (matching and crossword). Week three: This week is considered as the testing one, in which learners in all three groups were given a vocabulary test consisting of 30 items (10 multiple choice, 10 fill-in the-blank, and 10 cloze tests). 3.3.2. The Second Phase of the Study Week one: At first week, learners were taught 10 new English words through “family group” strategy; in other words, the same materials were given to them (10 identical new English words) through the same teaching strategy (family group) having the same teacher. Week two: During this week, the teacher asked learners to practice these newly taught words; again, learners in the control group were required to practice these words by doing some textbook drills, and no questionnaire was given to this group. However, learners in the first experimental group played two competitive word games (matching and crossword) in order to practice the new words they had been taught in the previous week. After practicing, the teacher gave them three questionnaires; a motivation questionnaire to see whether these games could increase their motivation, a word game questionnaire to investigate their attitudes toward the games they had played as well as their attitudes toward their teacher, a classroom atmosphere questionnaire to discover whether playing these games could provide a more positive atmosphere in the class. Finally, two learners were selected randomly by the teacher to take part in the interview and express their feelings and opinions about using competitive games as instructional tools for practicing the new words in the class. While, learners in the second experimental group were asked to practice the new words through playing two cooperative word games (Contact and Jotto). After practicing, again, the teacher gave them three questionnaires; a motivation questionnaire to see whether these games could increase their motivation, a word game questionnaire to investigate their attitudes toward the games they had played as well as their attitudes toward their teacher, a classroom atmosphere questionnaire to discover whether playing these games could change the class atmosphere into a more positive one. Finally, two learners were selected randomly by the teacher to take part in the interview and express their feelings and opinions about using cooperative games as instructional tools for practicing the new words in the class.
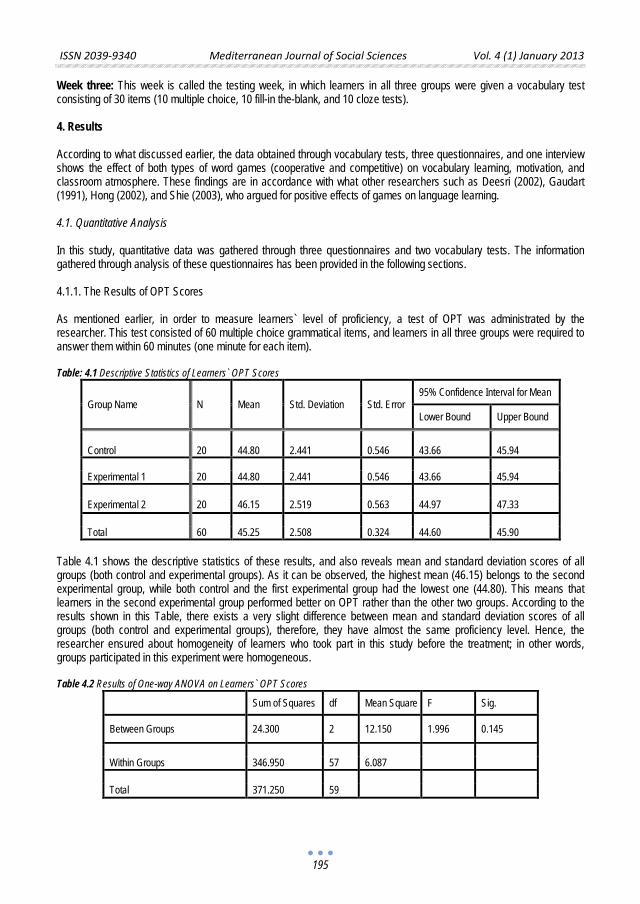
ISSN 2039-9340 Mediterranean Journal of Social Sciences Vol. 4 (1) January 2013
195
Week three: This week is called the testing week, in which learners in all three groups were given a vocabulary test consisting of 30 items (10 multiple choice, 10 fill-in the-blank, and 10 cloze tests). 4. Results According to what discussed earlier, the data obtained through vocabulary tests, three questionnaires, and one interview shows the effect of both types of word games (cooperative and competitive) on vocabulary learning, motivation, and classroom atmosphere. These findings are in accordance with what other researchers such as Deesri (2002), Gaudart (1991), Hong (2002), and Shie (2003), who argued for positive effects of games on language learning. 4.1. Quantitative Analysis In this study, quantitative data was gathered through three questionnaires and two vocabulary tests. The information gathered through analysis of these questionnaires has been provided in the following sections. 4.1.1. The Results of OPT Scores As mentioned earlier, in order to measure learners` level of proficiency, a test of OPT was administrated by the researcher. This test consisted of 60 multiple choice grammatical items, and learners in all three groups were required to answer them within 60 minutes (one minute for each item). Table: 4.1 Descriptive Statistics of Learners` OPT Scores
Group Name N Mean Std. Deviation Std. Error 95% Confidence Interval for Mean
Lower Bound Upper Bound
Control
20
44.80
2.441
0.546
43.66
45.94
Experimental 1 20 44.80 2.441 0.546 43.66 45.94 Experimental 2 20 46.15 2.519 0.563 44.97 47.33 Total 60 45.25 2.508 0.324 44.60 45.90
Table 4.1 shows the descriptive statistics of these results, and also reveals mean and standard deviation scores of all groups (both control and experimental groups). As it can be observed, the highest mean (46.15) belongs to the second experimental group, while both control and the first experimental group had the lowest one (44.80). This means that learners in the second experimental group performed better on OPT rather than the other two groups. According to the results shown in this Table, there exists a very slight difference between mean and standard deviation scores of all groups (both control and experimental groups), therefore, they have almost the same proficiency level. Hence, the researcher ensured about homogeneity of learners who took part in this study before the treatment; in other words, groups participated in this experiment were homogeneous. Table 4.2 Results of One-way ANOVA on Learners` OPT Scores
Sum of Squares df Mean Square F Sig.
Between Groups 24.300 2 12.150 1.996 0.145
Within Groups 346.950 57 6.087 Total 371.250 59
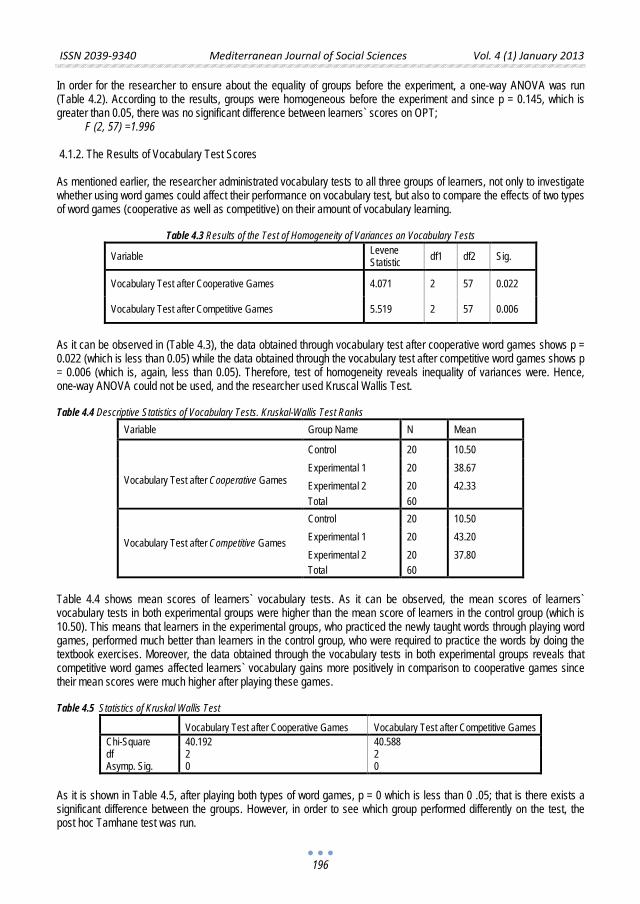
ISSN 2039-9340 Mediterranean Journal of Social Sciences Vol. 4 (1) January 2013
196
In order for the researcher to ensure about the equality of groups before the experiment, a one-way ANOVA was run (Table 4.2). According to the results, groups were homogeneous before the experiment and since p = 0.145, which is greater than 0.05, there was no significant difference between learners` scores on OPT;
F (2, 57) =1.996
4.1.2. The Results of Vocabulary Test Scores As mentioned earlier, the researcher administrated vocabulary tests to all three groups of learners, not only to investigate whether using word games could affect their performance on vocabulary test, but also to compare the effects of two types of word games (cooperative as well as competitive) on their amount of vocabulary learning.
Table 4.3 Results of the Test of Homogeneity of Variances on Vocabulary Tests
Variable Levene Statistic df1 df2 Sig.
Vocabulary Test after Cooperative Games 4.071 2 57 0.022
Vocabulary Test after Competitive Games 5.519 2 57 0.006
As it can be observed in (Table 4.3), the data obtained through vocabulary test after cooperative word games shows p = 0.022 (which is less than 0.05) while the data obtained through the vocabulary test after competitive word games shows p = 0.006 (which is, again, less than 0.05). Therefore, test of homogeneity reveals inequality of variances were. Hence, one-way ANOVA could not be used, and the researcher used Kruscal Wallis Test. Table 4.4 Descriptive Statistics of Vocabulary Tests. Kruskal-Wallis Test Ranks
Variable Group Name N Mean
Vocabulary Test after Cooperative Games
Control 20 10.50 Experimental 1 20 38.67 Experimental 2 20 42.33 Total 60
Vocabulary Test after Competitive Games
Control 20 10.50 Experimental 1 20 43.20 Experimental 2 20 37.80 Total 60
Table 4.4 shows mean scores of learners` vocabulary tests. As it can be observed, the mean scores of learners` vocabulary tests in both experimental groups were higher than the mean score of learners in the control group (which is 10.50). This means that learners in the experimental groups, who practiced the newly taught words through playing word games, performed much better than learners in the control group, who were required to practice the words by doing the textbook exercises. Moreover, the data obtained through the vocabulary tests in both experimental groups reveals that competitive word games affected learners` vocabulary gains more positively in comparison to cooperative games since their mean scores were much higher after playing these games. Table 4.5 Statistics of Kruskal Wallis Test
Vocabulary Test after Cooperative Games Vocabulary Test after Competitive Games Chi-Square 40.192 40.588 df 2 2 Asymp. Sig. 0 0
As it is shown in Table 4.5, after playing both types of word games, p = 0 which is less than 0 .05; that is there exists a significant difference between the groups. However, in order to see which group performed differently on the test, the post hoc Tamhane test was run.
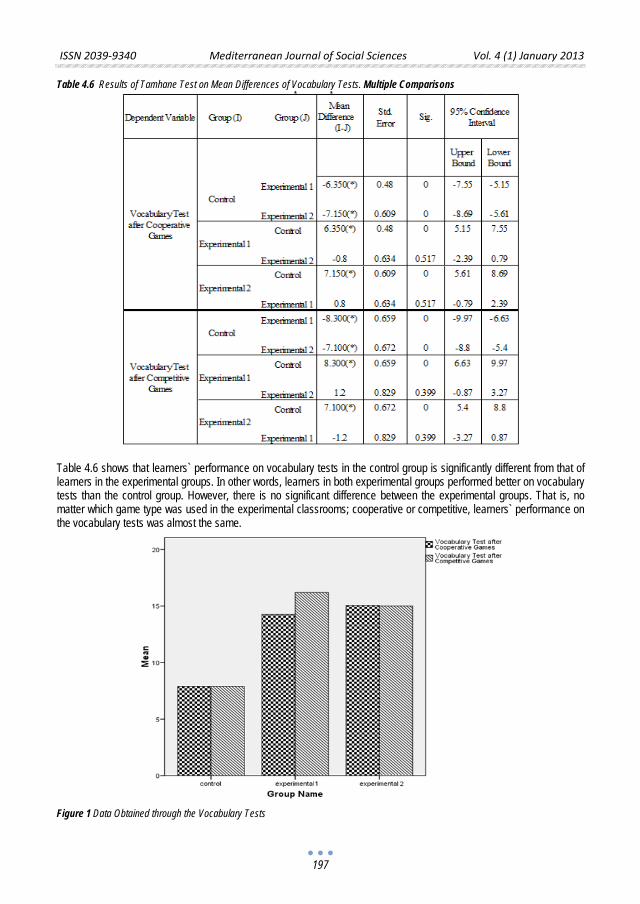
ISSN 2039-9340 Mediterranean Journal of Social Sciences Vol. 4 (1) January 2013
197
Table 4.6 Results of Tamhane Test on Mean Differences of Vocabulary Tests. Multiple Comparisons
Table 4.6 shows that learners` performance on vocabulary tests in the control group is significantly different from that of learners in the experimental groups. In other words, learners in both experimental groups performed better on vocabulary tests than the control group. However, there is no significant difference between the experimental groups. That is, no matter which game type was used in the experimental classrooms; cooperative or competitive, learners` performance on the vocabulary tests was almost the same.
Figure 1 Data Obtained through the Vocabulary Tests
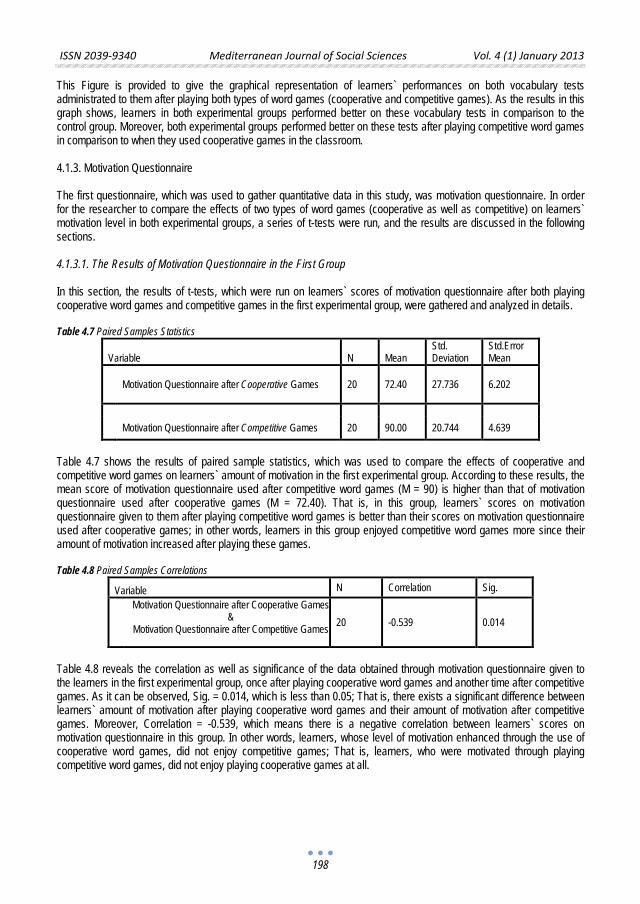
ISSN 2039-9340 Mediterranean Journal of Social Sciences Vol. 4 (1) January 2013
198
This Figure is provided to give the graphical representation of learners` performances on both vocabulary tests administrated to them after playing both types of word games (cooperative and competitive games). As the results in this graph shows, learners in both experimental groups performed better on these vocabulary tests in comparison to the control group. Moreover, both experimental groups performed better on these tests after playing competitive word games in comparison to when they used cooperative games in the classroom. 4.1.3. Motivation Questionnaire The first questionnaire, which was used to gather quantitative data in this study, was motivation questionnaire. In order for the researcher to compare the effects of two types of word games (cooperative as well as competitive) on learners` motivation level in both experimental groups, a series of t-tests were run, and the results are discussed in the following sections. 4.1.3.1. The Results of Motivation Questionnaire in the First Group In this section, the results of t-tests, which were run on learners` scores of motivation questionnaire after both playing cooperative word games and competitive games in the first experimental group, were gathered and analyzed in details. Table 4.7 Paired Samples Statistics
Variable N Mean Std. Deviation
Std.Error Mean
Motivation Questionnaire after Cooperative Games
20 72.40 27.736 6.202
Motivation Questionnaire after Competitive Games 20 90.00 20.744 4.639
Table 4.7 shows the results of paired sample statistics, which was used to compare the effects of cooperative and competitive word games on learners` amount of motivation in the first experimental group. According to these results, the mean score of motivation questionnaire used after competitive word games (M = 90) is higher than that of motivation questionnaire used after cooperative games (M = 72.40). That is, in this group, learners` scores on motivation questionnaire given to them after playing competitive word games is better than their scores on motivation questionnaire used after cooperative games; in other words, learners in this group enjoyed competitive word games more since their amount of motivation increased after playing these games. Table 4.8 Paired Samples Correlations
Variable N Correlation Sig.
Motivation Questionnaire after Cooperative Games &
Motivation Questionnaire after Competitive Games 20 -0.539 0.014
Table 4.8 reveals the correlation as well as significance of the data obtained through motivation questionnaire given to the learners in the first experimental group, once after playing cooperative word games and another time after competitive games. As it can be observed, Sig. = 0.014, which is less than 0.05; That is, there exists a significant difference between learners` amount of motivation after playing cooperative word games and their amount of motivation after competitive games. Moreover, Correlation = -0.539, which means there is a negative correlation between learners` scores on motivation questionnaire in this group. In other words, learners, whose level of motivation enhanced through the use of cooperative word games, did not enjoy competitive games; That is, learners, who were motivated through playing competitive word games, did not enjoy playing cooperative games at all.

ISSN 2039-9340 Mediterranean Journal of Social Sciences Vol. 4 (1) January 2013
199
Table 4.9 Paired Samples Test
Dependent Variable
Paired Differences
t df Sig. (2-tailed) Mean Std. Deviation Std. Erro
Mean
95% Confidence Interval of the Difference Upper Lower
Motivation Questionnaire after Cooperative Games
& Motivation Questionnaire after Competitive Games
-17.600 42.655 9.538 -37.563 2.363 -1.845 19 0.081
In order to see whether the differences between the mean scores were statistically significant or not, paired samples t-tests were used (Table 4.9). According to the results, t (19) = -1.845, p = 0. 081 which is greater than 0.05; that is, there isn`t such a noticeable difference between learners` amount of motivation after playing cooperative word games and their amount of motivation after competitive games. 4.1.3.2. The Results of Motivation Questionnaire in the Second Group In this section, however, the results of the t-tests, which were run on learners` scores of motivation questionnaire in the second experimental group, were gathered and analyzed in details. Table 4.10 Paired Samples Statistics
Variable N Mean Std. Deviation Std. Error Mean
Motivation Questionnaire after Cooperative Games 20 82.55 24.395 5.455
Motivation Questionnaire after Competitive
Games 20 83.30 25.654 5.736
As the results in Table 4.10 shows, the mean scores of motivation questionnaires obtained from learners in the second experimental group after playing competitive word games (Mean = 83.30) is higher than the mean score after cooperative games (Mean =82.55). This means that learners` amount of motivation in this group have been increased more when they used competitive word games for the purpose of practicing the newly taught words, in comparison to when they used cooperative games. In other words, learners` amount of motivation in this group enhanced more through the use of competitive word games, which led these games to be more enjoyable for them. Table 4.11 Paired Samples Correlations
Variable N Correlation Sig.
Motivation Questionnaire after Cooperative Games & Motivation Questionnaire after Competitive Games
20 -0.413 0.07
Table 4.11 reveals the correlation as well as significance of the data obtained through motivation questionnaire given to the learners in the second experimental group, once after playing cooperative word games and another time after competitive games. As it can be observed, Sig. = 0.07, which is less than 0.05; That is, there exists a significant difference between learners` amount of motivation after playing cooperative word games and their amount of motivation after competitive games. Moreover, Correlation = -0.413, which means there is a negative correlation between learners` scores on motivation questionnaire in this group. In other words, learners, whose level of motivation enhanced through the use of cooperative word games, did not enjoy competitive games; That is, learners, who were motivated through playing competitive word games, did not enjoy playing cooperative games at all.
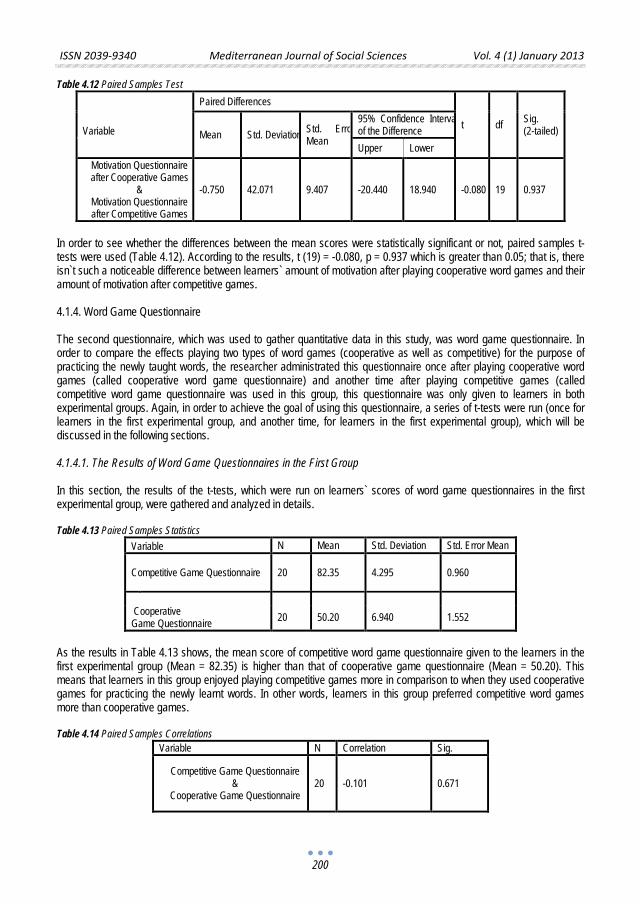
ISSN 2039-9340 Mediterranean Journal of Social Sciences Vol. 4 (1) January 2013
200
Table 4.12 Paired Samples Test
Variable
Paired Differences
t df Sig. (2-tailed) Mean Std. Deviation Std. Erro
Mean
95% Confidence Interva of the Difference
Upper Lower Motivation Questionnaire after Cooperative Games
& Motivation Questionnaire after Competitive Games
-0.750 42.071 9.407 -20.440 18.940 -0.080 19 0.937
In order to see whether the differences between the mean scores were statistically significant or not, paired samples t-tests were used (Table 4.12). According to the results, t (19) = -0.080, p = 0.937 which is greater than 0.05; that is, there isn`t such a noticeable difference between learners` amount of motivation after playing cooperative word games and their amount of motivation after competitive games. 4.1.4. Word Game Questionnaire The second questionnaire, which was used to gather quantitative data in this study, was word game questionnaire. In order to compare the effects playing two types of word games (cooperative as well as competitive) for the purpose of practicing the newly taught words, the researcher administrated this questionnaire once after playing cooperative word games (called cooperative word game questionnaire) and another time after playing competitive games (called competitive word game questionnaire was used in this group, this questionnaire was only given to learners in both experimental groups. Again, in order to achieve the goal of using this questionnaire, a series of t-tests were run (once for learners in the first experimental group, and another time, for learners in the first experimental group), which will be discussed in the following sections. 4.1.4.1. The Results of Word Game Questionnaires in the First Group In this section, the results of the t-tests, which were run on learners` scores of word game questionnaires in the first experimental group, were gathered and analyzed in details. Table 4.13 Paired Samples Statistics
Variable N Mean Std. Deviation Std. Error Mean Competitive Game Questionnaire
20 82.35 4.295 0.960
Cooperative Game Questionnaire 20 50.20 6.940 1.552
As the results in Table 4.13 shows, the mean score of competitive word game questionnaire given to the learners in the first experimental group (Mean = 82.35) is higher than that of cooperative game questionnaire (Mean = 50.20). This means that learners in this group enjoyed playing competitive games more in comparison to when they used cooperative games for practicing the newly learnt words. In other words, learners in this group preferred competitive word games more than cooperative games. Table 4.14 Paired Samples Correlations
Variable N Correlation Sig.
Competitive Game Questionnaire &
Cooperative Game Questionnaire 20 -0.101 0.671
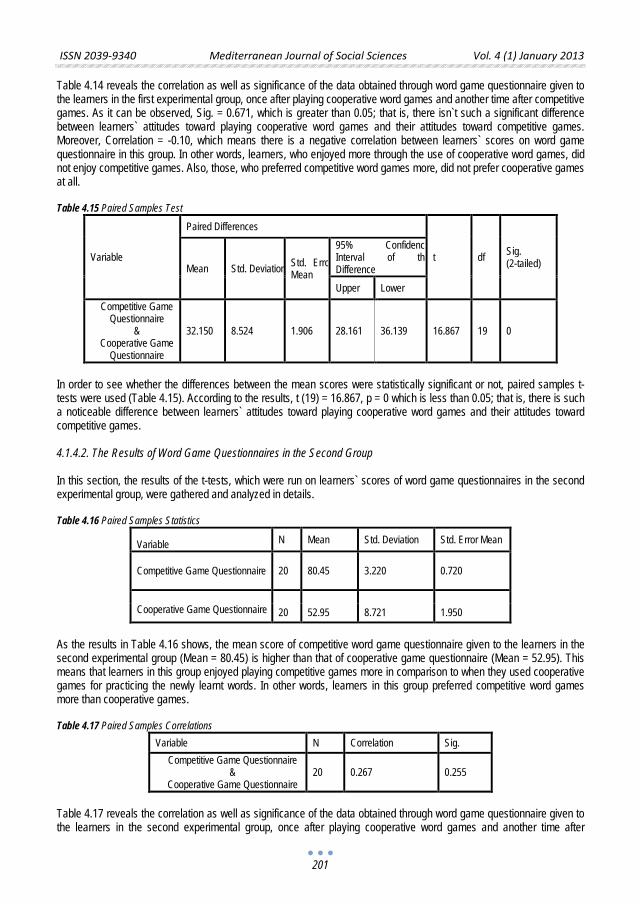
ISSN 2039-9340 Mediterranean Journal of Social Sciences Vol. 4 (1) January 2013
201
Table 4.14 reveals the correlation as well as significance of the data obtained through word game questionnaire given to the learners in the first experimental group, once after playing cooperative word games and another time after competitive games. As it can be observed, Sig. = 0.671, which is greater than 0.05; that is, there isn`t such a significant difference between learners` attitudes toward playing cooperative word games and their attitudes toward competitive games. Moreover, Correlation = -0.10, which means there is a negative correlation between learners` scores on word game questionnaire in this group. In other words, learners, who enjoyed more through the use of cooperative word games, did not enjoy competitive games. Also, those, who preferred competitive word games more, did not prefer cooperative games at all. Table 4.15 Paired Samples Test
Variable
Paired Differences
t df Sig. (2-tailed) Mean Std. Deviation Std. Erro
Mean
95% Confidence Interval of the Difference Upper Lower
Competitive Game Questionnaire
& Cooperative Game
Questionnaire
32.150 8.524 1.906 28.161 36.139 16.867 19 0
In order to see whether the differences between the mean scores were statistically significant or not, paired samples t-tests were used (Table 4.15). According to the results, t (19) = 16.867, p = 0 which is less than 0.05; that is, there is such a noticeable difference between learners` attitudes toward playing cooperative word games and their attitudes toward competitive games. 4.1.4.2. The Results of Word Game Questionnaires in the Second Group In this section, the results of the t-tests, which were run on learners` scores of word game questionnaires in the second experimental group, were gathered and analyzed in details. Table 4.16 Paired Samples Statistics
Variable N Mean Std. Deviation Std. Error Mean
Competitive Game Questionnaire
20 80.45 3.220 0.720
Cooperative Game Questionnaire
20 52.95 8.721 1.950
As the results in Table 4.16 shows, the mean score of competitive word game questionnaire given to the learners in the second experimental group (Mean = 80.45) is higher than that of cooperative game questionnaire (Mean = 52.95). This means that learners in this group enjoyed playing competitive games more in comparison to when they used cooperative games for practicing the newly learnt words. In other words, learners in this group preferred competitive word games more than cooperative games. Table 4.17 Paired Samples Correlations
Variable N Correlation Sig. Competitive Game Questionnaire
& Cooperative Game Questionnaire
20 0.267 0.255
Table 4.17 reveals the correlation as well as significance of the data obtained through word game questionnaire given to the learners in the second experimental group, once after playing cooperative word games and another time after
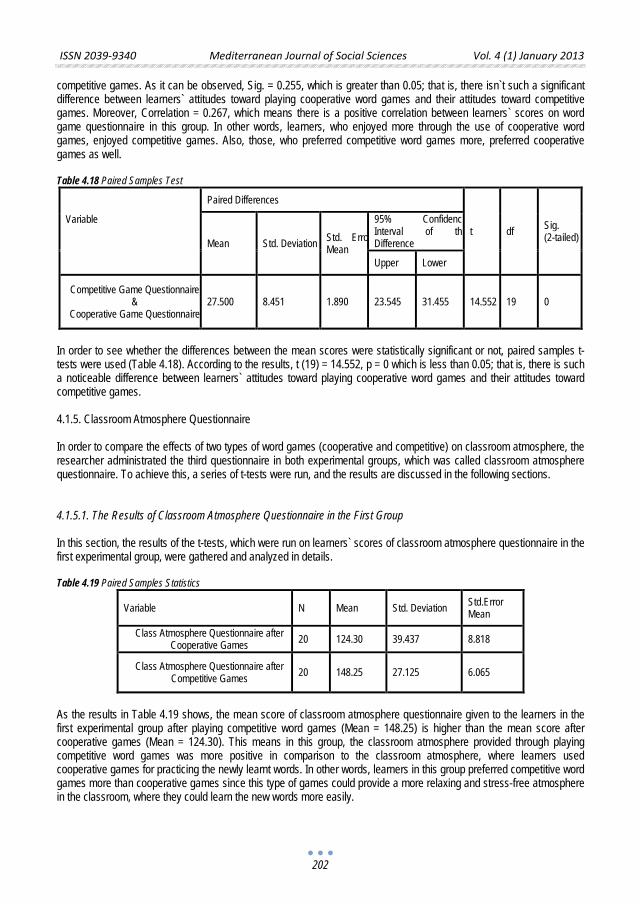
ISSN 2039-9340 Mediterranean Journal of Social Sciences Vol. 4 (1) January 2013
202
competitive games. As it can be observed, Sig. = 0.255, which is greater than 0.05; that is, there isn`t such a significant difference between learners` attitudes toward playing cooperative word games and their attitudes toward competitive games. Moreover, Correlation = 0.267, which means there is a positive correlation between learners` scores on word game questionnaire in this group. In other words, learners, who enjoyed more through the use of cooperative word games, enjoyed competitive games. Also, those, who preferred competitive word games more, preferred cooperative games as well. Table 4.18 Paired Samples Test
Variable
Paired Differences
t df Sig. (2-tailed) Mean Std. Deviation Std. Erro
Mean
95% Confidence Interval of the Difference
Upper Lower
Competitive Game Questionnaire &
Cooperative Game Questionnaire 27.500 8.451 1.890 23.545 31.455 14.552 19 0
In order to see whether the differences between the mean scores were statistically significant or not, paired samples t-tests were used (Table 4.18). According to the results, t (19) = 14.552, p = 0 which is less than 0.05; that is, there is such a noticeable difference between learners` attitudes toward playing cooperative word games and their attitudes toward competitive games. 4.1.5. Classroom Atmosphere Questionnaire In order to compare the effects of two types of word games (cooperative and competitive) on classroom atmosphere, the researcher administrated the third questionnaire in both experimental groups, which was called classroom atmosphere questionnaire. To achieve this, a series of t-tests were run, and the results are discussed in the following sections. 4.1.5.1. The Results of Classroom Atmosphere Questionnaire in the First Group In this section, the results of the t-tests, which were run on learners` scores of classroom atmosphere questionnaire in the first experimental group, were gathered and analyzed in details. Table 4.19 Paired Samples Statistics
Variable N Mean Std. Deviation Std.Error Mean
Class Atmosphere Questionnaire after Cooperative Games 20 124.30 39.437 8.818
Class Atmosphere Questionnaire after Competitive Games 20 148.25 27.125 6.065
As the results in Table 4.19 shows, the mean score of classroom atmosphere questionnaire given to the learners in the first experimental group after playing competitive word games (Mean = 148.25) is higher than the mean score after cooperative games (Mean = 124.30). This means in this group, the classroom atmosphere provided through playing competitive word games was more positive in comparison to the classroom atmosphere, where learners used cooperative games for practicing the newly learnt words. In other words, learners in this group preferred competitive word games more than cooperative games since this type of games could provide a more relaxing and stress-free atmosphere in the classroom, where they could learn the new words more easily.
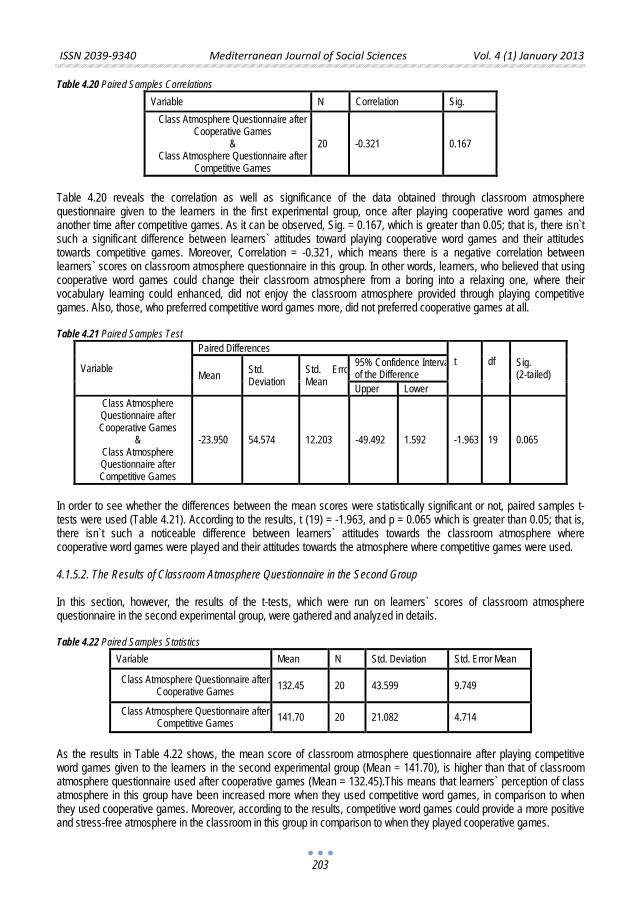
ISSN 2039-9340 Mediterranean Journal of Social Sciences Vol. 4 (1) January 2013
203
Table 4.20 Paired Samples Correlations Variable N Correlation Sig.
Class Atmosphere Questionnaire after Cooperative Games
& Class Atmosphere Questionnaire after
Competitive Games
20 -0.321 0.167
Table 4.20 reveals the correlation as well as significance of the data obtained through classroom atmosphere questionnaire given to the learners in the first experimental group, once after playing cooperative word games and another time after competitive games. As it can be observed, Sig. = 0.167, which is greater than 0.05; that is, there isn`t such a significant difference between learners` attitudes toward playing cooperative word games and their attitudes towards competitive games. Moreover, Correlation = -0.321, which means there is a negative correlation between learners` scores on classroom atmosphere questionnaire in this group. In other words, learners, who believed that using cooperative word games could change their classroom atmosphere from a boring into a relaxing one, where their vocabulary learning could enhanced, did not enjoy the classroom atmosphere provided through playing competitive games. Also, those, who preferred competitive word games more, did not preferred cooperative games at all. Table 4.21 Paired Samples Test
Variable
Paired Differences t df Sig.
(2-tailed) Mean Std. Deviation
Std. Erro Mean
95% Confidence Interva of the Difference Upper Lower
Class Atmosphere Questionnaire after Cooperative Games
& Class Atmosphere Questionnaire after Competitive Games
-23.950 54.574 12.203 -49.492 1.592 -1.963 19 0.065
In order to see whether the differences between the mean scores were statistically significant or not, paired samples t-tests were used (Table 4.21). According to the results, t (19) = -1.963, and p = 0.065 which is greater than 0.05; that is, there isn`t such a noticeable difference between learners` attitudes towards the classroom atmosphere where cooperative word games were played and their attitudes towards the atmosphere where competitive games were used. 4.1.5.2. The Results of Classroom Atmosphere Questionnaire in the Second Group In this section, however, the results of the t-tests, which were run on learners` scores of classroom atmosphere questionnaire in the second experimental group, were gathered and analyzed in details. Table 4.22 Paired Samples Statistics
Variable Mean N Std. Deviation Std. Error Mean
Class Atmosphere Questionnaire after Cooperative Games 132.45 20 43.599 9.749
Class Atmosphere Questionnaire after Competitive Games 141.70 20 21.082 4.714
As the results in Table 4.22 shows, the mean score of classroom atmosphere questionnaire after playing competitive word games given to the learners in the second experimental group (Mean = 141.70), is higher than that of classroom atmosphere questionnaire used after cooperative games (Mean = 132.45).This means that learners` perception of class atmosphere in this group have been increased more when they used competitive word games, in comparison to when they used cooperative games. Moreover, according to the results, competitive word games could provide a more positive and stress-free atmosphere in the classroom in this group in comparison to when they played cooperative games.
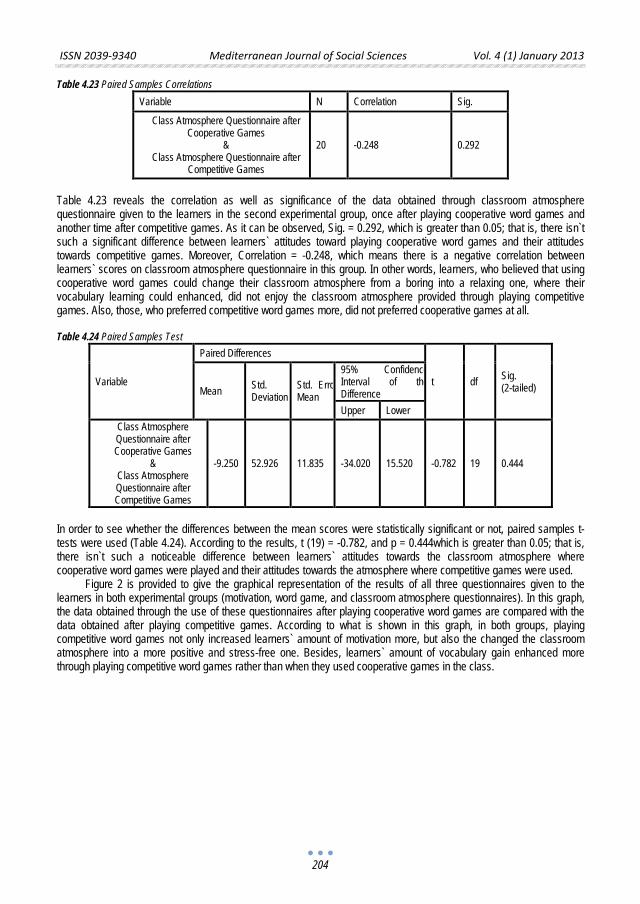
ISSN 2039-9340 Mediterranean Journal of Social Sciences Vol. 4 (1) January 2013
204
Table 4.23 Paired Samples Correlations Variable N Correlation Sig.
Class Atmosphere Questionnaire after Cooperative Games
& Class Atmosphere Questionnaire after
Competitive Games
20 -0.248 0.292
Table 4.23 reveals the correlation as well as significance of the data obtained through classroom atmosphere questionnaire given to the learners in the second experimental group, once after playing cooperative word games and another time after competitive games. As it can be observed, Sig. = 0.292, which is greater than 0.05; that is, there isn`t such a significant difference between learners` attitudes toward playing cooperative word games and their attitudes towards competitive games. Moreover, Correlation = -0.248, which means there is a negative correlation between learners` scores on classroom atmosphere questionnaire in this group. In other words, learners, who believed that using cooperative word games could change their classroom atmosphere from a boring into a relaxing one, where their vocabulary learning could enhanced, did not enjoy the classroom atmosphere provided through playing competitive games. Also, those, who preferred competitive word games more, did not preferred cooperative games at all. Table 4.24 Paired Samples Test
Variable
Paired Differences
t df Sig. (2-tailed) Mean Std.
Deviation Std. Erro Mean
95% Confidence Interval of the Difference Upper Lower
Class Atmosphere Questionnaire after Cooperative Games
& Class Atmosphere Questionnaire after Competitive Games
-9.250 52.926 11.835 -34.020 15.520 -0.782 19 0.444
In order to see whether the differences between the mean scores were statistically significant or not, paired samples t-tests were used (Table 4.24). According to the results, t (19) = -0.782, and p = 0.444which is greater than 0.05; that is, there isn`t such a noticeable difference between learners` attitudes towards the classroom atmosphere where cooperative word games were played and their attitudes towards the atmosphere where competitive games were used.
Figure 2 is provided to give the graphical representation of the results of all three questionnaires given to the learners in both experimental groups (motivation, word game, and classroom atmosphere questionnaires). In this graph, the data obtained through the use of these questionnaires after playing cooperative word games are compared with the data obtained after playing competitive games. According to what is shown in this graph, in both groups, playing competitive word games not only increased learners` amount of motivation more, but also the changed the classroom atmosphere into a more positive and stress-free one. Besides, learners` amount of vocabulary gain enhanced more through playing competitive word games rather than when they used cooperative games in the class.
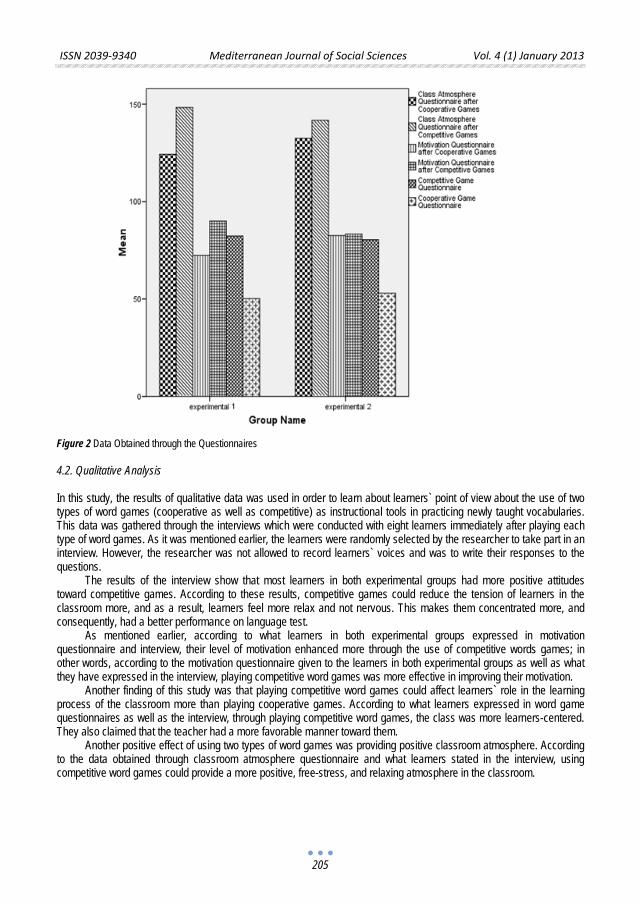
ISSN 2039-9340 Mediterranean Journal of Social Sciences Vol. 4 (1) January 2013
205
Figure 2 Data Obtained through the Questionnaires 4.2. Qualitative Analysis In this study, the results of qualitative data was used in order to learn about learners` point of view about the use of two types of word games (cooperative as well as competitive) as instructional tools in practicing newly taught vocabularies. This data was gathered through the interviews which were conducted with eight learners immediately after playing each type of word games. As it was mentioned earlier, the learners were randomly selected by the researcher to take part in an interview. However, the researcher was not allowed to record learners` voices and was to write their responses to the questions.
The results of the interview show that most learners in both experimental groups had more positive attitudes toward competitive games. According to these results, competitive games could reduce the tension of learners in the classroom more, and as a result, learners feel more relax and not nervous. This makes them concentrated more, and consequently, had a better performance on language test.
As mentioned earlier, according to what learners in both experimental groups expressed in motivation questionnaire and interview, their level of motivation enhanced more through the use of competitive words games; in other words, according to the motivation questionnaire given to the learners in both experimental groups as well as what they have expressed in the interview, playing competitive word games was more effective in improving their motivation.
Another finding of this study was that playing competitive word games could affect learners` role in the learning process of the classroom more than playing cooperative games. According to what learners expressed in word game questionnaires as well as the interview, through playing competitive word games, the class was more learners-centered. They also claimed that the teacher had a more favorable manner toward them.
Another positive effect of using two types of word games was providing positive classroom atmosphere. According to the data obtained through classroom atmosphere questionnaire and what learners stated in the interview, using competitive word games could provide a more positive, free-stress, and relaxing atmosphere in the classroom.
ISSN 2039-9340 Mediterranean Journal of Social Sciences Vol. 4 (1) January 2013
206
5. Implications 5.1. Theoretical Implications The results of the study have implications for the field of second language acquisition. This study explored the effects of two types of word games on EFL learners` motivation, classroom atmosphere, and vocabulary achievements. In this respect, having fun is the result of experiencing word games as the pedagogical tools in learning new English words, as well as enjoying engaging in a learning task (Ojeda, 2004; Yu, 2005). Naturally, this assertion begs the question of whether learners learn better, or learn more, if the learning experience provokes joy, laughter, glee (especially when the activity has specific pedagogical objectives with which to comply). Future research may investigate the effect ludic tasks may have on language learning.
The design of the word games used in the classroom should adhere to certain parameters to ensure success in language acquisition. They ought to obligate the learners to use specific vocabulary features, in a repetitive manner without falling into the rote, and routine reviewing of words that is unproductive. In the case of the cooperative word games, learners played in groups in order to practice the newly taught words. This permitted them to participate in the learning procedure more actively. Moreover, they can motivate learners in learning new vocabulary items, and change the classroom atmosphere into a more relaxing, positive one. Besides, learners ought to learn in a cooperative manner. However, using competitive word games could tap into a source of motivation that may facilitate second language acquisition. Competitive games often engage learners to actively participate in the activities. These games, also, provide a more stress-free atmosphere in the classroom which may foster learning process. When learners compete in a classroom setting, they often allocate additional energy and focus toward word production (if one of the objects of the game is to produce the correct words). When that is the case, these types of word games have been identified as important conditions for second language acquisition (Fotos, 1993). 5.2. Pedagogical Implications The findings of this can give useful information to language teachers as well as curriculum designers, since it can help them get familiar with new teaching strategies which can provide better learning environment for language learners to promote their amount of learning. Curriculum designers can use the findings of this study to get familiar with useful, enjoyable, and effective game-based language instruction and use these games in English textbooks to provide more productive and creative language classroom, and, as a result, a relaxed, flexible, and effective learning environment.
Instructional games can help teachers minimize their use of traditional strategies which are boring and learners dislike them. This has an important effect on learners` amount of motivation which encourages them to continue their language learning process. However, it does not mean that language teachers can use all kinds of language games in their classrooms, but the games which are going to be used must be in accordance with the time of language class since timing is a critical factor in these classes, so they must be used during reasonable times.
Another factor which is of great importance is that language games must be used to achieve particular pedagogical goals, such as learning vocabulary, grammar, pronunciation, and etc. Therefore, if language games are implemented strategically, they can be effective compliment for communicative language teaching. 6. Suggestions for Further Research This study shows the effects of two types of word games on EFL learners` motivation, attitudes toward their teacher, classroom atmosphere, and vocabulary achievement, but some other questions remained unanswered and to be investigated more. For example:
• Does the effect of instructional games on learners` motivation change in accordance with learners` age? • Do instructional games have an effect on teachers` motivation for teaching foreign languages? • Do instructional games have an effect on the rate of language learning? • Do instructional games improve learners` retention of language? Since this study used non-computer games, it can be replicated with computer games as well. It can be also
suggested that other researchers investigate other games which improve learners` learning of other language elements such as grammar, pronunciation, intonation, idioms, etc.
ISSN 2039-9340 Mediterranean Journal of Social Sciences Vol. 4 (1) January 2013
207
7. Conclusion As mentioned before, language games are components of communicative approach in language teaching which can maximize learners` use of target language by providing collaborative as well as competitive problem solving tasks. This is what mentioned by the learners who took part in this study.
In this way, competitive word games can be used as a communicative approach to promote learners` motivation for learning a foreign language. These games can not only diversify the language teaching methodology, but also provide more fun and interest in the language classroom; besides, they can produce a lively atmosphere in the classroom which makes vocabulary instruction more effective.
According to the results of this study, using competitive word games as dynamic and communicative pedagogical strategies, instead of tedious, old ones in English vocabulary cases have many positive results, such as:
• They motivate learners to enjoy language learning; • They help learners adopt different attitudes not only to language learning process but also to their teachers; • They provide a learning environment which enhances interaction among language learners; • They provide a positive, relaxed, and stress-free atmosphere in the classroom which enhances learners`
performance in the classroom. According to what has been found in this study, it can be concluded that whatever teacher does in a language
classroom has a profound effect on learners` success or failure in language learning process. In this regard, using pedagogical strategies which can promote learners` motivation is considered as an effective strategy for language learning and teaching. In order to achieve this goal, particular types of language games can be used. References Allery, L.A. (2004). Educational games and structured experiences. Medical Teacher, 26(6), 504-505. Anderson, K.S. (1998). Let the game begin: The gaming approach as an alternative paradigm in nursing education. Unpublished Eds.
Dissertation, North Carolina State University, North Carolina. Bailey, S.M. (2008). Content assessment in intelligent computer-aided language learning: Meaning error diagnosis for English as a
second language. Unpublished Doctoral dissertation, The Ohio State University, USA. Bygate, M.(1996). Effects of task repetition: Appraising the developing language of learners. In J. Willis & D. Willis (Eds.) Challenge and
change in language teaching (pp. 136-146). London: Heinemann. Carson, L. (1990). Cooperative learning in the home economics classroom. Journal of Home Economics, 82(4), 37-41. Dalton E. (2005). Language Learning Games. ISAGA at a watershed (pp.178-187)20 (2), 305-326. Deesri, A. (2002). Games in the ESL and EFL class. Retrieved June 17, 2003, from http://iteslj.org/Techniques/Deesri-Games.html. DeHann, J.W. (2008). Video games and second language acquisition: The effect of interactivity with a rhythm video game on second
language vocabulary recall, cognitive load, and telepresence. Unpublished doctoral dissertation, New York University, USA. Doughty, C. (1991). Second Language instruction does make a difference. Studies in Second Language Acquisition, 13, 431-469. Ellis, R. (2006). Current issues in the teaching of grammar: An SLA perspective. TESOL Quarterly, 40, 83-107. Fotos, S. (1993). Consciousness Raising and Noticing Focus on Forms: Grammar Task Performance versus Formal Instruction. Applied
Linguistics, 14, 385-407. Gardner, R.C. (1995). Social psychology and second language learning: The role of attitudes and motivation. London: Edward Arnold. Guadart, H. (1991). Games as teaching tools fro teaching English to speakers of other languages. Retrieved September 05/2001, from
http://sag.sagepub.com/cgi/content/abstract/30/3/283. Hadfield, J. (1996). Elementary communication games: A collection of games and activities for elementary students of English. England:
Wesley Longman. Hajdu, J. (2000). A journey in language teaching and learning. Unpublished EdD dissertation. University of Melbourne, Vic. Harmer, J. (2001). The Practice of English Language Teaching. Longman, Harlow, Essex. Hildebrandt, R. Edmiaston, & C. Sales (Eds.), Developing constructivist early childhood curriculum: Practical principals and activities (p. 181-191). New York: Teachers College Press. Hong, L. (2002). Using games in teaching English to young learners. Retrieved September 11,2003, from http://iteslj.org/Lessons/Lin-
UsingGames.html. Johnson, D.W., Johnson, R.T., & Holubec, E.J. (1986). Circles of learning: Cooperation in the classroom. Edina, MN: Interaction Book
Company. Johnson, D.W., & Johnson, R.T. (1987). Learning together and alone: Cooperative, competitive, and individualistic. Englewood Cliffs,
NJ: Prentice Hall. Johnson, D.W., & Johnson, R.T. (1991). Learning together and alone: Cooperative, competitive, and individualistic learning. (3rd ED.)
Boston, MA: Allyn and Bacon. Lantolf, J. (2000). Socio-cultural Theory and Second Language Learning. Oxford: Oxford University Press.
ISSN 2039-9340 Mediterranean Journal of Social Sciences Vol. 4 (1) January 2013
208
Li, Y.C. (2003). Effects of the “focus on form” approach on EFL learning in an immersion program in Taiwan. Unpublished master`s thesis, National Chin Hwa University, Chin Sun.
Macedonia, M. (2005). Games and foreign language teaching. Support for Learning, 20(3), 135-140 Ojeda,F.A. (2004). The role of word games in second language acquisition: second language pedagogy, motivation, and ludic tasks.
Unpublished doctoral dissertation, University of Florida. Pica, T. (1987). Second Language Acquisition, social interaction, and the classroom. Applied Linguistics, 8(1), 3-21. Richardm J.C., Platt, J., & Platt, H. (1992). Dictionary of language teaching and applied linguistics (2nd ED.). Essex: Longman. Robinson, P. (2001). Task complexity, task difficulty, and task production: Exploring interactions in a componential framework. Applied
Linguistics, 22(1), 27-57. Shie, J.S. (2003). Aspects of EFL games. Tai Pei: The Crance publishing Company. Silberman, M. (1996). Active Learning: 101 strategied for teaching any subject. Baston: Allyn and Bacon. Sysoyev, P.V. (1999). Integrative L2 grammar teaching: Exploration, explanation, and expression. Retrieved November 20, 2005, from
http://iteslu.org/Articles/Sysoyev_Integrative.html. Yen, S.W. (2002). A study of teaching grammar communicatively in the EFL vocational high school classroom. Unpublished master`s
thesis, Chung Cheng University, Chian Yi. Yu Shu-yun (2005). The Effects of Games on the Acquisition of Some Grammatical Features of L2 German on Students’ Motivation and on Classroom Atmosphere. A thesis submitted in partial fulfillment the requirements of the
degree of Doctor of education. Australian Catholic University Office of Research, Locked Bag 4115, Fitzroy, Victoria 3065, Australia.
Vygotsky, L.S. (1987). Mind in Society. Cambridge, MA: Harvard University Press. Williams, J. (1999). Learner-generated attention to form. Language Learning 49,583-625.
ISSN 2039-9340 Mediterranean Journal of Social Sciences Vol. 4 (1) January 2013
209
Classroom Activities as Measure of Academic Performance of Senior
Secondary School Students in Core Science Subjects
Dr. M.F Omodara
Department of Guidance and Counseling, Faculty of Education, Ekiti State University Ado-Ekiti
E-mail: [email protected] Phone No: 08034694654
Prof. E.B Kolawole
Institute of Education, Faculty of Education Ekiti State University, Ado-Ekiti
Phone No: 08033966701
Dr J.A Oluwatayo
Institute of Education, Faculty of Education,Ekiti State University Ado-Ekiti
E-mail: [email protected], Phone No:+234(0)8033964547 Doi:10.5901/mjss.2013.v4n1p209 Abstract
The study investigated classroom activities as measure of academic performance of senior secondary school students in core science subjects. Participants were 54 science teachers and 1,620 SS2 students selected from the Schools across the 16 local Government Areas of Ekiti State using purposive and stratified random sampling techniques. Data were collected using a 28-item interaction schedule and achievement tests in biology, chemistry and physics constructed and administered by the Ekiti State Ministry of Education. The data collected were analyzed using correlation and regression analyses. The findings revealed that there existed significant relationship between students’ participation in class lessons and their academic performance, the relationship between the teachers activities in science lessons and the students’ Academic performance was significant, positive and very high. The classroom activities in science lessons accounted for 94.5% of the variability in students’ academic performance.
Key words: Science activities, observation, participation and academic performance.
1. Introduction It is a common phenomenon that when students perform very well in external examinations in a particular subject, the school authority usually singles out the teacher who taught the subject for honour or commendation. The performance is said to be the result of the effectiveness in teacher’s teaching. The issue of effectiveness in teaching is obviously vital in education (Kukuru, 2010). For teaching to be effective, the teacher must stimulate, encourage and maintain active participation of students in science lessons. The use of aid materials is fundamental to active participation of students in science lessons because students have opportunity to torch, weigh, examine, sort, or manipulate learning aid materials. The students’ participation in learning process includes contributing ideas, analyzing the factors associated with the ideas, developing possible solutions to problems raised in the class, placing the solutions into actions and evaluating the results of the solution (Yawe, 2011). The activities typical of science classroom lessons include manipulating equipment and materials, writing or drawing on the board or in students note book, asking and answering questions, Explaining or presenting facts, reflecting on scientific concepts, giving and following instructions or giving direction on experimental procedures or how to carry out an activity/exercise, listening or observing, relating with colleagues among others (Omodara and Bandele, 2010). The activities can be broadly classified into cognitive, affective and psychomotor activities or dichotomized into verbal and non verbal, activities.

ISSN 2039-9340 Mediterranean Journal of Social Sciences Vol. 4 (1) January 2013
210
Omodara (2010,a) found out in a study that more than two third of the time spent in the science class lessons are usually devoted to cognitive activities at the neglect of affective and psychomotor activities. While Inamulla, Naseer and Husain (2008) asserted that there is no provision for the development of intellectual and thinking skills among students who are given little time for active participation and interaction in class lessons.
The science classroom activities are characterized by story telling and parroting, monologue, practical lessons turn to lecture sessions, writing notes and complete absence of teaching aids in the classes. Exercises, assignments and activities that would enhance mastery of concepts are very rare. The few ones given are not marked or thoroughly supervised. Corroborating this was a study which revealed that most science lessons in senior secondary schools in Ekiti and Ondo States of Nigeria were monologue i.e the teacher did the talking and the students were only listening or observing or occasionally writing (Omodara, 2010,b).
In the work of Oguntola (2008) it was revealed that students typically do not ask questions in the classroom discussion, nor are they encouraged to do so. Also in Omodara (2012,b) it was asserted that teachers punctuated the presentation of facts with brief questions only designed to keep the students alert and not necessarily meant to initiate critical thinking or trigger inquiring mind of the students. Under this condition student may not probably perform at high level in subsequent examinations. Study have also revealed that there exists strong linear dependency of students activities on teachers’ activities in science classroom lessons (Omodara, 2010, c). This implies that it is the teacher that dictates the level of participation of students in class lessons. Classroom performance of the teacher is an important factor in teaching learning process. 2. Statement of the Problem It is often reported that students’ performance in both internal and external examinations in science subjects is low. The evidence is obviously traceable to classroom situations and practices of which both the teachers and the students’ participation in class activities are very vital. It is therefore necessary to access the participation of the teachers and students in science classroom activities Vis-a-Vis the performance of the students in examinations with the view to making classroom teaching more effective and consequently ensure better performance of students in science. 3. Purpose of the Study The study used activities of teachers and students in science lessons to measure students’ academic performance. The use of a systematic observation technique of the category option was employed to record the activities of both the teachers and the students as they occur in science lessons. The observation data obtained were used to measure academic performance of students in SS2 Joint Promotion Examination conducted at the end of the session by the Ekiti State Ministry of Education. 4. Research Hypotheses
1. There is no significant relationship between students’ participation in science classroom activities and their performance in SS2 JPE
2. There is no significant relationship between activities of teachers in science lessons and the performance of SS2 students in JPE
3. Activities of the teachers and students’ in science lessons will not predict academic performance of the students in JPE
5. Procedure This study is a descriptive case study type of which teachers and students activities in biology, chemistry and physics classroom lessons served as the predictors i.e the independent variables. While the grades of senior secondary school two, SS 2, students in the JPE conducted by the Ekiti State Ministry of Education was the criterion measure/independent variable. The sample used in the study consisted of 54 teachers (18 Biology, 18 Chemistry and 18 Physics) and 1,620 SS2 science students. The sample was selected using purposive and stratified random sampling techniques from all the senior secondary schools in Ekiti State of Nigeria. The strafication was done along type of school (Male only, female only or mixed schools) and also along rural and urban schools.
The instruments for the study were 28-item science classroom interaction sheet used to collect observation data from SS2 science lessons in the schools during 2010/2011 academic session and a proforma used for the collection of
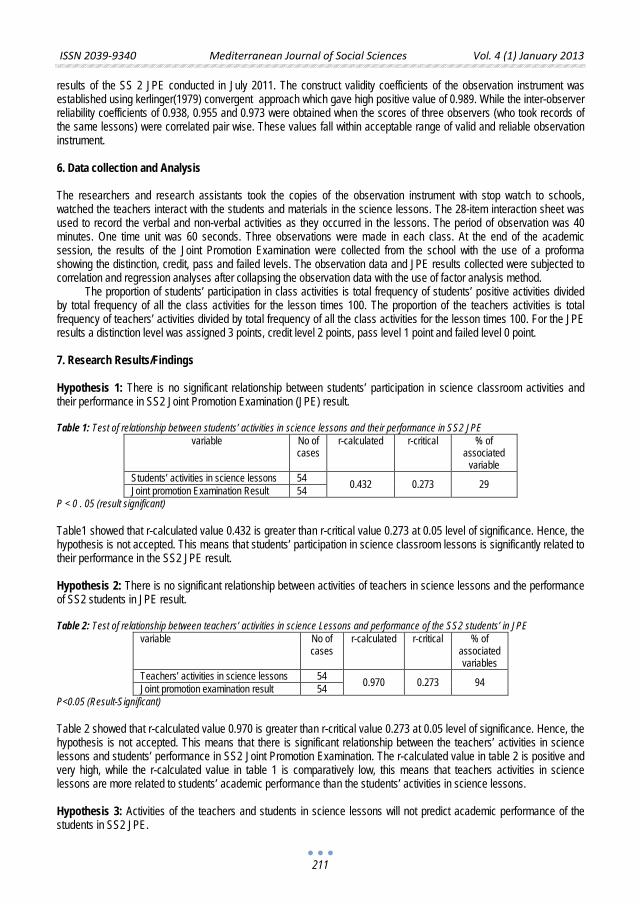
ISSN 2039-9340 Mediterranean Journal of Social Sciences Vol. 4 (1) January 2013
211
results of the SS 2 JPE conducted in July 2011. The construct validity coefficients of the observation instrument was established using kerlinger(1979) convergent approach which gave high positive value of 0.989. While the inter-observer reliability coefficients of 0.938, 0.955 and 0.973 were obtained when the scores of three observers (who took records of the same lessons) were correlated pair wise. These values fall within acceptable range of valid and reliable observation instrument. 6. Data collection and Analysis The researchers and research assistants took the copies of the observation instrument with stop watch to schools, watched the teachers interact with the students and materials in the science lessons. The 28-item interaction sheet was used to record the verbal and non-verbal activities as they occurred in the lessons. The period of observation was 40 minutes. One time unit was 60 seconds. Three observations were made in each class. At the end of the academic session, the results of the Joint Promotion Examination were collected from the school with the use of a proforma showing the distinction, credit, pass and failed levels. The observation data and JPE results collected were subjected to correlation and regression analyses after collapsing the observation data with the use of factor analysis method.
The proportion of students’ participation in class activities is total frequency of students’ positive activities divided by total frequency of all the class activities for the lesson times 100. The proportion of the teachers activities is total frequency of teachers’ activities divided by total frequency of all the class activities for the lesson times 100. For the JPE results a distinction level was assigned 3 points, credit level 2 points, pass level 1 point and failed level 0 point. 7. Research Results/Findings Hypothesis 1: There is no significant relationship between students’ participation in science classroom activities and their performance in SS2 Joint Promotion Examination (JPE) result. Table 1: Test of relationship between students’ activities in science lessons and their performance in SS2 JPE
variable No of cases
r-calculated r-critical % of associated
variable Students’ activities in science lessons 54 0.432 0.273 29 Joint promotion Examination Result 54
P < 0 . 05 (result significant) Table1 showed that r-calculated value 0.432 is greater than r-critical value 0.273 at 0.05 level of significance. Hence, the hypothesis is not accepted. This means that students’ participation in science classroom lessons is significantly related to their performance in the SS2 JPE result. Hypothesis 2: There is no significant relationship between activities of teachers in science lessons and the performance of SS2 students in JPE result. Table 2: Test of relationship between teachers’ activities in science Lessons and performance of the SS2 students’ in JPE
variable No of cases
r-calculated r-critical % of associated variables
Teachers’ activities in science lessons 54 0.970 0.273 94 Joint promotion examination result 54 P<0.05 (Result-Significant) Table 2 showed that r-calculated value 0.970 is greater than r-critical value 0.273 at 0.05 level of significance. Hence, the hypothesis is not accepted. This means that there is significant relationship between the teachers’ activities in science lessons and students’ performance in SS2 Joint Promotion Examination. The r-calculated value in table 2 is positive and very high, while the r-calculated value in table 1 is comparatively low, this means that teachers activities in science lessons are more related to students’ academic performance than the students’ activities in science lessons. Hypothesis 3: Activities of the teachers and students in science lessons will not predict academic performance of the students in SS2 JPE.
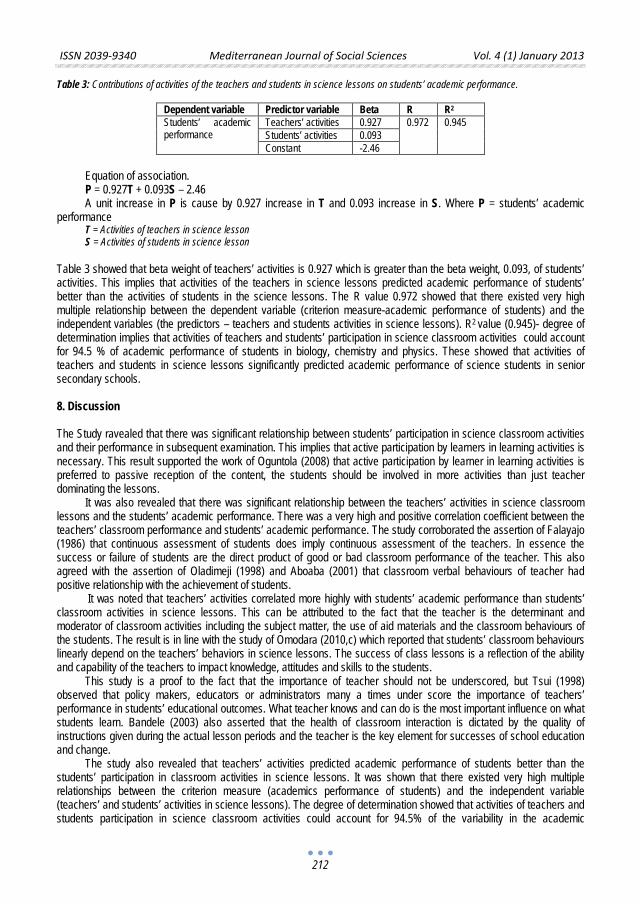
ISSN 2039-9340 Mediterranean Journal of Social Sciences Vol. 4 (1) January 2013
212
Table 3: Contributions of activities of the teachers and students in science lessons on students’ academic performance.
Dependent variable Predictor variable Beta R R2 Students’ academic performance
Teachers’ activities 0.927 0.972 0.945 Students’ activities 0.093 Constant -2.46
Equation of association. P = 0.927T + 0.093S – 2.46 A unit increase in P is cause by 0.927 increase in T and 0.093 increase in S. Where P = students’ academic
performance T = Activities of teachers in science lesson S = Activities of students in science lesson
Table 3 showed that beta weight of teachers’ activities is 0.927 which is greater than the beta weight, 0.093, of students’ activities. This implies that activities of the teachers in science lessons predicted academic performance of students’ better than the activities of students in the science lessons. The R value 0.972 showed that there existed very high multiple relationship between the dependent variable (criterion measure-academic performance of students) and the independent variables (the predictors – teachers and students activities in science lessons). R2 value (0.945)- degree of determination implies that activities of teachers and students’ participation in science classroom activities could account for 94.5 % of academic performance of students in biology, chemistry and physics. These showed that activities of teachers and students in science lessons significantly predicted academic performance of science students in senior secondary schools. 8. Discussion The Study ravealed that there was significant relationship between students’ participation in science classroom activities and their performance in subsequent examination. This implies that active participation by learners in learning activities is necessary. This result supported the work of Oguntola (2008) that active participation by learner in learning activities is preferred to passive reception of the content, the students should be involved in more activities than just teacher dominating the lessons.
It was also revealed that there was significant relationship between the teachers’ activities in science classroom lessons and the students’ academic performance. There was a very high and positive correlation coefficient between the teachers’ classroom performance and students’ academic performance. The study corroborated the assertion of Falayajo (1986) that continuous assessment of students does imply continuous assessment of the teachers. In essence the success or failure of students are the direct product of good or bad classroom performance of the teacher. This also agreed with the assertion of Oladimeji (1998) and Aboaba (2001) that classroom verbal behaviours of teacher had positive relationship with the achievement of students.
It was noted that teachers’ activities correlated more highly with students’ academic performance than students’ classroom activities in science lessons. This can be attributed to the fact that the teacher is the determinant and moderator of classroom activities including the subject matter, the use of aid materials and the classroom behaviours of the students. The result is in line with the study of Omodara (2010,c) which reported that students’ classroom behaviours linearly depend on the teachers’ behaviors in science lessons. The success of class lessons is a reflection of the ability and capability of the teachers to impact knowledge, attitudes and skills to the students.
This study is a proof to the fact that the importance of teacher should not be underscored, but Tsui (1998) observed that policy makers, educators or administrators many a times under score the importance of teachers’ performance in students’ educational outcomes. What teacher knows and can do is the most important influence on what students learn. Bandele (2003) also asserted that the health of classroom interaction is dictated by the quality of instructions given during the actual lesson periods and the teacher is the key element for successes of school education and change.
The study also revealed that teachers’ activities predicted academic performance of students better than the students’ participation in classroom activities in science lessons. It was shown that there existed very high multiple relationships between the criterion measure (academics performance of students) and the independent variable (teachers’ and students’ activities in science lessons). The degree of determination showed that activities of teachers and students participation in science classroom activities could account for 94.5% of the variability in the academic
ISSN 2039-9340 Mediterranean Journal of Social Sciences Vol. 4 (1) January 2013
213
performance of science students – that is classroom activities could account for 94.5% of success or failure of science students in examination. 9. Conclusion Based on data analyses and interpretation of results the following conclusions were drawn for the study. Students’ participation and teachers’ activities in science classroom lessons respectively have significant relationship with students’ academic performance. There existed high multiple relationships between students’ and teachers’ activities in Science lessons and the performance of students in subsequent examination. Also science classroom activities accounted for about 94.5% of the variability in the academic performance of science students. 10. Recommendations Based on the findings of the study the following recommendations were made.
1. Science teacher should make deliberate efforts to ensure that students participate actively in class lessons for favourable performance in science subjects.
2. There should be provision of teaching instructional resources – laboratory equipment, Libraries, Chairs, Desks, Cabinets and many other teaching aid materials, and the teachers should be encouraged to utilize them effectively for quality teaching which will in turn produce better performed science students.
3. There should be effective supervision and evaluation of the science classroom activities by subject heads, head of department, vice-principals, principals and the Inspectorate Division of the Ministry of Education.
4. Performance award programme for teachers who excel in classroom activities should be instituted to encourage them to put forth their best.
References Aboaba, R (2001). Effect of instruction on students’ performance on knowledge, comprehension and application task in mathematics.
African Journal of Education Research 3(2): 42-46 Bandele, S.O (2003). The Universal Basic Education in perspective. Need for formative evaluation. Nigeria Journal of Educational
Research and Evaluation 4(1): 54-58 Inamullah, M; Naseer, Uddini M. and Husain, Ishatiaq (2008). Teacher-students verbal interaction patterns at the tertiary level of
education. Contemporary issues in Education Research 1 (1): 45-50 Kukuru, Jolly D. (2010). Extent of use of indices of questioning by class teachers. African Journal of Educational Research and
Administration 3(2): 127-139 Oguntola, B.M (2008). Classroom interaction analysis in the teaching and Learning of mathematics in Lagelu L.G.A of Oyo State.
Unpublished M.Ed thesis. University of Ado-Ekiti. Oladimeji, O (1999). Educational Management and Evaluation. Lagos. Longman group limited. Omodara, M.F. (2010,a). A comparative analysis of Cognitive, affective and psychomotor activities in science classroom lessons.
International Journal of Sustainable Development 3(1): 73-80 Omodara, M.F (2010,b). Analysis of teacher-student classroom interactions in science lessons in senior secondary schools. African
Journal of Education Research and Administration 3(1): 83-88 Omodara, M.F (2010,c). Influence of the teacher on Students’ participation in science classroom activities International Journal of
Research in Education 2(1): 122-128 Omodara, M.F and Bandele, S.O (2010). Construction and validating of an observation system for classroom science activities in senior
secondary Schools. Academic scholarship Journal 2(1): 190-198 Tsui; K.J (1998).Understanding teacher performance: Toward a comprehensive frame work. Asia pacific Journal of Teacher Education
and Development 1(2):81-89. Yawe, A.A (2011). Impact of demonstration and discussion methods instruction on Junior Secondary Schools achievement in Business
studies in Makurdi Metropolis, Benue State. NASHER Journal 9(1): 70-73.

ISSN 2039-9340 Mediterranean Journal of Social Sciences Vol. 4 (1) January 2013
215
The Development Strategy of Local Shop to Promote the
Economic Strength of the Community
Mr. Suwan Ronnahong-sa
Ph.D. Candidate Student of Development Strategy Program, Nakhon Sawan Rajabhat University.
Prof. Dr. Chaloi Buripakdee
Major Advisor, Development Strategy Program,
Nakhon Sawan Rajabhat University.
Assoc.Prof. Dr. Suchart Saengthong
Co-Advisor, Development Strategy Program, Nakhon Sawan Rajabhat University.
Doi:10.5901/mjss.2013.v4n1p215 Abstract
This study is a quantitative and qualitative research. The quantitative was quasi-experimental research with one group pretest-posttest design was used to study and analyze the problem of Houna village’s people. The samples for trial the development strategy of local shop to promote the economic strength of the community were 60 peoples used as the experimental group. The sample groups were selected by purposive selection. Then results were compared between before and after the trial for 6 months. The mean differences before and after treatment were analyzed by t-test dependent. The developed strategy was evaluated by rating scale and the data were analyzed with the mean and standard deviation. The results revealed that the model of local shop showed that the less income people suffered from lack of source for buying a reasonable prize of good. The suffering of customer from analysis was found target problem that lack of shop selling with reasonable prize. The In-Dept interview was conducted with experimental group of 60 peoples. It was found that as whole of development strategy, they had knowledge and understanding of local shop development with 44 percents. Considering to each aspect, it was found that strategy for local shop establishment with 47 percents, local shop establishment with 90 percents, local shop membership system with 90 percents, local shop management with 16.38 percents, saving with 53 percents, and community product promotion with 63 percents. The development strategies were included from the focus group discussion, therefore the work unit systems were as the followings.1) The appropriate local shop model 2) Local shop establishment 3) The trial management of local shops 4) Evaluation of local shop management and service. The result of trail development strategy was revealed as the following: 1. Comparison training achievement of participants between before and after, it was found that after training the achievement was higher than before with statistical significance at level of 0.5. 2.Evaluation of the successful results was as the followings. 2.1 Comparison of opinion of community people before and after experiment, it was found that the community strength was more than before with statistical significance at level of 0.5. 2.2 The satisfaction to strategy for development of local shop of 60 members had mean at more level (3.80). 2.3 Result of quality evaluation to strategy for development of local shop at the end of the first month and forth month, it was found that the forth month was higher than the first month with statistical significance at level of 0.5.
Keywords: development strategy, local shop, economic strength of the community
1. Introduction Banrai, Uthaithani, is a community surrounding by forest that is door to enter to Huai Kha Khaeng Wildlife Sanctuary (Wikipedia, 2012). Even though, civilization would penetrate into Banrai. However, it seems to be here the world is rotate slower than usual 5 years because the district has no convenient shop provide for 24 hours. There is no theater, pub, bar or shopping center but it has only small fresh market that the villagers bring vegetables, fruit, and local consumer products for sell. However, people live with happy. They have slogan as “Banrai Free from Pollution, Sufficiency Life, and
ISSN 2039-9340 Mediterranean Journal of Social Sciences Vol. 4 (1) January 2013
216
together with Virtue”. Even though, it is a small district but it is natural beautiful area with culture, tradition, art, food and ethnic simple way of life (Banrai Local Government Office, 2012, & Office of National Culture Commission, 2011).
At present, district municipality of Ban Rai faces with poor or less income people. This problem is more severe increasingly from past because the situation of municipality development is growth gradually. District municipality of Banrai is a small municipality but the tendency of population growth and density because a part of development aims to the center of business of Baan Rai District and center for tourism promotion to be able to support Uthai Province as important tourism site in this region. The geographical situation of Baan Rai District Municipality is a valley surrounding community in Municipality of 6 communities that are Bann Huona Community, Sanam-Keela Community, Talad Sod Community, Baan Yai Community 1, Baan Yai Community 2, and Baan Bueng. There is total household in municipality with 956 households (Banrai Local Government Office, 2012).
Majority of population was children and elderly because young adults and adults migrate to work in other provinces. Most of main occupation is daily general hire and good production in community is household product. Beside they are government officer, private company, agriculturist, and stand selling. Moreover, some part of people migrates from rural area to municipal area (Banrai Local Government Office, 2012).
Providing sources for buying nearby the living area for less income people in municipal area or semi-city, it will help to decrease the problem of cost living and to be complementary income for household (Tuntiwongvanich, 2009). Additionally, gathering of community is controllable and government is able to fully support for various aspects. It should be in terms of grouping to community development. There is a source of good consumption with not expensiveness and do not take advantage of people (Hongthong, 2005). There is a source for good selling of community that buyers can bargain (Jiamsripong, 2010). At present, from primary interview, it was found people in community and majority of rural has problem of taking advantage of buying for consumption good for essential living and not receiving fairness for selling community product (Kanjanapa, 2010, & Jiamsripong, 2010). Beside lacking of knowledge, experience and bargaining power for buying, it cannot bring local wisdom product to develop in business during passing period, government has policy to distribute income and progress to region to prevent concentration at center and delegate to work unit of government to collaborate to support for effectiveness (Puripakdee, 2010). Implementation of activity to community and occupational group from this policy, Ministry of Commerce implemented to support for group gathering of people for establishing “Community Shop” in remote rural area to be able to buy product (The Office of Business Promotion and Development, 2010). Consumption product in the fair prize and increasing power for business bargain are included. Additionally, the community shop is able to be a learning center under the administration of group people in community and governmental sector to be supporter in budget and academic in terms of administration and accounting (The Office of Small and Medium Enterprises Promotion, 2010).
Therefore, researcher had objectives to implement on research of “The Development Strategy of Local Shop to Promote the Economic Strength of the Community” by implementing for shop establishment for community in city. Particularly, Banrai District Municipality, has different contexts for living. Majority of occupation is daily general hire and no land for agriculture. Moreover, the extended of urban community with high independence, the researcher had studied from documents, literature reviews about promotion of community shop, promotion of creation of community product, group gathering, community participation, and successful and failure community shop to sell consumption product and raw material for community production nearby shelter for less income people (The Office of Business Promotion and Development, 2010).
Additionally, it is a source of community product distribution and characteristics urban community shop with appropriate pattern of implementation for urban community for community living in environment of urban community with suitable and better further (Banrai Local Government Office, 2012, & The Office of Business Promotion and Development, 2010). 2. Objective The research objectives were as followings:
1) To design the development strategy for local shop development to promote the economic strength of the community through community people participation.
2) To experiment the development strategy for local shop development to promote the economic strength of the community of Houna village.
3. Methodology The research design was implemented in steps by step as followings:
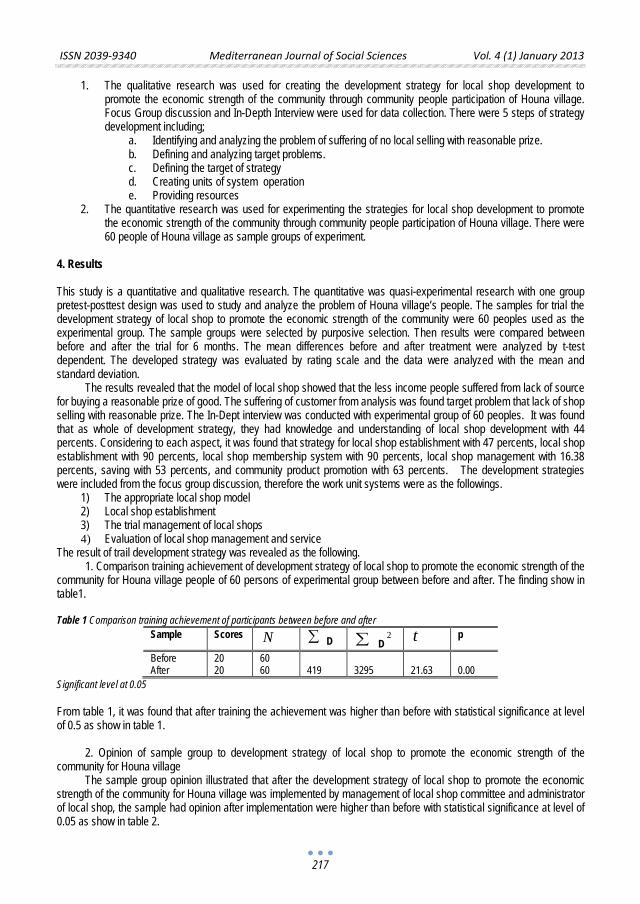
ISSN 2039-9340 Mediterranean Journal of Social Sciences Vol. 4 (1) January 2013
217
1. The qualitative research was used for creating the development strategy for local shop development to promote the economic strength of the community through community people participation of Houna village. Focus Group discussion and In-Depth Interview were used for data collection. There were 5 steps of strategy development including;
a. Identifying and analyzing the problem of suffering of no local selling with reasonable prize. b. Defining and analyzing target problems. c. Defining the target of strategy d. Creating units of system operation e. Providing resources
2. The quantitative research was used for experimenting the strategies for local shop development to promote the economic strength of the community through community people participation of Houna village. There were 60 people of Houna village as sample groups of experiment.
4. Results This study is a quantitative and qualitative research. The quantitative was quasi-experimental research with one group pretest-posttest design was used to study and analyze the problem of Houna village’s people. The samples for trial the development strategy of local shop to promote the economic strength of the community were 60 peoples used as the experimental group. The sample groups were selected by purposive selection. Then results were compared between before and after the trial for 6 months. The mean differences before and after treatment were analyzed by t-test dependent. The developed strategy was evaluated by rating scale and the data were analyzed with the mean and standard deviation.
The results revealed that the model of local shop showed that the less income people suffered from lack of source for buying a reasonable prize of good. The suffering of customer from analysis was found target problem that lack of shop selling with reasonable prize. The In-Dept interview was conducted with experimental group of 60 peoples. It was found that as whole of development strategy, they had knowledge and understanding of local shop development with 44 percents. Considering to each aspect, it was found that strategy for local shop establishment with 47 percents, local shop establishment with 90 percents, local shop membership system with 90 percents, local shop management with 16.38 percents, saving with 53 percents, and community product promotion with 63 percents. The development strategies were included from the focus group discussion, therefore the work unit systems were as the followings.
1) The appropriate local shop model 2) Local shop establishment 3) The trial management of local shops 4) Evaluation of local shop management and service
The result of trail development strategy was revealed as the following. 1. Comparison training achievement of development strategy of local shop to promote the economic strength of the
community for Houna village people of 60 persons of experimental group between before and after. The finding show in table1. Table 1 Comparison training achievement of participants between before and after
Sample Scores N ∑ D ∑ D2
t p
Before After
20 20
60 60
419
3295
21.63
0.00
Significant level at 0.05 From table 1, it was found that after training the achievement was higher than before with statistical significance at level of 0.5 as show in table 1.
2. Opinion of sample group to development strategy of local shop to promote the economic strength of the community for Houna village
The sample group opinion illustrated that after the development strategy of local shop to promote the economic strength of the community for Houna village was implemented by management of local shop committee and administrator of local shop, the sample had opinion after implementation were higher than before with statistical significance at level of 0.05 as show in table 2.
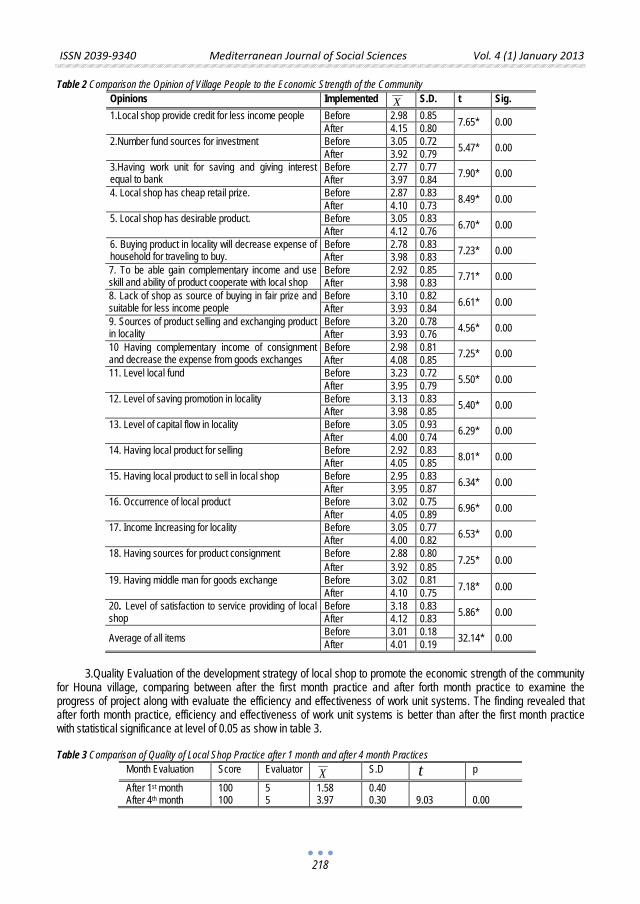
ISSN 2039-9340 Mediterranean Journal of Social Sciences Vol. 4 (1) January 2013
218
Table 2 Comparison the Opinion of Village People to the Economic Strength of the Community Opinions Implemented X S.D. t Sig. 1.Local shop provide credit for less income people Before 2.98 0.85 7.65* 0.00 After 4.15 0.80 2.Number fund sources for investment Before 3.05 0.72 5.47* 0.00 After 3.92 0.79 3.Having work unit for saving and giving interest equal to bank
Before 2.77 0.77 7.90* 0.00 After 3.97 0.84 4. Local shop has cheap retail prize. Before 2.87 0.83 8.49* 0.00 After 4.10 0.73 5. Local shop has desirable product. Before 3.05 0.83 6.70* 0.00 After 4.12 0.76 6. Buying product in locality will decrease expense of household for traveling to buy.
Before 2.78 0.83 7.23* 0.00 After 3.98 0.83 7. To be able gain complementary income and use skill and ability of product cooperate with local shop
Before 2.92 0.85 7.71* 0.00 After 3.98 0.83 8. Lack of shop as source of buying in fair prize and suitable for less income people
Before 3.10 0.82 6.61* 0.00 After 3.93 0.84 9. Sources of product selling and exchanging product in locality
Before 3.20 0.78 4.56* 0.00 After 3.93 0.76 10 Having complementary income of consignment and decrease the expense from goods exchanges
Before 2.98 0.81 7.25* 0.00 After 4.08 0.85 11. Level local fund Before 3.23 0.72 5.50* 0.00 After 3.95 0.79 12. Level of saving promotion in locality Before 3.13 0.83 5.40* 0.00 After 3.98 0.85 13. Level of capital flow in locality Before 3.05 0.93 6.29* 0.00 After 4.00 0.74 14. Having local product for selling Before 2.92 0.83 8.01* 0.00 After 4.05 0.85 15. Having local product to sell in local shop Before 2.95 0.83 6.34* 0.00 After 3.95 0.87 16. Occurrence of local product Before 3.02 0.75 6.96* 0.00 After 4.05 0.89 17. Income Increasing for locality Before 3.05 0.77 6.53* 0.00 After 4.00 0.82 18. Having sources for product consignment Before 2.88 0.80 7.25* 0.00 After 3.92 0.85 19. Having middle man for goods exchange Before 3.02 0.81 7.18* 0.00 After 4.10 0.75 20. Level of satisfaction to service providing of local shop
Before 3.18 0.83 5.86* 0.00 After 4.12 0.83
Average of all items Before 3.01 0.18 32.14* 0.00 After 4.01 0.19
3.Quality Evaluation of the development strategy of local shop to promote the economic strength of the community for Houna village, comparing between after the first month practice and after forth month practice to examine the progress of project along with evaluate the efficiency and effectiveness of work unit systems. The finding revealed that after forth month practice, efficiency and effectiveness of work unit systems is better than after the first month practice with statistical significance at level of 0.05 as show in table 3. Table 3 Comparison of Quality of Local Shop Practice after 1 month and after 4 month Practices
Month Evaluation Score Evaluator X S.D t p
After 1st month After 4th month
100 100
5 5
1.58 3.97
0.40 0.30
9.03
0.00
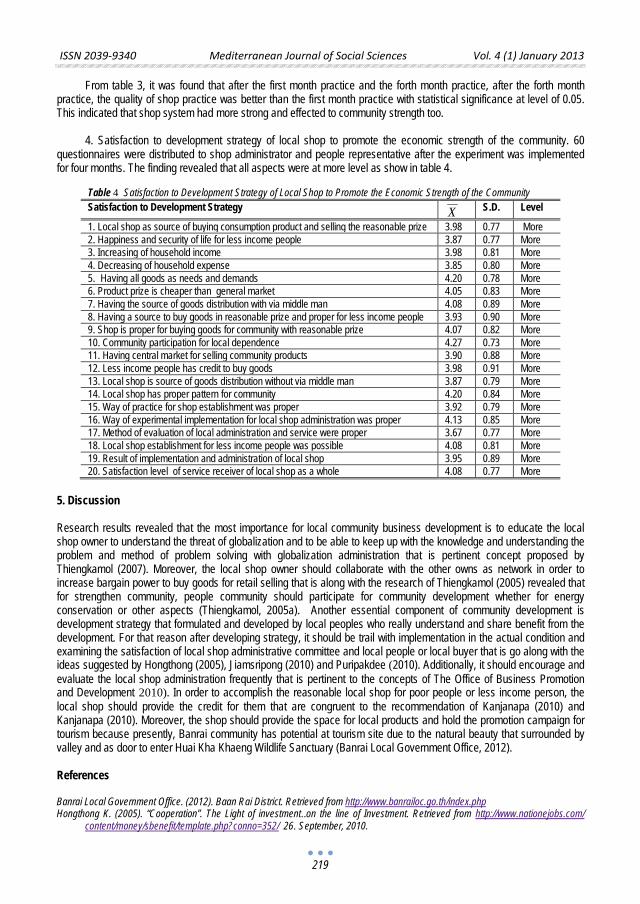
ISSN 2039-9340 Mediterranean Journal of Social Sciences Vol. 4 (1) January 2013
219
From table 3, it was found that after the first month practice and the forth month practice, after the forth month practice, the quality of shop practice was better than the first month practice with statistical significance at level of 0.05. This indicated that shop system had more strong and effected to community strength too.
4. Satisfaction to development strategy of local shop to promote the economic strength of the community. 60
questionnaires were distributed to shop administrator and people representative after the experiment was implemented for four months. The finding revealed that all aspects were at more level as show in table 4.
Table 4 Satisfaction to Development Strategy of Local Shop to Promote the Economic Strength of the Community Satisfaction to Development Strategy X
S.D. Level
1. Local shop as source of buying consumption product and selling the reasonable prize 3.98 0.77 More 2. Happiness and security of life for less income people 3.87 0.77 More 3. Increasing of household income 3.98 0.81 More 4. Decreasing of household expense 3.85 0.80 More 5. Having all goods as needs and demands 4.20 0.78 More 6. Product prize is cheaper than general market 4.05 0.83 More 7. Having the source of goods distribution with via middle man 4.08 0.89 More 8. Having a source to buy goods in reasonable prize and proper for less income people 3.93 0.90 More 9. Shop is proper for buying goods for community with reasonable prize 4.07 0.82 More 10. Community participation for local dependence 4.27 0.73 More 11. Having central market for selling community products 3.90 0.88 More 12. Less income people has credit to buy goods 3.98 0.91 More 13. Local shop is source of goods distribution without via middle man 3.87 0.79 More 14. Local shop has proper pattern for community 4.20 0.84 More 15. Way of practice for shop establishment was proper 3.92 0.79 More 16. Way of experimental implementation for local shop administration was proper 4.13 0.85 More 17. Method of evaluation of local administration and service were proper 3.67 0.77 More 18. Local shop establishment for less income people was possible 4.08 0.81 More 19. Result of implementation and administration of local shop 3.95 0.89 More 20. Satisfaction level of service receiver of local shop as a whole 4.08 0.77 More
5. Discussion Research results revealed that the most importance for local community business development is to educate the local shop owner to understand the threat of globalization and to be able to keep up with the knowledge and understanding the problem and method of problem solving with globalization administration that is pertinent concept proposed by Thiengkamol (2007). Moreover, the local shop owner should collaborate with the other owns as network in order to increase bargain power to buy goods for retail selling that is along with the research of Thiengkamol (2005) revealed that for strengthen community, people community should participate for community development whether for energy conservation or other aspects (Thiengkamol, 2005a). Another essential component of community development is development strategy that formulated and developed by local peoples who really understand and share benefit from the development. For that reason after developing strategy, it should be trail with implementation in the actual condition and examining the satisfaction of local shop administrative committee and local people or local buyer that is go along with the ideas suggested by Hongthong (2005), Jiamsripong (2010) and Puripakdee (2010). Additionally, it should encourage and evaluate the local shop administration frequently that is pertinent to the concepts of The Office of Business Promotion and Development 2010). In order to accomplish the reasonable local shop for poor people or less income person, the local shop should provide the credit for them that are congruent to the recommendation of Kanjanapa (2010) and Kanjanapa (2010). Moreover, the shop should provide the space for local products and hold the promotion campaign for tourism because presently, Banrai community has potential at tourism site due to the natural beauty that surrounded by valley and as door to enter Huai Kha Khaeng Wildlife Sanctuary (Banrai Local Government Office, 2012). References Banrai Local Government Office. (2012). Baan Rai District. Retrieved from http://www.banrailoc.go.th/index.php Hongthong K. (2005). “Cooperation”. The Light of investment..on the line of Investment. Retrieved from http://www.nationejobs.com/
content/money/sbenefit/template.php?conno=352/ 26. September, 2010.
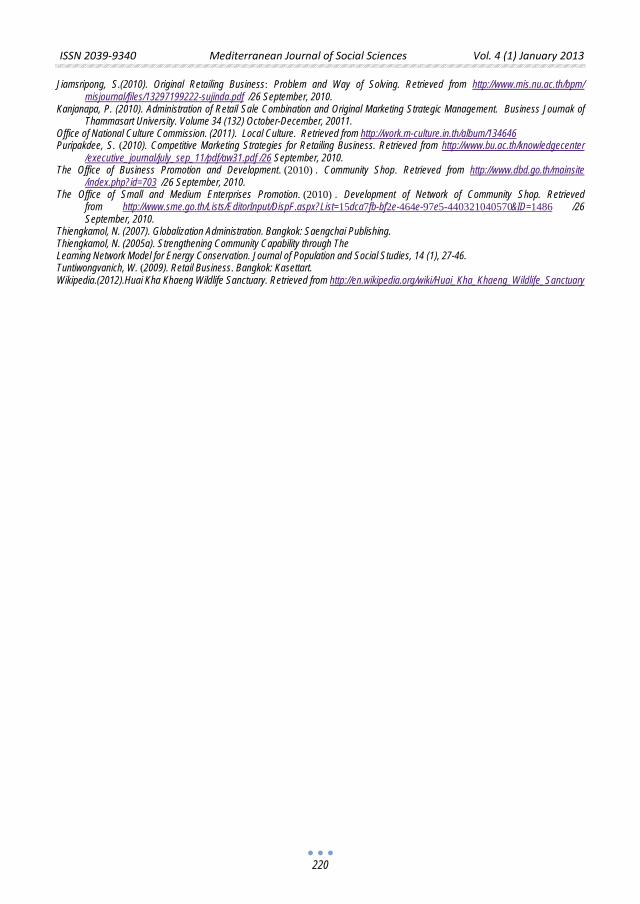
ISSN 2039-9340 Mediterranean Journal of Social Sciences Vol. 4 (1) January 2013
220
Jiamsripong, S.(2010). Original Retailing Business: Problem and Way of Solving. Retrieved from http://www.mis.nu.ac.th/bpm/ misjournal/files/13297199222-sujinda.pdf /26 September, 2010.
Kanjanapa, P. (2010). Administration of Retail Sale Combination and Original Marketing Strategic Management. Business Journak of Thammasart University. Volume 34 (132) October-December, 20011.
Office of National Culture Commission. (2011). Local Culture. Retrieved from http://work.m-culture.in.th/album/134646 Puripakdee, S. (2010). Competitive Marketing Strategies for Retailing Business. Retrieved from http://www.bu.ac.th/knowledgecenter
/executive_journal/july_sep_11/pdf/aw31.pdf /26 September, 2010. The Office of Business Promotion and Development. (2010) . Community Shop. Retrieved from http://www.dbd.go.th/mainsite
/index.php?id=703 /26 September, 2010. The Office of Small and Medium Enterprises Promotion. (2010) . Development of Network of Community Shop. Retrieved
from http://www.sme.go.th/Lists/EditorInput/DispF.aspx?List=15dca7fb-bf2e-464e-97e5-440321040570&ID=1486 /26 September, 2010.
Thiengkamol, N. (2007). Globalization Administration. Bangkok: Saengchai Publishing. Thiengkamol, N. (2005a). Strengthening Community Capability through The Learning Network Model for Energy Conservation. Journal of Population and Social Studies, 14 (1), 27-46. Tuntiwongvanich, W. (2009). Retail Business. Bangkok: Kasettart. Wikipedia.(2012).Huai Kha Khaeng Wildlife Sanctuary. Retrieved from http://en.wikipedia.org/wiki/Huai_Kha_Khaeng_Wildlife_Sanctuary
ISSN 2039-9340 Mediterranean Journal of Social Sciences Vol. 4 (1) January 2013
221
Health Care Financing in Nigeria: Prospects and Challenges
S. A. J. Obansa
Department of Economics
University of Abuja,Nigeria Corresponding author: E-mail [email protected]
Akinnagbe Orimisan
Department of Economics University of Abuja.Nigeria
Doi:10.5901/mjss.2013.v4n1p221 Abstract
Fifty years after independence, Nigeria is still struggling with the provision of basic health services for its teeming population, now estimated at over 150million. The health care sector is still a labour-intensive handicraft industry, in spite of advances in technology, and health care provision has now become more complicated than in the past. Infant and under-five mortality rates are near the highest in the world, and maternal mortality is extremely high. It has the second largest number of people infected with HIV/AIDS in the world only next to South Africa and in 2008, between 3million and 3.5million people were estimated to be living with HIV/AIDS. Nigeria has the fourth highest number of TB cases in the world, with a 2004 estimate of 293 new cases per 100,000 population and 546 per 100,000 total cases. The reasons for a dysfunctional health system include: gross in adequate infrastructural support, electricity, potable water and diagnostic laboratories, very low per capita health spending, high out-of-pocket expenditure by citizens, and a total absence of a community-based integrated system for disease prevention, surveillance and treatment amongst others. Some strategies to tackle health sector challenges in Nigeria may include improved access to primary healthcare; strategic and purposeful leadership in health delivery services; increasing funding to the health sector; amongst others.
Key words: Health Sector, Health Sector Reforms, Challenges and prospects
1. Introduction The health sector in any country has been recognized as the primary engine of growth and development. But despite the laudable contributions of the health sector to economic development, the Nigerian health sector has witnessed various turbulence that has negatively revised the progress recorded at various times.
Nearly 15 percent of Nigerian children do not survive to their fifth birthday. Two leading causes of child mortality are malaria (30 percent) and diarrhea (20 percent). Malnutrition contributes to 52 percent of death of children under five. A household survey conducted by the government in 2003-2004 showed that 54.4 percent of the population is poor, with a higher poverty rate in rural area of 63.3 percent (HERFON, 2006). The incidence of poverty in Nigeria is widespread and increasing with some of the worst poverty linked health indicators in Africa. There has been a sharp increase in poverty from 1992 to 1996, with an estimated third of the population living below $1 per day and nearly two thirds below $2 per day (FMoH, 2005).
Some of the factors that affect the overall performance of the health system include; inadequate health facilities/structure, poor human resources and management, poor remuneration and motivation, lack of fair and sustainable health care financing, unequal economic and political relations, the neo-liberal economic policies of the Nigerian state, corruption, illiteracy, very low government spending on health, high out-of-pocket expenditure in health and absence of integrated system for disease prevention, surveillance and treatment, inadequate mechanisms for families to access health care, shortage of essential drugs and supplies and inadequate supervision of health care providers are among some of the persistent problems of the health system in Nigeria.
1.1 Problem Statement In spite of huge government spending, coupled with bilateral and multilateral assistance in the health sector, the patterns
ISSN 2039-9340 Mediterranean Journal of Social Sciences Vol. 4 (1) January 2013
222
of health status in Nigeria mirror many other Sub-Saharan African nations but are worse than would be expected given Nigeria’s GDP per capita. The health system is in shambles, policy somersault and reversals tends to have under-mined several reforms in the health sector over the years. Poor human resources and policy management have led to unprecedented brain drain in the health sector as health professionals in search for better conditions of service abroad often vote with their feet in droves (FMoH, 2005). (Federal Ministry of Health).
The Nigerian health system is in comatose, few hospitals with few drugs, inadequate and substandard technology and a lack of infrastructural support, including electricity, water and diagnostic laboratories resulting in misdiagnosis. Medical record keeping is rudimentary and diseases surveillance is very poor. Delivery of health care becomes a personal affair and dependent on ability to pay for basic laboratory and physician services. These have exacerbated the disease burden (FMoH, 2004). Health care financing is worse hit especially in the poor continent where health care faces serious problem of acceptability with out-of-pocket expenditure accounting for over 70% of total private health expenditure is enough to dent the little progress of the health system made. Hence, the increasing out-of-pocket expenditure due to high disease burden on most poverty-stricken households has kept them in the vicious cycle of the poverty trap. Risk pooling in the form of private/commercial health insurance is often lopsided while the much touted social insurance is limited to those in Federal government service (HERFON, 2006). 1.2 Objective of the Study The provision of accessible and affordable health care services on a sustainable basis in any country, including Nigeria, is an important obligation of government and the fundamental right of the citizens, through direct participation in health delivery system and good legislature on health. The government of Nigeria, through the Federal Ministry of health, has been undertaking this responsibility, but with abysmal result (FMoH, 2005). In economic parlance it is believed that health and education are the two important prerequisites for human capital development, and have been demonstrated to be the basis of individual’s economic productivity. Health is the basis for job productivity, the capacity to learn in school, and the capability to grow intellectually, physically and emotionally. As with economic well being of individual households, good health is a critical input into poverty reduction, economic growth and long-term economic development at the scale of whole societies (Sachs et al, 2001).
The broad objective of the study is to assess the challenges of health sector as it is expected to provide an important role in national economic development strategy. Specifically, the study will address the following major issues:-
(i) The problems confronting the health sector in Nigeria (ii) The measures to reverse the trend through reforms (iii) The impact of reform on the health sector and the challenges (iv) Health care financing for economic development (v) Make recommendation on the way forward.
1.3 Organization of the Study There are seven sections in this study and there are subsections in some of the sections. Section one deals with the general introduction to the topic of research. It is further grouped into subsections. 1.1 is the problem definition, 1.2 explores the objective of the study, and 1.3 contains the organization of the study. Section 2 –Chronicled challenges of the health sector in Nigeria. Section 3 looks into health sector reform process in Nigeria. Section 4 examines to what extent, the health sector reform in Nigeria has helped in addressing the health sector challenges –achievements and gaps. Section 5 appraises the health care financing mechanism in Nigeria. Section 6 compares the status of the health sector with other sectors and its performance so far. Section 7 points the way forward while session 8 provides the references employed in the study. 2. The Challenges The poor health status of a large percentage of people in sub-Sahara Africa is widely known for years. Over the past decade, however, Africa’s health care crisis has received renewed attention because of the greater awareness of the militating factors and a greater understanding of the link between health and economic development (Lowel et al (2010). The major factors that affect the overall contribution of the health system to economic growth and development in Nigeria include inter alia; lack of consumer awareness and participation, inadequate laboratory facilities, lack of basic infrastructure and equipment, poor human resource management, poor remuneration and motivation, lack of fair and sustainable health care financing, Unequal and unjust economic and political relations between Nigeria and advanced
ISSN 2039-9340 Mediterranean Journal of Social Sciences Vol. 4 (1) January 2013
223
countries, the neo-liberal economic policies of the Nigerian State, Pervasive Corruption, Very low government spending on health, High out-of-pocket expenditure on health, Absence of integrated system for disease prevention, surveillance and treatment.
(i) Lack of consumer awareness and participation: The majority of consumers are ignorant or unaware of available services and their rights regarding health service delivery mainly because of the absence of a bill of rights for consumers (claim holders) and providers (duty bearers). The role of the family in preventing and managing illness is also underestimated or inadequately supported by government programmes. It is now well known that interventions should be implemented through the health system as well as at the household level. The capacity of families and communities should be developed to increase awareness for meaningful participation in their health care and that of their children.
(ii) Inadequate laboratory facilities: In many states of Nigeria, most of the laboratories in the primary and secondary health care centers require some infrastructural upgrading to provide a safe, secure and appropriate working environment. Some basic health centre laboratories are better equipped than those in comprehensive health centers and some secondary level hospitals, but equipment was often minimal. Most laboratory staff in secondary facilities were qualified as medical laboratory scientist or technicians, whereas most of those in primary health care facilities were qualified as science laboratory technicians. There is minimal quality control of laboratory test in secondary facilities and none in primary facilities because they lack appropriate professional supervision.
(iii) Lack of basic infrastructure and equipment: Basic life-saving commodities are in short supply in most low income health systems. This is, in part, a result of resource shortages, but, there are still problems even when substantial increase in funding are available, as in the case of Global Fund to fight AIDS, Tuberculosis and Malaria. Building effective and accountable national procurement and drug management systems is an increasing prominent component of the health system action agenda.
The provision of health services relies on the availability of regular supplies of drugs and equipment, as well as appropriate infrastructure at the facility level. Facilities without safe water and electricity, with non-functioning equipments, and inadequate deliveries of drugs, diagnostic and other supplies are all too common in many states of the country. The Nigerian health system is characterized by inadequate and poorly maintained health facilities, particularly at the PHC level. Poor state of infrastructure such as buildings, equipments, materials, and supplies and inequitable distribution of available facilities is the norm in many places. In some communities, people have to travel over 5 km to access health care because sitting of structures is often based on political expediency rather than perceived need.
The drug system is plagued with ‘out-of-stock syndrome’. Fake, substandard, adulterated, and unaffordable drugs are prevalent across the country. Erratic supplies, non-availability of some basis essential and specialized drugs and other health supplies as a result of dependence on imported drugs are common. In addition to this, the drug distribution system is chaotic because of adherence to pharmaceutical regulations that need to be updated. Although very vital to provision of quality service, provision of drugs and vaccines alone cannot build systems nor ensure quality of care, but without the appropriate facilities and materials to do their job, health workers cannot function. Therefore, whenever health systems cannot deliver, people turn elsewhere. This has contributed greatly to poor client satisfaction, which makes clients to turn to private sector and unqualified health workers. This poor drug supply system has also led to drug resistance, the resistance to anti-malaria drugs by the disease pathogens is clear example, (HERFON, 2006, FMoH, 2004, Travis et al, 2004).
(iv) Poor human resources and management: Although human resources are no panacea for the poor health situation in any country, no health intervention can be successful without an effective workforce. Every country should, therefore, have a national workforce plan to build sustainable health systems to address national health needs. These plans should aim to provide access to every family to a motivated, skilled, and supported health worker. To optimize health system performance, workers should be recruited from, accountable to, and supported for work in their community where feasible. The 2003 and 2004 World Health Reports proposed improving rewards to health workers to improve productivity, along with deploying community health workers and engaging community in their health care. The 2004 report advocated using such approaches as contracting local government financing, empowering community, using vouchers, etc., to subsidize key health services for the poor.
There is currently inadequate and inequitable distribution of health personnel at various levels in Nigeria, especially in the rural and hard-to-reach areas. The provider-client relationship is also poor, while poor
ISSN 2039-9340 Mediterranean Journal of Social Sciences Vol. 4 (1) January 2013
224
incentives and compensation for health workers and structures are already worsening the brain drain syndrome and refusal of health workers to accept posting to rural areas.
(v) Poor remuneration and motivation: Over the years, poor remuneration of health workers have had an adverse effect on their morale such that over 21,000 Nigerian doctors are practicing abroad, while there is an acute shortage of physicians in Nigeria. Health workers are paid meager salaries (about 75% lower than that of a doctor even in Eastern Europe) and they work in insecure areas and have heavy workloads, but lack the most basic resources, and have little chance of career advancement. Doctors complain of ‘brain waste’ and seek better opportunities for professional development in countries with better medical infrastructure. Nigeria is one of the several major health-staff-exporting countries in Africa. For example, 432 nurses legally migrated to work in Britain between April 2001 and March 2002, out of a total of about 2000 legally emigrating African nurses, a trend perceived by Nigeria’s government as a threat to sustainable health care delivery (Lambo, 2006).
(vi) Lack of fair and sustainable health care financing: Beyond the level of spending, the key questions concern how the health system is financed and what proportion of contributions comes from users themselves, either through out-of-pocket expenditure or through insurance payments. The WHO is promoting the principle that whatever system of financing a country adopts should not deter people from seeking and using services. In most cases, this will mean that payment at the point of service will need to be eliminated, or at least be related to ability to pay. The financing system should also, as a minimum, protect people from catastrophic expenditure when they become ill, promote treatment according to need, and encourage providers to offer an effective mix of curative and preventive services.
(vii) Pervasive Corruption: Corruption has often manifested in Nigeria’s health sector through the supply of fake drugs, substandard equipments, willful misdiagnosis of diseases, sharing of unallocated budget funds, inflation of contracts, diversion of drugs, favoritism in treatment and appointments based on political patronage. Some examples abound: a consignment of vitamin A supplement by the Canadian government through its bilateral assistance to Nigeria was diverted in 2008 and it is now found in most itinerant chemist shops across the country (UNICEF, 2007). A formal minister of health, Adenike Grange was sacked in 2008 for her complacency in the sharing of N300 million unallocated health sector fund. Corruption deprives the economy in general and the health sector in particular of vitally needed funds (Thisday, 2008). It has been estimated that Nigeria lost £225 billion to corruption over the period. Nigeria’s Debt Management Office (DMO) has also indicated that the country wasted US$300 billion during the period (World Bank, 2006, DMO, 2006).
Given the pervasiveness of corruption in Nigeria’s national life and its acknowledged consequences for development and good governance, the consequences of corruption for public and private health is a matter of major interest to health professionals and social scientists. Some observers of the pervasiveness of corruption in African countries have suggested that it should be treated as a disease that afflicts the African condition. While this has been rightly criticized for its racist undertones of the observation, there is, no doubt, that corruption is symptomatic of the level of anomie that characterizes a society which can be treated as a major problem of health sector growth and development.
(viii) Very low governments spending on health: According to Central Bank of Nigeria reports, federal government health spending increased from the equivalent of US$141 million in 1998 to the equivalent of US$228 million in 2003. Health spending as a proportion of total federal spending decline between 1998 and 2000, but increased in subsequent years, reaching 3.2% in 2003. Most federal health spending goes to teaching and specialized hospitals and federal medical centres. State spending on health is currently around 6.3% of total spending, estimated for 2003 at about US$420 million or US$3.50 per capita. Like federal spending, state health spending is concentrated on the main area of state responsibility, secondary hospitals, and is also most likely on personnel. For 2003, the data available showed that spending on health was equivalent to US$300 million or US$2.45 per capita. Like other levels of government, most health spending by local governments is on personnel (World Bank CRS, Nigeria, 2005).
(ix) High out-of-pocket expenditure on health: This has further exacerbated the pauperization of the adverse economic condition of the poor. The 2004 Nigeria Living Standard Survey (NLSS) collected data on household health expenditures from a representative sample of 19,159 households. The estimate from these data of average annual per capita out-of-pocket spending on health is Naira 2,999, equivalent to around US$22.50. The survey data indicate that this out-of-pocket spending on health services accounts for 8.7% of total household expenditures. This health spending includes expenditure on outpatient care, transportation to health care facilities and medication. This is one of the largest share of health expenditure out of total household expenditure in developing countries.
ISSN 2039-9340 Mediterranean Journal of Social Sciences Vol. 4 (1) January 2013
225
Over the years, government resources dedicated to health are extremely low in Nigeria. According to World health Organization (WHO; 2004), private health spending represents the largest proportion of total health expenditures in Nigeria. In 2004, private out-of-pocket health expenditure was equal to nearly 70% of total health expenditure in Nigeria. Prepaid plan represent around 5% of total health spending. Government health expenditures represent 30.4% of total health expenditure for the period.
(x) Absence of integrated system for disease prevention, surveillance and treatment: This has manifested in the lack of targeted efforts at outreach, health promotion and disease prevention activities designed to reach the people where they are. This has resulted in low immunization coverage, pre-natal care and screening. Public health, where it exists, is in a passive mode, with little activity designed to motivate people to change their behavior or to adopt attitudes and practices that reduce their risk to disease. The result is that many children are still not immunized, pregnant mothers do not receive the pre-natal care they need, older men and women do not have the regular screening they need for blood sugar and cholesterol, for breast and cervical cancer. When health professionals refer to low incidence rate for cancer in Africa, they forget that what is not screened for is not reported. Given the extremely low screening rates for cancer, diabetes, hypertension and other chronic and communicable diseases, no wonder the reported incidence and prevalence rate are low too!
3. Health Sector Reforms in Nigeria Health sector reform is defined as the fundamental change in policy, regulation, financing, provision of health services, re-organization, management and institutional arrangements, which is led by government and designed to improve the performance of the health system to attain a better health status for the population. (Regional Committee, WHO African Region, 1999).
According to World Health Organization, (1995), health sector reform is defined as a sustained process of fundamental change in policies and institutional arrangements, guided by government, designed to improve the functioning and performance of the health sector and ultimately the health status of the population.
The goals of reform are to make health care accessible and, therefore, equitable, affordable, cost-effective, and cost-efficient. It also includes the reduction of the disease burden, particularly due to the malaria scourge and the HIV/AIDS epidemic and various other communicable and chronic diseases in general (FMoH, 2004; FRN, 2004; NACA, 2002). It is the duty of the government to provide the citizenry with accessible, affordable, qualitative, efficient and effective healthcare system. Against this background, the Nigerian government has adopted various national health policies and reforms. Health policy reforms are specifically designed to facilitate the achievement of stated health programme goals and objectives. They are meant to help in strengthening the elements of the enabling environment for better health so as to make the implementation of health programmes achieve their objectives in terms of coverage, equity, efficiency and effectiveness. These include: safe water and sanitation, food security and nutrition, health care, especially primary health care, education especially that of women, purchasing power; decent housing, family planning, cultural consideration (World Bank, 1994).
There are different strategies for reform, and these include decentralization and centralization, substitution policies, redefinition of functions of hospitals and primary care centres, creation of new roles for professionals, improved management, cost-containment, and orientation. No matter the strategy adopted, the aim of a reform is to provide health care that is oriented towards outcomes, based on evidence, and focused on effectiveness and efficiency. It is to increase availability and accessibility of services, client/patient satisfaction, and quality of care.
The health sector in Nigeria has witnessed several policy and institutional reforms, particularly since the enunciation of the National Health Policy (NHP), a strategy to achieve health for all Nigerians in 1988. This development has, in essence, been a vindication of government’s readiness to demonstrate its real commitment to the attainment of the desired goal of a level of health that would enable all Nigerians to achieve socially and economically productive lives (Aregbeyen, 2001, Olaniyan, 1995)).
The response of FMoH to the unacceptable health conditions in Nigeria through increased commitment and willingness was undertaken to achieve a comprehensive health sector reform. A new reform commenced in 2003 within the context of the National Economic Empowerment and Development Strategy (NEEDS), MDGs and NEPAD. The National Health Policy which was revised in 2004 created the reform environment whilst the health sector reform programme 2004 established the framework including goals, target and priorities that should guide the action and work of the FMoH and, to some extent, those of State Ministry of Health (SMoH) and health development partners over a four-year period (2004-2007). The document describes the direction for strategic reforms and investment in key areas of the national health system (FMoH, 2004).
ISSN 2039-9340 Mediterranean Journal of Social Sciences Vol. 4 (1) January 2013
226
In 2004, the Federal Government launched the National Economic Empowerment and Development Strategy (NEEDS), in it the government promised to “improve the health status of Nigerians as a significant co-factor in the country’s health sector reform aimed at strengthening the national health system and enhancing the delivery of effective, efficient, quality and affordable health services to Nigerians”. The federal government explained that the reform was aimed at raising life expectancy in Nigeria to 65 years and reducing infant mortality to 50 per 1,000 births.
The policy thrust includes: a) To improve Government performance of its stewardship role of policy formulation, health legislation,
regulation, resource mobilization, coordination, monitoring and evaluation. The WHO defines stewardship as the oversight role of the state in shaping, regulating and managing health systems. Government is expected to provide public and private health system actors with an overall policy direction, to create conditions that allow them to do their jobs and ensure oversight across the whole system with particular attention to equity concerns. Stewardship is also often used to describe the more political function of the State in relation to health systems.
b) To strengthen the National Health System and improve its management. c) To improve the availability and management of health resources (financial, human, infrastructure, etc). d) To reduce the disease burden attributable to poverty, diseases, and health problems including, malaria,
tuberculosis, HIV/AIDS and reproductive ill health. e) To improve the populations’ physical and financial access to quality health services through the:
i) Establishment and institutionalization of a system for quality assurance; ii) Registration and regulation of traditional and alternative health care providers; iii) Establishment of a reliable system for the procurement, distribution, and management of drugs and
medical supplies; iv) Establishment of a system that will regulate the location, practice and quality of human and material
resources in both public and private health facilities, and to strengthen regulatory mechanisms, including professional codes of conduct.
f) To increase consumer’s awareness of their health rights and obligations, and g) To foster effective collaboration and partnership with all health actors
The expected results from these policy thrust was equally outlined with plans of action. There have been some achievements but other challenges still remain. Improving access to health care services and infrastructure, especially for the poor is feasible if the new health sector reform programme is pursued vigorously with focus and sincere commitment from the presidency and the implementers. The key challenges are the effective revitalization of PHC and getting the health bill, which defines the role of the different levels of government passed by the relevant bodies into law.
The current Federal government plans to tackle the disturbing health scenarios through the adoption of several health policy options aimed at the transformation of the health system. These measures are encapsulated in the human capital development (health and education) policy plan of action of its 7-point agenda.
In its health policy reform implementation plan of action towards the realization of human capital development, it notes that: “The provision of health, education and functional social safety nets are absolutely essential to achieving desirable human capital outcomes. Human Capital outcomes in Nigeria lag behind other countries at similar stages of development. The country’s dismal health system is ranked 191 out of 201 in the comity of nations, according to the World Health Organization. …Infant mortality rate is 260 deaths/1000 live births in the North Western and North Eastern parts of Nigeria. This is one of the highest anywhere in the world. About 2.6 million or 4.4% of 15-49year olds are living with HIV/AIDs (FGN, 2007).
One of the several health policy options to be adopted would be to domesticate the sectoral transformation in order to model globally acceptable health transformation around our unique national culture and institutions. Structural transformation will emphasize on strengthening the management capacity of the National Primary Health Care Development Agency (NPHDA) to co-ordinate Primary Health Care (PHC) Policy, re-establishment or enthronement of the health referral system within 24 months in every state. It will also require improving human resources for tackling maternal and child mortality, and mobilizing additional resources to address funding gaps for health sector programmes. In addition, all public funded health agencies should align their expenditure with key priorities that address basic health services, with effective pro-poor services at secondary and tertiary levels.
Despite the health sector policy reform in Nigeria, institutional reforms were also prominent; Institutional reforms in the health sector are needed to strengthen the sector’s institutional capacities and
management practices of federal, state and local government levels in order to enhance efficiency, effectiveness, transparency and equity in the provision of health care services. Moreover, health sector reforms cannot be very effective
ISSN 2039-9340 Mediterranean Journal of Social Sciences Vol. 4 (1) January 2013
227
without the required institutional arrangements that are conducive to the attainment of stated health programme goals and objectives. Such arrangement would for example enhance inter-agency approach to the promotion, delivery and management of health care services. An effective institutional reform must address the three (3) critical areas below:
a) Organizational change –effective organization b) Financing change –financial sustainability c) Service delivery change –service delivery function.
a) Organizational change: This entails a process of ensuring a more purposeful, result oriented, cost effective and sustainable health care delivery system that can be achieved if changes are made to respond to prevailing health issues. Some changes have been made in the health sector in response to the many intractable health issues in the country. They include professionalization of the health ministries, decentralization and institutional pluralism and intersectoral cooperation.
Professionalization of the health ministry’s have revealed through experience that health system cannot be run efficiently without skilled managers required for planning, programming and budgeting. Such skills are required to translate policies into implementable projects and programmes and also to ensure the availability of human and material resources. Since managers with such skills are often lacking in most ministries, the federal government in response to this need, professionalized all ministries both at the federal and state levels following the 1998 civil service reform in the country. Consequently, eight and five departments were established in each ministry at the federal and state levels respectively. The federal level department, which is Federal Ministry of Health (FMoH) is as follows:
i) department of primary health care ii) department of population activities iii) department of disease control and international health iv) department of hospital services and training v) department of drug and food administration and control vi) department of finance and supplies vii) department of health management viii) department of planning, research and statistics
The National Health policy (NHP) provides for the appointment of Local Government Health Committees (LGHCs) in each LGA for the purpose of facilitating the delivery of health services to the communities and to enhance community participation. The establishment of the State Hospital Management Board (SHMB) was informed by the need to promote efficiency, effectiveness and transparency in the management of state-owned hospital. The SHMB function under the general supervision of and the policies established by the State Ministry of Health (SMoH), and is responsible for management of hospitals which comes under the jurisdiction of the SMoH.
Decentralization is meant for the devolution of decision making responsibilities to the point of service delivery so as to afford an effective implementation of health programmes. This has become important because local government authorities (LGA’s), Non-Governmental Organizations (NGOs) and communities are becoming increasingly involved in priority-setting and decision making. Decentralization brings decision-making nearer to the grassroots and gives opportunity to those who understand the problems of the local communities to be directly involved in the planning and execution of programmes meant to benefit such communities. Furthermore, it enhances community participation which gives room for the adaptation of health programmes to local cultures and traditions in contrast to the hitherto top-down programme that sought to change behavior, thereby disregarding the socio-cultural concerns of the communities. This has informed the thinking that prompted the Federal Government to make PHC delivery services the primary responsibility of the local government areas in Nigeria.
Institutional pluralism and inter-sectoral cooperation is vital because improving health services management as well as institutional reforms in the health sector alone cannot bring about better health, rather, other social and economic sectors concerned with state and community development and whose activities directly and indirectly impact on health should be encouraged. Hence, the national health care system in Nigeria emphasizes a coordinated health care system which encourages; the federal, state and local governments to coordinate their efforts in order to provide the citizens with effective health services at all levels; cooperate with private voluntary and non-governmental organizations which provide health care to ensure that the services provided by these other agencies are properly coordinated with those of governments and are in line with the overall national health policy; the involvement and coordination of the activities of all sectors related to health and all aspects of national and community development in particular agriculture, animal

ISSN 2039-9340 Mediterranean Journal of Social Sciences Vol. 4 (1) January 2013
228
husbandry, rural development, food industry, social development, housing, water supply, sanitation and communications (FMoH, 1988). b) Financing Change: This involves the various reforms through which the government seeks to make health care system affordable, accessible and financially sustainable to the people. That the poor in Nigeria lack easy access to basic health care services and receive low quality medical care due to their inability to pay for quality medical care is a truism that should not be overlooked (Aregbeyen, 1992). This is why it is stipulated in the Nigerian National Health Policy that “government of the federation shall explore avenues for financing the health care system” (FMoH, 1988). Previous reforms in health care financing in Nigeria includes -reallocation of public expenditure in line with identified priorities, appropriate pricing policy and NHIS and community financing.
Reallocation of public expenditure in line with identified priorities is concerned with the fact that the common causes of morbidity in Nigeria are still preventable infectious and avoidable disease; government is encouraging the shift of investment to preventive services from the hitherto high investment on curative services which had often been to the detriment of preventive services.
Appropriate pricing policies arises from the experience of the down-turn of the Nigerian economy during the last two decades resulted in a decline in the funding of many vital sectors of the economy including health. Since government can no longer bear the burden of providing certain health care services alone as a result of financial constraints, and to ensure an uninterrupted provision of adequate, regular and high quality services, minimal fees which are infact less than the cost of providing such services are charged. Such services includes laboratory and ancillary services, surgical operation fees, private/special admission facilities, private ambulance use, mortuary services, hospital bed and feeding services, specific ante-natal care and so on (Aregbeyen, 2001). c) Service Delivery Change: Service delivery change reform in the health system is aimed at improving the quality of care and consumer satisfaction, ensure efficiency in the use of resources as well as enhance clinical effectiveness and to ensure equity and access to health care and thus promote social well-being. Some of the important health care services delivery reforms in operations in the country are -priority setting and essential health service packages
Priority setting involves various actions directed towards those in vulnerable groups who may be marginalizes if they are left to the competitive market. Hence, commitments to the provision of such services are in accord with the goal of health equity which closely correlates with efficiency consideration. An example of priority setting/targeting is the national programme on immunization against the major infectious diseases which is specially directed towards the eradication of the six childhood killer diseases (diphtheria, persussis –whooping cough, polio myelitis, measles, tetanus and tuberculosis). So also is family planning which is directed towards the reproductive group.
Essential health services packages reform was adopted in pursuit of the goal of health for all Nigerians and certain health care services delivery reforms were enunciated. These include:
i) The Primary Health Care (PHC) Scheme -the adoption of the PHC system was a major development in health policy reform in the country. Consequently, the national health system has since been based on primary health care. The concept of PHC clearly articulates the need for multisectoral linkages and community participation, not only to bring about individual health care but more importantly, to cater for the health of communities on an area-wide basis.
ii) The revolving fund scheme -the drug revolving fund scheme was introduced following government’s adoption of the Bamako Initiative in March, 1990 in order to alleviate the problem of persistent shortage of drugs in public health care facilities. The principle objective of this reform is to ensure a self-sustaining supply of drugs and to provide continuity in funding the purchases, utilization and evaluation of essential drugs (Aregbeyen, 2001, Berman, 1995).
4. Some Major Achievements of the Reform Government has made some key achievements in the implementation of the health sector reform programme towards the attainment of the health MDGs. These achievements are summarized as follows.
1. To provide a favourable environment for the establishment and implementation of the Health Sector Reform Program (HSRP), the National Health Policy was revised in 2004 and approved by the Federal Government

ISSN 2039-9340 Mediterranean Journal of Social Sciences Vol. 4 (1) January 2013
229
and National Council on Health (NCH), providing favourable platform for addressing most of the issues already highlighted. The stewardship role of the FMoH has been defined in the national policy to consist of three basic tasks: a. Setting an explicit health policy framework b. Exerting influence and ensuring compliance through regulation, and c. Generating a reliable information base system for informed decision-making and performance
assessment 2. A National Health Sector Reform Program has been formulated approved by the Federal Government and
signed into law and is currently being implemented. 3. A number of new national policies have also been developed in many areas; health promotion, public-private
partnership in health, traditional medicine practice, national health equipment, national health management information system, national drug policy, national food and nutrition policy, integrated disease surveillance and response, child health, blood transfusion service policy, among others.
4. In addition to these, FMoH has developed a national health care finance policy and a national human resource policy to guide health care financing and human resource planning and management for the country.
5. Development of cost medium-term strategic plans for routine immunization, VVF control, health sector response to HIV/AIDS, TB control, malaria control, and adolescent health and development are in progress.
6. Launching and implementation of National Health Insurance Scheme, (NHIS), aimed at improving access of the people to quality health care at the three levels of care.
7. An increasingly effective NAFDAC is reducing the menace of adulterated and sub-standard drugs and foods, resulting in greater availability of quality drugs and establishment of pharmacovigilance.
8. Blood supply and screening is largely ad hoc, but a number of centralized transfusion centres are being established. The government is making efforts to address the blood supply situation in order to reduce the risks of transmitting infectious diseases, particularly HIV, through transfusion. Government also has opened some of the planned seven centralized transfusion centres where screening will be routine and standardized.
9. A National Health Bill was presented by the Federal government to the National Assembly in 2004, this bill codifies the structures of the 1988 Health Policy, answers some of the implementation questions raised by the NEEDS, and the MDG program, particularly the division of responsibility between the federal, state and local governments, with a significant role in primary health care for the federal government.
10. There is a steady increase in numbers of health professionals produced in Nigeria and serving Nigeria’s healthcare needs. There were reported 31,000 physicians in 2001, produced from the 15 medical schools in the country. The number of newly trained nurses and midwives was reported to be about 95,000 nurses and 70,000 registered midwives.
4. 1 Gap in Reform and Outcome
1. Developing and ensuring the availability of nationally acceptable integrated data management tools. The HSRP document of the current administration makes the following observations in relation to health information: “…the FMoH is accountable for the health of the nation, it is imperative that it sets goals for the entire nation and monitors progress. This is not yet happening …There is an ineffective and fragmented information system in place …” The health management information system is weak and has not been able to provide adequate data and evidence for policy/programme development and implementation.
2. Putting in place clearly defined mechanisms for intra and inter-sectoral relationships for better coordination, collaboration, and partnership. The coordination committee, made up of key stakeholders set up to monitor progress of the reform process, is currently not functioning.
3. Marketing and giving adequate technical support to states, the private sector and other stakeholders to adapt and utilize the tools already developed at the federal level to create appropriate institutions, and to drive and speak the same language of reform at all levels.
4. In spite of the apparently more visible attention to Primary Health Care (PHC), Nigeria’s MCH health status indicators have not been particularly encouraging over the years. Studies suggest that inconsistent policies, implementation of uncoordinated and highly fragmented vertical programmes, which have high short-term impact but largely unsustainable, as well as poor funding and lack of political will by governments at all levels, are some of the causes of these problems.
5. There are defective basic infrastructure and lack of logistics support in most public health care facilities: This situation is attributed in part to inadequate maintenance of buildings, equipment, vehicles and infrastructure
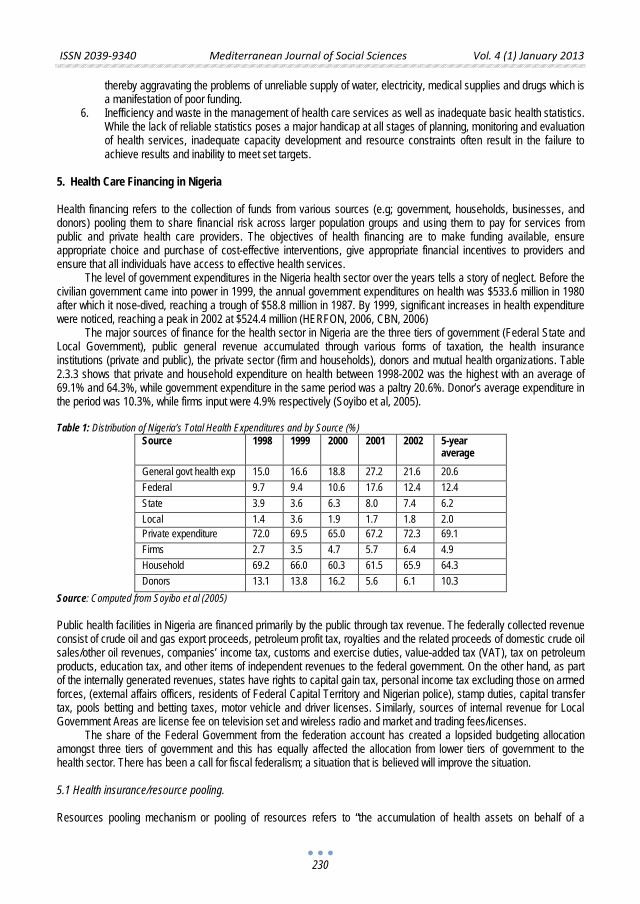
ISSN 2039-9340 Mediterranean Journal of Social Sciences Vol. 4 (1) January 2013
230
thereby aggravating the problems of unreliable supply of water, electricity, medical supplies and drugs which is a manifestation of poor funding.
6. Inefficiency and waste in the management of health care services as well as inadequate basic health statistics. While the lack of reliable statistics poses a major handicap at all stages of planning, monitoring and evaluation of health services, inadequate capacity development and resource constraints often result in the failure to achieve results and inability to meet set targets.
5. Health Care Financing in Nigeria Health financing refers to the collection of funds from various sources (e.g; government, households, businesses, and donors) pooling them to share financial risk across larger population groups and using them to pay for services from public and private health care providers. The objectives of health financing are to make funding available, ensure appropriate choice and purchase of cost-effective interventions, give appropriate financial incentives to providers and ensure that all individuals have access to effective health services.
The level of government expenditures in the Nigeria health sector over the years tells a story of neglect. Before the civilian government came into power in 1999, the annual government expenditures on health was $533.6 million in 1980 after which it nose-dived, reaching a trough of $58.8 million in 1987. By 1999, significant increases in health expenditure were noticed, reaching a peak in 2002 at $524.4 million (HERFON, 2006, CBN, 2006)
The major sources of finance for the health sector in Nigeria are the three tiers of government (Federal State and Local Government), public general revenue accumulated through various forms of taxation, the health insurance institutions (private and public), the private sector (firm and households), donors and mutual health organizations. Table 2.3.3 shows that private and household expenditure on health between 1998-2002 was the highest with an average of 69.1% and 64.3%, while government expenditure in the same period was a paltry 20.6%. Donor’s average expenditure in the period was 10.3%, while firms input were 4.9% respectively (Soyibo et al, 2005). Table 1: Distribution of Nigeria’s Total Health Expenditures and by Source (%)
Source 1998 1999 2000 2001 2002 5-year average
General govt health exp 15.0 16.6 18.8 27.2 21.6 20.6 Federal 9.7 9.4 10.6 17.6 12.4 12.4 State 3.9 3.6 6.3 8.0 7.4 6.2 Local 1.4 3.6 1.9 1.7 1.8 2.0 Private expenditure 72.0 69.5 65.0 67.2 72.3 69.1 Firms 2.7 3.5 4.7 5.7 6.4 4.9 Household 69.2 66.0 60.3 61.5 65.9 64.3 Donors 13.1 13.8 16.2 5.6 6.1 10.3
Source: Computed from Soyibo et al (2005)
Public health facilities in Nigeria are financed primarily by the public through tax revenue. The federally collected revenue consist of crude oil and gas export proceeds, petroleum profit tax, royalties and the related proceeds of domestic crude oil sales/other oil revenues, companies’ income tax, customs and exercise duties, value-added tax (VAT), tax on petroleum products, education tax, and other items of independent revenues to the federal government. On the other hand, as part of the internally generated revenues, states have rights to capital gain tax, personal income tax excluding those on armed forces, (external affairs officers, residents of Federal Capital Territory and Nigerian police), stamp duties, capital transfer tax, pools betting and betting taxes, motor vehicle and driver licenses. Similarly, sources of internal revenue for Local Government Areas are license fee on television set and wireless radio and market and trading fees/licenses.
The share of the Federal Government from the federation account has created a lopsided budgeting allocation amongst three tiers of government and this has equally affected the allocation from lower tiers of government to the health sector. There has been a call for fiscal federalism; a situation that is believed will improve the situation. 5.1 Health insurance/resource pooling. Resources pooling mechanism or pooling of resources refers to “the accumulation of health assets on behalf of a
ISSN 2039-9340 Mediterranean Journal of Social Sciences Vol. 4 (1) January 2013
231
population“. By pooling of resources, the financial and health risks are spread and transferred among the population. By pooling, the financial resources are no longer tied to particular contributor. The essence of “health insurance” is the pooling of funds and spreading the risk for illness and financing.
The various types of resources pooling mechanism are social insurance (such as the National Health Insurance Scheme (NHIS), Private insurance and community based insurance scheme.
a) National Health Insurance Scheme. The National health insurance scheme (NHIS) is a corporate body established under act 35 of 1999 by the federal government of Nigeria to improve the health of all Nigerian at an affordable cost. At present, the programme covers only federal government employee. Contributions are earnings related and currently represent 15% basic salary. The employer is to pay 10% while the employee will only contribute 5% of basic salary to enjoy the benefit package. The contributions made by/for an insured person entitled him or herself, a spouse and four children under the age of 18 years to full health benefit. There are health maintenance organizations that ensure that the affiliated providers provide health care services to the contributor who registers with their organizations through their employer or directly as the case may be. Health care providers under this programme are either paid by capitation or fee-for-services.
b) Community health insurance. Community based health financing or community financing for health is referred to as a mechanism whereby households in a community (the population in a village, district or other geographical area, or a social-economic or ethnic population group) finance or co-finance the current and/or capital costs associated with a given set of health services, thereby also having some involvement in the management of the community financing scheme and organization of health services.
There may also be various forms of community financing; a scheme can involve the direct payment of health services or health services inputs such as drugs, the payment of user fees for services organized via the scheme, or community based health insurance. Community health insurance is common denominator for voluntary health insurance schemes that are labeled alternatively as mutual health insurance schemes (mutual health organization, HMO) and medical aid societies or medical aid schemes. The common characteristics however are that they are run on a non-profit basis and they apply the basic principle of social health insurance.
c) Private health insurance. Private health insurance (PHI) is funded through direct and voluntary pre-payments by insured members. Benefit packages depend on insured people’s contributions. In Nigeria, approximately one million individuals hold private insurance, that is, around 0.8% of the population. However, the private health sector is expanding across the country.
Private health insurance in one way might reduce the out-of-pocket (OOP) expenditure and evolve in the long run towards a broader social health insurance system. Unless majority of the people is covered by the social health insurance or tax based financial health systems, there is a need to have appropriate regulation of private health insurance schemes to ensure the basic principles of solidarity, solvency requirements, cross-subsidization and control of exclusion (Ogunbekun et al, 1999).
Private health insurance financing may also be in the form of servicing of medical retainer-ship. This is an arrangement under which workers and specified dependants obtain medical treatment in designated hospitals at the expense of their employers.
5.2 Out-of-pocket health financing. Out-of-pocket health expenditure is another form of private health financing. Out-of-pocket health expenditures are payments for health services at the time of illness (that is, out-of-pocket expenditures), often levied on essential interventions. Experience has taught repeatedly that user fee end up excluding the poor from essential health services, while at the same time recovering only a tiny fraction of cost. Out-of-pocket health expenditures can represent a large and sometimes catastrophic burden on a household. An overall trend on OOPs is that consultations and medications are the most costly to individuals relative to other health related expenses. However for the non-poor, hospitalization is on average more costly than medications (Ogunbekun et al, 1999). 5.3 Strategic purchasing. Strategic purchasing requires that the insurance agency or agency managing insurance fund must make various arrangements for purchasing services from health care providers on behalf of insured consumers. Health care providers from national public or private health care systems should ensure that the health care packages which they provide have to be responsive and financially fair. This can be achieved through strategic purchasing.
ISSN 2039-9340 Mediterranean Journal of Social Sciences Vol. 4 (1) January 2013
232
The successes in strategic purchasing depend not only on what types or mixes of health care interventions to buy, but also from whom to buy and how to buy them. Good purchasing contributes to achieving health sector policy goals by ensuring that funds are allocated and used effectively. Strategic purchasing of an appropriate set of interventions requires a continuous search for the best interventions to purchase, the best providers to purchase from and also the establishment of the best payment mechanisms and contracting arrangements. The provision of competition, either between providers or, more rarely, between financiers of health care, is already being used as a strategy to finance health reform programmes in Nigeria. There are evidences across the country of the effective implementation of public-private-partnership in financing and provision of health services. 5.4 Donor/foreign aid health financing. Donor health funding is a form of health financing which is required to fill the domestic health sector savings-investment gap. Even if poor countries allocate more domestic resources to health, this would still not resolve the basic problem, because poor countries lack the needed financial resources to meet the most basic health needs of their populations. At $30 to $40 per capita for essential interventions, basic health costs would represent more than 10% of GNP of the least developed countries, far above what can be mobilized out of domestic resources.
With the return of the country to democratic governance in 1999, and subsequent lifting of economic sanctions, donor interest in Nigeria has been increasing. This is likely to reverse the declining trend in external assistance and hence lead to increased funding to the Nigerian economy. In particular, total external assistance, which was estimated at $375.1 million in 1994, declined to $83.4 million in 1998 and rose by 87% (to $156.0 million) in 1999 and $185.9 million in 2000.
Aids assistance to Nigeria has been through investment projects with technical cooperation component, free standing technical cooperation (FTC), and concessional loans and grants. Investment project assistance remains the major source of external assistance to Nigeria, with its share at 52.4% in 1997, increasing to 56.5% in 1998 and 58.2% in 1999. Government macroeconomic reforms attracted some support under programme budget assistance; which amounted to 1.4% external assistance in 1998 (HERFON, 2006).
5.5 Debt relief health financing. Debt relief is another method of health financing in low-income countries through deeper debt relief with the savings allocated to the health sector. The heavily indebted poor countries (HIPC) initiative will reduce debt servicing by around 2% of GNP for some 30 heavily indebted poor countries, and perhaps around one-fourth of that will be allocated directly to the health sector. Given the outstanding results of the first phase, in terms of channeling debt savings into social expenditure, there seem to be additional initiatives worth taking, although it would entail further bilateral financial support for strengthening the HIPC initiative.
Nigeria was able to negotiate her exit from the burden of debt overhang of her various creditor institutions, which created about $18 billion in savings from debt servicing. Government has committed itself to spending such savings on social and economic development such as health, education, agriculture, and infrastructure (HERFON, 2006). 6. Comparism of Health Sector with other Sectors Federal government capital expenditure on health has not been significant over the years. In the Abuja Declaration which Nigeria and other 43 other African countries signed, in 2001, they committed themselves to spending 15% of their annual budgets on public health, but this has not been achieved over the years as the Nigerian government continues to pay leap service to the funding of the nation’s health services system.
Table 6.1.1 and 6.1.2 below shows Federal Government capital and recurrent expenditures to the health sector between 2003 and 2007. The federal government capital expenditure on health were N6.4 billion (2.6%) in 2003, N18.2 billion (5.2%) in 2004, N21.8 billion (4.2%) in 2005, N32.2 billion (5.8%) in 2006 and N41.8 billion (5.5%) in 2007, a clear downward trend. The health sector total capital expenditure in the period 2003-2007 was 5.0% compared with allocation to agriculture, (13.7%), education (6.5%), administration, (33.1%), economic services, (47.9%). Funding to the health sector got to its peak in 2006 after which it started to decline in subsequent years.
The WHO’s Commission on Macroeconomic and Health has estimated that most developing nations need to spend $30 to $40 per person a year to reach the United Nations’Millenium Development Goal, Nigeria’s annual per capital spending is only about $20. This is far less than the minimum of $34 per capital to deliver essential services package as recommended by the commission on macroeconomics and health.
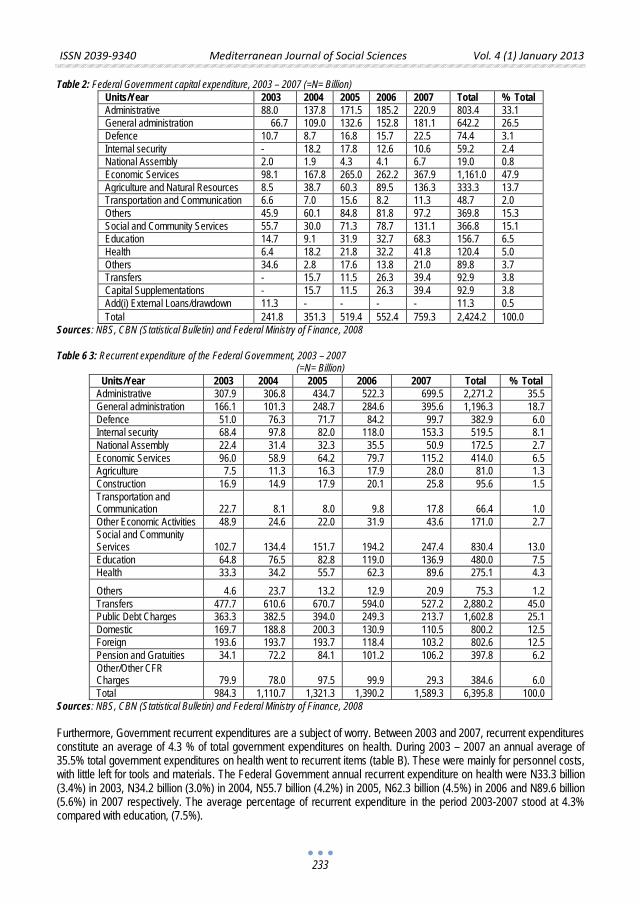
ISSN 2039-9340 Mediterranean Journal of Social Sciences Vol. 4 (1) January 2013
233
Table 2: Federal Government capital expenditure, 2003 – 2007 (=N= Billion) Units/Year 2003 2004 2005 2006 2007 Total % Total Administrative 88.0 137.8 171.5 185.2 220.9 803.4 33.1 General administration 66.7 109.0 132.6 152.8 181.1 642.2 26.5 Defence 10.7 8.7 16.8 15.7 22.5 74.4 3.1 Internal security - 18.2 17.8 12.6 10.6 59.2 2.4 National Assembly 2.0 1.9 4.3 4.1 6.7 19.0 0.8 Economic Services 98.1 167.8 265.0 262.2 367.9 1,161.0 47.9 Agriculture and Natural Resources 8.5 38.7 60.3 89.5 136.3 333.3 13.7 Transportation and Communication 6.6 7.0 15.6 8.2 11.3 48.7 2.0 Others 45.9 60.1 84.8 81.8 97.2 369.8 15.3 Social and Community Services 55.7 30.0 71.3 78.7 131.1 366.8 15.1 Education 14.7 9.1 31.9 32.7 68.3 156.7 6.5 Health 6.4 18.2 21.8 32.2 41.8 120.4 5.0 Others 34.6 2.8 17.6 13.8 21.0 89.8 3.7 Transfers - 15.7 11.5 26.3 39.4 92.9 3.8 Capital Supplementations - 15.7 11.5 26.3 39.4 92.9 3.8 Add(i) External Loans/drawdown 11.3 - - - - 11.3 0.5 Total 241.8 351.3 519.4 552.4 759.3 2,424.2 100.0
Sources: NBS, CBN (Statistical Bulletin) and Federal Ministry of Finance, 2008
Table 6 3: Recurrent expenditure of the Federal Government, 2003 – 2007 (=N= Billion)
Units/Year 2003 2004 2005 2006 2007 Total % Total Administrative 307.9 306.8 434.7 522.3 699.5 2,271.2 35.5 General administration 166.1 101.3 248.7 284.6 395.6 1,196.3 18.7 Defence 51.0 76.3 71.7 84.2 99.7 382.9 6.0 Internal security 68.4 97.8 82.0 118.0 153.3 519.5 8.1 National Assembly 22.4 31.4 32.3 35.5 50.9 172.5 2.7 Economic Services 96.0 58.9 64.2 79.7 115.2 414.0 6.5 Agriculture 7.5 11.3 16.3 17.9 28.0 81.0 1.3 Construction 16.9 14.9 17.9 20.1 25.8 95.6 1.5 Transportation and Communication 22.7 8.1 8.0 9.8 17.8 66.4 1.0 Other Economic Activities 48.9 24.6 22.0 31.9 43.6 171.0 2.7 Social and Community Services 102.7 134.4 151.7 194.2 247.4 830.4 13.0 Education 64.8 76.5 82.8 119.0 136.9 480.0 7.5 Health 33.3 34.2 55.7 62.3 89.6 275.1 4.3 Others 4.6 23.7 13.2 12.9 20.9 75.3 1.2 Transfers 477.7 610.6 670.7 594.0 527.2 2,880.2 45.0 Public Debt Charges 363.3 382.5 394.0 249.3 213.7 1,602.8 25.1 Domestic 169.7 188.8 200.3 130.9 110.5 800.2 12.5 Foreign 193.6 193.7 193.7 118.4 103.2 802.6 12.5 Pension and Gratuities 34.1 72.2 84.1 101.2 106.2 397.8 6.2 Other/Other CFR Charges 79.9 78.0 97.5 99.9 29.3 384.6 6.0 Total 984.3 1,110.7 1,321.3 1,390.2 1,589.3 6,395.8 100.0
Sources: NBS, CBN (Statistical Bulletin) and Federal Ministry of Finance, 2008
Furthermore, Government recurrent expenditures are a subject of worry. Between 2003 and 2007, recurrent expenditures constitute an average of 4.3 % of total government expenditures on health. During 2003 – 2007 an annual average of 35.5% total government expenditures on health went to recurrent items (table B). These were mainly for personnel costs, with little left for tools and materials. The Federal Government annual recurrent expenditure on health were N33.3 billion (3.4%) in 2003, N34.2 billion (3.0%) in 2004, N55.7 billion (4.2%) in 2005, N62.3 billion (4.5%) in 2006 and N89.6 billion (5.6%) in 2007 respectively. The average percentage of recurrent expenditure in the period 2003-2007 stood at 4.3% compared with education, (7.5%).
ISSN 2039-9340 Mediterranean Journal of Social Sciences Vol. 4 (1) January 2013
234
7. The Way Forward The Federal Government should explore ways towards improving access to primary health care. Extending the reach of primary health care and improving its performance requires action on several fronts’ simultaneously-including new delivery models to increase access, a greater role for nonprofit and private organizations in service delivery, and the introduction of performance incentives to improve it.
There should be a ban on the financing of government officials going overseas for medical treatment. It is very wrong. Taking cue from the practice in Saudi Arabia, which I think could be very helpful in this country, is that no matter the kind of illness anybody, even the king of Saudi Arabia has, nobody sends him overseas for treatment. What they do is to import any machine required. If they don‘t have the manpower that can handle it, they would import the manpower as well so that when that VIP recovers, other people can use the same machine. But here, one person runs abroad, spend the whole money that can build a hospital just on one person and at the end of the day, nothing comes to the people.
Better mind-sets and behaviour. Pay-for- performance bonuses and other incentive programs would motivate health workers to provide high-quality care efficiently. Improved delivery of supplies would reduce frustration. Better management capabilities would help ensure that workers were paid on time. To further improve the attitudes of health workers, the system should give them management training and other skill-development opportunities and a more supportive working environment. A mind-set shift among patients is needed as well so that they seek needed treatments more promptly. The presence of community health workers in each village may help change the mind-sets by making patients see that the health system is addressing their immediate needs. Experience in other sub-Saharan countries suggest that many of them face similar problems.
The systems delivering health to Nigerian people need a radical reform, with clear explicit goals against which progress can be measured not just by bureaucrats but also by the common people. Examples of such targets could be a 20% reduction in maternal mortality over the next 5 years or putting 100,000 people living with HIV/AIDS on treatment in the next 3 years. The health of the Nigerian people should no longer be measured in terms of how many health centres are built or how many teaching hospitals are refurbished or indeed how many tones of fake drugs are burnt, but in terms of real quantifiable change in disease burdens and mortality. Can we reduce the number of children who dies from vaccine preventable diseases such as measles and polio? Can we eradicate guinea worm? Reform in health sector, should not be vague rhetorical term that means nothing to the average Nigerian but a collection of measurable policies and strategies with well defined, measurable outcomes.
Strategic and progressive leadership in health delivery service. At a time when much is being made of foreign reserves that are being built up and the general improvement in Nigerian economic indices, it is perhaps time to re-examine the systems that will be needed to deliver results to the Nigerian people from the funds that have been stock piled through prudent economic management. We owe a duty to the people of Nigeria to utilize the windfalls from the increases in oil prices to effect changes in their lives. One way we can do this is through ensuring that these funds are used to eradicate preventable diseases and despair.
To achieve this, the Federal Ministry of Health will need to provide strategic, progressive leadership. A leadership that is willing to discard failed and tired structures, systems and indeed individuals. A leadership that is willing and able to maximize and harness all resources that come the country’s way through this ministry; one that can manage and direct these in a planned and structured way with the best interest of all Nigerians as its ultimate goal. A leadership that is willing to set targets for itself, is ready to communicate these targets to the general public and willing to be held to account in the way that, for instance, the Ministry of Finance has taken the lead in publishing its accounts and disbursements. The Nigerian public and the media will then be in a better position to judge when real progress is being made in improving the health of the nation.
Effective monitoring and evaluation (M&E) of performance and tracking the use of resources, health policies and reforms. The Government should appoint a committee or set up an agency in the monitoring and evaluation (M&E) of performance and tracking the use of resources, health policies and reforms continuously to enable technical efficiency in the delivery of their services. Implementation of health financing policies and actions need to be monitored and evaluated at regular intervals. Monitoring and evaluation exercise is needed for building evidence for future policies and for the assessment of whether the policy objectives have achieved the expected results. Monitoring and evaluation strategies contribute to the assessment of MDG, child and maternal health and other national and international development goals. The evidence will be useful for better targeting of donor action on MDG. The amount of investments in health is expected to increase with the provision of evidence to justify the magnitude of investment. It is also necessary to ensure the effectiveness of public health expenditure through the institutionalization of performance based budgeting and other mechanisms for preventing fraud.
ISSN 2039-9340 Mediterranean Journal of Social Sciences Vol. 4 (1) January 2013
235
Building a fairer economic relation with the world. There should be concerted effort to “build a fairer world” that limits the health damaging consequences of the unjust economic and political relation between the developed and the developing countries, to which Nigeria belong. In this regard, the power of the World Bank, the IMF and WTO in forcing programmes on the poor countries that exacerbate poverty and endanger the health of the population must be addressed. The current WTO agreements on intellectual property rights, which effectively limit the access of the poor countries to essential medicines and cheap drugs, must also be opposed by the governments and peoples of the poor countries. The framework of unequal economic and political relations between Nigeria and the advanced capitalist countries -unequal trade, the ecological debt, the external debt, has to be addressed. Specifically, the neo-liberal economic policies of the Nigerian State privatization, deregulation, massive retrenchment of employees in the public sector, which are dictated by the global unequal framework, must be rejected in favour of policies that advance the true interest of Nigeria, including its health interest. The NEEDS and the 7-point agenda framework, which is a product of the neo-liberal ideology, cannot therefore provide the answer to the critical challenges that the health sector and the health needs of the Nigerian people pose in current period.
Increased funding to the health sector. Government should massively increase investment and public spending on health. The health system currently rely on mixture of government budget, health insurance, external funding and private sources including non-governmental arrangements and out of pocket payments. Despite the variety of financing sources, the level of health spending is relatively low. Nigeria spends less than 5% of her gross domestic product (GDP) on health and per capita health spending is slightly lower than US$35 per person per year. The ridiculously low per capita health spending in Nigeria indicates a negligent lack of commitment by Federal, State and Local Government to health, and the leadership continues to pay lip service to healthcare services. At a minimum, per capita health spending must increase to $60 in order to provide a minimum range of services.
Implementation of integrated model for community-based chronic and communicable disease control in health services delivery. The FMoH should promote the implementation of integrated model for community-based chronic and communicable disease control in health services delivery. Government should develop guidelines for the practice of traditional medicine and facilitate the retraining and registration of traditional medical practitioners to improve their skills and effectiveness and thus, help promote their integration with the primary health care system. Also, government should strive to promote the development of industries and relevant manpower to enhance local capabilities in the production of drugs, including ARV and laboratory reagents, medical equipment and spare parts to improve supplies and maintenance capabilities so as to reduce cost and improve efficiency.
Reform in itself is not an event, but a description of a process that should lead to an improvement in the way a service is delivered. True reform takes time, but even in the realm of public health, where indices takes time to change, seven years is long enough time for measurable change to have occurred. If over a period of seven years, these improvements are still difficult to quantify, or cannot be described, then there is no justification for the use of the term ”reform” (Chike et al, 2006). References Aregbeyen J.B.O (1992) “Dimension of Policy and Institutional Reforms in the Health Sector”. Lecture Delivered at Training Programme
on Sectoral Policy Analysis and Management organized by NCEMA Aregbeyen J.B.O (2001) “Health Sector Reforms in Nigeria”. Nigeria Institute of Social and Economic Research (NISER), Ibadan. NISER
Monograph Series No. 1 Pg 22-27, 32 -39. Berman, P. (1995) “Health Sector Reform: Making Health Development Sustainable”. Health policy. pg1-3; 13-29, 32 CBN (2008) “Annual Reports and Statement of Accounts”. CBN (Various issues) CBN (2005) “Annual Reports and Statement of Accounts”. CBN Reports, 2000, 2001, 2002, 2003 as quoted in World Bank Country
Report for Nigeria, 2005 Chike I, et al (2006) “Nigeria Health Sector Reforms: Rhetoric or Real?” Nigeriaworld Onlinenewspaper, Thursday, June 22. Federal Republic of Nigeria (2004). “Health sector Reform Programme Strategic thrusts with a logical framework and a plane of action
2004-2007” (Sept). FGN (2007) ‘’My 7-Point Agenda for Development. FMoH (1988) “The National Health Policy and Strategies to achieve Health for all” Nigeria, Lagos. FMoH (2004) “Achieving Health-Related Millennium Development Goals in Nigeria – A Report of the Presidential Committee on
Achieving Millennium Development Goals in Nigeria” (August 9) – Executive Summary. FMoH (2004) “Health sector reform programme: Strategic Thrust with logical framework and plan of action 2004 – 2007”. HERFON, (2006) “Nigeria Health Review”, Health Reform Foundation of Nigeria, Kenbim press Ltd, Ibadan. Pg10-12,130,191 Lambo, E (2006) ‘’Linkages Between Poverty, Health and Sustainable Development inn Africa Lowell B. et al (2010), ‘’Strengthening Sub-Saharan Africa’s Health Systems” Businessday, Monday, July 28, pg 42 – 43 NACA (2004) “HIV/AIDS: National Strategic Framework, 2005 – 2009, Abuja.
ISSN 2039-9340 Mediterranean Journal of Social Sciences Vol. 4 (1) January 2013
236
National Bureau of Statistics (2008) ““Annual extract of Statistical Bulletin” pg 393, 395. Ogunbekun, et al (1999) “Private Health care in Nigeria, Walking a Tightrope. Health policy planning”, Pg 174-181. Olaniyan, R.O (1995) “Managing Health Development in Nigeria”. Nigeria Journal of Health Planning and Management 1995 Pg31-35. Sachs J.D. et al (2001) “Macroeconomic and Health; Investing in Health for economic Development. Report of the Commission on
Macroeconomics and Health.Geneva: WHO, Pg21. Soyibo A, et al (2005) “National Health Accounts of Nigeria, 1998 – 2002”. Draft Report Submitted to the World Health Organization,
Nigeria. Thisday (2008) ‘’EFCC Quizzes Gange, Aduku, Iyabo Again” Travis et al (2004) ‘’Overcoming the Health Systems Constraints to Achieve the Milennium Development Goals. Lancet, 2004 Pg
364:900-906 UNICEF (2007) ‘’Vitamin A Supplementation. A Decade of Progress) Pg 24 -31 WHO (2004) ‘’Regional Overview of Social Health Insurance in South-East Asia WHO/AFRO (1999) “Strategic Health Research Plan
(1999-2003) for the WHO Africa Region. WHO/Regional Committee for Africa Resolution AFR/RC48/R/4. Harare. WHO (1995) ‘’United Nations Country Report. September, 1995 World Bank,CRS (2005) ‘’Country Status Report for Nigeria”. World Bank/DMO, (2006) ‘’Country Status Report for Nigeria, Nigeria Debt Management Office report as quoted by World Bank”.
ISSN 2039-9340 Mediterranean Journal of Social Sciences Vol. 4 (1) January 2013
237
The Examination of the Effect of Participation in Entrepreneurial
Development Programmes on Enterprise Performance: A Case of Small-Scale Business in Nigeria
Aribaba Foluso Olugbenga
Obafemi Awolowo University
Centre for Distance Learning, Ile-Ife, Osun State, Nigeria. E-mail: [email protected]
Doi:10.5901/mjss.2013.v4n1p237 Abstract
Entrepreneurial Development programmes have contributed significantly to small-scale business development. Their impact includes increased business income, accelerated business growth, improved productivity and increased sales. The success story of Entrepreneurial Development programmes notwithstanding, they have problem of excluding small entrepreneurs due to accessibility of the programmes, finance, timing duration and lack of awareness of the programme. This study examined the effect of Entrepreneurial Development programmes on enterprises development and performance.The study area was Ondo State of Nigeria. The study carried out a comparative study of different types of small-scale business entrepreneurs. Questionnaires were administered to small-scale business entrepreneurs. This study concluded that participation in Entrepreneurial Development programmes had a positive impact on the performance of small-scale business in Nigeria.
Keywords; Entrepreneurial Development programmes, small-scale business, Entrepreneur, International Labour Organisation, National Directorate of Employment.
1. Intrduction The failure of large scale industries to bring about the required development in the economy led to the promotion of small-scale businesses in Nigeria (Aribaba, 2008). Sequel to this, government established some institutions to provide financial, managerial and technical assistance to small-scale businesses. These included the setting up of 13 industrial development centres in the six geo-political zones of the country to provide technical appraisals of application for loan; training for the entrepreneurs carrying out applied research into product design for small-scale industries and industrial extension services. Other institutions set up to promote small-scale business are: the Nigeria Bank for Commerce and Industry (NBCI), Micro credit schemes, Small and Medium Scale Enterprises Development Agency of Nigeria (SMEDAN), and National Directorate of Employment (NDE).
Small-scale businesses are easy to establish and maintain because it requires little set up capital. It is a type of business that the poor in the society will easily established because of the small amount of capital involvement. Thus, the need to research on this all important sector in order to bring about the needed development in the economy.
2. Why the study is Necessary In Nigeria, the government emphasized the need for the establishment and development of small-scale enterprises. This however, became necessary as a result of the failure of the large scale industries to achieve the needed economic development and growth and consequent failure of it to address the unemployment situation in the econmony.
A number of entrepreneurial development programmes which was aimed at developing the entrepreneurial imaginations, traits, performance, growth and behaviours of Nigerian industralisation and new investors/entrepreneur was implemented by government with the technical support of the United Nation Development Programme (UNDP) and the International Labour Organisation (ILO) (Aribaba, 2008).
Apart from the above, government ministries and agencies such as Ministry of Commerce and Industry and the National Directorate of Employment (NDE) organized entrepreneurial development programmes for small-scale business entrepreneurs in order to further promote the development this all important sector of the economy (Ojo, 1996).
The economic problem of this study is that small-scale business development is hindered by access to technical-know-how and attitudes required by the entrepreneurs to develop their enterprises. Entrepreneurial Development
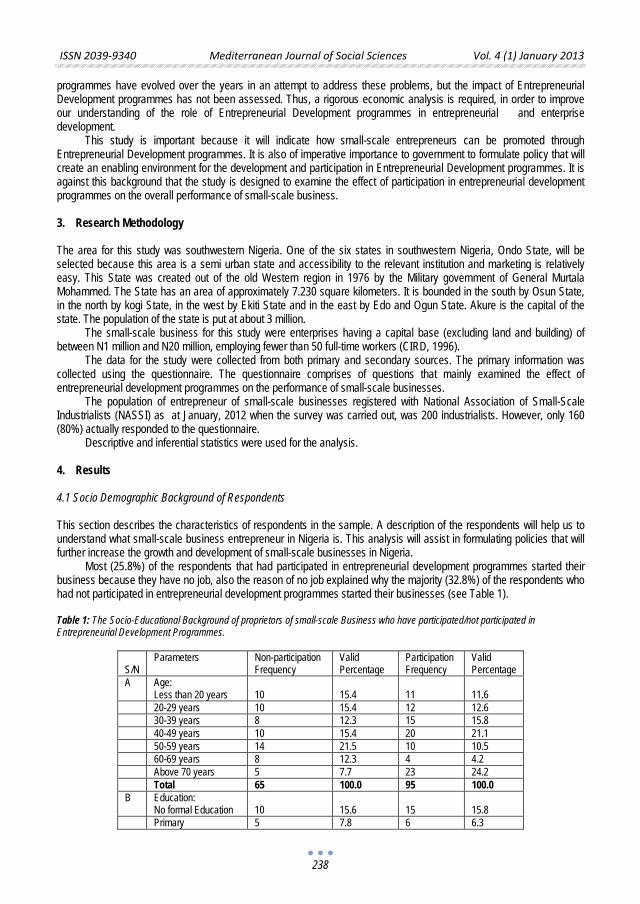
ISSN 2039-9340 Mediterranean Journal of Social Sciences Vol. 4 (1) January 2013
238
programmes have evolved over the years in an attempt to address these problems, but the impact of Entrepreneurial Development programmes has not been assessed. Thus, a rigorous economic analysis is required, in order to improve our understanding of the role of Entrepreneurial Development programmes in entrepreneurial and enterprise development.
This study is important because it will indicate how small-scale entrepreneurs can be promoted through Entrepreneurial Development programmes. It is also of imperative importance to government to formulate policy that will create an enabling environment for the development and participation in Entrepreneurial Development programmes. It is against this background that the study is designed to examine the effect of participation in entrepreneurial development programmes on the overall performance of small-scale business.
3. Research Methodology The area for this study was southwestern Nigeria. One of the six states in southwestern Nigeria, Ondo State, will be selected because this area is a semi urban state and accessibility to the relevant institution and marketing is relatively easy. This State was created out of the old Western region in 1976 by the Military government of General Murtala Mohammed. The State has an area of approximately 7.230 square kilometers. It is bounded in the south by Osun State, in the north by kogi State, in the west by Ekiti State and in the east by Edo and Ogun State. Akure is the capital of the state. The population of the state is put at about 3 million.
The small-scale business for this study were enterprises having a capital base (excluding land and building) of between N1 million and N20 million, employing fewer than 50 full-time workers (CIRD, 1996).
The data for the study were collected from both primary and secondary sources. The primary information was collected using the questionnaire. The questionnaire comprises of questions that mainly examined the effect of entrepreneurial development programmes on the performance of small-scale businesses.
The population of entrepreneur of small-scale businesses registered with National Association of Small-Scale Industrialists (NASSI) as at January, 2012 when the survey was carried out, was 200 industrialists. However, only 160 (80%) actually responded to the questionnaire.
Descriptive and inferential statistics were used for the analysis.
4. Results 4.1 Socio Demographic Background of Respondents This section describes the characteristics of respondents in the sample. A description of the respondents will help us to understand what small-scale business entrepreneur in Nigeria is. This analysis will assist in formulating policies that will further increase the growth and development of small-scale businesses in Nigeria.
Most (25.8%) of the respondents that had participated in entrepreneurial development programmes started their business because they have no job, also the reason of no job explained why the majority (32.8%) of the respondents who had not participated in entrepreneurial development programmes started their businesses (see Table 1). Table 1: The Socio-Educational Background of proprietors of small-scale Business who have participated/not participated in Entrepreneurial Development Programmes.
S/N
Parameters Non-participation Frequency
Valid Percentage
Participation Frequency
Valid Percentage
A Age: Less than 20 years
10
15.4
11
11.6
20-29 years 10 15.4 12 12.6 30-39 years 8 12.3 15 15.8 40-49 years 10 15.4 20 21.1 50-59 years 14 21.5 10 10.5 60-69 years 8 12.3 4 4.2 Above 70 years 5 7.7 23 24.2 Total 65 100.0 95 100.0 B Education:
No formal Education 10
15.6
15
15.8
Primary 5 7.8 6 6.3
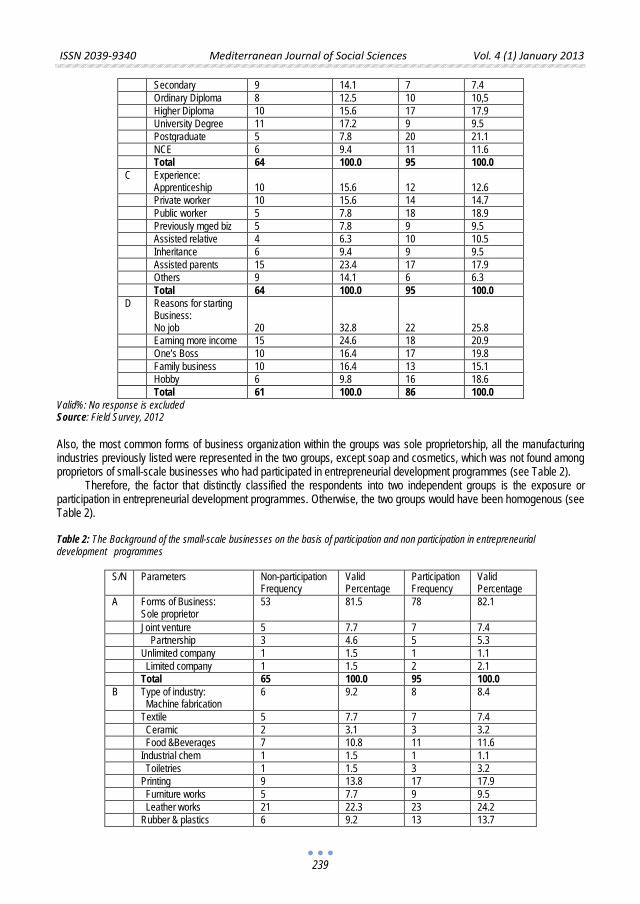
ISSN 2039-9340 Mediterranean Journal of Social Sciences Vol. 4 (1) January 2013
239
Secondary 9 14.1 7 7.4 Ordinary Diploma 8 12.5 10 10,5 Higher Diploma 10 15.6 17 17.9 University Degree 11 17.2 9 9.5 Postgraduate 5 7.8 20 21.1 NCE 6 9.4 11 11.6 Total 64 100.0 95 100.0 C Experience:
Apprenticeship 10
15.6
12
12.6
Private worker 10 15.6 14 14.7 Public worker 5 7.8 18 18.9 Previously mged biz 5 7.8 9 9.5 Assisted relative 4 6.3 10 10.5 Inheritance 6 9.4 9 9.5 Assisted parents 15 23.4 17 17.9 Others 9 14.1 6 6.3 Total 64 100.0 95 100.0 D Reasons for starting
Business: No job
20
32.8
22
25.8
Earning more income 15 24.6 18 20.9 One’s Boss 10 16.4 17 19.8 Family business 10 16.4 13 15.1 Hobby 6 9.8 16 18.6 Total 61 100.0 86 100.0
Valid%: No response is excluded Source: Field Survey, 2012
Also, the most common forms of business organization within the groups was sole proprietorship, all the manufacturing industries previously listed were represented in the two groups, except soap and cosmetics, which was not found among proprietors of small-scale businesses who had participated in entrepreneurial development programmes (see Table 2).
Therefore, the factor that distinctly classified the respondents into two independent groups is the exposure or participation in entrepreneurial development programmes. Otherwise, the two groups would have been homogenous (see Table 2). Table 2: The Background of the small-scale businesses on the basis of participation and non participation in entrepreneurial development programmes
S/N Parameters Non-participation Frequency
Valid Percentage
Participation Frequency
Valid Percentage
A Forms of Business: Sole proprietor
53 81.5 78 82.1
Joint venture 5 7.7 7 7.4 Partnership 3 4.6 5 5.3 Unlimited company 1 1.5 1 1.1 Limited company 1 1.5 2 2.1 Total 65 100.0 95 100.0 B Type of industry:
Machine fabrication 6 9.2 8 8.4
Textile 5 7.7 7 7.4 Ceramic 2 3.1 3 3.2 Food &Beverages 7 10.8 11 11.6 Industrial chem 1 1.5 1 1.1 Toiletries 1 1.5 3 3.2 Printing 9 13.8 17 17.9 Furniture works 5 7.7 9 9.5 Leather works 21 22.3 23 24.2 Rubber & plastics 6 9.2 13 13.7
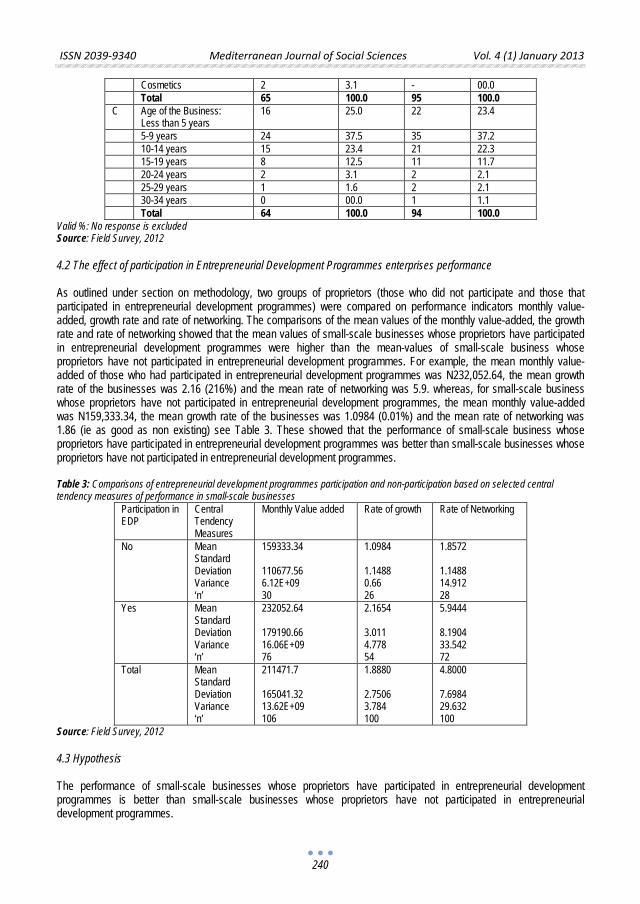
ISSN 2039-9340 Mediterranean Journal of Social Sciences Vol. 4 (1) January 2013
240
Cosmetics 2 3.1 - 00.0 Total 65 100.0 95 100.0 C Age of the Business:
Less than 5 years 16 25.0 22 23.4
5-9 years 24 37.5 35 37.2 10-14 years 15 23.4 21 22.3 15-19 years 8 12.5 11 11.7 20-24 years 2 3.1 2 2.1 25-29 years 1 1.6 2 2.1 30-34 years 0 00.0 1 1.1 Total 64 100.0 94 100.0
Valid %: No response is excluded Source: Field Survey, 2012 4.2 The effect of participation in Entrepreneurial Development Programmes enterprises performance As outlined under section on methodology, two groups of proprietors (those who did not participate and those that participated in entrepreneurial development programmes) were compared on performance indicators monthly value-added, growth rate and rate of networking. The comparisons of the mean values of the monthly value-added, the growth rate and rate of networking showed that the mean values of small-scale businesses whose proprietors have participated in entrepreneurial development programmes were higher than the mean-values of small-scale business whose proprietors have not participated in entrepreneurial development programmes. For example, the mean monthly value-added of those who had participated in entrepreneurial development programmes was N232,052.64, the mean growth rate of the businesses was 2.16 (216%) and the mean rate of networking was 5.9. whereas, for small-scale business whose proprietors have not participated in entrepreneurial development programmes, the mean monthly value-added was N159,333.34, the mean growth rate of the businesses was 1.0984 (0.01%) and the mean rate of networking was 1.86 (ie as good as non existing) see Table 3. These showed that the performance of small-scale business whose proprietors have participated in entrepreneurial development programmes was better than small-scale businesses whose proprietors have not participated in entrepreneurial development programmes.
Table 3: Comparisons of entrepreneurial development programmes participation and non-participation based on selected central tendency measures of performance in small-scale businesses
Participation in EDP
Central Tendency Measures
Monthly Value added Rate of growth Rate of Networking
No Mean Standard Deviation Variance ‘n’
159333.34 110677.56 6.12E+09 30
1.0984 1.1488 0.66 26
1.8572 1.1488 14.912 28
Yes Mean Standard Deviation Variance ‘n’
232052.64 179190.66 16.06E+09 76
2.1654 3.011 4.778 54
5.9444 8.1904 33.542 72
Total Mean Standard Deviation Variance ‘n’
211471.7 165041.32 13.62E+09 106
1.8880 2.7506 3.784 100
4.8000 7.6984 29.632 100
Source: Field Survey, 2012 4.3 Hypothesis The performance of small-scale businesses whose proprietors have participated in entrepreneurial development programmes is better than small-scale businesses whose proprietors have not participated in entrepreneurial development programmes.
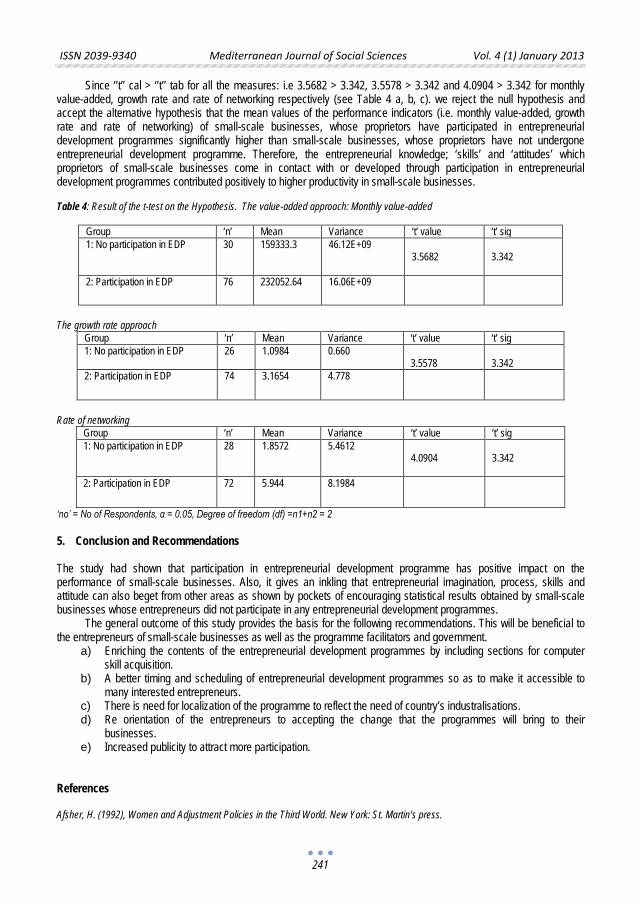
ISSN 2039-9340 Mediterranean Journal of Social Sciences Vol. 4 (1) January 2013
241
Since ‘’t’’ cal > ‘’t’’ tab for all the measures: i.e 3.5682 > 3.342, 3.5578 > 3.342 and 4.0904 > 3.342 for monthly value-added, growth rate and rate of networking respectively (see Table 4 a, b, c). we reject the null hypothesis and accept the alternative hypothesis that the mean values of the performance indicators (i.e. monthly value-added, growth rate and rate of networking) of small-scale businesses, whose proprietors have participated in entrepreneurial development programmes significantly higher than small-scale businesses, whose proprietors have not undergone entrepreneurial development programme. Therefore, the entrepreneurial knowledge; ‘skills’ and ‘attitudes’ which proprietors of small-scale businesses come in contact with or developed through participation in entrepreneurial development programmes contributed positively to higher productivity in small-scale businesses. Table 4: Result of the t-test on the Hypothesis. The value-added approach: Monthly value-added
Group ‘n’ Mean Variance ‘t’ value ‘t’ sig 1: No participation in EDP 30 159333.3 46.12E+09
3.5682 3.342
2: Participation in EDP 76 232052.64 16.06E+09
The growth rate approach
Group ‘n’ Mean Variance ‘t’ value ‘t’ sig 1: No participation in EDP 26 1.0984 0.660
3.5578 3.342
2: Participation in EDP 74 3.1654 4.778
Rate of networking
Group ‘n’ Mean Variance ‘t’ value ‘t’ sig 1: No participation in EDP 28 1.8572 5.4612
4.0904
3.342
2: Participation in EDP 72 5.944 8.1984
‘no’ = No of Respondents, α = 0.05, Degree of freedom (df) =n1+n2 = 2
5. Conclusion and Recommendations The study had shown that participation in entrepreneurial development programme has positive impact on the performance of small-scale businesses. Also, it gives an inkling that entrepreneurial imagination, process, skills and attitude can also beget from other areas as shown by pockets of encouraging statistical results obtained by small-scale businesses whose entrepreneurs did not participate in any entrepreneurial development programmes.
The general outcome of this study provides the basis for the following recommendations. This will be beneficial to the entrepreneurs of small-scale businesses as well as the programme facilitators and government.
a) Enriching the contents of the entrepreneurial development programmes by including sections for computer skill acquisition.
b) A better timing and scheduling of entrepreneurial development programmes so as to make it accessible to many interested entrepreneurs.
c) There is need for localization of the programme to reflect the need of country’s industralisations. d) Re orientation of the entrepreneurs to accepting the change that the programmes will bring to their
businesses. e) Increased publicity to attract more participation.
References Afsher, H. (1992), Women and Adjustment Policies in the Third World. New York: St. Martin’s press.
ISSN 2039-9340 Mediterranean Journal of Social Sciences Vol. 4 (1) January 2013
242
Aribaba, F.O. (2008), The impact of Technological Innovative Entrepreneurial Development Programmes on the performance of small-scale businesses in Ondo state, Nigeria, An MSc Thesis, OAU, Ile Ife, Nigeria
Bolton. J.E. (1978), “The financial Needs of the small firm”. The Banks and Small Businesses. The Institute of Bankers (Cambridge Seminar) London.
Callaghy, T.M. (1988, The State and Development of Capitalisation in Africa: Theoretical Historical and Comparative Reflections in D. Rothchild.
Cantillon. R. (1931,”Essai surla nature do commerce en general” in Higas. eds. . “Essai sur Ia nature du commerce en general”, Macmillian, London.
Casson, M. (1982), The Entrepreneur: An Economic Theory. Martin Robertson Oxford, 23. C1RD, (1996), Definitions and Problems of Small scale and medium scale Enterprises in Nigeria, Industrial Unit, O.A.U., Ile-Ife. Cole, A. H. (1965), Business Enterprise in its Social Setting, Harvard University Press, Boston. Drucker, P.F. (1954), The practice of management, Harper and Roco, Nev’ York. Drucker, P. (1970), “Entrepreneurship in Business Enterprise”. Journal of Business Policy, 1, 50-52. Drucker, P.F. (1986, Innovation and Entrepreneurship. Pan Books, London. Ekpeyong, N. (1992), “Entrepreneurship Development Programme which way for Nigeria” Nigerian Management Review, 3, (2) 115-129. Federal Ministry of Economic Development, (1975), “Third National Development plan 1975-1980”. 2, Lagos. Ojo, A (1996), Management of Small and Medium Enterprises in Nigeria, Nigeria: Pumak, Nigeria Ltd. Say, J.B., quoted in Cole, A.H. (1965), The Entrepreneur: Introductory remarks: in H.J.G., Altkeu, (eds.), Explorations in enterprise: an
approach to the study of entrepreneurship, Harvard University press, Cambridge Mass., 32-33. Schumpeter, J.A. (1934), The Theory of Economic Development”, Harvard University Press, Cambridge, 64. Schumpeter, J.A. (1939), Business Cycles: A Theoretical Historical and Statistical Analysis of capitalist process, 1 edition, 2nd
impression, Mcgraw-Hill. Maridenhead, 64. Schumpeter, J.A. (1950): Capitalism. Socialism, and Dernocrac), 3rd edition, Harper and Row, New York. Steinhoff. D. (1982), Small Business Management Fundamentals, Ne York: Mac Grax Hill inc. Streeton, p. (1987), “Structural Adjustment: A survey of issues and options World Development Report” 15/12, 1469-1682. Sule, E.I.K. (1986), “Small-Scale Industries in Nigeria: Concepts, Appraisals of some Government Policies and suggested solutions to
identified problems”. Economic and financial Review of CBN, 24/4. 24.
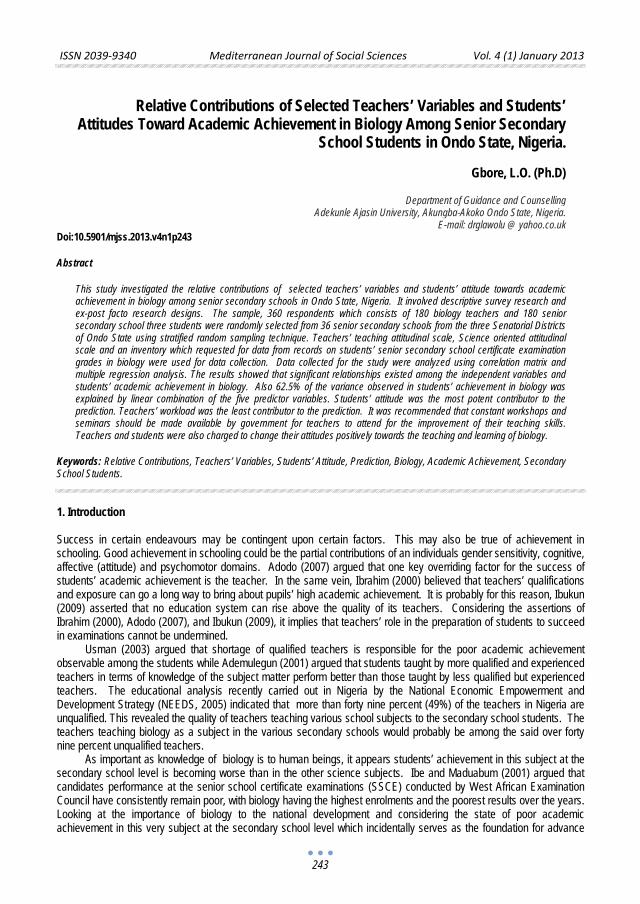
ISSN 2039-9340 Mediterranean Journal of Social Sciences Vol. 4 (1) January 2013
243
Relative Contributions of Selected Teachers’ Variables and Students’
Attitudes Toward Academic Achievement in Biology Among Senior Secondary School Students in Ondo State, Nigeria.
Gbore, L.O. (Ph.D)
Department of Guidance and Counselling
Adekunle Ajasin University, Akungba-Akoko Ondo State, Nigeria. E-mail: drglawolu @ yahoo.co.uk
Doi:10.5901/mjss.2013.v4n1p243 Abstract
This study investigated the relative contributions of selected teachers’ variables and students’ attitude towards academic achievement in biology among senior secondary schools in Ondo State, Nigeria. It involved descriptive survey research and ex-post facto research designs. The sample, 360 respondents which consists of 180 biology teachers and 180 senior secondary school three students were randomly selected from 36 senior secondary schools from the three Senatorial Districts of Ondo State using stratified random sampling technique. Teachers’ teaching attitudinal scale, Science oriented attitudinal scale and an inventory which requested for data from records on students’ senior secondary school certificate examination grades in biology were used for data collection. Data collected for the study were analyzed using correlation matrix and multiple regression analysis. The results showed that significant relationships existed among the independent variables and students’ academic achievement in biology. Also 62.5% of the variance observed in students’ achievement in biology was explained by linear combination of the five predictor variables. Students’ attitude was the most potent contributor to the prediction. Teachers’ workload was the least contributor to the prediction. It was recommended that constant workshops and seminars should be made available by government for teachers to attend for the improvement of their teaching skills. Teachers and students were also charged to change their attitudes positively towards the teaching and learning of biology.
Keywords: Relative Contributions, Teachers’ Variables, Students’ Attitude, Prediction, Biology, Academic Achievement, Secondary School Students.
1. Introduction Success in certain endeavours may be contingent upon certain factors. This may also be true of achievement in schooling. Good achievement in schooling could be the partial contributions of an individuals gender sensitivity, cognitive, affective (attitude) and psychomotor domains. Adodo (2007) argued that one key overriding factor for the success of students’ academic achievement is the teacher. In the same vein, Ibrahim (2000) believed that teachers’ qualifications and exposure can go a long way to bring about pupils’ high academic achievement. It is probably for this reason, Ibukun (2009) asserted that no education system can rise above the quality of its teachers. Considering the assertions of Ibrahim (2000), Adodo (2007), and Ibukun (2009), it implies that teachers’ role in the preparation of students to succeed in examinations cannot be undermined.
Usman (2003) argued that shortage of qualified teachers is responsible for the poor academic achievement observable among the students while Ademulegun (2001) argued that students taught by more qualified and experienced teachers in terms of knowledge of the subject matter perform better than those taught by less qualified but experienced teachers. The educational analysis recently carried out in Nigeria by the National Economic Empowerment and Development Strategy (NEEDS, 2005) indicated that more than forty nine percent (49%) of the teachers in Nigeria are unqualified. This revealed the quality of teachers teaching various school subjects to the secondary school students. The teachers teaching biology as a subject in the various secondary schools would probably be among the said over forty nine percent unqualified teachers.
As important as knowledge of biology is to human beings, it appears students’ achievement in this subject at the secondary school level is becoming worse than in the other science subjects. Ibe and Maduabum (2001) argued that candidates performance at the senior school certificate examinations (SSCE) conducted by West African Examination Council have consistently remain poor, with biology having the highest enrolments and the poorest results over the years. Looking at the importance of biology to the national development and considering the state of poor academic achievement in this very subject at the secondary school level which incidentally serves as the foundation for advance
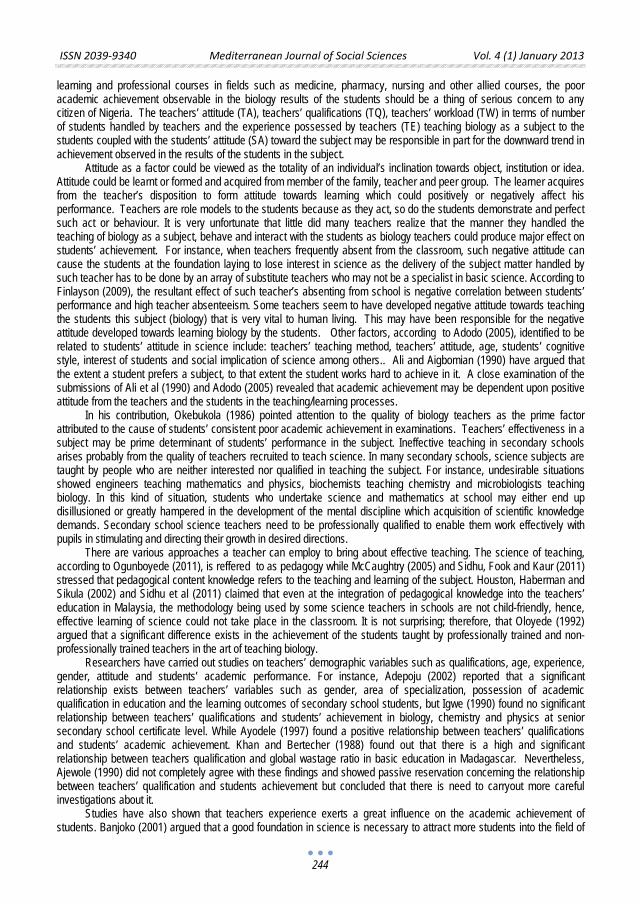
ISSN 2039-9340 Mediterranean Journal of Social Sciences Vol. 4 (1) January 2013
244
learning and professional courses in fields such as medicine, pharmacy, nursing and other allied courses, the poor academic achievement observable in the biology results of the students should be a thing of serious concern to any citizen of Nigeria. The teachers’ attitude (TA), teachers’ qualifications (TQ), teachers’ workload (TW) in terms of number of students handled by teachers and the experience possessed by teachers (TE) teaching biology as a subject to the students coupled with the students’ attitude (SA) toward the subject may be responsible in part for the downward trend in achievement observed in the results of the students in the subject.
Attitude as a factor could be viewed as the totality of an individual’s inclination towards object, institution or idea. Attitude could be learnt or formed and acquired from member of the family, teacher and peer group. The learner acquires from the teacher’s disposition to form attitude towards learning which could positively or negatively affect his performance. Teachers are role models to the students because as they act, so do the students demonstrate and perfect such act or behaviour. It is very unfortunate that little did many teachers realize that the manner they handled the teaching of biology as a subject, behave and interact with the students as biology teachers could produce major effect on students’ achievement. For instance, when teachers frequently absent from the classroom, such negative attitude can cause the students at the foundation laying to lose interest in science as the delivery of the subject matter handled by such teacher has to be done by an array of substitute teachers who may not be a specialist in basic science. According to Finlayson (2009), the resultant effect of such teacher’s absenting from school is negative correlation between students’ performance and high teacher absenteeism. Some teachers seem to have developed negative attitude towards teaching the students this subject (biology) that is very vital to human living. This may have been responsible for the negative attitude developed towards learning biology by the students. Other factors, according to Adodo (2005), identified to be related to students’ attitude in science include: teachers’ teaching method, teachers’ attitude, age, students’ cognitive style, interest of students and social implication of science among others.. Ali and Aigbomian (1990) have argued that the extent a student prefers a subject, to that extent the student works hard to achieve in it. A close examination of the submissions of Ali et al (1990) and Adodo (2005) revealed that academic achievement may be dependent upon positive attitude from the teachers and the students in the teaching/learning processes.
In his contribution, Okebukola (1986) pointed attention to the quality of biology teachers as the prime factor attributed to the cause of students’ consistent poor academic achievement in examinations. Teachers’ effectiveness in a subject may be prime determinant of students’ performance in the subject. Ineffective teaching in secondary schools arises probably from the quality of teachers recruited to teach science. In many secondary schools, science subjects are taught by people who are neither interested nor qualified in teaching the subject. For instance, undesirable situations showed engineers teaching mathematics and physics, biochemists teaching chemistry and microbiologists teaching biology. In this kind of situation, students who undertake science and mathematics at school may either end up disillusioned or greatly hampered in the development of the mental discipline which acquisition of scientific knowledge demands. Secondary school science teachers need to be professionally qualified to enable them work effectively with pupils in stimulating and directing their growth in desired directions.
There are various approaches a teacher can employ to bring about effective teaching. The science of teaching, according to Ogunboyede (2011), is reffered to as pedagogy while McCaughtry (2005) and Sidhu, Fook and Kaur (2011) stressed that pedagogical content knowledge refers to the teaching and learning of the subject. Houston, Haberman and Sikula (2002) and Sidhu et al (2011) claimed that even at the integration of pedagogical knowledge into the teachers’ education in Malaysia, the methodology being used by some science teachers in schools are not child-friendly, hence, effective learning of science could not take place in the classroom. It is not surprising; therefore, that Oloyede (1992) argued that a significant difference exists in the achievement of the students taught by professionally trained and non-professionally trained teachers in the art of teaching biology.
Researchers have carried out studies on teachers’ demographic variables such as qualifications, age, experience, gender, attitude and students’ academic performance. For instance, Adepoju (2002) reported that a significant relationship exists between teachers’ variables such as gender, area of specialization, possession of academic qualification in education and the learning outcomes of secondary school students, but Igwe (1990) found no significant relationship between teachers’ qualifications and students’ achievement in biology, chemistry and physics at senior secondary school certificate level. While Ayodele (1997) found a positive relationship between teachers’ qualifications and students’ academic achievement. Khan and Bertecher (1988) found out that there is a high and significant relationship between teachers qualification and global wastage ratio in basic education in Madagascar. Nevertheless, Ajewole (1990) did not completely agree with these findings and showed passive reservation concerning the relationship between teachers’ qualification and students achievement but concluded that there is need to carryout more careful investigations about it.
Studies have also shown that teachers experience exerts a great influence on the academic achievement of students. Banjoko (2001) argued that a good foundation in science is necessary to attract more students into the field of
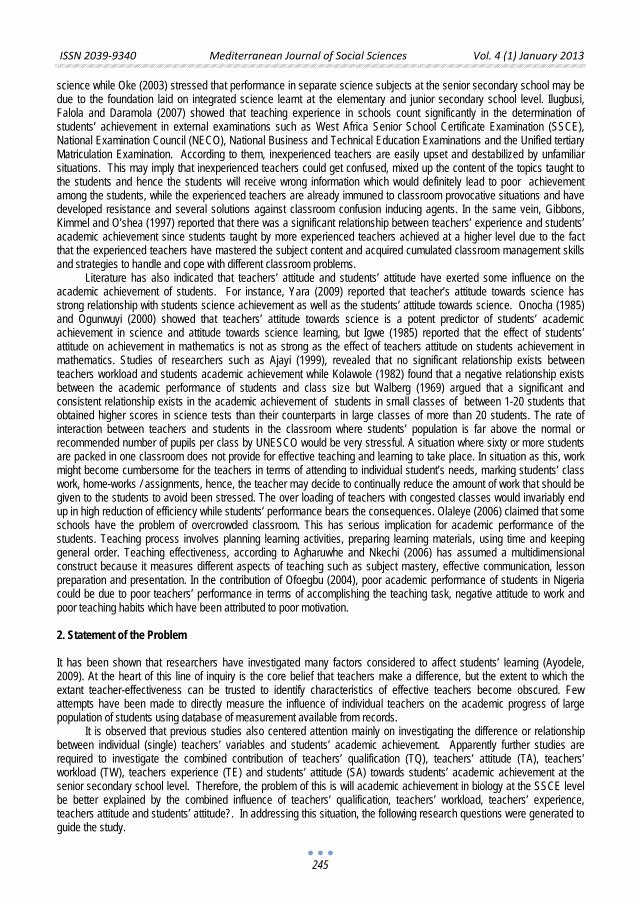
ISSN 2039-9340 Mediterranean Journal of Social Sciences Vol. 4 (1) January 2013
245
science while Oke (2003) stressed that performance in separate science subjects at the senior secondary school may be due to the foundation laid on integrated science learnt at the elementary and junior secondary school level. Ilugbusi, Falola and Daramola (2007) showed that teaching experience in schools count significantly in the determination of students’ achievement in external examinations such as West Africa Senior School Certificate Examination (SSCE), National Examination Council (NECO), National Business and Technical Education Examinations and the Unified tertiary Matriculation Examination. According to them, inexperienced teachers are easily upset and destabilized by unfamiliar situations. This may imply that inexperienced teachers could get confused, mixed up the content of the topics taught to the students and hence the students will receive wrong information which would definitely lead to poor achievement among the students, while the experienced teachers are already immuned to classroom provocative situations and have developed resistance and several solutions against classroom confusion inducing agents. In the same vein, Gibbons, Kimmel and O’shea (1997) reported that there was a significant relationship between teachers’ experience and students’ academic achievement since students taught by more experienced teachers achieved at a higher level due to the fact that the experienced teachers have mastered the subject content and acquired cumulated classroom management skills and strategies to handle and cope with different classroom problems.
Literature has also indicated that teachers’ attitude and students’ attitude have exerted some influence on the academic achievement of students. For instance, Yara (2009) reported that teacher’s attitude towards science has strong relationship with students science achievement as well as the students’ attitude towards science. Onocha (1985) and Ogunwuyi (2000) showed that teachers’ attitude towards science is a potent predictor of students’ academic achievement in science and attitude towards science learning, but Igwe (1985) reported that the effect of students’ attitude on achievement in mathematics is not as strong as the effect of teachers attitude on students achievement in mathematics. Studies of researchers such as Ajayi (1999), revealed that no significant relationship exists between teachers workload and students academic achievement while Kolawole (1982) found that a negative relationship exists between the academic performance of students and class size but Walberg (1969) argued that a significant and consistent relationship exists in the academic achievement of students in small classes of between 1-20 students that obtained higher scores in science tests than their counterparts in large classes of more than 20 students. The rate of interaction between teachers and students in the classroom where students’ population is far above the normal or recommended number of pupils per class by UNESCO would be very stressful. A situation where sixty or more students are packed in one classroom does not provide for effective teaching and learning to take place. In situation as this, work might become cumbersome for the teachers in terms of attending to individual student’s needs, marking students’ class work, home-works / assignments, hence, the teacher may decide to continually reduce the amount of work that should be given to the students to avoid been stressed. The over loading of teachers with congested classes would invariably end up in high reduction of efficiency while students’ performance bears the consequences. Olaleye (2006) claimed that some schools have the problem of overcrowded classroom. This has serious implication for academic performance of the students. Teaching process involves planning learning activities, preparing learning materials, using time and keeping general order. Teaching effectiveness, according to Agharuwhe and Nkechi (2006) has assumed a multidimensional construct because it measures different aspects of teaching such as subject mastery, effective communication, lesson preparation and presentation. In the contribution of Ofoegbu (2004), poor academic performance of students in Nigeria could be due to poor teachers’ performance in terms of accomplishing the teaching task, negative attitude to work and poor teaching habits which have been attributed to poor motivation. 2. Statement of the Problem It has been shown that researchers have investigated many factors considered to affect students’ learning (Ayodele, 2009). At the heart of this line of inquiry is the core belief that teachers make a difference, but the extent to which the extant teacher-effectiveness can be trusted to identify characteristics of effective teachers become obscured. Few attempts have been made to directly measure the influence of individual teachers on the academic progress of large population of students using database of measurement available from records.
It is observed that previous studies also centered attention mainly on investigating the difference or relationship between individual (single) teachers’ variables and students’ academic achievement. Apparently further studies are required to investigate the combined contribution of teachers’ qualification (TQ), teachers’ attitude (TA), teachers’ workload (TW), teachers experience (TE) and students’ attitude (SA) towards students’ academic achievement at the senior secondary school level. Therefore, the problem of this is will academic achievement in biology at the SSCE level be better explained by the combined influence of teachers’ qualification, teachers’ workload, teachers’ experience, teachers attitude and students’ attitude?. In addressing this situation, the following research questions were generated to guide the study.
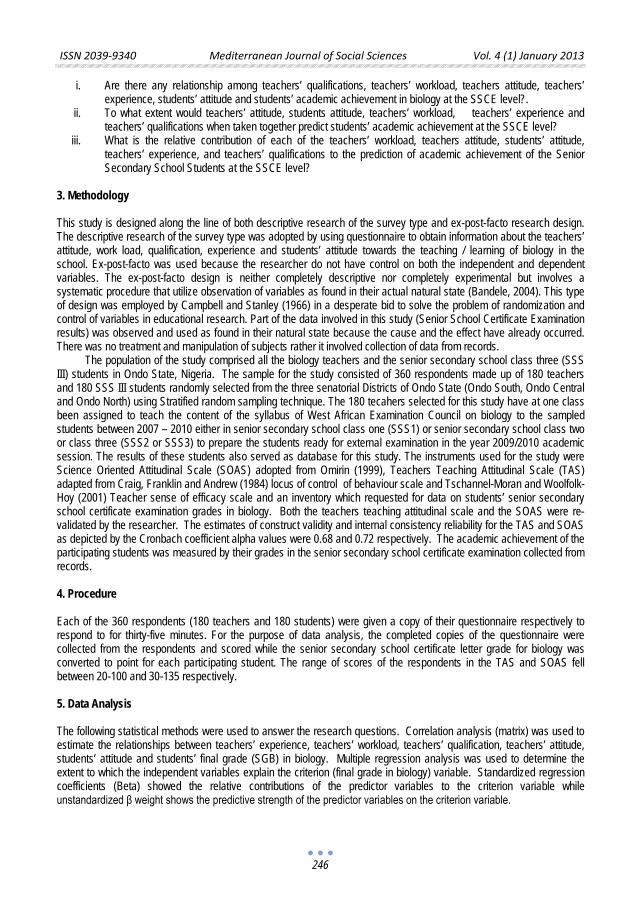
ISSN 2039-9340 Mediterranean Journal of Social Sciences Vol. 4 (1) January 2013
246
i. Are there any relationship among teachers’ qualifications, teachers’ workload, teachers attitude, teachers’ experience, students’ attitude and students’ academic achievement in biology at the SSCE level?.
ii. To what extent would teachers’ attitude, students attitude, teachers’ workload, teachers’ experience and teachers’ qualifications when taken together predict students’ academic achievement at the SSCE level?
iii. What is the relative contribution of each of the teachers’ workload, teachers attitude, students’ attitude, teachers’ experience, and teachers’ qualifications to the prediction of academic achievement of the Senior Secondary School Students at the SSCE level?
3. Methodology This study is designed along the line of both descriptive research of the survey type and ex-post-facto research design. The descriptive research of the survey type was adopted by using questionnaire to obtain information about the teachers’ attitude, work load, qualification, experience and students’ attitude towards the teaching / learning of biology in the school. Ex-post-facto was used because the researcher do not have control on both the independent and dependent variables. The ex-post-facto design is neither completely descriptive nor completely experimental but involves a systematic procedure that utilize observation of variables as found in their actual natural state (Bandele, 2004). This type of design was employed by Campbell and Stanley (1966) in a desperate bid to solve the problem of randomization and control of variables in educational research. Part of the data involved in this study (Senior School Certificate Examination results) was observed and used as found in their natural state because the cause and the effect have already occurred. There was no treatment and manipulation of subjects rather it involved collection of data from records.
The population of the study comprised all the biology teachers and the senior secondary school class three (SSS III) students in Ondo State, Nigeria. The sample for the study consisted of 360 respondents made up of 180 teachers and 180 SSS III students randomly selected from the three senatorial Districts of Ondo State (Ondo South, Ondo Central and Ondo North) using Stratified random sampling technique. The 180 tecahers selected for this study have at one class been assigned to teach the content of the syllabus of West African Examination Council on biology to the sampled students between 2007 – 2010 either in senior secondary school class one (SSS1) or senior secondary school class two or class three (SSS2 or SSS3) to prepare the students ready for external examination in the year 2009/2010 academic session. The results of these students also served as database for this study. The instruments used for the study were Science Oriented Attitudinal Scale (SOAS) adopted from Omirin (1999), Teachers Teaching Attitudinal Scale (TAS) adapted from Craig, Franklin and Andrew (1984) locus of control of behaviour scale and Tschannel-Moran and Woolfolk-Hoy (2001) Teacher sense of efficacy scale and an inventory which requested for data on students’ senior secondary school certificate examination grades in biology. Both the teachers teaching attitudinal scale and the SOAS were re-validated by the researcher. The estimates of construct validity and internal consistency reliability for the TAS and SOAS as depicted by the Cronbach coefficient alpha values were 0.68 and 0.72 respectively. The academic achievement of the participating students was measured by their grades in the senior secondary school certificate examination collected from records. 4. Procedure Each of the 360 respondents (180 teachers and 180 students) were given a copy of their questionnaire respectively to respond to for thirty-five minutes. For the purpose of data analysis, the completed copies of the questionnaire were collected from the respondents and scored while the senior secondary school certificate letter grade for biology was converted to point for each participating student. The range of scores of the respondents in the TAS and SOAS fell between 20-100 and 30-135 respectively. 5. Data Analysis The following statistical methods were used to answer the research questions. Correlation analysis (matrix) was used to estimate the relationships between teachers’ experience, teachers’ workload, teachers’ qualification, teachers’ attitude, students’ attitude and students’ final grade (SGB) in biology. Multiple regression analysis was used to determine the extent to which the independent variables explain the criterion (final grade in biology) variable. Standardized regression coefficients (Beta) showed the relative contributions of the predictor variables to the criterion variable while unstandardized β weight shows the predictive strength of the predictor variables on the criterion variable.
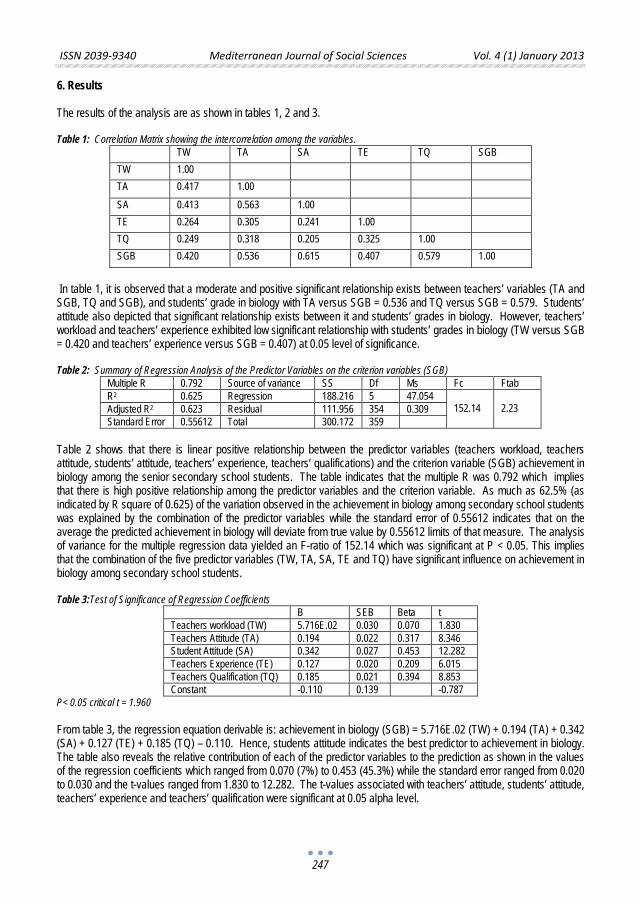
ISSN 2039-9340 Mediterranean Journal of Social Sciences Vol. 4 (1) January 2013
247
6. Results The results of the analysis are as shown in tables 1, 2 and 3. Table 1: Correlation Matrix showing the intercorrelation among the variables.
TW TA SA TE TQ SGB TW 1.00 TA 0.417 1.00 SA 0.413 0.563 1.00 TE 0.264 0.305 0.241 1.00 TQ 0.249 0.318 0.205 0.325 1.00 SGB 0.420 0.536 0.615 0.407 0.579 1.00
In table 1, it is observed that a moderate and positive significant relationship exists between teachers’ variables (TA and SGB, TQ and SGB), and students’ grade in biology with TA versus SGB = 0.536 and TQ versus SGB = 0.579. Students’ attitude also depicted that significant relationship exists between it and students’ grades in biology. However, teachers’ workload and teachers’ experience exhibited low significant relationship with students’ grades in biology (TW versus SGB = 0.420 and teachers’ experience versus SGB = 0.407) at 0.05 level of significance. Table 2: Summary of Regression Analysis of the Predictor Variables on the criterion variables (SGB)
Multiple R 0.792 Source of variance SS Df Ms Fc Ftab R2 0.625 Regression 188.216 5 47.054
152.14 2.23 Adjusted R2 0.623 Residual 111.956 354 0.309
Standard Error 0.55612 Total 300.172 359
Table 2 shows that there is linear positive relationship between the predictor variables (teachers workload, teachers attitude, students’ attitude, teachers’ experience, teachers’ qualifications) and the criterion variable (SGB) achievement in biology among the senior secondary school students. The table indicates that the multiple R was 0.792 which implies that there is high positive relationship among the predictor variables and the criterion variable. As much as 62.5% (as indicated by R square of 0.625) of the variation observed in the achievement in biology among secondary school students was explained by the combination of the predictor variables while the standard error of 0.55612 indicates that on the average the predicted achievement in biology will deviate from true value by 0.55612 limits of that measure. The analysis of variance for the multiple regression data yielded an F-ratio of 152.14 which was significant at P < 0.05. This implies that the combination of the five predictor variables (TW, TA, SA, TE and TQ) have significant influence on achievement in biology among secondary school students.
Table 3:Test of Significance of Regression Coefficients
B SEB Beta t Teachers workload (TW) 5.716E.02 0.030 0.070 1.830 Teachers Attitude (TA) 0.194 0.022 0.317 8.346 Student Attitude (SA) 0.342 0.027 0.453 12.282 Teachers Experience (TE) 0.127 0.020 0.209 6.015 Teachers Qualification (TQ) 0.185 0.021 0.394 8.853 Constant -0.110 0.139 -0.787
P< 0.05 critical t = 1.960
From table 3, the regression equation derivable is: achievement in biology (SGB) = 5.716E.02 (TW) + 0.194 (TA) + 0.342 (SA) + 0.127 (TE) + 0.185 (TQ) – 0.110. Hence, students attitude indicates the best predictor to achievement in biology. The table also reveals the relative contribution of each of the predictor variables to the prediction as shown in the values of the regression coefficients which ranged from 0.070 (7%) to 0.453 (45.3%) while the standard error ranged from 0.020 to 0.030 and the t-values ranged from 1.830 to 12.282. The t-values associated with teachers’ attitude, students’ attitude, teachers’ experience and teachers’ qualification were significant at 0.05 alpha level.
ISSN 2039-9340 Mediterranean Journal of Social Sciences Vol. 4 (1) January 2013
248
7. Discussion The results above showed that the predictor variables in predicting academic achievement in biology among the senior secondary school three students could not be attributed to chance factor. The relationship between the predictor variables (TW, TA, SA, TE and TQ) in predicting academic achievement in biology among senior secondary school students is reflected in the value of coefficient of multiple regression (0.792) and in the adjusted R-square (0.623) as shown in table 2. The F-ratio value of 152.14 which is significant at 0.05 level of significance attested to the fact that predictive capacity of the independent variables could not be attached to the effect of chance factor. The findings of this study showed that there was positive significant relationships among the teachers’ variables and students’ attitude. This finding is in agreement with the findings of Yara (2009) and Adodo (2005) who claimed that teachers and students attitude toward teaching and learning respectively go side by side to record achievement in science. This is because good or bad professional conduct on the part of the teachers goes a long way to stimulate, influence and encourage student to develop positive or negative attitude respectively to the studying of biology. Demonstration of good professional teaching behaviours probably stirred up the potentials in the students to manifest positive attitude to learning. By implication, positive and effective relationship between the teacher and the pupils will perhaps show positive interrelationship with educational performance in the school subjects on the part of the pupils.
The findings also revealed that moderate and positive relationships exist between the teachers’ variables and students’ academic achievement and grade points in biology. Statistically, students achievement and teachers attitudes are both tending towards the same direction, this may not signify high academic achievement because negative attitude on the part of teachers would also breed negative attitudes on the parts of the students that can lead to lackadaisical behaviour and frustration in learning the subjects. Hence, the students will automatically return poor achievement in their academic work in the subject. Again, attitude towards learning a subject may be positively correlated with achievement in the subject but that is not enough a yardstick to conclude that the cause of such achievement is completely attitude. It could be that such achievement assisted in shaping the students attitudes towards the subjects. The findings did not undermine Omotayo (2002) argument that students bring into classroom acquired attitude which could hinder or facilitate learning. By implication, pedagogical teachers, should as a matter of necessity, make great effort and sacrifice in terms of time to design and inculcate attitude-shaping behaviours into the teaching/learning processes for the benefit of the learners in the school. This finding is in line with the finding of Adepoju (2002), Ogunwuyi (2000), and Gibbons et al (1997). The low and significant relationship observable between teachers’ workload, teachers experience and students achievement in biology could be due to lack of commitment on the part of the teachers, as well shallow knowledge of application of methodology and psychology of imparting the biology course content by the teachers into the students. This finding further gave credence to the fact that attitude towards teaching subject is a strong and potent weapon that can influence achievement in learning.
The result of this study further indicated that 62.5% of the variance in the academic achievement in biology among secondary school students was explained by linear combination of the teachers’ attitude, qualification, experience, workload and students’ attitude. It also shows that students’ attitude has the most potent contribution to the prediction followed by the teachers’ qualification and the teachers’ attitude while the teachers work load shows the least contribution to the academic achievement in biology. This finding corroborate the findings of (Onocha, 1985; Mukerjee, 2002; Houston et al, 2002, and Sidhu et al, 2011) who reported that attitude to Mathematics explained more of the total variance than the children intelligence and that attitude of students towards science were linked with some personality factors through relationship with teachers. This finding have shown that students’ attitude, teachers’ qualification and teachers’ attitude were the most important factors than the other independent variables in the prediction of academic achievement in biology among Senior Secondary School students. The result that students’ attitude showed to be the most potent contributing factor among the variables to the prediction can be explained from inter-relationship between the students and the teachers. Teachers are supposed to be a role model to the students, and if teachers’ attitude towards studying biology is positive, such teacher(s) should device all methods entice students to develop positive attitude to learning the subject. This suggests that teachers should not bring into the teaching/learning situations behavior that can jeopardize the development and acquisition of positive attitude towards the learning by the students.
Teacher’s qualification is another factor identified as making contribution to the prediction but the contribution is not as weighty as students’ attitude because teachers’ qualification which deals with the mastery of secondary school biology content alone could not guarantee appropriately and effective transmission of acquired body of knowledge but the combination of appropriate training of personnel and application of appropriate methodology of teaching can achieve it. Teachers, therefore, need to develop positive healthy work ethics, attitude and zeal to their teaching job, and by implication, it becomes imperative that a would-be teacher should receive training on pedagogical teaching and educational psychology to guide would-be teachers in the “art of teaching”.
ISSN 2039-9340 Mediterranean Journal of Social Sciences Vol. 4 (1) January 2013
249
8. Conclusion Therefore, there is need for both the students and teachers of biology in senior secondary schools to have positive attitudinal change towards learning and teaching of biology accordingly to improve on the learning outcomes of secondary school students in biology. Government, both at the Federal and States Ministry of Education level, should as a matter concern, organize regular seminar and workshops for the teachers to refresh their memories about new developments and skills currently in use in the field of teaching biology to secondary school pupils in order to improve the quality of teaching strategies of the teachers as well as improving the learning processes of the students. References
Ademulegun, D. (2001). Monitoring learning achievement of junior secondary school students in Lagos State. A prototype of state
assessment. Unpublished Ph.D Thesis. University of Ibadan. Adepoju, O.A. (2002). Evaluation of the school conservation programme of the Nigerian conservation foundation. Unpublished M.Ed
Dissertation, University of Ibadan, Ibadan. Adodo, S.O. (2005). Correlates of student variables and achievement in integrated science. Journal of Educational Research &
Development, 1(2), 208-214 Adodo, S.O. (2007). Effect of diagnostic remediation instructional strategies and students learning outcomes in junior secondary school
Integrated Science. Unpublished Ph.D Thesis, University of Ado-Ekiti, Ekiti State. Agharuwhe, A.A. & Nkechi, M.U. (2009). Teachers’ effectiveness & student academic performance in public secondary schools in Delta
State in student Home Community Science. Educational Administration and Policy Studies, Delta state university, Abraka Nigeria. 3(2). Online Retrieved on 9th October, 2010.
Ajayi, I.A. (1999). Teachers’ assessment of parents teachers association roles in administration of Secondary Schools . Journal of Educational Research and Evaluation 3(2), 110 -116.
Ajewole, G.A. (1990). Why there are not enough science applicants for university admission. Journal of Science Teachers Association of Nigeria, 20(2) 90-99
Ali, A. and Aigbomian, D. (1990). Level of content competence in Physics attained by respective teachers for teaching secondary school Physics in Nigeria. Journal of Science Teachers Association of Nigeria, 27, 63 -72.
Ayodele, J.B. (1997). The influence of teachers qualification on students’ academic performance in social studies in Ekiti-State. Ife Journal of Educational Studies, 4(1), 42-47.
Ayodele, H.O. (2009). The impact of teachers’ effectiveness in students’ academic performance on senior secondary school Physics in Akure town, Ondo State. Unpublished B.Sc.Ed project, Obafemi Awolowo University, Ile-Ife
Bandele, S.O. (2004). Educational research in perspectives. Ibadan, Niyi commercial and printing ventures. Campbell, D.T. and Stanley, J.O. (1966). Experimental and quasi-experimental designs for research, Boston, Houghton Mifflin. Craig, A.R.; Franklin, J.A. and Andrew, G. (1984). A scale to measure locus of control of behaviours. British Journal of Medical
Psychology, 57, 173-180. Finlayson, M. (2009). The impact of teachers’ absenteeism on students performance. The case of Cobb Country School District.
Dissertation abstract. Kennesaw State University. Online Retrieved on 7th October, 2011. Gibbons, S.; Kimmel, H. and O’shea, M. (1997). Changing teacher behaviour through staff development: implementing the teaching and
content standards in science. School Science And Mathematics, 97 (6), 302-310. Houston, W.R., Haberman, M. & Sikula, J. (2002). Handbook of research on teacher education. New York: Macmillan. Ibe, B.O., and Maduabum, M.A. (2001) Teachers qualification and experience as correlates of secondary school students’ achievement
in biology. Journal of Education Thought, 1(2), 176-183. Ibrahim, A. (2000). Evaluating the pedagogical competence of junior secondary school Integrated Science. Teachers’ 40th STAN
Annual Conference Proceedings. 138-142. Ibukun, W.O. (2009). Building the future: Invest in teachers now. A paper presented at the Ondo State world teachers day Monday, 5th
October. Igwe, D.O., (1985). Poor performance in Chemistry in Technical College of Education: Causes and Implications. Unpublished PGDE
Dissertation. ABU, Zaria. Igwe,. D.O. (1990). Science teachers’ qualifications and students performance in secondary school s in Kano State. Journal of Science
Teachers Association of Nigeria, 26(2), 47-51. Ilugbusi, A.A.; Falola, E.O. and Daramola, M.A. (2007). Relative effects of demographic variables on levels of anxiety of Integrated
Science trainee teachers in junior secondary school in Ekiti State. Journal of Educational Focus, 1(1), 88-95 Khan, Q.U. and Bertecher, D. (1988). The problem of repetition and drop out in basic education in Magadascar. Summary results of a
study undertaken in cooperation with UNICEF and Ministry of Secondary and Basic Education. Paris unit for Cooperation with UNICEF and WPP, January, No 180.
Kolawole, S.K.(1982). Impact of class size on students achievement in selected secondary schools in Ibadan. Unpublished M.Ed Thesis, University of Ibadan.
McCaughtry, N. (2005). Elaborating pedagogical content knowledge: What it means to know students and think about teaching. Teachers and Teaching: Theory & Practice, 11(4), 379-395
ISSN 2039-9340 Mediterranean Journal of Social Sciences Vol. 4 (1) January 2013
250
Mukherjee, A. (2002). Educational Psychology, 2nd edition. Zaria. Frontus publishing (Nig.) Ltd. National Economic Empowerment and Development Strategies (NEEDS, 2005). National planning commission, Central Bank of Nigeria,
Abuja, 3, 34-38. Ofoegbu, G.O. (2004). Teachers’ influence in motivating students to read and appreciate literature. Nigerian Journal of Counselling and
Applied Psychology. 2(1), 202-210. Ogunboyede, M.O. (2011). Effects of some teachers’ variables on the academic achievement of secondary school students in South
West, Nigeria. Akungba Journal of Research in Education, 1(1), 163-178. Ogunwuyi, O. (2000). A causal model of teacher and student factors as determinants of achievement in secondary school integrated
science. Unpublished Ph.D Thesis. University of Ibadan, Ibadan. Oke, O.A. (2003). Scientific attitude: A challenge for effective integrated science education in Nigeria. Journal of Science Education and
Practice. 1(1), 17-22. Okebukola, P.A. (1986). Some presage, context and process variables relative to students’ achievement in biology. Journal of Science
Teachers Association of Nigeria, 24 (1&2), 171 -176. Olaleye, F.O. (2006). Management of overcrowded classrooms by secondary school principals in Oyo State, Nigerian .Journal of
Educational Thought, 5(1), 15-22 Oloyede, A. (1992). A comparative analysis of the school certificate performance in biology of professionally trained and non-
professionally trained teachers in Lagos State. Lagos Journal of Science Education ,1 (1), 70-75. Omirin, M.S. (1999). Construction and validation of science-oriented attitude scale for Nigerian schools Unpublished Ph.D Thesis, Ondo
State University, Ado-Ekiti. Omotayo, K.A. (2002). Correlates of attitude towards science & academic achievement of secondary school students in science
subjects. Journal of Teachers Education. 10(1), 20-27. Onocha, C.O. (1985). Pattern of relationships between home and school factors and pupils’ learning outcomes in Bendel Primary
Science Project. Unpublished Ph.D Thesis, University of Ibadan, Ibadan. Sidhu, G.K., Fook, C.Y. & Kaur, S. (2011). Assessing ESL teacher trainees’ content, pedagogical, and professional knowledge base.
The Assessment Books. 4(2), 3-18. Tschannel-Moran, M., and Woolflk-Hoy, A. (2001). Teacher efficacy: Capturing an elusive construct. Teaching and Teacher Education,
117,783-805. Usman, K.O. (2003). Influence of shortage of human resources on the effective instruction of mathematics in secondary schools. The
Journal of WCCI Nigeria Chapter Forum, 4 (2), 176-184. Walberg, H.J. (1991). Improving school science in advanced and developing countries. Review of Educational Research, 61(1), 25-29. Yara, P. O. (2009). Relationship between teachers attitude and students’ academic achievement in mathematics in some selected senior
secondary schools in South West, Nigeria. European Journal of Social Sciences, 11(3), 364-369.

ISSN 2039-9340 Mediterranean Journal of Social Sciences Vol. 4 (1) January 2013
251
Time Series and Trend Analysis of Fatalities from Road Traffic
Accident in Lagos State, Nigeria
Atubi, Augustus .O. (Ph.D)
Associate Professor Department of Geography and Regional Planning
Delta State University, Abraka E-mail: [email protected]
Phone No.: 08037450078 Doi:10.5901/mjss.2013.v4n1p251 Abstract
This study examined time series and trend analysis of fatalities from road traffic accident in Lagos State, Nigeria. The data generated were mostly secondary data; accident records where obtained from the Nigeria Police Force and Federal Road Safety Commission. The data were obtained for the period of thirty two (32) years. From the time series and trend analysis, it was observed that fatalities from road traffic accidents for each of the Local Governments under study between 1970 and 2001, showed that fatalities is on the decrease with the exception of Lagos Island Local Government Area over the period of study. The 16 harmonics for all the Local Government Areas considered contributed above 90% of the total variance in the time series. This means that more than 90% of road traffic accident in Lagos State could be attributed to recklessness on the part of drivers, ignorance of highway codes, driving under the influence of alcohol, over speeding etc. based on the findings, recommendations were proffered on how to reduce the phenomenon of fatalities from traffic accidents in Lagos State.
Keywords: Fatalities; trend; time analysis; traffic; accident; road; Lagos State
1. Introduction Road traffic accident rates and fatality rates in the industrialised countries have tended to exhibit pronounced decreasing time trends. Some scholars like Oppe (1991) interprets the downward trend as evidence of experimental learning, while others like Peltzman (1975), Harvey and Durbin (1986) and Broughton (1999) treat it as a nuisance parameter that happens to be essential for model fitting.
Nigeria has the highest rate of fatalities from motor accidents in the world according to statistics compiled by the Federal Road Safety Commission (FRSC). The country leads 43 other nations with deaths in 10,000 vehicle crashes. Ethiopia ranked second with 219 deaths per 10,000 vehicles while Malawi, took the third position and Ghana took the fourth position with 183 and 178 deaths respectively (Daramola, 2004, Atubi, 2012g).
While traffic related injuries take a very large tool in almost every country around the world particularly in developing countries or less industrialized countries, significant progress towards prevention and control has been limited to high income and/or highly industrialized countries (Soderland and Zori 2001; Zaza et al, 2003). Much of the progress in developed countries is attributed to the combination of interventions, strategies and policies that have been developed mainly in these developed countries settings over the past few decades. Such factors as high health budgets, adequate number of researchers, high levels of health and safety awareness, and near universal literacy, have also catalyzed this progress (Rivera et al, 2000; Barss et al, 2001; Forjuoh, 2003).
As in other developing countries, road traffic accidents in Nigeria are one of the most serious problem in need of pragmatic solution. Yet this problem has been difficult to address probably because of the country’s level of development. Nigeria is said to have the highest road traffic accident rates in Africa and the second in the world (Akpogomeh, 1998; Obinna, 2007, P. 35, and Atubi 2012e).
In Nigeria, road traffic accident situation over the last three decades has been particularly disturbing. In 1976, there were 53,897 road traffic accidents resulting in 7,717 deaths. Although in 1981, the magnitude reduced to 5,114 accidents but the fatality increased to 10,236 which means that there was an average of 96 accidents and situation in subsequent years has not been any better. The number of people killed in road accident between 1990 and 2005 rose from 28,253 and the fatality rate remains consistently high (Atubi, 2009c).
International comparison indicates that the chances of a vehicle killing someone in Nigeria is 47 times higher than in Britain. The proportion of fatalities to injuries reported is also very high. For example, while Czech Republic has only
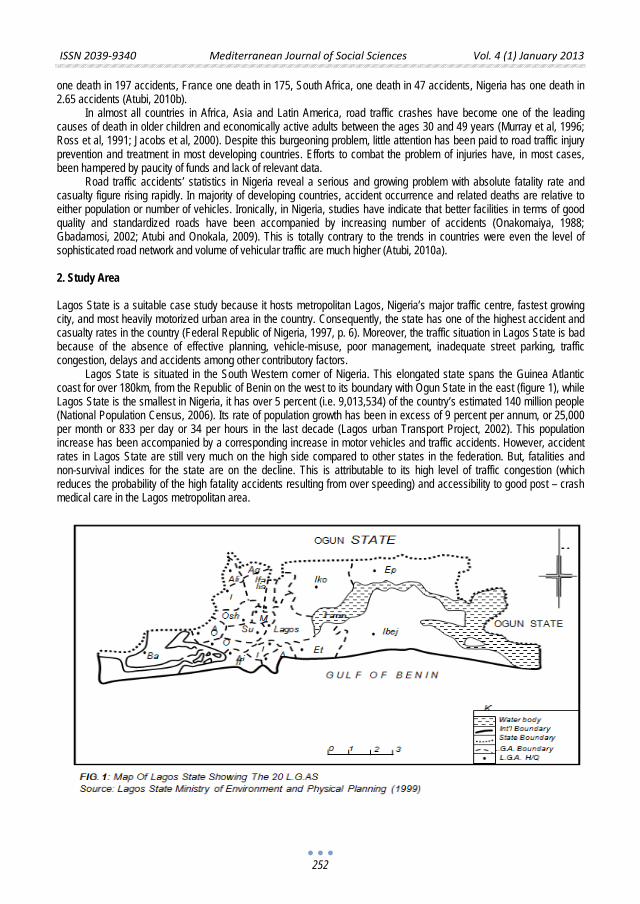
ISSN 2039-9340 Mediterranean Journal of Social Sciences Vol. 4 (1) January 2013
252
one death in 197 accidents, France one death in 175, South Africa, one death in 47 accidents, Nigeria has one death in 2.65 accidents (Atubi, 2010b).
In almost all countries in Africa, Asia and Latin America, road traffic crashes have become one of the leading causes of death in older children and economically active adults between the ages 30 and 49 years (Murray et al, 1996; Ross et al, 1991; Jacobs et al, 2000). Despite this burgeoning problem, little attention has been paid to road traffic injury prevention and treatment in most developing countries. Efforts to combat the problem of injuries have, in most cases, been hampered by paucity of funds and lack of relevant data.
Road traffic accidents’ statistics in Nigeria reveal a serious and growing problem with absolute fatality rate and casualty figure rising rapidly. In majority of developing countries, accident occurrence and related deaths are relative to either population or number of vehicles. Ironically, in Nigeria, studies have indicate that better facilities in terms of good quality and standardized roads have been accompanied by increasing number of accidents (Onakomaiya, 1988; Gbadamosi, 2002; Atubi and Onokala, 2009). This is totally contrary to the trends in countries were even the level of sophisticated road network and volume of vehicular traffic are much higher (Atubi, 2010a).
2. Study Area Lagos State is a suitable case study because it hosts metropolitan Lagos, Nigeria’s major traffic centre, fastest growing city, and most heavily motorized urban area in the country. Consequently, the state has one of the highest accident and casualty rates in the country (Federal Republic of Nigeria, 1997, p. 6). Moreover, the traffic situation in Lagos State is bad because of the absence of effective planning, vehicle-misuse, poor management, inadequate street parking, traffic congestion, delays and accidents among other contributory factors.
Lagos State is situated in the South Western corner of Nigeria. This elongated state spans the Guinea Atlantic coast for over 180km, from the Republic of Benin on the west to its boundary with Ogun State in the east (figure 1), while Lagos State is the smallest in Nigeria, it has over 5 percent (i.e. 9,013,534) of the country’s estimated 140 million people (National Population Census, 2006). Its rate of population growth has been in excess of 9 percent per annum, or 25,000 per month or 833 per day or 34 per hours in the last decade (Lagos urban Transport Project, 2002). This population increase has been accompanied by a corresponding increase in motor vehicles and traffic accidents. However, accident rates in Lagos State are still very much on the high side compared to other states in the federation. But, fatalities and non-survival indices for the state are on the decline. This is attributable to its high level of traffic congestion (which reduces the probability of the high fatality accidents resulting from over speeding) and accessibility to good post – crash medical care in the Lagos metropolitan area.
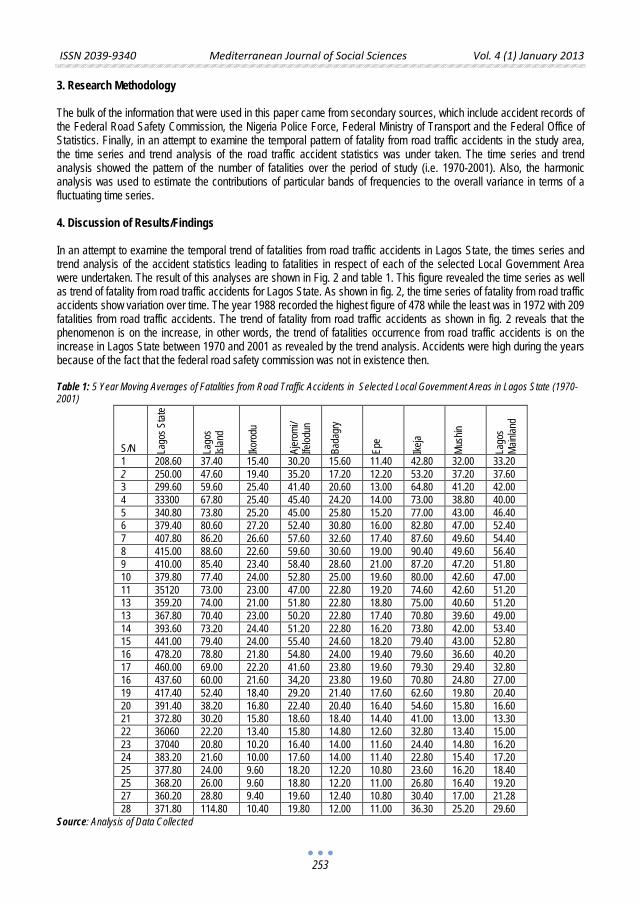
ISSN 2039-9340 Mediterranean Journal of Social Sciences Vol. 4 (1) January 2013
253
3. Research Methodology The bulk of the information that were used in this paper came from secondary sources, which include accident records of the Federal Road Safety Commission, the Nigeria Police Force, Federal Ministry of Transport and the Federal Office of Statistics. Finally, in an attempt to examine the temporal pattern of fatality from road traffic accidents in the study area, the time series and trend analysis of the road traffic accident statistics was under taken. The time series and trend analysis showed the pattern of the number of fatalities over the period of study (i.e. 1970-2001). Also, the harmonic analysis was used to estimate the contributions of particular bands of frequencies to the overall variance in terms of a fluctuating time series.
4. Discussion of Results/Findings In an attempt to examine the temporal trend of fatalities from road traffic accidents in Lagos State, the times series and trend analysis of the accident statistics leading to fatalities in respect of each of the selected Local Government Area were undertaken. The result of this analyses are shown in Fig. 2 and table 1. This figure revealed the time series as well as trend of fatality from road traffic accidents for Lagos State. As shown in fig. 2, the time series of fatality from road traffic accidents show variation over time. The year 1988 recorded the highest figure of 478 while the least was in 1972 with 209 fatalities from road traffic accidents. The trend of fatality from road traffic accidents as shown in fig. 2 reveals that the phenomenon is on the increase, in other words, the trend of fatalities occurrence from road traffic accidents is on the increase in Lagos State between 1970 and 2001 as revealed by the trend analysis. Accidents were high during the years because of the fact that the federal road safety commission was not in existence then. Table 1: 5 Year Moving Averages of Fatalities from Road Traffic Accidents in Selected Local Government Areas in Lagos State (1970-2001)
S/N La
gos S
tate
Lago
s Isl
and
Ikoro
du
Ajer
omi/
Ifelod
un
Bada
gry
Epe
Ikeja
Mush
in
Lago
s Ma
inlan
d
1 208.60 37.40 15.40 30.20 15.60 11.40 42.80 32.00 33.20 2 250.00 47.60 19.40 35.20 17.20 12.20 53.20 37.20 37.60 3 299.60 59.60 25.40 41.40 20.60 13.00 64.80 41.20 42.00 4 33300 67.80 25.40 45.40 24.20 14.00 73.00 38.80 40.00 5 340.80 73.80 25.20 45.00 25.80 15.20 77.00 43.00 46.40 6 379.40 80.60 27.20 52.40 30.80 16.00 82.80 47.00 52.40 7 407.80 86.20 26.60 57.60 32.60 17.40 87.60 49.60 54.40 8 415.00 88.60 22.60 59.60 30.60 19.00 90.40 49.60 56.40 9 410.00 85.40 23.40 58.40 28.60 21.00 87.20 47.20 51.80 10 379.80 77.40 24.00 52.80 25.00 19.60 80.00 42.60 47.00 11 35120 73.00 23.00 47.00 22.80 19.20 74.60 42.60 51.20 13 359.20 74.00 21.00 51.80 22.80 18.80 75.00 40.60 51.20 13 367.80 70.40 23.00 50.20 22.80 17.40 70.80 39.60 49.00 14 393.60 73.20 24.40 51.20 22.80 16.20 73.80 42.00 53.40 15 441.00 79.40 24.00 55.40 24.60 18.20 79.40 43.00 52.80 16 478.20 78.80 21.80 54.80 24.00 19.40 79.60 36.60 40.20 17 460.00 69.00 22.20 41.60 23.80 19.60 79.30 29.40 32.80 16 437.60 60.00 21.60 34,20 23.80 19.60 70.80 24.80 27.00 19 417.40 52.40 18.40 29.20 21.40 17.60 62.60 19.80 20.40 20 391.40 38.20 16.80 22.40 20.40 16.40 54.60 15.80 16.60 21 372.80 30.20 15.80 18.60 18.40 14.40 41.00 13.00 13.30 22 36060 22.20 13.40 15.80 14.80 12.60 32.80 13.40 15.00 23 37040 20.80 10.20 16.40 14.00 11.60 24.40 14.80 16.20 24 383.20 21.60 10.00 17.60 14.00 11.40 22.80 15.40 17.20 25 377.80 24.00 9.60 18.20 12.20 10.80 23.60 16.20 18.40 25 368.20 26.00 9.60 18.80 12.20 11.00 26.80 16.40 19.20 27 360.20 28.80 9.40 19.60 12.40 10.80 30.40 17.00 21.28 28 371.80 114.80 10.40 19.80 12.00 11.00 36.30 25.20 29.60
Source: Analysis of Data Collected
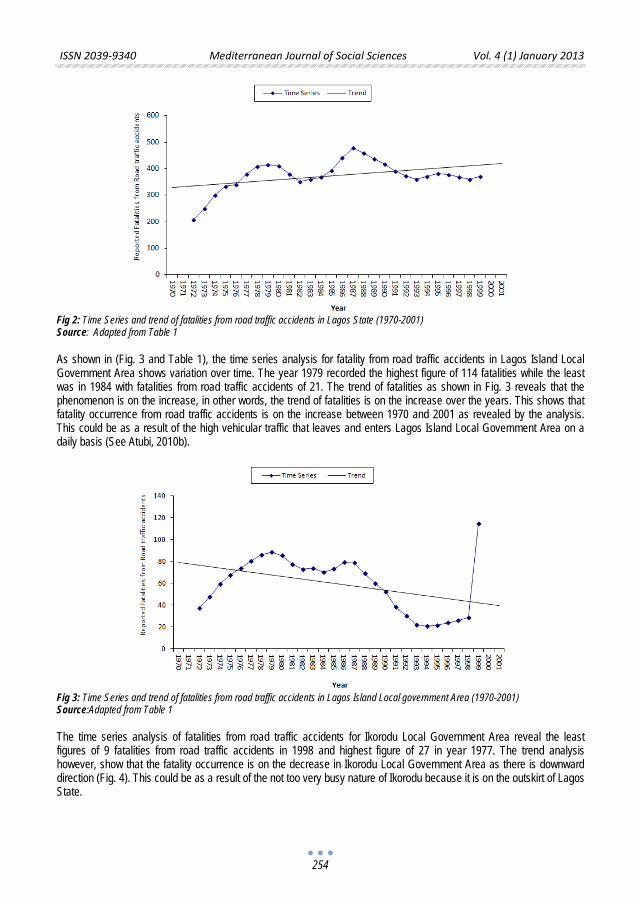
ISSN 2039-9340 Mediterranean Journal of Social Sciences Vol. 4 (1) January 2013
254
Fig 2: Time Series and trend of fatalities from road traffic accidents in Lagos State (1970-2001) Source: Adapted from Table 1
As shown in (Fig. 3 and Table 1), the time series analysis for fatality from road traffic accidents in Lagos Island Local Government Area shows variation over time. The year 1979 recorded the highest figure of 114 fatalities while the least was in 1984 with fatalities from road traffic accidents of 21. The trend of fatalities as shown in Fig. 3 reveals that the phenomenon is on the increase, in other words, the trend of fatalities is on the increase over the years. This shows that fatality occurrence from road traffic accidents is on the increase between 1970 and 2001 as revealed by the analysis. This could be as a result of the high vehicular traffic that leaves and enters Lagos Island Local Government Area on a daily basis (See Atubi, 2010b).
Fig 3: Time Series and trend of fatalities from road traffic accidents in Lagos Island Local government Area (1970-2001) Source:Adapted from Table 1 The time series analysis of fatalities from road traffic accidents for Ikorodu Local Government Area reveal the least figures of 9 fatalities from road traffic accidents in 1998 and highest figure of 27 in year 1977. The trend analysis however, show that the fatality occurrence is on the decrease in Ikorodu Local Government Area as there is downward direction (Fig. 4). This could be as a result of the not too very busy nature of Ikorodu because it is on the outskirt of Lagos State.
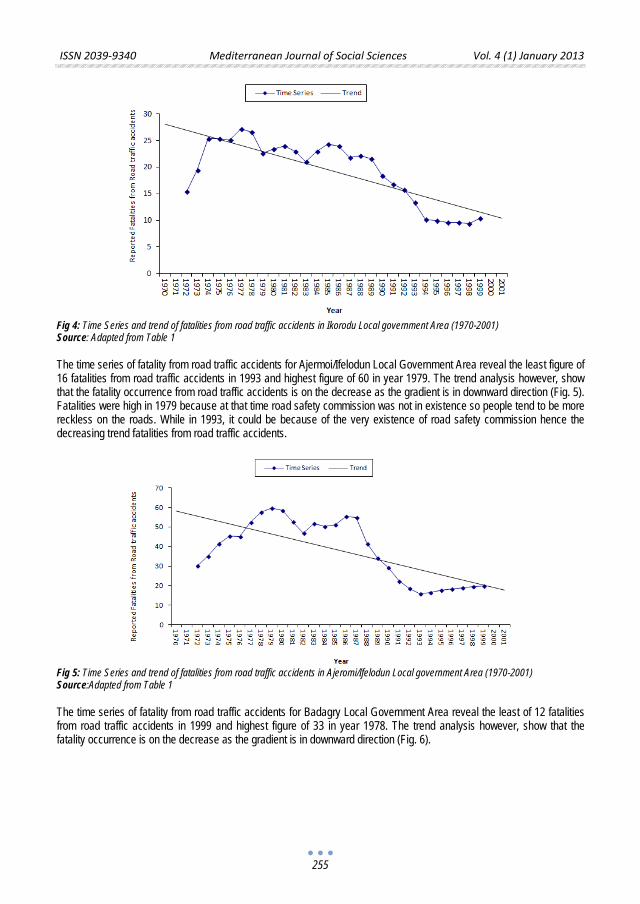
ISSN 2039-9340 Mediterranean Journal of Social Sciences Vol. 4 (1) January 2013
255
Fig 4: Time Series and trend of fatalities from road traffic accidents in Ikorodu Local government Area (1970-2001) Source: Adapted from Table 1 The time series of fatality from road traffic accidents for Ajermoi/Ifelodun Local Government Area reveal the least figure of 16 fatalities from road traffic accidents in 1993 and highest figure of 60 in year 1979. The trend analysis however, show that the fatality occurrence from road traffic accidents is on the decrease as the gradient is in downward direction (Fig. 5). Fatalities were high in 1979 because at that time road safety commission was not in existence so people tend to be more reckless on the roads. While in 1993, it could be because of the very existence of road safety commission hence the decreasing trend fatalities from road traffic accidents.
Fig 5: Time Series and trend of fatalities from road traffic accidents in Ajeromi/Ifelodun Local government Area (1970-2001) Source:Adapted from Table 1 The time series of fatality from road traffic accidents for Badagry Local Government Area reveal the least of 12 fatalities from road traffic accidents in 1999 and highest figure of 33 in year 1978. The trend analysis however, show that the fatality occurrence is on the decrease as the gradient is in downward direction (Fig. 6).
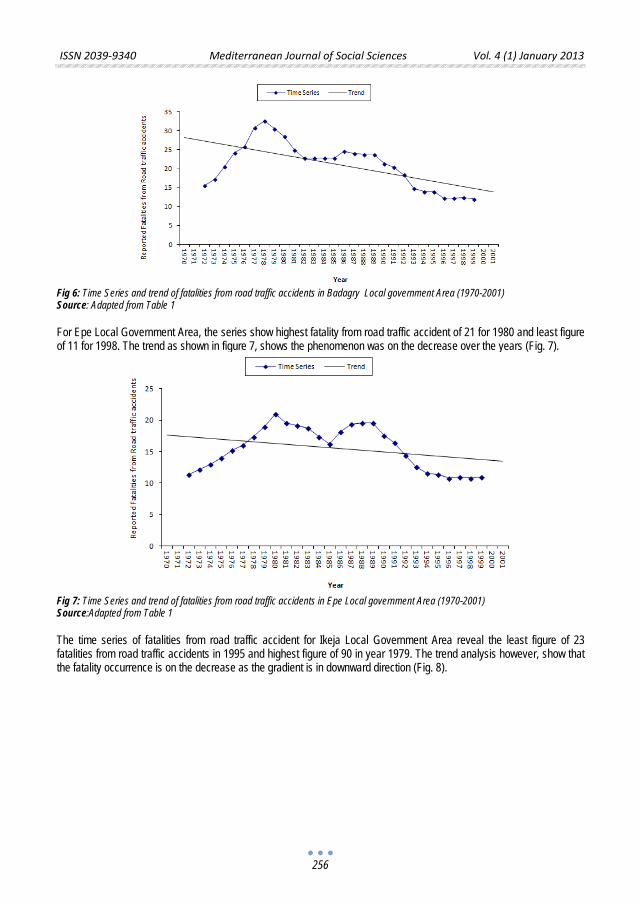
ISSN 2039-9340 Mediterranean Journal of Social Sciences Vol. 4 (1) January 2013
256
Fig 6: Time Series and trend of fatalities from road traffic accidents in Badagry Local government Area (1970-2001) Source: Adapted from Table 1 For Epe Local Government Area, the series show highest fatality from road traffic accident of 21 for 1980 and least figure of 11 for 1998. The trend as shown in figure 7, shows the phenomenon was on the decrease over the years (Fig. 7).
Fig 7: Time Series and trend of fatalities from road traffic accidents in Epe Local government Area (1970-2001) Source:Adapted from Table 1 The time series of fatalities from road traffic accident for Ikeja Local Government Area reveal the least figure of 23 fatalities from road traffic accidents in 1995 and highest figure of 90 in year 1979. The trend analysis however, show that the fatality occurrence is on the decrease as the gradient is in downward direction (Fig. 8).
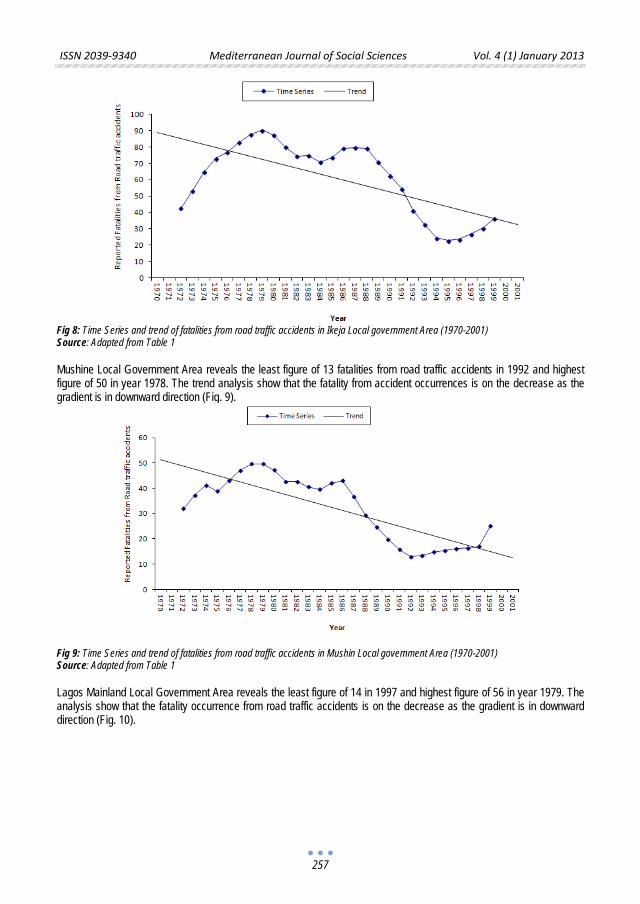
ISSN 2039-9340 Mediterranean Journal of Social Sciences Vol. 4 (1) January 2013
257
Fig 8: Time Series and trend of fatalities from road traffic accidents in Ikeja Local government Area (1970-2001) Source: Adapted from Table 1 Mushine Local Government Area reveals the least figure of 13 fatalities from road traffic accidents in 1992 and highest figure of 50 in year 1978. The trend analysis show that the fatality from accident occurrences is on the decrease as the gradient is in downward direction (Fig. 9).
Fig 9: Time Series and trend of fatalities from road traffic accidents in Mushin Local government Area (1970-2001) Source: Adapted from Table 1 Lagos Mainland Local Government Area reveals the least figure of 14 in 1997 and highest figure of 56 in year 1979. The analysis show that the fatality occurrence from road traffic accidents is on the decrease as the gradient is in downward direction (Fig. 10).
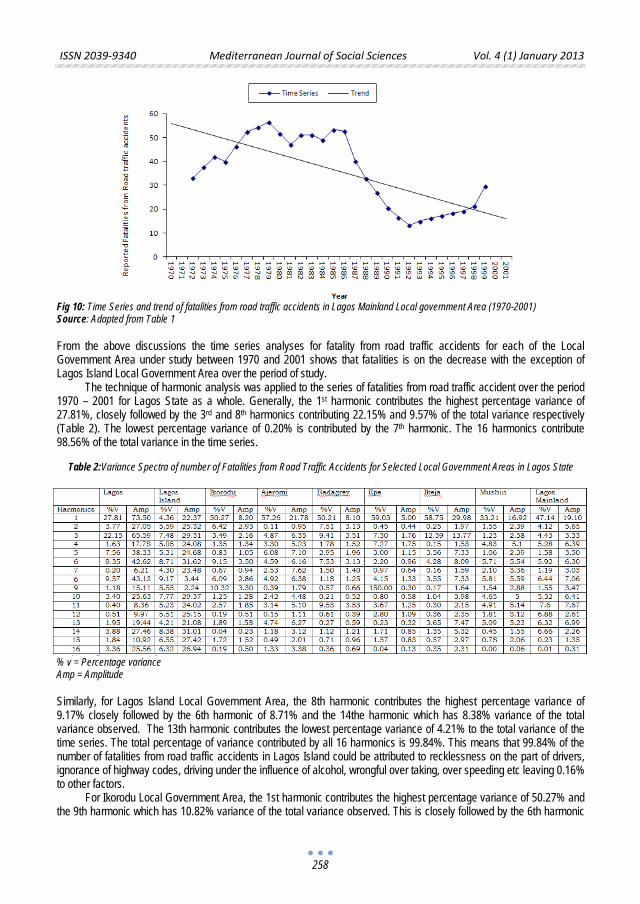
ISSN 2039-9340 Mediterranean Journal of Social Sciences Vol. 4 (1) January 2013
258
Fig 10: Time Series and trend of fatalities from road traffic accidents in Lagos Mainland Local government Area (1970-2001) Source: Adapted from Table 1 From the above discussions the time series analyses for fatality from road traffic accidents for each of the Local Government Area under study between 1970 and 2001 shows that fatalities is on the decrease with the exception of Lagos Island Local Government Area over the period of study.
The technique of harmonic analysis was applied to the series of fatalities from road traffic accident over the period 1970 – 2001 for Lagos State as a whole. Generally, the 1st harmonic contributes the highest percentage variance of 27.81%, closely followed by the 3rd and 8th harmonics contributing 22.15% and 9.57% of the total variance respectively (Table 2). The lowest percentage variance of 0.20% is contributed by the 7th harmonic. The 16 harmonics contribute 98.56% of the total variance in the time series.
Table 2:Variance Spectra of number of Fatalities from Road Traffic Accidents for Selected Local Government Areas in Lagos State
% v = Percentage variance Amp = Amplitude
Similarly, for Lagos Island Local Government Area, the 8th harmonic contributes the highest percentage variance of 9.17% closely followed by the 6th harmonic of 8.71% and the 14the harmonic which has 8.38% variance of the total variance observed. The 13th harmonic contributes the lowest percentage variance of 4.21% to the total variance of the time series. The total percentage of variance contributed by all 16 harmonics is 99.84%. This means that 99.84% of the number of fatalities from road traffic accidents in Lagos Island could be attributed to recklessness on the part of drivers, ignorance of highway codes, driving under the influence of alcohol, wrongful over taking, over speeding etc leaving 0.16% to other factors.
For Ikorodu Local Government Area, the 1st harmonic contributes the highest percentage variance of 50.27% and the 9th harmonic which has 10.82% variance of the total variance observed. This is closely followed by the 6th harmonic
ISSN 2039-9340 Mediterranean Journal of Social Sciences Vol. 4 (1) January 2013
259
of 9.15%. The total percentage variance contributed by all 16 harmonics is 96.94%. The 14th harmonic contributes the lowest percentage variance of 0.04% to the total variance of the time series.
Similarly, the 1st harmonic accounts for the highest percentage variance of 57.26% for Ajeromi/Ifelodun Local Government Area, closely followed by the 5th and 8th harmonics with percentage variances of 6.08% and 4.92% respectively. The 2nd harmonic contributes the lowest percentage variance of 0.11%. The 16 harmonics contributes a total of 97.6% to the temporal pattern of fatalities from road traffic accident occurrence.
For Badagry Local Government Area, the 1st harmonic contributes the highest percentage (50.21%) of the total variance, closely followed by the 11th and 3rd harmonics which contributes 9.53% of the variance respectively. The 10th harmonic contributes the lowest percentage variance (0.21%). All 16 harmonics contributes a total of 95.48% of the variance in the temporal occurrence of the number of fatalities from road traffic accidents over the 32 years.
Similarly, the 1st harmonic account for the highest percentage variance of 59.03% for Epe Local Government Area, closely followed by the 3rd and 4th harmonics with percentage variance of 7.30% and 7.27% respectively. The 16th harmonic contributes the lowest percentage variance (0.04%). The 16 harmonics contribute a total of 96.8% to the temporal pattern of number of fatalities from road traffic accident occurrence.
For Ikeja Local Government Area, the 1st harmonic contributes the highest percentage variance of 58.75%, closely followed by the 3rd and 6th harmonics which contributes 12.39% and 4.28% of the variance respectively. The 4th harmonic contributes the lowest percentage variance of 0.15%. All 16 harmonics contribute a total of 91.38% of the variance in the temporal occurrence of fatalities over the 32 years.
Similarly, the 1st harmonic account for the highest percentage variance of 53.21% for Mushin Local Government Area, closely followed by the 8th and 6th harmonics with percentage variances of 5.81% and 5.71% respectively. The 16th harmonic contributes the lowest percentage variance (0.01%). The 16 harmonics contributes a total of 94.74% to the temporal pattern of fatalities from road traffic accident occurrence.
For Lagos Mainland Local Government Area, the 1st harmonic contributes the highest percentage (47.14%) of the total variance, closely followed by the 11th and 8th harmonics which contributes 7.60% and 6.44% of the variance respectively. The 16th harmonic contributes the lowest percentage variance (0.01%). All 16 harmonics contribute a total of 94.87% of the variance in the temporal occurrence of number of fatalities from road traffic accidents over the 32 years. In other words, 94.87% of the number of fatalities from road traffic accident variation in Lagos Mainland are composed of different cycles. 5. Policy Implications/Recommendations By the serious road traffic accident situation in the study area, Local Government Areas like Lagos Island, Lagos Mainland, Ikorodu, Epe, Ikeja, Badagry, Ajeromi/Ifelodun and Mushin Local Government Areas can be described as fatalities prone areas, because they are all associated with high accident rate, high number of fatalities and so on. This trend therefore, suggest that these Local Government Areas of Lagos State are associated with the menace of road traffic accidents, and these deserves urgent attention and appropriate policy intervention.
Government efforts towards road traffic accident reduction in the study area, should be elaborate, total and wide spread covering every segment of the state. Both the police and the FRSC should consider the whole of the study area as accident prone area, and thus, police, FRSC should be treated with respect. It is important to say that the setting up of Lagos Metropolitan Area Transport Authority (LAMATA) as an additional law enforcement agent for the maintenance of the roads, towing of broken down vehicles and those involved in road traffic accidents is inevitable.
Since the driver of a vehicle is the most important determinant of the occurrence of an accident, the quality of drivers on the roads in the study area cannot be over-emphasised. Consequently, training and retraining of drivers should be a basic effort towards reducing the carnage on over roads. The training and retraining of drivers constitute a formidable means of effectively dealing with the issue of road traffic accident reduction.
However, for historical and for operational convenience, road traffic law is enforced by the Nigerian Police, but recently this function has been shifted to the Federal Road Safety Commission whose activities have been limited through insufficient resources for checking speed violation, careless and dangerous driving and parking offences. Laws and regulations may carry little force of the probability of detection and perception of detection are so low that they can safely be ignored; with the present situation the chances of getting caught in a traffic violation are remarkably small. A further escape route for offenders exists in the court which often has erratic patterns of sentencing for road traffic law violation. This situation needs to be improved upon, by ensuring that Federal Road Safety Corps is well funded as no amount should be considered too great for saving the nation of economic loss associated with road fatalities.
ISSN 2039-9340 Mediterranean Journal of Social Sciences Vol. 4 (1) January 2013
260
6. Conclusion Road traffic accident, a well documented consequence of motorization is the leading cause of deaths in Nigeria. While accidents occur in all modes of transport, including rail ways, no mode approaches the importance of the motor car in the scale of deaths and injuries. Living safely is a challenge that must be accepted by every one if we are to continue to move forward in an ever-changing society. References Akpogomeh, O.S. (1998) Temporal Variations in road traffic accident parameters in the Port Harcourt metropolis. Journal of Transport
Studies, Vol. 2, No. 1, Pp. 15-36. Atubi, A.O. (2010a) Spatial and Temporal Perspective on Road Traffic Accident variations in Lagos mainland, South Western Nigeria.
African Research Review, Vol. 14 (1) pp.256-272. Atubi, A.O. (2010b) Road Transport System Management and Traffic in Lagos, South Western Nigeria. Journal of African Research
Review. Vol. 4, No. 4, Pp. 459-470. Atubi, A.O. (2012e) Epidemiology of Injuries from Road Traffic Accidents in Lagos State, Nigeria. International Journal of Science and
Technology, Vol. 1, No. 2, Pp. 56-75. Atubi, A.O. (2012g) Variations of Injuries from road traffic accidents in Lagos State; An Analysis of Variance Spectra. Journal of
Alternative Perspective in the Social Sciences (Forthcoming). Atubi, A.O. and Onokala, P.C. (2009) Contemporary Analysis of Variability in Road Traffic Accidents in Lagos State, Nigeria. Journal of
African Geographical Review. Vol. 28, Pp. 11-41. Atubi,A.O.(2009c) Modelling Road Traffic Accidents in Lagos State, South Western Nigeria. Journal of Society and State Vol. 1. Nos 1
&2, pp 57-74. Barss, P.; Smith, G.S.; Baker, S.P.; Mohan, D. (2001) Injury prevention: An International Perspective. New York: Oxford University
Press. Broughton, J. (1999) Forecasting road accident casualties in Great Britain. Accident Analysis and Prevention. 23, 353-362. Daramola, A.Y. (2004) “Innovative Options for financing transport infrastructure in Nigeria”. In Nisereel, The Magazine of the Nigerian
Institute of Social and Economic Research, Nos. 485, December, Ibadan. Forjuoh, S.N. (2003) “Injury control in developing nations; what can be learnt from industrialized countries”. Journal of Public Health
Policy. 14: 355-359. Gbadamosi, K.T. (2002) ‘Traffic Regulations and Road Traffic Accidents in Nigeria – A Spatial Analysis. Unpublished Ph.D. Thesis,
Department of Geography, University of Ibadan. Jacobs, G.D.; Arron-Thomas, A. and Astrop, A. (2000) Estimating Global Road Fatalities. Crowthorne, U.K.: Transport Research
Laboratory Report. 445: 1-35. Murray, C.J. and Lopez, A. (1996) The global Burden of diseases, Vol. 1. A Comprehensive assessment of mortality and disability from
diseases, injuries and risk factors in 1990 and projected to 2010. Cambridge: Harvard University Press. Obinna, C. (2007) Road traffic crashes Kill 0.4million youths every year. Vanguard, April, 24, P. 35. Onakomaiya, S.O. (1988) Unsafe at any speed: Toward road transportation for survival; Inaugural Lecturer, University of Ilorin, Ilorin. Oppe, S. (1991) The Development of traffic and traffic safety in six developed countries. Accident Analysis and Prevention. 23, 401-412. Peltzmans, C. (1975) The Effects of automobile safety regulations. Journal of Political Economy, 83, 677-726. Rivara, F.P.; Koepsell, T.D.; Grossman, D.C.; Mock, C. (2000) Effectiveness of automatic shoulder but systems in motor vehicle
crashes. Journal of American Medical Association. 283: 2826-2828. Ross, A.; Bagunley, C.; Hills, B.; McDonald, M. and Silcock, D. (1991) Towards safer roads in developing countries – A guide for
planners and engineers, IRL, Crowthorne, U.K.; Transport Research Laboratories. Soderland, N. and Zwi, A.B. (2001) Traffic Related Mortality in Industrialised and less developed countries. Bulletin of World Health
Organisation. 73:175-182. Zaza, S. and Sleet, D.A. (2003) Reviews of Evidence regarding interventions to increase use of child safety seats. American Journal of
Preventive Medicine, 21-45, 31-47.
ISSN 2039-9340 Mediterranean Journal of Social Sciences Vol. 4 (1) January 2013
261
Globalization of Localized Social Integration:
Disembodied ‘Selves’, New Form of Social Interaction and Re-Identification of ‘Who We Are’ in a Virtual Environment
Assist. Prof. Dr. Tutku Akter
Girne American University, Kyrenia, Northern Cyprus
E-mail: [email protected], [email protected]
Doi:10.5901/mjss.2013.v4n1p261
Abstract
Social network systems and virtual environment as one of the consequences of the globalization process, and its influences on its users, are discussed in the present study. Some basic concepts, including the necessity of redefining and even reconceptualizing them, are discussed briefly. This research addresses the facilities as well as the attributes of Facebook as a Social Network System, and particular features of disembodiment, re-construction, and re-presenting social identities which are already constructed as a member of small societies. Due to this, “Whether ‘virtual communication environments’, ‘social networks’ are perceived as something like ‘escape way’ from socio-cultural restrictions or not” was questioned. For the purpose of the study, an online questionnaire consisting of 55 close-ended questions, with brief information about the purpose and the significance of the study, was posted at various FB users’ profiles. However, only the first 100 volunteer ‘Turkish Cypriot’ users were taken as the sample.
Keywords: Globalization, virtual communication, Facebook, social integration and Northern Cyprus
1. Introduction As any other innovation or novelty that has left its mark in history in the field of social sciences, the rapid development of new communication technologies has brought new discussions, negotiations, and conceptualizations with itself. Interrelations between each technological development and social systems have been a matter of debate for many decades. Most of them drew attention to the necessity of analyzing new communication systems, which are directly related with our everyday lives, and ‘anatomizing’ their probable socio-psychological influences on potential ‘consumers’.
Various globalization supporter scholars claim that increasing technological innovations, especially in the field of communication, has brought the world closer together within the political-economic and socio-cultural context (Jia, 2001).
McLuhan, who can be assumed as the “eponym” of the concept entitled ‘Global Village’, insisted on the fact that an interconnected global village would be created by linking of electronic information. Apart from this, as noted by Walkosz, Jolls and Sund (2008), Jenkins (2006) highlighted the fact that the development of a “participatory culture” that extends beyond the posting or downloading of media has been contributed by the development of social media. Therefore, the need to redefine and to reconceptualize some social issues such as culture and community was also clearly highlighted by the authors.
Beerkens’ (2004:13) definition of globalization also highlights new reforms in socio-cultural, politic and economic framework. Articulated relationship between globalization and changing face of communication is declared by
The world-wide interconnectedness between nation-states becomes supplemented by globalisation as a process in which basic social arrangements (like power, culture, markets, politics, rights, values, norms, ideology, identity, citizenship, solidarity) become disembedded from their spatial context (mainly the nation-state) due to the acceleration, massification, flexibilisation, diffusion and expansion of transnational flows of people, products, finance, images and information.
As has been known and has been discussed broadly by many theoreticians, Internet-based activities widely spread their access beyond the social fields as well as economic and political fields. Social network sites (SNS) as a means of communication or as Internet-based new space of communication have penetrated almost into each part of our everyday lives. Jia (2001) noted the influence of the Internet within the context of globalization by asserting that
ISSN 2039-9340 Mediterranean Journal of Social Sciences Vol. 4 (1) January 2013
262
Technological progress, especially the Internet, has brought people closer together. International and domestic concerns are becoming increasingly intertwined. Under these circumstances, national borders have lost their previous significance and national sovereignty is becoming both anachronistic and a less valid excuse for idiosyncratic rule within national borders. (Jia, Q. 2001:32).
Social networks can be defined as “communities built around the interpersonal relationships of their members. By keeping track of who each participant knows- and how they know one another- each member creates a private community through a white list of known friends” (Croll & Power, 2009:458).
Hence, opportunities offered within the socio-cultural context can be declared as indubitable. As Boyd and Ellison (online) also stated, SNSs allow its users to
(1) Construct a public or semi-public profile within a bounded system, (2) articulate a list of other users with whom they share a connection, and (3) view and traverse their list of connections and those made by others within the system.
Facebook (FB), which is assumed as one of the most popular SNSs, and its probable influences on its users were questioned during the present study. Disembodied communication networks, such as FB, as any other novelty have both positive and negative influences on its users as an individual, and thus, on social structures which are usually entitled as a ‘society’.
As it is known, mass communication technologies, which influence and change the structure of oral culture, were innovated in the conditions that were strictly tied with the rise of nation-states, based on the Fordist economy model, mass production and mass consumption. (Akter, T. 2012).
Social network systems, as a new form of communication, has freed its ‘audiences’ from spatiotemporal boundedness and has also offered its users the opportunity to (re)actualize themselves in a brand new and quite different environment.
This ‘virtual’ environment, and its probable influences on its users, is one of the highly disputed issues by social scientists. Whether being able to choose the ‘community’ that an individual would like to be part of, influence the construction of ‘self-schemas’ or not; whether self actualization of an individual differs in virtual environment because of disembodiment or not; whether e-socialization is a kind of dis-socialization or not; are social network users freed from bounded means of ‘real life’ at a ‘virtual environment’?; if this is so, what are the outcomes of being freed from spatial restrictions?
Questions listed above are only few of the subject matters that are projected by social scientists. Due to this, the present study explored the influences of Facebook as a social network and a means of communication, on its users who are citizens of a small society and surrounded by restrictions of socio-cultural as much as political patterns. For the purpose of the study, this study explored ‘Turkish Cypriot’ Facebook users, who live in Northern Cyprus, as citizens of small and unrecognized country, and the opportunities that they found in a virtual environment. Accordingly, whether their virtual identities are a reflection of their ‘real’ identities or a deception of them was investigated.
2. Literature review
2. 1. Globalization via new communication technologies Globalization, which is defined as “intensification of worldwide social relations linking distant localities in such a way that local happenings are shaped by events occurring miles away and vice versa” by Giddens (1999:21), is a term used to describe the interconnectedness of social events and relationships (Waters, 2001).
Scholte (2005) noted five general conceptions of globalization which are distinguished from one another: globalization as liberalization, as internationalization, as universalization, as westernization, and as respatialization. Globalization as respatialization, which provides bases for the present study, brought an end to territorial geography.
Throughout the definition of globalization by Giddens & Griffiths (2006), people all live in one world which is rapidly increasing, and individuals as well as groups and nations become interdependent. They also underline the fact that it is created by political, socio-cultural, and economic factors, all highlighted by communication technologies that have strengthened the speed and opportunity of interaction between people.
This interaction between people was made possible by a wide web of communication technologies. As cited by Akter (2012), Giddens (1991) pointed out the consequential separation of time from place and space as one of the outcomes of the evolution of modernity. He then added that the disembodied social systems or the “lifting out” of social
ISSN 2039-9340 Mediterranean Journal of Social Sciences Vol. 4 (1) January 2013
263
relations from local contexts of interaction and their restructuring indefinitely spans across time-space (Akter, 2012; Giddens, 1991).
Communication that involves producing and exchanging meanings occurs within a context; and as it is known, this context is full of social and cultural codes. These codes are interwoven within social relationships which can be assumed as part and parcel of communication process. Influences of globalization, and thus, technological developments lead some changes at structure and context of communication, some of social standards of life. While carrying these socio-cultural, political and economic structure changes, it would also draw attention to spatial-temporal restrictions of our ‘real life’ (Akter, T., 2011).
Subsequently, new communication technologies eliminated the concepts of time and space as well as minimized the significance of body. This spatial and temporal freedom brought the necessity of re-thinking some concepts within the socio-cultural context.
2.2. Socio-cultural and political influences of the Internet on its users As it is known, as an outcome of the globalization; and thus, new communication technologies, cultures and societies are no longer bounded by specific places but by the electronic transfer of ideas images, transgressing established boundaries (Akter, 2012).
The Internet, which cannot be considered to encompass a single medium, consists of a range media that gives an opportunity to its participants to have more power to control in determining information experience that will be produced. (December: 1996)
In addition to this, as pointed out by Whitley (1997), the new form of communication environment enables people to socialize with other gender. However, this is not only limited with gender but also with any other factors that are dependent on our physical appearances such as color, race, nation, and so forth.
People, in virtual ‘life’ practices, are assumed as being isolated from some spatial-temporal restrictions of the real life. Hartley (2002:232), by claiming that “virtual communitarians contribute to the established body of community theory by demonstrating that community is not tied to geographic locations but can exist through mediated communication,” did underline facility of establishing, being part of and experiencing ‘virtual communities’.
Cyberspace is demonstrated by Rheingold (1993) as a space that provides “spaces where new authentic places are being created, supporting new forms of community” (Dodge & Kitchen, 2001: 52). Computer networks usually are recognized as social networks; therefore, understanding the structure of cyberspace, most of the time, entails an understanding of social structures.
In addition to this, Vasseleu (1997), while defining cyberspace, noted that it can be assumed as the space within the electronic network of computers from which virtual realities, that are computer-generated systems for simulating various aspects of interactive space, among other things, can be made.
Communities, as Smith (1999) noted, are renewed via networks by strengthening the bonds that attach us to the wider social world as well as by concurrently increasing our control and authority in the world. Furthermore, it is also stated that “lack of accountability and facelessness of individuals within virtual communities can lead practices that may not be risked within the norms of real face-to-face social relationships” (Hartley 2002: 232).
The concept of “community” also is reformed by the outcomes of the development of the communication technologies. It made participating within several social networks that are called “virtual communities” possible.
There are various researches, articles, and books written about probable influences or effects of this new form of communication. Guangrong (1998), as one of those scholars, investigated the negative socio-cultural and political influences impacts of the Internet. The author categorized the negative influences of the Internet into three groups: political influence, cultural influence, and security threats of the Internet.
While dealing with political influences, the author stated that the Internet perfectly makes and spreads propaganda about Western democratic values, and degrades and repudiates those countries and authorities that have different ideologies from those of the West. Moreover, Guangrong added that the Internet can be harmful for national domination and conflict with internal associations of other countries.
On the other hand, Guangrong (1998) insisted that the Internet advocates western lifestyles, helps dominant cultures impact and homogenize cultures in an inferior position, corrupts people’s minds, and influences and changes people’s moral perspectives and ethical values.
However, apart from the negative influences, it is necessary to deal with the positive influences or look on the bright side of these ‘negative’ influences. While spreading propaganda of western values and being harmful for national domination, it gives an opportunity to its participants to find out a distinctive social structure. Being freed from the boundedness of ‘nationalism’ and being freed from liabilities, obligations and social pressures that it brings with itself
ISSN 2039-9340 Mediterranean Journal of Social Sciences Vol. 4 (1) January 2013
264
open a new door for participants; being citizens of a ‘global village’ and constituting their own communities or to belong to any ‘community’ with their free will.
The present study neither ignores nor neglects the risky influences of new communication technologies but also insists on the possibility, normality and neutrality of bringing some risks with itself while easing our lives or fulfilling our needs. Moreover, the negative influences which were noted by Guangrong (1998) are a matter of traditional mass media as well. Therefore, rather than structure of influences and their efficiency on its users, it is related with the characteristics of its ‘participants’; as being ‘active’ or ‘passive’ recipients.
2.3. Reconstruction and re-conceptualization of social integration in ‘unbounded’ spaces The concept of social interaction which principally has five fundamental patterns as exchange, cooperation, competition, conflict, and coercion, is one of those concepts that should be re-negotiated by the development of new communication forms.
As one of the most important concepts in social psychology, social interaction and its influences on identity should also be investigated within the context of new spaces that makes interaction possible. Argyle (2007:25) demonstrated that “....patterns of interaction have been worked out by earlier members of the society, embodied in cultural rules and norms, and are taught to the young”.
In simple terms, social interaction can be defined as mutual influence of two or more people on each other’s behavior (Thompson & Hickey, 2005).
These definitions raise another question with itself: whether it is “necessary” to interact only within bounded patterns of ‘real’ life to speak of social interaction and integration or it is also possible to comprise disembodied interactions to be able to talk about them. Redefinition and re-conceptualization of the ‘system’ that provided and required for actualization of social interaction, and thus, integration also brought attention to the problems within the system.
By defining the Internet as an ‘arbitrator’ or ‘carrier’ of a form of social integration, Holmes (1997) also highlighted the possibility of social integration at an ‘unbounded’ spatial-temporal dimension. He also addressed three levels of communicative integration, which is proposed by James and Carkek, to draw attention to the ‘un-necessity’ of embodied integrations. As he noted, communicative integration can be in the form of ‘face to face’, ‘agency-extended’, and ‘disembodied-extended’ integration. By disembodied-extended integration, the authors highlighted the possibility of overwhelming the restrictions of embodiment by means of technological extension.
Interacting with others in a social environment, whether an individual practices it within spatial relationships or within ‘unbounded’ spaces, would engender social interaction. Conversation, which is one of the essentials of social interaction, and sustaining relationships, would be enough to constitute social interaction. As Argyle also claimed “...social interaction consists partly of conversation, which is usually a mixture of problem-solving and information-conveying on the one hand, and sustaining social relationships and enjoying social interaction o the other” (Argyle, 2007:69).
Within this context, the problem of the present study was based upon opportunities that are offered by Facebook, as a new form of communication, its influences on ‘socialization’, and the ‘social integration’ process of its users.
3. Research methodology During the present study, the quantitative method was used. Online questionnaires were conducted to volunteer Facebook users who are originally ‘Turkish Cypriot’ in order to figure out whether their virtual identities are a reflection of their ‘real’ identities or a deception of them. Only the first 100 respondents were included in the sample.
3.1 Participants For the purpose of the study, volunteer Facebook (FB) users were chosen as the sample group. Stratified sampling was used as a method of selecting a valid sample from the entire population and to ensure ‘Cypriots’ who live in Northern Cyprus.
‘Turkish Cypriot’ FB users were informed about the purpose and the coverage of the research, link of online questionnaires shared via several FB users. More than 100 FB users did respond to the questionnaire but only the first 100 volunteer ‘Turkish Cypriot’ FB users were selected as sampling. As has been mentioned, only original ‘Turkish Cypriots’ were asked to answer questions; neither immigrants nor emigrants in Northern Cyprus were included.
The purpose of limiting participants as original ‘ Turkish Cypriots’ was to be able to figure out the ‘psychological pressure’ of being part of a small society and to examine whether ‘virtual communication environments’ or ‘social networks’ are perceived as something like an ‘escape way’ from socio-cultural restrictions or not.
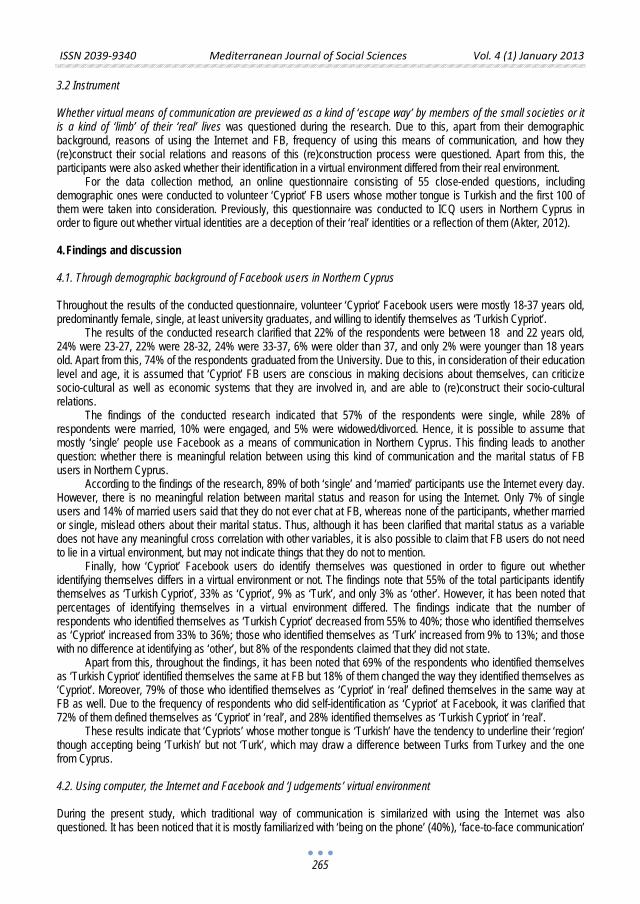
ISSN 2039-9340 Mediterranean Journal of Social Sciences Vol. 4 (1) January 2013
265
3.2 Instrument Whether virtual means of communication are previewed as a kind of ‘escape way’ by members of the small societies or it is a kind of ‘limb’ of their ‘real’ lives was questioned during the research. Due to this, apart from their demographic background, reasons of using the Internet and FB, frequency of using this means of communication, and how they (re)construct their social relations and reasons of this (re)construction process were questioned. Apart from this, the participants were also asked whether their identification in a virtual environment differed from their real environment.
For the data collection method, an online questionnaire consisting of 55 close-ended questions, including demographic ones were conducted to volunteer ‘Cypriot’ FB users whose mother tongue is Turkish and the first 100 of them were taken into consideration. Previously, this questionnaire was conducted to ICQ users in Northern Cyprus in order to figure out whether virtual identities are a deception of their ‘real’ identities or a reflection of them (Akter, 2012).
4. Findings and discussion
4.1. Through demographic background of Facebook users in Northern Cyprus Throughout the results of the conducted questionnaire, volunteer ‘Cypriot’ Facebook users were mostly 18-37 years old, predominantly female, single, at least university graduates, and willing to identify themselves as ‘Turkish Cypriot’.
The results of the conducted research clarified that 22% of the respondents were between 18 and 22 years old, 24% were 23-27, 22% were 28-32, 24% were 33-37, 6% were older than 37, and only 2% were younger than 18 years old. Apart from this, 74% of the respondents graduated from the University. Due to this, in consideration of their education level and age, it is assumed that ‘Cypriot’ FB users are conscious in making decisions about themselves, can criticize socio-cultural as well as economic systems that they are involved in, and are able to (re)construct their socio-cultural relations.
The findings of the conducted research indicated that 57% of the respondents were single, while 28% of respondents were married, 10% were engaged, and 5% were widowed/divorced. Hence, it is possible to assume that mostly ‘single’ people use Facebook as a means of communication in Northern Cyprus. This finding leads to another question: whether there is meaningful relation between using this kind of communication and the marital status of FB users in Northern Cyprus.
According to the findings of the research, 89% of both ‘single’ and ‘married’ participants use the Internet every day. However, there is no meaningful relation between marital status and reason for using the Internet. Only 7% of single users and 14% of married users said that they do not ever chat at FB, whereas none of the participants, whether married or single, mislead others about their marital status. Thus, although it has been clarified that marital status as a variable does not have any meaningful cross correlation with other variables, it is also possible to claim that FB users do not need to lie in a virtual environment, but may not indicate things that they do not to mention.
Finally, how ‘Cypriot’ Facebook users do identify themselves was questioned in order to figure out whether identifying themselves differs in a virtual environment or not. The findings note that 55% of the total participants identify themselves as ‘Turkish Cypriot’, 33% as ‘Cypriot’, 9% as ‘Turk’, and only 3% as ‘other’. However, it has been noted that percentages of identifying themselves in a virtual environment differed. The findings indicate that the number of respondents who identified themselves as ‘Turkish Cypriot’ decreased from 55% to 40%; those who identified themselves as ‘Cypriot’ increased from 33% to 36%; those who identified themselves as ‘Turk’ increased from 9% to 13%; and those with no difference at identifying as ‘other’, but 8% of the respondents claimed that they did not state.
Apart from this, throughout the findings, it has been noted that 69% of the respondents who identified themselves as ‘Turkish Cypriot’ identified themselves the same at FB but 18% of them changed the way they identified themselves as ‘Cypriot’. Moreover, 79% of those who identified themselves as ‘Cypriot’ in ‘real’ defined themselves in the same way at FB as well. Due to the frequency of respondents who did self-identification as ‘Cypriot’ at Facebook, it was clarified that 72% of them defined themselves as ‘Cypriot’ in ‘real’, and 28% identified themselves as ‘Turkish Cypriot’ in ‘real’.
These results indicate that ‘Cypriots’ whose mother tongue is ‘Turkish’ have the tendency to underline their ‘region’ though accepting being ‘Turkish’ but not ‘Turk’, which may draw a difference between Turks from Turkey and the one from Cyprus.
4.2. Using computer, the Internet and Facebook and ‘Judgements’ virtual environment During the present study, which traditional way of communication is similarized with using the Internet was also questioned. It has been noticed that it is mostly familiarized with ‘being on the phone’ (40%), ‘face-to-face communication’
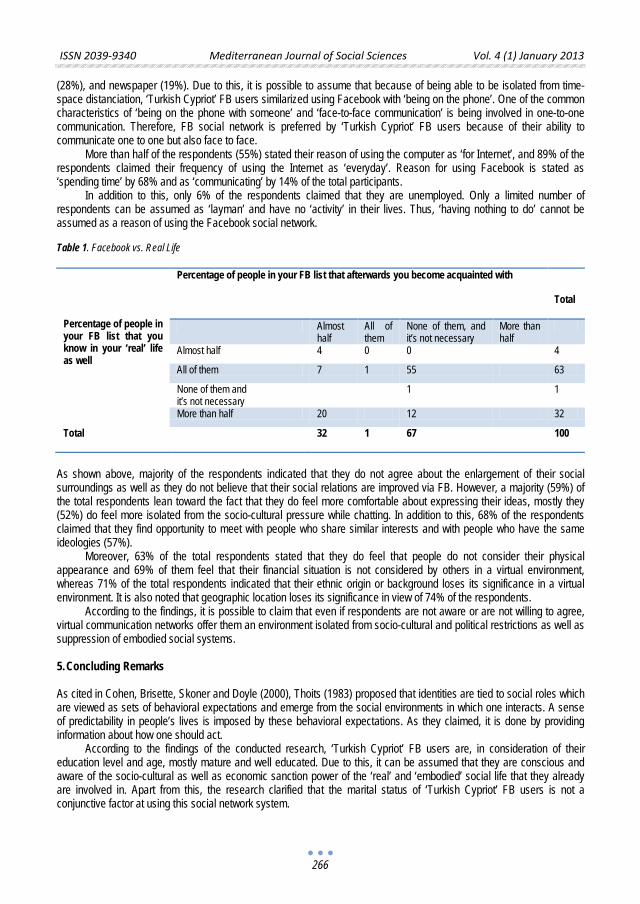
ISSN 2039-9340 Mediterranean Journal of Social Sciences Vol. 4 (1) January 2013
266
(28%), and newspaper (19%). Due to this, it is possible to assume that because of being able to be isolated from time-space distanciation, ‘Turkish Cypriot’ FB users similarized using Facebook with ‘being on the phone’. One of the common characteristics of ‘being on the phone with someone’ and ‘face-to-face communication’ is being involved in one-to-one communication. Therefore, FB social network is preferred by ‘Turkish Cypriot’ FB users because of their ability to communicate one to one but also face to face.
More than half of the respondents (55%) stated their reason of using the computer as ‘for Internet’, and 89% of the respondents claimed their frequency of using the Internet as ‘everyday’. Reason for using Facebook is stated as ‘spending time’ by 68% and as ‘communicating’ by 14% of the total participants.
In addition to this, only 6% of the respondents claimed that they are unemployed. Only a limited number of respondents can be assumed as ‘layman’ and have no ‘activity’ in their lives. Thus, ‘having nothing to do’ cannot be assumed as a reason of using the Facebook social network.
Table 1. Facebook vs. Real Life
Percentage of people in your FB list that you know in your ‘real’ life as well
Percentage of people in your FB list that afterwards you become acquainted with Total
Almost half
All of them
None of them, and it’s not necessary
More than half
Almost half 4 0 0 4
All of them 7 1 55 63
None of them and it’s not necessary
1 1
More than half 20 12 32
Total 32 1 67 100
As shown above, majority of the respondents indicated that they do not agree about the enlargement of their social surroundings as well as they do not believe that their social relations are improved via FB. However, a majority (59%) of the total respondents lean toward the fact that they do feel more comfortable about expressing their ideas, mostly they (52%) do feel more isolated from the socio-cultural pressure while chatting. In addition to this, 68% of the respondents claimed that they find opportunity to meet with people who share similar interests and with people who have the same ideologies (57%).
Moreover, 63% of the total respondents stated that they do feel that people do not consider their physical appearance and 69% of them feel that their financial situation is not considered by others in a virtual environment, whereas 71% of the total respondents indicated that their ethnic origin or background loses its significance in a virtual environment. It is also noted that geographic location loses its significance in view of 74% of the respondents.
According to the findings, it is possible to claim that even if respondents are not aware or are not willing to agree, virtual communication networks offer them an environment isolated from socio-cultural and political restrictions as well as suppression of embodied social systems.
5. Concluding Remarks
As cited in Cohen, Brisette, Skoner and Doyle (2000), Thoits (1983) proposed that identities are tied to social roles which are viewed as sets of behavioral expectations and emerge from the social environments in which one interacts. A sense of predictability in people’s lives is imposed by these behavioral expectations. As they claimed, it is done by providing information about how one should act.
According to the findings of the conducted research, ‘Turkish Cypriot’ FB users are, in consideration of their education level and age, mostly mature and well educated. Due to this, it can be assumed that they are conscious and aware of the socio-cultural as well as economic sanction power of the ‘real’ and ‘embodied’ social life that they already are involved in. Apart from this, the research clarified that the marital status of ‘Turkish Cypriot’ FB users is not a conjunctive factor at using this social network system.
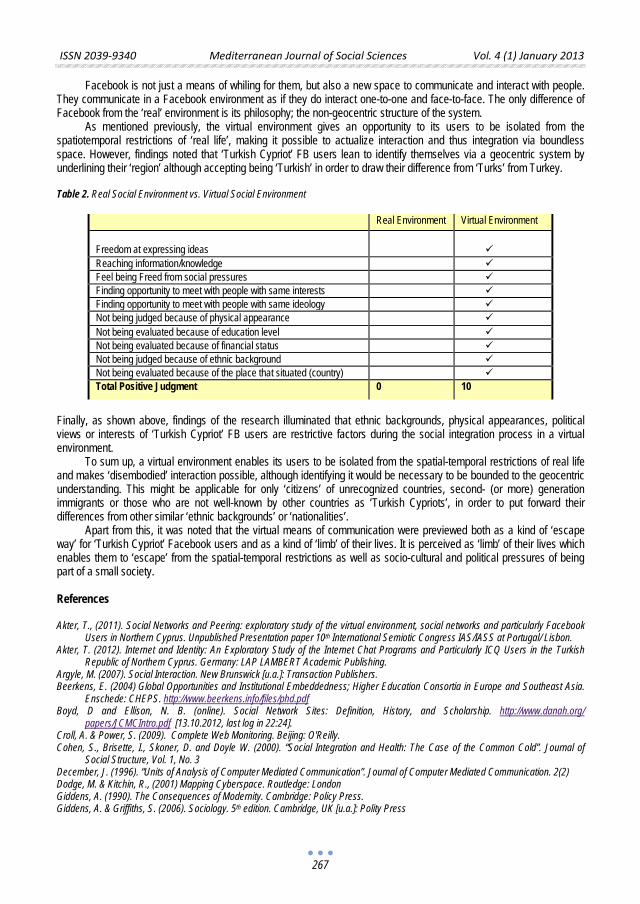
ISSN 2039-9340 Mediterranean Journal of Social Sciences Vol. 4 (1) January 2013
267
Facebook is not just a means of whiling for them, but also a new space to communicate and interact with people. They communicate in a Facebook environment as if they do interact one-to-one and face-to-face. The only difference of Facebook from the ‘real’ environment is its philosophy; the non-geocentric structure of the system.
As mentioned previously, the virtual environment gives an opportunity to its users to be isolated from the spatiotemporal restrictions of ‘real life’, making it possible to actualize interaction and thus integration via boundless space. However, findings noted that ‘Turkish Cypriot’ FB users lean to identify themselves via a geocentric system by underlining their ‘region’ although accepting being ‘Turkish’ in order to draw their difference from ‘Turks’ from Turkey.
Table 2. Real Social Environment vs. Virtual Social Environment
Real Environment Virtual Environment Freedom at expressing ideas
Reaching information/knowledge Feel being Freed from social pressures Finding opportunity to meet with people with same interests Finding opportunity to meet with people with same ideology Not being judged because of physical appearance Not being evaluated because of education level Not being evaluated because of financial status Not being judged because of ethnic background Not being evaluated because of the place that situated (country) Total Positive Judgment 0 10
Finally, as shown above, findings of the research illuminated that ethnic backgrounds, physical appearances, political views or interests of ‘Turkish Cypriot’ FB users are restrictive factors during the social integration process in a virtual environment.
To sum up, a virtual environment enables its users to be isolated from the spatial-temporal restrictions of real life and makes ‘disembodied’ interaction possible, although identifying it would be necessary to be bounded to the geocentric understanding. This might be applicable for only ‘citizens’ of unrecognized countries, second- (or more) generation immigrants or those who are not well-known by other countries as ‘Turkish Cypriots’, in order to put forward their differences from other similar ‘ethnic backgrounds’ or ‘nationalities’.
Apart from this, it was noted that the virtual means of communication were previewed both as a kind of ‘escape way’ for ‘Turkish Cypriot’ Facebook users and as a kind of ‘limb’ of their lives. It is perceived as ‘limb’ of their lives which enables them to ‘escape’ from the spatial-temporal restrictions as well as socio-cultural and political pressures of being part of a small society.
References Akter, T., (2011). Social Networks and Peering: exploratory study of the virtual environment, social networks and particularly Facebook
Users in Northern Cyprus. Unpublished Presentation paper 10th International Semiotic Congress IAS/IASS at Portugal/ Lisbon. Akter, T. (2012). Internet and Identity: An Exploratory Study of the Internet Chat Programs and Particularly ICQ Users in the Turkish
Republic of Northern Cyprus. Germany: LAP LAMBERT Academic Publishing. Argyle, M. (2007). Social Interaction. New Brunswick [u.a.]: Transaction Publishers. Beerkens, E. (2004) Global Opportunities and Institutional Embeddedness; Higher Education Consortia in Europe and Southeast Asia.
Enschede: CHEPS. http://www.beerkens.info/files/phd.pdf Boyd, D and Ellison, N. B. (online). Social Network Sites: Definition, History, and Scholarship. http://www.danah.org/
papers/JCMCIntro.pdf [13.10.2012, last log in 22:24]. Croll, A. & Power, S. (2009). Complete Web Monitoring. Beijing: O'Reilly. Cohen, S., Brisette, I., Skoner, D. and Doyle W. (2000). “Social Integration and Health: The Case of the Common Cold”. Journal of
Social Structure, Vol. 1, No. 3 December, J. (1996). “Units of Analysis of Computer Mediated Communication”. Journal of Computer Mediated Communication. 2(2) Dodge, M. & Kitchin, R., (2001) Mapping Cyberspace. Routledge: London Giddens, A. (1990). The Consequences of Modernity. Cambridge: Policy Press. Giddens, A. & Griffiths, S. (2006). Sociology. 5th edition. Cambridge, UK [u.a.]: Polity Press
ISSN 2039-9340 Mediterranean Journal of Social Sciences Vol. 4 (1) January 2013
268
Guangrong, R. (1998). “The Negative Impact of the Internet and Its Solutions”. In The Chinese Defense Science and Technology Information Monthly. Issue 121, 5th Issue of 1998. http://www.uscc.gov/researchpapers/2000_2003/pdfs/neg.pdf
Hartley, J. (2002). Communication, Cultural and Media Studies: The key concepts. London: Routledge. 3rd Ed Holmes, D. (1997). “Virtual Identity: Communities of Broadcast, Communities of Interactivity”. In Virtual Politics: Identity and Community
in Cyberspace. Pp. 26-46. London: Sage. Jia, Q. (2001). Our Global Village: Prospects for Globalization and National Borders. In Feature: Globalization. Winter
2001, http://web.mit.edu/lipoff/www/hapr/winter01_development/globalization.pdf, [17/10/2012, 22:00] Scholte, J. A. (2005). Globalization: A Critical Introduction. 2nd edition. New York: Palgrave Macmillan. Smith, M. A. (2005). Communities in Cyberspace. London, New York: Taylor & Francis e-Library. ISBN 0-203-19498-5 (Adobe eReader
Format) Thompson, W. E. & Hickey, J. W. (2005). Society in Focus: An Introduction to Sociology. Boston: Pearson. Vasseleu, C. (1997). “Virtual Bodies/Virtual Worlds”. In Virtual Politics: Identity and Community in Cyberspace. Pp. 46-59. London: Sage. Walkosz, B. J., Jolls, T. & Sund, M. A. (2008). Global/Local: Media Literacy for the Global Village. Paper Submitted for International
Media Literacy Research Forum Inaugural Meeting., 14-16 May 2008, Ofcom: London. http://www.medialit.org/sites/default/files/33_globallocal.pdf [17/10/2012, 22:44]
Waters, M. (2001). Globalization. 2nd edition. London: Routledge. Whitley, E. A. (1997). "In Cyberspace All They See Is Your Words: A review of the relationship between body, behaviour and identity
drawn from the sociology of psychology." OCLC Systems and Services 13(4), (pp.152- 163).
ISSN 2039-9340 Mediterranean Journal of Social Sciences Vol. 4 (1) January 2013
269
Censorship, Resistance and Transformation in Modern Indonesian Literature
Ferdinal Ferdinal
Deakin University, Australia E-mail: [email protected]
Doi:10.5901/mjss.2013.v4n1p269 Abstract
This paper investigates the way in which Indonesian literature has reflected violations of human rights in Indonesia in the last decade of the New Order (1990-1998). The regime was authoritarian and responded harshly to any challenge which could cause trouble to national stability. Some writers, such as Seno Gumira Ajidarma, used the power of allegory to resist this oppression. The three works examined here – ‘Saksi Mata’, ‘Pelajaran Sejarah’, and ‘Misteri Kota Ninggi’ – can be considered as a form of resistance literature.
Keywords: censorship; resistance; transformation; Seno Gumira Ajidarma; modern Indonesian literature
1. Introduction This paper examines three works by Seno Gumira Ajidarma (Seno) on human rights-related topics. As in many other countries, the boundary between literature and political advocacy has been contested in Indonesian literature since its birth. A number of fiction writers, playwrights, and poets have ventured into the territory of ‘protest’ writing. Writers such as Pramoedya Ananta Toer, W. S. Rendra, Wiji Tukul, and Seno Gumira Ajidarma are among Indonesian prominent literary figures who have been banned, jailed, or kidnapped.
In this paper, the analysis will deal with three questions. Firstly, as all the stories are preoccupied with the issue of human rights violations, I observe the reasons why Seno turns to literature of resistance to address the issue of freedom of expression. Secondly, I examine the stories in some detail. My reading of the three stories diverges from the assumptions that they merely depict the sociopolitical realities in Indonesia’s New Order of the 1990s. Thirdly, I argue that Seno is definitely resistant towards the state’s treatment of the Indonesian people’s freedom of expression, right to life and right to assembly. 2. Being Silenced: Seno’s Personal Motive to Disseminate Facts Seno has had contradictory careers: he has been simultaneously a journalist and a writer. As a journalist, he is expected to use facts in his reportage, but as a prose writer he is free to use his skills and imagination to deliver what he wants. Interestingly, he has been successful in maintaining both forms side by side: facts to be used as sources of fiction and fiction to be used to deliver the facts. His literary career rocketed after he was threatened with being banned for publishing the humanitarian facts of the 1991 Dili massacre his team gathered in East Timor: he was suspended as an editor of Jakarta-Jakarta (J-J) in 1992 and two other colleagues were dismissed from their position as the editors. These incidents are the major focus of the three stories discussed here.
Peter Carey (2003: 28) divides the Indonesian occupation of East Timor into three periods: “(1) the initial years of conquest between 1975-79; (2) the middle period of the partial “consolidation” of the occupation … (1979-89); and (3) the final decade (1989-99), which witnessed the rapid unraveling of Jakarta’s authority as the situation in East Timor became internationalized through events such as the November 12, 1991 Santa Cruz massacre.” The Dili incident was possibly the peak case of the 24 year history of the Indonesian occupation of the former Portuguese colony. Carey clearly illustrates that the last period describes the move toward insecurity East Timorese felt during their “sleeping with the enemy” (Carey, 2003: 27). The Dili incident stood as an important moment in the occupation and was of concern not only to Indonesians and East Timorese but also to International audiences.
Although Seno was not known as a controversial or subversive writer at that time, his experience as someone who was ‘banned’1 1 Seno’s work was never formally censored. However, his being banned by the government has caused him to be more effective in writing works which can pass the censoring eyes the editors of the various media he sends his works might have applied.
by the government and his own employer inspired him to resist their hegemonic and political powers.
ISSN 2039-9340 Mediterranean Journal of Social Sciences Vol. 4 (1) January 2013
270
These powers preferred to conceal facts about East Timor rather than to tell the truth to the public. Seno resisted the act of concealment and wanted the public to know what had really happened. Seno (2010: 371) had said: “I consciously want to make the silence fail. I fight. This makes every second of my life much more valuable than ever before.” Being unemployed after his suspension, Seno never avoided opportunities to express his resistance. He found his most effective instrument in literature. 3. The Stories The three stories: ‘Saksi Mata’ (Eye Witness) (1992), ‘Pelajaran Sejarah’ (The History Lesson) (1992), and ‘Misteri Kota Ninggi’ (The Mystery of the Town of Ninggi) (1993) grapple with the historical humanitarian incidents in Indonesia, which were internationally condemned and nationally deplored. They represent philosophical and practical problems with human rights discourse and rights enforcement. They also expose the loss of rights under mass oppression due to the failure of state policy to handle important problems such as military operations that open doors for the state and its apparatus to violate the rights of weaker citizens. 3.1 The first story, ‘Saksi Mata’, can be considered as a form of allegory. Seno presents an eye-witness who has no eyes, a man who has had his eyes scooped out by a gang of ninja. The man testifies in a courtroom about a massacre he has witnessed. He is the only one who would like to testify before the court despite his having no eyes. Instead of asking what he knows about the massacre, the judge asks him questions about when, how, and where he lost his eyes and who committed such a crime. Through his depiction of an eyeless witness with blood flowing from his eye-sockets and soaking his shirt, pants, shoes, and the floor, Seno suggests the multiple layers of cruelty and oppression an East Timorese could have experienced during and after the massacre. Through this bizarre character, Seno further presents how the ninjas have continued to destroy the rights of those who witnessed the massacre.
In the second half of the story, Seno presents additional layers of cruelty through questions of the judge to the eyewitness. The questions such as ‘Can you testify?’, ‘Do you still remember everything that happened, even though you‘ve no longer got any eyes?’, ‘Do you still remember how the massacre occurred?’ Do you still remember how they fired wildly and people toppled like fallen banana palms?’, ‘Do you still remember how blood flowed, and people moaned and those who were still half alive were stabbed to death?’, all refer the readers to what happened during the incident. 3.2 The second story, ‘Pelajaran Sejarah’ takes readers on a journey with a history teacher Alfonso who is the survivor of a massacre. Having experienced first hand the effects of the tragedy, he wants his elementary students to remember such an incident by taking them to the site of the tragedy and telling them what the real story is. In the place of the massacre, Alfonso recalls what really happened and tells them things which are not recorded in history books: many inhuman acts such as the shooting, the beating, the stabbing, inflicted upon East Timorese during the massacre.
‘Pelajaran Sejarah’ is largely based on the factual report of J-J which included a number of references such as the place and time of the event, and some pieces of information about the tragedy. It uses surrealist techniques to convey its critical message about the Indonesian military to suggest that its personnel were sadistic, cruel and inhuman in their treatment of the East Timorese. Seno makes a political attack on the government’s military brutality by dramatizing the communication between a history teacher and his six grade students.
Seno’s ‘Pelajaran Sejarah’ not only reveals what the teacher and his fellow citizens see, feel and experience, but it also implicitly tells the readers that there is much more they need to know about the tragedy than is recorded in history books. When a student asks the teacher about what cannot be learned in the classroom, he replies:
“History isn’t just a record of dates and names Florencio. There’s history remaining in the grass, or hidden in the wind or tossing behind the waves. History, Florencio, creeps around outside the classroom, and you have to study it”. (Ajidarma, 1995: 97)
The teacher says that there are many more things which history books do not record. He tells his students that what they know about the incident is far less than what they should know. At the same time, he wants his students to know the truth that the state does not tell to the public. 3.3 The third story, ‘Misteri Kota Ninggi’ is presented through the eyes of a census collector. This magic-realist story begins with his first day of work; he arrives at the house of a family occupied by seven people, one of whom is dead but still present spiritually. As he moves from one house to another, he continues to find the same situation. The collector is surprised to discover that while the population of the Town of Ninggi has decreased, the population of “saudara kami”
ISSN 2039-9340 Mediterranean Journal of Social Sciences Vol. 4 (1) January 2013
271
(our relatives, those who are missing and coming back invisible) has increased. In the story, the census collector is puzzled by the conclusion that the population of the town of Ninggi has decreased but nobody has died because those who have been abducted and held hostages survive as invisible people and continue to live alongside their visible fellow inhabitants. It implies that the population should have reached the number of the people as noted in the census plus those who have gone missing. Seno’s emphasis here on the population statistics becomes a way of announcing the number of East Timorese who have become the victims of Indonesian military occupation.
‘Misteri Kota Ninggi’ indicates some further tricks Seno plays to avoid censorship. For example, the naming of the Town of Ninggi is Seno’s way of avoiding any mention of Dili. Seno (2010: 421) says that “Accepting the order from Kompas to write a short story about Christmas, I narrated how Christmas was going on there, I changed Dili into Ninggi.” Seno realizes that writing Dili as Dili was not possible as any publication would almost certainly censor that. Had the strategy failed, the newspaper may have lost its right to publication. Further, the use of a Portuguese name, Adelino, also points to an East Timorese name. The second device the story uses is to quote the statistics of the town twice:
It was very strange. At a time when the world was frowning with worry because of the frightening, rapid growth in population, the population of Ninggi was shrinking. When I dug out the archives, the records for 1974 showed a total population of 688,771. But when I counted again in 1978 it seemed the population had shrunk to 329,271 people. Where had the other 359.500 gone to? It was very peculiar. (Ajidarma, 1995: 104)
Reading through the statistics of the Town of Ninggi, Seno questions the government about the decrease in the population of Dili which was more than halved. He also implies that the government was responsible for the large number of missing people, i.e., more than a hundred thousand East Timorese. Consider the following.
According to my experience as a census collector, if the rate of population growth in Ninggi was normal, that is nine per cent per annum based on data from 1970-1973, then in 1980, the population should have been 667,100. It turned out that when I counted from house to house the total was only 555.350 people. I was very surprised. There was no epidemic, no war, and no large-scale exodus, but where had those 111.750 human beings disappeared to? In one village at the edge of town, which had once had a population of 9,607, 5,021 of the population had gone missing – was it they who’d become the invisible beings, the wandering spirits? (Ajidarma, 1995: 107)
In quoting these statistics, Seno asks readers to think about the size of the decrease in population and what might have happened to them. Were they dead? If so, how had they died? Were they killed? If so, who killed them? Right until the end of the story, Seno asks his readers to deal with the tremendous decrease in population. Almost at the end of the story, Seno gives references for the length of time the decrease of population had been going on in the town:
So far, I have been living in Ninggi for fifteen years and my life was really lonely. By day I work counting people and at night I don’t dare leave the house because there are gangs of masked men like ninjas. Actually, the theory is, they won’t come into my house because I am only an outsider. During all this time those gangs of masked men have only entered the home of the local Ninggi people. That’s the way it all happened, until the population of Ninggi has disappeared completely. (Ajidarma, 1995: 109)
Seno has provided clues as to how people had gone missing, who the perpetrators were, and over what period of time it had happened. Yet, the questions remain: who are the ninjas?, what did they do?, how?, and what was behind their actions. These are the questions readers need to ponder. 4. Concluding Remarks Analysis of the three works: ‘Saksi Mata’, ‘Pelajaran Sejarah’, and ‘Misteri Kota Ninggi,’ shows Seno’s testimonio, “the strategy attempt to control representation, to interpose a voice that has been silenced, oppressed or misrepresented, a goal which lies at the core of all interpolating strategies” (Ashcroft 2001: 114). His work is a strategy to have his voice heard.
The term resistance, which Harlow (1987) draws on from Kanafani can be applied to Seno Gumira Ajidarma’s East Timor fiction: the stories are a form of cultural resistance in which Seno resists the state policy of political and military aggression in East Timor. These policies resulted in state oppression of the people who were powerless to defend themselves. Seno has used techniques in order to mourn the disregard of those rights.
Although these stories were not written by the colonized East Timorese themselves, they do speak for them. The stories resist what Kanafani (in Harlow, 1987) calls the “occupying power”, the Indonesian military. Unlike Palestinian
ISSN 2039-9340 Mediterranean Journal of Social Sciences Vol. 4 (1) January 2013
272
literature which resists the Israeli occupation, for example, Seno’s stories do not call for independence. However they do speak the forbidden truth in the wider Indonesian context. In other words, Seno, through his East Timor stories, resists any type of gagging or pre-censorship: whether that be governmental, institutional, or self-censorship.
References Ajidarma, Seno Gumira. Eyewitness: Protest Stories from Indonesia. Trans. Linggard, Jan. New York: HarperCollins, 1995. ---. Jazz, Parfum Dan Insiden. Yogyakarta: Yayasan Bentang Budaya, 1996. ---. "Misteri Kota Ninggi." Lampor: Cerpen Pilihan Kompas 1994. Ed. Kompas, Tim. Jakarta: Harian Kompas, 1994. 122-28. ---. Saksi Mata. Jakarta: Bentang, 2002. ---. “Pelajaran Sejarah.” Republika 5 December 1993. ---. Trilogi Insiden. Jakarta: Bentang, 2010. ---. "Misteri Kota Ninggi." Kompas 26 December 1993. ---. "Saksi Mata." Suara Pembaruan 1992. Ashcroft, Bill. Post-Colonial Transformation. London: Routledge, 2001. Carey, Peter. "Third-World Colonialism, the Geracau Foun, and the Birth of a New Nation: Indonesia through East Timorese Eyes, 1975-
99." Indonesia 76. October (2003): 23-67. Harlow, Barbara. Resistance Literature. London and New York: Methuen, 1987.
ISSN 2039-9340 Mediterranean Journal of Social Sciences Vol. 4 (1) January 2013
273
Exploring the Mismatch Between Teacher Demand-Supply in Sub-Sahara
Africa: Ghana as Case Study
Stephen Ntim, Ph.D
Faculty of Education Catholic University of Ghana
P.O. BOX 363, Fiapre-Sunyani, B/A, Ghana, W/Africa Email: [email protected]
Doi:10.5901/mjss.2013.v4n1p273 Abstract
This study presents an analysis of the factors affecting the supply and demand of school teachers in Ghana. The findings suggest that the major pull causing the mismatch in teacher supply-demand equation can be summed up under: a) economic demand, b) demographic factors and c) market forces. Sixty percent of those sampled constituting 162 of the respondents were of the view that there was a significant correlation between remuneration and supply while the other 40% (108) not attributing it to remuneration per se, nevertheless saw a link between supply and other economic issues such as end of service benefit. Ninety five percent of respondents were of the view that teacher upgrading in higher market premium courses in institutions of higher learning exacerbate teacher attrition into other better paid jobs: an indication of non-incentives pulling teachers from the teaching profession. The objective of the study is to contribute to advocacy on teacher issues, especially increased resources as well as innovative funding for the employment of sufficient number of teachers.
Keywords: Teacher, demand, supply, attrition, remuneration
1. Introduction
The concern for quality education, especially in the developing nations is crucial because of the symbiosis between education and productivity, between education and human capital development and between education and the demands of the labour market (Naidoo, 2006). Any serious discussion on quality education cannot ignore the need to maintain sustainable and efficient teacher training, since at the heart of the education debate is the teacher. It is in this light that national policies are vital especially in the developing nations on such issues as teacher supply and demand, quality of training, funding, and curriculum development (Lewin and Stuart, 2003). This calls not only for sufficient funding, but above all a strong political will to put structures in place to cater for teacher education policies. Most researchers agree that school teachers have a powerful impact on the learning experiences of school students. It is therefore important that quality teaching be facilitated by the availability of appropriately skilled teachers, as well as appropriate supplies of education leaders. High quality school level educational experiences will foster better transitions to work and further education for school students, giving better outcomes for individuals, and from an employer perspective, a more skilled and productive workforce. (http://www.mceecdya.edu.au/verve/_resources/-DAS_teachers-PartsA-d.pdf)
The acute shortage of qualified teachers has been identified as one of the biggest challenges confronting Sub-Sahara Africa in its efforts to realize the Education for all (EFA) by 2015 (www.unesdoc.unesco.org). It is estimated that in Sub-Sahara Africa, 1.6 million new posts and four (4) million additional teachers will be needed if the Universal Primary Education (UPE) is to be achieved. Traditional teacher training colleges cannot keep up with the demand. Teaching is seen as a career in decline with low status and salaries and little opportunity for professional development and career progression. These challenges lead to difficulties with respect to recruiting and retaining adequately trained and motivated teachers (ibid).
These challenges become more critical when seen within the context of the mismatch between teacher demand and supply in Africa south of the Sahara. For example, between 1999 and 2005, it is estimated that children enrolled in pre-primary schools in Sub-Sahara Africa increased by 61%, with the average gross enrolment ratio rising from 10% to 14%. Some countries such as Ghana, Cameroon, Lesotho, Namibia and South Africa, have substantially increased their enrolment ratios while others such as Burundi, Burkina Faso, Chad, the Central African Republic, the Democratic Republic of Congo, the Niger and Uganda having preprimary gross enrolment ratio of less than 5%. The implication is that with the gross enrolment ratio increasing in most countries, the demand for more qualified teachers at the basic level
ISSN 2039-9340 Mediterranean Journal of Social Sciences Vol. 4 (1) January 2013
274
is likely to go up such that the supply might not commensurate with the demand(http://unesdoc.unesco.org). Thus the greatest challenge with respect to teacher supply lies in countries in sub-Saharan Africa. According to estimates, the region will need to raise its current stock of teachers by 68%- from 2.4 to 4.0 million- in less than a decade. For example, by 2015, Chad will need almost four times as many primary teachers and Ethiopia will need to double its stock of primary teachers (UNESCO Institute for Statistics, Montreal, 2006).
In Ghana, for example, in the 1970’s and early 1980’s, per capita income fell by 23% between 1975 and 1983. The real value of government financing for education fell sharply from 6.4% of GDP in 1976 to 1.4 % in 1983. This resulted in near collapse of the education system (Akyeampong et al 2000). This of course had a negative impact on teacher demand and supply. Many teachers in Ghana migrated to nearby Nigeria with the consequent fall in the students’ performance coming far below the standard of education. Improving access to basic education de facto implies the need for a sufficient number of teachers who are trained, have access to upgrading their skills as well as motivated enough to be retained in the teaching service. Given the expansion of schools and the increase in school enrolment coupled with financial constraints of a fragile economy, can nations in Sub-Sahara Africa be able to meet the required number of qualified teachers?
2. Purpose of the Study The purposes of this study therefore were to:
1) identify the inter-related factors that cause the mismatch between teacher supply and demand at the basic level of education in Ghana;
2) examine the link between teacher upgrading and attrition in Ghana; 3) discuss financial constraints and how these set limit to teacher education, recruitment and retaining of
teachers; 4) make some projections for teacher stock and outflows; 5) identify roles of government and other stakeholders in the recruitment of qualified teachers to meet up with the
increasing enrolment of the students; 6) to offer some recommendations for policy framework for teacher recruitment, maintaining and retaining of
teachers.
3. Statement of Problem
Improving the quality of education requires the recruitment of more and better trained teachers. For example, it is estimated that preprimary pupil/teacher ratios (PTRs) are high in Sub-Sahara Africa, above 31:1 on average in 2005- and it has increased since 1999. We have a situation where either the supply of teachers grew, but not enough to commensurate with the large increase in enrolments such as in countries like Burundi, the Congo and Senegal; or it could also be that it remained stable while enrolment increased as in Benin. The shortage of teachers observed in many countries on the continent south of the Sahara is compounded by a low percentage of trained teachers. The shortage of trained teachers worsened between 1999 and 2005. The significant increase in primary enrolment (by 29 million, or 36%) between 1999 and 2005 translated into a rise of the average primary NER for the region from 57% to 70%. Benin,Ethiopia, Guinea, Lesotho, Madagascar, Mozambique, the United Republic of Tanzania and Zambia saw their primary NERs increase by more than twenty percentage points between 1999 and 2005 (http://unesdoc.unesco.org).
In Ghana, it is estimated that basic education alone needs fifteen thousand (15,000) teachers annually to fill vacancies (Anamuah-Mensah and Benneh Margaret, 2006). Meanwhile the thirty-eight (38) public Teacher Training Institutions at any given year supply an average of eight thousand five hundred (8,500). Teacher attrition rate in Ghana, even though it is difficult to estimate the exact figures continues to be on the increase (Mereku, 2000). In a survey jointly conducted by the Ghana National Association of Teachers (GNAT) and the Teachers of Education Workers Union (TEWU) in 2009, ninety percent (90%) of teachers interviewed have plans for further studies and this exacerbates the rate of attrition.
Total projected estimates for funding education in Ghana in 2005 was 6.8 trillion cedis, out of which 57% was Government contribution, 11% from external donors, 22% from the Ghana Education Trust Fund (GET- fund) (MOESS, 2005a:97). Thus financial limitation is also one of the challenges facing education generally and particularly teacher education in Ghana. For example, it is estimated that teacher education in Ghana, receives only 2.4% of the Ministry of Education budget. Thus, notwithstanding the above challenges facing teacher education such as teacher supply falling short of demand, increasing enrolment of schools, financial constraints, higher rate of teacher attrition, etc. not much
ISSN 2039-9340 Mediterranean Journal of Social Sciences Vol. 4 (1) January 2013
275
study has been conducted to explore the determining factors of these teacher related issues and their consequent impact on quality education in Ghana. It is in the light of this, that this study was undertaken. 4. Research Questions
This survey focused on five major teacher-related issues, namely, teacher demand, teacher supply, teacher attrition, teacher remuneration and teacher education funding. It was carried out in the Ashanti and the Brong Ahafo regions of Ghana. The following five questions guided this research:
1. What are the factors that affect the demand of teachers in Ghana? 2. What are the factors that affect the supply of teachers in Ghana? 3. Are there any significant relationships between teacher remuneration and the teacher supply equation? 4. To what extent does teacher upgrading in higher market value courses in the Universities exacerbate the rate
of teacher attrition into other more lucrative professions? 5. Is there a link between teacher education funding and the teacher demand-supply equation?
5. Hypothesis
The underlying assumption in this study is that there are five fundamental determinants that are the push and pull of the mismatch between teacher supply and demand in most countries of Sub-Sahara Africa especially in Ghana. Thus, the imbalance between teacher demand and supply can hardly be understood without reference to these five critical factors. Based on this assumption the research was conducted to test the following hypothesis:
1. There exists a correlation between the present teacher demand in Ghana with the high level of school
enrolment, population increase and the historical antecedent of the early post independent development agenda.
2. On the supply side, there is a link between the increase in the duration of teacher education in the Colleges of Education, increase of school enrolment and the increasing awareness of education as the means towards social mobility in developing nations.
3. There are significant relationships between teacher remuneration and teacher supply. 4. There is a connection between teacher-upgrading in higher market value courses in the Universities vis-à-vis
the low morale of the teaching profession precipitating teacher attrition. 5. Low Funding for Education is also a determining factor in the teacher-demand supply equation.
6. Some theoretical perspectives on attrition/turnover
Any analysis of teacher demand-supply needs to consider possible workplace and labour market considerations. For example, possible dissatisfaction with the workplace can be a critical pulling factor for teachers to seek alternative opportunities. Thus the more teachers believe there are other alternative opportunities the less willing they might be to address workplace frustrations. Crouch and Perry (2003:496) has identified what they refer to as ‘looming’ shortage in their analysis of the South African teaching profession in which they attributed this ‘looming’ shortage to factors such as HIV/AIDS, administrative control of educators training capacity in the 1990’s, and lack of interest in the teaching profession in South Africa.
Turnover/attrition is described as the movement of employees out of the organization or any permanent departure beyond organisational boundaries(Croasmun, Hampton & Herrmann, 2002:1; Rohr & Lynch 1995).Various researchers advance theories on employee turnover.Ruhland (2001:3)cites Chapman's theory, which expands on Holland'stheory of vocational choice. The theory posits that vocational satisfaction,stability and achievement depend on the congruence between one's personality and work environment. Ruhland (2001:3) also cites Krumbolt's social learning theory of career selection, which propounds that factors like genetic endowment and special abilities, environmental conditions and events, learning experiences and task approach skills explain why individuals change occupations throughout their lives. Ruhland (2001:4) uses these theories to develop a public school teacher retention/attrition model. According to this model, teacher retention and thus attrition is a function of teachers' personal characteristics, educational preparation, initial commitment to teaching, quality of first teaching experience, social and professional integration into teaching and external influences.
Khatri, Budhwar and Fern's study of employee turnover (1999) employs a model that posits three groups of factors influencing employee turnover, namely, demographic, uncontrollable and controllable factors. Demographic factors
ISSN 2039-9340 Mediterranean Journal of Social Sciences Vol. 4 (1) January 2013
276
include age, gender, education, tenure, income level, managerial and non-managerial positions. Uncontrollable factors are the perceived alternative employment opportunity and job-hopping. Controllable factors include pay, nature ofwork, supervision, organisational commitment, distributive justice andprocedural justice (cf. Institute of Management, 1999:55; Special Reports, 1999:1).
Celep (2003) draws from the organisational commitment theory and posits that teachers' levels of commitment are determined by factors such as their belief and acceptance of the school organisation's goals and values, the willingness to exert effort on behalf of the school and a strong desire to keep up membership in the organisation. Lower commitment to the school organisation affects both the effectiveness of the school and causes teachers to be less successful or to leave the profession.
Ingersoll (2001a:26) draws from theories advocating teacher turnover as a function of ageing and increasing student numbers. He postulates that teacher turnover can be understood by examining the school organisational characteristics and conditions. His exposition asserts that improvement in organisational conditions such as salaries,increased support from the school administration, reduction of student discipline problems and enhanced teacher input in decision-making would all contribute to lower rates of teacher turnover.The foregoing theoretical exposition of factors influencing turnover seem to confirm school organisational factors as being critical in teacher turnover. These factors include the teaching job itself, supervision,incentives and rewards, which relate to compensation and recognition, career development, advancement and employment] security, poor job performance, which relates to lack of skills, lowmotivation, bad performance and lack of resources (cf. Jackson & Schuler, 2000:280). 7. Possible Selves Theory
Possible selves are dynamic, future-oriented, representations of the self. These self-representations are concerned with both what one hopes to become (i.e., hoped-for possible selves) as well as what one might fear becoming in the future (i.e., feared possible selves). Markus and Nurius (1986) described possible selves as self-knowledge pertaining to “how individuals think about their potential and about their future” (p. 954). Possible selves result from individual actions and beliefs, the social environment, and the interaction between individual and the social environment (Markus & Wurf, 1989). Just as knowledge in an information-processing model is stored in long-term memory and may remain inactive until accessed, so too are self-representations, including possible selves stored, but inactive in long-term memory. When stimuli or cues from environmental or interpersonal contexts are perceived, specific self-representations become active in the working self. As such, possible selves, then, are dynamic in that they are being formed in response to the contingencies of intrapersonal goals and interpersonal influences. They are also “working self-conceptions” that are formed from self-representations related to goals, efficacy and other self-beliefs made salient under specific circumstances and settings (Doug & Chasidy 2007).
8. Research Methodology 8.1 Sample and Design This study used the purposive sampling design from two hundred and seventy (270) sample from two administrative regions of Ghana: the Ashanti and the Brong Ahafo. One hundred and seventy (170) out of the 270 sample was drawn from the Ashanti region, while the remaining one hundred (100) was sampled from the Brong Ahafo region. In both regions, half of those sampled were both males and females, that is one hundred and thirty-five (135) were males and the remaining one hundred and thirty-five (135) were females. In both two administrative regions, the study was concentrated in the capital, namely, Kumasi and its environs and Sunyani and its neighboring villages in the Ashanti and the Brong Ahafo regions respectively.
Out of the one hundred and seventy (170) interviewed in Kumasi and its environs in the Ashanti region, ninety (90) were teachers, sixty (60) were university lecturers and twenty (20) were in top administration in the Ghana Education Service Secretariat. The one hundred (100) sample drawn from the Brong Ahafo region was in the following distribution: sixty (60) were teachers, twenty (20) were lecturers in the University and Polytechnic and twenty (20) were in the Ghana Education Service administration. Kumasi was chosen for this study in the Ashanti region, because Kumasi is geographically a nodal city: people from North and South, East and West of Ghana converge on this city. This allowed for easy sampling drawing. Besides, the Ashanti region is territorially the third largest of the ten (10) administrative regions in Ghana occupying a total land surface of 24,389 square kilometers or 10.2 per cent of the total land area of Ghana. In terms of population, however, it is the most populated region with a population of 4,780,380, accounting for 19.4 per cent of Ghana’s total population (2012 Ghana Census)
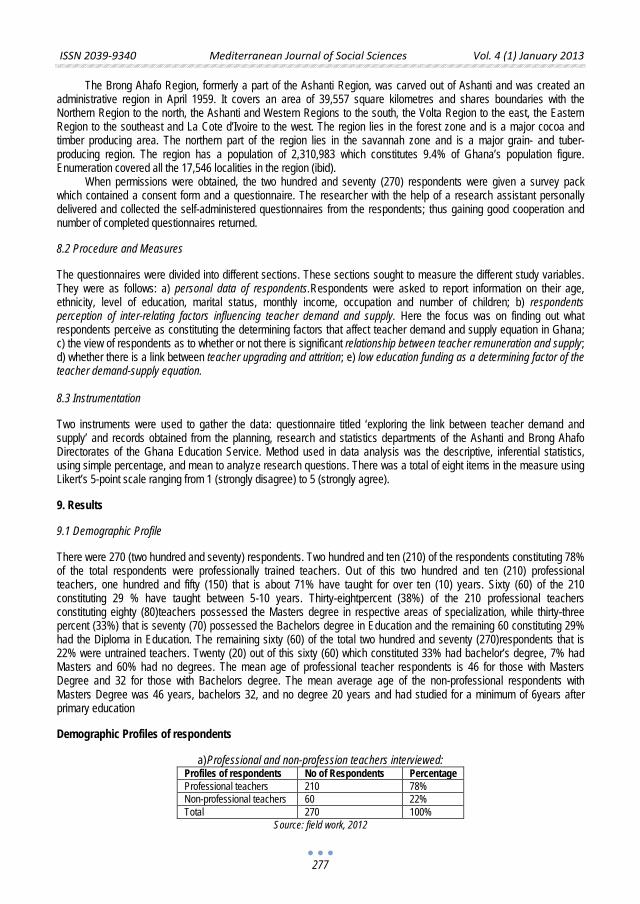
ISSN 2039-9340 Mediterranean Journal of Social Sciences Vol. 4 (1) January 2013
277
The Brong Ahafo Region, formerly a part of the Ashanti Region, was carved out of Ashanti and was created an administrative region in April 1959. It covers an area of 39,557 square kilometres and shares boundaries with the Northern Region to the north, the Ashanti and Western Regions to the south, the Volta Region to the east, the Eastern Region to the southeast and La Cote d’Ivoire to the west. The region lies in the forest zone and is a major cocoa and timber producing area. The northern part of the region lies in the savannah zone and is a major grain- and tuber-producing region. The region has a population of 2,310,983 which constitutes 9.4% of Ghana’s population figure. Enumeration covered all the 17,546 localities in the region (ibid).
When permissions were obtained, the two hundred and seventy (270) respondents were given a survey pack which contained a consent form and a questionnaire. The researcher with the help of a research assistant personally delivered and collected the self-administered questionnaires from the respondents; thus gaining good cooperation and number of completed questionnaires returned. 8.2 Procedure and Measures The questionnaires were divided into different sections. These sections sought to measure the different study variables. They were as follows: a) personal data of respondents.Respondents were asked to report information on their age, ethnicity, level of education, marital status, monthly income, occupation and number of children; b) respondents perception of inter-relating factors influencing teacher demand and supply. Here the focus was on finding out what respondents perceive as constituting the determining factors that affect teacher demand and supply equation in Ghana; c) the view of respondents as to whether or not there is significant relationship between teacher remuneration and supply; d) whether there is a link between teacher upgrading and attrition; e) low education funding as a determining factor of the teacher demand-supply equation. 8.3 Instrumentation Two instruments were used to gather the data: questionnaire titled ‘exploring the link between teacher demand and supply’ and records obtained from the planning, research and statistics departments of the Ashanti and Brong Ahafo Directorates of the Ghana Education Service. Method used in data analysis was the descriptive, inferential statistics, using simple percentage, and mean to analyze research questions. There was a total of eight items in the measure using Likert’s 5-point scale ranging from 1 (strongly disagree) to 5 (strongly agree). 9. Results 9.1 Demographic Profile There were 270 (two hundred and seventy) respondents. Two hundred and ten (210) of the respondents constituting 78% of the total respondents were professionally trained teachers. Out of this two hundred and ten (210) professional teachers, one hundred and fifty (150) that is about 71% have taught for over ten (10) years. Sixty (60) of the 210 constituting 29 % have taught between 5-10 years. Thirty-eightpercent (38%) of the 210 professional teachers constituting eighty (80)teachers possessed the Masters degree in respective areas of specialization, while thirty-three percent (33%) that is seventy (70) possessed the Bachelors degree in Education and the remaining 60 constituting 29% had the Diploma in Education. The remaining sixty (60) of the total two hundred and seventy (270)respondents that is 22% were untrained teachers. Twenty (20) out of this sixty (60) which constituted 33% had bachelor’s degree, 7% had Masters and 60% had no degrees. The mean age of professional teacher respondents is 46 for those with Masters Degree and 32 for those with Bachelors degree. The mean average age of the non-professional respondents with Masters Degree was 46 years, bachelors 32, and no degree 20 years and had studied for a minimum of 6years after primary education Demographic Profiles of respondents
a) Professional and non-profession teachers interviewed: Profiles of respondents No of Respondents Percentage Professional teachers 210 78% Non-professional teachers 60 22% Total 270 100%
Source: field work, 2012
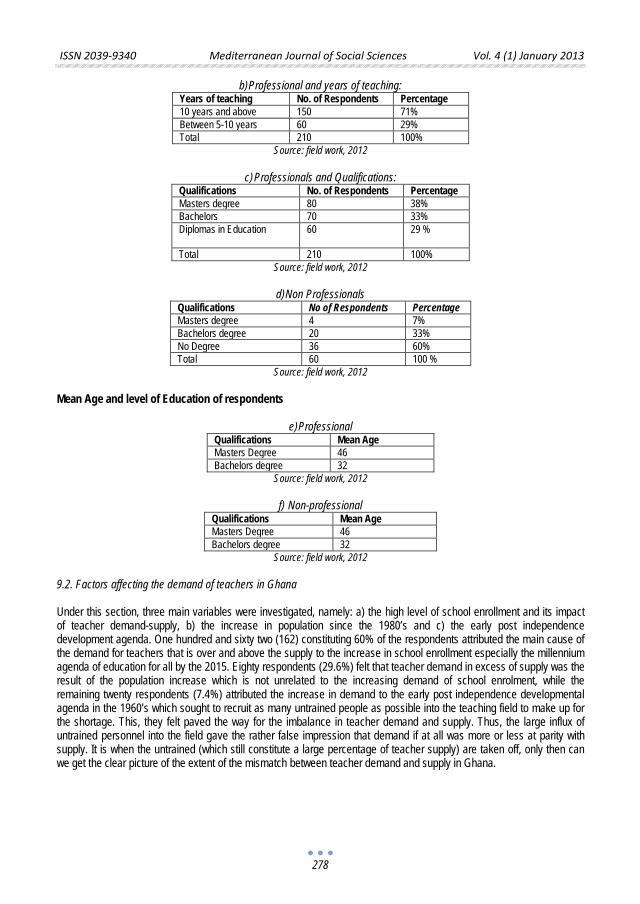
ISSN 2039-9340 Mediterranean Journal of Social Sciences Vol. 4 (1) January 2013
278
b) Professional and years of teaching: Years of teaching No. of Respondents Percentage 10 years and above 150 71% Between 5-10 years 60 29% Total 210 100%
Source: field work, 2012
c) Professionals and Qualifications: Qualifications No. of Respondents Percentage Masters degree 80 38% Bachelors 70 33% Diplomas in Education 60 29 %
Total 210 100%
Source: field work, 2012
d) Non Professionals Qualifications No of Respondents Percentage Masters degree 4 7% Bachelors degree 20 33% No Degree 36 60% Total 60 100 %
Source: field work, 2012
Mean Age and level of Education of respondents
e) Professional Qualifications Mean Age Masters Degree 46 Bachelors degree 32
Source: field work, 2012
f) Non-professional Qualifications Mean Age Masters Degree 46 Bachelors degree 32
Source: field work, 2012
9.2. Factors affecting the demand of teachers in Ghana
Under this section, three main variables were investigated, namely: a) the high level of school enrollment and its impact of teacher demand-supply, b) the increase in population since the 1980’s and c) the early post independence development agenda. One hundred and sixty two (162) constituting 60% of the respondents attributed the main cause of the demand for teachers that is over and above the supply to the increase in school enrollment especially the millennium agenda of education for all by the 2015. Eighty respondents (29.6%) felt that teacher demand in excess of supply was the result of the population increase which is not unrelated to the increasing demand of school enrolment, while the remaining twenty respondents (7.4%) attributed the increase in demand to the early post independence developmental agenda in the 1960’s which sought to recruit as many untrained people as possible into the teaching field to make up for the shortage. This, they felt paved the way for the imbalance in teacher demand and supply. Thus, the large influx of untrained personnel into the field gave the rather false impression that demand if at all was more or less at parity with supply. It is when the untrained (which still constitute a large percentage of teacher supply) are taken off, only then can we get the clear picture of the extent of the mismatch between teacher demand and supply in Ghana.
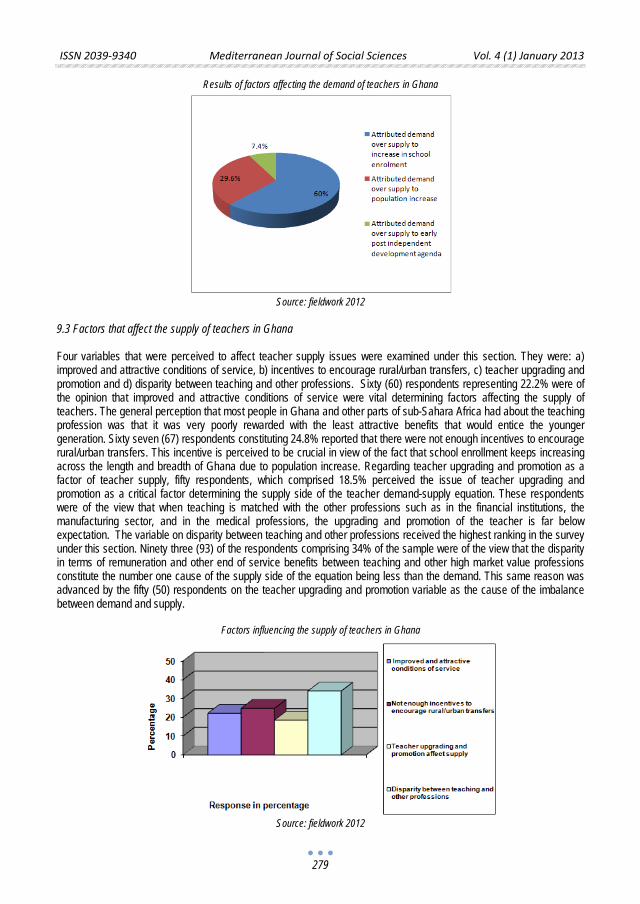
ISSN 2039-9340 Mediterranean Journal of Social Sciences Vol. 4 (1) January 2013
279
Results of factors affecting the demand of teachers in Ghana
Source: fieldwork 2012
9.3 Factors that affect the supply of teachers in Ghana Four variables that were perceived to affect teacher supply issues were examined under this section. They were: a) improved and attractive conditions of service, b) incentives to encourage rural/urban transfers, c) teacher upgrading and promotion and d) disparity between teaching and other professions. Sixty (60) respondents representing 22.2% were of the opinion that improved and attractive conditions of service were vital determining factors affecting the supply of teachers. The general perception that most people in Ghana and other parts of sub-Sahara Africa had about the teaching profession was that it was very poorly rewarded with the least attractive benefits that would entice the younger generation. Sixty seven (67) respondents constituting 24.8% reported that there were not enough incentives to encourage rural/urban transfers. This incentive is perceived to be crucial in view of the fact that school enrollment keeps increasing across the length and breadth of Ghana due to population increase. Regarding teacher upgrading and promotion as a factor of teacher supply, fifty respondents, which comprised 18.5% perceived the issue of teacher upgrading and promotion as a critical factor determining the supply side of the teacher demand-supply equation. These respondents were of the view that when teaching is matched with the other professions such as in the financial institutions, the manufacturing sector, and in the medical professions, the upgrading and promotion of the teacher is far below expectation. The variable on disparity between teaching and other professions received the highest ranking in the survey under this section. Ninety three (93) of the respondents comprising 34% of the sample were of the view that the disparity in terms of remuneration and other end of service benefits between teaching and other high market value professions constitute the number one cause of the supply side of the equation being less than the demand. This same reason was advanced by the fifty (50) respondents on the teacher upgrading and promotion variable as the cause of the imbalance between demand and supply.
Factors influencing the supply of teachers in Ghana
Source: fieldwork 2012
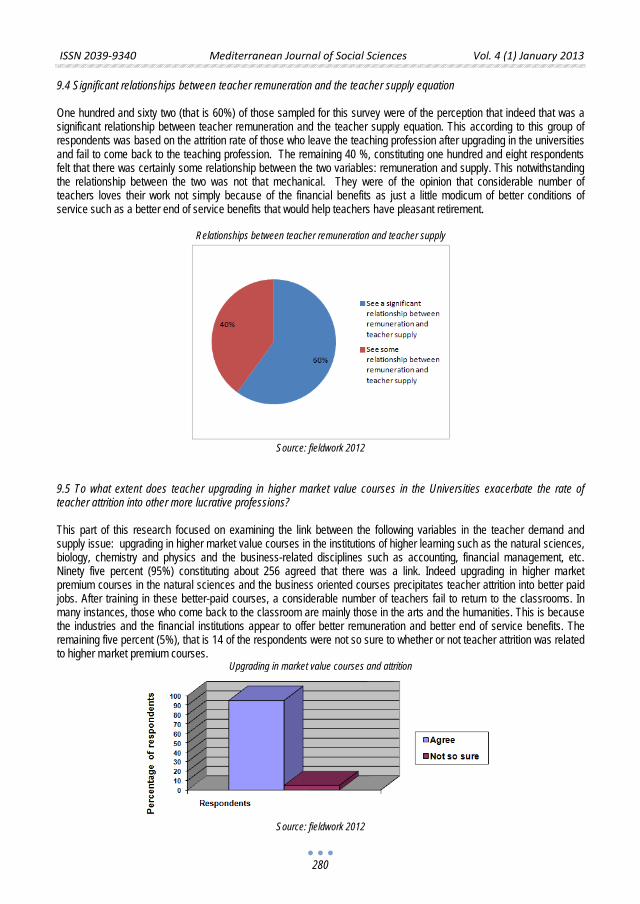
ISSN 2039-9340 Mediterranean Journal of Social Sciences Vol. 4 (1) January 2013
280
9.4 Significant relationships between teacher remuneration and the teacher supply equation One hundred and sixty two (that is 60%) of those sampled for this survey were of the perception that indeed that was a significant relationship between teacher remuneration and the teacher supply equation. This according to this group of respondents was based on the attrition rate of those who leave the teaching profession after upgrading in the universities and fail to come back to the teaching profession. The remaining 40 %, constituting one hundred and eight respondents felt that there was certainly some relationship between the two variables: remuneration and supply. This notwithstanding the relationship between the two was not that mechanical. They were of the opinion that considerable number of teachers loves their work not simply because of the financial benefits as just a little modicum of better conditions of service such as a better end of service benefits that would help teachers have pleasant retirement.
Relationships between teacher remuneration and teacher supply
Source: fieldwork 2012
9.5 To what extent does teacher upgrading in higher market value courses in the Universities exacerbate the rate of teacher attrition into other more lucrative professions?
This part of this research focused on examining the link between the following variables in the teacher demand and supply issue: upgrading in higher market value courses in the institutions of higher learning such as the natural sciences, biology, chemistry and physics and the business-related disciplines such as accounting, financial management, etc. Ninety five percent (95%) constituting about 256 agreed that there was a link. Indeed upgrading in higher market premium courses in the natural sciences and the business oriented courses precipitates teacher attrition into better paid jobs. After training in these better-paid courses, a considerable number of teachers fail to return to the classrooms. In many instances, those who come back to the classroom are mainly those in the arts and the humanities. This is because the industries and the financial institutions appear to offer better remuneration and better end of service benefits. The remaining five percent (5%), that is 14 of the respondents were not so sure to whether or not teacher attrition was related to higher market premium courses.
Upgrading in market value courses and attrition
Source: fieldwork 2012
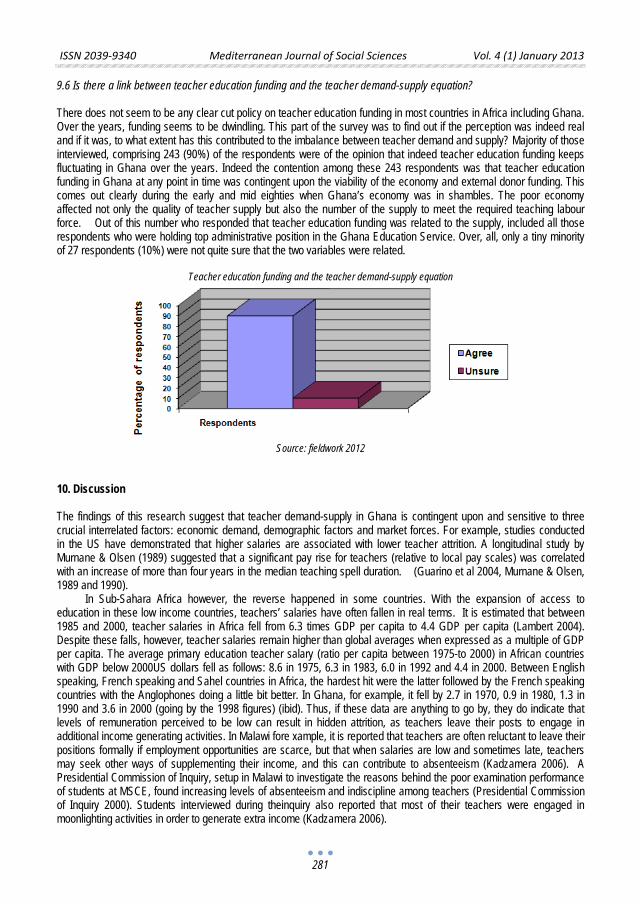
ISSN 2039-9340 Mediterranean Journal of Social Sciences Vol. 4 (1) January 2013
281
9.6 Is there a link between teacher education funding and the teacher demand-supply equation?
There does not seem to be any clear cut policy on teacher education funding in most countries in Africa including Ghana. Over the years, funding seems to be dwindling. This part of the survey was to find out if the perception was indeed real and if it was, to what extent has this contributed to the imbalance between teacher demand and supply? Majority of those interviewed, comprising 243 (90%) of the respondents were of the opinion that indeed teacher education funding keeps fluctuating in Ghana over the years. Indeed the contention among these 243 respondents was that teacher education funding in Ghana at any point in time was contingent upon the viability of the economy and external donor funding. This comes out clearly during the early and mid eighties when Ghana’s economy was in shambles. The poor economy affected not only the quality of teacher supply but also the number of the supply to meet the required teaching labour force. Out of this number who responded that teacher education funding was related to the supply, included all those respondents who were holding top administrative position in the Ghana Education Service. Over, all, only a tiny minority of 27 respondents (10%) were not quite sure that the two variables were related.
Teacher education funding and the teacher demand-supply equation
Source: fieldwork 2012
10. Discussion The findings of this research suggest that teacher demand-supply in Ghana is contingent upon and sensitive to three crucial interrelated factors: economic demand, demographic factors and market forces. For example, studies conducted in the US have demonstrated that higher salaries are associated with lower teacher attrition. A longitudinal study by Murnane & Olsen (1989) suggested that a significant pay rise for teachers (relative to local pay scales) was correlated with an increase of more than four years in the median teaching spell duration. (Guarino et al 2004, Murnane & Olsen, 1989 and 1990).
In Sub-Sahara Africa however, the reverse happened in some countries. With the expansion of access to education in these low income countries, teachers’ salaries have often fallen in real terms. It is estimated that between 1985 and 2000, teacher salaries in Africa fell from 6.3 times GDP per capita to 4.4 GDP per capita (Lambert 2004). Despite these falls, however, teacher salaries remain higher than global averages when expressed as a multiple of GDP per capita. The average primary education teacher salary (ratio per capita between 1975-to 2000) in African countries with GDP below 2000US dollars fell as follows: 8.6 in 1975, 6.3 in 1983, 6.0 in 1992 and 4.4 in 2000. Between English speaking, French speaking and Sahel countries in Africa, the hardest hit were the latter followed by the French speaking countries with the Anglophones doing a little bit better. In Ghana, for example, it fell by 2.7 in 1970, 0.9 in 1980, 1.3 in 1990 and 3.6 in 2000 (going by the 1998 figures) (ibid). Thus, if these data are anything to go by, they do indicate that levels of remuneration perceived to be low can result in hidden attrition, as teachers leave their posts to engage in additional income generating activities. In Malawi fore xample, it is reported that teachers are often reluctant to leave their positions formally if employment opportunities are scarce, but that when salaries are low and sometimes late, teachers may seek other ways of supplementing their income, and this can contribute to absenteeism (Kadzamera 2006). A Presidential Commission of Inquiry, setup in Malawi to investigate the reasons behind the poor examination performance of students at MSCE, found increasing levels of absenteeism and indiscipline among teachers (Presidential Commission of Inquiry 2000). Students interviewed during theinquiry also reported that most of their teachers were engaged in moonlighting activities in order to generate extra income (Kadzamera 2006).
ISSN 2039-9340 Mediterranean Journal of Social Sciences Vol. 4 (1) January 2013
282
Thus, as per the findings of this research, supported by other research work there appears to be significant relationships between teacher remuneration and the teacher supply equation. Sixty percent (60%) constituting one hundred and sixty two (162) of those who participated in the study were of the view that the supply of teacher cannot be divorced from the economic dimension, specifically on remuneration, while the other 40% (one hundred and eight) while not attributing it to remuneration per se, nonetheless saw that there was some connection between teacher supply and other economic issues such as conditions of service and end of service benefits. This finding also gives some support to the Ghana experience in the early and mid 1980’s, when the economy was in shambles, teacher supply fell sharply and many Ghanaian teachers left for neighboring African countries for greener pastures. Thus the relative pay of teachers as well as the relative pay progression in the teacher labour market condition can be a pull factor for teachers either to leave for alternative employment or chose to remain but find ways to supplement their meager income resulting in absenteeism and poor student performance (as in the case of report from Malawi). This gives some strength to confirm our hypothesis that teacher remuneration is significantly related to the supply equation. The more teachers feel motivated in terms of salaries, the less likely it is that they would leave into other better paid jobs.
The influence of the market forces does affect the supply of teachers. In a study conducted in Ghana in 2009, the analysis shows that the majority (90%) of respondents intended to further their education. This is an indication that most teachers want to acquire higher knowledge which may have positive effects on the quality of education. However, it may alsobe an indication of the rate at which teachers want to leave the classroom (even if for a shortperiod). Thus, most teachers want to pursue higher education in the universities either for bachelor’s degree or for a higher qualification. This implies that teachers who pursue further education on full time basis are likely to stay out of the classroom for between two and five years depending on the course of study (Gnat & Tewu, 2009). Sixty four percent (64%, representing a frequency of 502) in this Gnat & Tewu survey said they wanted to come back to the classroom and the teaching profession if adequately remunerated, while 35 % (frequency of 275) said they would not come back. Some of these who obtain higher qualifications in better remunerated jobs fail to come back to the classroom. In this 2009 Ghanaian survey the respondents who do not intend to return to the teaching profession after further education were asked to indicate what sector they intend to move to. The results show that about 60% ofthem would want to take a job either in the finance sector or in the community, social and personal sectors. The remaining 40% are distributed fairly across the other major economic sectors as agriculture, mining, manufacturing etc.
This implies that the market forces especially with respect to better paid opportunities in the market do affect negatively the demand and supply of teachers. It is likely that after upgrading in higher studies at the universities some fail to come back. This finding from this 2009 Ghana survey gives some plausibility to this research findings in which 60% and 40% attributed the teacher demand-supply to both remuneration and better conditions of service and end of service benefits respectively. Besides when one examines the combined results of respondents in our research on the variable factors affecting the supply of teachers, one can see that the scores are evenly distributed among respondents: 22.2% were of the view that improved and attractive conditions of service, 24.8% said there was not enough incentives to encourage rural/urban transfers, while 18.5% saw teacher upgrading and promotion and 34 % were of the view of other economic matters. This underscores the fact that disparity in terms of remuneration, and other conditions of service between teaching and other professions is a major cause of the pull affecting both the demand and supply.
Global available data suggest that there is often high attrition of teachers in the early years of their careers (Bobbitt et al., 1994; Boe et al.; Stinebrickner, 1998, 1999, 2001; Theobald, 1990,Quartz 2008). A study in Texas (Kirby et al 1999) characterized this as a U-shaped pattern of attrition with high attrition in the early years, followed by lower attrition of mid-careerteachers, and rising attrition in late career as teachers approach retirement age. They found that the attrition rate of young teachers was about 11-13%; for those aged 40-54, the attrition rate was only 5% and for those aged 55 and older attrition rose sharply because of retirement.Similar patterns of high attrition in the early years have been found for the US as a whole, with11% of teachers leaving after the first year, but only 6% leaving after the fifth year.
Thus these data confirm one of the hypotheses of this research finding, namely that there is a connection between teacher-upgrading in higher market value courses in the Universities vis-à-vis the low morale of the teaching profession precipitating teacher attrition. The fact that globally, there appears to be a u-shaped pattern of teacher attrition, that is, in the early years, attrition is high, in the middle years it goes down and getting to retiring age it shoots up again, is a pointer to the fact that new teachers entering the field are not oblivious of the attractiveness of other better paid jobs in the labour market compared to teaching and may decide in the early periods to switch professions before it is late. As teachers grow older and confer with their peers in retirement, they realize the hard fact that retirement benefits are really meager and will not be enough to support them and may decide to opt out. In the Ghana survey mentioned above in 2009, 98 % were not satisfied with their pay: some respondents received as low as GH¢ 74 ($52) per month while others also received an average monthly salary GH¢ 405 (or approximately $287 per month in 2009)(Gnat & Tewu, 2009).Teacher retaining and maintaining is therefore contingent upon motivation and job satisfaction. In some countries in sub-Sahara Africa such as
ISSN 2039-9340 Mediterranean Journal of Social Sciences Vol. 4 (1) January 2013
283
Zambia, 2008 report indicated that attrition of basic education teachers totaled 6,745 out of which 2,191 constituting 32.5% resigned from teaching profession. Twenty four percent (24%) of teachers comprising 1,626 left for other reasons (cf. ITFT, EFA, 2010).Thus all these give some plausibility to the findings of this research, namely that teacher attrition even though difficult to have exact estimates is nevertheless a factor to the mismatch between teacher demand and supply in sub-Sahara Africa. 11. Conclusion At the beginning of the millennium, the World Education Forum defined the Education for all (EFA) agenda. Six core areas were identified, namely, a) early childhood care and education, b) primary education, c) youth and adult learning needs, d)literacy, e) gender equality and f) quality education. In addition to these core areas three main goals were set for 2015: a) to reduce global illiteracy by 50%, b) ensuring universal primary education and c) gender equality. All these could hardly be realized without adequate numbers and quality of teachers. Thus the precondition to the achievement of these goals is contingent upon a large number of qualified trained teachers who have job satisfaction and fulfillment, adequately remunerated to dedicate themselves to teaching. With only three years from 2015, this study and other research findings seem to suggest that there are still gaps in the provision of teachers in Ghana and other sub-Sahara Africa. In Ghana alone, it is estimated that it will need about fifteen thousand (15,000) teachers annually to fill vacancies (Anamuah-Mensah and Benneh Margaret, 2006). Approximately one million (1,000,000) teachers have to be replaced in Africa every year to balance out the attrition of teachers (cf. Projection figures from 2007 (source: UIS). Not many nations in Sub-Sahara Africa are economically in a position to raise this number of qualified teachers. This de facto puts such nations at risk to achieving the millennium goals. This calls for national, continental and a global policy framework based on findings of research work to help nations at risk to come out with clear-cut comprehensive national teacher policies on teacher recruitment, retaining and maintaining. This will call for the following:
a) advocacy on teacher issues, especially increased resources as well as innovative funding for the employment
of sufficient number of teachers; b) strengthening geographic partnerships such as north-south and south-south that will aim at filling the teacher
demand-supply imbalance; c) responding to poor countries request for support to address the teacher demand and supply mismatch; d) supporting the development of national strategies and plans to rectify the teacher gap in Sub-Sahara Africa
regarding data, policy making, policy implementation and evaluation. References
Akyeampong K., Furlong D. & Lewin K. (2000). The Cost and financing of teacher education in Ghana.Muster Discussion paper no.18.
Centre for International Education, University of Sussex. Anamuah- Mensah & Benneh, M. (2006). Particular issues of teacher education in Ghana. The UNESCO Teacher Training initiative for
sub – Saharan Africa, Bobbitt, S. A., Leich, M. C., Whitener, S. D., & Lynch, H. F. (1994). Characteristics of stayers, movers, and leavers: Results from the
teacher follow-up survey: 1991-1992. Washington, DC: National Center for Education Statistics. Boe, E. E., Bobbitt, S. A., Cook, L. H., Whitener, S. D., & Weber, A. L. (1997). Why didst thou go? Predictors of retention, transfer, and
attrition of special and general educationteachers from a national perspective. The Journal of Special Education, 30, 390-411. Celep C. (2003). Teachers' organizational commitment in educational organizations. Turkey: Trakya University Edirne. http://www.natio n
alforum.com /17c elep.htm Croasmun J, Hampton & D Herrman S (2002). Teacher attrition: Is time running out? [Online] Available url:
http://horizon.unc.edu/courses/287/papers/hampton/paper.html Crouch L & Perry H. (2003). Educators in HSRC Human resources development review 2003: Education, Employment and Skills in
South Africa. Cape Town: HSRC Publisher Doug H. & Chasidy Wood-Harp (2007). Possible selves theory and why new teachers leave. International Journal of Arts & Sciences 2
(1) 1-3 Ghana Census (2012). Ghana Statistical office, Ghana National Association of Teachers& Teachers of Education Workers Union (GNAT & TEWU) (2009). Teacher attrition in Ghana:
Results of a Questionnaire Survey. Guarino C et al(2004). A Review of the Research Literature on Teacher Recruitment and Retention, Prepared for the Education
Commission of the States, RAND corporation, CA. Ingersoll R.M. (2001a). Teacher turnover, teacher shortages, and the organisation of schools. Washington: Centre for the Stud y of
Teaching and Policy. [Online] Available url: http://ctp.org
ISSN 2039-9340 Mediterranean Journal of Social Sciences Vol. 4 (1) January 2013
284
Institute of Management 1999. People Management. London: Hodder & Stoughton International Task force on Teacher (ITFT) for EFA (2010). Teacher Attrition in Sub-Sahara Africa: The neglected dimension of teacher
supply (retrieved from www.teachersforefa.unesco.org.) Jackson S.E & Schuler R.S (2000). Managing Human Resources — A partnership perspective. Cincinnati.: OHIO: South Western
Publishing. Kadzamira(2006). Teacher Motivation and Incentives In Malawi, Research Fellow Centre for Educational Research and Training
University of Malawi Khatri N, Budhwar P & Fern CT 1999. Employee turnover: bad attitude or poor management? Singapore: Nanyang Technological
University. [Online] Available url: http://www.ntu.edu.sg/nbs/sabre/working_papers/12-99 .pdf Kirby, S. N., Berends, M., & Naftel, S. (1999). Supply and demand of minority teachers in Texas: Problems and prospects. Educational
Evaluation and Policy Analysis, 21, 47- 66. Lambert,S.(2004). Teachers' Pay and Conditions: an assessment of recent trends in Africa. Paris-Jourdan LEA-INRA. Lewin Keith. M., & Stuart J.M. (2003) Insight into the policy and practice of teacher education in low-income countries: the Multi-Site
Teacher Education Research project British Educational Research Journal, 29, 5, pp.691-707 Markus, H., & Nurius, P. (1986). Possible selves. American Psychologist, 41 (9) 954-969. Markus, H., & Wurf, E. (1987). The dynamic self-concept: A social psychological perspective. Annual Review of Psychology, 38, 299-
337. Mereku D.K. (2000). Demand and supply of basic school teachers in Ghana. National Teacher Education Forum, UCEW, Winneba Ministry of Education and Sports (Ghana)(MOESS, 2005a:97). 2005 Education Report Murnane, R. J., & Olsen, R. J.(1990). The effects of salaries and opportunity costs on length of stay in teaching: Evidence from North
Carolina. The Journal of Human Resources, 25, 106-124. Murnane, R. J., & Olsen, R. J. (1989). The effect of salaries and opportunity costs on duration in teaching: Evidence from Michigan. The
Review of Economics and Statistics, 71, 347-352. Naidoo J.P. (2006). The contribution of national parent organization to the Achievement of EFA, Draft, ADEA. Quartz et al(2008). Careers in Motion: A Longitudinal Retention Study of Role Changing among Early-Career Urban Educators.
Teachers College Record Volume 110 Number 1, 2008, p. 218-250. Rohr C.L & Lynch H.F (1995). Migration and attrition of public and private school teachers: 1991-1992 . NCES. [Online] Available url:
http://www.nces.ed.gov/pubs/web/95770.asp Ruhland S.K. (2001). Factors that influence the turnover and retention of Minnesota's Technical College teachers. Journal of
VocationalEducation Research, 26.[Online] Available url: http://scholar.lib.vt.ed u/journals/JVER/v26n1/ruhland.htm l Special Reports (1999).How do you manage turnover. Vol. 3. Bevendam Research Inc. [Online] Available url: www.bevendam.com Stinebrickner, T. R. (1998). An empirical investigation of teacher attrition. Economics of Education Review, 17, 127-136. Stinebrickner, T.R.(1999). Estimation of a duration model in the presence of mission data , Review of Economics and Statistics 81, 529-
542. Theobald, N. D. (1990). An examination of the influence of personal, professional, and school district characteristics on public school
teacher retention. Economics of Education Review, 9, 241-250. (cited in Quartz et al 2008 - Nuala) UNESCO Institute for Statistics, Montreal, (2006).Teacher and Educational Quality: Monitoring Global Needs for 2015(retrieved
from www.uis.unesco.org) www.mceecdya.edu.au/verve/_resources/-DAS_teachers-PartsA-d.pdf (www.unesdoc.unesco.org).
ISSN 2039-9340 Mediterranean Journal of Social Sciences Vol. 4 (1) January 2013
285
Needs Analysis Regarding Residents of Environmentally
Affected Areas. Patos - Marinza Case
Marilda Jance PhD candidate
Lecturer, University of Shkodra “Luigj Gurakuqi”, [email protected]
Doi:10.5901/mjss.2013.v4n1p285 Abstract
Societies are faced with the problems which are of many and various, but now days there are increasing evidences on the close links that exist between environmental problems and social injustice. Various studies tent to place their focus on solving environmental problems through integrated and multi-dimensional social policies. Often the treatment of isolated environmental policies may slow down the progress towards achieving social wellbeing or vice versa. Social and environmental issues can proportionally often be in conflict to each other, but with an integrated package of policies it would be a proper way for avoiding or resolving these conflicts. This study tents to see social injustice issues through environmental lens and vice versa by analyzing environmental issues more clearly in terms of social justice. New effective ways for dealing with each should be developed rather than each issue is tackled separately. This study is focused on the Marinze (Patos-Fier) area as such as that in recent years is facing many environmental and social issues and tends to emphasize the needs of the residents referred to these problems. The data collected through the survey (including open and closed questions), clearly demonstrate the effects on health and livelihoods of the inhabitants facing air pollution, mainly to residents living near sources of pollution. This paper emphasizes the importance that the inclusion of environmental policies in other social policies in order to ensure and enhance the welfare of individuals and the importance that local institutions should play to ensure and protect the health of residents who need supportive services.
Key words: health, services, environment, polluted areas, social policy, environmental policy.
1. Introduction
Albania continues to face social problems, for this reason, environmental issues probably did not have the proper attention. On the other hand their treatment requires broad institutional and consequently respective instruments to give a proper solution. It should be noted that recently there is a growing interest towards the environment and its constituent elements, both by society and the relevant institutions of the country in an effort to give due importance. The reason is that these issues are considered to be directly related to the health of individuals and their welfare, the limitation of living resources or income in society. Actually there are several environmentally contaminated areas for which there are not taken actions to address them (UNEP 2000)1
Environmental problems are not a phenomenon of the past few years but they are attributed to a long past, mainly due to the development of heavy industry. Major problems arise in those cities where the contamination of the area continues as a result of private economic activities, such as the region's oil production and processing Marinze (Patos-Fier) (UNDP 2008)
.
2
In all these areas with environmental problems are hampered by overcrowding situation sufficiently large, where uncontrolled displacement and unstudied population migration has created a difficult situation for regional structures
. However, environmental degradation is a growing problem related not only to the past but also due to the current
misuse of resources, due to the lack of standards and the malfunctioning of institutions at the local and at the central government level. Albania has not taken serious steps on regular monitoring and dynamic assessment on the impact of pollution over the health of the population, level of morbidity or means of prevention and treatment of diseases or cost evaluation on national economy spent for social or medical treatment to these individuals.
1 UNEP (2000): Post Conflict Environmental Assessment – Albania, Switzerland, pp.5 2 UNDP (2008): International consultancy for preliminary site investigation of a number of environmental hot spots in Albania - Main Report, Albania, pp. 12;
ISSN 2039-9340 Mediterranean Journal of Social Sciences Vol. 4 (1) January 2013
286
themselves. On the other hand the high level of unemployment seems to have encouraged residents to a compromise with the risk of not losing the only source of income (some area residents are employed in these activities).
In addition to the foregoing, to the inhabitants of these areas are identified with emergences of many diseases as a result of the high level of pollution (including air, water, and soil). For these reasons, this paper identifies the main problems faced by residents located in areas with environmental degradation and attempts to analyze their needs for support services at the institutional level. Research is carried to city Marinze (Patos-Fier) (areas nearby wells and the oil industry).
2. Current Situation
The oil field of Patos Marinza is one of the largest and most important field in the country and also in Europe in terms of oil reserves. It concludes about 2,000 wells and covers an area of about 160 km2 (MMPAU report 2010).
Unfortunately, the area is tremendous source of air pollution, soil and water. Pollution in the area is generated by the extraction of sulfur and hydrocarbon gas. Groundwater is significantly contaminated by oil wells, pumps, pipelines and oil processing equipment. Families living in small villages within the area are exposed to high risks to their health3. According to national experts, drinking consumed water which comes from household wells is filtered by layers of clay. Oil wells, however, penetrate clay layers and it very is likely to allow hydrocarbon pollution of drinking water pipelines. Pump equipments are seriously amortized shedding significant amounts of oil into the surrounding environment. Oil is transported by pipeline grid in processing equipment is mortised too. Pipelines are outdated and loose significant amounts of oil. There has never been conducted a proper and accurate estimation of oil contamination of the zone and the surrounding environment. Companies exploiting the resources the area have not achieved an accurate estimation about the exact amount of crude oil spilled in the area, but it is estimated that loses 1-2% of the total amount issued for 4 - 8 tons per day. Similar serious problems also appear to exist in the other oil field located nearby. Due to the malfunction of processing equipments, raw wastes of oil are directly discharged into the environment and deposited in Gjanica river nearby. This Gjanica river is the main drinking water source to residents through private wells in the area. Oil fields are also a source of air pollution. Oil is stored in open tanks, from which hydrocarbon evaporates and spreads out in the atmosphere. Pumps discharge 8,000 cubic meters of gas which contains sulfur components. Only a fifth of that amount used for energy production wells, the remaining four-fifths empty into the atmosphere. This is equal to the extraction of sulfur in a quantity of 115 tons per year4. There is a heavy redolence of hydrocarbon and hydrogen sulfate in the air. Prolonged exposure to hydrogen sulfate can cause respiratory problems. A sample analyzed by UNEP showed elliptic hydrocarbons and aromatic concentration in the limits of 4-90 mikrogram/m3 (5
According to MEFWA)
6
3. Demographic changes and environmental impact on the socio-economic situation
assessed in terms of the soil, there are around 1480 oil sludge ponds occupying an area of 95 hectares and comprising an open exposure of residents to this pollution. In terms of surface water pollution, it is estimated that about 117 km are contaminated by substances / petroleum polymers, here including river waters Gjanica, Seman and streams in the area.
This water reserves condition poses direct risk to the agricultural food chain as a result of the use of water for irrigation of lands. Air has volatile cargo of hydrocarbon substances, hydrogen sulfide or sulfur oxides. Observations show that the health condition of the population is directly negatively affected by the environmental condition of the area as a result of air quality and drinking water in the area.
Considering the above, it can be said that economic damage, environmental and health situation has a direct link on the area's economic production system, low productivity and increased agricultural production estimated health care costs directly related to the study area's environmental situation. Area of Patos Marinza is not managed according to environmental standards, ranking alongside area network hot spots that need intervention and rehabilitation.
Pollution and environmental degradation are significantly associated with social welfare in communities or regions. Here we can mention the major consequences that pollution causes in drinkable water resources and agricultural lands, both very important elements, especially in rural areas, to make a living. Therefore environmental degradation leads not only
3 UNEP (2000): Post Conflict Environmental Assessment – Albania, Switzerland, pp. 6 4 UNEP (2000): Post Conflict Environmental Assessment – Albania, Switzerland, pp. 6 5 UNEP (2000): Post Conflict Environmental Assessment – Albania, Switzerland 6 Ministry of Environment, Forest and Water Administration (MEFWA) (2010): Action Plan for the Health and Environment in the Patos-Marinza area, www.moe.gov.al
ISSN 2039-9340 Mediterranean Journal of Social Sciences Vol. 4 (1) January 2013
287
to economic impoverishment, increasing dependence from other expensive, sources but often in the social exclusion of populations living in these areas with environmental problems. From the analysis of environmental elements we cannot exclude those related to demographic developments. From this perspective, urbanization is a major factor producing environmental impacts for new problems previously unknown. Radical changes starting in Albania in the 90s, opened a completely different demographic dynamics from previous periods closely related to the phenomenon of internal and external migration 7
Urban developments, often outside the criteria and technical standards, have been associated with damage to pollution of drinking water networks, their shortcomings in waste management system, have caused a relatively high level durability and hydro borne diseases food, compared to other European countries, although the lack of a comprehensive analysis of the links between environmental condition. All elements demographic prognosis, in the event that will take place out of action and policy development regarding population, the economy or the feasibility for spatial regulation of the process of urbanization, will bring the same intensity adverse impact on the social and biophysical environment as well as up to date
. Unplanned and unregulated development of cities in terms of the rapid development of private enterprises is associated with uncontrolled interventions in existing infrastructure triggered off in some cases health and environmental problems caused by deficiencies in urban infrastructure (such as drinking water network , as well as water waste network) from the mismanagement of waste, as well as damage to the soil, groundwater pollution, etc..
8
4. Environmental impact on the health of the population
.
Health problems are directly related to the socio-economic situation and lifestyle. In many cases they are conditioned and environmental health problems directly related to human exposure to air pollution, water, soil, or other factors that affect the quality of the environment. These last few years have made significant strides in the institutional and legal aspects. There have been a number of studies and projects aimed at addressing contemporary environmental health problems that aim to integrate economic and social development with environmental and health protection. Despite these achievements, there exist deficiencies in determining the incidence of diseases caused by environmental pollution. Also, the level of information available to the public health and the environment is low. In institutional terms the appropriate infrastructure exists, but there are major deficiencies in terms of exchange and disclosure of information for environmental health, the improvement of which would affect the best management of these problems. It is important because it recognizes and declares the areas that pose the highest risk to health, but inter agencies and institutions cooperation is not coordinated. There is not or there exist not specified actions designation of how to assist groups directly affected locations or areas included in the study.
5. Methodology
Considering the nature of the information needed to be collected for the purposes of this paper, the methodology selected for use in this paper is:
- Questionnaire with closed and open questions - Analysis of the Albanian legal framework Regarding the questionnaire, it is organized into sections. First column aims to obtain data regarding the level of information on environmental pollution by its constituent
elements air, water, soil and agricultural products and livestock. Second columns related to data collection for the services required and provided in the area and the role played by local government. Third column is associated with the collection of data about the health of residents. General data of the residents, which are secondary but very important for the interpretation of data collected in the study area are located at the end of the questionnaire. The data collected are mainly qualitative. Using this method allows the collection of a broad and specific information related to the field of study, the problems and issues addressed, the treatment by the legal and institutional framework necessary for social support and new schemes seen from the perspective of local government. Formulation of questions took into account the level of social, economic and educational development, in order to facilitate the process of readability, understandability and completing it. Completion of the questionnaire was carried out by people in adulthood, as the nature of information requires a maturity and commitment on the part of respondents. The questionnaire was distributed in the oil extraction Marinze Patos. To best serve the purpose of this study is the use and analysis of the environmental legislation in force no. 10431, dated 9.6.2011 "On Environmental Protection". 7 INSTAT, (2007): Social Index – Environment, www.instat.gov.al. 8 Ministry of Environment, Forest and Water Administration (MMPAU), (2006): National Strategy of Environment, Tirana, pp. 16.

ISSN 2039-9340 Mediterranean Journal of Social Sciences Vol. 4 (1) January 2013
288
6. Results of the study According to the surveyed residents, their situation is critical and hopeless. Although there are drafting laws that intend to keep control of degradation phenomena, protect and care for and promote the further development policy environment still Albania remains a place where much remains to be done in this regard. This is mainly in terms of the practical side of implementing legislation. Compliance with the law would be one of the ways that will bring about significant improvements in the functioning of society.
So referring to the Law no. 10431, dated 9.6.2011 "On Environmental Protection"9
a) Promote activities to protect the environment, to prevent or reduce pollution, as well as projects that reduce the use of certain substances, raw materials and energy, or pollute less the environment;
, in its Article 14 "The principle of promoting environmental protection activities", stipulates that public authorities within their powers can:
b) Engage into agreements with polluting entities and their associations for voluntary measures that they can take in order to further reduce environmental impact.
These two points of this article would be a positive factor if you will find practical application, as support burden will not be left solely in the hands of local government that operates with defined budgets, but would involve directly the operators exercise activities. This creates the possibility for institutions to play their role not only monitoring but also to act in support of to residents who faces constantly with such complex issues. This increases awareness of operators engaged in private activities sensitize them as to protect and respect the lives of residents, but also to comply with manufacturing standards by directly protecting the environment and its elements. This is clearly defined in Article 50 "Liability for damage to the environment" 10
Health problems are directly related to the socio-economic situation and lifestyle. In many cases these health problems are conditioned by environmental health associated with human exposure to air pollution, water, soil and other factors affecting the quality of the environment. For these reasons, this paper highlights the importance the inclusion of environmental policy has in social policies to protect the lives of individuals in society, but on the other hand to ensure and enhance their welfare. Undoubtedly a crucial role remains for local institutions to be played as institutions which control and guarantee the fulfilling the needs of society. A guarantee needed especially for those that obviously in a greater need for support services. Mankind and the environment cannot be understood as two separate issues
, through the principle of "polluter pays" principle, where prevention and compensation of all damages caused to the environment, through the introduction of measures and practices to minimize the risk of environmental damage thus ensuring the health of the residents must be returned in an efficient standard for all.
Referred to above, the case study related to the area Marinze - Patos, it seems that it identifies precisely the fact that the adoption of legislation should not only be taken in its theoretical aspect. By the relevant local government bodies or private operators there do not appear specific initiatives to minimize pollution caused manufacturing activities. Is contradictory there appears no prompt residents organized reaction, this mainly as a result of fear, mistrust, job loss, or different pressures. According to them there is not any act or measure in informing the public on the activities carried out and activities that disrupt the environmental equilibrium. Residents surveyed said that despite numerous requests by them for taking action, not single preventive initiatives of any kind has taken place. Even in their manufacturing activities in the area operate at night, it possible to escape control by local bodies. Residents claim that they face every day with these phenomena degrading and that it is significantly more difficult their life in the area. Many argue that in the lack of hope for amelioration, local residents are relocating to other areas and other cities and abandoning homes, lands and their daily activities. Respondents, residents of the area for several years, claiming that they have started to feel concern about breathing, the appearance of asthma (young children), skin problems, spine problems, headaches, insomnia or skin problems. Despite starting to feel their health problems, residents claim they have been reluctant to carry out visits or medical tests, because they have low incomes and are unable to proceed. In some of their alleged cases of medical treatments have not given effect and did not bring improvements in their health.
Water situation in the area appears a very critical. It is completely inappropriate and even dangerous for consumption, as it contains hazardous wastes which have already penetrated even underground sources.
Pollution has affected even Food Products making a good part of them unfit for human consumption resulting thus in rising their purchase costs contrasted to their modest households budget.
11
9 Albanian Law n. 10431, date 9.6.2011 “On Environmental Protection”; 10 Albanian Law n. 10431, date 9.6.2011 “On Environmental Protection”; 11 OECD (2006): The Social Dimension of Environmental Policy; www.oecd.org / publications / Policybriefs;
. Environmental issues should occupy an important place in the social policy agenda. Since that environmental issues are
ISSN 2039-9340 Mediterranean Journal of Social Sciences Vol. 4 (1) January 2013
289
of varying level of impact to people also, their treatment requires not just reactive steps such as cleaning the area, reducing or eliminating pollution, but a more proactive multidimensional approach should be considered in regard to environment, health and social policies. This contributes not only in the improvement of human health and quality of life for citizens, but also integrates influencing public policies in the minimizing costs of economic activities in different ways. It can be said that the some of the social policies aimed to compensate victims of society return to be inefficient, if they themselves environment continues to be a threat. Typically these are national health services which require close consideration over the environmental impact, in addition to other causes of social or economic, that affect in health condition of individuals.
Reference
Huby M. (1998): Social Policy and the Environment, Open University Press, UK; INSTAT, (2007): Social Index – Environment, www.instat.gov.al. Law no. 10431, dated 9.6.2011 "On Environmental Protection"; Ministry of Environment, Forest and Water Administration (MMPAU), (2006): National Strategy of Environment, Tirana, pp. 16. MMPAU (2010): Action Plan for the Health and Environment in the Patos-Marinza area, www.moe.gov.al OECD (2006): The Social Dimension of Environmental Policy; www.oecd.org / publications / Policybriefs; UNDP (2008): International consultancy for Preliminary site Investigation of a number of Environmental hot spots in Albania - Main
Report, Albania; UNEP (2000): Post Conflict Environmental Assessment - Albania, Switzerland.

ISSN 2039-9340 Mediterranean Journal of Social Sciences Vol. 4 (1) January 2013
291
Corruption Reduction in Nigerian: Appraisal of the Role of Music
Ogunrinade D. O. A.
Music Department,
Osun State College of Education, Ilesa, Nigeria Doi:10.5901/mjss.2013.v4n1p291 Abstact
Corruption, also known as dishonesty has been the major hindrance to the development of a nation. The resultant effect of this deceit to any country is backwardness and underdevelopment. The root of corruption grows from the heart of a dissatisfied person. Such an individual does not find happiness from within and thus hankers for fulfillment in wealth, power and fame. He is hungry spiritually, so he gets his temporary pleasures from the world. It is a deep problem that can only be purged by strength more superior than political power. Music as one of the most common means by which man expresses his emotions, feelings and sentiments has the ability and the power to shape and reshape the character of human beings since it performs innumerable functions from birth through adolescence to adulthood and at death in African setting. Similarly, it plays important roles in daily activities of man and its relevance in curbing social vices in the society cannot be over emphasized since corruption is a behavioural pattern than ordinary occurrence. An effort is made in this article to examine the concept of corruption, its effect on the nation economy, Music attributes to humanity and its roles to control this social device called dishonesty are the key motivator for this paper.
1. Introduction Nigerian societies have to be carefully and thoroughly educated on the need to eradicate corruption out of its system in order to promote appropriate and rapid development of the country for the present generation and future generation. Discontentment leads to covetousness, while covetousness results to corruption. Corrupt practices are not a new phenomenon; but its history is as old as the world (Lipset and Lenz, 2000). Corruption remains one of the many unresolved problems that have critically hobbled and skewed development in Nigeria (Ayobolu, 2006). It remains a long-term major political and economic challenge for Nigeria . It is seen as a canker worm that has eaten deep into the fabric of the country and had stunted growth in all sectors. The bane behind the country slow pace of development stemmed from corruption. This fact could be attested to in Transparent International’s consistent rating of Nigeria as one of the top three most corrupt countries in the world (Ribadu, 2003).
Conversely, a country with diverse ethnic groups with cultural diversities, different languages, distance from one another within the same nation, topographical and geographical demarcations like Nigeria needs to exploit a formidable machineries to combat and wrestle the endemic menace of corruption out of its system. However, Music is one of the salient tools to accomplish this end because it is a worldwide occurrence accepted to every culture of the globe, an indispensable part of the fabric of our society. A perfect medium of expressing the experience and activities of man in relation to his environment is a universal phenomenon. Ogunrinade (2007) explicates, “Music is the life wire of the nation’s social life and therefore should be well accommodated in the nation’s education policy”. Besides, the natural indispensable value of music to individual is widely recognized in many cultures that make up Nigeria. Undeniably, every culture of the globe uses music to promote its ideas and ideals. Akpabot (1986) attests to the usefulness of music in shaping individual abilities and characters when he elucidates the fact that music is a tradition that affects the behavioural pattern of African. It has positive effects on our moods, which can make learning easier if properly used. It is a living treasure capable of bringing transformation to the public when its idiom is properly understood and positively utilized.
Music is extremely helpful in the process of corruption reduction when properly use, in view of the fact that it is a medium of communication. Communication is one of the underlying problems in almost all dysfunctional groups. Music is also predominantly useful because it uses visual, auditory, and kinesthetic cues all at the same time. Thou shall not steal. Thou shall not kill, thou shall not commit anomalies, and thou shall not subject other people to misery, if you enjoy a certain position, don’t use it to exploit others. Despite the fact that the law of karma is always at work, it seems this untruthfulness of our country is escalating everyday. Honest and pious men possess real wealth that no one can steal. They have peace, happiness and joy. Music as an integral part of life to every society plays significant roles in the daily
ISSN 2039-9340 Mediterranean Journal of Social Sciences Vol. 4 (1) January 2013
292
activities of man, which can stimulate and soothe the mind and help toward a wider education and wider mental perspective.
Omojola (1994:117) corroborates this view when he explicates the serious relationship between life and music thus:
An integral part of life, music is used in such day - to - day activities as disseminating information of societal interest and arousing emotion; and for important occasional events like initiation, rituals and coronation ceremonies. In its various forms, traditional music is rich in historical and philosophical issues, validating communally binding, social value, warning erring member of society, praising people to whom honour is due, reminiscing on the achievement of the past leader as well as reinforcing the legitimacy of present ones.
Looking at the above assertion, music is seen as a strong branch of learning that affects human character in numerous ways either bad or good, this depend on the type of music available to the listener that will determine their character. The influence of music in the lives of human being is more compelling and potent. Good music affects favourably both in the intellectual and emotional lives of people due to the power in it that tone up the mind which increase quickness of perception. It has a potency to socialize with possibility to prepare an individual for a worthy leisure time and immeasurable increase in human happiness. Man could hardly exist without it, in view of the fact that it is available to man at work, play, home and everywhere. However, if the tool is rightly employed, it has capacity and potential to reduce, shrink and wipe out corruption out of the nations system. The anticipation of this paper therefore, is to bring into conviction that music can be favorably employed to transform and equally exploit to control the endemic spread of corruption in Nigeria .
2. Concept of Corruption The mutilation of integrity, virtue, or moral principle is Corruption; it also means depravity,decay, decomposition and inducement to any wrong thing by improper or unlawful means (as bribery) a departure from the original or from what is pure or correct. Corruption threatens people and their governments. It makes societies unfair (Dike, 2007). For instance, it is argued that bribery is a negotiated rent, as the beginning of all illegalities and tyranny. There is no more powerful engine of injustice and cruelty, for bribery destroys both faith and state. The serious consequence of corruption thus is not only State Capture but also Mind Capture. Rent-seeking behavior occupies the human mind and removes it from useful task. (Mauro, P. 2000, Nwabuzor, A. 2005, Ribadu, M.N. 2003 and VOA 2007).
Sachs, G. (2007) elucidates that corruption is the negative and indiscriminate embezzlement and misappropriation of public fund to one’s selfish interest. It is an abuse of office of public office for private gains that include fraud, bribery, fixing of public money in private accounts, outright embezzlement and presentation of forged cheques. Corruption is universal; it is present in developed and developing countries in the bureaus of public or private sectors and in charitable organizations. Shift from governance to management only changes its residence. Consequences of rent seeking and rent giving can be seen on income distribution, consumption patterns (in each social stratification), and rise of an underground economy. Rent seeking and rent giving are major obstacles in the process of planned change of economic layers. A promise of democracy remains undone. However, it does allow selective change in economic-cycle of an individual, an individual household and a business.
Corruption is usually a kept secret and therefore the behavior of the corrupt agent near impossible to observe in real life. The character of rent-seeking has all the qualities one can ask for such as charm and acting talent to create a mirror image of the truth like that of an actor or an accountant; to understand and manipulate rules and regulations, and ability to protect. It makes distinction between "need driven" and "greed driven" necessity harder. Campaigns against corruption have not met with much success. It is a worrisome development. When the majority of people operate under such a system, individuals have no incentive to try to change it or to refrain from taking part in it. Corruption is a strategy in which two or more actors undertake an exchange relation by way of a successful transfer of money (material) or power (political or status) or promoting gene (genetic), which sidesteps legality, morality or civility to regulate the relation. (Lipset, S. M., and Lenz G. S. 2000); (Eigen P. (2001). It is a strategic interaction or an art of nonviolent negotiation. As mentioned before, social action is strategic when it is aimed at the successful realisation of personally defined goals. 3. Effect of Corruption in Nigeria Corruption should be approached from the point of view of the effects it has on development, it is one of the major obstacles to progress, and that its effects on development are disastrous. Looking at some of the effects that corruption
ISSN 2039-9340 Mediterranean Journal of Social Sciences Vol. 4 (1) January 2013
293
has on development, it increases the cost of goods and services, and not insignificantly either. It is therefore the national economy that ultimately suffers the consequences of an unjustified surcharge on the goods or services, with the difference being pocketed by some government official or politician who has abused power for his own personal gain. However, the damaging effects of such practices do not stop there, the corrupt decision-maker may well be tempted to accept a substandard quality of service which will make his personal profit all the greater. Thus, with a road building project for example, complicity between government departments and contractors undeniably result in corner cutting with regard to agreed on substandard of quality so that the savings made may be shared out between the two parties. At their very worst, the disastrous effects of corruption mean that the conception of a project, and ultimately its very choice, are determined by corruption. As far as conception is concerned, a good example would be the purchase of a technology which is wholly unsuited to the particular needs of a country or the choice of a capital-intensive project - more lucrative in terms of corruption - rather than a labour-intensive one which would nevertheless be far more beneficial to that nation's development.
Moreover, Corruption kills enterprise, it kills professionalism and it kills hard work. Nobody wants to work hard where corruption is prevalent. For example, some students, rather than study hard to pass the Examination (JAMB), relax and patronise the so-called “Special Centers”. The philosophical question, which comes to mind in this kind of situation, is “Why should I work hard when I can always get what I want through other easier means?” Because of corruption, many things today are wrong in Nigeria . Other countries use money collected from tolls to maintain their roads, but when we had tolls in this country, nothing came out of it. Additionally, a typical university has about 10 faculties and it takes about N300 million to build a faculty, translating into N3 billion, yet people steal more than that and we do not still have enough universities. With a population of about 47 million, South Africa generates 32,400 megawatts of power, while Nigeria , with about 140 million people, does not generate up to 1,000 megawatts all because of corruption. Corruption also undermines democracy and good governance by subverting due process. It makes the cost of doing business to skyrocket, which ultimately affects the cost of goods. When contractors pay kickbacks on demand, it affects compliance with government’s specifications. It makes officials to contrive new rules and delay the performance of their legitimate duties.
It is worthwhile mentioning at this point that a country which borrows money to finance projects that do not satisfy its real needs, and which may indeed be considered economically futile or absurd, will see its debt burden increased in terms of the cost of the unproductive investment to its national economy. In most cases, they become unserviceable on account of the ineffective use of overseas aid - the sort of bad management to which corruption contributes considerably. Likewise, by deflecting the sparse resources that do exist towards non-priority or low-priority areas, corruption contributes to a large extent to ensuring that fundamental needs such as food, health and education, are not met. This is therefore one of the major causes of underdevelopment and of poverty in general.
Undeniably, Dike (2007) rightly examines that corruption has done Nigeria exhorbitant impairments both within and outside. Some of the damage of this hazard according to him are stated below:
The menace of corruption leads to slow movement of files in offices, Police extortion at toll gates and slow traffics on the high ways, port congestion, queues at passport offices and gas stations, ghost workers syndrome, election irregularities…even the mad people on the street recognize the havoc caused by corruption, the funds allocated for their welfare disappear into the thin air.
Corruption generates economic distortions in the public sector by diverting public investment into capital project where bribes and kickback are more plentiful. In addition, corruption destroys countries and is the chief vice that has destroyed Nigeria . Though a corrupt country has legislations to protect and guard against corruption, but when these become subverted, the aim is to a large extent defeated. The rigging of elections is the worst form of political indiscipline and ethical corruption. It has devastating consequences because it creates instability in the polity and negates the march of development.
A country that needs development must place itself at the cutting edge of the war against electoral fraud. Any society that places premium on proper election and genuine leaders has chances to lead their people out of backwardness, fear, disease and political stupor. Nigeria should borrow a leaf from other lands. What this means is that the war against indiscipline and corruption must be prosecuted by all of us. A state governor who upholds justice will wage a war on indiscipline and corruption, just as the committed Bishop working in the Lord’s Vineyard. The same goes for the school teacher, the doctor, the pilot and the rest. In fact, irrespective of our walk of life should continue with the good fight that brings the good life that ultimately brings life everlasting.
The absolute peak of perversion, however, is when the very choice of priorities - and therefore of projects - is determined by corruption. These are situations where the real development priorities of a country are neglected in favour

ISSN 2039-9340 Mediterranean Journal of Social Sciences Vol. 4 (1) January 2013
294
of operations that generate the greatest personal gain for the decision-makers. Nigeria is littered with vast deserted motorways, a nation with fully functional but empty factories which have been left to fall into ruin only a few years after they were opened, with railway lines which are now impassable through a lack of maintenance to mention few. These 'follies of development' are to be found in many developing countries and in Nigeria in particular. Some have never produced, others have failed to reach full production capacity while others still face such prohibitive costs that big state subsidies are needed to keep them going. 4. Attributes of Music to Humanity Music is a general phenomenon that cut across racial, cultural, social, educational, and economic barriers, which enhances cultural appreciation and awareness. Its symbol systems are important as letters and numbers. Music integrates mind, body, and spirit as well as provides opportunities for self-expression, bringing the inner world into the outer world of concrete reality, which in turn offer the avenue to "flow states" and peak experiences. It also creates a seamless connection between motivation, instruction, assessment, and practical application - leading to "deep understanding." Nothing is inspirational like music. It has an intellectual mission and makes intellectual activities graceful and refreshing. Rhythm is the best mental action and music is one of the rhythmic arts.
Also, Music makes it possible to experience processes from beginning to end, develop both independence and collaboration and thereby provide immediate feedback and opportunities for reflection. It makes it possible to use personal strengths in meaningful ways and to bridge into understanding sometimes-difficult abstractions through these strengths. It merges the learning of process and content thus improve academic achievement which results in enhancing test scores, attitudes, social skills, critical and creative thinking. Music exercises and develops higher order thinking skills including analysis, synthesis, evaluation, and "problem-finding." It is essential components of any alternative assessment program which provide the means for every student to learn 5. Roles of Music in Human Life The issue of music role in human life has something to do with the listeners. It is a sound that is arranged in a way that is pleasant or exciting to listen to. To start with, it serves as an entertainment tool. For instance, in an occasion and event, it plays a vital role that makes the event to be lively for the people. Similarly, it creates cordial relationship among the people, a vehicle for both propaganda and an agent of comfort in wartime; it produces a complex web of pleasure, power, and identity. Music social function during wartime presents an intersection between two significant social experiences, musicality and conflict. It serves as a meeting point of two seemingly disparate practices that work powerfully to promote political goals. Correspondingly, the social role of music in violent conflicts is multifaceted; it serves as tool for settling dispute between two or more people as a result of disagreement. It can be played to bring harmony between the aggrieved citizens, active involvement in music making enhance self-esteem and promote the development of a range of social and transferable skills
Moreover, Music serves as a tool for corrective measure, that is, it informs the people of the habit that is uncultured so that such behavior can be spurned. Furthermore, People not only listen to music, they actively take part in making it. It is an agent that can be used to educate people on several things that will develop and advance the society at large. In addition, it serves as a source of income to human life, a profession for particular class of people. It also serves as a message or symbol that indicates occurrence going on in a particular place or within a society such as bad occurrence in a particular place; the type of music played will show the audience or listeners the happenings in such place. Example of such can be clearly seen in an Africa setting during naming, wedding ceremonies and so on. Music is being used by individuals to enhance the quality of live. The increased availability of music encouraging people to use music to manipulate their own moods, reduce stress, alleviate boredom while undertaking tedious or repetitive tasks, and create environments appropriate for particular kinds of social occasion.
6. Music as a Tool of Corruption Reduction Music has charms to soothe the savage breast and it goes along with the inspiration that can be more effectively used to spread the anti-corruption message through song. It is a useful tool for promulgating the anti-corruption message. The lyrics of a song could be designed to promote integrity and discourage corruption. Music, being popular forms of entertainment, is also powerful media for getting information and messages across. Through music, singers are able to relate stories and ideas on a wide range of topics, based on this concept, they are able to spice up their lyrics by infusing
ISSN 2039-9340 Mediterranean Journal of Social Sciences Vol. 4 (1) January 2013
295
a lot of entertainment into the message. Above view is supported by Zoltán Kodály in Dickinson (2001) when he expounds that
Music is the manifestation of the human spirit, similar to language. It’s greatest practitioners have conveyed to mankind things not possible to say in any other language.
In pursuing the goal of promoting integrity and eradicating corruption in Nigeria , which made up of different ethnic groups with varieties of religious beliefs and ideologies. Some, for whatever reason, when speaking to an audience on corruption may conceal a misconception that represents trouble, for this reason, it is good to set their minds at ease through tender and soft music. The power of music in this regard can be very effective by lightening the atmosphere and make populace to be more easily persuaded to consent anti-corruption message. Ebo (2009;107) was so optimistic when he clarifies the aptitude of music as stated below;
Music carry messages, signals and awareness, creating information communicated to the audience with the help of various musical instruments. There is always some sensation or emotion stimulating attributes of music, which its listener react to music has communicative and didactic values, to agitate, to please, to energize and to conscientize ardent listener.
Additionally, Music can be used to spread sometimes both good and evil messages to the point that people often touched by the experience and moved to the point of tears. Through music, we can go on to build a successful nation by persuading more people of the need to combat corruption and the misuse of power. Conversely, the development of the electronic media in the latter part of the 20th Century revolutionized access to and use of music in our everyday lives. We can turn on the radio, play a CD or tape, or listen to music on video or TV with very little effort. This has not always been the case prior to these developments, then music was only accessible to people mostly when they made it themselves or attended particular religious or social events. The effects of these changes have been dramatic. Accessibility of various types of music make it possible for us to use music to manipulate personal moods, arousal and feelings, and create environments which may manipulate the ways that other people feel and behave. Individuals can use music as an aid to relaxation, to overcome powerful emotions, to generate the right mood , to stimulate concentration, in a nutshell, to promote their well being. It has become a tool to be used to enhance our self presentation and promote our development.
In the words of William Shakespeare: "If music be the food of love, play on." It is an effective and pervasive medium for the dissemination of values, attitudes, and messages. As mentioned above that in African setting and Nigeria in particular, people not only listen to music, they actively take part in making it, which enable them to digest the full understanding of its content. Aristotle in his politics expounds how music influences the will of human being - through the principle of imitation. Music directly imitates the passion and state of the soul –mildness, anger, courage, temperance, the opposite and other quality, hence, listening to music imitates a certain passion, one becomes permeated with the same passion; and if over a long time he habitually listens to the kind of music that arouses aristocratic passions his whole will be shaped to an noble form.”(Grout,1973)
Alternatively, listening to wrong type of music with abnormal wording would lead a man to erroneous thoughts, which turn out to fabricate wrong character in the live of the listeners. In contrast, listening to the right variety of music leads to moral character and refine taste since music has the potential to regulate the emotion of man. The question then is, how to identify the right kind of music from wrong kind of music? Any music that teaches good morals, patriotism, and solidarity can be said to be the right kind of music that can positively affect the character of man . Listening to music can be for several reasons at various time and places. The choice of the kind of music to be listening to may be as a result of a particular occurrence. In view of the fact that music affects an individual’s character, and that character could be affected in different ways by different kinds of music. Therefore, for the nation to be corruption free and to enable her citizen to be patriotic, the right type of music to be played must be patriotic and stimulating in nature, this implies that, certain type of music with wrong wordings must be completely stopped.
Music performs several functions in the society, which include: “emotional expression, aesthetic enjoyment, entertainment, communication, symbolic representation (as found in the texts of songs, cultural meaning of the sounds, and deep symbolism related to human experience), physical response (the use of music for dancing to accompany physical activities), enforcement of conformity to social norms (the use of music in providing instruction and warnings), validation of social institutions and religious rituals (the use of music for religious services and state occasions), contribution to the continuity and stability of culture, and integration of society ( music is often used to draw people together )”.
An additional functions of music include: “the perception of the societal group and its solidarity to meet the need and satisfaction of individuals, social responsibility, moral values and skills; as an instrument of unity in binding members
ISSN 2039-9340 Mediterranean Journal of Social Sciences Vol. 4 (1) January 2013
296
of the society together, used in the community as a way of mobilizing people for communal labour as a means of communicating to people during political transition on the radio, as an effective means of communication in the educational system, a tool for bringing positive change in the moral activities of children in schools and colleges”. (Adesokan 2002) All these demonstrate the importance of music in the daily activities of people in any given society and that such influential tool could be significantly utilised to reduce and trim down the spread of menace of dishonesty in Nigeria . .
In recent time, several agencies of government akin to Economics and Financial Crimes Commission (EFCC), National Agency for Food and Drug Administration and Control (NAFDAC), National Drug Law Enforcement Agency (NDLEA), Independent Corrupt Practices and other Related Offences Commission (ICPC) and many others have tried and are still trying in their brawl against corruption in the Nigerian society. The use of music as a precious ingredient to advertisement on Radio and Television stations, encompassing both the mayhem of the menace to the nation’s economy and consequence of such act to an individual that perpetrated in the court of law has done so much in getting the message across the board in a refined and pleasing manner. This has contributed genuinely to the reduction and thereby curbing the menace in the society. This is to show that music has been known from the time immemorial to be a powerful tool in regulating the morals of people in the society, especially in African setting.
Akpabot (1986) while writing on the music meant for social control notes that songs of social control are usually newsworthy and appropriate to a given community; they are either of praise or abuse designed to regulate the social order. To him, sometimes being philosophical and humorous should constitute the bulk of the wording of such song in view of the fact that Africa ’s sense of humour is best expressed in song and proverbs. He accentuates that songs of social control with their cautiously and carefully worded texts, which often serve as community broadcasting medium, intensifying on important happenings in the daily life of the society such as the prominent man in the village who is an elite by day but an armed robber at night, the beautiful girl in the village who is promiscuous, bribery and some other social vices of corrupt practices that can hindered the development of the community. This could be done during the festive period of a particular deity.
He pointed out, fourteen categories of songs text that are easily recognizable in African music, which embrace historical, social control, insult, obscene, praise, children, funeral, work, war, humorous, communication, women’s, philosophical and ritual. These were recapitulating into three headings, Songs of praise, song of insult and songs for entertainment. Out of these classifications, songs of praise are used to praise good leaders and good deeds in the society while the songs of insult are used to reprimand, condemn and correct harmful deportment of people in the society. There are historical songs where the stories of past leaders are authenticated with their past actions and reactions during their days. These songs are utilized to refresh the memories of the listeners and inspire others to live up to expectation”.
Currently, there are various jingles by musicians on how to trim down and control corruption in the society but only the few ones are heard on the Radio and Television, more music that teaches morals and ethics should be used at various occasions, its evil effect on the society, what an individual in the society is expected to do in staying away from various corrupt practices in the society and the consequent of such attitude when taking to the court of law. Failure to adhere to this, individuals concerned should be allow to face the music. The extract of the jingles are cited below:
Let’s Just Build a Nation Let’s just build a nation, with just and fair play. Let’s just build a nation, where corruption has no place. We deserve the better way to live our lives Throw corruption away, from our lives (ICPC Jingle)
Late Sunny Okosun of blessed memory contributed his own quota when he sang this song: War against corruption Let us break down the walls of corruption in Nigeria Let us break down the walls of apartheid, When we do these, our nation will progress, Reformation will not stop.(Sunny Okosun)
The above songs are serving the entertainment, educative and communicative roles of music in the society. Adherence to the wordings of the songs and many others, which are not cited here, will help in reducing and curbing corrupt practices in the society. It will make individuals in the society have a change of heart on how best to handle the various resources
ISSN 2039-9340 Mediterranean Journal of Social Sciences Vol. 4 (1) January 2013
297
that are available to the society for the betterment of the people instead of acquiring the same for personal selfish interest.
The Nigerian national anthem Arise, O compatriots O God of creation Nigeria’s call obey; Direct our noble cause; To serve our father land Guide our leaders right, With love and strength and faith. Help our youth that truth to know The labour of our heroes past In love and honesty to grow Shall never be in vain; And living just and true; To serve with heart and might Great lofty height attain One nation bound in freedom, To build a nation where peace, Peace and unity And justice shall reign.
7. Conclusion Corruption reduction is an enormous task that requires combined efforts for its realization. Its effects on the society are underdevelopment. This paper underscores the concept of corruption and its effects on national economy, attributes of music to humanity, the role of music to life and music as a tool of corruption reduction. It was fronted in this discussion several methods in which Music can be meaningfully curbed the widespread of dishonesty. Compliance and obedience to the text of the Nigeria national anthem –our identity, is considered to be a good starting point. To the virtuous citizens of our noble country, Nigeria , it is imperative to hold fast genuinely, devotedly and honestly to the text and meaning of each line of Nigeria national anthem, if this is done aptly, corruption in its various forms will no longer have a place to stay in our society and Nigeria will develop. Leaders are charged to live up to expectation in whatever position of authority they occupy. There is need for transparency and accountability in all the dealings of the government, with a view to eradicate corruption in the Nigerian society. 8. Recommendation The citizens of this noble country need to develop the spirit of patriotism in order to salvage our country from the bondage of perpetual dishonesty. The down side to the easy availability of music is that there is a tendency for it to be taken for granted. At the same time, as music is becoming a more integral part of every day life, the place of music in formal education of Nigeria is consistently being questioned. Music already plays an important role in promoting human well being. In view of the fact that positive benefits of music are increasingly demonstrated in health, psychology and other fields demand will increase. If this is to be met, society will need appropriately educated musicians who are morally trained with integrity to teach and promote appropriate types of music that will instill truthfulness and honesty to the mind of the public especially in all level of Nigerian educational system. Such music that will promote honesty in the mind of the people should only be encouraged for public consumption while numerous kinds of music with filthy and muddy wording that can influence people to act unenthusiastically, corrupt and misleading music should be completely stopped and spurn by the government and throw out from public consumption especially to the adolescent age group who are the leaders of tomorrow.
Lastly, the various broadcast and electronic medias industries in the country are implored to play more of Nigerian Music that teach good morals and the spirit of patriotism, loyalty, unity, hope, peace and love, on the radio and television stations across the country. Rendition of Nigerian national anthem and national pledge at public functions should be re- awakened and enforced even to the Nigerian schools and institutions of higher learning.
References Akpabot,S.E (1986) Foundation of Nigerian Traditional Music.Ibadan Spectrum Books Limited. Adesokan,Z A (2000) ‘The Role of Music in Mass Mobilization in the Nigerian Society’ Journal of Nigerian Music Education. University
of Ilorin , Nigeria . . NO.3 David Francis(2001Performing Right Society, Berners Street , London , W1T 3AB Dickinson D (2001) “Music and the Mind” New
Horizons for Learning Seattle WA 98103 USA http://www.newhorizons.org) Dike, Victor E(2001) ‘Democracy and political life in Nigeria ’. Kaduna ; Ahmadu Bello University press.
ISSN 2039-9340 Mediterranean Journal of Social Sciences Vol. 4 (1) January 2013
298
Dike, Victor E (2007) ‘Corruption in Nigeria : A New Paradigm for effective Control’. Http/www.African Economy Analysis.Org. Grout, D.J. (1973) A History of Western music. New York : W.W Norton and Co., Ibekwe, Eunice. U (2009) ‘performing Arts And Nation Building-The ole of Music’ Interlink: A Journal of Research in Music. Nnamidi
Azikiwe University , Awka, Anambra State , Nigeria Volume 4 Lipset, S. M., and Lenz G. S. (2000) Corruption, Culture, and Markets, in Culture Matters.” Lawrence E. Harrison, and Samuel P.
Huntington, eds., New York : Basic Books. Mauro, P. (2000); “Why Worry About Corruption.” editor, IMF Publications: Economic Issues, No. 6, Nwabuzor, A. (2005); “Corruption and Development: New in Economic Openness and Strengthened Rule of Law Ethics.” a publication
of Springer Volume 59, Number 1. Omojola, Bode (1994) ‘Towards a More Effective Music Education in Nigeria ’ Issue in Contemporary Asfrican Social and Political
Thought, Ilorin : Academia Publications vol. II. Okafor, R .C (2005). Music in Nigerian Society. Enugu New Generation Books.Ogunrinade, D.O.A (2007) ‘Students’ Conception of
Music as a School Subject in Ilesa West and East Local Government Area of Osun State ’ Nigerian Music Review. Obafemi Awolowo University , Ile-Ife . Nigeria Vol.6&7
Ribadu, M.N. (2003) ; “ Economic Crime and Corruption in Nigeria : the Causes, Effects and Efforts aimed at combating these vices in Nigeria .” Paper Presented at the Monaco World Summit 5th International Summit on Transnational Crime Monte Carlo, October 23rd and 24th.
Sachs, G. (2007); “Corruption Remains Nigeria’s Long Term Challenges”. The Daily Independent Newspapers, Tuesday, 24th April. VOA (2007).Nigerian Minister of Justice Takes Charge of Corruption Prosecution.” VOA News, August 7
ISSN 2039-9340 Mediterranean Journal of Social Sciences Vol. 4 (1) January 2013
299
Politics of Economy: The Case of China's Involvement in Africa
Md. Matiul Hoque Masud
Lecturer, Department of International Relations
The University of Chittagong, Chittagong-4331, Bangladesh. Email: [email protected]
Helal Uddin Ahmmed
Lecturer, Department of International Relations
The University of Chittagong, Chittagong-4331, Bangladesh. Email: [email protected]
Muhammad Ridwan Mostafa
Lecturer, Department of Sociology,
The University of Chittagong, Chittagong-4331. Email: [email protected]
Anwar Hossain Choudhury
Lecturer, Department of Sociology,
The University of Chittagong, Chittagong-4331. Email: [email protected]
Doi:10.5901/mjss.2013.v4n1p299 Abstract China's economy based engagement with Africa has some political dimensions. China's political intention is to fill up the power vacuum in Africa, raising a new great game with Western and European powers. To secure its investment aid and future trade, China has taken policy implication. Whereas China takes this relation as mutually beneficial win-win situation, other competing big powers take it as security threat. To implement its business first policy, China ahead militarily too. As a developing leader of the third world states, China wants to bring African states together to share its booming economy. Economy centered political relations with African states will start the door of common allegation against Chinese human rights violation and reforming in governance. This paper, without neglecting the historical background of Sino-Afro relations, will highlight the Chinese political ambition behind the scene of its economic relations with Africa and it also focus on mutual political interest in this relations. The motives of great powers in upcoming new great non-zero-sum game in Africa will also be forecasted in this paper. Key Words: China's involvement in Africa, Political Economy, Sino-Afro relations, Neo-colonialism
1. Introduction No other countries but China has followed the speech of Bismarck as "He who controls Africa, will control Europe" (Campbell, 2007: 120). Assisting the fragile and failed states of Africa in building peace and developing infrastructure can secure its energy and resource dependency on Africa region. China's military assistance to rogue regimes and rival groups exacerbates civil conflicts in African states. China's 'non-interference in domestic politics' policy is suit to some rogue regime in African states on the one hand, newly developing states of Africa wants to build a cemented economic relations neglecting human rights and governance violation in China on the other hand have fulfilled their common ground. The Western states are suspicious about the purpose of China's involvement in Africa as it emerged as a neo-colonial power without any negative colonial background. A common blame against China that it is destroying African resources for its own short cut development and it continuing relations with rouge states those are under sanction of Western powers as well as UN. It is clear that though the staring of Afro-Sino relations was ideological now it has become
ISSN 2039-9340 Mediterranean Journal of Social Sciences Vol. 4 (1) January 2013
300
eco-political. China hinders the Western values (like democracy, human rights) exporting process. Extensive debt relief, expanding aid program of China has undermined such activities of Western actors. China's policy to 'lock-up' access to vital natural resources has undermined traditional Western influence. African states think China as a leader of developing countries to reform the unipolar international order. China has clear political and economic objectives in Africa. First of all, China intended to reduce the number of African states that recognize Taiwan as the legitimate government of China and block Taiwan's entry as member in any international organization. 2nd, China focused on a sole access to natural resources to fuel its appetite for energy and make the game Zero-sum. 3rd, to raise supportive statements on Chinese contentious issues in international forums. 4th, China is trying to reduce its energy dependency on any source like Middle East that wholly dominated by the US and shifted its dependency to Africa. 5th, by providing tariff- free export products and make the total Africa as 'made in China'. 6th, China intends to promote its soft power by hard means to adapt itself to its new international status. 7th, in ideological sense, China want to counter the US's mercantilist and militarist policy in Africa. 8th, China offers favorable loan to Africa to undermine the necessity of conditional debt of World Bank and Western aid. 9th, China continued arms sales to such groups that are anti-western in their feelings and continuing revolutionary struggle against imperialism. 2. Historical Foundation of China's Africa Policy The foundation of Sino-Afro relations was laid at the Afro-Asian Conference held in Indonesia in 1955. China asserts its leadership over the third world and nonaligned movement against colonialism and imperialistic motives. Ideology based foreign policy was the only hindrance to China's ties with the continent. China and the African states adopted the 'five principles of peaceful co-existence'. Though between 1955 and 1965, trade between Africa and China increased nearly seven folds but China's interest in Africa was ideological rather than economic (Ayenabo et al, 2012:6421). The 1960s showed a great deal of African independence and the recognition between China and newly independent African countries. Following the Sino-Soviet split, China's primary goal in the region was to increase third world solidarity by exporting its model of national revolution and economic development to African nations. Chinese assistance was provided to revolutionary groups who struggled to assert their sovereignty by offering $2 billion in foreign assistance to African liberation movements between 1954 and 1974 (O' Brien, 2008: 77). Noticeable changes have happened in 1970s in Sino-Afro relations, 1st, the number of African countries with diplomatic ties gradually increased. Between 1967 and 1974, the number of diplomatic mission of China in African states increased from 13 to 30 (De Looy, 2006: 2).2nd, China joined the UNSC in 1971 with African support taking over Taiwan's seat.
The 1970s Sino-American rapprochement quickly led to marginalization of Africa in Chinese foreign policy. As China focus on its modernization and opening up to the developed world, its attention to Africa waned in 1980s. Chinese aid commitments for Africa fell from $254 million in 1980 to $25 million in 1981 (Ayenabo et al, 2012:6425). The initial honeymoon period between China and the west stopped due to the Tiananmen events in 1989. This event forced China to turn its attention to Africa once again. Support of African states in the UN and other international forums got importance to China. Many African states gradually cut off ties with Taipei and normalized relations with Beijing and currently only five of 53 African states uphold ties with Taipei (Meidan, 2006: 76). In the late 1990s, Africa got importance to China gradually because China needs energy to fuel its appetite for quick industrialization and it need a market for raw materials. To further cemented the relations between Sino-Africa, in 2000, China Africa Cooperation Forum was established. 3. Economic Dimension Africa is lack in capital and basic infrastructure. Its economy is import dependent and its base of economy is weak whereas all types of opposite condition are applicable to China. China's trade policy is clear; in exchange for oil and other natural resources that will serve China's economy with both the energy it needs to continue its economic booming and a more diverse marketplace in which Chinese manufactures goods can be solved, China will invest and export low cost manufactures.
With the establishment of the Forum on China-Africa Cooperation (FOCAC) in 2000, Chinese trade and investment in Africa skyrocketed. In 1999, prior to the establishment of FOCAC, bilateral trade between the two regions totaled $2 billion but in 2007 the volume rose to more than $40 billion a year and in 2010 it become about $114 billion (O' Brien, 2008: 78). More than 800 Chinese corporations are doing business in Africa mainly in infrastructure, energy and banking sector (Financial Times, 2009). Unconditional and low-rate credit interest of China is very attracting. Since 2000 more than $10 billion in debt owned by African nations to Chins has been cancelled (Wikipedia). One-third of Chinese oil
ISSN 2039-9340 Mediterranean Journal of Social Sciences Vol. 4 (1) January 2013
301
supplies come from the African continent. In 2008 and consecutive four years, China has been Africa's largest trading partner.
In 2007 China announced cutting tariffs for all goods imported from 25 out of 49 African countries with which China does business (O' Brien, 2008: 77). China increased tariff free export products from 190 to 440 between 2003 and 2007 to African states (Meidan, 2006: 83). China's trade with Africa has some basic characteristics. First of all, China's economic interests in Africa don't vary from those of western states. 2nd, it is not clear that China's engagement will substantially improve Africa's prospects for development. 3rd, the aggregate African trade with China has a huge deficit. 4th, local retailers are facing competition from expatriate Chinese traders. 5th, China's investment mainly covers labor-intensive and export oriented sectors. 6th, China's trade relations has soften the impact of the US and the EU economic sanctions. 7th, China's massive transfer of skilled personnel will have a negative impact on African job market. 8th, African capital-intensive export will create and imbalance in African job market. It is estimated that about 750000 Chinese workers have moved to Africa between 2000 and 2009 (Arvin and Shariff, 2009: 36). 9th, China encourages domestic capital to seek foreign investment opportunities. It is noted that China's FDI in Africa have jumped ten folds from 2000 to 2006 ((Arvin and Shariff, 2009: 36).). 10th, in recent years African states have received less western aid than they did during the 1980s. In 2007 alone, China offered $ 8.1 billion to Africa compared with only $2.3 billion from the World Bank ((Arvin and Shariff, 2009: 39). Finally, China is investing in countries where it is getting its natural resources from. In 2004, China's 54% of total investment has gone to oil-exporting states like Algeria, Libya, Nigeria and Sudan (De Looy, 2006: 26). At last, China's energy consumption is increasing day by day; by 2025 China will import an additional 7.2 million b/d of foreign oil which is now nearly 3.7 million b/d (Butts and Bankus, 2009: 5). After the Middle East, that constitutes 44%, the African region, which accounts for 32%, is the second largest source of energy imports for China (.Butts and Bankus, 2009: 5). In addition, every economic site has political dimensions here because the 'one-China' principle is the political foundation for the establishment of Afro-Sino economic relations (Oloo, 2011: 2). 4. More than Business Beyond simply economic and trade relations between the two, higher political and diplomatic exchange has increased. Referring to itself as the largest developing state, China exposed itself to the African nations as an important alternative non-western model of governance and economic development. China makes African states understood that China is one of their own. This kind of solidarity has provided notable support to China. This partnership will prove integral in any disputes that may arise with the west. China puts a high priority on preserving strong relations with its African energy suppliers through investment, debt relief, aid, high level visit and a policy of non-interference in domestic affairs that is really suit to African autocratic government. China imports its 82% of oil from Africa mainly are of grim human rights records (Langan, 2008). There are three groups of African states, 1st, transition countries-those are continuing their political transitions from autocratic to democratic political system. Promoting democracy is not an objective of China's Africa policy. 2nd, energy rich countries-simply resourceful states, China holds access to those resources by subordinating international attempts to solve the political problems of those states (Tull, 2006: 474). 3rd, post-conflict states- China is politically willing to solve these conflict through UN guidance by sending troops to serve its military interest as well. It is noted that, negative political development that almost cannot contribute to the promotion of peace. Chinese aid has been considered as foreign policy instrument to manipulate its donors' political decision. 5. Military Engagement Though China follows 'non-interference in domestic politics' policy, it maintains a military relation with African states. China sells arms and keeps military relations to some pariah states in Africa especially the conflict-zones which have come under western sanctions and UN's embargo so that China gain support from African states in the UN to serve its political goals. China's proliferation of arms helps to start conflict or exacerbate the existing ones. China mainly offers security alternative to the West for African states through its military deals.
During the revolutionary struggle for independence in 1950s, China exported arms to fight Western imperialism. Between 1955 and 1977 a worth of $142 million military equipment was sold to African countries (Le Monde Diplomatique, 2009). To fight against the French colonial power, from 1957 to Algerian independence, China supplied military training and weapons to the Algerian National Liberation Front. China offered to send 280000 volunteers to Egypt during the Suez crisis (Chuka, 2011: 70). It is reported that Chinese military instructor made Ghana a base for training guerrilla fighters and Rhodesian freedom fighters Mozambique Liberation Front received training in China (Chuka: 17).
ISSN 2039-9340 Mediterranean Journal of Social Sciences Vol. 4 (1) January 2013
302
After the Cold War, due to the low prices of Chinese made weaponry and military equipment an increasing number of African countries shifted from their traditional sources like Russia to China. China maintains close military relations with some African states which are experiencing high levels of internal instability and serious governance deficits.
Recently, China's military involvement in Africa mainly covers its arms selling, construction of small arms factory, participation in UN peacekeeping operation and defending its involvement and personnel (Holslag, 2009: 24). There is no Chinese military presence in Africa other than that used in UN peacekeeping missions. In 2004, China deployed newly 1500 solders under the UN peacekeeping mission in Africa (Le Monde Diplomatique, 2009).
China's arms sales to Africa between 1996 and 2003 made up 10% of all arms transfers to Africa, from 2004 to 2007 China's percentage increased to almost 18% (Chuka, 2011: 72). China's arms sales to Africa stood at $1.3 billion in 2003 (Alden, 2007). The Chinese have set up three small arms factories in Sudan. Faced with Western sanction, Mugabe's Zimbabwe got $28 million in arms between 2005 and 2007 (Chuka, 2011: 71). China granted Nigeria $1 million in 2001 to upgrade its military facilities (Chuka, 2011: 71). China clearly opposed efforts within the UNSC to preserve of punish these frugal governments of Africa. Many Chinese firms were accused of smuggling illegal arms. During the Ethiopian-Eritrean war in 1998, China delivered arms to both sides for a total of more than $1 billion (De Looy, 2006: 25). Such military involvement in ongoing civil wars and conflict in Africa is not conducive for peace in Africa. 6. Environment-that matters China's indiscriminate investment and exported Chinese-model, that is quick industrialization denying environment, have contributed to unchecked environmental degradation in Africa. As Chinese companies don't maintain environmental standard in China, they are not conscious in environmental protection in Africa as well. These companies are more concerned with extracting energy resources than environmental degradation in African host countries. China wants to export its environmental problem to Africa. Mainly China's investment covers in such sectors those are environmentally sensitive such as oil and gas exploration, mining, hydropower, timber extraction and so on that causes environmental problem. Chinese companies chose Africa as investment friendly region because of lack in environmental governance. For example, in 2002, Chinese Exim bank agreed to fund for building the Merowe Dam in Sudan which was refused to support by France's Official Credit Agency because of its environmental and social impacts. The dam displaced up to 70,000 Sudanese and the Sudanese government violated the Environmental Protection Act of 2000 (Langan, 2008). As China banned extracting timber from its own states, Chinese companies import timber from African states and now China is the biggest importer of timber out of which 80% imports from African states. China wants to transfer polluting companies to African states to manage its emission. 7. The Great Game: Making it Non-zero-sum Britain and France in history fought major wars of occupation to control African gold, copper, and cocoa. By establishing military and commercial partnership with African states, the US at the end of the Cold war kicked European powers out of Africa. Western powers racist policies hampered in common values of indigenous African. The EU under the flag of partnership for peace and security emerged as a new player in Africa. The emergence of Chins as a force in Africa complicated the game. The Chinese leaders were drawing attention to the common anti-imperialist struggle of China and Africa. After the Cold war, the relationship between Europe and Africa can be described as neo-colonial. Chinese investment, loan, debt relief provides an alternative for western ones. As China was not involved in trans-Atlantic slave trade; colonialism on the one hand, African liberation struggle was promoted by Chinese support in all types; China and AU states formed the part of the South-South bloc on the other hand makes the Afro-Sino relations cemented than that of with Western ones.
In practice, China and the US have different approaches to the continent. Whereas China prefers business and non-interference policy, the US highlights conditional business and interferes in domestic affairs. While Chinese premier and president frequently visit Africa, the US president's visit to this area is not noteworthy. China gives emphasis on business on the other hand the US puts a high priority on countering terrorism, piracy and drug trafficking. The US has a designed military command-AFRICOM- for Africa with a base about 3000 military and civilian personnel in Djibouti (Shinn, 2011: 3). China passed the US and become Africa's most important trade partner in 2009. China-Africa trade totaled $127 billion in 2010 compared to $113 billion for the US-Afro trade (Shinn, 2011: 3). The US and EU countries each import almost one-third of Africa's total oil exports, significantly more than China imports. The Chinese aid, FDI volume is more than that of the US.
The major inherent challenges for the US-China cooperation in Africa is to overcome long standing suspicions between the two countries and it is urgent to convince the African countries that the US and China are not trying to gang
ISSN 2039-9340 Mediterranean Journal of Social Sciences Vol. 4 (1) January 2013
303
up on them. Now the US and China are working hand in hand in UN peacekeeping mission and combating malaria. Both seek stability in Africa.
China's conditions of aid and loan have been widely criticized by the US. China's military equipment export to the autocratic states is the target of criticism and sanctions by America. The US warns that China's unwillingness to criticize its African allies' human rights records and corrupt governance will undermine the development initiatives in Africa. By assisting economically and diplomatically, China enabled them to refuse Western-imposed reforms. The US government is also alarmed by China's role as one of Africa's primary arms dealers. On the other side, European states are increasingly reluctant to interfere in African affairs. None of the EU member states drives as active policy towards Africa. The volume of trade between the two regions has decreased. Such as, between 1985 and 2006, EU's share of foreign trade with Sub-Saharan Africa has decreased from 3.2% to less than 1.4% (Tull, 2008: 4). However, European perceptions of China's involvement with Africa have been extremely negative because of China's economically 'industrialization through economic exploitation' and politically 'see no evil' policy. To say Chinese factor has contributed to a renewed European interest in Africa. 8. Neo-colonialism? China's policy is going to be mercantilist system in African region. China extracts raw materials and using them in its industrial revolution and then exporting finished products back to Africa is similar to the policy of colonial states. China's relationship with some of Africa's unsavory regimes has inhibited the international community from protecting human rights. Though China wanted to cover its neo-colonial look under its non-interference policy but China's involvement in Africa is under both skepticism and criticism by international community. China is going to flood the African market with its low-cost-made products and harming the expansion and survival of African local industries and business. 9. Soft-products A combination of economic and political consideration has increased the soft cultural exchanges between Africa and China. At the end of 2005, China had signed 65 cultural agreements with African nations and implemented 151 plans of cultural exchange (O' Brien, 2008: 82).. Relations in terms of bilateral education, tourism, sports are highly preferred in this context. There are three Chinese cultural centers in Africa. The Confucius Institute has 20 centers distributed around 13 African countries. China provides about 1200 government scholarships to African students every year and by the end of 2005, a total of 18,919 scholarships had been granted to students from 50 African countries (Ayenabo et al, 2012:6424). Tourism has become a major source of Sino-Afro cultural exchange. To note, 110,000 Chinese nationals visited in 2005 to the African continent (Ayenabo et al, 2012:6425). Though historical bitter experience is a barrier in Afro-Western relations, Chins will cultivate a favorable national image through its soft power. 10. Concluding Remarks In real terms, Afro-Sino relation is not mutually beneficial. It is not in a win-win position. China doesn't want to make this global game as non-zero-sum. China's booming economy, enormous investment, huge debt relief has till now failed to make Africa a sound economy based continent. On the other hand, it is not only China's responsibility to make Africa developed; others should come forward in cooperating gesture. China's non-interference policy should not be applicable to human rights, democracy promotion so that stable governance should be established. China should not make the policy implication of international community difficult in Africa. Only business cannot fill the vacuum that created in phase of history, other issues like environment, workers' conditions should be listed in. International community without any more criticism should think China as a catalyst in African development. References
Alden C (2007) China Into Africa. London: Zed Books Arvin, B Mak and Shariff, Ismail (2009) "China's Position in Africa: A Political Anatomy" World Affairs, Vol. 13, No 1 p.p.32-42 Ayenagbo, Kossi et al. (2012) "Sino-Africa Economic and Trade Relations: Its Impact and Implications on the African Continent" African
Journal of Business Management Vol. 6, No. 21, p.p. 6420-6427 Butts, Kent Hughes and Bankus, Brent (2009) "China's Pursuit of Africa's Natural Resources" Collins Center Study p.p. 1-12 Campbell, Horace (2007) " China in Africa: Challenging US Global Hegemony" in Manji. Firoze (eds.) "African Perspectives of China in
Africa" Fahamu: Nairobi

ISSN 2039-9340 Mediterranean Journal of Social Sciences Vol. 4 (1) January 2013
304
ChukaEnuka (2011) "China's Military Presence in Africa: Implications for Continental Instability" Sacha Journal of Policy and Studies Vol. 1, No 1, p.p.68-81
De Looy, Judith Van (2006) " Africa and China: A Strategic Partnership?" African Studies Centre, ASC Working Paper 67. Holslag, Jonathan (2009) "China's New Security Strategy for Africa" Parameters p.p. 23-37 Langan, Nora (2008) "Sino-African Relations: Mutually Beneficial" Asia in Diaspora, St. Lawrence University Meidan, Michal (2006) "China's Africa Policy: Business Now, Politics Later" Asian Perspective, Vol. 30 No.4 p.p. 69-93 O' Brien, Robert (2008) "The Implications of China's Increased Involvement in Africa: An Economic, Political and Cultural Analysis"
Journal of the Washington Institute of China Studies Vol. 3, No 1p.p. 75-86 Oloo, Dr. Adams (2011) "China's Threat to America in Africa" Al Jazeera Centre for Studies Shinn, David H. (2011) "China's Growing Role in Africa: Implications for U.S. policy" Hearing held by Senate Committee on Foreign
Relations Subcommittee on African Affairs. Tull, Denis M. (2006) " China's Engagement in Africa: Scope, Significance and Consequences" Journal of Modern African Studies, Vol.
44, no 3, p.p. 459-479 Tull, Denis M. (2008) " China in Africa: European Perceptions and Responses to the Chinese Challenge" African Studies Program, SAIS
Working Papers
ISSN 2039-9340 Mediterranean Journal of Social Sciences Vol. 4 (1) January 2013
305
Spiritual Well-Being and Fulfilment, or Exploitation by a Few Smart Ones?
The Proliferation of Christian Churches in West African Immigrant Communities in Canada
Michael Baffoe, MSW, PhD
Faculty of Social Work, 500B Tier Building
University of Manitoba, Winnipeg, MB, R3T 2N2, Canada Tel: 204-474-9682, Fax: 204-474-7594
E-mail: [email protected] Doi:10.5901/mjss.2013.v4n1p305 Abstract
Africans are spiritual by nature and hold strong beliefs in and their reverence for a Supreme Being, Spirits and their ancestors. The need for this strong spiritual attachment is not left behind when Africans migrate to Western countries. Often, the first step in their resettlement process is to join a religious grouping. One of such countries is Canada where there is a huge presence of Christian churches in the West African immigrant communities. While some have their origins from the continent, others were founded in Canada by some immigrants. Using Post-Colonial theory as basis for analysis, this paper, explores the phenomenal growth of these religious groupings within the West African communities in Canada, examines their backgrounds and modus operandi. The motives for founding or participating in these church groupings were found to be spiritual needs, socio-cultural and economic considerations. Among the followers, these include the use of the churches as conduits for maintaining religious and cultural identity, and ensuring security in foreign lands. For the leaders of these churches, the motives are about not only responding to spiritual needs but facilitating status improvement and financial gains.
Key Words: immigrants; diaspora; Africans; religion; spiritual well-being; exploitation; post-colonial theories; Canada
The Shortest Route to the African Mind is through his religion Chancellor (1961)
1. Introduction
The large migration from the African continent to Europe and North America from the mid 1970s to the present has given rise to the “importation” and recreation of Christian religious groupings or the African forms of them in their new homelands in the diaspora. For African immigrant communities in Canada, this is a growing phenomenon which calls for serious attention and study. Mensah (2009) calls this trend the “growth of ethnic Christianity in Canada” (p.24), which has introduced new dimensions, and cultural rituals to the religious landscape of Canada. Much research on immigrant communities in North America and particularly in Canada has focused on their economic and linguistic adaptation (Connor, 2009). There is however a dearth in the literature on research on the religious adaption of immigrants, especially African immigrants in Canada. The role of religion in the integration and settlement activities of African immigrant groups in Canada are those that have received the least attention in the available research.
In recognizing this gap in the immigrant religion literature, especially in Canada, this study is therefore an attempt to shed some light on this important and critical aspect of their lives in Canada: religion. An important aspect of this study is on a disturbing phenomenon of splinter or breakaway factions of these immigrant churches in the diaspora especially in Canada. It begins with some historical perspectives dealing with religion in Africa, Canadian migration trends, African migration into Canada, and the growing religious diversity this migration trend has produced. Post-colonialism, which is the theoretical framework for the study, is then presented and briefly examined. Thirdly, an overview of immigrant experiences in new societies is presented. Next, the methodology used for the study is discussed. The last section of the paper highlights the findings from the study and ends with a discussion of some of the reasons or factors for the proliferation of Christian Church groups in the West African immigrant communities in Canada, and their modus operandi which has produced tensions and problems within the West African immigrant Christian communities in Canada.
ISSN 2039-9340 Mediterranean Journal of Social Sciences Vol. 4 (1) January 2013
306
2. Historical Perspectives: Religion in Africa and Canadian migration trends The introduction of Christianity to West Africa dates back to the fifteenth century when Portuguese exploration and commercial voyages brought Roman Catholic missionaries to the West African Coast (Ojo, 1997). It is widely believed that these early missionary activities were the forerunners of the colonial conquests of many territories in Africa (Baffoe, 2002). The early Christian Missionary activities were led by the Orthodox Missions, mainly Catholic and later joined by the Presbyterians, Anglicans and Methodists. For a long time these were the main Christian Missionary Groups in West Africa (Gifford, 2004).
Colonization that followed the early missionary foray into West Africa brought new impetus to Christian missions and by the late nineteenth century, Christianity was firmly established in most parts of West Africa (Ojo, 1996). Roman Catholicism spread more in the French-speaking African colonies in the nineteenth century as a result of the policy of the French aimed at counteracting the growing influence of the British and their protestant missions (Sundkler, 2000).
The period from the 1970s has, however, witnessed a religious missionary revolution in Africa with the introduction of indigenous Pentecostal forms of worship. This new trend, referred to by some authors as the “Charismatic Renewal”, has resulted in the proliferation of Pentecostal and Charismatic Churches in the West Africa sub-region and beyond (Ojo, 1996; Onyina, 2004). Through their dramatic growth and missionary vigour incorporating much of African drumming and dancing into their modes of worship, this Pentecostal missionary revolution has, as Ojo (1996) points out, contributed in shifting Christianity’s centre of gravity to the non-Western world. Most of the early established Churches have been losing members to these Charismatic Churches over the past three decades (Gifford, 2004; Onyina, 2004).
Onyina, (2004) and Opoku (1990) argue that indigenous African Churches started to emerge on the African continent in the mid twentieth century when agitation for more scope for African leadership in the mission churches and the quest to make the church more indigenous, resulted in secessions from the mission churches. These secessions resulted in the emergence of African Independent Churches. They were known in Nigeria as Aladura churches, in Ghana as Spiritual churches and Harrist churches in Cote d’Ivoire (Ojo, 1996). These indigenous African churches witnessed tremendous growth as their mode of worship incorporating African cultural drumming and dancing was more appealing to the indigenous populations. Their evangelical zeal and emphasis on “healing” and “prophesy” was also attractive to their Africa adherents. They were able to attract Christians and non-Christians alike in large numbers (Turner, 1979). These movements have now become trans-cultural and international in scope.
Writers on African Charismatic Renewal (see Asamoah-Gyedu, 1998; Opoku, 1990; Tonah, 2007) document three phases of the growth of these West African indigenous Pentecostal and Charismatic missions. They position the first phase from the early 1970s to the late 1970s which was the era when the foundation for the missions was laid by evangelistic activity, with second phase in the 1980s witnessing the growth of mission consciousness and its sustenance with the formation of many indigenous mission agencies. The third phase, beginning in the early 1990s, was an era of rapid advance, a period when these indigenous African missions assumed an international focus. It is an aspect of this international focus and its current ramifications among West African diasporans in Canada that is the subject of this study
3. Immigrant Experiences in New Societies Canada’s demographic landscape has changed dramatically since the late 1960s, thanks mainly to immigration (Connor, 2009). Canadian immigration from the late 1960s to the present has been dominated by people from the previous non-traditional immigration sources of Northern and Southern Europe (Citizenship and Immigration Canada 2008). Most of the new arrivals have been from Asia, Latin America, the Caribbean and Africa. The periods from the mid 1970s and beyond, have seen the acceleration of African immigrant populations settling in Europe and North America (Onyina, 2004). Many of these have settled in Canada.
As at 2006, nearly twenty per cent of the Canadian population was foreign-born (Statistics Canada Census 2006). Many of this new wave of immigrants into Canada have been Africans. The earlier ones from the 1970s came as students and stayed on the completion of their studies while a large number of them also arrived from the mid 1980s through the 1990s as refugees as a result of political and social upheavals that swept through the African continent during this period (Torzcener, 1997). Canada has made great attempts to attract a growing skilled immigrant labour force, estimated at 62 per cent of all immigrants to Canada in 2001 (Citizenship and Immigration Canada 2008). With some of the Canadian Provinces also making strong attempts at attracting large numbers of skilled immigrants, including Africans, to boost their populations and labour force, the percentage of immigrants to the Canadian population is increasing. (Connor, 2009; Kelley and Trebilock, 1998).
First generation, new diaspora immigrants often choose to draw on the community expressive culture of their homelands to shape their group identities in their host country (Ekué, 2009). Through actively creating and re-creating
ISSN 2039-9340 Mediterranean Journal of Social Sciences Vol. 4 (1) January 2013
307
practicing and performing traditions from home, both among community members and in public settings, they use tradition and other forms of expression as tools to build a sense of community in their new societies (Connor, 2009). It is said that: You can take an African out of Africa, but you can never take Africa out of an African. African immigrants actively and consciously attempt to recreate their culture, eating habits, and other expressive items in their settlement in their new diasporan societies with the goal of maintaining cultural and other connections between their original homeland in Africa, themselves and their children born in the diaspora (Mensah, 2009).
Immigrants arriving in new societies become involved with religious organizations for a number of reasons. These include the desire for religious and spiritual support and the opportunity to socialize with others from their ethnic and language groups (Cadge and Ecklund, 2006). Immigrant religious congregations also provide formal and informal social services and networks that are needed to assist in the process of settlement and adaptation (Hurh & Kim, 1990; Blankston & Zhou, 1996; Ebaugh & Chafetz, 2000).
As Mensah (2009) explains, the Christian Religious groups in the African communities in Canada can be divided into two distinct groups: There are the overseas replicas or branches of mainstream Mission Churches like the Catholic, Methodist, Presbyterian, Anglican and Seventh-Day Adventists. The second group, the largest and ever-growing, consists of what has become known on the African continent and in disaporan settings as African Initiated Churches (AICs). These are Christian bodies that were established as a result of African initiatives, rather than on the initiative of foreign missionary organisations (Turner, 1979). This study will be looking at the history, and modus operandi of these churches in the West African immigrant communities in Canada.
The changing demographic face of Canada, as a result of immigration, has also led to ethnic and religious diversity across the country (Statistics Canada Census 2006). Immigration, voluntary or involuntary (as in the case of refugees), is a transition that often entails the severing of community ties, the loss of social networks, supports and familiar bonds (Berry, 1997). It can also, as Sonn (2002) puts it, mean the loss of taken-for-granted sources and systems of meaning (see also Ogbu, 1994). It has also been shown in some studies that the loss of interpersonal and social supports that may follow migration can contribute to negative social and psychological health outcomes for individuals and groups (Caplan, 1964; Cox, 1989).
Religion is seen to play a lot of roles in the lives of immigrants (Peschke, 2009). It affects various aspects of the immigrant’s life in his/her new society which include the development of personal identity and the day-to-day aspects of his/her life. Some researchers have posited that immigrants, especially racial minority immigrants, use religious associations and religious practices to counteract the cultural shock, alienation and discrimination they encounter in their new societies (Krupinski, 1984). Some have also attempted to highlight the interconnections between religion and migration (Mensah, 2009, Bramadat, 2005). In this connection, Smith (1978) characterises immigration as often a theologizing experience. As Adogame (2003) succinctly puts it, the discourse on immigration often privileges political and socio-economic considerations in a way that glosses over the religious factors that stimulate and impugn transmigration processes. He further points out that “religion is largely at the pivot of immigrants’ sense of individual and collective identities” (p.24). Adogame also strongly contends that “communities of the African diaspora (in Europe) organize themselves in such a way as to validate their sense of ethnic and religious identity, ensure and maintain security, and seek solidarity” (p.33).
There is a general agreement among most authors on immigrant adaptation that most immigrants put a lot of energy, when they migrate to new societies, into finding or rebuilding, in the host country, a faith community in which they can actively live out their faith (Sonn, 2002; Adogame, 2003; Mensah, 2009). Peschke (2009) also points out that religion is an important component of the personal identities for many people and in such situations their religion becomes the basis of their value system which also shapes their daily lives in new societies. Other authors assert that religion may also become an important part of the identity of an immigrant even if he or she had rather little interest in religious matters until leaving his or country of origin. Immigrants may join religious communities more eagerly as a way of seeking social and support networks in the absence of family and social links they have left behind in their home countries (see alsoConnor, 2009; Ekué, 2009).
Since immigrants are seen to be subject to arrays of adaptation pressures and challenges in their new society, they are likely to use their participation in religious congregations as mitigating factors (Connor, 2009). This has been observed as critical in the first phase of the immigrant’s integration process where religious observance and attachment to a religious community may provide the immigrant with a feeling of home and belonging that instils a sense of security and mutual support (Hirschman, 2004). Statistics Canada in their commentary in response to the changing religious composition of Canada as unearthed in the 2001 Census concluded that immigrants remain faithful to their religion, and even increase their devotion, because it eases their transition to Canada, offers them comfort and provides a support group (Statistics Canada, 2001).
ISSN 2039-9340 Mediterranean Journal of Social Sciences Vol. 4 (1) January 2013
308
Other writers have also pointed to the fact that religion has, in some cases, acted as a pull factor for migration where religious communities may play an important role in directing migration movements (Hagan and Ebaugh, 2003; Peschke, 2009). Sometimes migrants choose the point of migration destination because of particular religious links in that place where it will be easier to feel at home and to receive support (see also: Connor, 2008; Finke and Stark 1992, Killian, 2001, Wuthnow and Christiano, 1979).
For the purposes of this study, it is pertinent to refer to other studies that have highlighted the characteristics of some Charismatic Pentecostal Churches in Africa, and in African communities in the diaspora, (see Adogame & Weisskoppell (eds), 2005; Anderson, 2001; Bediako, 1995; Ekue, 2009). They point to the spread of Pentecostal and neo-charismatic Christianity in Africa, especially on the West Coast, due to an intentional transnational outreach of individual evangelists and the accentuated mobility of many Africans across national borders (see also Komolafe and Sunday, 2004). Religion, according to Hagan and Ebaugh (2003), is now drawn into virtually all aspects of international migration. In most parts of Africa, it not uncommon to see church or religious adherents consult with their pastors or church leaders on various aspects of their migration process: from the decision to migrate, the point of destination, the visa application process, other preparations for the journey, to the eventual arrival and settlement processes in the new society Tonah, 2007; Hagan and Ebaugh (2003).
4. Theoretical Framework This study and its findings are analyzed within the realms of post-colonial and post-colonialism theory. According to Ghandi (1968), post-colonial theory is a post modern intellectual discourse that consists of reactions to, and analysis of, cultural legacies of colonialism. It is also referred to as the cultural, intellectual, political, and literary movement of the twentieth and twenty-first centuries that is characterized by the representation and analysis of the historical experiences and subjectivity of the victims, individuals and nations of colonial power (Browne et. al, 2005; Macey, 2000). Furthermore, postcolonialism is marked by its resistance to colonialism and by the attempt to understand the historical and other conditions of its emergence as well as its lasting consequences (Macey, 2000).
Postcolonial theoretical perspectives can contribute to understanding how continuities from the past shape the present context of issues and events affecting former colonial subjects (Browne et al, 2005). Christianity is a legacy of colonialism, and it is pertinent to examine its lingering practice among Africans, both on the continent and as immigrants in the diaspora, more than half a century after the end of colonial rule in Africa. It was believed in many African societies that the influence of religion will fade with the decolonization movements and subsequent attainment of independence by most African countries up to the end of the 1960s (Adogame, 2003; Mensah, 2009). However, the opposite has happened and the influence of Christian religion has rather expanded across Africa (Mensah, 2009). In the process, religious groupings, especially those professing the Christian faith, have also mushroomed and proliferated among African immigrant communities in the dioaspora (Gifford, 2004; Adogame, 2003, Mensah, 2009).
I will argue that Christianity practices among Africans in the diaspora, the establishment of African Initiated Churches, must be linked to decolonization efforts, a process that centers on regaining political, cultural, economic and social self-determination as well as positive identities as individuals, families, communities and nations. Decolonization can be seen as a solution that draws on ‘colonized time’ and ‘pre-colonized time’ addressing the legacy of colonialism and drawing on knowledge and practices from pre-colonial times. 5. Methodology I employed a qualitative research methodology which privileges the experiences and perceptions of the participants and allows for the development of a rich and in-depth understanding of the community from the vantage point of its members (Sonn, 2002). By giving priority to the voices of the participants through their lived experiences, the researcher was better placed to develop emic understandings of individual and group experiences of the research participants. I utilized a Judgement sample approach. Also known as purposeful sample, this is the most common sampling technique in which the researcher actively selects the most productive sample to answer the research questions (Marshall, 1996; Burgess, 1989). 6. Research Questions The study sought to find answers to the following major research questions: Do immigrants of West African origins in Canada join religious groupings as part of normal integration process or as a cushion for the pressures of integration in a new society? Do leaders of religious organizations in West African immigrant communities in Canada tap into, and in
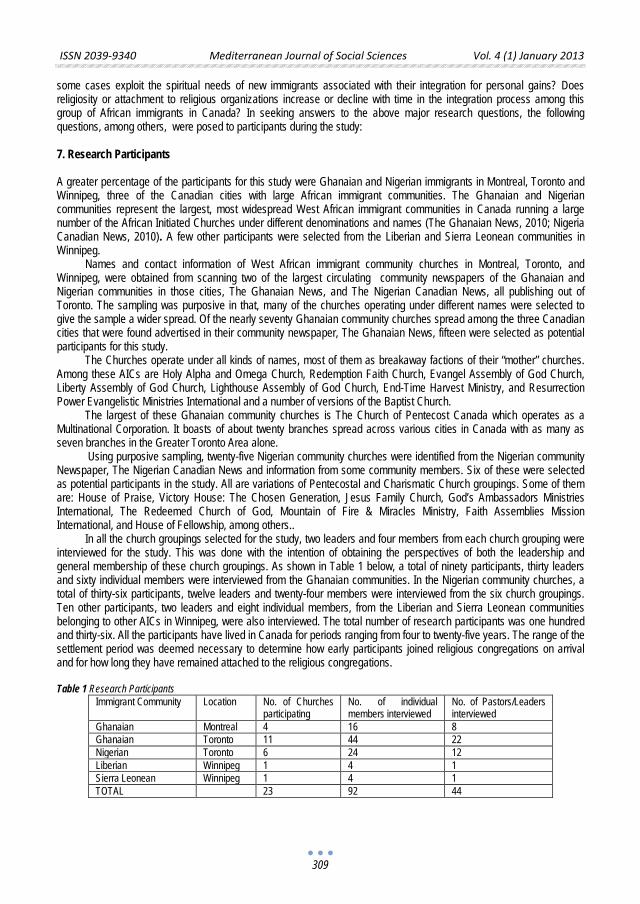
ISSN 2039-9340 Mediterranean Journal of Social Sciences Vol. 4 (1) January 2013
309
some cases exploit the spiritual needs of new immigrants associated with their integration for personal gains? Does religiosity or attachment to religious organizations increase or decline with time in the integration process among this group of African immigrants in Canada? In seeking answers to the above major research questions, the following questions, among others, were posed to participants during the study: 7. Research Participants A greater percentage of the participants for this study were Ghanaian and Nigerian immigrants in Montreal, Toronto and Winnipeg, three of the Canadian cities with large African immigrant communities. The Ghanaian and Nigerian communities represent the largest, most widespread West African immigrant communities in Canada running a large number of the African Initiated Churches under different denominations and names (The Ghanaian News, 2010; Nigeria Canadian News, 2010). A few other participants were selected from the Liberian and Sierra Leonean communities in Winnipeg.
Names and contact information of West African immigrant community churches in Montreal, Toronto, and Winnipeg, were obtained from scanning two of the largest circulating community newspapers of the Ghanaian and Nigerian communities in those cities, The Ghanaian News, and The Nigerian Canadian News, all publishing out of Toronto. The sampling was purposive in that, many of the churches operating under different names were selected to give the sample a wider spread. Of the nearly seventy Ghanaian community churches spread among the three Canadian cities that were found advertised in their community newspaper, The Ghanaian News, fifteen were selected as potential participants for this study.
The Churches operate under all kinds of names, most of them as breakaway factions of their “mother” churches. Among these AICs are Holy Alpha and Omega Church, Redemption Faith Church, Evangel Assembly of God Church, Liberty Assembly of God Church, Lighthouse Assembly of God Church, End-Time Harvest Ministry, and Resurrection Power Evangelistic Ministries International and a number of versions of the Baptist Church.
The largest of these Ghanaian community churches is The Church of Pentecost Canada which operates as a Multinational Corporation. It boasts of about twenty branches spread across various cities in Canada with as many as seven branches in the Greater Toronto Area alone.
Using purposive sampling, twenty-five Nigerian community churches were identified from the Nigerian community Newspaper, The Nigerian Canadian News and information from some community members. Six of these were selected as potential participants in the study. All are variations of Pentecostal and Charismatic Church groupings. Some of them are: House of Praise, Victory House: The Chosen Generation, Jesus Family Church, God’s Ambassadors Ministries International, The Redeemed Church of God, Mountain of Fire & Miracles Ministry, Faith Assemblies Mission International, and House of Fellowship, among others..
In all the church groupings selected for the study, two leaders and four members from each church grouping were interviewed for the study. This was done with the intention of obtaining the perspectives of both the leadership and general membership of these church groupings. As shown in Table 1 below, a total of ninety participants, thirty leaders and sixty individual members were interviewed from the Ghanaian communities. In the Nigerian community churches, a total of thirty-six participants, twelve leaders and twenty-four members were interviewed from the six church groupings. Ten other participants, two leaders and eight individual members, from the Liberian and Sierra Leonean communities belonging to other AICs in Winnipeg, were also interviewed. The total number of research participants was one hundred and thirty-six. All the participants have lived in Canada for periods ranging from four to twenty-five years. The range of the settlement period was deemed necessary to determine how early participants joined religious congregations on arrival and for how long they have remained attached to the religious congregations. Table 1 Research Participants
Immigrant Community Location No. of Churches participating
No. of individual members interviewed
No. of Pastors/Leaders interviewed
Ghanaian Montreal 4 16 8 Ghanaian Toronto 11 44 22 Nigerian Toronto 6 24 12 Liberian Winnipeg 1 4 1 Sierra Leonean Winnipeg 1 4 1 TOTAL 23 92 44
ISSN 2039-9340 Mediterranean Journal of Social Sciences Vol. 4 (1) January 2013
310
8. Findings/Analysis 8.1 Characteristics of African Initiated Churches in Canada Many of the community members surveyed for this study had arrived in Canada as refugees from the mid-1980s to the early 1990s. Being unsure of their immigration status, combined with economic difficulties and social isolation in their early lives in Canada, seeking another refuge in the Pentecostal/Charismatic Churches was not accidental or surprising. It corresponds to the pattern of the growth of the Pentecostal/Charismatic Church movements in West Africa from the late 1970s and early 1980s, periods of serious economic decline and social difficulties in West Africa. When most people in West Africa during these periods of economic difficulties found it difficult to make ends meet, they took solace in religion and flocked to the then emerging Pentecostals/Charismatic Churches. These churches promised hope, confidence, economic and social salvation to their followers in times of national gloom and personal difficulties (Gifford, 2004; Tonah, 2007). It is therefore not surprising that many of the West African immigrants and refugees who came to Canada in the mid 1980s and early 1990s chose the African Initiated Pentecostal/Charismatic Churches as their first points of religious call.
The study unearthed a very strong presence of Christian religious groupings in the West African immigrant communities in Canada. A total of one hundred and thirty active Christian Churches were identified in the West African immigrant communities in the three Canadian Cities surveyed, the largest numbers in Toronto. This is a very high number considering the population of these communities. The researcher also learned that there were other “churches”, “prayer groups” and “healing organizations” that operate out of the basements of their founders and leaders which we could not reach or publicly identify to be part of the study. Majority of these religious organizations are of Pentecostal/Charismatic persuasions.
Most of the Pentecostal and Charismatic Churches in the West African immigrant communities in Canada are typically led by strong and powerful leaders who are usually the “founders” of these churches. A typical characteristic of these churches is that they do not have a clearly laid-down structure of leadership and a church hierarchy (Tonah, 2007). The management of these churches therefore rests largely in the hands of a small group of charismatic pastors, founders and small circles of trusted followers of the pastors and founders. It is these loose structures and the concentration of management and power in the hands of the pastors, founders and a few leaders that have created a lot of tension within these churches and led to some members breaking away to form their own churches where the same cycle of leadership and management continue.
Of the Ghanaian community churches surveyed for this study, all the five Orthodox and Protestant churches were led by pastors “imported” from the original homeland, Ghana. All, but four of the AICs were founded and led by pastors “grown” in the local Ghanaian community in Canada. The Orthodox and Protestant churches had management structures quite similar to the “mother” churches introduced by the colonial missionaries in West Africa. All the Nigerian community churches were led by “Canadian-grown” Nigerian pastors who, like their Ghanaian community counterparts, virtually “owned” their churches.
Most of the respondents indicated that they have joined, and continue to belong to, other social networks within their communities in addition to their membership in the religious congregations. They point out that their social networks, mostly formed around their ethnic groups, and the religious congregations, provide them with a sense of belonging as well as socio-economic benefits. Some claimed to have accessed jobs through networking information obtained from their church congregations. Many also expressed the emotional, social and economic support they receive from their religious congregations in times of joy and sorrow: on the birth and baptism of their children in their new strange society, and in their periods of sorrow, mourning the death of family members ‘back home’ in their countries of origin as well as on the death of friends or relatives here in Canada. The above is buttressed by Hirschman’s (2004) formulation of the three Rs: refuge, respect, and resources, as motivation for immigrant religious group membership in host societies.
In the case of the Ghanaian community members, it is estimated from responses from participants that, the formation of their African Initiated Churches (AICs) started in the early 1990s when many of them who arrived in Canada as refugees obtained their permanent residence status. Before then, from the mid 1980s to the early 1990s most of the respondents said that they attended mainstream Canadian Church Congregations in Montreal and Toronto. The Congregations of choice for the Protestants were the United Churches of Canada, the Baptist Churches, and the Catholic Church Congregations for those of the Catholic faith. An interesting reason given by most of the respondents for starting or joining the African Initiated Churches (AICs) was that they wanted to worship in their native languages and cultures.
It also emerged from the study that attachment to religious organizations and church attendance among the targeted study population increased during their stay and settlement process in Canada, contrary to findings from other research with other immigrant groups in Canada and the United States which show declines in religious attendance and
ISSN 2039-9340 Mediterranean Journal of Social Sciences Vol. 4 (1) January 2013
311
attachments with time in the settlement process (Beyer, 1997; Cadge & Ecklund, 2006; Connor, 2009; Smith, 1998, van Tubergen, 2006; Wuthnow, & Christiano, 1979). Most of the participants reported joining the religious organizations within the first few months after their arrival in Canada. Many of them have undergone internal migration in Canada after their initial stay in one city, but continue their attachment to religious organizations even after their move from one Canadian City to another. 8.2 Breakaway factions Of significance to note, from the findings of this study, is the multiplication and division that have occurred within the churches established by these West African immigrant communities. An interesting finding from the study is that many of the members of the now established Catholic and Protestant churches in the West African communities in Montreal and Toronto were previously members of the emerging Pentecostal/Charismatic Congregations which were the first points of religious affiliation in their early years of settlement in Canada.
The breakaways from the Pentecostal/Charismatic Churches within the West African immigrant communities in Montreal and Toronto started with members who were originally of the Catholic and Protestant faith. After obtaining their permanent resident status and job security, many no more found the need for the message of hope, quick salvation and solace that is the central tenet of the Pentecostal/Charismatic Churches which the members loved to hear in times of uncertainty and fear. Other significant reasons for these breakaways, according to most participants, have been disagreements among the church leaderships and between the church leaderships and their followers on a number of issues, among which are the following:
a. Disputes over church finances, their mode of generation and use b. Disputes over processes for choosing or selecting leaders known in most of the African Initiated Churches as
“Elders”, “Deacons”, “Wardens”, “Evangelists” etc. These disputes and grievances that have erupted within many of the churches have led to suspensions and/or
dismissals of members from the churches by their leaders (pastors). Some church members complain of dictatorships by the leaders of these churches. Some have been changing churches and starting new ones as a result of unresolved disputes and grievances within their churches. For example, information obtained from study participants indicate that the Ghanaian community in Toronto started out in the early 1990s with less than ten churches. By the end of 2010, in less than twenty years, there are close to one hundred churches within the community estimated to be around 70,000 showing a high per capita church rate among that immigrant community in Toronto (The Ghanaian News, October, November, and December, 2010 editions).
The “growth” in the number of churches does not result from a large increase in the community’s population. They have been the result of divisions within these African Initiated Churches themselves due to unresolved grievances and disputes in the churches. For example, in the Ghanaian community in Toronto, what started as a small branch of the Ghana Methodist Church in someone’s basement in the early 1990s has resulted in the formation and existence of three different branches of the same Methodist Church as a result of grievances and disputes over Church leadership and finances. They now have the Ghana Methodist Church of Toronto, the Ghana Calvary Methodist United Church and the Wesley Methodist Church all with their own pastors, either posted from their country of origin or “ordained” here in Canada. The following are some excerpts from the interviews with some participants on the reasons for their breakaways from the churches:
One member lamented as follows:
Our pastor ran the church as his private property. Although we had a Council of Deacons and Elders in the Church, the pastor always took unilateral decisions, announced them in the church and demanded total agreement and compliance from the membership. It became clearer and clearer everyday that the so-called collective leadership we put in place in the church was a farce. He always appointed his cronies and those that never challenged his decisions to leadership positions especially those that involved finances. Over time, he and his wife had total control of the church finances and the membership had no idea what the financial situation of the church was. It was when all means for resolving the issue failed that we took the drastic step of breaking away to form our own church.
Another had this to say:
The problem we had in our former church was how decisions were taken by the pastor of and his small circle of loyalists in revenue collection. They will always come up with all kinds of new programs and demands for collecting monies. One of
ISSN 2039-9340 Mediterranean Journal of Social Sciences Vol. 4 (1) January 2013
312
such programs was his insistence that we buy him a big house to be designated as the Church Mission House. Some of us felt that our membership and revenue could not support the purchase of a house and monthly mortgage payments since we had a year before bought the pastor a brand new car valued at over $27,000 which was being paid from the church funds monthly. This led to serious disagreement within the church. Eventually the pastor managed to get some of the church Elders to sign for the mortgage for the five-bedroom house. This led to serious conflict and disagreement and when some of us were not being listened to, we broke away and started our own church and we are doing well.
Another complaint:
Our church was run like a dictatorship by our former pastor and a few of his loyal cronies, if I may call them so. You see some of us run to Canada as refugees because of political repression and dictatorships by our military and political leaders on our country of birth. Since we are in Canada and everything is run democratically, the last place we hope or feared to experience another dictatorship was within the very church that we had taken a second refuge. But the pastor of our former church demanded absolute loyalty from church members especially those he considered church “elders”. Whenever some of us disagreed with any of his directives and policies, he will use his next Sunday preaching to openly castigate us, sometimes describing our actions as driven by demons. Eventually he only consulted with very few people in the church whom I will describe as his “yes men”. The central disagreement was about money. When some of us could no longer stand the church-run dictatorship, we left with other to start our Catholic Church, our mother church from home.
Other disputes arose from the selection processes of church leaders. Some respondents pointed out that their complaints and grievances in their church revolved around issues of how leaders were chosen. While some complained about the selection processes involved in choosing the church leaders, other complained about the practice of importing “pastors” from their countries of origin which involved additional costs and strain to the churches’ financial strength.
Some excerpts from respondents:
A constant issue that always generated problems in our church was how Church Elders and Deacons were selected and/or promoted. There were no laid-down procedures for electing or even selecting the Elders and Deacons of the Church. Some members got “promoted” because of their close relationship with the pastor or because they don’t complain when things were going wrong. So we had situations where long-time members were by-passed for recent members in appointments as Elders and Deacons or membership to influential church committees
Another on processes for “importing” pastors from the country of origin:
Some of us were strongly against bringing in pastors from Ghana to head our church here. We suggested sponsoring some of the youth of the church who were graduating from universities here in Canada to train as pastors to lead the church as against spending huge sums of money to bring in pastors and their families from Ghana. That process cost a lot of money if you consider accommodation, transportation, the salary of the pastors and other expenses. We always had to buy a new car anytime a new pastor was posted from Ghana. Our suggestions were always overruled and this constant posting of pastors to the church from Ghana has cost a lot of money. Many people complained but were not listened to. That is the major reason why we broke away from the church and formed a new one. In our new church, we insist that the pastors have to be already residents of Canada. It has helped a lot.
Another complaint:
We have had three pastors posted to our church from Ghana since we started our church nearly ten years ago. The first stayed for three years and was transferred to another city in Canada. The second spent a full five years and was ‘recalled” back to Ghana. When the General Apostle in Ghana decided to send another from Ghana, some church members complained about the cost. The issue is that church members here in Montreal are never consulted on the selection of the pastors from Ghana. Some of us believed that this is out church; we started it before we got affiliated with the Head Branch in Ghana so decisions affecting our own church should be taken in consultation with our leadership here in Montreal. Our concerns and views were ignored and eventually this current pastor was sent from Ghana with his whole family of his wife and six children. We had to bear the cost of their transportation and settlement running close to $20,000. People are not happy but many don’t complain openly for fear of being branded. But I am afraid trouble is brewing and may explode one day which will affect the church
Most of the church members with grievances against their leadership point to the lavish lifestyles led by their pastors. Many of them point to the large houses and flashy cars driven by their pastors all of which are purchased by the churches ostensibly as church “property” but have never been returned to the churches when the pastors either leave the churches or return to their countries of origin at the end of their duty tours in Canada.
ISSN 2039-9340 Mediterranean Journal of Social Sciences Vol. 4 (1) January 2013
313
The responses from the pastors/church leaders were equally interesting. Almost all of them claim that their motivation for starting, leading or taking over the leadership of these AICs in Canada stem from the need to minister unto the religious and spiritual needs of their followers. They point to other social services and emotional support they provide to their members which include personal and marriage counselling, some financial support and avenues for networking for all kinds of needs for their members. An interesting excerpt from an interview with one pastor:
Our church, like the life of Jesus Christ, serves as the pillar for our members in their lives in Canada. We offer them hope where there is gloom, counselling in times of difficulties and even financial help where needed. I can say confidently that we have done more than the government agencies in assisting immigrants who come to our churches to find their way in settling in Canada While some admitted that their congregations have experienced some difficulties and even breakaways by some members at some points in time, they sought to put a religious spin to those grievances and crisis insisting that some of those problems with their congregations were either “temptations” or work of “the devil” which Christians must strive and pray constantly to overcome. They virtually dismiss the accusations some of the members levelled against some of the church leadership of personal financial gains, with some even claiming that those breaking away from their “mother” churches are either driven by greed or, to put it in religious parlance, succumbing to the “work of the devil”. An interesting spin on the breakaways by another pastor:
As a leader, when you are running a church, like the Lord’s vineyard, and ministering unto the flock, you must bear in mind that there will be temptations and the devil will always be at work to try to scatter the Lord’s sheep. You need to stand up to the devil and fight to protect the Lord’s flock. This is what I see happening in most churches here in Toronto. The devil is busy at work and we, as the Lord’s chosen commanders of his army need to stand up and fight. This is what I have done in my church by the power of God. Some people have left but I think they represented the hand of the devil which we managed to cut off to save the righteous ones and to protect the Lord’s work 9. Discussion Migration, as many authors maintain, is undoubtedly a transitional phase in which people experience both vulnerability and strength (Ekué, 2009; Ganiel, 2008; Miroslav, 1996). Being uprooted from familiar cultural contexts and resettling in new societies can cause serious acculturation problems. In these transitional phases therefore, the new migrants need safe spaces where these tensions can be articulated and shared with others. Most new immigrants in diasporan settings have sought solace in religion and religious organizations as cushions for their uncertainties. As Ekué, (2009) points out, migration churches, and in the case of West Africa immigrants in Canada, the AICs, offer such spaces, allowing people to express and live their faith in a new cultural context.
An interesting issue that emerged from the study is the fact that the issue of identity construction and consolidating a sense of belonging and acceptance in their new society are central themes for African immigrants in the diaspora. The quest for identity therefore becomes rooted in religion. New West African immigrants in Canada get attracted to these AICs as a way of creating spaces where these transnational situations can be articulated in familiar symbolic languages and cultures, drawing from a common world view and ritual action. In worship, in religious praxis, as Ekué, (2009) maintains, migrants are sending strong signals of self-esteem, pride and belief, “but also signs against the experience of injustice, suffering, and alienation” (p. 393).
The findings from this confirm some of the attributes of post-colonial theories: former colonial subjects engaging in actions or symbolisms seen as attempts to rid themselves of the vestiges of colonialism. Many of the study participants actually view their establishment and attachment to the AICs as attempts to worship in their own indigenous ways, different from the mode of worship introduced by the colonialists. It was inferred from the responses of participants that the post-colonial struggle was only used as a mask by its initiators in the leadership of these churches to reap some benefits from unsuspecting followers. The leadership of the AICs in the diapsora, as shown from this study, hold on tenaciously to this Mission House lifestyle where they insist on the Churches purchasing huge bungalows, also designated as ‘Mission Houses’ and automobiles for the Pastors and Church leaders. Nothing has changed much. The situation is likened to what Fanon (1952) called ‘Black Skins, White Masks’.
While recognizing their need to worship within the comforts of their own cultures and languages as one of the earlier motivating factors for setting up these AICs, this “motivating” reason is negated by the fact that visits made by the researcher to many of these Church Congregations revealed that all of them conducted their services in English, the colonizers’ language. In a few of the churches, the pastors preached in English and translation to the native West African languages was provided by interpreters. Apart from the addition of African drumming and high energy dancing, the mode of worship remains the same as those introduced by the colonizers on the African continent. As Ghandi (1968) points out,
ISSN 2039-9340 Mediterranean Journal of Social Sciences Vol. 4 (1) January 2013
314
the mere repression of colonial memory is, never in itself, tantamount to a surpassing of, or emancipation from, the uncomfortable realities of the colonial encounter.
It is clear from the reactions of members of the religious congregations studied that, in some cases, religion is used by the leaders/pastors to promise worldly happiness as well as heavenly salvation. But the reality seems to betray both religion and the legitimate pursuit of worldly happiness. The constant friction between some of the pastors/leaders of these immigrant churches and their members over finances and leadership positions point to motives other than religion and spiritual fulfilment. 10. Conclusion This study has been an attempt to scan another area of research into the religiosity of immigrants: the motivations and experiences of both founders and adherents of African Initiated Churches in the diaspora. Furthermore, it has provided evidence for the fact that many immigrants get attached to, and attend religious organizations that include large numbers of people from their ethnic backgrounds, language, or national group, to maintain and sustain their ethnic heritage and traditions. It also confirms the fact that immigrant communities in Canada, like their counterparts elsewhere in the diaspora, join religious organizations for social, legal and spiritual support. However, findings from the study also point to the dissatisfaction of some of the church members with their leadership on suspicions of exploitation for personal gains.
A number of respondents felt that they have not and are not getting a good return on the massive investments they have made in the churches in terms of time, money and emotional capital. Despite these views, they still see their churches as institutions for social and emotional support in new homelands. On the other hand, the pastors/leaders strongly maintain that they have provided and continue to provide for, and support the spiritual needs of their followers which, according to most of the pastors/leaders, are what they promise, not materialist prosperity. But, as Ehrenreich (2009) has suggested, and as this study discovered, many of these churches and their pastors/leaders exhibit behaviours or engage in lifestyles that are not explicitly religious. The leaders also strongly maintain the need to have congregations and mode of worship that is in line with their own cultures and indigenous ways. However, as Memmi (1968) argues, the colonial aftermath is fundamentally deluded in its hope that the architecture of a new world will magically emerge from the physical ruins of colonialism.
Post-colonial subjects, Memmi (1968) maintains, usually underestimate the psychologically tenacious hold of the colonial past on the post-colonial present which entails visible apparatus of freedom but the concealed persistence of unfreedom, always clinging to the structures and ways of life of the colonizer. The post-colonial leaders in this study, church leaders/pastors, pretend to be shedding memories and vestiges of colonialism, but maintaining the colonial structures that ensure or provide them with the same benefits enjoyed by the colonial masters, a situation of Black Skins, White Masks (Fanon, 1952). It is my hope that this will generate interest in further studies on the motivations of the leaders/pastors who found and lead these religious organizations in the diaspora. References Aboagye Mensah (1998). The Protestant Experience, in Ghana. In, the Journal of African Christian Thought, vol. 1, no. 2, 34-42 Adogame, A. (2003). Betwixt Identity and Security: African New Religious Movements and the Politics of Religious Networking in
Europe. Nova Religio: The Journal of Alternative and Emerging Religions, vol. 7, Issue 2, 24-41 Adogame, A. & Weisskoppell, C. (eds), 2005. Religion in the Context of African Migration, Bayreuth African Studies Series, no. 75,
Bayreuth, Germany: Pia Thielmann & Eckhard Breitnger Anderson, A. H. (2001). African Reformation: African Initiated Christianity in the 20th Century, Trenton, NJ: Africa World Press, Inc. Asamoah-Gyedu (1998): The Church in the African state – The Pentecostal/Charismatic Experience in Ghana, Journal of African
Christian Thought, Vol. 1, No. 2, 51-57 Baffoe, M. (2002). Demonizing African Culture in the Name of Christianity. Black Studies, Center, Montreal, QC Bediako, K. (1995). Christianity in Africa: The Renewal of a Non-Western Religion. Edinburgh, UK: Edinburgh University Press Berry, J. W. (1997). Immigration, acculturation and adaptation. Applied Psychology: An International Review, 46, 5-34 Beyer, P. (1997). Religious vitality in Canada: The complementarity of religious market and secularization perspectives. Journal for the
Scientific Study of Religion, 36(2), 272-287. Blanckston, C, L., & Zhou, M. (1996). The ethnic church, ethnic identification, and the social adjustment of Vietnamese adolescents.
Review of Religious Research, 38, 18-37 Bramadat, P. (2005). ‘Beyond Christian Canada: Religion and Ethnicity in a Multicultural Society’. In Bramadat, P & Seljak, D. (eds).
Religion and Ethnicity in Canada, pp. 1-29, Toronto: Pearson Longman Browne, A .J., Smye, V. L., and Varcoe, C. (2005). The Relevance of Postcolonial Theoretical Perspectives to Research in Aboriginal
Health. Canadian Journal of Nursing Research, 37(4): 16-37.
ISSN 2039-9340 Mediterranean Journal of Social Sciences Vol. 4 (1) January 2013
315
Burgess, R. G (1989, ed.). Field research: a sourcebook and manual. London: Routledge Cadge, W. & Ecklund, E. H. (2006). Religious Attendance Among Immigrants. Evidence from the New Immigrant Survey-Pilot. American Behavioral Scientist, vol. 49 no. 11, July 2006, 1574-1595
Cox, D. R. (1989). Welfare practice in a multicultural society. Sydney, Australia: Prentice Hall Citizenship and Immigration Canada. (2008). Facts and Figures 2006 immigration overview: Permanent residents. http://www.cic.gc.ca/
english/resources/statistics/facts2006/permanent/01.asp. Connor, P. (2009). Immigrant Religiosity in Canada: Multiple Trajectories. International Migration & Integration (2009) 10:159-175 Connor, P. (2008). Increase or decrease? The impact of the international migratory event on immigrant religious participation. Journal of
the Scientific Study of Religion, 47(2), 243-257 Ebaugh, H. R., & Chafetz, J. S. (2000). Religion and the new immigrants: Continuities and adaptations in immigrant congregations. New
York: Alta Mira Press Ekué, A, A. (2009). Migrant Christians: Believing Wanderers between Cultures and Nations, The Ecumenical Review, vol. 61, no.4,
December 2009. Ehrenreich, B. (2009). Bright-Sided: How the Relentless Promotion of Positive Thinking has Undermined America. New York:
Metropolitan Books. Fanon, F. (1952). Black Skin, White Masks (1967 Translation by Charles Lam) Markmann: NY, Grove Press. Finke, R. & Stark, R. (1992). The churching of America, 1776-1990: Winners and losers in our religious economy. New Brunswick:
Rutgers University Press Ganiel, G. (2008). Is the Multicultural Congregation an Answer to the Problem of Race? Comparative Perspectives from South Africa
and the USA. Journal of Religion in Africa 38, p.263-283 Gifford, P. (2004). Ghana’s New Christianity: Pentecostalism in a Globalizing African Economy. Hurst & Company, London Habermas, J. (2002). Religion and Rationality: Essays on Reason, God, and Modernity, Cambridge, Massachusetts: the MIT Press. Hagan, J. & Ebaugh, H. R. (2003). ‘Calling upon the Sacred: Migrants’ Use of Religion in the Migration Process.’ International Migration
Review, 37, 4: 1145-11962 Hirschman, C. (2004). The role of religion in the origins and adaptation of immigrant groups in the United States. The International
Migration Review, 38(3), 1206-1234. Hurh, W. M., & Kim, K. C. (1990). Religious participation of Korean immigrants in the United States. Journal for the Scientific Study of
Religion, 29, 19-34 Kelley, N. & Trebilock, M. J. (1998). The making of a mosaic: A History of Canadian immigration policy. Toronto: University of Toronto
Press Killian, C. (2001). Cultural Choices and identity negotiation of Muslim Maghrebin women in France. Ph. D dissertation, Department of
Sociology, Emory University Komolafe, C. F, and Sunday B. (2004). The Changing Face of Christianity: Revisiting African Creativity, Missiology Vol. 31, No. 2, p.
217-238 Krupinski, J. (1984). Changing patterns of migration to Australia and their influences on the health of immigrants. Social Science and
Medicine, 18, 927-937 Macey, D. (2000). Dictionary of Critical Theory. London: Penguin Books. Marshall, MN. Sampling for qualitative research. Family Practice 1996; 13: 522-525. Mensah, J. (2009). ‘Doing Religion’ Overseas: The Characteristics and Functions of Ghanaian Immigrant Churches in Toronto, Canada.
Societies Without Borders 4(2009) 21-44 Mensah, J. (2008). Religious transnationalism among Ghanaian immigrants in Toronto: a binary logistic regression analysis. The
Canadian Geographer, 52, no. 3(2008) 309-330 Miroslav, V. (1996). Exclusion and Embrace: A Theological Expression of Identity, Otherness and Reconciliation, Nashville: Abingdon
Press Ojo, M. A. (1997). The Dynamics of Indigenous Charismatic Missionary Enterprises in West Africa, Missionalia 25, no.4 (1977): 537 -61 Ojo, M. A. (1996). Charismatic Movements in Africa. In Christianity in Africa in the 1990s, Walls, A. F. & Fyfe, C. (eds). Edinburgh:
University of Edinburgh: 92-96 Ojo, M. A. (1995). The Charismatic Movement in Nigeria Today. International Bulletin of Missionary Research, 19(3): 114-118. Onyina, O. (2004). Pentecostalism and the African Diaspora: An Examination of the Mission Activities of the Church of Pentecost.
PNEUMA: The Journal of the Society for Pentecostal Studies vol. 26, No. 2, Fall 2004 Opoku, K. A. (1990). A Brief History of Independent Church Movements in Ghana since 1862,in The Rise of Independent Churches in
Ghana, Accra, Asempa Publishers, 22-26 Pescheke, D. (2009). Role of Religion for the Integration of Migrants in Europe: some Reflections. World Council of Churches Rouner, L. S. (1995). In pursuit of Happiness. Notre Dame: University of Notre Dame Press Schleiermacher, F. (1988). On Religion: Speeches to Its Uncultured Despisers. Trans. Richard Crouter. Cambridge: Cambridge
University Press. Smith, C. (2000). Christian America? What Evangelicals Really Want, Berkeley and Los Angeles: University of California Press. Smith, T. W. (1998). A review of church attendance measures. American Sociological Review, 631(1), 131-136 Smith, J. Z. (1982). “The Devil in Mr. Jones.” Imagining Religion: From Babylon to Jonestown. Chicago and London: University of
Chicago Press, 102-20. Smith, T. (1978). Religion and Ethnicity in America. American Historical Review, 83, 1155-1185

ISSN 2039-9340 Mediterranean Journal of Social Sciences Vol. 4 (1) January 2013
316
Sonn, C. C. (2002). Immigrant Adaptation: Understanding the Process through a Sense of Community. Migration and Sense of Community Research. New York: Kluwer
Statistics Canada (2006). Canadian Census 2006. www.statscan.ca. Accessed December, 2010 Statistics Canada (2001). Census of Canada, Catalogue #97F0010XCB01040 Sundlker, B. (2000). A history of the church in Africa, Cambridge: Cambridge University Press The Ghanaian News, (May, 2010, October 2010, February, 2011). The Ghanaian News Corporation, Toronto, Canada The Nigerian Canadian News (March, 2010, September 2010, January, 2011), Toronto, Canada Tonah, S. (2007). Ghanaians Abroad and Their Ties Home: Cultural and Religious Dimensions of Transnational Migration. COMCAD
Arbeitspapiere – Working Papers, Center for Interdisciplinary Research, Bielefeld, Germany, May 31 –June 2007 Torczener, J. (1997). The Demographic profiles of the Black Communities in Canada, McGill University, Montreal Turner, H. W. (1979). Religious Innovation in Africa, Boston: G. K. Hall van Tubergen, F. (2006). Religious affiliation and attendance among immigrants in eight western countries: Individual and contextual
effects. Journal for the Scientific Study of Religion, 45(1), 123-134. Wuthnow, R. & Christiano, K. (1979). The effects of residential migration on church attendance in the United States. In R. Wuthnow
(ed). The religious dimension: New directions in quantitative research. New York: Academic Press
ISSN 2039-9340 Mediterranean Journal of Social Sciences Vol. 4 (1) January 2013
317
Strategy for Developing a Body of Knowledge on Graduate Entrepreneurship
Miss Pimchanok Sangkaew1
Asst. Prof. Dr. Suphawan Vongkamjan 2 Dr. Somkiat Chaipiboon3
1. Candidate Student of Development Strategy Program, Nakhon Sawan Rajabhat University.
2. Major Advisor, Development Strategy Program, Nakhon Sawan Rajabhat University. 3. Co-Advisor, Development Strategy Program, Nakhon Sawan Rajabhat University.
Doi:10.5901/mjss.2013.v4n1p317 Abstract
The objectives were 1) to create strategy for developing a body of knowledge on graduate entrepreneurship and 2) to experiment strategies for developing a body of knowledge on graduate entrepreneurship. Qualitative research and quantitative research approaches were used. Data collection and analysis were done with In-Depth interview and focus group discussion for qualitative research. The experiment group composed of 60 students from Kamphaeng Phet Rajabhat University Maesot and was selected with Purposive Sampling Technique. The strategic for developing a body of knowledge on graduate entrepreneurship was composed of 3 system units as the followings.1. Changing attitudes 2. Organizing activities 3. Developing a sustainability. The experimental results of the 60 students showed that their post-test attitude mean score with 4.33 , was higher than their pre-test attitude mean score with 3.03. In addition, 83.33 percents of the students gained a better understanding on how to write a business plan, and they were able to real practice by setting up their own. The overall outcome of the strategy for developing a body of knowledge on graduate entrepreneurship was at good level. Those trained students had increased knowledge and ability of entrepreneurship than untrained with statistical significance at 0.0001. There were 56 students who can use body of knowledge on graduate entrepreneurship 60 students, 93.33 percents. Moreover, they have applied what they have learned into their real life. These outcomes have led us to believe that the students will be able to continue developing and improving themselves to be well-mannered entrepreneurs.
Key Words: Development Strategy, Body of Knowledge, Entrepreneur
1. Introduction The national research period during economic crisis to national restore, it was concluded that Thai educational system could not develop Thai people quality with full competence and not for all. Moreover, it did not build the human to be able to think with moral and ethic as it should be. It needs to reform education to be an education for all (The National Economic Development Board Office of the Prime Minister, 2007). Problem of education system was accumulated for long time to systemically improve and correct but the facing problem at present that is problem of education. Particularly, the qualities of teaching-learning, teacher quality, quality of teaching-learning media were in both governmental and private sectors and in both formal and non-formal educational system. Problem of retired between the semesters of student, problem of unemployment from work of graduate, problem of no change for education and problem of national youth had change for increased undesirable and it causes social problem and health and sanitation. These affected to educational quality of nation in every levels (National Research Council of Thailand, 2004).
Since 2007, Thailand faced with economic crisis due to global economy. The unemployment was recognized by social interest. Information of National Statistical Office surveyed the state of working. There is a rate of working status and it was found that rate of unemployment of Thai labor with approximate at 1-2 percents of labor force since 2006 to middle of 2009 (National Statistical Office, 2010 and The National Economic Development Board Office of the Prime Minister, 2007).
Thai Health Promotion Foundation (2010) latent unemployment or lower payment employment or receive lower income. It might be vigorous and severe at level four. The new graduate or higher was mostly impacted, particularly, the program that is not congruent to the market demand. It was obviously seen that survey was conducted the demand of work force of work place in 2009 (The last year was surveyed) of National Statistical Office. It was revealed that unemployment of graduate or higher was at two folds of force labor number at bachelor or higher than the demand of work place. Conversely, the other educational levels, the work place had demand of labor force more than supply.
ISSN 2039-9340 Mediterranean Journal of Social Sciences Vol. 4 (1) January 2013
318
Particularly, at secondary school level or lower (proportion of unemployment to demand of lower labor force), except, occupational certificate had equal proportion. This might make the bachelor or higher must be accepted to work in lower level of education than the graduation.
The degree of graduation and the income is lower than that he should receive, Jeerawan Boonperm, Administrator of National Statistical Office expressed the survey results that the state of peoples who had works in monthly in April of 2010. It was found that state of unemployment of 4.51 hundred thousand or 1.2 percents when compared with the same period of 2009, the number of unemployment was decreasingly with 3.66 hundred thousand or 0.9 percents. It is obviously seen that the state of unemployment of population has good trend. However, if considering on new graduate, it is still high unemployment and it was classified according to age group, it was found that one who is ld between 15-24 years and the youth had a rate of unemployment of 4.7 percents since this age group is new labor force, therefore this age group enters to market labor forces, then it has high rate of unemployment about 4-8 percents. From the past information, even though at present, the rate of unemployment of youth has decreased but it is still at high rate with 4.7 percents. Considering information from National Statistical Office, it was find that at present, the population with age group of working, there is 42.6 million or 64.0 percents of whole population. The major proportions were private employee with 38.0 percents. Subsequence was private business with 32.0 percents, family business with 18.0 percents, governmental employee with 9.0 percents and employer with 3.0 percents (Thiengkamol, 2007 and Thai Health Promotion Foundation, 2010).
Survey was conducted with the working of bachelor that graduated from governmental educational institute in Chiang Mai Province during 2006-2009, it was found that rate of graduate working in the first year before receiving the certificate, and most of graduate had occupation of employee in both government and private sectors. The proportions of working are interchanging in each year (Wikipedia, 2012).
With reason mentioned above, it needs to develop body of knowledge on graduate entrepreneurship by method of teaching-learning management. The body of knowledge of Maejo University and other universities had success as good fundamental pattern in collecting and developing body of knowledge on graduate entrepreneurship to be benefit for graduates. The lecturers and related persons would have body of knowledge on graduate entrepreneurship as teaching-learning management for student in university or educational institute. Moreover the academic can use the body of knowledge on graduate entrepreneurship and via real practice, therefore it affects to make student to realize and aware the importance of entrepreneurship and be able to be entrepreneur after graduation (National Research Council of Thailand, 2004).
2. Objective The research objectives were as followings:
1) To create strategy for developing a body of knowledge on graduate entrepreneurship. 2) To experiment strategies for developing a body of knowledge on graduate entrepreneurship.
3. Methodology The research design was implemented in steps by step as followings:
1. The qualitative research was used for strategy for developing a body of knowledge on graduate entrepreneurship. In-Depth Interview was used for data collection from 20 graduates who were business owners with business family and the others worked for 5-15 years before become business owners (Thiengkamol, 2011a). Focus group discussion was held with lecturer and administrator of every faculty of Kamphaeng Phet Rajabhat University (Thiengkamol, 2011a). There were 3 unit work systems of strategy development including; 1.1 Attitude Changing. 1.2 Promote and construct learning from real experiences. 1.3 Constructing continuity for sustainability
The quantitative research was used for experimenting strategies for developing a body of knowledge on graduate entrepreneurship. The experiment group composed of 60 students from Kamphaeng Phet Rajabhat University and was selected with Purposive Sampling Technique.
ISSN 2039-9340 Mediterranean Journal of Social Sciences Vol. 4 (1) January 2013
319
4. Results 4.1 In-Depth Interview Results The selected 20 graduate entrepreneurs of Kamphaeng Phet Rajabhat University were interviewed, they gave recommendations that the educational institutes should provide the additional knowledge of multi-disciplinary academics for student and provide an opportunity for student to have network of friend from other programs since to be an entrepreneur needs to have different knowledge and wide network to assist him to open his perspectives to search more careers. Moreover, it should suggest student to have a change to learn from real practice and have an opportunity to learn on benefit and loss, money administration, and planning including knowing about solving problems.
4.2 Focus Group Discussion Results Focus group discussion, the participants gave various guidelines for problem solving and the conclusion was the promotion of learning to be entrepreneur, theory and practice. The results of activity implementation of clear development of target problem, the results were as the followings.
1) Body of knowledge on graduate entrepreneurship, it can be concluded that the guideline of development, holding the entrepreneur camp that emphasized on multi-disciplinary academic together and provide an opportunity for student to have a real practice and continuous promotion for sustainability.
2) Analysis the thinking model on “Development Strategy” from focus group discussion to know problem and components of problem structure and it concluded that information from real existing was analyzed with thinking model on “Development Strategy” by defining and analyzing the target problems as the followings. a. Target problem was “lack of body of knowledge to be entrepreneur of graduate”. All participants agreed
that university lack of process of promotion for student to be entrepreneur or business owner because it emphasized on lecturer part with no practice or with less practice, therefore it should provide learning with practice for individual to learn together in problem analysis with learning process and reflecting continuously by working on real problems and reflecting based on their own experiences. Finally, the student will be able to propose guideline for solving problem and introducing the guideline to be practiced (Vanichcharoenchai, 2012).
b. Construct Component has cause and process that make target problem from conclusion of analysis among participants by method of data analysis of construct and 16 characteristics of teaching - learning as followings (Wikipedia, 2012). 1. Regarding to individual difference 2. Emphasizing on the need of learner 3. Developing the life quality of learner 4. Learning must be interesting not boring 5. Implementing with mercy and kindness to learner 6. Must be challenged for learner to eager to learn 7. To be aware the appropriate time for learner to learn 8. Must build the situation for learner to learn 9. Support and promote for learning 10. Must have aim of teaching 11. Must be able to understand learner 12. Regarding to background of learner 13. Not holding only one method 14. Good teaching and learning must be dynamic that is movement and changing all the time in terms of
activity arrangement, circumstance building, learning pattern, content and techniques etc. 15. Must teaching in thing that is not far from learner. 16. Must be systemic planning for teaching-learning
Therefore, learning of learner would be more efficiency, if planner of teaching-learning considers on good characteristics of learning, method of learning, principle of effective learning, principle of effective teaching and characteristics of teaching –learning as mentioned above in order to be information for planning of learning further.
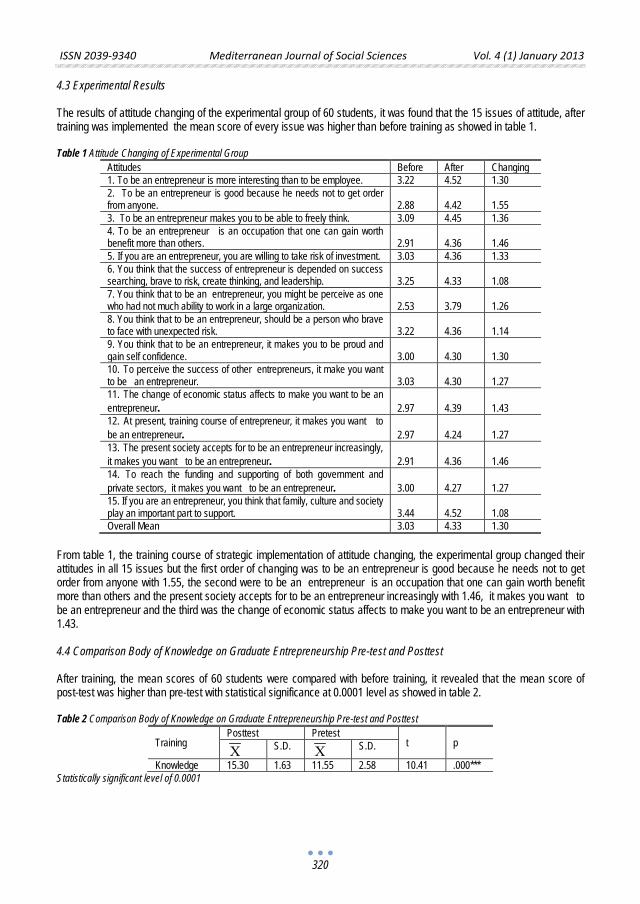
ISSN 2039-9340 Mediterranean Journal of Social Sciences Vol. 4 (1) January 2013
320
4.3 Experimental Results The results of attitude changing of the experimental group of 60 students, it was found that the 15 issues of attitude, after training was implemented the mean score of every issue was higher than before training as showed in table 1.
Table 1 Attitude Changing of Experimental Group
Attitudes Before After Changing 1. To be an entrepreneur is more interesting than to be employee. 3.22 4.52 1.30 2. To be an entrepreneur is good because he needs not to get order from anyone. 2.88 4.42 1.55 3. To be an entrepreneur makes you to be able to freely think. 3.09 4.45 1.36 4. To be an entrepreneur is an occupation that one can gain worth benefit more than others. 2.91 4.36 1.46 5. If you are an entrepreneur, you are willing to take risk of investment. 3.03 4.36 1.33 6. You think that the success of entrepreneur is depended on success searching, brave to risk, create thinking, and leadership. 3.25 4.33 1.08 7. You think that to be an entrepreneur, you might be perceive as one who had not much ability to work in a large organization. 2.53 3.79 1.26 8. You think that to be an entrepreneur, should be a person who brave to face with unexpected risk. 3.22 4.36 1.14 9. You think that to be an entrepreneur, it makes you to be proud and gain self confidence. 3.00 4.30 1.30 10. To perceive the success of other entrepreneurs, it make you want to be an entrepreneur. 3.03 4.30 1.27 11. The change of economic status affects to make you want to be an entrepreneur. 2.97 4.39 1.43 12. At present, training course of entrepreneur, it makes you want to be an entrepreneur. 2.97 4.24 1.27 13. The present society accepts for to be an entrepreneur increasingly, it makes you want to be an entrepreneur. 2.91 4.36 1.46 14. To reach the funding and supporting of both government and private sectors, it makes you want to be an entrepreneur. 3.00 4.27 1.27 15. If you are an entrepreneur, you think that family, culture and society play an important part to support. 3.44 4.52 1.08 Overall Mean 3.03 4.33 1.30
From table 1, the training course of strategic implementation of attitude changing, the experimental group changed their attitudes in all 15 issues but the first order of changing was to be an entrepreneur is good because he needs not to get order from anyone with 1.55, the second were to be an entrepreneur is an occupation that one can gain worth benefit more than others and the present society accepts for to be an entrepreneur increasingly with 1.46, it makes you want to be an entrepreneur and the third was the change of economic status affects to make you want to be an entrepreneur with 1.43. 4.4 Comparison Body of Knowledge on Graduate Entrepreneurship Pre-test and Posttest After training, the mean scores of 60 students were compared with before training, it revealed that the mean score of post-test was higher than pre-test with statistical significance at 0.0001 level as showed in table 2. Table 2 Comparison Body of Knowledge on Graduate Entrepreneurship Pre-test and Posttest
Training Posttest Pretest
t p X
S.D. X S.D.
Knowledge 15.30 1.63 11.55 2.58 10.41 .000*** Statistically significant level of 0.0001
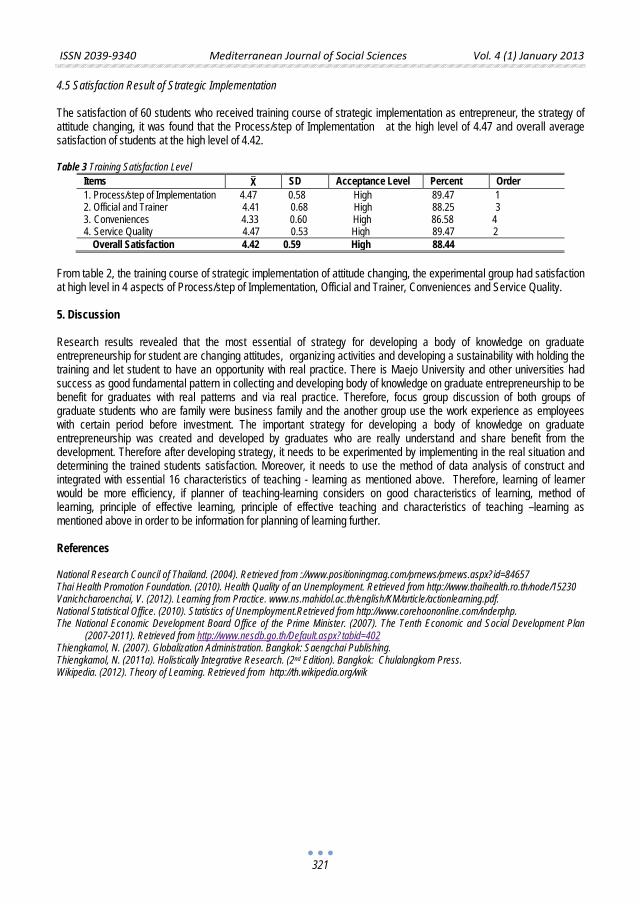
ISSN 2039-9340 Mediterranean Journal of Social Sciences Vol. 4 (1) January 2013
321
4.5 Satisfaction Result of Strategic Implementation
The satisfaction of 60 students who received training course of strategic implementation as entrepreneur, the strategy of attitude changing, it was found that the Process/step of Implementation at the high level of 4.47 and overall average satisfaction of students at the high level of 4.42. Table 3 Training Satisfaction Level
Items X� SD Acceptance Level Percent Order 1. Process/step of Implementation 4.47 0.58 High 89.47 1 2. Official and Trainer 4.41 0.68 High 88.25 3 3. Conveniences 4.33 0.60 High 86.58 4 4. Service Quality 4.47 0.53 High 89.47 2 Overall Satisfaction 4.42 0.59 High 88.44
From table 2, the training course of strategic implementation of attitude changing, the experimental group had satisfaction at high level in 4 aspects of Process/step of Implementation, Official and Trainer, Conveniences and Service Quality.
5. Discussion Research results revealed that the most essential of strategy for developing a body of knowledge on graduate entrepreneurship for student are changing attitudes, organizing activities and developing a sustainability with holding the training and let student to have an opportunity with real practice. There is Maejo University and other universities had success as good fundamental pattern in collecting and developing body of knowledge on graduate entrepreneurship to be benefit for graduates with real patterns and via real practice. Therefore, focus group discussion of both groups of graduate students who are family were business family and the another group use the work experience as employees with certain period before investment. The important strategy for developing a body of knowledge on graduate entrepreneurship was created and developed by graduates who are really understand and share benefit from the development. Therefore after developing strategy, it needs to be experimented by implementing in the real situation and determining the trained students satisfaction. Moreover, it needs to use the method of data analysis of construct and integrated with essential 16 characteristics of teaching - learning as mentioned above. Therefore, learning of learner would be more efficiency, if planner of teaching-learning considers on good characteristics of learning, method of learning, principle of effective learning, principle of effective teaching and characteristics of teaching –learning as mentioned above in order to be information for planning of learning further.
References National Research Council of Thailand. (2004). Retrieved from ://www.positioningmag.com/prnews/prnews.aspx?id=84657 Thai Health Promotion Foundation. (2010). Health Quality of an Unemployment. Retrieved from http://www.thaihealth.ro.th/node/15230 Vanichcharoenchai, V. (2012). Learning from Practice. www.ns.mahidol.ac.th/english/KM/article/actionlearning.pdf. National Statistical Office. (2010). Statistics of Unemployment.Retrieved from http://www.corehoononline.com/inderphp. The National Economic Development Board Office of the Prime Minister. (2007). The Tenth Economic and Social Development Plan
(2007-2011). Retrieved from http://www.nesdb.go.th/Default.aspx?tabid=402 Thiengkamol, N. (2007). Globalization Administration. Bangkok: Saengchai Publishing. Thiengkamol, N. (2011a). Holistically Integrative Research. (2nd Edition). Bangkok: Chulalongkorn Press. Wikipedia. (2012). Theory of Learning. Retrieved from http://th.wikipedia.org/wik

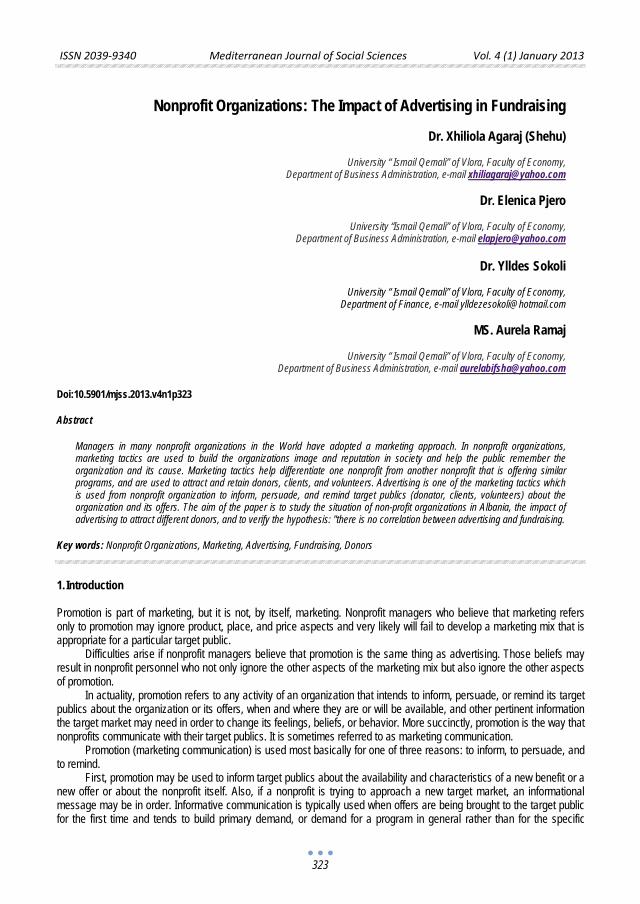
ISSN 2039-9340 Mediterranean Journal of Social Sciences Vol. 4 (1) January 2013
323
Nonprofit Organizations: The Impact of Advertising in Fundraising
Dr. Xhiliola Agaraj (Shehu)
University “ Ismail Qemali” of Vlora, Faculty of Economy,
Department of Business Administration, e-mail [email protected]
Dr. Elenica Pjero
University “Ismail Qemali” of Vlora, Faculty of Economy, Department of Business Administration, e-mail [email protected]
Dr. Ylldes Sokoli
University “ Ismail Qemali” of Vlora, Faculty of Economy,
Department of Finance, e-mail [email protected]
MS. Aurela Ramaj
University “ Ismail Qemali” of Vlora, Faculty of Economy, Department of Business Administration, e-mail [email protected]
Doi:10.5901/mjss.2013.v4n1p323 Abstract
Managers in many nonprofit organizations in the World have adopted a marketing approach. In nonprofit organizations, marketing tactics are used to build the organizations image and reputation in society and help the public remember the organization and its cause. Marketing tactics help differentiate one nonprofit from another nonprofit that is offering similar programs, and are used to attract and retain donors, clients, and volunteers. Advertising is one of the marketing tactics which is used from nonprofit organization to inform, persuade, and remind target publics (donator, clients, volunteers) about the organization and its offers. The aim of the paper is to study the situation of non-profit organizations in Albania, the impact of advertising to attract different donors, and to verify the hypothesis: "there is no correlation between advertising and fundraising.
Key words: Nonprofit Organizations, Marketing, Advertising, Fundraising, Donors
1. Introduction
Promotion is part of marketing, but it is not, by itself, marketing. Nonprofit managers who believe that marketing refers only to promotion may ignore product, place, and price aspects and very likely will fail to develop a marketing mix that is appropriate for a particular target public.
Difficulties arise if nonprofit managers believe that promotion is the same thing as advertising. Those beliefs may result in nonprofit personnel who not only ignore the other aspects of the marketing mix but also ignore the other aspects of promotion.
In actuality, promotion refers to any activity of an organization that intends to inform, persuade, or remind its target publics about the organization or its offers, when and where they are or will be available, and other pertinent information the target market may need in order to change its feelings, beliefs, or behavior. More succinctly, promotion is the way that nonprofits communicate with their target publics. It is sometimes referred to as marketing communication.
Promotion (marketing communication) is used most basically for one of three reasons: to inform, to persuade, and to remind.
First, promotion may be used to inform target publics about the availability and characteristics of a new benefit or a new offer or about the nonprofit itself. Also, if a nonprofit is trying to approach a new target market, an informational message may be in order. Informative communication is typically used when offers are being brought to the target public for the first time and tends to build primary demand, or demand for a program in general rather than for the specific
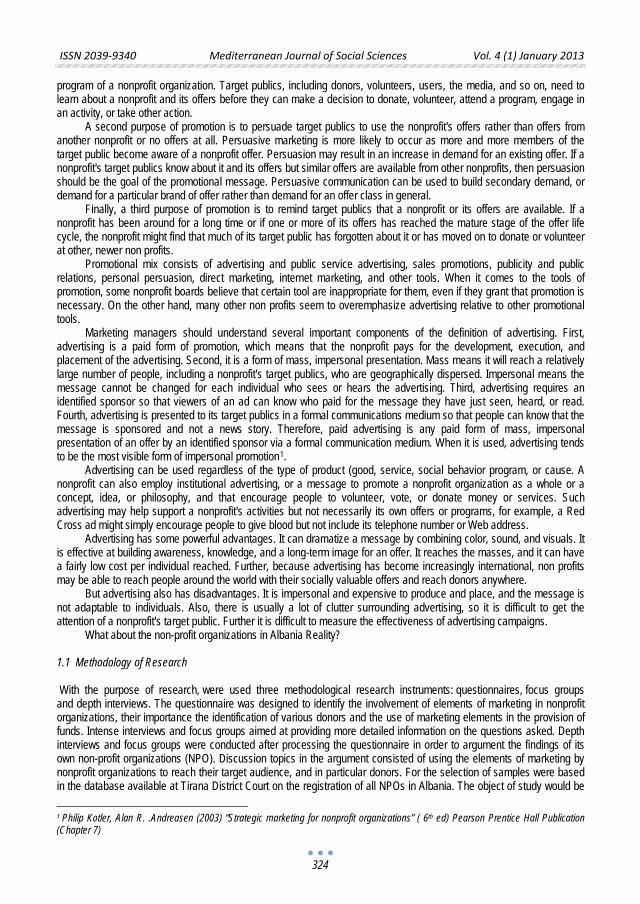
ISSN 2039-9340 Mediterranean Journal of Social Sciences Vol. 4 (1) January 2013
324
program of a nonprofit organization. Target publics, including donors, volunteers, users, the media, and so on, need to learn about a nonprofit and its offers before they can make a decision to donate, volunteer, attend a program, engage in an activity, or take other action.
A second purpose of promotion is to persuade target publics to use the nonprofit's offers rather than offers from another nonprofit or no offers at all. Persuasive marketing is more likely to occur as more and more members of the target public become aware of a nonprofit offer. Persuasion may result in an increase in demand for an existing offer. If a nonprofit's target publics know about it and its offers but similar offers are available from other nonprofits, then persuasion should be the goal of the promotional message. Persuasive communication can be used to build secondary demand, or demand for a particular brand of offer rather than demand for an offer class in general.
Finally, a third purpose of promotion is to remind target publics that a nonprofit or its offers are available. If a nonprofit has been around for a long time or if one or more of its offers has reached the mature stage of the offer life cycle, the nonprofit might find that much of its target public has forgotten about it or has moved on to donate or volunteer at other, newer non profits.
Promotional mix consists of advertising and public service advertising, sales promotions, publicity and public relations, personal persuasion, direct marketing, internet marketing, and other tools. When it comes to the tools of promotion, some nonprofit boards believe that certain tool are inappropriate for them, even if they grant that promotion is necessary. On the other hand, many other non profits seem to overemphasize advertising relative to other promotional tools.
Marketing managers should understand several important components of the definition of advertising. First, advertising is a paid form of promotion, which means that the nonprofit pays for the development, execution, and placement of the advertising. Second, it is a form of mass, impersonal presentation. Mass means it will reach a relatively large number of people, including a nonprofit's target publics, who are geographically dispersed. Impersonal means the message cannot be changed for each individual who sees or hears the advertising. Third, advertising requires an identified sponsor so that viewers of an ad can know who paid for the message they have just seen, heard, or read. Fourth, advertising is presented to its target publics in a formal communications medium so that people can know that the message is sponsored and not a news story. Therefore, paid advertising is any paid form of mass, impersonal presentation of an offer by an identified sponsor via a formal communication medium. When it is used, advertising tends to be the most visible form of impersonal promotion1
1.1 Methodology of Research
. Advertising can be used regardless of the type of product (good, service, social behavior program, or cause. A
nonprofit can also employ institutional advertising, or a message to promote a nonprofit organization as a whole or a concept, idea, or philosophy, and that encourage people to volunteer, vote, or donate money or services. Such advertising may help support a nonprofit's activities but not necessarily its own offers or programs, for example, a Red Cross ad might simply encourage people to give blood but not include its telephone number or Web address.
Advertising has some powerful advantages. It can dramatize a message by combining color, sound, and visuals. It is effective at building awareness, knowledge, and a long-term image for an offer. It reaches the masses, and it can have a fairly low cost per individual reached. Further, because advertising has become increasingly international, non profits may be able to reach people around the world with their socially valuable offers and reach donors anywhere.
But advertising also has disadvantages. It is impersonal and expensive to produce and place, and the message is not adaptable to individuals. Also, there is usually a lot of clutter surrounding advertising, so it is difficult to get the attention of a nonprofit's target public. Further it is difficult to measure the effectiveness of advertising campaigns.
What about the non-profit organizations in Albania Reality?
With the purpose of research, were used three methodological research instruments: questionnaires, focus groups and depth interviews. The questionnaire was designed to identify the involvement of elements of marketing in nonprofit organizations, their importance the identification of various donors and the use of marketing elements in the provision of funds. Intense interviews and focus groups aimed at providing more detailed information on the questions asked. Depth interviews and focus groups were conducted after processing the questionnaire in order to argument the findings of its own non-profit organizations (NPO). Discussion topics in the argument consisted of using the elements of marketing by nonprofit organizations to reach their target audience, and in particular donors. For the selection of samples were based in the database available at Tirana District Court on the registration of all NPOs in Albania. The object of study would be 1 Philip Kotler, Alan R. .Andreasen (2003) “Strategic marketing for nonprofit organizations” ( 6th ed) Pearson Prentice Hall Publication (Chapter 7)
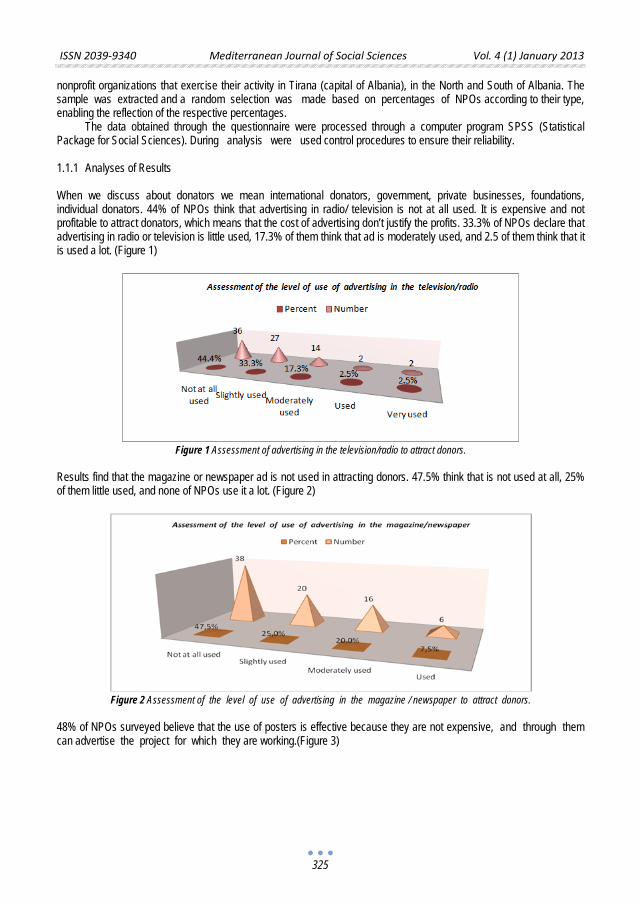
ISSN 2039-9340 Mediterranean Journal of Social Sciences Vol. 4 (1) January 2013
325
nonprofit organizations that exercise their activity in Tirana (capital of Albania), in the North and South of Albania. The sample was extracted and a random selection was made based on percentages of NPOs according to their type, enabling the reflection of the respective percentages.
The data obtained through the questionnaire were processed through a computer program SPSS (Statistical Package for Social Sciences). During analysis were used control procedures to ensure their reliability.
1.1.1 Analyses of Results
When we discuss about donators we mean international donators, government, private businesses, foundations, individual donators. 44% of NPOs think that advertising in radio/ television is not at all used. It is expensive and not profitable to attract donators, which means that the cost of advertising don’t justify the profits. 33.3% of NPOs declare that advertising in radio or television is little used, 17.3% of them think that ad is moderately used, and 2.5 of them think that it is used a lot. (Figure 1)
Figure 1 Assessment of advertising in the television/radio to attract donors.
Results find that the magazine or newspaper ad is not used in attracting donors. 47.5% think that is not used at all, 25% of them little used, and none of NPOs use it a lot. (Figure 2)
Figure 2 Assessment of the level of use of advertising in the magazine / newspaper to attract donors.
48% of NPOs surveyed believe that the use of posters is effective because they are not expensive, and through them can advertise the project for which they are working.(Figure 3)
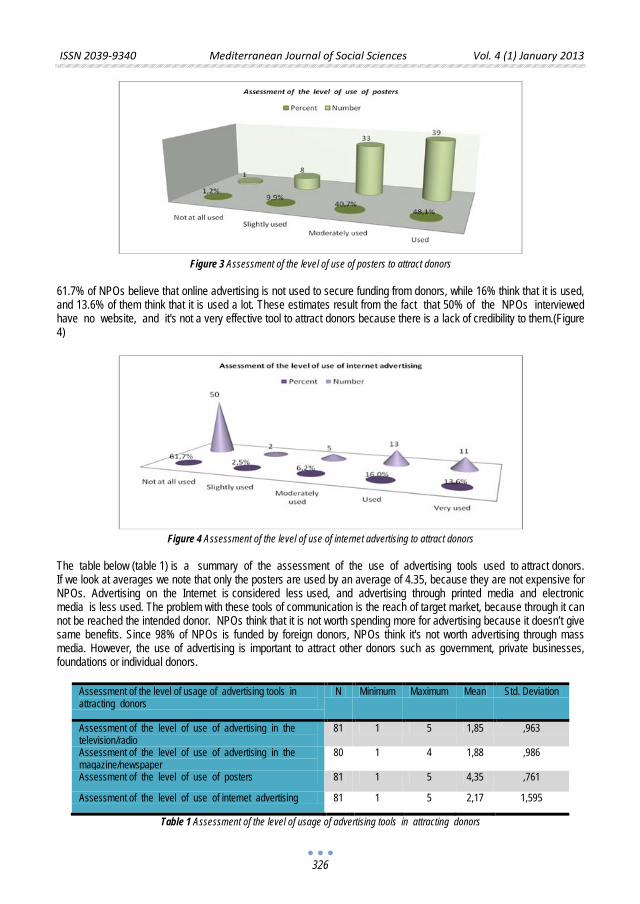
ISSN 2039-9340 Mediterranean Journal of Social Sciences Vol. 4 (1) January 2013
326
Figure 3 Assessment of the level of use of posters to attract donors
61.7% of NPOs believe that online advertising is not used to secure funding from donors, while 16% think that it is used, and 13.6% of them think that it is used a lot. These estimates result from the fact that 50% of the NPOs interviewed have no website, and it's not a very effective tool to attract donors because there is a lack of credibility to them.(Figure 4)
Figure 4 Assessment of the level of use of internet advertising to attract donors
The table below (table 1) is a summary of the assessment of the use of advertising tools used to attract donors. If we look at averages we note that only the posters are used by an average of 4.35, because they are not expensive for NPOs. Advertising on the Internet is considered less used, and advertising through printed media and electronic media is less used. The problem with these tools of communication is the reach of target market, because through it can not be reached the intended donor. NPOs think that it is not worth spending more for advertising because it doesn’t give same benefits. Since 98% of NPOs is funded by foreign donors, NPOs think it's not worth advertising through mass media. However, the use of advertising is important to attract other donors such as government, private businesses, foundations or individual donors.
Assessment of the level of usage of advertising tools in attracting donors
N Minimum Maximum Mean Std. Deviation
Assessment of the level of use of advertising in the television/radio
81 1 5 1,85 ,963
Assessment of the level of use of advertising in the magazine/newspaper
80 1 4 1,88 ,986
Assessment of the level of use of posters 81 1 5 4,35 ,761
Assessment of the level of use of internet advertising 81 1 5 2,17 1,595
Table 1 Assessment of the level of usage of advertising tools in attracting donors
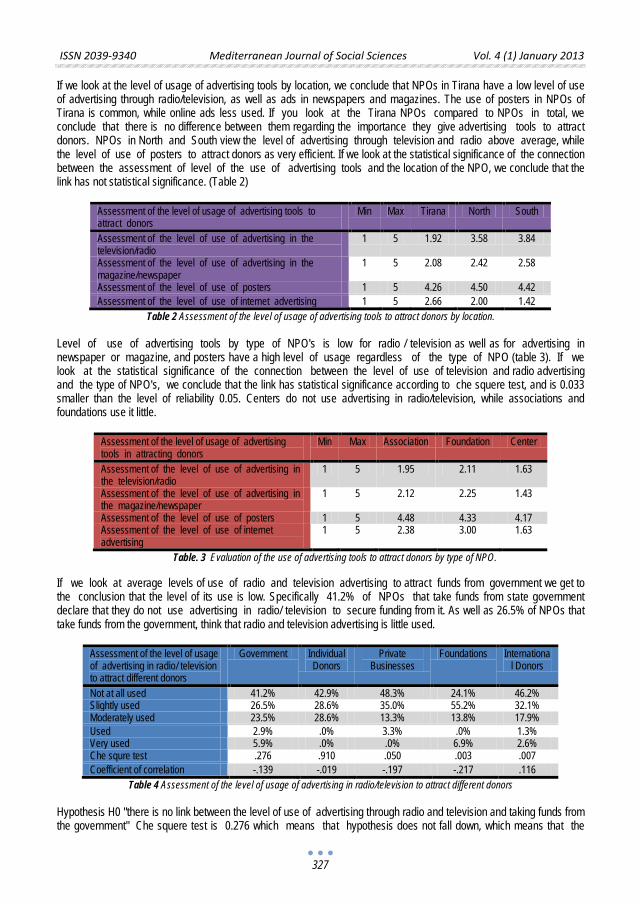
ISSN 2039-9340 Mediterranean Journal of Social Sciences Vol. 4 (1) January 2013
327
If we look at the level of usage of advertising tools by location, we conclude that NPOs in Tirana have a low level of use of advertising through radio/television, as well as ads in newspapers and magazines. The use of posters in NPOs of Tirana is common, while online ads less used. If you look at the Tirana NPOs compared to NPOs in total, we conclude that there is no difference between them regarding the importance they give advertising tools to attract donors. NPOs in North and South view the level of advertising through television and radio above average, while the level of use of posters to attract donors as very efficient. If we look at the statistical significance of the connection between the assessment of level of the use of advertising tools and the location of the NPO, we conclude that the link has not statistical significance. (Table 2)
Assessment of the level of usage of advertising tools to attract donors
Min Max Tirana North South
Assessment of the level of use of advertising in the television/radio
1 5 1.92 3.58 3.84
Assessment of the level of use of advertising in the magazine/newspaper
1 5 2.08 2.42 2.58
Assessment of the level of use of posters 1 5 4.26 4.50 4.42 Assessment of the level of use of internet advertising 1 5 2.66 2.00 1.42
Table 2 Assessment of the level of usage of advertising tools to attract donors by location.
Level of use of advertising tools by type of NPO's is low for radio / television as well as for advertising in newspaper or magazine, and posters have a high level of usage regardless of the type of NPO (table 3). If we look at the statistical significance of the connection between the level of use of television and radio advertising and the type of NPO's, we conclude that the link has statistical significance according to che squere test, and is 0.033 smaller than the level of reliability 0.05. Centers do not use advertising in radio/television, while associations and foundations use it little.
Assessment of the level of usage of advertising tools in attracting donors
Min Max Association Foundation Center
Assessment of the level of use of advertising in the television/radio
1 5 1.95 2.11 1.63
Assessment of the level of use of advertising in the magazine/newspaper
1 5 2.12 2.25 1.43
Assessment of the level of use of posters 1 5 4.48 4.33 4.17 Assessment of the level of use of internet advertising
1 5 2.38 3.00 1.63
Table. 3 Evaluation of the use of advertising tools to attract donors by type of NPO.
If we look at average levels of use of radio and television advertising to attract funds from government we get to the conclusion that the level of its use is low. Specifically 41.2% of NPOs that take funds from state government declare that they do not use advertising in radio/ television to secure funding from it. As well as 26.5% of NPOs that take funds from the government, think that radio and television advertising is little used.
Assessment of the level of usage of advertising in radio/ television to attract different donors
Government Individual Donors
Private Businesses
Foundations International Donors
Not at all used 41.2% 42.9% 48.3% 24.1% 46.2% Slightly used 26.5% 28.6% 35.0% 55.2% 32.1% Moderately used 23.5% 28.6% 13.3% 13.8% 17.9% Used 2.9% .0% 3.3% .0% 1.3% Very used 5.9% .0% .0% 6.9% 2.6% Che squre test .276 .910 .050 .003 .007 Coefficient of correlation -.139 -.019 -.197 -.217 .116
Table 4 Assessment of the level of usage of advertising in radio/television to attract different donors Hypothesis H0 "there is no link between the level of use of advertising through radio and television and taking funds from the government" Che squere test is 0.276 which means that hypothesis does not fall down, which means that the
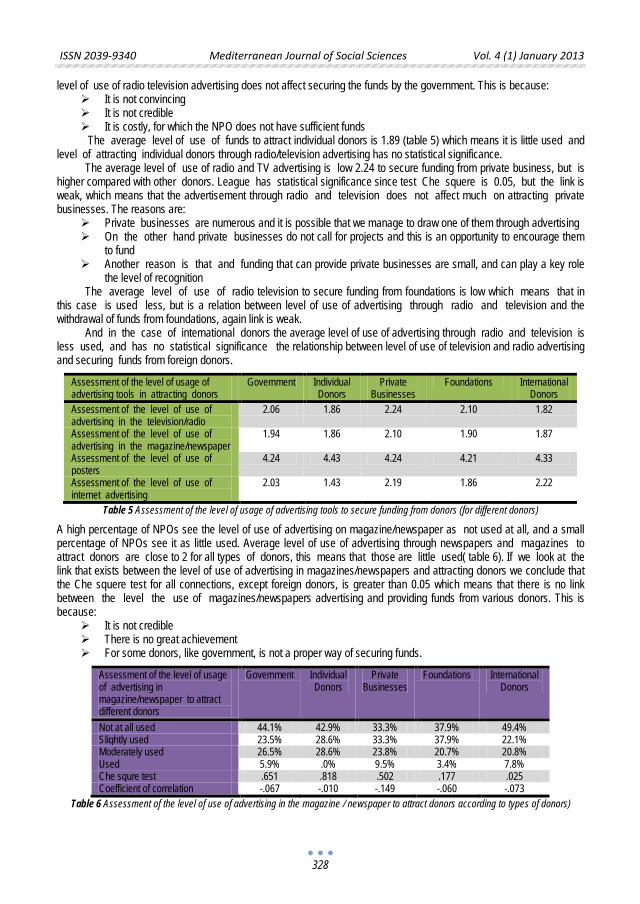
ISSN 2039-9340 Mediterranean Journal of Social Sciences Vol. 4 (1) January 2013
328
level of use of radio television advertising does not affect securing the funds by the government. This is because: It is not convincing It is not credible It is costly, for which the NPO does not have sufficient funds The average level of use of funds to attract individual donors is 1.89 (table 5) which means it is little used and
level of attracting individual donors through radio/television advertising has no statistical significance. The average level of use of radio and TV advertising is low 2.24 to secure funding from private business, but is
higher compared with other donors. League has statistical significance since test Che squere is 0.05, but the link is weak, which means that the advertisement through radio and television does not affect much on attracting private businesses. The reasons are:
Private businesses are numerous and it is possible that we manage to draw one of them through advertising On the other hand private businesses do not call for projects and this is an opportunity to encourage them
to fund Another reason is that and funding that can provide private businesses are small, and can play a key role
the level of recognition The average level of use of radio television to secure funding from foundations is low which means that in
this case is used less, but is a relation between level of use of advertising through radio and television and the withdrawal of funds from foundations, again link is weak.
And in the case of international donors the average level of use of advertising through radio and television is less used, and has no statistical significance the relationship between level of use of television and radio advertising and securing funds from foreign donors.
Assessment of the level of usage of advertising tools in attracting donors
Government Individual Donors
Private Businesses
Foundations International Donors
Assessment of the level of use of advertising in the television/radio
2.06 1.86 2.24 2.10 1.82
Assessment of the level of use of advertising in the magazine/newspaper
1.94 1.86 2.10 1.90 1.87
Assessment of the level of use of posters
4.24 4.43 4.24 4.21 4.33
Assessment of the level of use of internet advertising
2.03 1.43 2.19 1.86 2.22
Table 5 Assessment of the level of usage of advertising tools to secure funding from donors (for different donors)
A high percentage of NPOs see the level of use of advertising on magazine/newspaper as not used at all, and a small percentage of NPOs see it as little used. Average level of use of advertising through newspapers and magazines to attract donors are close to 2 for all types of donors, this means that those are little used( table 6). If we look at the link that exists between the level of use of advertising in magazines/newspapers and attracting donors we conclude that the Che squere test for all connections, except foreign donors, is greater than 0.05 which means that there is no link between the level the use of magazines/newspapers advertising and providing funds from various donors. This is because:
It is not credible There is no great achievement For some donors, like government, is not a proper way of securing funds.
Assessment of the level of usage of advertising in magazine/newspaper to attract different donors
Government Individual Donors
Private Businesses
Foundations International Donors
Not at all used 44.1% 42.9% 33.3% 37.9% 49.4% Slightly used 23.5% 28.6% 33.3% 37.9% 22.1% Moderately used 26.5% 28.6% 23.8% 20.7% 20.8% Used 5.9% .0% 9.5% 3.4% 7.8% Che squre test .651 .818 .502 .177 .025 Coefficient of correlation -.067 -.010 -.149 -.060 -.073
Table 6 Assessment of the level of use of advertising in the magazine / newspaper to attract donors according to types of donors)
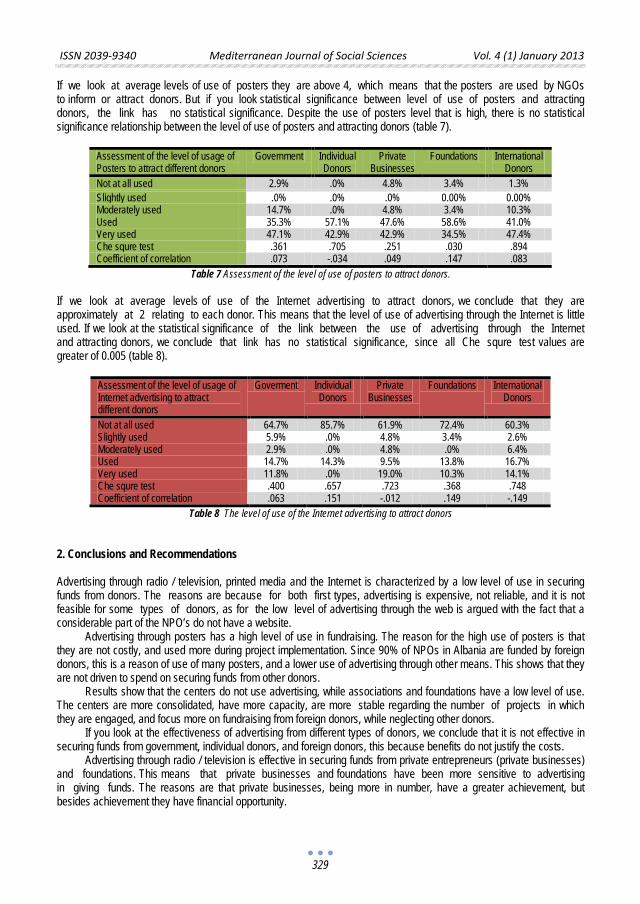
ISSN 2039-9340 Mediterranean Journal of Social Sciences Vol. 4 (1) January 2013
329
If we look at average levels of use of posters they are above 4, which means that the posters are used by NGOs to inform or attract donors. But if you look statistical significance between level of use of posters and attracting donors, the link has no statistical significance. Despite the use of posters level that is high, there is no statistical significance relationship between the level of use of posters and attracting donors (table 7).
Assessment of the level of usage of Posters to attract different donors
Government Individual Donors
Private Businesses
Foundations International Donors
Not at all used 2.9% .0% 4.8% 3.4% 1.3% Slightly used .0% .0% .0% 0.00% 0.00% Moderately used 14.7% .0% 4.8% 3.4% 10.3% Used 35.3% 57.1% 47.6% 58.6% 41.0% Very used 47.1% 42.9% 42.9% 34.5% 47.4% Che squre test .361 .705 .251 .030 .894 Coefficient of correlation .073 -.034 .049 .147 .083
Table 7 Assessment of the level of use of posters to attract donors.
If we look at average levels of use of the Internet advertising to attract donors, we conclude that they are approximately at 2 relating to each donor. This means that the level of use of advertising through the Internet is little used. If we look at the statistical significance of the link between the use of advertising through the Internet and attracting donors, we conclude that link has no statistical significance, since all Che squre test values are greater of 0.005 (table 8).
Assessment of the level of usage of Internet advertising to attract different donors
Goverment Individual Donors
Private Businesses
Foundations International Donors
Not at all used 64.7% 85.7% 61.9% 72.4% 60.3% Slightly used 5.9% .0% 4.8% 3.4% 2.6% Moderately used 2.9% .0% 4.8% .0% 6.4% Used 14.7% 14.3% 9.5% 13.8% 16.7% Very used 11.8% .0% 19.0% 10.3% 14.1% Che squre test .400 .657 .723 .368 .748 Coefficient of correlation .063 .151 -.012 .149 -.149
Table 8 The level of use of the Internet advertising to attract donors 2. Conclusions and Recommendations Advertising through radio / television, printed media and the Internet is characterized by a low level of use in securing funds from donors. The reasons are because for both first types, advertising is expensive, not reliable, and it is not feasible for some types of donors, as for the low level of advertising through the web is argued with the fact that a considerable part of the NPO’s do not have a website.
Advertising through posters has a high level of use in fundraising. The reason for the high use of posters is that they are not costly, and used more during project implementation. Since 90% of NPOs in Albania are funded by foreign donors, this is a reason of use of many posters, and a lower use of advertising through other means. This shows that they are not driven to spend on securing funds from other donors.
Results show that the centers do not use advertising, while associations and foundations have a low level of use. The centers are more consolidated, have more capacity, are more stable regarding the number of projects in which they are engaged, and focus more on fundraising from foreign donors, while neglecting other donors.
If you look at the effectiveness of advertising from different types of donors, we conclude that it is not effective in securing funds from government, individual donors, and foreign donors, this because benefits do not justify the costs.
Advertising through radio / television is effective in securing funds from private entrepreneurs (private businesses) and foundations. This means that private businesses and foundations have been more sensitive to advertising in giving funds. The reasons are that private businesses, being more in number, have a greater achievement, but besides achievement they have financial opportunity.
ISSN 2039-9340 Mediterranean Journal of Social Sciences Vol. 4 (1) January 2013
330
Statistics show that the proportion of NPO financing from individual donors is very low, this means that there is no social culture to give funds for charity. NPOs must do more to sensitize this donor type. And this can be achieved through projects that can be applied in school in order to create a social culture to give funds for charity.
In addition to individual donors in the spotlight for NPOs should be private businesses. This can be achieved through increased reliability, and transparency in the manner of use of funds by NPOs. NPOs themselves need to be more driven to attract funds from both types of donors mentioned above, because the results show that they themselves do not hope to obtain funds from these two types of donors.
References
Adrian Sargeant (2005) “Marketing management for nonprofit organization”(2nd ed), Oxford University press (Chapter 6) Arnold, M.J., & Yapp,S.R (2003) “Direct Marketing in nonprofit services” Journal of Services Marketing, pp141 160 Kline Henley.T (2001) “Integrated marketing communication for local nonprofit organization: Communication tool and Method”. Journal of
Nonprofit & Public Sector Marketing pp 157-168 Kline Henly, T. (2001) “Integrated marketing communication for local nonprofit organization: Developing an integrated marketing
communication strategy: Journal of nonprofit & Public Sector Marketing, pp 141-155 Philip Kotler, Alan R. .Andreasen (2003) “Strategic marketing for nonprofit organizations” (6th ed) Pearson Prentice Hall Publication
(Chapter 18) Sridhar Samu, Walter W.Wymer,Jr. (2003) Nonprofit-Business Alliance Model: Formation and outcomes. Journal of Nonprofit & Public
Sector Marketing pp 45-62 Walter W. Wymer, (2003) Dimensions of Business and Nonprofit Collaborative Relationships. Journal of nonprofit & Public Sector
Marketing, pp 3-22 Walter Wymer, Patricia Knowles, Roger Gomes (2006) “Nonprofit Marketing. Marketing Management for Charitable and
Nongovernmental Organizations” Sage Publication, (Chapter 6)
ISSN 2039-9340 Mediterranean Journal of Social Sciences Vol. 4 (1) January 2013
331
Assessment of the Administration and Practice of Juvenile
Justice System in Abuja, Nigeria
Dr. Godswill James
Department of Sociology, Kaduna State University, Kaduna, Nigeria
E-mail: [email protected] Doi:10.5901/mjss.2013.v4n1p331 Abstract
No social group seems to bear the direct brunt of economic crises like children and young persons. Because of their vulnerable nature, some of them resort to different forms of deviant activities, which bring them in conflict with the law. As a result, there is a range of laws at the international and local levels which set standard practice as it concerns juvenile offenders. However, the practice of juvenile justice system in Nigeria tends to be at variance with these laws. This study examines the practice of juvenile justice system in Nigeria, with the view to assessing the effort of government in the administration and control of juvenile delinquency in line with established standard in Federal Capital Territory, Abuja. The study used structured questionnaires to elicit information from the respondents. Findings reveal that there exist laws to protect the rights and conditions of juveniles, but these laws do not adequately conform to international standard. Juveniles are subjected to poor conditions in police and prison cells; they are poorly fed, subjected to verbal and physical abuses, and not separated from adult prisoners. The study concludes that Nigerian juvenile justice administration needs to be reviewed and properly coordinated to reflect international rules and standards for the treatment of juvenile offenders.
Key Words: Justice administration, Juvenile, justice system; Abuja; Nigeria
1. Introduction
The Children and Young Persons Act (CYPA) defines a child as “a person under the age of fourteen years”. Similarly, a young person is defined by the law as “a person who has attained the age of fourteen years”. However, the Beijing Rules of the United Nations Standard Minimum Rules for the Administration of Juvenile Justice defines a juvenile as “a child or young person who, under the respective legal systems, may be dealt with for an offence in a manner which is different from an adult”.
No social group bears the direct brunt of the global economic crises like children and young persons. The social, economic and cultural activities and benefits hitherto accrued to them have either dwindled or are no more in existence. The most vulnerable groups in this regard are children from poor and broken homes (Human Rights Monitor, 1997). The economic hardship, occasion by the introduction of Structural Adjustment Programme in the 1980s, devaluation of the Nigerian Currency and the global economic melt-down have had devastating impart on the social, economic and cultural relations of the middle class and the less privileged in the society. They have significantly dislocated the family structure and strained family relationships; it has increasingly become difficult for families and government to meet their basic commitments, such as provision of good health care services, good educational opportunities, good recreational facilities, and other goods and services. Those who could not survive on the meager salaries and income have to look for other means and opportunities to supplement them. The impact of these has led to break-up of families, increase in the number of commercial sex workers, trafficking in women, child labor, high incidence of theft, armed robbery, high mortality rate, abandoned babies and economic deprivation.
The juveniles bear and feel the greater impact of the dwindled purchasing power of the middle class and the poor in society. Most young men are pushed into the world of business the moment they finished from the primary school; the juvenile is forced to the street as a hawker; in the process, they mix with anti-social elements and are trained on how to make money as quickly as possible. These manifest in the high rate of juvenile crime pervading the society. Some became big time criminals, while others roam around in the big cities with no visible mean of livelihood. The girls fall victim to social perverts who sexually abuse and exploit them. These situations are very visible in Abuja Municipal Area Council, like any other parts of cities in Nigeria. More children are becoming homeless, in poverty, abused, orphaned or
ISSN 2039-9340 Mediterranean Journal of Social Sciences Vol. 4 (1) January 2013
332
single-parent, especially those born out-of-wedlock. The current state of destitute, “area-boys” and “almajiri” in parts of Abuja are all indications of the plight of Nigerian juveniles, and the break down of community norms and values. Most parents with poor economic background can hardly afford to send their children to school. When they do, only one or two of their wards will be sent to school; the rest are distributed to well-to-do relatives who use their discretion to determine what they feel is best for them. Some are engaged in petty trading in the market or to hawk wares on the streets, while others are used as house boys and girls; they grow up with no formal education and no skills. Yet, others remain in shops and in workshops from morning till night. They hardly get the type of rest and leisure that is their entitlement by virtue of their age, consequently, they become hardened at a very early age. Because of their vulnerable nature, some of them resort to different forms of anti-social behavior and end up running foul of the law. In the last few decades, juvenile delinquency rates have soared, leaving some to argue for adult punishments as deterrence. For instance, in United States in 2007, juveniles were responsible for 16% of all violent crimes. Juvenile crime rates increase in 2005 and 2006 and deceased slightly in 2007 (www.ehow.com2010). In Nigeria, however, there has been no meaningful statistics on juvenile delinquency (Alemika and Chukwuma 2001:26). Unreliable, because many cases brought to them are informally settled and information management is very poor in the absence of statistics; therefore, it is not surprising that government officials, moral entrepreneurs and especially the mass media, decry alarming increasing incidence of juvenile delinquency. In addition to the above, there seems to be no clear-cut children-friendly policies of government, and where they exist, they only remain at the level of legislation begging for implementation.
A child in conflict with the law has the right to treatment that promotes his sense of dignity and worth taking his age into account, and which aims at his reintegration into and assumption of a constructive role in society (UNICEF, 2001). Consequently, there is a range of laws at the international and local levels which set standards of prison conditions as they concern juvenile offenders specifically. This is because, the fundamental purpose of the law in the treatment of juveniles is for their rehabilitation and unusual reintegration into the society, as well as to protect them from both the harshness of prison life and the unwholesome influence of adults and, possibly, irreparably crooked offenders. Given reported variance in the treatment of juvenile offenders in Nigeria with established standards, this study assesses the administration and practice of juvenile justice system in Abuja Area Council. 2. Literature Review 2.1. International Law and Treatment of Juvenile Offenders Juvenile Justice Administration has been influenced by the activities of humanitarian and penal reformers who protested against cruelty to children under the guise of administering justice. Prior to the 19th century, children were harshly punished for even petty offences, but in the 19th century, there were concerns, first, about increasing rates of delinquency and second, about the handling of juvenile offenders. It was the realization of the negative consequences of the punitive treatment of young offenders that spurred humanitarian and penal reformers to advocate lenient treatment of young offenders (Alemika and Chukwuma 2001:27). They argued that young offenders should be given opportunity for correction, reformation, rehabilitation and be restored into society as useful and law-abiding citizens, instead of being punished. These concerns heightened as delinquency rates increased, and the reformers realized that the young offenders were not “born criminals” but victims of circumstances beyond their control.
These agitations led to the emergence of general international legal instruments – conventions, charters and principles, rules and guidelines that regulate the promotion and protection of the rights of the child and treatment of juvenile offenders which to some, Nigeria is signatory such as, the Beijing rules of the United Nations Standard Minimum Rules for the Administration of Juvenile Justice, the Children and Young Persons Act, the United Nations Convention on the Rights of the Child, the O.A.U Charter on Rights and Welfare of the Child etc. The underlying principles of these conventions and charters is to extend the same rights accorded to adults within the criminal justice system to juvenile offenders, and to offer guidance for the treatment of juvenile offenders. To fully appreciate the rights of the Nigerian juveniles, it is important to take a look at these International Conventions, Charters, guidelines and rules visa-avis Nigeria laws. This is because they serve as standard for the evaluation or assessment of government policies and administration of juvenile justice system in Nigeria.
Article 19 of the United Nations Convention on the Rights of the Child, provided that:
State parties shall take all appropriate legislative, administrative, social and educational measures to protect the violence, injury or abuse, neglect or negligent treatment, maltreatment or exploitation including sexual abuse, while in the care of parents(s) legal guardian(s) or any other person who has the care of the child.
ISSN 2039-9340 Mediterranean Journal of Social Sciences Vol. 4 (1) January 2013
333
Again, the United Nations Convention on the Rights of the Child set out in Article 40 the principles that should guide the treatment of young offenders; Article 40 (1) states that:
State parties recognize the right of every child alleged as, accused of or recognized as having infringed the penal law to be treated in a manner consistent with the promotion of the child’s sense of dignity and worth, which reinforces the child’s respect for the human rights and fundamental freedoms of others and which takes into account the child’s age and the desirability of promoting the child’s reintegration and the child’s assuming a constructive role in society.
Essentially, the handling of juvenile offenders should promote “the child’s reintegration and the child’s assuming constructive role in society” rather than inflicting punishment or executing retribution and vengeance. Article 40 (2) consists of elaborate provisions on the rights of child during trial, which is primarily intended to extend the observance of rule of law or due process rights to the trial and treatment of juveniles accused of violating the penal laws. Subsections 3 and 4 of the Article 40 made specific provisions for philosophy, principles, legal safeguards, institutional framework and practices for treating juvenile offenders. The underlying principle of the provisions is to extend the same rights accorded to adults within the criminal justice system to juvenile offenders, and to offer guidance for the treatment of juvenile offenders. For instance, Article 40 (4) made provisions for the disposition and treatment programmes for juvenile offenders adjudicated to have infringed the law. It provides that:
A variety of dispositions, such as care, guidance and suspension orders, counseling, probation, foster care, education and vocational training programmes and other institutional care shall be available to ensure that children are dealt with in a manner appropriate to their well-being and proportionate to both their circumstances and the offence.
These provisions serve as guidance for the treatment of juvenile offenders by member nations of the United Nations Organizations.
The OAU Charter on Rights and Welfare of the Child in its preamble recognized that “the child due to the needs of his physical and mental development requires particular care with regard to health, physical, mental, moral and social development, and requires legal protection in conditions of freedom, dignity and security”. The provisions of the Charter in this regard are important in the light of the peculiarity of the conditions of most African children that remain “critical due to the unique factors of their socio-economic, cultural, traditional and developmental circumstances, natural disasters, armed conflicts, exploitation and hunger”. They are important because of cultural and religious traditions in Africa that do not give adequate opportunity to the children for self-expression (Alemika and Chukwuma 2001:35).
There is also United Nations Standard Minimum Rules for the Administration of Juvenile Justice (Beijing Rules), and the United Nations Guidelines for the prevention of Juvenile Justice (the Riyadh Guidelines). The Minimum Rules and Guidelines provide a desirable balance between Juvenile Justice Administration and juvenile delinquency prevention. Juvenile delinquency prevention must be embedded in national economic, social development, health, educational and youth development policies. The Guidelines especially provided that:
The need for and importance of progressive delinquency prevention policies and systematic study and the elaboration of measures should be recognized. These should avoid criminalizing and penalizing a child for behaviour that does not cause serious damage to the development of the child or harm to others.
The Minimum Rule was adopted by the General Assembly Resolution 40/33 of 29 November, 1985. Section 5 states the aims of juvenile justice system as follows:
The Juvenile Justice System shall emphasize the well being of the juvenile and shall ensure that reaction to juvenile offenders shall always be in proportion to the circumstances of both the offenders and offence.
Section 7 affirms the due process outlined in the UN Convention and OAU Charters on the Rights of the Child. Section 13 deals with detention of juveniles pending trial:
Juvenile under detention pending trial shall be kept separate from adults, and shall be detained in a separate institution or in separate part of an institution also holding adults. While in custody juveniles shall receive care, protection and all necessary individual assistance–social, education, vocational, psychological, medical and physical, that they require in view of their age, sex and personality.
This is to ensure that young offenders are not subjected to “criminal contamination” and descend deeper into criminal subculture.
Nigeria and other member states of United Nations and the Organization of African Unity are expected to align their laws and policies on juvenile justice administration to the various provisions described above, and the contents of
ISSN 2039-9340 Mediterranean Journal of Social Sciences Vol. 4 (1) January 2013
334
other UNO instruments, including the Standard Minimum Rules for the Treatment of Prisoners. Nigeria, as a member state has taken certain steps in this direction. Successive Nigerian constitutions since independence from British imperialism in 1960, guaranteed the rights of accused persons to fair trial and due process as contained in chapter 4, section 36 of the Constitution the Federal Republic of Nigeria 1999. These provisions conform to the relevant United Nations Rules and Guidelines on treatment of offenders as well as the Charter and Conventions on Human rights.
The Children and Young Persons Act (CYPA) remains the most important legislation in the country pertaining to the treatment of juvenile offenders. It was enacted to make provision for the welfare of the young person and treatment of young offenders and the establishment of juvenile courts. In order to ensure that only juvenile courts deal with children and young persons, section 29 of CYPA provided that:
Where a person, whether charged with an offence or not, is brought before any court other wise than for the purpose of giving evidence and it appears to the court that he is a child or young person, the court shall make due inquiry as to the age of that person, and for that purpose shall require the production of a birth certificate or other direct evidence as to the date of birth and in the absence of such certificate or evidence, a certificate signed by a medical officer in the service of the government giving his opinion as to such age…...
In accordance with the United Nations Minimum Rules for the Administration of Juvenile Justice (section 26), provisions were made in a different law for the establishment of Borstal Institutions. The law, Borstal Institution and Remand Centre Act (No 32 of 1960) establish Borstal and Remand Centre as federal juvenile correctional institutions. The purpose of the institution is to bring to bearing upon the inmates every good influence which may establish in them the will to lead a good and useful life on release, and to fit him to do so by fullest development of his character, capacities, and sense of personal responsibilities.
From above discussion, attempt has been made to review international laws – Convention, Charter, Guidelines and Rules. However, in spite the efforts made by the government to ensure compliance in administration and control of juvenile delinquency, it is pertinent to note that Nigerian juvenile justice laws and especially juvenile justice administration have not been reviewed and properly coordinated to reflect those international rules and standards for the treatment of juvenile offenders. 3. Materials and Methods
Abuja, the Federal Capital Territory (FCT) is a “planned” city. It came into existence by virtue of the Federal Capital Territory Act of 1976 and officially became Nigeria’s capital on 12 December 1991, replacing the role of the former capital, Lagos. The Territory covers a total land area of approximately 8,000 square kilometers and it is presently made up of 6 Area Councils, namely Municipal, Abaji, Bwari, Gwagwalada, Kuje and Kwali. Over 60% of its populace still lives in the rural areas across the 6 Area Councils. With an estimated population of 1.4 million, according to the 2006 census data, the territory has a growth rate of 9.3% due to the influx of Nigerians from all parts of the country.
The bulk of federal institutions, ministries and embassies are located within the confines of the Area Council, these no doubt affect the economic and social life of the people. The inequality produced by this circumstance manifest itself in patterns of style of life among families in terms of their economic circumstances, the extent of social provision and pattern of socialization.
The social structure of the Area council and the cost of living doubtless affect family life. The implication is that values, morality, discipline, rationality and approved achievement orientation expected of moral society began to dwindle or is being compromised in order to survive. Juveniles became engaged in petty trading and in the process, many children become exposed to vices. This situation tends to present some social implications for the residents of the Area Councils. For instance, cases of juvenile delinquency became pronounced among families in the lower strata of the community. An average child becomes loathed for his/her outrageous sense of irresponsibility. They steal and lack courtesies. They are not forthcoming and consistent in school, and are fundamentally delinquent. Generally, the Area Councils began to witness high incidence of alcoholism among youths, violence, early initiation into sex-free union, high incidence of children abandonment, etc. The desperation therefore, to make ends meet brings these children into conflict with the law. Today many of these children are either serving different jail terms or in detention in Kuje prison and other Borstal Institutions and Remand Homes in the country.
The primary data on which this study mainly relied were collected by means of survey questionnaire. The informants were drawn from the Police, Prison Service and the Judiciary. This is because these three institutions are the major pillars of the Nigerian criminal justice system. The questionnaire schedule consisted of both close and open-ended questions. For the purpose of selecting the respondents, the researcher used a combination of cluster and simple random sampling techniques. For the Police personnel, Abuja Municipal Area Council was clustered into the existing 18 Divisional
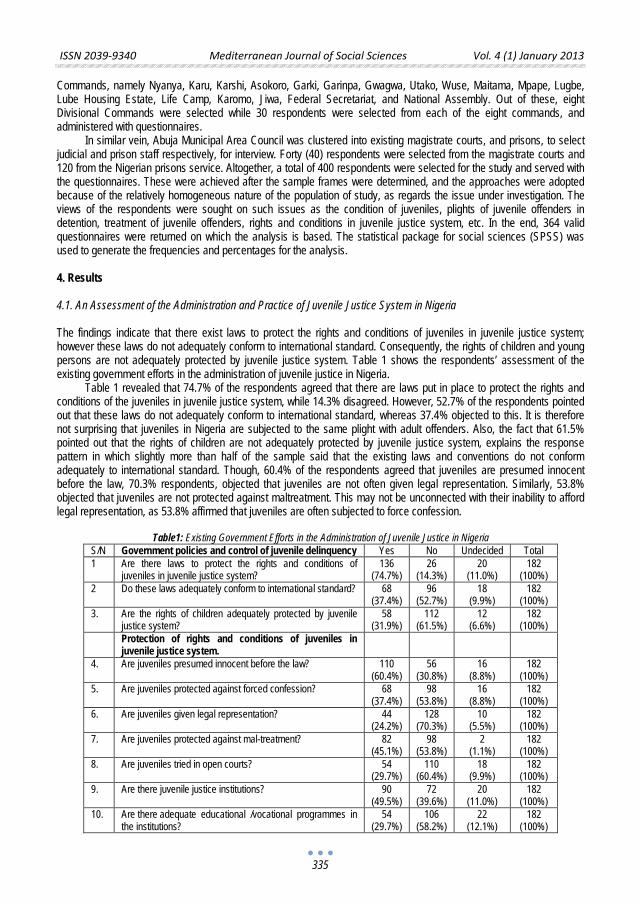
ISSN 2039-9340 Mediterranean Journal of Social Sciences Vol. 4 (1) January 2013
335
Commands, namely Nyanya, Karu, Karshi, Asokoro, Garki, Garinpa, Gwagwa, Utako, Wuse, Maitama, Mpape, Lugbe, Lube Housing Estate, Life Camp, Karomo, Jiwa, Federal Secretariat, and National Assembly. Out of these, eight Divisional Commands were selected while 30 respondents were selected from each of the eight commands, and administered with questionnaires.
In similar vein, Abuja Municipal Area Council was clustered into existing magistrate courts, and prisons, to select judicial and prison staff respectively, for interview. Forty (40) respondents were selected from the magistrate courts and 120 from the Nigerian prisons service. Altogether, a total of 400 respondents were selected for the study and served with the questionnaires. These were achieved after the sample frames were determined, and the approaches were adopted because of the relatively homogeneous nature of the population of study, as regards the issue under investigation. The views of the respondents were sought on such issues as the condition of juveniles, plights of juvenile offenders in detention, treatment of juvenile offenders, rights and conditions in juvenile justice system, etc. In the end, 364 valid questionnaires were returned on which the analysis is based. The statistical package for social sciences (SPSS) was used to generate the frequencies and percentages for the analysis. 4. Results 4.1. An Assessment of the Administration and Practice of Juvenile Justice System in Nigeria The findings indicate that there exist laws to protect the rights and conditions of juveniles in juvenile justice system; however these laws do not adequately conform to international standard. Consequently, the rights of children and young persons are not adequately protected by juvenile justice system. Table 1 shows the respondents’ assessment of the existing government efforts in the administration of juvenile justice in Nigeria.
Table 1 revealed that 74.7% of the respondents agreed that there are laws put in place to protect the rights and conditions of the juveniles in juvenile justice system, while 14.3% disagreed. However, 52.7% of the respondents pointed out that these laws do not adequately conform to international standard, whereas 37.4% objected to this. It is therefore not surprising that juveniles in Nigeria are subjected to the same plight with adult offenders. Also, the fact that 61.5% pointed out that the rights of children are not adequately protected by juvenile justice system, explains the response pattern in which slightly more than half of the sample said that the existing laws and conventions do not conform adequately to international standard. Though, 60.4% of the respondents agreed that juveniles are presumed innocent before the law, 70.3% respondents, objected that juveniles are not often given legal representation. Similarly, 53.8% objected that juveniles are not protected against maltreatment. This may not be unconnected with their inability to afford legal representation, as 53.8% affirmed that juveniles are often subjected to force confession.
Table1: Existing Government Efforts in the Administration of Juvenile Justice in Nigeria S/N Government policies and control of juvenile delinquency Yes No Undecided Total 1 Are there laws to protect the rights and conditions of
juveniles in juvenile justice system? 136
(74.7%) 26
(14.3%) 20
(11.0%) 182
(100%) 2 Do these laws adequately conform to international standard? 68
(37.4%) 96
(52.7%) 18
(9.9%) 182
(100%) 3. Are the rights of children adequately protected by juvenile
justice system? 58
(31.9%) 112
(61.5%) 12
(6.6%) 182
(100%) Protection of rights and conditions of juveniles in
juvenile justice system.
4. Are juveniles presumed innocent before the law? 110 (60.4%)
56 (30.8%)
16 (8.8%)
182 (100%)
5. Are juveniles protected against forced confession? 68 (37.4%)
98 (53.8%)
16 (8.8%)
182 (100%)
6. Are juveniles given legal representation? 44 (24.2%)
128 (70.3%)
10 (5.5%)
182 (100%)
7. Are juveniles protected against mal-treatment? 82 (45.1%)
98 (53.8%)
2 (1.1%)
182 (100%)
8. Are juveniles tried in open courts? 54 (29.7%)
110 (60.4%)
18 (9.9%)
182 (100%)
9. Are there juvenile justice institutions? 90 (49.5%)
72 (39.6%)
20 (11.0%)
182 (100%)
10. Are there adequate educational /vocational programmes in the institutions?
54 (29.7%)
106 (58.2%)
22 (12.1%)
182 (100%)
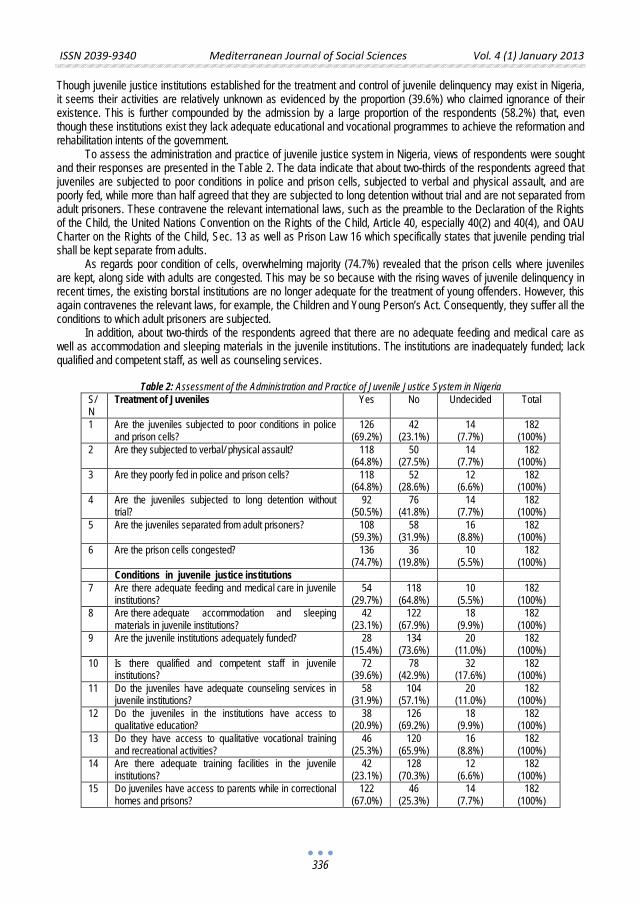
ISSN 2039-9340 Mediterranean Journal of Social Sciences Vol. 4 (1) January 2013
336
Though juvenile justice institutions established for the treatment and control of juvenile delinquency may exist in Nigeria, it seems their activities are relatively unknown as evidenced by the proportion (39.6%) who claimed ignorance of their existence. This is further compounded by the admission by a large proportion of the respondents (58.2%) that, even though these institutions exist they lack adequate educational and vocational programmes to achieve the reformation and rehabilitation intents of the government.
To assess the administration and practice of juvenile justice system in Nigeria, views of respondents were sought and their responses are presented in the Table 2. The data indicate that about two-thirds of the respondents agreed that juveniles are subjected to poor conditions in police and prison cells, subjected to verbal and physical assault, and are poorly fed, while more than half agreed that they are subjected to long detention without trial and are not separated from adult prisoners. These contravene the relevant international laws, such as the preamble to the Declaration of the Rights of the Child, the United Nations Convention on the Rights of the Child, Article 40, especially 40(2) and 40(4), and OAU Charter on the Rights of the Child, Sec. 13 as well as Prison Law 16 which specifically states that juvenile pending trial shall be kept separate from adults.
As regards poor condition of cells, overwhelming majority (74.7%) revealed that the prison cells where juveniles are kept, along side with adults are congested. This may be so because with the rising waves of juvenile delinquency in recent times, the existing borstal institutions are no longer adequate for the treatment of young offenders. However, this again contravenes the relevant laws, for example, the Children and Young Person’s Act. Consequently, they suffer all the conditions to which adult prisoners are subjected.
In addition, about two-thirds of the respondents agreed that there are no adequate feeding and medical care as well as accommodation and sleeping materials in the juvenile institutions. The institutions are inadequately funded; lack qualified and competent staff, as well as counseling services.
Table 2: Assessment of the Administration and Practice of Juvenile Justice System in Nigeria S/N
Treatment of Juveniles Yes No Undecided Total
1 Are the juveniles subjected to poor conditions in police and prison cells?
126 (69.2%)
42 (23.1%)
14 (7.7%)
182 (100%)
2 Are they subjected to verbal/ physical assault? 118 (64.8%)
50 (27.5%)
14 (7.7%)
182 (100%)
3 Are they poorly fed in police and prison cells? 118 (64.8%)
52 (28.6%)
12 (6.6%)
182 (100%)
4 Are the juveniles subjected to long detention without trial?
92 (50.5%)
76 (41.8%)
14 (7.7%)
182 (100%)
5 Are the juveniles separated from adult prisoners? 108 (59.3%)
58 (31.9%)
16 (8.8%)
182 (100%)
6 Are the prison cells congested? 136 (74.7%)
36 (19.8%)
10 (5.5%)
182 (100%)
Conditions in juvenile justice institutions 7 Are there adequate feeding and medical care in juvenile
institutions? 54
(29.7%) 118
(64.8%) 10
(5.5%) 182
(100%) 8 Are there adequate accommodation and sleeping
materials in juvenile institutions? 42
(23.1%) 122
(67.9%) 18
(9.9%) 182
(100%) 9 Are the juvenile institutions adequately funded? 28
(15.4%) 134
(73.6%) 20
(11.0%) 182
(100%) 10 Is there qualified and competent staff in juvenile
institutions? 72
(39.6%) 78
(42.9%) 32
(17.6%) 182
(100%) 11 Do the juveniles have adequate counseling services in
juvenile institutions? 58
(31.9%) 104
(57.1%) 20
(11.0%) 182
(100%) 12 Do the juveniles in the institutions have access to
qualitative education? 38
(20.9%) 126
(69.2%) 18
(9.9%) 182
(100%) 13 Do they have access to qualitative vocational training
and recreational activities? 46
(25.3%) 120
(65.9%) 16
(8.8%) 182
(100%) 14 Are there adequate training facilities in the juvenile
institutions? 42
(23.1%) 128
(70.3%) 12
(6.6%) 182
(100%) 15 Do juveniles have access to parents while in correctional
homes and prisons? 122
(67.0%) 46
(25.3%) 14
(7.7%) 182
(100%)
ISSN 2039-9340 Mediterranean Journal of Social Sciences Vol. 4 (1) January 2013
337
However, these scenarios suggest that, the existing Borstal Institutions meant for the treatment of juveniles with rehabilitation as the ultimate aim can hardly play these significant roles.
On access to qualitative education, a large proportion of the respondents revealed that the juveniles in borstal institutions are not accessible to qualitative education, nor qualitative vocational training and recreational facilities; they admitted that the training facilities in these institutions are grossly inadequate. These again contravene Rule 12 of the SMR which prescribed specialized training for officials handling the juveniles. However, 67.0% of the respondents agreed that the juveniles do have access to parents while in correctional homes and prisons, in compliance with the provision of the relevant international and local laws that prescribed access of young offenders who are in correctional institutions to their parents and guardians.
However, though not much has been achieved by government in the administration and control of juvenile justice, the identification by this study of some notable effort such as enactment of appropriate laws to protect the rights of children, establishment of juvenile justice institutions in Enugu and Kaduna, are in conformity with the works and reports of Alemika and Chukwuma (2001:6)), Borstal Institution and Remand Centre Act No. 32 of 1960, Human Rights Monitor (1997:2), the 1999 Nigerian Constitution and the Children and Young Persons Act. The Children and Young Persons Act remains the most important legislation in the country pertaining to the treatment of juvenile offenders. It was enacted to make provision for the welfare of the young persons and treatment of young offenders and the establishment of juvenile courts. Also, Borstal Institution and Remand Act established Borstal and Remand Centre as federal juvenile correctional institutions. However, it is pertinent to note that, Nigerian juvenile laws, and especially juvenile justice administration have not been reviewed and properly coordinated to reflect those of international rules and standards for the treatment of juvenile offenders.
On the assessment of the administration and practice of juvenile justice system, findings revealed that Nigeria juvenile justice laws and the treatment of juveniles do not reflect those of international laws, as they are subjected to inhuman treatments in both conventional prisons and juvenile custodian institutions. For instance, the report of the Nigerian Law Reform 1983 revealed that at Kirikiri Prison, juveniles are not separated from adult prisoners which negate the great cardinal point in the treatment of offenders, which is the minimization of contamination. The juvenile justice system is guided by a philosophy of concern, care and reformation for possible reintegration into the society. To this end, the purpose of establishing Borstal institutions is to bring to bear upon the inmates every good influence which may establish in the children the will to lead a good and useful life on release, and to fit them to do so by fullest development of their character, capacities and sense of personal responsibility.
Unfortunately, the laudable goals are not realized due to lack of proper policy, legal and institutional frameworks for juvenile offenders’ correction, and juvenile delinquency prevention, as young offenders are subjected to inhuman treatments and conditions that tend to have more negative impact on their transformation and rehabilitation against the intended purpose. For instance, the juveniles are not just incarcerated in regular prisons, but are not separated from adult prisoners. Consequently, they suffer like adult prisoners from deprivations, poor feeding and medical care, etc. In lines with the social learning and differential association theory, because the young persons share the same police and prison cells with adult prisoners, they are forced to interact with the adult prisoners who are already carriers of anti-social norms. These help in the transformation of the juveniles into hardened and more experienced offenders. Given the above, any effort to reduce the current wave of increasing juvenile delinquency in Nigeria should be orientated towards a carefully planned and balanced social welfare for the juveniles and correctional programmes for juvenile offenders that will promote the best interests of children and youth. 5. Conclusion Obviously, there is a range of international laws which member states are expected to align their laws and policies on juvenile justice administration. Nigeria as a member state has taken certain steps in this direction. However, in spite of these efforts, it is important to realize that, Nigerian juvenile justice laws, and especially juvenile justice administration have not been reviewed and properly coordinated to reflect those of international rules and standards for the treatment of juvenile offenders. The practice of juvenile justice is counter productive as they criminalize young children more than the reformation, rehabilitation and reintegration intents. The structural causes of this situation are poor funding, limited juvenile remand homes, and the consequent deterioration and decay of prisons and Borstal Institutions’ facilities.
The Nigerian juveniles suffer various degrees of maltreatment in both police and prison cells, and even in custodian institutions. On the contrary the treatment of juveniles should rather be anchored in provisions for social and economic welfare of the child and the prevention of juvenile delinquency instead of the present practice of punishment and institutionalization of juvenile delinquents. Evidently, the inadequacy of approved institutions has resulted in the juveniles being incarcerated in regular prisons. Provisions should therefore be made for the establishment of well-
ISSN 2039-9340 Mediterranean Journal of Social Sciences Vol. 4 (1) January 2013
338
equipped, properly staffed approved institutions by federal and state governments. The institutions should provide adequate educational and vocational training, feeding and clothing as well as healthcare and recreational facilities for the institutionalized offenders. There is need for improved government’s funding of the approved correctional institutions in Nigeria to meet the UN standards and to protect the rights of the child and young offenders. If this is provided and properly utilized, it will help to improve the state of facilities for vocational and educational training and thereby contribute meaningfully to the reformation and rehabilitation of offenders.
Given its negative implications, there is also the need to discontinue the practice of detaining juvenile offenders along side their adult counterparts. Where it is imperative to keep juveniles in regular prisons, administrations should ensure that they are kept separately from the adults to avoid contamination. Thus, this study recommends that a carefully balanced social welfare for juveniles and correctional programmes for juvenile offenders that promote the best interests of children and youth be put in place through deliberate and sincere policies and programmes. References Alemika, E.E.O. and I.C. Chukwuma (2001) Juvenile Justice Administration in Nigeria: Philosophy and Practice. Lagos, Nigeria: Center
for Law Enforcement Education. Human Rights Monitor (1997) Administration of Juvenile Justice: the Example of the Borstal Training Institution Kaduna: Human Rights
Monitor. UNICEF, MONEE Project (2001) “Ten Years of Transition”, Regional Monitoring Report No.7 (Florence, UNICEF Innocenti Research
Centre) United Nations Guidelines for the Prevention of Juvenile Delinquency (The Riyadh Guidelines), Adopted and proclaimed by General
Assembly resolution 45/112 of 14 December, 1990. United Nations Standard Minimum Rules for the Administration of Juvenile Justice (“The Beijing Rules”), Adopted by General Assembly
resolution 40/33 of 29 November, 1985. www.ehow.com2010. World Youth Report of the Ninth United Nations Congress on the Prevention of Crime and Treatment of offenders (A/CONF. 169.16).
ISSN 2039-9340 Mediterranean Journal of Social Sciences Vol. 4 (1) January 2013
339
The Missing Third Question
Prof. As. Dr. Aleksandër Kocani
Faculty of Sociale Sciences, Tirana University, Albania
Email: [email protected]
Doi:10.5901/mjss.2013.v4n1p339 Abstract
This is about a question that could have been put logically by Einstein or anyone that has followed his way of reasoning, following two other guided or heuristic questions. In the literature that analyses Einstein’s scientific work, it is said that in his analysis of so-called mechanical principle of relativity, he was trying to understand if there was something in the laws of nature that was justifying it. Logically, a question comes up: Did something exist in laws of nature that conditioned discrimination in identification possibilities of the difference between mechanical experiments from one side and optical, magnetic etc. ones on the other? Why in principle was impossible for mechanical experiments to identify this difference, but it was not for, say, optical experiments? Einstein by his principle of restricted relativity gives an answer to this question. He did the same for “Why”-s of principal impossibility to differentiate the rest from the straight-lined uniformed motion by any physical experiment carried within a system of reference. Now is the time to ask the third “Why” which logically follows the two mentioned and to propose an answer. That is the “Why”-s of principal impossibility to differentiate the immobility (or the rest) from the any mechanical motion by any physical experiment carried within a system of reference.
Keywords: missing question, motion, rest.
This is about a question that could have been put logically by Einstein or anyone that has followed his way of reasoning, following two other guided or heuristic questions. In the literature that analyses Einstein’s scientific work, or that sets forth, in a popular style, ideas and importance of a special as well as general theories of relativity (2), (3), (4), (5), (6) it is said (perhaps metaphorically as well) that in his (philosophical) analysis of so-called mechanical principle of relativity (or that of Galileo), he was trying to understand if there was something in the laws of nature that was justifying it. In short, the essence of the problem posed by Einstein, logically, lays the ground for the question to be asked if there was something in nature that conditioned the fact that the state of a uniform straight-line motion could not be differentiated from that of a immobility (or rest) with mechanical experiments being done within the system of reference where they have been analysed. This principal impossibility to differentiate the mentioned two opposed state constituted the substance of the Galileo’s principle of relativity. Therefore, it was quite reasonable to ask why this difference was not possible through mechanical experiments, as it was with other physical experiments, e.g. optical experiments. It was this conviction that, on the eve of the 20th century, led towards the so-called experimentations of Michelson – Morley. Whose aim was to measure, through optical methods, the speed of light in relation to what was called ‘æther of space’ (2), a kind of hypothetical environment conceptualised as something with unusual features in classical physics (e.g. being in itself absolutely at rest) (2), (3). Since, according to traditional (classical) physics, this æther was thought as an environment in total immobility (as opposed to any other system of referral consisting of physical objects!!??), to measure the speed of light toward this aether would have meant to differentiate the rest from the straight-lined motion of the earth and the light opposed to it. Logically, a question comes up: why would exist, if one takes for granted this principle, this kind of asymmetry or preference in nature? Did something exist in laws of nature that conditioned this discrimination in identification possibilities of the difference between mechanical experiments from one side and optical, magnetic etc. ones on the other? Why in principle was impossible for mechanical experiments to identify this difference, but it was not for, say, optical experiments? It is too likely to suppose that Einstein thought that this kind of consideration that “discriminated” the mechanics against other branches of classical physics was simply a model of thought that could not stand against strict physical-philosophical critical analysis. This being so because there was nothing in the laws and phenomena of physics to justify it. As a result, a physical model was postulated in classical physics (the principle of relativity of classical mechanics) that could not pass the logical tests – the “filter” of physical-philosophical reasoning. Therefore, the above-mentioned discrimination would fail if one would give up this unjustified model. This would require replacing this model with a better one that would, initially, resist to physical-philosophical critical analysis. This is exactly
ISSN 2039-9340 Mediterranean Journal of Social Sciences Vol. 4 (1) January 2013
340
what Einstein did; a replacement of a model with a more general one that would be able to avoid this discrimination. More specifically, using the postulate: no physical experiment (not only mechanical) carried within a system can distinguish the state of motionlessness from that of a uniform straight lined motion [“…it is not only in mechanics that not a single feature of phenomena corresponds with the notion of absolute motion but in electrodynamics as well” (1)]. With this, “the democracy”, denied arbitrarily between different physical (as well as mechanical) phenomena, “was replaced”. This is named as “the special principle of relativity”1 and, as it is known, its author is Albert Einstein (2). So, the answer to the “why” question results fruitful: a very important physical principle can been formulated: a principle of special relativity. The genius of Einstein was that he was not satisfied with this conclusion, instead, he went further. That is, he probably was searching for “Why”-s of principal impossibility to differentiate the immobility (or the rest) from the straight-lined uniformed motion by any physical experiment carried within a system of reference. Why was in meantime, according to the traditional well-established opinion in physics, possible to distinguish the rest from the accelerated motion through even mechanical experiments, based on what is known as “inertial” phenomena (e.g. the moving forward when the bus brakes suddenly). Using the same logic, we may possibly think that Einstein was looking for an answer to the question if there was something in nature or in its laws that was conditioning this discrimination (6). Then, based on the analysis of famous virtual experiments in a laboratory-styled lift [the lift being in a free motion towards an earthly gravitational field is equal to the lift being stationary but with an added anti-gravitational field. In this case, principally, neither of these two states (the rest or the motion) can be chosen as the real cause of the consequences observed] and the equality of inertial mass with the gravitational one, he came to the same conclusion as with the first case. I.e. there was nothing in the laws of nature that would make possible the distinction between a accelerated motion and the state of rest with experiments carried within one system of reference. If we were to believe Blanche, he cites Einstein as saying that in physics, everything that can not be measured or observed it has no physical reality (5), (6). So, the difference discussed above has no physical reality. That would mean, we could consider that we could not differentiate the state of rest from that of motion in general through any kind of physical experiment carried within a system of reference. And this acknowledgement forms the so-called “principle of generalised relativity” and represents his first formulation conceived on a kinematic approach according to so so-called “Euclidean space”. So, the answer to the second ‘Why’ question led logically towards generalisation of the principle of special relativity in its first formulation by Einstein. In the second one Einstein has considered the gravitational field, in which “there are no such things as rigid bodies with Euclidean properties;…The motion of clocks is also influenced by gravitational fields…” 2. By doing this, Einstein, “mathematically speaking”, substituted the Galileian reference-body with the Gaussian four-dimensional co-ordinate system. So He not only generalised its special principle of relativity, but also, in a mathematical-physical point of view, “upgraded” it. This work made in a mathematical-physical field, refer more, let say, to a “Quantitative approach”, which is very necessary for dying measurement in physics3, formulating laws as hypothesis and testing its. But, by our opinion, if we refer to a “Qualitative approach”, which needs no for measurement, in essence, we have not to do with any kind of reference-body (i.e. “rigid”, “Galileian”, “mollusc” etc.) (6). Quoting Einstein, “If it is simply a question of detecting or describing the motion involved, it is in principle immaterial to what reference-body we refer the motion. As already mentioned, this is self-evident, but it must not be confused with the much more comprehensive statement called “the principle of relativity”, which we have taken as the basis of our investigation.”4
1 Merleau-Ponty named it as “principle of restricted relativity” (in French, principe de relativité restreinte) (6), p.161-164. 2 (2), p.98. 3 Merleau-Ponty underlined this especially for classical physics theories (6), p.169-171. 4 (2), p.61-62.
Here Einstein underlined not only the relativity of choosing one of two reference-bodies for detecting the motion, but also the equivalence of anyone of two reference-bodies for physical description of natural processes. As mentioned, our intention is not related to such a mathematical – physical description, but to a philosophical-physical one. I.e., for us very important is the possibility to detect the motion or the rest of bodies despite of considering them as Galileian or Gaussian co-ordinate systems. In this framework, it was, and it still is, logically possible to accomplish on with the series of logical questions (the “why”-s) that are looking for the answer as to why there is a difference between the state of rest and that of any kind of motion with physical experiments carried within a system. So, it is possible to search for the answer to the third “Why” or to set a problem that in essence incorporates it and that has not been done before. In other words, why not a single experiment carried within a system cannot show us the difference between the state of rest and that of any kind of motion. What is in the laws or phenomena of nature that conditions this principal uniqueness? To put it differently, does this kind of principal difference really exist? Or, is there something outside us that forms it? Does this difference make a physical reality or, the same as two other models mentioned above, is simply a product of our limited modelling abilities and can be avoided without infringing on the study of physical phenomena? So, is it being imposed to us from the outside or is something that we want to impose to physical
ISSN 2039-9340 Mediterranean Journal of Social Sciences Vol. 4 (1) January 2013
341
phenomena’s performance as their appropriate model? So far, we’ve seen that the first two “Why”-s were related to two relatively not appropriate models of the performance of physical phenomena and, being so, getting rid of them would not damage the process of understanding and the performance of physical phenomena, on the contrary, it would further improve it.
Since formally it is possible to follow with the logic of their formulation through another question, we can expect this line of argument to continue further with the third “Why”. That means, the answer that would replace the less-appropriate model with a more appropriate one as well as deepen our understanding of physical phenomena, the same as with other two previous “why”-s. If we go back at Einstein’s line of argument, according to R. Blanche (5), something that cannot be observed or measured to physics has no physical reality. That means, in our example, that a difference between the rest and the motion or, in other words, the identification of a motion or a rest of a system that in principle cannot be observed, has no physical being or is physically inexistent. It simply constitutes a model or relatively inappropriate physical performance in an analogous way with Galileo’s principles of relativity and the principle of special relativity. Therefore, it needs to give way to another, more advanced, model that would demonstrate relatively in a better way physical phenomena. Essentially, this model would prove that any mechanical motion couldn’t have been distinguished from rest with any kind of physical experiment carried out within a system because the rest as well as any kind of motion, do not constitute genuine features of this system. They feature not a system or an object in itself, but only the relationship that they have with something akin to them (be it a system or an object). Therefore, they can not be certified to either of the system (or objects) in particular, but only to the relationship between them. This is the reason we find it difficult to identify them in any of them: they simply do not exist within a given system (or object) as its individual feature. While the considerations for the motion of particular objects that operate in physics are necessary models that are required to measure mechanical motion. In order to measure this, we must replace the symmetrical model that demonstrates the relationship between two physical systems in motion as well as in rest with two asymmetrical models that polarise in opposing ways the “motion” and the “rest” in any of the mentioned systems. So, we need to consider one of the systems in “rest” and, in connection with it, to measure the mechanical “motion” that we have “ascribed” to the other system Otherwise, it is impossible for us to accomplish these measurements. But, the need that we have to carry empirical procedures of quantitative analysis of the motion does not have to be imposed to us when we do our analysis in a qualitative way. We do not need simplified quantitative models in order to carry a qualitative examination of the mechanical motion; instead, we can go back to symmetrical model (“synthetic model”) that considers the motion and the rest the features of the relationship between the systems and not of either of them in particular (6).
In conclusion, it is worth noting that it’s not difficult to recognise that physical implications that can logically be deducted from this kind of generalisation would, without doubt, require skills beyond capacity and real possibilities for a modest researcher, as is the case with the author of this article, and as such, it would not have been right for anyone to require so.
Bibliography Einstein A. (1973) Sur l’Électrodynamique des corps en mouvement, në Einstein A., Réflexions sur l’électrodynamique, l’éther, la
géométrie et la relativité, traduit par Solovine M. Et Tonnelat M. A., Paris, Gauthier-Villars, 6. Einstein A. (2001) Relativity. The Special and General Theory, London and New York, Routledge Classics. Frank, F. (1989) Albert Ajnshtajni, Tiranë, 8 Nëntori, 96-103, 166-168; Tonnelat, M.A. (1971) Histoire du principe de relativité, Flammarion, 115-116, 123-129, 133-136, 140, 238; Blanché, R. (1964) La Science Actuelle et le Relativisme, Paris, P.U.F. Merleau-Ponty, J., (1993), Einstein, Flammarion. Kocani, A. (2005) Mbi elektrodinamikën e trupave në lëvizje. Disa refleksione mbi referatin e famshëm të Ajnshtajnit, Tiranë, ORA [About
the electrodynamics of moving bodies. Some reflections on the famous paper of Einstein.Tirana, ORA.]

ISSN 2039-9340 Mediterranean Journal of Social Sciences Vol. 4 (1) January 2013
343
McDonaldization of Nigerian Banking Industry in the Post-consolidated Era:
An Exploration of the Unavoidable Consequences
Emeka W. Dumbili
Department of Sociology and Anthropology Nnamdi Azikiwe University
PMB 5025, Awka, Anambra State, Nigeria Email: [email protected]
Doi:10.5901/mjss.2013.v4n1p343 Abstract
This article explores the McDonaldization of banking operation in Nigeria. In doing so, it brings to light a critical analysis of the increasing rationalization process in light of a developing economy. McDonaldization thesis has generated serious academic debate since it was introduced by George Ritzer the American sociologist in 1993. However, it has received seldom attention among Nigerian scholars and none to my knowledge has applied it to examine the banking industry which is invariably the most McDonaldized sector in Nigeria. This article therefore, draws on the thesis to explore the increasing rationalization process the sector is undergoing since consolidation and recapitalization exercises began in 2005. The article argues that the sector is McDonaldized and this has engendered efficiency, predictability, calculability and control. The article further argues that this McDonaldization process inevitably has led to increasing negative impacts of McDonaldization and concludes by pointing out some remedies.
Keywords: consolidation, McDonaldization, Nigerian banking industry, recapitalization, rationalization
1. Introduction For a contemporary economy to develop, it is imperative the financial sector be robust. This is because the sector occupies a central position and serves as catalyst or lubricant for growth and development of the entire economy. Any major threat to the sector definitely affects other sectors within the same economy (Abubakar & Tasmin, 2012) and even beyond. The Nigerian commercial banking industry as part of the financial sector occupies this pivotal position in the nation’s quest for development. It accounts for 64 per cent of the total stock listed in the Nigerian Stock Market (Adeleye, 2011) and employs over 77,000 workforce, both contract and permanent staff as at 2008 (Gunu, 2009).
Banking on a commercial basis started in 1892 in what is now known as Nigeria following the establishment of the Standard Bank of Nigerian Limited which metamorphosed to the First Bank (Ogujiuba & Obiechina, 2011) in 1979. Subsequently, the sector began to attract many investors that made the number of banks to multiply in the 1980s. As some were being established, a number of others were closing down shops, making the number to fall substantially from 89 as at July 2004 to 24 in 2005 (Gunu, 2009; Sanusi, 2010). Gunu & Olabisi (2011 p.225) revealed that these changes witnessed in the Nigerian banking sector have been orchestrated by number of factors which include inter alia, deregulation of the sector, ‘globalization of operation and technological innovations’.
The sector has passed through several reforms in a bid to standardise operations and enhance efficiency since independence in 1960. There was a major reform in 1986, following the introduction of Structural Adjustment Program (SAP) and many other reforms followed in the 1990s. Irrespective of these reforms, the sector’s performance remained far from desired. Financial experts pointed out inter alia, weak corporate governance, unethical practices, bankruptcy, late or outright non-publication of annual report and weak financial base as the causal factors of this malaise (Sanusi, 2012). This has often resulted in crises or failures. The crises necessitated another reform and the panacea was the Central Bank’s (CBN) 2004 consolidation exercise. In this reform, all the commercial banks were given up to 31 December 2005 to raise capital base from two to twenty-five billion Naira or get liquidated (Ogujiuba & Obiechina, 2011). This reform made the number of commercial banks to reduce from 89 to 24 strong banks (Ogujiuba & Obiechina, 2011) due to merger, acquisition and liquidation of those unable to beat the deadline.
The recapitalised banks immediately went into acquisition of modern technology because it is believed that technology enhances faster services that can engender bank’s profits (Kundu & Datta, 2012) and other internal reforms
ISSN 2039-9340 Mediterranean Journal of Social Sciences Vol. 4 (1) January 2013
344
also ensued. While some of these nouveau strategies were good, others became curses rather than blessings. The post consolidated period saw the survived banks going into aggressive deposit pursuit by adopting different marketing strategies. While some went into stock market to raise capital through initial public offers (IPOs), others adopted other measures such as ‘special marketing’ via the use of young employees especially ladies to attract depositors.
Though the 2005 consolidation reform that engendered the foregoing has been adjudged one of the best, the financial sector still remained volatile due to some inherent crisis of confidence and other problems such as inadequate disclosure of financial position (Ogujiuba & Obiechina, 2011; Sanusi, 2012). Other problems include abuse of positions by Chief Executives (CEOs) due to tenure elongation and other sharp practices such as trading in capital market with depositors’ money (Sanusi, 2012). These illicit practices led to the collapse of the Nigerian Stock Market in 2008-9 because it lacked the capacity to absorb shock orchestrated by global financial crisis that originated from American economy (Ritzer, 2011). In order to check some of these anomalies, the CBN began the post consolidation reform in 2009 with a ten to twelve year reform plan aimed at the stabilization of the shaky financial sector and this is still on-going (Ogujiuba & Obiechina, 2011; Sanusi, 2012). One of the measures adopted is the removal of eight CEOs who have served more than ten years and fixing maximum ten-year tenure for CEOs. Another important part of the reform is the prosecution of the CEOs who engaged in fraudulent practices during their tenures and bail out of the ailing banks through direct lending by the CBN (Sanusi, 2012). According to Sanusi (2012), out of the eight banks, five went into merger and the remaining three were nationalised.
As the consolidation exercise took effect from December 2005, the post-consolidation era made the commercial banks to embrace internal and external restructuring. Technological innovations and extreme competition became the norms among banks. Their services began to improve gradually (at least better than what it used to be) through the use of modern facilities such as Automated Teller Machine (ATM) to dispense cash, debit and credit cards, mobile and internet banking (E-banking). The sector also began to adopt more systematized, modern and efficient ways of doing business in a global perspective. One of this modern ways is the rationalization of operations through the elimination of every possible hindrance so as to satisfy the customers and win their patronage within the shortest possible time. This sums up what McDonaldization process entails. Though the sector seems McDonaldized prior to the consolidation period, evidence abound as the article will reveal that it came to light as consolidation and recapitalization were introduced.
Against this backdrop, the article draws on Ritzer’s McDonaldization thesis to explore this rationalization process in light of the Nigerian banking sector in the post-consolidation era. The article reveals the evidence to prove that McDonaldization process has encroached into the sector. It further documents the negative aspects of this McDonaldization process in the sector. To properly situate this article, it is divided into four sections. The next section is the theoretical conceptual clarification. The third part examines some evidences to prove that the sector is McDonaldized. It also examines the negative consequences of McDonaldization in the sector. The last section is the concluding remark that pointed out some remedies for the negative impacts.
2. Theoretical framework 2.1 The McDonaldization Thesis
This is a sociological construct introduced by Ritzer in 1993 to describe the trend of events happening in an increasing rational modern social milieu. In his seminal work entitled: The McDonaldization of Society, Ritzer succinctly offered being guided by Weber’s modern bureaucracy how the process of rationalization has encroached every sphere of post-modern society (Ritzer, 2000). He posited that the process of McDonald’s fast food industry with extreme rationalization has increasingly dominated not just American life but is becoming widely spread worldwide.
To him, McDonaldization is ‘the process by which the principles of fast-food restaurant are coming to dominate more and more sectors of American society as well as the rest of the world’ (Ritzer, 2000 p.1). In a typical McDonalds, four major principles guide the operation of food production right from preparation, serving and down to the consumption of food. These principles are efficiency, calculability, predictability and control but they also lead to the fifth dimension which is irrationality of rationality (Ritzer, 2000). McDonaldization connotes increasing rationalization of everything in order to achieve maximum result. Though this term is an extension of Max Weber’s rationalization theory, it connotes rationalization in excess. In fact, Ritzer (2001 p.178) citing Levine (1981) averred that ‘Weber was interested in objectified rationality: that is, action that is in accord with some process of external systematization’. Against this backdrop, he noted that McDonald’s success is hinged on the fact that his restaurant offers ‘consumers, workers, and the managers: efficiency, calculability, predictability, and control’ (Ritzer, 2001 p.198) in a much rationalized way.
Weber posited that bureaucracy is the best for the modern social organization because it is organized along rational lines (Lippmann & Aldrich, 2003). The rationalization of bureaucratic organization of Weber is what the
ISSN 2039-9340 Mediterranean Journal of Social Sciences Vol. 4 (1) January 2013
345
McDonaldization of McDonald’s fast-food is to Ritzer but the later involves extreme level rationalization (Ritzer, 2000; Weaver, 2005) or what I may describe as an oversized rationalization because extremes are not always the best. Just as a rationalized bureaucratic organization is expected to be efficient due to standardized rules and routine ways of operation, McDonaldization also leads to homogenization and standardization of products and routine services. It engenders mass similarities (Lyon, Taylor, & Smith, 1994; Ritzer, 2000) and this is why Ritzer contented that diversity humans naturally crave for has been reduced if not eradicated by the McDonaldization process. In the ensuing section of the article, I will further elucidate these five dimensions and explore how they are extant in Nigerian banking industry. 2.2 Efficiency This means the ‘optimum method for getting from one point to another’ (Ritzer, 2000 p.12). It connotes the selection of most favourable and fast means to achieve a desired end. For example, fast food restaurant offers customers the optimum ways to get satisfied when hungry by providing already made food that is efficiently prepared and served. To ensure efficiency in a typical McDonald’s, rules are set and employees and customers are required to believe in these rules hook, line, and sinker and adhere willy-nilly.
For example, preparation of food is guided by already made procedures and timetable which must be followed because deviation can interrupt the whole process and in turn engenders customers’ dissatisfaction (Weaver, 2005). This is why the employees are trained in order to follow the rules of the organization to guarantee efficient work (Ritzer, 2001). 2.3 Calculability To Ritzer (2001 p.199), this is ‘an emphasis on the quantitative aspects of products sold (portion size, cost) and service offered (the time it takes to get the product)’. With much emphasis on size in a McDonald’s, quality is often sacrificed for quantity. Employees and customers alike are made to believe that the more service is rendered quickly, the best it will be. In this setting, those doing the Mcjobs also emphasize quantification than quality of jobs i.e. how quick jobs can be done irrespective of the quality in order to satisfy employers. It connotes the ability to reduce everything to countable or quantifiable term. 2.4 Predictability This is an assurance that McDonald’s product and service delivery will be homogenous every time and in everywhere (Ritzer, 2000; Ritzer, 2001). This means that customers can predict what they will eat and how it will taste like in any McDonald’s anywhere they enter the restaurant. Workers also are expected to behave in a predictable manner. This is because they follow rules and are guided by scripts, thus, what they do and may say are highly predictable (Ritzer, 2001) and even what they wear. 2.5 Control This is the ‘substitution of nonhuman for human technology’ (Ritzer, 2001 p.200). It is aimed at the eradication of possible uncertainty through technology because human actions are most times unpredictable (Ritzer, 2000). Those who eat in McDonald’s are controlled by the technology though this may be difficult to detect. The nature or quality of buns and other food machines offer is what customers will eat. That is, customers are controlled by the menu McDonald’s offer. They are meant to serve themselves and water or drink dispensers serve drinks in predetermined quantity (Ritzer, 2000). Customers who are not satisfied are meant to buy more because the more money they spend, the more profit is made by McDonald’s.
The customers are also meant to eat fast and leave so as to give way for other customers, and this is achieved via the provision of seats that are not comfortable to sit on for a long time (Ritzer, 2000). Those who do Mcjobs are also controlled by this technology. They must follow instructions to operate the technology willy-nilly, and their skills or suggestions are immaterial. McDonald’s also controls employees by ‘threatening to use, and ultimately using, nonhuman technology to replace human workers’ (Ritzer, 2001 p.201). 2.6 Irrationality of rationality The rationalization of society has brought many benefits no doubt, but has also engendered some severe consequences (Weaver, 2005). This in part is because a rationalised world is a social construct and not a natural phenomenon and this
ISSN 2039-9340 Mediterranean Journal of Social Sciences Vol. 4 (1) January 2013
346
makes it sometimes problematic (Lippmann & Aldrich, 2003). Irrationality means that over-rationalized process will always produce outcomes that are unplanned or unfavourable. Ritzer (2001) posited that this can be taken as the fifth dimension of McDonaldization because rational system is not always producing rational results. Efficiency often ends in inefficiency, calculability culminates to incalculability, and predictability generates unpredictability, while control leads to lack of control (Ritzer, 2000). When this occurs, the outcomes are irrationalities of rationality because ‘rational systems serve to deny human reason; rational systems often are unreasonable’ (Ritzer, 2001 p.201). Some of the irrationalities of rationality found in McDonaldized setting are ‘dehumanization of work, red tape, poor quality of product and misguided anger of employees and customers’ (Lippmann & Aldrich, 2003 p.140). 3. Evidences of McDonaldization of the Nigerian banking sector McDonaldization process comes with several advantages according Ritzer and that is why many sectors globally are becoming rationalised. Ritzer’s contention was that the features of rationalization of production that underpin Western manufacturing industries have crept in recently into service industries and many scholars (Lyon et al., 1994; Wood, 1994) agreed that this has infested banking industries.
Ritzer posited that to the degree at which the five dimensions of McDonaldization discussed above are manifest in any sector, that sector can be said to be undergoing McDonaldization process (Ritzer & Malone, 2000b). Nigerian economy is a capitalist growing economy that is rapidly experiencing modernization and with much emphasis on profit making within a short period of time. It is a popular thing to hear people say that time is money and this is evidence in the banking business where different marketing strategies are introduced (Ayo, Adewoye, & Oni, 2010) in quest for profit.
This is in agreement with Nancarrow, Vir, & Barker (2005) assertion that McDonaldization is merely a fashionable name for the rationalization process that occurs in many businesses and the real drivers are capitalism and profit motives (Ritzer & Stillman, 2001). Nigerian banking sector operates with capitalism principles and this involves extreme competition, technological innovation and profit maximization. Therefore, it craves for efficiency so as to woo customers and win their patronage because customers deposit determines profit to a large extent.
Just as efficiency in a McDonald’s restaurant involves routine, standardized and systematized ways of preparing and serving food with the use of customers as labourers or in Ritzer’s words- prosumers (Ritzer & Jurgenson, 2010), this prosumption process (Denegri-Knott & Zwick, 2012; Rey, 2012) is becoming increasingly seen in Nigerian banks. This is because customers are now unpaid working customers (Rieder & Voß, 2010). They use the ATM machines to do their transactions as against human tellers and still pay for serving themselves. This means they are the customers as well as the workers though without payment and this is a means to cut cost and make more profit in a McDonaldized capitalist society.
The sector in pursuit of efficiency, is becoming increasingly McDonaldized on daily basis and this is evidence in the use of credit and debit cards because Ritzer & Goodman (2007 p.424) noted that ‘...credit cards,… can be seen as part of our McDonaldized, formally rationalized, and therefore ultimately modern society’. Credit cards represent extreme rationality because in reality, they replace loan and cash transaction (Ritzer, 2000). Little wonder why Lagos State has recently introduced a ‘cashless society’ because assurance is that through the extant McDonaldized banks the state will achieve the policy. The sector in pursuit of efficiency and control is replacing human technology with nonhuman technologies and this is why many people have lost their jobs.
Following the capitalization, 8641 bankers lost their jobs (Gunu & Olabisi, 2011). Technological innovations that merger, acquisition and recapitalization engendered (Atiku, Genty, & Akinlabi, 2011) in order to guarantee efficiency, predictability of business outcome, led to the replacement of human with nonhuman technology which is what Ritzer called control.
From 2009 to 2011, 8,000 bankers were sacked (Ngutor, 2011) and as the quest for control continued Access Bank acquired Intercontinental Bank and laid off 1,500 staff of Intercontinental Banks in the first quarter of 2012 (Punch, 2012) and encouraged 1,900 to voluntarily resign. A McDonaldized business is ran with staff turnover because Mcjobs require flexibility and to achieve this, workers must be changed at intervals (Ritzer, 2000; Ritzer, 2001). Mcjobs are often mechanized and require little human labour. This is exactly what Nigerian banks are turning into presently.
The sector has also begun to fill the remaining positions with contract and casual staff employed through outsourcing (Adeleye, 2011) with low pay and no job security. Out of 16056 staff of five banks survey in 2011, 12682 were employed on casual basis (Fapohunda, 2012). The implication is that McDonaldized business is a capitalist conception and cost cutting (calculability) to maximize profit is a norm. It can also be inferred that the aim is to weaken labour union which may ask for increased pay and other benefits of which McDonaldized businesses do not tolerate.
Calculability is replete in Nigerian banking sector presently because bankers’ promotions today are hinged on the number of customers they attract and the amount the customers end up depositing irrespective of how the money was
ISSN 2039-9340 Mediterranean Journal of Social Sciences Vol. 4 (1) January 2013
347
acquired. McDonaldization replaces quality by quantity and this is evidence in Nigerian banks where looters deposit their money and get covered by bank managers. Bank employees are always given targets to meet and those who are able to meet up are rewarded with promotions which attract higher salaries irrespective of how they met the target. Those who are unable to beat the target are shown the way out (workers’ turnover). Loyal customers are also rewarded with higher interest rate (different from official rate) and sometimes cash through periodic promotions. In McDonaldized settings, quantity is more important than quality (Ritzer & Stillman, 2001) and this is a feature of Nigerian banks where branches are increasingly opened in many cities in order to attract more customers (calculability) without corresponding quality of services.
In order to attain predictability, banks now standardize and homogenise products, services and procedures right from customer service to corporate banking and down to administrative services. There are products and services uniformity in all branches in all the banks presently. For example, ATM cards have same size, same structure, similar functions and ATM machines equally look alike as well as render similar services nationwide. This makes the techno-based banking services more predictable. To add to this, banks welcome and bid their customers farewell in same manner. Customers can predict how they will be greeted at the door or at the counter each time they visit a particular branch of any bank in Nigeria. The kind of attire bankers will don on each work day and the type of services they will render when there is ‘network or not’ can be predicted.
Another aspect of control is that nonhuman technology has become the order of the day. Bankers use different computer software and other machines in quest for efficiency and control and these technologies control both the employees and the customers though the latter may be unaware of this control. Employees are controlled and dehumanized because the technologies are built in a way that employees’ input, idea or skill are inconsequential and not required. They are just there to follow the instructions given by the programmer to do the Mcjobs. On the part of the customers, ATM machines exert control because they determine how much customers can withdraw on daily basis, the type of currency notes (old, new, torn or sellotape) they will be paid with and even how it will be paid. Many banks have their maximum limit set as 100,000 Naira. This means that even if the customer has a need of more than that, the machine will not dispense more than the set limit.
Most times, the machine seizes the card or debit customers’ account without payment, leaving the customers stranded because e-banking in Nigeria is still at abysmal level (Akinyele & Olorunleke, 2010). Other technologies that the McDonaldization introduced such as the automated doors permit or disallow customers from accessing banking floors. Cases are rife where people are barred from entering just because of their belts, keys, phones, etc. In most cases, even amputees with metals inserted into their bodies through surgery are also denied access. Sometimes customers are trapped inside the electronic doors due to erratic power supply. Each time this occurs, it results in time wasting than saving which is the original intention of the McDonaldized capitalist in Nigeria. Customers are further controlled by the ‘menu’ of service these banks offer of which they have no option than to accept.
The technology makes the sector to enhance mass market. Many banks operate many branches nationwide while some have extended their frontiers across the border. This may seem to be advantageous but not totally because mass market leads to consumers’ powerlessness (Wood, 1994). This is because the kind of products and services banks provide are what customers will accept willy-nilly just like McDonald’s food menu. Presently, ATM cards are mass-produced and every customer is encouraged to use it. In fact, whether customers use it or not, once you open an account in a bank in Nigeria, you will be charged for it because banks deduct ATM fees from customers’ initial deposits. Hence, the four dimensions of McDonaldization are replete in Nigerian banking sector, the fifth dimension must be present because extreme rationalization is sine qua non to irrationalities of rationality (Ritzer, 2000).
4. Irrationalities of rationality in Nigerian banking industry
There is no gainsaying that Nigerian banking sector is bedevilled by high level of irrationalities of rationality. This is because rationalised process is never without inherent, though unintended internal contradictions and imperfections that give rise to inefficiency or irrationalities (Ritzer, 2000; 2001). Bankers work longer hours than workers in other sectors in Nigeria. They are meant to resume work as early as 7am and close late just to ensure efficient services. Many bank employees go to work on weekends including Sundays and with little or no benefit (cost cutting). Oreoluwa & Oludele (2010) findings show that bankers face several stress-related illnesses such as chest pain, headache, nausea, sleeplessness etc. They reported that many are over loaded with responsibilities. Following the bank merger, few workers that were not sacked now do the work of the other sacked employees. This is another aspect of irrationality. Mcjobs require few hands so as to cut cost and make more profit (Ritzer, 2000) at the expense of people’s health and wellbeing.
McDonaldized business emphasises profit making because it is rooted in capitalism. In Nigerian banks, profit is pursued at all cost and employers are used to pursue the profit willy-nilly. Many female employees have been turned to
ISSN 2039-9340 Mediterranean Journal of Social Sciences Vol. 4 (1) January 2013
348
sex machines by some top management staff just in order to keep their jobs because they were unable to meet the unrealistic target set by these managers (Abati, 2007) . Many marriages have been ruined due to infidelities of spouses. These irregularities are not widely reported because of lack of proper legal framework of seeking for justice in Nigeria.
According to Olufayo (2011) findings, beauty and youthfulness are major criteria for employing female bankers presently and they are asked not to get married until they are permitted to do so or be ready to lose their jobs (Abati, 2007; Olufayo, 2011). These beautiful ladies are used as marketers who woo male customers to deposit money in their banks because deposit determines banks profit (calculability). Abati revealed that a lady gave up her employment the day she was supposed to resume because the manager of the bank learnt she was newly married and asked her not to get pregnant (Abati, 2007).
Similarly, many female bankers are arguably now into ‘organized prostitution’ just because they must meet the target set by their employers and many are at risk of contracting HIV/AIDs (Olufayo, 2011). ‘They are encouraged to use what they have to get what they want’. In a McDonaldized business often driven by principles of capitalism (Ritzer & Jurgenson, 2010), increasing profit is always the aim and every ‘efficient’ means must be employed to make profit. These targets are impossible targets and might induce the girls to ‘do whatever is possible’ to woo customers to deposit money in the bank so as to retain their jobs. This is because part of banks’ profit is determined by number of customers and the amount they deposit (calculability). Just like Weber in Ritzer (2000) posited that economic interests drive rationalization in capitalist societies, McDonaldization emphasises highest profit with lowest cost. This is evidence in the Nigerian banks that are now McDonaldized in the ways they pursue profit at all cost and do everything possible to cut cost. This is why they use young girls (employed on contract/casual terms) as marketers to trap moneybags in Nigeria to deposit large sum in their banks.
Bankers now go to ‘bed thinking deposit, dreaming deposit and waking up to chase deposit’ (Abati, 2007) because the number of customers one attracts, the amount they deposit (calculability) reflects one’s performance and determines his promotion. This might be one of the reasons why bank managers hide the identity of customers who make large deposit that is higher than the legally approved limits. In fact, many of these banks are mere painted sepulchre with high level of chicanery businesses. Olufayo (2011) revealed that children of rich men who make large deposits (calculability) are given automatic employment. This means that the criterion for employment is no longer based on qualification but on how much ones parents can deposit (calculability) irrespective of how they got the money.
This leads to quality being replaced by quantity. Non-bankers in the industry are not spared either; drivers, cleaners, secretaries etc. are also instructed to bring customers to deposit money. With the high rate of unemployment in the country and the resultant hardship, many young ladies do what ordinarily they would have frowned at in order to remain employed. This lends credence to Ritzer’s calculability- the more customers you bring the more profit is made and the source is immaterial to a McDonaldized capitalist (Ritzer, 2000) who emphasises quantity than quality. Thus, the issue of morality or value does not come to play and integrity is totally jettisoned.
In many banks presently, customers pay hidden fees and many banks give mendacious financial reports (Sanusi, 2010) as bank auditors are paid to prepare two financial statements: a fictitious one to deceive the unsuspecting customers and the other revealing the real state of bank to be used by bank owners/managers. The hidden fee ranges from the short message service (SMS) fees to monthly service deductions. Many customers are unaware that the birthday, Christmas and other SMSs banks send are not free in Nigeria. They equally charge customers monthly whether they use the ATM or not and often leave customers unsatisfied (Ehigie, 2006). This arguably makes them to spend more due to the techno-based McDonaldized banking system.
Some of the CEOs set up Special Purpose Vehicles as a mechanism to borrow depositors’ money in order to trade in stock before 2009 (Sanusi, 2010; 2012). The profit derived was not paid to customers nor did they even know that their money was used to trade in stock. ‘Some banks even engage in manipulating their books by colluding with other banks to artificially enhance financial positions and stock prices’ (Sanusi, 2010 p.6). This manipulation is aided by ICT (control) and the quest for profit and these are features of McDonaldized society that lay emphasis on profit maximization.
Sanusi averred that one of the CEOs of the eight distressed banks had ‘200 real estate in Dubai and other properties in Johannesburg as well as four private jets’ (Sanusi, 2012). In his lecture in Kano, he posited that one of the banks bought jets which were later discovered to have been registered in the name of the CEO’s son (Sanusi, 2010). McDonaldization as I have earlier noted involves the use of sophisticated technologies and this aided these CEOs to cover up leading to irrationalities of rationality (Ritzer, 2000). The increasing investment in ICT in Nigerian banks is yet to yield the maximum result (Ekata, 2012) and this is a major problem facing the sector.
Though it has improved customers’ satisfaction to some extent, it has equally aided some sharp practices such as illegal withdrawals, unauthorized transfer of fund from customers’ account and error from bank employees with unprecedented financial consequences (Dauda & Akingbade, 2011). According to Ezeoha (2006), hackers use real and fake bank websites to swindle unsuspecting customers of their hard earned money. They use real bank website because
ISSN 2039-9340 Mediterranean Journal of Social Sciences Vol. 4 (1) January 2013
349
some work in collaboration with some bank staff or ex-bankers who are angry due to their dismissal. This security issue affects presently the acceptance and use of E-banking in Nigeria (Adamu & Adeola, 2012; Odumeru, 2012; Ojeka & Ikpefan, 2012; Oni & Ayo, 2010) because security and trust are among important factors that affect e-banking (Hassan et al., 2012; Okafor & Ezeani, 2012). This means that the quest for ‘efficiency has led to inefficiency’.
Balogun & Obe (2010) revealed that some ex-employees who are seeking revenge for unjust dismissal involve in electronic crime. This is very popular in Nigeria lately where many have lost their money to hackers through the use of ATMs. It is clear that some of the insiders are involved in this crime and Nigerian banks hardly report it because it will appear like washing one’s dirty linen in public (Idowu, 2009). This is irrationality orchestrated by the use of technology and this leads to customers’ dissatisfaction that is rife in Nigerian banking sector (Adeoye & Lawanson, 2012). Prior to the era of technological innovation in quest for control, it was difficult to withdraw money from another customer’s savings account without being caught because customers appeared in person before human tellers. It goes that efficiency has led to inefficiency especially due to the adoption of internet or branchless banking in Nigeria.
On the other hand, the sector still experiences long queue in banking floor due to network failure or unavailability (Anwana, 2010; Dogarawa, 2005; Ehikhamenor, 2003; Madueme & Ude, 2012; Olatokun & Igbinedion, 2009). The ATM most times debit customers without payment and this takes weeks and sometimes months to be reversed in most cases. It equally encourages excess spending and reduces savings (Ogbuji, Onuoha, & Izogo, 2012). Another fact is that many transfers via these technologies end up spending days before getting to the appropriate designated accounts (Adeoye & Lawanson, 2012). The bankers still complain of slow network and sometimes shut down services for hours due to unsuccessful network. During this period, customers are left stranded by the more confused bank staff. Therefore, the pursuit of efficiency through time saving is defeated leading to irrationalities of rationality.
In today’s Nigerian banks, the ‘production-consumption dichotomy’ (Shaw & Benkler, 2012 p.446) is fading away and ‘production is increasingly enacted at the site of consumption’ (Rey, 2012); customers as prosumers and part of this prosumption process (Ritzer & Jurgenson, 2010; Ritzer, Dean, & Jurgenson, 2012) do the work of tellers and still go uncompensated. This is in agreement with what Ritzer (2000 p. 124-125) posited:
Oh Lord, with each advance of computer age, I was told I would benefit. But with each ‘benefit’, I wind up doing more work. This is ATM… rule of life… I was told…that I could avoid lines at the bank and make deposits or withdrawals any time of the day. Now, there are lines at the ATMs, the bank seems to take a percentage of whatever I withdraw or deposit and of course I’m doing what tellers… used to do….
The McDonaldization process makes customers to ‘produce much of their own consumption experience’ (Ritzer et al., 2012 p.384) and they can be called manufacturing customers (Zwick & Denegri Knott, 2009). Many customers fill in the deposit slip, pay in through the ATM, register their names in notebooks, drop the deposit slip in boxes provided, press the door control button and leave the banking floor without any bank staff’s assistance. The only staff they may meet is the trained staff (positioned at the door) who says to them from the ‘invisible script’: have a nice day. When they are to withdraw money through an ATM, similar thing happens. Just as Ritzer (2000) posited that in a McDonald’s, customers line up to serve themselves, take away the food with the rubbish, or sit and eat fast, clear the rubbish and leave as fast as possible, so is the McDonaldized Nigerian banks. All these processes are highly predictable and result in Ritzer’s predictability (Ritzer, 2000).
Customers use the ATMs to do the work of tellers and still pay the monthly deduction ‘for serving themselves’. So they are unpaid workers and this is exploitation in the emergent prosumers capitalism (Ritzer & Jurgenson, 2010). This shows that McDonaldized banks are not completely efficient as thought because in a rationalized system customers pay more and do more jobs themselves and this leads to exploitation which is a character of any capitalist economy (Rey, 2012). The unique characteristics of this scenario is that these customers (prosumers) are made to believe they are doing the best by serving themselves efficiently but this is false consciousness though not on the side of workers but on the part of unpaid customers.
Another aspect of irrationality of rationality is predictability of everything in the system which gives no room for diversity. Walking into a bank in Nigeria, one can predict the kind of greetings s/he will be offered by both the security men and other bankers. This include inter alia: ‘welcome sir, how was your night, have a nice day’. The uninformed customers will take them serious and fall into illusion of thinking they are appreciated without knowing that those greetings are not from the heart but from scripts. This is just to make them feel important and win their patronages. This is ‘false fraternity’ (Ritzer, 2000 p.130) and with a close look at the nature of McDonaldized settings driven by post modernity, it is clear that those greetings lack according to Jameson, emotion and affects (Ritzer, 2000; Ritzer, 2001). In essence, the salutations are scripted and thus, void of empathy. This is because employees are trained to act and respond to customers in a uniformed manner based on memorized scripts- all aimed at efficiency. Similarly, this scripted
ISSN 2039-9340 Mediterranean Journal of Social Sciences Vol. 4 (1) January 2013
350
conversation makes customers dehumanized and disenchanted because they appear unnatural and highly uniformed; they lead to ‘impersonal and anonymous relationship’ between customers and employees (Ritzer, 2000 p.140).
Predictability is also seen in bankers’ uniforms and even bank buildings. Buildings are structured to look alike in all the cities they are located and ATM machines and cards look alike leading to what Jameson called ‘simulacrum: the identical copy for which no original ever existed’ (Jameson, 1984 p.66) or what Ritzer termed globalization of nothing (Beckfield, 2007). Services rendered are standardized and homogenised leading to predictability of operations which of course is tantamount to disenchantment of both the employees and customers.
Coming to other aspects of control, nonhuman technology is rapidly taking over jobs previously done by humans and this is leading to increasing job insecurity. Control is not bad completely because human actions are highly unpredictable (Ritzer, 2000) but the more employees are controlled by the technology, the more they are deskilled and this makes people to lose the ability to think for themselves. In fact, in a McDonaldized jobs, employees can only use a minute part of their skills (Ritzer, 2000). This is why medical doctors, zoologists, lawyers, engineers and even fine artists etc. are employed in Nigerian banks to do the work of accountants. All they require is to train you with technology to do the Mcjobs. Little wonder why these jobs lead to dissatisfaction and are highly unstable. This use of technology to control humans and much emphasis on speed and efficiency leave both the workers and customers disenchanted (Denegri-Knott & Zwick, 2012) and make the whole experience of banking artificial and monotonous.
Postmodernism involves waning of emotion or affect (Jameson, 1984; Jameson, 1991) and this is replete in Nigerian banking sector. This is because little or no emotional bond exists among employees (due to casualization of staff and regular turn-over), between employees and employers and between employees and customers. The employers strive to eliminate genuine emotion so as to make business go on fast and make more profit. This is achieved through regular staff turnover, contract staffing and the outlaw of unionism in most banks presently which further threatens job security (Adenugba & Oteyowo, 2012). This is irrationalities of rationality because workers who are alienated from one another can never ‘unite to lose their chain’. Though Ritzer has argued that there is escape in McDonaldized settings because it is not like Weber’s iron cage (Ritzer, 2003a), I have a contrary view because as a developing economy, there may be no route of escape in Nigeria due to the fact that these McDonaldized organizations are increasingly becoming grobalized (Ritzer, 2003b).
5. Conclusion This article has examined how McDonaldization process which involves efficiency, calculability, predictability and control so as to ensure maximum profit at a minimum time is operational in the Nigerian banking sector. It revealed therefore, that as the sector is exposed to the process of McDonaldization, it may continue to experience the negative side which is the irrationalities of rationality (Bruenderman, 2009). So the question is: are we going to escape from it? The future will remain bleak if customers do not realise the implications of this process in light of the Nigerian banking industry.
Just as Weber’s iron cage is inescapable, so are we trapped by the McDonaldized system even though Ritzer (2003a) has argued that those who wished to escape can have escape route. The implication is that there may be a continued downsizing, outsourcing of contract workers and the use of customers as unpaid labourers because banks want to make more profit at lowest cost. This is because as new technologies are introduced, the sector will continue to procure them in pursuit of efficiency, predictability, calculability and control that engender irrationalities of rationality.
The only glimpse of hope is to begin to resist some aspects of this process especially those that lead to replacement of human with nonhuman technology because technology often creates ambiguity (Turner, 2003). Another solution is to de-McDonaldized the aspects that make customers to be used as unpaid labourers and those that lead to homogeneity of everything because there is limit to McDonaldization (Ahuvia & Izberk-Bilgin, 2011). Banks should also adopt pragmatic ways of doing business that is not totally centred on cost cutting and profit maximization. There should be as a matter of urgency laws to deter banks from employing young graduates on contract or casual basis and the use of young ladies to attract deposit should be legislated against. Acknowledgment I would like to express my appreciation to Blessing Oyima for her comments on the first draft of this article.
ISSN 2039-9340 Mediterranean Journal of Social Sciences Vol. 4 (1) January 2013
351
References Abati, R. (2007). CBN, bankers’ committee and female bankers. (online) available at: Http://www.nigeriavillagesquare.com/
index2.php?option=com_content&_pdf=1&id=7302do...accessed 20 August 2012. Abubakar, A. A., & Tasmin, R. B. H. J. (2012). The impact of information and communication technology on banks’ performance and
customer service delivery in the banking industry. International Journal of Latest Trends in Finance and Economic Sciences, 2: 80-90.
Adamu, M., & Adeola, B. (2012). A statistical evaluation of factors that attract customers to banks in Lagos, Nigeria. Global Journal of Management and Business Research, 12, Doi:1109007027.
Adeleye, I. (2011). The diffusion of employment flexibility in Nigeria’s banking industry: Its nature, extent and causes. International Journal of Business and Management, 6: 150-160.
Adenugba, A. A., & Oteyowo, O. (2012). Job insecurity in selected banks in Ibadan southwest Nigeria. Mediterranean Journal of Social Sciences, 3: 47-60.
Adeoye, B., & Lawanson, O. (2012). Customers satisfaction and its implications for bank performance in Nigeria. British Journal of Art and Social Sciences, 5: 13-29.
Ahuvia, A., & Izberk-Bilgin, E. (2011). Limits of the McDonaldization thesis: EBayization and ascendant trends in post-industrial consumer culture. Consumption Markets & Culture, 14: 361-384.
Akinyele, S., & Olorunleke, K. (2010). Technology and service quality in the banking industry: An empirical study of various factors in electronic banking services. International Business Management, 4: 209-221.
Anwana, E. O. (2010). Geographic Factors Inhibiting E-Banking in Nigeria: A Case Study of Akwa Ibom and Cross River States. International Journal of Economic Development Research and Investment, 1: 68-81.
Atiku, S. O., Genty, K. I., & Akinlabi, B. H. (2011). Effect of electronic banking on employees’ job security in Nigeria. European Journal of Humanities and Social Sciences , 4: 68-84.
Ayo, C., Adewoye, J., & Oni, A. (2010). The state of e-banking implementation in Nigeria: A post-consolidation review. Journal of Emerging Trends in Economics and Management Sciences (JETEMS), 1: 37-45.
Balogun, V. F., & Obe, O. O. (2010). E-crime in Nigeria: Trends, tricks, and treatment. The Pacific Journal of Science and Technology, 11, 343-355.
Beckfield, J. (2007). The globalization of nothing. International Sociology, 22, 169-172. Bruenderman, A. (2009). Negative effects of McDonaldization. Gatton Student Research Publication, Gatton College of Business &
Economics, University of Kentucky, 1, 1-8. Dauda, Y. A., & Akingbade, W. A. (2011). Technological innovation and Nigeria banks performance: The assessment of employee’s and
customer’s responses. American Journal of Social and Management Sciences, 2: 329-340. Denegri-Knott, J., & Zwick, D. (2012). Tracking prosumption work on eBay reproduction of desire and the challenge of slow re-
McDonaldization. American Behavioural Scientist, 56, 439-458. Dogarawa, A. B. (2005). The impact of E-banking on customer satisfaction in Nigeria. MPRA Paper, 1-13. Ehigie, B. O. (2006). Correlates of customer loyalty to their bank: A case study in Nigeria. International Journal of Bank Marketing, 24:
494-508. Ehikhamenor, F. A. (2003). Information technology in Nigerian banks: The limits of expectations. Information Technology for
Development, 10: 13-24. Ekata, G. E. (2012). The IT productivity paradox: Evidence from the Nigerian banking industry. The Electronic Journal of Information
Systems in Developing Countries, 51(0). Ezeoha, A. E. (2006). Regulating internet banking in Nigeria: Some success Prescriptions–Part 2. Journal of Internet Banking and
Commerce, 11: 1. Fapohunda, T. M. (2012). Employment casualization and degradation of work in Nigeria. International Journal of Business and Social
Science, 3: 257-267. Gunu, U. (2009). The impact of the banking industry recapitalization on employment in Nigeria banks. European Journal of Social
Sciences, 11: 486-495. Gunu, U., & Olabisi, J. O. (2011). Impact of banks merger and acquisition on their staff employment. The Journal of Commerce, 3: 35-
44. Hassan, M. T., Mukhtar, A., Ullah, R. K., Shafique, H., Rehmna, S. U., & Anwar, A. (2012). Customer service quality perception of
internet banking. International Journal of Learning and Development, 2: 86-100. Idowu, A. (2009). An assessment of fraud and its management in Nigeria commercial banks. European Journal of Social Sciences, 10:
628-640. Jameson, F. (1984). Postmodernism or cultural logic of late capitalism. New Left Review, 146: 53-92. Jameson, F. (1991). Postmodernism, or, the cultural logic of late capitalism. Durham: Duke University Press Books. Kundu, S., & Datta, S. K. (2012). A comparative evaluation of customer perception and satisfaction of M-banking and I-banking. Journal
of Transnational Management, 17: 118-136. Lippmann, S., & Aldrich, H. (2003). The rationalization of everything? Using Ritzer’s McDonaldization thesis to teach weber. Teaching
Sociology, 31: 134-145. Lyon, P., Taylor, S., & Smith, S. (1994). McDonaldization: A reply to Ritzer’s thesis. International Journal of Hospitality Management, 13:
95-99.
ISSN 2039-9340 Mediterranean Journal of Social Sciences Vol. 4 (1) January 2013
352
Madueme, D., & Ude, S. (2012). Consumer Appraisal of the Implementation of Electronic Banking System in Nigeria. International Journal of Engineering Science and Technology, 4: 1718-1722.
Nancarrow, C., Vir, J., & Barker, A. (2005). Ritzer's McDonaldization and applied qualitative marketing research. Qualitative Market Research: An International Journal, 8: 296-311.
Ngutor, I. D. (2011). The impact of downsizing on competitiveness of banks in Nigeria: A study of selected banks in Makurdi metropolis. International Journal of Business and Management Tomorrow, 1: 1-6.
Odumeru, J. A. (2012). Diffusion of online recruiting technology in Nigeria. World Review of Business Research, 2: 62-74. Ogbuji, C. N., Onuoha, C. B., & Izogo, E. E. (2012). Analysis of the negative effects of the automated teller machine (ATM) as a channel
for delivering banking services in Nigeria. International Journal of Business and Management, 7: 180-190. Ogujiuba, K., & Obiechina, E. M. (2011). Financial sector reforms in Nigeria: Issues and challenges. International Journal of Business
and Management, 6: 222-233. Ojeka, S. A., & Ikpefan, O. A. (2012). Electronic commerce, automation and online banking in Nigeria: Challenges and benefits.
International Journal of Innovation in the Digital Economy (IJIDE), 3: 11-26. Okafor, E. E., & Ezeani, F. N. (2012). Empirical study of the use of automated teller machine (ATM) among bank customers in Ibadan
metropolis, south western Nigeria. European Journal of Business and Management, 4: 18-33. Olatokun, W. M., & Igbinedion, L. (2009). The adoption of automatic teller machines in nigeria: An application of the theory of diffusion of
innovation. Issues in Information Science and Information Technology, 6: 373-379. Olufayo, O. (2011). The Nigerian bank consolidation exercise and the plight of female employees. British Journal of Art and Social
Sciences, 3, 229-241. Oni, A., & Ayo, C. (2010). An empirical investigation of the level of users’ acceptance of e-banking in Nigeria. Journal of Internet Banking
and Commerce, 15: 1-13. Oreoluwa, A., & Oludele, A. (2010).Occupational stress and the Nigerian banking industry. Journal of Economics and Engineering,14-21. Punch, Newspaper. (2012). Access bank sacks 1500 intercontinental employees, shut branches www.punchng.com/...access-bank-
sacks-1500-intercontinental-emplo. Punch Online News, doi: www.punchng.com/...access-bank-sacks-1500-intercontinental-emplo
Rey, P. (2012). Alienation, exploitation, and social media. American Behavioural Scientist, 56: 399-420. Rieder, K., & Voß, G. G. (2010). The working customer–an emerging new type of consumer. Psychology of Everyday Activity, 3: 2-10. Ritzer, G. (2000). The McDonaldization of society (new century edition). Thousand Oaks, CA: Pine Forge Press. Ritzer, G. (2001). Explorations in social theory: From Metatheorizing to rationalization. London: Sage Publications Ltd. Ritzer, G. (2003a). Islands of the living dead. American Behavioural Scientist, 47: 119-136. Ritzer, G. (2003b). Rethinking globalization: Glocalization/grobalization and something/nothing. Sociological Theory, 21: 193-209. Ritzer, G. (2011). Ignoring credit and consumption discredits sociology. Contemporary Sociology: A Journal of Reviews, 40: 417-420. Ritzer, G., Dean, P., & Jurgenson, N. (2012). The coming of age of the prosumer. American Behavioural Scientist, 56: 379-398. Ritzer, G., & Goodman, D. (2007). Sociological theory (sixth edition) New York: McGraw-Hill. Ritzer, G., & Jurgenson, N. (2010). Production, consumption, prosumption the nature of capitalism in the age of the digital ‘prosumer’.
Journal of Consumer Culture, 10: 13-36. Ritzer, G., & Malone, E. L. (2000b). Globalization theory: Lessons from the exportation of McDonaldization and the new means of
consumption. American Studies, 41, 97-118. Ritzer, G., & Stillman, T. (2001). The postmodern ballpark as a leisure setting: Enchantment and simulated de-McDonaldization. Leisure
Sciences, 23: 99-113. Sanusi, S. L. (2010). The Nigerian banking industry: What went wrong and the way forward. Convocation Lecture Delivered at the
Convocation Square, Bayero University, Kano, on Friday, 26. Sanusi, S. L. (2012). Cleaning up corruption in Nigerian banks. Lecture delivered at Warwick Economics Summit February 17-19, 2012,
University of Warwick, United Kingdom. Unpublished manuscript. Shaw, A., & Benkler, Y. (2012). A tale of two blogospheres discursive practices on the left and right. American Behavioural Scientist, 56:
459-487. Turner, B. S. (2003). McDonaldization: Linearity and Liquidity in Consumer Culture. American Behavioural Scientist, 47: 137-153. Weaver, A. (2005). The McDonaldization thesis and cruise tourism. Annals of Tourism Research, 32: 346-366. Wood, R. C. (1994). Misunderstanding and misinterpreting McDonaldization: A comment on Lyon, Taylor and smith. International
Journal of Hospitality Management, 13: 293-295. Zwick, D., & Denegri Knott, J. (2009). Manufacturing Customers. The database as new means of production, Journal of Consumer
Culture, 9: 221-247..
ISSN 2039-9340 Mediterranean Journal of Social Sciences Vol. 4 (1) January 2013
353
The Effect of Using Moodle Reader as an Extensive Reading Tool on Learners’
Awareness of Affective Dimensions of Deep Vocabulary Knowledge
Ramin Vaezi
Islamic Azad University, Science and Research Branch, Tehran, Iran E-mail: [email protected] (corresponding author)
Somayeh Nilforooshan
MA in TEFL
Doi:10.5901/mjss.2013.v4n1p353
Abstract
This study aimed at investigating the effect of using MoodleReader to promote extensive reading (ER) in an Iranian EFL context, emphasizing its effect on learners' awareness of two affective dimensions namely evaluation and potency of deep vocabulary knowledge. Sixty intermediate EFL female adult learners participated in this study; they were chosen from among 90 students through Preliminary English Test and a general vocabulary knowledge test. They were thus randomly divided into two groups, experimental and control, each consisting of 30 students. As for the treatment, the experimental group used the MoodleReader for their extensive reading program, while the control group followed the conventional extensive reading curriculum, reading a small number of pre-assigned graded readers during the semester. At the end, students took a test of awareness of evaluation and potency dimensions of deep vocabulary knowledge. To see if using MoodleReader had statistically significant effects on awareness of evaluation and potency dimensions of deep vocabulary knowledge, independent T-test with 0.05 significant level was administered revealing that using MoodleReader as an extensive reading tool significantly improved learners’ awareness of the two dimensions.
Keywords: Extensive reading program; Conventional extensive reading; MoodleReader; Deep vocabulary knowledge; Affective dimensions; Evaluation dimension; Potency dimension
1. Introduction
1.1 Overview
Vocabulary is an inseparable part of any language learning process. It would be impossible to learn a language without vocabulary. The important role that this component plays has been emphasized in all different methods of language teaching. River (1981) states, "vocabulary cannot be taught. It can be presented, explained, included in all kinds of activities, but it must be learnt by individuals" (p. 28). She further states that, "As language teachers, we must raise interest in words, a certain excitement in personal development in this area" (p. 29). She also suggests that language teachers must help their students by giving them ideas on how to learn vocabulary and some guidance on what to learn.
Vocabulary as a major component of language learning has been the object of numerous studies each of which has its own contribution to the field. Laufer (1997) considers vocabulary learning as the heart of language learning and language use. In fact, it is this vocabulary learning that makes the essence of any language. Without vocabulary, speakers cannot convey meaning and communicate with each other in any particular language.
As teachers, the researchers have encountered many students who have considerable vocabulary knowledge. They, however, fail to use them correctly in different domains. Learners, mainly, the upper intermediate and advanced ones, are often able to produce grammatically correct sentences. However, they produce very plain utterances which are unable to convey different emotional loads or to express shades of intensity of connotations.
It seems that this problem is due to the lack of depth vocabulary knowledge and that the students’ criterion in choosing words in context is surface structure and they fail to address the depth of vocabulary knowledge. Iranian EFL learners’ poor deep vocabulary knowledge is a matter of concern among those involved in education and their quest for finding suitable remedies is getting more and more intense. Thus, this study was conducted to see whether using
ISSN 2039-9340 Mediterranean Journal of Social Sciences Vol. 4 (1) January 2013
354
MoodleReader as an extensive reading tool is an effective technique in increasing the affective dimensions of learners’ deep vocabulary knowledge, especially evaluation and potency dimensions. 1. 2 Research Questions
There is no evidence to prove that Iranian EFL learners of English pay attention to affective dimensions of vocabulary knowledge in their vocabulary use. Therefore, the current study examined the effect of using MoodleReader on affective dimensions of EFL learners’ vocabulary knowledge. According to Osgood, May and Miron (1975), deep vocabulary knowledge involves evaluation, potency, and activity of vocabularies. The effect of using MoodleReader on increasing awareness of evaluation and potency dimensions of deep vocabulary knowledge was the focus of this study with the following two research questions formulated:
1. Does the use of MoodleReader as an extensive reading tool have any statistically significant effect on Iranian EFL learners’ awareness of evaluation dimension of vocabulary knowledge?
2. Does the use of MoodleReader as an extensive reading tool have any statistically significant effect on Iranian EFL learners’ awareness of potency dimension of vocabulary knowledge?
2. Review of the Related Literature
2.1 Extensive Reading Program
So far, several ER-promoting programs have been suggested and used, two of which having been more successful than others: the Accelerated Reader (Paul, VanderZee, Rue, & Swanson, 1996) and the MoodleReader (Robb, 2005).
2.1.1 The Accelerated Reader
In the early 1990s, the computerized program known as the Accelerated Reader was influenced by Paul, VanderZee, Rue, and Swanson, (1996). Using the Accelerated Reader (henceforth AR), language learners go through three stages. First, they are required to read a book, fiction, non-fiction, subject matter textbook, or magazine. Having finished their books, the learners log in to the AR software and take quizzes on the material they have studied, which are available in the software database for each title. The information with regard to each learner is delivered to the teacher at the end of the program. 2.1.2 The MoodleReader
Although the AR was working well for several language teachers and ER practitioners, it was not without its problems. One of the shortcomings according to Robb (2010) was the inability to add quizzes for newly published graded readers. Another major problem was the fact that the quiz questions were not randomized, and all students got the same questions which in turn, caused the problems of quiz security and cheating. In response to these shortcomings, Robb (2005) created the MoodleReader.
The MoodleReader is a database of over 1600 online quizzes on global readers from different series and publications (Oxford Series, Cambridge, Macmillan, Cengage/Heinle and Penguin to name just a few), developed at Kyoto Sangyo University, Japan. The program carefully follows the ER approach by exposing ESL/EFL learners to a large number of reading materials. After reading a book at their own level and choice of genre and title, learners are able to take their quizzes by logging in to the system at anytime, from anywhere. Teachers can set a time limit for the completion of each quiz and control the book level suitable for each student. Moreover, the questions are randomized so that each student receives question sets which are different from those of other students. The positive and practical feature of the MoodleReader, as well as its ease of use and convenience makes it a useful tool to implement ER in any ESL context. 2.2 Evaluation and Potency Dimensions of Deep Vocabulary Knowledge
Deep vocabulary knowledge involves how well a person knows a word, in contrast to breadth of vocabulary knowledge which involves how many words are known (Brown, 2007).
ISSN 2039-9340 Mediterranean Journal of Social Sciences Vol. 4 (1) January 2013
355
Evaluation dimension of vocabulary knowledge refers to how good or bad something is, that is, whether the entity has people’s approval or disapproval in terms such as good vs. bad (Hiese 2002, p. 37). People may evaluate something as positive such as adjective "good" and they may evaluate something as negative such as adjective "bad".
Potency dimension of deep vocabulary knowledge refers to an entity’s impact in terms of being big versus little, powerful versus powerless, consequential versus immaterial (Heise 2002, p. 37). Potency shows the range of power or impact of an entity. "Powerful" is a potent adjective because it has the greatest impact, whereas "powerless" is non- potent because it has the least impact. 3. Method
3.1 Participants
The participants of this study were 60 Iranian adult intermediate EFL learners selected from amongst 90 intermediate students based on their performance on Preliminary English Test (PET) and a general vocabulary test to assure their homogeneity. 90 students were randomly chosen from all students studying at the intermediate level of Tehran-Cambridge Language School in Tehran. Then, they were randomly divided into two groups of 30 students: one group as the control group and the other one as the experimental one. All the participants were female and had been studying English for about two years. The whole term took 3.5 months.
3.2 Instruments
A sample PET was used to select 60 participants from 90 intermediate learners. The test had three sections including listening part (25 questions), reading part (35 questions), and five questions of fill-in-the-blanks for the writing part. Before the main administration, the test was piloted among 30 intermediate students who were not the main subjects of this study. Item facility and item discrimination indices were calculated.
Alongside the PET, a test of general vocabulary knowledge was constructed and used for homogenizing the participants. This test consisted of 40 multiple-choice items and the questions were made based on the vocabulary presented in the intermediate level books of "Interchange 3rd Edition" and "True to Life". The vocabulary test was made based on the topics such as jobs, people, human characteristics and feelings, disasters, expressions, prepositions, and animals. The test was piloted among 30 intermediate students who were not the main subjects of this study. All the items were checked with regard to their item facility and item discrimination. The average score of students on PET and vocabulary test were used for homogenizing the selected participants.
A MoodleReader course was set up for the students of the experimental group. As mentioned before, this website provides on-line quizzes on over 1600 graded readers and books for young and adult readers. Students read a graded reader according to their level, logged into the program and took an online quiz made consisting of 10 randomized questions.
Finally, a test was designed to assess the participants’ awareness of evaluation and potency dimensions of vocabulary knowledge. In this test, the students were given 20 sentences and for each they had to choose adjectives from a list of 20 for the names of people in the given sentences by paying attention to the verb. This test was used at the end of the term as another posttest. For preparing this test, 20 adjectives that describe human characteristics and 20 verbs that are used for the interpersonal domain were taken from Carrigon tables of evaluatin and potency (2001) which has the classification for positive/negative and potent/non-potent adjectives and verbs. Five verbs and adjectives were potent and positive such as confident, five were potent and negative such as selfish, five were non-potent and positive such as polite, and five were non-potent and negative such as dishonest. All the verbs and adjectives were the ones which are normally used in interpersonal interaction. The names were paired with two proper names to form the sentence such as "John hit Ted". Students had to choose one of the adjectives that they thought would be the best descriptor for each of the nouns in the sentence. The test was scored twice, once to measure the evaluation dimension of students’ vocabulary knowledge and once to measure the potency dimension of the vocabulary knowledge.
3.3 Procedure
Prior to the experiment, the general vocabulary knowledge test, the PET, and the test of awareness of affective dimensions of vocabulary knowledge were piloted on 30 intermediate students who were not the main subjects of this study.
ISSN 2039-9340 Mediterranean Journal of Social Sciences Vol. 4 (1) January 2013
356
For choosing and homogenizing 60 participants for this experiment, the PET and the test of general vocabulary knowledge were given to 90 intermediate Iranian EFL learners. Their average scores in these two tests were used for homogenizing them, and those who achieved scores between one standard deviation above and below the mean were chosen.
Subsequently, the 60 participants were randomly divided into two groups of 30 students. One group participated as the control group for whom conventional extensive reading of department was used. At the beginning of the term, four graded readers were selected by the instructor and assigned to students to read as their extensive reading material. The titles and the levels of these books were the same for all the students, and no choice whatsoever was allowed. For the experimental group, however, a MoodleReader course was created to promote extensive reading. Members of this group were required to enroll in and take at least 12 quizzes in a period of 3.5 months according to their language level. They had to complete a 12-book MoodleReader program.
At the end of the term, all students took a test as posttest namely a test for determining the students’ awareness of evaluation and potency dimensions of vocabulary knowledge which was scored twice for the two dimensions. First, it was scored paying attention to whether students chose potent adjectives for nouns in the sentences in which verbs were potent. Second, whether students chose the non-potent adjectives for noun in the sentences in which non-potent verbs were used. In the case where there was congruence between the potency of the verb and the potency of the adjectives, students received one score and the total score out of 34 (the number of the sentences on the test) was calculated.
In the next stage, the same test was scored based on the evaluation of verbs and adjectives to see whether students had chosen positive adjectives for the nouns in the sentences in which verbs were positive and negative adjectives for the nouns in sentences in which verbs were negative. Any congruence between adjectives and verbs with regard to their evaluation received one mark and the total score was calculated out of 20.
Then, t-test method was used two times to compare the results of control and experimental groups. Once between the means of two groups in test of measuring awareness of evaluation dimension of deep vocabulary knowledge to see whether there was significant difference between two groups in awareness of evaluation dimension of deep vocabulary knowledge after treatment and once between the means of two groups in test of measuring potency dimension of deep vocabulary knowledge to see whether there was significant difference in two groups in awareness of potency dimension of deep vocabulary knowledge after treatment.
3.4 Design
The design of this research is experimental. There were two groups, one group as an experimental one and one as a control group. The treatment was MoodleReader as an extensive reading tool for experimental group. At the end of the term, both groups participated in posttest. An independent t-test was used for comparing the experimental and control groups.
The independent variable in this study was "the use of MoodleReader". Dependent variables were "awareness of potency dimensions of deep vocabulary knowledge" and "awareness of evaluation dimensions of deep vocabulary knowledge". The controlled variable in this study was "gender".
4. Results
To initiate the experiment, 90 intermediate students took part in a PET and a general vocabulary test. Both were primarily piloted (as described earlier) with their reliability indices using the Cronbach Alpha index being 0.98 and 0.9, respectively. Hence, both tests were used to homogenize the participants required for this study and the average scores of students on the PET and the general vocabulary knowledge test were used as the criterion for selection.
Figure 1 depicts the normal curve for the mean of PET and general vocabulary knowledge test, and table 1 shows mean score and standard score of students in these tests.
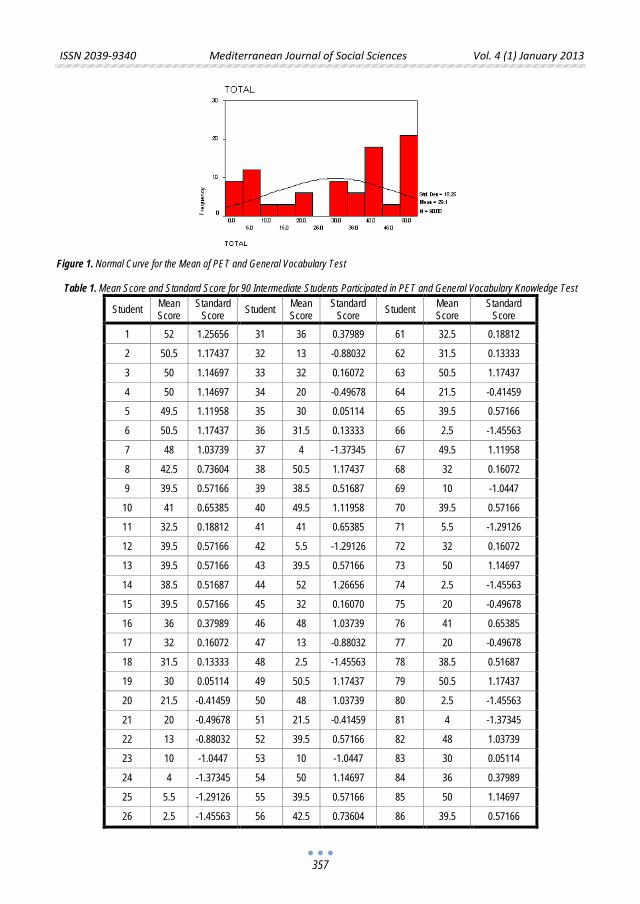
ISSN 2039-9340 Mediterranean Journal of Social Sciences Vol. 4 (1) January 2013
357
Figure 1. Normal Curve for the Mean of PET and General Vocabulary Test
Table 1. Mean Score and Standard Score for 90 Intermediate Students Participated in PET and General Vocabulary Knowledge Test
Standard Score
Mean Score Student Standard
Score Mean Score Student Standard
Score Mean Score Student
0.18812 32.5 61 0.37989 36 31 1.25656 52 1
0.13333 31.5 62 -0.88032 13 32 1.17437 50.5 2
1.17437 50.5 63 0.16072 32 33 1.14697 50 3
-0.41459 21.5 64 -0.49678 20 34 1.14697 50 4
0.57166 39.5 65 0.05114 30 35 1.11958 49.5 5
-1.45563 2.5 66 0.13333 31.5 36 1.17437 50.5 6
1.11958 49.5 67 -1.37345 4 37 1.03739 48 7
0.16072 32 68 1.17437 50.5 38 0.73604 42.5 8
-1.0447 10 69 0.51687 38.5 39 0.57166 39.5 9
0.57166 39.5 70 1.11958 49.5 40 0.65385 41 10
-1.29126 5.5 71 0.65385 41 41 0.18812 32.5 11
0.16072 32 72 -1.29126 5.5 42 0.57166 39.5 12
1.14697 50 73 0.57166 39.5 43 0.57166 39.5 13
-1.45563 2.5 74 1.26656 52 44 0.51687 38.5 14
-0.49678 20 75 0.16070 32 45 0.57166 39.5 15
0.65385 41 76 1.03739 48 46 0.37989 36 16
-0.49678 20 77 -0.88032 13 47 0.16072 32 17
0.51687 38.5 78 -1.45563 2.5 48 0.13333 31.5 18
1.17437 50.5 79 1.17437 50.5 49 0.05114 30 19
-1.45563 2.5 80 1.03739 48 50 -0.41459 21.5 20
-1.37345 4 81 -0.41459 21.5 51 -0.49678 20 21
1.03739 48 82 0.57166 39.5 52 -0.88032 13 22
0.05114 30 83 -1.0447 10 53 -1.0447 10 23
0.37989 36 84 1.14697 50 54 -1.37345 4 24
1.14697 50 85 0.57166 39.5 55 -1.29126 5.5 25
0.57166 39.5 86 0.73604 42.5 56 -1.45563 2.5 26
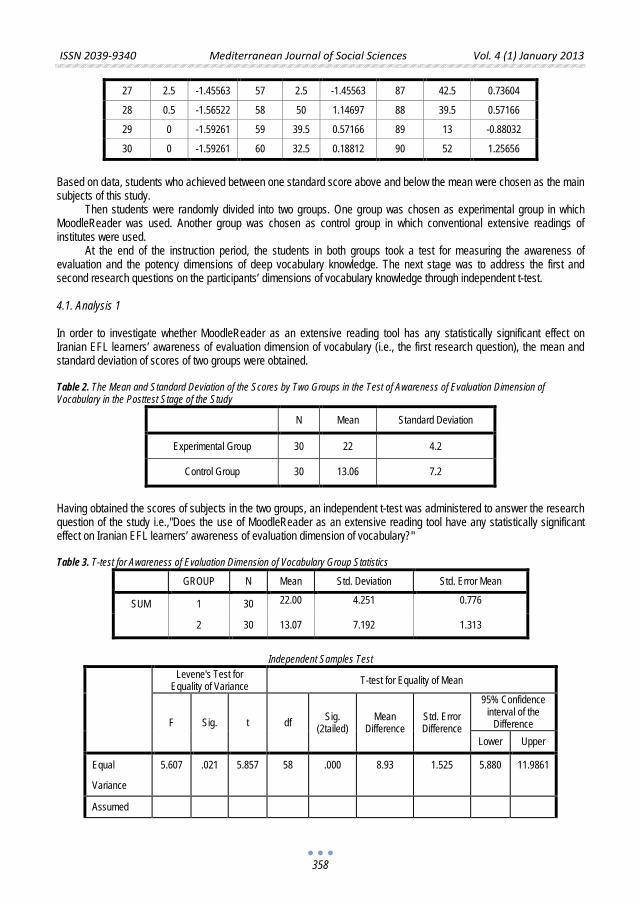
ISSN 2039-9340 Mediterranean Journal of Social Sciences Vol. 4 (1) January 2013
358
0.73604 42.5 87 -1.45563 2.5 57 -1.45563 2.5 27
0.57166 39.5 88 1.14697 50 58 -1.56522 0.5 28
-0.88032 13 89 0.57166 39.5 59 -1.59261 0 29
1.25656 52 90 0.18812 32.5 60 -1.59261 0 30
Based on data, students who achieved between one standard score above and below the mean were chosen as the main subjects of this study.
Then students were randomly divided into two groups. One group was chosen as experimental group in which MoodleReader was used. Another group was chosen as control group in which conventional extensive readings of institutes were used.
At the end of the instruction period, the students in both groups took a test for measuring the awareness of evaluation and the potency dimensions of deep vocabulary knowledge. The next stage was to address the first and second research questions on the participants’ dimensions of vocabulary knowledge through independent t-test. 4.1. Analysis 1 In order to investigate whether MoodleReader as an extensive reading tool has any statistically significant effect on Iranian EFL learners’ awareness of evaluation dimension of vocabulary (i.e., the first research question), the mean and standard deviation of scores of two groups were obtained. Table 2. The Mean and Standard Deviation of the Scores by Two Groups in the Test of Awareness of Evaluation Dimension of Vocabulary in the Posttest Stage of the Study
N Mean Standard Deviation
Experimental Group 30 22 4.2
Control Group 30 13.06 7.2
Having obtained the scores of subjects in the two groups, an independent t-test was administered to answer the research question of the study i.e.,"Does the use of MoodleReader as an extensive reading tool have any statistically significant effect on Iranian EFL learners’ awareness of evaluation dimension of vocabulary?" Table 3. T-test for Awareness of Evaluation Dimension of Vocabulary Group Statistics
GROUP N Mean Std. Deviation Std. Error Mean
SUM 1 30 22.00
4.251
0.776
2 30 13.07 7.192 1.313
Independent Samples Test
Levene's Test for Equality of Variance T-test for Equality of Mean
F Sig. t df Sig. (2tailed)
Mean Difference
Std. Error Difference
95% Confidence interval of the
Difference Lower Upper
Equal 5.607 .021 5.857 58 .000 8.93 1.525 5.880 11.9861
Variance
Assumed
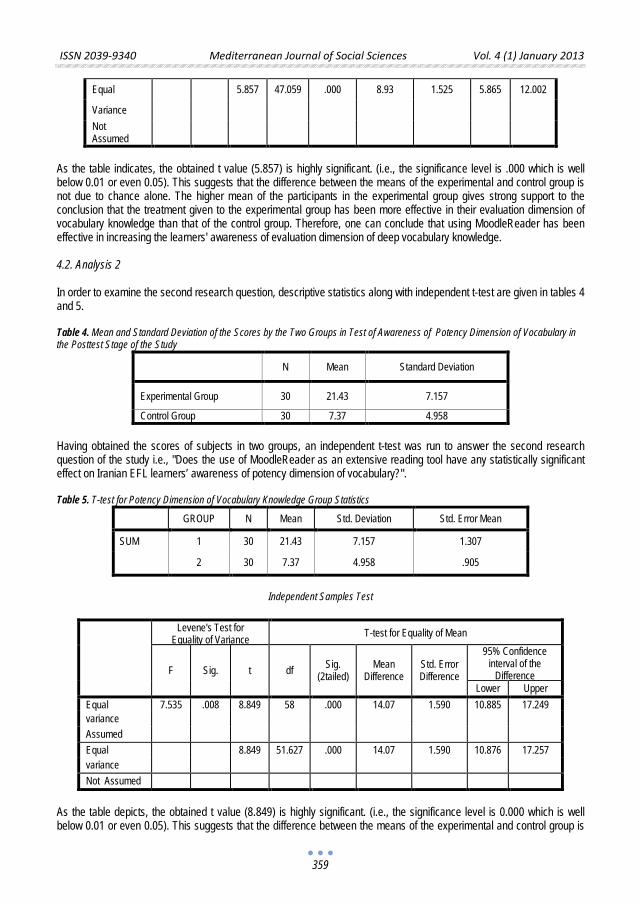
ISSN 2039-9340 Mediterranean Journal of Social Sciences Vol. 4 (1) January 2013
359
Equal 5.857 47.059 .000 8.93 1.525 5.865 12.002
Variance Not Assumed
As the table indicates, the obtained t value (5.857) is highly significant. (i.e., the significance level is .000 which is well below 0.01 or even 0.05). This suggests that the difference between the means of the experimental and control group is not due to chance alone. The higher mean of the participants in the experimental group gives strong support to the conclusion that the treatment given to the experimental group has been more effective in their evaluation dimension of vocabulary knowledge than that of the control group. Therefore, one can conclude that using MoodleReader has been effective in increasing the learners' awareness of evaluation dimension of deep vocabulary knowledge. 4.2. Analysis 2 In order to examine the second research question, descriptive statistics along with independent t-test are given in tables 4 and 5. Table 4. Mean and Standard Deviation of the Scores by the Two Groups in Test of Awareness of Potency Dimension of Vocabulary in the Posttest Stage of the Study
N Mean Standard Deviation
Experimental Group 30 21.43 7.157
Control Group 30 7.37 4.958
Having obtained the scores of subjects in two groups, an independent t-test was run to answer the second research question of the study i.e., "Does the use of MoodleReader as an extensive reading tool have any statistically significant effect on Iranian EFL learners’ awareness of potency dimension of vocabulary?".
Table 5. T-test for Potency Dimension of Vocabulary Knowledge Group Statistics
GROUP N Mean Std. Deviation Std. Error Mean
SUM 1 30 21.43 7.157 1.307
2 30 7.37 4.958 .905
Independent Samples Test
As the table depicts, the obtained t value (8.849) is highly significant. (i.e., the significance level is 0.000 which is well below 0.01 or even 0.05). This suggests that the difference between the means of the experimental and control group is
Levene's Test for Equality of Variance T-test for Equality of Mean
F Sig. t df Sig. (2tailed)
Mean Difference
Std. Error Difference
95% Confidence interval of the
Difference Lower Upper
Equal 7.535 .008 8.849 58 .000 14.07 1.590 10.885 17.249 variance Assumed Equal 8.849 51.627 .000 14.07 1.590 10.876 17.257 variance Not Assumed
ISSN 2039-9340 Mediterranean Journal of Social Sciences Vol. 4 (1) January 2013
360
not due to chance alone. The higher mean of the participants in the experimental group gives strong support to the conclusion that the treatment given to the experimental group has been more effective than that of the control group in their potency dimension of vocabulary knowledge. Therefore, one can conclude that using MoodleReader has been effective in increasing the learners' awareness of potency dimension of deep vocabulary knowledge. 5. Discussion
The outcome of the posttest data analysis revealed that the subjects in the experimental group significantly outperformed the subjects in the control group. Therefore, the obvious conclusion is that the devised treatment, i.e., the application of MoodleReader as an extensive reading tool has helped the participants to perform better than those being taught in routine manner in extensive reading. Hence, we can conclude that if students are exposed to MoodleReader as an extensive reading tool, they can improve deep vocabulary awareness in terms of the evaluation and potency dimensions of the skill.
The findings of this study may benefit EFL teachers and EFL teaching in general. Teachers can make use of MoodleReader tool not only as a tool for extensive reading, but also as a way for increasing students’ awareness of affective dimensions of deep vocabulary knowledge. Using MoodleReader can be beneficial in teaching vocabularies because they can create new context for students and learning would be more interesting. When students receive vocabulary instruction incidentally and through such a course, they can increase deeper knowledge of vocabulary which would help them to use vocabularies in appropriate situations.
Teachers can utilize a proper type of input to improve the learners’ deep vocabulary knowledge. Exposing students to MoodleReader will enhance learners’ appropriate use of vocabularies. It can be pointed out that in this way, learning vocabularies can be more interesting and more authentic to learners. MoodleReader can create a more preparatory pretext to achieve deeper knowledge of vocabularies. They can increase the amount of understanding and reducing the amount of difficulties in understanding abstract vocabularies.
References
Brown, H.D. (2007).Principles of language learning and teaching (2nd ed.). NJ: Englewood Cliffs, Prentice Hall. Corrigan, R. (2001). Semantic influence on attributions of casualty in interpersonal events. In A. Cienka, B. Luka, & M. Smith (Eds.),
Conceptual and discourse factors in linguistic structure (pp.77-89). Standford, CA: CSLL. Heise, D. (2002). Understanding social interaction with affect control theory. In Berger, J. & Zelditch, M. (Eds.), New direction in
contemporary sociological theory. Lanham, MD: Rowman & Littlefield. Laufer, B. (1997). The lexical plight in second language reading. Cambridge: Cambridge University Press. Osgood, C., May, C., & Miran, M. (1975). Cross-cultural universals of affective meaning. Urbana, IL: University of Illinois Press. Paul, T. S., VanderZee, D., Rue, T., & Swanson, S. (1996). Impact of the accelerated reader technology-based literacy program on
overall academic achievement and school attendance. Paper presented at the Literacy and Technology for the 21th Century conference of the National Reading Research Center, Atlanta, GA.
River, W. M. (1981). Foreign Language Skills. Chicago: University of Chicago Press. Robb, T. N. (2005). Outline of MoodleReader features. Retrieved December 10, 2010, from
http://moodlereader.org/moodle/ mod/resource/view.php?inpopup=true&id=3521.
Robb, T. N. (2010). Getting them to read outside of class: Let Moodle be the enforcer! MEXTESOL Journal, 34(2), 1-7.
ISSN 2039-9340 Mediterranean Journal of Social Sciences Vol. 4 (1) January 2013
361
The Education Effects in Personal Finance Management
Sanie Doda, PhD Candidate
Lecturer, “Aleksander Moisiu” University
Durres, Albania E-mail: [email protected]
Doi:10.5901/mjss.2013.v4n1p361
Abstract
This research tries to identify the importance of the education in the well-managment of the personal finances. To improve your inputs, it means to start a way toward a financiar fredoom. This doesn’t mean obligatorly to have a luxiory life, but to adapt efficient supplies to achive a given confort, assuring a more successful future. The education is one of the more important elements, which push the development of the country. This is one of the basic reasons, why one of the strategic goals it is the liberalization of the teaching\education. The education is a potential variable, which has a large impact to take personal financiar decisions and in the managerial capability of the money, where the whole society aims a high financial turn into the investment into the high school\universities. It exists an unique connection between the education and the education’s results and these results into personal finances and the economical welfare, in general.
Keyword : Education, Personal finance, Economic development.
1. Education and incomes The level of the quality of the education has a direct influence in to the individs’ payment. This is, still, a fact. We already know this fact, but although we ask: How precise is education part of this change in payment and reward? Recently the experience’s level is one of the factors a manager has in consideration before he\she emplys a new staff member. This standart should be fulfilled, as criteria for qualified profesionists.
The rules and the rule makers or rulecheckers are every day more been updated. This is happening in some appropriate sectors, where the employers may see if staff members have the specified certification. If it doesn’t happen, it means they are not ready for the market, because they are not assured as it is asked, to do the work carried as it should be. The market asks quality.
The education and the battle against the illiteracy are important elements, which push the development of the country.1
All this factors and achievements will bring to the descent of the drop out of the school, promoting the children motivation. This is particularly important into rural aereas, where a lot from them dream to move to improve the economical situation of their families. According to the Rapport for the Objectives oft him Millenium for Development
This is the reason why one of the strategic goals of the Spanish Cooperation, is the contribution to realise effectfully the studies, to reduce the fail level and to drop out the school. Another point is the contribute to improve the quality of the education through the restoration of the schools, to supply it with equipments, the training of the teaching staff, the consolidation of the school community and the public education system.
Albanian Education System is one of the more undermined structures during the Albanian political and socio-economical transition. Even so the level of the illiteracy is clearly reduced, it should be improved more the teaching\education level and should reduce the level of failure or the drop out of the school, especially into the rural aereas.
Other challanges with which we should afford are: schools must be furnitured with didactic supplies; it must be aasured the development of the educative activities into pleased levels in case to avoid congestions inside the classrooms. They must be checked the pedagogical and educative methods and the techniques to be adapted to the necessities of the children.
1 Chen, H., & Volpe, R. (1998). An analysis of personal financial literacy among college students. Financial Services Review, 7, 107–128.
ISSN 2039-9340 Mediterranean Journal of Social Sciences Vol. 4 (1) January 2013
362
(OMZH- in Albanian) for the year 2009, an important progress it is done for the accomplishment on a universal secondary school education.
Although this, more than 10% of the children in scholar age don’t the school. This is e very anxious problem. Let’s take an example: the percentage of motherhood with only secondary school or at maximum with the hight school, it directly means the reduction of the level of the infantine’s death-rate and in the same time improvement in the process of nutrition. We have to underline that when the parents are educated, the level of frequentation of the school will be higher.
The project “The upgrowth of human capacities” through the Albanian Education System has brought a positive impact into the educational level of Albaninans. The support of the educational reform, the management of human resources and the funded improvement of the infrastructure and furniture, it includes a detailed analises to the actual situation into the secondary schools in Scutari, Tirana, assuring dates for the quality of the schools, infrastucturs, equipments, the supplies and the staff qualification.
It also, analises the basic reasons of the pupils’ failure and the drop out of it, stressing the economical level of the families.
In the end, it propones recomandations for recruited staff into teaching, the local and national authorities, to promote qualitative education in Albania.
The involvement of the new components into the priuniversity structure of the curricula. The modernization of the methodologies of teaching through projects in base of regions or schools, paying
attention to the pupil, his independent thought and opinion. Teacher and headmaster’s capability through trainings, to spread modern mentality and to manage the
situations created by the transition. The contraction of work days into priuniversity education from six days into five days. This has been done
according to the new social-economical conditions. The notable improvement of the curricula’s high school quality, through the research permanent work and
important intervents into content, study’s system, the quality’s evaluation and to the strengthening of institucional capacities. The above changes have been and are still important elements to whole reforma of the educational system in Albania.
Having in consideration all these reasons, we hope this document to be a basement stone for the teaching\education institutions, organization and communities, which work to develop and to improve the Education in Albania, in that way to rise the Europian standarts and to guarantee access in secondary livel for all the children, who will write the country’s future.
Albanians, historically, consider the education as a precious heritage2. Following the tradition of the forefather’s generations, not only in the years, but into the century, the education continues to be one of the basic values of the albaninan society and one of the keys of its future3
The elimination of the political and ideological dimention of monist system from the curriculas of all the priuniversity level education.
. This is consisted into years. Above, we will introduce a detailed description to the origin of the education of our country.
The first school, ufficially is known that of the seventh March 1887, but the roofs and its truth speak earlier. From this time to today’s time, in the education’s Albanian history are registered a lot of significant facts, which testify the wish and the achievements into education. In the same time, are shown a lot of important celebre figures, whose efforts are concentrated into the richment of the minds of Albanians to optimize the Albanian nation’s values.
In the Republic of Albania, from decades, seventh March, is celebrated as the National Day of the Teacher. In fact the first written Albanian documents, respect the XV-th century. The oldest book, into the Albanian is “Missal” of Gjon Buzukut, edited on 1555. The enriched language and the relational permanent orthography testify that this document is upheld into an earlier tradition to the Albanian writing.
After the 1990’s, the Albanian society entered into a new epoch. Democratic changes involved the entire life field, which were reflected into education. The market economy and new social occurrence, propound the necessity for urgent changes to the educational system, as:
The envolvment of the priuniversity education new subjects curricula, as social education, healthily education, education for the human rights, informatics, which ask as a necessity the new concept and the croscurricular into the school.
Actually, the basic aducation or differently the obligated education is 9 years. All the children from six to sixteen years old must follow the basic education. The parents have the right to choose between the public and nopublic schools, where 2 Biberaj, E. Albania in Transition, Tiranë: Ora, 2001, p.20-30. 3 Friedman, M. Capitalism and Freedom, Tiranë : ISP & DITA 2000, 2005.
ISSN 2039-9340 Mediterranean Journal of Social Sciences Vol. 4 (1) January 2013
363
the firsts are free schools and the seconds are with the payment. The children are obligated to start the school in the age six. There aren’t any counts out criteria to take up the first class, except the rare cases, when the children suffer salubrity.
The basic education aims to develop the intellectual, creative, practice and physic capability of the pupils, to develop their persobality and to give them the essential elements of general cultura and citizen education. This is why we are underlining these aspects, because they build the grounds of individual’s education.
Albania is one of the last countries into the region for budget’s percentage into education versus the PBB’s members. Albania leaves Turkey meanwhile; it’s so far away from the average EU’s countries. “Having in consideration the descent trend, this evidence has recently taken in Albania, adding the 2.8% for 2011, it might be said, that the standarts’ EU achievement for the outgoings, still remains a illusion, evaluates ODA organization.4
Other components into the Albanians income are incomes from proprieties, annuities etc. Their spread is different this by the size and the tipes of the families. For the families with a person, the incomes come principally from the annuities and transfers etc.
According to the dates introduced from the ODA, Cypius is the state which invests more form the GDP into
education, approximately 6.4%, after which comes Slovenia with 5.63 % and Hungary with 5.15 %. These tree contries stand over the average of UE, from 5.1 %. Albania should fullfill the percent of 30 degreed through 100 citizens, to achive in this way the standarts with high quality into high education.
By this study of ODA, this is a determinated condition placed form the Europe Council and the last 10 years, the high education seems to have changed shape. But Albania is still under the numeral 30. Meanwhile, another problem is connected with the fact of the validity of the degrees realesed from the universities’ institutions.
The dates introduced from ODA, show that only 25% of the programes of the private universities are accredited. In walking process there are 20 programesm meanwhile the bigger part are still unaccredited. The private university’s accreditation pays special attention to the public, this duethe fact they are new and not so much consolidated institutions.
On the other side the public education has already created a tradition and an opinion gained into years. In the moment of speaking, we may judge the problem of accreditation, over the better part of the private universities. This remains one of the standarts to be fulfilled, as ODA, says.
According to a study edited from the World Bank, on April 2011, it is seen that, quite in all the surviewed schools, are reported infrastructures and room problems. By the surview, in almost 95 % of the classrooms, it is imposible to have classes, especially when the weather is bad or there isn’t any electicity power.
The rural schools resulted very small, without a telephone cable, without any electricity and quite ofen, without a library. Meanwhile, in the Global Competition Raport, Albania is listed in the 84-th place, a lot lower, compared with Southern Europe, having a better place than Bosnje.
The education system shows a demonstration in a flabbily situation in a place which aspirates to have a permament economical rise to be integrated into the UE. Meanwhile, rapports and published dates in a lot of organizations and institutions spread a bitter panorama of these sectors in Albania, which still are, the more underfeet and bedmanaged.
The education and the medicine are the two priorities from the Albanian government, during the last years, which don’t result to have performed well. In fact, we are placed somewhere in the end of the list, in Europe and Ballcan. These are results published form Open Data Albania and a lot of other institutions. The bad performance into the educative and medical systems, rappresent two important piles of public sercives isn’t shown any improvement.
2. The education affects in economy
5
In the year 2002 it was made the fist surview from th LSMS, campionated over the living livel of the families from the Stattistic Institute (INSTAD). This surview, made it possible to gather a large information over the Albanian families, their demographic situation, how have moved during the transition years and which have been the conditions, how do they
this is a characteristic edhe for the couples without children and the families with a single parent. From the other side, private transfers are sensibile for the families with a person and those with a single partner, takin one forth of the incomes. For the children with one or two children, the main income source is it from the work, which take three four of them. In general, the income from work make more than two third of familiar total income. 2.1 Albanian income, the researches started from 2002
4 Open Data Albania 5 Bank of Albania, April 2011
ISSN 2039-9340 Mediterranean Journal of Social Sciences Vol. 4 (1) January 2013
364
live, how much do they earn, how much do they spend for the family and how much do they spend for theirselves, how do they take care about theirselves, how do they evaluate their financial situation, the acces to the basic services and so on.
Gathered information makes possible the realisation of economic conditions and family social synthesis and the appropriate studies over the poverty, according to the recent charges of the World Bank and the Union Nations for a multidimetional of the poverty into the surview of the key indicators, which express the economic growth and the reduction of the poverty. LSMS will continue to be applied almost year after year to gather the information from the half of the sample of 2002 year. It will have into attention happenings and processes, which affect into the living level and will surview the progress made into the application of the strategy of the government for Economic and Social Development, the objectives of the new millennium. The methodology which will lead the study will be completly appoyed into the europian experience over the surviewes over the Albanian families.
So, starting to the above indicators, we can reach into the definition the young people; see the education as a way to reach their aims, their goals. Normally, this trend is more than welcomed from the educational Albanian institutions, because young people and their educational level, expresses the quality of the human capital, which our country owns.
We, generally, think for the university education, into personal aspect. Students invest a lot of time and energy, as well as money, to build their future, through education. This is a huger perspective and a higher standart of living, which bring the Albanian families into the conditions to save money, to sacrifice the consume possibility, to lend money, with the aim to make possible their children to continue the universities. In this large aspect, the assignees of the investments into the high education are less paid the attention, but they are too important into the welfare of our nation. The more powerful state’s government, invest milliards of dollars a year into public colleges and universities.
The government offers grants, ticks and working help, duty ticks, to help the second level students. Although the way to realize young men, the way in which is underlined the scrounger’s role (in this case the student’s), where the education’s possibility is already risen. It is quite impossible to evaluate the investment appropriate livel, whether private, whether public into the hight education without a concrete meaning of the individual and the society, so the relationship for the scrounger, apart from the costs and charges. Is the personal and public investment into the hight teaching into the value’s cost? Is it the most appropriate investment? Sure it is, the most approporiate and the surest.
A lot of people think the higher livels of the education are related with the higher winnings and the university is a condition to have a comfortable living6
The goal is to show the role the ecomony plays into education’s quality. With a full education, individuals may be able to make a better life. The education plays a very important role to raise the cost of the society. As a result we will
. Logically, people degreed from universities give their contribution more than the others for the public thesaurus and in other different ways to improve the social welfare. Samelly, the university education slows the propability of being depended from the society. The consolidation of those general concepts may grow up our understanding for the contributions of the high education raising the efficasity of well working of the society.
In the previous pages, it is described a variety of the living ways, differently from the incomes, the life style and the models of behaving which correspond with the different levels of the education. We have tied to bring out gereral statistics due to the govern archives, not known academicly. We aim to show up a general view of the situation. Somewhere we have mentioned some detailed summaries, according to the style of presentation in this report.
Individual characteristics, the ability of registration that is degreed from the sevond level institutions, may have a direct and systematic influence into other results.
For example it may happen that the abilities and the necessary motivation to be successful will raise the income even for those with less formal education.
The influence of the high education into the economic necessities and general achievements contributes into a lower security. People, who have been condemned before they got the hight school degree, may not go to the college. The characteristics and the circumstances of the life, which push people into criminal achievements, it may happen for them not to be able to follow higer levels of education.
Sophisticated statistic analyzes may help to clearfy the change between the correlation and the cause. Generally, it may be said, the high education has a powerful influence into all the individuals of the society. If so
these models should be interpreted carefully, they offer some persuasive arguments for our investments value into the high education.
Another helpful factor to do the right interpretation it is that not all the persons who profit from the high education have the same qualitative level. Personal enjoyment and the experiences to improve life, which are generated from high education, are practically possible to be misured. Such profits as the growth of the citizens into involvement can’t be truly translated into the comparision conditions between costs and investments.
6 Sen, A. Development as Freedom. Tiranë : Dudaj, 1999.
ISSN 2039-9340 Mediterranean Journal of Social Sciences Vol. 4 (1) January 2013
365
have lower demands into the social appoyment programes, lower percentage of jailed people and high level of citizenship.
The registration norms into universities are clearly raised during the last thirty years, in all the demographic groups. This is good news due to the participation of the second level in the process of education. There are the persons who earn less money, the families whose parents hasn’t followed an university or the minorities. It may be said the children whose parents used to go to universities, might follow their father’s steps, so to go to the university or to take a degree.
To be part of universities there exist a lot of factors: economic limitation, large contrasts from elementary school to college, academic preparation, insufficient financiar aspirations, which create a hedge to the participation to college. There are a lot of psrents in Albania, which want to educate their children, but for economic reason, the children afer finish the Hight School are forces to work.
2.2 Educative level The aim is not to analize the consenguences or to propone the solutions fot the empties into the envolvment into universities or post-universities courses, but to bring out the lost possibilities for individuals and society. If all the demographic groups are educated, they will find easier to find a work. The society will work efficiently enjoying a variety of common profits.
It isn’t possible to be seen the public and private investments costs into hight education. It is important both successes and shortness of these investments tobe clear. Students who follow the hight hight education institutions have a large kind of knowledges into the management of personal finances. This way the citizens and the duty-payers bring out a new number of people who profit directly or indirectly when the citizens have access for the university’s level of ecucations.
For this reason the inequal norms of involvement into hight education, in all different the segments of Albaninan society, may be an urgent question with interes not only directly for the individuals, but also as a public, state local and central’s question. It may be said that this is a detailed attestation for both the assignees private and public of the high education. It, also puts light over the spreading of the assignees, taking in consideration as improvement.
2.3 The hight educationed individuals profits
The hight education level brings higher profits for all the races, groups, ethni, as well for men and women. The tranch between the incomes of the people who have finished only the Hight School and them who have
finished the university is clealy raisen recently. The payments of the people with only high school are lower. Each university’sexperience gives misured profits, so we can say that the individuals who have a university
degree, posses a high level of knowledges.
2.4 Social profits o The high level of the education correspond with lower levels of unemployment and poverty, so apart the fact
the individuals give their contribute; they don’t need the social programmes, generating the drop of the demand for public budgets.
o Educated individuals are more considerated in realation to their personal health, smore less and are quite not involved into law problems.
o The high levels of education are closely correlated with higer percentage of the citizen involvement into volunteer community works, voting, blood donation etc.
2.5 The observed models into the participation into the high education involve
o Practicaly all the pupils, with high incomes, are registred into universities, but only 80 per cent of them, who
have lower incomes, continue the high education after finishing the high school. o Changed incomes are a tendency which has a little influence into the registration norms into university. o The involvement into high education changes the racial\ethnic groups. It emancipates and improves the
differences. Meanwhile the trench between rom and the othet part it is raisen recently. About this problem, should be taken responsabilities.
o The deficiencies to individuals, who don’t frequent universities, make a big influence into the future generation.
ISSN 2039-9340 Mediterranean Journal of Social Sciences Vol. 4 (1) January 2013
366
o The history shows the education is a long-life treasure. He gives a high level of turning for all the students form all the racial7ethinic groups, either for men either for women. It also affects into the society.
The major part of incomes from the high education is realised individually from students and their families. For the members of all demographic groups, their average incomes are risen from teaching level. The degreed earn around 73 per cent more and those with advanced grades earn 2-3 times more than the high school degreed. The educated individuals aren’t quite untouchable from the unemployment and poverty.
In general, the society gains a financial turn back from high education investments. The education raises the productivity, brings higher incomes, generates high payments taxilibity, and reduces the independence of the incomes form the public programes transfers. In general, the high education improves the whole life.
More, the economic advantages are almost underlined with a large range of implications. For example, a part the growth of the standarts of living, the poverty reduction improves the general welfare of the population, where the unemployment psychologic implications are obviously.
The chindren who are grown up in a well educated family, are more intelligent and abler than the other category of children. We should pay more antention to the education, so to create the possibility to take back the money invested into their education.
Let’s try treat the situation with a slogan: More education today, more money tomorrow”. Ufficialy, the average of the incomes grows up the education level. The people who have followed a good studing
programme are surer in the work market. We will be to choose between the alternatives we might be offred. The education as the third social – economic indicator, we are treating, has a basic role into the influence the general living of our country.
2..6 The natioan weekly average incomes The knowledge capital exists just when the knowledges are put under a function, and when they generate new knowledge and abilities. Only the knowledge capital is into the function of the human development, because the knowledges which aren’t applied don’t produce new konowlegdes and abilities. Accoding to the OECD, 7
Seen from this aspect, the investment into education is a general politic of development. This is a very specific politic due to its strategic long – life character.
the return gained from the invenstment into education, may be manifested with higher incomes, related more with the work market, with the better health and a lot of other non-monitory profist.
8
Teaching politics aren’t productive only in the context of Human Development and Human Capital but also in the context of social capital, because through the teaching process may have influence into the growth of the social capital, which includes social nets, the norms and the values through the individuals in a society.
Conceptual mistakes into teaching politics result with long-term conseguences, which, first, are investigated into the work market to equilibrate the offer with the demand, which is later manifested into the general economical locking.
9 According to the influence of teaching politics not only into the human capital, but also the social capital, Fukuyama, declares: “The area where the government may generate social capital, it is the education”.10
7 Blondal, Field, Girouard, 2002 8 Chen, H., & Volpe, R, An analysis of personal financial literacy among college students, p.100–128 9 Schuller, 2001, fq. 20 10 Kvalitetno obrazovane za sve, Izazovi obrazovanja u Srbiji (2004), Ministarstvo prosvete i sporta, Beograd, p. 101-102.
The human process of development it is an important hanger into the total chain: Education-Teaching-Knowledge
and Capability. The knowledge capital-the knowledge application, brings the human development. The application of the knowledges and individual capabilities for the economic development produce human capital. The uninon of the people into social nets, the obeisance of the norms and fixed ethic cods, forms the social capital.
Social capital in Albania is in low levels. Teaching organizations aren’t carring only the human capital, but also the social one, in the norms and rules form. It isn’t worth only for the elementary level and the high one, but for the university one. The doctors learn only the medicine, but Hipocrat’s attestation too. Better defence form the malversation it is the qualitative professional gift of high officials.
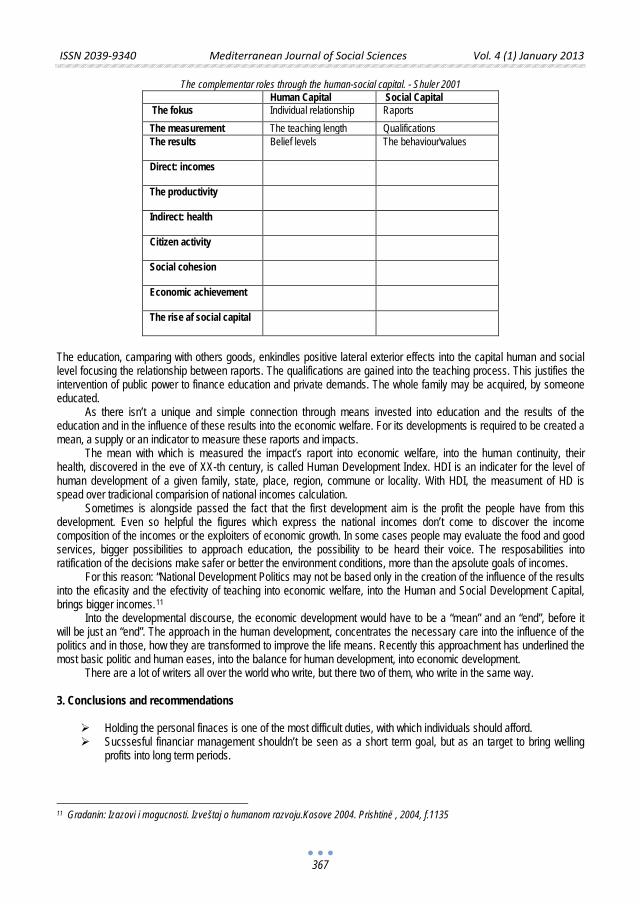
ISSN 2039-9340 Mediterranean Journal of Social Sciences Vol. 4 (1) January 2013
367
The complementar roles through the human-social capital. - Shuler 2001 Human Capital Social Capital The fokus Individual relationship Raports The measurement The teaching length Qualifications The results
Belief levels The behaviour\values
Direct: incomes
The productivity
Indirect: health
Citizen activity
Social cohesion
Economic achievement
The rise af social capital
The education, camparing with others goods, enkindles positive lateral exterior effects into the capital human and social level focusing the relationship between raports. The qualifications are gained into the teaching process. This justifies the intervention of public power to finance education and private demands. The whole family may be acquired, by someone educated.
As there isn’t a unique and simple connection through means invested into education and the results of the education and in the influence of these results into the economic welfare. For its developments is required to be created a mean, a supply or an indicator to measure these raports and impacts.
The mean with which is measured the impact’s raport into economic welfare, into the human continuity, their health, discovered in the eve of XX-th century, is called Human Development Index. HDI is an indicater for the level of human development of a given family, state, place, region, commune or locality. With HDI, the measument of HD is spead over tradicional comparision of national incomes calculation.
Sometimes is alongside passed the fact that the first development aim is the profit the people have from this development. Even so helpful the figures which express the national incomes don’t come to discover the income composition of the incomes or the exploiters of economic growth. In some cases people may evaluate the food and good services, bigger possibilities to approach education, the possibility to be heard their voice. The resposabilities into ratification of the decisions make safer or better the environment conditions, more than the apsolute goals of incomes.
For this reason: “National Development Politics may not be based only in the creation of the influence of the results into the eficasity and the efectivity of teaching into economic welfare, into the Human and Social Development Capital, brings bigger incomes.11
Holding the personal finaces is one of the most difficult duties, with which individuals should afford.
Into the developmental discourse, the economic development would have to be a “mean” and an “end”, before it
will be just an “end”. The approach in the human development, concentrates the necessary care into the influence of the politics and in those, how they are transformed to improve the life means. Recently this approachment has underlined the most basic politic and human eases, into the balance for human development, into economic development.
There are a lot of writers all over the world who write, but there two of them, who write in the same way.
3. Conclusions and recommendations
Sucssesful financiar management shouldn’t be seen as a short term goal, but as an target to bring welling profits into long term periods.
11 Gradanin: Izazovi i mogucnosti. Izveštaj o humanom razvoju.Kosove 2004. Prishtinë , 2004, f.1135
ISSN 2039-9340 Mediterranean Journal of Social Sciences Vol. 4 (1) January 2013
368
Albania has passed a very difficult economical and political transition, so still, in Albania, doesn’t work the special ticket windows or agencies to be on the function of personal financies only. This is a reason why nowdays, the majority of Albanian families, has encountered problems with personal financies.
Education is a potential variable with impact into individual financiar decisions even so the capability to manage the money. More educated the individuals more capable to manage and take decisions towards personal financies.
Education as an important social-economic indicator has a basic role into to affect the general life in our country. The society enjoys a high financial turning back into investments into university education.
The teaching plays positive role to manage money and to encourage savings. High school and universities should be more involved into youth financiar education, to asure all involved individuals into teaching process are a very important instrument to promote economic and personal financies in Albania.
Culture, as an essential aspect, plays a very important role to take personal decisions. Unfortunately, a lot of people in Albania suffer the lack of financiar education, causing they to take weak decisions according to thier management of financies.
Bibliography
Biberaj, E. Albania in Transition Tiranë: Ora, 2001. Gradanin: Izazovi i mogucnosti. Izveštaj o humanom razvoju.Kosove 2004. Prishtin 2004, p.1135 Friedman, M. Capitalism and freedom, Tiranë: ISP & DITA 2000, 2005. Gradanin: Izazovi i mogucnosti. Izveštaj o humanom razvoju.Kosove 2004. Prishtinë , 2004, f.1135. Chen, H. & Volpe, R, An analysis of personal financial literacy among college students, p.100–128 Joo, S. & Bagwell, D. C. (2003). Tools for the financial professional: personal financial wellness. Journal of Personal Finance, p. 39–53. Joo, S. & Garman, E. T. (1998b). Financial wellness may be the missing factor in understanding and reducing worker absenteeism. In:
E. T. Garman, P. L. Camp, D. C. Bagwell, & J. Kim, Personal finances and worker productivity, p. 172–182. Raport for the Millenium Objectives t for Development (OMZH), Tiranë 2009 Sen, A. Development as Fredoom. Tiranë: Dudaj, 1999. John Hancock. (2001). Insight into participant investment knowledge & behavior, p.30-53. Spencer, H. The man against the state. Tiranë : ISP & DITA 2000. Manski, C. “Economic analysis of social interactions", Journal of Economic Perspectives 14, 115-136. Soros, G. Capitalism’s crisis Global. Tiranë: Botimet Toena, 1999.
ISSN 2039-9340 Mediterranean Journal of Social Sciences Vol. 4 (1) January 2013
369
Global Marketing of Agricultural and Mineral Products,
Pre-Requisite for Africa’s Economic Development
O.S. Ibidunni (Ph.D Marketing, FNIMN)
College Of Development Studies,Department Of Business Studies, Covenant University, Canaanland, Ota, Ogun-State, Nigeria.
Email: [email protected],Phone. No. 08033323989
Doi:10.5901/mjss.2013.v4n1p369
Abstract
The study was on global marketing of agricultural and mineral products for economic development of African countries. Export activities of the fifty-three member countries of the Continent, with particular focus on the five North African countries making up Arab Maghreb Union (AMU) were investigated. Relevant literatures, with theories, were explored to substantiate the study. Qualitative method of research was adopted using secondary data. Africa: intra-regional export trade statistics by countries were sourced; for 2006 to 2008. Measures of central tendency, dispersion, skewness and kurtosis; and the relationship in-between them were highlighted to bring out the required results needed from the study. Data were expressed in United State of America, (US$) billion dollars. Findings revealed that Africa was so endowed with abundant natural resources, expanse of uncultivated fertile land, skilled and unskilled labour, water and unexplored mineral deposits. Products from agriculture and minerals are mostly for subsistence while the exportable ones are not being produced mechanically. It was recommended that Africa should move beyond international marketing as global marketing guarantees abundant production of quality products for exports, the regional economic communities should be united in their regional policies and programmes to foster specialization and optimal productivity of the representative country’s products.
1. Introduction Of the seven continents of the world, (Hirsch, (Jr), Kett, and Trefil (2002), Africa is so much endowed with natural resources (Alao, 2005). The colonial masters then found Africa, a place, where raw-materials and mineral deposits abound to cultivate and extract for further processing. As a result of African countries lacking modern technology and know-how, colonial masters and other foreign investors carted away the raw-materials, technologically processed them into finished goods, repackaged, and sent them back to African countries to sell at high prices (Awodun, 2007, Otokiti, 2007). Most of the fifty-five African countries, for now, are involved in international marketing as they export in raw forms only; the quantities of agricultural and mineral products they believe they could afford. However, hardly does the value of the exportable raw-materials pay for the required foreign goods and services that the exporting countries need (Jain and Mboma, 2007). Cateora and Graham (2005) claimed that the transition from international marketing to global marketing is catalyzed by a company’s crossing the threshold of more than half its sales revenues coming from abroad. Hence, the first challenge of this study was that African countries’ orientation towards global markets and associated planning activities rarely assisted the countries achieve economic development. Another challenge is the fact that most of them are more into international marketing rather than global marketing of these products, hence the economic development of the continent generally and the individual countries in particular is yet to advance. The objectives of this paper therefore are:
(i) To illustrate why African countries should employ global marketing for their agricultural, and mineral products to penetrate international markets.
(ii) To propose agricultural and mineral products for African countries’ production specialization. (iii) To highlight the role of Regional Economic Communities in achieving desired volume production for export.
2. Review of Related Literature
Theodore, (1983) Kotabe, and Helsen, (2004), Kotler and Keller, (2006), Hughes, et al (2010 ) referred to global marketing as marketing activities that are coordinated and integrated across multiple country markets. The integration is said to involve standardized products, uniform packaging, identical brand names, synchronized products introduction,
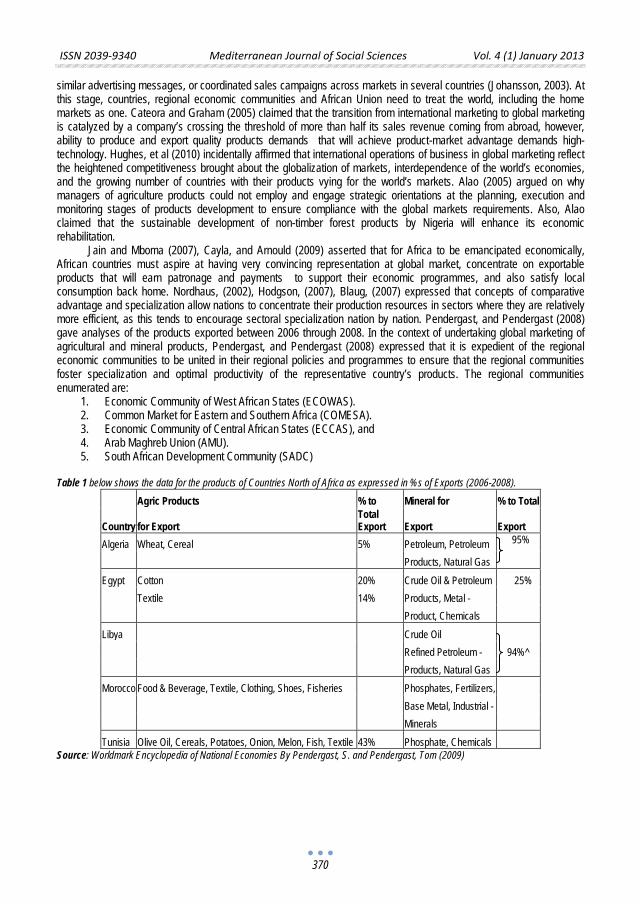
ISSN 2039-9340 Mediterranean Journal of Social Sciences Vol. 4 (1) January 2013
370
similar advertising messages, or coordinated sales campaigns across markets in several countries (Johansson, 2003). At this stage, countries, regional economic communities and African Union need to treat the world, including the home markets as one. Cateora and Graham (2005) claimed that the transition from international marketing to global marketing is catalyzed by a company’s crossing the threshold of more than half its sales revenue coming from abroad, however, ability to produce and export quality products demands that will achieve product-market advantage demands high-technology. Hughes, et al (2010) incidentally affirmed that international operations of business in global marketing reflect the heightened competitiveness brought about the globalization of markets, interdependence of the world’s economies, and the growing number of countries with their products vying for the world’s markets. Alao (2005) argued on why managers of agriculture products could not employ and engage strategic orientations at the planning, execution and monitoring stages of products development to ensure compliance with the global markets requirements. Also, Alao claimed that the sustainable development of non-timber forest products by Nigeria will enhance its economic rehabilitation.
Jain and Mboma (2007), Cayla, and Arnould (2009) asserted that for Africa to be emancipated economically, African countries must aspire at having very convincing representation at global market, concentrate on exportable products that will earn patronage and payments to support their economic programmes, and also satisfy local consumption back home. Nordhaus, (2002), Hodgson, (2007), Blaug, (2007) expressed that concepts of comparative advantage and specialization allow nations to concentrate their production resources in sectors where they are relatively more efficient, as this tends to encourage sectoral specialization nation by nation. Pendergast, and Pendergast (2008) gave analyses of the products exported between 2006 through 2008. In the context of undertaking global marketing of agricultural and mineral products, Pendergast, and Pendergast (2008) expressed that it is expedient of the regional economic communities to be united in their regional policies and programmes to ensure that the regional communities foster specialization and optimal productivity of the representative country’s products. The regional communities enumerated are:
1. Economic Community of West African States (ECOWAS). 2. Common Market for Eastern and Southern Africa (COMESA). 3. Economic Community of Central African States (ECCAS), and 4. Arab Maghreb Union (AMU). 5. South African Development Community (SADC)
Table 1 below shows the data for the products of Countries North of Africa as expressed in %s of Exports (2006-2008).
Agric Products % to Mineral for % to Total
Country for Export Total Export Export Export
Algeria Wheat, Cereal 5% Petroleum, Petroleum 95%
Products, Natural Gas Egypt Cotton 20% Crude Oil & Petroleum 25% Textile 14% Products, Metal - Product, Chemicals Libya Crude Oil
Refined Petroleum - 94%^ Products, Natural Gas Morocco Food & Beverage, Textile, Clothing, Shoes, Fisheries Phosphates, Fertilizers, Base Metal, Industrial - Minerals Tunisia Olive Oil, Cereals, Potatoes, Onion, Melon, Fish, Textile 43% Phosphate, Chemicals
Source: Worldmark Encyclopedia of National Economies By Pendergast, S. and Pendergast, Tom (2009)
ISSN 2039-9340 Mediterranean Journal of Social Sciences Vol. 4 (1) January 2013
371
3. Theoretical and Empirical Framework 3.1 Factor Proportions Theory Heckscher-Ohlin (1900s) propounded an international trade theory called factor proportions theory. The theory stresses that countries should produce and export goods that require resources (factors) that are abundant and import goods that require resources in short supply. This theory differs from the theories of comparative advantage and absolute advantage since those theories focus on the productivity of the production process for a particular good. On the contrary, the Heckscher-Ohlin (1900s) theory states that a country should specialize on the production and export using the factors that are most abundant, and thus the cheapest. Not to produce, as earlier theories stated, the goods it produces most efficiently. The theory argues that the pattern of international trade is determined by differences in factor endowments. It predicts that countries will export those goods that make intensive use of locally abundant factors and will import goods that make intensive use of factors that are locally scarce. The problem with the H-O theory, however, is that it excludes the trade of capital goods (including materials and fuels). In the H-O theory, labour and capital are fixed entities endowed to each country. In a modern economy, capital goods are traded internationally. Gains from trade of intermediate goods are considerable, as it was emphasized by Samuelson (2001). 3.2 Reality and Applicability of the Heckscher-Ohlin Model The Heckscher-Ohlin theory (1900s) is preferred to the Ricardo theory by many economists, because it makes fewer simplifying assumptions. Leontief (1953) published a study, where he tested the validity of the Heckscher-Ohlin theory. The study showed that the U.S was more abundant in capital compared to other countries; therefore the U.S would export capital- intensive goods and import labour-intensive goods. Leontief found out that the U.S's export was less capital intensive than import. After the appearance of Leontief's paradox, many researchers tried to save the Heckscher-Ohlin theory, either by new methods of measurement, or either by new interpretations. Leamer (1953) emphasized that Leontief (1953) did not interpret HO theory properly and claimed that with a right interpretation, paradox did not occur. Brecher and Choudri (1982) found that, if Leamer was right, the American workers consumption per head should be lower than the workers’ average consumption. Many famous textbook writers, including Krugman and Obstfeld (1988) and Bowen, Hollander and Viane (1998) were negative about the validity of H-O model. After examining the long history of empirical research, Bowen, Hollander and Viane concluded: "recent tests of the factor abundance theory, H-O theory and its developed form into many-commodity and many-factor case, that the H-O-V equations also indicated the rejection of the theory." Heckscher-Ohlin theory was not well adapted to the analyze South-North trade problems. The assumptions of HO are less realistic with respect to North-South than North-North (or South-South) trade. Income differences between North and South is the one that third world cares most. The factor price equalization, a consequence of HO theory, has not shown much sign of realization. HO model assumes identical production functions between countries. This is highly unrealistic. Technological gap between developed and developing countries is the main concern of the poor countries. 3.3 Neo-Ricardian trade theory The main contributors on neo-Ricardian trade theory included Steedman (1979) and Metcalfe (2007). They have criticized the Heckscher-Ohlin model on the basis that the notion of capital as primary factor has no method of measuring it before the determination of profit rate (thus trapped in a logical vicious circle). The merit of neo-Ricardian trade theory is that input goods are explicitly included to the analytical framework. This is in accordance with Sraffa's (1960) idea that any commodity is a product made by means of commodities. The limit of this theory is that the analysis is limited to small country cases. Ricardian trade theory ordinarily assumes that the labor is the unique input. This is a great deficiency as a trade theory, for the intermediate goods occupy the major part of the world international trade. McKenzie and Jones emphasized the necessity to expand the Ricardian theory to the cases of traded inputs. 3.4 Ricardo-Sraffa trade theory (1955) Chipman (1965) observed in his survey that McKenzie (1956) stumbled upon the questions of intermediate products and discovered that "introduction of trade in intermediate product necessitates a fundamental alteration in classical analysis." It took many years until recently when Shiozawa (2009) succeeded in removing this deficiency. The Ricardian trade
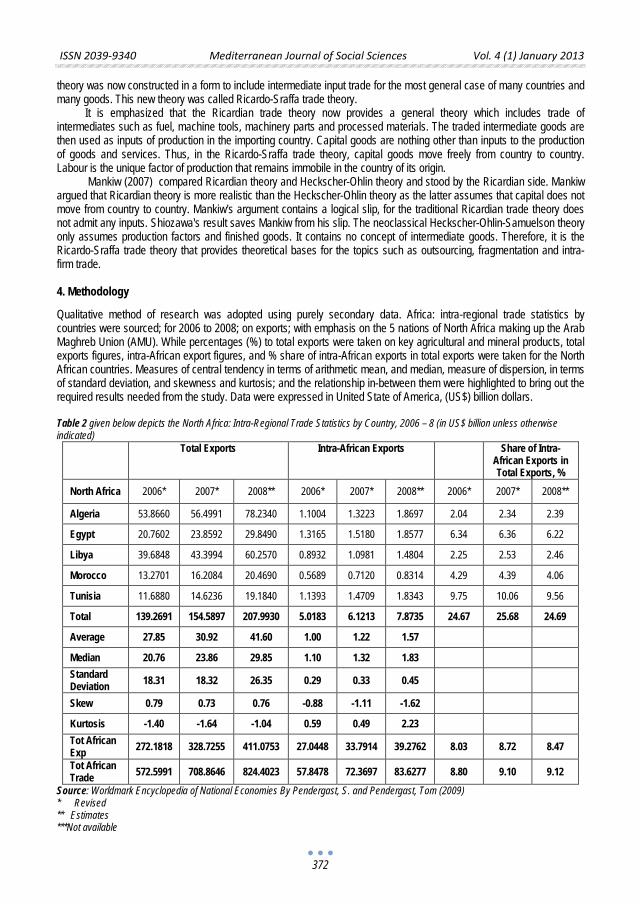
ISSN 2039-9340 Mediterranean Journal of Social Sciences Vol. 4 (1) January 2013
372
theory was now constructed in a form to include intermediate input trade for the most general case of many countries and many goods. This new theory was called Ricardo-Sraffa trade theory.
It is emphasized that the Ricardian trade theory now provides a general theory which includes trade of intermediates such as fuel, machine tools, machinery parts and processed materials. The traded intermediate goods are then used as inputs of production in the importing country. Capital goods are nothing other than inputs to the production of goods and services. Thus, in the Ricardo-Sraffa trade theory, capital goods move freely from country to country. Labour is the unique factor of production that remains immobile in the country of its origin.
Mankiw (2007) compared Ricardian theory and Heckscher-Ohlin theory and stood by the Ricardian side. Mankiw argued that Ricardian theory is more realistic than the Heckscher-Ohlin theory as the latter assumes that capital does not move from country to country. Mankiw's argument contains a logical slip, for the traditional Ricardian trade theory does not admit any inputs. Shiozawa's result saves Mankiw from his slip. The neoclassical Heckscher-Ohlin-Samuelson theory only assumes production factors and finished goods. It contains no concept of intermediate goods. Therefore, it is the Ricardo-Sraffa trade theory that provides theoretical bases for the topics such as outsourcing, fragmentation and intra-firm trade.
4. Methodology Qualitative method of research was adopted using purely secondary data. Africa: intra-regional trade statistics by countries were sourced; for 2006 to 2008; on exports; with emphasis on the 5 nations of North Africa making up the Arab Maghreb Union (AMU). While percentages (%) to total exports were taken on key agricultural and mineral products, total exports figures, intra-African export figures, and % share of intra-African exports in total exports were taken for the North African countries. Measures of central tendency in terms of arithmetic mean, and median, measure of dispersion, in terms of standard deviation, and skewness and kurtosis; and the relationship in-between them were highlighted to bring out the required results needed from the study. Data were expressed in United State of America, (US$) billion dollars.
Table 2 given below depicts the North Africa: Intra-Regional Trade Statistics by Country, 2006 – 8 (in US$ billion unless otherwise indicated)
Total Exports Intra-African Exports
Share of Intra-African Exports in Total Exports, %
North Africa 2006* 2007* 2008** 2006* 2007* 2008** 2006* 2007* 2008**
Algeria 53.8660 56.4991 78.2340 1.1004 1.3223 1.8697 2.04 2.34 2.39
Egypt 20.7602 23.8592 29.8490 1.3165 1.5180 1.8577 6.34 6.36 6.22
Libya 39.6848 43.3994 60.2570 0.8932 1.0981 1.4804 2.25 2.53 2.46
Morocco 13.2701 16.2084 20.4690 0.5689 0.7120 0.8314 4.29 4.39 4.06
Tunisia 11.6880 14.6236 19.1840 1.1393 1.4709 1.8343 9.75 10.06 9.56
Total 139.2691 154.5897 207.9930 5.0183 6.1213 7.8735 24.67 25.68 24.69
Average 27.85 30.92 41.60 1.00 1.22 1.57
Median 20.76 23.86 29.85 1.10 1.32 1.83 Standard Deviation 18.31 18.32 26.35 0.29 0.33 0.45
Skew 0.79 0.73 0.76 -0.88 -1.11 -1.62
Kurtosis -1.40 -1.64 -1.04 0.59 0.49 2.23 Tot African Exp 272.1818 328.7255 411.0753 27.0448 33.7914 39.2762 8.03 8.72 8.47
Tot African Trade 572.5991 708.8646 824.4023 57.8478 72.3697 83.6277 8.80 9.10 9.12
Source: Worldmark Encyclopedia of National Economies By Pendergast, S. and Pendergast, Tom (2009) * Revised ** Estimates ***Not available
ISSN 2039-9340 Mediterranean Journal of Social Sciences Vol. 4 (1) January 2013
373
Table 2 above shows the export trade analysis of North African countries, 2006 through 2008. The total exports for the five countries grew progressively in 2006 through to 2008. Also, the data presented as the intra-African exports for the five countries for 2006 to 2008 grew progressively. It was therefore right that in the re-arrangement of the entire data, median was found as 20.76, 23.86, and 29.85 respectively for 2006, 2007, and 2008, which incidentally fell on Egypt. The standard deviation also showed how each country export drives deviated from the other, both in total exports and in intra-African exports for the same period of time. The implication of the positive skewness, that is, 0.79, 0.73 and 0.76 with lower data than the negative skewness, that is, -0.88, -1.11, and -1.62 with higher data, was that the five North African countries exported less quantities of products than the quantities imported, while the reverse was the case with kurtosis analysis. That is, the negative kurtosis data, -1.40, -1.64, and -1.79 depicting lower data than the positive kurtosis data, that is, 0.59, 0.49, 2.23 with higher data was that, the five North African countries imported more quantities of products than the quantities exported. However, the Continent’s share of global trade edged upwards to 9.12% in 2008 from 8.80% in 2006; while the Continent’s share of global exports also improved during the period from a level of 8.03% in 2006 to 8.47% in 2008 (Ekra, 2009). Generally the African trading partners include United States of America, members of European Union, members of Asia continent and their African counterparts.
5. Conclusion and Implications
The following conclusions were drawn and the implications proffered:
i. With the fertile land, academically and professionally qualified agriculturalists, geologists and favourable climatic conditions all year round, Africa and its countries are in good position to supply the required food items to other continents of the world.
ii. The exploration of the numerous mineral deposits should be a task in this 21st century. Their availability will open up Africa and indeed the countries into the riches of global markets.
iii. Africa might not meet up with world’s demand of its agricultural and mineral products except it fully employs modern technology in its exploration of the deposits and production of the world demands of the goods.
iv. To this end, regional economic communities/countries should identify and target key high growth sectors internally with greatest growth potential and marketability.
v. The export process should be sector-specific, and sector strategies should offer the framework within which exports are encouraged and incentivized.
vi. African countries should employ modern technologies in the development of agriculture, mineral, and other products and services yielding revenue.
vii. African countries via the Economic Commission for Africa (ECA) should operate under a Custom Union with a common external tariff, enjoy freed internal tariffs among each other under Free Trade Agreement and enjoy preferential market access to the E.U and Western Markets respectively with trade preferences of duty and quota free entry of all agricultural and mineral products.
viii. The Economic Commission of Africa (ECA) should endeavour to give proper policy guidelines, control and coordination to the activities of regional economic communities. Production of products should be intensified mechanically for local consumption, as well as for exports.
ix. Lastly, the effective global marketing programmes employed will increase the 9.12% expansion in the value of African trade in 2008 to achieve over 21.28% of the world export trade in 2015.
References
Alao, J. S (2005) “ Sustainable Development of Non-Timber Forest Products For Economic Rehabilitation and Reliance,” Multi-
disciplinary Journal of Research Develpoment (NAID), 5, (2), May, pp. 66-73 Awodun, Muritala (2007) “A Comparative Analysis of Strategies for Managing Multinational and Domestic Enterprises in Emerging
Economies,” Unpublished Doctoral Dissertation, Lagos State University, Ojo, Nigeria. pg.3-18 Baldwin, R. and C. Wyplosz, (2004). The Economics of European Integration, Berkshier: McGraw-Hill Education. Blaug, Mark (2007). "The Social Sciences: Economics" (Postwar developments, Methodological considerations in contemporary
economics), The New Encyclopædia Britannica, Vol. 27, pp. 346–47. Bowen, H.P, Hollander, A, and Viane, J-M. (1998). Applied International Trade Analysis. London: Macmillan Press. Brecher, Choudri (1982). "The Leontief Paradox: Continued". Journal of Political Economy, Vol. 90, pp. 820–823. Cayla, Julien and Arnould, Eric (2009), “A Cultural Approach to Branding in the Global Marketplace,” Journal of International Marketing,
Special Issue on International Branding, 16 (4), pp.86-112. Cateora, P.R, and Graham, J.L (2005) International Marketing, New York: McGraw-Hill Irwin.
ISSN 2039-9340 Mediterranean Journal of Social Sciences Vol. 4 (1) January 2013
374
Chipman, John S. (1965) “A Survey of the Theory of International Trade: Part 1, The Classical Theory,” Econometrica, 33(3), pp. 477-519, Section 1.8
Ekra, J.L. (2009).”Powering Growth Through New Markets and Commodities.” Cairo: African Trade Report of African Export Import Bank, pp. 55-63
Frame, I. and K. Murison (2005). Africa, South of Sahara, New York, Europa Publications, 34th Edition. Heckscher, E (1919) “The Effects of Foreign Trade on the Distribution of Income,” Ekonomist Tidskriff, pp. 497-512. Translated as
Chapter 13 in American Economic Association; Readings in the Theory of International Trade, Philadelphia Blakiston, 1949, pp. 272-300.
Hirsch, E.D. Jr, Kett, Joseph F, and Trefil, James (2002) The New Dictionary of Cultural Literacy, 3rd edition, Houghton Mifflin Company. Hodgson, G.M (2007). "Evolutionary and Institutional Economics as the New Mainstream". Evolutionary and Institutional Economics
Review, 4 (1), pp. 7–25, http://www.jstage.jst.go.jp/article/eier/4/1/7/ Hughes, Mathew, Martin, Silvia L, Morgan, Robert E, and Robson, Matthew J. (2010) “Realizing Product-Market Advantage in High-
Technology International New Ventures: The Mediating Role of Ambidextrous Innovation," Journal of International Marketing, 18 (4), pp. 4-7
Jain, Dei and Mboma, Lucy, M (2007) “ Marketing Philosophy and Marketing of Agricultural Products By Non-Governmental Organizations in Tanzania,” Published in Proceedings of 8th International Academy of African Business and Development (IAABD), pp. 384-389.
Johansson, J.K. (2003). Global Marketing, New York: McGraw-Hill Irwin, 3rd edition. Kotabe, Masaki and Helsen, Kristiaan (2004) Global Marketing Management, 3rd Edition, John Wiley & Sons, Inc. Kotler, P, and Keller, K Lane (2006) Marketing Management, New Jersey, Pearson Education Inc, 12th Edition. Krugman, P.R, and Obstfeld, M (1988). International Economics: Theory and Policy. Glenview: Scott, Foresman. Leamer, E.E. (1980). "The Leontief Paradox Reconsidered". Journal of Political Economy, Vol. 88: 495–503. Leontief, Wassily (1953) “Domestic Production and Foreign Trade: The American Capital Position Reexamined,” Proceedings of the
American Philosophical Society, Vol. 97, pp. 332–349. Mankiw, Gregory (2007) Essentials of Economics, 4th Edition, Harvard University McKenzie, Lionel W. (1956) “ Specialization in Production and the Production Possibility Locus, “ Review of Economic Studies, 23(3), pp.
56-64. Metcalf, J. Stanley (2007). " Alfred Marshall's Mecca: Reconciling the Theories of Value and Development," The Economic Record, The
Economic Society of Australia, 83(s1), pp. S1- S22, 09. Nordhaus, William D. (2002). "The Economic Consequences of a War with Iraq", in War with Iraq: Costs, Consequences, and
Alternatives, pp. 51–85. American Academy of Arts and Sciences, Cambridge, MA. Retrieved October 21, 2007. Ohlins, B (1933) Inter-regional and International Trade, Cambridge, Harvard University Press. Otokiti, S. O. (2007) International Business; How to Get Started in the International Business Environment, Dubai Printing Press, Dubai,
United Arab Emirates. Pendergast, S and T. Pendergast, (2002). Worldmark, Encyclopedia of National Economies, Galegroup, Thomson Learning. Vol. 1 –
Africa. \“Ricardo, David’s Discovery of Comparative Advantage,” by Roy J. Ruffin, History of Political Economy, Vol. 34, Winter 2002, pp.727–
48. Samuelson, P. (2001) “A Ricardo-Sraffa Paradigm Comparing Gains from Trade in Inputs and Finished Goods,” Journal of Economic
Literature, 39(4), pp. 1204-1214. Shiozawa, Yoshinori (2009) "Samuelson's Implicit Criticism against Sraffa and the Sraffians and Two Other Questions" The Kyoto
Economic Review, 78(1): 19-37. Sraffa, Piero,and Ricardo, David (1955), The Works and Correspondence of David Ricardo: Volume 10, Biographical Miscellany,
Cambridge, UK: Cambridge University Press, pp. 434, Sraffa, Piero (1960) Production of Commodities by Means of Commodities: Prelude to a Critique of Economic Theory, Britain,
Cambridge University Press. Steedman, Ian (Ed) (1979) Fundamental Issues in Trade Theory, London: MacMillan and New York: St. Martin's Press. Steedman, Ian
1979 Trade Amongst Growing Economies, Cambridge: Cambridge University Press. Theodore, Levitt (1993) “ The Globalization of Markets,” Harvard Business Review, Vol. 61, (May–June), pp. 92-102.
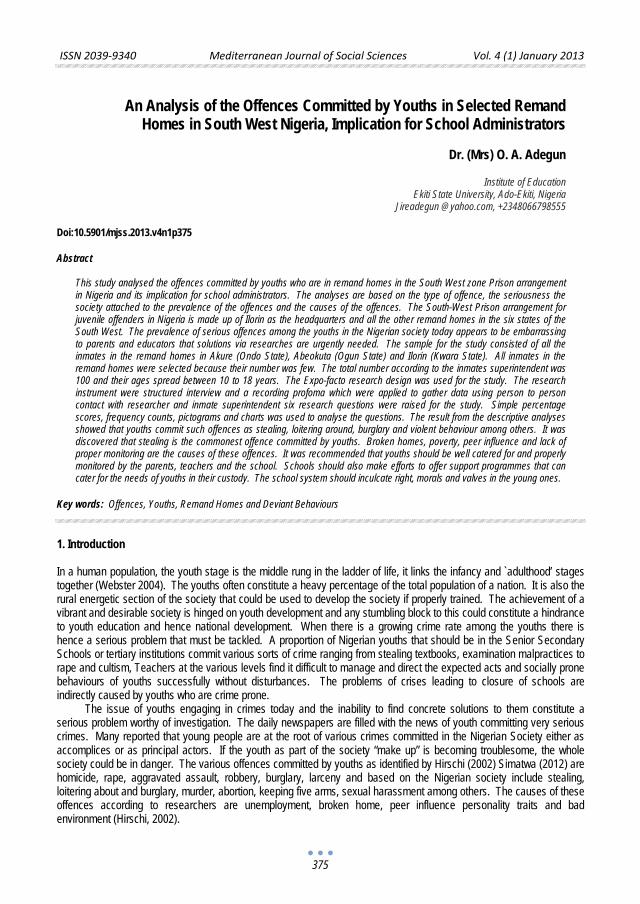
ISSN 2039-9340 Mediterranean Journal of Social Sciences Vol. 4 (1) January 2013
375
An Analysis of the Offences Committed by Youths in Selected Remand
Homes in South West Nigeria, Implication for School Administrators
Dr. (Mrs) O. A. Adegun
Institute of Education Ekiti State University, Ado-Ekiti, Nigeria
Jireadegun @yahoo.com, +2348066798555
Doi:10.5901/mjss.2013.v4n1p375
Abstract This study analysed the offences committed by youths who are in remand homes in the South West zone Prison arrangement in Nigeria and its implication for school administrators. The analyses are based on the type of offence, the seriousness the society attached to the prevalence of the offences and the causes of the offences. The South-West Prison arrangement for juvenile offenders in Nigeria is made up of Ilorin as the headquarters and all the other remand homes in the six states of the South West. The prevalence of serious offences among the youths in the Nigerian society today appears to be embarrassing to parents and educators that solutions via researches are urgently needed. The sample for the study consisted of all the inmates in the remand homes in Akure (Ondo State), Abeokuta (Ogun State) and Ilorin (Kwara State). All inmates in the remand homes were selected because their number was few. The total number according to the inmates superintendent was 100 and their ages spread between 10 to 18 years. The Expo-facto research design was used for the study. The research instrument were structured interview and a recording profoma which were applied to gather data using person to person contact with researcher and inmate superintendent six research questions were raised for the study. Simple percentage scores, frequency counts, pictograms and charts was used to analyse the questions. The result from the descriptive analyses showed that youths commit such offences as stealing, loitering around, burglary and violent behaviour among others. It was discovered that stealing is the commonest offence committed by youths. Broken homes, poverty, peer influence and lack of proper monitoring are the causes of these offences. It was recommended that youths should be well catered for and properly monitored by the parents, teachers and the school. Schools should also make efforts to offer support programmes that can cater for the needs of youths in their custody. The school system should inculcate right, morals and valves in the young ones.
Key words: Offences, Youths, Remand Homes and Deviant Behaviours
1. Introduction
In a human population, the youth stage is the middle rung in the ladder of life, it links the infancy and `adulthood’ stages together (Webster 2004). The youths often constitute a heavy percentage of the total population of a nation. It is also the rural energetic section of the society that could be used to develop the society if properly trained. The achievement of a vibrant and desirable society is hinged on youth development and any stumbling block to this could constitute a hindrance to youth education and hence national development. When there is a growing crime rate among the youths there is hence a serious problem that must be tackled. A proportion of Nigerian youths that should be in the Senior Secondary Schools or tertiary institutions commit various sorts of crime ranging from stealing textbooks, examination malpractices to rape and cultism, Teachers at the various levels find it difficult to manage and direct the expected acts and socially prone behaviours of youths successfully without disturbances. The problems of crises leading to closure of schools are indirectly caused by youths who are crime prone.
The issue of youths engaging in crimes today and the inability to find concrete solutions to them constitute a serious problem worthy of investigation. The daily newspapers are filled with the news of youth committing very serious crimes. Many reported that young people are at the root of various crimes committed in the Nigerian Society either as accomplices or as principal actors. If the youth as part of the society “make up” is becoming troublesome, the whole society could be in danger. The various offences committed by youths as identified by Hirschi (2002) Simatwa (2012) are homicide, rape, aggravated assault, robbery, burglary, larceny and based on the Nigerian society include stealing, loitering about and burglary, murder, abortion, keeping five arms, sexual harassment among others. The causes of these offences according to researchers are unemployment, broken home, peer influence personality traits and bad environment (Hirschi, 2002).
ISSN 2039-9340 Mediterranean Journal of Social Sciences Vol. 4 (1) January 2013
376
The Nigeria educational system provides procedures and materials for the education of her youths. These include good curricular for learning, instructional facilities, enabling environment and manpower. With all these good plans and provisions, the goal for youthful education may not be achieved because of certain emerging problems. Among many problems facing youthful education in Nigeria today are lack of interest in serious studies, the desire to get rich quickly, inclination to criminal activities and a host of other related problems.
The rate of offence among the youths going to jail, remand homes and detention camps is increasing astronomically nowadays (Powel and Hawkins, 1996). Fax and Pierce (1994) reported cases of between 10 years to 15 years old stabbing their colleagues to death at school, robbing elderly people of valuable things at home and committing many serious offences that could only be associated with adult in the time past.
The seriousness of youth offences today calls for urgent solution. There is the need to know these offences that are rampart among the youths, reasons why these youths commit offences and the various backgrounds and condition that favour criminality among youths in order to proffer meaningful solutions. The study of this nature will assist the school administrators and managers to know how to administer schools in terms of disciplinary measures to be put in place, moral instructions to be given and guidance and counselling needs of the students. The school administrators could plan for meaningful and interesting activities that will engage the youths in school so as to prevent them from having time or interest at going into criminal activities.
The studies of Hopkins (1983) revealed that offences are categorized as delinquent behaviours especially when the youth is between ages 12 and 13 years. Webster (2004) defined delinquent behaviour as anti social behaviour that is beyond parents control and therefore subject to legal action Gottfredson (1987) established the Nigerian version of delinquent behaviour as an aggressive type of behaviour which does not agree with societal norms and expectations.
Misoula (2006) noted that youth offences ranged from stealing, assault and gambling. He maintained that crime in Nigeria for the last few years was becoming more brutal, more irrational, more random and more frightening due to the activities of youths. Although delinquencies and crimes are great problems with their continuous shattering effects on the education system and the society and the alarming rate at which those maladaptive behaviours are being committed by youths are becoming more embarrassing to schools and the society. Gottfredson and Hirschi (1990) and Aladeloye (2000) Established that when there is lack of social constraints due to attachment to parental control or commitment to good home background or involvement and strong belief in a good religious circle, youths are said to find themselves free to engage in virtually any deviant behaviour that presents itself. In contrast to empirical findings some competing theories assumed specialization. They claimed that deviant either learned to engage in a particular type of delinquent behaviour or adopt a particular delinquent act (Hirschi 2002). Deviants were thought to specialize in drug use, property offences, criminal violence, or some other type of deviant activity. Consistent with Hirschi (2002) contention, delinquent acts tend to be correlated. This means that although deviant behaviours may show a small degree of specialization, there is strong tendency for persons who engage in one type of delinquent behaviour to engage in other types as well. Gottfredson and Hirschi (1990) referred to smoking, drug use, driving fast cars, gambling and engaging in sexual promiscuity as an analogy of offences committed by youths.
Relevant surveys of the Nigerian society showed that the common offences committed by youths are examination malpractices. Impersonation, copying of pre-written texts brought to examination halls (WAEC 1992, 2000). A cursory look at the news media showed a rising trend in the commitment of these crimes like rape, cultism, street fighting, robberies, rioting, drug pushing, assassinations, assault and murder. Saturday Tribune of 1st January 2006) reported cases of robbery among the youths. The Punch of 22nd October 2003 and 16th August 2006 reported that cultism is a great problem in the various institutions of learning in Nigeria today.
Piaget and Inhelder (1969) and Erickson (1968) discovered that the natural tendencies of these coupled with the physiological complexes at this time would be the reasons why youth commit offences. While Farrington (2007) put the major causes of crimes among the youths as low income and poor housing of parents youths living in deteriorated areas, low school attainment, poor parental supervision and broken homes. Others like Hirschi (2002) Thornlindson and Benniburg (2006) agreed with these findings. Other domestic factors according to Hirschi (2002) producing delinquency include authoritarian attitudes of parents, finish tendency in parents and collapse of family relationship leading to frequent disputes between the parents
The sex of youth is another notable factor expressed by Engle (2005), Silva (2007) as responsible for youth crime. They established that boys commit crimes more often than girls. According to Engel (2005) males are troubled by Neuro development disorder while females are not, tough both males and females are exposed to social interactions which affect them equally but only males are exposed to the neuro-developmental disorders based on the problem of this study, therefore it is necessary to investigate the offences committed by youths in the study area. This could help to solve some major problems facing the education system in Nigeria. This study therefore sought to find answers to the following questions which are pertinent to the study.
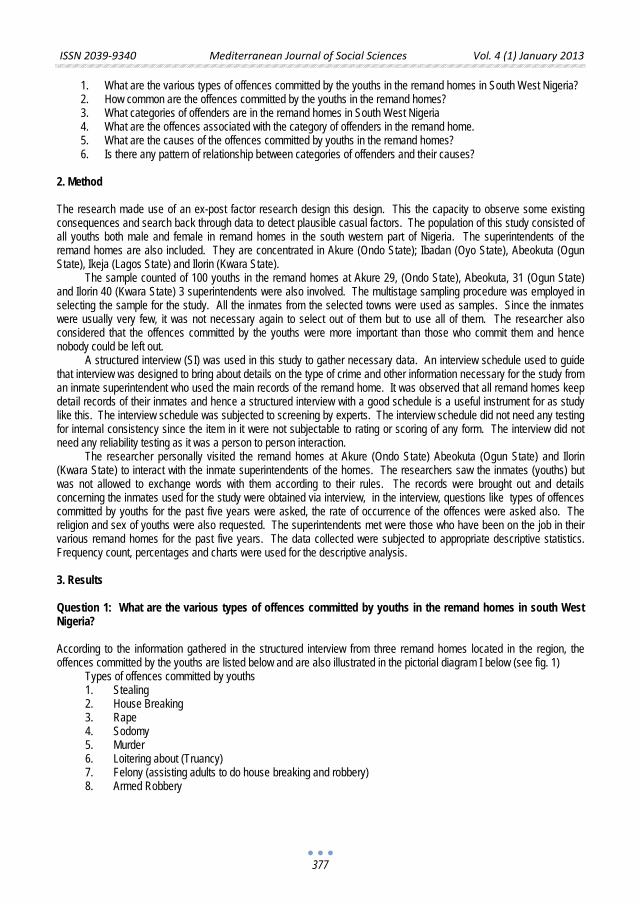
ISSN 2039-9340 Mediterranean Journal of Social Sciences Vol. 4 (1) January 2013
377
1. What are the various types of offences committed by the youths in the remand homes in South West Nigeria? 2. How common are the offences committed by the youths in the remand homes? 3. What categories of offenders are in the remand homes in South West Nigeria 4. What are the offences associated with the category of offenders in the remand home. 5. What are the causes of the offences committed by youths in the remand homes? 6. Is there any pattern of relationship between categories of offenders and their causes?
2. Method The research made use of an ex-post factor research design this design. This the capacity to observe some existing consequences and search back through data to detect plausible casual factors. The population of this study consisted of all youths both male and female in remand homes in the south western part of Nigeria. The superintendents of the remand homes are also included. They are concentrated in Akure (Ondo State); Ibadan (Oyo State), Abeokuta (Ogun State), Ikeja (Lagos State) and Ilorin (Kwara State).
The sample counted of 100 youths in the remand homes at Akure 29, (Ondo State), Abeokuta, 31 (Ogun State) and Ilorin 40 (Kwara State) 3 superintendents were also involved. The multistage sampling procedure was employed in selecting the sample for the study. All the inmates from the selected towns were used as samples. Since the inmates were usually very few, it was not necessary again to select out of them but to use all of them. The researcher also considered that the offences committed by the youths were more important than those who commit them and hence nobody could be left out.
A structured interview (SI) was used in this study to gather necessary data. An interview schedule used to guide that interview was designed to bring about details on the type of crime and other information necessary for the study from an inmate superintendent who used the main records of the remand home. It was observed that all remand homes keep detail records of their inmates and hence a structured interview with a good schedule is a useful instrument for as study like this. The interview schedule was subjected to screening by experts. The interview schedule did not need any testing for internal consistency since the item in it were not subjectable to rating or scoring of any form. The interview did not need any reliability testing as it was a person to person interaction.
The researcher personally visited the remand homes at Akure (Ondo State) Abeokuta (Ogun State) and Ilorin (Kwara State) to interact with the inmate superintendents of the homes. The researchers saw the inmates (youths) but was not allowed to exchange words with them according to their rules. The records were brought out and details concerning the inmates used for the study were obtained via interview, in the interview, questions like types of offences committed by youths for the past five years were asked, the rate of occurrence of the offences were asked also. The religion and sex of youths were also requested. The superintendents met were those who have been on the job in their various remand homes for the past five years. The data collected were subjected to appropriate descriptive statistics. Frequency count, percentages and charts were used for the descriptive analysis.
3. Results Question 1: What are the various types of offences committed by youths in the remand homes in south West Nigeria? According to the information gathered in the structured interview from three remand homes located in the region, the offences committed by the youths are listed below and are also illustrated in the pictorial diagram I below (see fig. 1)
Types of offences committed by youths 1. Stealing 2. House Breaking 3. Rape 4. Sodomy 5. Murder 6. Loitering about (Truancy) 7. Felony (assisting adults to do house breaking and robbery) 8. Armed Robbery
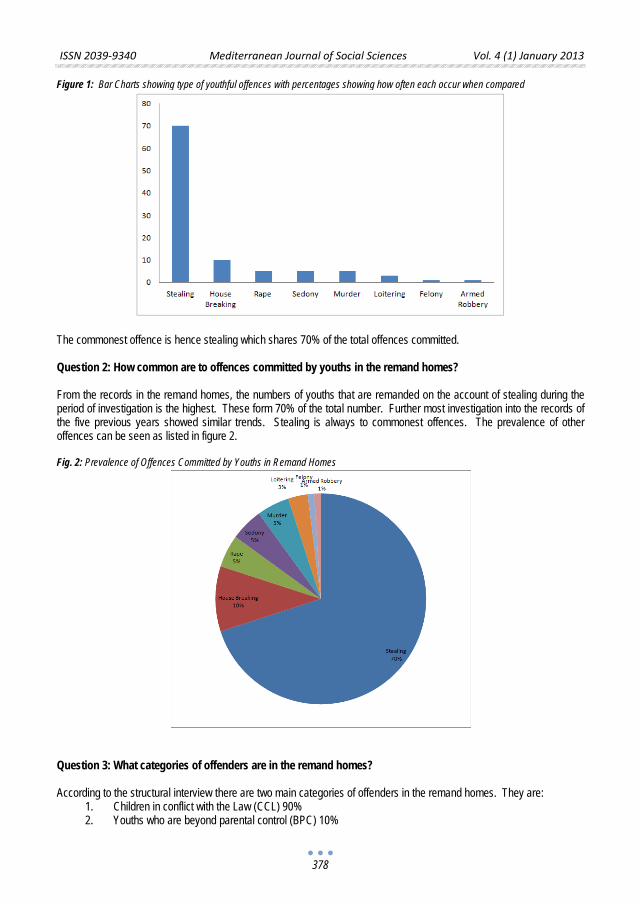
ISSN 2039-9340 Mediterranean Journal of Social Sciences Vol. 4 (1) January 2013
378
Figure 1: Bar Charts showing type of youthful offences with percentages showing how often each occur when compared
The commonest offence is hence stealing which shares 70% of the total offences committed. Question 2: How common are to offences committed by youths in the remand homes? From the records in the remand homes, the numbers of youths that are remanded on the account of stealing during the period of investigation is the highest. These form 70% of the total number. Further most investigation into the records of the five previous years showed similar trends. Stealing is always to commonest offences. The prevalence of other offences can be seen as listed in figure 2. Fig. 2: Prevalence of Offences Committed by Youths in Remand Homes
Question 3: What categories of offenders are in the remand homes? According to the structural interview there are two main categories of offenders in the remand homes. They are:
1. Children in conflict with the Law (CCL) 90% 2. Youths who are beyond parental control (BPC) 10%
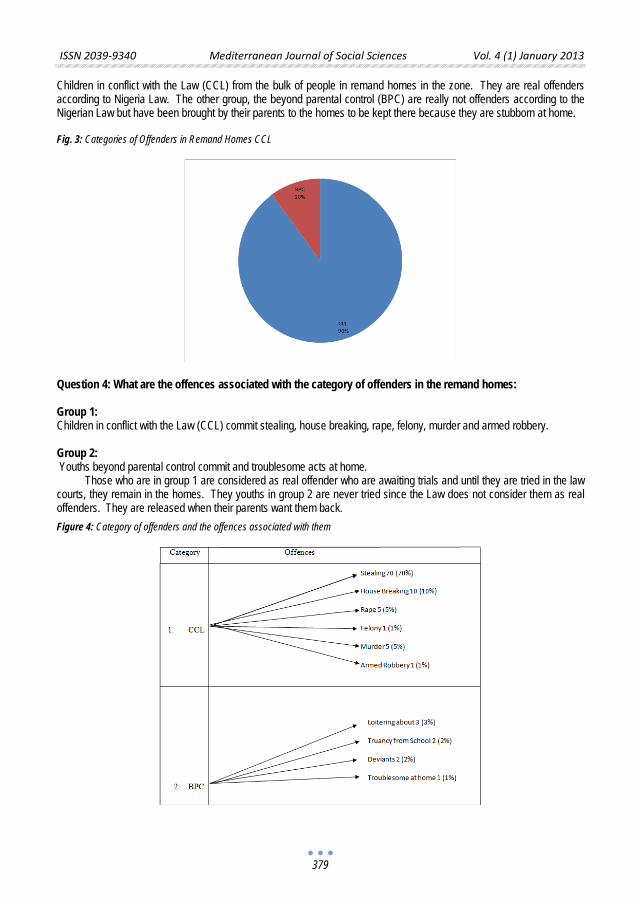
ISSN 2039-9340 Mediterranean Journal of Social Sciences Vol. 4 (1) January 2013
379
Children in conflict with the Law (CCL) from the bulk of people in remand homes in the zone. They are real offenders according to Nigeria Law. The other group, the beyond parental control (BPC) are really not offenders according to the Nigerian Law but have been brought by their parents to the homes to be kept there because they are stubborn at home. Fig. 3: Categories of Offenders in Remand Homes CCL
Question 4: What are the offences associated with the category of offenders in the remand homes: Group 1: Children in conflict with the Law (CCL) commit stealing, house breaking, rape, felony, murder and armed robbery. Group 2: Youths beyond parental control commit and troublesome acts at home.
Those who are in group 1 are considered as real offender who are awaiting trials and until they are tried in the law courts, they remain in the homes. They youths in group 2 are never tried since the Law does not consider them as real offenders. They are released when their parents want them back.
Figure 4: Category of offenders and the offences associated with them
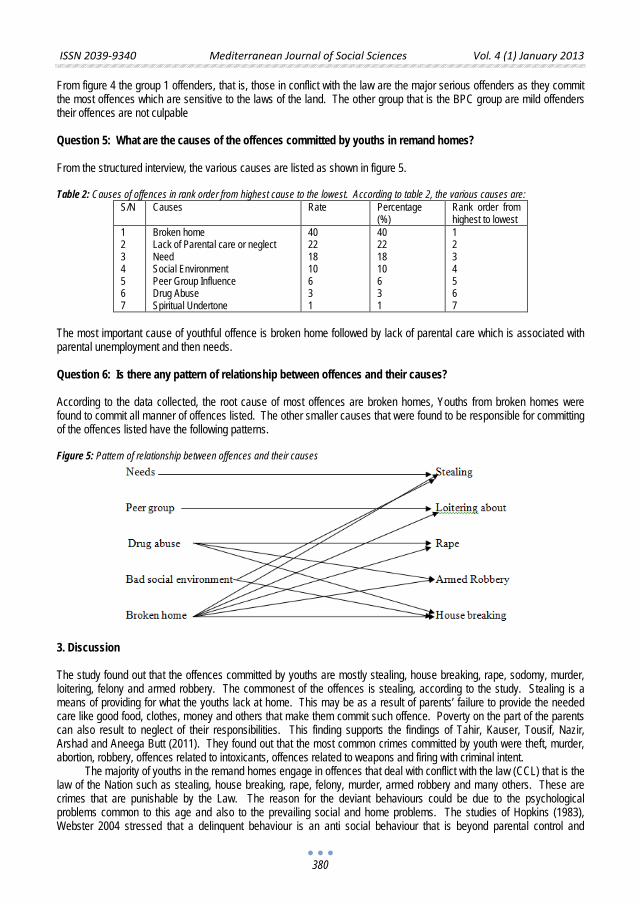
ISSN 2039-9340 Mediterranean Journal of Social Sciences Vol. 4 (1) January 2013
380
From figure 4 the group 1 offenders, that is, those in conflict with the law are the major serious offenders as they commit the most offences which are sensitive to the laws of the land. The other group that is the BPC group are mild offenders their offences are not culpable Question 5: What are the causes of the offences committed by youths in remand homes? From the structured interview, the various causes are listed as shown in figure 5. Table 2: Causes of offences in rank order from highest cause to the lowest. According to table 2, the various causes are:
S/N Causes Rate Percentage (%)
Rank order from highest to lowest
1 2 3 4 5 6 7
Broken home Lack of Parental care or neglect Need Social Environment Peer Group Influence Drug Abuse Spiritual Undertone
40 22 18 10 6 3 1
40 22 18 10 6 3 1
1 2 3 4 5 6 7
The most important cause of youthful offence is broken home followed by lack of parental care which is associated with parental unemployment and then needs. Question 6: Is there any pattern of relationship between offences and their causes? According to the data collected, the root cause of most offences are broken homes, Youths from broken homes were found to commit all manner of offences listed. The other smaller causes that were found to be responsible for committing of the offences listed have the following patterns. Figure 5: Pattern of relationship between offences and their causes
3. Discussion The study found out that the offences committed by youths are mostly stealing, house breaking, rape, sodomy, murder, loitering, felony and armed robbery. The commonest of the offences is stealing, according to the study. Stealing is a means of providing for what the youths lack at home. This may be as a result of parents’ failure to provide the needed care like good food, clothes, money and others that make them commit such offence. Poverty on the part of the parents can also result to neglect of their responsibilities. This finding supports the findings of Tahir, Kauser, Tousif, Nazir, Arshad and Aneega Butt (2011). They found out that the most common crimes committed by youth were theft, murder, abortion, robbery, offences related to intoxicants, offences related to weapons and firing with criminal intent.
The majority of youths in the remand homes engage in offences that deal with conflict with the law (CCL) that is the law of the Nation such as stealing, house breaking, rape, felony, murder, armed robbery and many others. These are crimes that are punishable by the Law. The reason for the deviant behaviours could be due to the psychological problems common to this age and also to the prevailing social and home problems. The studies of Hopkins (1983), Webster 2004 stressed that a delinquent behaviour is an anti social behaviour that is beyond parental control and
ISSN 2039-9340 Mediterranean Journal of Social Sciences Vol. 4 (1) January 2013
381
therefore subject to legal action, Aladeloye (2000) also established that when there is lack of social constraints due to attachment to parental control or commitment to good home background or involvement and strong belief in a good religion circle, youths are said to find themselves free to engage in virtually any deviant behaviour that presents itself.
Broken homes are found to be greatest or highest reason why youths commit offences. Fagan (1995), Hirschi (2002) and Home Office; U.K (2004) among many came to the conclusion that broken homes and poor homes are among the prominent reasons that could lead to youths crimes. There are also evidences according to Farrington (2007) that children from broken homes may not get proper monitoring and that those from poor homes may not get proper feeding and get necessary provisions for day to day living including school needs and hence they tend to find alternative means to provide these necessities. The alternative means are usually criminal in nature. 4. Conclusion and Recommendations From the findings of this study it is concluded that stealing is the commonest offence committed by youths and that broken homes are the highest cause of the offences. Lack of basic needs which could be caused by lack of parental care and monitoring are mostly responsible for why youths commit offences.
Based on the findings it is recommended that parents should provide for the needs of their children and monitor them properly. School administrators should find a way of assisting children from poor homes by providing them with basic needs. School administrators should liase with state social service officers and welfare divisions to chart means of proper monitoring and caring for youths from broken homes. The youths can as well be exposed to proper mentoring by the older people who could serve to them as role models. This can significantly reduce the criminal act in them, reduce violent behaviour, decrease the likelihood of drug use, improve school attendance and performance and also improve relationships with parents and friends. The school environment should be beautifully designed. This can make the youths interested in schooling and eventually reduce crime and fear. An effectively designed environment can also improve the overall quality of life.
References Aladeloye, E. T. (2000), Causes and Effects of Juvenile Delinquency in Schools. Unpublished M.Ed Thesis University of Ado-Ekiti,
Nigeria Engle Y. (2005), The Religious and Spiritual lives of America Teenagers. Journal of Adolescent Research 20(2): 263-283. Erickson, E. H. 1968, Identity: Youth an Crisis New Norton. Fagan, P. F, (1995), The real causes of violent crime, the breakdown of marriage, family and community. U.S. The heritage Foundation. Farrington, D. (2007), Understanding and Preventing youth crime, Cambridge University, Joseph Rouwtree Foundations. Foy J. A. and Pierce, G. (1994) American Killers are Getting Younger USA, Today, 24-26. Gottfredson, D.C. (1987), An organisation Development Approach to Reducing School Disorder American Review 11(6): 739-763. Gottfredson, M. R. and Hirschi, T. (1990) General Theory of Crime California: Stanford University Press. Hirschi, T. (2002) Causes of Delinquency h.ttp://www.Heritage. Org: Transaction Publishers. http://www.com.missoula. US (2006) Youth delinquency U.S. Missoula Country Home Page. Piaget, J and Inheler, B (1969). The Psychology of the Child N.Y. Basic Books. Powell, K. E and Hawkins D F. (1996) Youth Violence Prevention: Descriptions and Baseline Data from 13 Evaluation Projects. A
supplement to American Journal of Preventive Medicine 12. Silva, P. A. (2007) Sex difference in antisocial behaviour. Cambridge: Cambridge University Press. Simatwa, M.W. (2012) Management of Student Discipline in Secondary Schools in Kenya, a case study of Bungoma country.
Educational Research 3(2) 172-189. Tahir, M.W., Kauser, R., Tousif, S., Nazir M.A., Etslan Arshad, A and Butt A. (2011) Crime Trends Among Youth in Gujrat, Pakistan.
African Journal of Law and Criminology 1(2) 39-49. Thorlindson, T. and Bernburg, J.G. (2006) Community Structure Social Disorganisation and Adolescent Property Crime.Unpublished
paper of the American Sociological Association Montreal, Quebec, Canada http//www//academic. http://www.narco.org UK (2001) Why Youths Commit Crimes. Youth Crime. htm WAEC (1992) “Report on the Activities of WAEC” A paper presented to the 16th Plenary Session of JCCE at Katsina July 1992. Webster, Dictionary (2004 Ed) “Youth” London; Page 11.

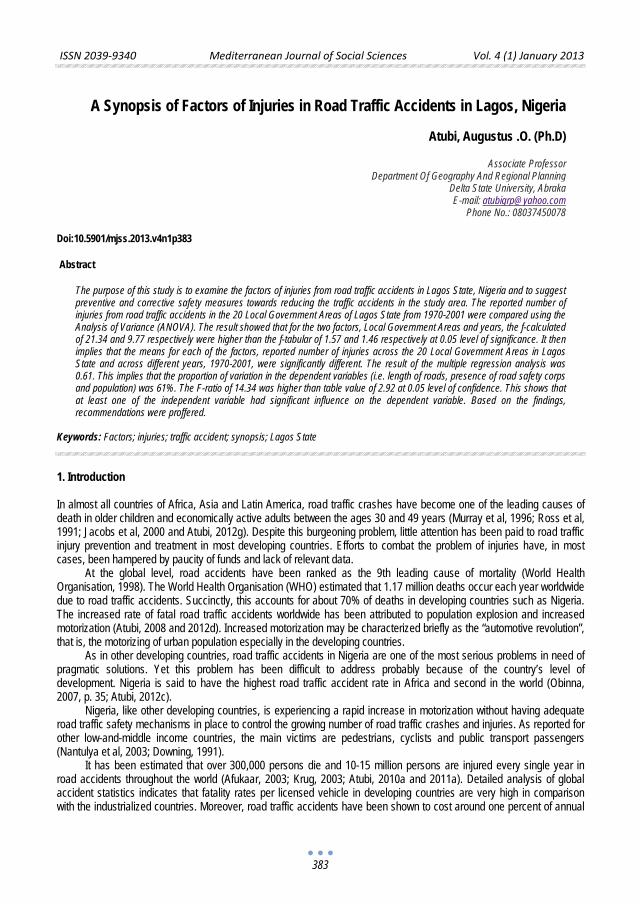
ISSN 2039-9340 Mediterranean Journal of Social Sciences Vol. 4 (1) January 2013
383
A Synopsis of Factors of Injuries in Road Traffic Accidents in Lagos, Nigeria
Atubi, Augustus .O. (Ph.D)
Associate Professor
Department Of Geography And Regional Planning Delta State University, Abraka E-mail: [email protected]
Phone No.: 08037450078 Doi:10.5901/mjss.2013.v4n1p383 Abstract
The purpose of this study is to examine the factors of injuries from road traffic accidents in Lagos State, Nigeria and to suggest preventive and corrective safety measures towards reducing the traffic accidents in the study area. The reported number of injuries from road traffic accidents in the 20 Local Government Areas of Lagos State from 1970-2001 were compared using the Analysis of Variance (ANOVA). The result showed that for the two factors, Local Government Areas and years, the f-calculated of 21.34 and 9.77 respectively were higher than the f-tabular of 1.57 and 1.46 respectively at 0.05 level of significance. It then implies that the means for each of the factors, reported number of injuries across the 20 Local Government Areas in Lagos State and across different years, 1970-2001, were significantly different. The result of the multiple regression analysis was 0.61. This implies that the proportion of variation in the dependent variables (i.e. length of roads, presence of road safety corps and population) was 61%. The F-ratio of 14.34 was higher than table value of 2.92 at 0.05 level of confidence. This shows that at least one of the independent variable had significant influence on the dependent variable. Based on the findings, recommendations were proffered.
Keywords: Factors; injuries; traffic accident; synopsis; Lagos State
1. Introduction In almost all countries of Africa, Asia and Latin America, road traffic crashes have become one of the leading causes of death in older children and economically active adults between the ages 30 and 49 years (Murray et al, 1996; Ross et al, 1991; Jacobs et al, 2000 and Atubi, 2012g). Despite this burgeoning problem, little attention has been paid to road traffic injury prevention and treatment in most developing countries. Efforts to combat the problem of injuries have, in most cases, been hampered by paucity of funds and lack of relevant data.
At the global level, road accidents have been ranked as the 9th leading cause of mortality (World Health Organisation, 1998). The World Health Organisation (WHO) estimated that 1.17 million deaths occur each year worldwide due to road traffic accidents. Succinctly, this accounts for about 70% of deaths in developing countries such as Nigeria. The increased rate of fatal road traffic accidents worldwide has been attributed to population explosion and increased motorization (Atubi, 2008 and 2012d). Increased motorization may be characterized briefly as the “automotive revolution”, that is, the motorizing of urban population especially in the developing countries.
As in other developing countries, road traffic accidents in Nigeria are one of the most serious problems in need of pragmatic solutions. Yet this problem has been difficult to address probably because of the country’s level of development. Nigeria is said to have the highest road traffic accident rate in Africa and second in the world (Obinna, 2007, p. 35; Atubi, 2012c).
Nigeria, like other developing countries, is experiencing a rapid increase in motorization without having adequate road traffic safety mechanisms in place to control the growing number of road traffic crashes and injuries. As reported for other low-and-middle income countries, the main victims are pedestrians, cyclists and public transport passengers (Nantulya et al, 2003; Downing, 1991).
It has been estimated that over 300,000 persons die and 10-15 million persons are injured every single year in road accidents throughout the world (Afukaar, 2003; Krug, 2003; Atubi, 2010a and 2011a). Detailed analysis of global accident statistics indicates that fatality rates per licensed vehicle in developing countries are very high in comparison with the industrialized countries. Moreover, road traffic accidents have been shown to cost around one percent of annual
ISSN 2039-9340 Mediterranean Journal of Social Sciences Vol. 4 (1) January 2013
384
gross national product (GNP) resources of the developing countries which they can ill-afford to lose (Afukaar, 2003; Atubi, 2011b, 2012d and Atubi and Onokala, 2009).
In Nigeria, road traffic accident situation over the last three decades has been particularly disturbing. In 1976, there were 53,897 road traffic accidents resulting in 7,717 deaths. Although in 1981, the magnitude reduced to 5,114 accidents, but the fatality increased to 10,236 which means that there was an average of 96 accidents and situation in subsequent years has not been any better. The number of people killed in road accidents between 1990 and 2005 rose from 28,253 and the fatality rate remains consistently high (Atubi, 2009c).
When compared with the road traffic accidents in the more developed countries of the world, it can be observed that the situation in Nigeria is simply pathetic. For example, while the road accident was as high as 14.45 per thousand in 23.16 per thousand in 2002, it was about 0.3 and 0.45 for north America and western Europe around the same time. This confirms the statement that RTA rates of Nigeria are as much as 20 times those of Europe and north America. Indeed Nigeria in the 21st century is in a far worse RTA situation than Europe and North America in 1930 and far worse than India, Pakistan, Thailand, Botswana, Niger, Kenya, Seri-Lanka and Tanzania in 2002 (Daramola, 2004; Atubi, 2006; 2012e).
All over the world the phenomenon of road traffic accident has become the most serious traffic problem in need of a pragmatic solution. In Nigeria this problem has been difficult to address probably because of the country’s level of development. At the end of 2011, Nigeria was known to have topped the list of 155 countries worldwide with the highest records of death by road traffic accidents (WHO, 2012; Atubi, 2012h).
According to data from the Nigerian Federal Road Safety Commission, the country has the highest rate of death from motor accidents in Africa; leading 43 other nations in the number of deaths per 10,000 vehicle crashes (FRSC, 2006; Obinna, 2007, p. 35). Nigeria is followed by Ethiopia, Malawi and Ghana with 219, 183 and 179 deaths per 10,000 vehicles respectively (Daramola, 2004; Atubi and Onokala, 2009; Atubi, 2012f).
International comparison indicates that the chance of a vehicle killing someone in Nigeria is 47 times higher than in Britain. The proportion of fatalities to injuries reported is also very low. For example, while Czech Republic has only one death in 175 accidents, France one death in 175 accidents, Nigeria has one death in 2.65 accidents (Atubi, 2010b).
Road traffic accidents’ statistics in Nigeria reveal a serious and growing problem with absolute fatality rate and casualty figure rising rapidly. In majority of developing countries, accident occurrence and related deaths are relative to either population or number of vehicles. Ironically, in Nigeria, studies have indicated that better facilities in terms of good quality and standardized roads have been accompanied by increasing number of accidents (Onakomaiya, 1988; Ghadamosi, 2002; Atubi, 2012g).
2. Research Methodology The data that were used in this research work were sourced from secondary sources. This include records of Road Traffic Accidents (RTA) characteristics, such as total number of accidents, total number of injuries from road traffic accident in Lagos State for a period of 32 years (i.e. 1970-2001). Analysis of variance (ANOVA) statistics was used to test for the significance of variability in the reported number of injuries from road traffic accident in the study area. This is becsue analysis of variance allows us to compare simultaneously three or more sample means in order to determine whether the differences between the samples (referred to as the “between sample difference”) are significantly higher than the differences that can be observed within each sample (referred to as the “within sample differences”).
The multiple regression analysis tools were also used to investigate the factors that influence the number of reported injuries from road traffic accidents in the study area. The dependent variable was reported number of injured from road traffic accidents, while the independent variables considered include length of roads in Lagos State from 1970-2001, presence of Road Safety Corps and population. 3. Study Area Lagos State is situated in the South Western corner of Nigeria. This elongated state spans the Guinea Atlantic coast for over 180km, from the Republic of Benin on the west to its boundary with Ogun State in the east (figure 1). It extends approximately from latitude 602’ north of 604’ north and from longitude 2045’ East of its total area of 3,577sq.km, about 787sq.km or 22 percent is water. Such an environment is bound to affect settlement in Lagos, and that is why the town is composed of separate sections connected by bridges.
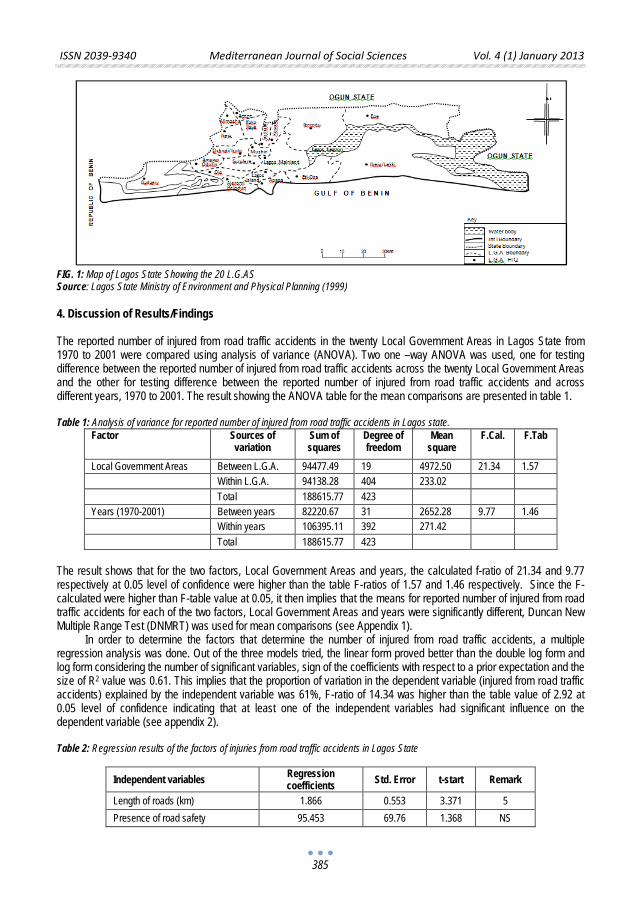
ISSN 2039-9340 Mediterranean Journal of Social Sciences Vol. 4 (1) January 2013
385
FIG. 1: Map of Lagos State Showing the 20 L.G.AS Source: Lagos State Ministry of Environment and Physical Planning (1999) 4. Discussion of Results/Findings The reported number of injured from road traffic accidents in the twenty Local Government Areas in Lagos State from 1970 to 2001 were compared using analysis of variance (ANOVA). Two one –way ANOVA was used, one for testing difference between the reported number of injured from road traffic accidents across the twenty Local Government Areas and the other for testing difference between the reported number of injured from road traffic accidents and across different years, 1970 to 2001. The result showing the ANOVA table for the mean comparisons are presented in table 1. Table 1: Analysis of variance for reported number of injured from road traffic accidents in Lagos state.
Factor Sources of variation
Sum of squares
Degree of freedom
Mean square
F.Cal. F.Tab
Local Government Areas Between L.G.A. 94477.49 19 4972.50 21.34 1.57 Within L.G.A. 94138.28 404 233.02 Total 188615.77 423 Years (1970-2001) Between years 82220.67 31 2652.28 9.77 1.46 Within years 106395.11 392 271.42 Total 188615.77 423
The result shows that for the two factors, Local Government Areas and years, the calculated f-ratio of 21.34 and 9.77 respectively at 0.05 level of confidence were higher than the table F-ratios of 1.57 and 1.46 respectively. Since the F-calculated were higher than F-table value at 0.05, it then implies that the means for reported number of injured from road traffic accidents for each of the two factors, Local Government Areas and years were significantly different, Duncan New Multiple Range Test (DNMRT) was used for mean comparisons (see Appendix 1).
In order to determine the factors that determine the number of injured from road traffic accidents, a multiple regression analysis was done. Out of the three models tried, the linear form proved better than the double log form and log form considering the number of significant variables, sign of the coefficients with respect to a prior expectation and the size of R2 value was 0.61. This implies that the proportion of variation in the dependent variable (injured from road traffic accidents) explained by the independent variable was 61%, F-ratio of 14.34 was higher than the table value of 2.92 at 0.05 level of confidence indicating that at least one of the independent variables had significant influence on the dependent variable (see appendix 2). Table 2: Regression results of the factors of injuries from road traffic accidents in Lagos State
Independent variables Regression coefficients Std. Error t-start Remark
Length of roads (km) 1.866 0.553 3.371 5 Presence of road safety 95.453 69.76 1.368 NS
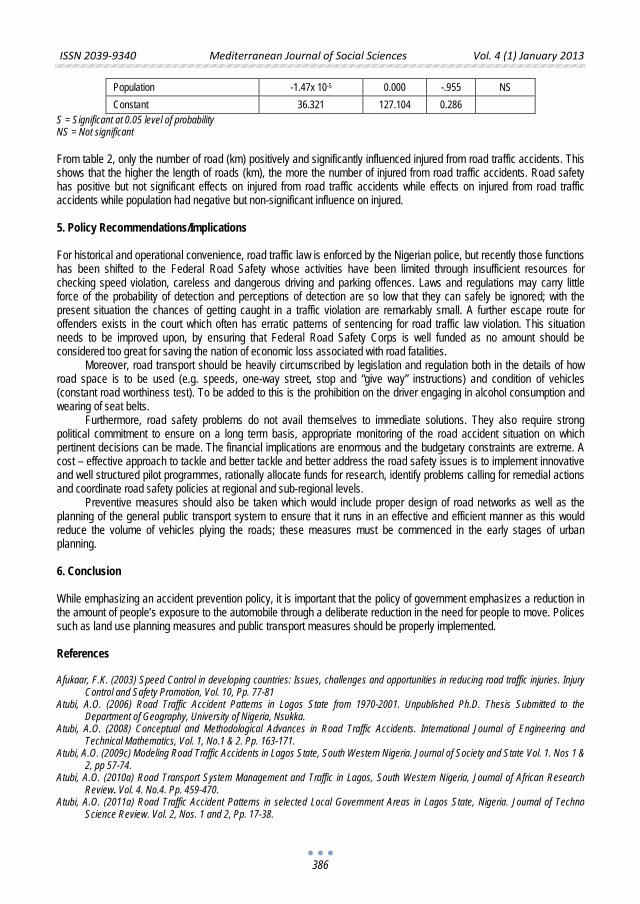
ISSN 2039-9340 Mediterranean Journal of Social Sciences Vol. 4 (1) January 2013
386
Population -1.47x 10⁻⁵ 0.000 -.955 NS Constant 36.321 127.104 0.286
S = Significant at 0.05 level of probability NS = Not significant
From table 2, only the number of road (km) positively and significantly influenced injured from road traffic accidents. This shows that the higher the length of roads (km), the more the number of injured from road traffic accidents. Road safety has positive but not significant effects on injured from road traffic accidents while effects on injured from road traffic accidents while population had negative but non-significant influence on injured. 5. Policy Recommendations/Implications For historical and operational convenience, road traffic law is enforced by the Nigerian police, but recently those functions has been shifted to the Federal Road Safety whose activities have been limited through insufficient resources for checking speed violation, careless and dangerous driving and parking offences. Laws and regulations may carry little force of the probability of detection and perceptions of detection are so low that they can safely be ignored; with the present situation the chances of getting caught in a traffic violation are remarkably small. A further escape route for offenders exists in the court which often has erratic patterns of sentencing for road traffic law violation. This situation needs to be improved upon, by ensuring that Federal Road Safety Corps is well funded as no amount should be considered too great for saving the nation of economic loss associated with road fatalities.
Moreover, road transport should be heavily circumscribed by legislation and regulation both in the details of how road space is to be used (e.g. speeds, one-way street, stop and “give way” instructions) and condition of vehicles (constant road worthiness test). To be added to this is the prohibition on the driver engaging in alcohol consumption and wearing of seat belts.
Furthermore, road safety problems do not avail themselves to immediate solutions. They also require strong political commitment to ensure on a long term basis, appropriate monitoring of the road accident situation on which pertinent decisions can be made. The financial implications are enormous and the budgetary constraints are extreme. A cost – effective approach to tackle and better tackle and better address the road safety issues is to implement innovative and well structured pilot programmes, rationally allocate funds for research, identify problems calling for remedial actions and coordinate road safety policies at regional and sub-regional levels.
Preventive measures should also be taken which would include proper design of road networks as well as the planning of the general public transport system to ensure that it runs in an effective and efficient manner as this would reduce the volume of vehicles plying the roads; these measures must be commenced in the early stages of urban planning.
6. Conclusion While emphasizing an accident prevention policy, it is important that the policy of government emphasizes a reduction in the amount of people’s exposure to the automobile through a deliberate reduction in the need for people to move. Polices such as land use planning measures and public transport measures should be properly implemented. References Afukaar, F.K. (2003) Speed Control in developing countries: Issues, challenges and opportunities in reducing road traffic injuries. Injury
Control and Safety Promotion, Vol. 10, Pp. 77-81 Atubi, A.O. (2006) Road Traffic Accident Patterns in Lagos State from 1970-2001. Unpublished Ph.D. Thesis Submitted to the
Department of Geography, University of Nigeria, Nsukka. Atubi, A.O. (2008) Conceptual and Methodological Advances in Road Traffic Accidents. International Journal of Engineering and
Technical Mathematics, Vol. 1, No.1 & 2. Pp. 163-171. Atubi, A.O. (2009c) Modeling Road Traffic Accidents in Lagos State, South Western Nigeria. Journal of Society and State Vol. 1. Nos 1 &
2, pp 57-74. Atubi, A.O. (2010a) Road Transport System Management and Traffic in Lagos, South Western Nigeria, Journal of African Research
Review. Vol. 4. No.4. Pp. 459-470. Atubi, A.O. (2011a) Road Traffic Accident Patterns in selected Local Government Areas in Lagos State, Nigeria. Journal of Techno
Science Review. Vol. 2, Nos. 1 and 2, Pp. 17-38.
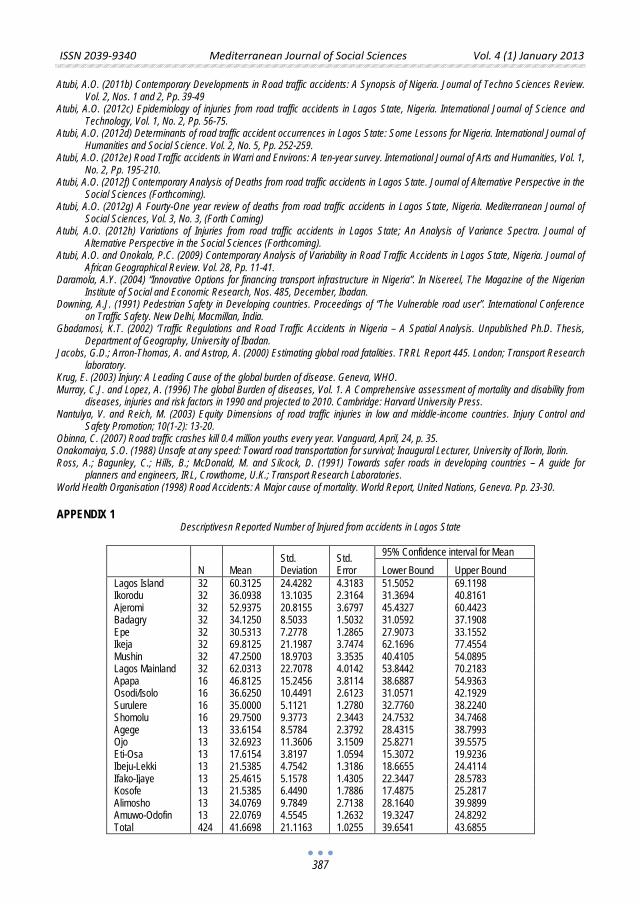
ISSN 2039-9340 Mediterranean Journal of Social Sciences Vol. 4 (1) January 2013
387
Atubi, A.O. (2011b) Contemporary Developments in Road traffic accidents: A Synopsis of Nigeria. Journal of Techno Sciences Review. Vol. 2, Nos. 1 and 2, Pp. 39-49
Atubi, A.O. (2012c) Epidemiology of injuries from road traffic accidents in Lagos State, Nigeria. International Journal of Science and Technology, Vol. 1, No. 2, Pp. 56-75.
Atubi, A.O. (2012d) Determinants of road traffic accident occurrences in Lagos State: Some Lessons for Nigeria. International Journal of Humanities and Social Science. Vol. 2, No. 5, Pp. 252-259.
Atubi, A.O. (2012e) Road Traffic accidents in Warri and Environs: A ten-year survey. International Journal of Arts and Humanities, Vol. 1, No. 2, Pp. 195-210.
Atubi, A.O. (2012f) Contemporary Analysis of Deaths from road traffic accidents in Lagos State. Journal of Alternative Perspective in the Social Sciences (Forthcoming).
Atubi, A.O. (2012g) A Fourty-One year review of deaths from road traffic accidents in Lagos State, Nigeria. Mediterranean Journal of Social Sciences, Vol. 3, No. 3, (Forth Coming)
Atubi, A.O. (2012h) Variations of Injuries from road traffic accidents in Lagos State; An Analysis of Variance Spectra. Journal of Alternative Perspective in the Social Sciences (Forthcoming).
Atubi, A.O. and Onokala, P.C. (2009) Contemporary Analysis of Variability in Road Traffic Accidents in Lagos State, Nigeria. Journal of African Geographical Review. Vol. 28, Pp. 11-41.
Daramola, A.Y. (2004) “Innovative Options for financing transport infrastructure in Nigeria”. In Nisereel, The Magazine of the Nigerian Institute of Social and Economic Research, Nos. 485, December, Ibadan.
Downing, A.J. (1991) Pedestrian Safety in Developing countries. Proceedings of “The Vulnerable road user”. International Conference on Traffic Safety. New Delhi, Macmillan, India.
Gbadamosi, K.T. (2002) ‘Traffic Regulations and Road Traffic Accidents in Nigeria – A Spatial Analysis. Unpublished Ph.D. Thesis, Department of Geography, University of Ibadan.
Jacobs, G.D.; Arron-Thomas, A. and Astrop, A. (2000) Estimating global road fatalities. TRRL Report 445. London; Transport Research laboratory.
Krug, E. (2003) Injury: A Leading Cause of the global burden of disease. Geneva, WHO. Murray, C.J. and Lopez, A. (1996) The global Burden of diseases, Vol. 1. A Comprehensive assessment of mortality and disability from
diseases, injuries and risk factors in 1990 and projected to 2010. Cambridge: Harvard University Press. Nantulya, V. and Reich, M. (2003) Equity Dimensions of road traffic injuries in low and middle-income countries. Injury Control and
Safety Promotion; 10(1-2): 13-20. Obinna, C. (2007) Road traffic crashes kill 0.4 million youths every year. Vanguard, April, 24, p. 35. Onakomaiya, S.O. (1988) Unsafe at any speed: Toward road transportation for survival; Inaugural Lecturer, University of Ilorin, Ilorin. Ross, A.; Bagunley, C.; Hills, B.; McDonald, M. and Silcock, D. (1991) Towards safer roads in developing countries – A guide for
planners and engineers, IRL, Crowthorne, U.K.; Transport Research Laboratories. World Health Organisation (1998) Road Accidents: A Major cause of mortality. World Report, United Nations, Geneva. Pp. 23-30.
APPENDIX 1
Descriptivesn Reported Number of Injured from accidents in Lagos State
N Mean Std. Deviation
Std. Error
95% Confidence interval for Mean Lower Bound Upper Bound
Lagos Island 32 60.3125 24.4282 4.3183 51.5052 69.1198 Ikorodu 32 36.0938 13.1035 2.3164 31.3694 40.8161 Ajeromi 32 52.9375 20.8155 3.6797 45.4327 60.4423 Badagry 32 34.1250 8.5033 1.5032 31.0592 37.1908 Epe 32 30.5313 7.2778 1.2865 27.9073 33.1552 Ikeja 32 69.8125 21.1987 3.7474 62.1696 77.4554 Mushin 32 47.2500 18.9703 3.3535 40.4105 54.0895 Lagos Mainland 32 62.0313 22.7078 4.0142 53.8442 70.2183 Apapa 16 46.8125 15.2456 3.8114 38.6887 54.9363 Osodi/Isolo 16 36.6250 10.4491 2.6123 31.0571 42.1929 Surulere 16 35.0000 5.1121 1.2780 32.7760 38.2240 Shomolu 16 29.7500 9.3773 2.3443 24.7532 34.7468 Agege 13 33.6154 8.5784 2.3792 28.4315 38.7993 Ojo 13 32.6923 11.3606 3.1509 25.8271 39.5575 Eti-Osa 13 17.6154 3.8197 1.0594 15.3072 19.9236 Ibeju-Lekki 13 21.5385 4.7542 1.3186 18.6655 24.4114 Ifako-Ijaye 13 25.4615 5.1578 1.4305 22.3447 28.5783 Kosofe 13 21.5385 6.4490 1.7886 17.4875 25.2817 Alimosho 13 34.0769 9.7849 2.7138 28.1640 39.9899 Amuwo-Odofin 13 22.0769 4.5545 1.2632 19.3247 24.8292 Total 424 41.6698 21.1163 1.0255 39.6541 43.6855
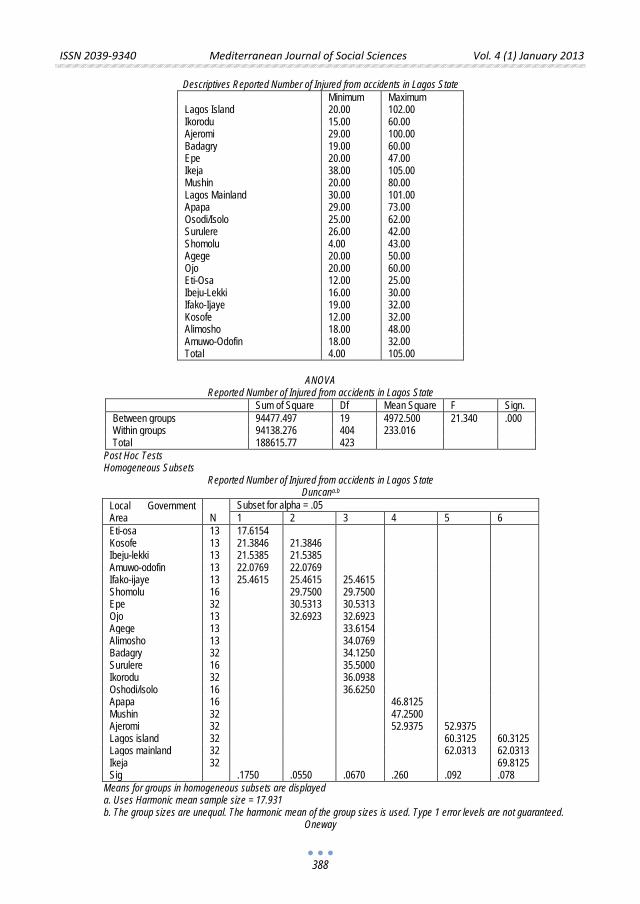
ISSN 2039-9340 Mediterranean Journal of Social Sciences Vol. 4 (1) January 2013
388
Descriptives Reported Number of Injured from accidents in Lagos State Minimum Maximum Lagos Island 20.00 102.00 Ikorodu 15.00 60.00 Ajeromi 29.00 100.00 Badagry 19.00 60.00 Epe 20.00 47.00 Ikeja 38.00 105.00 Mushin 20.00 80.00 Lagos Mainland 30.00 101.00 Apapa 29.00 73.00 Osodi/Isolo 25.00 62.00 Surulere 26.00 42.00 Shomolu 4.00 43.00 Agege 20.00 50.00 Ojo 20.00 60.00 Eti-Osa 12.00 25.00 Ibeju-Lekki 16.00 30.00 Ifako-Ijaye 19.00 32.00 Kosofe 12.00 32.00 Alimosho 18.00 48.00 Amuwo-Odofin 18.00 32.00 Total 4.00 105.00
ANOVA
Reported Number of Injured from accidents in Lagos State Sum of Square Df Mean Square F Sign. Between groups 94477.497 19 4972.500 21.340 .000 Within groups 94138.276 404 233.016 Total 188615.77 423
Post Hoc Tests Homogeneous Subsets
Reported Number of Injured from accidents in Lagos State Duncana.b
Local Government Area N
Subset for alpha = .05 1 2 3 4 5 6
Eti-osa 13 17.6154 Kosofe 13 21.3846 21.3846 Ibeju-lekki 13 21.5385 21.5385 Amuwo-odofin 13 22.0769 22.0769 Ifako-ijaye 13 25.4615 25.4615 25.4615 Shomolu 16 29.7500 29.7500 Epe 32 30.5313 30.5313 Ojo 13 32.6923 32.6923 Agege 13 33.6154 Alimosho 13 34.0769 Badagry 32 34.1250 Surulere 16 35.5000 Ikorodu 32 36.0938 Oshodi/isolo 16 36.6250 Apapa 16 46.8125 Mushin 32 47.2500 Ajeromi 32 52.9375 52.9375 Lagos island 32 60.3125 60.3125 Lagos mainland 32 62.0313 62.0313 Ikeja 32 69.8125 Sig .1750 .0550 .0670 .260 .092 .078
Means for groups in homogeneous subsets are displayed a. Uses Harmonic mean sample size = 17.931 b. The group sizes are unequal. The harmonic mean of the group sizes is used. Type 1 error levels are not guaranteed.
Oneway
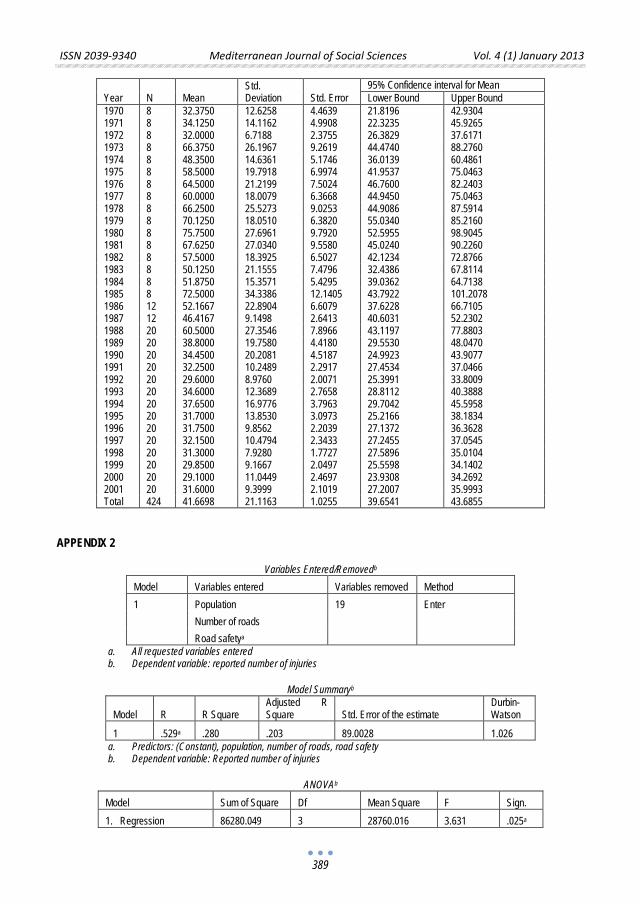
ISSN 2039-9340 Mediterranean Journal of Social Sciences Vol. 4 (1) January 2013
389
Year N Mean Std. Deviation Std. Error
95% Confidence interval for Mean Lower Bound Upper Bound
1970 8 32.3750 12.6258 4.4639 21.8196 42.9304 1971 8 34.1250 14.1162 4.9908 22.3235 45.9265 1972 8 32.0000 6.7188 2.3755 26.3829 37.6171 1973 8 66.3750 26.1967 9.2619 44.4740 88.2760 1974 8 48.3500 14.6361 5.1746 36.0139 60.4861 1975 8 58.5000 19.7918 6.9974 41.9537 75.0463 1976 8 64.5000 21.2199 7.5024 46.7600 82.2403 1977 8 60.0000 18.0079 6.3668 44.9450 75.0463 1978 8 66.2500 25.5273 9.0253 44.9086 87.5914 1979 8 70.1250 18.0510 6.3820 55.0340 85.2160 1980 8 75.7500 27.6961 9.7920 52.5955 98.9045 1981 8 67.6250 27.0340 9.5580 45.0240 90.2260 1982 8 57.5000 18.3925 6.5027 42.1234 72.8766 1983 8 50.1250 21.1555 7.4796 32.4386 67.8114 1984 8 51.8750 15.3571 5.4295 39.0362 64.7138 1985 8 72.5000 34.3386 12.1405 43.7922 101.2078 1986 12 52.1667 22.8904 6.6079 37.6228 66.7105 1987 12 46.4167 9.1498 2.6413 40.6031 52.2302 1988 20 60.5000 27.3546 7.8966 43.1197 77.8803 1989 20 38.8000 19.7580 4.4180 29.5530 48.0470 1990 20 34.4500 20.2081 4.5187 24.9923 43.9077 1991 20 32.2500 10.2489 2.2917 27.4534 37.0466 1992 20 29.6000 8.9760 2.0071 25.3991 33.8009 1993 20 34.6000 12.3689 2.7658 28.8112 40.3888 1994 20 37.6500 16.9776 3.7963 29.7042 45.5958 1995 20 31.7000 13.8530 3.0973 25.2166 38.1834 1996 20 31.7500 9.8562 2.2039 27.1372 36.3628 1997 20 32.1500 10.4794 2.3433 27.2455 37.0545 1998 20 31.3000 7.9280 1.7727 27.5896 35.0104 1999 20 29.8500 9.1667 2.0497 25.5598 34.1402 2000 20 29.1000 11.0449 2.4697 23.9308 34.2692 2001 20 31.6000 9.3999 2.1019 27.2007 35.9993 Total 424 41.6698 21.1163 1.0255 39.6541 43.6855
APPENDIX 2
Variables Entered/Removedb
Model Variables entered Variables removed Method 1 Population 19 Enter Number of roads Road safetya
a. All requested variables entered b. Dependent variable: reported number of injuries
Model Summaryb
Model R R Square Adjusted R Square Std. Error of the estimate
Durbin-Watson
1 .529a .280 .203 89.0028 1.026 a. Predictors: (Constant), population, number of roads, road safety b. Dependent variable: Reported number of injuries
ANOVAb
Model Sum of Square Df Mean Square F Sign. 1. Regression 86280.049 3 28760.016 3.631 .025a
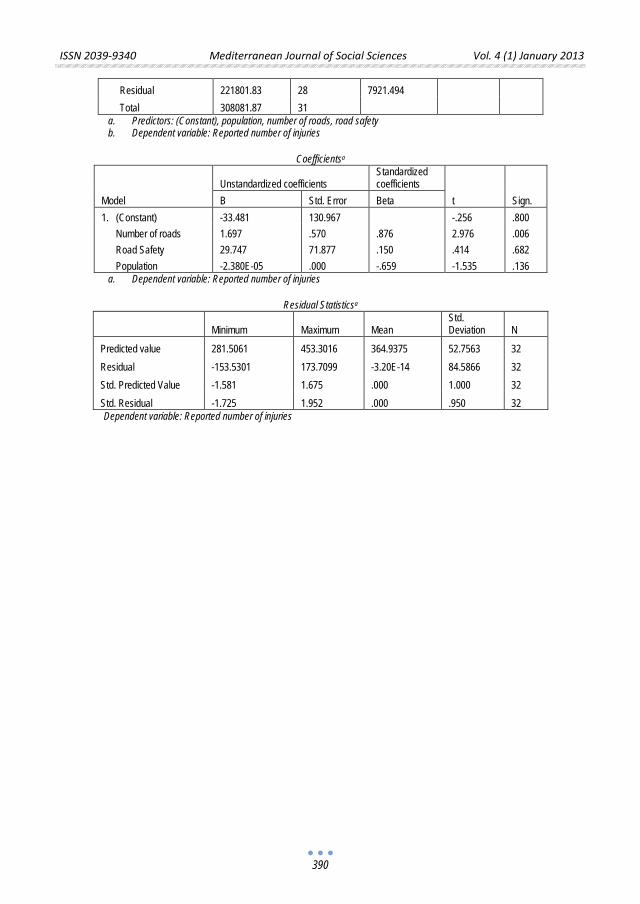
ISSN 2039-9340 Mediterranean Journal of Social Sciences Vol. 4 (1) January 2013
390
Residual 221801.83 28 7921.494 Total 308081.87 31 a. Predictors: (Constant), population, number of roads, road safety b. Dependent variable: Reported number of injuries
Coefficientsa
Model Unstandardized coefficients
Standardized coefficients
t Sign. B Std. Error Beta 1. (Constant) -33.481 130.967 -.256 .800
Number of roads 1.697 .570 .876 2.976 .006 Road Safety 29.747 71.877 .150 .414 .682 Population -2.380E-05 .000 -.659 -1.535 .136
a. Dependent variable: Reported number of injuries
Residual Statisticsa
Minimum Maximum Mean Std. Deviation N
Predicted value 281.5061 453.3016 364.9375 52.7563 32
Residual -153.5301 173.7099 -3.20E-14 84.5866 32 Std. Predicted Value -1.581 1.675 .000 1.000 32 Std. Residual -1.725 1.952 .000 .950 32 Dependent variable: Reported number of injuries
ISSN 2039-9340 Mediterranean Journal of Social Sciences Vol. 4 (1) January 2013
391
Constructivists’ Didactics in Teaching Technology Education in Ethiopian
Technology Universty- Practices and Challenges (The Case of Adama Science and Technology University)
Ziyn Engdasew (Ph.D)
Adama Science and Technology University
School of Educational Sciences [email protected]
Doi:10.5901/mjss.2013.v4n1p391
Abstract
The present study has been intended to assess the applicability of didactics of constructivism in the instructional process of technology education and identifying the prominent constraints that hinder the implementation of constructivist didactics in technological education classes. A descriptive survey research methodology was designed in order to attain the purpose. Simple random sampling and availability sampling techniques were utilized to select sample from the study site. Accordingly, 42 teachers and 147 students were selected from four technology education departments. The data were collected through questionnaire and observations. The analysis of quantitative data was made by descriptive statistics like frequency counts, percentage, t-test, and Ch-squire test.The result of the study revealed that most of technology education instructors neither undertake prior skill analysis nor attempted to integrate prior knowledge and skill lessons in their daily class lesson. Moreover, technology instructors are not enthusiastic to engage students to discover a new skill and apply in to practice. Diverse and goal free evaluation techniques were not employed to assess the skill mastery level of students. Furthermore, the research has shown that in availability of facilities, and diversity of student interest and lack of teachers training in modern techno- pedagogy found to be the major challenges in the practicality of constructivist didactics in technology education. Thus, it can be concluded that the major challenges in the utilisation of constructivist approach in teaching technology education are shortage of the required facilities and trainings. Therefore, it was recommended that the university should have to fulfil the required facilities and design specific and peculiar professional development programmes in order to acquaint instructors with modern instructional skills and techniques of technology education.
Key Words: Constructivism, Constructivist didactics, Technology Education, Techno-pedagogy
1. Introduction Excellence in technology education comes from innovative teaching techniques and appropriate instructional materials. This would require one to change the traditional way of delivering technology lessons in to modern approaches. For quarters of a century, the implicit approach underlying the curriculum and pedagogy of technological education has been behaviorism, but today’s dominant theory of learning and teaching becomes constructivism (Mayer, 2003). Recent research findings’ concerning technological education has discussed the usefulness of constructivist approaches positioning those principles within the framework of a constructivist perspective. The principles emphasize that, individuals based on their prior skills and experiences in their effort to sense their environment, actively construct meaning and mastery of skills (Doolittle and Camp, 1999).
Constructivism contrasts with behavioral view of learning that stress the influence of environment on the person, and also with cognitive accounts that place the locus of learning within the mind with little attention to the context in which it occurs (Bruning, 1995).The central idea in constructivist view of technological education is to help the student think about the nature of learning and develop conscious control over tools for learning, the position is taken that major tasks of technological education institutions are to increase capacity for learning that the student’s construction and mastery of skills can become increasingly sophisticated and efficient if we make the student an insider to the learning process (Joyce and Weil, 2003).
As per constructivist didactics, teachers don’t teach in the traditional sense of standing in front of a room of students and delivering instruction, rather they use materials with which learners become actively involved through manipulation and social interactions. Activities stress student’s observing, collecting data, generating and testing hypothesis and working collaboratively with others (Schunk, 1996).
ISSN 2039-9340 Mediterranean Journal of Social Sciences Vol. 4 (1) January 2013
392
Thus viewed, models of teaching aren’t only models for helping students construct knowledge and skills; they are learning strategies that can be taught directly to the students. Therefore, the teacher teach students to develop concepts and clues, to teach themselves skills, to use metaphorical thinking to solve problems and to inquire as a scientist does. This major and overarching characteristic of effective learning is nowadays supported by robust empirical evidences. It means that students are not passive recipient of information but that they learn how to learn, and actively construct their own knowledge and skills (Cobb, 1994).
Constructivists also advocate that, learning should involve social negotiation and mediation. This contention refers to the role of social interaction and cooperation works for the development of socially relevant skills and knowledge. Moreover, they asserts that contents of skills lessons should be relevant to the learner and with in the frame work of the learners prior knowledge and skill. Teachers are expected to serve primarily as guides or facilitators of learning, but not instructors, students on the other side should be encouraged to become self - regulatory, self mediated and self aware (Briwn and Palincsar, 1997).
According to Fosnot (1999), there are stages that help teachers to use and move towards constructivist didactics in teaching different subjects. These stages have practical implication in technological educations (Doolittle and Camp, 1999). Introduction is the first and foremost stage, in which prior skills and knowledge can be activated in many ways. Recall previous knowledge and skills in technological education, introducing new theories and principles, asking some questions, which make students to be active participant and eagerly involve in their technological education.
Exploration is the second stage in which students engage in collaborative and cooperative learning, experimentation, employ learners centered strategies, practice enquiry approach, and discuss with teachers and classmates about technological facts and issues. It is followed by the stage of experiential mode of learning, in which students interact and challenge each other and discover new ideas, construct their own understandings. Hence, meaningful learning occurs with authentic learning tasks.
Abstract conceptualization and understanding is the stage in constructivist pedagogical tenets in which, learning technical skills and theories, is a matter of associating and attaching a new meaning to past cognitive experiences, constructing new skills, explanations, and experiences and making decisions. It is followed by the stage of reflection in which, constructivist teacher encourage students to reflect on their current skills and findings in the light of earlier hypothesis. Application and evaluation is ongoing process of constructivist approach of learning and teaching. This process enable constructivist technology teacher to assess whether the learner has achieved understanding of concepts, theories and principles of technical skills or not. In general, such stages of strategies can be adopted by a committed technology teacher to be both constructive and effective technology teacher (Fosnot,1999).
The constructivists’ didactics challenges the longstanding societal view that knowledge and skill came in finished and polished pieces and the job of educational institutions is to take the piece out of the store house and give them to the learner intact until the picture puzzle of essential knowledge and skill is complete (Joyce and Weil, 2003). This conceptions contrasts sharply with the still prevailing, more or less implicit view of learning reflected in a lot of current teaching-learning practices in technology education, namely as the transmission and absorption of skills and knowledge gained and institutionalized by past generations (Bergen, 1998).
In Ethiopian context, developing student’s problem solving skills are among the major educational objectives stated in the education policy and education sectors development strategic documents. This abilities and skills are partly to be attained through expanding access and assuring qualities of technological education and trainings. Incorporating modern practices and research findings from the contemporary pedagogical and psychological theory of learning into the existing practices of technological education are among the areas that deserves serious considerations in educational quality assurances.
Traditionally, discipline expertise has been the most respected feature of a university teacher. In recent years, however, there have been discussions about the need to improve university teachers’ pedagogical thinking and skills as well. As a consequence, training of university teachers has recently become a widespread trend in many countries (Fosnot, 1999).
As to recent development of learning theories and instructional skills, efficient mastery of skills and acquisition of knowledge in technological education can be best developed in the learners, when the teaching and learning process are approached from the constructivist perspectives. Technology education is holistic and practically based curriculum, which is ideally suited to constructivist approaches to teaching and learning (Bergen, 1998).
Adama Science and Technology University is one of the pioneer technical universities in Ethiopia, which strives to achieve excellence in technological education as its major objectives. To this effect, Adama Science and Technology University has launched Pedagogical Skill Improvement and Support Training in 2005, with the major motto of acquainting technology instructors to be aware and implement modern approaches of teaching technological skills so as to provide quality technological education.
ISSN 2039-9340 Mediterranean Journal of Social Sciences Vol. 4 (1) January 2013
393
The aim of Pedagogical Skill Improvement and Support Training is to create reflective teachers, who recognize the value of reflection in education. It also aimed at look up the professional quality of instructors and learning of students. It provides instructors with a practical training to support their development as effective teacher, use modern active learning methods and employ student centered teaching methods to be reflective practitioners in technology education.
The endeavor to assess the challenges in the implementation of constructivist didactics as recent active learning and teaching strategy in the teaching-learning process of technological education is a virgin area of focus. In view of this, the study tries to evaluate the practices, prospects and challenges in the use of constructivist didactics in the teaching-learning arena of technological education in Adama Science and Technology University.
. 2. Statement of the Problem Experience and observations tell us that technological education in many countries is disheveled with many problems. The practical activities in which students engaged in technological education have low cognitive demand and learning of theoretical facts and principles. Most of the instructional process in technological education gives more emphasis on memorization of algorithms and transmissions of the already finished and polished skills rather than encouraging learners to construct their own skills, technical and conceptual schemes. Many factors could be hindrances to the instructional process of technological education in general and the application of constructivist strategies in particular. The textbook designed are inappropriate in facilitating the students’ interactions with the materials to be learned, in availability of instructional resources, equipments and facilities are among the major hindrances (Joyce and Weil, 2003).
As to constructivist pedagogical paradigm, learning in technological education should be taking place in authentic and real world environments. They affirm that:-
“When an automotive technology student learns to operate a micrometer in the course of solving an authentic problem such as the construction of a solar powered car, the knowledge constructed will be more accurate and viable than if the student merely practiced using the micrometer in isolation” (Doolittle,and Camp 1999:7)
Teachers’ beliefs, skills and understandings on how mastery of skills in technological education best acquired and developed in students can be put under question. The teacher's knowledge base and skills in applying and using elements of constructivist didactics to foster the instructional process in technological education is also another factor. The students’ beliefs about teaching and learning in technological education could also be another problem. However, it became very clear that under situation that are apart from the constructivist philosophical tenets of teaching and learning, learning technological skills is almost incomplete and unsustainable even in their carrier efficiency (Doolittle and Camp, 2003).
Hence to either improve the existing practices in technological education classes and to identify the major impediments that constrained in the practical usage of didactics of constructivists in technology education departments of Adama Science and Technology University, rigorous investigation required to be made. 3. Purpose of the Study The major purposes of these research undertakings are;
• Assessing the practicability and applicability of didactics of constructivism in the instructional process of technology education by instructors who are certified in professional teachers’ education.
• Identifying and analyzing the prominent constraints that hinder the practical usage of constructivist didactics in technological education classes.
In order to attain the purpose, the study is devoted to answer the following basic research questions. • To what extent are constructivist didactics used in the instructional process of technological education
classes? • What are the key impeding challenges in applying the constructivist didactics in the teaching learning process
of technological education classes? 4. Research Design and Methodology 4.1. Research Design
ISSN 2039-9340 Mediterranean Journal of Social Sciences Vol. 4 (1) January 2013
394
In this study a descriptive survey research methodology was designed to examine the state of application and usage of constructivist didactics and to identify the constraints in their application in technological education classes in Adama Science and Technology University. 4.2. Sample and Sampling Technique The target population was technology teachers and students in Wood Work Technology, Automotive Technology, Construction Technology and Manufacturing Technology departments. These departments are selected by using purposive sampling techniques because of their programmes are solely technological education. Teachers, who taught fulltime in the University, and graduated and certified in pedagogical skills improvement Program were selected by using available sampling techniques because of their manageable sizes. The final year students in each department were selected with simple random sampling techniques. These sources helped the researcher to acquire first hand and dependable information and draw valid inferences. 4.3. Instrumentation The instruments employed in this research were questionnaire, and personal observations. Data were gathered from teachers and student through questionnaire. Classrooms and workshop instructional processes were observed using structurally designed observation checklists. 4.4. Data Collection The Total Design Method (TDM) of conducting surveys was followed in all stages of the questionnaire construction and administering process. A packet containing a cover letter, instructions for administrating the questionnaire and copies of the questionnaire was distributed to teachers; who graduated from Pedagogical Skills Improvement and Support Training (PSIST). Another set of questionnaire was distributed to randomly selected final year technology students in the four departments. Personal observations of the researcher were also sources of dependable information. 4.5. Data Analysis Data secured through the above mentioned instruments was critically analyzed both qualitatively and quantitatively. The quantitative data gathered through questionnaire was tabulated and computed using the statistical package for social science (SPSS version-20for windows).Descriptive parameters including Chi-squire test and percentage were employed to organize and analyze the quantitative data. Data gathered through observations were tabulated and analyzed qualitatively and serve as a supplement for quantitative data secured through questionnaire. Finally, summary of findings, conclusions and recommendations were drawn and forwarded. 5. Analysis and Discussions In this part of the paper an attempt was made to analyze the respondents’ reflections about the extent of application of the major stages in the didactics of constructivism and major challenges which hinder its applications in technology educations lesson. Extent of Application of Didactics of Constructivism Table.1.Introduction
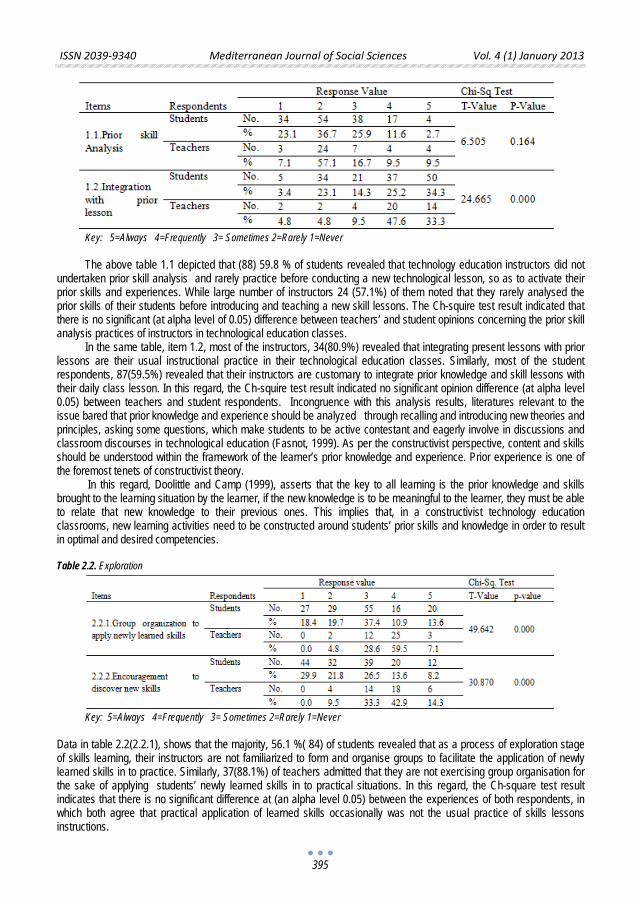
ISSN 2039-9340 Mediterranean Journal of Social Sciences Vol. 4 (1) January 2013
395
Key: 5=Always 4=Frequently 3= Sometimes 2=Rarely 1=Never The above table 1.1 depicted that (88) 59.8 % of students revealed that technology education instructors did not
undertaken prior skill analysis and rarely practice before conducting a new technological lesson, so as to activate their prior skills and experiences. While large number of instructors 24 (57.1%) of them noted that they rarely analysed the prior skills of their students before introducing and teaching a new skill lessons. The Ch-squire test result indicated that there is no significant (at alpha level of 0.05) difference between teachers’ and student opinions concerning the prior skill analysis practices of instructors in technological education classes.
In the same table, item 1.2, most of the instructors, 34(80.9%) revealed that integrating present lessons with prior lessons are their usual instructional practice in their technological education classes. Similarly, most of the student respondents, 87(59.5%) revealed that their instructors are customary to integrate prior knowledge and skill lessons with their daily class lesson. In this regard, the Ch-squire test result indicated no significant opinion difference (at alpha level 0.05) between teachers and student respondents. Incongruence with this analysis results, literatures relevant to the issue bared that prior knowledge and experience should be analyzed through recalling and introducing new theories and principles, asking some questions, which make students to be active contestant and eagerly involve in discussions and classroom discourses in technological education (Fasnot, 1999). As per the constructivist perspective, content and skills should be understood within the framework of the learner’s prior knowledge and experience. Prior experience is one of the foremost tenets of constructivist theory.
In this regard, Doolittle and Camp (1999), asserts that the key to all learning is the prior knowledge and skills brought to the learning situation by the learner, if the new knowledge is to be meaningful to the learner, they must be able to relate that new knowledge to their previous ones. This implies that, in a constructivist technology education classrooms, new learning activities need to be constructed around students’ prior skills and knowledge in order to result in optimal and desired competencies. Table 2.2. Exploration
Key: 5=Always 4=Frequently 3= Sometimes 2=Rarely 1=Never
Data in table 2.2(2.2.1), shows that the majority, 56.1 %( 84) of students revealed that as a process of exploration stage of skills learning, their instructors are not familiarized to form and organise groups to facilitate the application of newly learned skills in to practice. Similarly, 37(88.1%) of teachers admitted that they are not exercising group organisation for the sake of applying students’ newly learned skills in to practical situations. In this regard, the Ch-square test result indicates that there is no significant difference at (an alpha level 0.05) between the experiences of both respondents, in which both agree that practical application of learned skills occasionally was not the usual practice of skills lessons instructions.
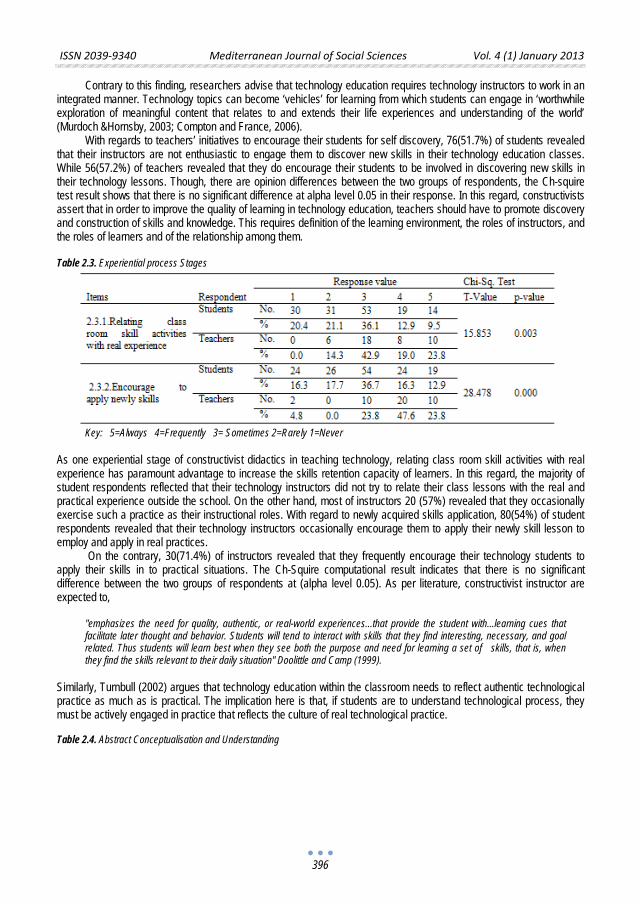
ISSN 2039-9340 Mediterranean Journal of Social Sciences Vol. 4 (1) January 2013
396
Contrary to this finding, researchers advise that technology education requires technology instructors to work in an integrated manner. Technology topics can become ‘vehicles’ for learning from which students can engage in ‘worthwhile exploration of meaningful content that relates to and extends their life experiences and understanding of the world’ (Murdoch &Hornsby, 2003; Compton and France, 2006).
With regards to teachers’ initiatives to encourage their students for self discovery, 76(51.7%) of students revealed that their instructors are not enthusiastic to engage them to discover new skills in their technology education classes. While 56(57.2%) of teachers revealed that they do encourage their students to be involved in discovering new skills in their technology lessons. Though, there are opinion differences between the two groups of respondents, the Ch-squire test result shows that there is no significant difference at alpha level 0.05 in their response. In this regard, constructivists assert that in order to improve the quality of learning in technology education, teachers should have to promote discovery and construction of skills and knowledge. This requires definition of the learning environment, the roles of instructors, and the roles of learners and of the relationship among them. Table 2.3. Experiential process Stages
Key: 5=Always 4=Frequently 3= Sometimes 2=Rarely 1=Never
As one experiential stage of constructivist didactics in teaching technology, relating class room skill activities with real experience has paramount advantage to increase the skills retention capacity of learners. In this regard, the majority of student respondents reflected that their technology instructors did not try to relate their class lessons with the real and practical experience outside the school. On the other hand, most of instructors 20 (57%) revealed that they occasionally exercise such a practice as their instructional roles. With regard to newly acquired skills application, 80(54%) of student respondents revealed that their technology instructors occasionally encourage them to apply their newly skill lesson to employ and apply in real practices.
On the contrary, 30(71.4%) of instructors revealed that they frequently encourage their technology students to apply their skills in to practical situations. The Ch-Squire computational result indicates that there is no significant difference between the two groups of respondents at (alpha level 0.05). As per literature, constructivist instructor are expected to,
"emphasizes the need for quality, authentic, or real-world experiences...that provide the student with...learning cues that facilitate later thought and behavior. Students will tend to interact with skills that they find interesting, necessary, and goal related. Thus students will learn best when they see both the purpose and need for learning a set of skills, that is, when they find the skills relevant to their daily situation" Doolittle and Camp (1999).
Similarly, Turnbull (2002) argues that technology education within the classroom needs to reflect authentic technological practice as much as is practical. The implication here is that, if students are to understand technological process, they must be actively engaged in practice that reflects the culture of real technological practice. Table 2.4. Abstract Conceptualisation and Understanding
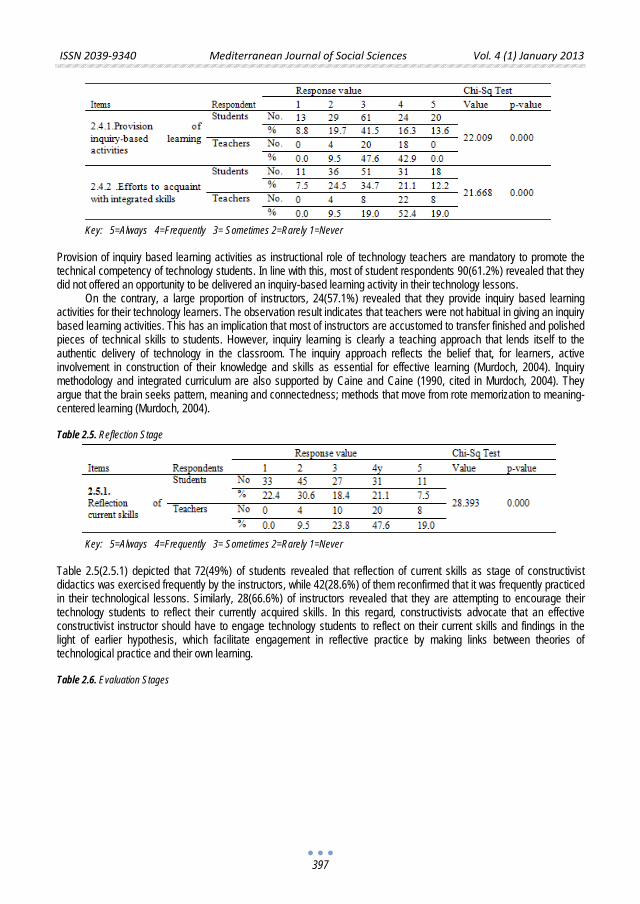
ISSN 2039-9340 Mediterranean Journal of Social Sciences Vol. 4 (1) January 2013
397
Key: 5=Always 4=Frequently 3= Sometimes 2=Rarely 1=Never
Provision of inquiry based learning activities as instructional role of technology teachers are mandatory to promote the technical competency of technology students. In line with this, most of student respondents 90(61.2%) revealed that they did not offered an opportunity to be delivered an inquiry-based learning activity in their technology lessons.
On the contrary, a large proportion of instructors, 24(57.1%) revealed that they provide inquiry based learning activities for their technology learners. The observation result indicates that teachers were not habitual in giving an inquiry based learning activities. This has an implication that most of instructors are accustomed to transfer finished and polished pieces of technical skills to students. However, inquiry learning is clearly a teaching approach that lends itself to the authentic delivery of technology in the classroom. The inquiry approach reflects the belief that, for learners, active involvement in construction of their knowledge and skills as essential for effective learning (Murdoch, 2004). Inquiry methodology and integrated curriculum are also supported by Caine and Caine (1990, cited in Murdoch, 2004). They argue that the brain seeks pattern, meaning and connectedness; methods that move from rote memorization to meaning-centered learning (Murdoch, 2004).
Table 2.5. Reflection Stage
Key: 5=Always 4=Frequently 3= Sometimes 2=Rarely 1=Never
Table 2.5(2.5.1) depicted that 72(49%) of students revealed that reflection of current skills as stage of constructivist didactics was exercised frequently by the instructors, while 42(28.6%) of them reconfirmed that it was frequently practiced in their technological lessons. Similarly, 28(66.6%) of instructors revealed that they are attempting to encourage their technology students to reflect their currently acquired skills. In this regard, constructivists advocate that an effective constructivist instructor should have to engage technology students to reflect on their current skills and findings in the light of earlier hypothesis, which facilitate engagement in reflective practice by making links between theories of technological practice and their own learning. Table 2.6. Evaluation Stages
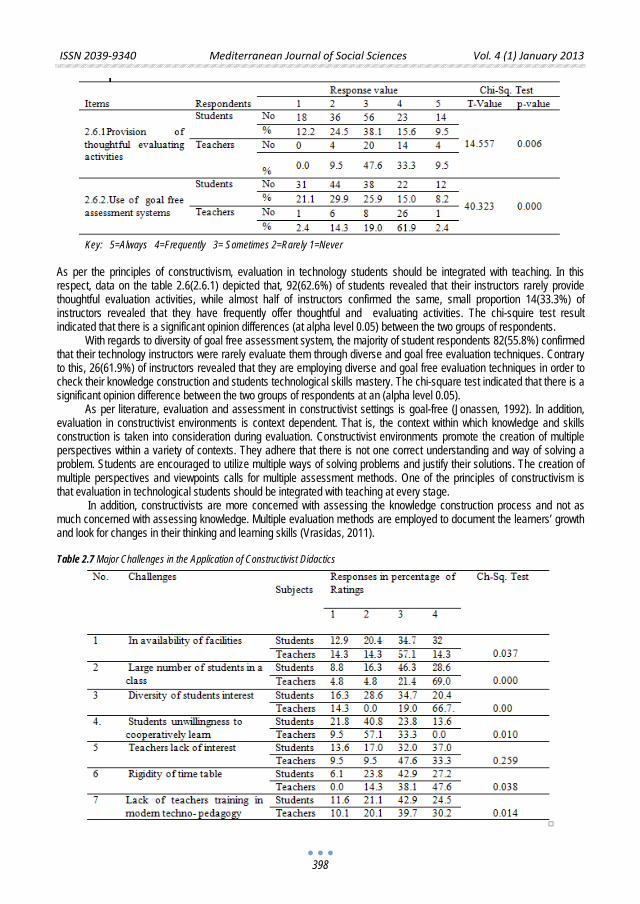
ISSN 2039-9340 Mediterranean Journal of Social Sciences Vol. 4 (1) January 2013
398
Key: 5=Always 4=Frequently 3= Sometimes 2=Rarely 1=Never
As per the principles of constructivism, evaluation in technology students should be integrated with teaching. In this respect, data on the table 2.6(2.6.1) depicted that, 92(62.6%) of students revealed that their instructors rarely provide thoughtful evaluation activities, while almost half of instructors confirmed the same, small proportion 14(33.3%) of instructors revealed that they have frequently offer thoughtful and evaluating activities. The chi-squire test result indicated that there is a significant opinion differences (at alpha level 0.05) between the two groups of respondents.
With regards to diversity of goal free assessment system, the majority of student respondents 82(55.8%) confirmed that their technology instructors were rarely evaluate them through diverse and goal free evaluation techniques. Contrary to this, 26(61.9%) of instructors revealed that they are employing diverse and goal free evaluation techniques in order to check their knowledge construction and students technological skills mastery. The chi-square test indicated that there is a significant opinion difference between the two groups of respondents at an (alpha level 0.05).
As per literature, evaluation and assessment in constructivist settings is goal-free (Jonassen, 1992). In addition, evaluation in constructivist environments is context dependent. That is, the context within which knowledge and skills construction is taken into consideration during evaluation. Constructivist environments promote the creation of multiple perspectives within a variety of contexts. They adhere that there is not one correct understanding and way of solving a problem. Students are encouraged to utilize multiple ways of solving problems and justify their solutions. The creation of multiple perspectives and viewpoints calls for multiple assessment methods. One of the principles of constructivism is that evaluation in technological students should be integrated with teaching at every stage.
In addition, constructivists are more concerned with assessing the knowledge construction process and not as much concerned with assessing knowledge. Multiple evaluation methods are employed to document the learners’ growth and look for changes in their thinking and learning skills (Vrasidas, 2011).
Table 2.7 Major Challenges in the Application of Constructivist Didactics
ISSN 2039-9340 Mediterranean Journal of Social Sciences Vol. 4 (1) January 2013
399
Key: 4=Most serious 3=Serious 2=Not serious 1=Not applicable
As it can be seen from table 2.7, 64.7% of students and 71.4% of teachers agree up on the lack of in availability of facilities and organized was the major challenge in the implementation of constructivist didactics in the teaching-learning arena of technology subjects. The Chi-Squire test (0.037 at alpha level 0.05) result revealed that there is no significant difference between the two groups of respondents. This is in line with (Joyce and Weil, 2003),that in availability of instructional resources, equipments and facilities are among the major hindrances to utilize and practice constructivists approach in teaching technical subjects.
In the same way, the two groups of respondents were asked to give their response to the fact that large in technology class rooms affect the practice of constructivists approach in the instructional process of technology education. The majority of student respondents (74.9% and 90.4%) of teacher’s respondents affirmed that it was the serious challenge. The Chi-squire test result (0.00 at alpha level 0.05) indicates that there is a significant association between the responses given by two groups of respondents.
In the same table, item 3 indicates that whether diversity of students interest affect the implementation or exercising of constructivist approach in teaching–learning process of technology education. Most of the student respondents (55.1%) and (66.7%) of teachers revealed that diversity of student interest was a challenge. The Ch-Squire test result (0.00 at alpha level 0.05) indicates that there is no significant difference between the responses given by students and teachers respondents.
With respect to (item 4), the majority of respondents (62.6%) of students and (66.6%) of teachers confirmed that students unwillingness to cooperatively learn was not a challenge in the practical implementation of didactics of constructivism in technology classes. The Ch-Squire test result (0.010 at alpha level 0.05) indicates that there is no significant difference between the responses given by students and teachers respondents. On the other hand, the majority of respondents of the two groups with no significant difference revealed that teacher’s lack of interest and rigidity of time table found to the major hindering factor in the implementation and use of didactics of constructivism in technology education.
The last item in the table indicates that, 73.5% of students and 66.7% of teachers reflected that lack of teachers training in modern techno- pedagogy and areas of modern approaches of teaching technological skills and contents are the serious challenges to make in to practice. In this regard, literature confirmed that shortage of instructional facilities and skills are factors in the implementation of constructivist didactics in technology education (Joyce and Weil,2003). 6. Summary and Conclusion The study revealed that most of technology education instructors were not undertaken priors kill analysis before conducting a new technological lesson so as to activate learning. Moreover, some instructors did not attempt to integrate prior knowledge and skill lessons with their daily class lesson. It was also evidenced that the majority instructors are not familiarized to form and organise groups to facilitate the application of newly learned skills in to practice and teachers’ are not enthusiastic to engage students to discover new skills in their technology education classes.
The study has also confirmed that technology instructors did not try to relate their class lessons with the real and practical experience outside the class and rarely encourage them to apply their newly skill lesson to employ and apply in real practices. Some instructors did not also offered an opportunity for students for inquiry-based learning activity and thoughtful assessing activities in their technology lessons. Moreover, most instructors were rarely evaluating them through diverse evaluation techniques. It would be therefore, possible to infer that most of instructors are not aware of the modern approach of teaching technology education and could not implement the didactics of constructivism.
The findings of the study also showed that in availability of facilities, and diversity of student interest and lack of teachers training in modern techno- pedagogy found to be the major challenges in the practicality of constructivist didactics in technology education. It can be concluded that though teachers attended Pedagogical skill improvement programs, the major challenges in the utilisation of constructivist approach in teaching technology education are shortage of the required and relevant trainings and material inputs. 7. The Way Forward These days, many developing countries including Ethiopia, have concentrated on the expansion and improvement on the quality of higher education in general and Science and technology higher education in particular. Assessing the practices, identifying and analyzing the hurdles in the effective utilization and practicability of modern approaches in the teaching–learning practice, is crucial aspect in the quality assurance of technological education so as to achieve the vision set. The constructivist pedagogy in technological education is relatively an emerging and widely accepted paradigm.
ISSN 2039-9340 Mediterranean Journal of Social Sciences Vol. 4 (1) January 2013
400
Constructivist pedagogy as a teaching method aims to promote higher levels of thinking skills. Hence, teachers should be aware that learning in technological subjects should take place in authentic and real-world environments. The acquisition of technological knowledge clearly aligns with several constructionist theories of knowing. While undertaking a constructivist based activity, students gain a rich understanding of theory related to technological practice and relevant links to learning in the classroom. Technology education within the classroom needs to reflect authentic technological practice as much as is practical. Therefore pedagogical trainings and CPDT(Continuous Professional Development Teachers) programmes in the university should be designed in such a way that enable instructors not to be deficient of modern and contemporary instructional skills in technology education, but to develop aspects of learning theory relevant to technology education in the tertiary sector, which requires continuous supervision of instructional activities in the university References Best and Kahn(1998).Research in Education. New Delhi: India prentice Hall private Ltd. Schunk,H, Dale(1996). Learning Theories USA: prentice hall. Joyie B., weil M.(2003). Models of Teaching. Newdelhi: prentice Hall Private limited Burgen.A.(1998).Goals and purposes of Higher Education in the 21 st century. London:Jessica Kingsley publisher. Mayer,R.(2003).Theories of Learning and their Application to Technology: in Neilo and Prez.s, Technology Applications in Education,
London Lawrence Eribaum publisher. Cobb, P. (1996). Constructivist, emergent, and Socio-cultural perspectives in the context of developmental research. Educational
psychologist, 31 (3/4). Doolittle P.and Camp.W.(1999)."Constructivism: The career and Technological education perspective." in Journal of Vocational and
Technical Education.Vol. 16,No. 1,Virgina Polytechnic institute Fosnot,T. (1999).”Constructivism: A psychological theory of Learning, in C.T.Fosnot (ed.) Constructivism, theory, perspectives and
practice, New York: Colombia University Press. Cobb.P.(1994)." where is the mind? A coordination of Socio cultural and cognitive constructivist perspectives "In
Fosnot(Ed.),Constructivist Theory, Perspectives, and Practice. Newyork: Teachers college press Compton, V., & France, B. (2006). Discussion document:background information on the new strands. Retrieved from
www.techlink.org.nz.. Brown, A.L, and Palincsar, A.S.(1987).Reciprocal teaching of comprehension strategies: a natural history program for enhancing
learning. In J. Borkowski and J. D. day (eds), cognition in special education: comparative approaches to retardation, learning Bruning,R. (1995).Cognitive Psychology and instruction. Upper Saddle River, NJ: Merrill. Geary,D.Co.(1995.) Reflections of evolutions and culture in children's Cognition: Implications for mathematical development and
Instruction, American psychologist, 50(24-37). Mayer, R. (2003) "Learners as Information Processors: Legacies and Limitations of Educational Psychology’s Second Metaphor."
Educational Psychologist. Vol. 31, pp. 151-161. Murdoch, K., & Hornsby, D. (2003). Planning curriculum connections whole school planning for integrated curriculum. South Yarra
Eleanor Curtain Publishing. Murdoch, K. (2004). Classroom connections – strategies for integrated learning. South Yarra: Eleanor Curtain Publishing. Cobb, P. (1994). Where is the mind? Constructivist and socio-cultural perspectives on Mathematical development. Educational
Researcher, 23(7), 13-20. Turnbull, W. (2002). The place of authenticity in technology in the New Zealand curriculum. International Journal of Technology and
Design Education, 12, 23-40.

ISSN 2039-9340 Mediterranean Journal of Social Sciences Vol. 4 (1) January 2013
401
An Investigation of the Performance of Cooperative Thrift and Credit Societies
In Financing Small-Scale Businesses in Nigeria
Aribaba, Foluso Olugbenga
Obafemi Awolowo University, Centre for Distance Learning, Ile-Ife, Nigeria.
Email:
1. Introduction
[email protected] Doi:10.5901/mjss.2013.v4n1p401 Abstract
This study investigated the performance of Cooperative Thrift and Credit Societies in financing small-scale businesses and identified the problems confronting CTCS in providing finances to small-scale businesses. This was with a view to providing information on the role of CTCS in the development and growth of small-scale businesses.Primary data involving the administration of questionnaire was utilized for the study. The instrument elicited information on the socio-demographic background of the cooperative leaders and small-scale entrepreneurs, the sources of funds to CTCS, sources of finance available to small-scale businesses and problems encountered by the CTCS in financing small-scale business. Data collected were analysed using descriptive statistics.The result of the study showed that CTCS has performed creditably well in providing funds to small-scale businesses. On the problems facing the CTCS in financing small-scale businesses of its members: inadequate fund (69.2%) and poor loan recovery (52.5%) were identified as the recurrent, while economic downturn (25.0%); bad leadership (15.8%); misappropriation of small-scale business capital (12.5%); poor accounting system (8.3%) and poor state of infrastructure (4.2%) are regarded as other problems facing the CTCS in financing small-scale businesses. The study concluded that in general, membership of CTCS by entrepreneurs had a positive impact on the growth and development of small-scale businesses in Nigeria.
Keywords: Keywords, cooperative thrift and credit society, small-scale business
The cooperative societies are member owned, volunteer-led, self-help, democratic institutions that provide financial services to their members. They are not constituted to make profit and are openly committed to service the needs of disadvantaged communities and individuals, many of whom have been abandoned by mainstream banking. The motivation behind the formation of Cooperative Societies is to encourage thrift among their members and to pool these savings into a fund so that members can borrow from this should they need to do so. Their depositors are also their borrowers who know one another through some common bond and this pre-existing social connection helps circumvent problems of imperfect information and enforceability.
The Cooperative Societies mobilize funds for use in the sectors where funds are needed and also create in the members the spirit of savings. Therefore, government at all levels should create the enabling environment for the Cooperative Societies to flourish and grow as this will increase or fast-track the development and growth of the SMEs and equally reduce drastically the unemployment rate in the country and as well increase the living standard of the people. The performance of CTCS in financing small-scale businesses is still relatively new, hence this study.
2. Types of Cooperative Cooperative Societies like other business organizations are established to perform certain tasks. They can be classified into four broad categories, according to the tasks performed. These include: marketing, purchasing, service and processing associations (King, 2002).
(i) Marketing Cooperatives: These are those Cooperatives through which members e.g. farmers sell the products of their farms. These Cooperatives may collect members’ product for sales, grade, package, and perform other functions. The objective of such organization is to secure the greatest possible amount for the products of their farmer-owners. Some associations act solely as commission agents. Some association act as bargaining agents and do not actually handle the products. Others will actually buy the commodity from the farmers for resale.
(ii) Purchasing Cooperatives: These are those Cooperatives through which members buy the supplies they need. Purchasing Cooperatives often engage only in retailing and wholesaling. In order instances, they
ISSN 2039-9340 Mediterranean Journal of Social Sciences Vol. 4 (1) January 2013
402
manufacture the products they sell and acquire the sources of raw materials. The objective of such organizations is to effect savings for members, especially the farmer on the things he buys. The principal source of such savings usually comes from lower prices or from higher quality and better adapted supplies and equipment.
(iii) Service Cooperatives: These are organized to provide their member with improved services or with service they could not otherwise obtain. The service undertaken may include credit, insurance, electric power, telephone, irrigation and drainage, hospital and mortuaries. Membership may be of rural or urban people or a combination of the two. The principal source of saving from membership in such association occurs largely because they are able to meet the specialized needs of members better than other kinds of organizations can.
(iv) Processing Cooperatives: These engage in the packing or processing of the farmer products. In many instances, the processing activities are part of the over-all activities of marketing Cooperatives. It is common for example, for Cooperative manufacturing association to undertake the marketing service of wholesaling the finished products. Through the integration of processing and marketing, made possible by Cooperative association, farmer or Cooperative members are able to extend control over their products as they move into consumption.
3. Growth of the Nigerian Cooperative Movement Cooperatives as a form of voluntary self help organization have been known in many parts of this country for several decades, Cooperative programmes in their own right have never featured in National Development Plan until the Third Plan (1975-1980). This reflected both the slow progress of the movement in Nigeria and a lack of active federal government interest, despite the fact that Cooperatives are potentially an important instrument of social transformation, especially in the rural areas. Before 1980, less than 1% of the Nigerian populations are member of the Cooperative Movement. The Federal Government of Nigeria in 1980 adopted a policy on rural Cooperatives in its “Green Revolution Programme” with the following objectives:
i. To foster the development of a virile rural Cooperative system in Nigeria, which can be used as an effective vehicle of social and economic development especially at the grassroots level throughout the federation?
ii. To intensify Cooperative education training and public enlightenment at all levels in order to bring about increased participation and involvement of farmers and other rural people in the cooperative movement and to enable there make decisions which will improve their income and enhance their general value and that of the masses;
iii. To use rural Cooperative to achieve increased domestic production of good industrial raw material and equal distribution of farm inputs and other commodities; and
iv. To widen the democratic base in the local communities through cooperative participation and effort, and thereby enhance personal achievement and satisfaction; social understanding and political unity for all the people.
v. In furtherance of its commitment to Cooperatives, the Federal Government of Nigeria established the Federal Department of Agricultural Cooperative (FDAC) in 1980. The FDAC’s main responsibility was to initiate series of policies and programmes to establish agricultural cooperative throughout the federation. It initiated national agricultural policy formulation in the area of inter-governmental cooperation concerning agricultural Cooperatives.
In order to better execute this mandate, it established in 1981 four zonal offices located in Ibadan, Enugu, Jos and Kaduna. Subsequently, state offices were opened in order to bring the technical services closer to the population. Initially, the FDAC was organized into five divisions:
(i) Agricultural Planning and Development (ii) Education and Training (iii) Public Relations and Extension Services (iv) Projects Implementation, Monitoring and Evaluation (v) Supply and Marketing.
The above divisions have the responsibility to oversee the efforts that are being made towards the rural population in terms of developing the Cooperative movement (Onyewaku and Fabiyi, 2001).
A number of capital Cooperative projects had been undertaken and these include feed mills, storage depots, and onshore fishing projects, Cooperatives for food processing, transportation and inter-state cooperative marketing of food crops. The feed mill project processes farmers’ raw produce such as maize, guinea corn, cotton seed, groundnut cake, etc. into animal feed. The establishment of storage depots is to collect and store food crops for eventual marketing and
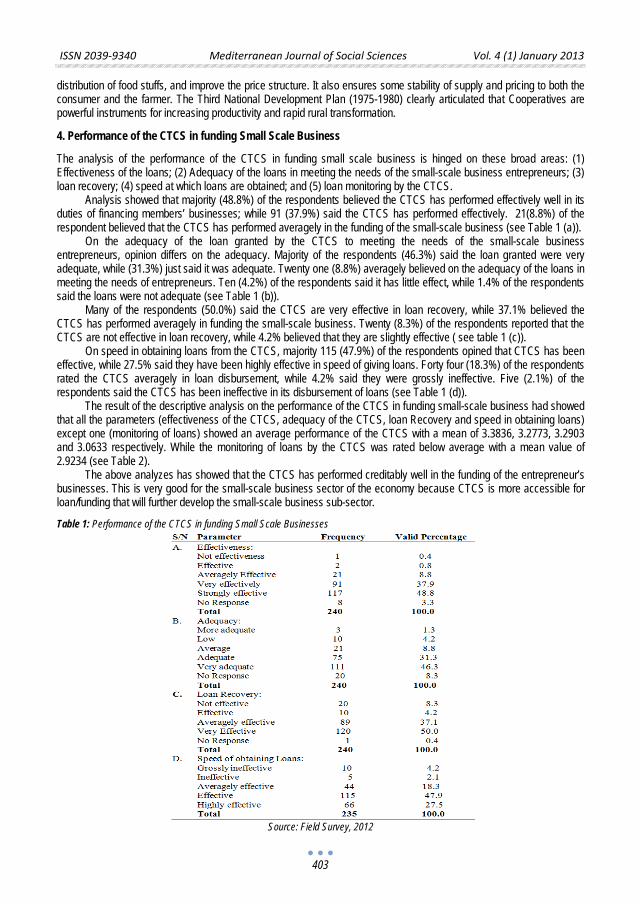
ISSN 2039-9340 Mediterranean Journal of Social Sciences Vol. 4 (1) January 2013
403
distribution of food stuffs, and improve the price structure. It also ensures some stability of supply and pricing to both the consumer and the farmer. The Third National Development Plan (1975-1980) clearly articulated that Cooperatives are powerful instruments for increasing productivity and rapid rural transformation. 4. Performance of the CTCS in funding Small Scale Business The analysis of the performance of the CTCS in funding small scale business is hinged on these broad areas: (1) Effectiveness of the loans; (2) Adequacy of the loans in meeting the needs of the small-scale business entrepreneurs; (3) loan recovery; (4) speed at which loans are obtained; and (5) loan monitoring by the CTCS.
Analysis showed that majority (48.8%) of the respondents believed the CTCS has performed effectively well in its duties of financing members’ businesses; while 91 (37.9%) said the CTCS has performed effectively. 21(8.8%) of the respondent believed that the CTCS has performed averagely in the funding of the small-scale business (see Table 1 (a)).
On the adequacy of the loan granted by the CTCS to meeting the needs of the small-scale business entrepreneurs, opinion differs on the adequacy. Majority of the respondents (46.3%) said the loan granted were very adequate, while (31.3%) just said it was adequate. Twenty one (8.8%) averagely believed on the adequacy of the loans in meeting the needs of entrepreneurs. Ten (4.2%) of the respondents said it has little effect, while 1.4% of the respondents said the loans were not adequate (see Table 1 (b)).
Many of the respondents (50.0%) said the CTCS are very effective in loan recovery, while 37.1% believed the CTCS has performed averagely in funding the small-scale business. Twenty (8.3%) of the respondents reported that the CTCS are not effective in loan recovery, while 4.2% believed that they are slightly effective ( see table 1 (c)).
On speed in obtaining loans from the CTCS, majority 115 (47.9%) of the respondents opined that CTCS has been effective, while 27.5% said they have been highly effective in speed of giving loans. Forty four (18.3%) of the respondents rated the CTCS averagely in loan disbursement, while 4.2% said they were grossly ineffective. Five (2.1%) of the respondents said the CTCS has been ineffective in its disbursement of loans (see Table 1 (d)).
The result of the descriptive analysis on the performance of the CTCS in funding small-scale business had showed that all the parameters (effectiveness of the CTCS, adequacy of the CTCS, loan Recovery and speed in obtaining loans) except one (monitoring of loans) showed an average performance of the CTCS with a mean of 3.3836, 3.2773, 3.2903 and 3.0633 respectively. While the monitoring of loans by the CTCS was rated below average with a mean value of 2.9234 (see Table 2).
The above analyzes has showed that the CTCS has performed creditably well in the funding of the entrepreneur’s businesses. This is very good for the small-scale business sector of the economy because CTCS is more accessible for loan/funding that will further develop the small-scale business sub-sector.
Table 1: Performance of the CTCS in funding Small Scale Businesses
Source: Field Survey, 2012
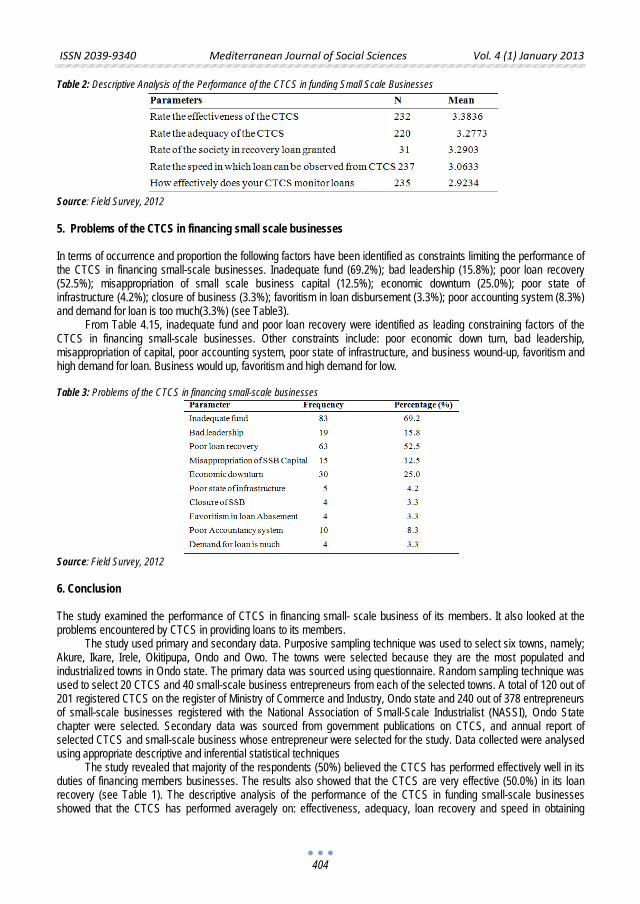
ISSN 2039-9340 Mediterranean Journal of Social Sciences Vol. 4 (1) January 2013
404
Table 2: Descriptive Analysis of the Performance of the CTCS in funding Small Scale Businesses
Source: Field Survey, 2012 5. Problems of the CTCS in financing small scale businesses In terms of occurrence and proportion the following factors have been identified as constraints limiting the performance of the CTCS in financing small-scale businesses. Inadequate fund (69.2%); bad leadership (15.8%); poor loan recovery (52.5%); misappropriation of small scale business capital (12.5%); economic downturn (25.0%); poor state of infrastructure (4.2%); closure of business (3.3%); favoritism in loan disbursement (3.3%); poor accounting system (8.3%) and demand for loan is too much(3.3%) (see Table3).
From Table 4.15, inadequate fund and poor loan recovery were identified as leading constraining factors of the CTCS in financing small-scale businesses. Other constraints include: poor economic down turn, bad leadership, misappropriation of capital, poor accounting system, poor state of infrastructure, and business wound-up, favoritism and high demand for loan. Business would up, favoritism and high demand for low. Table 3: Problems of the CTCS in financing small-scale businesses
Source: Field Survey, 2012 6. Conclusion The study examined the performance of CTCS in financing small- scale business of its members. It also looked at the problems encountered by CTCS in providing loans to its members.
The study used primary and secondary data. Purposive sampling technique was used to select six towns, namely; Akure, Ikare, Irele, Okitipupa, Ondo and Owo. The towns were selected because they are the most populated and industrialized towns in Ondo state. The primary data was sourced using questionnaire. Random sampling technique was used to select 20 CTCS and 40 small-scale business entrepreneurs from each of the selected towns. A total of 120 out of 201 registered CTCS on the register of Ministry of Commerce and Industry, Ondo state and 240 out of 378 entrepreneurs of small-scale businesses registered with the National Association of Small-Scale Industrialist (NASSI), Ondo State chapter were selected. Secondary data was sourced from government publications on CTCS, and annual report of selected CTCS and small-scale business whose entrepreneur were selected for the study. Data collected were analysed using appropriate descriptive and inferential statistical techniques
The study revealed that majority of the respondents (50%) believed the CTCS has performed effectively well in its duties of financing members businesses. The results also showed that the CTCS are very effective (50.0%) in its loan recovery (see Table 1). The descriptive analysis of the performance of the CTCS in funding small-scale businesses showed that the CTCS has performed averagely on: effectiveness, adequacy, loan recovery and speed in obtaining
ISSN 2039-9340 Mediterranean Journal of Social Sciences Vol. 4 (1) January 2013
405
loans; 3.3836, 3.2773, 3.2903 and 3.0633 respectively (see Table 2). The findings on the problems faced by the CTCS in financing businesses of its members showed that the major (52.5%) problem was poor loan recovery (see Table 3) .
References Adera,A. (2007), Agricultural Credit and the Mobilization of Resources in rural Africa”, Saving and Development Quarterly Review, No 1,
Finafrica foundation, pp. 29 – 73. Akeredolu-Ale, E.O. (1971), “Nigerian Entrepreneurs in the Lagos State. A Study in the Origins and Performance of Indigenous Business
Leadership in a Young Economy”.Ph.D. Thesis, University of London. Akeredolu–Ale, E.O. (1988), “Some Fundamental Obstacles to effective Cooperativization in Nigeria”, Procedures of a National
Conference on Mobilizing Cooperatives for Self-Reliance in Nigeria under the auspices of Directorate for Social Mobilization (MAMSER).The Presidency, Abuja, Nigeria, pp. 56 –61.
Alubo, S.O. (2008), “Democratizing Cooperatives in Nigeria”. Proceeding sof a National Conference on Mobilizing Cooperatives for Self-Reliance in Nigeria under the auspices of Directorate for Social Mobilization (MAMSER). The Presidency, Abuja, Nigeria, pp. 70 –74.
Asaolu, T.O. (2004), Evaluation of the Performance of the Cooperative Thrift and Credit Societies (CTCS) in Financing Small Scale Enterprises (SSE) in Osun State, Nigeria, a Ph.D Thesis, OAU, Nigeria.
Ayo, B.S. (2006), “Promoting rural Development through Small Scale Industries in Kwara State”, The Quarterly Journal of Administration, Vol. XX Nos. 3 and 4, pp. 202- 214.
Ekpenyong, N. (2002), “The Nature of Returns: A Social Capital Markets Inquiry into Elements of Investment and Blended Value Proportion”, social Enterprise Series No. 17, HarvardBusinessSchool, Boston, MA
King, R. (2002), “Cooperative Policy and Village Development in Northern Nigeria”. J. Heyer et al., (eds). Pp. 259 – 280. Nasko, M.G. (1986), Keynote Address Delivered as the Honourable Minister of Agriculture, Water Resources and rural Development at
the Workshop on “Mobilizing Cooperatives for Food Self Sufficiency”, Jos Plateau State. Nourse, E.G. (2006), The Legal Status of Agricultural Cooperation. Macmillan, New York. Okuneye, P.A (2002), “The Role of Cooperative and Group Farms. For Expanding Food Production in Nigeria with particular reference to
Ogun State”, Ph.D. Thesis, University of Leeds. Onyewaku, C.E. and Y.I. Fabiyi, (2001), Relative Efficiency of Cooperative and Non-cooperative Farmers in Food Production in Imo
State.Press in AMSE Transactions, Finance Vol. 8, No. 4, pp. 23-32. Osuntogun, A. (2003), “Agricultural Credit Strategies for Nigerian Farmers: A Case Study of the Western Nigeria Agricultural Credit
Corporation “In Small Farmer Credit in Africa, A.I.D. Spring Review, Vol. VI. Patil, S.M. (2008), “A Case Study of the Repayment of Group Loans and Causes of their non repayment in Maharashtera State”. Indian
Journal of Agricultural Economics, Vol. 33. Schaars, M. (2001).“Cooperatives, principles and Practices”.Cooperative Extension Programmes, University of Wisconsin. Taylor, C.C. (1999), Objectives of Farmer Cooperative: By A Sociologist. American Cooperation. Weitz, R. (2001), From Peasant to Farmer: A Revolutionary Strategy for Development. Columbia University Press, New York.

ISSN 2039-9340 Mediterranean Journal of Social Sciences Vol. 4 (1) January 2013
407
Fier By-Pass and its Role in the Socio-Economic Development of Fier Region
Phd.Candidate, Nevila Çinaj
“Aleksandër Moisiu” University, Rr. Currilave, Lagjja Nr.1, Durrës [email protected]
PhD. Jostina Dhimitri
University of Tirana, Faculty of History and Philology, Tirana
[email protected] Doi:10.5901/mjss.2013.v4n1p407 Abstract
During the last decade, a growth has been noticed in the investments for the improvement and transformation of the road infrastructure. The realization of these investments according to the National Plan for Transportation is carried to support the socio-economic developments in the country. The main purpose of this plan is the growth of the efficiency of the transportation sector, which supports and prompts the growth of the other sectors in economy. The far-reaching plans aim to make a better use of the farming & cattle growth, especially of the development of a decent sector for the economy, the services sector. This sector is of a far greater importance when it comes to the tourism and its diversity in the country. Various studies have shown that transportation infrastructure doesn’t bring a new economic growth, but it simply pushes the redistribution of this growth that will happen somewhere else. This is the reason why the highways are designed for those areas where there is a potential for economic growth in the future. As a result, the truth is that the highway need is due to economic growth and not vice versa.To verify this fact was considered the case of Fier By-pass, part of the north-south corridor (highway). Giving high consideration to time and space element, the working aims to show how this investment will affect the socio-economic development of the Fier region. This analysis is also based on the weak socio-economic indexes of this region during the transition period. To draw the conclusions, the working project uses SOWT analysis. This shows briefly the advantages and disadvantages of Fieri By-pass and what options and threats will be offered from this new transportation segment for Fieri region.
Keywords: Fieri By-pass, growth redistribution, socio-economic differentiations, SOWT analysis, tourism, services sector, socio-economic development.
1. Introduction In view of the general plan of development and modernization of the infrastructure, to carry out its goals and objectives determined according to National Transportation Plan and Transportation Strategy Sector, Fieri By-pass remains the last segment to be constructed to complete the connection of North-South Corridor with other segments that have already finished, the Levan-Vlore, and Levan-Tepelene segments that are in the process of being constructed. The direct impact of this investment is to grow and to simplify the circulation of the vehicles, to drive faster, to shorten the time of travel, which on the other hand will enhance the circulation of vehicles and their load. Whereas the indirect impact is the result that it will give to the social-economic development of the south of Albanian and at the same time to the areas where it touches. To argue this fact was considered the case of Fieri By-pass, part of the north-south corridor. Analyzing the time and space aspect of this project, the working aims to show the impact of this investment in the socio-economic development of Fieri circuit, and to demonstrate the possible differentiations within the region. The analysis is also based on the weak indexes this region had during the transition period. The study aims to predict which will be the new tendencies of the socio-economic development of the region, resulting from this investment. The method of the construction is characterized by a combination of the region profile study, comparing analysis of the socio-economic development of Fieri region, which goal is to describe the phenomenon in chronological manner, with the cause-consequence analysis through statistics methodology. Analysis SOWT helps to draw the conclusions. This analysis shows in brief which will be the pros and cons of Fieri By-pass and which are the options and threats of this new transport new segment for this region.
ISSN 2039-9340 Mediterranean Journal of Social Sciences Vol. 4 (1) January 2013
408
2. Fieri Region Profile The western region is defined and esteemed as the most important in social-economic development aspect when compared to the other regions. The region1
Presently the region continues to play the same important role both as a connection joint or the important street arteries of the country, and in the crossroad of the north-south corridor
of Fieri is one the region stretching in this location and at the same time one of most developed from social-economic viewpoint. Factors affecting this development include not only geographical position of the region where it is located, but also the geographical position of the region inside the region. It covers ¼ of the western region and 6.6% of the general area. The territorial stretch by the shore of Adriatic sea is from the delta of Vjosa river to Shkumbini delta with a length of 52 km or 15 % of the coastal line of Adriatic with a general area including 1910 km2, according to INSTAT 2010, a statistics source in Fier, Mallakaster, Lushnje for April 2010, is one of the main factors affecting in the development and economic differentiation, compared to the nearby circuits of Albania. This conclusion is also supported by the fact that:” since antiquity in the historic terrain of this region is established one of the Hellenistic colonies such as Apollonia, which is defined Apollonia, a country full of crossroads that connected together within our country and then passed out in the world, by earth or sea route”.
2 with West-East3
The positive interrelation between infrastructure of transport and productivity in national range is often misinterpreted. This interrelation is a direct one when the small geographical areas and their impact are considered (as in the case of Fieri region). Different studies suggest that transport infrastructure does not prompt a new growth in economy,
corridor, whereas the railway corridor is Tiranë-Vlorë. The construction of the new segments Fier-Levan and Levan-Vlore will minimize the distances and will make it easier for trading loads and passengers in the main harbors of the country, in Durrës and Vlora. The region of Fieri as a developed area will continue to be a joint between north regions and south ones, as well as between western and eastern regions. The region, with a length of 80 km north-south and of 50 km width east-west, represents the most productive area of Albania, the field of the Big and Small Myzeqea which covers ¼ of the Western plain, known as the Barn of Albania. It includes three regions: Fieri, Lushnja and Mallakastra. Fieri which has the biggest population in the country with some 492.592 inhabitants according to Fieri region INSTAT, 2010; Buletin Statistikor Fier, Mallakastër, Lushnje, prill 2010,INSTAT 2010; a progress report about the growth of its strategy objectives and from 36 communes and six town halls in all its three districs. The population of the region covers 12% of the country population, according to Instat 2010, Statistics source in Fier, from which 67.73% is active population of ages 15-65 years old. Kuqi,Iris;Shutina,Dritan; Zhvillimi Rajonal në Shqipëri - sfida e zhvillimit apo e integrimit? Pdf, the level of illiteracy was reduced from 7.3% in 1989 to about 1% in 2001, During transition era, the transformation in economy has affected the trading economy and the growth of the well-being for many families and at the same time in the drop of the well-being in general. The affecting factors are: first, closing, reestablishing and privatization of the firms were accompanied with massive unemployment and high level of emigration in urban areas. Regional and foreign investments did not create enough employment places for those people that before worked in big state companies. The second factor is connected with the distribution of the terrain according to law 7501 in rural areas; the soil that before belonged to a state farming company and farming cooperatives was given to the families in the form of small land plots. However the results of living through these small lands seemed enough. The favorable geographical position with the many rich natural and human sources list the region among the three main regions of the country after Tiran and Durres. EGIS Route, 12/05/2008; Fier and Levan Bypass.
3. The construction of Fieri By-pass: A convenience and a must! Fieri By-pass includes the construction of a new road, defined as highway, as a compound part of the north-south corridor and the last one being a segment of the paneuropian corridor. The construction of this corridor is carried out in harmony with the objectives of the National Transportation Plan for infrastructure improvement in Albania. During the last decade investments in transport infrastructure have been among the main goals of the Albanian government. The investments in this area firstly have been supported from the direct connection that the infrastructure has in the economic growth through reduced expenditure of the transport, growth of integration in regional markets, growth of similarity with them, development of supply chains and growth of similarity with working markets; secondly from indirect connection with the impact of the investment in socio-economic development in the areas it covers.
1 Region stands for the administrative unit which is considered as the object of our analyses ,respectively Fieri region . 2 North –south corridor ( routes under construction are : Fieri By pass , Fier-Levan,Levan-Vlorw, Levan-Tepelenw, Tepelenw-Gjirokastwr, Patos-Fier) 3West –east corridor ( its secondary axe is Vlorw-Fier-Lushnje-Rrogozhinw which is 77 km long )
ISSN 2039-9340 Mediterranean Journal of Social Sciences Vol. 4 (1) January 2013
409
but simply redirects the growth that will happen somewhere else. The highways usually are planned for regions with future prospective; hence there is a request for highway in the area so that it brings a better economy. Based on socio-economic analysis in the context of regional development Fieri region is considered to be a region with an average development index between 75 and 125 ,following this way Tirana with an average development index of 125. Thus, the By-pass will offer this region a new orientation towards spaces where its new construction is being planned. The investment connected to this segment is in accordance with the objectives of Regional Strategy of the Fieri Region, compiled in 2005 and the Strategy of Development of Fier City which have as a priority:
• To exhort integral development of the rural area, to increase farming produce and marketing to support this produce.
• To ensure the stability of environment through rehabilitation of polluted areas, among them the important goal of getting rid of pollution in the region of Fieri. This goal is considered as a big challenge to be confronted with by the region of Fieri.
• To improve the infrastructure and urban planning. This strategy proposes the compilation of urban plans and other plan for integral sectors, such as transportation.
• To minimize environment degradation. Treatment and changes of soil have caused pressure on environment, bringing loss of vital natural area because of deforestation, erosion, abundance and dryness of drinkable water sources.
• To fortify the private sector in Fier, aiming mainly in agribusiness and tourism through supporting the developing of farming produce, the promotion of tourism options in agricultural areas, historic and coastal tourism and to include Fieri in the national and regional tourist guide itineraries. CO-Plan, Instituti për zhvillimin e Habitatit, Bashkia Fier, 2006; Strategjia e zhvillimit të Qytetit të Fierit; PNUD, 2005, “Srategjia e zhvillimit të qarkut të Fier”.
4. By Pass-connecting node of the main highways in the country By Pass- has a length of 22.1 km and consists of the construction of a highway with two lanes on each side in the western part of the city of Fier and Levan. The scheme in the north and south will be connected by two-ways route, on one of which is built, Fier-Lushnje route and on the other one Levan-Tepelena route is under construction. The road track goes by a flat landform with some irrigation and drainage channels crossing. For the construction of this highway five alternatives were offered as part of technical, socio-economic and environmental analysis. Option A was selected because it met the geometric standards of security and it will respond to increasing traffic of 2,647 cars / day in 2009 and 3,570 cars / day in 2014. This will minimize the environmental impacts. This alternative was reviewed to avoid the crossing through the National Archeological Park of Apollonia by shifting 300 m to the west of the park, Egis Route, 12/05/2008; Fier and Levan.
Fier-By Pass - or Fier-Levan highway begins in the north of Mbrostar municipality and ends in the south-west of Levan municipality. It crosses through the existing railway line and the existing route in Fier, before you go past Seman river it stretches out in the west of Fier town and continues nearby Hoxhara channel. In the municipality area of Dermenasi the proposed extension follows a tangential line in the south of the urban area. From there the road lies down the foot of the Havaleasi, Pojani and Shtyllasi’ hills. By crossing to the west of the channel without interfering to the urban area around the populated center of Levan. Egis Route, 12/05/2008; Fier and Levan.
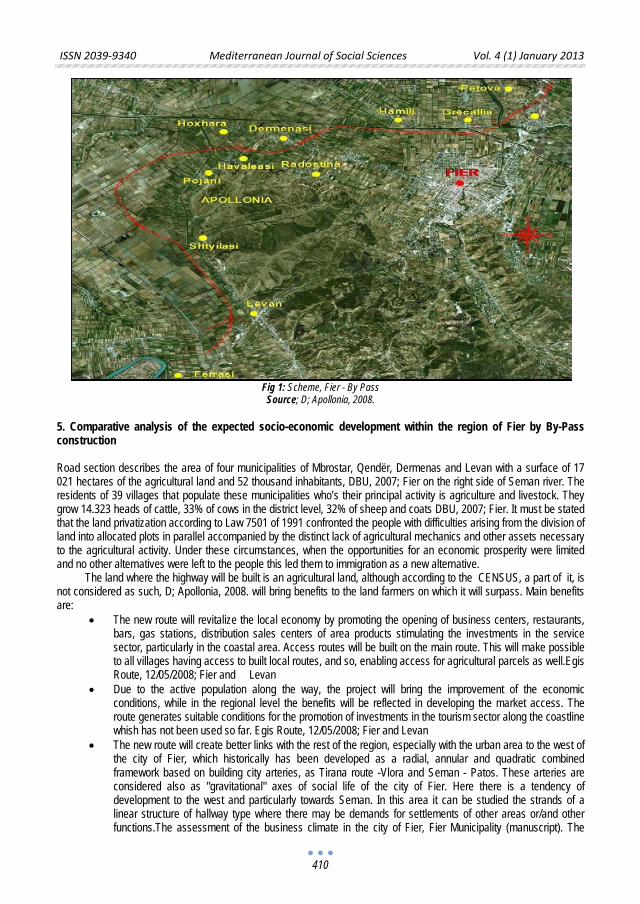
ISSN 2039-9340 Mediterranean Journal of Social Sciences Vol. 4 (1) January 2013
410
Fig 1: Scheme, Fier - By Pass Source; D; Apollonia, 2008.
5. Comparative analysis of the expected socio-economic development within the region of Fier by By-Pass construction Road section describes the area of four municipalities of Mbrostar, Qendër, Dermenas and Levan with a surface of 17 021 hectares of the agricultural land and 52 thousand inhabitants, DBU, 2007; Fier on the right side of Seman river. The residents of 39 villages that populate these municipalities who’s their principal activity is agriculture and livestock. They grow 14.323 heads of cattle, 33% of cows in the district level, 32% of sheep and coats DBU, 2007; Fier. It must be stated that the land privatization according to Law 7501 of 1991 confronted the people with difficulties arising from the division of land into allocated plots in parallel accompanied by the distinct lack of agricultural mechanics and other assets necessary to the agricultural activity. Under these circumstances, when the opportunities for an economic prosperity were limited and no other alternatives were left to the people this led them to immigration as a new alternative.
The land where the highway will be built is an agricultural land, although according to the CENSUS, a part of it, is not considered as such, D; Apollonia, 2008. will bring benefits to the land farmers on which it will surpass. Main benefits are:
• The new route will revitalize the local economy by promoting the opening of business centers, restaurants, bars, gas stations, distribution sales centers of area products stimulating the investments in the service sector, particularly in the coastal area. Access routes will be built on the main route. This will make possible to all villages having access to built local routes, and so, enabling access for agricultural parcels as well.Egis Route, 12/05/2008; Fier and Levan
• Due to the active population along the way, the project will bring the improvement of the economic conditions, while in the regional level the benefits will be reflected in developing the market access. The route generates suitable conditions for the promotion of investments in the tourism sector along the coastline whish has not been used so far. Egis Route, 12/05/2008; Fier and Levan
• The new route will create better links with the rest of the region, especially with the urban area to the west of the city of Fier, which historically has been developed as a radial, annular and quadratic combined framework based on building city arteries, as Tirana route -Vlora and Seman - Patos. These arteries are considered also as "gravitational" axes of social life of the city of Fier. Here there is a tendency of development to the west and particularly towards Seman. In this area it can be studied the strands of a linear structure of hallway type where there may be demands for settlements of other areas or/and other functions.The assessment of the business climate in the city of Fier, Fier Municipality (manuscript). The
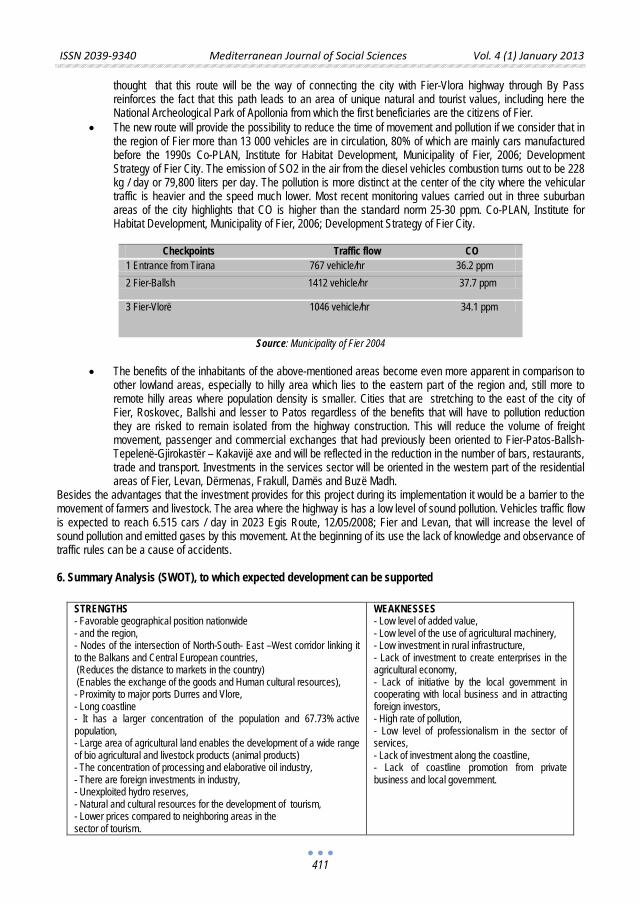
ISSN 2039-9340 Mediterranean Journal of Social Sciences Vol. 4 (1) January 2013
411
thought that this route will be the way of connecting the city with Fier-Vlora highway through By Pass reinforces the fact that this path leads to an area of unique natural and tourist values, including here the National Archeological Park of Apollonia from which the first beneficiaries are the citizens of Fier.
• The new route will provide the possibility to reduce the time of movement and pollution if we consider that in the region of Fier more than 13 000 vehicles are in circulation, 80% of which are mainly cars manufactured before the 1990s Co-PLAN, Institute for Habitat Development, Municipality of Fier, 2006; Development Strategy of Fier City. The emission of SO2 in the air from the diesel vehicles combustion turns out to be 228 kg / day or 79,800 liters per day. The pollution is more distinct at the center of the city where the vehicular traffic is heavier and the speed much lower. Most recent monitoring values carried out in three suburban areas of the city highlights that CO is higher than the standard norm 25-30 ppm. Co-PLAN, Institute for Habitat Development, Municipality of Fier, 2006; Development Strategy of Fier City.
Checkpoints Traffic flow CO
1 Entrance from Tirana 767 vehicle/hr 36.2 ppm 2 Fier-Ballsh 1412 vehicle/hr 37.7 ppm
3 Fier-Vlorë 1046 vehicle/hr 34.1 ppm
Source: Municipality of Fier 2004 • The benefits of the inhabitants of the above-mentioned areas become even more apparent in comparison to
other lowland areas, especially to hilly area which lies to the eastern part of the region and, still more to remote hilly areas where population density is smaller. Cities that are stretching to the east of the city of Fier, Roskovec, Ballshi and lesser to Patos regardless of the benefits that will have to pollution reduction they are risked to remain isolated from the highway construction. This will reduce the volume of freight movement, passenger and commercial exchanges that had previously been oriented to Fier-Patos-Ballsh-Tepelenë-Gjirokastër – Kakavijë axe and will be reflected in the reduction in the number of bars, restaurants, trade and transport. Investments in the services sector will be oriented in the western part of the residential areas of Fier, Levan, Dërmenas, Frakull, Damës and Buzë Madh.
Besides the advantages that the investment provides for this project during its implementation it would be a barrier to the movement of farmers and livestock. The area where the highway is has a low level of sound pollution. Vehicles traffic flow is expected to reach 6.515 cars / day in 2023 Egis Route, 12/05/2008; Fier and Levan, that will increase the level of sound pollution and emitted gases by this movement. At the beginning of its use the lack of knowledge and observance of traffic rules can be a cause of accidents.
6. Summary Analysis (SWOT), to which expected development can be supported
STRENGTHS - Favorable geographical position nationwide - and the region, - Nodes of the intersection of North-South- East –West corridor linking it to the Balkans and Central European countries, (Reduces the distance to markets in the country) (Enables the exchange of the goods and Human cultural resources), - Proximity to major ports Durres and Vlore, - Long coastline - It has a larger concentration of the population and 67.73% active population, - Large area of agricultural land enables the development of a wide range of bio agricultural and livestock products (animal products) - The concentration of processing and elaborative oil industry, - There are foreign investments in industry, - Unexploited hydro reserves, - Natural and cultural resources for the development of tourism, - Lower prices compared to neighboring areas in the sector of tourism.
WEAKNESSES - Low level of added value, - Low level of the use of agricultural machinery, - Low investment in rural infrastructure, - Lack of investment to create enterprises in the agricultural economy, - Lack of initiative by the local government in cooperating with local business and in attracting foreign investors, - High rate of pollution, - Low level of professionalism in the sector of services, - Lack of investment along the coastline, - Lack of coastline promotion from private business and local government.
ISSN 2039-9340 Mediterranean Journal of Social Sciences Vol. 4 (1) January 2013
412
7. Conclusions
Expectations by building Fier’s BY-PASS will be reflected in:
1. The new orientation of the population displacement in the western part of the city of Fier, Levan and the municipalities where this segment will pass, promoting urban development and infrastructure in the area.
2. Encourage of the investments in the agricultural economy in order to increase agricultural production, in particular bio products and investment in rural infrastructure. In this way, the development of agro-processing and rural tourism will be promoted in the western part of the region.
3. The transformation of the road Seman-Patos as a "gravitational" road of socio-economic life of the city and district of Fier. It will affect in shortening the time of traveling, and in reducing pollution.
4. Revitalizing the local economy by promoting the opening of business centers, restaurants, bars, gas stations, sales centers and distribution of products of the area. It will encourage the investments in the services sector, especially along the coastline, which is still unexplored today.
5. Reduction to the volume of circulation of commodities, passenger commercial exchanges and to the number of bars and restaurants in Fier- Patos-Ballsh- Tepelen axis.
6. Increase of the noise and gases pollution that are emitted from this displacement, in areas where it will pass. 7. Tendency to increase the number of accidents due to the lack of knowledge and respect for the rules of signs.
References
EGIS Route, 12/05/2008; Fier and Levan Bypass http://www.dprr.gov.al/dpr/attachments/005_110721_EIA_Fier_
Bypass_V6b%20FINAL%20.pdf Bërxoli, Arqile; Cinaj,Nevila; Tase.Mirela; Kristo, Vasil, 2011.Gjeografia Doka,Dh, “Rëndësia e sotme e zhvillimeve rajonal dhe lokale në Shqipëri”. Doka.Dh, 2005, “Zhvillime social ekonomike dhe rajonale të Shqipërisë pas vitit 1990. CO-Plan, Instituti për zhvillimin e Habitatit, Bashkia Fier, 2006; Strategjia e zhvillimit të Qytetit të Fierit PNUD, 2005, “Srategjia e zhvillimit të qarkut të Fier Vlerësim I klimës së biznesit në qytetin e Fierit, Bashkia Fier (dorëshkrim) INSTAT, 2009; Vjetar statistikor INSTAT, 2010; Vjetar statistikor SNV,Komiteti i turizmit Fier; Strategjia e turizmit me plan veprimi Bërxoli, Arqile; Cinaj,Nevila; Tase.Mirela; Kristo, Vasil, 2011.Gjeografia Të dhëna nga Drejtoria e statistikës, të rrethit Fier. INSTAT 2001-2011, “Treguesit sipas qarqeve” Kuqi,Iris;Shutina,Dritan; Zhvillimi Rajonal në Shqipëri - sfida e zhvillimit apo e integrimit? http://www.coplan.org/zhvillimi%20rajonal
%20per%20qellime%20lokale%20dhe%20te%20integrimit.pdf D. Apoloni, 2008 Material prezantues për publikun I projektit, http://www.dprr.gov.al/dpr/attachments/004_Prezantimi
%20per%20Konsultimin%20me%20Publikun%20Apollonia.pdf Emiri, Hysen, 2001; Historia e Fierit, Kavajë http://Policyinstitute.Eu/Images/Uploads/Autostrada_Morine_
Merdare_Dhe_Prespektivat_Pr_Zhvillimin_Ekonomik_Ne_Kososove_Final_2.pdf
OPPORTUNITIES - Marketing of agricultural products not only in Albania, - The growing number of visitors who relax on the shores of Seman, -The Increase of cultural activities, -The increased attendance of more alternative forms of tourism (such as. It archaeological, medical, coastal, etc.) -The creation of investment opportunities in the fishery branch, Facilities in the delivery of supportive infrastructure for agricultural economy.
THREATS - Non-compliance with deadlines for implementation of the project, - Rivalry from other destinations with better conditions, - The growth of non-bio products - The country's economic crisis may hamper the development of this area - Forecasting the growth of the flow in the future, will increase the level of air pollution, - Limited local autonomy.
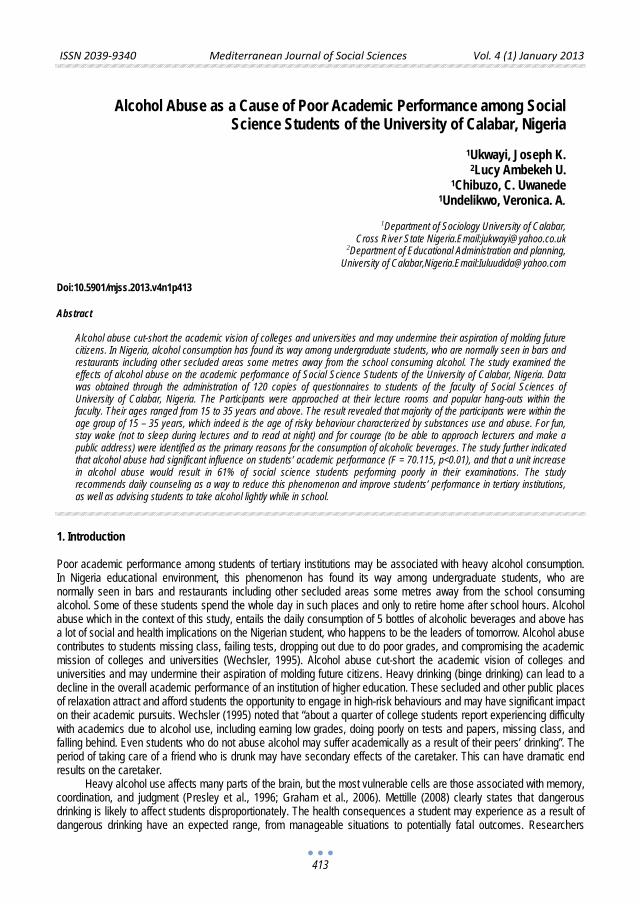
ISSN 2039-9340 Mediterranean Journal of Social Sciences Vol. 4 (1) January 2013
413
Alcohol Abuse as a Cause of Poor Academic Performance among Social
Science Students of the University of Calabar, Nigeria
1Ukwayi, Joseph K. 2Lucy Ambekeh U.
1Chibuzo, C. Uwanede 1Undelikwo, Veronica. A.
1Department of Sociology University of Calabar, Cross River State Nigeria.Email:[email protected]
2Department of Educational Administration and planning, University of Calabar,Nigeria.Email:[email protected]
Doi:10.5901/mjss.2013.v4n1p413
Abstract
Alcohol abuse cut-short the academic vision of colleges and universities and may undermine their aspiration of molding future citizens. In Nigeria, alcohol consumption has found its way among undergraduate students, who are normally seen in bars and restaurants including other secluded areas some metres away from the school consuming alcohol. The study examined the effects of alcohol abuse on the academic performance of Social Science Students of the University of Calabar, Nigeria. Data was obtained through the administration of 120 copies of questionnaires to students of the faculty of Social Sciences of University of Calabar, Nigeria. The Participants were approached at their lecture rooms and popular hang-outs within the faculty. Their ages ranged from 15 to 35 years and above. The result revealed that majority of the participants were within the age group of 15 – 35 years, which indeed is the age of risky behaviour characterized by substances use and abuse. For fun, stay wake (not to sleep during lectures and to read at night) and for courage (to be able to approach lecturers and make a public address) were identified as the primary reasons for the consumption of alcoholic beverages. The study further indicated that alcohol abuse had significant influence on students’ academic performance (F = 70.115, p<0.01), and that a unit increase in alcohol abuse would result in 61% of social science students performing poorly in their examinations. The study recommends daily counseling as a way to reduce this phenomenon and improve students’ performance in tertiary institutions, as well as advising students to take alcohol lightly while in school.
1. Introduction Poor academic performance among students of tertiary institutions may be associated with heavy alcohol consumption. In Nigeria educational environment, this phenomenon has found its way among undergraduate students, who are normally seen in bars and restaurants including other secluded areas some metres away from the school consuming alcohol. Some of these students spend the whole day in such places and only to retire home after school hours. Alcohol abuse which in the context of this study, entails the daily consumption of 5 bottles of alcoholic beverages and above has a lot of social and health implications on the Nigerian student, who happens to be the leaders of tomorrow. Alcohol abuse contributes to students missing class, failing tests, dropping out due to do poor grades, and compromising the academic mission of colleges and universities (Wechsler, 1995). Alcohol abuse cut-short the academic vision of colleges and universities and may undermine their aspiration of molding future citizens. Heavy drinking (binge drinking) can lead to a decline in the overall academic performance of an institution of higher education. These secluded and other public places of relaxation attract and afford students the opportunity to engage in high-risk behaviours and may have significant impact on their academic pursuits. Wechsler (1995) noted that “about a quarter of college students report experiencing difficulty with academics due to alcohol use, including earning low grades, doing poorly on tests and papers, missing class, and falling behind. Even students who do not abuse alcohol may suffer academically as a result of their peers’ drinking”. The period of taking care of a friend who is drunk may have secondary effects of the caretaker. This can have dramatic end results on the caretaker.
Heavy alcohol use affects many parts of the brain, but the most vulnerable cells are those associated with memory, coordination, and judgment (Presley et al., 1996; Graham et al., 2006). Mettille (2008) clearly states that dangerous drinking is likely to affect students disproportionately. The health consequences a student may experience as a result of dangerous drinking have an expected range, from manageable situations to potentially fatal outcomes. Researchers
ISSN 2039-9340 Mediterranean Journal of Social Sciences Vol. 4 (1) January 2013
414
according to Mettille identified negative health consequences to include hangover, unprotected sexual behaviour, alcohol dependence, blackouts, assault and even death. Alcohol abuse has physiological and psychological effects on students, as it inhibit students’ performance in that their cognitive abilities are affected by even small amounts of alcohol and can persist for a substantial period of time after the acute effects of alcohol impairment disappear. For example, alcohol may impair memory by slowing down the transfer and coordination of information and may reduce students’ ability to remember information that was learned prior to going out for drinks (Presley et al., 1996). Earlier studies by Presley et al., (1996), Lindsay (2006), Graham et al. (2006), Mettille (2008), Oteyo and Kariuki (2009) indicate gross brain impairment and the decline in academic performance as a result of the dependence and heavy consumption of alcoholic beverages. These studies report a wide array or variety of consequences associated with the alcohol. For instance, among female students, consumption of heavy alcohol may increase their risk of being victims of date rape, unwanted sex, harassment and physical assault. This study specifically examines the effects of alcohol abuse on the academic performance of undergraduate students of the University of Calabar, Nigeria. 2. Review of related literature Among adolescents, alcohol is the most widely used and abused drug in the world today. Awoyinfa (2012) investigated the incidence of alcohol use and abuse among University of Lagos female students. The study indicated a significant relationship between female students’ use and abuse of alcohol and their social relationship, as well as a significant relationship between female students’ use and abuse of alcohol and their morals. The study however revealed that no significant relationship between use and abuse of alcohol and female student academic performance. The National Center on Addiction and Substance Abuse at Columbia University (1994) noted that alcohol is responsible for 41% of academic problems and 28% of all dropouts in schools. In a similar view, Powell et al., (2004) believed academic problems and alcohol use are highly related. Wolaver (2002) opined that drinking has both a direct effect on grade point average and an indirect effect because it leads to a decrease in study hours. Williams et al., (2003) reported that the main effect of alcohol consumption is manifested in the reduced number of hours spent studying.
Wechsler (1995) was of the opinion that poor academic performance among college students is associated with alcohol consumption. Alcohol abuse has several consequences such as students failing tests, being absent in class, dropping out of school due to do poor grades. Alcohol abuse undermines the academic mission of colleges and universities. As a result, campuses may face declining retention rates, increased expenses due to vandalism, and a diminished reputation. Presley et al., (1996) reported that alcohol affects many parts of the brain, but the most vulnerable cells are those associated with memory, coordination, and judgment. They argued that alcohol has several physiological and psychological effects, which inhibit students’ performance as cognitive abilities are affected by even small amounts of alcohol and can persist for a substantial period of time after the acute effects of alcohol impairment disappear. In addition to cognitive impairments, consumption of alcohol and the resulting recovery period (i.e., hang-over) wastes time that might be better spent studying or having fun.
Mettille (2008) clearly stated that negative consequences of dangerous drinking are likely to affect students disproportionately. The health consequences a student may experience as a result of dangerous drinking have an expected range, from manageable situations to potentially fatal outcomes. Researchers according to Mettille identified negative health consequences to include hangovers, unprotected sexual behaviour, alcohol dependence, blackouts, assault and even death. The health consequences alone are jarring enough to garner the attention of campus administrators, and students themselves. According to Lindsay (2006) dangerous drinking can lead to driving under the influence which is approximated to happen 2.1 million times annually, or about 25% of all reported cases of drunk driving. They alleged that female students who drink are at an increased risk of being victims of date rape, unwanted sex, harassment and physical assault. Further, the more an individual drinks, especially in a public forum, the more likely he or she is to be victims of violence. All students who consume alcohol at dangerous levels are at risk of a variety of consequences.
Graham et al., (2006) alleged that the time and stress spent dealing with any legal impacts of college student drinking is time and energy not spent on academic inquiries. Yet, the negative impact of dangerous drinking extends beyond those who are consuming the alcohol themselves, as researchers have found a variety of “second-hand” effects of alcohol use. Second-hand alcohol effects can be defined as situations or scenarios that impact other people who have not been drinking, such as loud noise, vandalism, among others. Oteyo and Kariuki (2009) reported that the prevalence of alcohol use has caused the concern that the students may not reach their full potential and may be at high risk to abuse drugs later in life. The toxic effects of alcohol and cigarettes may cause short term and long term health damage on students. Students, who use drugs, are likely to perform poorly in school, have strained relationship with their parents and teachers and engage in delinquent behaviors. The review of literature makes it clear that students who engage in
ISSN 2039-9340 Mediterranean Journal of Social Sciences Vol. 4 (1) January 2013
415
dangerous drinking and who takes alcohol as a hobby put themselves at risk for a wide variety of negative consequences which include cognitive disorder, missing class, failing tests, dropping out due to do poor grades and in all perform badly in examinations thereby undermining the motives or dreams of a university education. As many ends us not understanding some basic concepts and theories in their courses of study. 3. Purpose of the study The purpose of the present study is to:
Examine the possible reasons for alcohol consumption among social science students of the University of Calabar.
Determine the frequency of alcohol consumption and number of bottles consumed by social science students. Analyse the effect of alcohol use and abuse on social science students’ academic performance Find out if the frequency of alcohol use differs between sexes.
4. Hypotheses The following hypotheses were investigated in the study:
Alcohol abuse has a significant influence on students’ academic performance The frequency of alcohol use differs between sexes
5. Materials and method 5.1 Research design The study adopted descriptive research design using the ex-post facto type. The researcher was interested in knowing the influence of the independent variables (alcohol abuse, frequency of alcohol consumption) on the dependent variable (academic performance) without necessarily manipulating the independent variable 5.2 Participants The population of the study comprised students in the faculty of Social Sciences of University of Calabar, Nigeria. Accidental sampling technique was used to sample one hundred and twenty students across the four departments that make up the faculty of the Social Science. Participants were approached at their lecture rooms and popular hang-outs within the faculty. The participants were made up of 84 males and 36 females. Their ages ranged from 15 to 35 years and above. 5.3 Instrument A structured questionnaire was the research instrument used to gather data for the study. The questionnaire was designed to contain questions in relation to the purpose of the study. The instrument was divided into three sections. Section A measured students’ socio-economic background; section B contained questions designed to examine reasons why undergraduate students drink and frequency of alcohol use, while Section C measured the effects of alcohol use and abuse on the academic performance of students using responses ranging from strongly agree (SA) to strongly disagree (SD). 5.4 Procedure The instrument was administered to the participants with the help of trained research assistants. The instrument was collected immediately after completion. The exercise lasted for about two weeks. The status and names of respondents were made unknown. 5.5 Method of data analysis Data obtained were analyzed using frequency, tables, and charts, independent samples test and bivariate regression. The items on frequency of alcohol use and alcohol abuse (number of bottles consumed) coded for descriptive analysis
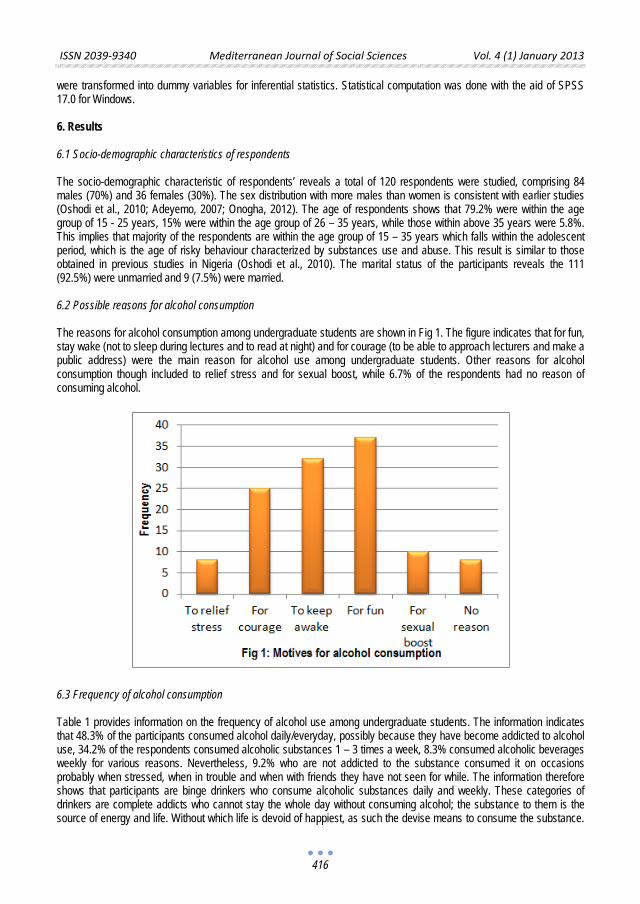
ISSN 2039-9340 Mediterranean Journal of Social Sciences Vol. 4 (1) January 2013
416
were transformed into dummy variables for inferential statistics. Statistical computation was done with the aid of SPSS 17.0 for Windows. 6. Results 6.1 Socio-demographic characteristics of respondents The socio-demographic characteristic of respondents’ reveals a total of 120 respondents were studied, comprising 84 males (70%) and 36 females (30%). The sex distribution with more males than women is consistent with earlier studies (Oshodi et al., 2010; Adeyemo, 2007; Onogha, 2012). The age of respondents shows that 79.2% were within the age group of 15 - 25 years, 15% were within the age group of 26 – 35 years, while those within above 35 years were 5.8%. This implies that majority of the respondents are within the age group of 15 – 35 years which falls within the adolescent period, which is the age of risky behaviour characterized by substances use and abuse. This result is similar to those obtained in previous studies in Nigeria (Oshodi et al., 2010). The marital status of the participants reveals the 111 (92.5%) were unmarried and 9 (7.5%) were married.
6.2 Possible reasons for alcohol consumption The reasons for alcohol consumption among undergraduate students are shown in Fig 1. The figure indicates that for fun, stay wake (not to sleep during lectures and to read at night) and for courage (to be able to approach lecturers and make a public address) were the main reason for alcohol use among undergraduate students. Other reasons for alcohol consumption though included to relief stress and for sexual boost, while 6.7% of the respondents had no reason of consuming alcohol.
6.3 Frequency of alcohol consumption Table 1 provides information on the frequency of alcohol use among undergraduate students. The information indicates that 48.3% of the participants consumed alcohol daily/everyday, possibly because they have become addicted to alcohol use, 34.2% of the respondents consumed alcoholic substances 1 – 3 times a week, 8.3% consumed alcoholic beverages weekly for various reasons. Nevertheless, 9.2% who are not addicted to the substance consumed it on occasions probably when stressed, when in trouble and when with friends they have not seen for while. The information therefore shows that participants are binge drinkers who consume alcoholic substances daily and weekly. These categories of drinkers are complete addicts who cannot stay the whole day without consuming alcohol; the substance to them is the source of energy and life. Without which life is devoid of happiest, as such the devise means to consume the substance.
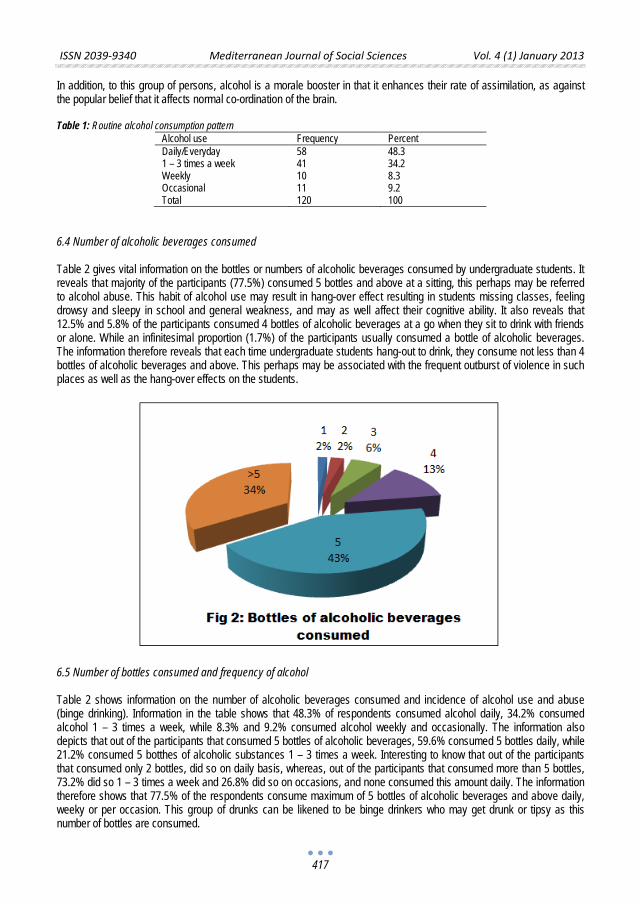
ISSN 2039-9340 Mediterranean Journal of Social Sciences Vol. 4 (1) January 2013
417
In addition, to this group of persons, alcohol is a morale booster in that it enhances their rate of assimilation, as against the popular belief that it affects normal co-ordination of the brain.
Table 1: Routine alcohol consumption pattern
Alcohol use Frequency Percent Daily/Everyday 58 48.3 1 – 3 times a week 41 34.2 Weekly 10 8.3 Occasional 11 9.2 Total 120 100
6.4 Number of alcoholic beverages consumed Table 2 gives vital information on the bottles or numbers of alcoholic beverages consumed by undergraduate students. It reveals that majority of the participants (77.5%) consumed 5 bottles and above at a sitting, this perhaps may be referred to alcohol abuse. This habit of alcohol use may result in hang-over effect resulting in students missing classes, feeling drowsy and sleepy in school and general weakness, and may as well affect their cognitive ability. It also reveals that 12.5% and 5.8% of the participants consumed 4 bottles of alcoholic beverages at a go when they sit to drink with friends or alone. While an infinitesimal proportion (1.7%) of the participants usually consumed a bottle of alcoholic beverages. The information therefore reveals that each time undergraduate students hang-out to drink, they consume not less than 4 bottles of alcoholic beverages and above. This perhaps may be associated with the frequent outburst of violence in such places as well as the hang-over effects on the students.
6.5 Number of bottles consumed and frequency of alcohol Table 2 shows information on the number of alcoholic beverages consumed and incidence of alcohol use and abuse (binge drinking). Information in the table shows that 48.3% of respondents consumed alcohol daily, 34.2% consumed alcohol 1 – 3 times a week, while 8.3% and 9.2% consumed alcohol weekly and occasionally. The information also depicts that out of the participants that consumed 5 bottles of alcoholic beverages, 59.6% consumed 5 bottles daily, while 21.2% consumed 5 botthes of alcoholic substances 1 – 3 times a week. Interesting to know that out of the participants that consumed only 2 bottles, did so on daily basis, whereas, out of the participants that consumed more than 5 bottles, 73.2% did so 1 – 3 times a week and 26.8% did so on occasions, and none consumed this amount daily. The information therefore shows that 77.5% of the respondents consume maximum of 5 bottles of alcoholic beverages and above daily, weeky or per occasion. This group of drunks can be likened to be binge drinkers who may get drunk or tipsy as this number of bottles are consumed.
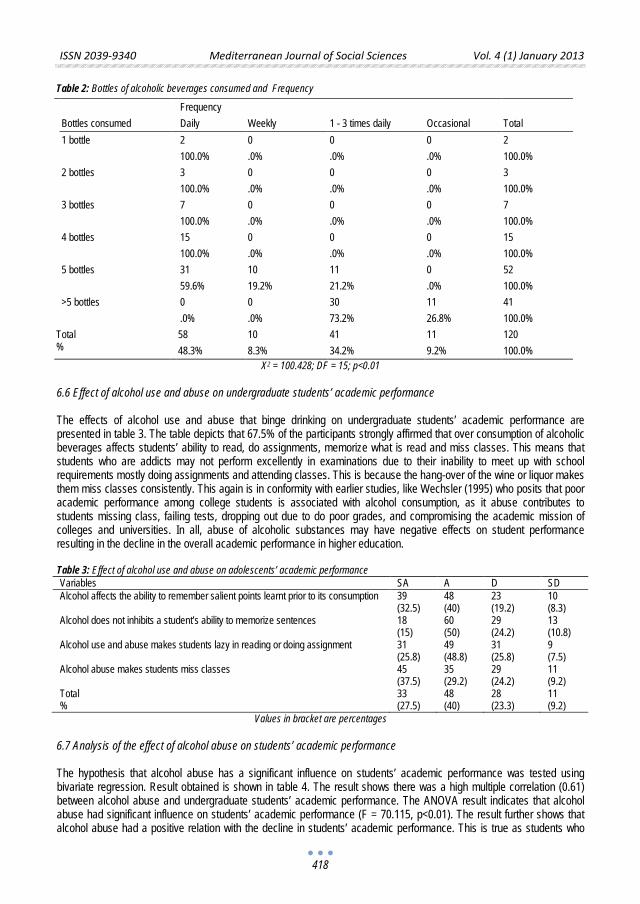
ISSN 2039-9340 Mediterranean Journal of Social Sciences Vol. 4 (1) January 2013
418
Table 2: Bottles of alcoholic beverages consumed and Frequency
Frequency Total Bottles consumed Daily Weekly 1 - 3 times daily Occasional
1 bottle 2 0 0 0 2 100.0% .0% .0% .0% 100.0%
2 bottles 3 0 0 0 3 100.0% .0% .0% .0% 100.0%
3 bottles 7 0 0 0 7 100.0% .0% .0% .0% 100.0%
4 bottles 15 0 0 0 15 100.0% .0% .0% .0% 100.0%
5 bottles 31 10 11 0 52 59.6% 19.2% 21.2% .0% 100.0%
>5 bottles 0 0 30 11 41 .0% .0% 73.2% 26.8% 100.0%
Total %
58 10 41 11 120 48.3% 8.3% 34.2% 9.2% 100.0%
X2 = 100.428; DF = 15; p<0.01
6.6 Effect of alcohol use and abuse on undergraduate students’ academic performance The effects of alcohol use and abuse that binge drinking on undergraduate students’ academic performance are presented in table 3. The table depicts that 67.5% of the participants strongly affirmed that over consumption of alcoholic beverages affects students’ ability to read, do assignments, memorize what is read and miss classes. This means that students who are addicts may not perform excellently in examinations due to their inability to meet up with school requirements mostly doing assignments and attending classes. This is because the hang-over of the wine or liquor makes them miss classes consistently. This again is in conformity with earlier studies, like Wechsler (1995) who posits that poor academic performance among college students is associated with alcohol consumption, as it abuse contributes to students missing class, failing tests, dropping out due to do poor grades, and compromising the academic mission of colleges and universities. In all, abuse of alcoholic substances may have negative effects on student performance resulting in the decline in the overall academic performance in higher education.
Table 3: Effect of alcohol use and abuse on adolescents’ academic performance Variables SA A D SD Alcohol affects the ability to remember salient points learnt prior to its consumption 39
(32.5) 48 (40)
23 (19.2)
10 (8.3)
Alcohol does not inhibits a student’s ability to memorize sentences 18 (15)
60 (50)
29 (24.2)
13 (10.8)
Alcohol use and abuse makes students lazy in reading or doing assignment 31 (25.8)
49 (48.8)
31 (25.8)
9 (7.5)
Alcohol abuse makes students miss classes 45 (37.5)
35 (29.2)
29 (24.2)
11 (9.2)
Total %
33 (27.5)
48 (40)
28 (23.3)
11 (9.2)
Values in bracket are percentages 6.7 Analysis of the effect of alcohol abuse on students’ academic performance The hypothesis that alcohol abuse has a significant influence on students’ academic performance was tested using bivariate regression. Result obtained is shown in table 4. The result shows there was a high multiple correlation (0.61) between alcohol abuse and undergraduate students’ academic performance. The ANOVA result indicates that alcohol abuse had significant influence on students’ academic performance (F = 70.115, p<0.01). The result further shows that alcohol abuse had a positive relation with the decline in students’ academic performance. This is true as students who
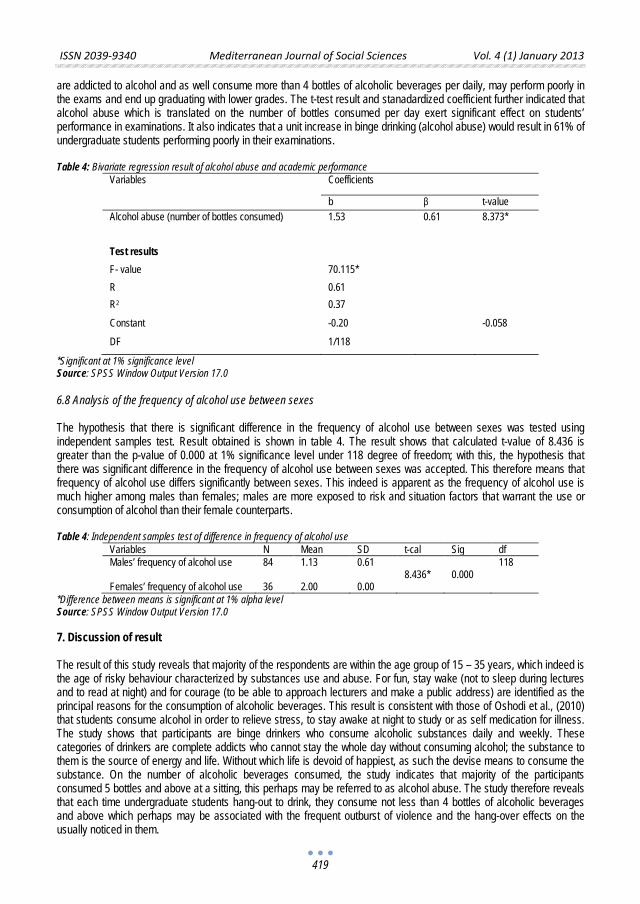
ISSN 2039-9340 Mediterranean Journal of Social Sciences Vol. 4 (1) January 2013
419
are addicted to alcohol and as well consume more than 4 bottles of alcoholic beverages per daily, may perform poorly in the exams and end up graduating with lower grades. The t-test result and stanadardized coefficient further indicated that alcohol abuse which is translated on the number of bottles consumed per day exert significant effect on students’ performance in examinations. It also indicates that a unit increase in binge drinking (alcohol abuse) would result in 61% of undergraduate students performing poorly in their examinations.
Table 4: Bivariate regression result of alcohol abuse and academic performance
Variables Coefficients
b β t-value Alcohol abuse (number of bottles consumed) 1.53 0.61 8.373* Test results F- value 70.115* R 0.61 R2 0.37
Constant -0.20 -0.058
DF 1/118
*Significant at 1% significance level Source: SPSS Window Output Version 17.0
6.8 Analysis of the frequency of alcohol use between sexes The hypothesis that there is significant difference in the frequency of alcohol use between sexes was tested using independent samples test. Result obtained is shown in table 4. The result shows that calculated t-value of 8.436 is greater than the p-value of 0.000 at 1% significance level under 118 degree of freedom; with this, the hypothesis that there was significant difference in the frequency of alcohol use between sexes was accepted. This therefore means that frequency of alcohol use differs significantly between sexes. This indeed is apparent as the frequency of alcohol use is much higher among males than females; males are more exposed to risk and situation factors that warrant the use or consumption of alcohol than their female counterparts.
Table 4: Independent samples test of difference in frequency of alcohol use
Variables N Mean SD t-cal Sig df Males’ frequency of alcohol use 84 1.13 0.61 118 8.436* 0.000 Females’ frequency of alcohol use 36 2.00 0.00
*Difference between means is significant at 1% alpha level Source: SPSS Window Output Version 17.0
7. Discussion of result The result of this study reveals that majority of the respondents are within the age group of 15 – 35 years, which indeed is the age of risky behaviour characterized by substances use and abuse. For fun, stay wake (not to sleep during lectures and to read at night) and for courage (to be able to approach lecturers and make a public address) are identified as the principal reasons for the consumption of alcoholic beverages. This result is consistent with those of Oshodi et al., (2010) that students consume alcohol in order to relieve stress, to stay awake at night to study or as self medication for illness. The study shows that participants are binge drinkers who consume alcoholic substances daily and weekly. These categories of drinkers are complete addicts who cannot stay the whole day without consuming alcohol; the substance to them is the source of energy and life. Without which life is devoid of happiest, as such the devise means to consume the substance. On the number of alcoholic beverages consumed, the study indicates that majority of the participants consumed 5 bottles and above at a sitting, this perhaps may be referred to as alcohol abuse. The study therefore reveals that each time undergraduate students hang-out to drink, they consume not less than 4 bottles of alcoholic beverages and above which perhaps may be associated with the frequent outburst of violence and the hang-over effects on the usually noticed in them.
ISSN 2039-9340 Mediterranean Journal of Social Sciences Vol. 4 (1) January 2013
420
The result reveals that 48.3% of respondents consumed alcohol daily, 34.2% consumed alcohol 1 – 3 times a week, while 8.3% and 9.2% consumed alcohol weekly and occasionally. And that 77.5% of the respondents consume maximum of 5 bottles of alcoholic beverages and above daily, weeky or per occasion. This group of drunks can be likened to be binge drinkers who may get drunk or tipsy as this number of bottles are consumed. And as they keep consuming this number, they become addicted such that they will not get satisfied if they do not consume up to or above this number of bottles. The rate of drinking reported here is consistent with earlier studies (Thomas et al., 2009). The study further indicates that alcohol abuse has significant influence on students’ academic performance, and that a unit increase in binge drinking (alcohol abuse) would result in 61% of undergraduate students performing poorly in their examinations. The frequency of alcohol use differs significantly between sexes. This indeed is apparent as the frequency of alcohol use is much higher among males than females; males are more exposed to risk and situation factors that warrant the use or consumption of alcohol than their female counterparts. The prevalence of alcohol use and abuse is predominant among males than females; a visit to drinking bars or restaurants will convince us. This therefore means that alcohol use is a common phenomenon among males. This result agrees with the findings of Adebiyi et al., (2010) that males accounted for 60% of substance users compared to 40% amongst females.
8. Conclusion/Recommendations From the foregoing, the study reveals that the consumption of alcoholic beverages is higher among male undergraduates because they more exposed to risk and situation factors that warrant the use or consumption of alcohol than their female counterparts. The primary reasons for the consumption of alcoholic beverages are for fun, stay wake (not to sleep during lectures and to read at night) and for courage (to be able to approach lecturers and make a public address). The study further indicates that alcohol abuse affects students’ academic performance. However, in order to reduce this phenomenon and improve students’ performance in tertiary institutions, students should be counseled daily on the need to give up with binge drinking, as well as take alcohol lightly while in school. References Adebiyi, A. O., Faseru, B., Sangowawa, A. O. and Owoaje, E. T. (2010) Tobacco Use amongst Out of School Adolescents in a Local
Government Area in Nigeria. Retrieved from: http://www.substanceabusepolicy.com/content/5/1/24 Adeyemo, D. A. (2007) Interpersonal Factors as Correlates of Alcohol Use among Secondary School Adolescents in Oyo State, Nigeria.
Anthropologist, 9(4): 321 – 326. Awoyinfa, J. O. (2012) An Investigation into the Incidence of Alcohol Usage and Abuse among Female Student of the University of
Lagos, Nigeria, West Africa. Journal of Emerging Trends in Educational Research and Policy Studies (JETERAPS), 3 (2): 174 – 178.
Graham, E., Kratochvil, C., Vitiello, B., Silva, S., Mayes, T., McNulty, S., Weller, E., Waslick, B., Casat, C., Walkup, J., Pathak, S., Rohde, P., Posner, K., March, J., and Columbia Suicidality Classification Group; TADS Team. (2006) Treatment for Adolescents with Depression Study (TADS): Safety Results. J. Am. Acad. Child Adolesc. Psychiatry 45, 1440–1455.
Lindsay, V. (2006) Factors that Predict Freshmen College Students’ Preference to Drink Alcohol. Journal of Alcohol and Drug Education, 50, 7-19.
Mettille, T. T. (2008) Cognitive Dissonance Theory and Alcohol Awareness Messages: College Student Reactions. A thesis Submitted in Partial Fulfillment of the Requirements for the Master of Science Degree in Communication. The University of Wisconsin – Whitewater
Onongha, G. I. (2012) The Influence of some Factors on Alcohol Use and Abuse among Education Students of Osun State University, Nigeria. International Journal of Humanities and Social Sciences, 2 (11): 276 – 283.
Oshodi1, O. Y., Aina, O. F. and Onajole, A. T. (2010) Substance Use among Secondary School Students in an Urban Setting in Nigeria: Prevalence and Associated Factors. African J. Psychiatry, 13: 52 – 57.
Oteyo, J. and Kariuki, M. (2009) Extent to which Selected Factors Contribute to Alcohol and Cigarette Use among Public Day Secondary Schools Male Students: A Case of Nakuru Municipality, Kenya. Educational Research and Review, 4(6): 327 – 333.
Powell, L. M., Williams, J., & Wechsler, H. (2004) Study Habits and the Level of Alcohol Use among College Students. Education Economics, 12(2), 135-149.
Presley, C., Meilman, P. and Cashin, J. (1996) Alcohol and Drugs on American College Campuses, Volume IV: 1992-1994. Carbondale, IL: Core Institute.
The National Center on Addiction and Substance Abuse at Columbia University (1994) Rethinking Rites of Passage: Substance Abuse on America’s Campuses. Retrieved From: http://www.casacolumbia.org/pdshopprov/files/ rethinking_rites_of_passage_6_1_94.pdf
Thomas, D. L., Olds, R. S., Bondy, S. J., Winchell, J., Baliunas, D. and Rehm, J. (2009) Undergraduate Drinking and Academic Performance: A Prospective Investigation with Objective Measures. J. Stud. Alcohol Drugs, 70: 776 – 785.

ISSN 2039-9340 Mediterranean Journal of Social Sciences Vol. 4 (1) January 2013
421
Wechsler, H. (1995) Binge Drinking on American College Campuses: A New Look at an Old Problem. Boston, MA: Harvard School of Public Health, August 1995.
Williams, J., Powell, L. M., & Wechsler, H. (2003) Does Alcohol Consumption Reduce Human Capital Accumulation? Evidence from the College Alcohol Study. Applied Economics, 35(10), 1227-1239.
Wolaver, A. M. (2002) Effects of Heavy Drinking in College on Study Effort, Grade Point Average, and Major Choice. Contemporary Economic Policy, 20(4), 415-428.

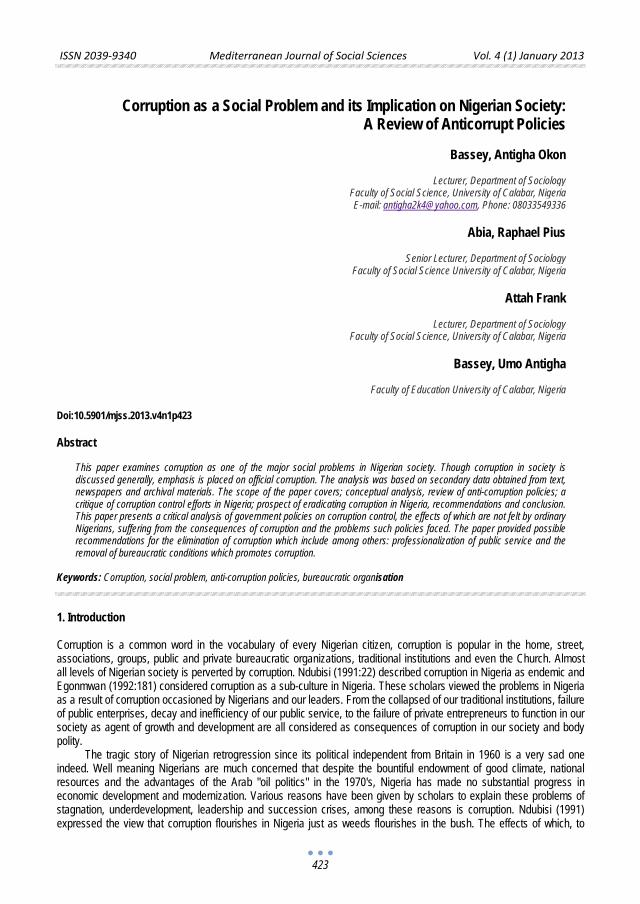
ISSN 2039-9340 Mediterranean Journal of Social Sciences Vol. 4 (1) January 2013
423
Corruption as a Social Problem and its Implication on Nigerian Society:
A Review of Anticorrupt Policies
Bassey, Antigha Okon
Lecturer, Department of Sociology Faculty of Social Science, University of Calabar, Nigeria E-mail: [email protected], Phone: 08033549336
Abia, Raphael Pius
Senior Lecturer, Department of Sociology
Faculty of Social Science University of Calabar, Nigeria
Attah Frank
Lecturer, Department of Sociology Faculty of Social Science, University of Calabar, Nigeria
Bassey, Umo Antigha
Faculty of Education University of Calabar, Nigeria
Doi:10.5901/mjss.2013.v4n1p423 Abstract
This paper examines corruption as one of the major social problems in Nigerian society. Though corruption in society is discussed generally, emphasis is placed on official corruption. The analysis was based on secondary data obtained from text, newspapers and archival materials. The scope of the paper covers; conceptual analysis, review of anti-corruption policies; a critique of corruption control efforts in Nigeria; prospect of eradicating corruption in Nigeria, recommendations and conclusion. This paper presents a critical analysis of government policies on corruption control, the effects of which are not felt by ordinary Nigerians, suffering from the consequences of corruption and the problems such policies faced. The paper provided possible recommendations for the elimination of corruption which include among others: professionalization of public service and the removal of bureaucratic conditions which promotes corruption.
Keywords: Corruption, social problem, anti-corruption policies, bureaucratic organisation
1. Introduction Corruption is a common word in the vocabulary of every Nigerian citizen, corruption is popular in the home, street, associations, groups, public and private bureaucratic organizations, traditional institutions and even the Church. Almost all levels of Nigerian society is perverted by corruption. Ndubisi (1991:22) described corruption in Nigeria as endemic and Egonmwan (1992:181) considered corruption as a sub-culture in Nigeria. These scholars viewed the problems in Nigeria as a result of corruption occasioned by Nigerians and our leaders. From the collapsed of our traditional institutions, failure of public enterprises, decay and inefficiency of our public service, to the failure of private entrepreneurs to function in our society as agent of growth and development are all considered as consequences of corruption in our society and body polity.
The tragic story of Nigerian retrogression since its political independent from Britain in 1960 is a very sad one indeed. Well meaning Nigerians are much concerned that despite the bountiful endowment of good climate, national resources and the advantages of the Arab "oil politics" in the 1970's, Nigeria has made no substantial progress in economic development and modernization. Various reasons have been given by scholars to explain these problems of stagnation, underdevelopment, leadership and succession crises, among these reasons is corruption. Ndubisi (1991) expressed the view that corruption flourishes in Nigeria just as weeds flourishes in the bush. The effects of which, to
ISSN 2039-9340 Mediterranean Journal of Social Sciences Vol. 4 (1) January 2013
424
Ndubisi (1991:46) includes failure of government policies and programmes, which are constantly subverted by corrupt practices.
The main purpose of this paper is to explain the level of corruption in Nigeria, and to see if government policies towards the eradication of corruption or the reduction of the level of corruption achieved their set objectives. Investigation of findings of this paper was limited by the difficulties involved in obtaining information about the subject matter "Corruption". The investigator relied on Secondary data obtained from text, journals and archival materials. The paper was not limited in scope as it focused generally on the Nigerian society and analogies were drawn from various constituencies and groups, associations and particularly the state and its agencies.
Considering the level of corruption in Nigerian society and its effect on socio-economic development, successive government in Nigeria made different policies and established institutional framework with which to fight corruption and bring about probity and accountability in order to ensure good governance and efficient management of national resources for the good of all citizens and development. This paper presents an overview of corruption in Nigeria, a conceptual analysis of corruption, evaluation of anti-corruption policies in Nigeria, prospect of eliminating corruption in Nigeria as well as major recommendations for elimination of corruption.
2. Conceptual Analysis and Review Section 98 of the criminal code refers to corruption as "the receiving or offering of some benefits, rewards or inducement to sway or deflect a person employed in the public service from the honest and impartial discharge of his duties." In common usage, corruption is used synonymously with bribery. But in real application corruption applies to the Bureaucracy whether public or private. In this sense, one can talk of Bureaucratic corruption, which Ndubusi (1991:49) defined as "any act by a public official which violates the accepted standards of behaviour in order to serve private or selfish ends." The end which this behaviour will serve may be social, economic or political. The standard so violated by the official maybe legal or conventional, the emphasis of the notion of corruption is on the violation of such legal or conventional norms for private gain. 2.1 Parties in corrupt Acts and Level of Corruption In any corrupt act there are three classes of mediating actors in our public institutions, namely, the corrupt, the corruptor and the non-participating audience. The corruptor is the person who offers gratification in order to change the standard. The corrupt receives the gratis and perform the actual act of undermining the standard. The audience are those who observed the corrupt act and keep quite. The audience do not participate in the act but the condoned the act. Bell (1953:103) maintained that all the actors are part of the act.
Corruption as it exists in governmental institutions is either voluntary or involuntary. In voluntary corruption, the person who receives a favour or expedites his things will volunteer to reward the officials to his right. In involuntary corruption, things will not be one, even the legitimate ones, unless the officer(s) are bribed, however, reluctant one may be. Ndubusi (1991:46) maintained that whether corruption is voluntary or involuntary the contact may be direct or indirect.
2.2 Classification of Corruption Sabongo (1993) identified two dimensions of corruption namely; petty corruption and big corruption. Petty corruption is the one that is visible, common among citizens and detectable by law. It is common among junior civil servants and users of public services. It is rampant among finance officers, customs officers, police, and other military and para-military officers. The finance officers are those who authorize expenditure and those that collect revenue. These finance officers engaged in such corrupt practices as collection of brides before expenditure is approved or payment is made while the customs officers are the grave diggers of the import and export trade at airports, seaports and other entry and exit routes. The police and other para-military collect bribes from road users and other offenders to pervade justice. The big corruption are those that take place behind the scene as opposed to open corruption, and it has more serious consequences. It thrives in unsuspected, imperceptible circles. More educated people who conduct their affairs more discretely are involved. It is carried out by top bureaucrats in the public services. It includes such corrupt practices as the payment of certain percent of contract value before contract is signed, fictitious budgeting, inflation of payroll to increase personnel cost and subvention.
Ndubisi (1991:47) identified and explained three types of corruption prevalence in Nigeria to include endemic, planned and developmental corruption. Endemic corruption is the abuse of office which occurs in varying degrees. It
ISSN 2039-9340 Mediterranean Journal of Social Sciences Vol. 4 (1) January 2013
425
prevails in the administrative systems which control exclusively the distribution of scarce welfare services. In endemic corruption money is given to, or demanded by public officials so that they will ignore the rules of conduct set up by the government for public good. Planned corruption is an instrument of controlled by politicians to retain power at all cost, while developmental corruption are all activities by public officials which are at variance with standard rules and hinders the success of developmental programmes.
Yahaya (1993:70) discovered three categories of corruption i n Nigeria, in which there various forms of corruption identified above can be classified. These categories are; political corruption, corruption in the routine course of government business and corruption in the exercise of substantive government business.
Political Corruption: This include election and electoral fraud, rigging of election result, awards of false contracts, wealth acquisition through financial impropriety by political officer holders, misuse and abuse of political or bureaucratic office, nepotism and tribalism.
Corruption in the routine course of Government Business: This includes bribes solicited for and paid to have compromising documents retrieve from files and for other favours, payment for letters of recommendation, kick-backs for hiring government equipment, all forms of brides, false travel documents and other claims, ghost workers and salary frauds, neglect of public service for personnel business.
Corruption in the exercise of substantive government business: This includes false bills, court tampering, postal frauds, all form of tax frauds and auditing frauds. This list is not in any way exhaustive, but does help to expose the various corrupt practices which strive in Nigerian governmental institutions. 2.3 Corruption as a Social Problem A social problem, according to Ottong and Bassey (2011), is a problem whose causes and solutions lie outside the individual and the individual’s immediate environment. Etuk (2002) defines social problem as a social condition that negatively affects the lives and proper social functioning of a significant number of people in the society. Lauer and Lauer (2007) maintains that:
‘‘A social problem is a condition or pattern of behaviour that contradicts some other condition or patterns of behaviour and is defined as incompatible with the desired quality of life; is caused, facilitated, or prolonged by factors that operate at multiple levels of social life; involves intergroup conflicts; and requires social action to be resolved.’’
Corruption in all its ramifications is a social problem. The causes of corruption are well outside an individual. Corruption affects the entire society. The attempt by government to formulate and implement different policies to combat corruption reveals collective action in resolving it. Corruption in all its ramifications contradicts the accepted standard of behaviour and value in any society. It is in this regard that this paper looks at corruption as one of the pressing social problems in Nigerian society in contemporary time. 2.4 Theoretical Analysis of Corruption Bell (1953) analyzed the functional effects of corruption maintained that corruption provides a process by which members of a society can manipulate a political system which is unable to cope with the demands made upon it. To Bell (1953) the system is essentially unworkable without the existence of corruption. Consequently, Bell (1953) suggested that criminal behaviour including corruption by public officials can be considered a substitute avenue of achieving positive response to demand emanating from environment to the Bureaucratic machinery. Bell’s notion is doubtful because corruption is not only induce by the environment but can be initiated by the officials of the bureaucratic institutions as noted by Ndubusi (1981:47) analysis of endemic corruption which is the actual demand for bribe by bureaucrats to ignore the rules of conduct set up by the government for public good. Bell (1953) also provides the dysfunctional aspect of corruption.
Departing from Bell (1953) functional analysis of corruption, Leff (1964:8,14) presented corruption as a stabilizing force which by protecting special interests in a crucial stage in the countries development, helps to increase investment, economic stability and growth. Considering Nigeria and the outlawed parallel market for foreign exchange (black market), instead of stimulating inflow of capital, it encourages outflow. Secondly, corrupt wealth in Nigeria is spent on consumption rather than on investment. On these two grounds, there is total objection to Leff thesis that corruption induces development, thus, functional to the development of society in line with Merton (1968) social function as the observed consequences of action on the system. In view of this theoretical analysis, it is proper to review government efforts at eliminating or reducing corruption.
ISSN 2039-9340 Mediterranean Journal of Social Sciences Vol. 4 (1) January 2013
426
3. Anti-Corruption Policies in Nigeria As noted earlier, the level of corruption in Nigeria is alarming and these conditions have been on for over three decades now, commencing immediately after the civil war in the early 1970's. One of the major reasons for the overthrow of Gowon's administration in 1976 was widespread corruption by public officials. This condition also led to the overthrow of Shagari government in 1983. The massive corruption of the late 1980's to 1998 by Babangida and Abacha government plunged Nigeria into the unbridle debt position, inflation, economic regression, social unrest and a near state of anarchy experience even till date.
Successive governments in Nigeria are aware of the problems associated with massive and alarming rate of corruption. All Nigerians are part of the corruption subculture, as they participate either voluntary or involuntary. Corruption is today in the words of Okigbo (1993:103) systemic. Hence, anybody who is a part of the Nigerian system is compelled to participate in all systemic activities, which corruption is one of.
In order for our society to move forward and Nigeria project to move ahead towards improvement, successive government have put certain policies and institutions in place in order to reduce the level of corruption in Nigeria. These policies include: anticorruption campaign, the Ombudsman system; system of inventory of property and assets; illegal wealth investigation system; internationalisation of corruption control; anti-corruption law; and Economic and Financial Crimes Commission.
3.1 Anti-corruption campaign This consists of appealing to the people, workers, judges and law enforcement agencies to fight corruption in the civil services and public life. This presupposes a merciless and decisive struggle devoid of any extenuating circumstances. In Nigeria, this was possible with the activities of War Against Indiscipline and Corruption (WAI-C), Agency for Mass Mobilization Social and Economic Recovery (MANSER), National Orientation Agency (N.O.A). These bodies performed anti-corruption functions by promoting functional high ethical and moral value. The problem with this process is that successive government changes such bodies to suit them. 3.2 The Ombudsman System This consists in entrusting to a person within an institution invested with considerable powers under the common law, the protection of individuals or users of public freedom and property from which they may suffer on the part of civil servants. In Nigeria Public Complaints Commission was established in 1975 to perform this function. The major problem is that the Commission lacks the power to enforce its recommendations (Oluwu 1993:96). 3.3 System of Inventory of Property and Assets This system involves making civil and public servants from certain level to declare their property and assets on taking and leaving office. Section 158 of the 1979 constitution spelt out code of conduct, for public officers (now section 172 of 1999 constitution). It was designed to remove the incidence of corrupt practices and ill-gotten wealth by public officers from entire public service. Two institutions so created were Code of Conduct Bureau and Code of Conduct Tribunal. The Bureau is to receive the declaration of assets made by public officers, while the tribunal is to enforce the penalties spelt out in the code. Their setback is the power of superior court of record to set aside its decisions 3.4. Illegal Wealth Investigation System It is a "Posteriori" control method which presumes that the constitutive facts of illegal wealth have already been accomplished. In Nigeria, this principle has just been recently introduced through the Money Laundering and Related Offences Act. The power is vested in the National Drug Law Enforcement Agency (NDLEA) to investigate all wealth suspected to be acquired through corrupt means. Consequently, all Bank transaction above N5,000,000.00 for corporate organisations and N1,000,000.00 for individuals must be reported to National Drug Law Enforcement Agency (Buhari, 1994). 3.5 Internationalization of Anti-corruption Today, countries go into bi-lateral and multi-lateral agreements to fight corruption. International conventions impose
ISSN 2039-9340 Mediterranean Journal of Social Sciences Vol. 4 (1) January 2013
427
economic sanctions against countries with corrupt leaders. Leaders who stole money to foreign accounts are compelled to return such moneys. This is the case of Sani Abacha loots return to Nigerian government by foreign Banks and Government. The case of the Governor of Bayelsa State arrested with foreign currency in Britain, and the imprisonment of the Delta State governor and his wife in Britain, is also worthy of note. 3.6. Anti Corruption Law of 2000 This is a law to prohibit and prescribe punishment for corrupt practices and other related offences passed by the National Assembly and signed into law by the President of Federal Republic of Nigeria at Abuja, on Tuesday, 13th June 2000. Major Provision
A. The act established "The Independent Corrupt Practices and Related Offences Commission. B. Duty of the Commission:
(1) Implementation of the Anti-corruption Act. (2) Instruct, advise government on ways corruption and fraud may be eliminated, minimized or reduced. (3) To educate the public on and against bribery, corruption and related offences. (4) To enlist and foster public support in combating corruption. (5) To examine practices and procedures, and if it aids corruption, to direct and supervise a review.
C. The act highlights offences and penalties. D. Power to investigate, seize, search and arrest.
It is worthy to note that the commission is subject to the power of the Attorney General of the Federation as the Act stipulates that the Commission should not do anything without the consent of the Attorney General. The High Court has jurisdiction over all cases related to the act.
3.7. Economic and Financial Crime Commission This is another institution established by Act of National Assembly to examine corrupt wealth. It focuses on economic crime, bank fraud etc. The Commission is established by money laundry and related offences Act Decree 419, now Economic and Related Offences Act. 4. A critique of Corruption Control Effort in Nigeria Government effort at reducing the level of corruption in Nigeria has been on for a long time, considering the various strategies listed and explained above. Despite the government attempt to combat corruption, proper management of public property by our public administration today is disastrous due to corruption. Corruption is the root cause of economic crisis, as well as the social and political problems besetting Nigeria. As it is now, it is either the Nigerian state kills corruption or corruption kills her. Corruption is an evil that spread terror among citizens who are the victims and comforts those who use it as a means to acquire wealth. It is a sickness difficult to cure once infected of. The anti-corruption policy currently in force in Nigeria to fight corruption is on the whole ineffective. The underlisted facts explained why the anti-corruption policies cannot help reduce the level of corruption or eliminate it: Lack of continuity and change in Policy framework; Inappropriate organizational structure in implementation of policies; Politicization of policy and political opposition during policy implementation; Lack of political will; Low level of public enlightenment; Socio-cultural constraints. 4.1 Lack of continuity and change in policy framework In Nigeria, successive government always enact laws on every major issue of our social life, which corruption is one. The numerous anti-corruption strategies are what government put in place from time to time. The frequency at which these policies are changed does not give each policy adequate time for implementation, and as such the goals or objectives can not be achieved when the policies are changed. Egonmwan (1987:245) maintained that rapid regimes changes causes alteration in policy priorities and make policy implementation more difficult because new regime always come with entirely different priorities and objective resulting in policy switch over.
ISSN 2039-9340 Mediterranean Journal of Social Sciences Vol. 4 (1) January 2013
428
4.2 Inappropriate organizational structure in implementation The choice of appropriate organizational structure in the implementation of policy is problematic. Today we have in Nigeria various organizations combating corruption, to what extent are these anti-corruption organizations able to penetrate all states and local governments, or all ministries, agencies and parastatals in Nigeria? Inadequate personnel, communication gadgets, infrastructures affect such organization like National Drug Law Enforcement Agency, Economic and Financial Crimes Commission to function effectively in State and Local Government Areas. The level of centralization without decentralization for holistic coverage also influence the efficiency of these anti-corruption organizations. 4.3 Politicization of policy and political opposition to policy implementation Anti-corruption institutions and policies are often politicized. For instance, during Buhari-ldiagbon Administration War Against Indiscipline and Corruption was used for clamping down political opponents, while Obasanjo’s administration used Economic and Financial Crime Commission to clamped down opposition. Soyinka (2006) analysis of anti-corruption effort in Nigeria noted that the arrest of General Marwa by EFCC is politically motivated. This politicization prompted the opposition to cry out that the anti-corruption law is nothing more than instrument of suppression against political opponent. 4.4 Lack of political will Government at times made very good policies, but the implementation of such policy is another problem. For instance, the Economic and Financial Crime Commission received report on the Minister of Water Resources. EFCC refused to investigate and prosecute as appropriate because the government was scared that anything done to him may affect the political support for Federal Government from North Eastern Region. (Guardian 4th Feb., 2006). 4.5 Inadequate public enlightenment There may be an issue of public concern like corruption, and policies to eliminate such problems. But it is another if member of the society are sufficiently aware of such problem and the policy remedies for such problem. Many Nigerians are not aware of the rate of corruption and the negative consequences of corruption, neither are they aware of the various policy options aim at eliminating corruption. The National Orientation Agency (NOA) which replaces Agency for Mass Mobilization for Social and Economic Recovery (MAMSER) failed to penetrate the grassroot and the rural population. Neither of these two agencies maintained officers or other networking structures in the rural areas to sensitize rural populace about corruption. 4.6 Cultural constraints Based on cultural background of some communities, certain policies are opposed to by the Community. For instance, the northern religious view does not see smuggling as a crime but government officials, private individual uses government apparatus to promote smuggling in the North.
This countered government anti-corruption drives. The socio-economic condition of people also promote corruption, some communities in Nigeria encourages gratification and this affects members of such communities in discharging their function in bureaucratic organizations. In this regard, is the high level of poverty, where everybody considers corrupt practices as the only way of generating additional income for poverty alleviation. All these acted against government effort using policies formulation and implementation for the eradication of corruption in Nigeria. 5. Prospect for Eradicating Corruption in Nigeria The future of our great country is bleak without eradication of corruption. We must put every thing in place to eliminate corruption from our society. Any country with high level of corruption cannot achieve economic advancement and social development. The fight against corruption is the responsibility of every citizen.
The first approach to reduce and eradicate corruption in future is to carry out extensive anti-corruption campaign in order to ensure social re-orientation. Enlightenment programmes, and campaign for social re-orientation will automatically build up anti-corruption national consciousness in the mind of all Nigerians (Bassey, 1997:46).
ISSN 2039-9340 Mediterranean Journal of Social Sciences Vol. 4 (1) January 2013
429
Another way of eradicating corruption from our social conduct is by ensuring the "Rule of Law." Rule of law according to Tyagi (1981) is concerned with independence of the Judiciary, the equality of citizens before the law, the supremacy of judicial pronouncement and subjection of both bureaucratic and general social norms to judicial interpretation. If these are achieved, the level of corruption by public official will be greatly reduced. When there is reduction in the level of corruption in public life, other segments of the society will automatically re-examine itself. These facts give us hope. There are many other things to be considered in view of recommendation to create a corruption free future for Nigeria.
6. Recommendations and Conclusion 6.1 Recommendation Having thus established the persistence of corruption and its crippling effects on performance of social institutions in our society, the following recommendations have been made towards curbing corruption in Nigeria. The issue of democratization must be pursued vigorously by the government in order to ensure legislative control of all anti-corruption policies to promote accountability and reduce corruption. The only way to reduce the effect of traditional values which promotes corruption is by ensuring national integration through equitable distribution of national wealth.
Focus should be directed towards eliminating institutional weakness that promotes corruption in the Public Service. Adebayo (1985) also suggested professionalism, as it is only professional associations that can effectively discipline their member by withdrawing practicing license. The fear of withdrawal of license will not allowed professionals employed by organizations to engage in corrupt practices. In this regard, all chartered professional institutes should join in the fight against corruption, public and private organizations must be professionalized for corruption to be a thing of the past. Other ways of controlling corruption are outlined by Anandu (1990) which include: public declaration of asset, retirement and termination of appointment of all officials who engage in corruption, investigation of all suspected illegal wealth.
6.2 Conclusion The consequences of corruption are enormous, for instance, corruption causes capacity underutilization, personnel inefficiency and ineffectiveness, capital wastage, policy distortion, as well as organizational and system decay. In view of the negative consequences of corruption on our social institutions and society as a whole, this paper provides both theoretical background to the understanding of corruption and the various ways corruption manifest itself in our society. The high rate of corruption makes the future and destiny of our great nation bleak. Recommendations are made on how to combat corruption and move our great country Nigeria forward. But the greatest recommendation is for the government to avoid changing the grand norm of our Nation (the constitution) to help selfish leaders achieve their goal of perpetuating themselves in office as it is an act of corruption.
Bibliography Adebayo, A. (1986): Power in Politics. Ibadan: Spectrum Books Limited. Anam-ndu, E., (1990): Consociational Democracy in Nigeria: Agenda for the 1990s and Beyond, Lagos: Geoken Associates Limited. Bassey, A. (1997): "Bureaucratic Corruption and Economic underdevelopment of Nigeria: A case study of Cross River State" B.Sc.
Project unpublished Uyo: Department of Political Science and Public Administration, University of Uyo. Bell, D. (1953): Crimes as an American way of life Antioch Review, Vol. 13, New York: American Sociological Association. Buhari, A. (1994): Public Finance, Lagos: Longman Egonmwan, J. (1992): Public Policy Analysis: Concepts and Applications, Benin City: SMO Aka and Brokers Press. Etuk, G. (2002): Social Work: An Introductory Analysis, Calabar: University of Calabar Press Lauer, R. and Lauer, J. (2001): Social Problems and the Quality of Life, Boston: McGraw Hill Left, N., (1964): "Economic development through Bureaucratic Corruption" in American Behaviour Scientist, Vol. 7, November. Merton, R. (1968): The Social Theory and Social Structure, New York: The Free Press Ndubusi, A., (1991): Nigeria What Hope? Enugu: Fourth Dimension Publishers. Okigbo, P., (1993): Essays in Public Philosophy of Development, Vol. 3, Enugu: Fourth Dimension Publishers. Olowu, D., (1993) Ethics and Accountability in African Public Service. Ethiopia: Association of African Public Administration and
Management. Ottong, G. and Bassey, A. (2011): Principles and Practice of Social Welfare, Calabar: Ephraim Printers Soyinka, W. (2006): The Guardian. Lagos: Feb. 4th Sabongo, U., (1993): "Ethical violation in Nigeria Public Service: Patterns, Explanations and Remedies" in Oluwu, D. ed. (1993): Ethics
and Accountability in African Public Service, Ethiopia: A. A. PAM

ISSN 2039-9340 Mediterranean Journal of Social Sciences Vol. 4 (1) January 2013
430
Yahaya I., (1993): "The Economic Crisis, Resources Scarcity and Decline in Ethical Standard in Public Agencies" in Olowu ed. Ethical and Accountability in African Public Service: Ethiopia: A. A. PAM
Tyagi, A. (1981): Public Administration: Principles and Practice, Delhi: Atma Ram and Sons. 1979 Constitution of Federal Republic of Nigeria, Lagos: Federal Ministry of Information. 1999 Constitution of Federal Republic of Nigeria, Lagos: Federal Ministry of Information. Anti-corruption law of the Federal Republic of Nigeria 2000. Lagos: Times Press Limited
ISSN 2039-9340 Mediterranean Journal of Social Sciences Vol. 4 (1) January 2013
431
An Analysis about Albanian Politics and Constitutional Changes of 2008
Elda Zotaj
PhD students “Institute of European Studies” University of Tirana;
Lecturer, University of “Aleksandër Moisiu” Durrës: [email protected]
Doi:10.5901/mjss.2013.v4n1p431 Abstract
In some Eastern Europe ex-communist countries, the political transition is still an unfinished process. There are many reasons and causes that have contributed to the unsuccessful set out and within the timeframes of this process. In this way of transformation, institutional democratization and the establishment of independent institutions had result a real challenge for these countries. In the context of the whole, Albania is a special case regarding the conflict of the political actors reflected this in slowing the institutional processes of country democratization. The main purpose of this paper is to examine the impact it has had the politics and political class in the direction of institutional democratization process and the creation of independent institutions. The main argument of this paper is that the political class of these 20 years of transition is not yet completely well detached from the totalitarian party-state system legacy, which is reflected in the not yet realization of independent and solid institutions of the Albanian state.
Keywords: Independent Institutions, Political Class, Transition, Constitutional Changes
1. Introduction
"As large as is a conflict between government and opposition, greater are the probabilities that each party attempt to deny the other’s possibilities for effective participation in policymaking." (Dahl, 2005)
The value of independent and democratic institutions is a permanent objective, but, in the transition countries their existence is vital because the fragile democracies will be transformed into consolidated democracy. If we refer to the definition of Adam Przeworski-t we will accept that: "it would be worth the transition from an authoritarian system to a democratic system should be thought as something that consists of two simultaneous processes, and partially autonomous: the process of authoritarian regime disintegration, which often appears in the form of "liberalization" and the process of democratic institutions performance" (Etzioni-Halevy, 2009). Politics is formulated in different ways, but it is responsibility of those who have political power to realize the formulations on the country's democratization functions. "Strengthening the institutions and the rule of law are profoundly political processes and as such are products and not the source of the political process."(Polis 4)
For the Albanian politics during 20-years of transition these two processes has resulted almost insurmountable challenge. Still today the "liberalization" process and the creation of independent state institutions suffer from a strong connection with politics and its dictate. During this period the political actors have tried that instead the country and nation’s interests to give priority their interests. This assertion is based on the form that has taken the state, society and economy during the transition years. Since the beginning, the political pluralism was transformed from the political parties in a struggle for power deforming so the principles of democracy and becoming a dominant factor of the transition prolongation in Albania.(Pellumbi, 2006) To confirm this statement is worth to mention shortly the marathon of the non recognizing election results that have begun in 1991 (where the opposition of that time have accused for election manipulation), and from this moment and ongoing, the elections contesting and the charges have been a ritual that is followed by both political sides not to spare the welfare, political and economic stability, integration and implementation of democratization reforms in the country.
In modern constitutional democracies, the split and balance of powers is the basic feature where indisputably the placements of specific limitations on the state power against the people are fundamental to democracy. (Constitution and explanatory material, 1998) The existence of some powers within the state, which operate as independent of each other is vital for the development of democratic institutions and state strengthening. How politic affects the development or restriction the democratization and consolidation of state institutions it became clear from the consequences which we live today, of the post-election political crisis of 2009.
ISSN 2039-9340 Mediterranean Journal of Social Sciences Vol. 4 (1) January 2013
432
Excessive length and lack of compromise led to a lack of series of reforms realization, resulting in the denial of candidate country status by the European Union, where the European representatives a strong criticism have addressed just to them. From this we arrive at a simple conclusion that the political process led by the dominant political parties dominates and conditions the functioning of democratic system and dependent institutions.
Since the moment when Albania has its democratic Constitution in 1998 is worth to emphasize that regarding the fact of its compiling, it was achieved without the participation and consent by opposition. The importance of a constitution with a wide consent is essential in order that the state structure to be built on secure and longevity foundations. Despite the fact that the Constitute of 1998 was approved by popular referendum, for the Albanian state a constitution drafted without wide political consent (in its drafting the opposition did not take part) has produced somewhat fragile institutions.
Constitution of 1998 (despite the drafting process) was the main act breaking the tradition of the past and the beginning of a democratic Albanian state. They began the basic institutions and were exacted definitely the division of the three powers: legislative, executive and judiciary. Under Article 1 paragraph 1 of the constitution adopted in 1998 the Albanian government was declared "Parliamentary Republic", (Constitution, 1998) which means the parliamentary supremacy. For the time and moment in which Albania was and having a not positive experience from the rejects of the draft constitution 1994 year by a popular referendum this was seen as the most appropriate form of state organization. Despite criticism of the opposition at that time, the country and foreign experts have appreciated the spirit and its structure. (Constitution and explanatory material, 1998)
But what has changed in the balance of three powers after constitutional amendments of 2008? Do they have the constitutional amendments violated or not any of the independent institutions? Why these changes that affecting the essence of the political system were not approved by popular referendum? Perhaps political parties feared the people judgment and "avoided" the referendum to assure the next "arrangement"? Or perhaps these changes were "sincere" and "the right" but people will not proper understand...? These questions raise many points, but above all concern the researcher and citizens about of "risk" that might arise from the political class when it forgets the citizen’s interests and on their behalf meets its interests, and apparently this is the spirit of the recent constitutional changes.
In this paper was tried to analyze the political class impact as the main actor in retardment the creation and consolidation of independent institutions. The focus of the work will be directed mainly in constitutional amendments that were adopted on 21 April 2008 with the consent of the two main political parties DP and SP. Difference in content that incurred the institution of parliament, the president, the Central Election Commission and the electoral system.
2. Constitutional amendments a necessity or a hasty process!
It’s a fact that political power expressed in the governing power is covetousness and a part of his strategy for getting it from any political force. The essential difference of this process in countries with developed democracy from that of countries in transition has to do mostly with legal and institutional way they follow in the democratic principles implementation of the government’s justify. On this we want to express that the election results recognition and acceptance is the basis of its democratic discourse. This means that elected representatives from the sovereign have the recognition and "the blessing" the losing party.
Since the political changes of 90 – 91, the history of elections in Albania is one of the most dramatic issues in terms of diversity, forms and distortions that this process has been with the crisis of representation of the sovereign’s will. Despite that "the parties promoted the values of democracy and creating a political system completely in opposite with the dictatorship model of party-state, during these years in many cases they are showing the mentality of the old system, including the tendency of maintaining political monopoly over the state and society"(Bufi, 2010;146). Political parties have dominated the political process by diminishing the role of civil society, and researchers and experts in many important cases having to do with the country’s democratizing. According to researcher Fisher:
"It is very discouraging the notion that exists on cooperation. Political culture greatly influences the nature of the Albanian political parties. They do not make arrangements for democracy within the party ranks, and even between other parties. But if there is no democracy in political parties, Albania will have difficulties to develop a functional democracy in his country1
From this statement it appears that with this political class is difficult to "built" institutions "truly" independent and functional. It is so much the political life catch by the political parties as out of their system is not promoted any individual, interest group or civil society instead in their interest are used and misused in certain moments. This overview serves to emphasize the domination and the major influence that political parties have taken on particularly in fragile democratic
".
1http://www.ama-news.al/2011/10/fisher-bllokimi-i-integrimit-vjen-nga-mungesa-e-kultures-politike/
ISSN 2039-9340 Mediterranean Journal of Social Sciences Vol. 4 (1) January 2013
433
system like ours. One of these examples is the power that they themselves attributed by the constitutional changes implementation bypassing the comprehensive democratic logic that should be expressed by the referendum keeping. Only a disinterested political class for freedom fears the popular consultation). In our opinion the referendum was necessary for their approval, regarding the specific conditions in which our country is. This deformation and it’s overpower is expressed in their discourse that they give themselves by their representatives in the Parliament (which will analyze the issue below).
It is worth mentioning the fact that: "The Assembly is the first state institution to be subject of the "party" model imposition that transmit it to the other
state institutions with very negative consequences,"(Bufi, 2010; 144) this avow is easily proved by our politicians governance style and manner of these 21 years. This implies that all the regression and the inability of state and independent institutions consolidation is inevitably also product of the political class and their power games. "When political majority operates as "party" model logic, the Assembly cannot fulfill his constitutional responsibilities, it suffocates2
In many developed countries, the constitution’s changes are a very serious matter that requires approval by referendum. "The referendum or plebiscite is a directly free willing of people’s democracy. In this sense we can say that the referendum itself embodies the realization of the highest democratic values" (Meidani, 2009;). Examples show that "the deputies in most cases, appears more as a" cardboard voting party" rather than a responsible decision maker (Meidani, 2009)", and the game of numbers and fictitious cartoons was strengthened considerably after the changes made to the constitution regarding the electoral system. With the contestations and allegations of vote and deputy fraud in the parliamentary elections of 2005, the created Assembly as a result of them probably should not have allowed himself the authority to make substantial intervention to the constitution. We agree with Mr. Kopliku when he says: "this ‘megadushku’ Assembly
”. Seen in this light, the parties that agreed together the recent constitutional changes, if it will be completely conscious for their necessity to embody the popular willingness, they naturally should have been demanded the approval by the citizens. It didn’t happen, even such initiative was taken by some small parties they didn’t find support; rather they faced fierce opposition from both major parties and failed in their purpose. Leaders of both major parties went so far as the referendum question was sold as the wrong idea or initiative. Here is what the opposition leader said about the referendum issue:
"By considering deputies as representatives of people, Rama had assessed that the package of constitutional amendments had received even popular approval: “For constitutional changes the Parliament was expressed once and the parliament members are the voice of sovereign people" (Author’s emphasis) (Century Newspaper 2 May 2008).
The above statement clearly shows that when for their close and un-argued purposes they speak in the name of people by not considering their voice. Taking reserves for opposite leader statement, naturally the question arises is: To whom sovereign he is referring to? If we take in consideration the elections history of course the sovereign real representative lack is the subject of any argument. The dispute, electoral tricks, contesting the election results, etc., are made precisely to manipulate, change or bad represented the sovereign’s will. If really it would have respect for and right reading of sovereign’s vote then we would not have a lack of representation and political life democratization in reality there is representative of the sovereign needs and demands. Then to whom sovereign did the leaders of the two major political parties in the country refer?
3
In that time within the Democratic Party members had objections about the proposed changes. Some members had commented that the process was not transparent and not letting the necessary time to make their review. Mr. Besnik
should not affect the Constitution at all, except the necessary minimum to avoid ‘megadushku’. In this line Mr. Sabri Godo said that "the constitution is not the work of several party groups. Cannot be made by throwing things on the table only once and then will be forced the deputies to give their vote based in their party discipline (Century Newspaper 16 April 2008)".
Constitutional amendments are not a taboo, but they must be done within the governance and stability in government, spending and respecting all procedural stages, when in this case except procedural problems from both parties was denied the referendum approval. As above if we are going to refer dynamics of events, the socialist party has had various time demanding changes in the electoral system and those that has to do with the deputy’s selection. The Democratic Party from his its side had demanded the abolition of CEC institution from a constitutional institution to a administrative one. But beyond that, Democratic Party around on April 10, 2008 had presented the "second" changes also.
2Ibid. 3 a term which is used in Albania Politic about manipulation in elections
ISSN 2039-9340 Mediterranean Journal of Social Sciences Vol. 4 (1) January 2013
434
Mustafaj4
We believe that this is not helping democracy and Albania institutions strengthening but the party leaders position strengthening and depletion the different thoughts from the ONE. Seen from this perspective it appears that these changes were accelerated and in a big part of them unnecessary. Have passed three years after interventions in the constitution and a part of politics changes initiators feel "remorseful" and even they have gone so far as to specify them wrong
said that "we are witness that the process is conducted without transparence," he adds also that, "My concern in this process is that the Parliamentary Group of DP is completely avoided, is left out" (Albanian Newspaper 17 April 2008). While the deputy Mr. Ngjela for these initiatives has expressed that "society is facing an anti constitutional coup" (Albanian Newspaper 18 April 2008). The above statements leave no place for comment they are clearly legible. Despite the opinions and voices against, the compromise was: each of the parties should "fix" articles that were in their best interest based on this logic at least the other side would do the same thing, so that will achieve the necessary consensus.
5. Despite initial short-term benefits, the changes especially them on the electoral system, so the eliminating of some fictitious political parties that really was a necessity, the manner and lack of constitutional expertise still left many gaps. Time showed that these changes have not resolved "the political cramps" but they blocked further existing cramps, even created new ones6
4 Deputy and ex-minister of Foreign affairs 5 Referring the opposite leader declaration that: seen after three years later the constitutional changes were a mistake and he is remorseful for these constitutional interventions, even goes so far that requires other changes to repair the “made mistake” online: 6 Exp: The manner of electing the president, SP-DP parties had agreed that in the fifth round the president might be elected with simple majority, now SP party consider the question open and that had to be revised. The debate is also for the other changes for example the election system etc.
. We think that the only real and urgent problem that our country had in its constitution, was “megadushku” elimination, theft of the deputies through procedures that skip the people’s will. In our opinion even in this point wasn’t found the best solution, was highlighted further the role of party presidents. Significantly strengthen and deepen the fundamental problem that our political parties and politics in general have, enforcement of the One: the infallibles, the incorrectness and irreplaceable. These changes resulted a failure in the democratizing and power control of "the party One" and then "the Executive One". In the following sub issues we will see “the refractions” that the institution of parliament incurred from the constitutional changes of 2008. 3. Parliament Institution seen under constitutional amendments of 21 April 2008 The Constitution of year 1998 in its entirety kept the spirit of Parliamentary Republic with a multi-polar power.
It was formulated in such way for each institution that in testified a correct balance of powers and constitutional institutions. It is worth mentioning that the constitutional power, the election manner and appointments, competences and integrity of each institution was in framework of this philosophy. "The consensual” changes touched the constitutional base of some institutions, so in essence was changed the fundamental law of the State. Which is the procedure that parliament follow on constitutional changes?
In our Constitutional (article 177 paragraphs 3, 4, 5) the constitution review function was lead to the Parliament. Parliament can exercise this power only through special procedures. These procedures consist in qualified majority requirement. In case of review is the parliament that decides for the referendum of the amendments. (Constitution and explanatory material, 1998) As above is indispensable the dialogue and agreement among political parties, as the amendment procedures required the 3/5 votes (qualified majority) of members. Since the date of the constitution approval were made two changes; on 13 January 2007 and 21 April 2008. They were firstly created and supported by both major political parties, the Democratic Party (in power) and Socialist Party (in opposite).
Since the establishment of these two parties in Albania politic has dominated the lack of dialogue and compromise, so we shall allow ourselves that after so much disputes and disagreements between them to define such cooperation (constitution changes) as a "great compromise". This warm wave of dialogue between two parties was turn in an exchange give me to give you, the amended articles, without leaving the necessary space and time to be "discussed" from each party.
In the Albanian political leader’s tradition is noted a primitive vision over the state concept. This affirmation is shown on the factice deformation of the democratic concept of Rule of Law State. It is based simply on the willing of the political party that has parliamentary majority. When is required demanded by the circumstances, the autocratic features of country's leaders appears and influence or usurping institutions that polarize the power. This means that regardless the leader’s political spectrum, winner of parliament, as per close personal and short-term interests extend the hand of power everywhere, damaging the building of strong institutions of state.
ISSN 2039-9340 Mediterranean Journal of Social Sciences Vol. 4 (1) January 2013
435
In this context is necessary to ask such questions like: How much and how have these changes influenced in candidates for deputy election? So until where a parliamentary majority can extend its power after have won the election? Does a parties’ leader has strengthened their position with this new election system? What kind of representatives gives us the electoral system in the institution of Parliament? How much is conserved the deputy’s decision maker integrity when he is elected by closed multi-names lists?
Are these political parties prepared to conduct this election system? Do they have the required democratic standards to achieve it? It is understood that most of these questions may not be exhausted by only a paper like this, but they guide us to the centre of the issue, what meanings take the constitutional changes regarding the institution of Parliament?
In the constitutional amendments of April 21st, 10 amendments from 183 were changed and half of them are amendments that affect important aspects of the political system and governmental. These changes were approved adopted with 115 votes. From these 10 amendments, 4 articles and practically the Articles 64, 65, 67, 68 belongs to their third part where they speaking to the assembly. From the mentioned above articles we will explain the Article 64 as it carries a special significance. Article 64 defines “the parliamentarian product” that will emerge from the general election. This means that changes made in the constitution are essential terms regarding “representation and selection criteria” by the people. Let's see as follows:
The Constitution of 1998, Article 64 point 1 and 2 said, 1. Assembly is composed of 140 deputies. 100 deputies are elected directly in single-member zones with
approximate number of voters. 40 deputies are elected from parties’ multi-name lists and/or coalitions of parties according the order.
2. The total number of deputies of every party and/or coalition is defined in the report as close to the valid votes obtained by them throughout the country in the first round of elections.
3. Parties that receive less than 2.5 percent and coalitions that receive less than four percent of the valid votes throughout the country in the first round of elections do not benefit from multi-name lists.
This article was changed on April 21, 2008 as follows: 1. The assembly is composed of 140 deputies, elected by proportional electoral system of multi-name electoral
zones. 2. The electoral multi-name zone matches with administrative division of one of the levels of administrative-
territorial organization. 3. The criteria and rules for implementation of the proportional electoral system, for electoral zones defining and
for the number of mandates for each zone are defined in the elections law. Changes in the electoral system are somewhat better. The number of parties in parliament was reduced considerably as a result of it. He avoided a number of parties with without real electorate. On the other side this system obliges the voters to vote only for the party avoiding the voter from selecting the candidate. The system to be functional and reliable requires clear rules of the game (i.e. a new electoral reform), their correct implementation, and the establishment of a comprehensive procedure based on the most militant opinion and over all transparency in its application. Naturally the question is how people can exercise their rule when its rule representatives in parliament were chosen de facto by the “heads” of political parties?
The experience and practice of these pluralism’ years has shown that “politics” have had a bad relationship with transparency and respect for rules laid down by them. Seen from this perspective this elected practice may be used as an instrument against each member how thing differently from leader. In these conditions the parliament would be returned a tribune dominated by parties’ leaders and the other rest of deputies as megaphones delivering the voice and will of one man, the leader’s voice.
In case when they are elected directly by vote of people they are more representative, having more legitimacy stature. In that case, they have more resistance to pressure from leader and party in the decision making freedom. The directly elected members of Parliament have more responsibility and are more associated with their electoral zone than the electoral list members. Cases where the list of elected, are carried out by "party leadership", is under doubt the selection way of candidates. The most happening scenario is the potential leader influence chooses the most faithful members. As above even this new election system doesn’t avoided essential problems, as the issue raised is not how good or bad is the procedures, but how are they implemented.
4. President institution seen under the constitutional amendments of 21 April 2008 In the election of the president, takes value and significance the principles, correctness, numbers and procedure of its election. Interventions that affect the institution of the President are constitutional changes reflected in Articles 87 – 88.
ISSN 2039-9340 Mediterranean Journal of Social Sciences Vol. 4 (1) January 2013
436
The referendum avoidance for constitutional changes, might be interpreted as threaten and dangerous for democracy in Albania.
To emphasize the changing balance of power toward the executive is worth analyzing "the role and election of head of state". We think that the recent constitutional changes the election of President is realized as a simple decision-making process by the party or executive coalition. Under this approach only the change of this procedure (election procedure) inevitably affects in constitutional power, authority and integrity of the institution of the President.
In this way the president is likely to be turned as an instrument of the ruling party. The Constitution of year 1998 has insisted too must for a President elected by consensus. Theoretically (because in reality It doesn’t happen) the constitution has foreseen that the country could pass two general elections round and only after exhausting these procedures it was foreseen a president elected by 50% of the deputies votes of Parliament. In such way this constitution "imposed a president who doesn’t come from political race, but from the maximum possible consensus". (Albanian Newspaper 21 April 2008) It wasn’t unintentional a design procedure of these dimensions, if the parliament couldn’t elect a president by a qualified majority, how it would be able to carry out the reforms and laws that require such a compromise during his 4 year? If was really had a "handicap" or "cramp" in the electing process president, it was fully justified by the role and function of the President institution. It can’t have a required legitimacy a president elected only by a half of Parliament!
What meaning would have the phrase "representative of the people unity” when the President is elected with 71 votes of parliament members? What meaning it has that the General Prosecutor, chairman of the supreme state audit and some other bodies nominated by the President to be elected with more votes than President? What meaning might have the approvement of the prime minister by the President? Mr. Gjinushi had been objector to those constitutional changes, he had argues that "if is touched the article that deals with the President, the President is the Chairman of the HJC (High Justice Council), he is the one that balances the powers between parliamentary majority and he can’t be from the same parliamentary majority". (Albanian Newspaper, 18 April 2008) In this regard the constitution of 1998 had specified the importance and value of proper procedures for the election of the President. So his election remains a major issue that closely relates with the fulfillment of his constitutional powers.
We can say convicted that this way of president election foreseen in last constitutional changes affects president institution, creating many gaps and contradictions. It is changed and aggravated negatively his relations with parliament, executive and some other institutions. So these changes (as they were served by politicians) were not just easily procedures and elimination of artificial cramps but the intervention in substance of the process of control over the other powers and especially the executive to the president's institution. According to Mr. Krasniqi "the new constitutional changes aimed that these parties which govern the executive and have the majority in the Assembly to have the choice right of "the head of state" the representatives of the people's unity". (Albanian Newspaper, 18 April 2008)
In our opinion the constitutional amendments that affect the institution of the president have changed the essence of the political system. We have separation and balance of power avoidance and especially the role of executive head is much strengthened by these changes. Cannot be avoided the prime minister and majority control on the president, because he will be chosen not necessarily have to be consensual and not necessarily his life will be 5 years. These changes tend to create a presidential institution without political power, under the pressure and control by the parliamentary majority.
5. Constitutional changes and the position of Prime Minister and the executive The Prime minister represents the leading authority of the executive power. His relations with Parliament are cooperating and account-giving also. The Premier in collaboration with the Council of Ministers creates the development policies. To analyze the impact that have the 21st April 2008 changes on the executive power and especially the premier role is worth the comparing of article 104 of the Constitution of 1998 and how it was adopted under the constitutional amendment of 2008. The Constitution of 1998, Article 104, paragraph 1 and 2 has foreseen as below:
1. If a motion of confidence presented by the Prime Minister is refused by a majority of all members of the assembly. The assembly within 15 days chooses another primer. In this case, the President appoints the new Prime Minister.
2. When the Assembly fails to elect new Prime Minister, President of the Republic dissolves the Assembly. (Constitution, 1998)
This article was amended as follows:
ISSN 2039-9340 Mediterranean Journal of Social Sciences Vol. 4 (1) January 2013
437
1. The premier has the right to present a motion of confidence to the Assembly for the Council of Ministers. If this motion of confidence is voted by less than half of all members of Assembly, the primer within 48 hours from the motion voting, ask to the President of Republic to dissolve the Assembly.
2. President dissolves the Assembly within 10 days from the request receiving. The confidence motion request cannot be presented during the analyzing period of the confidence motion, according the article 105. (Constitution, 2009)
The mechanism of "confidence motion" serves to test the credo that the prime minister enjoys in parliament for reforms or initiatives that he wants to accomplish, but formulated in this way this mechanism loses its essence by allowing spaces for abuse by the Prime Minister. Even if we going deepened in our judgment this mechanism can be used by the Prime Minister even as a pressure form against its parliamentary majority to approve laws that can be objected from certain deputies or groups. Consequently, the independent institution of parliament is “depending” by the executive rather by the Prime Minister, because it allows the manipulation of Representatives and consequently the voters will. So, the Prime Minister has the right that for his own interests to lead the country into early elections? We can raise the question that is provided in the constitution any other mechanisms to avoid the abuse by the Prime Minister? Are taken measures to render more difficult the "malevolence" of the prime minister? According to Mr. Kopliku with the "confidence motion" the prime minister could dissolve the assembly when it has a fancy, without obstacles. With this has on his hands a new type of “megadushk”: to shape the new Assembly, according to his personal will, and not in accordance with the voters’ free will. (Albanian Newspaper 20 May 2008)
If we analyze the article 105 which has undergone substantial changes also, it becomes clear that the mechanism of no-confidence motion is in favor of primer also. The "confidence motion" is the term used to present the case where is requested the prime minister's dismissal from members of the assembly.
Prime Minister and his work is controlled and overseen by parliament through the confidence motion mechanism. This mechanism is preserved even with the new changes but the initiator and dissolver isn’t more of the parliament but of the primer. Why does the prime minister (in case of no confidence) within 48 hours of voting to request the President to dissolve the Assembly? Is violated the parliamentary supremacy in this case? Seen by this new reformulation seems that the primer has all the necessary conditions to dissolve the Assembly when he wants enough to use or manipulate some of his deputies not to vote because the opposition is “known” that they vote contrary. But here are expressed the differences.
The Constitution of 1998, Article 105 paragraph 1 and 2 has foreseen: 1. If a motion of no confidence presented by one-fifth of the deputies is approved by the majority of Assembly
members, the Assembly within 15 days has to choose another primer. In this case, the President appoints the new Prime Minister.
2. When Assembly fails to elect a new Prime Minister, the President of the Republic dissolves the Assembly. (Albanian Newspaper 20 May 2008)
This article was amended on April 21st, 2008 as follows: 1. One fifth of the members have right to send it for voting in the Assembly a non confidence motion against
Prime Minister in duty, proposing a new Prime Minister. 2. The assembly may vote a non confidence motion against Prime Minister only electing by more than half of its
members votes a new Prime Minister. (Author’s underline) As above, even in this case the Prime Minister removal becomes impossible, especially when parallel to the motion vote was demanded the new prime minister voting. This change has enforced further its constitutional position. The prime minister that in case of not voting a confidence motion asking the President to dissolve the Assembly!! It has changed the balance between Assembly and Government. According to this change the deputies that’s supporting the government becomes more dependent on its will. Thus, we see clearly that constitutional amendments of April 21, 2008, accentuate more the primacy of executive power over other powers.
In an article published in the century Newspaper dated May 2nd, 2008 Mr. Brace argues as follows:
“If any majority, even that of most fluid manages to make votes to overthrow prime minister has certainly possible to make the votes and to vote the new prime minister! There is no encroachment, everything is quite normal".
The logic leads us in the conclusion that the mentioned above citation is simply a political demagoguery to argue the great "compromise" and also in this compromise there is nothing wrong and even more an occupation or empowering of one power over another. The new changes are clearly legible and in that is transcribed the fact that the removing is impossible in this case. (Meidani, 2009) Its riskiness (constitutional changes) also consists in installation of a concentrated state model in the center of executive power, checking and submission other powers".
ISSN 2039-9340 Mediterranean Journal of Social Sciences Vol. 4 (1) January 2013
438
6. Conclusions As a conclusion we can say that the Albanian political class has played in many times a deceleration role in the consolidation of independent institutions. A particular importance takes the constitutional changes of 21 April 2008. As per our opinion those changes has affected the equilibrium and the separation powers mechanism. Under these changes was strengthened more the prime minister’s role. As a consequence the president’s powers were reduced. The new procedure of electing the President has diminished the institution legitimacy. In framework of these conditions the president can be any of the majority members as he is elected with simple majority and without the determined necessity of opposition in this process. In this new constitutional situation not only the president institution but also the other institutions that depends on it, are not in good situation. The Opposition can’t has anymore the right to overthrow the government (with the mechanism of rejection of the president after five rounds of voting), which in terms of our democracy it is not a good sign. As per above we can say that the Constitution’s intervention have affected a range of independent institutions, is sufficient to mention the limitation of the General Prosecutor mandate, the return of the CEC from a constitutional institution in an administrative one and many other changes that affected the justice institutions. In the road toward state and democracy development, these interventions in the country's fundamental law changes are a step back in terms of Albanian institutions strengthening and consolidation.
Bibliography
Bufi, Ylli (2010). The temple of democracy Ombra GVG pg.144, 146 Dahl, Robert (2005). Poliarchy, Participation and the Opposition Pegi pg.14 Meidani Rexhep. (2009) Constitution: Balance and perspectives Toena pg. 24, 34 Pëllumbi, Servet (2006). Political Pluralism, Experience and Challenges, Rinia pg.54 Przeworski, Adam Some problems is stady of the transition to democracy op cit on Eva Etzioni- Halevy, “Classes and elites in
Democracy and Democratization”, Dudaj pg.152 Polis 4 Journal, Kajsiu Blendi. Democratization without politic: Conceptual base of international model in Albania pg.16 online:
http://revistapolis.com/polis/images/stories/Polis%204/Blendi%20Kajsiu.pdf The Albanian Republic Constitution May 2009 Pg.43-4 Constitution and explanatory material (1998) QAKAPP pg.1-9, 54 Constitution (1998) Here begin the future, pg.4, 36 http://www.ama-news.al/2011/10/fisher-bllokimi-i-integrimit-vjen-nga-mungesa-e-kultures-politike/ Century Newspaper 2 May 2008 pg.4 Century Newspaper 16 April 2008. Pg.5 Albanian Newspaper 17 April 2008 pg. 4 Albanian Newspaper 18 April 2008 pg. 4 Albanian Newspaper 21 April 2008 pg.29 Albanian Newspaper, 18 April 2008 pg. 4, 25 Albanian Newspaper 20 May 2008 pg. 29
ISSN 2039-9340 Mediterranean Journal of Social Sciences Vol. 4 (1) January 2013
439
The Rights of Albanian Nationals under the Stabilization and Association
Agreement between Albania and the European Communities
LL. M. Anduena Gjevori
Lecturer, “Aleksander Xhuvani” State University Faculty of Economy Department of Economics and Law
Email: [email protected] Doi:10.5901/mjss.2013.v4n1p439 Abstract
This paper investigates the legal effects of the EU Association Agreements in the EU legal order and in the legal order of Albania with a special focus on the rights established for Albanian nationals by the Stabilization and Association Agreement (SAA). It first considers the legal effects of the EU Association Agreements in the EU legal order during the pre-accession period. Such analysis shows that agreements between the Union and non-member states countries which follow the procedure provided by Article 218 of the TFEU form part of the EU legal order. According to the ECJ, provisions of association agreements can have direct effect provided that they contain a clear and precise obligation. Therefore, nationals of non-member state countries party to an agreement with the EU can rely on the provisions of those agreements before the courts of the Member States. On the other hand, the legal effects of the SAA in the Albanian legal order during the pre-accession period depend on the interpretation of the Constitution from Constitutional Court especially of those provisions which concern the relationship of international law with national law and on the interpretation of the objectives of the SSA itself by national judges. Therefore, the second part of the paper will analyse the relationship of international and national law according to the constitution and also the possibilities for supremacy and direct effect of the European law in the Albanian legal order. We will supplement such analysis with recent Constitutional Court decisions, which address the problem of legal effects of EU law in the Albanian legal order. The overall purpose of such analysis is to shed light on the citizen’s rights in regard to the so-called pre-accession effect of EU law when the aspiring member state is on the way to full membership. This analytical perspective is important to both Albania and other South East European countries which are in the same legal position and are confused about the rights that their citizens gain from the SAA.
Keywords: the European Union, Europe Agreements, EU law, Albania, Stabilisation and Association Agreements, pre-accession effects.
1. Introduction
The European Integration of the Central and Eastern European Countries (CEECs) has been initiated with the so-called Europe Agreements (EA) and has been complemented by the pre-accession strategy. In 1993, the Copenhagen European Council, agreed on some conditions regarding the accession in the EU of the associated East European countries. The so-called “Copenhagen criteria” required the candidate countries to satisfy the political and economic criteria 1. These criteria were followed by a pre-accession strategy developed by the European Council in Essen in December 1994 and reinforced by the Agenda 2000. The EAs, as one of the tools for structuring accession, aimed at establishing a political dialogue among the Association Council Bodies and gradually introduce a free trade area to liberalise trade and provide for co-operation in areas such as competition law, environment, education and training and contained provisions on free movement of persons, establishment and supply of services to Member States and candidate countries2
Regarding the Western Balkan Countries the European Commission proposed the creation of the Stabilization and Association Process (SAP) as a new framework for the relationships between the EU and Western Balkan Countries. The
.
1 The European Council stated: “Membership requires that the candidate country has achieved the stability of institutions guaranteeing democracy, the rule of law, human rights and respect for the protection of minorities, the existence of a functioning market economy as well as the capacity to cope with competitive pressure and market forces with the Union. Membership presupposes the candidates’ ability to take on the obligations of membership including adherence to the aims of political, economic and monetary union.” 2 Ott. Andrea, “The rights of self-employed citizens in the Member States under the Europe Agreement” 2001 The European legal forum, at pg. 498
ISSN 2039-9340 Mediterranean Journal of Social Sciences Vol. 4 (1) January 2013
440
purpose of this process was to assist these countries in fulfilling the EU criteria and being accepted as official candidate for membership. The Stabilization and Association Agreements were a very important element of the SAP process from the legal point of view. These agreements were concluded based on the same legal basis as EAs, Article 218 TFEU (ex Article 310 ETC). From the point of view of their content the SAAs were also based on the existing EAs even if they included new elements related to the new specific situation of the Western Balkan countries3. The objective of these agreements was to support the consolidation of democracy, the rule of law, the economic development and the regional cooperation4
The sources of EU law can be divided into primary and secondary EU law. The primary EU law consists of the EU constituent treaties which were adopted directly by the Member States. Primary law includes also annexes, appendices and protocols attached to the founding treaties, later additions and amendments, concluded international agreements like the Europe Agreements, Stabilization and Association Agreements and Accession Treaties
. In the framework of the SAP process, the Stabilization and Association Agreements between Albania and the EU was signed on 12 June 2006 and has entered into force on 1 April 2009.
Both the EAs and SAAs are EU association agreements and have legal effects in the different legal orders. Provisions of these agreements can have direct effect and can establish rights for the citizens of the candidate countries once they come into power. Therefore, this paper will analyze the legal effects of the SAA between European Communities and the Member States on one hand and Albania on the other, for Albanian nationals. After explaining briefly the sources and the features of EU law, the paper will give an overview regarding the pre-accession effects of Europe Agreements in the EU legal order, as they make a good example for the SAAs. However, as Albania is not yet a member of the EU the legal effects of the SAA in the Albanian legal order depend on the interpretation of the constitutional provisions regarding the relationship between international law and national law. Consequently, this paper will briefly analyse the relationship between international and national law, focusing on the so-called integration Articles part of the Albanian Constitution. At the end, possible legal effects of the SAA in the Albanian legal order will be investigated in the light of the case law of the Albanian Constitutional Court regarding the SAA.
2. Brief overview of European Union Law
5. Secondary EU law consists of acts of the European institutions. The norms issued by the institutions of the Union are regulations, directives, decisions, recommendations and opinions. According to Article 288 TFEU (ex Article 249 of TEC) in order to exercise the Union’s competences the institutions shall adopt regulations, directives, decisions, recommendations and opinions. The relationship between primary and secondary law is not expressly provided in the Treaties, but a hierarchy of norms can be implied by Article 263 TFEU (ex Article 230 TEC) according to which one of the reasons for the annulment of actions of EU Institutions can be infringement of the Treaties or of any rule of law related to their application6. Primary community law stands at the top of the hierarchy of the system of sources of EU law and all treaties concluded between the Union and third countries and acts of the institutions of the Union should be conform it. The Court of Justice of the European Union, according to Article 267 TFEU (ex Article 234 TEC), has jurisdiction to give preliminary rulings related to the interpretation of the Treaties and the validity of the acts of the institutions, bodies, offices or agencies of the Union. Thus the ECJ has no jurisdiction to rule on validity of provisions forming an integral part of accession, for example the Europe Agreements, the Stabilization and Association Agreements, Partnership and Cooperation Agreements7
The two main principles related to the status of EU law, the principle of supremacy and the principle of direct effect, are developed by ECJ as they had no formal basis in the EC Treaty
.
8. It was ECJ, which from the early existence of the Community, touched the issue of supremacy of EU law by stating in Van Gend en Loos9 that the Community constituted a new legal order of international law for the advantage of which the States had limited their sovereign rights10
3 Steven Blockmans, “Tough love: the European Union’s relation with the Western Balkans” (T.M.C. Asser Instituut 2007) at pg 155. 4 Hoffmann Judith, “Integrating Albania: The role of the European Union in the Democratization Process” I (1) Albanian Journal of Politics (2005) at pg. 58 5 Alfed Kellerman, “The rights of Non-Member State nationals under the EU Association Agreements”, 3 European Journal of Law Reform, (2008) at pg. 341 6 Article 263, TFEU para.2 provides that: “It shall for this purpose have jurisdiction in actions brought by a Member State, the European Parliament, the Council or the Commission on grounds of lack of competence, infringement of an essential procedural requirement, infringement of the Treaties or of any rule of law relating to their application, or misuse of powers. 7 Supra note 5 at pg. 343 8 Paul Craig Grainne De Burca, “ EU law text, cases and materials” (Oxford University Press 2008) at pg. 344 9 Case 26/62 NV Algemene Transporten Expeditie Onderneming van Gend en Loos v. Nederlandse Amministratie der Belastigen [1963] ECR 1. 10 Supra note 8 at pg. 345.
. This
ISSN 2039-9340 Mediterranean Journal of Social Sciences Vol. 4 (1) January 2013
441
principle was the main focus in the decision Costa v. Enel11, where ECJ held that EC Treaty had created its own legal order which became part of the legal systems of the Member States and the Member States had transferred to the Community institutions “real powers stemming from a limitation of sovereignty”. The Court went on by giving other arguments such as the spirit and the aims of the treaty which made it ‘impossible” for the Member States to accord primacy to their national law 12 . Finally the Court argued that Article 249 TEC (now Article 288TFEU) would be meaningless if Member States would not respect it by approving inconsistent national law. After having created a basis in Costa v Enel in the following cases such as: Internationale Handelsgesellschaft13 and Simmenthal14 ECJ held that not even a fundamental rule part of the national constitution could challenge the supremacy of directly applicable Community law15. It is now established by the case law of the Court of Justice that Community law is supreme over the national law of the member states, including the fundamental norms of their national constitutions16
Another important principle related to the EU law is the principle of direct effect. According to the broader definition of this principle, provisions of EU law which are clear and precise and unconditional enough to considered justiciable can be invoked and relied by individuals before national courts
.
17. According to the “narrower” or classical concept of the direct effect it can be defined as the capacity of a provision of EU law to confer rights on individuals18
International agreements are binding upon the institutions of the Union and its Member States, according to Article 216 (2) TFEU. ECJ has consistently held since Haegeman ruling that once an agreement enters into force, its provisions form an “integral part” of Community law
.This principle was initially established by ECJ in its case Van Gend en Loos and after it is was extended and now applies to EU primary law, secondary legislation and international agreements.
3. Legal effects of the Association Agreements in the EU legal order – Stabilization and Association Agreement between EU and Albania
19. This reflects the monist approach regarding the relationship between international law and domestic law according to which agreements concluded by the Union form part of the Union legal order without the necessity of transposing those provisions in the Union legal order. According to the ECJ’s case law international agreements can have direct effect. In its reasoning in Demirel’s case ECJ reasoned that a provision of an international agreement concluded by the Community with non-member countries can be directly applicable when the provision contains a clear and precise obligation which is not subject, in its implementation or effect to the adoption of any subsequent measure20
Article 217 TFEU (ex Article 310 TEC) provides the power of the Union to conclude Association Agreements. The Association Agreements concluded with the CEECs are the so-called “Europe Agreements”. Although there is no suggestion in the Treaty about the content of the Association Agreements, they establish the frameworks which would enable the applicant country to integrate gradually into the union
.
21. Association Agreements include also the Stabilization and Association Agreements with the countries of the Western Balkans, whose objective is to support the consolidation of democracy, the rule of law, the economic development and the regional cooperation. The Association Agreements have been invoked before ECJ which continuously reasoned that they form an integral part of the EU legal order and that it had a broad jurisdiction on them22
In order to understand the possibilities for direct effect of the SAAs, it is necessary to analyze the preliminary rulings of the ECJ on the direct effect of the Europe Agreements as they form a good example. There are several cases regarding the direct effect of the provisions on the right of establishment and free movement of workers provided in the Europe Agreements. In cases such as Gloszczuk, Kondova, Barkoci and Malik, Jany
.
23
11 Case 6/64 Faminio Costa v. Enel [1964] ECR 585, 593 12 Supra note 8 at pg. 346. 13 Case 11/70 Internationale Hnadelsgesellschaft mbH v. Einfuhr und Vorratsstelle fur Getreide und Futtermittel [1970] ECR 1125. 14 Case 106/77 Amministrazione delle Finanze dello Stato v. Simmenthal SpA [1978] ECR 629. 15 Supra note 8 at pg 347. 16 Anneli Albi, “Supremacy of EC Law in the New Member States” 3 European Constitutional Law Review, (2007) at pg. 25. 17 Supra note 8 at pg. 268 18 Ibid at pg. 268 19 Supra note 8 at pg. 202 20 Case C-12/86 ECR 1987, 3719 21 Neill Nugent, “The Government and the politics of the European Union” (Duke University Press 2006) at pg. 71 22 Supra note 8 at pg 186 23 Case C-63/99 Gloszcuk; Case C-235/99 Kondova; Case C-257/99 Barkoci and Malik [2001] ECR I-6557; Case C-268/99 Jany [2001] ECR I-8615
nationals of Central and Eastern
ISSN 2039-9340 Mediterranean Journal of Social Sciences Vol. 4 (1) January 2013
442
European Countries asked entry into and residence in the territory of the EU member states as they wanted to work there as self-employed persons. Given that they did not have such rights of entry and residence under their national law they invoked provisions on the right of establishment provided in the respective Europe Agreements24. ECJ in answering the question of direct effect of the provisions on the right of establishment provided in the Europe Agreements considered their wording and the purpose and the nature of the Europe Agreements. The court concluded that the provisions on the right of establishment in the Association Agreements, is to be construed as establishing within the scope of application of those Agreements a precise and unconditional principle which is sufficiently operational to be applied by national court and which is therefore capable of governing the legal position of individuals25
Albania signed a Stabilization and Association Agreement with the EU on 12 June 2006, which entered into force on 1 April 2009 after having been ratified by all EU Member States. Although, there hasn’t been a court case in any of the EU Member States involving an Albanian national, which asked for a preliminary ruling of the ECJ on the interpretation of the SAA with Albania, it can have direct effect and Albanian nationals can enforce their rights in the EU legal order. Read in the light of the above mentioned case law of the ECJ regarding direct effect of certain provisions of the EAs, also provisions of the SAA with Albania can have direct effect. The SAA contains the provisions related to the movement of workers, Article 46 SAA
. Therefore, nationals of Europe Agreement countries have the right to invoke the provisions on equal treatment before the courts of the host Member State, even though the authorities of this state remain competent to apply to those nationals their own national laws and regulations regarding entry, stay and establishment. Regarding the right of the free movement of workers for nationals of the Europe Agreement countries, the Europe Agreements grant a right to equal treatment to those nationals who are legally residing and working in one of the Member States, however they do not establish a freedom of movement of workers for them. There is a line of cases of the ECJ concerning provisions on the free movement of workers contained in different Europe Agreements, which according to the Court can have direct effect, but those provisions grant to the nationals of EA countries only a right on equal treatment if they are legally employed in the territory of a Member State.
26, in Title V, Chapter I on “Movement of workers” can have direct effect. According to this Article Albanian nationals, legally employed in one of the EU Member States, may enforce their rights and rights of their spouse and children on the equal treatment coming from Article 46, before one of the courts of the EU Member States. The SAA accords rights to the self-employed Albanian citizens, thus according to Article 5027
ECJ ruled in Van Gend & Loos that provisions containing negative obligations or the so-called standstill provisions can have direct effect. Identical standstill provisions are also set out in the SAA with Albania. For example, Article 33 of the SAA, which provides that no new customs duties or new equivalent restrictions on imports or exports or charges or measures having equivalent effect shall be introduced, nor shall those already applied be increased in trade between the Community and Albania
of the SAA Albanian nationals have the right to invoke the equal treatment provision before the courts of the host Member State, however the authorities of that Member State remain competent to apply their own national laws and regulations regarding entry, stay and establishment.
28
24 In the Glozczuk case the Europe Agreement between EC and Poland was invoked (OJ 1993, L 348/1); the Kondova case concerned EC/Bulgaria Agreement (OJ 1994, L 358/1); in the Barkoci & Malik case the EC/Czech Republic Agreement was invoked (OJ 1994 L 360/1); in Jany case the Europe Agreements with Poland and the Czech Republic were relied upon. 25 Supra note 23 26 Article 46 SAA para. 1 provides that: “1. Subject to the conditions and modalities applicable in each Member State:– treatment accorded to workers who are Albanian nationals and who are legally employed in the territory of a Member State shall be free of any discrimination based on nationality, as regards working conditions, remuneration or dismissal, compared to its own nationals;– the legally resident spouse and children of a worker legally employed in the territory of a Member State, with the exception of seasonal workers and of workers coming under bilateral Agreements within the meaning of Article 47, unless otherwise provided by such Agreements, shall have access to the labour market of that Member State, during the period of that worker's authorized stay of employment.” 27 Article 50 SAA para.1 provides that:” Albania shall facilitate the setting-up of operations on its territory by Community companies and nationals. To that end, it shall grant, upon the date of entry into force of this Agreement: (i) as regards the establishment of Community companies treatment no less favourable than that accorded to its own companies or to any third country company, whichever is the better, and; (ii) as regards the operation of subsidiaries and branches of Community companies in Albania, once established, treatment no less favourable than that accorded to its own companies and branches or to any subsidiary and branch of any third country company, whichever is the better. 28 Article 33 para. 1&2 of the SAA provide that: “1. From the date of entry into force of this Agreement no new customs duties on imports or exports or charges having equivalent effect shall be introduced, nor shall those already applied be increased, in trade between the Community and Albania.2. From the date of entry into force of this Agreement no new quantitative restriction on imports or exports or measure having equivalent effect shall be introduced, nor shall those existing be made more restrictive, in trade between the Community and Albania.”
, is similar to Articles 30 and 34 of TFEU (ex Article 25 & 28 TEC), which prohibit customs
ISSN 2039-9340 Mediterranean Journal of Social Sciences Vol. 4 (1) January 2013
443
duties and quantitative restrictions between Member States. According to the case law of the ECJ Articles 30 and 34 of the TFEU can have direct effect, thus also Article 33 of the SAA with Albania, as a standstill provision, can have direct effect. Every person and company established in the EU Member States could bring a case before a national court in one of the EU Member States based on Article 33 of the SAA29
Another case might concern fiscal discrimination provided in Article 34 of the SAA. This Article prohibits fiscal discrimination by providing that the parties should refrain from and abolish any measure or practice of an internal fiscal nature establishing, whether directly or indirectly, discrimination between the products of one Party and like products originating in the territory of another party. This Article is similar to Article 110 of TFEU (ex Article 90 TEC). The first paragraph of Article 110, which can be compared to Article 34 (1) of the SAA, prohibits discriminatory taxation in respect of goods which are similar, such as one type of beer and another. There is a line of cases of the ECJ concerning the taxation of alcoholic drinks, where the court suspected that internal taxation schemes favored national products to the disadvantage of similar or potentially equivalent products produced elsewhere, and so applied Article 90 TEC (now Article 110 TFEU)
.
30. The test used by the ECJ to determine whether the goods are similar, was laid down in Commission v Denmark31. The scope of Article 90 (1) is decided not only on the basis of strictly identical nature of the products but also on their similar and comparable use32
Article 5 of the Constitution, provides that Albania should apply international law binding upon it.
. Thus, a producer of one of the Member States of the EU can sue the Albanian Tax Administration before its national court, in case of discriminatory taxation in respect of goods which are similar and that court would ask for a preliminary ruling from the ECJ.
4. International law in the Albanian legal order
33The way in which the
Albanian Constitution has solved the issue of the relationship between international law and national law is closer to the monistic approach. As it will be explained, ratified international agreements are part of the Albanian legal order after being published in the Official Journal, they have supremacy over the national law in case of conflict and they can be directly applied. Article 116 of the Constitution creates a hierarchy between normative acts which are effective in the territory of the Republic of Albania, by placing the ratified international agreements before the national laws. According to Article 122/134 every ratified international agreement constitutes part of the Albanian legal order and can be directly applied except for the cases when it is not self-executing and its implementation needs issuance of a law. Paragraph 2 of Article 122 recognizes the supremacy of the ratified international agreements over national laws and such agreements prevail over national laws which contradict them35. Thus, the Albanian Constitution provides for the supremacy of international law over the national laws and automatically solves problems of conflicts between them in favor of international law. This confirmed supremacy of international law towards national law separates Albania from the solution given by the dualistic countries regarding the relationship between international and national law36. Many Constitutions of other countries have only provided that their legislation is in conformity with rules and norms of international law, but they leave unsolved the problem of conflict between national norms and international norms. This is a partial solution given by the Constitutions of these countries37. The Albanian Constitution is similar to the Constitutions of Poland, Croatia, which provide for the supremacy of ratified international agreements over the laws of the land, in case of conflict between them38
29 Supra note 5 at pg. 353 30 Cathrine Barnard, “The substantive law of the EU the four freedoms” (Oxford University Press 2007) at pg. 48 31 Case 106/84 Commission v. Denmark (1986) ECR 833 para.12 32 Supra note 31 at pg. 50. 33 Article 5 of the Albanian Constitution provides that: “The republic of Albania applies international law that is binding upon it” 34 Article 122/1 of the Albanian Constitution provides that: “Any international agreement that has been ratified constitutes part of the internal juridical system after it is published in the Official Journal of the Republic of Albania. It is implemented directly, except for cases when it is not self-executing and its implementation requires issuance of a law. The amendment, supplementing and repeal of laws approved by the majority of all members of the Assembly, for the effect of ratifying an international agreement, is done with the same majority. 35 Article 122/2 of the Albanian Constitution provides that: “An international agreement that has been duly ratified by law has superiority over laws of the country that are not compatible with it” 36 Sokol Sadushi, “Jurisprudenca e Gjykates Kushtetuese ne frymen e Koneventes Europiane per te Drejtat e Njeriut”, XI, E drejta Parlamentare dhe Politiokat Ligjore (2003). 37 Ksenofon Kristafi, “Kushtetuta Shqiptare dhe e Drejta Nderkombetare ”, 47 (2) Tribuna Juridike (2004). 38 Aurela Anastasi, “Internacionalizimi i se Drejtes Kushtetuese Klauzolat Kushtetuese te Integrimit te Shqiperise” 4 Polis, (2008) at pg.19.
.
ISSN 2039-9340 Mediterranean Journal of Social Sciences Vol. 4 (1) January 2013
444
The Albanian Constitution creates two systems regarding the relationship between international law and national law39. The first system as it was explained above is based on two basic principles: first on the principle of direct applicability of the ratified international agreements (except for the cases when they are not self-executing and their implementation requires issuance of a law) second on the principle of the superiority of the ratified international agreements over the laws of the country, that are not compatible with them40
The second system is related to the third paragraph of Article 122.
41 , which introduces some special characteristics different from the general system of the relationship between ratified international treaties and national law. This Article provides that norms issued by an international organization can have supremacy over the laws of the country in case of conflict, but with one condition that the ratified agreement for the participation of the Republic of Albania in that organization should provide for the direct effect of the norms issued by that organization. The norms issued by this international organization will have supremacy not only over the national laws, as it was for the international norms of public international law, but they will have supremacy over the laws of the country. From a literal interpretation of Article 122/3, the laws of the country include all internal norms including the constitution itself, so it is understandable supremacy over the Constitution itself and not only over the national laws42
Article 122/3, is not clear as long as it is not implemented in practice and for as long as there is no interpretation by the Constitutional Court. It does not distinguish between international law and EU law. This separation should recognize the specific nature of the EU law. Under these conditions foreign experts, who consider the specific nature of EU law, supported also by Albanian experts, recommend that it would be better to add in the Albanian Constitution appropriate provisions giving EU law legal authority, supremacy and direct effect when possible
.
43. This Article would not change the position held by the Albanian Constitution towards international law in general as it would only provide for the special status of the Community law within the Albanian legal order44
The definition of the relationship between international law and national law in the framework of Albanian’s Euro – Atlantic integration was one of the tasks of the drafters of the constitution. By carefully analyzing the constitutional status of international acts, besides the general standing explained above, there are also so-called specific articles which provide for the participation of Albania in supranational organizations
.
5. Legal effects of the Stabilization and Association Agreement between Albania and EU – Constitutional case law
According to Article 122 of the Albanian Constitution, international agreements ratified by law by the Republic of Albania, are part of the internal legal order, they can have direct effect and they can be applied by the national courts. The supremacy of international law over national laws sanctioned in the Constitution has also been applied in practice. The Albanian Constitutional Court abrogated provisions of the Criminal Code and provisions of the Criminal Military Code which predicted death penalty, in order to comply with Protocol No. 6 of the European Convention on Human Rights. Regarding the European Convention on Human Rights the Constitutional Court has developed a practice according to which it has invalidated Albanian laws contrary to the provisions of the Convention and it has also used decisions of the European Court on Human Rights as an interpretative tool. The Constitutional Court has developed a practice according to which non-conformity of Albanian laws with an international treaty construes a breach of the principle of the rule of law and is contrary to the Constitution.
45. One of this is Article 122/3, mentioned above, according to which norms issued by an international organization can have supremacy over the laws of the country in case of conflict thus, over the Constitution itself and also direct effect. There are authors46
39 Xhezair Zaganjori, Aurela Anastasi, Eralda Cani, “Shteti i se drejtes ne Kushtetuten e Republikes se Shqiperise” (Adelprint 2011) at pg. 60 40 Ibid pg. 60 41Article 122/3 of the Albanian Constitution provides that: “The norms issued by an international organization have superiority, in case of conflict, over the laws of the country if the agreement ratified by the Republic of Albania for its participation in the organization expressly contemplates their direct applicability”. 42 Luan Omari, Aurela Anastasi, “E drejta kushtetuese” (Shtepia Botuese Adelprint 2010) at pg 40 43 Alfred Kellermann, “Impakti i Anetaresimit ne BE ne Rendin e Brendshem Ligjor te Republikes se Shqiperise”, XXXV E Drejta Parlamentare dhe Politikat Ligjore, (2007). at pg. 372 44 Ibid at 372 45 Supra note 43 at pg. 42. 46 Supra note 5 at pg. 353
which think, that regarding the SAA with Albania, Article 122/3 might serve as a constitutional base for the Albanian courts, when giving their decisions about cases for non-compliance by the Government of the standstill provisions provided in the SAA. For example, the
ISSN 2039-9340 Mediterranean Journal of Social Sciences Vol. 4 (1) January 2013
445
Albanian courts can refer directly to the SAA, when Albanian and European companies established in Albania, dispute the correctness of implementation of obligations under SAA regarding custom duties, quantitative restrictions etc. However, during the pre-accession period the Constitutional Court has to interpret the national constitutional provisions regarding the priority of the provisions of the SAA in the Albanian legal order.
After the entrance into force of the SAA, the Albanian Constitutional Court has referred to the provisions of the SAA directly and it has recognized supremacy of its provisions over the national legislation. Case No. 24/2009 47 the Hydrocarbon Companies Association challenged the constitutionality of a Council Ministers Decision concerning the quality standards of gasoil, as a byproduct of crude oil, drilled in the territory of the Republic of Albania and traded for vehicles and generators. The association claimed among others that the above-mentioned decision could not be reconciled with the SAA because it allowed dominant position of a private company in the market regarding products that independently of their origin have the same usage and create the same effects related to the air pollution. The Constitutional Court referred to Article 33 point 248
An important obligation for Albania during the pre-accession period is to adjust to the acquis communautaire. This adjustment is achieved not only by adaptation of compatible legal norms but also by assuring the same application of legal norms in practice. Thus, interpretation of Albanian laws and other acts in the light of EU law can be interpreted as one of the obligations according to the SAA. The Albanian Constitutional Court seems to be willing to interpret national law as far as possible in compliance with EU law. Case No. 3/2010
of the SAA which, according to it, limited the right of the Albanian State to regulate the execution of the freedom of economic activity. The Court furthermore stated that the above-mentioned decision through the exclusion it provided changed the Albanian legislation, by creating a situation which banned imports for a certain product and favored the internal products compared to other products. The Court decided that the decision of Council of the Ministers was not in compliance with the SAA and it was abolished.
49
During the pre-accession period, the effects of the SAA in the Albanian legal order will depend on the interpretation by the Constitutional Court of the constitution regarding the priority of the provisions of the SAA within the Albanian legal order
, concerned the constitutionality of the law “On statutory audit, the organization of the profession of the statutory auditors and chartered accountants” Among others the Professional Organization of the Economist claimed that the abovementioned law created a monopoly position of the statutory audit in the market because there was only one professional association, which grouped the statutory auditors and membership in that professional association was a condition in order to become a statutory auditor. The Constitutional Court ruled based on the Directive 2006/43/EC of the European Parliament and of the Council, of 17 May 2006, “On statutory audits of annual accounts and consolidated accounts”, which obliged the Member States to harmonize their legislation on auditing and auditors with this directive. The Court did a comparative interpretation, pointing out that almost in all Member States of the European Union, and also candidate countries there was one professional association for auditors, which was based on national laws or other national regulatory acts, independently of the fact that, these associations in some countries, based on their tradition, included also chartered accountants. Under this point of view the Court pointed out that there was no monopoly situation, as the law didn’t prevent anybody to take the expert license, it only provided the way this license was approved and its continuous control.
6. Conclusions The EU Association Agreements form an integral part of the EU legal order and their provisions can have direct effect when they contain a clear and precise obligation which is not subject in its implementation or in its effects, to the adaptation of any subsequent measure. Thus, nationals of countries which have signed an Association Agreement with the EU and that agreement has come into power can enforce their rights derived by those agreements before the courts of the EU Member States. The ECJ in many cases related to the EU Association Agreements has had the opportunity to interpret the legal effects of EU Association Agreements. It ruled that provisions on freedom of establishment and free movement of workers create rights for the nationals of the EU Association Agreements countries. Thus, based on the case law regarding the Europe Agreements it can be inferred that also Albanian nationals can enforce their rights derived by the SAA with the EU. Legally employed Albanian workers in one of the EU Member-States shall be free from any form of discrimination based on nationality, regarding working conditions, remuneration, and dismissal compared to the nationals of that Member States. Also self-employed Albanian nationals who legally reside in the territory of the Member States must be treated equally and they cannot be discriminated against because of their nationality.
47 Decisions of the Constitutional Court of the Republic of Albania 2009 published 2010. 48 From the date of entry into force of this Agreement no new quantitative restriction on imports or exports or measure having equivalent effect shall be introduced, nor shall those existing be made more restrictive, in trade between the Community and Albania 49 Decisions of the Albanian Constitutional Court 2010 at pg. 34
ISSN 2039-9340 Mediterranean Journal of Social Sciences Vol. 4 (1) January 2013
446
and on the interpretation given to the objectives of the SAA. It can be inferred from the above-mentioned case law of the Albanian Constitutional Court that it is very willing to refer to the provisions of the SAA directly, after it’s entering into force, and to acknowledge it’s supremacy over national laws. The Albanian Constitutional Court is also willing to interpret Albanian laws in the light of the relevant EU law provisions. Thus, it takes into account one of the obligations under the SAA regarding the approximation of laws. Article 70 of the SAA provides that Albania is under obligation to ensure that existing laws and future legislation should be gradually made compatible with Community acquis. In principle, the Albanian Constitutional Court has used in its reasoning Articles of the SAA and its objectives in order to interpret Albanian law in the light of EU law. Bibliography
Books: Kristaq Traja, “Drejtesia Kushtetuese” Tirane (2000). A. Cassese, “International Law” (2004). Neill Nugent, “The Government and the politics of the European Union” (Duke University Press 2006). Cathrine Barnard, “The substantive law of the EU the four freedoms” (Oxford University Press 2007). Steven Blockmans, “Tough love: the European Union’s relation with the Western Balkans” (T.M.C. Asser Instituut 2007). Aurela Anastasi “E dreja kushtetuese” (Tirane 2008). Luan Omari, “Shteti i se Drejtes”, (Tirane 2008). Paul Craig Grainne De Burca, “EU law text, cases and materials” (Oxford University Press 2008). Luan Omari, Aurela Anastasi, “E drejta kushtetuese” (Shtepia Botuese Adelprint 2010). Xhezair Zaganjori, Aurela Anastasi, Eralda Cani, “Shteti i se drejtes ne Kushtetuten e Republikes se Shqiperise” (Adelprint 2011). Articles: Sokol Sadushi, “Nje Veshtrim i Shkurter per Kontrollin Kushtetues”, II E Drejta Parlamentare dhe Politikat Ligjore, (2001). Ott, Andrea, “The rights of self-employed CEEC citizens in the Member States under the Europe Agreements”, the European Legal
Forum (2001). Kujtim Puto, “Raporti i Gjykates Kushtetuese me gjykatat e juridiksionit te zakoshem”, 12, E drejta Parlamentare dhe Politikat Ligjore
(2002). Ronald Van Ooik, “Freedom of movement of self-employed persons and the Europe Agreements”4, European Journal of Migration and
Law (2002). Sokol Sadushi, “Jurisprudenca e Gjykates Kushtetuese ne frymen e Koneventes Europiane per te Drejtat e Njeriut”, XI, E drejta
Parlamentare dhe Politiokat Ligjore (2003). Xhezair Zaganjori, “Vendi i se Drejtes Nderkombetare ne Kushtetuten e Republikes se Shqiperise”, 2 Jeta Juridike, (2004). Ksenofon Kristafi, “Kushtetuta Shqiptare dhe e Drejta Nderkombetare”, 47 (2) Tribuna Juridike (2004). Hoffmann Judith, “Integrating Albania: The role of the European Union in the Democratization Process” I Albanian Journal of Politics
(2005). Anneli Albi, “Supremacy of EC Law in the New Member States” 3 European Constitutional Law Review, (2007). Alfred Kellermann, “Impakti i Anetaresimit ne BE ne Rendin e Brendshem Ligjor te Republikes se Shqiperise”, XXXV E Drejta
Parlamentare dhe Politikat Ligjore, (2007). Aurela Anastasi, “Internacionalizimi i se Drejtes Kushtetuese Klauzolat Kushtetuese te Integrimit te Shqiperise” 4 Polis, (2008). Alfred Kellermann, “The rights of Non-Member States Nationals under the EU Association Agreements” 3, European Journal of Law
Reform (2008).
ISSN 2039-9340 Mediterranean Journal of Social Sciences Vol. 4 (1) January 2013
447
Competition in Marketing:
Survival Yardstick for Small and Medium Enterprises in Nigeria
O.S. Ibidunni (Ph.D Marketing, Fnimn)
Covenant University, Canaanland, Ota, College of Development Studies,
Department Of Business Studies, Ogun-State, Nigeria. Email address: [email protected], Phone. No. 08033323989
O . J . K . Ogundele, Ph.D
Lagos State University,
Department Of Business Administration and Management Technology, Ojo, Lagos State.
E-mail Address: [email protected], Phone. No. 08055415293
Doi:10.5901/mjss.2013.v4n1p447 Abstract
The study investigated how competition on firms’ life-cycle operations ensures the survival of small and medium enterprises in Nigeria. Relevant models and theories were employed to evolve detailed analysis of issues relating to the variables used in terms of competition in marketing and survival of juice-producing small and medium enterprises. Two hypotheses were investigated through the survey of 20 prominent Ikeja based small and medium enterprises using Cluster sampling. 5-point Likert summated rating scale was adopted, while Yard’s formula with 95% confidence level and 5% error tolerance was used. Alternative form validity of the instrument was measured at 0.63 while its reliability was measured at Cronbach’s alpha of 0.70. Pearson’s product-moment correlation was used in testing hypothesis 1 while standard multiple regressions were used to test hypothesis 2. Findings revealed that there was strong relationship between survival of juice-producing small and medium enterprises with forms of competition on a firm’s life-cycle; while competition had positive effects on survival components for the enterprises. It was concluded that since competition subsists in any firm’s life-cycle, strategies to support operations for survival must be adopted. It was recommended that operators of small and medium enterprises have to monitor and manage competition as it affects their businesses positively and/or negatively.
Key words: Competition in Marketing, Firms’ life-cycle, Survival of small and medium enterprises, Strategies to support operations, Operators of SMEs, Monitor and manage competition.
1. Introduction/Background to the Study Today’s business in any industry in Nigeria is multi-dimensional. According to Okaka, 1990, Ogundele and Opeifa, 2004, Ogujiuba, et al, 2004, Ogundele, 2007, forms of small and medium enterprises include retailing, wholesaling, servicing, agriculture and extractive activities in mining and lumbering. Competition remains a programme to participate in and manage effectively within Nigerian business environment in order for small and medium enterprises to achieve stated and anticipated goals and objectives. With the strength of multinational enterprises operating also, small and medium enterprises in Nigeria have not found it easy facing the fierce competition, hence numerous of them die prematurely. (Okaka, 1990, Ogundele and Opeifa, 2004). Prior to Nigeria’s independence in 1960, multinational enterprises, with the spread of their subsidiaries and other allies, have dominated almost all facets of business in the country. The adoption and usage of improved technology, coupled with the financial and managerial supports from the parent companies enable the multinational enterprises to operate almost freely in the regions of Nigeria. On the contrary, many challenges of the small and medium enterprises emphasized in literature hinder their competitive strength (Beck and Demirguc, 2003, Ayozie, 2006). Akingunola, 1995, Heller, 2002, Ogujiuba, et al, 2004, Amatus, 2007 proclaimed three ways by which small and medium enterprises face competition, the intra-competition, which is competition among the domestic organizations producing similar products, the inter-competition, which is competition between domestic firms and foreign multinational firms operating in the country, and competition between domestic firms and quality imported brands of
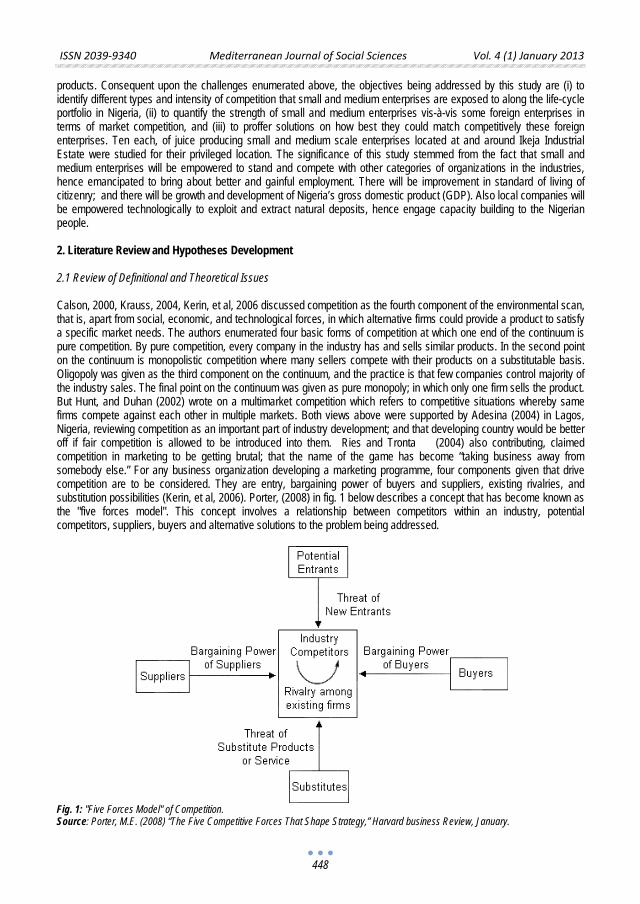
ISSN 2039-9340 Mediterranean Journal of Social Sciences Vol. 4 (1) January 2013
448
products. Consequent upon the challenges enumerated above, the objectives being addressed by this study are (i) to identify different types and intensity of competition that small and medium enterprises are exposed to along the life-cycle portfolio in Nigeria, (ii) to quantify the strength of small and medium enterprises vis-à-vis some foreign enterprises in terms of market competition, and (iii) to proffer solutions on how best they could match competitively these foreign enterprises. Ten each, of juice producing small and medium scale enterprises located at and around Ikeja Industrial Estate were studied for their privileged location. The significance of this study stemmed from the fact that small and medium enterprises will be empowered to stand and compete with other categories of organizations in the industries, hence emancipated to bring about better and gainful employment. There will be improvement in standard of living of citizenry; and there will be growth and development of Nigeria’s gross domestic product (GDP). Also local companies will be empowered technologically to exploit and extract natural deposits, hence engage capacity building to the Nigerian people. 2. Literature Review and Hypotheses Development 2.1 Review of Definitional and Theoretical Issues Calson, 2000, Krauss, 2004, Kerin, et al, 2006 discussed competition as the fourth component of the environmental scan, that is, apart from social, economic, and technological forces, in which alternative firms could provide a product to satisfy a specific market needs. The authors enumerated four basic forms of competition at which one end of the continuum is pure competition. By pure competition, every company in the industry has and sells similar products. In the second point on the continuum is monopolistic competition where many sellers compete with their products on a substitutable basis. Oligopoly was given as the third component on the continuum, and the practice is that few companies control majority of the industry sales. The final point on the continuum was given as pure monopoly; in which only one firm sells the product. But Hunt, and Duhan (2002) wrote on a multimarket competition which refers to competitive situations whereby same firms compete against each other in multiple markets. Both views above were supported by Adesina (2004) in Lagos, Nigeria, reviewing competition as an important part of industry development; and that developing country would be better off if fair competition is allowed to be introduced into them. Ries and Tronta (2004) also contributing, claimed competition in marketing to be getting brutal; that the name of the game has become “taking business away from somebody else.” For any business organization developing a marketing programme, four components given that drive competition are to be considered. They are entry, bargaining power of buyers and suppliers, existing rivalries, and substitution possibilities (Kerin, et al, 2006). Porter, (2008) in fig. 1 below describes a concept that has become known as the "five forces model". This concept involves a relationship between competitors within an industry, potential competitors, suppliers, buyers and alternative solutions to the problem being addressed.
Fig. 1: "Five Forces Model" of Competition. Source: Porter, M.E. (2008) “The Five Competitive Forces That Shape Strategy,” Harvard business Review, January.
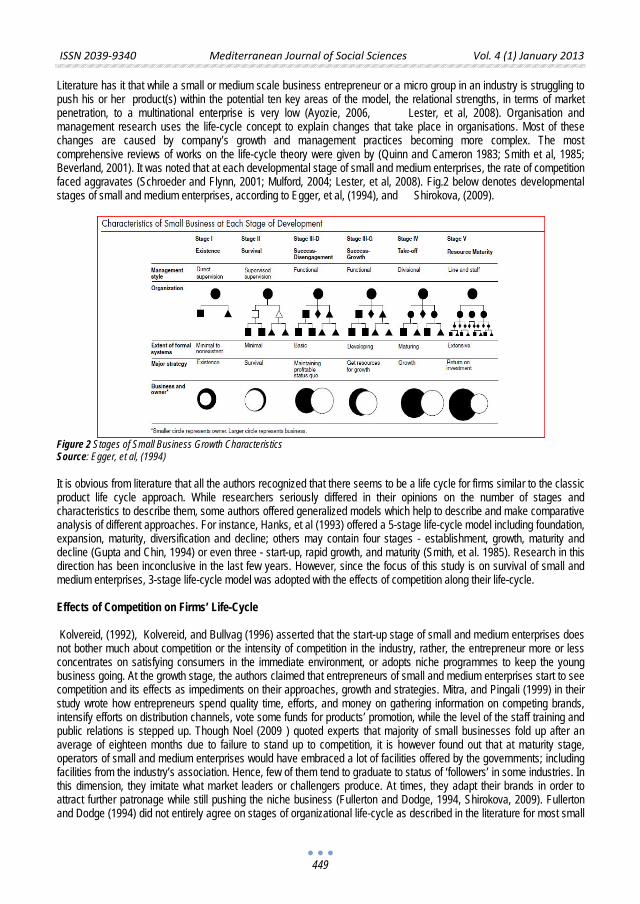
ISSN 2039-9340 Mediterranean Journal of Social Sciences Vol. 4 (1) January 2013
449
Literature has it that while a small or medium scale business entrepreneur or a micro group in an industry is struggling to push his or her product(s) within the potential ten key areas of the model, the relational strengths, in terms of market penetration, to a multinational enterprise is very low (Ayozie, 2006, Lester, et al, 2008). Organisation and management research uses the life-cycle concept to explain changes that take place in organisations. Most of these changes are caused by company’s growth and management practices becoming more complex. The most comprehensive reviews of works on the life-cycle theory were given by (Quinn and Cameron 1983; Smith et al, 1985; Beverland, 2001). It was noted that at each developmental stage of small and medium enterprises, the rate of competition faced aggravates (Schroeder and Flynn, 2001; Mulford, 2004; Lester, et al, 2008). Fig.2 below denotes developmental stages of small and medium enterprises, according to Egger, et al, (1994), and Shirokova, (2009).
Figure 2 Stages of Small Business Growth Characteristics Source: Egger, et al, (1994)
It is obvious from literature that all the authors recognized that there seems to be a life cycle for firms similar to the classic product life cycle approach. While researchers seriously differed in their opinions on the number of stages and characteristics to describe them, some authors offered generalized models which help to describe and make comparative analysis of different approaches. For instance, Hanks, et al (1993) offered a 5-stage life-cycle model including foundation, expansion, maturity, diversification and decline; others may contain four stages - establishment, growth, maturity and decline (Gupta and Chin, 1994) or even three - start-up, rapid growth, and maturity (Smith, et al. 1985). Research in this direction has been inconclusive in the last few years. However, since the focus of this study is on survival of small and medium enterprises, 3-stage life-cycle model was adopted with the effects of competition along their life-cycle. Effects of Competition on Firms’ Life-Cycle Kolvereid, (1992), Kolvereid, and Bullvag (1996) asserted that the start-up stage of small and medium enterprises does not bother much about competition or the intensity of competition in the industry, rather, the entrepreneur more or less concentrates on satisfying consumers in the immediate environment, or adopts niche programmes to keep the young business going. At the growth stage, the authors claimed that entrepreneurs of small and medium enterprises start to see competition and its effects as impediments on their approaches, growth and strategies. Mitra, and Pingali (1999) in their study wrote how entrepreneurs spend quality time, efforts, and money on gathering information on competing brands, intensify efforts on distribution channels, vote some funds for products’ promotion, while the level of the staff training and public relations is stepped up. Though Noel (2009 ) quoted experts that majority of small businesses fold up after an average of eighteen months due to failure to stand up to competition, it is however found out that at maturity stage, operators of small and medium enterprises would have embraced a lot of facilities offered by the governments; including facilities from the industry’s association. Hence, few of them tend to graduate to status of ‘followers’ in some industries. In this dimension, they imitate what market leaders or challengers produce. At times, they adapt their brands in order to attract further patronage while still pushing the niche business (Fullerton and Dodge, 1994, Shirokova, 2009). Fullerton and Dodge (1994) did not entirely agree on stages of organizational life-cycle as described in the literature for most small
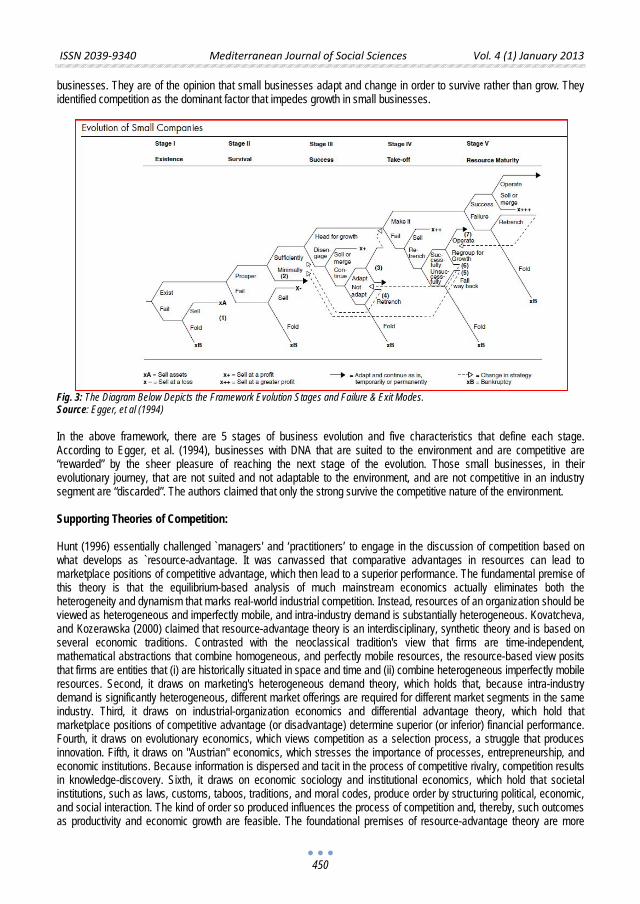
ISSN 2039-9340 Mediterranean Journal of Social Sciences Vol. 4 (1) January 2013
450
businesses. They are of the opinion that small businesses adapt and change in order to survive rather than grow. They identified competition as the dominant factor that impedes growth in small businesses.
Fig. 3: The Diagram Below Depicts the Framework Evolution Stages and Failure & Exit Modes. Source: Egger, et al (1994)
In the above framework, there are 5 stages of business evolution and five characteristics that define each stage. According to Egger, et al. (1994), businesses with DNA that are suited to the environment and are competitive are “rewarded” by the sheer pleasure of reaching the next stage of the evolution. Those small businesses, in their evolutionary journey, that are not suited and not adaptable to the environment, and are not competitive in an industry segment are “discarded”. The authors claimed that only the strong survive the competitive nature of the environment. Supporting Theories of Competition: Hunt (1996) essentially challenged `managers' and ‘practitioners’ to engage in the discussion of competition based on what develops as `resource-advantage. It was canvassed that comparative advantages in resources can lead to marketplace positions of competitive advantage, which then lead to a superior performance. The fundamental premise of this theory is that the equilibrium-based analysis of much mainstream economics actually eliminates both the heterogeneity and dynamism that marks real-world industrial competition. Instead, resources of an organization should be viewed as heterogeneous and imperfectly mobile, and intra-industry demand is substantially heterogeneous. Kovatcheva, and Kozerawska (2000) claimed that resource-advantage theory is an interdisciplinary, synthetic theory and is based on several economic traditions. Contrasted with the neoclassical tradition's view that firms are time-independent, mathematical abstractions that combine homogeneous, and perfectly mobile resources, the resource-based view posits that firms are entities that (i) are historically situated in space and time and (ii) combine heterogeneous imperfectly mobile resources. Second, it draws on marketing's heterogeneous demand theory, which holds that, because intra-industry demand is significantly heterogeneous, different market offerings are required for different market segments in the same industry. Third, it draws on industrial-organization economics and differential advantage theory, which hold that marketplace positions of competitive advantage (or disadvantage) determine superior (or inferior) financial performance. Fourth, it draws on evolutionary economics, which views competition as a selection process, a struggle that produces innovation. Fifth, it draws on "Austrian" economics, which stresses the importance of processes, entrepreneurship, and economic institutions. Because information is dispersed and tacit in the process of competitive rivalry, competition results in knowledge-discovery. Sixth, it draws on economic sociology and institutional economics, which hold that societal institutions, such as laws, customs, taboos, traditions, and moral codes, produce order by structuring political, economic, and social interaction. The kind of order so produced influences the process of competition and, thereby, such outcomes as productivity and economic growth are feasible. The foundational premises of resource-advantage theory are more
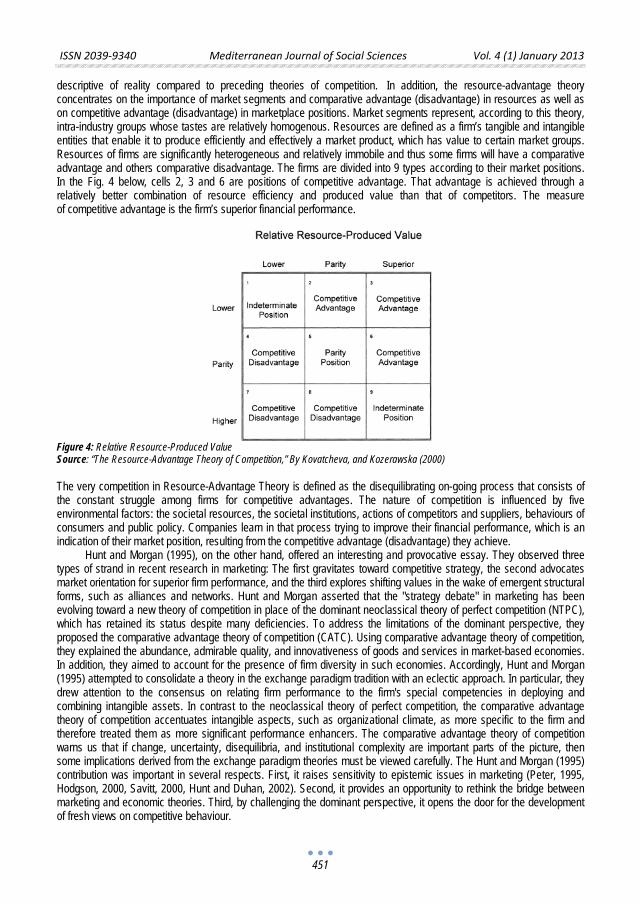
ISSN 2039-9340 Mediterranean Journal of Social Sciences Vol. 4 (1) January 2013
451
descriptive of reality compared to preceding theories of competition. In addition, the resource-advantage theory concentrates on the importance of market segments and comparative advantage (disadvantage) in resources as well as on competitive advantage (disadvantage) in marketplace positions. Market segments represent, according to this theory, intra-industry groups whose tastes are relatively homogenous. Resources are defined as a firm’s tangible and intangible entities that enable it to produce efficiently and effectively a market product, which has value to certain market groups. Resources of firms are significantly heterogeneous and relatively immobile and thus some firms will have a comparative advantage and others comparative disadvantage. The firms are divided into 9 types according to their market positions. In the Fig. 4 below, cells 2, 3 and 6 are positions of competitive advantage. That advantage is achieved through a relatively better combination of resource efficiency and produced value than that of competitors. The measure of competitive advantage is the firm’s superior financial performance.
Figure 4: Relative Resource-Produced Value Source: “The Resource-Advantage Theory of Competition,” By Kovatcheva, and Kozerawska (2000)
The very competition in Resource-Advantage Theory is defined as the disequilibrating on-going process that consists of the constant struggle among firms for competitive advantages. The nature of competition is influenced by five environmental factors: the societal resources, the societal institutions, actions of competitors and suppliers, behaviours of consumers and public policy. Companies learn in that process trying to improve their financial performance, which is an indication of their market position, resulting from the competitive advantage (disadvantage) they achieve.
Hunt and Morgan (1995), on the other hand, offered an interesting and provocative essay. They observed three types of strand in recent research in marketing: The first gravitates toward competitive strategy, the second advocates market orientation for superior firm performance, and the third explores shifting values in the wake of emergent structural forms, such as alliances and networks. Hunt and Morgan asserted that the "strategy debate" in marketing has been evolving toward a new theory of competition in place of the dominant neoclassical theory of perfect competition (NTPC), which has retained its status despite many deficiencies. To address the limitations of the dominant perspective, they proposed the comparative advantage theory of competition (CATC). Using comparative advantage theory of competition, they explained the abundance, admirable quality, and innovativeness of goods and services in market-based economies. In addition, they aimed to account for the presence of firm diversity in such economies. Accordingly, Hunt and Morgan (1995) attempted to consolidate a theory in the exchange paradigm tradition with an eclectic approach. In particular, they drew attention to the consensus on relating firm performance to the firm's special competencies in deploying and combining intangible assets. In contrast to the neoclassical theory of perfect competition, the comparative advantage theory of competition accentuates intangible aspects, such as organizational climate, as more specific to the firm and therefore treated them as more significant performance enhancers. The comparative advantage theory of competition warns us that if change, uncertainty, disequilibria, and institutional complexity are important parts of the picture, then some implications derived from the exchange paradigm theories must be viewed carefully. The Hunt and Morgan (1995) contribution was important in several respects. First, it raises sensitivity to epistemic issues in marketing (Peter, 1995, Hodgson, 2000, Savitt, 2000, Hunt and Duhan, 2002). Second, it provides an opportunity to rethink the bridge between marketing and economic theories. Third, by challenging the dominant perspective, it opens the door for the development of fresh views on competitive behaviour.
ISSN 2039-9340 Mediterranean Journal of Social Sciences Vol. 4 (1) January 2013
452
Hunt and Duhan (2002) propounded the theory of multimarket competition; suggesting that the phenomenon of mutual forbearance may reduce the market-level intensity of competition between two firms when the multimarket contact between them (the number of markets in which they compete) increases. Mutual forbearance, a form of tacit collusion in which firms avoids competitive attacks against those rivals they meet in multiple markets, is proposed to occur because multimarket competition increases the familiarity between firms and their ability to deter each other. In this article, the authors examine how multimarket contact increases familiarity and deterrence. Furthermore, they provide an extension of the theory of multimarket competition by developing a conceptual model that identifies competitive and market factors that moderate the relationship between the degree of multimarket contact and the intensity of competition. The authors also examine the implications of multimarket competition for marketing strategy in the context of two marketing strategy issues: product line rivalry and entry strategy. From the review of literature above the following two hypotheses were formulated for testing and substantiating based on null hypothesis:
(i) Ho: Survival of juice-producing small and medium enterprises does not have relationship with any form of competition on a firm’s life-cycle.
(ii) Ho: Competition does not have positive effects on survival components for juice-producing small and medium enterprises in Nigeria
3. Methodology Both survey and observation methods were used with a well structured questionnaire to elicit information from workers or staffs of small and medium enterprises producing juice-drinks. Cluster sampling was used to choose 20 prominent Ikeja based SMEs by dividing the Lagos finite SMEs population into mutually exclusive clusters, that is, Ikeja, Lagos Island, Lagos Mainland/Surulere, Badagry, Epe, and Ikorodu. Two research administrators holding Ordinary National Diploma in Business Administration were engaged for two weeks to support the effort of the researcher. They were trained on the assignment and fairly gainfully rewarded. 660 copies of questionnaires were administered on a 50:50 ratio basis to the two categories of the enterprise. 474 copies of the questionnaire, representing 71.8% were returned. 276 copies, representing 83.6% were returned by staffs of small scale enterprises while 269 copies, representing 97.5% were eventually used, 7 (2.5%) copies were rejected due to improper filling. On the other hand, 198 copies of the questionnaire representing 60% were returned by staffs of medium scale enterprises. 192 (97%) copies could only be utilized, as 6(3%) copies had to be rejected. In all, 461 (69.85%) respondents had their views utilized for the study. 5-point Likert summated rating scale was adopted. Also Yard’s formula with 95% confidence level and 5% error tolerance was used. Internal consistency implied a high degree of generalization across the items within the measurement. Alternative form validity of the instrument was measured at 0.63 while its reliability was measured at Cronbach’s alpha of 0.70. Pearson’s product-moment correlation was used in testing the stated hypothesis 1 while standard multiple regressions were used to test the stated hypothesis 2. Competition, as a dependent variable (Y), was operationalized to contain pure, monopolistic, oligopoly, pure monopoly, and multimarket types of competition as components. Survival, as an independent variable (X), was operationalized with sales revenue (Sr), profit (Pr), return- on-investment (R.O.I), lower cost (Lc), and loyalty (Loy) as components. 4. Discussion of the Findings: (Theoretical and Empirical) Of the 461copies of the questionnaire used, 258 (56%) respondents were male staff, while 203 (44%) were female staff of small and medium enterprises producing juice-drinks.
452 (98%) respondents expressed the view that juice products of small and medium enterprises sold better under pure competition situation than any form of competition, while 9 (2.0%) respondents were undecided.
305 (66.2%) respondents strongly agreed, 125 (27.1%) agreed, 28 (6.1%) were undecided while only 3 (0.6%) disagreed with the view that small and medium enterprises would have done better in market places if they could have substitute brands of juice products to market.
401 (87.0%) respondents strongly agreed, 55 (11.9%) agreed, 5 (1.1%) were undecided on the views that majority of small and medium enterprises did not have what it takes to control the industry’s sales.
All, 461 (100%) respondents agreed that no small or medium enterprise has been able to dominate sales of the industry’s products.
All, 461 (100%) respondents agreed that juice-drinks producing small and medium enterprises would have been able to sell and dominate markets, local and foreign, but for their low productivity.
ISSN 2039-9340 Mediterranean Journal of Social Sciences Vol. 4 (1) January 2013
453
288 (62.5%) respondents strongly agreed, 116 (25.2%) agreed, 31(6.7%) were undecided, 20 (4.3%) disagreed, while 6 (1.3%) strongly disagreed that same category of small and medium enterprises compete against each other in multiple markets.
337(73.1%) respondents strongly agreed, 117(25.4%) agreed, 2 (0.4%) were undecided while only 5 (1.1%) strongly disagreed with the view that products of small and medium enterprises compete with some products from multinational enterprises on the start-up stage of firms’ life-cycle in Nigerian markets.
26 (4.1%) respondents strongly agreed, 19 (17.0%) agreed, 11 (2.7%) were undecided, 233 (42.5%) disagreed while 172 (33.7%) strongly disagreed that intensive rate of competition does not affect the productivity of small and medium enterprises at the growth stage of firms’ life-cycle.
8 (1.7%) respondents strongly agreed, 13 (2.8%) agreed, 4 (0.9%) were undecided, 192 (41.7%) disagreed while 244 (52.9%) strongly disagreed that very insignificant number of juice producing small and medium enterprises outlive maturity stage of firms’ life-cycle.
447 (98%) respondents strongly agreed expressly, while 14 (2.0%) agreed the view that orientations and training in management and marketing practices will endow small and medium entrepreneurs the skill to effectively manage any form of competition in juice segments of Nigerian market. 5. Testing of Hypotheses 5.1 Hypothesis 1 Ho: Survival of juice producing small and medium enterprises does not have relationship with forms of competition on a firm’s life-cycle.
In order to test for the relationship between survival of juice-producing small and medium enterprises and forms of competition on firm’s life-cycle, Pearson’s product-moment correlation was used. Pure, monopolistic, oligopoly, pure monopoly, and multimarket types of competition are components of Competition, as a dependent variable (Y). On the other hand, sales revenue (Sr), profit (Pr), return- on-investment (R.O.I), lower cost (Lc), and loyalty (Loy) are components of Survival, as an independent variable (X).
Table 4: Descriptive statistics
Mean Std. Deviation N CIM SSMEs
2.2715 2.1968
.48488 .47189
461 461
Source: field Survey, 2010
From table 4 above, for the twenty items represented in the questionnaire, the mean and the standard deviation for competition were 2. 2715, and 2.1968; while the mean and standard deviation for survival of small and medium enterprises were 0.4849, and 0.4719. These signified close relationship between competition and survival variables of the study.
Table 5: Correlations
CIM SSMEs CIM Pearson Correlation Sig.(2-tailed) N SSMEs Pearson correlation Sig. (2-tailed) N
1 461 .931(**) .000 461
.931(**) .000 461 1 461
** Correlation is significant at the 0.01 level (2-tailed). Source: field survey, 2010
Tables 5 above reveals a significant relationship between the dependent and independent variables, and it corroborated the result of the descriptive statistics on table 4 above; as the combined components of competition and survival variables had correlation coefficient of [ r = .931, n = 461, p 0.01] each. Therefore, the correlative relationship that existed between the dependent variable, that is competition, and the independent variable, that is survival of small and medium enterprises indicated that the null hypothesis will not be accepted but the alternative hypothesis accepted. The null hypothesis suggested no relationship between the dependent competition and independent survival variables on firm’s
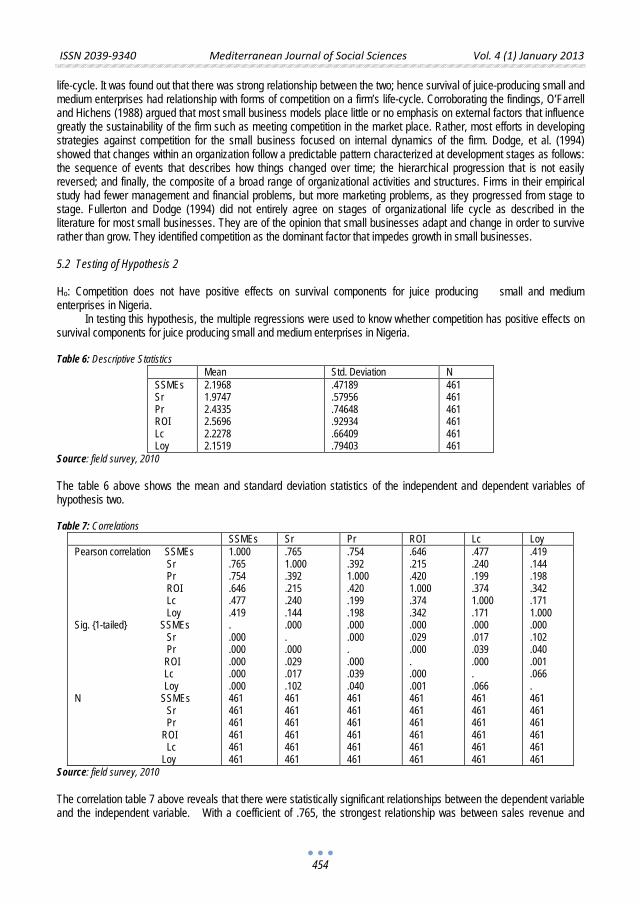
ISSN 2039-9340 Mediterranean Journal of Social Sciences Vol. 4 (1) January 2013
454
life-cycle. It was found out that there was strong relationship between the two; hence survival of juice-producing small and medium enterprises had relationship with forms of competition on a firm’s life-cycle. Corroborating the findings, O’Farrell and Hichens (1988) argued that most small business models place little or no emphasis on external factors that influence greatly the sustainability of the firm such as meeting competition in the market place. Rather, most efforts in developing strategies against competition for the small business focused on internal dynamics of the firm. Dodge, et al. (1994) showed that changes within an organization follow a predictable pattern characterized at development stages as follows: the sequence of events that describes how things changed over time; the hierarchical progression that is not easily reversed; and finally, the composite of a broad range of organizational activities and structures. Firms in their empirical study had fewer management and financial problems, but more marketing problems, as they progressed from stage to stage. Fullerton and Dodge (1994) did not entirely agree on stages of organizational life cycle as described in the literature for most small businesses. They are of the opinion that small businesses adapt and change in order to survive rather than grow. They identified competition as the dominant factor that impedes growth in small businesses. 5.2 Testing of Hypothesis 2 Ho: Competition does not have positive effects on survival components for juice producing small and medium enterprises in Nigeria.
In testing this hypothesis, the multiple regressions were used to know whether competition has positive effects on survival components for juice producing small and medium enterprises in Nigeria.
Table 6: Descriptive Statistics
Mean Std. Deviation N SSMEs Sr Pr ROI Lc Loy
2.1968 1.9747 2.4335 2.5696 2.2278 2.1519
.47189
.57956
.74648
.92934
.66409
.79403
461 461 461 461 461 461
Source: field survey, 2010
The table 6 above shows the mean and standard deviation statistics of the independent and dependent variables of hypothesis two. Table 7: Correlations
SSMEs Sr Pr ROI Lc Loy Pearson correlation SSMEs Sr Pr ROI Lc Loy Sig. {1-tailed} SSMEs Sr Pr ROI Lc Loy N SSMEs Sr Pr ROI Lc Loy
1.000 .765 .754 .646 .477 .419 . .000 .000 .000 .000 .000 461 461 461 461 461 461
.765 1.000 .392 .215 .240 .144 .000 . .000 .029 .017 .102 461 461 461 461 461 461
.754
.392 1.000 .420 .199 .198 .000 .000 . .000 .039 .040 461 461 461 461 461 461
.646
.215
.420 1.000 .374 .342 .000 .029 .000 . .000 .001 461 461 461 461 461 461
.477
.240
.199
.374 1.000 .171 .000 .017 .039 .000 . .066 461 461 461 461 461 461
.419
.144
.198
.342
.171 1.000 .000 .102 .040 .001 .066 . 461 461 461 461 461 461
Source: field survey, 2010
The correlation table 7 above reveals that there were statistically significant relationships between the dependent variable and the independent variable. With a coefficient of .765, the strongest relationship was between sales revenue and
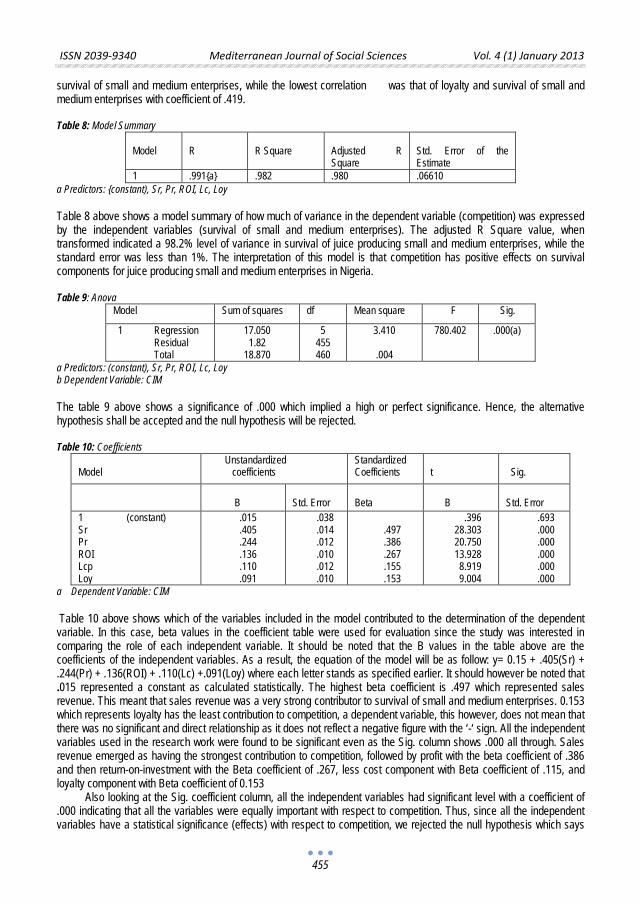
ISSN 2039-9340 Mediterranean Journal of Social Sciences Vol. 4 (1) January 2013
455
survival of small and medium enterprises, while the lowest correlation was that of loyalty and survival of small and medium enterprises with coefficient of .419.
Table 8: Model Summary
Model
R
R Square
Adjusted R Square
Std. Error of the Estimate
1 .991{a} .982 .980 .06610 a Predictors: {constant), Sr, Pr, ROI, Lc, Loy
Table 8 above shows a model summary of how much of variance in the dependent variable (competition) was expressed by the independent variables (survival of small and medium enterprises). The adjusted R Square value, when transformed indicated a 98.2% level of variance in survival of juice producing small and medium enterprises, while the standard error was less than 1%. The interpretation of this model is that competition has positive effects on survival components for juice producing small and medium enterprises in Nigeria.
Table 9: Anova
Model Sum of squares df Mean square F Sig.
1 Regression Residual Total
17.050 1.82
18.870
5 455 460
3.410
.004
780.402 .000(a)
a Predictors: (constant), Sr, Pr, ROI, Lc, Loy b Dependent Variable: CIM
The table 9 above shows a significance of .000 which implied a high or perfect significance. Hence, the alternative hypothesis shall be accepted and the null hypothesis will be rejected.
Table 10: Coefficients
Model
Unstandardized coefficients
Standardized Coefficients
t
Sig.
B
Std. Error
Beta
B
Std. Error
1 (constant) Sr Pr ROI Lcp Loy
.015 .405 .244 .136 .110 .091
.038 .014 .012 .010 .012 .010
.497 .386 .267 .155 .153
.396 28.303 20.750 13.928 8.919 9.004
.693 .000 .000 .000 .000 .000
a Dependent Variable: CIM
Table 10 above shows which of the variables included in the model contributed to the determination of the dependent variable. In this case, beta values in the coefficient table were used for evaluation since the study was interested in comparing the role of each independent variable. It should be noted that the B values in the table above are the coefficients of the independent variables. As a result, the equation of the model will be as follow: y= 0.15 + .405(Sr) + .244(Pr) + .136(ROI) + .110(Lc) +.091(Loy) where each letter stands as specified earlier. It should however be noted that .015 represented a constant as calculated statistically. The highest beta coefficient is .497 which represented sales revenue. This meant that sales revenue was a very strong contributor to survival of small and medium enterprises. 0.153 which represents loyalty has the least contribution to competition, a dependent variable, this however, does not mean that there was no significant and direct relationship as it does not reflect a negative figure with the ‘-‘ sign. All the independent variables used in the research work were found to be significant even as the Sig. column shows .000 all through. Sales revenue emerged as having the strongest contribution to competition, followed by profit with the beta coefficient of .386 and then return-on-investment with the Beta coefficient of .267, less cost component with Beta coefficient of .115, and loyalty component with Beta coefficient of 0.153
Also looking at the Sig. coefficient column, all the independent variables had significant level with a coefficient of .000 indicating that all the variables were equally important with respect to competition. Thus, since all the independent variables have a statistical significance (effects) with respect to competition, we rejected the null hypothesis which says
ISSN 2039-9340 Mediterranean Journal of Social Sciences Vol. 4 (1) January 2013
456
that competition does not have positive effects on survival components for juice producing small and medium enterprises in Nigeria, and accepted the alternative view that competition has positive effects on survival components for small and medium enterprises in Nigeria. The regression analysis however gave an equation for the model in other to predict the gravity of competition which was outside the scope of this study. Andretsch, Clarysse, and Duchene (2000) expressed, at a Conference of Ministers responsible for small and medium enterprises, the ability of small and medium enterprises to create, access, and commercialize new knowledge on global markets to be fundamental to their sustained competitiveness. The survival moves identified some principle strategies small and medium enterprises have pursued on their own, which included: the innovation strategy, in which small and medium enterprises try to appropriate returns from their knowledge base(which may or may not involve own investments in research and development. The information technology strategy makes innovative uses of information technology, in order to reduce enterprises’ costs and increase productivity. The niche strategy is chosen by the enterprises to become sophisticated global players in a narrow product line. The network strategy, in which small and medium enterprises work and co-operate with other firms, be they small and medium enterprises or large enterprises in order to improve their ability to access and absorb innovations. The cluster strategy, in which small and medium enterprises locate in close proximity with competitors in order to take advantage of knowledge spill-over's, especially in the early stages of the industrial life-cycle. However, Andretsch, Clarysse, and Duchene (2000) emphasized that both scale economies and research and development have become more important instruments for competitiveness in the global economy. Since small and medium enterprises seem to be at a disadvantage for both these factors, many experts predicted their demise in terms of competitiveness as globalization increases. While many small and medium enterprises have indeed succumbed to a deterioration of competitiveness, others have found ways to actually enhance their positions in global markets. The actual record of the competitiveness of small and medium enterprises in the Organization of Economic Co-operation and Development countries has been heterogeneous and complex due to their sheer numbers, which span a broad range of economic activities in a disparate set of industries across different countries.
6. Concluding Remarks and Implications of the Study
1. From the findings, it was evident that competition subsists in any industry; not only in Nigeria, also globally and it bites hard in terms of loss of revenue, profits, and return-on-investment on any business organization that does not have the strategies to support its operations.
2. Every business organization goes through life-cycle. Small and medium enterprises in Nigeria have to monitor and manage the rate at which competition affects their businesses positively and/or negatively.
3. Operators of small and medium enterprises in Nigeria need to be trained to understand different forms of competition available so as to be able to determine the required strategies adoptable for survival of particular business enterprise.
4. So far, majority of small and medium enterprises in Nigeria have businesses operating within pure and multimarket forms of competition, Nigerian governments should assist the operators, through their agents, to technologically tap agricultural and mineral resources which would give Nigerian entrepreneurs opportunity and privilege to produce goods that can operate on monopolistic, oligopoly and pure monopoly forms of competition. By this, the dominant structure of the multinational enterprises in Nigerian industries will subside or reduce.
5. Since competition is pre-requisite to survival of small and medium enterprises, Nigerian entrepreneurs should hold it as a ‘factor’ among other factors of consideration during planning and operational stages of business.
6. Consequently, there will be reduction in high mortality rate of small and medium enterprises in Nigeria, instead SMEs will grow and outlive the founding entrepreneurs.
References Adesina, K. (2004) “Competition is Key in the Market, Marketing Edge, Vol.1, No. 2, p.24 Akingunola, R. O. (1995) Financial of Small and Medium Scale Enterprises Through Equity Sources, in Ojo, A. T. (ed) Management of
Small and Medium Scale Enterprises in Nigeria, pp. 87-94. Pumark Nigeria, Lagos. Amatus, A. (2007) “ This Man Invented a Formula For Wealth Creation,” Daily Sun, Monday, March 12, p.16. Audretsch, D, Clarysse, B, and Duchêne, V. (2000) “Enhancing Competitiveness of Small and Medium Enterprises Through Innovation.”
Conference of Ministers Responsible for Small and Medium Enterprises; and Industry Ministers, Bologna, Italy, pp.14-15, June. Ayozie, O, D. (2006) “The Role of Small Scale Industry in National Development in Nigeria,” Association of Small Business and
Entrepreneurship 32nd Annual Conference, pp. 2-5, http://www.scribd.com/doc/23665278/
ISSN 2039-9340 Mediterranean Journal of Social Sciences Vol. 4 (1) January 2013
457
Beck, T and Demirguc, K. (2003) “Small and Medium Enterprises, Growth and Poverty” World Bank Public Policy For Private Sector, Note 268
Beverland, M. (2001) “Organizational Life Cycles in Small New Zealand Wineries,” Journal of Small Business Management, Vol. 12, No. 3, p. 5, Monday, October 1
Calson, D. (2000) “ The Old Economy in the New Economy,” Business Week, November 13, p. 42H. Fullerton, S, Dodge, H, and Robbins, J. (1994)."Stage of the Organizational Life -Cycle and Competition as Mediators of Problem
Perception for Small Businesses." Strategic Management Journal, Vol, 15, pp. 121-134, February Eggers, J.H, Leahy, K.T, and Churchill, N.C.(1994), “Stages of Small Business Growth Revisited: Insights into Growth Path and
Leadership/Management Skills in Low- and High-Growth Companies,’’ Journal of Humanities, Psychology and Social Science, Vol. 5, No. 4, pp. 110-119.
Gupta, Y. P, and Chin, D. W (1994) “Organizational Life-cycle: A Review and Proposed Directions,” The Mid-Atlantic Journal of Business, South Orange, Vol. 4, No. 3, pp. 71-83, December.
Hanks, S, Watson, C, Jansen, E, and Chandler, G. (1993)"Tightening the Life-Cycle Construct: A Taxonomic Study of Growth Stage Configurations in High-Technology Organizations," Entrepreneurship Theory and Practice, Vol. 18, No. 2, pp. 5-19, Winter.
Heller, R. (2002) “Assessing Your Entrepreneurship Profile; Do You Have What It Takes?” Business The Ultimate Resource TM, Bloomsbury Reference Book, pp. 818-819, London.
Hodgson, G. M. (2000) ”The Marketing of Wisdom: Resource-Advantage Theory, Journal of Macromarketing, Vol.20, Issue 1, pp. 16-27, June.
Hunt, S. D, and Morgan, R. M (1995)“The Comparative Advantage Theory of Competition,” Journal of Marketing, Vol. 14, No. 3, pp. 1-12, April.
Hunt, S. D. (1996) “The Resource-Advantage Theory of Competition: Dynamics, Path Dependencies, and Evolutionary Dimensions,” The Journal of Marketing, American Marketing Association, Vol. 60, No. 4, Oct., pp. 107-114 , Stable URL: http://www.jstor.org/stable/1251905
Hunt, S. D, and Duhan, D. F. (2002) ”Competition in the Third Millenium: Efficiency or Effectiveness?, Journal of Business Research Vol.55, issue 2, , pp. 97-102, February.
Kerin, R. A, Hartley, S. W, Berkowitz, E. N, and Rudelins, W. (2006) Marketing, 8th Edition, Mc Graw- Hill, Irwin, New York. Kolvereid, L. (1992). "Growth Aspirations among Norwegian Entrepreneurs," Journal of Business Venturing, Volume 7, Issue 3, May
1992, pp. 209-222 Kolvereid, L., and Bullvag, E (1996). "Growth Intentions and Actual Growth: The Impact of Entrepreneurial Choice," Journal of
Enterprising Culture, Vol. 4. No.1, pp. 1-17. Kovatcheva, . Elizabeth, and Kozerawska, Anna (2000) “Marketing of Wisdom: Resource-Advantage Theory, Journal of
Macromarketing, Vol.20, Issue 1, June www.pafis.shh.fi/~elikov02/Case_1/RAtheory.html Krauss, Machael (2004) “Young Net Entrepreneurs Leverage Web Anew,” Marketing News, p.4, Feb. 1 Lester, Donald L, and Tran, Thuhang T (2008) “Organizational Life-cycle and Performance Among Small and Medium Enterprises:
Generic Strategies For High and Low Performers,” International Journal of Commerce and Management, Vol. 1, pp. 4-7, December.
Mitra, R., and Pingali, V. (1999). "Analysis of Growth Stages in Small Firms: A Case Study of Automobile Ancillaries in India," Journal of Small Business Management, Vol. 37, No. 3, pp. 43-61.
Mulford, Brooke, (2004) “Let All the Competition Eat Their Hearts Out”! sbynews.blogspot.com/2009/11/brooke-mulford-update_13.html, pp. 1-6
Noel, Jones (2009) “Small and Medium Enterprises’ Life-Cycle: Steps to Failure or Success? www.moyak.com/papers/small-medium-enterprises.pdf, pp. 11-14, June 2
O’Farrell, P. N, and Hitchen, D. M. (1988) “Alternative Theories of Small Firms’ Growth: A Critical Review,” Environmental and Planning, Vol. 20, No.2, pp. 1365-1383.
Ogujiuba, K. K, Ohuche, F. K, and Adenuga, A. O. (2004) “Credit Availability to Small and MediumScale Enterprises in Nigeria: Importance of New Capital Base For Banks,” Background and Issues Bullion: Central Bank of Nigeria, Vol. 28, No.4, pp.57-68.
Ogundele, O. J. K, and Opeifa, A. Z. (2004) “The Influence of External Political Environment On the Processes of Entrepreneurship,” The Nigerian Academic Forum: A Multidisciplinary Journal, Vol.7, No. 5, p. 7, October.
Ogundele, O. J. K. (2007) Introduction to Entrepreneurship Development, Corporate Governance and Small Business Management, Molofin Nominees, Lagos.
Okaka, P. O. (1990) “Entrepreneurship Development Programme in Kenya” Directorate of Technical Training and Applied Technology, pp. 8-10, July.
Peters, Tom. (1995) "New Products, New Markets, New Competition, New Thinking," The Economist, Vol. 4, March, pp. 27-32. Porter, M.E. (2008) “The Five Competitive Forces That Shape Strategy,” Harvard business Review, January. Quinn, R., and K. Cameron,( 1983) "Organizational Life Cycles and Shifting Criteria of Effectiveness: Some Preliminary Evidence."
Management Science, January. Ries, Al, and Trout, Jack. (2004) Marketing Warfare, Washington, Bjoern, September, 22 http://blogcritics.org/books/article/al-ries-
jack-trout-marketing-warfare/#ixzz2MSh5FsCn Free Press. Savitt, Ronald (2000) ”A Philosophical Essay About a General Theory of Competition: Resources, Competencies, Productivity,
Economic Growth,” Journal of Macromarketing, Vol. 20, Issue 1, pp. 73-76, June. Schroeder, Roger G, and. Flynn, Barbara B, (2001) High Performance Manufacturing: Global
Perspectives, http://books.google.com.ng/books?id=XWrt4dN7U5IC&pg=PA278&l

ISSN 2039-9340 Mediterranean Journal of Social Sciences Vol. 4 (1) January 2013
458
Shirokova, Galina (2009) “Organizational life-cycle: The Characteristics of Developmental Stages in Russian companies,” Journal for East European Management Studies.
Smith, K, Mitchell, T, and Summer, C. (1985) "Top Level Management Priorities in Different Stages of the Organizational Life Cycle," Academy of Management Journal. December.
ISSN 2039-9340 Mediterranean Journal of Social Sciences Vol. 4 (1) January 2013
459
The Impact of Direct and Indirect Experience of Insurance Services
on Customer-Based Brand Equity Some Research Questions and Implications
Hassan, Ghorbani
Department of Management and Accounting, Islamic Azad University
Mobarakeh Branch, Isfahan, Iran E-mail: [email protected]
Seyedeh Masoomeh, Abdollahi (corresponding author)
Department of management, University of Isfahan, Hezarjerib Street, Isfahan, Iran
E-mail: [email protected]
Mohammad Reza, Dalvi Esfahan
Department of management, Islamic Azad University Dehaghan Branch, Isfahan, Iran
[email protected] Doi:10.5901/mjss.2013.v4n1p459 Abstract
Brand equity has been introduced as a key issue in marketing. A crucial communication task for unknown brands is to build the brand knowledge in consumers’ minds necessary to become established. This study explores the way in which brand equity and quality of experience are developed in insurance industry from customer's perspective, providing a conceptual framework. The statistical population consists of customers who have used services offered by Parsian Insurance Company's branches in Isfahan city. Random sampling method has been applied to select the appropriate sample. The examinations were done through 185 available questionnaires. In order to test the conceptual model, structural equations' model (SEM) has been used. Results based on SEM outputs demonstrate acceptance and confirmation of all studied factors. These findings indicate that advertising spend, word of mouth and service performance have a positive impact on quality of experience, while monetary promotion influence the dependent variable negatively. Quality of experience also has a positive relation with overall brand equity.
Keywords: Brand equity, Quality of experience, advertising spend, service performance, word of mouth (WoM).
1. Introduction
Building a strong brand in a marketplace is the goal of every organization. Strong brand names provide a host of benefits for firms, including less vulnerability to competitive marketing actions, greater intermediary cooperation and support, larger margins, and brand extension opportunities (Ballester & Aleman, 2005). Most marketing activities work, successfully or unsuccessfully, to build, manage, and expand brand equity (Yoo et.al, 2000). Since the late 1980s, brand equity has been one of the most important marketing concepts in both academia and practice. This concept has interested academics and practitioners for more than a decade primarily due to the importance in today's marketplace of building, maintaining and using brands to obtain strategic advantage (Erdem et.al, 1999). Branding has been emerged as a top management priority in the last decade due to the growing realization that brands are one of the most valuable intangible assets that firms have (Keller & Lehman, 2006). However, while brand equity associated with tangible goods has gained a great deal of attention in the literature, a basic understanding of the nature of brand equity for services has yet to emerge. Most of what is known about brand equity for services is based on theoretical or anecdotal evidence (Krishnan & Hortlin, 2001), whereas, today service organizations are increasingly extending their activities in different areas. Insurance industry is one of these areas in which brand names play a prominent role. Not surprisingly, the role of
ISSN 2039-9340 Mediterranean Journal of Social Sciences Vol. 4 (1) January 2013
460
brand considerations and relationship marketing in financial service marketplaces is growing in importance (Colosi, 2005). Service marketers’ understanding of how to measure and manage brand power has occurred primarily through the investigation of brand equity (Taylor et.al, 2007). The belief that brand equity is an important consideration for service marketers and should therefore be managed as an asset is well supported by the literature (Davis, 2000). Despite the importance of managing brand equity in both products and services, there is a difference between these areas. Service brands are particularly different due to service characteristics which are different from those of physical goods and that they rely on employees’ actions and attitudes (Blankson & Kalafatis, 1999). This difference is based on the belief that services are conceptually different from products in that services are seen to have a number of unique characteristics including intangibility, inseparability of production and consumption, heterogeneity of quality and perishability and insurance organizations share the same characteristics applicable to the services (Kayaman & Arasil, 2007). How brand equity operates is one of the most interesting questions academics have tried to explain. The belief that one of the most important aspects of assessing service organizations such as insurance organizations is the quality of provided services highlights the importance of determining factors affecting quality of experience perceived by consumers and the impact of this perception on brand knowledge and brand equity.
2. Literature Review 2.1 Brand equity
In the past decade, researchers have paid more attention to the issue of brand equity, since a strong brand provides added value to company's products and makes it different from its competitors. Scholars have presented different definitions for the concept of brand equity. According to Farquhar (1989) brand equity is the value endowed by the brand to the product or service. Aaker (1991) also has defined brand equity as "a set of brand assets and liabilities linked to a brand, its name and symbol, that add to or subtract from the value provided by a product or service to a firm and/or to that firm’s customers". Keller (1993) provided a new definition for bran equity as "the differential effect of brand knowledge on the consumer response to the marketing of the brand". Finally, Kotler (1997) has proposed a more comprehensive definition for brand equity by explaining it as "a name, term, sign, symbol or design, or a combination of them which is intended to identify the goods and services of one seller or a group of sellers and to differentiate them from those of competitors". Brand equity is the incremental utility gained by a product or service by virtue of its brand name (Ranjbarian et.al, 2011). Collectively, brand equity consists of four dimensions: brand loyalty, brand awareness, perceived quality of brand, and brand associations, as proposed by marketing researchers Aaker (1996) and Keller (1993). These assets provide value to the customer as well as to the firm. They improve the firm's efficiency via reducing marketing costs and raising prices and margins. From consumer's point of view, they help a consumer to interpret and process information about the product and also affect the customer's confidence in the purchase decision (Fernandez-Barcala & Gonzalez-Diaz, 2006). Elements of a brand's equity positively influence consumers' perceptions and subsequent brand buying behaviors (Reynolds & Philips, 2006). Brands serve several valuable functions. At their most basic level, brands serve as markers for the offerings of a firm. For customers, brands can simplify choice, promise a particular quality level, reduce risk, and/or engender trust. Brands are built on the product itself, the accompanying marketing activity, and the use by customers as well as others (Keller & Lehman, 2006). In recognition of the value of brands as intangible assets, the emphasis has been placed increasingly on understanding how to build, measure, and manage brand equity (Kapferer, 2005). In the service industry, brand management requires brand managers to take a holistic view of the brand that transcends beyond the marketing and service function and makes it a rallying cry for the firm (Smith et.al, 2004). Academics have introduced three principal and distinct perspectives to study brand equity: 1) customer based, 2) company based and 3) financial based brand equity (Keller & Lehman, 2006). However, one of the most important roles played by brands is their effect on consumer brand choice and consideration (Erdem & Swait, 2004). Researchers believe that branding plays a special role in service companies because strong brands increase customer's trust of the invisible, enabling them to better visualise and understand the intangible side of the product and services. Moreover, they reduce customer's perceived financial, social or safety risk in buying services, helping them optimize their cognitive processing abilities (Kayaman & Arasil, 2007; Berry, 2000). The most prominent factor distinguishing between products and services is tangibility. In other words, intangible aspect of services causes assessing service organizations to be different from other firms. As noted in previous part, service brands are particularly different due to service characteristics which are different from those of physical goods and that they rely on employees’ actions and attitudes. Therefore, some intangible sides of a brand name should be considered in order to measure brand equity in service organizations. The concept and measurement of brand equity in insurance industry has been focused by academicians, practitioners, and researchers in recent years. As noted above there are a variety of reasons cited in the literature for the growth of
ISSN 2039-9340 Mediterranean Journal of Social Sciences Vol. 4 (1) January 2013
461
branding within the insurance industry. To increase the likelihood of positive contributions of the overall brand equity and manage brands properly, companies need to develop strategies which encourage the growth of brand equity (Keller, 2007). In other words, it is important for the firms to know the factors by which brand equity can be achieved and used towards goal achieving and enhancing their status among rivals and external environment.
2.2 Quality of experience
The importance of quality of experience is increasingly considered in today's world (Xu & Chan, 2010), whereas previous studies focusing on brand equity have not paid sufficient attention to this concept. In fact, the emphasis is only placed on service performance and delivery in the service industry which obscures the importance of experience in conveying the contemporary concept of a brand and service to the consuming public (Xu & Chan, 2010). It means that the customer experience has been underscored in academia and is considered to be closely affiliated with brand management (Cai & Hobson, 2004; Pine & Gilmor, 1999). Experience economy is a new kind of emerging economy in which increasing numbers of industrial practitioners find out the importance of capitalizing on the customer experience (Xu & Chan, 2010). Service quality is one of the antecedents of brand equity (Lee & Back, 2008) and its role is highlighted in service organizations including insurance industry. Service quality is widely known to involve five dimensions: reliability, assurance, responsiveness, empathy, and tangibles (Lee & Back). While the brand equity from the customer perspective has been ever-increasingly discussed in the past research, the focus on the experiential aspect of service and brand consumption remains to be scant. What leads a service company to success is the service quality perceived by customers and it is the key leading to customer based brand equity. It means that what is experienced by customers about different service quality dimensions when dealing with a service company plays a prominent role in brand image and in turn brand equity stamped on their memories. Therefore, a superior and profitable brand in today’s service-dominated competitive environment delivers quality of experience rather than quality of service (Klaus & Maklan, 2007). Experiential brand attributes have been highlighted due to their importance in representing emotional and subjective quality of experiences. Creating value-added experiences for customers is viewed as a pivotal issue in managing the customer-brand relationship, particularly in service-dominant industries, whereas, few empirical studies have investigated the way in which experiences play a role in establishing brand equity (Xu & Chan, 2010). Customers have two alternative ways of seeking information about the quality of goods: one is to search external sources, and the other is to rely on personal experience (Fodness & Murray, 1998). Xu and Chan (2010) believe that brands are no exception. In fact, they argue that every brand contains both search and experience attributes. The quest for search attribute information can occur prior to a purchase, whereas experience attribute information can only be obtained after consumption of the brand (Xu & Chan, 2010). Therefore, the first hypothesis of the research is presented as: H1: There is a relationship between quality of experience and overall brand equity.
2.3 Advertising Spend
Customers find information about through both external and internal information searches (Gursay & McCleary, 2004) that together form their overall brand equity judgment and brand choice (Xu & Chan, 2010). In service organizations the customer based brand equity is the result of both customers' direct experience which is generated by service performance and indirect experience which originates in advertising and WoM (Xu & Chan, 2010). Advertising is one of the most visible marketing activities. Researchers claim that advertising is successful in building consumer-based brand equity, having a sustainable and accumulative effect on this asset. Advertising is a powerful way of communicating a brand's functional and emotional values (Buil et.al, 2011). Advertising can link strong and favorable associations to the brand in consumers' memory, and elicits positive brand judgments and feelings in their minds (Keller, 2007). It arouses brand awareness and imparts both search and experiential brand image (Xu & Chan, 2010). However, all of these desirable effects depend on both the amount invested and the types of messages communicated (Martinez et.al, 2009). In fact, advertising needs a suitable design and execution, thus one of the main concerns devising an advertising strategy relates to the creative strategy (Keller, 2007). A number of scholars have investigated how actual and perceived advertising spend influences brand equity and its dimensions (Yoo et.al, 2000; Villarejo & Sanchez, 2005; Bravo et.al, 2007; Buil et.al, 2011) and have found positive relationships between advertising spend and brand equity. They conclude that perceptions of high advertising spend contribute to developing a more positive perception of brand quality, higher brand awareness and stronger brand associations (Yoo et.al, 2000). Rao and Monroe (1989) claimed that advertising expenditure influences brand equity dimensions in several ways. Perceived advertising spend is an extrinsic quality cue that consumers use when judging the product's quality (Buil et.al, 2011). Moreover, large advertising investments favor
ISSN 2039-9340 Mediterranean Journal of Social Sciences Vol. 4 (1) January 2013
462
brand recall and recognition and can increase the scope and frequency of brand appearance and in turn, the level of brand awareness (Keller, 2007). Several studies proved positive relations between perceived advertising spend and perceived quality (Buil et.al, 2011) and consumers generally perceive highly advertised brands as higher quality brands (Bravo et.al, 2007). Therefore, the relationship between advertising spend and quality of experience is predicted as: H2: Advertising spend perceived by customers influences quality of experience positively.
2.4 Word of Mouth (WoM)
Companies interact with their customers through different channels and use several marketing communications to introduce products. WoM does not belong to any of the traditional types of marketing communication implemented by companies. WoM stems from loyal customers who are committed to a brand and then act as an alternative source of information to help others making brand decisions. It is considered to be more trustworthy, as it is not perceived as marketing, and it most often comes from relatives or friends who have close relationships with the recipients of the information (Derbaix & Vanhamme, 2003). Companies try to create paradigms through which customers exchange ideas and share experiences and to nurture loyal customers for potential WoM communications (Xu & Chan, 2010). However, beside positive consequences WoM can also lead to negative results when dissatisfied customers share their problems with the product or service with others. Favorable WoM increases purchase probability for decision makers, whereas negative WoM engenders the dissemination of complaints and thus has an opposite effect (Litvin et.al, 2008). In the service industry, customers rely dramatically on WoM messages, either positive or negative, to evaluate a service brand (Litvin et.al, 2008). Researchers suggest that positive WoM messages could affect perception of customers about quality of experience and also brand equity positively (Xu & Chan, 2010). All these arguments lead to the following hypothesis: H3: WoM influences quality of experience in a positive way.
2.5 Monetary Promotions
Sales promotions are another key marketing tools in communication programs which can influence brand equity (Vallete et.al, 2011). Companies use different types of monetary promotions such as price discounts and coupons to influence their customers. It can be fruitful in short term success whereas the empirical evidence suggests that monetary promotions have a negative impact on brand equity (Yoo et.al, 2000). Buil, Chernatony and Martinez (2011) believe that monetary promotions are likely to have a negative influence on perceived quality focusing on the direct effects on brand equity dimensions. One of the main reasons why monetary promotions influence perceived quality negatively is the reduction in the internal reference price because consumers use price as an extrinsic cueinfer product quality (Agarwal & Teas, 2002), therefore, the influence of price discounting on consumers' reference price can lead to unfavorable quality evaluations by them (Buil et.al, 2011). Since frequent use of price promotions leads customers to think primarily about price, and not about the brand, researchers claimed that this tool has a negative impact on perceived quality (Yoo et.al, 2000). According to what is mentioned the fourth hypothesis of the study stated: H4: Monetary promotions have a negative influence on quality of experience.
2.6 Service Performance
As noted earlier advertising activities, WoM and monetary promotions make an indirect experience which can contribute to enhance experienced service quality and as a consequence high levels of brand equity. However, it is not the only way of achieving this desire. In addition to indirect experience which is obtained from companies' activities, customer usually rely on their direct experience own direct experience to evaluate goods and services (Hoch, 2002). Customers with no knowledge or with self-complacence prefer to first check their own stock of internal information (Xu & Chan, 2010). This is even more important in service industries due to their intangible components. Service performance is considered to comprise three dimensions including: 1) interaction between service providers and consumers, 2) the physical environment, and 3) outcomes (Brady & Cronin, 2001). Service providers play an interactive role with customers to generate quality of experience. The physical environment is a thematic stage for the presentation of service actors and Customer-based brand equity audiences. The outcome of service delivery also is identified by Brady and Cronin (2001) to include experiential valence (Xu & Chan, 2010). These factors are combined to engender an experience. In other words,
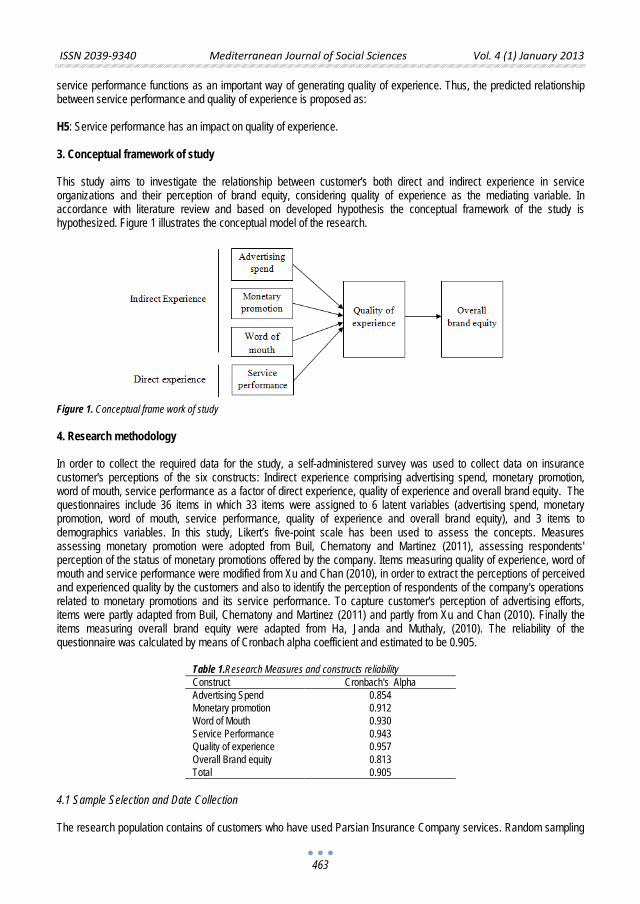
ISSN 2039-9340 Mediterranean Journal of Social Sciences Vol. 4 (1) January 2013
463
service performance functions as an important way of generating quality of experience. Thus, the predicted relationship between service performance and quality of experience is proposed as: H5: Service performance has an impact on quality of experience.
3. Conceptual framework of study This study aims to investigate the relationship between customer's both direct and indirect experience in service organizations and their perception of brand equity, considering quality of experience as the mediating variable. In accordance with literature review and based on developed hypothesis the conceptual framework of the study is hypothesized. Figure 1 illustrates the conceptual model of the research.
Figure 1. Conceptual frame work of study 4. Research methodology In order to collect the required data for the study, a self-administered survey was used to collect data on insurance customer's perceptions of the six constructs: Indirect experience comprising advertising spend, monetary promotion, word of mouth, service performance as a factor of direct experience, quality of experience and overall brand equity. The questionnaires include 36 items in which 33 items were assigned to 6 latent variables (advertising spend, monetary promotion, word of mouth, service performance, quality of experience and overall brand equity), and 3 items to demographics variables. In this study, Likert’s five-point scale has been used to assess the concepts. Measures assessing monetary promotion were adopted from Buil, Chernatony and Martinez (2011), assessing respondents' perception of the status of monetary promotions offered by the company. Items measuring quality of experience, word of mouth and service performance were modified from Xu and Chan (2010), in order to extract the perceptions of perceived and experienced quality by the customers and also to identify the perception of respondents of the company's operations related to monetary promotions and its service performance. To capture customer's perception of advertising efforts, items were partly adapted from Buil, Chernatony and Martinez (2011) and partly from Xu and Chan (2010). Finally the items measuring overall brand equity were adapted from Ha, Janda and Muthaly, (2010). The reliability of the questionnaire was calculated by means of Cronbach alpha coefficient and estimated to be 0.905.
Table 1.Research Measures and constructs reliability Construct Cronbach's Alpha Advertising Spend 0.854 Monetary promotion 0.912 Word of Mouth 0.930 Service Performance 0.943 Quality of experience 0.957 Overall Brand equity 0.813 Total 0.905
4.1 Sample Selection and Date Collection The research population contains of customers who have used Parsian Insurance Company services. Random sampling
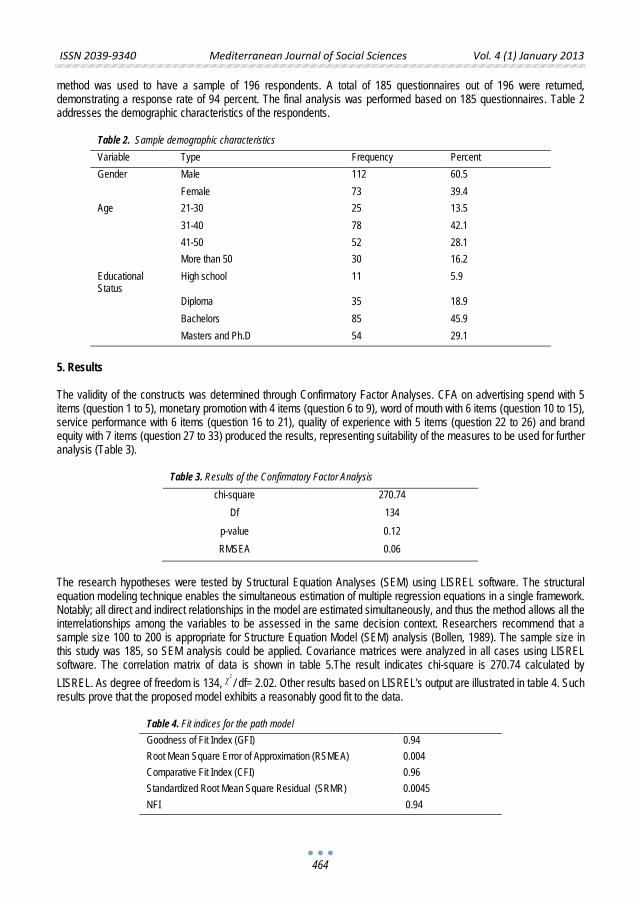
ISSN 2039-9340 Mediterranean Journal of Social Sciences Vol. 4 (1) January 2013
464
method was used to have a sample of 196 respondents. A total of 185 questionnaires out of 196 were returned, demonstrating a response rate of 94 percent. The final analysis was performed based on 185 questionnaires. Table 2 addresses the demographic characteristics of the respondents.
Table 2. Sample demographic characteristics Variable Type Frequency Percent Gender Male 112 60.5 Female 73 39.4 Age 21-30 25 13.5 31-40 78 42.1 41-50 52 28.1 More than 50 30 16.2 Educational Status
High school 11 5.9
Diploma 35 18.9 Bachelors 85 45.9 Masters and Ph.D 54 29.1
5. Results The validity of the constructs was determined through Confirmatory Factor Analyses. CFA on advertising spend with 5 items (question 1 to 5), monetary promotion with 4 items (question 6 to 9), word of mouth with 6 items (question 10 to 15), service performance with 6 items (question 16 to 21), quality of experience with 5 items (question 22 to 26) and brand equity with 7 items (question 27 to 33) produced the results, representing suitability of the measures to be used for further analysis (Table 3).
Table 3. Results of the Confirmatory Factor Analysis chi-square 270.74
Df 134 p-value 0.12 RMSEA 0.06
The research hypotheses were tested by Structural Equation Analyses (SEM) using LISREL software. The structural equation modeling technique enables the simultaneous estimation of multiple regression equations in a single framework. Notably; all direct and indirect relationships in the model are estimated simultaneously, and thus the method allows all the interrelationships among the variables to be assessed in the same decision context. Researchers recommend that a sample size 100 to 200 is appropriate for Structure Equation Model (SEM) analysis (Bollen, 1989). The sample size in this study was 185, so SEM analysis could be applied. Covariance matrices were analyzed in all cases using LISREL software. The correlation matrix of data is shown in table 5.The result indicates chi-square is 270.74 calculated by LISREL. As degree of freedom is 134, / df= 2.02. Other results based on LISREL's output are illustrated in table 4. Such results prove that the proposed model exhibits a reasonably good fit to the data.
Table 4. Fit indices for the path model Goodness of Fit Index (GFI) 0.94 Root Mean Square Error of Approximation (RSMEA) 0.004 Comparative Fit Index (CFI) 0.96 Standardized Root Mean Square Residual (SRMR) 0.0045 NFI 0.94
2χ
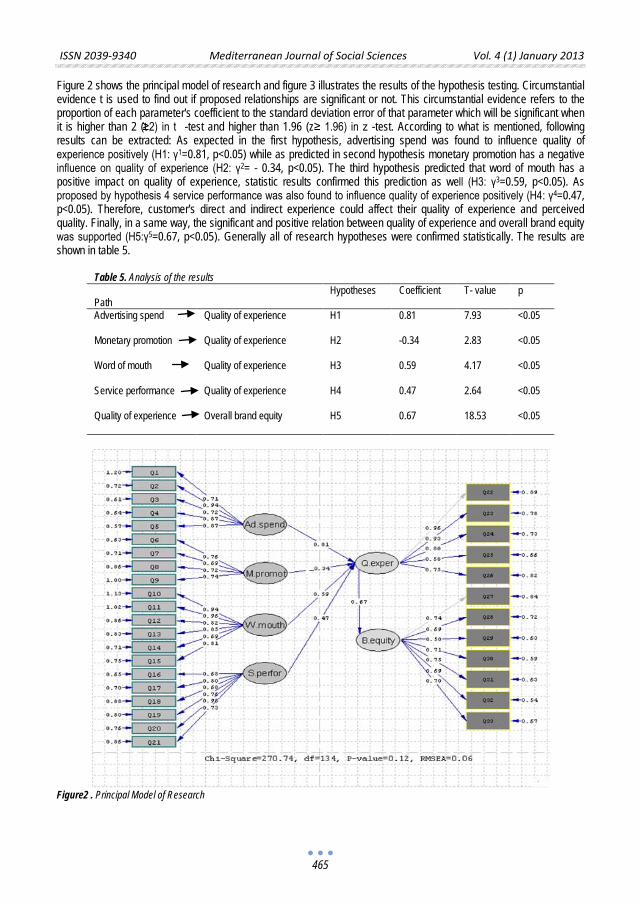
ISSN 2039-9340 Mediterranean Journal of Social Sciences Vol. 4 (1) January 2013
465
Figure 2 shows the principal model of research and figure 3 illustrates the results of the hypothesis testing. Circumstantial evidence t is used to find out if proposed relationships are significant or not. This circumstantial evidence refers to the proportion of each parameter's coefficient to the standard deviation error of that parameter which will be significant when it is higher than 2 (t ≥2) in t -test and higher than 1.96 (z ≥ 1.96) in z -test. According to what is mentioned, following results can be extracted: As expected in the first hypothesis, advertising spend was found to influence quality of experience positively (H1: γ1=0.81, p<0.05) while as predicted in second hypothesis monetary promotion has a negative influence on quality of experience (H2: γ2= - 0.34, p<0.05). The third hypothesis predicted that word of mouth has a positive impact on quality of experience, statistic results confirmed this prediction as well (H3: γ3=0.59, p<0.05). As proposed by hypothesis 4 service performance was also found to influence quality of experience positively (H4: γ4=0.47, p<0.05). Therefore, customer's direct and indirect experience could affect their quality of experience and perceived quality. Finally, in a same way, the significant and positive relation between quality of experience and overall brand equity was supported (H5:γ5=0.67, p<0.05). Generally all of research hypotheses were confirmed statistically. The results are shown in table 5.
Table 5. Analysis of the results Path
Hypotheses Coefficient T- value p
Advertising spend Quality of experience
H1 0.81 7.93 <0.05
Monetary promotion
Quality of experience
H2 -0.34 2.83 <0.05
Word of mouth
Quality of experience
H3 0.59 4.17 <0.05
Service performance
Quality of experience
H4 0.47 2.64 <0.05
Quality of experience
Overall brand equity H5 0.67 18.53 <0.05
Figure2 . Principal Model of Research
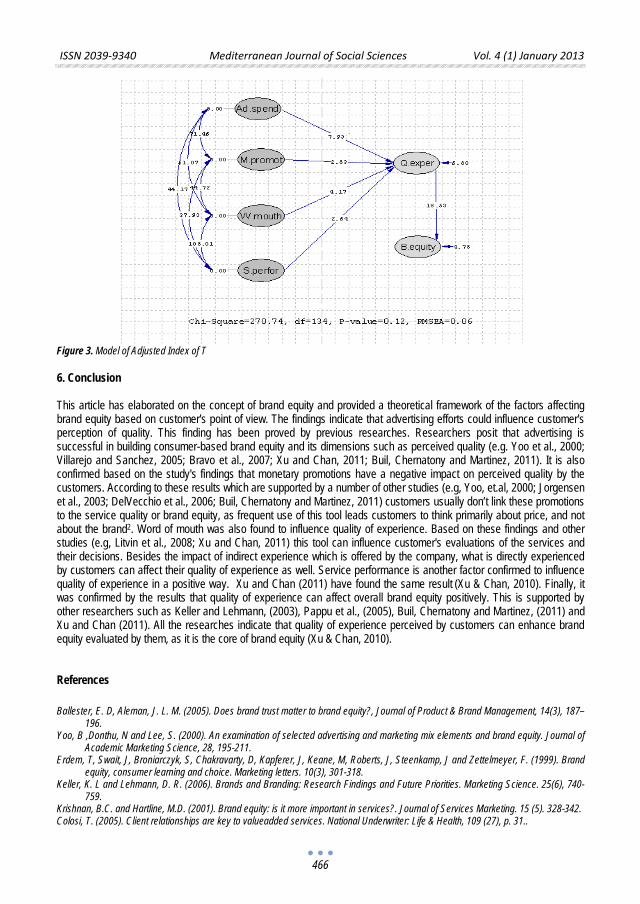
ISSN 2039-9340 Mediterranean Journal of Social Sciences Vol. 4 (1) January 2013
466
Figure 3. Model of Adjusted Index of T 6. Conclusion This article has elaborated on the concept of brand equity and provided a theoretical framework of the factors affecting brand equity based on customer's point of view. The findings indicate that advertising efforts could influence customer's perception of quality. This finding has been proved by previous researches. Researchers posit that advertising is successful in building consumer-based brand equity and its dimensions such as perceived quality (e.g. Yoo et al., 2000; Villarejo and Sanchez, 2005; Bravo et al., 2007; Xu and Chan, 2011; Buil, Chernatony and Martinez, 2011). It is also confirmed based on the study's findings that monetary promotions have a negative impact on perceived quality by the customers. According to these results which are supported by a number of other studies (e.g, Yoo, et.al, 2000; Jorgensen et al., 2003; DelVecchio et al., 2006; Buil, Chernatony and Martinez, 2011) customers usually don’t link these promotions to the service quality or brand equity, as frequent use of this tool leads customers to think primarily about price, and not about the brand2. Word of mouth was also found to influence quality of experience. Based on these findings and other studies (e.g, Litvin et al., 2008; Xu and Chan, 2011) this tool can influence customer's evaluations of the services and their decisions. Besides the impact of indirect experience which is offered by the company, what is directly experienced by customers can affect their quality of experience as well. Service performance is another factor confirmed to influence quality of experience in a positive way. Xu and Chan (2011) have found the same result (Xu & Chan, 2010). Finally, it was confirmed by the results that quality of experience can affect overall brand equity positively. This is supported by other researchers such as Keller and Lehmann, (2003), Pappu et al., (2005), Buil, Chernatony and Martinez, (2011) and Xu and Chan (2011). All the researches indicate that quality of experience perceived by customers can enhance brand equity evaluated by them, as it is the core of brand equity (Xu & Chan, 2010). References
Ballester, E. D, Aleman, J. L. M. (2005). Does brand trust matter to brand equity?, Journal of Product & Brand Management, 14(3), 187–196.
Yoo, B ,Donthu, N and Lee, S. (2000). An examination of selected advertising and marketing mix elements and brand equity. Journal of Academic Marketing Science, 28, 195-211.
Erdem, T, Swait, J, Broniarczyk, S, Chakravarty, D, Kapferer, J, Keane, M, Roberts, J, Steenkamp, J and Zettelmeyer, F. (1999). Brand equity, consumer learning and choice. Marketing letters. 10(3), 301-318.
Keller, K. L and Lehmann, D. R. (2006). Brands and Branding: Research Findings and Future Priorities. Marketing Science. 25(6), 740-759.
Krishnan, B.C. and Hartline, M.D. (2001). Brand equity: is it more important in services?. Journal of Services Marketing. 15 (5). 328-342. Colosi, T. (2005). Client relationships are key to valueadded services. National Underwriter: Life & Health, 109 (27), p. 31..
ISSN 2039-9340 Mediterranean Journal of Social Sciences Vol. 4 (1) January 2013
467
Taylor, S. A, Hunter, J. L and Lindberg, D. L. (2007). Understanding (customer-based) brand equity in financial services. Journal of Services Marketing. 21(4), 241–252.
Davis, S.M. (2000). Brand Asset Management, Jossey-Bass, San Francisco, CA. Blankson, C. and Kalafatis, S.P. (1999). Issues and challenges in the positioning of service brands: a review. The Journal of Product and
Brand Management. 8 (2). 106-118. Kayaman, R and Arasil, H. (2007). Customer based brand equity: evidence from the hotel industry. Managing Service Quality. 17(1). 92-
109. Aaker, D. A. (1991). Managing Brand Equity. New York: The Free Press. P: 15. Keller, K. L. (1993). Conceptualizing, Measuring, and Managing Customer-Based Brand Equity. Journal of Marketing, 57, 1-22. P:8. Kotler, Philip, Marketing Management, (1997). 7th ed., Englewood Cliffs, NJ: Prentice-Hall. P: 443. Ranjbarian, B, Abdollahi, M and Khorsandnejad, A. (2011). The Impact of Brand Equity on Advertising Effectiveness (Samsung and
Snowa brand names as a case study). Interdisciplinary Journal of Contemporary Research in Business. 3(5). 229-238. Aaker, D. A. (1996). Measuring brand equity across products and markets. California Management Review, 38(3). 102-120. Fernandez-Barcala, M and Gonzalez-Diaz, M. (2006). Brand equity in the European fruit and vegetable sector: A transaction cost
approach. International Journal of Research in Marketing. 23, 31 – 44. Reynolds TJ, Phillips CB. (2005). In search of true brand equity metrics: all market share ain't created equal. Journal of Advertising
Research, 45(2), 171–186. Kapferer, J. N, (2005). The New Strategic Brand Management. Kogan- Page, London, UK. Smith, S.L.J, (2004). “Brand experience”, in Clifton, R. and Simmons, J. (Eds), Brands and Branding, Bloomberg Press, Princeton, NJ. Erdem, T and Swait, J. (2004). Brand Credibility, Brand Consideration, and Choice. The Journal of Consumer Research. 13. 191-198. Berry, L.L. (2000). Cultivating service brand equity. Journal of the Academy of Marketing Science. 28. 128-137. Keller KL. (2007). Strategic brand management: Building, measuring, and managing brand equity. 3rd ed. New York: Prentice Hall. Xu, B. J and Chan, A. (2010). A conceptual framework of hotel experience and customer-based brand equity Some research questions
and implications. International Journal of Contemporary Hospitality Management. 22 (2), 174-193. Cai, L.P. and Hobson, J.S.P. (2004). Making hotel brands work in a competitive environment. Journal of Vacation Marketing, 10 (3), 197-
208. Pine, B.J. and Gilmore, J.H. (1999). The Experience Economy: Work Is Theatre and Every Business a Stage. Harvard Business School
Press, Boston, MA. Lee, J. S and Back, K. J, (2008). Attendee-based brand equity, Tourism Management, 29. 331-344. Klaus, P. and Maklan, S. (2007). The role of brands in a service-dominated world. Journal of Brand Management, 15 (2), 115-122. Fodness, D. and Murray, K.B, (1998). A typology of tourist information search strategies, Journal of Travel Research, 37(2), 108-119. Gursoy, D and McCleary, K.W, (2004). An integrative model of tourists’ information search behavior, Annals of Tourism Research, 31
(2), 353-373. Buil, I, Chernatony, L and Martinez, A, (2011). Examining the role of advertising and sales promotions in brand equity creation, Journal
of Business Research, 1-8. Martinez E, Montaner T, Pina JM. (2009). Brand extension feedback: the role of advertising. Journal of Business Research, 62, 305–
313. Villarejo AF, Sanchez MJ. (2005). The impact of marketing communication and price promotion on brand equity. Journal of Brand
Management, 12(6), 431–445. Bravo R, Fraj E, Martinez E. (2007). Family as a source of consumer-based brand equity. The Journal of Product and Brand
Management, 16(3), 188–199. Rao. A. R, Monroe. K. B. (1989). The effect of price, brand name, and store name on buyers' perceptions of product quality: an
integrative review. Journal of Marketing Research, 26. 351–357. Derbaix, C. and Vanhamme, J. (2003). Inducing word-of-mouth by eliciting surprise – a pilot investigation, Journal of Economic
Psychology, 24 (1), 99-116. Litvin, S.W, Goldsmith, R.E. and Pan, B. (2008). Electronic word-of-mouth in hospitality and tourism management, Tourism
Management, 29 (3), 458-468. Valette-Florence. P, Guizani. H, Merunka. D. (2011). The impact of brand personality and sales promotions on brand equity. Journal of
Business Research, 64. 24–8. Agarwal. S, Teas. R. K. (2002). Cross-national applicability of a perceived quality model. The Journal of Product and Brand
Management, 11(4/5). 213–36. Hoch, S. J. (2002). Product experience is seductive, Journal of Consumer Research, 29 (3), 448-454. Brady, M. K. and Cronin. J. J, (2001). Some new thoughts on conceptualizing perceived service quality: a hierarchical approach, Journal
of Marketing, 65 (3), 34-49. Ha. H, Janda. S, Muthaly S. (2010). Development of brand equity: evaluation of four alternative models. The Service Industries Journal.
30 (6), 911–928. Bollen, Kenneth A. (1989). Social sciences; Latent variables; Statistical methods. New York; willey. Jorgensen S, Taboubi S, Zaccour G. (2003). Retail promotions with negative brand effects: is cooperation possible? European Journal of
Operational Research, 150(2), 395–405. Del Vecchio. D, Henard. DH, Freling. TH. (2006). The effect of sales promotion on post-promotion brand preference: a meta-analysis.
Journal of Retailing, 82(3). 203–213.

ISSN 2039-9340 Mediterranean Journal of Social Sciences Vol. 4 (1) January 2013
468
Keller. K. L, Lehmann. D. R. (2003). How do brands create value? Marketing Management, 27–31. Pappu. R, Quester. P. G, Cooksey. R. W. (2005). Consumer-based brand equity: improving the measurement, empirical evidence. The
Journal of Product and Brand Management. 14(3), 143–154.
ISSN 2039-9340 Mediterranean Journal of Social Sciences Vol. 4 (1) January 2013
469
Constructing America’s “New Blacks:” Post 9/11 Social Policies
and their Impacts on and Implications for the Lived Experiences of Muslims, Arabs and “Others”
Buster C. Ogbuagu, Ph.D., M.S.W.
College of Arts & Sciences Department of Social Work
University of St. Francis 500 Wilcox Street, Joliet, Illinois, 60435, USA
Email: [email protected]
Doi:10.5901/mjss.2013.v4n1p469
Abstract
Problem Statement: Blacks in North America have been oppressed, discriminated against and marginalized for over four hundred years. While there have been social polices enacted by various world governments in attempts to stem the tide of the oppression of Blacks and other minorities, these forms of oppressions continue, are practiced and reproduced by individuals and systems in the United States and across the world, albeit insidiously. Approach:The oppression of Blacks is not the issue here, for that remains in suspended animation, with the discovery and construction, since the unfortunate September 11, 2001 events of America’s“New Blacks” represented by Muslims, Arabs, Asians and “Others.”Results:Using interlocking oppressions and empowerment theories embodied by Critical Race Theory, the study explores post 9/11 social policies and their unsavory impacts on the lived experiences of Muslims, Arabs and “Others.”Conclusion:It also attempts a reconnaissance of prosocial resistance skills and strategies to deal with the upsurge and continued profiling, singling-out and marginalization of this population by polices that having primarily been designed to protect America and Americans from further acts of terror, amplify, reproduce and sustain the emasculation of minority populations in and outside of the United States.
Key words: Arabs, Muslims, Blacks,ethnic minorities, 9/11, September 11, Terrorism, Homeland Security, Whiteness, PATRIOT Act, oppression, profiling, policies, empowerment, resiliency
1. Introduction The United States of America as we know it today was founded on the basis of immigration by Anglo-Saxons, a large number of whom were religious separatists fleeing the autocracy of the kings of England (Elson, 1904). Others arrived with mercantilists ideologies which fertile grounds they strongly believed existed in the New World. When the English arrived, they met the original owners of the land, the Native Americans, who welcomed them with open hands, taught them techniques of surviving the harsh winters and frontier environment. With time, most of the Native Americans were either purposefully exterminated, forced to march into the wilderness in the “Trail of Tears”(Perdue and Green 1995), or they became victims of foreign aliments, especially smallpox to which they had no natural immunity. With the decimation of the native population, the Anglo-Saxons became the majority population. Burgeoned by other Europeans from Ireland, Italy and others, the entrenchment of exclusion and “Otherness” began first with the Native Americans, followed by Blacks, who had initially arrived in America as indentured servants and later brought in their hundreds of thousands in shackles. Prior to this time, the Irish, who were fleeing failed crops occasioned by potato blight [phytophthorainfestans] and persecution by the English fared no better in the New World as they were roundly denigrated by the English in America (Bankston and Hidalgo, 2006; Graves, 1999). Help Wanted: “No Irish Need Apply”-NINA (Jensen, 2002) was a common cliché circa 1862 in England, Philadelphia and many parts of the New World. Eventually, the Irish presence became somewhat normalized, even boring when Blacks were perceived and initiated as cannon fodder for collective White persecution.
The Chinese began their own spate of immigration around 1849, but were not initially perceived as a threat by the majority population, owning to the already existing Naturalization Act of 1790, which tenets reserved citizenship for Whites. Not with standing the intolerable conditions under which the Chinese lived and labored in America, they developed resilience and established a successful and enviable commercial-oriented community in previously ghettoized Chinatown. This success had the effect of drawing envy and the ire of White labor organizations, which successfully
ISSN 2039-9340 Mediterranean Journal of Social Sciences Vol. 4 (1) January 2013
470
lobbied for the enactment of the Chinese Exclusion Act of 1882 (Smith-Barusch, 2012). The Chinese Exclusion Act expressly outlawed immigration of Chinese laborers, representing the first notable legislation that explicitly outlawed the immigration of a readily identifiable people or nation state. By 1942, following the initiation of hostilities by Japan, which destroyed Pearl Harbor, the Japanese, who previously had a “Gentleman’s Agreement” with President Roosevelt, became the next plausible target for discrimination, harassment and the politics of exclusion.
Executive Order 9066 which interned over 120, 000 Japanese became a cause célèbre that continues to reverberate globally and in America’s body politic today. The relaxation of the 1790 Naturalization Act, by the Johnson administration under the Immigration and Nationality Act of 1965, significantly altered US immigration policy to include non-Europeans. This act provided macadamfor previously non-European “undesirables” (Bankston and Hidalgo, 2006) to enter the United States as immigrants. These included Asians, Arabs and others from non-European nations. These Arabs, a large percentage of whom were Muslims overtime became naturalized American citizens, while siring offspring who became American citizens by birth. The Arabs and a host of others, especially those at the higher socioeconomic rung did not see the blatant exclusion of Blacks and the accompanying Civil Rights Movement, which they did not join as any concern of theirs. Then came September 11, 2001, when some misguided and terrorist Arab, Muslim youths from Saudi Arabia employed commercial jetliners to bring down the twin towers of the World Trade Center, as well as demolished a part of the Pentagon (Bergen, 2002; Cooley, 2002).
From then on, policy attention and enactment expediency shifted from Blacks, who, unlike the European victims of American historical exclusion still had not transcended the American discourses and intersectionalities of racism and exclusion, to Arabs, South Asians, Muslims and “Others.” With the event of September 11, 2001, US immigration policy, with extensive legislative and executive responses now encompasses, even focuses on the exclusion of suspected terrorists, especially since the attacks were perpetrated by immigrants and non US citizens. Immigrating to the US or even the request for a visitor visa sends signals that are deemed coterminous with terrorism. Funding for the strict control of the US/Canada border has been increased exponentially under the auspices of 2001 Border Security Act. An overarching component of the Act mandates the fingerprinting of foreign visitors. The USA PATRIOT Act of October 25, 2001 provided unprecedented powers to the US Attorney General to arrest, detain indefinitely and without the benefit of a writ of habeas corpus, prosecute and deport suspected terrorists or those who are subjectively adjudged by the border control officer as having potentials for causing trouble. By means of the Enhanced Border Security and Visa Entry Reform Act of 2001, foreigners now run gauntlets to obtain US entry visa. Those who are brave enough [and there are many] are subjected to protracted background checks. This includes foreign students who must register with the Department of Homeland Security under SEVIS-Student and Exchange Visitor Program, on a regular basis or risk detention and deportation (Bergen, 2002; Cooley, 2002).
This study explores some of the post 9/11 policies aimed to stem the tide of terrorist activities against the United States and its citizenry. It also aims to explore how those policy pronouncements have been applied and the ways in which they have disproportionately impacted on the civil liberties and lived experiences of immigrants to the United States, non-US citizens and non-mainstream US citizens alike; Arabs, Muslims and potential “enemies” of the US state. The study uses phenomenological interviews of the aforementioned minority groups to elicit a comprehension of their lived experiences. Simultaneously it applied the findings to conceptualize and understand America’s construction of Arabs and Muslims as the “New Blacks,” for the purposes of emasculation. The occurrence of 9/11 suddenly rendered the issues engendered by the presence of Blacks or the so-called African Americans in the American polity quite boring.It was now time to move on.
2. Literature Review The history of America is the history of multi-layered oppression, from the period of the Frontiers to the Suffragist Movement, to the era of the Civil Rights Movements, the GLTB population and currently, Muslims, Arabs and Asians. In this context, the government of the United States has from the onset been a willing participant in race-based oppression and racist outbursts against minorities in its policy making pronouncements, processes, and actions (Davis and Ben-Goodley, 2004; Loewen, 1995). Embedded in the history of the United States is a preoccupation, be it national, racial or religious affiliation with the concept of the “enemy,” real or imagined. This construct of an “enemy” is brought full cycle and amplified in times of national crises or emergency, when such “enemy or enemies” are routinely targeted and scapegoated (Jansson, 2012; Kampf and Sen, 2006). According to Kampf and Sen, the unfortunate incident of September 11, 2001 in which Muslims from Saudi Arabia were implicated in the committal of acts of terrorism against the United States created convenient scapegoats in all Muslims, Arabs and Asians in a symphony of collective guilt.Crises and war time events create significant fissures in the civil liberties of already vulnerable populations, and assist in
ISSN 2039-9340 Mediterranean Journal of Social Sciences Vol. 4 (1) January 2013
471
theintersectionalization and amplification of the discourses of race, gender, ethnicity, national origin and socioeconomic power. 2.1 Historical antecedents The first wave of Japanese immigration into the United States began in 1885; forty years after the Chinese began their immigration wave to the United States (Barusch, 2012). In this equation most of those Japanese immigrants had attained US citizenship prior to the WWII. And then came Pearl Harbor, when Japan bombed it, triggering not only one of the more egregious deprivations of earned freedoms and liberties in US history, but also representing an antithesis of the liberties and freedoms that America and its constitution frequently prides itself. With the deftness of his pen, President Franklin DRoosevelt in February of 1942 etched Executive Order 9066 into the history of infamy, by approving the Internment in one of ten locations across the US of approximately 120,000 Japanese Americans and permanent residents. This Order was ostensibly to prevent them from collaborating with their fellow Japanese and sabotaging the war effort.
Paradoxically, two-thirds or 70 thousand of the men, women and children of Japanese ancestry were also bona fide American citizens by virtue of birth and 50 thousand by naturalization, and most of them had never been to Japan or knew anything about their ancestral home. When challenged under the writ of error coramnobis (writ to correct a previous error), the United States Supreme Court in 1944, except for Justice Jackson who dissented, upheld the Executive Order [which provides the President a carte blanche to override or sidestep the Congress in the event of an emergency] as constitutional in Korematsu v. United States (Kampf and Sen, 2006). In the same vein, 23, 000 Issei[Japanese-born] and Nisei[American or Canadian-born-mostly children sired by Japanese parents] Canadian citizens of Japanese ancestry were marched and interned in British Columbia, Canada on the same flawed assumptions(Villanuev and Ross, 2007).
The import of the Japanese Internment draws a parallel with the current treatment of Muslims, Arabs and Asians following the events of September 11, 2001. In such cases, American policies have found it expedient to sacrifice the liberties of an apparently expendable minority group in its midst, depicted as presenting a clear and present danger in the interest of national security and dominant group survival. In its sincere but sometimes misguided effort to protect America, the United States government has out of panic enacted protectionist policies, as evidenced by the PATRIOT Act and National Security Entry-Exit Registration System repertoire (Kampf and Sen, 2006) or other Special Registration Programs that have disproportionately targeted or impacted on the civil liberties of Arabs and Muslims, in America and elsewhere and South Asians and “Others.”
The creation of the Department of Homeland Security and its operational mandate appears somehow to have equated immigration and the migrant ethnic minority with terrorism, which has provided it with the latitude to apply insidious but pervasive racism in its operational repertoire (Kampf and Sen, 2006). For instance and as Kampf and Sen maintained, the Special Registration Program of 2002 and 2003 mandated alien visitors in the United States, between the ages of 16 to 25, from twenty-four countries, Iran, Iraq, Saudi Arabia, Lebanon, Libya, Afghanistan, Morocco, Bahrain, Syria, Eritrea, North Korea, Oman, Qatar, Tunisia, Yemen, Egypt, Bangladesh, Jordan, Kuwait, Pakistan, Indonesia, Sudan, Somalia, United Arab Emirate, having a preponderance of Muslims to present and register with the Department of Homeland Security in order to abate terrorism. In an act that simulates the Internment of 120, 000 Japanese during WWII, 80,000 [eighty thousand] of these minority, mainly Arabs, mainly Muslim cohorts entered the Special Registration in Security during the years under review. Predictably over 13,000 of them were arrested and deportation proceedings initiated against them.
3. Theoretical framework The study applied theories of interlocking oppressions, gleaned from a body of knowledge on Critical Race Theory-CRT, which seeks to deconstruct “otherness” and subordinating relationships through counter-storytelling, or the act of telling one’s own story. Critical Race Theory in its use of counter-storytelling engages primarily in unraveling societal inequities that are the outcomes of race and racism, especially those systemically perpetrated, sustained and reproduced by Whites and their institutions(Feagan, 2006; Delgado &Stefancic, 2005; McDonald, 2003; Harris, 2002; Razack and Jeffrey, 2002). There is a cognizance that racism and racialization are embedded in the fabric of American society, to the extent that it does not only take an individual perpetrating racism to articulate its pervasiveness in mainstream and dominant culture. Racism is institutionally embedded alb initio, period. Delgado and Stefancic (2000) argue vehemently that CRT debunks legal scholarship, with its framework surreptitiously embedded in color-blind justice.
White privilege and White supremacy are primordially wired to engender, reproduce and perpetuate the emasculation of ethnic minorities, especially those of color (UCLA School of Public Affairs, 2009). Since it is an accident
ISSN 2039-9340 Mediterranean Journal of Social Sciences Vol. 4 (1) January 2013
472
waiting to happen, because it is on a hair trigger, all it takes is an event for its insidiousness to rear up like the Kraken and devour its already buttered-up victim (Bonilla-Silva, 2010). Critical Race Theory exposes the hydraheadedness or intersectionalityof oppressions, highlighting the activities of other overt, mostly covert participants in the oppression feeding frenzy which are manifest in a myriad of interactional environments. These participants include but are not limited to wealth, power, privilege, national origin or ethnicity, religion and societal appurtenances.
The use of narratives and counter-stories by the oppressed challenge the lop-sided and single narratives of White and other supremacies, especially the notion of Liberalism, which present prima facie as value-free, when in actual fact it is highly value-laden. Liberalism for Bonilla-Silva (2010) hides under four frames, namely: abstract liberalism, naturalization, cultural racism (see also Naber, 2008) and minimization. The theoretical framework applied in this study focuses on emancipatory empowerment in attempt to address the problems of the construction of “New Blacks,” a nomenclature that has been used in this study to speak to and enhance the discourse of transplantable, transferable oppression. Emancipatory empowermentconsents to the use of CRT as the vanguard of Social Justice, which toils daily to unmask subordination, end racial oppression in the first instance, and as a fulcrum for deconstructing and eradicating all forms of oppression, while simultaneously reconstructing the true lived experiences of those under the siege of oppression.
4. Methodology The study utilized the ethnographic, ethnomethodology, therefore qualitative methodology in eliciting the lived experiences of those involved in this phenomenon. Ethnography and ethnomethodology involve phenomenological interviews, which are applied in the elicitation of appropriate information as they relate to the lived experience or that phenomenon under study. In order to accomplish an appropriate elicitation of information, the studyemployed phenomenological interviews, which speak to the lived experiences of those who are not only a part of the phenomenon, but have experienced it also-Arabs, Asians, Muslims and “Others” who are neither Arabs or Muslims, but have experienced the same phenomenon based on several variables that only those who have experienced the policies are able to fully articulate. Phenomenological interviews as pertinent as they are in eliciting knowledge about a lived experience are fraught with many epistemological dilemmas, including access and method of gaining access, some of which may call ethics into question (Alcadipani& Hodgson, 2009).
In the case of ethnography, Parthasarathy (2008) perceives it literally as representing a culture through searching for patterns that can be applied to explain formal and informal local relationships. It also means attempts to articulate the implicit and explicit meanings that are attached to behaviors that make sense to those who practice them in juxtaposition with their social relationships, local social setting and a wider societal context. For Bate (1997) ethnography represents an activity involving field work, an intellectual paradigm or as a narrative style engagement. Ethnography for Spradley (1979) surrenders important data and information about situational lives of a people, Here, and as Hammersley and Atkinson (1995) argue, the researcher of the ethnographic paradigm is in an overt or covert participation mode, observing for an extended period of time the participants activities and ways of doing things. To this extent, ethnography is not so much a specific data collection technique, although data is collected in this process, as it is an approach to understanding a social phenomenon, through the use of Participant Observation and access to key informers. The key informers’ narratives are juxtaposed with other narratives to ensure their veracity (Wright, 2003).
The researcher enters the holy grail of the people and the phenomenon, immerse themselves in the people and phenomenon to gather pertinent fact through sometime unstructured and often open-ended questions, which are spontaneous and triggered by a previous response from the participant (Babbie, 2004; Beins, 2004). Most ethnographic studies are not for the purposes of testing a hypothesis, since the researcher has either through a hypothesis or other means acquired knowledge about the issues they intend to study. Ethnography is frequently applied to describe the lived experiences of a people in a location, as well as use findings to amplify their silent voices. However, the ethnographer must be cognizant of the need to be self-critical and reflexive (Davis, 1999) prior to, during and after their sojourn in order to eschew harm to those that have yielded of themselves.
Argue Alcadipani and Hodgson (2009), ethnography’s “cousin,” ethnomethodology, uses several means to attempt to appreciate and analyze a people’s modus operandi for everyday negotiation of their environment and how they apply this in their survival. In this, the researcher exposes those behaviors and practices of everyday life, including social practices that were hitherto taken for granted. Although ethnomethodology may be perceived as less intense, therefore less likely to promote serious ethical concerns and scrutiny, its properties, involving access, consent, anonymity, confidentiality and publication mirror the hazards of ethnography.
The participants in this study are mainly Arabs, Asians and Muslims, with the interspersion of “Others” who are neither Arabs nor Muslim, but have in many ways experienced similar policy subjectivities. In all, there were 50 study
ISSN 2039-9340 Mediterranean Journal of Social Sciences Vol. 4 (1) January 2013
473
participants, drawn from Chicago, Detroit, New York, Los Angeles and Atlanta. In light of the fact that the United States has collaborated with Canada on protecting their mutual borders, and the so called “War on Terror” many Canadians from minority ethnicities have also admitted to experiencing the full extent of the post 9/11 policies. The Canadian participants were drawn from Toronto, Ottawa, Montreal and Manitoba. For the fact that the post 9/11 policies disproportionately targeted Arabs and Muslims, 40 participants came from this population, while the rest 10 participants were of mixed ethnicities, but mainly immigrants from Africa. There were 20 women participants, 18 of whom were Arabic speaking and Muslim immigrants. Of these 50 participants 35 were citizens of either the United States or Canada and have resided in one of the two countries for periods ranging from 15 to 40years. The balance of 15 participants were recent immigrants, having begun their residency in the US and Canada in the last 5-10 years.
The study participants were randomly selected from a pool of individuals residing in the aforementioned cities in the US and Canada. Some were either personally known to the researcher, who has resided or frequently visited the cities. In other cases they were introduced in person or proxy by friends, acquaintances and professional colleagues, who believed that insights into the phenomenon under review could be gleaned by their participation. All the participants were issued with informed consent forms and allowed ample time to peruse, sign and voluntarily agree to participate in the study. In some cases, the researcher conducted face-to-face interviews with the participants. The others were by telephone or Skype, and the interview process and duration were anywhere between one to one and half hours.
5. Limitations of the Study The study is limited by the fact that the participants all came from visible ethnic minority populations, which means that none was White or Anglo-Saxon by heritage and may have opinions that are lopsided in their favor. Perhaps the infusion of participants of European descent may have generated other outcomes. Again, the reason for the choice of participants from a visible ethnic minority groups was contingent on their disproportionate experience with the post 9/11 and other policies. Another limitation is the fact that the researcher, having experienced the same subjectivities as the participants may have inadvertently structured the research questions in ways that show sympathy for the participants, thereby granting unintended taints to their narratives and skewing some of the outcomes. 6. Emergent Themes Several and varied themes emerged from the phenomenological interviews related to post-9/11 social policies. There was a general consensus that the post 9/11 policies designed by the US government to protect America and its citizenry disproportionately impacted on Arabs, Muslims and other ethnic minorities in the following prominent variables. The most mentioned variables were profiling, including disproportionate searches and scrutiny at airports and points of entry; post 9/11 labor market participation and integration; non-mainstream attiring-turban, hijab; spotting a full beard and mustache; having an Arabic, Muslim-or non-mainstream-sounding name; and harassment in educational institutions. 7. Discussion 7.1. Profiling and disproportionate searches at airports and points of entry All the participants in the study admitted to experience with disproportionate scrutiny and searches at airports and points of entry in the United States and Canada. In contrast to the women, the men reported significantly enhanced searches and scrutiny than the women. Indeed, most of the men expressed dreading going through the airports owing to how they have frequently been perceived, leading to the type of treatment they received at airports by the security agents. The participants derived their summation by watching others from other nationalities, mainly Europeans, Chinese and Japanese travelers, who they believed were not subjected to the same degree of searches and scrutiny, and certainly did not observe the security agents to spend the same amount of time as they would routinely do with them (Cainkar, 2008; Murray, 2004). The men, more than the women reportedly endured intimate bodily searches, some of which they felt very embarrassed and uncomfortable with. Of the 50 participants, 42 or 84% admitted to experience with embarrassing intimate bodily searches and these were disproportionately males between the ages of 25 and 40. Of the 20 female participants, only 8 or 40% did report intimate bodily searches. Many of the participants have university or college degrees, and since the enactment of the Patriot Act of 2001, have read it, subsequently convincing themselves that they and their ethnicities, or religion were the target or at least disproportionately targeted. I have taken the liberty to provide a resume of the Patriot Act and other historically relevant policies that disproportionately impact on minorities and others to further the discussion on the issue.
ISSN 2039-9340 Mediterranean Journal of Social Sciences Vol. 4 (1) January 2013
474
7.1.1. The PATRIOT Act The USA PATRIOT ACT of 2001was enacted in response to the September 11, 2001 terrorist attacks by foreigners believed to be Saudi Arabians against the United States of America. The PATRIOT ACT is a bacronym for Uniting and Strengthening America by Providing Appropriate Tools Required to Intercept and Obstruct Terrorism. The bill was introduced as H.R. 3162 on October 23, 2001 by Republican Congressman from Wisconsin, Jim Sensenbrenner, but was crafted by Viet Dinh, Assistant Attorney General of the United States. On October 24, 2001, the bill was hurriedly and overwhelmingly approved by Congress in the ratio of 357 to 66, and the Senate on October 25, 2001by a ratio of 98 to 1. Senator Russ Feingold, a Democrat from Wisconsin was the only dissenting voice (US Department of Justice, n.d.). 7.2. Tenets of the PATRIOT Act The Act provides carte blanche authority to the law and law enforcement agencies to detain immigrants indefinitely without the benefit of a writ of habeas corpus[you have the body]; provides for searches without warrant, of a home, business or other without the consent of or knowledge by of the property owners. The provisions of the Patriot Act also elasticizes the application of previously existing National Security Letters, extends to the FBI the power to search, investigate and intercept telephone calls, roving wire taps, e-mail or financial records without a warrant or court mandate. In the case of law enforcement agencies, the Act expands their authority and inroad into financial, business and library records. The PATRIOT Act was initially designed to sunset on December 31, 2005. However, its proponents have fought vigorously to make its sunsetting provisions permanent, which it now appears to have. President Obama approved its extension in 2011 by another four years by automatic pen while in France to avoid its sunsetting, just as the act was about to sunset(Electronic Privacy Information Center, n.d.; Mascoro, 2011; US Department of Justice, n.d.).
It is noteworthy that the PATRIOT Act would not represent the first time that American government, mainly out of fear and panic would denude and completely sacrifice the civil liberties of immigrants and minorities. President Woodrow Wilson during WWI enacted the Espionage Act of 1917 (ch. 30, tit. I § 3, 40 Stat. 217, 219)(ACLU, 2010) suppressing constitutionally granted freedom of speech and the press, due mainly to a growing resentment over the war. Additionally, there were incessant labor strikes, which a lot of Americans feared would lead to anarchy and civil unrest. Just like the Patriot Act, the Espionage Act of 1917 was quickly approved by Congress and in 1918 amended with the Sedition Act, which tenet was the criminalization and prosecution of any activity or action that appeared threatening to the administration. Protests against this Dracon resulted in multi-city riots, including the bombing of Attorney General, Mitchell Palmer’s primary residence, which held the cities to a standstill and necessitated the involvement of federal troops to quell the riots(ACLU, 2010; Manz, 2007; Stone, 2004; 2003; Kohn, 1994). Just like September 11, 2001, US law enforcement agencies targeted and arrested 6,000 suspected “radicals” in 33 cities, most of whom were immigrants. Consistent with the provisions of the Patriot Act of 2001, the raids and arrests of 1918 were without warrants, involved unreasonable searches and seizures, abuses of the law, including, police brutality, indefinite detentions and wanton destruction of property. It was against this backdrop that the American Civil Liberties Union was founded in 1920 to represent those who would otherwise have no voice (ACLU, 2010; Manz, 2007; Stone, 2004; 2003; Kohn, 1994). ACLU insists that since January 11, 2002 approximately 775 non-citizens of the United States have been in indefinite detention in Guantanamo Bay.
7.3. Post-9/11 Labor market participation and integration Many Arab Muslims and those with profiles akin to the terrorists of 9/11 were significantly impacted upon by labor market discrimination. Among the study participants, those who felt the impact most were those who were laid off prior to the attack. 10 of the participants who are in this cohort had been laid off previously and over many years but were rehired. They reported that following September 11, 2001, they had to wait for upwards of 7 months to hear anything from their employer. Of these, only 4 were recalled. The rest stated that they waited until their unemployment insurance ran out and they had to look for employment elsewhere. Most of those affected were between the ages of 25-35. The findings in this study is in consonance with Mora (2005); Kaestner, Kaushal and Reimer (2007) who reported an impressive reduction in the wages and earnings of Arabs and Muslims in juxtaposition with non-Latino Whites. What this finding suggests is that demographic categories, especially ethnicity, including names that bear semblance to those of the terrorists were impacted in the labor market.
Ethnic minorities, especially those that are visible and represented by Blacks, Hispanics and Asians have primordially been the subjects of labor market exclusions in the US, Canada and Europe. These discriminatory practices against them have occurred irrespective of their high educational attainment and comparative job skills when juxtaposed

ISSN 2039-9340 Mediterranean Journal of Social Sciences Vol. 4 (1) January 2013
475
with their cohort of the majority population, mainly those of Anglo-Saxon descent (Jansson, 2012; Ogbuagu, 2012; Krager and Stoesz, 2010). The events of September 11, 2001 appear to have given a dog a bad name in order to find a rationale for hanging it. 7.4. Wearing of Hijab and Turban, or spotting a beard and or mustache by an Arab, Asian or Muslim There are many cultures and religious institutions that wear head gear for this purpose and they include Muslims, Sikhs of Punjab, Orthodox Jews who adorn Kippa or Yarmulke and the Borsalino, wide-rimmed black fedora hats. Prior to September 11, 2001 wearing of hijab or any form of head cover, including turban for religious purposes received moot frowns at the very best. Wearers, especially Muslims and Sikhs were reminded, albeit without a single word that that they were out of place. After 9/11 Muslims and Sikhs especially have been singled out for harassment and even physical assault, including stripping them of it (Naber, 2008). Such epithets as rag-head and other racial slurs have been hurled at them simply for fitting the profile that have been constructed about the religion of the terrorists(Alsalah and Olsen, n.d.).
The current opprobrium that turbans, hijab and other headgear, when worn by Arabs, Asians and Muslims attracts have intersectionality with race, religion and gender, as espoused by Wadud (1999). Wadud used the narratives of a Black woman who wears a hijab and is a Muslim as exemplifying such intersectionality or multiple whammies. The fact is that the Black woman is already one down because she is Black. When she wears a hijab because she is a Muslim, she is not perceived as African any longer and her words are measured with sarcastic politeness. On the other hand, when a hijab is not covering her hair she returns to being the despised Black and her words lose all value.
7.5. Harassment of Muslim students It would appear that Muslims, Arabs and other Asians have not been spared the indignities of the September 11, 2001 aftermath even ten years after the fact, and even in such hallowed grounds as the school and educational institutions. Although there were no students in this study, however 36 or 72% of the participants stated having school and college-going children at the time of the 9/11 attacks. According to 26 or 52% of the respondents, their children returned home with serious tales of racial slurs and harassment by their peers, but surprisingly also from their teachers and administrators. Some unprintable epithets were used against them, making life unbearable in the school environment. Jandali (2012) reported that some of the epithets used against Muslim students even in 2012 includes terrorist, son of Bin Ladin, towel-head, camel jockey, rag-head, she’s going to blow up the school, jihad girl, etc. Several reports to the school administration yielded limited outcomes, minimization and admonition to the victim of this bullying that the offending students were simply expressing their First Amendment rights. When the student complained over the teacher’s stand the teacher retorted that “ her people had caused a lot of problems in the world, and she should understand if people were frustrated with her” (para. 5). 5 participants had to withdraw their children from school and later place them elsewhere at an untold cost and inconvenience.
Similarly and according to the US Department of Justice (2011) in Owatonnna, Minnesota, American students of Somali descent endured disproportionate discipline by their teachers and school officials, while being buffeted by harassment from their cohort and classmates from the majority population. The harassment became the catalyst for a department of education wide settlement agreement, which provisions included enactment of an anti-harassment policy, establishment of a working group and partnership comprising parents, students and educational district personnel, as well as competency training for faculty and staff. Similarly, in Cape Henlopen, Delaware, a fourth-grade Muslim student was the subject of ridicule by her teacher, including ridiculing the student’s mother for wearing the hijab (US Department of Justice, 2011). 7.6. “Others”
7.7. National Security Entry-Exit Registration System (NSEERS) (Port of Entry Registration and Departure Registration
Requirements) According to Khanna (2012); Aldin (2011) following the events of September 11, 2001 the Bush administration targeted, as a form of profiling, a number of designated nonimmigrant alien visitors from Iran, Iraq, Libya, Sudan, Syria, Pakistan, Saudi Arabia, and Yemen for subjection to National Security Entry-Exit Registration System (NSEERS), referred also as Special Registration, on arrival at any United States port of entry. If other nonimmigrant aliens from any other country, whether they reside in or outside the US are adjudged by the Secretary of Homeland Security as meeting the criteria that it established, they may also be registered at the discretion of the Department of State consular officer. Registration of
ISSN 2039-9340 Mediterranean Journal of Social Sciences Vol. 4 (1) January 2013
476
nonimmigrant person/s from a country outside of the aforementioned ones may also be carried out at the discretion of the Inspection officer, where they believe this to be pertinent in the interest of law enforcement and national security.
NSEERS’ letters are deemed to have been violated by the nonimmigrant alien, and my constitute reasons for denial of entry, detention or deportation should they fail to register their departure at a designated port. Also, nonimmigrant aliens from any country may be registered if they are determined to meet criteria established by the secretary of Homeland Security, if they are referred by a Department of State consular officer, or if the inspecting officer believes the alien should be registered in the interest of law enforcement or national security. Although the US Customs and Border Protection (2012) informed that a section of NSEERS requiring nonimmigrant persons to register when they depart has been suspended since April 27, 2011, not much appears to have changed and the disproportionate scrutiny continues and appears to have intensified somewhat. This is where non-Muslims, non-Arabs such as I enter the fray.
I am citizen of Canada, having resided in that country for at least 20 years. I am also a citizen of Nigeria by birth. Although I have very infrequently visited Nigeria, it is one of those countries that allows its citizens to maintain dual and multiple citizenships. During that time and with the US/Canada cross border arrangement, and NAFT that provides flexibility for any of the citizens of both countries to enter and leave with minimum hassle I had entered and departed at will.For many years, my family and I have traversed the length and breadth of both countries without incident, as well as crossed and reentered both the US and Canadian borders without unnecessary scrutiny by the INS and border agents.
Suddenly, on December 25, 2009, an apparently misguided youth, said to be of Nigerian nationality but resident in England,Umar Farouk Abdulmutallab,currently and with the notorious appellation ofthe “underwear bomber” reportedly engaged in a terrorist activity, where he was alleged to have worn a bomb inside his underwear, aimed at bringing down the flight he was on to Michigan. This lad’s stupid choice has now assigned to me and anyone from my country of birth and region or nationality with the same subjectivities as Muslims, Arabs, Asians and suspected terrorist. As a non-Muslim, non-Arab, non-Asian, non-terrorist, I have since that event been subjected to all sorts of indignities at the airports and border crossings, an experience that was largely alien to me and “Others” prior to the “undergarment” bomb threat. My personal experience, my family’s as well as others who are neither Arabs, Asians nor Muslims accounts for insertion of “Others” in the title of this study. The reason that my case and those of “Others” is poignant is that I have been a resident of the United States since 5 years, therefore frequently move between the US and Canada, which makes the enactment and execution of applicable post 9/11 and post “undergarment” laws and ordinances particularly painful.
Anecdotally, I have experienced intimate bodly searches, machine searches, irrelevant questioning and my Canadian passport, which also bears the name of my country of birth has now been assigned special scrutiny. Indeed, just in November 2012, after a conference in Winnipeg, Manitoba, I returned to the United States and at one of the airports, I was for the first time in 20 years photographed and finger and palm printed. After the routine questions, which I had now got accustomed to and don’t really mind, I was taken aback when the HLS officer curtly told me “Professor, you put your right finger on this, gesturing to a machine with a green, blinding light? I complied as I had always done, bewildered. He barked again “put your left fingers,” then palm and finally asked me to look up at the camera, which shuttered. Feeling humiliated, as I had observed all the other passengers, most carrying Korean and Chinese passports waved through quickly, I gently inquired of the officer why this was the case and his response was “this is the order for the week; maybe next week there will be another type of order, professor.”
What this experience told me is that I and my country of birth and region have entered the disproportionate scrutiny that was originally the domain of post 9/11 Arabs and Muslims. I have friends and colleagues from Ghana, Kenya, Liberia, Cameroon, Colombia for whom disproportionate searches and interrogations have been their lived experiences. Each time and following any trip outside the United States and even within the States, I have experienced disproportionate searches and scrutiny, which experience I normally bring up for discussion with my students as a part of my pedagogy on American social policy. As soon as I enter the class, the students would ask me to share my experience at the port of entry and the airports, which although we try to make light of, allows us to articulate serious social policy issues of the post 9/11 era and American social policy in general.
With these experiences I began to and have now largely been able to tease out why I get the disproportionate searches, questions and attention whenever I try to cross the US/Canada borderor fly out of any airport in Canada, but especially the US. I had wondered why each time I cross the borders, be it by road or air, I am “randomly,” as the border officers of both countries would always strongly suggest, selected for further scrutiny and extra portion of searches. After I pass the machines and nothing beeps, and I attempt to continue on my way, I am always told to hold it as the system indicated that I should be further evaluated, which now gives the officers the latitude to “frisk” me bodily.From the foregoing, it would be correct to surmise that although I have the nomenclature of Black imposed on me and those like me, and on this account subsequently endured racism, social exclusion and “otherness,”we have also now doubly qualified as “New Blacks.” This maiden designation has become imperative contingent on being recipients of all and
ISSN 2039-9340 Mediterranean Journal of Social Sciences Vol. 4 (1) January 2013
477
same subjectivities that Arabs, South Asians and Muslims have endured since September 11, 2001, based onthe enactment of the applicable laws ostensibly aimed to hold any further acts of terrorism against the US at a full Nelson. 8. Prosocial resistance strategies 8.1. Active surveillance and self-interrogation
“And you all know, security is mortal’schiefest enemy” (Shakespare-Macbeth, Act 3, Scene 5, Page 2). As the axiom goes, therefore, no one in their right mind would blame the American government for trying to protect its land, citizens and sovereignty. While some would like to argue that American international policy is often narcissistic and selective, it certainly did not deserve its people being terrorized and killed within their continental shelf and territorial waters, as evidenced by the terrorist attacks of September 11, 2001. If anyone had a serious grudge against America, the existence of which is not in short supply, the 9/11 attacks did not select its victims based on their nationality as American. Rather the attacks randomly killed most people in their part, including minorities, Muslims and Arabs, which sense is somewhat unfathomable, if the attacks were designed as retribution against the American government and its citizenry.
The import of this argument is that like a lot of Judeo-Christian fundamentalists, who have historically committed mayhem against others of the non-Christian faith, radical Islam exists also with some non-stellar records. Prior to 9/11, Muslim extremist demagoguery in the West including in America found a culture of acquiescence, even tolerance amongstmanydecent American Muslims. Now that 9/11 has occurred and the repercussions and after-shock continue to be felt by Muslims and those who have been cloned with them, it is time for those moderates to engage in self-interrogation and stand strong against those who would preach harm and terrorism against America, even if those were of the same faith. The fact of the matter is that other Muslims know some of these extremists for they reside amongst them and pray with them during Jum’ahprayers.
The Bedouin syndrome that currently exists, especially owing to religion and ethnicity needs to be reexamined, deconstructed and appropriate paradigm shifts applied. Whether one is an Arab, Muslim or “Other” the fact that you live and benefit somehow from the American state as your country is an overarching reason to protect it against all who would seek to destroy it along with you for reasons that are best known to them. An Igbo adage states that “when one finger is smeared with oil, it takes no time to saturate and soil the other fingers.”Regardless of how,manyminorities may feel about America’s policies, some of which are racially and culturally emasculatory, the fact of the matter is that living here there are no winners when something terrible and untoward is directed against the American state. Everyone instantaneously loses. As a sovereign nation and from what we know about America, it will fight back and hard, and those who will be disproportionately victimized will be minorities, because that’s just the way the cookie crumbles. So, when such radicals begin their secular and religious rhetoric, the only plausible recourse would be to borrow Ronald Reagan’s drug abuse prevention axiom and “Just say no.” 8.2. Religion and spirituality Clay (2011) reports a publication in Psychology of Religion and Spirituality by Abu-Raiya, et. al (as cited in Sekandi and Mojaddidi, 2011, para. 5) which documents coping strategies by Muslim Americans following on-going post 9/11 discrimination and harassment. A survey of 138 Muslims living in the United States shows that most are exhibiting at least one stressful event consistent with their identity and identification as Muslims, the anti-Muslim rhetoric, disproportionate airport and border security scrutiny and singling out. In this case, the participants reported the resurgence of personal strength , integrity and sense of self-worth when they invoked their religion and spirituality. On the other hand, those who bottled-up and isolated themselves were dogged by serious mental health issues, chiefly depression and anger. At least 50% of the respondents in this study admitted to using religion and spirituality and the belief in supernatural intervention and protection to shield themselves from the oppressive discourses that appear to engulf them.
The use of religion and faith to moderate the post 9/11 backlash against Muslims, Arabs and “Others” finds support in the findings of (Bakalian and Bozorgmehr, 2009; Barrett, 2008; Rippy and Newman, 2008; and Abdo, 2006), all of whom maintain that feeling the heat of the 9/11 attacks, American Muslims sought succor in their religion and community. They also argued for a renewed sense of community solidarity, esprit de corps and religious renaissance amidst the widespread and unrelenting attack against Islam and its practices. Gould and Klor (2012) disagree with the findings, arguing instead that the study outcomes may have been related to sample size, the experience of the study participants and their thoughts and actions which may not be in consonance with their actions.
ISSN 2039-9340 Mediterranean Journal of Social Sciences Vol. 4 (1) January 2013
478
8.3. Patience and Resilience The current construction of “New Blacks” in Arabs, Muslims and “Others,” just like most forms of discrimination and oppression have a shelf life and will one day soon come to an end, at least for the current recipients of the discrimination and harassment. It is a historical fact that during the periods of national emergencies, the majority population tends to find common tantrumic grounds with the minorities amongst them.United States history abounds with multi-ethnicities such as the Irish, Jews, Italians, Japanese and Chinese, who underwent persecution just for the mere fact of their ethnicities. They are all now mainstreamed and thriving as Americans and have become the majority population who currently has become the producers and reproducers of oppression against other minorities. Although it is unlikely that the “Othering” of Blacks in America will ever end even with the election and reelection of President Obama, who is routinely and whimsically demanded by Donald Trump and American “birthers,” to produce his birth certificate and other evidences as they consider him an outsider, Black experiences with discrimination appear to be ebbing somewhat. The reason for advising caution and patience with the current scapegoats is that the way we have come to know America, it may not be long before another set of “New Blacks” are identified and constructed and routinized, a situation that stands to provide the much needed relief from the negative attention that the Arabs, Muslims and “Others” within our society currently face. 8.4. Positive outcomes of 9/11 According to Clay (2011) 9/11 was devastating to Americans and others alike. However, it has also imparted a strong and invaluable lesson in Civil Rights to those, not Black Americans and not Whites, who thought previously that they were immune from subordination, therefore above the Civil Rights fray, because, as they believed, those matters only pertained to Blacks and African Americans. An Indian Muslim opined that prior to the 9/11 mayhem, Muslims and Arabs, as well as Indians and those of South Asia, especially ones that occupied a higher socioeconomic echelon did not feel that prejudice, discrimination and the entire racial discourse was a part of their existence and life construct. They expressed an unwillingness to stand with Blacks against the oppression that they were enduring and refused to participate in Civil or Human Rights struggles most of which they witnessed within or outside the boundaries of America. Now they believe that they know better, as the discourses of subordination transcends race and ethnicity, exposing their own inclusion and adequacy mirages. Now, they understandand state that even the younger generation has joined and has shifted attention to their identity, rights and civil engagement by asserting themselves as Americans first and Muslim-Americans second. 9. Conclusion and final thoughts Like Pearl Harbor before it, the terrorist events of 9/11 will remain indelible in the minds and psyche of all those who witnessed it, all Americans and those who have been sieged by some of the policies that were created to prevent further acts of terror against Americans. For better or for worse, the events of the 9/11 have changed not only America, but the whole world, including the ways we think, perceive and act. One of the ways that terrorist activities changed the world as we knew it was in the way America chose to protect itself. It used immigration, profiling, covert and overt surveillance of its citizenry, especially minority groups as represented by Arabs, Muslims and “Others” who have been lumped in the same category for fitting profiles that were created by the Department of Homeland Security.
Tensions apparently are beginning to relax somewhat, especially following the abrogation of some of the tenets of the PATRIOT Act, such as a section of NSEERS in 2011 requiring nonimmigrant persons to register when they depart. However, the time it takes for its impact to be felt within the rank and file of security agencies at the airports and borders may be protracted. To this extent, those who are disproportionately impacted by the policies may not only have to be patient, but exercise constraints, a lot of it in the way they think, act or even associate with others, especially those who may harbor grudges against America. One of the key elements in reducing unwanted and painful contact with the security agencies is in compliance, for most of those who work here are simply following orders, despite the fact that a few may be engaged in an ego trip, due to the enormous powers that the Act has assigned to them. For in this, cooperation with the procedure is a form of prosocial resistance, which will go a long way to easing the tension and other unsavory outcomes more than any other form of resistance . The major solace is that eventually the unsavory experiences of those who are the disproportionate targets of the post 9/11 policy may soon be mainstreamed when other events may necessitate America’s construction of other “New Blacks.”
ISSN 2039-9340 Mediterranean Journal of Social Sciences Vol. 4 (1) January 2013
479
References Abdo, Geneive (2006). Mecca and Main Street: Muslim Life in America after 9/11. New York: Oxford University Press. Alcadipani, R. & Hodgson, D. (2009). By Any Means Necessary? Ethnographic Access, Ethics and the Critical Researcher. TAMARA:
Journal of Critical Postmodern Organization Science, 7(3/4), 127-146. Aldin, Edward (2011, April 28). DHS Ends National Security Entry-Exit Registration System (NSEERS). Adfero Group, The George Washington University Homeland Security Policy Institute. Retrieved November 26, 2012
from http://securitydebrief.com/2011/04/28/dhs-ends-national-security-entry-exit-registration-system-nseers/ Alsalah, Said, and Olsen, Matt (n.d.) Arabs and Islam in America: Wearing the Hijab, an Overview. University of Michigan. Retrieved December 1, 2012 from http://sitemaker.umich.edu/arabamericansandramadan/wearing_the_hijab American Civil Liberties Union (ACLU) (2010, September 1) ACLU History: Defending Liberty in Times of National Crisis. Retrieved
November 24, 2012 from http://www.aclu.org/national-security/aclu-history-defending-liberty-times-national-crisis. Babbie, E. (2004). The Practice of social research. (5thEd.). Belmont, California: Wadsworth Publishing Company. Bakalian, Anny P. and Mehdi Bozorgmehr (2009). Backlash 9/11: Middle Eastern and Muslim Americans Respond. Berkeley: University
of California Press. Bankston, Carl, L., and Hidalgo, Danielle, (Eds.). (2006). Immigration in US History. Pasadena, CA: Salem Press. Retrieved from
Bukari, Zahid (2004, October). Muslims in the American Public Square: Shifting Political Winds and the Fallout from 9/11, Afghanistan and Iraq. Georgetown University Project MAPS/Zogby International. Retrieved December 1, 2012 from
http://salempress.com/store/samples/us_immigration_history/ us_immigration_history_history.htm
Barrett, Paul M. (2008). American Islam: The Struggle for the Soul of a Religion, New York: Picador. Barusch-Smith, Amanda (2012). Foundations of Social Policy: Social Justice in Human Perspectives (4thEd.). Brooks/Cole, Cengage
Learning. Beins, B.C. (2004). Research Methods: A Tool for Life. Boston: Pearson/Allyn& Bacon. Bergen, Peter (2002). Holy War, Inc. New York: Simon and Schuster. Bonilla-Silva, Eduardo (2010). Racism Without Racists: Color-Blind Racism & Racial Inequality in Contemporary America (3rd Edition).
Toronto: Rowman and Littlefield Publishers, Inc.
http://www.projectmaps.com/AMP2004report.pdf Cainkar, L. (2008). Thinking Outside the Box: Arabs and Race in the United States. In A. Jamal & N. Naber (Eds.), Race and Arab Americans Before and After 9/11, from Invisible Citizens to Visible Subjects (pp. 46–80). Syracuse, NY:
Syracuse University Press. Clay, Rebecca A. (2011, September). Muslims in America, Post 9/11. American Psychological Association, Vol. 42, No. 8, p.72.
Retrieved from http://www.apa.org/monitor/2011/09/muslims.aspx Cooley, John (2002). Unholy Wars: Afghanistan, America, and International Terrorism. London: Pluto Press Davies, C. (1999). Reflexive Ethnography London: Routledge. Davila, Al, and Mora, M.T. (2005). Changes in Earnings of Arab Men in the US Between 2000 and 2002. Journal of Population
Economics, 18, 587-601. Davis, K. E., & Bent-Goodley, T. B. (2004). The Color of Social Policy. Alexander, VA: Council on Social Work Education. Delgado, R., &Stefancic, J. (2005). The Derrick Bell Reader. New York: New York: University Press. Delgado, R., &Stefancis, J. (2000). Critical Race Theory: The Cutting Edge. Philadelphia: Temple University Press. Electronic Privacy Information Center (EPIC). (n.d.). USA PATRIOT Act (H.R. 3162. Retrieved November 24, 2012
from http://epic.org/privacy/terrorism/hr3162.html Elson, Henry, William (1904). (Transcribed by Kathy Leigh). "History of the United States of America, Chapter IV, pp. 99-103. New York:
The MacMillan Company. Retrieved from http://www.usahistory.info/New-England/Pilgrims.html Feagan, Joe. R. (2007). Systemic Racism: A Theory of Oppression.Community Development Journal, Vol. 42, No. 1, pp. 134-145. Gould, Eric.D., and Klor, Esteban. F. (2012). The Long-Run Effect of 9/11: Terrorism, Backlash, and the Assimilation of Muslim
Immigration in the West. Discussion Paper No. 8797, Center for Economic Policy Research, London: UK. Graves, Jeanette (1999). Irish Immigrants are Good Example for Persecuted Groups. Retrieved November 26, 2012 from
http://articles.courant.com/1999-03-17/news/9903140025_1_potato-famine-irish-americans-irish-immigrants Hammersley, M., & Atkinson, P. (1995). Ethnography: Principles in Practice (2nd Ed.). New York: Routledge. Harris, C.I. (2002). Critical Race Studies: An Introduction. UCLA Law Review, 49: 1215-1239 Jansson, Bruce. S. (2012). The Reluctant Welfare State; Engaging History to Advance Social Work Practicein Contemporary Society (7th
Ed.). USA: Brooks/Cole Cengage Learning. Jensen, Richard (2002). “No Irish Need Apply”: A Myth of Victimization. Journal of Social History 36.2 405-429. Retrieved December 1,
2012 from http://tigger.uic.edu/~rjensen/no-irish.htm. Jindali, Ameena. K. (2012, October). Muslim Students in Post-9/11 Classrooms: Interventions that can Stem Stereotypes and Bullying
that Accompany Islamophobia in Schools. School Administrator, No. 9, vol. 69, pp. 32-35. Retrieved from http://www.aasa.org/content.aspx?id=24990.
Kaestner, R., Kaushal, N., and Reimers, C. (2007). Labor Market Effects of September 11th on Arab and Muslim Residents in the United States. The Journal of Human Resources, 42, 2.
ISSN 2039-9340 Mediterranean Journal of Social Sciences Vol. 4 (1) January 2013
480
Kempf, Lena &SenIndra (2006). History Does Not Repeat Itself, But Ignorance Does: Post-9/11 Treatment of Muslims and the Liberty-Security Dilemma.Retrieved November 17, 2012 from
Mascoro, Lisa (2011, May 27). Patriot Act Provisions Extended Just In Time. Los Angeles Times. Retrieved November 24, 2012 from
http://www.humanityinaction.org/knowledgebase/168-history-does-not-repeat-itself-but-ignorance-does-post-9-11-treatment-of-muslims-and-the-liberty-security-dilemma
Khanna, Rajiv. S. (2009) National Security Entry-Entry-Exit Registration System (NSEERS). Law offices of Rajiv. S. Khanna, P.C. Retrieved November 26, 2012 from http://www.immigration.com/visa/general-nonimmigrant-visa/national-
security-entry-exit-registration-system-nseers Kohn, Stephen M. (1994). American Political Prisoners: Prosecutions Under the Espionage and Sedition Acts. Westport, Conn.:
Praeger. Krager, Howard. J., &Stoesz, David (2010). American Social Welfare Policy: A Pluralist Approach (6thEd.). New York: Ally & Bacon. Loewen, J. (1995). Lies My Teacher Told Me. New York: Simon and Schuster. Manz, William H., (Ed.). (2007). Civil Liberties in Wartime: Legislative Histories of the Espionage Act of 1917 and the Sedition Act of
1918. Buffalo, N.Y: W. S. Hein
http://articles.latimes.com/2011/may/27/nation/la-na-patriot-act-20110527 McDonald, H. (2003). Exploring Possibilities Through Critical Race Theory: Exemplary Pedagogical Practices for Indigenous Students.
Paper Prepared for NZARE/AARE. Australia: James Cook University. Murray, N. (2004). Profiled: Arabs, Muslims, and the Post-9/11 Hunt for the Enemy Within. In E. C. Hagopian (Ed.), Civil rights in peril:
The targeting of Arabs and Muslims. Chicago: Haymarket Books. Naber, N. (2008). Look, Mohammed the Terrorist is Coming!: Cultural Racism, Nation-Based Racism, and the Intersectionality of
Oppressions After 9=11. In A. Jamal & N. Naber (Eds.), Race and Arab Americans Before and After 9=11, From Invisible Citizens to Visible Ssubjects (pp. 276–304). Syracuse, NY: SyracuseUniversity Press.
Ogbuagu, B. C. (2012). Nice CV! You Will Hear From US: Canadian Labor Market & the Phenomenology of the Marginalized Ethnic Professional Migrant. Journal of Social Sciences 8 (1): 1-12, 2012; ISSN 1549-3652s.
Parthasarathy, Balaji (2008). The Ethnographic Case Study Approach: Global Impact Study, Technology and Social Change Group, University of Washington Information School. Retrieved November 29, 2012 from http://www.globalimpactstudy.org/2008/07/the-ethnographic-case-study-approach/
Perdue, Theda and Green, Michael D (Eds.), (1995).The Cherokee Removal: A Brief History with DocumentsNew York: Bedford Books of St. Martin's Press.
Razack, N., and Jeffrey, D. (2002). Critical Race Discourse and Tenets for Social Work. Canadian Social Work Review, 19, Vol.2: 257-271.
Rippy, A. E., & Newman, E. (2006). Perceived Religious Discrimination and its Relationship to Anxiety and Paranoia among Muslim Americans. Journal ofMuslim Mental Health, 1(1), 5–20.
Rowe, Katherine (2012). Macbeth: Evans Shakespeare Edition, 1st Edition. New York: Cengage Learning. Selandi, Nafisa&Mojaddidi, Hosai (2011, September, 27). The Impact of 9/11 on the Mental Health of Muslims: 10 Years Later. Mental
Health 4 Muslims. Retrieved from http://mentalhealth4muslims.com/2011/09/27/the-impact-of-911-on-the-mental-health-of-muslims-10-years-later/
Spradley, J.P. (1979). The ethnographic Interview. New York: Holt, Rinehart & Winston. Stone, Geoffrey R. (2004). Perilous Times: Free Speech in Wartime from the Sedition Act of 1798 to the War on Terrorism. New York:
W. W. Norton. Stone, Geoffrey R. (2003). "Judge Learned Hand and the Espionage Act of 1917: A Mystery Unraveled." University of Chicago Law
Review 70 (winter). UCLA School of Public Affairs (2009). What is Critical Race Theory? Critical Race Studies. Retrieved December 2012
from http://spacrs.wordpress.com/what-is-critical-race-theory/ US Department of Justice (2011, October 19). Confronting Discrimination in the Post-9/11 Era: Challenges and Opportunities Ten Year
Later. A RepA Report on the Civil Rights Division’s Post-9/11 Civil Rights Summit Hosted by George Washington University Law School. Retrieved from http://www.justice.gov/crt/publications/post911/post911summit_report_2012-04.pdf
US Department of Justice (n.d.). The USA PATRIOT Act: Preserving Life and Liberty(Uniting and Strengthening America by Providing Appropriate Tools Required to Intercept and Obstruct Terrorism). Retrieved from http://www.justice.gov/archive/ll/highlights.htm
U.S. Customs and Border Protection (2012) Special Registration (NSEERS): What is the status of the National Security Entry-Exit Registration System (NSEERS)? Retrieved November 26, 2012
from https://help.cbp.gov/app/answers/detail/a_id/1214/~/special-registration-(nseers) Villanueva, Ricco& Ross, Shmuel (2007). Japanese Relocation Centers:During World War II, nearly 120,000 Japanese Americans were
under lock and key. Pearson Education, Inc. Retrieved November 26, 2012 from http://www.infoplease.com /spot/internment1.html
Wright, C. (2003). Saving the Differences: Essays on Themes from Truth and Objectivity. Cambridge, Mass.: Harvard University Press.
ISSN 2039-9340 Mediterranean Journal of Social Sciences Vol. 4 (1) January 2013
481
A Qualitative Study Exploring Factors Contributing to Gender
Inequality in Rural Ghana
Mavis Dako-Gyeke, PhD
Department of Social Work University of Ghana, Legon, Ghana
Corresponding Author : Email: [email protected]
Prince Owusu
Department of Social Work University of Ghana, Legon, Ghana Email: [email protected]
Doi:10.5901/mjss.2013.v4n1p481
Abstract
Gender inequality hinders the development efforts of countries worldwide, especially developing countries. Despite Ghana government’s efforts to address gender inequality, the issue continues to prevail, and invariably retards development mostly in rural communities. This qualitative study, explored factors that perpetuated gender inequality in Kyebi, in the Ashanti Region of Ghana. Purposive and convenience sampling techniques were utilized to recruit twenty-five participants and in-depth interviews were conducted to gather data for the study. The findings of the study revealed that deep rooted patterns of culture and socialization continue to perpetuate gender inequality in rural communities denying women equal access to services as well as to physical and social capital. Based on the findings of our study, we draw attention to the need for research and policy interventions that would reduce gender inequalities and ensure women’s active participation in social and economic development.
Keywords: Culture, Gender, Ghana, Inequality, Rural Community.
1. Introduction Globally, the discourse on inequalities between males and females has attracted concerns over a considerable period of time. These concerns arose due to a shared understanding within the development community that development policies and strategies that fail to take gender inequality into account and do not address disparities between males and females will have limited effectiveness and grave cost implications (World Bank, 2003). Considering that insufficient allocation of resources to gender inequality issues is a barrier to development (United Nations Population Fund, 2008), researchers, policy experts, and practitioners cannot claim genuine progress in development (Potts, Ryan, & Toner, 2003) if they do not ensure that gender equality is emphasized in development intervention programs, especially in rural communities.
Gender inequality cannot be ignored in international, regional and national efforts because there is no region of the world, especially in developing countries that women and men are equal (World Bank Gender and Development Group, 2003). In Ghana as in many countries in Africa, women have more limited opportunities to improve their economic, educational and health conditions and access services than do men (Zuckerman, 2002). Echoing her concern, Rasmussen (2008) concludes that inequality is growing in large parts of the world, and is grossly related to poverty and other social problems. Gender inequality often creates gender gaps in access to and control of resources, in economic opportunities and political voice (World Bank Policy Research Report, 2001). The report further notes that while women and girls bear the largest and most direct costs of these inequalities, the costs ultimately harms everyone because it cuts broadly across society.
Gender is a set of roles which, like costumes or masks in the theatre, communicate to other people that we are feminine or masculine (Cleves, 1993). The author further notes that this set of particular behaviors encompasses all aspects of our lives, such as appearance, personality, sexuality, family commitments and work, altogether form our gender roles. Differences in gender roles and behaviours often create inequalities whereby one gender becomes empowered to the disadvantage of the other (World Health Organization, WHO, 2009). As noted by Kimmel (2000),
ISSN 2039-9340 Mediterranean Journal of Social Sciences Vol. 4 (1) January 2013
482
gender is not simply a system of classification of biological males and females but also expresses universal hierarchy, power, and inequality between females and males. Gender inequality according to Schalkwyk, (2000) is a social construct that is transmitted through culture, and has perpetuated over time. The World Bank Policy Research Report (2001) suggests that societal institutions like social norms, customs and laws as well as economic institutions shape roles and relationships between men and women and influence what resources women and men have access to and in what forms they can participate in the economy and in the broader society.
Even though gender inequality is not confined to particular areas of a society, most often it is rife in rural populations, where culture is revered and greatly cherished. The defence of culture and tradition is often used by men to rationalize practices that limit women’s life chances and outcomes (Reeves & Baden, 2000). Efforts to challenge power imbalances are often denied legitimacy, or where an international agency is involved, denounced as western interference or cultural imperialism (Reeves & Baden). Women’s domestic role and place within rural communities, both reinforces and is reinforced by dominant rural beliefs and practices (Little, 1987). Generally in rural settings, compared to men, women hold positions that are secondary or marginal in importance (Bandiaky, 2008), which underpins the notions and expectations regarding household chores, responsibilities and decision making in families. Paechter (2003) asserts that in order to sustain gender power differentials in families and communities, males and females are required to behave in particular ways and they are recompensed or punished for conformity to, or deviance from the norm.
While globally, rural women contribute through different livelihood strategies to lift their families and communities out of poverty and hunger, their potential to do so is hindered by various and diverse constraints due to systematic and structural gender differences (Ministry of Women and Children Affairs, MOWAC, 2012). These gender disparities often prevent women from enjoying their economic, social and other rights outlined in the reports of the Convention on the Elimination of Discrimination Against Women and the Millennium Development Goals (MOWAC). These restrictions adversely affect agriculture productivity and ultimately rural development, given that in most developing countries like Ghana, women are mostly rural dwellers who engage in agricultural production. 2. The Ghanaian Context
To better understand the influence of gender inequality on development in rural communities in Ghana, it is essential to provide some background information on the status of rural women’s livelihoods. Although there is a growing urban population, Ghana’s population continues to be largely rural and agrarian. The 2010 population and housing census provided by the Ghana Statistical Service (2012) indicated that women constitute 51.2 percent of the total Ghanaian population of 24,658,823 and are mostly rural dwellers engaged in agricultural production, which is the backbone of the Ghanaian economy. Rural women in Ghana produce about 70% of food crops and are key stakeholders in agro-forestry, fisheries, and major actors in processing and food distribution (Ministry of Food and Agriculture, MOFA, 2010; MOWAC, 2012). While agriculture continues to be the backbone of Ghana’s economy, its gendered facets, such as the sexual division of labor; sex-differences in access to land, labour, technology and credit; and differences in marketing of produce, have not received much attention and thus continue to obstruct the development of the sector (Boateng, Adomako-Ampofo, Flanagan, & Yakah, 2006; MOWAC, 2012). This will eventually hinder women’s development and wellbeing in rural areas because their inability to have access to both farm and non-farm activities could reinforce their poverty.
There are various traditions in Ghana that promote stratification of gender roles and are reinforced by passing these traditions from one generation to the next (Boateng et al., 2006). Rural households in Ghana are therefore shaped by several factors because they are complex, culturally varied, and guided by dynamic institutional arrangements (MOWAC, 2012). In Ghana, culture plays an important role in the organization of domestic and communal activities. The behavior of males in their families is influenced by expectations of their fellow men about what it means to be a man in the community in which they live and conformity with certain norms and practices and these expectations perpetuate masculine tendencies among boys and men (Boateng et al). Additionally, in order to ensure that males and females recognize and respect their appropriate gender positions in society, proverbs are often used in daily discourse to explain, describe and reinforce stereotypes about men and women (Adomako-Ampofo, 2001; Boateng et al).
In the economic and social spheres, men are often assigned responsibilities that involve leaving home and the emphasis in their training is on public activities while girls’ tasks are home based (Boateng et al., 2006; Barry, Bacon, & Child, 1973; Nabila, 2001). As Boateng et al argue, girls are taught to look up to men and boys as stronger, wiser, and more responsible and boys are socialized to lead and control women. In view of this, girls carry the greater burden of domestic work and boys are permitted more time for play and to be away from home. The assigned male and female roles that are expressed in community norms and values are often used to maintain social control over females (Nukunya, 1992; Abu, 1991). Boateng and colleagues (2006) therefore conclude that though there are constitutional and
ISSN 2039-9340 Mediterranean Journal of Social Sciences Vol. 4 (1) January 2013
483
legal guarantees in Ghana, the reality on the ground does not measure up to equal rights for both males and females, especially in rural areas.
Ghana as a country has shown commitment to conventions and laws that aim at ensuring gender equality by ratifying them and making local provisions in laws and policies to meet the standards set by international conventions. Some of the conventions and laws that Ghana endorsed are the Universal Declaration of Human Rights, Convention on the Elimination of All Forms of Discrimination against Women and the African Charter on people’s rights (Ardayfio-Schandorf, 2005). This notwithstanding, gender inequality continues to prevail in Ghana, especially in rural communities due to lack of law enforcement and cultural barriers that have confined most of these laws to rhetoric and as a result never function on the ground.
At all levels of Ghanaian society, women are often held to a higher level of cultural compliance than men because many forms of discrimination against women are practiced in the name of culture (Women’s Manifesto for Ghana, 2004). This perpetuates gender inequality which undermines Ghana’s efforts to achieve the Millennium Development Goals, as well as the development aspirations of the nation. Although gender inequality often denies, especially rural girls and women equal opportunities and choices and limits their ability to realize their potentials, most research studies have concentrated on gender inequalities in urban settings. This study, which is part of a larger project, however goes beyond extant studies to explore factors that contribute to gender inequality in a rural community in the Ashanti Region of Ghana. This study is important because gender inequality conflicts with the fundamental tenet of human development that emphasizes the broadening of people’s choices and building human capabilities (UNDP, 2006). 3. Research Methods 3.1 Research Design A qualitative research methodology was employed for the study. Qualitative research methods give an understanding of the situation in its uniqueness, presenting what respondents perceive about the situation and what their meanings are (Patton, 2002). Specifically, a phenomenological approach was used because it provides a description of what people experience and how they experience what they experience (Patton, 2002). The phenomenological paradigm was useful because it provided complex descriptions of how respondents experienced the phenomenon being studied (Mack, Woodsong, Macqueen, Guest & Namey, 2005). This study adopted an exploratory approach with the aim of seeking the thoughts and perceptions of rural households on gender inequality. The respondents were allowed to freely recount their lived experiences in relation to the objectives of the study. 3.2 Study Area Ghana is a country located along the coast of West Africa and is a typical hot and humid tropical country. It comprises of a large number of ethnic groups giving rise to a variety of sub-cultures in the country (Ardayfio-Schandorf, 2005). The study was conducted in Kyebi, which is located in the Sekyere Central district. The district is one of the twenty-seven administrative districts in the Ashanti Region of Ghana and its strategic location fosters trade with other districts within the region. Kyebi is a rural community with unique cultural systems and the predominant occupation of the inhabitants is farming.
3.3 Participants For this study, a total of twenty-five respondents were recruited through a purposive sampling method. The respondents comprised of 10 men and 10 women within the community and five key informants made up of the assembly man (a community representative at the District Assembly), one official each from the desks of governmental and non-governmental organizations involved in gender issues, the head of the community clinic and the head of community development for the Sekyere Central district. This allowed for the selection of individuals whose experiences were useful for the purpose of the study (Patton, 2002).
The age of the participants ranged from 30 to 60 years with most of the participants aged between 50 and 60 years. Older persons who had lived in the community for a long time were purposively selected because they had experience regarding culturally relevant norms related to gender issues. The participants were mainly farmers who engaged in subsistence farming. A few of the participants who engaged in cash crop farming on a large scale were men. Some women participants who engaged in large scale cash crops farming also had joint farms with their husbands. Some of the participants were petty traders.
ISSN 2039-9340 Mediterranean Journal of Social Sciences Vol. 4 (1) January 2013
484
3.4 Data Collection Procedures Data was collected from respondents through in-depth interviews using open-ended questions. The open-ended questions allowed respondents to express themselves freely and enabled the researchers and participants to discuss emerging issues in much detail. Additionally, the data collection method allowed the researchers to probe participants’ responses for elaboration and to explore key issues raised by respondents, which were useful for the study. The consent of the respondents was sought before the in-depth interviews were conducted. Participation in the study was voluntary and participants were assured of anonymity and confidentiality regarding the information they provided. 3.5 Data Analysis The data gathered from the interviews using a voice recorder was played and listened to several times before the actual transcription was done. Also, because most of the in-depth interviews were conducted in Twi (local language) the data was translated into English language by the researchers who are fluent in the Twi language. The raw data was analyzed inductively because it enabled the dominant or significant themes to emerge without the restraints imposed by structured methodologies (Thomas, 2003). The transcribed data was categorized into themes by looking for fits and recurring patterns in the data. The researchers analyzed specific statements and searched for possible meanings that made the information more meaningful (Creswell, 1998). The most illustrative quotations were extracted and used to support important points that emerged from the data gathered from respondents.
4. Findings and Discussion The findings revealed four factors that entrenched gender inequality within the Kyebi community. These were cultural and traditional practices, gender socialization, poverty and discrimination in access to land. 4.1 Cultural and Traditional Gender Roles Respondents’ perceptions regarding culturally assigned roles of females and males were explored and culture was the major factor that was found to perpetuate gender inequality. The findings showed that, culture prescribed authoritative roles for males whereas females were responsible for caring roles within the household. These stereotypes place greater emphasis and value on the role of men and boys in public life and in the work place, as opposed to women’s role in unpaid family labor, care giving and community work (Marinova, 2003). Majority of the respondents indicated that traditionally, women were responsible for maintaining the household by performing chores such as sweeping, cleaning, preparing food and bathing children. During the interviews some respondents said:
“The duty of the man is to ensure that all the needs of the children are met, for instance providing money for the feeding of the kids.” (Female respondent). “The man is the head of the family, it is his responsibility to take care of his household, if he is married he has to take care of his wife and children, especially the education of his children.” (Male respondent). “A woman has several responsibilities . . . does everything in the home, the man’s role is just to put money down for the household, but the woman takes care of the house, sees to it that the children take their bath, their clothes are washed, cleans the rooms, provides what to eat and takes care of the general up keep of the home.” (Female respondent) “It is the responsibility of the woman to prepare food for the family, she also has to fetch water for the man to take his bath and sweep and clean the house.” (Male respondent).
As indicated in the responses, compared to women, men had more authority over the affairs of their households. Within rural households, men were responsible for the upkeep of their families and as a result provided money for the family needs. Women on the other hand were responsible for domestic chores. Our finding corroborates Boateng and colleagues’ (2006) assertion that the responsibilities of being man in a marital relationship include being a provider for wife and children, and authority over his nuclear family. Also, Amu (2005) concluded that in Ghana as well as in other African countries, women’s roles and participation have been defined and shaped along biological and cultural lines. We would therefore argue that cultural and traditional practices play an important role in the perpetuation of gender inequality
ISSN 2039-9340 Mediterranean Journal of Social Sciences Vol. 4 (1) January 2013
485
as it prescribes decision making and caring roles for men and women respectively. As a result, males are revered by females who usually have limited opportunities to influence decision making in their households.
Even though some men recognized the immense pressure that emanated from their role as household heads, they equally recognized this responsibility as in conformity with traditional practices and norms. The following statements from some respondents illuminate this finding:
“. . . the responsibility of men is to only suffer because if you are a man then you have lots of trouble and problems to deal with . . .” (Female respondent) “. . . a man must always show his worth, he is the person who marries a woman, has to take care of her and all their children, it is not an easy task at all but what can we do? . . . as men, we are doing our best . . .” (Male respondent)
In many societies in Ghana, traditionally men are expected to protect their families by being strong even in the face of adversity. As Boateng et al (2006) argue, male characteristics that are respected and encouraged in Ghana include virility, strength, establishing authority, power and leadership qualities, the ability to offer protection and the ability to bear physical and emotional pain. In this study, it was found that language played a very important role in the respondents’ perceptions about gender roles. Given that language is closely entwined with culture, it plays a vital role in it. Some respondents used expressions and proverbs to portray and explain their beliefs about the roles and responsibilities of men and women in their community. Boateng and colleagues (2006) assert that proverbs are often used to explain, describe and hold in place stereotypes about women and men. Two respondents, a female and male noted respectively:
“. . . a woman is there for a man and the reason why I am saying this is that in everything men take the leadership position, even if you see a scary animal and can’t kill it you will call for the help of a man to come and kill it”. “If anything happens it is a man that has to tie a cloth around his chest as the old people say, we use humans to establish a nation, we use humans to tie a community together and use humans as Kings . . . humans represent men.”
The assertions made by respondents suggest that compared to women, men were honoured and revered in the rural community. Reynolds and Herman-Kinney (2003) observed that the sheer amount of talk in a situation and the object of the speaker indicate who is important and who is not. In most societies, language reflects culture and is influenced and shaped by it because it is the symbolic representation of a group of people and comprises their historical and cultural backgrounds, as well as their approach to life and ways of living and thinking (Jiang, 2000). Culture and language are inseparable for the reason that language is part of culture and culture is part of language and the two are intricately interwoven in a way that the two cannot be separated without losing the importance of either language or culture (Brown, 1994). Given that the language of a people reflects the realities of their lives, the findings of this study indicate that people in the rural community used daily discourse to support masculine proclivity which perpetuates gender inequality. This suggests that intervention programs that aim at promoting gender equality would be an illusion, unless cultural and traditional practices and beliefs are taken into consideration.
4.2 Gender Socialization Another factor that was found to perpetuate gender inequality in the Kyebi community is gender socialization. The study explored key aspects of socialization processes to find out how they influenced the expectations, responsibilities and roles played by females and males in the community. As Marinova (2003) opines, socialization processes and belief systems influence adherence to particular gender stereotypes and patterns of behaviour. In their responses, participants did indicate the different ways in which they raised their male and female children as reflected in the responses below by a female respondent:
“. . . for the boy I teach him how to manage my business and be serious about it, because sometimes I leave the shop and go home to cook . . . be serious about all that he does because at the end of the day he will have to marry a woman and take care of her. He is not a female that someone will come and marry . . . be serious about his education since it is his future and that is what will help him.” “. . . the most important thing is to teach my daughter how to take care of the home, for instance, she must learn how to scrub the toilet and the bath house, prepare food and the rest . . . anyway, her education is also relevant and she has to study.”
ISSN 2039-9340 Mediterranean Journal of Social Sciences Vol. 4 (1) January 2013
486
Consistently, the respondents mentioned that for female children, teaching them caring roles and how to do household chores was very important. These were emphasized by both men and women because they believed it was essential for every girl, who hopes to get married and have children. In most societies, especially in Africa, there is deep stereotypical belief that only women can take care of children (Marinova, 2003). In consonance with this point, Boateng and his colleagues (2006) asserted that, girls carry the greater burden of domestic work while boys are geared towards more productive work and are permitted more time for play and to be away from home. In most societies, women are restricted because their mobility is curtailed in public spheres as they are confined mostly to domestic activities and reproductive responsibilities (Kabeer, 2008).
More importantly, the knowledge children acquire through socialization further entrenches the inequalities that exist between men and women as they are likely to hold these views throughout their lives. Some traditions in Ghana encourage stratification of gender roles and are reinforced by passing these traditions down from one generation to the next (Boateng et al., 2006). Not only are children taught but they also observe what unfolds at home and other environments like the school. Even though the process of socialization begins before school, it is an environment that conscious socialization takes place (Marinova, 2003). In this study, it was found that the education of boys was considered to be very important. With regard to the education of girls, majority of the respondents were concerned about teenage pregnancy which according to them, negatively affected girls’ progress and completion of school.
4.3 Poverty It is vital to examine the links between gender equality and poverty because norms, values, divisions of assets, work, responsibility, power and control make poverty a gendered experience (Sen, 2008). In addition, gender norms and practices tend to worsen the effects of scarcity in a way that most poor women enter the labour market with lower levels of health, nutrition, education, skills and fewer productive assets than poor men (Kabeer, 2008) especially in rural communities. Moreover, the impact of poverty does not only make a distinction between women and men, but also differentiates how care work burdens and responsibilities are experienced by different women (Sen, 2008). For instance, Sen (2008) further argued that for poor women, time is often the most valuable resource for the reason that their time is so much taken up by caring work that they can remain caught in a vicious circle of poverty.
From the findings of this study, it became evident that, in most poor households men strictly maintained their positions as heads of family and treated women as subordinates since they did not engage in paid work and were unable to contribute to the family income. Wadesango, Rembe, and Chabaya (2011) suggest that role differentiation and expectations in society relegate women to inferior positions which have colossal implications for vulnerability and exclusion. During the in-depth interviews, a male farmer who cultivates crops and rears animals on a small scale and had nine children recounted:
“. . . as a man, I work and bring in all the money, I am in charge of the household decision making . . .women just play a minor role. For instance, if there is an issue you can choose to inform the woman or not, but the man is the one who plays an active role by taking care of the woman, family and even the woman’s extended family”
Affirming the above statement other female respondents said: “. . . in my house, my husband controls everybody. He provides money for the entire family so what he says is final . . .” “… as you can see we are poor people . . . advice my daughter to be careful of boys in this community . . . she has to get married to a wealthy man who will help her reduce her burden rather than become a burden herself if she becomes impregnated by any of the boys in this community” “. . . my prayer is that one day my daughter will get a rich man to marry, a man who can take care of her and even our entire family and that will be the end of all our worries . . .”
The responses provided by participants of this study affirm the World Bank’s (2002) assertion that poverty has significant gender dimensions in Ghana, where women dominate among the core poor. As revealed in the study, although women were responsible for domestic chores, since men were primarily the breadwinners, they had power in influencing household decisions. Marinova (2003) concludes that patterns of production and reproduction are indicative of gender relations that reflect traditional images and expectations related to men’s and women’s roles, such as those of breadwinner, care giver, or head of household. These specializations lower women’s earnings potential and reinforces established gender dynamics and dependency on male breadwinners at household level (Heintz, 2008). Even worse,
ISSN 2039-9340 Mediterranean Journal of Social Sciences Vol. 4 (1) January 2013
487
some women in our study expected their daughters to marry wealthy men as a means of reducing poverty. Although this could develop into new and deeper forms of gender inequalities, this practice is acceptable in most rural communities in Ghana because women’s access to income could change gender roles and household norms and values. These norms and values are part of culture and therefore would be difficult to change.
Given that compared to men, women often have primary responsibility for unpaid, non-market housework and caring labour, they are normally constrained in their choices in terms of labour force participation and access to both formal and informal paid employment (Heintz, 2008). The constraints indicate that women are likely to face more challenges than men in translating their labour into paid work (Kabeer, 2008). Many households are able to stay out of poverty because women participate in the labour market and have access to decent paid employment (Heintz, 2008). However, this is not the case in most rural communities in Ghana because access to employment has implications for individual freedoms, power, capabilities and dignity (Heintz, 2008), which are normally considered male characteristics and have implications for intra-household gender relations and dynamics.
4.4 Discrimination in Access to Land Within the Kyebi community, as in many rural communities in Ghana, land is a major resource that determines the livelihoods of people. This is because majority of people in Ghanaian rural communities are farmers who depend solely on agriculture (Women’s Manifesto for Ghana, 2004). Gender discrimination in land is a common phenomenon because there is a wealth of evidence showing that fewer women own land (Alsop & Healey, 2008). In sub-Saharan African countries like Ghana, while the majority of women work in the agricultural sector, patriarchal traditions and practices often deny them the right to own and manage the land they cultivate (Drechsler, Jütting & Lindberg, 2008). Also, although different categories of land users face problems of access and control, women are most vulnerable, either as family members or wives due to discriminatory customary practices in Ghana (Women’s Manifesto for Ghana, 2004).
It was found in our study that there were three major ways through which people had access to land for farming in the community and these were through (a) family, (b) hiring, or (c) a partnership agreement. It was very difficult for women in the community to either hire or enter into partnership because both required huge capital investment which they did not have. In this regard, it became evident that most women farmers in this study acquired land through their extended families where the family heads of the various clans in the community distributed the land prior to the farming season. In the words of some respondents:
“Every clan has its own farming area . . for instance, Oyoko people have their own area for farming so when the year comes to an end and we want to farm we sit down and discuss, having discussed we go to the land and share accordingly . . .”. “. . . when it is farming season, we meet and everyone is given a portion of land to farm but as you know farming is for men, so we give men more land to farm . . .”. “. . , since my husband passed on, things have been very difficult, now I don’t have capital to farm on a large scale as my husband did. He controlled everything; the land, money, customers and everything . . . it is difficult for me to start all over again, I have a small portion of land on which I farm in order to earn some money for my children and myself . . . “
Although most of rural dwellers in Ghana are farmers, and majority of those who engage in farm related activities are women, the study findings indicated that compared to men, women were discriminated against in access to land. The discriminatory practices ensure that women are often given land of poor quality and size because those who control land gain social and political power and authority (Women’s Manifesto for Ghana, 2004). Unequal access to land could adversely affect opportunities rural dwellers, especially women could harness within their communities and would likely plunge them into poverty and consequently perpetuate already existing gender inequalities.
While there are constitutional provisions that protect women’s land rights in Ghana, women continue to face diverse forms of discrimination in access to land, among others (Food and Agriculture Organization 2012; MOWAC, 2012). Most rural women face constraints than men in access to land and other structures and processes, such as credit, labour and appropriate technology that increase agricultural productivity (Augustin, Assad & Jaziri, 2012; MOWAC, 2012). This gender gap hampers women’s productivity, reduces their contributions to the agriculture sector and hinders their achievement of broader economic and social development goals (Food and Agricultural Organization, 2011). In this regard, closing the gender gap in access to land and other related farming needs could increase the productivity of rural women, which would reduce their poverty and ultimately enhance their well-being.
ISSN 2039-9340 Mediterranean Journal of Social Sciences Vol. 4 (1) January 2013
488
5. Conclusions Evidently, findings from this study and others indicate that gender inequalities exist in many countries including Ghana. Regrettably, this has led society to place greater emphasis and value on the role of men and boys in public life and in the work place, as opposed to women’s role in unpaid family labour, care giving, and community work (Marinova, 2003). Since factors that perpetuate gender inequality, especially in rural communities are manifold (e.g., cultural practices, traditional gender roles, gender socialization, poverty and discrimination in access to land) they have implications for policy and research.
Gender inequality represents an untapped source for stimulating economic growth and advancing social development (Marinova, 2003). Thus, there is a pressing need for policy makers and actors to better understand how prevailing patriarchal gender stereotypes and expectations about men’s and women’s roles negatively affect women and design interventions that would reduce such practices. This is essential because it is an issue that seems to be poorly understood and greatly neglected. Furthermore, given that reducing gender inequalities implies benefits not only for women but also for all vulnerable persons and groups (Costa & Silva, 2008), research should focus on structural inequalities that continually deprive women of having equal access to social and economic opportunities and services. This is essential because gender inequalities could have both short and long-term consequences not only for women but the entire society.
References Abu, K. (1991). Family welfare and work dynamics in urban Northern Ghana. Geneva: International Labour Office. Alsop, R., & Healey, P. (2008). Gender equality and economic growth for poverty reduction. In D. Ehrenpreis (Ed.), Poverty in focus:
Gender equality (pp. 14-15). Brazil: International Poverty Centre. Amu, J. N. (2005). The role of women in Ghana’s economy. Retrieved on January 13, 2012 from http://library.fes.de/pdf-
files/bueros/ghana/02990.pdf Adomako Ampofo, A. (2001). When men speak women listen: Gender socialization and young adolescents attitudes to sexual and
reproductive issues. African Journal of Reproductive Health, 5(3), 196-212. Ardayfio-Schandorf, E. (2005). Violence against women: The Ghanaian case. Presented at an Expert group meeting on Violence
against women: A statistical overview, challenges and gaps in data collection and methodology and approaches for overcoming them. Geneva: United Nations, Economic Commission for Europe and World Health Organization.
Augustin, E., Assad, R., & Jaziri, D. (2012). Women empowerment for improved research in agricultural development, innovation and knowledge transfer in the West Asia/ North Africa Region. Jordan: Association of Agricultural Research Institutions in the Near East and North Africa
Barry, H., Bacon, M. K., & Child, I. L. (1973). A Cross-cultural survey of some sex differences in socialization. In S. Scarr-Salapatek and P. Salapatek (eds) Socialization. Columbus: Merrill Publishing Company.
Boateng, J. K., Adomako-Ampofo, A., Flanagan, C. C., & Yakah, J.(2006). Gender socialization of pre-teen youths in Ghana: Alternative approaches for extension. Retrieved on November 13, 2012, from http://www.aiaee.org/attachments/article/901/070.pdf
Bandiaky, S. (2008). Gender Inequality in Malidino biodiversity community-based reserve, Senegal: Political parties and the village approach. Conservation and Society, 6(1), 62-73.
Brown, H. D. (1994). Principles of language learning and teaching. Englewood Cliffs, N J: Prentice Hall Regents. Cleves, M. J. (1993). Half the world, half a chance: An introduction to gender and development. USA: Oxfam. Costa, J., & Silva, E. (2008). The burden of gender inequalities for society. In D. Ehrenpreis (Ed.), Poverty in focus: Gender equality (pp.
8-9). Brazil: International Poverty Centre. Creswell, J. W. (1998). Qualitative inquiry and research design: choosing among five traditions. Thousand Oaks: Sage. Drechsler, D., Jütting, J., & Lindberg, C. (2008). Gender, institutions and development: Better data, better policies. In D. Ehrenpreis
(Ed.), Poverty in focus: Gender equality (pp. 10-11). Brazil: International Poverty Centre. Food and Agriculture Organization. (2011). The state of food and agriculture, women in agriculture: Closing the gender gap for
development, 2010-2011. Rome: United Nations. Food and Agriculture Organization. (2012). Gender inequalities in rural employment in Ghana: Policy and legislation. Italy: United
Nations. Ghana Statistical Service. (2012). 2010 population and housing census. Accra, Ghana: Ghana Statistical Service. Heintz, J. (2008). Poverty, employment and globalisation: A gender perspective. In D. Ehrenpreis (Ed.), Poverty in focus: Gender
equality (pp. 12-13). Brazil: International Poverty Centre. Jiang, W. (2000). The relationship between culture and language. ELT Journal, 54(4), 328-334. Kabeer, N. (2008). Gender, labour markets and poverty: An overview. In D. Ehrenpreis (Ed.), Poverty in focus: Gender equality (pp. 3-5).
Brazil: International Poverty Centre. Kimmel, M. S. (2000). The gendered society. New York: Oxford University Press, Inc. Little, J. (1987). Gender relations in rural areas: The importance of women’s domestic role. Journal of Rural Studies, 3(4), 335-342.
ISSN 2039-9340 Mediterranean Journal of Social Sciences Vol. 4 (1) January 2013
489
Mack, N., Woodsong C., Macqueen., M. K., Guest, G., & Namey, E. (2005). Qualitative research methods: A data collector’s field guide. North Carolina, Family Health International.
Marinova, J. (2003). Gender stereotypes and the socialization process. Brasilia, Brazil: United Nations and International Labour Organization. Ministry of Women and Children Affairs. (2012). Rural women and the MDGS 1 and 3: Ghana’s success and challenges. Retrieved on
November 13, 2012, from http://www.mowacghana.net/UN%20CSW%20GH%20technical%20paper.pdf Ministry of Food and Agriculture. (2010). Agriculture in Ghana: Facts and figures 2009. Retrieved on November 15, 2012,
from http://mofa.gov.gh/site/wp- content/uploads/2011/10/AGRICULTURE-IN-GHANA-FF-2010.pdf Nabila, P. (2001). Traditional socialization practices and women’s empowerment: A study of adolescent gender socialization in Dagbon.
M. Phil thesis presented to the Institute of African Studies, University of Ghana, Legon. Nukunya, G. K. (1992). Tradition and change: The case of the family. Accra: Ghana University Press. Paechter, C. (2003). Learning masculinities and femininities: Power/knowledge and legitimate peripheral participation.Women’s Studies
International Forum 26(6), 541-552. Patton, M. Q. (2002). Qualitative research and evaluation methods. Thousand Oaks, CA: Sage Publications. Potts, D., Ryan, P., & Toner, A. (2003). Development planning and poverty reduction. London: Palgrave Macmillan. Rasmussen, T. (2008). Social problems and development in the concept of inequality in a Danish context. Retrieved on December 02,
2011, from http://www.epa.aau.dk/fileadmin/user_upload/ime/CCWS/researchnotes/Socia-inequality-tr.pdf Reeves, H., & Baden, S. (2000). Gender and development: Concepts and definitions. Brighton, UK: Institute of Development Studies. Reynolds, L. T. & Herman-Kinney, N. J. (2003). Handbook of symbolic interactionism. United States of America: Rowman Altamira
Press. Schalkwyk, J. (2000). Culture, gender equality and development cooperation. Canada: Canadian International Development Agency
(CIDA). Retrieved on February 01, 2012 from http://www.oecd.org/dataoecd/2/9/1896320.pdf Sen, G. (2008). Poverty as a gendered experience: The policy implications. In D. Ehrenpreis (Ed.),Poverty in focus: Gender equality (pp.
6-7). Brazil: International Poverty Centre. Thomas, R. D. (2008). A general inductive approach for qualitative data analysis. Retrieved on February 23, 2012,from http://www.
Fmhs.auckland.ac.nz/soph/centres/hrmas/_docs/Inductive2003.pdfUnited Nations Development Programme. (2006). Support package for human development report focal points. Retrieved on November
13, 2012, from
http://hdr.undp.org/en/media/SupportPackage_en g.pdf United Nations Population Fund. (2008). UNFPA worldwide: sub-Saharan Africa. Retrieved on December 20, 2012,
from http://www.unfpa.org/worldwide/africa/html Wadesango, N., Rembe, S., & Chabaya, O. (2011). Violation of women’s rights by harmful traditional practices. Anthropologist, 13 (2),
121-129. Women’s Manifesto for Ghana. (2004). The Coalition on the Women’s Manifesto for Ghana. Retrieved on July 20, 2011
from http://library.fes.de/pdf-files/bueros/ghana/02983.pdf World Bank. (2002). Ghana strategic country gender assessment: Briefing note for the Ghana’s poverty reduction strategy. Retrieved on
February 2, 2012, from http://siteresources.worldbank.org/EXTAFRREGTOPGENDER/Resources/GhanaCGA-R.pdf World Bank. (2003). Gender equality and the millennium development goals. Washington, D.C: World Bank. World Bank Gender and Development Group. (2003). Gender equality and the millennium development goals. World Bank. World Bank Policy Research Report. (2001). Engendering development: Through gender equality in rights, resources, and voice. USA:
World Bank and Oxford University. World Health Organization. (2009). Violence Prevention: The evidence, promoting gender equality to prevent violence against women.
Geneva: WHO. Retrieved on July 20, 2011, from http://whqlibdoc.who.int/publications/2009/9789241597883_eng.pdf Zuckerman, E. (2002). A primer on poverty reduction strategy papers and gender. Retrieved on February 6,
2012,fromhttp://www.eif.govcy/mlsi/dl/genderequality.nsf/0/12D2A22FAC60DA74C22579A6002D950A/$file/aprimer_on_gender_poverty.pdf

ISSN 2039-9340 Mediterranean Journal of Social Sciences Vol. 4 (1) January 2013
491
Implementation of National Accounting Standards Focused in Albanian Reality
Shqipe Xhaferri, Phd Candidate
Lecturer at Aleksander Moisiu University,
Faculty of Business, Durres, Albania
Doi:10.5901/mjss.2013.v4n1p491
Abstract
This paper deals with the achievements and weaknesses of the implementation of the National and International Standards of Accounting, for property in general, the problems encountered in the implementation of these standards as well as comparisons between different societies.This work will be carried out through questionnaires and direct interviews with various businesses, especially those businesses that deal with the implementation of IAS 16 and 5.The methodology used will be qualitative and quantitative methods and empirical data - where you will get the right information about the problems and difficulties faced by various companies and qualitative methods through a detailed analysis of the data obtained to reflect the reasons for non-compliance with these standards. Benefits of International Accounting Standards may be financial, economic and political.Preliminary evidence suggests that companies, lenders and investors would prefer, a convergence of domestic accounting standards with the International Accounting Standards to create a framework of financial reporting quality. Although there are many significant benefits for the implementation of International Accounting Standards and has grown pretty its importance, there are still many challenges for the further development and implementation authoritative. To better understand these challenges need to look at the factors that influence the development of accounting regulations. These factors may include social and cultural values, political and legal systems, business activities and economic conditions; standard-setting processes; capital markets and forms of ownership; and finally the cooperative efforts of nations. These factors need to be understood if we can mitigate or even eliminate the challenges of International Accounting Standards. International Accounting Standards are important today and will probably become even more important in the future, as they are further developed. This work will be carried out in close cooperation with the theme leader Prof. Jorgji Bolanos to reach the criticism and solutions to problems encountered in this research.: “Which are the problems that implementation process will face in Albanian reality?”
Keywords: International Accounting Standards (IAS), National Accounting Standard, implementation process.
1. Introduction Developments in the field of accounting have started since 90 years. 'At that time, Albania is facing big changes going from a centralized economy to a free market, which of course requires major changes in the field of accounting and information providing by it as well. This fact made the reform in the accounting and fiscal legislation a necessity. As a part of overall economic transformation, accounting reform was based on the recommendations provided by the Institute for European and International Financial by the circumstances, past experiences and qualifications. This reform was crucial given the need to have government and all economic sectors, for accurate and reliable information as a key factor for the decision-making process.
The main objective of the reform was the adoption of a new accounting system in light of the drastic changes taking place in Albania.However, besides efforts during this period a lot of problems and issues were identified in both the legislation and regulation framework: Law 9228, dated 19.01.1993 "For accounting" was not in line with IAS. Law " For accounting" and the law " For Commercial Entities" were written on the same time without having the possibility for coordination and harmonization of rules applied by both laws. Application of an Accounting Legislation, far from International Standards, brought up problems for foreign investors for the consolidation of their financial statements, etc.. In order to address the shortcomings in the previous law, a new accounting law was enacted in 2004. So, the Accounting Law (1993).
Complemented by General Accounting Plan which provided detailed guidance for all business entities in Albania was repealed when the new Law on Accounting and Financial Statements (2004) became effective on January 1st, 2006. However, as a lot of delays happened, like: the translation process finished only end of 2006, just before the date set up for implementation, the professionals involved in the process and moreover the government and public institutions were not prepared to start and assist the implementation process. In these conditions was decided to postpone the
ISSN 2039-9340 Mediterranean Journal of Social Sciences Vol. 4 (1) January 2013
492
implementation date until January 1st, 2008. This decision for postponement was the first signal that the implementation process was not going to be a smooth one.
Referring to different studies and cases, we find that exist two different positions held by researches whilst analyzing this kind of process. So, Cheney, (2002), draw attention to the fact that, in many countries within the EU, especially those countries with a local GAAP that is not particularly developed or where it quickly adjusts to international standards, will have no difficulties to prepare consolidated statements in accordance with IAS. In the other hand,Wilson (2001) believes that IAS implementation problem will be huge for many European companies. This is because Europe is embracing a future for financial reporting that is not necessarily that widely known or understood.). In the other hand,Wilson (2001) believes that IAS implementation problem will be huge for many European companies. This is because Europe is embracing a future for financial reporting that is not necessarily that widely known or understood.
In Albanian case, considering the basis of the old accounting system used, far from IAS principals, outdated in respond to the new economic development, not sufficient for the foreign investors interest, we believe that implementation process will have problems that need to be analyze.
National Accounting Standards (NAS) must be applied starting from January 1, 2008 accounting. Standards was prepared by the National Accounting Committee (CCC), thanks to a project assisted by the World Bank in collaboration with the "Price eater House Coopers. "This set is prepared in accordance with International Accounting Standards (IAS) and are in force to be applied by all Albanians, from medium-sized and small businesses. While, large companies, financial institutions should implement only (IAS) . Realistically application (NAS), was scheduled for 1 January 2006, but the process of implementation or enforcement was not and will not be easy considering the transition from the model of the French school (the overall accounting) Anglo-model Saxon (standards).
National Accounting Standards conflict with Albanian legislation and tax these conflicts will not be resolved in the near future. In addition, there are other reasons for professional and administrative resources to be taken into consideration such as: not all IAS have been translated into Albanian language. Most of accountants were not sufficiently familiar with the standards IAS, KAS and to implement them etc.
The final section presents the main conclusion from the surveys and interviews conducted outside conclusions are based on analysis of these findings and other information, which contained. These guidelines are intended to provide objective answers to this topic and question that arises from this: “Which are the problems that implementation process will face in Albanian reality?”? 2. Methodology In orders to give readers the opportunity to make his/her own judgment concerning the quality of the results (Gill & Johnson1997), I will describe the methods used.
In this study, I first compared the old accounting rules with the new standards and then analyzed the consequences of different perspectives. My approach, the abductive one, was neither to build up a new theory nor to test an existing one, as in induction and deduction. As the abductive approach is a combination of the deductive and the inductive approach (Alversson & Sköldberg, 1994), I started with the comparison between the accounting standards, got ideas for theory, and then went back to the empirical findings for further analyses. Regarding the ollection of empirical data, as referring from the literature, there are two different research methods, quantitative and qualitative (Merriam, 1988). The qualitative method is harder to define than the quantitative. When applying the qualitative research the aim is to understand the significance of a particular phenomenon or experience. Based on this theory we have explored the differences between NAS and General Accounting Plan and the consequences of the implementation of these NAS, which is a qualitative approach. We explored NAS documents, General Accounting Plan manuals, the National Accounting Standards, the IASB’s and the FASB’s accounting standards.
The quantitative method focuses on the common, the average or the representative. The research objects must be able to be measured and the result must be able to be presented in numeric form (Eneroth, 1984). In this frame, a postal questionnaire (Annex 1.), was prepared and sent out in order to collect empirical data. After designing the questionnaire, we consulted it with other colleges of accounting field, through interviews, in order to refine the questionnaire and later to check the reliability of the survey results and seek further explanation for some of the responses. Contacting a number of experts in the accounting field was considered from us as an important technique to make the project worthwhile.
The questionnaire was sent to about 600 accountants approved (by 1300 approvals ationally). Only 50 of them responded. However, the information gathered was considered sufficient for the purpose of statistical analysis.
Finally, all parts in theoretical frame of reference and the empirical findings where analysed and conclusions where drawn.
ISSN 2039-9340 Mediterranean Journal of Social Sciences Vol. 4 (1) January 2013
493
3. A Review on the Old Accounting System and its Gaps Before the new law on Accounting (2004) as the basis of accounting financial reporting in Albania was the law of the year (1993) completed by the General Accounting Plan, which provides detailed guidance including a gafik accounts summarized in demand applicability Accounting Financial Reporting for all business entities Albanians.
Accounting old law (1993) was based on the French model where the state had a major impact on the economy and related fields. This was intended to protect the owners and the interests of the creditors of the companies organizing a fiscal goal oriented accounting process of the state and maintain national account. Key features of GAP were:
Storage revenue was expressed in more detail, especially in the detection of categories of labor costs. • GAP was intended to require the classification of costs, based on the nature or type of expenditure and not
according to company functions; • There were no adjustments on financial consolidation for groups of companies; • GAP did not provide an appropriate regulations for specific businesses acquired companies and lease
(leasing); • Translation of assets and liabilities in foreign currency circulation were made using sites balanced accounting
and non-accounting P &L; • GAP predicted no treatment differences by changing accounting methods and accounting matjtet; • Construction construction treatment and treatment postponement of tax does not exist. All these led to the conclusion that this model is highly centralized and does not provide flexibility and freedom for
judgment in preparing financial situation thus creating the conditions for the implementation of a new law. Thus the law no. 9228 "Accounting Financial Reporting" was completed after 2 years of work. (2004). Based on this new law GAP had to be restored by MRS. Then began the process of writing the MRS as a responsibility of the National Accounting Committee, a process that was completed only at the end of 2006. Meanwhile began the translation and publication of IASs. Now we are at the moment where fourteen NAS are approved and in force since 1 January 2008.Këto be implemented by small and medium companies, while IAS and IFRS should apply only to financial institutions and the banking activities Although not yet published in the English language. 4. Achievements and shortcomings in the way of implementation of standards Design and implementation of Accounting Standards have thought and perceived not as something immediate and unchanging, but as an ongoing process, a process which will own time and that has to do with providing material infrastructure and professional capacity, as well as reflect post-practice requirements for the necessary changes in order to modernize and simplify them.Experience two years of implementation of standards has highlighted achievements and shortcomings. 5. Achievements The greatest achievement is that Albania starting in 2008, implementing an accounting system that prepares financial statements based on International Standards and National Accounting Standards developed in coherence with the first. The question is: Are we fully prepared to start the implementation of Accounting Standards 1 January 2008?
We are confident that no work, no project can not start waiting carried all conditions, which in our case say to begin implementation as we were familiar with the standards and to have adopted the broad masses of professionals. When we talk about and hence accounting for its standards, they are taught by working as teaching and being introduced into the water swimming. A good experience in this regard had to the implementation of the General Accounting Plan.
From surveys made and verifications have shown that, in general, the preparation of financial statements for the 2008 closure was based on the standard. Thekësojmë preparation of financial statements and bookkeeping, for there are many entities in the first year did not change in bookkeeping but did fit in time prepared financial statements. In the second year increased interest entities organized on the basis of accounting standards, having as support for the drafting of financial statements.
Better in this regard have been working entities adopting International Financial Reporting Standards.This has its reasons that are:
• A good portion of them are subsidiaries of foreign companies and as such have been working and preparing financial statements with both local Fiscal issues and international standards for consolidation with the parent.
ISSN 2039-9340 Mediterranean Journal of Social Sciences Vol. 4 (1) January 2013
494
• Banks have generally been working and preparing financial statements based on manuals that come close to International Standards.
• Insurance companies, some of them are part of the group of foreign companies, which allow these to prepare financial statements in accordance with IAS.
• The other major domestic societies have engaged foreign companies, consulting for drafting the financial statements.
• the above companies have been able to hire professionals to assess and professional capabilities. Regarding entities that implement the National Accounting Standards, in the first part began to organize accounting and financial statements are prepared on the basis of standards, another continued with existing accounting adjustments; while another part is not prepared financial statements, as previously had no organized accounting and had not prepared financial statements. These latest units called mikronjësi except the reason that they lack experience, can not afford even the cost of maintaining accounting and financial statements.
Given the purpose of the use of information about the state and performance that prepare financial entities, the National Accounting Council concluded that these economic mikronjësi (as a bakery, a shoe repairer, a professional, etc.) be exempted from the obligation of implementing Standards National Accounting. These units occupy a significant percentage of the total small and medium units and as such can not be left out of accounting regulation. Necessary legal changes were made in the framework of the National Accounting Standards was developed and published a special standard number 15 "On principles of Accounting and Financial Reporting by small and medium business".
This standard is intended to give basic concepts and principles and to establish rules for the application of these principles to the presentation of economic events and the preparation of financial statements. Small and medium business physical status with turnover up to 2,000,000 ALL will hold a simplified accounting not prepared financial statements, and other units, up to 10 000 000, will hold a progressive accounting and prepare only two simplified statements;
• Balance and • Statement of income and expenses and related notes.
During the period of implementation of the standards was done in cooperation with the supervisory and regulatory bodies with the Department of Taxation for better harmonization of legislation and special rules with accounting legislation. 6. Deficiencies Implementation of Standards for a number of entities characterized by low level of preparation of financial statements makers. Another part of entities with considerable sensitivity to the importance of the implementation of the Standards and legal obligation to do so had difficulties and problems related to:
1. Transition problems, the transition from the existing arrangements in accounting standards. 2. Measurement, evaluation and presentation of the elements of financial statements. 3. New financial statements.
7. Transition problems They dealt with the treatment of the previous balance elements, which will have a new treatment in the accounting future period. Worth mentioning some of them:
Referring conversion differences, entities have their voices considerable value of the asset or liability, and standards should make another accounting treatment. With the new standards, conversion differences would profit and expenses element. So we can mention and startup and expansion costs. They were significant voices of the asset, while the new standards should make another accounting treatment. These problems are more difficult due to entities that apply IAS given that these changes will be reflected retrospectively, which means to correct previous years, while the entities that will implement the National Accounting Standards these changes will be reflected in the way prospectively, which means not to touch the past. 8. Problems of measurement, evaluation and presentation. They had to do mainly with the new concept of evaluating the elements of financial statements. Mainly fair value problems. Refer property, as there is no active market for them, then the problem of presenting their fair value is a problem for these economic entities. While use of alternative modes requires a highly qualified relevant staff that deals
ISSN 2039-9340 Mediterranean Journal of Social Sciences Vol. 4 (1) January 2013
495
with the design of the financial statements. Referred to intangible assets and liabilities, little has been done by entities to present them at fair value. In this, the impact has been insufficient training of staff, as well as reporting culture as it is known has been leaning towards reporting purposes fiscal issues. In this context entities have not made serious efforts to make a statement as true and correct the position of financial performance. 9. Problems encountered in the design of new financial statements New financial statements which differ from the previous ones created in the first place on the formal side problems in their development. The tradition of presenting information in a certain way to create problems of adjustment. Already had to be inverted such concepts as:
a) by two financial statements and three specific reporting formats for fiscal purposes, developed five standards required financial statements, including financial statements and notes attachments
b) ratio of asset and liability items, the order of which on the balance sheet would be otherwise previous submission.
c) Presentation of property and equipment in the balance sheet would be to net book value. d) Submission of revenue statement and would be spending on a single statement (by nature or by function)
already presented several items in their net value (allowing compensation). 10. Conclusions This year is compiled and distributed by the Board of Standards, for the discussion of international financial reporting standard (IFRS) for small and medium enterprises (SME). Which is obtained, and translated and is making a comparison with national accounting standards and have observed:
1. Both are consistent with international accounting standards. 2. Differences are not significant.
National Accounting Council, as the only professional organization, with the authority to draft MRS and other accounting rules, after having received the opinions of stakeholders, will officially express its opinion regarding the above standard. In advance, we can say that we will continue to implement NAS after a 4-5 year period because:
a) We have national standards as noted above in two levels - For small and medium enterprises - For small enterprises
b) Entities have two years invested in their application and are still fully not familiar. c) There are no an opinion expressed by the European Community to make mandatory this.
Based on the above treated conclude that Albania is on the implementation of national and international accounting standards that are consistent with the first; international auditing standards and progress has been made in this way. A significant contribution to this achievement has given the Ministry of Finance and the Government which have been ready to resolve any proposal made by professional organizations related to the simplification and modernization of accounting information. Also no less important assistance given us international professional organizations updated with material us and invited us in conference and video conference organized from time to time in order to increase professional skills in terms of financial reporting 11. Recommendations.
1. Under the process of educating the teaching profession should be a process that starts at school and continues indefinitely while exercising. By this we must understand that university education should provide the theoretical foundations of future professionals or accounting audit and this should be reviewed curricula and programs.
2. Professional organizations and continuing education training of preparers and auditors of financial statements need to consider as a priority in their work, programs updated with changes to standard treatment by the relevant competent bodies and reflecting to problems arising from the practices and seeking solutions.
3. Encourage and stimulate individual works or bashkëautorësi accounting educators and professionals as well as organizations and various professional organizations.
4. To give special attention sensibilitimit business environment the importance of the implementation of accounting standards.
ISSN 2039-9340 Mediterranean Journal of Social Sciences Vol. 4 (1) January 2013
496
- The business community, especially senior management must understand that financial statements are drawn not only to the tax office, but also for many other users. The correct application of accounting standards means treating the whole and not a few of them.
- In this context, we believe that a much more efficient resolution towards increasing business for the implementation of the mandatory accounting standards would be an additional change in the law "On Accounting and Financial Statements," which relates to establishing appropriate penalties in its violation. Liberal spirit of the rule of law does not help in this case because the lack of penalties integration process is one of the reasons why standards have not been applied to a portion of entities.
5. Set up and operate the necessary structures professionally capable to solve problems dealing with assessments and revaluations of assets and as required by the standards.
6. Increase limits for classifying economic units making the change in the legislation approaching them with those of other countries in the region, which will bring a cost reduction for business information. Currently these terms of turnover criteria, we have several times lower than in the region, while those of the EU have more.
7. To expand and further intesify cooperation and exchange of experience with regional counterparts in the field of accounting.
And finally I would like to add that references and conclusions that will emerge in this paper, both from the theoretical and practical, will be not only a fulfillment of what refer, but an in-depth treatment of specific problems argued that have arisen in the way of implementation of accounting standards that require solutions.
Now we live in a time where the need to change our culture of thought and action, for the preparation of financial reporting statements and their audit. Today we are a candidate to join the EU and have to think of the act as such. The opening of capital markets, the signing of the Stabilization and Association Agreement, the signing of the Free Trade Agreement and the Europeanization of the Albanian Economy requires transparency and accounting same language. The fulfillment of these conditions would also facilitate Albania's EU integration problems. Expressed confidence that the army of accountants and auditors of our country will be able to evaluate and utilize all opportunities to move with time requirements by not allowing themselves to remain behind. References
Blanc, L. (2003) International Accounting Standards - The impact on Your Business Systems Financials, Cheney, G.(2002) The dream of a common language. Australian CPA;Issue 2, Dennis, A.(1999) Translating the standards. Journal of Accountancy; Dumontier, P. and Raffouriner, B. (1998) Why Firms Comply with IAS:an Empirical Analysis with Swiss Data. Journal of International
Financial Management and Accounting, 9(3). Gill, J., Johnson, P.(1997) Research methods for managers. London Hofste, P.(2002) The revolution will be itemised, Financial World; February J.Bollano,(2011), Achievements and shortcomings in the way of implementation of standards Karamanou, I. and Nishiotis, G. (2005) The Valuation of Firm Voluntary Adoption of International Accounting Standards. Working Paper,
University of Cyprus Law”On Accounting and Financial Statements” 2004, Naco-Gaxha, (2008), Implementation of National Accounting Standards and Its problems in Albanian reality. Robert W. McGee, Galina G. Preobragenskaya, Problems of Implementing International Accounting Standards in a Transition Economy:
A Case Study of Russia (2004). SKK, (2006). National Accounting Standards Law 9228 “For Accounting and Financial Statements” (2004) Accounting Law (1993) &
General Accounting Plan Wilson, A. (2001) IAS: the challenge for management. Accountancy; December,
Websites
European Parliament (2002). Report on the proposal for a European Parliament and Council regulation on the application of international accounting standards. FASB (Financial Accounting Standard Board), Website. IASB (International Accounting Standard Board), Website.
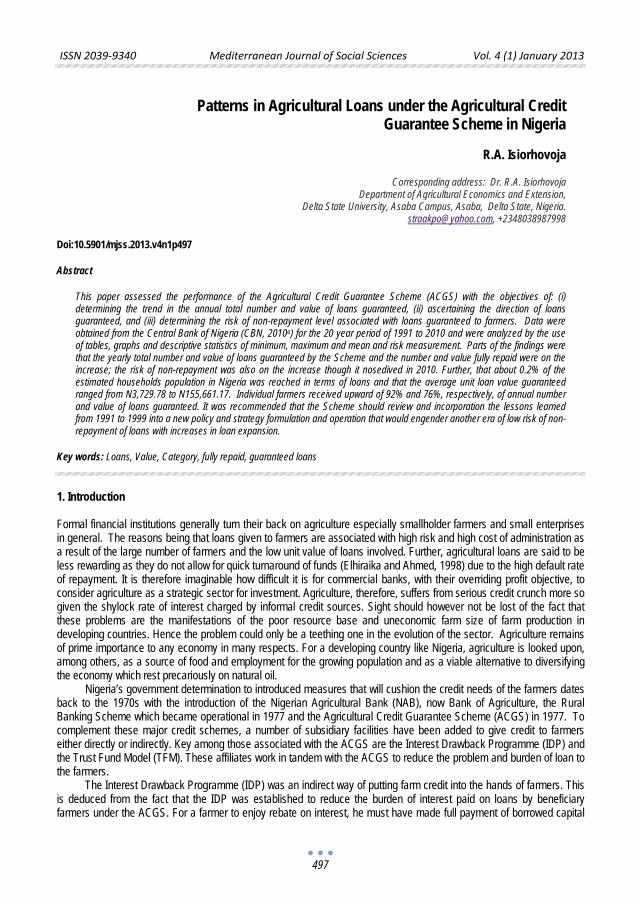
ISSN 2039-9340 Mediterranean Journal of Social Sciences Vol. 4 (1) January 2013
497
Patterns in Agricultural Loans under the Agricultural Credit
Guarantee Scheme in Nigeria
R.A. Isiorhovoja
Corresponding address: Dr. R.A. Isiorhovoja Department of Agricultural Economics and Extension,
Delta State University, Asaba Campus, Asaba, Delta State, Nigeria. [email protected], +2348038987998
Doi:10.5901/mjss.2013.v4n1p497
Abstract
This paper assessed the performance of the Agricultural Credit Guarantee Scheme (ACGS) with the objectives of: (i) determining the trend in the annual total number and value of loans guaranteed, (ii) ascertaining the direction of loans guaranteed, and (iii) determining the risk of non-repayment level associated with loans guaranteed to farmers. Data were obtained from the Central Bank of Nigeria (CBN, 2010a) for the 20 year period of 1991 to 2010 and were analyzed by the use of tables, graphs and descriptive statistics of minimum, maximum and mean and risk measurement. Parts of the findings were that the yearly total number and value of loans guaranteed by the Scheme and the number and value fully repaid were on the increase; the risk of non-repayment was also on the increase though it nosedived in 2010. Further, that about 0.2% of the estimated households population in Nigeria was reached in terms of loans and that the average unit loan value guaranteed ranged from N3,729.78 to N155,661.17. Individual farmers received upward of 92% and 76%, respectively, of annual number and value of loans guaranteed. It was recommended that the Scheme should review and incorporation the lessons learned from 1991 to 1999 into a new policy and strategy formulation and operation that would engender another era of low risk of non-repayment of loans with increases in loan expansion.
Key words: Loans, Value, Category, fully repaid, guaranteed loans
1. Introduction Formal financial institutions generally turn their back on agriculture especially smallholder farmers and small enterprises in general. The reasons being that loans given to farmers are associated with high risk and high cost of administration as a result of the large number of farmers and the low unit value of loans involved. Further, agricultural loans are said to be less rewarding as they do not allow for quick turnaround of funds (Elhiraika and Ahmed, 1998) due to the high default rate of repayment. It is therefore imaginable how difficult it is for commercial banks, with their overriding profit objective, to consider agriculture as a strategic sector for investment. Agriculture, therefore, suffers from serious credit crunch more so given the shylock rate of interest charged by informal credit sources. Sight should however not be lost of the fact that these problems are the manifestations of the poor resource base and uneconomic farm size of farm production in developing countries. Hence the problem could only be a teething one in the evolution of the sector. Agriculture remains of prime importance to any economy in many respects. For a developing country like Nigeria, agriculture is looked upon, among others, as a source of food and employment for the growing population and as a viable alternative to diversifying the economy which rest precariously on natural oil.
Nigeria’s government determination to introduced measures that will cushion the credit needs of the farmers dates back to the 1970s with the introduction of the Nigerian Agricultural Bank (NAB), now Bank of Agriculture, the Rural Banking Scheme which became operational in 1977 and the Agricultural Credit Guarantee Scheme (ACGS) in 1977. To complement these major credit schemes, a number of subsidiary facilities have been added to give credit to farmers either directly or indirectly. Key among those associated with the ACGS are the Interest Drawback Programme (IDP) and the Trust Fund Model (TFM). These affiliates work in tandem with the ACGS to reduce the problem and burden of loan to the farmers.
The Interest Drawback Programme (IDP) was an indirect way of putting farm credit into the hands of farmers. This is deduced from the fact that the IDP was established to reduce the burden of interest paid on loans by beneficiary farmers under the ACGS. For a farmer to enjoy rebate on interest, he must have made full payment of borrowed capital
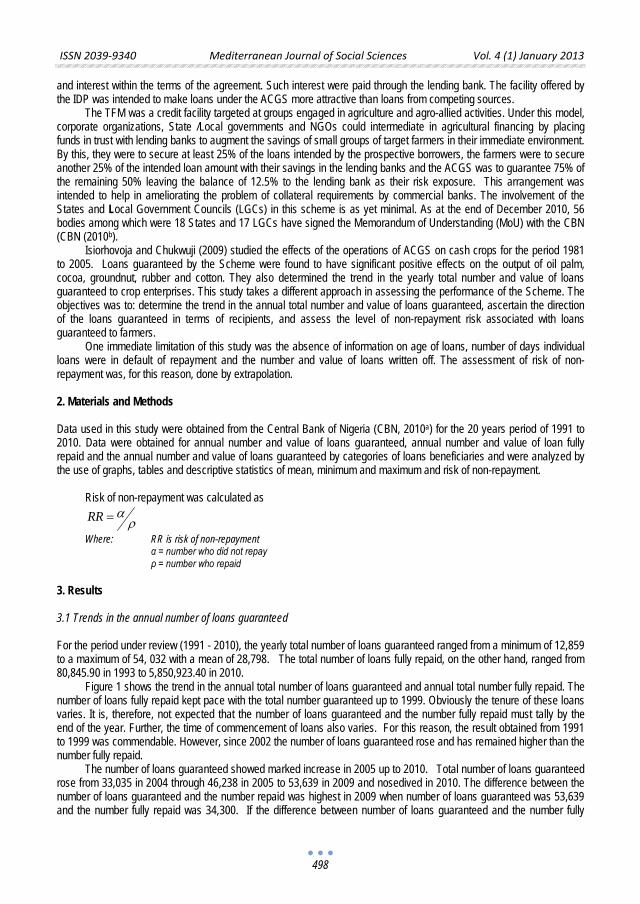
ISSN 2039-9340 Mediterranean Journal of Social Sciences Vol. 4 (1) January 2013
498
and interest within the terms of the agreement. Such interest were paid through the lending bank. The facility offered by the IDP was intended to make loans under the ACGS more attractive than loans from competing sources.
The TFM was a credit facility targeted at groups engaged in agriculture and agro-allied activities. Under this model, corporate organizations, State /Local governments and NGOs could intermediate in agricultural financing by placing funds in trust with lending banks to augment the savings of small groups of target farmers in their immediate environment. By this, they were to secure at least 25% of the loans intended by the prospective borrowers, the farmers were to secure another 25% of the intended loan amount with their savings in the lending banks and the ACGS was to guarantee 75% of the remaining 50% leaving the balance of 12.5% to the lending bank as their risk exposure. This arrangement was intended to help in ameliorating the problem of collateral requirements by commercial banks. The involvement of the States and Local Government Councils (LGCs) in this scheme is as yet minimal. As at the end of December 2010, 56 bodies among which were 18 States and 17 LGCs have signed the Memorandum of Understanding (MoU) with the CBN (CBN (2010b).
Isiorhovoja and Chukwuji (2009) studied the effects of the operations of ACGS on cash crops for the period 1981 to 2005. Loans guaranteed by the Scheme were found to have significant positive effects on the output of oil palm, cocoa, groundnut, rubber and cotton. They also determined the trend in the yearly total number and value of loans guaranteed to crop enterprises. This study takes a different approach in assessing the performance of the Scheme. The objectives was to: determine the trend in the annual total number and value of loans guaranteed, ascertain the direction of the loans guaranteed in terms of recipients, and assess the level of non-repayment risk associated with loans guaranteed to farmers.
One immediate limitation of this study was the absence of information on age of loans, number of days individual loans were in default of repayment and the number and value of loans written off. The assessment of risk of non-repayment was, for this reason, done by extrapolation. 2. Materials and Methods Data used in this study were obtained from the Central Bank of Nigeria (CBN, 2010a) for the 20 years period of 1991 to 2010. Data were obtained for annual number and value of loans guaranteed, annual number and value of loan fully repaid and the annual number and value of loans guaranteed by categories of loans beneficiaries and were analyzed by the use of graphs, tables and descriptive statistics of mean, minimum and maximum and risk of non-repayment.
Risk of non-repayment was calculated as
ρα=RR
Where: RR is risk of non-repayment
α = number who did not repay ρ = number who repaid
3. Results 3.1 Trends in the annual number of loans guaranteed For the period under review (1991 - 2010), the yearly total number of loans guaranteed ranged from a minimum of 12,859 to a maximum of 54, 032 with a mean of 28,798. The total number of loans fully repaid, on the other hand, ranged from 80,845.90 in 1993 to 5,850,923.40 in 2010.
Figure 1 shows the trend in the annual total number of loans guaranteed and annual total number fully repaid. The number of loans fully repaid kept pace with the total number guaranteed up to 1999. Obviously the tenure of these loans varies. It is, therefore, not expected that the number of loans guaranteed and the number fully repaid must tally by the end of the year. Further, the time of commencement of loans also varies. For this reason, the result obtained from 1991 to 1999 was commendable. However, since 2002 the number of loans guaranteed rose and has remained higher than the number fully repaid.
The number of loans guaranteed showed marked increase in 2005 up to 2010. Total number of loans guaranteed rose from 33,035 in 2004 through 46,238 in 2005 to 53,639 in 2009 and nosedived in 2010. The difference between the number of loans guaranteed and the number repaid was highest in 2009 when number of loans guaranteed was 53,639 and the number fully repaid was 34,300. If the difference between number of loans guaranteed and the number fully
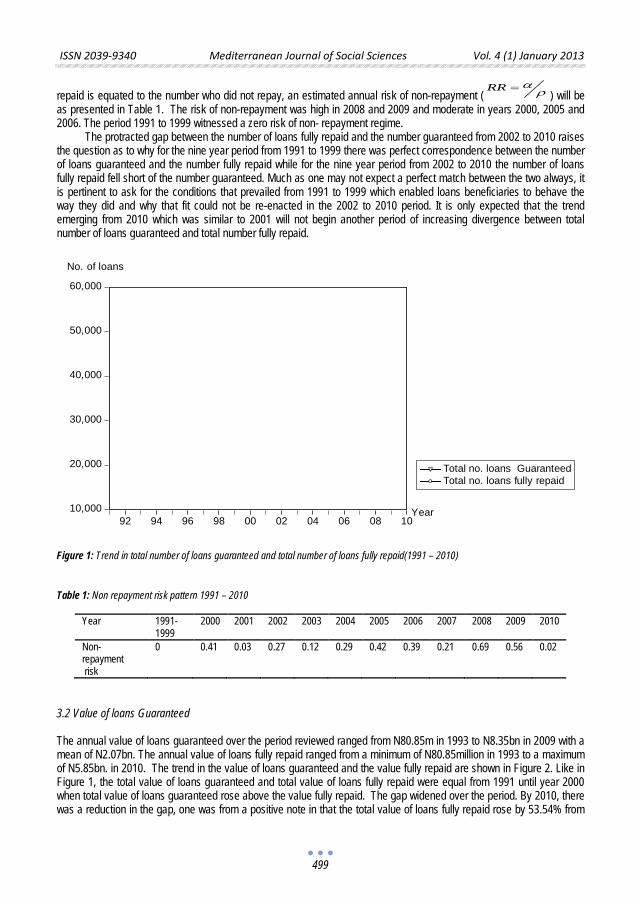
ISSN 2039-9340 Mediterranean Journal of Social Sciences Vol. 4 (1) January 2013
499
repaid is equated to the number who did not repay, an estimated annual risk of non-repayment ( ρα=RR
) will be as presented in Table 1. The risk of non-repayment was high in 2008 and 2009 and moderate in years 2000, 2005 and 2006. The period 1991 to 1999 witnessed a zero risk of non- repayment regime.
The protracted gap between the number of loans fully repaid and the number guaranteed from 2002 to 2010 raises the question as to why for the nine year period from 1991 to 1999 there was perfect correspondence between the number of loans guaranteed and the number fully repaid while for the nine year period from 2002 to 2010 the number of loans fully repaid fell short of the number guaranteed. Much as one may not expect a perfect match between the two always, it is pertinent to ask for the conditions that prevailed from 1991 to 1999 which enabled loans beneficiaries to behave the way they did and why that fit could not be re-enacted in the 2002 to 2010 period. It is only expected that the trend emerging from 2010 which was similar to 2001 will not begin another period of increasing divergence between total number of loans guaranteed and total number fully repaid.
Figure 1: Trend in total number of loans guaranteed and total number of loans fully repaid(1991 – 2010)
Table 1: Non repayment risk pattern 1991 – 2010
Year 1991-1999
2000 2001 2002 2003 2004 2005 2006 2007 2008 2009 2010
Non-repayment risk
0 0.41 0.03 0.27 0.12 0.29 0.42 0.39 0.21 0.69 0.56 0.02
3.2 Value of loans Guaranteed The annual value of loans guaranteed over the period reviewed ranged from N80.85m in 1993 to N8.35bn in 2009 with a mean of N2.07bn. The annual value of loans fully repaid ranged from a minimum of N80.85million in 1993 to a maximum of N5.85bn. in 2010. The trend in the value of loans guaranteed and the value fully repaid are shown in Figure 2. Like in Figure 1, the total value of loans guaranteed and total value of loans fully repaid were equal from 1991 until year 2000 when total value of loans guaranteed rose above the value fully repaid. The gap widened over the period. By 2010, there was a reduction in the gap, one was from a positive note in that the total value of loans fully repaid rose by 53.54% from
10,000
20,000
30,000
40,000
50,000
60,000
92 94 96 98 00 02 04 06 08 10
Total no. loans GuaranteedTotal no. loans fully repaid
Year
No. of loans
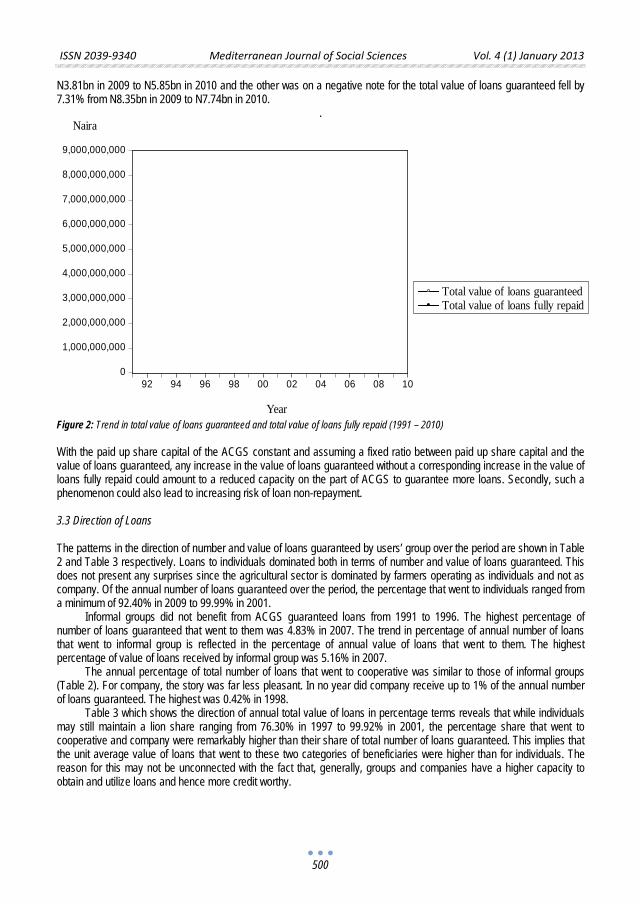
ISSN 2039-9340 Mediterranean Journal of Social Sciences Vol. 4 (1) January 2013
500
N3.81bn in 2009 to N5.85bn in 2010 and the other was on a negative note for the total value of loans guaranteed fell by 7.31% from N8.35bn in 2009 to N7.74bn in 2010.
.
Figure 2: Trend in total value of loans guaranteed and total value of loans fully repaid (1991 – 2010)
With the paid up share capital of the ACGS constant and assuming a fixed ratio between paid up share capital and the value of loans guaranteed, any increase in the value of loans guaranteed without a corresponding increase in the value of loans fully repaid could amount to a reduced capacity on the part of ACGS to guarantee more loans. Secondly, such a phenomenon could also lead to increasing risk of loan non-repayment. 3.3 Direction of Loans The patterns in the direction of number and value of loans guaranteed by users’ group over the period are shown in Table 2 and Table 3 respectively. Loans to individuals dominated both in terms of number and value of loans guaranteed. This does not present any surprises since the agricultural sector is dominated by farmers operating as individuals and not as company. Of the annual number of loans guaranteed over the period, the percentage that went to individuals ranged from a minimum of 92.40% in 2009 to 99.99% in 2001.
Informal groups did not benefit from ACGS guaranteed loans from 1991 to 1996. The highest percentage of number of loans guaranteed that went to them was 4.83% in 2007. The trend in percentage of annual number of loans that went to informal group is reflected in the percentage of annual value of loans that went to them. The highest percentage of value of loans received by informal group was 5.16% in 2007.
The annual percentage of total number of loans that went to cooperative was similar to those of informal groups (Table 2). For company, the story was far less pleasant. In no year did company receive up to 1% of the annual number of loans guaranteed. The highest was 0.42% in 1998.
Table 3 which shows the direction of annual total value of loans in percentage terms reveals that while individuals may still maintain a lion share ranging from 76.30% in 1997 to 99.92% in 2001, the percentage share that went to cooperative and company were remarkably higher than their share of total number of loans guaranteed. This implies that the unit average value of loans that went to these two categories of beneficiaries were higher than for individuals. The reason for this may not be unconnected with the fact that, generally, groups and companies have a higher capacity to obtain and utilize loans and hence more credit worthy.
0
1,000,000,000
2,000,000,000
3,000,000,000
4,000,000,000
5,000,000,000
6,000,000,000
7,000,000,000
8,000,000,000
9,000,000,000
92 94 96 98 00 02 04 06 08 10
Total value of loans guaranteedTotal value of loans fully repaid
Naira
Year
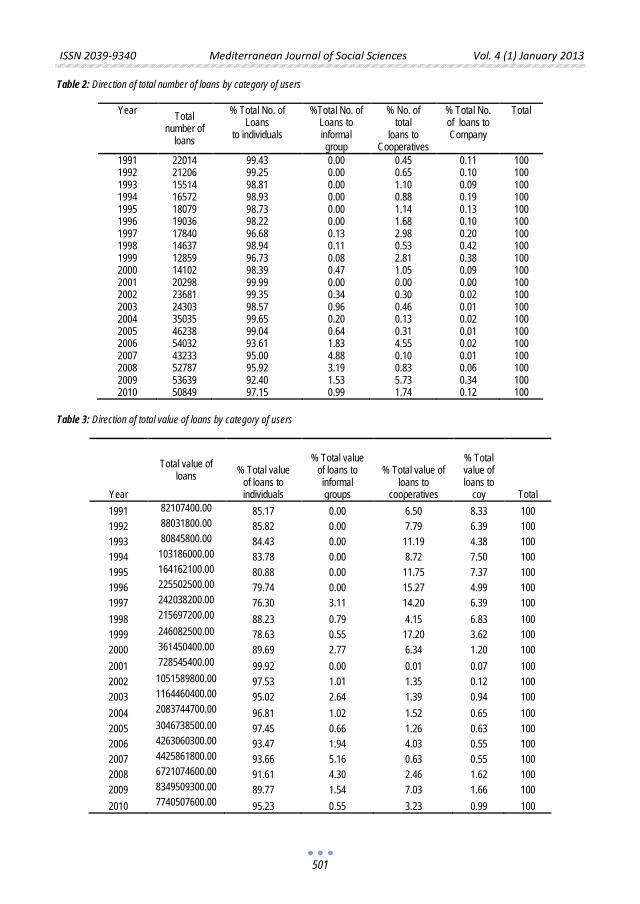
ISSN 2039-9340 Mediterranean Journal of Social Sciences Vol. 4 (1) January 2013
501
Table 2: Direction of total number of loans by category of users
Year Total number of
loans
% Total No. of Loans
to individuals
%Total No. of Loans to informal group
% No. of total
loans to Cooperatives
% Total No. of loans to Company
Total
1991 22014 99.43 0.00 0.45 0.11 100 1992 21206 99.25 0.00 0.65 0.10 100 1993 15514 98.81 0.00 1.10 0.09 100 1994 16572 98.93 0.00 0.88 0.19 100 1995 18079 98.73 0.00 1.14 0.13 100 1996 19036 98.22 0.00 1.68 0.10 100 1997 17840 96.68 0.13 2.98 0.20 100 1998 14637 98.94 0.11 0.53 0.42 100 1999 12859 96.73 0.08 2.81 0.38 100 2000 14102 98.39 0.47 1.05 0.09 100 2001 20298 99.99 0.00 0.00 0.00 100 2002 23681 99.35 0.34 0.30 0.02 100 2003 24303 98.57 0.96 0.46 0.01 100 2004 35035 99.65 0.20 0.13 0.02 100 2005 46238 99.04 0.64 0.31 0.01 100 2006 54032 93.61 1.83 4.55 0.02 100 2007 43233 95.00 4.88 0.10 0.01 100 2008 52787 95.92 3.19 0.83 0.06 100 2009 53639 92.40 1.53 5.73 0.34 100 2010 50849 97.15 0.99 1.74 0.12 100
Table 3: Direction of total value of loans by category of users
Year
Total value of loans % Total value
of loans to individuals
% Total value of loans to informal groups
% Total value of loans to
cooperatives
% Total value of loans to
coy Total 1991 82107400.00 85.17 0.00 6.50 8.33 100 1992 88031800.00 85.82 0.00 7.79 6.39 100 1993 80845800.00 84.43 0.00 11.19 4.38 100 1994 103186000.00 83.78 0.00 8.72 7.50 100 1995 164162100.00 80.88 0.00 11.75 7.37 100 1996 225502500.00 79.74 0.00 15.27 4.99 100 1997 242038200.00 76.30 3.11 14.20 6.39 100 1998 215697200.00 88.23 0.79 4.15 6.83 100 1999 246082500.00 78.63 0.55 17.20 3.62 100 2000 361450400.00 89.69 2.77 6.34 1.20 100 2001 728545400.00 99.92 0.00 0.01 0.07 100 2002 1051589800.00 97.53 1.01 1.35 0.12 100 2003 1164460400.00 95.02 2.64 1.39 0.94 100 2004 2083744700.00 96.81 1.02 1.52 0.65 100 2005 3046738500.00 97.45 0.66 1.26 0.63 100 2006 4263060300.00 93.47 1.94 4.03 0.55 100 2007 4425861800.00 93.66 5.16 0.63 0.55 100 2008 6721074600.00 91.61 4.30 2.46 1.62 100 2009 8349509300.00 89.77 1.54 7.03 1.66 100 2010 7740507600.00 95.23 0.55 3.23 0.99 100
ISSN 2039-9340 Mediterranean Journal of Social Sciences Vol. 4 (1) January 2013
502
4. Discussion Farmers are in both the rural and urban areas of Nigeria. Farming is however predominant in the rural economy. The 1991 census which put Nigeria’s population at 88,992,220 also estimated that 63.72% of the population were rural dwellers (Ekong, 2003). Seventy percent of the rural dwellers are said to be in agriculture or agro-allied occupations. This is to say that of the estimated 57 million rural dwellers in Nigeria, going by the 1991 census, 39.69 million people were in agriculture or agro-allied occupation. If an average family size of six persons is assumed this will give an estimated 6.12 million farming households in Nigeria. It was out of this population of households that the ACGS guaranteed a total number of loans of 12,859 to 54,032 between 1991 and 2010. This was about 0.20% of the farming households in 1991. This is another side of the sorry situation of farmers’ access to institutional sources of credit in Nigeria. This is in addition to the low unit value of loan obtained by them.
There is the Bank of Agriculture (BOA) in Nigeria. It was the former Nigerian Agricultural, Co-operative and Rural Development Bank (NACRDB), which was renamed in 2010 but retains the mandate to, among others, provide all classes of agricultural loans for farming, livestock, poultry, and fisheries. It offers various types of loans such as micro credit, macro credit, on-lending credit etc. to accommodate all categories of farmers. Isiorhovoja (2010), reported that there were 192 branches of the erstwhile NACRDB in the federation in which there were 774 local government areas (LGAs) in 2012. On the average, this translates to one branch office of the BOA to four LGAs. Considering the distance between a branch office and the farmer, the BOA may yet to be adequately positioned to serve the resource poor credit starved farmers effectively. Hence the estimated whooping 99.80% of farming households may not be adequately reached with loans. In view of the low unit average value of loans guaranteed by ACGS which ranged from N3,729.78 to N155,661.20 with a mean of N49, 169.04 and the low proportion of farming households reached, much as it cannot be recommended that credit should be extended to all farmers, it is not unlikely that with increased farmers’ awareness of the Scheme, the number of applicants who are credit worthy may increase substantially over the number reached during the period reviewed. If this is coupled with a review and incorporation of the lessons learned from 1991 to 1999 into a new policy and strategy formulation and operations, it could engender another era of low risk of non-repayment of loans with increases in loan expansion.
5. Conclusion The ACGS has a minimal reach to farmers both in terms of coverage and unit average value of loan guaranteed. Since the year 2000, both the number and value of loans guaranteed have been on the increase and individual farmers benefit the most. The risk of non-repayment of loans is on the increase but a review of past lessons could make for the co-existence of a low risk of non-repayment of loans and expansion of loans guaranteed in terms of number and value. References
Central Bank of Nigeria (CBN) (2004) Annual Report and Statement of Account. CBN, Abuja, Nigeria Central Bank of Nigeria (CBN) (2010a) Statistical Bulletin. Vol.21, CBN, Abuja, Nigeria Central Bank of Nigeria (CBN) (2010b) Annual Report. CBN, Abuja, Nigeria Ekong, E.E. (2003) An Introduction to Rural Sociology. Nigeria. Dove Educational Publishers. Elhiraika, A.B. and Ahmed, S.A. (1998) Agricultural credit under economic liberalization and Islamization in Sudan. AERC Research
Paper 79. African Economic Research Consortium, Nairobi. Isiorhovoja, R.A. and Chukwuji, C.O. (2009) “Effects of the Operations of the Agricultural Credit Guarantee Scheme Fund on Cash
Crops”. International Journal of Rural Studies Vol. 16(2), p3-7. Gramodaya College & Research Institute, Amarpurkashi, India.
Isiorhovoja, R.A (2010): “Institutional Arrangement for Farm Credit Delivery in Nigeria”. International Journal of Agriculture and Rural Development. IJARD 1 (2) p65 – 73.
ISSN 2039-9340 Mediterranean Journal of Social Sciences Vol. 4 (1) January 2013
503
The Convergence of Accounting Treatment for Intangible Assets in Albania
Shqipe Xhaferri, Phd Candidate
Lecturer at Aleksander Moisiu University, Faculty of Business
Durres, Albania
Doi:10.5901/mjss.2013.v4n1p503
Abstract
This study aims at analysing the accounting treatment for identifiable intangible assets. Our research is based on the analysis of the Albania regulation under the current General Accounting Plan of 2003 (from now on referred to as PGC-2003) and the international regulations stated by two important accounting regulation organisms: the International Accounting Standards Board (IASB) and the Financial Accounting Standards Board (FASB). In particular, we will carry out a comparative study of the definition, recognition criteria, valuation, amortisation, impairment of value as well as its recovery and information to be provided in the Notes to the Financial Statements. The review of these accounting regulations shows that there is no homogeneous treatment, despite the great advance achieved on this subject, to obtain a higher level of convergence.
Keywords: intangible assets, accounting treatment, IASB, FASB, Albania regulation.
1. Introduction
Intangible assets are an essential key for the development and success of organizations competing in the economic and technological context of our time. They become the main instigators in the creation of value in entities. They are getting such an importance that their identification and measurement have become highly relevant.
However, despite the great efforts made in recent years to understand the nature of intangible assets and the vast literature on them, there is not a unanimous definition for a clear and objective delimitation of intangible assets. In this situation, both academic and regulating bodies currently face the challenge of making joint efforts to develop an appropriate definition of intangible assets and establish a coherent classification.
Thus, we need first to clarify and define the term intangible asset. To do so, we are going to gather different definitions used in accounting regulations, both Albania and international, in order to extract a series of common aspects, which will allow us to progress in their identification and delimitation. To start with, we are going to revise the concept and classification of intangible asset; then, we will move on to the analysis of the accounting treatment for identifiable intangible assets in Albania as well as international regulations, through two important accounting regulating organisms: the International Accounting Standards Board (IASB) and the Financial Accounting Standards Board (FASB), since they are the most influential on accounting practices.
In this comparative analysis, the lack of homogeneity among the different norms analysed regarding these assets is notable. Nevertheless, we must point out the effort made by IAS 38, SFAS 141 and 142, and PGC-2004 to achieve a larger convergence level among regulations.
2. Definition of intangible asset
From the accounting perspective, Stolowy and Jeny-Cazavan (2001) show the existence of two different ways for defining intangible assets:
a) By means of a definition of intangible asset, that is, a conceptual approach, or b) By means of the elaboration of a list of the elements considered as recognized intangible assets, that is, an
assets “inventories” approach. In most countries, the accounting regulation defines intangible assets by the elaboration of a list, but there is no
specific definition. However, in the definition suggested by the FASB in USA, the ASB in the UK or the IASB, both conceptual and asset’s inventories approach appear as the intangible asset concept is accompanied by a list of assets that are seemingly intangible.
ISSN 2039-9340 Mediterranean Journal of Social Sciences Vol. 4 (1) January 2013
504
In Figure 1, the different characteristics derived from the definitions of intangible asset by the IASB (IASB, 1989, paragraph 49 and IAS 38, 2004, paragraph 8), the FASB (SFAS Nº 6, 1985 and SFAS 141 and 142, 2001, appendix f) and Albania PGC-2003 (1st and 5th part of the PGC) are shown.
When comparing the definition of intangible asset, we observe how they all agree in stating that they are: non-tangible resources (that is, without physical substance); controlled by entities from previous transactions; and that they will provide future economic benefits to the entity. However, we can also observe some differences such as the presence of the identifiability requirement. Thus, in the definition of intangible assets provided by IASB an intangible asset must be identifiable, whereas this requirement is absent in the definition by FASB or the Albania PGC-2003, although it appears in accounting recognition.
From the definition of intangible assets by FASB, it is worth pointing out these assets’ long life character, their immaterial nature and, the main difference with IASB’ statements: their non-financial character. According to Rojo and Sierra (2000:17), the term non-financial is wider than the term non- monetary and it should be used to avoid inclusions within these resources that, because of the lack of physical substance, are not considered immaterial assets.
In addition to the conceptual definitions offered, we can also find a list of possible intangible assets (see IAS 38 (2004, paragraph 9); SFAS 141.A14; and PGC-2003: part 5 on definitions and accounting relations, subgroup 20).
3. Classification of intangible assets
Different criteria have been used for the classification of intangible assets in different regulations, such as identifiability, acquisition method, benefit-making capability, separability, etc. In this sense, the accounting norms provided by IASB, FASB and the Albania Accounting and Auditing Institute (ICAC) generally use two criteria to define intangible assets: their identifiability (identifiable or non-identifiable) and the way they were acquired and became part of the company’s estate (whether acquired externally or generated internally).
We propose a classification based on the criteria followed by the different regulations, as well as the proposals by Nevado and López (2002:18) and García (2001:72).
Identifiability is established as our first criterion, hence distinguishing two categories of intangible assets: identifiable, which are those whose future economic benefits can be clearly distinguished (separable or with legal right upon them) and unidentifiable which constitute the goodwill.
The second criterion regards the origin of the assets, that is, the way they were incorporated to the company’s estate. Within each of these categories, we distinguish between intangible assets acquired in business combinations (or external) and intangible assets created by the company itself (internal).Besides, within the acquired assets, we distinguish those acquired individually, those acquired as components of a business combination and those arising from other special or peculiar acquisitions, such as assets exchange, gratuitous acquisitions (grants or donations), contributions to the entity’s capital as well as extensions and improvements.
Finally, the different intangible elements will be grouped according to the nature and content of the corresponding investments. Within identifiable intangible assets (whether acquired or developed internally) we find: research and development expenditures, industrial property (patents, trademarks, utility models, business names and signs), copyright intellectual property, transfer rights, computer applications, franchises, etc.
Unidentifiable intangible assets from the acquisition of another company are called acquired goodwill or external goodwill or simply goodwill. These assets can be recognized in the balance sheet of the entity and consist on elements such as customers, business name, business location, market share, commercial competition level, organization structure, prestige, creativity, human resources, good management team, efficient staff and commercial channels. In contrast, the internally generated goodwill (self-generated goodwill or internal goodwill) would not meet the recognition requirements and would not be considered an asset in the entity’s balance.
Moreover, intangible assets can be grouped into visible and hidden, depending on whether they are accountably recognised. We call visible intangible assets those that comply with the recognition requirements (such as the possibility of reliable measurement), therefore they are recognised as assets in the entities’ balance. These are regulated by the different accounting regulations, although as previously mentioned, there is no single, unanimously accepted, treatment. On the contrary, hidden intangible assets are those that cannot be recognised as assets according to current accounting regulations and therefore, at present they do not appear in balance sheets. Within hidden intangible assets we find internally generated unidentifiable intangible assets.
Finally, note that although most of existing literature on models of intellectual capital measurement equal intellectual capital with intellectual assets, García-Parra et al. (2009) suggest the existence of intangible liabilities. So, companies sometimes must incur liabilities to make intellectual assets truly actionable. Thus, based on classical accounting models, the intangible capital would be then calculated as the difference between an organisation’s intangible
ISSN 2039-9340 Mediterranean Journal of Social Sciences Vol. 4 (1) January 2013
505
assets and its liabilities. These authors define intangible liabilities as the organisational non-monetary obligations that the company must accept and acknowledge in order to avoid the depreciation of its intangible assets. See the work of García-Parra et al., 2009 and García-Parra et al., 2004, who carry out a literature review and bring a more refined, theoretically-and empirically-based conceptualisation of intangible liabilities than those provided so far.
4. Accounting treatment for identifiable intangible assets
Based on the proposed classification of intangible assets, we will continue focusing our study on the accounting treatment for identifiable intangible assets, whether acquired externally or generated internally, included in Albania regulation (PGC-2003) as well as in the international IASB and FASB. In particular, we are going to carry out a comparative study of the definition, recognition criteria, valuation, amortisation, impairment of value and its recovery as well as information to be provided for the Notes to the Financial Statements on these intangible assets.
The accounting norms analysed are the following: In the scope of the Financial Accounting Standards Board (FASB): • SFAS 141 (2001) on Business Combinations, and • SFAS 142 (2001) on Goodwill and other Intangible Assets. In the scope of the International Accounting Standards Board (IASB): • IAS 38 (2004) regarding Intangible Assets • IAS 36 (2004) concerning the impairment of assets value
Externally Acquired Identifiable Intangible Assets
From the comparative analyses of the treatment for acquired identifiable intangible assets, the following aspects are emphasized:
Accounting Recognition
The criterion adopted unanimously by the different regulations analysed allows the acknowledgment of externally acquired intangible as assets, when they fulfil the recognition criteria (Cañibano and Gisbert, 2004a, 2006; Ramírez, 2010).
For intangible “resources” to be included as assets in an entities’ balance, they must comply with: a) The definition of intangible assets (as seen in previous sections); and b) The recognition criteria established in accounting regulations. The accounting recognition of externally acquired intangible assets is simple since there is a price that justifies
both the probability of obtaining benefits and the reliability of such measurement.
Initial Recognition
Regarding initial recognition, all norms describe clearly and in detail the recognition for each one of the different acquisition options.
In the specific case of intangible assets independently acquired, the IAS 38 (2004) and the Albania PGC-2007 stipulate that they should be valued by its acquisition cost. Both regulations indicate how to measure that cost: acquisition expenditure plus non-recoverable taxes and all additional expenditures until the assets are put into operation, including financial expenditures. Specifically, the IASB (IAS 23 revised on March, 2007) indicates that the entity should capitalize financial expenditures attributed directly to acquisition, construction or production of assets, which fulfil the criteria to be qualified. Likewise, Albania PGC-2003 indicates the need to attribute financial expenditures to the asset’s value for those needing more than one year before they are put into operation. The FASB (SFAS 142, 2001) states that intangible assets individually acquired should be valued by its fair value.
With respect to goods exchanges, Albania PGC-2003 agrees completely to the valuation established in IAS 38, using fair value in business transactions and using the given asset net value to measure the asset arising from non-business exchanges. On the other hand, FASB does not distinguish between business and non-business exchanges, and it considers the fair value of assets given in exchange as the recognition criteria.
In relation to intangible assets acquired as part of a business combination, all analyzed norms agree on recording them for their fair value at the time of purchase. FASB regards fair value as the amount at which an asset could be
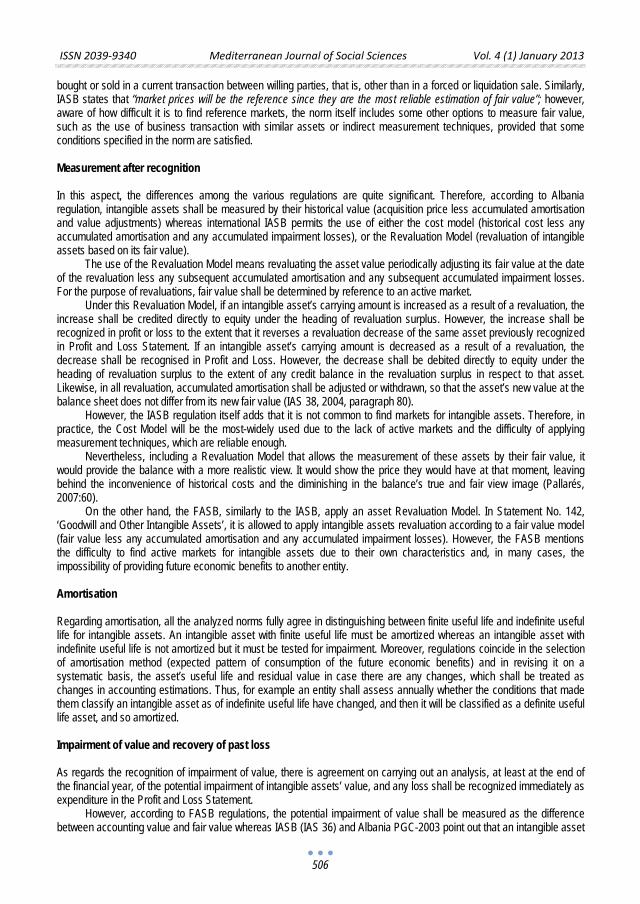
ISSN 2039-9340 Mediterranean Journal of Social Sciences Vol. 4 (1) January 2013
506
bought or sold in a current transaction between willing parties, that is, other than in a forced or liquidation sale. Similarly, IASB states that “market prices will be the reference since they are the most reliable estimation of fair value”; however, aware of how difficult it is to find reference markets, the norm itself includes some other options to measure fair value, such as the use of business transaction with similar assets or indirect measurement techniques, provided that some conditions specified in the norm are satisfied.
Measurement after recognition
In this aspect, the differences among the various regulations are quite significant. Therefore, according to Albania regulation, intangible assets shall be measured by their historical value (acquisition price less accumulated amortisation and value adjustments) whereas international IASB permits the use of either the cost model (historical cost less any accumulated amortisation and any accumulated impairment losses), or the Revaluation Model (revaluation of intangible assets based on its fair value).
The use of the Revaluation Model means revaluating the asset value periodically adjusting its fair value at the date of the revaluation less any subsequent accumulated amortisation and any subsequent accumulated impairment losses. For the purpose of revaluations, fair value shall be determined by reference to an active market.
Under this Revaluation Model, if an intangible asset’s carrying amount is increased as a result of a revaluation, the increase shall be credited directly to equity under the heading of revaluation surplus. However, the increase shall be recognized in profit or loss to the extent that it reverses a revaluation decrease of the same asset previously recognized in Profit and Loss Statement. If an intangible asset’s carrying amount is decreased as a result of a revaluation, the decrease shall be recognised in Profit and Loss. However, the decrease shall be debited directly to equity under the heading of revaluation surplus to the extent of any credit balance in the revaluation surplus in respect to that asset. Likewise, in all revaluation, accumulated amortisation shall be adjusted or withdrawn, so that the asset’s new value at the balance sheet does not differ from its new fair value (IAS 38, 2004, paragraph 80).
However, the IASB regulation itself adds that it is not common to find markets for intangible assets. Therefore, in practice, the Cost Model will be the most-widely used due to the lack of active markets and the difficulty of applying measurement techniques, which are reliable enough.
Nevertheless, including a Revaluation Model that allows the measurement of these assets by their fair value, it would provide the balance with a more realistic view. It would show the price they would have at that moment, leaving behind the inconvenience of historical costs and the diminishing in the balance’s true and fair view image (Pallarés, 2007:60).
On the other hand, the FASB, similarly to the IASB, apply an asset Revaluation Model. In Statement No. 142, ‘Goodwill and Other Intangible Assets’, it is allowed to apply intangible assets revaluation according to a fair value model (fair value less any accumulated amortisation and any accumulated impairment losses). However, the FASB mentions the difficulty to find active markets for intangible assets due to their own characteristics and, in many cases, the impossibility of providing future economic benefits to another entity.
Amortisation
Regarding amortisation, all the analyzed norms fully agree in distinguishing between finite useful life and indefinite useful life for intangible assets. An intangible asset with finite useful life must be amortized whereas an intangible asset with indefinite useful life is not amortized but it must be tested for impairment. Moreover, regulations coincide in the selection of amortisation method (expected pattern of consumption of the future economic benefits) and in revising it on a systematic basis, the asset’s useful life and residual value in case there are any changes, which shall be treated as changes in accounting estimations. Thus, for example an entity shall assess annually whether the conditions that made them classify an intangible asset as of indefinite useful life have changed, and then it will be classified as a definite useful life asset, and so amortized.
Impairment of value and recovery of past loss
As regards the recognition of impairment of value, there is agreement on carrying out an analysis, at least at the end of the financial year, of the potential impairment of intangible assets’ value, and any loss shall be recognized immediately as expenditure in the Profit and Loss Statement.
However, according to FASB regulations, the potential impairment of value shall be measured as the difference between accounting value and fair value whereas IASB (IAS 36) and Albania PGC-2003 point out that an intangible asset
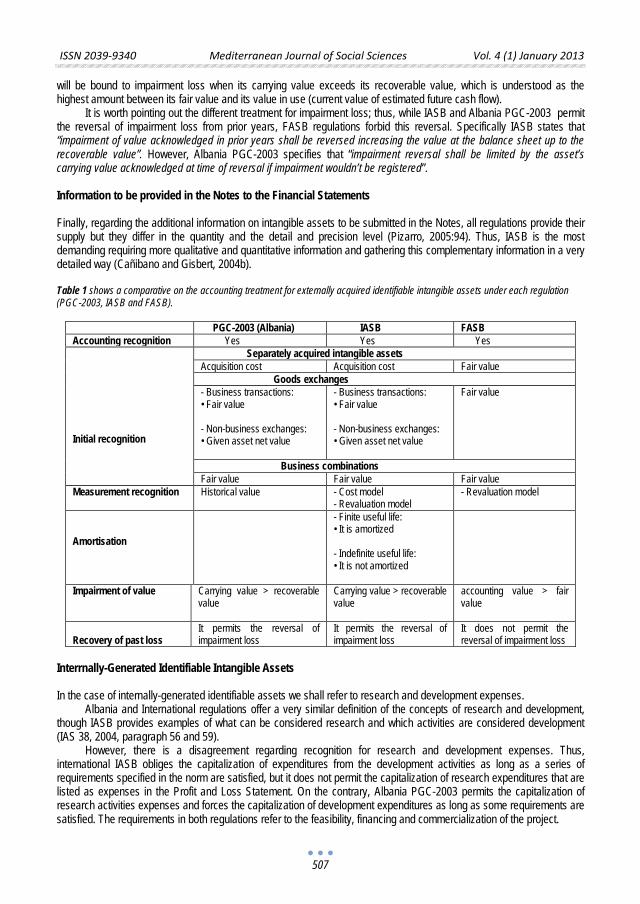
ISSN 2039-9340 Mediterranean Journal of Social Sciences Vol. 4 (1) January 2013
507
will be bound to impairment loss when its carrying value exceeds its recoverable value, which is understood as the highest amount between its fair value and its value in use (current value of estimated future cash flow).
It is worth pointing out the different treatment for impairment loss; thus, while IASB and Albania PGC-2003 permit the reversal of impairment loss from prior years, FASB regulations forbid this reversal. Specifically IASB states that “impairment of value acknowledged in prior years shall be reversed increasing the value at the balance sheet up to the recoverable value”. However, Albania PGC-2003 specifies that “impairment reversal shall be limited by the asset’s carrying value acknowledged at time of reversal if impairment wouldn’t be registered”.
Information to be provided in the Notes to the Financial Statements
Finally, regarding the additional information on intangible assets to be submitted in the Notes, all regulations provide their supply but they differ in the quantity and the detail and precision level (Pizarro, 2005:94). Thus, IASB is the most demanding requiring more qualitative and quantitative information and gathering this complementary information in a very detailed way (Cañibano and Gisbert, 2004b).
Table 1 shows a comparative on the accounting treatment for externally acquired identifiable intangible assets under each regulation (PGC-2003, IASB and FASB).
PGC-2003 (Albania) IASB FASB Accounting recognition Yes Yes Yes Initial recognition
Separately acquired intangible assets Acquisition cost Acquisition cost Fair value Goods exchanges - Business transactions: • Fair value - Non-business exchanges: • Given asset net value
- Business transactions: • Fair value - Non-business exchanges: • Given asset net value
Fair value
Business combinations Fair value Fair value Fair value
Measurement recognition Historical value - Cost model - Revaluation model
- Revaluation model
Amortisation
- Finite useful life: • It is amortized - Indefinite useful life: • It is not amortized
Impairment of value Carrying value > recoverable value
Carrying value > recoverable value
accounting value > fair value
Recovery of past loss
It permits the reversal of impairment loss
It permits the reversal of impairment loss
It does not permit the reversal of impairment loss
Interrnally-Generated Identifiable Intangible Assets In the case of internally-generated identifiable assets we shall refer to research and development expenses.
Albania and International regulations offer a very similar definition of the concepts of research and development, though IASB provides examples of what can be considered research and which activities are considered development (IAS 38, 2004, paragraph 56 and 59).
However, there is a disagreement regarding recognition for research and development expenses. Thus, international IASB obliges the capitalization of expenditures from the development activities as long as a series of requirements specified in the norm are satisfied, but it does not permit the capitalization of research expenditures that are listed as expenses in the Profit and Loss Statement. On the contrary, Albania PGC-2003 permits the capitalization of research activities expenses and forces the capitalization of development expenditures as long as some requirements are satisfied. The requirements in both regulations refer to the feasibility, financing and commercialization of the project.
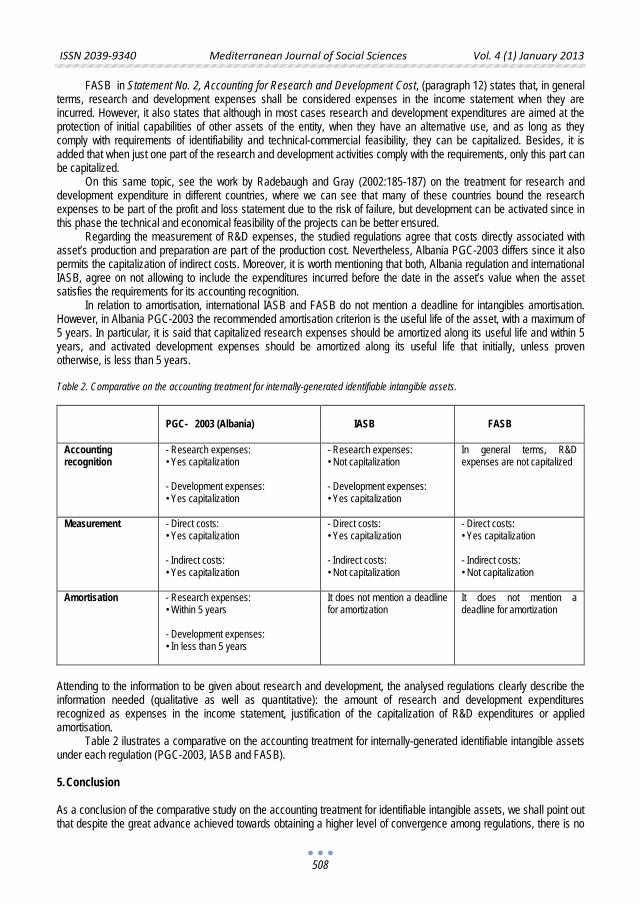
ISSN 2039-9340 Mediterranean Journal of Social Sciences Vol. 4 (1) January 2013
508
FASB in Statement No. 2, Accounting for Research and Development Cost, (paragraph 12) states that, in general terms, research and development expenses shall be considered expenses in the income statement when they are incurred. However, it also states that although in most cases research and development expenditures are aimed at the protection of initial capabilities of other assets of the entity, when they have an alternative use, and as long as they comply with requirements of identifiability and technical-commercial feasibility, they can be capitalized. Besides, it is added that when just one part of the research and development activities comply with the requirements, only this part can be capitalized.
On this same topic, see the work by Radebaugh and Gray (2002:185-187) on the treatment for research and development expenditure in different countries, where we can see that many of these countries bound the research expenses to be part of the profit and loss statement due to the risk of failure, but development can be activated since in this phase the technical and economical feasibility of the projects can be better ensured.
Regarding the measurement of R&D expenses, the studied regulations agree that costs directly associated with asset’s production and preparation are part of the production cost. Nevertheless, Albania PGC-2003 differs since it also permits the capitalization of indirect costs. Moreover, it is worth mentioning that both, Albania regulation and international IASB, agree on not allowing to include the expenditures incurred before the date in the asset’s value when the asset satisfies the requirements for its accounting recognition.
In relation to amortisation, international IASB and FASB do not mention a deadline for intangibles amortisation. However, in Albania PGC-2003 the recommended amortisation criterion is the useful life of the asset, with a maximum of 5 years. In particular, it is said that capitalized research expenses should be amortized along its useful life and within 5 years, and activated development expenses should be amortized along its useful life that initially, unless proven otherwise, is less than 5 years.
Table 2. Comparative on the accounting treatment for internally-generated identifiable intangible assets.
PGC- 2003 (Albania)
IASB
FASB
Accounting recognition
- Research expenses: • Yes capitalization - Development expenses: • Yes capitalization
- Research expenses: • Not capitalization - Development expenses: • Yes capitalization
In general terms, R&D expenses are not capitalized
Measurement - Direct costs: • Yes capitalization - Indirect costs: • Yes capitalization
- Direct costs: • Yes capitalization - Indirect costs: • Not capitalization
- Direct costs: • Yes capitalization - Indirect costs: • Not capitalization
Amortisation - Research expenses: • Within 5 years - Development expenses: • In less than 5 years
It does not mention a deadline for amortization
It does not mention a deadline for amortization
Attending to the information to be given about research and development, the analysed regulations clearly describe the information needed (qualitative as well as quantitative): the amount of research and development expenditures recognized as expenses in the income statement, justification of the capitalization of R&D expenditures or applied amortisation.
Table 2 ilustrates a comparative on the accounting treatment for internally-generated identifiable intangible assets under each regulation (PGC-2003, IASB and FASB).
5. Conclusion
As a conclusion of the comparative study on the accounting treatment for identifiable intangible assets, we shall point out that despite the great advance achieved towards obtaining a higher level of convergence among regulations, there is no
ISSN 2039-9340 Mediterranean Journal of Social Sciences Vol. 4 (1) January 2013
509
homogeneous treatment. The main differences are found in: 1) the use of fair value to measure some types of acquisition; 2) the measurement criteria applied subsequently; 3) the revaluation of intangible assets; 4) the measurement of the losses for impairment of value and their possible reversal; and 5) the recognition and amortisation of research and development expenditures.
Regarding the achievements towards a greater homogeneity in the accounting treatment for identifiable intangible assets, the new IAS 38 (IASB, 2004) meant a higher convergence level with norms SFAS 141 and 142 of FASB (2001). Besides, Spanish PGC-2007 is closer to the international regulation emitted by IASB gathering and transmitting a large part of its content although less detailed in most sections.
The aspects of the treatment for identifiable intangible assets on which there is more agreement are: 1) the same accounting recognition criteria for externally acquired identifiable assets; 2) the introduction of a very similar definition of the concept of “identifiability”; 3) the use of fair value as measurement criteria of intangible assets arising from exchange operations and
intangible assets acquired as part of a business combination; 4) the possibility for intangible assets of an indefinite useful life; and 5) the removal of the amortisation criterion for those intangible assets with indefinite useful life, which will be
checked annually for impairment of value.
References
Financial Accounting Standards Board (1974). Statement No. 2, Accounting for Research and Development Cost. John Wiley & Sons, Inc.
Financial Accounting Standards Board (1985). Elements of Financial Statements. Statement of Financial Accounting Concepts No. 6. John Wiley & Sons, Inc.
Financial Accounting Standards Board (2001). Goodwill and Intangible Assets, Statement of Financial Accounting Standards, n. 142. Connecticut.
Financial Accounting Standards Board (2007). Business Combinations, Statement of Financial Accounting Standards, n. # 141. Connecticut.
Garcia, M. (2001). The accounting information on intangible assets. Ph. D. dissertation, University San Pablo CEU. Madrid. García-Parra, M., Simo, P.; Mundet, J.; Guzman, J. (2004). Intangibles: assets and liabilities. Intangible Capital, 0 (3) :70-86. García-Parra, M., Simo, P., Sallan, Jm; Mundet, J. (2009). International Accounting Standards Board (IASB) (1989). Framework for the
Preparation and Presentation of Financial Statements. London: IASC. International Accounting Standards Board (IASB) (2004a). Intangible Assets. International Accounting Standard, IAS, no. 38 revised.
London: IASB. International Accounting Standards Board (IASB) (2004b). Impairment of assets. International Accounting Standard, IAS, No. 36 revised.
London, IASB. SNOW, D., Lopez, V.R. (2002). Intellectual Capital: Assessment and Measurement. Models, reports, and applications development.
Madrid: Ed Pretince Hall. Pallares, J. (2007). Recognition and measurement of intangible assets under IAS 38, Intangible Assets. Technical Accounting, 702:47-
60. Radebaugh, L. H., GRAY, S. (2002). International Accounting and Multinational Enterprises. John Wiley & Sons, Inc. Ramirez, Y. (2010). Can accounting recognition of intangibles. " Journal of Accounting and Taxation, 328: 125-146. Royal Decree 1514/2007 of 16 November, approving the Spanish General Accounting Plan. Red, A.; Sierra, M. (2000). Intangible assets (intellectual capital) in Financial Accounting. Carlos Cubillo Valverde IV Award. Stolowy, H.; Jeny-Cazavan, A. (2001). International accounting disharmony: The case of intangibles. Accounting, Auditing and
Accountability Journal, 14 (4): Y. R. Córcoles, (2009), Twoards the convergence of accounting treatment for intangible assets

ISSN 2039-9340 Mediterranean Journal of Social Sciences Vol. 4 (1) January 2013
511
Socioeconomic Factors as Predictors of Entrepreneurial
Behaviour in Poultry Farm
R.A. Isiorhovoja
Corresponding address: Dr. R.A. Isiorhovoja Department of Agricultural Economics and Extension,
Delta State University, Asaba Campus, Asaba, Delta State, Nigeria. [email protected], +2348038987998
Doi:10.5901/mjss.2013.v4n1p511
Abstract
This paper sets out to assess the effect of socioeconomic factors on the likelihood of respondent being a poultry farm entrepreneur. The 275 poultry farms registered with the Livestock department of Delta State Ministry of Agriculture, Delta State, Nigeria, was the population studied. Data on socio-economic characteristics of poultry farmers and their relationship with the farms were collected with the aid of questionnaire. Data obtained were analyzed using descriptive statistics and binary logistic regression. The results revealed that the ages of respondents ranged from 18 to 68 years with a mean of 43.91 years and a standard deviation of 9.29; the age group 38 - 47 years had the highest frequency of poultry entrepreneurs (39.60%). Majority of poultry operators (42.18%) had either a diploma or certificate of education. Other findings were that age, gender, number of years of study and nature of parents’occupation were socio-economic factors which significantly affect the likelihood of the respondent being a poultry farm entrepreneur. The authors recommend that entrepreneurial development programmes should take cognizance of these factors in their design.
Key words: Entrepreneur, determinants, likelihood, logistic regression
1. Introduction Kilby’s (1971) apt description of the entrepreneur as a heffa-lump underscores the difficulty in capturing the total image of the entrepreneur. Heffa-lump, Kilby said, is a rather large and very important proverbial animal which is variously described by its hunters depending on the side from which a hunter caught sight of it. The on-going debate in the literature about the identity of the entrepreneur tends to suggest that the different sides so far captured and described are yet to perfectly fit together. It is probable that there are gaps in the fragmented sides so far identified or like in a game of jig saw puzzle, the right permutation of the pieces of the jig saw puzzle to make the required whole remains elusive because nobody has a comprehensive picture of the object. Furthermore, because individuals have identified the entrepreneur generally from the perceptive of their respective discipline, it may not have sufficiently dawn on researchers to allow for the possibility of viewing the entrepreneur as the product of psychological traits impacted upon by factors submitted by researchers from other discipline. For example, the views of the psychologists that the entrepreneur can be identified by such traits as need for achievement (n Ach), internal locus of control, Risk taking, need for autonomy, Tolerance of ambiguity, need for affiliation among others (Driessen and Zwart, 2002) may still be true but like the colour of an object exposed to the effect of the weather, the original sole effect of these traits on the identity of the entrepreneur may have been impacted upon by one or more non psychological factors. Such interaction is likely to have a reinforcing or weakening effect on psychological traits in the individual being an entrepreneur. For example, Jackson and Okhomina (2006), two behavioral theorists, affirmed that the level of education of the individual entrepreneur and his/her prior experiences in a related business are other factors that influence business outcome. This is to say that prior experience is essential to being an entrepreneur. Low, Hendersen, and Weiler, (2005) added that proximity to densely populated area, infrastructure (roads and telecommunication networks, access to financial capital) also affect business success. Thus while psychological traits may be regarded as push factors into the entrepreneurial class, the non psychological factors may be regarded as pull factors since they serve to attract the individual into being an entrepreneur. There is therefore the likelihood of varying factors interaction in the making of the entrepreneur. Drucker (1985) belongs to this school of thought when he said that individuals can be taught to become entrepreneurs. Baran and Velickaite (2008) are however of the view that entrepreneurs are born even though the “nuts and bolts of entrepreneurship can be studied and learned,
ISSN 2039-9340 Mediterranean Journal of Social Sciences Vol. 4 (1) January 2013
512
the soul of the entrepreneur is something else altogether”. But it needs to be ascertained whether non psychological factors have any effects on the likelihood of an individual being an entrepreneur.
This study therefore, using the poultry subsector of the agricultural sector of Delta State as a premise assesses the effect of socioeconomic factors on the likelihood of respondents being a poultry farm entrepreneur. The hypothesis tested was H0: Socio-economic factors do not affect the likelihood of a poultry farmer being a poultry farm entrepreneur
2. Materials and Methods The study area was Delta State of Nigeria. Nigeria lies between latitude 40N and 140N of the Equator and between longitude 30E and 150E of the Greenwich Meridian. There are 25 local government areas (LGAs) in the Delta State and has its headquarters at Asaba. The State lies between longitude 50 and 60 451 East and latitude 50 201 and 60 301 North of the Equator.
The study covered the three agricultural zones Delta State State, namely; Delta North, Delta Central and Delta South Agricultural zones. Primary data were collected from the 275 poultry farmers in Delta State as per records of the Livestock Department, Delta State Ministry of Agriculture, Asaba, using copies of a structured questionnaire.
The questionnaire collected information on the socio-economic characteristics of the farmer (age, education, and family background, position on the farm). Copies of the questionnaire were administered to poultry farm owner-Managers, poultry farm owner non-Managers and poultry farm non-owner-Managers and Supervisors. Field officers of the Livestock department of the State ministry of agriculture assisted in administering the questionnaire.
Descriptive statistics such as mean, standard deviation and frequency distribution were used to summarize the data on the socioeconomic characteristics of respondents. The objective of this study which was “to determine the effect of socioeconomic factors on the likelihood of the respondent to be a poultry farm entrepreneur” was captured by using binary regression model. There are two possible outcomes in the dependent variable, namely; entrepreneur and non entrepreneur
The use of binary logistic regression is indicated where the categorical response (dependent) variable has two alternative events coded “0” or "1” and at least one explanatory variable is continuous (Upton and Cook, 2008). Logistic regression applies maximum likelihood estimation (MLE). MLE attempts to maximize the log likelihood, that is, how likely it is (the odds) that the observed values of the dependent variable may be predicted from the observed values of the independent variables. Thus logistic regression estimates the odds of a certain event occurring, that is, it calculates changes in the log odds of the dependent, not changes in the dependent itself as ordinary least square regression does. The idea therefore is to determine the predictors of an individual respondent in the population responding with 1 or 0 given his/her socioeconomic characteristics. The binary logistic regression model is generally expressed as:
..................................................................................................(1)
Where: ƒ (Z) is the event or dependent variable, e is the exponential of the predictors. The exponent of the predictor (e-z) indicates the log odds in favour of the respondent being an entrepreneur. And z is a vector of predictor variables defined as:
Z = β0 + β1x1 + β2x2 + βn Where: Z is the logit or log odds of the dependent variables (the event that the respondent is an entrepreneur), β0 is the
intercept and β1, β2 to βn are the regression coefficients of the independent variables x1, x2,… xn are the independent variables and n is the number of independent (X) variables in the model. The intercept (β0) is the value of Z when the value of all explanatory variables is zero. The βn parameter estimates is interpreted as the additive effect on the log odds ratio for a unit change in the jth explanatory variable. In other words, the regression coefficients describe the size of the contribution of the independent variables to the respondent being an entrepreneur. A positive regression coefficient means that the particular independent variable increases the odds of the individual respondent being an entrepreneur, while a negative coefficient means that the particular risk factor decreases the odds of the individual respondent being an entrepreneur. A large regression coefficient means that the risk factor strongly influences the probability of the event; while a near-zero regression coefficient indicates that the particular independent variable has little influence on the probability of occurrence of the event. Chen and Hughes (2004) and Abreu, Siqueira, Cardoso and Caiaffa (2008) reported that the same logistic model can be written in various forms but the version that shows the function of the probabilities that result in linear combination of parameters is written as:
e ZZf −+=
11)(
ISSN 2039-9340 Mediterranean Journal of Social Sciences Vol. 4 (1) January 2013
513
........................................(2)
The output function logit (pi) is the log of the odds that the respondent is an entrepreneur given that one or more explanatory variables (Xn) have occurred. The odd that an event occurs, in this case an entrepreneur, is a ratio of the number of respondents who are actually entrepreneurs (P) to the number of respondents who are not (1-P). Logit (Pi) is a measure of the total contribution of all the independent variables used in the model. The logistic model for this study therefore is specified as:
ln .... ( ) xxxP
P Zi
i7722110
...1 ββββ +++==−
.............................................( 3)
Where: Logit (Pi) = the probability that the event entrepreneur occurs X1 = age (Age) (continuous) X2 = gender (Gen) (male =1, otherwise, 0) X3 = any prior experience (Ape) (yes = 1, otherwise, 0) X4 = Position in family (PIF) X5= Number of years of schooling (NS) (continuous) X6 = Fired from job (FJ) (yes = 1, otherwise, 0) X7= Nature of parents’ occupation (NPO) (entrepreneur = 1, otherwise, 0)
Age is a continuous variable. For gender (Gen) male was coded “Gen 1” and female (Gen 0”). A respondent with any prior experience (Ape) was coded Ape (1) and Ape (0) for respondents who have no prior experience. There are four categories of position in family (PIF) namely; oldest child (PIF 1) middle child (PIF 2), youngest child (PIF 3) and Others (PIF 4). Thus PIF 4, the highest coded is the reference category. A respondent who has been fired from job was coded FJ “1” and FJ “0” if otherwise. The nature of respondents’parents’ occupation (NPO) was coded NPO 1 for respondents with parents in self employment and NPO “0” for respondents with parents in wage employment.
The Wald statistic was used to test the significance of individual independent variables. The overall fit of the model was tested using the Hosmer and Lemeshow‘s goodness of fit test. A finding of non significance indicates that the model adequately fits the data. The Omnibus statistic, the equivalent of the F-test in linear regression, was used to test the null hypothesis that all slope coefficients are simultaneously equal to zero. Gujarati (2004) however opined that in binary dependent models it is the expected signs of the regression coefficients and their statistical and or practical significance that are of prime importance and not the goodness of fit which is only of secondary importance 3. Results And Discussion 3.1 Socio-economic characteristics of Poultry farmers Table 1 shows the age distribution of poultry farmers in Delta State. The figures in bracket are the percentage of the population of poultry farmers in the respective group. The ages of the respondents ranged from 18 years to 68 years with a mean of 43.91 years and a standard deviation of 9.29 years.
The age group 38 - 47 years has the highest frequency of poultry farm operators (39.60%). This was followed by the age group 48 – 57 (34.20%) and 28 – 37 years (13.50%). Fitzsimons, O’Gorman, Hart and McGloin (2003) in their study of the Global Entrepreneurship Monitor (GEM) countries found that the age group 25 to 34 years was the modal age bracket for men and women who are active as entrepreneurs.
The gender distribution of poultry farmers also in Table 1 reveals that 58% of the respondents were female and about 42% male. About 77.45% of the respondents were married and 20% had never married. Only 2.55% were single again. (Table 1) 3.2 Human capital characteristics The distribution of poultry farmers by qualification is shown in Table 2. The figures in bracket are percentages of the column total. The Table 2 indicates that 4.36% of the population had no formal education and another 4.36% had primary school leaving certificate. Twenty one (21%) had senior secondary school certificate (SSSCE) or its equivalent, 42.18%
( ) xxxPP
nni
iPIn ββββ ...)( 221101+++==
−
ISSN 2039-9340 Mediterranean Journal of Social Sciences Vol. 4 (1) January 2013
514
had national diploma (ND) or National Certificate of Education (NCE) and 24% had a university degree or its equivalent. Also, 4% indicated holding a higher degree. Middle level manpower, that is ND/NCE holders, thus constituted the majority of operators in poultry production.
The number of years of experience prior to setting up the poultry farm is also shown in Table 2. About 65.45% of the population had experience in poultry management prior to being in the present farm. From this, it can be deduced that apprenticeship is an important means of human capital development in poultry production in Delta State. 3.3 Socio-economic characteristics of poultry farmers and the likelihood of the respondent being a Poultry entrepreneur To determine the effect of socioeconomic factors on the likelihood of a poultry farmer being a poultry farm entrepreneur, the researchers tested the hypothesis: H0: Socio-economic factors do not affect the likelihood of a poultry farmer being an entrepreneur. The logistic regression result of the test of the hypothesis is presented in Table 3. The enter method was used, that is, all model terms were entered in one step. The Nagelkerke R2 was 0.28 indicating that the independent variables in the logistic regression model were able to explain about 28% of the variation in the decision to become entrepreneur. The Homer and Lemeshow test of goodness of fit result (X2 =7.89, df = 8 and P = .45) failed to reject the null hypothesis that there is no difference between observed and model predicted values. Hence the model estimates fit the data at an acceptable level. The test of adequacy of fit of the model was also supported by the Omnibus tests of model coefficients (X2 = 42.06, df = 9 and P = 0.00). That the Omnibus test is significant indicates that socio-economic factors affect the likelihood of an individual being a poultry farm entrepreneur. Hence the null hypothesis is rejected and the alternative hypothesis that Socio-economic factors affect the likelihood of a poultry farmer being an entrepreneur is accepted.
The binary regression result had achieved significant success given the various test results of Homer and Lemeshow test and Omnibus test. The apparently low Nagelkerke R2 of 0.28 may be attributed to the fact that: firstly, the decision to become an entrepreneur is not influenced by only socio-economic factors. There are other factors like psychological traits, culture, government policy and macro economic factors, peers groups and role model, access to finance and, of course the inborn qualities of the individual, to mention but a few. Hence it is more appropriate to view the logistic regression coefficients as partial regression coefficients. Secondly and more importantly, Gujarati (2004) stated that in binary dependent variable models, what matters is the expected signs of the regression coefficients and their statistical and or practical significance that are of prime importance.
Coming to the individual independent variables, the result suggests that age, gender (Gen “1”), number of years of study (NS) and nature of parents’occupation (NPO) are socio-economic factors which significantly affect the likelihood of the respondent being a poultry farm entrepreneur (P < 0.05). For age, an increase by one year will increase the odd ratio of being an entrepreneur by 1.108 times over a person one year younger, all things being equal.
For gender, being a male reduces the odd ratio of being a poultry farm entrepreneur compared to the female (EXP = 0.358, and (B = -1.028). In other words, female are more likely to become poultry farm entrepreneurs than male. About 58.18% of the poultry farmers were females. That the odd ratio of being a poultry farm entrepreneur was higher for the female may suggest gender preference and for that reason may indicate a wisdom to take into consideration in designing economic empowerment programmes.
The number of years of study also significantly affect the decision of being a poultry farm entrepreneur. A one year increase in the number of years of schooling increases the odd ratio of being a poultry farm entrepreneur by 1.131 times that of the default person. If the odd ratio of being a poultry farm entrepreneur increases with the number of years of study, the likely assumpion is that the amount of relevant knowledge and skill acquired also increase. This finding tend to support Holcombe (2003) posited that there is a close connection between the advance of knowledge and the production of entrepreneurial activity especially in situations where investing in knowledge advancement is profitable entrepreneurially. Hence there might be the need to further develop the existing farmers and also intending operators by way of knowledge and skill acquisition.
On the effect of nature of parent’s occupation on the decision to become a poultry entrepreneur, the odd ratio of being an entrepreneur (3.016), was significantly higher for respondents with self employed parents (P = .02) compared to those who have wage employed parents. Hence self employed parents are effective role models to their children becoming entrepreneurs.
The independent variable PIF (position in farmily) where the “Other position” was the refrence category, indicates that being the oldest child (PIF 1) reduces the likelihood (-0.019) of the individual being an entrepreneur, though not significantly so (P = 0.981). It is the a priori expectation that the first born or the eldest child in the family has a higher
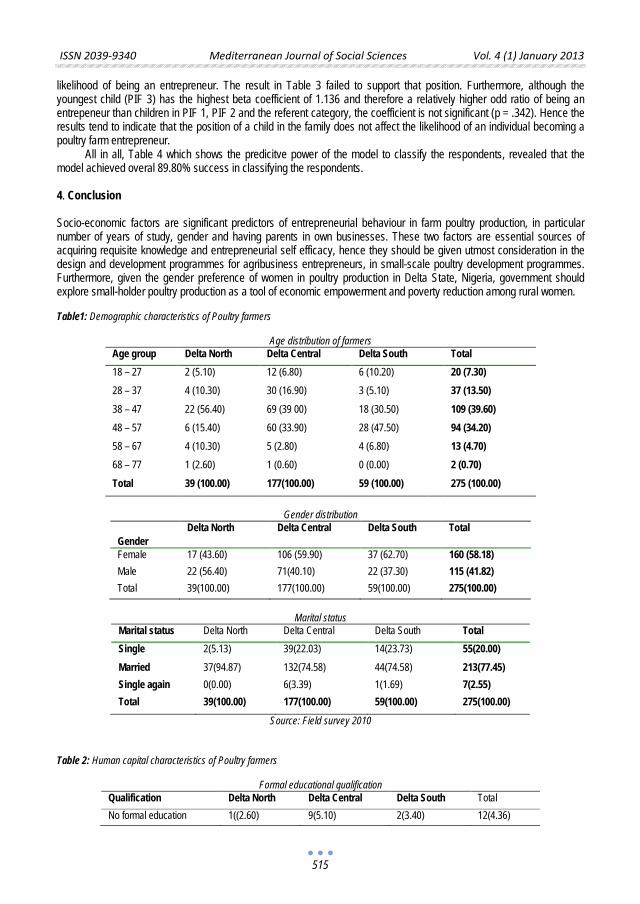
ISSN 2039-9340 Mediterranean Journal of Social Sciences Vol. 4 (1) January 2013
515
likelihood of being an entrepreneur. The result in Table 3 failed to support that position. Furthermore, although the youngest child (PIF 3) has the highest beta coefficient of 1.136 and therefore a relatively higher odd ratio of being an entrepeneur than children in PIF 1, PIF 2 and the referent category, the coefficient is not significant (p = .342). Hence the results tend to indicate that the position of a child in the family does not affect the likelihood of an individual becoming a poultry farm entrepreneur.
All in all, Table 4 which shows the predicitve power of the model to classify the respondents, revealed that the model achieved overal 89.80% success in classifying the respondents.
4. Conclusion Socio-economic factors are significant predictors of entrepreneurial behaviour in farm poultry production, in particular number of years of study, gender and having parents in own businesses. These two factors are essential sources of acquiring requisite knowledge and entrepreneurial self efficacy, hence they should be given utmost consideration in the design and development programmes for agribusiness entrepreneurs, in small-scale poultry development programmes. Furthermore, given the gender preference of women in poultry production in Delta State, Nigeria, government should explore small-holder poultry production as a tool of economic empowerment and poverty reduction among rural women.
Table1: Demographic characteristics of Poultry farmers
Age distribution of farmers
Age group Delta North Delta Central Delta South Total 18 – 27 2 (5.10) 12 (6.80) 6 (10.20) 20 (7.30) 28 – 37 4 (10.30) 30 (16.90) 3 (5.10) 37 (13.50) 38 – 47 22 (56.40) 69 (39 00) 18 (30.50) 109 (39.60) 48 – 57 6 (15.40) 60 (33.90) 28 (47.50) 94 (34.20) 58 – 67 4 (10.30) 5 (2.80) 4 (6.80) 13 (4.70) 68 – 77 1 (2.60) 1 (0.60) 0 (0.00) 2 (0.70) Total 39 (100.00) 177(100.00) 59 (100.00) 275 (100.00)
Gender distribution
Gender
Delta North Delta Central Delta South Total
Female 17 (43.60) 106 (59.90) 37 (62.70) 160 (58.18) Male 22 (56.40) 71(40.10) 22 (37.30) 115 (41.82) Total 39(100.00) 177(100.00) 59(100.00) 275(100.00)
Marital status
Marital status Delta North Delta Central Delta South Total Single 2(5.13) 39(22.03) 14(23.73) 55(20.00) Married 37(94.87) 132(74.58) 44(74.58) 213(77.45) Single again 0(0.00) 6(3.39) 1(1.69) 7(2.55) Total 39(100.00) 177(100.00) 59(100.00) 275(100.00)
Source: Field survey 2010
Table 2: Human capital characteristics of Poultry farmers
Formal educational qualification Qualification Delta North Delta Central Delta South Total No formal education 1((2.60) 9(5.10) 2(3.40) 12(4.36)
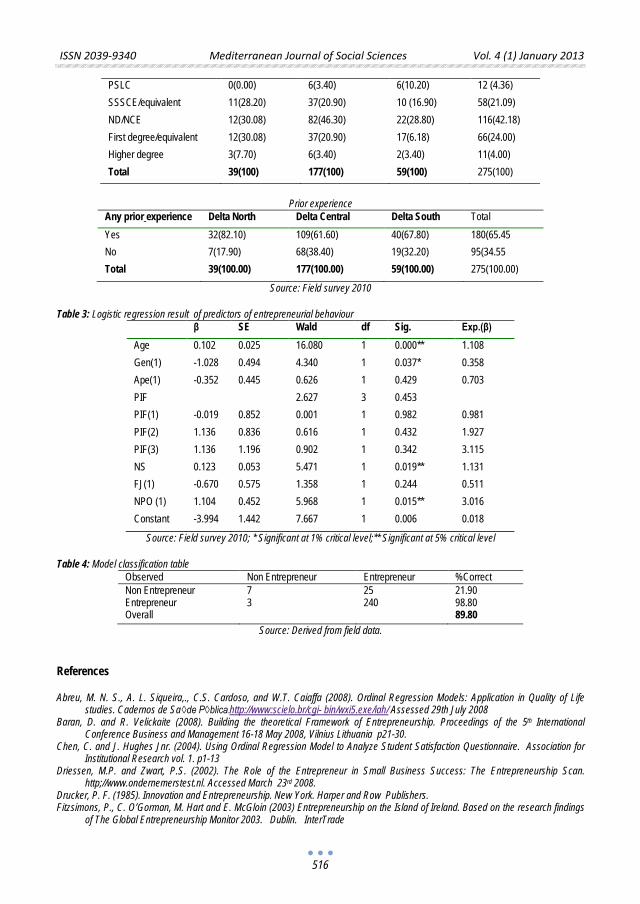
ISSN 2039-9340 Mediterranean Journal of Social Sciences Vol. 4 (1) January 2013
516
PSLC 0(0.00) 6(3.40) 6(10.20) 12 (4.36) SSSCE/equivalent 11(28.20) 37(20.90) 10 (16.90) 58(21.09) ND/NCE 12(30.08) 82(46.30) 22(28.80) 116(42.18) First degree/equivalent 12(30.08) 37(20.90) 17(6.18) 66(24.00) Higher degree 3(7.70) 6(3.40) 2(3.40) 11(4.00) Total 39(100) 177(100) 59(100) 275(100)
Prior experience
Any prior experience Delta North Delta Central Delta South Total Yes 32(82.10) 109(61.60) 40(67.80) 180(65.45 No 7(17.90) 68(38.40) 19(32.20) 95(34.55 Total 39(100.00) 177(100.00) 59(100.00) 275(100.00)
Source: Field survey 2010
Table 3: Logistic regression result of predictors of entrepreneurial behaviour β SE Wald df Sig. Exp.(β) Age 0.102 0.025 16.080 1 0.000** 1.108 Gen(1) -1.028 0.494 4.340 1 0.037* 0.358 Ape(1) -0.352 0.445 0.626 1 0.429 0.703 PIF 2.627 3 0.453 PIF(1) -0.019 0.852 0.001 1 0.982 0.981 PIF(2) 1.136 0.836 0.616 1 0.432 1.927 PIF(3) 1.136 1.196 0.902 1 0.342 3.115 NS 0.123 0.053 5.471 1 0.019** 1.131 FJ(1) -0.670 0.575 1.358 1 0.244 0.511 NPO (1) 1.104 0.452 5.968 1 0.015** 3.016 Constant -3.994 1.442 7.667 1 0.006 0.018
Source: Field survey 2010; * Significant at 1% critical level;** Significant at 5% critical level
Table 4: Model classification table Observed Non Entrepreneur Entrepreneur %Correct Non Entrepreneur Entrepreneur Overall
7 3
25 240
21.90 98.80 89.80
Source: Derived from field data. References Abreu, M. N. S., A. L. Siqueira,., C.S. Cardoso, and W.T. Caiaffa (2008). Ordinal Regression Models: Application in Quality of Life
studies. Cadernos de Sa◊de P◊blica.http://www:scielo.br/cgi- bin/wxi5.exe/iah/ Assessed 29th July 2008 Baran, D. and R. Velickaite (2008). Building the theoretical Framework of Entrepreneurship. Proceedings of the 5th International
Conference Business and Management 16-18 May 2008, Vilnius Lithuania p21-30. Chen, C. and J. Hughes Jnr. (2004). Using Ordinal Regression Model to Analyze Student Satisfaction Questionnaire. Association for
Institutional Research vol. 1. p1-13 Driessen, M.P. and Zwart, P.S. (2002). The Role of the Entrepreneur in Small Business Success: The Entrepreneurship Scan.
http;//www.ondernemerstest.nl. Accessed March 23rd 2008. Drucker, P. F. (1985). Innovation and Entrepreneurship. New York. Harper and Row Publishers. Fitzsimons, P., C. O’Gorman, M. Hart and E. McGloin (2003) Entrepreneurship on the Island of Ireland. Based on the research findings
of The Global Entrepreneurship Monitor 2003. Dublin. InterTrade

ISSN 2039-9340 Mediterranean Journal of Social Sciences Vol. 4 (1) January 2013
517
Gujarati, D.N. (2004). Basic Econometrics. New Delhi: Tata McGraw-Hill. Kilby, P. (1971). Hunting the Entrepreneur in Kilby (ed) Entrepreneurship and Economic Development. New York: The Free Press. Low, S., J. Hendersen and S. Weiler (2005). Gauging a Region’s Entrepreneurial Potential. Federal Reserve Bank of Kansas City.
Economic Review. Third quarter 2005.Pp61- 89. www.kc.frb.org/publication/Econrev/pdf/3q05/ON. Assessed October 25th 2007. Upton, G and Cook, I (2008). Oxford Dictionary of Statistics. London; Oxford University Press.

ISSN 2039-9340 Mediterranean Journal of Social Sciences Vol. 4 (1) January 2013
519
Basic Psychological Needs at Work of Mental Health Professionals in Albania
Lediana Xhakollari
University of Shkodra “Luigj Gurakuqi” E-mail: [email protected]
Doi:10.5901/mjss.2013.v4n1p519
Abstract
Research has supported the important role of meeting the needs of autonomy, competence and relatedness within the workplace, in order to enhance wellbeing, including lowered stress, burnout, and anxiety and enhanced workplace engagement The subjects of this study are mental health workers in Albania. This article reviews the meaning of quality of work life and analyses constructs of basic psychological needs at work based on Deci & Ryan model. The constructs of basic psychological needs at work discussed are, the need for autonomy, the need for competence and the need for relatedness.. This is mainly a quantitative study, with some elements of qualitative methods. Specifically, are used the scale measuring satisfaction with basic psychological needs at work (adapted from the model of Deci & Ryan), interviews and observations. At the conclusion of the study came out that overall mental health workers are satisfied with their basic psychological needs at work. Basic psychological need at work is positively related to all its constructs.
Keywords: basic psychological need; autonomy, competence, relatedness, mental health worker;
1. Introduction
Human needs are diverse. They may be physiological, psychological and social. Needs are very different, depending on individual and social-economic development of society. Individuals in different environments have different needs. A part of these needs appear in the work environment.
By definition, a “need” indicates some deficient state within and individual. Psychologists have proposed the humans have psychological needs that serve to drive much of human behavior (Jex, 2002, p. 211). Self Determination Theory (SDT) is a positive psychological motivation theory based on the premise that people actively seek opportunities to satisfy their basic psychological needs for competence, relatedness and autonomy (Greguras & Diefendorff, 2009). According Deci and Ryan (1985), people are always trying to overcome challenges to meet their needs for competence and self-determination. What everyone agrees is that first there must be a lack of something that is necessary for the welfare or for the operation and optimal growth. This serves as an inspiration or impetus to do something towards achieving a favorite state, where the need no longer exists or is completely filled. (Deci, & Ryan, 1985).
In this study are analyzed basic psychological needs at work of mental health workers located in four regions of the country, Tirana, Elbasan, Vlora and Shkodra. Services are provided by psychiatric hospitals, protected homes and community mental health centers. The study aims to assess satisfaction of basic psychological needs at work of Albanian mental health workers taking into consideration all its dimensions. Therefore, it aims to identify weaknesses and strengths of employees’ life, and to provide specific recommendations to improve the situation.
Research has supported the important role of meeting the needs of autonomy, competence and relatedness within the workplace, in order to enhance wellbeing, including lowered stress, burnout, anxiety and enhanced workplace engagement (Van den Broeck et.al., 2008). 2. Literature review
2.1 Theories of needs Need-based theories explain work motivation in terms of the extent to which employees satisfy important needs in the work place ((Jex, 2002, p. 211). People differ in their individual needs, perceptions and aspirations. Such differences are reflected in their behaviors at work. Some are good performers while others are not. Some are cooperative while others are not. The manager must know and understand the needs and interests of his subordinates. To motivate them to reach peak performance is to satisfy first their needs and interests. A high salary is not only the motivating factor. There are
ISSN 2039-9340 Mediterranean Journal of Social Sciences Vol. 4 (1) January 2013
520
higher needs which people want to satisfy, like recognition, belongingness, and honor. Employees who are satisfied are happy. This makes them efficient (Fajardo, 1997, p. 177). Each of us as a human being has needs and personal goals. We recognize some of our needs and take care of them objectively, while we respond to other needs subconsciously and spontaneously. A human need is a personal, unfilled vacancy that determines and organizes mental processes and physical behavior so that fulfillment can occur. Each of us possesses may needs, and those needs differ from person to person. The needs we have individually are quite varied, as are the way our needs are triggered. The type of needs an employee has will in many ways shape the individual`s behavior. The degree of individual initiative, the level of willingness to take risks, and the desire to climb the organizational ladder are specific results of the type and strength of unfilled needs (Harris & Hartman, 2002, p. 200-201). Need is a state in a person`s life that triggers action and activates behavior. Some theories arrange needs in hierarchical levels, with each level activating a different behavior aimed at satisfying that need. Some arrange them on a continuum, indicating that they could influence a person`s behavior (Singh, 2010, p. 143). All need theories share fundamental focus: a deficit created by an unsatisfied need, and motivated behavior being aimed at restoration of balance or satisfaction. Yet, there are differences among the major need theories. Some of major theories of motivation based on needs are them given by Abraham Maslow (1954), Herzberg (1967), Adlerfer (1969), and McClelland (1961). The theories of Herzberg and Alderfer are more or less modifications of Maslow`s work (Parikh& Gupta, 2010, p. 141-142).
2.2 Theory of basic needs
The concept of basic psychological needs has played an important, though often implicit, role in Sef-Determination-Theory and each of its mini-theories from the time the work began. To qualify as a need, a motivating force must have a direct relation to well-beings. Needs, when satisfied, promote well-being, but when thwarted, lead to negative consequences. Further, because needs are hypothesized to be universal, this relation between satisfaction and well-being must apply across ages, genders, and cultures. Of course, the means through which needs and satisfied (versus thwarted) vary as a function of age, gender, and culture. Thus, in an extreme case, it is possible for the same behavior to be need satisfying for one group and need thwarting for another (Deci & Ryan, 2004, p. 22). In SDT, needs specify innate psychological nutriments that are essential for ongoing psychological growth, integrity, and well-being. We identified three, the needs for competence, relatedness, and autonomy.” (Deci & Ryan, 2000, p. 229). Everyone is assumed to have these innate needs (regardless of the strength of their reported desires for those outcomes), so the degree of a person`s need satisfaction is hypothesized to predict positive work-related outcome. When need satisfaction is assessed, determining which aspects of the work context allow need satisfaction becomes a matter for empirical exploration, rather than for assumption (Baard, Deci, & Ryan, 2004, p. 2047). Self determination theory argues that there are three universal and evolved human needs, which when satisfied, lead a person to thrive in the same way that a plant thrives when it is given sun, soil, and water. The needs ase: autonomy (to be self-regulation, to be the maker or at least the owner of one`s choise); competence (to be effective in what one does mastering new skills in the process); and relatedness (to feel connected an in sympathy with at least some others) (Martocchio, & Ferris, 2003, p. 366). According to Deci and Ryan (1991), needs are defined as nutriments essential to a living entity’s growth, integrity, and health. They derive this definition of needs from biological and evolutionary approaches that determine organismic needs using functional criteria. For instance, a plant can be said to need water, sunlight, and specific minerals based on the observation that growth, health, and integrity are compromised when any one of these nutriments is withheld or is unavailable. Extending this reasoning to psychological systems, Deci and Ryan have argued that in humans, at least three types of nutriments are functionally essential to ongoing personal growth, integrity, and well-being. These are the needs for autonomy, competence, and relatedness. Factors in the person or situation that facilitate autonomy, competence, and relatedness are thus expected to enhance well-being, whereas factors that detract from fulfillment of these needs should undermine well-being ( Reis, Sheldon, Gable, Roscoe, & Ryan, 2000, p. 420). Whether or not one is aware of “needing” autonomy, competence or relatedness, one`s access to them will impact upon one`s tendencies toward growth and integration, and thus the experience of wellbeing and health. Not only are one`s conscious desires not definitional of needs; conscious wants and desires may often run counter to basic needs. For example, because of various dynamic and cultural influences, an individual may come to consciously vale “independence” and be strong oriented to avoid relying on others. Such a value may conflict with relatedness needs and thus have deleterious consequences for integration and well-being. Similarity, one may place a high value on material success and thus enslave oneself to attain it, thereby losing one`s autonomy in the process. These examples show one advantage of defining psychological needs independently of acquired desires and values (Ryan, 1995, p. 413-414). Need for competence: The need for competence refers to the needs to experience ourselves as capable and competent in controlling the environment and being able to reliably predict outcomes. Need for autonomy: The need for autonomy refers to our need to actively participate in determining our own
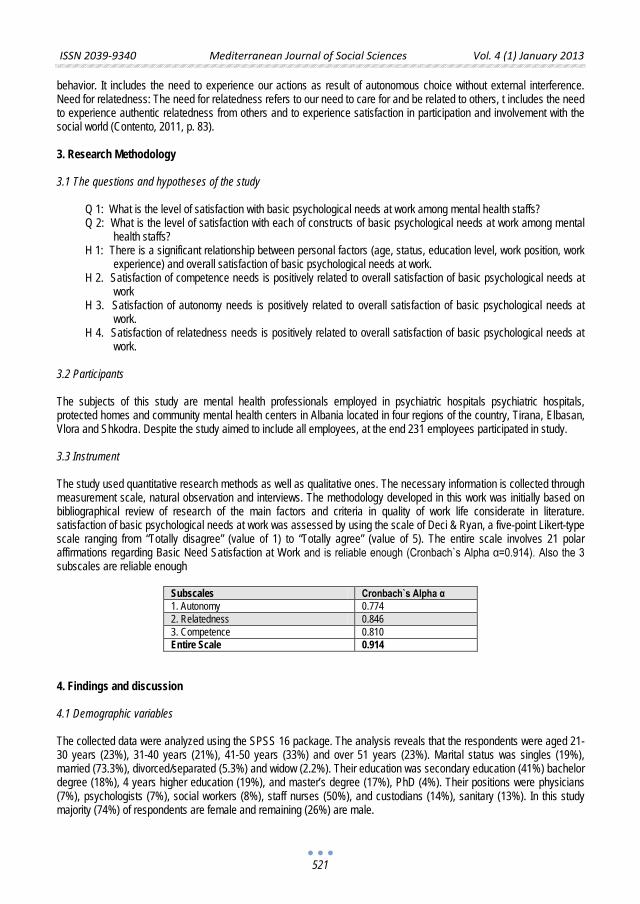
ISSN 2039-9340 Mediterranean Journal of Social Sciences Vol. 4 (1) January 2013
521
behavior. It includes the need to experience our actions as result of autonomous choice without external interference. Need for relatedness: The need for relatedness refers to our need to care for and be related to others, t includes the need to experience authentic relatedness from others and to experience satisfaction in participation and involvement with the social world (Contento, 2011, p. 83).
3. Research Methodology
3.1 The questions and hypotheses of the study
Q 1: What is the level of satisfaction with basic psychological needs at work among mental health staffs? Q 2: What is the level of satisfaction with each of constructs of basic psychological needs at work among mental
health staffs? H 1: There is a significant relationship between personal factors (age, status, education level, work position, work
experience) and overall satisfaction of basic psychological needs at work. H 2. Satisfaction of competence needs is positively related to overall satisfaction of basic psychological needs at
work H 3. Satisfaction of autonomy needs is positively related to overall satisfaction of basic psychological needs at
work. H 4. Satisfaction of relatedness needs is positively related to overall satisfaction of basic psychological needs at
work.
3.2 Participants The subjects of this study are mental health professionals employed in psychiatric hospitals psychiatric hospitals, protected homes and community mental health centers in Albania located in four regions of the country, Tirana, Elbasan, Vlora and Shkodra. Despite the study aimed to include all employees, at the end 231 employees participated in study.
3.3 Instrument
The study used quantitative research methods as well as qualitative ones. The necessary information is collected through measurement scale, natural observation and interviews. The methodology developed in this work was initially based on bibliographical review of research of the main factors and criteria in quality of work life considerate in literature. satisfaction of basic psychological needs at work was assessed by using the scale of Deci & Ryan, a five-point Likert-type scale ranging from “Totally disagree” (value of 1) to “Totally agree” (value of 5). The entire scale involves 21 polar affirmations regarding Basic Need Satisfaction at Work and is reliable enough (Cronbach`s Alpha α=0.914). Also the 3 subscales are reliable enough
Subscales Cronbach`s Alpha α 1. Autonomy 0.774 2. Relatedness 0.846 3. Competence 0.810 Entire Scale 0.914
4. Findings and discussion
4.1 Demographic variables
The collected data were analyzed using the SPSS 16 package. The analysis reveals that the respondents were aged 21-30 years (23%), 31-40 years (21%), 41-50 years (33%) and over 51 years (23%). Marital status was singles (19%), married (73.3%), divorced/separated (5.3%) and widow (2.2%). Their education was secondary education (41%) bachelor degree (18%), 4 years higher education (19%), and master’s degree (17%), PhD (4%). Their positions were physicians (7%), psychologists (7%), social workers (8%), staff nurses (50%), and custodians (14%), sanitary (13%). In this study majority (74%) of respondents are female and remaining (26%) are male.
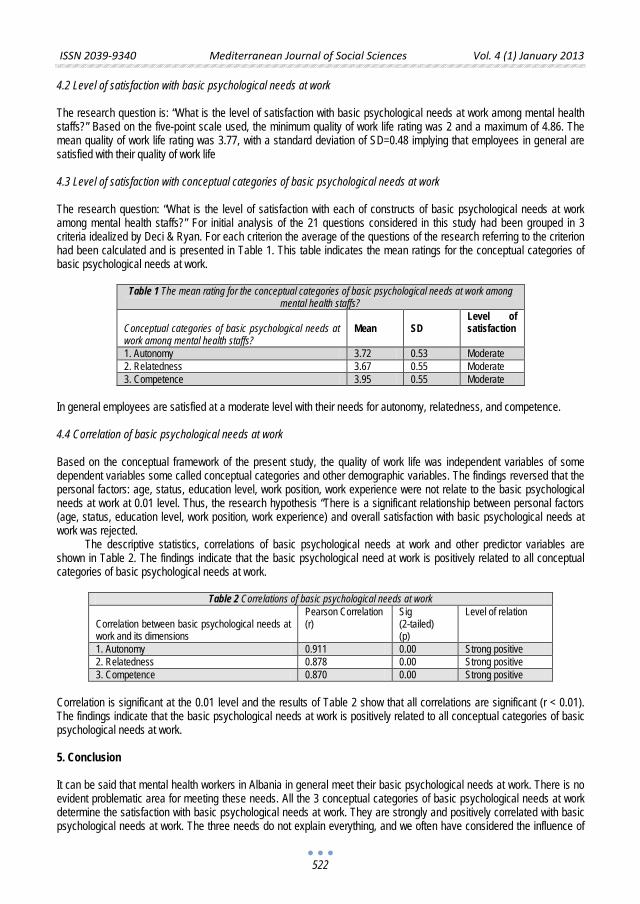
ISSN 2039-9340 Mediterranean Journal of Social Sciences Vol. 4 (1) January 2013
522
4.2 Level of satisfaction with basic psychological needs at work
The research question is: “What is the level of satisfaction with basic psychological needs at work among mental health staffs?” Based on the five-point scale used, the minimum quality of work life rating was 2 and a maximum of 4.86. The mean quality of work life rating was 3.77, with a standard deviation of SD=0.48 implying that employees in general are satisfied with their quality of work life
4.3 Level of satisfaction with conceptual categories of basic psychological needs at work
The research question: “What is the level of satisfaction with each of constructs of basic psychological needs at work among mental health staffs?” For initial analysis of the 21 questions considered in this study had been grouped in 3 criteria idealized by Deci & Ryan. For each criterion the average of the questions of the research referring to the criterion had been calculated and is presented in Table 1. This table indicates the mean ratings for the conceptual categories of basic psychological needs at work.
Table 1 The mean rating for the conceptual categories of basic psychological needs at work among
mental health staffs? Conceptual categories of basic psychological needs at work among mental health staffs?
Mean
SD
Level of satisfaction
1. Autonomy 3.72 0.53 Moderate 2. Relatedness 3.67 0.55 Moderate 3. Competence 3.95 0.55 Moderate
In general employees are satisfied at a moderate level with their needs for autonomy, relatedness, and competence.
4.4 Correlation of basic psychological needs at work
Based on the conceptual framework of the present study, the quality of work life was independent variables of some dependent variables some called conceptual categories and other demographic variables. The findings reversed that the personal factors: age, status, education level, work position, work experience were not relate to the basic psychological needs at work at 0.01 level. Thus, the research hypothesis “There is a significant relationship between personal factors (age, status, education level, work position, work experience) and overall satisfaction with basic psychological needs at work was rejected.
The descriptive statistics, correlations of basic psychological needs at work and other predictor variables are shown in Table 2. The findings indicate that the basic psychological need at work is positively related to all conceptual categories of basic psychological needs at work.
Table 2 Correlations of basic psychological needs at work
Correlation between basic psychological needs at work and its dimensions
Pearson Correlation (r)
Sig (2-tailed) (p)
Level of relation
1. Autonomy 0.911 0.00 Strong positive 2. Relatedness 0.878 0.00 Strong positive 3. Competence 0.870 0.00 Strong positive
Correlation is significant at the 0.01 level and the results of Table 2 show that all correlations are significant (r < 0.01). The findings indicate that the basic psychological needs at work is positively related to all conceptual categories of basic psychological needs at work.
5. Conclusion
It can be said that mental health workers in Albania in general meet their basic psychological needs at work. There is no evident problematic area for meeting these needs. All the 3 conceptual categories of basic psychological needs at work determine the satisfaction with basic psychological needs at work. They are strongly and positively correlated with basic psychological needs at work. The three needs do not explain everything, and we often have considered the influence of
ISSN 2039-9340 Mediterranean Journal of Social Sciences Vol. 4 (1) January 2013
523
other factors such as genetics and neurobiological processes in shaping people’s behavioral vulnerabilities and resources. Nonetheless, we think that most significant events in social life relate to basic psychological needs and that need dynamics explain squeal to the events. (Ryan, & Deci, 2003, p. 328). Acknowledgement The author would like to thank the mental health workers at Tirana, Elbasan, Vlora and Shkodra institutions for their support in data collection. This study would not have been possible without their assistance.
References Baard, P. P., Deci, E. L., Ryan, R, M. (2004). Intrinsic need satisfaction: a motivational basis of performance and well-being in tow work
settings. Journal of Applied Social Psychology. 34(10). V.H. Winston & Son, Inc. 2047. Contento, I. R. (2011). Nutrition Education: Linking research, Theory and Practice. (2nd ed). USA: Jones and Batlett Publishers LLC. 83. Deci, E.L.., & Ryan, R.M. (1985). Intrinsic motivation and self-determination in human behaviour. New York: Plenum Press. Deci, E. L., & Ryan, R. M. (2000). The What and Why of Goal Pursuits: Human Needs and the Self-Determination of Behavior.
Psychology Inquiry, Vol.11. No. 4. 229. Dec, E, L., & Ryan, R. M. (2004). Handbook of self-determination research. University of Rochester Press. 22. Fajardo, F, R. (1997). Management. Manila, Philippines: Rex Book Store Inc. 177. Greguras, G. J., & Diefendorff, J. M. (2009). Different fits satisfy different needs: Linking person– environment fit to employee
commitment and performance using self-determination theory. Journal of Applied Psychology, 94, 465–477. Harris, O. J., & Hartman, S. J. (2002). Organizational behavior. Binghamton, NY: Best Business Books. 210-211. Jex, S. M. (2002). Organizational psychology: A scientist-practitioner approach. New York: John Wiley & Sons. 211. Martocchio, J. J., & Ferris, G. R. (2003). Research personnel and human resources management. 22. Elsevier. Ltd. pp. 366-367. Parikh, M., & Gupta, R. (2010). Organizational Behaviour. New Dehli: Tata McGraw Hill Education Private Limited. 141-142. Reis, H. T., Sheldon, K. M., Gable, S.L., Roscoe, J., & Ryan, R.M. (2000). Daily well-being: The role of autonomy, competence and
relatedness. Personality and Social Psychology Bulletin, 26 (4). The Society for Personality and Social Psychology, Inc. 420. Ryan, R. M. (1995). Psychological Needs and the Facilitation of Integrative Processes. Journal of Personality 63(3). Duke University
Press. 413-414. Ryan, R. M., & Deci, E. L. (2003). The darker and brighter sides of human existence: Basic psychological needs and a unifying concept.
Psychology Inquiry. 11(4). Lawrence Erlbaum Associates, Inc. 328. Singh, K. (2010). Organizational Behaviour – Text and Cases. New Delhi: Dorling Kindersley (India). Pvt. Ltd. 143. Van den Broeck, A., Vansteenkiste, M., De Witte, H., & Lens, W. (2008). Explaining the relationship between job characteristics,
burnout, and engagement: the role of basic psychological needs satisfaction. Work & Stress, 22(3), 277-294.

ISSN 2039-9340 Mediterranean Journal of Social Sciences Vol. 4 (1) January 2013
525
The Impact of Joseph Heller Post-Modernist Features in
the Recent Scientific Studies
Anita Neziri
“Alexander Moisiu” Univesity of Durres
Doi:10.5901/mjss.2013.v4n1p525
Abstract
It is a crucial issue alongside other important topics to the academic level and also for the students who are interested in this regard. After the Second World War there were some writers who possessed some characteristics that we may categorize only to that period. One of these writers is the famous American one Joseph Heller. There are many books about the war but Heller’s masterpiece “Catch-22” is uncomparable to none of them. Heller is a satirical novelist, a short story writer and a playwright.(a) The features that led to “Black Humor” .The humor that Heller makes use of is obviously a human selfishness in vain, this is very well represented in almost all the characters of this novel. The humor is dressed up in these characters to explain the absurdity even when they think that they are being moral and fair. (b)Humor as a stylistic choice. Joseph Heller is interested in a non-chronological narration and has been focused in a repetitive style approach. Heller was not alone in the war novels there many other such as Kurt Vonnegut ,or Thomas Pynchon etc
Key words: Black humor, morality destroyed, non-chronological events, irrationality, Catch-22, literary pun, mortality.
1. Introduction Numerous scholars agree that the climactic epiphany of Joseph Heller’s funny and horrifying World War II novel Catch-22 (1961) is the protagonist Yossarian.
Returning with his B-25 squadron from a bombing run over Avignon, Yossarian, an American bombardier, futilely tends to a mortally wounded gunner on his plane:
Yossarian ripped open the snaps of Snowden’s flak suit and heard himself scream wildly as Snowden’s insides slithered down to the floor in a soggy pile and just kept dripping out. . . . he gazed down despondently at the grim secret Snowden had spilled all over the messy floor. It was easy to read them message in his entrails. Man was matter, that was Snowden’s secret. Drop him out a window and he’ll fall. Set fire to him and he’ll burn. Bury him and he’ll rot, like other kinds of garbage. The spirit gone, man is garbage. That was Snowden’s secret. (429–30)
The critics may perceive the novel’s terrified naturalistic vision of human mortality, but they may have missed it a striking literary irony underscoring that dour vision. In one of the most renowned poems in the English language, William Wordworth’s The Prelude (1850), the work’s climactic vision occurs atop Mt. Snowdon in Northern Wales, the highest point in England and Wales. Could Heller have joined a more contrasting association with the somber Villon allusion, or Wordsworth’s vision of life everlasting? 2. Humor as a Stylistic Choice Catch 22 combines formal innovation and popular appeal.This is anomalous and hence instructive. The conventional novel has as its correlate a readership more or less well versed in the conventions of the novel. There is a presumption of shared background expectations about plotting and narrative sequence, about characterisation and the exploration of personality.
Seen in this way the novel is a commodity of consciousness, in which author and reader are linked by a nexus of cash and culture, the aesthetic expression of which is the novel's form.
Sociologically speaking it is thus the form of a novel which is its content. This means that whereas a novel which breaches these conventions is not axiomatically of sociological or aesthetic interest, a successful novel of this kind always is, whether success is defined by the standards of the market or the standards of critical taste, or by both.
Catch 22 is just such a work. Temporal sequence is so disordered that the reader is shuttled backwards and forwards in both time and space in so apparently random a fashion that it requires detailed notes to reconstruct the action
ISSN 2039-9340 Mediterranean Journal of Social Sciences Vol. 4 (1) January 2013
526
in linear time. A host of bizarre characters appear, reappear and disappear, sub-plots proliferate, and Heller withholds any clearcut indication of the novel's narrative line until the final chapters. A recipe for obscurity, one might suppose, its limited readership sanctioned by the arcane requirements of a handful of university courses. Indeed the manuscript was turned down by a spate of publishers. Yet the book proved to be an enormous comitierdal success. It has a publishing history of reprints that is even lengthier than that initial inventory of rejection slips, and had sold several million copies even before its eventual acquisition of a Hollywood imprimatur.
The story can be summarized by saying that it is set largely on an Italian island during World War II and concerns the efforts of Yossarian, a bombardier in the US Army Air Corps, to evade further combat duty. The death of a young gunner called Snowden in Yossarian's own aircraft transforms his lack of enthusiasm for flying combat missions into a desperate aversion to them. Between him and his intense desire to stay on the ground, however, are the aspirations of Colonel Cathcart, who is anxious to secure promotion by continually increasing the number of missions his men must fly. These rival action tendencies are displayed in an organisational setting of people.
3. The Features that Led to “Black Humor” Catch, class and bureaucracy a whole host of other characters (in which the entrepreneurial activities of Milo Minderbinder are of especial significance). Yossarian finally refuses to fly any more and Colonels Cathcart and Korn, unwilling to risk a court martial, offer him a deal, a flight back to the USA if he will promote their interests there. Yossarian at first accepts, then changes liis mind, and only then learns that a pilot called Orr, Yossarian's extent mate who was missing presumed killed, had in fact rowed all the way to Sweden and safety. Yossarian determines to join him, and deserts. This is not, however, how Heller tells the story. Such a conventional reconstruction of the narrative is simply not available during a first reading. For example, it is not until the penultimate forty-first chapter that the reader grasps the full import of Snowden's death, whereas chapter one begins about halfway through the timescale that the novel covers, and chapter eighteen is set in part at least, in the USA before Yossarian leaves for the combat zone. These are not simply isolated instances of flashback/flashforward technique. They exemplify an approach to linear time which is integral to the book's form. That there is an order to the text's forty-two chapters will be argued later in this paper. For the moment the relevant point is that order is not temporal. That this has implications for the reader can be seen from the initial critical reaction. 4. Critical Evaluation and Commercial Success
When the book was ilnally published (having taken eight years to write), the response of cultural gatekeepers was very mixed,"The unstinting admiration of novelists Nelson Algren ('the best American novel that has come out of anywhere in years') and Julian Mitchell ('a book of enormous richness and art, of deep thought and brilliant writing') was not shared by professional critics like Whitney Balliett and R.G. Stern. Balliett argued that Heller fallows in his own laughter and fmally drowns in it. What remains is a debris of sour jokes, stage anger, dirty words, synthetic looniness.' In a more measured tone. Stern suggested that 'Catch 22 has much passion, comic and fervent, but it gasps for want of craft and sensibility. . . . The book is an emotional hodge-podge; no mood is sustained long enough to register for more than a chapter.' Such mapping of the critical response to Catch 22 is to be distinguished from the task of establishing the reasons for its popular appeal. As the book's sales climbed into the millions however, the pattern of critical evaluation increasingly touched upon, and sought to 721
Nick Perry respond to, the fact of its commercial success. For example, speculated as to the book's readership, and summarised its attractions as follows: Catch 22 obviously appeals to the student, who beneath his complacency and hipster frigidity is very confused and afraid.
It appeals to the sophisticated professional the educator, lawyer, professor - who must work at something he cannot fully trust. It appeals to the businessman, who does not really believe that his empire primarily serves the public good. It certainly appeals to all the new professionals - the advertisers, publicity men, television writers - whose world is little different from the absurd one Heller presents. There is here the suggestion that Heller's primary 'constituency' is what Gouldner and others have called the new class, the possessors of cultural capital. And there is the observation that the novel explores aspects of anxiety, ambivalence and absurdity which are somehow germane to their social and cultural situation. This cultural bourgeoisie differs from both the old moneyed class and the old working class. It has an ideologically grounded commitment to consistency, expiicitness, reflexivity and understanding (all congruent with its resource base in knowledge). This is at odds with the organisational conditions under which many such class members are required to act, but these are the precondition for those privileges which they enjoy vis-a-vis the old working class.
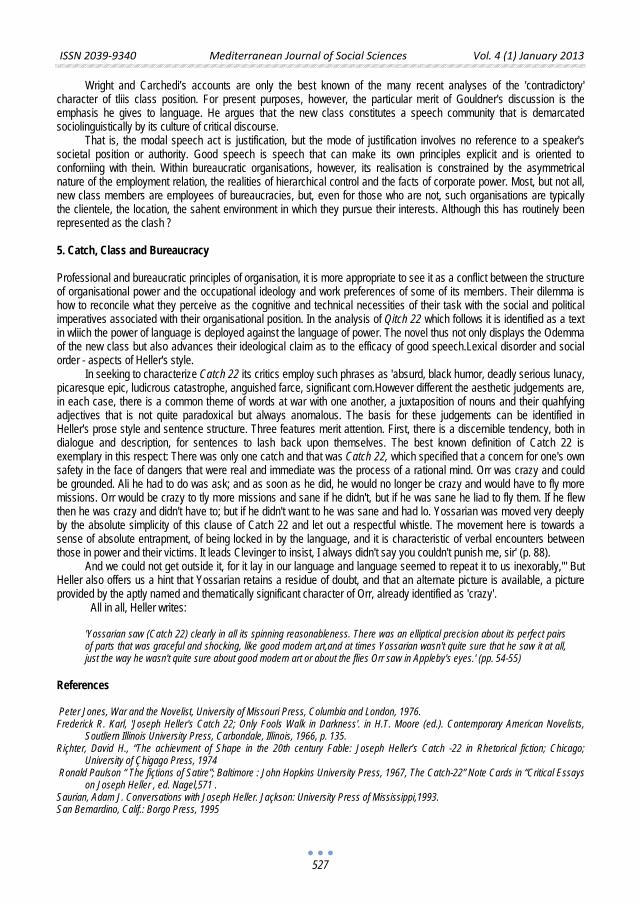
ISSN 2039-9340 Mediterranean Journal of Social Sciences Vol. 4 (1) January 2013
527
Wright and Carchedi’s accounts are only the best known of the many recent analyses of the 'contradictory' character of tliis class position. For present purposes, however, the particular merit of Gouldner's discussion is the emphasis he gives to language. He argues that the new class constitutes a speech community that is demarcated sociolinguistically by its culture of critical discourse.
That is, the modal speech act is justification, but the mode of justification involves no reference to a speaker's societal position or authority. Good speech is speech that can make its own principles explicit and is oriented to conforniing with thein. Within bureaucratic organisations, however, its realisation is constrained by the asymmetrical nature of the employment relation, the realities of hierarchical control and the facts of corporate power. Most, but not all, new class members are employees of bureaucracies, but, even for those who are not, such organisations are typically the clientele, the location, the sahent environment in which they pursue their interests. Although this has routinely been represented as the clash ? 5. Catch, Class and Bureaucracy
Professional and bureaucratic principles of organisation, it is more appropriate to see it as a conflict between the structure of organisational power and the occupational ideology and work preferences of some of its members. Their dilemma is how to reconcile what they perceive as the cognitive and technical necessities of their task with the social and political imperatives associated with their organisational position. In the analysis of Qitch 22 which follows it is identified as a text in wliich the power of language is deployed against the language of power. The novel thus not only displays the Odemma of the new class but also advances their ideological claim as to the efficacy of good speech.Lexical disorder and social order - aspects of Heller's style.
In seeking to characterize Catch 22 its critics employ such phrases as 'absurd, black humor, deadly serious lunacy, picaresque epic, ludicrous catastrophe, anguished farce, significant corn.However different the aesthetic judgements are, in each case, there is a common theme of words at war with one another, a juxtaposition of nouns and their quahfying adjectives that is not quite paradoxical but always anomalous. The basis for these judgements can be identified in Heller's prose style and sentence structure. Three features merit attention. First, there is a discernible tendency, both in dialogue and description, for sentences to lash back upon themselves. The best known definition of Catch 22 is exemplary in this respect: There was only one catch and that was Catch 22, which specified that a concern for one's own safety in the face of dangers that were real and immediate was the process of a rational mind. Orr was crazy and could be grounded. Ali he had to do was ask; and as soon as he did, he would no longer be crazy and would have to fly more missions. Orr would be crazy to tly more missions and sane if he didn't, but if he was sane he liad to fly them. If he flew then he was crazy and didn't have to; but if he didn't want to he was sane and had lo. Yossarian was moved very deeply by the absolute simplicity of this clause of Catch 22 and let out a respectful whistle. The movement here is towards a sense of absolute entrapment, of being locked in by the language, and it is characteristic of verbal encounters between those in power and their victims. It leads Clevinger to insist, I always didn't say you couldn't punish me, sir' (p. 88).
And we could not get outside it, for it lay in our language and language seemed to repeat it to us inexorably,'" But Heller also offers us a hint that Yossarian retains a residue of doubt, and that an alternate picture is available, a picture provided by the aptly named and thematically significant character of Orr, already identified as 'crazy'.
All in all, Heller writes: 'Yossarian saw (Catch 22) clearly in all its spinning reasonableness. There was an elliptical precision about its perfect pairs of parts that was graceful and shocking, like good modern art,and at times Yossarian wasn't quite sure that he saw it at all, just the way he wasn't quite sure about good modern art or about the flies Orr saw in Appleby's eyes.' (pp. 54-55)
References Peter Jones, War and the Novelist, University of Missouri Press, Columbia and London, 1976. Frederick R. Karl, 'Joseph Heller's Catch 22; Only Fools Walk in Darkness'. in H.T. Moore (ed.). Contemporary American Novelists,
Soutliern Illinois University Press, Carbondale, Illinois, 1966, p. 135. Riçhter, David H., “The achievment of Shape in the 20th century Fable: Joseph Heller’s Catch -22 in Rhetorical fiction; Chicago;
University of Çhigago Press, 1974 Ronald Paulson “ The fiçtions of Satire”; Baltimore : John Hopkins University Press, 1967, The Catch-22” Note Cards in “Critical Essays
on Joseph Heller , ed. Nagel,571 . Saurian, Adam J. Conversations with Joseph Heller. Jaçkson: University Press of Mississippi,1993. San Bernardino, Calif.: Borgo Press, 1995

ISSN 2039-9340 Mediterranean Journal of Social Sciences Vol. 4 (1) January 2013
528
Scoggins, Miçhael Ç. “Joseph Heller’s Combat Experiences in Catch-22.” War, Literature, and the Arts: An International Journal of the Humanities 15 Seed, David. The Fiction of Joseph Heller. New York: St. Martin’s Press, 1989.
Scotto, Robert M. “ The three Contemporary Novelists : An Annuated of Works by and about Way, Brian. “ Formal Experiment and Soçial Discontent : Joseph Heller ‘s Catch-22” Jounrnal of American Studies 2 (1968)
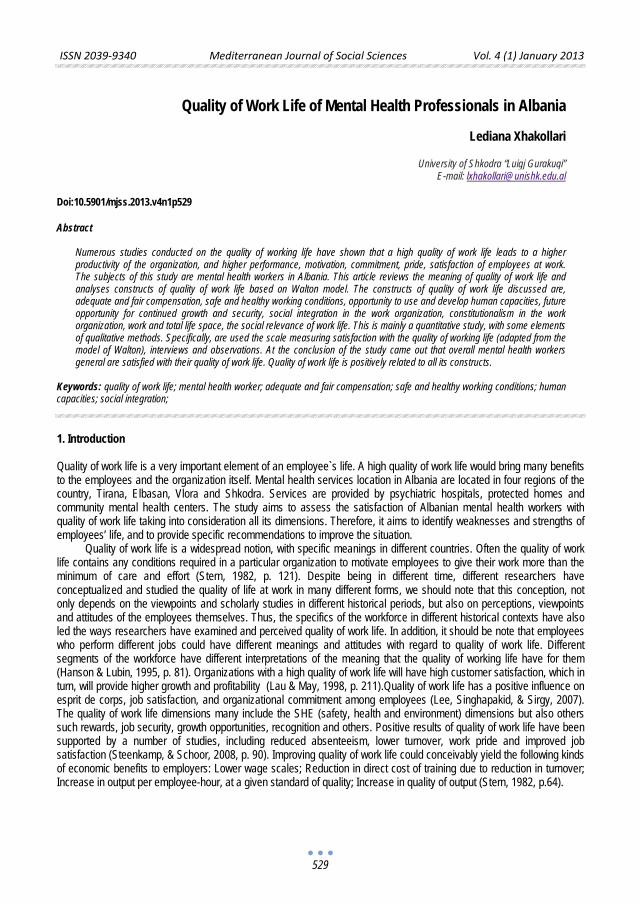
ISSN 2039-9340 Mediterranean Journal of Social Sciences Vol. 4 (1) January 2013
529
Quality of Work Life of Mental Health Professionals in Albania
Lediana Xhakollari
University of Shkodra “Luigj Gurakuqi”
E-mail: [email protected]
Doi:10.5901/mjss.2013.v4n1p529
Abstract
Numerous studies conducted on the quality of working life have shown that a high quality of work life leads to a higher productivity of the organization, and higher performance, motivation, commitment, pride, satisfaction of employees at work. The subjects of this study are mental health workers in Albania. This article reviews the meaning of quality of work life and analyses constructs of quality of work life based on Walton model. The constructs of quality of work life discussed are, adequate and fair compensation, safe and healthy working conditions, opportunity to use and develop human capacities, future opportunity for continued growth and security, social integration in the work organization, constitutionalism in the work organization, work and total life space, the social relevance of work life. This is mainly a quantitative study, with some elements of qualitative methods. Specifically, are used the scale measuring satisfaction with the quality of working life (adapted from the model of Walton), interviews and observations. At the conclusion of the study came out that overall mental health workers general are satisfied with their quality of work life. Quality of work life is positively related to all its constructs.
Keywords: quality of work life; mental health worker; adequate and fair compensation; safe and healthy working conditions; human capacities; social integration;
1. Introduction
Quality of work life is a very important element of an employee`s life. A high quality of work life would bring many benefits to the employees and the organization itself. Mental health services location in Albania are located in four regions of the country, Tirana, Elbasan, Vlora and Shkodra. Services are provided by psychiatric hospitals, protected homes and community mental health centers. The study aims to assess the satisfaction of Albanian mental health workers with quality of work life taking into consideration all its dimensions. Therefore, it aims to identify weaknesses and strengths of employees’ life, and to provide specific recommendations to improve the situation.
Quality of work life is a widespread notion, with specific meanings in different countries. Often the quality of work life contains any conditions required in a particular organization to motivate employees to give their work more than the minimum of care and effort (Stern, 1982, p. 121). Despite being in different time, different researchers have conceptualized and studied the quality of life at work in many different forms, we should note that this conception, not only depends on the viewpoints and scholarly studies in different historical periods, but also on perceptions, viewpoints and attitudes of the employees themselves. Thus, the specifics of the workforce in different historical contexts have also led the ways researchers have examined and perceived quality of work life. In addition, it should be note that employees who perform different jobs could have different meanings and attitudes with regard to quality of work life. Different segments of the workforce have different interpretations of the meaning that the quality of working life have for them (Hanson & Lubin, 1995, p. 81). Organizations with a high quality of work life will have high customer satisfaction, which in turn, will provide higher growth and profitability (Lau & May, 1998, p. 211).Quality of work life has a positive influence on esprit de corps, job satisfaction, and organizational commitment among employees (Lee, Singhapakid, & Sirgy, 2007). The quality of work life dimensions many include the SHE (safety, health and environment) dimensions but also others such rewards, job security, growth opportunities, recognition and others. Positive results of quality of work life have been supported by a number of studies, including reduced absenteeism, lower turnover, work pride and improved job satisfaction (Steenkamp, & Schoor, 2008, p. 90). Improving quality of work life could conceivably yield the following kinds of economic benefits to employers: Lower wage scales; Reduction in direct cost of training due to reduction in turnover; Increase in output per employee-hour, at a given standard of quality; Increase in quality of output (Stern, 1982, p.64).
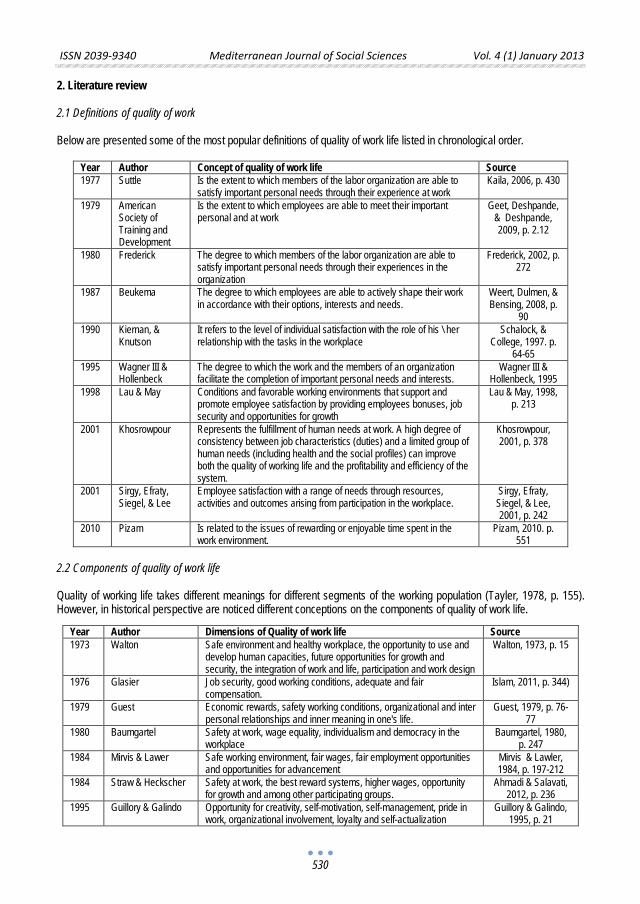
ISSN 2039-9340 Mediterranean Journal of Social Sciences Vol. 4 (1) January 2013
530
2. Literature review
2.1 Definitions of quality of work Below are presented some of the most popular definitions of quality of work life listed in chronological order.
Year Author Concept of quality of work life Source 1977 Suttle Is the extent to which members of the labor organization are able to
satisfy important personal needs through their experience at work Kaila, 2006, p. 430
1979 American Society of Training and Development
Is the extent to which employees are able to meet their important personal and at work
Geet, Deshpande, & Deshpande, 2009, p. 2.12
1980 Frederick The degree to which members of the labor organization are able to satisfy important personal needs through their experiences in the organization
Frederick, 2002, p. 272
1987 Beukema The degree to which employees are able to actively shape their work in accordance with their options, interests and needs.
Weert, Dulmen, & Bensing, 2008, p.
90 1990 Kiernan, &
Knutson It refers to the level of individual satisfaction with the role of his \ her relationship with the tasks in the workplace
Schalock, & College, 1997. p.
64-65 1995 Wagner III &
Hollenbeck The degree to which the work and the members of an organization facilitate the completion of important personal needs and interests.
Wagner III & Hollenbeck, 1995
1998 Lau & May Conditions and favorable working environments that support and promote employee satisfaction by providing employees bonuses, job security and opportunities for growth
Lau & May, 1998, p. 213
2001 Khosrowpour Represents the fulfillment of human needs at work. A high degree of consistency between job characteristics (duties) and a limited group of human needs (including health and the social profiles) can improve both the quality of working life and the profitability and efficiency of the system.
Khosrowpour, 2001, p. 378
2001 Sirgy, Efraty, Siegel, & Lee
Employee satisfaction with a range of needs through resources, activities and outcomes arising from participation in the workplace.
Sirgy, Efraty, Siegel, & Lee, 2001, p. 242
2010 Pizam Is related to the issues of rewarding or enjoyable time spent in the work environment.
Pizam, 2010. p. 551
2.2 Components of quality of work life Quality of working life takes different meanings for different segments of the working population (Tayler, 1978, p. 155). However, in historical perspective are noticed different conceptions on the components of quality of work life.
Year Author Dimensions of Quality of work life Source 1973 Walton Safe environment and healthy workplace, the opportunity to use and
develop human capacities, future opportunities for growth and security, the integration of work and life, participation and work design
Walton, 1973, p. 15
1976 Glasier Job security, good working conditions, adequate and fair compensation.
Islam, 2011, p. 344)
1979 Guest Economic rewards, safety working conditions, organizational and inter personal relationships and inner meaning in one's life.
Guest, 1979, p. 76-77
1980 Baumgartel Safety at work, wage equality, individualism and democracy in the workplace
Baumgartel, 1980, p. 247
1984 Mirvis & Lawer Safe working environment, fair wages, fair employment opportunities and opportunities for advancement
Mirvis & Lawler, 1984, p. 197-212
1984 Straw & Heckscher Safety at work, the best reward systems, higher wages, opportunity for growth and among other participating groups.
Ahmadi & Salavati, 2012, p. 236
1995 Guillory & Galindo Opportunity for creativity, self-motivation, self-management, pride in work, organizational involvement, loyalty and self-actualization
Guillory & Galindo, 1995, p. 21
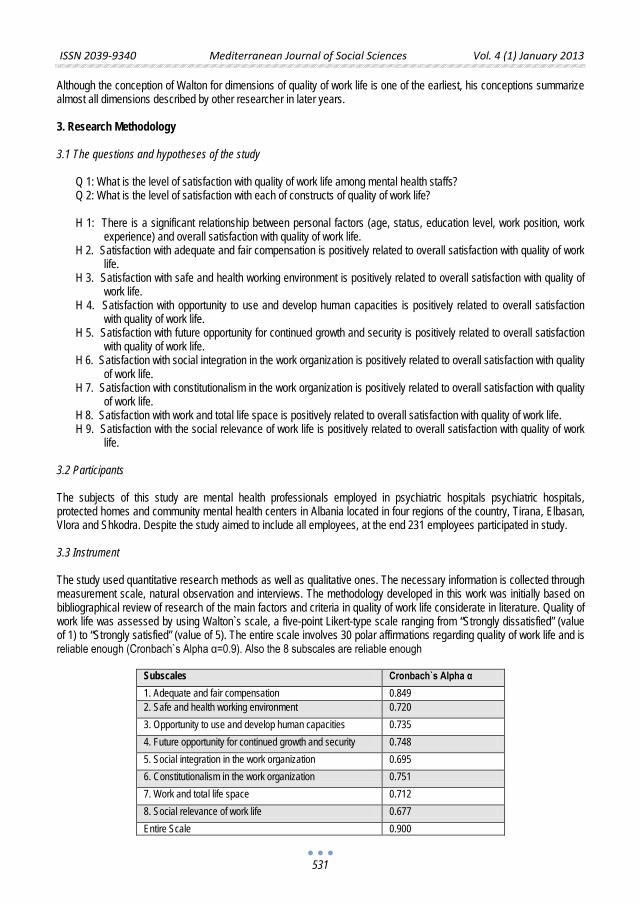
ISSN 2039-9340 Mediterranean Journal of Social Sciences Vol. 4 (1) January 2013
531
Although the conception of Walton for dimensions of quality of work life is one of the earliest, his conceptions summarize almost all dimensions described by other researcher in later years.
3. Research Methodology
3.1 The questions and hypotheses of the study
Q 1: What is the level of satisfaction with quality of work life among mental health staffs? Q 2: What is the level of satisfaction with each of constructs of quality of work life?
H 1: There is a significant relationship between personal factors (age, status, education level, work position, work
experience) and overall satisfaction with quality of work life. H 2. Satisfaction with adequate and fair compensation is positively related to overall satisfaction with quality of work
life. H 3. Satisfaction with safe and health working environment is positively related to overall satisfaction with quality of
work life. H 4. Satisfaction with opportunity to use and develop human capacities is positively related to overall satisfaction
with quality of work life. H 5. Satisfaction with future opportunity for continued growth and security is positively related to overall satisfaction
with quality of work life. H 6. Satisfaction with social integration in the work organization is positively related to overall satisfaction with quality
of work life. H 7. Satisfaction with constitutionalism in the work organization is positively related to overall satisfaction with quality
of work life. H 8. Satisfaction with work and total life space is positively related to overall satisfaction with quality of work life. H 9. Satisfaction with the social relevance of work life is positively related to overall satisfaction with quality of work
life.
3.2 Participants The subjects of this study are mental health professionals employed in psychiatric hospitals psychiatric hospitals, protected homes and community mental health centers in Albania located in four regions of the country, Tirana, Elbasan, Vlora and Shkodra. Despite the study aimed to include all employees, at the end 231 employees participated in study.
3.3 Instrument The study used quantitative research methods as well as qualitative ones. The necessary information is collected through measurement scale, natural observation and interviews. The methodology developed in this work was initially based on bibliographical review of research of the main factors and criteria in quality of work life considerate in literature. Quality of work life was assessed by using Walton`s scale, a five-point Likert-type scale ranging from “Strongly dissatisfied” (value of 1) to “Strongly satisfied” (value of 5). The entire scale involves 30 polar affirmations regarding quality of work life and is reliable enough (Cronbach`s Alpha α=0.9). Also the 8 subscales are reliable enough
Subscales Cronbach`s Alpha α 1. Adequate and fair compensation 0.849 2. Safe and health working environment 0.720 3. Opportunity to use and develop human capacities 0.735 4. Future opportunity for continued growth and security 0.748 5. Social integration in the work organization 0.695 6. Constitutionalism in the work organization 0.751 7. Work and total life space 0.712 8. Social relevance of work life 0.677 Entire Scale 0.900
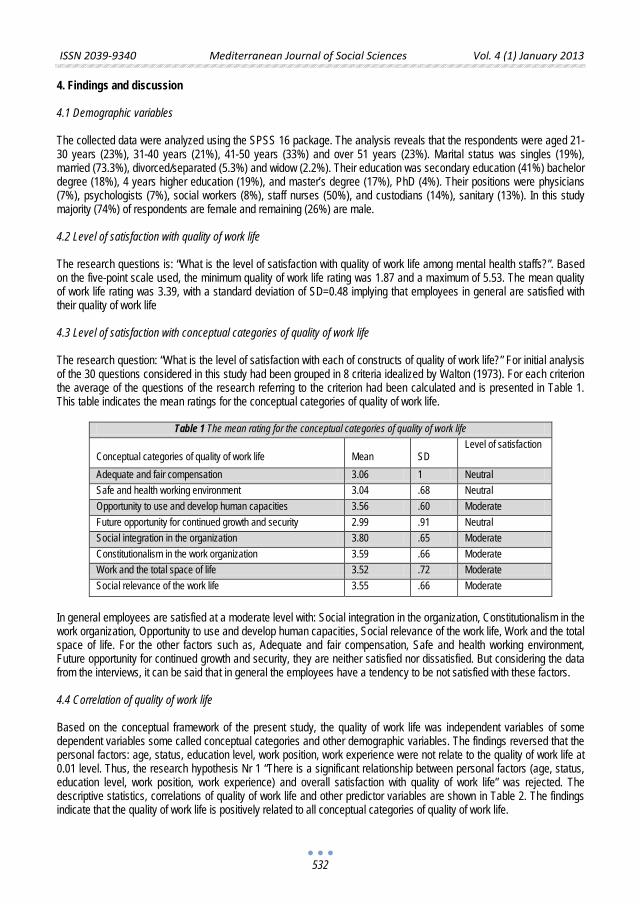
ISSN 2039-9340 Mediterranean Journal of Social Sciences Vol. 4 (1) January 2013
532
4. Findings and discussion
4.1 Demographic variables
The collected data were analyzed using the SPSS 16 package. The analysis reveals that the respondents were aged 21-30 years (23%), 31-40 years (21%), 41-50 years (33%) and over 51 years (23%). Marital status was singles (19%), married (73.3%), divorced/separated (5.3%) and widow (2.2%). Their education was secondary education (41%) bachelor degree (18%), 4 years higher education (19%), and master’s degree (17%), PhD (4%). Their positions were physicians (7%), psychologists (7%), social workers (8%), staff nurses (50%), and custodians (14%), sanitary (13%). In this study majority (74%) of respondents are female and remaining (26%) are male.
4.2 Level of satisfaction with quality of work life
The research questions is: “What is the level of satisfaction with quality of work life among mental health staffs?”. Based on the five-point scale used, the minimum quality of work life rating was 1.87 and a maximum of 5.53. The mean quality of work life rating was 3.39, with a standard deviation of SD=0.48 implying that employees in general are satisfied with their quality of work life
4.3 Level of satisfaction with conceptual categories of quality of work life
The research question: “What is the level of satisfaction with each of constructs of quality of work life?” For initial analysis of the 30 questions considered in this study had been grouped in 8 criteria idealized by Walton (1973). For each criterion the average of the questions of the research referring to the criterion had been calculated and is presented in Table 1. This table indicates the mean ratings for the conceptual categories of quality of work life.
Table 1 The mean rating for the conceptual categories of quality of work life
Conceptual categories of quality of work life
Mean
SD
Level of satisfaction
Adequate and fair compensation 3.06 1 Neutral Safe and health working environment 3.04 .68 Neutral Opportunity to use and develop human capacities 3.56 .60 Moderate Future opportunity for continued growth and security 2.99 .91 Neutral Social integration in the organization 3.80 .65 Moderate Constitutionalism in the work organization 3.59 .66 Moderate Work and the total space of life 3.52 .72 Moderate Social relevance of the work life 3.55 .66 Moderate
In general employees are satisfied at a moderate level with: Social integration in the organization, Constitutionalism in the work organization, Opportunity to use and develop human capacities, Social relevance of the work life, Work and the total space of life. For the other factors such as, Adequate and fair compensation, Safe and health working environment, Future opportunity for continued growth and security, they are neither satisfied nor dissatisfied. But considering the data from the interviews, it can be said that in general the employees have a tendency to be not satisfied with these factors.
4.4 Correlation of quality of work life
Based on the conceptual framework of the present study, the quality of work life was independent variables of some dependent variables some called conceptual categories and other demographic variables. The findings reversed that the personal factors: age, status, education level, work position, work experience were not relate to the quality of work life at 0.01 level. Thus, the research hypothesis Nr 1 “There is a significant relationship between personal factors (age, status, education level, work position, work experience) and overall satisfaction with quality of work life” was rejected. The descriptive statistics, correlations of quality of work life and other predictor variables are shown in Table 2. The findings indicate that the quality of work life is positively related to all conceptual categories of quality of work life.
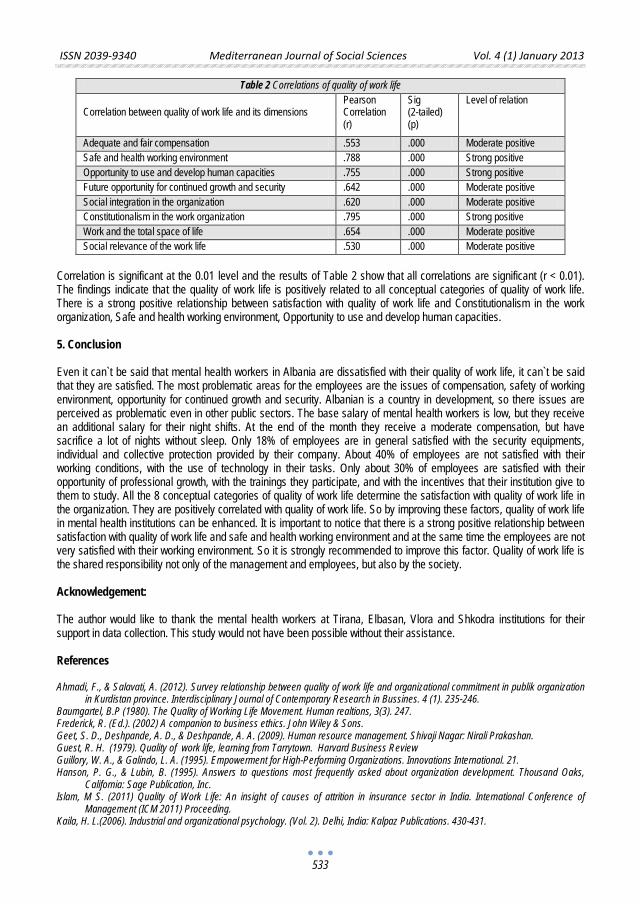
ISSN 2039-9340 Mediterranean Journal of Social Sciences Vol. 4 (1) January 2013
533
Table 2 Correlations of quality of work life Correlation between quality of work life and its dimensions
Pearson Correlation (r)
Sig (2-tailed) (p)
Level of relation
Adequate and fair compensation .553 .000 Moderate positive Safe and health working environment .788 .000 Strong positive Opportunity to use and develop human capacities .755 .000 Strong positive Future opportunity for continued growth and security .642 .000 Moderate positive Social integration in the organization .620 .000 Moderate positive Constitutionalism in the work organization .795 .000 Strong positive Work and the total space of life .654 .000 Moderate positive Social relevance of the work life .530 .000 Moderate positive
Correlation is significant at the 0.01 level and the results of Table 2 show that all correlations are significant (r < 0.01). The findings indicate that the quality of work life is positively related to all conceptual categories of quality of work life. There is a strong positive relationship between satisfaction with quality of work life and Constitutionalism in the work organization, Safe and health working environment, Opportunity to use and develop human capacities.
5. Conclusion
Even it can`t be said that mental health workers in Albania are dissatisfied with their quality of work life, it can`t be said that they are satisfied. The most problematic areas for the employees are the issues of compensation, safety of working environment, opportunity for continued growth and security. Albanian is a country in development, so there issues are perceived as problematic even in other public sectors. The base salary of mental health workers is low, but they receive an additional salary for their night shifts. At the end of the month they receive a moderate compensation, but have sacrifice a lot of nights without sleep. Only 18% of employees are in general satisfied with the security equipments, individual and collective protection provided by their company. About 40% of employees are not satisfied with their working conditions, with the use of technology in their tasks. Only about 30% of employees are satisfied with their opportunity of professional growth, with the trainings they participate, and with the incentives that their institution give to them to study. All the 8 conceptual categories of quality of work life determine the satisfaction with quality of work life in the organization. They are positively correlated with quality of work life. So by improving these factors, quality of work life in mental health institutions can be enhanced. It is important to notice that there is a strong positive relationship between satisfaction with quality of work life and safe and health working environment and at the same time the employees are not very satisfied with their working environment. So it is strongly recommended to improve this factor. Quality of work life is the shared responsibility not only of the management and employees, but also by the society.
Acknowledgement: The author would like to thank the mental health workers at Tirana, Elbasan, Vlora and Shkodra institutions for their support in data collection. This study would not have been possible without their assistance.
References Ahmadi, F., & Salavati, A. (2012). Survey relationship between quality of work life and organizational commitment in publik organization
in Kurdistan province. Interdisciplinary Journal of Contemporary Research in Bussines. 4 (1). 235-246. Baumgartel, B.P (1980). The Quality of Working Life Movement. Human realtions, 3(3). 247. Frederick, R. (Ed.). (2002) A companion to business ethics. John Wiley & Sons. Geet, S. D., Deshpande, A. D., & Deshpande, A. A. (2009). Human resource management. Shivaji Nagar: Nirali Prakashan. Guest, R. H. (1979). Quality of work life, learning from Tarrytown. Harvard Business Review Guillory, W. A., & Galindo, L. A. (1995). Empowerment for High-Performing Organizations. Innovations International. 21. Hanson, P. G., & Lubin, B. (1995). Answers to questions most frequently asked about organization development. Thousand Oaks,
California: Sage Publication, Inc. Islam, M S. (2011) Quality of Work Life: An insight of causes of attrition in insurance sector in India. International Conference of
Management (ICM 2011) Proceeding. Kaila, H. L.(2006). Industrial and organizational psychology. (Vol. 2). Delhi, India: Kalpaz Publications. 430-431.
ISSN 2039-9340 Mediterranean Journal of Social Sciences Vol. 4 (1) January 2013
534
Khosrowpour, M. (2001). Managing information technology in a global economy. USA: Idea Group Publishing (IGP). Lau, R.S., & May B.E. (1998). A win-win paradigm for quality of work life and business performance. Human Resource Development
Quarterly, 9 (3). 211-226. Lee, D., Singhapakid, A., & Sirgy, M. J. (2007). Further validation of need based quality of work-life (QWL) measure: Evidence from
marketing practitioners. Applied Research Quality of Life, 2 (4), 273-287. Mirvis, P.H & Lawler, E.E. (1984). Accounting for the quality of work life. Journal of Occupational Behavior. 5. Pizam, A (Ed.). (2010). International encyclopedia of hospitality management. (2nd ed.). Burlington, USA: Elsevier Ltd. Schalock, R. L., College, H. (Eds.). (1997) Quality of life: Application to persons with disabilities. (Vol. 2). Washington, DC: American
Association on Mental Retardation. Sirgy, M.J., Efraty, D., Siegel, P., & Lee, D.J. (2001). A new measure of quality of work life (QWL) based on need satisfaction and
spillover theories. Social Indicators Research. 55(3). 241-302. Steenkamp, R., & Schoor, A. (2008). The quest for quality of work life: A TQM approach. Juta Education. Stern, D. (1982). Managing human resource: The art of full employment. Boston, Massachusetts: Auburn House Publishing Company. Tayler, J. C (1978). An empirical examination of the dimensions of quality of ork life. Omega, 6 (2), 153-160. Wagner, III J, A., & Hollenbeck, J. R. (1995) Management of Organizational Behavior. Prentice Hall of Inc. Walton. R. E. (1973). Quality
of working life: What is it? Sloan Management Review, 15, 11-21. Weert, J. C. M. van., Dulmen, A. M. van., & Bensing, J. M. (2008) What factors affect caregiver communication in psychogeriatric care?
In: A.M. Visser. Alzheimer's disease: new research. New York: Nova Science Publishers, 2008. 87-117.
ISSN 2039-9340 Mediterranean Journal of Social Sciences Vol. 4 (1) January 2013
535
Impact of Age and Level of Experience on Occupational Stress of Academic Managers at Higher Educational Level
Dr. Azhar Mahmood
Department of Education, International Islamic University, Islamabad
Shazia Zamir, Qurat-ul-Ain, Saira Nudrat
Department of Education, National University of Modern Languages, Islamabad Email: [email protected]
Fatima Zahoor, Ph.D
Research Scholar Department of Education,
International Islamic University, Islamabad Doi:10.5901/mjss.2012.v4n1p535 Abstract
The present study was aimed to analyze the impact of age and management experience on occupational stress of academic managers in Higher Education Institutions of Pakistan. Qualitative and quantitative approaches have been used to explore the impact of age and management experience of occupational stress by using a sample of 120 academic managers of public sector institutions of higher education located in Punjab, Pakistan. In order to select representative sample from the population, simple random sampling technique was used .Data were collected through registered mail and personal visits to the offices of principals. Total sample size was 120.For data analysis; both descriptive and inferential statistics were used. Research instrument Occupational Stress Inventory–revised (OSI-R) was used to collect data. For data analysis Pearson Correlation and ANOVA were applied. Data analysis revealed that significant negative relationship was found in responses of academic managers regarding impact of age and management experience on occupational stress. Findings also suggest that there is a connection between age, management experience and the way stress is perceived.
Keywords: Occupational stress, age, management experience.
1. Introduction No society can flourish without significant and sustained higher education. Today, as the world becomes increasingly interconnected, higher education is considered critical for the achievement of economic progress, political stability and peace. Higher education forms an important part for the development of the country. Higher education makes student a trained asset for the country. Development of any country depends on the skills of a country's people. And that in turn requires a robust and effective higher education system .higher education plays an important role in the personality development of the students. Through higher education, students get to learn and polish their skills in terms of both oral and written communication. Higher education contributes in the country’s development in different ways. For attaining objectives of higher education, academic managers are of supreme importance and manager’s job is highly orchestrated. Academic Manager has to deal with number of areas at the same time, so patience, vision, crises management ability and accomplished of task are almost unavoidable traits. Success of any process directly co-relates to its management. Management effectiveness could be due to the personality of the manager. The role of an academic manager and his array of responsibilities are of great importance. Much is expected of him in connection with the successful accomplishments of management, process and a system. Academic Manager can take best decision, if they are psychologically healthy and strong. In such a complex scenario, management may seriously be affected by the occupational stress.
Occupational stress is a term used to define ongoing stress that is related to the workplace. Stress is defined in terms of its physical and physiological effects on a person, and can be a mental, physical or emotional strain. It can also
ISSN 2039-9340 Mediterranean Journal of Social Sciences Vol. 4 (1) January 2013
536
be a tension or a situation or factor that can cause stress. Occupational stress occurs when there is a discrepancy between the demands of the environment/workplace and an individual’s ability to carry out and complete these demands. Occupational stress can eventually affect both physical and emotional well being if not managed effectively. The literature concerning occupational stress in educational settings has typically focused on teachers, but not other academic management staff. The present research tends to explore the impact of age and level of experience on occupational stress in academic managers in public sector higher education institutions in Pakistan. 2. Literature Review Stress at work is an increasingly common feature of modern life and it has become one of the important parts of our daily lives which cause a great deal of stress. Due to the competitive nature of the job environment most of the people in the world are spending their time for job related work purposes resulting ignore the stressor those are influencing their work and life. Modern life is full of stress. Stress is basically a word derived from a Latin word “stringer” meaning to draw tight. The word stress is defined by the Oxford Dictionary as a “state of affair involving demand on physical or mental energy.” According to American Heritage Dictionary, stress is a state of extreme difficulty, pressure, or strain.
(Selye, 1975) an early authority on this subject, said that stress constitutes the factors affecting wear and tear on the body. The bodily strain that an individual experiences as a result of coping with some environmental factor is stress. (Lazarus & Folkman ,1986) defined stress as a particular interaction between the person and the environment, appraised or evaluated by the person as being taxing or exceeding his or her personal resources, and, as a consequence, disrupting his or her daily routines. Occupational stress often occurs when individuals’ physical and emotional do not match or cannot handle their job demands, constraints and/or opportunities (Leka et al., 2004; Ugoji & Isele, 2009) may establish two major types of stress: eustress (good stress) and distress (bad stress) (Fevre et al., 2003). Eustress is often defined as individuals who have experienced moderate and low stress levels and distress is frequently defined as individuals who have experienced high stress level. Individuals who experience eustress will be able to meet job demands and this may help them to increase positive work life (e.g., satisfaction and positive moral values). Conversely, individuals who experience distress will not able to fulfill job demands and this may motivate them to decrease quality of work life (e.g., dissatisfaction and negative moral values) (Fevre et al., 2003; Leka et al., 2004).
Occupational stress, in particular, is the inability to deal with the demands in a job (Rees, 1997), because of a poor fit between someone’s abilities and his/her work requirements and conditions (Holmlund, Rytkönen & Strandvik, 2005). It is a mental and physical condition which affects an individual’s productivity, effectiveness, personal health and quality of work (Comish & Swindle, 1994). Occupational stress is an extremely difficult construct to define. Obviously, it is stress on the job, but stress on the job occurs in a person. For now several sources of occupational stress exist. Some of these stressors are intrinsic to the job. Some are related to the employee’s role with the organization, some to career development, some to relationship at work, and some to the structure and climate of the organization.
In 1992 the United Nations (Akinboye, et al, 2002) describes “job stress” as the twentieth century disease. In the words of (Akinboye et al, 2002) over 70% of employees world-wide describe their jobs as stressful with more than one in five reporting high levels of stress at work on a daily basis. In further corroboration of this scenario, (Winfield,2000) indicated that the prevalence of occupational stress among academic and general staff of higher education institutions from across the globe is alarmingly widespread and increasing.
Stress is an unavoidable characteristic of life and work. It is a generalized non-specific response of the body to any demand made on it. Occupational stress describes physical, mental and emotional wear and tear brought about by incongruence between the requirement of the job and the capabilities, resources and needs of the employee to cope with job demands (Akinboye et al, 2002).
Occupational stress has been described as the experience of negative feelings, such as frustration, worry and anxiety, perceived to arise from work related factors (Kyriacou, 2001). The literature suggests four variables that may have significant interactions with occupational stress: gender, age, experience in the job and position (Antoniou, et al, 2006; Lau, Yuen & Chan, 2005).Demographic variables that are proven to relate to someone’s job stressor relationships include gender, age, marital status, job tenure, job title, and hierarchical level (Dua, 1994; Murphy, 1995),Concerning the relationship between age and occupational stress, the ability to handle stress associated with job and organization was found to increase with age and experience (Sager, 1990). Age can be explained in the terms that the individuals matured personality disposition related to the attainment of developmental tasks specific to each developmental tasks specific to; each developmental phase and its influence on individual’s perception of the situations as stressful or otherwise.
Researches revealed that younger staff members reported more job stress than older staff and staff between the ages 31 and 40 suffered the most from job stress (Sharpley, et al, 1996), employees who are less than 30 years old experience the highest levels of stress (Ben-Bakr, et al, 1995), and that younger teachers experienced higher levels of
ISSN 2039-9340 Mediterranean Journal of Social Sciences Vol. 4 (1) January 2013
537
burnout, specifically in terms of emotional exhaustion and disengagement from the profession (Antoniou, et al, 2006). The major explanation for such a finding is that older employees have often reached a stage where career development is not their major concern, and hence a number of job characteristics which may cause stress to younger staff, who have their career ahead of them, do not cause stress to older staff (Dua, 1994). Several researchers reported that in industrial setting job satisfaction and job involvement increases with age and as a result occupational stress would decreases (Cherrington, 1979) in view of dearth of conclusive studies about whether the same this is true with the teachers at different age levels in India, the present study was conducted. (Nina & Ana, 2007) Study revealed that older people perceive significantly higher levels of stress.
Levels of occupational stress experienced by staff members in similar work environments can vary from one individual to another. Demographic factors may play a role in the level of occupational stress felt by teachers and other staff (Kyriacou, 2001). Four variables have been suggested in literature that may have significant interactions with occupational stress: gender, age, position and experience in the job (Laughlin, 1984; McCormick, 1997; Punch & Tuetteman, 1996). (John & John, 2007) reported that age is a significant predictor of occupational stress, younger staff members reported higher levels than older colleagues. The differences were particularly strong between the youngest and the oldest staff members. These results appear to support the findings of some studies (Lau et al, 2005) found relationship between age and occupational stress. Demographic variables that are proven to relate to someone’s job stressor/health relationships include gender, age, marital status, job tenure, job title, and hierarchical level (Murphy, 1995), among which gender, age and hierarchical level were found to be the most significant. Some studies have found that teachers with low levels of experience reported greater stress than their more experienced colleagues (Laughlin, 1984; Manthei & Gilmore, 1996). While (Clunies-Ross et al; 2008) found that experience has no relationship with occupational stress. (McCormick, 1997) noted that stress increased with experience among school teachers. (Borg and Falzon, 1991) identified differing rank orders of the strengths of a set of stressors for each years-of-experience category. However, a number of studies suggest that experience has no relationship with occupational stress (Chaplain, 1995; Jepson & Forrest, 2006).
A complex relationship appears to exist between occupational stress and age. (Laughlin, 1984) reported significant differences in stress among age groups, but these differed according to the stressors. For example, the youngest group of teachers (aged under 26 years) reported greater stress from pupil behavior issues than older colleagues, while teachers aged between 26 and 30 years reported higher stress from professional recognition needs than their younger and older colleagues. In the same study the oldest group of teachers (aged over 40 years) reported higher levels of stress from curriculum demands than their younger colleagues. (Solman & Feld, 1989) reported similar findings with regard to pupil behavior and curriculum demands from a later study of Australian Catholic schools. (Lau et al, 2005) reported higher levels of occupational stress among younger teachers. Younger and relatively new in the profession teachers present higher levels of stress and Stress levels may differ in relation to age .It is documented that younger people present higher levels of emotional exhaustion as compared to their older colleagues(Byrne,1991). (Balakrishnamurthy and Swetha, 2009) study strongly indicates the relationship between stress and demographic variables such as age and level of experience. As adults, stress is a daily event, but children are not exempt from its impact and subsequent consequences. Symptoms of stress are especially apparent in teenagers (Bittman, 1999). Chandraiah, et al, (2003) study reveals higher levels of job stress among managers of (25-35 years) age than their counterparts in the middle age (36-45 years) and the old age groups(46-55 years). The study also found that the age found to be negatively correlated with occupational stress. Andrew Smith, et al (2000) study indicated that the middle aged workers (30-50 year olds) had slightly higher proportions in the high reported stress category than those at the extremes of the age range.There is no age at which we are exempt from stress. Most of us are well aware that as a person chronologically ages, there are more responsibilities and situational stressors that become part of our lives which subsequently can bring about consequences affecting our well being. Age and level of experience were the biographical variables identified as being related to occupational stress of academic managers in the sample. This study sought to determine whether there is a significant relationship between the stress levels exhibited by an individual having specific chronological age and management experience. There is a lack of consistency of findings with regard to biographical variables and stress. There exists, therefore, a need to investigate how biographical differences are related to occupational stress of academic managers at higher education level. 3. Methodology Descriptive research was involved to collecting data to testing the hypothesis of this study. Survey type study was applied to explore the impact of age and management experience on the level of occupational stress among academic managers at higher educational level. All the Public sector degree colleges of Punjab were taken as population of the present study.
ISSN 2039-9340 Mediterranean Journal of Social Sciences Vol. 4 (1) January 2013
538
There were 295 public sector degree colleges in Punjab. Male degree colleges were 132, female degree colleges were 163. In order to select representative sample from the population, random sampling technique was used.60 male and 60 female heads of degree colleges were selected as a sample. The sample size was 120 heads of degree colleges. For measuring the stress of the subjects in work place, the Occupational Stress Inventory–Revised (OSI-R) developed by Osipow, 1998 was used. For examining the reliability, an analysis of internal consistency of items was made. For this purpose, Cronbach’s alpha was used. Reliability of occupational stress inventory was .91 which indicated that instrument was reliable. Data were collected from sampled degree colleges through personal visits of the researcher. After data collection, whole data were transferred to the computer and with the help of SPSS, data were analyzed with appropriate statistical technique such as mean; standard deviation, ANOVA, and Pearson correlation. On the basis of data interpretation, analysis and findings were drawn and conclusions were made. Biographical data were also collected. Respondents were required to indicate their age (30-40, 41-50, 51>) and years of experience in the current role (0-5, 6-10, 11-15, 16-20 and 21>). 4. Discussion This study aimed to investigate what relationships biographical variables had with occupational stress. This study will leave a new dimension to the whole education system. Results of the study will help the top management of higher education institutions to establish appropriate environment to reducing the occupational stress that can enhance the level of performance among academic managers. Two variables; age and management experience were investigated. Both variables were shown to have associations with occupational stress. Table 1 shows the fragments of ages of the academic managers. The academic managers were categorized into three major age groups, namely, 30-40years, 41-50 years, and 51>years. This table shows stress levels of academic managers classified in terms of three major occupational experience categories. Comparison of all the three groups of stress level, showed the calculated F value (17.744) significant at 0.01 level which shows significant differences exist between the academic managers stress levels and their age. Among the above, the age group between 30-40 years had noticeably higher amount of stress than their counterparts, the mean stress score of the group with age of 41 to 50 years revealed low levels of stress when compared with all the other experience groups. While the mean stress score of the group with age of 51> years indicated high levels of stress when compared with age group of 41 to 50 years. This means younger and older academic managers experience more stress than middle one. This study is supported by the study of (Ramsey, 2000), which found that younger staff members reported more occupational stress than older colleagues. (Madya, Shahrin ,Tee 2006)study indicated that there was no significant correlation between stress levels and demographic factors, such as age and length of teaching experience in technical teachers. While this study is consistent with study of (Kyriacou & Sutcliffe 1978) which concluded that age and length of teaching experience are associated with stress level.
Result of Table 2 shows the fragments of management experience of the academic managers. The management experience of academic managers were categorized into five major experiences groups, namely, 0-5 years, 6-10 years, 11-15 years, 16-20 years and 21>years. Result of this study classifies stress levels of academic managers into five major occupational experience categories. Comparison of all the three groups of stress level, showed the calculated F value (9.356) significant at 0.01 level which indicates significant differences exist between academic managers’ stress levels and their management experiences. Among the above, the experience group between 0-5 years had distinctly higher amount of stress than their counterparts, the mean stress score of the group with experience of 11 to 15 years revealed low levels of stress when compared with all the other experience groups. This means more experienced people had learnt certain stress-coping tactics in the course of their experience, thereby enabling them to effectively deal with the stress triggered due to their personal and professional commitments. This trend was inverted in the less experienced groups. Possibly, in their long job tenure, they learned how to master the particulars of work and thereby feel work as relatively less exhausting than younger managers. The middle aged is more satisfied than the other two younger groups. The middle age group seems to be more satisfied, when compared to the other groups. It is also reported that the younger age managers (30-40yrs) experiencing significantly higher stress than the middle aged and older managers Table 3 shows mean scores, standard deviation, and Pearson correlation of academic managers. The calculated Pearson correlation (-.330**) is significant at 0.05 level of significance. This shows that there is a significant negative relationship between academic managers’ age and occupational stress. This means the age of respondents is associated with their stress levels. Older academic managers are not having higher stress levels than their younger colleagues. Where age was a significant predictor of occupational stress, younger staff members reported higher levels than older colleagues. The differences were particularly strong between the youngest and the oldest staff members. The result of this study appears to support the findings of study (Lau et al, 2005) but is incongruent with study of (Nina & Ana, 2007).
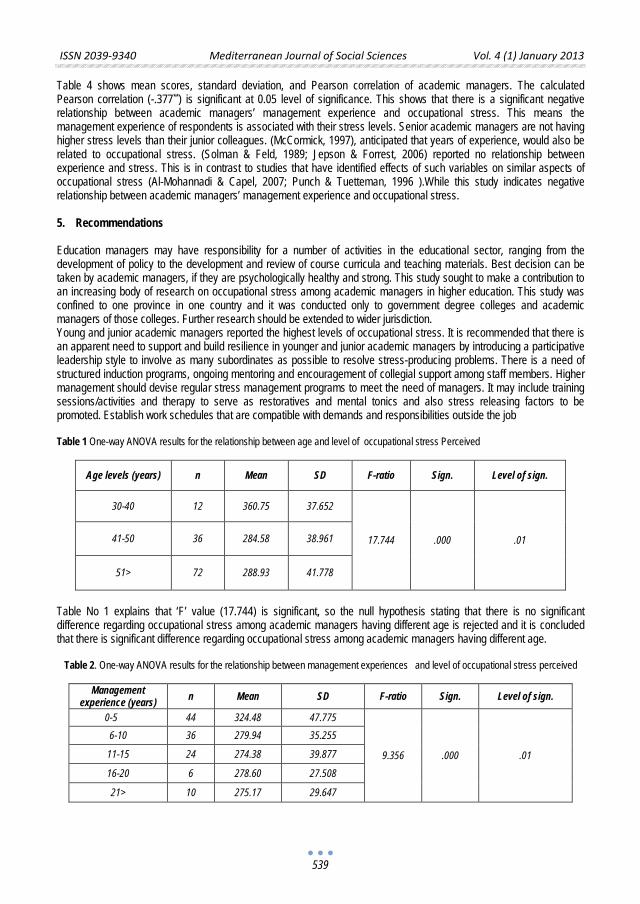
ISSN 2039-9340 Mediterranean Journal of Social Sciences Vol. 4 (1) January 2013
539
Table 4 shows mean scores, standard deviation, and Pearson correlation of academic managers. The calculated Pearson correlation (-.377**) is significant at 0.05 level of significance. This shows that there is a significant negative relationship between academic managers’ management experience and occupational stress. This means the management experience of respondents is associated with their stress levels. Senior academic managers are not having higher stress levels than their junior colleagues. (McCormick, 1997), anticipated that years of experience, would also be related to occupational stress. (Solman & Feld, 1989; Jepson & Forrest, 2006) reported no relationship between experience and stress. This is in contrast to studies that have identified effects of such variables on similar aspects of occupational stress (Al-Mohannadi & Capel, 2007; Punch & Tuetteman, 1996 ).While this study indicates negative relationship between academic managers’ management experience and occupational stress. 5. Recommendations Education managers may have responsibility for a number of activities in the educational sector, ranging from the development of policy to the development and review of course curricula and teaching materials. Best decision can be taken by academic managers, if they are psychologically healthy and strong. This study sought to make a contribution to an increasing body of research on occupational stress among academic managers in higher education. This study was confined to one province in one country and it was conducted only to government degree colleges and academic managers of those colleges. Further research should be extended to wider jurisdiction. Young and junior academic managers reported the highest levels of occupational stress. It is recommended that there is an apparent need to support and build resilience in younger and junior academic managers by introducing a participative leadership style to involve as many subordinates as possible to resolve stress-producing problems. There is a need of structured induction programs, ongoing mentoring and encouragement of collegial support among staff members. Higher management should devise regular stress management programs to meet the need of managers. It may include training sessions/activities and therapy to serve as restoratives and mental tonics and also stress releasing factors to be promoted. Establish work schedules that are compatible with demands and responsibilities outside the job Table 1 One-way ANOVA results for the relationship between age and level of occupational stress Perceived
Age levels (years) n Mean SD F-ratio Sign. Level of sign.
30-40 12 360.75 37.652
17.744 .000 .01 41-50 36 284.58 38.961
51> 72 288.93 41.778
Table No 1 explains that ‘F’ value (17.744) is significant, so the null hypothesis stating that there is no significant difference regarding occupational stress among academic managers having different age is rejected and it is concluded that there is significant difference regarding occupational stress among academic managers having different age.
Table 2. One-way ANOVA results for the relationship between management experiences and level of occupational stress perceived
Management experience (years) n Mean SD F-ratio Sign. Level of sign.
0-5 44 324.48 47.775
9.356 .000 .01
6-10 36 279.94 35.255
11-15 24 274.38 39.877
16-20 6 278.60 27.508
21> 10 275.17 29.647
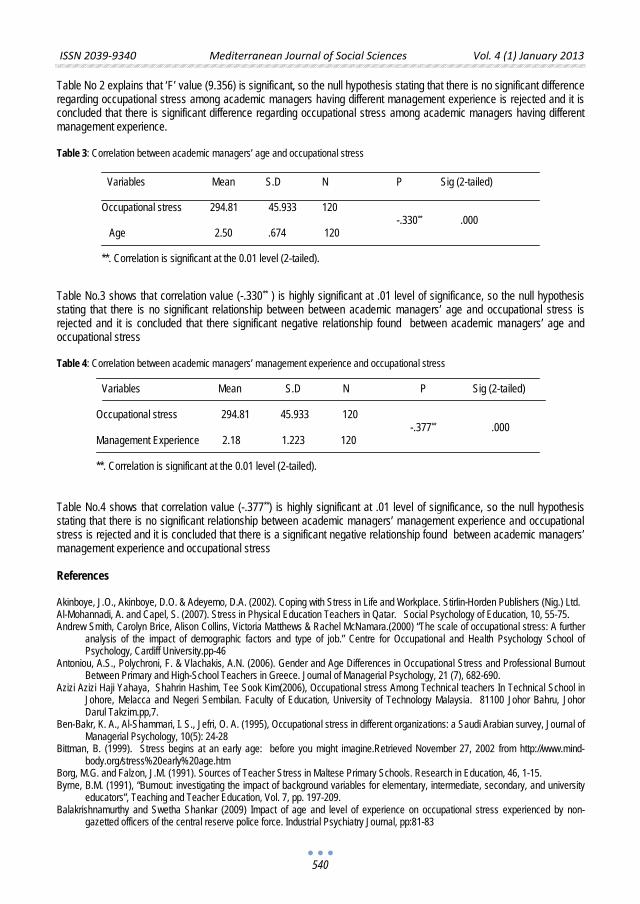
ISSN 2039-9340 Mediterranean Journal of Social Sciences Vol. 4 (1) January 2013
540
Table No 2 explains that ‘F’ value (9.356) is significant, so the null hypothesis stating that there is no significant difference regarding occupational stress among academic managers having different management experience is rejected and it is concluded that there is significant difference regarding occupational stress among academic managers having different management experience.
Table 3: Correlation between academic managers’ age and occupational stress
Table No.3 shows that correlation value (-.330** ) is highly significant at .01 level of significance, so the null hypothesis stating that there is no significant relationship between between academic managers’ age and occupational stress is rejected and it is concluded that there significant negative relationship found between academic managers’ age and occupational stress Table 4: Correlation between academic managers’ management experience and occupational stress
Table No.4 shows that correlation value (-.377**) is highly significant at .01 level of significance, so the null hypothesis stating that there is no significant relationship between academic managers’ management experience and occupational stress is rejected and it is concluded that there is a significant negative relationship found between academic managers’ management experience and occupational stress References Akinboye, J.O., Akinboye, D.O. & Adeyemo, D.A. (2002). Coping with Stress in Life and Workplace. Stirlin-Horden Publishers (Nig.) Ltd. Al-Mohannadi, A. and Capel, S. (2007). Stress in Physical Education Teachers in Qatar. Social Psychology of Education, 10, 55-75. Andrew Smith, Carolyn Brice, Alison Collins, Victoria Matthews & Rachel McNamara.(2000) “The scale of occupational stress: A further
analysis of the impact of demographic factors and type of job.” Centre for Occupational and Health Psychology School of Psychology, Cardiff University.pp-46
Antoniou, A.S., Polychroni, F. & Vlachakis, A.N. (2006). Gender and Age Differences in Occupational Stress and Professional Burnout Between Primary and High-School Teachers in Greece. Journal of Managerial Psychology, 21 (7), 682-690.
Azizi Azizi Haji Yahaya, Shahrin Hashim, Tee Sook Kim(2006), Occupational stress Among Technical teachers In Technical School in Johore, Melacca and Negeri Sembilan. Faculty of Education, University of Technology Malaysia. 81100 Johor Bahru, Johor Darul Takzim.pp,7.
Ben-Bakr, K. A., Al-Shammari, I. S., Jefri, O. A. (1995), Occupational stress in different organizations: a Saudi Arabian survey, Journal of Managerial Psychology, 10(5): 24-28
Bittman, B. (1999). Stress begins at an early age: before you might imagine.Retrieved November 27, 2002 from http://www.mind-body.org/stress%20early%20age.htm
Borg, M.G. and Falzon, J.M. (1991). Sources of Teacher Stress in Maltese Primary Schools. Research in Education, 46, 1-15. Byrne, B.M. (1991), “Burnout: investigating the impact of background variables for elementary, intermediate, secondary, and university
educators”, Teaching and Teacher Education, Vol. 7, pp. 197-209. Balakrishnamurthy and Swetha Shankar (2009) Impact of age and level of experience on occupational stress experienced by non-
gazetted officers of the central reserve police force. Industrial Psychiatry Journal, pp:81-83
Variables Mean S.D N P Sig (2-tailed) Occupational stress 294.81 45.933 120 -.330** .000 Age 2.50 .674 120 **. Correlation is significant at the 0.01 level (2-tailed).
Variables Mean S.D N P Sig (2-tailed) Occupational stress 294.81 45.933 120 -.377** .000 Management Experience 2.18 1.223 120 **. Correlation is significant at the 0.01 level (2-tailed).
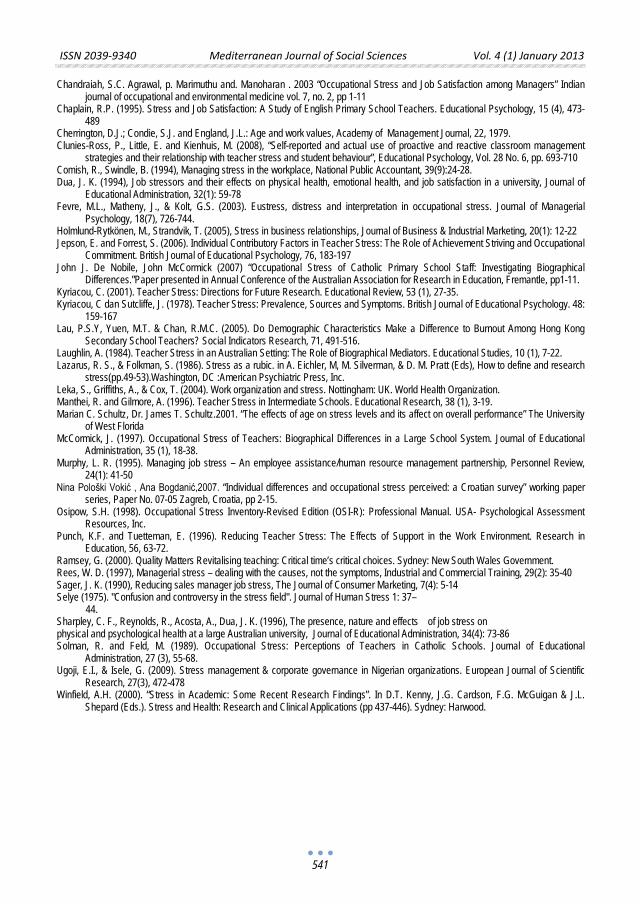
ISSN 2039-9340 Mediterranean Journal of Social Sciences Vol. 4 (1) January 2013
541
Chandraiah, S.C. Agrawal, p. Marimuthu and. Manoharan . 2003 “Occupational Stress and Job Satisfaction among Managers” Indian journal of occupational and environmental medicine vol. 7, no. 2, pp 1-11
Chaplain, R.P. (1995). Stress and Job Satisfaction: A Study of English Primary School Teachers. Educational Psychology, 15 (4), 473-489
Cherrington, D.J.; Condie, S.J. and England, J.L.: Age and work values, Academy of Management Journal, 22, 1979. Clunies-Ross, P., Little, E. and Kienhuis, M. (2008), “Self-reported and actual use of proactive and reactive classroom management
strategies and their relationship with teacher stress and student behaviour”, Educational Psychology, Vol. 28 No. 6, pp. 693-710 Comish, R., Swindle, B. (1994), Managing stress in the workplace, National Public Accountant, 39(9):24-28. Dua, J. K. (1994), Job stressors and their effects on physical health, emotional health, and job satisfaction in a university, Journal of
Educational Administration, 32(1): 59-78 Fevre, M.L., Matheny, J., & Kolt, G.S. (2003). Eustress, distress and interpretation in occupational stress. Journal of Managerial
Psychology, 18(7), 726-744. Holmlund-Rytkönen, M., Strandvik, T. (2005), Stress in business relationships, Journal of Business & Industrial Marketing, 20(1): 12-22 Jepson, E. and Forrest, S. (2006). Individual Contributory Factors in Teacher Stress: The Role of Achievement Striving and Occupational
Commitment. British Journal of Educational Psychology, 76, 183-197 John J. De Nobile, John McCormick (2007) “Occupational Stress of Catholic Primary School Staff: Investigating Biographical
Differences.”Paper presented in Annual Conference of the Australian Association for Research in Education, Fremantle, pp1-11. Kyriacou, C. (2001). Teacher Stress: Directions for Future Research. Educational Review, 53 (1), 27-35. Kyriacou, C dan Sutcliffe, J. (1978). Teacher Stress: Prevalence, Sources and Symptoms. British Journal of Educational Psychology. 48:
159-167 Lau, P.S.Y, Yuen, M.T. & Chan, R.M.C. (2005). Do Demographic Characteristics Make a Difference to Burnout Among Hong Kong
Secondary School Teachers? Social Indicators Research, 71, 491-516. Laughlin, A. (1984). Teacher Stress in an Australian Setting: The Role of Biographical Mediators. Educational Studies, 10 (1), 7-22. Lazarus, R. S., & Folkman, S. (1986). Stress as a rubic. in A. Eichler, M, M. Silverman, & D. M. Pratt (Eds), How to define and research
stress(pp.49-53).Washington, DC :American Psychiatric Press, Inc. Leka, S., Griffiths, A., & Cox, T. (2004). Work organization and stress. Nottingham: UK. World Health Organization. Manthei, R. and Gilmore, A. (1996). Teacher Stress in Intermediate Schools. Educational Research, 38 (1), 3-19. Marian C. Schultz, Dr. James T. Schultz.2001. “The effects of age on stress levels and its affect on overall performance” The University
of West Florida McCormick, J. (1997). Occupational Stress of Teachers: Biographical Differences in a Large School System. Journal of Educational
Administration, 35 (1), 18-38. Murphy, L. R. (1995). Managing job stress – An employee assistance/human resource management partnership, Personnel Review,
24(1): 41-50 Nina Pološki Vokić , Ana Bogdanić,2007. “Individual differences and occupational stress perceived: a Croatian survey” working paper
series, Paper No. 07-05 Zagreb, Croatia, pp 2-15. Osipow, S.H. (1998). Occupational Stress Inventory-Revised Edition (OSI-R): Professional Manual. USA- Psychological Assessment
Resources, Inc. Punch, K.F. and Tuetteman, E. (1996). Reducing Teacher Stress: The Effects of Support in the Work Environment. Research in
Education, 56, 63-72. Ramsey, G. (2000). Quality Matters Revitalising teaching: Critical time’s critical choices. Sydney: New South Wales Government. Rees, W. D. (1997), Managerial stress – dealing with the causes, not the symptoms, Industrial and Commercial Training, 29(2): 35-40 Sager, J. K. (1990), Reducing sales manager job stress, The Journal of Consumer Marketing, 7(4): 5-14 Selye (1975). "Confusion and controversy in the stress field". Journal of Human Stress 1: 37– 44. Sharpley, C. F., Reynolds, R., Acosta, A., Dua, J. K. (1996), The presence, nature and effects of job stress on physical and psychological health at a large Australian university, Journal of Educational Administration, 34(4): 73-86 Solman, R. and Feld, M. (1989). Occupational Stress: Perceptions of Teachers in Catholic Schools. Journal of Educational
Administration, 27 (3), 55-68. Ugoji, E.I., & Isele, G. (2009). Stress management & corporate governance in Nigerian organizations. European Journal of Scientific
Research, 27(3), 472-478 Winfield, A.H. (2000). “Stress in Academic: Some Recent Research Findings”. In D.T. Kenny, J.G. Cardson, F.G. McGuigan & J.L.
Shepard (Eds.). Stress and Health: Research and Clinical Applications (pp 437-446). Sydney: Harwood.

ISSN 2039-9340 Mediterranean Journal of Social Sciences Vol. 4 (1) January 2013
543
Gender Differences in Participation and Achievement in Science:
Implications and Intervention Strategies for Scientific and Technological Development in the Caribbean
Babalola J. Ogunkola PhD
The University of the West Indies, Faculty of Humanities and Education
School of Education, Cave Hill Campus, Barbados. E-mail: [email protected]
Leah Garner – O’Neale PhD
The University of the West Indies, Faculty of Science and Technology,
Cave Hill Campus, Barbados. E-mail: [email protected]
Doi:10.5901/mjss.2013.v4n1p543 Abstract
Gender differences in science have received serious attention in science education research for the last two decades. Boys and girls have been compared on various variables such as achievement, attitude, motivation, interest, and performance behaviors. Moreover, the differences have been linked with unequal representation of men and women in science and technology – related careers indicating levels of contributions of men and women to national development. Therefore, this paper contends that it is difficult to address the issue of national development particularly in science and technology without recourse to the gender factor. Specifically, the 1995 Commonwealth Plan of Action on gender and development, indicates that “the Commonwealth shall work towards a world in which women and men have equal rights and opportunities in all stages of their lives to express their creativity in all fields of human endeavour and in which women are respected and valued as equal and able partners in establishing values of social justice”. This paper poses and answers these questions: (a) What is the pattern of gender differences in science achievement internationally and in the Caribbean? (b) What are the possible explanations for gender differences in science achievement internationally and in the Caribbean? (c) What are the effects of gender differentials in science on national development? (d) What are the possible intervention strategies towards gender balance in science achievement? This paper presents answers to these questions using reports of meta-analysis of science education research and goes ahead to offer suggestions for action as to how gender gaps can be bridged in the Caribbean in order to ensure contributions of both men and women to regional scientific and technological development.
Key words: Gender, science achievement, science participation, scientific development, technological development
1. Introduction As science and technology is becoming increasingly important in all nations of the world, so is participation and achievement in science and technology education. However, the role of gender in science and technology education has been and is being hotly contested. Some advocate single-sex schooling as a way to let girls’ talents blossom, freed from boys’ domination in the classroom and from sexual harassment by boys. Others emphasize gender differences in learning styles, citing evidence that girls perform best under cooperative learning conditions and boys perform best in competitive learning environments. According to Hyde and Linn (2006), these arguments rest on the assumption that psychological gender differences are large and exist in numerous domains. Also, boys and girls have been compared on various variables such as achievement, attitude, motivation, interest, and performance behaviors (Greenfield, 1997; Jovanovich & King, 1998) and the differences have been indicted to be responsible for unequal representation of men and women in science and technology – related careers and ultimately indicative of varying levels of contributions of men and women to national development. For instance, in a set of collected data in the United States of America in 2005, women earn 46% and men earn 54% of the PhDs in biology but women earn 25% and men earn 75% of the PhDs respectively in physical science. In engineering women earn 15% while men earn 85%. Also, 30% of the assistant professors in biology are women, 16% of the assistant professors in physical science are women and 17% of the assistant professors in engineering are women.
ISSN 2039-9340 Mediterranean Journal of Social Sciences Vol. 4 (1) January 2013
544
The Canadian Council on Learning (CCL) (2007) revealed that the dearth of women in scientific fields of study is reflected by a similar under-representation of women in science and engineering occupations. Over the past three decades, women in Canada have joined the labour force in ever-increasing numbers: as of 2006, women accounted for 47% of all workers in Canada. Over the same period, women have accounted for a steadily increasing proportion of workers in health care and social assistance and educational services, but the relative proportion of women in professional, scientific and technical services has declined compared to the overall proportion of women in the labour force. In the United States of America, the Committee on maximizing the potential of women in academic science and engineering, National Academy of Sciences, National Academy of Engineering, and Institute of Medicine reported that twenty-five years ago, Congress passed the Science and Engineering Equal Opportunity Act, which declares that “it is the policy of the United States that men and women have equal opportunity in education, training, and employment in scientific and technical fields. The committee reported further that major advances have occurred since then in the numbers of women enrolling in science and engineering classes in high school and college. In Europe, the European Commission (2009) reported that the overall situation of women and men in the European Union. Described below is a summary of their findings:
• The employment rate of women increases but remains lower than men’s, although women represent a majority of students and university graduates.
• Women continue to earn an average of 17.4% less than men for every hour worked and this figure remains stable.
• Women are still very under-represented in economic and political decision-making positions, although their share has increased over the last decade.
• The division of family responsibilities is still very unequal between women and men. • The risk of poverty is higher for women than for men. • Women are the main victims of gender-based violence and women and girls are more vulnerable to trafficking
of human beings. Generally, women remain sharply under-represented in some fields of study, particularly mathematics, physical sciences, engineering and applied sciences. CCL (2007) reported that this is true at all levels of post-secondary education, including college, undergraduate and graduate levels of study but in contrast, women are over-represented in other fields of study including education and health sciences. Needless to say then, that the dearth of women in scientific fields of study is reflected by a similar under-representation of women in science and engineering occupations. In Canada, CCL (2007) also reiterated that the under-representation of women in science and engineering contributes to a gender-based wage gap and that in recent years real wages have declined in female-dominated disciplines such as health and education while real wages have increased in male-dominated disciplines such as engineering, mathematics, computer science and physical sciences. Supporting this by an example, CCL reveals that the occupations commonly held by young women with university degrees are elementary and kindergarten teaching and that between 1995 and 2000, average earnings for women in these occupations increased by less than 1%. In contrast, earnings by young men in computer and information systems which are the most commonly held occupations among university-educated men increased by 15%. This wage gap is supported by Kimmel (2000) who recognized that once females entered a particular work force it is appears less demanding and requires a lower level of skills and hence the pay decreases. In the Caribbean, Martin-DeLeon (2010) asserts that some conclusions can be gleaned from available data:
• Despite the preponderance of female students entering tertiary institutions, females have a disproportionately low representation in the pure and applied sciences and engineering, unlike the social sciences.
• Females who enter Pure and Applied Sciences and Engineering at the Bachelor’s level compete favourably for postgraduate positions and graduates in proportions equal to, or higher than, those for males, This suggests that the females who enter these fields perform as well as or better than males. This is also supported by Kimmel (2000) who purports that only women or girls who are secure and most able undertake the task of courses such as physical sciences, therefore, those that do although they are few tend to achieve high grades.
• As academic professionals, females appear to be under-represented in the Pure and Applied Sciences, despite their success in completing postgraduate programs.
• Since male students enter the Caribbean institutions in lower proportions than females but females are under-represented in Pure and Applied Sciences and Engineering, both pursue scientific careers in lower proportions than they are represented in the population.
ISSN 2039-9340 Mediterranean Journal of Social Sciences Vol. 4 (1) January 2013
545
• It is noticeable that the Caribbean is not unique with respect to under-representation of females in Pure and Applied Sciences and in the preponderance of females in the Health or Medical Sciences as well as Healthcare providers in the workforce.
Globally, UNESCO (2010) revealed that: • 29% of the world’s researchers are women, but regional disparities occur, for example 46% in Latin America
and the Caribbean, compared to 15% in Asia • There is no gender parity in primary and secondary education in 60% of countries. • Horizontal gender segregation occurs within sciences at PhD and research levels. • In 91% of countries, men out-number women in science and engineering courses
These findings are most likely responsible for the clear statement in one of the UNESCO’s global priorities called the UNESCO’s Medium Term strategy for 2008 – 2013; 34 C/4 that priority will be given to the pursuit of gender equality through action in all of UNESCO’s fields of competence.
The background provided so far brings to focus reasons for the recent rising global consciousness both at the grassroots and policy levels regarding the impact of gender issues in education and national development. According to Aguele and Agwagah (2007), there is also the growing consciousness that women constitute more than half of the world’s population. Thus, this paper contends that it is difficult to discuss the issue of national development, particularly in science and technology without recourse to the gender factor. In other words, we cannot afford to ignore women in matters regarding national development and science and technology education which is a vital tool in the development of nations and regions of the world.
Moreover, on the Commonwealth front, there have been various moves and activities on gender equality and development. Specifically, the 1995 Commonwealth Plan of Action on gender and development indicated that “the Commonwealth shall work towards a world in which women and men have equal rights and opportunities in all stages of their lives to express their creativity in all fields of human endeavor and in which women are respected and valued as equal and able partners in establishing values of social justice”. Within such a framework of values, men and women work in collaboration and partnership to ensure people-oriented development for all nations. The need to involve women equitably in national development needs no further emphasis. Hence, issues of governance and democracy, socio-economic development and peace can not be divorced from those of gender equality (King, 2000). In addition, it is becoming obvious that when women learn, a nation stands to benefit. Abbe and Momodu (1999) cited in Aguele and Agwagah (2007) states that women education positively correlates with several national and international goals and aspirations. The under-representation of women in science and technology careers is therefore a problem. Against this background, this paper poses and answers these questions:
• What is the pattern of gender differences in participation in science and technology internationally and in the Caribbean?
• What is the pattern of gender differences in achievement in science and technology internationally and in the Caribbean?
• What are the possible intervention strategies towards gender balance in science achievement and participation?
2. Pattern of Gender Differences in Participation in Science and Technology The fact that female participation is low in Science, Technology, Engineering and Mathematics (STEM) subjects and careers appears to be a global issue. For instance, Croxford (2002) reported that in Scotland, females were less likely than males to study mathematics, informatics and engineering and that one quarter of students with two or more sciences at higher grade was studying medicine and dentistry, or subjects allied to medicine. The situation appears to be the same pattern in the United States of America where Billings (2000) reported that despite efforts over the last 20 years to redress female under-representation, the percentage of women studying computing and related subjects continue to fall. In the United Kingdom, the same trend was observed with females making up only 18% of those studying computer science and 11% of those studying software and engineering (Aguele and Agagah, 2007). They explained further that, not only are the enrolments low and declining, but proportionately more women than men drop out, fail courses or choose to major in another subject other than science. The deleterious trend is found in New Zealand also with women accounting for a mere 20% of undergraduates in information technology and the sciences (Brook et al, 2000).
Interestingly in the Caribbean, the tertiary educational institutions have gender distributions that are greatly skewed. Table 1 as given by Martin-DeLeon (2010) reveals a glaring and alarming paucity of males entering tertiary institutions.
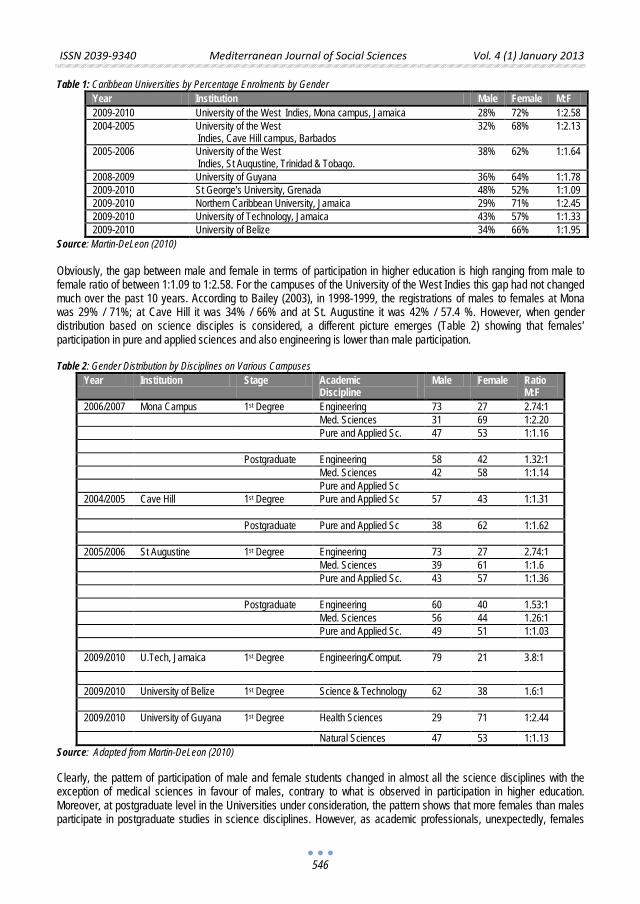
ISSN 2039-9340 Mediterranean Journal of Social Sciences Vol. 4 (1) January 2013
546
Table 1: Caribbean Universities by Percentage Enrolments by Gender Year Institution Male Female M:F 2009-2010 University of the West Indies, Mona campus, Jamaica 28% 72% 1:2.58 2004-2005 University of the West
Indies, Cave Hill campus, Barbados 32% 68% 1:2.13
2005-2006 University of the West Indies, St Augustine, Trinidad & Tobago.
38% 62% 1:1.64
2008-2009 University of Guyana 36% 64% 1:1.78 2009-2010 St George’s University, Grenada 48% 52% 1:1.09 2009-2010 Northern Caribbean University, Jamaica 29% 71% 1:2.45 2009-2010 University of Technology, Jamaica 43% 57% 1:1.33 2009-2010 University of Belize 34% 66% 1:1.95
Source: Martin-DeLeon (2010) Obviously, the gap between male and female in terms of participation in higher education is high ranging from male to female ratio of between 1:1.09 to 1:2.58. For the campuses of the University of the West Indies this gap had not changed much over the past 10 years. According to Bailey (2003), in 1998-1999, the registrations of males to females at Mona was 29% / 71%; at Cave Hill it was 34% / 66% and at St. Augustine it was 42% / 57.4 %. However, when gender distribution based on science disciples is considered, a different picture emerges (Table 2) showing that females’ participation in pure and applied sciences and also engineering is lower than male participation. Table 2: Gender Distribution by Disciplines on Various Campuses
Year Institution Stage Academic Discipline
Male Female Ratio M:F
2006/2007 Mona Campus 1st Degree Engineering 73 27 2.74:1 Med. Sciences 31 69 1:2.20 Pure and Applied Sc. 47 53 1:1.16 Postgraduate Engineering 58 42 1.32:1 Med. Sciences 42 58 1:1.14 Pure and Applied Sc 2004/2005 Cave Hill 1st Degree Pure and Applied Sc 57 43 1:1.31 Postgraduate Pure and Applied Sc 38 62 1:1.62 2005/2006 St Augustine 1st Degree Engineering 73 27 2.74:1 Med. Sciences 39 61 1:1.6 Pure and Applied Sc. 43 57 1:1.36 Postgraduate Engineering 60 40 1.53:1 Med. Sciences 56 44 1.26:1 Pure and Applied Sc. 49 51 1:1.03 2009/2010 U.Tech, Jamaica 1st Degree Engineering/Comput. 79 21 3.8:1
2009/2010 University of Belize 1st Degree Science & Technology 62 38 1.6:1 2009/2010 University of Guyana 1st Degree Health Sciences 29 71 1:2.44
Natural Sciences 47 53 1:1.13 Source: Adapted from Martin-DeLeon (2010) Clearly, the pattern of participation of male and female students changed in almost all the science disciplines with the exception of medical sciences in favour of males, contrary to what is observed in participation in higher education. Moreover, at postgraduate level in the Universities under consideration, the pattern shows that more females than males participate in postgraduate studies in science disciplines. However, as academic professionals, unexpectedly, females
ISSN 2039-9340 Mediterranean Journal of Social Sciences Vol. 4 (1) January 2013
547
appear to be under-represented in the Pure and Applied Sciences, despite their success in completing postgraduate programs.
Researchers (Ferreira, 2003; Nelson and Rogers, 2003) offer several explanations for the low numbers of women at all stages of STEM careers:
The classroom climate for girls in school classroom is not encouraging to them because ways of conducting discussions promote inequalities when boys are given more attention and praise than girls by the teacher.
A dearth of role models. Poor preparation and lack of encouragement in STEM subjects. A lack of ‘critical mass’ of women. The theory of ‘critical mass’ asserts that as representation of women
increases, so will their access to important resources and social network. ‘Critical mass’ is only meaningful if the organization is democratic and inclusive.
Bias and discrimination in hiring and advancement of women leads to slower advancement of women in science, particularly in academic science.
3. Pattern of Gender Differences in Achievement in STEM On the other hand, international student science assessment surveys report different gender patterns. According to Euridice Network (2010), Martin (2004 & 2008); OECD (2004) the Trends in International Mathematics and Science Study (TIMSS) often find gender gaps in favour of boys, whereas the Programme for International Student Assessment (PISA) reports generally show no significant gender differences and the analysis is thus:
In 1995, TIMSS data showed that there were no significant gender differences in science achievement in the fourth year of school in seven participating European educational systems but in the eighth year, gender differences in science achievement in most participating countries started to emerge. Boys had higher achievement, particularly in physics, chemistry and earth sciences. By the final year of secondary school, males had significantly higher scientific literacy than females in all countries.
Similar findings were also reported in the TIMSS 2003 and 2007 reports. Contrary to TIMSS findings, the PISA 2000 assessment of 15-year olds’ science achievements did not report
significant gender differences. PISA 2003 reported male advantage only in few countries and no gender gap in the majority. Girls
outperformed boys in Finland and Iceland. The differences in the results of TIMSS and PISA might be explained by the fact that the PISA assessment emphasizes life sciences more than TIMSS which is an area females perform better also in.
In the United States of America, among the fourth graders, trends reveal that the science achievement gap may be narrowing down between males and females. Amelink (2009) summarized the trend of science achievement in the USA as follows:
In 2007, males and females showed no measurable difference in their average science performance. However, males outperformed females in earth science (536 v. 531) There was no measurable difference detected in the average scores by gender in either the life science or physical science domains.
Males outperformed females overall in science in 2003, which was also the case in 1995. Among U.S. eighth-graders, trends reveal continued higher performance in science by males in certain content areas:
In 2007, males performed significantly higher than female classmates overall in science, scoring higher in three of the four content domains: biology (533 v. 527); physics (514 v. 491) and earth science (534 v. 516). There was no measurable difference detected in the average science scores of U.S. eighth-grade males and females in the chemistry domain.
In 2003, males outperformed females in science, which was also the case in 1999 and 1995 (Gonzales et al.,2004).
In the Caribbean, many countries did not participate in both TIMSS and PISA therefore cannot be compared with other nations of the world based on those studies. However, the Caribbean Secondary Examination Certificate (CSEC) results and Caribbean Advanced Proficiency Examinations (CAPE) results organized by the Caribbean Examination Council (CXC) are reliable data for analyzing gender participation and achievement in the Caribbean region.
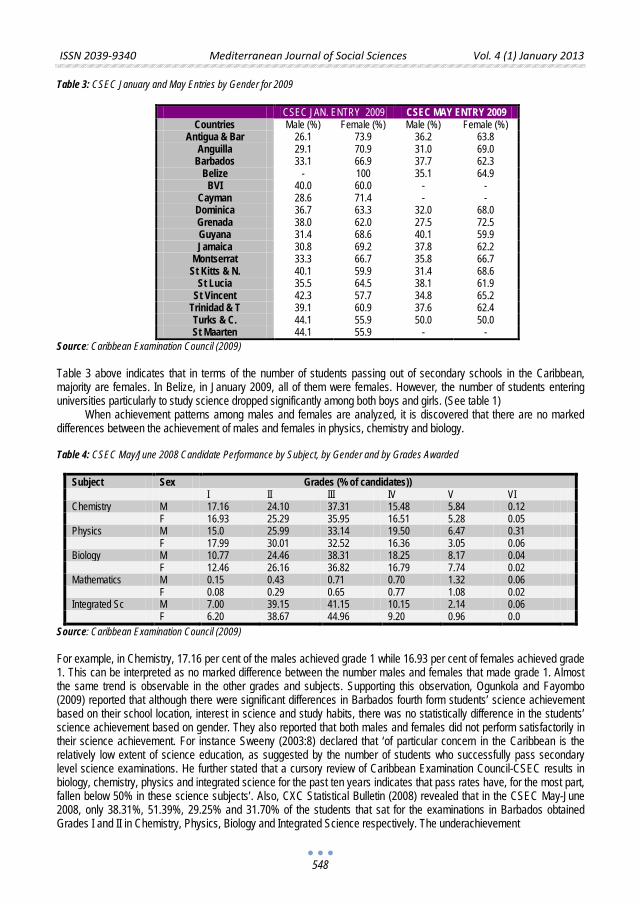
ISSN 2039-9340 Mediterranean Journal of Social Sciences Vol. 4 (1) January 2013
548
Table 3: CSEC January and May Entries by Gender for 2009
CSEC JAN. ENTRY 2009 CSEC MAY ENTRY 2009 Countries Male (%) Female (%) Male (%) Female (%)
Antigua & Bar 26.1 73.9 36.2 63.8 Anguilla 29.1 70.9 31.0 69.0
Barbados 33.1 66.9 37.7 62.3 Belize - 100 35.1 64.9
BVI 40.0 60.0 - - Cayman 28.6 71.4 - -
Dominica 36.7 63.3 32.0 68.0 Grenada 38.0 62.0 27.5 72.5 Guyana 31.4 68.6 40.1 59.9 Jamaica 30.8 69.2 37.8 62.2
Montserrat 33.3 66.7 35.8 66.7 St Kitts & N. 40.1 59.9 31.4 68.6
St Lucia 35.5 64.5 38.1 61.9 St Vincent 42.3 57.7 34.8 65.2
Trinidad & T 39.1 60.9 37.6 62.4 Turks & C. 44.1 55.9 50.0 50.0 St Maarten 44.1 55.9 - -
Source: Caribbean Examination Council (2009) Table 3 above indicates that in terms of the number of students passing out of secondary schools in the Caribbean, majority are females. In Belize, in January 2009, all of them were females. However, the number of students entering universities particularly to study science dropped significantly among both boys and girls. (See table 1)
When achievement patterns among males and females are analyzed, it is discovered that there are no marked differences between the achievement of males and females in physics, chemistry and biology. Table 4: CSEC May/June 2008 Candidate Performance by Subject, by Gender and by Grades Awarded
Subject Sex Grades (% of candidates)) I II III IV V VI Chemistry M 17.16 24.10 37.31 15.48 5.84 0.12 F 16.93 25.29 35.95 16.51 5.28 0.05 Physics M 15.0 25.99 33.14 19.50 6.47 0.31 F 17.99 30.01 32.52 16.36 3.05 0.06 Biology M 10.77 24.46 38.31 18.25 8.17 0.04 F 12.46 26.16 36.82 16.79 7.74 0.02 Mathematics M 0.15 0.43 0.71 0.70 1.32 0.06 F 0.08 0.29 0.65 0.77 1.08 0.02 Integrated Sc M 7.00 39.15 41.15 10.15 2.14 0.06 F 6.20 38.67 44.96 9.20 0.96 0.0
Source: Caribbean Examination Council (2009) For example, in Chemistry, 17.16 per cent of the males achieved grade 1 while 16.93 per cent of females achieved grade 1. This can be interpreted as no marked difference between the number males and females that made grade 1. Almost the same trend is observable in the other grades and subjects. Supporting this observation, Ogunkola and Fayombo (2009) reported that although there were significant differences in Barbados fourth form students’ science achievement based on their school location, interest in science and study habits, there was no statistically difference in the students’ science achievement based on gender. They also reported that both males and females did not perform satisfactorily in their science achievement. For instance Sweeny (2003:8) declared that ‘of particular concern in the Caribbean is the relatively low extent of science education, as suggested by the number of students who successfully pass secondary level science examinations. He further stated that a cursory review of Caribbean Examination Council-CSEC results in biology, chemistry, physics and integrated science for the past ten years indicates that pass rates have, for the most part, fallen below 50% in these science subjects’. Also, CXC Statistical Bulletin (2008) revealed that in the CSEC May-June 2008, only 38.31%, 51.39%, 29.25% and 31.70% of the students that sat for the examinations in Barbados obtained Grades I and II in Chemistry, Physics, Biology and Integrated Science respectively. The underachievement
ISSN 2039-9340 Mediterranean Journal of Social Sciences Vol. 4 (1) January 2013
549
was even more pronounced in CSEC January 2008 with 15.38%, 25%, 0.00% of the students in Barbados obtaining Grades I and II in Biology, Chemistry and Physics respectively. 4. Implications and intervention strategies towards gender balance in participation and achievement in science for better contributions to scientific and technological development in the Caribbean The implications of the findings enumerated in this paper on the issue of gender differences in participation and achievement in science and technology are:
i. The problem of participation and achievement in science is not restricted to the Caribbean. It is an issue of global concern.
ii. Participation of both males and females in science and technology in terms of studying science and technology disciplines and taking up careers in the area is still lower than expected.
iii. The participation of females in studying and taking up careers in pure and applied science disciplines, engineering, computer science, information and technology, etc with the exception of medicine is lower than that of males.
iv. The prevalent lower participation in science and technology careers by females is a reflection of some factors impacting negatively on female students learning. In other words, although, boys and girls have similar cognitive abilities and abilities in complex problem solving which is a skill considered to be highly relevant for science and engineering, as girls grow up, they tend to decrease in their interest for science. This explains why in both TIMSS and PISA, there were no significant gender differences in science achievement of fourth grade students but there were significant gender differences in science achievement among eighth grade students.
In order to have more females participate and excel in science and technology courses and careers, the following intervention strategies may be useful: (a) Encourage girls’ interests in science It is well established in literature (e.g. Canadian Council on Learning, 2007) that parental encouragement is positively correlated to children’s participation in science activities. Parents can encourage their children to participate in science by providing support for them – ask them what they did in science at school, source for whatever materials they need for science activities, facilitate opportunities for the children to meet successful women scientists, etc. The poorer mathematical reasoning ability exhibited by many female adolescents have several educational implications. Beginning at age 12, girls begin to like mathematics and science less and to like language arts and social studies more than boys. They also do not expect to do as well in these subjects and attribute their failures to lack of ability. So, by high school, girls self-select out of higher-level, academic-track mathematics and science courses such as calculus and surds. Early intervention in form of encouragement helps at the time. (b) Science teachers should create more “girl-friendly” classroom environment Teacher characteristics and the classroom environment are crucial in attracting or repelling students to or from science classrooms. Some young students have identified a science teacher as “a person who has made science, mathematics or engineering interesting” for them. (Gilbert, 1996). Many females have even complained of being passed over in classroom discussions, not encouraged by the teacher, and made to feel stupid. A girl-friendly classroom incorporates:
• Reduction of competition, public drill, and practice to very important ones • Highly expressive teachers • Hands-on activities • Use of community resource-persons who are female role models • Same-sex cooperative learning communities • Avoidance of gender-biased books
(c) Use of variety of instructional strategies Teachers’ creation of instructional environments that make use of a variety of instructional strategies that address different learning styles have been shown to encourage female achievement in science classrooms (Amelink, 2009). It is
ISSN 2039-9340 Mediterranean Journal of Social Sciences Vol. 4 (1) January 2013
550
important then to expose teachers to professional development efforts that focus on gender equity in science classrooms. (d) Mentoring Along with an alteration in the method of instruction and curricular content, mentoring is required to reverse the current trend of low participation of females and to increase the number of students who choose careers in science and technology fields. Mentoring, according to Martin-DeLeone (2010) is not teaching but is often done by a teacher, it is devoting time to promote another person’s career. It protects and nurtures and is a powerful natural human relationship with a lasting legacy. 5. Conclusion Today, both knowledge-based society and economy of the 21st century are supported by vibrant scientific enterprise and are greatly dependent on innovations and technological advances. In order to enhance the international competitiveness of the Caribbean nations, it is important to promote science and technology. One way to do this is to ensure that more men and women are involved in science and technology either as students or as professionals. References
Abbe, F.A. & Momodu (1999) Women Education: Implication for Good Citizenship and National Development Nigerian Journal of
Citizenship Education, 1 (1 and 2), 159-166 Aguele, L.I & Agwagah U.N.V (2007) Female participation in STM education and national development Journal of social sciences, 15 (2),
121 – 126 Amelink, C. (2009). Literature Overview: Gender Differences in Mathematics Performance. SWE-AWE CASEE Overviews. Retrieved
<4th June, 2011> from http://www.AWEonline.org. pp 1 Bailey, B. in Nain, G.T. and Bailey, B. Eds. (2003). Gender equality in the Caribbean: reality or illusion. Jamaica. Ian Randle Publishers.
8 – 16 Billings, D. (2000). Women‘s ways of knowing and the digital divide. an interactive paper presentation. Brook, P., Mann, S., & Virtue, A. (2000). Aberrant behaviour. In Proceedings of the 13th Annual conference of the National Advisory
Committee on Computing Qualifications (NACCQ) conference. Wellington, New Zealand, 29-36. Caribbean Examination Council (2009). Annual Reports. Jamaica. Caribbean Examination Council. 59 – 84 Croxford, L. (2002) Participation in Science, Engineering and Technology at School and in Higher Education, Scottish School Leavers
Survey Special Study. Edinburgh: CES, University of Edinburg. CXC Statistical Bulletin (2008). Report on CSEC. (Barbados, Caribbean Examination Council). Eurydice Network (2010). Gender differences in educational outcomes: Study on the measures taken and the current situation in
Europe. Publication of Education, Audio-Visual and Culture executive Agency. Ferreira, M. (2003) Gender Issues related to graduate student attrition in two science departments International Journal of Science
Education 25 (8), 969-989 Gilbert, A (1996) ‘The Anglo-Indians in Australia, from unsuccessful caste members to attaining immigrants: an examination of Anglo-
Indian labour force performance and their life perceptions’, PhD Thesis. Monash University, Melbourne, viewed 4 June 2011, http://www.alphalink.com.au/~agilbert/agthesis.html
Gonzales, P., Guzman, J.C., Partelow, L., Pahike, E., Jocelyn, L., Kastberg, D., & Williams, T. (2004). Highlights from the Trends in International Mathematics and Science Study (TIMSS) 2003. (NCES Publication No. 2005-005). Washington, DC: U.S. Government Printing Office.
Greenfield, T. A. (1997). Gender- and grade-level differences in science interest and participation. Science Education, 81, 259-275. Hyde, J.S. and Linn, M.C. (2006). Gender Similarities in Mathematics and Science. Science, Vol. 314 no. 5799 pp. 599-600 Jovanovich, J., & King, S. (1998). Boys and girls in the performance-based science classroom: Who’s doing the performing? American
Educational Research Journal, 35(3), 477-496. Kimmel, Michael (2000) The Gendered Society. Oxford University Press, New York. 150 - 151 King, A. (2000). “Gender Programme Makes Impact.” Commonwealth Currents 4: 2-3. Martin-DeLeon, P.A. (2010). Increasing the Caribbean’s human capital in the STEM (Science, Engineering, and Mathematics) fields: The
pivotal role of mentoring. 11th William G. Demas Memorial Lecture at the Caribbean Development Bank Martin, M.O. et al. (2004). TIMSS 2003 International Science Report: Findings From IEA’s Trends in International Mathematics and
Science Study at the Fourth and Eighth Grades. Chestnut Hill, MA: TIMSS & PIRLS International Study Center, Boston College. Martin, M.O. et al., (2008). TIMSS 2007 International Science Report: Findings from IEA’s Trends in International Mathematics and
Science Study at the Fourth and Eighth Grades. Chestnut Hill, MA: TIMSS & PIRLS International Study Center, Boston College. Nelson, D.J. and Rogers, D.C. (2003). A national analysis of diversity in science and engineering faculties at research universities.
National Organisation for Women. OECD (2004). Learning for Tomorrow’s World: First Results from PISA 2003. Paris: OECD.

ISSN 2039-9340 Mediterranean Journal of Social Sciences Vol. 4 (1) January 2013
551
Ogunkola, B.J. and Fayombo, G.A. (2009). Investigating the Combined and Relative Effects of some Student Related Variables on Science Achievement among Secondary School Students in Barbados. European Journal of Scientific Research 37 (3), pp.481-489
Sweeny, A.E. (2003). Science Education in the Caribbean: Analysis of Trends. In T.Bastick and A. Ezenne (Eds): Researching Change in Caribbean Education. Jamaica, Department of Educational Studies, University of the West Indies, Kingston.
The Canadian Council on Learning. (2007). Gender differences in career choices: Why girls don’t like science. Lessons in Learning. Available at: http://www.ccl-cca.ca/pdfs/LessonsInLearning/Nov-01-07-Gender-Difs.pdf
The European Commission (2009). Employment, Social Affairs and Inclusion. Available at: http://ec.europa.eu/social/main.jsp?catId=418 UNESCO (2010). Factors associated with the cognitive achievement of students in Latin America in Latin America and the Caribbean.

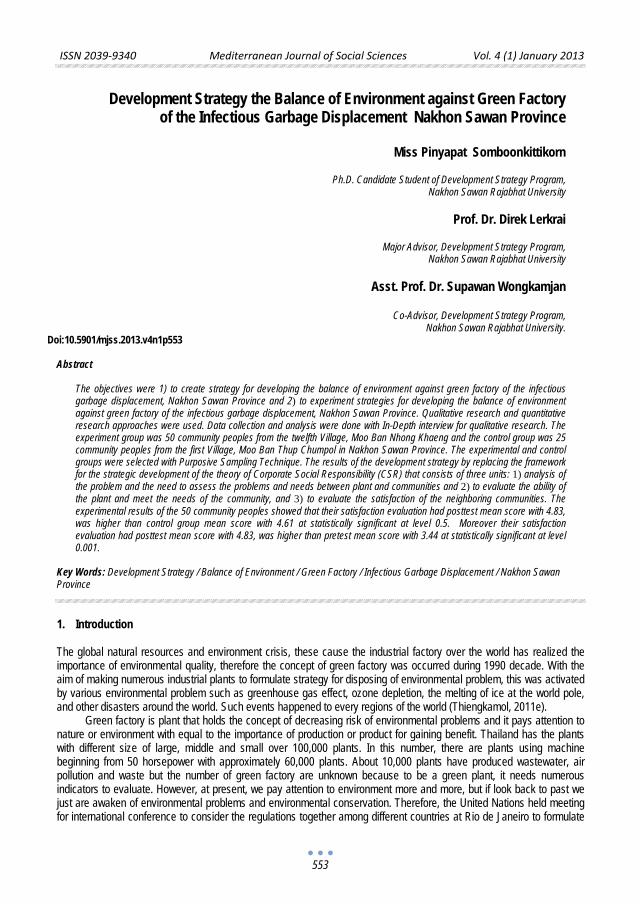
ISSN 2039-9340 Mediterranean Journal of Social Sciences Vol. 4 (1) January 2013
553
Development Strategy the Balance of Environment against Green Factory of the Infectious Garbage Displacement Nakhon Sawan Province
Miss Pinyapat Somboonkittikorn
Ph.D. Candidate Student of Development Strategy Program,
Nakhon Sawan Rajabhat University
Prof. Dr. Direk Lerkrai
Major Advisor, Development Strategy Program, Nakhon Sawan Rajabhat University
Asst. Prof. Dr. Supawan Wongkamjan
Co-Advisor, Development Strategy Program,
Nakhon Sawan Rajabhat University. Doi:10.5901/mjss.2013.v4n1p553
Abstract
The objectives were 1) to create strategy for developing the balance of environment against green factory of the infectious garbage displacement, Nakhon Sawan Province and 2) to experiment strategies for developing the balance of environment against green factory of the infectious garbage displacement, Nakhon Sawan Province. Qualitative research and quantitative research approaches were used. Data collection and analysis were done with In-Depth interview for qualitative research. The experiment group was 50 community peoples from the twelfth Village, Moo Ban Nhong Khaeng and the control group was 25 community peoples from the first Village, Moo Ban Thup Chumpol in Nakhon Sawan Province. The experimental and control groups were selected with Purposive Sampling Technique. The results of the development strategy by replacing the framework for the strategic development of the theory of Corporate Social Responsibility (CSR) that consists of three units: 1) analysis of the problem and the need to assess the problems and needs between plant and communities and 2) to evaluate the ability of the plant and meet the needs of the community, and 3) to evaluate the satisfaction of the neighboring communities. The experimental results of the 50 community peoples showed that their satisfaction evaluation had posttest mean score with 4.83, was higher than control group mean score with 4.61 at statistically significant at level 0.5. Moreover their satisfaction evaluation had posttest mean score with 4.83, was higher than pretest mean score with 3.44 at statistically significant at level 0.001.
Key Words: Development Strategy / Balance of Environment / Green Factory / Infectious Garbage Displacement / Nakhon Sawan Province
1. Introduction
The global natural resources and environment crisis, these cause the industrial factory over the world has realized the importance of environmental quality, therefore the concept of green factory was occurred during 1990 decade. With the aim of making numerous industrial plants to formulate strategy for disposing of environmental problem, this was activated by various environmental problem such as greenhouse gas effect, ozone depletion, the melting of ice at the world pole, and other disasters around the world. Such events happened to every regions of the world (Thiengkamol, 2011e). Green factory is plant that holds the concept of decreasing risk of environmental problems and it pays attention to nature or environment with equal to the importance of production or product for gaining benefit. Thailand has the plants with different size of large, middle and small over 100,000 plants. In this number, there are plants using machine beginning from 50 horsepower with approximately 60,000 plants. About 10,000 plants have produced wastewater, air pollution and waste but the number of green factory are unknown because to be a green plant, it needs numerous indicators to evaluate. However, at present, we pay attention to environment more and more, but if look back to past we just are awaken of environmental problems and environmental conservation. Therefore, the United Nations held meeting for international conference to consider the regulations together among different countries at Rio de Janeiro to formulate
ISSN 2039-9340 Mediterranean Journal of Social Sciences Vol. 4 (1) January 2013
554
Agenda 21 for sustainable development principles. This aimed to have economic development, social development and environmental protection in the same time. In Agenda 21, there is emphasizing on implementation of people at local level. These regulations were accepted by 178 countries in 1992 (Punjasuwan, 2005 and Thiengkamol, 2011e). Chote Korn Phibun Ltd. (infectious garbage plant) locates Nong Krot District, Nakhon Sawan Province has opened to operate for infectious garbage disposal of hospital and general community waste at 22 February 2007 and has the head office at 196/157 Moo 1, nakhonsawantok Sub-district, Muang District, Nakhon Sawan Province (locates between Moo Ban Thup Chumpol and the twelfth Village, Moo Ban Nhong Khaeng), Nong Krot District, Nakhon Sawan Province. In order to response toward industrial business in Thailand with more extension and to make the administration of Chote Korn Phibun Ltd., plant is accepted by universal level with incessant efficiency and increasing it competency to be continuous development. It has introduced the system of quality administration of ISO 9001:2008 and environmental management system of ISO14001:2004. These international standard are emphasized on continuous improvement of working efficiency and environmental quality protection and these are adapted to use inside plant and nearby community. Nevertheless, it explained the situation of green plant development as infectious garbage disposal before this study was done. However these managements did not serve the needs of nearby community people (Arunsrimorakot, 2005 and Wattanasaroch, et al., 2012). The majority of current situation, society pays attention to social responsibility for economic, social and environmental development similarly. It is not aim only environmental protection and surveillance but it needs to pay attention to other aspects consideration together. Therefore, the balance modification of environment and green plant of infectious garbage disposal are used the concept of Theory of Corporate Social Responsibility (CSR) to adjust environmental balance and green plant of infectious garbage disposal (Williamson, et al., 2006; Russo and Tencati, 2009; O’Riordan, and Fairbrass, 2008 and Perrini, Francesco, et al., 2007). Therefore, to operate plant, it should regard to nearby communities to satisfy the implementation of this green plant of infectious garbage disposal by considering on life quality of people of nearby communities. Even though, this plant had environmental protection and complied in accordance with law such as measurement of air pollution at the terminal of chimney, and measurement of wastewater, odor, smoke, light, color and sound but it needs to consider both economic growth and social development, therefore it not only adjusts the environmental balance but also needs create the nearby community satisfaction at a certain level. Creation of development strategy the balance of environment against green factory of the infectious garbage displacement to support the community society with happiness, the practical method of problem solving environmental impact to nearby communities of plant should be introduced. This development strategy was introduced the international standard organization, ISO 9001 (quality management) and ISO 14001 (environmental management) (Arunsrimorakot, 2005). Moreover, the plant adjusts the production process in accordance to Theory of green industry with 5 levels by following the criteria and condition of Ministry of Industry. The first level is “Green Commitment” and it implies that the organization has intention to run business with environment friendly implementation. The second level is “Green Activity” that it implies that organization has operated until it achieves its attention to run business with environment friendly implementation. The third level is “Green System” that it implies that organization has systemically operated environmental work. The forth level is “Green Culture” that it implies that organization has systemically operated and has process of building organization culture and it practices to be effectiveness and the fifth “Green Network” that it implies that organization has accomplished of building organization culture and building network. Additionally, it is able to inspire for other work units to consider to environment and community in order to meet ISO 26000 or social responsibility with inside process adaptation. By regarding to adjustment of environmental balance of green factory of infectious garbage disposal of Nakhon Sawan Province, it uses the framework of Theory of CSR (ISO 26000) since it not only pays attention to economy, environment and implement under the law regulation but also regards to different social problem to response the real needs of nearby communities to have good life quality (Suebchuewong, 2002; Thiengkamol, 2005a; Russo and Tencati, 2009; and Williamson, et al., 2006). The researcher has searched the problems and demand between green factory of infectious garbage disposal by using incinerator without pollution and nearby community within 5 kilometer radius. The meeting was held at the twelfth Village, Moo Ban Nhong Khaeng by inviting representatives of community peoples, administrator and factorial personnel and academic persons in community. The implementation of meeting was used the framework of Theory of CSR (O’Riordan, and Fairbrass, 2008 and Perrini, Francesco, et al., 2007) about the environmental, social and economic impacts. This implantation was used to response the needs of nearby community peoples in order to create a certain level of satisfaction. The results of meeting was concluded different problems for instances as the following. 1) Plants and community had no activity together, 2) some activity is implemented by community but the plant only participating, 3) there is no activity that plant implemented for community and be able to response the real needs of community and society, and 4) communities unsatisfied toward plant operation.
ISSN 2039-9340 Mediterranean Journal of Social Sciences Vol. 4 (1) January 2013
555
These issues express to the relationship between plant and community that lacked of connection and collaboration. Moreover, plant has no project or policy to seriously take part with responsibility for locality and regards to the environmental, social and economic impacts with evaluation of problems and community needs. The nearby communities wish green factory of the infectious garbage displacement to participate in problem solving, evaluating problem and perceiving real needs of nearby community and society for urgent problem solving. Therefore, the researcher aimed to study for development strategy the balance of environment against green factory of the infectious garbage displacement, Nakhon Sawan Province for serving the needs of nearby community and the development strategy can be applied for other plants in other provinces in order to adjust the balance of environment against green factory of the infectious garbage displacement and to create satisfaction for nearby communities with a certain level. 2. Objective The research objectives were as followings: 1) To create strategy for developing the balance of environment against green factory of the infectious garbage displacement, Nakhon Sawan Province. 2) To experiment strategies for developing the balance of environment against green factory of the infectious garbage displacement, Nakhon Sawan Province. 3. Methodology The research design was implemented in steps by step as followings:
1) The qualitative research was used to study for development strategy the balance of environment against green factory of the infectious garbage displacement, Nakhon Sawan Province. In-Depth Interview was used for data collection from 20 representatives of community peoples, administrator and factorial personnel and academic persons in community nearby plant about 5 kilometers radius (Thiengkamol, 2011a). There were 4 unit work systems of strategy development including;
Work unit system 1: Analysis of problems and needs between plant and nearby community to response the real need of communities and society (Analysis of environmental problems, social problems and economic problems).
Work unit system 2: Evaluation and response the needs of nearby communities according to concept of CSR. Work unit system 3: Development mechanism in cooperation understand for nearby community according to
concept of CSR. Work unit system 4: Satisfaction evaluation toward creation the balance of environment of nearby community.
2) The quantitative research was used to experiment for development strategy the balance of environment against green factory of the infectious garbage displacement, Nakhon Sawan Province. The experiment group was 50 community peoples from the twelfth Village, Moo Ban Nhong Khaeng and the control group was 25 community peoples from the first Village, Moo Ban Thup Chumpol in Nakhon Sawan Province. The experimental and control groups were selected with Purposive Sampling Technique.
4. Results 4.1 In-Depth Interview Results The selected 20 representatives of community peoples, administrator and factorial personnel and academic persons in community nearby plant about 5 kilometers radius were interviewed, and they gave recommendations as the followings. 1) Plants and community had no activity together, 2) some activity is implemented by community but the plant only participating, 3) there is no activity that plant implemented for community and be able to response the real needs of nearby community and society, and 4) communities unsatisfied toward plant operation. 4.2 Experimental Results of Satisfaction Evaluation of Experimental Group between Pretest and Posttest The results of satisfaction evaluation of the experimental group of 50 community peoples, after training was implemented, the mean score of the whole aspect of development strategy of CSR of plant was higher than before training with
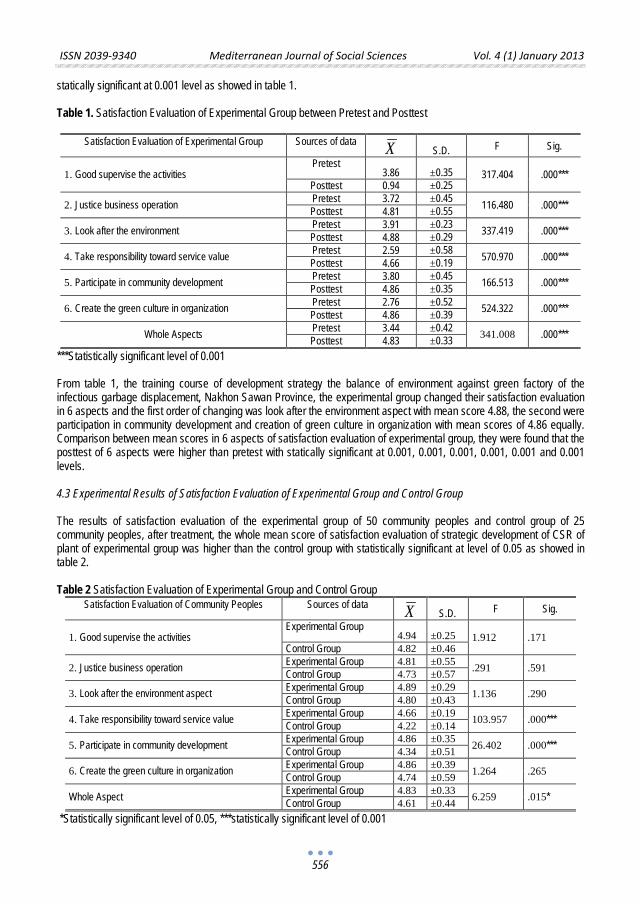
ISSN 2039-9340 Mediterranean Journal of Social Sciences Vol. 4 (1) January 2013
556
statically significant at 0.001 level as showed in table 1. Table 1. Satisfaction Evaluation of Experimental Group between Pretest and Posttest
Satisfaction Evaluation of Experimental Group Sources of data X S.D. F Sig.
1. Good supervise the activities Pretest
3.86 ±0.35 317.404 .000*** Posttest 0.94 ±0.25
2. Justice business operation Pretest 3.72 ±0.45 116.480 .000*** Posttest 4.81 ±0.55
3. Look after the environment Pretest 3.91 ±0.23 337.419 .000*** Posttest 4.88 ±0.29
4. Take responsibility toward service value Pretest 2.59 ±0.58 570.970 .000*** Posttest 4.66 ±0.19
5. Participate in community development Pretest 3.80 ±0.45 166.513 .000*** Posttest 4.86 ±0.35
6. Create the green culture in organization Pretest 2.76 ±0.52 524.322 .000*** Posttest 4.86 ±0.39
Whole Aspects Pretest 3.44 ±0.42 341.008 .000*** Posttest 4.83 ±0.33 ***Statistically significant level of 0.001 From table 1, the training course of development strategy the balance of environment against green factory of the infectious garbage displacement, Nakhon Sawan Province, the experimental group changed their satisfaction evaluation in 6 aspects and the first order of changing was look after the environment aspect with mean score 4.88, the second were participation in community development and creation of green culture in organization with mean scores of 4.86 equally. Comparison between mean scores in 6 aspects of satisfaction evaluation of experimental group, they were found that the posttest of 6 aspects were higher than pretest with statically significant at 0.001, 0.001, 0.001, 0.001, 0.001 and 0.001 levels.
4.3 Experimental Results of Satisfaction Evaluation of Experimental Group and Control Group
The results of satisfaction evaluation of the experimental group of 50 community peoples and control group of 25 community peoples, after treatment, the whole mean score of satisfaction evaluation of strategic development of CSR of plant of experimental group was higher than the control group with statistically significant at level of 0.05 as showed in table 2. Table 2 Satisfaction Evaluation of Experimental Group and Control Group
Satisfaction Evaluation of Community Peoples Sources of data X S.D. F Sig.
1. Good supervise the activities Experimental Group
4.94 ±0.25 1.912 .171 Control Group 4.82 ±0.46
2. Justice business operation Experimental Group 4.81 ±0.55 .291 .591 Control Group 4.73 ±0.57
3. Look after the environment aspect Experimental Group 4.89 ±0.29 1.136 .290 Control Group 4.80 ±0.43
4. Take responsibility toward service value Experimental Group 4.66 ±0.19 103.957 .000*** Control Group 4.22 ±0.14
5. Participate in community development Experimental Group 4.86 ±0.35 26.402 .000*** Control Group 4.34 ±0.51
6. Create the green culture in organization Experimental Group 4.86 ±0.39 1.264 .265 Control Group 4.74 ±0.59
Whole Aspect Experimental Group 4.83 ±0.33 6.259 .015* Control Group 4.61 ±0.44 *Statistically significant level of 0.05, ***statistically significant level of 0.001
ISSN 2039-9340 Mediterranean Journal of Social Sciences Vol. 4 (1) January 2013
557
From table 2, satisfaction evaluation of experimental group and control group, it indicated that there were taking responsibility toward service value aspect and participating in community development were highly statistical significance at 0.001, and 0.001 levels and the whole aspect, it indicated that the whole aspect was statistical significance at 0.05 level.
5. Discussion Research results revealed that from In-depth Interview with selected 20 peoples in community nearby plant about 5 kilometers radius were interviewed, they gave recommendations including; 1) plants and community had no activity together, 2) some activity is implemented by community but the plant only participating, 3) there is no activity that plant implemented for community and be able to response the real needs of nearby community and society, and 4) communities unsatisfied toward plant operation. Moreover, the most essential of strategy for developing the balance of environment against green factory of the infectious garbage displacement, Nakhon Sawan Province, were looking after the environment, organizing activities, participating in community development and creating the green culture in organization. Therefore, after the factory administrators perceived and understand the needs of community people. They implemented in 6 aspects of the followings. There are, 1.Good supervise the activities, 2. Justice business operation aspect, 3. Look after the environment aspect, 4. Take responsibility toward service value, 5. Participate in community development and 6. Create the green culture in organization. These implementations are able to serve the needs of community people and society, therefore this leads to the good understanding between plant and nearby communities. It also provides good environmental quality, social justice and developing the economic with peace and happiness of both plant and community. References
Arunsrimorakot, S. (2005). Development of Document of Environmental Management ISO14001: 2004 for Industrial Factory. Faculty of
Environment and Resource Studies. Mahidol Unviversity, Nakhon Prathom Province. O’Riordan, Linda and Fairbrass, Jenny. (2008). Corporate Social Responsibility (CSR): Models and Theories in Stakeholder
Dialogue. Journal of Business Ethics (2008) 83: 745-758. Perrini, Francesco and Others. (2007). CSR Strategies of SMEs and Large Firms. Evidence from Italy. Journal of Business Ethics
(2007) 74:285–300. Punjasuwan, J. (2005). Management of Natural Resources and Environment. Bangkok: Odean Store. Russo, Angeloantonio and Tencati, Antonio. (2009). Formal vs. Informal CSR Strategies: Evidence from Italian Micro, Small,
Medium-sized, and Large Firms. Journal of Business Ethics (2009) 85:339–353. Suebchuewong, P. (2002). Problem of Implementation to Standard System of ISO 14001 of Certified School in the Bangkok Area. Bangkok: Phranakhon Rajabhat University. Thiengkamol, N., (2005a). Strengthening Community Capability through The Learning Network Model for Energy Conservation. Journal of Population and Social Studies, Volume14, Number1, July 2005. Thiengkamol, N. (2011a). Holistically Integrative Research. (2nd Edition). Bangkok: Chulalongkorn Press. Thiengkamol, N., (2011e). Environment and Development Book 1. Published 4th Edition. Bangkok: Chulalongkorn University Press. Wattanasaroch, K., Thiengkamol, N., Navanugraha, C., & Thiengkamol, C. (2012). Development of Green Dormitory Standard for Mahasarakham University. Journal of the Social Sciences, 7 (2):90-95. Williamson, D. et al. (2006). Drivers of Environmental Behaviour in Manufacturing SMEs and the Implications for CSR. Journal of
Business Ethics (2006) 67:317–330.


ISSN 2039-9340 Mediterranean Journal of Social Sciences Vol. 4 (1) January 2013
559
Development of Flood Disaster Model through PAIC Process
Cherdpong Mongkonsin
Department of Environmental Education
Faculty of Environment and Resource Studies Mahasarakham University, Mahasarakham 44150, Thailand
Nongnapas Thiengkamol
Major Advisor, Department of Environmental Education
Faculty of Environment and Resource Studies Mahasarakham University, Mahasarakham 44150, Thailand
Email: [email protected]
Tanarat Thiengkamol
Co- Advisor, School of Management, Assumption University, Hua Mak Campus, 592/3 Ramkhamhaeng 24,
Hua Mak, Bangkok 10240, Thailand
Doi:10.5901/mjss.2013.v4n1p559 Abstract
The integrative research was done with participatory action research with Participatory Appreciate-Influence-Control technique (PAIC) and qualitative research with focus group discussion. The sample was selected according to purposive sampling technique. The PAIC was implemented with 38 community leaders who came from community that faced with flood disaster in 2011 from Kuntarawichai District in Mahasarakham Province with brain storming integrated in focus group discussion during the training process. During training, Three Dimensional Evaluation (TDE) covers Self-evaluation, Friend-evaluation, and Facilitator-evaluation. One -Way-ANOVA, and Paired t-test were used for data analysis. The research results illustrated that before and after PAIC process implemented the posttest mean scores of knowledge of environmental education principle, natural disaster from flood disaster, flood response behavior and training achievement score were higher than pretest with statistical significance (p< .01, p< .01, p< .01, and p< .01). Three Dimensional Evaluations were employed for determination the perceptions of 38 community leaders in three aspects evaluation covering Self-evaluation, Friend-evaluation, and Facilitator-evaluation by using One-way ANOVA in order to investigate the participation of peoples and the result showed that there were no difference of mean scores for participation in training process in past, present and future situations with statistical significance (p>.05, p>.05, and p>.05). Moreover, supervising, monitoring, and evaluating for flood response behaviors, it was found that the community leaders set plan and hold meeting with community peoples to implement project for life safety with preparation of communication equipment, boat, food, water, drug, and place for living including establishing the committee for surveillance, warning, and support from involved work unit. Moreover they hold program of disaster exercise to move to safety place at good and very good levels in all aspects.
Key Words: Flood Disaster Model / PAIC Process
1. Introduction It is claimed that a disaster might be caused by a natural or man-made with resulting in a significant physical damage or destruction, loss of life, or drastic change to the environment, therefore a disaster can be evidently defined as any terrible event origin from events such as earthquakes, floods, catastrophic accidents, fires, or explosions. It is a occurrence that can cause harm to life, property and demolish the economic, social and life quality of people. In current scholastic spheres, disasters are seen as the result of improperly managed risk. These risks are the product of a combination of both dangers and vulnerability. Hazards that strike in areas with low vulnerability will never become disasters, as is the case in unoccupied regions (Wikipedia, 2012).
Generally, a flood is an run over of water that occupies land. The European Union (EU) Floods Directive defines a flood as a covering by water of land not usually covered by water. In the sense of “flowing water”, the word may also be
ISSN 2039-9340 Mediterranean Journal of Social Sciences Vol. 4 (1) January 2013
560
applied to the inflow of the tide. Flooding may result from the volume of water within a body of water, such as a river or lake, which overflows or breaks levels, with the result that some of the water escapes its usual boundaries, or may be due to accumulation of rainwater on saturated ground in an area flood (Wikipedia, 2012, and Directive, 2007).
Throughout the summer and autumn of 2011, heavy monsoons and succeeding typhoons killed nearly 800 peoples and affected more than 8 million others across Thailand, Cambodia, Laos, Vietnam and the Philippines, reported by the United Nations. Various businesses needed expert disaster restoration services after Thailand experienced the most disturbing floods in a half century significant in the most expensive natural disaster ever. Flood water affected more than 14,000 factories, displacement of more than 600,000 workers, disrupted global supply chains, destroyed farms and drove up worldwide prices for computer hard drives and rice. In Thailand alone, where floodwaters covered an area approximately the size of the state of Florida, insured losses were estimated at more than 15 billion and total damage was expected to peak at 45 billion. The cruel flooding across Thailand in 2011 was over for several months and affected more than three million peoples and this flood was the most rigorous during five decades. Major industrial zones were hard hit, but they have built major flood walls to prevent a returning of the flood (Corben, 2012, MENAFN, 2012 and Figge, 2012).
However, the flood disaster might occur due to natural or human activities, moreover, it is complex to make decision that it is only natural situation because human have interrupted the natural system for long time ago, then the balance of natural system is also loss as well. In addition, the rapid growth of world population with 7 billion peoples, was just celebrated on 11july 2012 (UNFPA, 2012). On the other hand, the huge population was a main problem for natural resources consumption, especially, the violation of forest in every countries across the world has been arose for long ages and it also essential factors of devastation of soil surface, consequently it creates a flood and soil erosion. Moreover forests stabilize climate and adjust the water cycle by absorbing and redistributing rainwater quite equally to every species living within its range. Predominantly, in the case of tropical forests where up to 90% of the planet’s species live. Tropical forests hold the highest level of biodiversity and therefore supply the biggest genes reservoir (Environment for Beginners, 2012). Therefore, it might be concluded that the flood can take place from natural and/or human origins.
Considering to characteristics of environmental education volunteer or trainer, Thiengkamol explained that its importance includes knowledge and understanding, attitude, awareness, responsibility and public mind based on inspiration of public mind. Additionally, supporting on environmental activities and decision making on environmental problem solving would be given prominence to daily life practice until it turns into established environmental behaviors such as consumption behavior, recycling behavior, energy conservation behavior, traveling behavior, forest conservation behavior and knowledge transferring behavior, consequently these behaviors are able to bring about real sustainable development.
In general, these critical characteristics should be established through all educational channels whether the formal education, informal education, non-formal education and lifelong education (Thiengkamol, 2009a, 2009b, 2011e, & 2012a). These concepts are consistent with results that discovered from the research that there are 14 essential Environmental Education Characteristics (EECs) comprised 1) ability to transfer environmental knowledge, 2) to stimulate others to realize the importance of environmental conservation, 3) to have deeply awareness about environment and natural resources, 4) to have public consciousness for environmental conservation, 5) to have positive attitude for environmental conservation, 6) to have value that for environmental conservation be everyone duty, 7) to have a sensitivity of environmental conservation, 8) to wish to take a responsibility for environmental conservation, 9) to participate to environmental conservation activities regularly, 10) to be consistency of self practice for environmental conservation, 11) to have ability to make correct decision for environmental conservation, 12) to practice as a role model of environmental conservation for public perception, 13) to have correct environmental knowledge and 14) to understanding to introduce and transfer environmental knowledge for others to practice correctly (Charoensilpa, et al, 2012b).
The development of flood disaster model through Participatory-Appreciation-Influence-Control (PAIC) process for community leaders from Kuntarawichai District in Mahasarakham Province was implemented. The samples were 38 community leaders who faced with flooding disaster in 2001 at Kuntarawichai District in Mahasarakham Province and were selected by purposive sampling method. Moreover, flood disaster model can be developed through PAIC process and flood disaster network can be built through Multi-level Management Linkage (MML) in order to share their experiences and lessons learned to their expanded network to other communities in the same province or nearby provinces including the same region in order to maintain the environment and natural resources including to save their lives and properties from flood disaster as much as possible through prevent with flood surveillance, warning, formulate policy and preparedness of administration during and after flooding disaster (Thiengkamol, 2004, Thiengkamol, 2005a, Thiengkamol, 2005b, Thiengkamol, 2011a, Thiengkamol, 2011b, Thiengkamol, 2011c, Thiengkamol, 2011g,
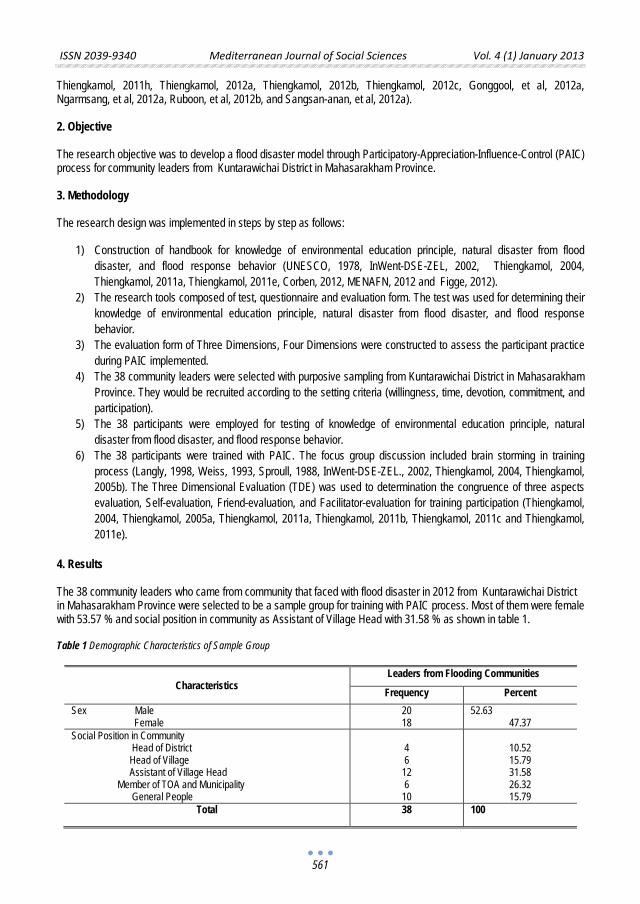
ISSN 2039-9340 Mediterranean Journal of Social Sciences Vol. 4 (1) January 2013
561
Thiengkamol, 2011h, Thiengkamol, 2012a, Thiengkamol, 2012b, Thiengkamol, 2012c, Gonggool, et al, 2012a, Ngarmsang, et al, 2012a, Ruboon, et al, 2012b, and Sangsan-anan, et al, 2012a). 2. Objective The research objective was to develop a flood disaster model through Participatory-Appreciation-Influence-Control (PAIC) process for community leaders from Kuntarawichai District in Mahasarakham Province.
3. Methodology The research design was implemented in steps by step as follows:
1) Construction of handbook for knowledge of environmental education principle, natural disaster from flood disaster, and flood response behavior (UNESCO, 1978, InWent-DSE-ZEL, 2002, Thiengkamol, 2004, Thiengkamol, 2011a, Thiengkamol, 2011e, Corben, 2012, MENAFN, 2012 and Figge, 2012).
2) The research tools composed of test, questionnaire and evaluation form. The test was used for determining their knowledge of environmental education principle, natural disaster from flood disaster, and flood response behavior.
3) The evaluation form of Three Dimensions, Four Dimensions were constructed to assess the participant practice during PAIC implemented.
4) The 38 community leaders were selected with purposive sampling from Kuntarawichai District in Mahasarakham Province. They would be recruited according to the setting criteria (willingness, time, devotion, commitment, and participation).
5) The 38 participants were employed for testing of knowledge of environmental education principle, natural disaster from flood disaster, and flood response behavior.
6) The 38 participants were trained with PAIC. The focus group discussion included brain storming in training process (Langly, 1998, Weiss, 1993, Sproull, 1988, InWent-DSE-ZEL., 2002, Thiengkamol, 2004, Thiengkamol, 2005b). The Three Dimensional Evaluation (TDE) was used to determination the congruence of three aspects evaluation, Self-evaluation, Friend-evaluation, and Facilitator-evaluation for training participation (Thiengkamol, 2004, Thiengkamol, 2005a, Thiengkamol, 2011a, Thiengkamol, 2011b, Thiengkamol, 2011c and Thiengkamol, 2011e).
4. Results The 38 community leaders who came from community that faced with flood disaster in 2012 from Kuntarawichai District in Mahasarakham Province were selected to be a sample group for training with PAIC process. Most of them were female with 53.57 % and social position in community as Assistant of Village Head with 31.58 % as shown in table 1. Table 1 Demographic Characteristics of Sample Group
Characteristics
Leaders from Flooding Communities
Frequency Percent Sex Male Female
20 18
52.63 47.37
Social Position in Community Head of District Head of Village Assistant of Village Head Member of TOA and Municipality General People
4 6
12 6
10
10.52 15.79 31.58 26.32 15.79
Total 38 100
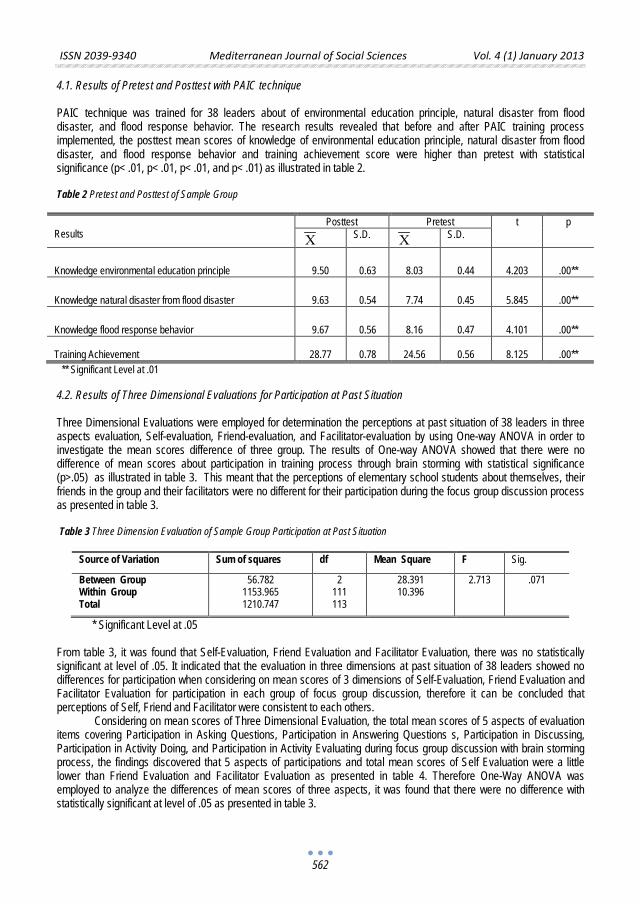
ISSN 2039-9340 Mediterranean Journal of Social Sciences Vol. 4 (1) January 2013
562
4.1. Results of Pretest and Posttest with PAIC technique PAIC technique was trained for 38 leaders about of environmental education principle, natural disaster from flood disaster, and flood response behavior. The research results revealed that before and after PAIC training process implemented, the posttest mean scores of knowledge of environmental education principle, natural disaster from flood disaster, and flood response behavior and training achievement score were higher than pretest with statistical significance (p< .01, p< .01, p< .01, and p< .01) as illustrated in table 2. Table 2 Pretest and Posttest of Sample Group Results
Posttest Pretest t p X
S.D. X S.D.
Knowledge environmental education principle 9.50 0.63 8.03 0.44 4.203 .00**
Knowledge natural disaster from flood disaster 9.63 0.54 7.74 0.45 5.845 .00**
Knowledge flood response behavior 9.67 0.56 8.16 0.47 4.101 .00**
Training Achievement 28.77 0.78 24.56 0.56 8.125 .00** ** Significant Level at .01 4.2. Results of Three Dimensional Evaluations for Participation at Past Situation Three Dimensional Evaluations were employed for determination the perceptions at past situation of 38 leaders in three aspects evaluation, Self-evaluation, Friend-evaluation, and Facilitator-evaluation by using One-way ANOVA in order to investigate the mean scores difference of three group. The results of One-way ANOVA showed that there were no difference of mean scores about participation in training process through brain storming with statistical significance (p>.05) as illustrated in table 3. This meant that the perceptions of elementary school students about themselves, their friends in the group and their facilitators were no different for their participation during the focus group discussion process as presented in table 3. Table 3 Three Dimension Evaluation of Sample Group Participation at Past Situation
Source of Variation Sum of squares df Mean Square F Sig.
Between Group Within Group Total
56.782 1153.965 1210.747
2 111 113
28.391 10.396
2.713 .071
* Significant Level at .05 From table 3, it was found that Self-Evaluation, Friend Evaluation and Facilitator Evaluation, there was no statistically significant at level of .05. It indicated that the evaluation in three dimensions at past situation of 38 leaders showed no differences for participation when considering on mean scores of 3 dimensions of Self-Evaluation, Friend Evaluation and Facilitator Evaluation for participation in each group of focus group discussion, therefore it can be concluded that perceptions of Self, Friend and Facilitator were consistent to each others.
Considering on mean scores of Three Dimensional Evaluation, the total mean scores of 5 aspects of evaluation items covering Participation in Asking Questions, Participation in Answering Questions s, Participation in Discussing, Participation in Activity Doing, and Participation in Activity Evaluating during focus group discussion with brain storming process, the findings discovered that 5 aspects of participations and total mean scores of Self Evaluation were a little lower than Friend Evaluation and Facilitator Evaluation as presented in table 4. Therefore One-Way ANOVA was employed to analyze the differences of mean scores of three aspects, it was found that there were no difference with statistically significant at level of .05 as presented in table 3.
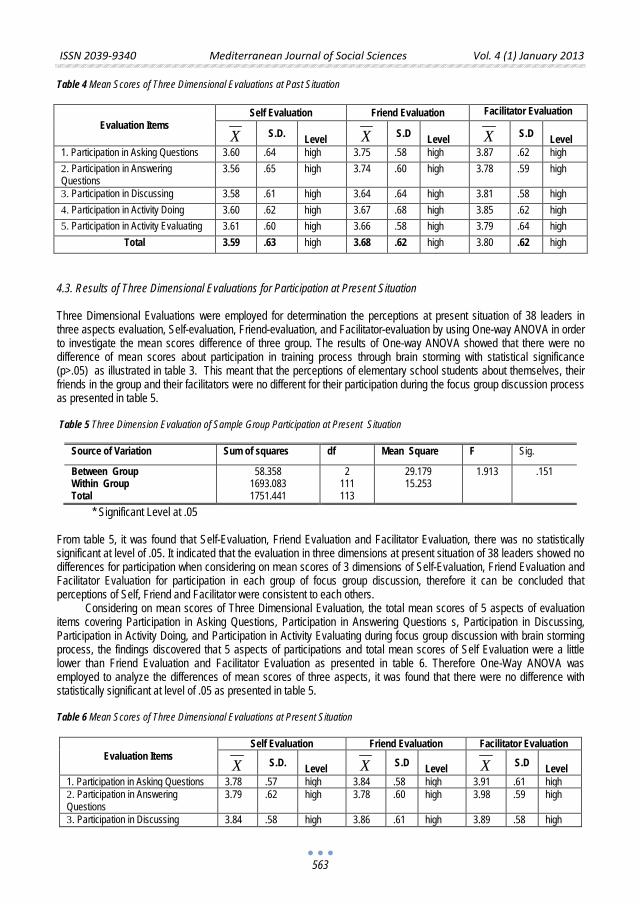
ISSN 2039-9340 Mediterranean Journal of Social Sciences Vol. 4 (1) January 2013
563
Table 4 Mean Scores of Three Dimensional Evaluations at Past Situation
Evaluation Items Self Evaluation Friend Evaluation Facilitator Evaluation
X S.D. Level X S.D
Level X S.D Level
1. Participation in Asking Questions 3.60 .64 high 3.75 .58 high 3.87 .62 high 2. Participation in Answering Questions
3.56 .65 high 3.74 .60 high 3.78 .59 high
3. Participation in Discussing 3.58 .61 high 3.64 .64 high 3.81 .58 high 4. Participation in Activity Doing 3.60 .62 high 3.67 .68 high 3.85 .62 high 5. Participation in Activity Evaluating 3.61 .60 high 3.66 .58 high 3.79 .64 high
Total 3.59 .63 high 3.68 .62 high 3.80 .62 high
4.3. Results of Three Dimensional Evaluations for Participation at Present Situation Three Dimensional Evaluations were employed for determination the perceptions at present situation of 38 leaders in three aspects evaluation, Self-evaluation, Friend-evaluation, and Facilitator-evaluation by using One-way ANOVA in order to investigate the mean scores difference of three group. The results of One-way ANOVA showed that there were no difference of mean scores about participation in training process through brain storming with statistical significance (p>.05) as illustrated in table 3. This meant that the perceptions of elementary school students about themselves, their friends in the group and their facilitators were no different for their participation during the focus group discussion process as presented in table 5. Table 5 Three Dimension Evaluation of Sample Group Participation at Present Situation
Source of Variation Sum of squares df Mean Square F Sig.
Between Group Within Group Total
58.358 1693.083 1751.441
2 111 113
29.179 15.253
1.913 .151
* Significant Level at .05 From table 5, it was found that Self-Evaluation, Friend Evaluation and Facilitator Evaluation, there was no statistically significant at level of .05. It indicated that the evaluation in three dimensions at present situation of 38 leaders showed no differences for participation when considering on mean scores of 3 dimensions of Self-Evaluation, Friend Evaluation and Facilitator Evaluation for participation in each group of focus group discussion, therefore it can be concluded that perceptions of Self, Friend and Facilitator were consistent to each others.
Considering on mean scores of Three Dimensional Evaluation, the total mean scores of 5 aspects of evaluation items covering Participation in Asking Questions, Participation in Answering Questions s, Participation in Discussing, Participation in Activity Doing, and Participation in Activity Evaluating during focus group discussion with brain storming process, the findings discovered that 5 aspects of participations and total mean scores of Self Evaluation were a little lower than Friend Evaluation and Facilitator Evaluation as presented in table 6. Therefore One-Way ANOVA was employed to analyze the differences of mean scores of three aspects, it was found that there were no difference with statistically significant at level of .05 as presented in table 5. Table 6 Mean Scores of Three Dimensional Evaluations at Present Situation
Evaluation Items Self Evaluation Friend Evaluation Facilitator Evaluation
X S.D. Level X S.D
Level X S.D Level
1. Participation in Asking Questions 3.78 .57 high 3.84 .58 high 3.91 .61 high 2. Participation in Answering Questions
3.79 .62 high 3.78 .60 high 3.98 .59 high
3. Participation in Discussing 3.84 .58 high 3.86 .61 high 3.89 .58 high
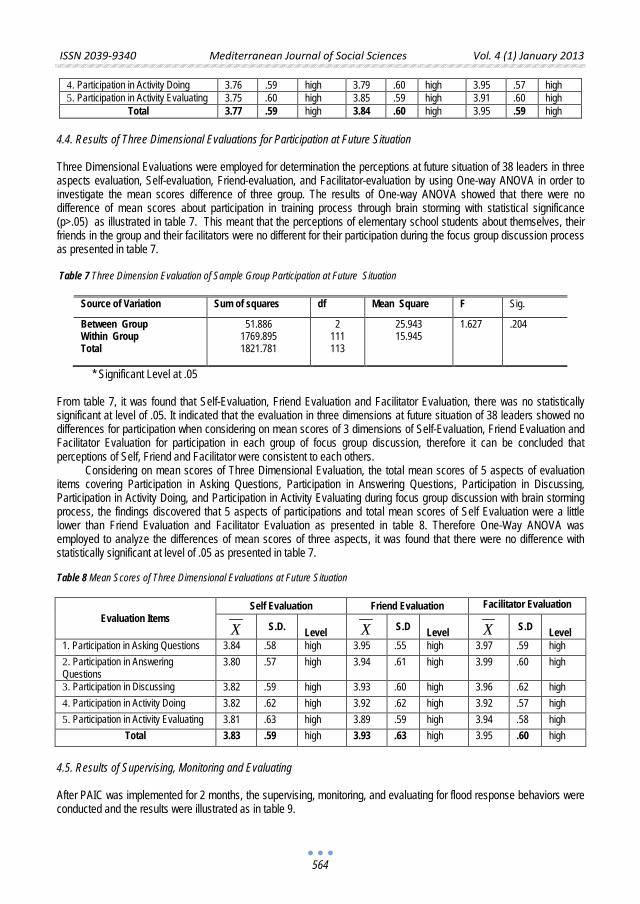
ISSN 2039-9340 Mediterranean Journal of Social Sciences Vol. 4 (1) January 2013
564
4. Participation in Activity Doing 3.76 .59 high 3.79 .60 high 3.95 .57 high 5. Participation in Activity Evaluating 3.75 .60 high 3.85 .59 high 3.91 .60 high
Total 3.77 .59 high 3.84 .60 high 3.95 .59 high 4.4. Results of Three Dimensional Evaluations for Participation at Future Situation Three Dimensional Evaluations were employed for determination the perceptions at future situation of 38 leaders in three aspects evaluation, Self-evaluation, Friend-evaluation, and Facilitator-evaluation by using One-way ANOVA in order to investigate the mean scores difference of three group. The results of One-way ANOVA showed that there were no difference of mean scores about participation in training process through brain storming with statistical significance (p>.05) as illustrated in table 7. This meant that the perceptions of elementary school students about themselves, their friends in the group and their facilitators were no different for their participation during the focus group discussion process as presented in table 7. Table 7 Three Dimension Evaluation of Sample Group Participation at Future Situation
Source of Variation Sum of squares df Mean Square F Sig.
Between Group Within Group Total
51.886 1769.895 1821.781
2 111 113
25.943 15.945
1.627 .204
* Significant Level at .05 From table 7, it was found that Self-Evaluation, Friend Evaluation and Facilitator Evaluation, there was no statistically significant at level of .05. It indicated that the evaluation in three dimensions at future situation of 38 leaders showed no differences for participation when considering on mean scores of 3 dimensions of Self-Evaluation, Friend Evaluation and Facilitator Evaluation for participation in each group of focus group discussion, therefore it can be concluded that perceptions of Self, Friend and Facilitator were consistent to each others.
Considering on mean scores of Three Dimensional Evaluation, the total mean scores of 5 aspects of evaluation items covering Participation in Asking Questions, Participation in Answering Questions, Participation in Discussing, Participation in Activity Doing, and Participation in Activity Evaluating during focus group discussion with brain storming process, the findings discovered that 5 aspects of participations and total mean scores of Self Evaluation were a little lower than Friend Evaluation and Facilitator Evaluation as presented in table 8. Therefore One-Way ANOVA was employed to analyze the differences of mean scores of three aspects, it was found that there were no difference with statistically significant at level of .05 as presented in table 7. Table 8 Mean Scores of Three Dimensional Evaluations at Future Situation
Evaluation Items Self Evaluation Friend Evaluation Facilitator Evaluation
X S.D. Level X S.D
Level X S.D Level
1. Participation in Asking Questions 3.84 .58 high 3.95 .55 high 3.97 .59 high 2. Participation in Answering Questions
3.80 .57 high 3.94 .61 high 3.99 .60 high
3. Participation in Discussing 3.82 .59 high 3.93 .60 high 3.96 .62 high 4. Participation in Activity Doing 3.82 .62 high 3.92 .62 high 3.92 .57 high 5. Participation in Activity Evaluating 3.81 .63 high 3.89 .59 high 3.94 .58 high
Total 3.83 .59 high 3.93 .63 high 3.95 .60 high
4.5. Results of Supervising, Monitoring and Evaluating After PAIC was implemented for 2 months, the supervising, monitoring, and evaluating for flood response behaviors were conducted and the results were illustrated as in table 9.
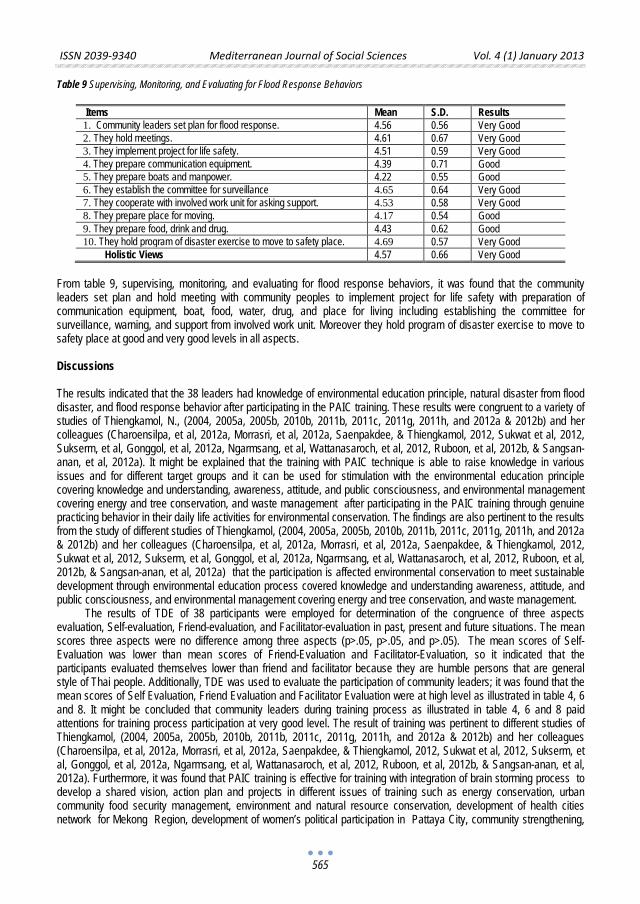
ISSN 2039-9340 Mediterranean Journal of Social Sciences Vol. 4 (1) January 2013
565
Table 9 Supervising, Monitoring, and Evaluating for Flood Response Behaviors
Items Mean S.D. Results 1. Community leaders set plan for flood response. 4.56 0.56 Very Good 2. They hold meetings. 4.61 0.67 Very Good 3. They implement project for life safety. 4.51 0.59 Very Good 4. They prepare communication equipment. 4.39 0.71 Good 5. They prepare boats and manpower. 4.22 0.55 Good 6. They establish the committee for surveillance 4.65 0.64 Very Good 7. They cooperate with involved work unit for asking support. 4.53 0.58 Very Good 8. They prepare place for moving. 4.17 0.54 Good 9. They prepare food, drink and drug. 4.43 0.62 Good 10. They hold program of disaster exercise to move to safety place. 4.69 0.57 Very Good Holistic Views 4.57 0.66 Very Good
From table 9, supervising, monitoring, and evaluating for flood response behaviors, it was found that the community leaders set plan and hold meeting with community peoples to implement project for life safety with preparation of communication equipment, boat, food, water, drug, and place for living including establishing the committee for surveillance, warning, and support from involved work unit. Moreover they hold program of disaster exercise to move to safety place at good and very good levels in all aspects. Discussions
The results indicated that the 38 leaders had knowledge of environmental education principle, natural disaster from flood disaster, and flood response behavior after participating in the PAIC training. These results were congruent to a variety of studies of Thiengkamol, N., (2004, 2005a, 2005b, 2010b, 2011b, 2011c, 2011g, 2011h, and 2012a & 2012b) and her colleagues (Charoensilpa, et al, 2012a, Morrasri, et al, 2012a, Saenpakdee, & Thiengkamol, 2012, Sukwat et al, 2012, Sukserm, et al, Gonggol, et al, 2012a, Ngarmsang, et al, Wattanasaroch, et al, 2012, Ruboon, et al, 2012b, & Sangsan-anan, et al, 2012a). It might be explained that the training with PAIC technique is able to raise knowledge in various issues and for different target groups and it can be used for stimulation with the environmental education principle covering knowledge and understanding, awareness, attitude, and public consciousness, and environmental management covering energy and tree conservation, and waste management after participating in the PAIC training through genuine practicing behavior in their daily life activities for environmental conservation. The findings are also pertinent to the results from the study of different studies of Thiengkamol, (2004, 2005a, 2005b, 2010b, 2011b, 2011c, 2011g, 2011h, and 2012a & 2012b) and her colleagues (Charoensilpa, et al, 2012a, Morrasri, et al, 2012a, Saenpakdee, & Thiengkamol, 2012, Sukwat et al, 2012, Sukserm, et al, Gonggol, et al, 2012a, Ngarmsang, et al, Wattanasaroch, et al, 2012, Ruboon, et al, 2012b, & Sangsan-anan, et al, 2012a) that the participation is affected environmental conservation to meet sustainable development through environmental education process covered knowledge and understanding awareness, attitude, and public consciousness, and environmental management covering energy and tree conservation, and waste management.
The results of TDE of 38 participants were employed for determination of the congruence of three aspects evaluation, Self-evaluation, Friend-evaluation, and Facilitator-evaluation in past, present and future situations. The mean scores three aspects were no difference among three aspects (p>.05, p>.05, and p>.05). The mean scores of Self-Evaluation was lower than mean scores of Friend-Evaluation and Facilitator-Evaluation, so it indicated that the participants evaluated themselves lower than friend and facilitator because they are humble persons that are general style of Thai people. Additionally, TDE was used to evaluate the participation of community leaders; it was found that the mean scores of Self Evaluation, Friend Evaluation and Facilitator Evaluation were at high level as illustrated in table 4, 6 and 8. It might be concluded that community leaders during training process as illustrated in table 4, 6 and 8 paid attentions for training process participation at very good level. The result of training was pertinent to different studies of Thiengkamol, (2004, 2005a, 2005b, 2010b, 2011b, 2011c, 2011g, 2011h, and 2012a & 2012b) and her colleagues (Charoensilpa, et al, 2012a, Morrasri, et al, 2012a, Saenpakdee, & Thiengkamol, 2012, Sukwat et al, 2012, Sukserm, et al, Gonggol, et al, 2012a, Ngarmsang, et al, Wattanasaroch, et al, 2012, Ruboon, et al, 2012b, & Sangsan-anan, et al, 2012a). Furthermore, it was found that PAIC training is effective for training with integration of brain storming process to develop a shared vision, action plan and projects in different issues of training such as energy conservation, urban community food security management, environment and natural resource conservation, development of health cities network for Mekong Region, development of women’s political participation in Pattaya City, community strengthening,
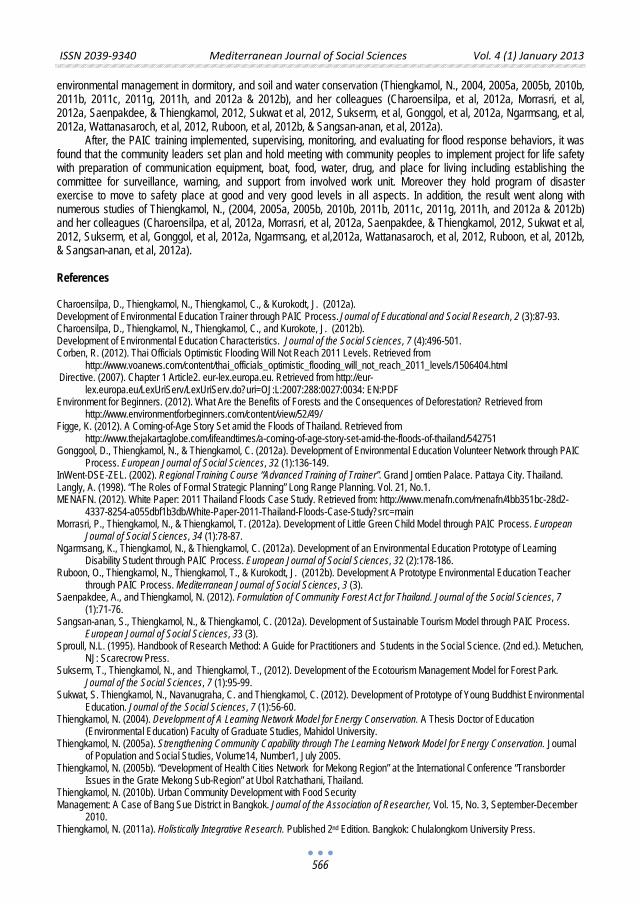
ISSN 2039-9340 Mediterranean Journal of Social Sciences Vol. 4 (1) January 2013
566
environmental management in dormitory, and soil and water conservation (Thiengkamol, N., 2004, 2005a, 2005b, 2010b, 2011b, 2011c, 2011g, 2011h, and 2012a & 2012b), and her colleagues (Charoensilpa, et al, 2012a, Morrasri, et al, 2012a, Saenpakdee, & Thiengkamol, 2012, Sukwat et al, 2012, Sukserm, et al, Gonggol, et al, 2012a, Ngarmsang, et al, 2012a, Wattanasaroch, et al, 2012, Ruboon, et al, 2012b, & Sangsan-anan, et al, 2012a). After, the PAIC training implemented, supervising, monitoring, and evaluating for flood response behaviors, it was found that the community leaders set plan and hold meeting with community peoples to implement project for life safety with preparation of communication equipment, boat, food, water, drug, and place for living including establishing the committee for surveillance, warning, and support from involved work unit. Moreover they hold program of disaster exercise to move to safety place at good and very good levels in all aspects. In addition, the result went along with numerous studies of Thiengkamol, N., (2004, 2005a, 2005b, 2010b, 2011b, 2011c, 2011g, 2011h, and 2012a & 2012b) and her colleagues (Charoensilpa, et al, 2012a, Morrasri, et al, 2012a, Saenpakdee, & Thiengkamol, 2012, Sukwat et al, 2012, Sukserm, et al, Gonggol, et al, 2012a, Ngarmsang, et al,2012a, Wattanasaroch, et al, 2012, Ruboon, et al, 2012b, & Sangsan-anan, et al, 2012a). References
Charoensilpa, D., Thiengkamol, N., Thiengkamol, C., & Kurokodt, J. (2012a). Development of Environmental Education Trainer through PAIC Process. Journal of Educational and Social Research, 2 (3):87-93. Charoensilpa, D., Thiengkamol, N., Thiengkamol, C., and Kurokote, J. (2012b). Development of Environmental Education Characteristics. Journal of the Social Sciences, 7 (4):496-501. Corben, R. (2012). Thai Officials Optimistic Flooding Will Not Reach 2011 Levels. Retrieved from
http://www.voanews.com/content/thai_officials_optimistic_flooding_will_not_reach_2011_levels/1506404.html Directive. (2007). Chapter 1 Article2. eur-lex.europa.eu. Retrieved from http://eur-
lex.europa.eu/LexUriServ/LexUriServ.do?uri=OJ:L:2007:288:0027:0034: EN:PDF Environment for Beginners. (2012). What Are the Benefits of Forests and the Consequences of Deforestation? Retrieved from
http://www.environmentforbeginners.com/content/view/52/49/ Figge, K. (2012). A Coming-of-Age Story Set amid the Floods of Thailand. Retrieved from
http://www.thejakartaglobe.com/lifeandtimes/a-coming-of-age-story-set-amid-the-floods-of-thailand/542751 Gonggool, D., Thiengkamol, N., & Thiengkamol, C. (2012a). Development of Environmental Education Volunteer Network through PAIC
Process. European Journal of Social Sciences, 32 (1):136-149. InWent-DSE-ZEL. (2002). Regional Training Course “Advanced Training of Trainer”. Grand Jomtien Palace. Pattaya City. Thailand. Langly, A. (1998). “The Roles of Formal Strategic Planning” Long Range Planning. Vol. 21, No.1. MENAFN. (2012). White Paper: 2011 Thailand Floods Case Study. Retrieved from: http://www.menafn.com/menafn/4bb351bc-28d2-
4337-8254-a055dbf1b3db/White-Paper-2011-Thailand-Floods-Case-Study?src=main Morrasri, P., Thiengkamol, N., & Thiengkamol, T. (2012a). Development of Little Green Child Model through PAIC Process. European
Journal of Social Sciences, 34 (1):78-87. Ngarmsang, K., Thiengkamol, N., & Thiengkamol, C. (2012a). Development of an Environmental Education Prototype of Learning
Disability Student through PAIC Process. European Journal of Social Sciences, 32 (2):178-186. Ruboon, O., Thiengkamol, N., Thiengkamol, T., & Kurokodt, J. (2012b). Development A Prototype Environmental Education Teacher
through PAIC Process. Mediterranean Journal of Social Sciences, 3 (3). Saenpakdee, A., and Thiengkamol, N. (2012). Formulation of Community Forest Act for Thailand. Journal of the Social Sciences, 7
(1):71-76. Sangsan-anan, S., Thiengkamol, N., & Thiengkamol, C. (2012a). Development of Sustainable Tourism Model through PAIC Process.
European Journal of Social Sciences, 33 (3). Sproull, N.L. (1995). Handbook of Research Method: A Guide for Practitioners and Students in the Social Science. (2nd ed.). Metuchen,
NJ: Scarecrow Press. Sukserm, T., Thiengkamol, N., and Thiengkamol, T., (2012). Development of the Ecotourism Management Model for Forest Park.
Journal of the Social Sciences, 7 (1):95-99. Sukwat, S. Thiengkamol, N., Navanugraha, C. and Thiengkamol, C. (2012). Development of Prototype of Young Buddhist Environmental
Education. Journal of the Social Sciences, 7 (1):56-60. Thiengkamol, N. (2004). Development of A Learning Network Model for Energy Conservation. A Thesis Doctor of Education
(Environmental Education) Faculty of Graduate Studies, Mahidol University. Thiengkamol, N. (2005a). Strengthening Community Capability through The Learning Network Model for Energy Conservation. Journal
of Population and Social Studies, Volume14, Number1, July 2005. Thiengkamol, N. (2005b). “Development of Health Cities Network for Mekong Region” at the International Conference “Transborder
Issues in the Grate Mekong Sub-Region” at Ubol Ratchathani, Thailand. Thiengkamol, N. (2010b). Urban Community Development with Food Security Management: A Case of Bang Sue District in Bangkok. Journal of the Association of Researcher, Vol. 15, No. 3, September-December
2010. Thiengkamol, N. (2011a). Holistically Integrative Research. Published 2nd Edition. Bangkok: Chulalongkorn University Press.
ISSN 2039-9340 Mediterranean Journal of Social Sciences Vol. 4 (1) January 2013
567
Thiengkamol, .N. (2011e). Environment and Development Book 1. Published 4th Edition. Bangkok: Chulalongkorn University Press. Thiengkamol, N. (2011g). Development of Energy Security Management for Rural Community. Canadian Social Science, 7 (5), October
31, 2011. Thiengkamol, N. (2011h). Development of a Food Security Management Model for Agricultural Community. Canadian Social Science,
7 (5), October 31, 2011. Thiengkamol, N. (2011i). Development of Model of Environmental Education and Inspiration of Public Consciousness Influencing to
Global Warming Alleviation. European Journal of Social Sciences, 25 (4):506-514. Thiengkamol, N. (2011j). Model of Psychological State Affecting to Global Warming Alleviation. Canadian Social Science, 7 (6):89-95,
December 31, 2011. Thiengkamol, .N. (2012a). Development of A Prototype of Environmental Education Volunteer. Journal of the Social Sciences, 7 (1):77-
81. Thiengkamol, N. (2012b). Development of Food Security Management for Undergraduate Student Mahasarakham University. European
Journal of Social Sciences, 27 (2):246-252. Thiengkamol, N. (2012c). Model of Psychological Trait Affecting to Global Warming Alleviation. European Journal of Social Sciences, 30
(3), 484-492. http://en.wikipedia.org/wiki/List_of_countries_by_carbon_dioxide_emissions_per_capita. UNESCO. (1978). Intergovernmental
Conference on Environmental Education Organized by UNESCO in Cooperation with UNEP Tbilisi (USSR) 14-16 October 1977. Final Reports. Paris: UNESCO.
UNFPA. (2012). World Population Day 2012. Retrieved from http://www.unfpa.org/public/world-population-day Wattanasaroch, K., Thiengkamol, N. Navanugraha, C., & Thiengkamol, T. (2012). Training ISO 14001 to Develop Green Dormitory
Standards. Journal of The Social Sciences, 7 (2): 98-110. Weiss, J. W. (1995). Organizational Behavior and Change: Managing Diversity, Cross Cultural Dynamics and Ethics. Anaheim, CA:
West Publishers. Wikipedia. (2012). Disaster. Retrieved from http://en.wikipedia.org/wiki/Disaster Wikipedia. (2012). Flood. Retrieved from http://en.wikipedia.org/wiki/Flood

ISSN 2039-9340 Mediterranean Journal of Social Sciences Vol. 4 (1) January 2013
569
Democracy and Development in Africa: The Nigerian Experience
S.M. Omodia Ph.D., FCIM
Associate Professor, Department of Political Science,
Kogi State University, Anyigba, Nigeria Email: [email protected],
[email protected] +2348020651272
Doi:10.5901/mjss.2013.v4n1p569 Abstract
This paper discusses the hyphen and buckle between democracy and development in Africa with specific focus on the Nigerian State. Its major focus is anchored on the positive transformation of the standard of living of the people. This transformational change in the lives of the Nigerian people was unfolded through the factorial analysis of the concepts: poverty, quality of governance cum political participation and national integration. The conception and argument of the researcher is that democracy as a political mechanism for development has witnessed minimal or no qualitative transformation in the lives of the people as it pertain poverty reduction, political participation and national integration as a result of poor governance. Thus, the researcher recommends that if democracy is to positively impact on development especially in the Nigerian State, there is need for the present democratic system to be restructured in such a way that the system is largely integrative of the people through their involvement in policy or programme initiation at the party level, communal and national level. Coupled with the above is the need for vibrant political opposition that would provide functional alternatives to issues that borders on poverty, performance and national integration.
Keywords: Democratization, Governance, National integration, Political participation, Poverty, Rotational presidency.
1. Introduction The conception of democracy here is the liberal type through which political power resides in the people. This political power could be directly exercised by the people especially in modern times through their decisions on sensitive matters expressed in form of plebiscite or referendum; or indirectly through their representatives in government (Magstadt, 2009). The import of this notion therefore is that democracy is a process and indeed a developmental process which encompasses the people. In other words, the people are so central to democracy in that when the people develop politically, then the democratic process is bound to transform to maturity stage.
Conversely, while the above paragraph unfolds democracy as part of development, as a matter of fact political development; it is also important to note that democracy itself could also impact on development. This is because the democratic processes, especially in emerging states of Africa, constitute a learning process in which democratic attributes such as tolerance, accountability, effective organization, and transparency are learnt and manifested as part of democratic norm for the good of the system and for political development.
In Africa, the need for democratization especially as witnessed in most nation-states in the 1990’s is based on the conception that democratic governance constitutes a major tool for socio-economic and institutional transformation or development (Olagunju et.al 1993; Omodia 2007; Johari 2011; Omodia 2012a). Thus, the pattern of democratization was majorly anchored on the transition from either one-partyism to competitive party democracy or from military rule to competitive party democracy.
In the case of Nigeria political transitions into republicanism except in the first republic, were from military dictatorship to competitive party politics. Although it must be stated that under military governance, developmental strides at reducing poverty and strengthening national integration were intended through the adoption of various strategies (Aku et.al 2007; Omodia 2005; Omodia 2007b). However, one need to mention that political development was quite minimal as a result of the nature of military governance which is not designed to be integrative of the people. This factor no doubt also negatively impacted on the success of poverty reduction and national integration strategies of military regimes.
Thus, democratic governance especially in the mid 1990’s and late 1990’s in Nigeria was viewed as a functional mechanism that would bring about an enduring development to the Nigerian state. As a result, the focus of this paper is

ISSN 2039-9340 Mediterranean Journal of Social Sciences Vol. 4 (1) January 2013
570
to unfold the extent through which the present democratic experiment has brought development to the Nigerian people with specific focus on the concept of poverty, political participation cum governance and national integration.
In order to achieve the above stated objective, this paper in addition to the introduction is sectionalized into the followings: Framework of analysis, democracy and poverty reduction, democracy and governance, democracy and national integration, towards national development in Nigeria and concluding remarks. 2. Framework of Analysis The framework of analysis is anchored on the elitist democratic theory. This is basically for the purpose of unfolding the pattern of poverty, political participation cum governance and national integration in the Nigerian state with reference to democracy and development. The elitist democratic theory views democracy as a process in which the notion of majority rule is ideal and utopian (Janda et al. 1997). The conception of this school of thought is that the democratic process tends to be manipulated in favour of the elitist class as a result of their organizational political skills. And although the democratic system unlike an autocratic system allows for various interests to be articulated, there is no doubt that policy output and political representation is basically a function of elitist interest. As a matter of fact, the argument is such that the democratic process could be viewed as cosmetic in term of majoritarian rule because the electorates are often manipulated to choose between elites or candidates thrown – up by elitist determined party primaries.
Conversely, the notion that the competition for the acquisition of political power is restricted to the political elites as conceptualized by the elitist democratic theorists (Geraint 1969; Robert 1975; Jenda et.al 1997; Omodia 2004) is an indication that contradiction tend to exist within the same class and that the elitist class is not as homogenous as operationalized by Robert (1975).
When the above stated scenario is related to the Nigerian state, the questions that come to mind are: what has been the impact of elitist dominated democratic system on poverty? What has been the impact on political participation or governance? What is the impact of elitist contradiction as regard the competition for the acquisition of political power on national integration? Could threats to the survival of the Nigerian multi-ethnic state be attributed to the manipulation of the state structure in favour of personal and class survival?
Thus, the justification of the elitist democratic theory as a framework of analysis could be based on its utility in addressing the above stated questions using the concepts of poverty, political participation and national integration with specific focus on the Nigerian Fourth Republic. 3. Analysis and Discussion 3.1 Democracy and Poverty Reduction Poverty is a multi – faceted concept which encompasses economic, political, social, ideological and even technological dimensions. Economic poverty focuses on the inability of an individual or group to meet – up with the basic necessities of human existence. Political poverty on the other hand exists based on the exclusion of an individual or group from political participation. That is, politically an individual or group could be said to be poor based on their exclusion from participation in the political process.
Conversely, social poverty exist when an individual or group of people are discriminated against on the basis of social status; while ideological and technological poverty exist when an individual or group of people lack the value for developmental process or exist on primitive productive capability respectively (Aku et.al. 1997; Dike 1997; Omodia 2007b).
From the above understanding of the perspectives of poverty, it is important to accentuate that the dimensions of poverty are not mutually exclusive in that the existence of ideological, technological, political or social poverty in an individual or a nation state could impact greatly on economic poverty. For instance, a country that is lacking in technological capability for production would no doubt manifest attributes of economic poverty, and a country that is economically buoyant would no doubt possess the capability for technological advancement.
Thus, this section focuses on economic poverty as means of understanding democracy and poverty in Nigeria basically because other dimensions of poverty especially social, ideological, political and technological tend to influence the state of economic buoyancy.
As earlier stated, one of the reasons while Nigerians favoured democratic governance to military dictatorship especially in the 1990’s was their conviction that democratic governance would be able to salvage the disgusting economic scenario in the Nigerian state which was to a great extent associated with long years of military dictatorship (Dinneya 2006). For instance while poverty was just 28% in 1980 during Shehu Shagari civilian administration, it rose to
ISSN 2039-9340 Mediterranean Journal of Social Sciences Vol. 4 (1) January 2013
571
46% five years after, and further rose to 66% in 1996 and in 1999 when the military transited to civilian governance poverty had risen to 70% (National Poverty Eradication Blueprint 2001; NEEDS 2004). Under democratic governance, although the poverty level reduced from 70% in 1999 to 54.7% in 2004, however in 2010 there was an upward shift to 60.9% and it is expected to increase further in 2012 (Ale 2012) because of such factors as corruption and poor political governance. Infact, under the present democratic dispensation of the fourth republic, while the economy has been growing positively, the rate of poverty has been increasing. This could be associated with political corruption which has led to improved economic status of the few, especially the political office holders at the expense of the majority who live in abject poverty.
The effect of this scenario has been loss of confidence in democratic governance which has heightened military as a means of economic survival in most parts of Nigeria. Examples that come to mind are: the Niger – Delta militancy as a result of the poverty associated with the environmental degradation of that part of the country. This is coupled with the frustration and loss of confidence in democratic governance by the northern group ‘Boko Haram’ who called for the islamization of governance in the North. 3.2 Democracy and Governance Democracy as a political system could be said to be antithetical to political poverty in that it is design to empower the people as regard political participation. However, if the conceptualization of democracy by the elitist school is taken cognizance of, it means that democratic governance especially as it pertain to political participation and majority rule could be viewed as ‘ideal’ which is different from the reality.
In the Nigerian state, the democratic process of governance and political participation is seen as a learning one. This is because the democratic structures and institutions are very fragile and coupled with the fact that the citizenry to a great extent manifest low level of democratic culture as a result of long years of military dictatorship. Thus, the democratic process is associated with low level of voter cum political education, party indiscipline on the part of party officials and party representatives in government, vote manipulations and political representation that is not people centred, weak party opposition among others.
As regard political education, the fragile and weak nature of political institutions in Nigeria, especially political parties, has led to a scenario in which voting is not base on issues. This is coupled with the fact that, political parties in opposition do not present themselves as credible alternatives to the party in government, the effect therefore is that the electorate in most cases do not tend to make informed decisions on what the parties stand for and how their programmes are likely going to affect them. This is in addition to the fact that vote cancellation is still on the high side and voter turn – out is on the average and this cannot be divorced from political education (Omodia 2012b).
On party indiscipline, the present democratic dispensation has manifested a lot of it. As a matter of fact, the period between 1999 to 2007 was associated with the cross – carpeting of elected government officials from one party to the other for the purpose of securing political advantage thereby betraying the trust of those who voted for them based on party affiliation (Omodia 2010). This is in addition to conflict that exists between party executives and party elected officials in government. A typical example is the conflict that existed between Audu Ogbeh, the National Chairman of the Peoples Democratic Party (PDP) and Obasanjo, the head of the PDP administered executive arm of government as a result of utterances that were not complementary to the PDP administered federal government (Omodia 2010). Worthy of mentioning is the conflict between arms of elected government officials of the same party as the case between the President Olusegun Obasanjo led executive and PDP dominated legislative arm that threatened impeachment against president Obasanjo. The effect of course was the overbearing influence of the Executive in legislative affairs which led to instability in leadership in both the Senate and the Federal House of Representatives (Omodia 2010). This is not forgetting conflict and party indiscipline on the part of elected officials in the same arm of government. E.g. the President/Vice President conflict under the Obasanjo led administration and the several conflicts between Governors and their deputies in most states of the federation.
As regard vote manipulation and political representation, as a matter of fact, elections in the Nigerian fourth republic has been characterized by a scenario in which to a great extent votes are manipulated and design not to count by the parties in government in collaboration with the electoral body. The fact that electoral victories of the 2007 gubernatorial elections in states like Ondo, Edo, Ekiti, Osun to mention a few were redeemed through the judicial process is an indication of the magnitude of electoral manipulations that takes place at electoral booths, collations centres and the announcement of electoral results.
The implication of the above is that political representation and governance is not people centred and this of course is antithetical to democratic stability because for democracy or democratic governance to endure, it must be built on the people.
ISSN 2039-9340 Mediterranean Journal of Social Sciences Vol. 4 (1) January 2013
572
3.3 Democracy and National Integration At this juncture, the question that comes to mind is: If democratic governance in Nigeria has not been able to curb poverty, if it has not been able to enhance governmental performance in contrary to the expectations of the people on democratic governance, what then is the implication on national integration? In discussing democracy and national integration, it is important to emphasize that the researcher’s conception of national integration is not limited to territorial integration or sovereignty but most especially it is anchored on shared value system, and belief system in the project called the Nigerian state and its system.
Conversely, unfolding events in the Nigerian state, especially in the Nigerian fourth republic is indicative of threats to national integration as a result of frustration and loss of confidence in governance because of such factors as poverty and poor political leadership or representation. These frustration and loss of confidence in governance have led to persistent demand for the convocation of a sovereign national confidence in order to address the problem of Nigeria’s federalism, revenue allocation, rights of the minority among others, in order to strengthen the national belief system.
As a matter of fact, the present democratic dispensation has manifested traits of poor integrative mechanism based on conflict and mutual suspicion that exist not only between the North and South, but also within regions. In fact, democratically speaking, the Nigerian state exist as a divide between the North and South in term of power acquisition at the federal level based on the principle of ‘Rotational presidency’. This no doubt explain the political topsy-turvy associated with the demise of Umaru Musa Yar’Adua as the president of Nigeria in May 2010 vis-à-vis the heightened activity of ‘Boko-Haram’ – the northern ethnic militia that favours the islamization of the north (Omodia 2012a) based on its expression of lack of confidence in the Nigerian constitution that favoured the constitutional take – over of the Presidential Seat by Goodluck Jonathan from the South. The implication has been costly and damaging to national integration because of the anomic scenario in the north especially after the outcome of the 2011 presidential election which witnessed mass killings of Southerners in the North, and the subsequent rejection of about 6696 Batch B 2012 Southern National Youth Service Corps members from serving in some states in the northern part of the country (Daily Trust 2012).
As regard intra-regional conflict, the present democratic arrangement and dispensation could be said to have thrown – up a lot of it in the history of the Nigerian state. This is because the nature of the conflict to a great extent is associated with democratic representation. A typical example is the conflict of ‘indigeneship – settleship’ which is associated with political rights of representation and governance in Plateau State. Others include the Bassa – Egbira conflict in Nasarawa State, Ife – Modakeke conflict in Osun State, Uhrobo – Itsekiri conflict in Delta State among others. It is however, important to state that these conflicts cannot be divorced from political governance and representation especially at the local level. 4. Towards National Development The discourse on democracy and development in Africa with specific focus on the Nigerian state from the perspective of this paper has shown that a lot still need to be done especially in the aspects of poverty reduction, quality governance and national integration. In order for the present democratic experiment to impact positively on Nigerians there is need for the present party system, though multi – partyism, to be restructured and rationalized with emphasis on membership recruitment, structure for political education, national spread to eschew ethnicism, practice of internal democracy and mode of funding. This will not only enable for party discipline in government, but also enable for vibrancy in political opposition that would allow for functional alternatives to issues that borders on poverty, performance and national integration. 5. Conclusion The Nigerian experience as regard democracy and development based on the analysis of this paper has shown that poverty reduction, quality of governance and national integration constitute a major challenge to democratic survival and consolidation in the Nigerian fourth republic. The implication is that while these challenges could be viewed as challenges associated with democratic development, the conception here is that if the challenges are not properly managed and development integrative of the people, the present republic might go the way of past republics.
ISSN 2039-9340 Mediterranean Journal of Social Sciences Vol. 4 (1) January 2013
573
References Aku, P.S., Ibrahim M.J., and Bulus, Y.D. (1997). Poverty and poverty alleviation strategies in Nigeria. Proceedings of the Nigerian
Economic Society, University of Ibadan. Ale, S. (2012). Creating a sustainable knowledge based and innovation driven economy, A Convocation Lecture Presented at the 4th
Convocation of Kogi State University Anyigba, Kogi State Nigeria, 20th September. Daily Trust Newspapers, Tuesday October 2, 2012 p.1 and 5. Dike W. (1997). Understanding the multi dimensional nature of poverty. Proceedings of the Nigerian Economic Society, University of
Ibadan. Dinneya G. (2006). Political Economy of Democratization in Nigeria. Lagos: Concept Publications. Geraint, P. (1969). Political Elites. London: George Allen and Unwin Ltd. Janda, K., Berry, J. and Goldman, J. (1997). The Challenge of Democracy. New York: Houghton Mifflin Company Johari, J.C. (2011). Comparative Politics. New Delhi: Sterling Publishers Magstadt, T.M. (2009). Understanding Politics: Ideas, Institutions and Issues. USA: Wadsworth Cengage Learning. National Economic Empowerment Development Strategy (NEEDS) Nigeria: Meeting Everyone’s Needs (2004). Abuja: National Planning
Commission. National Poverty Eradication Programme: Blueprint for the Scheme, 2001. Olangunju, T., Jinandu, A. and Oyovbaire, S. (1993). Transition to Democracy in Nigeria. Ibadan: Spectrum Books. Omodia, S.M (2004). Elitist hedonism and democratic survival in Nigeria. The Nigeria Academic Forum 7(3):52-55 Omodia, S.M. (2005). Poverty alleviation in a deregulated economy: challenges prospects for sustainable democracy in Nigeria.
Nasarawa Journal of Administration 2(1):118-124. Omodia, S.M. (2007a). Governance and democratization in Africa; The Nigerian experience. The Social Sciences (2):134-138 Omodia, S.M. (2007b). Poverty alleviation sustainable democracy in Nigeria: a case study of Keffi town in Keffi Local Government Area
of Nasarawa State. Ph.D Thesis. Department of Political Science, University of Abuja, Nigeria. Omodia, S.M. (2010). Political parties and party polities in the Nigerian fourth Republic. Trakia Journal of Science 8(3):65-69. Omodia S.m (2012a). Political leadership and national security in the Nigerian fourth republic: a discourse. African Journal of Social
Sciences. 2(4): 90-96 Omodia, S.M. (2012b). Political parties and the challenge of free and fair elections in Nigeria: a focus on Kogi State 2011
gubernatorial election. European Scientific Journal 8(3):188-199. Robert, P. (1975). The comparative study of political Elites. New York: Prentice-Hall Incorporation.

ISSN 2039-9340 Mediterranean Journal of Social Sciences Vol. 4 (1) January 2013
575
Multidimensional Determinants of foreign Direct Investment in
Central Africa: A Modified Gravity GMM Panel Approach
Ibrahim Ngouhouo
Senior lecturer at the Faculty of Economics and Management, University of Dschang, Cameroon
Email: [email protected] Tel: 237-94662260 Doi:10.5901/mjss.2013.v4n1p575 Abstract
This research's objective is to highlight the multidimensional determinants of FDI in Central Africa countries, especially in the Economic and Monetary Community of Central Africa (EMCCA). To do this, a modified and adapted gravity model is constructed and tested by the GMM method. The main result shows that natural resources are by far the most significant determinant of FDI in the EMCCA. Market size (population and gross domestic product) may also play a role in attracting FDI in addition to natural resources and infrastructure. However, we find that economic openness remains to be perfect to attract foreign investors.
Key words: Determinants; Specific advantage; FDI; Gravity model; natural resources;
1. Introduction The reasons why multinational companies (MNCs) locate in Central Africa than elsewhere are difficult to understand. Dunning (2001) argued that firms must locate where the "specific advantages" of a country maximize the benefits of the firm. In light of the case of other developing countries that Dunning thought, the question that arises is whether these reasons are the same in the EMCCA. What are the determinants of FDI in Central Africa? Are these determinants the same as elsewhere? Is there a specific instruction to draw FDI to Central Africa? We try to answer these various questions in this research.
The scientific basis of FDI has been built from three major schools of thought: the traditionalist, the modernist and the integrationists. The greatest contribution of the traditionalists to FDI comes from its attention to the impact of FDI in developing countries (DCs) and its critics to the OLI paradigm that looks at FDI as essentially positive. On the other hand, the contributions of modernist (Mundell (1957), Hymer and Kindgleberger (1950-1960)…, and the structuralists have been widely criticized that all these theories are not verifiable. The image of Africa and particularly in Central Africa as a host area for FDI has not always been favorable. Often, Africa has been presented through its problems of famine, economic chaos, and political instability. However, Central Africa is the area in Africa that has achieved the highest average growth rate of GDP over the past ten years. The discovery and the beginning of oil production in Chad and Equatorial Guinea (two countries that were among the poorest in the world), and the rising price of a barrel of oil, opened new perspectives to these countries. However, the renewed growth seen over the last ten years after the two oil crises of the 1980s with disastrous consequences has been possible without the important contribution of foreign investors. Indeed, Chad's oil investment required several times the budget of this country, as well as that of Equatorial Guinea. At the same time, surveys undertaken in the former oil-producing countries such as Congo and Gabon led to discovery of a major marine deposit in the Congo, and operation of a new well in Gabon. All these achievements wouldn’t have been possible without the FDI in the hydrocarbons sector. Determinants of FDI in developing countries are increasingly the subject of numerous studies. Authors such as Assiedu (2001), Stiglitz (2002), Dupuch (2004), mold (2004), and especially Dunning (2001) have contributed, but little or no study was conducted in Central Africa. Is the abundance of natural resources in itself sufficient to attract FDI in the EMCCA? 75% of EMCCA countries are part of the least developed countries; it is necessary to check whether there is a particular form of FDI going to that
ISSN 2039-9340 Mediterranean Journal of Social Sciences Vol. 4 (1) January 2013
576
area. It's also necessary to know if corruption (often indexed in developing countries as a brake on FDI inflows), much maligned in the CEMAC represents an obstacle to the attractiveness of FDI. 2. Review of the Literature There is extensive literature on the determinants of FDI in developing countries. We first examine the results of some investigations that have been carried out. We then examine the literature on institutional factors (good governance, political stability and corruption) and economic factors (market size, fiscal and monetary policy, natural resources, etc.). 2.1 The investigation of the determinants of FDI In the years 1990, the Foreign Investment Advisory Service conducted a survey of hundreds of large multinationals in the Triad to try to identify the most important components in terms of FDI attractiveness. The results show that the political and economic stability at the top part of the conditions precedent to foreign direct investment in the area. Studies by AT Kearney with the leaders of very large global companies are in turn that five factors have the most influence on the choice of investment location: the market size, political stability and macroeconomic growth, the regulatory environment, the ability to repatriate profits (Business Development, 1999). The first survey covers 10,000 companies in 80 countries. The sample of African countries south of the Sahara (PASS) covers 413 companies in 16 countries including countries of the EMCCA (Cameroon). The companies concerned must give the 4 points which they say are forcing the business environment (1 = no stress to severe stress = 4). The second survey was conducted in 1996 and 1997 and covered 3,600 firms in 63 countries. The sample included 540 PASS for firms in 22 countries with two CEMAC countries (Chad and Cameroon). The same question was posed to stakeholders, but this time the notes ranged from 1 to 6 (1 = no stress to severe stress = 6). The third survey conducted in 1999/2000 covered 63 major multinational companies selected on a database of 100 largest multinationals, respondents were given the factors that had a negative impact on FDI in PASS. The last survey, covering 81 multinationals in the countries of the South Africa Development Community (SADC) and they were asked to provide the main sources of risks to FDI in this part of Africa. According to Assiedu the result of this survey shows that corruption is by far the biggest obstacle for FDI, followed by the laws and regulations on FDI, poor infrastructure, macroeconomic instability (which includes inflation and devaluation) and political instability. 2.2 Institutional Determinants of FDI in empirical models In general, there is some consensus about the role of institutions on the attractiveness of FDI in developing countries. The literature highlights some predominant aspects: the quality of institutions, the investment climate (reforms), corruption, political risk, and good governance.
Lucas (1993) thinks that political instability is a concern of foreign investors in developing countries. This instability is often manifested by the confiscation of property, dislocation of production structures, the change in macroeconomic management and especially the regulatory environment. McMillan (1995) believes instead that the stability of institutions may not have the expected positive effect, because even if the security of the investment is insured, it can have an effect as strong as that created by market forces. In the same vein, Wang and Swain (1997) find a negative correlation between FDI flows and political instability of multinational corporations and their subsidiaries: political instability, corruption, non-institutional transparency, payment or modification of sovereign debt, wars and coups are other situations that affect the business environment and therefore reduce the inflow of FDI. These changes may affect operating profits as the value of capital. Thus, country risk is multidimensional and pervasive in all international economic transactions.
Wilhelms (1998) analyzes the determinants of inward FDI in emerging economies between 1978 and 1995. For this, it uses an innovative concept called "institutional fitness" which is rooted in the theory of FDI and integrationist states that FDI is mainly determined by the institutional variables that may change in policy, laws and their applications. To test the concept, it uses an econometric model panel. The result obtained shows that the variable "government" and "market" are the most significant determinants of FDI inflows. It is clear from his analysis that when investors are willing to negotiate, they seek stability and transparency through just laws with respect to privileges.
Globerman and Shapiro (1999) abound in the same line and show that good institutions may have similar effects on the outward and inward FDI to the extent that they create an environment conducive to multinationals abroad. These authors deepen their idea in 2002 in a study on the impact of governance on FDI inflows from the United States to
ISSN 2039-9340 Mediterranean Journal of Social Sciences Vol. 4 (1) January 2013
577
developing countries using a probit model OLS. They find that national political infrastructure, measured by the six governance indicators estimated by Kaufmann, Kraay and Zoido-Lobaton (1999), is a determining factor for the output of U.S. FDI to countries with economies in transition.
The work of J. Morisset and O. Lumenga Neso (2002) lean instead on corruption and poor governance. The authors argue that corruption increases the administrative costs and thus discourage the entry of FDI. Other studies confirm the robustness of the political and institutional factors as important determinants of the location of FDI to developing countries [and Daude Stein (2001)] or in Latin America [Stevens (2000)].
Some empirical studies focus on the investment climate as a determinant of FDI. Econometric work in panel data with fixed effects led by K. Sekkat and M. Véganzonès-Varoudakis (2004) on a sample of 72 developing countries during the 1990s, show that reforms that focus on trade liberalization and exchange rate coefficient expressed by the Sachs-Warner and the investment climate (political and economic) are the determinants of the attractiveness of FDI. According to their findings, some countries in the MENA region (Algeria, Syria, Egypt and Iran) suffer from a lack of attractiveness related mainly to the delay of reforms and the deficiency of the political and economic conditions.
Some authors focus on country risk in the location decision of MNCs in developing countries. Thus, Hassan and Zlata (2001) attempt to explain the uneven distribution of FDI in developing countries by the country risk. Michalet (1997) argues in turn that when the legal and regulatory environment is constantly being changed arbitrarily, and there is no court that can ensure compliance, companies are forced to limit or even suspend their financial commitments.
Benassy-Quéré, Coupet and Mayer (2007) attempt to assess econometrically the role of institutional quality in a set of 52 countries on FDI in both origin and host countries to include an institutional variable. They build a panel gravity model and the results obtained show that the institutions of the host country influence the FDI with or without the inclusion of GDP per capita in the model.
2.3 Determinants of FDI in economic empirical models For Aisenman (1992), if an MNC has a flexible production structure, the volatility of exchange rates can result in a shift from the production of its activities. As against it has little effect on the location of FDI when the production structure is rigid. The decision of FMN risk aversion in their location abroad depends on their anticipation of future changes in the real exchange rate.
The study by Darby et al. (1999) emphasizes the value of the waiting option, stress of uncertainty and "sunk costs". In the same vein, Cushman (1988) estimated that occur in the destination market for exports is an alternative if there is strong uncertainty about exchange rates. After all, if Cushman found that the theoretical effects of the volatility of the exchange rate are ambiguous, in fact, he finds a positive impact on the volatility of exchange rates on outward FDI. Urata and Kawai (2000) believe that inflation increases the cost of production and hence it has a negative impact on FDI flows, this is confirmed by Schneider and Frey (1985), Yung et al. (2000) and Urata and Kawai (2000) and Ngouhouo (2005) for which inflation is generally used as a measure of domestic economic stability. For this author, a high inflation rate reflects macroeconomic instability, which increases uncertainty and makes it less attractive to FDI. Several studies have used econometric models to explain gravity type of FDI (eg Walid and Safarian (1963), Egger and Pfafermayr (1998), Anderson (2004) etc...), to identify the main determinants of FDI and make the empirical validation to competing models. Thus, Grosse and Trevino (1996) analyzed in the context of a gravity model determinants of FDI flows entering the U.S. from 23 countries on a bilateral basis, for the period 1980-1992. Their results using OLS indicate that the main sources of positive influence on inward FDI are exports and market size of country of origin of FDI, while the main sources of negative influence are the cultural differences between these countries and the United States, the geographical distance and the exchange rate. Wang and Swain (1997), Mallampally and Sauvant (1999), Basile (2004) and Kruger (2004) believe that the market size is the first element of the investment strategy abroad. For these authors, market growth is an indicator of development potential. In the same vein, a study on a group of 29 African countries for the period 1996 to 1997 highlights the importance of local market size on FDI inflows. A positive correlation is made between direct investment and GDP (equal to 0.99) is established (Morisset, 2000).
The ability of African countries to attract private capital is largely determined by the existence of natural resources (Morisset, 2000). Thus countries like Nigeria and Angola and to a lesser extent Equatorial Guinea, despite their political and economic instability, have managed to attract much private capital due to their oil resources.
ISSN 2039-9340 Mediterranean Journal of Social Sciences Vol. 4 (1) January 2013
578
Krugel (1997) uses the number of telephone lines per 1000 inhabitants as proxy variable of infrastructure, and built a panel model on a set of 17 countries in sub-Saharan Africa. The author finds that infrastructure promotes the entry of FDI, which in turn increase the productivity of multinational firms. He also found that in these countries, the infrastructure remains a bottleneck for the entry of FDI. Given the empirical review of the literature, we find that most of the work agrees that the determinants of FDI depend on the country or economic area home. These studies also show that certain factors are often significant (market size, institutions, natural resources etc...), While others are less so (distance, monetary variables, etc.). These studies also fish on several issues including poor specification of the model (gravitational model without countries of origin’s effects as Walid (1963) and Mafizur (2006)). Still others estimate without specification tests to select the appropriate model. This results in the presence of multicollinearity and the existence of selection bias in the model. Our job is to use the gravity model analyzed by the GMM method in a dynamic panel which we believe is sufficiently robust to tackle econometric deficiencies raised. 3. Econometric Model 3.1 A Gravity Equation The gravity model that we will remember is an enriched form from that of Anderson and Matyas (1996, 1997, and 1998) and Melo et al. (2005). In fact, instead of the flow of goods that are exchanged between two countries or between two blocks, or even trade within a country between two or more regions, we consider here FDI flows to range from a block of selected countries which we call investors countries (PI) to another group of countries (the countries of the EMCCA) which we call the PC. The EMCCA countries under study are five in number and are the host country for FDI from PI. Apart from FDI made in the model instead of imports, we used as recommended by the gravity model, incomes of PI and PC, which will be given here by the gross domestic product (GDP) of the group of PI and of each PC used here as a proxy for market size; the variable distance between the IP and host countries (Dij) and populations variables of Ni and Nj of PI and PC.
(4)
Dijt = Distance between country i and country j, IDEij = FDI flows from PIs to the PC; Ni and Nj represent respectively the population of the group of PI and PC; constant; = parameters; is the error term.
Thus, after linearization in logarithmic form we obtain the following initial model:
(5)
Our model is enriched by some financial variables, economic, institutional, such as the inflation rate (INF), the exchange rate (TC), the rate of opening (OPEN), the interest rate (INT) natural resources by taking proxy major export products of each of the countries of the CEMAC (RN), country risk (PR), the number of telephone lines per thousand capita as a proxy of infrastructure (TEL). Hence the equation 6 below:
(6)
represents the origin country effect (PI), ; the FDI’s effect of host country (PC), the error term; i = 1, j = 1, ..., T-1; T = 1, ..., N; J = 1 with the additional countries represented by the PI (Group of investors in the EMCCA). As we have already defined above in the gravity model chosen, i represent the country of origin also known as (PI), j host countries (PC) and t is time. Equation (6) represents the model to be estimated in a dynamic panel GMM.
oijtIDE β=ijtijjijtit DYYNN µβββββ 54321
oβ 543,21 ,,, βββββ ijtµ
ijt
jijtitoij
DijLnYLnYLnNLnNLnIDELn
µβ
βββββ
++
++++=
)(
)()()()()(
5
4321
ijtjiji
jtitijtoijt
YLnYLnTELLnDUMINTLnRPLnRNLnouvLnTCLnINFLn
DISLnNLnNLnIDELnIDELn
µϑγββββββββββ
βββββ
++++++++++−++
++++−+=
)()()()()()())1(()()(
)()()())1(()(
1413121110
98765
4321
iγ jϑ itµ
ISSN 2039-9340 Mediterranean Journal of Social Sciences Vol. 4 (1) January 2013
579
3.2 Variables We consider three types of variables: the dependent variables, the explanatory variables and instrumental variables. Instrumental variables will be selected in the econometric tests and will be the one year lagged values for explanatory variables, two years for the lagged dependent variable. It is generally accepted in the literature that the lagged values are good instruments for the explanatory variables. 3.2.1 - The dependent variables: the dependent variable is: Ln (IDEijt). In general, the variables are in logarithm. One advantage of estimating the relationship is logarithmic in the parameters which can be interpreted as elasticities. The index i indicates the group of industrialized countries (PI). They consist of the main countries that make direct investments in the countries of the CEMAC. In order of importance include the United States, France, China, the United Kingdom, Italy, Germany, Belgium, Switzerland, Malaysia, Benelux ... and the index j the group of CEMAC (PC). The index t indicates the time or year. The amounts are expressed in dollars or in millions of current dollars (USD) for each year t. 3.2.2 - The explanatory variablesDistance; Ln (Dij): when the model is applied to the flow of goods, the distance is generally regarded as an approximate measure of transportation costs. This interpretation, however, is more defensible in the case of capital movements. Also the role of distance is it attributed to transaction costs and information that a company suffers when investing abroad (Portes and Rey, 2000). The distance generally used for the estimation is the distance as the crow flies. Most Central African countries have trade with European countries, which is why we took the center of Europe as the distance of access to industrial countries (PI). The PI (including China and Malaysia) are considered a group as whole and not individual countries. So this is a distance from a center taken as a proxy Capital Group (Brussels) to the different capitals of the CEMAC that are Yaoundé for Cameroon, Libreville for Gabon, N'Djamena for Chad, Brazzaville for Congo and Malabo for Equatorial Guinea. Most studies based on the gravity model shows that distance plays a negative role on trade and for this reason; we expect a negative sign between FDI and distance. Infrastructure: Ln (LTE); the level of infrastructure can provide an environment conducive to the entry of foreign investment. In the absence of statistical data, we take as proxy variable the number of telephone facilities per 1000 population in each of the CEMAC countries. The infrastructure of the area will mean the aggregate of the five countries under study. We expect a positive relationship between infrastructure and FDI. Gross domestic product: Ln ((Yi and Yj)); the GDP is a measure of the extent of the market: the higher this variable is, the higher the market size is able to attract FDI. In the literature, this variable was very relevant in developed countries and less so in developing countries. We test whether FDI is directly related to these two variables in the CEMAC. Natural resources: Ln (RNAT); natural resources here represent the sum of the principal exports (exports + agricultural exports of mining and oil + other exports) of each of the CEMAC countries such as cotton and oil in Chad, cocoa, coffee, oil, timber, bauxite, plantain in Cameroon, timber, manganese and oil in Gabon, wood and oil for the Congo, oil and cocoa and coffee for Equatorial Guinea. Given the weight of natural resources including oil in the economy of the CEMAC, we expect a positive relationship between FDI and natural resources. Population: Ln ((Ni and Nj)); the population as income is a measure of market size and generally, a country with a high population attracts more FDI than a country low inhabited. It can be seen in Africa as in the rest of the world, countries with large populations are also more attractive. We test if there is a positive influence of population on FDI in the EMCCA. Openness: Ln (OPEN); the openness of an economy is measured by the ratio of trade to GDP (exports plus imports divided by GDP). It measures the importance of trade (Wilhems, 1998) and more indirect trade restrictions. This ratio can be an attractive for FDI. We expect a positive sign between economic openness and FDI. Inflation: Ln (INF); The growth rate of consumer price is a factor that appears to be closely involved in situations of excess liquidity. In the empirical literature, a high rate of inflation often leads to a negative relationship with FDI and vice versa for a low rate. Given the difficulties that most CEMAC countries are in compliance with the convergence criteria for inflation, we expect a negative sign between FDI and inflation. The interest rate: Ln (INT); the interest rate measures the borrowing capacity of local resources by foreign investors. The lower it is, the more favorable to FDI inflows. The dimension of the relationship between interest rate changes and FDI, however, according to the regime where we are. As part of the CEMAC (area where the interest rate is often referred to as partial liability), we are unsure of the significance of the relationship and the expected sign. The exchange rate: Ln (TCH); the exchange rate affects FDI through "exchange distortion", and its instability described by the "volatility of exchange. Two theoretical arguments can be advanced to explain this relationship: the flexibility of production and risk aversion. A high exchange rate in the host country pushes investors to invest more in the context of
ISSN 2039-9340 Mediterranean Journal of Social Sciences Vol. 4 (1) January 2013
580
repatriation of more profit if the production is sold inside. But this advantage can become harmful if the production is directed towards exports. We are undecided about the expected sign between FDI and exchange rates. Country risk: Ln (RP); the indicators that seem most appropriate and which we retain in our econometric model is the data of the International Country Risk Guide (ICRG). The ICRG was created to predict the economic, financial and political risk in 1980 by the editors of International Reports, "Political Risk Services." The evaluation of the International Country Risk Guide (ICRG) is based on 22 variables divided into three subcategories of risk: political risk, financial risk and economic risk. The expected sign of the relationship between this variable and FDI is negative. Debt levels: DUM; a dummy variable is considered to represent the level of debt: it is set to 1 for periods of low debt countries in the EMCCA (1960-1985) and 0 otherwise. We expect a negative sign of the relationship that this variable can have the IDE. 3.3 Statistical data Like any empirical study based on developing countries, it is very difficult to collect statistics. Thus, countries such as Equatorial Guinea and Gabon do not have a statistically reliable service; we relied on the services of the Central Bank of EMCCA and especially on the website of the Division of Statistics of the United Nations.
The data collected from these two sources for the period 1970-2005 are: foreign direct investment to the CEMAC between 1970 and 2005, GDP or Yjt and Yit noted respectively for PI and PC in the same period; populations Ni and Nj of PI and PC infrastructure (with proxy for the number of telephone lines per 1000 inhabitants (LTE)), changes in consumer prices or inflation rates. Data on the country risk were collected from the site of the NGO specialized in the field (ICRG). We have monthly data ranging from 1984 to 1997 and from 2001 to 2004 for different categories of country risk. Since we work with annual data, we took the average of each risk category. These indices are calculated due to a combination of variables: thus we find the variables that relate to the cancellation of contracts by government (scale of 0 to 10), the risk of expropriation (0-10), corruption in government (0-6), law and order / rule of law (0-6) and bureaucratic quality (0-6). These criteria determine the fair and transparent legal and administrative, and therefore the underlying determinants of institutional adaptation to the IDE. The evaluation of the International Country Risk Guide (ICRG) is based on 22 variables divided into three subcategories of risk: political risk, financial risk and economic risk. These indices are constant in time for the EMCCA countries; we used the average of the data.
Data on natural resources have been collected from the website of the CEMAC, the BEAC, the "Penn World Table" and the website of the United Nations. The distance between the PI and PC noted (Dij) is collected from the website CEFI (University of Aix Marseille 2). The exchange rate between the PI and PC, the interest rate in the PC, the inflation rate of PC were collected from the Statistics Division of the United Nations. The same source can give the dummy variable set to 1 in the highly indebted poor countries and 0 otherwise. For this work, we used the software e-views 5.1". In general, a missing observation between two periods was replaced by the mean of the last ten years or five years. The data variables such as population, openness, infrastructure has been supplemented by data from the website of the University of Sherbrooke in Canada, the Information Office of the Embassy of France in Cameroon, the site of Bank of France, and websites of Eurostat and Afristat in terms of FDI. Note that log-linear model is not defined for cases with a nil or negative. Two solutions are often proposed to solve the problem of the presence of 0 in the sample: either ignores the zeros, or adding a constant to each observation on the dependent variable. We opted for the more general technique, like that used on the data of the dependent variable IDE. In the presence of a negative number in the sample, we take the smallest observation to serve as a common denominator for all observations in the sample which we add a constant. This technique has the dual advantage of both solving the problem of the presence of an observation with a value of zero or the presence of an observation with a negative value (as in the case of disinvestment in the EMCCA). This method also allows us to avoid a selection bias if the variables with zero values as the amount are not distributed in a random manner.
3.4 Statistical method for estimating
Our gravity model was originally estimated in a panel by ordinary least squares, then a fixed effect panel. These estimates raise several issues: 1) there is a strong correlation between exogenous variables and the error term. This correlation produces bias in the OLS estimator. We also note that this estimator is not convergent even in the event of non-correlation of the error term. This bias will be even higher than the variance of the individual effect is high; 2) the existence of the variables constant over time (e.g distance or dummy variable) whose fixed effect model does not adapt. For these reasons, we estimate it by generalized method of moments (GMM) has become one of the standard
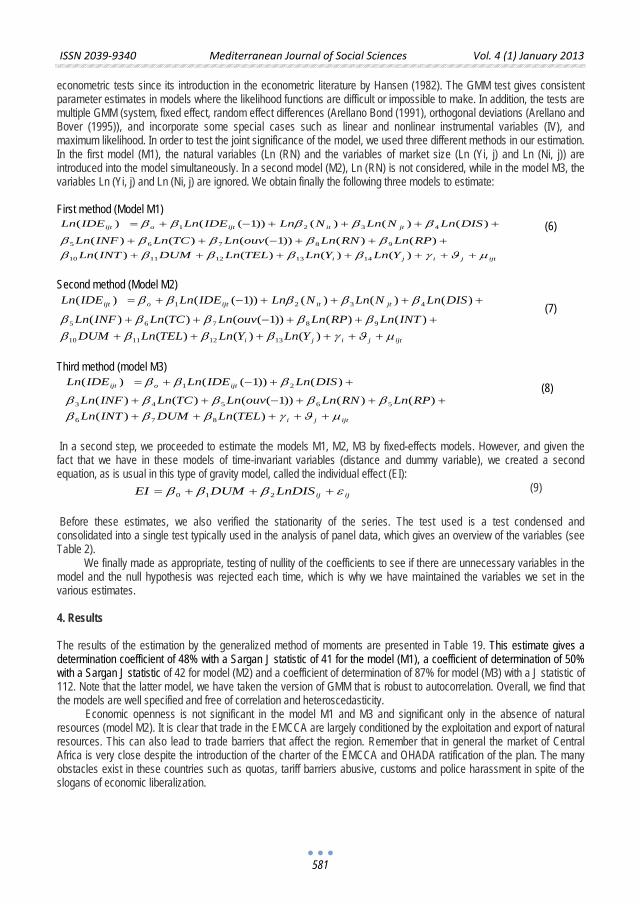
ISSN 2039-9340 Mediterranean Journal of Social Sciences Vol. 4 (1) January 2013
581
econometric tests since its introduction in the econometric literature by Hansen (1982). The GMM test gives consistent parameter estimates in models where the likelihood functions are difficult or impossible to make. In addition, the tests are multiple GMM (system, fixed effect, random effect differences (Arellano Bond (1991), orthogonal deviations (Arellano and Bover (1995)), and incorporate some special cases such as linear and nonlinear instrumental variables (IV), and maximum likelihood. In order to test the joint significance of the model, we used three different methods in our estimation. In the first model (M1), the natural variables (Ln (RN) and the variables of market size (Ln (Yi, j) and Ln (Ni, j)) are introduced into the model simultaneously. In a second model (M2), Ln (RN) is not considered, while in the model M3, the variables Ln (Yi, j) and Ln (Ni, j) are ignored. We obtain finally the following three models to estimate: First method (Model M1)
(6)
Second method (Model M2)
(7)
Third method (model M3)
(8)
In a second step, we proceeded to estimate the models M1, M2, M3 by fixed-effects models. However, and given the fact that we have in these models of time-invariant variables (distance and dummy variable), we created a second equation, as is usual in this type of gravity model, called the individual effect (EI): (9) Before these estimates, we also verified the stationarity of the series. The test used is a test condensed and consolidated into a single test typically used in the analysis of panel data, which gives an overview of the variables (see Table 2). We finally made as appropriate, testing of nullity of the coefficients to see if there are unnecessary variables in the model and the null hypothesis was rejected each time, which is why we have maintained the variables we set in the various estimates. 4. Results The results of the estimation by the generalized method of moments are presented in Table 19. This estimate gives a determination coefficient of 48% with a Sargan J statistic of 41 for the model (M1), a coefficient of determination of 50% with a Sargan J statistic of 42 for model (M2) and a coefficient of determination of 87% for model (M3) with a J statistic of 112. Note that the latter model, we have taken the version of GMM that is robust to autocorrelation. Overall, we find that the models are well specified and free of correlation and heteroscedasticity.
Economic openness is not significant in the model M1 and M3 and significant only in the absence of natural resources (model M2). It is clear that trade in the EMCCA are largely conditioned by the exploitation and export of natural resources. This can also lead to trade barriers that affect the region. Remember that in general the market of Central Africa is very close despite the introduction of the charter of the EMCCA and OHADA ratification of the plan. The many obstacles exist in these countries such as quotas, tariff barriers abusive, customs and police harassment in spite of the slogans of economic liberalization.
ijtjiji
jtitijtoijt
YLnYLnTELLnDUMINTLnRPLnRNLnouvLnTCLnINFLn
DISLnNLnNLnIDELnIDELn
µϑγββββββββββ
βββββ
++++++++++−++
++++−+=
)()()()()()())1(()()(
)()()())1(()(
1413121110
98765
4321
ijtjiji
jtitijtoijt
YLnYLnTELLnDUMINTLnRPLnouvLnTCLnINFLn
DISLnNLnNLnIDELnIDELn
µϑγβββββββββ
βββββ
+++++++++−++
++++−+=
)()()()()())1(()()(
)()()())1(()(
13121110
98765
4321
ijtji
ijtoijt
TELLnDUMINTLnRPLnRNLnouvLnTCLnINFLn
DISLnIDELnIDELn
µϑγββββββββ
βββ
++++++++−++
++−+=
)()()()())1(()()(
)())1(()(
876
56543
21
ijijLnDISDUMEI εβββ +++= 210
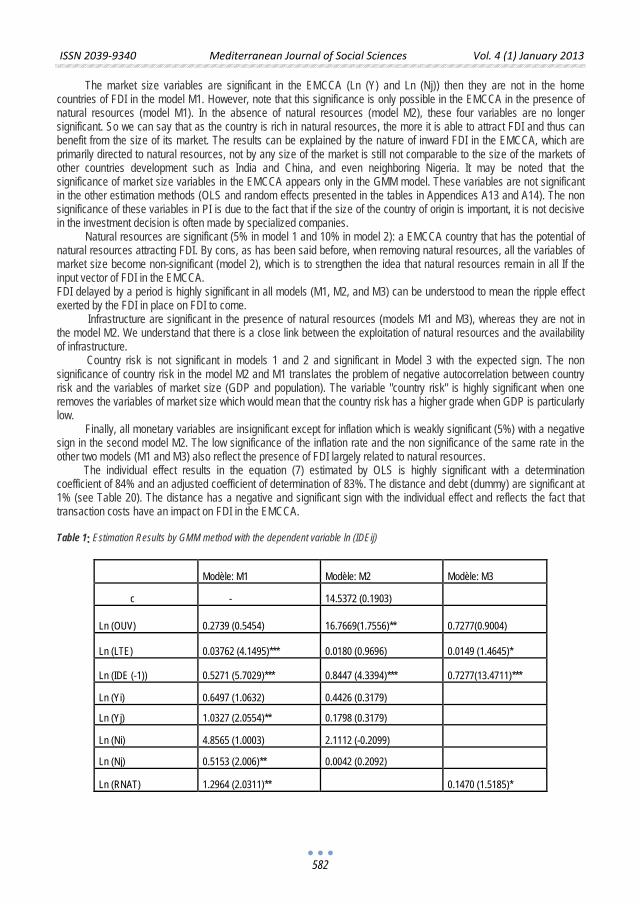
ISSN 2039-9340 Mediterranean Journal of Social Sciences Vol. 4 (1) January 2013
582
The market size variables are significant in the EMCCA (Ln (Y) and Ln (Nj)) then they are not in the home countries of FDI in the model M1. However, note that this significance is only possible in the EMCCA in the presence of natural resources (model M1). In the absence of natural resources (model M2), these four variables are no longer significant. So we can say that as the country is rich in natural resources, the more it is able to attract FDI and thus can benefit from the size of its market. The results can be explained by the nature of inward FDI in the EMCCA, which are primarily directed to natural resources, not by any size of the market is still not comparable to the size of the markets of other countries development such as India and China, and even neighboring Nigeria. It may be noted that the significance of market size variables in the EMCCA appears only in the GMM model. These variables are not significant in the other estimation methods (OLS and random effects presented in the tables in Appendices A13 and A14). The non significance of these variables in PI is due to the fact that if the size of the country of origin is important, it is not decisive in the investment decision is often made by specialized companies.
Natural resources are significant (5% in model 1 and 10% in model 2): a EMCCA country that has the potential of natural resources attracting FDI. By cons, as has been said before, when removing natural resources, all the variables of market size become non-significant (model 2), which is to strengthen the idea that natural resources remain in all If the input vector of FDI in the EMCCA. FDI delayed by a period is highly significant in all models (M1, M2, and M3) can be understood to mean the ripple effect exerted by the FDI in place on FDI to come.
Infrastructure are significant in the presence of natural resources (models M1 and M3), whereas they are not in the model M2. We understand that there is a close link between the exploitation of natural resources and the availability of infrastructure. Country risk is not significant in models 1 and 2 and significant in Model 3 with the expected sign. The non significance of country risk in the model M2 and M1 translates the problem of negative autocorrelation between country risk and the variables of market size (GDP and population). The variable "country risk" is highly significant when one removes the variables of market size which would mean that the country risk has a higher grade when GDP is particularly low.
Finally, all monetary variables are insignificant except for inflation which is weakly significant (5%) with a negative sign in the second model M2. The low significance of the inflation rate and the non significance of the same rate in the other two models (M1 and M3) also reflect the presence of FDI largely related to natural resources. The individual effect results in the equation (7) estimated by OLS is highly significant with a determination coefficient of 84% and an adjusted coefficient of determination of 83%. The distance and debt (dummy) are significant at 1% (see Table 20). The distance has a negative and significant sign with the individual effect and reflects the fact that transaction costs have an impact on FDI in the EMCCA. Table 1: Estimation Results by GMM method with the dependent variable ln (IDEij)
Modèle: M1 Modèle: M2 Modèle: M3
c - 14.5372 (0.1903)
Ln (OUV) 0.2739 (0.5454) 16.7669(1.7556)** 0.7277(0.9004)
Ln (LTE) 0.03762 (4.1495)*** 0.0180 (0.9696) 0.0149 (1.4645)*
Ln (IDE (-1)) 0.5271 (5.7029)*** 0.8447 (4.3394)*** 0.7277(13.4711)***
Ln (Yi) 0.6497 (1.0632) 0.4426 (0.3179)
Ln (Yj) 1.0327 (2.0554)** 0.1798 (0.3179)
Ln (Ni) 4.8565 (1.0003) 2.1112 (-0.2099)
Ln (Nj) 0.5153 (2.006)** 0.0042 (0.2092)
Ln (RNAT) 1.2964 (2.0311)** 0.1470 (1.5185)*
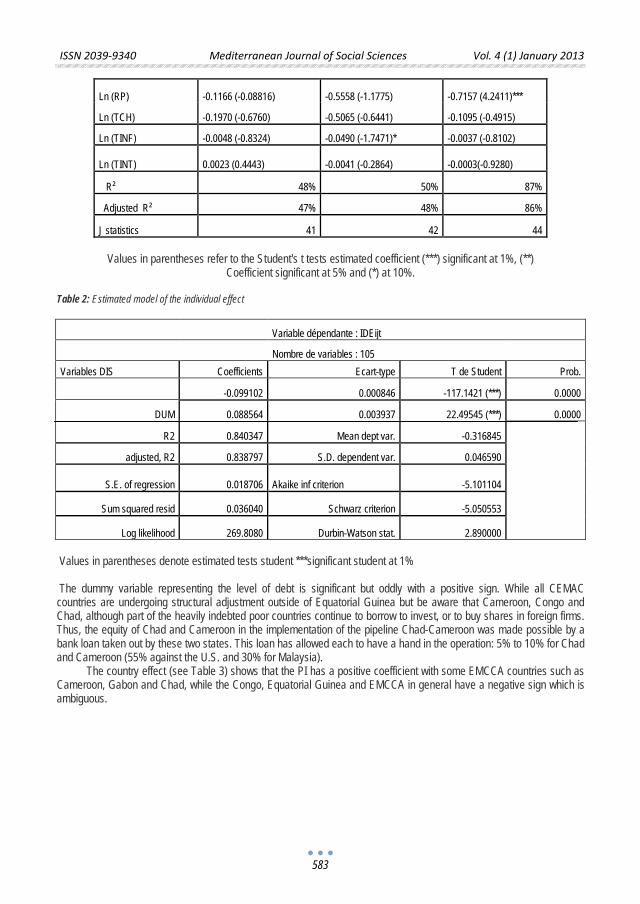
ISSN 2039-9340 Mediterranean Journal of Social Sciences Vol. 4 (1) January 2013
583
Ln (RP) -0.1166 (-0.08816) -0.5558 (-1.1775) -0.7157 (4.2411)***
Ln (TCH) -0.1970 (-0.6760) -0.5065 (-0.6441) -0.1095 (-0.4915)
Ln (TINF) -0.0048 (-0.8324) -0.0490 (-1.7471)* -0.0037 (-0.8102)
Ln (TINT) 0.0023 (0.4443) -0.0041 (-0.2864) -0.0003(-0.9280)
R² 48% 50% 87%
Adjusted R² 47% 48% 86%
J statistics 41 42 44
Values in parentheses refer to the Student's t tests estimated coefficient (***) significant at 1%, (**) Coefficient significant at 5% and (*) at 10%.
Table 2: Estimated model of the individual effect
Variable dépendante : IDEijt
Nombre de variables : 105
Variables DIS Coefficients Ecart-type T de Student Prob.
-0.099102 0.000846 -117.1421 (***) 0.0000
DUM 0.088564 0.003937 22.49545 (***) 0.0000
R2 0.840347 Mean dept var. -0.316845
adjusted, R2 0.838797 S.D. dependent var. 0.046590
S.E. of regression 0.018706 Akaike inf criterion -5.101104
Sum squared resid 0.036040 Schwarz criterion -5.050553
Log likelihood 269.8080 Durbin-Watson stat. 2.890000
Values in parentheses denote estimated tests student ***significant student at 1% The dummy variable representing the level of debt is significant but oddly with a positive sign. While all CEMAC countries are undergoing structural adjustment outside of Equatorial Guinea but be aware that Cameroon, Congo and Chad, although part of the heavily indebted poor countries continue to borrow to invest, or to buy shares in foreign firms. Thus, the equity of Chad and Cameroon in the implementation of the pipeline Chad-Cameroon was made possible by a bank loan taken out by these two states. This loan has allowed each to have a hand in the operation: 5% to 10% for Chad and Cameroon (55% against the U.S. and 30% for Malaysia). The country effect (see Table 3) shows that the PI has a positive coefficient with some EMCCA countries such as Cameroon, Gabon and Chad, while the Congo, Equatorial Guinea and EMCCA in general have a negative sign which is ambiguous.
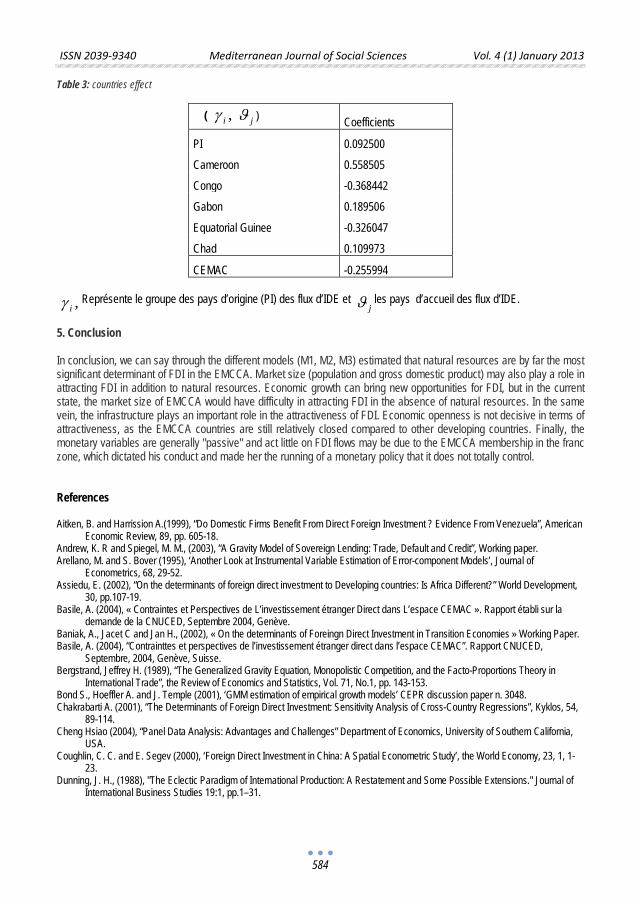
ISSN 2039-9340 Mediterranean Journal of Social Sciences Vol. 4 (1) January 2013
584
Table 3: countries effect
( ) Coefficients
PI 0.092500
Cameroon 0.558505
Congo -0.368442
Gabon 0.189506
Equatorial Guinee -0.326047
Chad 0.109973
CEMAC -0.255994
Représente le groupe des pays d’origine (PI) des flux d’IDE et les pays d’accueil des flux d’IDE.
5. Conclusion In conclusion, we can say through the different models (M1, M2, M3) estimated that natural resources are by far the most significant determinant of FDI in the EMCCA. Market size (population and gross domestic product) may also play a role in attracting FDI in addition to natural resources. Economic growth can bring new opportunities for FDI, but in the current state, the market size of EMCCA would have difficulty in attracting FDI in the absence of natural resources. In the same vein, the infrastructure plays an important role in the attractiveness of FDI. Economic openness is not decisive in terms of attractiveness, as the EMCCA countries are still relatively closed compared to other developing countries. Finally, the monetary variables are generally "passive" and act little on FDI flows may be due to the EMCCA membership in the franc zone, which dictated his conduct and made her the running of a monetary policy that it does not totally control. References
Aitken, B. and Harrission A.(1999), “Do Domestic Firms Benefit From Direct Foreign Investment ? Evidence From Venezuela”, American
Economic Review, 89, pp. 605-18. Andrew, K. R and Spiegel, M. M., (2003), “A Gravity Model of Sovereign Lending: Trade, Default and Credit”, Working paper. Arellano, M. and S. Bover (1995), ‘Another Look at Instrumental Variable Estimation of Error-component Models’, Journal of
Econometrics, 68, 29-52. Assiedu, E. (2002), “On the determinants of foreign direct investment to Developing countries: Is Africa Different?” World Development,
30, pp.107-19. Basile, A. (2004), « Contraintes et Perspectives de L’investissement étranger Direct dans L’espace CEMAC ». Rapport établi sur la
demande de la CNUCED, Septembre 2004, Genève. Baniak, A., Jacet C and Jan H., (2002), « On the determinants of Foreingn Direct Investment in Transition Economies » Working Paper. Basile, A. (2004), “Contrainttes et perspectives de l’investissement étranger direct dans l’espace CEMAC”. Rapport CNUCED,
Septembre, 2004, Genève, Suisse. Bergstrand, Jeffrey H. (1989), “The Generalized Gravity Equation, Monopolistic Competition, and the Facto-Proportions Theory in
International Trade”, the Review of Economics and Statistics, Vol. 71, No.1, pp. 143-153. Bond S., Hoeffler A. and J. Temple (2001), ‘GMM estimation of empirical growth models’ CEPR discussion paper n. 3048. Chakrabarti A. (2001), “The Determinants of Foreign Direct Investment: Sensitivity Analysis of Cross-Country Regressions”, Kyklos, 54,
89-114. Cheng Hsiao (2004), “Panel Data Analysis: Advantages and Challenges” Department of Economics, University of Southern California,
USA. Coughlin, C. C. and E. Segev (2000), ‘Foreign Direct Investment in China: A Spatial Econometric Study’, the World Economy, 23, 1, 1-
23. Dunning, J. H., (1988), "The Eclectic Paradigm of International Production: A Restatement and Some Possible Extensions." Journal of
International Business Studies 19:1, pp.1–31.
,iγ jϑ
,iγ jϑ
ISSN 2039-9340 Mediterranean Journal of Social Sciences Vol. 4 (1) January 2013
585
Dupuch, S. (2004), “ Les investissements directs étrangers dans les nouveaux pays adhérents à l’Union européenne, Région et Développement, n°20, 45-64.
Froot, Kenneth, Stein and Jeremy (1991), “Exchange Rate and Foreign Direct investment an imperfect capital markets approach”, Quaterly Journal of Economics, Vol.196.pp.1191-1218.
Globerman, S., Shapiro, D., Tang, Y. (2004), “Governance and Foreign Direct Investment in Emerging and Transition European Countries”.
Hassane, B. H et Zatla N. (2001), « L’IDE dans le basin méditerranéen, ses déterminants et son effet sur la croissance ». Synthèse du rapport de recherche, contrat FEM-REF/99/B2-04.
Mallampally P., K. and Sauvant (1999), “Foreign Direct Investment in Developing Countries”, Finance and Development, Vol.36, n°1. Mafizur, M. R. (2006), “A Panel Data Analysis of Bangladesh’s Trade: The Gravity Model Approach”. University of Sydney, NSW 2006,
Australia. Markusen, J.A. Venables, Konan D., and Zhang K., (1996). “A Unified Treatment of Horizontal Direct Investment, Vertical Direct
Investment and the pattern of Trade in Goods and Services”. NBER Working PAPER n); 5696? Ngouhouo, I., Khaled El M. and Sa’adi S. (2005), “Does FDI means productivity growth For The Host Country ?” American Journal of
Business and Management. Oguledo I.V. and MacPhee C.R. (1994), “Gravity Models: a Reformulation and an Application to Discriminatory Trade Arrangements”,
Applied Economics, Vol.26, pp. 107-120. Rugman, A. (1980), "Internalization as a General Theory of Foreign Direct Investment: A Reappraisal of the Literature."
Weltwirtschaftliches Archiv, Vol. 116, No. 2, 365–379. Saskia, K.S.W. (1998), “Foreign Direct Investment And its Determinants in Emerging Economies”, United States Agency for International
Development Bureau for Africa, Washington, D.C. Sekkat, K. and M. Veganzones-Varoudakis (2005), « Trade and Foreign Exchange Liberalization, Investment Climate and FDI in the
MENA ». Working paper DULBEA.N°5. Servers, L. and Solimano, A., (1992), “Private Investment and Macroeconomic adjustment: A Survey”, The World Bank Research
Observer, Vol. 7, N°.1, January. Stiglitz, J., 2002. Globalisations an its Discontents, Allen Lane, London. Urata, and Kawai, H. (2000), “The determinants of the location of foreign direct investment by Japanese small and medium-sized
enterprises”, Small Business Economics, 15, 179 – 103. Wang, Z. Q. And Swain, N., (1995), “The Determinants of Foreign Direct Investments In Transforming Economics: Empirical Evidence
From Hungary and China”. Weltwirtschaftliches Archv. 131: 358-82. Westerlundy, J. and Walid H. et Safarian A.E, (1999),“Modelling Links between Canadian Trade And Foreign Direct Investment”,
Perspectives On North American Free Trade. Industry Canada, Research Publications Wilhelms, Saskia K. S. (1988), “Institutional FDI Fitness: Determinants of Foreign Direct Investment to Emerging Economies”. PhD
Thesis. Medford, MA: Fletcher School of Law and Diplomacy.

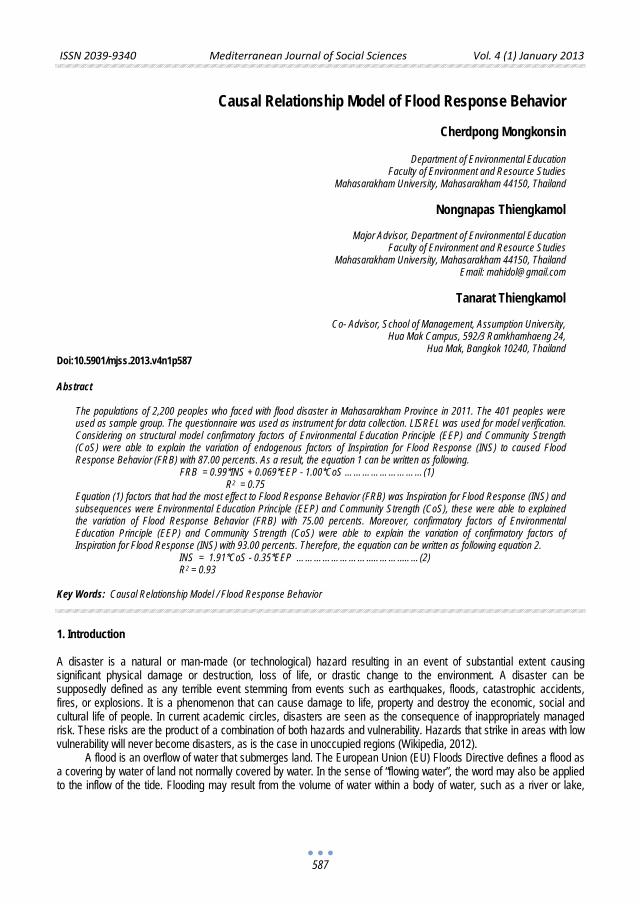
ISSN 2039-9340 Mediterranean Journal of Social Sciences Vol. 4 (1) January 2013
587
Causal Relationship Model of Flood Response Behavior
Cherdpong Mongkonsin
Department of Environmental Education
Faculty of Environment and Resource Studies Mahasarakham University, Mahasarakham 44150, Thailand
Nongnapas Thiengkamol
Major Advisor, Department of Environmental Education
Faculty of Environment and Resource Studies Mahasarakham University, Mahasarakham 44150, Thailand
Email: [email protected]
Tanarat Thiengkamol
Co- Advisor, School of Management, Assumption University, Hua Mak Campus, 592/3 Ramkhamhaeng 24,
Hua Mak, Bangkok 10240, Thailand Doi:10.5901/mjss.2013.v4n1p587 Abstract
The populations of 2,200 peoples who faced with flood disaster in Mahasarakham Province in 2011. The 401 peoples were used as sample group. The questionnaire was used as instrument for data collection. LISREL was used for model verification. Considering on structural model confirmatory factors of Environmental Education Principle (EEP) and Community Strength (CoS) were able to explain the variation of endogenous factors of Inspiration for Flood Response (INS) to caused Flood Response Behavior (FRB) with 87.00 percents. As a result, the equation 1 can be written as following. FRB = 0.99*INS + 0.069*EEP - 1.00*CoS ………………………(1) R2 = 0.75 Equation (1) factors that had the most effect to Flood Response Behavior (FRB) was Inspiration for Flood Response (INS) and subsequences were Environmental Education Principle (EEP) and Community Strength (CoS), these were able to explained the variation of Flood Response Behavior (FRB) with 75.00 percents. Moreover, confirmatory factors of Environmental Education Principle (EEP) and Community Strength (CoS) were able to explain the variation of confirmatory factors of Inspiration for Flood Response (INS) with 93.00 percents. Therefore, the equation can be written as following equation 2.
INS = 1.91*CoS - 0.35*EEP ……………………..………..……(2) R2 = 0.93 Key Words: Causal Relationship Model / Flood Response Behavior
1. Introduction A disaster is a natural or man-made (or technological) hazard resulting in an event of substantial extent causing significant physical damage or destruction, loss of life, or drastic change to the environment. A disaster can be supposedly defined as any terrible event stemming from events such as earthquakes, floods, catastrophic accidents, fires, or explosions. It is a phenomenon that can cause damage to life, property and destroy the economic, social and cultural life of people. In current academic circles, disasters are seen as the consequence of inappropriately managed risk. These risks are the product of a combination of both hazards and vulnerability. Hazards that strike in areas with low vulnerability will never become disasters, as is the case in unoccupied regions (Wikipedia, 2012).
A flood is an overflow of water that submerges land. The European Union (EU) Floods Directive defines a flood as a covering by water of land not normally covered by water. In the sense of “flowing water”, the word may also be applied to the inflow of the tide. Flooding may result from the volume of water within a body of water, such as a river or lake,
ISSN 2039-9340 Mediterranean Journal of Social Sciences Vol. 4 (1) January 2013
588
which overflows or breaks levels, with the result that some of the water escapes its usual boundaries, or may be due to accumulation of rainwater on saturated ground in an area flood (Wikipedia, 2012, and Directive, 2007). All through the summer and autumn of 2011, heavy monsoons and subsequent typhoons killed nearly 800 peoples and affected more than 8 million others across Thailand, Cambodia, Laos, Vietnam and the Philippines, along with the United Nations. Numerous businesses needed expert disaster restoration services after Thailand experienced the most devastating floods in a half century resulting in the most expensive natural disaster ever. Flood water damage affected more than 14,000 factories, displaced more than 600,000 workers, disrupted global supply chains, destroyed farms and drove up worldwide prices for computer hard drives and rice. In Thailand alone, where floodwaters covered an area roughly the size of the state of Florida, insured losses were estimated at more than 15 billion and total damage was expected to top 45 billion. The severe flooding across Thailand in 2011 lasted for several months and affected more than three million peoples and this flood was the most severe during five decades. Major industrial zones were hard hit, but they have built major flood walls to prevent a recurring of the deluge (Corben, 2012, MENAFN, 2012 and Figge, 2012).
Therefore, flood disaster might occur due to natural or human being activities, sometime, it is difficult to just that it is only natural situation because human have interrupted the natural system for long time ago, then the balance of natural system is also loss as well. Additionally, with rapid growth of global population of 7 billion peoples, it was celebrated on 11july 2012 (UNFPA, 2012). Nevertheless, the huge population was a major problem for natural resources consumption, especially, the encroachment of forest in every countries across the world has been occurred for long periods and it also key factors of destruction of soil surface for absorption the water from the rain, therefore this creates a flood and soil erosion. Moreover forests stabilize climate and regulate the water cycle by absorbing and redistributing rainwater quite equally to every species living within its range. Particularly in the case of tropical forests where up to 90% of the planet’s species live. Tropical forests possess the highest level of biodiversity and therefore provide the biggest genes reservoir (Environment for Beginners, 2012). In conclusion for flood, it might occur from natural and/or human origins.
Principally, Thiengkamol declared that the significant characteristics of environmental education volunteer or trainer should have knowledge and understanding, and awareness, responsibility and public mind based on inspiration of public mind. Furthermore, contribution in environmental activities and decision making on environmental problem solving would be emphasized in daily life practice until it turns into various environmental behaviors such as consumption behavior, recycling behavior, energy conservation behavior, traveling behavior, forest conservation behavior and knowledge transferring behavior, therefore these behaviors are able to bring about real sustainable development. Commonly, these essential characteristics should be established through all educational channels whether the formal education, informal education, non-formal education and lifelong education (Thiengkamol, 2009a, 2009b, 2011e, & 2012a). These concepts are also harmonious to findings that disclosed from the research that there are 14 essential Environmental Education Characteristics (EECs) composed of 1) ability to transfer environmental knowledge, 2) to stimulate others to realize the importance of environmental conservation, 3) to have deeply awareness about environment and natural resources, 4) to have public mind for environmental conservation, 5) to have positive attitude for environmental conservation, 6) to have value that for environmental conservation be everyone duty, 7) to have a sensitivity of environmental conservation, 8) to wish to take a responsibility for environmental conservation, 9) to participate to environmental conservation activities regularly, 10) to be consistency of self practice for environmental conservation, 11) to have ability to make correct decision for environmental conservation, 12) to practice as a role model of environmental conservation for public perception, 13) to have correct environmental knowledge and 14) to understanding to introduce and transfer environmental knowledge for others to practice correctly (Charoensilpa, et al, 2012b).
Considering on another essential factor, the inspiration of public consciousness or public mind also should not be neglected. Public mind or public consciousness was defined by different perceptions or considerations of people, however in Thai society gave various meaning such as National Research Council of Thailand giving definition of public mind that take notice and participate in the public issues with providing advantage to country with consciousness and holding the system of morality and ethics together with indignity for good action and emphasizing on being neat, economizing, and balance between human and nature.
Additionally, Thiengkamol mentioned that public consciousness or public mind based on inspiration is occurred from insight of people and inspiration is different from motivation because inspiration needs no rewards. Inspiration of public consciousness or public mind, especially, for natural resources and environment conservation, one will not receive any reward, admiration or complement for their action to protect and conserve natural resources and environment. Inspiration might occur from appreciation in a person as role model or idle, events, situations, environment, and media
ISSN 2039-9340 Mediterranean Journal of Social Sciences Vol. 4 (1) January 2013
589
perceived such as movies, television, radio, book, magazine, internet or other public media (Thiengkamol, 2009b, Thiengkamol, 2009c, Thiengkamol, 2011a, Thiengkamol, 2011e, Thiengkamol, 2011i, and Thiengkamol, 2012c). In order to develop a causal relationship model of flood response behavior, it is essential to understand the relationship among environmental education principle, community strength, inspiration for flood response and numerous flood response behaviors to prevent and alleviate damage to environment and natural resources, human lives and their properties with verification the model with different statistical index. These relationships would be guidance for national government, local administration organization, community people to realize for the importance of their leadership, community participation, community social capital, self-dependence, and support from involved work unit to decrease the loss of lives and properties with inspiration for flood response through flood response behavior including community flood surveillance, community flood warning, policy for flood response, and preparation for administration during and after flooding to conserve environment and natural resources to achieve genuine sustainable development (Thiengkamol, 2008, 2009a, 2009b, 2011e, 2011f, 2011i, 2011j, 2012a, 2012b, & 2012c). 2. Objective The research objective was to develop a causal relationship model of flood response behavior for peoples who faced with flood disaster in Mahasarakham Province in 2011. 3. Methodology The research design was implemented in steps by step as follows: The populations of 2,200 peoples who faced with flood disaster in Mahasarakham Province. The 401 peoples were used as sample group. The research instrument was the questionnaire and it was used for data collection. LISREL was used for model verification. The content and structural validity were determined by Item Objective Congruent (IOC) with 5 experts in the aspects of environmental education, psychology, social science and social research methodology. The reliability was done by collecting the sample group from 37 peoples who faced with flood disaster in Mahasarakham Province but they were not sample group. The reliability was determined by Cronbach's Alpha. It was tried out with the group that was not sample group. The reliability in aspects of environmental education principle, community strength, inspiration of emergency response preparedness for flood disaster, emergency response preparedness behavior, and whole questionnaire were 0.884, 0.873, 0.937, 0.960 and 0.966 respectively. 1) The descriptive statistics used were frequency, percentage, mean and standard deviation. The inferential statistics used was LISREL by considering on Chi-Square value differs from zero with no statistical significant at 0.05 level or Chi-Square/df value with lesser or equal to 5, P-value with no statistical significant at 0.05 level and RMSEA (Root Mean Square Error Approximation) value with lesser than 0.05 including index level of model congruent value, GFI (Goodness of Fit Index) and index level of model congruent value, AGFI (Adjust Goodness of Fit Index) between 0.90-1.00.
4. Results 4.1 General Characteristics of Sample Group
The 401 peoples who faced with flood disaster in Mahasarakham Province were used as sample group. Most of them had age with mean of 40.93 years and were female with 50.87%. Majority of their father had marriage status with 77.55 %, their father education level at bachelor or higher with 76.64%, and occupation as government officer with 47.09%. Majority of their mother had marriage status with 91.97%, their father education level at bachelor or higher with 77.014%, and occupation as government officer with 51.11%. Father age and mother age had mean of 43.008 and 40.334 years. Father income and mother income had mean of 1,000,000 and 500,000 Bahts as presented in table 1.
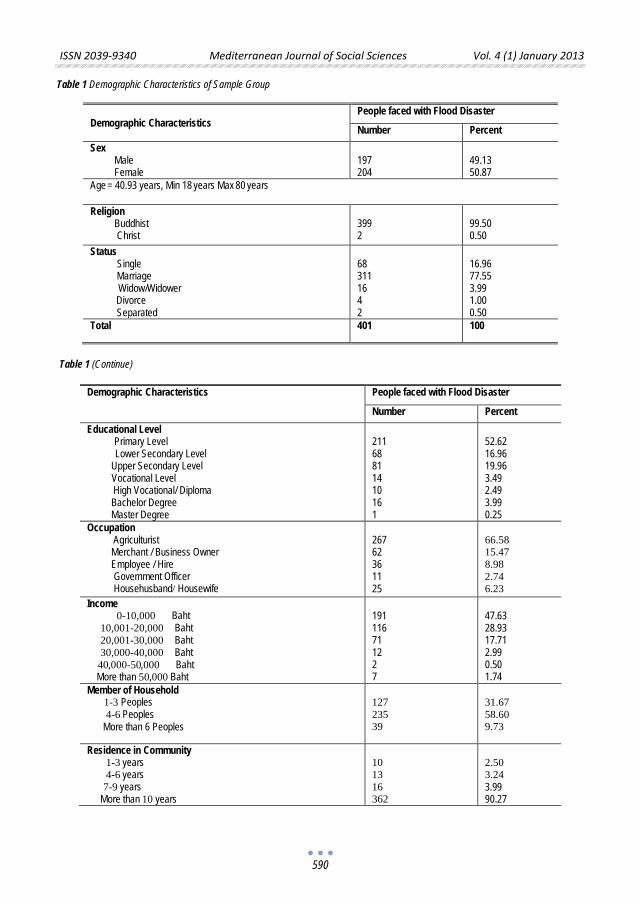
ISSN 2039-9340 Mediterranean Journal of Social Sciences Vol. 4 (1) January 2013
590
Table 1 Demographic Characteristics of Sample Group
Demographic Characteristics
People faced with Flood Disaster
Number Percent Sex Male Female
197 204
49.13 50.87
Age = 40.93 years, Min 18 years Max 80 years
Religion Buddhist Christ
399 2
99.50 0.50
Status
Single Marriage Widow/Widower Divorce Separated
68 311 16 4 2
16.96 77.55 3.99 1.00 0.50
Total 401 100
Table 1 (Continue)
Demographic Characteristics People faced with Flood Disaster
Number Percent Educational Level Primary Level Lower Secondary Level Upper Secondary Level Vocational Level High Vocational/ Diploma Bachelor Degree Master Degree
211 68 81 14 10 16 1
52.62 16.96 19.96 3.49 2.49 3.99 0.25
Occupation Agriculturist Merchant / Business Owner Employee / Hire Government Officer Househusband/ Housewife
267 62 36 11 25
66.58 15.47 8.98 2.74 6.23
Income 0-10,000 Baht 10,001-20,000 Baht 20,001-30,000 Baht 30,000-40,000 Baht 40,000-50,000 Baht More than 50,000 Baht
191 116 71 12 2 7
47.63 28.93 17.71 2.99 0.50 1.74
Member of Household 1-3 Peoples 4-6 Peoples More than 6 Peoples
127 235 39
31.67 58.60 9.73
Residence in Community 1-3 years 4-6 years 7-9 years More than 10 years
10 13 16 362
2.50 3.24 3.99 90.27
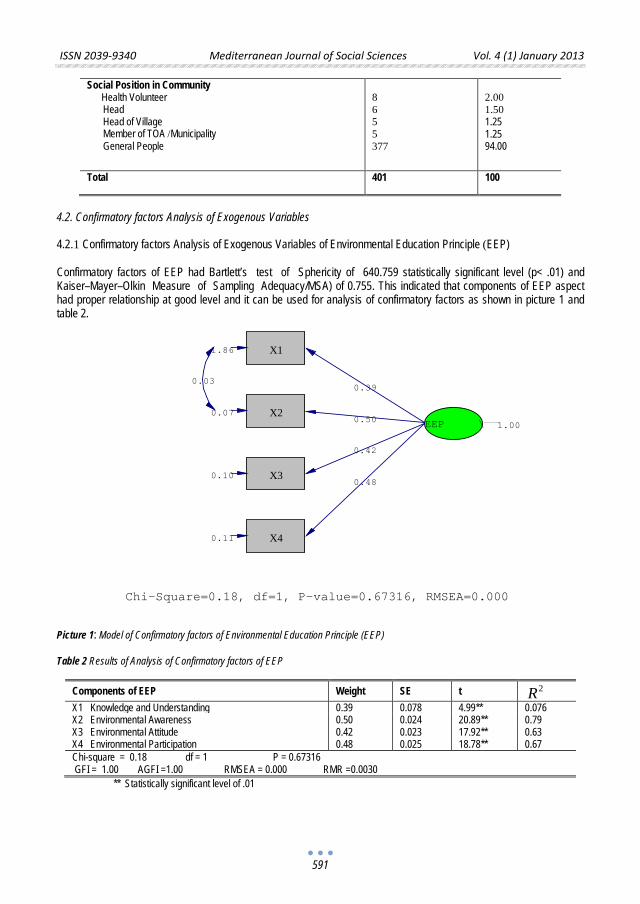
ISSN 2039-9340 Mediterranean Journal of Social Sciences Vol. 4 (1) January 2013
591
Social Position in Community Health Volunteer Head Head of Village Member of TOA /Municipality General People
8 6 5 5 377
2.00 1.50 1.25 1.25 94.00
Total 401 100
4.2. Confirmatory factors Analysis of Exogenous Variables 4.2.1 Confirmatory factors Analysis of Exogenous Variables of Environmental Education Principle (EEP) Confirmatory factors of EEP had Bartlett’s test of Sphericity of 640.759 statistically significant level (p< .01) and Kaiser–Mayer–Olkin Measure of Sampling Adequacy/MSA) of 0.755. This indicated that components of EEP aspect had proper relationship at good level and it can be used for analysis of confirmatory factors as shown in picture 1 and table 2.
Picture 1: Model of Confirmatory factors of Environmental Education Principle (EEP) Table 2 Results of Analysis of Confirmatory factors of EEP
Components of EEP Weight SE t 2R X1 Knowledge and Understanding 0.39 0.078 4.99** 0.076 X2 Environmental Awareness 0.50 0.024 20.89** 0.79 X3 Environmental Attitude 0.42 0.023 17.92** 0.63 X4 Environmental Participation 0.48 0.025 18.78** 0.67 Chi-square = 0.18 df = 1 P = 0.67316 GFI = 1.00 AGFI =1.00 RMSEA = 0.000 RMR =0.0030
** Statistically significant level of .01
X11.86
X20.07
X30.10
X40.11
EEP \ 1.00
Chi-Square=0.18, df=1, P-value=0.67316, RMSEA=0.000
0.39
0.50
0.42
0.48
0.03
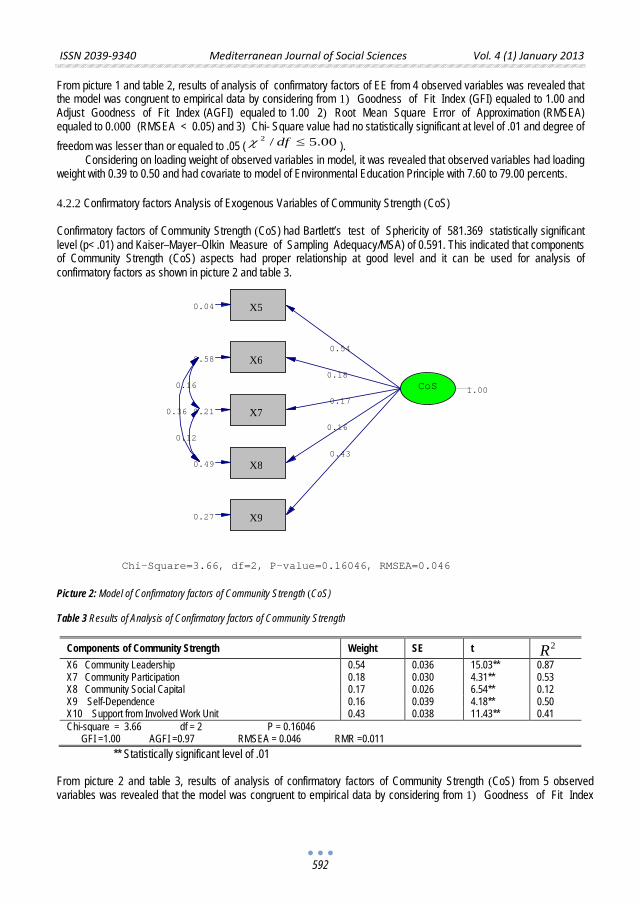
ISSN 2039-9340 Mediterranean Journal of Social Sciences Vol. 4 (1) January 2013
592
From picture 1 and table 2, results of analysis of confirmatory factors of EE from 4 observed variables was revealed that the model was congruent to empirical data by considering from 1) Goodness of Fit Index (GFI) equaled to 1.00 and Adjust Goodness of Fit Index (AGFI) equaled to 1.00 2) Root Mean Square Error of Approximation (RMSEA) equaled to 0.000 (RMSEA < 0.05) and 3) Chi- Square value had no statistically significant at level of .01 and degree of freedom was lesser than or equaled to .05 ( 00.5/2 ≤dfχ ).
Considering on loading weight of observed variables in model, it was revealed that observed variables had loading weight with 0.39 to 0.50 and had covariate to model of Environmental Education Principle with 7.60 to 79.00 percents.
4.2.2 Confirmatory factors Analysis of Exogenous Variables of Community Strength (CoS) Confirmatory factors of Community Strength (CoS) had Bartlett’s test of Sphericity of 581.369 statistically significant level (p< .01) and Kaiser–Mayer–Olkin Measure of Sampling Adequacy/MSA) of 0.591. This indicated that components of Community Strength (CoS) aspects had proper relationship at good level and it can be used for analysis of confirmatory factors as shown in picture 2 and table 3.
Picture 2: Model of Confirmatory factors of Community Strength (CoS) Table 3 Results of Analysis of Confirmatory factors of Community Strength
Components of Community Strength Weight SE t 2R X6 Community Leadership 0.54 0.036 15.03** 0.87
X7 Community Participation 0.18 0.030 4.31** 0.53
X8 Community Social Capital 0.17 0.026 6.54** 0.12
X9 Self-Dependence 0.16 0.039 4.18** 0.50
X10 Support from Involved Work Unit 0.43 0.038 11.43** 0.41
Chi-square = 3.66 df = 2 P = 0.16046 GFI =1.00 AGFI =0.97 RMSEA = 0.046 RMR =0.011
** Statistically significant level of .01 From picture 2 and table 3, results of analysis of confirmatory factors of Community Strength (CoS) from 5 observed variables was revealed that the model was congruent to empirical data by considering from 1) Goodness of Fit Index
X5 0.04
X6 0.58
X7 0.21
X8 0.49
X9 0.27
CoS 1.00
Chi-Square=3.66, df=2, P-value=0.16046, RMSEA=0.046
0.54
0.18
0.17
0.16
0.43
0.16
0.36
0.12
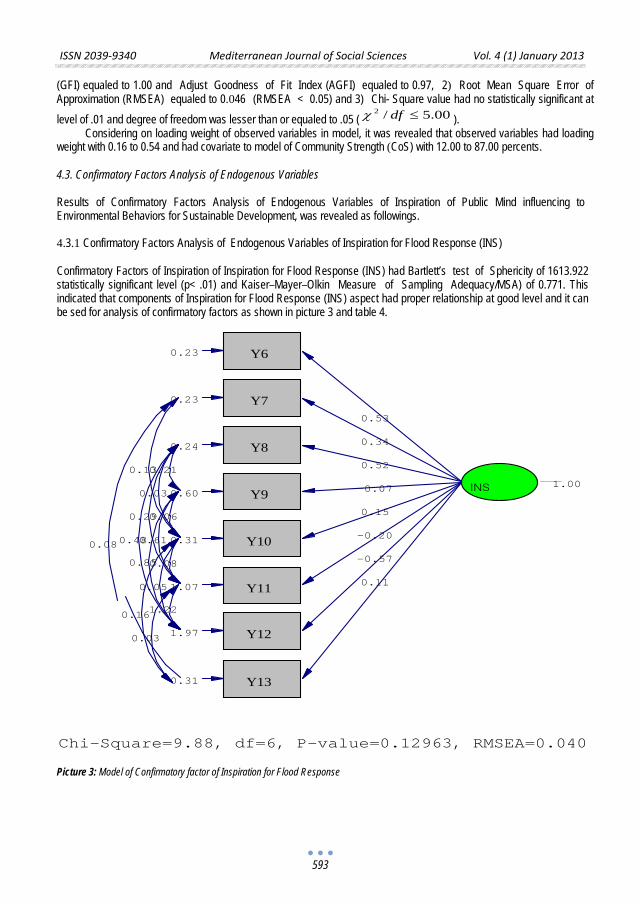
ISSN 2039-9340 Mediterranean Journal of Social Sciences Vol. 4 (1) January 2013
593
(GFI) equaled to 1.00 and Adjust Goodness of Fit Index (AGFI) equaled to 0.97, 2) Root Mean Square Error of Approximation (RMSEA) equaled to 0.046 (RMSEA < 0.05) and 3) Chi- Square value had no statistically significant at level of .01 and degree of freedom was lesser than or equaled to .05 ( 00.5/2 ≤dfχ ). Considering on loading weight of observed variables in model, it was revealed that observed variables had loading weight with 0.16 to 0.54 and had covariate to model of Community Strength (CoS) with 12.00 to 87.00 percents. 4.3. Confirmatory Factors Analysis of Endogenous Variables Results of Confirmatory Factors Analysis of Endogenous Variables of Inspiration of Public Mind influencing to Environmental Behaviors for Sustainable Development, was revealed as followings. 4.3.1 Confirmatory Factors Analysis of Endogenous Variables of Inspiration for Flood Response (INS) Confirmatory Factors of Inspiration of Inspiration for Flood Response (INS) had Bartlett’s test of Sphericity of 1613.922 statistically significant level (p< .01) and Kaiser–Mayer–Olkin Measure of Sampling Adequacy/MSA) of 0.771. This indicated that components of Inspiration for Flood Response (INS) aspect had proper relationship at good level and it can be sed for analysis of confirmatory factors as shown in picture 3 and table 4.
Picture 3: Model of Confirmatory factor of Inspiration for Flood Response
Y6 0.23
Y7 0.23
Y8 0.24
Y9 0.60
Y10 0.31
Y11 1.07
Y12 1.97
Y13 0.31
INS 1.00
Chi-Square=9.88, df=6, P-value=0.12963, RMSEA=0.040
0.53
0.34
0.52
-0.07
0.15
-0.20
-0.57
0.11
0.21 0.13
0.03
0.06 0.29
0.61
0.08
0.48
0.85
0.05
1.22
0.08
0.16
0.03
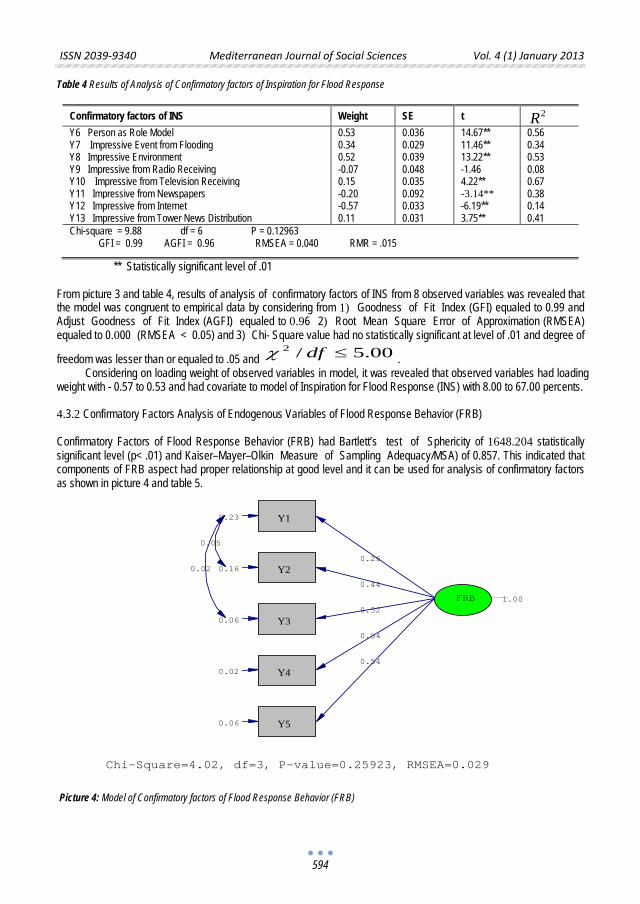
ISSN 2039-9340 Mediterranean Journal of Social Sciences Vol. 4 (1) January 2013
594
Table 4 Results of Analysis of Confirmatory factors of Inspiration for Flood Response
Confirmatory factors of INS Weight SE t 2R Y6 Person as Role Model 0.53 0.036 14.67** 0.56 Y7 Impressive Event from Flooding 0.34 0.029 11.46** 0.34 Y8 Impressive Environment 0.52 0.039 13.22** 0.53 Y9 Impressive from Radio Receiving -0.07 0.048 -1.46 0.08 Y10 Impressive from Television Receiving 0.15 0.035 4.22** 0.67 Y11 Impressive from Newspapers -0.20 0.092 -3.14** 0.38 Y12 Impressive from Internet -0.57 0.033 -6.19** 0.14 Y13 Impressive from Tower News Distribution 0.11 0.031 3.75** 0.41 Chi-square = 9.88 df = 6 P = 0.12963 GFI = 0.99 AGFI = 0.96 RMSEA = 0.040 RMR = .015
** Statistically significant level of .01 From picture 3 and table 4, results of analysis of confirmatory factors of INS from 8 observed variables was revealed that the model was congruent to empirical data by considering from 1) Goodness of Fit Index (GFI) equaled to 0.99 and Adjust Goodness of Fit Index (AGFI) equaled to 0.96 2) Root Mean Square Error of Approximation (RMSEA) equaled to 0.000 (RMSEA < 0.05) and 3) Chi- Square value had no statistically significant at level of .01 and degree of
freedom was lesser than or equaled to .05 and 00.5/2 ≤dfχ . Considering on loading weight of observed variables in model, it was revealed that observed variables had loading
weight with - 0.57 to 0.53 and had covariate to model of Inspiration for Flood Response (INS) with 8.00 to 67.00 percents. 4.3.2 Confirmatory Factors Analysis of Endogenous Variables of Flood Response Behavior (FRB) Confirmatory Factors of Flood Response Behavior (FRB) had Bartlett’s test of Sphericity of 1648.204 statistically significant level (p< .01) and Kaiser–Mayer–Olkin Measure of Sampling Adequacy/MSA) of 0.857. This indicated that components of FRB aspect had proper relationship at good level and it can be used for analysis of confirmatory factors as shown in picture 4 and table 5.
Picture 4: Model of Confirmatory factors of Flood Response Behavior (FRB)
Y1 0.23
Y2 0.16
Y3 0.06
Y4 0.02
Y5 0.06
FRB 1.00
Chi-Square=4.02, df=3, P-value=0.25923, RMSEA=0.029
0.26
0.44
0.52
0.54
0.54
0.05
0.02
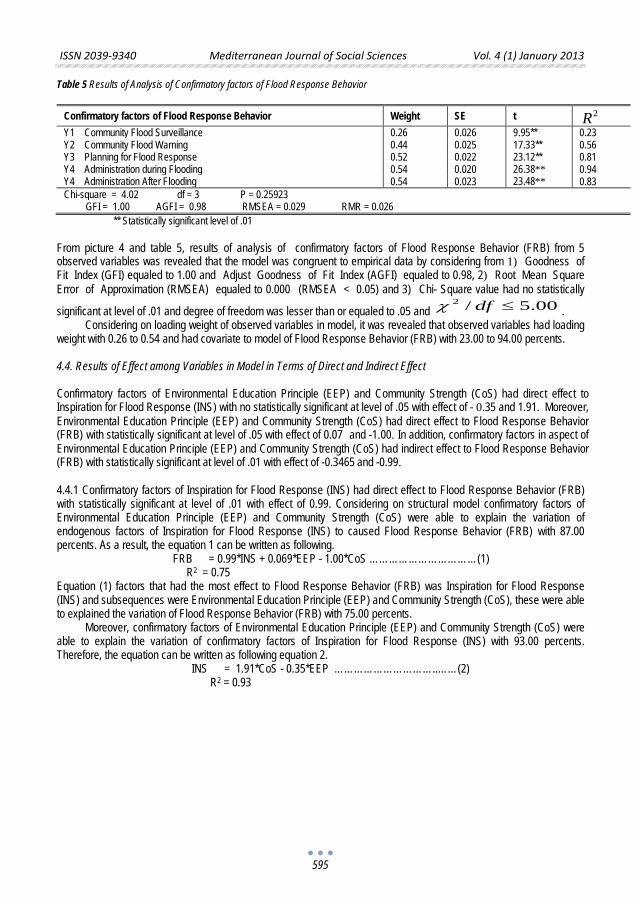
ISSN 2039-9340 Mediterranean Journal of Social Sciences Vol. 4 (1) January 2013
595
Table 5 Results of Analysis of Confirmatory factors of Flood Response Behavior
Confirmatory factors of Flood Response Behavior Weight SE t 2R Y1 Community Flood Surveillance 0.26 0.026 9.95** 0.23 Y2 Community Flood Warning 0.44 0.025 17.33** 0.56 Y3 Planning for Flood Response 0.52 0.022 23.12** 0.81 Y4 Administration during Flooding 0.54 0.020 26.38** 0.94 Y4 Administration After Flooding 0.54 0.023 23.48** 0.83 Chi-square = 4.02 df = 3 P = 0.25923 GFI = 1.00 AGFI = 0.98 RMSEA = 0.029 RMR = 0.026
** Statistically significant level of .01 From picture 4 and table 5, results of analysis of confirmatory factors of Flood Response Behavior (FRB) from 5 observed variables was revealed that the model was congruent to empirical data by considering from 1) Goodness of Fit Index (GFI) equaled to 1.00 and Adjust Goodness of Fit Index (AGFI) equaled to 0.98, 2) Root Mean Square Error of Approximation (RMSEA) equaled to 0.000 (RMSEA < 0.05) and 3) Chi- Square value had no statistically
significant at level of .01 and degree of freedom was lesser than or equaled to .05 and 00.5/2 ≤dfχ . Considering on loading weight of observed variables in model, it was revealed that observed variables had loading
weight with 0.26 to 0.54 and had covariate to model of Flood Response Behavior (FRB) with 23.00 to 94.00 percents. 4.4. Results of Effect among Variables in Model in Terms of Direct and Indirect Effect Confirmatory factors of Environmental Education Principle (EEP) and Community Strength (CoS) had direct effect to Inspiration for Flood Response (INS) with no statistically significant at level of .05 with effect of - 0.35 and 1.91. Moreover, Environmental Education Principle (EEP) and Community Strength (CoS) had direct effect to Flood Response Behavior (FRB) with statistically significant at level of .05 with effect of 0.07 and -1.00. In addition, confirmatory factors in aspect of Environmental Education Principle (EEP) and Community Strength (CoS) had indirect effect to Flood Response Behavior (FRB) with statistically significant at level of .01 with effect of -0.3465 and -0.99. 4.4.1 Confirmatory factors of Inspiration for Flood Response (INS) had direct effect to Flood Response Behavior (FRB) with statistically significant at level of .01 with effect of 0.99. Considering on structural model confirmatory factors of Environmental Education Principle (EEP) and Community Strength (CoS) were able to explain the variation of endogenous factors of Inspiration for Flood Response (INS) to caused Flood Response Behavior (FRB) with 87.00 percents. As a result, the equation 1 can be written as following. FRB = 0.99*INS + 0.069*EEP - 1.00*CoS ……………………………(1) R2 = 0.75 Equation (1) factors that had the most effect to Flood Response Behavior (FRB) was Inspiration for Flood Response (INS) and subsequences were Environmental Education Principle (EEP) and Community Strength (CoS), these were able to explained the variation of Flood Response Behavior (FRB) with 75.00 percents.
Moreover, confirmatory factors of Environmental Education Principle (EEP) and Community Strength (CoS) were able to explain the variation of confirmatory factors of Inspiration for Flood Response (INS) with 93.00 percents. Therefore, the equation can be written as following equation 2. INS = 1.91*CoS - 0.35*EEP …………………………..……(2) R2 = 0.93
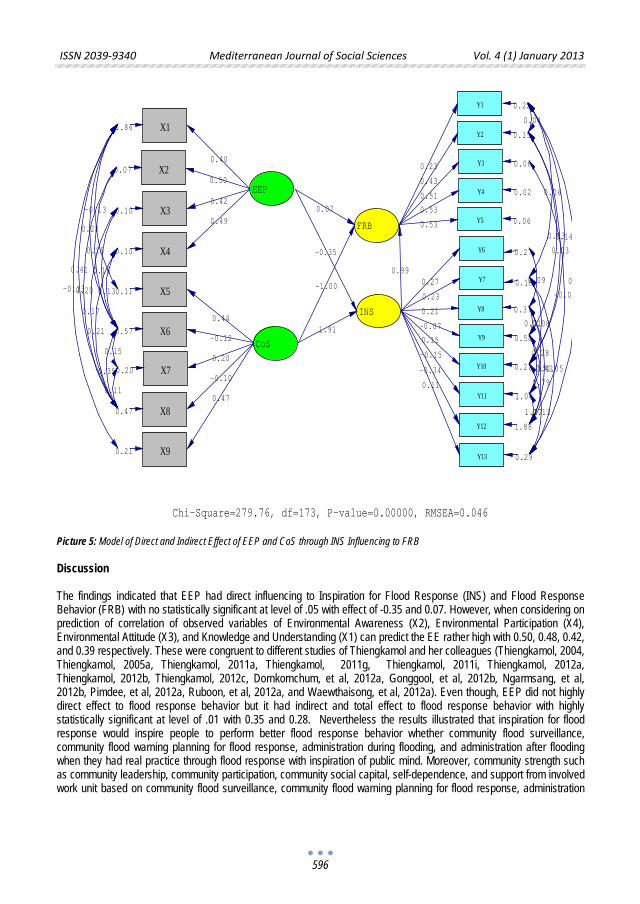
ISSN 2039-9340 Mediterranean Journal of Social Sciences Vol. 4 (1) January 2013
596
Picture 5: Model of Direct and Indirect Effect of EEP and CoS through INS Influencing to FRB Discussion The findings indicated that EEP had direct influencing to Inspiration for Flood Response (INS) and Flood Response Behavior (FRB) with no statistically significant at level of .05 with effect of -0.35 and 0.07. However, when considering on prediction of correlation of observed variables of Environmental Awareness (X2), Environmental Participation (X4), Environmental Attitude (X3), and Knowledge and Understanding (X1) can predict the EE rather high with 0.50, 0.48, 0.42, and 0.39 respectively. These were congruent to different studies of Thiengkamol and her colleagues (Thiengkamol, 2004, Thiengkamol, 2005a, Thiengkamol, 2011a, Thiengkamol, 2011g, Thiengkamol, 2011i, Thiengkamol, 2012a, Thiengkamol, 2012b, Thiengkamol, 2012c, Dornkornchum, et al, 2012a, Gonggool, et al, 2012b, Ngarmsang, et al, 2012b, Pimdee, et al, 2012a, Ruboon, et al, 2012a, and Waewthaisong, et al, 2012a). Even though, EEP did not highly direct effect to flood response behavior but it had indirect and total effect to flood response behavior with highly statistically significant at level of .01 with 0.35 and 0.28. Nevertheless the results illustrated that inspiration for flood response would inspire people to perform better flood response behavior whether community flood surveillance, community flood warning planning for flood response, administration during flooding, and administration after flooding when they had real practice through flood response with inspiration of public mind. Moreover, community strength such as community leadership, community participation, community social capital, self-dependence, and support from involved work unit based on community flood surveillance, community flood warning planning for flood response, administration
X11.86
X20.07
X30.10
X40.10
X50.11
X60.57
X70.20
X80.47
X90.21
EEP
CoS
FRB
INS
Y1 0.22
Y2 0.15
Y3 0.06
Y4 0.02
Y5 0.06
Y6 0.27
Y7 0.18
Y8 0.37
Y9 0.58
Y10 0.27
Y11 1.04
Y12 1.88
Y13 0.29
Chi-Square=279.76, df=173, P-value=0.00000, RMSEA=0.046
0.23
0.43
0.51
0.53
0.53
0.27
0.23
0.21
-0.07
0.15
-0.15
-0.34
0.11
0.40
0.50
0.42
0.49
0.44
-0.12
0.20
-0.10
0.47
0.99
0.07
-1.00
-0.35
1.91
0.04
0.06
0.09
0.03
0.21
0.14
0.03
0.08
0.28
0.59
-0.0
0.42
0.79
1.17
0
0.05
0.13
-0.13
0.28
0.15
0.16
0.13
0.15
0.41
0.20
0.17
0.21
0.35
0.11
-0.13
ISSN 2039-9340 Mediterranean Journal of Social Sciences Vol. 4 (1) January 2013
597
during flooding, and administration after flooding also lead to good practice of flood response behavior for alleviation the flood disaster and decrement of damage to human life and their properties.
Consequently, Community Strength (CoS) such as community leadership, community participation, community social capital, self-dependence, and support from involved work unit had direct influencing to Inspiration for Flood Response (INS) and had indirect influencing to Flood Response Behavior (FRB) with highly statistically significant at level of .01 with effect of 1.91 and 1.89. Additionally, when considering on prediction of correlation of observed variables of Community Leadership (X6), Support from Involved Work Unit (X10), Community Participation (X7), Community Social Capital (X8), and Self-Dependence (X9) can predict the CoS rather high with 0.54, 0.69, 0.18, 0.17 and 0.16 respectively.
Moreover, Inspiration for Flood Response (INS) had direct effect to Flood Response Behavior (FRB) with statistically significant at level of .01 with effect of .99. Particularly, when considering on prediction of correlation of observed variables of Person as Role Model (Y5), Impressive Event from Flooding (Y6), impressive Environment (Y7), and Impressive from Television Receiving (Y10), can predict the INS with 0.53, 0.34, 0.52, and 0.15 respectively (Thiengkamol, 2011i, Thiengkamol, 2011j, Thiengkamol, 2012c, Thiengkamol, 2012d, , Dornkornchum, and Thiengkamol, 2012, Dornkornchum, et al, 2012a, Gonggool, et al, 2012b, Ngarmsang, et al, 2012b, Ruboon, et al, 2012a, Pimdee, et al, 2012, and Waewthaisong, et al, 2012a).
However, it might be concluded that EEP observed from observed variables of Knowledge and Understanding (X1), Environmental Awareness (X2), Environmental Attitude (X3), and Environmental Participation (X4), and CoS observed from observed variables of Community Leadership (X6), Community Participation (X7), Community Social Capital (X8), Self-Dependence (X9), and Support from Involved Work Unit (X10 ), can influence through Inspiration for Flood Response (INS) composing of Person as Role Model (Y6), impressive Event from Flooding (Y7), Impressive Environment (Y8), Impressive from Radio Receiving (Y9), Impressive from Television Receiving (Y10), Impressive from Newspapers (Y11), Impressive from Internet (Y12), and Impressive from Tower News Distribution (Y13) to Flood Response Behavior (FRB) that included Community Flood Surveillance (Y1), Community Flood Warning (Y2), Planning for Flood Response (Y3),
Administration during Flooding (Y4), and Administration after Flooding (Y5). Therefore, the model of EEP and CoS influencing through INS to FRB was verified the proposed model was fitted with all observed variables according to criteria of Chi-Square value differs from zero with no statistical significant at .01 level or Chi-Square/df value with lesser or equal to 2, P-value with no statistical significant at .01 level and RMSEA (Root Mean Square Error Approximation) value with lesser than 0.05 including index level of model congruent value, GFI (Goodness of Fit Index) and index level of model congruent value, AGFI (Adjust Goodness of Fit Index) between 0.90-1.00. References Charoensilpa, D., Thiengkamol, N., Thiengkamol, C., and Kurokote, J. (2012b). Development of Environmental Education
Characteristics. Journal of the Social Sciences, 7 (4):496-501. Corben, R. (2012). Thai Officials Optimistic Flooding Will Not Reach 2011 Levels. Retrieved from
http://www.voanews.com/content/thai_officials_optimistic_flooding_will_not_reach_2011_levels/1506404.html Directive. (2007). Chapter 1 Article2. eur-lex.europa.eu. Retrieved fromhttp://eur-lex.europa.eu/LexUriServ/ LexUriServ.do?uri=
OJ:L:2007:288:0027:0034: EN:PDF Dornkornchum, S. and Thiengkamol, N. (2012). Model of Environmental Education and Psychological State Affecting to Global Warming
Alleviation. International Proceedings of Economic Development and Research, 44, 1-5. Dornkornchum, S. Thiengkamol, N., & Thiengkamol, C. (2012a). Causal Relationship Model of Environmental Conservation Behavior
Integrated with LCA Knowledge. European Journal of Social Sciences, 33 (1):5-16. Environment for Beginners. (2012). What Are the Benefits of Forests and the Consequences of Deforestation? Retrieved from
http://www.environmentforbeginners.com /content/view/52/49/ Figge, K. (2012). A Coming-of-Age Story Set amid the Floods of Thailand. Retrieved from http://www.thejakartaglobe.com
/lifeandtimes/a-coming-of-age-story-set-amid-the-
MENAFN. (2012). White Paper: 2011 Thailand Floods Case Study. Retrieved from:
floods-of-thailand/542751 Gonggool, D., Thiengkamol, N., & Thiengkamol, C. (2012b). Development of Environmental Education Volunteer Model through
Inspiration of Public Consciousness for Sustainable Development. European Journal of Social Sciences, 32 (1):150-160. http://www.menafn.com/menafn/4bb351bc-28d2-
4337-8254-a055dbf1b3db/White-Paper-2011-Thailand-Floods-Case-Study?src=main Ngarmsang, K., Thiengkamol, N., & Thiengkamol, C. (2012b). Development of an Environmental Education and Environmental
Management Model for Learning Disability Student. European Journal of Social Sciences, 32 (1):120-127.
ISSN 2039-9340 Mediterranean Journal of Social Sciences Vol. 4 (1) January 2013
598
Pimdee, P., Thiengkamol, N., & Thiengkamol, T. (2012a). Causal Relationship Model of Electrical Energy Conservation. European Journal of Social Sciences, 32 (3):306-315.
Ruboon, O., Thiengkamol, N, Thiengkamol, T, & Kurukodt, J. (2012a). Model of Environmental Education Teacher with Inspiration of Environmental Conservation for Global Warming Alleviation. European Journal of Social Sciences, 31 (1):92-102.
Thiengkamol, N. (2004). Development of A Learning Network Model for Energy Conservation. A Thesis Doctor of Education (Environmental Education) Faculty of Graduate Studies, Mahidol University.
Thiengkamol, N. (2005a). Strengthening Community Capability through The Learning Network Model for Energy Conservation. Journal of Population and Social Studies, Volume14, Number1, July 2005.
Thiengkamol, N. (2008). Globalization Administration. . Bangkok: Saengchai Publication. Thiengkamol, N. (2009a). The Great Philosopher: the Scientist only know but Intuition is Lord Buddha. Bangkok: Prachya Publication. Thiengkamol, N. (2009b). The Happiness and the Genius can be created before Born. Bangkok: Prachya Publication. Thiengkamol, N. (2011a). Holistically Integrative Research. Published 2nd Edition. Bangkok: Chulalongkorn University Press. Thiengkamol, .N. (2011e). Environment and Development Book 1. Published 4th Edition. Bangkok: Chulalongkorn University Press. Thiengkamol, N. (2011g). Development of Energy Security Management for Rural Community. Canadian Social Science, 7 (5), October
31, 2011. Thiengkamol, N. (2011i). Development of Model of Environmental Education and Inspiration of Public Consciousness Influencing to
Global Warming Alleviation. European Journal of Social Sciences, 25 (4):506-514. Thiengkamol, N. (2011j). Model of Psychological State Affecting to Global Warming Alleviation. Canadian Social Science, 7 (6):89-95,
December 31, 2011. Thiengkamol, .N. (2012a). Development of A Prototype of Environmental Education Volunteer. Journal of the Social Sciences, 7 (1):77-
81. Thiengkamol, N. (2012b). Development of Food Security Management for Undergraduate Student Mahasarakham University. European
Journal of Social Sciences, 27 (2):246-252. Thiengkamol, N. (2012c). Model of Psychological Trait Affecting to Global Warming Alleviation. European Journal of Social Sciences, 30
(3) : 484-492. Thiengkamol, N. (2012d). Model of Psychological Factors Affecting to Global Warming Alleviation.International Proceedings of Economic
Development and Research, 44, 6-12. UNFPA. (2012). World Population Day 2012. Retrieved fromhttp://www.unfpa.org/public/world-population-day Waewthaisong, S. Thiengkamol, N., & Thiengkamol, C. (2012a). Development of Environmental Traveling Behavior Model through
Inspiration of Public Mind for Global Warming Alleviation. European Journal of Social Sciences, 33 (1). Wikipedia. (2012). Disaster. Retrieved from http://en.wikipedia.org/wiki/Disaster Wikipedia. (2012). Flood. Retrieved from http://en.wikipedia.org/wiki/Flood

ISSN 2039-9340 Mediterranean Journal of Social Sciences Vol. 4 (1) January 2013
599
Analyzing the Determinants of Export Trade in Cameroon (1970 – 2008)
Ibrahim Ngouhouo Ph.D
Senior lecturer at the Faculty of Economics and Management,
University of Dschang and the Acting Director of the Institute of Fine Arts (Corresponding author) Email: [email protected]
Alex Audrin Makolle
Pstgraduate student, University of Bamenda
Doi:10.5901/mjss.2013.v4n1p599 Abstract
This research analyses empirically the determinants of export trade in Cameroon from 1970 to 2008. We use the two Stage Least Square to show that exchange rate, trade openness and export lag one period are the main determinants of export in Cameroon. This result, although common in most Developing Countries are in contradiction with former studies, mostly because the foreign direct Investment was found to be not significant in determining the export in this Country.
Keywords : export trade, openness, TSLS, exchange rate, determinant
1. Introduction
Cameroon has seen itself engaged in international trade, and specifically in the exportation of goods and services for the past years. According to Bamou (2002), three main phases in the evolution of Cameroon’s total exports can be picked out from independence (1960) up to date: (1) rapid growth from 1960 to 1986: characterized by rapid growth at an annual rate of 106% and was spurred by the good performances of primary agricultural products; (2) a fall from 1987 to 1994: marked by a fall in both agricultural and industrial contributions and a boom in the oil contribution to total exports and also was characterized by the “Dutch Disease” as described by Benjamin and Devarajan (1985); and (3) continuous growth recovery since 1994, even though occurring in fluctuating pattern. This phase began with some major changes in the country’s trade policy; a fiscal reform was implemented and the local currency (CFAF) devaluated by 100% relative to the French franc (FF). The export growth in this last phase was also accompanied by a relative harmonization of contributions to total exports, especially in the industrial sector1
There is ample evidence that export trade in Cameroon has been occurring in a fluctuating manner. Also, it is true that unfavorable domestic terms of trade and declining output are the principal contributors to the fluctuating and poor performance of Cameroon’s exports (which is mainly agricultural in nature)
.
2
Where export supply responds negatively to exchange rate or inflation for example, currency value changes cannot bring about an increase in export volume.
. Coupled to these, there is the effect of the interaction between inappropriate domestic and foreign reform policies. This situation has led the country to a number of macroeconomic imbalances, including budget deficits and balance of payments (and debt) problems. The low foreign exchange earnings constrain the importation of vital raw materials and this induces the deterioration of the quality of both the social and economic infrastructure. In such a situation, and attempting to follow an export-led growth approach, an increase in exports is expected to contribute significantly to the improvement of most of these imbalances. The overall success of any strategy to increase exports will depend, among others, on the knowledge of what factors constrain export growth.
Our main objective is to analyze the factors that determined the volume of export trade in Cameroon (1970-2008). Specifically, we are out to identifying some factors and analyzing the extent to which these factors have influenced the magnitude of export trade in Cameroon for the years under study. 1See Bamou (2002), Njong (2008), 2See Gbetnkom and Sunday A. Khan (2002).
ISSN 2039-9340 Mediterranean Journal of Social Sciences Vol. 4 (1) January 2013
600
Following our objectives stated above, we hypothesize that the factors we will identify are significant in determining the volume of export trade in Cameroon during the period of study. 2. Empirical Literature Several cross-country studies found support for the hypothesis of a negative relationship between FDI and export (Jeon 1992). Moreover, Sharma (2000) does not see any statistically significant impact of FDI on Indian exports. In contrast, other studies indicated that FDI actually has a positive effect on export performance of host countries (Cabral, 1995; Blake and Pain, 1994). In this light, Njong (2008) investigates the effects of foreign direct investment on export performance in Cameroon. According to this author, theoretical relationship between FDI and export growth can be explained by using the flying geese model, Vernon’s product life cycle theory and the new growth model. These three theories all agree that FDI has an influence on the recipient economy. First, MNE subsidiaries exploit the host country’s factor endowments for lowering production costs to increase their export competitiveness. Therefore, the host country’s export expansion by MNE subsidiaries is to be expected (capacity-increasing effect). Secondly, the host country’s export can be increased by domestic firms through the spillover effects of FDI such as competition and transfer of knowledge (spillover effect). In an attempt to estimate the potential effects of FDI inflows on export growth in Cameroon over the 1980-2003, he separates the effects of FDI into supply capacity-increasing effects and spillover effects. Hypothesizing that FDI has had a positive impact on Cameroon export performance, he finds evidence that FDI inflows contributed to higher supply capacity and spillover effects in Cameroon, leading to higher export growth during the period of study.
In the Journal of African Economies (2000), a sample of 38 manufacturing firms from Cameroon is examined for the period 1980-95. A production function and an export function are estimated in order to study the determinants of TFP and export performance. The results demonstrate a mutually reinforcing relation between productivity and manufacturing export performance. Moreover, the study provides evidence indicating that adequate management of the real exchange rate is a crucial factor for the promotion of manufacturing exports. The performance of the manufacturing sector in Cameroon has deteriorated substantially since the mid-1980s. This decline is to a large degree explained by Dutch disease symptoms and inward-looking policies for the manufacturing sector, resulting in a highly overvalued real effective exchange rate (REER).
Gbetnkom, D. and Khan, A.S. (2002) investigate the determinants of three agricultural exports from Cameroon between 1971/72 and 1995/1996. Export supply functions are specified and estimated for the three export crops chosen: cocoa, coffee and banana. Quantitative estimates obtained from the ordinary least squares (OLS) estimation procedure indicate the following: the response of export supply of all the crops to relative price changes is positive, but fairly significant. This can be attributed to the price constraining nature of the international markets for these commodities. Changes in the nature of the road network positively affect the export supply of cocoa, coffee and banana. More credit to crop exporters has a significant and positive influence on the export supply of all the crops. Equally, rainfall’s influence on the growth of the three commodities is positive, but significant only for cocoa and coffee. Finally, structural adjustment dummies show a positive effect on the export supply of crops for policies implemented. These results point to two conclusions. First, the marginal sensitivity of crops to the relative price changes means that the price incentives are not sufficient to generate desired export supply of agricultural commodities in Cameroon. Second, the significant sensitivity of crops under consideration to the availability of credit to exporters, the improved road networks and the specific policy changes implemented in the framework of the SAP implies that attempts to increase the export supply of agricultural crops in Cameroon should focus on these variables.
Amin (1996) estimates the effects of exchange rate policies on prices of export crops and on Cameroon’s agricultural export competitiveness. After calculating the nominal protection coefficient (NPC) and the nominal protection rates (NPR) for the crops considered (cocoa, coffee), and estimating the real exchange rate (RER) and the extent of the over-valuation, Amin reached at the following conclusions: the agricultural sector is heavily taxed through a high level of intervention and over-valuation. The levels of real over-valuation are quite high, up to 77%, and estimates show that a 10% depreciation of RER stimulates about 1.0% increase of cocoa.
Tshibaka (1998) addresses the effects of external shocks and domestic sectoral and macroeconomic policies on the structure of price incentives of major agricultural export commodities, and their repercussions on output and producer income. He concludes that during the period 1971–1993, Cameroon’s export commodities faced a very unfavorable world market environment as their real world terms of trade declined at an average rate of 3.1% per year. The domestic sectoral and commodity specific policies that prevailed during this period were also detrimental to the export crop subsector. Finally, the real exchange rate decreased at an average annual rate of 3.9%, suggesting an appreciation of
ISSN 2039-9340 Mediterranean Journal of Social Sciences Vol. 4 (1) January 2013
601
the CFA franc. The analysis has also shown that external factors have been the leading cause of the observed fall in the overall level of export earnings and real producer income in Cameroon.
Sangita (2000) analyzes “the determinants of exports in Fiji.” The paper identifies some of the main determinants of exports in Fiji. A single equation model for exports is developed in which trading partner income and relative prices play a central role. The underlying conceptual framework of the study is an imperfect substitution model, in which the key assumption is that exports are not perfect substitutes for domestic goods in importing countries. A distinguishing feature of the analysis is the incorporation of the effects of agricultural supply-side shocks in the export equation. The results show that in the long run, trading partner income largely drives movements in Fiji’s exports. In the short run, exports are mainly influenced by changes in factors which affect the output capacity of agricultural production, such as weather conditions and industrial disputes, as well as relative prices and changes in foreign demand.
Using quartile regression techniques, Marco Fugazza (2004) analyzes the major determinants of export performance. Results indicate that, while trade barriers continue to be of concern, poor supply-side conditions have often been the more important constraint on export performance in various regions, particularly in Africa and the Middle East despite a generalized deepening of international trade integration. Beside strong linkages to international markets, good transport infrastructures, macroeconomic soundness and good quality institutions appear to be major determinants in the development process of the external sector.
The performance of a country’s export trade is highly dependent on its exchange rate regime, and more specifically the real exchange rate (Agasha, 2007). Various studies have shown that the demand for a country’s exports increases when its export prices fall in relation to the world prices. The depreciation of its currency compared to other currencies makes its exports cheaper on the international market. Sharma (2001) discovered that the demand for Indian exports increased when its export prices fell. He also argued that the appreciation of the Indian Rupee at one time adversely affected Indian exports.
Musinguzi and Obwona (2000) regressed export growth on real exchange, TOT and lagged export growth. They found that TOT had a marginal but statistically significant impact on export growth. They also found out that export growth rate in Uganda is significantly and positively affected by its previous growth and terms of trade, but is not significantly affected by real exchange rate. Similarly, Ngeno (1996), using export growth function of output and real exchange rate found that both variables significantly affect export growth in Kenya. JayantParimal (2006) associated deteriorating TOT with contraction of export earnings in Burundi.
Before estimating the aggregate and individual agricultural export supply, Fosu (1992) noted that the real exchange rate (RER) of a domestic currency does not influence the economy’s agricultural exports directly; instead, it influences agricultural exports through its effects on the incentive structure. In total, four agricultural export functions were estimated using the ordinary least squares method. First is an aggregate real agricultural export function, followed by cocoa, coffee and sheanut export equations. At the 5% level, the lagged export variable turned out to be the only significant variable in the aggregate model. The cocoa base capacity (Qt), cocoa to food price ratio (Px/Pf) and the trend term are statistically significant. The coffee to food price ratio and the foreign income are significant, but the negative sign of the response of the latter implies that contrary to expectation, an increase in foreign income tends to precipitate falls in the volume of coffee and cocoa exports. A 10% increase in Yttends to generate a 13.73% fall in the volume of coffee exports in Ghana.
Studies on export performance in developing countries show that FDI has a significant positive impact on export structure (Njong, 2008; Amelia and Santos, 2000). Amelia and Santos (2000) in Agasha (2007); reveal that foreign direct investment sometimes chooses sectors of the economy where a country may not be relatively specialized and that this also affects export performance. Also, the study suggested that imports of intermediate inputs and machinery are important determinants of changes in the export sector. Gross Domestic Product is also coined to have a positive impact on exports3
The price of exports on the international market is proven to be one of the main determinants of export growth, especially for countries like Cameroon which depend on exportation of agricultural products whose prices fluctuate frequently. Edwards and Golub (2004) found that foreign prices have strong impact on manufacturing sector’s export performance in South Africa. Using time series data, they got significant positive coefficient of foreign prices
.
4
3Kumar et al. (1997) and Ngeno (1990) both found positive significant effect of GDP on export growth. 4 Similar results are found in Rakif and Sverdberg (1990).
.
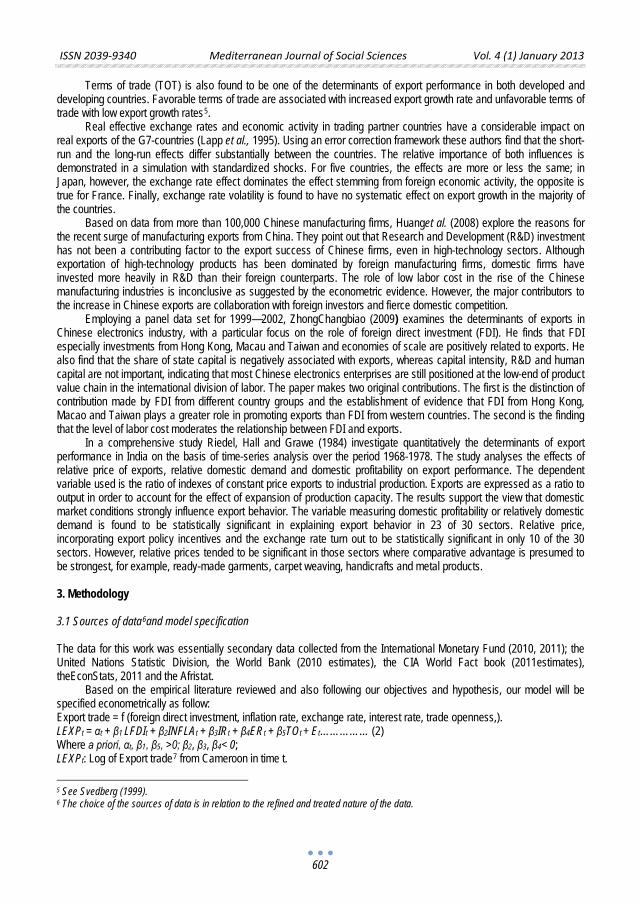
ISSN 2039-9340 Mediterranean Journal of Social Sciences Vol. 4 (1) January 2013
602
Terms of trade (TOT) is also found to be one of the determinants of export performance in both developed and developing countries. Favorable terms of trade are associated with increased export growth rate and unfavorable terms of trade with low export growth rates5
Based on data from more than 100,000 Chinese manufacturing firms,
. Real effective exchange rates and economic activity in trading partner countries have a considerable impact on
real exports of the G7-countries (Lapp et al., 1995). Using an error correction framework these authors find that the short-run and the long-run effects differ substantially between the countries. The relative importance of both influences is demonstrated in a simulation with standardized shocks. For five countries, the effects are more or less the same; in Japan, however, the exchange rate effect dominates the effect stemming from foreign economic activity, the opposite is true for France. Finally, exchange rate volatility is found to have no systematic effect on export growth in the majority of the countries.
Huanget al. (2008) explore the reasons for the recent surge of manufacturing exports from China. They point out that Research and Development (R&D) investment has not been a contributing factor to the export success of Chinese firms, even in high-technology sectors. Although exportation of high-technology products has been dominated by foreign manufacturing firms, domestic firms have invested more heavily in R&D than their foreign counterparts. The role of low labor cost in the rise of the Chinese manufacturing industries is inconclusive as suggested by the econometric evidence. However, the major contributors to the increase in Chinese exports are collaboration with foreign investors and fierce domestic competition.
Employing a panel data set for 1999—2002, ZhongChangbiao (2009) examines the determinants of exports in Chinese electronics industry, with a particular focus on the role of foreign direct investment (FDI). He finds that FDI especially investments from Hong Kong, Macau and Taiwan and economies of scale are positively related to exports. He also find that the share of state capital is negatively associated with exports, whereas capital intensity, R&D and human capital are not important, indicating that most Chinese electronics enterprises are still positioned at the low-end of product value chain in the international division of labor. The paper makes two original contributions. The first is the distinction of contribution made by FDI from different country groups and the establishment of evidence that FDI from Hong Kong, Macao and Taiwan plays a greater role in promoting exports than FDI from western countries. The second is the finding that the level of labor cost moderates the relationship between FDI and exports.
In a comprehensive study Riedel, Hall and Grawe (1984) investigate quantitatively the determinants of export performance in India on the basis of time-series analysis over the period 1968-1978. The study analyses the effects of relative price of exports, relative domestic demand and domestic profitability on export performance. The dependent variable used is the ratio of indexes of constant price exports to industrial production. Exports are expressed as a ratio to output in order to account for the effect of expansion of production capacity. The results support the view that domestic market conditions strongly influence export behavior. The variable measuring domestic profitability or relatively domestic demand is found to be statistically significant in explaining export behavior in 23 of 30 sectors. Relative price, incorporating export policy incentives and the exchange rate turn out to be statistically significant in only 10 of the 30 sectors. However, relative prices tended to be significant in those sectors where comparative advantage is presumed to be strongest, for example, ready-made garments, carpet weaving, handicrafts and metal products. 3. Methodology 3.1 Sources of data6
and model specification
The data for this work was essentially secondary data collected from the International Monetary Fund (2010, 2011); the United Nations Statistic Division, the World Bank (2010 estimates), the CIA World Fact book (2011estimates), theEconStats, 2011 and the Afristat.
Based on the empirical literature reviewed and also following our objectives and hypothesis, our model will be specified econometrically as follow: Export trade = f (foreign direct investment, inflation rate, exchange rate, interest rate, trade openness,). LEXPt = αt + β1 LFDIt + β2INFLAt + β3IRt + β4ERt + β5TOt + Et…………… (2) Where a priori, αt, β1, β5, >0; β2, β3, β4< 0; LEXPt: Log of Export trade7
5 See Svedberg (1999). 6 The choice of the sources of data is in relation to the refined and treated nature of the data.
from Cameroon in time t.
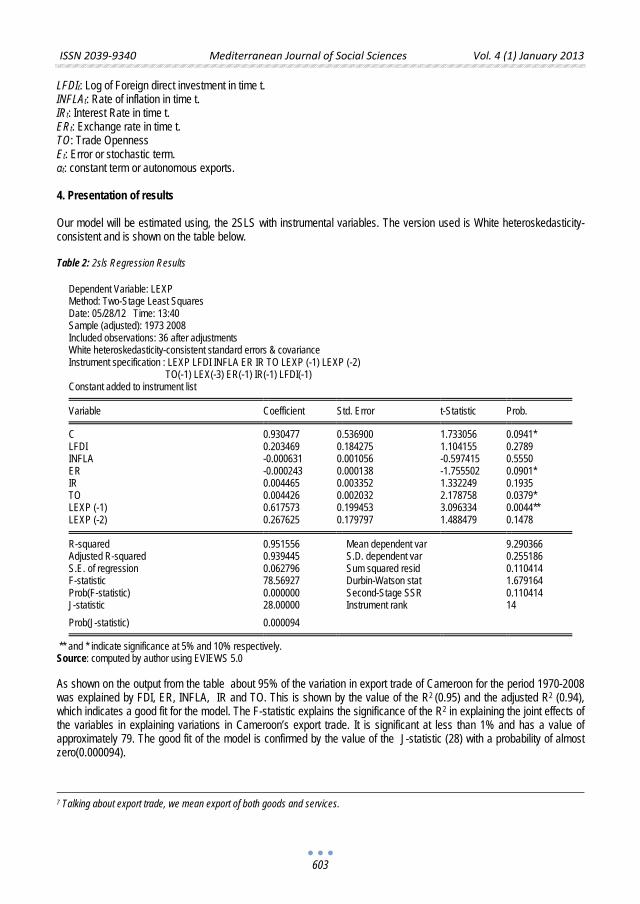
ISSN 2039-9340 Mediterranean Journal of Social Sciences Vol. 4 (1) January 2013
603
LFDIt: Log of Foreign direct investment in time t. INFLAt: Rate of inflation in time t. IRt: Interest Rate in time t. ERt: Exchange rate in time t. TO: Trade Openness Et: Error or stochastic term. αt: constant term or autonomous exports. 4. Presentation of results
Our model will be estimated using, the 2SLS with instrumental variables. The version used is White heteroskedasticity-consistent and is shown on the table below. Table 2: 2sls Regression Results
Dependent Variable: LEXP Method: Two-Stage Least Squares Date: 05/28/12 Time: 13:40 Sample (adjusted): 1973 2008 Included observations: 36 after adjustments White heteroskedasticity-consistent standard errors & covariance Instrument specification : LEXP LFDI INFLA ER IR TO LEXP (-1) LEXP (-2) TO(-1) LEX(-3) ER(-1) IR(-1) LFDI(-1) Constant added to instrument list Variable Coefficient Std. Error t-Statistic Prob. C 0.930477 0.536900 1.733056 0.0941* LFDI 0.203469 0.184275 1.104155 0.2789 INFLA -0.000631 0.001056 -0.597415 0.5550 ER -0.000243 0.000138 -1.755502 0.0901* IR 0.004465 0.003352 1.332249 0.1935 TO 0.004426 0.002032 2.178758 0.0379* LEXP (-1) 0.617573 0.199453 3.096334 0.0044** LEXP (-2) 0.267625 0.179797 1.488479 0.1478 R-squared 0.951556 Mean dependent var 9.290366 Adjusted R-squared 0.939445 S.D. dependent var 0.255186 S.E. of regression 0.062796 Sum squared resid 0.110414 F-statistic 78.56927 Durbin-Watson stat 1.679164 Prob(F-statistic) 0.000000 Second-Stage SSR 0.110414 J-statistic 28.00000 Instrument rank 14 Prob(J-statistic) 0.000094 ** and * indicate significance at 5% and 10% respectively.
Source: computed by author using EVIEWS 5.0 As shown on the output from the table about 95% of the variation in export trade of Cameroon for the period 1970-2008 was explained by FDI, ER, INFLA, IR and TO. This is shown by the value of the R2 (0.95) and the adjusted R2 (0.94), which indicates a good fit for the model. The F-statistic explains the significance of the R2 in explaining the joint effects of the variables in explaining variations in Cameroon’s export trade. It is significant at less than 1% and has a value of approximately 79. The good fit of the model is confirmed by the value of the J-statistic (28) with a probability of almost zero(0.000094).
7 Talking about export trade, we mean export of both goods and services.
ISSN 2039-9340 Mediterranean Journal of Social Sciences Vol. 4 (1) January 2013
604
The export trade of the previous quarter significantly (at 5%) impacts on the current quarter’s export trade. This finding is consistent with that of Fosu (1992), Musinguziet al. (2000) and Agasha (2007) who found out that lagged export trade has a statistically significant impact on current year’s export trade.
In conformity with Agasha (2007), FDI has a positive coefficient but is not statistically significant in explaining variation in the export trade volume of Cameroon during our period of study. This finding is however contrary to that of Njong (2008), who found out that FDI has significantly contributed to higher exports in Cameroon for the period 1980- 2003. Also, INFLA and IR are found to be insignificant in explaining variations in Cameroon’s export trade volume during our period of study.
The positive (0.930477) and significant (at 10%) coefficient of the constant term in our model tells us that holding all of our stated variables constant, Cameroon’s exports would still increase, everything being equal. This means there are other variables not included in our model that influenced Cameroon’s export growth during our period of study. If the values of these variables increased, export trade would also increase. These other factors could include TOT and GDP.
Having a negative coefficient, exchange rate is found to be significant (at 10%) in explaining variation in the volume of export trade in Cameroon during our period of study. This is in conformity with our apriori expectations and with the studies of Fosu (1992) and Sharma (2001), carried out in Ghana and India respectively, and contrary to that of Agasha (2007). A fall in Cameroon’s domestic prices due to exchange rate depreciation makes exports cheaper in the international markets, resulting to their increase. The negative coefficient (-0.000243) tells us that an appreciation of Cameroon’s exchange rate will cause exports in Cameroon to drop. Also, depreciation in the exchange rate will have an expansionary effect on Cameroon’s export volume. Therefore, if Cameroon’s exchange rate was to be increased by 100, its exports would reduce by 2.4%8
8The interpretation is so because of the log linear form of the model.
. Conversely, if Cameroon’s exchange rate fell by 100, its export trade would increase by 2.4%.
From the results obtained, trade openness (TO) is found to be significant (at 10%) in explaining variations in export trade growth in Cameroon from 1970 to 2008. Its positive coefficient (0.0044) is in conformity with our apriori expectations. Cameroon as an open economy will have greater market opportunities, at the same time she will face greater competition from businesses based in other countries. In 1998 for example, Cameroon had a TO index of 5.2, which can explain the relatively higher growth rate of its export trade. From 1980 to 2008, Cameroon had fluctuating trade openness indices, which reflected the fluctuations in its volume of export growth. In 1980 for example, its TO index was 5.44 an annual export growth was 30.7%. In 1990, TO index was 5.5, with export growth rate of -9.8. In 2000, its trade openness index was at 5.8 with export growth of -5%. As such, if Cameroon’s economic freedom index increases by 10, its exports will increase by 4%. This result is in line with that of Kimura and Lee (2004), who found that a country with a high economic freedom index will realize higher exports. As such, as Cameroon moves towards economic liberalization its export trade will be seen to improve. 5. Conclusion
This study was set out to identify and analyze the determinants of export trade in Cameroon, over the period 1970 -2008. Given that Cameroon’s export trade is constituted mainly by primary products, external shocks and policy reforms have caused its export growth to be cyclical over the period of study. Empirical analysis and results showed that exchange rate, lagged export values and trade openness had significant effects on Cameroon’s export trade during our period of study. The negative relationship existing between exchange rate and export trade is consistent with past findings but contradicts the results of Majeed and Ahmad (2006), who found positive relationship between exchange rate and export growth. However, in contrast with many studies for which FDI significantly and positively affects export trade, our results showed that FDI was not significant in determining export growth in Cameroon during the period of study. Inflation and interest rates were also found to be insignificant in causing variations in export volume of Cameroon. The results made us to conclude that some variables (ER, LEXPt-1, and TO) actually caused variations in Cameroon’s export volume during our period of study, while some did not (FDI, INFLA and IR). From our results, we see that trade openness had a significant positive impact on export trade in Cameroon during our period of study. The low value of the coefficient could be as a result of the country not being effectively economically free. As such, policy reforms aimed at effectively liberalizing trade in Cameroon should be revised. This could make the impact of trade openness to be important in determining export growth in Cameroon. In terms of financial development, trade openness will be a way to obtain money from other countries, in other to invest its surplus in other countries.
ISSN 2039-9340 Mediterranean Journal of Social Sciences Vol. 4 (1) January 2013
605
Also, considering the exchange rate as a significant determinant of Export trade in Cameroon during our period of study, there is evidence indicating that policy reforms should also be geared towards adequate management of the exchange rate which is a crucial factor for the promotion of Cameroon’s exports. Nevertheless, given the significance of the constant term, there is evidence that policy reforms should also be geared towards others variables not included in the model. Emphasis should be laid on other economic indicators.
Based on the results found in this work, there is need for further research. We restricted our model based on aggregated data. The use of the aggregated data made us to assume that the effects of the identified factors are equal across sectors. Using disaggregated data, we recommend a sound sectoral analysis to show the effects of the determinants identified on each sector of the economy. Again, there is need to disintegrate the factors determining export trade in Cameroon into supply and demand factors. References Agasha, N. (2007). Determinants of Export Growth in Uganda 1987-2006, Uganda Revenue Authority, Research and Planning,
Kampala, Uganda, pp.1-17. Amin, A.A. (1996). The Effects of Exchange Rate Policy on Cameroon’s Agricultural Competitiveness, AERC Research Paper No. 42,
Nairobi. Bamou, L. T. (2002). Promoting export diversification in Cameroon: Toward which products?AERC Research Paper 114, Nairobi, pp. 9-
10. Benjamin, N. and S. Devarajan (1985).Oil Revenues and Economic Policy in Cameroon: Results from a Computable General Equilibrium
Model, Working Papers No.745, World Bank, Washington, D.C. Blake, A., and N. Pain. (1994). Investigating Structural Change in U.K. Export Performance: the role of innovation and direct investment,
Discussion Paper No. 71, National Institute of Economic and Social Research (NIESR). Cabral, L. (1995) Sunk Costs, Firm Size and Firm Growth, Journal of Industrial Economics, 43: 161-172. De Mellor, L.R. and Sinclair M. T. (1995) Foreign Direct Investment, Joint Ventures and Endogenous Growth, Department of Economics,
University of Kent, UK. Edwards, L. and Golub, S. (2004), South Africa’s International Cost Competitiveness and Productivity in Manufacturing, World
Development 32, (8): pp. 1323-1339. Fosu, Yerfi K. (1992), The Real Exchange Rate and Ghana’s Agricultural Exports, AERC Research Paper No. 9. Nairobi. Fugazza, Marco (2004), Export Performance and its determinants: supply and demand constraints, Division on International Trade in
Goods and Services, and Commodities, UNCTAD Policy Issues in International Trade and Commodities., Geneva, Switzerland. Gbetnkom, D. and Khan, A. S. (2002), Determinants of agricultural exports: The case of Cameroon, AERC Research Paper 120, ISBN
9966-944-87-7. Geneva. Huang, C., Mingqian Zhang, M., Yanyun Zhao, Y., and Celeste AmorimVarum, A. C. (2008), Determinants of exports in China: a
microeconometric analysis, The European Journal of Development Research Volume 20, DOI: 10.1080/09578810802060793. Jeon, Y. (1992), The Determinants of Korean Foreign Direct Investment in Manufacturing Industries,Weltwirtschaftliches Archive 128;
pp. 527-541. Journal of African Economies, (2000), Dynamics of export performance, productivity and real effective exchange rate in manufacturing:
the case of Cameroon,Oxford University Press, Volume 9. Kimura, L. and Lee, H.Y. (2004), The Gravity Equation in International Trade in Services, European Trade Study Group Conference,
University of Nottingham, pp. 3-21. Lapp, S., Scheide, J. and Solveen, R. (1995), Determinants of exports in the G7-countries, Paper provided by Kiel Institute for the World
Economy in its series Kiel Working Papers with number 707. Majeed, M. T., and Ahmad, E.* (2006), Determinants of Exports in Developing Countries, The Pakistan Development Review 45 : 4 Part
II, pp. 1265–1276 Musinguzi, P. and Obwona, M (2000), The use of Econometrics in Policy Design in Uganda, Afriacan Economic Policy Discussion Paper
Number 23, Economic Research Center, Kampala. Ngeno, K. N. (1996), Comparative analysis of economic reform and structural adjustment programme in Eastern Africa with emphasis
on Trade Policies, Technoserve/University of Nairobi, Technical Paper N0 19 and 20, Nairobi, Kenya. Njong, A. M. (2008), Investigating The Effects Of Foreign Direct Investment On Export Growth In Cameroon, Final version of paper
submitted to UNECA for the 24-25 November Ad-hoc Expert Group Meeting in Addis Ababa, Ethiopia. Riedel, J., Hall, C. and Grawe, R. (1984), Determinants of Indian Exports Performance in the 1970s, Weltwirtschaftliches Archive 120:1,
pp. 40–63. Sangita Prasad (2000),Determinants of Exports in Fiji, Working Paper, Economics Department, Reserve Bank of Fiji. Shan, J., Tian, G.G. and Sun, F. (1997), The FDI-led growth hypothesis: Further econometric evidence from China, Research School of
Pacific and Asian Studies, Working Paper 97/2. Sharma, K. (2000), Export Growth in India: Has FDI played a role?, Center Discussion Paper No 816, Yale University.

ISSN 2039-9340 Mediterranean Journal of Social Sciences Vol. 4 (1) January 2013
606
Tshibaka, Tshikala (1997), Effects of domestic economic policies and external factors on export prices and their implications for output and income in Cameroon, AERC Final Report, Nairobi.
Zhang, K. H. (2004), how does FDI Affect a Host Country’s Export Performance? The Case of China, Department of Economics, Illinois State University.
ZhongChangbiao (2009), Determinants of Exports in Chinese Electronics Industry, Economic Research Journal, Business School of Ningbo University.
ISSN 2039-9340 Mediterranean Journal of Social Sciences Vol. 4 (1) January 2013
607
A Study of Errors in Bilingual Road, Street and Shop Signs in Iran
Alireza Hojati
Amin Higher Education Institution, Fouladshahr, Iran
E-mail: [email protected] Doi:10.5901/mjss.2013.v4n1p607 Abstract
Bilingual signs are becoming a regular feature of our increasingly globalized and inter-connected world. One problem many bilingual signs suffer from is their having different linguistic errors of varying degrees of seriousness. This study was carried out to investigate different linguistic errors, including grammatical, lexical and spelling, errors featuring in a sample of bilingual signs in Iran. To this end, a number of Farsi-English road, street and shop signs were randomly selected and photographed by the researcher. The pictorial data were then subjected to error-identification and error-analysis procedures. Findings suggest that most errors in bilingual Farsi-English signs are lexical ones, though grammatical and other errors also have fairly high frequencies of occurrence in them.
Keywords: Bilingual Signs, Linguistic Errors, Iranian EFL
1. Introduction 1.1. Overview In recent years, a number of highly influential factors, including globalization and the phenomenal rise of the English language as the foremost and most-widely-used international language, have led to the increasing use of bilingual signs in different countries (Vaish 2008, Bhagwati 2007). Today, bilingual signs featuring English and one dominant local or national language can be found in many non-Anglophone countries such as China, Thailand, Japan, South Korea, the Philippines, Singapore, Malaysia, Spain, Belgium, Pakistan and Iran Rengel (2004), Gorter (2006), Fu (2008), Hobbs & Postings (2008), Cybriwsky (2011). One notable thing associated with bilingual signs is that many of them contain errors of different types (Shohamy 2008). Elaborating on this point, Richmond(2009) has made important comments:
Bilingual road signs are making a slow appearance along some highways, but much remains to confuse would-be drivers from abroad. … keep in mind that foreigners have been jailed for being involved in traffic accidents, even if they were not at fault.(p. 356).
Qiao (2010), who examined different errors in Chinese-English signs, has noted that errors associated with bilingual signs fall into a number of broad categories including ‘spelling’, ‘lexical choices’ and ‘grammar’ (2010). Echoing this point, Shohamy (2008) has indicated that spelling errors are among the most common errors featuring in bilingual signs. Further, Chiasuanchong (2011) has noted that some signs contain serious grammatical and/or lexical errors and, as a result, are more baffling than helpful to those reading them. Many of the errors which bilingual signs contain can also be considered as ‘translation Errors’. Recently, a number of authors have sharply criticized badly or poorly translated bilingual signs and have explicitly called for the rectification of errors they contain regardless of whether they are linguistic errors or translation problems (Kassin, Fein & Markus 2010), Bateman 2010). Perhaps one of the most recent example of a gross and puzzling translation error in bilingual signs can be observed in the case of a sign posted in the Vale of Glamorgan. The sign’s translated version reads: “Station Current Closed In Front Follow Entertainment” to warn motorists that road maintenance work in under way in the area and they have to change course. The correct translation of the sign is “Station Road Closed Ahead Follow Diversion” (cited in Morgan 2012). This example clearly shows how the failure to select an appropriate lexical item can profoundly change and distort the original message and turn a bilingual sign, which
ISSN 2039-9340 Mediterranean Journal of Social Sciences Vol. 4 (1) January 2013
608
is supposed to benefit a greater number of people, into an almost useless laughing stock. In Iran, as stated earlier, bilingual signs featuring Farsi, the national language of the country, and English are becoming increasingly common, especially in big cities and on major roads and thoroughfares (Nijs 2011), Cybriwsky 2011). Up until now, it seems, no published study has focused specifically on the examination of errors of bilingual signs in Iranian contexts. This point, which the review of literature on the topic reveals, coupled with the increasing use of Farsi-English signs in Iran, points to the need for having research in this area. 1.2. Purpose of the Study The current study had two aims: identifying errors of a sample of randomly-chosen Iranian bilingual signs and qualitatively examining high-frequency errors of the signs. Given the increasing use of Farsi-English bilingual signs in Iran and the dearth of existing literature on the topic, this study enjoys a strong rationale. 2. Methodology 2.1.Materials To collect enough data for the current research study, the researcher used a mobile phone set as a simple picture-taking device with which to document his data. He went to different parts of the Iranian metropolis of Isfahan and a number of counties of Isfahan Province, including Fouladshahr, Felavarjan and Najafabad. He took pictures of many bilingual street, road and shop signs using the mobile phone set. A total of 80 bilingual signs were photographed and used as this study’s data.
What is worth noting here is that all the bilingual signs were randomly photographed and no attempt was made by the researcher to examine the signs in terms of linguistic accuracy prior to the analysis of the obtained research data. 50 out of the 85 signs were street signs, 15 were road signs and 20 were shop signs. The small number of road signs is due to the fact that noticing and taking pictures of bilingual road signs while sitting in a fast-moving vehicle was a tricky thing for the researcher to do. To partly overcome this problem, the researcher took a trip to some major roads leading to the metropolis of Isfahan using a cab during two consecutive weekends. Each time he noticed bilingual road signs, he asked the cab driver to stop the car in a safe place, got out of the car and took pictures of them. 2.2. Procedures The researcher spent four weeks collecting the research data. In the first two weeks, he went to fifteen different places, including tourist attractions, historical sites and large shopping centers, of the city of Isfahan, identified bilingual signs in those places and took pictures of them. He managed to take 70 pictures corresponding to 20 shop signs and 50 street signs. The second two-week period was devoted to the collection of data from bilingual road signs. Given the difficulties associated with this task, the researcher managed to take only 15 pictures corresponding to 15 bilingual road signs during the foregoing period.
After the completion of data-collection procedures, the researcher embarked upon the analysis of research data. First, he examined each bilingual sign in terms of grammatical and lexical and spelling accuracy. Then, he separated flawed signs from the ones which were free from errors and identified the types of errors faulty signs contained. After that, he tabulated the data, computed frequencies of each error category and identified high-frequency categories of errors. Finally, he examined the obtained results by juxtaposing them with relevant highlights of literature. 3. Results The tables below summarize results of the study.
ISSN 2039-9340 Mediterranean Journal of Social Sciences Vol. 4 (1) January 2013
609
Table 1. Error Categories and Their Frequencies.
Error Category Frequency of Occurrence in Bilingual Signs Wrong Word Order 6 Literal Translation from Farsi to English 11 Incorrect Lexical Equivalents 21 Literal Translation of Part of a Proper Noun 14 Non-use of Apostrophe to Refer to Shop Names 9 Wrong Spelling 3 Total Frequency of Errors 64
Table 2. Examples of Errors in Each Error Category.
Error Category Example/s Wrong Word Order Mosque Al-Quds/ Farabi South Street Literal Translation from Farsi to English with Inappropriate lexical choices
Uneven Immunity(To refer to ‘speed hump’/ Mill Steel(To refer to Zobahan Steel Company
Incorrect Lexical Equivalents Fish and Hen Shop(To refer to a shop selling fish and chicken)/ Majid Car Exhibition(Instead of ‘Majid Car Dealership’
Literal Translation of Part of a Proper Noun City Bank(to refer to بانک شهر)/ Abrisham City(to refer to شهر ابريشم)
Non-use of Apostrophe to Refer to Shop Names Azadegan Dry-cleaning(Instead of ‘Dry-cleaner’s’ or ‘Dry-cleaning Shop’/ Navid Barber(Instead of ‘Barber Shop’ or ‘Barber’s’
Wrong Spelling Well Come to Isfahan!(Instead of ‘Welcome to Isfahan’
4. Discussion and Conclusions As numerical data presented in table 1 indicate, there were notable differences between frequencies associated with the six error categories. As the table’s data show, errors falling into categories of ‘Incorrect Lexical Equivalents’, ‘Literal Translation of Part of a Proper Noun’ and ‘Literal Translation from Farsi to English’ had the first, second and third highest frequencies of occurrence (21, 14 and 11) respectively. The table also shows that errors associated with categories of ‘Wrong Spelling’, ‘Wrong Word Order’ and ‘Non-use of Apostrophe to Refer to Shop Names’ had the lowest frequencies of occurrence (3, 6 and 9 respectively). Also, the total number of errors identified in this research (64), illustrates that a sizeable number of bilingual signs examined in the current study (21 out of the total of 85) were free from errors.
Table 2, which provides examples of errors detected in each of the six error categories, provides a general picture of the extent to which bilingual signs’ textual contents deviated from correct forms and how serious the errors were. One problem which flawed bilingual signs pose is confusion and lack of comprehension on the part of foreigners who are not familiar with Farsi and pay attention only to English contents of the signs they have exposure to in Iran. So, it is arguable that gross errors in bilingual Farsi-English signs, such as the translation of ‘سرعت گير’ as ‘Uneven Immunity’, are bound to confuse foreigners visiting Iran and need to be corrected. To qualitatively analyze the high-frequency error categories, a couple of points need to be mentioned and borne in mind. The first point is that the making of incorrect lexical choices is very common in translation and constitutes one of the major obstacles to having a clear and comprehensible translation (Luttikhuizen 2000), Leonardi (2007) ,Goutte, Cancedda & Dymetman (2009). The second point is that literal translation of L1 items into L2 is bound to lead to problems. This is perhaps the easiest type of translation and many are tempted to resort to it, but the problem with this approach is that it often fails to take into account semantic boundaries and distinctions between L1 and L2 items (Wills 1982), and does not work when the items translated reach the “literal/figurative boundary (Low 2010). The third, and final, point is that proper nouns should not be translated from L1 to L2. In this regard, West’s (2011) words are notable; “Proper nouns (names) are the same in most languages, and therefore, they are not translated”(p. 251). So, it can be said that the literal translation of some
ISSN 2039-9340 Mediterranean Journal of Social Sciences Vol. 4 (1) January 2013
610
proper nouns are not only wrong and unacceptable, but also totally unhelpful in translation as it generates bizarre items that can be more confusing that helpful. If, for example, ‘the Dead Sea’ is translated into Farsi as .it will lose its status as a proper noun and can confuse the reader of the translated material ,’دريای مرده‘
Taking the above points into consideration, it can be stated that high-frequency errors detected and examined in this study, which deal with incorrect lexical choices and literal translation, have come about partly thanks to the failure of translator/s to pay adequate heed to semantic boundaries between lexical items in English and Farsi as well as to the failure to stick to the rule prohibiting verbatim translation of proper nouns.
Understandably, most translators use different bilingual dictionaries which help them do their work more efficiently. The problem with many of these dictionaries, however, is that most of them fail to illustrate and explain the semantic boundaries between words which are similar in meaning (Wilss 1982). To give an example, Aryanpour’s (1984) Persian-English Dictionary, which is widely used in Iran and has been reprinted many times in the past three decades, has provided many English equivalents for the Persian words ;including ’حفظ /نگهداری‘ “preservation, immunization, safeguarding, defending, sheltering, custody, care, guarding, memory, memorizing” (p. 314). If one is not adequately aware of the existence of substantial semantic differences between the equivalents provided above, he may easily make wrong lexical choices and use one of the words wrongly in his translation. The case of the translation of ‘سرعت گير’ as ‘Uneven Immunity’ is perhaps a clear example of both ignoring semantic boundaries between words and translating an item verbatim. Another word, which is bound to lead to the making of incorrect lexical choices in translation is ‘نمايشگاه’. Aryanpour’s bilingual dictionary(1984) has provided the words “theatre, fair, place of exhibition, exposition, exhibit, show place, showroom” as English equivalents of ‘نمايشگاه’. In many bilingual signs, the word ‘exhibition’ has been used as the lexical equivalent of But, as we know, ‘exhibition’ refers to a place where exhibits are put on display and cannot be sold to .’نمايشگاه‘visitors, while ‘fair’ refers to a place where exhibits can be put on display and are sold to potential customers (see Oxford Advanced Learner’s Dictionary, 2007). So, referring to a car dealership as ‘a car exhibition’ can distort the original message and confuse reader of the translated version of the message. What can be concluded from this study is that despite the increasing use of Farsi-English bilingual road, street and shop signs in Iran, a large number of signs contain errors of different types and varying levels of seriousness. Further, high-frequency errors, as stated before, mainly deal with selecting wrong lexical equivalents and translating proper nouns. Given the existence of a fairly large number of errors in Iranian bilingual signs, there is a need for their treatment and rectification. Also, given the lack of any published article on this research’s topic, there is room for future research to focus on this topic and examine larger, more diverse samples of bilingual signs from different parts of Iran to enrich this area of research. References Bateman, C. (2010). String Fellows. The United Kingdom: Troubador Publishing Ltd. Bhagwati, J. (2007). In Defense of Globalization:With a New Afterword: With a New Afterword. New York: Oxford University Press. Chiasuanchong. (2012). To Save or Not to Save. Retrieved from Uhttp://chiasuanchong.com /2011/06/U on November 6th, 2012. Cybriwsky, R. (2011). Roppongi Crossing: The Demise of a Tokyo Nightclub District and the Reshaping of a Global City. The United
States of America: University of Georgia Press. Fu, P.(Editor). (2008). China Forever: The Shaw Brothers and Diasporic Cinema. The United States of America: John Benjamins
Publishing. Gorter, D. (Editor).(2006). Linguistic Landscape: A New Approach to Multilingualism Great Britain: Multilingual Matters. Goutte, C., Cancedda, N., Dymetman, M. (Editors). (2009). Learning machine translation. The United States of America: MIT Press. Hobbs, G., Postings, H. (2008). Live & Work in Spain. Hong Kong:Crimson Publishing. Kassin, S., Fein, S., Markus, H. (2010). Social Psychology. The United States of America: Cengage Learning. Leonardi, V. (2007). Gender and Ideology in Translation: Do Women and Men Translate Differently? : a Contrastive Analysis from Italian
Into English. Switzerland: Peter Lang. Low, G. (2010). Researching and Applying Metaphor in the Real World. The United States of America: John Benjamins Publishing. Luttikhuizen, F. (Editor). (2000). III Congrés Internacional sobre Llengües per a Finalitats Especifiques: ease seminar : actes : 8, 9 i 10
de setembre de 1999, Canet de Mar. Spain: Edicions Universitat Barcelona. Morgan, S. (2012). Another Bizarre Welsh Translation Sign Tells Readers to ‘Follow Entertainment’. Retrieved
from Uhttp://www.walesonline.co.uk/news/need-to-read/U on November 5th, 2012. Nijs, D. (2011). Sand and Pomegranates: Slowly Crossing the Desert in Iran. Retrieved from Uwww.transitionsabroad.com/listingsU. on
November 6th, 2011.,

ISSN 2039-9340 Mediterranean Journal of Social Sciences Vol. 4 (1) January 2013
611
Qiao, X. (2010). A Study of Inappropriate English Translations of Chinese Signs. Retrieved from http://cardinalscholar.bsu.edu/handle /123456789/194692. on November 2th, 2012.
Richmond, S. (2009). Trans-Siberian Railway. The United States of America: Lonely Planet. Shohamy, E. (2008). Linguistic Landscape: Expanding the Scene. New York: Taylor & Francis. Vaish, V. (2008). Biliteracy and globalization: English language education in India. Great Britain: Multilingual Matters. West, W. (2011). A Resurrection to Immortality: The Resurrection, Our Only Hope of Life After Death. The United States of America:
West Bow Press. Wilss, W. (1982). The Science of Translation: Problems and Methods. The United States of America: G. Narr.
ISSN 2039-9340 Mediterranean Journal of Social Sciences Vol. 4 (1) January 2013
612
Note form the Editor
Retraction and Apology
With the present note we would extend an apology to Dr. Binod Paudyal for publishing in the Vol 3 No 1 January 2012 a paper of Mrs Najmeh Nouri titled:
“Floating World: Re-imagining Rhizomatic Identities in Jhumpa Lahiri’s The Namesake” It has come to the journal’s attention that this particular essay by Najmeh Nouru was in fact plagiarized. As a result of the plagiarism the essay has now been removed from our journal. Ms. Nouri’s essay plagiarized the work of Binod Paudyal at the University of Utah titled: “Re-Imagining Transnational Identities In Norma Cantú‟S Canícula And Jhumpa Lahiri‟S The Namesake” . Thank you for understanding, Sincerely yours, Dr. Andrea Carteny, Editor in chief, MJSS Sapienza University of Rome

Printed for MCSER in December 2012 by Gruppo Atena.net Srl
Via del Lavoro 22, 36040 Grisignano, VI, Italy
www.atena.net


