Embed Size (px)
Citation preview

i
Measuring Behavior 2022
Volume 2
12th International Conference on Methods and Techniques in
Behavioral Research, and 6th Seminar on Behavioral Methods
18 – 20 May 2022. Online.
Volume Editors
Proceedings

ii Volume 2 of the Proceedings of the joint 12th International Conference on Methods and Techniques in Behavioral Research and 6th
Seminar on Behavioral Methods held online, May 18-20, 2022. www.measuringbehavior.org. Editors: Andrew Spink, Jarosław
Barski, Anne-Marie Brouwer, Gernot Riedel, & Annesha Sil (2022). DOI 10.6084/m9.figshare.20066849. ISBN: 978-90-74821-94-0
Volume Editors
Andrew Spink
Noldus Information Technology; [email protected]
Jarosław Barski
Medical University of Silesia, Katowice; [email protected]
Anne-Marie Brouwer
Perceptual and Cognitive Systems, TNO; [email protected]
Gernot Riedel
University of Aberdeen; [email protected]
Annesha Sil
University of Aberdeen; [email protected]
iii Volume 2 of the Proceedings of the joint 12th International Conference on Methods and Techniques in Behavioral Research and 6th
Seminar on Behavioral Methods held online, May 18-20, 2022. www.measuringbehavior.org. Editors: Andrew Spink, Jarosław
Barski, Anne-Marie Brouwer, Gernot Riedel, & Annesha Sil (2022). DOI 10.6084/m9.figshare.20066849. ISBN: 978-90-74821-94-0
Table of Contents
Volume Editors ................................................................................................................................ i
Table of Contents ........................................................................................................................... iii
Preface to Volume 2 of Measuring Behavior 2022 ........................................................................ ix
Andrew Spink, Jarosław Barski, Anne-Marie Brouwer, Gernot Riedel, Annesha Sil
Oral Presentations
Session Theme: Measuring the Behavior of Farm Animals........................................................... 11
Using Cow Location Data for Practical On-farm Applications – A Pilot Study ............................ 12
E. van Erp- van der Kooi, G. Hofstra and M. Terlien
Using Infrared Thermographic Images for Early Detection of Clinical Lameness in Dairy Cattle
........................................................................................................................................................ 16
G. Hofstra, E. van Erp-van der Kooij, P. Broeren, A.A. van Dieren, W.A. van Ettekoven, L. van de
Klundert, R. Petie and J.L. Gonzales Rojas
Turkey Gait Analysis: Predicting Expert Score With Machine Learning Based on IMU Data. .... 21
J.E. Doornweerd, A. Savchuk, B. Visser, A.C. Bouwman
What do pregnant mares do at night? Activity budget in pregnant mares before foaling – a pilot
study ............................................................................................................................................... 25
L. Pålsson, P Haubro Andersen and J Lundblad
Scope of consistent inter-individual differences in mean movement behavior within a commercial
aviary early on ................................................................................................................................ 37
Camille Montalcini, Michael J. Toscano, and Matthew Petelle
Session Theme: New developments in analysis and statistics ........................................................ 43
The Effects of Stimulus Duration and Group Size on Wearable Physiological Synchrony ........... 44
I.V. Stuldreher, J.B.F. van Erp, A.-M. Brouwer
Start Making Sense: Predicting confidence in virtual human interactions using biometric signals.
........................................................................................................................................................ 47
S. Dalzel-Job, R.L. Hill, R. Petrick
Improving the Annotation Efficiency for Animal Activity Recognition using Active Learning ... 51
S.J. Spink, J.W. Kamminga and A. Kamilaris
Collaborative learning interactions among university students in face-to-face and online meetings
during the COVID-19 pandemic: An observational study ............................................................. 60
H.Q. Chim, Mirjam G.A. oude Egbrink, Diana H.J.M. Dolmans, Renate H.M. de Groot, Pascal
W.M. Van Gerven, Gudberg K. Jonsson, & Hans H.C.M. Savelberg
Session Theme: Sensors and multi-modal measurements .............................................................. 67
Multi-modal assessment of the behavioral markers of apathy under real-life context - Towards a
telemonitoring instrument of patient-caregiver couples’ psychological health .............................. 68
iv Volume 2 of the Proceedings of the joint 12th International Conference on Methods and Techniques in Behavioral Research and 6th
Seminar on Behavioral Methods held online, May 18-20, 2022. www.measuringbehavior.org. Editors: Andrew Spink, Jarosław
Barski, Anne-Marie Brouwer, Gernot Riedel, & Annesha Sil (2022). DOI 10.6084/m9.figshare.20066849. ISBN: 978-90-74821-94-0
Valérie Godefroy
Quantifying Interactions between Physiological Signals to Identify Exposure to Different
Chemicals ....................................................................................................................................... 72
J.U. van Baardewijk, S. Agarwal, A.S. Cornelissen, C. Varon, R.C. Hendriks, J. Kentrop, M.J.A.
Joosen, A.-M. Brouwer
Recognition of Basic Gesture Components using Body-Attached Bending Sensors ..................... 83
D. Krumm, A. Zenner, G. Sanseverino and S. Odenwald
Assessing the Pupil Dilation as Implicit Measure of the Sense of Embodiment in Two User
Studies ............................................................................................................................................ 89
Sara Falcone, Gwenn Englebienne, Anne-Marie Brouwer, Liang Zhang, Saket Pradhan, Ivo
Stuldreher, Ioana Cocu, Martijn Heuvel, Pietre Vries, Kaj Gijsbertse, Dirk Heylen, Jan van Erp
A Distance–Based Classification Method to Assess Frontal Behavior from Human Behavioral
Sensing ........................................................................................................................................... 95
Bénédicte Batrancourt, Frédéric Marin, Caroline Peltier, François-Xavier Lejeune, Delphine
Tanguy, Valérie Godefroy, Idil Sezer, Mathilde Boucly, David Bendetowicz, Guilhem Carle,
Armelle Rametti-Lacroux, Raffaella Migliaccio and Richard Levy
Optimal subgroup identification in a P300-based collaborative Brain-Computer Interface ........ 102
Luigi Bianchi, Chiara Liti,Veronica Piccialli
Setup for Multimodal Human Stress Dataset Collection ............................................................. 109
B. Mahesh, D. Weber, J. Garbas, A. Foltyn, M. P. Oppelt, L. Becker, N. Rohleder, N. Lang
Understanding the effects of sleep deprivation and acute social stress on cognitive performance
using a comprehensive approach .................................................................................................. 114
Charelle Bottenheft, Ivo Stuldreher, Koen Hogenelst, Eric Groen, Jan van Erp, Robert Kleemann
and Anne-Marie Brouwer
Session Theme: Methods and tools for measuring emotions ....................................................... 116
Ethnicity & FaceReader 9 – A FairFace Case Study ................................................................... 117
Jason L Rogers
Using EquiFACS annotation of video recordings “in the wild” to describe facial expressions of
emotionally stressed horses .......................................................................................................... 123
Johan Lundblad
A Tool for Measuring Intuition Using Audio Synthesizer Tasks ................................................. 129
M.J. Tomasik, H. Minarik, F. Vogel and J.M.Tomasik
Session Theme: Methods in food and eating studies .................................................................... 135
The Effect of Virtual Reality on Eating Behaviours and Hunger: A Randomized Crossover Study
...................................................................................................................................................... 136
Billy Langlet
An Attempt to Assess the Effects of Social Demand using Explicit and Implicit Measures of Food
Experience .................................................................................................................................... 143
P. Sabu, D. Kaneko, I.V. Stuldreher, A.-M. Brouwer

v Volume 2 of the Proceedings of the joint 12th International Conference on Methods and Techniques in Behavioral Research and 6th
Seminar on Behavioral Methods held online, May 18-20, 2022. www.measuringbehavior.org. Editors: Andrew Spink, Jarosław
Barski, Anne-Marie Brouwer, Gernot Riedel, & Annesha Sil (2022). DOI 10.6084/m9.figshare.20066849. ISBN: 978-90-74821-94-0
How Diet Composition Correlates with Cognitive Functioning - Application of Principal
Component Analysis (PCA) to Nutritional Data .......................................................................... 147
Aleksandra Bramorska, Wanda Zarzycka, Jagna Żakowicz, Natalia Jakubowska, Bartłomiej
Balcerzak, Wiktoria Podolecka, Aneta Brzezicka, Katarzyna Kuć
Conscious and unconscious emotional response evoked by food appearance in children: a study
based on automatic facial expression analysis and skin conductance response ........................... 156
N. da Quinta, A. Baranda, Y. Ríos, R. Llorente, I. Martinez de Marañon
Session Theme: Automatic behavior recognition in rodents: how new technology moves the
field forward ..................................................................................................................................... 166
Self-supervised learning as a gateway to reveal underlying dynamics in animal behavior ........ 167
K. Luxem and P. Mocellin
uBAM: Unsupervised Behavior Analysis and Magnification using Deep Learning ................... 171
Björn Ommer
Learning to embed lifetime social behavior from interaction dynamics ...................................... 174
B. Wild, D.M. Dormagen, M.L. Smith, T. Landgraf
Multi-animal pose estimation, identification, tracking and action segmentation with DeepLabCut
...................................................................................................................................................... 189
Alexander Mathis
Session Theme: Automotive human factors ...................................................................................... 191
A comparison of two methodologies for subjective evaluation of comfort in automated vehicles
...................................................................................................................................................... 192
Chen Peng, Foroogh Hajiseyedjavadi, and Natasha Merat
Do Car Drivers Respond Earlier to Close Lateral Motion Than to Looming? The Importance of
Data Selection .............................................................................................................................. 200
M. Svärd, J. Bärgman, G. Markkula and M. Ljung Aust
Session Theme: Addressing the reproducibility problem in research: Challenges and future
prospects ........................................................................................................................................... 209
The EQIPD Quality System: a unique tool to improve the robustness of preclinical drug discovery
research data ................................................................................................................................. 210
Björn Gerlach
Can We Replicate Our Own Results? .......................................................................................... 212
Richard E. Brown
Assessing the scientific quality of online interventions for psychological well-being: Are we
doing good science in times of the pandemic? ............................................................................. 218
Cristina Rodríguez-Prada, Luis Fernández Morís, Miguel A. Vadillo
How to replicate behavior in the lab: lessons learned from 50 users a year ................................. 221
Lior Bikovski
Session Theme: Using Drones to Transform the Measurement of Behaviour ........................... 222
vi Volume 2 of the Proceedings of the joint 12th International Conference on Methods and Techniques in Behavioral Research and 6th
Seminar on Behavioral Methods held online, May 18-20, 2022. www.measuringbehavior.org. Editors: Andrew Spink, Jarosław
Barski, Anne-Marie Brouwer, Gernot Riedel, & Annesha Sil (2022). DOI 10.6084/m9.figshare.20066849. ISBN: 978-90-74821-94-0
Use of Aerial Thermal Imaging to Compare Assess Surface Temperatures Between Light and
Dark Variants of Black Angus x Canadian Speckle Park Cattle .................................................. 223
John S. Church, Justin T. Mufford, and Joanna S. Urban
Using UAVs to measure behavioral indicators of heat stress in cattle ......................................... 227
Justin T. Mufford and John S. Church
Use of Unmanned Aerial Vehicles for Applied Animal Ethology ............................................... 234
John S. Church
Choosing the Right Drone for Animal Research .......................................................................... 238
Spencer Serin and John S. Church
Measuring Social Behavior from Video and Trajectory Data of Interacting Animals ................ 240
Jennifer J. Sun
Session Theme: New tests in pre-clinical neuroscience ................................................................ 244
See what you have been missing: what locomotor activity can teach us in terms of refinement,
reduction and replicability ‘round the CLOCK (24/7) animal studies ......................................... 245
S. Gaburro
Riccardo Storchi, Timothy F. Cootes, Robert J. Lucas
Session Theme: Animal welfare ..................................................................................................... 250
The use 24-hour activity and video monitoring to determine the social preference of male and
female C57BL/6J mice ................................................................................................................. 251
J.L. Moore
ZooMonitor: A User-friendly App to Record Behavior and Space Use of Animals.................... 255
Jason D. Wark, Katherine A. Cronin, Tony Niemann, Megan R. Ross
Designing tasks to compare behaviours in a range of different species: A case study in whisker
movement analysis ....................................................................................................................... 261
Robyn A Grant
Different approaches to study emotions and social interactions of farm animals for a deeper
understanding of animal welfare .................................................................................................. 263
Jan Langbein, Borbala Foris, Annika Krause, Helena Maudanz, Nina Melzer
Session Theme: Measuring Behaviour in Sport and exercise ...................................................... 268
Measuring Performance and Infringements in elite racewalkers: the IART system .................... 269
T. Caporaso, and S. Grazioso
Assessing the likelihood of serve success using nearest neighbourhood methods ....................... 271
Andy Hext
Chainring eccentricity affects pedal force profiles and musculoskeletal responses during cycling
...................................................................................................................................................... 276
Amy Robinson
Posters

vii Volume 2 of the Proceedings of the joint 12th International Conference on Methods and Techniques in Behavioral Research and 6th
Seminar on Behavioral Methods held online, May 18-20, 2022. www.measuringbehavior.org. Editors: Andrew Spink, Jarosław
Barski, Anne-Marie Brouwer, Gernot Riedel, & Annesha Sil (2022). DOI 10.6084/m9.figshare.20066849. ISBN: 978-90-74821-94-0
Meeting Data Analytics for IoT-enabled Communication Systems ............................................. 280
Sowmya Vijayakumar, Ronan Flynn, Niall Murray, Muhammad Intizar Ali
A review: three-dimensional data acquisition in cattle management ........................................... 288
Yaowu Wang, Wensheng Wang, Sander Mücher, Leifeng Guo, and Lammert Kooistra
Integrating behavioral and physiological parameters to characterize emotional contagion in pigs
...................................................................................................................................................... 291
A. Krause, J. Langbein and K. Siebert
Adult zebrafish behavior as tool to study muscular dystrophy .................................................... 293
A.R. Campos and S.A.A.R. Santos
Cylinder test vs skilled reaching test: comparison of two methods used to investigate unilateral
motor impairments in rat model of Parkinson’s disease............................................................... 297
M. Paleczna, A. Jurga, D. Biała and K.Z. Kuter
Robust inference and modeling of social effects on mice learning in Intellicages ...................... 300
Michał Lenarczyk, Bartosz Jura, Zofia Harda, Magdalena Ziemiańska, Łukasz Szumiec, Jan
Rodriguez Parkitna, Daniel K. Wójcik
Robust Scratching Behavior Detection in Mice from Generic Features and a Lightweight Neural
Network in 100 fps Videos ........................................................................................................... 301
Elsbeth A. van Dam, Marco Hernandez Roosken, Lucas P. J. J. Noldus
Improving biomedical research by automated behaviour monitoring in the animal home-cage.. 306
A. Bartelik, M. Čater, S. M. Hölter
A semi-automatic user-friendly tracking software (TrAQ) for animal models capable of automatic
turning rotation behaviour characterization .................................................................................. 308
D. Di Censo, I. Rosa, M. Alecci, T. Di Lorenzo, T.M. Florio, A. Galante
Assessing behavioral toxicity of different substances using Caenorhabditis elegans as a biosensor
...................................................................................................................................................... 311
R. Sobkowiak
Early development of animal behaviour data acquisition “swiss-army knife” system ................ 314
Pavlo Fiialkovskyi and Jorge Cassinello
Generative Neural Networks for Experimental Manipulation of Complex Psychological
Impressions in Face Perception Research and Beyond ................................................................ 316
A. Sobieszek
Use of facial analysis software to determine facial expression differences in children with autism
spectrum disorder ......................................................................................................................... 319
Alexis B. Jones
The Colour Nutrition Information (CNI) As New Tool For Educating Consumers ................... 321
K. Pawlak-Lemańska, K. Włodarska
Computer Vision Assessment of Children’s Fine Motor Skills in Block Stacking ...................... 323

viii Volume 2 of the Proceedings of the joint 12th International Conference on Methods and Techniques in Behavioral Research and 6th
Seminar on Behavioral Methods held online, May 18-20, 2022. www.measuringbehavior.org. Editors: Andrew Spink, Jarosław
Barski, Anne-Marie Brouwer, Gernot Riedel, & Annesha Sil (2022). DOI 10.6084/m9.figshare.20066849. ISBN: 978-90-74821-94-0
M.J. Tomasik, K.K. Nakka and M. Salzmann
The importance of flow for the course of learning complex skills in training video players ...... 325
Justyna Józefowicz
In-cage monitoring of individual movement patterns and space use in laboratory housed
macaques ...................................................................................................................................... 328
J. Reukauf, C.L. Witham and D.S. Soteropoulos
Automated detection of behaviours used to assess temperament in rhesus macaques ................. 330
G. Ciminelli, C. Witham
ix Volume 2 of the Proceedings of the joint 12th International Conference on Methods and Techniques in Behavioral Research and 6th
Seminar on Behavioral Methods held online, May 18-20, 2022. www.measuringbehavior.org. Editors: Andrew Spink, Jarosław
Barski, Anne-Marie Brouwer, Gernot Riedel, & Annesha Sil (2022). DOI 10.6084/m9.figshare.20066849. ISBN: 978-90-74821-94-0
Preface to Volume 2 of Measuring Behavior 2022
Andrew Spink1, Jarosław Barski2, Anne-Marie Brouwer3, Gernot Riedel4, Annesha Sil4
1 Noldus Information Technology, Wageningen, The Netherlands, [email protected]
2 Medical University of Silesia, Katowice, Poland, Jarosław Barski, [email protected]
3 Perceptual and Cognitive Systems, TNO, Soesterberg, The Netherlands, [email protected],
4 University of Aberdeen, Aberdeen, UK, [email protected] & [email protected].
The current Measuring Behavior conference was origially planned for May 2020. Due to the COVID pandemic, it
has been rescheduled a number of times and in the end the scientific program committee decided to go for a
completely virtual online event. We had to decide on the format in February 2022 in order to give people time to
make travel arrangements (if it was physical) and to allow one last round of submissions (for the virtual event),
and at that moment there was simply too much uncertainty about the prognosis with respect to the pandemic. It
also turns out that Polish cities, including our original venue of Kraków, have been filled with large numbers of
refugees from Ukraine, resulting from the war there. After that occurred, the program committee decided not to
allow delegates from the Russian Federation to participate in the conference. Although that is a small action itself,
by taking that stance, we are standing together with a huge number of universities and other organizations
throughout Europe and the rest of the world.
Because the conference was originally scheduled for 2020, a number of delegates had submitted short papers for
the Proceedings at that date. Some were able to update the papers for the 2022 edition, but that was not possible
for everyone. For instance, some delegates needed the publication in order to graduate for their PhD. We decided
to split the Proceedings into two. In October 2020, we published Volume 1 [1], for those who could not wait, and
this Volume contains the rest of the presentations for the 2022 conference. Both volumes have been double-blind
peer reviewed, and the scientific program committee are very grateful for all hard work of the reviewers.
As usual the conference covers a wide range of topics, reflecting both its multi-disciplinary nature and the
continuing evolution of the subject since the original meeting in 1996. New technologies such as drones and
various sensors are prominent in the program and new analysis techniques, especially those based on AI and
machine learning are also increasingly important. The presentations are split about 40/40/20 between methods
relating to human behavior, methods measuring the behavior of other animals (mostly but laboratory rodents, but
also e.g. farm animals) and more technical papers on analysis and sensors. There are also quite a few presentations
on more applied topics such as consumer science and sports science.
This will be the first time that Measuring Behavior has taken place as a completely virtual event, and we hope that
it will also be for the last time. There are major disadvantages such as not actually being able to meet and discuss
with other delegates and the lack of opportunities for exhibiting companies. Nevertheless, there are also
advantages. We know a number of delegate are attending who would not be able to come otherwise, it save a lot
of greenhouse gas emissions and our impression at the time of writing this preface is that the geographical spread
of participants is even wider than usual.
With all the changes and delays, Measuring Behavior 2022 has been a long time coming and we are happy to see
that despite everything, the program is as interesting, diverse and cutting-edge as ever. We hope that you will enjoy
it!
References
1. Spink, Andrew; Barski, Jarosław; Brouwer, Anne-Marie; Riedel, Gernot; Sil, Annesha (2020): Volume 1 of the
Proceedings of the joint 12th International Conference on Methods and Techniques in Behavioral Research and
6th Seminar on Behavioral Methods to be held in Krakow, Poland, October 15-18, 2021.
doi.org/10.6084/m9.figshare.13013717.

10 Volume 2 of the Proceedings of the joint 12th International Conference on Methods and Techniques in Behavioral Research and 6th
Seminar on Behavioral Methods held online, May 18-20, 2022. www.measuringbehavior.org. Editors: Andrew Spink, Jarosław
Barski, Anne-Marie Brouwer, Gernot Riedel, & Annesha Sil (2022). DOI 10.6084/m9.figshare.20066849. ISBN: 978-90-74821-94-0
Oral Presentations
11 Volume 2 of the Proceedings of the joint 12th International Conference on Methods and Techniques in Behavioral Research and 6th
Seminar on Behavioral Methods held online, May 18-20, 2022. www.measuringbehavior.org. Editors: Andrew Spink, Jarosław
Barski, Anne-Marie Brouwer, Gernot Riedel, & Annesha Sil (2022). DOI 10.6084/m9.figshare.20066849. ISBN: 978-90-74821-94-0
Session Theme: Measuring the Behavior of
Farm Animals
12 Volume 2 of the Proceedings of the joint 12th International Conference on Methods and Techniques in Behavioral Research and 6th
Seminar on Behavioral Methods held online, May 18-20, 2022. www.measuringbehavior.org. Editors: Andrew Spink, Jarosław
Barski, Anne-Marie Brouwer, Gernot Riedel, & Annesha Sil (2022). DOI 10.6084/m9.figshare.20066849. ISBN: 978-90-74821-94-0
Using Cow Location Data for Practical On-farm Applications – A Pilot Study
E. van Erp- van der Kooij1, G. Hofstra2 and M. Terlien3
1 Department of Animal Husbandry, HAS University of Applied Science, ‘s Hertogenbosch, the Netherlands.
2 Department of Applied Biology, HAS University of Applied Science, ‘s Hertogenbosch, the Netherlands.
3 Department of Geo Media and Design, HAS University of Applied Science, ‘s Hertogenbosch, the Netherlands.
Introduction
The last decades, the number of dairy cows per farm has increased and the time spent on individual cows by the
farmer has been reduced. To help the farmer detect changes in activity of cows associated with fertility or health
issues, activity monitoring systems have been developed. These systems can help with daily farm management
decisions, thus increasing farm profitability. Besides this economic benefit there is a social benefit: farmers highly
value the herd being under continuous surveillance [1–4]. A further step in helping the farmer monitor the cows is
a location system. When the farmer gets an alert to check on a certain cow, a location system can tell the farmer
where to find her. Besides ‘find my cow’, these systems can also be used to monitor behaviour, by determining
behaviour from location data. For example, it is assumed that when a cow is standing at the feeding rack, she is
probably eating [5,6]. However, more could be deduced from these location data. In this study, new ways of using
location data in everyday farm management were explored.
Farm, animals, and methods
First a brainstorm session was performed with 4 students of HAS University and a dairy farmer. Ideas were brought
up on how to use location data in the daily farm management. Second, one of the ideas of the farmer was explored
in a pilot study. In this pilot study it was determined whether the location data could be used for this purpose and
what the advantages and disadvantages were.
The pilot study was performed at a commercial dairy farm associated with HAS University, with 117 Holstein
Friesian dairy cows. Cows were milked using an AMS with two stands (Gea MIOne) and fed a total mixed ration
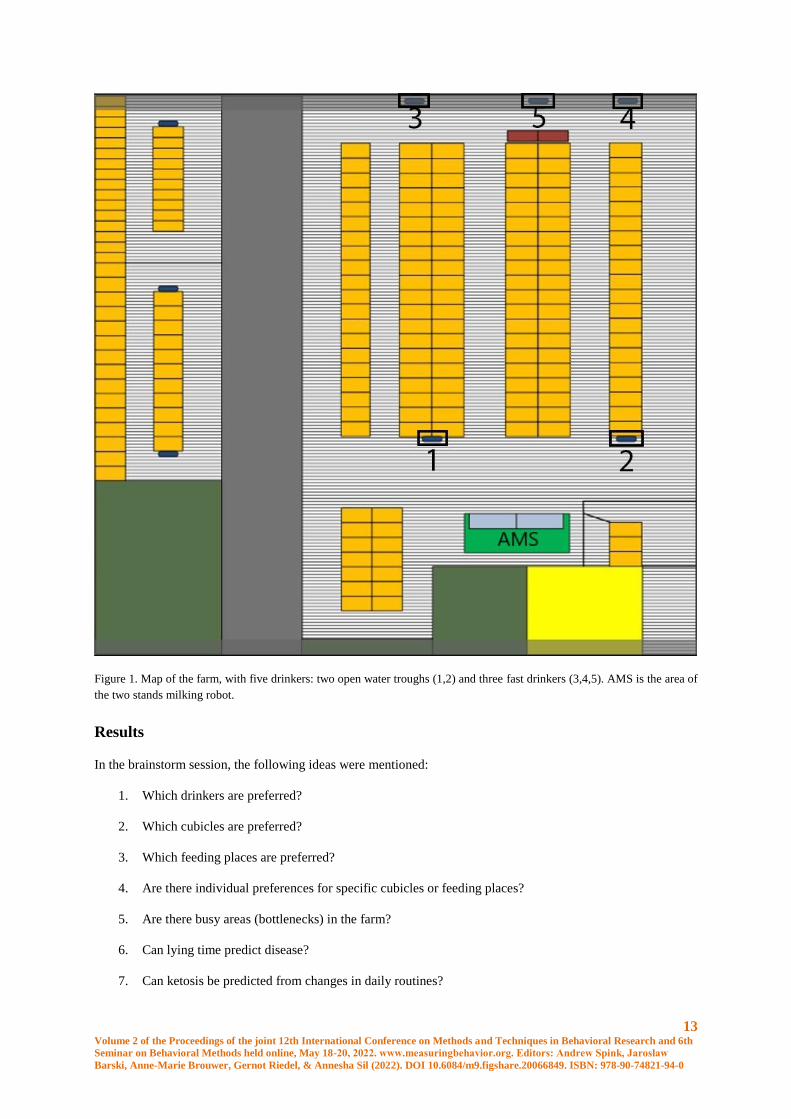
with extra concentrates in a feeding box. There were five drinkers available for the cows: two open water troughs
and three fast drinkers, see Figure 1. At the farm, the Nedap Positioning System was installed. Cows were fitted
with a sensor in the necktag, that uses triangulation to correspond with beacons at the farm. Every five seconds,
location data (x,y coordinates) were sent to a central system. Location data of the cows were automatically stored
in one minute files on a OneDrive, each line containing a time stamp, cow number, tag number and x and y
coordinates. Data files were copied to a database at HAS University and stored. In the HAS database, data were
reduced so that subsequent cow locations were only stored when cows moved >30 cm. Cow location and walking
patterns were derived from the database using SQL. No animal observations were performed.
In the pilot study, it was determined which of the five drinkers in the farm was used most by the cows by analysing
location data. This was done by determining how much time was spent by the cows in the near proximity of each
of the five drinkers. A drinking event was defined as a cow being within 20 cm of the drinker for at least 20
seconds. Data of a three day period from 9-12 December 2016 were used in the analysis. Total drinking times at
each of the five different drinkers and between drinker types were compared using a One Way ANOVA in SPSS.
Differences in average drinking time between the two types of drinkers were determined using a T-Test in SPSS
(SPPS24.0.0.0, IBM Company inc., USA).
13 Volume 2 of the Proceedings of the joint 12th International Conference on Methods and Techniques in Behavioral Research and 6th
Seminar on Behavioral Methods held online, May 18-20, 2022. www.measuringbehavior.org. Editors: Andrew Spink, Jarosław
Barski, Anne-Marie Brouwer, Gernot Riedel, & Annesha Sil (2022). DOI 10.6084/m9.figshare.20066849. ISBN: 978-90-74821-94-0
Figure 1. Map of the farm, with five drinkers: two open water troughs (1,2) and three fast drinkers (3,4,5). AMS is the area of
the two stands milking robot.
Results
In the brainstorm session, the following ideas were mentioned:
1. Which drinkers are preferred?
2. Which cubicles are preferred?
3. Which feeding places are preferred?
4. Are there individual preferences for specific cubicles or feeding places?
5. Are there busy areas (bottlenecks) in the farm?
6. Can lying time predict disease?
7. Can ketosis be predicted from changes in daily routines?
14 Volume 2 of the Proceedings of the joint 12th International Conference on Methods and Techniques in Behavioral Research and 6th
Seminar on Behavioral Methods held online, May 18-20, 2022. www.measuringbehavior.org. Editors: Andrew Spink, Jarosław
Barski, Anne-Marie Brouwer, Gernot Riedel, & Annesha Sil (2022). DOI 10.6084/m9.figshare.20066849. ISBN: 978-90-74821-94-0
8. What is the hierarchy of the cows?
From these ideas, the first question was studied, chosen because this was the most feasible to do in a limited time
frame. Drinking time at each of the five drinkers was determined during three subsequent days in December 2016.
In three days, 117 cows spent 33.6 hours drinking, an average of 5.8 minutes per cow per day. An average drinking
event had a duration of 59-84 seconds, depending on the type of drinker. Cows spent more total time drinking at
the open water troughs than at the fast drinkers (P=0.003) while the drinking time per event was slightly longer at
the fast drinkers (76.5 versus 68.2 seconds, P=0.008). Furthermore, cows had a preference for open water trough
number 2 (P<0.05); the order in wich the preferred the drinkers was 2-1-4-5-3, with the numbers one and two
being the open water troughs and 3,4 and 5 being the fast drinkers.
Discussion and conclusion
Cow location data can be used for more than just ‘find my cow’; monitoring behaviour and noticing health issues
are applications that are studied in ongoing research. Similar applications were mentioned in the brainstorm in this
study: finding relations between lying time or walking patterns and ketosis or lameness. Other ideas for
applications of location data are preference studies for certain cubicles, feeders or drinkers, for the herd or for
individual cows; finding busy areas in the farm that might cause problems, and determining hierarchy of the cows
by using location data. In the pilot study, it was determined that the open water troughs were used more than the
fast drinkers and that open water trough number 2 was the preferred drinker. This is the drinker that the cows will
pass first after exiting the milking robot, which might explain their preference for this drinker. After milking, cows
usually want to drink immediately; it is logical to use the first drinker they encounter. Next to this drinker, the
other open water trough is used most, probably because these type of drinkers are easier to use than the fast
drinkers. Cows have to push down on a lever in the fast drinker in order to get water, while a trough has water
freely available and can be shared with three cows. From earlier studies it was concluded that cows prefer drinking
from drinkers with a larger surface area [7].
We conclude that cow location data, gathered automatically, is a rich new data source and that there are several
possible applications for daily management. Preference of cows for a certain area or device within the farm can
easily be deduced from these data, which allows these type of studies to be done with relatively little effort: manual
observations are no longer needed. Furthermore, it would be interesting to determine hierarchy from location data;
this should be possible, e.g. by using data on competition near the drinkers [8].
Acknowledgments
Many thanks to Mark Terlien of HAS University who built the data infrastructure and helped with SQL and to
Marco van Esch, Corbert Nagel, Jan Pruissers and Wessel Willems of HAS University who performed the pilot
study.
References
1. Van Erp- Van der Kooij, E.; Van de Brug, M.; Roelofs, J. (2016). Validation of Nedap Smarttag Leg and
Neck to Assess Behavioural Activity Level in Dairy Cattle. In Precision Dairy Farming 2016;
Kamphuis, C., Steeneveld, W., Eds.; Wageningen Academic Press: Leeuwarden; pp. 321–326.
2. Roelofs, J.B.; Van Eerdenburg, F.J.C.M.; Soede, N.M.; Kemp, B. (2005). Pedometer readings for estrous
detection and as predictor for time of ovulation in dairy cattle. Theriogenology 64, 1690–1703.
3. Roelofs, J.B.; Van Erp-Van Der Kooij, E. (2015). Estrus detection tools and their applicability in cattle:
recent and perspectival situation. Animal Reproduction 12, 498–504.
4. Roelofs, J.B.; Krijnen, C.; van Erp-van der Kooij, E. (2017). The effect of housing condition on the
performance of two types of activity meters to detect estrus in dairy cows. Theriogenology 93, 12–15.
5. Meunier, B.; Pradel, P.; Sloth, K.H.; Cirié, C.; Delval, E.; Mialon, M.M.; Veissier, I. (2018). Image

15 Volume 2 of the Proceedings of the joint 12th International Conference on Methods and Techniques in Behavioral Research and 6th
Seminar on Behavioral Methods held online, May 18-20, 2022. www.measuringbehavior.org. Editors: Andrew Spink, Jarosław
Barski, Anne-Marie Brouwer, Gernot Riedel, & Annesha Sil (2022). DOI 10.6084/m9.figshare.20066849. ISBN: 978-90-74821-94-0
analysis to refine measurements of dairy cow behaviour from a real-time location system. Biosystems
Engineering 173, 32–44.
6. Vázquez Diosdado, J.A.; Barker, Z.E.; Hodges, H.R.; Amory, J.R.; Croft, D.P.; Bell, N.J.; Codling, E.A.
(2018). Space-use patterns highlight behavioural differences linked to lameness, parity, and days in milk
in barn-housed dairy cows. PLoS ONE 13, 1–23.
7. Teixeira, D.L.; Hötzel, M.J.; Machado Filho, L.C.P. (2006). Designing better water troughs: 2. Surface
area and height, but not depth, influence dairy cows’ preference. Applied Animal Behaviour Science 96,
169–175.
8. McDonald, P. V; von Keyserlingk, M.A.G.; Weary, D.M. (2019). Using an electronic drinker to monitor
competition in dairy cows. Journal of Dairy Science 102, 3495–3500.
16 Volume 2 of the Proceedings of the joint 12th International Conference on Methods and Techniques in Behavioral Research and 6th
Seminar on Behavioral Methods held online, May 18-20, 2022. www.measuringbehavior.org. Editors: Andrew Spink, Jarosław
Barski, Anne-Marie Brouwer, Gernot Riedel, & Annesha Sil (2022). DOI 10.6084/m9.figshare.20066849. ISBN: 978-90-74821-94-0
Using Infrared Thermographic Images for Early Detection of Clinical Lameness
in Dairy Cattle
G. Hofstra1, E. van Erp-van der Kooij2, P. Broeren2, A.A. van Dieren2, W.A. van Ettekoven2, L. van de
Klundert2, R. Petie3 and J.L. Gonzales Rojas3
1 Department of Applied Biology, HAS University of Applied Sciences, ‘s Hertogenbosch, The Netherlands.
2 Department of Animal husbandry, HAS University of Applied Sciences, ‘s Hertogenbosch, The Netherlands.
3 Wageningen Bioveterinary Research, Lelystad, The Netherlands
Introduction
Lameness has a major impact on the dairy sector with a mean prevalence of 34% in Austria and Germany [1]
31,6% in the UK and Wales [2], 15 to 21 % in Canada [3] and ranging from 21 to 55% in the USA [4]. Not only
is it a serious welfare issue, but it also causes considerable economic losses through reduced milk yields[5,6] and
decreased estrus expression [7,8]. Clinical lameness is generally defined as an impaired gait caused by either a
structural or functional disorder of the locomotor system. To ensure a better welfare for the cows and to save
money, it is essential to detect lameness in an early stage. However this can prove to be difficult since cows as
prey animals tend to not overtly show behavioral differences until the disorder is in an advanced stage [9]. The
most commonly used methods for the assessment of lameness in dairy cattle are visual gait scorings and stall
lameness scorings [10–12]. Infrared Thermography (IRT) is a non-invasive, non-contact, diagnostic technique
used to detect surface temperature differences in animals as a result of e.g. inflammation and/or injury [13]. IRT
has the potential to be a veterinary health monitoring tool [14]especially since the technology has the potential for
automated collection of biometric data, which can be used for bio-surveillance purposes [15,16]. This study
focused on detecting clinical lameness in an early stage, by combining sensor data, data from thermographic
images and data from manual and visual scoring. In addition, the effects of barn design and management factors
were studied.
Material and Methods
The research was conducted at two dairy farms in the Netherlands. A total of sixty Holstein Friesian cows were
randomly selected. The cows were observed once a week, for an 8-week period from 27th of March until 22th of
May 2019. All research performed at HAS University of Applied Science was discussed with and approved by the
HAS supervisor for animal welfare, on behalf of the Animal Welfare Office Utrecht, in order to comply with
national legislation and institutional rules and regulations on animal welfare. The locomotion score (LMS) was
scored once a week per farm. This was executed by two researchers independently for every cow. The scoring
method was based on a five-point scale by Whay et al. [10]. During the observations, the cows walked at least
eight meters on the concrete slatted floor in a straight line and were observed from aside and from behind. In this
study, cows with an average gait score of ≥2,5 out of 5 were considered to be lame. The body condition score
(BCS) was scored once a week per farm, executed by two researchers independently. The scoring was recorded
using a five-point scale from 1 to 5 in 0,5 point increments where 1=severe underconditioning, 3=normal and
5=severe overconditioning [17]. During the research period expected and actual milk yield were collected from
either the milking robot or the farm management system. Activity data for all animals was collected during the
research period with either a smarttag by Nedap (farm 1) or a neck activity sensor by Delaval (farm 2). The
smarttag registered walking time and the activity sensor recorded relative activity. Oestrus and test days were
excluded from the dataset due to the higher activity on these days. Thermographic images of the legs and claws of
the cows were captured once a week at each farm with a Testo 882 camera while the animals were secured in the
17 Volume 2 of the Proceedings of the joint 12th International Conference on Methods and Techniques in Behavioral Research and 6th
Seminar on Behavioral Methods held online, May 18-20, 2022. www.measuringbehavior.org. Editors: Andrew Spink, Jarosław
Barski, Anne-Marie Brouwer, Gernot Riedel, & Annesha Sil (2022). DOI 10.6084/m9.figshare.20066849. ISBN: 978-90-74821-94-0
feeding fence. The legs were photographed from aside, with emphasis on the upper part of the legs at a distance
of about 1,0 metres. The claws were photographed from above with emphasis on the front of the coronary band at
a distance of about 0,3 metres. The legs and claws were not washed before taking the images. The thermographic
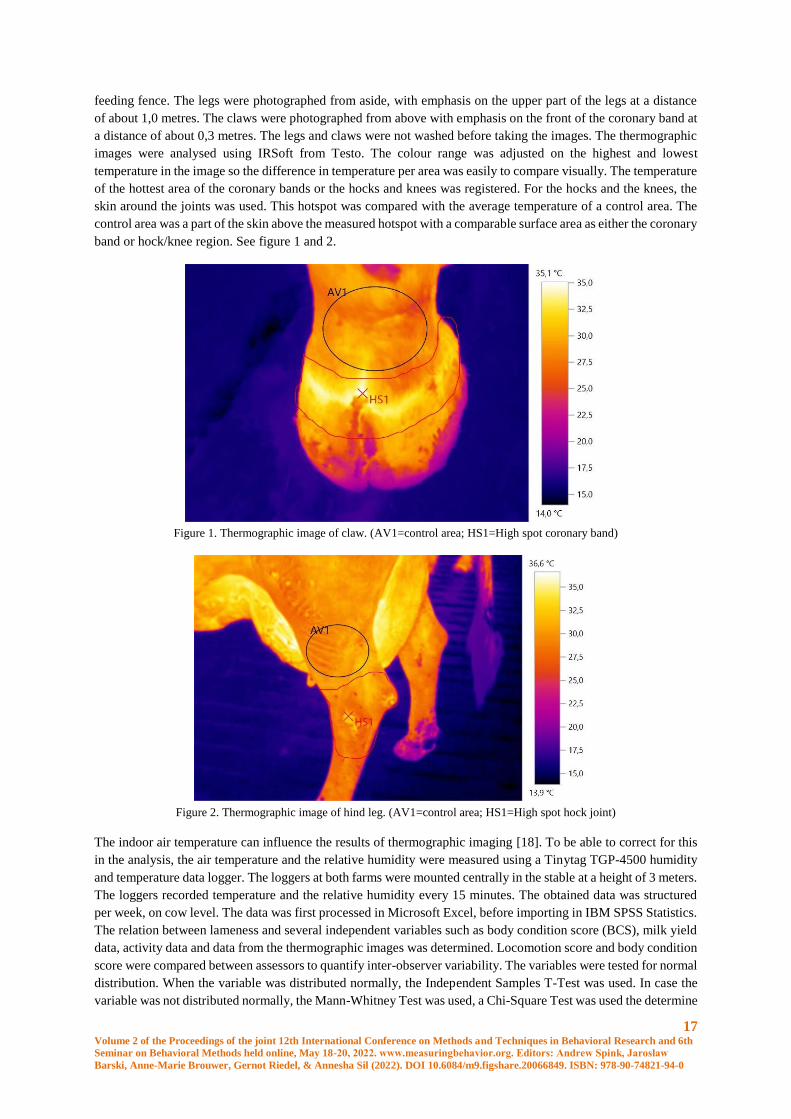
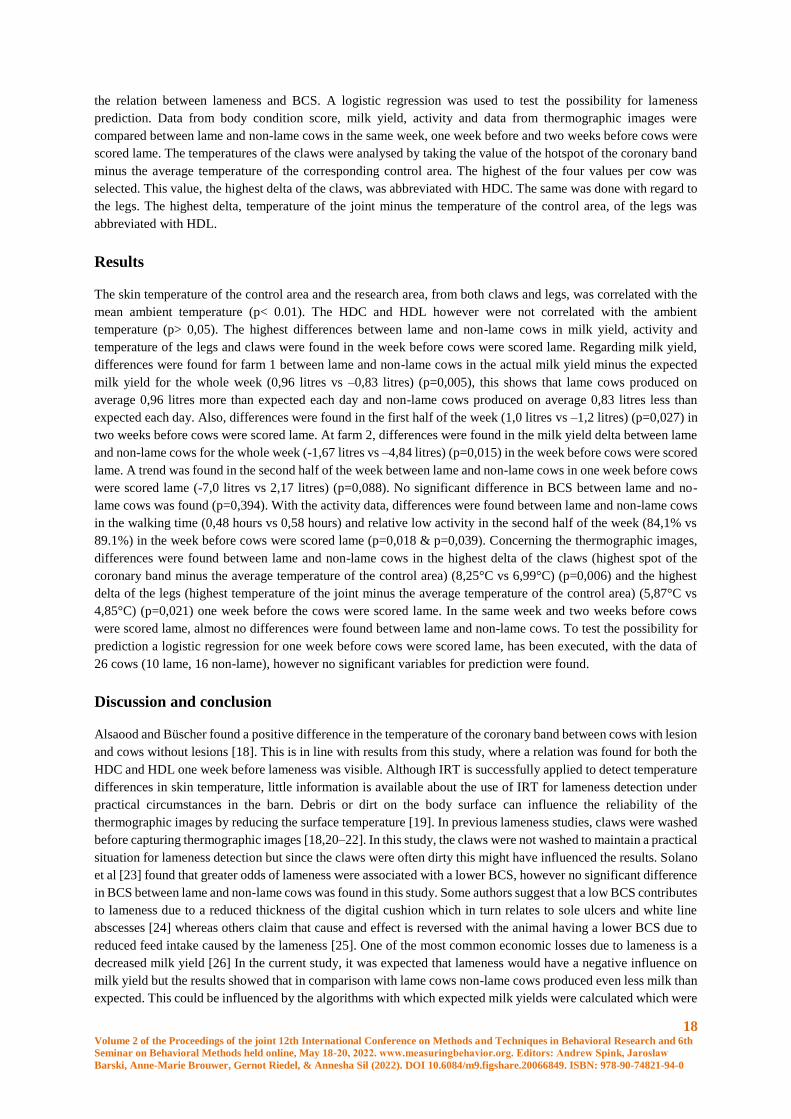
images were analysed using IRSoft from Testo. The colour range was adjusted on the highest and lowest
temperature in the image so the difference in temperature per area was easily to compare visually. The temperature
of the hottest area of the coronary bands or the hocks and knees was registered. For the hocks and the knees, the
skin around the joints was used. This hotspot was compared with the average temperature of a control area. The
control area was a part of the skin above the measured hotspot with a comparable surface area as either the coronary
band or hock/knee region. See figure 1 and 2.
Figure 1. Thermographic image of claw. (AV1=control area; HS1=High spot coronary band)
Figure 2. Thermographic image of hind leg. (AV1=control area; HS1=High spot hock joint)
The indoor air temperature can influence the results of thermographic imaging [18]. To be able to correct for this
in the analysis, the air temperature and the relative humidity were measured using a Tinytag TGP-4500 humidity
and temperature data logger. The loggers at both farms were mounted centrally in the stable at a height of 3 meters.
The loggers recorded temperature and the relative humidity every 15 minutes. The obtained data was structured
per week, on cow level. The data was first processed in Microsoft Excel, before importing in IBM SPSS Statistics.
The relation between lameness and several independent variables such as body condition score (BCS), milk yield
data, activity data and data from the thermographic images was determined. Locomotion score and body condition
score were compared between assessors to quantify inter-observer variability. The variables were tested for normal
distribution. When the variable was distributed normally, the Independent Samples T-Test was used. In case the
variable was not distributed normally, the Mann-Whitney Test was used, a Chi-Square Test was used the determine
18 Volume 2 of the Proceedings of the joint 12th International Conference on Methods and Techniques in Behavioral Research and 6th
Seminar on Behavioral Methods held online, May 18-20, 2022. www.measuringbehavior.org. Editors: Andrew Spink, Jarosław
Barski, Anne-Marie Brouwer, Gernot Riedel, & Annesha Sil (2022). DOI 10.6084/m9.figshare.20066849. ISBN: 978-90-74821-94-0
the relation between lameness and BCS. A logistic regression was used to test the possibility for lameness
prediction. Data from body condition score, milk yield, activity and data from thermographic images were
compared between lame and non-lame cows in the same week, one week before and two weeks before cows were
scored lame. The temperatures of the claws were analysed by taking the value of the hotspot of the coronary band
minus the average temperature of the corresponding control area. The highest of the four values per cow was
selected. This value, the highest delta of the claws, was abbreviated with HDC. The same was done with regard to
the legs. The highest delta, temperature of the joint minus the temperature of the control area, of the legs was
abbreviated with HDL.
Results
The skin temperature of the control area and the research area, from both claws and legs, was correlated with the
mean ambient temperature (p< 0.01). The HDC and HDL however were not correlated with the ambient
temperature (p> 0,05). The highest differences between lame and non-lame cows in milk yield, activity and
temperature of the legs and claws were found in the week before cows were scored lame. Regarding milk yield,
differences were found for farm 1 between lame and non-lame cows in the actual milk yield minus the expected
milk yield for the whole week (0,96 litres vs –0,83 litres) (p=0,005), this shows that lame cows produced on
average 0,96 litres more than expected each day and non-lame cows produced on average 0,83 litres less than
expected each day. Also, differences were found in the first half of the week (1,0 litres vs –1,2 litres) (p=0,027) in
two weeks before cows were scored lame. At farm 2, differences were found in the milk yield delta between lame
and non-lame cows for the whole week (-1,67 litres vs –4,84 litres) (p=0,015) in the week before cows were scored
lame. A trend was found in the second half of the week between lame and non-lame cows in one week before cows
were scored lame (-7,0 litres vs 2,17 litres) (p=0,088). No significant difference in BCS between lame and no-
lame cows was found (p=0,394). With the activity data, differences were found between lame and non-lame cows
in the walking time (0,48 hours vs 0,58 hours) and relative low activity in the second half of the week (84,1% vs
89.1%) in the week before cows were scored lame (p=0,018 & p=0,039). Concerning the thermographic images,
differences were found between lame and non-lame cows in the highest delta of the claws (highest spot of the
coronary band minus the average temperature of the control area) (8,25°C vs 6,99°C) (p=0,006) and the highest
delta of the legs (highest temperature of the joint minus the average temperature of the control area) (5,87°C vs
4,85°C) (p=0,021) one week before the cows were scored lame. In the same week and two weeks before cows
were scored lame, almost no differences were found between lame and non-lame cows. To test the possibility for
prediction a logistic regression for one week before cows were scored lame, has been executed, with the data of
26 cows (10 lame, 16 non-lame), however no significant variables for prediction were found.
Discussion and conclusion
Alsaood and Büscher found a positive difference in the temperature of the coronary band between cows with lesion
and cows without lesions [18]. This is in line with results from this study, where a relation was found for both the
HDC and HDL one week before lameness was visible. Although IRT is successfully applied to detect temperature
differences in skin temperature, little information is available about the use of IRT for lameness detection under
practical circumstances in the barn. Debris or dirt on the body surface can influence the reliability of the
thermographic images by reducing the surface temperature [19]. In previous lameness studies, claws were washed
before capturing thermographic images [18,20–22]. In this study, the claws were not washed to maintain a practical
situation for lameness detection but since the claws were often dirty this might have influenced the results. Solano
et al [23] found that greater odds of lameness were associated with a lower BCS, however no significant difference
in BCS between lame and non-lame cows was found in this study. Some authors suggest that a low BCS contributes
to lameness due to a reduced thickness of the digital cushion which in turn relates to sole ulcers and white line
abscesses [24] whereas others claim that cause and effect is reversed with the animal having a lower BCS due to
reduced feed intake caused by the lameness [25]. One of the most common economic losses due to lameness is a
decreased milk yield [26] In the current study, it was expected that lameness would have a negative influence on
milk yield but the results showed that in comparison with lame cows non-lame cows produced even less milk than
expected. This could be influenced by the algorithms with which expected milk yields were calculated which were

19 Volume 2 of the Proceedings of the joint 12th International Conference on Methods and Techniques in Behavioral Research and 6th
Seminar on Behavioral Methods held online, May 18-20, 2022. www.measuringbehavior.org. Editors: Andrew Spink, Jarosław
Barski, Anne-Marie Brouwer, Gernot Riedel, & Annesha Sil (2022). DOI 10.6084/m9.figshare.20066849. ISBN: 978-90-74821-94-0
undisclosed for both farms. A reliable lameness detection system should be able to detect lameness through the
data collected by the system. In this study sixty cows were observed for eight weeks. During the observation
period, seventeen cows were found lame. The small number of lame cows could very well be the reason why it
proved not possible to give a prediction of lameness with a multivariate logistic regression model.
References
1. Dippel, S.; Dolezal, M.; Brenninkmeyer, C.; Brinkmann, J.; March, S.; Knierim, U.; Winckler, C.
(2009). Risk factors for lameness in freestall-housed dairy cows across two breeds, farming systems, and
countries. Journal of Dairy Science 92, 5476–5486.
2. Griffiths, B.E.; White, D.G.; Oikonomou, G. (2018). A cross-sectional study into the prevalence of dairy
cattle lameness and associated herd-level risk factors in England and Wales. Frontiers in Veterinary
Science 5.
3. Jewell, M.T.; Cameron, M.; Spears, J.; McKenna, S.L.; Cockram, M.S.; Sanchez, J.; Keefe, G.P. (2019).
Prevalence of lameness and associated risk factors on dairy farms in the Maritime Provinces of Canada.
Journal of Dairy Science 102, 3392–3405.
4. Von Keyserlingk, M.A.G.; Barrientos, A.; Ito, K.; Galo, E.; Weary, D.M. (2012). Benchmarking cow
comfort on North American freestall dairies: Lameness, leg injuries, lying time, facility design, and
management for high-producing Holstein dairy cows. Journal of Dairy Science 95, 7399–7408.
5. Green, L.E.; Hedges, V.J.; Schukken, Y.H.; Blowey, R.W.; Packington, A.J. (2002). The impact of
clinical lameness on the milk yield of dairy cows. Journal of Dairy Science 85, 2250–2256.
6. Archer, S.C.; Green, M.J.; Huxley, J.N. (2010). Association between milk yield and serial locomotion
score assessments in UK dairy cows. Journal of Dairy Science 93, 4045–4053.
7. Bicalho, R.C.; Vokey, F.; Erb, H.N.; Guard, C.L. (2007). Visual locomotion scoring in the first seventy
days in milk: Impact on pregnancy and survival. Journal of Dairy Science 90, 4586–4591.
8. Walker, S.L.; Smith, R.F.; Routly, J.E.; Jones, D.N.; Morris, M.J.; Dobson, H. (2008). Lameness,
activity time-budgets, and estrus expression in dairy cattle. Journal of Dairy Science 91, 4552–4559.
9. Gleerup, K.B.; Andersen, P.H.; Munksgaard, L.; Forkman, B. (2015). Pain evaluation in dairy cattle.
Applied Animal Behaviour Science 171, 25–32.
10. Whay, H.R.; Main, D.C.J.; Green, L.E.; Webster, A.J.F. (2003). Assessment of the welfare of dairy
cattle using animal-based measurements: Direct observations and investigation of farm records.
Veterinary Record 153, 197–202.
11. Welfare Quality (2009). Welfare Quality Assessment protocol for cattle;
12. Gibbons, J.; Haley, D.B.; Higginson Cutler, J.; Nash, C.; Zaffino Heyerhoff, J.; Pellerin, D.; Adam, S.;
Fournier, A.; de Passillé, A.M.; Rushen, J.; et al. (2014). Technical note: A comparison of 2 methods of
assessing lameness prevalence in tiestall herds. Journal of Dairy Science 97, 350–353.
13. Eddy, A.L.; Van Hoogmoed, L.M.; Snyder, J.R. (2001). The role of thermography in the management of
equine lameness. Vet. J. 162, 172–181.
14. Poikalainen, V.; Praks, J.; Veermäe, I.; Kokin, E. (2012). Infrared temperature patterns of cow’s body as
an indicator for health control at precision cattle farming. Agronomy Research 10, 187–194.
15. Schaefer, A.L.; Cook, N.J.; Bench, C.; Chabot, J.B.; Colyn, J.; Liu, T.; Okine, E.K.; Stewart, M.;
Webster, J.R. (2012). The non-invasive and automated detection of bovine respiratory disease onset in
receiver calves using infrared thermography. Research in Veterinary Science 93, 928–935.
16. Zaninelli, M.; Redaelli, V.; Luzi, F.; Bronzo, V.; Mitchell, M.; Dell’Orto, V.; Bontempo, V.; Cattaneo,
D.; Savoini, G. (2018). First evaluation of infrared thermography as a tool for the monitoring of udder
health status in farms of dairy cows. Sensors (Switzerland) 18.
20 Volume 2 of the Proceedings of the joint 12th International Conference on Methods and Techniques in Behavioral Research and 6th
Seminar on Behavioral Methods held online, May 18-20, 2022. www.measuringbehavior.org. Editors: Andrew Spink, Jarosław
Barski, Anne-Marie Brouwer, Gernot Riedel, & Annesha Sil (2022). DOI 10.6084/m9.figshare.20066849. ISBN: 978-90-74821-94-0
17. Wildman, E.E.; Jones, G.M.; Wagner, P.E.; Boman, R.L.; Troutt, H.F.; Lesch, T.N. (1982). A Dairy
Cow Body Condition Scoring System and Its Relationship to Selected Production Characteristics.
Journal of Dairy Science 65, 495–501.
18. Alsaaod, M.; Büscher, W. (2012). Detection of hoof lesions using digital infrared thermography in dairy
cows. Journal of Dairy Science 95, 735–742.
19. Montanholi, Y.R.; Lim, M.; Macdonald, A.; Smith, B.A.; Goldhawk, C.; Schwartzkopf-Genswein, K.;
Miller, S.P. (2015). Technological, environmental and biological factors: Referent variance values for
infrared imaging of the bovine. Journal of Animal Science and Biotechnology 6.
20. Nikkhah, A.; Plaizier, J.C.; Einarson, M.S.; Berry, R.J.; Scott, S.L.; Kennedy, A.D. (2005). Short
communication: Infrared thermography and visual examination of hooves of dairy cows in two stages of
lactation. Journal of Dairy Science 88, 2749–2753.
21. Rodríguez, A.R.; Olivares, F.J.; Descouvieres, P.T.; Werner, M.P.; Tadich, N.A.; Bustamante, H.A.
(2016). Thermographic assessment of hoof temperature in dairy cows with different mobility scores.
Livestock Science 184, 92–96.
22. Gianesella, M.; Arfuso, F.; Fiore, E.; Giambelluca, S.; Giudice, E.; Armato, L.; Piccione, G. (2018).
Infrared thermography as a rapid and non-invasive diagnostic tool to detect inflammatory foot diseases
in dairy cows. Polish Journal of Veterinary Sciences 21, 299–305.
23. Solano, L.; Barkema, H.W.; Pajor, E.A.; Mason, S.; LeBlanc, S.J.; Zaffino Heyerhoff, J.C.; Nash,
C.G.R.; Haley, D.B.; Vasseur, E.; Pellerin, D.; et al. (2015). Prevalence of lameness and associated risk
factors in Canadian Holstein-Friesian cows housed in freestall barns. Journal of Dairy Science 98, 6978–
6991.
24. Bicalho, R.C.; Machado, V.S.; Caixeta, L.S. (2009). Lameness in dairy cattle: A debilitating disease or a
disease of debilitated cattle? A cross-sectional study of lameness prevalence and thickness of the digital
cushion. Journal of Dairy Science 92, 3175–3184.
25. Espejo, L.A.; Endres, M.I.; Salfer, J.A. (2006). Prevalence of lameness in high-producing Holstein cows
housed in freestall barns in Minnesota. Journal of Dairy Science 89, 3052–3058.
26. King, M.T.M.; LeBlanc, S.J.; Pajor, E.A.; DeVries, T.J. (2017). Cow-level associations of lameness,
behavior, and milk yield of cows milked in automated systems. Journal of Dairy Science 100, 4818–
4828.
21 Volume 2 of the Proceedings of the joint 12th International Conference on Methods and Techniques in Behavioral Research and 6th
Seminar on Behavioral Methods held online, May 18-20, 2022. www.measuringbehavior.org. Editors: Andrew Spink, Jarosław
Barski, Anne-Marie Brouwer, Gernot Riedel, & Annesha Sil (2022). DOI 10.6084/m9.figshare.20066849. ISBN: 978-90-74821-94-0
Turkey Gait Analysis: Predicting Expert Score With Machine Learning Based on
IMU Data.
J.E. Doornweerd1, A. Savchuk2,3, B. Visser2, A.C. Bouwman1
1 Animal Breeding and Genomics, Wageningen University & Research, Wageningen, the Netherlands.
2 Hendrix Genetics, Boxmeer, the Netherlands.
3 Jheronimus Academy of Data Science (JADS), ‘s-Hertogenbosch, the Netherlands.
Abstract
In livestock production, locomotion is an important health & welfare trait. Breed4Food aims to improve
locomotion through breeding and herd management using sensor technology for precision phenotyping. Usually,
locomotion is scored as a one-off subjective snapshot by a human expert. Motion sensor application in poultry is
largely underdeveloped. Therefore, this study aimed to predict expert locomotion scores based on inertial
measurement unit (IMU) data in turkeys. In turkey breeding, breeding candidates are subject to selection on
locomotion scores. Each bird is individually scored from poor (1) to good (6) by an expert whilst walking through
a corridor. During this routine procedure, three IMUs were attached to each bird (N = 83) with Velcro straps, one
on each leg and one on the neck. The IMU provides 3D accelerometer, gyroscope & magnetometer data. Gradient
boosting was used for step recognition based on leg IMU data (F-score: 0.82, on an allowed distance of 0.2s). The
steps (N=1736 after quality control) served as input for feature extraction, which were subsequently used for
prediction of locomotion scores of individual steps with gradient boosting. The model had a mean per class error
of 0.37 on the test set. The current approach shows promise in providing objective locomotion scoring, possibly
leading to more frequent scoring or continuous scoring of locomotion. Knowledge gained could also enhance the
application of motion sensor technology in other livestock species.
Introduction
In livestock production, locomotion is an important health & welfare trait. Impaired locomotion compromises
welfare and production. Generally, locomotion is scored as a one-off subjective snapshot by a human expert. In
turkey, locomotion scores are heritable [1], repeatable, and valuable for selection but the process to acquire them
is laborious, invasive, and subjective. Technological methods (e.g. force platforms [2], cameras [3], accelerometers
[4]) could provide effortless, non-invasive and objective measurements. Accelerometers have found the most
widespread use in livestock production, especially in cows and pigs, for the detection of behavioural changes as
indicators of estrus, health & welfare (e.g. [5] & [6]). However, motion sensor application in poultry is largely
underdeveloped, though, with technological advancements sensors are becoming smaller, cheaper and more
accurate making them more viable for application in the poultry sector.
Accelerometers, cameras, and force platforms have been used to assess differences between animals of different
locomotion scores [2,7], but not for the direct scoring of locomotion. Therefore, this study aimed to predict expert
locomotion scores based on inertial measurement unit (IMU) data in turkeys. Inertial measurement units (IMUs)
are like accelerometers but more extensive, providing 3D accelerometer, gyroscope & magnetometer data. Where
previous work (Bouwman et al., under review) was concerned with step segmentation, this study focusses on
feature extraction from those segmented steps and prediction of locomotion scores.
22 Volume 2 of the Proceedings of the joint 12th International Conference on Methods and Techniques in Behavioral Research and 6th
Seminar on Behavioral Methods held online, May 18-20, 2022. www.measuringbehavior.org. Editors: Andrew Spink, Jarosław
Barski, Anne-Marie Brouwer, Gernot Riedel, & Annesha Sil (2022). DOI 10.6084/m9.figshare.20066849. ISBN: 978-90-74821-94-0
Materials & Methods
Data collection
Data were collected on 85 animals during a standard walkway test applied in the turkey breeding program of
Hybrid Turkeys (Hendrix Genetics, Kitchener, Canada). Each bird was individually scored from behind on a scale
from poor (1) to good (6) by a human expert whilst walking through a corridor within the barn. During the test,
the animals were equipped with IMUs (MTw Awinda, XSens Technologies B.V., Enschede, the Netherlands) on
each upper leg, and stimulated to walk in one direction for approximately 5 meters. The animals often needed
stimulation to start or keep walking. Since the data was collected during a routine process there was little time for
habituation to the sensor presence.
The IMUs (16 g, 47x30x13 mm) recorded at 100Hz and recording was manually turned on and off, averaging 20s
of material per animal. IMU output consisted of calibrated time series data for 3D acceleration (m s-2), 3D angular
velocity (° s-1), and 3D magnetic field (arbitrary unit A.U., normalized to 1 during factory calibration). Orientation
data was provided in Euler representation (Pitch, Roll, Yaw) and unit quaternions (q = [W X Y Z]) [8].
Feature extraction and training
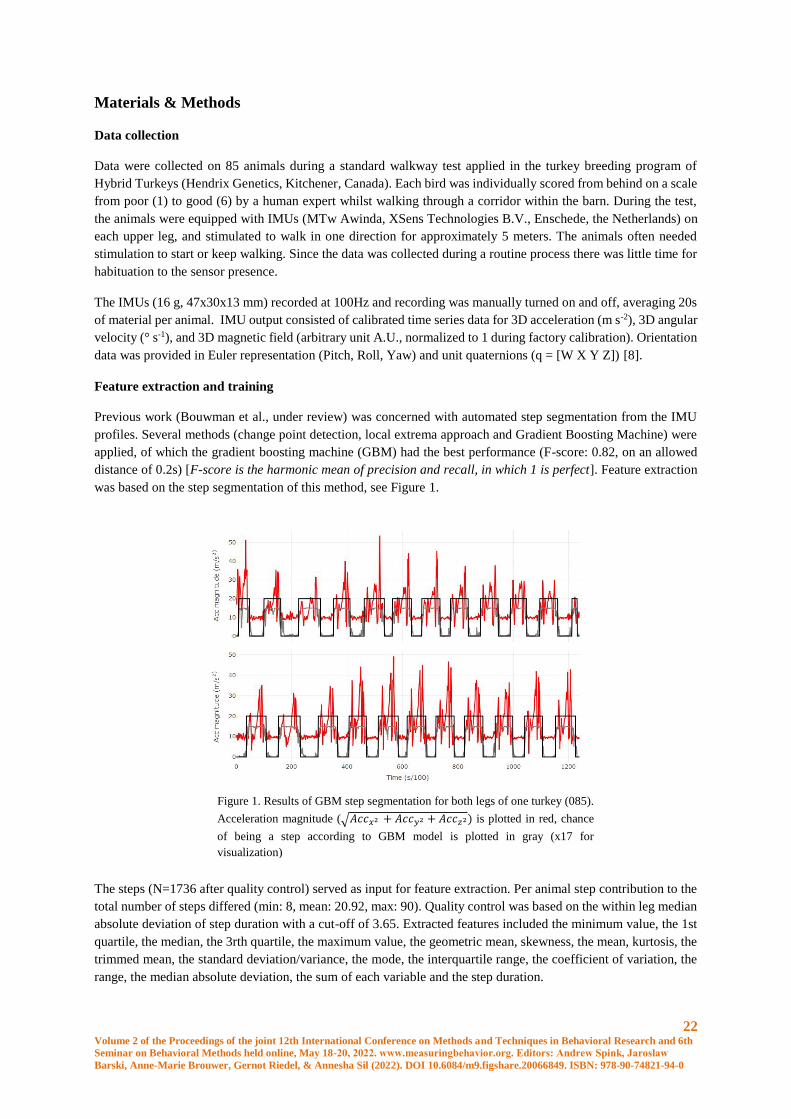
Previous work (Bouwman et al., under review) was concerned with automated step segmentation from the IMU
profiles. Several methods (change point detection, local extrema approach and Gradient Boosting Machine) were
applied, of which the gradient boosting machine (GBM) had the best performance (F-score: 0.82, on an allowed
distance of 0.2s) [F-score is the harmonic mean of precision and recall, in which 1 is perfect]. Feature extraction
was based on the step segmentation of this method, see Figure 1.
The steps (N=1736 after quality control) served as input for feature extraction. Per animal step contribution to the
total number of steps differed (min: 8, mean: 20.92, max: 90). Quality control was based on the within leg median
absolute deviation of step duration with a cut-off of 3.65. Extracted features included the minimum value, the 1st
quartile, the median, the 3rth quartile, the maximum value, the geometric mean, skewness, the mean, kurtosis, the
trimmed mean, the standard deviation/variance, the mode, the interquartile range, the coefficient of variation, the
range, the median absolute deviation, the sum of each variable and the step duration.
Figure 1. Results of GBM step segmentation for both legs of one turkey (085).
Acceleration magnitude (√𝐴𝑐𝑐𝑥2 + 𝐴𝑐𝑐𝑦2 + 𝐴𝑐𝑐𝑧2) is plotted in red, chance
of being a step according to GBM model is plotted in gray (x17 for
visualization)
23 Volume 2 of the Proceedings of the joint 12th International Conference on Methods and Techniques in Behavioral Research and 6th
Seminar on Behavioral Methods held online, May 18-20, 2022. www.measuringbehavior.org. Editors: Andrew Spink, Jarosław
Barski, Anne-Marie Brouwer, Gernot Riedel, & Annesha Sil (2022). DOI 10.6084/m9.figshare.20066849. ISBN: 978-90-74821-94-0
Feature selection was based upon absolute pair-wise correlations with a cut-off of 0.9, the feature with the highest
mean absolute correlation within the pair was removed. Mean absolute correlations were re-evaluated after each
removal, resulting in 201 remaining features.
Ninety-five percent of the total available data (N=1650) were used for model building to ensure class balance, the
remaining 5 percent will be used to evaluate the finalised model. From the model-building data, 80% was used for
training, 12.7% for validation, and 7.3% for testing. Current data only consists of animals from score 1 (N=30),
score 2 (N=26), score 3 (N=23), and score 4 (N=4). Score 3 and score 4 animals were combined to form score 3
(N=27).
The R version of H2O (Open-source software from H2O.ai, version 3.28.0.1) was used to train the gradient
boosting model to predict the scores of individual steps. Gradient boosting was chosen based on preliminary results
with the AutoML function of H2O. Training was done with 5-fold cross-validation, a learn rate of 0.06, learn rate
annealing of 0.995, a column sample rate of 0.1, a row sample rate of 0.9, a max depth of 11, a minimum number
of rows at 5, a stopping tolerance of 0.0275 with 5 stopping rounds and a minimal split improvement of 0.0001
with the total number of trees of being 113.
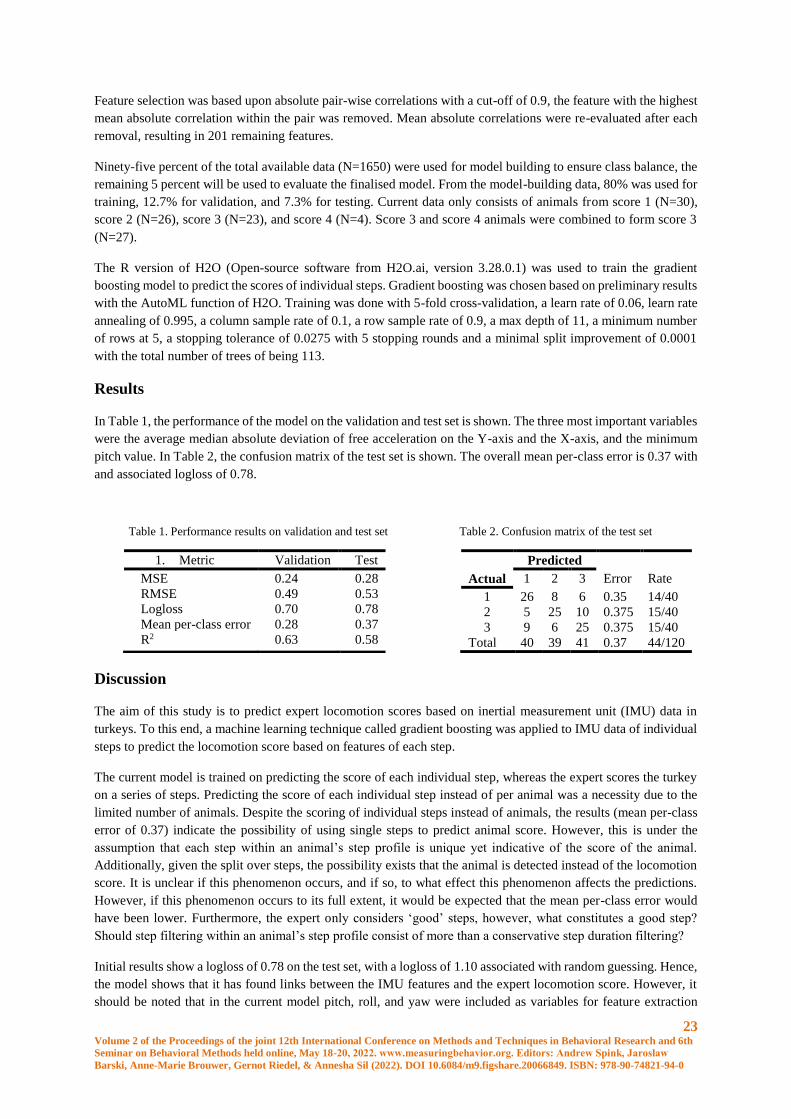
Results
In Table 1, the performance of the model on the validation and test set is shown. The three most important variables
were the average median absolute deviation of free acceleration on the Y-axis and the X-axis, and the minimum
pitch value. In Table 2, the confusion matrix of the test set is shown. The overall mean per-class error is 0.37 with
and associated logloss of 0.78.
Table 1. Performance results on validation and test set
1. Metric Validation Test
MSE 0.24 0.28
RMSE 0.49 0.53
Logloss 0.70 0.78
Mean per-class error 0.28 0.37
R2 0.63 0.58
Table 2. Confusion matrix of the test set
Predicted
Actual 1 2 3 Error Rate
1 26 8 6 0.35 14/40
2 5 25 10 0.375 15/40
3 9 6 25 0.375 15/40
Total 40 39 41 0.37 44/120
Discussion
The aim of this study is to predict expert locomotion scores based on inertial measurement unit (IMU) data in
turkeys. To this end, a machine learning technique called gradient boosting was applied to IMU data of individual
steps to predict the locomotion score based on features of each step.
The current model is trained on predicting the score of each individual step, whereas the expert scores the turkey
on a series of steps. Predicting the score of each individual step instead of per animal was a necessity due to the
limited number of animals. Despite the scoring of individual steps instead of animals, the results (mean per-class
error of 0.37) indicate the possibility of using single steps to predict animal score. However, this is under the
assumption that each step within an animal’s step profile is unique yet indicative of the score of the animal.
Additionally, given the split over steps, the possibility exists that the animal is detected instead of the locomotion
score. It is unclear if this phenomenon occurs, and if so, to what effect this phenomenon affects the predictions.
However, if this phenomenon occurs to its full extent, it would be expected that the mean per-class error would
have been lower. Furthermore, the expert only considers ‘good’ steps, however, what constitutes a good step?
Should step filtering within an animal’s step profile consist of more than a conservative step duration filtering?
Initial results show a logloss of 0.78 on the test set, with a logloss of 1.10 associated with random guessing. Hence,
the model shows that it has found links between the IMU features and the expert locomotion score. However, it
should be noted that in the current model pitch, roll, and yaw were included as variables for feature extraction
24 Volume 2 of the Proceedings of the joint 12th International Conference on Methods and Techniques in Behavioral Research and 6th
Seminar on Behavioral Methods held online, May 18-20, 2022. www.measuringbehavior.org. Editors: Andrew Spink, Jarosław
Barski, Anne-Marie Brouwer, Gernot Riedel, & Annesha Sil (2022). DOI 10.6084/m9.figshare.20066849. ISBN: 978-90-74821-94-0
despite problems with gimbal lock. Gimbal lock is the occurrence of axis alignment which causes singularities.
The occurrence of gimbal lock is dependent on the initial sensor placement and the movement of the animal. The
algorithm could have picked up on the phenomenon and partially base the predictions on it.
The classifications shown in Table 2 show that steps of animals with an actual score of 1 could be predicted as a
score 3 step and vice versa. A certain overlap between scores is expected, however, one would expect that the
largest overlap for steps of score 3 animals would occur with steps of score 2 animals, not steps of score 1 animals.
However, certain steps within an animal’s step profile could be considered anomalies given the rest of the steps
within that animal’s step profile. Currently, the reason(s) as to why the misclassifications happen is being
investigated.
Conclusion
Although the research is still in progress, the preliminary results show promise in predicting expert locomotion
scores based on IMU data. The IMU data seems to contain the information which the expert considers in scoring
the turkeys. Further refinement of the features and model hyperparameters could improve results.
Ethical statement
Ethical review and approval was not required for the animal study because The Animal Welfare Body (AWB) of
Wageningen Research decided ethical review was not necessary because the applied units were low in weight
(<1% of body weight), the units were attached for less than one hour, the animal is not isolated in the corridor
and more or less familiar with the corridor.
References
1. Quinton, C. D., Wood, B. J., & Miller, S. P. (2011). Genetic analysis of survival and fitness in Turkeys with
multiple-trait animal models. Poultry Science 90, 2479–2486. https://doi.org/10.3382/ps.2011-01604
2. De Alencar Naas, I., De Lima Almeida Paz, I. C., Baracho, M. dos S., De Menezes, A. G., De Lima, K. A. O.,
De Freitas Bueno, L. G., … De Souza, A. L. (2010). Assessing locomotion deficiency in broiler chicken. Scientia
Agricol, 67: 129–135. Retrieved from www.scielo.org
3. Kashiha, M. A., Bahr, C., Ott, S., Moons, C. P. H., Niewold, T. A., Tuyttens, F., & Berckmans, D. (2014).
Automatic monitoring of pig locomotion using image analysis. Livestock Science 159: 141–148.
https://doi.org/10.1016/j.livsci.2013.11.007
4. Stevenson, R., Dalton, H. A., & Erasmus, M. (2019). Validity of micro-data loggers to determine walking
activity of Turkeys and effects on Turkey gait. Frontiers in Veterinary Science 5: 1–12.
https://doi.org/10.3389/fvets.2018.00319
5. Martiskainen, P., Järvinen, M., Skön, J. P., Tiirikainen, J., Kolehmainen, M., & Mononen, J. (2009). Cow
behaviour pattern recognition using a three-dimensional accelerometer and support vector machines. Applied
Animal Behaviour Science 119: 32–38. https://doi.org/10.1016/j.applanim.2009.03.005
6. Thompson, R., Matheson, S. M., Plötz, T., Edwards, S. A., & Kyriazakis, I. (2016). Porcine lie detectors:
Automatic quantification of posture state and transitions in sows using inertial sensors. Computers and Electronics
in Agriculture, 127: 521–530. https://doi.org/10.1016/j.compag.2016.07.017
7. Aydin, A., Cangar, O., Ozcan, S. E., Bahr, C., & Berckmans, D. (2010). Application of a fully automatic analysis
tool to assess the activity of broiler chickens with different gait scores. Computers and Electronics in Agriculture
73: 194–199. https://doi.org/10.1016/j.compag.2010.05.004
8. Paulich, M., Schepers, M., Rudigkeit, N., & Bellusci, G. (2013). Xsens MTw : Miniature Wireless Inertial
Motion Tracker for Highly Accurate 3D Kinematic Applications. Xsens Technologies (April), 1–9.
25 Volume 2 of the Proceedings of the joint 12th International Conference on Methods and Techniques in Behavioral Research and 6th
Seminar on Behavioral Methods held online, May 18-20, 2022. www.measuringbehavior.org. Editors: Andrew Spink, Jarosław
Barski, Anne-Marie Brouwer, Gernot Riedel, & Annesha Sil (2022). DOI 10.6084/m9.figshare.20066849. ISBN: 978-90-74821-94-0
What do pregnant mares do at night? Activity budget in pregnant mares before
foaling – a pilot study
L. Pålsson, P Haubro Andersen and J Lundblad
Department of Anatomy, Physiology and Biochemistry, Swedish University of Agricultural Sciences, Uppsala,
Sweden. [email protected]
Introduction
In the mare, gestational length is highly variable (320-360 days), as are biochemical, anatomical and clinical signs
of imminent foaling [1]. Further, the majority of foalings take place during the night. This makes parturition hard
to predict, and manual surveillance labor-heavy. Should dystocia occur, quick intervention is needed to save foal
and mare [2]. Reliable systems that will alert personel when foaling is approaching are therefore sought after.
Today, many different systems are used, with varying success.
Mares change their behavior when foaling draws near. Increases in activity and recumbency time have been
reported to occur one to two days before partuition [3-5], as well as frequency of tail movements [6]. A few hours
prior to parturition restlessness is seen, expressed as increased walking, as well as lying down and standing up
again shortly. Increased frequency of defecation, of movements of the tail, head and neck, shaking the head and
looking at the flank have also been reported closer to parturition [4, 7, 8]. With the rupture of the allantochorion,
the mare usually lie down for the expulsion of the foal. This stage is generally short with the foal delivered after
20-30 minutes [9].
Very few quantitative behavioral measures have been studied as possible markers for approaching foaling. Two
studies have investigated changes in behavior of the mare based on movement patterns recorded by accelerometers
physically placed on the mare [3, 4]. However, non-interventional ethograms that can be used to predict time of
foaling has not been developed.
Manual inspection of video has been used for qualitative research purposes in pregnant mares [7] and widespread
use of simple surveillance cameras by breeders indicate that significant information may be obtained by inspection
of video. Manual labelling and analysis of film is very time consuming, which is an incentive to develop computer
vision/ artificial intelligence solutions for the purpose. To our knowledge only little scientific information is
available on the quantity and quality of horse behavior information that can be gained from a surveillance camera,
or whether such information is sufficient to predict foaling, either for the naked eye or for computer vision/
artificial intelligence.
Aim
Our aim was to develop an ethogram specific for pregnant mares and test how it performed during manual labelling
of videos of pre-parturition mares, recorded by a simple, ceiling mounted surveillance camera. The hypotheses
where 1) that it was possible to observe the changes in behavior from a ceiling mounted surveillance night camera,
2) that the mares would show an increase in activities the night before foaling, and 3) that the behaviors could be
assessed accurately.
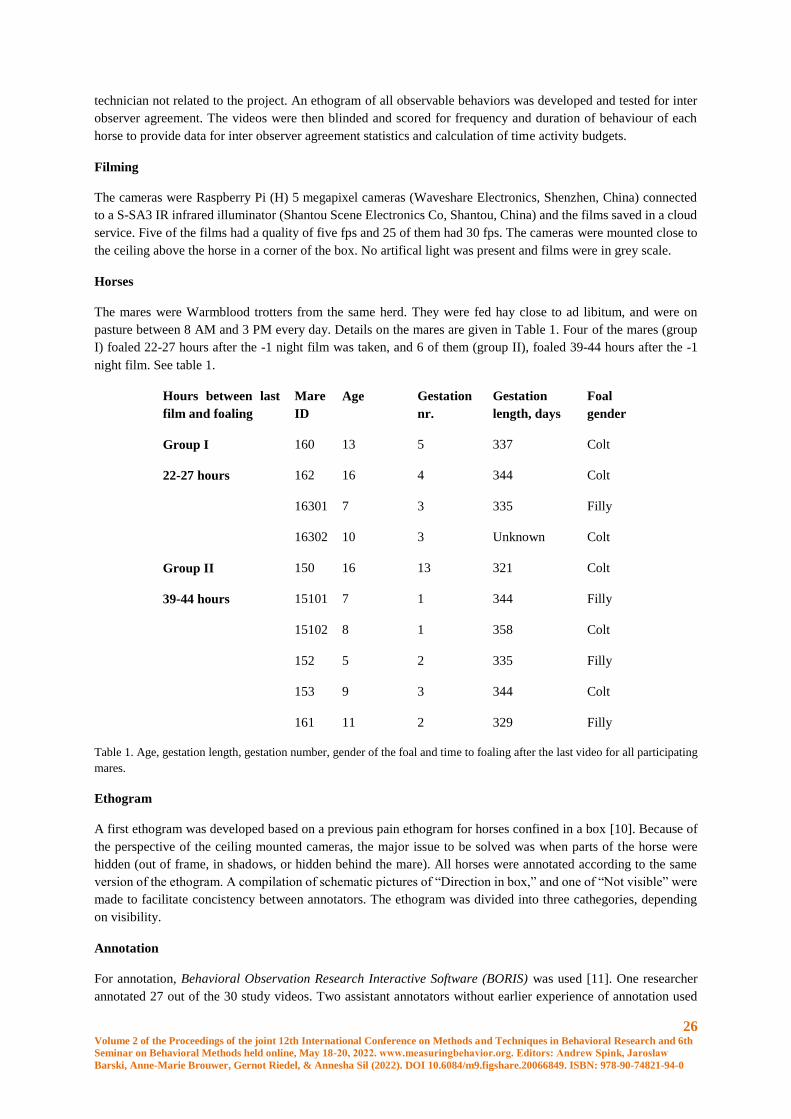
Materials and methods
Study design
The design was a repeated measurement retrospective study. Pregnant mares were filmed continuously during
February to April 2019 between 01.00 and 05.20 hours, by courtesy of Videquus Intelligent Horse Care,
Gothenburg, Sweden. Retrospectively, the date of foaling for each mare was identified and defined as night 0.
Videos (mean 39.16 min, SD 2.10 min) from night -12, night -5 and night -1 for each horse were produced by a
26 Volume 2 of the Proceedings of the joint 12th International Conference on Methods and Techniques in Behavioral Research and 6th
Seminar on Behavioral Methods held online, May 18-20, 2022. www.measuringbehavior.org. Editors: Andrew Spink, Jarosław
Barski, Anne-Marie Brouwer, Gernot Riedel, & Annesha Sil (2022). DOI 10.6084/m9.figshare.20066849. ISBN: 978-90-74821-94-0
technician not related to the project. An ethogram of all observable behaviors was developed and tested for inter
observer agreement. The videos were then blinded and scored for frequency and duration of behaviour of each
horse to provide data for inter observer agreement statistics and calculation of time activity budgets.
Filming
The cameras were Raspberry Pi (H) 5 megapixel cameras (Waveshare Electronics, Shenzhen, China) connected
to a S-SA3 IR infrared illuminator (Shantou Scene Electronics Co, Shantou, China) and the films saved in a cloud
service. Five of the films had a quality of five fps and 25 of them had 30 fps. The cameras were mounted close to
the ceiling above the horse in a corner of the box. No artifical light was present and films were in grey scale.
Horses
The mares were Warmblood trotters from the same herd. They were fed hay close to ad libitum, and were on
pasture between 8 AM and 3 PM every day. Details on the mares are given in Table 1. Four of the mares (group
I) foaled 22-27 hours after the -1 night film was taken, and 6 of them (group II), foaled 39-44 hours after the -1
night film. See table 1.
Hours between last
film and foaling
Mare
ID
Age Gestation
nr.
Gestation
length, days
Foal
gender
Group I 160 13 5 337 Colt
22-27 hours 162 16 4 344 Colt
16301 7 3 335 Filly
16302 10 3 Unknown Colt
Group II 150 16 13 321 Colt
39-44 hours 15101 7 1 344 Filly
15102 8 1 358 Colt
152 5 2 335 Filly
153 9 3 344 Colt
161 11 2 329 Filly
Table 1. Age, gestation length, gestation number, gender of the foal and time to foaling after the last video for all participating
mares.
Ethogram
A first ethogram was developed based on a previous pain ethogram for horses confined in a box [10]. Because of
the perspective of the ceiling mounted cameras, the major issue to be solved was when parts of the horse were
hidden (out of frame, in shadows, or hidden behind the mare). All horses were annotated according to the same
version of the ethogram. A compilation of schematic pictures of “Direction in box,” and one of “Not visible” were
made to facilitate concistency between annotators. The ethogram was divided into three cathegories, depending
on visibility.
Annotation
For annotation, Behavioral Observation Research Interactive Software (BORIS) was used [11]. One researcher
annotated 27 out of the 30 study videos. Two assistant annotators without earlier experience of annotation used
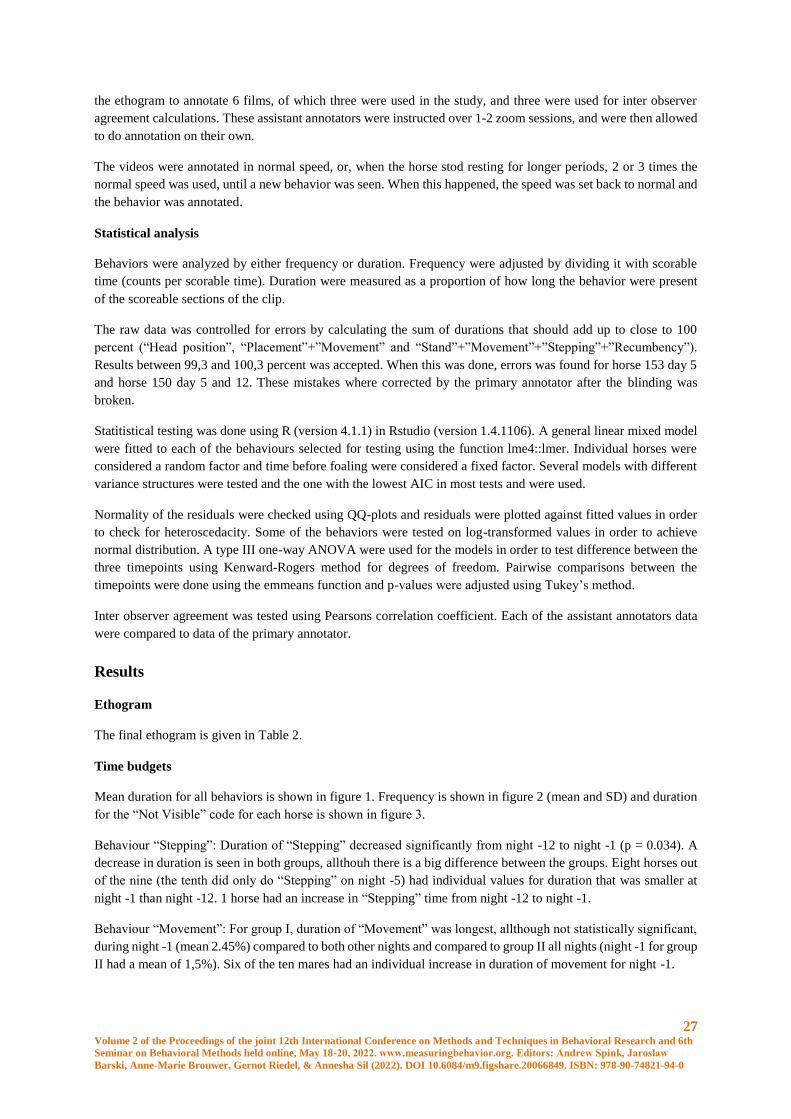
27 Volume 2 of the Proceedings of the joint 12th International Conference on Methods and Techniques in Behavioral Research and 6th
Seminar on Behavioral Methods held online, May 18-20, 2022. www.measuringbehavior.org. Editors: Andrew Spink, Jarosław
Barski, Anne-Marie Brouwer, Gernot Riedel, & Annesha Sil (2022). DOI 10.6084/m9.figshare.20066849. ISBN: 978-90-74821-94-0
the ethogram to annotate 6 films, of which three were used in the study, and three were used for inter observer
agreement calculations. These assistant annotators were instructed over 1-2 zoom sessions, and were then allowed
to do annotation on their own.
The videos were annotated in normal speed, or, when the horse stod resting for longer periods, 2 or 3 times the
normal speed was used, until a new behavior was seen. When this happened, the speed was set back to normal and
the behavior was annotated.
Statistical analysis
Behaviors were analyzed by either frequency or duration. Frequency were adjusted by dividing it with scorable
time (counts per scorable time). Duration were measured as a proportion of how long the behavior were present
of the scoreable sections of the clip.
The raw data was controlled for errors by calculating the sum of durations that should add up to close to 100
percent (“Head position”, “Placement”+”Movement” and “Stand”+”Movement”+”Stepping”+”Recumbency”).
Results between 99,3 and 100,3 percent was accepted. When this was done, errors was found for horse 153 day 5
and horse 150 day 5 and 12. These mistakes where corrected by the primary annotator after the blinding was
broken.
Statitistical testing was done using R (version 4.1.1) in Rstudio (version 1.4.1106). A general linear mixed model
were fitted to each of the behaviours selected for testing using the function lme4::lmer. Individual horses were
considered a random factor and time before foaling were considered a fixed factor. Several models with different
variance structures were tested and the one with the lowest AIC in most tests and were used.
Normality of the residuals were checked using QQ-plots and residuals were plotted against fitted values in order
to check for heteroscedacity. Some of the behaviors were tested on log-transformed values in order to achieve
normal distribution. A type III one-way ANOVA were used for the models in order to test difference between the
three timepoints using Kenward-Rogers method for degrees of freedom. Pairwise comparisons between the
timepoints were done using the emmeans function and p-values were adjusted using Tukey’s method.
Inter observer agreement was tested using Pearsons correlation coefficient. Each of the assistant annotators data
were compared to data of the primary annotator.
Results
Ethogram
The final ethogram is given in Table 2.
Time budgets
Mean duration for all behaviors is shown in figure 1. Frequency is shown in figure 2 (mean and SD) and duration
for the “Not Visible” code for each horse is shown in figure 3.
Behaviour “Stepping”: Duration of “Stepping” decreased significantly from night -12 to night -1 (p = 0.034). A
decrease in duration is seen in both groups, allthouh there is a big difference between the groups. Eight horses out
of the nine (the tenth did only do “Stepping” on night -5) had individual values for duration that was smaller at
night -1 than night -12. 1 horse had an increase in “Stepping” time from night -12 to night -1.
Behaviour “Movement”: For group I, duration of “Movement” was longest, allthough not statistically significant,
during night -1 (mean 2.45%) compared to both other nights and compared to group II all nights (night -1 for group
II had a mean of 1,5%). Six of the ten mares had an individual increase in duration of movement for night -1.
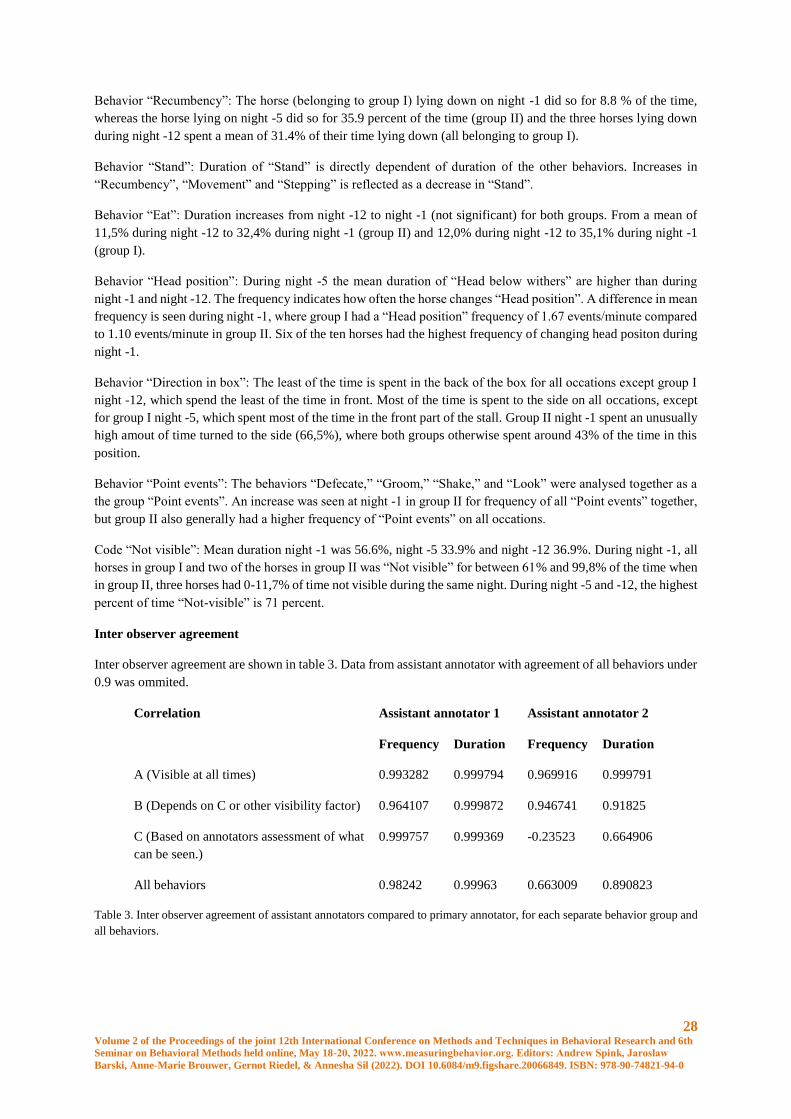
28 Volume 2 of the Proceedings of the joint 12th International Conference on Methods and Techniques in Behavioral Research and 6th
Seminar on Behavioral Methods held online, May 18-20, 2022. www.measuringbehavior.org. Editors: Andrew Spink, Jarosław
Barski, Anne-Marie Brouwer, Gernot Riedel, & Annesha Sil (2022). DOI 10.6084/m9.figshare.20066849. ISBN: 978-90-74821-94-0
Behavior “Recumbency”: The horse (belonging to group I) lying down on night -1 did so for 8.8 % of the time,
whereas the horse lying on night -5 did so for 35.9 percent of the time (group II) and the three horses lying down
during night -12 spent a mean of 31.4% of their time lying down (all belonging to group I).
Behavior “Stand”: Duration of “Stand” is directly dependent of duration of the other behaviors. Increases in
“Recumbency”, “Movement” and “Stepping” is reflected as a decrease in “Stand”.
Behavior “Eat”: Duration increases from night -12 to night -1 (not significant) for both groups. From a mean of
11,5% during night -12 to 32,4% during night -1 (group II) and 12,0% during night -12 to 35,1% during night -1
(group I).
Behavior “Head position”: During night -5 the mean duration of “Head below withers” are higher than during
night -1 and night -12. The frequency indicates how often the horse changes “Head position”. A difference in mean
frequency is seen during night -1, where group I had a “Head position” frequency of 1.67 events/minute compared
to 1.10 events/minute in group II. Six of the ten horses had the highest frequency of changing head positon during
night -1.
Behavior “Direction in box”: The least of the time is spent in the back of the box for all occations except group I
night -12, which spend the least of the time in front. Most of the time is spent to the side on all occations, except
for group I night -5, which spent most of the time in the front part of the stall. Group II night -1 spent an unusually
high amout of time turned to the side (66,5%), where both groups otherwise spent around 43% of the time in this
position.
Behavior “Point events”: The behaviors “Defecate,” “Groom,” “Shake,” and “Look” were analysed together as a
the group “Point events”. An increase was seen at night -1 in group II for frequency of all “Point events” together,
but group II also generally had a higher frequency of “Point events” on all occations.
Code “Not visible”: Mean duration night -1 was 56.6%, night -5 33.9% and night -12 36.9%. During night -1, all
horses in group I and two of the horses in group II was “Not visible” for between 61% and 99,8% of the time when
in group II, three horses had 0-11,7% of time not visible during the same night. During night -5 and -12, the highest
percent of time “Not-visible” is 71 percent.
Inter observer agreement
Inter observer agreement are shown in table 3. Data from assistant annotator with agreement of all behaviors under
0.9 was ommited.
Correlation Assistant annotator 1 Assistant annotator 2
Frequency Duration Frequency Duration
A (Visible at all times) 0.993282 0.999794 0.969916 0.999791
B (Depends on C or other visibility factor) 0.964107 0.999872 0.946741 0.91825
C (Based on annotators assessment of what
can be seen.)
0.999757 0.999369 -0.23523 0.664906
All behaviors 0.98242 0.99963 0.663009 0.890823
Table 3. Inter observer agreement of assistant annotators compared to primary annotator, for each separate behavior group and
all behaviors.
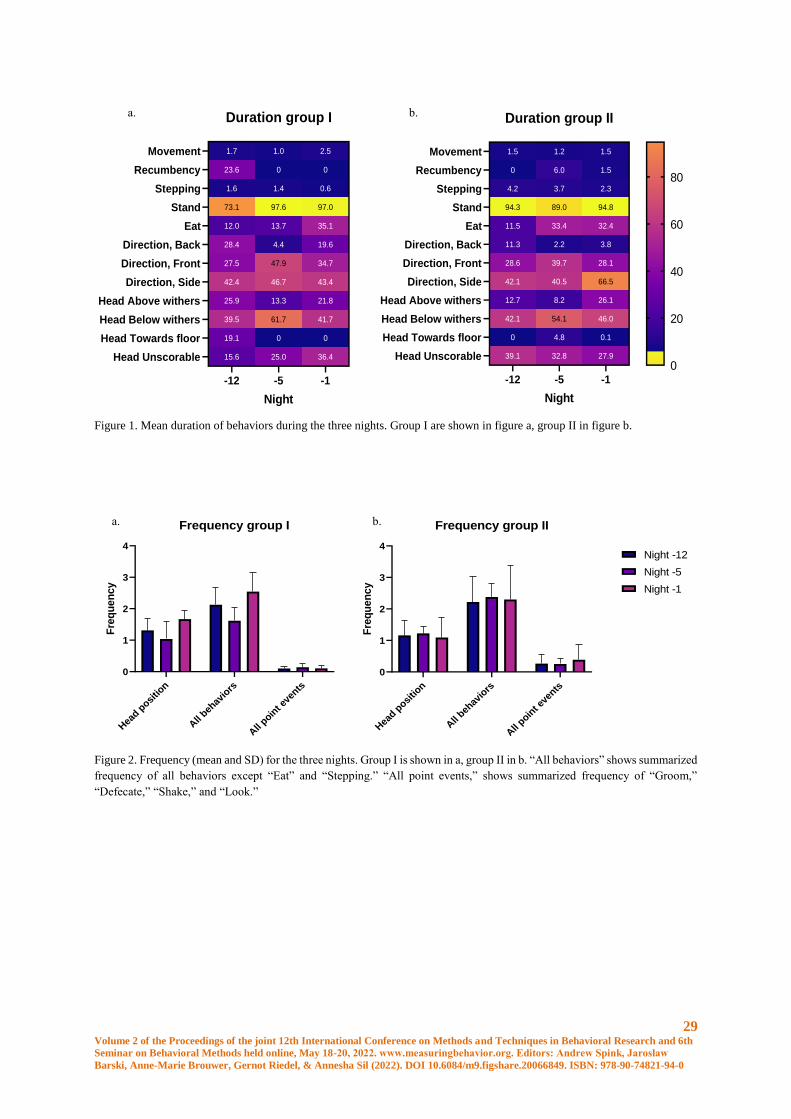
29 Volume 2 of the Proceedings of the joint 12th International Conference on Methods and Techniques in Behavioral Research and 6th
Seminar on Behavioral Methods held online, May 18-20, 2022. www.measuringbehavior.org. Editors: Andrew Spink, Jarosław
Barski, Anne-Marie Brouwer, Gernot Riedel, & Annesha Sil (2022). DOI 10.6084/m9.figshare.20066849. ISBN: 978-90-74821-94-0
Figure 1. Mean duration of behaviors during the three nights. Group I are shown in figure a, group II in figure b.
Figure 2. Frequency (mean and SD) for the three nights. Group I is shown in a, group II in b. “All behaviors” shows summarized
frequency of all behaviors except “Eat” and “Stepping.” “All point events,” shows summarized frequency of “Groom,”
“Defecate,” “Shake,” and “Look.”
1.5
0
4.2
94.3
11.5
11.3
28.6
42.1
12.7
42.1
0
39.1
1.2
6.0
3.7
89.0
33.4
2.2
39.7
40.5
8.2
54.1
4.8
32.8
1.5
1.5
2.3
94.8
32.4
3.8
28.1
66.5
26.1
46.0
0.1
27.9
-12 -5 -1
Movement
Recumbency
Stepping
Stand
Eat
Direction, Back
Direction, Front
Direction, Side
Head Above withers
Head Below withers
Head Towards floor
Head Unscorable
Duration group II
Night
Beh
avio
r0
20
40
60
80
1.7
23.6
1.6
73.1
12.0
28.4
27.5
42.4
25.9
39.5
19.1
15.6
1.0
0
1.4
97.6
13.7
4.4
47.9
46.7
13.3
61.7
0
25.0
2.5
0
0.6
97.0
35.1
19.6
34.7
43.4
21.8
41.7
0
36.4
-12 -5 -1
Movement
Recumbency
Stepping
Stand
Eat
Direction, Back
Direction, Front
Direction, Side
Head Above withers
Head Below withers
Head Towards floor
Head Unscorable
Duration group I
Night
Beh
avio
r
0
20
40
60
80
a. b.
b.
Hea
d posi
tion
All
behav
iors
All
point e
vents
0
1
2
3
4
Frequency group I
Fre
qu
en
cy
Night -12
Night -5
Night -1
a.
Hea
d posi
tion
All
behav
iors
All
point e
vents
0
1
2
3
4
Frequency group II
Fre
qu
en
cy
Night -12
Night -5
Night -1
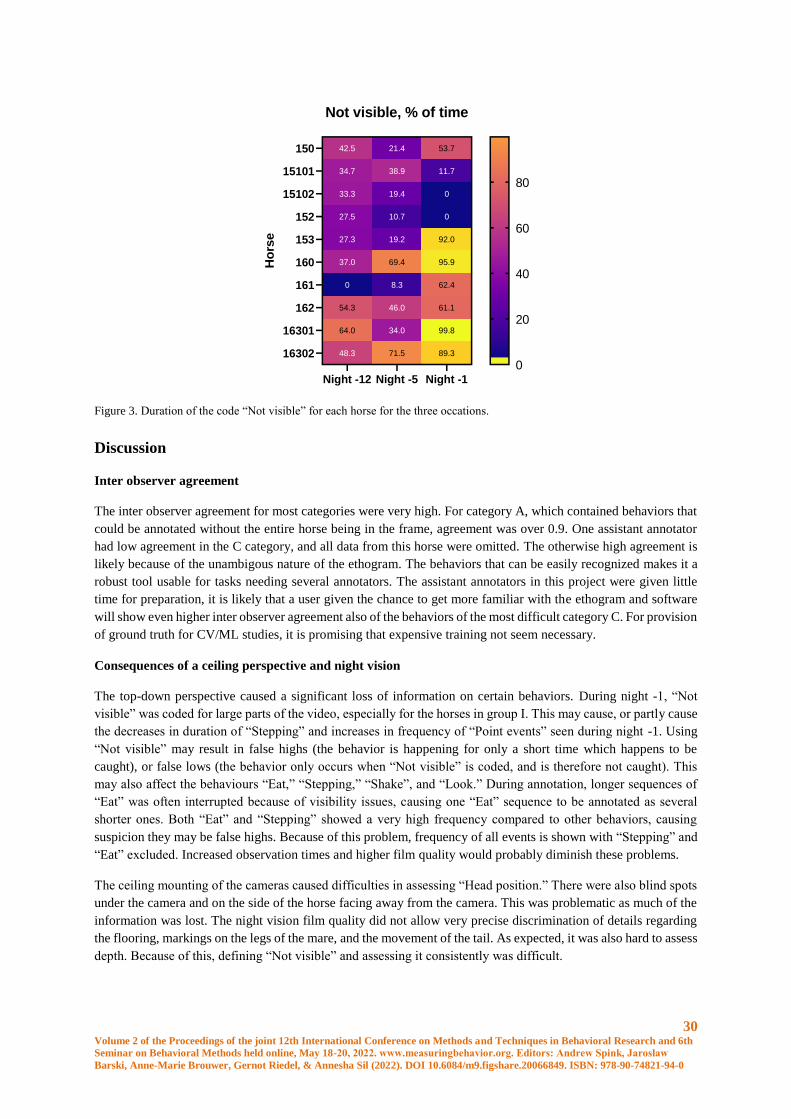
30 Volume 2 of the Proceedings of the joint 12th International Conference on Methods and Techniques in Behavioral Research and 6th
Seminar on Behavioral Methods held online, May 18-20, 2022. www.measuringbehavior.org. Editors: Andrew Spink, Jarosław
Barski, Anne-Marie Brouwer, Gernot Riedel, & Annesha Sil (2022). DOI 10.6084/m9.figshare.20066849. ISBN: 978-90-74821-94-0
Figure 3. Duration of the code “Not visible” for each horse for the three occations.
Discussion
Inter observer agreement
The inter observer agreement for most categories were very high. For category A, which contained behaviors that
could be annotated without the entire horse being in the frame, agreement was over 0.9. One assistant annotator
had low agreement in the C category, and all data from this horse were omitted. The otherwise high agreement is
likely because of the unambigous nature of the ethogram. The behaviors that can be easily recognized makes it a
robust tool usable for tasks needing several annotators. The assistant annotators in this project were given little
time for preparation, it is likely that a user given the chance to get more familiar with the ethogram and software
will show even higher inter observer agreement also of the behaviors of the most difficult category C. For provision
of ground truth for CV/ML studies, it is promising that expensive training not seem necessary.
Consequences of a ceiling perspective and night vision
The top-down perspective caused a significant loss of information on certain behaviors. During night -1, “Not
visible” was coded for large parts of the video, especially for the horses in group I. This may cause, or partly cause
the decreases in duration of “Stepping” and increases in frequency of “Point events” seen during night -1. Using
“Not visible” may result in false highs (the behavior is happening for only a short time which happens to be
caught), or false lows (the behavior only occurs when “Not visible” is coded, and is therefore not caught). This
may also affect the behaviours “Eat,” “Stepping,” “Shake”, and “Look.” During annotation, longer sequences of
“Eat” was often interrupted because of visibility issues, causing one “Eat” sequence to be annotated as several
shorter ones. Both “Eat” and “Stepping” showed a very high frequency compared to other behaviors, causing
suspicion they may be false highs. Because of this problem, frequency of all events is shown with “Stepping” and
“Eat” excluded. Increased observation times and higher film quality would probably diminish these problems.
The ceiling mounting of the cameras caused difficulties in assessing “Head position.” There were also blind spots
under the camera and on the side of the horse facing away from the camera. This was problematic as much of the
information was lost. The night vision film quality did not allow very precise discrimination of details regarding
the flooring, markings on the legs of the mare, and the movement of the tail. As expected, it was also hard to assess
depth. Because of this, defining “Not visible” and assessing it consistently was difficult.
42.5
34.7
33.3
27.5
27.3
37.0
0
54.3
64.0
48.3
21.4
38.9
19.4
10.7
19.2
69.4
8.3
46.0
34.0
71.5
53.7
11.7
0
0
92.0
95.9
62.4
61.1
99.8
89.3
Night -12 Night -5 Night -1
150
15101
15102
152
153
160
161
162
16301
16302
Not visible, % of time
Ho
rse
0
20
40
60
80
31 Volume 2 of the Proceedings of the joint 12th International Conference on Methods and Techniques in Behavioral Research and 6th
Seminar on Behavioral Methods held online, May 18-20, 2022. www.measuringbehavior.org. Editors: Andrew Spink, Jarosław
Barski, Anne-Marie Brouwer, Gernot Riedel, & Annesha Sil (2022). DOI 10.6084/m9.figshare.20066849. ISBN: 978-90-74821-94-0
Because the majority of foalings occur during the night, videos recorded during the night hours were chosen,
although we know horses show more activity during daylight hours [3], where RGB video can be obtained. It may
also be possible that the mares during day time would display behaviors different from the night behaviors.
Can the ethogram monitor changes when the mare approaches foaling?
The significant decrease from night -12 to -1 in duration of the “Stepping” behavior is peculiar since this activity
was expected to increase according to other studies [4, 3]. However, those studies do not discriminate between
different kinds of movement. The present study do show a (non significant) increase in duration of “Movement”
for group I. Shaw [5] suggests that increased walking seen before partuition is caused by the mares wish to
withdraw from the herd. Our data could support that hypothesis, and the increased walking might replace other
kinds of movement, like “Stepping.” In that aspect, the ethogram used in our study appear to be a more sensitive
tool for behavior studies than accelerometers. We also see other (non significant) signs of increased activity for
night -1, such as increses in changes in “Head position” and frequency of “all behaviors” (“Stepping” and “Eat”
excluded) for group I, and increased frequency of “all point events” for group II.
Duration of “Eat” was also increased during night -1 for group I. However, the picture quality was not sufficient
to identify if there was hay lying on the floor. Therefore, we can not differ between the mare that have already
eaten all the hay or the mare that is not interested. Therefore, this could either indicate a lesser interest in food, or
a higher interest in eating coming closer to foaling. Shaw [5] found no difference in eating time in pregnant mares
before foaling. Others have reported decreased interest in food when in pain [12, 13], but increased eating time
when in acute pain have also been reported [10]. In dairy cattle, overcrowding have, in some studies, been shown
to lead to increased dry matter intake, alltough lesser time spent eating [14], suggesting that stress may be a factor
increasing food intake.
What can we use this for?
The experiences from this pilot study yielded information of importance for later computer vision studies of foaling
behaviour. In general, the short duration behaviors may not be relied upon since they might not be caught by the
camera. It therefore seems realistic to focus on behaviors that can be assessed even when part of the horse is hidden
from view. Filming from more than one angle and with better light conditions would be helpful to increase
possibillities to collect more data and se less distinct behaviors, such as facial expressions. We expect that an
increased number of horses and prolonged observation times could consolidate and expand these preliminary
results. The data from this very small pilot study shows that it is already now very plausible that smart automated
methods for long term surveillance of behaviors relevant to predicition of foaling can be developed.
Conclusion
The quality of the night videos and placement of the camera provided a basis for an ethogram with high rater
agreement. The ethogram contained categories of behaviors that changed when foaling approached. Good rater
agreement promise a good ground truth for future studies. The ethogram appeared to be a more sensitive tool than
accelerometers to assess foaling relevant behavior.
Acknowledgements
The films were provided by Linus Jernbom and Videquus Intelligent Horse Care, Gothenburg, Sweden.
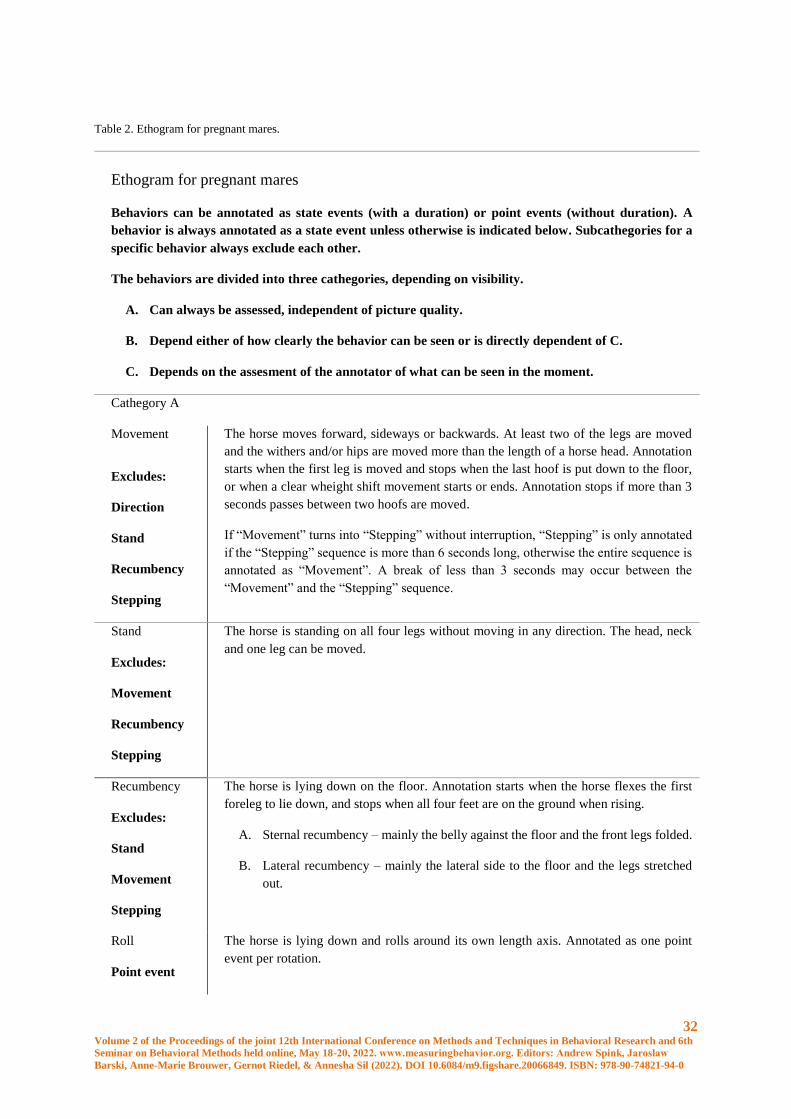
32 Volume 2 of the Proceedings of the joint 12th International Conference on Methods and Techniques in Behavioral Research and 6th
Seminar on Behavioral Methods held online, May 18-20, 2022. www.measuringbehavior.org. Editors: Andrew Spink, Jarosław
Barski, Anne-Marie Brouwer, Gernot Riedel, & Annesha Sil (2022). DOI 10.6084/m9.figshare.20066849. ISBN: 978-90-74821-94-0
Table 2. Ethogram for pregnant mares.
Ethogram for pregnant mares
Behaviors can be annotated as state events (with a duration) or point events (without duration). A
behavior is always annotated as a state event unless otherwise is indicated below. Subcathegories for a
specific behavior always exclude each other.
The behaviors are divided into three cathegories, depending on visibility.
A. Can always be assessed, independent of picture quality.
B. Depend either of how clearly the behavior can be seen or is directly dependent of C.
C. Depends on the assesment of the annotator of what can be seen in the moment.
Cathegory A
Movement The horse moves forward, sideways or backwards. At least two of the legs are moved
and the withers and/or hips are moved more than the length of a horse head. Annotation
starts when the first leg is moved and stops when the last hoof is put down to the floor,
or when a clear wheight shift movement starts or ends. Annotation stops if more than 3
seconds passes between two hoofs are moved.
If “Movement” turns into “Stepping” without interruption, “Stepping” is only annotated
if the “Stepping” sequence is more than 6 seconds long, otherwise the entire sequence is
annotated as “Movement”. A break of less than 3 seconds may occur between the
“Movement” and the “Stepping” sequence.
Excludes:
Direction
Stand
Recumbency
Stepping
Stand The horse is standing on all four legs without moving in any direction. The head, neck
and one leg can be moved.
Excludes:
Movement
Recumbency
Stepping
Recumbency
Excludes:
Stand
Movement
Stepping
The horse is lying down on the floor. Annotation starts when the horse flexes the first
foreleg to lie down, and stops when all four feet are on the ground when rising.
A. Sternal recumbency – mainly the belly against the floor and the front legs folded.
B. Lateral recumbency – mainly the lateral side to the floor and the legs stretched
out.
Roll
Point event
The horse is lying down and rolls around its own length axis. Annotated as one point
event per rotation.

33 Volume 2 of the Proceedings of the joint 12th International Conference on Methods and Techniques in Behavioral Research and 6th
Seminar on Behavioral Methods held online, May 18-20, 2022. www.measuringbehavior.org. Editors: Andrew Spink, Jarosław
Barski, Anne-Marie Brouwer, Gernot Riedel, & Annesha Sil (2022). DOI 10.6084/m9.figshare.20066849. ISBN: 978-90-74821-94-0
Direction in box
Excludes:
Movement
Describes what direction in the box the horse is turned. Where an arrow pointing forward
from the horse’s withers is directed. Does not indicate where the head is turned.
A. Front part - the withers is turned against the front wall or one of the two front
corners of the box.
B. Side walls – the withers is turned against one of the two side walls of the box.
C. Back part – the withers is turned against the back wall or one of the corners in the
back of the box.
Cathegory B – excluded by “Not visible” if nothing else is noted
Urinate
Point event
Urine is expelled through urethra.
Defecate
Point event
Faeces is expelled through the anus. Is annotated when it can clearly be seen, independent
of the “Not-visible” code.
Eat
Excludes:
Groom
The horse takes hay or other food with the lips and chews. Chewing movemens with the
jaws and/or the lips can be seen and the horse have the head lowered to the floor or the
muzzle in the manger. Starts when chewing movements can be seen and stops when
chewing stops. Can also be annotated if chewing starts during lowering of the head to the
floor, and if chewing is continued when head is lifted after an eating session. Annotation
is stoped when chewing stops. Chewing starting within ten seconds of the head being
lifted from a low position is also annotated as “Eating.” Chewing seen without any
lowering of the head or close proximity to the manger are not annotated. If the muzzle or
other small part of the head is hidden, “Eating” can still be annotated if clear chewing
movements are seen.
Must occur for more than three seconds to start annotation, and annotation stops if
chewing stops for more than tree seconds.
Drink The horse puts the lips below water and swallows. It can be annotated when this behavior
is seen, or (if it can’t be seen), when the horse lowers the muzzle into the water drinker
and stops when the muzzle leaves the water drinker.
Groom The horse is grooming. Either manipulating the skin with the tounge or the teeth, or
rubbing one part of the body against another (f. ex. head against forelegs) or against
something in the box. Is annotated between start and stop of the grooming movement.
Can still be annotated if the horse during grooming conceals some part of itself, but it
has to be clear from movements that can be seen that grooming is performed. Time of
start and stop might not be exact if the precise movement is concealed.
Is annotated when it is seen clearly, independent of the “Not visible” code.
Shake
Point event
The horse is shaking the head or the entire body. One shaking episode is annotated as a
point event.
Stepping The horse is stepping on the same spot. More than one leg is involved, and small
movements forward, sideways or backwards can occur, but the withers or hips doesn’t

34 Volume 2 of the Proceedings of the joint 12th International Conference on Methods and Techniques in Behavioral Research and 6th
Seminar on Behavioral Methods held online, May 18-20, 2022. www.measuringbehavior.org. Editors: Andrew Spink, Jarosław
Barski, Anne-Marie Brouwer, Gernot Riedel, & Annesha Sil (2022). DOI 10.6084/m9.figshare.20066849. ISBN: 978-90-74821-94-0
Excludes:
Movement
Stand
Recumbency
Not-visible
move more than the length of a horse head in any direction. Annotation starts as the horse
lift the first foot, and stops when the last foot is put down to the floor. Even smaller half-
lifts of the hooves that doesn’t entirely leaves the floor counts. If the horse lifts the leg
and keeps it in the air for more than 3 seconds, “Stepping” will be stopped when the leg
is lifted, otherwhise as it is put down. If there is a pause for over 3 seconds between
movements, annotation will stop. Resting one hind leg, and switch to rest the other
without any other movement is only counted as “Stepping” if it occurs several times
without pause. Sequences of “Stepping” that makes the horse become “Not visible” for
less than three seconds will not be annotated.
Look
Point event
The horse turns the head back (more than 90 degrees angle) on the left or right side of
itself. One turn of the head is annotated as one point event.
Cathegory C
Head position Describes where the horse head (the poll) is positioned. Shifts in head position that lasts
less than 3 seconds is not annotated.
A. Above the withers – the poll is positionend above the withers.
B. Below the withers – the poll is positionend below the withers.
C. On the floor - the head is resting with the muzzle or the lateral side on the floor
when the horse is in recumbency. Can be annotated if a horse in recumbency
keeps the head still in a position tha could be resting on the floor (even if it can
not be assessed if the head is actually touching the floor), or when it is clear that
it is resting on the floor.
D. Unscorable – used when the head is close to level with withers, and when the
horse is standing with such an angle to the camera that it can’t clearly be seen if
the head is positioned above, below or at level with withers. If there is any doubt,
this one should be used.
Not visible
Excludes:
Urinate
Eat
Drink
Stepping
Shake
Look
Some part of the horse is hidden (for more than 3 seconds) in a way that it can’t be
assessed what the horse does. Can be outside the picture, hidden by other body part, in
shadow, bad contrast or temporary disruption of the film.
Because of the quality of the film it is a matter of judgement for every point in time if a
behavior can be seen well enough to be annotated. If there is any doubt, “Not visible”
should be used. In the standing horse, if one leg or more is entirely hidden in a way that
it can’t be seen if it is moved, “Not visible” is annotated. If one or more leg is partly
hidden it is not annotated as “Not visible” (movements can usually be well evaluated
anyway). One leg is not considered hidden if it is just concealed by another leg, since it
can then be seen as soon as it moves.
In the recumbent horse, however, all legs could be hidden without annotation of “Not
visible.”
The head is considered hidden if it can’t be assessed what the head is doing, or if it is
completely hidden. If it can be seen that the horse does not do anything with the head, it
is considered seen. However, if the head is in shadow and the horse starts to do something
with the head, “Not visible” will be annotated for the duration of the behavior. This
because it can be seen that a behavior is executed, but not what it is. When the behavior

35 Volume 2 of the Proceedings of the joint 12th International Conference on Methods and Techniques in Behavioral Research and 6th
Seminar on Behavioral Methods held online, May 18-20, 2022. www.measuringbehavior.org. Editors: Andrew Spink, Jarosław
Barski, Anne-Marie Brouwer, Gernot Riedel, & Annesha Sil (2022). DOI 10.6084/m9.figshare.20066849. ISBN: 978-90-74821-94-0
stops, and it can be assessed that the horse is not doing anytning, annotation of “Not
visible” will stop.
In other cases, smaller parts of the head might be hidden, but despite this apparent
chewing movements can be seen. In this case, “Not visible” doesn’t need to be annotated,
instead “Eat,” could be annotated.
Annotation of “Not visible” stops if the entire horse can be seen for more than three
seconds.
References
1. Threlfall, W. R. (2007). CHAPTER 14 - Parturition and Dystocia. In R. S. Youngquist & W. R. Threlfall (Eds.),
Current Therapy in Large Animal Theriogenology (Second Edition) (pp. 118-130). Saint Louis: W.B. Saunders.
2. McCue, P. M., & Ferris, R. A. (2012). Parturition, dystocia and foal survival: A retrospective study of 1047
births. Equine veterinary journal, 44(s41), 22-25.
3. Giannetto, C., Bazzano, M., Marafioti, S., Bertolucci, C., & Piccione, G. (2015). Monitoring of total locomotor
activity in mares during the prepartum and postpartum period. Journal of Veterinary Behavior, 10(5), 427-432.
4. Bachmann, M., Wensch-Dorendorf, M., Hoffmann, G., Steinhöfel, I., Bothendorf, S., & Kemper, N. (2014).
Pedometers as supervision tools for mares in the prepartal period. Applied Animal Behaviour Science, 151, 51-60.
5. Shaw, E. B., Houpt, K. A., & Holmes, D. F. (1988). Body temperature and behaviour of mares during the last
two weeks of pregnancy. Equine veterinary journal, 20(3), 199-202.
6. Bueno, L., Tainturier, D., & Ruckebusch, Y. (1981). Detection of parturition in cow and mare by a useful
warning system. Theriogenology, 16(6), 599-605.
7. Auclair-Ronzaud, J., Jousset, T., Dubois, C., Wimel, L., Jaffrézic, F., & Chavatte-Palmer, P. (2020). No-contact
microchip measurements of body temperature and behavioural changes prior to foaling. Theriogenology, 157, 399-
406.
8. Jung, Y., Jung, H., Jang, Y., Yoon, D., & Yoon, M. (2021). Classification of behavioral signs of the mares for
prediction of the pre-foaling period. J Anim Reprod Biotechnol, 36(2), 99-105.
9. Brinsko, S. P., Blanchard, T. L., Varner, D. D., Schumacher, J., Love, C. C., Hinrichs, K., & Hartman, D. L.
(2011). CHAPTER 9 - Management of the Pregnant Mare. In S. P. Brinsko, T. L. Blanchard, D. D. Varner, J.
Schumacher, C. C. Love, K. Hinrichs, & D. L. Hartman (Eds.), Manual of Equine Reproduction (Third Edition)
(pp. 114-130). Saint Louis: Mosby.
10. Pålsson, L. (2020). Activity budget and pain behavior in horses with induced orthopedic pain. (Master).
Swedish University of Agricultural Sciences, Uppsala.
11. Friard, O., & Gamba, M. (2016). BORIS: a free, versatile open-source event-logging software for video/audio
coding and live observations. Methods in Ecology and Evolution, 7(11), 1325-1330.
12. Graubner, C., Gerber, V., Doherr, M., & Spadavecchia, C. (2011). Clinical application and reliability of a post
abdominal surgery pain assessment scale (PASPAS) in horses. The Veterinary Journal, 188(2), 178-183.
13. Price, J., Catriona, S., Welsh, E. M., & Waran, N. K. (2003). Preliminary evaluation of a behaviour–based
system for assessment of post–operative pain in horses following arthroscopic surgery. Veterinary Anaesthesia
and Analgesia, 30(3), 124-137.

36 Volume 2 of the Proceedings of the joint 12th International Conference on Methods and Techniques in Behavioral Research and 6th
Seminar on Behavioral Methods held online, May 18-20, 2022. www.measuringbehavior.org. Editors: Andrew Spink, Jarosław
Barski, Anne-Marie Brouwer, Gernot Riedel, & Annesha Sil (2022). DOI 10.6084/m9.figshare.20066849. ISBN: 978-90-74821-94-0
14. Krawczel, P. D., & Lee, A. R. (2019). Lying Time and Its Importance to the Dairy Cow: Impact of Stocking
Density and Time Budget Stresses. Veterinary Clinics of North America: Food Animal Practice, 35(1), 47-60.
37 Volume 2 of the Proceedings of the joint 12th International Conference on Methods and Techniques in Behavioral Research and 6th
Seminar on Behavioral Methods held online, May 18-20, 2022. www.measuringbehavior.org. Editors: Andrew Spink, Jarosław
Barski, Anne-Marie Brouwer, Gernot Riedel, & Annesha Sil (2022). DOI 10.6084/m9.figshare.20066849. ISBN: 978-90-74821-94-0
Scope of consistent inter-individual differences in mean movement behavior
within a commercial aviary early on
Camille Montalcini, Michael J. Toscano, and Matthew Petelle
1 ZTHZ, Division of Animal Welfare, VPH Institute, University of Bern, 3052 Zollikofen, Switzerland
Abstract
Individual-level movements are particularly relevant in cage-free poultry farming where hens inhabit densely-
populated space and have serious welfare issues. Yet, we lack quantification of consistent among-individual
differences in laying hen movements within commercial aviaries, limiting our capacity to understand drivers of
poultry welfare. Here, we monitored movement of 80 Dekalb white hens across 5 key-resource zone over 53 days
post-transfer to a commercial aviary. We quantified consistent among-individual differences using repeatability in
four space-use and movement behaviors and examined associations of the two most consistent behaviors with keel
bone fractures severity and feather damage. Results showed repeatability in daily vertical travelled distance per
hour, with a moderate repeatability estimate of 0.38 and low repeatability estimates for the daily number of stays
on the nestboxe zone per hour (R = 0.27), if the hen spent most of its time on the upper-tiers (0/1 (R = 0.17), and
if the hen went in the wintergarden over the day (0/1) (R = 0.18). Interestingly, we found no association between
the vertical travel distance or number of stays in the nestbox zone with either health indicator. Future work should
expand on these movement variables as well as investigate intra-individual variation and its association with
welfare.
Introduction
Animals can show changes in their daily movements as a consequence of variation in their health [1]. Therefore,
individual movements can be used as an early warning in farm animals [2]–[4]. Furthermore, health differences
across animals can be explained by among individual differences in movements [5]. In that case, individual
movements can be used to understand drivers of welfare in farm animals [5], [6] to ultimately improve their
welfare. For instance, by supporting more appropriate housing designs [7] or management practices. This interplay
between individual movement and animal welfare highlights both the complexity of individual variation in
movements and their relevance for farm animal welfare [2], [8]–[10].
A previous study have visually identified consistent individual movement behavioural differences within the
interior of aviaries [11], but repeatability (R), a population-level metric necessary for determining individual
differences, was not directly quantified. Therefore the scope and significance of consistent among individual
difference in movements of hens within commercial aviaries remains unclear. Previous studies further highlighted
association of individual movements and health indicators of laying hens. For instance, greater keel bone fractures
associated with hens that increase their time on the aviary’s top tier [10] and greater feather damage associated
with hens that use the free-range area less intensely [5]. These two health indicators are of particular relevance in
light of a high prevalence of keel bone damage found in cage-free systems (ranging from 56% to 97%[12], [13])
and a reported 49% of flocks during the laying period having signs of severe feather damage [14]. Furthermore,
keel bone fractures may induce pain [15] and a depressive-like state [16]. Therefore, individual movements could
be a valuable tool to increase our understanding on how hens interact with their environment and ultimately
enlighten poultry welfare.
Here, we evaluated individual differences in four daily movements metrics of 80 Dekalb White laying hen in a
commercial aviary, and their association with severity of keel bone fractures and feather damage assessed at the
end of production. To evaluate the extent of which hens differ in average of their daily movements, we studied
individual movements at the onset of transfer to a laying barn and the subsequent 53 days. In the weeks after
transfer to a laying barn, hens will experience various environmental and physiological changes that could
influence their behavior. More specifically, we expected individuals to differ in their reaction to be housed in a
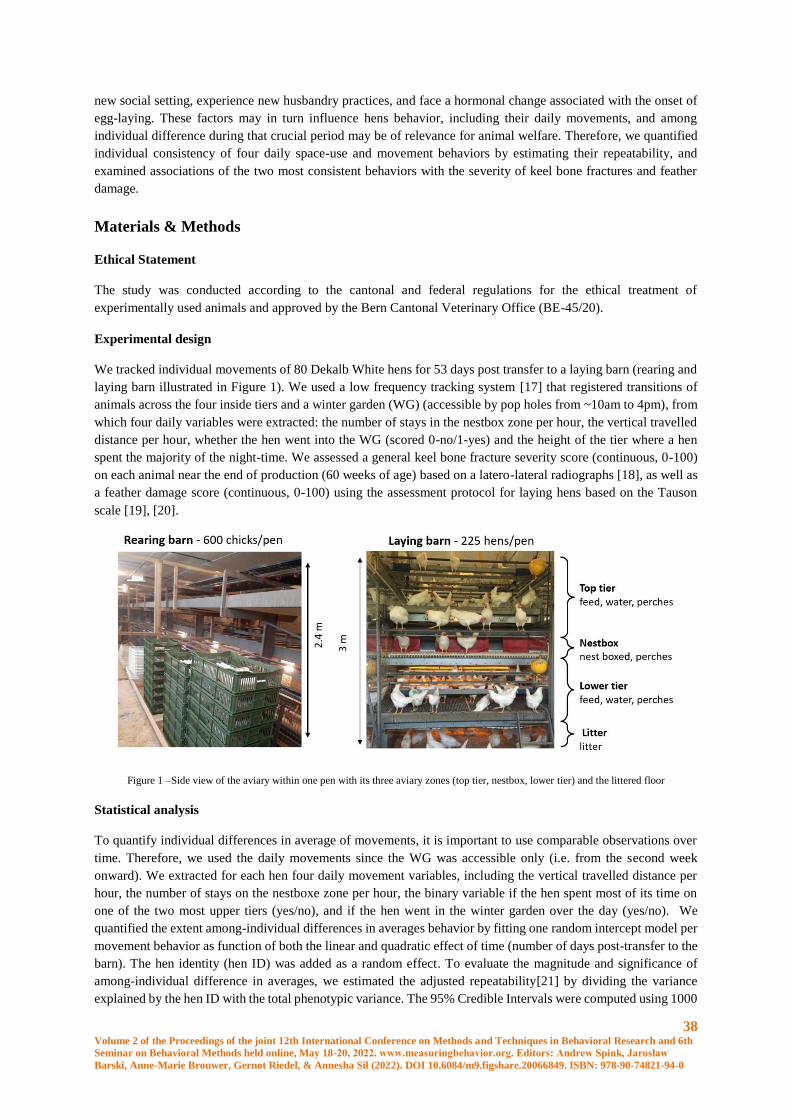
38 Volume 2 of the Proceedings of the joint 12th International Conference on Methods and Techniques in Behavioral Research and 6th
Seminar on Behavioral Methods held online, May 18-20, 2022. www.measuringbehavior.org. Editors: Andrew Spink, Jarosław
Barski, Anne-Marie Brouwer, Gernot Riedel, & Annesha Sil (2022). DOI 10.6084/m9.figshare.20066849. ISBN: 978-90-74821-94-0
new social setting, experience new husbandry practices, and face a hormonal change associated with the onset of
egg-laying. These factors may in turn influence hens behavior, including their daily movements, and among
individual difference during that crucial period may be of relevance for animal welfare. Therefore, we quantified
individual consistency of four daily space-use and movement behaviors by estimating their repeatability, and
examined associations of the two most consistent behaviors with the severity of keel bone fractures and feather
damage.
Materials & Methods
Ethical Statement
The study was conducted according to the cantonal and federal regulations for the ethical treatment of
experimentally used animals and approved by the Bern Cantonal Veterinary Office (BE-45/20).
Experimental design
We tracked individual movements of 80 Dekalb White hens for 53 days post transfer to a laying barn (rearing and
laying barn illustrated in Figure 1). We used a low frequency tracking system [17] that registered transitions of
animals across the four inside tiers and a winter garden (WG) (accessible by pop holes from ~10am to 4pm), from
which four daily variables were extracted: the number of stays in the nestbox zone per hour, the vertical travelled
distance per hour, whether the hen went into the WG (scored 0-no/1-yes) and the height of the tier where a hen
spent the majority of the night-time. We assessed a general keel bone fracture severity score (continuous, 0-100)
on each animal near the end of production (60 weeks of age) based on a latero-lateral radiographs [18], as well as
a feather damage score (continuous, 0-100) using the assessment protocol for laying hens based on the Tauson
scale [19], [20].
Figure 1 –Side view of the aviary within one pen with its three aviary zones (top tier, nestbox, lower tier) and the littered floor
Statistical analysis
To quantify individual differences in average of movements, it is important to use comparable observations over
time. Therefore, we used the daily movements since the WG was accessible only (i.e. from the second week
onward). We extracted for each hen four daily movement variables, including the vertical travelled distance per
hour, the number of stays on the nestboxe zone per hour, the binary variable if the hen spent most of its time on
one of the two most upper tiers (yes/no), and if the hen went in the winter garden over the day (yes/no). We
quantified the extent among-individual differences in averages behavior by fitting one random intercept model per
movement behavior as function of both the linear and quadratic effect of time (number of days post-transfer to the
barn). The hen identity (hen ID) was added as a random effect. To evaluate the magnitude and significance of
among-individual difference in averages, we estimated the adjusted repeatability[21] by dividing the variance
explained by the hen ID with the total phenotypic variance. The 95% Credible Intervals were computed using 1000
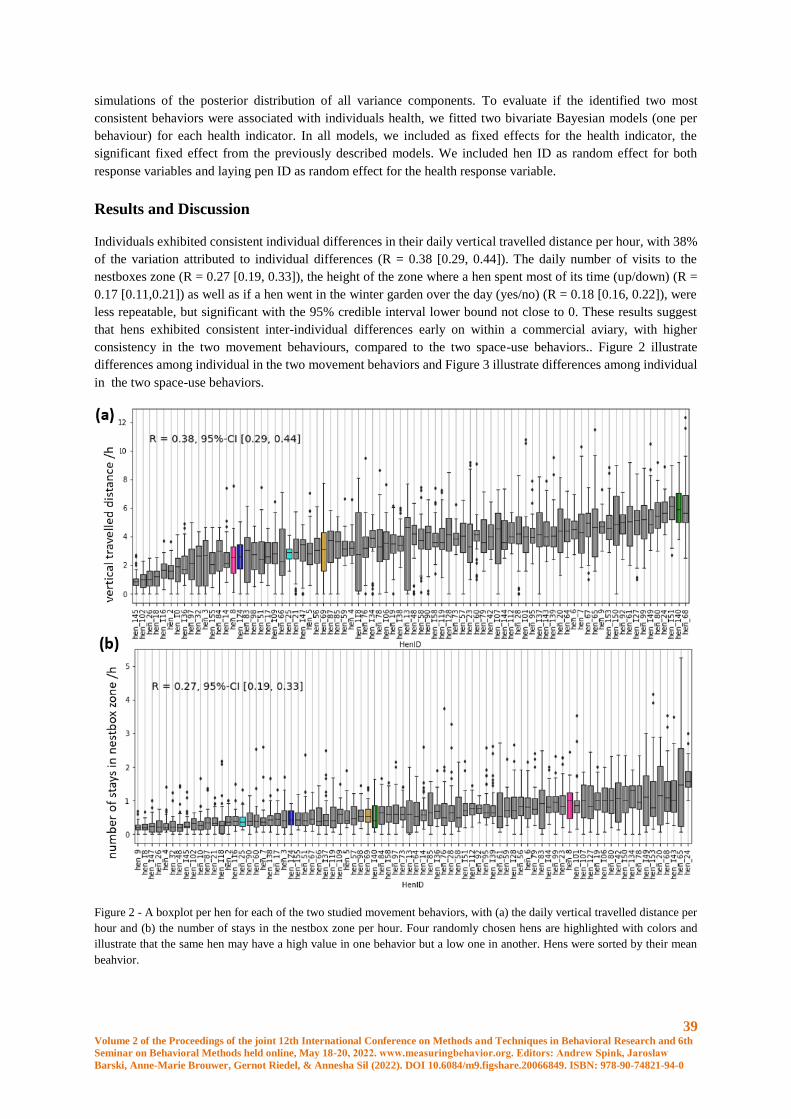
39 Volume 2 of the Proceedings of the joint 12th International Conference on Methods and Techniques in Behavioral Research and 6th
Seminar on Behavioral Methods held online, May 18-20, 2022. www.measuringbehavior.org. Editors: Andrew Spink, Jarosław
Barski, Anne-Marie Brouwer, Gernot Riedel, & Annesha Sil (2022). DOI 10.6084/m9.figshare.20066849. ISBN: 978-90-74821-94-0
simulations of the posterior distribution of all variance components. To evaluate if the identified two most
consistent behaviors were associated with individuals health, we fitted two bivariate Bayesian models (one per
behaviour) for each health indicator. In all models, we included as fixed effects for the health indicator, the
significant fixed effect from the previously described models. We included hen ID as random effect for both
response variables and laying pen ID as random effect for the health response variable.
Results and Discussion
Individuals exhibited consistent individual differences in their daily vertical travelled distance per hour, with 38%
of the variation attributed to individual differences (R = 0.38 [0.29, 0.44]). The daily number of visits to the
nestboxes zone (R = 0.27 [0.19, 0.33]), the height of the zone where a hen spent most of its time (up/down) (R =
0.17 [0.11,0.21]) as well as if a hen went in the winter garden over the day (yes/no) (R = 0.18 [0.16, 0.22]), were
less repeatable, but significant with the 95% credible interval lower bound not close to 0. These results suggest
that hens exhibited consistent inter-individual differences early on within a commercial aviary, with higher
consistency in the two movement behaviours, compared to the two space-use behaviors.. Figure 2 illustrate
differences among individual in the two movement behaviors and Figure 3 illustrate differences among individual
in the two space-use behaviors.
Figure 2 - A boxplot per hen for each of the two studied movement behaviors, with (a) the daily vertical travelled distance per
hour and (b) the number of stays in the nestbox zone per hour. Four randomly chosen hens are highlighted with colors and
illustrate that the same hen may have a high value in one behavior but a low one in another. Hens were sorted by their mean
beahvior.
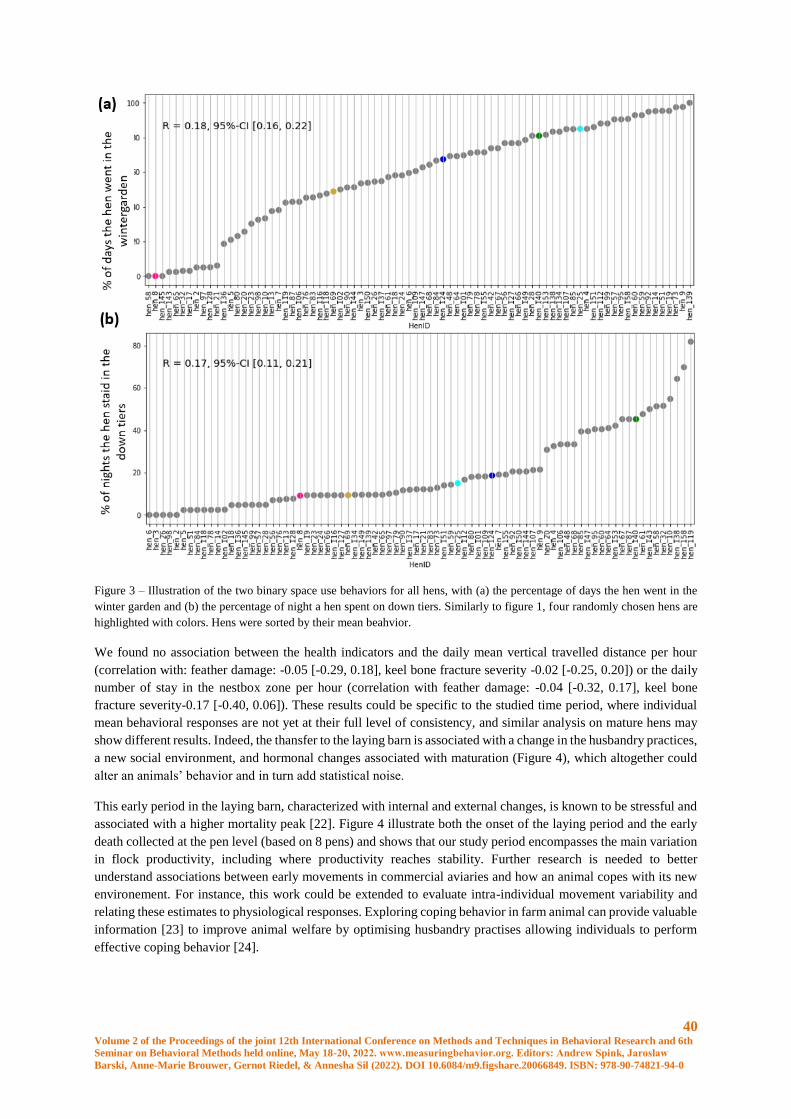
40 Volume 2 of the Proceedings of the joint 12th International Conference on Methods and Techniques in Behavioral Research and 6th
Seminar on Behavioral Methods held online, May 18-20, 2022. www.measuringbehavior.org. Editors: Andrew Spink, Jarosław
Barski, Anne-Marie Brouwer, Gernot Riedel, & Annesha Sil (2022). DOI 10.6084/m9.figshare.20066849. ISBN: 978-90-74821-94-0
Figure 3 – Illustration of the two binary space use behaviors for all hens, with (a) the percentage of days the hen went in the
winter garden and (b) the percentage of night a hen spent on down tiers. Similarly to figure 1, four randomly chosen hens are
highlighted with colors. Hens were sorted by their mean beahvior.
We found no association between the health indicators and the daily mean vertical travelled distance per hour
(correlation with: feather damage: -0.05 [-0.29, 0.18], keel bone fracture severity -0.02 [-0.25, 0.20]) or the daily
number of stay in the nestbox zone per hour (correlation with feather damage: -0.04 [-0.32, 0.17], keel bone
fracture severity-0.17 [-0.40, 0.06]). These results could be specific to the studied time period, where individual
mean behavioral responses are not yet at their full level of consistency, and similar analysis on mature hens may
show different results. Indeed, the thansfer to the laying barn is associated with a change in the husbandry practices,
a new social environment, and hormonal changes associated with maturation (Figure 4), which altogether could
alter an animals’ behavior and in turn add statistical noise.
This early period in the laying barn, characterized with internal and external changes, is known to be stressful and
associated with a higher mortality peak [22]. Figure 4 illustrate both the onset of the laying period and the early
death collected at the pen level (based on 8 pens) and shows that our study period encompasses the main variation
in flock productivity, including where productivity reaches stability. Further research is needed to better
understand associations between early movements in commercial aviaries and how an animal copes with its new
environement. For instance, this work could be extended to evaluate intra-individual movement variability and
relating these estimates to physiological responses. Exploring coping behavior in farm animal can provide valuable
information [23] to improve animal welfare by optimising husbandry practises allowing individuals to perform
effective coping behavior [24].
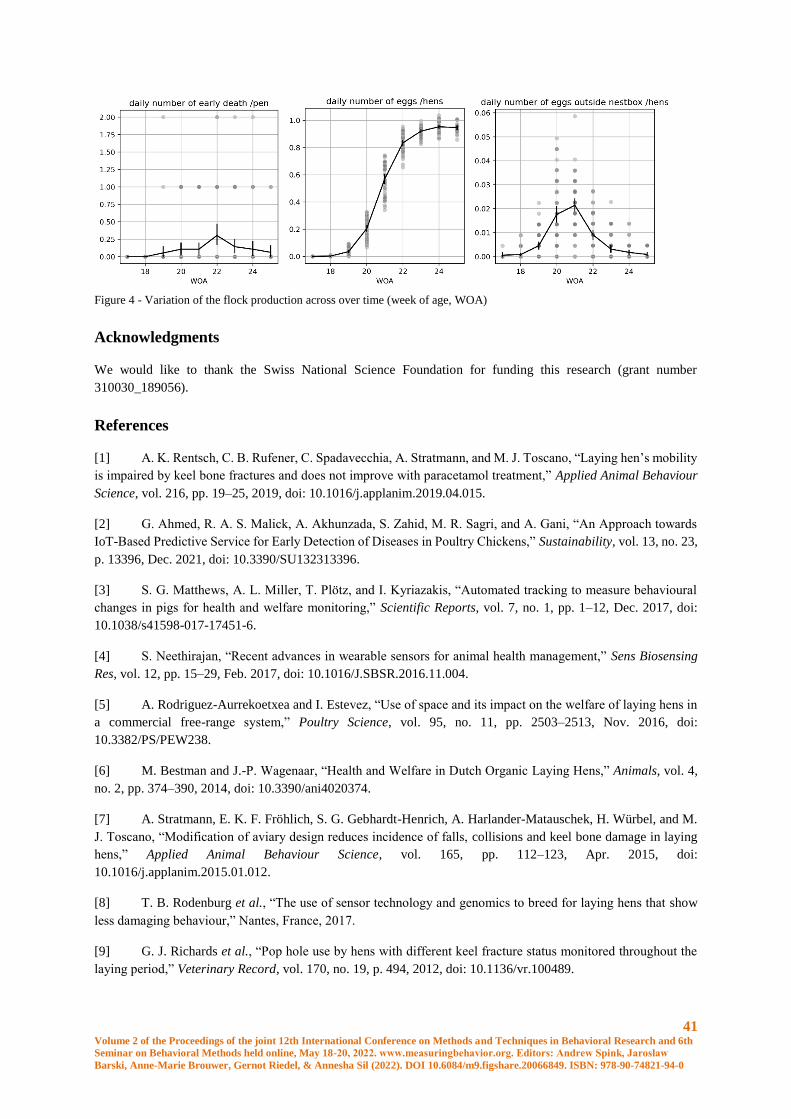
41 Volume 2 of the Proceedings of the joint 12th International Conference on Methods and Techniques in Behavioral Research and 6th
Seminar on Behavioral Methods held online, May 18-20, 2022. www.measuringbehavior.org. Editors: Andrew Spink, Jarosław
Barski, Anne-Marie Brouwer, Gernot Riedel, & Annesha Sil (2022). DOI 10.6084/m9.figshare.20066849. ISBN: 978-90-74821-94-0
Figure 4 - Variation of the flock production across over time (week of age, WOA)
Acknowledgments
We would like to thank the Swiss National Science Foundation for funding this research (grant number
310030_189056).
References
[1] A. K. Rentsch, C. B. Rufener, C. Spadavecchia, A. Stratmann, and M. J. Toscano, “Laying hen’s mobility
is impaired by keel bone fractures and does not improve with paracetamol treatment,” Applied Animal Behaviour
Science, vol. 216, pp. 19–25, 2019, doi: 10.1016/j.applanim.2019.04.015.
[2] G. Ahmed, R. A. S. Malick, A. Akhunzada, S. Zahid, M. R. Sagri, and A. Gani, “An Approach towards
IoT-Based Predictive Service for Early Detection of Diseases in Poultry Chickens,” Sustainability, vol. 13, no. 23,
p. 13396, Dec. 2021, doi: 10.3390/SU132313396.
[3] S. G. Matthews, A. L. Miller, T. Plötz, and I. Kyriazakis, “Automated tracking to measure behavioural
changes in pigs for health and welfare monitoring,” Scientific Reports, vol. 7, no. 1, pp. 1–12, Dec. 2017, doi:
10.1038/s41598-017-17451-6.
[4] S. Neethirajan, “Recent advances in wearable sensors for animal health management,” Sens Biosensing
Res, vol. 12, pp. 15–29, Feb. 2017, doi: 10.1016/J.SBSR.2016.11.004.
[5] A. Rodriguez-Aurrekoetxea and I. Estevez, “Use of space and its impact on the welfare of laying hens in
a commercial free-range system,” Poultry Science, vol. 95, no. 11, pp. 2503–2513, Nov. 2016, doi:
10.3382/PS/PEW238.
[6] M. Bestman and J.-P. Wagenaar, “Health and Welfare in Dutch Organic Laying Hens,” Animals, vol. 4,
no. 2, pp. 374–390, 2014, doi: 10.3390/ani4020374.
[7] A. Stratmann, E. K. F. Fröhlich, S. G. Gebhardt-Henrich, A. Harlander-Matauschek, H. Würbel, and M.
J. Toscano, “Modification of aviary design reduces incidence of falls, collisions and keel bone damage in laying
hens,” Applied Animal Behaviour Science, vol. 165, pp. 112–123, Apr. 2015, doi:
10.1016/j.applanim.2015.01.012.
[8] T. B. Rodenburg et al., “The use of sensor technology and genomics to breed for laying hens that show
less damaging behaviour,” Nantes, France, 2017.
[9] G. J. Richards et al., “Pop hole use by hens with different keel fracture status monitored throughout the
laying period,” Veterinary Record, vol. 170, no. 19, p. 494, 2012, doi: 10.1136/vr.100489.
42 Volume 2 of the Proceedings of the joint 12th International Conference on Methods and Techniques in Behavioral Research and 6th
Seminar on Behavioral Methods held online, May 18-20, 2022. www.measuringbehavior.org. Editors: Andrew Spink, Jarosław
Barski, Anne-Marie Brouwer, Gernot Riedel, & Annesha Sil (2022). DOI 10.6084/m9.figshare.20066849. ISBN: 978-90-74821-94-0
[10] C. Rufener et al., “Keel bone fractures are associated with individual mobility of laying hens in an aviary
system,” Applied Animal Behaviour Science, vol. 217, pp. 48–56, Aug. 2019, doi:
10.1016/j.applanim.2019.05.007.
[11] C. Rufener, J. Berezowski, F. Maximiano Sousa, Y. Abreu, L. Asher, and M. J. Toscano, “Finding hens
in a haystack: Consistency of movement patterns within and across individual laying hens maintained in large
groups,” Scientific Reports, vol. 8, no. 1, 2018, doi: 10.1038/s41598-018-29962-x.
[12] T. Rodenburg, F. Tuyttens, K. de Reu, L. Herman, J. Zoons, and B. Sonck, “Welfare assessment of laying
hens in furnished cages and non-cage systems: an on-farm comparison,” Animal Welfare, 2008.
[13] S. Käppeli et al., “Prevalence of keel bone deformities in Swiss laying hens,” British Poultry Science,
vol. 52, no. 5, pp. 531–536, Oct. 2011, doi: 10.1080/00071668.2011.615059.
[14] E. N. de Haas, J. E. Bolhuis, I. C. de Jong, B. Kemp, A. M. Janczak, and T. B. Rodenburg, “Predicting
feather damage in laying hens during the laying period. Is it the past or is it the present?,” Applied Animal
Behaviour Science, vol. 160, no. 1, pp. 75–85, Nov. 2014, doi: 10.1016/J.APPLANIM.2014.08.009.
[15] M. A. F. Nasr, C. J. Nicol, and J. C. Murrell, “Do Laying Hens with Keel Bone Fractures Experience
Pain?,” PLOS ONE, vol. 7, no. 8, p. e42420, Aug. 2012, doi: 10.1371/JOURNAL.PONE.0042420.
[16] E. A. Armstrong et al., “Keel bone fractures induce a depressive-like state in laying hens,” Scientific
Reports, vol. 10, no. 1, pp. 1–14, Feb. 2020, doi: 10.1038/s41598-020-59940-1.
[17] C. M. Montalcini, B. Voelkl, Y. Gómez, M. Gantner, and M. J. Toscano, “Evaluation of an Active LF
Tracking System and Data Processing Methods for Livestock Precision Farming in the Poultry Sector,” Sensors,
vol. 22, no. 2, p. 659, Jan. 2022, doi: 10.3390/S22020659.
[18] C. Rufener, S. Baur, A. Stratmann, and M. J. Toscano, “A Reliable Method to Assess Keel Bone Fractures
in Laying Hens From Radiographs Using a Tagged Visual Analogue Scale,” Front Vet Sci, vol. 5, p. 124, 2018,
doi: 10.3389/fvets.2018.00124.
[19] B. Andrew, A. C, van N. T.G.C.M, and V. Isabelle, “Assessment protocol for poultry (broilers, laying
hens). Lelystad: Welfare Quality® Consortium.,” Welfare Quality® Consortium, 2009, Accessed: Nov. 01, 2021.
[Online]. Available: http://www.welfarequalitynetwork.net/network/45848/7/0/40
[20] S. G. Gebhardt-Henrich, M. J. Toscano, and H. Würbel, “Perch use by broiler breeders and its implication
on health and production,” Poult Sci, vol. 96, no. 10, pp. 3539–3549, 2017, doi: 10.3382/ps/pex189.
[21] S. Nakagawa and H. Schielzeth, “Repeatability for Gaussian and non-Gaussian data: a practical guide for
biologists,” Biological Reviews, vol. 85, no. 4, pp. 935–956, Nov. 2010, doi: 10.1111/J.1469-185X.2010.00141.X.
[22] D. Vandekerchove, P. Herdt, H. Laevens, and F. Pasmans, “Colibacillosis in caged layer hens:
characteristics of the disease and the aetiological agent,” Avian Pathology, vol. 33, no. 2, pp. 117–125, 2004, doi:
10.1080/03079450310001642149.
[23] J. M. Koolhaas and C. G. van Reenen, “ANIMAL BEHAVIOR AND WELL-BEING SYMPOSIUM:
Interaction between coping style/personality, stress, and welfare: Relevance for domestic farm animals,” J Anim
Sci, vol. 94, no. 6, pp. 2284–2296, 2016, doi: 10.2527/jas.2015-0125.
[24] M.-A. Finkemeier, J. Langbein, and B. Puppe, “Personality Research in Mammalian Farm Animals:
Concepts, Measures, and Relationship to Welfare,” Frontiers in Veterinary Science, vol. 5, no. JUN, p. 131, Jun.
2018, doi: 10.3389/FVETS.2018.00131.
43 Volume 2 of the Proceedings of the joint 12th International Conference on Methods and Techniques in Behavioral Research and 6th
Seminar on Behavioral Methods held online, May 18-20, 2022. www.measuringbehavior.org. Editors: Andrew Spink, Jarosław
Barski, Anne-Marie Brouwer, Gernot Riedel, & Annesha Sil (2022). DOI 10.6084/m9.figshare.20066849. ISBN: 978-90-74821-94-0
Session Theme: New developments in analysis
and statistics
44 Volume 2 of the Proceedings of the joint 12th International Conference on Methods and Techniques in Behavioral Research and 6th
Seminar on Behavioral Methods held online, May 18-20, 2022. www.measuringbehavior.org. Editors: Andrew Spink, Jarosław
Barski, Anne-Marie Brouwer, Gernot Riedel, & Annesha Sil (2022). DOI 10.6084/m9.figshare.20066849. ISBN: 978-90-74821-94-0
The Effects of Stimulus Duration and Group Size on Wearable Physiological
Synchrony
I.V. Stuldreher1,2, J.B.F. van Erp2,3, A.-M. Brouwer1
1 Human Performance, TNO, Soesterberg, The Netherlands. [email protected]
2 Human Media Interaction, Faculty of Electrical Engineering, Mathematics and Computer Science, University of
Twente, Enschede, The Netherlands
3 Human Machine Teaming, TNO, Soesterberg, The Netherlands
Abstract
Physiological synchrony refers to the degree to which physiological measures such as heart rate and electrodermal
activity (EDA) across multiple individuals uniformly change. Physiological synchrony has shown to be
informative of attention among individuals presented with a narrative stimulus: higher physiological synchrony is
often related with better attention to the narrative. However, results are strongly dependent on basic factors such
as group size and recording length. In the current work we explore what group size and recording length are needed
for robust physiological synchrony results.
Introduction
Individuals that share attention to narrative stimuli show synchronized heart rate and electrodermal activity (EDA)
signals [1, 2]. The degree to which this synchrony occurs is reflective of attentional engagement; individuals with
higher physiological synchrony to others presented with the same stimulus generally also answer more questions
about the content of the narrative correctly [1], indicating that synchrony is a marker of attention. Furthermore,
physiological synchrony can distinguish between groups of individuals with different selective attentional focus
to the same narrative stimulus [3]. This synchrony is more sensitive in distinguishing between individuals with
different selective attentional focus than absolute levels of heart rate or EDA [1].
The degree of physiological synchrony is dependent on factors modulating attention, such as attentional
instructions, attentional saliency of stimuli and attentional motivation of individuals, but also on more basic factors
such as group size and recording length. We explore the amount of data that is required to obtain robust results,
where the amount of data is varied by the number of participants and the duration of (audiovisual) stimuli.
Methods
Thirty participants took part in the study. All participants signed an informed consent in accordane with the
Declaration of Helsinki. The experiment has been approved by the TNO internal review board (reference: 2020-
117). Participants’ HR and EDA were recorded with a Tickr chest-strap (Wahoo Fitness, Atlanta, GA, USA) and
EdaMove 4 (Movisens GmbH, Karlsruhe, Germany), respectively, while being presented with six movie clips of
approximately 10 minute duration (09:48 ± 00:41 minutes). The movie clips were selected from the Dutch
YouTube channels NPO3 and KORT! and featured short, moderately emotionally engaging stories. The
presentation order was randomized across participants. We assessed physiological synchrony by computing inter-
subject correlations following our earlier work. Significance of these inter-subject correlations was assessed by
comparing the real values to 500 circular-shuffles. We varied the amount of data included in analysis in two ways,
by varying the stimulus duration from 1 to 60 minutes and by varying the group size from 2 to 30 individuals. For
each iteration we computed the amount of participants with significant inter-subject correlations.
Results
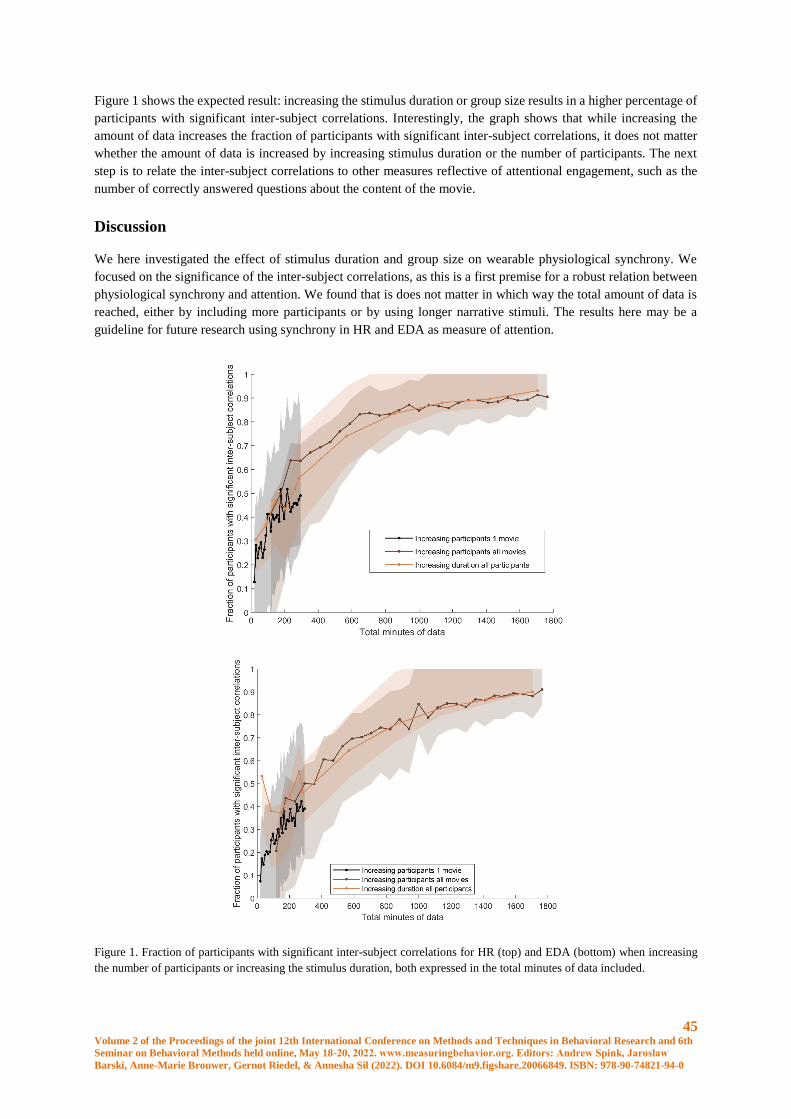
45 Volume 2 of the Proceedings of the joint 12th International Conference on Methods and Techniques in Behavioral Research and 6th
Seminar on Behavioral Methods held online, May 18-20, 2022. www.measuringbehavior.org. Editors: Andrew Spink, Jarosław
Barski, Anne-Marie Brouwer, Gernot Riedel, & Annesha Sil (2022). DOI 10.6084/m9.figshare.20066849. ISBN: 978-90-74821-94-0
Figure 1 shows the expected result: increasing the stimulus duration or group size results in a higher percentage of
participants with significant inter-subject correlations. Interestingly, the graph shows that while increasing the
amount of data increases the fraction of participants with significant inter-subject correlations, it does not matter
whether the amount of data is increased by increasing stimulus duration or the number of participants. The next
step is to relate the inter-subject correlations to other measures reflective of attentional engagement, such as the
number of correctly answered questions about the content of the movie.
Discussion
We here investigated the effect of stimulus duration and group size on wearable physiological synchrony. We
focused on the significance of the inter-subject correlations, as this is a first premise for a robust relation between
physiological synchrony and attention. We found that is does not matter in which way the total amount of data is
reached, either by including more participants or by using longer narrative stimuli. The results here may be a
guideline for future research using synchrony in HR and EDA as measure of attention.
Figure 1. Fraction of participants with significant inter-subject correlations for HR (top) and EDA (bottom) when increasing
the number of participants or increasing the stimulus duration, both expressed in the total minutes of data included.

46 Volume 2 of the Proceedings of the joint 12th International Conference on Methods and Techniques in Behavioral Research and 6th
Seminar on Behavioral Methods held online, May 18-20, 2022. www.measuringbehavior.org. Editors: Andrew Spink, Jarosław
Barski, Anne-Marie Brouwer, Gernot Riedel, & Annesha Sil (2022). DOI 10.6084/m9.figshare.20066849. ISBN: 978-90-74821-94-0
References
1. Stuldreher, I.V., Thammasan, N., van Erp, J.B., Brouwer, A.M. (2020). Physiological synchrony in EEG,
electrodermal activity and heart rate reflects shared selective auditory attention. Journal of Neural Engineering
17(4), 046028.
2. Pérez, P., Madsen, J., Banellis, L., Türker, B., Raimondo, F., Perlbarg, V., ... & Sitt, J. D. (2021). Conscious
processing of narrative stimuli synchronizes heart rate between individuals. Cell Reports 36(11), 109692.
3. Stuldreher, I.V., Merasli, A., Thammasan, N., van Erp, J.B., Brouwer, A.M. (2020). Unsupervised clustering of
individuals sharing selective attentional focus using physiological synchrony. Frontiers in Neuroergonomics 2,
750248.
47 Volume 2 of the Proceedings of the joint 12th International Conference on Methods and Techniques in Behavioral Research and 6th
Seminar on Behavioral Methods held online, May 18-20, 2022. www.measuringbehavior.org. Editors: Andrew Spink, Jarosław
Barski, Anne-Marie Brouwer, Gernot Riedel, & Annesha Sil (2022). DOI 10.6084/m9.figshare.20066849. ISBN: 978-90-74821-94-0
Start Making Sense: Predicting confidence in virtual human interactions using
biometric signals.
S. Dalzel-Job1, R.L. Hill1, R. Petrick2
1Department of Informatics, University of Edinburgh, Edinburgh, Scotland. [email protected], [email protected]
2School of Mathematical & Computer Sciences, Heriot-Watt University, Edinburgh, Scotland. [email protected]
Aims
This project investigates the use of biometric data to predict confidence levels during task-focused interaction
between humans and virtual humans. The project comprises of two main studies, the first of which examines the
relationship between biometric signals – galvanic skin response (GSR), heart rate, facial expression and eye
movements – and self-report levels of confidence during a task-oriented interaction between a human and a virtual
human. Through the manipulation of the feedback and task demands, participants were exposed to unexpected
situations and varying levels of ambiguity, resulting in a measurable range of perceived confidence as well as more
implicit biometric and behavioural indicators of confidence and success. The second study utilises the paradigm
and results from Experiment 1 to train an AI instruction giver to identify instances where behavioural and biometric
feedback from a human signal low confidence, enabling it to modify or supplement its instructions accordingly.
To ensure that the AI is acting in a useful way, and that the experimental manipulation and behavioural
demonstrations of confidence are valid, the participant judges the perceived success of the interaction, as well as
their trust in the AI under varying levels of feedback. This paradigm can then be adapted for use across a wide
range of situations and scenarios; from interactions with virtual human avatars or agents via AR, VR, desktop or
mobile devices, to fully embody conversational agents or robots, this paradigm will enable a successful, smooth
interactions between humans and Ais.
Background
Virtual humans – whether computer-controlled agents or human-controlled avatars – are widely used during online
interactions. Not only are they utilised during social interaction (e.g. gaming), but also in important joint-action or
task-oriented communication. Historically, virtual humans have been used in support and health [1-5], as well as
in areas such as teaching and training [6-10]. To date, there has been a wealth of research into how virtual humans
should behave during interactions with users in order to maximise success [11-16]. Our previous research has
discovered that the optimum behaviour of a virtual human, specifically its eye movements, varies depending on
the purpose of the interaction [15, 16]. This study aims to expand and extend these findings by investigating which
combination of behaviours maximise positive perceptions of a virtual agent, as well as maximising any given task
performance, with the aim of developing trustworthy, likeable and useful virtual humans. Furthermore, it aims to
develop a system that can utilise real-time non-verbal feedback from a user to indicate confusion or occasions of
uncertainty. This will enable the system to supplement or alter instructions to maximise the possibility of a smooth,
successful interaction.
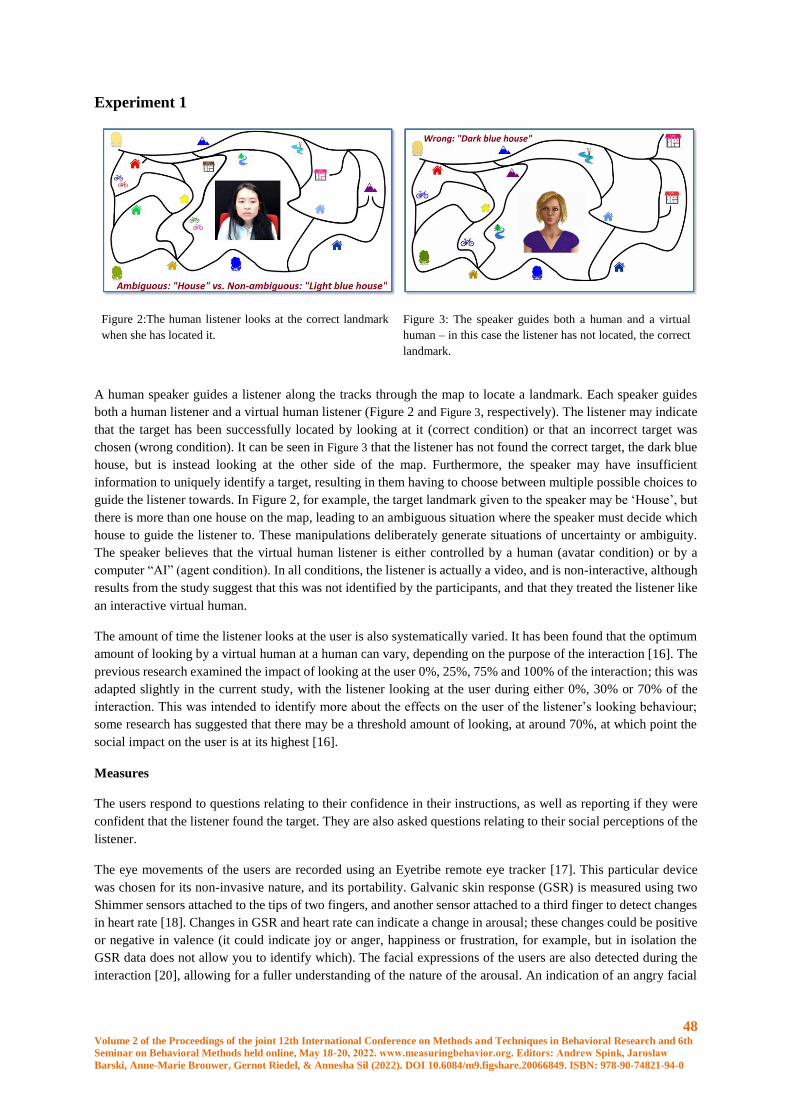
48 Volume 2 of the Proceedings of the joint 12th International Conference on Methods and Techniques in Behavioral Research and 6th
Seminar on Behavioral Methods held online, May 18-20, 2022. www.measuringbehavior.org. Editors: Andrew Spink, Jarosław
Barski, Anne-Marie Brouwer, Gernot Riedel, & Annesha Sil (2022). DOI 10.6084/m9.figshare.20066849. ISBN: 978-90-74821-94-0
Experiment 1
Figure 2:The human listener looks at the correct landmark
when she has located it.
Figure 3: The speaker guides both a human and a virtual
human – in this case the listener has not located, the correct
landmark.
A human speaker guides a listener along the tracks through the map to locate a landmark. Each speaker guides
both a human listener and a virtual human listener (Figure 2 and Figure 3, respectively). The listener may indicate
that the target has been successfully located by looking at it (correct condition) or that an incorrect target was
chosen (wrong condition). It can be seen in Figure 3 that the listener has not found the correct target, the dark blue
house, but is instead looking at the other side of the map. Furthermore, the speaker may have insufficient
information to uniquely identify a target, resulting in them having to choose between multiple possible choices to
guide the listener towards. In Figure 2, for example, the target landmark given to the speaker may be ‘House’, but
there is more than one house on the map, leading to an ambiguous situation where the speaker must decide which
house to guide the listener to. These manipulations deliberately generate situations of uncertainty or ambiguity.
The speaker believes that the virtual human listener is either controlled by a human (avatar condition) or by a
computer “AI” (agent condition). In all conditions, the listener is actually a video, and is non-interactive, although
results from the study suggest that this was not identified by the participants, and that they treated the listener like
an interactive virtual human.
The amount of time the listener looks at the user is also systematically varied. It has been found that the optimum
amount of looking by a virtual human at a human can vary, depending on the purpose of the interaction [16]. The
previous research examined the impact of looking at the user 0%, 25%, 75% and 100% of the interaction; this was
adapted slightly in the current study, with the listener looking at the user during either 0%, 30% or 70% of the
interaction. This was intended to identify more about the effects on the user of the listener’s looking behaviour;
some research has suggested that there may be a threshold amount of looking, at around 70%, at which point the
social impact on the user is at its highest [16].
Measures
The users respond to questions relating to their confidence in their instructions, as well as reporting if they were
confident that the listener found the target. They are also asked questions relating to their social perceptions of the
listener.
The eye movements of the users are recorded using an Eyetribe remote eye tracker [17]. This particular device
was chosen for its non-invasive nature, and its portability. Galvanic skin response (GSR) is measured using two
Shimmer sensors attached to the tips of two fingers, and another sensor attached to a third finger to detect changes
in heart rate [18]. Changes in GSR and heart rate can indicate a change in arousal; these changes could be positive
or negative in valence (it could indicate joy or anger, happiness or frustration, for example, but in isolation the
GSR data does not allow you to identify which). The facial expressions of the users are also detected during the
interaction [20], allowing for a fuller understanding of the nature of the arousal. An indication of an angry facial
49 Volume 2 of the Proceedings of the joint 12th International Conference on Methods and Techniques in Behavioral Research and 6th
Seminar on Behavioral Methods held online, May 18-20, 2022. www.measuringbehavior.org. Editors: Andrew Spink, Jarosław
Barski, Anne-Marie Brouwer, Gernot Riedel, & Annesha Sil (2022). DOI 10.6084/m9.figshare.20066849. ISBN: 978-90-74821-94-0
expression in conjunction with a large GSR peak, for example, is more informative about the effect of any stimuli
on a user than the GSR alone.
iMotions is software that allows the presentation of the stimuli, while collating, time-stamping and processing all
the behavioural, biometric and survey data in preparation for analysis [19]. Examining these behaviours and
biometrics together rather than independently allows the identification of the behaviour, or combination of
behaviours associated with varying levels of confidence, as indicated by their relationship with the responses to
the survey. This combination of objective and subjective measures enables us to begin to build a model of how
users respond and adjust to different types of feedback, and to use this information to design behaviourally
appropriate virtual humans, responding in real-time to non-verbal feedback that may indicate anything other than
a smooth interaction.
Experiment 2
The non-verbal behaviours identified in Experiment 1, which are associated with confidence – in self and in the
interlocutor – can be used by a planning system to identify instances of confusion, or where the user may require
extra information. The facial expressions and eye movements are fed into the planning system in real-time, and
upon breaching a pre-specified threshold the system responds accordingly, signalling the system to provide extra
information where low confidence or confusion is indicated, and continuing without additional clarification when
biometric responses suggest that the interaction is going well.
Outcomes and Applications
This research can be applied to several different situations: wherever it is desirable for a system to respond in real-
time to a user’s emotional state, the system can be trained to identify signals of confusion or uncertainty and
respond immediately to remedy the situation. With the advent of more mobile eye trackers and the increasing
popularity and affordability of smart watches, as well as other devices that already detect heart rate, which could
potentially be developed to identify changes in GSR, this paradigm presents the possibility of interactive systems
responding in real-time to behavioural and biometric cues provided via our everyday devices. Interactive and
ubiquitous, virtual companions, advisors, teachers, coaches or even mediators could soon be available to provide
customisable, interactive, responsive and truly trustworthy, effective virtual humans.
Ethical Statement
Ethics approval for this study was granted by the Informatics Ethics Committee, University of Edinburgh (rt
#3690),
References
1. Robillard, G., et al., Using virtual humans to alleviate social anxiety: preliminary report from a
comparative outcome study. Stud Health Technol Inform, 2010. 154: p. 57-60.
2. Kang, S.-H., et al. Does the contingency of agents' nonverbal feedback affect users' social anxiety? in
Proceedings of the 7th international joint conference on Autonomous agents and multiagent systems-
Volume 1. 2008. International Foundation for Autonomous Agents and Multiagent Systems.
3. Lok, B., Teaching communication skills with virtual humans. IEEE Computer Graphics and Applications,
2006. 26(3): p. 10-13.
4. Yuen, E.K., et al., Treatment of social anxiety disorder using online virtual environments in second life.
Behavior therapy, 2013. 44(1): p. 51-61.
5. Kenny, P., et al. Virtual patients for clinical therapist skills training. in International Workshop on
Intelligent Virtual Agents. 2007. Springer.
6. Kim, Y., J. Thayne, and Q. Wei, An embodied agent helps anxious students in mathematics learning.
Educational Technology Research and Development, 2017. 65(1): p. 219-235.
7. Johnson, W.L. and J. Rickel, Steve: An Animated Pedagogical Agent for Procedural Training in Virtual
Environments. Sigart Bulletin, 1997. 8(1-4): p. 12-16.
50 Volume 2 of the Proceedings of the joint 12th International Conference on Methods and Techniques in Behavioral Research and 6th
Seminar on Behavioral Methods held online, May 18-20, 2022. www.measuringbehavior.org. Editors: Andrew Spink, Jarosław
Barski, Anne-Marie Brouwer, Gernot Riedel, & Annesha Sil (2022). DOI 10.6084/m9.figshare.20066849. ISBN: 978-90-74821-94-0
8. Johnson, W.L., J.W. Rickel, and J.C. Lester, Animated Pedagogical Agents: Face-to-Face Interaction in
Interactive Learning Environments International Journal of Artificial Intelligence in Education, 2000. 11:
p. 47-78.
9. Johnson, W.L., et al. Evolution of User Interaction: The Case of Agent Adele. in 8th International
Conference on Intelligent user interfaces. 2003. Miami, Florida, USA.
10. Rickel, J. and W.L. Johnson. Virtual humans for team training in virtual reality. in Proceedings of the
ninth international conference on artificial intelligence in education. 1999. Citeseer.
11. Cassell, J., J. Sullivan, and S.e. Prevost, Embodied Conversational Agents, ed. M. Cambridge. 1999: MIT
Press.
12. Cassell, J. and K.R. Thorisson, The power of a nod and a glance: Envelope vs. emotional feedback in
animated conversational agents. Applied Artificial Intelligence, 1999. 13(4-5): p. 519-538.
13. Dalzel-Job, S., C. Nicol, and J. Oberlander. Comparing behavioural and self-report measures of
engagement with an embodied conversational agent: A first report on eye tracking in Second Life. in The
2008 Symposium on Eye Tracking Research & Applications. 2008. Savannah, Georgia.
14. Dalzel-Job, S., J. Oberlander, and T.J. Smith, Contested staring: issues and the use of mutual gaze as an
on-line measure of social presence. 2011.
15. Dalzel-Job, S., J. Oberlander, and T.J. Smith. Don't Look Now: The relationship between mutual gaze,
task performance and staring in Second Life. in The 33rd Annual Conference of the Cognitive Science.
2011. Boston, Massachusetts, USA.
16. Dalzel-Job, S., Social interaction in virtual environments: the relationship between mutual gaze, task
performance and social presence. 2015.
17. Eyetribe. The Eyetribe. [cited 2020 30.01.2020]; Available from:
https://theeyetribe.com/theeyetribe.com/about/index.html.
18. Shimmer. [cited 2020 07/02/2020]; Available from:
https://www.shimmersensing.com/products/shimmer3-wireless-gsr-sensor.
19. iMotions. [cited 2020 07/02/2020]; Available from: https://imotions.com/.
20. Affectiva. [cited 2020 07/02/2020]; Available from: https://www.affectiva.com/.
51 Volume 2 of the Proceedings of the joint 12th International Conference on Methods and Techniques in Behavioral Research and 6th
Seminar on Behavioral Methods held online, May 18-20, 2022. www.measuringbehavior.org. Editors: Andrew Spink, Jarosław
Barski, Anne-Marie Brouwer, Gernot Riedel, & Annesha Sil (2022). DOI 10.6084/m9.figshare.20066849. ISBN: 978-90-74821-94-0
Improving the Annotation Efficiency for Animal Activity Recognition using
Active Learning
S.J. Spink1, J.W. Kamminga1 and A. Kamilaris1, 2
1 Department of Pervasive Systems, University of Twente, Enschede, the Netherlands, [email protected]
2 CYENS Center of Excellence, Nicosia, Cyprus, a. [email protected]
Introduction
Animal activity recognition (AAR) is essential for the conservation of endangered species and the well-being of
livestock. The activity of animals is a rich source of information that not only provides insights into their life and
well-being but also their environment. Due to the advent of small, lightweight, and low-power electronics, we can
attach unobtrusive resource-constrained devices to animals that measure a wide range of aspects such as location,
temperature, and activity. These aspects can be used to support numerous application domains, including wildlife
monitoring, anti-poaching, and livestock management.
Many machine learning (ML) models that are used for AAR are supervised and require annotated datasets for
training and evaluation purposes [1], [2]. AAR is particularly a use case where active learning (AL) may have a
huge impact. AAR is harder than human activity recognition (HAR) because it is difficult to observe animal
behavior in the wild, while their activity patterns are not always known beforehand. Because we cannot ask (wild)
animals to perform all the activities that should automatically be recognized, the resulting dataset has to be huge.
Wild animals have to be monitored for long periods to opportunistically record the activity of interest. For example,
African wild dogs may only eat three times a day, while they can devour an antelope in just 15 minutes. As a
result, AAR datasets can be very large and severely imbalanced. Therefore, it is tedious for annotators to find those
segments of data that should be annotated for the best performance of the AAR classifier. Furthermore, the sensor
orientations are not fixed and the recorded data is very noisy which increases the difficulty of determining what
data is most useful for training [3]. It is difficult for annotators to determine what data is essential to annotate, thus
they tend to sequentially annotate large amounts of data to improve the performance of the trained classifiers. The
annotation process is tedious, labour intensive, and expensive because the availability of experts is limited and
their time costly.
In this paper, we show that AL increases annotation efficiency by selecting only the most informative data for
annotation and algorithm training. We consider a pool-based AL [4]– [7] setting. In pool-based AL there exists a
small set of labeled data and a large pool of unlabeled data. The idea behind AL is to select only those samples -
to be annotated - from the pool so that the performance of the classification task is maximized. This smarter way
of querying optimises the training process by helping the ML model to learn and converge faster. In practise, a
query occurs by asking a human ’oracle’ for the correct label and adding the annotated sample to the training set.
As a result, classification can become significantly faster and cheaper.
We use real-world inertial measurement unit (IMU) data recorded using four horses performing various activities
during a week at an equestrian facility. This paper focuses on the impact AL has in the field of AAR [6], [8]–[10],
considering the case of horses and activity data recorded by a three-axis accelerometer placed on the horses. To
the knowledge of the authors, this is the first effort to investigate AL in AAR using IMU sensors/data.
Related Work
This section includes all essential empirical research on activity recognition and AL, including the different types,
strategies, and techniques that have been used.
Active Learning Algorithms
52 Volume 2 of the Proceedings of the joint 12th International Conference on Methods and Techniques in Behavioral Research and 6th
Seminar on Behavioral Methods held online, May 18-20, 2022. www.measuringbehavior.org. Editors: Andrew Spink, Jarosław
Barski, Anne-Marie Brouwer, Gernot Riedel, & Annesha Sil (2022). DOI 10.6084/m9.figshare.20066849. ISBN: 978-90-74821-94-0
One way of deciding which instance to label next in a data set, is by random sampling. However, there are limited
experts in this area that can annotate this data well, which makes the process costly. This makes it more important
to not waste their time by randomly annotating unnecessary instances. With AL, the most ambiguous instance is
found to be annotated, to maximise the efficiency. This instance is added to a training set and classified again. This
process is done iteratively, each time asking the annotators to label the most ambiguous instance. There are two
main divisions in AL algorithms mostly used, namely Uncertainty sampling and Disagreement-based sampling.
Both are described below.
Uncertainty Sampling: Uncertainty sampling (UNCS) gives an intuitive view into how AL works [4]–[6] and it
has a low computational complexity [7]. It needs to be combined with a classifier. Many successful applications
can be found in natural language processing (NLP) tasks, which require enormous amounts of data and labelling
costs are consequently high. Dredze and Crammer [11] used the confidence margin technique of UNCS on four
different NLP tasks and compared the results with random sampling and margin sampling. Accuracy of AL was
significantly higher than random sampling and needed only 73% of the labels that random sampling needed.
Nonetheless, Zhu [12] found that UNCS does not work well if there are many or significantly large outliers, which
are not useful for the model to learn from, making it harder for the model to converge.
Disagreement-Based Sampling: Within disagreement based sampling (DBS), the committee of classifiers
algorithm is used most often. Muslea [10] maximized the efficiency of DBS in finding the correct label, by
introducing co-testing. This is a combination of a committee of classifiers, training all the classifiers at the same
time. Several classifiers are used and then the instances where they disagree on the most, called contention points,
are harnessed to train the classifier. However, co-testing can also be unfavourable [13], in case future data
acquisition gives substantially different data instances, e.g. new activities are introduced.
Activity Recognition
Many methods and algorithms have been applied to optimize classification in AAR, however, very limited research
has been conducted on AL applied in AAR. However, AL has been applied more widely in Human Activity
Recognition (HAR) in the past. This is a similar field, but the problem is easier since annotating humans and their
activities is more straightforward, while it is easier to recruit annotators. Animals cannot give feedback, move
unexpectedly and especially the behavioural pattern of wild animals in their natural habitat is still widely unknown.
This makes classification more difficult.
Animal Activity Recognition: Many classifiers have been proposed for AAR. Support Vector Machines (SVM) has
been used by Sturm et al. [2] for a similar purpose, classifying six activities based on IMU data. Furthermore, it
Gao et al. [1] used not only 3D accelerometer data but also videos. Both spatial features (i.e. standard deviation
and signal magnitude area) and frequency-domain features were extracted.
Human Activity Recognition: AL has been applied widely in HAR. Pool-based sampling was used for almost all
experiments while the algorithm type varied between them. Stikic [8] used a combination of pool-based sampling
with two different algorithms, UNCS and DBS, to classify ten activities. For UNCS, two samples were chosen
each time iteratively, while for DBS, one sample with the highest disagreement was chosen. The results showed
little difference in accuracy between the two, but both saw a large increase in accuracy when the number of labelled
instances increased. Furthermore, Vaith et al. [6] investigated AL with IMU data of humans, by doing a human
gait analysis. They observed that the Variation Ratio (VR) and Maximum entropy (EM) strategies were the most
accurate, within the UNCS spectrum. Finally, Liu [9] compared different AL algorithms, concluding that AL with
UNCS and DBS perform better than supervised learning and random selection.
Methodology
Activity data was collected by attaching sensors on horses that recorded 3D accelerometer data, as described in
[14]. Two AL algorithm types were then applied to the horses’ dataset created: disagreement-based sampling
(DBS) and uncertainty sampling (UNCS) [4]. Within UNCS, three algorithms were considered: least confident,
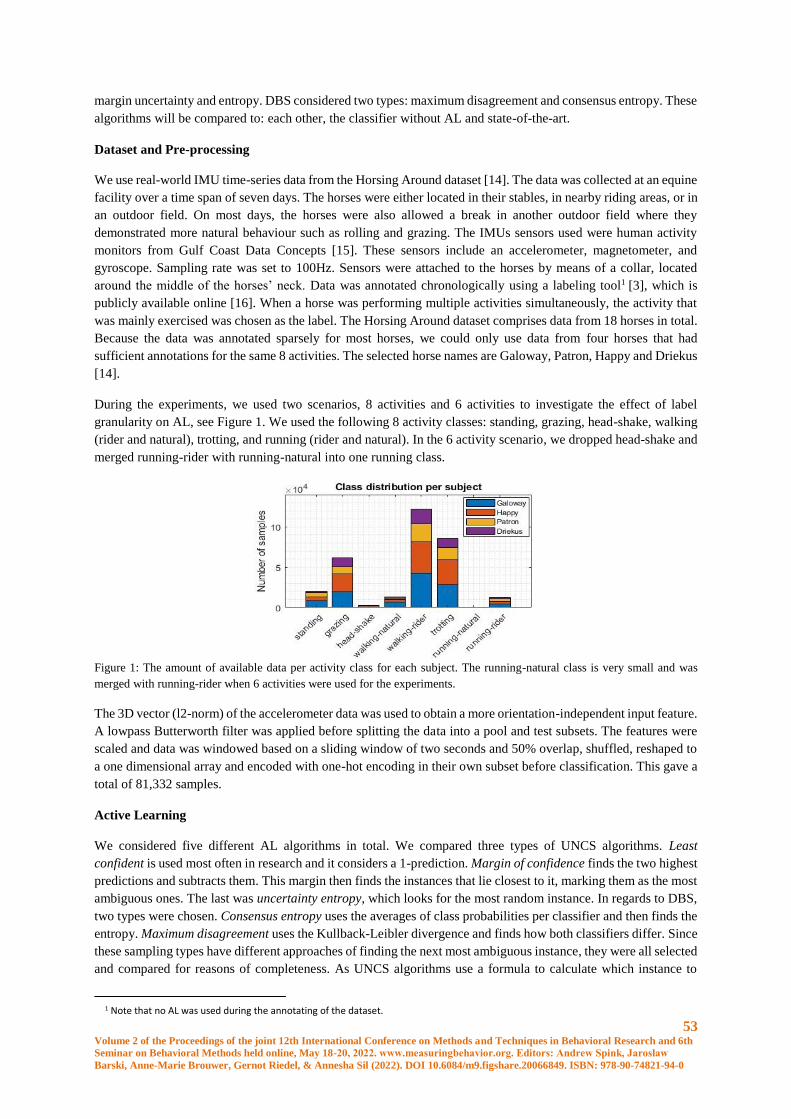
53 Volume 2 of the Proceedings of the joint 12th International Conference on Methods and Techniques in Behavioral Research and 6th
Seminar on Behavioral Methods held online, May 18-20, 2022. www.measuringbehavior.org. Editors: Andrew Spink, Jarosław
Barski, Anne-Marie Brouwer, Gernot Riedel, & Annesha Sil (2022). DOI 10.6084/m9.figshare.20066849. ISBN: 978-90-74821-94-0
margin uncertainty and entropy. DBS considered two types: maximum disagreement and consensus entropy. These
algorithms will be compared to: each other, the classifier without AL and state-of-the-art.
Dataset and Pre-processing
We use real-world IMU time-series data from the Horsing Around dataset [14]. The data was collected at an equine
facility over a time span of seven days. The horses were either located in their stables, in nearby riding areas, or in
an outdoor field. On most days, the horses were also allowed a break in another outdoor field where they
demonstrated more natural behaviour such as rolling and grazing. The IMUs sensors used were human activity
monitors from Gulf Coast Data Concepts [15]. These sensors include an accelerometer, magnetometer, and
gyroscope. Sampling rate was set to 100Hz. Sensors were attached to the horses by means of a collar, located
around the middle of the horses’ neck. Data was annotated chronologically using a labeling tool1 [3], which is
publicly available online [16]. When a horse was performing multiple activities simultaneously, the activity that
was mainly exercised was chosen as the label. The Horsing Around dataset comprises data from 18 horses in total.
Because the data was annotated sparsely for most horses, we could only use data from four horses that had
sufficient annotations for the same 8 activities. The selected horse names are Galoway, Patron, Happy and Driekus
[14].
During the experiments, we used two scenarios, 8 activities and 6 activities to investigate the effect of label
granularity on AL, see Figure 1. We used the following 8 activity classes: standing, grazing, head-shake, walking
(rider and natural), trotting, and running (rider and natural). In the 6 activity scenario, we dropped head-shake and
merged running-rider with running-natural into one running class.
Figure 1: The amount of available data per activity class for each subject. The running-natural class is very small and was
merged with running-rider when 6 activities were used for the experiments.
The 3D vector (l2-norm) of the accelerometer data was used to obtain a more orientation-independent input feature.
A lowpass Butterworth filter was applied before splitting the data into a pool and test subsets. The features were
scaled and data was windowed based on a sliding window of two seconds and 50% overlap, shuffled, reshaped to
a one dimensional array and encoded with one-hot encoding in their own subset before classification. This gave a
total of 81,332 samples.
Active Learning
We considered five different AL algorithms in total. We compared three types of UNCS algorithms. Least
confident is used most often in research and it considers a 1-prediction. Margin of confidence finds the two highest
predictions and subtracts them. This margin then finds the instances that lie closest to it, marking them as the most
ambiguous ones. The last was uncertainty entropy, which looks for the most random instance. In regards to DBS,
two types were chosen. Consensus entropy uses the averages of class probabilities per classifier and then finds the
entropy. Maximum disagreement uses the Kullback-Leibler divergence and finds how both classifiers differ. Since
these sampling types have different approaches of finding the next most ambiguous instance, they were all selected
and compared for reasons of completeness. As UNCS algorithms use a formula to calculate which instance to
1 Note that no AL was used during the annotating of the dataset.
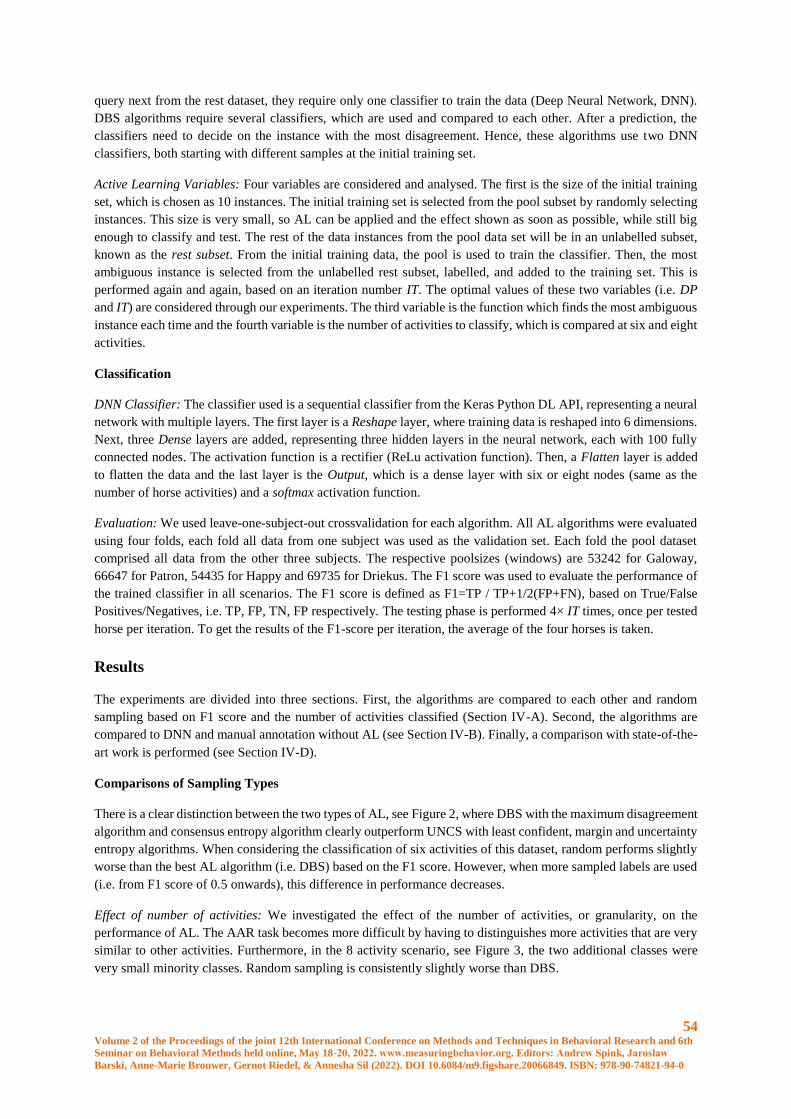
54 Volume 2 of the Proceedings of the joint 12th International Conference on Methods and Techniques in Behavioral Research and 6th
Seminar on Behavioral Methods held online, May 18-20, 2022. www.measuringbehavior.org. Editors: Andrew Spink, Jarosław
Barski, Anne-Marie Brouwer, Gernot Riedel, & Annesha Sil (2022). DOI 10.6084/m9.figshare.20066849. ISBN: 978-90-74821-94-0
query next from the rest dataset, they require only one classifier to train the data (Deep Neural Network, DNN).
DBS algorithms require several classifiers, which are used and compared to each other. After a prediction, the
classifiers need to decide on the instance with the most disagreement. Hence, these algorithms use two DNN
classifiers, both starting with different samples at the initial training set.
Active Learning Variables: Four variables are considered and analysed. The first is the size of the initial training
set, which is chosen as 10 instances. The initial training set is selected from the pool subset by randomly selecting
instances. This size is very small, so AL can be applied and the effect shown as soon as possible, while still big
enough to classify and test. The rest of the data instances from the pool data set will be in an unlabelled subset,
known as the rest subset. From the initial training data, the pool is used to train the classifier. Then, the most
ambiguous instance is selected from the unlabelled rest subset, labelled, and added to the training set. This is
performed again and again, based on an iteration number IT. The optimal values of these two variables (i.e. DP
and IT) are considered through our experiments. The third variable is the function which finds the most ambiguous
instance each time and the fourth variable is the number of activities to classify, which is compared at six and eight
activities.
Classification
DNN Classifier: The classifier used is a sequential classifier from the Keras Python DL API, representing a neural
network with multiple layers. The first layer is a Reshape layer, where training data is reshaped into 6 dimensions.
Next, three Dense layers are added, representing three hidden layers in the neural network, each with 100 fully
connected nodes. The activation function is a rectifier (ReLu activation function). Then, a Flatten layer is added
to flatten the data and the last layer is the Output, which is a dense layer with six or eight nodes (same as the
number of horse activities) and a softmax activation function.
Evaluation: We used leave-one-subject-out crossvalidation for each algorithm. All AL algorithms were evaluated
using four folds, each fold all data from one subject was used as the validation set. Each fold the pool dataset
comprised all data from the other three subjects. The respective poolsizes (windows) are 53242 for Galoway,
66647 for Patron, 54435 for Happy and 69735 for Driekus. The F1 score was used to evaluate the performance of
the trained classifier in all scenarios. The F1 score is defined as F1=TP / TP+1/2(FP+FN), based on True/False
Positives/Negatives, i.e. TP, FP, TN, FP respectively. The testing phase is performed 4× IT times, once per tested
horse per iteration. To get the results of the F1-score per iteration, the average of the four horses is taken.
Results
The experiments are divided into three sections. First, the algorithms are compared to each other and random
sampling based on F1 score and the number of activities classified (Section IV-A). Second, the algorithms are
compared to DNN and manual annotation without AL (see Section IV-B). Finally, a comparison with state-of-the-
art work is performed (see Section IV-D).
Comparisons of Sampling Types
There is a clear distinction between the two types of AL, see Figure 2, where DBS with the maximum disagreement
algorithm and consensus entropy algorithm clearly outperform UNCS with least confident, margin and uncertainty
entropy algorithms. When considering the classification of six activities of this dataset, random performs slightly
worse than the best AL algorithm (i.e. DBS) based on the F1 score. However, when more sampled labels are used
(i.e. from F1 score of 0.5 onwards), this difference in performance decreases.
Effect of number of activities: We investigated the effect of the number of activities, or granularity, on the
performance of AL. The AAR task becomes more difficult by having to distinguishes more activities that are very
similar to other activities. Furthermore, in the 8 activity scenario, see Figure 3, the two additional classes were
very small minority classes. Random sampling is consistently slightly worse than DBS.
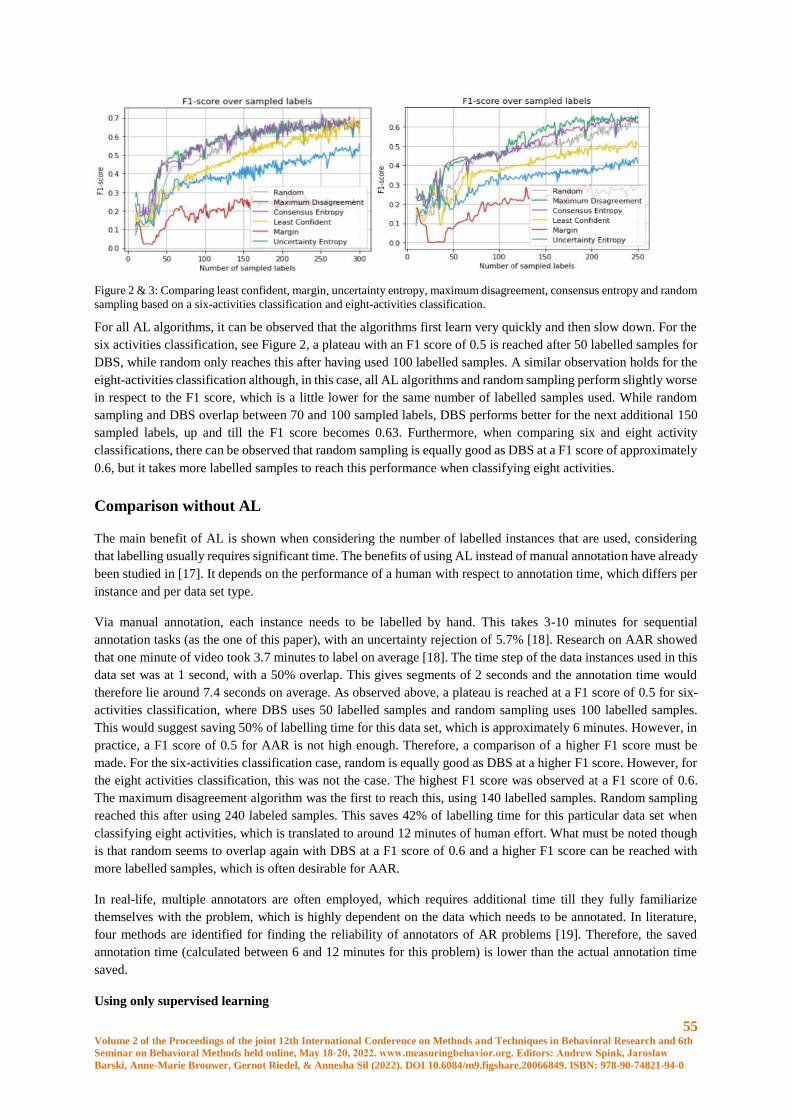
55 Volume 2 of the Proceedings of the joint 12th International Conference on Methods and Techniques in Behavioral Research and 6th
Seminar on Behavioral Methods held online, May 18-20, 2022. www.measuringbehavior.org. Editors: Andrew Spink, Jarosław
Barski, Anne-Marie Brouwer, Gernot Riedel, & Annesha Sil (2022). DOI 10.6084/m9.figshare.20066849. ISBN: 978-90-74821-94-0
Figure 2 & 3: Comparing least confident, margin, uncertainty entropy, maximum disagreement, consensus entropy and random
sampling based on a six-activities classification and eight-activities classification.
For all AL algorithms, it can be observed that the algorithms first learn very quickly and then slow down. For the
six activities classification, see Figure 2, a plateau with an F1 score of 0.5 is reached after 50 labelled samples for
DBS, while random only reaches this after having used 100 labelled samples. A similar observation holds for the
eight-activities classification although, in this case, all AL algorithms and random sampling perform slightly worse
in respect to the F1 score, which is a little lower for the same number of labelled samples used. While random
sampling and DBS overlap between 70 and 100 sampled labels, DBS performs better for the next additional 150
sampled labels, up and till the F1 score becomes 0.63. Furthermore, when comparing six and eight activity
classifications, there can be observed that random sampling is equally good as DBS at a F1 score of approximately
0.6, but it takes more labelled samples to reach this performance when classifying eight activities.
Comparison without AL
The main benefit of AL is shown when considering the number of labelled instances that are used, considering
that labelling usually requires significant time. The benefits of using AL instead of manual annotation have already
been studied in [17]. It depends on the performance of a human with respect to annotation time, which differs per
instance and per data set type.
Via manual annotation, each instance needs to be labelled by hand. This takes 3-10 minutes for sequential
annotation tasks (as the one of this paper), with an uncertainty rejection of 5.7% [18]. Research on AAR showed
that one minute of video took 3.7 minutes to label on average [18]. The time step of the data instances used in this
data set was at 1 second, with a 50% overlap. This gives segments of 2 seconds and the annotation time would
therefore lie around 7.4 seconds on average. As observed above, a plateau is reached at a F1 score of 0.5 for six-
activities classification, where DBS uses 50 labelled samples and random sampling uses 100 labelled samples.
This would suggest saving 50% of labelling time for this data set, which is approximately 6 minutes. However, in
practice, a F1 score of 0.5 for AAR is not high enough. Therefore, a comparison of a higher F1 score must be
made. For the six-activities classification case, random is equally good as DBS at a higher F1 score. However, for
the eight activities classification, this was not the case. The highest F1 score was observed at a F1 score of 0.6.
The maximum disagreement algorithm was the first to reach this, using 140 labelled samples. Random sampling
reached this after using 240 labeled samples. This saves 42% of labelling time for this particular data set when
classifying eight activities, which is translated to around 12 minutes of human effort. What must be noted though
is that random seems to overlap again with DBS at a F1 score of 0.6 and a higher F1 score can be reached with
more labelled samples, which is often desirable for AAR.
In real-life, multiple annotators are often employed, which requires additional time till they fully familiarize
themselves with the problem, which is highly dependent on the data which needs to be annotated. In literature,
four methods are identified for finding the reliability of annotators of AR problems [19]. Therefore, the saved
annotation time (calculated between 6 and 12 minutes for this problem) is lower than the actual annotation time
saved.
Using only supervised learning
56 Volume 2 of the Proceedings of the joint 12th International Conference on Methods and Techniques in Behavioral Research and 6th
Seminar on Behavioral Methods held online, May 18-20, 2022. www.measuringbehavior.org. Editors: Andrew Spink, Jarosław
Barski, Anne-Marie Brouwer, Gernot Riedel, & Annesha Sil (2022). DOI 10.6084/m9.figshare.20066849. ISBN: 978-90-74821-94-0
Finally, the DNN performance with and without AL was measured, comparing with the best UNCS and DBS
algorithms scoring the highest F1 score, namely the least confident and the maximum disagreement in the six-
activities classification scenario. This was at a F1 score of 0.7, which maximum disagreement reached by using
253 labelled samples while least confident by using 293 labelled samples. When no AL was used, the DNN
classifier used all the labelled data for training. The highest F1 score of 0.723 is achieved when all labeled data
instances are used, not using AL. However, the performance is only slightly better than the best performing AL
algorithm. The DNN had a F1 score of 0.723, while the least confident algorithm and maximum disagreement
0.703 and 0.697 respectively. The difference is therefore only 0.02 for the least confident and 0.026 for the
maximum disagreement.
Comparison to State-of-the-art Work
In literature, most research compared AL only to random sampling [11], [20], [21], not considering AAR. For the
higher initial training set sizes, some algorithms performed slightly better than random sampling. This was the
case for both DBS and UNCS. For DBS, results were similar to UNCS. This was also the case in this paper.
However, UNCS was also compared to supervised learning in literature, where Liu [9] found that AL scored a 4-
5% higher classification accuracy (CA) than supervised learning. Additionally, Stikic [8] found that co-training
with uncertainty sampling had an increase of 0.25 - 0.35 in CA over supervised learning. These findings do not
align with what was found in this research, where AL was slightly less efficient than when using the whole labeled
set. However, we should note that [8], [9] used CA as a metric and we used the F1-score because it is more
appropriate for activity recognition.
Discussion
The best performance was obtained when classifying six activities. Both DBS algorithms substantially
outperformed UNCS, especially at the lower number of sampled labels. The best performing DBS algorithm is the
maximum disagreement algorithm and the best performing UNCS algorithm is the least confident algorithm. Both
reached the same maximum F1 score of 0.7 using 300 sampled labels, but maximum disagreement was much faster
in doing so. There can also be observed that random sampling performs well. However, for the lower number of
sampled labels, DBS outperforms random sampling and this saves 50% in labelling time at 0.5 F1 score, but from
there, random sampling overlaps in performance with DBS. As often a higher F1 score is necessary in AAR, this
initial advantage over random sampling may not be significant in practice.
In addition, the DNN without AL still outperforms the DNN with AL, based on a small margin of 0.02 in the F1
score. However, this small margin is not significant, as AL can fluctuate based on many factors, e.g. the data used
and the subsequent samples queried. In addition, the DNN needed all 81,332 labeled samples for classification,
while AL only needed 293 labeled samples. This saves approximately 166 hours of manual annotation time,
although this comparison may not be as fair, considering that not all of the 81K labels would be necessary. The
work performed in this paper shows the potential that AL has for applications where some small error can be
accepted in the overall accuracy. However, as state-of-the-art work shows, the performance can be improved even
more by fine-tuning some variables more properly [17].
Recommendations
The AAR performance can be improved by elaborating the fine-tuning and pre-processing steps. Since outliers
were present in the dataset used, affecting overall results, those outliers could be detected and removed, or not
taken into account in the AL process. If an outlier is picked during an AL query, the model might learn that a rare
deviation is normal and will try to compensate all other classifications. Therefore, avoiding outliers may improve
performance. Furthermore, the sensors attached to the horses were not completely fixed. This means that the data
collected may have been noisy. While a low-pass Butterworth filter was applied to compensate for this noise, this
filter did not remove the noise completely. Finally, it would be beneficial to run the experiments multiple times,
considering more activities and similar datasets, to validate and compare our findings.
57 Volume 2 of the Proceedings of the joint 12th International Conference on Methods and Techniques in Behavioral Research and 6th
Seminar on Behavioral Methods held online, May 18-20, 2022. www.measuringbehavior.org. Editors: Andrew Spink, Jarosław
Barski, Anne-Marie Brouwer, Gernot Riedel, & Annesha Sil (2022). DOI 10.6084/m9.figshare.20066849. ISBN: 978-90-74821-94-0
Future Work
The recommendations mentioned in Section V-A will be addressed in future work, to give a more complete picture
of the potential effect of AL in the domain of AAR. Guidelines, lessons learned and best practices should be
defined and formalized, to help scientists harness AL in the most profitable way in their projects. These practices
include also the preprocessing steps required, such as the best combinations of initial training set sizes and optimal
number of iterations, which might need to be linked to AL algorithms and datasets used. Additionally, some other
aspects of AL were not applied in this study, but do have the potential for future use. For example, other classifiers
beyond the DNN classifier used could be employed, e.g. SVM, random forests, and more advanced DNN
architectures. This is especially useful for the case of DBS, where a focus could be on finding the effect of different
combinations of classifiers. The performance of this algorithm can in this way be optimised fully. Furthermore, it
was established that the number of activities to be classified has a big influence on the effectiveness of AL. To
quantify the precise influence, more research needs to be performed examining different numbers of classes and
types of instances, e.g. overlapping or clear differences within the classes. Moreover, other types of algorithms
within both UNCS and DBS can be considered. To understand the full potential of AL, a more in-depth look must
be taken.
Conclusion
This paper employed active learning as a promising technique for reducing the time and effort needed for manually
annotating data required for training supervised-based models, in the domain of animal activity recognition based
on IMU data. The paper demonstrated the use of AL considering horses and classification of their activities,
recorded by means of three-axis accelerometer sensors placed around their necks. A deep neural network (DNN)
was used as a classifier, together with AL, in order to classify six and eight activities of the horses. Different AL
strategies were considered, including three uncertainty sampling algorithms and two disagreement based sampling
algorithms. The overall findings on the horses’ dataset indicated that AL would have saved a person a lot of effort
and labelling time.
A clear preference for DBS over UNCS is found for this data set, where DBS was consistently higher. Furthermore,
classifying fewer activities (six) gave a higher performance than classifying more activities (eight). In addition,
AL shows an improvement of 50% in annotation effort at a low F1 score compared to random sampling within
this six activity classification. However, at higher F1 scores, which is often desirable with AAR, more labeled
samples are necessary and AL is not better than random sampling. The potential of AL is higher when classifying
more activities, as DBS consistently performed better than random sampling when classifying eight activities for
longer. However, again, at a higher F1 score, random sampling and DBS did overlap again, giving AL no
advantage.
AL is a promising field and its application in the domain of AAR is novel, having particular importance due to the
extra challenges of animal activity annotation as discussed in the paper. As can be seen, random sampling already
performs very well and sometimes equally well as AL. However, AL allows performing smarter and more efficient
labelling of instances, which are more important than others in the training dataset, when classifying many
activities at a low F1 score. This accelerates the training process, reducing the manual effort needed by annotators,
which are hard to find and expensive in the case of monitoring wildlife.
References
1. L. Gao, H. A. Campbell, O. R. Bidder, and J. Hunter, “A Webbased semantic tagging and activity recognition
system for species’ accelerometry data,” Ecological Informatics, vol. 13, pp. 47–56, 2013. [Online]. Available:
http://dx.doi.org/10.1016/j.ecoinf.2012.09.003
2. V. Sturm, D. Efrosinin, N. Efrosinina, L. Roland, M. Iwersen, M. Drillich, and W. Auer, “A Chaos Theoretic
Approach to Animal Activity Recognition,” Journal of Mathematical Sciences (United States), vol. 237, no. 5, pp.
730–743, 2019.
58 Volume 2 of the Proceedings of the joint 12th International Conference on Methods and Techniques in Behavioral Research and 6th
Seminar on Behavioral Methods held online, May 18-20, 2022. www.measuringbehavior.org. Editors: Andrew Spink, Jarosław
Barski, Anne-Marie Brouwer, Gernot Riedel, & Annesha Sil (2022). DOI 10.6084/m9.figshare.20066849. ISBN: 978-90-74821-94-0
3. J. W. Kamminga, D. V. Le, J. P. Meijers, H. Bisby, N. Meratnia, and P. J. Havinga, “Robust Sensor-Orientation-
Independent Feature Selection for Animal Activity Recognition on Collar Tags,” Proceedings of the ACM on
Interactive, Mobile, Wearable and Ubiquitous Technologies IMWUT, vol. 2, no. 1, pp. 1–27, 2018. [Online].
Available: https://dl.acm.org/citation.cfm?id=3191747
4. B. Settles, Active Learning, Burr Settles, 2013.
5. N. V. Cuong, W. S. Lee, and N. Ye, “Near-optimal adaptive pool-based active learning with general loss,”
Uncertainty in Artificial Intelligence - Proceedings of the 30th Conference, UAI 2014, pp. 122–131, 2014.
6. A. Vaith, “Uncertainty based active learning with deep neural networks for inertial gait analysis,” FUSION, vol.
23, p. 8, 2020.
7. P. Ren, Y. Xiao, X. Chang, P. Y. Huang, Z. Li, X. Chen, and X. Wang, “A survey of deep active learning,”
arXiv, 2020.
8. M. Stikic, K. Van Laerhoven, and B. Schiele, “Exploring semisupervised and active learning for activity
recognition,” Proceedings International Symposium on Wearable Computers, ISWC, pp. 81–88, 2008.
9. R. Liu, T. Chen, and L. Huang, “Research on human activity recognition based on active learning,” 2010
International Conference on Machine Learning and Cybernetics, ICMLC 2010, vol. 1, no. July, pp. 285–290,
2010.
10. I. Muslea, I. Muslea, S. Minton, S. Minton, C. a. Knoblock, and C. Knoblock, “Selective sampling with
redundant views,” Proceedings of the National Conference on Artificial Intelligence, p. 621–626, 2000. [Online].
Available: http://www.aaai.org/Papers/AAAI/2000/AAAI00095.pdf
11. M. Dredze and K. Crammer, “Active Learning with Confidence 2008,” no. June, pp. 233–236, 2008.
12. J. Zhu, H. Wang, B. K. Tsou, and M. Ma, “Active learning with sampling by uncertainty and density for data
annotations,” IEEE Transactions on Audio, Speech and Language Processing, vol. 18, no. 6, pp. 1323–1331, 2010.
13. W. Di and M. M. Crawford, “View generation for multiview maximum disagreement based active learning for
hyperspectral image classification,” IEEE Transactions on Geoscience and Remote Sensing, vol. 50, no. 5 PART
2, pp. 1942–1954, 2012.
14. J. W. Kamminga, L. M. Janßen, N. Meratnia, and P. J. M. Havinga, “Horsing Around—A Dataset Comprising
Horse Movement,” Data, vol. 4, no. 4, p. 131, 9 2019. [Online]. Available: https://www.mdpi.com/2306-
5729/4/4/131
15. L. Gulf Coast Data Concepts, “Human Activity Monitor: HAM,” online, 2019. [Online]. Available:
http://www.gcdataconcepts.com/ham.html
16. J. Kamminga, “Matlab movement data labeling tool,” 8 2019.
17. A. Olszowka-Myalska and J. Chrapo´ nskib, “Active Learning with Real´ Annotation Costs Burr,” Solid State
Phenomena, vol. 227, pp. 178–181, 2015.
18. M. Lorbach, R. Poppe, and R. C. Veltkamp, “Interactive rodent behavior annotation in video using active
learning,” Multimedia Tools and Applications, vol. 78, no. 14, pp. 19787–19806, 2019.
19. R. G. Jansen, L. F. Wiertz, E. S. Meyer, and L. P. Noldus, “Reliability analysis of observational data: Problems,
solutions, and software implementation,” Behavior Research Methods, Instruments, and Computers, vol. 35, no.
3, pp. 391–399, 2003.
20. D. D. Lewis and W. A. Gale, “A sequential algorithm for training text classifiers,” Proceedings of the 17th
Annual International ACM SIGIR Conference on Research and Development in Information Retrieval, SIGIR
1994, pp. 3–12, 1994.
21. L. Copa, D. Tuia, M. Volpi, and M. Kanevski, “Unbiased query-bybagging active learning for VHR image
classification,” Image and Signal Processing for Remote Sensing XVI, vol. 7830, no. October 2010, p. 78300K,
2010.

59 Volume 2 of the Proceedings of the joint 12th International Conference on Methods and Techniques in Behavioral Research and 6th
Seminar on Behavioral Methods held online, May 18-20, 2022. www.measuringbehavior.org. Editors: Andrew Spink, Jarosław
Barski, Anne-Marie Brouwer, Gernot Riedel, & Annesha Sil (2022). DOI 10.6084/m9.figshare.20066849. ISBN: 978-90-74821-94-0
60 Volume 2 of the Proceedings of the joint 12th International Conference on Methods and Techniques in Behavioral Research and 6th
Seminar on Behavioral Methods held online, May 18-20, 2022. www.measuringbehavior.org. Editors: Andrew Spink, Jarosław
Barski, Anne-Marie Brouwer, Gernot Riedel, & Annesha Sil (2022). DOI 10.6084/m9.figshare.20066849. ISBN: 978-90-74821-94-0
Collaborative learning interactions among university students in face-to-face and
online meetings during the COVID-19 pandemic: An observational study
H.Q. Chim1, Mirjam G.A. oude Egbrink2, Diana H.J.M. Dolmans3, Renate H.M. de Groot4, Pascal W.M. Van
Gerven5, Gudberg K. Jonsson6, & Hans H.C.M. Savelberg7
1 Department of Nutrition and Movement Sciences, School of Health Professions Education (SHE), Faculty of Health,
Medicine and Life Sciences (FHML), Maastricht University, the Netherlands; [email protected]
2 Department of Physiology, SHE, FHML, Maastricht University, the Netherlands;
3 Department of Educational Development and Research, SHE, FHML, Maastricht University, the Netherlands;
4 Faculty of Educational Sciences, Open University of the Netherlands, the Netherlands; [email protected]
5 Department of Educational Development and Research, SHE, FHML, Maastricht University, the Netherlands;
6 Human Behavior Laboratory, University of Iceland, Reykjavik, Iceland; [email protected]
7 Department of Nutrition and Movement Sciences, SHE, NUTRIM, FHML, Maastricht University, the Netherlands;
Abstract
The COVID-19 outbreak was classified as a pandemic in March 2020, making most higher education institutions
move to online education by April 2020. This study explores patterns in interactions among university students,
guided by a tutor, as they perform collaborative learning in online and face-to-face tutorial meetings. Observations
were made in tutorial meetings that occurred in May 2018 (online), May 2020 (face-to-face), and May 2021 (face-
to-face), where the same academic topic was discussed between students. All interactions in collaborative learning
classrooms were audio-recorded, transcribed, and coded as a type of learning- or non-learning-oriented interaction.
Unlike traditional ways of measuring interactions through sums and averages, we bring in a promising method –
T-pattern detection and analysis to identify recurring patterns in interactions that arise in these tutorial meetings.
T-patterns are sequences of events that occur repeatedly, not necessarily consecutively, but within in a specific
timeframe. With T-patterns, common interaction patterns in the tutorial classroom will be detected to inform
educators of the types and patterns of interactions that occurred in online and face-to-face tutorial meetings.
Furthermore, this study will demonstrate the value of T-patterns when analyzing interactions in a tutorial
classroom, which will bring research forward in better understanding the dynamic, nuanced, and frequent changes
in interactions between students, guided by their tutor, in a collaborative learning setting.
Introduction
As of 11 March 2020, the World Health Organization declared the Coronavirus disease 2019 (COVID-19)
outbreak as a pandemic1. By April 2020, a global survey of 424 higher education institutions reported that 67% of
the institutions switched to remote education, while 31% had educational activities suspended or cancelled2. For
those who accelerated their adoption of more online components, face-to-face classroom discussions were moved
to video-conferencing meetings. The decision to move online was based on safety precautions, rather than
didactical reasoning. This leaves a gap for research: how are online and face-to-face tutorial meetings different in
terms of the interactions that occur when students learn collaboratively?
61 Volume 2 of the Proceedings of the joint 12th International Conference on Methods and Techniques in Behavioral Research and 6th
Seminar on Behavioral Methods held online, May 18-20, 2022. www.measuringbehavior.org. Editors: Andrew Spink, Jarosław
Barski, Anne-Marie Brouwer, Gernot Riedel, & Annesha Sil (2022). DOI 10.6084/m9.figshare.20066849. ISBN: 978-90-74821-94-0
Interactions between students are especially relevant for problem-based learning (PBL), an instructional model
where students learn through guided problem solving3. In PBL, students interact with each other as they learn
collaboratively to solve a problem4. Interestingly, a recent study reported that women attending PBL online had
better exam grades than their peers who attended PBL face-to-face, but no difference was found in men5. Yet, the
researchers neither studied the interactions that occurred in PBL, nor did they explore other potential explanations
for the higher grade. The current study takes on the endeavor of exploring interactions used by students in online
and face-to-face collaborative learning settings.
As experienced during the pandemic, interactions in online meetings tend to be different when compared to a face-
to-face setting. In online meetings, interactions sued in collaborative learning between students tend to stay on-
task6,7 (i.e., focused on the academic topic). Cognitive exchanges are made, such as asking questions, building on
each other’s reasonings, and discussing disagreements8, in order to achieve individual and shared learning goals9.
By doing so, the students exchange learning-oriented interactions, indicative of in-depth learning, as opposed to
off-task and procedural interactions8. However, by staying on-task in online meetings, personal topics of
conversation, jokes, and other off-task interactions are dropped from the conversation. Students get straight to the
point, reporting their findings quickly and concisely, shortening online meetings so to minimize “Zoom fatigue”10.
This may lead to two outcomes. One, that students do not take the time to discuss details and each other’s
understanding of the topic. And two, that students do not take time to socialize, which is crucial for their academic
and social integration as they form their identities as new professionals. The lack of socializing may be why online
meetings tend to bring about feelings of social isolation among students11. A review on collaborative learning
highlight how researchers tend to focus on cognitive interactions, neglecting the social dialogue inherent in our
human exchanges12. Should we find that online meetings lead to less social interactions, then educators can take
the lead in initiating more connections with and between students.
Methods for analyzing learning-oriented interactions in the past were to make comparisons based on the sums and
averages of duration spent on the interaction types8. However, sums and averages reduce the available information
to a simple data point that can be meaningless when it comes to the dynamic, nuanced, and frequent changes in
human-to-human interactions. Therefore, T-pattern detection and analysis has been proposed as a method that
sheds light on recurring patterns in behavior13. T-patterns are pairs of events that occur within a specific time
interval, as opposed to random events, which occur by chance. This is illustrated in Figure 1, where the bottom-
most (black) string of 25 raw events occurs across time – blue (AB)C and green ((DE)(FG)) T-patterns are
detected14.
T-patterns provide a detailed account of the interplay of behaviors. For example, a previous study reported that
teachers engaged in behaviors that were 84% motivating and 16% demotivating for students, whereas students
spent 81% of their lesson time being positively engaged and 19% being negatively engaged15. Although these
findings are interesting, T-patterns enabled the researchers to bring in a crucial dimension. Using T-patterns, they
found that motivating teaching behaviors were followed by students’ positive engagement, especially with the use
of autonomy-supportive questions and positive feedback. Interestingly, a combination of motivating and
demotivating behaviors can also lead to positive engagement (e.g., teacher asking interrogative questions that
exercise control, followed by an autonomy-supportive question, which then led to the students asking questions
out of sheer interest)15. Hence, T-patterns allow for structural exploration, detecting significant patterns that could
have been hidden in the sums and averages of coded behaviors.
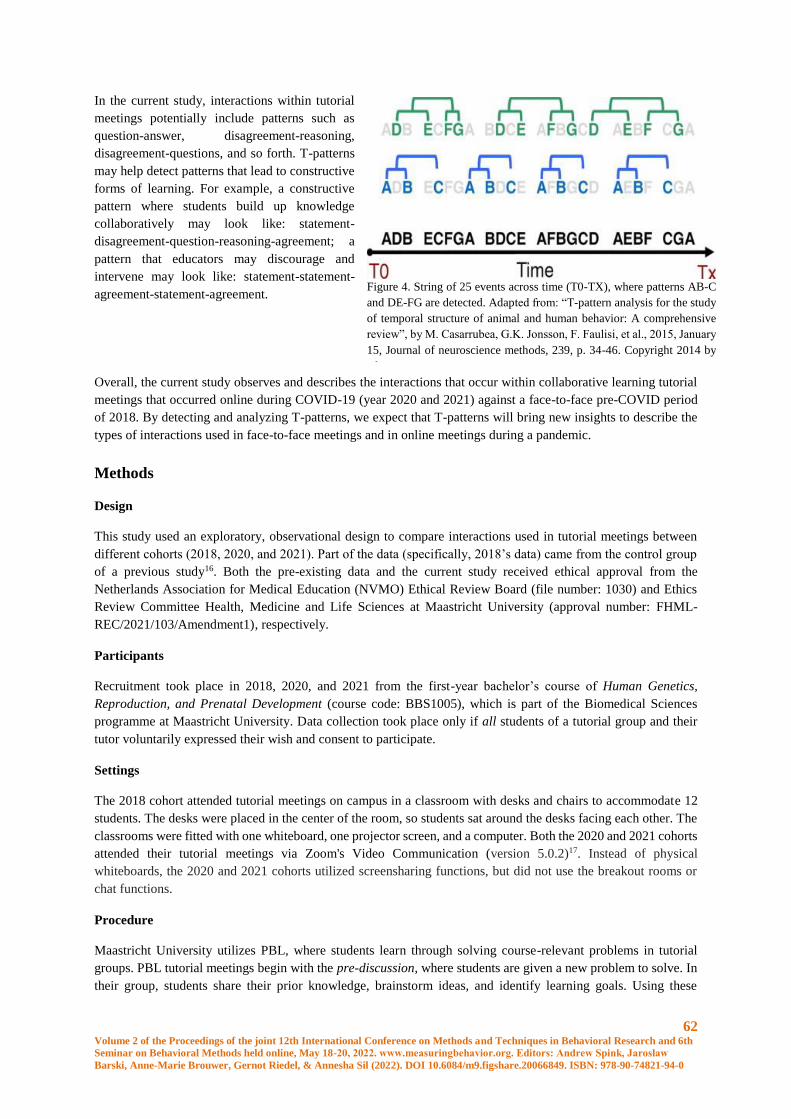
62 Volume 2 of the Proceedings of the joint 12th International Conference on Methods and Techniques in Behavioral Research and 6th
Seminar on Behavioral Methods held online, May 18-20, 2022. www.measuringbehavior.org. Editors: Andrew Spink, Jarosław
Barski, Anne-Marie Brouwer, Gernot Riedel, & Annesha Sil (2022). DOI 10.6084/m9.figshare.20066849. ISBN: 978-90-74821-94-0
In the current study, interactions within tutorial
meetings potentially include patterns such as
question-answer, disagreement-reasoning,
disagreement-questions, and so forth. T-patterns
may help detect patterns that lead to constructive
forms of learning. For example, a constructive
pattern where students build up knowledge
collaboratively may look like: statement-
disagreement-question-reasoning-agreement; a
pattern that educators may discourage and
intervene may look like: statement-statement-
agreement-statement-agreement.
Overall, the current study observes and describes the interactions that occur within collaborative learning tutorial
meetings that occurred online during COVID-19 (year 2020 and 2021) against a face-to-face pre-COVID period
of 2018. By detecting and analyzing T-patterns, we expect that T-patterns will bring new insights to describe the
types of interactions used in face-to-face meetings and in online meetings during a pandemic.
Methods
Design
This study used an exploratory, observational design to compare interactions used in tutorial meetings between
different cohorts (2018, 2020, and 2021). Part of the data (specifically, 2018’s data) came from the control group
of a previous study16. Both the pre-existing data and the current study received ethical approval from the
Netherlands Association for Medical Education (NVMO) Ethical Review Board (file number: 1030) and Ethics
Review Committee Health, Medicine and Life Sciences at Maastricht University (approval number: FHML-
REC/2021/103/Amendment1), respectively.
Participants
Recruitment took place in 2018, 2020, and 2021 from the first-year bachelor’s course of Human Genetics,
Reproduction, and Prenatal Development (course code: BBS1005), which is part of the Biomedical Sciences
programme at Maastricht University. Data collection took place only if all students of a tutorial group and their
tutor voluntarily expressed their wish and consent to participate.
Settings
The 2018 cohort attended tutorial meetings on campus in a classroom with desks and chairs to accommodate 12
students. The desks were placed in the center of the room, so students sat around the desks facing each other. The
classrooms were fitted with one whiteboard, one projector screen, and a computer. Both the 2020 and 2021 cohorts
attended their tutorial meetings via Zoom's Video Communication (version 5.0.2)17. Instead of physical
whiteboards, the 2020 and 2021 cohorts utilized screensharing functions, but did not use the breakout rooms or
chat functions.
Procedure
Maastricht University utilizes PBL, where students learn through solving course-relevant problems in tutorial
groups. PBL tutorial meetings begin with the pre-discussion, where students are given a new problem to solve. In
their group, students share their prior knowledge, brainstorm ideas, and identify learning goals. Using these
Figure 4. String of 25 events across time (T0-TX), where patterns AB-C
and DE-FG are detected. Adapted from: “T-pattern analysis for the study
of temporal structure of animal and human behavior: A comprehensive
review”, by M. Casarrubea, G.K. Jonsson, F. Faulisi, et al., 2015, January
15, Journal of neuroscience methods, 239, p. 34-46. Copyright 2014 by
Elsevier B.V.
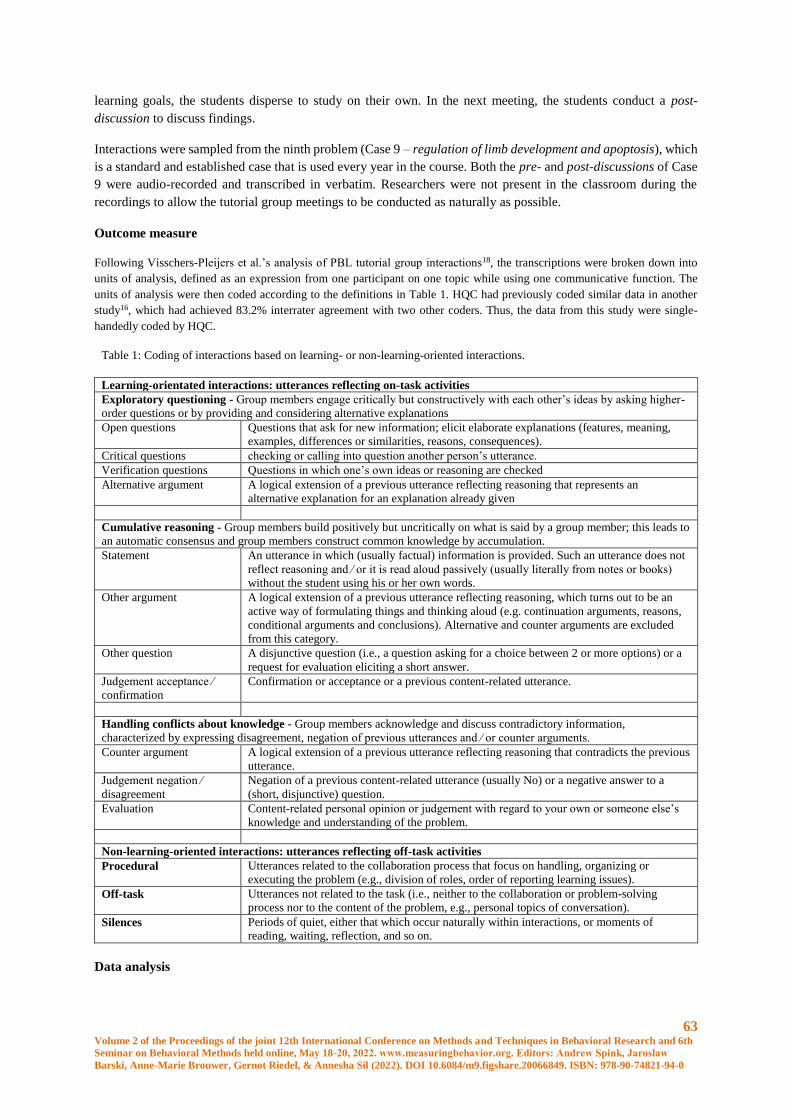
63 Volume 2 of the Proceedings of the joint 12th International Conference on Methods and Techniques in Behavioral Research and 6th
Seminar on Behavioral Methods held online, May 18-20, 2022. www.measuringbehavior.org. Editors: Andrew Spink, Jarosław
Barski, Anne-Marie Brouwer, Gernot Riedel, & Annesha Sil (2022). DOI 10.6084/m9.figshare.20066849. ISBN: 978-90-74821-94-0
learning goals, the students disperse to study on their own. In the next meeting, the students conduct a post-
discussion to discuss findings.
Interactions were sampled from the ninth problem (Case 9 – regulation of limb development and apoptosis), which
is a standard and established case that is used every year in the course. Both the pre- and post-discussions of Case
9 were audio-recorded and transcribed in verbatim. Researchers were not present in the classroom during the
recordings to allow the tutorial group meetings to be conducted as naturally as possible.
Outcome measure
Following Visschers-Pleijers et al.’s analysis of PBL tutorial group interactions18, the transcriptions were broken down into
units of analysis, defined as an expression from one participant on one topic while using one communicative function. The
units of analysis were then coded according to the definitions in Table 1. HQC had previously coded similar data in another
study16, which had achieved 83.2% interrater agreement with two other coders. Thus, the data from this study were single-
handedly coded by HQC.
Table 1: Coding of interactions based on learning- or non-learning-oriented interactions.
Learning-orientated interactions: utterances reflecting on-task activities
Exploratory questioning - Group members engage critically but constructively with each other’s ideas by asking higher-
order questions or by providing and considering alternative explanations
Open questions Questions that ask for new information; elicit elaborate explanations (features, meaning,
examples, differences or similarities, reasons, consequences).
Critical questions checking or calling into question another person’s utterance.
Verification questions Questions in which one’s own ideas or reasoning are checked
Alternative argument A logical extension of a previous utterance reflecting reasoning that represents an
alternative explanation for an explanation already given
Cumulative reasoning - Group members build positively but uncritically on what is said by a group member; this leads to
an automatic consensus and group members construct common knowledge by accumulation.
Statement An utterance in which (usually factual) information is provided. Such an utterance does not
reflect reasoning and ⁄ or it is read aloud passively (usually literally from notes or books)
without the student using his or her own words.
Other argument A logical extension of a previous utterance reflecting reasoning, which turns out to be an
active way of formulating things and thinking aloud (e.g. continuation arguments, reasons,
conditional arguments and conclusions). Alternative and counter arguments are excluded
from this category.
Other question A disjunctive question (i.e., a question asking for a choice between 2 or more options) or a
request for evaluation eliciting a short answer.
Judgement acceptance ⁄
confirmation
Confirmation or acceptance or a previous content-related utterance.
Handling conflicts about knowledge - Group members acknowledge and discuss contradictory information,
characterized by expressing disagreement, negation of previous utterances and ⁄ or counter arguments.
Counter argument A logical extension of a previous utterance reflecting reasoning that contradicts the previous
utterance.
Judgement negation ⁄
disagreement
Negation of a previous content-related utterance (usually No) or a negative answer to a
(short, disjunctive) question.
Evaluation Content-related personal opinion or judgement with regard to your own or someone else’s
knowledge and understanding of the problem.
Non-learning-oriented interactions: utterances reflecting off-task activities
Procedural Utterances related to the collaboration process that focus on handling, organizing or
executing the problem (e.g., division of roles, order of reporting learning issues).
Off-task Utterances not related to the task (i.e., neither to the collaboration or problem-solving
process nor to the content of the problem, e.g., personal topics of conversation).
Silences Periods of quiet, either that which occur naturally within interactions, or moments of
reading, waiting, reflection, and so on.
Data analysis
64 Volume 2 of the Proceedings of the joint 12th International Conference on Methods and Techniques in Behavioral Research and 6th
Seminar on Behavioral Methods held online, May 18-20, 2022. www.measuringbehavior.org. Editors: Andrew Spink, Jarosław
Barski, Anne-Marie Brouwer, Gernot Riedel, & Annesha Sil (2022). DOI 10.6084/m9.figshare.20066849. ISBN: 978-90-74821-94-0
We used the software Theme (version 7, Pattern Vision Ltd.)19 for the detection of interactional patterns between
students and tutors in tutorial meetings. Theme detects patterns across time, or T-patterns, defined as sets of events
that take place regularly across the students’ interactions, in the same arrangement and within significantly
invariant time intervals13. Theme detects critical time intervals bottom-up, starting from pairs of events (i.e.,
interaction types). Two events are significantly related to each other when the occurrences of the first event (A)
are followed by the second event (B) more often that would be expected by chance (p < .001, in the current study),
within the detected critical time interval. Should a pattern AB be identified, this AB pattern can also be related to
event C, so that ((AB) C) is discovered. The bottom-up search takes place continuously until no other significant
relationships between events are found. In the end, T-patterns can be visualized as a hierarchical tree of significant
binary relationships between events13.
Before the pattern identification procedure, we separated the pre- and post-discussions data, as the types of
interactions that occurred in the pre-discussion (brainstorming and identifying learning goals) were different from
those of the post-discussion (discussing solutions to problems). Then, the pre- and post-discussions were separately
concatenated according to the years 2018, 2020, and 2021.
The following search parameters were used. Significance level was set to .001. Patterns had to occur within
100% of the samples within a group, which meant that patterns had to occur within all tutorial meetings of the year
for it to be detected. To remove noise, lumping factor of 0.90 was selected (which means that if in 90% of its
occurrences A is significantly associated with B, they were considered jointly) and event types that occurred more
than 2.5 standard deviations from the mean frequency were excluded. Pattern selection was conducted by setting
pattern length of three or more events (where (AB)C is a T-pattern of three events). This is the smallest meaningful
length, as detection of two events will capture the beginning and ending of the same occurrence (e.g., beginning
and ending of sentences).
The demographical information of the sample was summarized using means (M), standard deviations (SD),
and sample size (n). To check that tutorial meetings of the same group were similar, the detected patterns were
visually checked.
Expected Results and Discussion
The results of this study are expected to shed light on what goes on in face-to-face meetings pre-pandemic and
online meetings during a pandemic as students interact with each other in collaborative learning setting. T-patterns
are expected to provide a detailed description of the nuances within online and face-to-face meetings.
Online meetings are expected to stay on-task, aligning with previous studies6,7. In contrast, face-to-face meetings
are likely to have durations in off-task conversations. Online meetings are anticipated to be shorter to counteract
“Zoom fatigue”10. Furthermore, silences are likely to occur more in online meetings, because fluent exchanges are
assumed to be disrupted by the lack of social cues (e.g., one-to-one eye contact).
T-patterns that occurred within the online and face-to-face meetings will be detected, as students discuss the
academic problem under the guidance of a tutor. The T-patterns will consist of student-student patterns and
student-tutor patterns. The exchanges between the students and tutors will be interesting, as it may be possible to
detect what happens after a tutor interrupts the students’ discussion. For example, should tutor probing encourage
in-depth discussions of the academic topic, then tutors would be informed to provide more probing. However, it
is also possible that if tutors take on the role of providing information, then student discussions become stagnant
as they take on a more passive role of listening to the tutor. Therefore, the results of this study has the potential to
inform tutors of how to support students in their interactions when learning collaboratively.
The strength of this study is that it describes interactions that occurred around the same academic topic across both
the online and face-to-face settings, thus minimizing extraneous variables. Although it is not a randomized,
controlled trial, observing what goes on in each setting will give researchers and educators an idea of how to further
support collaborative learning exchanges in both settings. Nonetheless, the study was conducted in an emergency
period as most higher education institutions rushed to move education online. This limited the number of
participating tutorial groups, hence limiting the available data.

65 Volume 2 of the Proceedings of the joint 12th International Conference on Methods and Techniques in Behavioral Research and 6th
Seminar on Behavioral Methods held online, May 18-20, 2022. www.measuringbehavior.org. Editors: Andrew Spink, Jarosław
Barski, Anne-Marie Brouwer, Gernot Riedel, & Annesha Sil (2022). DOI 10.6084/m9.figshare.20066849. ISBN: 978-90-74821-94-0
Overall, the results of this study will provide an observational account of what goes on in face-to-face meetings
during pre-pandemic times and online meetings during a pandemic. The study will also use a promising
methodology, T-patterns, to uncover the nuances in interactions that occur in the exchanges that students have
within a collaborative learning setting.
References
1. Cucinotta, D., Vanelli, M. (2020). WHO declares COVID-19 a pandemic. Acta Biomed 91(1):157-160.
doi:10.23750/ABM.V91I1.9397
2. Marinoni, G., Van’t Land, H., Jensen, T. (2020). The Impact of Covid-19 on higher education around the
World - IAU Global Survey Report.
3. Hmelo-Silver, C.E. (2004). Problem-based learning: What and how do students learn? Educational
psychology review 16(3), 235-266. doi: 10.1023/B:EDPR.0000034022.16470.f3
4. Dolmans, D.H.J.M., De Grave, W., Wolfhagen, I.H.A.P., Van Der Vleuten, C.P.M. (2005). Problem-
based learning: Future challenges for educational practice and research. Med Educ 39(7):732-741.
doi:10.1111/j.1365-2929.2005.02205.x
5. Elzainy, A., El Sadik, A., Al Abdulmonem, W. (2020). Experience of e-learning and online assessment
during the COVID-19 pandemic at the College of Medicine, Qassim University. J Taibah Univ Med Sci 15(6):456-
462. doi:10.1016/j.jtumed.2020.09.005
6. Lantz, A. (2001). Meetings in a distributed group of experts: Comparing face-to-face, chat and
collaborative virtual environments. Behaviour & Information Technology 20(2):111-117.
doi:10.1080/01449290010020693
7. Jonassen, D.H., Kwon, H. (2001). Communication patterns in computer mediated versus face-to-face
group problem solving. Educ Technol Res Dev. 49(1):35-51. doi:10.1007/BF02504505
8. Dolmans, D.H.J.M. (2019). How theory and design-based research can mature PBL practice and research.
Adv Heal Sci Educ 24(5):879-891. doi:10.1007/s10459-019-09940-2
9. Strijbos, J.W. (2016). Assessment of collaborative learning. In: Brown GTL, Harris LR, eds. Handbook
of Human and Social Conditions in Assessment. Routledge, 302-318.
10. Bailenson, J.N. (2021). Nonverbal Overload: A Theoretical Argument for the Causes of Zoom Fatigue.
Technol Mind, Behav 2(1). doi:10.1037/TMB0000030
11. Rasheed, R.A., Kamsin, A., Abdullah, N.A. (2020). Challenges in the online component of blended
learning: A systematic review. Comput Educ 144. doi:10.1016/j.compedu.2019.103701
12. Kreijns, K., Kirschner, P.A., Jochems, W. (2003). Identifying the pitfalls for social interaction in
computer-supported collaborative learning environments: a review of the research. Comput Human Behav
19(3):335-353. doi:10.1016/S0747-5632(02)00057-2
13. Magnusson, M.S. (2000). Discovering hidden time patterns in behavior: T-patterns and their detection.
Behav Res Methods, Instruments, Comput 32(1):93-110. doi:10.3758/BF03200792
14. Casarrubea, M., Jonsson, G.K., Faulisi, F., et al. (2015). T-pattern analysis for the study of temporal
structure of animal and human behavior: A comprehensive review. J Neurosci Methods 239:34-46.
doi:10.1016/J.JNEUMETH.2014.09.024

66 Volume 2 of the Proceedings of the joint 12th International Conference on Methods and Techniques in Behavioral Research and 6th
Seminar on Behavioral Methods held online, May 18-20, 2022. www.measuringbehavior.org. Editors: Andrew Spink, Jarosław
Barski, Anne-Marie Brouwer, Gernot Riedel, & Annesha Sil (2022). DOI 10.6084/m9.figshare.20066849. ISBN: 978-90-74821-94-0
15. Cents-Boonstra, M., Lichtwarck-Aschoff, A., Lara, M.M., Denessen, E. (2021). Patterns of motivating
teaching behaviour and student engagement: a microanalytic approach. Eur J Psychol Educ 1-29.
doi:10.1007/S10212-021-00543-3
16. Chim, H.Q., de Groot, R.H.M., Van Gerven, P.W.M., et al. (2021). The effects of standing in tutorial
group meetings on learning: A randomized controlled trial. Trends Neurosci Educ 24:100156.
doi:10.1016/J.TINE.2021.100156
17. Zoom’s Video Communication. Zoom Meeting [computer software], version 5.0.2. San Jose.
18. Visschers-Pleijers, A.J.S.F., Dolmans, D.H.J.M., Leng, B.A., Wolfhagen, I.H.A.P., Vleuten, C.P.M.
(2006). Analysis of verbal interactions in tutorial groups: a process study. Med Educ 40(2):129-137.
doi:10.1111/j.1365-2929.2005.02368.x
19. Pattern Vision. Theme [computer software], version 7, Reykjavik. Available at:
https://patternvision.com/products/theme/
67 Volume 2 of the Proceedings of the joint 12th International Conference on Methods and Techniques in Behavioral Research and 6th
Seminar on Behavioral Methods held online, May 18-20, 2022. www.measuringbehavior.org. Editors: Andrew Spink, Jarosław
Barski, Anne-Marie Brouwer, Gernot Riedel, & Annesha Sil (2022). DOI 10.6084/m9.figshare.20066849. ISBN: 978-90-74821-94-0
Session Theme: Sensors and multi-modal
measurements
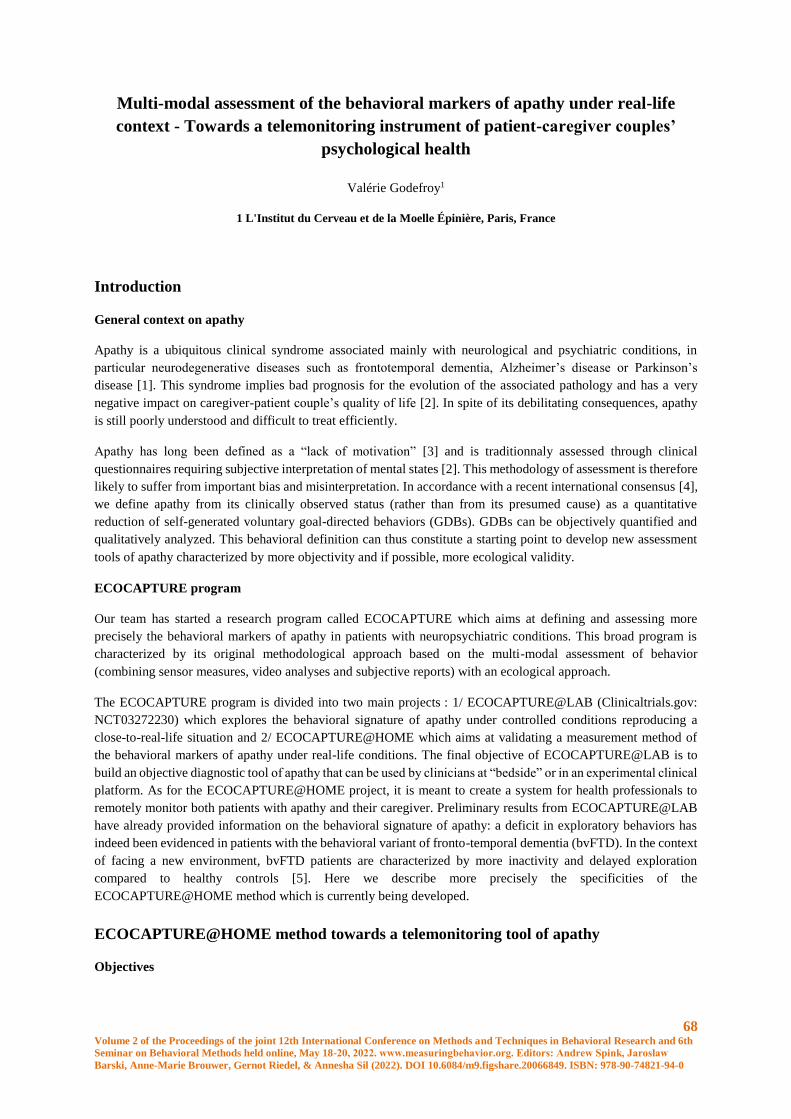
68 Volume 2 of the Proceedings of the joint 12th International Conference on Methods and Techniques in Behavioral Research and 6th
Seminar on Behavioral Methods held online, May 18-20, 2022. www.measuringbehavior.org. Editors: Andrew Spink, Jarosław
Barski, Anne-Marie Brouwer, Gernot Riedel, & Annesha Sil (2022). DOI 10.6084/m9.figshare.20066849. ISBN: 978-90-74821-94-0
Multi-modal assessment of the behavioral markers of apathy under real-life
context - Towards a telemonitoring instrument of patient-caregiver couples’
psychological health
Valérie Godefroy1
1 L'Institut du Cerveau et de la Moelle Épinière, Paris, France
Introduction
General context on apathy
Apathy is a ubiquitous clinical syndrome associated mainly with neurological and psychiatric conditions, in
particular neurodegenerative diseases such as frontotemporal dementia, Alzheimer’s disease or Parkinson’s
disease [1]. This syndrome implies bad prognosis for the evolution of the associated pathology and has a very
negative impact on caregiver-patient couple’s quality of life [2]. In spite of its debilitating consequences, apathy
is still poorly understood and difficult to treat efficiently.
Apathy has long been defined as a “lack of motivation” [3] and is traditionnaly assessed through clinical
questionnaires requiring subjective interpretation of mental states [2]. This methodology of assessment is therefore
likely to suffer from important bias and misinterpretation. In accordance with a recent international consensus [4],
we define apathy from its clinically observed status (rather than from its presumed cause) as a quantitative
reduction of self-generated voluntary goal-directed behaviors (GDBs). GDBs can be objectively quantified and
qualitatively analyzed. This behavioral definition can thus constitute a starting point to develop new assessment
tools of apathy characterized by more objectivity and if possible, more ecological validity.
ECOCAPTURE program
Our team has started a research program called ECOCAPTURE which aims at defining and assessing more
precisely the behavioral markers of apathy in patients with neuropsychiatric conditions. This broad program is
characterized by its original methodological approach based on the multi-modal assessment of behavior
(combining sensor measures, video analyses and subjective reports) with an ecological approach.
The ECOCAPTURE program is divided into two main projects : 1/ ECOCAPTURE@LAB (Clinicaltrials.gov:
NCT03272230) which explores the behavioral signature of apathy under controlled conditions reproducing a
close-to-real-life situation and 2/ ECOCAPTURE@HOME which aims at validating a measurement method of
the behavioral markers of apathy under real-life conditions. The final objective of ECOCAPTURE@LAB is to
build an objective diagnostic tool of apathy that can be used by clinicians at “bedside” or in an experimental clinical
platform. As for the ECOCAPTURE@HOME project, it is meant to create a system for health professionals to
remotely monitor both patients with apathy and their caregiver. Preliminary results from ECOCAPTURE@LAB
have already provided information on the behavioral signature of apathy: a deficit in exploratory behaviors has
indeed been evidenced in patients with the behavioral variant of fronto-temporal dementia (bvFTD). In the context
of facing a new environment, bvFTD patients are characterized by more inactivity and delayed exploration
compared to healthy controls [5]. Here we describe more precisely the specificities of the
ECOCAPTURE@HOME method which is currently being developed.
ECOCAPTURE@HOME method towards a telemonitoring tool of apathy
Objectives
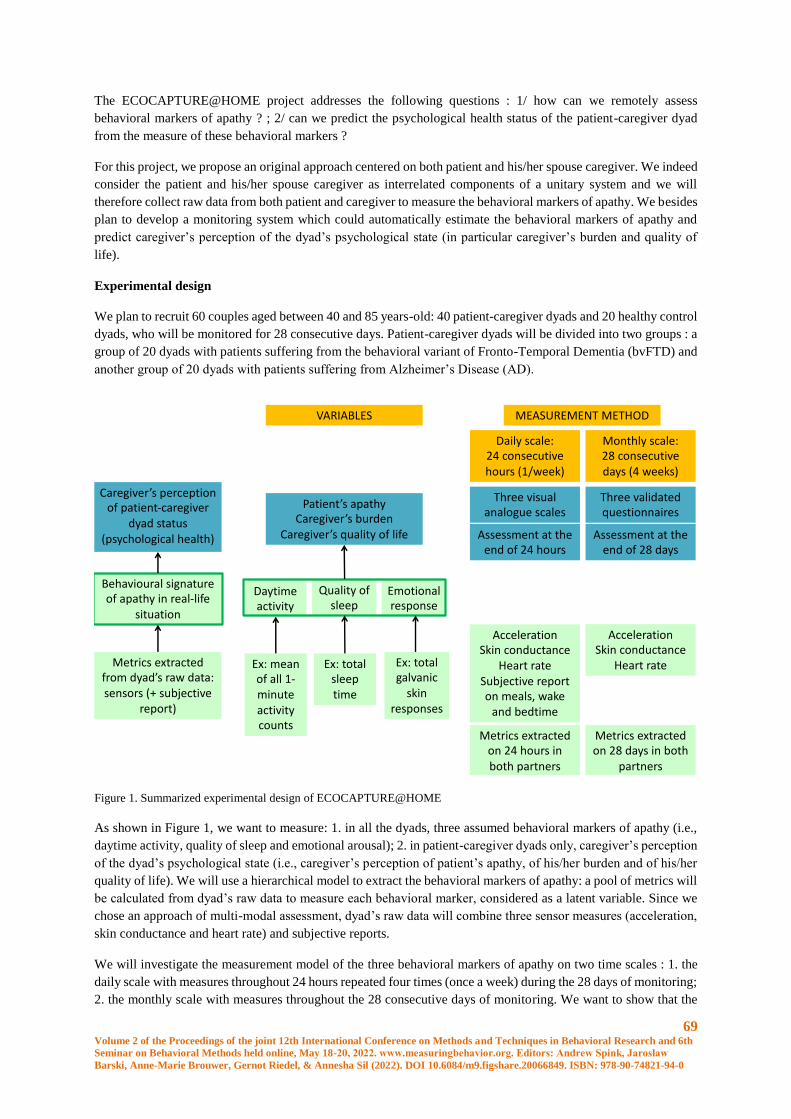
69 Volume 2 of the Proceedings of the joint 12th International Conference on Methods and Techniques in Behavioral Research and 6th
Seminar on Behavioral Methods held online, May 18-20, 2022. www.measuringbehavior.org. Editors: Andrew Spink, Jarosław
Barski, Anne-Marie Brouwer, Gernot Riedel, & Annesha Sil (2022). DOI 10.6084/m9.figshare.20066849. ISBN: 978-90-74821-94-0
The ECOCAPTURE@HOME project addresses the following questions : 1/ how can we remotely assess
behavioral markers of apathy ? ; 2/ can we predict the psychological health status of the patient-caregiver dyad
from the measure of these behavioral markers ?
For this project, we propose an original approach centered on both patient and his/her spouse caregiver. We indeed
consider the patient and his/her spouse caregiver as interrelated components of a unitary system and we will
therefore collect raw data from both patient and caregiver to measure the behavioral markers of apathy. We besides
plan to develop a monitoring system which could automatically estimate the behavioral markers of apathy and
predict caregiver’s perception of the dyad’s psychological state (in particular caregiver’s burden and quality of
life).
Experimental design
We plan to recruit 60 couples aged between 40 and 85 years-old: 40 patient-caregiver dyads and 20 healthy control
dyads, who will be monitored for 28 consecutive days. Patient-caregiver dyads will be divided into two groups : a
group of 20 dyads with patients suffering from the behavioral variant of Fronto-Temporal Dementia (bvFTD) and
another group of 20 dyads with patients suffering from Alzheimer’s Disease (AD).
Figure 1. Summarized experimental design of ECOCAPTURE@HOME
As shown in Figure 1, we want to measure: 1. in all the dyads, three assumed behavioral markers of apathy (i.e.,
daytime activity, quality of sleep and emotional arousal); 2. in patient-caregiver dyads only, caregiver’s perception
of the dyad’s psychological state (i.e., caregiver’s perception of patient’s apathy, of his/her burden and of his/her
quality of life). We will use a hierarchical model to extract the behavioral markers of apathy: a pool of metrics will
be calculated from dyad’s raw data to measure each behavioral marker, considered as a latent variable. Since we
chose an approach of multi-modal assessment, dyad’s raw data will combine three sensor measures (acceleration,
skin conductance and heart rate) and subjective reports.
We will investigate the measurement model of the three behavioral markers of apathy on two time scales : 1. the
daily scale with measures throughout 24 hours repeated four times (once a week) during the 28 days of monitoring;
2. the monthly scale with measures throughout the 28 consecutive days of monitoring. We want to show that the
Caregiver’s perception of patient-caregiver
dyad status(psychological health)
Behavioural signature of apathy in real-life
situation
Metrics extractedfrom dyad’s raw data: sensors (+ subjective
report)
Patient’s apathyCaregiver’s burden
Caregiver’s quality of life
Daytimeactivity
Quality of sleep
Emotionalresponse
VARIABLES MEASUREMENT METHOD
Daily scale: 24 consecutivehours (1/week)
Monthly scale: 28 consecutivedays (4 weeks)
Three visualanalogue scales
Three validatedquestionnaires
AccelerationSkin conductance
Heart rateSubjective report on meals, wake
and bedtime
AccelerationSkin conductance
Heart rate
Assessment at the end of 24 hours
Assessment at the end of 28 days
Metrics extractedon 24 hours in both partners
Metrics extractedon 28 days in both
partners
Ex: meanof all 1-minute activitycounts
Ex: total sleeptime
Ex: total galvanic
skin responses
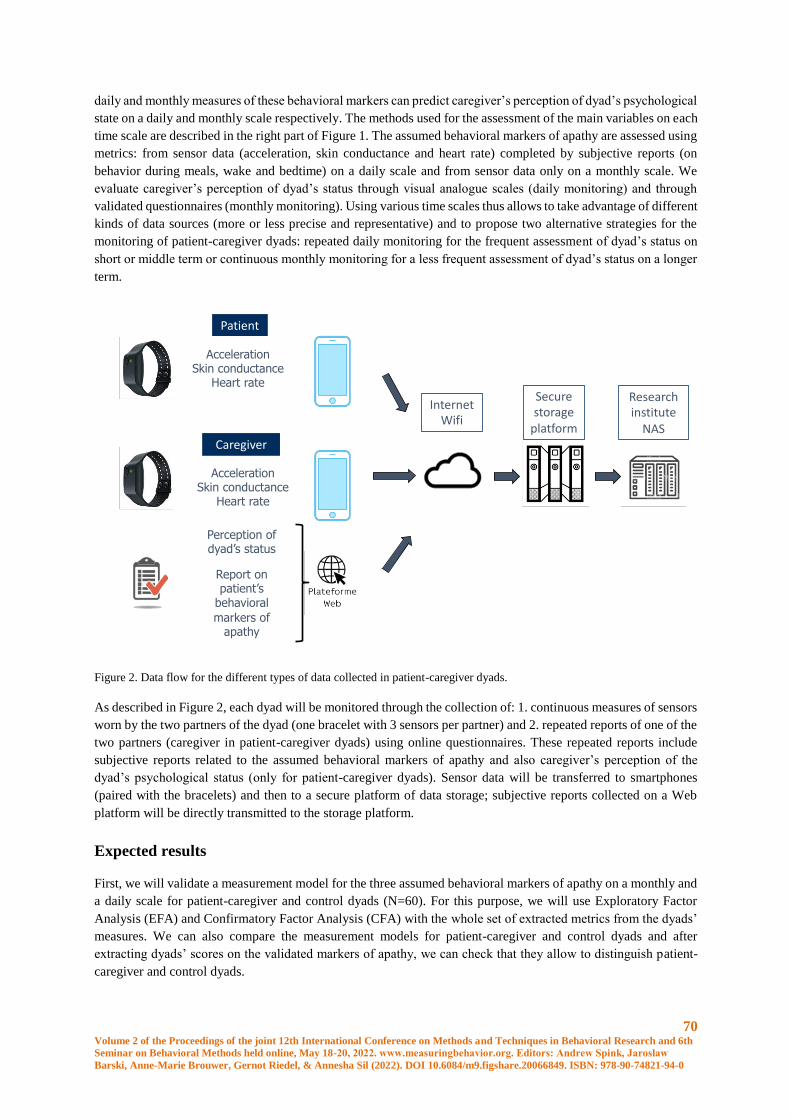
70 Volume 2 of the Proceedings of the joint 12th International Conference on Methods and Techniques in Behavioral Research and 6th
Seminar on Behavioral Methods held online, May 18-20, 2022. www.measuringbehavior.org. Editors: Andrew Spink, Jarosław
Barski, Anne-Marie Brouwer, Gernot Riedel, & Annesha Sil (2022). DOI 10.6084/m9.figshare.20066849. ISBN: 978-90-74821-94-0
daily and monthly measures of these behavioral markers can predict caregiver’s perception of dyad’s psychological
state on a daily and monthly scale respectively. The methods used for the assessment of the main variables on each
time scale are described in the right part of Figure 1. The assumed behavioral markers of apathy are assessed using
metrics: from sensor data (acceleration, skin conductance and heart rate) completed by subjective reports (on
behavior during meals, wake and bedtime) on a daily scale and from sensor data only on a monthly scale. We
evaluate caregiver’s perception of dyad’s status through visual analogue scales (daily monitoring) and through
validated questionnaires (monthly monitoring). Using various time scales thus allows to take advantage of different
kinds of data sources (more or less precise and representative) and to propose two alternative strategies for the
monitoring of patient-caregiver dyads: repeated daily monitoring for the frequent assessment of dyad’s status on
short or middle term or continuous monthly monitoring for a less frequent assessment of dyad’s status on a longer
term.
Figure 2. Data flow for the different types of data collected in patient-caregiver dyads.
As described in Figure 2, each dyad will be monitored through the collection of: 1. continuous measures of sensors
worn by the two partners of the dyad (one bracelet with 3 sensors per partner) and 2. repeated reports of one of the
two partners (caregiver in patient-caregiver dyads) using online questionnaires. These repeated reports include
subjective reports related to the assumed behavioral markers of apathy and also caregiver’s perception of the
dyad’s psychological status (only for patient-caregiver dyads). Sensor data will be transferred to smartphones
(paired with the bracelets) and then to a secure platform of data storage; subjective reports collected on a Web
platform will be directly transmitted to the storage platform.
Expected results
First, we will validate a measurement model for the three assumed behavioral markers of apathy on a monthly and
a daily scale for patient-caregiver and control dyads (N=60). For this purpose, we will use Exploratory Factor
Analysis (EFA) and Confirmatory Factor Analysis (CFA) with the whole set of extracted metrics from the dyads’
measures. We can also compare the measurement models for patient-caregiver and control dyads and after
extracting dyads’ scores on the validated markers of apathy, we can check that they allow to distinguish patient-
caregiver and control dyads.
Patient
Caregiver
AccelerationSkin conductance
Heart rate
Report on patient’s
behavioral
markers of apathy
AccelerationSkin conductance
Heart rate
Perception of dyad’s status
Securestorage
platform
Researchinstitute
NAS
Internet Wifi
71 Volume 2 of the Proceedings of the joint 12th International Conference on Methods and Techniques in Behavioral Research and 6th
Seminar on Behavioral Methods held online, May 18-20, 2022. www.measuringbehavior.org. Editors: Andrew Spink, Jarosław
Barski, Anne-Marie Brouwer, Gernot Riedel, & Annesha Sil (2022). DOI 10.6084/m9.figshare.20066849. ISBN: 978-90-74821-94-0
Secondly, we will demonstrate that patient-caregiver dyad’s scores on the three behavioral markers of apathy can
predict caregiver’s perception of the dyad’s psychological state. On the monthly scale, we can use simple linear
models and on the daily scale, since we have four repeated measures for each dyad, we will use linear mixed
models (to take account of the variability of the model of prediction from one dyad to the other). Confounding
variables such as patients’ and caregivers’ age will be added to the models.
Conclusion and perspectives
Despite some limitations in the process of measurement validation through the described method, this project
carries great potential to improve both patients’ care and caregivers’ social support. One can in particular discuss
the choice of the capacity to predict caregiver’s perception of the dyad’s psychological state as a criterion to
validate our measurement model of apathy. However we are confident that a good model is a useful one: in the
end, we judge the validity of our measurement model on the basis of its utility in the process of designing a
monitoring system for patient-caregiver couples. Such a system could present several interesting applications for
clinicians and in particular neurologists. It could for instance be used to: 1. precise apathy behavioral profile and
adapt treatment accordingly; 2. remotely check the evolution of dyads’ psychological status and prevent risky
situations (e.g., caregiver’s burn-out); 3. test real-time effects of therapeutic interventions targeting apathy which
would be implemented under real-life settings.
References
1. Robert, P. H., Clairet, S., Benoit, M., Koutaich, J., Bertogliati, C., Tible, O., ... & Bedoucha (2002) The
apathy inventory: assessment of apathy and awareness in Alzheimer’s disease, Parkinson’s disease and mild
cognitive impairment. International journal of geriatric psychiatry 17, 1099–1105
2. Levy R (2012) Apathy: A pathology of goal-directed behavior. A new concept of the clinic and
pathophysiology of apathy. Revue Neurologique 168, 585–597. https://doi.org/10.1016/j.neurol.2012.05.003
3. Marin RS (1991) Apathy: a neuropsychiatric syndrome. The Journal of neuropsychiatry and clinical
neurosciences
4. Robert, P., Lanctôt, K.L., Agüera-Ortiz, L., Aalten, P., Bremond, F., Defrancesco, M., Hanon, C., David, R.,
Dubois, B., Dujardin, K., Husain, M., König, A., Levy, R., Mantua, V., Meulien, D., Miller, D., Moebius,
H.J., Rasmussen, J., Robert, G., Ruthirakuhan, M., Stella, F., Yesavage, J., Zeghari, R., Manera, V. (2018)
Is it time to revise the diagnostic criteria for apathy in brain disorders? The 2018 international consensus
group. European Psychiatry 54, 71–76. https://doi.org/10.1016/j.eurpsy.2018.07.008
5. Batrancourt BM, Lecouturier K, Ferrand-Verdejo J, et al (2019) Exploration deficits under ecological
conditions as a marker of apathy in frontotemporal dementia. Frontiers in neurology 10, 941
72 Volume 2 of the Proceedings of the joint 12th International Conference on Methods and Techniques in Behavioral Research and 6th
Seminar on Behavioral Methods held online, May 18-20, 2022. www.measuringbehavior.org. Editors: Andrew Spink, Jarosław
Barski, Anne-Marie Brouwer, Gernot Riedel, & Annesha Sil (2022). DOI 10.6084/m9.figshare.20066849. ISBN: 978-90-74821-94-0
Quantifying Interactions between Physiological Signals to Identify Exposure to
Different Chemicals
J.U. van Baardewijk1, S. Agarwal1,2, A.S. Cornelissen3, C. Varon2, R.C. Hendriks2, J. Kentrop3, M.J.A. Joosen3,
A.-M. Brouwer1
1 Department Human Performance, The Netherlands Organisation for Applied Scientific Research (TNO),
Soesterberg, The Netherlands. [email protected]; [email protected]
2 Circuits and Systems (CAS) Group, Delft University of Technology, Delft, The Netherlands.
[email protected]; [email protected]; [email protected]
3 Department CBRN Protection, The Netherlands Organisation for Applied Scientific Research (TNO), Rijswijk, The
Netherlands. [email protected]; [email protected]; [email protected]
Abstract
Early detection of exposure to a toxic can be life-saving. We previously found that continuously recorded
physiology in guinea pigs can be used for early detection of exposure to an opioid (fentanyl) or a nerve agent (VX),
as well as for differentiating between the two. Here, we investigate how exposure to different chemicals affect the
relation between ECG and respiration parameters as determined by Granger causality. Features reflecting such
interactions may provide additional information and improve models differentiating between chemical agents. We
found that all examined ECG and respiration parameters are Granger-related under healthy conditions, and that
exposure to fentanyl and VX led to changes in these relations. Importantly, we found a difference between Granger
causality features between exposure to fentanyl versus VX, where fentanyl shows less coherence between
respiration parameters than VX, and VX shows less coherence in ECG parameters than fentanyl. Classification
analysis shows that the combination of traditional and Granger causality features performs slightly better than
traditional features alone. Future research will examine whether, and if so, which, Granger causality features are
more robust across variation in species and movement conditions to enhance methods for early and automatic
detection of exposure to toxics.
Introduction
Early detection of exposure to a toxic chemical in a military, industrial, or civilian context, can be life-saving. We
previously demonstrated that continuously measured electroencephalography (EEG), electrocardiography (ECG)
and respiration in guinea pigs can be used for early detection of exposure to an opioid (fentanyl) or a nerve agent
(VX), as well as for differentiating between the two. Machine learning models for exposure detection performed
very well using only features from respiration and ECG; for models for differentiation, EEG features were most
important [1].
Here, we investigate how exposure to different chemicals affect the relation between the different ECG and
respiration features as determined by Granger causality. Features reflecting such interactions may provide
additional information and allow good performance of models differentiating between chemical agents without
requiring EEG, which is relatively difficult to measure in real life situations.
Under normal physiological conditions, the various biological systems of the body exhibit oscillatory patterns due
to underlying feedback and feedforward mechanisms. For instance, heart rate is well-known to be regulated by
many such mechanisms. In healthy people, successive beats do not occur at a constant rhythm, instead, the (R-R)
intervals show considerable variability. The largest contributor to this heart rate variability (HRV) is respiratory
sinus arrhythmia (RSA). The heart rate increases with inspiration and decreases with expiration, a mechanism by
which the body optimizes pulmonary gas exchange [2,3]. RSA is thought to be regulated mainly by central
mechanisms [4]. Various pathological conditions have been linked to changes in HRV, such as congestive heart
failure, diabetes, and depression [5–8]. Even though the precise mechanisms of HRV remain poorly understood,
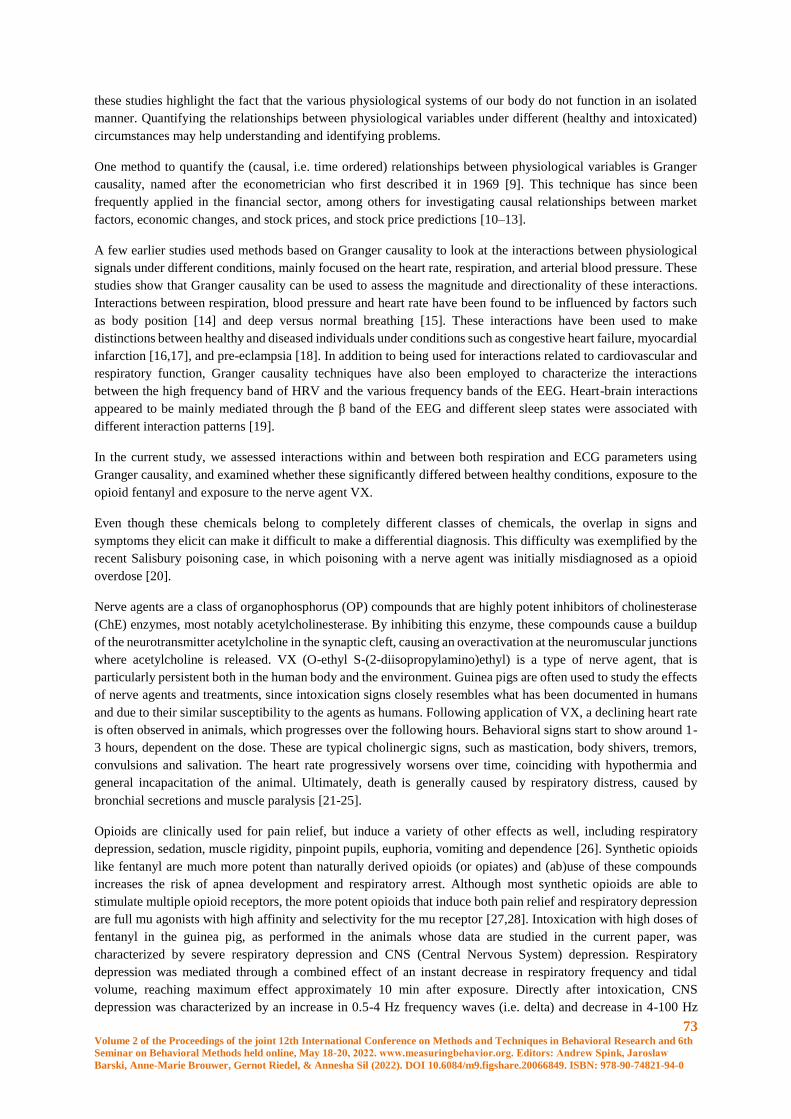
73 Volume 2 of the Proceedings of the joint 12th International Conference on Methods and Techniques in Behavioral Research and 6th
Seminar on Behavioral Methods held online, May 18-20, 2022. www.measuringbehavior.org. Editors: Andrew Spink, Jarosław
Barski, Anne-Marie Brouwer, Gernot Riedel, & Annesha Sil (2022). DOI 10.6084/m9.figshare.20066849. ISBN: 978-90-74821-94-0
these studies highlight the fact that the various physiological systems of our body do not function in an isolated
manner. Quantifying the relationships between physiological variables under different (healthy and intoxicated)
circumstances may help understanding and identifying problems.
One method to quantify the (causal, i.e. time ordered) relationships between physiological variables is Granger
causality, named after the econometrician who first described it in 1969 [9]. This technique has since been
frequently applied in the financial sector, among others for investigating causal relationships between market
factors, economic changes, and stock prices, and stock price predictions [10–13].
A few earlier studies used methods based on Granger causality to look at the interactions between physiological
signals under different conditions, mainly focused on the heart rate, respiration, and arterial blood pressure. These
studies show that Granger causality can be used to assess the magnitude and directionality of these interactions.
Interactions between respiration, blood pressure and heart rate have been found to be influenced by factors such
as body position [14] and deep versus normal breathing [15]. These interactions have been used to make
distinctions between healthy and diseased individuals under conditions such as congestive heart failure, myocardial
infarction [16,17], and pre-eclampsia [18]. In addition to being used for interactions related to cardiovascular and
respiratory function, Granger causality techniques have also been employed to characterize the interactions
between the high frequency band of HRV and the various frequency bands of the EEG. Heart-brain interactions
appeared to be mainly mediated through the β band of the EEG and different sleep states were associated with
different interaction patterns [19].
In the current study, we assessed interactions within and between both respiration and ECG parameters using
Granger causality, and examined whether these significantly differed between healthy conditions, exposure to the
opioid fentanyl and exposure to the nerve agent VX.
Even though these chemicals belong to completely different classes of chemicals, the overlap in signs and
symptoms they elicit can make it difficult to make a differential diagnosis. This difficulty was exemplified by the
recent Salisbury poisoning case, in which poisoning with a nerve agent was initially misdiagnosed as a opioid
overdose [20].
Nerve agents are a class of organophosphorus (OP) compounds that are highly potent inhibitors of cholinesterase
(ChE) enzymes, most notably acetylcholinesterase. By inhibiting this enzyme, these compounds cause a buildup
of the neurotransmitter acetylcholine in the synaptic cleft, causing an overactivation at the neuromuscular junctions
where acetylcholine is released. VX (O-ethyl S-(2-diisopropylamino)ethyl) is a type of nerve agent, that is
particularly persistent both in the human body and the environment. Guinea pigs are often used to study the effects
of nerve agents and treatments, since intoxication signs closely resembles what has been documented in humans
and due to their similar susceptibility to the agents as humans. Following application of VX, a declining heart rate
is often observed in animals, which progresses over the following hours. Behavioral signs start to show around 1-
3 hours, dependent on the dose. These are typical cholinergic signs, such as mastication, body shivers, tremors,
convulsions and salivation. The heart rate progressively worsens over time, coinciding with hypothermia and
general incapacitation of the animal. Ultimately, death is generally caused by respiratory distress, caused by
bronchial secretions and muscle paralysis [21-25].
Opioids are clinically used for pain relief, but induce a variety of other effects as well, including respiratory
depression, sedation, muscle rigidity, pinpoint pupils, euphoria, vomiting and dependence [26]. Synthetic opioids
like fentanyl are much more potent than naturally derived opioids (or opiates) and (ab)use of these compounds
increases the risk of apnea development and respiratory arrest. Although most synthetic opioids are able to
stimulate multiple opioid receptors, the more potent opioids that induce both pain relief and respiratory depression
are full mu agonists with high affinity and selectivity for the mu receptor [27,28]. Intoxication with high doses of
fentanyl in the guinea pig, as performed in the animals whose data are studied in the current paper, was
characterized by severe respiratory depression and CNS (Central Nervous System) depression. Respiratory
depression was mediated through a combined effect of an instant decrease in respiratory frequency and tidal
volume, reaching maximum effect approximately 10 min after exposure. Directly after intoxication, CNS
depression was characterized by an increase in 0.5-4 Hz frequency waves (i.e. delta) and decrease in 4-100 Hz
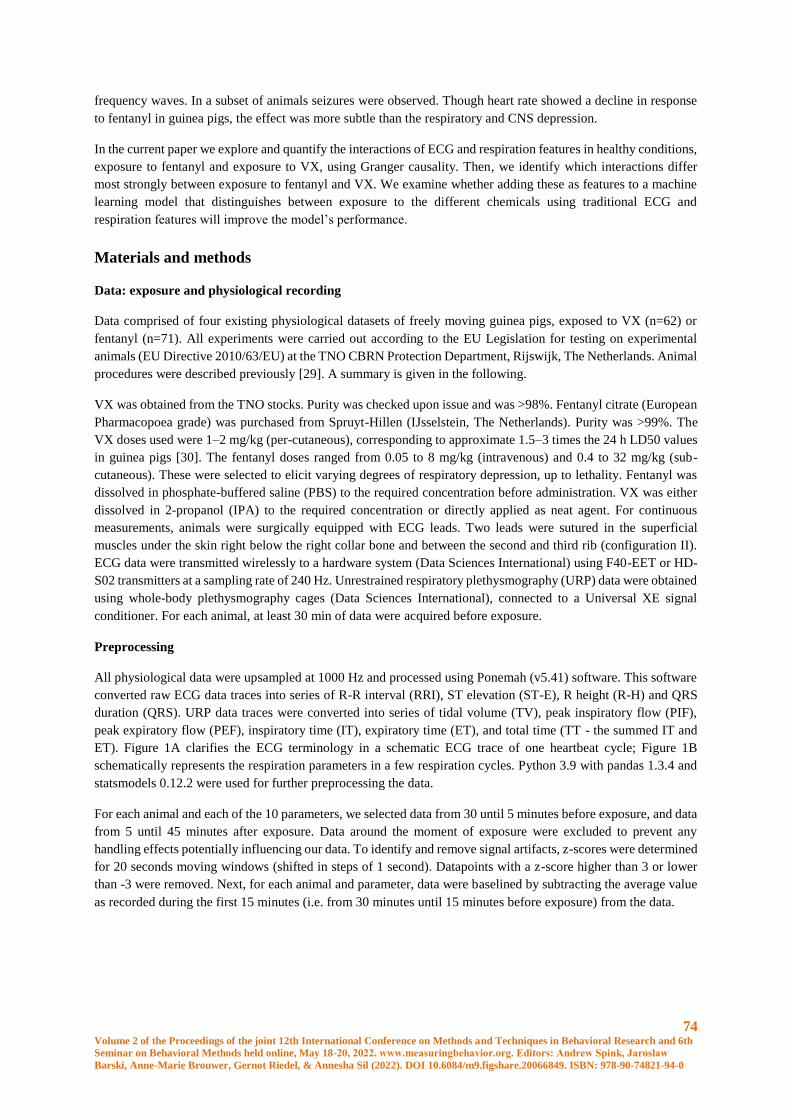
74 Volume 2 of the Proceedings of the joint 12th International Conference on Methods and Techniques in Behavioral Research and 6th
Seminar on Behavioral Methods held online, May 18-20, 2022. www.measuringbehavior.org. Editors: Andrew Spink, Jarosław
Barski, Anne-Marie Brouwer, Gernot Riedel, & Annesha Sil (2022). DOI 10.6084/m9.figshare.20066849. ISBN: 978-90-74821-94-0
frequency waves. In a subset of animals seizures were observed. Though heart rate showed a decline in response
to fentanyl in guinea pigs, the effect was more subtle than the respiratory and CNS depression.
In the current paper we explore and quantify the interactions of ECG and respiration features in healthy conditions,
exposure to fentanyl and exposure to VX, using Granger causality. Then, we identify which interactions differ
most strongly between exposure to fentanyl and VX. We examine whether adding these as features to a machine
learning model that distinguishes between exposure to the different chemicals using traditional ECG and
respiration features will improve the model’s performance.
Materials and methods
Data: exposure and physiological recording
Data comprised of four existing physiological datasets of freely moving guinea pigs, exposed to VX (n=62) or
fentanyl (n=71). All experiments were carried out according to the EU Legislation for testing on experimental
animals (EU Directive 2010/63/EU) at the TNO CBRN Protection Department, Rijswijk, The Netherlands. Animal
procedures were described previously [29]. A summary is given in the following.
VX was obtained from the TNO stocks. Purity was checked upon issue and was >98%. Fentanyl citrate (European
Pharmacopoea grade) was purchased from Spruyt-Hillen (IJsselstein, The Netherlands). Purity was >99%. The
VX doses used were 1–2 mg/kg (per-cutaneous), corresponding to approximate 1.5–3 times the 24 h LD50 values
in guinea pigs [30]. The fentanyl doses ranged from 0.05 to 8 mg/kg (intravenous) and 0.4 to 32 mg/kg (sub-
cutaneous). These were selected to elicit varying degrees of respiratory depression, up to lethality. Fentanyl was
dissolved in phosphate-buffered saline (PBS) to the required concentration before administration. VX was either
dissolved in 2-propanol (IPA) to the required concentration or directly applied as neat agent. For continuous
measurements, animals were surgically equipped with ECG leads. Two leads were sutured in the superficial
muscles under the skin right below the right collar bone and between the second and third rib (configuration II).
ECG data were transmitted wirelessly to a hardware system (Data Sciences International) using F40-EET or HD-
S02 transmitters at a sampling rate of 240 Hz. Unrestrained respiratory plethysmography (URP) data were obtained
using whole-body plethysmography cages (Data Sciences International), connected to a Universal XE signal
conditioner. For each animal, at least 30 min of data were acquired before exposure.
Preprocessing
All physiological data were upsampled at 1000 Hz and processed using Ponemah (v5.41) software. This software
converted raw ECG data traces into series of R-R interval (RRI), ST elevation (ST-E), R height (R-H) and QRS
duration (QRS). URP data traces were converted into series of tidal volume (TV), peak inspiratory flow (PIF),
peak expiratory flow (PEF), inspiratory time (IT), expiratory time (ET), and total time (TT - the summed IT and
ET). Figure 1A clarifies the ECG terminology in a schematic ECG trace of one heartbeat cycle; Figure 1B
schematically represents the respiration parameters in a few respiration cycles. Python 3.9 with pandas 1.3.4 and
statsmodels 0.12.2 were used for further preprocessing the data.
For each animal and each of the 10 parameters, we selected data from 30 until 5 minutes before exposure, and data
from 5 until 45 minutes after exposure. Data around the moment of exposure were excluded to prevent any
handling effects potentially influencing our data. To identify and remove signal artifacts, z-scores were determined
for 20 seconds moving windows (shifted in steps of 1 second). Datapoints with a z-score higher than 3 or lower
than -3 were removed. Next, for each animal and parameter, data were baselined by subtracting the average value
as recorded during the first 15 minutes (i.e. from 30 minutes until 15 minutes before exposure) from the data.
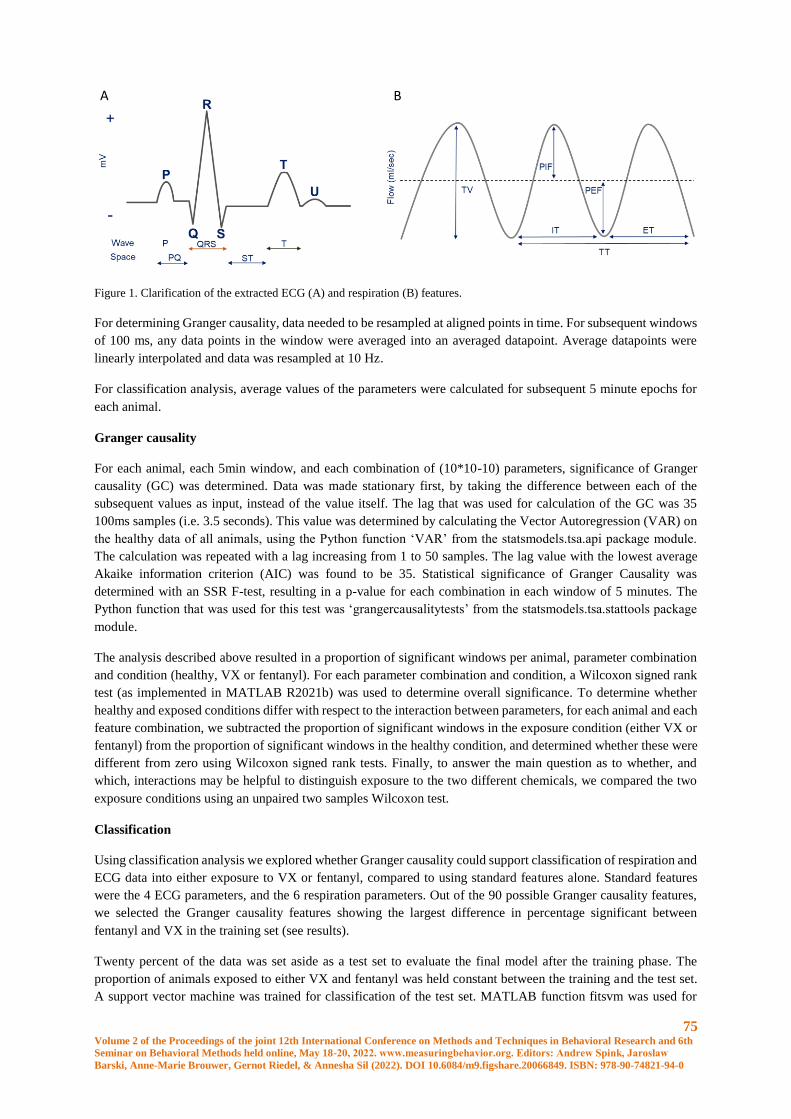
75 Volume 2 of the Proceedings of the joint 12th International Conference on Methods and Techniques in Behavioral Research and 6th
Seminar on Behavioral Methods held online, May 18-20, 2022. www.measuringbehavior.org. Editors: Andrew Spink, Jarosław
Barski, Anne-Marie Brouwer, Gernot Riedel, & Annesha Sil (2022). DOI 10.6084/m9.figshare.20066849. ISBN: 978-90-74821-94-0
Figure 1. Clarification of the extracted ECG (A) and respiration (B) features.
For determining Granger causality, data needed to be resampled at aligned points in time. For subsequent windows
of 100 ms, any data points in the window were averaged into an averaged datapoint. Average datapoints were
linearly interpolated and data was resampled at 10 Hz.
For classification analysis, average values of the parameters were calculated for subsequent 5 minute epochs for
each animal.
Granger causality
For each animal, each 5min window, and each combination of (10*10-10) parameters, significance of Granger
causality (GC) was determined. Data was made stationary first, by taking the difference between each of the
subsequent values as input, instead of the value itself. The lag that was used for calculation of the GC was 35
100ms samples (i.e. 3.5 seconds). This value was determined by calculating the Vector Autoregression (VAR) on
the healthy data of all animals, using the Python function ‘VAR’ from the statsmodels.tsa.api package module.
The calculation was repeated with a lag increasing from 1 to 50 samples. The lag value with the lowest average
Akaike information criterion (AIC) was found to be 35. Statistical significance of Granger Causality was
determined with an SSR F-test, resulting in a p-value for each combination in each window of 5 minutes. The
Python function that was used for this test was ‘grangercausalitytests’ from the statsmodels.tsa.stattools package
module.
The analysis described above resulted in a proportion of significant windows per animal, parameter combination
and condition (healthy, VX or fentanyl). For each parameter combination and condition, a Wilcoxon signed rank
test (as implemented in MATLAB R2021b) was used to determine overall significance. To determine whether
healthy and exposed conditions differ with respect to the interaction between parameters, for each animal and each
feature combination, we subtracted the proportion of significant windows in the exposure condition (either VX or
fentanyl) from the proportion of significant windows in the healthy condition, and determined whether these were
different from zero using Wilcoxon signed rank tests. Finally, to answer the main question as to whether, and
which, interactions may be helpful to distinguish exposure to the two different chemicals, we compared the two
exposure conditions using an unpaired two samples Wilcoxon test.
Classification
Using classification analysis we explored whether Granger causality could support classification of respiration and
ECG data into either exposure to VX or fentanyl, compared to using standard features alone. Standard features
were the 4 ECG parameters, and the 6 respiration parameters. Out of the 90 possible Granger causality features,
we selected the Granger causality features showing the largest difference in percentage significant between
fentanyl and VX in the training set (see results).
Twenty percent of the data was set aside as a test set to evaluate the final model after the training phase. The
proportion of animals exposed to either VX and fentanyl was held constant between the training and the test set.
A support vector machine was trained for classification of the test set. MATLAB function fitsvm was used for
B A

76 Volume 2 of the Proceedings of the joint 12th International Conference on Methods and Techniques in Behavioral Research and 6th
Seminar on Behavioral Methods held online, May 18-20, 2022. www.measuringbehavior.org. Editors: Andrew Spink, Jarosław
Barski, Anne-Marie Brouwer, Gernot Riedel, & Annesha Sil (2022). DOI 10.6084/m9.figshare.20066849. ISBN: 978-90-74821-94-0
training of the classifier with standardization turned on and all other parameters to default. Three models were
trained: a model trained on only the standard features, another model trained on only the Granger causality features
and a model trained on their combination. Cross-validation was applied where for each iteration one animal was
left out for validation and the model was trained on the other animals.
Results
Figures 2 through 7 present the proportions of 5min windows showing significant Granger causality for each
parameter combination, for each condition (healthy, fentanyl, VX) and their differences. Figures are ordered such
that panel A represents combinations between all ECG parameters, panel B represents ECG parameters causing
changes in respiration, panel C represents respiration causing changes in ECG, and panel D represents
combinations between all respiration parameters.
Granger causality per condition
In the healthy condition (Figure 2), all parameters are associated with one another as indicated by the size of the
discs and the finding that the proportion of intervals with significant Granger causality is significant for all
combinations. This is especially so for the intra-modal features (Figure 2A and 2D), and then especially so for
respiration features (Figure 2D). For cross-modal associations, when ECG and respiration features are examined,
the larger size of the discs in 2B than in 2C suggests that ECG is affected by breathing rather than the other way
around, which makes sense from a physiological point of view. Also for exposure to fentanyl (Figure 3) and VX
(Figure 4), all combinations are significant.
Differences in Granger causality between conditions
The difference in interactions between healthy and exposed is presented in Figure 5 (fentanyl) and 6 (VX). For
both chemicals, there is almost no difference between healthy and exposed when we examine breathing parameters
as caused by ECG (panels 5C and 6C). For the other panels, some significant differences are found, where usually,
the healthy condition shows more interactions than the exposed conditions (i.e. positive differences). The
difference seems clearest for fentanyl, and then especially when we look at panel D (intramodal breathing).
Figure 7 shows the difference between fentanyl and VX. The differences between the two chemicals are more
pronounced than between each of the chemicals and the healthy condition. All intramodal breathing associations
are stronger in VX than in fentanyl (all positive differences in panel D). Intramodal ECG shows an opposite pattern
where 6 out of 12 associations are significantly negative (panel A). Intermodal associations (panel B and C) show
a number of significant differences, mostly going in the direction of more associations in VX than fentanyl.
Classification results
Classification analysis to distinguish between VX and fentanyl exposed conditions was done using different sets
of interaction features: the top 3, 5, 7 and 10 of parameter combinations displaying the largest difference between
fentanyl and VX in the training set, i.e., the combinations of parameters resulting in the largest circles in Figure 7
(be it that Figure 7 represents all data rather than only the training set). Since including 7 features resulted in the
highest cross-validation classification accuracy (79.3%) in the training set, these were included in the model that
was performed on the test set. These features were (ordered from large to small differences, and indicated in pairs
of caused-being caused): PIF_ET; TV_ET; IT_ET; RR-I_R-H; PIF_TT; PIF_TV; TV_IT). Including 3, 5 and 10
features respectively resulted in 74.1%, 73.6 and 79.1% classification accuracy.
The final run on the test set resulted in a classification accuracy of 78.4% when only Granger causality features
were used. Classification accuracy reached when using only traditional features was 96.7% and combined with
Granger Causality features classification accuracy was 98.7%.
A B
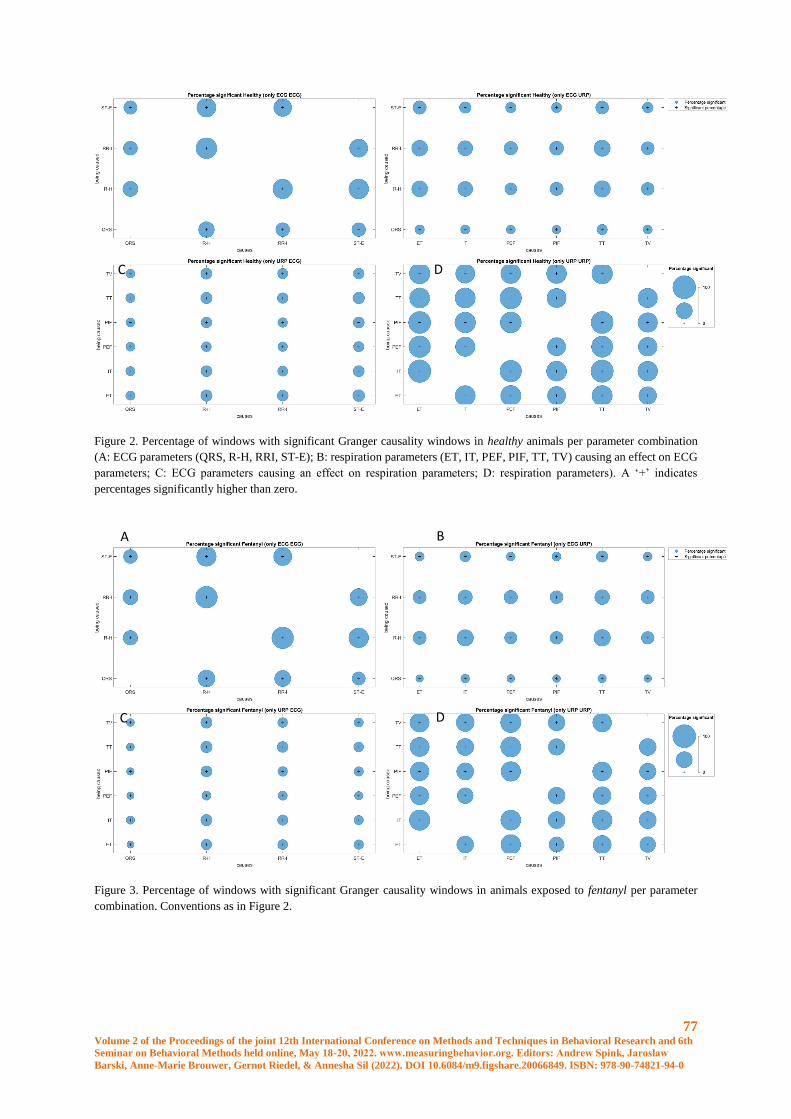
77 Volume 2 of the Proceedings of the joint 12th International Conference on Methods and Techniques in Behavioral Research and 6th
Seminar on Behavioral Methods held online, May 18-20, 2022. www.measuringbehavior.org. Editors: Andrew Spink, Jarosław
Barski, Anne-Marie Brouwer, Gernot Riedel, & Annesha Sil (2022). DOI 10.6084/m9.figshare.20066849. ISBN: 978-90-74821-94-0
Figure 2. Percentage of windows with significant Granger causality windows in healthy animals per parameter combination
(A: ECG parameters (QRS, R-H, RRI, ST-E); B: respiration parameters (ET, IT, PEF, PIF, TT, TV) causing an effect on ECG
parameters; C: ECG parameters causing an effect on respiration parameters; D: respiration parameters). A ‘+’ indicates
percentages significantly higher than zero.
Figure 3. Percentage of windows with significant Granger causality windows in animals exposed to fentanyl per parameter
combination. Conventions as in Figure 2.
C D
A
C
B
D
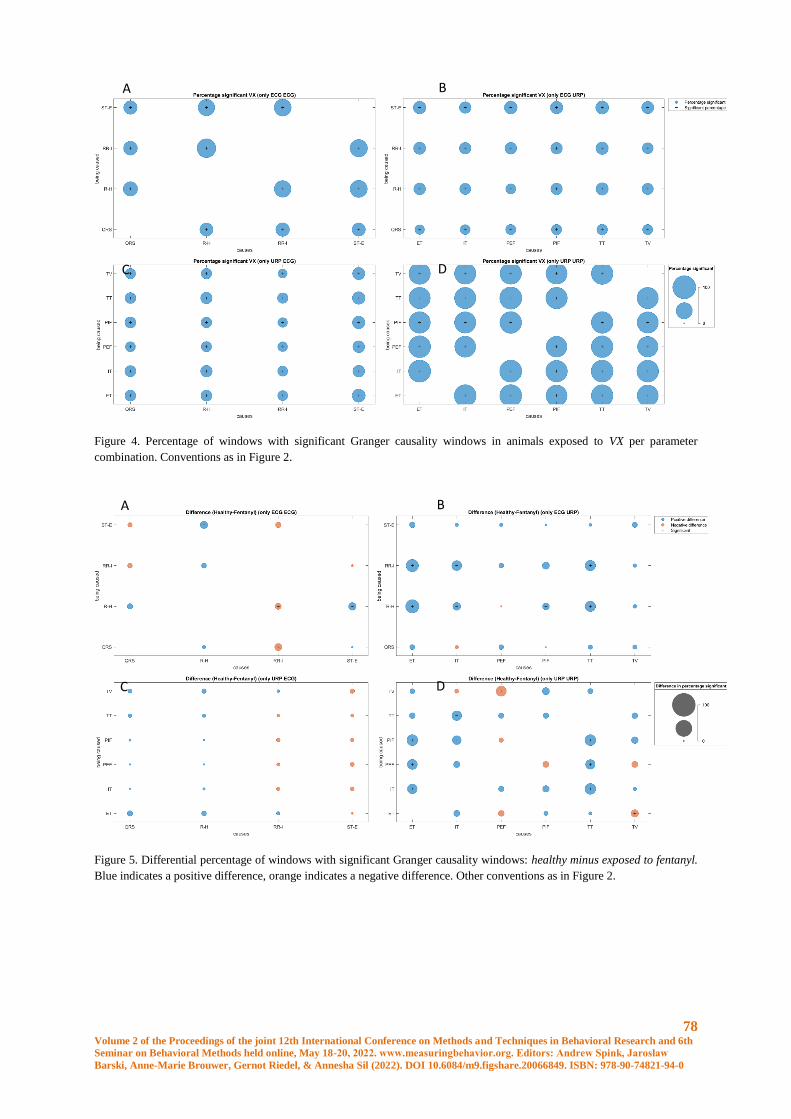
78 Volume 2 of the Proceedings of the joint 12th International Conference on Methods and Techniques in Behavioral Research and 6th
Seminar on Behavioral Methods held online, May 18-20, 2022. www.measuringbehavior.org. Editors: Andrew Spink, Jarosław
Barski, Anne-Marie Brouwer, Gernot Riedel, & Annesha Sil (2022). DOI 10.6084/m9.figshare.20066849. ISBN: 978-90-74821-94-0
Figure 4. Percentage of windows with significant Granger causality windows in animals exposed to VX per parameter
combination. Conventions as in Figure 2.
Figure 5. Differential percentage of windows with significant Granger causality windows: healthy minus exposed to fentanyl.
Blue indicates a positive difference, orange indicates a negative difference. Other conventions as in Figure 2.
A
C
B
D
A
C
B
D
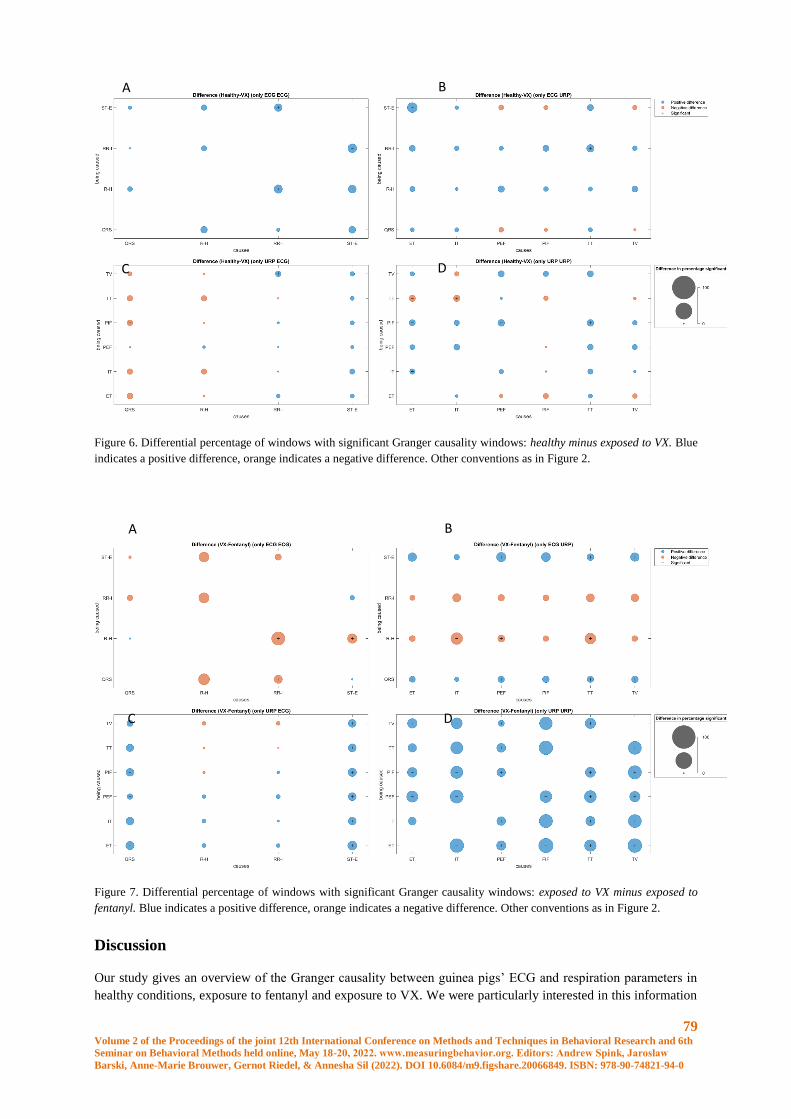
79 Volume 2 of the Proceedings of the joint 12th International Conference on Methods and Techniques in Behavioral Research and 6th
Seminar on Behavioral Methods held online, May 18-20, 2022. www.measuringbehavior.org. Editors: Andrew Spink, Jarosław
Barski, Anne-Marie Brouwer, Gernot Riedel, & Annesha Sil (2022). DOI 10.6084/m9.figshare.20066849. ISBN: 978-90-74821-94-0
Figure 6. Differential percentage of windows with significant Granger causality windows: healthy minus exposed to VX. Blue
indicates a positive difference, orange indicates a negative difference. Other conventions as in Figure 2.
Figure 7. Differential percentage of windows with significant Granger causality windows: exposed to VX minus exposed to
fentanyl. Blue indicates a positive difference, orange indicates a negative difference. Other conventions as in Figure 2.
Discussion
Our study gives an overview of the Granger causality between guinea pigs’ ECG and respiration parameters in
healthy conditions, exposure to fentanyl and exposure to VX. We were particularly interested in this information
A
C
B
D
A
C
B
D
80 Volume 2 of the Proceedings of the joint 12th International Conference on Methods and Techniques in Behavioral Research and 6th
Seminar on Behavioral Methods held online, May 18-20, 2022. www.measuringbehavior.org. Editors: Andrew Spink, Jarosław
Barski, Anne-Marie Brouwer, Gernot Riedel, & Annesha Sil (2022). DOI 10.6084/m9.figshare.20066849. ISBN: 978-90-74821-94-0
because of its potential to improve differentiation between exposure to fentanyl and VX, given that our previous
work [1] indicated that such differentiation was difficult without using EEG. We indeed found differences in
Granger causality between exposure to fentanyl and VX, where results indicated less respiration coherence after
exposure to fentanyl than to VX; and less ECG coherence after exposure to VX than fentanyl. These findings
match the symptoms as described in the introduction, where fentanyl is mostly characterized by disturbances in
respiration and VX by atypical heart rate. We found that using interaction features to classify between exposure to
fentanyl and VX was moderately successful. However, our new classification pipeline (cf. [1]) now led to a close
to ceiling classification accuracy when using only traditional features, with little room for improvement, though
adding interaction features still tended to increase performance.
While the current work did not demonstrate a large contribution of Granger causality features for the purpose of
distinguishing between exposure to different toxic chemicals, these features may add value for the purpose of
generalizing results across species and across movement conditions. Automatic and early detection of exposure to
toxic chemicals can save human lives, but studying the physiological effects of these chemicals can only be done
in animals where it is questionable how well these models generalize to humans. Also, large variations in body
movement and posture may make it hard to automatically detect and exposure to chemicals. In future work we
hope to examine how traditional as well as interaction features vary across species, movement and exposure
conditions in order to select the features that are insensitive to variations in species and movement (c.f. the
association between respiration and heart rate (RSA) being found in multiple animals [31], and no effect of
standing versus supine body orientation on the coupling between R-R variability and respiration [32]).
References
1. van Baardewijk JU, Agarwal S, Cornelissen AS, Joosen MJA, Kentrop J, Varon C, Brouwer A-M. Early
Detection of Exposure to Toxic Chemicals Using Continuously Recorded Multi-Sensor Physiology. Sensors 2021,
21, 3616
2. Goldberger AL, Goldberger ZD, Shvilkin A. Chapter 13 - Sinus and Escape Rhythms. In: Goldberger
AL, Goldberger ZD, Shvilkin A (editors) Goldberger's Clinical Electrocardiography (Eighth Edition).
Philadelphia: W.B. Saunders; 2013. p. 114–20.
3. Hayano J, Yasuma F, Okada A, Mukai S, Fujinami T. Respiratory sinus arrhythmia. A phenomenon
improving pulmonary gas exchange and circulatory efficiency. Circulation. 1996 Aug;94(4):842–7.
4. Gleb A, Pascual W, Roessler R. Respiratory variations of the heart rate - II—The central mechanism of
the respiratory arrhythmia and the inter-relations between the central and the reflex mechanisms. Proc R Soc
London Ser B - Biol Sci. 1936;119(813):218–30.
5. Wang J, Wang C. Detrended fluctuation analysis of pathological cardiac signals. J Biomed Eng. 2011
Jun;28(3):484–6.
6. Musialik-Łydka A, Sredniawa B, Pasyk S. Heart rate variability in heart failure. Kardiol Pol. 2003
Jan;58(1):10–6.
7. Hartmann R, Schmidt FM, Sander C, Hegerl U. Heart Rate Variability as Indicator of Clinical State in
Depression. Vol. 9, Frontiers in Psychiatry 2019. p. 735.
8. Young HA, Benton D. Heart-rate variability: a biomarker to study the influence of nutrition on
physiological and psychological health? Behav Pharmacol. 2018 Apr;29(2 and 3-Spec Issue):140–51.
9. Granger C. Investigating Causal Relations by Econometric Models and Cross-Spectral Methods.
Econometrica. 1969;37(3):424–38.
10. Thakkar A, Chaudhari K. Fusion in stock market prediction: A decade survey on the necessity, recent
developments, and potential future directions. Inf Fusion. 2021 Jan;65:95–107.

81 Volume 2 of the Proceedings of the joint 12th International Conference on Methods and Techniques in Behavioral Research and 6th
Seminar on Behavioral Methods held online, May 18-20, 2022. www.measuringbehavior.org. Editors: Andrew Spink, Jarosław
Barski, Anne-Marie Brouwer, Gernot Riedel, & Annesha Sil (2022). DOI 10.6084/m9.figshare.20066849. ISBN: 978-90-74821-94-0
11. Gherghina Ștefan C, Armeanu D Ștefan, Joldeș CC. Stock Market Reactions to COVID-19 Pandemic
Outbreak: Quantitative Evidence from ARDL Bounds Tests and Granger Causality Analysis. Int J Environ Res
Public Health. 2020 Sep;17(18).
12. Výrost T, Lyócsa Š, Baumöhl E. Granger causality stock market networks: Temporal proximity and
preferential attachment. Phys A Stat Mech its Appl. 2015;427:262–76.
13. Gao X, Huang S, Sun X, Hao X, An F. Modelling cointegration and Granger causality network to detect
long-term equilibrium and diffusion paths in the financial system. R Soc open Sci. 2018 Mar;5(3):172092.
14. Mary M.C. H, Singh D, Deepak KK. Assessment of Interaction Between Cardio-Respiratory Signals
Using Directed Coherence on Healthy Subjects During Postural Change. IRBM. 2019;40(3):167–73.
15. Helen Mary MC, Singh D, Deepak KK. Impact of respiration on cardiovascular coupling using Granger
causality analysis in healthy subjects. Biomed Signal Process Control. 2018;43:196–203.
16. Radovanović NN, Pavlović SU, Milašinović G, Kirćanski B, Platiša MM. Bidirectional Cardio-
Respiratory Interactions in Heart Failure. Front Physiol. 2018;9:165.
17. Nollo G, Faes L, Porta A, Pellegrini B, Ravelli F, Del Greco M, et al. Evidence of unbalanced regulatory
mechanism of heart rate and systolic pressure after acute myocardial infarction. Am J Physiol Circ Physiol. 2002
Sep 1;283(3):H1200–7.
18. Riedl M, Suhrbier A, Stepan H, Kurths J, Wessel N. Short-term couplings of the cardiovascular system
in pregnant women suffering from pre-eclampsia. Philos Trans R Soc A Math Phys Eng Sci. 2010 May
13;368(1918):2237–50.
19. Faes L, Marinazzo D, Jurysta F, Nollo G. Linear and non-linear brain-heart and brain-brain interactions
during sleep. Physiol Meas. 2015 Apr;36(4):683–98.
20. Eddleston M, Chowdhury FR. Organophosphorus poisoning: the wet opioid toxidrome. Lancet.
2020;6736(20):2020–2.
21. Mumford H, Price ME, Wetherell JR. A novel approach to assessing percutaneous VX poisoning in the
conscious guinea-pig. J Appl Toxicol. 2008 Jul;28(5):694–702.
22. Joosen MJA, van der Schans MJ, van Helden HPM. Percutaneous exposure to VX: clinical signs, effects
on brain acetylcholine levels and EEG. Neurochem Res. 2008 Feb;33(2):308–17.
23. Joosen MJA, van der Schans MJ, Kuijpers WC, van Helden HPM, Noort D. Timing of decontamination
and treatment in case of percutaneous VX poisoning: a mini review. Chem Biol Interact. 2013 Mar;203(1):149–
53.
24. Joosen MJA, van der Schans MJ, van Helden HPM. Percutaneous exposure to the nerve agent VX:
Efficacy of combined atropine, obidoxime and diazepam treatment. Chem Biol Interact. 2010;188(1).
25. Hamilton MG, Hill I, Conley J, Sawyer TW, Caneva DC, Lundy PM. Clinical Aspects of Percutaneous
Poisoning by the Chemical Warfare Agent VX: Effects of Application Site and Decontamination. Mil Med. 2004
Nov 1;169(11):856–62.
26. Al-Hasani R, Bruchas MR, Johnson AB. Molecular Mechanisms of Opioid Receptor-dependent Signaling
and Behavior. Vol. 115, Anesthesiology. 2011.
27. Pasternak GW, Pan YX. Mu opioids and their receptors: Evolution of a concept. Vol. 65, Pharmacological
Reviews. American Society for Pharmacology and Experimental Therapeutics; 2013. p. 1257–317.

82 Volume 2 of the Proceedings of the joint 12th International Conference on Methods and Techniques in Behavioral Research and 6th
Seminar on Behavioral Methods held online, May 18-20, 2022. www.measuringbehavior.org. Editors: Andrew Spink, Jarosław
Barski, Anne-Marie Brouwer, Gernot Riedel, & Annesha Sil (2022). DOI 10.6084/m9.figshare.20066849. ISBN: 978-90-74821-94-0
28. Ventura L, Carvalho F, Dinis-Oliveira RJ. Opioids in the Frame of New Psychoactive Substances
Network: A Complex Pharmacological and Toxicological Issue. Curr Mol Pharmacol. 2017;11(2):97–108.
29. Joosen MJA, van den Berg RM, de Jong AL, van der Schans MJ, Noort D, Langenberg JP. The impact
of skin decontamination on the time window for effective treatment of percutaneous VX exposure. Chem Biol
Interact. 2017 Apr;267:48–56.
30. Rice H, Dalton CH, Price ME, Graham SJ, Green AC, Jenner J, et al. Toxicity and medical
countermeasure studies on the organophosphorus nerve agents VM and VX. Proc R Soc A Math Phys Eng Sci.
2015;471(2176).
31. Bouairi E, Neff R, Evans C, Gold A, Andresen MC, Mendelowitz D. Respiratory sinus arrhythmia in
freely moving and anesthetized rats. J Appl Physiol. 2004 Oct 1;97(4):1431–6.
32. Gil E, Orini M, Bailon R, Vergara JM, Mainardi L, Laguna P. Time-varying spectral analysis for
comparison of HRV and PPG variability during tilt table test. Annu Int Conf IEEE Eng Med Biol Soc IEEE Eng
Med Biol Soc Annu Int Conf. 2010;2010:3579–82.
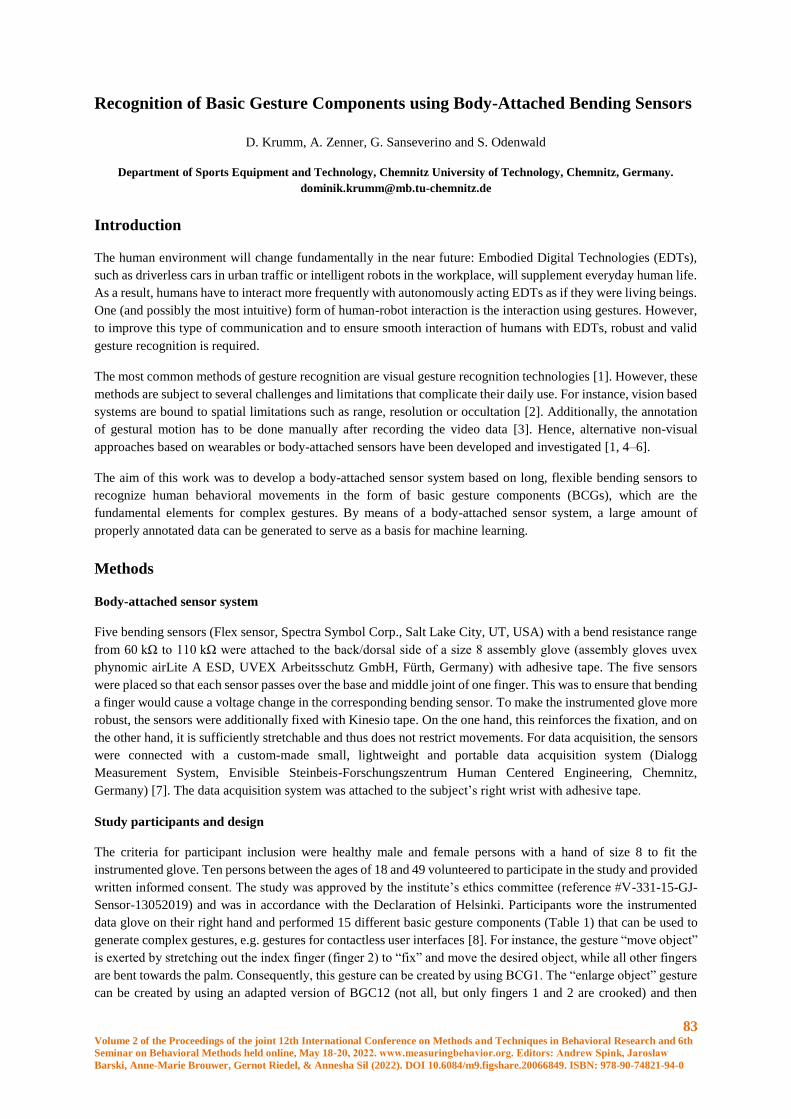
83 Volume 2 of the Proceedings of the joint 12th International Conference on Methods and Techniques in Behavioral Research and 6th
Seminar on Behavioral Methods held online, May 18-20, 2022. www.measuringbehavior.org. Editors: Andrew Spink, Jarosław
Barski, Anne-Marie Brouwer, Gernot Riedel, & Annesha Sil (2022). DOI 10.6084/m9.figshare.20066849. ISBN: 978-90-74821-94-0
Recognition of Basic Gesture Components using Body-Attached Bending Sensors
D. Krumm, A. Zenner, G. Sanseverino and S. Odenwald
Department of Sports Equipment and Technology, Chemnitz University of Technology, Chemnitz, Germany.
Introduction
The human environment will change fundamentally in the near future: Embodied Digital Technologies (EDTs),
such as driverless cars in urban traffic or intelligent robots in the workplace, will supplement everyday human life.
As a result, humans have to interact more frequently with autonomously acting EDTs as if they were living beings.
One (and possibly the most intuitive) form of human-robot interaction is the interaction using gestures. However,
to improve this type of communication and to ensure smooth interaction of humans with EDTs, robust and valid
gesture recognition is required.
The most common methods of gesture recognition are visual gesture recognition technologies [1]. However, these
methods are subject to several challenges and limitations that complicate their daily use. For instance, vision based
systems are bound to spatial limitations such as range, resolution or occultation [2]. Additionally, the annotation
of gestural motion has to be done manually after recording the video data [3]. Hence, alternative non-visual
approaches based on wearables or body-attached sensors have been developed and investigated [1, 4–6].
The aim of this work was to develop a body-attached sensor system based on long, flexible bending sensors to
recognize human behavioral movements in the form of basic gesture components (BCGs), which are the
fundamental elements for complex gestures. By means of a body-attached sensor system, a large amount of
properly annotated data can be generated to serve as a basis for machine learning.
Methods
Body-attached sensor system
Five bending sensors (Flex sensor, Spectra Symbol Corp., Salt Lake City, UT, USA) with a bend resistance range
from 60 kΩ to 110 kΩ were attached to the back/dorsal side of a size 8 assembly glove (assembly gloves uvex
phynomic airLite A ESD, UVEX Arbeitsschutz GmbH, Fürth, Germany) with adhesive tape. The five sensors
were placed so that each sensor passes over the base and middle joint of one finger. This was to ensure that bending
a finger would cause a voltage change in the corresponding bending sensor. To make the instrumented glove more
robust, the sensors were additionally fixed with Kinesio tape. On the one hand, this reinforces the fixation, and on
the other hand, it is sufficiently stretchable and thus does not restrict movements. For data acquisition, the sensors
were connected with a custom-made small, lightweight and portable data acquisition system (Dialogg
Measurement System, Envisible Steinbeis-Forschungszentrum Human Centered Engineering, Chemnitz,
Germany) [7]. The data acquisition system was attached to the subject’s right wrist with adhesive tape.
Study participants and design
The criteria for participant inclusion were healthy male and female persons with a hand of size 8 to fit the
instrumented glove. Ten persons between the ages of 18 and 49 volunteered to participate in the study and provided
written informed consent. The study was approved by the institute’s ethics committee (reference #V-331-15-GJ-
Sensor-13052019) and was in accordance with the Declaration of Helsinki. Participants wore the instrumented
data glove on their right hand and performed 15 different basic gesture components (Table 1) that can be used to
generate complex gestures, e.g. gestures for contactless user interfaces [8]. For instance, the gesture “move object”
is exerted by stretching out the index finger (finger 2) to “fix” and move the desired object, while all other fingers
are bent towards the palm. Consequently, this gesture can be created by using BCG1. The “enlarge object” gesture
can be created by using an adapted version of BGC12 (not all, but only fingers 1 and 2 are crooked) and then
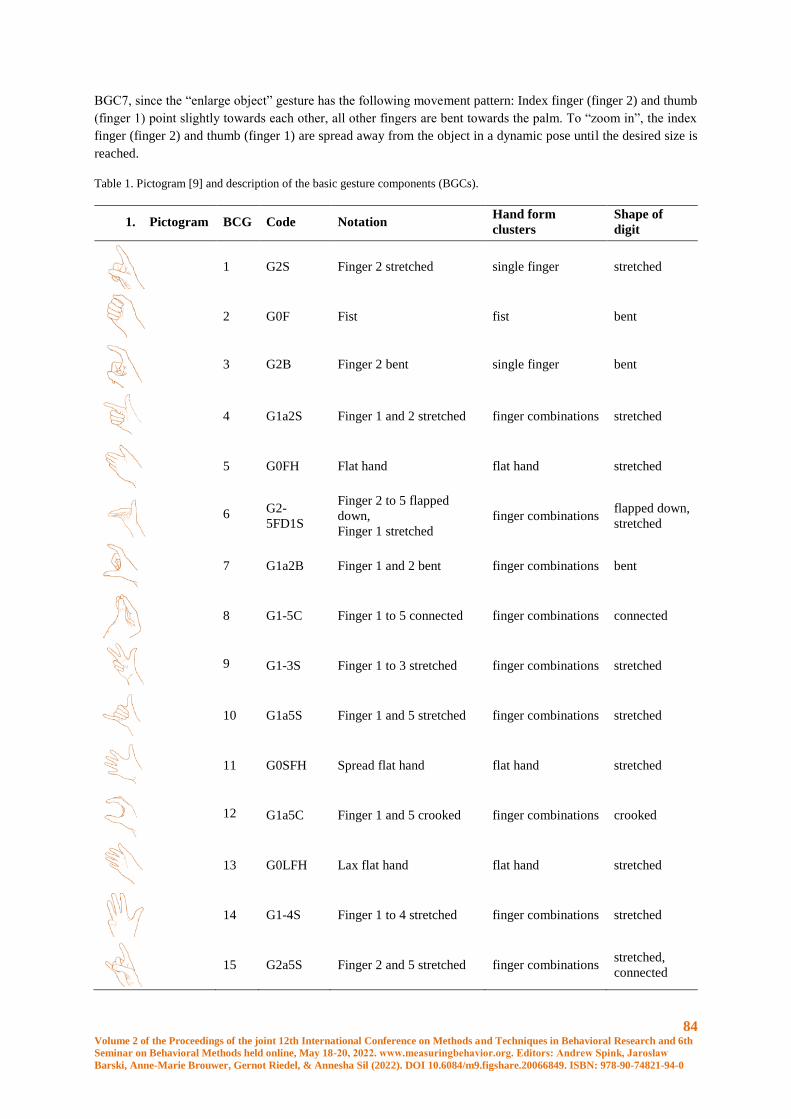
84 Volume 2 of the Proceedings of the joint 12th International Conference on Methods and Techniques in Behavioral Research and 6th
Seminar on Behavioral Methods held online, May 18-20, 2022. www.measuringbehavior.org. Editors: Andrew Spink, Jarosław
Barski, Anne-Marie Brouwer, Gernot Riedel, & Annesha Sil (2022). DOI 10.6084/m9.figshare.20066849. ISBN: 978-90-74821-94-0
BGC7, since the “enlarge object” gesture has the following movement pattern: Index finger (finger 2) and thumb
(finger 1) point slightly towards each other, all other fingers are bent towards the palm. To “zoom in”, the index
finger (finger 2) and thumb (finger 1) are spread away from the object in a dynamic pose until the desired size is
reached.
Table 1. Pictogram [9] and description of the basic gesture components (BGCs).
1. Pictogram BCG Code Notation Hand form
clusters
Shape of
digit
1 G2S Finger 2 stretched single finger stretched
2 G0F Fist fist bent
3 G2B Finger 2 bent single finger bent
4 G1a2S Finger 1 and 2 stretched finger combinations stretched
5 G0FH Flat hand flat hand stretched
6 G2-
5FD1S
Finger 2 to 5 flapped
down,
Finger 1 stretched
finger combinations flapped down,
stretched
7 G1a2B Finger 1 and 2 bent finger combinations bent
8 G1-5C Finger 1 to 5 connected finger combinations connected
9 G1-3S Finger 1 to 3 stretched finger combinations stretched
10 G1a5S Finger 1 and 5 stretched finger combinations stretched
11 G0SFH Spread flat hand flat hand stretched
12 G1a5C Finger 1 and 5 crooked finger combinations crooked
13 G0LFH Lax flat hand flat hand stretched
14 G1-4S Finger 1 to 4 stretched finger combinations stretched
15 G2a5S Finger 2 and 5 stretched finger combinations stretched,
connected
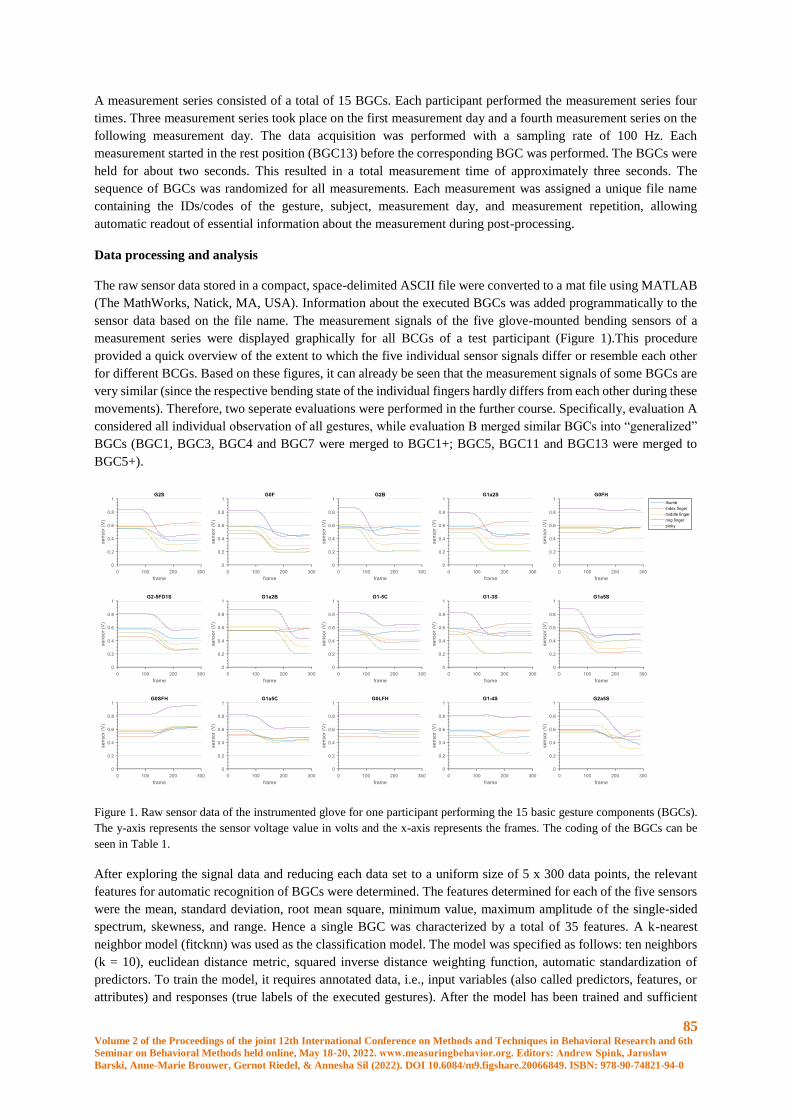
85 Volume 2 of the Proceedings of the joint 12th International Conference on Methods and Techniques in Behavioral Research and 6th
Seminar on Behavioral Methods held online, May 18-20, 2022. www.measuringbehavior.org. Editors: Andrew Spink, Jarosław
Barski, Anne-Marie Brouwer, Gernot Riedel, & Annesha Sil (2022). DOI 10.6084/m9.figshare.20066849. ISBN: 978-90-74821-94-0
A measurement series consisted of a total of 15 BGCs. Each participant performed the measurement series four
times. Three measurement series took place on the first measurement day and a fourth measurement series on the
following measurement day. The data acquisition was performed with a sampling rate of 100 Hz. Each
measurement started in the rest position (BGC13) before the corresponding BGC was performed. The BGCs were
held for about two seconds. This resulted in a total measurement time of approximately three seconds. The
sequence of BGCs was randomized for all measurements. Each measurement was assigned a unique file name
containing the IDs/codes of the gesture, subject, measurement day, and measurement repetition, allowing
automatic readout of essential information about the measurement during post-processing.
Data processing and analysis
The raw sensor data stored in a compact, space-delimited ASCII file were converted to a mat file using MATLAB
(The MathWorks, Natick, MA, USA). Information about the executed BGCs was added programmatically to the
sensor data based on the file name. The measurement signals of the five glove-mounted bending sensors of a
measurement series were displayed graphically for all BCGs of a test participant (Figure 1).This procedure
provided a quick overview of the extent to which the five individual sensor signals differ or resemble each other
for different BCGs. Based on these figures, it can already be seen that the measurement signals of some BGCs are
very similar (since the respective bending state of the individual fingers hardly differs from each other during these
movements). Therefore, two seperate evaluations were performed in the further course. Specifically, evaluation A
considered all individual observation of all gestures, while evaluation B merged similar BGCs into “generalized”
BGCs (BGC1, BGC3, BGC4 and BGC7 were merged to BGC1+; BGC5, BGC11 and BGC13 were merged to
BGC5+).
Figure 1. Raw sensor data of the instrumented glove for one participant performing the 15 basic gesture components (BGCs).
The y-axis represents the sensor voltage value in volts and the x-axis represents the frames. The coding of the BGCs can be
seen in Table 1.
After exploring the signal data and reducing each data set to a uniform size of 5 x 300 data points, the relevant
features for automatic recognition of BGCs were determined. The features determined for each of the five sensors
were the mean, standard deviation, root mean square, minimum value, maximum amplitude of the single-sided
spectrum, skewness, and range. Hence a single BGC was characterized by a total of 35 features. A k-nearest
neighbor model (fitcknn) was used as the classification model. The model was specified as follows: ten neighbors
(k = 10), euclidean distance metric, squared inverse distance weighting function, automatic standardization of
predictors. To train the model, it requires annotated data, i.e., input variables (also called predictors, features, or
attributes) and responses (true labels of the executed gestures). After the model has been trained and sufficient
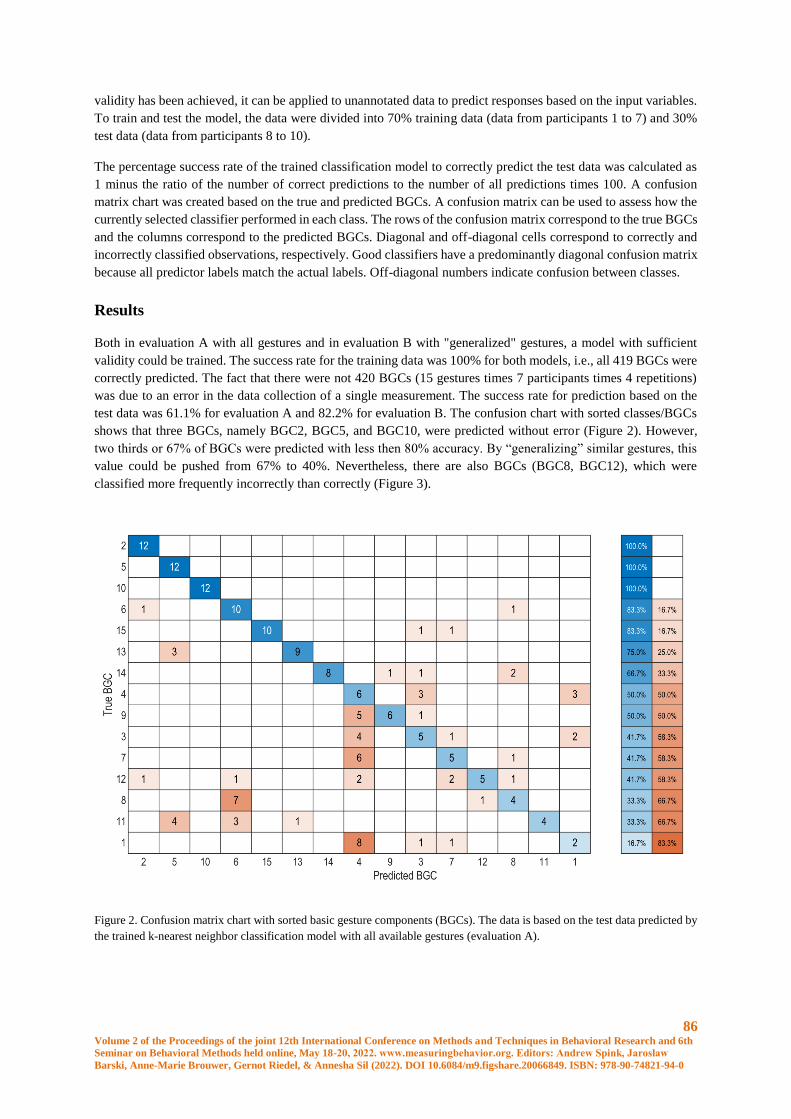
86 Volume 2 of the Proceedings of the joint 12th International Conference on Methods and Techniques in Behavioral Research and 6th
Seminar on Behavioral Methods held online, May 18-20, 2022. www.measuringbehavior.org. Editors: Andrew Spink, Jarosław
Barski, Anne-Marie Brouwer, Gernot Riedel, & Annesha Sil (2022). DOI 10.6084/m9.figshare.20066849. ISBN: 978-90-74821-94-0
validity has been achieved, it can be applied to unannotated data to predict responses based on the input variables.
To train and test the model, the data were divided into 70% training data (data from participants 1 to 7) and 30%
test data (data from participants 8 to 10).
The percentage success rate of the trained classification model to correctly predict the test data was calculated as
1 minus the ratio of the number of correct predictions to the number of all predictions times 100. A confusion
matrix chart was created based on the true and predicted BGCs. A confusion matrix can be used to assess how the
currently selected classifier performed in each class. The rows of the confusion matrix correspond to the true BGCs
and the columns correspond to the predicted BGCs. Diagonal and off-diagonal cells correspond to correctly and
incorrectly classified observations, respectively. Good classifiers have a predominantly diagonal confusion matrix
because all predictor labels match the actual labels. Off-diagonal numbers indicate confusion between classes.
Results
Both in evaluation A with all gestures and in evaluation B with "generalized" gestures, a model with sufficient
validity could be trained. The success rate for the training data was 100% for both models, i.e., all 419 BGCs were
correctly predicted. The fact that there were not 420 BGCs (15 gestures times 7 participants times 4 repetitions)
was due to an error in the data collection of a single measurement. The success rate for prediction based on the
test data was 61.1% for evaluation A and 82.2% for evaluation B. The confusion chart with sorted classes/BGCs
shows that three BGCs, namely BGC2, BGC5, and BGC10, were predicted without error (Figure 2). However,
two thirds or 67% of BGCs were predicted with less then 80% accuracy. By “generalizing” similar gestures, this
value could be pushed from 67% to 40%. Nevertheless, there are also BGCs (BGC8, BGC12), which were
classified more frequently incorrectly than correctly (Figure 3).
Figure 2. Confusion matrix chart with sorted basic gesture components (BGCs). The data is based on the test data predicted by
the trained k-nearest neighbor classification model with all available gestures (evaluation A).
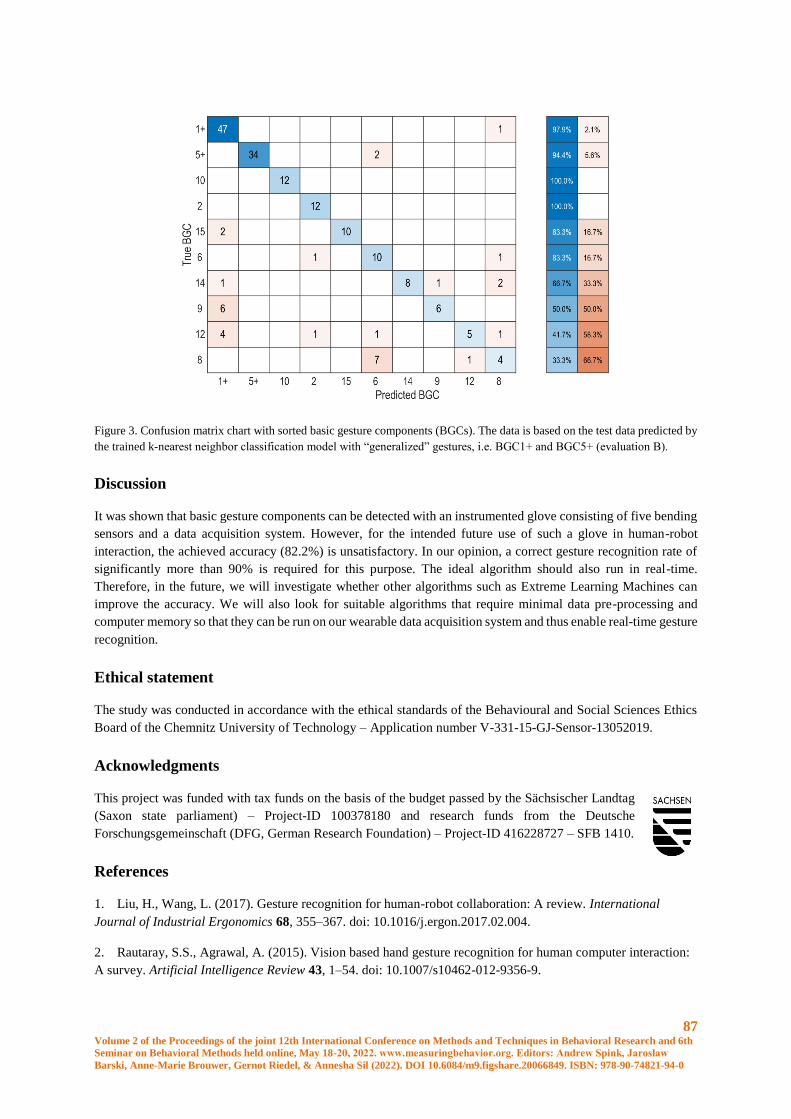
87 Volume 2 of the Proceedings of the joint 12th International Conference on Methods and Techniques in Behavioral Research and 6th
Seminar on Behavioral Methods held online, May 18-20, 2022. www.measuringbehavior.org. Editors: Andrew Spink, Jarosław
Barski, Anne-Marie Brouwer, Gernot Riedel, & Annesha Sil (2022). DOI 10.6084/m9.figshare.20066849. ISBN: 978-90-74821-94-0
Figure 3. Confusion matrix chart with sorted basic gesture components (BGCs). The data is based on the test data predicted by
the trained k-nearest neighbor classification model with “generalized” gestures, i.e. BGC1+ and BGC5+ (evaluation B).
Discussion
It was shown that basic gesture components can be detected with an instrumented glove consisting of five bending
sensors and a data acquisition system. However, for the intended future use of such a glove in human-robot
interaction, the achieved accuracy (82.2%) is unsatisfactory. In our opinion, a correct gesture recognition rate of
significantly more than 90% is required for this purpose. The ideal algorithm should also run in real-time.
Therefore, in the future, we will investigate whether other algorithms such as Extreme Learning Machines can
improve the accuracy. We will also look for suitable algorithms that require minimal data pre-processing and
computer memory so that they can be run on our wearable data acquisition system and thus enable real-time gesture
recognition.
Ethical statement
The study was conducted in accordance with the ethical standards of the Behavioural and Social Sciences Ethics
Board of the Chemnitz University of Technology – Application number V-331-15-GJ-Sensor-13052019.
Acknowledgments
This project was funded with tax funds on the basis of the budget passed by the Sächsischer Landtag
(Saxon state parliament) – Project-ID 100378180 and research funds from the Deutsche
Forschungsgemeinschaft (DFG, German Research Foundation) – Project-ID 416228727 – SFB 1410.
References
1. Liu, H., Wang, L. (2017). Gesture recognition for human-robot collaboration: A review. International
Journal of Industrial Ergonomics 68, 355–367. doi: 10.1016/j.ergon.2017.02.004.
2. Rautaray, S.S., Agrawal, A. (2015). Vision based hand gesture recognition for human computer interaction:
A survey. Artificial Intelligence Review 43, 1–54. doi: 10.1007/s10462-012-9356-9.

88 Volume 2 of the Proceedings of the joint 12th International Conference on Methods and Techniques in Behavioral Research and 6th
Seminar on Behavioral Methods held online, May 18-20, 2022. www.measuringbehavior.org. Editors: Andrew Spink, Jarosław
Barski, Anne-Marie Brouwer, Gernot Riedel, & Annesha Sil (2022). DOI 10.6084/m9.figshare.20066849. ISBN: 978-90-74821-94-0
3. Müller, C., Bressem, J., Ladewig, S.H. (2013). Towards a grammar of gestures: A form-based view. In
Müller C., Cienki A., Fricke E., Ladewig S., McNeill D., Tessendorf S. (eds.), Body - Language -
Communication / Körper - Sprache - Kommunikation, 1st edition. DE GRUYTER, Berlin, Boston.
4. Fang, B., Sun, F., Liu, H., Liu, C. (2018). 3D human gesture capturing and recognition by the IMMU-based
data glove. Neurocomputing 277, 198–207. doi: 10.1016/j.neucom.2017.02.101.
5. Lopes, J., Simão, M., Mendes, N., Safeea, M., Afonso, J., Neto, P. (2017). Hand/arm Gesture Segmentation
by Motion Using IMU and EMG Sensing. Procedia Manufacturing 11, 107–113. doi:
10.1016/j.promfg.2017.07.158.
6. Zhang Y., Harrison C. (2015). Tomo: Wearable, low-cost electrical impedance tomography for hand gesture
recognition (Charlotte, NC, USA, November 11 - 15), 167–173.
7. Hill, M., Hoena, B., Kilian, W., Odenwald, S. (2016). Wearable, Modular and Intelligent Sensor Laboratory.
Procedia Engineering 147, 671–676. doi: 10.1016/j.proeng.2016.06.270.
8. Seeling T., Bullinger A.C. (2017). Natürliche User Interfaces mit Anwendern gestalten - Eine Handreichung
für die Gestaltung intuitiver Gesten-Sets .
9. Bressem, J. (2013). A linguistic perspective on the notation of form features in gestures. In Müller C., Cienki
A., Fricke E., Ladewig S., McNeill D., Tessendorf S. (eds.), Body - Language - Communication / Körper -
Sprache - Kommunikation, 1st edition. DE GRUYTER, Berlin, Boston, pp. 1079–1098.
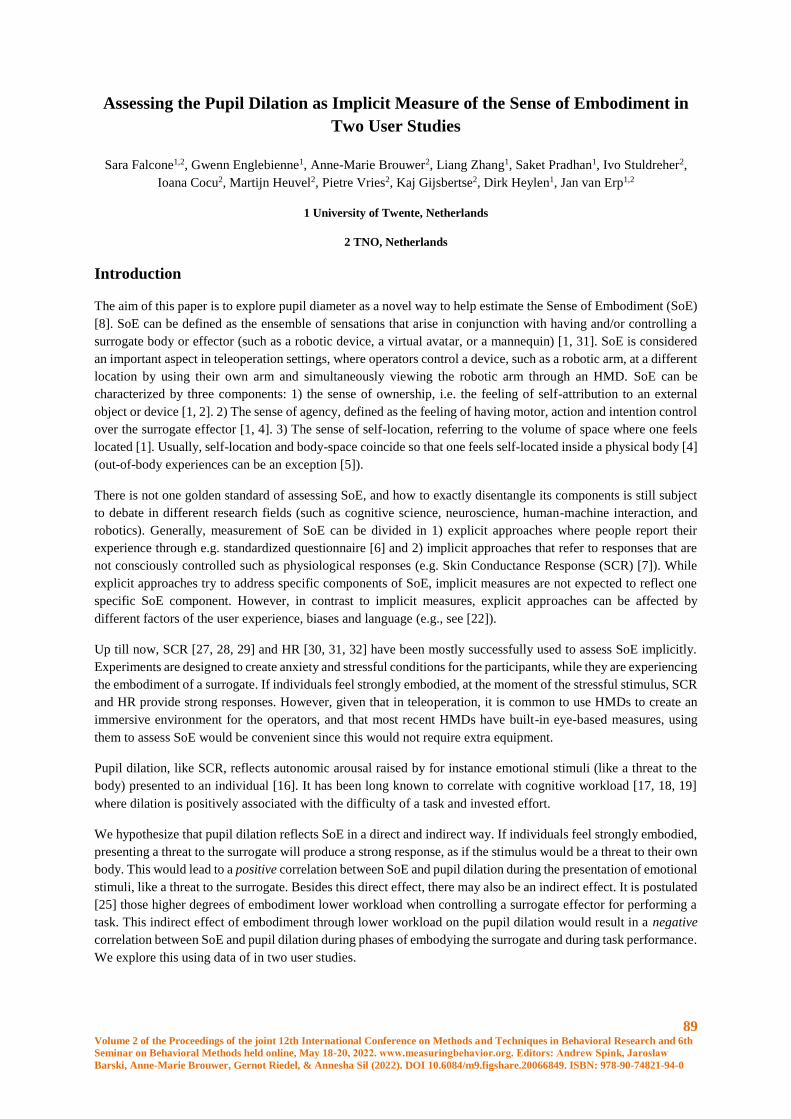
89 Volume 2 of the Proceedings of the joint 12th International Conference on Methods and Techniques in Behavioral Research and 6th
Seminar on Behavioral Methods held online, May 18-20, 2022. www.measuringbehavior.org. Editors: Andrew Spink, Jarosław
Barski, Anne-Marie Brouwer, Gernot Riedel, & Annesha Sil (2022). DOI 10.6084/m9.figshare.20066849. ISBN: 978-90-74821-94-0
Assessing the Pupil Dilation as Implicit Measure of the Sense of Embodiment in
Two User Studies
Sara Falcone1,2, Gwenn Englebienne1, Anne-Marie Brouwer2, Liang Zhang1, Saket Pradhan1, Ivo Stuldreher2,
Ioana Cocu2, Martijn Heuvel2, Pietre Vries2, Kaj Gijsbertse2, Dirk Heylen1, Jan van Erp1,2
1 University of Twente, Netherlands
2 TNO, Netherlands
Introduction
The aim of this paper is to explore pupil diameter as a novel way to help estimate the Sense of Embodiment (SoE)
[8]. SoE can be defined as the ensemble of sensations that arise in conjunction with having and/or controlling a
surrogate body or effector (such as a robotic device, a virtual avatar, or a mannequin) [1, 31]. SoE is considered
an important aspect in teleoperation settings, where operators control a device, such as a robotic arm, at a different
location by using their own arm and simultaneously viewing the robotic arm through an HMD. SoE can be
characterized by three components: 1) the sense of ownership, i.e. the feeling of self-attribution to an external
object or device [1, 2]. 2) The sense of agency, defined as the feeling of having motor, action and intention control
over the surrogate effector [1, 4]. 3) The sense of self-location, referring to the volume of space where one feels
located [1]. Usually, self-location and body-space coincide so that one feels self-located inside a physical body [4]
(out-of-body experiences can be an exception [5]).
There is not one golden standard of assessing SoE, and how to exactly disentangle its components is still subject
to debate in different research fields (such as cognitive science, neuroscience, human-machine interaction, and
robotics). Generally, measurement of SoE can be divided in 1) explicit approaches where people report their
experience through e.g. standardized questionnaire [6] and 2) implicit approaches that refer to responses that are
not consciously controlled such as physiological responses (e.g. Skin Conductance Response (SCR) [7]). While
explicit approaches try to address specific components of SoE, implicit measures are not expected to reflect one
specific SoE component. However, in contrast to implicit measures, explicit approaches can be affected by
different factors of the user experience, biases and language (e.g., see [22]).
Up till now, SCR [27, 28, 29] and HR [30, 31, 32] have been mostly successfully used to assess SoE implicitly.
Experiments are designed to create anxiety and stressful conditions for the participants, while they are experiencing
the embodiment of a surrogate. If individuals feel strongly embodied, at the moment of the stressful stimulus, SCR
and HR provide strong responses. However, given that in teleoperation, it is common to use HMDs to create an
immersive environment for the operators, and that most recent HMDs have built-in eye-based measures, using
them to assess SoE would be convenient since this would not require extra equipment.
Pupil dilation, like SCR, reflects autonomic arousal raised by for instance emotional stimuli (like a threat to the
body) presented to an individual [16]. It has been long known to correlate with cognitive workload [17, 18, 19]
where dilation is positively associated with the difficulty of a task and invested effort.
We hypothesize that pupil dilation reflects SoE in a direct and indirect way. If individuals feel strongly embodied,
presenting a threat to the surrogate will produce a strong response, as if the stimulus would be a threat to their own
body. This would lead to a positive correlation between SoE and pupil dilation during the presentation of emotional
stimuli, like a threat to the surrogate. Besides this direct effect, there may also be an indirect effect. It is postulated
[25] those higher degrees of embodiment lower workload when controlling a surrogate effector for performing a
task. This indirect effect of embodiment through lower workload on the pupil dilation would result in a negative
correlation between SoE and pupil dilation during phases of embodying the surrogate and during task performance.
We explore this using data of in two user studies.

90 Volume 2 of the Proceedings of the joint 12th International Conference on Methods and Techniques in Behavioral Research and 6th
Seminar on Behavioral Methods held online, May 18-20, 2022. www.measuringbehavior.org. Editors: Andrew Spink, Jarosław
Barski, Anne-Marie Brouwer, Gernot Riedel, & Annesha Sil (2022). DOI 10.6084/m9.figshare.20066849. ISBN: 978-90-74821-94-0
Methods
Ethical Approval
The ethics committee of the EEMCS faculty of the University of Twente approved User Study 1 (RP 2020-132),
while the ethichs committee of TNO approved User Study 2 (RP 2021-088).
User Studies
We performed two embodiment studies recording explicit measures of SoE and pupil dilation.
In user study 1, participants experienced an embodiment illusion through a pre-recorded video streamed in the
Head Mounted Display (HMD) that they wore during the experiment. Participants experienced the first-person
perspective of a surrogate (in this case a confederate), in the same room and in the same posture as the participants
were. Participants observed visuotactile stimuli and tasks administered to the hand of the surrogate while the same
stimuli and tasks were administered to their real hand. Both groups experienced the same synchronous embodiment
illusion.
In user study 2, participants received online visual feedback about their own or a robotic arm through an HMD.
For the supportive embodiment condition, they experienced a first person perspective of the workspace, while in
the suppressive embodiment condition the camera provided a third person perspective provided by a camera facing
the participants.
Table 1 summarizes the design of the two studies. Figures 1, 2, and 3 provide an overview of the setups.
User Study Participants Tasks Conditions Measures
1. How
kinesthetic
intelligence
affects SoE.
26 right-
handed
participants,
between 20
and 37 years
old, 9 females
and 17 males.
1) Cross-modal congruency
task: participants received
multisensory asynchronous
and synchronous stimuli.
2) Linking dots: participants
linked the dots on a drawing
by sliding their right index
finger on a tablet.
3) Glove: between task 2 and
4, we asked the participants
to tell us the colour of the
glove that they were
wearing (participants wore a
blue glove, while the
confederate a white one).
4) Threat: the participants
observed the surrogate hand
almost stabbed by scissors.
Experimental group:
individuals with high
kinesthetic
intelligence (dancers
and gymnasts at
professional level);
Control group:
individuals with
average kinesthetic
intelligence.
Embodiment
questionnaire;
Pupil dilation;
proprioceptiv
e drift;
behavioural
responses.
2. The relation
between SoE and
learning effect.
28 right-
handed
participants,
between 19
and 49 years
Peg-in-hole: participants
had 90 seconds to place a
peg back and forth in
designated holes as many
times as they could. They
repeated the task 6 times in
Group 1: sensory
cues supporting the
embodiment
experience.
Embodiment
questionnaire;
Cognitive
Workload
questionnaire;
Pupil
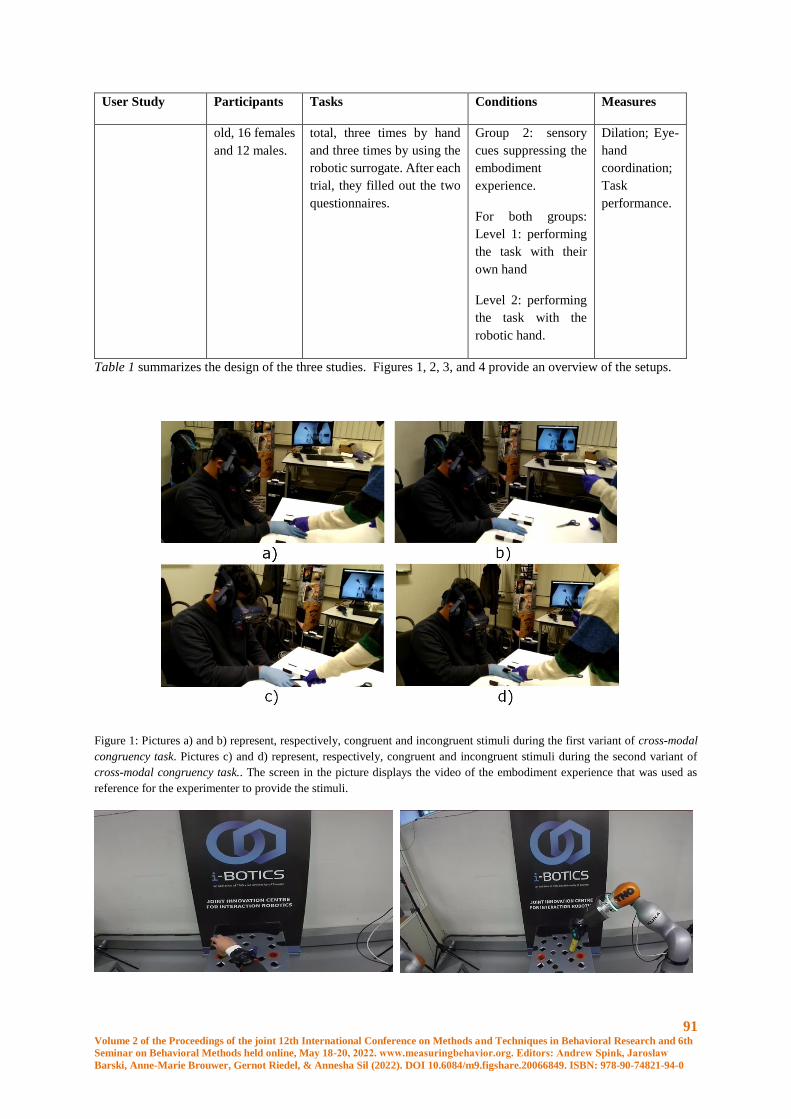
91 Volume 2 of the Proceedings of the joint 12th International Conference on Methods and Techniques in Behavioral Research and 6th
Seminar on Behavioral Methods held online, May 18-20, 2022. www.measuringbehavior.org. Editors: Andrew Spink, Jarosław
Barski, Anne-Marie Brouwer, Gernot Riedel, & Annesha Sil (2022). DOI 10.6084/m9.figshare.20066849. ISBN: 978-90-74821-94-0
User Study Participants Tasks Conditions Measures
old, 16 females
and 12 males.
total, three times by hand
and three times by using the
robotic surrogate. After each
trial, they filled out the two
questionnaires.
Group 2: sensory
cues suppressing the
embodiment
experience.
For both groups:
Level 1: performing
the task with their
own hand
Level 2: performing
the task with the
robotic hand.
Dilation; Eye-
hand
coordination;
Task
performance.
Table 1 summarizes the design of the three studies. Figures 1, 2, 3, and 4 provide an overview of the setups.
Figure 1: Pictures a) and b) represent, respectively, congruent and incongruent stimuli during the first variant of cross-modal
congruency task. Pictures c) and d) represent, respectively, congruent and incongruent stimuli during the second variant of
cross-modal congruency task.. The screen in the picture displays the video of the embodiment experience that was used as
reference for the experimenter to provide the stimuli.
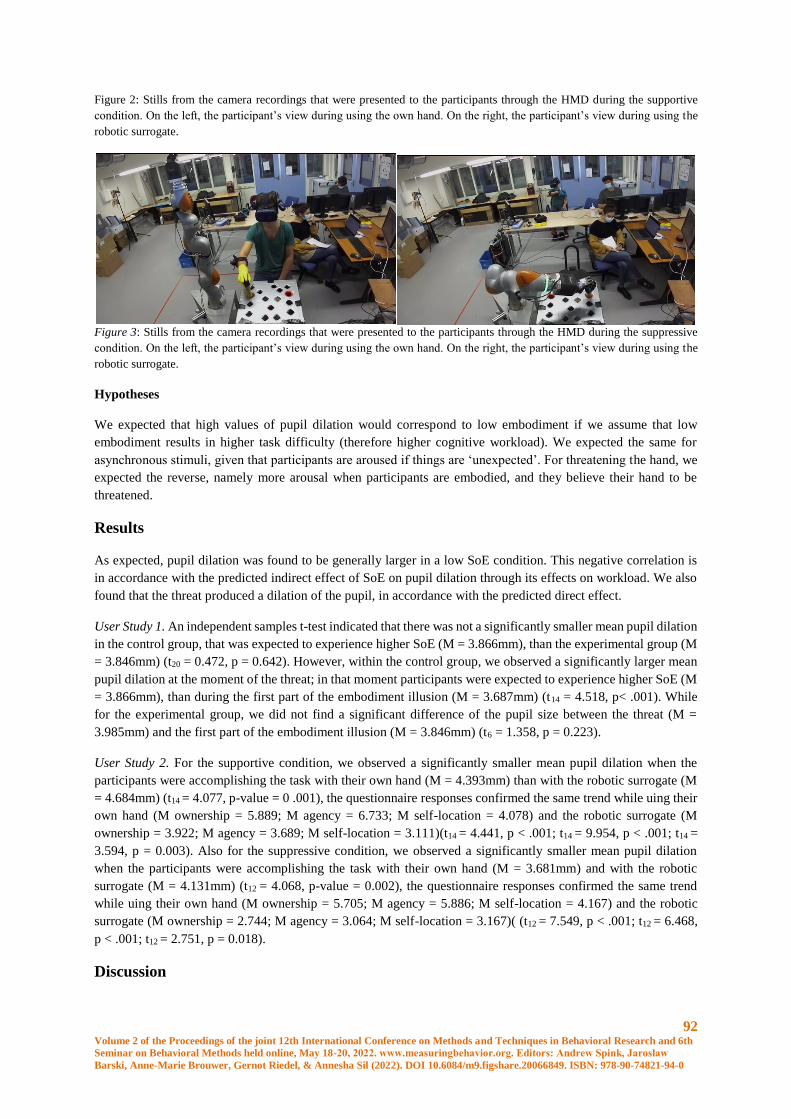
92 Volume 2 of the Proceedings of the joint 12th International Conference on Methods and Techniques in Behavioral Research and 6th
Seminar on Behavioral Methods held online, May 18-20, 2022. www.measuringbehavior.org. Editors: Andrew Spink, Jarosław
Barski, Anne-Marie Brouwer, Gernot Riedel, & Annesha Sil (2022). DOI 10.6084/m9.figshare.20066849. ISBN: 978-90-74821-94-0
Figure 2: Stills from the camera recordings that were presented to the participants through the HMD during the supportive
condition. On the left, the participant’s view during using the own hand. On the right, the participant’s view during using the
robotic surrogate.
Figure 3: Stills from the camera recordings that were presented to the participants through the HMD during the suppressive
condition. On the left, the participant’s view during using the own hand. On the right, the participant’s view during using the
robotic surrogate.
Hypotheses
We expected that high values of pupil dilation would correspond to low embodiment if we assume that low
embodiment results in higher task difficulty (therefore higher cognitive workload). We expected the same for
asynchronous stimuli, given that participants are aroused if things are ‘unexpected’. For threatening the hand, we
expected the reverse, namely more arousal when participants are embodied, and they believe their hand to be
threatened.
Results
As expected, pupil dilation was found to be generally larger in a low SoE condition. This negative correlation is
in accordance with the predicted indirect effect of SoE on pupil dilation through its effects on workload. We also
found that the threat produced a dilation of the pupil, in accordance with the predicted direct effect.
User Study 1. An independent samples t-test indicated that there was not a significantly smaller mean pupil dilation
in the control group, that was expected to experience higher SoE (M = 3.866mm), than the experimental group (M
= 3.846mm) (t20 = 0.472, p = 0.642). However, within the control group, we observed a significantly larger mean
pupil dilation at the moment of the threat; in that moment participants were expected to experience higher SoE (M
= 3.866mm), than during the first part of the embodiment illusion (M = 3.687mm) (t14 = 4.518, p< .001). While
for the experimental group, we did not find a significant difference of the pupil size between the threat (M =
3.985mm) and the first part of the embodiment illusion (M = 3.846mm) (t6 = 1.358, p = 0.223).
User Study 2. For the supportive condition, we observed a significantly smaller mean pupil dilation when the
participants were accomplishing the task with their own hand (M = 4.393mm) than with the robotic surrogate (M
= 4.684mm) (t14 = 4.077, p-value = 0 .001), the questionnaire responses confirmed the same trend while uing their
own hand (M ownership = 5.889; M agency = 6.733; M self-location = 4.078) and the robotic surrogate (M
ownership = 3.922; M agency = 3.689; M self-location = 3.111)(t14 = 4.441, p < .001; t14 = 9.954, p < .001; t14 =
3.594, p = 0.003). Also for the suppressive condition, we observed a significantly smaller mean pupil dilation
when the participants were accomplishing the task with their own hand (M = 3.681mm) and with the robotic
surrogate (M = 4.131mm) (t12 = 4.068, p-value = 0.002), the questionnaire responses confirmed the same trend
while uing their own hand (M ownership = 5.705; M agency = 5.886; M self-location = 4.167) and the robotic
surrogate (M ownership = 2.744; M agency = 3.064; M self-location = 3.167)( (t12 = 7.549, p < .001; t12 = 6.468,
p < .001; t12 = 2.751, p = 0.018).
Discussion
93 Volume 2 of the Proceedings of the joint 12th International Conference on Methods and Techniques in Behavioral Research and 6th
Seminar on Behavioral Methods held online, May 18-20, 2022. www.measuringbehavior.org. Editors: Andrew Spink, Jarosław
Barski, Anne-Marie Brouwer, Gernot Riedel, & Annesha Sil (2022). DOI 10.6084/m9.figshare.20066849. ISBN: 978-90-74821-94-0
We observed from the results of our studies that the pupil diameter was, or tended to be larger for participants who
were in a group, or experienced a condition designed to provide low SoE compared to one designed to provide
high SoE (User Study 3). This is in line with the predicted indirect effect of SoE on pupil dilation through workload
[24, 26]. The correlation would be negative in case individuals have to perform a task with a certain amount of
workload. Pupil dilation and SoE would be positive and direct correlated in case of emotional stimuli subjected to
the surrogate (e.g., a threat) (User Study 1). The Rubber Hand Illusion presents the same trend: there is no effect
as long as there are no emotional stimuli, while there is a large effect when rubber hand is under threat [5, 7, 25,
26, 27]. There would be no correlation in case of emotional neutral situations where there is no task to be performed
with the surrogate.
Pupil size may be a valuable measure to help estimate SoE implicitly, and also other eye recordings may be
informative, such as eye-hand coordination.
References
1. Kilteni, K., Groten, R., & Slater, M. (2012). The sense of embodiment in virtual reality. Presence:
Teleoperators and Virtual Environments, 21(4), 373-387.
2. Krom, B. N., Catoire, M., Toet, A., Van Dijk, R. J., & van Erp, J. B. (2019, July). Effects of likeness and
synchronicity on the ownership illusion over a moving virtual robotic arm and hand. In 2019 IEEE World
Haptics Conference (WHC) (pp. 49-54). IEEE.
3. Blanke, O., & Metzinger, T. (2009). Full-body illusions and minimal phenomenal selfhood. Trends in
cognitive sciences, 13(1), 7-13.
4. Lenggenhager, B., Mouthon, M., & Blanke, O. (2009). Spatial aspects of bodily self-
consciousness. Consciousness and cognition, 18(1), 110-117.
5. Ehrsson, H. H., Spence, C., & Passingham, R. E. (2004). That's my hand! Activity in premotor cortex reflects
feeling of ownership of a limb. Science, 305(5685), 875-877.
6. Peck, T. C., & Gonzalez-Franco, M. (2021). Avatar embodiment. a standardized questionnaire. Frontiers in
Virtual Reality, 1, 44.
7. Ehrsson, H. H., Wiech, K., Weiskopf, N., Dolan, R. J., & Passingham, R. E. (2007). Threatening a rubber
hand that you feel is yours elicits a cortical anxiety response. Proceedings of the National Academy of
Sciences, 104(23), 9828-9833.
8. Falcone, S., Pradhan, S., van Erp, J. B., & Heylen, D. K. (2021, July). Individuals with High Kinesthetic
Intelligence Experience an Active Embodiment Illusion Assessed with Pupil Dilation. In Cognitive Science
Society 2021.
9. Gonzalez-Franco, M., & Peck, T. C. (2018). Avatar embodiment. towards a standardized
questionnaire. Frontiers in Robotics and AI, 5, 74.
10. Yuan, Y., & Steed, A. (2010, March). Is the rubber hand illusion induced by immersive virtual reality?.
In 2010 IEEE Virtual Reality Conference (VR) (pp. 95-102). IEEE.
11. Zhang, J., & Hommel, B. (2016). Body ownership and response to threat. Psychological research, 80(6),
1020-1029.
12. Hart, S. G. (2006, October). NASA-task load index (NASA-TLX); 20 years later. In Proceedings of the
human factors and ergonomics society annual meeting (Vol. 50, No. 9, pp. 904-908). Sage CA: Los Angeles,
CA: Sage publications.
13. Wang, C. A., Baird, T., Huang, J., Coutinho, J. D., Brien, D. C., & Munoz, D. P. (2018). Arousal effects on
pupil size, heart rate, and skin conductance in an emotional face task. Frontiers in neurology, 9, 1029.

94 Volume 2 of the Proceedings of the joint 12th International Conference on Methods and Techniques in Behavioral Research and 6th
Seminar on Behavioral Methods held online, May 18-20, 2022. www.measuringbehavior.org. Editors: Andrew Spink, Jarosław
Barski, Anne-Marie Brouwer, Gernot Riedel, & Annesha Sil (2022). DOI 10.6084/m9.figshare.20066849. ISBN: 978-90-74821-94-0
14. Gutjahr, M. O., Ellermeier, W., Hardy, S., Göbel, S., & Wiemeyer, J. (2019). The pupil response as an
indicator of user experience in a digital exercise game. Psychophysiology, 56(10), e13418.
15. Hogervorst, M. A., Brouwer, A. M., & Van Erp, J. B. (2014). Combining and comparing EEG, peripheral
physiology and eye-related measures for the assessment of mental workload. Frontiers in neuroscience, 8, 322.
16. Oliva, M. (2019). Pupil size and search performance in low and high perceptual load. Cognitive, Affective, &
Behavioral Neuroscience, 19(2), 366-376.
17. May, J. G., Kennedy, R. S., Williams, M. C., Dunlap, W. P., & Brannan, J. R. (1990). Eye movement indices
of mental workload. Acta psychologica, 75(1), 75-89.
18. Porter, G., Troscianko, T., & Gilchrist, I. D. (2007). Effort during visual search and counting: Insights from
pupillometry. Quarterly journal of experimental psychology, 60(2), 211-229.
19. Hampson, R. E., Opris, I., & Deadwyler, S. A. (2010). Neural correlates of fast pupil dilation in nonhuman
primates: relation to behavioral performance and cognitive workload. Behavioural brain research, 212(1), 1-11.
20. Kaneko, D., Toet, A., Brouwer, A. M., Kallen, V., & Van Erp, J. B. (2018). Methods for evaluating emotions
evoked by food experiences: A literature review. Frontiers in psychology, 9, 911.
21. Larsen, R. S., & Waters, J. (2018). Neuromodulatory correlates of pupil dilation. Frontiers in neural
circuits, 12, 21.
22. Joshi, S., Li, Y., Kalwani, R. M., & Gold, J. I. (2016). Relationships between pupil diameter and neuronal
activity in the locus coeruleus, colliculi, and cingulate cortex. Neuron, 89(1), 221-234.
23. Toet, A., Kuling, I.A., Krom, B., & Van Erp, J.B.F. (2020). Toward enhanced teleoperation through
embodiment. Frontiers in Robotics and AI, 7, 14. Doi: 10.3389/frobt.2020.00014.
24. Hogervorst, M. A., Brouwer, A. M., & Van Erp, J. B. (2014). Combining and comparing EEG, peripheral
physiology and eye-related measures for the assessment of mental workload. Frontiers in neuroscience, 8, 322.
25. Garbarini, F., Fornia, L., Fossataro, C., Pia, L., Gindri, P., & Berti, A. (2014). Embodiment of others’ hands
elicits arousal responses similar to one’s own hands. Current Biology, 24(16), R738-R739.
26. Newport, R., & Preston, C. (2010). Pulling the finger off disrupts agency, embodiment and peripersonal
space. Perception, 39(9), 1296-1298.
27. Petkova, V. I., & Ehrsson, H. H. (2008). If I were you: perceptual illusion of body swapping. PloS
one, 3(12), e3832.
28. Kim, S. Y. S., Prestopnik, N., & Biocca, F. A. (2014). Body in the interactive game: How interface
embodiment affects physical activity and health behavior change. Computers in Human Behavior, 36, 376-384.
29. Sukalla, F., Bilandzic, H., Bolls, P. D., & Busselle, R. W. (2015). Embodiment of narrative
engagement. Journal of Media Psychology.
30. Slater, M., Spanlang, B., Sanchez-Vives, M. V., & Blanke, O. (2010). First person experience of body
transfer in virtual reality. PloS one, 5(5), e10564.
31. Falcone, S., Englebienne, G., Van Erp, J., & Heylen, D. (2022). Toward Standard Guidelines to Design the
Sense of Embodiment in Teleoperation Applications: A Review and Toolbox. Human–Computer Interaction, 1-
30.
95 Volume 2 of the Proceedings of the joint 12th International Conference on Methods and Techniques in Behavioral Research and 6th
Seminar on Behavioral Methods held online, May 18-20, 2022. www.measuringbehavior.org. Editors: Andrew Spink, Jarosław
Barski, Anne-Marie Brouwer, Gernot Riedel, & Annesha Sil (2022). DOI 10.6084/m9.figshare.20066849. ISBN: 978-90-74821-94-0
A Distance–Based Classification Method to Assess Frontal Behavior from Human
Behavioral Sensing
Bénédicte Batrancourt1, Frédéric Marin2, Caroline Peltier3, François-Xavier Lejeune1, Delphine Tanguy1, Valérie
Godefroy1, Idil Sezer1, Mathilde Boucly1, David Bendetowicz1, Guilhem Carle1, Armelle Rametti-Lacroux1,
Raffaella Migliaccio1, 4 and Richard Levy1,4
1 Sorbonne Université, Institut du Cerveau - Paris Brain Institute - ICM, Inserm, CNRS, AP-HP, Hôpital de la Pitié
Salpêtrière, Paris, France, [email protected]
2 Centre of Excellence for Human and Animal Movement Biomechanics (CoEMoB), Laboratoire de BioMécanique et
BioIngénierie (UMR CNRS 7338), Université de Technologie de Compiègne (UTC), Alliance Sorbonne Université,
60200 Compiègne, France.
3 Centre des Sciences du Goût et de l’Alimentation (CSGA), ChemoSens Platform, AgroSup Dijon, CNRS, INRAE,
University of Bourgogne Franche-Comté, PROBE research infrastructure, Dijon, France.
4 AP-HP, Hôpital de la Pitié Salpêtrière, Department of Neurology, Center of excellence of neurodegenerative disease
(CoEN), Institute of Memory and Alzheimer's Disease (IM2A), F-75013, Paris, France.
Introduction
Frontal Behavior
The frontal lobe of the brain, and particularly the prefontal cortex (PrFC) are linked to the more complex aspects
of human behavior. PrFC supports goal-directed behaviors (GDB) and is involved in cognitive and behavioral
aspects of adaptation to complex or new situations. Damage to the lateral part of the PrFC is associated with
deficits in planning, and damage to the ventral part of the PrFC with motivation disorders. Thus, patients with
prefrontal damage show deficits in the ability to plan and organize behavior
Apathy
Behavioral variant of frontotemporal dementia (bvFTD) is a neurodegenerative syndrome characterized by
cognitive and behavioral decline caused by progressive atrophy of frontal and temporal regions. Apathy is almost
universal in bvFTD, but it is also a pervasive neuropsychiatric symptom of most neurocognitive,
neurodegenerative, and psychiatric disorders [1]. Traditionally, apathy has been viewed as a symptom indicating
loss of interest or emotions. In 1990, in a highly influential conceptual framework, Marin defined apathy as
diminished motivation not attributable to diminished level of consciousness, cognitive impairment, or emotional
distress [2]. Marin proposed diagnostic criteria for the syndrome of apathy on the basis of its distinction from the
overt behavioral, cognitive, and emotional concomitants of goal-directed behavior [3]. In 2006, in another
influential theoretical framework, Levy and Dubois refined the definition of apathy to the quantitative reduction
of self-generated voluntary and purposeful behaviors [4]. Consequently, the authors argued that, first, apathy is an
observable state that can subsequently be quantified; second, apathy is a pathology of voluntary action or goal-
directed behavior (GDB); and third, the underlying mechanisms responsible for apathy are related to dysfunctions
of the elaboration, execution or control of GDB.
Assessment of Neuropsychiatric Symptoms (NPS)
NPS normally occur during the natural course of dementia [5] and include symptoms such as apathy and
disinhibition. NPS assessment is crucial in clinical practice as well as in clinical research and also in future clinical
trials targeting disease-modifying therapies [6]. Validated assessment scales are available for the majority of these
symptoms. Apathy is usually assessed by questionnaires administered to the patient and/or caregiver and providing
information about the patient’s internal state, thoughts and past activities, globally suggesting a loss of motivation
96 Volume 2 of the Proceedings of the joint 12th International Conference on Methods and Techniques in Behavioral Research and 6th
Seminar on Behavioral Methods held online, May 18-20, 2022. www.measuringbehavior.org. Editors: Andrew Spink, Jarosław
Barski, Anne-Marie Brouwer, Gernot Riedel, & Annesha Sil (2022). DOI 10.6084/m9.figshare.20066849. ISBN: 978-90-74821-94-0
to perform daily activities [7]. However, these scales are biased by the subjective nature of the patient or
caregiver’s perspective. More generally, complex behaviours and their disorders may be difficult to capture
through questionnaires and assessment scales, and would be more easily identified through an ecological
observation. This raises the question of the limitations of current neuropsychological assessments and tests. Two
sources of difficulty are traditionally identified in this area of research: the nature of the clinical material, and the
complexity of the behavioral deficits [8].
Behavioral Sensing
To address the specific question concerning the limitations of the assessment of NPS using interviews and rating
scales, and for supplementing the patient’s subjective evaluation of health state, we rely on behavioral sensing, an
emerging and promising behavioral research field, due to the rapid growth of wearable and/or wireless sensors, as
well as devices smart-sensor integration in mobile phones. Recent studies, demonstrated the relevance to use new
mobile technologies and wearable sensors for the assessment of the behavior in neurological conditions. Mobile
technologies can provide objective and frequent measurements of disease [9]. Major of these studies have focused
on the Parkinson disease (PD) to quantitatively capture movement patterns. Mobile Phone and wearable sensor
have also opened the prospect of access to psychiatric disorders and symptoms, allowing the collection of
quantitative behavioral and functional markers, providing an estimation of physiological and mental state [10].
The 2018 international consensus group of experts, in the domain of apathy in brain disorders stated that apathy
can be assessed through new information and communication technologies (ICT), and that these new ICT
approaches could provide clinicians with valuable additional information in terms of assessment, and therefore
more accurate diagnosis of apathy [1].
ECOCAPTURE Program
In line with these limitiations and considerations, we developed the ECOCAPTURE program (FRONTlab, ICM)
designed to identify and measure behavior and/or behavioral disorders to obtain objective and quantitative
measurements for assessing neuropsychiatric symptoms, such as apathy [11] and disinhibition [12]. This broad
research program is characterized by its original methodological approach using behavioral sensing under
ecological conditions. The ECOCAPTURE program is divided into two main projects : 1/ the
ECOCAPTURE@LAB study (Clinicaltrials.gov: NCT02496312, NCT03272230) aims to identify behavioral
signatures of apathy under controlled conditions (laboratory setting); 2/ the ECOCAPTURE@HOME study
(Clinicaltrials.gov: NCT04865172) aims to identify and measure behavioral markers of apathy in everyday life
conditions, and predict the psychological status of the patient-caregiver dyad from these markers of apathy. The
final goal of the ECOCAPTURE program is to contribute to the development of new therapeutic strategies, such
as non-pharmacological interventions (NPI), targeting apathy.
ECOCAPTURE@LAB paradigm
ECOCAPTURE@LAB explores participant’s behavior in a close-to-real-life situation (waiting room) under
controlled conditions (the ECOCAPTURE scenario). The experiments took place on the ICM’s core facility
(PRISME) [13] dedicated to the functional exploration of human behavior. The PRISME platform was equipped
with a six-ceiling camera system (not hidden) covering the entire waiting room. The subjects were informed at the
time of initial consent that their behavior would be tracked and recorded by video cameras located in the room.
The subject’s behavior was recorded for a 45-minutes period using a multimodal behavioral sensing system
consisting of video recording, 3D-accelerometer (Move II®, Movisens) and eye-tracking glasses (ETG 2w®,
SMI). The accelerometer was fixed at the subject’s right hip. Participants wore ETG for only a 7-minutes period.
The waiting room contains specific objects that provide opportunities for subjects to interact with the environment
and pass the time (games, magazines, food and drink, furniture such as a sofa, chairs, table, etc.). The subject is
explicitly encouraged to make himself/herself comfortable and to enjoy the room, using the space, as well as the
objects at his or her own convenience (“as if he/she was at home”). These guidelines are designed to promote the
ecological validity of the behavioral measurements. The main phases of the ECOCAPTURE scenario are a 7-
minute free phase (FP) and a 10-minute guided phase (GP). FP is a freely moving phase, during which the
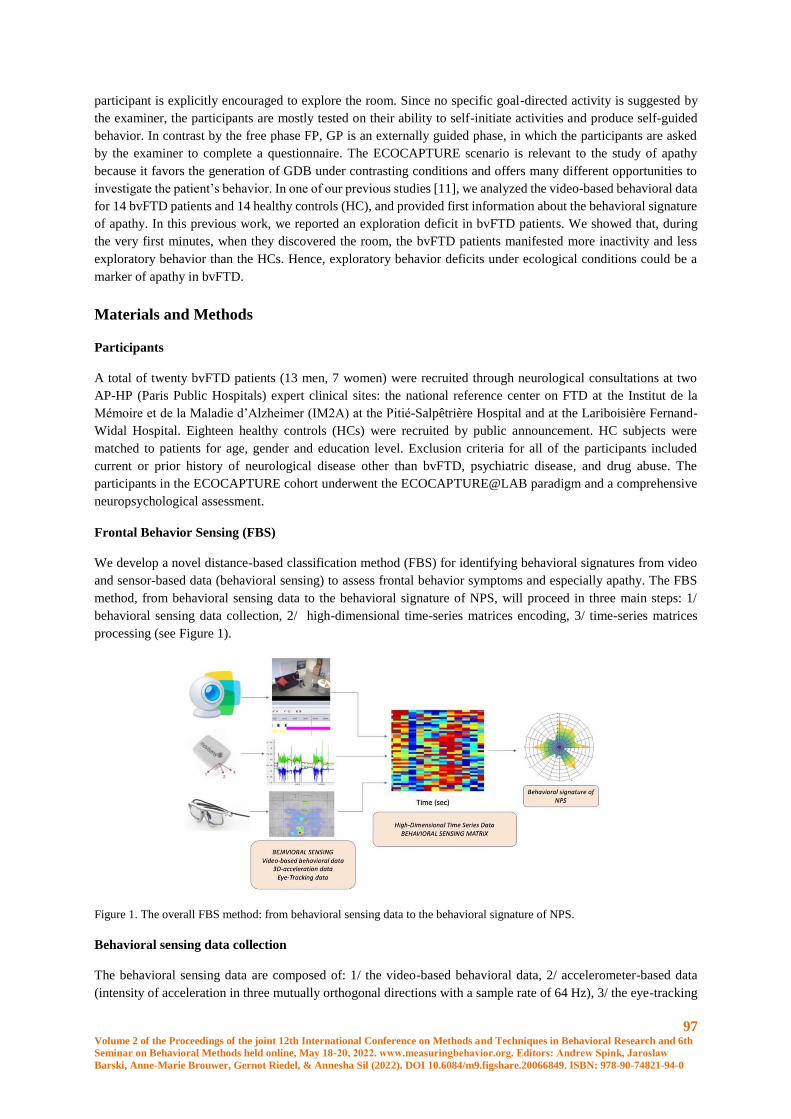
97 Volume 2 of the Proceedings of the joint 12th International Conference on Methods and Techniques in Behavioral Research and 6th
Seminar on Behavioral Methods held online, May 18-20, 2022. www.measuringbehavior.org. Editors: Andrew Spink, Jarosław
Barski, Anne-Marie Brouwer, Gernot Riedel, & Annesha Sil (2022). DOI 10.6084/m9.figshare.20066849. ISBN: 978-90-74821-94-0
participant is explicitly encouraged to explore the room. Since no specific goal-directed activity is suggested by
the examiner, the participants are mostly tested on their ability to self-initiate activities and produce self-guided
behavior. In contrast by the free phase FP, GP is an externally guided phase, in which the participants are asked
by the examiner to complete a questionnaire. The ECOCAPTURE scenario is relevant to the study of apathy
because it favors the generation of GDB under contrasting conditions and offers many different opportunities to
investigate the patient’s behavior. In one of our previous studies [11], we analyzed the video-based behavioral data
for 14 bvFTD patients and 14 healthy controls (HC), and provided first information about the behavioral signature
of apathy. In this previous work, we reported an exploration deficit in bvFTD patients. We showed that, during
the very first minutes, when they discovered the room, the bvFTD patients manifested more inactivity and less
exploratory behavior than the HCs. Hence, exploratory behavior deficits under ecological conditions could be a
marker of apathy in bvFTD.
Materials and Methods
Participants
A total of twenty bvFTD patients (13 men, 7 women) were recruited through neurological consultations at two
AP-HP (Paris Public Hospitals) expert clinical sites: the national reference center on FTD at the Institut de la
Mémoire et de la Maladie d’Alzheimer (IM2A) at the Pitié-Salpêtrière Hospital and at the Lariboisière Fernand-
Widal Hospital. Eighteen healthy controls (HCs) were recruited by public announcement. HC subjects were
matched to patients for age, gender and education level. Exclusion criteria for all of the participants included
current or prior history of neurological disease other than bvFTD, psychiatric disease, and drug abuse. The
participants in the ECOCAPTURE cohort underwent the ECOCAPTURE@LAB paradigm and a comprehensive
neuropsychological assessment.
Frontal Behavior Sensing (FBS)
We develop a novel distance-based classification method (FBS) for identifying behavioral signatures from video
and sensor-based data (behavioral sensing) to assess frontal behavior symptoms and especially apathy. The FBS
method, from behavioral sensing data to the behavioral signature of NPS, will proceed in three main steps: 1/
behavioral sensing data collection, 2/ high-dimensional time-series matrices encoding, 3/ time-series matrices
processing (see Figure 1).
Figure 1. The overall FBS method: from behavioral sensing data to the behavioral signature of NPS.
Behavioral sensing data collection
The behavioral sensing data are composed of: 1/ the video-based behavioral data, 2/ accelerometer-based data
(intensity of acceleration in three mutually orthogonal directions with a sample rate of 64 Hz), 3/ the eye-tracking
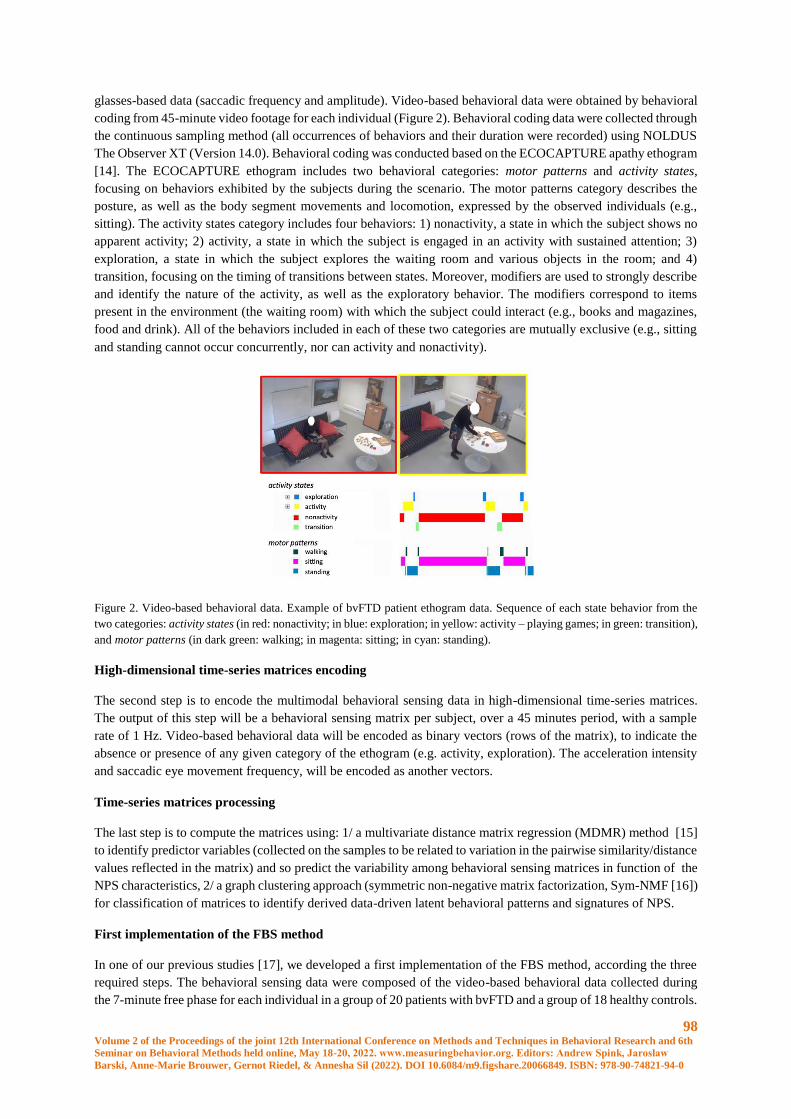
98 Volume 2 of the Proceedings of the joint 12th International Conference on Methods and Techniques in Behavioral Research and 6th
Seminar on Behavioral Methods held online, May 18-20, 2022. www.measuringbehavior.org. Editors: Andrew Spink, Jarosław
Barski, Anne-Marie Brouwer, Gernot Riedel, & Annesha Sil (2022). DOI 10.6084/m9.figshare.20066849. ISBN: 978-90-74821-94-0
glasses-based data (saccadic frequency and amplitude). Video-based behavioral data were obtained by behavioral
coding from 45-minute video footage for each individual (Figure 2). Behavioral coding data were collected through
the continuous sampling method (all occurrences of behaviors and their duration were recorded) using NOLDUS
The Observer XT (Version 14.0). Behavioral coding was conducted based on the ECOCAPTURE apathy ethogram
[14]. The ECOCAPTURE ethogram includes two behavioral categories: motor patterns and activity states,
focusing on behaviors exhibited by the subjects during the scenario. The motor patterns category describes the
posture, as well as the body segment movements and locomotion, expressed by the observed individuals (e.g.,
sitting). The activity states category includes four behaviors: 1) nonactivity, a state in which the subject shows no
apparent activity; 2) activity, a state in which the subject is engaged in an activity with sustained attention; 3)
exploration, a state in which the subject explores the waiting room and various objects in the room; and 4)
transition, focusing on the timing of transitions between states. Moreover, modifiers are used to strongly describe
and identify the nature of the activity, as well as the exploratory behavior. The modifiers correspond to items
present in the environment (the waiting room) with which the subject could interact (e.g., books and magazines,
food and drink). All of the behaviors included in each of these two categories are mutually exclusive (e.g., sitting
and standing cannot occur concurrently, nor can activity and nonactivity).
Figure 2. Video-based behavioral data. Example of bvFTD patient ethogram data. Sequence of each state behavior from the
two categories: activity states (in red: nonactivity; in blue: exploration; in yellow: activity – playing games; in green: transition),
and motor patterns (in dark green: walking; in magenta: sitting; in cyan: standing).
High-dimensional time-series matrices encoding
The second step is to encode the multimodal behavioral sensing data in high-dimensional time-series matrices.
The output of this step will be a behavioral sensing matrix per subject, over a 45 minutes period, with a sample
rate of 1 Hz. Video-based behavioral data will be encoded as binary vectors (rows of the matrix), to indicate the
absence or presence of any given category of the ethogram (e.g. activity, exploration). The acceleration intensity
and saccadic eye movement frequency, will be encoded as another vectors.
Time-series matrices processing
The last step is to compute the matrices using: 1/ a multivariate distance matrix regression (MDMR) method [15]
to identify predictor variables (collected on the samples to be related to variation in the pairwise similarity/distance
values reflected in the matrix) and so predict the variability among behavioral sensing matrices in function of the
NPS characteristics, 2/ a graph clustering approach (symmetric non-negative matrix factorization, Sym-NMF [16])
for classification of matrices to identify derived data-driven latent behavioral patterns and signatures of NPS.
First implementation of the FBS method
In one of our previous studies [17], we developed a first implementation of the FBS method, according the three
required steps. The behavioral sensing data were composed of the video-based behavioral data collected during
the 7-minute free phase for each individual in a group of 20 patients with bvFTD and a group of 18 healthy controls.
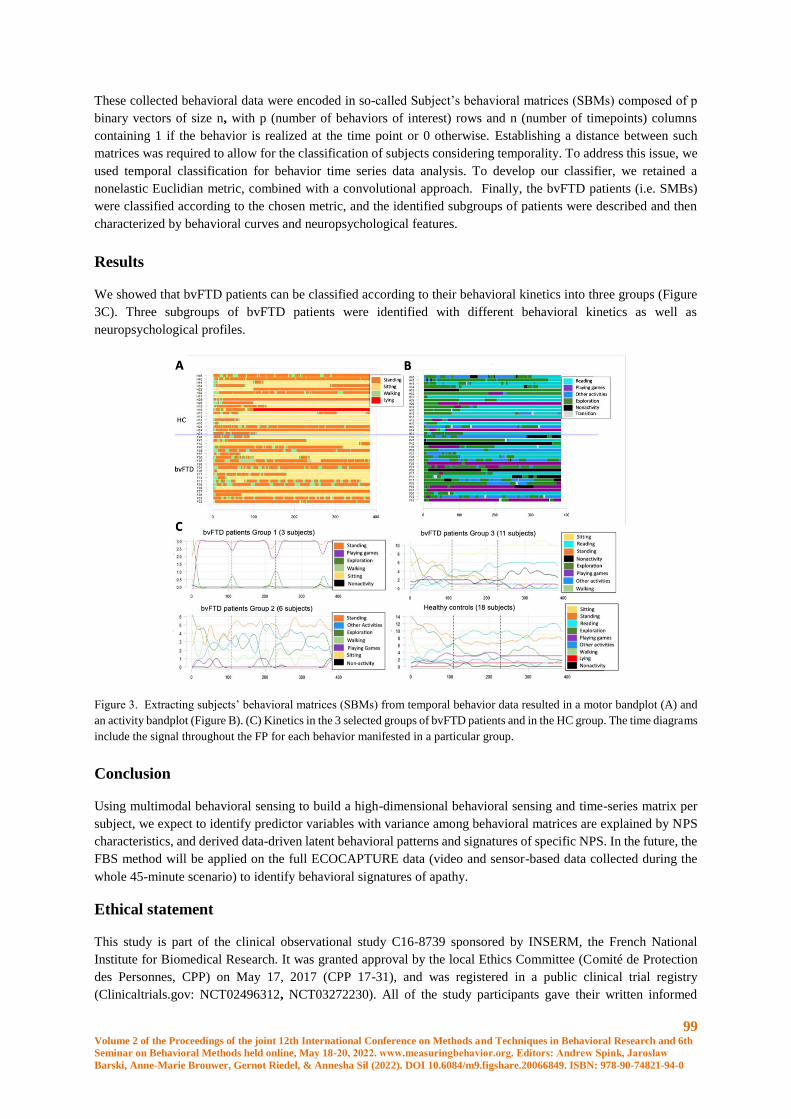
99 Volume 2 of the Proceedings of the joint 12th International Conference on Methods and Techniques in Behavioral Research and 6th
Seminar on Behavioral Methods held online, May 18-20, 2022. www.measuringbehavior.org. Editors: Andrew Spink, Jarosław
Barski, Anne-Marie Brouwer, Gernot Riedel, & Annesha Sil (2022). DOI 10.6084/m9.figshare.20066849. ISBN: 978-90-74821-94-0
These collected behavioral data were encoded in so-called Subject’s behavioral matrices (SBMs) composed of p
binary vectors of size n, with p (number of behaviors of interest) rows and n (number of timepoints) columns
containing 1 if the behavior is realized at the time point or 0 otherwise. Establishing a distance between such
matrices was required to allow for the classification of subjects considering temporality. To address this issue, we
used temporal classification for behavior time series data analysis. To develop our classifier, we retained a
nonelastic Euclidian metric, combined with a convolutional approach. Finally, the bvFTD patients (i.e. SMBs)
were classified according to the chosen metric, and the identified subgroups of patients were described and then
characterized by behavioral curves and neuropsychological features.
Results
We showed that bvFTD patients can be classified according to their behavioral kinetics into three groups (Figure
3C). Three subgroups of bvFTD patients were identified with different behavioral kinetics as well as
neuropsychological profiles.
Figure 3. Extracting subjects’ behavioral matrices (SBMs) from temporal behavior data resulted in a motor bandplot (A) and
an activity bandplot (Figure B). (C) Kinetics in the 3 selected groups of bvFTD patients and in the HC group. The time diagrams
include the signal throughout the FP for each behavior manifested in a particular group.
Conclusion
Using multimodal behavioral sensing to build a high-dimensional behavioral sensing and time-series matrix per
subject, we expect to identify predictor variables with variance among behavioral matrices are explained by NPS
characteristics, and derived data-driven latent behavioral patterns and signatures of specific NPS. In the future, the
FBS method will be applied on the full ECOCAPTURE data (video and sensor-based data collected during the
whole 45-minute scenario) to identify behavioral signatures of apathy.
Ethical statement
This study is part of the clinical observational study C16-8739 sponsored by INSERM, the French National
Institute for Biomedical Research. It was granted approval by the local Ethics Committee (Comité de Protection
des Personnes, CPP) on May 17, 2017 (CPP 17-31), and was registered in a public clinical trial registry
(Clinicaltrials.gov: NCT02496312, NCT03272230). All of the study participants gave their written informed

100 Volume 2 of the Proceedings of the joint 12th International Conference on Methods and Techniques in Behavioral Research and 6th
Seminar on Behavioral Methods held online, May 18-20, 2022. www.measuringbehavior.org. Editors: Andrew Spink, Jarosław
Barski, Anne-Marie Brouwer, Gernot Riedel, & Annesha Sil (2022). DOI 10.6084/m9.figshare.20066849. ISBN: 978-90-74821-94-0
consent to participate, in line with French ethical guidelines. This study was performed in accordance with the
Declaration of Helsinki. Anonymity was preserved for all participants.
Funding
Part of this work was funded by grants from the ENEDIS company (ERDF), 2015-2017, and from the foundation
“Fondation pour la recherche médicale”, FRM DEQ20150331725. The research leading to these results has
received funding from the program “Investissements d’avenir”, ANR-10- IAIHU-06. The funders played no role
in the study design, access to the data, or writing of this report.
References
1. Robert, P., Lanctôt, K.L., Agüera-Ortiz, L., Aalten, P., Bremond, F., Defrancesco, M., Hanon, C., David,
R., Dubois, B., Dujardin, K., Husain, M., König, A., Levy, R., Mantua, V., Meulien, D., Miller, D.,
Moebius, H.J., Rasmussen, J., Robert, G., Ruthirakuhan, M., Stella, F., Yesavage, J., Zeghari, R., Manera,
V. (2018). Is it time to revise the diagnostic criteria for apathy in brain disorders? The 2018 international
consensus group. Eur. Psychiatry J. Assoc. Eur. Psychiatr. 54, 71–76.
2. Marin, R.S. (1990). Differential diagnosis and classification of apathy. Am. J. Psychiatry 147, 22–30.
3. Marin, R.S. (1991). Apathy: a neuropsychiatric syndrome. J. Neuropsychiatry Clin. Neurosci. 3, 243–
254.
4. Levy, R., Dubois, B. (2006). Apathy and the Functional Anatomy of the Prefrontal Cortex–Basal Ganglia
Circuits. Cereb. Cortex 16, 916–928.
5. Steinberg, M., Shao, H., Zandi, P., Lyketsos, C.G., Welsh-Bohmer, K.A., Norton, M.C., Breitner, J.C.S.,
Steffens, D.C., Tschanz, J.T., Cache County Investigators (2008). Point and 5-year period prevalence of
neuropsychiatric symptoms in dementia: the Cache County Study. Int. J. Geriatr. Psychiatry 23, 170–
177.
6. David, R., Mulin, E., Mallea, P., Robert, P.H. (2010). Measurement of Neuropsychiatric Symptoms in
Clinical Trials Targeting Alzheimer’s Disease and Related Disorders. Pharm. Basel Switz. 3, 2387–2397.
7. Mohammad, D., Ellis, C., Rau, A., Rosenberg, P.B., Mintzer, J., Ruthirakuhan, M., Herrmann, N.,
Lanctôt, K.L. (2018). Psychometric Properties of Apathy Scales in Dementia: A Systematic Review. J.
Alzheimers Dis. 66, 1065–1082.
8. Mesulam, M.M. (1986). Frontal cortex and behavior. Ann. Neurol. 19, 320–325.
9. Dorsey, E.R., Glidden, A.M., Holloway, M.R., Birbeck, G.L., Schwamm, L.H. (2018). Teleneurology
and mobile technologies: the future of neurological care. Nat. Rev. Neurol. 14, 285–297.
10. Seppälä, J., De Vita, I., Jämsä, T., Miettunen, J., Isohanni, M., Rubinstein, K., Feldman, Y., Grasa, E.,
Corripio, I., Berdun, J., D’Amico, E., M-RESIST Group, Bulgheroni, M. (2019). Mobile Phone and
Wearable Sensor-Based mHealth Approaches for Psychiatric Disorders and Symptoms: Systematic
Review. JMIR Ment. Health 6, e9819.
11. Batrancourt, B., Lecouturier, K., Ferrand-Verdejo, J., Guillemot, V., Azuar, C., Bendetowicz, D.,
Migliaccio, R., Rametti-Lacroux, A., Dubois, B., Levy, R. (2019). Exploration Deficits Under Ecological
Conditions as a Marker of Apathy in Frontotemporal Dementia. Front. Neurol. 10, 941.
12. Godefroy, V., Tanguy, D., Bouzigues, A., Sezer, I., Ferrand‐Verdejo, J., Azuar, C., Bendetowicz, D.,
Carle, G., Rametti‐Lacroux, A., Bombois, S., Cognat, E., Jannin, P., Morandi, X., Ber, I.L., Levy, R.,
Batrancourt, B., Migliaccio, R. (2021). Frontotemporal dementia subtypes based on behavioral inhibition
deficits. Alzheimers Dement. Diagn. Assess. Dis. Monit. 13, e12178.

101 Volume 2 of the Proceedings of the joint 12th International Conference on Methods and Techniques in Behavioral Research and 6th
Seminar on Behavioral Methods held online, May 18-20, 2022. www.measuringbehavior.org. Editors: Andrew Spink, Jarosław
Barski, Anne-Marie Brouwer, Gernot Riedel, & Annesha Sil (2022). DOI 10.6084/m9.figshare.20066849. ISBN: 978-90-74821-94-0
13. “PRISME : human behavior exploration core facility,” Institut du Cerveau. (2022).
<https://institutducerveau-icm.org/fr/prisme-human-behavior-exploration-core-facility>.
14. Batrancourt, B., Migliaccio, R. Tanguy, D., Sezer, I., Godefroy, V., Bouzigues, A. (2022). The
ECOCAPTURE ethograms: apathy ethogram and disinhibition ethogram. Mendeley Data V2.
<https://doi.org/10.17632/mv8hndcd95/2>..
15. Zapala, M.A., Schork, N.J. (2006). Multivariate regression analysis of distance matrices for testing
associations between gene expression patterns and related variables. Proc. Natl. Acad. Sci. U. S. A. 103,
19430–19435.
16. Kuang, D., Ding, C., Park, H. (2012). Symmetric nonnegative matrix factorization for graph clustering.
Proceedings of the 2012 SIAM International Conference on Data Mining (SDM) (Anaheim, California,
USA).
17. Peltier, C., Lejeune, F.X., Jorgensen, L. G. T., Rametti-Lacroux, A., Tanguy, D., Godefroy, V.,
Bendetowicz, D., Carle, G., Cognat, E., Bombois, S., Migliaccio, R., Levy, R., Marin, F., Batrancourt,
B., ECOCAPTURE study group. (In review). A temporal classification method based on behavior time
series data in patients with behavioral variant of frontotemporal dementia and apathy. Journal of
Neuroscience Methods.
102 Volume 2 of the Proceedings of the joint 12th International Conference on Methods and Techniques in Behavioral Research and 6th
Seminar on Behavioral Methods held online, May 18-20, 2022. www.measuringbehavior.org. Editors: Andrew Spink, Jarosław
Barski, Anne-Marie Brouwer, Gernot Riedel, & Annesha Sil (2022). DOI 10.6084/m9.figshare.20066849. ISBN: 978-90-74821-94-0
Optimal subgroup identification in a P300-based collaborative Brain-Computer
Interface
Luigi Bianchi1, Chiara Liti1,Veronica Piccialli2
1 Dipartimento di Ingegneria Civile ed Ingegneria Informatica, Tor Vergata University, Rome, Italy;
[email protected]; [email protected]
2 Dipartimento di Ingegneria Informatica, Automatica e Gestionale, Sapienza University, Rome, Italy;
Abstract
Group decision-making is the process in which two or more people are engaged in generating a solution to a given
problem. Typically, groups have increased sensing and cognition capabilities with respect to single individuals.
Nevertheless, group decisions can be negatively affected by several observers-interaction biases. In the last decade,
researchers have started to use Brain-Computer Interfaces to enhance collective decision-making. A collaborative
Brain-Computer Interface is a system designed for integrating brain signals from a group of users for improving
the decision-making process. The integration of neurophysiological signals from non-communicative users shows
premises in overcoming some disadvantages generated by individuals' interaction while preserving the strength of
the group at the same time. In this work, single-trial ERPs have been averaged across group members and then
processed as a single-user BCI. All the possible group memberships and sizes have been analyzed evaluating both
accuracy and communication speed. The findings of this study further corroborate previous works available in the
literature. The users' contribution to group decisions has been analyzed for identifying the subjects that either
penalize or are fundamental for the group. It turns out that a well-chosen subset of subjects can provide better
performances than the full group and reduce the complexity of the experimental setup.
Introduction
In 1907, Francis Galton came across a weight-judging competition. Eight hundred people tried their luck guessing
the weight of a fat ox. By analyzing the average of the bets, Galton found that it was remarkably close to the true
weight of the ox [1], [2]. Paraphrasing, under the right circumstances, groups are very intelligent and are often
smarter than the smartest individual among them [2]. The “wisdom of crowds” [2] has been widely investigated
by social-psychological researchers, showing that groups typically have increased sensing and cognition
capabilities, allowing them to make better decisions than individuals [3]. Nevertheless, group decisions can be
negatively affected by several factors such as lack of time, sharing of information, group and leadership style, and
communication biases [3], [4]. Recently, researchers have started integrating neurophysiological signals within-
group decision-making processes to improve group performances. It has been shown that the integration of neural
activity could overcome some disadvantages generated by individuals' interactions while preserving the strength
of the group [4]. In this framework, collaborative Brain-Computer Interfaces (cBCIs), which are systems designed
for integrating brain signals from a group of users, show premises to enhance group decisions. Research on
collaborative BCI explores three different yet complementary aspects underlying a group decision: (i) how to
combine brain activity of group members to enhance group decision in both accuracy and communication speed,
(ii) how accuracy and communication speed change according to group size, and (iii) are there subjects that would
be better to remove or that are fundamental to improve group performance? In this work, both points (ii) and (iii)
have been investigated. In particular, single-trial ERPs have been averaged across group members and then
processed as a single-user BCI.
Literature Review
103 Volume 2 of the Proceedings of the joint 12th International Conference on Methods and Techniques in Behavioral Research and 6th
Seminar on Behavioral Methods held online, May 18-20, 2022. www.measuringbehavior.org. Editors: Andrew Spink, Jarosław
Barski, Anne-Marie Brouwer, Gernot Riedel, & Annesha Sil (2022). DOI 10.6084/m9.figshare.20066849. ISBN: 978-90-74821-94-0
Group (or Collective, or Collaborative) decision-making is the process in which two or more people are engaged
in generating a solution to a given problem [5]. A combination of sensing and cognition capabilities allows for
making better decisions [3]. In the last decade, researchers have started to use BCIs to enhance collective decision-
making. A cBCI is a system designed for integrating brain signals from a group of users for improving the decision-
making process. Various approaches to integrating electroencephalographic (EEG) signals have also been
proposed. For instance, single-trial event-related potentials (ERPs) can be averaged across group members and
then processed as in a single “mean user” BCI. Alternatively, EEG features can be inferred from the brain activity
of each user and then concatenated to build the group's feature vector. The obtained vector is then processed by a
single classifier. Finally, the output of several single-user BCI can be combined using a voting system [6]. In [7],
three different EEG-integration strategies namely (a) ERP averaging, (b) Feature Concatenating, and (c) Voting
have been applied to EEG data collected from twenty subjects in a movement-planning experiment. In (c), a
support vector machine (SVM) classifier was trained for each subject. The classification output was then weighted
according to each user's training accuracy. The findings in [7], can be summarized as follows: (1) the combination
of multiple EEG data significantly increases the accuracy. Although the mean accuracy across single-user BCIs
was 66%, the voting method, the ERP averaging, and the feature concatenating approach obtained 95%, 92%, and
84% of accuracy respectively; (2) the classification accuracy is enhanced when the group size increases. With the
voting approach, the accuracy increased from 66% to 80%, 88%, 93%, and 95% as the number of subjects
increased from 1 to 5, 10, 15, and 20 respectively; (3) the voting method achieved the best results; (4) the time
required to make a decision varies according to both the desired accuracy and the group size. In [8] and [9], a two-
layers SVM has been applied to combine multiple EEG data recorded during a visual target detection task and a
visual Go-NoGo task respectively. The first layer SVM was used to perform the single-user classification. In this
framework, the classification output is the probability for each user to be in the target condition. These probabilities
have been then concatenated generating the features vector for the group classification. In [9], the cBCI enhances
the performance with respect to both the average of single-user accuracy (11% higher) and the best individual
accuracy (6% higher). Similar findings can be achieved considering the Go-NoGo task [8]. The collaborative
system outperforms both the mean of the single-user accuracy and the performance of the best subject within the
group, reaching 80% of accuracy. Online results also suggested that cBCI is able to speed up the decision process
while maintaining a high level of accuracy. In [10], the authors integrated the EEG of twenty individuals engaged
in discriminating among pictures of cars and faces. Three different voting rules referred to as Optimal Linear,
Majority and Extreme have been used for combining information across the users. The integration of multiple
users' brain activity leads to much higher accuracy in identifying the visual stimuli with respect to single-user
BCIs. Moreover, the authors compared the performance of groups having different sizes showing that better
performances are obtained as the group size increases. In [11], ten healthy subjects were asked to copy-spell 40
characters using the standard P300 Speller [12]. Bayesian linear discriminant analysis has been used to perform
the single-user classification task. Different post-classification integration strategies have been evaluated by
varying the number of subjects engaged in the decision process. In both single-user and group settings, the number
of iterations needed for each selection ranges from 1 to 10. In particular, combining data across subjects provides
higher accuracy with respect to increasing the number of iterations per selection. By summing the output of each
Bayesian classifier, the accuracy reached a value of 92%. In [4], the combination of a BCI with human behavioral
responses has been investigated. Ten healthy subjects were asked to decide whether two visual patterns were the
same. The proposed cBCI exploits the following features: the decision made by each member, the neural features
extracted from the EEG signal of each group member (nf), and the time required to make the decision (RT). Three
different weighted voting rules have been used to perform the group's decision. The choice of each subject has
been weighed according to the RT, the nf and a combination of them, the RTnf methods. The authors evaluated the
performance of groups having increasing sizes by testing all the possible memberships of the groups. It has been
shown that group decisions outperformed single-users ones. Groups of size 2 gained 2.23%, 2.09%, and 2.76%
accuracy using the RT-, the nf-, and the RTnf-based methods respectively. Group size 10 achieved a mean accuracy
of 96.88%, 97.33%, and 96.88% with the RT-, the nf-, and the RTnf-based approaches respectively. The average
accuracy across all the subjects was 87.5%, while 6 subjects were enough to reach 95% of accuracy with all the
proposed integration strategies. The nf-based groups with ten members achieved a mean accuracy of 98%. The
RTnf-based voting rule was the most consistent, being the best or the second-best in 90% of the evaluated cases.
Moreover, it outperformed the best performer in each group. Findings in [4] further corroborated that the
104 Volume 2 of the Proceedings of the joint 12th International Conference on Methods and Techniques in Behavioral Research and 6th
Seminar on Behavioral Methods held online, May 18-20, 2022. www.measuringbehavior.org. Editors: Andrew Spink, Jarosław
Barski, Anne-Marie Brouwer, Gernot Riedel, & Annesha Sil (2022). DOI 10.6084/m9.figshare.20066849. ISBN: 978-90-74821-94-0
integration of perceptual information across non-communicating observers is possible and promising. From the
response time point of view, the authors evaluated the performance level achievable by making decisions from the
fastest user, the two fastest, the three fastest, and the four fastest ones. When the fastest observers make a decision,
there is a high improvement in accuracy for the RTnf-based method for all group sizes. The hybrid cBCI proposed
by Poli et al. [4] has been further investigated on visual search on both simple shapes in [13] and realistic stimuli
in [3], thus showing its reliability even on much harder visual tasks. In literature, cBCIs have been tested on several
visual tasks showing their high potential. Moreover, studies on collaborative BCI often suggested that voting
methods are optimal for collaborative EEG-based classification, especially when the decision values of the single
classifiers (instead of the predicted class) are used for the integration [6]. Moreover, the benefits of a cBCI in terms
of both accuracy and communication speed strongly vary according to the group size [4].
Materials and Methods
Data
In this work, data recorded from ten healthy subjects engaged in a P300 Speller task have been used for simulating
the group decision-making process. The subjects were asked to copy-spell 18 characters. Cues are arranged within
a 6 x 6 matrix, each character selection consists of 8 iterations. For each subject, a total of 1728 stimuli (18
characters x 8 iterations x 12 stimuli (6 columns + 6 rows)) have been analyzed. Scalp EEG potentials were
recorded through 16 Ag/AgCl electrodes covering the left, right, and central scalp (Fz, FCz, Cz, CPz, Pz, Oz, F3,
F4, C3, C4, CP3, CP4, P3, P4, PO7, PO8) based on the 10-10 standard (for more details see [14]). The dataset can
be downloaded from the BNCI Horizon-2020 database [15] (Dataset 9: Covert and overt ERP-based BCI (009-
2014)). Although the P300 speller is not typically employed in collaborative BCIs, this dataset can be successfully
used to test the benefits of combining the EEG data for performing a group decision offline. This is because the
characters to select as well as the used pseudo-random stimulation sequences and timings are the same for all
participants. Moreover, the participants performed the spelling tasks in isolation, thus allowing the potential of a
non-communicating cBCI setting to be reproduced.
Method
All the possible group memberships and sizes have been analyzed evaluating both accuracy and communication
speed. More in detail, 1023 different combinations have been processed. For each group, the single-trial ERPs
have been averaged across the group members. Two different classification strategies have been performed: (1)
the no-stopping method (NSM), and (2) the early-stopping method (ESM) proposed in [16]. Within (1), for each
character the brain responses to each stimulus have been averaged across the iterations before being classified. A
linear SVM [17] has then been trained to assign a positive decision value to the target stimuli – i.e., one row and
one column for each character’s selection. Based on the assumption that the P300 is elicited by exactly one of the
six rows/columns stimuli and, considering that its response is invariant to row/column stimuli, the target character
is identified as the intersection to the row/column stimulus matching the maximum decision value [18]. In (2), for
each character’s selection, the number of iterations is adapted according to the ongoing classification. A linear
SVM [17] has then been trained to assign a positive decision value as well as within the NSM. A score is then
assigned to each row/column stimulus based on the distribution of the decision values within the ongoing
row/column stimulation sequence. For each stimulus, the assigned scores are then summed up iteration by iteration.
The early stopping is performed at a certain iteration if the maximum cumulative score is greater than a suitable
threshold. The predicted character is then identified as the intersection of the selected row and column. All the
SVMs have been trained using three characters and evaluated over the remaining fifteen characters. The group
performance is assessed considering both the speed – i.e. the number of iterations needed for an accurate
classification – and the accuracy – i.e. the percentage of characters correctly classified [18]. The information
transfer rate (ITR, bit/min) has been used to evaluate the communication speed. It is a communication measure
based on Shannon channel theory with some simplifying assumptions. It can be computed by dividing the number
of bits transmitted per trial by the trial duration in minutes [19].
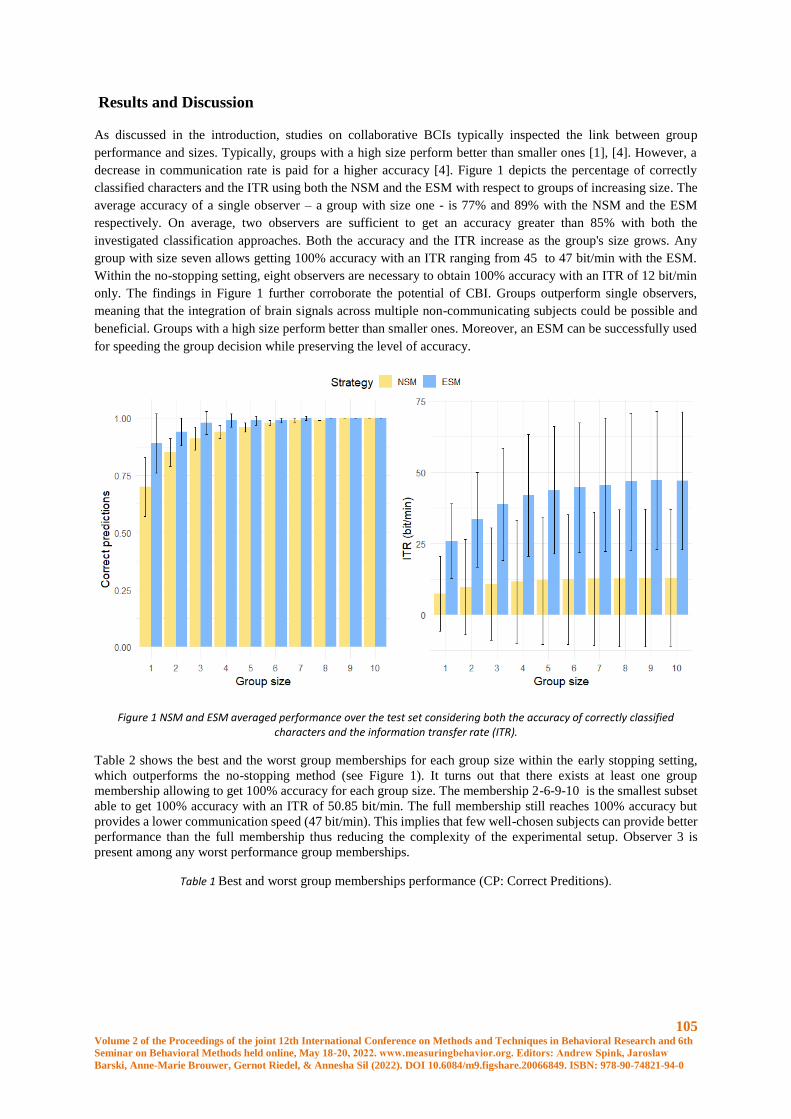
105 Volume 2 of the Proceedings of the joint 12th International Conference on Methods and Techniques in Behavioral Research and 6th
Seminar on Behavioral Methods held online, May 18-20, 2022. www.measuringbehavior.org. Editors: Andrew Spink, Jarosław
Barski, Anne-Marie Brouwer, Gernot Riedel, & Annesha Sil (2022). DOI 10.6084/m9.figshare.20066849. ISBN: 978-90-74821-94-0
Results and Discussion
As discussed in the introduction, studies on collaborative BCIs typically inspected the link between group
performance and sizes. Typically, groups with a high size perform better than smaller ones [1], [4]. However, a
decrease in communication rate is paid for a higher accuracy [4]. Figure 1 depicts the percentage of correctly
classified characters and the ITR using both the NSM and the ESM with respect to groups of increasing size. The
average accuracy of a single observer – a group with size one - is 77% and 89% with the NSM and the ESM
respectively. On average, two observers are sufficient to get an accuracy greater than 85% with both the
investigated classification approaches. Both the accuracy and the ITR increase as the group's size grows. Any
group with size seven allows getting 100% accuracy with an ITR ranging from 45 to 47 bit/min with the ESM.
Within the no-stopping setting, eight observers are necessary to obtain 100% accuracy with an ITR of 12 bit/min
only. The findings in Figure 1 further corroborate the potential of CBI. Groups outperform single observers,
meaning that the integration of brain signals across multiple non-communicating subjects could be possible and
beneficial. Groups with a high size perform better than smaller ones. Moreover, an ESM can be successfully used
for speeding the group decision while preserving the level of accuracy.
Figure 1 NSM and ESM averaged performance over the test set considering both the accuracy of correctly classified characters and the information transfer rate (ITR).
Table 2 shows the best and the worst group memberships for each group size within the early stopping setting,
which outperforms the no-stopping method (see Figure 1). It turns out that there exists at least one group
membership allowing to get 100% accuracy for each group size. The membership 2-6-9-10 is the smallest subset
able to get 100% accuracy with an ITR of 50.85 bit/min. The full membership still reaches 100% accuracy but
provides a lower communication speed (47 bit/min). This implies that few well-chosen subjects can provide better
performance than the full membership thus reducing the complexity of the experimental setup. Observer 3 is
present among any worst performance group memberships.
Table 1 Best and worst group memberships performance (CP: Correct Preditions).
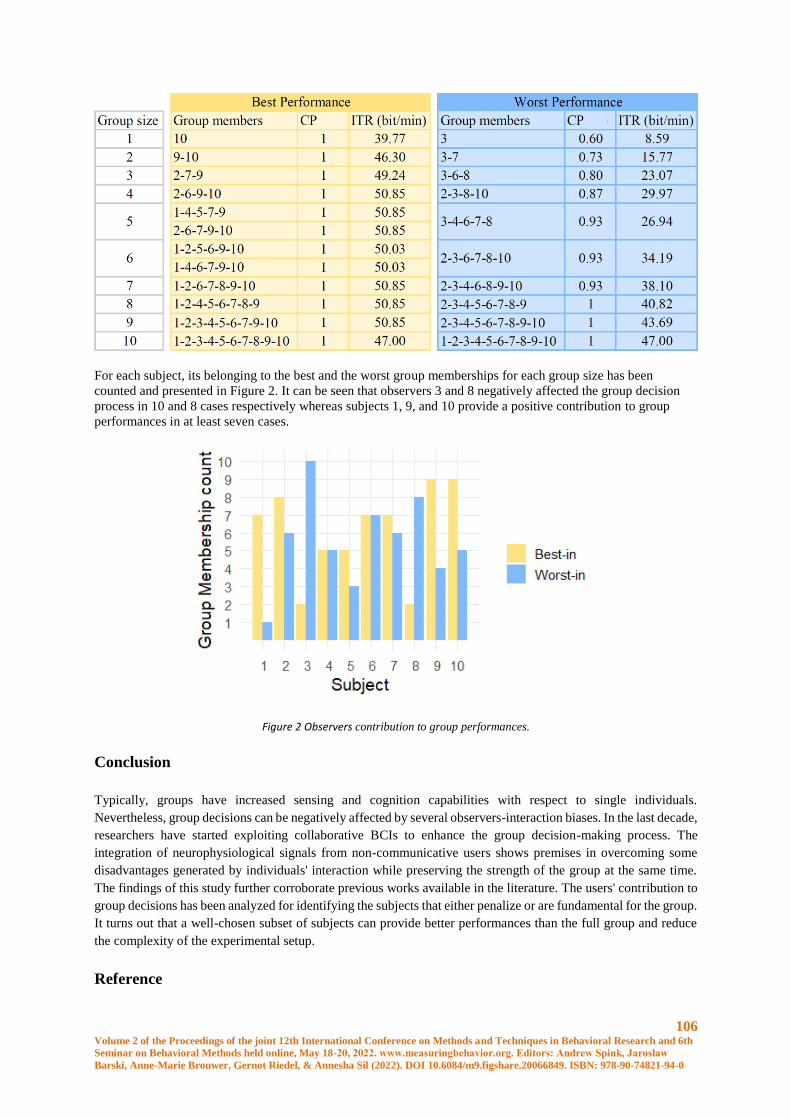
106 Volume 2 of the Proceedings of the joint 12th International Conference on Methods and Techniques in Behavioral Research and 6th
Seminar on Behavioral Methods held online, May 18-20, 2022. www.measuringbehavior.org. Editors: Andrew Spink, Jarosław
Barski, Anne-Marie Brouwer, Gernot Riedel, & Annesha Sil (2022). DOI 10.6084/m9.figshare.20066849. ISBN: 978-90-74821-94-0
For each subject, its belonging to the best and the worst group memberships for each group size has been
counted and presented in Figure 2. It can be seen that observers 3 and 8 negatively affected the group decision
process in 10 and 8 cases respectively whereas subjects 1, 9, and 10 provide a positive contribution to group
performances in at least seven cases.
Figure 2 Observers contribution to group performances.
Conclusion
Typically, groups have increased sensing and cognition capabilities with respect to single individuals.
Nevertheless, group decisions can be negatively affected by several observers-interaction biases. In the last decade,
researchers have started exploiting collaborative BCIs to enhance the group decision-making process. The
integration of neurophysiological signals from non-communicative users shows premises in overcoming some
disadvantages generated by individuals' interaction while preserving the strength of the group at the same time.
The findings of this study further corroborate previous works available in the literature. The users' contribution to
group decisions has been analyzed for identifying the subjects that either penalize or are fundamental for the group.
It turns out that a well-chosen subset of subjects can provide better performances than the full group and reduce
the complexity of the experimental setup.
Reference

107 Volume 2 of the Proceedings of the joint 12th International Conference on Methods and Techniques in Behavioral Research and 6th
Seminar on Behavioral Methods held online, May 18-20, 2022. www.measuringbehavior.org. Editors: Andrew Spink, Jarosław
Barski, Anne-Marie Brouwer, Gernot Riedel, & Annesha Sil (2022). DOI 10.6084/m9.figshare.20066849. ISBN: 978-90-74821-94-0
[1] M. P. Eckstein et al., “Neural decoding of collective wisdom with multi-brain computing,” NeuroImage,
vol. 59, no. 1. pp. 94–108, 2012, doi: 10.1016/j.neuroimage.2011.07.009.
[2] J. Surowiecki, THE WISDOM OF CROWDS. 2005.
[3] D. Valeriani, C. Cinel, and R. Poli, “Group Augmentation in Realistic Visual-Search Decisions via a
Hybrid Brain-Computer Interface,” Sci. Rep., vol. 7, no. 1, 2017, doi: 10.1038/s41598-017-08265-7.
[4] R. Poli, D. Valeriani, and C. Cinel, “Collaborative brain-computer interface for aiding decision-making,”
PLoS One, vol. 9, no. 7, 2014, doi: 10.1371/journal.pone.0102693.
[5] G. DeSanctis and R. B. Gallupe, “FOUNDATION FOR THE STUDY OF GROUP DECISION
SUPPORT SYSTEMS.,” Manage. Sci., vol. 33, no. 5, pp. 589–609, 1987, doi: 10.1287/mnsc.33.5.589.
[6] C. Cinel, D. Valeriani, and R. Poli, “Neurotechnologies for human cognitive augmentation: Current state
of the art and future prospects,” Frontiers in Human Neuroscience, vol. 13. 2019, doi:
10.3389/fnhum.2019.00013.
[7] Y. Wang and T. P. Jung, “A collaborative brain-computer interface for improving human performance,”
PLoS One, vol. 6, no. 5, 2011, doi: 10.1371/journal.pone.0020422.
[8] P. Yuan, Y. Wang, X. Gao, T. P. Jung, and S. Gao, “A collaborative brain-computer interface for
accelerating human decision making,” in International Conference on Universal Access in Human-
Computer Interaction, Springer, 2013, vol. 8009 LNCS, no. PART 1, pp. 672--681, doi: 10.1007/978-3-
642-39188-0-72.
[9] Peng Yuan, Yijun Wang, Wei Wu, Honglai Xu, Xiaorong Gao, and Shangkai Gao, “Study on an online
collaborative BCI to accelerate response to visual targets,” in Proceedings of 34nd IEEE EMBS
Conference, 2013, pp. 1736–1739, doi: 10.1109/embc.2012.6346284.
[10] M. P. Eckstein et al., “Neural decoding of collective wisdom with multi-brain computing,” Neuroimage,
vol. 59, no. 1, pp. 94–108, 2012, doi: 10.1016/j.neuroimage.2011.07.009.
[11] H. Cecotti and B. Rivet, “Subject combination and electrode selection in cooperative brain-computer
interface based on event related potentials,” Brain Sci., vol. 4, no. 2, pp. 335–355, 2014, doi:
10.3390/brainsci4020335.
[12] L. A. Farwell and E. Donchin, “Talking off the top of your head: toward a mental prosthesis utilizing
event-related brain potentials,” Electroencephalogr. Clin. Neurophysiol., vol. 70, no. 6, pp. 510–523,
1988, doi: 10.1016/0013-4694(88)90149-6.
[13] D. Valeriani, R. Poli, and C. Cinel, “Enhancement of group perception via a collaborative brain-
computer interface,” IEEE Trans. Biomed. Eng., vol. 64, no. 6, pp. 1238–1248, 2017, doi:
10.1109/TBME.2016.2598875.
[14] F. Aloise et al., “A covert attention P300-based brain-computer interface: Geospell,” Ergonomics, vol.
55, no. 5, pp. 538–551, May 2012, doi: 10.1080/00140139.2012.661084.
[15] B. H.- Horizon and U. 2020, “Roadmap-The Future in Brain/Neural-Computer Interaction.” [Online].
Available: http://bnci-horizon-2020.eu/database/data-sets. [Accessed: 29-Jan-2020].
[16] L. Bianchi, C. Liti, and V. Piccialli, “A New Early Stopping Method for P300 Spellers,” IEEE Trans.
Neural Syst. Rehabil. Eng., vol. 27, no. 8, pp. 1635–1643, 2019, doi: 10.1109/TNSRE.2019.2924080.
[17] J. Friedman, T. Hastie, and R. Tibshirani, The elements of statistical learning, vol. 1. 2001.

108 Volume 2 of the Proceedings of the joint 12th International Conference on Methods and Techniques in Behavioral Research and 6th
Seminar on Behavioral Methods held online, May 18-20, 2022. www.measuringbehavior.org. Editors: Andrew Spink, Jarosław
Barski, Anne-Marie Brouwer, Gernot Riedel, & Annesha Sil (2022). DOI 10.6084/m9.figshare.20066849. ISBN: 978-90-74821-94-0
[18] D. J. Krusienski et al., “A comparison of classification techniques for the P300 Speller,” J. Neural Eng.,
vol. 3, no. 4, Dec. 2006, doi: 10.1088/1741-2560/3/4/007.
[19] J. R. Wolpaw, H. Ramoser, D. J. McFarland, and G. Pfurtscheller, “EEG-based communication:
Improved accuracy by response verification,” IEEE Trans. Rehabil. Eng., vol. 6, no. 3, pp. 326–333,
1998, doi: 10.1109/86.712231.
109 Volume 2 of the Proceedings of the joint 12th International Conference on Methods and Techniques in Behavioral Research and 6th
Seminar on Behavioral Methods held online, May 18-20, 2022. www.measuringbehavior.org. Editors: Andrew Spink, Jarosław
Barski, Anne-Marie Brouwer, Gernot Riedel, & Annesha Sil (2022). DOI 10.6084/m9.figshare.20066849. ISBN: 978-90-74821-94-0
Setup for Multimodal Human Stress Dataset Collection
B. Mahesh1, D. Weber1, J. Garbas1, A. Foltyn1, M. P. Oppelt1, L. Becker2, N. Rohleder2, N. Lang1
1Fraunhofer Institute for Integrated Circuits IIS, Erlangen, Germany, 2Lehrstuhl für Gesundheitspsychologie,
Friedrich-Alexander-Universität Erlangen-Nürnberg, Germany; [email protected]
Introduction
Prolonged and intense exposure to stressful situations impacts a person negatively if the person-specific coping
levels are exceeded [1]. The growing trend of sensing devices and self-monitoring applications pave the way for
better stress management. However, building stress monitoring and alleviating systems is challenging due to the
highly subjective nature of stress responses. In this regard, a well-researched, representative dataset plays a key
role in harnessing potential information. The dataset should capture multidimensional aspects of stress responses
- psychological, physiological, behavioral, and contextual. The setup for building an information-rich dataset is
presented in this work. It brings together the expertise from hardware and software technology as well as biological
and health psychology.
Background
The major challenges posed by the nature of stress responses are the lack of consensus on the ground truth for
stress levels [2] and interpersonal and intrapersonal variabilities. Interpersonal variability is the lack of consistency
in the perception of stressful situations and responses to them [3], whereas intrapersonal variability is the variation
over time for an individual [4]. This highly subjective characteristic of stress responses persuades the consideration
of a clinically-validated stress protocol for stress induction and multiple reliable modalities.
Several datasets have been compiled and published over the past two decades for the detection of stress. Drivedb
dataset collected by Healey et al. [5] is one of the earliest public datasets with multiple physiological modalities
to detect automobile driver’s stress. The dataset is collected during real-life driving scenarios and annotated based
on the road conditions. However, the Drivedb dataset overlooks the driver’s self-reflection of perceived stress.
Koldijk et al. [6] collected the SWELL Knowledge Work dataset for user modelling based on realistic office-work-
related stress responses using unobtrusive sensors. This information-rich dataset is composed of physiological,
behavioral, as well as physical modalities. It also includes subjective experience-related and personality-related
questionnaires. Nevertheless, the dataset has a limited number of subjects. Distracted driving dataset by Taamneh
et al. [7] is collected during simulated driving under different kinds of stressors. The sample population of the
dataset is the highest and comprises of two age-groups. The dataset consists of multiple modalities, including
thermally extracted facial perspiration. Personality traits are recorded in the dataset as well. However, a limitation
of this dataset is the absence of electrocardiogram (ECG) which provides accurate heart rate variability and is a
promising indicator of stress [2]. Schmidt et al. [8] published Wearable Stress and Affect Detection dataset with a
focus on stress as well as affect detection using wearable devices. The dataset is collected using the Trier Social
Stress Test protocol as the stress induction method. TSST is identified to elicit cortisol activity [9, 10]. Five self-
reports were collected to assess their affective and stress states. The dataset includes promising modalities, such
as ECG. However, the deficits of this dataset are the low sample population and lack of self-reported information
on personality and behavior.
The proposed setup for the data collection is motivated by the requirements presented by Mahesh et al. [11] for a
reference dataset for stress detection. The work emphasizes on i) having a representative sample population, ii)
using an effective stress-inducing stimuli, iii) capturing multiple promising modalities including electrocardiogram
and electrodermal activity, vi) obtaining measurements from high-quality physiological sensors, and v) capturing
various self-reported information on the perception of stress, context, and personality. A clinically validated
protocol is necessary to ensure effective or generic stress induction [9]. Building upon these requirements and
adapting them to social stress that individuals face in daily life, a data collection setup is proposed. The resulting
dataset presents a unique combination of promising physiological modalities (such as ECG, salivary cortisol) as
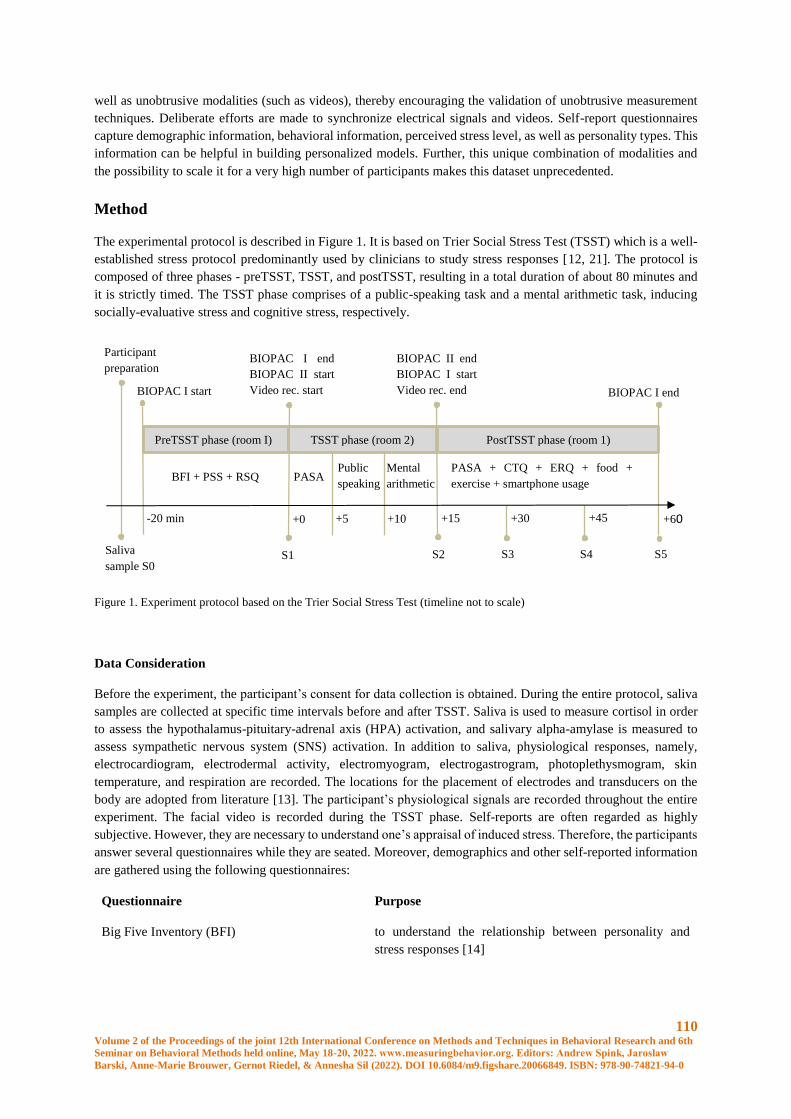
110 Volume 2 of the Proceedings of the joint 12th International Conference on Methods and Techniques in Behavioral Research and 6th
Seminar on Behavioral Methods held online, May 18-20, 2022. www.measuringbehavior.org. Editors: Andrew Spink, Jarosław
Barski, Anne-Marie Brouwer, Gernot Riedel, & Annesha Sil (2022). DOI 10.6084/m9.figshare.20066849. ISBN: 978-90-74821-94-0
well as unobtrusive modalities (such as videos), thereby encouraging the validation of unobtrusive measurement
techniques. Deliberate efforts are made to synchronize electrical signals and videos. Self-report questionnaires
capture demographic information, behavioral information, perceived stress level, as well as personality types. This
information can be helpful in building personalized models. Further, this unique combination of modalities and
the possibility to scale it for a very high number of participants makes this dataset unprecedented.
Method
The experimental protocol is described in Figure 1. It is based on Trier Social Stress Test (TSST) which is a well-
established stress protocol predominantly used by clinicians to study stress responses [12, 21]. The protocol is
composed of three phases - preTSST, TSST, and postTSST, resulting in a total duration of about 80 minutes and
it is strictly timed. The TSST phase comprises of a public-speaking task and a mental arithmetic task, inducing
socially-evaluative stress and cognitive stress, respectively.
Figure 1. Experiment protocol based on the Trier Social Stress Test (timeline not to scale)
Data Consideration
Before the experiment, the participant’s consent for data collection is obtained. During the entire protocol, saliva
samples are collected at specific time intervals before and after TSST. Saliva is used to measure cortisol in order
to assess the hypothalamus-pituitary-adrenal axis (HPA) activation, and salivary alpha-amylase is measured to
assess sympathetic nervous system (SNS) activation. In addition to saliva, physiological responses, namely,
electrocardiogram, electrodermal activity, electromyogram, electrogastrogram, photoplethysmogram, skin
temperature, and respiration are recorded. The locations for the placement of electrodes and transducers on the
body are adopted from literature [13]. The participant’s physiological signals are recorded throughout the entire
experiment. The facial video is recorded during the TSST phase. Self-reports are often regarded as highly
subjective. However, they are necessary to understand one’s appraisal of induced stress. Therefore, the participants
answer several questionnaires while they are seated. Moreover, demographics and other self-reported information
are gathered using the following questionnaires:
Questionnaire Purpose
Big Five Inventory (BFI) to understand the relationship between personality and
stress responses [14]
+30
PreTSST phase (room I) TSST phase (room 2) PostTSST phase (room 1)
Public
speaking
Mental
arithmetic
Saliva
sample S0 S1 S2 S3 S4 S5
-20 min +0 +5 +15 +10 +45 +60
Participant
preparation BIOPAC I end
BIOPAC II start
Video rec. start
BIOPAC II end
BIOPAC I start
Video rec. end BIOPAC I end
BFI + PSS + RSQ PASA
PASA + CTQ + ERQ + food +
exercise + smartphone usage
BIOPAC I start
111 Volume 2 of the Proceedings of the joint 12th International Conference on Methods and Techniques in Behavioral Research and 6th
Seminar on Behavioral Methods held online, May 18-20, 2022. www.measuringbehavior.org. Editors: Andrew Spink, Jarosław
Barski, Anne-Marie Brouwer, Gernot Riedel, & Annesha Sil (2022). DOI 10.6084/m9.figshare.20066849. ISBN: 978-90-74821-94-0
Response Styles Questionnaire (RSQ) to record coping styles in dealing with depressive symptoms
as traits [15]
Perceived Stress Scale (PSS) to assesses how often stressful situations have been
perceived in the last month. [16]
Primary and Secondary Appraisal (PASA)
to record situational cognitive appraisal [17]
Childhood Trauma Questionnaire (CTQ) to assess adverse childhood experiences [18]
Emotion Regulation Questionnaire (ERQ) to assess individual differences in the habitual use of
emotion regulation strategies [19]
Food habits, physical exercise and smartphone
usage reports
to assess the relationship between habits, behavior, and
stress
Table 1: Various questionnaires considered in the dataset
Hardware setup
The three different phases of the experiment are alternated between two separate rooms. One room is dedicated to
preTSST and postTSST and it is equipped with one BIOPAC [20] system for physiological recording. Another
room is dedicated to the TSST phase and is equipped with another BIOPAC system as well as an industrial camera.
Movement of the participant between the rooms is made effortless with the help of modular extension cables. Filter
settings of the BIOPAC hardware are chosen such that the noise is cancelled but the required signal information
is retained. In the TSST room, the camera view is adjusted to capture the face in the centre. Non-flickering lights
are used for noiseless video recording. Time is synchronized between the videos and the BIOPAC data using an
analog trigger signal, thereby making event analysis possible.
Software setup
Recordings on the BIOPAC system are controlled by BIOPAC’s AcqKnowledge data acquisition and analysis
software. A custom data acquisition template for physiological data acquisition is used. The signals are visually
inspected using the software for their correctness before the start of recording. The electrodermal response is
calibrated before recording. Physiological data from BIOPAC is saved in the text as well as graph format to enable
processing either using external software tools or with AcqKnowledge software.
Conclusion
This article describes a setup to collect a dataset for stress detection. The strength of the resulting dataset lies in
the diverse combination of modalities considered and the synchronization of these modalities. A dataset is being
collected with the described setup. The sample population of the complete dataset is expected to be seventy-nine.
The dataset is being collected in two stages and it could be conveniently scaled further. The first stage of the data
collection resulted in a dataset from thirty-six participants (mean age = 24, std = 3.74). 216 saliva samples and
2880 minutes of physiological data are collected. 540 minutes of high-quality video with a framerate of 25 and a
high resolution of 1980x1080 pixels are recorded.
The setup described results in a high-quality, multimodal dataset for stress research. The significance gained over
the other existing public datasets is attributed to using scientifically-backed stress induction protocol, huge sample
population, a diverse range of modalities, and sensing devices with research- and industry-grade technology. This
dataset opens up a possibility of assessing stress with physiology along with facial videos. The variety of self-
112 Volume 2 of the Proceedings of the joint 12th International Conference on Methods and Techniques in Behavioral Research and 6th
Seminar on Behavioral Methods held online, May 18-20, 2022. www.measuringbehavior.org. Editors: Andrew Spink, Jarosław
Barski, Anne-Marie Brouwer, Gernot Riedel, & Annesha Sil (2022). DOI 10.6084/m9.figshare.20066849. ISBN: 978-90-74821-94-0
reported information captured supports the development of personalized stress detection models. With the
availability of multimodal data, one can deduce various response patterns to stress, find correlations between
different aspects, such as physiology and personality, etc. The deductions from this well-founded dataset could
facilitate the development of stress level monitoring and alleviation systems. We hope that this dataset encourages
the study of physiological, psychological, and behavioral responses to stress.
Ethical Statement
This protocol was approved by the ethics committee of Friedrich –Alexander University Erlangen Nuremberg
under 350_17B on December 19, 2017.
Acknowledgement
We acknowledge Daniel Blatt, Riccarda Moro, Leonie Berger, and Antonia Gelardi for their assistance in data
collection. This work was supported by the Bavarian Ministry of Economic Affairs, Regional Development and
Energy through the Center for Analytics – Data – Applications (ADA-Center) within the framework of „BAYERN
DIGITAL II“(20-3410-2-9-8). This publication is partly funded by the Federal Ministry of Education and Research
under the project reference numbers 16FMD01K, 16FMD02 and 16FMD03.
References:
1. Selye, H., (1950). Stress and the general adaptation syndrome, British Med. J., vol. 1, no. 4667, pp. 1383-1392.
2. Thayer, J. F., Åhs, F., Fredrikson, M., Sollers, J. J., Wager, T. D. (2012). A meta-analysis of heart rate variability
and neuroimaging studies: Implications for heart rate variability as a marker of stress and health, Neuroscience &
Biobehavioral Reviews, 36(2), 747-756.
3. Lykken, D. T., Venables, P. H. (1971). Direct measurement of skin conductance: a proposal for standardization.
Psychophysiology. 8(5), 656-72.
4. Hernandez, J., Morris, R. R., Picard, R. W., (2011) Callcenter stress recognition with person-specific models.
Proceedings of the 4th international conference on Affective computing and intelligent interaction. Volume part I,
125-134.
5. Healey, J. A. and Picard, R. W. (2005). Detecting stress during real-world driving tasks using physiological
sensors, IEEE Transactions on Intelligent Transportation Systems, 6(2). 156-166.
6. Koldijk, S., Sappelli, M., Verberne, S., Neerincx, M., and Kraaij, W. (2014). The SWELL Knowledge Work
dataset for stress and user modeling research, In Proceedings of the 16th International Conference on
Multimodal Interaction, 14, 291-298.
7. Taamneh, S., Tsiamyrtzis, P., Dcosta, M., Buddharaju, P., Khatri, A., Manser, M., Ferris, T., Wunderlich, R.,
and Pavlidis, I. (2017). A multimodal dataset for various forms of distracted driving. Scientific data, 4, 170110.
https://doi.org/10.1038/sdata.2017.110
8. Schmidt, P., Reiss, A., Duerichen, R., Marberger, C. and Laerhoven, K. V. (2018). Introducing WESAD, a
Multimodal Dataset for Wearable Stress and Affect Detection. In Proceedings of the 20th ACM International
Conference on Multimodal Interaction, 400-408.
9. Skoluda, N., Strahler, J., Schlotz, W., Niederberger, L., Marques, S., Fischer, S., Thoma, M. V., Spoerri, C.,
Ehlert, U., Nater, U. M. (2015). Intra-individual psychological and physiological responses to acute laboratory
stressors of different intensity. Psychoneuroendocrinology, 51, 227-236

113 Volume 2 of the Proceedings of the joint 12th International Conference on Methods and Techniques in Behavioral Research and 6th
Seminar on Behavioral Methods held online, May 18-20, 2022. www.measuringbehavior.org. Editors: Andrew Spink, Jarosław
Barski, Anne-Marie Brouwer, Gernot Riedel, & Annesha Sil (2022). DOI 10.6084/m9.figshare.20066849. ISBN: 978-90-74821-94-0
10. Kirschbaum, C., Pirke, K. M., Hellhammer, D. H. (1993). The 'Trier Social Stress Test' - a tool for investigating
psychobiological stress responses in a laboratory setting. Neuropsychobiology. 28(1-2), 76-81.
11. Mahesh, B., Hassan, T., Prassler, E., and Garbas, J., (2019). Requirements for a reference dataset for
multimodal human stress detection, 2019 IEEE International Conference on Pervasive Computing and
Communications Workshops (PerCom Workshops), 492-498.
12. Kudielka, B. M., Hellhammer, D. H., and Kirschbaum, C. (2007). Ten years of research with the Trier Social
Stress Test--Revisited. In E. Harmon-Jones & P. Winkielman (Eds.), Social neuroscience: Integrating biological
and psychological explanations of social behavior, 56-83.
13. Cacioppo, J.T., Tassinary, L.G., and Berntson, G.G., (2007), The handbook of psychophysiology.
14. Rammstedta, B., John, O.P., (2007). Measuring personality in one minute or less: A 10-item short version of
the Big Five Inventory in English and German. Journal of Research in Personality, 41, 203-212.
15. Bürger, C., Kühner, C., (2007). Coping styles in response to depressed mood. Factor structure and
psychometric properties of the German version of the Response Styles Questionnaire (RSQ). Zeitschrift für
Klinische Psychologie und Psychotherapie: Forschung und Praxis, 36(1), 36-45.
16. Cohen, S., Kamarck, T., and Mermelstein, R. (1983). A global measure of perceived stress. Journal of Health
and Social Behavior, 24, 386-396.
17. Gaab, J. (2009). PASA – Primary Appraisal Secondary Appraisal. Verhaltenstherapie. 19. 114-115.
18. Bernstein, D. P., Stein, J. A., Newcomb, M. D., Walker, E., Pogge, D., Ahluvalia, T., Stokes, J., Handelsman,
L., Medrano. M., Desmond, D., and Zule, W. (2003). Development and validation of a brief screening version of
the Childhood Trauma Questionnaire. Child Abuse & Neglect., 27(2), 169-190.
19. Gross, J. J., and John, O.P. (2003). Individual differences in two emotion regulation processes: Implications
for affect, relationships, and well-being. Journal of Personality and Social Psychology, 85, 348-362.
20. BIOPAC Systems, Inc. https://www.biopac.com/product/mp150-system-221/. Accessed 31 March 2022.
21. Dickerson, S. S., & Kemeny, M. E. (2004). Acute stressors and cortisol responses: A theoretical integration
and synthesis of laboratory research. . Psychological Bulletin, 130(3), 355-391.
114 Volume 2 of the Proceedings of the joint 12th International Conference on Methods and Techniques in Behavioral Research and 6th
Seminar on Behavioral Methods held online, May 18-20, 2022. www.measuringbehavior.org. Editors: Andrew Spink, Jarosław
Barski, Anne-Marie Brouwer, Gernot Riedel, & Annesha Sil (2022). DOI 10.6084/m9.figshare.20066849. ISBN: 978-90-74821-94-0
Understanding the effects of sleep deprivation and acute social stress on cognitive
performance using a comprehensive approach
Charelle Bottenheft1, 3, Ivo Stuldreher1, 3, Koen Hogenelst1, Eric Groen1, Jan van Erp1, 3, Robert Kleemann2 and
Anne-Marie Brouwer1
1 TNO, Human Factors, Kampweg 55, 3679DE Soesterberg, the Netherlands, [email protected]
2 TNO, Metabolic Health Research, Zernikedreef 9, 2333CK Leiden, the Netherlands
3 Human Media Interaction, Computer Science, University of Twente, The Netherlands.
Objective
Different professionals (e.g. in the military) have to perform cognitive challenging tasks in multi-stressor
environments. However, our understanding how combined stressors interact and affect cognitive performance is
limited (Van Dongen & Belenky, 2009). This study examined how sleep deprivation (SD) and acute social stress
affect cognitive performance in isolation and in combination, and used a comprehensive approach to find evidence
for a (shared) mechanism. Recent research suggests that SD leads to higher amounts of proinflammatory markers
(i.e. cytokines) in the blood, which assumedly contribute to a decline in cognitive performance (Irwin, 2019;
Shields et al., 2017). In addition, acute social stressors have also been shown to elicit an immune response, as
reflected by circulating cytokines in blood (Marsland et al., 2017; Prather et al., 2014). These findings suggest that
different stressors may affect cognitive performance through an effect on the immune system. We therefore
hypothesize that individuals showing a high proinflammatory response to a combination of two stressors (SD and
acute social stress) are more vulnerable to cognitive decline compared to individuals showing a lower
proinflammatory response. To test this hypothesis, we measured not only cognitive performance, but also the
physiological response and biochemical determinants of metabolism and inflammation at baseline and after SD,
but also in response to an acute social stressor (Tkacheenko & Dinges, 2018).
Method
97 Participants took part in a two-day study. An approval for this study was granted by an accredited medical
research ethics committee (MREC Brabant, reference number: P2045). All participants gave written informed
consent. The SD group (52) underwent a night of controlled SD and the control group (45) had a normal night of
sleep at home. In the morning before and after this night, but also before and after a social stressor, both groups
performed a cognitive test battery to assess cognitive performance. Vigilant attention was measured using the
Psychomotor Vigilance Task (PVT) and executive functioning using the SYNWIN, Go/No-Go task (GN), Task
Switching task (TS) and Sternberg Working Memory task (SB). The widely used Trier Social Stress Test (TSST)
was used as social stressor. Inflammatory, as well as autonomic nervous system (ANS), endocrine and subjective
responses to the social stressor were also recorded prior to and after the night.
Results
First analyses show clear negative effects of SD on the cognitive performance of all tasks in the task battery, except
for task switching. The next step is to analyze and present the physiological and metabolic-inflammatory
parameters that are associated with cognitive decline after SD and acute social stress.
Discussion
To our knowledge, this is the first study that took a comprehensive approach to characterize the metabolic-
inflammatory, psychological and autonomic state at baseline and under acute social stress conditions. This research

115 Volume 2 of the Proceedings of the joint 12th International Conference on Methods and Techniques in Behavioral Research and 6th
Seminar on Behavioral Methods held online, May 18-20, 2022. www.measuringbehavior.org. Editors: Andrew Spink, Jarosław
Barski, Anne-Marie Brouwer, Gernot Riedel, & Annesha Sil (2022). DOI 10.6084/m9.figshare.20066849. ISBN: 978-90-74821-94-0
can contribute to predictions of stressor effects and development of mechanism-based strategies to intervene and
cope with negative effects of stressors in conditions where stressors are unavoidable.
References
1. Irwin, M.R. (2019) Sleep and inflammation: partners in sickness and in health. Nat Rev Immunol 19, 702–
715. https://doi.org/10.1038/s41577-019-0190-z
2. Marsland, A.L., Walsh, C., Lockwood, K., John-Henderson, N.A. (2017). The effects of acute psychological
stress on circulating and stimulated inflammatory markers: a systematic review and meta-analysis. Brain,
behavior, and immunity 64, 208-219.
3. Prather, A.A., Puterman, E., Epel, E. S., Dhabhar, F.S. (2014). Poor sleep quality potentiates stress-induced
cytokine reactivity in postmenopausal women with high visceral abdominal adiposity. Brain, behavior, and
immunity 35, 155-162.
4. Shields, G.S., Moons, W.G., Slavich, G.M. (2017). Inflammation, self-regulation, and health: An
immunologic model of self-regulatory failure. Perspectives on Psychological Science, 12(4), 588-612.
5. Tkachenko, O., Dinges, D.F. (2018). Interindividual variability in neurobehavioral response to sleep loss: A
comprehensive review. Neuroscience & Biobehavioral Reviews 89, 29-48.
6. Van Dongen, H.P., Belenky, G. (2009). Individual differences in vulnerability to sleep loss in the work
environment. Industrial health 47(5), 518-526.
116 Volume 2 of the Proceedings of the joint 12th International Conference on Methods and Techniques in Behavioral Research and 6th
Seminar on Behavioral Methods held online, May 18-20, 2022. www.measuringbehavior.org. Editors: Andrew Spink, Jarosław
Barski, Anne-Marie Brouwer, Gernot Riedel, & Annesha Sil (2022). DOI 10.6084/m9.figshare.20066849. ISBN: 978-90-74821-94-0
Session Theme: Methods and tools for
measuring emotions
117 Volume 2 of the Proceedings of the joint 12th International Conference on Methods and Techniques in Behavioral Research and 6th
Seminar on Behavioral Methods held online, May 18-20, 2022. www.measuringbehavior.org. Editors: Andrew Spink, Jarosław
Barski, Anne-Marie Brouwer, Gernot Riedel, & Annesha Sil (2022). DOI 10.6084/m9.figshare.20066849. ISBN: 978-90-74821-94-0
Ethnicity & FaceReader 9 – A FairFace Case Study
Jason L Rogers
Noldus Information Technology Inc
Abstract
The academic community generally agrees that there are universal human facial expressions, such as happy,
sadness, anger, surprise, etc. Within the past fifteen years, many commercial organizations have created automated,
software-based, facial expression analysis tools. One such tool, FaceReader, recognizes seven basic expressions,
twenty individual facial muscles, valence, and arousal (e.g., facial activation). The most recent release of
FaceReader, version 9, uses a Deep Learning network model to characterize facial expression. This model was
trained, tested, and validated against facial images demonstrating the basic expressions. The result is better model
quality and faster image processing; however, there are no published data detailing how well FaceReader models
faces of varying ethnicity. The goal of the present study was to compare facial images of seven ethnicities
contained within the FairFace Face Attribute Dataset in terms of the ability of FaceReader to model the face and
measure the valence and arousal. This dataset contains 108,501 images balanced on ethnicity. A subset of those
images (n = 50,001) were tested in FaceReader 9. The images were batch-processed and the “General” face model
was used throughout. Data were then exported and matched to the FairFace labels. It was hypothesized that the
model quality would not differ by ethnicity, only by resolution, lighting and/or angle of the face. As hypothesized,
there was no discernable difference among ethnicities with regards to model quality, valence, or facial activation,
demonstrating that FaceReader 9’s automated facial expression analysis is not biased for or against any ethnicity.
Introduction
The academic community generally agrees that there are universal human facial expressions, such as happy,
sadness, anger, surprise, etc. [1] Within the past fifteen years, many commercial organizations have created
automated, software-based, facial expression analysis tools. The most recent release of FaceReader, version 9,
uses a Deep Learning network model to characterize facial expression [2]. This model was trained, tested, and
validated against facial images demonstrating the basic expressions; however, there are no published data detailing
how well FaceReader models faces of varying ethnicity. Therefore, the goal of the present study was to compare
facial images of seven ethnicities contained within the FairFace Face Attribute Dataset in terms of the ability of
FaceReader to find the face and measure its valence (pleasantness), and arousal (facial activation).
Method
FaceReader 9 conducted the automatic facial expression analysis. FaceReader 9 uses a Deep Learning network
model [3] that utilizes a stochastic gradient descent with momentum [4]. In short, a facial image is presented to
the network, at which point low-level convolutional features detect low-level local patters (e.g., edges, corners,
etc). Next, a mid-level convolutional feature detection finds higher level representations (e.g., action unit
activations, face shape, etc). Finally, these high dimensional convolutional features are processed by the final fully-
connected layers of the network to determine a user readably low-dimensional high-level representation of the face
(e.g. emotion, age, gender, etc.). This high-level representation is post-processed to improve robustness and
integration with FaceReader, forming the output of deep face engine. The result is an improved face model and
faster modeling technique. In addition, FaceReader 9 has three built-in models for finding and classifying faces:
Baby (ages 6 months to 2 years), EastAsian, and General.
The dataset used in this experiment was FairFace: Face Attribute Dataset for Balanced Race, Gender, and Age [5]
that consists of a novel face image dataset containing 108,501 images balanced on ethnicity (see Figure 1). Seven
(7) groups were identified: Black, Indian, East Asian, Southeast Asian, Middle Eastern, Latino, and White. Images
were collected from the YFCC-100M Flickr dataset and labeled with race, gender, and age groups. The present
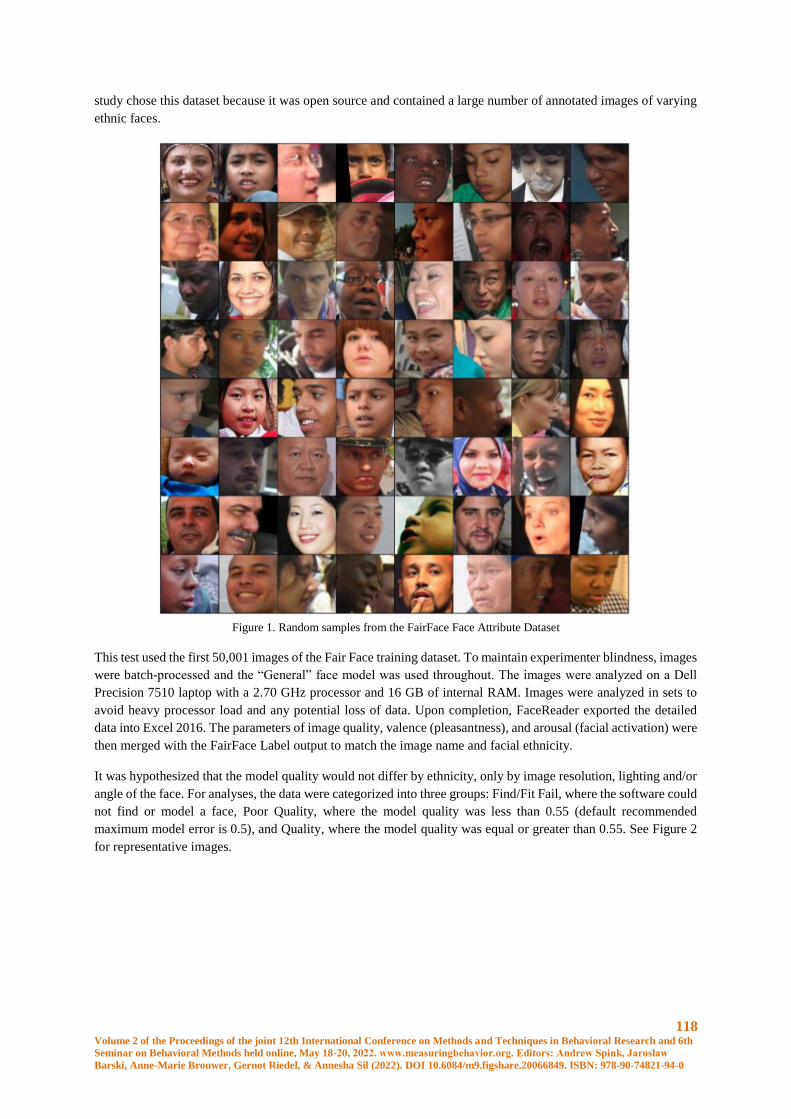
118 Volume 2 of the Proceedings of the joint 12th International Conference on Methods and Techniques in Behavioral Research and 6th
Seminar on Behavioral Methods held online, May 18-20, 2022. www.measuringbehavior.org. Editors: Andrew Spink, Jarosław
Barski, Anne-Marie Brouwer, Gernot Riedel, & Annesha Sil (2022). DOI 10.6084/m9.figshare.20066849. ISBN: 978-90-74821-94-0
study chose this dataset because it was open source and contained a large number of annotated images of varying
ethnic faces.
Figure 1. Random samples from the FairFace Face Attribute Dataset
This test used the first 50,001 images of the Fair Face training dataset. To maintain experimenter blindness, images
were batch-processed and the “General” face model was used throughout. The images were analyzed on a Dell
Precision 7510 laptop with a 2.70 GHz processor and 16 GB of internal RAM. Images were analyzed in sets to
avoid heavy processor load and any potential loss of data. Upon completion, FaceReader exported the detailed
data into Excel 2016. The parameters of image quality, valence (pleasantness), and arousal (facial activation) were
then merged with the FairFace Label output to match the image name and facial ethnicity.
It was hypothesized that the model quality would not differ by ethnicity, only by image resolution, lighting and/or
angle of the face. For analyses, the data were categorized into three groups: Find/Fit Fail, where the software could
not find or model a face, Poor Quality, where the model quality was less than 0.55 (default recommended
maximum model error is 0.5), and Quality, where the model quality was equal or greater than 0.55. See Figure 2
for representative images.
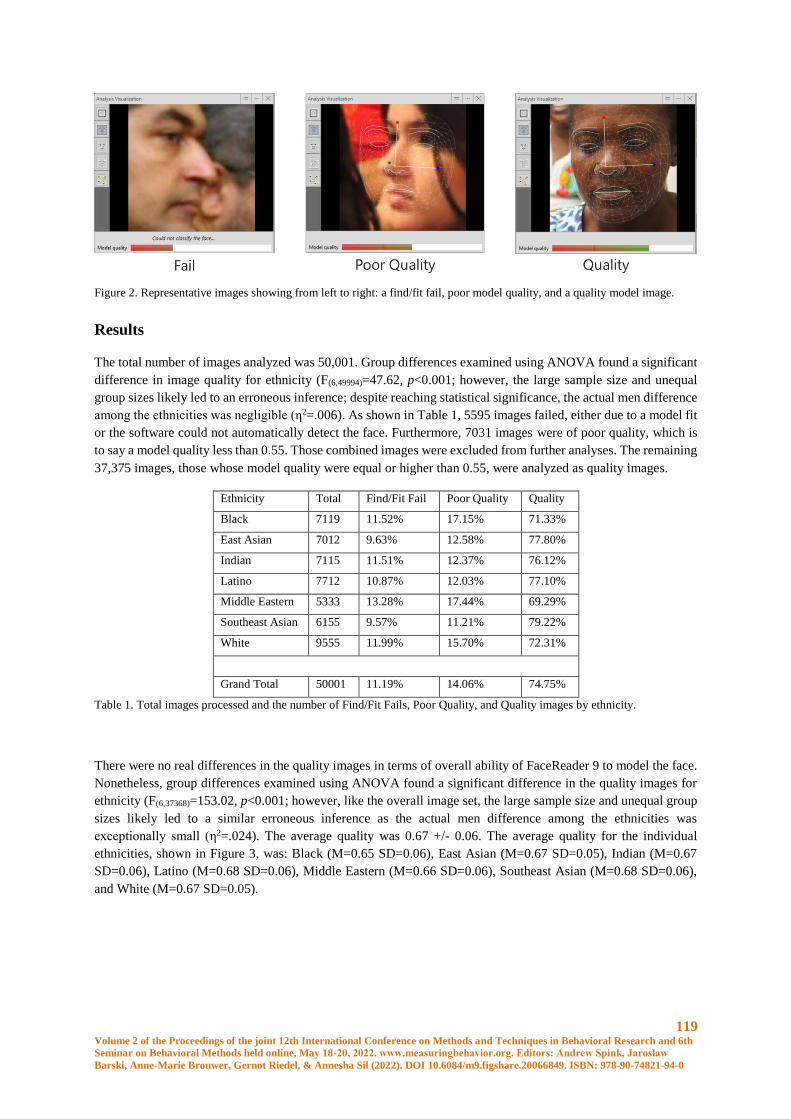
119 Volume 2 of the Proceedings of the joint 12th International Conference on Methods and Techniques in Behavioral Research and 6th
Seminar on Behavioral Methods held online, May 18-20, 2022. www.measuringbehavior.org. Editors: Andrew Spink, Jarosław
Barski, Anne-Marie Brouwer, Gernot Riedel, & Annesha Sil (2022). DOI 10.6084/m9.figshare.20066849. ISBN: 978-90-74821-94-0
Figure 2. Representative images showing from left to right: a find/fit fail, poor model quality, and a quality model image.
Results
The total number of images analyzed was 50,001. Group differences examined using ANOVA found a significant
difference in image quality for ethnicity (F(6,49994)=47.62, p<0.001; however, the large sample size and unequal
group sizes likely led to an erroneous inference; despite reaching statistical significance, the actual men difference
among the ethnicities was negligible (η2=.006). As shown in Table 1, 5595 images failed, either due to a model fit
or the software could not automatically detect the face. Furthermore, 7031 images were of poor quality, which is
to say a model quality less than 0.55. Those combined images were excluded from further analyses. The remaining
37,375 images, those whose model quality were equal or higher than 0.55, were analyzed as quality images.
Ethnicity Total Find/Fit Fail Poor Quality Quality
Black 7119 11.52% 17.15% 71.33%
East Asian 7012 9.63% 12.58% 77.80%
Indian 7115 11.51% 12.37% 76.12%
Latino 7712 10.87% 12.03% 77.10%
Middle Eastern 5333 13.28% 17.44% 69.29%
Southeast Asian 6155 9.57% 11.21% 79.22%
White 9555 11.99% 15.70% 72.31%
Grand Total 50001 11.19% 14.06% 74.75%
Table 1. Total images processed and the number of Find/Fit Fails, Poor Quality, and Quality images by ethnicity.
There were no real differences in the quality images in terms of overall ability of FaceReader 9 to model the face.
Nonetheless, group differences examined using ANOVA found a significant difference in the quality images for
ethnicity (F(6,37368)=153.02, p<0.001; however, like the overall image set, the large sample size and unequal group
sizes likely led to a similar erroneous inference as the actual men difference among the ethnicities was
exceptionally small (η2=.024). The average quality was 0.67 +/- 0.06. The average quality for the individual
ethnicities, shown in Figure 3, was: Black (M=0.65 SD=0.06), East Asian (M=0.67 SD=0.05), Indian (M=0.67
SD=0.06), Latino (M=0.68 SD=0.06), Middle Eastern (M=0.66 SD=0.06), Southeast Asian (M=0.68 SD=0.06),
and White (M=0.67 SD=0.05).
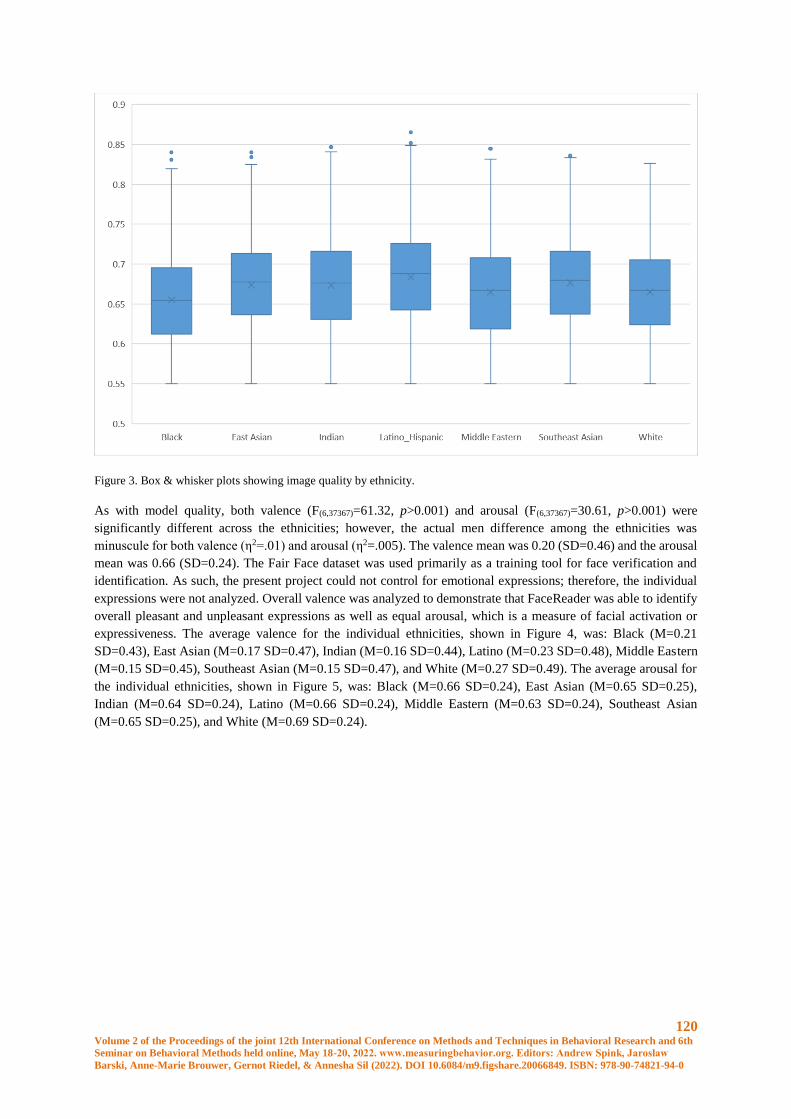
120 Volume 2 of the Proceedings of the joint 12th International Conference on Methods and Techniques in Behavioral Research and 6th
Seminar on Behavioral Methods held online, May 18-20, 2022. www.measuringbehavior.org. Editors: Andrew Spink, Jarosław
Barski, Anne-Marie Brouwer, Gernot Riedel, & Annesha Sil (2022). DOI 10.6084/m9.figshare.20066849. ISBN: 978-90-74821-94-0
Figure 3. Box & whisker plots showing image quality by ethnicity.
As with model quality, both valence (F(6,37367)=61.32, p>0.001) and arousal (F(6,37367)=30.61, p>0.001) were
significantly different across the ethnicities; however, the actual men difference among the ethnicities was
minuscule for both valence (η2=.01) and arousal (η2=.005). The valence mean was 0.20 (SD=0.46) and the arousal
mean was 0.66 (SD=0.24). The Fair Face dataset was used primarily as a training tool for face verification and
identification. As such, the present project could not control for emotional expressions; therefore, the individual
expressions were not analyzed. Overall valence was analyzed to demonstrate that FaceReader was able to identify
overall pleasant and unpleasant expressions as well as equal arousal, which is a measure of facial activation or
expressiveness. The average valence for the individual ethnicities, shown in Figure 4, was: Black (M=0.21
SD=0.43), East Asian (M=0.17 SD=0.47), Indian (M=0.16 SD=0.44), Latino (M=0.23 SD=0.48), Middle Eastern
(M=0.15 SD=0.45), Southeast Asian (M=0.15 SD=0.47), and White (M=0.27 SD=0.49). The average arousal for
the individual ethnicities, shown in Figure 5, was: Black (M=0.66 SD=0.24), East Asian (M=0.65 SD=0.25),
Indian (M=0.64 SD=0.24), Latino (M=0.66 SD=0.24), Middle Eastern (M=0.63 SD=0.24), Southeast Asian
(M=0.65 SD=0.25), and White (M=0.69 SD=0.24).
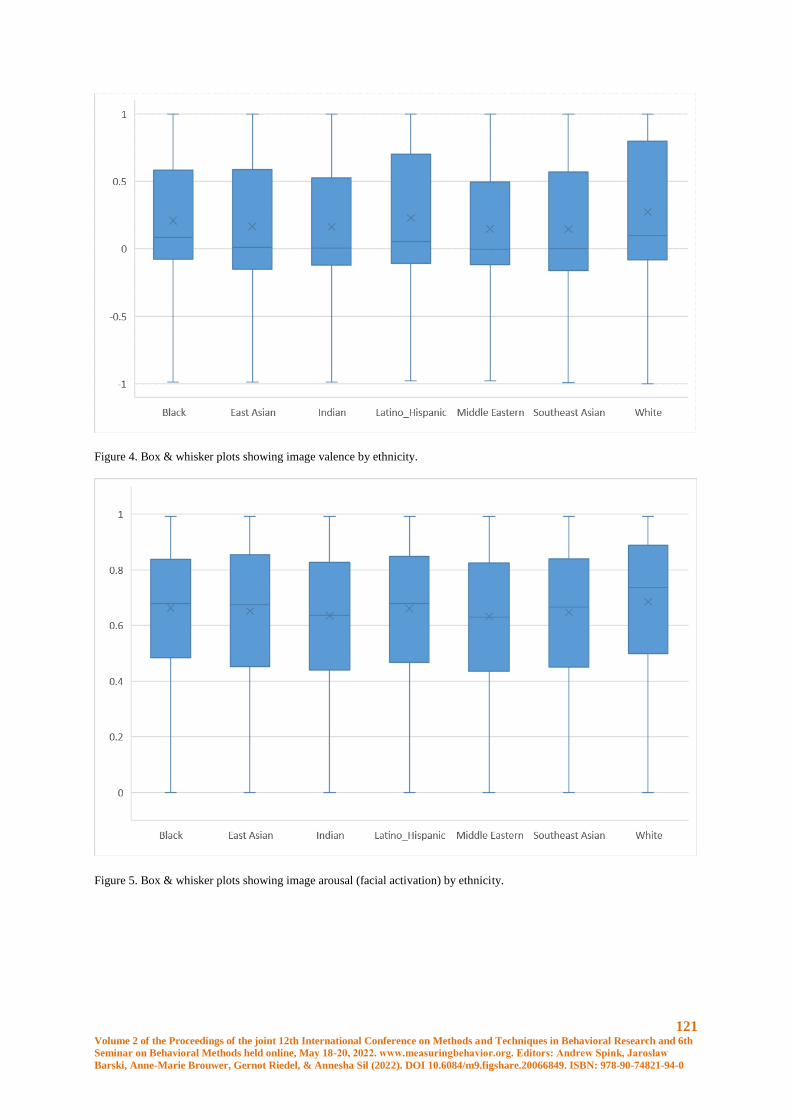
121 Volume 2 of the Proceedings of the joint 12th International Conference on Methods and Techniques in Behavioral Research and 6th
Seminar on Behavioral Methods held online, May 18-20, 2022. www.measuringbehavior.org. Editors: Andrew Spink, Jarosław
Barski, Anne-Marie Brouwer, Gernot Riedel, & Annesha Sil (2022). DOI 10.6084/m9.figshare.20066849. ISBN: 978-90-74821-94-0
Figure 4. Box & whisker plots showing image valence by ethnicity.
Figure 5. Box & whisker plots showing image arousal (facial activation) by ethnicity.
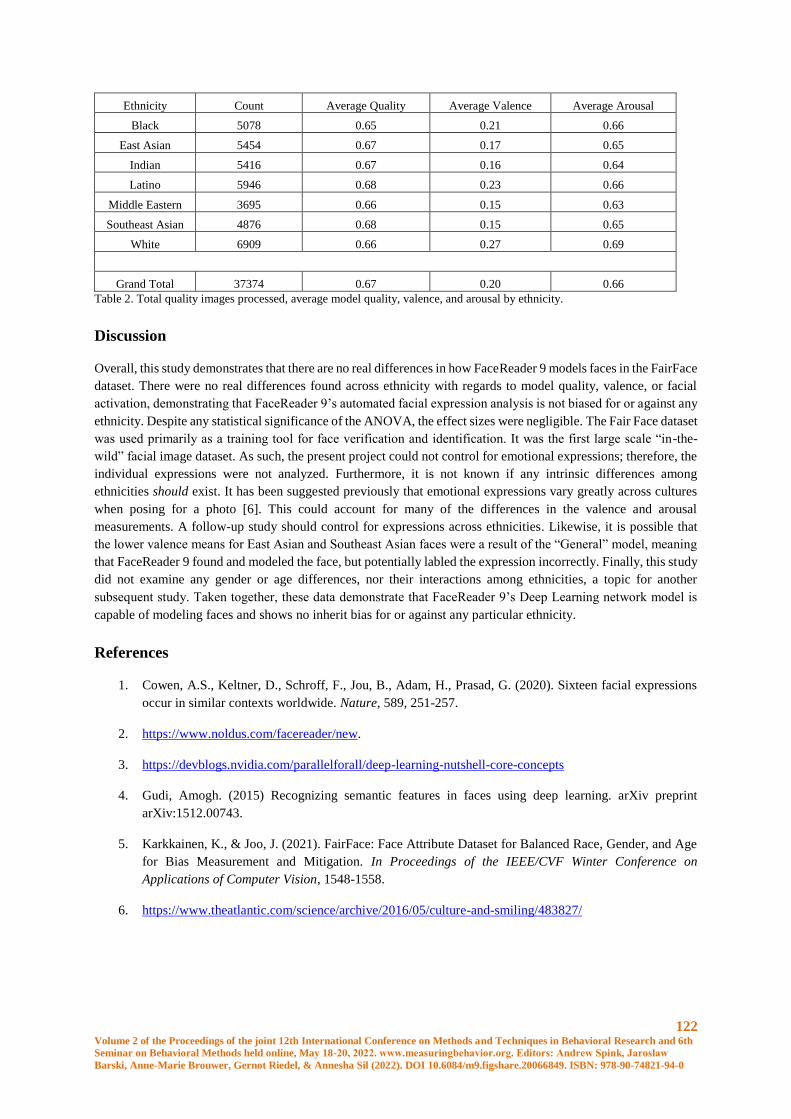
122 Volume 2 of the Proceedings of the joint 12th International Conference on Methods and Techniques in Behavioral Research and 6th
Seminar on Behavioral Methods held online, May 18-20, 2022. www.measuringbehavior.org. Editors: Andrew Spink, Jarosław
Barski, Anne-Marie Brouwer, Gernot Riedel, & Annesha Sil (2022). DOI 10.6084/m9.figshare.20066849. ISBN: 978-90-74821-94-0
Ethnicity Count Average Quality Average Valence Average Arousal
Black 5078 0.65 0.21 0.66
East Asian 5454 0.67 0.17 0.65
Indian 5416 0.67 0.16 0.64
Latino 5946 0.68 0.23 0.66
Middle Eastern 3695 0.66 0.15 0.63
Southeast Asian 4876 0.68 0.15 0.65
White 6909 0.66 0.27 0.69
Grand Total 37374 0.67 0.20 0.66
Table 2. Total quality images processed, average model quality, valence, and arousal by ethnicity.
Discussion
Overall, this study demonstrates that there are no real differences in how FaceReader 9 models faces in the FairFace
dataset. There were no real differences found across ethnicity with regards to model quality, valence, or facial
activation, demonstrating that FaceReader 9’s automated facial expression analysis is not biased for or against any
ethnicity. Despite any statistical significance of the ANOVA, the effect sizes were negligible. The Fair Face dataset
was used primarily as a training tool for face verification and identification. It was the first large scale “in-the-
wild” facial image dataset. As such, the present project could not control for emotional expressions; therefore, the
individual expressions were not analyzed. Furthermore, it is not known if any intrinsic differences among
ethnicities should exist. It has been suggested previously that emotional expressions vary greatly across cultures
when posing for a photo [6]. This could account for many of the differences in the valence and arousal
measurements. A follow-up study should control for expressions across ethnicities. Likewise, it is possible that
the lower valence means for East Asian and Southeast Asian faces were a result of the “General” model, meaning
that FaceReader 9 found and modeled the face, but potentially labled the expression incorrectly. Finally, this study
did not examine any gender or age differences, nor their interactions among ethnicities, a topic for another
subsequent study. Taken together, these data demonstrate that FaceReader 9’s Deep Learning network model is
capable of modeling faces and shows no inherit bias for or against any particular ethnicity.
References
1. Cowen, A.S., Keltner, D., Schroff, F., Jou, B., Adam, H., Prasad, G. (2020). Sixteen facial expressions
occur in similar contexts worldwide. Nature, 589, 251-257.
2. https://www.noldus.com/facereader/new.
3. https://devblogs.nvidia.com/parallelforall/deep-learning-nutshell-core-concepts
4. Gudi, Amogh. (2015) Recognizing semantic features in faces using deep learning. arXiv preprint
arXiv:1512.00743.
5. Karkkainen, K., & Joo, J. (2021). FairFace: Face Attribute Dataset for Balanced Race, Gender, and Age
for Bias Measurement and Mitigation. In Proceedings of the IEEE/CVF Winter Conference on
Applications of Computer Vision, 1548-1558.
6. https://www.theatlantic.com/science/archive/2016/05/culture-and-smiling/483827/
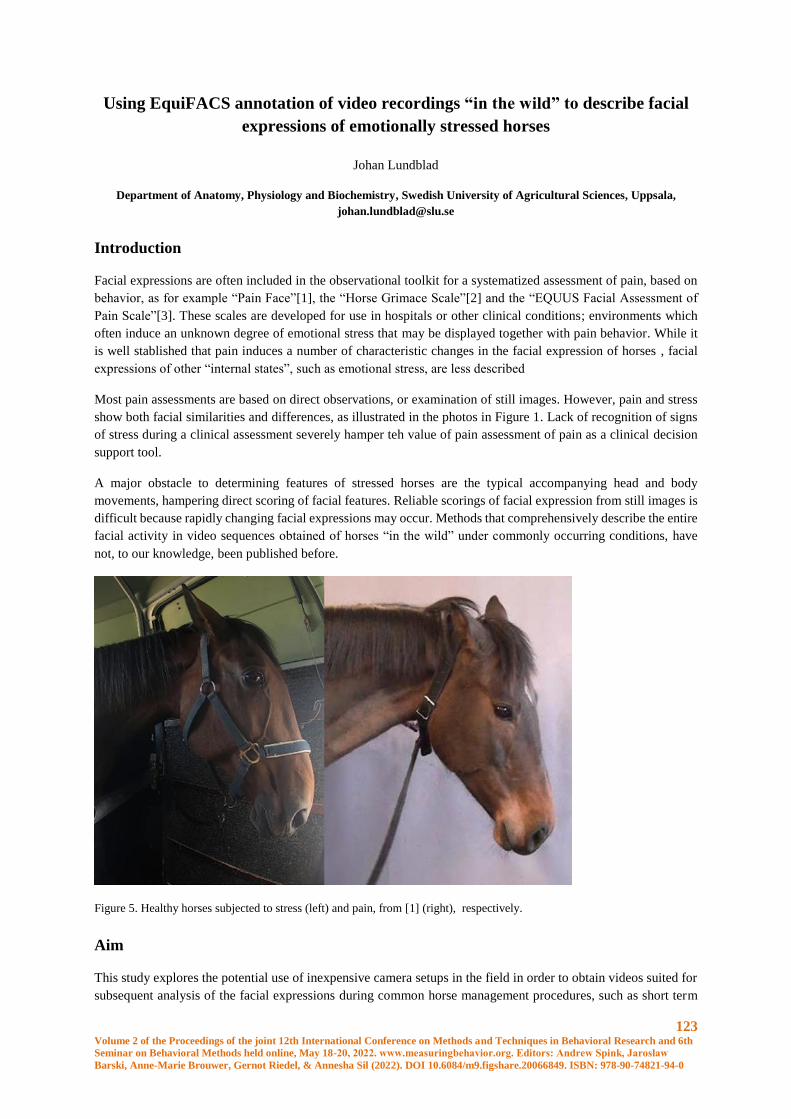
123 Volume 2 of the Proceedings of the joint 12th International Conference on Methods and Techniques in Behavioral Research and 6th
Seminar on Behavioral Methods held online, May 18-20, 2022. www.measuringbehavior.org. Editors: Andrew Spink, Jarosław
Barski, Anne-Marie Brouwer, Gernot Riedel, & Annesha Sil (2022). DOI 10.6084/m9.figshare.20066849. ISBN: 978-90-74821-94-0
Using EquiFACS annotation of video recordings “in the wild” to describe facial
expressions of emotionally stressed horses
Johan Lundblad
Department of Anatomy, Physiology and Biochemistry, Swedish University of Agricultural Sciences, Uppsala,
Introduction
Facial expressions are often included in the observational toolkit for a systematized assessment of pain, based on
behavior, as for example “Pain Face”[1], the “Horse Grimace Scale”[2] and the “EQUUS Facial Assessment of
Pain Scale”[3]. These scales are developed for use in hospitals or other clinical conditions; environments which
often induce an unknown degree of emotional stress that may be displayed together with pain behavior. While it
is well stablished that pain induces a number of characteristic changes in the facial expression of horses , facial
expressions of other “internal states”, such as emotional stress, are less described
Most pain assessments are based on direct observations, or examination of still images. However, pain and stress
show both facial similarities and differences, as illustrated in the photos in Figure 1. Lack of recognition of signs
of stress during a clinical assessment severely hamper teh value of pain assessment of pain as a clinical decision
support tool.
A major obstacle to determining features of stressed horses are the typical accompanying head and body
movements, hampering direct scoring of facial features. Reliable scorings of facial expression from still images is
difficult because rapidly changing facial expressions may occur. Methods that comprehensively describe the entire
facial activity in video sequences obtained of horses “in the wild” under commonly occurring conditions, have
not, to our knowledge, been published before.
Figure 5. Healthy horses subjected to stress (left) and pain, from [1] (right), respectively.
Aim
This study explores the potential use of inexpensive camera setups in the field in order to obtain videos suited for
subsequent analysis of the facial expressions during common horse management procedures, such as short term
124 Volume 2 of the Proceedings of the joint 12th International Conference on Methods and Techniques in Behavioral Research and 6th
Seminar on Behavioral Methods held online, May 18-20, 2022. www.measuringbehavior.org. Editors: Andrew Spink, Jarosław
Barski, Anne-Marie Brouwer, Gernot Riedel, & Annesha Sil (2022). DOI 10.6084/m9.figshare.20066849. ISBN: 978-90-74821-94-0
transportation or isolation. We hypothesized that 1) common horse management procedures will induce stress, and
that 2) facial expressions of stress can be identified by a comprehensive EquiFACS coding of video sequences of
horse faces selected by custom made horse face-finding software; and that 3) analysis of the EquiFACS codes will
reveal characteristics of facial activity in stressed horses, distinct from pain.
Materials and methods
Study design
Two standard horse management practices induced emotional stress: short-term transportation and short-term
isolation. Video was obtained without the presence of an observer via CCTVs or simple “¨point and shoot” action
cameras, before and during application of these stressors. A body-mounted and remotely controlled heart rate
monitor delivered continuous heart rate measurements in both situations, synced with the cameras to ensure heart
rate recording during the event.
The study population consisted of two groups of horses, the social isolation group (SIG) and a transportation group
(TG). The SIG consisted of a homogenous population of 10 horses owned by the department of Clinical Sciences,
xxx. Horses were 7-15 years of age, of the same breed and housed under similar conditions. The TG consisted of
28 privately owned horses and ponies of different breed, age and gender.
A remotely controlled human sport ECG-transmitter, Polar Wearlink (Polar Electro OY, Kempele, Finland) was
used together with its corresponding controlling unit in order to obtain continuous heart rate measurements without
the interference of an observer. Files containing R-R intervals were exported through Polar ProTrainer Equine
Edition (Polar Electro OY, Kempele, Finland). The files were processed in Kubios HRV Premium (Kubios,
Finland) in order to extract heart rate during the selected time intervals. Heart rate measures were extracted as a
mean during five minutes with onset two minutes and fifteen seconds before annotation.
Video filming
In the SIG condition (horses isolated in their own box) the filming setup consisted of four CCTV cameras placed
at head height (HIK Vision with night vision). Additional recorders were setup (one each) for the boxes of two
herd mates. This set up ensured that a video sequence containing the profiled horse head could be detected at any
given time point. The baseline measurements were performed for at least 45 minutes. The isolation procedure was
performed by removing the only herd mate from the stable for approximately 15 minutes. The induction method
lasted for at least 15 minutes. The procedures were repeated with the other herd mate.
For filming the transportation condition (TG), the videos were recorded using GoPro Hero 3+ Silver Edition- and
GoPro Hero 7 Black action cameras. Resolution were set to 1080p at 30 fps exporting to -.mp4 format. The cameras
were mounted at head height at two different angles when filming in the box, its locations depending on the design
of the box. The cameras recorded for a minimum of 10 minutes and a maximum of 20 minutes.
Video processing
For each occasion, a 30 seconds sequence of video was selected using an automated face detection system. If
several sections were available, a random number generator were used to select a clip. The clips were manually
inspected after the selection to make sure that the quality of film was suitable for annotation. If not, a new clip was
selected. In the transportation group, where the horse was tied to a bar, 30 seconds of video was manually cut from
the videos. If several sections were cut out, a random number generator were used to pick which clip to use. If the
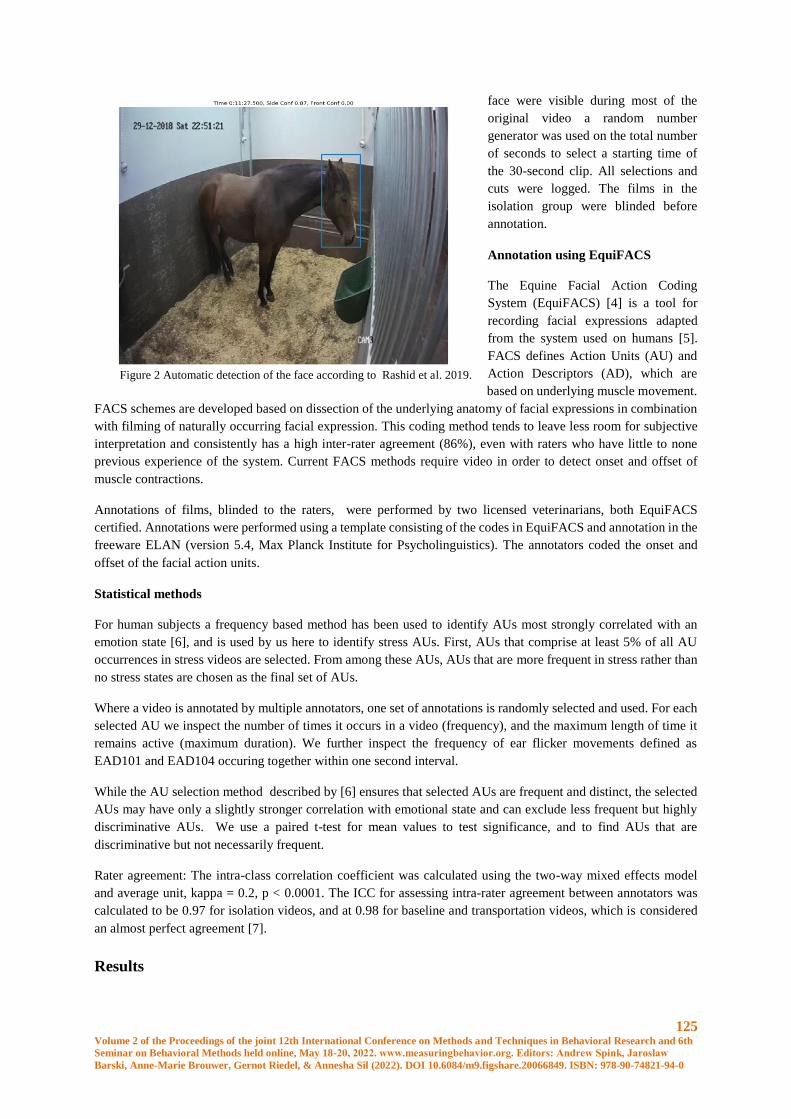
125 Volume 2 of the Proceedings of the joint 12th International Conference on Methods and Techniques in Behavioral Research and 6th
Seminar on Behavioral Methods held online, May 18-20, 2022. www.measuringbehavior.org. Editors: Andrew Spink, Jarosław
Barski, Anne-Marie Brouwer, Gernot Riedel, & Annesha Sil (2022). DOI 10.6084/m9.figshare.20066849. ISBN: 978-90-74821-94-0
face were visible during most of the
original video a random number
generator was used on the total number
of seconds to select a starting time of
the 30-second clip. All selections and
cuts were logged. The films in the
isolation group were blinded before
annotation.
Annotation using EquiFACS
The Equine Facial Action Coding
System (EquiFACS) [4] is a tool for
recording facial expressions adapted
from the system used on humans [5].
FACS defines Action Units (AU) and
Action Descriptors (AD), which are
based on underlying muscle movement.
FACS schemes are developed based on dissection of the underlying anatomy of facial expressions in combination
with filming of naturally occurring facial expression. This coding method tends to leave less room for subjective
interpretation and consistently has a high inter-rater agreement (86%), even with raters who have little to none
previous experience of the system. Current FACS methods require video in order to detect onset and offset of
muscle contractions.
Annotations of films, blinded to the raters, were performed by two licensed veterinarians, both EquiFACS
certified. Annotations were performed using a template consisting of the codes in EquiFACS and annotation in the
freeware ELAN (version 5.4, Max Planck Institute for Psycholinguistics). The annotators coded the onset and
offset of the facial action units.
Statistical methods
For human subjects a frequency based method has been used to identify AUs most strongly correlated with an
emotion state [6], and is used by us here to identify stress AUs. First, AUs that comprise at least 5% of all AU
occurrences in stress videos are selected. From among these AUs, AUs that are more frequent in stress rather than
no stress states are chosen as the final set of AUs.
Where a video is annotated by multiple annotators, one set of annotations is randomly selected and used. For each
selected AU we inspect the number of times it occurs in a video (frequency), and the maximum length of time it
remains active (maximum duration). We further inspect the frequency of ear flicker movements defined as
EAD101 and EAD104 occuring together within one second interval.
While the AU selection method described by [6] ensures that selected AUs are frequent and distinct, the selected
AUs may have only a slightly stronger correlation with emotional state and can exclude less frequent but highly
discriminative AUs. We use a paired t-test for mean values to test significance, and to find AUs that are
discriminative but not necessarily frequent.
Rater agreement: The intra-class correlation coefficient was calculated using the two-way mixed effects model
and average unit, kappa = 0.2, p < 0.0001. The ICC for assessing intra-rater agreement between annotators was
calculated to be 0.97 for isolation videos, and at 0.98 for baseline and transportation videos, which is considered
an almost perfect agreement [7].
Results
Figure 2 Automatic detection of the face according to Rashid et al. 2019.
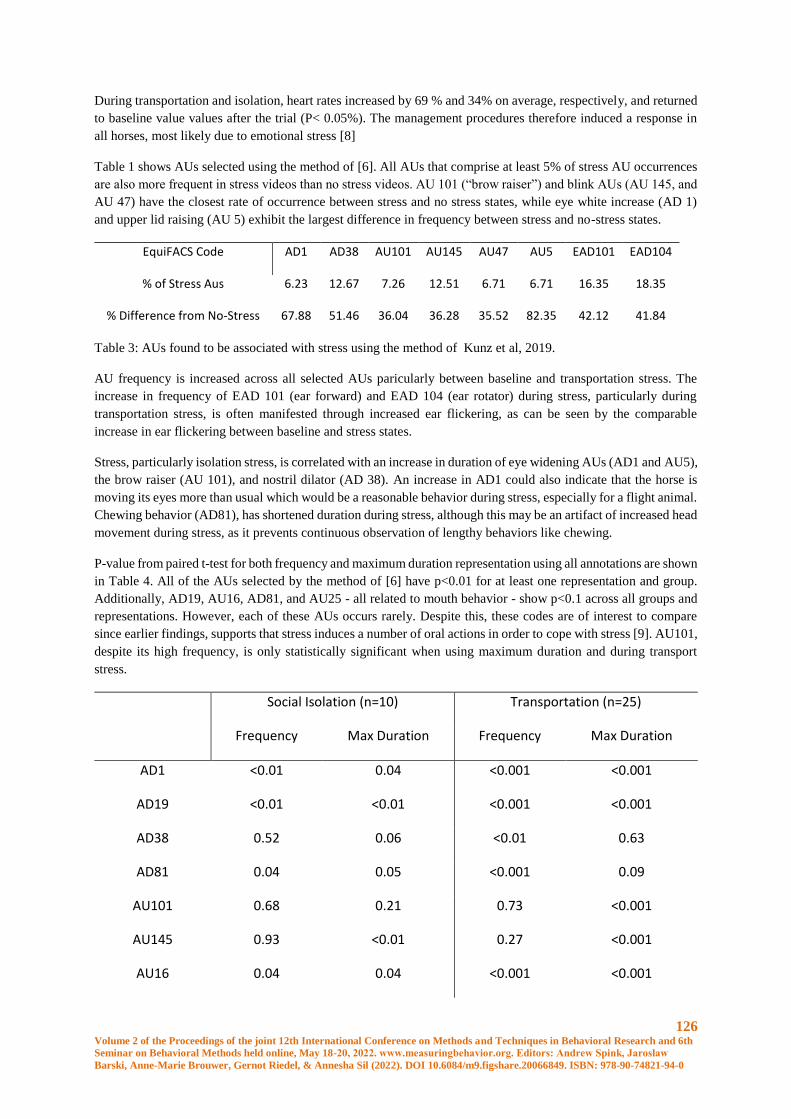
126 Volume 2 of the Proceedings of the joint 12th International Conference on Methods and Techniques in Behavioral Research and 6th
Seminar on Behavioral Methods held online, May 18-20, 2022. www.measuringbehavior.org. Editors: Andrew Spink, Jarosław
Barski, Anne-Marie Brouwer, Gernot Riedel, & Annesha Sil (2022). DOI 10.6084/m9.figshare.20066849. ISBN: 978-90-74821-94-0
During transportation and isolation, heart rates increased by 69 % and 34% on average, respectively, and returned
to baseline value values after the trial (P< 0.05%). The management procedures therefore induced a response in
all horses, most likely due to emotional stress [8]
Table 1 shows AUs selected using the method of [6]. All AUs that comprise at least 5% of stress AU occurrences
are also more frequent in stress videos than no stress videos. AU 101 (“brow raiser”) and blink AUs (AU 145, and
AU 47) have the closest rate of occurrence between stress and no stress states, while eye white increase (AD 1)
and upper lid raising (AU 5) exhibit the largest difference in frequency between stress and no-stress states.
Table 3: AUs found to be associated with stress using the method of Kunz et al, 2019.
AU frequency is increased across all selected AUs paricularly between baseline and transportation stress. The
increase in frequency of EAD 101 (ear forward) and EAD 104 (ear rotator) during stress, particularly during
transportation stress, is often manifested through increased ear flickering, as can be seen by the comparable
increase in ear flickering between baseline and stress states.
Stress, particularly isolation stress, is correlated with an increase in duration of eye widening AUs (AD1 and AU5),
the brow raiser (AU 101), and nostril dilator (AD 38). An increase in AD1 could also indicate that the horse is
moving its eyes more than usual which would be a reasonable behavior during stress, especially for a flight animal.
Chewing behavior (AD81), has shortened duration during stress, although this may be an artifact of increased head
movement during stress, as it prevents continuous observation of lengthy behaviors like chewing.
P-value from paired t-test for both frequency and maximum duration representation using all annotations are shown
in Table 4. All of the AUs selected by the method of [6] have p<0.01 for at least one representation and group.
Additionally, AD19, AU16, AD81, and AU25 - all related to mouth behavior - show p<0.1 across all groups and
representations. However, each of these AUs occurs rarely. Despite this, these codes are of interest to compare
since earlier findings, supports that stress induces a number of oral actions in order to cope with stress [9]. AU101,
despite its high frequency, is only statistically significant when using maximum duration and during transport
stress.
Social Isolation (n=10) Transportation (n=25)
Frequency Max Duration Frequency Max Duration
AD1 <0.01 0.04 <0.001 <0.001
AD19 <0.01 <0.01 <0.001 <0.001
AD38 0.52 0.06 <0.01 0.63
AD81 0.04 0.05 <0.001 0.09
AU101 0.68 0.21 0.73 <0.001
AU145 0.93 <0.01 0.27 <0.001
AU16 0.04 0.04 <0.001 <0.001
EquiFACS Code AD1 AD38 AU101 AU145 AU47 AU5 EAD101 EAD104
% of Stress Aus 6.23 12.67 7.26 12.51 6.71 6.71 16.35 18.35
% Difference from No-Stress 67.88 51.46 36.04 36.28 35.52 82.35 42.12 41.84
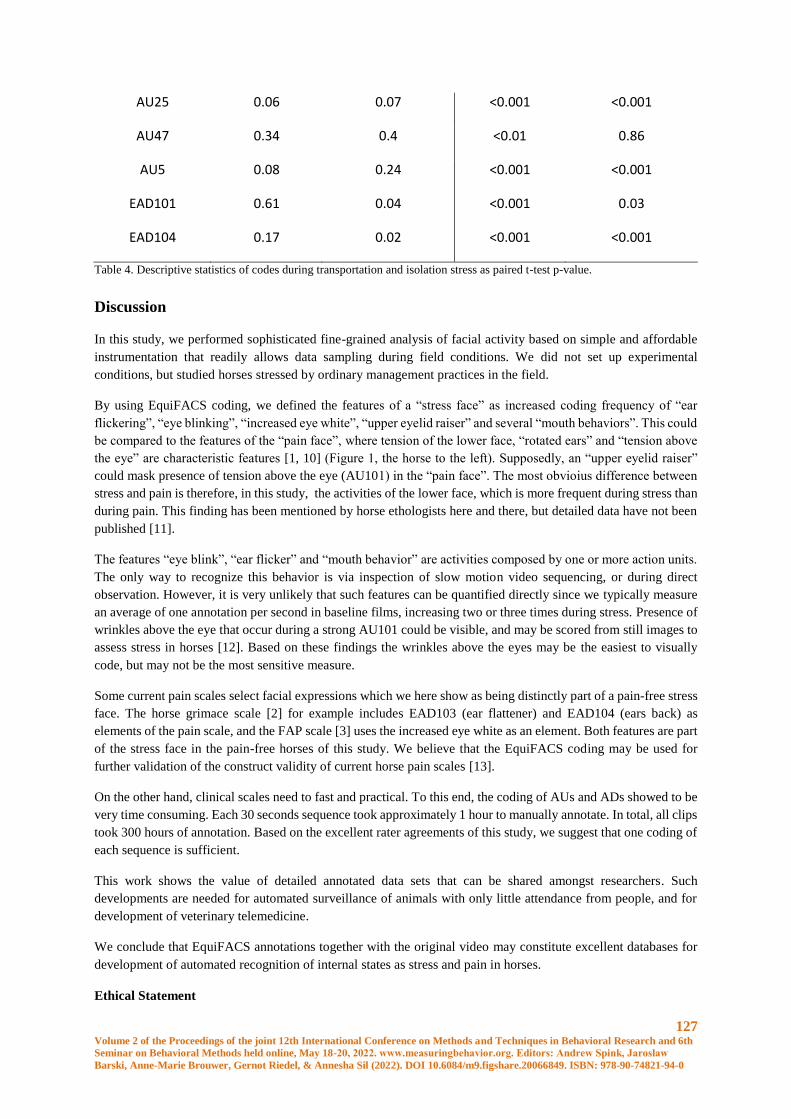
127 Volume 2 of the Proceedings of the joint 12th International Conference on Methods and Techniques in Behavioral Research and 6th
Seminar on Behavioral Methods held online, May 18-20, 2022. www.measuringbehavior.org. Editors: Andrew Spink, Jarosław
Barski, Anne-Marie Brouwer, Gernot Riedel, & Annesha Sil (2022). DOI 10.6084/m9.figshare.20066849. ISBN: 978-90-74821-94-0
AU25 0.06 0.07 <0.001 <0.001
AU47 0.34 0.4 <0.01 0.86
AU5 0.08 0.24 <0.001 <0.001
EAD101 0.61 0.04 <0.001 0.03
EAD104 0.17 0.02 <0.001 <0.001
Table 4. Descriptive statistics of codes during transportation and isolation stress as paired t-test p-value.
Discussion
In this study, we performed sophisticated fine-grained analysis of facial activity based on simple and affordable
instrumentation that readily allows data sampling during field conditions. We did not set up experimental
conditions, but studied horses stressed by ordinary management practices in the field.
By using EquiFACS coding, we defined the features of a “stress face” as increased coding frequency of “ear
flickering”, “eye blinking”, “increased eye white”, “upper eyelid raiser” and several “mouth behaviors”. This could
be compared to the features of the “pain face”, where tension of the lower face, “rotated ears” and “tension above
the eye” are characteristic features [1, 10] (Figure 1, the horse to the left). Supposedly, an “upper eyelid raiser”
could mask presence of tension above the eye (AU101) in the “pain face”. The most obvioius difference between
stress and pain is therefore, in this study, the activities of the lower face, which is more frequent during stress than
during pain. This finding has been mentioned by horse ethologists here and there, but detailed data have not been
published [11].
The features “eye blink”, “ear flicker” and “mouth behavior” are activities composed by one or more action units.
The only way to recognize this behavior is via inspection of slow motion video sequencing, or during direct
observation. However, it is very unlikely that such features can be quantified directly since we typically measure
an average of one annotation per second in baseline films, increasing two or three times during stress. Presence of
wrinkles above the eye that occur during a strong AU101 could be visible, and may be scored from still images to
assess stress in horses [12]. Based on these findings the wrinkles above the eyes may be the easiest to visually
code, but may not be the most sensitive measure.
Some current pain scales select facial expressions which we here show as being distinctly part of a pain-free stress
face. The horse grimace scale [2] for example includes EAD103 (ear flattener) and EAD104 (ears back) as
elements of the pain scale, and the FAP scale [3] uses the increased eye white as an element. Both features are part
of the stress face in the pain-free horses of this study. We believe that the EquiFACS coding may be used for
further validation of the construct validity of current horse pain scales [13].
On the other hand, clinical scales need to fast and practical. To this end, the coding of AUs and ADs showed to be
very time consuming. Each 30 seconds sequence took approximately 1 hour to manually annotate. In total, all clips
took 300 hours of annotation. Based on the excellent rater agreements of this study, we suggest that one coding of
each sequence is sufficient.
This work shows the value of detailed annotated data sets that can be shared amongst researchers. Such
developments are needed for automated surveillance of animals with only little attendance from people, and for
development of veterinary telemedicine.
We conclude that EquiFACS annotations together with the original video may constitute excellent databases for
development of automated recognition of internal states as stress and pain in horses.
Ethical Statement

128 Volume 2 of the Proceedings of the joint 12th International Conference on Methods and Techniques in Behavioral Research and 6th
Seminar on Behavioral Methods held online, May 18-20, 2022. www.measuringbehavior.org. Editors: Andrew Spink, Jarosław
Barski, Anne-Marie Brouwer, Gernot Riedel, & Annesha Sil (2022). DOI 10.6084/m9.figshare.20066849. ISBN: 978-90-74821-94-0
This study was approved by an ethical committee assigned by the xxxx Board of Agriculture according to xxxx
law. Written consent was obtained from owners of the privately owned horses.
Literature
1. Gleerup, K. B., Forkman, B., Lindegaard, C. & Andersen, P. H. (2015) An equine pain face, Veterinary
Anaesthesia and Analgesia. 42, 103-114.
2. Dalla Costa, E., Minero, M., Lebelt, D., Stucke, D., Canali, E. & Leach, M. C. (2014) Development of the
Horse Grimace Scale (HGS) as a Pain Assessment Tool in Horses Undergoing Routine Castration, PLoS One. 9.
3. van Loon, J. & Van Dierendonck, M. C. (2015) Monitoring acute equine visceral pain with the Equine Utrecht
University Scale for Composite Pain Assessment (EQUUS-COMPASS) and the Equine Utrecht University Scale
for Facial Assessment of Pain (EQUUS-FAP): A scale-construction study, Veterinary Journal. 206, 356-364.
4. Wathan, J., Burrows, A. M., Waller, B. M. & McComb, K. (2015) EquiFACS: The Equine Facial Action Coding
System (vol 10, e0131738, 2015), PLoS One. 10.
5. Ekman, P., Friesen, W. & Hagar, J. (2002) Facial Action Coding System, Salt Lake City.
6. Kunz, M., Meixner, D. & Lautenbacher, S. (2019) Facial muscle movements encoding pain-a systematic review,
Pain. 160, 535-549.
7. McHugh, M. L. (2012) Interrater reliability: the kappa statistic, Biochem Med (Zagreb). 22, 276-282.
8. Schmidt, A., Hodl, S., Mostl, E., Aurich, J., Muller, J. & Aurich, C. (2010) Cortisol release, heart rate, and
heart rate variability in transport-naive horses during repeated road transport, Domest Anim Endocrinol. 39, 205-
13.
9. Nagy, K., Bodó, G., Bárdos, G., Harnos, A. & Kabai, P. (2009) The effect of a feeding stress-test on the
behaviour and heart rate variability of control and crib-biting horses (with or without inhibition), Applied Animal
Behaviour Science. 121, 140-147.
10. Rashid, M., Silventoinen, A., Gleerup, K. B. & Andersen, P. H. (2019). Analyzing horse facial expressions of
pain with EquiFACS. Paper presented at the Pain in Animals WorkshopBethesda Maryland United States.
11. Torcivia, C. & McDonnell, S. (2020) In-Person Caretaker Visits Disrupt Ongoing Discomfort Behavior in
Hospitalized Equine Orthopedic Surgical Patients, Animals. 10.
12. Hintze, S., Smith, S., Patt, A., Bachmann, I. & Wurbel, H. (2016) Are Eyes a Mirror of the Soul? What Eye
Wrinkles Reveal about a Horse's Emotional State, PLoS One. 11, 15.
13. Descovich, K. A., Wathan, J., Leach, M. C., Buchanan-Smith, H. M., Flecknell, P., Farningham, D. & Vick,
S. J. (2017) Facial Expression: An Under-Utilized Tool for the Assessment of Welfare in Mammals, ALTEX-Altern
Anim Exp. 34, 409-429.
129 Volume 2 of the Proceedings of the joint 12th International Conference on Methods and Techniques in Behavioral Research and 6th
Seminar on Behavioral Methods held online, May 18-20, 2022. www.measuringbehavior.org. Editors: Andrew Spink, Jarosław
Barski, Anne-Marie Brouwer, Gernot Riedel, & Annesha Sil (2022). DOI 10.6084/m9.figshare.20066849. ISBN: 978-90-74821-94-0
A Tool for Measuring Intuition Using Audio Synthesizer Tasks
M.J. Tomasik1, H. Minarik2, F. Vogel3 and J.M.Tomasik4
1 University of Zurich, Zurich, Switzerland
2 University of Witten-Herdecke, Witten, Germany
3 Helmut-Schmidt-University, Hamburg, Germany
4 Technical University of Munich, Munich, Germany
Introduction
Faced with inherent uncertainty and ambiguity in an ill-defined problem or decision, people may revert to their
intuition in order to find an appropriate solution. Intuition can be defined as “a non-sequential information-
processing mode, which comprises both cognitive and affective elements and results in direct knowing without
any use of conscious reasoning” [1]. Non-conscious information processing is, hence, one of the four aspects
usually associated with intuition or intuitive judgement [2]. The other three characteristics of intuition are that it
usually involves drawing holistic and associative conclusions [3, 4] that are ‘affectively charged’ [5] and – unlike
analytic evaluations – operate relatively automatically and rapidly [6, 7]. Taken together, intuition is often
associated with an ‘immediate apprehension’ [8] of a situation and colloquially referred to as ‘gut feelings’ or ‘gut
instincts’ because of the non-conscious, holistic, emotional, and rapid processes involved. Neuroscience research
suggests that intuition is associated with an activation of basal ganglia and related structures [9, 10] that are
sometimes linked with executive coordination in general and action selection in particular [11].
First studies on intuition have focused on differences in decision making between experts and novices [12, 13] and
had quite a positive perspective on the advantages of expert knowledge in complex task situations. This view is
contrasted with research that points to the various biases that an intuitive approach entails. [14, 15]. Both positions
are still relevant today and subject to scientific investigation both in real-life settings and in the laboratory [16].
Our own research is intended to contribute to this debate by providing a laboratory paradigm for assessing
interindividual differences in intuitive behaviour in a way that is as independent of cognitive reasoning as possible.
Existing Paradigms for Measuring Intuition
Several methodological approaches exist for capturing intuition empirically [17]. Probably the simplest one is
direct instruction, where participants are either assigned to an analytical or intuitive condition and asked to solve
a judgement task. High level of researcher control here comes at the price of not knowing whether intuition is
actually employed differently in the different groups. A second approach are retrospective reports that can easily
be used in field research but have the disadvantage that post-hoc interpretation cannot be ruled out. In the
incubational method, participants are presented a focal task and then distracted by a second task that is supposed
to occupy their cognitive system. The assumption with this paradigm is that the nonconscious system will continue
operating upon the focal task. Although the likelihood of demand artifacts with this method is low, it may be
difficult to disentangle the different contributions of intuition and analysis here. In scenario-based approaches,
participants are confronted with a decision situation that may or may not involve a moral dilemma. Although this
method allows the assessment of subtle interindividual differences in reasoning, the presence of intuition can only
be inferred and the generalizability to real world intuiting (i.e., external validity) is doubtful. Neurological and
physiological paradigms involve, for instance, brain imaging and hence promise to provide more objective
accounts of intuitive processes. At the same time, they are costly, can only be conducted under very artificial
conditions, and offer a wide leeway for interpretation with regard to what is actually measured (i.e., internal
validity). Finally, affective priming has sometimes been used to put participants in a state in which intuitive
judgement becomes more likely than analytic approaches to a problem. This method, hence, only assumes that
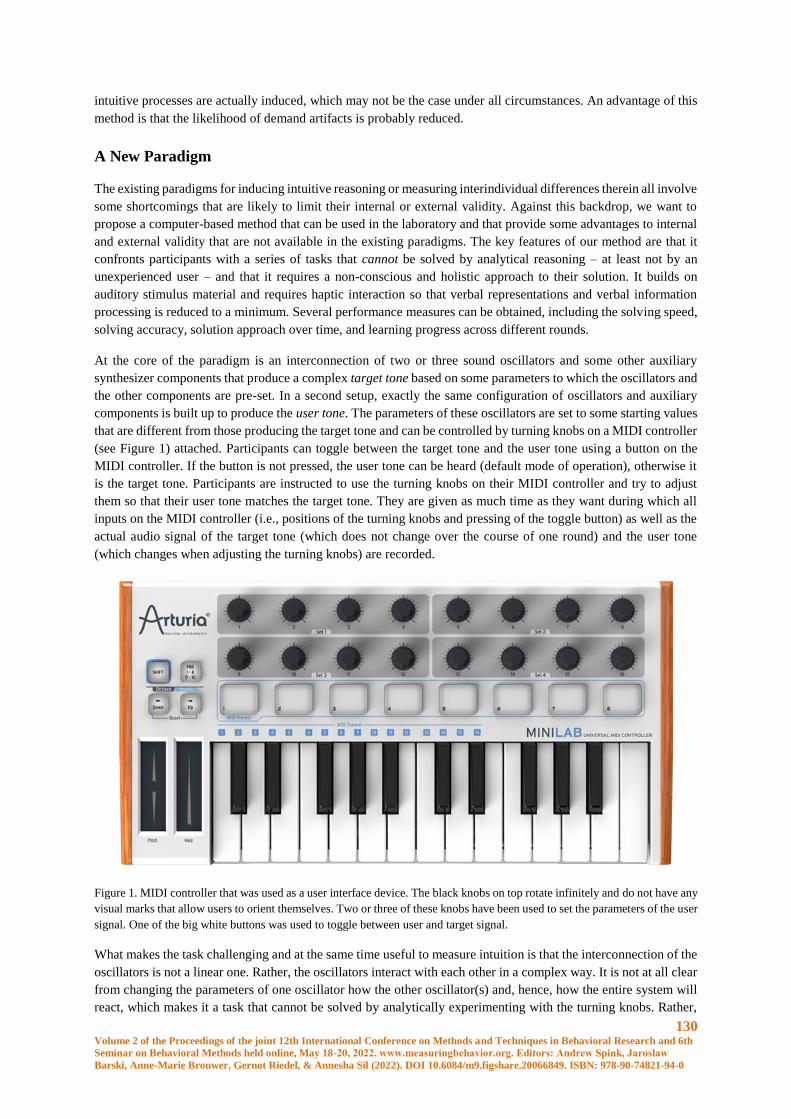
130 Volume 2 of the Proceedings of the joint 12th International Conference on Methods and Techniques in Behavioral Research and 6th
Seminar on Behavioral Methods held online, May 18-20, 2022. www.measuringbehavior.org. Editors: Andrew Spink, Jarosław
Barski, Anne-Marie Brouwer, Gernot Riedel, & Annesha Sil (2022). DOI 10.6084/m9.figshare.20066849. ISBN: 978-90-74821-94-0
intuitive processes are actually induced, which may not be the case under all circumstances. An advantage of this
method is that the likelihood of demand artifacts is probably reduced.
A New Paradigm
The existing paradigms for inducing intuitive reasoning or measuring interindividual differences therein all involve
some shortcomings that are likely to limit their internal or external validity. Against this backdrop, we want to
propose a computer-based method that can be used in the laboratory and that provide some advantages to internal
and external validity that are not available in the existing paradigms. The key features of our method are that it
confronts participants with a series of tasks that cannot be solved by analytical reasoning – at least not by an
unexperienced user – and that it requires a non-conscious and holistic approach to their solution. It builds on
auditory stimulus material and requires haptic interaction so that verbal representations and verbal information
processing is reduced to a minimum. Several performance measures can be obtained, including the solving speed,
solving accuracy, solution approach over time, and learning progress across different rounds.
At the core of the paradigm is an interconnection of two or three sound oscillators and some other auxiliary
synthesizer components that produce a complex target tone based on some parameters to which the oscillators and
the other components are pre-set. In a second setup, exactly the same configuration of oscillators and auxiliary
components is built up to produce the user tone. The parameters of these oscillators are set to some starting values
that are different from those producing the target tone and can be controlled by turning knobs on a MIDI controller
(see Figure 1) attached. Participants can toggle between the target tone and the user tone using a button on the
MIDI controller. If the button is not pressed, the user tone can be heard (default mode of operation), otherwise it
is the target tone. Participants are instructed to use the turning knobs on their MIDI controller and try to adjust
them so that their user tone matches the target tone. They are given as much time as they want during which all
inputs on the MIDI controller (i.e., positions of the turning knobs and pressing of the toggle button) as well as the
actual audio signal of the target tone (which does not change over the course of one round) and the user tone
(which changes when adjusting the turning knobs) are recorded.
Figure 1. MIDI controller that was used as a user interface device. The black knobs on top rotate infinitely and do not have any
visual marks that allow users to orient themselves. Two or three of these knobs have been used to set the parameters of the user
signal. One of the big white buttons was used to toggle between user and target signal.
What makes the task challenging and at the same time useful to measure intuition is that the interconnection of the
oscillators is not a linear one. Rather, the oscillators interact with each other in a complex way. It is not at all clear
from changing the parameters of one oscillator how the other oscillator(s) and, hence, how the entire system will
react, which makes it a task that cannot be solved by analytically experimenting with the turning knobs. Rather,
131 Volume 2 of the Proceedings of the joint 12th International Conference on Methods and Techniques in Behavioral Research and 6th
Seminar on Behavioral Methods held online, May 18-20, 2022. www.measuringbehavior.org. Editors: Andrew Spink, Jarosław
Barski, Anne-Marie Brouwer, Gernot Riedel, & Annesha Sil (2022). DOI 10.6084/m9.figshare.20066849. ISBN: 978-90-74821-94-0
an intuitive understanding of what is going on and how the different inputs interact with each other is needed.
There are five rounds that are increasingly difficult because the interconnection between the oscillators is
increasingly complex and increasingly chaotic.
Round 1
In the first setup, two voltage-controlled oscillators (VCO) are used, one producing a square wave at 824.21 Hz,
the other one a saw wave at 257.06 Hz. These are the two target frequencies that need to be matched. Both output
signals are mixed together additively and then chopped into distinguishable single tones by an attack-decay-
sustain-release (ADSR) gate with is triggered by low-frequency oscillator (LFO) set to a fixed frequency of 4.4
Hz. This output signal is sent to the speakers. Participants can control the frequency of each of the two VCOs in a
range between 11.56 and 5919.90 Hz, always starting with the lowest frequency by default.
Round 2
The second setup comprises two LFOs and one VCO. The first LFO set to 81.86 Hz is modulating the frequency
of the second LFO around 1.56 Hz. This LFO cascade is then used to modulate the frequency of the VCO using
the volt-per-octave (V/OCT) input. The VCO is producing a mix of a triangle and a square wave around 121.84
Hz. The ADSR gate frequency for chopping the waves into single tones is set to 2.00 Hz. This is the same frequency
used for constantly resetting the two LFOs in order to synchronize them with the single tones. This synchronization
is needed to produce exactly the same single tones. Participants can control the frequency of the first LFO in a
range between 0.01and 1024 Hz and the frequency of the VCO in a range between 11.56 and 5919.90 Hz, always
starting with the lowest frequency by default.
Round 3
The third setup is similar to the second one. Again, it comprises two LFOs and one VCO. The first LFO set to 1.80
Hz is modulating the frequency of the second LFO around 37.51 Hz. This LFO cascade is then used to modulate
the frequency of the VCO using the frequency modulation (FM) input with a sensitivity of 33.3%. This VCO is
producing a triangle wave around 850.61 Hz. The ADSR gate frequency for chopping the waves into single tones
is set to 3.02 Hz. This is the same frequency used for constantly resetting the two LFOs in order to synchronize
them with the single tones. Participants can control the frequency of the second LFO in a range between 0.01and
1024 Hz and the frequency of the VCO in a range between 11.56 and 5919.90 Hz, always starting with the lowest
frequency by default.
Round 4
The fourth setup again comprises two LFOs and one VCO. The first LFO set to 7.94 Hz is modulating the
frequency of the second LFO around 213.82 Hz. This LFO cascade is then used to modulate the frequency of the
VCO using the frequency modulation (FM) input with a sensitivity of 33.3%. This VCO is producing a triangle
wave around 261.63 Hz. The ADSR gate frequency for chopping the waves into single tones is set to 1.04 Hz.
This is the same frequency used for constantly resetting the two LFOs in order to synchronize them with the single
tones. Participants can control the frequencies of both LFOs in a range between 0.01 and 1024 Hz, always starting
with the lowest frequency by default.
Round 5
The fifth setup is similar to the fourth one with the main difference that there are three instead of two control
parameters. The first LFO set to 16.78 Hz is modulating the frequency of the second LFO around 372.73 Hz. This
LFO cascade is then used to modulate the frequency of the VCO using the frequency modulation (FM) input with
a sensitivity of 33.3%. This VCO is producing a triangle wave around 969.68 Hz. The ADSR gate frequency for
chopping the waves into single tones is set to 5.49 Hz. This is the same frequency used for constantly resetting the
two LFOs in order to synchronize them with the single tones. Participants can control the frequencies of both LFOs
in a range between 0.01 and 1024 Hz and the frequency of the VCO in a range between 11.56 and 5919.90 Hz,
always starting with the lowest frequency by default.
132 Volume 2 of the Proceedings of the joint 12th International Conference on Methods and Techniques in Behavioral Research and 6th
Seminar on Behavioral Methods held online, May 18-20, 2022. www.measuringbehavior.org. Editors: Andrew Spink, Jarosław
Barski, Anne-Marie Brouwer, Gernot Riedel, & Annesha Sil (2022). DOI 10.6084/m9.figshare.20066849. ISBN: 978-90-74821-94-0
Resulting Data
Following data can be obtained for each of the five rounds:
WAV file of the target tone, does not change over time but can be used to compute the distance between user
and target tone;
WAV file of the user tone, reflecting what the user is actually hearing;
one MIDI track for each of the synthesizer parameters (e.g., LFO frequency) at a resolution of 128 steps;
one MIDI track capturing pressing of the toggle button (which is also relevant for determining the timing of
the experiment which is defined by the first pressing of the toggle button).
Based on these parameters, several performance measures can be operationalized. The simplest ones would
probably be the time needed to solve the task (i.e., speed component) or the distance between the used and target
tone achieved at the end (i.e., accuracy component). More complex measures would comprise the pattern of
approaching the target tone over time or the strategic/systematic use if the two or three knobs in order to detect
patterns in how their adjustment affects the output tone.
Feasibility Study
The paradigm was piloted in a sample of N = 46 participants aged 19 to 48 years. All participants were instructed
to adjust the tone they heard (i.e., the user tone) as close as they could to a tone they could hear when pressing the
toggle button (i.e., target tone). They were left on their own to solve the task without imposing any time constraints.
Solving the five rounds with increasing difficulty on average took M = 16.51 minutes. At the same time, we
observed a large variation in the time used for this task, with some participants taking more than 45 minutes.
Participant have solved this task quite conscientiously and were in
The original purpose of this study was to investigate interindividual difference in their susceptibility to
environmental influences. Intuition, we were reasoning, was one aspect of this susceptibility because participants
who were more susceptible to environmental influences should be better able to detect hidden underlying patterns
in complex and obscure systems. We have therefore collected other behavioural and self-report indicators of
environmental susceptibility that we want to correlated with our measures of intuition. Furthermore, we have also
collected buccal swab samples from all participants and performed a gene sequencing analysis in order to detect
possible molecular genetic markers for higher intuition resp. environmental susceptibility in general. All these
analyses are currently conducted and are not subject to this paper.
Analytical Approach
A total of N = 22 participants with complete data across all five rounds took part in a first exploratory analysis.
The resulting data consisted of two WAV files containing the complete audio signals of the given target tone
(repeatedly played) and the user tone. The user-attempted convergence towards the target tone was conducted by
adjusting two (first four tasks) or three (last task) synthesizer parameters. Performance durations varied between
1.45 and 8.34 minutes (M = 4.11, SD = 2.14) per round. To quantify the similarity between target and user tone,
first analytical steps included the decomposition of the time-domain audio signals into frequency spectra (i.e.,
extracting all present frequencies with corresponding amplitudes and thus avoiding the need to deal with varying
signal lengths) and applying different metrics/distance measures onto them. We have been using several metrics
(such as the Itakura–Saito divergence or the log-spectral distance) as established in the literature and existing
implementations [18]. This was performed for both the “final” user tone (i.e., last seconds before the participant
indicated that he was done with the round) and the complete signals yielding some kind of distance/difference
signal over time and thus enabling a performance rating. Additionally, typical audio features such as short-term
energy and zero-crossing rates (time-domain speaking) or spectral entropy were extracted.

133 Volume 2 of the Proceedings of the joint 12th International Conference on Methods and Techniques in Behavioral Research and 6th
Seminar on Behavioral Methods held online, May 18-20, 2022. www.measuringbehavior.org. Editors: Andrew Spink, Jarosław
Barski, Anne-Marie Brouwer, Gernot Riedel, & Annesha Sil (2022). DOI 10.6084/m9.figshare.20066849. ISBN: 978-90-74821-94-0
Discussion
Although we cannot present any evidence on the validity of the measures obtained yet, our paradigm has the
potential to offer a new approach for measuring interindividual differences in intuiting. It does so in a way that is
highly consistent with the definition of the construct as a non-conscious, holistic, emotional, and rapid processes.
Furthermore, it offers a relatively inexpensive and versatile way of assessment that can be included in existing
psychological laboratory studies and in the future also in studies conducted online. By offering an intuitive user
interface, it can probably also be used with younger children and people with deficiencies in language
understanding and language production. However, much more work is needed for validating the measures
obtained, operationalizing them in the best way, and finally releasing a stable version of the present prototype.
Ethics Statement
This study was approved by the Ethical Review Board of the Faculty of Health at the University of Witten-
Herdecke.
References
1. Sinclair, M., & Ashkanasy, N. M. (2005). Intuition: Myth or decision-making tool? Management Learning 36,
353–370.
2. Dane, E. & Pratt, M. G. (2007). Exploring intuition and its role in managerial decision making. Academy of
Management Review 32, 33–54
3. Epstein, S. (1994). Integration of the cognitive and psychodynamic unconscious. American Psychologist 49,
709–724.
4. Shapiro, S. & Spence, M. T. (1997). Managerial intuition: a conceptual and operational framework. Business
Horizons 40, 63–68.
5. Epstein, S. (2002). Cognitive-experiential self-theory of personality. In T. Millon & M. J. Lerner (Eds),
Comprehensive Handbook of Psychology, Vol. 5: Personality and Social Psychology (pp. 159–184). Hoboken,
NJ: John Wiley & Sons.
6. Bastick, T. (1982). Intuition: How we think and act. New York: John Wiley & Sons.
7. Kahneman, D. (2003). A perspective on judgment and choice. American Psychologist 58, 697–720.
8. Rorty, R. (1967). Intuition. In P. Edwards (Ed.), Encyclopedia of philosophy. New York: MacMillan.
9. Lieberman, M. D. (2000). Intuition: A social cognitive neuroscience approach. Psychological Bulletin 126, 109–
137.
10. Lieberman, M. D. (2007). Social cognitive neuroscience: A review of core processes. Annual Review of
Psychology 58, 259–289.
11. Chakravarthy, V. S., Jospeph, D., & Bapi, R. S. (2010). What do the basal ganglia do? A modeling perspective.
Biological Cyberdynamics 103, 237–257.
12. de Groot, A. D. (1946). Thought and choice in chess. The Hague, Netherlands: Mouton.
13. Chase, W. G., & Simon, H. A. (1973). The mind’s eye in chess. In W. G. Chase (Ed.), Visual information
processing (pp. 215–281). New York: Academic Press.

134 Volume 2 of the Proceedings of the joint 12th International Conference on Methods and Techniques in Behavioral Research and 6th
Seminar on Behavioral Methods held online, May 18-20, 2022. www.measuringbehavior.org. Editors: Andrew Spink, Jarosław
Barski, Anne-Marie Brouwer, Gernot Riedel, & Annesha Sil (2022). DOI 10.6084/m9.figshare.20066849. ISBN: 978-90-74821-94-0
14. Meehl, P. E. (1954). Clinical vs. statistical prediction: A theoretical analysis and a review of the evidence.
Minneapolis: University of Minnesota Press.
15. Goldberg, L. R. (1970). Man versus model of man: A rationale, plus some evidence, for a method of improving
on clinical inferences. Psychological Bulletin 73, 422–432.
16. Kahneman, D., & Klein, G. (2009). Conditions for intuitive expertise: A failure to disagree. American
Psychologist 64, 515–526.
17. Dane, E., & Pratt, M. G. (2009). Conceptualizing and measuring intuition: A review of recent trends. In G. P.
Hodgkinson & J. K. Ford (Eds.), International review of industrial and organizational psychology (Vol. 24, pp.
1–49). Chichester, UK: Wiley.
18. Sueur, J., Aubin, T., & Simonis, C. (2008). Seewave: A free modular tool for sound analysis and synthesis.
Bioacoustics 18, 213–226.
135 Volume 2 of the Proceedings of the joint 12th International Conference on Methods and Techniques in Behavioral Research and 6th
Seminar on Behavioral Methods held online, May 18-20, 2022. www.measuringbehavior.org. Editors: Andrew Spink, Jarosław
Barski, Anne-Marie Brouwer, Gernot Riedel, & Annesha Sil (2022). DOI 10.6084/m9.figshare.20066849. ISBN: 978-90-74821-94-0
Session Theme: Methods in food and eating
studies
136 Volume 2 of the Proceedings of the joint 12th International Conference on Methods and Techniques in Behavioral Research and 6th
Seminar on Behavioral Methods held online, May 18-20, 2022. www.measuringbehavior.org. Editors: Andrew Spink, Jarosław
Barski, Anne-Marie Brouwer, Gernot Riedel, & Annesha Sil (2022). DOI 10.6084/m9.figshare.20066849. ISBN: 978-90-74821-94-0
The Effect of Virtual Reality on Eating Behaviours and Hunger: A Randomized
Crossover Study
Billy Langlet
Department of Biosciences and Nutrition, Karolinska Institutet, Sweden
Abstract
Anorexia Nervosa is a severe psychiatric disorder with poor treatment outcomes. Virtual Reality is used in many
areas of healthcare and could potentially be used for exposure therapy in the treatment of eating disorders. This
study investigated the effect of Virtual Reality on eating behaviour and hunger. Fourteen healthy women (mean
age = 23.1 years and mean body mass index (BMI) = 22.1 kg/m2) were recruited. The study employed a
randomized crossover design consisting of one control, two real, and two virtual meals, where meatballs with
potatoes were consumed. There was no significant difference between the virtual and real meal in food intake
(mean diff. = 2.68, p = 0.860), but the meal duration of the virtual meal was significantly shorter (mean diff. = -
4.57, p < 0.001). No significant difference between hunger before and after the virtual meal was found (mean diff.
= 4.85, p = 0.330). The correlation for both virtual and real meals was low between hunger and body mass index
(Virtual: R2 = 0.07, p = 0.184; Real: R2 = 0.08, p = 0.932) and meal duration (Virtual: R2 = 0.08, p = 0.930; Real:
R2 = 0.03, p = 0.467). The same low association was found in both conditions for food intake and meal duration
for both (Virtual: R2 = 0.14, p = 0.106; Real: R2 = 0.13, p = 0.110). The findings of our study suggest that eating a
virtual meal does not affect the hunger in healthy women, indicating that virtual reality can be used to train patients
on how to eat, but further research is needed.
Introduction
Eating disorders are defined by a persistent disturbance of eating behavior [1], which can result in both over and
underweight. The disturbed eating behaviour is often accompanied by severe physical and psychosocial health
complications and distress. EDs and the behaviors related to them are most common in young women. A study
done on 6728 Americans between the ages of 9 and 14 found that 7.1% of the boys and 14.4% of the girls exhibited
certain ED traits [2]. ED treatments usually include interpersonal psychotherapy or cognitive behavioural therapy
for adults [3] and family-based therapy for adolescents [4]. Inpatient care is required for severe ED cases,
especially for individuals suffering from AN. This usually involves supervised meals served by clinicians or nurses
to reduce any medical risk.
Virtual reality (VR) is a technology that is on the rise, having dominated tech headlines in recent years [5], and
can be divided into immersive and non-immersive VR [6]. Immersive VR allows the user to simulate a situation
or experience, using a VR headset or multi-projected environments to generate realistic images, sounds, and other
sensations, in an interactive computer-generated environment [7]. An immersive VR environment can induce the
sense of “being there”, called “presence” [8], as well as a sense of embodiment where individuals experience
ownership over a virtual limb or even over an entire body [9] Meanwhile, non-immersive VR environments only
provide individuals with a 360° panorama view by moving or rotating the device in which the content is displayed,
such as a computer, tablet, or smartphone [10].
Although VR has mainly been used in the gaming industry, it can be used in many areas of healthcare, for a variety
of applications from professional healthcare education to disease treatment [11]. The ability to control unexpected
situations in a VR environment makes the application of this technology safer and easier since exposure to certain
fears may be difficult to reproduce in real life [7]. Furthermore, VR technology has been used successfully to treat
conditions such as anxiety disorders, phobias, post-traumatic stress disorder, pain management, and physical injury
rehabilitation [12]. VR also seems well suited for treating mental disorders and especially EDs [13].
Research on non-immersive VR in EDs started in the late 1990s and was shown effective in studying, assessing,
and treating body image disturbance (BID) which is a key characteristic of AN and BN [14]. Another use of VR
137 Volume 2 of the Proceedings of the joint 12th International Conference on Methods and Techniques in Behavioral Research and 6th
Seminar on Behavioral Methods held online, May 18-20, 2022. www.measuringbehavior.org. Editors: Andrew Spink, Jarosław
Barski, Anne-Marie Brouwer, Gernot Riedel, & Annesha Sil (2022). DOI 10.6084/m9.figshare.20066849. ISBN: 978-90-74821-94-0
has been to measure the exposure-response from virtual food stimuli [15]. These studies have primarily been
conducted by Gutiérrez-Maldonados et al., assessing whether virtual food environments that simulate real-life
situations can trigger disordered eating behaviour, emotional responses, or compensatory behaviours to lose
weight. In one of these studies patients were exposed to a living room (neutral situation), a kitchen with high-
calorie food, a kitchen with low-calorie food, a restaurant with high-calorie food, a restaurant with low-calorie
food, and a swimming pool [16]. The ED patients' anxiety was higher in high-calorie food situations and in
locations where other people were present. A recent formative evaluation by clinicians of a VR method to expose
patients to fear foods showed that clinicians were positive to using the technology in treatment [17]. However,
clinicians were concerned that the VR method would reduce appetite in AN patients, resulting in lower actual food
intake and poorer treatment outcomes. The safety of exposure to food in VR could not be estimated due to a lack
of studies examining the effect of VR on eating behaviours and appetite using immersive equipment [15].
Therefore, the current study aims to examine whether eating in an immersive VR environment affects hunger
among healthy individuals. Our primary hypothesis is that eating in an immersive VR environment will not affect
participants' hunger. If the null hypothesis is accepted, these findings will lay the groundwork for a future study
that will use VR to train AN patients on how to eat. This approach might give a new dimension to the existing
treatments of EDs as well as other food related disorders.
Material and Methods
Participants
Inclusion criteria for participation in the study included the following: 1) woman, 2) age 18-28, 3) body mass index
(BMI) 18.5-29 kg/m2, 4) normal physical activity (PA), 5) non-smoker, 6) non-vegetarian, 7) no aversion to the
food served, 8) no previous history of EDs, 9) not pregnant or breastfeeding, 10) not undergoing treatment known
to affect appetite, and 11) not having temporomandibular disorders or recent serious dental surgery. Participants
were recruited via the digital meeting platform Accindi.
Instruments
BMI and weight was measured using a Tanita body composition analyzer BC-418 (Tokyo, Japan) and height was
measured using a Seca stadiometer (Model number: 216 1814009). To display and interact with the VR meal, HTC
VIVE Pro (HTC China) was used, which consists of a head-mounted device and accompanying hand-held
controllers. The headset provides an 110 degree view at a resolution of 1440×1600 pixels per eye and a refresh
rate of 90 Hz. Food intake was measured using a medical device that consists of a scale connected to a computer,
that measures the weight of the food on the plate at a sampling frequency of 1Hz (Mandometer®) [18].
Questionnaire data was collected via an in-house developed app on a Samsung Galaxy Tab A7 (Model number:
SM-T500).
To estimate PA the short International Physical Activity Questionnaire (IPAQ) was used, which consists of seven
questions (e.g., “During the last 7 days, on how many days did you do vigorous physical activities like heavy
lifting, digging, aerobics, or fast bicycling?”). To ensure individuals were healthy enough to participate a health
status questionnaire consisting of 25 general health questions (e.g., “During the past 12 months, have you had
eating disorders?”). Appetite, mood, and taste of the food were estimated using a meal questionnaire, which
consisted of 25 questions divided into 12 before meal and 13 after meal items. Before the meal participants
answered six questions about their mood (e.g., “Are you feeling tense right now?”) and six questions about their
appetite (e.g., “How hungry do you feel?”). After the meal participants answered the same questionnaire items on
appetite and seven questions regarding the taste of the food (e.g., “How fatty did the food taste?”). All
questionnaire items were answered on 100mm visual analogue scales (VAS) ranging from 0 to 100, with the verbal
anchors “Not at all” = 0 and “Extremely” = 100.
Procedure
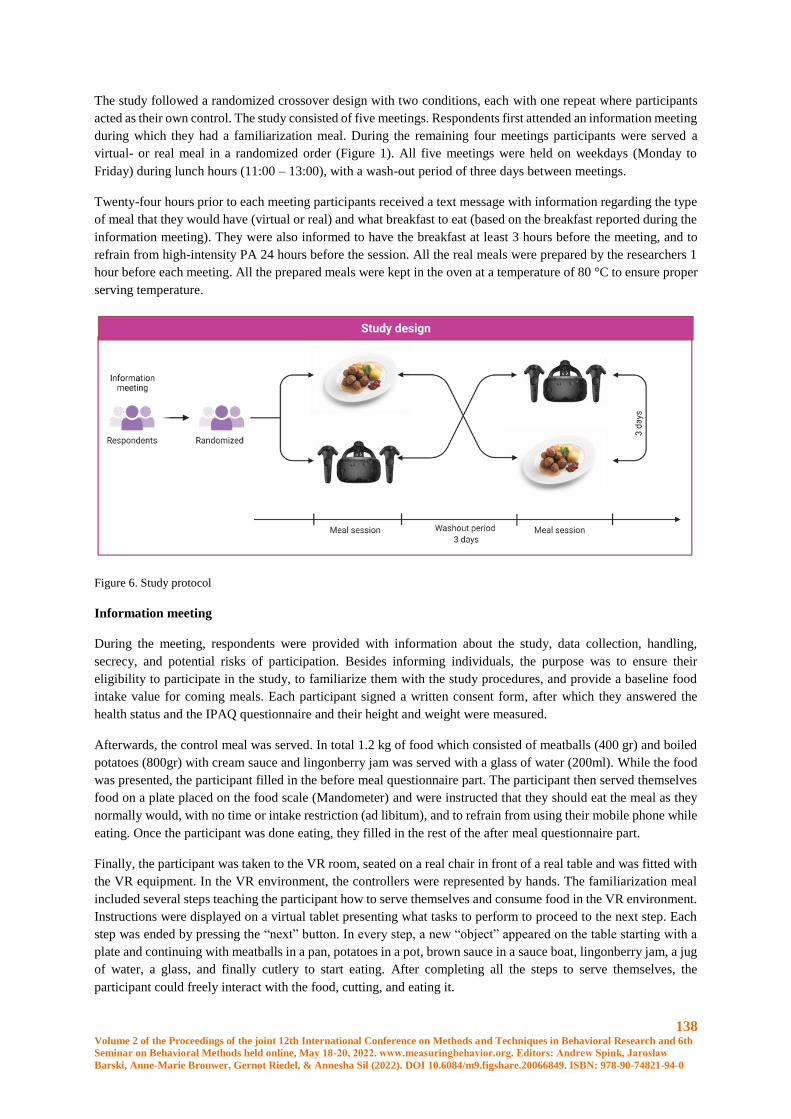
138 Volume 2 of the Proceedings of the joint 12th International Conference on Methods and Techniques in Behavioral Research and 6th
Seminar on Behavioral Methods held online, May 18-20, 2022. www.measuringbehavior.org. Editors: Andrew Spink, Jarosław
Barski, Anne-Marie Brouwer, Gernot Riedel, & Annesha Sil (2022). DOI 10.6084/m9.figshare.20066849. ISBN: 978-90-74821-94-0
The study followed a randomized crossover design with two conditions, each with one repeat where participants
acted as their own control. The study consisted of five meetings. Respondents first attended an information meeting
during which they had a familiarization meal. During the remaining four meetings participants were served a
virtual- or real meal in a randomized order (Figure 1). All five meetings were held on weekdays (Monday to
Friday) during lunch hours (11:00 – 13:00), with a wash-out period of three days between meetings.
Twenty-four hours prior to each meeting participants received a text message with information regarding the type
of meal that they would have (virtual or real) and what breakfast to eat (based on the breakfast reported during the
information meeting). They were also informed to have the breakfast at least 3 hours before the meeting, and to
refrain from high-intensity PA 24 hours before the session. All the real meals were prepared by the researchers 1
hour before each meeting. All the prepared meals were kept in the oven at a temperature of 80 °C to ensure proper
serving temperature.
Figure 6. Study protocol
Information meeting
During the meeting, respondents were provided with information about the study, data collection, handling,
secrecy, and potential risks of participation. Besides informing individuals, the purpose was to ensure their
eligibility to participate in the study, to familiarize them with the study procedures, and provide a baseline food
intake value for coming meals. Each participant signed a written consent form, after which they answered the
health status and the IPAQ questionnaire and their height and weight were measured.
Afterwards, the control meal was served. In total 1.2 kg of food which consisted of meatballs (400 gr) and boiled
potatoes (800gr) with cream sauce and lingonberry jam was served with a glass of water (200ml). While the food
was presented, the participant filled in the before meal questionnaire part. The participant then served themselves
food on a plate placed on the food scale (Mandometer) and were instructed that they should eat the meal as they
normally would, with no time or intake restriction (ad libitum), and to refrain from using their mobile phone while
eating. Once the participant was done eating, they filled in the rest of the after meal questionnaire part.
Finally, the participant was taken to the VR room, seated on a real chair in front of a real table and was fitted with
the VR equipment. In the VR environment, the controllers were represented by hands. The familiarization meal
included several steps teaching the participant how to serve themselves and consume food in the VR environment.
Instructions were displayed on a virtual tablet presenting what tasks to perform to proceed to the next step. Each
step was ended by pressing the “next” button. In every step, a new “object” appeared on the table starting with a
plate and continuing with meatballs in a pan, potatoes in a pot, brown sauce in a sauce boat, lingonberry jam, a jug
of water, a glass, and finally cutlery to start eating. After completing all the steps to serve themselves, the
participant could freely interact with the food, cutting, and eating it.
139 Volume 2 of the Proceedings of the joint 12th International Conference on Methods and Techniques in Behavioral Research and 6th
Seminar on Behavioral Methods held online, May 18-20, 2022. www.measuringbehavior.org. Editors: Andrew Spink, Jarosław
Barski, Anne-Marie Brouwer, Gernot Riedel, & Annesha Sil (2022). DOI 10.6084/m9.figshare.20066849. ISBN: 978-90-74821-94-0
Real-life meal
All the real-life meal meetings started by measuring the participants’ body weight and height. The participant was
then led to the room where they would eat, after which the meal followed the same procedures as during the real-
life meal of the information meeting, described above..
Virtual meal
The virtual meal meeting started by measuring the participant’s body weight and height. Afterward, the participant
was taken to the VR room, where they filled in the before meal questionnaire and were fitted with the VR
equipment. The VR environment was a kitchen which included a table and a chair. The meal served in VR
environment was meatballs and potatoes, similar to the real meal. The food portion of the virtual meal was
equivalent to the portion that was consumed during the control meal. There was extra food in the containers placed
on the table, so the participant could add more food to their plate if they wanted. The meal was consumed normally
with no time restriction (ad libitum), identical to the instructions of the real meal. Once the participant was done,
the after meal questionnaire was filled in.
Ethical statement
The research protocol included human subjects and was approved by the Swedish Ethical Review Authority (D.nr:
2019-04249).
Statistical analysis
Statistical analyses were carried out using Statistical Package for the Social Sciences (SPSS) software version 27.0
(IBM Corp., Armonk, NY, USA). The average from the two measurements of each condition is presented in the
results and was used for statistical tests. Unless stated outcomes measurements refer to the average values. A two-
tailed student's t-test that did not assume equal variance with a significance threshold of p < 0.05 was performed
for each outcome variable. A Pearson correlation was conducted between hunger and meal duration, food intake
and meal duration, as well as the influence of BMI on hunger.
Results
Participants
The sample comprised 14 healthy women with a mean age of 23.1 years (SD = 3.1). Therefore, the final analysis
included 14 participants. Demographic data of the participants were collected and are presented in Table 1. No
participant was excluded based on questionnaire responses.
Table 5. Demographic data
Mean SD
Age (years) 23.1 3.1
Weight (kg) 60.9 10.4
Height (cm) 165.9 7.5
BMI (kg/m2) 22.1 3.3
Body Fat percentage (%) 26.8 4.9
PA level (MVPA min/week) 741.3 779.4
BMI: body mass index, PA: physical activity, MET: metabolic equivalent of task, MVPA: moderate to vigorous physical
activity, SD: Standard Deviation
Hunger
140 Volume 2 of the Proceedings of the joint 12th International Conference on Methods and Techniques in Behavioral Research and 6th
Seminar on Behavioral Methods held online, May 18-20, 2022. www.measuringbehavior.org. Editors: Andrew Spink, Jarosław
Barski, Anne-Marie Brouwer, Gernot Riedel, & Annesha Sil (2022). DOI 10.6084/m9.figshare.20066849. ISBN: 978-90-74821-94-0
There was no significant difference in hunger before and after the meal in the VR condition (mean diff. = 4.85, p
= 0.330), while there was a significant difference in hunger before and after the real meal (mean diff. = 49.64,
p<0.001). The correlation was low between BMI and hunger for both VR (adjusted R2 = 0.07, p = 0.184) and real
meal (adjusted R2= 0.08, p = 0.932). The correlation between meal duration and hunger was low for both the VR
meal and real meal (adjusted R2 = 0.08, p = 0.930 and adjusted R2 = 0.03, p= 0.467, respectively).
Food intake and meal duration
There was no significant difference in food intake between the two conditions (mean diff. = 2.68, p = 0.860), while
the VR meals were significantly shorter than the real meals (mean diff. = -4.57, p < 0.001). The correlation between
food intake and meal duration was low for both VR and real meals (R2 = 0.14, p = 0.106 and R2 = 0.13, p = 0.110,
respectively)..
Familiarization effects
There was no significant difference in meal duration between the first and second VR meal (mean diff. = 0.32, p
= 0.325), as well as for the real meals (mean diff. = -0.10, p = 0.856). Similarly, there was no significant difference
in hunger between the first and second meal in both eating conditions (VR: mean diff. = 2.21, p = 0.606; real meal:
mean diff. = 3.29, p = 0.176).
Discussion
To our knowledge, this is the first study to investigate the difference in behavior between real and VR meals and
specifically aimed to investigate the effect of a VR meal on participants' hunger. The findings of our study indicated
that eating a VR meal does not affect hunger in healthy women. The results suggest food intake is similar in VR
and real meals, but that the mel duration is shorter in the VR meal. Finally, the findings indicate that BMI and
meal duration did not seem to influence hunger or food intake in both eating conditions.
The finding that hunger was not significantly affected by a VR meal is in contrast to a study by Morewedge et al.,
where repeatedly imagining eating a particular food (e.g. cheese) decreased food intake [19](25). Another study
found that individuals with higher levels of trait and state-craving both showed a greater desire to eat during non-
immersive VR exposure [20](26). Due to conflicting results, food related VR interventions incuding sensitive
groups such as patients require care. The main concern of clinicians is that AN (and other ED) patients will use
VR eating to reduce their already low food intake.
Although the aim of this study was not to prove that a VR meal mimics a real one the extent to which a VR meal
represents realistic eating conditions was also examined. Interestingly even though the mean meal duration of the
VR meal was shorter by 4.57min, which was significantly different; the amount of food consumed was
approximately the same as the real meal. A possible explanation for this finding is that the participants were eating
the food without chewing, which resulted in putting more food in their mouth than it could normally fit. As a
result, their eating rate was higher than what is expected when eating real food.
The strengths of the study was being conducted in a controlled setting, using a randomised crossover design with
single repeats to account for potential familiarization effects and confounders [21](29). An additional strength of
the study was the objective measurements of weight, height, food intake and meal duration. Normal desire to eat
was ensured by instructing the participants to have breakfast at least 3 hours before the meal session and refrain
from high-intensity PA the previous day. One limitation was the study’s small sample size which increases the
risk of type one and two error. A drawbacks was the use of meatbased products for the real meals, which excluded
vegetarians, that make up around 10% of the Swedish population [22](31). Future studies should investigate the
effect on hunger using take-home VR equipment, as the results might be influenced by the laboratory setting.
Another venue of enquiry could be to include more senses (e.g., sounds, olfactory information, and chewing gums
to imitate mastication).
Conclusion

141 Volume 2 of the Proceedings of the joint 12th International Conference on Methods and Techniques in Behavioral Research and 6th
Seminar on Behavioral Methods held online, May 18-20, 2022. www.measuringbehavior.org. Editors: Andrew Spink, Jarosław
Barski, Anne-Marie Brouwer, Gernot Riedel, & Annesha Sil (2022). DOI 10.6084/m9.figshare.20066849. ISBN: 978-90-74821-94-0
The present study investigated the effect of VR on hunger. It seems that eating in an immersive VR environment
has only minor effects on hunger, suggesting that VR can be used for ED patients without the risk of them replacing
real meals with VR meals. However, further research is needed to further these findings.
References
1. Eating Disorders: Recognition and Treatment (2017). National Guideline Alliance (UK), National
Institute for Health and Care Excellence.
2. Neumark-Sztainer, D., Hannan, P.J., (2000). Weight-related behaviors among adolescent girls and boys:
results from a national survey. Archives of Pediatrics & Adolescent Medicine, 154(6), 569-77.
3. Fairburn, C.G., Bailey-Straebler, S., Basden, S., Doll, H.A., Jones, R., Murphy, R., et al. (2015). A
transdiagnostic comparison of enhanced cognitive behaviour therapy (CBT-E) and interpersonal
psychotherapy in the treatment of eating disorders. Behavior Research and Therapy 70, 64-71.
4. Fairburn, C.G., Harrison, P.J., (2003). Eating disorders. Lancet 361(9355), 407-16.
5. Statista. Worldwide VR headset shipment 2018-2022, by segment. 2021 [cited 2021 29 December].
Available from: https://www.statista.com/statistics/754860/worldwide-vr-headset-shipment-by-
segment/.
6. Freeman, D., Reeve, S., Robinson, A., Ehlers, A., Clark, D., Spanlang, B., et al. (2017). Virtual reality in
the assessment, understanding, and treatment of mental health disorders. Psychological Medicine 47(14),
2393-400.
7. Kim, S., Kim, E., (2020). The Use of Virtual Reality in Psychiatry: A Review. Journal of Child &
Adolescent Psychiatry 31(1), 26-32.
8. Slater, M., (2009). Place illusion and plausibility can lead to realistic behaviour in immersive virtual
environments. Philosophical Transactions of the Royal Society London. Series B, Biological Sciences
364(1535), 3549-57.
9. Matamala-Gomez, M., Maselli, A., Malighetti, C., Realdon, O., Mantovani, F., Riva, G., (2021). Virtual
Body Ownership Illusions for Mental Health: A Narrative Review. Journal of Clinical Medicine 10(1).
10. Repetto, C., Germagnoli, S., Triberti, S., Riva, G., (2018). Learning into the Wild: A Protocol for the Use
of 360° Video for Foreign Language Learning. Pervasive Computing Paradigms for Mental Health.
Springer International Publishing.
11. Garrett, B., Taverner, T., Gromala, D., Tao, G., Cordingley, E., Sun, C., (2018). Virtual Reality Clinical
Research: Promises and Challenges. JMIR Serious Games 6(4), e10839.
12. Valmaggia, L.R., Latif, L., Kempton, M.J., Rus-Calafell, M., (2016). Virtual reality in the psychological
treatment for mental health problems: An systematic review of recent evidence. Psychiatry Research 236,
189-95.
13. de Carvalho, M.R., Dias, T.R.S., Duchesne, M., Nardi, A.E., Appolinario, J.C., (2017). Virtual Reality as
a Promising Strategy in the Assessment and Treatment of Bulimia Nervosa and Binge Eating Disorder:
A Systematic Review. Behavioral Sciences (Basel, Switzerlad) 7(3).
14. Corno, G., Fonseca-Baeza, S., Baños, R., (2018). An intervention protocol proposal to modify the body
image disturbance using Virtual Reality. Calidad de Vida y Salud 11(2), 48-61.
15. Clus, D., Larsen, M.E., Lemey, C., Berrouiguet, S., (2018). The Use of Virtual Reality in Patients with
Eating Disorders: Systematic Review. Journa of Medical Internet Research 20(4), e157.
142 Volume 2 of the Proceedings of the joint 12th International Conference on Methods and Techniques in Behavioral Research and 6th
Seminar on Behavioral Methods held online, May 18-20, 2022. www.measuringbehavior.org. Editors: Andrew Spink, Jarosław
Barski, Anne-Marie Brouwer, Gernot Riedel, & Annesha Sil (2022). DOI 10.6084/m9.figshare.20066849. ISBN: 978-90-74821-94-0
16. Gutiérrez-Maldonado, J., Ferrer-García, M., Caqueo-Urízar, A., Letosa-Porta, A., (2006). Assessment of
emotional reactivity produced by exposure to virtual environments in patients with eating disorders.
Cyberpsychology & Behavior 9(5), 507-13.
17. Langlet,, B.S., Odegi, D., Zandian, M., Nolstam, J., Södersten, P., Bergh, C., (2021). Virtual Reality App
for Treating Eating Behavior in Eating Disorders: Development and Usability Study. JMIR serious games
9(2), e24998.
18. Esfandiari, M., Papapanagiotou, V., Diou, C., Zandian, M., Nolstam, J., Södersten, P., Bergh, C. (2018).
Control of eating behavior using a novel feedback system. Journal of visualized experiments: JoVE 135.
19. Morewedge, C.K., Huh, Y.E., Vosgerau, J., (2010). Thought for food: imagined consumption reduces
actual consumption. Science 330(6010), 1530-3.
20. Pla-Sanjuanelo, J., Ferrer-Garcia, M., Gutiérrez-Maldonado, J., Vilalta-Abella, F., Andreu-Gracia, A.,
Dakanalis, A., et al. (2015). Trait and State Craving as Indicators of Validity of VR-based Software for
Binge Eating Treatment. Studies in Health Technology and Informatics 219, 141-6.
21. Tinmouth. A., Hebert. P., (2007). Interventional trials: an overview of design alternatives. Transfusion
47(4), 565-7.
22. Statista. Survey on being vegetarian or vegan in Sweden 2015-2018 (2021) [cited 2021 29 December].
Available from: https://www.statista.com/statistics/684820/survey-on-vegetarianism-and-veganism-in-
sweden/.
143 Volume 2 of the Proceedings of the joint 12th International Conference on Methods and Techniques in Behavioral Research and 6th
Seminar on Behavioral Methods held online, May 18-20, 2022. www.measuringbehavior.org. Editors: Andrew Spink, Jarosław
Barski, Anne-Marie Brouwer, Gernot Riedel, & Annesha Sil (2022). DOI 10.6084/m9.figshare.20066849. ISBN: 978-90-74821-94-0
An Attempt to Assess the Effects of Social Demand using Explicit and Implicit
Measures of Food Experience
P. Sabu1, D. Kaneko2, I.V. Stuldreher1, A.-M. Brouwer1
1 Department Human Performance, The Netherlands Organisation for Applied Scientific Research (TNO),
Soesterberg, The Netherlands. [email protected]; [email protected]; [email protected]
2 Kikkoman Europe R&D Laboratory B.V., Wageningen, The Netherlands. [email protected]
Abstract
Explicit (questionnaire) and implicit (EEG and behavioral) measures were used to assess the impact of social
demand on appreciation of Japanese and Dutch food. Applied social pressure was too weak to increase liking of
Japanese food – however, the different measures were sensitive to other variables of interest such as food
neophobia.
Introduction
Food experience is generally measured using explicit, verbal measures such as responses to questionnaires [1].
However, implicit measures based on signals generated outside of conscious awareness, such as physiological
responses or facial expression, may add valuable information. For instance, it was previously found that when
testing responses to images and drinks in both Thai and Dutch participants, explicit measures showed a known
cultural response bias (Western participants using a larger range of the response scale than Asian participants),
while heart rate responses did not show this bias and were in line with hypothesized liking of the food from the
own culture [2]. Implicit measures may thus help to compare food experience across cultures, avoiding response
bias. Another case where response bias in explicit measures of food experience may be expected, and implicit
measures may aid assessment of food experience, is when social demand plays a role. An example of the effect of
social demand on an explicit measure is a study by Dell and colleagues [3]. They showed that respondents were
about 2.5 times more likely to favor a technology believed to be developed by the interviewer compared to an
exactly identical alternative which was not developed by the interviewer. In the current study, we investigate
whether social pressure towards favoring Asian food differentially affects explicit and implicit measures of food
experience. We hypothesize that it affects explicit measures - in this case, reported valence (pleasantness) and
arousal. Depending on whether social demand genuinely affects the experience, or only the conscious report, we
expect to see a concurrent change in implicit measures as recorded using a behavioural measure (amount
consumed) as well as Electroencephalograpic (EEG) brain measures: event related potentials, alpha asymmetry
[4,5] and intersubject correlation [6,7]. Another research question concerned the relation between food neophobia
(unwillingness to try novel foods [8]) and implicitly and explicitly recorded responses towards the different types
of food stimuli (further elaborated upon in [9]).
Methods
We recorded from 19 female and 23 male Dutch participants, with ages ranging from 19 to 64 years (M= 46.6,
SD= 15.3), who were free of any food allergy and not following any type of diet. Before performing the study,
approval was obtained from the TNO Institutional Review Board (IRB). The approval is registered under reference
2020-117. All participants signed informed consent before participating in the experiment, in accordance with the
Declaration of Helsinki.
Participants were fitted with a 32-electrode EEG cap and randomly assigned to the social demand or control group.
The experiment consisted of three phases: 1. pre-social demand, 2. movie, and 3. post-social demand (see Figure
1). In phase 1 and 3, participants were presented with pictures of food from the CROCUFID (Cross Cultural Food
Images Database [10]) on a computer screen in a randomized order. The images were of four different categories:
Japanese food, Dutch food, palatable food (universal food, such as fruits) and unpalatable food (moldy food and

144 Volume 2 of the Proceedings of the joint 12th International Conference on Methods and Techniques in Behavioral Research and 6th
Seminar on Behavioral Methods held online, May 18-20, 2022. www.measuringbehavior.org. Editors: Andrew Spink, Jarosław
Barski, Anne-Marie Brouwer, Gernot Riedel, & Annesha Sil (2022). DOI 10.6084/m9.figshare.20066849. ISBN: 978-90-74821-94-0
food beleaguered by insects or snails). In both phase 1 and phase 3, 80 unique images (20 from each category)
were presented for two seconds, preceded by a fixation cross displayed for 0.5 seconds. Immediately after viewing
each image, participants were prompted to rate their emotion using the EmojiGrid, which is a graphical and
language-independent self-reporting tool to measure the emotional dimensions of valence (x-axis) and arousal (y-
axis) [11]. After viewing and rating the images, a Dutch (Vegetable or Tomato) and a Japanese (Miso or Sumashi)
soup were presented to the participants in a randomized order to taste and rate using the EmojiGrid. The amount
of soup consumed (sip size), was recorded.
After phase 1 (pre-social demand), the movie phase started. In this phase, participants watched a 15-minute movie
on the origin, production and use of Japanese Kikkoman soy sauce. Just prior to the movie, we attempted to exert
social pressure on participants to increase liking for Japanese food. For this, one of the experiment leaders, who is
visibly from Japanese origin, told the participants anecdotes and his favorable opinion of Japanese food. The
control group was told neutral anecdotes by a different (non-Japanese) experiment leader. After watching the
movie, the experiment leader again intended to apply social pressure to the social demand group by referring to
the movie. With the control group, the other experiment leader conducted basic small talk without mentioning
anything about the movie’s content. The conversation around the attempt to induce social pressure, and the control
in the other group, followed a predetermined protocol.
Results and Discussion
We had expected that after applying social pressure, participants would score Japanese food more favorably with
respect to Dutch food as compared to how they scored them before the social pressure, and compared to the control
group. After establishing this, evaluating the implicit responses would have indicated whether social pressure only
caused the participants to adjust their scores, or whether the social pressure affected food experience more
profoundly. However, there was no effect of social pressure on explicit measures in the first place. It also did not
affect any of the other variables. We did find hypothesized effects of other factors on our dependent variables. We
found effects of food image category (Japanese, Dutch, palatable, unpalatable) on explicit scores and ERPs, and
we found effects of drink category (Japanese, Dutch) on both explicit scores and sip size. In addition, food
neophobia affected, or tended to affect, all of these variables. Food neophobia also strongly affected EEG inter-
subject correlation (reflecting attentional engagement during watching the movie) though not alpha asymmetry
(reflecting approach-avoidance motivation during watching the movie). The effects of food category and food
neophobia indicate that the lack of effect of social pressure was not caused by a complete lack of sensitivity of the
variables. The method we used of applying social pressure appeared to not have been strong enough. We speculate
that the major aspect that could be improved in future experiments is to ask participants for explicit reports in a
way that it is clear that the person inducing social pressure perceives their response. Repeating a study similar to
the current one but with a more potent way to induce social demand would still be of strong interest in order to
increase our understanding of the pervasiveness of social demand on food experience. Especially when implicit
and explicit measures diverge, this would speak to expanding the usual measuring toolbox from explicit measures
only to including implicit ones.
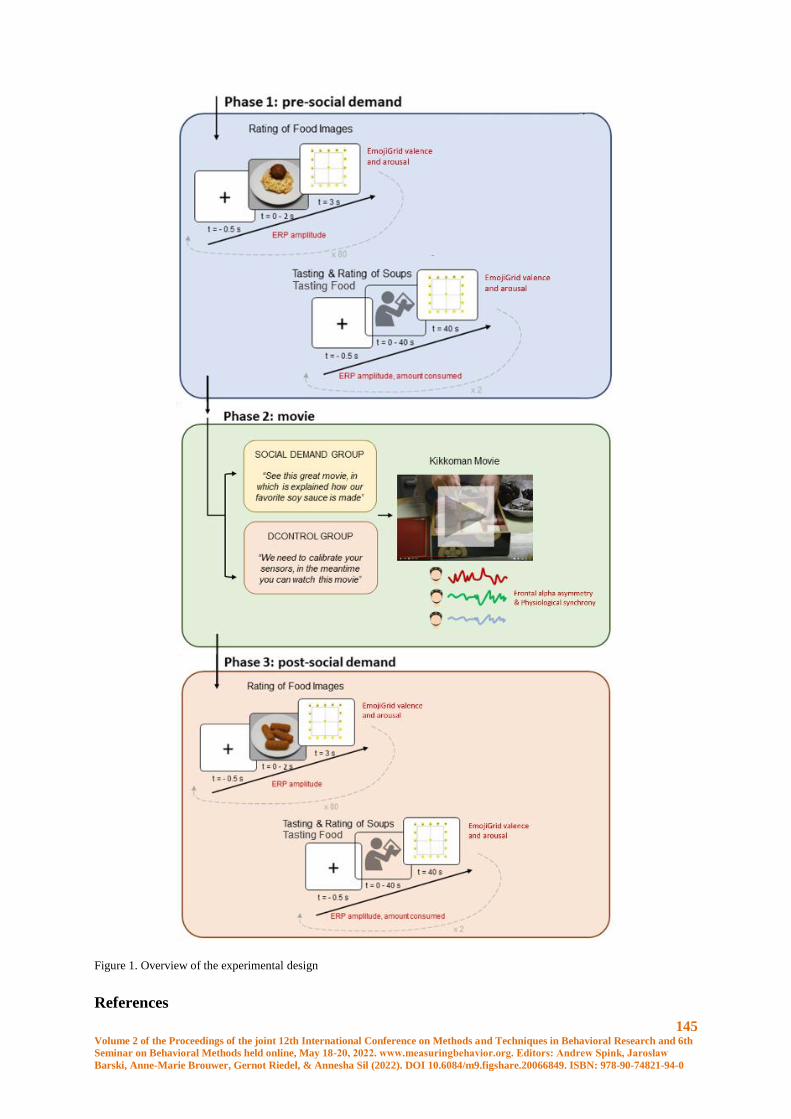
145 Volume 2 of the Proceedings of the joint 12th International Conference on Methods and Techniques in Behavioral Research and 6th
Seminar on Behavioral Methods held online, May 18-20, 2022. www.measuringbehavior.org. Editors: Andrew Spink, Jarosław
Barski, Anne-Marie Brouwer, Gernot Riedel, & Annesha Sil (2022). DOI 10.6084/m9.figshare.20066849. ISBN: 978-90-74821-94-0
Figure 1. Overview of the experimental design
References

146 Volume 2 of the Proceedings of the joint 12th International Conference on Methods and Techniques in Behavioral Research and 6th
Seminar on Behavioral Methods held online, May 18-20, 2022. www.measuringbehavior.org. Editors: Andrew Spink, Jarosław
Barski, Anne-Marie Brouwer, Gernot Riedel, & Annesha Sil (2022). DOI 10.6084/m9.figshare.20066849. ISBN: 978-90-74821-94-0
1. Kaneko, D., Toet, A., Brouwer, A.-M., Kallen, V., van Erp, J.B.F. (2018). Methods for evaluating
emotions evoked by food experiences: A literature review. Frontiers in Psychology 9, 911.
2. Kaneko, D., Stuldreher, I. V., Reuten, A., Toet, A., van Erp, Brouwer, A.-M. (2021). Comparing explicit
and implicit measures for assessing cross-cultural food experience. Frontiers in Neuroergonomics 2,
646280.
3. Dell, N., Vaidyanathan, V., Medhi, I., Cutrell, E., Thies, W. (2012). ”Yours is better!” participant
response bias in HCI. CHI '12: Proceedings of the SIGCHI Conference on Human Factors in Computing
Systems, 1321–1330.
4. Harmon-Jones, E., Gable, P.A., Peterson, C.K. (2010). The role of asymmetric frontal cortical activity in
emotion-related phenomena: A review and update. Biological psychology 84(3), 451–462.
5. Papousek I., Weiss, E.M., Schulter, G., Fink, A., Reiser, E.M., Lackner, H.K. (2014). Prefrontal EEG
alpha asymmetry changes while observing disaster happening to other people: cardiac correlates and
prediction of emotional impact. Biological psychology 103, 184–194.
6. Stuldreher, I. V., Thammasan, N., van Erp, J.B.F., Brouwer, A.-M. (2020). Physiological synchrony in
EEG, electrodermal activity and heart rate reflects shared selective auditory attention. Journal of Neural
Engineering 17(4), 046028,
7. Dmochowski, J. P., Sajda, P., Dias, J., Parra, L. C. (2012). Correlated components of ongoing EEG point
to emotionally laden attention–a possible marker of engagement? Frontiers in Human Neuroscience,
6:112.
8. Pliner, P. Hobden, K. (1992). Development of a scale to measure the trait of food neophobia in humans.
Appetite 19(2), 105–120.
9. Stuldreher, I. V., Kaneko, D., van Erp, J.B.F., Brouwer, A.-M. (in preparation). Food neophobia is
associated with EEG measures of attention toward food-related stimuli.
10. Toet, A., Kaneko, D., De Kruijf, I., Ushiama, S., Van Schaik, M.G., Brouwer, A.-M., Kallen, V., Van
Erp, J.B.F. (2019). CROCUFID: A cross-cultural food image database for research on food elicited
affective responses. Frontiers in Psychology 10.
11. Toet, A., Kaneko, D., Ushiama, S., Hoving, S., de Kruijf, I., Brouwer, A.-M., Kallen, V., Van Erp, J.B.F.
(2018). EmojiGrid: a 2D pictorial scale for the assessment of food elicited emotions. Frontiers in
Psychology 9, 2396.
147 Volume 2 of the Proceedings of the joint 12th International Conference on Methods and Techniques in Behavioral Research and 6th
Seminar on Behavioral Methods held online, May 18-20, 2022. www.measuringbehavior.org. Editors: Andrew Spink, Jarosław
Barski, Anne-Marie Brouwer, Gernot Riedel, & Annesha Sil (2022). DOI 10.6084/m9.figshare.20066849. ISBN: 978-90-74821-94-0
How Diet Composition Correlates with Cognitive Functioning - Application of
Principal Component Analysis (PCA) to Nutritional Data
Aleksandra Bramorska1,2, Wanda Zarzycka1, Jagna Żakowicz1,2, Natalia Jakubowska1,2, Bartłomiej Balcerzak2,
Wiktoria Podolecka1, Aneta Brzezicka1,3, Katarzyna Kuć1
1 University of Social Sciences and Humanities, Warsaw, Poland
2 Polish-Japanese Academy of Information Technology, Warsaw, Poland
3 Cedar-Sinai Medical Centre, Los Angeles, USA
Abstract
Maintaining health depends on diet. The quality and frequency of food consumed can improve cognitive functions
such as memory but may also cause inflammation and thus disrupt cognition.
Data collected from 202 (n = 202; 101 males; Mage = 35.97, SD = 9.303) subjects were included in the statistical
analysis. Participants filled out 3 online questionnaires: Personal Questionnaire, FFQ and DFS. They also took the
SynWin cognitive task. PCA was used to aggregate the dietary data collected. Specific aggregates were analyzed
in correlation with results from the cognitive task.
We found that the top 10 components held 55% of the original variance. We selected 5 components above a p-
value of 0,05 for further analysis. After applying PCA to the dataset, we successfully derived dietary patterns
consistent with the literature. These dietary patterns were found to be correlated with distinct effects on cognition.
Introduction
Diet and lifestyle are important factors affecting the functioning of the human organism. Specific patterns of caloric
and nutrients intake have an impact on cognition and emotions [1,2]. A High fat and high sugar diet (HFHS) can
cause a response in the immune system and peripherally influence circulating satiety hormones [2]. High body
mass index scores (BMI), frequently indicative of obesity, are associated with impaired cognitive functioning [3].
Moreover, cognitive impairment is not just associated with high BMI scores. Overeating also affects the brain and
can lead to deficits in attention and episodic memory [4].
Nutrients are strongly associated with brain functioning [5], some can improve cognitive performance, such as
memory [6], while others can have the opposite effect. Research shows that a diet high in fat and sugar may cause
the deterioration of cognitive functioning through hippocampal disruption caused by dietary factors [7] or insulin
level disturbances [5]. Frequent consumption of unhealthy foods in an unbalanced diet causes an inflammatory
response in the brain, primarily in the hippocampus - a structure in the brain responsible for e.g. memory and
learning [2].
As the body constantly uses energy taken from nutrients, the effects of one’s current diet will not be reflected only
in long-term consequences. Beilharz et al. (2016) showed that short-term consumption (1-7 days) of unhealthy
products (high in saturated fat and sugar) may cause an inflammatory response in the body [8].
Similarly, evidence from rodents [9] and human studies [10, 11, 12] indicate that the Western Diet (WD) (abundant
in added sugars and fats) negatively affects the hippocampus, which causes a deterioration in learning and memory
outcomes [5]. Beilharz (2014) reports that rats fed high fat and high sugar diets (HFSD) showed significantly
worse results while performing a spatial memory task than rats from a control group. An increase in inflammatory
markers in the hippocampus has also been noted, indicating that the hippocampus is a structure sensitive to the
dietary changes associated with a HFSD [13]. These results were confirmed by subsequent studies from the same
team, which showed that the HFSD diet can lead to hippocampal-dependent memory deficits and inflammation
markers during one week exposure to HFSD [8,14].
148 Volume 2 of the Proceedings of the joint 12th International Conference on Methods and Techniques in Behavioral Research and 6th
Seminar on Behavioral Methods held online, May 18-20, 2022. www.measuringbehavior.org. Editors: Andrew Spink, Jarosław
Barski, Anne-Marie Brouwer, Gernot Riedel, & Annesha Sil (2022). DOI 10.6084/m9.figshare.20066849. ISBN: 978-90-74821-94-0
A diet rich in highly processed foods is associated with harmful substances being produced. This then leads to
them penetrating the blood brain barrier (BBB) [15], which causes deterioration in learning and memory processes
[9]. Even a week-long increase in sugar supply in rat diets causes deterioration of spatial memory. An increase in
inflammatory markers in the brain was also observed in rats subjected to a high-sugar diet [9,13,14]. However,
recent discoveries from Reichelt [1], showed that WD causes many negative effects in animals, such as: memory
deterioration and glucose metabolism disorders. This effect is more pronounced in younger specimens compared
to adults [15,16,17,18]. In contrast the impact of the WD on humans is evident also in adulthood [19,20,21]. 102
young adults with normal body weight, who on a daily basis ate a diet with a relatively low sugar and fat content,
were randomly assigned to experimental and control groups. During a four-day experiment, participants from the
experimental group ate a breakfast rich in saturated fat and high sugar level, while subjects from the control group
received breakfasts with an average content of these nutrients. The study showed that even such a short exposure
to a HFSD led to a reduced performance on The Hopkins Verbal Learning Task (HLVT) - a task involving verbal
learning and memory abilities. Test results were obtained from both groups during the first and last days of the
study and were later compared with each other. The magnitude of change in results was significantly correlated
with changes in blood glucose after breakfast. Most importantly, the experimental group became less sensitive to
signals from the body regarding hunger and satiety [20]. The PCA method is used in nutritional research mainly
in relation to specific health problems such as diabetes [22]. Usually it is also related to age groups such as the
elderly [23] or children [24] .We decided to use this method to analyze the eating patterns of healthy adults across
the wide age range to see if any eating patterns related to cognitive functioning are emerging.
The aim of the study was to investigate the relationship between sugar and fat intake and cognitive functioning
through the technique for reducing the dimensionality such as Principal Component Analysis (PCA) to improve
interpretability of dietary patterns, which may be more fitting for such a wide and complicated database than a
traditional covariance analysis. We used three carefully selected questionnaires and one behavioral task to assess
the quality and variability of participants' dietary habits. Since eating habits may impact many aspects of cognitive
functioning, we decided to use a complex behavioral task, which may evaluate several cognitive functions. Then,
during the study, participants were also subjected to a cognitively demanding task, SynWin, to assess their abilities
in multitasking.
Methods
Participants. A total of 204 volunteers participated in the online study. All of them were recruited via Ariadna
Nationwide Research Panel (NRP), in exchange for points exchangeable for awards. Two participants failed to
complete all of the questionnaires and were thus excluded from further analysis. All included participants (n =
202; 101 males; Mage = 35.97, SD = 9.303) reported normal or corrected-to-normal visual acuity, normal hearing
and no history of neurological or psychiatric disorders and injuries, including no previous head trauma, no previous
head or neck surgery and no brain tumors.
Procedure. Data collection took place over the 12 consecutive weeks. The study was conducted on-line and,
because of NRP regulations, was divided into two parts, lasting 30 minutes each. The first part included one
questionnaire (Personal Questionnaire) and one computerized cognitive task (SynWin) [25]. The second part
contained two questionnaires (Food Frequency Questionnaire FFQ [26,27], The Dietary Fat and free Sugar – Short
Questionnaire DFS [28].
The study was approved by a local Ethical Committee at the University of Social Sciences and Humanities. All
participants provided consent in accordance with the Declaration of Helsinki.
Questionnaires. All questionnaires were used with the goal of gathering specific information about the participants
and their eating habits. Through the Personal Questionnaire, we collected socio-demographic and health-related
information. To properly refer to specific eating habits based on certain products, the FFQ was applied. The FFQ
consists of 111 questions and is a semi-quantitative questionnaire. It enables the assessment of food consumed
during the year and contains questions about the frequency and quantity of consumption of 165 products. It also
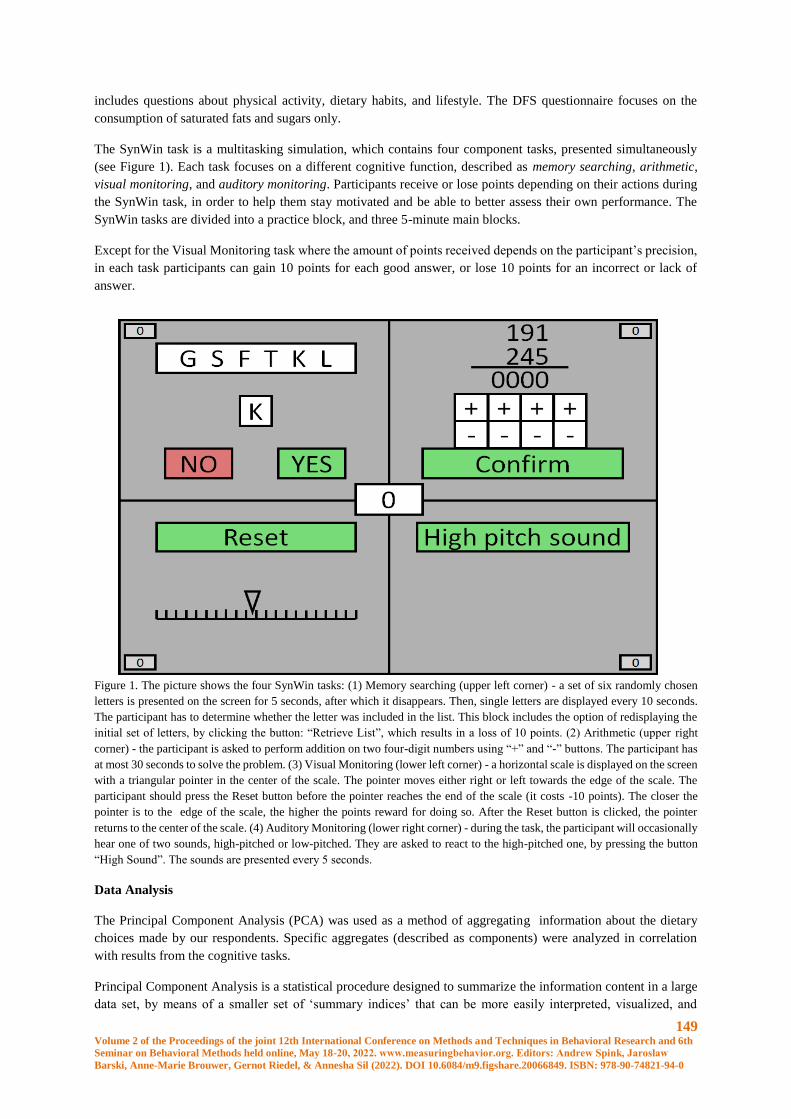
149 Volume 2 of the Proceedings of the joint 12th International Conference on Methods and Techniques in Behavioral Research and 6th
Seminar on Behavioral Methods held online, May 18-20, 2022. www.measuringbehavior.org. Editors: Andrew Spink, Jarosław
Barski, Anne-Marie Brouwer, Gernot Riedel, & Annesha Sil (2022). DOI 10.6084/m9.figshare.20066849. ISBN: 978-90-74821-94-0
includes questions about physical activity, dietary habits, and lifestyle. The DFS questionnaire focuses on the
consumption of saturated fats and sugars only.
The SynWin task is a multitasking simulation, which contains four component tasks, presented simultaneously
(see Figure 1). Each task focuses on a different cognitive function, described as memory searching, arithmetic,
visual monitoring, and auditory monitoring. Participants receive or lose points depending on their actions during
the SynWin task, in order to help them stay motivated and be able to better assess their own performance. The
SynWin tasks are divided into a practice block, and three 5-minute main blocks.
Except for the Visual Monitoring task where the amount of points received depends on the participant’s precision,
in each task participants can gain 10 points for each good answer, or lose 10 points for an incorrect or lack of
answer.
Figure 1. The picture shows the four SynWin tasks: (1) Memory searching (upper left corner) - a set of six randomly chosen
letters is presented on the screen for 5 seconds, after which it disappears. Then, single letters are displayed every 10 seconds.
The participant has to determine whether the letter was included in the list. This block includes the option of redisplaying the
initial set of letters, by clicking the button: “Retrieve List”, which results in a loss of 10 points. (2) Arithmetic (upper right
corner) - the participant is asked to perform addition on two four-digit numbers using “+” and “-” buttons. The participant has
at most 30 seconds to solve the problem. (3) Visual Monitoring (lower left corner) - a horizontal scale is displayed on the screen
with a triangular pointer in the center of the scale. The pointer moves either right or left towards the edge of the scale. The
participant should press the Reset button before the pointer reaches the end of the scale (it costs -10 points). The closer the
pointer is to the edge of the scale, the higher the points reward for doing so. After the Reset button is clicked, the pointer
returns to the center of the scale. (4) Auditory Monitoring (lower right corner) - during the task, the participant will occasionally
hear one of two sounds, high-pitched or low-pitched. They are asked to react to the high-pitched one, by pressing the button
“High Sound”. The sounds are presented every 5 seconds.
Data Analysis
The Principal Component Analysis (PCA) was used as a method of aggregating information about the dietary
choices made by our respondents. Specific aggregates (described as components) were analyzed in correlation
with results from the cognitive tasks.
Principal Component Analysis is a statistical procedure designed to summarize the information content in a large
data set, by means of a smaller set of ‘summary indices’ that can be more easily interpreted, visualized, and
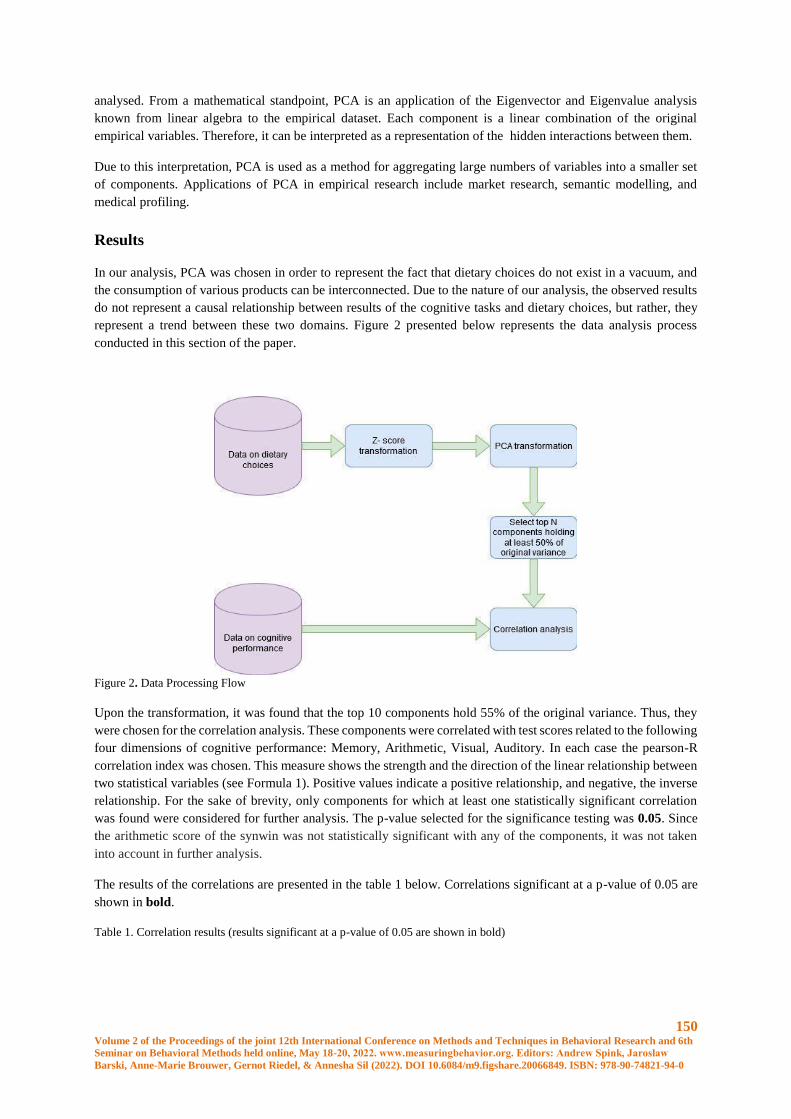
150 Volume 2 of the Proceedings of the joint 12th International Conference on Methods and Techniques in Behavioral Research and 6th
Seminar on Behavioral Methods held online, May 18-20, 2022. www.measuringbehavior.org. Editors: Andrew Spink, Jarosław
Barski, Anne-Marie Brouwer, Gernot Riedel, & Annesha Sil (2022). DOI 10.6084/m9.figshare.20066849. ISBN: 978-90-74821-94-0
analysed. From a mathematical standpoint, PCA is an application of the Eigenvector and Eigenvalue analysis
known from linear algebra to the empirical dataset. Each component is a linear combination of the original
empirical variables. Therefore, it can be interpreted as a representation of the hidden interactions between them.
Due to this interpretation, PCA is used as a method for aggregating large numbers of variables into a smaller set
of components. Applications of PCA in empirical research include market research, semantic modelling, and
medical profiling.
Results
In our analysis, PCA was chosen in order to represent the fact that dietary choices do not exist in a vacuum, and
the consumption of various products can be interconnected. Due to the nature of our analysis, the observed results
do not represent a causal relationship between results of the cognitive tasks and dietary choices, but rather, they
represent a trend between these two domains. Figure 2 presented below represents the data analysis process
conducted in this section of the paper.
Figure 2. Data Processing Flow
Upon the transformation, it was found that the top 10 components hold 55% of the original variance. Thus, they
were chosen for the correlation analysis. These components were correlated with test scores related to the following
four dimensions of cognitive performance: Memory, Arithmetic, Visual, Auditory. In each case the pearson-R
correlation index was chosen. This measure shows the strength and the direction of the linear relationship between
two statistical variables (see Formula 1). Positive values indicate a positive relationship, and negative, the inverse
relationship. For the sake of brevity, only components for which at least one statistically significant correlation
was found were considered for further analysis. The p-value selected for the significance testing was 0.05. Since
the arithmetic score of the synwin was not statistically significant with any of the components, it was not taken
into account in further analysis.
The results of the correlations are presented in the table 1 below. Correlations significant at a p-value of 0.05 are
shown in bold.
Table 1. Correlation results (results significant at a p-value of 0.05 are shown in bold)
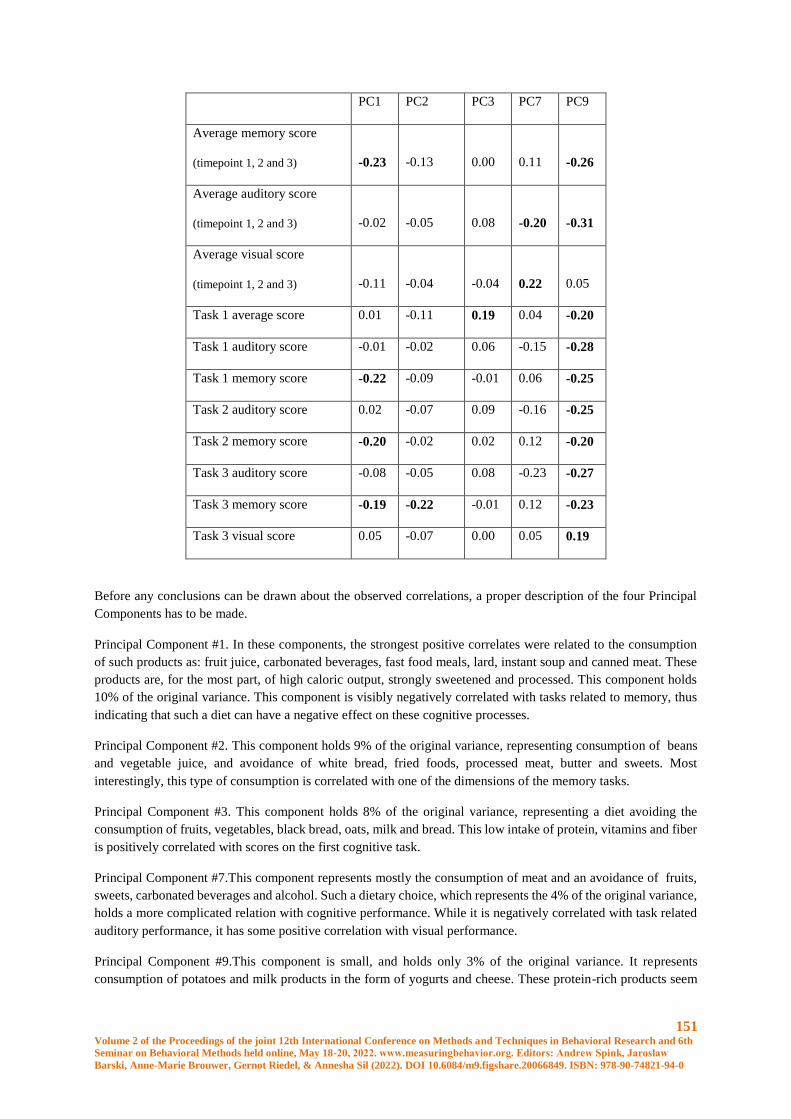
151 Volume 2 of the Proceedings of the joint 12th International Conference on Methods and Techniques in Behavioral Research and 6th
Seminar on Behavioral Methods held online, May 18-20, 2022. www.measuringbehavior.org. Editors: Andrew Spink, Jarosław
Barski, Anne-Marie Brouwer, Gernot Riedel, & Annesha Sil (2022). DOI 10.6084/m9.figshare.20066849. ISBN: 978-90-74821-94-0
PC1 PC2 PC3 PC7 PC9
Average memory score
(timepoint 1, 2 and 3) -0.23 -0.13 0.00 0.11 -0.26
Average auditory score
(timepoint 1, 2 and 3) -0.02 -0.05 0.08 -0.20 -0.31
Average visual score
(timepoint 1, 2 and 3) -0.11 -0.04 -0.04 0.22 0.05
Task 1 average score 0.01 -0.11 0.19 0.04 -0.20
Task 1 auditory score -0.01 -0.02 0.06 -0.15 -0.28
Task 1 memory score -0.22 -0.09 -0.01 0.06 -0.25
Task 2 auditory score 0.02 -0.07 0.09 -0.16 -0.25
Task 2 memory score -0.20 -0.02 0.02 0.12 -0.20
Task 3 auditory score -0.08 -0.05 0.08 -0.23 -0.27
Task 3 memory score -0.19 -0.22 -0.01 0.12 -0.23
Task 3 visual score 0.05 -0.07 0.00 0.05 0.19
Before any conclusions can be drawn about the observed correlations, a proper description of the four Principal
Components has to be made.
Principal Component #1. In these components, the strongest positive correlates were related to the consumption
of such products as: fruit juice, carbonated beverages, fast food meals, lard, instant soup and canned meat. These
products are, for the most part, of high caloric output, strongly sweetened and processed. This component holds
10% of the original variance. This component is visibly negatively correlated with tasks related to memory, thus
indicating that such a diet can have a negative effect on these cognitive processes.
Principal Component #2. This component holds 9% of the original variance, representing consumption of beans
and vegetable juice, and avoidance of white bread, fried foods, processed meat, butter and sweets. Most
interestingly, this type of consumption is correlated with one of the dimensions of the memory tasks.
Principal Component #3. This component holds 8% of the original variance, representing a diet avoiding the
consumption of fruits, vegetables, black bread, oats, milk and bread. This low intake of protein, vitamins and fiber
is positively correlated with scores on the first cognitive task.
Principal Component #7.This component represents mostly the consumption of meat and an avoidance of fruits,
sweets, carbonated beverages and alcohol. Such a dietary choice, which represents the 4% of the original variance,
holds a more complicated relation with cognitive performance. While it is negatively correlated with task related
auditory performance, it has some positive correlation with visual performance.
Principal Component #9.This component is small, and holds only 3% of the original variance. It represents
consumption of potatoes and milk products in the form of yogurts and cheese. These protein-rich products seem
152 Volume 2 of the Proceedings of the joint 12th International Conference on Methods and Techniques in Behavioral Research and 6th
Seminar on Behavioral Methods held online, May 18-20, 2022. www.measuringbehavior.org. Editors: Andrew Spink, Jarosław
Barski, Anne-Marie Brouwer, Gernot Riedel, & Annesha Sil (2022). DOI 10.6084/m9.figshare.20066849. ISBN: 978-90-74821-94-0
to be mostly negatively correlated with performance in the memory and auditory aspect of the tasks given to the
respondents.
Discussion
The aim of the study was to determine whether the answers of the subjects in the nutritional questionnaires can be
divided into aggregated product groups, as well as whether or not they could be connected with performance on a
cognitive task. An important issue is not only whether you can find a group of products that will have a positive
effect on health, in accordance with WHO recommendations on their consumption, but also whether the frequency
of their consumption may correlate with performance on the cognitive task. The next issue was to determine which
of the general factors, healthy diet or specific products, influenced cognitive functioning more strongly.
We used PCA to aggregate the information about the frequency of consumption of a specific group of products
with the option of grading of the diet. As we mentioned in the results, 10 components of PCA were aggregated
from the analysis. Five components were revealed to be significant and could be correlated with the score on the
cognitive task. All of the components correspond to theoretical groups of food products that we have interpreted
as: 1. PC1 as a western-style diet (WD, diet rich in processed foods); 2. PC2 with lower consumption of processed
foods and sweets and eating large amounts of beans and vegetable juice; 3. PC3 (is) as an unbalanced diet due to
low consumption of fruit and vegetables, milk, complex carbohydrates and fiber, which may be due to insufficient
supply of daily rations of vitamins and minerals; 4. components PC7 and PC9 have been interpreted together as a
high intake of saturated fat and animal products also milk, high-protein products. According to the
recommendations of the Polish Institute of Food and Nutrition (IFN; polish - IŻŻ), dairy products should not be
consumed often, while meat should be consumed at most once a week.
As we mentioned above, five components were significantly related to cognitive functioning in its various
dimensions. The components related to memory tasks, which include components PC1, PC2 and PC9, were
extremely interesting due to their coherency. Another tendency which should be emphasized is the consistent
reference of components PC7 and PC9 to the perceptual aspects of cognitive functioning, while the PC3 component
seems to be related only to the first block of the SynWin task.
Thanks to the use of PCA analysis, we have obtained results that allow us to identify certain patterns related to the
preferred diet. The WD pattern includes products such as processed fruit juices, carbonated drinks, lard, fast food,
instant soups and canned meat. Many studies confirm that a diet based on highly processed, high-sugar and high-
fat products may lead to problems with cognitive functioning both in animals [8,15] and humans [20]. In our
results, we can observe this by analysing the PC1 component, which indicates that subjects who prefer such a diet,
simultaneously achieved lower results in the cognitive task regarding memory. It should be emphasized that this
result is completely consistent over all three stages of the task, which indicates the strength of the relationship
between these variables. A similar effect could be observed during the PC9 component analyses. Due to the fact
that PC9 was connected with a high-protein diet, mainly derived from dairy, the results obtained were astonishing.
Dairy products, especially in processed forms such as cheese or yogurt, are perceived in the literature as a dietary
component that positively affects our functioning and health [29]. On the other hand, if we look at the healthy
eating pyramid prepared by the IŻŻ, we can see that dairy products are high in this pyramid, which means that
they should not be consumed in excessive amounts. Especially in the case of cheese, IŻŻ recommends their
occasional consumption (see Figure 3). Furthermore, recent studies have shown that dairy products such as milk,
yogurt and lactose-containing cheese can cause a heightened insulin response [30].
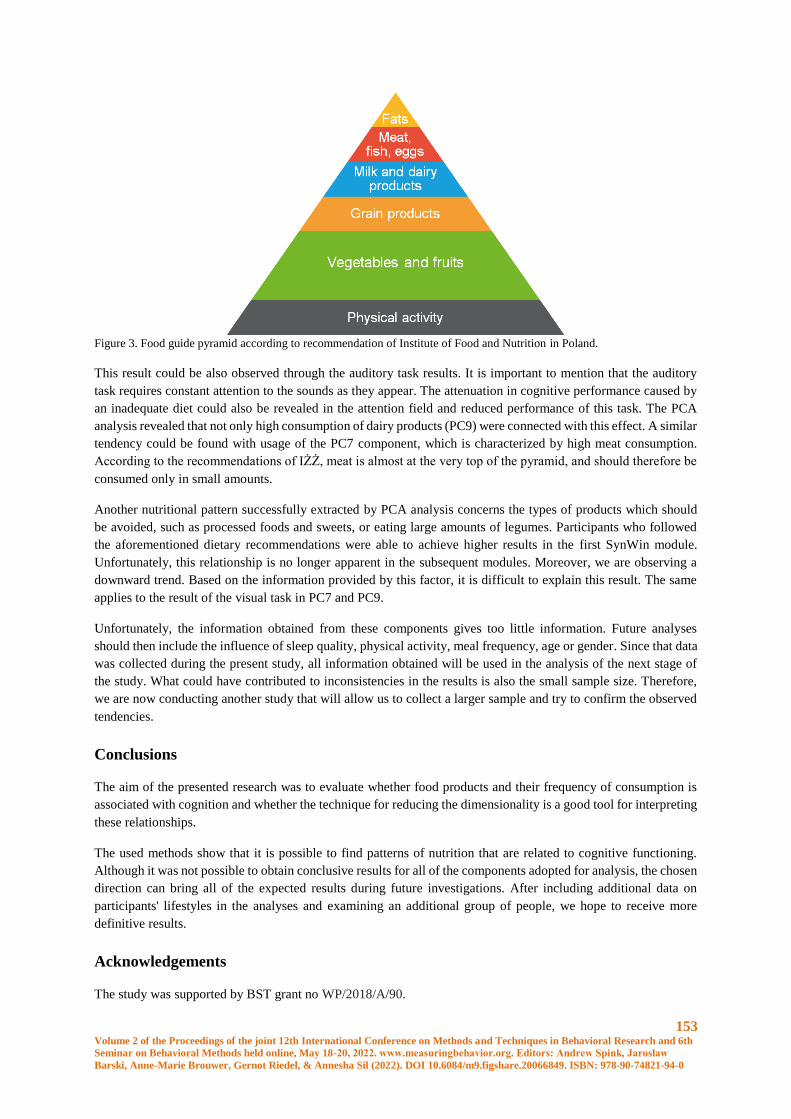
153 Volume 2 of the Proceedings of the joint 12th International Conference on Methods and Techniques in Behavioral Research and 6th
Seminar on Behavioral Methods held online, May 18-20, 2022. www.measuringbehavior.org. Editors: Andrew Spink, Jarosław
Barski, Anne-Marie Brouwer, Gernot Riedel, & Annesha Sil (2022). DOI 10.6084/m9.figshare.20066849. ISBN: 978-90-74821-94-0
Figure 3. Food guide pyramid according to recommendation of Institute of Food and Nutrition in Poland.
This result could be also observed through the auditory task results. It is important to mention that the auditory
task requires constant attention to the sounds as they appear. The attenuation in cognitive performance caused by
an inadequate diet could also be revealed in the attention field and reduced performance of this task. The PCA
analysis revealed that not only high consumption of dairy products (PC9) were connected with this effect. A similar
tendency could be found with usage of the PC7 component, which is characterized by high meat consumption.
According to the recommendations of IŻŻ, meat is almost at the very top of the pyramid, and should therefore be
consumed only in small amounts.
Another nutritional pattern successfully extracted by PCA analysis concerns the types of products which should
be avoided, such as processed foods and sweets, or eating large amounts of legumes. Participants who followed
the aforementioned dietary recommendations were able to achieve higher results in the first SynWin module.
Unfortunately, this relationship is no longer apparent in the subsequent modules. Moreover, we are observing a
downward trend. Based on the information provided by this factor, it is difficult to explain this result. The same
applies to the result of the visual task in PC7 and PC9.
Unfortunately, the information obtained from these components gives too little information. Future analyses
should then include the influence of sleep quality, physical activity, meal frequency, age or gender. Since that data
was collected during the present study, all information obtained will be used in the analysis of the next stage of
the study. What could have contributed to inconsistencies in the results is also the small sample size. Therefore,
we are now conducting another study that will allow us to collect a larger sample and try to confirm the observed
tendencies.
Conclusions
The aim of the presented research was to evaluate whether food products and their frequency of consumption is
associated with cognition and whether the technique for reducing the dimensionality is a good tool for interpreting
these relationships.
The used methods show that it is possible to find patterns of nutrition that are related to cognitive functioning.
Although it was not possible to obtain conclusive results for all of the components adopted for analysis, the chosen
direction can bring all of the expected results during future investigations. After including additional data on
participants' lifestyles in the analyses and examining an additional group of people, we hope to receive more
definitive results.
Acknowledgements
The study was supported by BST grant no WP/2018/A/90.

154 Volume 2 of the Proceedings of the joint 12th International Conference on Methods and Techniques in Behavioral Research and 6th
Seminar on Behavioral Methods held online, May 18-20, 2022. www.measuringbehavior.org. Editors: Andrew Spink, Jarosław
Barski, Anne-Marie Brouwer, Gernot Riedel, & Annesha Sil (2022). DOI 10.6084/m9.figshare.20066849. ISBN: 978-90-74821-94-0
References
1. Reichelt, A.C., Stoeckel, L.E., Reagan, L.P., Winstanley, C.A., Page, K.A. (2018). Dietary influences on
cognition. Physiology & Behavior 192(February),118–26.
2. Spencer, S. J., Korosi, A., Layé, S., Shukitt-Hale, B., & Barrientos, R. M. (2017). Food for thought: how
nutrition impacts cognition and emotion. npj Science of Food, 1(1), 1-8.
3. Grillo, C. A., Piroli, G. G., Evans, A. N., Macht, V. A., Wilson, S. P., Scott, K. A., ... & Reagan, L. P. (2011).
Obesity/hyperleptinemic phenotype adversely affects hippocampal plasticity: effects of dietary
restriction. Physiology & behavior, 104(2), 235-241.
4. Gunstad, J., Sanborn, V., & Hawkins, M. (2020). Cognitive dysfunction is a risk factor for overeating and
obesity. American Psychologist, 75(2), 219.
5. Noble, E. E., Hsu, T. M., Jones, R. B., Fodor, A. A., Goran, M. I., & Kanoski, S. E. (2017). Early-life sugar
consumption affects the rat microbiome independently of obesity. The Journal of nutrition, 147(1), 20-28.
6. Devore, E. E., Kang, J. H., Breteler, M. M., & Grodstein, F. (2012). Dietary intakes of berries and flavonoids
in relation to cognitive decline. Annals of neurology, 72(1), 135-143.
7. Kanoski, S. E., & Davidson, T. L. (2010). Different patterns of memory impairments accompany short-and
longer-term maintenance on a high-energy diet. Journal of Experimental Psychology: Animal Behavior
Processes, 36(2), 313.
8. Beilharz, J. E., Maniam, J., & Morris, M. J. (2016). Short-term exposure to a diet high in fat and sugar, or
liquid sugar, selectively impairs hippocampal-dependent memory, with differential impacts on
inflammation. Behavioural brain research, 306, 1-7.
9. Kanoski, S. E., Zhang, Y., Zheng, W., & Davidson, T. L. (2010). The effects of a high-energy diet on
hippocampal function and blood-brain barrier integrity in the rat. Journal of Alzheimer's Disease, 21(1), 207-
219.
10. Kalmijn, S., Van Boxtel, M. P. J., Ocke, M., Verschuren, W. M. M., Kromhout, D., & Launer, L. J. (2004).
Dietary intake of fatty acids and fish in relation to cognitive performance at middle age. Neurology, 62(2),
275-280.
11. Francis, H. M., & Stevenson, R. J. (2011). Higher reported saturated fat and refined sugar intake is associated
with reduced hippocampal-dependent memory and sensitivity to interoceptive signals. Behavioral
neuroscience, 125(6), 943.
12. Baym, C. L., Khan, N. A., Monti, J. M., Raine, L. B., Drollette, E. S., Moore, R. D., ... & Cohen, N. J. (2014).
Dietary lipids are differentially associated with hippocampal-dependent relational memory in prepubescent
children. The American journal of clinical nutrition, 99(5), 1026-1032.
13. Beilharz, J. E., Maniam, J., & Morris, M. J. (2014). Short exposure to a diet rich in both fat and sugar or sugar
alone impairs place, but not object recognition memory in rats. Brain, behavior, and immunity, 37, 134-141.
14. Beilharz, J. E., Kaakoush, N. O., Maniam, J., & Morris, M. J. (2016). The effect of short-term exposure to
energy-matched diets enriched in fat or sugar on memory, gut microbiota and markers of brain inflammation
and plasticity. Brain, behavior, and immunity, 57, 304-313.
15. Hsu, T. M., & Kanoski, S. E. (2014). Blood-brain barrier disruption: mechanistic links between Western diet
consumption and dementia. Frontiers in aging neuroscience, 6, 88.
155 Volume 2 of the Proceedings of the joint 12th International Conference on Methods and Techniques in Behavioral Research and 6th
Seminar on Behavioral Methods held online, May 18-20, 2022. www.measuringbehavior.org. Editors: Andrew Spink, Jarosław
Barski, Anne-Marie Brouwer, Gernot Riedel, & Annesha Sil (2022). DOI 10.6084/m9.figshare.20066849. ISBN: 978-90-74821-94-0
16. Reichelt, A. C., & Rank, M. M. (2017). The impact of junk foods on the adolescent brain. Birth defects
research, 109(20), 1649-1658.
17. Boitard, C., Etchamendy, N., Sauvant, J., Aubert, A., Tronel, S., Marighetto, A., ... & Ferreira, G. (2012).
Juvenile, but not adult exposure to high‐fat diet impairs relational memory and hippocampal neurogenesis in
mice. Hippocampus, 22(11), 2095-2100.
18. Hsu, T. M., Konanur, V. R., Taing, L., Usui, R., Kayser, B. D., Goran, M. I., & Kanoski, S. E. (2015). Effects
of sucrose and high fructose corn syrup consumption on spatial memory function and hippocampal
neuroinflammation in adolescent rats. Hippocampus, 25(2), 227-239.
19. Noble, E. E., Hsu, T. M., & Kanoski, S. E. (2017). Gut to brain dysbiosis: mechanisms linking western diet
consumption, the microbiome, and cognitive impairment. Frontiers in behavioral neuroscience, 11, 9.
20. Attuquayefio, T., Stevenson, R. J., Oaten, M. J., & Francis, H. M. (2017). A four-day Western-style dietary
intervention causes reductions in hippocampal-dependent learning and memory and interoceptive
sensitivity. PLoS One, 12(2), e0172645.
21. Wang, K. S., Lu, Y., Xie, X., Gong, S., Xu, C., & Sha, Z. (2017). Principal component regression analysis of
nutrition factors and physical activities with diabetes. Journal of Biometrics & Biostatistics, 8(4).
22. Thorpe, M., Milte, C., Crawford, D., McNaughton, S. (2016). A comparison of the dietary patterns derived
by principal component analysis and cluster analysis in older Australians. International Journal of Behavioral
Nutrition and Physical Activity, 13(1), 1-14
23. Smith, A. D., Emmett, P. M., Newby, P. K., & Northstone, K. (2011). A comparison of dietary patterns derived
by cluster and principal components analysis in a UK cohort of children. European journal of clinical
nutrition, 65(10), 1102-1109.
24. Cordner, Z. A., & Tamashiro, K. L. (2015). Effects of high-fat diet exposure on learning &
memory. Physiology & behavior, 152, 363-371.
25. Elsmore, T. F. (1994). SYNWORK1: A PC-based tool for assessment of performance in a simulated work
environment. Behavior Research Methods, Instruments, & Computers, 26(4), 421-426.
26. Jeżewska‐Zychowicz, M., Gawęcki J., Wądołowska, L., Czarnocińska, J., Galiński, G., Kołłajtis‐Dołowy, A.,
Roszkowski, W., Wawrzyniak, A., Przybyłowicz, K., Krusińska, B., Hawrysz, I., Słowińska, M.A.,
Niedźwiedzka, E. (2014). The dietary habits and nutrition beliefs questionnaire (KomPAN) in Polish
adolescents and adults, aged 16-65 years, ver. 1.2 - self-administered Wydawnictwo Komitetu Nauki o
Żywieniu Człowieka Polskiej Akademii Nauk, Warszawa, 2014, 21‐33.
27. Kowalkowska, J., Wadolowska, L., Czarnocinska, J., Czlapka-Matyasik, M., Galinski, G., Jezewska-
Zychowicz, M., ... & Wyka, J. (2018). Reproducibility of a questionnaire for dietary habits, lifestyle and
nutrition knowledge assessment (KomPAN) in Polish adolescents and adults. Nutrients, 10(12), 1845.
28. Francis, H., & Stevenson, R. (2013). Validity and test–retest reliability of a short dietary questionnaire to
assess intake of saturated fat and free sugars: a preliminary study. Journal of Human Nutrition and
Dietetics, 26(3), 234-242.
29. Guyonnet, D., Chassany, O., Ducrotte, P., Picard, C., Mouret, M., Mercier, C. H., & Matuchansky, C. (2007).
Effect of a fermented milk containing Bifidobacterium animalis DN‐173 010 on the health‐related quality of
life and symptoms in irritable bowel syndrome in adults in primary care: a multicentre, randomized, double‐
blind, controlled trial. Alimentary pharmacology & therapeutics, 26(3), 475-486.
30. Carrera-Bastos, P., Fontes-Villalba, M., O’Keefe, J. H., Lindeberg, S., & Cordain, L. (2011). The western diet
and lifestyle and diseases of civilization. Res Rep Clin Cardiol, 2(1), 15-35.
156 Volume 2 of the Proceedings of the joint 12th International Conference on Methods and Techniques in Behavioral Research and 6th
Seminar on Behavioral Methods held online, May 18-20, 2022. www.measuringbehavior.org. Editors: Andrew Spink, Jarosław
Barski, Anne-Marie Brouwer, Gernot Riedel, & Annesha Sil (2022). DOI 10.6084/m9.figshare.20066849. ISBN: 978-90-74821-94-0
Conscious and unconscious emotional response evoked by food appearance in
children: a study based on automatic facial expression analysis and skin
conductance response
N. da Quinta1,2, A. Baranda1, Y. Ríos1, R. Llorente1, I. Martinez de Marañon1
1 AZTI, Basque Research and Technological Alliance (BRTA)
2 Basque Country University (UPV/EHU)
Introduction
Children food behaviour is mainly driven by hedonic factors (Poelman et al., 2017). Nevertheless, it is thought
that the measurement of the emotions elicited by food products could contribute to the understanding of children’s
preferences and food choices in the same manner that it was reported for adults (Dalenberg et al., 2014). Laureati
et al. (2015) outlined that the methodology chosen to be used with children should be adapted to their cognitive,
physical and social stage of development. Considering this, the traditional verbal self-questionnaires used in
sensory testing might not be appropriate to children (specially young children) due to their reduced capability of
reading and to the high cognitive effort that questionnaires demand (Köster & Mojet, 2015). On the contrary,
methods that involve cognitive, physiological and/or behavioural expressions could be an alternative to evaluate
conscious and unconscious emotional responses without the limitation of traditional methods (Kaneko et al., 2018).
Facial expressions are the most studied type of behavioural expression for the study of emotions (Coppin & Sander,
2016). The standard for measuring facial expressions is the Facial Action Coding System (FACS) (Ekman &
Friesen, 1976). This anatomy-based system allows human coders to identify facial muscle movements and to turn
them into facial expressions. An action unit (AU) is defined as the minimum visible muscular activity that produces
momentary changes in facial appearance (Ekman et al., 2002). In addition, according to Ekman et al.’s research,
the activation of different AUs could be considered a behavioural feature (or blueprint) for a basic emotion (Ekman
& Friesen, 1975). This theory was considered as basis to develop automatic facial coding systems that allow users
to automatically analyse the activation of the AUs described in FACS and to translate them into basic emotions.
Nevertheless, it is important to bear in mind that the universality and objectivity of facial expressions is still under
debate since voluntary control over the facial muscles was reported (Girard et al., 2019; Soussignan & Schaal,
1996). Cernea & Kerren (2015) classified facial expressions into two categories depending on the level of
consciousness required to their performance: voluntary and involuntary. It is widely acknowledged that the former
contributes to the social behaviour, while the latter (i.e., spontaneous facial expressions) is related to the emotional
state.
On the contrary, the physiological responses of the autonomic nervous system (ANS) act below the level of
consciousness (Danner et al., 2014). They are often related to stress, arousal, and emotion. Among ANS
measurements, electrodermal activity relies on autonomic changes in the electrical properties of the skin
(Braithwaite et al., 2013). The most widely studied property is the skin conductance which varies with changes in
the humidity of the skin due to the activation of the sweat glands as a response to an arousing stimuli.
For this study we decided to use an approach that combined a behavioural and a physiological response in order
to have a deeper understanding of the emotions elicited by food products. Therefore, the aims of this study were
(i) to determine if food samples only varing in texture elicited different facial expression and emotion profiles as
well as a different physiological response in children, (ii) to determine the ability of each individual methodology
and the combination of them to discriminate the facial and emotion profiles evoked by the samples.
157 Volume 2 of the Proceedings of the joint 12th International Conference on Methods and Techniques in Behavioral Research and 6th
Seminar on Behavioral Methods held online, May 18-20, 2022. www.measuringbehavior.org. Editors: Andrew Spink, Jarosław
Barski, Anne-Marie Brouwer, Gernot Riedel, & Annesha Sil (2022). DOI 10.6084/m9.figshare.20066849. ISBN: 978-90-74821-94-0
Materials and Methods
Participants
A total of 50 children (54% boys, 46% girls) from 5 to 12 yrs took part in a consumers test. To be eligible to
participate in the study, parents signed an informed consent before the experimental session began. The CEISH,
the Basque Country University’s Ethical Committee, approved the study protocol.
Samples
To evaluate the effect of texture on the emotional response of children we used two food products, one liquid and
one solid. Both food products were designed in AZTI’s facilities from apple juice and were developed to have the
same colour and odour. The portion of each sample evaluated in the study was 16 gr per sample.
Equipment
A HD webcam placed over the table that was used for the sensory tasting recorded the facial expression of each
participant during the experimental session. We selected this location to have a better perspective of the face during
the evaluation of the food products. The FaceReader software (version 8.0, Noldus Information Technology,
Wageningen, The Netherlands) measured changes in the facial expressions of each participant during the session.
FaceReader provided probability-like values for 20 action units (AUs) and for each basic emotion evaluated in a
0 to 1 scale, in which 0 is the absence of the AU activation or the emotion and 1 the highest probability to match
with a FACE coder. Data was collected at a sampling rate of 30 Hz.
During the session, Shimmer3 GSR+ (Shimmer, Dublin, Ireland) monitored the skin conductance response (SCR)
of each participant as an indicator of the arousal. To measure SCR, a researcher placed two Velcro-strap electrodes
on proximal phalanges of index and middle fingers, on the non-dominant hand of the subject. Data was collected
at a sampling rate of 128 Hz and processed by iMotions’ software suite (version 8.0, iMotions, Inc., Copenhagen,
Denmark).
Experimental procedure
Each participant performed one experimental session individually. To minimised baseline differences in skin
conductance among subjects, children cleaned their hands with water and non-alcoholic soap before the
experimental session began. Afterwards, each participant sit comfortably and a researcher placed the Shimmer
device on the non-dominant hand. After explaining the experimental procedure to the child, the webcam recorded
a baseline measure of his/her facial expression for 10 seconds while the subject looked at a non-relevant sample
placed over the table as an example. To minimised expression biases, this baseline measure was used as individual
calibration. In addition, each subject was exposed to an arousing task (i.e., a demanding arithmetical task
appropriate for the age of the children) to obtain a theoretical maximum of skin conductance response as a
consequence of an exciting event. This task allowed us to established a range of skin conductance response in
which 0=basal measure and 100=theoretical maximum. The changes obtained in skin conductance response during
the experiment were then express as a relative measure what allowed us to compare the results obtained for all the
subjects.
Afterwards, a researcher placed the food sample on the table in front of the participant and the child observed it
with no time restrictions. Then, the subject was asked to smell, touch the sample with a spoon/fingers and to
consume it. Once that the sample was tasted, each child answered a question regarding how much they liked it by
using a 7-point Likert scale anchored at 1=extremely disagree and 7=extremely agree. All subjects evaluated firstly
the liquid sample.
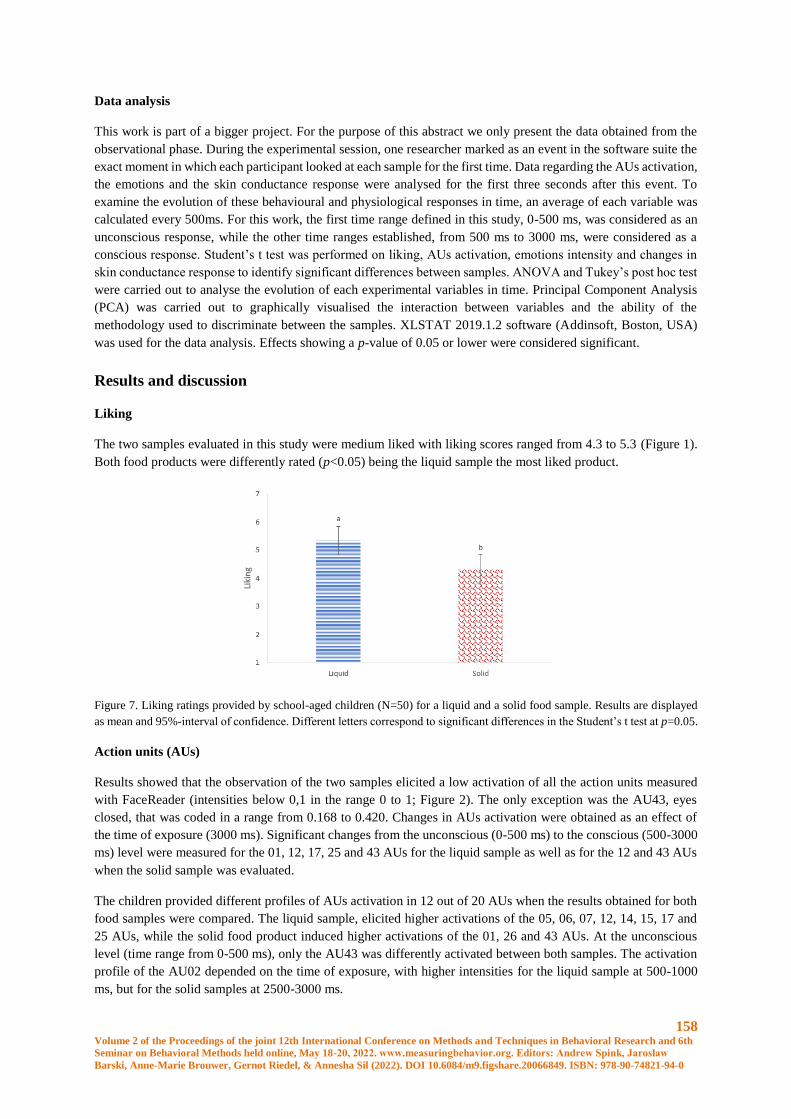
158 Volume 2 of the Proceedings of the joint 12th International Conference on Methods and Techniques in Behavioral Research and 6th
Seminar on Behavioral Methods held online, May 18-20, 2022. www.measuringbehavior.org. Editors: Andrew Spink, Jarosław
Barski, Anne-Marie Brouwer, Gernot Riedel, & Annesha Sil (2022). DOI 10.6084/m9.figshare.20066849. ISBN: 978-90-74821-94-0
Data analysis
This work is part of a bigger project. For the purpose of this abstract we only present the data obtained from the
observational phase. During the experimental session, one researcher marked as an event in the software suite the
exact moment in which each participant looked at each sample for the first time. Data regarding the AUs activation,
the emotions and the skin conductance response were analysed for the first three seconds after this event. To
examine the evolution of these behavioural and physiological responses in time, an average of each variable was
calculated every 500ms. For this work, the first time range defined in this study, 0-500 ms, was considered as an
unconscious response, while the other time ranges established, from 500 ms to 3000 ms, were considered as a
conscious response. Student’s t test was performed on liking, AUs activation, emotions intensity and changes in
skin conductance response to identify significant differences between samples. ANOVA and Tukey’s post hoc test
were carried out to analyse the evolution of each experimental variables in time. Principal Component Analysis
(PCA) was carried out to graphically visualised the interaction between variables and the ability of the
methodology used to discriminate between the samples. XLSTAT 2019.1.2 software (Addinsoft, Boston, USA)
was used for the data analysis. Effects showing a p-value of 0.05 or lower were considered significant.
Results and discussion
Liking
The two samples evaluated in this study were medium liked with liking scores ranged from 4.3 to 5.3 (Figure 1).
Both food products were differently rated (p<0.05) being the liquid sample the most liked product.
Figure 7. Liking ratings provided by school-aged children (N=50) for a liquid and a solid food sample. Results are displayed
as mean and 95%-interval of confidence. Different letters correspond to significant differences in the Student’s t test at p=0.05.
Action units (AUs)
Results showed that the observation of the two samples elicited a low activation of all the action units measured
with FaceReader (intensities below 0,1 in the range 0 to 1; Figure 2). The only exception was the AU43, eyes
closed, that was coded in a range from 0.168 to 0.420. Changes in AUs activation were obtained as an effect of
the time of exposure (3000 ms). Significant changes from the unconscious (0-500 ms) to the conscious (500-3000
ms) level were measured for the 01, 12, 17, 25 and 43 AUs for the liquid sample as well as for the 12 and 43 AUs
when the solid sample was evaluated.
The children provided different profiles of AUs activation in 12 out of 20 AUs when the results obtained for both
food samples were compared. The liquid sample, elicited higher activations of the 05, 06, 07, 12, 14, 15, 17 and
25 AUs, while the solid food product induced higher activations of the 01, 26 and 43 AUs. At the unconscious
level (time range from 0-500 ms), only the AU43 was differently activated between both samples. The activation
profile of the AU02 depended on the time of exposure, with higher intensities for the liquid sample at 500-1000
ms, but for the solid samples at 2500-3000 ms.
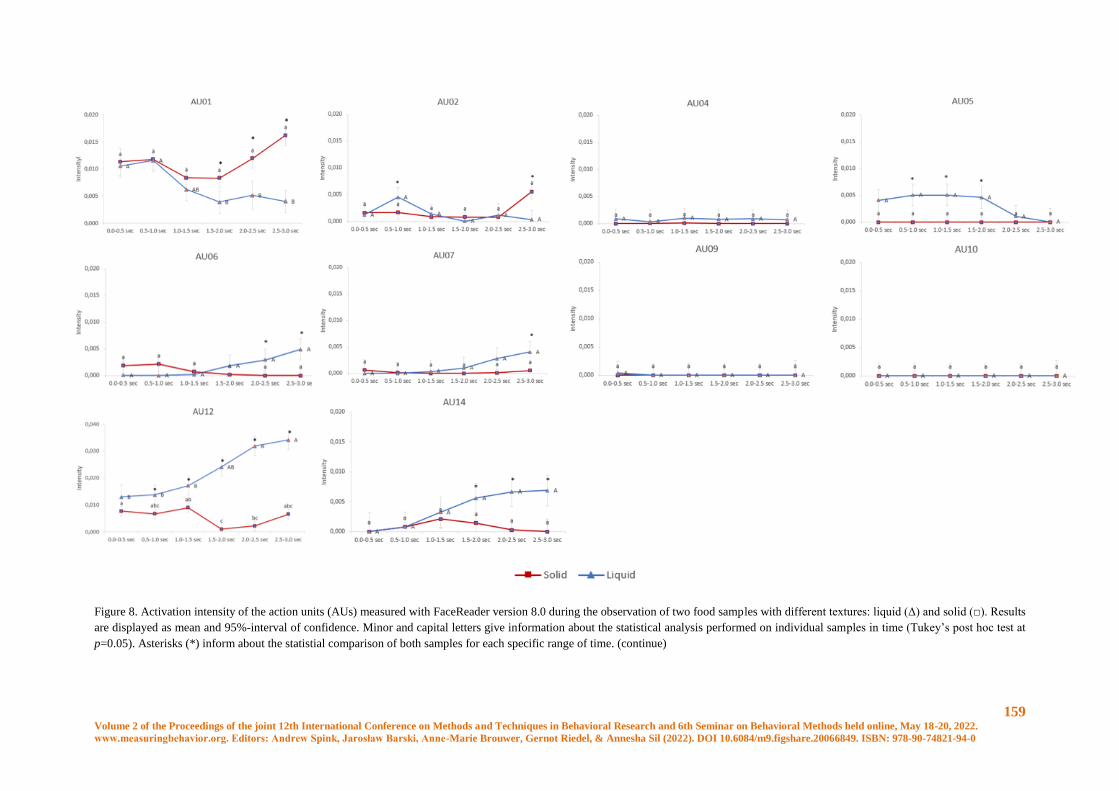
159 Volume 2 of the Proceedings of the joint 12th International Conference on Methods and Techniques in Behavioral Research and 6th Seminar on Behavioral Methods held online, May 18-20, 2022.
www.measuringbehavior.org. Editors: Andrew Spink, Jarosław Barski, Anne-Marie Brouwer, Gernot Riedel, & Annesha Sil (2022). DOI 10.6084/m9.figshare.20066849. ISBN: 978-90-74821-94-0
Figure 8. Activation intensity of the action units (AUs) measured with FaceReader version 8.0 during the observation of two food samples with different textures: liquid (Δ) and solid (□). Results
are displayed as mean and 95%-interval of confidence. Minor and capital letters give information about the statistical analysis performed on individual samples in time (Tukey’s post hoc test at
p=0.05). Asterisks (*) inform about the statistial comparison of both samples for each specific range of time. (continue)
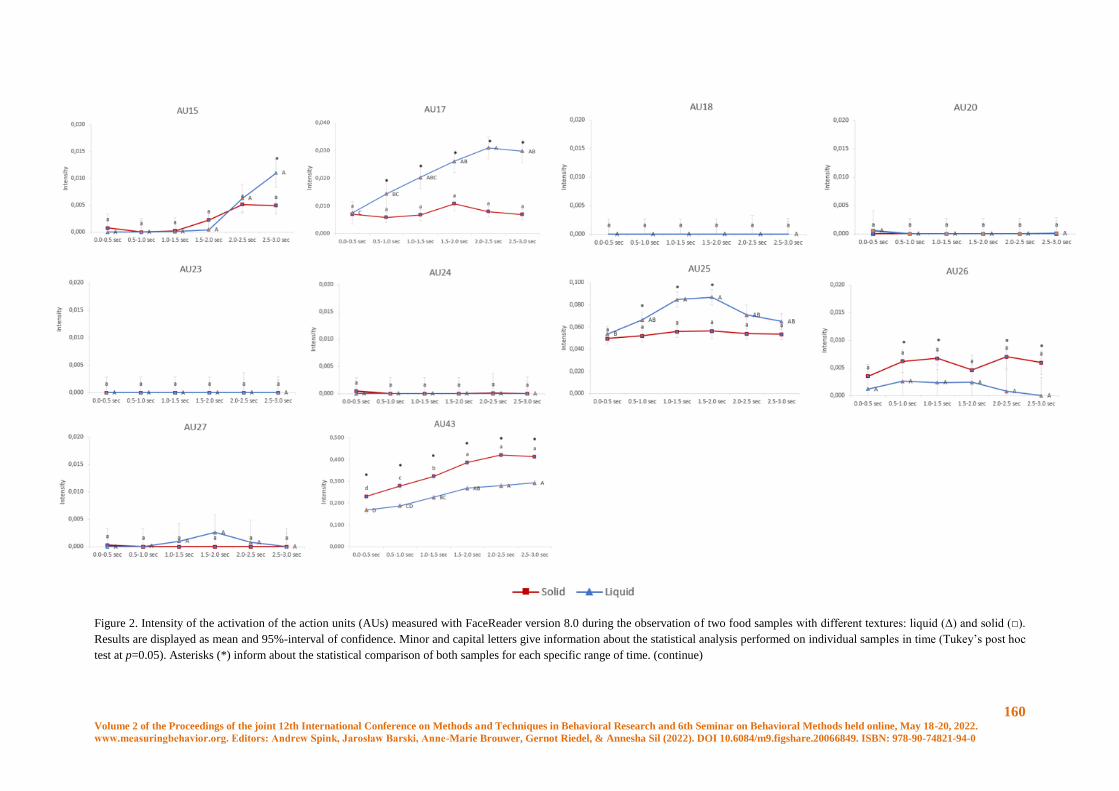
160 Volume 2 of the Proceedings of the joint 12th International Conference on Methods and Techniques in Behavioral Research and 6th Seminar on Behavioral Methods held online, May 18-20, 2022.
www.measuringbehavior.org. Editors: Andrew Spink, Jarosław Barski, Anne-Marie Brouwer, Gernot Riedel, & Annesha Sil (2022). DOI 10.6084/m9.figshare.20066849. ISBN: 978-90-74821-94-0
Figure 2. Intensity of the activation of the action units (AUs) measured with FaceReader version 8.0 during the observation of two food samples with different textures: liquid (Δ) and solid (□).
Results are displayed as mean and 95%-interval of confidence. Minor and capital letters give information about the statistical analysis performed on individual samples in time (Tukey’s post hoc
test at p=0.05). Asterisks (*) inform about the statistical comparison of both samples for each specific range of time. (continue)

161 Volume 2 of the Proceedings of the joint 12th International Conference on Methods and Techniques in Behavioral Research and 6th
Seminar on Behavioral Methods held online, May 18-20, 2022. www.measuringbehavior.org. Editors: Andrew Spink, Jarosław
Barski, Anne-Marie Brouwer, Gernot Riedel, & Annesha Sil (2022). DOI 10.6084/m9.figshare.20066849. ISBN: 978-90-74821-94-0
Basic emotions
Similarly to the results obtained for the action units, FaceReader coded the basic emotions with low intensities
during the observation of the two food samples, except for the neutral and sad emotions which obtained intensities
over 0.10 in the 0-1 range (Figure 3). During the time of exposure (3000 ms), the liquid sample elicited significant
changes from the unconscious (0-500 ms) to the conscious (500-3000 ms) emotional response in emotions with
low intensities: angry, surprised and contempt. On the contrary, the observation of the solid sample induced
changes from the unconscious to the conscious emotional response in emotions with both high (neutral and sad)
and low intensities (happy, surprised, scared and contempt).
Significant differences in all emotions were identified (p<0.05) when we compared the results obtained for both
food samples. Most differences between samples relied on the conscious emotional response (time range 500-3000
ms), while significant differences at the unconscious level (time range 0-500 ms) were also obtained for the neutral
and surprised emotions.
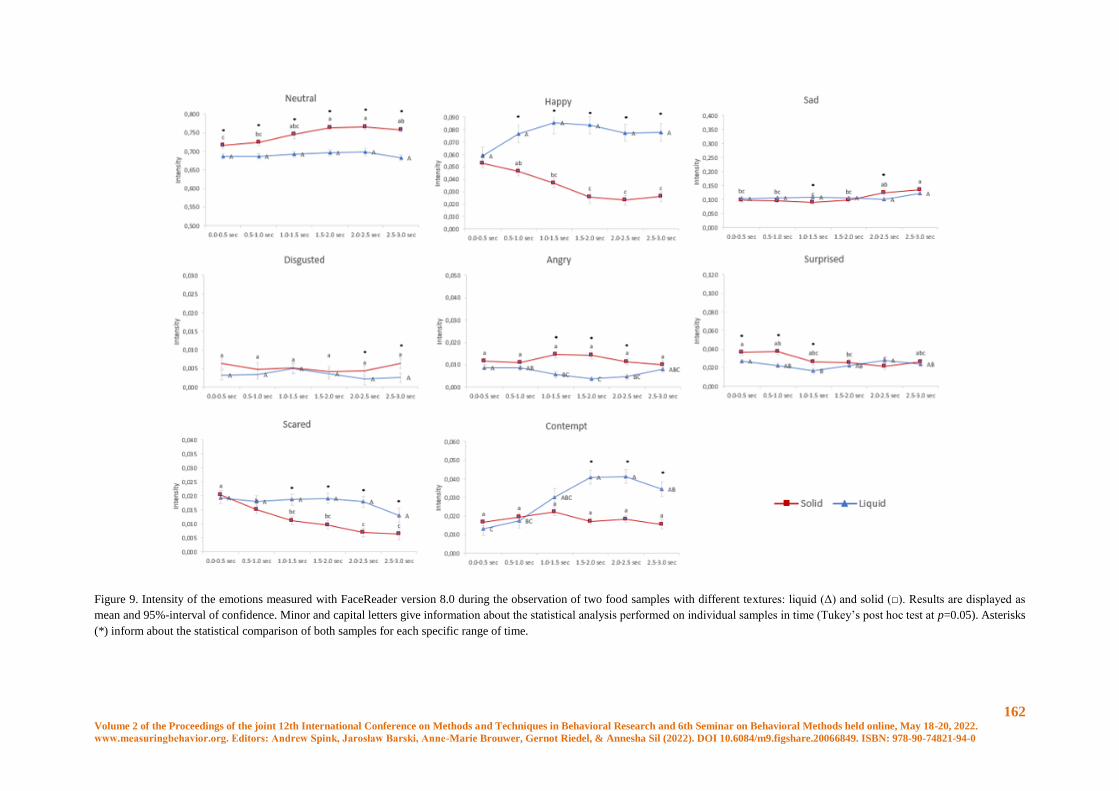
162 Volume 2 of the Proceedings of the joint 12th International Conference on Methods and Techniques in Behavioral Research and 6th Seminar on Behavioral Methods held online, May 18-20, 2022.
www.measuringbehavior.org. Editors: Andrew Spink, Jarosław Barski, Anne-Marie Brouwer, Gernot Riedel, & Annesha Sil (2022). DOI 10.6084/m9.figshare.20066849. ISBN: 978-90-74821-94-0
Figure 9. Intensity of the emotions measured with FaceReader version 8.0 during the observation of two food samples with different textures: liquid (Δ) and solid (□). Results are displayed as
mean and 95%-interval of confidence. Minor and capital letters give information about the statistical analysis performed on individual samples in time (Tukey’s post hoc test at p=0.05). Asterisks
(*) inform about the statistical comparison of both samples for each specific range of time.
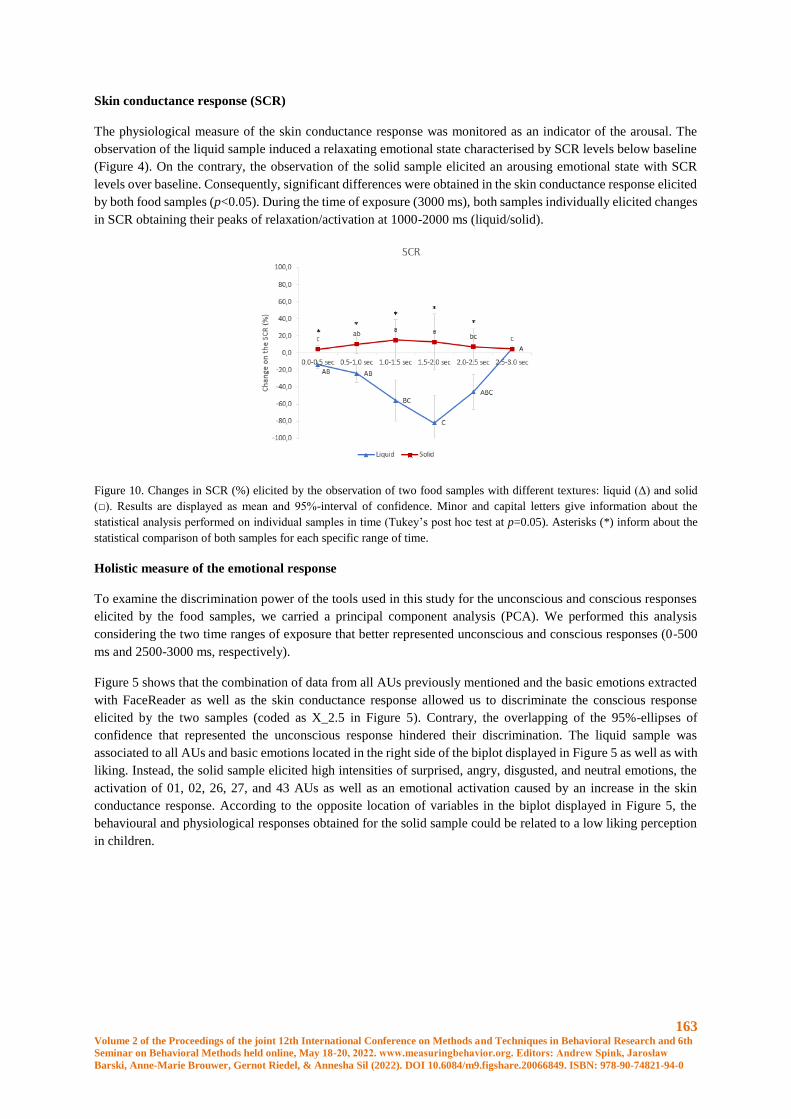
163 Volume 2 of the Proceedings of the joint 12th International Conference on Methods and Techniques in Behavioral Research and 6th
Seminar on Behavioral Methods held online, May 18-20, 2022. www.measuringbehavior.org. Editors: Andrew Spink, Jarosław
Barski, Anne-Marie Brouwer, Gernot Riedel, & Annesha Sil (2022). DOI 10.6084/m9.figshare.20066849. ISBN: 978-90-74821-94-0
Skin conductance response (SCR)
The physiological measure of the skin conductance response was monitored as an indicator of the arousal. The
observation of the liquid sample induced a relaxating emotional state characterised by SCR levels below baseline
(Figure 4). On the contrary, the observation of the solid sample elicited an arousing emotional state with SCR
levels over baseline. Consequently, significant differences were obtained in the skin conductance response elicited
by both food samples (p<0.05). During the time of exposure (3000 ms), both samples individually elicited changes
in SCR obtaining their peaks of relaxation/activation at 1000-2000 ms (liquid/solid).
Figure 10. Changes in SCR (%) elicited by the observation of two food samples with different textures: liquid (Δ) and solid
(□). Results are displayed as mean and 95%-interval of confidence. Minor and capital letters give information about the
statistical analysis performed on individual samples in time (Tukey’s post hoc test at p=0.05). Asterisks (*) inform about the
statistical comparison of both samples for each specific range of time.
Holistic measure of the emotional response
To examine the discrimination power of the tools used in this study for the unconscious and conscious responses
elicited by the food samples, we carried a principal component analysis (PCA). We performed this analysis
considering the two time ranges of exposure that better represented unconscious and conscious responses (0-500
ms and 2500-3000 ms, respectively).
Figure 5 shows that the combination of data from all AUs previously mentioned and the basic emotions extracted
with FaceReader as well as the skin conductance response allowed us to discriminate the conscious response
elicited by the two samples (coded as X_2.5 in Figure 5). Contrary, the overlapping of the 95%-ellipses of
confidence that represented the unconscious response hindered their discrimination. The liquid sample was
associated to all AUs and basic emotions located in the right side of the biplot displayed in Figure 5 as well as with
liking. Instead, the solid sample elicited high intensities of surprised, angry, disgusted, and neutral emotions, the
activation of 01, 02, 26, 27, and 43 AUs as well as an emotional activation caused by an increase in the skin
conductance response. According to the opposite location of variables in the biplot displayed in Figure 5, the
behavioural and physiological responses obtained for the solid sample could be related to a low liking perception
in children.
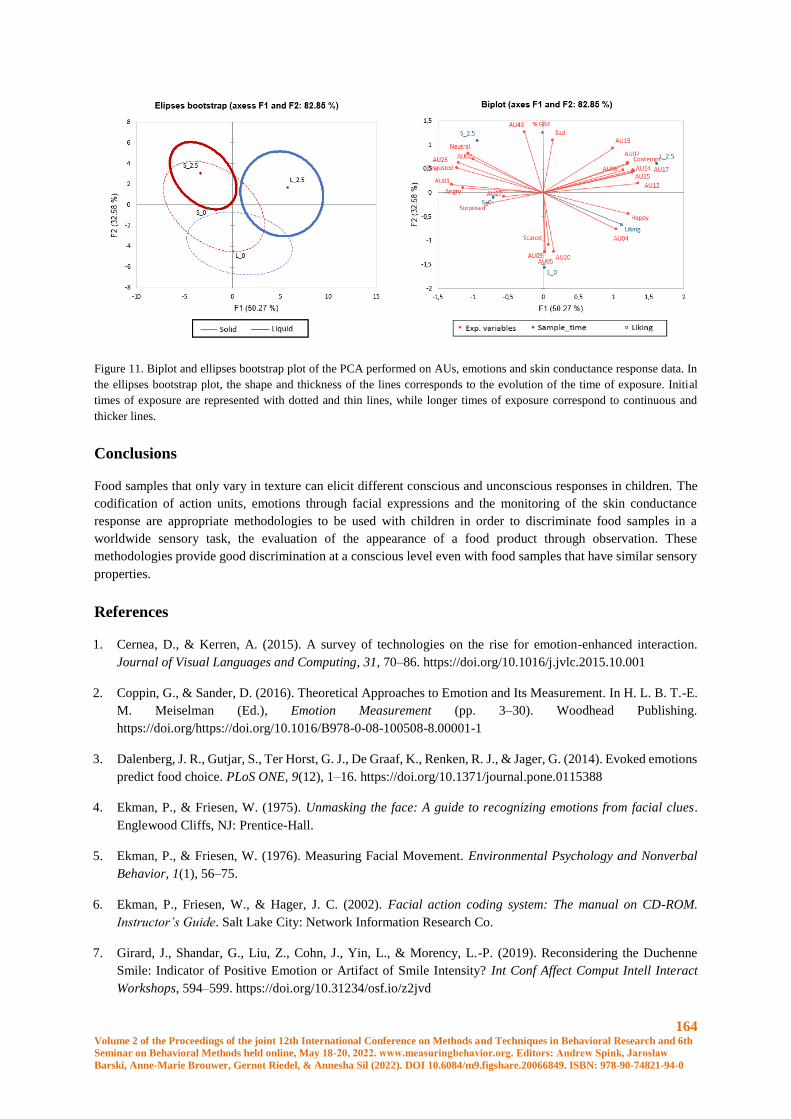
164 Volume 2 of the Proceedings of the joint 12th International Conference on Methods and Techniques in Behavioral Research and 6th
Seminar on Behavioral Methods held online, May 18-20, 2022. www.measuringbehavior.org. Editors: Andrew Spink, Jarosław
Barski, Anne-Marie Brouwer, Gernot Riedel, & Annesha Sil (2022). DOI 10.6084/m9.figshare.20066849. ISBN: 978-90-74821-94-0
Figure 11. Biplot and ellipses bootstrap plot of the PCA performed on AUs, emotions and skin conductance response data. In
the ellipses bootstrap plot, the shape and thickness of the lines corresponds to the evolution of the time of exposure. Initial
times of exposure are represented with dotted and thin lines, while longer times of exposure correspond to continuous and
thicker lines.
Conclusions
Food samples that only vary in texture can elicit different conscious and unconscious responses in children. The
codification of action units, emotions through facial expressions and the monitoring of the skin conductance
response are appropriate methodologies to be used with children in order to discriminate food samples in a
worldwide sensory task, the evaluation of the appearance of a food product through observation. These
methodologies provide good discrimination at a conscious level even with food samples that have similar sensory
properties.
References
1. Cernea, D., & Kerren, A. (2015). A survey of technologies on the rise for emotion-enhanced interaction.
Journal of Visual Languages and Computing, 31, 70–86. https://doi.org/10.1016/j.jvlc.2015.10.001
2. Coppin, G., & Sander, D. (2016). Theoretical Approaches to Emotion and Its Measurement. In H. L. B. T.-E.
M. Meiselman (Ed.), Emotion Measurement (pp. 3–30). Woodhead Publishing.
https://doi.org/https://doi.org/10.1016/B978-0-08-100508-8.00001-1
3. Dalenberg, J. R., Gutjar, S., Ter Horst, G. J., De Graaf, K., Renken, R. J., & Jager, G. (2014). Evoked emotions
predict food choice. PLoS ONE, 9(12), 1–16. https://doi.org/10.1371/journal.pone.0115388
4. Ekman, P., & Friesen, W. (1975). Unmasking the face: A guide to recognizing emotions from facial clues.
Englewood Cliffs, NJ: Prentice-Hall.
5. Ekman, P., & Friesen, W. (1976). Measuring Facial Movement. Environmental Psychology and Nonverbal
Behavior, 1(1), 56–75.
6. Ekman, P., Friesen, W., & Hager, J. C. (2002). Facial action coding system: The manual on CD-ROM.
Instructor’s Guide. Salt Lake City: Network Information Research Co.
7. Girard, J., Shandar, G., Liu, Z., Cohn, J., Yin, L., & Morency, L.-P. (2019). Reconsidering the Duchenne
Smile: Indicator of Positive Emotion or Artifact of Smile Intensity? Int Conf Affect Comput Intell Interact
Workshops, 594–599. https://doi.org/10.31234/osf.io/z2jvd

165 Volume 2 of the Proceedings of the joint 12th International Conference on Methods and Techniques in Behavioral Research and 6th
Seminar on Behavioral Methods held online, May 18-20, 2022. www.measuringbehavior.org. Editors: Andrew Spink, Jarosław
Barski, Anne-Marie Brouwer, Gernot Riedel, & Annesha Sil (2022). DOI 10.6084/m9.figshare.20066849. ISBN: 978-90-74821-94-0
8. Kaneko, D., Toet, A., Brouwer, A. M., Kallen, V., & van Erp, J. B. F. (2018). Methods for evaluating emotions
evoked by food experiences: A literature review. Frontiers in Psychology, 9(JUN).
https://doi.org/10.3389/fpsyg.2018.00911
9. Köster, E. P., & Mojet, J. (2015). From mood to food and from food to mood: A psychological perspective on
the measurement of food-related emotions in consumer research. Food Research International, 76(P2), 180–
191. https://doi.org/10.1016/j.foodres.2015.04.006
10. Laureati, M., Pagliarini, E., Toschi, T. G., & Monteleone, E. (2015). Research challenges and methods to
study food preferences in school-aged children: A review of the last 15 years. Food Quality and Preference,
46(2), 92–102. https://doi.org/10.1016/j.foodqual.2015.07.010
11. Poelman, A. A. M., Delahunty, C. M., & Graaf, C. De. (2017). Vegetables and other core food groups : A
comparison of key flavour and texture properties. Food Quality and Preference, 56, 1–7.
https://doi.org/10.1016/j.foodqual.2016.09.004
12. Soussignan, R., & Schaal, B. (1996). Children’ s facial responsiveness to odors: Influences of hedonic valence
of odor, gender, age, and social presence. Developmental Psychology, 32(2), 367–379.
https://doi.org/10.1037/0012-1649.32.2.367
166 Volume 2 of the Proceedings of the joint 12th International Conference on Methods and Techniques in Behavioral Research and 6th
Seminar on Behavioral Methods held online, May 18-20, 2022. www.measuringbehavior.org. Editors: Andrew Spink, Jarosław
Barski, Anne-Marie Brouwer, Gernot Riedel, & Annesha Sil (2022). DOI 10.6084/m9.figshare.20066849. ISBN: 978-90-74821-94-0
Session Theme: Automatic behavior recognition
in rodents: how new technology moves the field
forward
167 Volume 2 of the Proceedings of the joint 12th International Conference on Methods and Techniques in Behavioral Research and 6th
Seminar on Behavioral Methods held online, May 18-20, 2022. www.measuringbehavior.org. Editors: Andrew Spink, Jarosław
Barski, Anne-Marie Brouwer, Gernot Riedel, & Annesha Sil (2022). DOI 10.6084/m9.figshare.20066849. ISBN: 978-90-74821-94-0
Self-supervised learning as a gateway to reveal underlying dynamics
in animal behavior
K. Luxem1 and P. Mocellin1,2
1 Cellular Neuroscience, Leibniz Institute for Neurobiology, Magdeburg, Germany
2 German Center for Neurodegenerative Diseases, Bonn, Germany
Introduction
With the advent of deep learning, many supervised problems in computer vision and natural language processing
have seen an unprecedented spike in classification accuracy. Deep supervised methods as the popular ResNet
architectures [1] show higher generalization capabilities than humans on benchmark datasets. These advances are
also already applied for the classification of animal behavior [2, 3, 4]. While these algorithms are revolutionary
and make fast and robust automation possible, they struggle with identifying a representative hidden structure of
the spatiotemporal dynamics. Robustly identifying the full repertoire of those dynamics in animal behavior will
enable scientists to study behavioral correlates of neural activity in an unseen form. One approach in this direction
is called Variational Animal Motion Embedding (VAME) [5], a self-supervised method to learn the spatiotemporal
embedding of animal motion from pose estimation signals [6, 7, 8] or video representations [14].
In this perspective, we review a recent breakthrough in self-supervised learning and its applicability to measuring
animal behavior. We here present an approach that, with further development, can advance the landscape of
behavioral quantification tools based on redundancy reduction networks [11].
Self-supervised learning for animal behavior
Using artificial neural networks, self-supervised learning aims to determine an approximate distribution ��(𝑥) of
the original data distribution 𝑝(𝑥). The supervisory signals are coming from the data itself by leveraging the
underlying data structure. Most methods introduce a lower dimensional latent variable z, in which the most
important factors of the input signal are encoded. This type of learning is also called generative modelling. Once
the model is trained on the data, it is able to sample new and unseen data points from ��(𝑥), which resemble the
original data. Prominent variants of generative modelling are generative adversarial networks (GAN) and
variational autoencoder (VAE). While GANs suffer from various problems like mode collapse and unstable
training [9], the latter, VAE, has already been successfully applied to the goal of learning underlying dynamics in
animal behavior [5, 10]. However, VAEs tend to fail to distinguish reliably the true signal from its noise
component.
A recent breakthrough in the field of self-supervised learning, which can overcome this issue, is redundancy
reduction networks (Barlow Twins (BT)) [11]. The mechanism of these networks follows the simple principle to
recode highly redundant sensory inputs into a factorial code, making them an instanciation of the information
bottleneck principle [12]. In brief, those are two identical networks that receive each a different distorted version
of a signal. Their aim is to learn a represantation of the original signal that captures its most important information.
One advantage of this network archtitecture is that it does not rely on the concept of contrastive learning [13],
which involves a high number of negative samples and can be computationally expensive. Furthermore, while
(variational) autoencoder try to recreate every detail of an input signal and are therefore misguided due to different
artifacts like diverse light conditions or missing information. [14], these models directly learn to reduce those
redundancies.
Barlow Twins to learn a dynamical embedding from video
The most common way to investigate behavior is through video recordings of the animal´s actions. Several factors
determine the quality, reliability and noise level of the signal. Their variation e.g. light conditions, camera
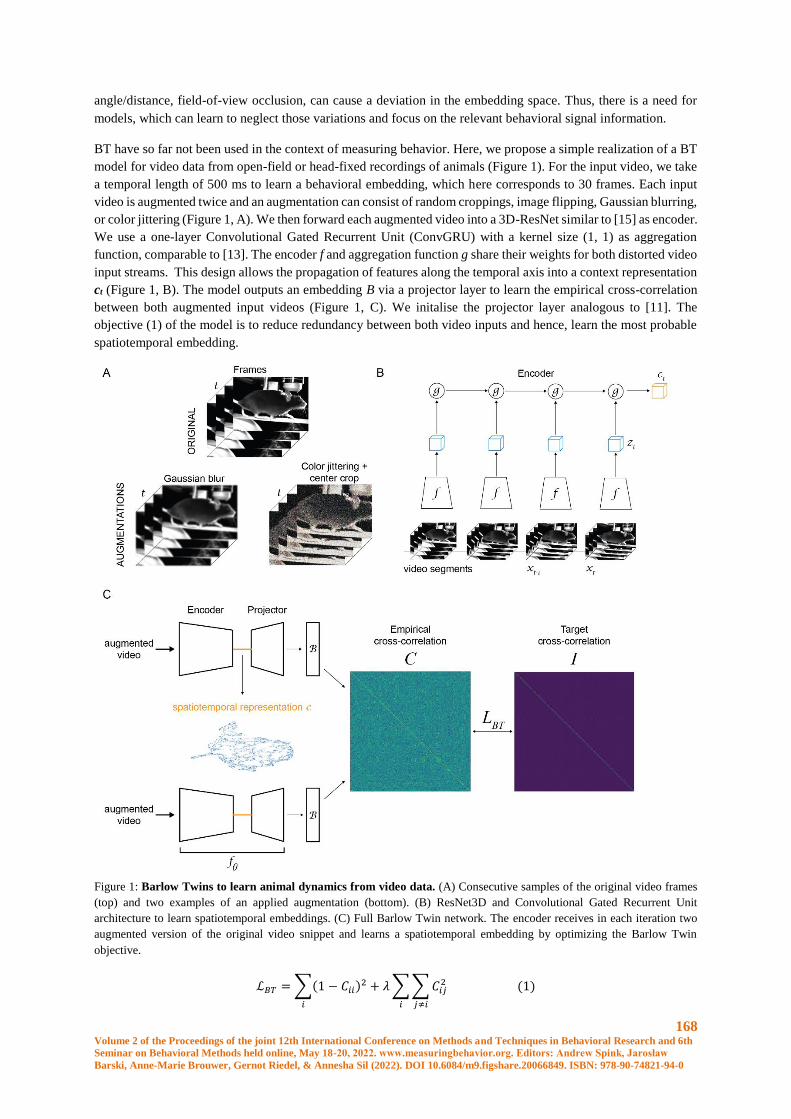
168 Volume 2 of the Proceedings of the joint 12th International Conference on Methods and Techniques in Behavioral Research and 6th
Seminar on Behavioral Methods held online, May 18-20, 2022. www.measuringbehavior.org. Editors: Andrew Spink, Jarosław
Barski, Anne-Marie Brouwer, Gernot Riedel, & Annesha Sil (2022). DOI 10.6084/m9.figshare.20066849. ISBN: 978-90-74821-94-0
angle/distance, field-of-view occlusion, can cause a deviation in the embedding space. Thus, there is a need for
models, which can learn to neglect those variations and focus on the relevant behavioral signal information.
BT have so far not been used in the context of measuring behavior. Here, we propose a simple realization of a BT
model for video data from open-field or head-fixed recordings of animals (Figure 1). For the input video, we take
a temporal length of 500 ms to learn a behavioral embedding, which here corresponds to 30 frames. Each input
video is augmented twice and an augmentation can consist of random croppings, image flipping, Gaussian blurring,
or color jittering (Figure 1, A). We then forward each augmented video into a 3D-ResNet similar to [15] as encoder.
We use a one-layer Convolutional Gated Recurrent Unit (ConvGRU) with a kernel size (1, 1) as aggregation
function, comparable to [13]. The encoder f and aggregation function g share their weights for both distorted video
input streams. This design allows the propagation of features along the temporal axis into a context representation
ct (Figure 1, B). The model outputs an embedding B via a projector layer to learn the empirical cross-correlation
between both augmented input videos (Figure 1, C). We initalise the projector layer analogous to [11]. The
objective (1) of the model is to reduce redundancy between both video inputs and hence, learn the most probable
spatiotemporal embedding.
Figure 1: Barlow Twins to learn animal dynamics from video data. (A) Consecutive samples of the original video frames
(top) and two examples of an applied augmentation (bottom). (B) ResNet3D and Convolutional Gated Recurrent Unit
architecture to learn spatiotemporal embeddings. (C) Full Barlow Twin network. The encoder receives in each iteration two
augmented version of the original video snippet and learns a spatiotemporal embedding by optimizing the Barlow Twin
objective.
ℒ𝐵𝑇 = ∑(1 − 𝐶𝑖𝑖)2 + 𝜆 ∑ ∑ 𝐶𝑖𝑗
2
𝑗≠𝑖𝑖𝑖
(1)
169 Volume 2 of the Proceedings of the joint 12th International Conference on Methods and Techniques in Behavioral Research and 6th
Seminar on Behavioral Methods held online, May 18-20, 2022. www.measuringbehavior.org. Editors: Andrew Spink, Jarosław
Barski, Anne-Marie Brouwer, Gernot Riedel, & Annesha Sil (2022). DOI 10.6084/m9.figshare.20066849. ISBN: 978-90-74821-94-0
Here, 𝜆 is a positive constant trading off the importance between the first and second loss term. C is the cross-
correlation matrix computed between the output of the two identical networks along the batch dimension and is a
square matrix with values between -1 (i.e. perfect anti-correltation) and 1 (perfect correlation). The first term is
the invariance term, which tries to equate the diagonal elements of the cross-correltation matrix to 1. This in turn
makes the embedding invariant to the applied distortion. The second term is a redundancy term, by trying to equate
the off-diagonal elements of the cross-correlation matrix to 0, hence it decorrelates the different vector components
of the embedding. It therefore enables the model to learn non-redundant information about the video sample. For
more details on the working of BT, refer to the original paper [11].
First iterations of our preliminary model achieved already compelling results, which we will further explore
(results not shown). A major advantage of this kind of model is that it can operate directly on the video signal of
a behaving animal without any supervision or predefining key points of interests. This advantage could also be
extended to a mutliview system, where instead of distorted versions of the video, different camera angles are shown
to the model.
Overall, we here discussed recent advancements in the field of self-supervised learning and applied them to
measure animal behavior. This work is an example of how the field of (computational) ethology can leverage
recent advances in the area of machine learning to study animal behavior.
References
1. He K., Zhang X., Ren S., Sun J. (2015). Deep Residual Learning for Image Recognition. Conference on
Computer Vision and Pattern Recognition 2015
2. Bohnslav J. P., Wimalasena N. K., Clausing K. J., Dai Y. Y., Yarmolinsky D. A., Cruz T., Kashlan A. D.,
Chiappe M. E., Orefice L. L., Woolf C. J., Harvey C. D. (2021). DeepEthogram, a machine learning pipeline for
supervised behavior classification from raw pixels. eLife 2021
3. Nilsson S. R. O., Goodwin N. L., Choong J. J., Hwang S., Wright H. R., Norville Z. C., Tong X., Lin D.,
Bentzley B. S., Eshel N., McLaughlin R. J., Golden S. A. (2020). Simple Behavioral Analysis (SimBA). bioRxiv
2020
4. Segalin C., Williams J., Karigo T., Hui M., Zelikowsky M., Sun J. J., Perona P., Anderson D., Kennedy A.
(2021). The Mouse Action Recognition System (MARS) software pipeline for automated analysis of social
behaviors in mice. eLife 2021
5. Luxem K., Mocellin P., Fuhrmann F., Kürsch J., Remy P., Bauer P. (2020). Identifying behavioral structure
from deep variational embeddings of animal motion. bioRxiv 2020
6.Mathis A., Mamidanna P., Cury K. M., Taiga A., Murthy V. N., Mathis M. W., Bethge M. (2018).
DeepLabCut: markerless pose estimation of user-defined body parts with deep learning. Nature Neuroscience
2018
7. Pereira T. D., Tabris N., Li J., Ravindranath S., Papadoyannis E. S., Wang Z. Y., Turner D. M. (2020). SLEAP:
Multi-Animal Pose Tracking. bioRxiv 2020
8. Graving J. M., Chae D., Naik H., Li L., Koger B., Costelloe B. R., Couzin I. D. (2019). DeepPoseKit, a
software toolkit for fast and robust animal pose estimation using deep learning. eLife 2019
9. Durall R., Chatzimichailidis A., Labus P., Keuper J. (2020). Combating Mode Collapse in GAN training: An
Empirical Analysis using Hessian Eigenvalues. arxiv 2020
10. Sun J. J., Kennedy A., Zhan E., Anderson D. J., Yue Y., Perona P. (2021). Task programming: Learning data
efficient behavior representations. Conference on Computer Vision and Pattern Recognition 2021

170 Volume 2 of the Proceedings of the joint 12th International Conference on Methods and Techniques in Behavioral Research and 6th
Seminar on Behavioral Methods held online, May 18-20, 2022. www.measuringbehavior.org. Editors: Andrew Spink, Jarosław
Barski, Anne-Marie Brouwer, Gernot Riedel, & Annesha Sil (2022). DOI 10.6084/m9.figshare.20066849. ISBN: 978-90-74821-94-0
11. Zbontar J., Jing L., Misra I., LeCunn Y., Deny S. (2021). Barlow Twins: Self-Supervised Learning via
Redundancy Reduction. Proceedings of the 38 th International Conference on Machine Learning 2021
12. Tishby N., Pereira F. C., Bialek W. (2000). The information bottleneck method. arxiv 200
13. Han T., Xie W., Zisserman A. (2019). Video Representation Learning by Dense Predictive Coding. arxiv 2019
14. Shi C., Schwartz S., Levy S., Achvat S., Abboud M., Ghanayim A., Schiller J., Mishne G. (2021) Learning
Disentangled Behavior Embeddings. Advances in Neural Information Processing Systems 34 pre-proceedings
(NeurIPS) 2021
15. Hara K., Kataoka H, Satoh Y. (2018). Can spatiotemporal 3d cnns retrace the history of 2d cnns and imagenet?
CVPR 2018
171 Volume 2 of the Proceedings of the joint 12th International Conference on Methods and Techniques in Behavioral Research and 6th
Seminar on Behavioral Methods held online, May 18-20, 2022. www.measuringbehavior.org. Editors: Andrew Spink, Jarosław
Barski, Anne-Marie Brouwer, Gernot Riedel, & Annesha Sil (2022). DOI 10.6084/m9.figshare.20066849. ISBN: 978-90-74821-94-0
uBAM: Unsupervised Behavior Analysis and Magnification using Deep Learning
Björn Ommer
University of Munich
Abstract
Motor behavior analysis is essential to biomedical research and clinical diagnostics as it provides a non-invasive
strategy for identifying motor impairment and its change caused by interventions. State-of-the-art instrumented
movement analysis is time- and cost-intensive, since it requires placing physical or virtual markers. Besides the
effort required for marking keypoints or annotations necessary for training or finetuning a detector, users need to
know the interesting behavior beforehand to provide meaningful keypoints.
We present uBAM, a novel, automatic deep learning algorithm for behavior analysis by discovering and
magnifying deviations. At its core is an unsupervised learning of posture and behavior representations that enable
an objective behavior comparison even across subjects. Moreover, we propose a deep generative model to visually
magnify subtle behavior differences across subjects directly in video without requiring a detour via keypoints or
annotations. Essential for this magnification of deviations, even across different individuals, is a disentangling of
appearance and behavior representations. Evaluations on rodents and human patients with neurological diseases
demonstrate the wide applicability of the approach. Moreover, combining optogenetic stimulation with our
unsupervised behavior analysis shows that our approach can also serve as a non-invasive diagnostic tool for
measuring structural plasticity in the cortex.
Introduction
The precise analysis of motor behavior and its deviations constitutes an essential, non-invasive diagnostic strategy
[1] in many fields ranging from biomedical fundamental research on animals to clinical diagnosis of patients.
Behavior is the output of coordinated internal processes of the brain including the planning and fine tuning of
movements in higher brain regions, trans-ducting the spinal to the spinal cord and converting it to an orchestrated
muscle activation for complex movements. A detailed analysis of skilled behavior and its impairment is, therefore,
crucial for the neuroscientific understanding of brain (dys-)function. Moreover, the objective quantification of
motor impairment is not only valuable to detect and classify distinct functional deficits. It can also serve as basis
for individually optimised treatment strategies. Videos of behavior recorded during the long-term recovery after
neurological diseases provide an easily available, rich source of information to evaluate and adjust drug application
and treatment paradigms.
The main bottleneck in behavioral studies is presently that all analysis of skilled motor function depends on a time-
intensive, potentially subjective, and costly manual evaluation of behavior: Behavior analysis has so far mainly
relied on reflective physical markers placed on body joints [1,2] or on tracking manually labelled virtual keypoints
in video recordings of behavior [3, 4, 5, 6, 7, 8]. However, placing physical markers can be tedious and distracting,
especially when working with animals. In contrast, virtual keypoints are beneficial due to their non-invasiveness,
but they require significant effort for keypoint annotation. To avoid labelling every video frame, machine learning
has been employed to automatically track body-parts [6, 7, 8, 9]. For example, DeepLabCut [9] has been
successfully applied to different experimental settings and utilized for different species and behaviors. However,
applying a keypoint model to novel datasets requires fine-tuning based on extra manual annotation for the specific
data. Where such manual annotation is not an issue or for data for which existing models already work sufficiently
well, keypoint approaches offer a simple and effective solution.
However, the great benefit of simplicity of a posture representation based on keypoints limits a detailed analysis
of arbitrary novel, e.g. impaired, behavior: A detailed representation of a priori unknown body movements requires
trained keypoints for almost every body joint, which presents an impracticable effort to supervised training.
Therefore, users have to limit the keypoints to a predefined feasible subset. We argue that this introduces a
172 Volume 2 of the Proceedings of the joint 12th International Conference on Methods and Techniques in Behavioral Research and 6th
Seminar on Behavioral Methods held online, May 18-20, 2022. www.measuringbehavior.org. Editors: Andrew Spink, Jarosław
Barski, Anne-Marie Brouwer, Gernot Riedel, & Annesha Sil (2022). DOI 10.6084/m9.figshare.20066849. ISBN: 978-90-74821-94-0
problem: to select the optimal keypoints for a detailed analysis, the user needs to know what the behavior of interest
is before applying the posture detection. However, a true diagnostic tool should discover and localize deviant
behavior, rather than only confirm it. Consequently, there is a human annotator bias: the behavior analysis is
restricted to the keypoints that a user has decided for and different annotators may favor different points. Thus, it
is missing features that may be relevant to fully characterise motor behavior and draw appropriate conclusions on
underlying neuronal mechanisms. Several recent works on behavior analysis also confirm these drawbacks of
using a parametric model, such as the loss of information [10], and, thus, propose approaches using non-parametric
models that avoid the aforementioned prior assumptions on the data. Compared to their method, our model is also
able to compare behavior across different subjects and over time, moreover we can identify and visually magnify
the movement deviation between subjects.
Approach
We propose a fully automatic, unsupervised diagnostic support system for behavior analysis that can discover even
subtle deviations of motor function. The approach not only extracts and classifies behavior [11], but it can also
compare and quantify even small differences. Neither analysis of novel video sequences nor training of the
underlying deep neural network require physical markers or supervision with tedious keypoint annotations. This
avoids a user bias of having to select appropriate keypoints for training a keypoint model and also supports an
objective analysis. Our approach automatically discovers characteristic behavior, localises it temporally and
spatially, and, above all, provides a behavior magnification that not just highlights but also amplifies subtle
differences in behavior directly in the video: Given a novel video sequence, the approach can automatically
compare the behavior against reference videos showing healthy or impaired behavior of other individuals, since it
is invariant to inter-subject variations in appearance. Also, behavior can be contrasted against previous videos of
the same individual during a recovery process to identify the fine differences. Behavior magnification then uses a
generative neural network to synthesise a new video with the subtle deviations between healthy and impaired being
amplified so they become clearly visible.
Key to our model is a disentangling of posture and appearance for image synthesis to amplify only the deviations
in behavior across individuals despite differences in appearance. We assume a clinical or research setting with
static background and controlled recording. Disentangling should not merely separate moving from static image
regions. Otherwise we would merge non-moving body parts with the background, hindering analysis and
magnification across different subjects. Rather we need to learn the commonalities of reference behavior across
different subjects and disentangle this from their individual deviations in appearance. Our algorithm is promising
for diverse applications in the field of biomedical research and was evaluated on rodents and human patients with
disease models such as stroke and multiple sclerosis.
References
1. Berman, G.J. (2018). Measuring behavior across scales. BMC biology 16, 23.
2. Loper, M.M., Mahmood, N. & Black, M.J. MoSh. (2014). Motion and shape capture from sparse markers. ACM
Transactions on Graphics, (Proc. SIGGRAPH Asia) 33, 220:1–220:13.
3. Robie, A.A., Seagraves, K.M., Egnor, S.R. & Branson, K. (2017). Machine vision methods for analyzing social
interactions. Journal of Experimental Biology 220, 25–34.
4. Dell, A.I. et al. (2014). Automated image-based tracking and its application in ecology. Trends in ecology &
evolution 29, 417–428.
5. Peters, S.M. et al. (2016). Novel approach to automatically classify rat social behavior using a video tracking
system. Journal of neuroscience methods 268, 163–170.

173 Volume 2 of the Proceedings of the joint 12th International Conference on Methods and Techniques in Behavioral Research and 6th
Seminar on Behavioral Methods held online, May 18-20, 2022. www.measuringbehavior.org. Editors: Andrew Spink, Jarosław
Barski, Anne-Marie Brouwer, Gernot Riedel, & Annesha Sil (2022). DOI 10.6084/m9.figshare.20066849. ISBN: 978-90-74821-94-0
6. Arac, A., Zhao, P., Dobkin, B.H., Carmichael, S.T. & Golshani, P. (2019). Deepbehavior: A deep learning
toolbox for automated analysis of animal and human behavior imaging data. Frontiers in systems neuroscience 13,
20.
7. Graving, J.M. et al. (2019). Deepposekit, a software toolkit for fast and robust animal pose estimation using
deep learning. eLife 8.
8. Pereira, T.D. et al. (2019). Fast animal pose estimation using deep neural networks. Nature methods 16, 117–
125.
9. Mathis, A. et al. (2018). Deeplabcut: markerless pose estimation of user-defined body parts with deep learning.
Nature Neuroscience 21, 1281–1289.
10. Batty, E. et al. (2019). Behavenet: nonlinear embedding and bayesian neural decoding of behavioral videos. In
Advances in Neural Information Processing Systems, 15680–15691.
11. Kabra, M., Robie, A. A., Rivera-Alba, M., Branson, S. & Branson, K. (2012). JAABA: interactive machine
learning for automatic annotation of animal behavior. Nat. Methods 10, 64–67.
174 Volume 2 of the Proceedings of the joint 12th International Conference on Methods and Techniques in Behavioral Research and 6th
Seminar on Behavioral Methods held online, May 18-20, 2022. www.measuringbehavior.org. Editors: Andrew Spink, Jarosław
Barski, Anne-Marie Brouwer, Gernot Riedel, & Annesha Sil (2022). DOI 10.6084/m9.figshare.20066849. ISBN: 978-90-74821-94-0
Learning to embed lifetime social behavior from interaction dynamics
B. Wild1, D.M. Dormagen1, M.L. Smith2,3, T. Landgraf1
1 Department of Computer Science, Freie Universität, Berlin, Germany,
2 Department of Biological Sciences, Auburn University, Auburn, AL 36849, USA,
3 Department of Collective Behaviour, Max Planck Institute of Animal Behavior, Konstanz, Germany
Introduction
Animals living in groups often coordinate their behavior, resulting in emergent properties at the group level. The
dynamics of the inter-individual interactions produce, for example, the coherent motion patterns of flocking birds
and shoaling fish, or the results of democratic elections in human societies. In many social systems, individuals
differ consistently in how, when, and with whom they interact. The way an individual participates in social
interactions and therefore contributes to the emergence of group-level properties can be understood as its functional
role within the collective [1–4].
Technological advances have made it possible to track all individuals and their interactions, ranging from social
insects to primate groups [5–10]. These methods produce datasets that have unprecedented scale and complexity,
but identifying and understanding the functional roles of the individuals within their groups has emerged as a new
and challenging problem in itself. Social network analysis of interaction networks has proven to be a promising
approach because interaction networks are comparatively straightforward to obtain from tracking data, and the
networks represent each individual in the global context of the group [2,3,11,12].
In most social systems, the way individuals interact changes over time, due to new experiences, environmental
changes, or physiological conditions. Furthermore, groups themselves also tend to change, both in size and
composition [13–18]. Despite these changes over time, an objective measure of the functional role should identify
individuals that serve a similar function (e.g. a guard versus a forager). Unfortunately, we are now facing a
recursive definition of function: We are trying to derive the function of an individual from the network, but the
network itself is also a function of the individuals’ behavior (and other factors). Still, consider a group-living
species in which only a subset of individuals engage in nursing duties. If we analyze the networks of different
groups of the same species in different environmental conditions and group sizes, we still expect an objective
measure of function to be shared among individuals engaged in nursing, regardless of these confounding factors.
How can we extract such an objective measure from a constantly changing network of interactions without a fixed
frame of reference?
In many social systems, individuals share common factors that partially determine the roles they take. For example,
an individual’s age can have a strong influence on behavior. In humans, factors such as socioeconomic status are
comparatively easy to measure yet determine behavior and, therefore, interactions to a large extent. If individuals
take on roles partially determined by a common factor, can we use this dependency to learn an objective measure
of function? Here, we show that such common factors are a powerful inductive bias to learn semantically consistent
functional descriptors of individuals over time, even in highly dynamic social systems.
In recent years, methods that automatically learn semantic embeddings from high-dimensional data have become
popular. These methods map entities into a learned vector space. For example, in natural language models, a word
can be represented as a vector, such that specific regions in the manifold of learned embeddings correspond to
words with similar meaning. Similarly, recommender systems can learn meaningful embeddings of users and
items, for example, movies, such that similar entities cluster in the manifold of learned embeddings [19–22].
Such embeddings are usually learned from the data without additional supervision. In recommender systems, a
movie’s genre is usually not given in a dataset of user ratings, yet the genre can be identified given the learned
embeddings [23]. This capability of learning embeddings from raw data and using them in downstream tasks is
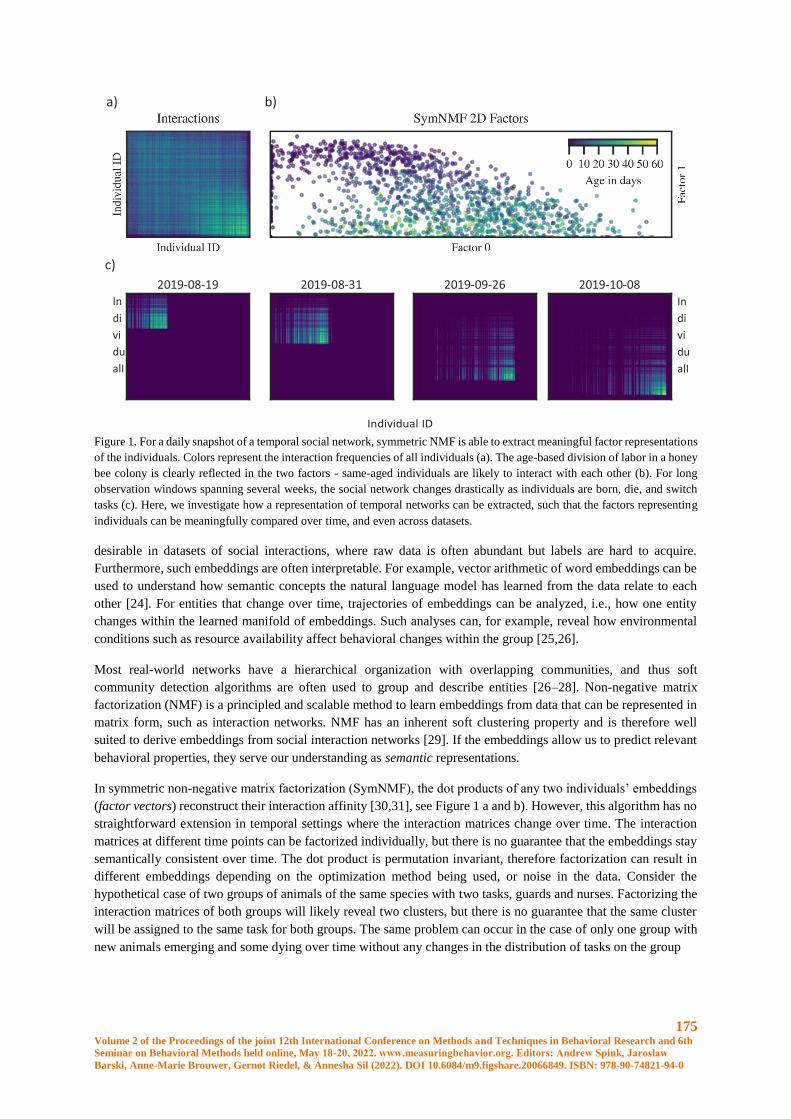
175 Volume 2 of the Proceedings of the joint 12th International Conference on Methods and Techniques in Behavioral Research and 6th
Seminar on Behavioral Methods held online, May 18-20, 2022. www.measuringbehavior.org. Editors: Andrew Spink, Jarosław
Barski, Anne-Marie Brouwer, Gernot Riedel, & Annesha Sil (2022). DOI 10.6084/m9.figshare.20066849. ISBN: 978-90-74821-94-0
a) b)
c)
Figure 1. For a daily snapshot of a temporal social network, symmetric NMF is able to extract meaningful factor representations
of the individuals. Colors represent the interaction frequencies of all individuals (a). The age-based division of labor in a honey
bee colony is clearly reflected in the two factors - same-aged individuals are likely to interact with each other (b). For long
observation windows spanning several weeks, the social network changes drastically as individuals are born, die, and switch
tasks (c). Here, we investigate how a representation of temporal networks can be extracted, such that the factors representing
individuals can be meaningfully compared over time, and even across datasets.
desirable in datasets of social interactions, where raw data is often abundant but labels are hard to acquire.
Furthermore, such embeddings are often interpretable. For example, vector arithmetic of word embeddings can be
used to understand how semantic concepts the natural language model has learned from the data relate to each
other [24]. For entities that change over time, trajectories of embeddings can be analyzed, i.e., how one entity
changes within the learned manifold of embeddings. Such analyses can, for example, reveal how environmental
conditions such as resource availability affect behavioral changes within the group [25,26].
Most real-world networks have a hierarchical organization with overlapping communities, and thus soft
community detection algorithms are often used to group and describe entities [26–28]. Non-negative matrix
factorization (NMF) is a principled and scalable method to learn embeddings from data that can be represented in
matrix form, such as interaction networks. NMF has an inherent soft clustering property and is therefore well
suited to derive embeddings from social interaction networks [29]. If the embeddings allow us to predict relevant
behavioral properties, they serve our understanding as semantic representations.
In symmetric non-negative matrix factorization (SymNMF), the dot products of any two individuals’ embeddings
(factor vectors) reconstruct their interaction affinity [30,31], see Figure 1 a and b). However, this algorithm has no
straightforward extension in temporal settings where the interaction matrices change over time. The interaction
matrices at different time points can be factorized individually, but there is no guarantee that the embeddings stay
semantically consistent over time. The dot product is permutation invariant, therefore factorization can result in
different embeddings depending on the optimization method being used, or noise in the data. Consider the
hypothetical case of two groups of animals of the same species with two tasks, guards and nurses. Factorizing the
interaction matrices of both groups will likely reveal two clusters, but there is no guarantee that the same cluster
will be assigned to the same task for both groups. The same problem can occur in the case of only one group with
new animals emerging and some dying over time without any changes in the distribution of tasks on the group
In
di
vi
du
alI
D
In
di
vi
du
alI
D
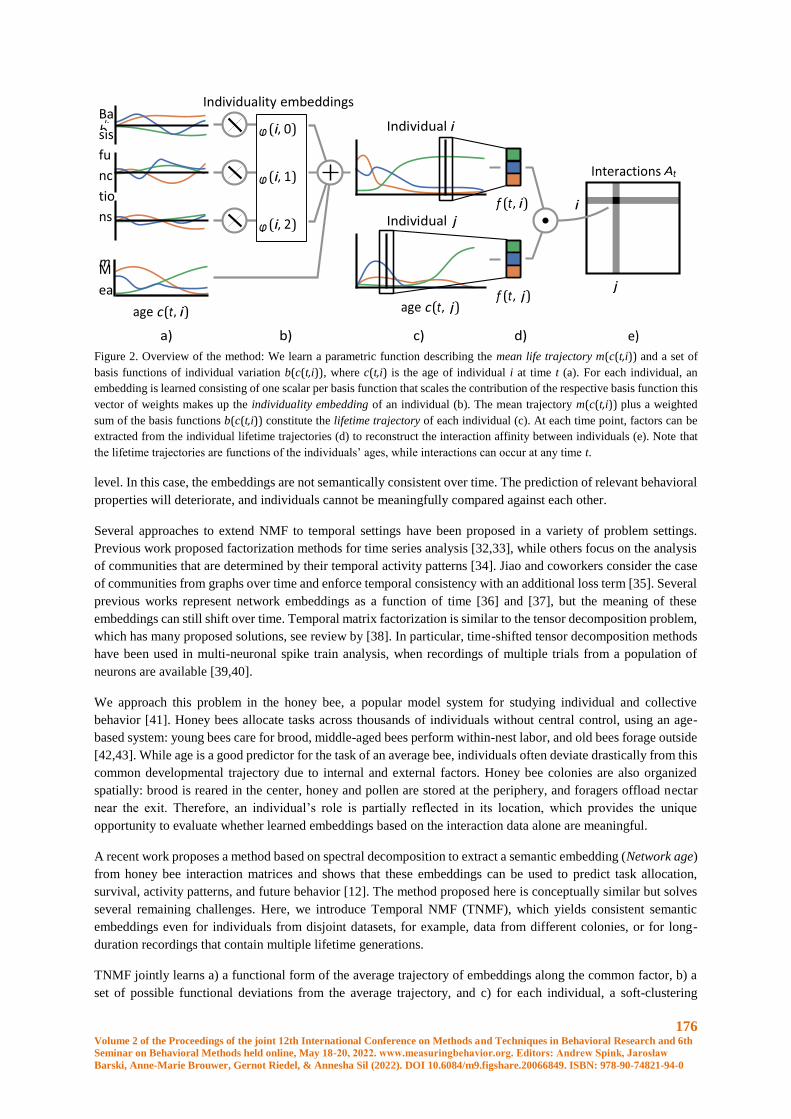
176 Volume 2 of the Proceedings of the joint 12th International Conference on Methods and Techniques in Behavioral Research and 6th
Seminar on Behavioral Methods held online, May 18-20, 2022. www.measuringbehavior.org. Editors: Andrew Spink, Jarosław
Barski, Anne-Marie Brouwer, Gernot Riedel, & Annesha Sil (2022). DOI 10.6084/m9.figshare.20066849. ISBN: 978-90-74821-94-0
Figure 2. Overview of the method: We learn a parametric function describing the mean life trajectory m(c(t,i)) and a set of
basis functions of individual variation b(c(t,i)), where c(t,i) is the age of individual i at time t (a). For each individual, an
embedding is learned consisting of one scalar per basis function that scales the contribution of the respective basis function this
vector of weights makes up the individuality embedding of an individual (b). The mean trajectory m(c(t,i)) plus a weighted
sum of the basis functions b(c(t,i)) constitute the lifetime trajectory of each individual (c). At each time point, factors can be
extracted from the individual lifetime trajectories (d) to reconstruct the interaction affinity between individuals (e). Note that
the lifetime trajectories are functions of the individuals’ ages, while interactions can occur at any time t.
level. In this case, the embeddings are not semantically consistent over time. The prediction of relevant behavioral
properties will deteriorate, and individuals cannot be meaningfully compared against each other.
Several approaches to extend NMF to temporal settings have been proposed in a variety of problem settings.
Previous work proposed factorization methods for time series analysis [32,33], while others focus on the analysis
of communities that are determined by their temporal activity patterns [34]. Jiao and coworkers consider the case
of communities from graphs over time and enforce temporal consistency with an additional loss term [35]. Several
previous works represent network embeddings as a function of time [36] and [37], but the meaning of these
embeddings can still shift over time. Temporal matrix factorization is similar to the tensor decomposition problem,
which has many proposed solutions, see review by [38]. In particular, time-shifted tensor decomposition methods
have been used in multi-neuronal spike train analysis, when recordings of multiple trials from a population of
neurons are available [39,40].
We approach this problem in the honey bee, a popular model system for studying individual and collective
behavior [41]. Honey bees allocate tasks across thousands of individuals without central control, using an age-
based system: young bees care for brood, middle-aged bees perform within-nest labor, and old bees forage outside
[42,43]. While age is a good predictor for the task of an average bee, individuals often deviate drastically from this
common developmental trajectory due to internal and external factors. Honey bee colonies are also organized
spatially: brood is reared in the center, honey and pollen are stored at the periphery, and foragers offload nectar
near the exit. Therefore, an individual’s role is partially reflected in its location, which provides the unique
opportunity to evaluate whether learned embeddings based on the interaction data alone are meaningful.
A recent work proposes a method based on spectral decomposition to extract a semantic embedding (Network age)
from honey bee interaction matrices and shows that these embeddings can be used to predict task allocation,
survival, activity patterns, and future behavior [12]. The method proposed here is conceptually similar but solves
several remaining challenges. Here, we introduce Temporal NMF (TNMF), which yields consistent semantic
embeddings even for individuals from disjoint datasets, for example, data from different colonies, or for long-
duration recordings that contain multiple lifetime generations.
TNMF jointly learns a) a functional form of the average trajectory of embeddings along the common factor, b) a
set of possible functional deviations from the average trajectory, and c) for each individual, a soft-clustering
( , )
( , )
( , )
Ba
sis
fu
nc
tio
ns
b k
M
ea
n
m
( , )
( , )
( , ) ( , )
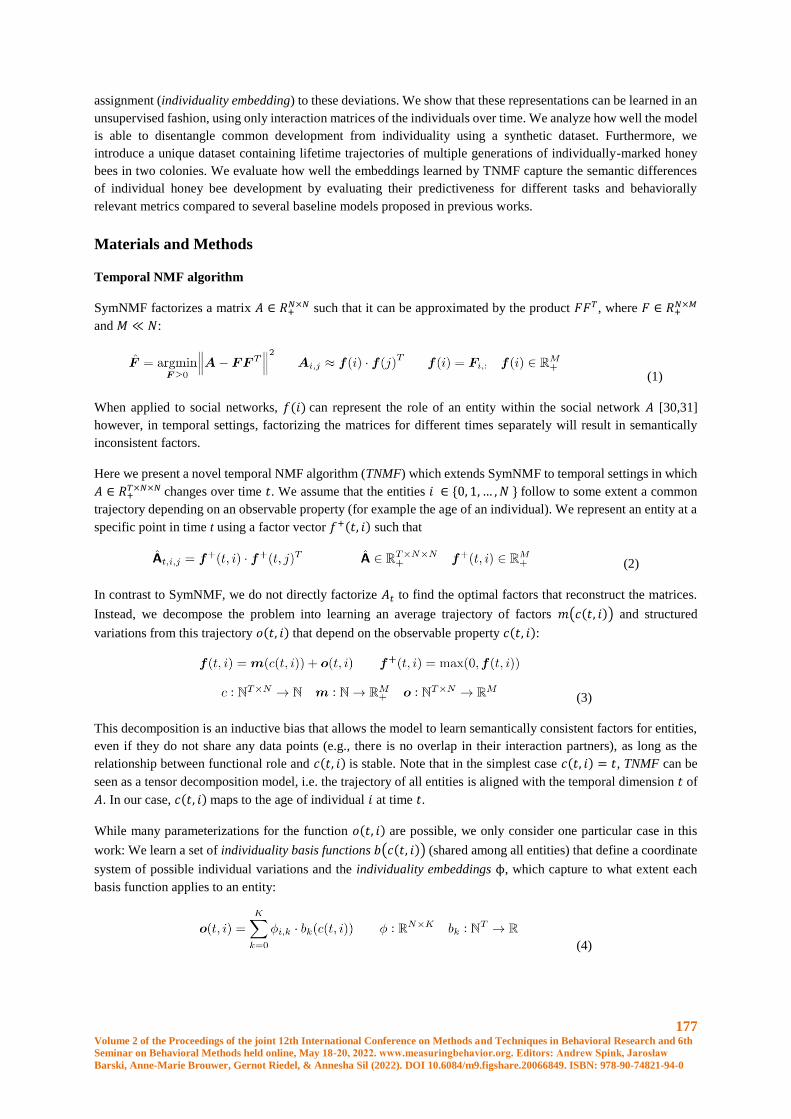
177 Volume 2 of the Proceedings of the joint 12th International Conference on Methods and Techniques in Behavioral Research and 6th
Seminar on Behavioral Methods held online, May 18-20, 2022. www.measuringbehavior.org. Editors: Andrew Spink, Jarosław
Barski, Anne-Marie Brouwer, Gernot Riedel, & Annesha Sil (2022). DOI 10.6084/m9.figshare.20066849. ISBN: 978-90-74821-94-0
assignment (individuality embedding) to these deviations. We show that these representations can be learned in an
unsupervised fashion, using only interaction matrices of the individuals over time. We analyze how well the model
is able to disentangle common development from individuality using a synthetic dataset. Furthermore, we
introduce a unique dataset containing lifetime trajectories of multiple generations of individually-marked honey
bees in two colonies. We evaluate how well the embeddings learned by TNMF capture the semantic differences
of individual honey bee development by evaluating their predictiveness for different tasks and behaviorally
relevant metrics compared to several baseline models proposed in previous works.
Materials and Methods
Temporal NMF algorithm
SymNMF factorizes a matrix 𝐴 ∈ 𝑅+𝑁×𝑁 such that it can be approximated by the product 𝐹𝐹𝑇, where 𝐹 ∈ 𝑅+
𝑁×𝑀
and 𝑀 ≪ 𝑁:
(1)
When applied to social networks, 𝑓(𝑖) can represent the role of an entity within the social network 𝐴 [30,31]
however, in temporal settings, factorizing the matrices for different times separately will result in semantically
inconsistent factors.
Here we present a novel temporal NMF algorithm (TNMF) which extends SymNMF to temporal settings in which
𝐴 ∈ 𝑅+𝑇×𝑁×𝑁 changes over time 𝑡. We assume that the entities 𝑖 ∈ {0, 1, … , 𝑁 } follow to some extent a common
trajectory depending on an observable property (for example the age of an individual). We represent an entity at a
specific point in time t using a factor vector 𝑓+(𝑡, 𝑖) such that
(2)
In contrast to SymNMF, we do not directly factorize 𝐴𝑡 to find the optimal factors that reconstruct the matrices.
Instead, we decompose the problem into learning an average trajectory of factors 𝑚(𝑐(𝑡, 𝑖)) and structured
variations from this trajectory 𝑜(𝑡, 𝑖) that depend on the observable property 𝑐(𝑡, 𝑖):
(3)
This decomposition is an inductive bias that allows the model to learn semantically consistent factors for entities,
even if they do not share any data points (e.g., there is no overlap in their interaction partners), as long as the
relationship between functional role and 𝑐(𝑡, 𝑖) is stable. Note that in the simplest case 𝑐(𝑡, 𝑖) = 𝑡, TNMF can be
seen as a tensor decomposition model, i.e. the trajectory of all entities is aligned with the temporal dimension 𝑡 of
𝐴. In our case, 𝑐(𝑡, 𝑖) maps to the age of individual 𝑖 at time 𝑡.
While many parameterizations for the function 𝑜(𝑡, 𝑖) are possible, we only consider one particular case in this
work: We learn a set of individuality basis functions 𝑏(𝑐(𝑡, 𝑖)) (shared among all entities) that define a coordinate
system of possible individual variations and the individuality embeddings ϕ, which capture to what extent each
basis function applies to an entity:
(4)
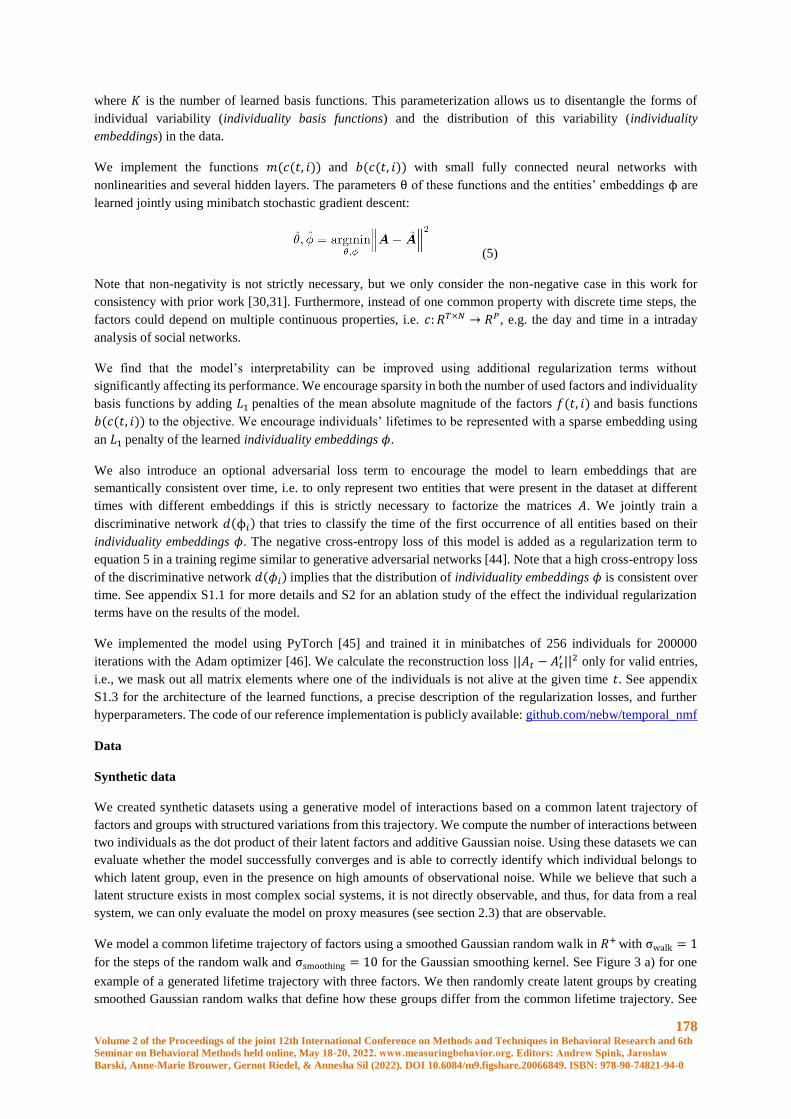
178 Volume 2 of the Proceedings of the joint 12th International Conference on Methods and Techniques in Behavioral Research and 6th
Seminar on Behavioral Methods held online, May 18-20, 2022. www.measuringbehavior.org. Editors: Andrew Spink, Jarosław
Barski, Anne-Marie Brouwer, Gernot Riedel, & Annesha Sil (2022). DOI 10.6084/m9.figshare.20066849. ISBN: 978-90-74821-94-0
where 𝐾 is the number of learned basis functions. This parameterization allows us to disentangle the forms of
individual variability (individuality basis functions) and the distribution of this variability (individuality
embeddings) in the data.
We implement the functions 𝑚(𝑐(𝑡, 𝑖)) and 𝑏(𝑐(𝑡, 𝑖)) with small fully connected neural networks with
nonlinearities and several hidden layers. The parameters θ of these functions and the entities’ embeddings ϕ are
learned jointly using minibatch stochastic gradient descent:
(5)
Note that non-negativity is not strictly necessary, but we only consider the non-negative case in this work for
consistency with prior work [30,31]. Furthermore, instead of one common property with discrete time steps, the
factors could depend on multiple continuous properties, i.e. 𝑐: 𝑅𝑇×𝑁 → 𝑅𝑃, e.g. the day and time in a intraday
analysis of social networks.
We find that the model’s interpretability can be improved using additional regularization terms without
significantly affecting its performance. We encourage sparsity in both the number of used factors and individuality
basis functions by adding 𝐿1 penalties of the mean absolute magnitude of the factors 𝑓(𝑡, 𝑖) and basis functions
𝑏(𝑐(𝑡, 𝑖)) to the objective. We encourage individuals’ lifetimes to be represented with a sparse embedding using
an 𝐿1 penalty of the learned individuality embeddings 𝜙.
We also introduce an optional adversarial loss term to encourage the model to learn embeddings that are
semantically consistent over time, i.e. to only represent two entities that were present in the dataset at different
times with different embeddings if this is strictly necessary to factorize the matrices 𝐴. We jointly train a
discriminative network 𝑑(ϕ𝑖) that tries to classify the time of the first occurrence of all entities based on their
individuality embeddings 𝜙. The negative cross-entropy loss of this model is added as a regularization term to
equation 5 in a training regime similar to generative adversarial networks [44]. Note that a high cross-entropy loss
of the discriminative network 𝑑(𝜙𝑖) implies that the distribution of individuality embeddings 𝜙 is consistent over
time. See appendix S1.1 for more details and S2 for an ablation study of the effect the individual regularization
terms have on the results of the model.
We implemented the model using PyTorch [45] and trained it in minibatches of 256 individuals for 200000
iterations with the Adam optimizer [46]. We calculate the reconstruction loss ||𝐴𝑡 − 𝐴𝑡′ ||2 only for valid entries,
i.e., we mask out all matrix elements where one of the individuals is not alive at the given time 𝑡. See appendix
S1.3 for the architecture of the learned functions, a precise description of the regularization losses, and further
hyperparameters. The code of our reference implementation is publicly available: github.com/nebw/temporal_nmf
Data
Synthetic data
We created synthetic datasets using a generative model of interactions based on a common latent trajectory of
factors and groups with structured variations from this trajectory. We compute the number of interactions between
two individuals as the dot product of their latent factors and additive Gaussian noise. Using these datasets we can
evaluate whether the model successfully converges and is able to correctly identify which individual belongs to
which latent group, even in the presence on high amounts of observational noise. While we believe that such a
latent structure exists in most complex social systems, it is not directly observable, and thus, for data from a real
system, we can only evaluate the model on proxy measures (see section 2.3) that are observable.
We model a common lifetime trajectory of factors using a smoothed Gaussian random walk in 𝑅+ with σwalk = 1
for the steps of the random walk and σsmoothing = 10 for the Gaussian smoothing kernel. See Figure 3 a) for one
example of a generated lifetime trajectory with three factors. We then randomly create latent groups by creating
smoothed Gaussian random walks that define how these groups differ from the common lifetime trajectory. See
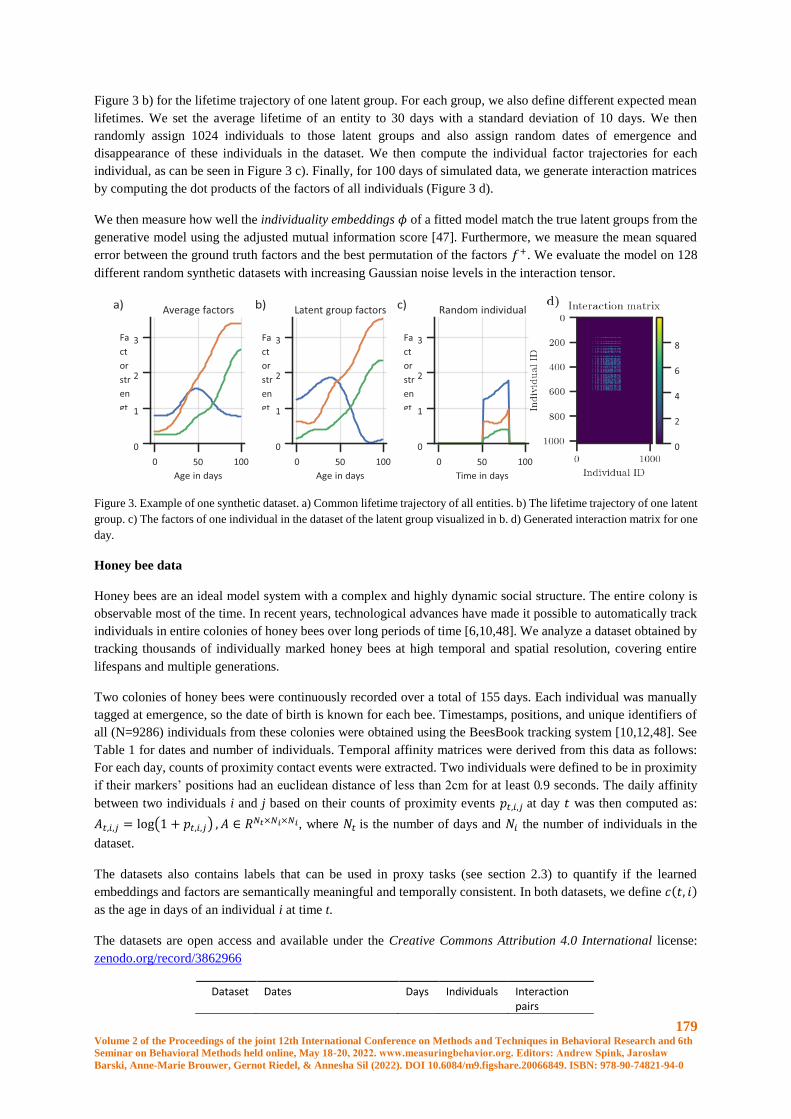
179 Volume 2 of the Proceedings of the joint 12th International Conference on Methods and Techniques in Behavioral Research and 6th
Seminar on Behavioral Methods held online, May 18-20, 2022. www.measuringbehavior.org. Editors: Andrew Spink, Jarosław
Barski, Anne-Marie Brouwer, Gernot Riedel, & Annesha Sil (2022). DOI 10.6084/m9.figshare.20066849. ISBN: 978-90-74821-94-0
Figure 3 b) for the lifetime trajectory of one latent group. For each group, we also define different expected mean
lifetimes. We set the average lifetime of an entity to 30 days with a standard deviation of 10 days. We then
randomly assign 1024 individuals to those latent groups and also assign random dates of emergence and
disappearance of these individuals in the dataset. We then compute the individual factor trajectories for each
individual, as can be seen in Figure 3 c). Finally, for 100 days of simulated data, we generate interaction matrices
by computing the dot products of the factors of all individuals (Figure 3 d).
We then measure how well the individuality embeddings 𝜙 of a fitted model match the true latent groups from the
generative model using the adjusted mutual information score [47]. Furthermore, we measure the mean squared
error between the ground truth factors and the best permutation of the factors 𝑓+. We evaluate the model on 128
different random synthetic datasets with increasing Gaussian noise levels in the interaction tensor.
Figure 3. Example of one synthetic dataset. a) Common lifetime trajectory of all entities. b) The lifetime trajectory of one latent
group. c) The factors of one individual in the dataset of the latent group visualized in b. d) Generated interaction matrix for one
day.
Honey bee data
Honey bees are an ideal model system with a complex and highly dynamic social structure. The entire colony is
observable most of the time. In recent years, technological advances have made it possible to automatically track
individuals in entire colonies of honey bees over long periods of time [6,10,48]. We analyze a dataset obtained by
tracking thousands of individually marked honey bees at high temporal and spatial resolution, covering entire
lifespans and multiple generations.
Two colonies of honey bees were continuously recorded over a total of 155 days. Each individual was manually
tagged at emergence, so the date of birth is known for each bee. Timestamps, positions, and unique identifiers of
all (N=9286) individuals from these colonies were obtained using the BeesBook tracking system [10,12,48]. See
Table 1 for dates and number of individuals. Temporal affinity matrices were derived from this data as follows:
For each day, counts of proximity contact events were extracted. Two individuals were defined to be in proximity
if their markers’ positions had an euclidean distance of less than 2cm for at least 0.9 seconds. The daily affinity
between two individuals i and j based on their counts of proximity events 𝑝𝑡,𝑖,𝑗 at day 𝑡 was then computed as:
𝐴𝑡,𝑖,𝑗 = log(1 + 𝑝𝑡,𝑖,𝑗) , 𝐴 ∈ 𝑅𝑁𝑡×𝑁𝑖×𝑁𝑖, where 𝑁𝑡 is the number of days and 𝑁𝑖 the number of individuals in the
dataset.
The datasets also contains labels that can be used in proxy tasks (see section 2.3) to quantify if the learned
embeddings and factors are semantically meaningful and temporally consistent. In both datasets, we define 𝑐(𝑡, 𝑖)
as the age in days of an individual i at time t.
The datasets are open access and available under the Creative Commons Attribution 4.0 International license:
zenodo.org/record/3862966
Dataset Dates Days Individuals Interaction pairs
Fa
ct
or
str
en
gt
Fa
ct
or
str
en
gt
Fa
ct
or
str
en
gt
180 Volume 2 of the Proceedings of the joint 12th International Conference on Methods and Techniques in Behavioral Research and 6th
Seminar on Behavioral Methods held online, May 18-20, 2022. www.measuringbehavior.org. Editors: Andrew Spink, Jarosław
Barski, Anne-Marie Brouwer, Gernot Riedel, & Annesha Sil (2022). DOI 10.6084/m9.figshare.20066849. ISBN: 978-90-74821-94-0
BN16 2016-07-23 to 2016-09-17
56 2443 43174748
BN19 2019-07-25 to 2019-11-01
99 6843 167366381
Table 1. The honey bee datasets contain the number of proximity-inferred interactions extracted from tracking data of all
individuals in two long-term recordings spanning a total of 155 days and 9286 individuals.
Evaluation
Reconstruction: We measure how well the original interaction matrices A can be reconstructed from the factors.
We do not require the model to reconstruct the interaction matrices as well as possible because we only use the
reconstruction as a proxy objective to learn a meaningful representation. Still, a high reconstruction loss could
indicate problems with the model, such as excessive regularization.
Consistency: We measure to what extent the individuality embeddings 𝜙 change over time. For each model, we
train a multinomial logistic regression model to predict the source cohort (date of birth) and calculate the area
under the ROC curve (AUCcohort) using a stratified 100-fold cross-validation with scikit-learn [49]. The baseline
models do not learn an individuality embedding; therefore we compute how well the model can predict the cohort
using the mean factor representation of the individuals over their lives. We define consistency as 1−AUCcohort of
this linear model. Note that a very low temporal consistency would indicate that the development of individual
bees changes strongly between cohorts and colonies, which we know not to be true.
Mortality and Rhythmicity: We evaluate how well a linear regression model can predict the mortality (number of
days until death) and circadian rhythmicity of the movement [12] (R2 score of a sine with a period of 24 h fitted to
the velocity over a three-day window). These metrics are strongly correlated with an individual’s behavior (e.g.
foragers exhibit strong circadian rhythms because they can only forage during the daytime; foragers also have a
high mortality). We follow the procedure given in [12] and report the 100-fold cross-validated R2 scores for these
regression tasks.
Time spent on different nest substrates: For a subset of the data, from 2016-08-01 to 2016-08-25, nest substrate
usage information is also available. This data contains the proportion of time each individual spends in the brood
area, honey storage, and on the dance floor. This data was previously published and analyzed [12,50]. The task of
an honey bee worker is strongly associated with her spatial distribution in the hive. We therefore expect a good
representation of the individuals’ functional role to correlate with this distribution.
For this data, we expect the factors 𝑓+ and individuality embeddings 𝜙 to be semantically meaningful and
temporally consistent if they reflect an individual’s behavioral metrics (mortality and rhythmicity) and if they do
not change strongly over time (measured in the consistency metric).
Baseline models
Biological Age: Task allocation in honey bee is partially determined by temporal polyethism. Certain tasks are
usually carried out by individuals of about the same age, e.g. young bees are usually occupied with nursing tasks.
We therefore use the age of an individual as a baseline descriptor.
Symmetric NMF: We compute the factors that optimally reconstruct the original interaction matrices using the
standard symmetric NMF algorithm [31,51], for each day separately, using the same number of factors as in the
TNMF model.
Optimal permutation SymNMF: We consider a simple extension of the standard SymNMF algorithm that aligns
the factors to be more consistent over time. For each pair of subsequent days, we consider all combinatorial
reorderings of the factors computed for the second day. For each reordering, we compute the mean L2 distance of
all individuals that were alive on both days. We then select the reordering that minimizes those pairwise L2
distances and greedily continue with the next pair of days until all factors are aligned. Furthermore, we align the
factors across colonies (where individuals cannot overlap) as follows: we run this algorithm for both datasets
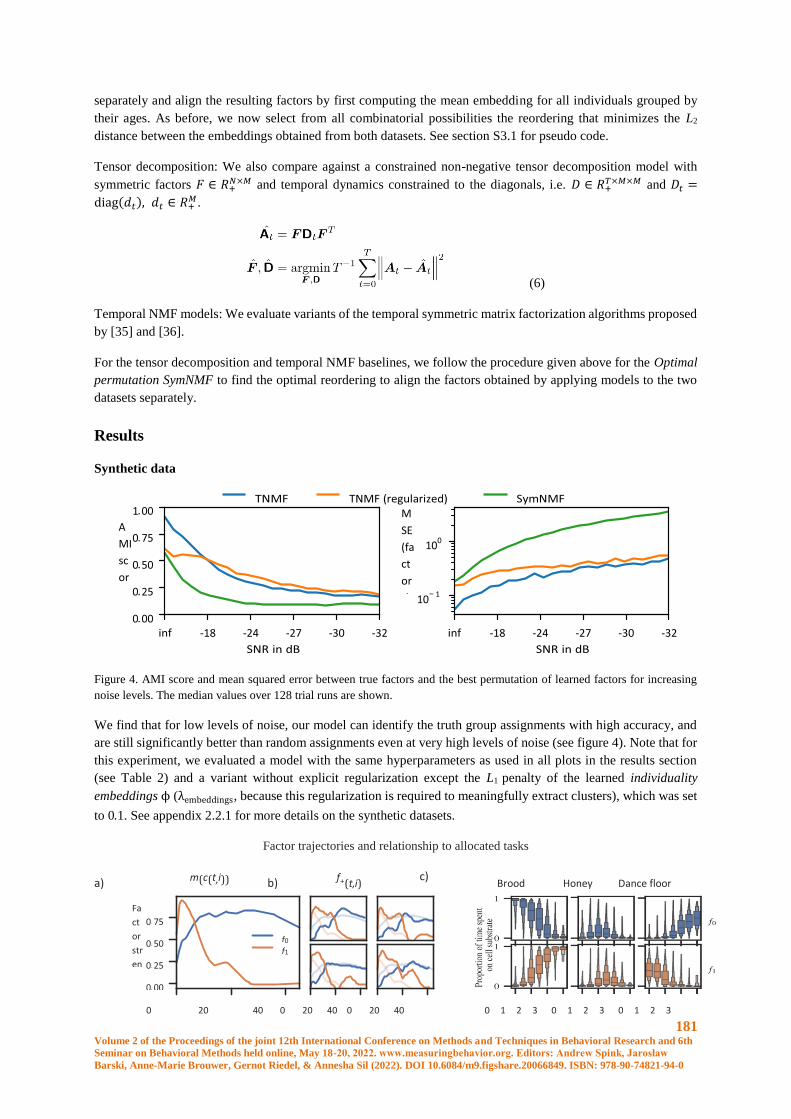
181 Volume 2 of the Proceedings of the joint 12th International Conference on Methods and Techniques in Behavioral Research and 6th
Seminar on Behavioral Methods held online, May 18-20, 2022. www.measuringbehavior.org. Editors: Andrew Spink, Jarosław
Barski, Anne-Marie Brouwer, Gernot Riedel, & Annesha Sil (2022). DOI 10.6084/m9.figshare.20066849. ISBN: 978-90-74821-94-0
separately and align the resulting factors by first computing the mean embedding for all individuals grouped by
their ages. As before, we now select from all combinatorial possibilities the reordering that minimizes the L2
distance between the embeddings obtained from both datasets. See section S3.1 for pseudo code.
Tensor decomposition: We also compare against a constrained non-negative tensor decomposition model with
symmetric factors 𝐹 ∈ 𝑅+𝑁×𝑀 and temporal dynamics constrained to the diagonals, i.e. 𝐷 ∈ 𝑅+
𝑇×𝑀×𝑀 and 𝐷𝑡 =
diag(𝑑𝑡), 𝑑𝑡 ∈ 𝑅+𝑀.
(6)
Temporal NMF models: We evaluate variants of the temporal symmetric matrix factorization algorithms proposed
by [35] and [36].
For the tensor decomposition and temporal NMF baselines, we follow the procedure given above for the Optimal
permutation SymNMF to find the optimal reordering to align the factors obtained by applying models to the two
datasets separately.
Results
Synthetic data
Figure 4. AMI score and mean squared error between true factors and the best permutation of learned factors for increasing
noise levels. The median values over 128 trial runs are shown.
We find that for low levels of noise, our model can identify the truth group assignments with high accuracy, and
are still significantly better than random assignments even at very high levels of noise (see figure 4). Note that for
this experiment, we evaluated a model with the same hyperparameters as used in all plots in the results section
(see Table 2) and a variant without explicit regularization except the L1 penalty of the learned individuality
embeddings ϕ (λembeddings, because this regularization is required to meaningfully extract clusters), which was set
to 0.1. See appendix 2.2.1 for more details on the synthetic datasets.
Factor trajectories and relationship to allocated tasks
a) m(c(t,i)) b) f+(t,i) c)
Brood Honey Dance floor
0 20 40 0 20 40 0 20 40 0 1 2 3 0 1 2 3 0 1 2 3
-18 -24 -27 -30 -32
.
.
.
.
. A
MI
sc
or
e
-18 -24 -27 -30 -32
−
M
SE
(fa
ct
or
s)
.
.
.
. Fa
ct
or
str
en
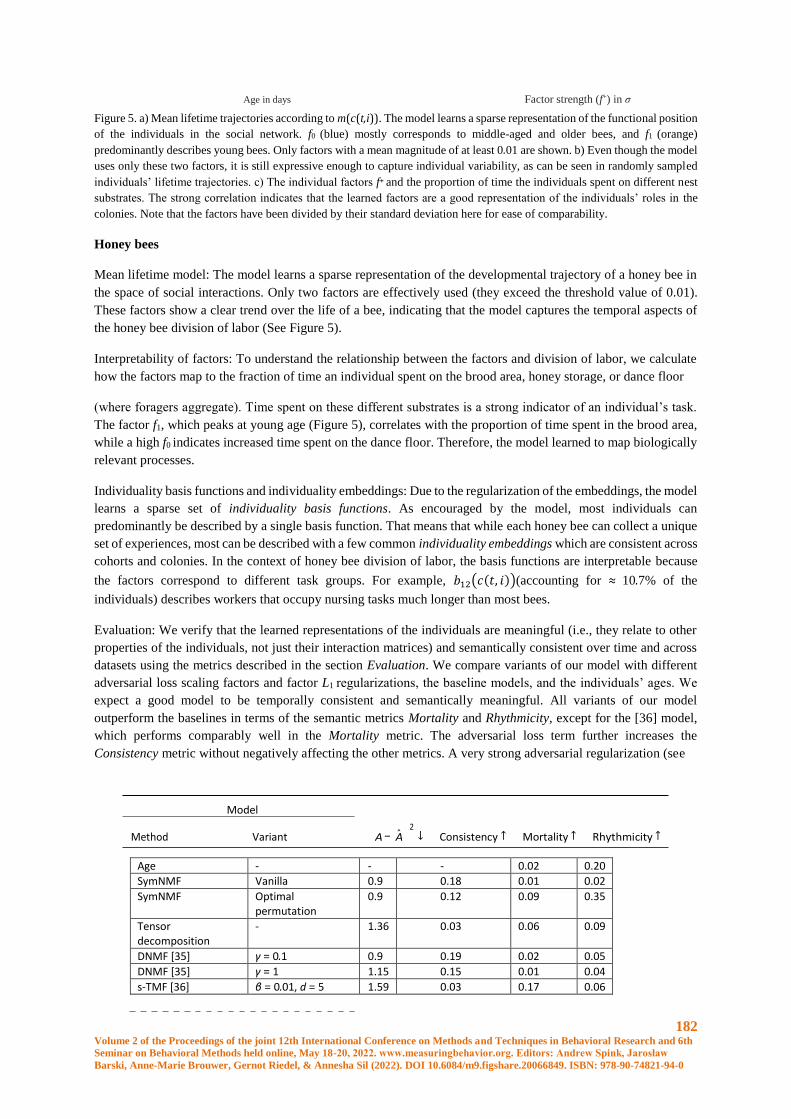
182 Volume 2 of the Proceedings of the joint 12th International Conference on Methods and Techniques in Behavioral Research and 6th
Seminar on Behavioral Methods held online, May 18-20, 2022. www.measuringbehavior.org. Editors: Andrew Spink, Jarosław
Barski, Anne-Marie Brouwer, Gernot Riedel, & Annesha Sil (2022). DOI 10.6084/m9.figshare.20066849. ISBN: 978-90-74821-94-0
Age in days Factor strength (f+) in σ
Figure 5. a) Mean lifetime trajectories according to m(c(t,i)). The model learns a sparse representation of the functional position
of the individuals in the social network. f0 (blue) mostly corresponds to middle-aged and older bees, and f1 (orange)
predominantly describes young bees. Only factors with a mean magnitude of at least 0.01 are shown. b) Even though the model
uses only these two factors, it is still expressive enough to capture individual variability, as can be seen in randomly sampled
individuals’ lifetime trajectories. c) The individual factors f+ and the proportion of time the individuals spent on different nest
substrates. The strong correlation indicates that the learned factors are a good representation of the individuals’ roles in the
colonies. Note that the factors have been divided by their standard deviation here for ease of comparability.
Honey bees
Mean lifetime model: The model learns a sparse representation of the developmental trajectory of a honey bee in
the space of social interactions. Only two factors are effectively used (they exceed the threshold value of 0 .01).
These factors show a clear trend over the life of a bee, indicating that the model captures the temporal aspects of
the honey bee division of labor (See Figure 5).
Interpretability of factors: To understand the relationship between the factors and division of labor, we calculate
how the factors map to the fraction of time an individual spent on the brood area, honey storage, or dance floor
(where foragers aggregate). Time spent on these different substrates is a strong indicator of an individual’s task.
The factor f1, which peaks at young age (Figure 5), correlates with the proportion of time spent in the brood area,
while a high f0 indicates increased time spent on the dance floor. Therefore, the model learned to map biologically
relevant processes.
Individuality basis functions and individuality embeddings: Due to the regularization of the embeddings, the model
learns a sparse set of individuality basis functions. As encouraged by the model, most individuals can
predominantly be described by a single basis function. That means that while each honey bee can collect a unique
set of experiences, most can be described with a few common individuality embeddings which are consistent across
cohorts and colonies. In the context of honey bee division of labor, the basis functions are interpretable because
the factors correspond to different task groups. For example, 𝑏12(𝑐(𝑡, 𝑖))(accounting for ≈ 10.7% of the
individuals) describes workers that occupy nursing tasks much longer than most bees.
Evaluation: We verify that the learned representations of the individuals are meaningful (i.e., they relate to other
properties of the individuals, not just their interaction matrices) and semantically consistent over time and across
datasets using the metrics described in the section Evaluation. We compare variants of our model with different
adversarial loss scaling factors and factor L1 regularizations, the baseline models, and the individuals’ ages. We
expect a good model to be temporally consistent and semantically meaningful. All variants of our model
outperform the baselines in terms of the semantic metrics Mortality and Rhythmicity, except for the [36] model,
which performs comparably well in the Mortality metric. The adversarial loss term further increases the
Consistency metric without negatively affecting the other metrics. A very strong adversarial regularization (see
Age - - - 0.02 0.20 SymNMF Vanilla 0.9 0.18 0.01 0.02 SymNMF Optimal
permutation 0.9 0.12 0.09 0.35
Tensor decomposition
- 1.36 0.03 0.06 0.09
DNMF [35] γ = 0.1 0.9 0.19 0.02 0.05 DNMF [35] γ = 1 1.15 0.15 0.01 0.04 s-TMF [36] β = 0.01, d = 5 1.59 0.03 0.17 0.06
Model
−
↓ ↑ ↑ ↑
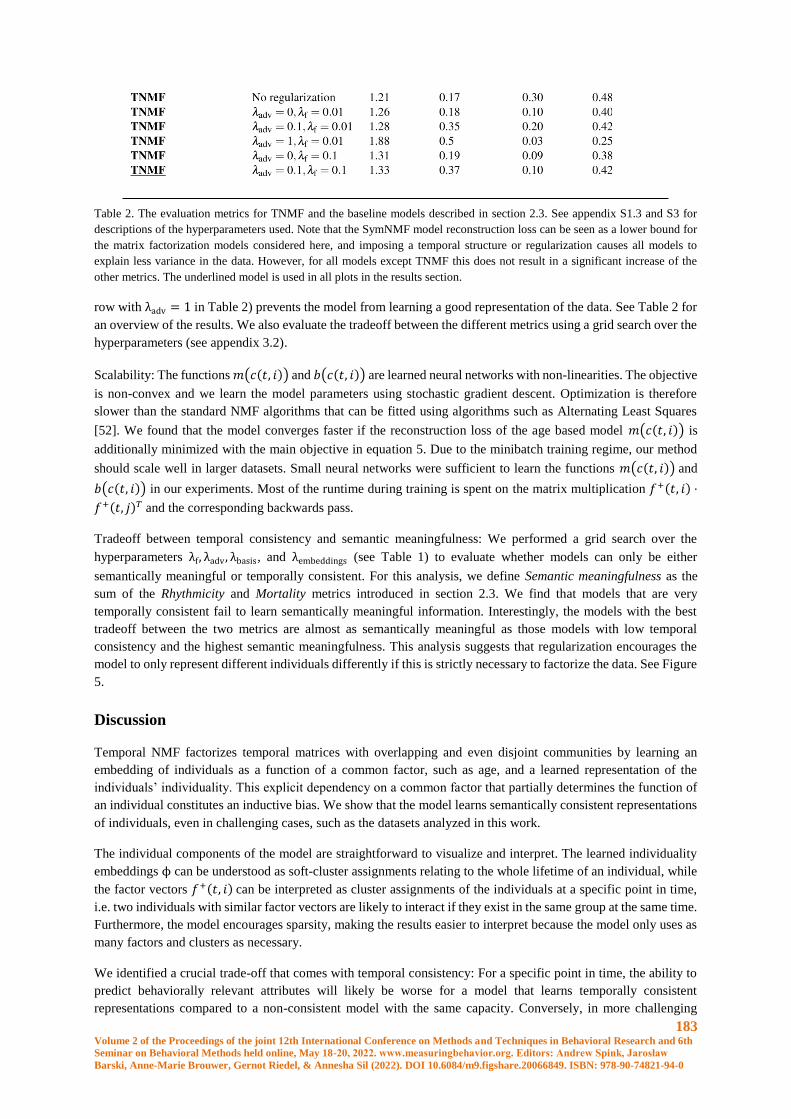
183 Volume 2 of the Proceedings of the joint 12th International Conference on Methods and Techniques in Behavioral Research and 6th
Seminar on Behavioral Methods held online, May 18-20, 2022. www.measuringbehavior.org. Editors: Andrew Spink, Jarosław
Barski, Anne-Marie Brouwer, Gernot Riedel, & Annesha Sil (2022). DOI 10.6084/m9.figshare.20066849. ISBN: 978-90-74821-94-0
Table 2. The evaluation metrics for TNMF and the baseline models described in section 2.3. See appendix S1.3 and S3 for
descriptions of the hyperparameters used. Note that the SymNMF model reconstruction loss can be seen as a lower bound for
the matrix factorization models considered here, and imposing a temporal structure or regularization causes all models to
explain less variance in the data. However, for all models except TNMF this does not result in a significant increase of the
other metrics. The underlined model is used in all plots in the results section.
row with λadv = 1 in Table 2) prevents the model from learning a good representation of the data. See Table 2 for
an overview of the results. We also evaluate the tradeoff between the different metrics using a grid search over the
hyperparameters (see appendix 3.2).
Scalability: The functions 𝑚(𝑐(𝑡, 𝑖)) and 𝑏(𝑐(𝑡, 𝑖)) are learned neural networks with non-linearities. The objective
is non-convex and we learn the model parameters using stochastic gradient descent. Optimization is therefore
slower than the standard NMF algorithms that can be fitted using algorithms such as Alternating Least Squares
[52]. We found that the model converges faster if the reconstruction loss of the age based model 𝑚(𝑐(𝑡, 𝑖)) is
additionally minimized with the main objective in equation 5. Due to the minibatch training regime, our method
should scale well in larger datasets. Small neural networks were sufficient to learn the functions 𝑚(𝑐(𝑡, 𝑖)) and
𝑏(𝑐(𝑡, 𝑖)) in our experiments. Most of the runtime during training is spent on the matrix multiplication 𝑓+(𝑡, 𝑖) ⋅
𝑓+(𝑡, 𝑗)𝑇 and the corresponding backwards pass.
Tradeoff between temporal consistency and semantic meaningfulness: We performed a grid search over the
hyperparameters λf, λadv, λbasis, and λembeddings (see Table 1) to evaluate whether models can only be either
semantically meaningful or temporally consistent. For this analysis, we define Semantic meaningfulness as the
sum of the Rhythmicity and Mortality metrics introduced in section 2.3. We find that models that are very
temporally consistent fail to learn semantically meaningful information. Interestingly, the models with the best
tradeoff between the two metrics are almost as semantically meaningful as those models with low temporal
consistency and the highest semantic meaningfulness. This analysis suggests that regularization encourages the
model to only represent different individuals differently if this is strictly necessary to factorize the data. See Figure
5.
Discussion
Temporal NMF factorizes temporal matrices with overlapping and even disjoint communities by learning an
embedding of individuals as a function of a common factor, such as age, and a learned representation of the
individuals’ individuality. This explicit dependency on a common factor that partially determines the function of
an individual constitutes an inductive bias. We show that the model learns semantically consistent representations
of individuals, even in challenging cases, such as the datasets analyzed in this work.
The individual components of the model are straightforward to visualize and interpret. The learned individuality
embeddings ϕ can be understood as soft-cluster assignments relating to the whole lifetime of an individual, while
the factor vectors 𝑓+(𝑡, 𝑖) can be interpreted as cluster assignments of the individuals at a specific point in time,
i.e. two individuals with similar factor vectors are likely to interact if they exist in the same group at the same time.
Furthermore, the model encourages sparsity, making the results easier to interpret because the model only uses as
many factors and clusters as necessary.
We identified a crucial trade-off that comes with temporal consistency: For a specific point in time, the ability to
predict behaviorally relevant attributes will likely be worse for a model that learns temporally consistent
representations compared to a non-consistent model with the same capacity. Conversely, in more challenging
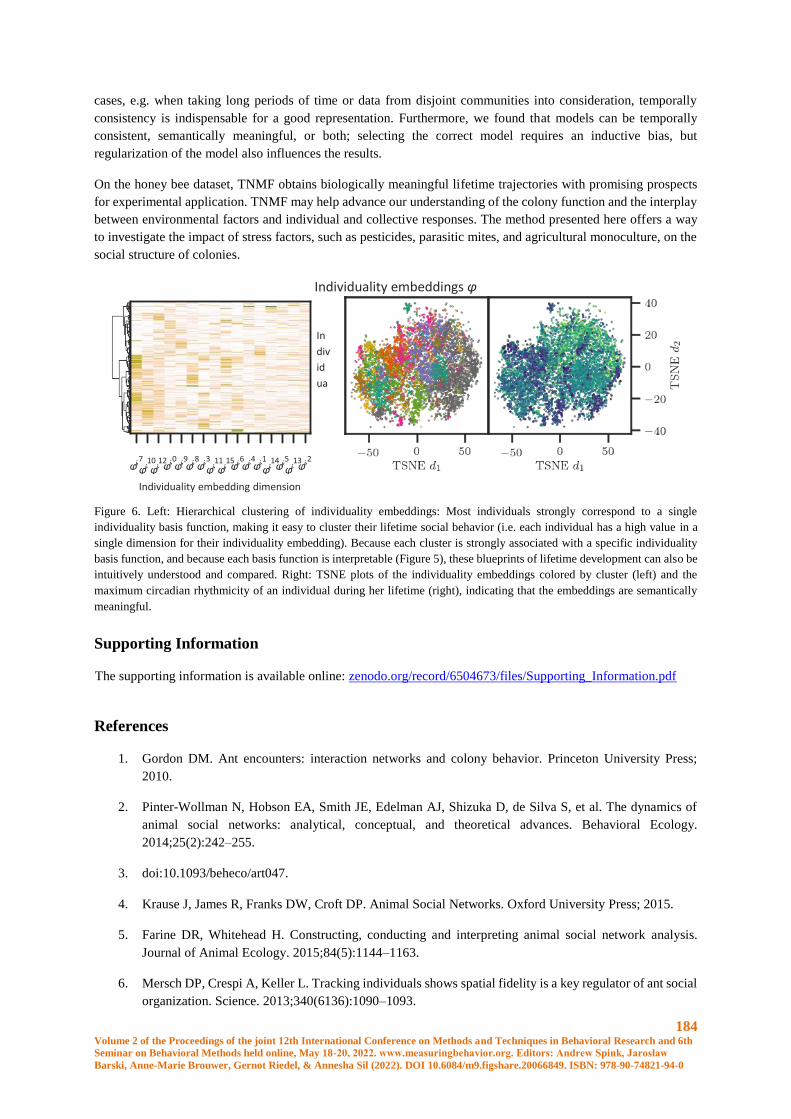
184 Volume 2 of the Proceedings of the joint 12th International Conference on Methods and Techniques in Behavioral Research and 6th
Seminar on Behavioral Methods held online, May 18-20, 2022. www.measuringbehavior.org. Editors: Andrew Spink, Jarosław
Barski, Anne-Marie Brouwer, Gernot Riedel, & Annesha Sil (2022). DOI 10.6084/m9.figshare.20066849. ISBN: 978-90-74821-94-0
cases, e.g. when taking long periods of time or data from disjoint communities into consideration, temporally
consistency is indispensable for a good representation. Furthermore, we found that models can be temporally
consistent, semantically meaningful, or both; selecting the correct model requires an inductive bias, but
regularization of the model also influences the results.
On the honey bee dataset, TNMF obtains biologically meaningful lifetime trajectories with promising prospects
for experimental application. TNMF may help advance our understanding of the colony function and the interplay
between environmental factors and individual and collective responses. The method presented here offers a way
to investigate the impact of stress factors, such as pesticides, parasitic mites, and agricultural monoculture, on the
social structure of colonies.
Individuality embeddings φ
Figure 6. Left: Hierarchical clustering of individuality embeddings: Most individuals strongly correspond to a single
individuality basis function, making it easy to cluster their lifetime social behavior (i.e. each individual has a high value in a
single dimension for their individuality embedding). Because each cluster is strongly associated with a specific individuality
basis function, and because each basis function is interpretable (Figure 5), these blueprints of lifetime development can also be
intuitively understood and compared. Right: TSNE plots of the individuality embeddings colored by cluster (left) and the
maximum circadian rhythmicity of an individual during her lifetime (right), indicating that the embeddings are semantically
meaningful.
Supporting Information
The supporting information is available online: zenodo.org/record/6504673/files/Supporting_Information.pdf
References
1. Gordon DM. Ant encounters: interaction networks and colony behavior. Princeton University Press;
2010.
2. Pinter-Wollman N, Hobson EA, Smith JE, Edelman AJ, Shizuka D, de Silva S, et al. The dynamics of
animal social networks: analytical, conceptual, and theoretical advances. Behavioral Ecology.
2014;25(2):242–255.
3. doi:10.1093/beheco/art047.
4. Krause J, James R, Franks DW, Croft DP. Animal Social Networks. Oxford University Press; 2015.
5. Farine DR, Whitehead H. Constructing, conducting and interpreting animal social network analysis.
Journal of Animal Ecology. 2015;84(5):1144–1163.
6. Mersch DP, Crespi A, Keller L. Tracking individuals shows spatial fidelity is a key regulator of ant social
organization. Science. 2013;340(6136):1090–1093.
φ i , 7 φ i ,
10 φ i ,
12 φ i ,
0 φ i ,
9 φ i ,
8 φ i ,
3 φ i ,
11 φ i ,
15 φ i ,
6 φ i ,
4 φ i ,
1 φ i ,
14 φ i ,
5 φ i ,
13 φ i ,
2
Individuality embedding dimension
In
div
id
ua
l
185 Volume 2 of the Proceedings of the joint 12th International Conference on Methods and Techniques in Behavioral Research and 6th
Seminar on Behavioral Methods held online, May 18-20, 2022. www.measuringbehavior.org. Editors: Andrew Spink, Jarosław
Barski, Anne-Marie Brouwer, Gernot Riedel, & Annesha Sil (2022). DOI 10.6084/m9.figshare.20066849. ISBN: 978-90-74821-94-0
7. Gernat T, Rao VD, Middendorf M, Dankowicz H, Goldenfeld N, Robinson GE. Automated monitoring
of behavior reveals bursty interaction patterns and rapid spreading dynamics in honeybee social networks.
Proceedings of the National Academy of Sciences. 2018;115(7):1433–1438.
doi:10.1073/pnas.1713568115.
8. Mathis A, Mamidanna P, Cury KM, Abe T, Murthy VN, Mathis MW, et al. DeepLabCut: markerless
pose estimation of user-defined body parts with deep learning. Nature Neuroscience. 2018;21(9):1281–
1289. doi:10.1038/s41593-0180209-y.
9. Graving JM, Chae D, Naik H, Li L, Koger B, Costelloe BR, et al. DeepPoseKit, a software toolkit for
fast and robust animal pose estimation using deep learning. eLife. 2019;8:e47994.
doi:10.7554/eLife.47994.
10. Pereira TD, Aldarondo DE, Willmore L, Kislin M, Wang SSH, Murthy M, et al. Fast animal pose
estimation using deep neural networks. Nature Methods. 2019;16(1):117–125. doi:10.1038/s41592-018-
0234-5.
11. Boenisch F, Rosemann B, Wild B, Dormagen D, Wario F, Landgraf T. Tracking All Members of a Honey
Bee Colony Over Their Lifetime Using Learned Models of Correspondence. Frontiers in Robotics and
AI. 2018;5. doi:10.3389/frobt.2018.00035.
12. Brask JB, Ellis S, Croft DP. Animal social networks – an introduction for complex systems scientists.
arXiv:200509598 [physics, q-bio]. 2020;.
13. Wild B, Dormagen DM, Zachariae A, Smith ML, Traynor KS, Brockmann D, et al. Social networks
predict the life and death of honey bees. Nature Communications. 2021;12(1):1110. doi:10.1038/s41467-
021-21212-5.
14. Gordon DM, Mehdiabadi NJ. Encounter rate and task allocation in harvester ants. Behavioral Ecology
and Sociobiology. 1999;45(5):370–377. doi:10.1007/s002650050573.
15. Naug D. Structure of the social network and its influence on transmission dynamics in a honeybee colony.
Behavioral Ecology and Sociobiology. 2008;62(11):1719–1725. doi:10.1007/s00265-008-0600-x.
16. Sendova-Franks AB, Hayward RK, Wulf B, Klimek T, James R, Planque R, et al. Emergency networking:
famine relief´ in ant colonies. Animal Behaviour. 2010;79(2):473–485.
doi:10.1016/j.anbehav.2009.11.035.
17. Ament SA, Wang Y, Robinson GE. Nutritional regulation of division of labor in honey bees: toward a
systems biology perspective. WIREs Systems Biology and Medicine. 2010;2(5):566–576.
doi:10.1002/wsbm.73.
18. Aplin LM, Farine DR, Morand-Ferron J, Cockburn A, Thornton A, Sheldon BC. Experimentally induced
innovations lead to persistent culture via conformity in wild birds. Nature. 2015;518(7540):538–541.
doi:10.1038/nature13998.
19. Davidson JD, Gordon DM. Spatial organization and interactions of harvester ants during foraging
activity. Journal of The Royal Society Interface. 2017;14(135):20170413. doi:10.1098/rsif.2017.0413.
20. Frome A, Corrado GS, Shlens J, Bengio S, Dean J, Ranzato MA, et al. DeViSE: A Deep Visual-Semantic
Embedding Model. In: Burges CJC, Bottou L, Welling M, Ghahramani Z, Weinberger KQ, editors.
Advances in Neural Information Processing Systems 26. Curran Associates, Inc.; 2013. p. 2121–2129.
21. Asgari E, Mofrad MRK. Continuous Distributed Representation of Biological Sequences for Deep
Proteomics and Genomics. PLOS ONE. 2015;10(11):e0141287. doi:10.1371/journal.pone.0141287.
186 Volume 2 of the Proceedings of the joint 12th International Conference on Methods and Techniques in Behavioral Research and 6th
Seminar on Behavioral Methods held online, May 18-20, 2022. www.measuringbehavior.org. Editors: Andrew Spink, Jarosław
Barski, Anne-Marie Brouwer, Gernot Riedel, & Annesha Sil (2022). DOI 10.6084/m9.figshare.20066849. ISBN: 978-90-74821-94-0
22. Camacho-Collados J, Pilehvar MT. From word to sense embeddings: a survey on vector representations
of meaning. Journal of Artificial Intelligence Research. 2018;63(1):743–788. doi:10.1613/jair.1.11259.
23. Nelson W, Zitnik M, Wang B, Leskovec J, Goldenberg A, Sharan R. To Embed or Not: Network
Embedding as a Paradigm in Computational Biology. Frontiers in Genetics. 2019;10.
doi:10.3389/fgene.2019.00381.
24. Koren Y, Bell R, Volinsky C. Matrix Factorization Techniques for Recommender Systems. Computer.
2009;42(8):30–37. doi:10.1109/MC.2009.263.
25. Mikolov T, Yih Wt, Zweig G. Linguistic Regularities in Continuous Space Word Representations. In:
Proceedings of the 2013 Conference of the North American Chapter of the Association for Computational
Linguistics: Human Language Technologies. Atlanta, Georgia: Association for Computational
Linguistics; 2013. p. 746–751. Available from: https://aclanthology.org/N13-1090.
26. Smith ML, Davidson JD, Wild B, Dormagen DM, Landgraf T, Couzin ID. The dominant axes of lifetime
behavioral variation in honey bees; 2021.
27. Richardson TO, Kay T, Braunschweig R, Journeau OA, Ruegg M, McGregor S, et al. Ant behavioral
maturation is medi-¨ ated by a stochastic transition between two fundamental states. Current Biology.
2021;doi:10.1016/j.cub.2020.05.038.
28. Palla G, Derenyi I, Farkas I, Vicsek T. Uncovering the overlapping community structure of complex
networks in nature´ and society. Nature. 2005;435(7043):814–818. doi:10.1038/nature03607.
29. Ahn YY, Bagrow JP, Lehmann S. Link communities reveal multiscale complexity in networks.
Nature.
30. 2010;466(7307):761–764. doi:10.1038/nature09182.
31. Ding C, He X, Simon HD. On the equivalence of nonnegative matrix factorization and spectral clustering.
In: in SIAM International Conference on Data Mining; 2005.
32. Wang F, Li T, Wang X, Zhu S, Ding C. Community discovery using nonnegative matrix factorization.
Data Mining and Knowledge Discovery. 2011;22(3):493–521. doi:10.1007/s10618-010-0181-y.
33. Shi X, Lu H, He Y, He S. Community detection in social network with pairwisely constrained symmetric
non-negative matrix factorization. In: 2015 IEEE/ACM International Conference on Advances in Social
Networks Analysis and Mining (ASONAM); 2015. p. 541–546.
34. Yu HF, Rao N, Dhillon IS. Temporal Regularized Matrix Factorization for High-dimensional Time Series
Prediction. In: Lee DD, Sugiyama M, Luxburg UV, Guyon I, Garnett R, editors. Advances in Neural
Information Processing Systems
35. 29. Curran Associates, Inc.; 2016. p. 847–855.
36. Mackevicius EL, Bahle AH, Williams AH, Gu S, Denisenko NI, Goldman MS, et al. Unsupervised
discovery of temporal sequences in high-dimensional datasets, with applications to neuroscience. eLife.
2019;8:e38471. doi:10.7554/eLife.38471.
37. Gauvin L, Panisson A, Cattuto C. Detecting the Community Structure and Activity Patterns of Temporal
Networks: A Non-Negative Tensor Factorization Approach. PLoS ONE. 2014;9(1).
doi:10.1371/journal.pone.0086028.
38. Jiao P, Lyu H, Li X, Yu W, Wang W. Temporal community detection based on symmetric nonnegative
matrix factorization. International Journal of Modern Physics B. 2017;doi:10.1142/S0217979217501028.
187 Volume 2 of the Proceedings of the joint 12th International Conference on Methods and Techniques in Behavioral Research and 6th
Seminar on Behavioral Methods held online, May 18-20, 2022. www.measuringbehavior.org. Editors: Andrew Spink, Jarosław
Barski, Anne-Marie Brouwer, Gernot Riedel, & Annesha Sil (2022). DOI 10.6084/m9.figshare.20066849. ISBN: 978-90-74821-94-0
39. Yu W, Aggarwal CC, Wang W. Temporally Factorized Network Modeling for Evolutionary Network
Analysis. In: Proceedings of the Tenth ACM International Conference on Web Search and Data Mining.
WSDM ’17. New York, NY, USA: Association for Computing Machinery; 2017. p. 455–464.
40. Wang W, Yu W, Cheng W, Aggarwal CC, Chen H. Link Prediction with Spatial and Temporal
Consistency in Dynamic Networks. Proceedings of the Twenty-Sixth International Joint Conference on
Artificial Intelligence. 2017; p. 3343–3349.
41. Kolda T, Bader B. Tensor Decompositions and Applications. SIAM Rev. 2009;doi:10.1137/07070111X.
42. Mørup M, Hansen LK, Arnfred SM, Lim LH, Madsen KH. Shift-invariant multilinear decomposition of
neuroimaging data. NeuroImage. 2008;42(4):1439–1450. doi:10.1016/j.neuroimage.2008.05.062.
43. Williams AH. Combining tensor decomposition and time warping models for multi-neuronal spike train
analysis. bioRxiv. 2020; p. 2020.03.02.974014. doi:10.1101/2020.03.02.974014.
44. Elekonich MM, Roberts SP. Honey bees as a model for understanding mechanisms of life history
transitions. Comparative Biochemistry and Physiology Part A, Molecular & Integrative Physiology.
2005;141(4):362–371. doi:10.1016/j.cbpb.2005.04.014.
45. Seeley TD. Adaptive significance of the age polyethism schedule in honeybee colonies. Behavioral
Ecology and Sociobiology. 1982;11(4):287–293. doi:10.1007/BF00299306.
46. Johnson BR. Division of labor in honeybees: form, function, and proximate mechanisms. Behavioral
Ecology and Sociobiology. 2010;64(3):305–316. doi:10.1007/s00265-009-0874-7.
47. Goodfellow IJ, Pouget-Abadie J, Mirza M, Xu B, Warde-Farley D, Ozair S, et al. Generative Adversarial
Networks. arXiv:14062661 [cs, stat]. 2014;.
48. Paszke A, Gross S, Massa F, Lerer A, Bradbury J, Chanan G, et al. PyTorch: An Imperative Style, High-
Performance Deep Learning Library. In: Wallach H, Larochelle H, Beygelzimer A, Alche-Buc Fd, Fox
E, Garnett R, editors. Advances´ in Neural Information Processing Systems 32. Curran Associates, Inc.;
2019. p. 8026–8037.
49. Kingma DP, Ba J. Adam: A Method for Stochastic Optimization. In: Bengio Y, LeCun Y, editors. 3rd
International Conference on Learning Representations, ICLR 2015, San Diego, CA, USA, May 7-9, 2015,
Conference Track Proceedings; 2015.
50. Vinh NX, Epps J, Bailey J. Information theoretic measures for clusterings comparison: is a correction for
chance necessary? In: Proceedings of the 26th Annual International Conference on Machine Learning.
ICML ’09. New York, NY, USA: Association for Computing Machinery; 2009. p. 1073–1080.
51. Wario F, Wild B, Couvillon MJ, Rojas R, Landgraf T. Automatic methods for long-term tracking and the
detection and decoding of communication dances in honeybees. Frontiers in Ecology and Evolution.
2015;3. doi:10.3389/fevo.2015.00103.
52. Pedregosa F, Varoquaux G, Gramfort A, Michel V, Thirion B, Grisel O, et al. Scikit-learn: Machine
Learning in Python. Journal of Machine Learning Research. 2011;12(Oct):2825–2830.
53. Wild B, Dormagen D, Landgraf T. Social networks predict the life and death of honey bees - Data; 2021.
Available from: https://zenodo.org/record/4438013.
54. Kuang D, Yun S, Park H. SymNMF: nonnegative low-rank approximation of a similarity matrix for graph
clustering. Journal of Global Optimization. 2015;62(3):545–574. doi:10.1007/s10898-014-0247-2.

188 Volume 2 of the Proceedings of the joint 12th International Conference on Methods and Techniques in Behavioral Research and 6th
Seminar on Behavioral Methods held online, May 18-20, 2022. www.measuringbehavior.org. Editors: Andrew Spink, Jarosław
Barski, Anne-Marie Brouwer, Gernot Riedel, & Annesha Sil (2022). DOI 10.6084/m9.figshare.20066849. ISBN: 978-90-74821-94-0
55. Kim J, He Y, Park H. Algorithms for nonnegative matrix and tensor factorizations: a unified view based
on block coordinate descent framework. Journal of Global Optimization. 2014;58(2):285–319.
doi:10.1007/s10898-013-0035-4.
189 Volume 2 of the Proceedings of the joint 12th International Conference on Methods and Techniques in Behavioral Research and 6th
Seminar on Behavioral Methods held online, May 18-20, 2022. www.measuringbehavior.org. Editors: Andrew Spink, Jarosław
Barski, Anne-Marie Brouwer, Gernot Riedel, & Annesha Sil (2022). DOI 10.6084/m9.figshare.20066849. ISBN: 978-90-74821-94-0
Multi-animal pose estimation, identification, tracking and action segmentation
with DeepLabCut
Alexander Mathis
École Polytechnique Fédérale de Lausanne
School of Lfe Sciences, Lausanne, Switzerland, [email protected]
Markerless pose estimation has become a powerful tool in neuroscience for digitizing video data [1, 2].
Estimating the pose of multiple animals is a challenging computer vision problem: frequent interactions cause
occlusions and complicate the association of detected keypoints to the correct individuals. Additionally,
individual animals that interact more closely than in typical multi-human benchmarking datasets add further
challenges. To tackle this problem, we build on DeepLabCut [3], an open-source pose estimation toolbox, and
provide high-performance animal assembly and tracking features. We propose a multi-task architecture that
predicts multiple conditional outputs and therefore can predict keypoints, within-animal body part connections,
as well as the animal identity in a spatial manner. Advantageously, the definition of an animal’s skeleton, i.e., the
list of limbs that will be employed for the assembly of individuals, is data-driven, thus requires no user input. We
demonstrate that this architecture outperforms HigherHRNet [4], a method that achieves state of the art on
COCO.
For tracking we developed a computational module that casts tracking as a network flow optimization problem
based on local detect-and-track methods. This jointly aims to find globally optimal solutions in a divide and
conquer fashion. Additionally, we integrate the ability to predict an animal's identity both in a supervised and in
an unsupervised setting to assist tracking (in case of occlusions). We illustrate the power of this framework with
four datasets of varying complexity, which we also release to serve as a benchmark for future algorithm
development [5]. Additionally, I will comment on novel approaches for creating models that work robustly
across labs, so called Super Models [6].
Furthermore, I will discuss a system that can use pose estimation data for multiple animals to perform action
segmentation for datasets on rodents. This system achives state of the art performance on CalMS21, a dyadic
mouse behavioral classification dataset, [7] and it integrates nicely with the DeepLabCut ecosystem.
References:
1 Mathis, M. W., & Mathis, A. (2020). Deep learning tools for the measurement of animal behavior in
neuroscience. Current opinion in neurobiology, 60, 1-11.
2 Pereira, T. D., Shaevitz, J. W., & Murthy, M. (2020). Quantifying behavior to understand the brain. Nature
neuroscience, 23(12), 1537-1549.
3. Mathis, A., Mamidanna, P., Cury, K. M., Abe, T., Murthy, V. N., Mathis, M. W., & Bethge, M. (2018).
DeepLabCut: markerless pose estimation of user-defined body parts with deep learning. Nature
neuroscience, 21(9), 1281-1289.
4. Cheng, B., Xiao, B., Wang, J., Shi, H., Huang, T. S., & Zhang, L. (2020). Higherhrnet: Scale-aware
representation learning for bottom-up human pose estimation. In Proceedings of the IEEE/CVF conference on
computer vision and pattern recognition (pp. 5386-5395).
5. Lauer, J., Zhou, M., Ye, S., Menegas, W., Schneider, S., Nath, T., Rahman, M.M., Di Santo, V., Soberanes,
D., Feng, G. and Murthy, V.N., 2022. Multi-animal pose estimation, identification and tracking with
DeepLabCut. Nature Methods, pp.1-9.

190 Volume 2 of the Proceedings of the joint 12th International Conference on Methods and Techniques in Behavioral Research and 6th
Seminar on Behavioral Methods held online, May 18-20, 2022. www.measuringbehavior.org. Editors: Andrew Spink, Jarosław
Barski, Anne-Marie Brouwer, Gernot Riedel, & Annesha Sil (2022). DOI 10.6084/m9.figshare.20066849. ISBN: 978-90-74821-94-0
6. Ye, S., Mathis, A. and Mathis, M.W., 2022. Panoptic animal pose estimators are zero-shot performers. arXiv
preprint arXiv:2203.07436.
7. Sun, J. J., Karigo, T., Chakraborty, D., Mohanty, S. P., Wild, B., Sun, Q., ... & Kennedy, A. (2021). The
multi-agent behavior dataset: Mouse dyadic social interactions. arXiv preprint arXiv:2104.02710.
191 Volume 2 of the Proceedings of the joint 12th International Conference on Methods and Techniques in Behavioral Research and 6th
Seminar on Behavioral Methods held online, May 18-20, 2022. www.measuringbehavior.org. Editors: Andrew Spink, Jarosław
Barski, Anne-Marie Brouwer, Gernot Riedel, & Annesha Sil (2022). DOI 10.6084/m9.figshare.20066849. ISBN: 978-90-74821-94-0
Session Theme: Automotive human factors
192 Volume 2 of the Proceedings of the joint 12th International Conference on Methods and Techniques in Behavioral Research and 6th
Seminar on Behavioral Methods held online, May 18-20, 2022. www.measuringbehavior.org. Editors: Andrew Spink, Jarosław
Barski, Anne-Marie Brouwer, Gernot Riedel, & Annesha Sil (2022). DOI 10.6084/m9.figshare.20066849. ISBN: 978-90-74821-94-0
A comparison of two methodologies for subjective evaluation of comfort in
automated vehicles
Chen Peng1, Foroogh Hajiseyedjavadi1 2, and Natasha Merat1
1 Institute for Transport Studies, University of Leeds, Leeds, UK. [email protected]; [email protected]
2 School of Engineering and the Built Environment, Birmingham City University, Birmingham, UK.
Abstract
This paper compared two different methodologies, used in two driving simulator studies, for real-time evaluation
of comfort imposed by the driving style of different Automated Vehicle (AV) controllers. The first method
provided participants with two options for assessing three different AV controllers. Participants rated each
controller in terms of whether or not it was comfortable/safe/natural, when it navigated a simulated road. The
evaluation was either positive (yes) or negative (no), indicated by pressing one of two buttons on a handset. In the
second study, an 11-point Likert-type scale (from -5 to +5) was used to evaluate the extent to which a controller’s
driving style was “comfortable” and/or “natural”, separately. Participants provided this evaluation for three
different AV controllers. Here, they were instructed to utter a number from the scale, at designated points during
the drive. To understand which method is better for such evaluations, we compared the data collected from the
two studies, and investigated the patterns of data obtained for the two methodologies. Results showed that, despite
the multiple response options provided by the 11-point scale, a similar pattern was seen to that of the binary
method, with more positive responses provided for all controllers. The Likert scale is useful for identifying
differences because of the multiple levels of responses. However, allowing people to present their ratings as often
as they want, also makes the binary technique useful for such evaluations.
Introduction
One of the factors that contributes to the broad acceptance of Automated Vehicles (AVs), is users’ evaluation of
comfort of the automated driving style [1], [2]. For automated driving, comfort is more than ensuring acceptable
levels of noise, vibrations and temperature etc. of the vehicle, which are aspects also applied to traditional,
manually driven, vehicles[3], [4]. For higher levels of automation (SAE Levels 4 and 5) [5], the role of the on-
board occupant shifts from an active operator, to a passive user of the vehicle. Here, the user will have less control
of the vehicle, and less ability to predict the vehicle’s behaviours, which might lead to an uncomfortable ride [6],
[7]. How a controller negotiates the road, and whether or not this is the same as how the user handles the vehicles,
is also thought to affect comfort [8][9]. Studies in this field have used a range of concepts to describe comfort,
including familiar/natural manoeuvres that are likely to fulfil the rider’s expectations of AV manoeuvres, and
perceived safety, induced by the suitable distance kept with other on-road obstacles [2], [10]. In a number of
studies, the description of comfort is very much based on the emphasising the users’ subjective state and feelings.
For example, comfort in AVs is described as “a subjective, pleasant state of relaxation given by confidence and
an apparently safe vehicle operation, which is achieved by the removal or absence of uneasiness and distress” (p.
1019) [1], or “the subjective feeling of pleasantness of driving/riding in a vehicle in the absence of both
physiological and psychological stress” (p. 12) [11]. However, currently, there is no commonly agreed definition
of comfort, and there are no widely employed behavioural techniques for measuring this concept.
An AV’s controllers can navigate the road in different ways. For example, in terms of lateral control, it can
precisely follow the lane centre [8], deviate from the lane centre within an acceptable boundary [8], or adjust its
position, based on road-based objects and surrounding features (e.g. high hedges and parked cars) [12]. To
understand how the user wants to be driven by an AV, it is important to measure their perceived comfort in different
automated driving conditions. Several measurements have been adopted for such studies. The majority of these
studies have conducted evaluations after participants complete the whole experimental drive. For example, [13]
asked participants to rate their perceived comfort and enjoyment after each drive using a questionnaire composed
193 Volume 2 of the Proceedings of the joint 12th International Conference on Methods and Techniques in Behavioral Research and 6th
Seminar on Behavioral Methods held online, May 18-20, 2022. www.measuringbehavior.org. Editors: Andrew Spink, Jarosław
Barski, Anne-Marie Brouwer, Gernot Riedel, & Annesha Sil (2022). DOI 10.6084/m9.figshare.20066849. ISBN: 978-90-74821-94-0
of 32 items. [6] provided a one-item rating scale after each trial for participants to evaluate if the deceleration and
lane-changing manoeuvres of automated vehicles were comfortable. Similarly, [14] instructed participants to
evaluate driving behaviours of different driving styles (simulated by a human driver using the Wizard-of-Oz
technique) regarding comfort, pleasantness, and safety, separately, after each driving session. These post-hoc
ratings provide some insights about comfortable automated driving. However, they are based on the participant’s
memory of the finished drive, and only depict the experience of the entire session. As several elements influence
ride comfort, including the AV’s speed, and how it negotiates different road geometries, and road-based obstacles
[8], [9], real-time assessments are more informative than post-session evaluations, for capturing users’ feedback
in this context. Previous studies in this context have used a range of methods for real-time subjective feedback.
Examples include a handset control for reporting discomfort [1], vehicle pedals for expressing satisfaction with
the AV’s speed [15], a rotary knob for measuring perceived vehicle motion, and a slider for assessing perceived
pressure from passing through tunnels for train passengers [16]. These tools allow participants to give feedback
about more specific manoeuvres, or situations, when the vehicle is operating, rather than after the whole trip. The
use of real-time feedback provides knowledge on how the AV should drive in response to more dynamic changes
in the road, such as changes in speed for different road geometries. However, a comparison of different methods
and scales that assess real-time feedback in AVs, especially regarding driving comfort, is currently lacking.
Taking real-time and post-experiment assessments together, the range of scales used for these evaluations have
varied between binary and multi-scale (e.g., 5, 7, 11, 100) levels. A recent between-subject study compared
differences in the number of response options (incl. 3, 5, 7 and 11) of the Usability Metric for User Experience
(UMUX-LITE) questionnaire, that is used to assess perceived usability of an auto insurance Web site [17]. The
same questionnaire items were used for this online survey, while the number of response options varied for
different groups of participants. Results suggested that there were no differences between the 5, 7, and 11 response
options, whereas weak reliability and correlation was observed between the scales, with the 3-point option.
However, this study was used to assess perceived usability of a web page, based on an elaborate standardized
questionnaire. To our knowledge, there is currently a distinct lack of studies about the optimal number of response
options, and methods, used to evaluate the comfort of an AV controller.
In the present work, we compared two different methodologies, used in two driving simulator studies, conducted
as part of the UK-funded HumanDrive project, measuring real-time subjective experience of different highly
automated driving styles [8], [9]. For each study, different AV controllers negotiated a range of UK roads, which
differed in terms of their geometry, speed limit, and presence of road-based features. Participants were required to
rate their ride experience when being driven by each AV controller, using one of two different methods. The two
methodologies differed in terms of assessment tools (handset-based versus verbal) and the number of response
options (binary versus 11-point).
Method
For study one [8], participants rated three automated driving styles. These were two model-based human-like
controllers, at either slow or fast speeds, and a playback of the participant’s own manual drive, named Slow, Fast,
and Replay, respectively. During the drive, participants used two buttons of an X-box handset, to indicate if they
found the controllers comfortable/safe/natural, pressing the right button for Yes, and the left button for No (see
Figure 12). Therefore, only one of two buttons was used for evaluating the overall pleasant or unpleasant affect
experienced of the three concepts (i.e., comfort, safety and naturalness). This method was used based on the
assumption that these three concepts did not differ in terms of reflecting a pleasant drive, as a number of studies
have used these concepts interchangeably (e.g., [10], [18], [19]). Participants were asked to provide their response
immediately after hearing an auditory beep, which was presented at different road segments, throughout the drives.
In addition, they were encouraged to press the two buttons anytime along the drive.

194 Volume 2 of the Proceedings of the joint 12th International Conference on Methods and Techniques in Behavioral Research and 6th
Seminar on Behavioral Methods held online, May 18-20, 2022. www.measuringbehavior.org. Editors: Andrew Spink, Jarosław
Barski, Anne-Marie Brouwer, Gernot Riedel, & Annesha Sil (2022). DOI 10.6084/m9.figshare.20066849. ISBN: 978-90-74821-94-0
Figure 12. The handset used in Study 1 for rating AV controllers [8]
For study two [9], three automated controllers were evaluated. These included two recorded and replayed from
human drivers, and one based on a machine learning (ML) algorithm, named Defensive, Aggressive, and Turner,
respectively. Using an 11-point Likert scale (see Figure 13), users provided a verbal response to rate the “comfort”
and “naturalness” of the controllers, separately: very comfortable/natural (+5) to very uncomfortable/unnatural (-
5). Participants were provided with definitions of the two concepts at the beginning of the study, via an information
sheet. They were taught how to use the scale and were able to practice it in a practice drive. A comfortable drive
was defined as “a driving style that does not cause any feeling of uneasiness or discomfort”, and a natural drive
was defined as “a driving style that is closest to your own driving”. Due to a lack of clear description of each
concept, these definitions were created following an expert group meeting [9]. Participants evaluated each
controller in terms of comfort or naturalness by speaking out a value from the 11-point scale, after hearing an
auditory beep, which coincided with different road sections (a total of 24 sections), during the drive. They also
provided an overall rating for the controller after completing the entire drive, which is not included in the present
study.
Figure 13. The scale used in Study 2 for AV controller evaluation [9]
It is notable that, as a follow-up of study one, the two concepts were defined and evaluated separately in study
two. The aim here was to establish differences in preference between human-like and machine-like AV controllers,
and especially whether or not natural manoeuvres are comfortable, as suggested by [2]. Therefore, an 11-point
scale was used, to provide more options for the participants on both the positive and negative side, than that used
in study one. A summary of the two methods is provided in Table 6.
All participants (24 in study one, and 24 in study two) were recruited, using the University of Leeds Driving
Simulator database. All participants provided informed consent to take part in each study. These two studies were
approved by the University of Leeds Ethics Committee (LTTRAN-086).

195 Volume 2 of the Proceedings of the joint 12th International Conference on Methods and Techniques in Behavioral Research and 6th
Seminar on Behavioral Methods held online, May 18-20, 2022. www.measuringbehavior.org. Editors: Andrew Spink, Jarosław
Barski, Anne-Marie Brouwer, Gernot Riedel, & Annesha Sil (2022). DOI 10.6084/m9.figshare.20066849. ISBN: 978-90-74821-94-0
Table 6. Summary of the two methods used in the two simulator studies
Study 1 Study 2
Questions “I found the behaviour of the controller safe/ natural/ comfortable”
Rate the driving style in terms of comfort. OR Rate the driving style in terms of naturalness.
Options Yes or No -5, -4, -3, -2, -1, 0, 1, 2, 3, 4, 5
Tools Press one of two buttons on an X-box handset Speak out the number
Frequency Rate after an auditory beep; Free to press buttons throughout the drive.
Rate after an auditory beep during the drive; Rate after the entire drive.
Results
We compared the two methods, by examining the pattern of responses obtained from the two studies.
In study 1, the average number of positive and negative button presses were calculated for each controller [8], as
a function shown below. This was calculated for positive and negative assessments, respectively.
𝐴𝑣𝑒𝑟𝑎𝑔𝑒 𝑏𝑢𝑡𝑡𝑜𝑛 𝑝𝑟𝑒𝑠𝑠𝑒𝑠
= 𝑇ℎ𝑒 𝑡𝑜𝑡𝑎𝑙 𝑛𝑢𝑚𝑏𝑒𝑟 𝑜𝑓 𝑏𝑢𝑡𝑡𝑜𝑛 𝑝𝑟𝑒𝑠𝑠𝑒𝑠 𝑜𝑓 𝑎 𝑝𝑎𝑟𝑡𝑖𝑐𝑖𝑝𝑎𝑛𝑡 𝑖𝑛 𝑎𝑛 𝑒𝑥𝑝𝑒𝑟𝑖𝑚𝑒𝑛𝑡𝑎𝑙 𝑐𝑜𝑛𝑑𝑖𝑡𝑖𝑜𝑛
𝑇ℎ𝑒 𝑛𝑢𝑚𝑏𝑒𝑟 𝑜𝑓 𝑒𝑥𝑝𝑜𝑠𝑢𝑟𝑒𝑠 𝑡𝑜 𝑡ℎ𝑖𝑠 𝑒𝑥𝑝𝑒𝑟𝑖𝑚𝑒𝑛𝑡𝑎𝑙 𝑐𝑜𝑛𝑑𝑖𝑡𝑖𝑜𝑛
In study 2, as described above, evaluations were provided based on an 11-point scale. To compare with study 1,
we allocated “positive” for ratings larger than 0, and “negative” for ratings equal to or smaller than 0. For each
participant, the number of positive and negative ratings obtained from a total of 24 driving segments were
computed. For example, participant 1 gave 23 positive ratings and one negative rating to the the Defensive
controller, for the 24 driving segments. This value was then divided by the number of evaluations for each
controller, which was 24, for comparable reasons. After that, the means and standard errors of positive and negative
ratings across participants were calculated, as illustrated in .
The common pattern
It is worth mentioning that the AV controllers evaluated in the two different studies varied in modelling algorithms.
Moreover, as the simulated road geometries were different between the two studies, the way that each controller
negotiated the road was different. However, as shown in Figure 3, a common trend in responses was seen for both
methods, whereby participants provided more positive evaluations for all controllers, regardless of whether their
evaluation was based on a combination of comfort/safety/naturalness (study 1), or “comfort” and “naturalness”
separately (study 2).
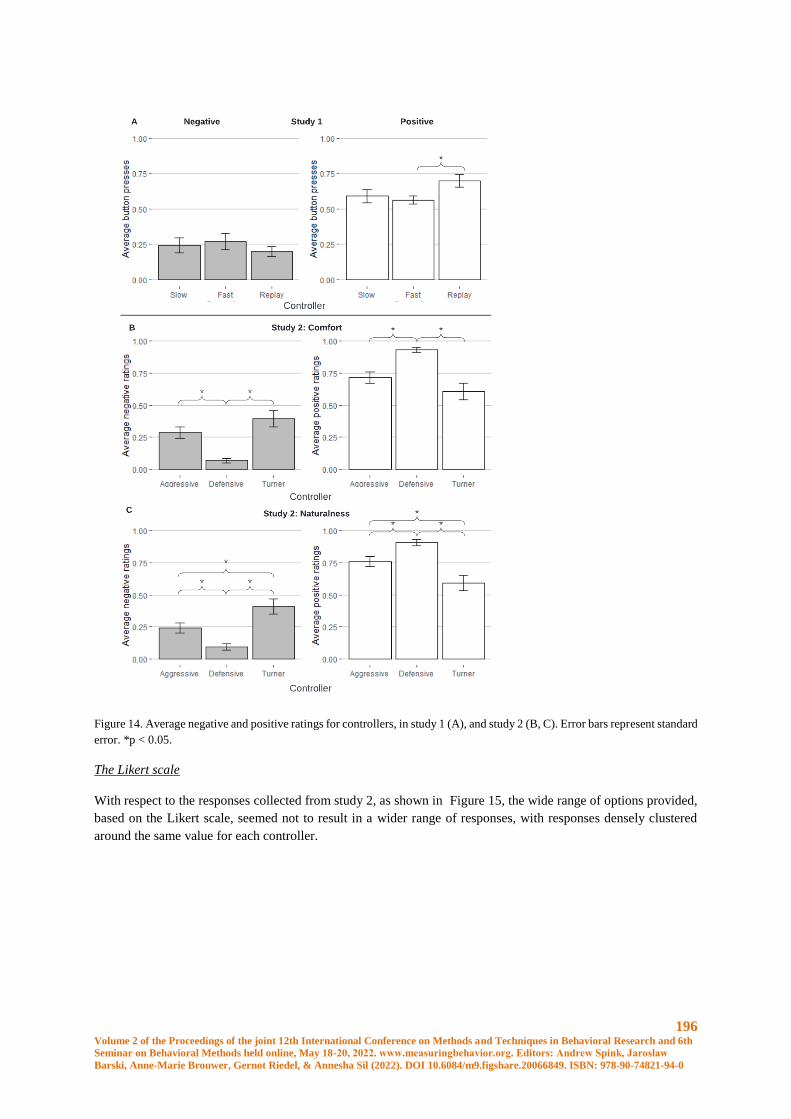
196 Volume 2 of the Proceedings of the joint 12th International Conference on Methods and Techniques in Behavioral Research and 6th
Seminar on Behavioral Methods held online, May 18-20, 2022. www.measuringbehavior.org. Editors: Andrew Spink, Jarosław
Barski, Anne-Marie Brouwer, Gernot Riedel, & Annesha Sil (2022). DOI 10.6084/m9.figshare.20066849. ISBN: 978-90-74821-94-0
Figure 14. Average negative and positive ratings for controllers, in study 1 (A), and study 2 (B, C). Error bars represent standard
error. *p < 0.05.
The Likert scale
With respect to the responses collected from study 2, as shown in Figure 15, the wide range of options provided,
based on the Likert scale, seemed not to result in a wider range of responses, with responses densely clustered
around the same value for each controller.
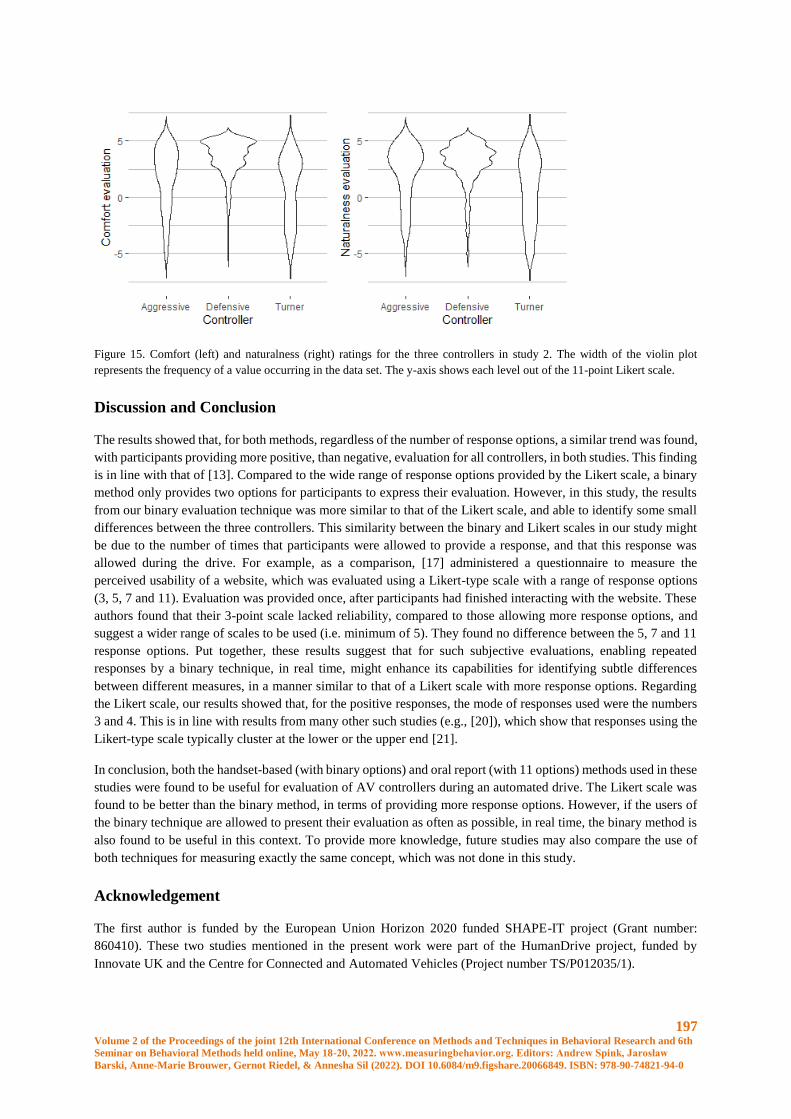
197 Volume 2 of the Proceedings of the joint 12th International Conference on Methods and Techniques in Behavioral Research and 6th
Seminar on Behavioral Methods held online, May 18-20, 2022. www.measuringbehavior.org. Editors: Andrew Spink, Jarosław
Barski, Anne-Marie Brouwer, Gernot Riedel, & Annesha Sil (2022). DOI 10.6084/m9.figshare.20066849. ISBN: 978-90-74821-94-0
Figure 15. Comfort (left) and naturalness (right) ratings for the three controllers in study 2. The width of the violin plot
represents the frequency of a value occurring in the data set. The y-axis shows each level out of the 11-point Likert scale.
Discussion and Conclusion
The results showed that, for both methods, regardless of the number of response options, a similar trend was found,
with participants providing more positive, than negative, evaluation for all controllers, in both studies. This finding
is in line with that of [13]. Compared to the wide range of response options provided by the Likert scale, a binary
method only provides two options for participants to express their evaluation. However, in this study, the results
from our binary evaluation technique was more similar to that of the Likert scale, and able to identify some small
differences between the three controllers. This similarity between the binary and Likert scales in our study might
be due to the number of times that participants were allowed to provide a response, and that this response was
allowed during the drive. For example, as a comparison, [17] administered a questionnaire to measure the
perceived usability of a website, which was evaluated using a Likert-type scale with a range of response options
(3, 5, 7 and 11). Evaluation was provided once, after participants had finished interacting with the website. These
authors found that their 3-point scale lacked reliability, compared to those allowing more response options, and
suggest a wider range of scales to be used (i.e. minimum of 5). They found no difference between the 5, 7 and 11
response options. Put together, these results suggest that for such subjective evaluations, enabling repeated
responses by a binary technique, in real time, might enhance its capabilities for identifying subtle differences
between different measures, in a manner similar to that of a Likert scale with more response options. Regarding
the Likert scale, our results showed that, for the positive responses, the mode of responses used were the numbers
3 and 4. This is in line with results from many other such studies (e.g., [20]), which show that responses using the
Likert-type scale typically cluster at the lower or the upper end [21].
In conclusion, both the handset-based (with binary options) and oral report (with 11 options) methods used in these
studies were found to be useful for evaluation of AV controllers during an automated drive. The Likert scale was
found to be better than the binary method, in terms of providing more response options. However, if the users of
the binary technique are allowed to present their evaluation as often as possible, in real time, the binary method is
also found to be useful in this context. To provide more knowledge, future studies may also compare the use of
both techniques for measuring exactly the same concept, which was not done in this study.
Acknowledgement
The first author is funded by the European Union Horizon 2020 funded SHAPE-IT project (Grant number:
860410). These two studies mentioned in the present work were part of the HumanDrive project, funded by
Innovate UK and the Centre for Connected and Automated Vehicles (Project number TS/P012035/1).
198 Volume 2 of the Proceedings of the joint 12th International Conference on Methods and Techniques in Behavioral Research and 6th
Seminar on Behavioral Methods held online, May 18-20, 2022. www.measuringbehavior.org. Editors: Andrew Spink, Jarosław
Barski, Anne-Marie Brouwer, Gernot Riedel, & Annesha Sil (2022). DOI 10.6084/m9.figshare.20066849. ISBN: 978-90-74821-94-0
References
[1] Beggiato, M., Hartwich, F., & Krems, J. (2018). Using Smartbands, Pupillometry and Body Motion to
Detect Discomfort in Automated Driving. Frontiers in Human Neuroscience, 12(September), 1–12.
https://doi.org/10.3389/fnhum.2018.00338
[2] Elbanhawi, M., Simic, M., & Jazar, R. (2015). In the Passenger Seat: Investigating Ride Comfort
Measures in Autonomous Cars. IEEE Intelligent Transportation Systems Magazine, 7(3), 4–17.
https://doi.org/10.1109/MITS.2015.2405571
[3] da Silva, M. C. G. (2002). Measurements of comfort in vehicles. Measurement Science and Technology,
13(6). https://doi.org/10.1088/0957-0233/13/6/201
[4] Oborne, D. J. (1978). Passenger comfort - an overview. Applied Ergonomics, 9(3), 131–136.
https://doi.org/10.1016/0003-6870(78)90002-9
[5] SAE International. (2016). Taxonomy and Definitions for Terms Related to Driving Automation Systems
for On-Road Motor Vehicles. SAE International. https://doi.org/https://doi.org/10.4271/J3016_201806
[6] Bellem, H., Klüver, M., Schrauf, M., Schöner, H. P., Hecht, H., & Krems, J. F. (2017). Can We Study
Autonomous Driving Comfort in Moving-Base Driving Simulators? A Validation Study. Human Factors, 59(3),
442–456. https://doi.org/10.1177/0018720816682647
[7] Sivak, Micheal, Schoettle, B. (2015). Motion sickness in self-driving vehicles (Issue April).
https://deepblue.lib.umich.edu/handle/2027.42/111747
[8] Hajiseyedjavadi, F., Romano, R., Paschalidis, E., Wei, C., Solernou, A., Jamson, A. H., Boer, E. R., &
Merat, N. (2021). Effect of Environmental Factors and Individual Differences on Subjective Experience of
Human-Like and Conventional Automated Vehicle Controllers [Manuscript submitted for publication] .
https://doi.org/10.13140/RG.2.2.13778.68808
[9] Peng, C., Merat, N., Romano, R., Hajiseyedjavadi, F., Paschalidis, E., Wei, C., Radhakrishnan, V.,
Solernou, A., Forster, D., & Boer, E. (2021). Drivers’ Evaluation of Different Automated Driving Styles: Is It
both Comfortable and Natural? [Manuscript submitted for publication].
[10] Summala, H. (2007). Towards Understanding Motivational and Emotional Factors in Driver Behaviour:
Comfort Through Satisficin. In Modelling Driver Behaviour in Automotive Environments: Critical Issues in
Driver Interactions with Intelligent Transport Systems (pp. 189–207). https://doi.org/10.1007/978-1-84628-618-
6
[11] Carsten, O., & Martens, M. H. (2018). How can humans understand their automated cars? HMI
principles, problems and solutions. Cognition, Technology and Work, 21(1), 3–20.
https://doi.org/10.1007/s10111-018-0484-0
[12] Wei, C., Romano, R., Merat, N., Wang, Y., Hu, C., Taghavifar, H., Hajiseyedjavadi, F., & Boer, E. R.
(2019). Risk-based autonomous vehicle motion control with considering human driver’s behaviour.
Transportation Research Part C: Emerging Technologies, 107(August), 1–14.
https://doi.org/10.1016/j.trc.2019.08.003
[13] Hartwich, F., Beggiato, M., & Krems, J. F. (2018). Driving comfort, enjoyment and acceptance of
automated driving–effects of drivers’ age and driving style familiarity. Ergonomics, 61(8), 1017–1032.
https://doi.org/10.1080/00140139.2018.1441448
[14] Yusof, N. M., Karjanto, J., Terken, J., Delbressine, F., Hassan, M. Z., & Rauterberg, M. (2016). The
exploration of autonomous vehicle driving styles: Preferred longitudinal, lateral, and vertical accelerations.
AutomotiveUI 2016 - 8th International Conference on Automotive User Interfaces and Interactive Vehicular
Applications, Proceedings, 245–252. https://doi.org/10.1145/3003715.3005455
[15] Lee, J. D., Liu, S. Y., Domeyer, J., & DinparastDjadid, A. (2019). Assessing Drivers’ Trust of
Automated Vehicle Driving Styles With a Two-Part Mixed Model of Intervention Tendency and Magnitude.
Human Factors. https://doi.org/10.1177/0018720819880363

199 Volume 2 of the Proceedings of the joint 12th International Conference on Methods and Techniques in Behavioral Research and 6th
Seminar on Behavioral Methods held online, May 18-20, 2022. www.measuringbehavior.org. Editors: Andrew Spink, Jarosław
Barski, Anne-Marie Brouwer, Gernot Riedel, & Annesha Sil (2022). DOI 10.6084/m9.figshare.20066849. ISBN: 978-90-74821-94-0
[16] Schwanitz, S., Wittkowski, M., Rolny, V., Samel, C., & Basner, M. (2013). Continuous assessments of
pressure comfort on a train - A field-laboratory comparison. Applied Ergonomics, 44(1), 11–17.
https://doi.org/10.1016/j.apergo.2012.04.004
[17] Lewis, J. R. (2021). Measuring User Experience With 3, 5, 7, or 11 Points: Does It Matter? Human
Factors, 63(6), 999–1011. https://doi.org/10.1177/0018720819881312
[18] Basu, C., Yang, Q., Hungerman, D., Singhal, M., & Dragan, A. D. (2017). Do You Want Your
Autonomous Car to Drive Like You? ACM/IEEE International Conference on Human-Robot Interaction, Part
F1271, 417–425. https://doi.org/10.1145/2909824.3020250
[19] Rossner, P., & Bullinger, A. C. (2020). How Do You Want to be Driven? Investigation of Different
Highly-Automated Driving Styles on a Highway Scenario. Advances in Intelligent Systems and Computing, 964,
36–43. https://doi.org/10.1007/978-3-030-20503-4_4
[20] Bachman, J. G., & O’Malley, P. M. (1984). Yea-Saying , Nay-Saying , and Going to Extremes : Black-
White Differences in Response Styles. The Public Opinion Quarterly, 48(2), 491–509.
[21] Rossi, P. E., Gilula, Z., & Allenby, G. M. (2001). Overcoming scale usage heterogeneity: A bayesian
hierarchical approach. Journal of the American Statistical Association, 96(453), 20–31.
https://doi.org/10.1198/016214501750332668
200 Volume 2 of the Proceedings of the joint 12th International Conference on Methods and Techniques in Behavioral Research and 6th
Seminar on Behavioral Methods held online, May 18-20, 2022. www.measuringbehavior.org. Editors: Andrew Spink, Jarosław
Barski, Anne-Marie Brouwer, Gernot Riedel, & Annesha Sil (2022). DOI 10.6084/m9.figshare.20066849. ISBN: 978-90-74821-94-0
Do Car Drivers Respond Earlier to Close Lateral Motion Than to Looming? The
Importance of Data Selection
M. Svärd1,2, J. Bärgman1, G. Markkula3 and M. Ljung Aust2
1 Crash Analysis and Prevention Unit in the Division of Vehicle Safety, Chalmers University of Technology,
Gothenburg, Sweden. [email protected]; [email protected]
2 Volvo Cars Safety Centre, Volvo Car Corporation, Gothenburg, Sweden. [email protected];
3 Institute for Transport Studies, University of Leeds, Leeds, United Kingdom. [email protected]
Abstract
It is essential to understand drivers’ responses to visual stimuli when analyzing or reconstructing driver behavior
in critical traffic situations. In a controlled experiment, drivers’ on-road glances relevant to a situation may
however be obscured by the presence of check glances which are not induced by the visual input that the
experiment intends to study. The purpose of this work is to compare five methods to reduce the influence check
glances may have on the results in studies of drivers’ glance responses. We apply the methods to a comparison of
driver glance response times in a critical lead vehicle brake event (characterized by strong looming) and a non-
critical close cut-in event (characterized by a distinct lateral motion), using data from a previously conducted
driving simulator experiment. Without the noise added to the analysis from the check glances, our study shows
that drivers look back towards the road in front earlier when exposed to close lateral motion, than when exposed
to looming. We conclude that a careful data selection process aiming to minimize the influence of potential check
glances is important to ensure relevance of the results in glance response studies.
Introduction
Understanding drivers’ glance patterns in potentially critical situations is a necessary part in modelling driver
behavior and eventually in understanding the implication of gaze patterns on overall road safety. Safe driving
requires the driver to constantly process and react upon visual information from the surrounding environment.
However, modern drivers are increasingly prone to direct their gaze away from the forward roadway due to the
increasing number of entertainment systems and nomadic devices, such as smartphones, capturing the driver’s
attention. While attending to secondary tasks, visual information from the surroundings will be processed by the
driver’s peripheral view. Several studies have been performed on the effects of driving performance when the
driver controls the vehicle using peripheral vision [1–5] or when the driver is visually distracted [6–9], but few
studies concentrate on the visual response process of a distracted driver [10–15].
A typical way to quantify the visual response process is to measure the driver’s glance response time (GRT) to a
visual stimulus. To do this, it is essential to have the ability to control the direction and timing of the driver’s off-
road gaze without influencing the glance behavior under study. Visual distraction tasks (e.g., the surrogate
reference task, SuRT; [16]) are commonly used to make the driver’s off-road glances coincide with a critical event,
such as a severe lead vehicle deceleration.
A common study purpose is the analysis of how drivers’ glance responses are influenced by some perceptual cue,
for instance the onset of a visual forward collision warning [17,18]. A major challenge with the distraction tasks
is to make the driver look away long enough to fulfil this purpose, typically for 1-3 seconds. Henceforth, we will
refer to glances towards the forward roadway that are not caused by the perceptual cue under study, and thus not
contributing to the purpose of the study, as check glances. Such glances could for example be induced by the
driver’s subjective feeling of having looked away from the forward roadway for too long for safe driving, as
opposed to an on-road glance caused by the detection of a possible threat in front (using the driver’s peripheral
vision).
201 Volume 2 of the Proceedings of the joint 12th International Conference on Methods and Techniques in Behavioral Research and 6th
Seminar on Behavioral Methods held online, May 18-20, 2022. www.measuringbehavior.org. Editors: Andrew Spink, Jarosław
Barski, Anne-Marie Brouwer, Gernot Riedel, & Annesha Sil (2022). DOI 10.6084/m9.figshare.20066849. ISBN: 978-90-74821-94-0
It is often difficult to make a clear distinction between check glances and glances relevant for the study purpose.
A failure to make this distinction and exclude check glances from the dataset finally analyzed may lead to biased
results. Some studies exclude all data from test subjects with on-road glances starting prior to some predefined
threshold in order to minimize the dilution of relevant glances by check glances. Typically, the threshold is at the
onset of a warning system, or when the distraction task ends (see e.g., [12,14]). Other studies monitor secondary
task performances and subsequently carry out plausibility analyses of the results [11], or simply assume that the
drivers manage to keep their glance off-road for the entire duration of the distraction task [10]. There is however
limited research on how the data selection method influences the conclusions of studies on the driver glance
response process.
Furthermore, little work has been done on investigating differences in the response process for different sorts of
visual stimuli which drivers may be exposed to. For example, a recent study did not investigate this difference, but
aimed to explore whether the gaze angle relative to the forward roadway influenced the drivers’ GRT when the
drivers were exposed to strong looming [15]. It was not studied whether the drivers reacted to the looming stimulus
per se, or whether the reactions would have been similar with the stimulus consisting of pure lateral motion
(without a looming component).
The purpose of this work is to further explore car drivers’ natural glance response processes when exposed to
visual stimuli of different kinds, and to show how the data selection method may influence the conclusions. We
hypothesized that results and conclusions of glance response studies can be substantially influenced by the data
selection criteria related to check glances. Specifically, we compare GRTs to visual stimuli originating from a
critical looming to GRTs to visual stimuli from a lateral motion caused by a close, but non-critical, cut-in maneuvre
of an adjacent vehicle. We show that drivers tend to respond earlier to close lateral motion than to looming, and
that this difference in reaction time is only manifest when check glances are excluded from the original dataset.
Method
The data in this work originates from a previously conducted between-group study performed in a high-fidelity,
moving-base driving simulator. Details about the experiment setup can be found in [15]. The experiment included
83 participants, predominantly male (77 %) in the age interval 24-62 years (M = 36). All participants were
employed by Volvo Car Corporation (who conducted the study) at the time of the original study, and took part of
the study as part of their employment (they did not receive any additional renumeration). While driving on a two-
lane separated highway, all participants were exposed to three critical events in which the vehicle in front
performed a sudden, severe brake maneuver at a time headway (THW) of 2.4 s. The drivers were also exposed to
four non-critical events with an adjacent vehicle cutting in from the side at a constant THW. At the start of the cut-
in event we study in this work, the adjacent car was positioned in the middle of the lane to the left of the host car,
at a lateral distance of approximately 3.7 m measured between the mid points of the two vehicles (depending on
the current test driver’s own chosen lateral position in the lane) and at a THW of 0.9 s.
In this work, our focus is to study the last brake and cut-in event in the experiment, both of which happened after
approximately 40 minutes of driving (including a short warm-up session to get used to the driving environment).
Because of the previous exposure to critical situations, we assumed the drivers to expect that something would
happen that would require their immediate attention.
To ensure that the drivers looked off-road during the brake and cut-in events, all participants were to perform a
self-paced, game-like, visual-manual distraction task. The distraction task was presented at one out of three touch
screen monitors positioned at a horizontal angle of 12°, 40° and 60° relative to the road in front. The time for
completing the task was fixed to approximately 3 s for the brake event and 2.5 s for the cut-in event.
Since the original intention of the experiment was to study the effect of gaze angle [15], the drivers were divided
into three different groups. Each group performed the distraction task at a specific gaze angle during the brake
event and at another gaze angle during the cut-in event (for example, all individuals in one group of drivers
performed the secondary task at 40° during the brake event, but at 60° during the cut-in event).

202 Volume 2 of the Proceedings of the joint 12th International Conference on Methods and Techniques in Behavioral Research and 6th
Seminar on Behavioral Methods held online, May 18-20, 2022. www.measuringbehavior.org. Editors: Andrew Spink, Jarosław
Barski, Anne-Marie Brouwer, Gernot Riedel, & Annesha Sil (2022). DOI 10.6084/m9.figshare.20066849. ISBN: 978-90-74821-94-0
We manually annotated the glance data using recordings from a camera monitoring the driver face with a frame
rate of 15 frames per second. Each driver’s GRTs were calculated and defined as the time between the start of the
event and the start of the first glance transition from the distraction task towards the road in front. We defined
event start as either the start of deceleration of the lead vehicle (for the brake event) or from the start of the adjacent
car’s lateral motion (for the cut-in event).
To ensure that all events of the same kind (i.e., all brake and all cut-in events, respectively) were comparable, we
removed data where the kinematics of the situation was too different from the target kinematics, as well as data
from drivers who looked away from the road after the event start, from the final dataset. The following exclusion
criteria were used:
Faulty event: A change in situation kinematics due to technical problems, or the absence of an event.
No off-road glance: The driver did not look off-road at all during the event.
On-road glance at event start: The driver looked on-road at event start.
High/low speed: The speed was not within 90 +/- 18 km/h at event start (same speed criterion as in [15]).
Deviating lateral position: The lateral distance to the adjacent car was not within 3.7 +/- 0.5 m at event start
(cut-in event only).
In addition, we did not include on-road glances occurring after the end of the distraction task in the study.
Moreover, for the brake event, we removed GRTs that were longer than the mean task duration for the cut-in event,
since the duration of the distraction task of the brake event was longer than that of the cut-in event.
While the data selection process described above will reduce the effects of the most evident confounding factors
in the study, there will still be undesirable GRTs left in the dataset originating from the drivers’ check glances. In
this work we investigate the following five methods to mitigate the influence of such glances on the final results
when comparing the distribution of GRTs in the brake and cut-in events:
The multiple glance (MG) method: The MG method assumes that the check glances are independent from the event
and may happen at any time during the event (i.e., not only early on in the event). It removes all data from test
drivers who made one or several on-road glances, but then looked back towards the distraction task again before
the task ended.
The early glances measured from event start (EGE) method: The EGE method assumes that check glances occur
much earlier than a typical glance induced by translational motion or looming. It aims to remove the data from
drivers who looked back towards the road earlier than they would do in a corresponding “baseline” situation with
the possible threat removed (i.e., in a situation with the same kinematics but with no vehicle braking or cutting in).
Since we did not have this “baseline” data available, we chose to study three alternative time thresholds for what
should be counted as a check-glance: 0.5 s, 1 s and 1.5 s. The EGE method is event dependent and measures the
glance duration from event start.
The early glances measured from glance off-road (EGOff) method: Similarly to the EGE method, the EGOff
method assumes that check glances occur at an early stage in the event. In contrast to the EGE method, the EGOff
method is independent of event start and measures the glance duration from the start of the off-road glance (taking
into account the time drivers already had their gaze directed off-road before the event started). Also here we study
three alternative on-road glance time thresholds: 0.5 s, 1 s and 1.5 s.
The MG+EGE method: A combination of the MG and EGE methods, considering check glances to be more likely
at the start of the event but still with the possibility to occur at any time.
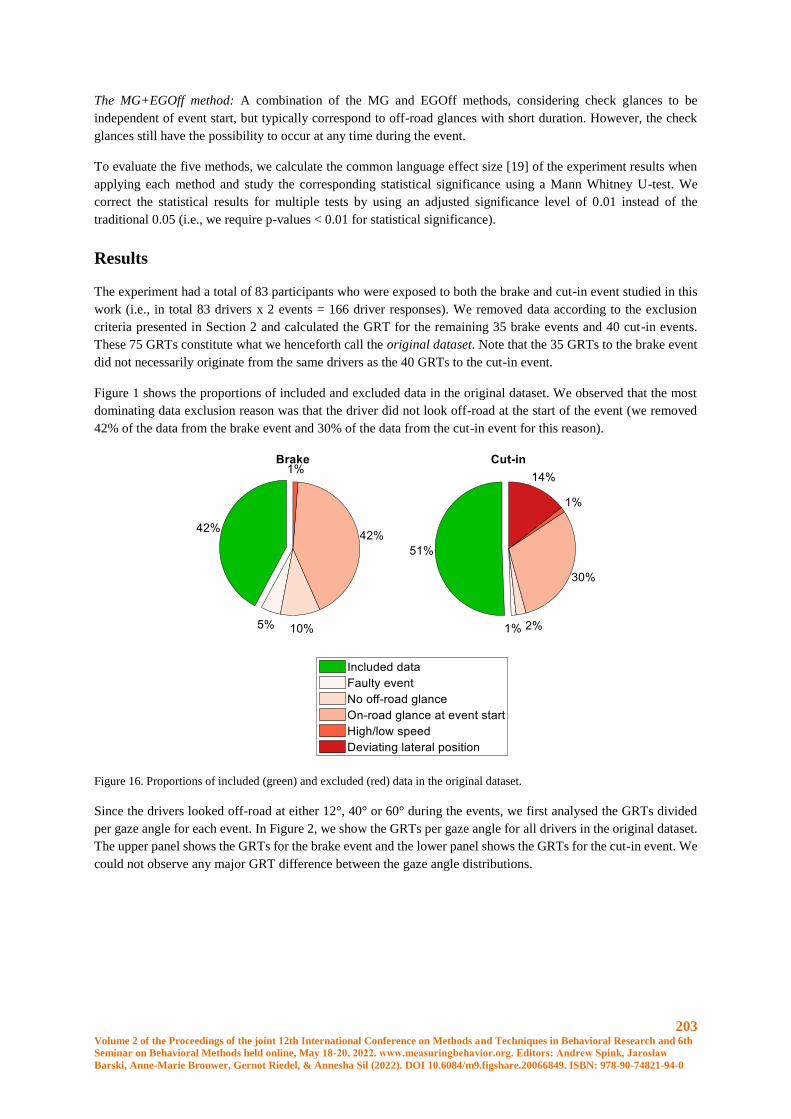
203 Volume 2 of the Proceedings of the joint 12th International Conference on Methods and Techniques in Behavioral Research and 6th
Seminar on Behavioral Methods held online, May 18-20, 2022. www.measuringbehavior.org. Editors: Andrew Spink, Jarosław
Barski, Anne-Marie Brouwer, Gernot Riedel, & Annesha Sil (2022). DOI 10.6084/m9.figshare.20066849. ISBN: 978-90-74821-94-0
The MG+EGOff method: A combination of the MG and EGOff methods, considering check glances to be
independent of event start, but typically correspond to off-road glances with short duration. However, the check
glances still have the possibility to occur at any time during the event.
To evaluate the five methods, we calculate the common language effect size [19] of the experiment results when
applying each method and study the corresponding statistical significance using a Mann Whitney U-test. We
correct the statistical results for multiple tests by using an adjusted significance level of 0.01 instead of the
traditional 0.05 (i.e., we require p-values < 0.01 for statistical significance).
Results
The experiment had a total of 83 participants who were exposed to both the brake and cut-in event studied in this
work (i.e., in total 83 drivers x 2 events = 166 driver responses). We removed data according to the exclusion
criteria presented in Section 2 and calculated the GRT for the remaining 35 brake events and 40 cut-in events.
These 75 GRTs constitute what we henceforth call the original dataset. Note that the 35 GRTs to the brake event
did not necessarily originate from the same drivers as the 40 GRTs to the cut-in event.
Figure 1 shows the proportions of included and excluded data in the original dataset. We observed that the most
dominating data exclusion reason was that the driver did not look off-road at the start of the event (we removed
42% of the data from the brake event and 30% of the data from the cut-in event for this reason).
Figure 16. Proportions of included (green) and excluded (red) data in the original dataset.
Since the drivers looked off-road at either 12°, 40° or 60° during the events, we first analysed the GRTs divided
per gaze angle for each event. In Figure 2, we show the GRTs per gaze angle for all drivers in the original dataset.
The upper panel shows the GRTs for the brake event and the lower panel shows the GRTs for the cut-in event. We
could not observe any major GRT difference between the gaze angle distributions.
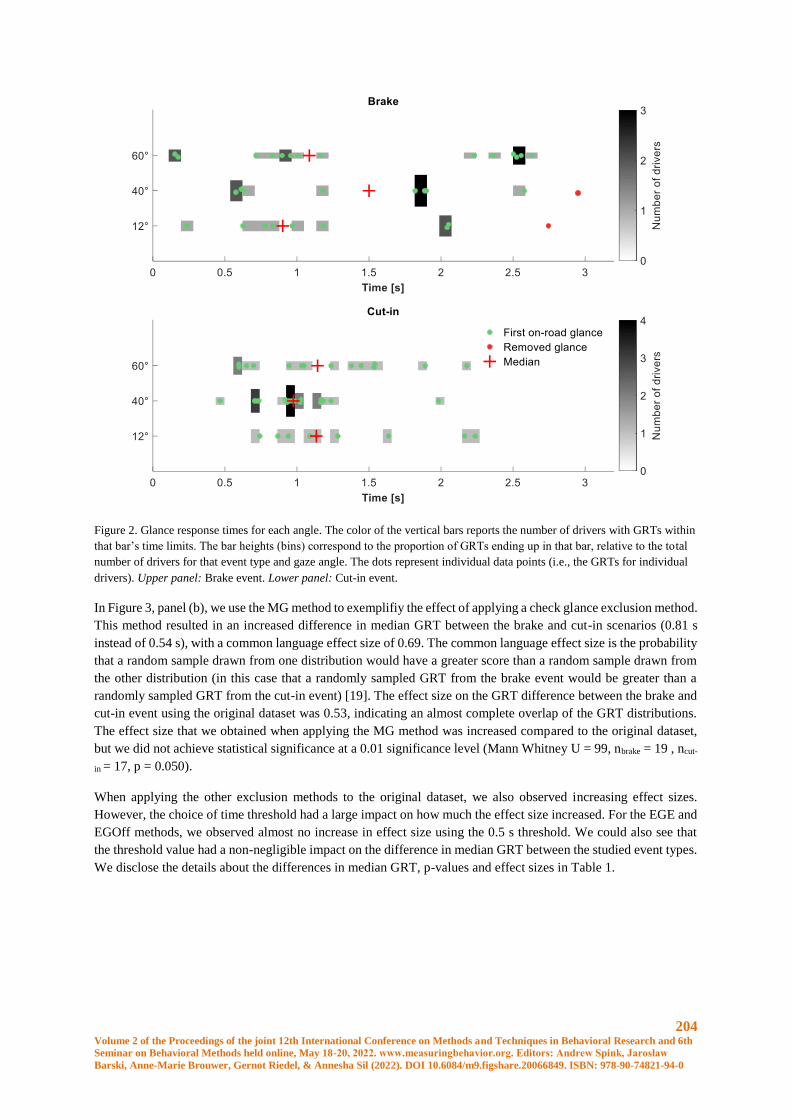
204 Volume 2 of the Proceedings of the joint 12th International Conference on Methods and Techniques in Behavioral Research and 6th
Seminar on Behavioral Methods held online, May 18-20, 2022. www.measuringbehavior.org. Editors: Andrew Spink, Jarosław
Barski, Anne-Marie Brouwer, Gernot Riedel, & Annesha Sil (2022). DOI 10.6084/m9.figshare.20066849. ISBN: 978-90-74821-94-0
Figure 2. Glance response times for each angle. The color of the vertical bars reports the number of drivers with GRTs within
that bar’s time limits. The bar heights (bins) correspond to the proportion of GRTs ending up in that bar, relative to the total
number of drivers for that event type and gaze angle. The dots represent individual data points (i.e., the GRTs for individual
drivers). Upper panel: Brake event. Lower panel: Cut-in event.
In Figure 3, panel (b), we use the MG method to exemplifiy the effect of applying a check glance exclusion method.
This method resulted in an increased difference in median GRT between the brake and cut-in scenarios (0.81 s
instead of 0.54 s), with a common language effect size of 0.69. The common language effect size is the probability
that a random sample drawn from one distribution would have a greater score than a random sample drawn from
the other distribution (in this case that a randomly sampled GRT from the brake event would be greater than a
randomly sampled GRT from the cut-in event) [19]. The effect size on the GRT difference between the brake and
cut-in event using the original dataset was 0.53, indicating an almost complete overlap of the GRT distributions.
The effect size that we obtained when applying the MG method was increased compared to the original dataset,
but we did not achieve statistical significance at a 0.01 significance level (Mann Whitney U = 99, nbrake = 19 , ncut-
in = 17, p = 0.050).
When applying the other exclusion methods to the original dataset, we also observed increasing effect sizes.
However, the choice of time threshold had a large impact on how much the effect size increased. For the EGE and
EGOff methods, we observed almost no increase in effect size using the 0.5 s threshold. We could also see that
the threshold value had a non-negligible impact on the difference in median GRT between the studied event types.
We disclose the details about the differences in median GRT, p-values and effect sizes in Table 1.
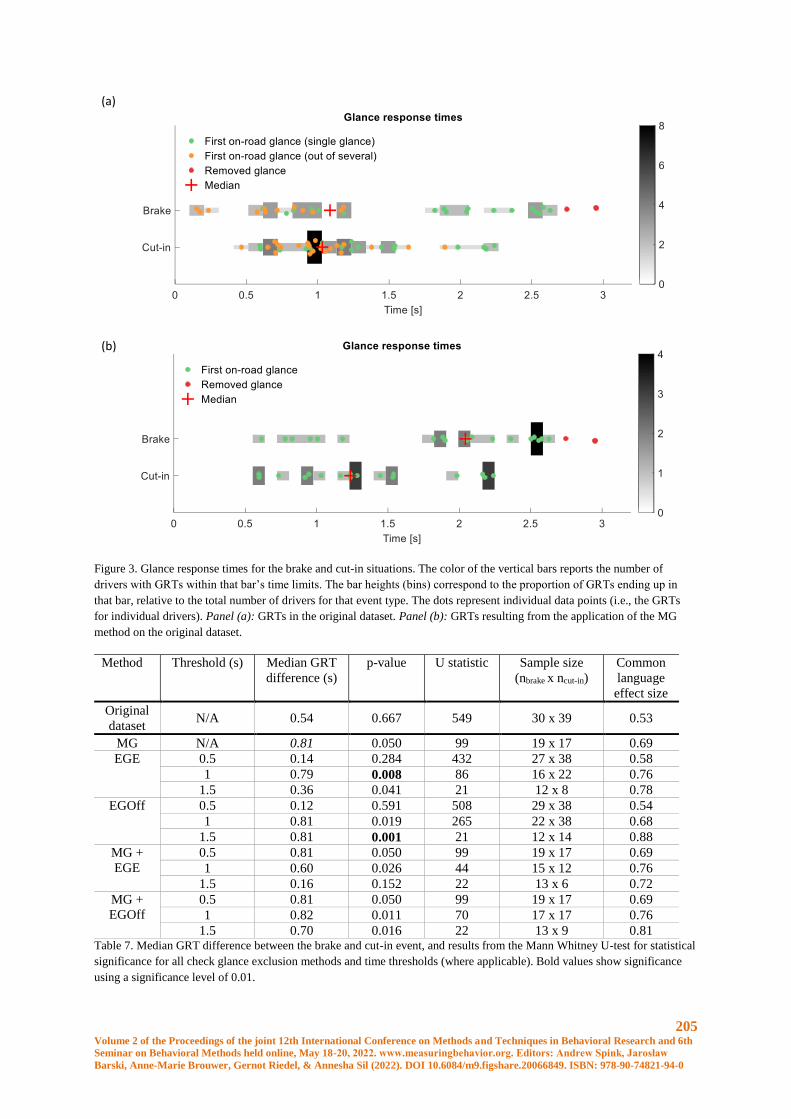
205 Volume 2 of the Proceedings of the joint 12th International Conference on Methods and Techniques in Behavioral Research and 6th
Seminar on Behavioral Methods held online, May 18-20, 2022. www.measuringbehavior.org. Editors: Andrew Spink, Jarosław
Barski, Anne-Marie Brouwer, Gernot Riedel, & Annesha Sil (2022). DOI 10.6084/m9.figshare.20066849. ISBN: 978-90-74821-94-0
(a)
(b)
Figure 3. Glance response times for the brake and cut-in situations. The color of the vertical bars reports the number of
drivers with GRTs within that bar’s time limits. The bar heights (bins) correspond to the proportion of GRTs ending up in
that bar, relative to the total number of drivers for that event type. The dots represent individual data points (i.e., the GRTs
for individual drivers). Panel (a): GRTs in the original dataset. Panel (b): GRTs resulting from the application of the MG
method on the original dataset.
Method Threshold (s) Median GRT
difference (s)
p-value U statistic Sample size
(nbrake x ncut-in)
Common
language
effect size
Original
dataset N/A 0.54 0.667 549 30 x 39 0.53
MG N/A 0.81 0.050 99 19 x 17 0.69
EGE 0.5 0.14 0.284 432 27 x 38 0.58
1 0.79 0.008 86 16 x 22 0.76
1.5 0.36 0.041 21 12 x 8 0.78
EGOff 0.5 0.12 0.591 508 29 x 38 0.54
1 0.81 0.019 265 22 x 38 0.68
1.5 0.81 0.001 21 12 x 14 0.88
MG +
EGE
0.5 0.81 0.050 99 19 x 17 0.69
1 0.60 0.026 44 15 x 12 0.76
1.5 0.16 0.152 22 13 x 6 0.72
MG +
EGOff
0.5 0.81 0.050 99 19 x 17 0.69
1 0.82 0.011 70 17 x 17 0.76
1.5 0.70 0.016 22 13 x 9 0.81 Table 7. Median GRT difference between the brake and cut-in event, and results from the Mann Whitney U-test for statistical
significance for all check glance exclusion methods and time thresholds (where applicable). Bold values show significance
using a significance level of 0.01.
206 Volume 2 of the Proceedings of the joint 12th International Conference on Methods and Techniques in Behavioral Research and 6th
Seminar on Behavioral Methods held online, May 18-20, 2022. www.measuringbehavior.org. Editors: Andrew Spink, Jarosław
Barski, Anne-Marie Brouwer, Gernot Riedel, & Annesha Sil (2022). DOI 10.6084/m9.figshare.20066849. ISBN: 978-90-74821-94-0
Discussion
In this work, we studied glance response times (GRT) from a critical brake event and a non-critical close cut-in
event collected in a previously conducted driving simulator experiment. We applied five different methods to
exclude check glances – glances that were not caused by a reaction to the perceptual input under study (looming
or lateral motion).
We observed that the GRTs for each scenario were independent of the drivers’ gaze angle relative to the road in
front. This aligns well with previous work [15] and permitted a gaze angle independent comparison of the GRT
distributions. When we applied check glance exclusion methods on the gaze angle independent data, we could
see that the drivers tended to react sooner when they were exposed to the close lateral motion induced by the cut-
in event than to the looming from the brake event. The effect size on the GRT difference was more or less
pronounced depending on method choice.
We observed a clear increase in effect size when we applied any check glance exclusion method on the original
dataset (for at least two of the associated time thresholds), compared to when we included all data in the analysis.
However, we did not achieve statistical significance in all cases. Since multiple comparisons were made on
subsets of the same original dataset, we chose to require a significance level to 0.01 (instead of 0.05) to consider
the GRT differences to be statistically significant. As a result, we only got significance when applying the EGE
(1 s threshold) and EGOff (1.5 s threshold) methods to the original dataset. We also observed marginal
significance when we applied the MG+EGOff method to the original dataset (1 s threshold; Mann Whitney U
= 70, nbrake = 17 , ncut-in = 17, p = 0.011).
An alternative to using a significance level of 0.01 could be to use Bonferroni correction, which is our case
would require a test to have p < 0.0036 for statistical significance. However, Bonferroni correction can be
considered very restrictive, since it is a method developed to remove Type I errors (i.e., rejecting the null
hypothesis when it is true) and may at worst increase the occurrence of Type II errors (i.e., accepting the null
hypothesis when it is false) [20]. Nevertheless, we observed one statistically significant GRT difference between
lateral motion and looming also under such a strict condition when applying the EGEOff method (1.5 s
threshold) to the data.
The median GRT to lateral motion was, for most methods, approximatelly 0.8 s faster than the median GRT to
looming. This is somewhat surprising since the lateral motion was associated with a non-critical event and the
looming was induced by a highly critical situation. Previous research suggest that that humans attend to stimuli
that may require an immediate reaction [21] and that people are more likely to attend to stimuli that are on a
collision course with themselves, than to stimuli not being on a collision course [22,23]. Thus, we expected an
earlier reaction to the looming from the brake event than to the lateral motion from the cut-in event. However,
the quick reactions to the lateral motion may be explained by the fact that the drivers were influenced by the
previous critical brake events during the experiment and thus may have expected the cut-in situation to become
critical as well. In addition, due to the exponential nature of looming, the change in translational motion was
larger in the beginning of the cut-in event than in beginning of the brake event. This may have contributed to the
lateral motion being earlier detectable by the peripheral vision system, compared to the looming.
The choice of time threshold used in all methods (except the MG method) influenced the effect size of the
results, with a higher effect size observed for higher thresholds. We observed the largest increase in effect size
when changing the threshold value from 0.5 s to 1 s. An explanation for this may be that very few GRTs in the
original dataset were lower than 0.5 s, thus using this threshold did not alter the original dataset much. Moreover,
it is reasonable to believe that a large proportion of glances shorter than 1 s were correctly classified as undesired
check glances and, as such, attenuated the effect of the relevant glance responses in the original dataset. The
optimal time threshold for check glance exclusion is likely to differ depending on the individual study and
dataset. Yet, previous literature has shown that drivers in general are comfortable with looking away from the
road for 1 s without check glancing, when performing secondary tasks (although the exact time is highly
dependent on the individual) [24].
207 Volume 2 of the Proceedings of the joint 12th International Conference on Methods and Techniques in Behavioral Research and 6th
Seminar on Behavioral Methods held online, May 18-20, 2022. www.measuringbehavior.org. Editors: Andrew Spink, Jarosław
Barski, Anne-Marie Brouwer, Gernot Riedel, & Annesha Sil (2022). DOI 10.6084/m9.figshare.20066849. ISBN: 978-90-74821-94-0
Although statistical significance for a difference in GRTs between the brake and cut-in events was not reached
for all methods studied in this work, the effect sizes were still increased compared to the effect size obtained
with the original dataset. A main point of this study is thus that it is reasonable to conclude that drivers have
lower GRTs to close lateral motion than to looming. We would however recommend more studies on the topic to
confirm this conclusion. In the current study, we used data from a simulator study with participants that were
potentially influenced by the earlier exposure to critical events. This may have resulted in earlier reactions, and
more check glances, than what would have been the case in a corresponding situation in a real vehicle on a real
road. Nonetheless, check glances will remain a common problem in controlled studies of driver glance behavior,
and a thorough data selection process is important to reduce the risk of erroneous conclusions.
Conclusion
In this paper, we explored several methods for exclusion of undesired glance behaviors (check glances). We
applied the methods to the comparison of glance response data from two situations in a driving simulator
experiment: a critical lead vehicle brake event and a non-critical close cut-in event.
We observed that the choice of exclusion method had an influence on the median GRT difference between the two
driving situations, as well as on the statistical significance and effect sizes of the results. Removing data from
participants that exhibited multiple on-road glances during the studied event (the MG method) proved to increase
the effect size, but we could achieve even larger effect sizes using the time threshold methods (the EGE and EGOff
methods) or by combining the methods (the MG+EGE and MG+EGOff methods).
Regardless of data selection method, we showed that drivers tend to react earlier when exposed to a situation with
a vehicle cutting in at a relatively short THW than when exposed to a critical lead-vehicle event. Compared to the
original dataset, there was a clear increase in the effect size of the difference in glance behavior between the events
for at least two time threshold values for each check glance exclusion method. In addition, the EGE and EGOff
methods showed statistical significance of the GRT difference at a 0.01 significance level, using threshold values
of 1 s and 1.5 s, respectively.
To conclude, the results of this exploratory study indicate that drivers exhibit quicker reactions to close lateral
motion than to looming. Moreover, the data selection process proved to be essential to attenuating the noise from
check glances and thus showing a difference in glance behavior between events. For future studies, we recommend
to thoroughly analyze how the data selection process, particularly in terms of check glance exclusion methods,
may influence the conclusions. It is also important to disclose the details of the data selection process to enhance
methodological transparency.
References
1. Summala, H., Nieminen, T., Punto, M. (1996). Maintaining Lane Position with Peripheral Vision during
In-Vehicle Tasks. Human Factors: The Journal of the Human Factors and Ergonomics Society, 38 (3),
442–451.
2. Robertshaw, K.D., Wilkie, R.M. (2008). Does gaze influence steering around a bend? Journal of Vision,
8 (4), 1–13.
3. Land, M., Horwood, J. (1995). Which parts of the road guide steering? Nature, 377 (6547), 339–340.
4. Michon, J.A. (2011). A Critical View of Driver Behavior Models: What Do We Know, What Should We
Do? Human Behavior and Traffic Safety, 485–524.
5. Cooper, J.M., Medeiros-Ward, N., Strayer, D.L. (2013). The impact of eye movements and cognitive
workload on lateral position variability in driving. Human Factors, 55 (5), 1001–1014.
6. Engström, J., Johansson, E., Östlund, J. (2005). Effects of visual and cognitive load in real and simulated
motorway driving. Transportation Research Part F: Traffic Psychology and Behaviour, 8 (2 SPEC.
ISS.), 97–120.
208 Volume 2 of the Proceedings of the joint 12th International Conference on Methods and Techniques in Behavioral Research and 6th
Seminar on Behavioral Methods held online, May 18-20, 2022. www.measuringbehavior.org. Editors: Andrew Spink, Jarosław
Barski, Anne-Marie Brouwer, Gernot Riedel, & Annesha Sil (2022). DOI 10.6084/m9.figshare.20066849. ISBN: 978-90-74821-94-0
7. Greenberg, J., Tijerina, L., Curry, R., Artz, B., Cathey, L., Kochhar, D., Kozak, K., Blommer, M., Grant,
P. (2003). Driver distraction: Evaluation with event detection paradigm. Transportation Research
Record, (1843), 1–9.
8. Horberry, T., Anderson, J., Regan, M.A., Triggs, T.J., Brown, J. (2006). Driver distraction: The effects
of concurrent in-vehicle tasks, road environment complexity and age on driving performance. Accident
Analysis and Prevention, 38 (1), 185–191.
9. He, D., Donmez, B. (2018). The effects of distraction on anticipatory driving. Proceedings of the Human
Factors and Ergonomics Society, 3, 1960–1964.
10. Lamble, D., Laakso, M., Summala, H. (1999). Detection thresholds in car following situations and
peripheral vision: implications for positioning of visually demanding in-car displays. Ergonomics, 42
(6), 807–815.
11. Wolfe, B., Sawyer, B.D., Kosovicheva, A., Reimer, B., Rosenholtz, R. (2019). Detection of brake lights
while distracted: Separating peripheral vision from cognitive load. Attention, Perception, and
Psychophysics.
12. Bakowski, D.L., Davis, S.T., Moroney, W.F. (2015). Reaction Time and Glance Behavior of Visually
Distracted Drivers to an Imminent Forward Collision as a Function of Training, Auditory Warning, and
Gender. Procedia Manufacturing, 3, 3238–3245.
13. Lubbe, N., Rosén, E. (2014). Pedestrian crossing situations: Quantification of comfort boundaries to
guide intervention timing. Accident Analysis and Prevention, 71, 261–266.
14. Lubbe, N. (2017). Brake reactions of distracted drivers to pedestrian Forward Collision Warning
systems. Journal of Safety Research, 61, 23–32.
15. Svärd, M., Bärgman, J., Victor, T. (2021). Detection and response to critical lead vehicle deceleration
events with peripheral vision: Glance response times are independent of visual eccentricity. Accident
Analysis and Prevention, 150.
16. International Organization for Standardization (2012). Road vehicles — Ergonomic Aspects of Transport
Information and Control Systems — Calibration Tasks for Methods Which Assess Driver Demand Due
to the Use of In-vehicle Systems (ISO/TS 14198:2012).
17. Aust, M.L., Engström, J., Viström, M. (2013). Effects of forward collision warning and repeated event
exposure on emergency braking. Transportation Research Part F: Traffic Psychology and Behaviour,
18, 34–46.
18. Ljung Aust, M. (2014). Effects of haptic versus visual modalities when combined with sound in forward
collision warnings. Driving Simulation Conference, 1 (1), 1–6.
19. McGraw, K.O., Wong, S.P. (1992). A common language effect size statistic. Psychological Bulletin, 111
(2), 361–365.
20. Perneger, T. V. (1998). What’s wrong with Bonferroni adjustments. British Medical Journal, 316
(7139), 1236–1238.
21. Franconeri, S.L., Simons, D.J. (2003). Moving and looming stimuli capture attention. Perception and
Psychophysics, 65 (7), 999–1010.
22. Lin, J.Y., Franconeri, S., Enns, J.T. (2008). Objects on a collision path with the observer demand
attention: Research article. Psychological Science, 19 (7), 686–692.
23. Terry, H.R., Charlton, S.G., Perrone, J.A. (2008). The role of looming and attention capture in drivers’
braking responses. Accident Analysis and Prevention, 40, 1375--1382.
24. Aust, M.L., Rydström, A., Broström, R., Victor, T. (2015). Reliability Improvement Needed in the Eye
Glance Measurement Using Driving Simulator Test. ESV, 1–9.
209 Volume 2 of the Proceedings of the joint 12th International Conference on Methods and Techniques in Behavioral Research and 6th
Seminar on Behavioral Methods held online, May 18-20, 2022. www.measuringbehavior.org. Editors: Andrew Spink, Jarosław
Barski, Anne-Marie Brouwer, Gernot Riedel, & Annesha Sil (2022). DOI 10.6084/m9.figshare.20066849. ISBN: 978-90-74821-94-0
Session Theme: Addressing the reproducibility
problem in research: Challenges and future
prospects
210 Volume 2 of the Proceedings of the joint 12th International Conference on Methods and Techniques in Behavioral Research and 6th
Seminar on Behavioral Methods held online, May 18-20, 2022. www.measuringbehavior.org. Editors: Andrew Spink, Jarosław
Barski, Anne-Marie Brouwer, Gernot Riedel, & Annesha Sil (2022). DOI 10.6084/m9.figshare.20066849. ISBN: 978-90-74821-94-0
The EQIPD Quality System: a unique tool to improve the robustness of
preclinical drug discovery research data
Björn Gerlach
Partnership for the Assessement and Advancement of Scientific Practice (PAASP), Hauptstrasse 25, D- 69117,
Heidelberg, Germany, [email protected]
Abstract
Drug development success rate is currently low and influenced by different factors, insufficient data robustness is
considered as one of them. Currently, there is no comprehensive expectation for a quality system available for the
non-regulated biomedical research. The European Quality In Preclinical Data (EQIPD), an Innovative Medicine
Initiative consortium, has been developing a fit-for-purpose quality system for preclinical research for the past
three years. This quality system consists of core and extended requirements, which provide a tailored framework
for improving data quality in preclinical research units. The consortium developed three components (the Toolbox,
the Planning Tool and the Dossier) to guide and facilitiate the set-up of the quality system. Currently, the system
is tested in several labs and will be made available by the end of 2020.
Introduction
The low drug development success rate is an important concern in the scientific community. One factor which
contributes to the high rate of preclinical-to-clinical translation failures is the insufficient robustness of preclinical
evidence. To address this issue, a fit-for-purpose quality system (QS) for non-regulated drug discovery research is
being developed by the European Quality In Preclinical Data consortium (EQIPD, www.eqipd.org) under the
umbrella of the Innovative Medicine Initiative. This project involves partners from academia, pharma industry,
CROs and consultancies.
Results
The basis for the QS was a status-quo analysis performed by interviewing over 70 stakeholders with backgrounds
in academic and/or industrial preclinical research. Building on this analysis and the expertise of consortium
partners, a Delphi process including 20 consortium members was performed to identify essential elements for the
QS which were named the Core Requirements. Overall, the guiding principal for designing the QS was improve
data quality and transparency, as well as to be lean, fit-for-purpose and user-friendly. Additionally, it should be
easy to apply in research labs without being an unnecessary regulary burden for scientists. This will be achieved
by using the three interlinked components developed by the consortium: A) the online Toolbox, B) the Planning
Tool and C) the Dossier. These tools will enable the user to develop, implement and organise solutions to monitor
and improve work processes as well as to increase data quality by addressing core and unit-specific requirements.
The above mentioned three components provide a framework for the use and implementation of the QS in three
phases:
During the first phase, the Planning Tool assists the user in addressing the critical data quality requirements. This
results in the generation of an Action Plan, which provides an overview of the tasks to be tackled in order to
establish a functional QS. It also includes several essential quality elements, such as best practice procedures for
study documentation, organisation of communication lines and aspects of study desgin. The Plannning Tool is
directly linked to information in the Toolbox and the Dossier. The Toolbox is built similar to an online Wiki page
and provides information for different aspects of the research process. In contrast, the Dossier can only be accessed
by the research unit and is considered the central local storage place for all QS-related files of that unit.
211 Volume 2 of the Proceedings of the joint 12th International Conference on Methods and Techniques in Behavioral Research and 6th
Seminar on Behavioral Methods held online, May 18-20, 2022. www.measuringbehavior.org. Editors: Andrew Spink, Jarosław
Barski, Anne-Marie Brouwer, Gernot Riedel, & Annesha Sil (2022). DOI 10.6084/m9.figshare.20066849. ISBN: 978-90-74821-94-0
During the second phase, further research unit-specific needs can be addressed, taking advantage of the modular
nature of the system. At this stage, research units focus on their specific needs and requirements to improve a
particular part in their research environment.
During the third phase, additional complementary items can be added to finalise the QS. If not already introduced
at this point, this could be for example the self-assessment protocol for a research unit’s internal procedures. On
an experimental level, this could be the implementation of a standardized approach for blinding to perform
experiments in an unbiased way. If desired, this finalization step would also allow for external assessment and
accreditation by an EQIPD governing body.
The EQIPD QS for generating robust research data is currently tested by several research groups and will be
available to the research community by the end of 2020.
Summary
The EQIPD QS aims to be a tailored working solution that will make the research process more transparent, reduce
bias and safeguard good research practice. The tools developed by EQIPD will provide guidance for research units
to achieve this goal and should be a helpful resource to improve data quality.
Funding
This project has received funding from the Innovative Medicines Initiative 2 Joint Undertaking under grant
agreement No 777364. This Joint Undertaking receives support from the European Union’s Horizon 2020 research
and innovation programme and EFPIA.
Reference
1. Vollert J, Schenker E, Macleod M, Bespalov A, Wuerbel H, Michel M, Dirnagl U, Potschka H, Waldron AM,
Wever K, Steckler T, Van de Casteele T, Altevogt B, Sil A, Rice A (2020) A systematic review of guidelines for
internal validity in the design, conduct and analysis of biomedical experiments involving laboratory animals.
British Medical Journal Open Science, in press.
2. Macleod M, Steckler T (2019) A European initiative to unclog pipeline for new medicines. Nature 568, 458.
212 Volume 2 of the Proceedings of the joint 12th International Conference on Methods and Techniques in Behavioral Research and 6th
Seminar on Behavioral Methods held online, May 18-20, 2022. www.measuringbehavior.org. Editors: Andrew Spink, Jarosław
Barski, Anne-Marie Brouwer, Gernot Riedel, & Annesha Sil (2022). DOI 10.6084/m9.figshare.20066849. ISBN: 978-90-74821-94-0
Can We Replicate Our Own Results?
Richard E. Brown
Department of Psychology and Neuroscience, Dalhousie University, Halifax, Nova Scotia, Canada.
Introduction
Genetically modified mice are the most popular animal models for the study of human diseases [1]. In the study
of mouse models of neurodevelopmental and neurodegenerative disorders, we use batteries of tests to measure
deficits in behaviour and to make inferences about the mental states of the mice that we interpret as deficits in
"learning", "memory", "anxiety", etc. But how are we to know the mental state of the mouse from studying its
behaviour? We observe behaviour under controlled experimental situations, and we interpret it. Unfortunately,
the results from studies of many mouse models have been difficult to replicate. Thus, there is a demand for
improved mouse models of neurological disorders and for reproducible results [2]. Since many
neurodevelopmental and neurodegenerative disorders are primarily defined by behavioural deficits, it is essential
to have valid and reliable behavioural bioassays for these mouse models. All research conducted in my lab that is
reported in this paper was done under the approval of the Dalhousie University Committee on Animal Care.
Validity
When assessing the validity of a mouse models, the best approach we have is to assess the behavioural phenotype
and compare it with that of humans with the disorder to ensure high construct validity [3,4]. Transgenic mice are
produced from inbred strains and each of these background strains has specific attributes so that a genetic mutation
may give different results depending on the background strain [1,5] and this has plagued many studies of transgenic
mouse models. The background strain may confound the effects of the genetic manipulation in many ways [6].
For example, Inbred strains differ in their lifespans [7], sensory [8,9], and motor abilities [10,11], and in their
developmental parameters [12], all of which may act as confounds in behavioural studies of transgenic mice.
For example, to be a valid behavioural test of deficits in learning and memory, the test must measure learning and
memory. Many tests have been developed for measuring the behavioural phenotypes of transgenic mouse models
[13], but how do we make inferences about the mental states of the mouse from the results of these tests? Many
types of data can be collected in behavioural tests, but which data actually provide measures of the phenomenon
of interest? Put another way; we design the tests but the mice do what they bloody well please and we make
inferences about their mental states from their behaviour. However, our accuracy or the validity of our inferences
depends on which behaviours we attend to. For that we need to have specific behavioural bioassays [14].
Replicability between labs
Much has been written on the "replicability problem" in animal research in general [15] and in behavioural
neuroscience in particular [16]. This issue is not new. Crabbe et al. [17] found that some results of behavioural
tests were replicable across labs and some depended on the laboratory test environment. What do you do when
other labs cannot replicate your results? When this happened to me, I redid the experiment, replicating the different
methods used in the two laboratories and was able to show that the differences in social and sexual experience of
the rats produced the different behavioural results [18]. The differences in the two studies were not due to test
procedures per se, but to the housing and social experiences of the rats. There are many such laboratory effects
that can confound the results of behavioural experiments [19]. Knowing that there are such laboratory effects
between labs, we wondered whether the same issues existed within our lab.
213 Volume 2 of the Proceedings of the joint 12th International Conference on Methods and Techniques in Behavioral Research and 6th
Seminar on Behavioral Methods held online, May 18-20, 2022. www.measuringbehavior.org. Editors: Andrew Spink, Jarosław
Barski, Anne-Marie Brouwer, Gernot Riedel, & Annesha Sil (2022). DOI 10.6084/m9.figshare.20066849. ISBN: 978-90-74821-94-0
Reliablity of results within our own lab
We examined intra-experimenter reliability by testing mice in cohorts and comparing the results between cohorts
and by testing the same mice at different ages. The results of each cohort are not always the same.
Vision in mice: Behaviour and physiology
In studies of visual ability across the lifespan we found that the C57BL/6J mice improved with age while the DBA
mice began to show failure in vision between 9 and 12 months of age. One could interpret this as an age-related
deficit in discrimination learning ability (a cognitive deficit) or an age-related decline in visual ability (a sensory
deficit) [20]. By repairing the visual deficits, we showed that the results were due to age-related glaucoma and not
age-related cognitive dysfunction [21]. The important feature of this study was that the behavioural measures of
visual ability were correlated with physiological measures of inter-ocular pressure, retinal ganglion cell counts,
and number of cells in the superior colliculus. The validity of the behavioural measures was verified by the
significant correlations with the physiological measures. Changes in visual ability also explained differences in
performance in tests of spatial learning and memory in the Morris water maze: mice with improved vision showed
improved spatial learning and memory [22].
Lifespan development: Cross-sectional versus longitudinal studies
In our studies of lifespan changes in learning and memory, we found differences in working and reference memory
between 3xTg-AD and WT mice, from 2-16 months of age in cross-sectional studies [22]. There were differences
at each age, but the differences were not always significant. Likewise in our lifespan studies of motor behaviour
[11] and spatial learning and memory in 5xFAD and WT mice [24] there were both age-related and sex differences,
but these were only significant at specific ages. What these studies show is that even though the results of each
test are in the same direction, some differences are significant and some are not. The same mice tested by the same
experimenter in the same apparatus do not always give the same results.
Different experimenters in the same lab
When the same mice are tested by different experimenters, how well do their results agree? Chesler et al. [25]
found that the experimenter effect was larger than genotype differences in mouse studies of pain research. In our
lab we have had different experimenters test mice on the same tests at different ages. Stover tested mice at 6
months of age [26] and another student tested the same strain of mice at 16 months of age, but 4 years later. The
results of the two studies are very comparable [27]. We have also tested olfactory learning in over 14 strains of
mice and replicated these results in different experiments by the same experimenter [8, 20] and by different
experimenters [28]. Although there is a report that the sex of the experimenter effects results in studies of pain
perception in mice [29], we have not analyzed our data for sex of experimenter. We do, however, have a large
study on olfactory learning in progress which is designed to analyze experimenter effects.
Examining laboratory effects
As pointed out by a number of studies [17, 25, 30], the housing conditions and laboratory environment affect the
results of behavioural studies. We have found effects of apparatus and test procedure on learning in the Barnes
maze [31], of strain differences in maternal behaviour on pup development [32, 33], and the effects of single versus
group housing on feeding behaviour in 5xFAD mice [34]. Finally we have shown how background strain affects
the behavioural phenotypes of the MDGA2+/- mouse model of Autism Spectrum Disorder [12].
Failure to replicate: curse or blessing?
214 Volume 2 of the Proceedings of the joint 12th International Conference on Methods and Techniques in Behavioral Research and 6th
Seminar on Behavioral Methods held online, May 18-20, 2022. www.measuringbehavior.org. Editors: Andrew Spink, Jarosław
Barski, Anne-Marie Brouwer, Gernot Riedel, & Annesha Sil (2022). DOI 10.6084/m9.figshare.20066849. ISBN: 978-90-74821-94-0
There have been a number of proposals for improving the reliability and validity of published research [35, 36].
Even so, some authors have argued that most published research is not replicable [37], while others argue that
failure to replicate is an inherent property of scientific research. Redish et al. [38] point out that "reproducibility is
a broad concept that includes a number of issues" and that failures of reproducibility play a crucial role in scientific
research. Nigri et al. [39] suggest that testing mice in more than one laboratory will increase the reliability of the
results.
Failure to replicate: Errors and what they tell us.
All research involves some level of error. We have learned how to spot erors from equipment and experimenter
errors in studies of olfactory discrimination using an olfactomer, from testing mice in an automated Barnes maze
and from experimenter errors in the conditioned odour preference test. In each case, the behaviour of the mice told
us that there was an equipment or an experimenter error. And so, when we have abnormal data from our mice, we
want to know what has gone wrong and we always ask: "What is that mouse trying to tell us?" This a lesson that
can be learned from the studies of Breland and Breland [40] on “mouse misbehaviour”, in which the mice show
that species-typical responses may confound the best laid plans of Skinnerian operant conditioning.
Data versus interpretation
Of the many behaviours that we score in a behavioural test, which ones tell us about the mind of the mouse? We
have previously argued that in order to interpret the behaviour of a mouse model, a specific behavioural bioassay
in required [14]. Search paths may give a better measure of learning in the Morris water maze and Barnes maze
than measures of latency or distance [24, 31]. Species-typical behaviours may be a better measure of anxiety than
time in the dark or time in the open arms of a maze [41]. In the end, we require the careful combination of
ethological and experimental studies to develop sensitive behavioural bioassays which measure the behaviour of
mice, followed by judicious interpretation of that data to make inferences about the “mind of the mouse”. If a
mouse fails to learn a discrimination, is it a cognitive, sensory, motor, emotional or motivational deficit? It may
depend on which data we collect and how we interpret it [24].
The importance of conducting a complete behavioural phenotype
If we are interested in whether a mouse model of Alzheimer’s disease has cognitive deficits, we must consider all
of the possible confounds other than cognitive deficits which may produce the behavioural deficits [11, 24, 42]. In
order to do this, we need to complete a full behavioural phenotyping of the mouse model: measuring sensory,
motor, cognitive, social, emotional and motivational behaviours, all of which can be mis-interpreted as cognitive
deficits [4, 22, 41, 42].
What have we learned?
All behavioural research involves the interaction between the mouse and the lab environment. The use of home
cage testing reduces much of the variability between labs, but not all behavioural tests can be done in the home
cage and laboratory effects persist [39, 43]. Thus we can conclude that laboratory effects will always be with us.
We have to be able to identify and measure these laboratory effects to understand how they influence the results
of our behavioural tests. Finally, we must be aware that even if two labs get the same behavioural results from a
test, they may interpret these results differently.
References
1. Brown, R.E. (2022). Genetically modified mice for research on human diseases: A triumph for Biotechnology
or a work in progress? The EurobioTech Journal, 6, 61-88.

215 Volume 2 of the Proceedings of the joint 12th International Conference on Methods and Techniques in Behavioral Research and 6th
Seminar on Behavioral Methods held online, May 18-20, 2022. www.measuringbehavior.org. Editors: Andrew Spink, Jarosław
Barski, Anne-Marie Brouwer, Gernot Riedel, & Annesha Sil (2022). DOI 10.6084/m9.figshare.20066849. ISBN: 978-90-74821-94-0
2. Fisher, E.M.C., Bannerman, D.M. (2019). Mouse models of neurodegeneration: Know your question, know
your mouse. Science Translational Medicine, 11, eaaq1818.
3. Gunn, R.E., Huentelman, M.J., Brown, R.E. (2011). Are Sema5a mice a good model of Autism? A behavioural
analysis of sensory systems, emotionality and cognition. Behavioural Brain Research, 225, 142-150.
4. Silverman, J.L., Thurm, A., Ethridge, S.B., Soller, M.M., Petkova, S.P., Abel, T., Bauman, M.D., Brodkin, E.S.,
Harony-Nicolas, H., Wöhr, M., Halladay, A. (2022). Reconsidering animal models used to study autism spectrum
disorder: Current state and optimizing future. Genes Brain and Behavior, 2022:e12803.
5. Gerlai, R. (1996). Gene-targeting studies of mammalian behavior: is it the mutation or the background genotype?
Trends in Neurosciences, 19, 177-181.
6. Fontaine, D.A., Davis, D.B. (2016). Attention to background strain is essential for metabolic research: C57BL/6
and the international knockout mouse consortium. Diabetes, 65, 25-33.
7. Rae, E.A. Brown, R.E. (2015). The problem of genotype and sex differences in life expectancy in transgenic
AD mice. Neuroscience and Biobehavioral Reviews, 57, 238-251.
8. Wong, A.A., Brown R.E. (2006). Visual detection, pattern discrimination and visual acuity in 14 strains of mice.
Genes, Brain and Behavior, 5, 389-403.
9. Simanaviciute, U., Ahmed, J., Brown, R.E., Connor-Robson, N., et al. (2020). Recommendations for measuring
whisker movements and locomotion in mice with sensory, motor, and cognitive deficits. Journal of Neuroscience
Methods, 331, 108532.
10. Brooks, S.P., Pask, T., Jones, L., Dunnett, S.B. (2004). Behavioural profiles of inbred mouse strains used as
transgenic backgrounds. 1: motor tests. Genes Brain and Behavior, 3, 206-215.
11. O’Leary, T.P., Mantolino, H.M., Stover, K., Brown, R.E. (2020). Age-related deterioration of motor function
in male and female 5xFAD mice from 3-16 months of age. Genes, Brain and Behavior, 19, e12538.
12. Fertan, E., Wong, A.A., Purdon, M.K., Weaver, I.C.C.G., Brown, R.E. (2021). The effect of background strain
on the behavioural phenotypes of the MDGA2+/- mouse model of Autism Spectrum Disorder. Genes Brain and
Behavior, 20, e12696.
13. Wahlsten, D. (2011). Mouse behavioral testing. Amsterdam: Elsevier.
14. Brown, R.E., Bolivar, S. (2018). The importance of behavioural bioassays in neuroscience. Journal of
Neuroscience Methods, 300, 68-76.
15. Macleod, M., Mohan, S. (2019). Reproducibility and rigor in animal-based research. ILAR Journal, 60, 17-23.
16. Bespalov, A., Steckler, T. (2018). Lacking quality in research: Is behavioral neuroscience affected more than
other areas of biomedical science? Journal of Neuroscience Methods, 300, 4-9.
17. Crabbe, J.C., Wahlsten, D., Dudek, B. (1999). Genetics of mouse behavior: Interactions with laboratory
environment. Science, 284, 1670-1672.
18. Brown, R.E. (1991). Effects of rearing condition, gender and sexual experience on odor preferences and urine-
marking in Long-Evans rats. Animal Learning and Behavior, 19, 18-28.

216 Volume 2 of the Proceedings of the joint 12th International Conference on Methods and Techniques in Behavioral Research and 6th
Seminar on Behavioral Methods held online, May 18-20, 2022. www.measuringbehavior.org. Editors: Andrew Spink, Jarosław
Barski, Anne-Marie Brouwer, Gernot Riedel, & Annesha Sil (2022). DOI 10.6084/m9.figshare.20066849. ISBN: 978-90-74821-94-0
19. Schellinck, H.M., Cyr, D.P., Brown, R.E. (2010). How many ways can mouse behavioral experiments go
wrong? Confounding variables in mouse models of neurodegenerative diseases and how to control them. Advances
in the Study of Behavior, 41, 255-366.
20. Wong, A.A., Brown. R.E. (2007). Age-related changes in visual acuity, learning and memory in C57BL/6J and DBA/2J
mice. Neurobiology of Aging, 28, 1577-1593.
21. Wong, A.A., Brown, R.E. (2012). A neuro-behavioral analysis of the prevention of visual impairment in the
DBA/2J mouse model of glaucoma. Investigative Opthalmology and Visual Science (IOVS), 53, 5956-5966.
22. Brown, R.E., Wong, A.A. (2007). The influence of visual ability on learning and memory performance in 13
strains of mice. Learning and Memory, 14, 134-144.
23. Stevens, L.M., Brown, R.E. (2015). Reference and working memory deficits in the 3xTg-AD mouse between
2 and 15 months of age: A cross-sectional study. Behavioural Brain Research, 278, 496-505.
24. O’Leary, T.P., Brown, R.E. (2022). Visuo-spatial learning and memory impairments in the 5xFAD mouse
model of Alzheimer’s disease: Effects of age, sex, albinism and motor impairments. Genes, Brain and Behavior,
2022, e12794.
25. Chesler, E.J., Wilson, S.G., Lariviere, W.R., Rodriguez-Zas, S.L., Mogil, J.S. (2002). Identification and
ranking of genetic and laboratory environment factors influencing a behavioral trait, thermal nociception, via
computational analysis of a large data archive. Neuroscience and Biobehavioral Reviews, 26, 907-923.
26. Stover, K.R., Campbell, M.A., Van Winssen, C.M., Brown, R.E. (2015). Analysis of motor function in 6-
month-old male and female 3xTg-AD mice. Behavioural Brain Research, 281, 16-23.
27. Garvock-de Montbrun, T., Fertan, E., Stover, K., Brown, R.E. (2019). Motor deficits in 16-month-old male
and female 3xTg-AD mice. Behavioural Brain Research, 356, 305-313.
28. O’Leary, T.P., Stover, K., Mantolino, H.M., Darvesh, S., Brown R.E. (2020). Olfactory memory from 3 to 15
months of age in the 5xFAD mouse model of Alzheimer disease. Behavioural Brain Research, 393, 112731.
29. Sorge, R.E., Martin, L.J., Isbester ,K.A, Sotocinal, S.G., Rosen, S., et al. (2014). Olfactory exposure to males,
including men, causes stress and related analgesia in rodents. Nature Methods, 11, 629-632.
30. Lewejohann, L., Reinhard, C., Schrewe, A., Brandewiede, J., Haemisch, A., Görtz, N., Sc.hachner ,M.,
Sachser, N. (2006). Environmental bias? Effects of housing conditions, laboratory environment and experimenter
on behavioral tests. Genes Brain and Behavior, 5, 64-72.
31. O’Leary, T.P., Brown, R.E. (2012). The effects of apparatus design and test procedure on learning and memory
performance of C57BL/6J mice on the Barnes maze. Journal of Neuroscience Methods, 203, 315-324.
32. Brown, R.E., Mathieson, W.B., Stapleton, J., Neumann, P.E. (1999). Maternal behavior in female C57BL/6J
and DBA/2J inbred mice. Physiology and Behavior, 67, 599-605.
33. Blaney, C.E., Gunn, R.K., Stover, K.R., Brown, R.E. (2013). Maternal genotype influences development of 3xTg-AD
mouse pups. Behavioural Brain Research, 252, 40-48.
34. Gendron, W.H., Fertan, E., Pelletier, S, Roddick, K.M., O’Leary,T.P., Anini, Y., Brown, R.E. (2021). Age
related weight loss in female 5xFAD mice from 3 to 12 months of age. Behavioural Brain Research, 406, 113214.
217 Volume 2 of the Proceedings of the joint 12th International Conference on Methods and Techniques in Behavioral Research and 6th
Seminar on Behavioral Methods held online, May 18-20, 2022. www.measuringbehavior.org. Editors: Andrew Spink, Jarosław
Barski, Anne-Marie Brouwer, Gernot Riedel, & Annesha Sil (2022). DOI 10.6084/m9.figshare.20066849. ISBN: 978-90-74821-94-0
35. Ioannidis, J.P. (2014). How to make more published research true. PLoS Medicine, 11, e1001747.
36. Rudeck, J., Vogl, S., Banneke, S., Schönfelder, G., Lewejohann, L. (2020). Repeatability analysis improves
the reliability of behavioral data. PLoS One, 15, e0230900.
37. Ioannidis, J.P.A. (2005) Why most published research findings are false. PLoS Medicine, 2, e124.
38. Redish, A.D., Kummerfeld, E., Morris, R.L., Love, A.C. (2018). Reproducibility failures are essential to
scientific enquiry. Proceedings of the National Academies of Science, USA, 115, 5042-5046.
39. Nigri ,M., Åhlgren, J., Wolfer, D.P., Voikar, V. (2022) Role of environment and experimenter in
reproducibility of behavioral studies with laboratory mice. Frontiers in Behavioural Neuroscience, 16, 835444.
40. Breland, K., Breland, M. (1961). The misbehavior of organisms. American Psychologist, 16, 681-684
41. O'Leary, T.P., Gunn, R.K., Brown, R.E. (2013). What are we measuring when we test strain differences in
anxiety in mice? Behavior Genetics, 43, 34-50.
42. O'Leary, T.P., Shin, S., Fertan, E., Dingle, R.N., Almuklass, A., Gunn, R.K., Yu, Z., Wang, J., Brown, R.E.
(2017). Reduced acoustic startle response and peripheral hearing loss in the 5XFAD mouse model of Alzheimer’s
disease. Genes Brain and Behavior, 16, 554-563.
43. Robinson, L., Spruijt, B., Riedel, G. (2018). Between and within laboratory reliability of mouse behaviour
recorded in home-cage and open-field. Journal of Neuroscience Methods, 300, 10-19.

218 Volume 2 of the Proceedings of the joint 12th International Conference on Methods and Techniques in Behavioral Research and 6th
Seminar on Behavioral Methods held online, May 18-20, 2022. www.measuringbehavior.org. Editors: Andrew Spink, Jarosław
Barski, Anne-Marie Brouwer, Gernot Riedel, & Annesha Sil (2022). DOI 10.6084/m9.figshare.20066849. ISBN: 978-90-74821-94-0
Assessing the scientific quality of online interventions for psychological well-
being: Are we doing good science in times of the pandemic?
Cristina Rodríguez-Prada, Luis Fernández Morís, Miguel A. Vadillo1
1 Multisensory Research Group, Center for Brain and Cognition, Pompeu Fabra University, Barcelona
Abstract
The impact of the COVID-19 pandemic on psychological well-being has led to a proliferation of online
psychological interventions, as well as research aimed at testing their effectiveness. However, it is unknown
whether the scientific quality of this evidence may have been compromised during the pandemic, similar to other
fields in biomedical research. This work assessed the quality of research addressing the effectiveness of online
psychological interventions published after the outbreak of the COVID-19 pandemic, with respect to control
articles published pre-pandemic. The aim of this work is to develop a checklist to assess the methodological quality
of research conducted on online interventions in clinical psychology before and after the pandemic.
Introduction
On January 30, 2020, the World Health Organization declared a public health emergency caused by the SARS-
CoV-2 virus, and it was not until March 11, 2020 that it acquired pandemic status. Apart from the logical
uncertainty and fear of contagion this situation has had substantial economic, social and psychological
consequences. The latter have been exacerbated by strong limitations of mobility, social isolation, productive
activity and seclusion, which have been associated with significant mental discomfort. Anxiety and depression
problems have increased in the last two years [1, 2].
Importantly, there is evidence that the COVID-19 outbreak has had a negative differential impact on the quality
of scientific production. The scientific community has been under stress for quick answers. Given the urgency of
publishing relevant findings, faster revisions responding to the current context and the different difficulties
associated with the process (e.g., lack of availability of physical means for research due to movement restrictions),
these factors could have altered the results that could be included within good practices [3].
In addition to gathering evidence on a given phenomenon and its consequences, it is important to ensure that the
quality of the evidence is adequate and to be able to build firm scientific knowledge. This is especially critical
when it comes to research that has direct consequences on people's health. Given the large amount of evidence on
the consequences of the pandemic for mental health, the relevance of this topic for research activity -and also for
industry-, as well as the direct impact of clinical interventions on people's wellbeing, we are interested in analyzing
the production related to online psychological interventions for mental health. This interest responds, in the same
way, to a sort of homogenization due to the common characteristics of the studies of interventions, as well as the
existence of standards that allow us to evaluate their quality.
Taking all this into consideration, the aim of this paper is to make a diagnosis of the quality of scientific production
related to COVID within Clinical Psychology. In this way, by describing the reality that research in the field of
clinical psychology is experiencing, we can provide new guidelines or recommendations to generate
improvements.
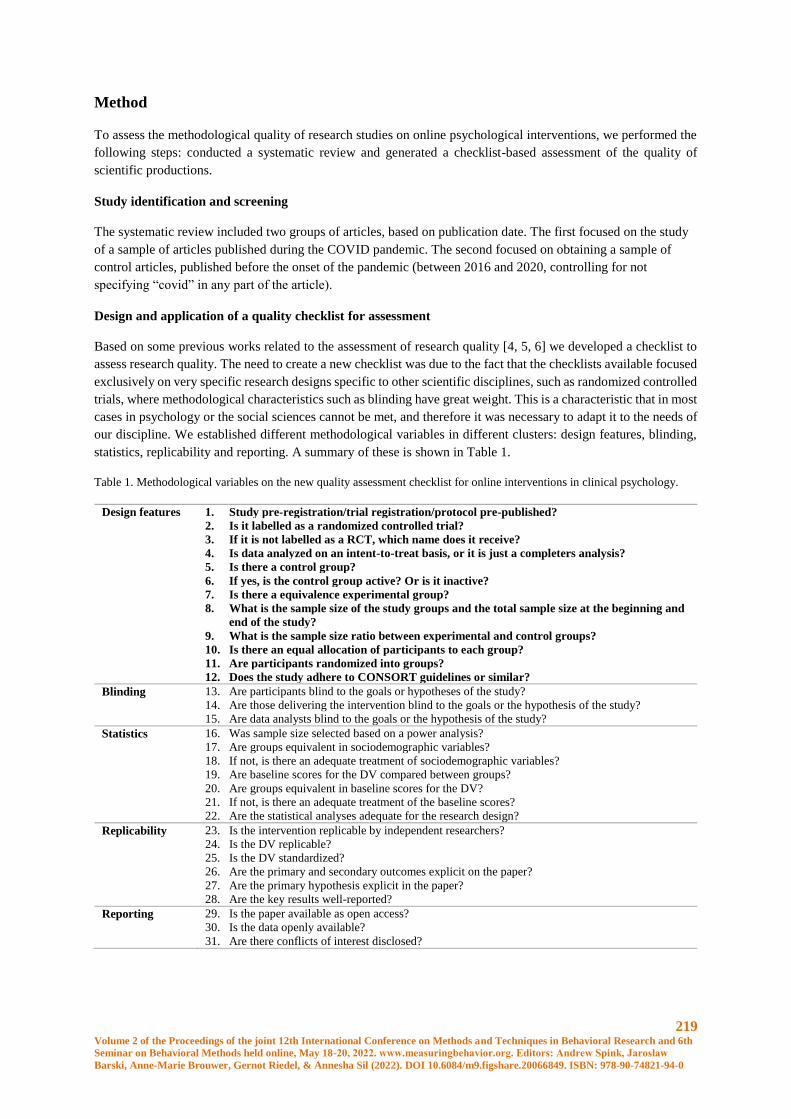
219 Volume 2 of the Proceedings of the joint 12th International Conference on Methods and Techniques in Behavioral Research and 6th
Seminar on Behavioral Methods held online, May 18-20, 2022. www.measuringbehavior.org. Editors: Andrew Spink, Jarosław
Barski, Anne-Marie Brouwer, Gernot Riedel, & Annesha Sil (2022). DOI 10.6084/m9.figshare.20066849. ISBN: 978-90-74821-94-0
Method
To assess the methodological quality of research studies on online psychological interventions, we performed the
following steps: conducted a systematic review and generated a checklist-based assessment of the quality of
scientific productions.
Study identification and screening
The systematic review included two groups of articles, based on publication date. The first focused on the study
of a sample of articles published during the COVID pandemic. The second focused on obtaining a sample of
control articles, published before the onset of the pandemic (between 2016 and 2020, controlling for not
specifying “covid” in any part of the article).
Design and application of a quality checklist for assessment
Based on some previous works related to the assessment of research quality [4, 5, 6] we developed a checklist to
assess research quality. The need to create a new checklist was due to the fact that the checklists available focused
exclusively on very specific research designs specific to other scientific disciplines, such as randomized controlled
trials, where methodological characteristics such as blinding have great weight. This is a characteristic that in most
cases in psychology or the social sciences cannot be met, and therefore it was necessary to adapt it to the needs of
our discipline. We established different methodological variables in different clusters: design features, blinding,
statistics, replicability and reporting. A summary of these is shown in Table 1.
Table 1. Methodological variables on the new quality assessment checklist for online interventions in clinical psychology.
Design features 1. Study pre-registration/trial registration/protocol pre-published?
2. Is it labelled as a randomized controlled trial?
3. If it is not labelled as a RCT, which name does it receive?
4. Is data analyzed on an intent-to-treat basis, or it is just a completers analysis?
5. Is there a control group?
6. If yes, is the control group active? Or is it inactive?
7. Is there a equivalence experimental group?
8. What is the sample size of the study groups and the total sample size at the beginning and
end of the study?
9. What is the sample size ratio between experimental and control groups?
10. Is there an equal allocation of participants to each group?
11. Are participants randomized into groups?
12. Does the study adhere to CONSORT guidelines or similar?
Blinding 13. Are participants blind to the goals or hypotheses of the study?
14. Are those delivering the intervention blind to the goals or the hypothesis of the study?
15. Are data analysts blind to the goals or the hypothesis of the study?
Statistics 16. Was sample size selected based on a power analysis?
17. Are groups equivalent in sociodemographic variables?
18. If not, is there an adequate treatment of sociodemographic variables?
19. Are baseline scores for the DV compared between groups?
20. Are groups equivalent in baseline scores for the DV?
21. If not, is there an adequate treatment of the baseline scores?
22. Are the statistical analyses adequate for the research design?
Replicability 23. Is the intervention replicable by independent researchers?
24. Is the DV replicable?
25. Is the DV standardized?
26. Are the primary and secondary outcomes explicit on the paper?
27. Are the primary hypothesis explicit in the paper?
28. Are the key results well-reported?
Reporting 29. Is the paper available as open access?
30. Is the data openly available?
31. Are there conflicts of interest disclosed?

220 Volume 2 of the Proceedings of the joint 12th International Conference on Methods and Techniques in Behavioral Research and 6th
Seminar on Behavioral Methods held online, May 18-20, 2022. www.measuringbehavior.org. Editors: Andrew Spink, Jarosław
Barski, Anne-Marie Brouwer, Gernot Riedel, & Annesha Sil (2022). DOI 10.6084/m9.figshare.20066849. ISBN: 978-90-74821-94-0
Discussion
The checklist that we have developed in this paper covers key issues to address when talking about science and
replicability in psychological research. Analysing whether the studies that are carried out have pre-registration
protocols, what the research groups and sample sizes are like, and how these have been decided are relevant aspects
for understanding the results obtained. Although our discipline does not often allow for the use of blinding
standards, we believe that it is also relevant to be able to collect these aspects and see how they are adapted the
specific context of behavioral sciences. Another fundamental aspect is the use of the data analysis employed, a
key tool for obtaining valid results, together with the research design. In this sense, not controlling for some
variables can lead to biased results. This also interacts with the last two major areas, namely replicability and the
reporting of results, since it is necessary to pay sufficient attention to an article so that it can make it clear what
steps to follow for other researchers seeking to reproduce it. Analysing these variables, making a diagnosis and
exploring the contextual effect that the pandemic may have on them is of particular relevance in order to build
better scientific practices.
References
1. Usher, K., Durkin, J., & Bhullar, N. (2020). The COVID‐19 pandemic and mental health
impacts. International journal of mental health nursing, 29(3), 315.
2. Usher, K., Bhullar, N. and Jackson, D. (2020), Life in the pandemic: Social isolation and mental health. J Clin
Nurs, 29: 2756-2757. https://doi.org/10.1111/jocn.15290
3. Kodvanj, I., Homolak, J., Virag, D. (2022). Publishing of COVID-19 preprints in peer-reviewed journals,
preprinting trends, public discussion and quality issues. Scientometrics. https://doi.org/10.1007/s11192-021-
04249-7
4. Jung, R.G., Di Santo, P., Clifford, C. et al. (2021). Methodological quality of COVID-19 clinical research. Nat
Commun 12, 943 (2021). https://doi.org/10.1038/s41467-021-21220-5
5. Sterne, J. A., Savović, J., Page, M. J., Elbers, R. G., Blencowe, N. S., Boutron, I., ... & Higgins, J. P. (2019).
RoB 2: a revised tool for assessing risk of bias in randomised trials. bmj, 366.
6. Ferrero, M., Vadillo, M. A., & León, S. P. (2021). Is project-based learning effective among kindergarten and
elementary students? A systematic review. PLoS ONE, 16:e0249627

221 Volume 2 of the Proceedings of the joint 12th International Conference on Methods and Techniques in Behavioral Research and 6th
Seminar on Behavioral Methods held online, May 18-20, 2022. www.measuringbehavior.org. Editors: Andrew Spink, Jarosław
Barski, Anne-Marie Brouwer, Gernot Riedel, & Annesha Sil (2022). DOI 10.6084/m9.figshare.20066849. ISBN: 978-90-74821-94-0
How to replicate behavior in the lab: lessons learned from 50 users a year
Bikovski Lior1,2
1The Myers Neuro-Behavioral Core Facility, Sackler School of Medicine, Tel Aviv University, Tel Aviv, Israel. 2School of Behavioral Sciences, Netanya academic college, 4223587, Netanya, Israel
Replication of scientific process is a known challenge, specifically in pre-clinical behavioral neuroscience [1,2,3,4],
and as a consequence the ability to establish a known mouse model or behavioral tool in ones lab is a limited and
challenging process.
The Myers Neuro-Behavioral Core Facility (MNBCF) is an academic research unit which every year service over
50 different users (e.g. academic labs, pharma companies, contract research organisations, and government
facilities), who all have unique research demands and needs. Common to everyone is the need to assess the effects
of different manipulations (e.g. genetic, pharmacology) on behavior, which poses a continuing challenges for the
MNBCF.
The MNBCF deals with these challenges through calibration of methods and adjustment of conditions so they will
meet every unique challenge (e.g. experimenter effect, mouse strain, disorder model) our users introduce. In turn,
calibration promotes standardisation between the different projects, which leads to an ability to assess results in
light of a bigger picture.
Examples of MNBCF calibration and standardization processes will be disscused during the talk.
References
1. Brown, R E, Stanford, L., & Schellinck, H. M. (2000). Developing standardized behavioral tests for
knockout and mutant mice. ILAR Journal / National Research Council, Institute of Laboratory Animal
Resources, 41(3), 163–174. https://doi.org/10.1093/ilar.41.3.163
2. Brown, Richard E, & Wong, A. A. (2007). The influence of visual ability on learning and memory
performance in 13 strains of mice. Learning and Memory, 14(3), 134–144.
https://doi.org/10.1101/lm.473907.Nguyen
3. Gouveia, K., & Hurst, J. L. (2017). Optimising reliability of mouse performance in behavioural testing :
the major role of non-aversive handling. Nature Publishing Group, (September 2016), 1–12.
https://doi.org/10.1038/srep44999
4. Crabbe, J. C. (1999). Genetics of Mouse Behavior: Interactions with Laboratory Environment. Science,
284(5420), 1670–1672.
Wahlsten, D. (2001). Standardizing tests of mouse behavior : Reasons , recommendations , and reality.
Physiology and Behavior, 73(5), 695–704.
222 Volume 2 of the Proceedings of the joint 12th International Conference on Methods and Techniques in Behavioral Research and 6th
Seminar on Behavioral Methods held online, May 18-20, 2022. www.measuringbehavior.org. Editors: Andrew Spink, Jarosław
Barski, Anne-Marie Brouwer, Gernot Riedel, & Annesha Sil (2022). DOI 10.6084/m9.figshare.20066849. ISBN: 978-90-74821-94-0
Session Theme: Using Drones to Transform the
Measurement of Behaviour
223 Volume 2 of the Proceedings of the joint 12th International Conference on Methods and Techniques in Behavioral Research and 6th
Seminar on Behavioral Methods held online, May 18-20, 2022. www.measuringbehavior.org. Editors: Andrew Spink, Jarosław
Barski, Anne-Marie Brouwer, Gernot Riedel, & Annesha Sil (2022). DOI 10.6084/m9.figshare.20066849. ISBN: 978-90-74821-94-0
Use of Aerial Thermal Imaging to Compare Assess Surface Temperatures
Between Light and Dark Variants of Black Angus x Canadian Speckle Park
Cattle
John S. Church, Justin T. Mufford, and Joanna S. Urban
Department of Natural Resource Science & Biological Sciences, Thompson Rivers University, Kamloops BC, Canada.
Introduction
This study presents a novel, non-invasive approach to studying heat stress in beef cattle. We used thermal imagery
acquired by an unmanned aerial vehicle to compare surface temperature between colour variants of Black Angus
x Speckle Park calves. Our results show that light-coated variants have lower surface temperature than dark during
peak ambient air temperature; this suggests that light coats may confer heat tolerance by facilitating internal heat
dissipation more easily.
Climate change models project the number of days on which cattle experience heat stress will increase in many
North American rangelands (Reeves & Bagne 2016). Heat stress is emerging as a major concern for the cattle
industry in both tropical and temperate regions as it reduces foraging, growth, metabolic efficiency, and sometimes
increases mortality rates (Reeves & Bagne 2016; Bernabucci et al. 2010). In response to increased heat stress and
mortality due to climate change, the industry needs to develop and adopt best management practices to mitigate
losses in production.
Selecting for heat-tolerant morphological traits is a potentially feasible strategy to optimize production in hot
climates. It has been shown that coat characteristics partially explain differences in heat tolerance between Bos
taurus breeds (Bernabucci et al. 2010). For example, breeds with dark and/or thick coats such as Black Angus and
MARC III have a stronger thermoregulatory response (i.e., higher respiration rate and panting scores) to a hot
environment compared to breeds with light and/or thin coats such as Gelbvieh and Charolais (Brown-brandl et al.
2006). Darker coats, having a lower albedo, absorb more solar radiation than light ones, which can result in greater
heat gain compared to light coats (Finch 1985; Finch et al. 1984). Thick and dense coats insulate more than thinner
and less dense coats (Bernabucci et al. 2010; Dikmen et al. 2008; Finch 1985). Thus, selecting heat-tolerant coat
characteristics may prove beneficial in beef production settings.
In North America, Black Angus is commonly used in beef production despite their susceptibility to heat stress
compared to other breeds (Brown-brandl et al. 2006). Cross breeding Angus with Speckle Park cattle and selecting
for heat-tolerant traits such as coat colour may be an effective and practical strategy to adapt cattle for production
during hot conditions. Individuals produced by this cross are completely black, predominantly white, or partially
mixed.
In this study, we investigated differences in the surface temperature between dark and light variants of Black
Angus x Speckle Park calves in order to perform a preliminary analysis of heat tolerance conferred by coat colour.
We used a novel and non-invasive approach to measure coat surface temperature in a field setting using infrared
thermography data acquired by an unmanned aerial vehicle (UAV) borne thermal infrared (TIR) radiometer.
Methods
Animals & Study Site
Our study animals consisted of 12 calves, between two and three months old, produced from breeding Black Angus
cross heifers with Canadian Speckle Park bulls. Of these 12 calves, five were completely black. The other seven
calves had the following coat colour pattern: White head and rump, a wide white stripe running from the head to
224 Volume 2 of the Proceedings of the joint 12th International Conference on Methods and Techniques in Behavioral Research and 6th
Seminar on Behavioral Methods held online, May 18-20, 2022. www.measuringbehavior.org. Editors: Andrew Spink, Jarosław
Barski, Anne-Marie Brouwer, Gernot Riedel, & Annesha Sil (2022). DOI 10.6084/m9.figshare.20066849. ISBN: 978-90-74821-94-0
the rump, and a varied speckled pattern of white and black on the legs, feet and rounds. We deemed the six black
Speckle Park calves as dark variants and the six remaining animals light variants. Animals were held in a 20-ha
enclosed pasture, near Monte Lake, British Columbia.
Prior to data collection, cattle were acclimated to the UAV hovering above them and remaining stationary at an
altitude of 20 metres above ground level (magl). We also allowed the cattle to become habituated to the UAVs
flying past them at speeds of up to 40 km hr–1. We started our acclimation period three weeks prior to the study.
During the first week of this period, we flew our UAV at 40m magl; in the second week, 30 magl; and the third
week, 20 magl. By the third week, none of the cattle showed any behavioural response to the UAV flying above
them and remaining stationary at 20 magl.
Measurements
Data collection occurred in spring, 2 Jun. 2017, between 1225–1415 hours (Pacific daylight savings time, PDT);
this was close to solar noon (1158 hours) on this date, during which the intensity of sunlight is greatest.
Approximately every 15 min, ambient air temperature, max wind speed, and relative humidity were measured
using a Kestrel 3500 Weather Meter (Nielsen-Kellerman Company, Boothwyn, PA, USA) and the intensity of
solar radiation was measured with a Newport 815 Digital Power Meter (Newport Corporation, Irvine, CA, USA).
A DJI Inspire 1 V2.0 quadcopter integrated with a DJI Zenmuse XTradiometric imaging TIR radiometer (Dà-Jiāng
Innovations Science and Technology Co., Ltd, Shenzhen, China) measured animal surface temperature from the
air. The TIR imager captures photos at a resolution of 96 dpi. It was calibrated to an emissivity of 0.98, which is
an appropriate value for measuring the surface temperature of cattle (McManus et al. 2016). The UAV was flown
at approximately 20 magl. Based on the results of Nyamuryekung’e et al. (2016) who found that at 25 magl UAVs
had no effect on the feeding behaviour of cattle in both habituated and non-habituated groups, this altitude was
considered high enough above the cattle to ensure that the UAV did not affect their behaviour. Images were
acquired approximately every five min with the TIR imager in a downward pointing direction. The order in which
the animals were imaged was selected at random. Images were stored as radiometric jpeg files, in which a surface
temperature can be measured for every pixel. We used FLIR Tools + software (FLIR® Systems, Inc., OR, USA)
to measure the surface temperature of the backs of the cattle by digitizing a polygon around each animal,
encompassing the surface of the animal from the end of the rump to the base of the neck (Figure 1), and then
computing the average temperature of the pixels within the polygon.
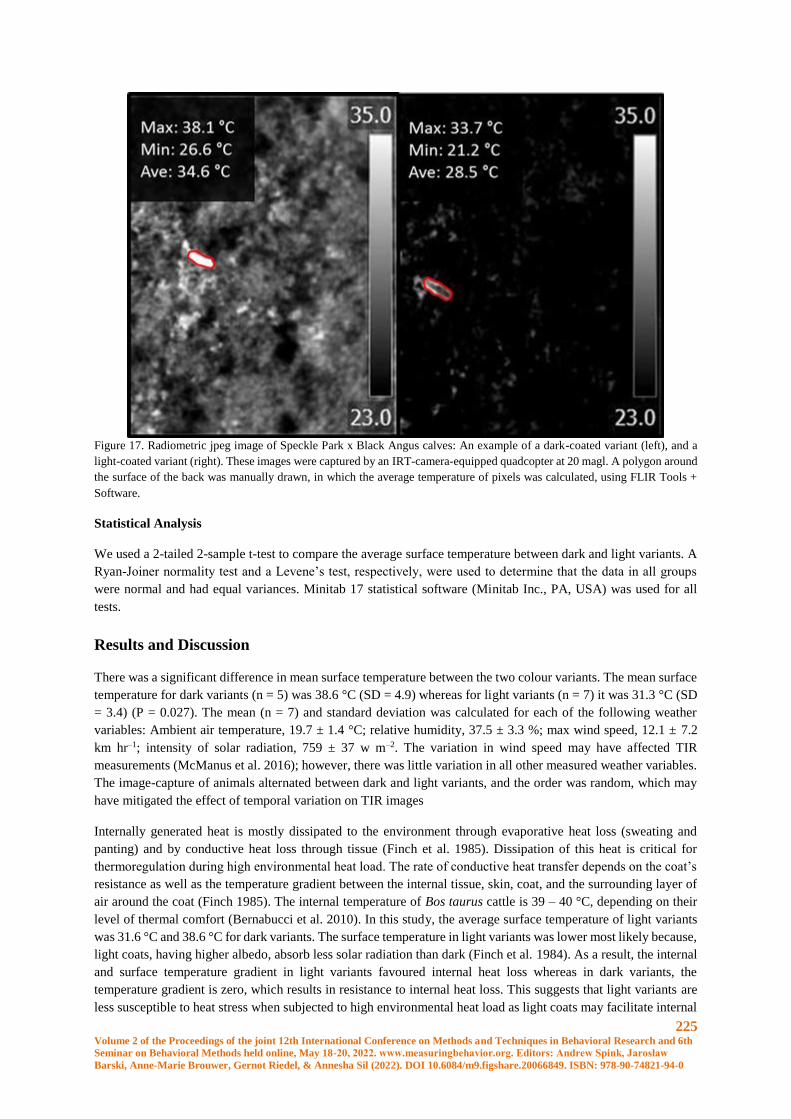
225 Volume 2 of the Proceedings of the joint 12th International Conference on Methods and Techniques in Behavioral Research and 6th
Seminar on Behavioral Methods held online, May 18-20, 2022. www.measuringbehavior.org. Editors: Andrew Spink, Jarosław
Barski, Anne-Marie Brouwer, Gernot Riedel, & Annesha Sil (2022). DOI 10.6084/m9.figshare.20066849. ISBN: 978-90-74821-94-0
Figure 17. Radiometric jpeg image of Speckle Park x Black Angus calves: An example of a dark-coated variant (left), and a
light-coated variant (right). These images were captured by an IRT-camera-equipped quadcopter at 20 magl. A polygon around
the surface of the back was manually drawn, in which the average temperature of pixels was calculated, using FLIR Tools +
Software.
Statistical Analysis
We used a 2-tailed 2-sample t-test to compare the average surface temperature between dark and light variants. A
Ryan-Joiner normality test and a Levene’s test, respectively, were used to determine that the data in all groups
were normal and had equal variances. Minitab 17 statistical software (Minitab Inc., PA, USA) was used for all
tests.
Results and Discussion
There was a significant difference in mean surface temperature between the two colour variants. The mean surface
temperature for dark variants (n = 5) was 38.6 °C (SD = 4.9) whereas for light variants (n = 7) it was 31.3 °C (SD
= 3.4) (P = 0.027). The mean (n = 7) and standard deviation was calculated for each of the following weather
variables: Ambient air temperature, 19.7 ± 1.4 °C; relative humidity, 37.5 ± 3.3 %; max wind speed, 12.1 ± 7.2
km hr–1; intensity of solar radiation, 759 ± 37 w m–2. The variation in wind speed may have affected TIR
measurements (McManus et al. 2016); however, there was little variation in all other measured weather variables.
The image-capture of animals alternated between dark and light variants, and the order was random, which may
have mitigated the effect of temporal variation on TIR images
Internally generated heat is mostly dissipated to the environment through evaporative heat loss (sweating and
panting) and by conductive heat loss through tissue (Finch et al. 1985). Dissipation of this heat is critical for
thermoregulation during high environmental heat load. The rate of conductive heat transfer depends on the coat’s
resistance as well as the temperature gradient between the internal tissue, skin, coat, and the surrounding layer of
air around the coat (Finch 1985). The internal temperature of Bos taurus cattle is 39 – 40 °C, depending on their
level of thermal comfort (Bernabucci et al. 2010). In this study, the average surface temperature of light variants
was 31.6 °C and 38.6 °C for dark variants. The surface temperature in light variants was lower most likely because,
light coats, having higher albedo, absorb less solar radiation than dark (Finch et al. 1984). As a result, the internal
and surface temperature gradient in light variants favoured internal heat loss whereas in dark variants, the
temperature gradient is zero, which results in resistance to internal heat loss. This suggests that light variants are
less susceptible to heat stress when subjected to high environmental heat load as light coats may facilitate internal
226 Volume 2 of the Proceedings of the joint 12th International Conference on Methods and Techniques in Behavioral Research and 6th
Seminar on Behavioral Methods held online, May 18-20, 2022. www.measuringbehavior.org. Editors: Andrew Spink, Jarosław
Barski, Anne-Marie Brouwer, Gernot Riedel, & Annesha Sil (2022). DOI 10.6084/m9.figshare.20066849. ISBN: 978-90-74821-94-0
heat dissipation more easily than dark coats. Further research should compare the productivity between colour
variants under extreme heat loads and take into account of evaporative heat loss through sweating and panting as
well as their behavioral responses.
The inclusion of Canadian Speckle Park animals in primarily Black Angus commercial breeding programs has the
potential to introduce heat tolerant traits into the popular Angus breed. Simple morphological characteristics such
as coat colour may confer a significant increase in heat tolerance. Modifying these characteristics, while still
maintaining most of the qualities that make Black Angus cattle popular among commercial breeders, would cause
little disruption to the North American industry.
Acknowledgements
We thank the Duck Hill Cattle Company for use of their cattle and research site. This projected was supported by
the National Science and Engineering Research Council (NSERC) Undergraduate Student Research Award
(USRA).
Ethical Statement
Animals used in these experiments were authorized by Thompson Rivers Universities Animal Care Committee
under the purview of the Canadian Council of Animal Care.
References
1. Bernabucci, U., Lacetera, N., Baumgard, L.H., Rhoads, R.P., Ronchi, B., Nardone, A. (2010). Metabolic and
hormonal acclimation to heat stress in domesticated ruminants. Animal 4,1167–1183.
doi:10.1017/S175173111000090X.
2. Brown-Brandl, T.M,. Eigenberg, R.A., Nienaber, J.A., Hahn, G.L. (2005). Dynamic response indicators of heat
stress in shaded and non-shaded feedlot cattle, part 1: Analyses of indicators. Biosyst. Eng. 90, 451–462.
doi:10.1016/j.biosystemseng.2004.12.006.
3. Dikmen, S., Alava, E., Pontes, E., Fear, J.M., Dikmen, B.Y., Olson T.A., Hansen ,P.J. (2008). Differences in
thermoregulatory ability between slick-haired and wild-type lactating holstein cows in response to acute heat
stress. J. Dairy Sci. 91, 3395–3402. doi:10.3168/jds.2008-1072.
4. Finch, A.F., Bennett, I.L., Holmes ,CR. (1984). Coat colour in cattle: Effect on thermal balance, behaviour and
growth, and relationship with coat type. J. Agric. Sci. Camb. 102, 141–147.
5. Finch, VA. (1985). Body temperature in beef cattle: Its control and relevance to production in the tropics. J.
Anim. Sci. 62, 531–542.
6. Mcmanus, C., Tanure, C.B., Peripolli, V., Seixas, L., Fischer, V., Gabbi, A.M., Menegassi, S.R.O., Stumpf,
M.T., Kolling, G.J., Dias, E., et al. (2016). Infrared thermography in animal production : An overview.
Comput. Electron. Agric. 123, 10–16. doi:10.1016/j.compag.2016.01.027.
7. Nyamuryekung’e, S., Cibils, A.F., Estell, R.E., Gonzalez, A.L. (2016). Use of an unmanned aerial vehicle -
Mounted video camera to assess feeding behavior of raramuri criollo cows. Rangel. Ecol. Manag. 69, 386–389.
doi:10.1016/j.rama.2016.04.005.
8. Reeves, M.C., and Bagne, K.E. (2016). Vulnerability of cattle production to climate change on U.S. rangelands.
United States Department of Agriculture General Technical Report.
227 Volume 2 of the Proceedings of the joint 12th International Conference on Methods and Techniques in Behavioral Research and 6th
Seminar on Behavioral Methods held online, May 18-20, 2022. www.measuringbehavior.org. Editors: Andrew Spink, Jarosław
Barski, Anne-Marie Brouwer, Gernot Riedel, & Annesha Sil (2022). DOI 10.6084/m9.figshare.20066849. ISBN: 978-90-74821-94-0
Using UAVs to measure behavioral indicators of heat stress in cattle
Justin T. Mufford and John S. Church
Department of Natural Resource Science, Thompson Rivers University, Kamloops BC, Canada.
Introduction
Heat stress is a growing problem for both animal welfare and production in the cattle industry. Heat stress in cattle
(Bos taurus) adversely affects growth, feed conversion efficiency, and reproductive performance [1, 2]. In addition,
heat waves can cause mortalities which result in devastating economic losses [2]. Climate change models predict
that average summer temperatures and the frequency and magnitude of heat waves are both projected to increase
[3]. Concurrently, the number of days on which cattle experience heat stress are expected to increase [4].
In response to the worsening problem of heat stress, there is interest in determining factors associated with heat
stress susceptibility [5]. Identifying these factors may be useful for mitigating production loss. Animals known to
be susceptible to heat stress can be selectively managed; this can be more efficient than applying the same heat
stress management procedure to every animal [6]. Furthermore, determining heat stress factors can aid in the
selection of heat tolerant traits [7].
One important factor that affects heat stress susceptibility is coat color. Darker coats, having a higher albedo,
absorb more solar radiation than lighter coats [8, 9]. The impact of coat color on heat stress is well studied in
feedlot cattle [5] but little work has been conducted on cattle on pasture. Furthermore, little work has been done
in Canada even though heat stress is likely an emerging problem in the Canadian cattle industry [10].
Measuring indicators of heat stress in a cow-calf operation on pasture or rangeland is logistically challenging.
Monitoring physiological indicators of heat stress such as rumen temperature requires invasive devices that are
reliable but may be cost prohibitive, especially in large scale studies [11]. Monitoring behavioral indicators may
be logistically easier and more affordable. For example, respiration rate is a reliable indicator of heat stress that
does not require invasive procedures to obtain [12]. However, respiration rate is time- and labor- intensive to
measure in the field [13, 14]. Wearable devices that can obtain automated measures of respiration rate [15] are
expensive and logistically challenging to use, especially in large scale studies [7]. Given these challenges and
limitations, there is a growing interest in developing more effective tools to measure indicators of heat stress in
cattle [11, 12]
Unmanned aerial vehicles (UAVs) offer a non-invasive and practical approach to studying behavioral indicators
of heat stress in cattle in both large-scale feedlots and pasture conditions. The battery life, affordability, and data-
collection capability of consumer-grade UAVs have substantially improved in the last decade [16] and they have
much potential for use in cattle production and behavioural studies. UAVs have been used for identification [17],
enumeration [16, 18] monitoring feed intake [19] and studying social behavior in cows [20].
In this study, we developed a method to monitor behavioral indicators of heat stress in cattle using UAVs. We
used aerial-based video collected from the UAV to quantify respiration rate. We first sought to validate this method
by reproducing previous work studying factors associated with respiration rate in feedlot cattle [21]. We then
employed this method to determine if coat color is associated with respiration rate in an extensive cow-calf pasture
setting.
Methods
All the procedures used in our experiments were approved by the Animal Care Committee of Thompson Rivers
University (Kamloops, B.C., Canada).
228 Volume 2 of the Proceedings of the joint 12th International Conference on Methods and Techniques in Behavioral Research and 6th
Seminar on Behavioral Methods held online, May 18-20, 2022. www.measuringbehavior.org. Editors: Andrew Spink, Jarosław
Barski, Anne-Marie Brouwer, Gernot Riedel, & Annesha Sil (2022). DOI 10.6084/m9.figshare.20066849. ISBN: 978-90-74821-94-0
Site 1: Feedlot
The first study site was a feedlot operated by Kasco Cattle Company (Ltd.), located near Purple Springs, AB,
Canada (49°50'38.2"N, 111°58'39.8"W). This feedlot contained 66 lots, each containing 100–200 beef cattle. Lots
had a soil surface, and were 50 x 60 m, facing an east/west orientation. In addition, lots were adjacent to each
other, separated by eight-foot fencing and there were six rows of adjacent feedlots. Each lot contained a variety of
breeds including, but not limited to, black angus, hereford, charolais, Canadian speckle park, simmental and
various crosses. Cattle that were recently treated for disease were identified by ear tag and excluded from the study
Grain feed was provided by truck once in the morning at 8000–1000 hours in a feed bunk along the width of each
pen which was freely accessible. Each lot contained a water trough that enabled ad libitum water intake. There
were no artificial shade structures but fencing provided some shade for a few cattle depending on the time of day.
Cattle along the shaded fence line were not included in the study. In total there were roughly 9000 steers throughout
the feedlot. The average weight at arrival ranged between 450 to 700 kg and all individuals were kept on the lot
for approximately three months.
Site 2: Pasture
The second study site was the University of Alberta Mattheis Research pasture (50°53'41.8"N, 111°57'00.4"W).
Two cow-calf herds in different pastures were included in the study. The first herd consisted of approximately 175
black angus cow-calf pairs and 15 hereford cow-calf pairs; the age of the cows ranged from 5 to 10 years old. The
second herd consisted of approximately 350 hereford cow-calf pairs and 50 black angus cow-calf pairs; there was
a wide range in age of the cows, 3 to 14 years old. Only cows were included in the study. Each pasture was
approximately 300 ha of flat grasslands with no shade from trees or artificial covers. Water was available in each
pasture from natural sources or provided by truck to a watering trough on a consistent basis to ensure ad libitum
water intake.
Data Collection
At the feedlot, data collection occurred between July 25 and Aug 2 and between Aug 8 and 10 during a morning
period, 8030–1130 hours, and during an afternoon period, 1400–1700 hours. We used a DJI Mavic Pro quadcopter
(Dà-Jiāng Innovations Science and Technology Co., Ltd., Shenzhen, China) to record video of cattle at an altitude
of 8–10 meters above ground level. Because we were unable to identify individuals, we ran the risk of
pseudreplication in sampling. To minimize the potential effects of pseudoreplication, during each data collection
period, we flew the unmanned aerial vehicle (UAV) over randomly selected lots to record video of the cattle. After
finishing recording in one lot, we immediately moved to another randomly selected lot if there was sufficient
battery power. When the battery power was low, we flew the UAV back to its home point, exchanged batteries
and immediately moved on to the next lot; battery exchanges took approximately 5 minutes. Within each lot we
hovered the UAV over a randomly selected group of cattle, and recorded video for three minutes, with the UAV
in a stationary position. After three minutes, we moved the UAV over a different randomly selected group of cattle
within the same lot, recorded video and repeated this again to obtain three videos of different cattle per lot.
At the research pasture, data collection occurred between Aug 19 and 29, 2018. Each day we collected data during
the morning period, 8030–1130 hours, and the afternoon period, 1400–1700 hours. The two herds studied were
separated into different pastures spaced far enough apart that it was not logistically possible to collect data on both
herds during the same period. On the first day we collected data on one herd for both collection periods; the second
day we collected data on the other herd for both collection periods and we continued alternating herds each day.
During the collection period, we flew the UAV over a randomly selected group of cattle in the herd and recorded
video for three minutes at a stationary position at an altitude of approximately 8–10 m. After three minutes, we
immediately flew the UAV to a different randomly selected group and recorded video if battery power allowed. If
the battery power was low, we flew the UAV back to its home point, exchanged batteries, and flew back to the
herd; battery exchanges took approximately 10 minutes. Exchanges required more time on pasture than on feedlot
as cattle on pasture were farther away from the take-off point. We repeated this for the entire duration of the
collection period. We manually flew the UAV but moved in a grid pattern to avoid sampling the same cattle.
229 Volume 2 of the Proceedings of the joint 12th International Conference on Methods and Techniques in Behavioral Research and 6th
Seminar on Behavioral Methods held online, May 18-20, 2022. www.measuringbehavior.org. Editors: Andrew Spink, Jarosław
Barski, Anne-Marie Brouwer, Gernot Riedel, & Annesha Sil (2022). DOI 10.6084/m9.figshare.20066849. ISBN: 978-90-74821-94-0
Prior to data collection at the pasture and the feedlot, cattle were given a week to habituate to the UAV. On the
first day of exposure, we flew the UAV over the cattle at an altitude of 100 m and gradually descended to 80 m,
hovered stationary over the cattle and flew in various directions haphazardly above them. We descended 20 m
lower each subsequent day and repeated this process each day until we reached 10 m. At 10 m, most cattle did not
react to the UAV, but some showed behavioral responses, including sudden changes in position (i.e., lying to
standing or standing to a fast walking pace), rapid head turns, and frequent tail flicking. Any cattle exhibiting this
behavior were not included in the study. Cattle that did not show a behavioral response were considered habituated
and were included in the study.
Environmental Data
A Kestrel 5400AG portable weather station (Nielsen-Kellerman Company, Boothwyn, PA, USA) was used
throughout all data collection periods at both sites to measure wind speed, black globe temperature, ambient air
temperature and relative humidity. These variables were used to determine the heat load index (HLI), which was
calculated as follows [14]:
If Ta > 25 °C, then HLI = 8.62 + (0.38 × RH) + (1.55 × Tbg) − (0.5 × WS + e(2.4 − WS))
If Ta < 25 °C, then HLI = 10.66 + (0.28 × RH) + (1.3 × Tbg) − WS
where Ta is the ambient air temperature (°C), RH the relative humidity (%), Tbg the black globe temperature (°C),
and WS the wind speed (m/s).
HLI is highly predictive of heat stress behavior in cattle [5, 14]. These conditions were measured and automatically
recorded every 10 minutes. The portable weather station was mounted on a tripod within 3 km of the study animals
at each site.
Data Acquisition
Videos of cattle captured by the UAV were processed in Observer XT Software (Noldus) to quantify respiration
rate and behavior. Respiration rate was quantified by counting flank movements for three minutes; each flank
movement was recorded and time stamped as a behavioral event. Within those three minutes, any behavior that
obscured flank movement was also recorded and time stamped as a behavioral event. These behaviors included
but were not limited to changing positions, skin twitching, grooming, and regurgitating cud. The time duration of
a behavioral event that obscured flank movement was determined by calculating the duration of time between the
flank movement that occurred before and after the behavioral event. We determined the time during which flank
movements were observable by subtracting the total observation time by the total time spent exhibiting behaviors
that obscured flank movement. Respiration rate was calculated by dividing the total flank movements by the time
(seconds) during which flank movements were observable. This value was multiplied by 60 to obtain breaths per
minute (BPM). Standing, lying, and walking were recorded as durations that occurred mutually exclusive from
each other. Lying was recorded when the animal’s flank was touching the ground and standing was recorded when
the animal’s four legs were upright. Walking was recorded when both the front and back legs were moving at the
same time. The Observer coding system was configured such that behavioral events can be recorded at the same
time that standing, lying, and walking are recorded. Only observations in which the flank movements were
observable for at least two minutes were included in the dataset.
Observer analysis of videos was randomly divided between three observers. The intra- and inter-reliability was
determined by comparing BPM scores. Each observer randomly selected 25 cattle and quantified BPM on each
individual twice. The intra-observer reliability measured by correlation was 0.70, 0.80, and 0.98 for the three
observers. To determine inter-observer reliability, each observer quantified BPM of the same 40 cattle, which were
randomly selected. The inter-observer reliability, measured by correlation for each pair of observers was high (r2
= 0.89, 0.90, and 0.91). Both the intra- and inter-reliability scores were comparable to other behavioral studies [22,
23].
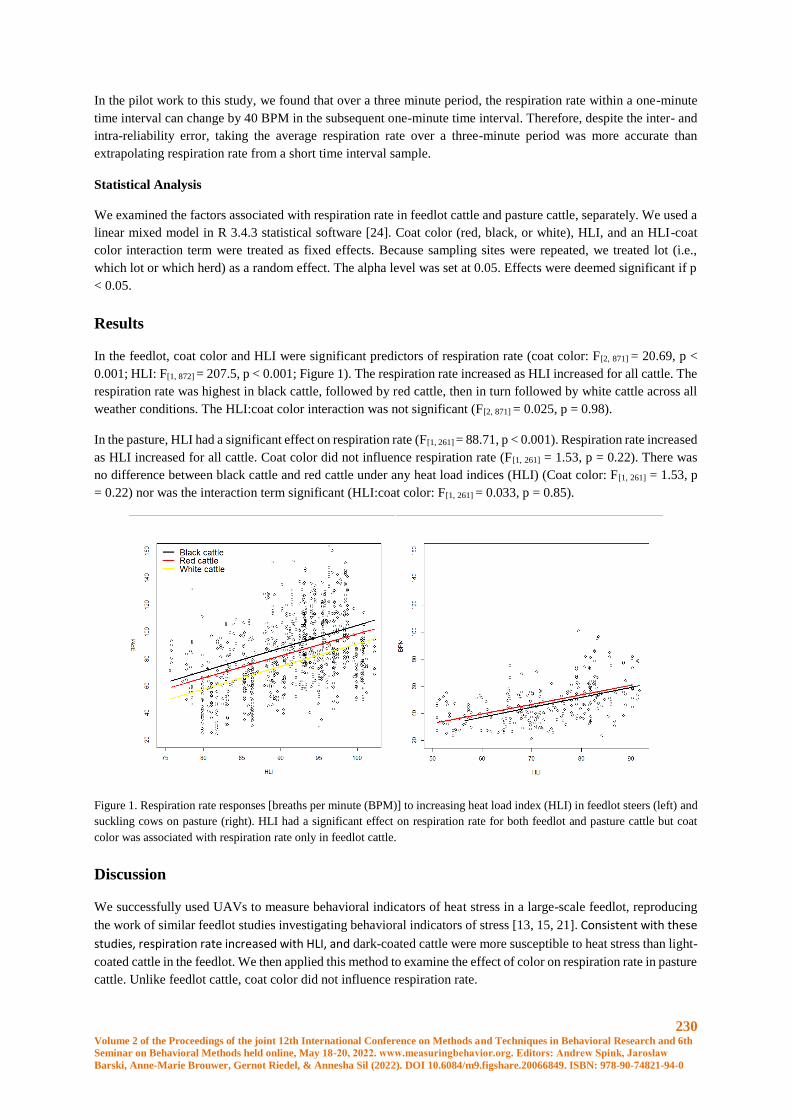
230 Volume 2 of the Proceedings of the joint 12th International Conference on Methods and Techniques in Behavioral Research and 6th
Seminar on Behavioral Methods held online, May 18-20, 2022. www.measuringbehavior.org. Editors: Andrew Spink, Jarosław
Barski, Anne-Marie Brouwer, Gernot Riedel, & Annesha Sil (2022). DOI 10.6084/m9.figshare.20066849. ISBN: 978-90-74821-94-0
In the pilot work to this study, we found that over a three minute period, the respiration rate within a one-minute
time interval can change by 40 BPM in the subsequent one-minute time interval. Therefore, despite the inter- and
intra-reliability error, taking the average respiration rate over a three-minute period was more accurate than
extrapolating respiration rate from a short time interval sample.
Statistical Analysis
We examined the factors associated with respiration rate in feedlot cattle and pasture cattle, separately. We used a
linear mixed model in R 3.4.3 statistical software [24]. Coat color (red, black, or white), HLI, and an HLI-coat
color interaction term were treated as fixed effects. Because sampling sites were repeated, we treated lot (i.e.,
which lot or which herd) as a random effect. The alpha level was set at 0.05. Effects were deemed significant if p
< 0.05.
Results
In the feedlot, coat color and HLI were significant predictors of respiration rate (coat color: F[2, 871] = 20.69, p <
0.001; HLI: F[1, 872] = 207.5, p < 0.001; Figure 1). The respiration rate increased as HLI increased for all cattle. The
respiration rate was highest in black cattle, followed by red cattle, then in turn followed by white cattle across all
weather conditions. The HLI:coat color interaction was not significant (F[2, 871] = 0.025, p = 0.98).
In the pasture, HLI had a significant effect on respiration rate (F[1, 261] = 88.71, p < 0.001). Respiration rate increased
as HLI increased for all cattle. Coat color did not influence respiration rate (F[1, 261] = 1.53, p = 0.22). There was
no difference between black cattle and red cattle under any heat load indices (HLI) (Coat color: F[1, 261] = 1.53, p
= 0.22) nor was the interaction term significant (HLI:coat color: F[1, 261] = 0.033, p = 0.85).
Figure 1. Respiration rate responses [breaths per minute (BPM)] to increasing heat load index (HLI) in feedlot steers (left) and
suckling cows on pasture (right). HLI had a significant effect on respiration rate for both feedlot and pasture cattle but coat
color was associated with respiration rate only in feedlot cattle.
Discussion
We successfully used UAVs to measure behavioral indicators of heat stress in a large-scale feedlot, reproducing
the work of similar feedlot studies investigating behavioral indicators of stress [13, 15, 21]. Consistent with these
studies, respiration rate increased with HLI, and dark-coated cattle were more susceptible to heat stress than light-
coated cattle in the feedlot. We then applied this method to examine the effect of color on respiration rate in pasture
cattle. Unlike feedlot cattle, coat color did not influence respiration rate.

231 Volume 2 of the Proceedings of the joint 12th International Conference on Methods and Techniques in Behavioral Research and 6th
Seminar on Behavioral Methods held online, May 18-20, 2022. www.measuringbehavior.org. Editors: Andrew Spink, Jarosław
Barski, Anne-Marie Brouwer, Gernot Riedel, & Annesha Sil (2022). DOI 10.6084/m9.figshare.20066849. ISBN: 978-90-74821-94-0
In feedlot cattle, the respiration rate was the highest in black cattle (bpm), followed by red (bpm) cattle, then white
cattle (bpm), across all weather conditions. This finding is consistent with other studies that modelled factors
associated with behavioral indicators of heat stress in feedlots in the United States [13, 21]. However, the HLI-
coat color interaction was not significant. Based on previous work [21] we suspect that the interaction may have
been significant if we had observed cattle in cooler conditions. All observations of feedlot cattle took place above
an HLI of 75 and an HLI above 70 is considered to be above the thermal neutral zone (TNZ) for feedlot cattle [13].
Other than individual variation, the respiration rate should not differ between cattle when they are in their TNZ.
Thus the respiration rate response between black, red, and white cattle may differ as the HLI increases above their
TNZ.
To our knowledge, this is the first study to examine heat stress indicators in feedlot cattle in Canada. The feedlot
in this study is located in an area with a high density of feedlot operations. Veterinarians and producers in this
region report that heat stress is a significant concern during summer heat waves. The results of this study suggest
that dark-coated cattle are more heat stressed in hot conditions compared to light-coated cattle. It is likely that
dark-coated cattle are less productive than light-coated cattle in hot conditions but further research is needed to
make a direct comparison of productivity. It may also be worth conducting a cost-benefit analysis of selectively
applying shading structures and/or sprinkling systems to dark-coated cattle.
After determining that it is logistically feasible to use UAVS to measure heat stress indicators in feedlot cattle, we
applied this method to cattle in a cow-calf operation on pasture. In these cows, there was no difference in
respiration rate between red cattle and black cattle. Pasture cattle were observed within an HLI range of 50.9-91.7,
part of the range being above their TNZ. The lack of difference shows that coat color does not have a significant
impact on heat stress in this HLI range. The respiration rate of black cattle and red cattle may be different in hotter
conditions. Further research should make this comparison at a higher HLI range.
It is possible that feedlot steers are more susceptible to heat stress compared to cows on pasture. Because feedlot
cattle are on grain- and cereal- based diets, they would produce more metabolically generated heat than pasture
cattle, which consume less energetically-dense forage. The feedlot cattle included in this study may have had, on
average, a higher body condition score (i.e., more fat cover directly underneath the skin) than pasture cattle. Cattle
with higher condition scores have stronger respiration responses to high heat loads [21] as fat cover affects heat
dissipation [6] Generally, feedlot cattle close to their finishing weight have high condition scores [6, 14] compared
to cows in cow-calf operations [25] that need to be in moderate condition for optimal reproductive performance
[26]. Feedlot steers may have been heavier on average than cows; heavier cattle are more susceptible to heat stress
[6]. The range of arrival weight of feedlot steers was 450 - 700 kg; there was no available data on the weight of
cows in this study but the average mature weight (measured at 4 years old) of beef cows is approximately 520 kg
[25]. The effect of sex may also explain differences in heat stress susceptibility between feedlot steers and pasture
cows; we are unable to separate the effects of sex from animal factors (body size and fat cover) or from the
operational context (pasture vs feedlot).
Future research should further improve the efficacy of UAVs as a tool for measuring heat stress behavior. For
example, camera lenses with optical zoom are available on consumer grade UAVs such as the one in this study;
this would make it possible to identify individual cattle within an extensive feedlot/pasture. This would reduce or
eliminate pseudoreplication in future studies similar to this. This would also allow for relating heat stress behavior
to genetic information which would benefit selection programs for heat tolerance [7]. Furthermore, this would be
useful for determining how individuals acclimate to hot environments over time [27]. Other behaviors associated
with heat stress can also be identified by aerial-based video; for example, panting is a severe sign of heat stress
and identifying this behavior would be useful from a management perspective. Potentially, quantifying respiration
rate could be automated through the use of machine learning, which would substantially decrease time and labor
for large-scale studies [11, 12]
This study has demonstrated that consumer-grade UAVs can be used as an effective tool for measuring the heat
stress behavior of cattle in large-scale operations. The method we have developed would greatly benefit future
research, with the potential to be used as a diagnostic tool for cattle health during extreme heat waves.

232 Volume 2 of the Proceedings of the joint 12th International Conference on Methods and Techniques in Behavioral Research and 6th
Seminar on Behavioral Methods held online, May 18-20, 2022. www.measuringbehavior.org. Editors: Andrew Spink, Jarosław
Barski, Anne-Marie Brouwer, Gernot Riedel, & Annesha Sil (2022). DOI 10.6084/m9.figshare.20066849. ISBN: 978-90-74821-94-0
References
1. Bernabucci, U. (2019). Climate change: Impact on livestock and how can we adapt. Animal Frontiers, 9, 1–5.
2. Lees, A. M., Sejian, V., Wallage, A. L., Steel, C. C., Mader, T. L., Lees, J. C., Gaughan, J. B. (2019). The impact
of heat load on cattle. Animals, 9(6), 1–20. https://doi.org/10.3390/ani9060322
3. Pasqui, M., Di Giuseppe, E. (2019). Climate change, future warming, and adaptation in Europe. Animal
Frontiers, 9(1), 6–11. https://doi.org/10.1093/af/vfy036
4. Reeves, M. C., Bagne, K. E. (2016). Vulnerability of cattle production to climate change on U.S. rangelands.
United States Department of Agriculture General Technical Report.
5. Brown-Brandl, T.M. (2013). Managing thermal stress in feedlot cattle: environment, animal susceptibility and
management options from a US perspective. In: Livestock housing: modern management to ensure optimal health
and welfare of farm animals. Wageningen Academic Publishers.
6. Brown-Brandl, T., Jones, D. D. (2011). Feedlot cattle susceptibility to heat stress: An animal-specific model.
Transactions of the American Society of Agricultural and Biological Engineers.
7. Carabaño, M. J., Ramón, M., Menéndez-Buxadera, A., Molina, A., Díaz, C. (2019). Selecting for heat tolerance.
Animal Frontiers, 9(1), 62–68. https://doi.org/10.1093/af/vfy033
8. Hillman, P. E., Gebremedhin, K. G., Brown-Brandl, T. M., Lee, C. N. (2005). Thermal analysis and behavioral
activity of heifers in shade or sunlight. Livestock Environment VII - Proceedings of the Seventh International
Symposium. https://doi.org/10.13031/2013.18360
9. Finch, V. A. (1985). Body temperature in beef cattle: its control and relevance to production in the tropics.
Journal of Animal Science, 62(2), 531–542.
10. Bishop-Williams, K. E., Berke, O., Pearl, D. L., Hand, K., Kelton, D. F. (2015). Heat stress related dairy cow
mortality during heat waves and control periods in rural Southern Ontario from 2010–2012. BMC Veterinary
Research, 11(1), 291. https://doi.org/10.1186/s12917-015-0607-2
11. Koltes, J. E., Koltes, D. A., Mote, B. E., Tucker, J., Hubbell, D. S. (2018). Automated collection of heat stress
data in livestock: New technologies and opportunities. Translational Animal Science, 2(3), 319–323.
https://doi.org/10.1093/tas/txy061
12. Lowe, G., Sutherland, M., Waas, J., Schaefer, A., Cox, N., Stewart, M. (2019). Infrared thermography—A
non-invasive method of measuring respiration rate in calves. Animals, 9(8), 4–11.
https://doi.org/10.3390/ani9080535
13. Gaughan, J. B., Mader, T. L., Holt, S. M., Sullivan, M. L., Hahn, G. L. (2010). Assessing the heat tolerance of
17 beef cattle genotypes. International Journal of Biometeorology, 54, 617–627. https://doi.org/10.1007/s00484-
009-0233-4
14. Gaughan, J. B., Mader, T. L., Holt, S. M., Lisle, A. (2008). A new heat load index for feedlot cattle. Journal
of Animal Science, 86(1), 226–234. https://doi.org/10.2527/jas.2007-0305
15. Brown-Brandl, T. M., Eigenberg, R. A., Nienaber, J. A., Hahn, G. L. (2005). Dynamic Response Indicators of
Heat Stress in Shaded and Non-shaded Feedlot Cattle , Part 1 : Analyses of Indicators. Biosystems Engineering,
90(4), 451–462. https://doi.org/10.1016/j.biosystemseng.2004.12.006
16. Whitehead, K., Hugenholtz, C. H., Myshak, S., Brown, O., LeClair, A., Tamminga, A., Barchyn, T. E.,
Moorman, B., Eaton, B. (2014). Remote sensing of the environment with small unmanned aircraft systems (UASs),

233 Volume 2 of the Proceedings of the joint 12th International Conference on Methods and Techniques in Behavioral Research and 6th
Seminar on Behavioral Methods held online, May 18-20, 2022. www.measuringbehavior.org. Editors: Andrew Spink, Jarosław
Barski, Anne-Marie Brouwer, Gernot Riedel, & Annesha Sil (2022). DOI 10.6084/m9.figshare.20066849. ISBN: 978-90-74821-94-0
part 2: a review of progress and challenges. Journal of Unmanned Vehicle Systems, 2(3), 86–102.
https://doi.org/10.1139/juvs-2014-0007
17. Andrew, W., Greatwood, C., Burghardt, T. (n.d.). Visual Localisation and Individual Identification of Holstein
Friesian Cattle via Deep Learning. 2017 IEEE International Conference on Computer Vision Workshops.
18. Shao, W., Kawakami, R., Yoshihashi, R., You, S., Kawase, H., Naemura, T. (2020). Cattle detection and
counting in UAV images based on convolutional neural networks. International Journal of Remote Sensing, 41(1),
31–52. https://doi.org/10.1080/01431161.2019.1624858
19. Nyamuryekung’e, S., Cibils, A. F., Estell, R. E., Gonzalez, A. L. (2016). Use of an unmanned aerial vehicle -
Mounted video camera to assess feeding behavior of raramuri criollo cows. Rangeland Ecology and Management,
69(5), 386–389. https://doi.org/10.1016/j.rama.2016.04.005
20. Mufford, J. T., Hill, D. J., Flood, N. J., Church, J. S. (2019). Use of unmanned aerial vehicles (UAVs) and
photogrammetric image analysis to quantify spatial proximity in beef cattle. Journal of Unmanned Vehicle
Systems, 7(3), 194–206. https://doi.org/10.1139/juvs-2018-0025
21. Brown-Brandl, Tami M, Eigenberg, R. A., Nienaber, J. A. (2006). Heat stress risk factors of feedlot heifers.
Livestock Science, 150(1–3), 57–68. https://doi.org/10.1016/j.livsci.2006.04.025
22. Vogt, A., Aditia, E. L., Schlechter, I., Schütze, S., Geburt, K., Gauly, M., König von Borstel, U. (2017). Inter-
and intra-observer reliability of different methods for recording temperament in beef and dairy calves. Applied
Animal Behaviour Science, 195(August 2016), 15–23. https://doi.org/10.1016/j.applanim.2017.06.008
23. Schütz, K. E., Rogers, A. R., Cox, N. R., Webster, J. R., Tucker, C. B. (2011). Dairy cattle prefer shade over
sprinklers: Effects on behavior and physiology. Journal of Dairy Science, 94(1), 273–283.
https://doi.org/10.3168/jds.2010-3608
24. R Core Team (2017). R: A language and environment for statistical computing. R Foundation for Statistical
Computing, Vienna, Austria. URL https://www.R-project.org/.
25. Nephawe, K. A., Cundiff, L. V., Dikeman, M. E., Crouse, J. D., Van Vleck, L. D. (2004). Genetic relationships
between sex-specific traits in beef cattle: Mature weight, weight adjusted for body condition score, height and
body condition score of cows, and carcass traits of their steer relatives. Journal of Animal Science, 82(3), 647–
653. https://doi.org/10.2527/2004.823647x
26. Diskin, M. G., Kenny, D. A. (2016). Managing the reproductive performance of beef cows. Theriogenology,
86(1), 379–387. https://doi.org/10.1016/j.theriogenology.2016.04.052
27. Bernabucci U., Lacetera N., Baumgard L.H., Rhoads R.P., Ronchi B., Nardone A. Metabolic and hormonal
acclimation to heat stress in domesticated ruminants. Animal. (2010), 4(7), 1167-1184.
doi:10.1017/S175173111000090X
234 Volume 2 of the Proceedings of the joint 12th International Conference on Methods and Techniques in Behavioral Research and 6th
Seminar on Behavioral Methods held online, May 18-20, 2022. www.measuringbehavior.org. Editors: Andrew Spink, Jarosław
Barski, Anne-Marie Brouwer, Gernot Riedel, & Annesha Sil (2022). DOI 10.6084/m9.figshare.20066849. ISBN: 978-90-74821-94-0
Use of Unmanned Aerial Vehicles for Applied Animal Ethology
John S. Church
Department of Natural Resource Science, Thompson Rivers University, Kamloops BC, Canada.
Specially equipped yet affordable unmanned aerial vehicles (UAVs) can be easily deployed to record behavior or
provide surveillance of a wide variety of species, even in difficult/impassible terrain [1]. Equipped with thermal
infrared imagers, UAVs have the ability to “see” through dense forest canopies, this allows researchers to locate
animals and assess their behavior more easily [2,3]. UAVs are proving to be an invaluable tool for routine
management procedures and practices in livestock, such as management observations during calving and breeding
seasons [4], even during nighttime. UAVs are also effective and practical for ethological studies involving wildlife
[5]. Furthermore, with the impressive zoom-capability of UAV-based cameras recently developed (30x optical, 6x
digital, 180x total) even the most sensitive and wary animals can be observed non-invasively from the air. This
technology has shown to be particularly beneficial when faced with missing livestock or potential threats from
predation.
Used in the past primarily on intensive crop farms, UAVs equipped with interchangeable visual, multispectral and
thermal cameras on rangelands and wildlands can now be used to monitor subtle changes in the visible, near-
infrared and infrared spectrum (radiation) that both plants and animals reflect [6]. The combined use of UAV-
based, high-resolution imagery (i.e., through multi/hyperspectral imagers) and vegetative mapping technology, is
greatly improving our ability to assess animal habitats. A single UAV can be used for both high-quality mapping
and behavioral analysis of animals, providing a comprehensive data-collection tool for ethological researchers.
The Smart Biome intelligent data platform we are developing is employing sophisticated computer vision, data
science and deep learning algorithms to effectively monitor the world’s natural capita, which includes both plants
and animals. All of these recent developments in UAV platforms, smart sensors, and image processing techniques
have also resulted in an increased uptake of this technology by the remote sensing community. Several studies
have successfully demonstrated UAV operations using small platforms equipped with sensors for RGB,
multispectral, hyperspectral, and thermal imaging, along with laser scanning capabilities (LiDAR) [7]. The UAVs’
ability to perform near-continuous acquisition of ultra-high spatial resolution imagery has provided both
opportunities and challenges in the area of vegetation mapping and monitoring because of the immense amount of
data that needs to be processed and analyzed [8]. There are significant opportunities in detecting plant species,
physiological and structural traits, plant communities, biophysical and biochemical characteristics of canopies,
and vegetation stress [6]. However, severe computing and data-storage bottlenecks currently exist that are
impeding the implementation and integration of these technologies. Similar limitations also exist when trying to
monitor animals on the land base using smart sensors. There will be tremendous future opportunity to monitor
animals on the land base using smart sensors, especially when coupled with UAV technology. Novel, UAV-based
imaging techniques and integrated animal tracking technology will be developed by specialized processing
workflows using artificial intelligence (AI) and deep structured learning through new mobility networks; this will
enable scientists to simultaneously monitor vegetation and address novel and important scientific questions
concerning animals efficiently and in near real-time. The new data platform that our current research group is
developing (Smart Biome) will implement expressive learning algorithms to improve understanding of vegetation
processes and interpret both geospatial and temporal effects on animal and vegetation dynamics, throughout the
environment.
The Smart Biome intelligent data project we envision is a revolutionary, high-tech data platform designed to affect
the decisions, productivity and ultimately the environmental sustainability of plants and animals in a given biome,
by making high-precision environmental research and decision-making more accessible to researchers. Biomes
are distinct biological communities that have formed in response to a shared physical climate. Biome is a broader
term than habitat; any biome can comprise a variety of habitats but they all incorporate both plants and animals
[9]. Many researchers currently rely on lower-resolution satellite data that provides an incomplete picture of
235 Volume 2 of the Proceedings of the joint 12th International Conference on Methods and Techniques in Behavioral Research and 6th
Seminar on Behavioral Methods held online, May 18-20, 2022. www.measuringbehavior.org. Editors: Andrew Spink, Jarosław
Barski, Anne-Marie Brouwer, Gernot Riedel, & Annesha Sil (2022). DOI 10.6084/m9.figshare.20066849. ISBN: 978-90-74821-94-0
vegetation while failing to incorporate information on animals [10]. Resource management and scientific study by
the strategic use of UAVs, wireless animal monitoring, and modern data processing software will find new
environmental applications globally. These new, innovative and largely unprecedented data platform solutions in
the future will use cutting edge technology that were, in the past, usually inaccessible to ethologists. The new
knowledge created will soon be rapidly accessible to a larger number of researchers. In addition, the collection of
precision data in the future will require highly trained ethologists to deploy UAVs in order to create high-precision
maps of rangeland and wildland areas; this will further bolster the demand for consumer/prosumer level drones
among the ethology community. Collected data will be processed and inserted into the Smart Biome data platform
with the ongoing support of big data experts and high-level programmers to ensure it can be done quickly, rapidly
and at a lower cost. Once data is processed using AI and deep learning it will become readily available to be
accessed and reviewed by researchers, policy makers and other relevant experts; this seamless process will better
inform decisions and help decide better courses of action.
We believe that landscape data in the future will be captured by off-the-shelf drone technology specially modified
to stream collected data, and respond to control information sent via a smart biome data platform. This new
approach has tremendous advantages over traditional remote-sensing methods such as satellite- and airplane-based
imagery. UAVs (more commonly known as drones) are capable of flying low and slow, and provide much higher
resolution data than that derived from other sources [2,3]. Data collected by these drones can be cataloged within
the smart biome data platform’s repository and used for analysis of ecosystem performance. Users in the future
will be able to browse these data, perform custom analyses, set up reoccurring analyses, and control behaviour of
the UAVs deployed in the field through an adaptive management portal. All automatic and user-specified data
manipulations can be logged by the system as metadata, ensuring that data lifecycle provenance is captured.
Additionally, original data and all derived data products can also be stored for re-analysis.
The solution we propose is a new data platform to enable whole-ecosystem monitoring, analysis and management.
Whole-ecosystem management recognizes the interconnectedness of human-mediated and natural processes that
drive ecosystem function and aims to optimize competing objectives to ensure ecosystem resilience [11]. The
proposed solution combines smart devices embedded in the physical environment with a digital environment for
data storage and analysis and decision-making as illustrated in Figure 1. The smart devices will include smart
collars, including wireless fencing, and smart ear tags that are fully integrated with UAVs. Smart collars are now
readily available [12, 13], whereas smart ear tags will require the extension of existing technology that presently
is only available in collar format. The data collected from these smart devices will then be streamed by wireless
technology from the UAVs, to mobility networks and finally into a new and unique digital environment. On arrival,
the data will be entered into a digital repository, which will serve the data to other components of the environment

236 Volume 2 of the Proceedings of the joint 12th International Conference on Methods and Techniques in Behavioral Research and 6th
Seminar on Behavioral Methods held online, May 18-20, 2022. www.measuringbehavior.org. Editors: Andrew Spink, Jarosław
Barski, Anne-Marie Brouwer, Gernot Riedel, & Annesha Sil (2022). DOI 10.6084/m9.figshare.20066849. ISBN: 978-90-74821-94-0
Figure 1: Architecture of the proposed new solution.
and store both metadata and provenance information. The analysis modules of the digital environment will include
preprocessing, image analysis and tracking tools. The preprocessing tools will automatically perform quality
assurance and control (QA/QC) as well as required preprocessing to create geodata that can be analyzed still
further. The image analysis and behavioural tracking analysis tools will provide new unprecedented abilities to
analyze the overall performance of a vast array of biomes in the future. In addition, data generated in the future
will consist primarily of geographic data (both raster and vector) and associated metadata. These data will be
collected by smart collars and/or smart ear tags, and integrated by drone technology to be streamed into the smart
biome data platform. The streamed data will constitute geospatial points and tracks, with attributes such as time,
animal behaviour, and device health; digital photography, multispectral images, thermal images, and LiDAR point
clouds. Post processing and analysis of these data will derive raster and vector data products, such as orthoimages
and land use classifications.
These tools will be made available in the end to human analysts (ethologists) through a management portal. The
management portal will also be used in the future to send control information back to the smart devices in the
physical environment via the UAVs. All these components will, in essence, create a new digital world, (aka a
digital twin), in which the scientists of the future will be able to explore the connection between plants and animals
using exciting new virtual reality tools. This will enable virtual fly-throughs of this digital world that serve as
proxies for the physical world, unlocking new perspectives and deeper understandings.
This new high precision data primarily derived by UAVs will, in the future, be of critical importance to scientists
at both academic and government institutions and NGOs responsible for the management of wildland
environments. Smart Biome intelligent data platforms like the one described here will help ethologists around the
globe gain new insights and generate new knowledge in areas of concern which will include domestic livestock,
wildlife (both non-concerning and species at-risk), and the land base, including the plant species the animals
depend on. We expect that in the end, exciting new tools will be provided to ethologists in the future that will
allow for high-precision remote sensing and animal tracking. These tools can be utilized in impactful land
management applications around the globe, especially when the technology is partnered with emergent mobility
and computing networks [14]. We anticipate that this will drive valuable new legislation and policy at global-scale,
237 Volume 2 of the Proceedings of the joint 12th International Conference on Methods and Techniques in Behavioral Research and 6th
Seminar on Behavioral Methods held online, May 18-20, 2022. www.measuringbehavior.org. Editors: Andrew Spink, Jarosław
Barski, Anne-Marie Brouwer, Gernot Riedel, & Annesha Sil (2022). DOI 10.6084/m9.figshare.20066849. ISBN: 978-90-74821-94-0
which will ultimately lower the current barriers to the widespread implementation of UAV-based land and animal
monitoring/management. In addition, new insights will be gained by employing smart collars such as wireless
fencing technology and smart ear tags. We envision that these technologies will be used not only to study animal
behaviour, but also to remotely manage animals in a variety of landscapes and rugged terrain. We anticipate that
animal tracking and handling enabled by the new “Smart Biome” technology will ultimately improve animal health
and welfare.
References
1. Chabot, D. (2018). Trends in drone research and applications as the Journal of Unmanned Vehicle Systems turns
5.. Journal of Unmanned Vehicle Systems 6(1), 6-15.
2. Whitehead, K,, Hugenholtz, C.H. (2014). Remote sensing of the environment with small unmanned aircraft
systems (UASs), part 1: a review of progress and challenges. Journal of Unmanned Vehicle Systems 2(3), 69-85.
3. Whitehead, K., Hugenholts, C.H., Myshak, S., Brown, O., LeClair, A., Tamminga, A., Barchyn, T.E., Moorman,
B., Eaton, B. (2014). Remote sensing of the environment with small unmanned aircraft systems (UASs), part 2:
scientific and commercial applications. Journal of Unmanned Vehicle Systems 2(3), 86-102.
4. Mufford, J.T., Hill, D.J., Flood, N.J., Church, J.S. (2019). Use of unmanned aerial vehicles (UAVs) and
photogrammetric image analysis to quantify spatial proximity in beef cattle. Journal of Unmanned Vehicle Systems
7(3), 194-206.
5. Blight, L.K., Bertram, D.F., Kroc, E. (2019). Evaluating UAV-based techniques to census an urban-nesting gull
population on Canada’s Pacific Coast. Journal of Unmanned Vehicle Systems 7(4), 312-324.
6. Assmann, J.J., Kerby, J.T., Cunliffe, A.M., Myers-Smith, I.H. (2019). Vegetation monitoring using multispectral
sensors- best practices and lessons learned from high latitudes. Journal of Unmanned Vehicle Systems 7(1), 54-
75.
7. McAnuff, C., Samson, C., Melanson, D., Polowick, C., Bethell. (2019). Structural mapping of rock walls imaged
with a LiDAR mounted on an unmanned aircraft system. Journal of Unmanned Vehicle Systems 7(1), 21-38.
8. Giagkas, F., Patias, P., Georgiadis, C. (2019). Photogrammetric surveying forests and woodlands with UAVs:
techniques for automatic removal of vegetation and digital terrain model production for hydrological applications.
Journal of Unmanned Vehicle Systems 7(1), 1-20.
9. Mellard, J.P., Audoye, P., Loreau, M. (2019). Seasonal patterns in species diversity across biomes. Ecology 100,
e02627.
10. Xie, X., He, B., Guo, L. Miao, C., Zhang, Y. (2019). Detecting hotspots of interactions between vegetation
greenness and terrestrial water storage using satellite observations. Remote Sensing of Environment 231, 111259.
11. Rennie, M.D., Kennedy, P.J., Mills, K.H., Rodgers, C.M.C., Charles, C., Hrenchuk, L.E., Chalanchuk, S.,
Blanchfield, P.J., Paterson, M.J., Podemski, C.L. (2019). Impacts of freshwater aquaculture on fish communities:
A whole-ecosystem experimental approach. Freshwater Biology 64, 870-885.
12. Campbell, D.L., Lea, J.M., Farrer, W.J., Haynes, S.J., Lee, C. (2017) Tech-savvy beef cattle? How heifers
respond to moving virtual fence lines. Animals 7,9, doi: https://doi.org/10.3390/ani7090072
13. Brunberg, E.I., Bergslid, I.K., Bøe, K.E., Sørhein. (2017). The ability of ewes with lambs to learn a virtual
fencing system. Animals 11, 1-6.
14. Nóbrega, L., Goncalves, P., Pedreiras, P., Pereira, J. (2019). An IoT-Based Solution for Intelligent Farming.
Sensors, 19(603), doi:10.3390/s19030603
238 Volume 2 of the Proceedings of the joint 12th International Conference on Methods and Techniques in Behavioral Research and 6th
Seminar on Behavioral Methods held online, May 18-20, 2022. www.measuringbehavior.org. Editors: Andrew Spink, Jarosław
Barski, Anne-Marie Brouwer, Gernot Riedel, & Annesha Sil (2022). DOI 10.6084/m9.figshare.20066849. ISBN: 978-90-74821-94-0
Choosing the Right Drone for Animal Research
Spencer Serin and John S. Church
Department of Natural Resource Science, Thompson Rivers University, Kamloops BC, Canada
The inherent value of Unmanned Aerial Systems (UASs), composed of an Unmanned Aerial Vehicle (UAV) and
sensor/computation package, for research into animal behaviour is obvious. These tools present a non-invasive
opportunity to observe large numbers of wildlife or livestock with reduced risk of the Observer Effect that can
influence behavior. Increased quality and decreased weight of specific cameras and sensors have improved the
quality of data obtained from UAVs (collectively known as ‘drones’). Further advances in computational
processing power and automation will uncover new applications for research and industry-lead initiatives. Still,
how does one determine which UAS is best suited for a given application or behavioral study? There are many
important considerations to take, which include but are not limited to: aircraft model, sensor type, image processing
requirements, and operational factors.
The UAV consumer/prosumer market has been a boon for researchers; aircraft cost has been driven down while
software and battery technology have improved dramatically. It is now possible to purchase several different UAV
models that are user-friendly right out-of-the-box (with a 4K or HD camera) for below $1000 (USD). This was
unimaginable 10 years ago. Today, it is hard to imagine extreme sports videos or wildlife documentaries without
footage obtained with the aid of a drone. However, the concerns and demands of a cinematographer (high image
quality) do not necessarily mirror those of an ethologist. In animal field use, UAVs may be employed in harsh
terrain (i.e., highly variable topography, extremely low temperatures) that may inhibit traditional observational
methods. To accomplish monitoring in difficult environments, it is important to select a suitable UAV that can
accommodate the weight/operation of multiple changing payloads.
UAVs fall under two distinct categories: multirotor and fixed-wing. Multirotor UAVs have three to eight sets of
rotating blades, are relatively easy to fly and land, can hover over fixed targets, and tend to be among the cheaper
options. Nevertheless, they have a more limited range of use (<1-hour of flight time), are difficult to operate in
windy conditions, and have less payload capacity than a fixed-wing option. These UAVs are most applicable for
precise agricultural surveying [1], farm-based livestock observation/management [2], and short-range wildlife
monitoring. Fixed-wing UAVs appear similar to small passenger aircraft and can have an extended range (flight
time several hours), payload capacity, and greater overall operational speed compared to multirotor UAVs.
However, they require more expertise to operate, are more expensive, cannot hover directly over a target, and are
generally less maneuverable. Long-range monitoring of wildlife such as large terrestrial mammals (e.g. deer,
elephants, rhinoceros), aquatic animals (e.g. alligators, whales), and birds (e.g. penguins) is best performed using
a fixed-wing UAV [3,4].
There are several sensors that can be attached to a UAV, assuming they are of suitable weight and software
compatibility [5]. These can range from RGB Digital or infrared thermal (IRT) cameras (which rely on visible-
spectrum and long-wave infrared absorbance, respectively) to Multispectral/Hyperspectral sensors (which collect
images from 4 to 250 distinct spectral bands) to LiDAR (light detection and ranging using laser pulses). For animal
identification and monitoring, digital and thermal cameras are the most common, while multispectral,
hyperspectral, and LiDAR sensors are best suited for aerial remote sensing of the land base (e.g., agricultural crops,
mining sites, forests). However, animal behavior is greatly influenced by its surrounding environment or specific
forage type. Thus, it is often valuable to collect visual data (e.g., orthomosaic) and overlay that with pertinent
vegetation data (e.g., normalized difference vegetation index [NDVI]) obtained by a secondary spectral sensor.
This information can be used to identify food sources or preferential nesting sites. Cameras with high resolution
and zoom capability are valuable assets to enhance individual animal identification but come with an increased
price tag as well as a weight burden. The specific application for the UAV must be considered when choosing the
sensor.
239 Volume 2 of the Proceedings of the joint 12th International Conference on Methods and Techniques in Behavioral Research and 6th
Seminar on Behavioral Methods held online, May 18-20, 2022. www.measuringbehavior.org. Editors: Andrew Spink, Jarosław
Barski, Anne-Marie Brouwer, Gernot Riedel, & Annesha Sil (2022). DOI 10.6084/m9.figshare.20066849. ISBN: 978-90-74821-94-0
More and more, animal research is frequently being performed using drones. While an obvious application is
species enumeration [3], the real potential of and long-term utility of UAVs will be monitoring animal behaviour.
For example, recent work has shown images or video obtained by UAVs can be used to observe social behavior
in cow-calf pairs [6], monitor feed intake in feedlot cattle [7], and even observe cetacean behaviour [8,9]. In all
cases, it is important to consider the unique habituation requirements and tolerance of different animal species
with respect to UAVs (i.e. distance or aircraft shape) [10]. However, given the dramatic reductions in price, along
with ease of use, increased battery life and substantial weight reductions, there is no question that UAVs will
continue revolutionizing the field of ethology in the future.
References
1. Hassler, S.C., Baysal-Gurel, F. (2019). Unmanned Aircraft System (UAS) Technology and Applications in
Agriculture. Agronomy 9, 618.
2. Barbedo, J., Koenigkan, L.V. (2018). Perspectives on the use of unmanned aerial systems to monitor cattle.
Outlook on Agriculture 47(3), 214-222.
3. Linchant, J., Lisein, J., Semeki, J., Lejeune, P, Vermeulen, C. (2015). Are unmanned aircraft systems (UASs)
the future of wildlife monitoring? A review of accomplishments and challenges. Mammal Review 45, 239-252.
4. Hodgson, J.; Baylis, S.; Mott, R., Herrod, A., Clarke, R.H. (2016). Precision wildlife monitoring using
unmanned aerial vehicles. Scientific Reports 6, 22574.
5. Hogan, S., Kelly, M., Stark, B., Chen, Y. (2017). Unmanned aerial systems for agriculture and natural
resources. California Agriculture 71(1), 5-14.
6. Mufford, J.T., Hill, D.J., Flood, N., Church, J.S. (2019). Use of unmanned aerial vehicles (UAVs) and
photogrammetric image analysis to quantify spatial proximity in beef cattle. Journal of Unmanned Vehicle
Systems 7, 194-206.
7. Nyamuryekung’e, S., Cibils, A.F., Estell, R.E., Gonzalez, A.L. (2016). Use of an Unmanned Aerial
Vehicle−Mounted Video Camera to Assess Feeding Behavior of Raramuri Criollo Cows. Rangeland Ecology &
Management 69(5), 386-389.
8. Hodgson, A., Peel, D., Kelly, N. (2017). Unmanned aerial vehicles for surveying marine fauna: assessing
detection probability. Ecological Applications 27, 1253-1267.
9. Nowacek, D.P.; Christiansen, F.; Bejder, L., Goldbogen, J.A., Friedlaender, A.S. (2016). Studying cetacean
behaviour: new technological approaches and conservation applications. Animal Behaviour 120, 235-244.
10. Mulero-Pázmány, M., Jenni-Eiermann, S., Strebel, N., Sattler, T., Negro, J.J., Tablado, Z. (2017) Unmanned
aircraft systems as a new source of disturbance for wildlife: A systematic review. PLOS ONE 12(6), e0178448.
240 Volume 2 of the Proceedings of the joint 12th International Conference on Methods and Techniques in Behavioral Research and 6th
Seminar on Behavioral Methods held online, May 18-20, 2022. www.measuringbehavior.org. Editors: Andrew Spink, Jarosław
Barski, Anne-Marie Brouwer, Gernot Riedel, & Annesha Sil (2022). DOI 10.6084/m9.figshare.20066849. ISBN: 978-90-74821-94-0
Measuring Social Behavior from Video and Trajectory Data
of Interacting Animals
Jennifer J. Sun
Department of Computing & Mathematical Sciences, California Institute of Technology, California, USA
Abstract
Automated methods for behavior quantification are crucial in order to study the social interactions of animals at
scale. Here, we summarize our work in this direction and discuss directions for future work. To advance the
development of methods of measuring social behavior, we presented a dataset of mice interactions called CalMS21
at the NeurIPS 2021 Datasets and Benchmarks Track, based on a standard resident-intruder assay from behavioral
neuroscience. Our dataset consists of video (700k frames) and trajectory data (9 million frames), with a subset
annotated with frame-level behavior (3 million frames). We define standardized tasks to evaluate behavior analysis
models across three settings: training behavior classifiers using annotations from a single annotator, learning styles
of different annotators, and classifying new behaviors with limited data. Based on CalMS21 and other behavioral
datasets, we explored methods, such as self-supervision and program synthesis, to integrate domain knowledge
into behavior analysis models. This domain knowledge often takes the form of behavior attributes identified by
researchers for classifying social behavior, such as distance between animals or speed of each animal. We found
that such methods can result in more data-efficient and interpretable models, which can help reduce human effort
for analyzing behavioral data.
Introduction
Computational models of behavior have enabled the large-scale analysis of animal movements and interactions,
with applications to fields such as neuroscience, pharmacology, and ethology. In comparison to automatic
models, manual categorization of behavior from recorded videos can be time consuming and monotonous for
annotators, and the annotations may be subjective [1]. To reduce effort for behavior analysis, models have been
developed for pose estimation and tracking of animals [2,3], as well as for automatically classifying behavior
from video or trajectory data [3,5,6]. Towards advancing behavior classification models, we have released a
dataset collected from behavioral neuroscience experiments for benchmarking multi-agent behavior modeling
[4]. Using our data as well as other datasets on model organisms such as flies, we study methods to improve
automatic behavior analysis.
Our dataset, the Caltech Mouse Social Interactions 2021 Dataset (CalMS21), consists of video and trajectory
data from a pair of interacting mice based on the standard resident-intruder assay [4]. This dataset was presented
at NeurIPS 2021 Datasets and Benchmarks Track. The mice are freely behaving as videos are recorded from the
top view, and we use the Mouse Action Recognition System (MARS) [3] to track the pose of the animals. We
introduced three tasks based on use-cases from behavioral neuroscience for measuring model performance, and
benchmark the performance of sequential models such as LSTMs and Temporal Convolutional Networks on our
dataset.
We studied models that integrate domain knowledge with machine learning on CalMS21 as well as other
publicly available behavioral datasets, such as CRIM13 [5] and Fly vs. Fly [6]. We summarize some of our
works in this direction, in particular, on improving data efficiency using task programming [7] and on
interpretable behavioral modeling using program synthesis [8]. For these methods, we start from trajectory data
extracted from video, which consists of the animal’s pose over time. We found that behavior attributes, such as
facing angle, speed, and distance, can be efficiently computed from trajectory data, since they are lower
dimensional than videos. Using these known structured information from behavioral data, in combination with
machine learning methods, we were able to improve data efficiency and interpretability for behavior analysis.
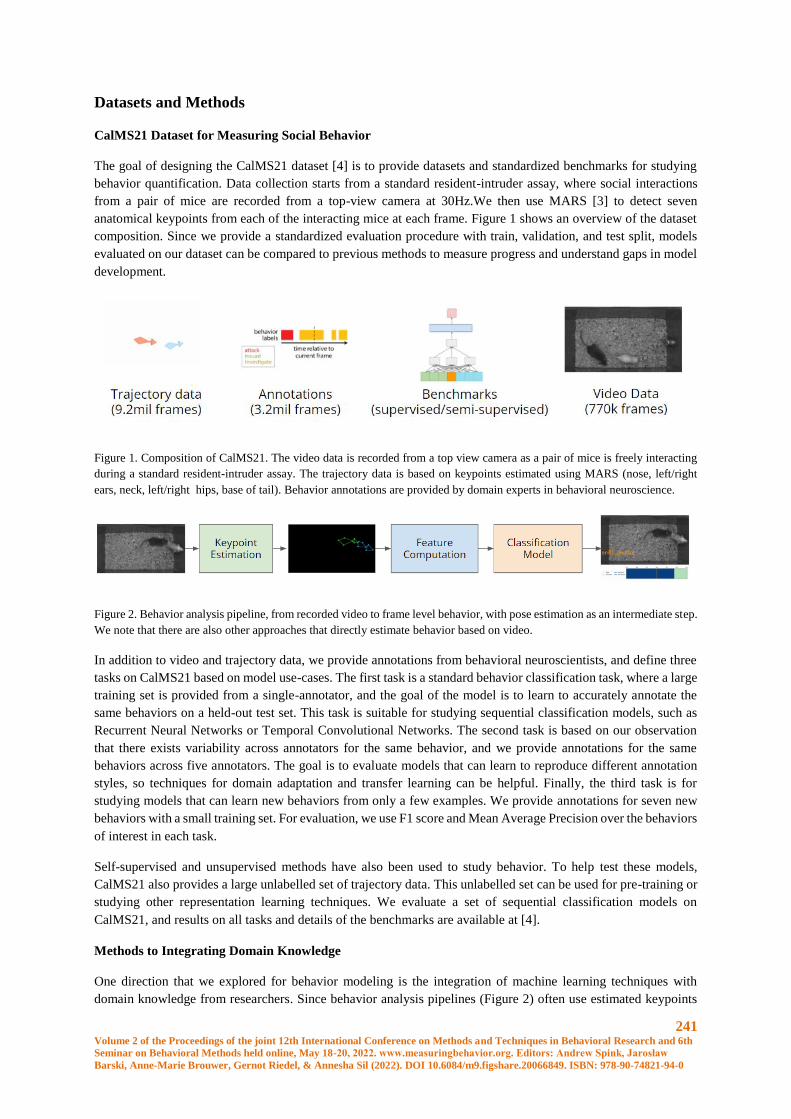
241 Volume 2 of the Proceedings of the joint 12th International Conference on Methods and Techniques in Behavioral Research and 6th
Seminar on Behavioral Methods held online, May 18-20, 2022. www.measuringbehavior.org. Editors: Andrew Spink, Jarosław
Barski, Anne-Marie Brouwer, Gernot Riedel, & Annesha Sil (2022). DOI 10.6084/m9.figshare.20066849. ISBN: 978-90-74821-94-0
Datasets and Methods
CalMS21 Dataset for Measuring Social Behavior
The goal of designing the CalMS21 dataset [4] is to provide datasets and standardized benchmarks for studying
behavior quantification. Data collection starts from a standard resident-intruder assay, where social interactions
from a pair of mice are recorded from a top-view camera at 30Hz.We then use MARS [3] to detect seven
anatomical keypoints from each of the interacting mice at each frame. Figure 1 shows an overview of the dataset
composition. Since we provide a standardized evaluation procedure with train, validation, and test split, models
evaluated on our dataset can be compared to previous methods to measure progress and understand gaps in model
development.
Figure 1. Composition of CalMS21. The video data is recorded from a top view camera as a pair of mice is freely interacting
during a standard resident-intruder assay. The trajectory data is based on keypoints estimated using MARS (nose, left/right
ears, neck, left/right hips, base of tail). Behavior annotations are provided by domain experts in behavioral neuroscience.
Figure 2. Behavior analysis pipeline, from recorded video to frame level behavior, with pose estimation as an intermediate step.
We note that there are also other approaches that directly estimate behavior based on video.
In addition to video and trajectory data, we provide annotations from behavioral neuroscientists, and define three
tasks on CalMS21 based on model use-cases. The first task is a standard behavior classification task, where a large
training set is provided from a single-annotator, and the goal of the model is to learn to accurately annotate the
same behaviors on a held-out test set. This task is suitable for studying sequential classification models, such as
Recurrent Neural Networks or Temporal Convolutional Networks. The second task is based on our observation
that there exists variability across annotators for the same behavior, and we provide annotations for the same
behaviors across five annotators. The goal is to evaluate models that can learn to reproduce different annotation
styles, so techniques for domain adaptation and transfer learning can be helpful. Finally, the third task is for
studying models that can learn new behaviors from only a few examples. We provide annotations for seven new
behaviors with a small training set. For evaluation, we use F1 score and Mean Average Precision over the behaviors
of interest in each task.
Self-supervised and unsupervised methods have also been used to study behavior. To help test these models,
CalMS21 also provides a large unlabelled set of trajectory data. This unlabelled set can be used for pre-training or
studying other representation learning techniques. We evaluate a set of sequential classification models on
CalMS21, and results on all tasks and details of the benchmarks are available at [4].
Methods to Integrating Domain Knowledge
One direction that we explored for behavior modeling is the integration of machine learning techniques with
domain knowledge from researchers. Since behavior analysis pipelines (Figure 2) often use estimated keypoints
242 Volume 2 of the Proceedings of the joint 12th International Conference on Methods and Techniques in Behavioral Research and 6th
Seminar on Behavioral Methods held online, May 18-20, 2022. www.measuringbehavior.org. Editors: Andrew Spink, Jarosław
Barski, Anne-Marie Brouwer, Gernot Riedel, & Annesha Sil (2022). DOI 10.6084/m9.figshare.20066849. ISBN: 978-90-74821-94-0
as an intermediate step, we found that many important behavior attributes can be computed from keypoints. These
attributes include speed, distance between animals, facing angle between animals, and angular speed. In our work,
we use attributes based on previous works such as MARS [3] and Fly vs. Fly [6], and study how these structured
knowledge can be used to inform trained models.
Task programming is one way in which domain knowledge can be used to inform representation learning for
behavior analysis. In this work, we use behavior attributes defined by domain experts with a self-supervised
learning framework (Trajectory Variational Autoencoders) to learn trajectory representations [7]. Our
representation learning model is trained on unlabelled data using self-supervision and programmatic supervision
from behavior attributes. Then, we applied our learned representations on downstream behavior classification
tasks, and found that our representation resulted in more data-efficient models. Our study shows that researchers
can trade-off annotating less data in order to provide more domain knowledge during model training.
We further studied program synthesis as a way to automatically generate programs for studying behavior. Here,
the goal is to produce interpretable, programmatic descriptions of behaviors-of-interest, by identifying behaviors
using inherently interpretable programs instead of black-box models. Program synthesis learns to compose
symbolic primitives, based on a domain-specific language. Our work introduced a domain-specific language for
behavior classification, consisting of learnable temporal filters and behavior attributes, and we apply our
framework to classify mouse social behavior [8]. We found that our learned programs perform comparably to
black-box models, such as Temporal Convolutional Networks, for behavior classification, while being simpler and
more interpretable. Visualizations of the learned programs are available at [8].
Discussion
We have introduced a new dataset for studying models of social behavior, based on mice experiments in
behavioral neuroscience. In addition to benchmarking the performance of behavior classifiers, we would like to
note the importance of studying annotator variability in behavior analysis (also studied in [3,9]). Understanding
annotator disagreement across individuals and labs is crucial for improving the reproducibility of experimental
results. The annotation style transfer task in CalMS21 annotated by multiple domain experts provides a dataset
for this investigation.
In order to improve the usability of behavior models, the performance of models given limited training data is an
important consideration. Data annotation is a time-consuming process, and large datasets are not often available
for new behaviors-of-interest. Decreasing training data requirements for models can enable rapid adaptation to
new behaviors, such as those studied in the limited training data tasks on CalMS21.
In general, we note the importance of community benchmarks for measuring progress in model development.
Although evaluating on lab-specific datasets and tasks can be helpful, evaluating on standardized datasets is
useful to enable comparisons between different models and techniques, and for studying gaps in model
development. When developing our dataset, we followed NeurIPS guidelines to document the content and
development process using the Datasheets for Datasets framework [10]. We additionally used the Machine
Learning Reproducibility Checklist [11] during development of our benchmarks. More work in this direction can
help connect the modeling challenges in behavioral neuroscience with other fields studying behavior analysis,
such as sports analytics and autonomous vehicles, as well as with the computer science community at large.
Ethical statement
The dataset described in [4] were collected from mice experiments performed in accordance with NIH
guidelines. All experiments were approved by the Institutional Animal Care and Use Committee (IACUC) and
Institutional Biosafety Committee at Caltech. Please see [4] for more details on the ethical review process.
References

243 Volume 2 of the Proceedings of the joint 12th International Conference on Methods and Techniques in Behavioral Research and 6th
Seminar on Behavioral Methods held online, May 18-20, 2022. www.measuringbehavior.org. Editors: Andrew Spink, Jarosław
Barski, Anne-Marie Brouwer, Gernot Riedel, & Annesha Sil (2022). DOI 10.6084/m9.figshare.20066849. ISBN: 978-90-74821-94-0
1. Anderson, D. J., & Perona, P. (2014). Toward a science of computational ethology. Neuron, 84(1), 18-
31.
2. Mathis, A., Mamidanna, P., Cury, K. M., Abe, T., Murthy, V. N., Mathis, M. W., & Bethge, M. (2018).
DeepLabCut: markerless pose estimation of user-defined body parts with deep learning. Nature
neuroscience, 21(9), 1281-1289.
3. Segalin, C., Williams, J., Karigo, T., Hui, M., Zelikowsky, M., Sun, J. J., Perona, P., Anderson, D. J., &
Kennedy, A. (2021). The Mouse Action Recognition System (MARS) software pipeline for automated
analysis of social behaviors in mice. Elife, 10, e63720.
4. Sun, J. J., Karigo, T., Chakraborty, D., Mohanty, S. P., Wild, B., Sun, Q., Chen, C., Anderson, D. J.,
Perona, P., Yue, Y., & Kennedy, A. (2021). The multi-agent behavior dataset: Mouse dyadic social
interactions. NeurIPS Datasets and Benchmarks 2021.
5. Burgos-Artizzu, X. P., Dollár, P., Lin, D., Anderson, D. J., & Perona, P. (2012, June). Social behavior
recognition in continuous video. In 2012 IEEE Conference on Computer Vision and Pattern Recognition
(pp. 1322-1329). IEEE.
6. Eyjolfsdottir, E., Branson, S., Burgos-Artizzu, X. P., Hoopfer, E. D., Schor, J., Anderson, D. J., & Perona,
P. (2014, September). Detecting social actions of fruit flies. In European Conference on Computer Vision
(pp. 772-787). Springer, Cham.
7. Sun, J. J., Kennedy, A., Zhan, E., Anderson, D. J., Yue, Y., & Perona, P. (2021). Task programming:
Learning data efficient behavior representations. In Proceedings of the IEEE/CVF Conference on
Computer Vision and Pattern Recognition (pp. 2876-2885).
8. Tjandrasuwita, M., Sun, J. J., Kennedy, A., Chaudhuri, S., & Yue, Y. (2021). Interpreting Expert
Annotation Differences in Animal Behavior. CV for Animals Workshop at CVPR 2021.
9. Leng, X., Wohl, M., Ishii, K., Nayak, P., & Asahina, K. (2020). Quantitative comparison of Drosophila
behavior annotations by human observers and a machine learning algorithm. bioRxiv.
10. Gebru, T., Morgenstern, J., Vecchione, B., Vaughan, J. W., Wallach, H., Iii, H. D., & Crawford, K.
(2021). Datasheets for datasets. Communications of the ACM, 64(12), 86-92.
11. Pineau, J., Vincent-Lamarre, P., Sinha, K., Larivière, V., Beygelzimer, A., d’Alché-Buc, F., ... &
Larochelle, H. (2021). Improving reproducibility in machine learning research: a report from the NeurIPS
2019 reproducibility program. Journal of Machine Learning Research, 22.

244 Volume 2 of the Proceedings of the joint 12th International Conference on Methods and Techniques in Behavioral Research and 6th
Seminar on Behavioral Methods held online, May 18-20, 2022. www.measuringbehavior.org. Editors: Andrew Spink, Jarosław
Barski, Anne-Marie Brouwer, Gernot Riedel, & Annesha Sil (2022). DOI 10.6084/m9.figshare.20066849. ISBN: 978-90-74821-94-0
Session Theme: New tests in pre-clinical
neuroscience
245 Volume 2 of the Proceedings of the joint 12th International Conference on Methods and Techniques in Behavioral Research and 6th
Seminar on Behavioral Methods held online, May 18-20, 2022. www.measuringbehavior.org. Editors: Andrew Spink, Jarosław
Barski, Anne-Marie Brouwer, Gernot Riedel, & Annesha Sil (2022). DOI 10.6084/m9.figshare.20066849. ISBN: 978-90-74821-94-0
See what you have been missing: what locomotor activity can teach us in terms of
refinement, reduction and replicability ‘round the CLOCK (24/7) animal studies
S. Gaburro
Tecniplast S.p.A., Buggiate, Italy
Abstract
A growing body of evidence suggests that Home Cage Monitoring studies are becoming key tools for in vivo
animal research for three main reasons: i) reduction in animal distress thereby increasing welfare, ii) minimization
of biases (wanted and unwanted), iii) increased reproducibility of data.
Taking into consideration what current home cage monitoring systems can offer, a completely patented novel
solution has been created to simultaneously track locomotor activity of rodents 24/7 while in their home cage
(where they spend 99% of their life) in single- or group-housed conditions.
Such technology opens the possibilities to perform more relevant studies (e.g. at night, where rodents are mostly
active). Also reducing external equipment used when animals are tested in sequence across the experimental day,
for example, classical behavioral experiments.
With our Home Cage Monitoring we have shown:
Time locked adaptation of inverting to day-night rhythms or dietary restrictions indicating that the animals adapt
much quicker than expected according to the conditions provided.
A multicentric study demonstrated that, despite all factors being controlled (n=X, age, sex, breed), the diurnal
locomotor activity varied across different centers mainly due to environmental factors, therefore raising an
important point in data reproducibility.
Increased sensitivity when detecting hypoactivity in stroke models as well as amelioration of locomotor activity
after 21 days as compared to classical open field where the recovery effects remained undetected.
Presymptomatic recognition of neurodegenerative disease (ALS) based on new digital biomarker that would allow
novel treatment development.
Overall, the system is proven, and demonstrates, an unparalleled solution to detect events of change in activity
across different experimental conditions.
246 Volume 2 of the Proceedings of the joint 12th International Conference on Methods and Techniques in Behavioral Research and 6th
Seminar on Behavioral Methods held online, May 18-20, 2022. www.measuringbehavior.org. Editors: Andrew Spink, Jarosław
Barski, Anne-Marie Brouwer, Gernot Riedel, & Annesha Sil (2022). DOI 10.6084/m9.figshare.20066849. ISBN: 978-90-74821-94-0
Beyond locomotion: stimulus selectivity of sensory evoked behaviours unfolds in a
higher dimensional space
Riccardo Storchi1,2, Timothy F. Cootes1,3, Robert J. Lucas1,2
1 University of Manchester, Faculty of Biology, Medicine and Health
2 School of Biological Science, Division of Neuroscience & Experimental Psychology
3 School of Health Science, Division of Informatics, Imaging & Data Science
Introduction
A fundamental goal of neuroscience is to map neural circuits to behaviours. In order to achieve this goal an accurate
charting of ethologically relevant behaviours is required. However this key step has been constrained by
technological limitations in quantifying motor actions. We focus on mouse sensory guided behaviours, such as
freezing or escape, which can be evoked by visual stimuli (e.g. a black looming disc) or loud sounds. These
behaviours have so far been defined on the basis of a clear phenotype – a sudden change in locomotion state.
However, mice do more than run and a variety of body movements and postures could, at least in principle, better
characterize their sensory experience. In this study we ask whether a richer quantification of motor actions would
provide additional information about the mapping between sensations and behaviours.
Methods
To address this questions we first developed a multi-camera systema (4 cameras) and a model-based method to
perform 3D reconstruction of mouse poses. Body landmarks were detected independently for each camera by using
DeepLabCut software [1]. Then the 3D coordinates of each landmark was obtained by triangulation. The four
camera system was calibrated using the Direct Linear Transform algorithm [2] before data collection by using
Lego® objects of known dimensions. The raw reconstruction via LS linear triangulation contained outlier poses
caused by incorrect landmark detections (occurring e.g. when the relevant body parts were occluded). To correct
those outliers we used a Statistical Shape Model (SSM) [3] trained on a separate dataset of images. This approach
allowed to express the coordinates of the mouse body at any given time with a simple mathematical formulation
based on SSM (Figure 1a). Using these data we were able to quantify a wide range of body movements and
postures as described in Figure 1b. For more details see [4].
Results
We used our method to quantify behavioural responses to three classes of stimuli: bright flashes of light, looming
discs and loud sounds. To understand whether a richer representation of motor actions was beneficial we decoded
the stimulus class by using the full set of body movements and postures (Figure 1b) and we compared the results
to those obtained by relying on locomotion only. We independently decoded pairs of stimuli (flash vs loom, sound
vs flash and loom vs sound) across three distinct epochs of the behavioural response (0-1s, 1-2s and 2-3s from the
stimulus onset). We found that the full set of body movements and postures allowed more accurate decoding in
most conditions and those results were robust in respect to the choice of a specific decoding algorithms (Figure
2a, K-Nearest Neighbour and Random Forest decoding respectively shown in left and right panel). The advantage
of using a wide range of body movements and postures instead of just locomotion was particularly evident when
decoding looming vs sound. Both stimuli often evoked identical patterns of locomotion arrest that could be
distinguished only by quantifying body postures (Figure 2b).
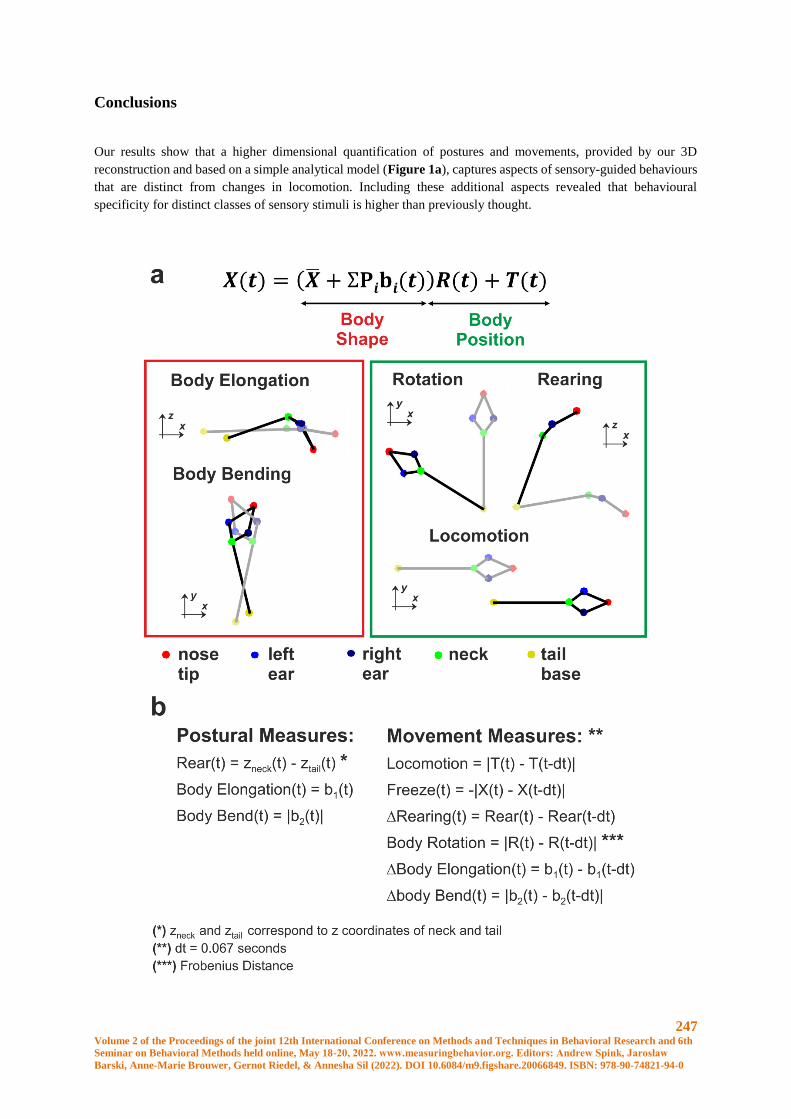
247 Volume 2 of the Proceedings of the joint 12th International Conference on Methods and Techniques in Behavioral Research and 6th
Seminar on Behavioral Methods held online, May 18-20, 2022. www.measuringbehavior.org. Editors: Andrew Spink, Jarosław
Barski, Anne-Marie Brouwer, Gernot Riedel, & Annesha Sil (2022). DOI 10.6084/m9.figshare.20066849. ISBN: 978-90-74821-94-0
Conclusions
Our results show that a higher dimensional quantification of postures and movements, provided by our 3D
reconstruction and based on a simple analytical model (Figure 1a), captures aspects of sensory-guided behaviours
that are distinct from changes in locomotion. Including these additional aspects revealed that behavioural
specificity for distinct classes of sensory stimuli is higher than previously thought.
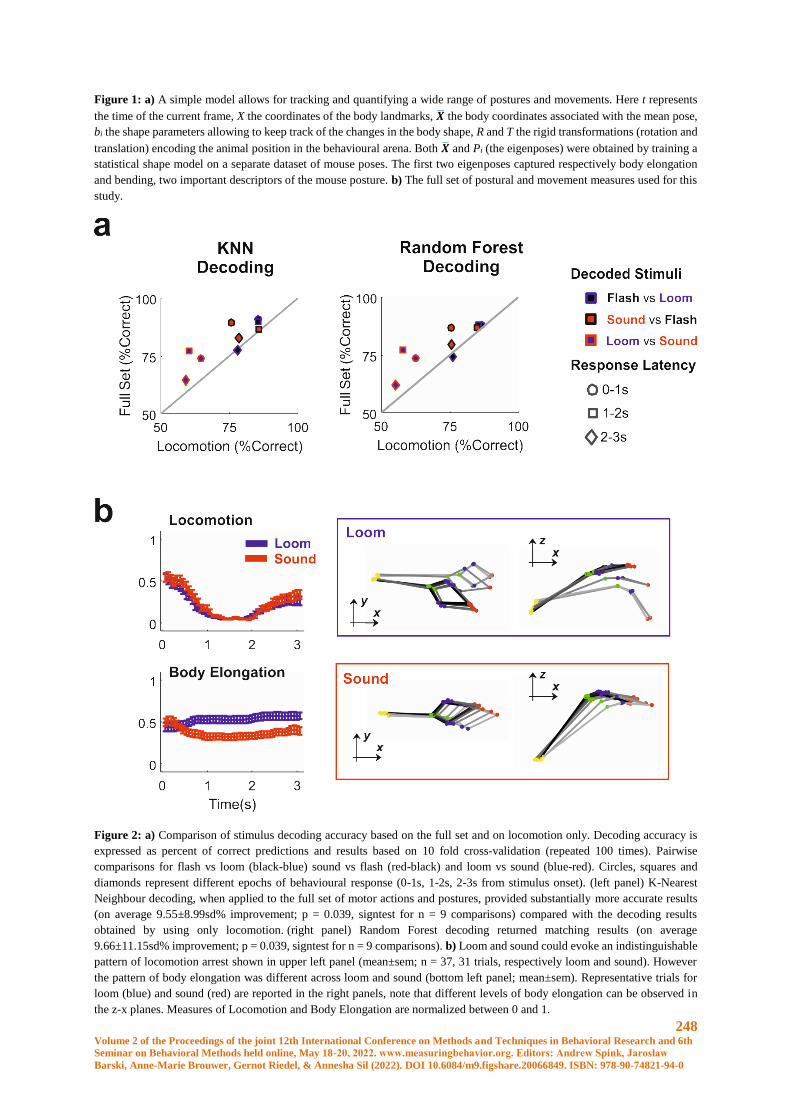
248 Volume 2 of the Proceedings of the joint 12th International Conference on Methods and Techniques in Behavioral Research and 6th
Seminar on Behavioral Methods held online, May 18-20, 2022. www.measuringbehavior.org. Editors: Andrew Spink, Jarosław
Barski, Anne-Marie Brouwer, Gernot Riedel, & Annesha Sil (2022). DOI 10.6084/m9.figshare.20066849. ISBN: 978-90-74821-94-0
Figure 1: a) A simple model allows for tracking and quantifying a wide range of postures and movements. Here t represents
the time of the current frame, X the coordinates of the body landmarks, �� the body coordinates associated with the mean pose,
bi the shape parameters allowing to keep track of the changes in the body shape, R and T the rigid transformations (rotation and
translation) encoding the animal position in the behavioural arena. Both �� and Pi (the eigenposes) were obtained by training a
statistical shape model on a separate dataset of mouse poses. The first two eigenposes captured respectively body elongation
and bending, two important descriptors of the mouse posture. b) The full set of postural and movement measures used for this
study.
Figure 2: a) Comparison of stimulus decoding accuracy based on the full set and on locomotion only. Decoding accuracy is
expressed as percent of correct predictions and results based on 10 fold cross-validation (repeated 100 times). Pairwise
comparisons for flash vs loom (black-blue) sound vs flash (red-black) and loom vs sound (blue-red). Circles, squares and
diamonds represent different epochs of behavioural response (0-1s, 1-2s, 2-3s from stimulus onset). (left panel) K-Nearest
Neighbour decoding, when applied to the full set of motor actions and postures, provided substantially more accurate results
(on average 9.55±8.99sd% improvement; p = 0.039, signtest for n = 9 comparisons) compared with the decoding results
obtained by using only locomotion. (right panel) Random Forest decoding returned matching results (on average
9.66±11.15sd% improvement; p = 0.039, signtest for n = 9 comparisons). b) Loom and sound could evoke an indistinguishable
pattern of locomotion arrest shown in upper left panel (mean±sem; n = 37, 31 trials, respectively loom and sound). However
the pattern of body elongation was different across loom and sound (bottom left panel; mean±sem). Representative trials for
loom (blue) and sound (red) are reported in the right panels, note that different levels of body elongation can be observed in
the z-x planes. Measures of Locomotion and Body Elongation are normalized between 0 and 1.

249 Volume 2 of the Proceedings of the joint 12th International Conference on Methods and Techniques in Behavioral Research and 6th
Seminar on Behavioral Methods held online, May 18-20, 2022. www.measuringbehavior.org. Editors: Andrew Spink, Jarosław
Barski, Anne-Marie Brouwer, Gernot Riedel, & Annesha Sil (2022). DOI 10.6084/m9.figshare.20066849. ISBN: 978-90-74821-94-0
Ethical Statement
Experiments were conducted in accordance with the Animals, Scientific Procedures Act of 1986 (United
Kingdom) and approved by the University of Manchester ethical review committee.
References
[1] Mathis, A., Mamidanna, P., Cury, K.M., Abe, T., Murthy, V.N., Mathis, M.W., and Bethge, M. (2018).
DeepLabCut: markerless pose estimation of user-defined body parts with deep learning. Nat Neurosci 21, 1281-
1289.
https://doi.org/10.1038/s41593-018-0209-y
[2] Hartley, R., Zisserman., A. (2004). Multiple View Geometry in Computer Vision, Second edn (Cambridge
University Press).
https://doi.org/10.1017/CBO9780511811685
[3] Cootes, T.F., Taylor, C.J., Cooper, D.H., and Graham, J. (1995). Active Shape Models - Their Training and
Application. Comput Vis Image Und 61, 38-59.
https://doi.org/10.1006/cviu.1995.1004
[4] Storchi, R., Milosavljevic, N., Allen, A.E., Zippo, A.G., Agnihotri, A., Cootes. T.F., Lucas, R.J. (2020) A
High-Dimensional Quantification of Mouse Defensive Behaviors Reveals Enhanced Diversity and Stimulus
Specificity. Curr. Biol. 30(23); 4619-4630.e5.
https://doi.org/10.1016/j.cub.2020.09.007
250 Volume 2 of the Proceedings of the joint 12th International Conference on Methods and Techniques in Behavioral Research and 6th
Seminar on Behavioral Methods held online, May 18-20, 2022. www.measuringbehavior.org. Editors: Andrew Spink, Jarosław
Barski, Anne-Marie Brouwer, Gernot Riedel, & Annesha Sil (2022). DOI 10.6084/m9.figshare.20066849. ISBN: 978-90-74821-94-0
Session Theme: Animal welfare
251 Volume 2 of the Proceedings of the joint 12th International Conference on Methods and Techniques in Behavioral Research and 6th
Seminar on Behavioral Methods held online, May 18-20, 2022. www.measuringbehavior.org. Editors: Andrew Spink, Jarosław
Barski, Anne-Marie Brouwer, Gernot Riedel, & Annesha Sil (2022). DOI 10.6084/m9.figshare.20066849. ISBN: 978-90-74821-94-0
The use 24-hour activity and video monitoring to determine the social preference
of male and female C57BL/6J mice
J.L. Moore
GlaxoSmithKline, GlaxoSmithKline, Medicines Research Park, Gunnels Wood Road, Stevenage, UK
Introduction
Male mice are generally considered to be one of the least social of laboratory animals, and more inclined to be
aggressive towards each other compared to female mice [1]. However, housing them in social groups can be
achieved, and gives the mice the opportunity for social interactions. There are important factors to consider when
group housing animals. A review of studies exploring male mice housing, in conjunction with conducting their
own studies, came up with some recommendations for housing [1]; one of their conclusions was to house male
mice in trios, because individual housing may induce depression-like symptoms, pair housing may increase
aggression, and larger groups may have an unstable hierarchy. Therefore, in this study we housed all our mice in
trios. Mice are typically group housed in a small cage environment and males can be aggressive, even with
mezzanines or other methods used to reduce the fighting [2] as these can be high value items for them. Less is
known about the preference of female mice to live together, whether there is a differnce between male and female
mouse preference for companionship is something we wanted to explore.
This study aimed to look at whether giving the mice substantially more space and monitoring their activity would
give us a good indication of whether male mice are more or less social with their conspecifics than female mice
housed in the same conditions. We used a purpose-built set-up of three connecting cages kept on the Digital
Ventilated Cage system (DVC®) (Tecniplast S.p.A) as a study has shown there was no apparent effect on the mice
housed in cages close to low frequency electromagnetic fields (EMF) therefore, the DVC®’s EMF monitoring will
not influence the data generated or impact animal welfare [3]. We also used video monitoring system (Tracksy) to
enable us to monitor the activity and location of the mice. Our aim was to investigate whether group housed male
mice, given a significant amount of additional space, will spend a comparable amount of time together as group
housed female mice in the same cage set-up.
Ethical Statement
All animal studies were ethically reviewed and carried out in accordance with Animals (Scientific Procedures) Act
1986 and the GSK Policy on the Care, Welfare and Treatment of Animals.
Materials And Methods
Subjects, housing and husbandry
Four compatible groups of male and female C57BL/6J mice, housed in trios (total of 12 male mice and 12 female
mice) were sourced from CRUK and were 9-10 weeks old at the start of the study. The health status of the mice
complied with Federation of European Laboratory Animal Science Associations Health Monitoring
recommendations for mice.
On arrival to the animal room the mice were checked carefully for signs of ill health, and randomly assigned to
groups of three in GM500 DVCs made from a clear Polypropylene plastic base with a stainless steel bar lid, the
internal measurements of the GM500 cage is 35.5 x 17.5 x 12cm. All home cages had 1cm depth of Lignocel
woodchips, and an aspen wood chew block 1cm x 1cm x 3cm long (Datesand) with a Lignocel Large disc (IPS)
for nesting, a mouse Mini Fun Tunnels 10cm long, 3cm circumference (LBS), and a red dome (LBS) measuring
10cm diameter x 6cm high. The rack was placed along the wall at the back of the animal holding room. The mice
252 Volume 2 of the Proceedings of the joint 12th International Conference on Methods and Techniques in Behavioral Research and 6th
Seminar on Behavioral Methods held online, May 18-20, 2022. www.measuringbehavior.org. Editors: Andrew Spink, Jarosław
Barski, Anne-Marie Brouwer, Gernot Riedel, & Annesha Sil (2022). DOI 10.6084/m9.figshare.20066849. ISBN: 978-90-74821-94-0
were acclimatised for at least seven days prior to the start of the study. Mice were fed ad libitum with 5LF2
irradiated diet (IPS) via food hoppers. Irradiated drinking water (LBS) was available via water bottles attached to
the cages. Mice were weighed as per unit health and welfare requirements.
In data produced inhouse and in a recent study [4] it was observed that major disruption in activity pattern is caused
when mice are moved to new cages or handled. To avoid this confounding factor, we structured the cage changing
schedule to enable us to cage change one day before the start of the study. All cages were changed on the same
day. Cage bases were replaced with a clean base once a week, with disposable enrichment kept in the cage to
reduce fighting. Throughout the facility there was a piped radio tuned into a local commercial station during the
light phase. The light cycle was on a 14:10 light/dark with light phase from 06.00h – 20.00h and a gradual increase
or decrease of lighting over a ten-minute dawn; dusk period. The room temperature was 21 - 24oC, humidity was
55% +/-10%, and there were 20 air changes per hour.
Activity Monitoring
The DVC® worked by using an electric sensor board to continuously detect spontaneous locomotion of the cage
occupants by counting electrode activations caused by mouse movements across the 12 electrodes [4]. In our study
data was collected continuously with measurement taken four times per second. Periods where no data was
collected in a single cage indicated there was no activity. The DVC ® did not always locate the position of each
mouse in the system (for example; if they were in the tunnel), therefore, we included the use of cameras and direct
observations to enable us to determine the location of the mice within individual cages and tunnels. DVC® data
was used to assess the amount of activations and activity time in each cage at key time-points across the set up.
Time lapse low light CCTV cameras and web video CCTV video manager software equipment were supplied by
Tracksys. The night vision camera had an infra-red light source; this allowed recording of mouse activity during
night hours without undue disturbance. The PC screen was only switched on when high activity from staff working
in the room (normally at 07am-11.00am); at all other times the screen was turned off. There was no discernible
noise to humans, although this was not tested for the mice; there was no perceptible change in mouse behaviour
when the recording equipment was switched off and on. The mice were videoed for 20 hours a day (9am - 7am).
The cameras were placed at the centre of the set up to enable the entry and exit from the tunnel to the cages of the
mice to be observed. The recording was sampled by a trained observer to determine the location of the mice in the
set up during periods of no sensor activations, and to be confident that mice were present when activations
occurred.
Choice Test Apparatus
Interlinked cages have been used for previous studies with mice [5,6]. Figure 1 is a picture of the Choice test set
up which was made up of three interlinked GM500 cages, each interlinked cage had the same enrichment as the
home cage to reduce bias and were linked with a purpose made plastic tunnel which could be dismantled for
cleaning. The plastic was slightly opaque to enable good visibility of the mice. Prior to the start of this study we
completed a 48-hour test to make sure cameras were aligned with the activity monitoring, the DVC detects the
movement of mice, and we can be confident that the mice are using the tunnels and will enter all areas prior to the
start of the study and will enter all areas. The movement in the group home-cage will be tracked using the DVC®
for one week, alongside this the floor space of each GM500 will be divided into three (front, middle and back) and
a daily cage observation will be made to see where each mouse is at three set times each day. Once in the morning,
once at lunch time, and once in the afternoon (same time each day). A note will be made of which cage the mice
are in (left, middle and right) and the location of the mice in the cage (front, middle and back), and this data will
be compared with data from the DVC® to validate whether the DVC® is accurately registering the location of the
mouse/mice.
The study started once the animals have had seven days to acclimatise to the facility. As there were only four
preference test set-ups we randomly placed the mice into three groups of two male trios and two female trios and
repeated the test until all of the mice had been run through the preference test set-up. Each trio of mice were run
as shown in Table 1.
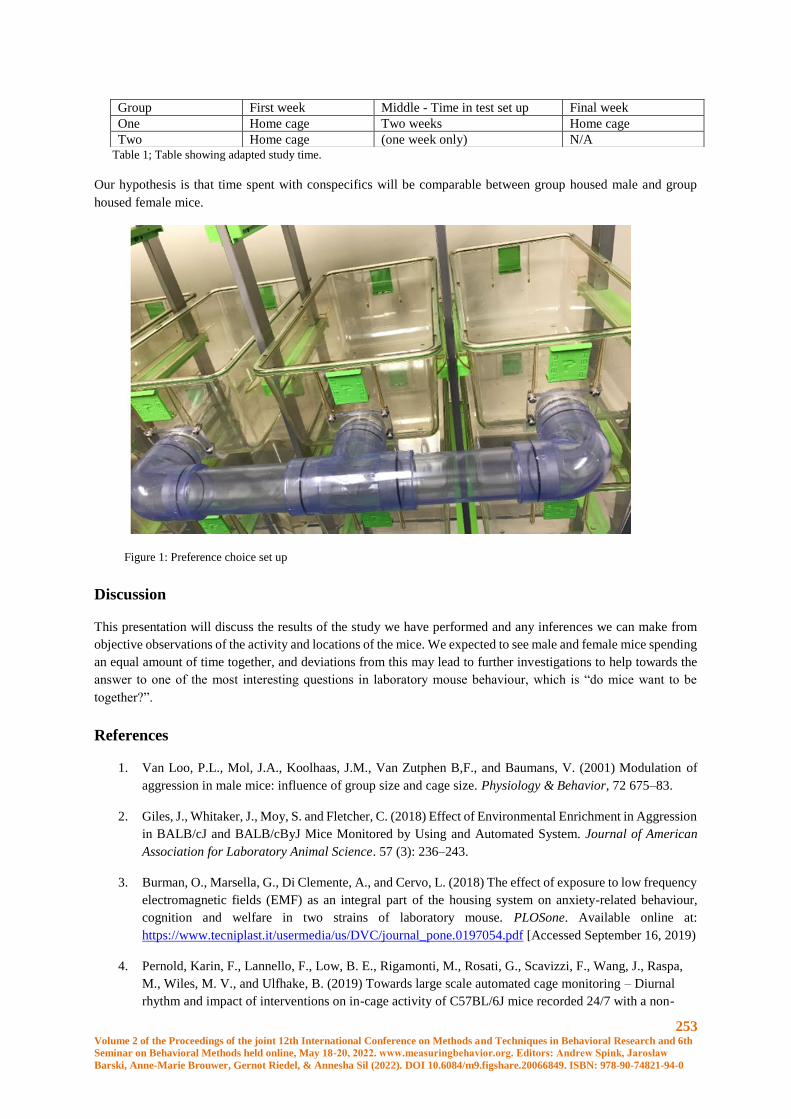
253 Volume 2 of the Proceedings of the joint 12th International Conference on Methods and Techniques in Behavioral Research and 6th
Seminar on Behavioral Methods held online, May 18-20, 2022. www.measuringbehavior.org. Editors: Andrew Spink, Jarosław
Barski, Anne-Marie Brouwer, Gernot Riedel, & Annesha Sil (2022). DOI 10.6084/m9.figshare.20066849. ISBN: 978-90-74821-94-0
Table 1; Table showing adapted study time.
Our hypothesis is that time spent with conspecifics will be comparable between group housed male and group
housed female mice.
Figure 1: Preference choice set up
Discussion
This presentation will discuss the results of the study we have performed and any inferences we can make from
objective observations of the activity and locations of the mice. We expected to see male and female mice spending
an equal amount of time together, and deviations from this may lead to further investigations to help towards the
answer to one of the most interesting questions in laboratory mouse behaviour, which is “do mice want to be
together?”.
References
1. Van Loo, P.L., Mol, J.A., Koolhaas, J.M., Van Zutphen B,F., and Baumans, V. (2001) Modulation of
aggression in male mice: influence of group size and cage size. Physiology & Behavior, 72 675–83.
2. Giles, J., Whitaker, J., Moy, S. and Fletcher, C. (2018) Effect of Environmental Enrichment in Aggression
in BALB/cJ and BALB/cByJ Mice Monitored by Using and Automated System. Journal of American
Association for Laboratory Animal Science. 57 (3): 236–243.
3. Burman, O., Marsella, G., Di Clemente, A., and Cervo, L. (2018) The effect of exposure to low frequency
electromagnetic fields (EMF) as an integral part of the housing system on anxiety-related behaviour,
cognition and welfare in two strains of laboratory mouse. PLOSone. Available online at:
https://www.tecniplast.it/usermedia/us/DVC/journal_pone.0197054.pdf [Accessed September 16, 2019)
4. Pernold, Karin, F., Lannello, F., Low, B. E., Rigamonti, M., Rosati, G., Scavizzi, F., Wang, J., Raspa,
M., Wiles, M. V., and Ulfhake, B. (2019) Towards large scale automated cage monitoring – Diurnal
rhythm and impact of interventions on in-cage activity of C57BL/6J mice recorded 24/7 with a non-
Group First week Middle - Time in test set up Final week
One Home cage Two weeks Home cage
Two Home cage (one week only) N/A

254 Volume 2 of the Proceedings of the joint 12th International Conference on Methods and Techniques in Behavioral Research and 6th
Seminar on Behavioral Methods held online, May 18-20, 2022. www.measuringbehavior.org. Editors: Andrew Spink, Jarosław
Barski, Anne-Marie Brouwer, Gernot Riedel, & Annesha Sil (2022). DOI 10.6084/m9.figshare.20066849. ISBN: 978-90-74821-94-0
disrupting capacitive-based technique. PLOSone. Available online at
https://doi.org/10.1371/journal.pone.0211063 (Accessed January 26, 2020
5. Blom, H. J. M., Van Vorstenbosch, C. J. A. H. V., Baumans, V, Hoogervorst, M. J. C., Beynen, A. C.,
and Van Zuthpen, L. F. M. (1992) Description and validation of a preference test system to evaluate
housing conditions for laboratory mice. Applied Animal Behaviour Science, 35 67-82.
6. Van Loo, P. L. P., Blom, H. J. M., Meijer, M. K., and Baumans, V. (2005) Assessment of the use of two
commercially available environmental enrichments by laboratory mice by preference testing.
Laboratory Animals, 39 58-67.
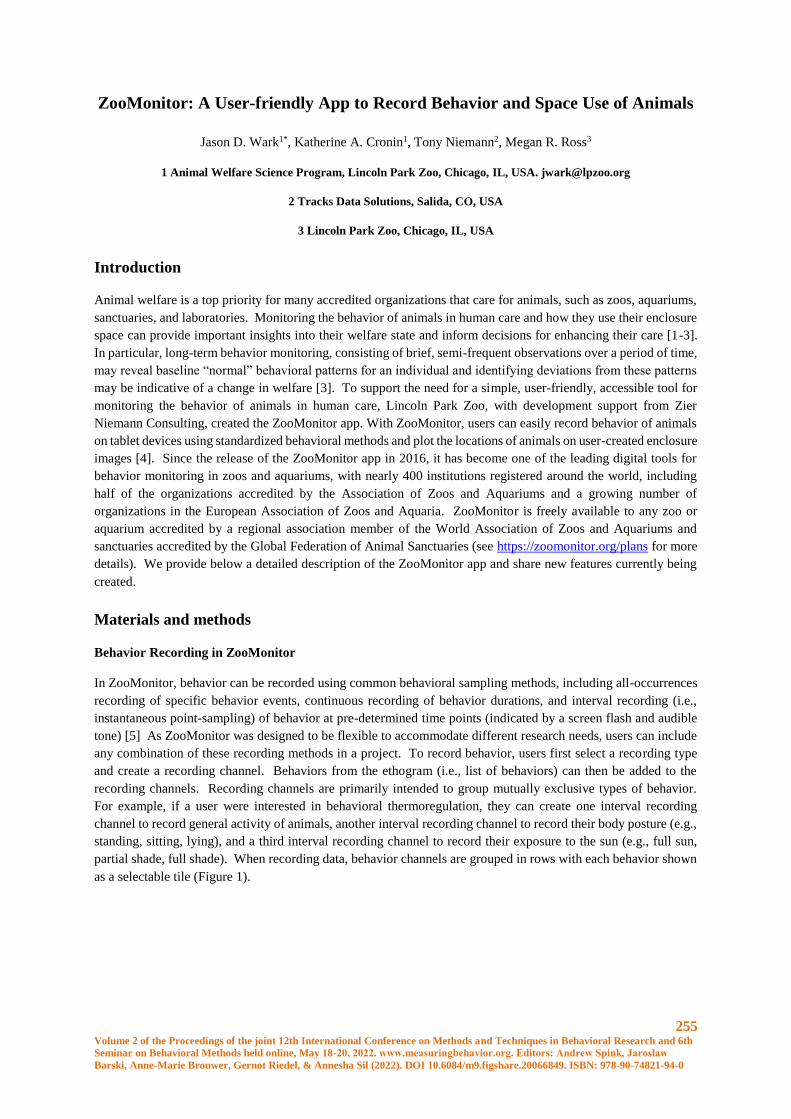
255 Volume 2 of the Proceedings of the joint 12th International Conference on Methods and Techniques in Behavioral Research and 6th
Seminar on Behavioral Methods held online, May 18-20, 2022. www.measuringbehavior.org. Editors: Andrew Spink, Jarosław
Barski, Anne-Marie Brouwer, Gernot Riedel, & Annesha Sil (2022). DOI 10.6084/m9.figshare.20066849. ISBN: 978-90-74821-94-0
ZooMonitor: A User-friendly App to Record Behavior and Space Use of Animals
Jason D. Wark1*, Katherine A. Cronin1, Tony Niemann2, Megan R. Ross3
1 Animal Welfare Science Program, Lincoln Park Zoo, Chicago, IL, USA. [email protected]
2 Tracks Data Solutions, Salida, CO, USA
3 Lincoln Park Zoo, Chicago, IL, USA
Introduction
Animal welfare is a top priority for many accredited organizations that care for animals, such as zoos, aquariums,
sanctuaries, and laboratories. Monitoring the behavior of animals in human care and how they use their enclosure
space can provide important insights into their welfare state and inform decisions for enhancing their care [1-3].
In particular, long-term behavior monitoring, consisting of brief, semi-frequent observations over a period of time,
may reveal baseline “normal” behavioral patterns for an individual and identifying deviations from these patterns
may be indicative of a change in welfare [3]. To support the need for a simple, user-friendly, accessible tool for
monitoring the behavior of animals in human care, Lincoln Park Zoo, with development support from Zier
Niemann Consulting, created the ZooMonitor app. With ZooMonitor, users can easily record behavior of animals
on tablet devices using standardized behavioral methods and plot the locations of animals on user-created enclosure
images [4]. Since the release of the ZooMonitor app in 2016, it has become one of the leading digital tools for
behavior monitoring in zoos and aquariums, with nearly 400 institutions registered around the world, including
half of the organizations accredited by the Association of Zoos and Aquariums and a growing number of
organizations in the European Association of Zoos and Aquaria. ZooMonitor is freely available to any zoo or
aquarium accredited by a regional association member of the World Association of Zoos and Aquariums and
sanctuaries accredited by the Global Federation of Animal Sanctuaries (see https://zoomonitor.org/plans for more
details). We provide below a detailed description of the ZooMonitor app and share new features currently being
created.
Materials and methods
Behavior Recording in ZooMonitor
In ZooMonitor, behavior can be recorded using common behavioral sampling methods, including all-occurrences
recording of specific behavior events, continuous recording of behavior durations, and interval recording (i.e.,
instantaneous point-sampling) of behavior at pre-determined time points (indicated by a screen flash and audible
tone) [5] As ZooMonitor was designed to be flexible to accommodate different research needs, users can include
any combination of these recording methods in a project. To record behavior, users first select a recording type
and create a recording channel. Behaviors from the ethogram (i.e., list of behaviors) can then be added to the
recording channels. Recording channels are primarily intended to group mutually exclusive types of behavior.
For example, if a user were interested in behavioral thermoregulation, they can create one interval recording
channel to record general activity of animals, another interval recording channel to record their body posture (e.g.,
standing, sitting, lying), and a third interval recording channel to record their exposure to the sun (e.g., full sun,
partial shade, full shade). When recording data, behavior channels are grouped in rows with each behavior shown
as a selectable tile (Figure 1).
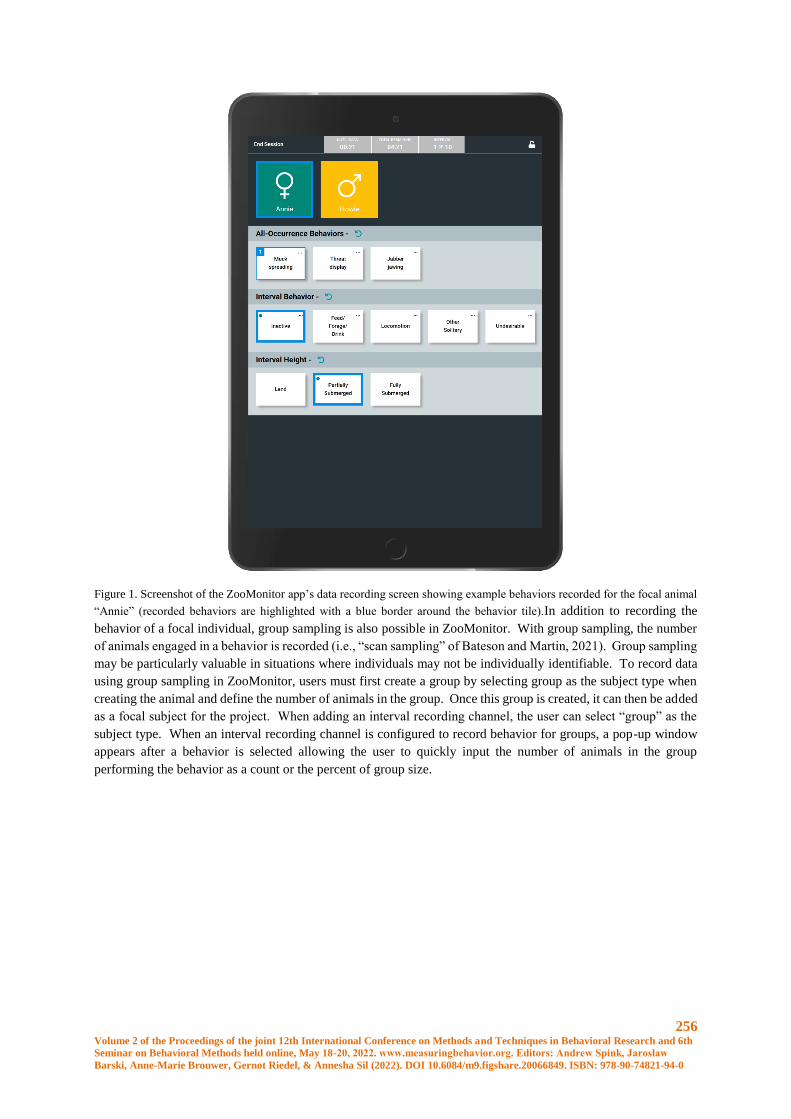
256 Volume 2 of the Proceedings of the joint 12th International Conference on Methods and Techniques in Behavioral Research and 6th
Seminar on Behavioral Methods held online, May 18-20, 2022. www.measuringbehavior.org. Editors: Andrew Spink, Jarosław
Barski, Anne-Marie Brouwer, Gernot Riedel, & Annesha Sil (2022). DOI 10.6084/m9.figshare.20066849. ISBN: 978-90-74821-94-0
Figure 1. Screenshot of the ZooMonitor app’s data recording screen showing example behaviors recorded for the focal animal
“Annie” (recorded behaviors are highlighted with a blue border around the behavior tile).In addition to recording the
behavior of a focal individual, group sampling is also possible in ZooMonitor. With group sampling, the number
of animals engaged in a behavior is recorded (i.e., “scan sampling” of Bateson and Martin, 2021). Group sampling
may be particularly valuable in situations where individuals may not be individually identifiable. To record data
using group sampling in ZooMonitor, users must first create a group by selecting group as the subject type when
creating the animal and define the number of animals in the group. Once this group is created, it can then be added
as a focal subject for the project. When adding an interval recording channel, the user can select “group” as the
subject type. When an interval recording channel is configured to record behavior for groups, a pop-up window
appears after a behavior is selected allowing the user to quickly input the number of animals in the group
performing the behavior as a count or the percent of group size.
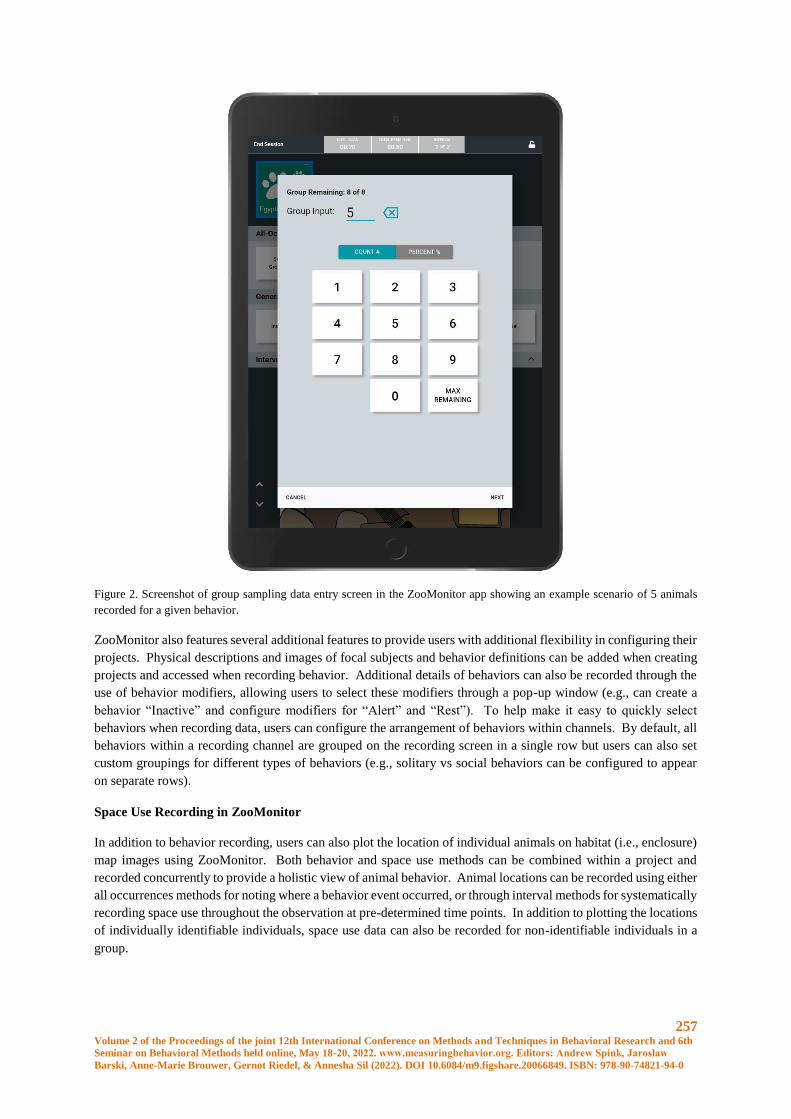
257 Volume 2 of the Proceedings of the joint 12th International Conference on Methods and Techniques in Behavioral Research and 6th
Seminar on Behavioral Methods held online, May 18-20, 2022. www.measuringbehavior.org. Editors: Andrew Spink, Jarosław
Barski, Anne-Marie Brouwer, Gernot Riedel, & Annesha Sil (2022). DOI 10.6084/m9.figshare.20066849. ISBN: 978-90-74821-94-0
Figure 2. Screenshot of group sampling data entry screen in the ZooMonitor app showing an example scenario of 5 animals
recorded for a given behavior.
ZooMonitor also features several additional features to provide users with additional flexibility in configuring their
projects. Physical descriptions and images of focal subjects and behavior definitions can be added when creating
projects and accessed when recording behavior. Additional details of behaviors can also be recorded through the
use of behavior modifiers, allowing users to select these modifiers through a pop-up window (e.g., can create a
behavior “Inactive” and configure modifiers for “Alert” and “Rest”). To help make it easy to quickly select
behaviors when recording data, users can configure the arrangement of behaviors within channels. By default, all
behaviors within a recording channel are grouped on the recording screen in a single row but users can also set
custom groupings for different types of behaviors (e.g., solitary vs social behaviors can be configured to appear
on separate rows).
Space Use Recording in ZooMonitor
In addition to behavior recording, users can also plot the location of individual animals on habitat (i.e., enclosure)
map images using ZooMonitor. Both behavior and space use methods can be combined within a project and
recorded concurrently to provide a holistic view of animal behavior. Animal locations can be recorded using either
all occurrences methods for noting where a behavior event occurred, or through interval methods for systematically
recording space use throughout the observation at pre-determined time points. In addition to plotting the locations
of individually identifiable individuals, space use data can also be recorded for non-identifiable individuals in a
group.
258 Volume 2 of the Proceedings of the joint 12th International Conference on Methods and Techniques in Behavioral Research and 6th
Seminar on Behavioral Methods held online, May 18-20, 2022. www.measuringbehavior.org. Editors: Andrew Spink, Jarosław
Barski, Anne-Marie Brouwer, Gernot Riedel, & Annesha Sil (2022). DOI 10.6084/m9.figshare.20066849. ISBN: 978-90-74821-94-0
Figure 3. Screenshot of the ZooMonitor app’s data recording screen showing example behaviors and space use recorded for
the focal animal “Annie” (recorded behaviors are highlighted with a blue border around the behavior tile and recorded space
use location is represented by the blue-green dot in the top left region of the habitat map image).
Data Reporting and Exporting
ZooMonitor features several built-in reports to provide quick behavior insights (Fig. 4). Behavior data can be
visualized through a behavior (i.e., activity) budget report to identify broad patterns, or as a behavior trends report
to view the change in behavior over time. Space use data can be visualized as a heat map report, showing “hot
spot” areas of the enclosure animals frequently spend time in. For manual analyses, data can be exported to a
comma-separated-values (CSV) file.
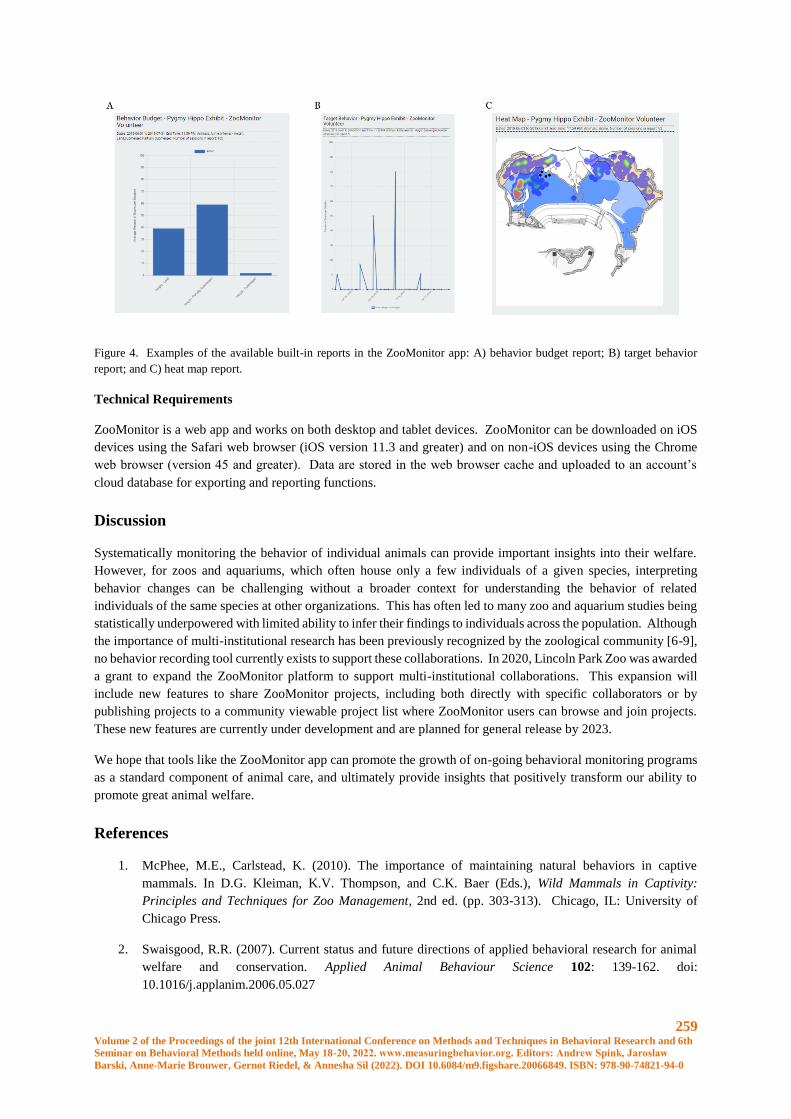
259 Volume 2 of the Proceedings of the joint 12th International Conference on Methods and Techniques in Behavioral Research and 6th
Seminar on Behavioral Methods held online, May 18-20, 2022. www.measuringbehavior.org. Editors: Andrew Spink, Jarosław
Barski, Anne-Marie Brouwer, Gernot Riedel, & Annesha Sil (2022). DOI 10.6084/m9.figshare.20066849. ISBN: 978-90-74821-94-0
Figure 4. Examples of the available built-in reports in the ZooMonitor app: A) behavior budget report; B) target behavior
report; and C) heat map report.
Technical Requirements
ZooMonitor is a web app and works on both desktop and tablet devices. ZooMonitor can be downloaded on iOS
devices using the Safari web browser (iOS version 11.3 and greater) and on non-iOS devices using the Chrome
web browser (version 45 and greater). Data are stored in the web browser cache and uploaded to an account’s
cloud database for exporting and reporting functions.
Discussion
Systematically monitoring the behavior of individual animals can provide important insights into their welfare.
However, for zoos and aquariums, which often house only a few individuals of a given species, interpreting
behavior changes can be challenging without a broader context for understanding the behavior of related
individuals of the same species at other organizations. This has often led to many zoo and aquarium studies being
statistically underpowered with limited ability to infer their findings to individuals across the population. Although
the importance of multi-institutional research has been previously recognized by the zoological community [6-9],
no behavior recording tool currently exists to support these collaborations. In 2020, Lincoln Park Zoo was awarded
a grant to expand the ZooMonitor platform to support multi-institutional collaborations. This expansion will
include new features to share ZooMonitor projects, including both directly with specific collaborators or by
publishing projects to a community viewable project list where ZooMonitor users can browse and join projects.
These new features are currently under development and are planned for general release by 2023.
We hope that tools like the ZooMonitor app can promote the growth of on-going behavioral monitoring programs
as a standard component of animal care, and ultimately provide insights that positively transform our ability to
promote great animal welfare.
References
1. McPhee, M.E., Carlstead, K. (2010). The importance of maintaining natural behaviors in captive
mammals. In D.G. Kleiman, K.V. Thompson, and C.K. Baer (Eds.), Wild Mammals in Captivity:
Principles and Techniques for Zoo Management, 2nd ed. (pp. 303-313). Chicago, IL: University of
Chicago Press.
2. Swaisgood, R.R. (2007). Current status and future directions of applied behavioral research for animal
welfare and conservation. Applied Animal Behaviour Science 102: 139-162. doi:
10.1016/j.applanim.2006.05.027

260 Volume 2 of the Proceedings of the joint 12th International Conference on Methods and Techniques in Behavioral Research and 6th
Seminar on Behavioral Methods held online, May 18-20, 2022. www.measuringbehavior.org. Editors: Andrew Spink, Jarosław
Barski, Anne-Marie Brouwer, Gernot Riedel, & Annesha Sil (2022). DOI 10.6084/m9.figshare.20066849. ISBN: 978-90-74821-94-0
3. Watters, J.V., Margulis, S.W., Atsalis, S. (2009). Behavioral monitoring in zoos and aquariums: A tool
for guiding husbandry and directing research. Zoo Biology 28: 35-48. doi: 10.1002/zoo.20207
4. Wark, J.D., Cronin, K.A., Niemann, T., Shender, M.A., Horrigan, A., Kao, A., Ross, M.R. (2019).
Monitoring the behavior and habitat use of animals to enhance welfare using the ZooMonitor app. Animal
Behavior and Cognition 6: 158-167. doi: 10.26451/abc.06.03.01.2019
5. Bateson, M, Martin, P. 2021. Measuring Behaviour: An Introductory Guide, 4th ed. Cambridge, UK:
Cambridge University Press.
6. Shepherdson, D., Wielebnowski, N. (2015). The power of multi-institutional and longitudinal studies for
zoo animal welfare research. World Association of Zoos and Aquariums Magazine 16: 6-10.
7. Swaisgood, R.R., Shepherdson, D.J. (2005). Scientific approaches to enrichment and stereotypies in zoo
animals: What’s been done and where should we go next? Zoo Biology 24: 499-518.
8. Ward, S.J., Hosey, G. (2019). The need for a convergence of agricultural/ laboratory and zoo-based
approaches to animal welfare. Journal of Applied Animal Welfare Science 23: 484-492. doi:
10.1080/10888705.2019.1678038
9. Whitham, J.C., Wielebnowski, N. (2013). New directions for animal welfare science. Applied Animal
Behaviour Science 147: 247-260. doi: 10.1016/j.applanim.2013.02.004
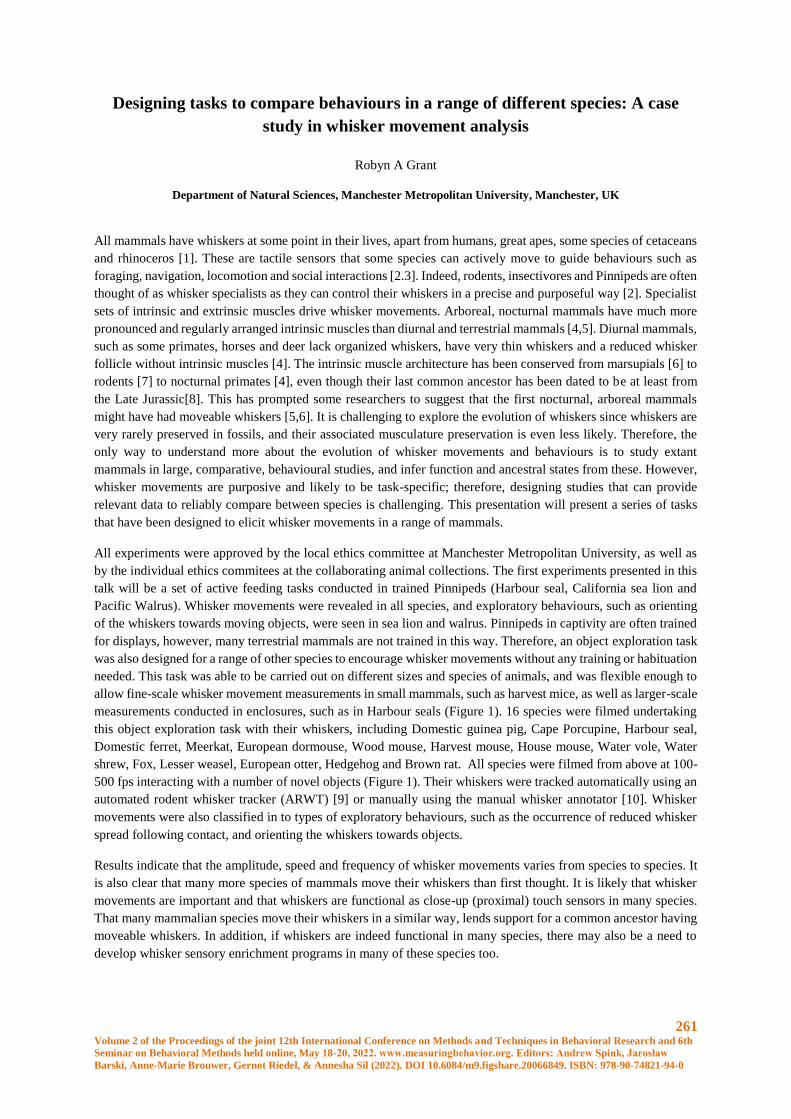
261 Volume 2 of the Proceedings of the joint 12th International Conference on Methods and Techniques in Behavioral Research and 6th
Seminar on Behavioral Methods held online, May 18-20, 2022. www.measuringbehavior.org. Editors: Andrew Spink, Jarosław
Barski, Anne-Marie Brouwer, Gernot Riedel, & Annesha Sil (2022). DOI 10.6084/m9.figshare.20066849. ISBN: 978-90-74821-94-0
Designing tasks to compare behaviours in a range of different species: A case
study in whisker movement analysis
Robyn A Grant
Department of Natural Sciences, Manchester Metropolitan University, Manchester, UK
All mammals have whiskers at some point in their lives, apart from humans, great apes, some species of cetaceans
and rhinoceros [1]. These are tactile sensors that some species can actively move to guide behaviours such as
foraging, navigation, locomotion and social interactions [2.3]. Indeed, rodents, insectivores and Pinnipeds are often
thought of as whisker specialists as they can control their whiskers in a precise and purposeful way [2]. Specialist
sets of intrinsic and extrinsic muscles drive whisker movements. Arboreal, nocturnal mammals have much more
pronounced and regularly arranged intrinsic muscles than diurnal and terrestrial mammals [4,5]. Diurnal mammals,
such as some primates, horses and deer lack organized whiskers, have very thin whiskers and a reduced whisker
follicle without intrinsic muscles [4]. The intrinsic muscle architecture has been conserved from marsupials [6] to
rodents [7] to nocturnal primates [4], even though their last common ancestor has been dated to be at least from
the Late Jurassic[8]. This has prompted some researchers to suggest that the first nocturnal, arboreal mammals
might have had moveable whiskers [5,6]. It is challenging to explore the evolution of whiskers since whiskers are
very rarely preserved in fossils, and their associated musculature preservation is even less likely. Therefore, the
only way to understand more about the evolution of whisker movements and behaviours is to study extant
mammals in large, comparative, behavioural studies, and infer function and ancestral states from these. However,
whisker movements are purposive and likely to be task-specific; therefore, designing studies that can provide
relevant data to reliably compare between species is challenging. This presentation will present a series of tasks
that have been designed to elicit whisker movements in a range of mammals.
All experiments were approved by the local ethics committee at Manchester Metropolitan University, as well as
by the individual ethics commitees at the collaborating animal collections. The first experiments presented in this
talk will be a set of active feeding tasks conducted in trained Pinnipeds (Harbour seal, California sea lion and
Pacific Walrus). Whisker movements were revealed in all species, and exploratory behaviours, such as orienting
of the whiskers towards moving objects, were seen in sea lion and walrus. Pinnipeds in captivity are often trained
for displays, however, many terrestrial mammals are not trained in this way. Therefore, an object exploration task
was also designed for a range of other species to encourage whisker movements without any training or habituation
needed. This task was able to be carried out on different sizes and species of animals, and was flexible enough to
allow fine-scale whisker movement measurements in small mammals, such as harvest mice, as well as larger-scale
measurements conducted in enclosures, such as in Harbour seals (Figure 1). 16 species were filmed undertaking
this object exploration task with their whiskers, including Domestic guinea pig, Cape Porcupine, Harbour seal,
Domestic ferret, Meerkat, European dormouse, Wood mouse, Harvest mouse, House mouse, Water vole, Water
shrew, Fox, Lesser weasel, European otter, Hedgehog and Brown rat. All species were filmed from above at 100-
500 fps interacting with a number of novel objects (Figure 1). Their whiskers were tracked automatically using an
automated rodent whisker tracker (ARWT) [9] or manually using the manual whisker annotator [10]. Whisker
movements were also classified in to types of exploratory behaviours, such as the occurrence of reduced whisker
spread following contact, and orienting the whiskers towards objects.
Results indicate that the amplitude, speed and frequency of whisker movements varies from species to species. It
is also clear that many more species of mammals move their whiskers than first thought. It is likely that whisker
movements are important and that whiskers are functional as close-up (proximal) touch sensors in many species.
That many mammalian species move their whiskers in a similar way, lends support for a common ancestor having
moveable whiskers. In addition, if whiskers are indeed functional in many species, there may also be a need to
develop whisker sensory enrichment programs in many of these species too.
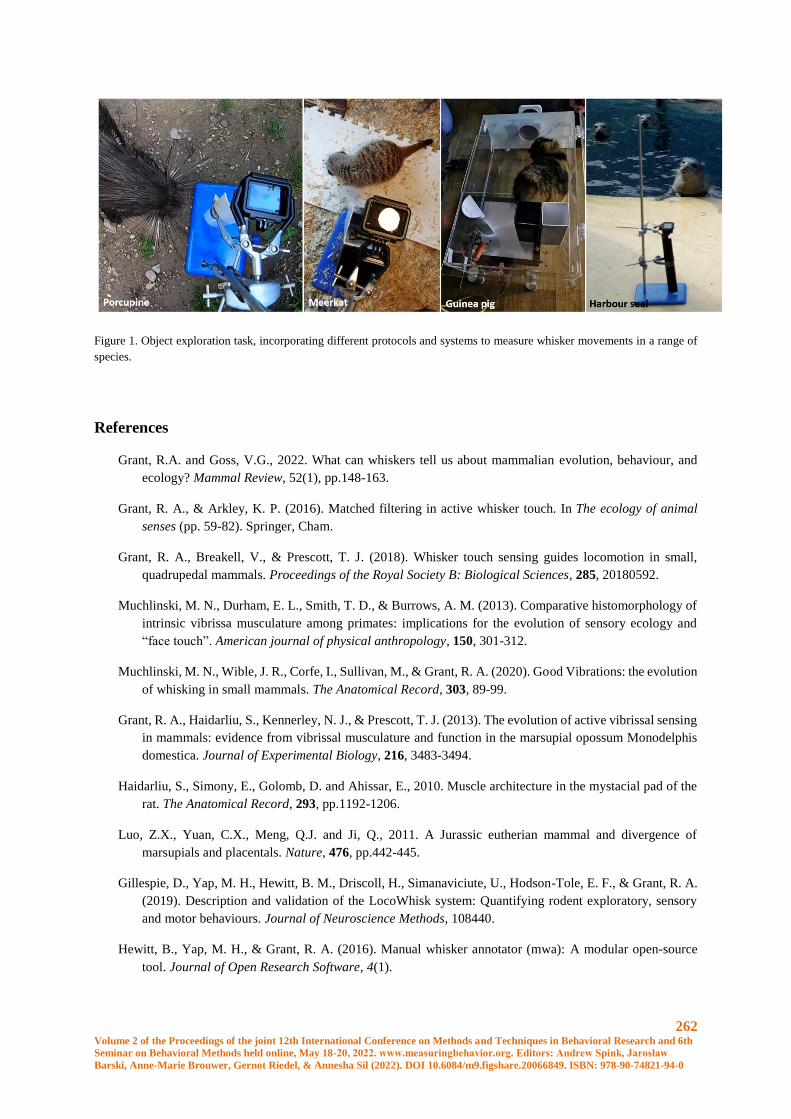
262 Volume 2 of the Proceedings of the joint 12th International Conference on Methods and Techniques in Behavioral Research and 6th
Seminar on Behavioral Methods held online, May 18-20, 2022. www.measuringbehavior.org. Editors: Andrew Spink, Jarosław
Barski, Anne-Marie Brouwer, Gernot Riedel, & Annesha Sil (2022). DOI 10.6084/m9.figshare.20066849. ISBN: 978-90-74821-94-0
Figure 1. Object exploration task, incorporating different protocols and systems to measure whisker movements in a range of
species.
References
Grant, R.A. and Goss, V.G., 2022. What can whiskers tell us about mammalian evolution, behaviour, and
ecology? Mammal Review, 52(1), pp.148-163.
Grant, R. A., & Arkley, K. P. (2016). Matched filtering in active whisker touch. In The ecology of animal
senses (pp. 59-82). Springer, Cham.
Grant, R. A., Breakell, V., & Prescott, T. J. (2018). Whisker touch sensing guides locomotion in small,
quadrupedal mammals. Proceedings of the Royal Society B: Biological Sciences, 285, 20180592.
Muchlinski, M. N., Durham, E. L., Smith, T. D., & Burrows, A. M. (2013). Comparative histomorphology of
intrinsic vibrissa musculature among primates: implications for the evolution of sensory ecology and
“face touch”. American journal of physical anthropology, 150, 301-312.
Muchlinski, M. N., Wible, J. R., Corfe, I., Sullivan, M., & Grant, R. A. (2020). Good Vibrations: the evolution
of whisking in small mammals. The Anatomical Record, 303, 89-99.
Grant, R. A., Haidarliu, S., Kennerley, N. J., & Prescott, T. J. (2013). The evolution of active vibrissal sensing
in mammals: evidence from vibrissal musculature and function in the marsupial opossum Monodelphis
domestica. Journal of Experimental Biology, 216, 3483-3494.
Haidarliu, S., Simony, E., Golomb, D. and Ahissar, E., 2010. Muscle architecture in the mystacial pad of the
rat. The Anatomical Record, 293, pp.1192-1206.
Luo, Z.X., Yuan, C.X., Meng, Q.J. and Ji, Q., 2011. A Jurassic eutherian mammal and divergence of
marsupials and placentals. Nature, 476, pp.442-445.
Gillespie, D., Yap, M. H., Hewitt, B. M., Driscoll, H., Simanaviciute, U., Hodson-Tole, E. F., & Grant, R. A.
(2019). Description and validation of the LocoWhisk system: Quantifying rodent exploratory, sensory
and motor behaviours. Journal of Neuroscience Methods, 108440.
Hewitt, B., Yap, M. H., & Grant, R. A. (2016). Manual whisker annotator (mwa): A modular open-source
tool. Journal of Open Research Software, 4(1).
263 Volume 2 of the Proceedings of the joint 12th International Conference on Methods and Techniques in Behavioral Research and 6th
Seminar on Behavioral Methods held online, May 18-20, 2022. www.measuringbehavior.org. Editors: Andrew Spink, Jarosław
Barski, Anne-Marie Brouwer, Gernot Riedel, & Annesha Sil (2022). DOI 10.6084/m9.figshare.20066849. ISBN: 978-90-74821-94-0
Different approaches to study emotions and social interactions of farm animals
for a deeper understanding of animal welfare
Jan Langbein1, Borbala Foris2, Annika Krause1, Helena Maudanz1, Nina Melzer1
1 Research Institute for Farm Animal Biology (FBN), Dummerstorf, Germany
2 University of British Columbia, Vancouver, Canada
The welfare of farm animals plays an increasingly important role in society, administration, and food production.
Over the past 20 years, there has been increasing interest in a more comprehensive knowledge of how farm animals
perceive and interact with their physical and social environment. This information is critical to applied ethology
because it allows for adaptation of husbandry practices to the specific behavioural needs of the animals. We present
two recent experimental approaches to study emotional contagion in pigs and to evaluate a real-time location
system to study social interactions of cattle in a free stall barn.
Study 1 - Do you feel what I feel? Emotional contagion in pigs
In farm animal husbandry, the study of emotional states of single animals is increasingly playing a role in reliably
characterizing animal welfare [1]. However, farm animals live predominantly in social groups and, to date, few
studies have addressed the social component of emotional states [2]. Group-living animals are also thought to
exhibit a high sensitivity to the emotional state of their group mates, mediated by the process of emotional
contagion (EC). Thus EC is an important prerequisite for the development of empathy [3]. Two processes are
described that play an important role in the manifestation of EC: socially-mediated arousal (SMA) and
ethological/physiological mimicry. The latter is reflected by a certain level of synchronization of behaviour and
physiology between demonstrator and observer [4]. To date, in farm animals, only few approaches have addressed
the individual contribution of SMA or ethological and physiological synchronization in the context of EC.
The study of EC in animals usually integrates multiple behavioural and physiological measures to map not only
the level of arousal but also the emotional valence with which a situation is perceived [5]. Behavioural indicators
may include vocalizations, tail movement, ear position, freezing, or facial expressions. Different emotional
perceptions of a social interaction also can cause a shift in autonomic balance. The interaction of both branches of
the autonomic nervous system (ANS), parasympathetic and sympathetic nerve, causes complex variations in heart
rate (HR) and heart rate variability (HRV). While changes in HR allow inferences about general arousal, changes
in HRV are more likely to mediate emotional valence [6]. The aim of the study was to investigate changes in the
ethological and autonomic response of pigs that are appropriate to verify EC in pigs.
Animals, material, and methods
Fourteen pigs were randomly divided into fixed dyads and exposed to four different treatments, in each of which
one animal was directly confronted with the treatment (demonstrator), while the partner acted as observer. In two
consecutive test phases (T1, T2), the dyads were kept in two adjacent compartments separated by a grid in the
lower area and acrylic glass in the upper area (to allow visual, olfactory, acoustic, and partial tactile contact). To
investigate the influence of prior experience with the test situation, the roles of the animals were reversed in the
second test phase (T2). The following four treatments were realized: movement restriction (negative, C-); inactive
human present (neutral, C0); handling by a familiar person (positive, C+); food ball dropping salt sticks (very
positive, C++). The behaviour of the observer (head orientation to the demonstrator, contact to the separating grid)
was recorded in T1 and T2 using a video camera (Panasonic WV-CP500) and analyzed by The Observer XT
(version 12, Noldus, Wageningen, The Netherlands). The ECG of the observer in T1 and T2 was recorded using
implantable transmitters (M11; DSI, Minneapolis, MN) and/or external heart rate belts (BioHarness™, BIOPAC
Systems Inc.,Goleta, CA) and imported into Kubios (Kubios HRV Premium 3.3.0, Kubios Oy, Finland). The first
minute of the ECG in T1 and T2, respectively, was evaluated, and delta values to an individual reference interval
during a baseline measurement were calculated for HR, RMSSD (root mean square of successive differences of
264 Volume 2 of the Proceedings of the joint 12th International Conference on Methods and Techniques in Behavioral Research and 6th
Seminar on Behavioral Methods held online, May 18-20, 2022. www.measuringbehavior.org. Editors: Andrew Spink, Jarosław
Barski, Anne-Marie Brouwer, Gernot Riedel, & Annesha Sil (2022). DOI 10.6084/m9.figshare.20066849. ISBN: 978-90-74821-94-0
RR intervals), and SDNN (standard deviation of RR intervals). Changes (Δ) of the mean duration of the behaviours
and of HR, RMSSD, and SDNN were analysed using mixed linear models (MIXED procedures) with test phase
(1,2), treatment (C-, C0, C+, C++), and the interaction of both as fixed effects. Pairwise comparisons were made
using the t-test (Tukey-Kramer-correction).
Results
The treatment had a significant effect on head orientation (F3,34 = 3.2, p < 0.05) and on contact to the separating
grid (F3.35 = 4.98, p < 0.01). Observers in C- oriented longer towards the demonstrator and had significantly longer
contact with the grid compared to all other test situations (C0: p < 0.05, C+: p < 0.05, C++: p < 0.05). With regard
to the autonomous response of the observer, there was a trend effect of the treatment on HR (F3,30 = 2.28, p < 0.1;).
Observers in C- responded with an increased HR compared to C+ (p < 0.1). The pairwise comparisons showed
that this difference was mainly due to T2. Neither treatment nor phase or their interaction had an effect on RMSSD
of the observer. In the pairwise comparisons, however, there was a tendency for RMSSD to be lower in C-
compared to C+ (p < 0.1), but this occurred only in T2.
Discussion
The study shows that the treatment experienced by the demonstrator triggers behavioural and physiological
responses in the observer that might be indicative of EC. This response is most pronounced in the negative
treatment. Prior experience with the particular treatment had no additional effect on behaviour of the observer, but
apparently did on the ANS. The ethological and physiological responses observed in the observers could be
interpreted as indicative of SMA, as has also been observed, for example, in hens whose chicks were exposed to
multiple aversive air blasts [7]. It could also be discussed that this response is based on increased interest or
curiosity about what is happening in the neighbouring compartment, rather than EC per se. However, SMA is
detectable exclusively in the observers of the negative treatment (C-), but not in the context of the neutral treatment
(C0). The evidence of EC would allow gaining better insight in the emotional experience of animals and could
have profound implications on animal health and welfare, especially for group-housed animals.
Study 2 - Validation of a real-time location system for neighbour detection in dairy cow
groups
While older socio-ethological literature on farm animals primarily examined intragroup socio-negative interactions
and resulting social hierarchies, giving the impression that agonistic behaviour is of overwhelming importance in
the social life of animals, recent research has focused more on socio-positive interaction as a key driver of group
cohesion and well-structured social life. Group living animals often repeatedly seek the proximity of a particular
partner in different behavioural contexts, which is thought to reflect affiliative bonds. Recently scientists started
to refer to long-term dyadic social ties as ‘friendship’ [8, 9]. These preferential attachments are thought to promote
positive emotions and favour the partners involved [10], lowering heart rate [11], strengthening cohesion within
the herd [12], and reducing stress level [13]. In cattle, allogrooming (or social grooming), feeding side by side, or
lying next to each other are reliable indicators of affiliative bonds [14]. To date, it is largely unknown which
variables influence the formation of cohesive dyadic relationships in cow groups. Collecting data on affiliative
behaviour has predominantly been done through direct or video observation. Advanced technologies such as real-
time location systems (RTLS) are now available for indoor use, enabling remote tracking of animals with high
temporal resolution and promised centimeter-level accuracy. However, the accuracy of these systems needs to be
verified and raw data preparation guidelines are needed so that the data generated by these systems are suitable for
the interpretation of social relationships. In previous work, the validation of the agreement between spatial
proximity and real social behaviour in cow barns is limited [15] or missing [16]. In this study, we investigated the
impact of different RTLS setups, as well as smoothing and filtering methods of the raw data on the resulting
tracking accuracy of a group of dairy cows in a free stall barn. We validated the RTLS data using one day of
continuous video analysis determining the locations of all cows and the presence at electronic feed and water bins
as references.
265 Volume 2 of the Proceedings of the joint 12th International Conference on Methods and Techniques in Behavioral Research and 6th
Seminar on Behavioral Methods held online, May 18-20, 2022. www.measuringbehavior.org. Editors: Andrew Spink, Jarosław
Barski, Anne-Marie Brouwer, Gernot Riedel, & Annesha Sil (2022). DOI 10.6084/m9.figshare.20066849. ISBN: 978-90-74821-94-0
Animals, material, and methods
We conducted data collection in a group of lactating cows for three successive days in December 2015 (period 1,
P1; 15 cows), and October 2016 (period 2, P2; 14 cows). These two observation periods corresponded to two
different RTLS setups. Tags for transmitting radio signals (Ubisense Series 7000 Industrial tag) were fixed on the
top of the cows’ neck collars. Twelve ultra-wideband sensors (IP65, Ubisense 2010) for detecting the radio signals
from the tags were fixed on the walls and the ceiling of the barn. Before P1, the system was calibrated using
reference points determined by a laser distance meter with a measurement accuracy of 5 cm. Before P2, a
calibration point field was created based on a tachymetric survey of the cattle barn by a professional company
(Neuvia Ingenieure, Rostock, Germany), where the measurement accuracy was in the one-digit mm range
(personal communication) and re-calibration of the Ubisense system was performed [17].
We applied our developed R-pipeline (R version 3.6.1) to prepare the exported RTLS data, including the use of
four commonly used approaches (i.e., Kalman filter, median filter, sliding window, jump filter,) for handling
outlier measurements. Resulting data sets were stepwise linearly interpolated to standardize the resolution of the
location data (1 s). All location data measurements were assigned to corresponding zones in the pen (i.e, specific
area (e.g., specific bin) or main zones (e.g. feedbunk)). To evaluate the quality of the zone assignment in view to
RTLS setup as well as to the different approaches for outlier measurements, we calculated sensitivity and precision.
We also tested if cows that occupied neighboring bins or lying stalls could be detected reliably based on prepared
RTLS data. To determine neighboring cows we used a distance approach (following [16]; using distances between
1.5 m and 3 m) and a zone approach. We determined for each cow pair and day the total duration as neighbors at
the feed bunk or in lying stalls and compared this with corresponding neighbor events based on video footage or
data from electronic bins via Spearman’s rank correlation coefficient (R).
Results
The number of raw measurements over the three days were within 45–80% of expected measurements for P1. By
contrast, in P2, the number of measurements increased by more than 12%, with a range of 61–94%. In P1, we
obtained a bias for raw measurements at the feed bunk and a broad band with high variation despite limited postural
variation in the lying stalls. By contrast, in P2, the measurements at the feedbunk and in the lying stalls show
considerably less deviation. In both periods, the main zone lying stalls showed highest sensitivity and precisision
(all >0.97). The sensitivity and precision at the feedbunk and walking alley clearly differed between P1 and P2. In
P1, many measurements that actually occurred at the feed bunk were assigned to the walking alley resulting in that
feed bunk showed low sensitivity (<0.23), whereas walking alley showed a low precision (<0.46). In P2, the
sensitivity and precision were clearly improved in both zones (both >0.84). Generally, both neighbor detection
approaches performed well in P2 in both zones (all R>0.9). In P1 the correlation (R< 0.6) was low at the feed bunk
for both approaches.
Discussion
RTLS data for studying the spatio-temporal behaviour of animals need careful assessment as well as preparation.
Our results show that after calibrating the RTLS based on tachymetric survey, a better overall performance of the
system can be achieved. Generally, we observed that data smoothing or filtering to handle outlier measurements
did not improve the zone assignment nor the neighbor detection when the data quality was high. We found that
relying on zones instead of distances to reveal neighbors is reliable and has the advantage that no threshold has to
be found. Applying a distance approach needs an evalution which threshold is appropriate. Our results demonstrate
the importance of the RTLS setup, as to evaluate and to test different approaches to improve RTLS data and finding
appropriate thresholds would be impractical for each barn. In this study, we focused on spatial associations
(neighbors in specific functional areas) between cows, in a similar manner to Rocha et al. [16]. The consistent
spatial proximity of cow pairs may indicate socio-positive bonds (i.e., friendship [18, 19]) and long-term RTLS
data may help to better understand the social dynamics of dairy cow groups.

266 Volume 2 of the Proceedings of the joint 12th International Conference on Methods and Techniques in Behavioral Research and 6th
Seminar on Behavioral Methods held online, May 18-20, 2022. www.measuringbehavior.org. Editors: Andrew Spink, Jarosław
Barski, Anne-Marie Brouwer, Gernot Riedel, & Annesha Sil (2022). DOI 10.6084/m9.figshare.20066849. ISBN: 978-90-74821-94-0
References
1. Mendl, M., Burman, O.H., Paul, E.S. (2010). An integrative and functional framework for the study of animal
emotion and mood. Proceedings of the Royal Society B-Biological Science 277, 2895-2904.
2. Goumon, S., Spinka, M. (2016). Emotional contagion of distress in young pigs is potentiated by previous
exposure to the same stressor. Animal Cognition 19, 501-511.
3. Preston, S.D., de Waal, F.B.M. (2002). Empathy: Its ultimate and proximate bases. Behavioral and Brain
Sciences 25, 1-20.
4. Edgar, J.L., and Nicol, C.J. (2018). Socially-mediated arousal and contagion within domestic chick broods.
Scientific Reports 8, 10509.
5. Düpjan, S., Krause, A., Moscovice, L.R., Nawroth, C. (2020). Emotional contagion and its implications for
animal welfare. CAB Reviews 15, 1-6.
6. Krause, A., Puppe, B., Langbein, J. (2017). Coping style modifies general and affective autonomic reactions of
domestic pigs in different behavioral contexts. Frontiers in Behavioral Neuroscience 11, 103.
7. Edgar, J.L., Lowe, J.C., Paul, E.S., Nicol, C.J. (2011). Avian maternal response to chick distress. Proceedings
of the Royal Society B-Biological Science 278, 3129-3134.
8. Silk, J.B. (2002). Using the 'F'-word in primatology. Behaviour 139, 421-446.
9. Massen, J., Sterck, E., de Vos, H. (2010). Close social associations in animals and humans: functions and
mechanisms of friendship. Behaviour 147, 1379-1412.
10. Baciadonna, L., Duepjan, S., Briefer, E.F., de la Torre, M.P., Nawroth, C. (2018). Looking on the Bright Side
of Livestock Emotions-the Potential of Their Transmission to Promote Positive Welfare. Frontiers in Veterinary
Science 5, 218.
11. Laister, S., Stockinger, B., Regner, A.-M., Zenger, K., Knierim, U., Winckler, C. (2011). Social licking in
dairy cattle—Effects on heart rate in performers and receivers. Applied Animal Behaviour Science 130, 81-90.
12. Gibbons, J.M., Lawrence, A.B., Haskell, M.J. (2010). Measuring sociability in dairy cows. Applied Animal
Behaviour Science 122, 84-91.
13. Boissy, A., Le Neindre, P. (1990). Social influences on the reactivity of heifers: implications for learning
abilities in operant conditioning. Applied Animal Behaviour Science 25, 149-165.
14. de Sousa, K.T., Machado Filho, L.C.P., Bica, G.S., Deniz, M., Hötzel, M.J. (2021). Degree of affinity among
dairy heifers affects access to feed supplementation. Applied Animal Behaviour Science 234.
15. Chopra, K., Hodges, H.R., Barker, Z.E., Vázquez Diosdado, J.A., Amory, J.R., Cameron, T.C., Croft, D.P.,
Bell, N.J., Codling, E.A. (2020). Proximity Interactions in a Permanently Housed Dairy Herd: Network Structure,
Consistency, and Individual Differences. Frontiers in Veterinary Science 7, 583715.
16. Rocha, L.E.C., Terenius, O., Veissier, I., Meunier, B., Nielsen, P.P. (2020). Persistence of sociality in group
dynamics of dairy cattle. Applied Animal Behaviour Science 223.
17. Rose, T. (2015). Real-time location system Series 7000 from Ubisense for behavioural analysis in dairy cows.
Doctoral thesis. Christian-Albrechts-Universitat zu Kiel, Kiel, Germany.
18. Seyfarth, R.M., Cheney, D.L. (2012). The Evolutionary Origins of Friendship. Annual Review of Psychology
63, 153-177.

267 Volume 2 of the Proceedings of the joint 12th International Conference on Methods and Techniques in Behavioral Research and 6th
Seminar on Behavioral Methods held online, May 18-20, 2022. www.measuringbehavior.org. Editors: Andrew Spink, Jarosław
Barski, Anne-Marie Brouwer, Gernot Riedel, & Annesha Sil (2022). DOI 10.6084/m9.figshare.20066849. ISBN: 978-90-74821-94-0
19. Gutmann, A.K., Špinka, M., and Winckler, C. (2015). Long-term familiarity creates preferred social partners
in dairy cows. Applied Animal Behaviour Science 169, 1-8.
268 Volume 2 of the Proceedings of the joint 12th International Conference on Methods and Techniques in Behavioral Research and 6th
Seminar on Behavioral Methods held online, May 18-20, 2022. www.measuringbehavior.org. Editors: Andrew Spink, Jarosław
Barski, Anne-Marie Brouwer, Gernot Riedel, & Annesha Sil (2022). DOI 10.6084/m9.figshare.20066849. ISBN: 978-90-74821-94-0
Session Theme: Measuring Behaviour in Sport
and exercise
269 Volume 2 of the Proceedings of the joint 12th International Conference on Methods and Techniques in Behavioral Research and 6th
Seminar on Behavioral Methods held online, May 18-20, 2022. www.measuringbehavior.org. Editors: Andrew Spink, Jarosław
Barski, Anne-Marie Brouwer, Gernot Riedel, & Annesha Sil (2022). DOI 10.6084/m9.figshare.20066849. ISBN: 978-90-74821-94-0
Measuring Performance and Infringements in elite racewalkers: the IART
system
T. Caporaso1, and S. Grazioso1
1 Fraunhofer Joint Lab IDEAS, Department of Industrial Engineering, University of Naples Federico II, Naples, Italy
Introduction
Race-walking performance is related to the best chronometric time constrained by the infringements (“bent knee”
and “visible loss of ground contact”). The performance and risk of infringements in race-walking can be measured
and assessed using the IART (Inertial Assistant Referee and Trainer) system [1], which is based on the evaluation
of the following biomechanical parameters: loss of ground contact time (LOGC), loss of ground contact step
classification, step length, step cadence and smoothness. In this work we describe the IART system, and we present
its benefits through its positive usage by elite athletes.
Methods
IART system is based on a measurement unit (inertial sensor) located at the bottom of the vertebral column of the
athlete and a management unit (installed on a mobile device). The data for system validation are collected by nine
elite race-walkers. Five parameters are assessed to describe infringements and performance: loss of ground contact
time (LOGC), loss of ground contact step classification, step length, step cadence and smoothness. Using this
approach, race-walking infringement related to the LOGC can be assessed in terms of legal or illegal sequence of
steps performed by the race-walker. Radar charts are used for intuitive representation of the biomechanical
indicators [2]. Field data are processed and stored on a management unit that shows the outcomes customized for
the different user’s (coaches and judges). This system is developed according to user’s need (based on user’s centre
study [3]) and allows data collection in typical training session.
Results and Discussion
The experimental phase shows how the IART system offers a highly reliable and valuable tool to estimate the
LOGC and identify legal and illegal step sequences. Indeed, using as benchmark the LOGC classification based
on high speed camera videos, the IART system achieves an accuracy equal to 87% in step sequence classification
and 92% of acceptable classification. In race-walking these results are clearly desirable to assist the judging as
well as to allow an improvement of the training analysis for the coaches. Indeed, in comparison to the score
performance of a judges’ evaluation [4, 5], the IART system has a higher level of accuracy, although a
simultaneous sequence evaluation could be useful. The extension to real competition scenario presents some
limitations. Indeed, in this study we assume a fixed exact threshold for visible loss of ground contact (40 ms),
although actually in the competition rules there is no exact threshold value for loss of contact. The performance of
the IART classifier are better than the a previous method (Lee’s approach also based on inertial parameters [6])
presented in the literature. However, a comparison with the other measuring systems based on pressure sensors is
desirable. For the gesture and performance analysis, IART highlight strengths and weakness of the race-walker’s
technique and can suggest the optimal compromise between step length and step cadence to achieve the best
performances without occurring in infringements. However, a customized strategy for the main types of race
competitions (men’s and women’s 20 and 35 km) could improve the analysis of the race-walker’s gesture for
specific competition races. In conclusion, the IART system is able to give a greater confidence and a better support
service to elite athletes, judges and coaches.

270 Volume 2 of the Proceedings of the joint 12th International Conference on Methods and Techniques in Behavioral Research and 6th
Seminar on Behavioral Methods held online, May 18-20, 2022. www.measuringbehavior.org. Editors: Andrew Spink, Jarosław
Barski, Anne-Marie Brouwer, Gernot Riedel, & Annesha Sil (2022). DOI 10.6084/m9.figshare.20066849. ISBN: 978-90-74821-94-0
References
1. Caporaso, T., & Grazioso, S. (2020). Iart: Inertial assistant referee and trainer for race walking. Sensors, 20(3),
783.
2. Caporaso, T., Grazioso, S., Di Gironimo, G., & Lanzotti, A. (2020). Biomechanical indices represented on radar
chart for assessment of performance and infringements in elite race-walkers. Sports Engineering, 23(1), 1-8.
3. G. Di Gironimo, T. Caporaso, D. M. Del Giudice, A. Lanzotti. (2017). Towards a New Monitoring System to
Detect Illegal Steps in Race-Walking. International Journal of Interactive Design and Manufacturing. 11(2), 217-
239 (pp.)
4. Di Gironimo, G., Caporaso, T., Amodeo G., Lanzotti, A., Odenwald, S., Del Giudice, D.M (2016). Outdoor
tests for the validation of an inertial system able to detect illegal steps in race-walking. Procedia Engineering 147,
544-549 (pp.)
5. Hanley, B., Tucker, C. B., & Bissas, A. (2019). Assessment of IAAF racewalk judges' ability to detect legal and
non-legal technique. Frontiers in Sports and Active Living, 9.
6. Lee, J.B., Mellifont, R.B., Burkett, B.J., James, D.A. (2013). Detection of illegal race walking: a tool to assist
coaching and judging. Sensors, 13(12), 16065-16074 (pp.)
271 Volume 2 of the Proceedings of the joint 12th International Conference on Methods and Techniques in Behavioral Research and 6th
Seminar on Behavioral Methods held online, May 18-20, 2022. www.measuringbehavior.org. Editors: Andrew Spink, Jarosław
Barski, Anne-Marie Brouwer, Gernot Riedel, & Annesha Sil (2022). DOI 10.6084/m9.figshare.20066849. ISBN: 978-90-74821-94-0
Assessing the likelihood of serve success using nearest neighbourhood methods
Andy Hext
Centre for Sports Engineering Research, Sheffield Hallam University, Sheffield, UK
Introduction
The progression of technology has greatly improved the ability to measure the game of tennis. Early work
focused on physical interactions of the ball and racket in isolation [1,2] or on player movement in controlled
conditions [3,4]. As technology developed, sophisticated measurements of racket movement could be made
during free-play (non-competitive) conditions [5]. However, in all cases, data was collected non-routinely as part
of a specific research investigation.
In the modern era, technology allows sophisticated ball and player tracking during competition conditions. This
data is collected routinely as part of the Hawk-Eye™ Electronic Line-calling System (ELS) which is used at
many competitions and has given players the ability to challenge line-calling decisions. The camera-based
system automatically detects the ball and players during play and calculates their position with relation to the
court—giving metrics such as velocities, bounce locations and flight trajectories. The data is used to generate
match-statistics during play but has also been used in scientific research. The large datasets formed over the
course of tournaments have given sports engineers new tools for analysing and understanding the effects of
equipment on sporting performance. A number of authors have used data captured by the Hawkeye system to
investigate aspects of Tennis. Whiteside et al. [6] examined metrics that distinguish between lower and higher
ranked players in the Australian Open. Lane et al. [7] looked for differences in ball performance during ball
degradation. Wei et al. used sophisticated modelling and statistical techniques to try to predict shot outcomes [8–
10].
Given the size and range of these datasets, authors have attempted to characterise behaviours. For example, Wei
et al. [10] grouped serves into different style priors using clustering techniques. Establishing discrete groups
allowed further predicting modelling, but this approach has its disadvantages. In a large dataset the physical
properties of a serve (speed and trajectory) lie on a continuum rather than in discrete groups. As such, clustering
imposes boundaries within the data. Serves that lie close to these boundaries will be assigned to different groups
despite having very similar physical properties. This paper demonstrates the use of a neighbourhood approach as
an alternative to clustering. It is used to calculate the likelihood that different serves will be returned (the serve
returnability).
Methods
A dataset was formed from Hawk-Eye data recorded during Davis Cup tournaments between 2012 to 2018, it
comprised 39,846 serves in total.
The shot data table was the largest and contained detailed information regarding the physical characteristics of a
shot—summarized in Figure 1. In addition each serve has a number of associated data such as type of serve
(first/second) side of court (advantage/deuce) etc.

272 Volume 2 of the Proceedings of the joint 12th International Conference on Methods and Techniques in Behavioral Research and 6th
Seminar on Behavioral Methods held online, May 18-20, 2022. www.measuringbehavior.org. Editors: Andrew Spink, Jarosław
Barski, Anne-Marie Brouwer, Gernot Riedel, & Annesha Sil (2022). DOI 10.6084/m9.figshare.20066849. ISBN: 978-90-74821-94-0
Figure 1. The Hawk-Eye system provided positions and velocities of ball and player at three distinct points: ball impact, passing
the net and court impact.
In order to characterise each serve, the following physical properties were calculated:
Ball position in x, y and z directions (sampled at 50 timepoints from impact to court contact)
Ball velocity in x, y and z direction (sampled at 50 timepoints from impact to court contact)
Ball velocity in x, y and z directions immediately after bounce
Position of receiver in x and y directions when ball was hit
These properties created a 305 element feature vector for each serve.
The dataset also contained information for each serve regarding whether it was returned or not. While the dataset
contained a number of possible outcomes of the serve (Ace, let, fault, double fault, returned and not returned) the
outcome was simplified to a binary: returned or not returned. Lets, faults and double faults were filtered from the
dataset.
In order to calculate the returnability of a serve (a probability of return) it was necessary to group similar serves in
order to translate a binary outcome (returned/not returned) into a continuous probability. A nearest neighbourhood
search within the 305-dimensional feature space was conducted using a kd-tree. The maximum radius of the search
was 10 (m or ms-1 depending on whether the feature was a position or velocity) and the maximum number of
neighbours was set at 1,000. The returnability of each serve was calculated as the proportion of serves within each
neighbourhood that were successfully returned.
The advantage of this approach was that the dataset was not reduced in size. Alternatively, the serves could have
been clustered into groups with similar characteristics. The disadvantage of this approach is that each cluster is
assigned the same returnability value, effectively reducing the granularity of the dataset.
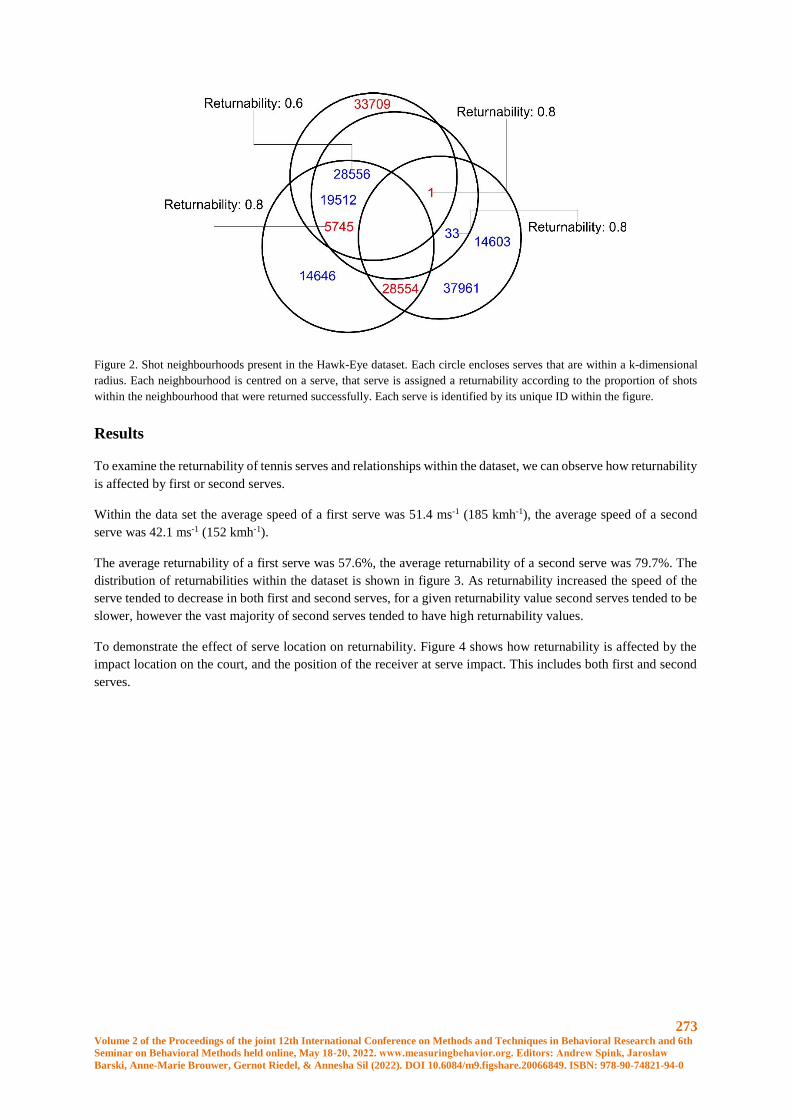
273 Volume 2 of the Proceedings of the joint 12th International Conference on Methods and Techniques in Behavioral Research and 6th
Seminar on Behavioral Methods held online, May 18-20, 2022. www.measuringbehavior.org. Editors: Andrew Spink, Jarosław
Barski, Anne-Marie Brouwer, Gernot Riedel, & Annesha Sil (2022). DOI 10.6084/m9.figshare.20066849. ISBN: 978-90-74821-94-0
Figure 2. Shot neighbourhoods present in the Hawk-Eye dataset. Each circle encloses serves that are within a k-dimensional
radius. Each neighbourhood is centred on a serve, that serve is assigned a returnability according to the proportion of shots
within the neighbourhood that were returned successfully. Each serve is identified by its unique ID within the figure.
Results
To examine the returnability of tennis serves and relationships within the dataset, we can observe how returnability
is affected by first or second serves.
Within the data set the average speed of a first serve was 51.4 ms-1 (185 kmh-1), the average speed of a second
serve was 42.1 ms-1 (152 kmh-1).
The average returnability of a first serve was 57.6%, the average returnability of a second serve was 79.7%. The
distribution of returnabilities within the dataset is shown in figure 3. As returnability increased the speed of the
serve tended to decrease in both first and second serves, for a given returnability value second serves tended to be
slower, however the vast majority of second serves tended to have high returnability values.
To demonstrate the effect of serve location on returnability. Figure 4 shows how returnability is affected by the
impact location on the court, and the position of the receiver at serve impact. This includes both first and second
serves.
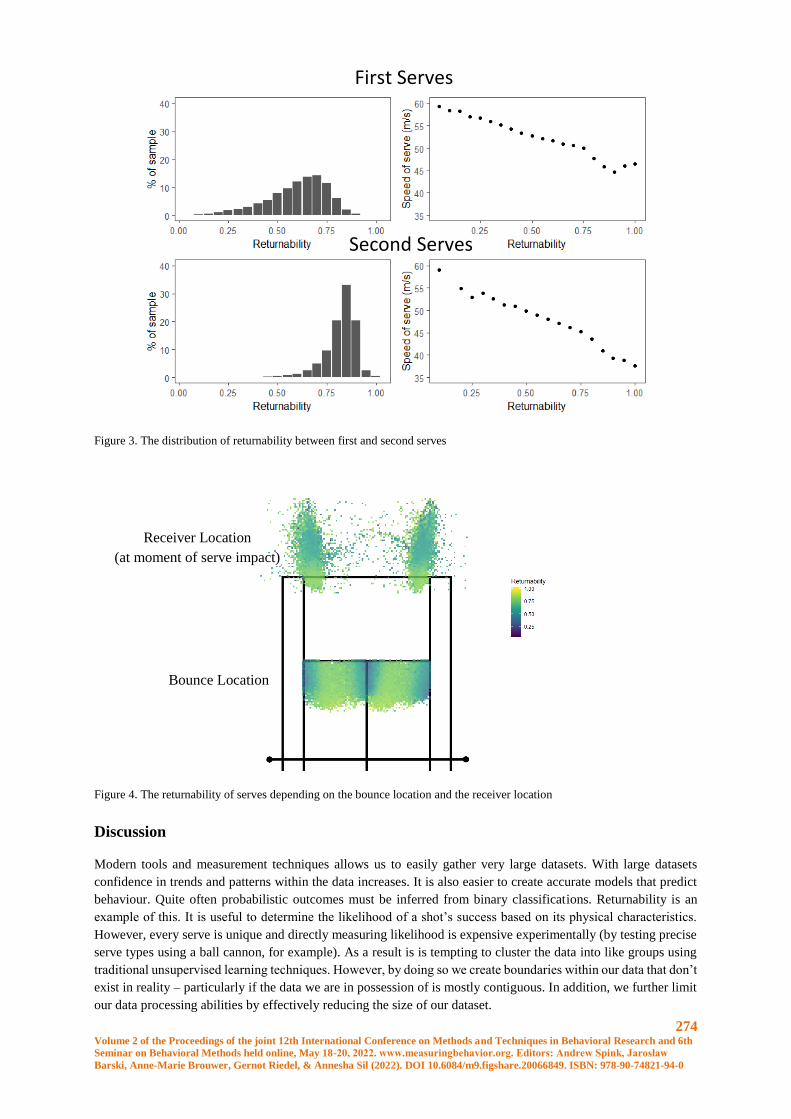
274 Volume 2 of the Proceedings of the joint 12th International Conference on Methods and Techniques in Behavioral Research and 6th
Seminar on Behavioral Methods held online, May 18-20, 2022. www.measuringbehavior.org. Editors: Andrew Spink, Jarosław
Barski, Anne-Marie Brouwer, Gernot Riedel, & Annesha Sil (2022). DOI 10.6084/m9.figshare.20066849. ISBN: 978-90-74821-94-0
Figure 3. The distribution of returnability between first and second serves
Figure 4. The returnability of serves depending on the bounce location and the receiver location
Discussion
Modern tools and measurement techniques allows us to easily gather very large datasets. With large datasets
confidence in trends and patterns within the data increases. It is also easier to create accurate models that predict
behaviour. Quite often probabilistic outcomes must be inferred from binary classifications. Returnability is an
example of this. It is useful to determine the likelihood of a shot’s success based on its physical characteristics.
However, every serve is unique and directly measuring likelihood is expensive experimentally (by testing precise
serve types using a ball cannon, for example). As a result is is tempting to cluster the data into like groups using
traditional unsupervised learning techniques. However, by doing so we create boundaries within our data that don’t
exist in reality – particularly if the data we are in possession of is mostly contiguous. In addition, we further limit
our data processing abilities by effectively reducing the size of our dataset.
Second Serves
Bounce Location
First Serves
Receiver Location
(at moment of serve impact)
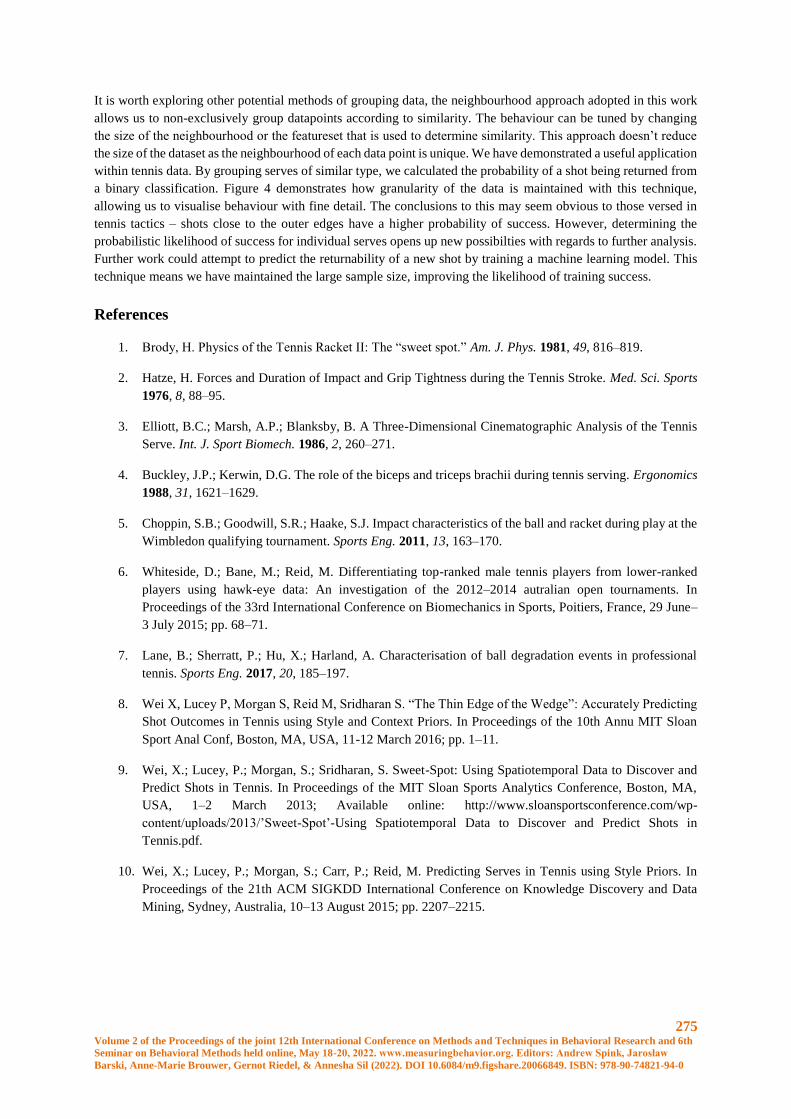
275 Volume 2 of the Proceedings of the joint 12th International Conference on Methods and Techniques in Behavioral Research and 6th
Seminar on Behavioral Methods held online, May 18-20, 2022. www.measuringbehavior.org. Editors: Andrew Spink, Jarosław
Barski, Anne-Marie Brouwer, Gernot Riedel, & Annesha Sil (2022). DOI 10.6084/m9.figshare.20066849. ISBN: 978-90-74821-94-0
It is worth exploring other potential methods of grouping data, the neighbourhood approach adopted in this work
allows us to non-exclusively group datapoints according to similarity. The behaviour can be tuned by changing
the size of the neighbourhood or the featureset that is used to determine similarity. This approach doesn’t reduce
the size of the dataset as the neighbourhood of each data point is unique. We have demonstrated a useful application
within tennis data. By grouping serves of similar type, we calculated the probability of a shot being returned from
a binary classification. Figure 4 demonstrates how granularity of the data is maintained with this technique,
allowing us to visualise behaviour with fine detail. The conclusions to this may seem obvious to those versed in
tennis tactics – shots close to the outer edges have a higher probability of success. However, determining the
probabilistic likelihood of success for individual serves opens up new possibilties with regards to further analysis.
Further work could attempt to predict the returnability of a new shot by training a machine learning model. This
technique means we have maintained the large sample size, improving the likelihood of training success.
References
1. Brody, H. Physics of the Tennis Racket II: The “sweet spot.” Am. J. Phys. 1981, 49, 816–819.
2. Hatze, H. Forces and Duration of Impact and Grip Tightness during the Tennis Stroke. Med. Sci. Sports
1976, 8, 88–95.
3. Elliott, B.C.; Marsh, A.P.; Blanksby, B. A Three-Dimensional Cinematographic Analysis of the Tennis
Serve. Int. J. Sport Biomech. 1986, 2, 260–271.
4. Buckley, J.P.; Kerwin, D.G. The role of the biceps and triceps brachii during tennis serving. Ergonomics
1988, 31, 1621–1629.
5. Choppin, S.B.; Goodwill, S.R.; Haake, S.J. Impact characteristics of the ball and racket during play at the
Wimbledon qualifying tournament. Sports Eng. 2011, 13, 163–170.
6. Whiteside, D.; Bane, M.; Reid, M. Differentiating top-ranked male tennis players from lower-ranked
players using hawk-eye data: An investigation of the 2012–2014 autralian open tournaments. In
Proceedings of the 33rd International Conference on Biomechanics in Sports, Poitiers, France, 29 June–
3 July 2015; pp. 68–71.
7. Lane, B.; Sherratt, P.; Hu, X.; Harland, A. Characterisation of ball degradation events in professional
tennis. Sports Eng. 2017, 20, 185–197.
8. Wei X, Lucey P, Morgan S, Reid M, Sridharan S. “The Thin Edge of the Wedge”: Accurately Predicting
Shot Outcomes in Tennis using Style and Context Priors. In Proceedings of the 10th Annu MIT Sloan
Sport Anal Conf, Boston, MA, USA, 11-12 March 2016; pp. 1–11.
9. Wei, X.; Lucey, P.; Morgan, S.; Sridharan, S. Sweet-Spot: Using Spatiotemporal Data to Discover and
Predict Shots in Tennis. In Proceedings of the MIT Sloan Sports Analytics Conference, Boston, MA,
USA, 1–2 March 2013; Available online: http://www.sloansportsconference.com/wp-
content/uploads/2013/’Sweet-Spot’-Using Spatiotemporal Data to Discover and Predict Shots in
Tennis.pdf.
10. Wei, X.; Lucey, P.; Morgan, S.; Carr, P.; Reid, M. Predicting Serves in Tennis using Style Priors. In
Proceedings of the 21th ACM SIGKDD International Conference on Knowledge Discovery and Data
Mining, Sydney, Australia, 10–13 August 2015; pp. 2207–2215.
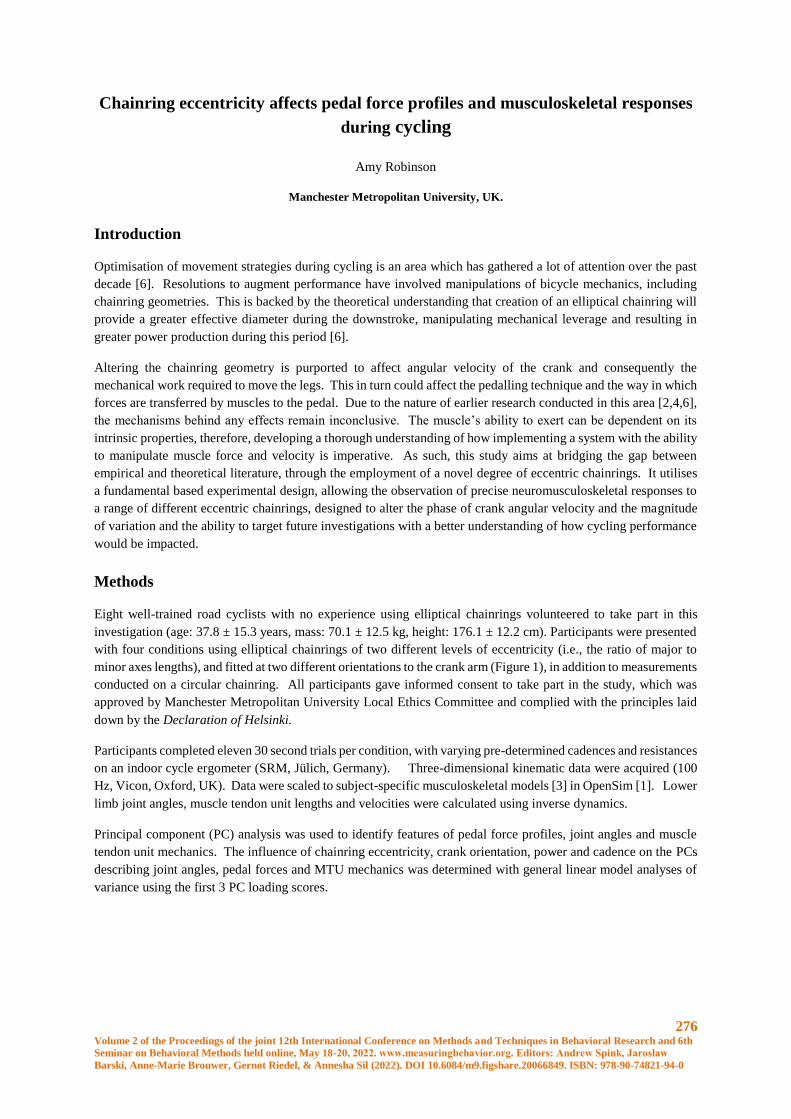
276 Volume 2 of the Proceedings of the joint 12th International Conference on Methods and Techniques in Behavioral Research and 6th
Seminar on Behavioral Methods held online, May 18-20, 2022. www.measuringbehavior.org. Editors: Andrew Spink, Jarosław
Barski, Anne-Marie Brouwer, Gernot Riedel, & Annesha Sil (2022). DOI 10.6084/m9.figshare.20066849. ISBN: 978-90-74821-94-0
Chainring eccentricity affects pedal force profiles and musculoskeletal responses
during cycling
Amy Robinson
Manchester Metropolitan University, UK.
Introduction
Optimisation of movement strategies during cycling is an area which has gathered a lot of attention over the past
decade [6]. Resolutions to augment performance have involved manipulations of bicycle mechanics, including
chainring geometries. This is backed by the theoretical understanding that creation of an elliptical chainring will
provide a greater effective diameter during the downstroke, manipulating mechanical leverage and resulting in
greater power production during this period [6].
Altering the chainring geometry is purported to affect angular velocity of the crank and consequently the
mechanical work required to move the legs. This in turn could affect the pedalling technique and the way in which
forces are transferred by muscles to the pedal. Due to the nature of earlier research conducted in this area [2,4,6],
the mechanisms behind any effects remain inconclusive. The muscle’s ability to exert can be dependent on its
intrinsic properties, therefore, developing a thorough understanding of how implementing a system with the ability
to manipulate muscle force and velocity is imperative. As such, this study aims at bridging the gap between
empirical and theoretical literature, through the employment of a novel degree of eccentric chainrings. It utilises
a fundamental based experimental design, allowing the observation of precise neuromusculoskeletal responses to
a range of different eccentric chainrings, designed to alter the phase of crank angular velocity and the magnitude
of variation and the ability to target future investigations with a better understanding of how cycling performance
would be impacted.
Methods
Eight well-trained road cyclists with no experience using elliptical chainrings volunteered to take part in this
investigation (age: 37.8 ± 15.3 years, mass: 70.1 ± 12.5 kg, height: 176.1 ± 12.2 cm). Participants were presented
with four conditions using elliptical chainrings of two different levels of eccentricity (i.e., the ratio of major to
minor axes lengths), and fitted at two different orientations to the crank arm (Figure 1), in addition to measurements
conducted on a circular chainring. All participants gave informed consent to take part in the study, which was
approved by Manchester Metropolitan University Local Ethics Committee and complied with the principles laid
down by the Declaration of Helsinki.
Participants completed eleven 30 second trials per condition, with varying pre-determined cadences and resistances
on an indoor cycle ergometer (SRM, Jülich, Germany). Three-dimensional kinematic data were acquired (100
Hz, Vicon, Oxford, UK). Data were scaled to subject-specific musculoskeletal models [3] in OpenSim [1]. Lower
limb joint angles, muscle tendon unit lengths and velocities were calculated using inverse dynamics.
Principal component (PC) analysis was used to identify features of pedal force profiles, joint angles and muscle
tendon unit mechanics. The influence of chainring eccentricity, crank orientation, power and cadence on the PCs
describing joint angles, pedal forces and MTU mechanics was determined with general linear model analyses of
variance using the first 3 PC loading scores.
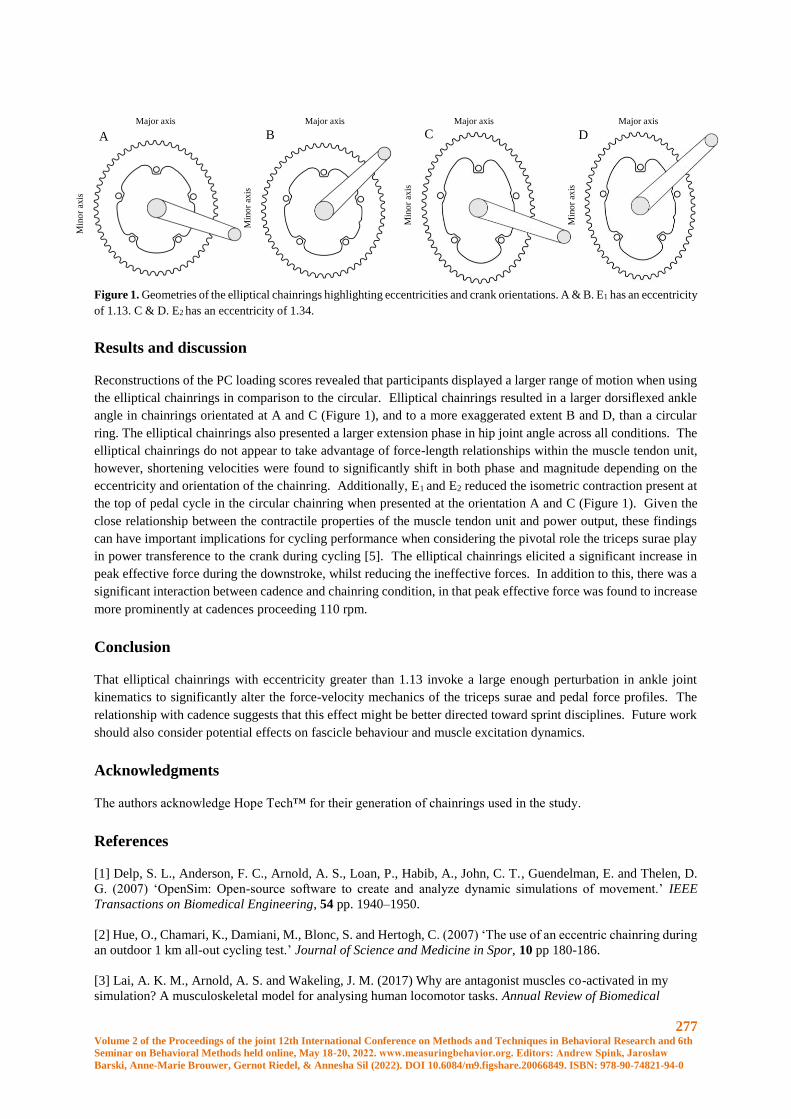
277 Volume 2 of the Proceedings of the joint 12th International Conference on Methods and Techniques in Behavioral Research and 6th
Seminar on Behavioral Methods held online, May 18-20, 2022. www.measuringbehavior.org. Editors: Andrew Spink, Jarosław
Barski, Anne-Marie Brouwer, Gernot Riedel, & Annesha Sil (2022). DOI 10.6084/m9.figshare.20066849. ISBN: 978-90-74821-94-0
Figure 1. Geometries of the elliptical chainrings highlighting eccentricities and crank orientations. A & B. E1 has an eccentricity
of 1.13. C & D. E2 has an eccentricity of 1.34.
Results and discussion
Reconstructions of the PC loading scores revealed that participants displayed a larger range of motion when using
the elliptical chainrings in comparison to the circular. Elliptical chainrings resulted in a larger dorsiflexed ankle
angle in chainrings orientated at A and C (Figure 1), and to a more exaggerated extent B and D, than a circular
ring. The elliptical chainrings also presented a larger extension phase in hip joint angle across all conditions. The
elliptical chainrings do not appear to take advantage of force-length relationships within the muscle tendon unit,
however, shortening velocities were found to significantly shift in both phase and magnitude depending on the
eccentricity and orientation of the chainring. Additionally, E1 and E2 reduced the isometric contraction present at
the top of pedal cycle in the circular chainring when presented at the orientation A and C (Figure 1). Given the
close relationship between the contractile properties of the muscle tendon unit and power output, these findings
can have important implications for cycling performance when considering the pivotal role the triceps surae play
in power transference to the crank during cycling [5]. The elliptical chainrings elicited a significant increase in
peak effective force during the downstroke, whilst reducing the ineffective forces. In addition to this, there was a
significant interaction between cadence and chainring condition, in that peak effective force was found to increase
more prominently at cadences proceeding 110 rpm.
Conclusion
That elliptical chainrings with eccentricity greater than 1.13 invoke a large enough perturbation in ankle joint
kinematics to significantly alter the force-velocity mechanics of the triceps surae and pedal force profiles. The
relationship with cadence suggests that this effect might be better directed toward sprint disciplines. Future work
should also consider potential effects on fascicle behaviour and muscle excitation dynamics.
Acknowledgments
The authors acknowledge Hope Tech™ for their generation of chainrings used in the study.
References
[1] Delp, S. L., Anderson, F. C., Arnold, A. S., Loan, P., Habib, A., John, C. T., Guendelman, E. and Thelen, D.
G. (2007) ‘OpenSim: Open-source software to create and analyze dynamic simulations of movement.’ IEEE
Transactions on Biomedical Engineering, 54 pp. 1940–1950.
[2] Hue, O., Chamari, K., Damiani, M., Blonc, S. and Hertogh, C. (2007) ‘The use of an eccentric chainring during
an outdoor 1 km all-out cycling test.’ Journal of Science and Medicine in Spor, 10 pp 180-186.
[3] Lai, A. K. M., Arnold, A. S. and Wakeling, J. M. (2017) Why are antagonist muscles co-activated in my
simulation? A musculoskeletal model for analysing human locomotor tasks. Annual Review of Biomedical
Major axis
Min
or
axis
B
Major axis
Min
or
axis
Major axis
Min
or
axis
Major axis
Min
or
axis
A C D

278 Volume 2 of the Proceedings of the joint 12th International Conference on Methods and Techniques in Behavioral Research and 6th
Seminar on Behavioral Methods held online, May 18-20, 2022. www.measuringbehavior.org. Editors: Andrew Spink, Jarosław
Barski, Anne-Marie Brouwer, Gernot Riedel, & Annesha Sil (2022). DOI 10.6084/m9.figshare.20066849. ISBN: 978-90-74821-94-0
Engineering, 45 pp. 2762–2774.
[4] Leong, C.-H., Elmer, S. J. and Martin, J. C. (2017) Noncircular Chainrings Do Not Influence Maximum
Cycling Power, Journal of Applied Biomechanics 33 pp. 410–418.
[5] Martin JC & Nichols JA. (2018) Simulated work loops predict maximal human cycling power, Journal of
Experimental Biology, 221: Pt 13.
[6] Rankin, J. W. and Neptune, R. R. (2008) A theoretical analysis of an optimal chainring shape to maximize
crank power during isokinetic pedaling, Journal of Biomechanics 41 pp. 1494–1502.

279 Volume 2 of the Proceedings of the joint 12th International Conference on Methods and Techniques in Behavioral Research and 6th
Seminar on Behavioral Methods held online, May 18-20, 2022. www.measuringbehavior.org. Editors: Andrew Spink, Jarosław
Barski, Anne-Marie Brouwer, Gernot Riedel, & Annesha Sil (2022). DOI 10.6084/m9.figshare.20066849. ISBN: 978-90-74821-94-0
Posters
Note that PDFs of all the posters are downloadable from www.measuringbehavior.org
280 Volume 2 of the Proceedings of the joint 12th International Conference on Methods and Techniques in Behavioral Research and 6th
Seminar on Behavioral Methods held online, May 18-20, 2022. www.measuringbehavior.org. Editors: Andrew Spink, Jarosław
Barski, Anne-Marie Brouwer, Gernot Riedel, & Annesha Sil (2022). DOI 10.6084/m9.figshare.20066849. ISBN: 978-90-74821-94-0
Meeting Data Analytics for IoT-enabled Communication Systems
Sowmya Vijayakumar1, Ronan Flynn1, Niall Murray1, Muhammad Intizar Ali2
1 Department of Computer and Software Engineering, Athlone Institute of Technology, Ireland.
[email protected]; [email protected]; [email protected];
2 Insight Centre or Data Analytics, National University of Ireland, Galway, Ireland. [email protected]
Abstract
Meeting design characteristics are specified by meeting organizers and participants. The different design
characteristics have a direct impact on the quality of the meeting. In this paper, different meeting characteristics
are assessed to determine the optimum conditions for effective meetings as perceived by the meeting members. A
number of meetings took place in an IoT-enabled meeting environment. Sensing data on users, their interactions
and their environments are becoming an increasingly important research topic. Data collection included user
surveys and data from heterogeneous IoT-based sensor system. A total of 44 participants from 28 organizational
meetings rated the meeting in terms of procedural, attendees’ behavioural and environmental factors. The IoT
multimodal sensor system captured temperature, humidity and visible light in the meeting rooms. The data
collected from questionnaires and sensors are analysed and their correlations are presented. The findings confirm
the direct association of procedural and attendee characteristics with meeting satisfaction. The results also show
the effect of environmental factors on psychological characteristics of the participants thereby indirectly affecting
the quality of the meeting. The findings from this study such as effective meeting start time, the association of
environmental factors with stress and posture, can be applied to rule definitions and recommendation engines for
IoT enabled meeting management systems (IoT-MMS).
Introduction
Modern-day meetings add flexibility to the workplace enabling easier communication with the use of enterprise
communication systems. Collaboration products provide audio, video and calendar services for online
communication enabling remote participation. However, the number of meetings of unacceptable quality are still
significant costing enormous losses to the organizations [1]. Meeting outcomes are impacted by meeting processes
and meeting satisfaction as perceived by the participants. The quality of the meeting can be improved by providing
participants with positive meeting experiences. This, in turn, affects their attitude towards meetings [1], [2]. The
participants are less likely to continue the use of collaborative systems if they encounter negative experience [2].
The state-of-the-art IoT-enabled meeting management systems (IoT-MMS) [3] are designed to provide a rich
enterprise communication experience and maximise efficiency. The system is based on Linked data frameworks
combining semantic technologies and rule-based reasoning [4]. This framework integrates sensory input and
enterprise data, such as agenda, calendar data, and attendees’ details, and updates the capabilities of the participants
through IoT related icons. Smart decisions are facilitated by the stream reasoning component using real-time events
and background knowledge. For example, an important participant of a meeting is far from the venue, and her
location is detected with the help of sensors embedded in her mobile phone. IoT-MMS can support the meeting
host in dynamically rescheduling the meeting on-the-fly providing a reason for the change in agenda e.g. delay in
the arrival of an important participant. Such reasoning capabilities of IoT-MMS demands background knowledge
of the incoming data streams. These streams can then be learned and updated in real-time from heterogeneous
sources. This allows off-line data analytics of meeting events and its characteristics.
This research reviews different design characteristics that influence meeting effectiveness. The meeting
effectiveness is assessed as a function of perceived meeting satisfaction by participants. In this work, sensors are
deployed in two meeting rooms to acquire sensor data related to the environment using IoT-MMS framework. The
rest of the paper is organized as follows: related research considers existing research methodologies to assess the
meeting effectiveness; then the experimental setup is outlined followed by presentation and discussion of the
results from the data analysis. Finally, some conclusions on the scope of this work and key findings are given.
281 Volume 2 of the Proceedings of the joint 12th International Conference on Methods and Techniques in Behavioral Research and 6th
Seminar on Behavioral Methods held online, May 18-20, 2022. www.measuringbehavior.org. Editors: Andrew Spink, Jarosław
Barski, Anne-Marie Brouwer, Gernot Riedel, & Annesha Sil (2022). DOI 10.6084/m9.figshare.20066849. ISBN: 978-90-74821-94-0
Related Work
Measuring environmental conditions and indeed users, as they are consuming digital content and experiences, is
emerging as an important research topic across a range of application domains such as entertainment [5], [6],
training and education [7], health [8], [9], [10], tourism [11] and smart manufacturing [12], [13] among many
others. Attempting to understand the user perception of multisensory multimedia experiences, [5], [6] highlighted
differences and contradictions in user reporting between open-ended and closed-ended questions. In [7], [8] virtual
and augmented reality representation of an industry machine were presented and measured temperature and user
interaction metrics in a training application. In [9], [10], [11], a key focus on capturing physiological user metrics
and user performance in several health applications were presented and correlated with user surveys. Egan in [12]
captured user heart rate and electrodermal activity (EDA) as users experienced a multisensory tourism experience.
The importance of understanding social interactions in smart places was reported by Cook et al [13], where they
highlighted the importance of understanding a person’s physical and emotional wellbeing.
More focussed on capturing metrics and meetings, there have been several relevant studies that have considered
the dependencies between the different features and meeting effectiveness. The literature [1], [2], [14], [15]
identifies the key design characteristics as: procedural; attendee; and environmental characteristics. They have a
direct or indirect effect on the meeting effectiveness. Procedural characteristics refer to the protocol and agenda of
the meeting. These include preparation of the agenda and minutes taken and following the agenda [1]. The study
in [14] found that the attendee involvement, meeting satisfaction, facilities, decision making, punctuality, the role
of chairperson all had a significant influence on attendees’ perception of meeting quality. According to [16], one
way to evaluate the impact of the meeting in any organization is to consider productivity and satisfaction, as
perceived by the participants. [17] identified five procedural characteristics concerning the perception of
employees of meeting effectiveness: using an agenda; keeping minutes; punctuality (starting and ending on time);
having appropriate meeting facilities; having a chairperson.
Attendee characteristics include the presence of meeting coordinator, important stakeholders and meeting size [1].
A study on ninety-two videotaped meetings [18] reported that the groups who showed a lot of practical interaction
in their meetings in terms of problem-oriented, positive, procedural, and effective communication, were more
satisfied with their meetings. Environmental characteristics include meeting space, noise, temperature,
illumination, modality, noise, seating and space arrangement. These factors can divert participants’ focus,
minimizing their comfort [14]. The study [15] reports that noise and lighting have no direct impact on employees’
performance, but they do have direct effects on psychological symptoms such as stress and depression, which in
turn influence their performance. These design characteristics are used as a basis for this study to examine the key
influencing factors of the successful meeting in IoT-enabled meeting environment.
Experimental Methods
This section describes the IoT sensor system to capture different types of information during the meetings as well
as the meeting design characteristics.
Data Acquisition Strategies
A testbed was designed and implemented in two meeting rooms of a medium-sized organization consisting of 100
– 150 employees. The majority of the employees perform research-oriented work and attend at least one meeting
per week on average. Figure 1 shows the methods used to collect heterogeneous data types during meetings. In
this study, calendar data is observed manually since the APIs required for the data extraction were not available
due to the proprietary software used by the organization.
Survey Data Collection Method
The design of the questionnaires was inspired by [1], [14], [19] that instrumented design characteristics for
measuring the meeting success. It involved 33 attributes for evaluating the meeting effectiveness.
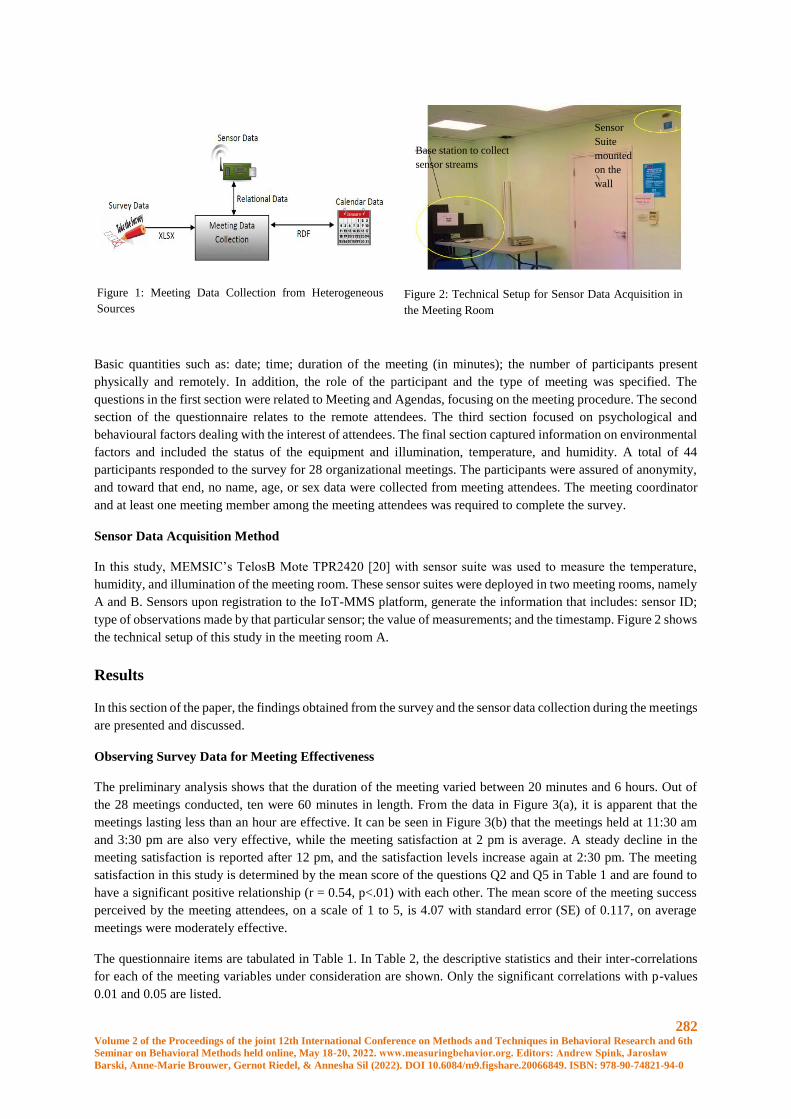
282 Volume 2 of the Proceedings of the joint 12th International Conference on Methods and Techniques in Behavioral Research and 6th
Seminar on Behavioral Methods held online, May 18-20, 2022. www.measuringbehavior.org. Editors: Andrew Spink, Jarosław
Barski, Anne-Marie Brouwer, Gernot Riedel, & Annesha Sil (2022). DOI 10.6084/m9.figshare.20066849. ISBN: 978-90-74821-94-0
Basic quantities such as: date; time; duration of the meeting (in minutes); the number of participants present
physically and remotely. In addition, the role of the participant and the type of meeting was specified. The
questions in the first section were related to Meeting and Agendas, focusing on the meeting procedure. The second
section of the questionnaire relates to the remote attendees. The third section focused on psychological and
behavioural factors dealing with the interest of attendees. The final section captured information on environmental
factors and included the status of the equipment and illumination, temperature, and humidity. A total of 44
participants responded to the survey for 28 organizational meetings. The participants were assured of anonymity,
and toward that end, no name, age, or sex data were collected from meeting attendees. The meeting coordinator
and at least one meeting member among the meeting attendees was required to complete the survey.
Sensor Data Acquisition Method
In this study, MEMSIC’s TelosB Mote TPR2420 [20] with sensor suite was used to measure the temperature,
humidity, and illumination of the meeting room. These sensor suites were deployed in two meeting rooms, namely
A and B. Sensors upon registration to the IoT-MMS platform, generate the information that includes: sensor ID;
type of observations made by that particular sensor; the value of measurements; and the timestamp. Figure 2 shows
the technical setup of this study in the meeting room A.
Results
In this section of the paper, the findings obtained from the survey and the sensor data collection during the meetings
are presented and discussed.
Observing Survey Data for Meeting Effectiveness
The preliminary analysis shows that the duration of the meeting varied between 20 minutes and 6 hours. Out of
the 28 meetings conducted, ten were 60 minutes in length. From the data in Figure 3(a), it is apparent that the
meetings lasting less than an hour are effective. It can be seen in Figure 3(b) that the meetings held at 11:30 am
and 3:30 pm are also very effective, while the meeting satisfaction at 2 pm is average. A steady decline in the
meeting satisfaction is reported after 12 pm, and the satisfaction levels increase again at 2:30 pm. The meeting
satisfaction in this study is determined by the mean score of the questions Q2 and Q5 in Table 1 and are found to
have a significant positive relationship (r = 0.54, p<.01) with each other. The mean score of the meeting success
perceived by the meeting attendees, on a scale of 1 to 5, is 4.07 with standard error (SE) of 0.117, on average
meetings were moderately effective.
The questionnaire items are tabulated in Table 1. In Table 2, the descriptive statistics and their inter-correlations
for each of the meeting variables under consideration are shown. Only the significant correlations with p-values
0.01 and 0.05 are listed.
Figure 1: Meeting Data Collection from Heterogeneous
Sources
Figure 2: Technical Setup for Sensor Data Acquisition in
the Meeting Room
Sensor
Suite
mounted
on the
wall
Base station to collect
sensor streams
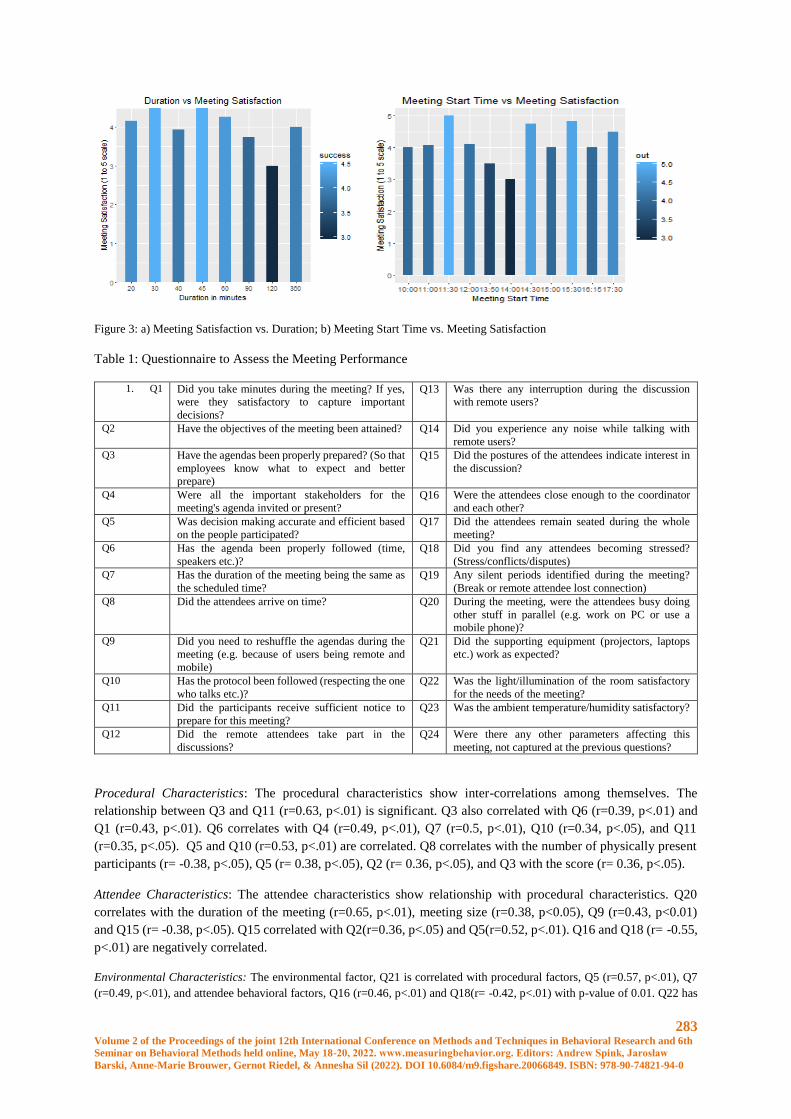
283 Volume 2 of the Proceedings of the joint 12th International Conference on Methods and Techniques in Behavioral Research and 6th
Seminar on Behavioral Methods held online, May 18-20, 2022. www.measuringbehavior.org. Editors: Andrew Spink, Jarosław
Barski, Anne-Marie Brouwer, Gernot Riedel, & Annesha Sil (2022). DOI 10.6084/m9.figshare.20066849. ISBN: 978-90-74821-94-0
Figure 3: a) Meeting Satisfaction vs. Duration; b) Meeting Start Time vs. Meeting Satisfaction
Table 1: Questionnaire to Assess the Meeting Performance
1. Q1 Did you take minutes during the meeting? If yes,
were they satisfactory to capture important
decisions?
Q13 Was there any interruption during the discussion
with remote users?
Q2 Have the objectives of the meeting been attained? Q14 Did you experience any noise while talking with
remote users?
Q3 Have the agendas been properly prepared? (So that
employees know what to expect and better
prepare)
Q15 Did the postures of the attendees indicate interest in
the discussion?
Q4 Were all the important stakeholders for the
meeting's agenda invited or present?
Q16 Were the attendees close enough to the coordinator
and each other?
Q5 Was decision making accurate and efficient based
on the people participated?
Q17 Did the attendees remain seated during the whole
meeting?
Q6 Has the agenda been properly followed (time,
speakers etc.)?
Q18 Did you find any attendees becoming stressed?
(Stress/conflicts/disputes)
Q7 Has the duration of the meeting being the same as
the scheduled time?
Q19 Any silent periods identified during the meeting?
(Break or remote attendee lost connection)
Q8 Did the attendees arrive on time? Q20 During the meeting, were the attendees busy doing
other stuff in parallel (e.g. work on PC or use a
mobile phone)?
Q9 Did you need to reshuffle the agendas during the
meeting (e.g. because of users being remote and
mobile)
Q21 Did the supporting equipment (projectors, laptops
etc.) work as expected?
Q10 Has the protocol been followed (respecting the one
who talks etc.)?
Q22 Was the light/illumination of the room satisfactory
for the needs of the meeting?
Q11 Did the participants receive sufficient notice to
prepare for this meeting?
Q23 Was the ambient temperature/humidity satisfactory?
Q12 Did the remote attendees take part in the
discussions?
Q24 Were there any other parameters affecting this
meeting, not captured at the previous questions?
Procedural Characteristics: The procedural characteristics show inter-correlations among themselves. The
relationship between Q3 and Q11 (r=0.63, p<.01) is significant. Q3 also correlated with Q6 (r=0.39, p<.01) and
Q1 (r=0.43, p<.01). Q6 correlates with Q4 (r=0.49, p<.01), Q7 (r=0.5, p<.01), Q10 (r=0.34, p<.05), and Q11
(r=0.35, p<.05). Q5 and Q10 (r=0.53, p<.01) are correlated. Q8 correlates with the number of physically present
participants (r= -0.38, p<.05), Q5 (r= 0.38, p<.05), Q2 (r= 0.36, p<.05), and Q3 with the score (r= 0.36, p<.05).
Attendee Characteristics: The attendee characteristics show relationship with procedural characteristics. Q20
correlates with the duration of the meeting (r=0.65, p<.01), meeting size (r=0.38, p<0.05), Q9 (r=0.43, p<0.01)
and Q15 (r= -0.38, p<.05). Q15 correlated with Q2(r=0.36, p<.05) and Q5(r=0.52, p<.01). Q16 and Q18 (r= -0.55,
p<.01) are negatively correlated.
Environmental Characteristics: The environmental factor, Q21 is correlated with procedural factors, Q5 (r=0.57, p<.01), Q7
(r=0.49, p<.01), and attendee behavioral factors, Q16 (r=0.46, p<.01) and Q18(r= -0.42, p<.01) with p-value of 0.01. Q22 has
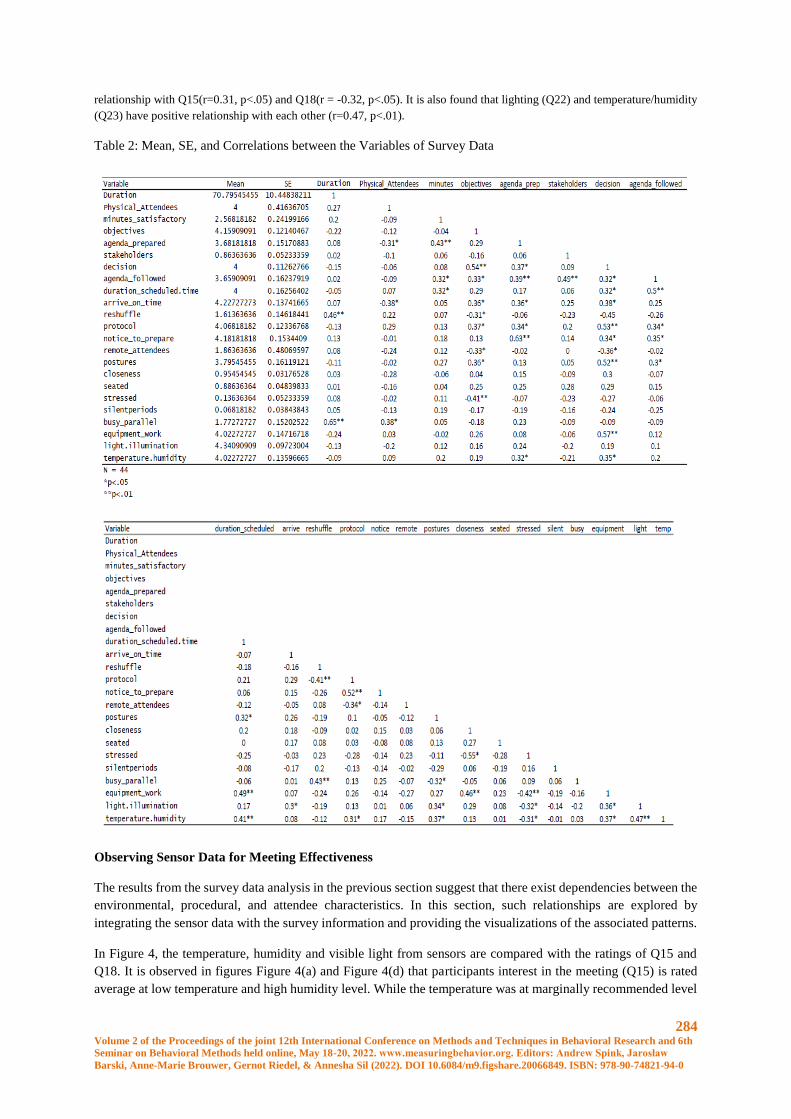
284 Volume 2 of the Proceedings of the joint 12th International Conference on Methods and Techniques in Behavioral Research and 6th
Seminar on Behavioral Methods held online, May 18-20, 2022. www.measuringbehavior.org. Editors: Andrew Spink, Jarosław
Barski, Anne-Marie Brouwer, Gernot Riedel, & Annesha Sil (2022). DOI 10.6084/m9.figshare.20066849. ISBN: 978-90-74821-94-0
relationship with Q15(r=0.31, p<.05) and Q18(r = -0.32, p<.05). It is also found that lighting (Q22) and temperature/humidity
(Q23) have positive relationship with each other (r=0.47, p<.01).
Table 2: Mean, SE, and Correlations between the Variables of Survey Data
Observing Sensor Data for Meeting Effectiveness
The results from the survey data analysis in the previous section suggest that there exist dependencies between the
environmental, procedural, and attendee characteristics. In this section, such relationships are explored by
integrating the sensor data with the survey information and providing the visualizations of the associated patterns.
In Figure 4, the temperature, humidity and visible light from sensors are compared with the ratings of Q15 and
Q18. It is observed in figures Figure 4(a) and Figure 4(d) that participants interest in the meeting (Q15) is rated
average at low temperature and high humidity level. While the temperature was at marginally recommended level
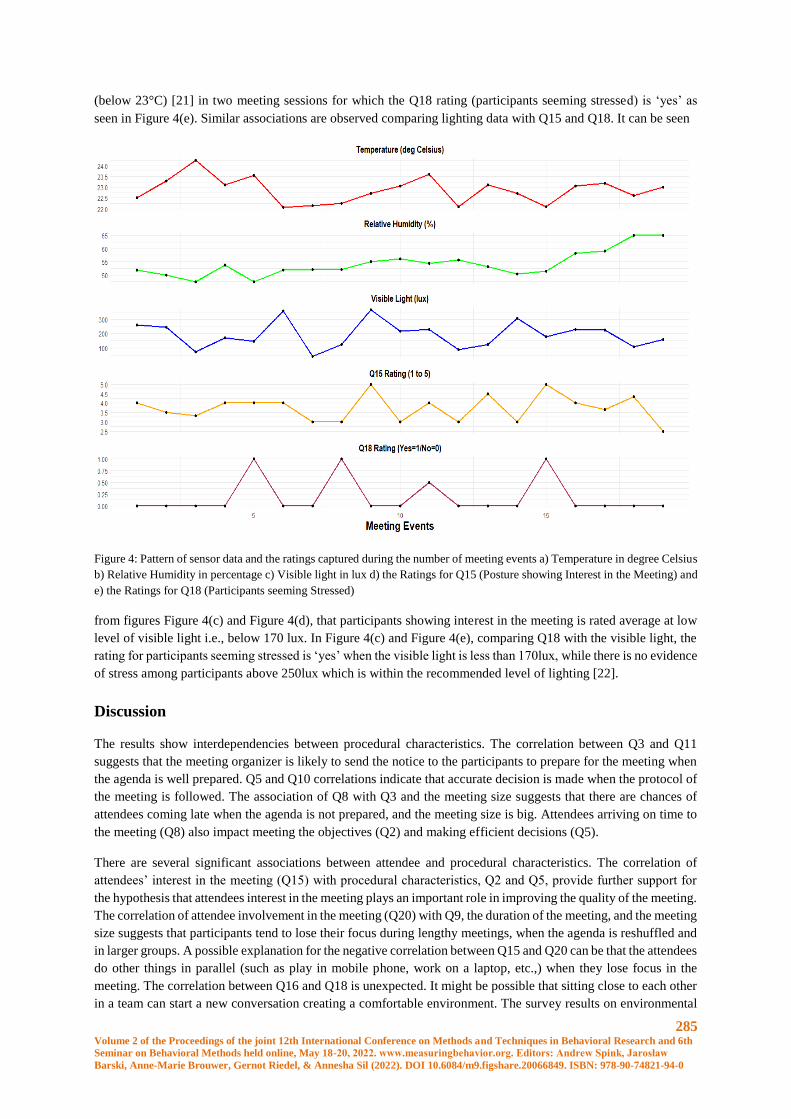
285 Volume 2 of the Proceedings of the joint 12th International Conference on Methods and Techniques in Behavioral Research and 6th
Seminar on Behavioral Methods held online, May 18-20, 2022. www.measuringbehavior.org. Editors: Andrew Spink, Jarosław
Barski, Anne-Marie Brouwer, Gernot Riedel, & Annesha Sil (2022). DOI 10.6084/m9.figshare.20066849. ISBN: 978-90-74821-94-0
(below 23°C) [21] in two meeting sessions for which the Q18 rating (participants seeming stressed) is ‘yes’ as
seen in Figure 4(e). Similar associations are observed comparing lighting data with Q15 and Q18. It can be seen
Figure 4: Pattern of sensor data and the ratings captured during the number of meeting events a) Temperature in degree Celsius
b) Relative Humidity in percentage c) Visible light in lux d) the Ratings for Q15 (Posture showing Interest in the Meeting) and
e) the Ratings for Q18 (Participants seeming Stressed)
from figures Figure 4(c) and Figure 4(d), that participants showing interest in the meeting is rated average at low
level of visible light i.e., below 170 lux. In Figure 4(c) and Figure 4(e), comparing Q18 with the visible light, the
rating for participants seeming stressed is ‘yes’ when the visible light is less than 170lux, while there is no evidence
of stress among participants above 250lux which is within the recommended level of lighting [22].
Discussion
The results show interdependencies between procedural characteristics. The correlation between Q3 and Q11
suggests that the meeting organizer is likely to send the notice to the participants to prepare for the meeting when
the agenda is well prepared. Q5 and Q10 correlations indicate that accurate decision is made when the protocol of
the meeting is followed. The association of Q8 with Q3 and the meeting size suggests that there are chances of
attendees coming late when the agenda is not prepared, and the meeting size is big. Attendees arriving on time to
the meeting (Q8) also impact meeting the objectives (Q2) and making efficient decisions (Q5).
There are several significant associations between attendee and procedural characteristics. The correlation of
attendees’ interest in the meeting (Q15) with procedural characteristics, Q2 and Q5, provide further support for
the hypothesis that attendees interest in the meeting plays an important role in improving the quality of the meeting.
The correlation of attendee involvement in the meeting (Q20) with Q9, the duration of the meeting, and the meeting
size suggests that participants tend to lose their focus during lengthy meetings, when the agenda is reshuffled and
in larger groups. A possible explanation for the negative correlation between Q15 and Q20 can be that the attendees
do other things in parallel (such as play in mobile phone, work on a laptop, etc.,) when they lose focus in the
meeting. The correlation between Q16 and Q18 is unexpected. It might be possible that sitting close to each other
in a team can start a new conversation creating a comfortable environment. The survey results on environmental
286 Volume 2 of the Proceedings of the joint 12th International Conference on Methods and Techniques in Behavioral Research and 6th
Seminar on Behavioral Methods held online, May 18-20, 2022. www.measuringbehavior.org. Editors: Andrew Spink, Jarosław
Barski, Anne-Marie Brouwer, Gernot Riedel, & Annesha Sil (2022). DOI 10.6084/m9.figshare.20066849. ISBN: 978-90-74821-94-0
characteristics show associations with attendee behavioural factors such as stress (Q18) and posture (Q15). This
is supported by the results of sensor data analysis. The patterns seen in Figure 4 indicate that the lighting has a
direct effect on the behavioral characteristics of the participants. The findings on environmental factors suggest
that creating a comfortable environment in the workplace have a positive influence on attendees’ mood thereby
improving the quality of the meeting.
The insights from this study can be used in IoT-MMS stream reasoning component as probabilistic rules for
facilitating smart decisions over incoming streams in real-time. For example, updating the rule that the meeting
starting at 11:30 am and 3:30 pm is effective while 2 pm is ineffective. IoT-MMS can prioritize to set up the
meeting at these times based on the availability of the meeting members and the rooms in the calendar. Also, the
capability of IoT-MMS can be extended by automating survey feedback after every meeting session. A future
implementation may consider the detection of the behavioral factors (such as aggressiveness, stress, leadership
and so on) during the meeting to further understanding of its effect.
Conclusion
The purpose of this study was to examine the dependencies between different meeting factors and identifying key
factors influencing the meeting effectiveness. In this project, the data acquisition mechanism was defined to collect
the meeting-related data from heterogeneous sources. The static meeting data was analyzed using statistical
methods, and the results have shown that procedural characteristics such as decision making, achieving the
objectives, preparing and following the agenda, presence of important stakeholder and following the protocol are
all interrelated to each other. The evaluations confirmed that procedural, attendee behavioral characteristics and
environmental factors have a direct or indirect effect on the meeting satisfaction and are consistent with the
literature. In addition, integrating sensor data with the survey results have found interesting correlations between
environmental characteristics and behavioral factors of attendees. The outcomes of this study can be used to
enhance the capabilities of IoT-MMS infrastructure to facilitate smart decisions in real-time.
Acknowledgement
This publication has emanated from research supported in part by a research grant from Science Foundation Ireland
(SFI) under Grant Number SFI/12/RC/2289_P2 (Insight Centre for Data Analytics), SFI/16/RC/3918 (Confirm
Centre for Smart Manufacturing) and co-funded by the European Regional Development Fund.
References
1. Cohen, M. A., Rogelberg, S. G., Allen, J. A., & Luong, A. (2011). Meeting Design Characteristics and Attendee
Perceptions of Staff/Team Meeting Quality. Group dynamics: Theory, Research and Practice, 15(1), 90-104.
2. Briggs, R.O., Reinig, B.A., & de Vreede, G.J. (2006). Meetings satisfaction for technology-supported groups:
An empirical validation of a goal-attainment model. Small Group Research, 37(6), 585-611.
3. Ali, M.I., et al. (2017). Real-time data analytics and event detection for IoT-enabled communication systems.
Journal of Web Semantics, 42, 19-37.
4. Ali, M.I., Ono, N., Kaysar, M., Griffin, K. and Mileo, A. (2015). A semantic processing framework for IoT-
enabled communication systems. In International Semantic Web Conference. Springer, Cham.
5. Murray, N., Lee, B., Qiao, Y., and Muntean, G.-M., (2016). The influence of human factors on olfaction based
mulsemedia quality of experience. Eighth International Conference on Quality of Multimedia Experience
(QoMEX), Lisbon, 1-6.
6. Murray, N., Lee, B., Qiao, Y., and Muntean, G.-M., (2014). Multiple-Scent Enhanced Multimedia
Synchronization. ACM Trans. Multimedia Comput. Commun. Appl. 11, 1s, Article 12, 28 pages.
287 Volume 2 of the Proceedings of the joint 12th International Conference on Methods and Techniques in Behavioral Research and 6th
Seminar on Behavioral Methods held online, May 18-20, 2022. www.measuringbehavior.org. Editors: Andrew Spink, Jarosław
Barski, Anne-Marie Brouwer, Gernot Riedel, & Annesha Sil (2022). DOI 10.6084/m9.figshare.20066849. ISBN: 978-90-74821-94-0
7. Concannon, D., Flynn, R., and Murray, N., (2019). A quality of experience evaluation system and research
challenges for networked virtual reality-based teleoperation applications. In Proceedings of the 11th ACM
Workshop on Immersive Mixed and Virtual Environment Systems (MMVE ’19). Association for Computing
Machinery, New York, NY, USA, 10–12.
8. Hynes, E., Flynn, R., Lee, B., Murray, N., (2019). A Quality of Experience Evaluation comparing Augmented
Reality and Paper based instructions for complex task assistance. In IEEE 21st International Workshop on
Multimedia Signal Processing, Kuala Lumpur, Malaysia, 2019.
9. Keighrey, C., Flynn, R., Lee, B., Murray, N., (2017). A QoE Evaluation of Immersive Augmented and Virtual
Reality Speech & Language Assessment Applications. In 9th International Conference on Quality of Multimedia
Experience.
10. Keighrey, C., Flynn, R., Murray, S., Brennan, S., and Murray, N., (2017). Comparing User QoE via
Physiological and Interaction Measurements of Immersive AR and VR Speech and Language Therapy
Applications. In Proceedings of the on Thematic Workshops of ACM Multimedia 2017 (Thematic Workshops
’17). Association for Computing Machinery, New York, NY, USA, 485–492.
11. Rodrigues, T.B., Ó Catháin, C., O’Connor NE, Murray N. (2020). A Quality of Experience assessment of
haptic and augmented reality feedback modalities in a gait analysis system. PLoS ONE, 15(3): e0230570.
12. Egan, D., Brennan, S., Barrett, J., Qiao, Y., Timmerer, C. and Murray, N. (2016). An evaluation of Heart Rate
and ElectroDermal Activity as an objective QoE evaluation method for immersive virtual reality environments.
Eighth International Conference on Quality of Multimedia Experience (QoMEX), Lisbon, pp. 1-6.
13. Cook DJ, Crandall A, Singla G, Thomas B. (2010). Detection of Social Interaction in Smart Spaces. Cybern
Syst, 41(2), 90‐104.
14. Leach, D. J., Rogelberg, S. G., Warr, P. B. & Burnfield, J. L. (2009). Perceived meeting effectiveness: The
role of design characteristics. Journal of Business and Psychology, 24, 65-76.
15. Realyvásquez A, Maldonado-Macías AA, García-Alcaraz J, Cortés-Robles G, Blanco-Fernández J. (2011).
Structural Model for the Effects of Environmental Elements on the Psychological Characteristics and Performance
of the Employees of Manufacturing Systems. International Journal of Environmental Research and Public Health,
13(1), 104.
16. Malouff, J., Calic, A., McGrory, C., Murrell, R., & Schutte, N. (2012). Evidence for a Needs-Based Model of
Organizational-Meeting Leadership. Current Psychology, 31, 35-48.
17. Romano, N. C., Jr., & Nunamaker, J. F., Jr. (2001). Meeting analysis: Findings from research and practice. In
Proceedings of the 34th Annual Hawaii International Conference on System Sciences.
18. Kauffeld, S., & Lehmann-Willenbrock, N. (2012). Meetings matter effects of team meetings on team and
organizational success. Small Group Research, 43(2), 130-158.
19. Davison, R. (1997). An instrument for measuring meeting success. Information & Management, 32, 163-176.
20.Memsic.TELOSB Mote Platform, datasheet 6020-0094-03 Rev A. [online]
<http://www.memsic.com/userfiles/files/Datasheets/WSN/telosb_datasheet.pdf>
21. Burroughs, H. E.; Hansen, Shirley (2011). Managing Indoor Air Quality. Fairmont Press. pp. 149–151.
Retrieved 25 January 2020.
22. Engineering ToolBox, (2005). Lights and Power Installed. [online]
https://www.engineeringtoolbox.com/light-level-rooms-d_708.html
288 Volume 2 of the Proceedings of the joint 12th International Conference on Methods and Techniques in Behavioral Research and 6th
Seminar on Behavioral Methods held online, May 18-20, 2022. www.measuringbehavior.org. Editors: Andrew Spink, Jarosław
Barski, Anne-Marie Brouwer, Gernot Riedel, & Annesha Sil (2022). DOI 10.6084/m9.figshare.20066849. ISBN: 978-90-74821-94-0
A review: three-dimensional data acquisition in cattle management
Yaowu Wang1, Wensheng Wang2,4, Sander Mücher3, Leifeng Guo4, and Lammert Kooistra1,
1 Laboratory of Geo-information Science and Remote Sensing, Wageningen University & Research, Wageningen, the
Netherlands. [email protected] / [email protected]
2 Information Centre, Ministry of Agriculture and Rural Affairs, Beijing, China. [email protected]
3 Earth Observation and Environmental Informatics, Wageningen University & Research, Wageningen, the
Netherlands. [email protected]
4 Agricultural Information Institute, Chinese Academy of Agriculture Sciences, Beijing, China. [email protected]
Abstract
The spread of depth cameras and light detection and ranging (LiDAR) devices for precision livestock farming is
accelerating and novel research is emerging. In cases where cattle management applications are based on three-
dimensional vision, it is fundamental that adequate three-dimensional data are gathered. However, in many
applications such as the measurements of morphometric characterization, the estimation of body condition score,
and the weight prediction, data acquisition can be difficult to conduct as well as laborious and time-consuming. It
also appears that it is difficult to conduct a generalizable process for this activity. This review analyses 47 published
research related to cattle management using three-dimensional vision in the precision livestock farming context,
underpinning the applied three-dimensional data acquisition techniques. The majority of the reviewed studies
utilized a single depth camera fixed at the nadir of a platform, such as a handmade frame and door, acquiring body
proportion data, and performed well, for example, body volume with 𝑅2 = 0.97. Moreover, some applied multiple
sensors capture the relatively still cattle data from diverse viewpoints, then fuse them into one whole point cloud
used for further progress. The conclusion of the review is that there is a lack of research on collecting data when
the movement of cattle happens as well as studies with objects on pasture. In summary, the procedure that is
summarized in this review should be reflected in the acquisition of three-dimensional data. An option in future
work could be adding the use of non-rigid registration, which can solve the problem of movement, into the process.
Introduction
With the spread of depth cameras and light detection and ranging (LiDAR) devices, three-dimensional computer
vision (3D CV) technology for precision livestock farming (PLF), has recently attracted considerable attention for
cattle management. An important advantage is a capacity for non-contact observing and monitoring cattle in a
three-dimensional manner. Earlier studies have presented methods for data acquisition and raw data processing.
The research of [1] proposed a method that performed cow identification by the unification of two complementary
features (gait and texture) through analyzing images from three-dimensional video captured by Red, Green, Blue,
Depth (RGB-D) cameras with 84.2% accuracy. Another study by [2] improved the performance of automated
classification of body condition score (BCS) by extracting morphological characteristics from 3 viewpoints using
3 identical 3D cameras. [3] conducted research using 3D cameras for estimating body weight (BW), BCS, and
dairy type traits (DTT) of Holstein dairy cows. A low-cost RGB-D camera was applied for individual cattle feed
intake measurements [4]. All those and the undergoing studies evidence that 3D computer vision has the potential
to revolutionize PLF.
In the 47 reviewed studies, applications ranging from BW to BCS to identification were all based on adequate
three-dimensional data acquisition, thereby conducting photogrammetry through which geometric parameters of
objects on digitally captured images are determined and make measurements on them. However, data acquisition
can be difficult to conduct as well as laborious and time-consuming. Sometimes, it might be even dangerous such
as when [5] measured Lidia Cattle Breed which is extremely aggressive. Moreover, it also appears that it is difficult
to conduct a generalizable process for this activity. The majority of the reviewed studies utilized a single depth
camera or LiDAR fixed at the nadir of a platform, such as a handmade frame and a door, acquiring data[4][6][7].
289 Volume 2 of the Proceedings of the joint 12th International Conference on Methods and Techniques in Behavioral Research and 6th
Seminar on Behavioral Methods held online, May 18-20, 2022. www.measuringbehavior.org. Editors: Andrew Spink, Jarosław
Barski, Anne-Marie Brouwer, Gernot Riedel, & Annesha Sil (2022). DOI 10.6084/m9.figshare.20066849. ISBN: 978-90-74821-94-0
On the other hand, some applied multiple depth sensors capture the relatively still cattle data from diverse
viewpoints, then fuse them into one whole point cloud used for further progress[2]. These drawbacks critically
hinder the widespread propagation of 3D CV in cattle management.
This review summarizes the separate steps distributed in these papers as a systematic procedure for 3D data
acquisition. The procedure should be reflected in the acquisition of three-dimensional data afterward. Moreover,
it also points out that in the future, using non-rigid registration, which can solve the problem of movement can be
squeezed into the proposed procedure.
Methodology
The author of this review selected 47 related studies from the web scientific indexing service Web of Science
(WoS) core collection through composing search conditions including the three-dimensional techniques and cattle
series and excluding several domains such as environment and medical, followed by a detailed review. The
selected papers were analyzed one by one while pre-defined questions were considered, for instance: what is/are
the sensor(s) for this research, how to conduct the experiment for the application. Then, the author performed an
analysis of the studies and related comparisons among them.
The General Procedure for Three-dimensional Data Acquisition
In this session, the author summarises the workflow of a general campaign for three-dimensional data acquisition
after the analysis of all the reviewed papers. The three-dimensional data acquisition procedure comprises the early
raw data acquiring step conducted in the experimental field and the later stage of handling these data through
computational resources. The first step is to determine the application(s) or tasks of the research, which is the final
purpose of the campaign. The second step is to design the experiment including selecting the proper experimental
cattle and sensor(s) as well as the platform in relation to being able to equip the sensor(s) in the campaign. In the
next step, the calibration procedure and related parameters are planned, synchronization is considered (if muti-
sensors) and the campaigns are carried out. Then, data selection, suitable extraction, pre-processing, and
processing, are carried out. Figure 1 presents a bottom-up demonstration of the standard procedure of 3D data
acquisition. The two steps at the bottom belong to the early stage while the others are the later stage of the 3D data
acquisition procedure.
Conclusions
The 47 reviewed studies were developing straightforward precision applications for a wide variety of cattle
management. The studies applied a wide range of sensor types, various viewpoints with diverse platforms,
constructed 3D computer vision data, and developed methods to complete management tasks. However, there is a
lack of a standard for 3D data acquisition. Research on collecting data when the movement of cattle happens and
studies research objects on pasture are also hardly seen. This review is submitted to solve the problem of 3D data
acquisition by summarizing a systematic procedure. Besides, it provides a potential approach for perfecting the
procedure in the future.
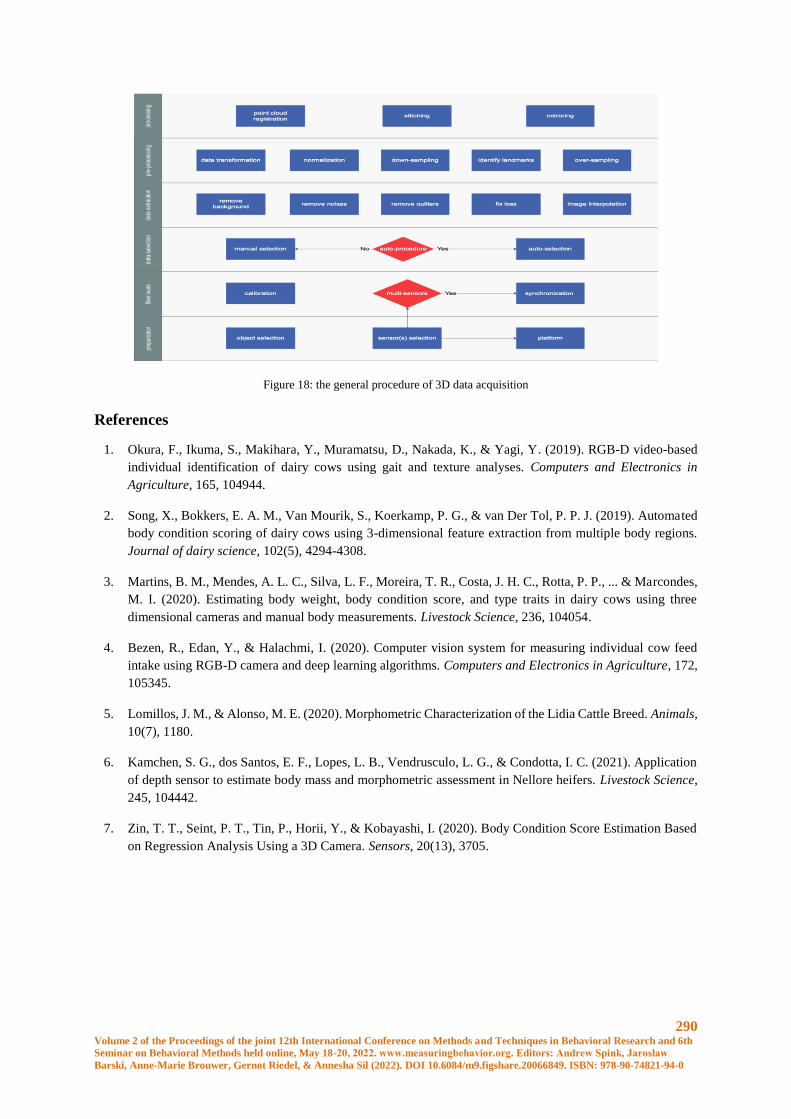
290 Volume 2 of the Proceedings of the joint 12th International Conference on Methods and Techniques in Behavioral Research and 6th
Seminar on Behavioral Methods held online, May 18-20, 2022. www.measuringbehavior.org. Editors: Andrew Spink, Jarosław
Barski, Anne-Marie Brouwer, Gernot Riedel, & Annesha Sil (2022). DOI 10.6084/m9.figshare.20066849. ISBN: 978-90-74821-94-0
Figure 18: the general procedure of 3D data acquisition
References
1. Okura, F., Ikuma, S., Makihara, Y., Muramatsu, D., Nakada, K., & Yagi, Y. (2019). RGB-D video-based
individual identification of dairy cows using gait and texture analyses. Computers and Electronics in
Agriculture, 165, 104944.
2. Song, X., Bokkers, E. A. M., Van Mourik, S., Koerkamp, P. G., & van Der Tol, P. P. J. (2019). Automated
body condition scoring of dairy cows using 3-dimensional feature extraction from multiple body regions.
Journal of dairy science, 102(5), 4294-4308.
3. Martins, B. M., Mendes, A. L. C., Silva, L. F., Moreira, T. R., Costa, J. H. C., Rotta, P. P., ... & Marcondes,
M. I. (2020). Estimating body weight, body condition score, and type traits in dairy cows using three
dimensional cameras and manual body measurements. Livestock Science, 236, 104054.
4. Bezen, R., Edan, Y., & Halachmi, I. (2020). Computer vision system for measuring individual cow feed
intake using RGB-D camera and deep learning algorithms. Computers and Electronics in Agriculture, 172,
105345.
5. Lomillos, J. M., & Alonso, M. E. (2020). Morphometric Characterization of the Lidia Cattle Breed. Animals,
10(7), 1180.
6. Kamchen, S. G., dos Santos, E. F., Lopes, L. B., Vendrusculo, L. G., & Condotta, I. C. (2021). Application
of depth sensor to estimate body mass and morphometric assessment in Nellore heifers. Livestock Science,
245, 104442.
7. Zin, T. T., Seint, P. T., Tin, P., Horii, Y., & Kobayashi, I. (2020). Body Condition Score Estimation Based
on Regression Analysis Using a 3D Camera. Sensors, 20(13), 3705.
291 Volume 2 of the Proceedings of the joint 12th International Conference on Methods and Techniques in Behavioral Research and 6th
Seminar on Behavioral Methods held online, May 18-20, 2022. www.measuringbehavior.org. Editors: Andrew Spink, Jarosław
Barski, Anne-Marie Brouwer, Gernot Riedel, & Annesha Sil (2022). DOI 10.6084/m9.figshare.20066849. ISBN: 978-90-74821-94-0
Integrating behavioral and physiological parameters to characterize emotional
contagion in pigs
A. Krause, J. Langbein and K. Siebert
Institute of Behavioural Physiology, Research Insitute for Farm Animal Biology (FBN), Dummerstorf, Germany.
Introduction
The assessment of emotional states in animals is increasingly important in terms of understanding and improving
animal welfare. For the welfare of social animals, such as domestic pigs, it is not only relevant what an individual
pig feels but also the extent to which its conspecifics are affected by its distress or pleasure. This transmission of
emotion in dyadic or group interactions can influence mood, decision making, behavior, and even group-level
dynamics, and is known as emotional contagion, emotion transference, or affective mimicry [1-3]. This
phenomenon describes a simple form of empathy [4], sharing the emotional state of the other.
Emotional processes are multifaceted, comprising physiological, behavioral and subjective components. The
subjective emotional experience can be inferred from linguistic report in humans, but is inaccessible to direct
measurement in animals. Measures of physiological indicators such as the activity of the autonomic nervous
system (ANS) based on the analysis of heart rate (HR) and HR variability (HRV), coupled with observations of
behavior may help to interpret the animal’s emotion state [5,6]. As changes in ANS activity are strongly influenced
by physical activity [7], the strong relationship between behavior and ANS function has to be taken into account
when comparing cardiovascular activity in experimental setups [8]. The goal of the experiment was to integrate
behavioral and physiological data of domestic pigs in order to investigate the time synchronized, context-related
emotional response of pigs in an emotional contagion paradigm.
Methodological approach
Eight group-housed pigs (age=23 weeks) were assigned either the role of observer or agent in fixed pairs.
Experiments with fixed observer-agent pairs were carried out in two adjacent pens separated from each other by a
metal grid. Experimental pigs were equipped with a belt to record electrocardiogram (ECG) to analyse HR and
HRV. Behavior and ECG were recorded before (10 mins), during (2 mins) and after (10 mins) the experience of a
rewarding (food ball) or aversive (restriction) event. Only the agent pig received the different treatments. The
behavior of the pigs was coded using The Observer XT 13 (Noldus, Wageningen). HR and HRV were analysed
using Kubios (©Kubios Oy) and exported as txt-files including all analysed parameters in 1-minute intervals and
the respective start and stop times. These txt-files were converted and adapted to an appropriate format for the
import into The Observer XT. A new start-stop Behavior Group with values as numerical Modifiers was set within
the coding scheme of the project prior to the import of HR and HRV values as Observational Data into the
respective observation using an adjusted import profile. For numerical analysis via the data profile of The Observer
XT, several interval filters were used: e.g. the analysis was reduced to intervals of the desired behavior (e.g.
inactive vs. active) and data were only included into the analysis if the respective behavior lasted for 1 minute. In
our experiment, Bioharness (Biopac® Systems, Inc.) was used to record ECG, but also other systems (DSI,
ADInstruments) may be suitable to combine the physiological data with behavior in The Observer XT.
Conclusion
The time synchronized, context-related integration of externally recorded physiological data into The Observer
XT enables the comprehensive characterization of subtle changes in emotional responses of pigs in an emotional
contagion paradigm.
References
292 Volume 2 of the Proceedings of the joint 12th International Conference on Methods and Techniques in Behavioral Research and 6th
Seminar on Behavioral Methods held online, May 18-20, 2022. www.measuringbehavior.org. Editors: Andrew Spink, Jarosław
Barski, Anne-Marie Brouwer, Gernot Riedel, & Annesha Sil (2022). DOI 10.6084/m9.figshare.20066849. ISBN: 978-90-74821-94-0
1. Hatfield, E., Cacioppo, J.T., Rapson, R.L. (1993). Emotional contagion. Current Directions in Psychological
Science 2, 96-100.
2. Barsade, S.G. (2002). The ripple effect: emotional contagion and its influence on group behavior.
Administrative Science Quarterly 47, 644-675.
3. Elfenbein, H.A. (2014). The many faces of emotional contagion: An affective process theory of affective
linkage. Organizational Psychology Review 4, 326-362.
4. De Waal, F.B.M. (2008) Putting the altruism back into altruism: the evolution of empathy. Annual Review of
Psychology 59, 279-300.
5. Boissy, A., Manteuffel, G., Jensen, M.B., Moe, R.O., Spruijt, B., Keeling, L.J., et al. (2007). Assessment of
positive emotions in animals to improve their welfare. Physiology & Behavior 92, 375–397.
6. Düpjan, S., Tuchscherer, A., Langbein, J., Schön, P.C., Manteuffel, G., Puppe, B. (2011). Behavioural and
cardiac responses towards conspecific distress calls in domestic pigs (Sus scrofa). Physiology & Behavior 103,
445-452.
7. Bernardi, L., Valle, F., Coco, M., Calciati, A., Sleight, P., (1996). Physical activity influences heart rate
variability and very-low-frequency components in Holter electrocardiograms. Cardiovascular Research 32,
234–237.
8. von Borell, E., Langbein, J., Despres, G., Hansen, S., Leterrier, C., Marchant-Forde, J. et al. (2007). Heart rate
variability as a measure of autonomic regulation of cardiac activity for assessing stress and welfare in farm
animals - A review. Physiology & Behavior 92, 293–316.
293 Volume 2 of the Proceedings of the joint 12th International Conference on Methods and Techniques in Behavioral Research and 6th
Seminar on Behavioral Methods held online, May 18-20, 2022. www.measuringbehavior.org. Editors: Andrew Spink, Jarosław
Barski, Anne-Marie Brouwer, Gernot Riedel, & Annesha Sil (2022). DOI 10.6084/m9.figshare.20066849. ISBN: 978-90-74821-94-0
Adult zebrafish behavior as tool to study muscular dystrophy
A.R. Campos1 and S.A.A.R. Santos1
1Experimental Biology Center, University of Fortaleza, Fortaleza, Brazil. [email protected]
Introduction
Muscular dystrophies are described as a progressive muscle degeneration that affects skeletal muscles [1]. Some
types of dystrophy exhibit the clinical phenomenon of myotonia (hyperexcitability and slow muscle relaxation),
such as myotonic dystrophies (MD), transmitted by autosomal dominant inheritance of trinucleotide expansion
(type 1 MD) or tetranucleotide (type 2 MD) mutations, congenital myotonias (CM), which are determined by
mutations in the gene encoding the chlorine channel (CLCN1) of skeletal muscle [2] and non-dystrophic myotonias
that close sodium channels [3], leading to progressive muscle fatigue [4].
Muscular dystrophy inversely impairs muscle excitability [5] and a better understanding of this disease is being
used to develop new treatment therapies [6]. There are several models using genetically modified animals to study
myotonia, which, despite being useful for understanding the pathophysiology of the disease, have limitations for
screening new drugs [7]. High costs make large-scale screening of drugs against human diseases in rodent models
virtually unattainable [8]. The zebrafish is a robust animal model for the study of human muscle diseases [9].
Due to its genetics similar to those of mammals [10], the use of adult zebrafish (Danio rerio) is widely used in
behavioral experiments [11] and has been used in studies as a method low-cost, high-yield alternative to rodent
tests [12].
The aim of this study was to propose new experimental models of muscular dystrophy in adult zebrafish.
Material and Methods
Zebrafish
Adult zebrafish (Danio rerio; wild-type; short-fin phenotype) of both sex, aged 60–90 days, of similar size
(3.5 ± 0.5 cm) and weight (0.3 ± 0.2 g) were obtained from Agroquímica: Comércio de Produtos Veterinários
LTDA, a supplier located in Fortaleza (Ceará, Brazil). The group of 50 fish were acclimated for 24 h in a 10-L
glass tank (30 × 15 × 20 cm) containing dechlorinated tap water (ProtecPlus®) and air pump with submerged filter
at 25 °C and pH 7.0, under near-normal circadian rhythm (14:10 h of light/dark cycle). The fish were fed ad libitum
24 h prior to the experiments. All experimental procedures were approved by the Ethics Committee on Animal
Research of the Ceará State University (CEUA-UECE; #7210149/2016).
Evaluation of the effect of 9-anthracenecarboxylic acid (9-AC) on zebrafish locomotor behavior
9-AC is a chloride channel inhibitor used to induce muscular dystrophy in rodents [7]. The 3 mg/mL concentration
was chosen from the studies by De Bellis [13].
Groups
The animals (n = 8/group) were divided into the following groups:
1 – Control (vehicle; 0.9 % NaCl + 1 % Tween 80; 20 μL; intraperitoneally - i.p.);
2 – 9-AC (3 mg/mL; 20 μL; i.p.);
3 – Naive (no treatment).
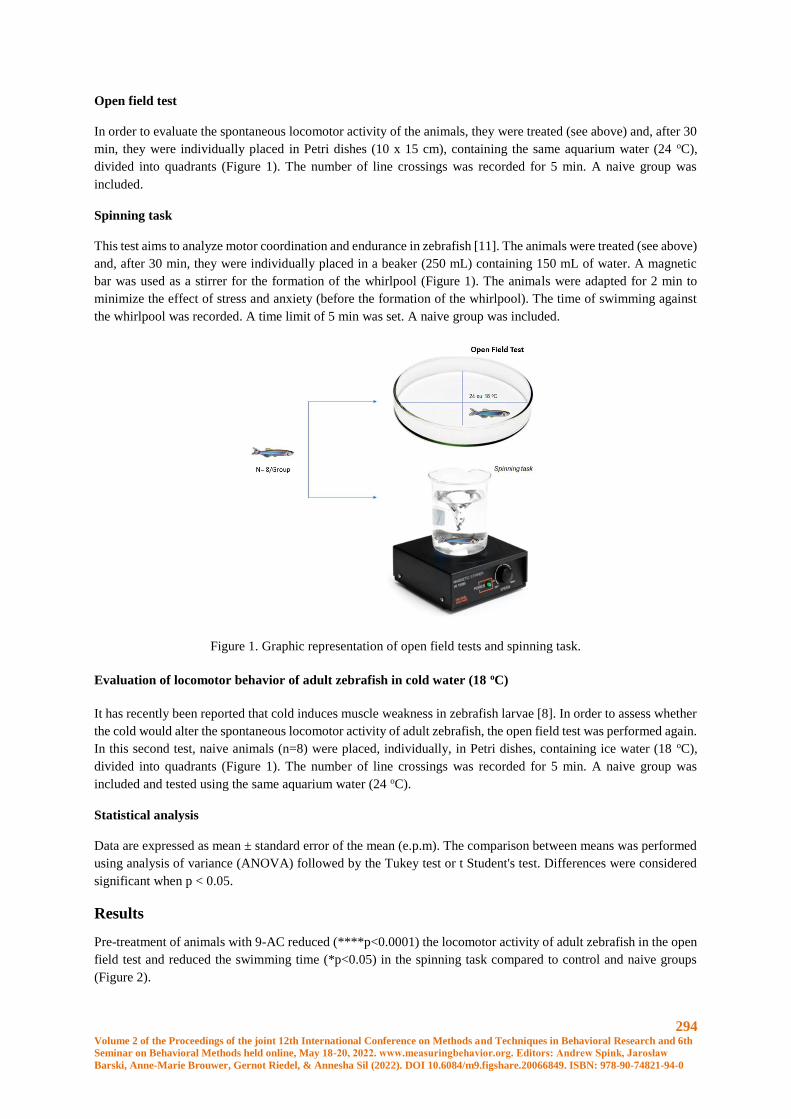
294 Volume 2 of the Proceedings of the joint 12th International Conference on Methods and Techniques in Behavioral Research and 6th
Seminar on Behavioral Methods held online, May 18-20, 2022. www.measuringbehavior.org. Editors: Andrew Spink, Jarosław
Barski, Anne-Marie Brouwer, Gernot Riedel, & Annesha Sil (2022). DOI 10.6084/m9.figshare.20066849. ISBN: 978-90-74821-94-0
Open field test
In order to evaluate the spontaneous locomotor activity of the animals, they were treated (see above) and, after 30
min, they were individually placed in Petri dishes (10 x 15 cm), containing the same aquarium water (24 oC),
divided into quadrants (Figure 1). The number of line crossings was recorded for 5 min. A naive group was
included.
Spinning task
This test aims to analyze motor coordination and endurance in zebrafish [11]. The animals were treated (see above)
and, after 30 min, they were individually placed in a beaker (250 mL) containing 150 mL of water. A magnetic
bar was used as a stirrer for the formation of the whirlpool (Figure 1). The animals were adapted for 2 min to
minimize the effect of stress and anxiety (before the formation of the whirlpool). The time of swimming against
the whirlpool was recorded. A time limit of 5 min was set. A naive group was included.
Figure 1. Graphic representation of open field tests and spinning task.
Evaluation of locomotor behavior of adult zebrafish in cold water (18 oC)
It has recently been reported that cold induces muscle weakness in zebrafish larvae [8]. In order to assess whether
the cold would alter the spontaneous locomotor activity of adult zebrafish, the open field test was performed again.
In this second test, naive animals (n=8) were placed, individually, in Petri dishes, containing ice water (18 oC),
divided into quadrants (Figure 1). The number of line crossings was recorded for 5 min. A naive group was
included and tested using the same aquarium water (24 oC).
Statistical analysis
Data are expressed as mean ± standard error of the mean (e.p.m). The comparison between means was performed
using analysis of variance (ANOVA) followed by the Tukey test or t Student's test. Differences were considered
significant when p < 0.05.
Results
Pre-treatment of animals with 9-AC reduced (****p<0.0001) the locomotor activity of adult zebrafish in the open
field test and reduced the swimming time (*p<0.05) in the spinning task compared to control and naive groups
(Figure 2).
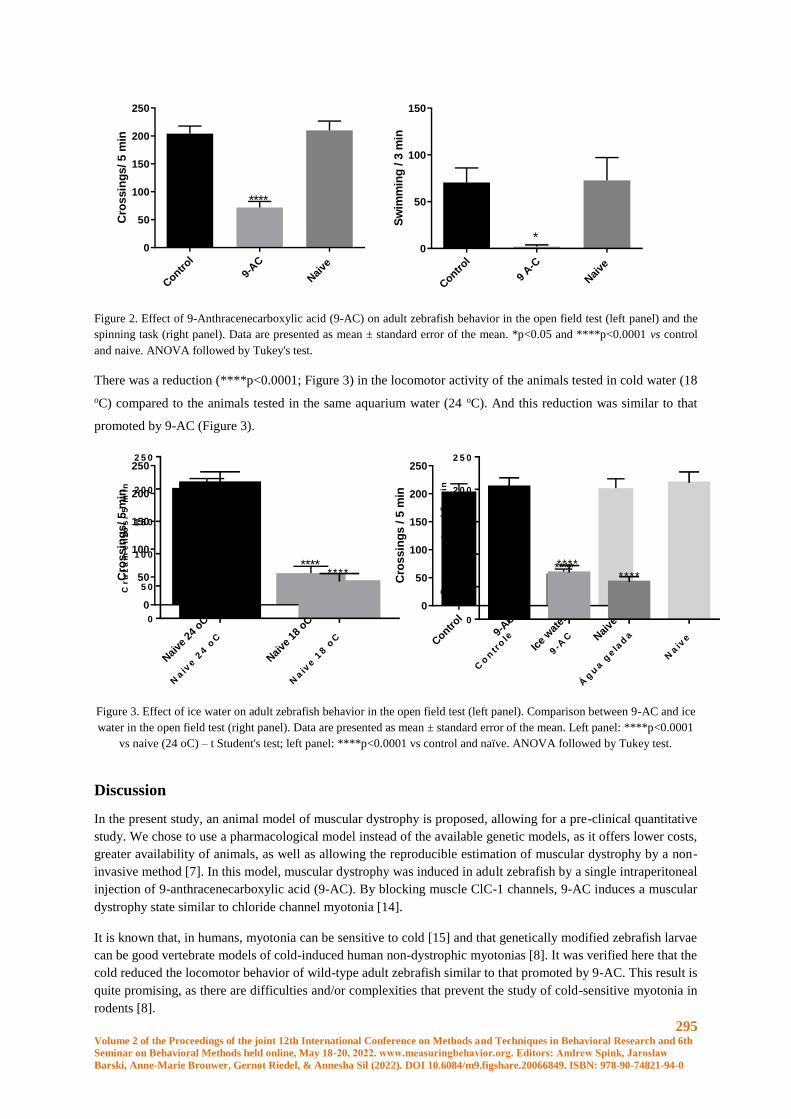
295 Volume 2 of the Proceedings of the joint 12th International Conference on Methods and Techniques in Behavioral Research and 6th
Seminar on Behavioral Methods held online, May 18-20, 2022. www.measuringbehavior.org. Editors: Andrew Spink, Jarosław
Barski, Anne-Marie Brouwer, Gernot Riedel, & Annesha Sil (2022). DOI 10.6084/m9.figshare.20066849. ISBN: 978-90-74821-94-0
Contr
ol
9-AC
Nai
ve
0
50
100
150
200
250C
rossin
gs/ 5 m
in
****
Contr
ol
9 A-C
Nai
ve
0
50
100
150
Sw
imm
ing
/ 3
min
*
Figure 2. Effect of 9-Anthracenecarboxylic acid (9-AC) on adult zebrafish behavior in the open field test (left panel) and the
spinning task (right panel). Data are presented as mean ± standard error of the mean. *p<0.05 and ****p<0.0001 vs control
and naive. ANOVA followed by Tukey's test.
There was a reduction (****p<0.0001; Figure 3) in the locomotor activity of the animals tested in cold water (18
oC) compared to the animals tested in the same aquarium water (24 oC). And this reduction was similar to that
promoted by 9-AC (Figure 3).
Nai
ve 2
4 oC
Nai
ve 1
8 oC
0
50
100
150
200
250
Cro
ssin
gs/ 5 m
in
****
Contr
ol
9-AC
Ice
wat
er
Nai
ve
0
50
100
150
200
250
Cro
ssin
gs / 5
min
********
Naiv
e 2
4 o
C
Naiv
e 1
8 o
C
0
5 0
1 0 0
1 5 0
2 0 0
2 5 0
Cru
za
me
nto
s/
5 m
in
****
Co
ntr
ole
9-A
C
Ág
ua g
ela
da
Naiv
e
0
5 0
1 0 0
1 5 0
2 0 0
2 5 0
Cru
za
me
nto
s /
5 m
in
********
Figure 3. Effect of ice water on adult zebrafish behavior in the open field test (left panel). Comparison between 9-AC and ice
water in the open field test (right panel). Data are presented as mean ± standard error of the mean. Left panel: ****p<0.0001
vs naive (24 oC) – t Student's test; left panel: ****p<0.0001 vs control and naïve. ANOVA followed by Tukey test.
Discussion
In the present study, an animal model of muscular dystrophy is proposed, allowing for a pre-clinical quantitative
study. We chose to use a pharmacological model instead of the available genetic models, as it offers lower costs,
greater availability of animals, as well as allowing the reproducible estimation of muscular dystrophy by a non-
invasive method [7]. In this model, muscular dystrophy was induced in adult zebrafish by a single intraperitoneal
injection of 9-anthracenecarboxylic acid (9-AC). By blocking muscle ClC-1 channels, 9-AC induces a muscular
dystrophy state similar to chloride channel myotonia [14].
It is known that, in humans, myotonia can be sensitive to cold [15] and that genetically modified zebrafish larvae
can be good vertebrate models of cold-induced human non-dystrophic myotonias [8]. It was verified here that the
cold reduced the locomotor behavior of wild-type adult zebrafish similar to that promoted by 9-AC. This result is
quite promising, as there are difficulties and/or complexities that prevent the study of cold-sensitive myotonia in
rodents [8].
296 Volume 2 of the Proceedings of the joint 12th International Conference on Methods and Techniques in Behavioral Research and 6th
Seminar on Behavioral Methods held online, May 18-20, 2022. www.measuringbehavior.org. Editors: Andrew Spink, Jarosław
Barski, Anne-Marie Brouwer, Gernot Riedel, & Annesha Sil (2022). DOI 10.6084/m9.figshare.20066849. ISBN: 978-90-74821-94-0
The adult zebrafish appears here as a viable alternative for screening potential new drugs for the treatment of
muscular dystrophy. The use of adult zebrafish has as advantages the possibility of using oral medication, which
is the common way used by patients. Other advantages include the easy standardization of protocols, the reduced
number of animals needed to obtain experimental points, and reduced experimentation costs.
Conclusion
Two new in vivo protocols for muscular dystrophy in adult zebrafish have been developed that may be useful to
assess the antimyotonic activity of compounds. It is noteworthy that the proposed models are easily reproducible
at low cost, favoring their use for screening new therapeutic targets.
References
[1] Carter, J.C., Sheehan, D.W., Prochoroff, A., Birnkrant, D.J. (2018). Muscular Dystrophies. Clin Chest Med 39,
377–389.
[2] Suetterlin, K., Mannikko, R., Hanna, M.G. (2014). Muscle channelopathies: Recent advances in genetics,
pathophysiology and therapy. Current Opinion in Neurology 27 (5), 583–590.
[3] Ryan, A.M., Matthrws, E., Hanna, M.G. (2007). Skeletal-muscle channelopathies: periodic paralysis and
nondystrophic myotonias. Curr. Opin. Neurol 20 (5), 558–563.
[4] Van Lunteren, E., Spiegler, S.E., Moyer, M. (2011). Fatigue-inducing stimulation resolves myotonia in a drug-
induced model. BMC Physiol 11.
[5] Pedersen, T.H., De Paoli, F.V., Flatman, J.A., Nielsen, O.B. (2009). Regulation of ClC-1 and KATP channels
in action potential-firing fast-twitch muscle fibers. J Gen Physiol 134, 309–322.
[6] Mercuri, E., Bönnemann, C.G., Muntoni, F. (2019). Muscular dystrophies. The Lancet 394 (10213): 2025–
2038.
[7] Desaphy, J.F., Costanza, T., Carbonara, R. & Conte Camerino, D. (2013). In vivo evaluation of antimyotonic
efficacy of β-adrenergic drugs in a rat model of myotonia. Neuropharmacology 65, 21–27.
[8] Nam, T.S., Zhang, J., Chandrasekaran, G., Jeong, I.Y., Li, W., Lee. S.H., Kang, K.W., Maeng, J.S., Kang, H.,
Shin, H.Y., Park, H.C., Kim, S., Choi, S.Y., Kim, M.K.A. (2020). zebrafish model of nondystrophic myotonia
with sodium channelopathy. Neuroscience Letters 714.
[9] Li, M., Hromowyk, K.J., Amacher, S.L., Currie, P.D. (2016). Muscular dystrophy modeling in zebrafish.
Methods Cell Biol 138, 347–380.
[10] Kari, G., Rodeck, U., Dicker, A.P. (2007). Zebrafish: an emerging model system for human disease and drug
Discovery. Clinical Pharmacolology and Therapeutis 82.
[11] Blazina, A.R., Vianna, M.R., Lara, D.R. (2013). The spinning task: a new protocol to easily assess motor
coordination and resistance in zebrafish. Zebrafish 10, 480–485.
[12] Smith, A.J., Hawkinsm, P. (2016). Good science, good sense and good sensibilities: the three Ss of Carol
Newton, Animals 6, 70–75.
[13] De Bellis, M., Carbonara, R., Roussel. J., Farinato, A., Massari, A., Pierno, S., Muraglia, M., Corbo, F.,
Franchini, C., Carratu, M. R., De Luca, A., Camerino, D. C., Desaphy, J. F. (2017). Neuropharmacology 113, 206–
216.
[14] Furman, R.E., Barchi, R.L. (1978). The pathophysiology of myotonia produced by aromatic carboxylic acids.
Ann Neurol 4, 357–365.
[15] Lossin, C., Nam, T. S., Shangian, S., Rogawski, M, A., Choi, S. Y., Kim, M. K., Sunwoo, I. N. (2012). Altered
fast and slow inactivation of the N440K Nav1.4 mutant in a periodic paralysis syndrome. Neurology 79, 1033–
1040.
297 Volume 2 of the Proceedings of the joint 12th International Conference on Methods and Techniques in Behavioral Research and 6th
Seminar on Behavioral Methods held online, May 18-20, 2022. www.measuringbehavior.org. Editors: Andrew Spink, Jarosław
Barski, Anne-Marie Brouwer, Gernot Riedel, & Annesha Sil (2022). DOI 10.6084/m9.figshare.20066849. ISBN: 978-90-74821-94-0
Cylinder test vs skilled reaching test: comparison of two methods used to
investigate unilateral motor impairments in rat model of Parkinson’s disease.
M. Paleczna1, A. Jurga 1 , D. Biała1 and K.Z. Kuter1
1 Department of Neuropsychopharmacology, Maj Institute of Pharmacology Polish Academy of Sciences, Cracow,
Poland. [email protected]
Introduction
Neurological diseases, including Parkinson’s disease (PD) and brain damage caused by stroke, cause severe motor
impairments. Deficits in hand use are one of the most debilitating motor symptoms [1]. An unique feature of PD
is the asymmetry of its motor signs giving the possibilities of using special set of behavioral tests. The skilled
reaching test and cylinder test measuring the spontaneous forelimb asymmetry are commonly used to study
asymmetric paw behavior. The aim of the present study is to compare these two methods, identify their weaknesses
and strengths as well as closer define to which parameters descriptions they should be especially used.
Materials and methods
Animals
Young adult, male Wistar rats (Charles River, Germany) were used in experimental procedures were conducted in
strict accordance with the European Communities Council Directive (2010/63/EU) and with the Second Cracow
Local Ethics Committee for Animal Experimentation (permission number: LKE 114/2019).
Surgery
To obtain asymmetric PD-like symptoms we used unilateral injection of 6-OHDA (6ug/3ul) into the medial
forebrain bundle destroying dopaminergic nigrostriatal system. Control animals were sham-operated. The 6-
OHDA or sham injection was applied to the hemisphere contralateral to each rats’ preferred paw [1].
Behavioral tests
Before the surgical procedure animals were adapted to the environment, handling, food pellets and experimental
cages. Rats were pre-trained to learn skilled reaching test and tested to identify the dominant paw. General
locomotor activity and rearing have been checked in automated cages with infrared detection. To receive
information about lesion effectiveness the spontaneous and apomorphine-induced rotation tests have been applied
[2]. During the night prior to the beginning of the following behavioral tests, rats were food deprived. Animals
were tested in several time points up to 56 days post surgery.
Spontaneous forelimb asymmetry test (cylinder test)
The cylinder test assesses the independent use of each forelimb in the context of a naturally occurring behavior,
driven by exploratory activity [3]. Rats were put individually in a plexiglass cylinder ( Ø 30 cm) and video recorded
for five minutes. The number of supporting wall contacts the rat executed with the right, left or both paws was
counted. Each touch of the wall was counted only after touching the floor with the front paws.
Skilled reaching test
Skilled reaching test was performed in plexiglas cage (30cm x 40cm x 29cm) with a 1 cm wide slit in the front
wall and a 2 cm wide shelf mounted outside, 3 cm above floor [4]. Food pellets (chocolate rice pellets) were placed
in one of three marks on the shelf (left, central or right). The test lasted ten minutes. Three consecutive pellets
298 Volume 2 of the Proceedings of the joint 12th International Conference on Methods and Techniques in Behavioral Research and 6th
Seminar on Behavioral Methods held online, May 18-20, 2022. www.measuringbehavior.org. Editors: Andrew Spink, Jarosław
Barski, Anne-Marie Brouwer, Gernot Riedel, & Annesha Sil (2022). DOI 10.6084/m9.figshare.20066849. ISBN: 978-90-74821-94-0
were placed on the central mark for encouragement. Then food was placed on the mark ipsilateral to the lesion site
to force the animal to use only one, contralateral forelimb After ten pellets successfully grasped or after 10 minutes
the test was ended. The number of all reaches, successful grasps and time in which the rat caught ten pellets were
counted. Different ratios were calculated and analysed.
Results
Because of the unilateral destruction of the nigrostriatal pathway 6 days after operation there were very small
deficits in the general locomotor activity observed. Similarly, the total rearing and rearing supported on the wall
were slightly decreased. Therefore the general ability of animals to move and stand up for rearing did not influence
the other behavioral tests.
The more distinct behavioral asymmetry was detected in spontaneous and apomorphine–induced rotation tests.
Spontaneous contralateral rotations totally diminished while drug-induced contralateral rotations dominated after
lesion, proving the efficacy and selectivity of dopaminergic system destruction.
Total paw use in cylinder test was slightly decreased as compared to control animals, while the use of contralateral
paw was totally eliminated. This effect was stable and lasted up to 42 days after operation.
In the skilled reaching test, lesioned animals showed more focused behaviour, their impaired paw movements were
less frequent but slower, hence more effectively grasping the pellets. It took them longer time to grasp 10 pellets,
they reached less but their effectiveness was higher (grasp/reach ratio). Control animals used their paw more often,
fast and chaotic, therefore their effectiveness was lower, however still they reached more pellets.
Conclusions
Although both tests analyse assymetric paw use their sensitivity and interpretation is much different.
Cylinder test: Disadvantages: The results correlate strongly with exploratory and general animal activity,
therefore cannot be performed repeatedly in too short time-periods. General physical activity and ability to stand
up and rear cannot be interfered in animal model. The animal character and social hierarchy affects the general
activity and number of wall touches. In the naïve animals the preferred hand use is partially dependent on the
direction in which animal is walking in the cylinder.
Advantages: Rapid and easy in its execution. It doesn’t require training of the animals and investigator’s
experience.
Skilled reaching test: Disadvantages: Time-consuming and requires patient, skilled experimentator. Repeated
adaptation and teaching sessions prior to testing are necessary and slow learning of grasping skills discriminates
some animals. Teaching sequence (which paw is tested as first) affects the results, especially in animals with lower
hand preference. If test is performed manually the speed of pellets positioning by experimentator can influence the
results.
Advantages: Multiple parameters can be analysed at the same time (skill, effectiveness, speed, precision) along
with detailed analysis of hand gestures.
Summary: The cylinder test shows more sensitivity and stronger discrimination factor along with easier and less
effort in performance as compared to the skilled reaching test when analyzing the results of dopaminergic system
degeneration in the rat model of PD.
References

299 Volume 2 of the Proceedings of the joint 12th International Conference on Methods and Techniques in Behavioral Research and 6th
Seminar on Behavioral Methods held online, May 18-20, 2022. www.measuringbehavior.org. Editors: Andrew Spink, Jarosław
Barski, Anne-Marie Brouwer, Gernot Riedel, & Annesha Sil (2022). DOI 10.6084/m9.figshare.20066849. ISBN: 978-90-74821-94-0
1. Kuter, K., Olech, Ł., Głowacka, U. (2018). Prolonged Dysfunction of Astrocytes and Activation of Microglia
Accelerate Degeneration of Dopaminergic Neurons in the Rat Substantia Nigra and Block Compensation of
Early Motor Dysfunction Induced by 6-OHDA. Mol Neurobiol. Apr;55(4):3049-3066
2. Ungerstedt, U., Arbuthnott, G.W. (1970). Quantitative recording of rotational behavior in rats after 6-hydroxy-
dopamine lesions of the nigrostriatal dopamine system. Brain Res. 24(3):485-93.
3. Schallert T, Fleming SM, Leasure JL, Tillerson JL, Bland ST (2000) CNS plasticity and assessment of forelimb
sensorimotor outcome in unilateral rat models of stroke, cortical ablation, parkinsonism and spinal cord injury.
Neuropharmacology 2000 Mar 3;39(5):777-87.
4. Klein, A.1., Sacrey, L.A., Whishaw, I.Q., Dunnett, S.B. (2012). The use of rodent skilled reaching as a
translational model for investigating brain damage and disease. Neurosci Biobehav Rev. 36(3):1030-42.
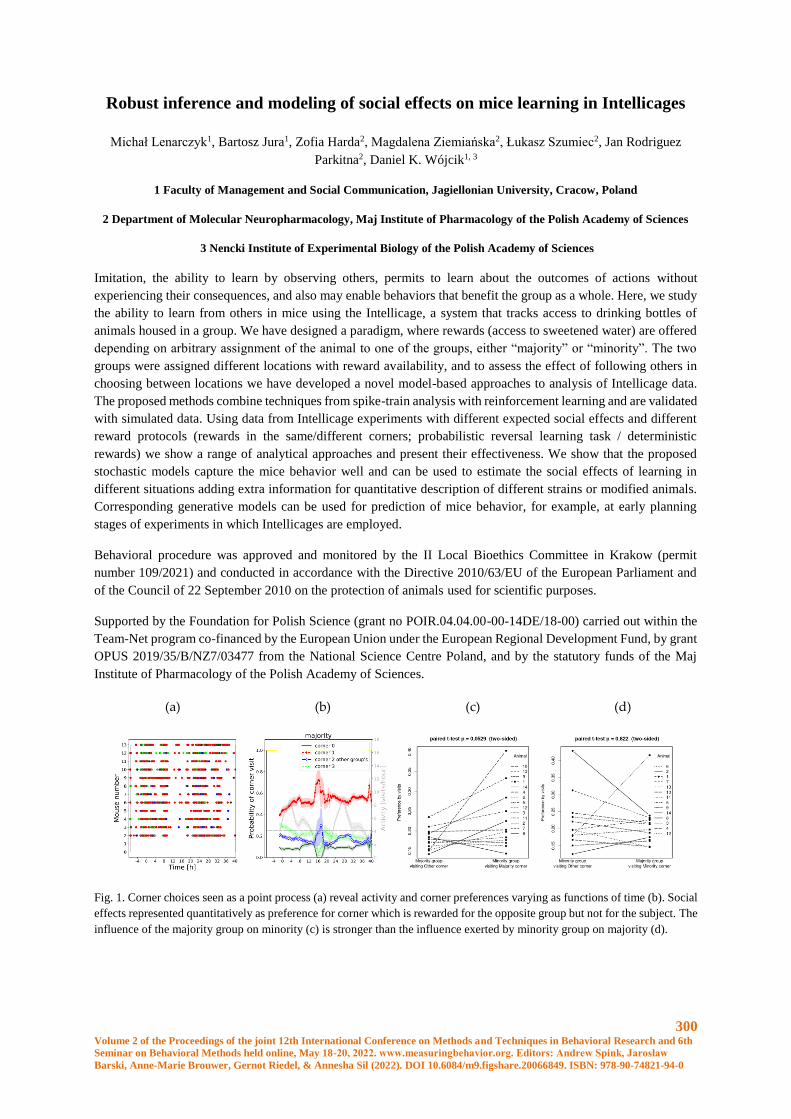
300 Volume 2 of the Proceedings of the joint 12th International Conference on Methods and Techniques in Behavioral Research and 6th
Seminar on Behavioral Methods held online, May 18-20, 2022. www.measuringbehavior.org. Editors: Andrew Spink, Jarosław
Barski, Anne-Marie Brouwer, Gernot Riedel, & Annesha Sil (2022). DOI 10.6084/m9.figshare.20066849. ISBN: 978-90-74821-94-0
Robust inference and modeling of social effects on mice learning in Intellicages
Michał Lenarczyk1, Bartosz Jura1, Zofia Harda2, Magdalena Ziemiańska2, Łukasz Szumiec2, Jan Rodriguez
Parkitna2, Daniel K. Wójcik1, 3
1 Faculty of Management and Social Communication, Jagiellonian University, Cracow, Poland
2 Department of Molecular Neuropharmacology, Maj Institute of Pharmacology of the Polish Academy of Sciences
3 Nencki Institute of Experimental Biology of the Polish Academy of Sciences
Imitation, the ability to learn by observing others, permits to learn about the outcomes of actions without
experiencing their consequences, and also may enable behaviors that benefit the group as a whole. Here, we study
the ability to learn from others in mice using the Intellicage, a system that tracks access to drinking bottles of
animals housed in a group. We have designed a paradigm, where rewards (access to sweetened water) are offered
depending on arbitrary assignment of the animal to one of the groups, either “majority” or “minority”. The two
groups were assigned different locations with reward availability, and to assess the effect of following others in
choosing between locations we have developed a novel model-based approaches to analysis of Intellicage data.
The proposed methods combine techniques from spike-train analysis with reinforcement learning and are validated
with simulated data. Using data from Intellicage experiments with different expected social effects and different
reward protocols (rewards in the same/different corners; probabilistic reversal learning task / deterministic
rewards) we show a range of analytical approaches and present their effectiveness. We show that the proposed
stochastic models capture the mice behavior well and can be used to estimate the social effects of learning in
different situations adding extra information for quantitative description of different strains or modified animals.
Corresponding generative models can be used for prediction of mice behavior, for example, at early planning
stages of experiments in which Intellicages are employed.
Behavioral procedure was approved and monitored by the II Local Bioethics Committee in Krakow (permit
number 109/2021) and conducted in accordance with the Directive 2010/63/EU of the European Parliament and
of the Council of 22 September 2010 on the protection of animals used for scientific purposes.
Supported by the Foundation for Polish Science (grant no POIR.04.04.00-00-14DE/18-00) carried out within the
Team-Net program co-financed by the European Union under the European Regional Development Fund, by grant
OPUS 2019/35/B/NZ7/03477 from the National Science Centre Poland, and by the statutory funds of the Maj
Institute of Pharmacology of the Polish Academy of Sciences.
(a) (b) (c) (d)
Fig. 1. Corner choices seen as a point process (a) reveal activity and corner preferences varying as functions of time (b). Social
effects represented quantitatively as preference for corner which is rewarded for the opposite group but not for the subject. The
influence of the majority group on minority (c) is stronger than the influence exerted by minority group on majority (d).
301 Volume 2 of the Proceedings of the joint 12th International Conference on Methods and Techniques in Behavioral Research and 6th
Seminar on Behavioral Methods held online, May 18-20, 2022. www.measuringbehavior.org. Editors: Andrew Spink, Jarosław
Barski, Anne-Marie Brouwer, Gernot Riedel, & Annesha Sil (2022). DOI 10.6084/m9.figshare.20066849. ISBN: 978-90-74821-94-0
Robust Scratching Behavior Detection in Mice from Generic Features and a
Lightweight Neural Network in 100 fps Videos
Elsbeth A. van Dam†,1,3, Marco Hernandez Roosken†,1, Lucas P. J. J. Noldus1,2
1 Noldus Information Technology BV, Wageningen, The Netherlands. [email protected]
2 Department of Biophysics, Donders Institute for Brain, Cognition and Behaviour, Radboud University, Nijmegen,
The Netherlands
3 Department of Artificial Intelligence, Donders Institute for Brain, Cognition and Behaviour, Radboud University,
Nijmegen, The Netherlands
†Shared first author
Introduction
Quantification of rodent scratching behavior is important because scratching is used in animal models for skin
diseases and stress. Scratching behavior consists of a rapid, repetitive moment of the hind paw around the neck.
Since scratching instances are usually rare and short, it is difficult to annotate them manually. Also in the field of
automated behavior recognition, short and infrequent events pose a challenge. Scratching usually takes less than a
second, hence only a small fraction of input frames are positive, which hinders the convergence of models.
Furthermore, the behavior is unevenly distributed over trials; it occurs frequently in one recording and does not
occur at all in others. Another important consideration for classification of this behavior is the high speed of paw
moments. This may cause part of the movement to be lost on recordings with a lower frame rate. The average
frequency of paw movements during scratching in our records is roughly 20 Hz. Given this information, Nyquist’s
Sampling Theorem implies that the frame-rate of the recordings should be at least 40 Hz to prevent distortions.
Although some authors report results using the CCTV standard video frame rate of 25 or 30 frames per second
(fps), e.g. Akita et al. (2019)[2], several others reported methods based on higher frame rates. For instance, Nie et
al. (2012) calculate the frame-to-frame difference on videos with 240 fps and use a short-pulse detection filter to
detect the scratches [5]. More recently, Kobayashi et al. (2021) applied a convolutional recurrent neural network
directly to the video input of 60 fps, on a sliding window of 20 frames [4]. Both methods were trained and tested
on videos from a single dataset and are not designed to work out of the box on footage recorded in other
circumstances, e.g with different cage, background, camera height and light. That severely limits the practical
applicability of these methods.
In this work we aim for automatic recognition of scratching behavior of mice in footage from multiple datasets
using the features described in Van Dam et al. (2013) [3], which are derived from tracked body-point locations
and optical flow. From this, a normalized 2D motion profile map of the animal movement over time is created.
The final set of 169 features is the result of sliding window statistics and 1D log-Gabor responses in the temporal
direction. Classification of these features enables robust behavior recognition of rodent behavior across datasets.
Methods
Data
The dataset consists of nine trials recorded at two different labs. The trials are roughly 30 minutes long and were
recorded with a Basler USB-3 IR camera (acA1920-155um) with 100 frames per second, resolution 1920 x 1080
pixels. The first setup combines three cages. Both setups use home cages, black mice, and sawdust covering.The
videos were recorded for other behavioral research studies that are covered by approval of authorized ethical
committees. These studies have not been published yet.
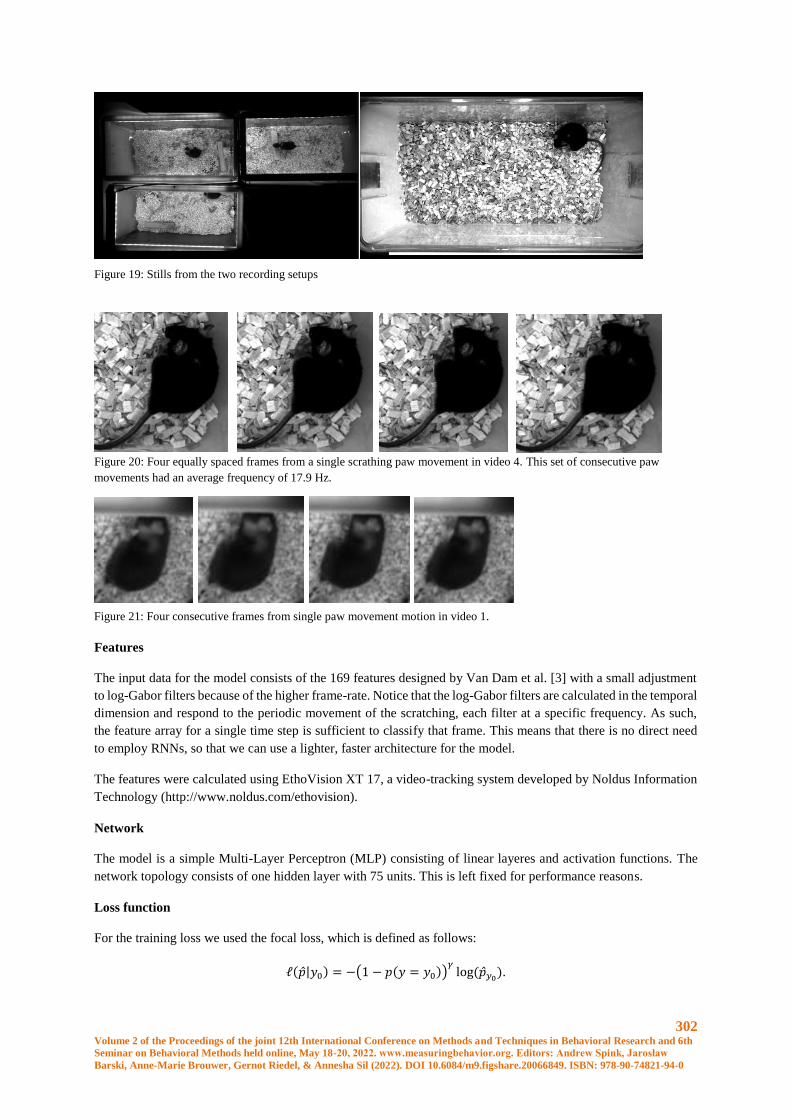
302 Volume 2 of the Proceedings of the joint 12th International Conference on Methods and Techniques in Behavioral Research and 6th
Seminar on Behavioral Methods held online, May 18-20, 2022. www.measuringbehavior.org. Editors: Andrew Spink, Jarosław
Barski, Anne-Marie Brouwer, Gernot Riedel, & Annesha Sil (2022). DOI 10.6084/m9.figshare.20066849. ISBN: 978-90-74821-94-0
Features
The input data for the model consists of the 169 features designed by Van Dam et al. [3] with a small adjustment
to log-Gabor filters because of the higher frame-rate. Notice that the log-Gabor filters are calculated in the temporal
dimension and respond to the periodic movement of the scratching, each filter at a specific frequency. As such,
the feature array for a single time step is sufficient to classify that frame. This means that there is no direct need
to employ RNNs, so that we can use a lighter, faster architecture for the model.
The features were calculated using EthoVision XT 17, a video-tracking system developed by Noldus Information
Technology (http://www.noldus.com/ethovision).
Network
The model is a simple Multi-Layer Perceptron (MLP) consisting of linear layeres and activation functions. The
network topology consists of one hidden layer with 75 units. This is left fixed for performance reasons.
Loss function
For the training loss we used the focal loss, which is defined as follows:
ℓ(��|𝑦0) = −(1 − 𝑝(𝑦 = 𝑦0))𝛾
log(��𝑦0).
Figure 20: Four equally spaced frames from a single scrathing paw movement in video 4. This set of consecutive paw
movements had an average frequency of 17.9 Hz.
Figure 21: Four consecutive frames from single paw movement motion in video 1.
Figure 19: Stills from the two recording setups
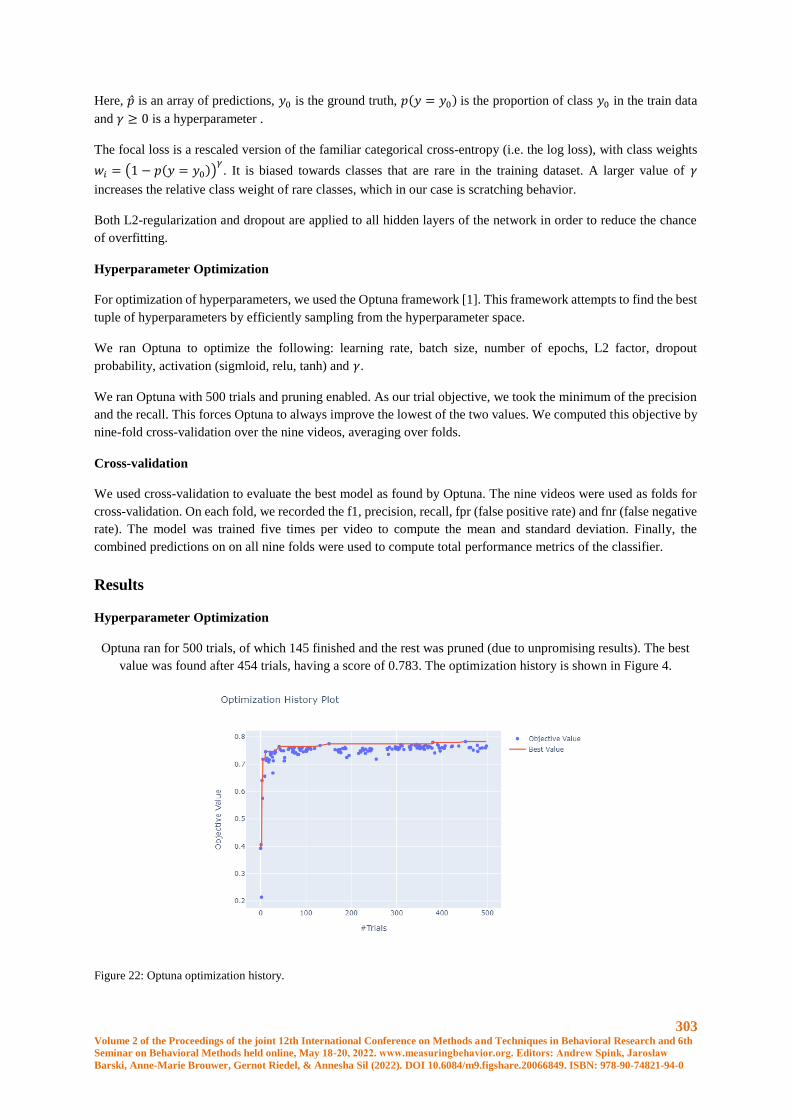
303 Volume 2 of the Proceedings of the joint 12th International Conference on Methods and Techniques in Behavioral Research and 6th
Seminar on Behavioral Methods held online, May 18-20, 2022. www.measuringbehavior.org. Editors: Andrew Spink, Jarosław
Barski, Anne-Marie Brouwer, Gernot Riedel, & Annesha Sil (2022). DOI 10.6084/m9.figshare.20066849. ISBN: 978-90-74821-94-0
Here, �� is an array of predictions, 𝑦0 is the ground truth, 𝑝(𝑦 = 𝑦0) is the proportion of class 𝑦0 in the train data
and 𝛾 ≥ 0 is a hyperparameter .
The focal loss is a rescaled version of the familiar categorical cross-entropy (i.e. the log loss), with class weights
𝑤𝑖 = (1 − 𝑝(𝑦 = 𝑦0))𝛾. It is biased towards classes that are rare in the training dataset. A larger value of 𝛾
increases the relative class weight of rare classes, which in our case is scratching behavior.
Both L2-regularization and dropout are applied to all hidden layers of the network in order to reduce the chance
of overfitting.
Hyperparameter Optimization
For optimization of hyperparameters, we used the Optuna framework [1]. This framework attempts to find the best
tuple of hyperparameters by efficiently sampling from the hyperparameter space.
We ran Optuna to optimize the following: learning rate, batch size, number of epochs, L2 factor, dropout
probability, activation (sigmloid, relu, tanh) and 𝛾.
We ran Optuna with 500 trials and pruning enabled. As our trial objective, we took the minimum of the precision
and the recall. This forces Optuna to always improve the lowest of the two values. We computed this objective by
nine-fold cross-validation over the nine videos, averaging over folds.
Cross-validation
We used cross-validation to evaluate the best model as found by Optuna. The nine videos were used as folds for
cross-validation. On each fold, we recorded the f1, precision, recall, fpr (false positive rate) and fnr (false negative
rate). The model was trained five times per video to compute the mean and standard deviation. Finally, the
combined predictions on on all nine folds were used to compute total performance metrics of the classifier.
Results
Hyperparameter Optimization
Optuna ran for 500 trials, of which 145 finished and the rest was pruned (due to unpromising results). The best
value was found after 454 trials, having a score of 0.783. The optimization history is shown in Figure 4.
Figure 22: Optuna optimization history.
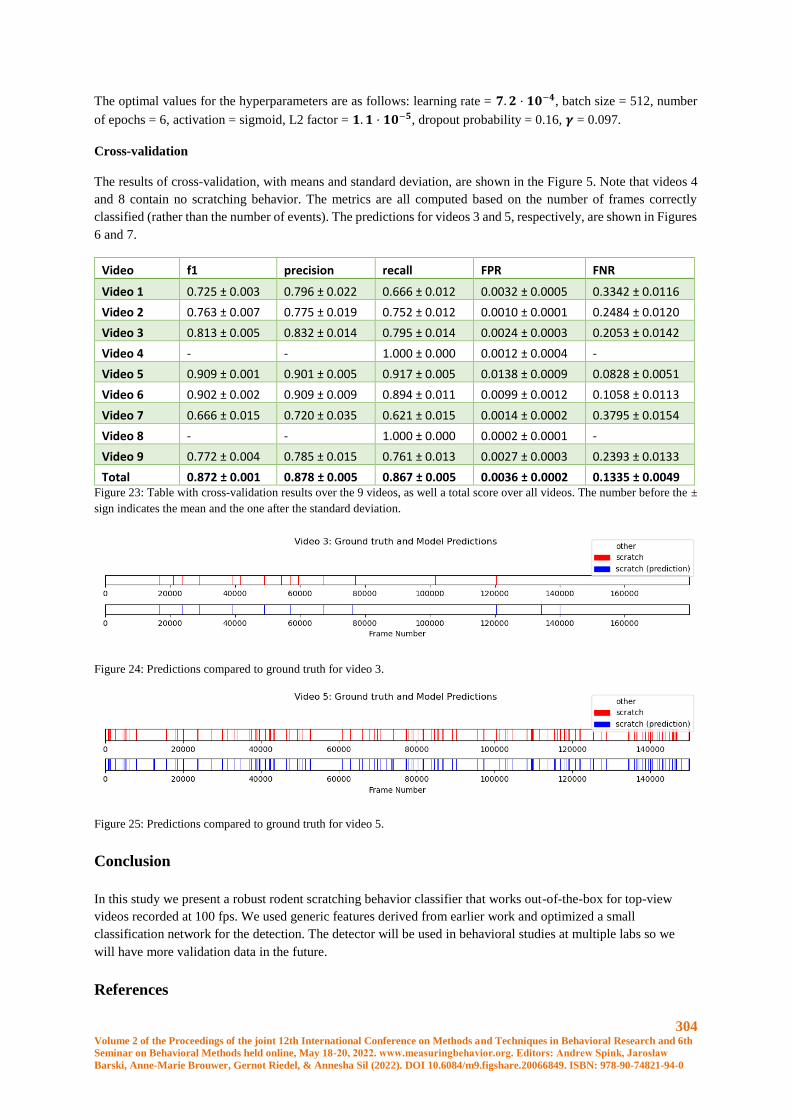
304 Volume 2 of the Proceedings of the joint 12th International Conference on Methods and Techniques in Behavioral Research and 6th
Seminar on Behavioral Methods held online, May 18-20, 2022. www.measuringbehavior.org. Editors: Andrew Spink, Jarosław
Barski, Anne-Marie Brouwer, Gernot Riedel, & Annesha Sil (2022). DOI 10.6084/m9.figshare.20066849. ISBN: 978-90-74821-94-0
The optimal values for the hyperparameters are as follows: learning rate = 𝟕. 𝟐 ⋅ 𝟏𝟎−𝟒, batch size = 512, number
of epochs = 6, activation = sigmoid, L2 factor = 𝟏. 𝟏 ⋅ 𝟏𝟎−𝟓, dropout probability = 0.16, 𝜸 = 0.097.
Cross-validation
The results of cross-validation, with means and standard deviation, are shown in the Figure 5. Note that videos 4
and 8 contain no scratching behavior. The metrics are all computed based on the number of frames correctly
classified (rather than the number of events). The predictions for videos 3 and 5, respectively, are shown in Figures
6 and 7.
Video f1 precision recall FPR FNR
Video 1 0.725 ± 0.003 0.796 ± 0.022 0.666 ± 0.012 0.0032 ± 0.0005 0.3342 ± 0.0116
Video 2 0.763 ± 0.007 0.775 ± 0.019 0.752 ± 0.012 0.0010 ± 0.0001 0.2484 ± 0.0120
Video 3 0.813 ± 0.005 0.832 ± 0.014 0.795 ± 0.014 0.0024 ± 0.0003 0.2053 ± 0.0142
Video 4 - - 1.000 ± 0.000 0.0012 ± 0.0004 -
Video 5 0.909 ± 0.001 0.901 ± 0.005 0.917 ± 0.005 0.0138 ± 0.0009 0.0828 ± 0.0051
Video 6 0.902 ± 0.002 0.909 ± 0.009 0.894 ± 0.011 0.0099 ± 0.0012 0.1058 ± 0.0113
Video 7 0.666 ± 0.015 0.720 ± 0.035 0.621 ± 0.015 0.0014 ± 0.0002 0.3795 ± 0.0154
Video 8 - - 1.000 ± 0.000 0.0002 ± 0.0001 -
Video 9 0.772 ± 0.004 0.785 ± 0.015 0.761 ± 0.013 0.0027 ± 0.0003 0.2393 ± 0.0133
Total 0.872 ± 0.001 0.878 ± 0.005 0.867 ± 0.005 0.0036 ± 0.0002 0.1335 ± 0.0049 Figure 23: Table with cross-validation results over the 9 videos, as well a total score over all videos. The number before the ±
sign indicates the mean and the one after the standard deviation.
Figure 24: Predictions compared to ground truth for video 3.
Figure 25: Predictions compared to ground truth for video 5.
Conclusion
In this study we present a robust rodent scratching behavior classifier that works out-of-the-box for top-view
videos recorded at 100 fps. We used generic features derived from earlier work and optimized a small
classification network for the detection. The detector will be used in behavioral studies at multiple labs so we
will have more validation data in the future.
References

305 Volume 2 of the Proceedings of the joint 12th International Conference on Methods and Techniques in Behavioral Research and 6th
Seminar on Behavioral Methods held online, May 18-20, 2022. www.measuringbehavior.org. Editors: Andrew Spink, Jarosław
Barski, Anne-Marie Brouwer, Gernot Riedel, & Annesha Sil (2022). DOI 10.6084/m9.figshare.20066849. ISBN: 978-90-74821-94-0
1. Akiba, T., Sano, S., Yanase, T., Ohta, T., & Koyama, M. (2019, July). Optuna: A next-generation
hyperparameter optimization framework. In Proceedings of the 25th ACM SIGKDD international conference on
knowledge discovery & data mining (pp. 2623-2631).
2. Akita, S., Tsuichihara, S., and Takemura, H. (2019). Detection of Rapid Mouse’s Scratching Behavior Based
on Shape and Motion Features. 41st Annual International Conference of the IEEE Engineering in Medicine and
Biology Society (EMBC), 925–928.
3. Van Dam, E.A.,Van der Harst, E., Ter Braak, C.J.F., Tegelenbosch, R.A.J., Spruijt, B.M., and Noldus, L.P.J.J.,
(2013). An automated system for the recognition of various specific rat behaviours. Journal of Neuroscience
Methods 218(2), 214–224.
4. Kobayashi, K, Matsushita, S., and Shimizu, N., Masuko, S., and Yamamoto, M. and Murata, T. (2021).
Automated detection of mouse scratching behaviour using convolutional recurrent neural network. Scientific
reports, 11(1), 1-10.
5. Nie, Y. Ishii, I.,Tanaka, A. and Matsuda, H. (2012). Automatic Scratching Analyzing System for Laboratory
Mice: SCLABA-Real. Human-Centric Machine Vision, 81.
306 Volume 2 of the Proceedings of the joint 12th International Conference on Methods and Techniques in Behavioral Research and 6th
Seminar on Behavioral Methods held online, May 18-20, 2022. www.measuringbehavior.org. Editors: Andrew Spink, Jarosław
Barski, Anne-Marie Brouwer, Gernot Riedel, & Annesha Sil (2022). DOI 10.6084/m9.figshare.20066849. ISBN: 978-90-74821-94-0
Improving biomedical research by automated behaviour monitoring in the
animal home-cage.
A. Bartelik¹, M. Čater², S. M. Hölter³ on behalf of COST TEATIME
1 International Clinical Research Center, St. Anne's University Hospital Brno, Brno, Czech Republic
2 Institute of Physiology, Faculty of Medicine, University of Maribor, Maribor, Slovenia;
3 Institute of Developmental Genetics, Helmholtz Munich and Technical University Munich, Munich, Germany.
Animal behaviour research and the analysis of responses to environmental stimuli deliver a lot of complex data
that can be used to determine the evolutionarily conserved mechanisms of an organism's ability to survive, thrive,
reproduce, and adapt to environmental conditions. The recording and subsequent analysis of behaviour leads to an
understanding of the species' behaviour and thus to the determination of variability and pathological behaviour. It
allows us to assess the effects of genetic and environmental changes affecting the organism, and therefore to
measure the effectiveness of therapeutic compounds [1][2]. The information obtained by observing and analysing
the behaviour of experimental animals is extremely valuable in advancing research in neuroscience, ethology, and
psychology, and plays a large role in preclinical research in neuroscience and psychiatry.
Behavioural research is based on various tests to measure specific types of behaviour. Due to classical behavioural
tests reflecting only a specific moment in the life of the tested laboratory animal and many different factors
influencing the reproducibility of the tests, scientists have developed techniques based on the observation of
animals in a stabilized social and living environment: Home Cage Monitoring (HCM) [3][4]. Over the past 20
years, many HCM systems have been released, based on various technologies and enabling long-term, 24-hours
observation of animals in their familiar environment. Sophisticated technologies (weight sensors, infrared systems,
electromagnetic detection, RFID system, telemetry, thermal imaging, etc.) that are in use in HCM systems, enable
automatic monitoring systems that limit human intervention to a minimum minimising a significant factor affecting
the repeatability and reproducibility of experiments. Automated HCM systems provide us with a complex pool of
additional data, such as social behaviour, abnormal behaviour, learning and memory, locomotor activity, heart
rate, food and water intake, i.e. HCM of the behaviour of an animal in its home environment gives us a better
understanding of behaviour and the development of behavioural pathologies and is therefore important for the
development of treatments with a great potential for their translation into medicine.
Further development of HCM systems is still needed, as each of them has advantages and limitations. Additionally,
interpreting the large amount of complex data collected is a demanding task and a great bottle neck affecting the
reproducibility of the research. In order to tackle these issues, in 2021 we enlisted a team of behavioural scientists
into a COST Action named TEATIME. COST (European Cooperation in Science and Technology) is an
organisation that supports researchers to connect initiatives and develop their innovative ideas. TEATIME
activities are aimed at examining the current state of the HCM systems and technologies, identifying the needs for
automatic animal monitoring systems, and finding solutions that will help interpret the large amount of data more
accurately, improving the reproducibility and validity of the research, reducing the number of laboratory animals
used for scientific purposes, and improving animal welfare, which is the basis of modern laboratory animal
research as well as aligns with the principles of Replacement, Reduction and Refinement ("3Rs").
Within COST_TEATIME, we are creating a network of behavioural scientists to facilitate cooperation and transfer
of knowledge and experience in the field of behavioural research in laboratory animals. Moreover, we are working
on a broad systematic review which will offer up-to-date information about the current status of automated HCM
systems. Additionally, in the next 4 years, our goal is to prepare guidelines for HCM system users, organise training
workshops and laboratory rotations and offer grants for related activities. Scientists from 23 European countries
already participate in the Action, and thanks to the openness of the project, new members are welcome to join:
https://www.cost.eu/actions/CA20135/

307 Volume 2 of the Proceedings of the joint 12th International Conference on Methods and Techniques in Behavioral Research and 6th
Seminar on Behavioral Methods held online, May 18-20, 2022. www.measuringbehavior.org. Editors: Andrew Spink, Jarosław
Barski, Anne-Marie Brouwer, Gernot Riedel, & Annesha Sil (2022). DOI 10.6084/m9.figshare.20066849. ISBN: 978-90-74821-94-0
Reference:
1. Tecott, L., Nestler, E. (2004). Neurobehavioral assessment in the information age. Nat Neurosci 7, 462–466.
https://doi.org/10.1038/nn1225
2. Richardson C.A. (2015). The power of automated behavioural homecage technologies in characterizing disease
progression in laboratory mice: A review. Applied Animal Behaviour Science 163, 19-27.
https://doi.org/10.1016/j.applanim.2014.11.018.
3. Spruijt B.M., Peters S.M., de Heer R.C., Pothuizen H.H.J., van der Harst J.E. (2014). Reproducibility and
relevance of future behavioral sciences should benefit from a cross fertilization of past recommendations and
today's technology: “Back to the future”. Journal of Neuroscience Methods 234, 2-12.
https://doi.org/10.1016/j.jneumeth.2014.03.001.
4. Bains, R.S., Wells S., Sillito R.R., Armstrong J.D., Cater H.L., Banks G., Nolan P.M. (2018). Assessing mouse
behaviour throughout the light/dark cycle using automated in-cage analysis tools. Journal of Neuroscience
Methods 300, 37-47. https://doi.org/10.1016/j.jneumeth.2017.04.014.
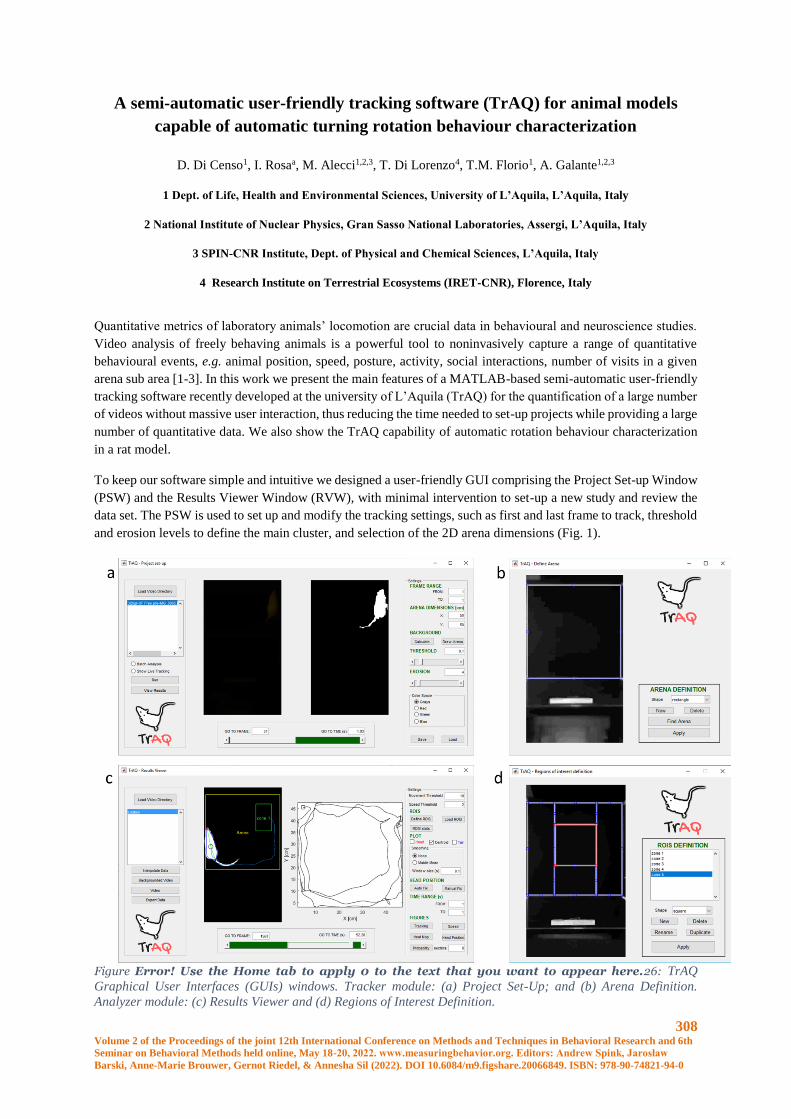
308 Volume 2 of the Proceedings of the joint 12th International Conference on Methods and Techniques in Behavioral Research and 6th
Seminar on Behavioral Methods held online, May 18-20, 2022. www.measuringbehavior.org. Editors: Andrew Spink, Jarosław
Barski, Anne-Marie Brouwer, Gernot Riedel, & Annesha Sil (2022). DOI 10.6084/m9.figshare.20066849. ISBN: 978-90-74821-94-0
A semi-automatic user-friendly tracking software (TrAQ) for animal models
capable of automatic turning rotation behaviour characterization
D. Di Censo1, I. Rosaa, M. Alecci1,2,3, T. Di Lorenzo4, T.M. Florio1, A. Galante1,2,3
1 Dept. of Life, Health and Environmental Sciences, University of L’Aquila, L’Aquila, Italy
2 National Institute of Nuclear Physics, Gran Sasso National Laboratories, Assergi, L’Aquila, Italy
3 SPIN-CNR Institute, Dept. of Physical and Chemical Sciences, L’Aquila, Italy
4 Research Institute on Terrestrial Ecosystems (IRET-CNR), Florence, Italy
Quantitative metrics of laboratory animals’ locomotion are crucial data in behavioural and neuroscience studies.
Video analysis of freely behaving animals is a powerful tool to noninvasively capture a range of quantitative
behavioural events, e.g. animal position, speed, posture, activity, social interactions, number of visits in a given
arena sub area [1-3]. In this work we present the main features of a MATLAB-based semi-automatic user-friendly
tracking software recently developed at the university of L’Aquila (TrAQ) for the quantification of a large number
of videos without massive user interaction, thus reducing the time needed to set-up projects while providing a large
number of quantitative data. We also show the TrAQ capability of automatic rotation behaviour characterization
in a rat model.
To keep our software simple and intuitive we designed a user-friendly GUI comprising the Project Set-up Window
(PSW) and the Results Viewer Window (RVW), with minimal intervention to set-up a new study and review the
data set. The PSW is used to set up and modify the tracking settings, such as first and last frame to track, threshold
and erosion levels to define the main cluster, and selection of the 2D arena dimensions (Fig. 1).
Figure Error! Use the Home tab to apply 0 to the text that you want to appear here.26: TrAQ
Graphical User Interfaces (GUIs) windows. Tracker module: (a) Project Set-Up; and (b) Arena Definition.
Analyzer module: (c) Results Viewer and (d) Regions of Interest Definition.
309 Volume 2 of the Proceedings of the joint 12th International Conference on Methods and Techniques in Behavioral Research and 6th
Seminar on Behavioral Methods held online, May 18-20, 2022. www.measuringbehavior.org. Editors: Andrew Spink, Jarosław
Barski, Anne-Marie Brouwer, Gernot Riedel, & Annesha Sil (2022). DOI 10.6084/m9.figshare.20066849. ISBN: 978-90-74821-94-0
It also allows the (optional) removal of static objects positioned in the arena by subtracting, frame by frame, a
reference background image to enhance the contrast of the video. A novel feature of TrAQ is the use of a
probabilistic algorithm to calculate the reference image by assigning, to each pixel of the background image, the
most probable value calculated from a random subset of frames. Based on our experience, this approach gives
much better performances when the animal shows a static behaviour during a significant (but not prevailing) time
interval within the video. In case of RGB videos, the user can convert them to BW or select a specific colour
channel to maximize the contrast with respect to the background. Then the Tracker automatically identifies the
animal signal intensity by subtracting two random frames of the video (threshold can be manually adjusted if
needed). The threshold is applied to all the video frames, thus producing a set of binary images. Before performing
a cluster analysis an erosion algorithm can be applied to remove small clusters (thus reducing the CPU time) and
delete some features from the animal’s cluster (i.e. the tail in rodents). Finally, the animal shape is identified with
the largest cluster. The Tracker data output are the animal’s centroid and the shape extremities, defined as: (i) the
geodesic farthest point from the centroid within the main cluster; and (ii) the farthest point (using the same geodesic
metrics) from the extremity identified in step (i). For rodent models they correspond respectively to the tail end
(or tail base if the appropriate erosion level has been defined so to eliminate the tail) and head [1] and for this
reason the two extremities are indicated in the following (as well as in the software) with tail and head labels.
Extremities can be used to infer the animal orientation in the arena and, for rodents, to extract the animal’s line of
sight. If, in a given frame, the algorithm is unable to track the animal, the frame is labelled as “untracked” and the
analysis proceeds to the next frame. One of the most powerful TrAQ features is the implementation of a video
batch process function: if the user needs to analyse a large set of videos taken in similar environmental conditions
(e.g. same arena and camera position, similar lighting levels), it is possible to set-up the tracking settings for the
first video and an entire batch of videos can be processed without any other operator interaction. Otherwise, the
tracking settings should be adjusted for each video.
The RVW is used to review and analyse the tracking results. It requires as input the physical dimensions of the
arena to set the pixel/cm ratio. Moreover, the user can set the velocity threshold used to discriminate the animal’s
activity and rest phases, define multiple ROIs within the arena to analyse the animal’s interaction with an
object/stimulus, activate the extremities positions correction which can improve the correct recognition of
head/tail. Indeed, while the centroid position is a very robust datum, the extremities positions are sensitive to the
shape of the main cluster, i.e. animal posture. This is not an issue for animal models that maintain similar shapes
during the test, but can be relevant, for example, for rodents that can substantially modify their 2D shape. This can
occur when a rodent step on its tail, during grooming or wall climbing activities and during compulsory behaviour
(like rotations around a body axis) induced by drugs. To avoid head/tail swap the automatic correction in the RVW
re-assigns the head and tail labels to the geodesic extremal points identified, using as selection criteria the actual
movement of the centroid and assuming a head-ahead motion. If the animal is at rest a continuity criterion is
enforced, identifying the head as the extremity point closest to the head position in the previous frames. Based on
this labelling algorithm, we have implemented in our TrAQ software the feature of automatic counting the number
of rotations performed by the animal around its centroid. To the best of our knowledge, this is the first software
capable of automatic rotation behaviour characterization. Moreover, the RVW software accomplishes the (linear)
interpolation of the “untracked” frames to produce an output without missing data, using the previous and
subsequent successfully tracked frames. The user can define a velocity threshold to calculate an index of the
animal’s activity, defined as motion-to-rest time fraction. All the time-dependent observables are saved in an
output file with the timeframe stamp. The absolute time identification allows TrAQ a posteriori output comparison
(within the video temporal resolution) with behavioural features recorded by other software tools and techniques
(e.g. electrophysiological data). The RVW allows to select the most common output graphical formats for data
presentation.
We validated the TrAQ software with a set of 20 smartphone-recorded videoclips of freely behaving rats in a
square (50cmx50cm) OFT arena. All animal experiments were performed in compliance with the European Union
Directive (2010/63/UE), with the national law 26/2014, and under the supervision of the University of L’Aquila
veterinary service. The TrAQ results were compared against a commercial software (EthoVision XT 13.0.1220)
[2] by calculating the centroid’s coordinates and the total distance travelled in each video. We observed an
excellent correlation, within 1%, among the X and Y coordinates of the rat centroid. Moreover, the mean difference

310 Volume 2 of the Proceedings of the joint 12th International Conference on Methods and Techniques in Behavioral Research and 6th
Seminar on Behavioral Methods held online, May 18-20, 2022. www.measuringbehavior.org. Editors: Andrew Spink, Jarosław
Barski, Anne-Marie Brouwer, Gernot Riedel, & Annesha Sil (2022). DOI 10.6084/m9.figshare.20066849. ISBN: 978-90-74821-94-0
between the centroid coordinates was less than 1% with respect to the total arena linear size (50 cm). Consequently,
we conclude that TrAQ performs well with respect to the commercial state of the art software. The ability to
evaluate the rotation behaviour of the animal was tested in well-established 6-OHDA induced rat model of
unilateral Parkinson’s Disease [4] after apomorphine administration. In this model body-centred rotations counting
is an essential quantitative parameter requiring, with the standard manual data acquisition modality, skilled
operators involved in a time-consuming process. The number of net body-centred turns automatically measured
with TrAQ was in excellent agreement with respect to the human operator counting with a robust correlation. The
maximum deviation between the two data set was less than 3% in tests characterized by compulsory rotation
behaviour (and a complete deformation of the animal shape) with hundreds of rotations during the test.
Currently, TrAQ allows accurate two-dimensional motion tracking of a single animal in the arena. The definition
of sub-areas of arbitrary shape makes TrAQ a versatile choice for a large set of behavioural experiments. The
MATLAB software is freely accessible at https://figshare.com/s/6c9c6b3df610b72d5f5a and works fine with
videos from non-professional devices (cameras, smartphones, etc.). TrAQ has already been successfully used with
a variety of animal models, like rodents [5] and underground water copepods in multi-well plates [6].
References
1. Soille, P., 2004. Morphological Image Analysis. Springer Berlin Heidelberg, Berlin, Heidelberg.
2. Noldus, L.P.J.J., Spink, A.J., Tegelenbosch, R.A., 2001. EthoVision: A versatile video tracking system for
automation of behavioral experiments. Behavior Research Methods, Instruments, and Computers 33, 398–414.
3. Di Censo, D., Florio, T.M., Rosa, I., Ranieri, B., Scarnati, E., Alecci, M., Galante, A. A Novel, Versatile and
Automated Tracking Software (TrAQ) for the Characterization of Rodent Behaviour. Book of Abstracts, 11th
FENS, Berlin, Germany, July 07-11 p. F18-4686 (2018).
4. Ungerstedt, U., 1971. Postsynaptic supersensitivity after 6-hydroxydopamine induced degeneration of the
nigro-striatal dopamine system. Acta Physiologica Scandinavica 82, 69–93. doi:10.1111/j.1365-201X.
1971.tb11000.x.
5. Rosa, I., Di Censo, D., Ranieri, B., Di Giovanni, G., Scarnati, E., Alecci, M., Galante, A., and Florio, T.M. The
Tail Suspension Swing Test, a novel drug-free method for assessing earlier motor and functional asymmetry
in 6-OHDA hemiparkinsonian rats. Book of Abstracts Italian Society for Neuroscience Workshop, University
of Naples, 1st March, p.22 (2019).
6. Di Lorenzo, T., Di Cicco, M., Di Censo, D., Galante, A., Boscaro, F., Messana, G., Galassi, D.M.P., 2019.
Environmental risk assessment of propranolol in the groundwater bodies of europe. Environmental Pollution
255, 113189.

311 Volume 2 of the Proceedings of the joint 12th International Conference on Methods and Techniques in Behavioral Research and 6th
Seminar on Behavioral Methods held online, May 18-20, 2022. www.measuringbehavior.org. Editors: Andrew Spink, Jarosław
Barski, Anne-Marie Brouwer, Gernot Riedel, & Annesha Sil (2022). DOI 10.6084/m9.figshare.20066849. ISBN: 978-90-74821-94-0
Assessing behavioral toxicity of different substances using Caenorhabditis elegans
as a biosensor
R. Sobkowiak
Department of Cell Biology, Institute of Experimental Biology, Faculty of Biology, Adam Mickiewicz University,
Poznań, Poland. [email protected]
Introduction
Behavior, even in simple worms like Caenorhabditis elegans (C. elegans), depends upon integrated processes at
the subcellular, cellular, and organismal level, and thus is susceptible to disruption by a broad spectrum of
chemicals. Locomotor behavior of the small free-living nematode C. elegans has proven to be useful in assessing
toxicity. This worm having even 80% homology with human genes offers a distinct advantage to be used as a
biosensor for the evaluation of pesticide-induced environmental toxicity and risk monitoring [1]. Despite simple
body structure C. elegans has an advanced chemosensory system that enables it to detect a wide variety of olfactory
and gustatory cues. Much of its nervous system and more than 5% of its genes are devoted to the recognition of
environmental chemicals [2]. Chemosensory cues can trigger chemotaxis, avoidance, and changes in overall
locomotor activity. C. elegans as a biosensor also enables the detection of organism-level end points, for example
feeding, reproduction, lifespan, and locomotion, the interaction of a chemical with multiple targets in an organism.
My goal was to construct a specialized platform that would enable the tracking of the nematode under high
magnification. The nematode should be able to move freely throughout the Petri dish using chemosensation for
navigation. The system should record and analyze the behavior of the nematode, its speed and position in relation
to the place where it was applied to the Petri dish, to point where the substance was applied, and to point where
the food was applied.
Method
I used my own worm tracker Matlab script to move the camera automatically to re-center the worm under the field
of view during recording. The automated tracking system comprises a stereomicroscope (Olympus SZ11), a web
camera to acquire worm videos, and a desktop PC running under Windows 10 (Fig 1).
Figure 1. A device recording locomotor activity and behavioral responses of nematode.
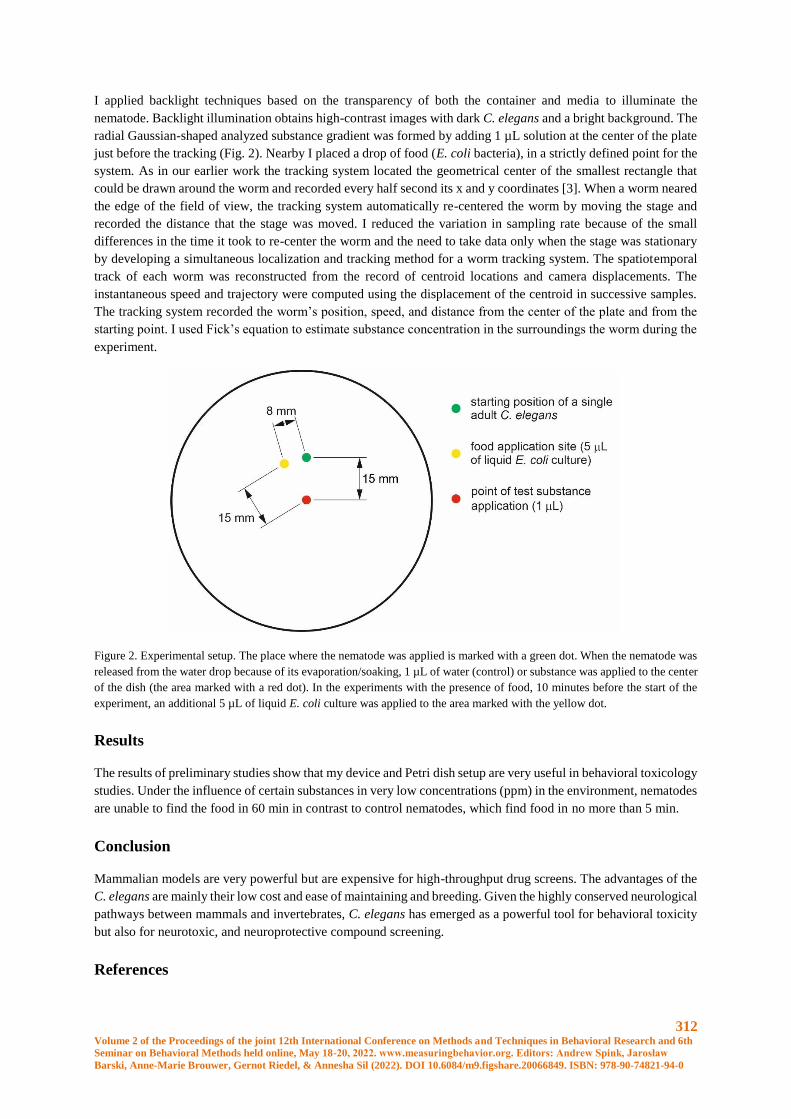
312 Volume 2 of the Proceedings of the joint 12th International Conference on Methods and Techniques in Behavioral Research and 6th
Seminar on Behavioral Methods held online, May 18-20, 2022. www.measuringbehavior.org. Editors: Andrew Spink, Jarosław
Barski, Anne-Marie Brouwer, Gernot Riedel, & Annesha Sil (2022). DOI 10.6084/m9.figshare.20066849. ISBN: 978-90-74821-94-0
I applied backlight techniques based on the transparency of both the container and media to illuminate the
nematode. Backlight illumination obtains high-contrast images with dark C. elegans and a bright background. The
radial Gaussian-shaped analyzed substance gradient was formed by adding 1 µL solution at the center of the plate
just before the tracking (Fig. 2). Nearby I placed a drop of food (E. coli bacteria), in a strictly defined point for the
system. As in our earlier work the tracking system located the geometrical center of the smallest rectangle that
could be drawn around the worm and recorded every half second its x and y coordinates [3]. When a worm neared
the edge of the field of view, the tracking system automatically re-centered the worm by moving the stage and
recorded the distance that the stage was moved. I reduced the variation in sampling rate because of the small
differences in the time it took to re-center the worm and the need to take data only when the stage was stationary
by developing a simultaneous localization and tracking method for a worm tracking system. The spatiotemporal
track of each worm was reconstructed from the record of centroid locations and camera displacements. The
instantaneous speed and trajectory were computed using the displacement of the centroid in successive samples.
The tracking system recorded the worm’s position, speed, and distance from the center of the plate and from the
starting point. I used Fick’s equation to estimate substance concentration in the surroundings the worm during the
experiment.
Figure 2. Experimental setup. The place where the nematode was applied is marked with a green dot. When the nematode was
released from the water drop because of its evaporation/soaking, 1 µL of water (control) or substance was applied to the center
of the dish (the area marked with a red dot). In the experiments with the presence of food, 10 minutes before the start of the
experiment, an additional 5 µL of liquid E. coli culture was applied to the area marked with the yellow dot.
Results
The results of preliminary studies show that my device and Petri dish setup are very useful in behavioral toxicology
studies. Under the influence of certain substances in very low concentrations (ppm) in the environment, nematodes
are unable to find the food in 60 min in contrast to control nematodes, which find food in no more than 5 min.
Conclusion
Mammalian models are very powerful but are expensive for high-throughput drug screens. The advantages of the
C. elegans are mainly their low cost and ease of maintaining and breeding. Given the highly conserved neurological
pathways between mammals and invertebrates, C. elegans has emerged as a powerful tool for behavioral toxicity
but also for neurotoxic, and neuroprotective compound screening.
References

313 Volume 2 of the Proceedings of the joint 12th International Conference on Methods and Techniques in Behavioral Research and 6th
Seminar on Behavioral Methods held online, May 18-20, 2022. www.measuringbehavior.org. Editors: Andrew Spink, Jarosław
Barski, Anne-Marie Brouwer, Gernot Riedel, & Annesha Sil (2022). DOI 10.6084/m9.figshare.20066849. ISBN: 978-90-74821-94-0
1. Saikia, S., Gupta, R., Pant, A., Pandey, R. (2014). Genetic revelation of hexavalent chromium toxicity using
Caenorhabditis elegans as a biosensor. Journal of Exposure Science and Environmental Epidemiology 24, 180-
184.
2. Bargmann, C.I. (2006). Chemosensation in C. elegans. WormBook, ed. The C. elegans Research Community,
WormBook, doi/10.1895/wormbook.1.123.1, http://www.wormbook.org.
3. Kowalski, M., Kaczmarek, P., Kabaciński, R., Matuszczak, M., Tranbowicz, K., Sobkowiak, R. (2014) A
simultaneous localization and tracking method for a worm tracking system. International Journal of Applied
Mathematics and Computer Science 24(3), 599-609.
314 Volume 2 of the Proceedings of the joint 12th International Conference on Methods and Techniques in Behavioral Research and 6th
Seminar on Behavioral Methods held online, May 18-20, 2022. www.measuringbehavior.org. Editors: Andrew Spink, Jarosław
Barski, Anne-Marie Brouwer, Gernot Riedel, & Annesha Sil (2022). DOI 10.6084/m9.figshare.20066849. ISBN: 978-90-74821-94-0
Early development of animal behaviour data acquisition “swiss-army knife”
system
Pavlo Fiialkovskyi1 and Jorge Cassinello2
1 Czech University of Life Sciences Prague, Czech Republic
2 EEZA, Almeria, Spain
Abstract
Animal behaviour studies implicitly involve carrying out and registering observations according to different
sampling techniques, consisting of data collection during certain time-lapses. However, unless they are carried
out in captivity, they are challenging to implement in the wild and face the problem of not identifying individuals
in highly cohesive societies.
Since many ethological studies nowadays are oriented towards supporting low budget scientific activities and
making them more affordable, we aim to suggest the best practices for the data collection of animal behaviour by
transitioning from manual to automatic data collection.
Thus, we aimed to build a core device that can be combined with peripherals on demand such as wireless data
transfer, GSM and GPS modules, different battery types and sizes and different enclosures. Furthermore, to
provide tools for data normalisation and analysis using a combination of CNN and ML and in this way having an
open-sourced, user-friendly, low-budget system cycle from the datalogger assembly to the analysis tools.
Ethical note
The collaring of the animals was carried out by qualified and suitably accredited staff for animal handling and
experimentation. The collars themselves were never exciding 1% of animals’ body mass and were equipped with
emergency breaking points. The research activities were approved by the managers responsible for the animals at
the study facilities.
Introduction
Since many ethological studies nowadays are oriented towards supporting low budget scientific activities and
making them more affordable, we want to present preliminary work on a semi-closed*, low budget, automatic
data acquisition ecosystem. Furthermore, we want to present a core device of this system designed for animal
movement data collection that can be combined with peripherals on demand such as wireless data transfer, GSM
and GPS modules, different battery types and sizes and different enclosures.
Materials and methods
The datalogger measures the subject’s acceleration in ±8g range, and inclination at set time intervals and
frequency. Each sensor reading gets a timestamp and subsequently is written to the flashcard.
The datalogger used in the experiment is based on Atmel ATmega 328P microcontroller, generic MPU-6050
accelerometer/gyroscope sensor, generic DS3231 Real-time clock, Pololu 5V Step-Up Voltage Regulator
U1V11F5, SanDisk Extreme 64GB class 10 microSD card. Pelican 1010 Micro cases with dimensions of 111 x
73 x 43 mm were used as an enclosure for the datalogger and batteries.

315 Volume 2 of the Proceedings of the joint 12th International Conference on Methods and Techniques in Behavioral Research and 6th
Seminar on Behavioral Methods held online, May 18-20, 2022. www.measuringbehavior.org. Editors: Andrew Spink, Jarosław
Barski, Anne-Marie Brouwer, Gernot Riedel, & Annesha Sil (2022). DOI 10.6084/m9.figshare.20066849. ISBN: 978-90-74821-94-0
The setting of the intervals and data sampling rate would depend entirely upon the requirements of the site.
Active and sleeping intervals can be set to the period starting from 1 second. The data sampling frequency can be
set up to 50 Hz. The programming is managed using Arduino IDE and open-source libraries.
Results
Small size: The dimensions and weight of the datalogger itself without battery and housing is 10 g. with the
dimensions of 48 x 26 x 12 mm.
Low power consumption: The power consumption of a given data logger in active mode is ≈ 71 mAh, with 16
MHz clock speed, class 10 microSD card and 5V logic. The power consumption in the sleeping mode is 5 µAh.
(Which can be even lower depending on clock speed, voltage logic and flashcard type/speed).
Successfully used in three pilot studies on a red deer (Cervus elaphus), a wild boar (Sus scrofa) and a house cat
(Felis catus).
One case study on captive aoudad (Ammotragus lervia) herd behaviour eventually having overall 2600 hours of
constant movement data. (the data are now in analysing process with the usage of the data normalisation and
analysis tools which will be represented later as a part of the ecosystem).
Summary
Hardware: we have wireless data transfer network prototypes and collar drop-off mechanisms.
Software: we have normalisation and analysing tools in the late-stage development.
Next steps in the ecosystem development would be:
The design of the best utility and space wise modular PCB (printed circuit board).
The development and testing sketches to be comparable with all possible modules.
The development of a system of housing/battery comparability in CAD (Computer-aided design) for 3D
printing option.
The development of a data marking smartphone app for ad libitum data acquisition for the ML tools.
316 Volume 2 of the Proceedings of the joint 12th International Conference on Methods and Techniques in Behavioral Research and 6th
Seminar on Behavioral Methods held online, May 18-20, 2022. www.measuringbehavior.org. Editors: Andrew Spink, Jarosław
Barski, Anne-Marie Brouwer, Gernot Riedel, & Annesha Sil (2022). DOI 10.6084/m9.figshare.20066849. ISBN: 978-90-74821-94-0
Generative Neural Networks for Experimental Manipulation of Complex
Psychological Impressions in Face Perception Research and Beyond
A. Sobieszek
Department of Psychology, University of Warsaw, Warsaw, Poland. [email protected]
Abstract
Face perception researchers have pioneered the use of computational models of certain psychological impressions,
such as trustworthiness, for experimental manipulation in psychological studies. However, these models, which
are based on 3d scans of faces do not produce realistic-looking results and are hard to generalize to stimuli from
other domains, such as pictures of animals, landscapes, products, and especially to stimuli from non-picture
domains. This paper proposes a framework for using neural networks to conduct experimental manipulation in
stimuli that aims to elicit complex psychological impressions, such as those used in face perception studies (e.g.
trustworthiness, dominance, competence, or attractiveness). The proposed method leverages the rich domain
representations learned by modern deep learning models to produce real-looking stimuli that can be minimally
manipulated to elicit higher or lower levels of a particular impression. I report the recent impressive results we’ve
achieved with this method for manipulating impressions of faces.
Introduction
No matter the experimental discipline, to ascribe differences in behavior to the thing being manipulated, the
experimental manipulation ought to be valid (in the sense it manipulates what it purports to manipulate), but also
specific (in the sense it does not change other relevant factors). This task is easier in subfields of psychology such
as cognitive psychology, where researchers may be concerned with the impact of simple visual attributes of stimuli
that can be easily manipulated on a computer. Copying this mindset into social psychology, where one might wish
to conduct precise manipulations of complex psychological impressions, is a much harder task and computational
solutions are hard to come by. An area of research, where such solutions have been developed, and which inspired
the method I will propose in this paper, are face perception and first impressions studies.
Faces are psychologically rich and visually complex stimuli. Say a researcher is interested in isolating the effect
that the trustworthiness of faces has on behavior. If they were to pick, from a database of faces, 10 faces high and
10 faces low in trustworthiness ratings, the two sets would surely differ in other substantial ways, such as the faces’
gender, or age, questioning the specificity of the manipulation. Creating a new dataset like this is moreover,
sometimes prohibitively, expensive. To combat these issues, some researchers have proposed the use of
computational models of these impressions, that can be used to manipulate features of 3d models of faces to
increase or decrease how much the face elicits this impression [1,2]. These approaches however do not produce
very realistic-looking results [3], and they limit the possible manipulations to shape and reflectance, leaving little
room to use the method for other types of stimuli. Finding another way of creating computational models of
impressions could open the door to the use of such models in other areas of research.
The present paper proposes an approach that, instead of 3d models, uses neural network-based representations and
generators of the stimuli to perform specific and valid manipulations of such complex psychological impressions.
The method can be summarized with a 3 step procedure: (a) train a neural net that generates images from a target
domain to obtain a representation of the domain, (b) generate stimuli from the target domain and collect their
ratings on the psychological trait of interest, (c) find, in the representation of the domain hidden in the neural
network, which features correspond to a difference in ratings and use this information to manipulate new stimuli
generated by the network. This process ensures manipulation validity by being data-driven — it relies on
impressions collected with human subjects — and ensures specificity by leveraging the power of modern deep
learning models to learn a fine-grained representation of its target domain.
In recent work we have implemented this procedure to manipulate the trustworthiness and dominance of photo-
realistic faces generated by a Generative Adversarial Network (GAN) [4]. There, we’ve also experimentally shown
the method to be extremely effective at manipulating human impressions of the faces, while only marginally
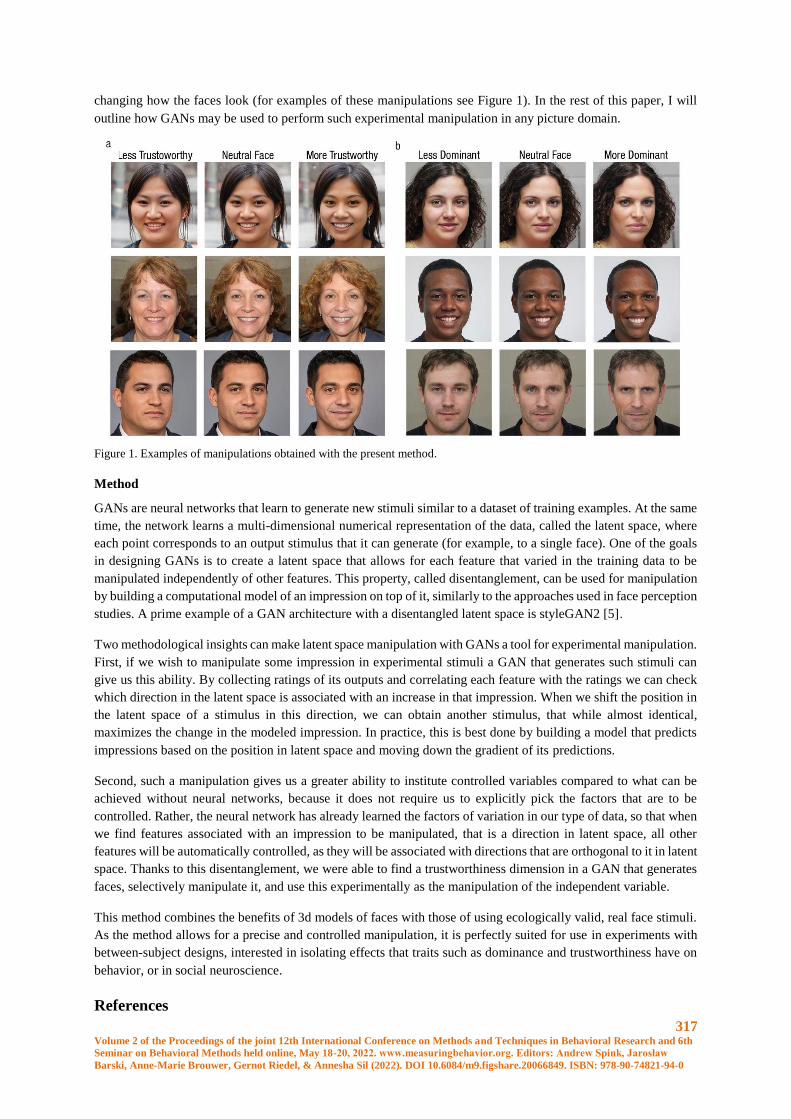
317 Volume 2 of the Proceedings of the joint 12th International Conference on Methods and Techniques in Behavioral Research and 6th
Seminar on Behavioral Methods held online, May 18-20, 2022. www.measuringbehavior.org. Editors: Andrew Spink, Jarosław
Barski, Anne-Marie Brouwer, Gernot Riedel, & Annesha Sil (2022). DOI 10.6084/m9.figshare.20066849. ISBN: 978-90-74821-94-0
changing how the faces look (for examples of these manipulations see Figure 1). In the rest of this paper, I will
outline how GANs may be used to perform such experimental manipulation in any picture domain.
Figure 1. Examples of manipulations obtained with the present method.
Method
GANs are neural networks that learn to generate new stimuli similar to a dataset of training examples. At the same
time, the network learns a multi-dimensional numerical representation of the data, called the latent space, where
each point corresponds to an output stimulus that it can generate (for example, to a single face). One of the goals
in designing GANs is to create a latent space that allows for each feature that varied in the training data to be
manipulated independently of other features. This property, called disentanglement, can be used for manipulation
by building a computational model of an impression on top of it, similarly to the approaches used in face perception
studies. A prime example of a GAN architecture with a disentangled latent space is styleGAN2 [5].
Two methodological insights can make latent space manipulation with GANs a tool for experimental manipulation.
First, if we wish to manipulate some impression in experimental stimuli a GAN that generates such stimuli can
give us this ability. By collecting ratings of its outputs and correlating each feature with the ratings we can check
which direction in the latent space is associated with an increase in that impression. When we shift the position in
the latent space of a stimulus in this direction, we can obtain another stimulus, that while almost identical,
maximizes the change in the modeled impression. In practice, this is best done by building a model that predicts
impressions based on the position in latent space and moving down the gradient of its predictions.
Second, such a manipulation gives us a greater ability to institute controlled variables compared to what can be
achieved without neural networks, because it does not require us to explicitly pick the factors that are to be
controlled. Rather, the neural network has already learned the factors of variation in our type of data, so that when
we find features associated with an impression to be manipulated, that is a direction in latent space, all other
features will be automatically controlled, as they will be associated with directions that are orthogonal to it in latent
space. Thanks to this disentanglement, we were able to find a trustworthiness dimension in a GAN that generates
faces, selectively manipulate it, and use this experimentally as the manipulation of the independent variable.
This method combines the benefits of 3d models of faces with those of using ecologically valid, real face stimuli.
As the method allows for a precise and controlled manipulation, it is perfectly suited for use in experiments with
between-subject designs, interested in isolating effects that traits such as dominance and trustworthiness have on
behavior, or in social neuroscience.
References

318 Volume 2 of the Proceedings of the joint 12th International Conference on Methods and Techniques in Behavioral Research and 6th
Seminar on Behavioral Methods held online, May 18-20, 2022. www.measuringbehavior.org. Editors: Andrew Spink, Jarosław
Barski, Anne-Marie Brouwer, Gernot Riedel, & Annesha Sil (2022). DOI 10.6084/m9.figshare.20066849. ISBN: 978-90-74821-94-0
1. Oosterhof NN, Todorov A. (2008) The functional basis of face evaluation. Proceedings of the National
Academy of Sciences 105: 11087–11092. doi:10.1073/pnas.0805664105
2. Todorov A, Oosterhof NN, States M. (2011) Modeling Social Perception of Faces. IEEE Signal
Processing Magazine 28: 117–122. doi:10.1109/MSP.2010.940006
3. Balas B, Pacella J. (2015) Artificial faces are harder to remember. Computers in human behavior 52: 331–
337. doi:10.1016/j.chb.2015.06.018
4. Goodfellow I, Warde-farley D, Courville A, Bengio Y. (2014) Generative Adversarial Networks.
Advances in neural information processing systems 27. doi:10.1145/3422622
5. Karras T, Laine S, Aittala M, Hellsten J, Lehtinen J, Aila T. (2020) Analyzing and improving the image
quality of stylegan. Proceedings of the IEEE/CVF conference on computer vision and pattern recognition 8107–
8116. doi:10.1109/CVPR42600.2020.00813
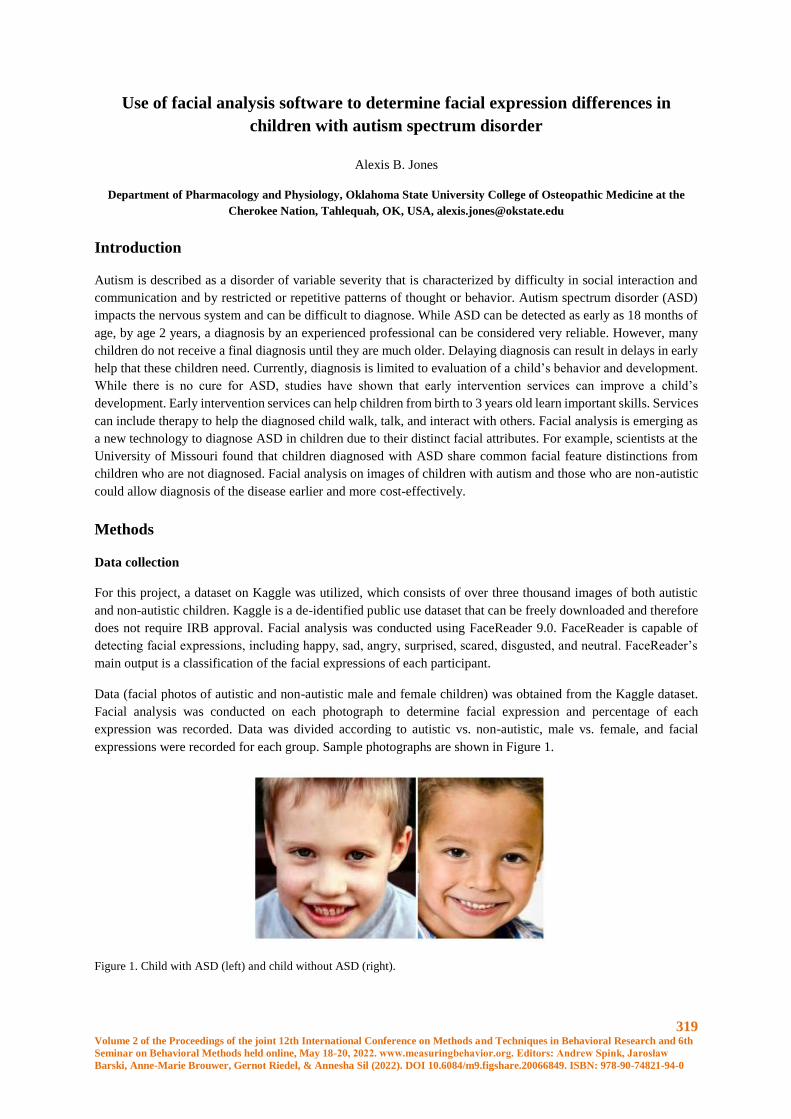
319 Volume 2 of the Proceedings of the joint 12th International Conference on Methods and Techniques in Behavioral Research and 6th
Seminar on Behavioral Methods held online, May 18-20, 2022. www.measuringbehavior.org. Editors: Andrew Spink, Jarosław
Barski, Anne-Marie Brouwer, Gernot Riedel, & Annesha Sil (2022). DOI 10.6084/m9.figshare.20066849. ISBN: 978-90-74821-94-0
Use of facial analysis software to determine facial expression differences in
children with autism spectrum disorder
Alexis B. Jones
Department of Pharmacology and Physiology, Oklahoma State University College of Osteopathic Medicine at the
Cherokee Nation, Tahlequah, OK, USA, [email protected]
Introduction
Autism is described as a disorder of variable severity that is characterized by difficulty in social interaction and
communication and by restricted or repetitive patterns of thought or behavior. Autism spectrum disorder (ASD)
impacts the nervous system and can be difficult to diagnose. While ASD can be detected as early as 18 months of
age, by age 2 years, a diagnosis by an experienced professional can be considered very reliable. However, many
children do not receive a final diagnosis until they are much older. Delaying diagnosis can result in delays in early
help that these children need. Currently, diagnosis is limited to evaluation of a child’s behavior and development.
While there is no cure for ASD, studies have shown that early intervention services can improve a child’s
development. Early intervention services can help children from birth to 3 years old learn important skills. Services
can include therapy to help the diagnosed child walk, talk, and interact with others. Facial analysis is emerging as
a new technology to diagnose ASD in children due to their distinct facial attributes. For example, scientists at the
University of Missouri found that children diagnosed with ASD share common facial feature distinctions from
children who are not diagnosed. Facial analysis on images of children with autism and those who are non-autistic
could allow diagnosis of the disease earlier and more cost-effectively.
Methods
Data collection
For this project, a dataset on Kaggle was utilized, which consists of over three thousand images of both autistic
and non-autistic children. Kaggle is a de-identified public use dataset that can be freely downloaded and therefore
does not require IRB approval. Facial analysis was conducted using FaceReader 9.0. FaceReader is capable of
detecting facial expressions, including happy, sad, angry, surprised, scared, disgusted, and neutral. FaceReader’s
main output is a classification of the facial expressions of each participant.
Data (facial photos of autistic and non-autistic male and female children) was obtained from the Kaggle dataset.
Facial analysis was conducted on each photograph to determine facial expression and percentage of each
expression was recorded. Data was divided according to autistic vs. non-autistic, male vs. female, and facial
expressions were recorded for each group. Sample photographs are shown in Figure 1.
Figure 1. Child with ASD (left) and child without ASD (right).

320 Volume 2 of the Proceedings of the joint 12th International Conference on Methods and Techniques in Behavioral Research and 6th
Seminar on Behavioral Methods held online, May 18-20, 2022. www.measuringbehavior.org. Editors: Andrew Spink, Jarosław
Barski, Anne-Marie Brouwer, Gernot Riedel, & Annesha Sil (2022). DOI 10.6084/m9.figshare.20066849. ISBN: 978-90-74821-94-0
Expected Results/Discussion:
This project represents a preliminary study to determine whether facial analysis can be used as a tool to determine
facial expression differences in children with ASD versus those without. We evaluated images of both male and
female children with and without ASD. We compared percentages of each facial expression displayed in each
image.
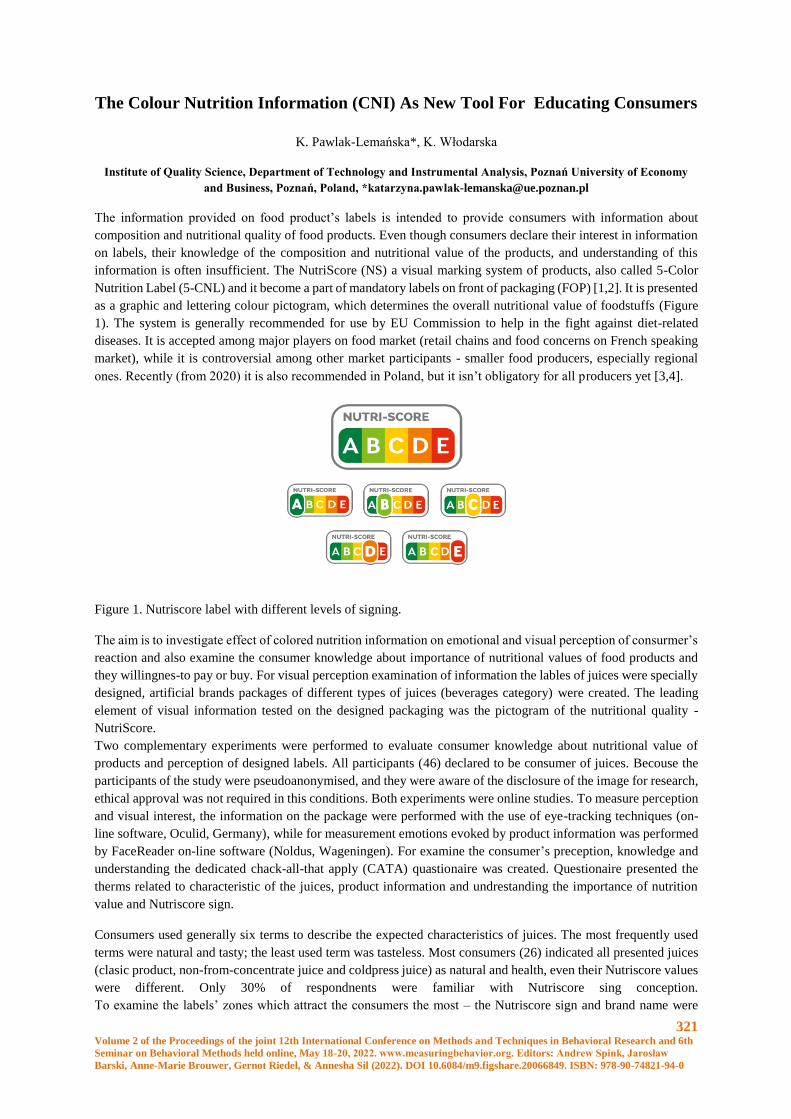
321 Volume 2 of the Proceedings of the joint 12th International Conference on Methods and Techniques in Behavioral Research and 6th
Seminar on Behavioral Methods held online, May 18-20, 2022. www.measuringbehavior.org. Editors: Andrew Spink, Jarosław
Barski, Anne-Marie Brouwer, Gernot Riedel, & Annesha Sil (2022). DOI 10.6084/m9.figshare.20066849. ISBN: 978-90-74821-94-0
The Colour Nutrition Information (CNI) As New Tool For Educating Consumers
K. Pawlak-Lemańska*, K. Włodarska
Institute of Quality Science, Department of Technology and Instrumental Analysis, Poznań University of Economy
and Business, Poznań, Poland, *[email protected]
The information provided on food product’s labels is intended to provide consumers with information about
composition and nutritional quality of food products. Even though consumers declare their interest in information
on labels, their knowledge of the composition and nutritional value of the products, and understanding of this
information is often insufficient. The NutriScore (NS) a visual marking system of products, also called 5-Color
Nutrition Label (5-CNL) and it become a part of mandatory labels on front of packaging (FOP) [1,2]. It is presented
as a graphic and lettering colour pictogram, which determines the overall nutritional value of foodstuffs (Figure
1). The system is generally recommended for use by EU Commission to help in the fight against diet-related
diseases. It is accepted among major players on food market (retail chains and food concerns on French speaking
market), while it is controversial among other market participants - smaller food producers, especially regional
ones. Recently (from 2020) it is also recommended in Poland, but it isn’t obligatory for all producers yet [3,4].
Figure 1. Nutriscore label with different levels of signing.
The aim is to investigate effect of colored nutrition information on emotional and visual perception of consurmer’s
reaction and also examine the consumer knowledge about importance of nutritional values of food products and
they willingnes-to pay or buy. For visual perception examination of information the lables of juices were specially
designed, artificial brands packages of different types of juices (beverages category) were created. The leading
element of visual information tested on the designed packaging was the pictogram of the nutritional quality -
NutriScore.
Two complementary experiments were performed to evaluate consumer knowledge about nutritional value of
products and perception of designed labels. All participants (46) declared to be consumer of juices. Becouse the
participants of the study were pseudoanonymised, and they were aware of the disclosure of the image for research,
ethical approval was not required in this conditions. Both experiments were online studies. To measure perception
and visual interest, the information on the package were performed with the use of eye-tracking techniques (on-
line software, Oculid, Germany), while for measurement emotions evoked by product information was performed
by FaceReader on-line software (Noldus, Wageningen). For examine the consumer’s preception, knowledge and
understanding the dedicated chack-all-that apply (CATA) quastionaire was created. Questionaire presented the
therms related to characteristic of the juices, product information and undrestanding the importance of nutrition
value and Nutriscore sign.
Consumers used generally six terms to describe the expected characteristics of juices. The most frequently used
terms were natural and tasty; the least used term was tasteless. Most consumers (26) indicated all presented juices
(clasic product, non-from-concentrate juice and coldpress juice) as natural and health, even their Nutriscore values
were different. Only 30% of respondnents were familiar with Nutriscore sing conception.
To examine the labels’ zones which attract the consumers the most – the Nutriscore sign and brand name were

322 Volume 2 of the Proceedings of the joint 12th International Conference on Methods and Techniques in Behavioral Research and 6th
Seminar on Behavioral Methods held online, May 18-20, 2022. www.measuringbehavior.org. Editors: Andrew Spink, Jarosław
Barski, Anne-Marie Brouwer, Gernot Riedel, & Annesha Sil (2022). DOI 10.6084/m9.figshare.20066849. ISBN: 978-90-74821-94-0
define as the main reference area (RA) in the experiment conditions. When analyzing the heatmaps of a single
juice label, we noted that consumers did not study some parts of the product information. This suggests that
consumers did not assess the presented information comprehensively. These observations are in agreement with
four previous findings [5]. Generally, consumers mainly turn their attention to the information given in larger
letters, information presented in an intense color (especially red), and pictograms (photos, drawings). The
Nutriscore sign was one of the most noticed element of the presented labels, together with brand name, pictograms
of the fruits and nutrition tables. During the facereading experiment with measuring emotions, results obtained
were not satisfactory, which could help to define the graphic factors influencing the perception of the product
information from the tested packages. We conclude that the experimental approach proposed in this study provided
a comprehensive view of the influence of the product information presented on packaging on the consumer
expectations and perception; moreover, combination of different measuring methods enabled to identify the
important features of the labels.
References
1. Franco-Arellano B., Vanderleea, L., Ahmeda, M., Oha A., L'Abbea, M. (2020) Influence of front-of-
pack labelling and regulated nutrition claims on consumers’ perceptions of product healthfulness and
purchase intentions:A randomized controlled trial. Appetite, 149, 104629; doi:
10.1016/j.appet.2020.104629
2. Bryła, P. (2020) Who Reads Food Labels? Selected Predictors of Consumer Interest in Front-of-
Package and Back-of-Package Labels during and after the Purchase, Nutrients, 12, 2605;
doi:10.3390/nu12092605
3. Raport from the Commission to the European Parliament and Council regarding the use of additional
forms of expression and presentation of the nutrition declaration, COM (2020) 207 final, 20.05.2020,
Burssels
4. Julia, Ch., Ducrot, P., Péneau, S., Deschamps, V., Méjean, C., Fézeu, L., Touvier, M., Hercberg, S.,
Kesse-Guyot, E. (2015) Discriminating nutritional quality of foods using the 5-Color nutrition label in
the French food market: consistency with nutritional recommendations, Nutrition Journal, 14:100, doi:
10.1186/s12937-015-0090-4
5. Włodarska, K., Pawlak-Lemańska, K., Górecki, T., Sikorska, E. (2019) Factors Influencing Consumers’
Perceptions of Food: A Study of Apple Juice Using Sensory and Visual Attention Methods, Foods, 8,
545; doi:10.3390/foods8110545
The project financed within the Regional Initiative for Excellence programme of the Polish Ministry
of Science and Higher Education, years 2019-2022, grant no. 004/RID/2018/19
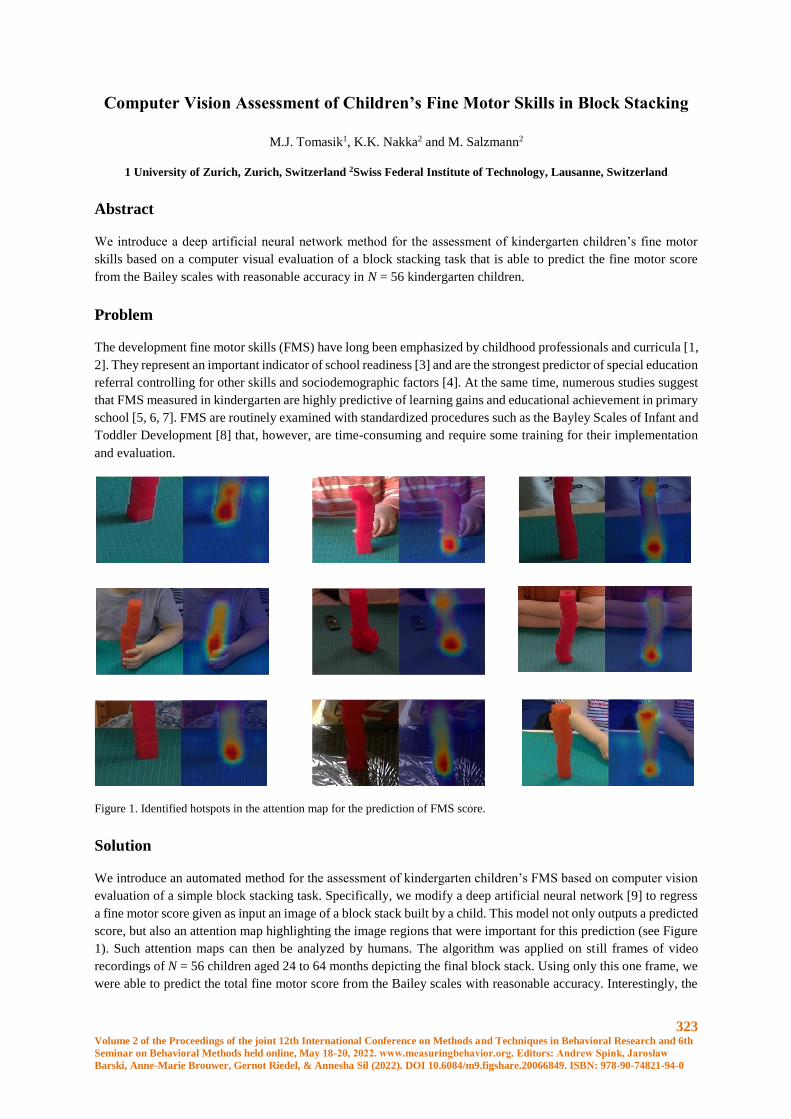
323 Volume 2 of the Proceedings of the joint 12th International Conference on Methods and Techniques in Behavioral Research and 6th
Seminar on Behavioral Methods held online, May 18-20, 2022. www.measuringbehavior.org. Editors: Andrew Spink, Jarosław
Barski, Anne-Marie Brouwer, Gernot Riedel, & Annesha Sil (2022). DOI 10.6084/m9.figshare.20066849. ISBN: 978-90-74821-94-0
Computer Vision Assessment of Children’s Fine Motor Skills in Block Stacking
M.J. Tomasik1, K.K. Nakka2 and M. Salzmann2
1 University of Zurich, Zurich, Switzerland 2Swiss Federal Institute of Technology, Lausanne, Switzerland
Abstract
We introduce a deep artificial neural network method for the assessment of kindergarten children’s fine motor
skills based on a computer visual evaluation of a block stacking task that is able to predict the fine motor score
from the Bailey scales with reasonable accuracy in N = 56 kindergarten children.
Problem
The development fine motor skills (FMS) have long been emphasized by childhood professionals and curricula [1,
2]. They represent an important indicator of school readiness [3] and are the strongest predictor of special education
referral controlling for other skills and sociodemographic factors [4]. At the same time, numerous studies suggest
that FMS measured in kindergarten are highly predictive of learning gains and educational achievement in primary
school [5, 6, 7]. FMS are routinely examined with standardized procedures such as the Bayley Scales of Infant and
Toddler Development [8] that, however, are time-consuming and require some training for their implementation
and evaluation.
Figure 1. Identified hotspots in the attention map for the prediction of FMS score.
Solution
We introduce an automated method for the assessment of kindergarten children’s FMS based on computer vision
evaluation of a simple block stacking task. Specifically, we modify a deep artificial neural network [9] to regress
a fine motor score given as input an image of a block stack built by a child. This model not only outputs a predicted
score, but also an attention map highlighting the image regions that were important for this prediction (see Figure
1). Such attention maps can then be analyzed by humans. The algorithm was applied on still frames of video
recordings of N = 56 children aged 24 to 64 months depicting the final block stack. Using only this one frame, we
were able to predict the total fine motor score from the Bailey scales with reasonable accuracy. Interestingly, the
324 Volume 2 of the Proceedings of the joint 12th International Conference on Methods and Techniques in Behavioral Research and 6th
Seminar on Behavioral Methods held online, May 18-20, 2022. www.measuringbehavior.org. Editors: Andrew Spink, Jarosław
Barski, Anne-Marie Brouwer, Gernot Riedel, & Annesha Sil (2022). DOI 10.6084/m9.figshare.20066849. ISBN: 978-90-74821-94-0
base of the stacks (i.e., the first 3 or 4 blocks) were more relevant for this prediction than the height of the stack
achieved.
Discussion
The finding that the base of the stack is more predictive than its height is somewhat surprising because the height
would have directly corresponded to the fine motor score given as input to the algorithm. This finding might have
technical reasons, because the height of the stack is not always visible on the still frame. It mght also mean,
however, that already the base of the stack comprises information that would predict the overall height of the stack.
More specifically, some kind of childrens’ cognitive planning skills might predict the structure of the base, which
would mean that the Bailey fine motor score does not only measure fine motor skills but also some other
competencies that are related to the task result. Possible extensions of this paradigm include progressing from
analyzing one still frame to analyzing video sequences. Taken together, computer vision methods might provide
promising tools for diagnostic and research purposes in the field of motor development and motor performance.
Ethics Statement
This study was approved by the Ethical Review Board of the Faculty of Health at the University of Witten-
Herdecke.
References
1. Bredekamp, S. & Copple, C. (1997). Developmentally appropriate practice in early childhood programs.
Washington, DC: National Association for the Education of Young Children.
2. Lillard, A. S. (2005). Montessori: The science behind the genius. New York: Oxford University Press.
3. Johnson, L. J., Gallagher, R. J., Cook, M., & Wong, P. (1995). Critical skills for kindergarten: Perceptions from
kindergarten teachers. Journal of Early Intervention, 19, 315–327.
4. Roth, M., McCaul, E., & Barnes, K. (1993). Who becomes an ‘‘at-risk’’ student? The predictive value of a
kindergarten screening battery. Exceptional Children, 59, 348–358.
5. McPhillips, M., & Jordan-Black, J.-A. (2007). The effect of social disadvantage on motor development in young
children: A comparative study. Journal of Child Psychology and Psychiatry, 48, 1214–1222.
6. Murrah, W. M. (2010). Comparing self-regulatory and early academic skills as predictors of later math,
reading, and science elementary school achievement. Unpublished doctoral dissertation, University of Virginia,
Charlottesville.
7. Son, S.-H., & Meisels, S. J. (2006). The relationship of young children’s motor skills to later reading and math
achievement. Merrill-Palmer Quarterly, 52, 755–778.
8. Bayley, N. (2006). Bayley scales of infant and toddler development (3rd ed.). San Antonio, TX: Harcourt
Assessment.
9. Nakka, K. K., & Salzmann, M. (2018). Deep attentional structured representation learning for visual recognition.
In L. Shao, H. P. H. Shum & T. Hospedales (Eds.), Proceedings of the 29th British Machine Vision Conference
(No. 214). Newcastle, United Kingdom: British Machine Vision Association.
325 Volume 2 of the Proceedings of the joint 12th International Conference on Methods and Techniques in Behavioral Research and 6th
Seminar on Behavioral Methods held online, May 18-20, 2022. www.measuringbehavior.org. Editors: Andrew Spink, Jarosław
Barski, Anne-Marie Brouwer, Gernot Riedel, & Annesha Sil (2022). DOI 10.6084/m9.figshare.20066849. ISBN: 978-90-74821-94-0
The importance of flow for the course of learning complex skills in training
video players
Justyna Józefowicz
SWPS, PJATK
Aims of the project
The purpose of the study is to identify the correlation between: 1. the dynamics of cognitive functioning change
resulting from the complex skill learning through play and the player’s evaluation of the game playability, 2. the
player’s evaluation of the game playability and perceived flow state/ motivation/ values/ location of control,
strategies for coping with stress, 3. results in the game and the player’s evaluation of the game playability.
Methods
Participants
The study involves 2 groups: an expert group and a training group, which is divided into two subgroups (SC2
training dynamic, SC2 training fixed). The expert group is a group of 44 SC2 players, amateurs, who have
experience playing SC2 a minimum of 6 hours per week for a minimum of 6 months, have reached Gold-
Diamond, Platinum-Masters, Diamond-Professional, Bronze-Professional levels in SC2. The training group is a
group of 44 people (22 participants in each of the 2 subgroups) who declare that they have not played video
games before participating in the project. Group SC2 training fixed plays with computer only, has fixed AI
strategy (economic) and fixed race (Terran). Group SC2 training dynamic plays up to 30h with AI, has 5
different AI strategies randomized by the system and 3 different races (Terran, Zerg, Protoss). After 30h the SC2
training dynamic group plays with humans. The project was approved by the Ethics Committee.
Course of the project
When the players start participating in the project, they go through a series of pre-tests: behavioral,
questionnaire, EEG and fMRI. The following material does not directly address this part of the study, except for
the PDFS-2, CISS, CwP questionnaires.
Next, participants from the training groups go through a brief initial training in the basics of the video game
StarCraft2 (SC2). The next step is to participate in a three-month training process for playing SC2. Training
takes place in a laboratory, according to procedures and under supervision of a qualified staff member.
During 60 hours of training, the player goes through flow (PFSS-2), playability (NExPlay) and motivation (IMI)
measurements 11 times. The basic element of the study is one session, i.e. the period starting from the first game
of SC2 from the preceding measurement to the next measurement. The average time of 1 session is
approximately 5.45 (60 h/11 = 5.45). The number of plays during a session is dependent on the player's
performance. The player, depending on the quality of performance during a given game, ranks on a scale of 1-8,
which indicates the level of play. During a single session, a player can function at different levels of play.
Players play matches in two conditions: they play against the AI (about 30 hours) and against another human -
random SC2 players (about 30 h).
Hypotheses
1. There is an individual characteristic of flow at the beginning of the study (examining the distribution of flow
measurements at the beginning of the study, using the PDFS-2 tool, a questionnaire that examines flow as a
characteristic).
2. Flow state changes over time (person-level analysis, based on the PFSS-2).
326 Volume 2 of the Proceedings of the joint 12th International Conference on Methods and Techniques in Behavioral Research and 6th
Seminar on Behavioral Methods held online, May 18-20, 2022. www.measuringbehavior.org. Editors: Andrew Spink, Jarosław
Barski, Anne-Marie Brouwer, Gernot Riedel, & Annesha Sil (2022). DOI 10.6084/m9.figshare.20066849. ISBN: 978-90-74821-94-0
4. Flow changes are correlated with player level (correlations from telemetry and behavioral data).
5. Flow state depends on condition (playing with computer or human) - moderation, logistic regression.
a. Flow state of players with internal locus of control is higher in games with humans than players with
external locus of control.
b. Flow state of players coping with stress using task-based strategies is higher in human games than
players coping with stress using emotion-based and avoidance-based strategies.
6. Flow state is related to playability ratings (correlations from behavioral data).
7. Flow state and playability ratings are related to the proportion of wins per session (correlations from telemetric
and behavioral data).
8. Flow state and playability rating depend on the outcome of the last game in the session just prior to
measurement (correlations from telemetry and behavioral data).
9. The player's level of play in the session is correlated with the win/loss in the preceding game.
10. The level of flow state depends on the time elapsed since the last game (an additional factor to the regression
model).
11. Player’s flow state is highest in the middle sessions of a condition (AI, human).
Summary
The proposed longitudinal study allows us to look at the role of flow as a state in the learning process of a
complex video game. It is hypothesized that flow may be an important mediator between independent variables
(e.g., game data) and dependent variables, i.e., cognitive functions.
References
1. Arnab, S., Perttula, A., & Suominen, M. (2014). Flow experience as a quality measure in evaluating
physically activating serious games. Lecture Notes in Computer Science (Including Subseries Lecture
Notes in Artificial Intelligence and Lecture Notes in Bioinformatics), 8605, 200–212.
2. Arzate Cruz, C., & Ramirez Uresti, J. A. (2017). Player-centered game AI from a flow perspective:
Towards a better understanding of past trends and future directions. Entertainment Computing, 20, 11–
24.
3. Bavelier, D., Bediou, B., & Green, C. S. (2018). Expertise and generalization: lessons from action video
games. Current Opinion in Behavioral Sciences, 20, 169–173.
4. Bediou, B., Adams, D. M., Mayer, R. E., Tipton, E., Green, C. S., & Bavelier, D. (2018). Meta-analysis
of action video game impact on perceptual, attentional, and cognitive skills. Psychological Bulletin,
144(1), 77–110.
5. Chen, J. (2007). Flow in games (and everything else). Communications of the ACM, 50(4), 31.
6. Cleeremans, A., & Cheron, G. (2016). How to Measure the Psychological “Flow”? A Neuroscience
Perspective. Frontiers in Psychology | Www.Frontiersin.Org, 7, 1823.
https://doi.org/10.3389/fpsyg.2016.01823
7. Engeser, S. (2014). Advances in flow research. Advances in Flow Research, 1–231.
8. Finneran, C. M., & Zhang, P. (2003). A person-artefact-task (PAT) model of flow antecedents in
computer-mediated environments. International Journal of Human Computer Studies, 59(4), 475–496.

327 Volume 2 of the Proceedings of the joint 12th International Conference on Methods and Techniques in Behavioral Research and 6th
Seminar on Behavioral Methods held online, May 18-20, 2022. www.measuringbehavior.org. Editors: Andrew Spink, Jarosław
Barski, Anne-Marie Brouwer, Gernot Riedel, & Annesha Sil (2022). DOI 10.6084/m9.figshare.20066849. ISBN: 978-90-74821-94-0
9. Gascon, J. G., Doherty, S. M., & Liu, D. (2015). Investigation of videogame flow: Effects of expertise
and challenge. Proceedings of the Human Factors and Ergonomics Society, 2015-Janua, 1853–1857.
10. Jackman, P. C., Hawkins, R. M., Crust, L., & Swann, C. (2019). Flow states in exercise: A systematic
review. Psychology of Sport and Exercise, 45(June).
11. Jackson, S. A., Martin, A. J., & Eklund, R. C. (2008). Long and short measures of flow: The construct
validity of the FSS-2, DFS-2, and new brief counterparts. Journal of Sport and Exercise Psychology,
30(5), 561–587.
12. Klarkowski, M., Johnson, D., Wyeth, P., Smith, S., & Phillips, C. (2015). Operationalising and measuring
flow in video games. OzCHI 2015: Being Human - Conference Proceedings, 114–118.
13. Labonté-Lemoyne, É., Léger, P. M., Resseguier, B., Roberge, M. C. B., Fredette, M., Sénécal, S., &
Courtemanche, F. (2016). Are we in flow? Neurophysiological correlates of flow states in a collaborative
game. Conference on Human Factors in Computing Systems - Proceedings, 07-12-May-, 1980–1988.
14. Mirvis, P. H., & Csikszentmihalyi, M. (1991). Flow: The Psychology of Optimal Experience. The
Academy of Management Review. https://doi.org/10.2307/258925 155. Moneta, G. B. (2017). Validation
of the short flow in work scale (SFWS). Personality and Individual Differences, 109, 83–88.
15. Nah, F. F. H., Eschenbrenner, B., Zeng, Q., Telaprolu, V. R., & Sepehr, S. (2014). Flow in gaming:
literature synthesis and framework development. International Journal of Information Systems and
Management, 1(1/2), 83.
16. Nakamura, J., & Csikszentmihalyi, M. (2014). The concept of flow. In Flow and the Foundations of
Positive Psychology: The Collected Works of Mihaly Csikszentmihalyi.
17. Smith, L. J., Gradisar, M., King, D. L., & Short, M. (2017). Intrinsic and extrinsic predictors of video-
gaming behaviour and adolescent bedtimes: the relationship between flow states, self-perceived risk-
taking, device accessibility, parental regulation of media and bedtime. Sleep Medicine, 30, 64–70.
328 Volume 2 of the Proceedings of the joint 12th International Conference on Methods and Techniques in Behavioral Research and 6th
Seminar on Behavioral Methods held online, May 18-20, 2022. www.measuringbehavior.org. Editors: Andrew Spink, Jarosław
Barski, Anne-Marie Brouwer, Gernot Riedel, & Annesha Sil (2022). DOI 10.6084/m9.figshare.20066849. ISBN: 978-90-74821-94-0
In-cage monitoring of individual movement patterns and space use in laboratory
housed macaques
J. Reukauf1, C.L. Witham2 and D.S. Soteropoulos1
1 Biosciences, Newcastle University, Newcastle upon Tyne, United Kingdom. [email protected]
2 Centre for Macaques, MRC Harwell Institute, Salisbury, United Kingdom
Background
Animals show individual differences in their expression of behaviour and movement. Morita et al. [1] showed that
laboratory housed Japanese Macaques display individuality in spatial location over time and that algorithms can
predict identity based on animal’s movement trajectories. Similarly, studies in Rhesus Macaques have shown
patterns of spatial preference and differences in space use depending on life history factors [2-4]. Therefore we
propose that there is individuality in spatial location in Rhesus Macaques. Consistent individual differences over
time, also known as animal personality, have been shown to correlate with welfare measures such as frequency of
injury and subjective well-being assessments [5, 6]. However, current methods of measuring these individual
differences are labour intensive, invasive and vulnerable to subjectivity. Advances in computer vision tools can
help to overcome these issues and are becoming more prominent in recent years in the field of animal behaviour.
Here we present a simple and adaptable design for a low cost and non-invasive camera module to capture footage
of laboratory pair housed Rhesus Macaques. We test automated methods to identify individual differences from
this data. In the future, this can be used to track individual levels of welfare and help to identify welfare measures
specifically on the individual level and hence augment animal care.
In cage module and tracking framework
We designed a camera module that can be mounted inside the cage to capture video footage with low occlusion.
The housing is splash proof and withstands cleaning procedures and animal interactions. The camera module is
based on a Raspberry Pi and is highly adaptable and cost efficient. Videos are captured with two synchronized
cameras giving the potential for 3D analysis or alternatively covering different angles of the enclosure
simultaneously. The Raspberry Pi is powered by two 5V batteries that are automatically switched using a relay
enabling video observation of ~30 hours. Batteries can be changed during daily care procedures of the animals and
hence add no impact on their daily schedule. We use Yolact based methods to track and identify monkeys within
the cage [7, 8], mask size and position can be used to predict location of the animals over time. From these
predictions we are planning to measure behavioural types, behavioural plasticity, and individual predictability of
each individual [9].
Application
We want to show that this method is capable of capturing individual differences and can identify average
behavioural expression and individual behavioural variability. This automated process could therefore enable us
to detect diverging patterns of behaviour in laboratory housed Rhesus Macaques. We aim to apply this method to
capture data that can help us to investigate individual differences and potentially automate personality measures.
Estimates of activity or boldness traits can be drawn from the movement and location data [10]. In the end we
propose this method to be a cheap complement for current welfare measures and a step toward individual welfare
approaches in laboratory housed animals.
Ethical Statement
All animals monitored are part of existing studies with their own ethical approval. This project is additionally
approved by the Newcastle ethics board under the reference number 6345/2020.
329 Volume 2 of the Proceedings of the joint 12th International Conference on Methods and Techniques in Behavioral Research and 6th
Seminar on Behavioral Methods held online, May 18-20, 2022. www.measuringbehavior.org. Editors: Andrew Spink, Jarosław
Barski, Anne-Marie Brouwer, Gernot Riedel, & Annesha Sil (2022). DOI 10.6084/m9.figshare.20066849. ISBN: 978-90-74821-94-0
References
1. Morita, T., et al., 2020. Animals exhibit consistent individual differences in their movement: A case study
on location trajectories of Japanese macaques. Ecological Informatics, 56: 101057.
2. Clarence, W.M., et al., 2006. Use of enclosures with functional vertical space by captive rhesus monkeys
(Macaca mulatta) involved in biomedical research. Journal of the American Association for Laboratory Animal
Science, 45(5): 31-34.
3. Reinhardt, V., 1992. Space utilization by captive rhesus macaques. Animal technology: journal of the
Institute of Animal Technology.
4. MacLean, E.L., et al., 2009. Primate location preference in a double-tier cage: The effects of illumination
and cage height. Journal of Applied Animal Welfare Science, 12(1): 73-81.
5. Robinson, L.M., et al., 2018. Rhesus macaque personality, dominance, behavior, and health. American
journal of primatology, 80(2): e22739.
6. Robinson, L.M., et al., 2021. Happiness, welfare, and personality in rhesus macaques (Macaca mulatta).
Applied Animal Behaviour Science, 236: 105268.
7. Bolya, D., et al. Yolact: Real-time instance segmentation. in Proceedings of the IEEE/CVF international
conference on computer vision. 2019.
8. Marks, M., et al., 2021. Deep-learning based identification, pose estimation and end-to-end behavior
classification for interacting primates and mice in complex environments. bioRxiv: 2020.10. 26.355115.
9. Hertel, A.G., et al., 2020. A guide for studying among-individual behavioral variation from movement
data in the wild. Movement ecology, 8(1): 1-18.
10. Nilsson, J.-Å., et al., 2014. Individuality in movement: the role of animal personality. Animal movement
across scales, 1: 90-109.
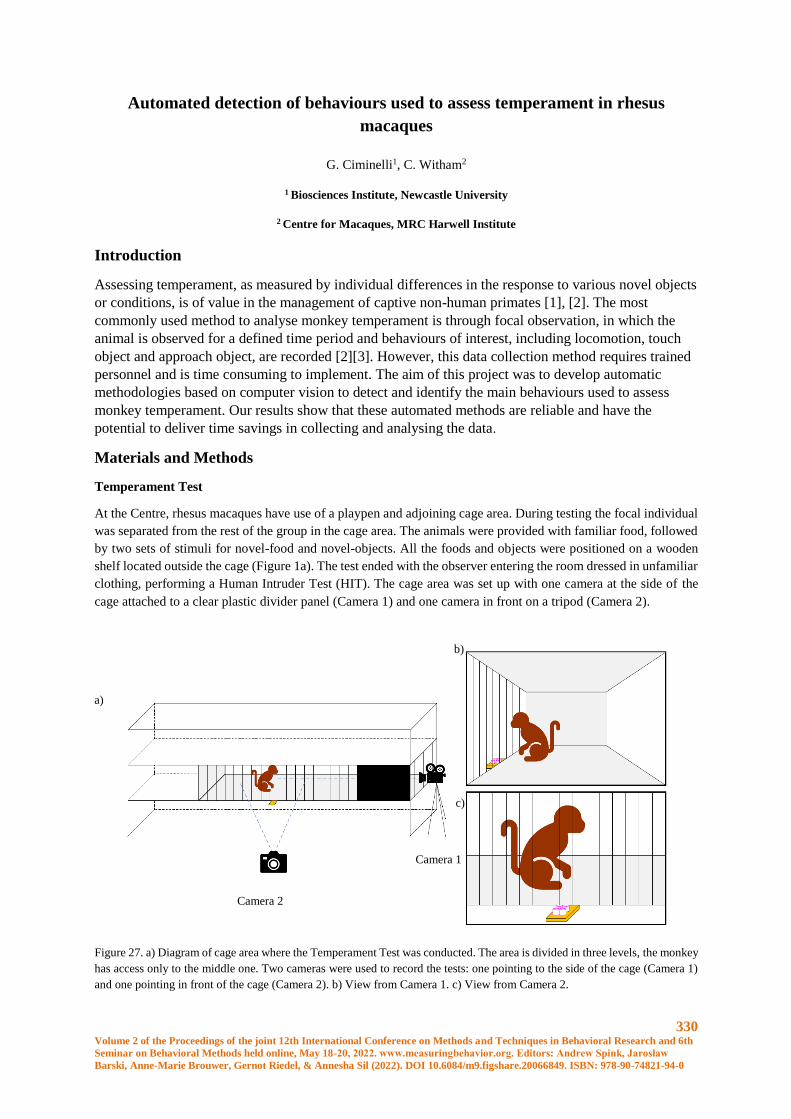
330 Volume 2 of the Proceedings of the joint 12th International Conference on Methods and Techniques in Behavioral Research and 6th
Seminar on Behavioral Methods held online, May 18-20, 2022. www.measuringbehavior.org. Editors: Andrew Spink, Jarosław
Barski, Anne-Marie Brouwer, Gernot Riedel, & Annesha Sil (2022). DOI 10.6084/m9.figshare.20066849. ISBN: 978-90-74821-94-0
Automated detection of behaviours used to assess temperament in rhesus
macaques
G. Ciminelli1, C. Witham2
1 Biosciences Institute, Newcastle University
2 Centre for Macaques, MRC Harwell Institute
Introduction
Assessing temperament, as measured by individual differences in the response to various novel objects
or conditions, is of value in the management of captive non-human primates [1], [2]. The most
commonly used method to analyse monkey temperament is through focal observation, in which the
animal is observed for a defined time period and behaviours of interest, including locomotion, touch
object and approach object, are recorded [2][3]. However, this data collection method requires trained
personnel and is time consuming to implement. The aim of this project was to develop automatic
methodologies based on computer vision to detect and identify the main behaviours used to assess
monkey temperament. Our results show that these automated methods are reliable and have the
potential to deliver time savings in collecting and analysing the data.
Materials and Methods
Temperament Test
At the Centre, rhesus macaques have use of a playpen and adjoining cage area. During testing the focal individual
was separated from the rest of the group in the cage area. The animals were provided with familiar food, followed
by two sets of stimuli for novel-food and novel-objects. All the foods and objects were positioned on a wooden
shelf located outside the cage (Figure 1a). The test ended with the observer entering the room dressed in unfamiliar
clothing, performing a Human Intruder Test (HIT). The cage area was set up with one camera at the side of the
cage attached to a clear plastic divider panel (Camera 1) and one camera in front on a tripod (Camera 2).
Figure 27. a) Diagram of cage area where the Temperament Test was conducted. The area is divided in three levels, the monkey
has access only to the middle one. Two cameras were used to record the tests: one pointing to the side of the cage (Camera 1)
and one pointing in front of the cage (Camera 2). b) View from Camera 1. c) View from Camera 2.
a)
b)
c)
Camera 2
Camera 1
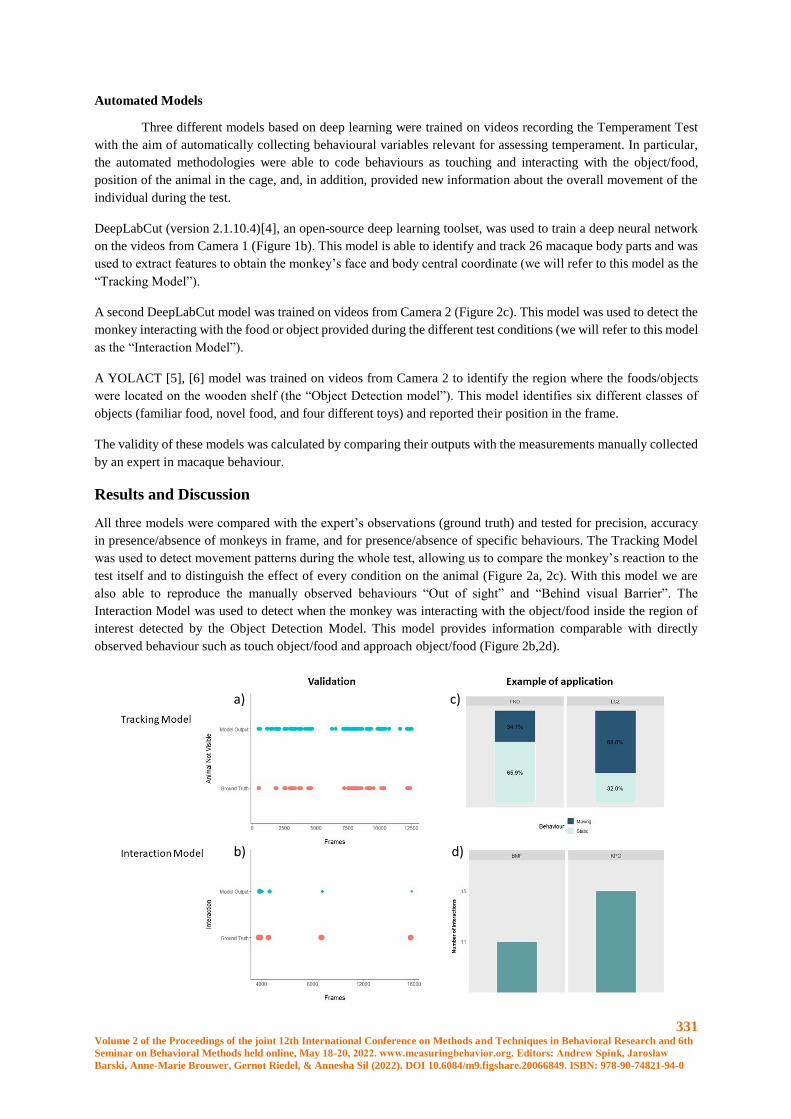
331 Volume 2 of the Proceedings of the joint 12th International Conference on Methods and Techniques in Behavioral Research and 6th
Seminar on Behavioral Methods held online, May 18-20, 2022. www.measuringbehavior.org. Editors: Andrew Spink, Jarosław
Barski, Anne-Marie Brouwer, Gernot Riedel, & Annesha Sil (2022). DOI 10.6084/m9.figshare.20066849. ISBN: 978-90-74821-94-0
Automated Models
Three different models based on deep learning were trained on videos recording the Temperament Test
with the aim of automatically collecting behavioural variables relevant for assessing temperament. In particular,
the automated methodologies were able to code behaviours as touching and interacting with the object/food,
position of the animal in the cage, and, in addition, provided new information about the overall movement of the
individual during the test.
DeepLabCut (version 2.1.10.4)[4], an open-source deep learning toolset, was used to train a deep neural network
on the videos from Camera 1 (Figure 1b). This model is able to identify and track 26 macaque body parts and was
used to extract features to obtain the monkey’s face and body central coordinate (we will refer to this model as the
“Tracking Model”).
A second DeepLabCut model was trained on videos from Camera 2 (Figure 2c). This model was used to detect the
monkey interacting with the food or object provided during the different test conditions (we will refer to this model
as the “Interaction Model”).
A YOLACT [5], [6] model was trained on videos from Camera 2 to identify the region where the foods/objects
were located on the wooden shelf (the “Object Detection model”). This model identifies six different classes of
objects (familiar food, novel food, and four different toys) and reported their position in the frame.
The validity of these models was calculated by comparing their outputs with the measurements manually collected
by an expert in macaque behaviour.
Results and Discussion
All three models were compared with the expert’s observations (ground truth) and tested for precision, accuracy
in presence/absence of monkeys in frame, and for presence/absence of specific behaviours. The Tracking Model
was used to detect movement patterns during the whole test, allowing us to compare the monkey’s reaction to the
test itself and to distinguish the effect of every condition on the animal (Figure 2a, 2c). With this model we are
also able to reproduce the manually observed behaviours “Out of sight” and “Behind visual Barrier”. The
Interaction Model was used to detect when the monkey was interacting with the object/food inside the region of
interest detected by the Object Detection Model. This model provides information comparable with directly
observed behaviour such as touch object/food and approach object/food (Figure 2b,2d).
a) c)
b) d)
332 Volume 2 of the Proceedings of the joint 12th International Conference on Methods and Techniques in Behavioral Research and 6th
Seminar on Behavioral Methods held online, May 18-20, 2022. www.measuringbehavior.org. Editors: Andrew Spink, Jarosław
Barski, Anne-Marie Brouwer, Gernot Riedel, & Annesha Sil (2022). DOI 10.6084/m9.figshare.20066849. ISBN: 978-90-74821-94-0
Figure 2: a) Example of comparison of data from a single monkey between the Tracking Model output and the ground truth. b)
Example of comparison of data from a single monkey between the Interaction Model output and the ground truth. c) Example
of application, on two different monkeys, of the Tracking Model to detect differences in monkeys’ movements during the test.
d) Example of application, on two different monkeys, of the Interaction Model to detect differences between the number of
interactions with food and objects during the test.
With our models it was possible to obtain the critical information to assess monkey’s personality with a minimal
need of human work. Using our methodologies, we were also able to obtain some of the directly observed
behaviours but also other continuous measurement (i.e., movement patterns), known to be time consuming for a
human observer.
Ethical statement
All methods were approved by the Animal Welfare Ethics Review Board (AWERB) from the Centre for Macaques
(Reference: CFM2019E001) and Newcastle University (Reference: 830).
References
[1] K. Coleman, L. A. Tully, and J. L. McMillan, “Temperament correlates with training success in adult
rhesus macaques,” Am. J. Primatol., vol. 65, no. 1, pp. 63–71, Jan. 2005, doi: 10.1002/ajp.20097.
[2] K. Coleman and P. J. Pierre, “Assessing Anxiety in Nonhuman Primates,” ILAR J., vol. 55, no. 2, pp.
333–346, Jan. 2014, doi: 10.1093/ilar/ilu019.
[3] D. H. Gottlieb, J. P. Capitanio, and B. McCowan, “Risk factors for stereotypic behavior and self-biting
in rhesus macaques ( Macaca mulatta ): Animal’s history, current environment, and personality,” Am. J.
Primatol., vol. 75, no. 10, pp. 995–1008, Oct. 2013, doi: 10.1002/ajp.22161.
[4] A. Mathis et al., “DeepLabCut: markerless pose estimation of user-defined body parts with deep
learning,” Nat. Neurosci., vol. 21, no. 9, pp. 1281–1289, Sep. 2018, doi: 10.1038/s41593-018-0209-y.
[5] D. Bolya, C. Z. Fanyi, X. Yong, and J. Lee, “YOLACT Real-time Instance Segmentation.” [Online].
Available: https://github.com/dbolya/yolact.
[6] S. Ray and M. A. Stopfer, “Argos: A toolkit for tracking multiple animals in complex visual
environments,” Methods Ecol. Evol., vol. 13, no. 3, pp. 585–595, Mar. 2022, doi: 10.1111/2041-
210X.13776.

333 Volume 2 of the Proceedings of the joint 12th International Conference on Methods and Techniques in Behavioral Research and 6th
Seminar on Behavioral Methods held online, May 18-20, 2022. www.measuringbehavior.org. Editors: Andrew Spink, Jarosław
Barski, Anne-Marie Brouwer, Gernot Riedel, & Annesha Sil (2022). DOI 10.6084/m9.figshare.20066849. ISBN: 978-90-74821-94-0


