Embed Size (px)
Citation preview
Measuring IPv6 Adoption
Jakub CzyzUniversity of Michigan
Mark AllmanInternational Computer
Science Institute
Jing ZhangUniversity of Michigan
Scott Iekel-JohnsonArbor Networks, Inc.
Eric OsterweilVerisign Labs
Michael BaileyUniversity of Michigan
ABSTRACTAfter several IPv4 address exhaustion milestones in the last threeyears, it is becoming apparent that the world is running out of IPv4addresses, and the adoption of the next generation Internet proto-col, IPv6, though nascent, is accelerating. In order to better un-derstand this unique and disruptive transition, we explore twelvemetrics using ten global-scale datasets to create the longest andbroadest measurement of IPv6 adoption to date. Using this per-spective, we find that adoption, relative to IPv4, varies by two or-ders of magnitude depending on the measure examined and thatcare must be taken when evaluating adoption metrics in isolation.Further, we find that regional adoption is not uniform. Finally, andperhaps most surprisingly, we find that over the last three years, thenature of IPv6 utilization—in terms of traffic, content, reliance ontransition technology, and performance—has shifted dramaticallyfrom prior findings, indicating a maturing of the protocol into pro-duction mode. We believe IPv6’s recent growth and this changingutilization signal a true quantum leap.
Categories and Subject DescriptorsC.2.5 [Local and Wide-Area Networks]: Internet
KeywordsInternet; IP; IPv4; IPv6; DNS; Measurement
1. INTRODUCTIONIPv4 is the common thread that has held the Internet together
since its very early years, and, thus, it is both the most importantand most widely-deployed networking protocol in existence. Forbasic end-to-end connectivity, devices need to have a unique IP ad-dress, but the world is rapidly running out of available IPv4 addressspace. Thus, if we want the Internet to continue growing and de-livering its societal and economic benefits for the next generation,we have a challenge. In just the three years since February 2011,the organizations responsible for allocating IPv4 addresses, includ-ing the Internet Assigned Numbers Authority (IANA), as well astwo of its five subordinate regional Internet registries (RIRs) have
Permission to make digital or hard copies of all or part of this work for personal orclassroom use is granted without fee provided that copies are not made or distributedfor profit or commercial advantage and that copies bear this notice and the full cita-tion on the first page. Copyrights for components of this work owned by others thanACM must be honored. Abstracting with credit is permitted. To copy otherwise, or re-publish, to post on servers or to redistribute to lists, requires prior specific permissionand/or a fee. Request permissions from [email protected]’14, August 17–22, 2014, Chicago, IL, USA.Copyright 2014 ACM 978-1-4503-2836-4/14/08$15.00.http://dx.doi.org/10.1145/2619239.2626295.
either completely exhausted address space or resorted to rationingtheir final address block. It appears that after years of both architec-ture changes and stop-gap measures forestalling IPv4 address ex-haustion (e.g., classless interdomain routing [CIDR] [12], networkaddress translation [NAT] [37]) the Internet has now begun its firstcore protocol change. Exhaustion is providing increased impetusfor the network to finally adopt the next version of IP, IPv6. Weshow that, while raw IPv6 Internet traffic is still a small fraction(0.64%), the nature of its use and the trajectory of growth haveshifted dramatically, and, consequently, IPv6 should no longer bedismissed by researchers as an uninteresting rarity.
In this paper, our aim is to empirically understand the adoptionof IPv6. A once-in-a-lifetime opportunity to observe technologicalchange on such a grand scale, this is both practically and scientifi-cally important. However, with a handful of exceptions, most of theindividual assessments of IPv6 that the community has produced,to date, are anecdotal (e.g., using one server’s, campus’s or Internetexchange point’s perspective) and/or focus on only a single aspectof IPv6 adoption (e.g., route advertisement). No single existingperspective or study suffices to truly gauge the state of IPv6 in thelarge. We argue that, while this previous body of work has beeninvaluable at tracking aspects of adoption, a broader approach tomeasuring IPv6 deployment, which assembles a breadth of obser-vations and compares existing datasets against each other, is neededto truly understand where we are. The goal is not to pick the “best”one, but to understand the systemic state of IPv6 deployment via allavailable measurements.
To achieve our goal we assemble a set of six publicly-accessibledatasets that speak to one or more aspects of IPv6 adoption. Weadd four additional, previously-unpublished datasets, including aglobal Internet traffic dataset that includes traffic statistics from260 providers and represents 16,200 petabytes/month, or approx-imately 33-50% of all Internet traffic—the largest traffic sample re-ported in an IPv6 study. In addition to the traffic data, we add DNSquery data from several of the largest globally-distributed IPv4-based replicas of the .com and .net top-level domains (TLDs), aswell as nearly all native IPv6 replicas for these TLDs.
To create a comprehensive view of IPv6 adoption, we enumerateand compare both previously-reported and novel metrics and weavethem into a taxonomy. In applying these metrics to our datasets, weseek to reveal relationships and patterns not otherwise visible whenstudying any single metric in isolation. Further, we speculate thatseveral recent IPv4 exhaustion events (IANA, APNIC, RIPE) andcommunity IPv6 “flag days” (World IPv6 Day 2011 and Launch2012) may have noticeably influenced the progression of adoption.
Through the lens of this comprehensive approach, we composea picture of the current state of global IPv6 adoption. We find:
• IPv6 is real. Over the last three years, IPv6 has reached asignificant developmental milestone and is finally being usednatively and for normal, production traffic, on a non-trivialand accelerating scale. While IPv6 is still under 1% of Inter-net traffic, it has increased over 400% in each of the last twoyears, relies much less on transition technologies, and is usedfor similar applications to IPv4, with similar performance.
• Measurements vary widely. IPv6 adoption level differs byup to two orders of magnitude depending on the metric used.For instance, although IPv6 monthly address allocations areabout 57% of IPv4, the percentage of IPv4 nameservers in.com that are IPv6-reachable is around 3%.
• Geographic adoption differs. Global regions are adoptingIPv6 at different rates, but the relative level of adoption in theregions also varies by metric, suggesting that incentives andbarriers to adopt the new protocol do not just vary globally,but across layers of the network within each region.
2. RELATED WORKThere are many papers in the literature that offer valuable data on
the IPv6 adoption process from various perspectives. Several stud-ies characterize IPv6 traffic from the perspective of one or moreISPs (e.g., [23, 34, 36]) and 6to4 relays (e.g., [18, 35]). On June8, 2011, the Internet Society sponsored “IPv6 World Day” [22]and several pieces of work explore this event explicitly (e.g., [34]).Other work examines IPv6 adoption from the perspective of theWorld Wide Web (e.g., [7, 29]). Additionally, a variety of con-tributions explore the technical, economic, and social factors thatinfluence adoption (e.g., [16, 20]). Finally, much previous workfocuses on topology measurements and performance in IPv6 andtheir relationships to IPv4 (e.g., [5, 10, 13, 31, 39, 43, 44]). In con-trast to much of these studies, our work sacrifices depth for breadthin order to understand the big picture of IPv6 adoption.
Claffy [6] discusses IPv6 evolution and observes that “we lacknot only a comprehensive picture of IPv6 deployment, but alsoconsensus on how to measure its growth, and what to do aboutit.” Our paper is in part a response to this call, offering a possi-ble way forward. Closest to our work in both spirit and substanceis Karpilovsky et al. [23], who provide a snapshot of IPv6 adop-tion from three main perspectives (allocation data, routing data,and traffic from a tier-1 ISP). In comparison, our work broadensthe traffic perspective to a large sample of global tier-1 ISPs andnearly 100 tier-2/regional ISPs (260 providers in total), includeslarge samples of .com and .net TLD data, and juxtaposes thesedatasets with seven additional (mostly public) datasets.
Our DNS packet analysis in § 5 extends work by researchersat Verisign [30, 40]. The key distinction of our contribution hereover this previous work is that we examine DNS queries via bothIPv4 and IPv6 traffic, we focus on IPv6 adoption, and the data pre-sented is more recent; the earlier Verisign work contains longitudi-nal IPv4-only traffic analysis, though performed at greater detail.
3. OUR APPROACHSince our aim is for a comprehensive picture of adoption, we
must first decide what aspects to study. We start by thinking aboutthe Internet Protocol from the perspective of the three major typesof Internet stakeholders: content providers, service providers, andcontent consumers. Although there are notable entities that straddleor defy these labels (e.g. vendors and policy makers), these threecategories encapsulate the key perspectives we believe should beconsidered to realistically assess deployment. We next divide the
key aspects of IP itself into two classes. The first is the prerequisitefunctions that IP performs and that must be in place for nodes tocommunicate, including addressing, naming, routing, and end-to-end reachability. The second class is operational characteristics thatare only evident once the network begins forwarding packets, theseinclude transition technology use, traffic volume, application mix,and performance.
In Table 1 we propose one or more metrics that characterize theadoption of IPv6 from the key viewpoints sketched above. Someof these metrics cover more than one branch in the taxonomy. Weadmit that our use of the term “metric” is somewhat loose. Our aimis to point to many aspects of adoption that should be measured, butwhose granularity and specificity varies. Thus, each metric coulditself be thought of more as a category or issue for which specificmeasurements should be obtained. In this paper, we present one orseveral such measurements for each metric that we defined.
While we believe we have identified a sufficiently comprehen-sive set of metrics to provide a broad picture of adoption, we do notclaim completeness. There are countless possible metrics that cantell a coherent and insightful story of the adoption process. Further,while a metric such as performance naturally breaks down into sub-metrics for assessing delay, loss, jitter, reordering, throughput, etc.,the specific facets of IPv6 operation that are important in any givencontext are likely to vary by application. As such, we do not meanto discourage further assessment along different axes or granulari-ties than we take in this paper. Rather, our goal is to set a course fordeveloping a high-level and comprehensive understanding of therecent IPv6 adoption process. To this end, we bring to bear sev-eral large original datasets, as well as several public or previouslypublished results, and use them to report measurements that alignwith our taxonomy. Table 2 summarizes the datasets we analyzed,separated into the public ones we reproduce and update, and theunique ones we contribute. We next discuss analyses of these datain detail, showing how adoption level differs and varies as we movefrom left to right in Table 1 and over time.
4. ADDRESSINGWe first examine the initial steps for IPv6 deployment: address
allocation and network advertisement.
A1: Address AllocationBefore wide-scale IPv6 communication is possible, IPv6 addressesmust be broadly available. Therefore, our first assessment is of thestatus of IPv6 address allocation. The allocation hierarchy beginswith the Internet Assigned Numbers Authority (IANA) allocatingaddress blocks to the five regional Internet registries (RIRs). Inturn, the RIRs make allocations to various national and local reg-istries and ISPs. Each RIR publishes a daily snapshot of the blocksof IP (v4 and v6) addresses (i.e., the number of prefixes) allocatedto entities below it in the hierarchy. We have captured ten years ofthese snapshots, starting in January 2004. As a minor caveat, notethat the size of a typical IPv6 prefix (296) is much larger than thatof an IPv4 prefix (210), thus, prefix-based comparisons should bemade with caution. However, address allocations typically corre-spond to network deployments, no matter the protocol; so, relativeallocations do shed light on protocol deployment.
Figure 1 shows the aggregate number of prefixes allocated eachmonth across all RIRs. There were less than 30 IPv6 prefixes al-located per month prior to 2007, generally increasing thereafter.In the past several years, we typically find more than 300 prefixesallocated per month, with a high point of 470 prefix allocations inFebruary 2011. By January 2004 there had been 650 IPv6 prefix al-locations, while at the end of December 2013 we observe 17,896 to-

Table 1: IPv6 adoption metric taxonomy, showing the main three perspectives that Internet stakeholders occupy, the prerequisitesfor IPv6 to be used, as well as the operational characteristics of the protocol, once deployed.
Prerequisite IP Functions Operational CharacteristicsAddressing Naming Routing End-to-End
ReachabilityUsage Profile Performance
Content Provider N1: Nameservers;R1: Server Readiness
R1: ServerReadiness
U3: Transition Technologies
Pers
pect
ive Service Provider A1: Address
Allocation;A2: AddressAdvertisement
N2: Resolvers A2: AddressAdvertisement;T1: Topology
U1: Traffic Volume;U3: Transition Technologies
P1: Network RTT
Content Consumer N3: Queries R2: ClientReadiness
U2: Application Mix;N3: Queries
Table 2: Dataset summary showing the time period, scale, and public or new status of the datasets we analyzed.
Dataset Metrics Time Period Recent Scale Public?RIR Address Allocations A1 Jan 2004 – Jan 2014 ≈18K allocation snapshots (5 daily)
Yes
Routing: Route Views A2, T1 Jan 2004 – Jan 201445,271 BGP table snapshots
Routing: RIPE A2, T1 Jan 2004 – Jan 2014Google IPv6 Client Adoption R2, U3 Sep 2008 – Dec 2013 millions of daily global samplesVerisign TLD Zone Files N1 Apr 2007 – Jan 2014 daily snapshots of ≈2.5 million A+AAAA glue records (.com & .net)CAIDA Ark Performance Data P1 Dec 2008 – Dec 2013 ≈10 million IPs probed daily
Arbor Networks ISP Traffic Data U1, U2, U3 Mar 2010 – Dec 2013 ≈33-50% of global Internet traffic; 2013 daily median: 50 terabits/sec (avg.)
NoVerisign TLD Packets: IPv4 N2, N3 Jun 2011 – Dec 2013 4 global sites, 5 of 13 gTLD NS letters (.com/.net), ≈4.5Bn queriesVerisign TLD Packets: IPv6 N2, N3 Jun 2011 – Dec 2013 15 global sites, both gTLD NS letters (.com/.net) w/IPv6, 647M queriesAlexa Top Host Probing R1 Apr 2011 – Dec 2013 10,000 servers probed twice/month
0
200
400
600
800
1000
2004 2005 2006 2007 2008 2009 2010 2011 2012 2013 2014 0
0.1
0.2
0.3
0.4
0.5
0.6
Mo
nth
ly P
refix A
lloca
tio
ns
Ra
tio
IP
v6
/IP
v4
IPv4IPv6
Ratio
Figure 1: Prefixes allocated. IPv4 and IPv6 allocations acceler-ate leading up to IANA exhaustion in early 2011. IPv4 droppedin 2012 and was flat in 2013, while IPv6 trended upward.
tal prefix allocations—an increase of 27-fold. Finally, we note thatat the end of our dataset the allocated IPv6 prefixes cover 2113 (i.e.,1.1×1034) addresses.
To put the IPv6 allocation data in context, Figure 1 also showsIPv4 prefix allocations over the same period. The number of IPv4prefix allocations grows from roughly 300 per month at the begin-ning of our observation period to a peak of 800–1000 per monthat the start of 2011, after which it drops to around 500 per monthin the last year, as the number of available addresses at RIRs hasdwindled. 1 Overall, we find nearly 69K IPv4 prefix allocations atthe beginning of our dataset and just over 136K at the end. Thisrepresents an increase of 67K prefixes—or, less than a doubling ofthe number of IPv4 prefix allocations over the course of the previ-ous ten years. The figure contains a ratio line to show the relativeallocation of IPv6 versus IPv4. We find that at the end of December2013, on a monthly basis, the ratio of IPv6 to IPv4 prefix alloca-tions is 0.57 and following a general upward trend. Thus, although
1We elide the April 2011 point such that the remainder of the plotis more readable. During that month, we find 2,217 IPv4 prefixallocations. This corresponds with APNIC’s IPv4 pool droppingto a single remaining /8 and their “Final /8 Policy” being invoked,which caused a brief spike in allocated prefixes [3].
100
1K
10K
100K
1M
2004 2005 2006 2007 2008 2009 2010 2011 2012 2013 2014
0.0001
0.001
0.01
0.1P
refix A
dve
rtis
em
en
ts
Ra
tio
IP
v6
/IP
v4
IPv4
IPv6
Ratio
Figure 2: Number of advertised prefixes. Over ten years, IPv6prefixes increase 37-fold, while IPv4 increase four-fold.
there are still significantly more allocated IPv4 prefixes (136k) thanIPv6 prefixes (18k), and the monthly rate of IPv4 allocations is stillabout double, we see the IPv6 allocation rate continuing to growwhile the IPv4 rate declines. The ≈300 IPv6 versus ≈500 IPv4allocations per month suggest IPv6 is, for the first time, being de-ployed or planned on a majority of new networks.
A2: Network AdvertisementAddress allocation is a start, but to be used for Internet traffic IPaddresses must be advertised in the global routing table. There-fore, our second metric is the number of IPv6 prefixes found in theInternet’s global routing table. The Route Views project [38] andRIPE [32] both have a number of routers used for data collection,each peering with production Internet routers to obtain the routingtables from those peers. Based on routing table snapshots madeavailable by these collection efforts, we obtain the number of pre-fixes announced on the first day of each month from January 2004to January 2014. While these routing datasets are known to havebiases, as we elaborate in § 6, these biases are not expected to affectthe view of globally-reachable network prefixes.
Figure 2 shows the number of announced prefixes over time.We find 526 IPv6 prefixes on January 1, 2004. In January 2014,19,278 IPv6 prefixes were advertised—an increase of 37-fold over

the course of ten years. For comparison, we also show the averagenumber of IPv4 prefixes advertised per day; these increased four-fold from 153K in 2004 to 578K by 2014.
While total and monthly allocations and advertisements are bothstill higher for IPv4, the rate of IPv6 allocations is increasing at afaster pace than IPv4. This is expected since IPv4 has been an In-ternet reality for 30+ years now, and, hence, the need for additionaladdresses is, naturally, incremental. The rate of IPv6 prefix alloca-tions is now where IPv4 was 8 years ago. What is more, in 2013 themonthly volume of allocations of IPv4 has dropped significantly, to2009 levels, likely due to the exhaustion events starting in 2011. Insum, the allocation and advertisement numbers and rates providethe basis for wide-scale Internet adoption of IPv6 from the address-ing perspective.
5. NAMINGOnce IPv6 addresses are allocated and announced by routers,
they must be used. The typical way addresses are referenced byInternet users and applications is via Domain Name System (DNS)names. Our next three metrics, therefore, focus on the prevalenceof IPv6 support and use within the DNS ecosystem. A detaileddescription of DNS [28] is beyond the scope of this paper, butwe remind the reader of some basic terminology. The authorita-tive groupings of names in the DNS hierarchy are called zones.DNS domain names map to IPv4 address via A records and to IPv6addresses via AAAA (“quad a”) records. DNS servers that man-age zones and return records are called authoritative nameservers,while servers that execute queries on behalf of (usually many) usersare broadly called resolvers.
N1: DNS Authoritative NameserversOur first naming metric aims to understand the prevalence of au-thoritative nameservers that themselves can communicate via IPv6.While IPv6-addressed nameservers are not required for an organi-zation to employ dual-stack IPv6 (i.e., it could serve AAAA recordsvia IPv4 nameservers), we believe that the prevalence of such name-servers offers telling evidence on the adoption of IPv6, especiallyby content providers.
The top level of DNS has been IPv6-enabled since 2008, whenroot nameservers deployed AAAA records [21]. As of Jan. 2014,reports from Hurricane Electric show that 91% of the 381 top-leveldomains (TLDs) also have IPv6-enabled nameservers [25]. Theseinclude the largest TLDs, such as, .com, .net, .cn, etc. Of the thir-teen .com and .net nameservers, all can serve AAAA but only two(a. and bmgtld-servers.net) are themselves IPv6-addressable. Tounderstand the prevalence of IPv6 nameservers for second-leveldomains (e.g., example.com), we survey the .com and .net TLDzones. We analyzed sample .com and .net zone files between April2007 and January 2014 to track the prevalence of DNS glue recordsfor authoritative nameservers in the zones.
Figure 3 shows the number of A and AAAA glue records inthe .com and .net zones over the last 7 years. IPv6-enabled name-servers (AAAA records) are dwarfed by IPv4 nameservers (A records),but both show long-term growth. Following the pattern of othermetrics, the growth rate (second derivative) of IPv6-capable name-servers is higher than that of IPv4, and the ratio of AAAA to A isincreasing. As of January 1, 2014, the ratio of AAAA to A gluerecords for .com is 0.0029. We also show the AAAA to A ratiofrom Hurricane Electric’s published probing data, starting in 2009,wherein A and AAAA lookups for all domains in the zone are pe-riodically performed [25]. Few nameservers in general have gluerecords in their zone, and IPv6-enabled ones seem to have this con-figuration even less often. The ratio of domains actually returning
10
100
1K
10K
100K
1M
2007 2008 2009 2010 2011 2012 2013 2014 1e-05
0.0001
0.001
0.01
Re
co
rds in
TL
D z
on
es
Ra
tio
IP
v6
/IP
v4
(.c
om
)
.com A glue.net A glue
.net AAAA glue.com AAAA glueRatio .com glue
Ratio .net all probed (H.E.)Ratio .com all probed (H.E.)
Figure 3: IPv6 nameserver and domain readiness. We see asteady increase in the glue records and a general increase inthe probed domain names.
AAAA records via queries (vs. A) is an order of magnitude higher(0.02 for .com) than the glue record ratio.
In sum, the authoritative nameserver data indicates low (0.0028for .com glue, 0.02 for probed) but increasing (56% growth in 2013for glue) support for IPv6 in the overall .com and .net zones.
N2: DNS ResolversA second naming metric we consider is the prevalence of resolversrequesting AAAA records. Due to caching within the DNS sys-tem, this is not a direct measure of demand; however, the num-ber of resolvers looking up AAAA records indicates the breadthof the use of IPv6, and speaks to the basic capability of resolversto issue AAAA queries as well as the existence of at least someclients within a resolver’s pool making AAAA requests. Viewedover time, this can be used to gauge whether demand for IPv6 con-tent is widespread or only from pockets of the network.Packet Datasets for .com and .net: As an initial assessment, weexamine two large datasets of packet-level DNS query traffic to the.com and .net TLD authoritative nameservers on five sample daysbetween June 23, 2011 and December 23, 2013. One dataset con-sists of IPv4 packets, while the second contains IPv6 packets. Bothare from Verisign, the registry operating the .com and .net zones.The IPv4 queries were captured at between three and five of the 17largest globally-distributed .com and .net TLD server clusters (e.g.,in Feb. 2013, from Dulles, VA; New York, NY; San Francisco, CA;and Amsterdam, NL). Our IPv4 data includes transactions with sev-eral instances of the lettered X.gtld-servers.net TLD nameservers.These 24-hour IPv4 datasets range from 2.3Bn to 4.2Bn queries(except for the first IPv4 sample, which only included 30 minutesof data and ≈110M queries). These same 17 global Verisign clus-ters support IPv6 traffic. The IPv6 samples analyzed were alsoeach 24 hours and consisted of 420M–1,052M queries. While thepacket collection apparatus for both datasets is known to be lossy,we performed analysis that suggests no systemic network effectsthat would skew the measurements we report [8].
We note that the IPv4 and IPv6 datasets shed light on slightlydifferent aspects of adoption. The IPv4 data give us insight intobehavior of networks that are not using IPv6 for their naming in-frastructure but that happen to have clients and resolvers that makeAAAA queries, which—given support by the resolver—is largelydetermined by operating system and application behavior. On theother hand, the IPv6 packet data represent networks where DNSresolvers are able to communicate via IPv6 to the .com and .netnameservers, which suggests a more advanced level of IPv6 adop-tion. Thus, the latter may be more representative of the behaviorof fully-capable clients, whereas the former represents clients that
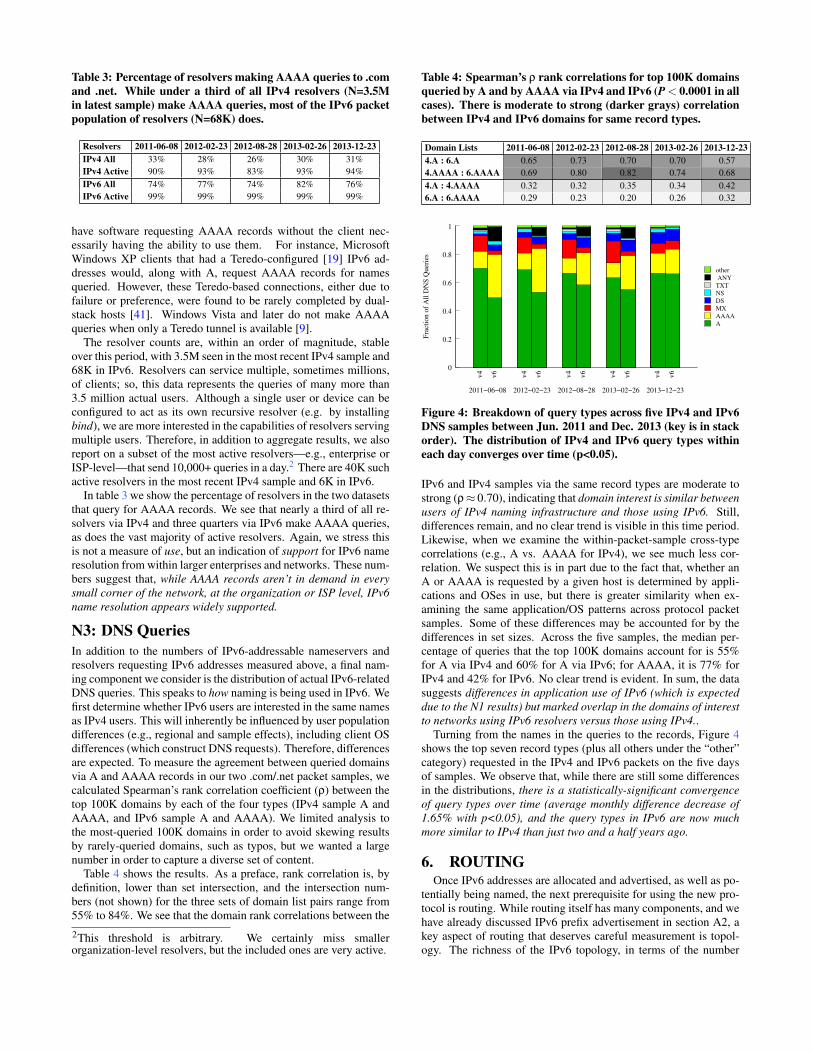
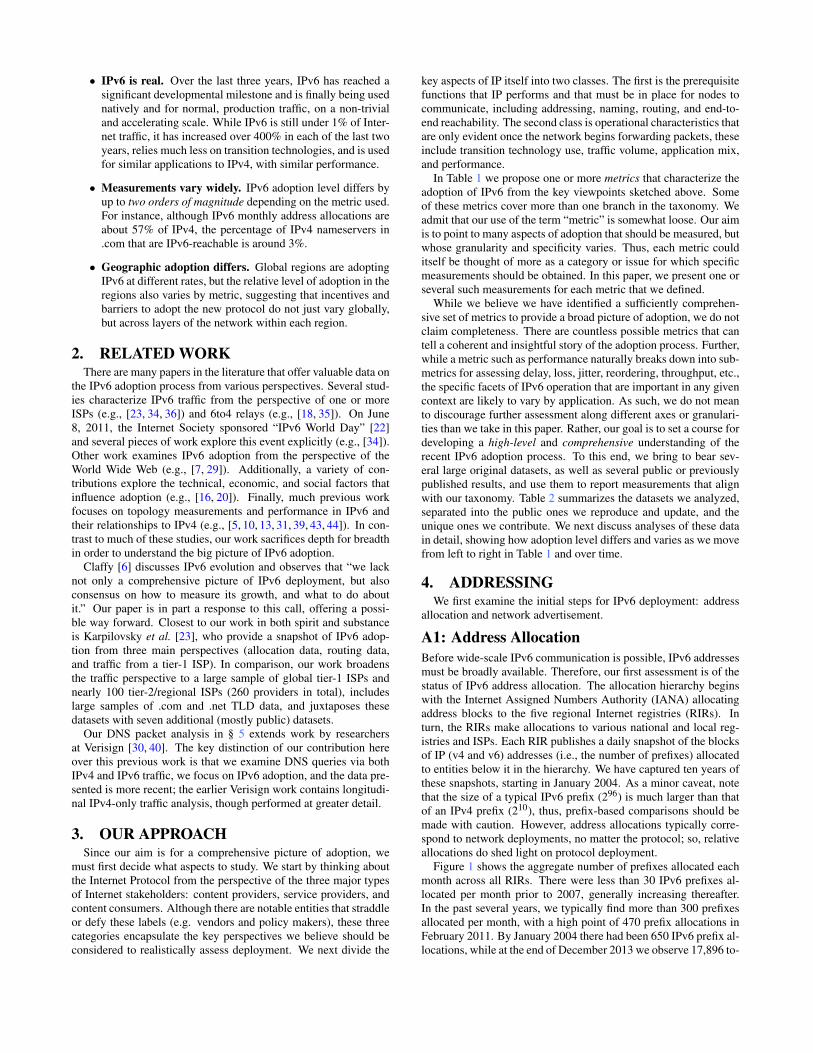
Table 3: Percentage of resolvers making AAAA queries to .comand .net. While under a third of all IPv4 resolvers (N=3.5Min latest sample) make AAAA queries, most of the IPv6 packetpopulation of resolvers (N=68K) does.
Resolvers 2011-06-08 2012-02-23 2012-08-28 2013-02-26 2013-12-23IPv4 All 33% 28% 26% 30% 31%IPv4 Active 90% 93% 83% 93% 94%IPv6 All 74% 77% 74% 82% 76%IPv6 Active 99% 99% 99% 99% 99%
have software requesting AAAA records without the client nec-essarily having the ability to use them. For instance, MicrosoftWindows XP clients that had a Teredo-configured [19] IPv6 ad-dresses would, along with A, request AAAA records for namesqueried. However, these Teredo-based connections, either due tofailure or preference, were found to be rarely completed by dual-stack hosts [41]. Windows Vista and later do not make AAAAqueries when only a Teredo tunnel is available [9].
The resolver counts are, within an order of magnitude, stableover this period, with 3.5M seen in the most recent IPv4 sample and68K in IPv6. Resolvers can service multiple, sometimes millions,of clients; so, this data represents the queries of many more than3.5 million actual users. Although a single user or device can beconfigured to act as its own recursive resolver (e.g. by installingbind), we are more interested in the capabilities of resolvers servingmultiple users. Therefore, in addition to aggregate results, we alsoreport on a subset of the most active resolvers—e.g., enterprise orISP-level—that send 10,000+ queries in a day.2 There are 40K suchactive resolvers in the most recent IPv4 sample and 6K in IPv6.
In table 3 we show the percentage of resolvers in the two datasetsthat query for AAAA records. We see that nearly a third of all re-solvers via IPv4 and three quarters via IPv6 make AAAA queries,as does the vast majority of active resolvers. Again, we stress thisis not a measure of use, but an indication of support for IPv6 nameresolution from within larger enterprises and networks. These num-bers suggest that, while AAAA records aren’t in demand in everysmall corner of the network, at the organization or ISP level, IPv6name resolution appears widely supported.
N3: DNS QueriesIn addition to the numbers of IPv6-addressable nameservers andresolvers requesting IPv6 addresses measured above, a final nam-ing component we consider is the distribution of actual IPv6-relatedDNS queries. This speaks to how naming is being used in IPv6. Wefirst determine whether IPv6 users are interested in the same namesas IPv4 users. This will inherently be influenced by user populationdifferences (e.g., regional and sample effects), including client OSdifferences (which construct DNS requests). Therefore, differencesare expected. To measure the agreement between queried domainsvia A and AAAA records in our two .com/.net packet samples, wecalculated Spearman’s rank correlation coefficient (ρ) between thetop 100K domains by each of the four types (IPv4 sample A andAAAA, and IPv6 sample A and AAAA). We limited analysis tothe most-queried 100K domains in order to avoid skewing resultsby rarely-queried domains, such as typos, but we wanted a largenumber in order to capture a diverse set of content.
Table 4 shows the results. As a preface, rank correlation is, bydefinition, lower than set intersection, and the intersection num-bers (not shown) for the three sets of domain list pairs range from55% to 84%. We see that the domain rank correlations between the
2This threshold is arbitrary. We certainly miss smallerorganization-level resolvers, but the included ones are very active.
Table 4: Spearman’s ρ rank correlations for top 100K domainsqueried by A and by AAAA via IPv4 and IPv6 (P < 0.0001 in allcases). There is moderate to strong (darker grays) correlationbetween IPv4 and IPv6 domains for same record types.
Domain Lists 2011-06-08 2012-02-23 2012-08-28 2013-02-26 2013-12-234.A : 6.A 0.65 0.73 0.70 0.70 0.574.AAAA : 6.AAAA 0.69 0.80 0.82 0.74 0.684.A : 4.AAAA 0.32 0.32 0.35 0.34 0.426.A : 6.AAAA 0.29 0.23 0.20 0.26 0.32
0
0.2
0.4
0.6
0.8
1
v4
v6
v4
v6
v4
v6
v4
v6
v4
v6
Fra
cti
on o
f A
ll D
NS
Queri
es
2011−06−08 2012−02−23 2012−08−28 2013−02−26 2013−12−23
other
ANY
TXT
NS
DS
MX
AAAA
A
Figure 4: Breakdown of query types across five IPv4 and IPv6DNS samples between Jun. 2011 and Dec. 2013 (key is in stackorder). The distribution of IPv4 and IPv6 query types withineach day converges over time (p<0.05).
IPv6 and IPv4 samples via the same record types are moderate tostrong (ρ≈ 0.70), indicating that domain interest is similar betweenusers of IPv4 naming infrastructure and those using IPv6. Still,differences remain, and no clear trend is visible in this time period.Likewise, when we examine the within-packet-sample cross-typecorrelations (e.g., A vs. AAAA for IPv4), we see much less cor-relation. We suspect this is in part due to the fact that, whether anA or AAAA is requested by a given host is determined by appli-cations and OSes in use, but there is greater similarity when ex-amining the same application/OS patterns across protocol packetsamples. Some of these differences may be accounted for by thedifferences in set sizes. Across the five samples, the median per-centage of queries that the top 100K domains account for is 55%for A via IPv4 and 60% for A via IPv6; for AAAA, it is 77% forIPv4 and 42% for IPv6. No clear trend is evident. In sum, the datasuggests differences in application use of IPv6 (which is expecteddue to the N1 results) but marked overlap in the domains of interestto networks using IPv6 resolvers versus those using IPv4..
Turning from the names in the queries to the records, Figure 4shows the top seven record types (plus all others under the “other”category) requested in the IPv4 and IPv6 packets on the five daysof samples. We observe that, while there are still some differencesin the distributions, there is a statistically-significant convergenceof query types over time (average monthly difference decrease of1.65% with p<0.05), and the query types in IPv6 are now muchmore similar to IPv4 than just two and a half years ago.
6. ROUTINGOnce IPv6 addresses are allocated and advertised, as well as po-
tentially being named, the next prerequisite for using the new pro-tocol is routing. While routing itself has many components, and wehave already discussed IPv6 prefix advertisement in section A2, akey aspect of routing that deserves careful measurement is topol-ogy. The richness of the IPv6 topology, in terms of the number
1K
10K
100K
1M
10M
100M
2004 2005 2006 2007 2008 2009 2010 2011 2012 2013 2014
0.0001
0.001
0.01
0.1N
um
be
r o
f P
ath
s
Ra
tio
IP
v6
/IP
v4
IPv4
IPv6
Ratio
Figure 5: Number of globally-seen IPv4 and IPv6 paths. Thereis a 110-fold increase in IPv6 paths over ten years.
and length of paths and the connectivity of ASes, speaks to the re-silience, and, thus, production-readiness of the network.
T1: TopologyThe IPv4 topology has been studied in depth (e.g., [26, 42]), butwe also need to understand the relationships between organizationswith respect to external IPv6 routing capability and connectivity tounderstand the overall strength or brittleness of the network. As wedid for the advertisement metric (A2) we use all of the routing tablesnapshots collected by Route Views [38] and RIPE-NCC RIS [33]between Jan. 2004 and Jan. 2014 in the following.Routing Table View Biases: Before we delve into the insightsthat these data afford, it is important to understand possible bias.As noted by earlier studies (e.g., [15]) the global public routingdatasets available (e.g., Route Views, RIS) suffer from at least twoforms of bias. The first is geographic, in that global routing datais collected from a finite set of collectors, whose global distribu-tion is not uniform, leading, for example, to fewer samples fromthe African continent. The second bias stems from most of the datain these collections coming from volunteer networks that turn outto generally be large top-tier ISPs. Therefore, many peer-to-peerpaths between smaller ISPs are not visible in the data, since theseroutes are never propagated to the top-tier ISPs. These biases area limitation of the data. However, we believe that even though im-perfect the data still yields useful information about IPv6 adoptionfor the following reasons: (i) no substitute data lacking bias exists(e.g., traceroute also has bias); (ii) the view of the global routing in-frastructure of ISPs whose routing data is represented is a real viewfrom their perspective, and any path or AS counts observed are, atworst, lower bounds; (iii) we have no reason to believe that the biaspresent in these data for IPv6 differs systematically relative to thatfor IPv4, suggesting that looking at ratios of adoption, especiallyover time, is reasonable; and (iv) in the cases of counting globally-visible prefixes or ASes seen supporting IPv6, the fact that somelocal paths are missed does not speak to the global adoption state.Therefore, we present the data knowing full well it is a less-than-full statement on the routing state. We encourage the communityto collect and refine our analysis using better data.AS Support and Connectivity: We first examine the number ofASes supporting IPv6 globally as well as the number of uniqueglobally-visible AS-paths (i.e., the paths with unique AS sequence).Both are indicators of IPv6 adoption, mostly at the service providerlevel. AS adoption is indicative of support for IPv6, while the num-ber of AS-paths is an indicator of maturing connectivity betweenASes. We omit the figure showing AS-level adoption in favor ofFigure 5, which shows the number of unique IPv6 and IPv4 pathsannounced on the first day of each month. We observe that the
0
2
4
6
8
10
12
14
16
2004 2005 2006 2007 2008 2009 2010 2011 2012 2013 2014
K-c
ore
de
gre
e
Dual-StackIPv6-Only
IPv4
Figure 6: AS centrality. Pure-IPv6 and dual-stack ASes arebecoming more prevalent at the edge.
number of IPv6 paths has a 110-fold increase from January 2004to January 2014, while there is only an eight-fold increase in thenumber of IPv4 paths. However, the IPv6 to IPv4 ratio is only0.02 in January 2014, indicating the IPv6 routing mesh is still atan early stage of maturity. AS-level support for IPv6 is not shown,but follows a faster upward trend, with an 18-fold increase (versustwo-fold for IPv4) and the current ratio of IPv6 to IPv4 ASes is0.19 – almost ten times the path count ratio. As expected, the in-dicator of ASes supporting IPv6 leads the measure of connectivity.Again, we note that, because of possible bias in the view affordedby this data, raw numbers of the IPv4 and IPv6 paths seen are lessmeaningful than is the overall ratio.AS Centrality: To understand the topological position of IPv6ASes, we next compute the k-core degree of each AS in the topol-ogy graph. A k-core of a graph is the maximal subgraph in whichevery node has at least degree k. A node has k-core degree of Nif it belongs to the N-core but not to the (N + 1)-core. As usedin [17], this measure represents a natural notion of the centralityof ASes. In other words, ASes with a high k-core represent well-connected, typically large, ISPs, while those with low k-core rep-resent edge or stub networks. We show the average k-core degreeof ASes in Figure 6. We find that dual-stack ASes have a muchhigher degree of centrality than other ASes. In 2004, the pure IPv6ASes were located in a relatively central position. However, we seepure-IPv6 ASes, a small fraction of all, becoming more prevalentat the edge after 2008. Our results are in accordance with those ofCAIDA [10], who report that IPv6 is largely deployed at the corebut lags in edge networks. Note [10] uses a deeper and more robustanalysis of these same public datasets, wherein, notably, they filterout transient links. The numbers we find indicate dual-stack be-coming more widely deployed among well-connected central ISPs,while single-protocol networks are mostly those at the edge. Inother words, the older edge networks are the laggards.
We caution that studying native IPv6 topology is useful but insuf-ficient. Transition from IPv4 to IPv6 introduces a co-dependencebetween the protocols. Therefore, unlike when studying IPv4 topol-ogy independently, when studying IPv6, we must consider the partsof IPv4 that glue together “islands” of IPv6. An in-depth analysisis beyond scope, but we point readers to recent work in [10].
7. END-TO-END REACHABILITYHaving dealt with the prerequisites of addressing, routing, and
naming in the previous three sections, we now turn to the readinessof Internet end hosts to use IPv6. We split this into two metrics forthe readiness of service-level devices and client-level devices.

0
0.005
0.01
0.015
0.02
0.025
0.03
0.035
0.04
2011-06 2011-12 2012-06 2012-12 2013-06 2013-12
Fra
ctio
n o
f A
lexa
To
p 1
0K
AAAA LookupsReachability
Figure 7: Fraction of top 10K sites with AAAA records andreachable via IPv6. Two discontinuous jumps correspond toWorld IPv6 Day 2011 and World IPv6 Launch 2012.
R1: Server-Side ReadinessObviously, wide-scale adoption requires services to be capable ofhandling IPv6 traffic; therefore, our first approach to end-host readi-ness involves assessing prevalence of IPv6-enabled services.
While not indicative of all services, one way to assess IPv6 ser-vice penetration is to measure popular web servers. Much likeNikkhah et al [29] and with congruent results we use Alexa [1]to determine the most popular web sites. We then determine whichsites have a AAAA record in DNS, and, for those that do, we thentest reachability of the web site via a tunnel to Hurricane Electric.Ideally, this metric tries to assess the server, but we have no way todo so without also assessing the path to the server. Hence, our mea-surements offer an approximation. We have been probing the top10K web sites for AAAA records since April 2011 and for reacha-bility since June 2011.3 Figure 7 shows our results. We first note ajump in June 2011 that corresponds to World IPv6 Day. We find aroughly five-fold increase in AAAA records available at that point.However, we also see a nearly immediate fallback. This is under-standable given that the stated goal of that day was merely to serveas a “test flight” of IPv6 capabilities, rather than to permanently en-able IPv6 services [22]. Subsequent to this drop off, in spite of thelimited goal, we find that World IPv6 Day 2011 is responsible fora sustained two-fold increase in the IPv6-capable web sites. In thefollowing year, the June 2012 World IPv6 Launch Day also resultedin a sustained doubling of AAAA records. Further, aside from thetwo jumps, we find a slowly growing trend across time with over3.2% of the Alexa top 10K now being reachable via IPv6. It is no-table what an impact concerted community efforts, such as the twoIPv6 readiness/launch days can have on IPv6 server readiness.
The second set of points on the plot show reachability. The datashows that most of the hosts for which we find AAAA records arealso reachable. Further, the reachability trends generally mirrorthose for web servers having AAAA records. Our results generallyagree with [29]. In conclusion, while only about 3.5% of the topmost popular websites are IPv6-ready, there has been significantgrowth in the last three years, and large jumps are possible.
R2: Client-Side ReadinessIn addition to IPv6-capable services, clients need to be IPv6-enabledas well. This metric examines the ability of client systems to em-ploy IPv6, subsuming all that is required on the client side (i.e.,working IPv6 network transport, DNS, operating system, etc.).
Google makes aggregate data about client adoption of IPv6 avail-able on an ongoing basis [14]. Their experiment consists of adding3Our probing data is available [2].
0
0.005
0.01
0.015
0.02
0.025
2009 2010 2011 2012 2013 2014
Fra
ctio
n C
lien
ts U
sin
g I
Pv6
Figure 8: Average monthly fraction of clients able to accessGoogle over IPv6. 2.5% of clients use IPv6, but this numberhas been growing sharply. The most recent two-year annualgrowth rate averages 150%, a more than doubling each year.
a JavaScript applet to search results from www.google.com for arandomly sampled set of users [7]. The script first performs a namelookup on one of two experimental host names and then sends arequest to the IP address returned in the DNS response. In 90%of the cases the script chooses a name representing a dual-stackedserver, while in the remaining cases a name representing a IPv4-only server is chosen for comparison purposes. The addresses pointto 2–5 data centers (in Asia, the US, and Europe). The experimentis conducted millions of times per day. Note that, as with the R1measurements, this data again conflates the client capabilities withthose of the path from the client, and, therefore, this is an approxi-mation of the ideal metric.
Figure 8 shows the average monthly fraction of clients that con-nect to Google via IPv6 over the last 5+ years. The plot showsa growth factor of 16 over the course of the dataset—from 0.15%in September 2008 to 2.5% in December 2013. Further, most ofthe growth comes in the last two years, where the ratio increasedmarkedly, by 125% in 2012 and 175% in 2013, more than doublingeach year. As discussed in section A3, this measure is probablysomewhat optimistic; since Google has many direct private peer-ings to ISPs, some clients may be able to reach Google by IPv6 butnot other content. However, these numbers are roughly in line withthose reported in another large client study [41], which found thatalthough 6% of a global sample of clients were IPv6-capable, only1-2% of dual-stack preferred IPv6. In sum, the data shows verystrong growth in Google clients’ ability to use IPv6, especially inthe last two years.
8. IPV6 USAGE PROFILEWhile the metrics and data sketched in the previous sections set
the stage for IPv6 adoption by measuring addressing, routing, nam-ing, and end-host capabilities, in this section we aim to directly as-sess IPv6 traffic “in the wild”. That is, we aim to understand theoperational characteristics, or usage profile, of how IPv6 is actuallyemployed by those that have adopted it.
U1: Traffic VolumeOur first traffic-related metric simply aims to understand how muchof Internet traffic is using IPv6. We begin by introducing the Inter-net traffic datasets we contribute.Arbor Internet Traffic Data: We assembled two datasets describ-ing the traffic traversing customer networks monitored by devicesfrom Arbor Networks, a provider of traffic analytics and securitydevices for large networks. Arbor’s customers include a signifi-
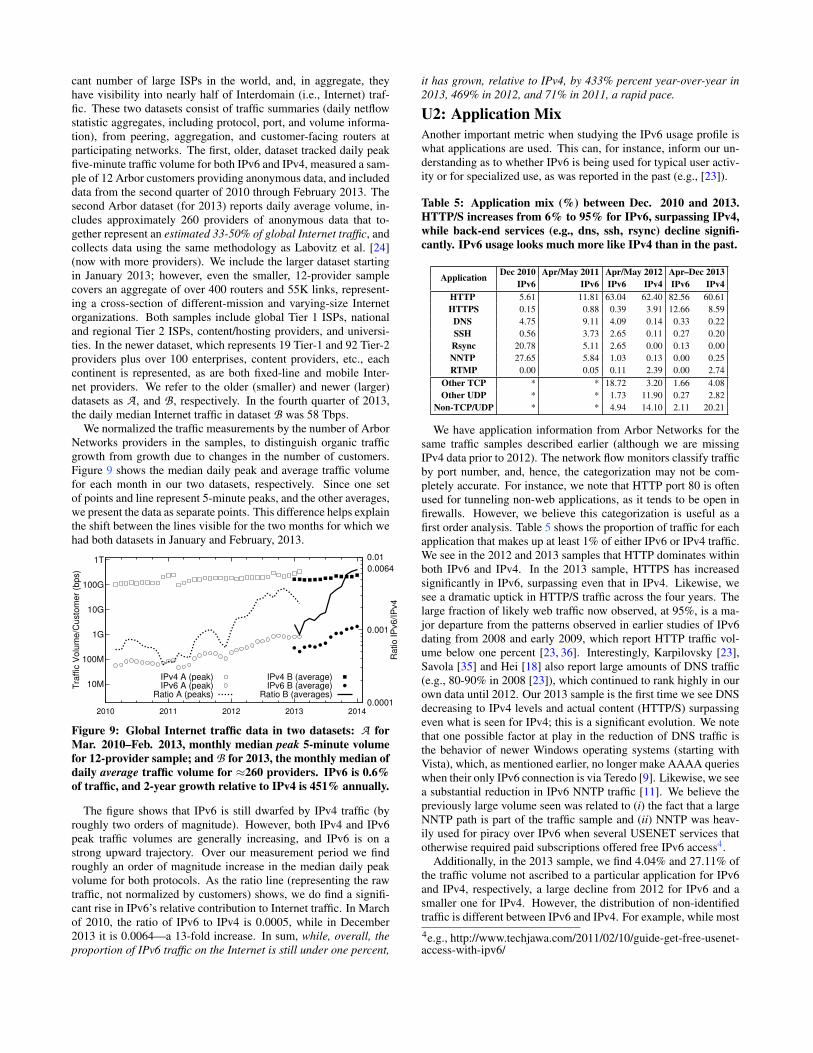
cant number of large ISPs in the world, and, in aggregate, theyhave visibility into nearly half of Interdomain (i.e., Internet) traf-fic. These two datasets consist of traffic summaries (daily netflowstatistic aggregates, including protocol, port, and volume informa-tion), from peering, aggregation, and customer-facing routers atparticipating networks. The first, older, dataset tracked daily peakfive-minute traffic volume for both IPv6 and IPv4, measured a sam-ple of 12 Arbor customers providing anonymous data, and includeddata from the second quarter of 2010 through February 2013. Thesecond Arbor dataset (for 2013) reports daily average volume, in-cludes approximately 260 providers of anonymous data that to-gether represent an estimated 33-50% of global Internet traffic, andcollects data using the same methodology as Labovitz et al. [24](now with more providers). We include the larger dataset startingin January 2013; however, even the smaller, 12-provider samplecovers an aggregate of over 400 routers and 55K links, represent-ing a cross-section of different-mission and varying-size Internetorganizations. Both samples include global Tier 1 ISPs, nationaland regional Tier 2 ISPs, content/hosting providers, and universi-ties. In the newer dataset, which represents 19 Tier-1 and 92 Tier-2providers plus over 100 enterprises, content providers, etc., eachcontinent is represented, as are both fixed-line and mobile Inter-net providers. We refer to the older (smaller) and newer (larger)datasets as A , and B , respectively. In the fourth quarter of 2013,the daily median Internet traffic in dataset B was 58 Tbps.
We normalized the traffic measurements by the number of ArborNetworks providers in the samples, to distinguish organic trafficgrowth from growth due to changes in the number of customers.Figure 9 shows the median daily peak and average traffic volumefor each month in our two datasets, respectively. Since one setof points and line represent 5-minute peaks, and the other averages,we present the data as separate points. This difference helps explainthe shift between the lines visible for the two months for which wehad both datasets in January and February, 2013.
10M
100M
1G
10G
100G
1T
2010 2011 2012 2013 2014 0.0001
0.001
0.01
Tra
ffic
Volu
me/C
usto
mer
(bps)
Ratio IP
v6/IP
v4
0.0064
IPv4 A (peak)IPv6 A (peak)
Ratio A (peaks)
IPv4 B (average)IPv6 B (average)
Ratio B (averages)
Figure 9: Global Internet traffic data in two datasets: A forMar. 2010–Feb. 2013, monthly median peak 5-minute volumefor 12-provider sample; and B for 2013, the monthly median ofdaily average traffic volume for ≈260 providers. IPv6 is 0.6%of traffic, and 2-year growth relative to IPv4 is 451% annually.
The figure shows that IPv6 is still dwarfed by IPv4 traffic (byroughly two orders of magnitude). However, both IPv4 and IPv6peak traffic volumes are generally increasing, and IPv6 is on astrong upward trajectory. Over our measurement period we findroughly an order of magnitude increase in the median daily peakvolume for both protocols. As the ratio line (representing the rawtraffic, not normalized by customers) shows, we do find a signifi-cant rise in IPv6’s relative contribution to Internet traffic. In Marchof 2010, the ratio of IPv6 to IPv4 is 0.0005, while in December2013 it is 0.0064—a 13-fold increase. In sum, while, overall, theproportion of IPv6 traffic on the Internet is still under one percent,
it has grown, relative to IPv4, by 433% percent year-over-year in2013, 469% in 2012, and 71% in 2011, a rapid pace.
U2: Application MixAnother important metric when studying the IPv6 usage profile iswhat applications are used. This can, for instance, inform our un-derstanding as to whether IPv6 is being used for typical user activ-ity or for specialized use, as was reported in the past (e.g., [23]).
Table 5: Application mix (%) between Dec. 2010 and 2013.HTTP/S increases from 6% to 95% for IPv6, surpassing IPv4,while back-end services (e.g., dns, ssh, rsync) decline signifi-cantly. IPv6 usage looks much more like IPv4 than in the past.
Application Dec 2010 Apr/May 2011 Apr/May 2012 Apr–Dec 2013IPv6 IPv6 IPv6 IPv4 IPv6 IPv4
HTTP 5.61 11.81 63.04 62.40 82.56 60.61HTTPS 0.15 0.88 0.39 3.91 12.66 8.59
DNS 4.75 9.11 4.09 0.14 0.33 0.22SSH 0.56 3.73 2.65 0.11 0.27 0.20Rsync 20.78 5.11 2.65 0.00 0.13 0.00NNTP 27.65 5.84 1.03 0.13 0.00 0.25RTMP 0.00 0.05 0.11 2.39 0.00 2.74
Other TCP * * 18.72 3.20 1.66 4.08Other UDP * * 1.73 11.90 0.27 2.82
Non-TCP/UDP * * 4.94 14.10 2.11 20.21
We have application information from Arbor Networks for thesame traffic samples described earlier (although we are missingIPv4 data prior to 2012). The network flow monitors classify trafficby port number, and, hence, the categorization may not be com-pletely accurate. For instance, we note that HTTP port 80 is oftenused for tunneling non-web applications, as it tends to be open infirewalls. However, we believe this categorization is useful as afirst order analysis. Table 5 shows the proportion of traffic for eachapplication that makes up at least 1% of either IPv6 or IPv4 traffic.We see in the 2012 and 2013 samples that HTTP dominates withinboth IPv6 and IPv4. In the 2013 sample, HTTPS has increasedsignificantly in IPv6, surpassing even that in IPv4. Likewise, wesee a dramatic uptick in HTTP/S traffic across the four years. Thelarge fraction of likely web traffic now observed, at 95%, is a ma-jor departure from the patterns observed in earlier studies of IPv6dating from 2008 and early 2009, which report HTTP traffic vol-ume below one percent [23, 36]. Interestingly, Karpilovsky [23],Savola [35] and Hei [18] also report large amounts of DNS traffic(e.g., 80-90% in 2008 [23]), which continued to rank highly in ourown data until 2012. Our 2013 sample is the first time we see DNSdecreasing to IPv4 levels and actual content (HTTP/S) surpassingeven what is seen for IPv4; this is a significant evolution. We notethat one possible factor at play in the reduction of DNS traffic isthe behavior of newer Windows operating systems (starting withVista), which, as mentioned earlier, no longer make AAAA querieswhen their only IPv6 connection is via Teredo [9]. Likewise, we seea substantial reduction in IPv6 NNTP traffic [11]. We believe thepreviously large volume seen was related to (i) the fact that a largeNNTP path is part of the traffic sample and (ii) NNTP was heav-ily used for piracy over IPv6 when several USENET services thatotherwise required paid subscriptions offered free IPv6 access4.
Additionally, in the 2013 sample, we find 4.04% and 27.11% ofthe traffic volume not ascribed to a particular application for IPv6and IPv4, respectively, a large decline from 2012 for IPv6 and asmaller one for IPv4. However, the distribution of non-identifiedtraffic is different between IPv6 and IPv4. For example, while most4e.g., http://www.techjawa.com/2011/02/10/guide-get-free-usenet-access-with-ipv6/

0
0.2
0.4
0.6
0.8
1
2009 2010 2011 2012 2013 2014
Fra
ctio
n o
f n
on
-na
tive
IP
v6
Internet Traffic AInternet Traffic B
Google Clients
Figure 10: Fraction of IPv6 traffic carried by the two mostprevalent transition technologies in the Internet traffic andGoogle client samples. Non-native IPv6 traffic was the major-ity of packets 3-4 years ago, but currently represents less thanthree percent of traffic and one percent of Google clients.
of the bytes in IPv4 are non-TCP/UDP at 20.21%, such traffic onlycontributes 2.11% of the overall bytes in IPv6. Although we wereunable to investigate this “other” category more deeply, we spec-ulate that the usage of peer-to-peer and similar popular non-well-known-port applications still differs between IPv4 and IPv6 in theTCP/UDP categories, while ICMP and tunneling protocol mix dif-fer in the non-TCP/UDP category. The method of aggregation ofuntracked protocols for 2010 and 2011 does not allow comparison,unfortunately. To summarize, over the last three years we see adramatic evolution in IPv6 application use, wherein content pack-ets now far outnumber infrastructure service packets (DNS, ICMP),and the profile now resembles IPv4.
U3: Transition TechnologiesIPv4 and IPv6 coexistence is greatly complicated by the lack ofbackward compatibility. In what is now acknowledged as one ofthe most significant IPv6 design limitations, native IPv6 networkdevices cannot communicate with their IPv4 counterparts withoutan explicit network translation layer [27]. As a result, the successof any large-scale IPv6 transition depends on the complex interplaybetween the cost and scalability of translation technologies and thecommercial incentives (or disincentives) motivating the transitionto native IPv6 infrastructure. A common transition technology istunneling. Tunneling technologies interconnect “islands” of IPv6using encapsulation across IPv4 infrastructure, or vice versa. In ad-dition to tunnels, Teredo [19] provides IPv6 connectivity to hostsbehind IPv4-NATs using UDP-encapsulation. Our next metric aimsto understand the prevalence of the most common transition tech-nologies being used in the wild where end-to-end IPv6 addressingis not fully in place. As IPv6 matures, we expect a smaller fractionof its traffic to use these technologies and more of it to be native.
Both the Google client and Arbor Networks datasets describedearlier include information on the prevalence of various transitiontechnologies. The Google perspective provides a view on the capa-bilities of end hosts, while the Arbor view is an assessment of ac-tual Internet traffic. Figure 10 shows the prevalence of non-nativeIPv6—which is defined as Teredo and IP protocol 41 traffic (usedby 6to4 and 6in4). The two Internet traffic data points A and B ,refer to the Arbor Internet traffic datasets, A and B , described ear-lier. The Google data shows that, while in 2008 only 30% of IPv6-enabled client end-hosts could use native IPv6, that number hasincreased to above 99% over the last four and a half years.
In 2010 we find the Internet traffic data shows nearly all IPv6traffic using some tunneling technology. However, as of the end of
December 2013, nearly 97% of the traffic is now native. We notethat, of the tunneled IPv6 traffic in late 2013, IP protocol 41 dom-inates, contributing over 90% of the tunneled volume compared toless than 10% for Teredo. The Arbor numbers between mid-2011and February 2012 correspond roughly to earlier measurementsfrom that time, (e.g. [34] and [41]), while the Google numbers showmuch less transition technology used than those studies; this maybe explained by the direct peerings phenomenon, described above.Overall, the data shows that native traffic is now the vast majorityof IPv6 traffic, a dramatic change from just three years ago. TheInternet’s IPv6 traffic is now real IPv6.
9. PERFORMANCEA crucial metric of IPv6 adoption is performance—which can
mean different things depending on the measurement perspectivewe take (e.g., the speed of a site to load for a user, or, for an ISP,the bandwidth across peering links). Several works predating IPv4address exhaustion offer initial results in the area of IPv6 perfor-mance (e.g., [5,7,39,44]). Further, there are some performance re-sults since the exhaustion milestones [10, 29]; both of these latterstudies report that performance over IPv6 paths that align with IPv4at the AS-level is similar for the two protocols but differs whenpaths diverge. More recent work exploring a methodology for pas-sive measurement of IPv6 and IPv4 performance was contributedby Plonka and Barford [31], who found great variability in relativeperformance of the protocols in a campus traffic sample. The datawe present here aims for a global and longitudinal, if less granular,examination of relative IPv6 network performance.
P1: Network RTTWe suspect that hardware, software, and configuration differencescould result in different quality of data transmission in IPv6 ver-sus IPv4; indeed, previous measurements and ones we report herehave shown differences. Although actual client-to-service networkperformance for large global sets of clients and services would bea more ideal metric, we use the approximation of average 10- and20-hop round trip time (RTT), tested from dozens of global per-spectives, as a proxy. This hides the details of path differencesand heterogeneity of end points, allowing a simple apples-to-applescomparison of raw network performance over the same number ofIPv4 versus IPv6 nodes. We don’t claim that this is the only or thebest IPv6 network performance metric, but it serves as a reasonableapproximation of long-term performance evolution.
Our analysis is conducted on the traceroute-based performancedata collected by CAIDA Archipelago Measurement Infrastructure(Ark) [4] to measure RTT in IPv4 and IPv6. Globally-distributedArk monitors probe all IPv4 /24s and all announced IPv6 prefixescontinuously. We analyze data from December 2008 to December2013. While this dataset is also the basis of earlier work ( [10]), were-analyze an updated longitudinal version to observe performancein the context of the other metrics we report.
Figure 11 shows the median RTT with hop distances 10 and 20for each month. We find that in 2009 RTTs were roughly 1.5 timeslonger for IPv6 than for IPv4. While the IPv4 RTTs have increasedslightly over this time period, IPv6 RTTs have decreased slightly.In 2013, the RTT for hop distance of 10 is almost identical forIPv4 and IPv6. IPv6 had better RTTs than IPv4 at 20 hops in 2012through mid-2013. To compare relative performance, we show theIPv6 to IPv4 ratio for the 10-hop RTT, as it has been less favorablefor IPv6. Since, the better the performance the smaller the RTT, weshow the ratio of the reciprocal of RTT for each protocol. As notedin [10], the sample of IPv6 data is small and the results might bedominated by a few paths. Also, evolving tunnel use likely impacts

0
100
200
300
400
500
2009 2010 2011 2012 2013 2014 0.5
0.6
0.7
0.8
0.9
1
Me
dia
n R
TT
(m
s)
Ra
tio
IP
v6
/IP
v4
pe
rfo
rma
nce
IPv6 - Hop 20IPv4 - Hop 20IPv6 - Hop 10IPv4 - Hop 10
Ratio - Hop 10
Figure 11: Median Round Trip Time (ms) with hop distance 10and 20 for IPv4 and IPv6. IPv6 showed poorer performancebefore 2010, but the last several years have seen performanceconverging to within about .90–.95 of IPv4.
RTT and hop count. Thus, we cannot conclude that IPv6 has betterRTT performance than IPv4, overall. However, the long-term trendshows clear improvement for IPv6, and it has approached paritywith IPv4 (≈95%), for the first time, in the last several years.
10. IPV6 PRESENT AND FUTUREWe examined a set of twelve metrics for assessing the adoption
of IPv6 based on a comprehensive set of ten longitudinal datasets—some original, some publicly available, most large and global. Insome cases, we updated and replicated similar measures reported inyears past (e.g. RIR allocation data, performance data); in others,we presented new large data samples (e.g. the Internet traffic data,the Verisign IPv6 .com and .net DNS packet data). Here, we firsthighlight what the current state of adoption looks like, when exam-ined through the broad set of perspectives we consulted. After that,we provide rough estimates of where we expect adoption to be infive years, based on recent trends.
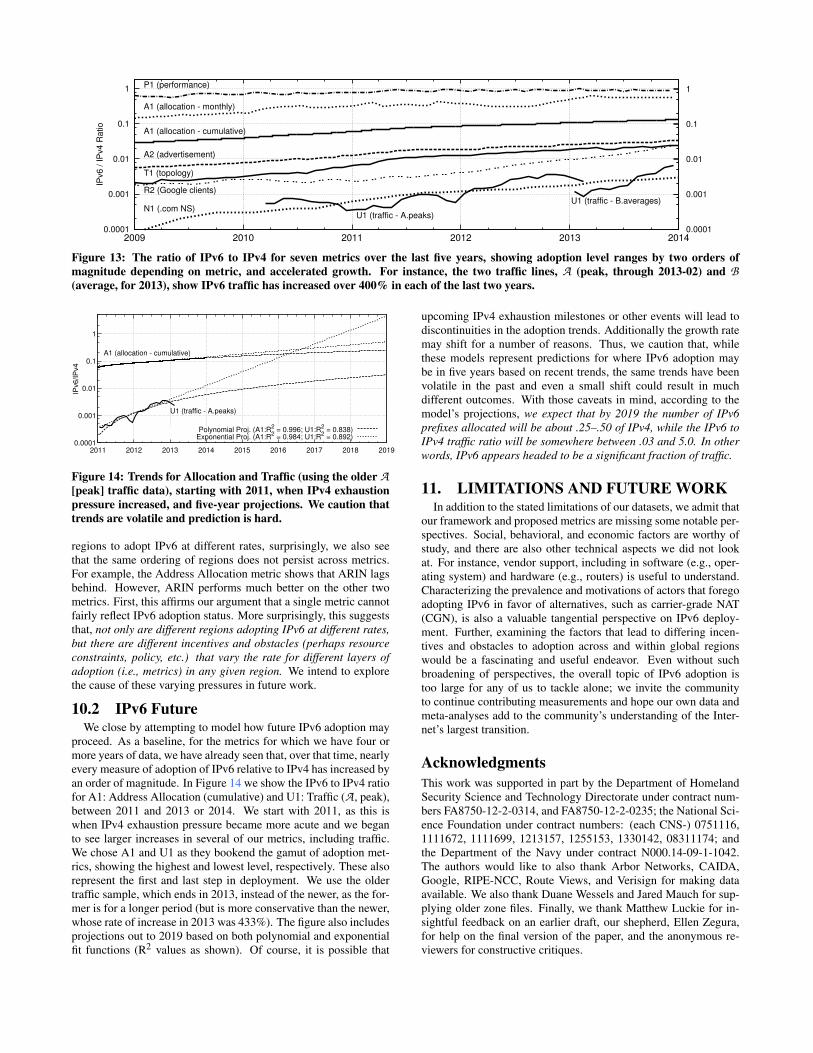
10.1 IPv6 PresentThe Value of a Broad Approach: In Figure 13 we show five-yearratios of IPv6 relative to IPv4 for seven of our metrics. Most promi-nent is the result that different metrics give entirely different insightinto the adoption of IPv6, and suggest orders of magnitude differ-ent progress. For instance, while roughly 36% of new monthly (and12% of cumulative) allocated prefixes are IPv6, we find just 0.63%of average traffic is carried over IPv6—a two-order-of-magnitudedifference. These differences across metrics serve to highlight thatmultiple viewpoints must be considered to fully understand the pro-gression and true state of adoption. In addition to the differencesseen when examining different types of data—i.e., different prereq-uisites or operational characteristics—differences within the sametype, but from distinct perspectives, are also important to consider.For example, recall that the difference in non-native IPv6 traffic asseen by Arbor Networks versus that seen by Google in metric U3has been noticeable. What is more, the order of adoption, as re-flected by the relative rank of metrics, generally follows the pre-requisites for IPv6 deployment (e.g., allocation precedes routing,which precedes clients, which precedes actual traffic).IPv6 is Now Real: Compared to prior work and earlier data, wesee in our recent data a dramatic qualitative and quantitative evo-lution in the state of IPv6 adoption, indicating a major shift in howthe protocol is being used in the last three years. Table 6 summa-rizes the usage profile of IPv6, and how it has evolved over thistime. Traffic data shows that IPv6, while just 0.63% of measuredInternet packets, is growing at a rate of over 400% in each of the
last two years; application mix data shows content packets nowdominating traffic; transition technology data shows that virtuallyall IPv6 traffic and Google clients are now native; and, performancedata shows IPv6 now nearly on par with IPv4. IPv6 is finally beingused natively, for production, and at a rapidly-increasing rate.
Table 6: Measures of actual operational characteristics of IPv6,recently and three years ago. These suggest that IPv6 is nowmature. We contend that IPv6, as a real, production protocol,has finally come of age.
Metric: Operational Aspect Measured IPv6 Status at End of:2010 2013
U1: IPv6 Percent of Internet Traffic 0.03% 0.64%U1: 1-yr. Growth vs. IPv4 (*Mar-2010 – Mar-2011) −12%* +433%U2: Content’s Portion of Traffic (HTTP+HTTPS) 6% 95%U3: Native IPv6 Packets vs. All IPv6 9% 97%U3: Native IPv6 Google Clients 78% 99%P1: Performance: 10-hop RTT−1 vs. IPv4 75% 95%
Inter and Intra-Regional Differences: Our cross-metric analysisallows us to see stark regional differences in adoption. For ex-ample, when breaking down the cumulative allocation data by RIR(A1), we find RIPE responsible for 46% of allocations, while ARINis responsible for 21%, and APNIC 18%. These three RIRs repre-sent the most-connected portions of the Internet, and, therefore, it isnot surprising that they allocate most of the new prefixes. We alsoobserve that LACNIC and AFRINIC are responsible for 12% and2% of the allocations, respectively. However, although the well-connected regions dominate the absolute number of prefixes, theratio of IPv6 to IPv4 prefix allocation per region tells a slightly dif-ferent story. Here, we find that LACNIC has, by far, the largest ratioat 0.280, followed by RIPE at 0.162, AFRINIC at 0.157, APNICwith 0.143, and we see only half as much IPv6 prefix allocation,0.072, for ARIN. Part of the likely reason is that the ARIN regionwas an early adopter of IPv4, accumulating many prefixes beforeresources became constrained.
1e-05
0.0001
0.001
0.01
0.1
1
Address(A1) Routing(T1) Traffic(U1)
AFRINICAPNIC
ARINLACNIC
RIPENCC
Figure 12: IPv6 to IPv4 ratio for three metrics, broken down byregion. We see that, not only do different regions have differentlevels of IPv6 adoption, but that the level of adoption varies bylayer; i.e., the relative rank of regions differs across metrics.
In Figure 12, we show an analysis of the IPv6 to IPv4 ratio for al-location (A1) as well as two additional metrics whose data allowedregion differentiation (T1 [announced AS paths] and U1 [averagetraffic, B]). Adoption level varies considerably across metrics forthe regions (note the log scale), with the highest measured regionfor each metric at least three times higher than the lowest. Wedo not show its numbers, but the A2 metric ranks closely matchT1, as they both track routing. While we might expect different
0.0001
0.001
0.01
0.1
1
2009 2010 2011 2012 2013 2014 0.0001
0.001
0.01
0.1
1
IPv6 / IP
v4 R
atio
A1 (allocation - monthly)
A1 (allocation - cumulative)
A2 (advertisement)
R2 (Google clients)
U1 (traffic - A.peaks)
U1 (traffic - B.averages)N1 (.com NS)
T1 (topology)
P1 (performance)
Figure 13: The ratio of IPv6 to IPv4 for seven metrics over the last five years, showing adoption level ranges by two orders ofmagnitude depending on metric, and accelerated growth. For instance, the two traffic lines, A (peak, through 2013-02) and B(average, for 2013), show IPv6 traffic has increased over 400% in each of the last two years.
0.0001
0.001
0.01
0.1
1
2011 2012 2013 2014 2015 2016 2017 2018 2019
IPv6
/IP
v4
A1 (allocation - cumulative)
U1 (traffic - A.peaks)
Polynomial Proj. (A1:R2 = 0.996; U1:R
2 = 0.838)
Exponential Proj. (A1:R2 = 0.984; U1:R
2 = 0.892)
Figure 14: Trends for Allocation and Traffic (using the older A[peak] traffic data), starting with 2011, when IPv4 exhaustionpressure increased, and five-year projections. We caution thattrends are volatile and prediction is hard.
regions to adopt IPv6 at different rates, surprisingly, we also seethat the same ordering of regions does not persist across metrics.For example, the Address Allocation metric shows that ARIN lagsbehind. However, ARIN performs much better on the other twometrics. First, this affirms our argument that a single metric cannotfairly reflect IPv6 adoption status. More surprisingly, this suggeststhat, not only are different regions adopting IPv6 at different rates,but there are different incentives and obstacles (perhaps resourceconstraints, policy, etc.) that vary the rate for different layers ofadoption (i.e., metrics) in any given region. We intend to explorethe cause of these varying pressures in future work.
10.2 IPv6 FutureWe close by attempting to model how future IPv6 adoption may
proceed. As a baseline, for the metrics for which we have four ormore years of data, we have already seen that, over that time, nearlyevery measure of adoption of IPv6 relative to IPv4 has increased byan order of magnitude. In Figure 14 we show the IPv6 to IPv4 ratiofor A1: Address Allocation (cumulative) and U1: Traffic (A , peak),between 2011 and 2013 or 2014. We start with 2011, as this iswhen IPv4 exhaustion pressure became more acute and we beganto see larger increases in several of our metrics, including traffic.We chose A1 and U1 as they bookend the gamut of adoption met-rics, showing the highest and lowest level, respectively. These alsorepresent the first and last step in deployment. We use the oldertraffic sample, which ends in 2013, instead of the newer, as the for-mer is for a longer period (but is more conservative than the newer,whose rate of increase in 2013 was 433%). The figure also includesprojections out to 2019 based on both polynomial and exponentialfit functions (R2 values as shown). Of course, it is possible that
upcoming IPv4 exhaustion milestones or other events will lead todiscontinuities in the adoption trends. Additionally the growth ratemay shift for a number of reasons. Thus, we caution that, whilethese models represent predictions for where IPv6 adoption maybe in five years based on recent trends, the same trends have beenvolatile in the past and even a small shift could result in muchdifferent outcomes. With those caveats in mind, according to themodel’s projections, we expect that by 2019 the number of IPv6prefixes allocated will be about .25–.50 of IPv4, while the IPv6 toIPv4 traffic ratio will be somewhere between .03 and 5.0. In otherwords, IPv6 appears headed to be a significant fraction of traffic.
11. LIMITATIONS AND FUTURE WORKIn addition to the stated limitations of our datasets, we admit that
our framework and proposed metrics are missing some notable per-spectives. Social, behavioral, and economic factors are worthy ofstudy, and there are also other technical aspects we did not lookat. For instance, vendor support, including in software (e.g., oper-ating system) and hardware (e.g., routers) is useful to understand.Characterizing the prevalence and motivations of actors that foregoadopting IPv6 in favor of alternatives, such as carrier-grade NAT(CGN), is also a valuable tangential perspective on IPv6 deploy-ment. Further, examining the factors that lead to differing incen-tives and obstacles to adoption across and within global regionswould be a fascinating and useful endeavor. Even without suchbroadening of perspectives, the overall topic of IPv6 adoption istoo large for any of us to tackle alone; we invite the communityto continue contributing measurements and hope our own data andmeta-analyses add to the community’s understanding of the Inter-net’s largest transition.
AcknowledgmentsThis work was supported in part by the Department of HomelandSecurity Science and Technology Directorate under contract num-bers FA8750-12-2-0314, and FA8750-12-2-0235; the National Sci-ence Foundation under contract numbers: (each CNS-) 0751116,1111672, 1111699, 1213157, 1255153, 1330142, 08311174; andthe Department of the Navy under contract N000.14-09-1-1042.The authors would like to also thank Arbor Networks, CAIDA,Google, RIPE-NCC, Route Views, and Verisign for making dataavailable. We also thank Duane Wessels and Jared Mauch for sup-plying older zone files. Finally, we thank Matthew Luckie for in-sightful feedback on an earlier draft, our shepherd, Ellen Zegura,for help on the final version of the paper, and the anonymous re-viewers for constructive critiques.
12. REFERENCES[1] ALEXA. Alexa Top 1M Sites on 2012-10-02.
http://www.alexa.com/topsites.[2] ALLMAN, M. IPv6 DNS & Reachability Dataset.
http://www.icir.org/mallman/data/ipv6-dns-data.tar.gz.[3] APNIC PTY. LTD. APNIC’s IPv4 Pool Usage, 2012.
http://www.apnic.net.[4] CAIDA. Archipelago Measurement Infrastructure.
http://www.caida.org/projects/ark/.[5] CHO, K., LUCKIE, M., AND HUFFAKER, B. Identifying IPv6
Network Problems in the Dual-stack World. In Proceedings of theACM SIGCOMM Workshop on Network Troubleshooting: Research,Theory and Operations Practice Meet Malfunctioning Reality (2004).
[6] CLAFFY, K. Tracking IPv6 Evolution: Data We Have and Data WeNeed. SIGCOMM Computer Communication Review (2011).
[7] COLITTI, L., GUNDERSON, S. H., KLINE, E., AND REFICE, T.Evaluating IPv6 Adoption in the Internet. In Proceedings of the 11thInternational Conference on Passive and Active NetworkMeasurement. 2010.
[8] CZYZ, J., ALLMAN, M., ZHANG, J., IEKEL-JOHNSON, S.,OSTERWEIL, E., AND BAILEY, M. Measuring IPv6 Adoption. ICSITechnical Report TR-13-004, August 2013.
[9] DAVIES, J. Domain Name System Client Behavior in WindowsVista. http://technet.microsoft.com/en-us/library/bb727035.aspx, 2006.
[10] DHAMDHERE, A., LUCKIE, M., HUFFAKER, B., CLAFFY, K.,ELMOKASHFI, A., AND ABEN, E. Measuring the Deployment ofIPv6: Topology, Routing and Performance. In Proceedings of the12th ACM SIGCOMM Conference on Internet Measurement (IMC)(2012).
[11] FEATHER, C. Network News Transfer Protocol (NNTP), 2006.[12] FULLER, V., AND LI, T. RFC4632 - Classless Inter-domain Routing
(CIDR): The Internet Address Assignment and Aggregation Plan,2006.
[13] GIOTSAS, V., AND ZHOU, S. Detecting and Assessing the HybridIPv4/IPv6 AS Relationships. SIGCOMM Computer CommunicationReview (2011).
[14] GOOGLE. IPv6 Statistics.http://www.google.com/intl/en/ipv6/statistics/.
[15] GREGORI, E., IMPROTA, A., LENZINI, L., ROSSI, L., AND SANI,L. On the Incompleteness of the AS-level Graph: a NovelMethodology for BGP Route Collector Placement. In Proceedings ofthe 12th ACM Conference on Internet Measurement (IMC) (2012).
[16] GUÉRIN, R., AND HOSANAGAR, K. Fostering IPv6 MigrationThrough Network Quality Differentials. SIGCOMM ComputerCommunication Review (2010).
[17] GÜRSUN, G., RUCHANSKY, N., TERZI, E., AND CROVELLA, M.Inferring Visibility: Who’s (Not) Talking to Whom? SIGCOMMComputer Communications Review (2012).
[18] HEI, Y., AND YAMAZAKI, K. Traffic Analysis and WorldwideOperation of Open 6to4 Relays for IPv6 Deployment. In Proceedingsof the International Symposium on Applications and the Internet(2004).
[19] HUITEMA, S. RFC 4380: Teredo: Tunneling IPv6 over UDP throughNetwork Address Translations (NATs), 2006.
[20] HUSTON, G. The Case for IPv6: Extinction, Evolution orRevolution? http://www.potaroo.net, 2006.
[21] IANA. IPv6 Addresses for the Root Servers.http://www.iana.org/reports/2008/root-aaaa-announcement.html, 2008.
[22] INTERNET SOCIETY. Internet Society - World IPv6 Day.http://www.worldipv6day.org/, 2011.
[23] KARPILOVSKY, E., GERBER, A., PEI, D., REXFORD, J., ANDSHAIKH, A. Quantifying the Extent of IPv6 Deployment. InProceedings of the 10th International Conference on Passive andActive Network Measurement (2009).
[24] LABOVITZ, C., IEKEL-JOHNSON, S., MCPHERSON, D.,OBERHEIDE, J., AND JAHANIAN, F. Internet Inter-Domain Traffic.In Proceedings of the 2010 Conference on Applications,Technologies, Architectures, and Protocols for ComputerCommunications (SIGCOMM) (2010).
[25] LEBER, M. Global IPv6 Deployment Progress Report.http://bgp.he.net/ipv6-progress-report.cgi, 2014.
[26] MAHADEVAN, P., KRIOUKOV, D., FOMENKOV, M.,DIMITROPOULOS, X., CLAFFY, K. C., AND VAHDAT, A. TheInternet AS-level Topology: Three Data Sources and One DefinitiveMetric. SIGCOMM Computer Communication Review (2006).
[27] MARSAN, C. Biggest Mistake for IPv6: It’s Not BackwardsCompatible.http://www.networkworld.com/news/2009/032509-ipv6-mistake.html, 2009.
[28] MOCKAPETRIS, P., AND DUNLAP, K. J. Development of theDomain Name System. In Proceedings of the 1998 Conference onApplications, Technologies, Architectures, and Protocols forComputer Communications (SIGCOMM) (1988).
[29] NIKKHAH, M., GUÉRIN, R., LEE, Y., AND WOUNDY, R. AssessingIPv6 Through Web Access: A Measurement Study and Its Findings.In Proceedings of the Seventh Conference on emerging NetworkingEXperiments and Technologies (CoNEXT) (2011).
[30] OSTERWEIL, E., MCPHERSON, D., DIBENEDETTO, S.,PAPADOPOULOS, C., AND MASSEY, D. Behavior of DNS’ TopTalkers, a .com/.net View. In Proceedings of the 13th InternationalConference on Passive and Active Network Measurement (2012).
[31] PLONKA, D., AND BARFORD, P. Assessing Performance of InternetServices on IPv6. In Proceedings of the IEEE Symposium onComputers and Communications (ISCC) (2013).
[32] RIPE. RIPE Routing Information Service (RIS) Raw data Project.http://www.ripe.net/data-tools/stats/ris/ris-raw-data.
[33] RIPE NCC. Routing Information Service (RIS).http://www.ripe.net/ris/.
[34] SARRAR, N., MAIER, G., AGER, B., SOMMER, R., AND UHLIG,S. Investigating IPv6 Traffic - What Happened at the World IPv6Day? In Proceedings of the 13th International Conference on Passiveand Active Network Measurement (2012).
[35] SAVOLA, P. Observations of IPv6 Traffic on a 6to4 Relay.SIGCOMM Computer Communication Review 35, 1.
[36] SHEN, W., CHEN, Y., ZHANG, Q., CHEN, Y., DENG, B., LI, X.,AND LV, G. Observations of IPv6 traffic. In Proceedings of theInternational Colloquium on Computing, Communication, Control,and Management (2009).
[37] SRISURESH, P., AND HOLDREGE, M. RFC2663 - IP NetworkAddress Translator (NAT) Terminology and Considerations, 1999.
[38] UNIVERSITY OF OREGON. Route Views project.http://www.routeviews.org/.
[39] WANG, Y., YE, S., AND LI, X. Understanding Current IPv6Performance: a Measurement Study. In 10th IEEE Symposium onComputers and Communications (2005).
[40] WESSELS, D., LARSON, M., AND MANKIN, A. Analysis of QueryTraffic to .com/.net Name Servers. http://www.apricot2013.net/__data/assets/pdf_file/0006/58884/130226-com-net-query-analysis-for-apricot-2013_1361840547.pdf, 2013.Slides of a talk given at APRICOT, Feb. 19–Mar. 1, Singapore.
[41] ZANDER, S., ANDREW, L. L., ARMITAGE, G., HUSTON, G., ANDMICHAELSON, G. Mitigating Sampling Error When MeasuringInternet Client IPv6 Capabilities. In Proceedings of the 12th ACMConference on Internet Measurement (IMC) (2012).
[42] ZHANG, B., LIU, R., MASSEY, D., AND ZHANG, L. Collecting theInternet AS-level Topology. SIGCOMM Computer CommunicationReview (2005).
[43] ZHANG, G., QUOITIN, B., AND ZHOU, S. Phase Changes in theEvolution of the IPv4 and IPv6 AS-Level Internet Topologies.Computer Communications 34, 5 (Apr. 2011).
[44] ZHOU, X., AND VAN MIEGHEM, P. Hopcount and e2e Delay: IPv6Versus IPv4. In Proceedings of the 6th International Conference onPassive and Active Network Measurement (2005).


