Embed Size (px)
Citation preview
I
Maximising seaweed concentration by considering different matrixes in
food products and consumer sensory techniques.
0905192 – Katrina Ross
Masters by Research (MbR)
August 2018
Word Count: 18,956
School of Science, Engineering and Technology
Abertay University, Dundee.

Maximising seaweed concentration by considering different matrixes in food products and consumer sensory techniques. Katrina Ross
ii | P a g e
Acknowledgments
I would like to express my gratitude to Dr Jonathan Wilkin for his patience and support
throughout my KTP journey and Masters by research. The help given to improve my
academic writing and statistics has been invaluable and would not have got to this
stage without his reassurance. Also, to Dr John Grigor for his insights into sensory
evaluation and assistance with TDS and the rest of the Food and Drink Division for all
their support and guidance.
To the production staff with New Wave Foods LTD for organising the seaweed to be
harvested, dried and sent to me at Abertay to experiment with in the kitchen. Also, to
all my friends and family for all their encouragement throughout my studies and
keeping me on track and semi sane along the way.
More importantly to the individuals who participated in all the sensory consumer trials,
there would be no data without them.
Maximising seaweed concentration by considering different matrixes in food products and consumer sensory techniques. Katrina Ross
iii | P a g e
Abstract
Despite the growth of the functional food convenience and snack market, seaweed
containing food products have been limited to small quantities of imported produce;
mainly as a salt replacer rather than a main ingredient. To improve this situation, this
work investigates UK consumer expectations and insights into seaweed containing
products. This research explores the possible application of seaweed as a functional
ingredient with unique nutritional, textural, and sensory characteristics, offering
innovative food design solutions. In addition, the study aimed to identify the maximum
concentrations of seaweed in a food-based application for rehydrated and dried edible
Scottish seaweed with the intention of encouraging seaweed consumption.
The first stage of this study investigated rehydrating several dried seaweeds sent to
Abertay, Scotland from the factory and harvest site in Wick, Scotland. Once the data
was recorded appropriate seaweeds were selected for varying food products based
on volumes, accessibility, seasonality and nutritional properties. Different
concentrations (20% and 40%) of Undariapinnatifida (Wakame) were incorporated in
a salad, 15% Himathalia Elongate (Sea Spaghetti) in a pesto, 30% Himathalia
Elongate (Sea Spaghetti) in crisps and 5, 10, 15 and 20% Undariapinnatifida Wakame)
and Himathalia Elongate (Sea Spaghetti) in crackers.
During this study, lower concentrations of seaweeds were considerably more
acceptable to consumers in the salads and crackers. Interestingly a higher fat
concentration of the pesto also was more consumer acceptable, and various flavours
of the crisps, which were determined by sensory analyses techniques. These results
will help the food industry promote seaweed into the food market with a range of
successful healthier products.
As a result of the new product development in this study the 20 % seaweed salads,
seaweed crisps and seaweed pesto added to pasta are being up scaled commercially.
They are now available to purchase online and in health food stores such as Ocado,
Real Foods and Whole Foods and other smaller retail outlets.
Maximising seaweed concentration by considering different matrixes in food products and consumer sensory techniques. Katrina Ross
iv | P a g e
Contents
Acknowledgments ....................................................................................................... ii
Abstract ...................................................................................................................... iii
Contents ..................................................................................................................... iv
List of Figures ............................................................................................................. vi
List of Tables ............................................................................................................. vii
1. Introduction ............................................................................................................ 1
2. Literature Review ................................................................................................... 5
2.1 Seaweed Harvesting ......................................................................................... 5
2.3 Seaweed Uses .................................................................................................. 5
2.2 Seaweed Production ......................................................................................... 5
2.4 Neophobia ......................................................................................................... 8
2.5 Health Benefits of Seaweed .............................................................................. 8
2.6 Current Studies on Seaweed Products ........................................................... 10
2.7 Oral Processing .............................................................................................. 11
2.8 Sensory Evaluation ......................................................................................... 13
2.9 Temporal Dominance of Sensation ................................................................. 13
2.10 Conclusion .................................................................................................... 15
3. Materials and Methods ......................................................................................... 16
3.1 Rehydration Trials ........................................................................................... 16
3.1.1 Sample Preparation .................................................................................. 16
3.1.2 Texture Measurements ............................................................................. 17
3.1.3 Experimental Design ................................................................................. 18
3.2 Milling Trials .................................................................................................... 20
3.3 Seaweed Species used for New Product Development .................................. 22
3.4 New Product Development and Utilisation of Rehydrated Seaweed ............... 25
Maximising seaweed concentration by considering different matrixes in food products and consumer sensory techniques. Katrina Ross
v | P a g e
3.4.1 Seaweed Salads ....................................................................................... 26
3.4.2 Seaweed Pesto ......................................................................................... 27
3.5 New Product Development and Utilisation of Dried Seaweed ......................... 27
3.5.1 Preparation of Seaweed Crisps ................................................................ 27
3.6 Consumer Trials .............................................................................................. 29
3.7 Preparation of the Seaweed Crackers for TDS ............................................... 30
3.7.1 Panellists selection for TDS sessions ....................................................... 32
3.7.2 Sensory Attribute Generation for TDS ...................................................... 32
3.7.3 Warm-up and Preparation Process ........................................................... 33
3.7.4 Experimental Process ............................................................................... 33
3.8 Method Justification ........................................................................................ 35
3.9 Data Analysis .................................................................................................. 36
3.9.1 Generation of Response Rate and Significance Line TDS Graphs ........... 36
3.9.2 Statistical Analysis .................................................................................... 36
4. Results ................................................................................................................. 38
4.1 Rehydration Results ........................................................................................ 38
4.2 Milling Results ................................................................................................. 42
4.3 Seaweed Salads with Rehydrated Seaweed .................................................. 43
4.4 Seaweed Pesto Products ................................................................................ 49
5. Results of Dried Seaweed Crackers and Seaweed Crisps ................................... 53
5.1 Seaweed Crisps .............................................................................................. 53
5.2 TDS response rate and significance graphs for Seaweed Crackers ............... 56
6. Discussion ............................................................................................................ 65
6.1 Rehydration Results ........................................................................................ 65
6.2 Milling .............................................................................................................. 66
6.3 Rehydrated Products ...................................................................................... 67
6.4 Dried Seaweed Food Products ...................................................................... 70
Maximising seaweed concentration by considering different matrixes in food products and consumer sensory techniques. Katrina Ross
vi | P a g e
6.5 Temporal Dominance of Sensations ............................................................... 70
6.6 Upscaling of Seaweed Products ..................................................................... 72
7. Conclusion and Future Work ................................................................................ 73
8. References ........................................................................................................... 75
9. Appendices .......................................................................................................... 84
List of Figures
Figure 1: Tidal zones where common seaweeds are found ....................................... 6
Figure 2: Seaweeds nutritional benefits (Food Navigator, 2015) .............................. 10
Figure 3: Probe method to measure burst force strength of each seaweed species 17
Figure 4: 50 g of seaweed inserted to different sized sieves .................................... 20
Figure 5: Nutrition results for Seaweed Species ...................................................... 22
Figure 6: Map of the chosen sites to harvest the wild seaweed in the north of
Scotland ................................................................................................................... 23
Figure 7: Seaweed hand cut to allow for regrowth ................................................... 24
Figure 8: New product development gated process ................................................. 25
Figure 9: NPD of Seaweed Salads ........................................................................... 26
Figure 10 NPD of Seaweed Crisps........................................................................... 28
Figure 11: Randomised Blinding codes generated by Compusense software ......... 33
Figure 12: Panellist at individual booth tasting sample ............................................. 34
Figure 13: Selection of attributes for each panellist to choose when dominant ........ 34
Figure 14: Burst strength of rehydrated seaweeds ................................................... 38
Figure 15: Boxplots of 20% seaweed salad ............................................................. 44
Figure 16 Box plots for seaweed salad .................................................................... 45
Figure 17: Seaweed pesto overall acceptance of seaweed pesto products ............. 49
Figure 18: Boxplot results of Seaweed Pesto ........................................................... 50
Figure 19: Seaweed crisp overall acceptability ........................................................ 53
Figure 20: Boxplot of Seaweed Crisp results ........................................................... 54
Figure 21: Seaweed cracker with two species of seaweed and different levels added
................................................................................................................................. 56
Figure 22: Main effects of Overall Acceptance ......................................................... 57
Maximising seaweed concentration by considering different matrixes in food products and consumer sensory techniques. Katrina Ross
vii | P a g e
Figure 23: Cracker without seaweed ........................................................................ 60
Figure 24: Cracker with 5% and 10% Wakame ........................................................ 61
Figure 25: Cracker with 15% and 20% Wakame ...................................................... 62
Figure 26: Cracker with 5% and 10% Sea Spaghetti................................................ 63
Figure 27: Cracker with 15% and 20% Sea Spaghetti.............................................. 64
Figure 28: Structure of the Wakame seaweed with chewy midrib through the middle
of the plant ............................................................................................................... 68
List of Tables
Table 1: Showing the Taghuci design and the responses from the experiment ....... 19
Table 2: Sensory attributes important for consumer acceptability ............................ 29
Table 3: Factorial design with 30 runs ...................................................................... 31
Table 4: Water holding capacity of species of seaweeds and rehydration time ....... 41
Table 5: Data recorded during the sieving process .................................................. 42
Maximising seaweed concentration by considering different matrixes in food products and consumer sensory techniques. Katrina Ross
1 | P a g e
1. Introduction
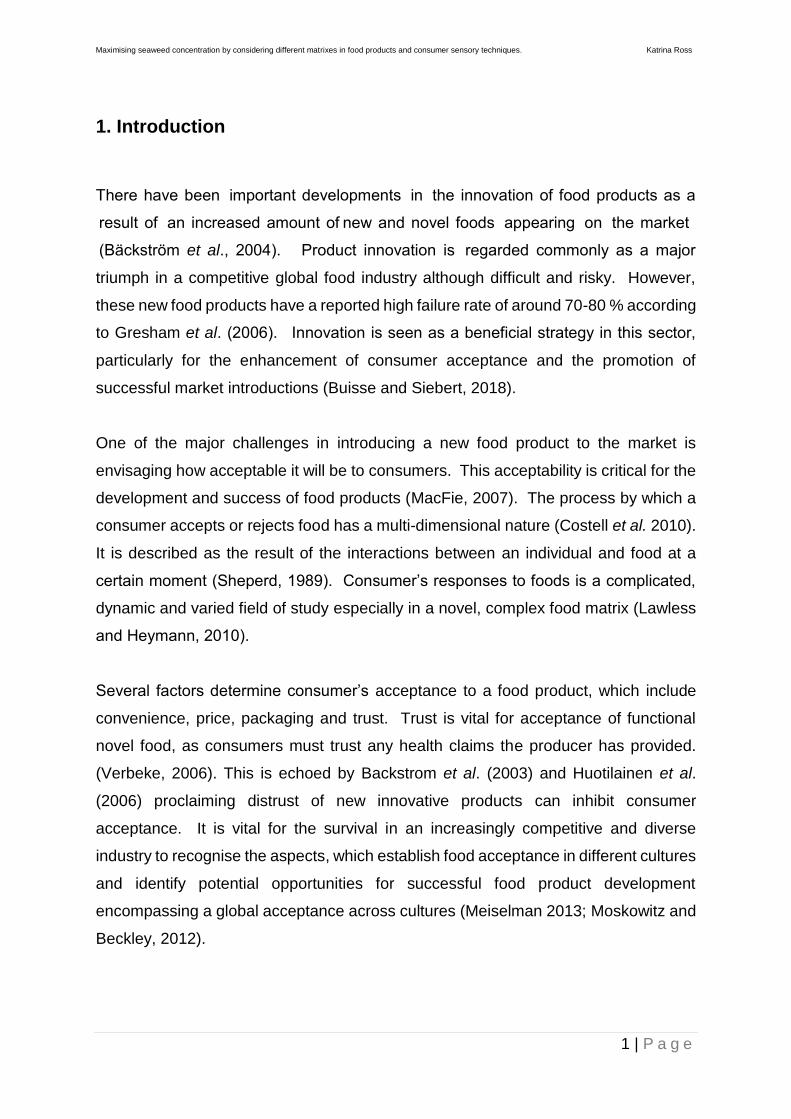
There have been important developments in the innovation of food products as a
result of an increased amount of new and novel foods appearing on the market
(Bäckström et al., 2004). Product innovation is regarded commonly as a major
triumph in a competitive global food industry although difficult and risky. However,
these new food products have a reported high failure rate of around 70-80 % according
to Gresham et al. (2006). Innovation is seen as a beneficial strategy in this sector,
particularly for the enhancement of consumer acceptance and the promotion of
successful market introductions (Buisse and Siebert, 2018).
One of the major challenges in introducing a new food product to the market is
envisaging how acceptable it will be to consumers. This acceptability is critical for the
development and success of food products (MacFie, 2007). The process by which a
consumer accepts or rejects food has a multi-dimensional nature (Costell et al. 2010).
It is described as the result of the interactions between an individual and food at a
certain moment (Sheperd, 1989). Consumer’s responses to foods is a complicated,
dynamic and varied field of study especially in a novel, complex food matrix (Lawless
and Heymann, 2010).
Several factors determine consumer’s acceptance to a food product, which include
convenience, price, packaging and trust. Trust is vital for acceptance of functional
novel food, as consumers must trust any health claims the producer has provided.
(Verbeke, 2006). This is echoed by Backstrom et al. (2003) and Huotilainen et al.
(2006) proclaiming distrust of new innovative products can inhibit consumer
acceptance. It is vital for the survival in an increasingly competitive and diverse
industry to recognise the aspects, which establish food acceptance in different cultures
and identify potential opportunities for successful food product development
encompassing a global acceptance across cultures (Meiselman 2013; Moskowitz and
Beckley, 2012).
Maximising seaweed concentration by considering different matrixes in food products and consumer sensory techniques. Katrina Ross
2 | P a g e
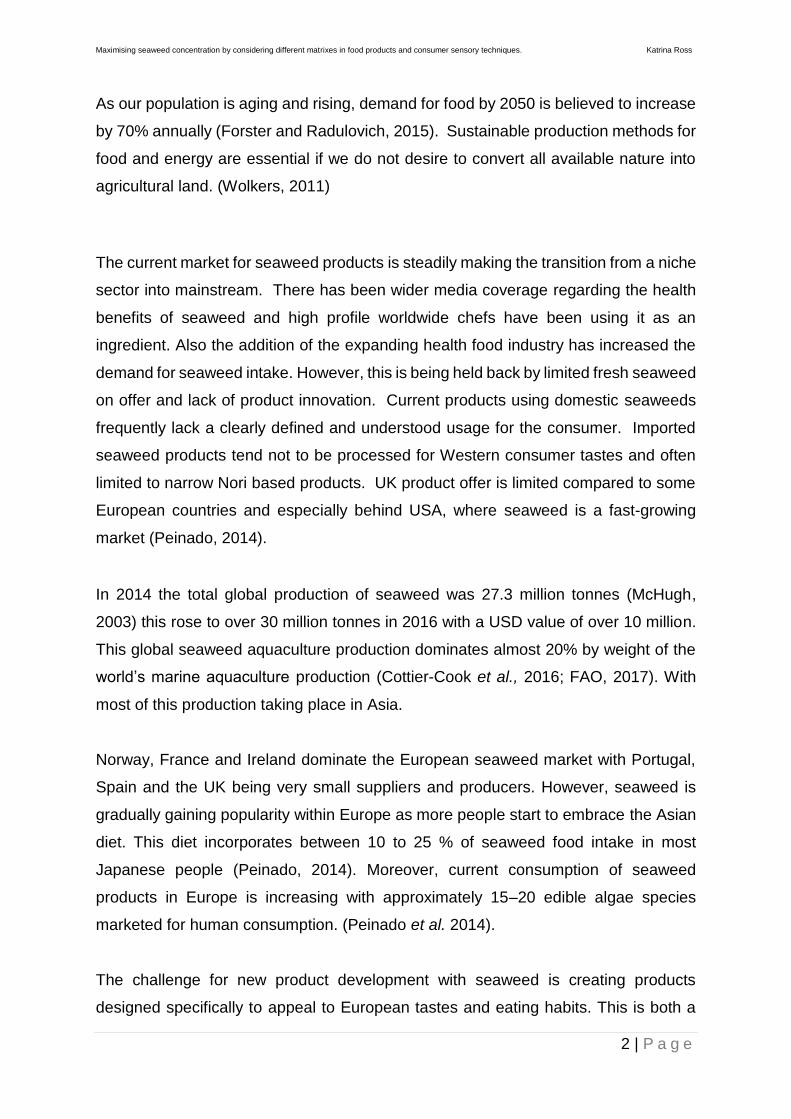
As our population is aging and rising, demand for food by 2050 is believed to increase
by 70% annually (Forster and Radulovich, 2015). Sustainable production methods for
food and energy are essential if we do not desire to convert all available nature into
agricultural land. (Wolkers, 2011)
The current market for seaweed products is steadily making the transition from a niche
sector into mainstream. There has been wider media coverage regarding the health
benefits of seaweed and high profile worldwide chefs have been using it as an
ingredient. Also the addition of the expanding health food industry has increased the
demand for seaweed intake. However, this is being held back by limited fresh seaweed
on offer and lack of product innovation. Current products using domestic seaweeds
frequently lack a clearly defined and understood usage for the consumer. Imported
seaweed products tend not to be processed for Western consumer tastes and often
limited to narrow Nori based products. UK product offer is limited compared to some
European countries and especially behind USA, where seaweed is a fast-growing
market (Peinado, 2014).
In 2014 the total global production of seaweed was 27.3 million tonnes (McHugh,
2003) this rose to over 30 million tonnes in 2016 with a USD value of over 10 million.
This global seaweed aquaculture production dominates almost 20% by weight of the
world’s marine aquaculture production (Cottier-Cook et al., 2016; FAO, 2017). With
most of this production taking place in Asia.
Norway, France and Ireland dominate the European seaweed market with Portugal,
Spain and the UK being very small suppliers and producers. However, seaweed is
gradually gaining popularity within Europe as more people start to embrace the Asian
diet. This diet incorporates between 10 to 25 % of seaweed food intake in most
Japanese people (Peinado, 2014). Moreover, current consumption of seaweed
products in Europe is increasing with approximately 15–20 edible algae species
marketed for human consumption. (Peinado et al. 2014).
The challenge for new product development with seaweed is creating products
designed specifically to appeal to European tastes and eating habits. This is both a
Maximising seaweed concentration by considering different matrixes in food products and consumer sensory techniques. Katrina Ross
3 | P a g e
technical challenge and a neophobic consumer challenge, and seaweed products
need to ensure flavours and textures appeal specifically to European tastes. This can
be measured based on Risso et al (2017) finding that tastes differ using a bio-cultural
approach to the study of food choice by investigating the contribution of population
and culture. Significant differences were distinguished in food habits across
populations. Three bitter foods and perceived bitterness of stevioside were
significantly higher in Northern Europeans compared to Maghrebis, Sri - Lankans and
Italians. The challenge regarding consumer acceptability of seaweed is apparent from
the seaweed’s texture, aroma and bitter and salty taste.
It is evident the species and quantity of seaweed in a food product has varying
attributes throughout the swallowing process. This study further investigated
consumer acceptability of food products containing various levels of seaweed.
This research project is industrially linked and was supported through a Knowledge
Transfer Partnership (KTP); the work was undertaken with the Small to Medium
Sized Enterprise (SME) New Wave Foods Ltd. The project came about from extensive
market intelligence with the start-up company New Wave Foods ltd who then required
further research at Abertay University for new product development. The aim of this
KTP was to develop two value added consumer acceptable products; which were a
nutritionally balanced salad option and a snack product. The outcomes of this piece of
research directly affected the company by increasing their product portfolio and
ultimately profit.
This study was undertaken with the following objectives:
1. Evaluate the addition of seaweed into new food product through the NPD
process to create a range of consumer acceptable food products.
2. Assess the optimum concentration of seaweeds in a range of food products in
order to maximise its ratio and its consumer acceptability.
Maximising seaweed concentration by considering different matrixes in food products and consumer sensory techniques. Katrina Ross
4 | P a g e
3. Appraise Temporal Dominance of Sensation (TDS) as a practical tool to assess
and optimise the concentration of seaweed within a new seaweed product.
Due to market intelligence and market research within the company, salads, pesto,
crisps and crackers were used as food vehicle to incorporate seaweed into a
mainstream diet. Additional products such as seaweed popcorn, seaweed salsa
verde, seaweed pasta and seaweed tea were also trialled in the NPD kitchen. The
final selection of seaweed used for these products were Wakame and Sea Spaghetti
due to availability annually at the harvesting sites in Wick. These species would grow
and be harvested in large volumes to keep up with NPD demand and be nutritionally
and financially viable.
Maximising seaweed concentration by considering different matrixes in food products and consumer sensory techniques. Katrina Ross
5 | P a g e
2. Literature Review
2.1 Seaweed Harvesting
The harvesting of seaweed is regulated by the EU and monitored by scientists and
regulators for prior biodiversity assessments. Licenses are granted for different
harvesting locations and size. Manual and mechanic harvesting is carried out
depending on the location, equipment and the use for the company. In this research
the company New Wave foods manually harvest their seaweeds by cutting it to allow
for regrowth during low tides for ease of access. The seaweed is then put in bags,
transported from shore to factory, where it is washed and dried.
Good water conditions are key to growing high quality seaweed that is fit for human
consumption. New Wave Foods harvesting sites are based around the far north of
Scotland, a remote area of low population density. The sites were selected after
extensive research and surveys of the Scottish coastline. To achieve highest quality
raw material the site selection criteria included many risk assessments including
distance from areas of possible contamination (urban areas, ports, major fresh water
inputs etc.). Seaweed must be harvested from exposed areas with high water
exchange allowing for renewal of nutrients and avoidance of fouling. Regular quality
tests are taken at each site to ensure no local pollutants, heavy metals, pesticides,
microorganisms. Harvest areas must have low human activity. All the seaweed is
hand harvested by trained harvesters where the seaweed is selected and cut by hand
for quality and re-growth. Each species is only harvested in season, ensuring high
quality and no fouling or bleaching.
2.2 Seaweed Production
As the world’s population is aging and rising, demand for food by 2050 is believed to
increase dramatically. Globally over 290 species of seaweeds are currently consumed,
mostly for food and the production of hydrocolloid, medicine, fertilizer, paper and
animal feed (Forster and Radulovich, 2015).
Maximising seaweed concentration by considering different matrixes in food products and consumer sensory techniques. Katrina Ross
6 | P a g e
Seaweed or edible algae are a rich source of micronutrients that are found on the
coast of many countries and they are valued as marine plants (Keyimu, 2013),
according to Bequette and France (2004) there are 45,000 species of marine macro
algae or Seaweed, plant like organisms belonging to three different groups: Brown
(Phaeophyceae), Green (Chloropgyceae) and Red (Rhodophyceae). Green algae are
commonly present in freshwater and even terrestrial locations such as rocks, walls
and tree bark, whereas red and brown algae are almost exclusively found in marine
environments. Seaweeds are diverse in nature in regards to their size, shape, colour,
seasonality and composition. Apart from colour, these seaweed varieties differ
considerably in quality, consistency, and nutrient content. In addition the chemical
composition of theses seaweeds vary with environmental conditions, habitat, species
and maturity (Ortiz et al., 2006)
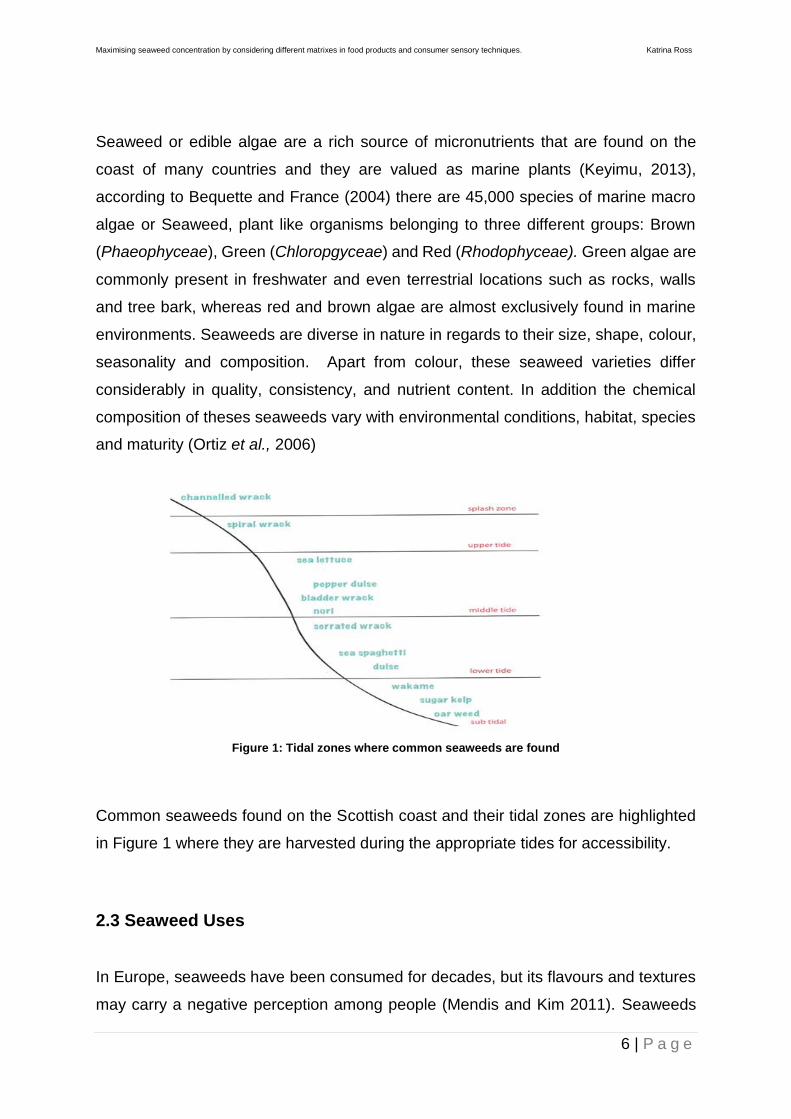
Figure 1: Tidal zones where common seaweeds are found
Common seaweeds found on the Scottish coast and their tidal zones are highlighted
in Figure 1 where they are harvested during the appropriate tides for accessibility.
2.3 Seaweed Uses
In Europe, seaweeds have been consumed for decades, but its flavours and textures
may carry a negative perception among people (Mendis and Kim 2011). Seaweeds
Maximising seaweed concentration by considering different matrixes in food products and consumer sensory techniques. Katrina Ross
7 | P a g e
are rich in a wide variety of bioactive components, contributing to many health benefits,
and accordingly can be classified as a source of functional food ingredients (Gannam
and Cox, 2013). Nevertheless, seaweed remains largely unexploited as a food source
in the Western diet and is principally used to provide extracts such as agar,
carrageenan, and alginate. Additionally, the aquatic plant is used in some regions as
fertiliser, animal feed, cosmetics and medicine (Kenicer et al. 2000). McHugh (2003)
further describes seaweeds to be significant marine bio resources utilised for
fertilisers, biofuels, and hydrocolloids extraction. An emulsifying gelling agent where
the alginate is further used for the cosmetics and pharmaceuticals industry
(Maneveldt, 2015).
According to Cox and Ghannam (2013), its widespread consumption in the East can
be accredited to its unique flavours and numerous nutritional benefits. Thus, high
nutritional benefits, alongside the growth of the health/food industry has enabled the
revival of seaweed in the diet of the UK population.
Around 95% of the current global seaweed production currently comes from Asia,
mainly due to its use in Asian cuisine (Scottish Enterprise, 2017). In 2004, 99% of the
world’s seaweed was produced by just eight Asian countries (Dhargalkar and Pereira,
2005). This inherently suggests that lack of exposure to the product is a factor in its
lack of consumption in Europe, significantly due to culture. Western consumers are
possibly unacquainted with eating seaweed other than sushi. Nevertheless, seaweed-
flavoured food products are superfoods that appear to be trending in Europe. A survey
conducted by Mintel (2016), highlighted further that seaweeds health benefits
appealed to European consumers, as 58% of German consumers and 44% UK
consumers either tried or would be interested in trying algae as a source of protein.
People are now becoming aware of seaweed’s potential as a food source with
evidence suggesting that it contains a source of nutrients, including many essential
vitamins and minerals (Roohinejad et. al., 2017; Cox, 2013; Lage-Yusty et al., 2012;
Hanjabamet. al., 2016; Kadam and Prabhasankar, 2010; Tibbetts et al., 2016). Also
containing an abundance of fibre, carbohydrates, protein and essential fatty acids
Maximising seaweed concentration by considering different matrixes in food products and consumer sensory techniques. Katrina Ross
8 | P a g e
(MacArtain et. al., 2007). This functional and sustainable benefit will enable seaweed
to have considerable scope to be incorporated into the UK diet.
Taking into account the wide spread data available on the functional attributes of
seaweed; it appears to have extensive uses and potential incorporation into many food
products (Roohinejad et al., 2017). With the application of seaweed and seaweed
extracts added to several food products could potentially increase the nutritional value,
improve texture and sensory profiles of foods such as meats, bakery and dairy items.
2.4 Neophobia
Nevertheless, seaweed is a challenge as these products do not normally appeal to
Western tastes, which can be due to neophobia. Neophobia is one of the many factors
affecting acceptability of innovative products. Unfamiliarity and lack of exposure, is a
strong barrier in food choice and can evoke negative responses to new foods. Prescott
(2004) states that particularly in a cultural context, acceptance of novel foods varies
depending on previous experience where repeated exposure can enhance sensory
perceptions.
Dovey et al (2008) defines food neophobia as a reluctance to eat unfamiliar foods,
although despite being extensively investigated the means behind the rejection of
foods have not been clearly identified. (Lafraire et al. 2016). Neophobia can have a
considerable impact on the quality of our diet, as it is such a crucial determinant of our
food choices. It can also have a detrimental effect to new food products entering the
market. As stated by Barrena and Sánchez (2013) new food products high failure rate
is an added result developed from negative attitudes with regard to food and food
neophobia.
2.5 Health Benefits of Seaweed
According to studies conducted in the south-east of Asia, seaweed has been found to
suppress diseases such as cancer and diabetes, as well as heart problems (Brown et
al. 2004). As stated by Kadam and Tiwari (2014) seaweeds are a good source of
Maximising seaweed concentration by considering different matrixes in food products and consumer sensory techniques. Katrina Ross
9 | P a g e
dietary fibre, reporting that Laminarin, a molecule found in brown algae possesses
functional dietary fibre activity. Ruperez and Saura‐Calixto (2001) established that
higher amounts of total dietary fibre (36.12 % dry weight) were contained in Laminaria
digitate in comparison with the species Chondruscrispus, F. vesiculosus
Porphyratenera and Undariapinnatifida.
In addition, an early study by Teas (1982), indicated a non-digestible fibre found in
Laminaria was a significant factor in the contribution of reduced breast cancer
incidences reported in Japan. More recent studies by Ji et al. (2012), and Ji and Ji
(2014) indicate Laminarian performs as an efficient and effective anti-tumour agent.
Moreover, research reviews have identified the anti-inflammatory properties and
immunostimulatory activity of marine algae (Lee et al.,2012; Neyrinck et al., 2007; and
Jaswir and Monsur, 2011). Furthermore, some seaweed molecules have been
understood to have anticoagulant properties (Miao et al.,1995; Shanmugam and
Mody, 2000) and research by Tsiapali et al., (2001), Balboa et al., (2013) and Choi et
al., (2012) highlighted the antioxidant activity in certain seaweed bioactive compounds.
Gupta and Ghannam (2011) and Kadam and Prabhasankar (2010) proclaim
seaweeds to be a rich source of micro and macronutrients. Seaweeds are also
recognised as an exceptional natural source of iodine (Nagataki 2008; Zimmermann
2008).
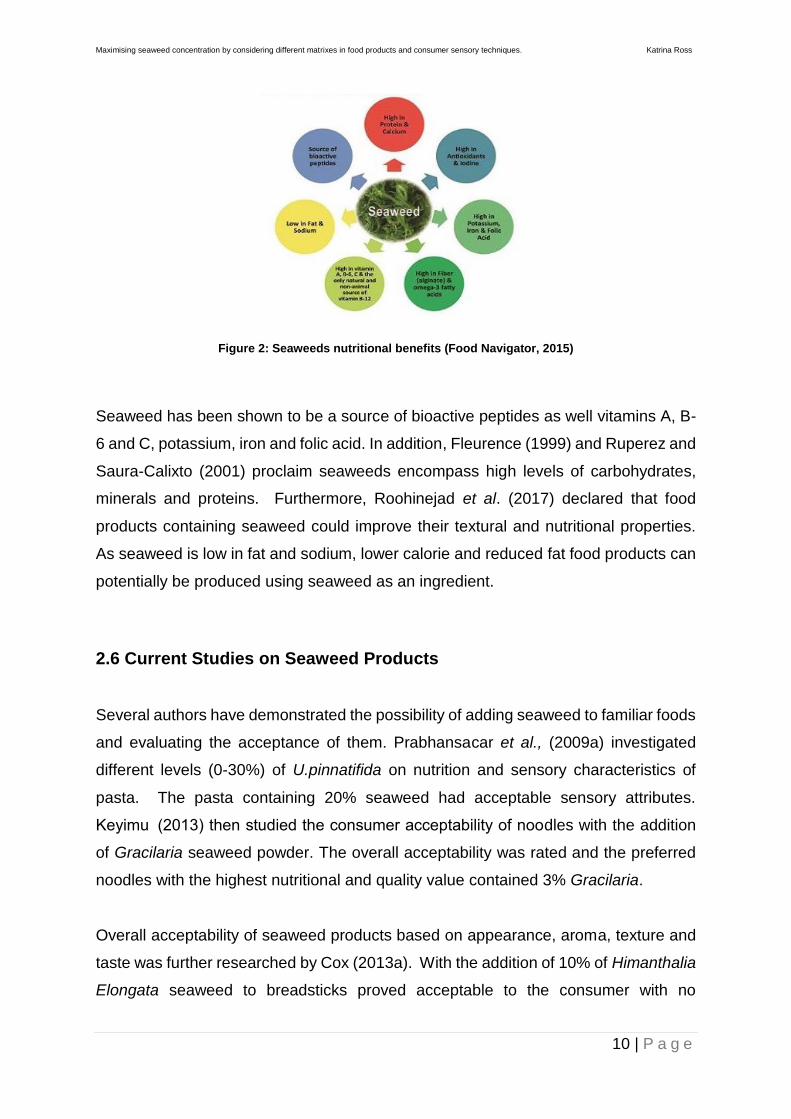
These micro and macronutrients are highlighted in Figure 2 below:
Maximising seaweed concentration by considering different matrixes in food products and consumer sensory techniques. Katrina Ross
10 | P a g e
Figure 2: Seaweeds nutritional benefits (Food Navigator, 2015)
Seaweed has been shown to be a source of bioactive peptides as well vitamins A, B-
6 and C, potassium, iron and folic acid. In addition, Fleurence (1999) and Ruperez and
Saura-Calixto (2001) proclaim seaweeds encompass high levels of carbohydrates,
minerals and proteins. Furthermore, Roohinejad et al. (2017) declared that food
products containing seaweed could improve their textural and nutritional properties.
As seaweed is low in fat and sodium, lower calorie and reduced fat food products can
potentially be produced using seaweed as an ingredient.
2.6 Current Studies on Seaweed Products
Several authors have demonstrated the possibility of adding seaweed to familiar foods
and evaluating the acceptance of them. Prabhansacar et al., (2009a) investigated
different levels (0-30%) of U.pinnatifida on nutrition and sensory characteristics of
pasta. The pasta containing 20% seaweed had acceptable sensory attributes.
Keyimu (2013) then studied the consumer acceptability of noodles with the addition
of Gracilaria seaweed powder. The overall acceptability was rated and the preferred
noodles with the highest nutritional and quality value contained 3% Gracilaria.
Overall acceptability of seaweed products based on appearance, aroma, texture and
taste was further researched by Cox (2013a). With the addition of 10% of Himanthalia
Elongata seaweed to breadsticks proved acceptable to the consumer with no
Maximising seaweed concentration by considering different matrixes in food products and consumer sensory techniques. Katrina Ross
11 | P a g e
significant difference with the control. In addition, Cox (2013b) researched beef patties
with the addition of Himanthalia Elongata. In terms of overall acceptability, the patties
containing 40% seaweed were rated highest, possibly due to improvement in texture
and mouthfeel. Furthermore Kwon et al., (2003) researched the addition of varied
concentrations (2.5 to 7.5%) of Laminaria powder in bread. They reported that bread
with the addition of 2.5% Laminaria powder was rated highest in consumer
acceptability and quality.
Sensory analysis and palatability were investigated in a study by Blouin et al., (2005),
children and adults were the subjects of a trial comparing Porphyra species in crackers
and popcorn. Children found the popcorn samples higher in acceptability although the
adults also found it palatable with marginally rating the crackers of higher acceptability.
A noticeable flavour was detected and accepted on both Porphyra species and food
products. This could explain the consumer’s previous experience with a similar product
to be texturally accepted.
Noodles, meat, and snacks are common food products in the western world and these
studies have concluded that the addition of seaweed was acceptable for all sensory
attributes. In addition, there is the potential of increasing seaweed consumption
among non-seaweed consumers. However, all these studies are based on relatively
small amounts of seaweed from Asia or Europe. No studies have been carried out on
the acceptability of seaweeds that lie on the Scottish coastline in abundance with ideal
conditions for both wild and cultivated growth remaining an untapped sustainable food
source.
2.7 Oral Processing
During the eating process, foods properties are altered through sequential
(continuous) physicochemical operations. (Chen, 2014). The eating process is
described by Chen (2009) as an assortment of operations achieved over a series of
stages. These operations change over time and are associated with the sensory
perception of food motivated by the physiological procedure of the food matrix
breaking down.
Maximising seaweed concentration by considering different matrixes in food products and consumer sensory techniques. Katrina Ross
12 | P a g e
Foster et al., (2011) and Boehm et al., (2013) illustrate that oral processing consists
of the study of the physics of eating, taking a multidisciplinary approach. Also including
sensory perception (Chen, 2014; Saint-Eve et al., 2009) and cognitive function
(Grabenhorst et al., 2010).
Taste is a complex mixture of mood-related sensations effected by the physical and
chemical properties of foods (Foster et al., 2011). As such, Di Monaco (2016), explains
that taste is a combination of several sensations including sweet, salty, bitter, acidic,
umami among others. Understanding ingestion, as well as how chemical and
mechanical digestion of foods affect a person’s food perceptions is important for the
food industry (Di-Monaco, 2016). He assesses the process involving the use of
muscles in chewing and mastication through which food is broken down, rolled into a
bolus by the tongue, and subsequently swallowed to be digested in the stomach. Cox
and Ghannam (2013), state that the consistency of the food, its texture, and volume
of the bite are dependent on significant chewing cycles to convert the food into a bolus
for swallowing. Foster et al., (2011) argue that perception of aroma decreases as the
viscosity of foods increases.
Food texture can be extremely important to the consumer (Lawless and Heymann,
2010). It is frequently used as an indicator for food quality unlike flavour and colour.
Lawless and Heymann (2010) further describe texture as being perceived by the
senses of touch, sight and sound with the consumer using a combination or just one
of these senses to asses a food product. These can have a negative or positive
influence towards the acceptability of a product.
Marine algae can provide texture and flavour to food, two outstanding characteristics
that may open to new culinary innovation (Rioux et al., 2017). The umami taste from
Seaweed glutamate content may contribute to the improvement of certain food
products.
As texture and mouth feel are deemed critical to consumer acceptability and choice
especially when introducing a novel food such as seaweed. The dynamic aspects of
Maximising seaweed concentration by considering different matrixes in food products and consumer sensory techniques. Katrina Ross
13 | P a g e
this oral process when consuming seaweed products can be captured from a sensory
perspective using Temporal Dominance Sensation.
2.8 Sensory Evaluation
The chemical and biological changes in food during oral processing produce several
sensory properties over time. Sensory evaluation has been defined as a scientific
method used to evoke, measure, analyse and interpret those responses to products
as perceived through the senses of sight, smell, touch, taste and hearing (Stone and
Sidel, 1993). Sensory evaluation can be a tool used to reduce any risk of products
failing. When consumer needs and company requirements are not addressed during
the development stage or optimisation of a product, it is unlikely that the new product
will be successful if launched (Dimple Singh-Ackbarali and Rohanie Maharaj, 2014).
According to Cox, and Abu Ghannam (2013) it is important for a company to address
consumer needs with regards to development of food products to have desirable
outcomes following their market penetration. This can be aided through the utilisation
of sensory evaluation. Sensory evaluation fundamentally involves the analysis of
changes in flavour and texture at each point in time.
According to (Pineau et al., 2009), comprehending cultural differences and how they
affect food sensory attributes is a crucial part to fully understanding people’s
preferences. This information is beneficial to the food industry. External factors such
as physical surroundings, colours, smells, time, as well as other people, significantly
affect individual inclinations (Davy, 2016). Eating behaviour is also controlled by
theinternal factors, which could be either physiological or psychological. Physiological
factors include hunger and satiety while the psychological factors include learnt
cultural practices as well as appetite (Henderson et al., 2003).
2.9 Temporal Dominance of Sensation
Maximising seaweed concentration by considering different matrixes in food products and consumer sensory techniques. Katrina Ross
14 | P a g e
An emerging method of sensory evaluation, called Temporal Dominance of
Sensations (TDS) has been proposed by Pineau et al., (2003). This technique enables
the recording of several sensory attributes simultaneously over time. It makes it
possible to collect temporal data during one single evaluation for up to 10 attributes
on complex food products such as seaweed. It is a valuable tool for future research
on the dynamics of texture and flavour perception (Foster et al., 2011). This technique
identifies and checks the intensity of sensory sensations during time of consumption
such as texture and flavour, using the results can be related to the consumer
acceptability. In addition, giving a deeper insight towards consumers’ perception of
seaweed products.
Graphs were generated from the TDS method and highlighted in the results section.
The response rate on the graphs is determined from the selected attributes and the
time that the participants responded in, within the 40 seconds. Labbe et al., (2009)
states a “significance level” line is typically included in every individual dominance rate
graph. This is also presented in the results section where this level is defined as the
highest limit of the confidence interval for dominance rate expected (Pineau et al.,
2009).
The higher the attributes dominance rate suggests a higher agreement among
participants towards the attribute at that time. A benefit of TDS is that participants
require limited training to use this technique if the attributes given are straightforward
enough to understand. Products overall liking can be easily measured, and sensory
attributes can modulate the hedonic appreciation and/or depreciation during
consumption (Labbe, 1999).
The temporal dominance method uses predetermined attributes presented on a
computer from which participant’s rate the intensity of sensation drawn from the list of
attributes on the computer screen. The dominant attribute selected is considered the
main perception and is of great importance to the research. If the consumer selects
Maximising seaweed concentration by considering different matrixes in food products and consumer sensory techniques. Katrina Ross
15 | P a g e
an attribute this is recorded as the strongest attribute and the time measured from the
first click until the next attribute is the dominant sensation, thus the temporal
dominance of sensation is measured (Pineau et al, 2009).
2.10 Conclusion
The majority of literature is based on small concentrations of dried seaweed powdered
products predominantly in baked goods such as pasta (Prabhasankar, 2008), noodles
(Keyimu, 2013; Chang and Wu, 2008) and breadsticks (Cox, 2013). With various meat
products incorporating dried seaweed (Cofrades et al., 2008 and Chun et al., 1999).
No consumer studies using TDS for seaweed products or any consumer studies
incorporating Scottish Seaweed into food products have been investigated. Currently
the common seaweed products on the UK market are salt replacers, seasonings, or
supplements. There is considerable scope to introduce new seaweed products such
as in salads, pesto, crisps and crackers that will be researched for acceptability in this
study. Moreover, culture aspects are important by introducing a new food into that
culture and combating neophobia.
Maximising seaweed concentration by considering different matrixes in food products and consumer sensory techniques. Katrina Ross
16 | P a g e
3. Materials and Methods
3.1 Rehydration Trials
The effects of rehydration on seaweed species and appropriate rehydration time is
essential to determine the texture and use for further development of seaweed
products to understand consumer’s preference. Dehydrated seaweed food products
are usually rehydrated before consumption (Cox, 2012). This is a complex process
intended to reinstate the properties of fresh seaweed with a liquid phase.
Following on from Cox’s (2012) rehydration trial with varying temperatures, a further
investigation into the force required to puncture each seaweed species and the
amount of water (by weight) the seaweed absorbed over time was evaluated, whilst
considering the sensory characteristics of the final product. This testing will establish
the texture and toughness of the product and this will be used to better understand the
acceptability of it to the consumer. Texture insight and texture acceptability are
significant factors in quality evaluation of food products offered on market (Nabil et.
al., 2012).
3.1.1 Sample Preparation
The texture analyser was used to investigate the texture after rehydration of five
seaweed species: Undariapinnarifida (Wakame), Laminariales (Kelp), Saccharina
Latissima (Sugar Kelp), Palmariapalmata (Dulse) and Himathalia Elongate (Sea
Spaghetti). In this report, the common names will be used.
Each sample was cut into 6 cm strips and trimmed to a weight of 1 g. There were 3
samples for each time interval to test. The samples were split evenly and placed into
separate bowls of 100 ml deionised water at room temperature. The same time
Maximising seaweed concentration by considering different matrixes in food products and consumer sensory techniques. Katrina Ross
17 | P a g e
intervals were set, these were 2, 5, 10, 15, 20 minutes. At each interval, the three
pieces were lightly dried on a paper towel then individually placed on the texture
analyser. Furthermore, to calculate the percentage uptake of water into the system,
samples were weighed gravimetrically, recorded and then rated using a 9-point
hedonic sensory scale by the researcher.
3.1.2 Texture Measurements
The rehydrated seaweeds were analysed in triplicate after 2, 5, 10, 15, 20 minutes.
Objective texture analyses on the seaweeds were performed using a texture analyser
(model TA.XT.Plus from Stable Microsystems, Godalming, UK). The test was based
on the probe test of spinach leaves used by More et al., (2014) with modifications.
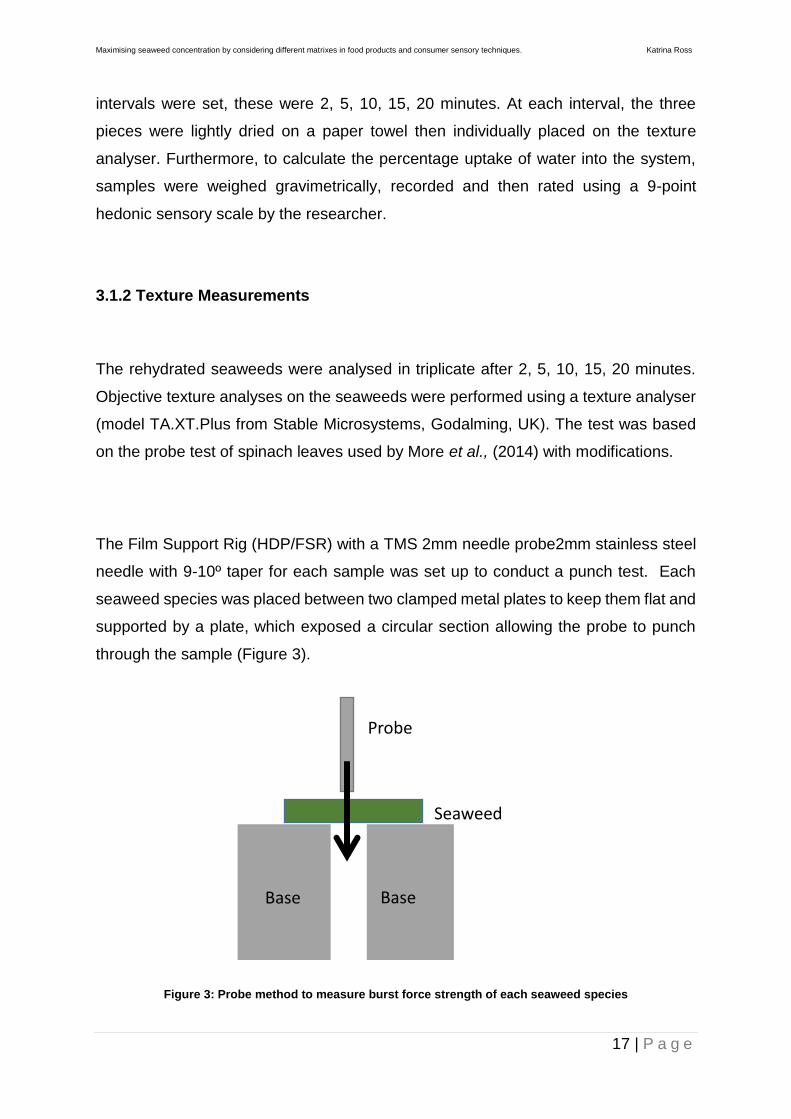
The Film Support Rig (HDP/FSR) with a TMS 2mm needle probe2mm stainless steel
needle with 9-10º taper for each sample was set up to conduct a punch test. Each
seaweed species was placed between two clamped metal plates to keep them flat and
supported by a plate, which exposed a circular section allowing the probe to punch
through the sample (Figure 3).
Figure 3: Probe method to measure burst force strength of each seaweed species
Probe
Seaweed
Base Base

Maximising seaweed concentration by considering different matrixes in food products and consumer sensory techniques. Katrina Ross
18 | P a g e
During a test, the maximum force to rupture the sample (burst strength) is recorded.
The probe penetrated the seaweed at a pre-test speed of 2.0 mm/s, test speed of 1
mm/s as the probe contacted the seaweed and a post-test speed of 10 mm/s using a
trigger force in Newtons (N). The probe moved a standard distance of 30 mm and the
clearance between the probe and the hole in the plates was 10 mm.
From this test of force, the fracture properties (1) burst strength and (2) the
displacement of the probe necessary to fracture seaweed sample was recorded and
documented in the results section. The peak force is the burst strength and the
displacement is the distance to burst, which is an indication of the flexibility of the
seaweed.
3.1.3 Experimental Design
The design of experiment was carried out by the software: Minitab Version 17, Taghuci
Design with five responses of seaweed species and five categories of time. This
method ensures good performance in the product design process aiming to reduce
the variability of a product (Table 1).
Maximising seaweed concentration by considering different matrixes in food products and consumer sensory techniques. Katrina Ross
19 | P a g e
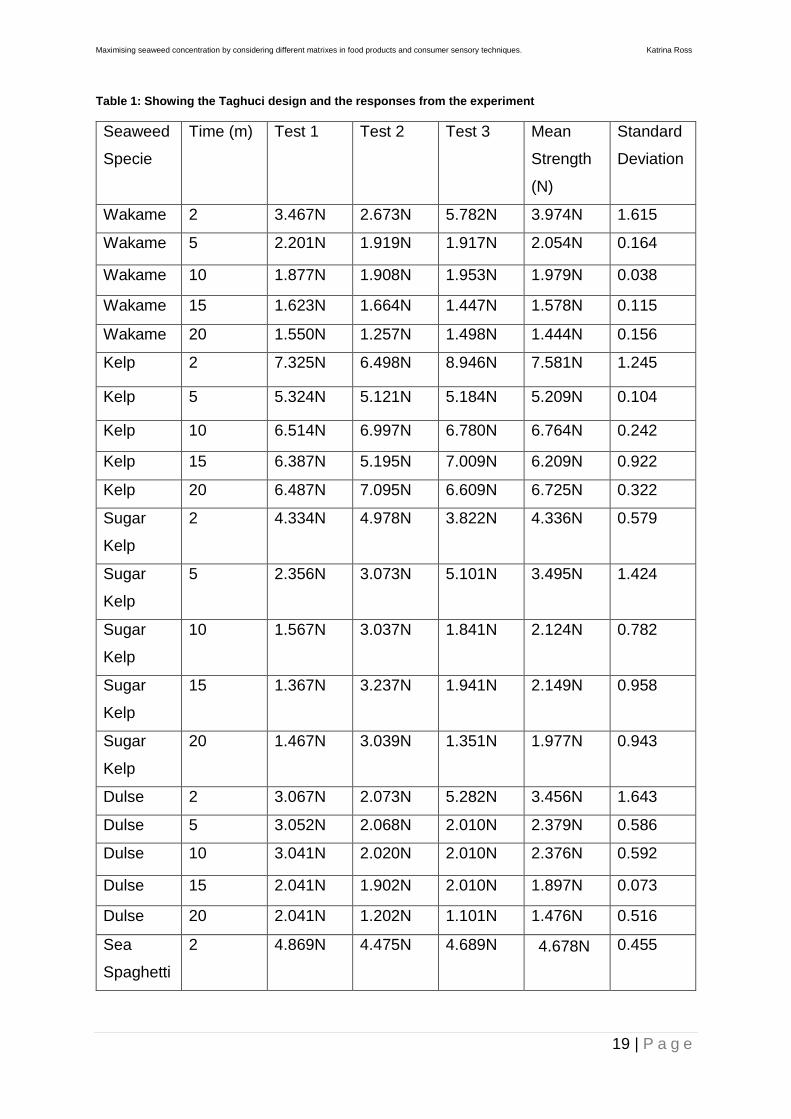
Table 1: Showing the Taghuci design and the responses from the experiment
Seaweed
Specie
Time (m) Test 1 Test 2 Test 3 Mean
Strength
(N)
Standard
Deviation
Wakame 2 3.467N 2.673N 5.782N 3.974N 1.615
Wakame 5 2.201N 1.919N 1.917N 2.054N 0.164
Wakame 10 1.877N 1.908N 1.953N 1.979N 0.038
Wakame 15 1.623N 1.664N 1.447N 1.578N 0.115
Wakame 20 1.550N 1.257N 1.498N 1.444N 0.156
Kelp 2 7.325N 6.498N 8.946N 7.581N 1.245
Kelp 5 5.324N 5.121N 5.184N 5.209N 0.104
Kelp 10 6.514N 6.997N 6.780N 6.764N 0.242
Kelp 15 6.387N 5.195N 7.009N 6.209N 0.922
Kelp 20 6.487N 7.095N 6.609N 6.725N 0.322
Sugar
Kelp
2 4.334N 4.978N 3.822N 4.336N 0.579
Sugar
Kelp
5 2.356N 3.073N 5.101N 3.495N 1.424
Sugar
Kelp
10 1.567N 3.037N 1.841N 2.124N 0.782
Sugar
Kelp
15 1.367N 3.237N 1.941N 2.149N 0.958
Sugar
Kelp
20 1.467N 3.039N 1.351N 1.977N 0.943
Dulse 2 3.067N 2.073N 5.282N 3.456N 1.643
Dulse 5 3.052N 2.068N 2.010N 2.379N 0.586
Dulse 10 3.041N 2.020N 2.010N 2.376N 0.592
Dulse 15 2.041N 1.902N 2.010N 1.897N 0.073
Dulse 20 2.041N 1.202N 1.101N 1.476N 0.516
Sea
Spaghetti
2 4.869N 4.475N 4.689N 4.678N
0.455
Maximising seaweed concentration by considering different matrixes in food products and consumer sensory techniques. Katrina Ross
20 | P a g e
Sea
Spaghetti
5 2.208N 3.118N 4.276N 3.321N 0.564
Sea
Spaghetti
10 3.108N 3.618N 2.999N 3.258N 0.330
Sea
Spaghetti
15 3.171N 2.804N 2.982N 2.985N 0.183
Sea
Spaghetti
20 2.298N 3.121N 1.916N 2.445N 0.615
Table 1 indicates quite a significant difference in measurements between the 3 tests
for certain species. Wakame had a range of 2.67 to 5.78 N which could be a result of
a different part of the plant and thickness which was rehydrated.
3.2 Milling Trials
Feedback from consumer research highlighted that the particle size of the seaweed is
too large resulting in an increased chewy texture when rehydrated. Especially the
midrib from the Wakame.
Figure 4: 50 g of seaweed inserted to different sized sieves
Varying mill sizes and heads were trialled to reduce the size of the seaweed once
dried. These different sizes were sieved to measure accuracy resulting in a more
consistent and acceptable product. Milling heads, A, K, and M with sizes of 2, 2.3, 3.0

Maximising seaweed concentration by considering different matrixes in food products and consumer sensory techniques. Katrina Ross
21 | P a g e
and 3.8 mm with species of Wakame and Sea Spaghetti were trialled for acceptability.
These different sizes and species were measured to 50 g and sieved for 5 minutes
through 2 mm and 1.18 mm as shown in Figure 4.
All measurements were recorded and featured in the results section. This trial was to
investigate the mill heads and the differences in sizes over 2 mm, between 1.18 mm
and 2 mm and below 1.18 mm to allow for a more consistent product.
Maximising seaweed concentration by considering different matrixes in food products and consumer sensory techniques. Katrina Ross
22 | P a g e
3.3 Seaweed Species used for New Product Development
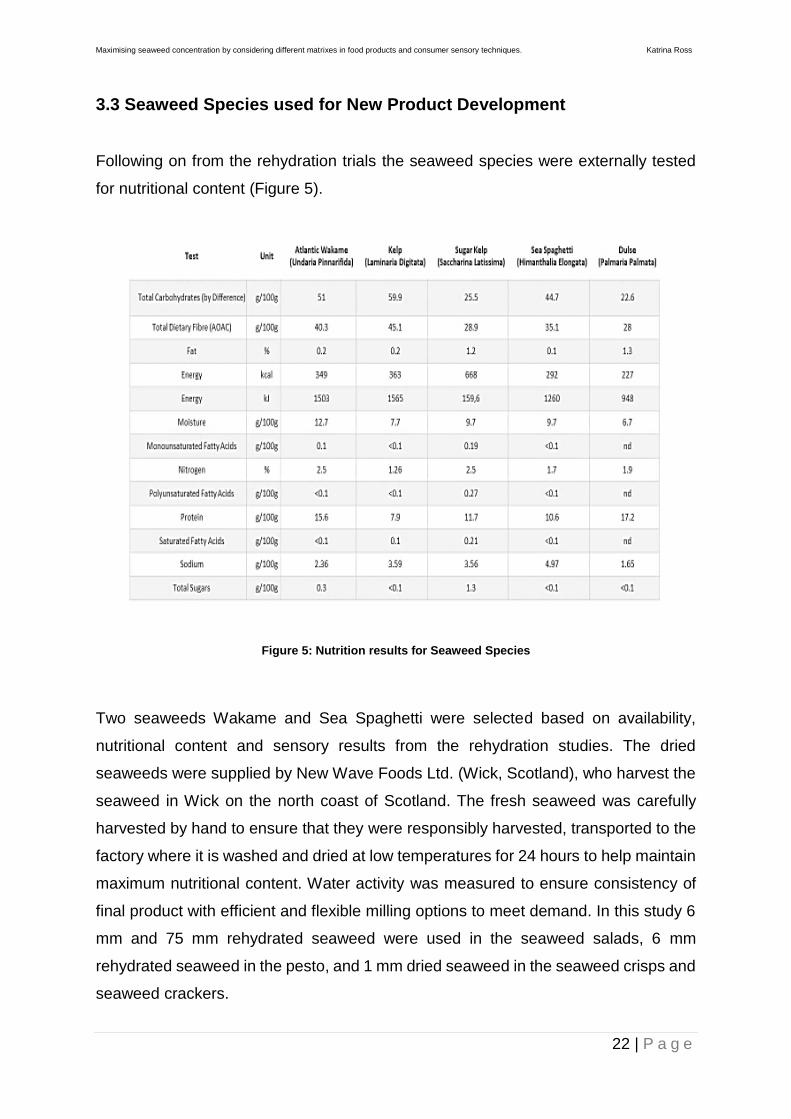
Following on from the rehydration trials the seaweed species were externally tested
for nutritional content (Figure 5).
Figure 5: Nutrition results for Seaweed Species
Two seaweeds Wakame and Sea Spaghetti were selected based on availability,
nutritional content and sensory results from the rehydration studies. The dried
seaweeds were supplied by New Wave Foods Ltd. (Wick, Scotland), who harvest the
seaweed in Wick on the north coast of Scotland. The fresh seaweed was carefully
harvested by hand to ensure that they were responsibly harvested, transported to the
factory where it is washed and dried at low temperatures for 24 hours to help maintain
maximum nutritional content. Water activity was measured to ensure consistency of
final product with efficient and flexible milling options to meet demand. In this study 6
mm and 75 mm rehydrated seaweed were used in the seaweed salads, 6 mm
rehydrated seaweed in the pesto, and 1 mm dried seaweed in the seaweed crisps and
seaweed crackers.
Maximising seaweed concentration by considering different matrixes in food products and consumer sensory techniques. Katrina Ross
23 | P a g e
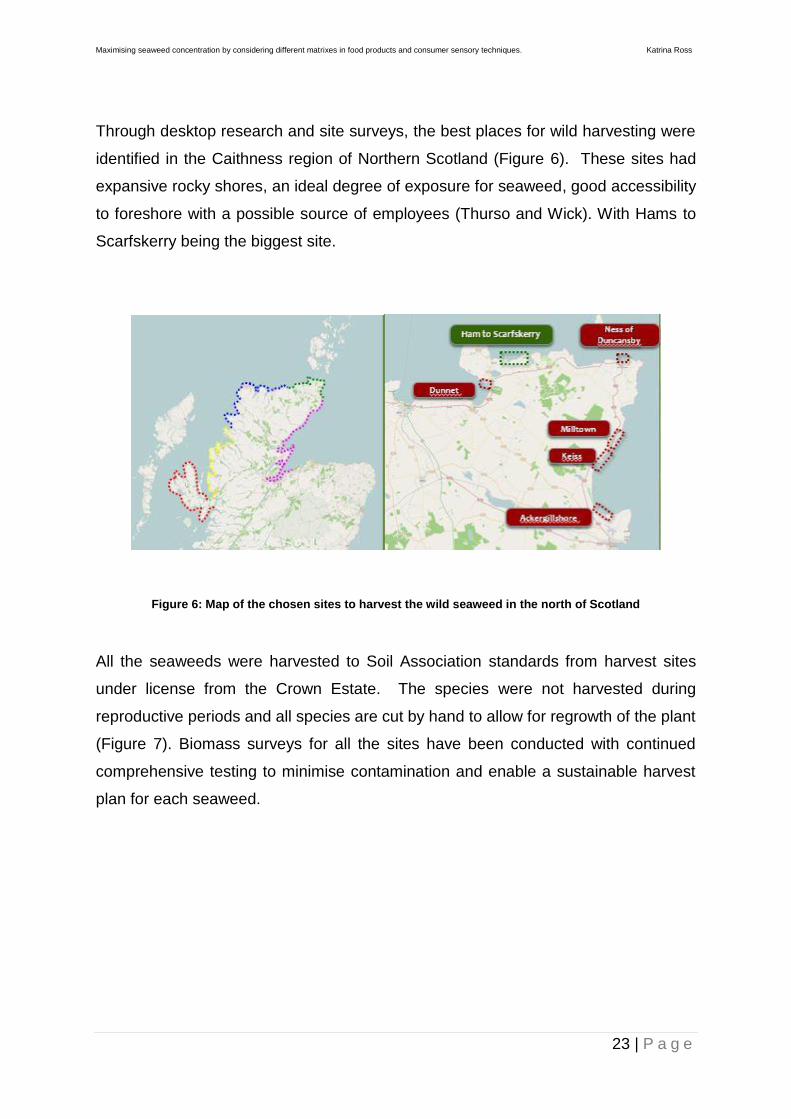
Through desktop research and site surveys, the best places for wild harvesting were
identified in the Caithness region of Northern Scotland (Figure 6). These sites had
expansive rocky shores, an ideal degree of exposure for seaweed, good accessibility
to foreshore with a possible source of employees (Thurso and Wick). With Hams to
Scarfskerry being the biggest site.
Figure 6: Map of the chosen sites to harvest the wild seaweed in the north of Scotland
All the seaweeds were harvested to Soil Association standards from harvest sites
under license from the Crown Estate. The species were not harvested during
reproductive periods and all species are cut by hand to allow for regrowth of the plant
(Figure 7). Biomass surveys for all the sites have been conducted with continued
comprehensive testing to minimise contamination and enable a sustainable harvest
plan for each seaweed.

Maximising seaweed concentration by considering different matrixes in food products and consumer sensory techniques. Katrina Ross
24 | P a g e
Figure 7: Seaweed hand cut to allow for regrowth
Both seaweeds were delivered to Abertay University, stored at room temperature in a
dark room and used within a month for all new product development and sensory
analysis.
Maximising seaweed concentration by considering different matrixes in food products and consumer sensory techniques. Katrina Ross
25 | P a g e
3.4 New Product Development and Utilisation of Rehydrated Seaweed
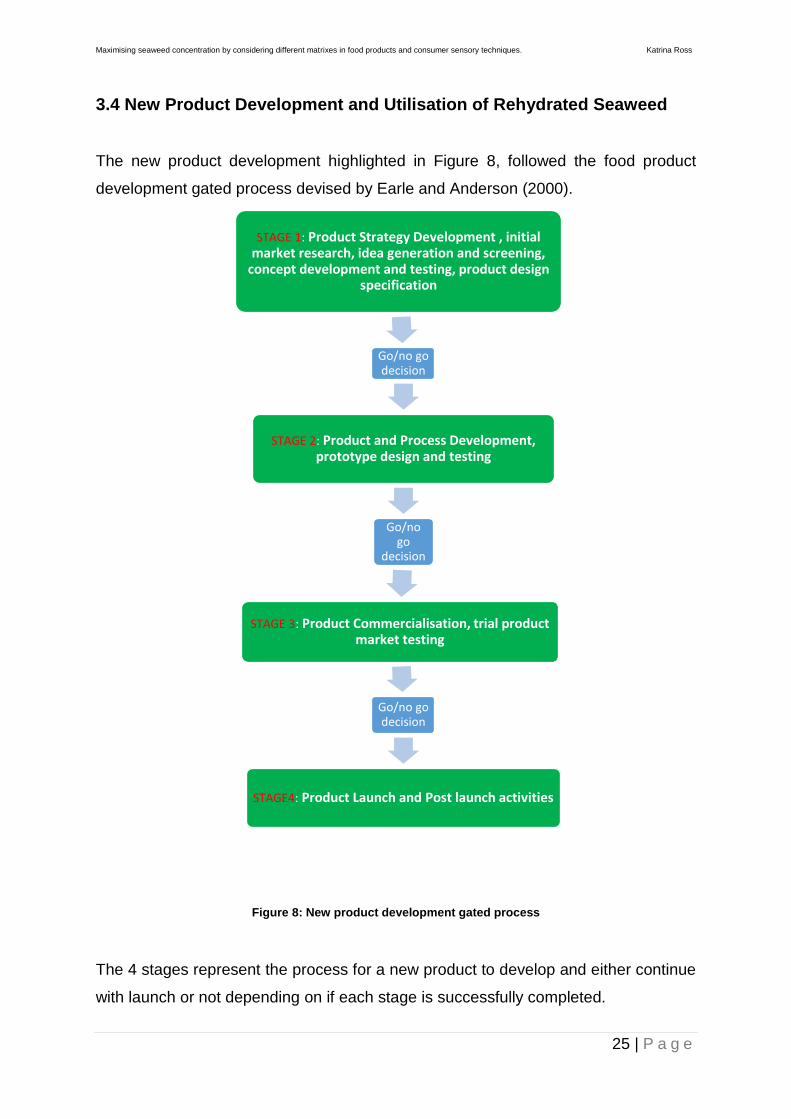
The new product development highlighted in Figure 8, followed the food product
development gated process devised by Earle and Anderson (2000).
Figure 8: New product development gated process
The 4 stages represent the process for a new product to develop and either continue
with launch or not depending on if each stage is successfully completed.
STAGE 1: Product Strategy Development , initial market research, idea generation and screening,
concept development and testing, product design specification
Go/no go decision
STAGE 2: Product and Process Development, prototype design and testing
Go/no go
decision
STAGE 3: Product Commercialisation, trial product market testing
Go/no go decision
STAGE4: Product Launch and Post launch activities
Maximising seaweed concentration by considering different matrixes in food products and consumer sensory techniques. Katrina Ross
26 | P a g e
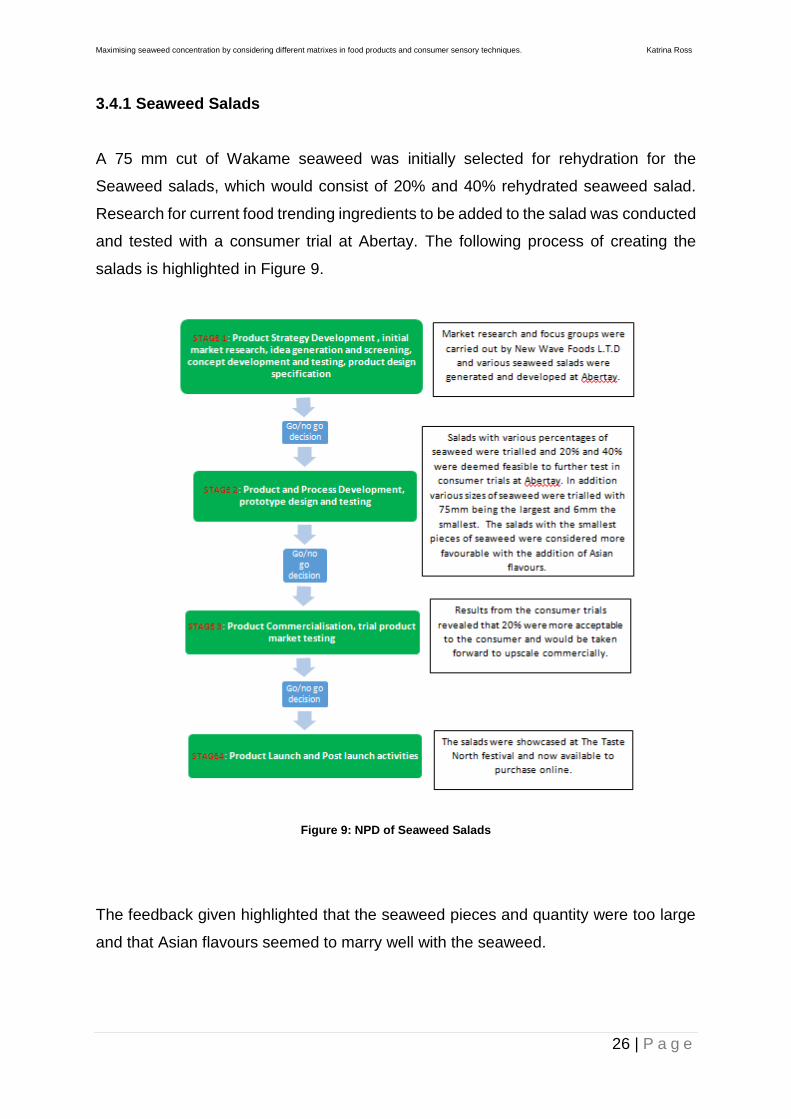
3.4.1 Seaweed Salads
A 75 mm cut of Wakame seaweed was initially selected for rehydration for the
Seaweed salads, which would consist of 20% and 40% rehydrated seaweed salad.
Research for current food trending ingredients to be added to the salad was conducted
and tested with a consumer trial at Abertay. The following process of creating the
salads is highlighted in Figure 9.
Figure 9: NPD of Seaweed Salads
The feedback given highlighted that the seaweed pieces and quantity were too large
and that Asian flavours seemed to marry well with the seaweed.
Maximising seaweed concentration by considering different matrixes in food products and consumer sensory techniques. Katrina Ross
27 | P a g e
Various kitchen trials concluded that a 6mm rehydrated cut of seaweed with 20%
rehydrated Wakame worked best with added ingredients of a carbohydrate such as
noodles and brown rice with various flavours to balance well with the seaweed.
3.4.2 Seaweed Pesto
Benchmarked on seaweed products from The Pembrokeshire Beach Food Company
and The Cornish Seaweed Company a pesto was developed with fresh, frozen and
reduced fat versions. The dried Himathalia Elongate (Sea Spaghetti) was placed in a
bowl with 40ml of water. After 15 minutes the seaweed was fully re-hydrated. The
hydrated seaweed was placed in a food processor along with the pine nuts, lemon
juice, various oil quantities, garlic paste and cheese. All ingredients were blended
together until the desired consistency was reached. A consumer trial was then
conducted in Abertay’s consumer labs to gain an understanding of the consumer
preference of each pesto.
3.5 New Product Development and Utilisation of Dried Seaweed
3.5.1 Preparation of Seaweed Crisps
According to Kayacier et al., (2014), the snack food market is worth approximately £22
- £26 billion annually in the world. The consumption of snacks is continuously
increasing in many countries and considered a large part of the human diet. (Taijner-
Czopek and Rytel, 2010). The most popular snack products are crisps, which were to
be developed in this study with the addition of dried seaweed.
The aim was that this new product would contain between 30 and 40 % dried 1 mm
seaweed with 70 % or 60 % flour mixture. These would be benchmarked on the Halo
seaweed crisp brand and contain gluten free flours such as rice flour and the possibility
of Tapioca and Soy flour. Including a constant measurement of oil, water and sugar.
Small-scale kitchen recipes were produced using a Lillo due – Bottene (Italy) pasta
machine with a mixer shaft and auger and a hold capacity of 1,400 kg to mix and
Maximising seaweed concentration by considering different matrixes in food products and consumer sensory techniques. Katrina Ross
28 | P a g e
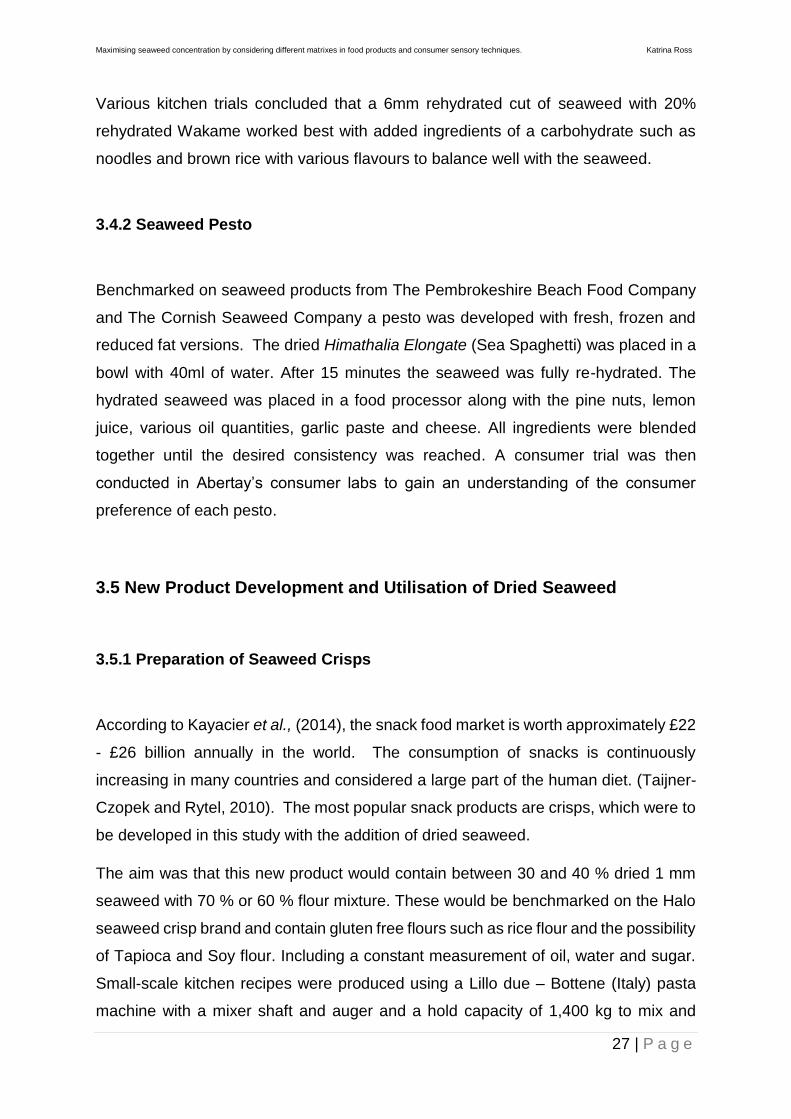
extrude the various crisp mixtures. Die heads were used to shape the crisp mixture
before it was baked for 10 minutes at 160 ºC. The following process of creating the
crisps is highlighted in Figure 10.
Figure 10: NPD of Seaweed Crisps
A Continua 37, Werner Pfleiderer Ltd. twin-screwed co-rotating cooker extruder was
then used to carry out pilot scale trials at Manchester Metropolitan University with the
recipes from the small kitchen trials. Various dial settings, screw speeds, temperatures
and dies were used with the mixture to produce the most accepted crisp product based
on small consumer trails conducted at Abertay
Maximising seaweed concentration by considering different matrixes in food products and consumer sensory techniques. Katrina Ross
29 | P a g e
3.6 Consumer Trials
The consumer trials took place in the Abertay sensory booths ISO9001 with 58
participants testing the salads, 60 testing the pesto, 59 for the seaweed crisps and 15
participants using TDS for the seaweed crackers. Samples were given at room
temperature and positioned in transparent plastic cups (89.0 mm x 56.0 mm), labelled
with random 3-digit codes which varied per panellist.
Samples were arranged according to a balanced serving order randomised within
each serving set to reduce physiological and psychological effects including contrast,
convergence and carry over effect (Lawless and Heymann, 2010). Any first order bias
was removed as consumers may consistently score the first product higher or lower
than other products regardless of what product is being evaluated (Pilgrim and
Peryman, 1996).
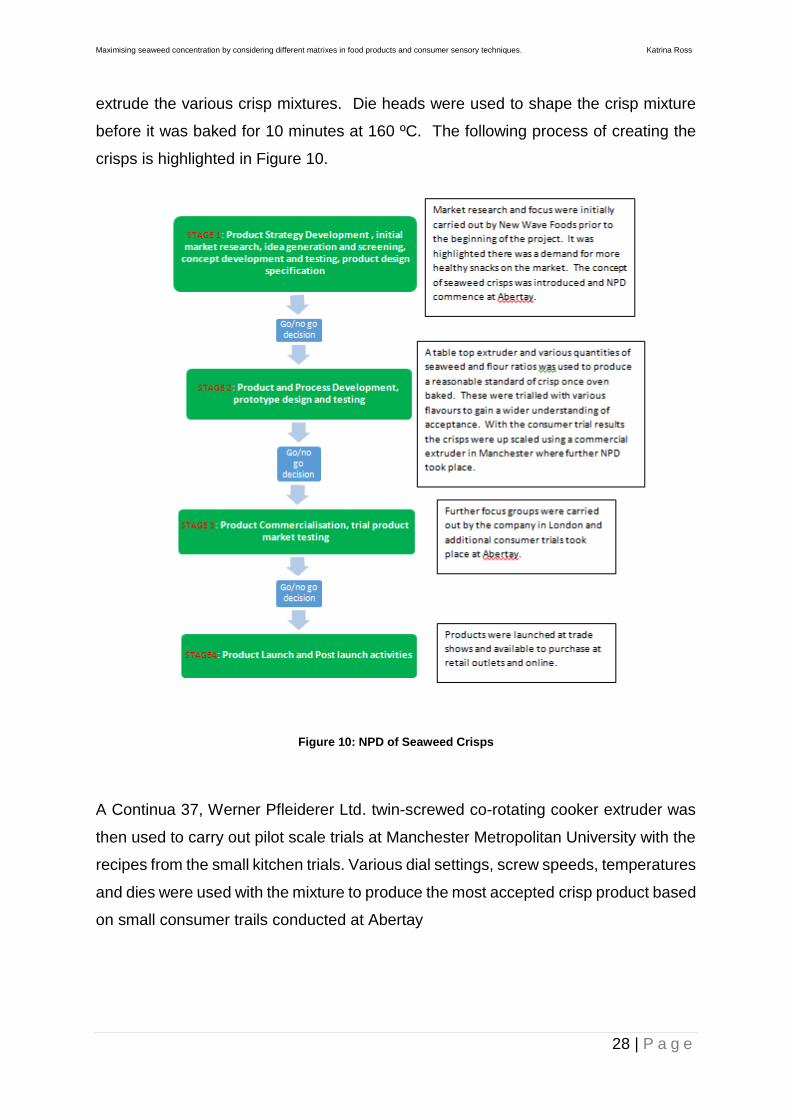
Water was given to cleanse the palette between each sample and participants were
asked to rate the appearance, texture, aroma and overall acceptance of each sample
using the traditional 9-point hedonic scale (Peryam and Pilgrim 1957). The sensory
attributes important for each product category in terms of consumer acceptability are
highlighted below (Table 2).
Table 2: Sensory attributes important for consumer acceptability
Product Sensory Attributes for Acceptability
Salads Not chewy, no strong fishy aroma,
colourful and fresh appearance
Crisps Crispy, not soft or gritty, no strong fishy
aroma
Pesto Not chewy, not oily, no strong fishy aroma
Crackers Crunchy, not soft or gritty, no strong fishy
aroma
Maximising seaweed concentration by considering different matrixes in food products and consumer sensory techniques. Katrina Ross
30 | P a g e
The 9-point hedonic scale has been adopted by researchers in the chemical senses
and became the dominant tool for measuring hedonic perception (Lim, Wood and
Green, 2009).
3.7 Preparation of the Seaweed Crackers for TDS
According to Kadam and Prabhasankar (2010) by researching the targeted population,
bakery products are deemed the best source of incorporating functional ingredients
such as seaweed as they are widely consumed all over the world.
Using TDS for the seaweed crackers is a novel area as no other studies appear to
have used it as a consumer sensory tool with seaweed. This will enable a deeper
understanding of what attributes are dominant whilst consuming a seaweed product
which may affect the acceptability of it.
Preliminary experiments were conducted to establish appropriate flour varieties and
maximum levels of dried seaweed that could be added to a cracker bread in terms of
stability of texture and flavour. The cracker bread was too tough with concentrations
higher than 20 % so this limit was deemed suitable by small kitchen panel testing.
A factorial design with three replicates was set up established using a statistical
software package Minitab version 17, to incorporate two different seaweeds into a
standard cracker mixture. The wholemeal flour constituent was replaced with the
following percentages of seaweed: 5, 10, 15 and 20. A control with no seaweed was
included and 30 runs were generated (Table 3). The constant ingredients in the recipe
were water, oil and sugar.
Maximising seaweed concentration by considering different matrixes in food products and consumer sensory techniques. Katrina Ross
31 | P a g e
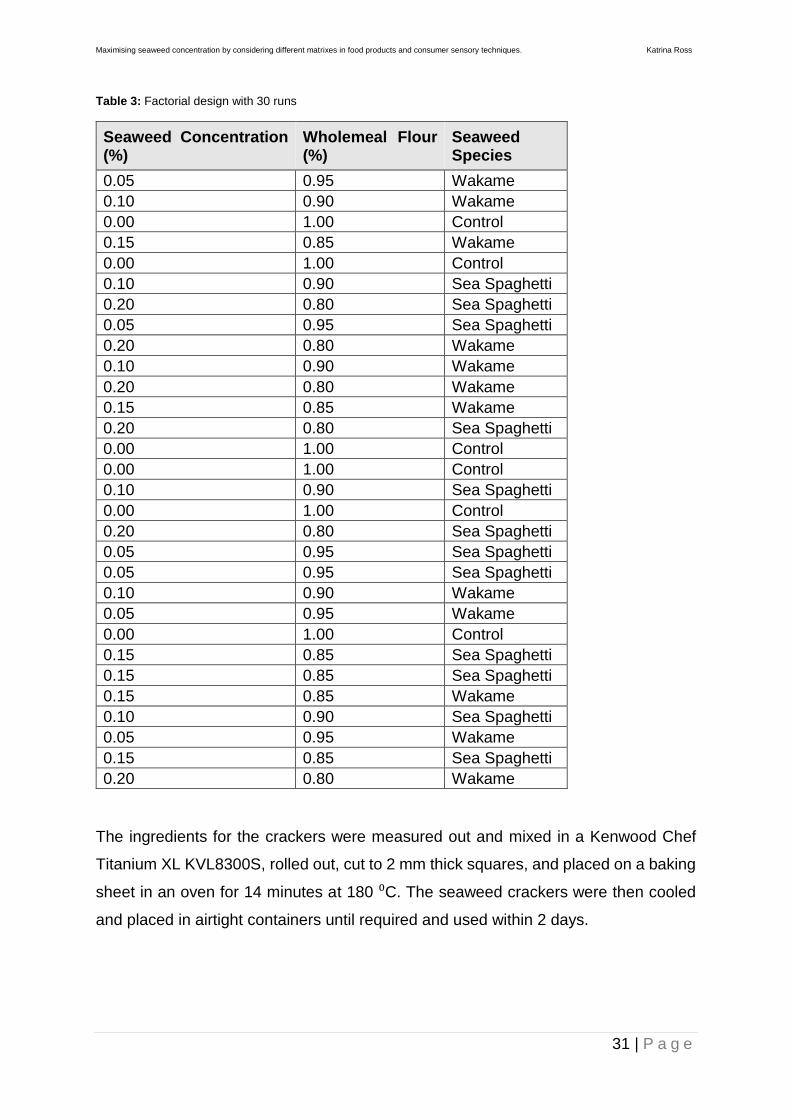
Table 3: Factorial design with 30 runs
Seaweed Concentration (%)
Wholemeal Flour (%)
Seaweed Species
0.05 0.95 Wakame
0.10 0.90 Wakame
0.00 1.00 Control
0.15 0.85 Wakame
0.00 1.00 Control
0.10 0.90 Sea Spaghetti
0.20 0.80 Sea Spaghetti
0.05 0.95 Sea Spaghetti
0.20 0.80 Wakame
0.10 0.90 Wakame
0.20 0.80 Wakame
0.15 0.85 Wakame
0.20 0.80 Sea Spaghetti
0.00 1.00 Control
0.00 1.00 Control
0.10 0.90 Sea Spaghetti
0.00 1.00 Control
0.20 0.80 Sea Spaghetti
0.05 0.95 Sea Spaghetti
0.05 0.95 Sea Spaghetti
0.10 0.90 Wakame
0.05 0.95 Wakame
0.00 1.00 Control
0.15 0.85 Sea Spaghetti
0.15 0.85 Sea Spaghetti
0.15 0.85 Wakame
0.10 0.90 Sea Spaghetti
0.05 0.95 Wakame
0.15 0.85 Sea Spaghetti
0.20 0.80 Wakame
The ingredients for the crackers were measured out and mixed in a Kenwood Chef
Titanium XL KVL8300S, rolled out, cut to 2 mm thick squares, and placed on a baking
sheet in an oven for 14 minutes at 180 ⁰C. The seaweed crackers were then cooled
and placed in airtight containers until required and used within 2 days.
Maximising seaweed concentration by considering different matrixes in food products and consumer sensory techniques. Katrina Ross
32 | P a g e
3.7.1 Panellists selection for TDS sessions
The panellists were selected using the following inclusion criteria: an interest in healthy
eating; trying new innovative food products; aged between 20 and 40 years old; and
predominantly female. Testing was conducted at Abertay’s Food Innovation sensory
consumer labs. Fifteen panellists (Pineau, 2009) aged between 21 and 40 were
selected. The panels consisted of food and consumer studies students and academics
from Abertay’s Food and Drink division.
Panellists were also non-smokers; had good oral health and overall general health;
could distinguish between sensory attributes from the given questionnaire; they all
spoke fluent English; and used computers frequently. Research Ethics was approved
by the School of Science, Engineering and Technology Research Ethics Committee
at Abertay University. All panellists were given information on the outline and aim of
the study. They gave informed consent and were given the opportunity to drop out at
any time.
3.7.2 Sensory Attribute Generation for TDS
Comments and feedback from the consumer trails were used to construct the attribute
list for the seaweed crackers. In addition, ten panellists from the consumer panels
were requested to consume approximately half of each cracker sample. Sensory
attributes were discussed and created describing each sample with a recommended
list of a maximum of 10 attributes (Pineau, 2012). The attribute list has a mixture of
types such as texture and taste included with the order balanced between panellists
to avoid position bias. The panellists who created these sensory attributes were not
permitted to partake in the study.
Maximising seaweed concentration by considering different matrixes in food products and consumer sensory techniques. Katrina Ross
33 | P a g e
3.7.3 Warm-up and Preparation Process
Limited training is required to use TDS if the attributes given are straightforward
enough to understand. Products overall liking can be easily measured, and sensory
attributes can modulate the hedonic appreciation and/or depreciation during
consumption (Labbe, 1999).Panellists were given a 5-minute warm-up period before
each session (5 in total with 6 samples per session). This was to give a further
explanation of the concept of TDS and the sensory attributes used. Questions were
welcomed at any stage for clarification.
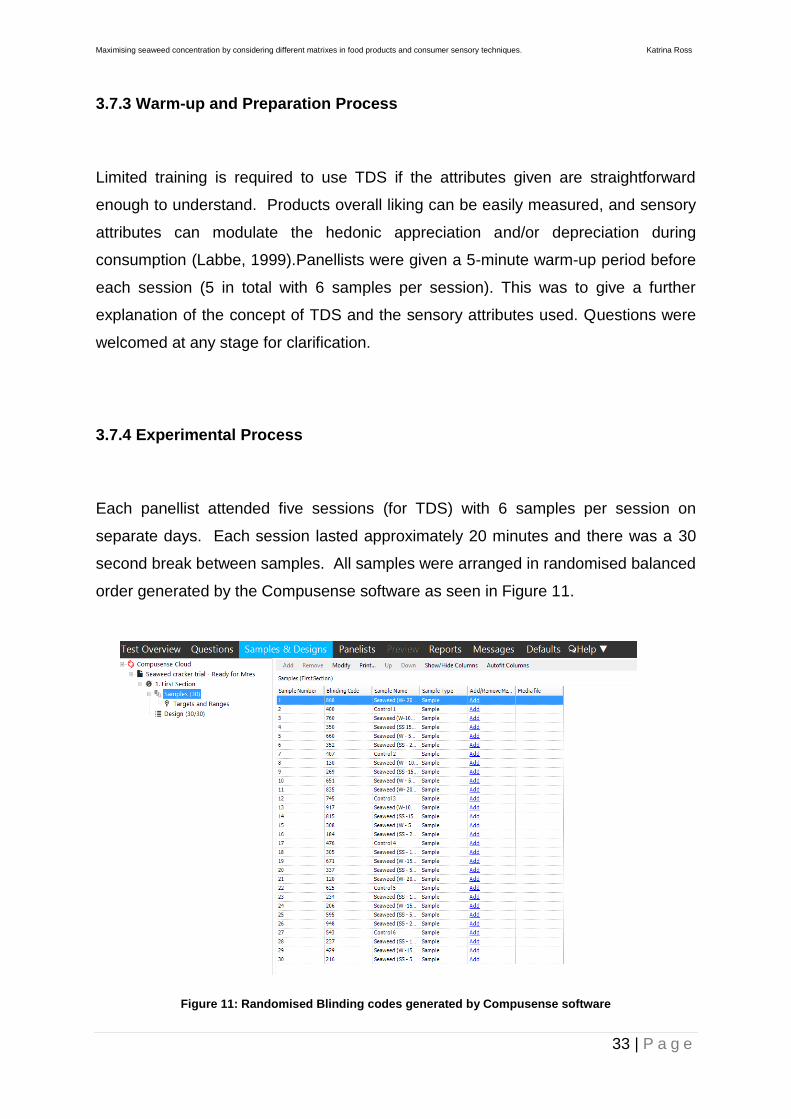
3.7.4 Experimental Process
Each panellist attended five sessions (for TDS) with 6 samples per session on
separate days. Each session lasted approximately 20 minutes and there was a 30
second break between samples. All samples were arranged in randomised balanced
order generated by the Compusense software as seen in Figure 11.
Figure 11: Randomised Blinding codes generated by Compusense software
Maximising seaweed concentration by considering different matrixes in food products and consumer sensory techniques. Katrina Ross
34 | P a g e
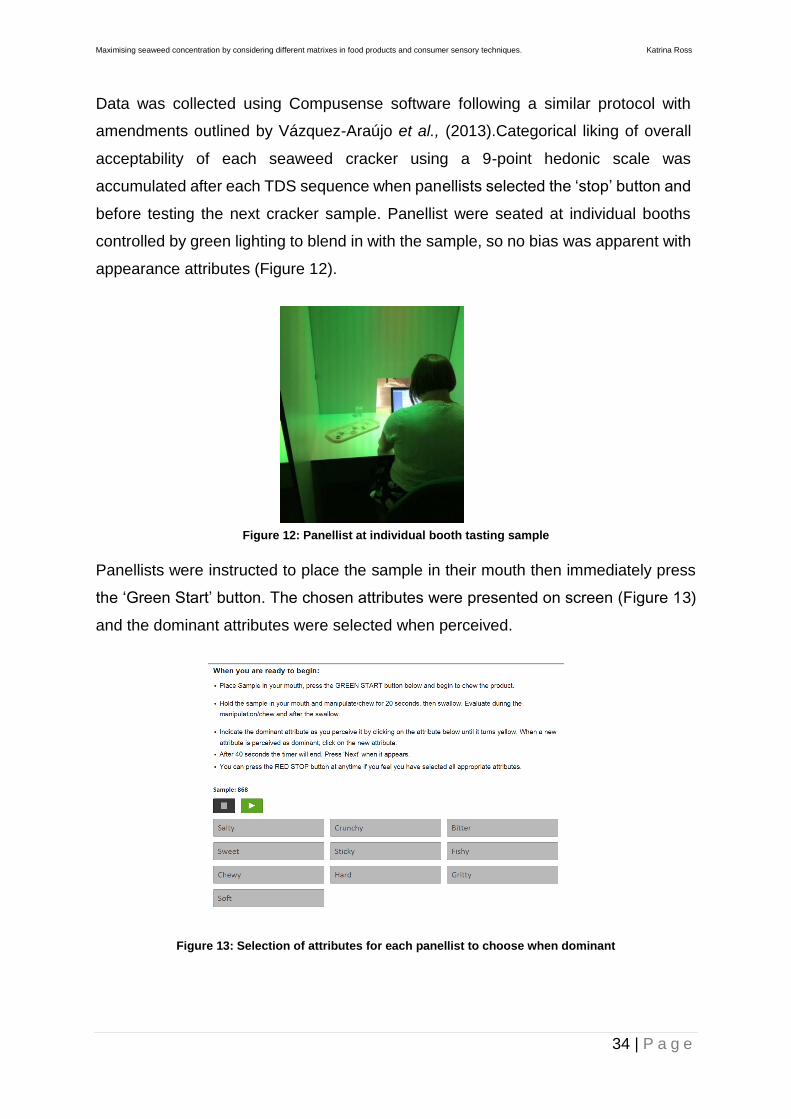
Data was collected using Compusense software following a similar protocol with
amendments outlined by Vázquez-Araújo et al., (2013).Categorical liking of overall
acceptability of each seaweed cracker using a 9-point hedonic scale was
accumulated after each TDS sequence when panellists selected the ‘stop’ button and
before testing the next cracker sample. Panellist were seated at individual booths
controlled by green lighting to blend in with the sample, so no bias was apparent with
appearance attributes (Figure 12).
Figure 12: Panellist at individual booth tasting sample
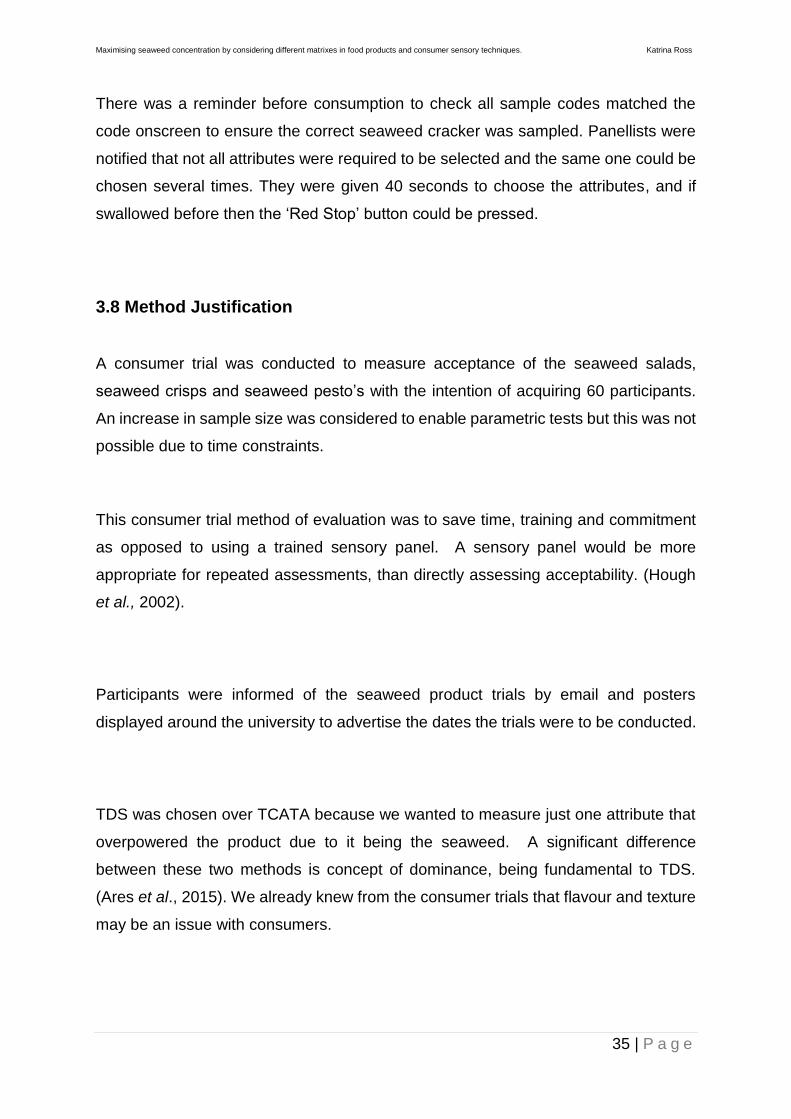
Panellists were instructed to place the sample in their mouth then immediately press
the ‘Green Start’ button. The chosen attributes were presented on screen (Figure 13)
and the dominant attributes were selected when perceived.
Figure 13: Selection of attributes for each panellist to choose when dominant
Maximising seaweed concentration by considering different matrixes in food products and consumer sensory techniques. Katrina Ross
35 | P a g e
There was a reminder before consumption to check all sample codes matched the
code onscreen to ensure the correct seaweed cracker was sampled. Panellists were
notified that not all attributes were required to be selected and the same one could be
chosen several times. They were given 40 seconds to choose the attributes, and if
swallowed before then the ‘Red Stop’ button could be pressed.
3.8 Method Justification
A consumer trial was conducted to measure acceptance of the seaweed salads,
seaweed crisps and seaweed pesto’s with the intention of acquiring 60 participants.
An increase in sample size was considered to enable parametric tests but this was not
possible due to time constraints.
This consumer trial method of evaluation was to save time, training and commitment
as opposed to using a trained sensory panel. A sensory panel would be more
appropriate for repeated assessments, than directly assessing acceptability. (Hough
et al., 2002).
Participants were informed of the seaweed product trials by email and posters
displayed around the university to advertise the dates the trials were to be conducted.
TDS was chosen over TCATA because we wanted to measure just one attribute that
overpowered the product due to it being the seaweed. A significant difference
between these two methods is concept of dominance, being fundamental to TDS.
(Ares et al., 2015). We already knew from the consumer trials that flavour and texture
may be an issue with consumers.
Maximising seaweed concentration by considering different matrixes in food products and consumer sensory techniques. Katrina Ross
36 | P a g e
3.9 Data Analysis
3.9.1 Generation of Response Rate and Significance Line TDS Graphs
The response rate was determined by the selected attributes and the time that
participants responded in, within the 40 seconds. Labbe et al. (2009) states a
“significance level” line is typically included in every individual dominance rate graph.
This level is defined as the highest limit of the confidence interval for dominance rate
expected (Pineau et al., 2009). Dominance rate at 10 % significance was recorded in
using the calculation:
Dominance Rate = 0.1 + (1.282*(√ (0.09/no. of participants))
The higher the attributes dominance rate suggests a higher agreement among
participants towards the attribute at that time.
3.9.2 Statistical Analysis
Statistical analysis (IBM SPSS Statistics v22) was performed to consider main effects
and interactions for seaweed type and seaweed concentration (p<0.05) using a two-
way ANOVA incorporating the general linear model. In addition, for the results of the
milling of the seaweed a normality test was carried out to discover if the data was
normally distributed. The results suggested that the data was non-parametric due to
the Shapiro Wilk test being below 0.05 for all milling factors. Statistical analyses were
carried out using a Mann-Whitney Test to determine any significant differences in
species being sieved or the mill head used.
A normality test was carried out for the 40% and 20% seaweed salad samples, the
seaweed pesto and seaweed crisps. The results suggested that the data was non-
parametric due to the Shapiro Wilk test being below 0.05 for all consumer testing.

Maximising seaweed concentration by considering different matrixes in food products and consumer sensory techniques. Katrina Ross
37 | P a g e
Each medium for every attribute were analysed using a K related Friedman test with
data shown to be significantly different. Each difference in attribute was further
analysed against each other by using a paired Wilcoxon test to further explore
significant differences between samples.
Maximising seaweed concentration by considering different matrixes in food products and consumer sensory techniques. Katrina Ross
38 | P a g e
4. Results
4.1 Rehydration Results
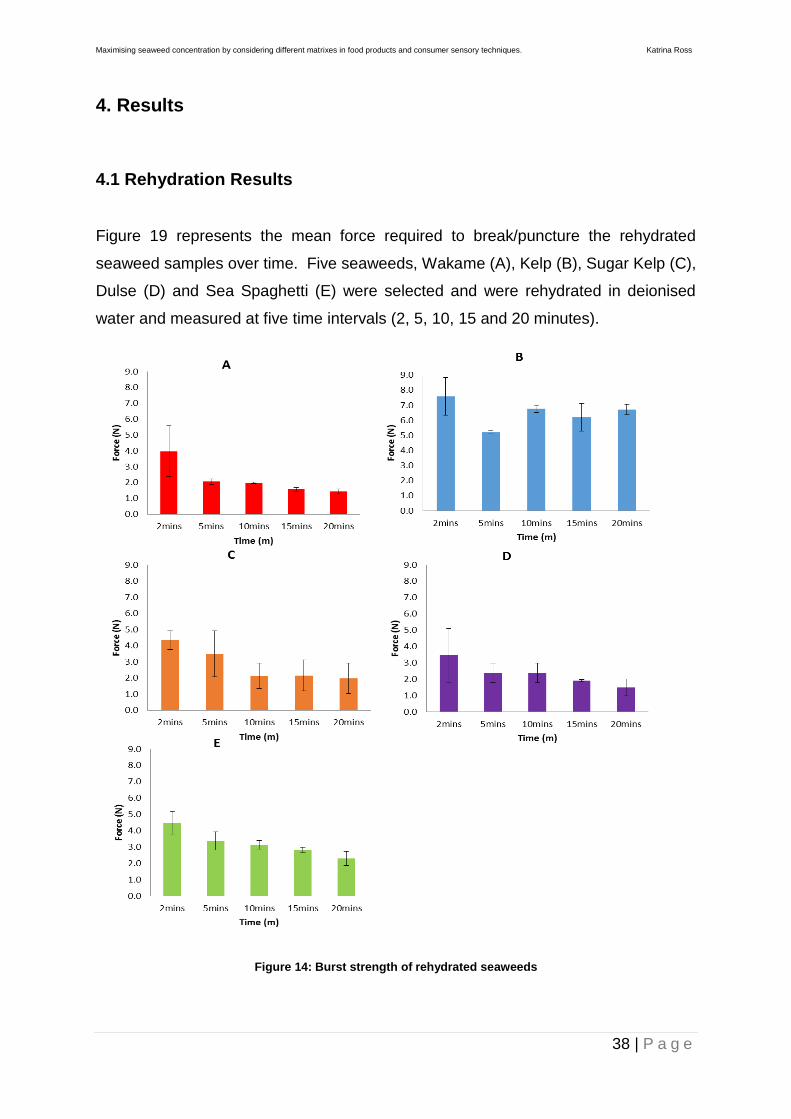
Figure 19 represents the mean force required to break/puncture the rehydrated
seaweed samples over time. Five seaweeds, Wakame (A), Kelp (B), Sugar Kelp (C),
Dulse (D) and Sea Spaghetti (E) were selected and were rehydrated in deionised
water and measured at five time intervals (2, 5, 10, 15 and 20 minutes).
Figure 14: Burst strength of rehydrated seaweeds
Maximising seaweed concentration by considering different matrixes in food products and consumer sensory techniques. Katrina Ross
39 | P a g e
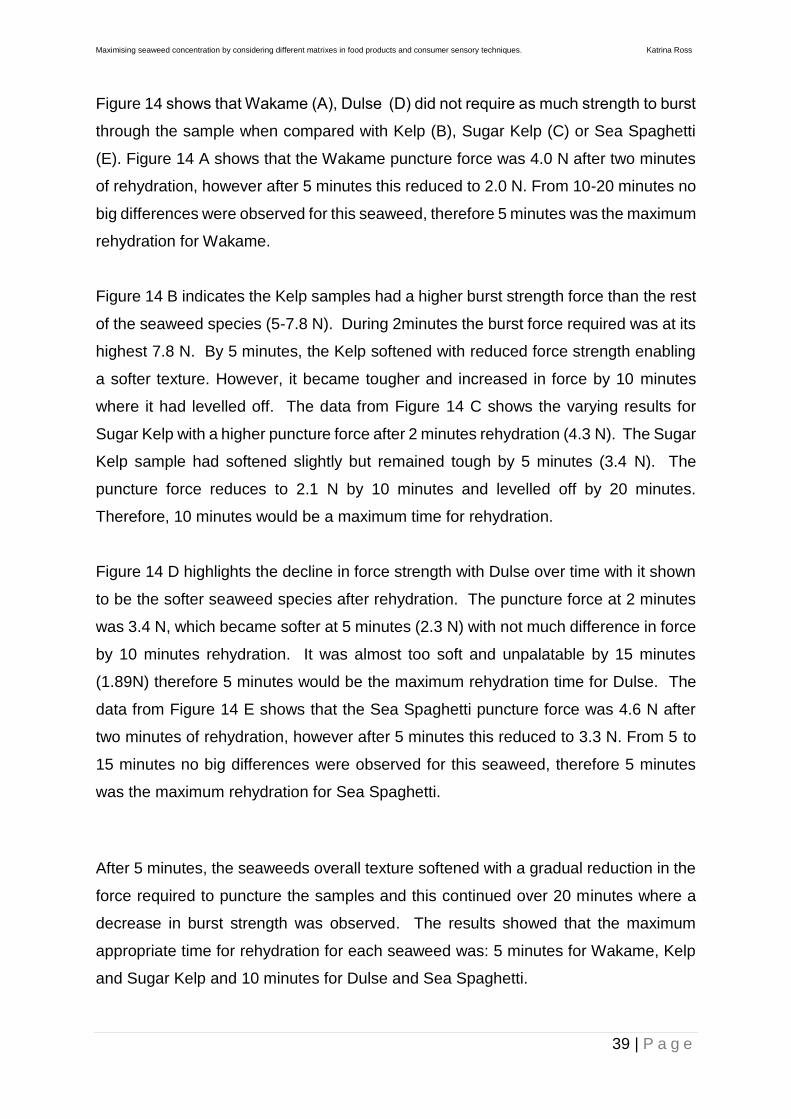
Figure 14 shows that Wakame (A), Dulse (D) did not require as much strength to burst
through the sample when compared with Kelp (B), Sugar Kelp (C) or Sea Spaghetti
(E). Figure 14 A shows that the Wakame puncture force was 4.0 N after two minutes
of rehydration, however after 5 minutes this reduced to 2.0 N. From 10-20 minutes no
big differences were observed for this seaweed, therefore 5 minutes was the maximum
rehydration for Wakame.
Figure 14 B indicates the Kelp samples had a higher burst strength force than the rest
of the seaweed species (5-7.8 N). During 2minutes the burst force required was at its
highest 7.8 N. By 5 minutes, the Kelp softened with reduced force strength enabling
a softer texture. However, it became tougher and increased in force by 10 minutes
where it had levelled off. The data from Figure 14 C shows the varying results for
Sugar Kelp with a higher puncture force after 2 minutes rehydration (4.3 N). The Sugar
Kelp sample had softened slightly but remained tough by 5 minutes (3.4 N). The
puncture force reduces to 2.1 N by 10 minutes and levelled off by 20 minutes.
Therefore, 10 minutes would be a maximum time for rehydration.
Figure 14 D highlights the decline in force strength with Dulse over time with it shown
to be the softer seaweed species after rehydration. The puncture force at 2 minutes
was 3.4 N, which became softer at 5 minutes (2.3 N) with not much difference in force
by 10 minutes rehydration. It was almost too soft and unpalatable by 15 minutes
(1.89N) therefore 5 minutes would be the maximum rehydration time for Dulse. The
data from Figure 14 E shows that the Sea Spaghetti puncture force was 4.6 N after
two minutes of rehydration, however after 5 minutes this reduced to 3.3 N. From 5 to
15 minutes no big differences were observed for this seaweed, therefore 5 minutes
was the maximum rehydration for Sea Spaghetti.
After 5 minutes, the seaweeds overall texture softened with a gradual reduction in the
force required to puncture the samples and this continued over 20 minutes where a
decrease in burst strength was observed. The results showed that the maximum
appropriate time for rehydration for each seaweed was: 5 minutes for Wakame, Kelp
and Sugar Kelp and 10 minutes for Dulse and Sea Spaghetti.
Maximising seaweed concentration by considering different matrixes in food products and consumer sensory techniques. Katrina Ross
40 | P a g e
The aim of this investigation was to determine whether species of seaweed (n=5) and
time of rehydration (n=5) influenced the force required to puncture the seaweed. These
findings were confirmed using a two-way ANOVA where no significant differences
observed for species of seaweed and time of rehydration (F (16, 50) = 1.198; p=0.302),
however time of rehydration and species of seaweed were significantly different
independently, (F=15.717; p<0.001; and F=76.780; p<0.001, respectively). Post hoc
analysis (Tukey) revealed that 2 minutes was significantly different compared to all
other times (p<0.001), whilst all other times were not significant (p>0.05). Regarding
species a post hoc analysis (Tukey) revealed that Kelp was the significant different
species (p<0.001) than all other species (p>0.05), no other significant differences were
observed. The ANOVA method is sufficiently robust to cope with small deviations from
the assumptions and is more powerful and preferable to equivalent non-parametric
tests.
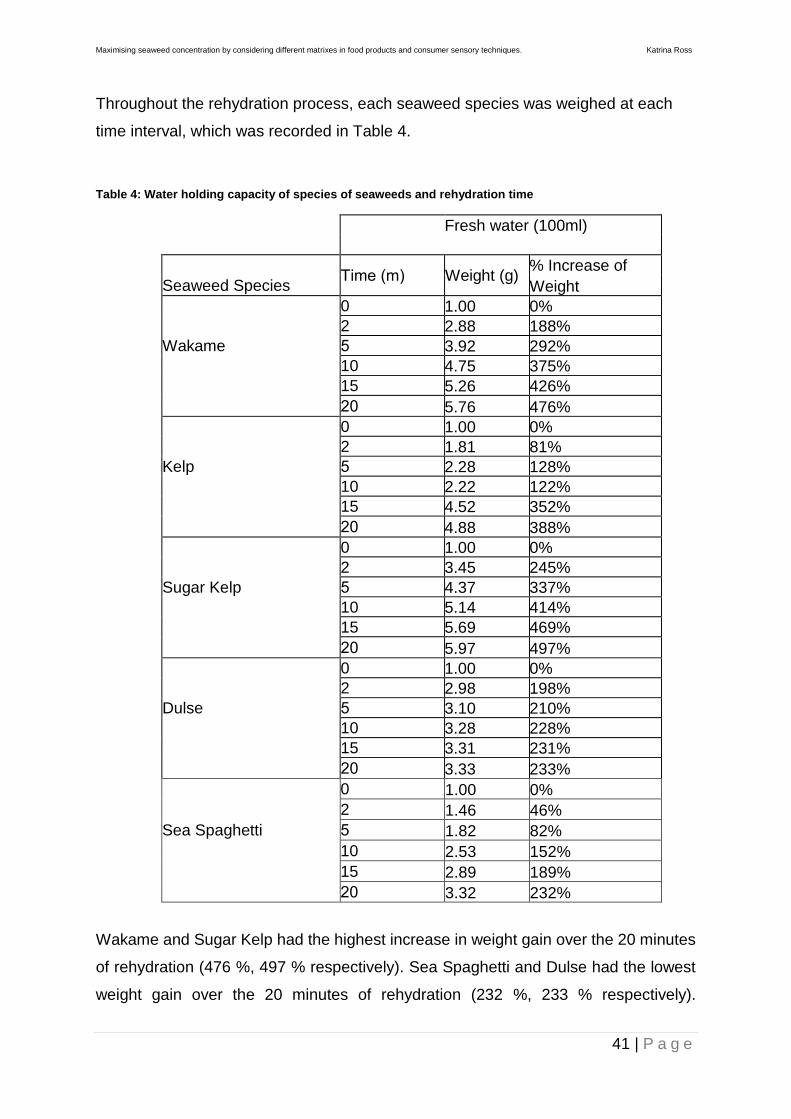
Maximising seaweed concentration by considering different matrixes in food products and consumer sensory techniques. Katrina Ross
41 | P a g e
Throughout the rehydration process, each seaweed species was weighed at each
time interval, which was recorded in Table 4.
Table 4: Water holding capacity of species of seaweeds and rehydration time
Fresh water (100ml)
Time (m) Weight (g)
% Increase of
Seaweed Species Weight
0 1.00 0%
2 2.88 188%
Wakame 5 3.92 292%
10 4.75 375%
15 5.26 426%
20 5.76 476%
0 1.00 0%
2 1.81 81%
Kelp 5 2.28 128%
10 2.22 122%
15 4.52 352%
20 4.88 388%
0 1.00 0%
2 3.45 245%
Sugar Kelp 5 4.37 337%
10 5.14 414%
15 5.69 469%
20 5.97 497%
0 1.00 0%
2 2.98 198%
Dulse 5 3.10 210%
10 3.28 228%
15 3.31 231%
20 3.33 233%
0 1.00 0%
2 1.46 46%
Sea Spaghetti 5 1.82 82%
10 2.53 152%
15 2.89 189%
20 3.32 232%
Wakame and Sugar Kelp had the highest increase in weight gain over the 20 minutes
of rehydration (476 %, 497 % respectively). Sea Spaghetti and Dulse had the lowest
weight gain over the 20 minutes of rehydration (232 %, 233 % respectively).
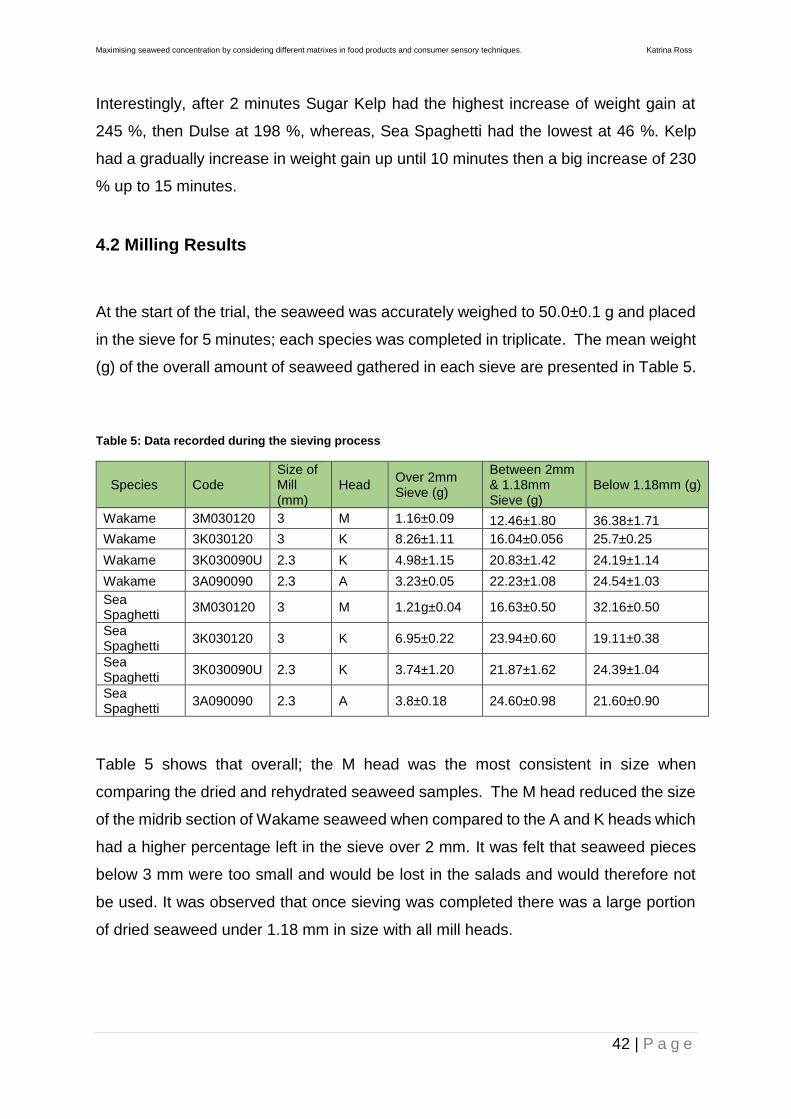
Maximising seaweed concentration by considering different matrixes in food products and consumer sensory techniques. Katrina Ross
42 | P a g e
Interestingly, after 2 minutes Sugar Kelp had the highest increase of weight gain at
245 %, then Dulse at 198 %, whereas, Sea Spaghetti had the lowest at 46 %. Kelp
had a gradually increase in weight gain up until 10 minutes then a big increase of 230
% up to 15 minutes.
4.2 Milling Results
At the start of the trial, the seaweed was accurately weighed to 50.0±0.1 g and placed
in the sieve for 5 minutes; each species was completed in triplicate. The mean weight
(g) of the overall amount of seaweed gathered in each sieve are presented in Table 5.
Table 5: Data recorded during the sieving process
Species Code Size of Mill (mm)
Head Over 2mm Sieve (g)
Between 2mm & 1.18mm Sieve (g)
Below 1.18mm (g)
Wakame 3M030120 3 M 1.16±0.09 12.46±1.80 36.38±1.71
Wakame 3K030120 3 K 8.26±1.11 16.04±0.056 25.7±0.25
Wakame 3K030090U 2.3 K 4.98±1.15 20.83±1.42 24.19±1.14
Wakame 3A090090 2.3 A 3.23±0.05 22.23±1.08 24.54±1.03
Sea Spaghetti
3M030120 3 M 1.21g±0.04 16.63±0.50 32.16±0.50
Sea Spaghetti
3K030120 3 K 6.95±0.22 23.94±0.60 19.11±0.38
Sea Spaghetti
3K030090U 2.3 K 3.74±1.20 21.87±1.62 24.39±1.04
Sea Spaghetti
3A090090 2.3 A 3.8±0.18 24.60±0.98 21.60±0.90
Table 5 shows that overall; the M head was the most consistent in size when
comparing the dried and rehydrated seaweed samples. The M head reduced the size
of the midrib section of Wakame seaweed when compared to the A and K heads which
had a higher percentage left in the sieve over 2 mm. It was felt that seaweed pieces
below 3 mm were too small and would be lost in the salads and would therefore not
be used. It was observed that once sieving was completed there was a large portion
of dried seaweed under 1.18 mm in size with all mill heads.
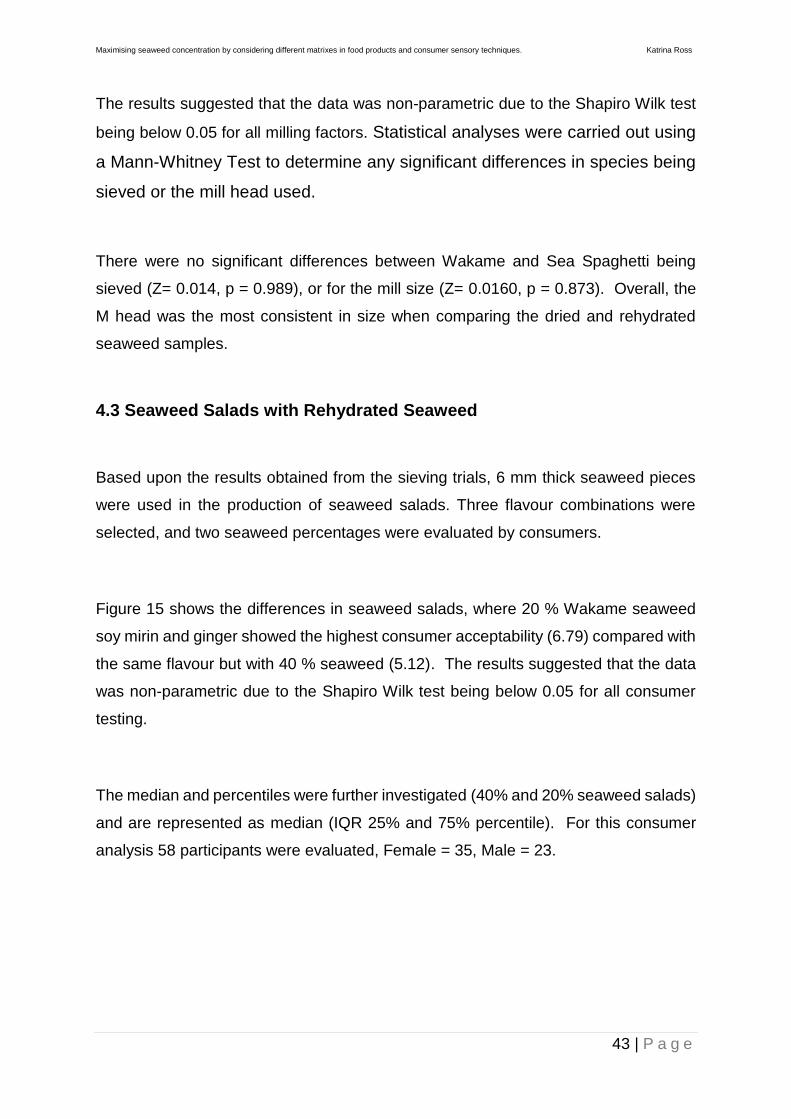
Maximising seaweed concentration by considering different matrixes in food products and consumer sensory techniques. Katrina Ross
43 | P a g e
The results suggested that the data was non-parametric due to the Shapiro Wilk test
being below 0.05 for all milling factors. Statistical analyses were carried out using
a Mann-Whitney Test to determine any significant differences in species being
sieved or the mill head used.
There were no significant differences between Wakame and Sea Spaghetti being
sieved (Z= 0.014, p = 0.989), or for the mill size (Z= 0.0160, p = 0.873). Overall, the
M head was the most consistent in size when comparing the dried and rehydrated
seaweed samples.
4.3 Seaweed Salads with Rehydrated Seaweed
Based upon the results obtained from the sieving trials, 6 mm thick seaweed pieces
were used in the production of seaweed salads. Three flavour combinations were
selected, and two seaweed percentages were evaluated by consumers.
Figure 15 shows the differences in seaweed salads, where 20 % Wakame seaweed
soy mirin and ginger showed the highest consumer acceptability (6.79) compared with
the same flavour but with 40 % seaweed (5.12). The results suggested that the data
was non-parametric due to the Shapiro Wilk test being below 0.05 for all consumer
testing.
The median and percentiles were further investigated (40% and 20% seaweed salads)
and are represented as median (IQR 25% and 75% percentile). For this consumer
analysis 58 participants were evaluated, Female = 35, Male = 23.
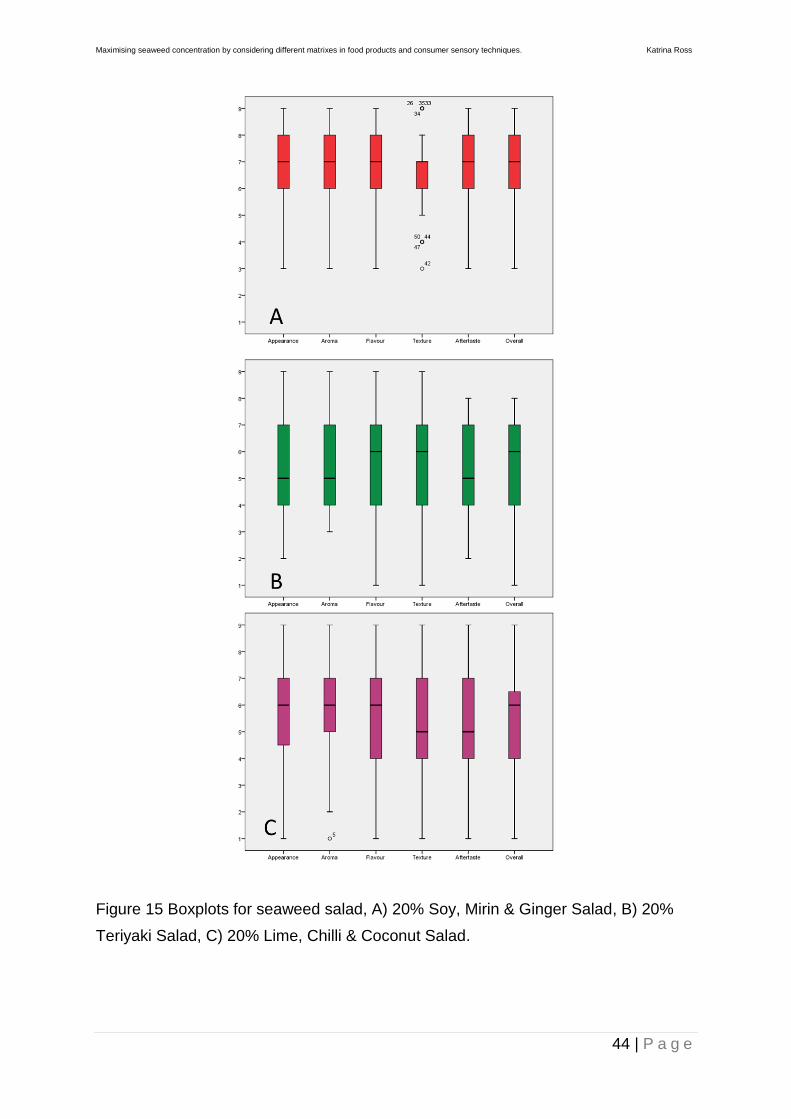
Maximising seaweed concentration by considering different matrixes in food products and consumer sensory techniques. Katrina Ross
44 | P a g e
Figure 15: Boxplots of 20% seaweed salad
Figure 15 Boxplots for seaweed salad, A) 20% Soy, Mirin & Ginger Salad, B) 20%
Teriyaki Salad, C) 20% Lime, Chilli & Coconut Salad.
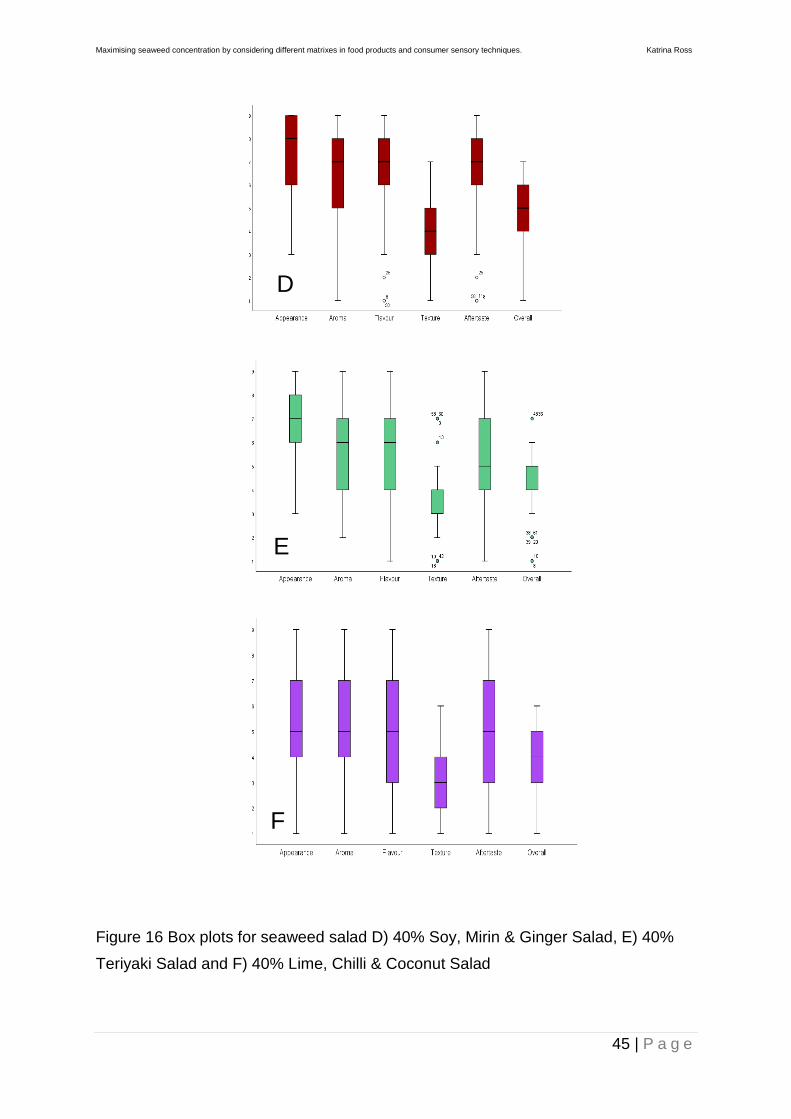
Maximising seaweed concentration by considering different matrixes in food products and consumer sensory techniques. Katrina Ross
45 | P a g e
Figure 16 Box plots for seaweed salad
Figure 16 Box plots for seaweed salad D) 40% Soy, Mirin & Ginger Salad, E) 40%
Teriyaki Salad and F) 40% Lime, Chilli & Coconut Salad
D
E
F
Maximising seaweed concentration by considering different matrixes in food products and consumer sensory techniques. Katrina Ross
46 | P a g e
The boxplot results for each salad are based on consumer acceptance on a 9 point
hedonic scale.
Interestingly, the soy and teriyaki salads appearances, aroma and flavour were
preferred by the consumer (Figure 16) (6.0-8.0). The soy flavoured salad score 7.0
for aftertaste, however each salad showed a very low acceptability on texture (3.0-
4.0), and this could have reduced the overall acceptability of the salads. The texture
between all salads differed in acceptability and were rated considerably lower in the
40% seaweed salads (4.0, 3.0, 3.0) than the 20% seaweed salads (7.0, 6.0, 5.0).
Lime, chilli and coconut at 40 % seaweed scored a lower rating than other products
within this consumer testing. In the 20 % seaweed salad lime, chilli and coconut
scoring was consistently higher than the 40 % (ranging from 5.0-6.0for the 20 %
seaweed salad and 3.0-5.0 for the 40 % seaweed salad).
Each median for every attribute of the 40 and 20 % seaweed salads were analysed
using a K related Friedman test with data shown to be significantly different. Each
difference in attribute was further analysed against each other by using a paired
Wilcoxon test to further explore significant differences between samples.
There was a statistically difference in consumer acceptance towards appearance
depending on what seaweed salad (Figure 16) sample was tested, X2 (2) = 43.518,
p<0.001. Post hoc analysis with Wilcoxon signed-rank tests was conducted with a
Bonferroni correction applied, resulting in a significance level set at p< 0.01. Median
(IQR) perceived appearance levels for the soy, mirin & ginger salad, teriyaki salad,
lime, chilli &coconut salad were 8.0 (6.0,9.0), 7.0 (5.5,8.0) and 5.0 (4.0,7.0),
respectively.
There were significant differences between the 40% seaweed salads (Figure 16)soy,
mirin & ginger salad - lime, chilli & coconut salad (Z= -5.464, p<0.001), teriyaki salad,
Maximising seaweed concentration by considering different matrixes in food products and consumer sensory techniques. Katrina Ross
47 | P a g e
lime, chilli &coconut salad (Z=-3.587 p<0.001). There was a statistical difference in
consumer acceptance towards flavour depending on what seaweed salad sample was
tested, X2 (2) = 27.930, p<0.001. Post hoc analysis with Wilcoxon signed-rank tests
was conducted with a Bonferroni correction applied, resulting in a significance level
set at p< 0.01. Median (IQR) perceived flavour levels for the soy, mirin & ginger salad,
teriyaki salad, lime, chilli & coconut salad were 7.0 (6.0,8.0), 6.0 (4.0,7.75) and 5.0
(3.0,7.0), respectively. There were significant differences between the soy, mirin &
ginger salad, lime, chilli & coconut salad (Z=-4.312, p<0.001), soy, mirin & ginger salad
- teriyaki salad (Z=--3.224, p = 0.001).
There was a statistically difference in consumer acceptance towards aftertaste
depending on what seaweed salad sample was tested, X2 (2) = 27.508, p<0.001. Post
hoc analysis with Wilcoxon signed-rank tests was conducted with a Bonferroni
correction applied, resulting in a significance level set at p< 0.01. Median (IQR)
perceived aftertaste levels for the soy, mirin & ginger salad, teriyaki salad, lime, chilli
& coconut salad were 7.0 (6.0,8.0), 5.0 (4.0,7.0) and 5.0 (3.0,7.0), respectively.
There were significant differences between the soy, mirin & ginger salad, teriyaki salad
(Z=-3.389, p = 0.001), soy, mirin & ginger salad - lime, chilli & coconut salad (Z=-4.221,
p = 0.001).
There was a statistically difference in consumer acceptance towards overall
acceptability depending on what seaweed salad sample was tested, X2 (2) = 27.420,
p<0.001. Post hoc analysis with Wilcoxon signed-rank tests was conducted with a
Bonferroni correction applied, resulting in a significance level set at p< 0.01. Median
(IQR) perceived overall acceptability levels for the soy, mirin & ginger salad, teriyaki
salad, lime, chilli & coconut salad were 5.0 (4.0,6.0), 5.0 (4.0,5.0) and 4.0 (3.0,5.0),
respectively. There were significant differences between the soy, mirin & ginger salad
- teriyaki salad (Z=-2.764, p = 0.006), soy, mirin & ginger salad - lime, chilli & coconut
salad (Z=--4.842, p<0.001).
Further statistical analysis was conducted using a Wilcoxon signed-rank tests with a
Bonferroni correction applied, resulting in a significance level set at p< 0.01. This was
to determine any significant differences with the appearance of 40% soy, mirin &
Maximising seaweed concentration by considering different matrixes in food products and consumer sensory techniques. Katrina Ross
48 | P a g e
ginger salad seaweed salad against the 20% soy, mirin & ginger salad seaweed salad.
There were no significant differences with appearance (Z=-1.912, p = 0.056), aroma
(Z=-0.846, p = 0.397), flavour (Z=--1.215, p = 0.224) and aftertaste (Z=--1.066, p =
0.286).
There were however significant differences between the 40% soy, mirin & ginger salad
seaweed salad against the 20% soy, mirin & ginger salad for texture ((Z=5282,
p<0.001) and overall acceptance (Z=4.266, p<0.001).
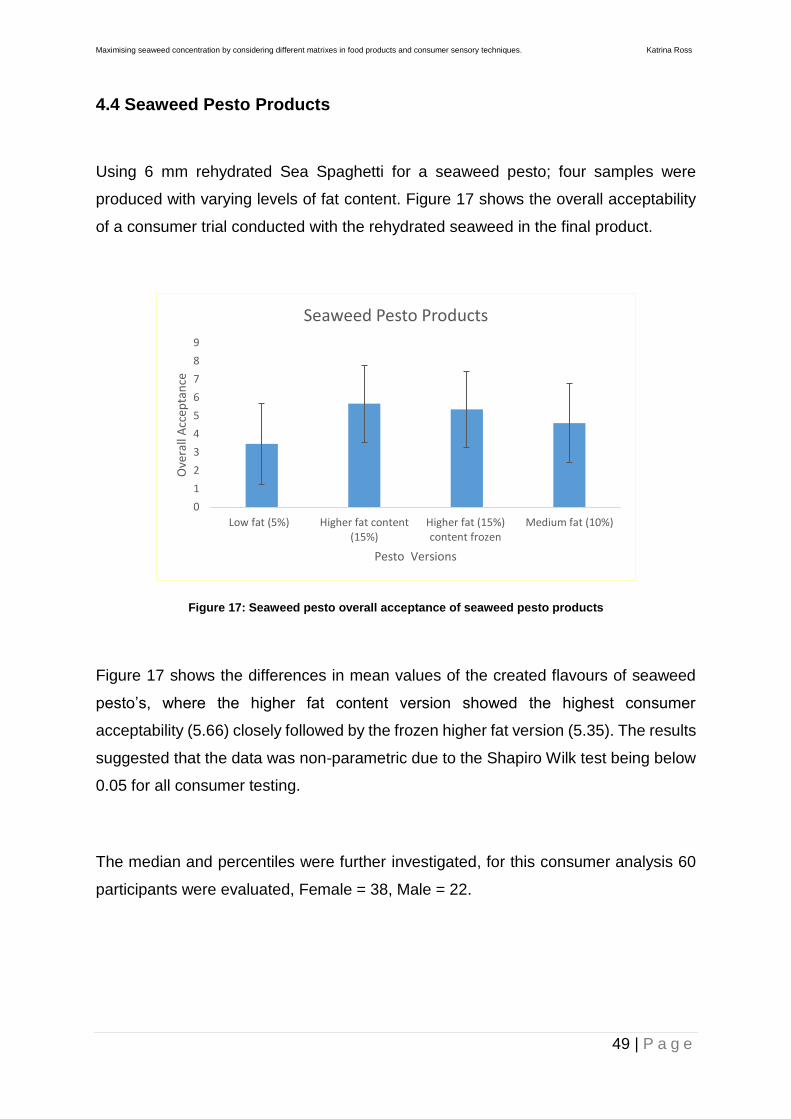
Maximising seaweed concentration by considering different matrixes in food products and consumer sensory techniques. Katrina Ross
49 | P a g e
4.4 Seaweed Pesto Products
Using 6 mm rehydrated Sea Spaghetti for a seaweed pesto; four samples were
produced with varying levels of fat content. Figure 17 shows the overall acceptability
of a consumer trial conducted with the rehydrated seaweed in the final product.
Figure 17: Seaweed pesto overall acceptance of seaweed pesto products
Figure 17 shows the differences in mean values of the created flavours of seaweed
pesto’s, where the higher fat content version showed the highest consumer
acceptability (5.66) closely followed by the frozen higher fat version (5.35). The results
suggested that the data was non-parametric due to the Shapiro Wilk test being below
0.05 for all consumer testing.
The median and percentiles were further investigated, for this consumer analysis 60
participants were evaluated, Female = 38, Male = 22.
0
1
2
3
4
5
6
7
8
9
Low fat (5%) Higher fat content(15%)
Higher fat (15%)content frozen
Medium fat (10%)
Ove
rall
Acc
epta
nce
Pesto Versions
Seaweed Pesto Products
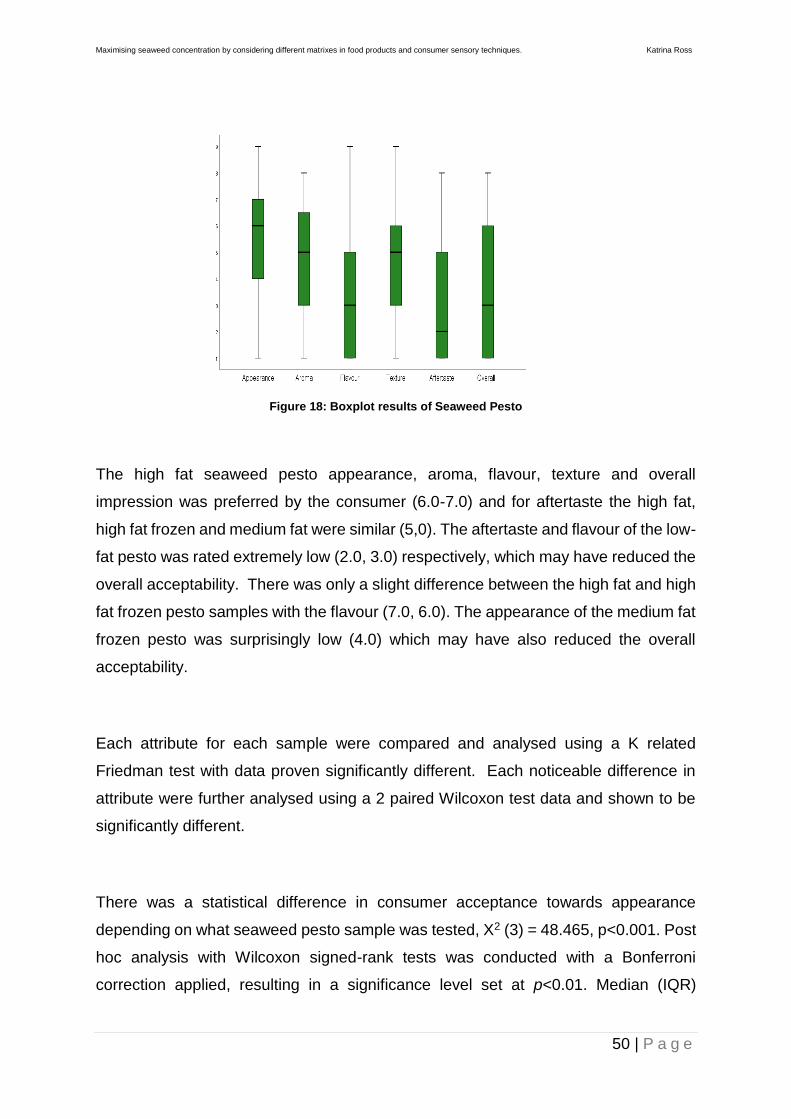
Maximising seaweed concentration by considering different matrixes in food products and consumer sensory techniques. Katrina Ross
50 | P a g e
Figure 18: Boxplot results of Seaweed Pesto
The high fat seaweed pesto appearance, aroma, flavour, texture and overall
impression was preferred by the consumer (6.0-7.0) and for aftertaste the high fat,
high fat frozen and medium fat were similar (5,0). The aftertaste and flavour of the low-
fat pesto was rated extremely low (2.0, 3.0) respectively, which may have reduced the
overall acceptability. There was only a slight difference between the high fat and high
fat frozen pesto samples with the flavour (7.0, 6.0). The appearance of the medium fat
frozen pesto was surprisingly low (4.0) which may have also reduced the overall
acceptability.
Each attribute for each sample were compared and analysed using a K related
Friedman test with data proven significantly different. Each noticeable difference in
attribute were further analysed using a 2 paired Wilcoxon test data and shown to be
significantly different.
There was a statistical difference in consumer acceptance towards appearance
depending on what seaweed pesto sample was tested, X2 (3) = 48.465, p<0.001. Post
hoc analysis with Wilcoxon signed-rank tests was conducted with a Bonferroni
correction applied, resulting in a significance level set at p<0.01. Median (IQR)
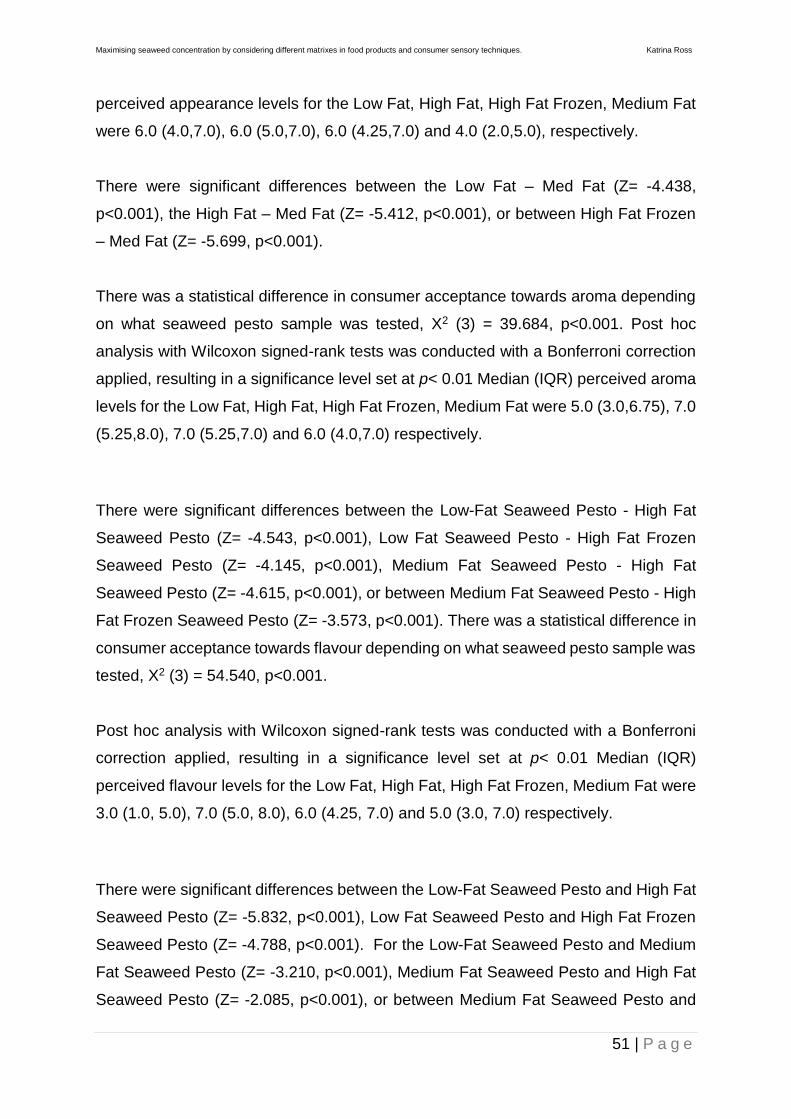
Maximising seaweed concentration by considering different matrixes in food products and consumer sensory techniques. Katrina Ross
51 | P a g e
perceived appearance levels for the Low Fat, High Fat, High Fat Frozen, Medium Fat
were 6.0 (4.0,7.0), 6.0 (5.0,7.0), 6.0 (4.25,7.0) and 4.0 (2.0,5.0), respectively.
There were significant differences between the Low Fat – Med Fat (Z= -4.438,
p<0.001), the High Fat – Med Fat (Z= -5.412, p<0.001), or between High Fat Frozen
– Med Fat (Z= -5.699, p<0.001).
There was a statistical difference in consumer acceptance towards aroma depending
on what seaweed pesto sample was tested, X2 (3) = 39.684, p<0.001. Post hoc
analysis with Wilcoxon signed-rank tests was conducted with a Bonferroni correction
applied, resulting in a significance level set at p< 0.01 Median (IQR) perceived aroma
levels for the Low Fat, High Fat, High Fat Frozen, Medium Fat were 5.0 (3.0,6.75), 7.0
(5.25,8.0), 7.0 (5.25,7.0) and 6.0 (4.0,7.0) respectively.
There were significant differences between the Low-Fat Seaweed Pesto - High Fat
Seaweed Pesto (Z= -4.543, p<0.001), Low Fat Seaweed Pesto - High Fat Frozen
Seaweed Pesto (Z= -4.145, p<0.001), Medium Fat Seaweed Pesto - High Fat
Seaweed Pesto (Z= -4.615, p<0.001), or between Medium Fat Seaweed Pesto - High
Fat Frozen Seaweed Pesto (Z= -3.573, p<0.001). There was a statistical difference in
consumer acceptance towards flavour depending on what seaweed pesto sample was
tested, X2 (3) = 54.540, p<0.001.
Post hoc analysis with Wilcoxon signed-rank tests was conducted with a Bonferroni
correction applied, resulting in a significance level set at p< 0.01 Median (IQR)
perceived flavour levels for the Low Fat, High Fat, High Fat Frozen, Medium Fat were
3.0 (1.0, 5.0), 7.0 (5.0, 8.0), 6.0 (4.25, 7.0) and 5.0 (3.0, 7.0) respectively.
There were significant differences between the Low-Fat Seaweed Pesto and High Fat
Seaweed Pesto (Z= -5.832, p<0.001), Low Fat Seaweed Pesto and High Fat Frozen
Seaweed Pesto (Z= -4.788, p<0.001). For the Low-Fat Seaweed Pesto and Medium
Fat Seaweed Pesto (Z= -3.210, p<0.001), Medium Fat Seaweed Pesto and High Fat
Seaweed Pesto (Z= -2.085, p<0.001), or between Medium Fat Seaweed Pesto and
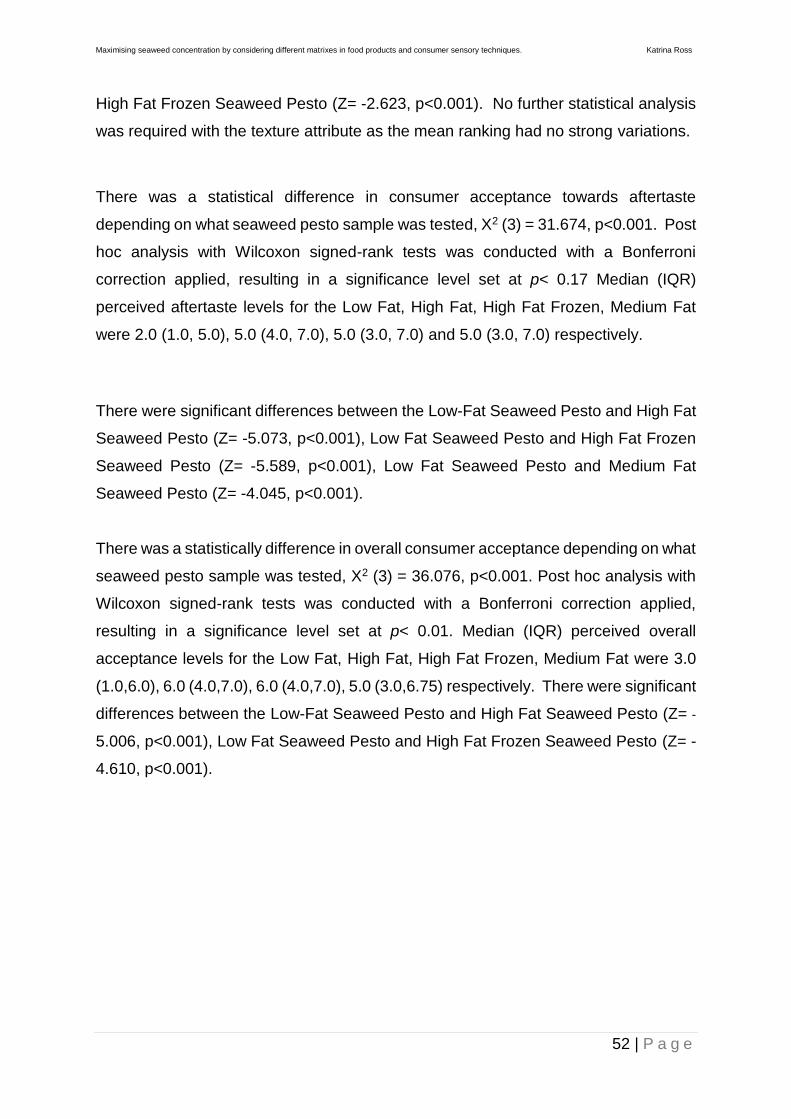
Maximising seaweed concentration by considering different matrixes in food products and consumer sensory techniques. Katrina Ross
52 | P a g e
High Fat Frozen Seaweed Pesto (Z= -2.623, p<0.001). No further statistical analysis
was required with the texture attribute as the mean ranking had no strong variations.
There was a statistical difference in consumer acceptance towards aftertaste
depending on what seaweed pesto sample was tested, X2 (3) = 31.674, p<0.001. Post
hoc analysis with Wilcoxon signed-rank tests was conducted with a Bonferroni
correction applied, resulting in a significance level set at p< 0.17 Median (IQR)
perceived aftertaste levels for the Low Fat, High Fat, High Fat Frozen, Medium Fat
were 2.0 (1.0, 5.0), 5.0 (4.0, 7.0), 5.0 (3.0, 7.0) and 5.0 (3.0, 7.0) respectively.
There were significant differences between the Low-Fat Seaweed Pesto and High Fat
Seaweed Pesto (Z= -5.073, p<0.001), Low Fat Seaweed Pesto and High Fat Frozen
Seaweed Pesto (Z= -5.589, p<0.001), Low Fat Seaweed Pesto and Medium Fat
Seaweed Pesto (Z= -4.045, p<0.001).
There was a statistically difference in overall consumer acceptance depending on what
seaweed pesto sample was tested, X2 (3) = 36.076, p<0.001. Post hoc analysis with
Wilcoxon signed-rank tests was conducted with a Bonferroni correction applied,
resulting in a significance level set at p< 0.01. Median (IQR) perceived overall
acceptance levels for the Low Fat, High Fat, High Fat Frozen, Medium Fat were 3.0
(1.0,6.0), 6.0 (4.0,7.0), 6.0 (4.0,7.0), 5.0 (3.0,6.75) respectively. There were significant
differences between the Low-Fat Seaweed Pesto and High Fat Seaweed Pesto (Z= -
5.006, p<0.001), Low Fat Seaweed Pesto and High Fat Frozen Seaweed Pesto (Z= -
4.610, p<0.001).
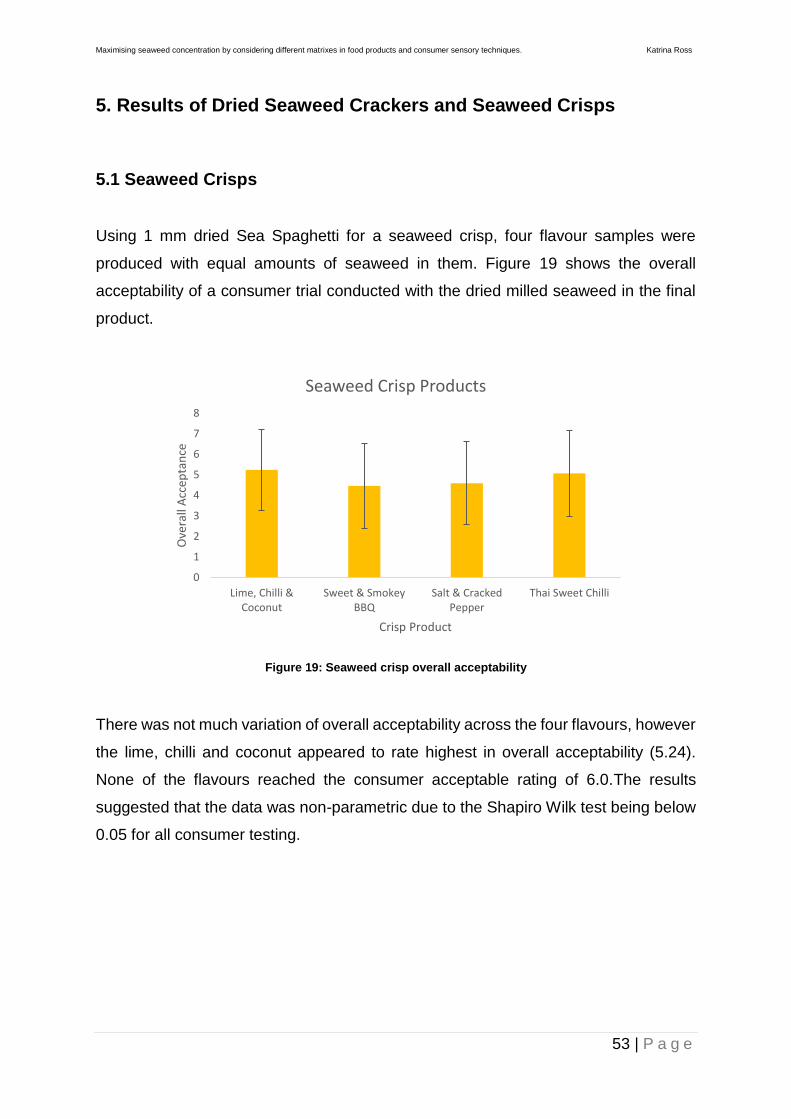
Maximising seaweed concentration by considering different matrixes in food products and consumer sensory techniques. Katrina Ross
53 | P a g e
5. Results of Dried Seaweed Crackers and Seaweed Crisps
5.1 Seaweed Crisps
Using 1 mm dried Sea Spaghetti for a seaweed crisp, four flavour samples were
produced with equal amounts of seaweed in them. Figure 19 shows the overall
acceptability of a consumer trial conducted with the dried milled seaweed in the final
product.
Figure 19: Seaweed crisp overall acceptability
There was not much variation of overall acceptability across the four flavours, however
the lime, chilli and coconut appeared to rate highest in overall acceptability (5.24).
None of the flavours reached the consumer acceptable rating of 6.0.The results
suggested that the data was non-parametric due to the Shapiro Wilk test being below
0.05 for all consumer testing.
0
1
2
3
4
5
6
7
8
Lime, Chilli &Coconut
Sweet & SmokeyBBQ
Salt & CrackedPepper
Thai Sweet Chilli
Ove
rall
Acc
epta
nce
Crisp Product
Seaweed Crisp Products
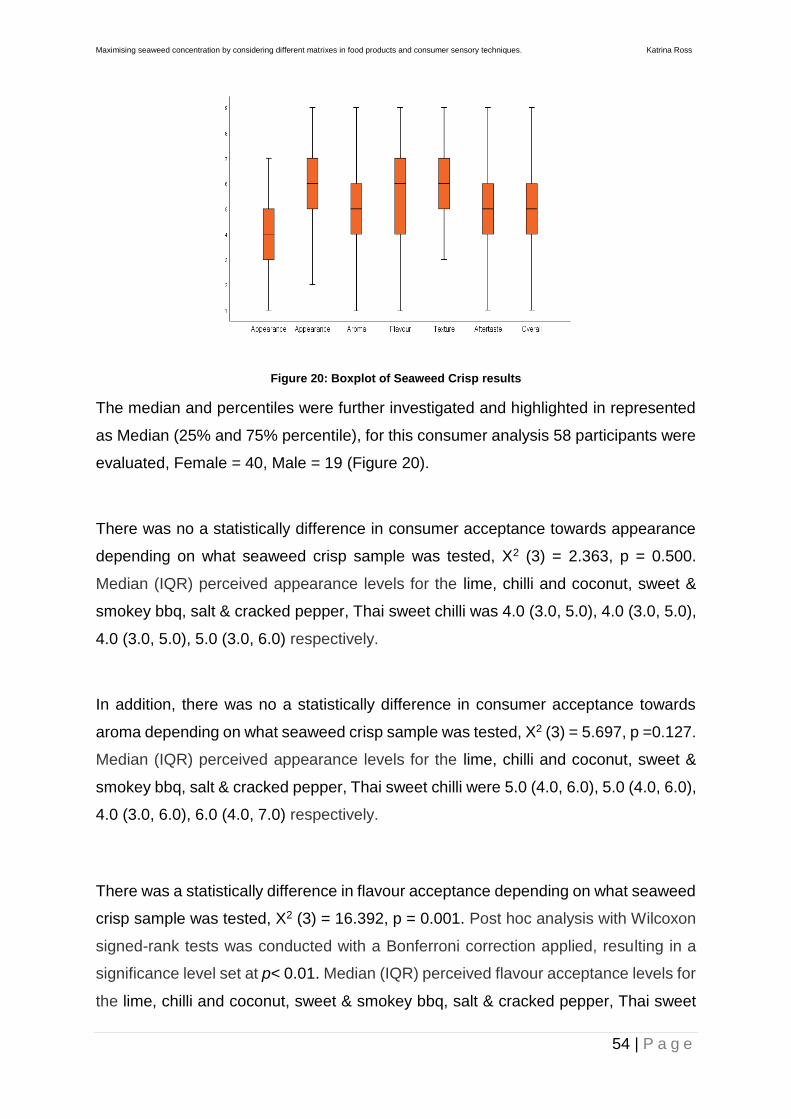
Maximising seaweed concentration by considering different matrixes in food products and consumer sensory techniques. Katrina Ross
54 | P a g e
Figure 20: Boxplot of Seaweed Crisp results
The median and percentiles were further investigated and highlighted in represented
as Median (25% and 75% percentile), for this consumer analysis 58 participants were
evaluated, Female = 40, Male = 19 (Figure 20).
There was no a statistically difference in consumer acceptance towards appearance
depending on what seaweed crisp sample was tested, X2 (3) = 2.363, p = 0.500.
Median (IQR) perceived appearance levels for the lime, chilli and coconut, sweet &
smokey bbq, salt & cracked pepper, Thai sweet chilli was 4.0 (3.0, 5.0), 4.0 (3.0, 5.0),
4.0 (3.0, 5.0), 5.0 (3.0, 6.0) respectively.
In addition, there was no a statistically difference in consumer acceptance towards
aroma depending on what seaweed crisp sample was tested, X2 (3) = 5.697, p =0.127.
Median (IQR) perceived appearance levels for the lime, chilli and coconut, sweet &
smokey bbq, salt & cracked pepper, Thai sweet chilli were 5.0 (4.0, 6.0), 5.0 (4.0, 6.0),
4.0 (3.0, 6.0), 6.0 (4.0, 7.0) respectively.
There was a statistically difference in flavour acceptance depending on what seaweed
crisp sample was tested, X2 (3) = 16.392, p = 0.001. Post hoc analysis with Wilcoxon
signed-rank tests was conducted with a Bonferroni correction applied, resulting in a
significance level set at p< 0.01. Median (IQR) perceived flavour acceptance levels for
the lime, chilli and coconut, sweet & smokey bbq, salt & cracked pepper, Thai sweet
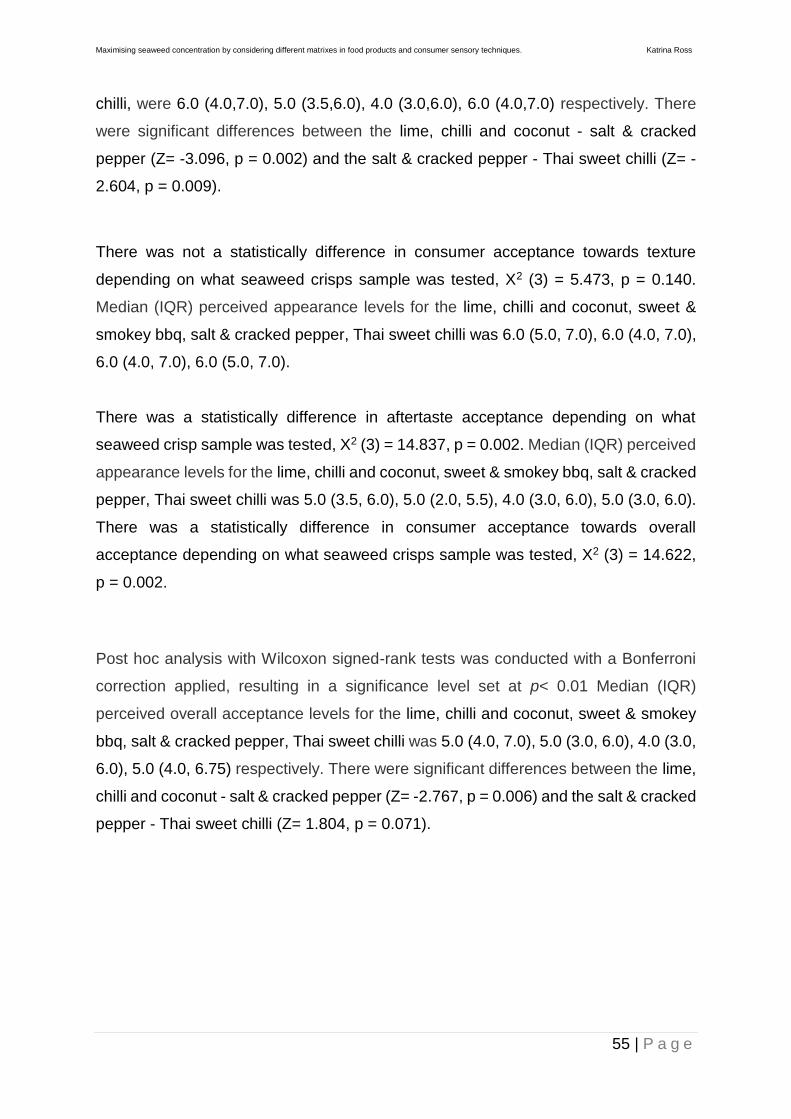
Maximising seaweed concentration by considering different matrixes in food products and consumer sensory techniques. Katrina Ross
55 | P a g e
chilli, were 6.0 (4.0,7.0), 5.0 (3.5,6.0), 4.0 (3.0,6.0), 6.0 (4.0,7.0) respectively. There
were significant differences between the lime, chilli and coconut - salt & cracked
pepper (Z= -3.096, p = 0.002) and the salt & cracked pepper - Thai sweet chilli (Z= -
2.604, p = 0.009).
There was not a statistically difference in consumer acceptance towards texture
depending on what seaweed crisps sample was tested, X2 (3) = 5.473, p = 0.140.
Median (IQR) perceived appearance levels for the lime, chilli and coconut, sweet &
smokey bbq, salt & cracked pepper, Thai sweet chilli was 6.0 (5.0, 7.0), 6.0 (4.0, 7.0),
6.0 (4.0, 7.0), 6.0 (5.0, 7.0).
There was a statistically difference in aftertaste acceptance depending on what
seaweed crisp sample was tested, X2 (3) = 14.837, p = 0.002. Median (IQR) perceived
appearance levels for the lime, chilli and coconut, sweet & smokey bbq, salt & cracked
pepper, Thai sweet chilli was 5.0 (3.5, 6.0), 5.0 (2.0, 5.5), 4.0 (3.0, 6.0), 5.0 (3.0, 6.0).
There was a statistically difference in consumer acceptance towards overall
acceptance depending on what seaweed crisps sample was tested, X2 (3) = 14.622,
p = 0.002.
Post hoc analysis with Wilcoxon signed-rank tests was conducted with a Bonferroni
correction applied, resulting in a significance level set at p< 0.01 Median (IQR)
perceived overall acceptance levels for the lime, chilli and coconut, sweet & smokey
bbq, salt & cracked pepper, Thai sweet chilli was 5.0 (4.0, 7.0), 5.0 (3.0, 6.0), 4.0 (3.0,
6.0), 5.0 (4.0, 6.75) respectively. There were significant differences between the lime,
chilli and coconut - salt & cracked pepper (Z= -2.767, p = 0.006) and the salt & cracked
pepper - Thai sweet chilli (Z= 1.804, p = 0.071).
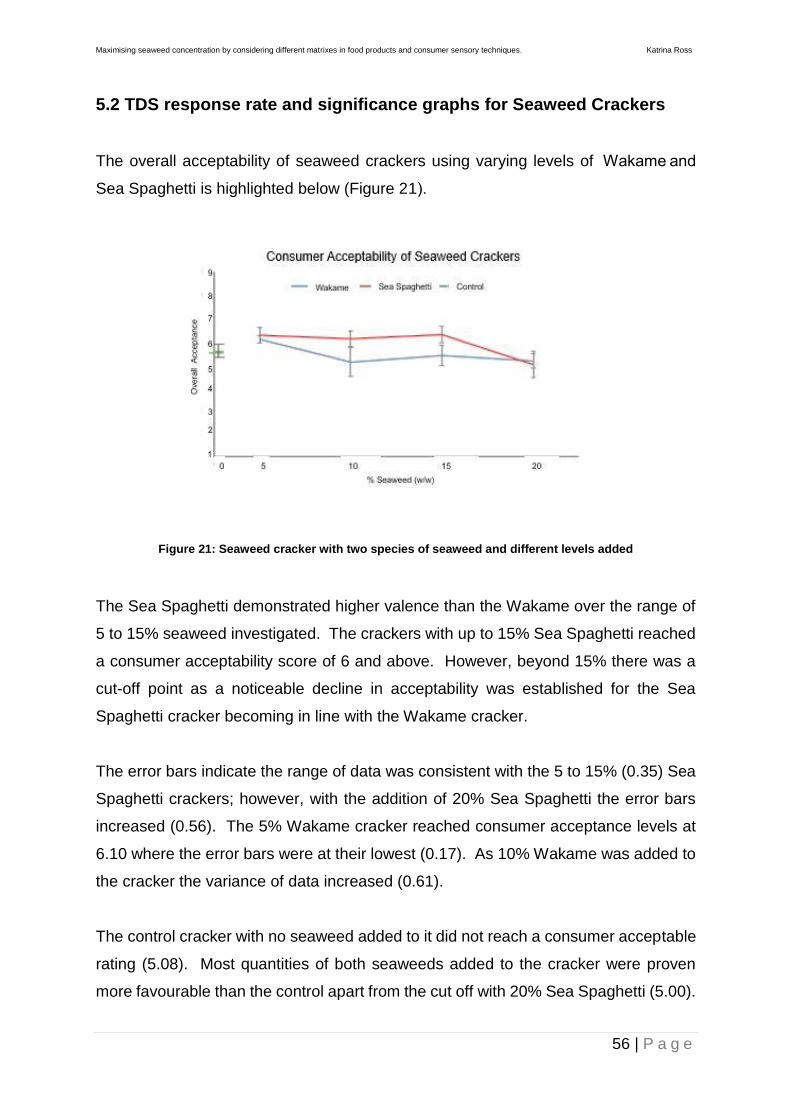
Maximising seaweed concentration by considering different matrixes in food products and consumer sensory techniques. Katrina Ross
56 | P a g e
5.2 TDS response rate and significance graphs for Seaweed Crackers
The overall acceptability of seaweed crackers using varying levels of Wakame and
Sea Spaghetti is highlighted below (Figure 21).
Figure 21: Seaweed cracker with two species of seaweed and different levels added
The Sea Spaghetti demonstrated higher valence than the Wakame over the range of
5 to 15% seaweed investigated. The crackers with up to 15% Sea Spaghetti reached
a consumer acceptability score of 6 and above. However, beyond 15% there was a
cut-off point as a noticeable decline in acceptability was established for the Sea
Spaghetti cracker becoming in line with the Wakame cracker.
The error bars indicate the range of data was consistent with the 5 to 15% (0.35) Sea
Spaghetti crackers; however, with the addition of 20% Sea Spaghetti the error bars
increased (0.56). The 5% Wakame cracker reached consumer acceptance levels at
6.10 where the error bars were at their lowest (0.17). As 10% Wakame was added to
the cracker the variance of data increased (0.61).
The control cracker with no seaweed added to it did not reach a consumer acceptable
rating (5.08). Most quantities of both seaweeds added to the cracker were proven
more favourable than the control apart from the cut off with 20% Sea Spaghetti (5.00).
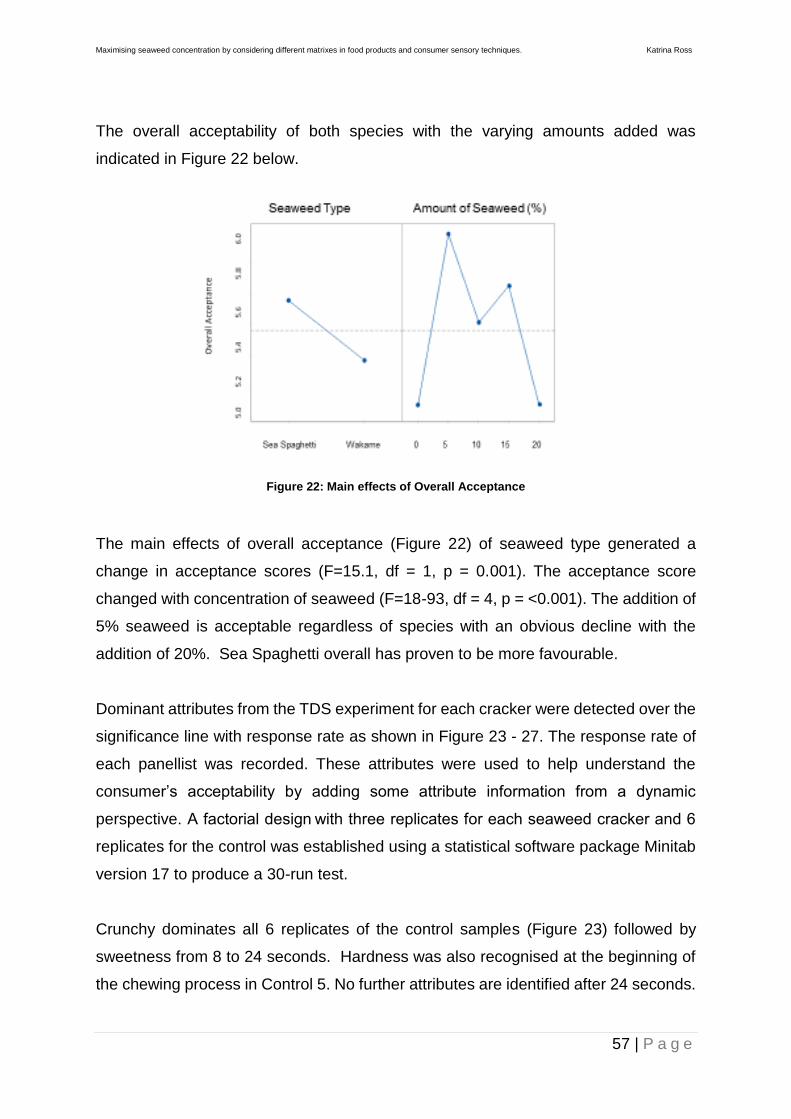
Maximising seaweed concentration by considering different matrixes in food products and consumer sensory techniques. Katrina Ross
57 | P a g e
The overall acceptability of both species with the varying amounts added was
indicated in Figure 22 below.
Figure 22: Main effects of Overall Acceptance
The main effects of overall acceptance (Figure 22) of seaweed type generated a
change in acceptance scores (F=15.1, df = 1, p = 0.001). The acceptance score
changed with concentration of seaweed (F=18-93, df = 4, p = <0.001). The addition of
5% seaweed is acceptable regardless of species with an obvious decline with the
addition of 20%. Sea Spaghetti overall has proven to be more favourable.
Dominant attributes from the TDS experiment for each cracker were detected over the
significance line with response rate as shown in Figure 23 - 27. The response rate of
each panellist was recorded. These attributes were used to help understand the
consumer’s acceptability by adding some attribute information from a dynamic
perspective. A factorial design with three replicates for each seaweed cracker and 6
replicates for the control was established using a statistical software package Minitab
version 17 to produce a 30-run test.
Crunchy dominates all 6 replicates of the control samples (Figure 23) followed by
sweetness from 8 to 24 seconds. Hardness was also recognised at the beginning of
the chewing process in Control 5. No further attributes are identified after 24 seconds.

Maximising seaweed concentration by considering different matrixes in food products and consumer sensory techniques. Katrina Ross
58 | P a g e
All three replicates with the 5% Wakame (Figure 24) also indicate crunchy as the
dominant attribute at the initial eating process followed by sweetness halfway through.
Over 65% participants had finished chewing by 37 seconds.
Figure 24 also shows the three replicates of the 10% Wakame cracker. Cracker E
and F have crunchy at the initial eating process followed by fishy with a slight
sweetness (F). Fishy was the dominant attribute throughout the eating process with
Cracker D. Over 72% had completed chewing by the 38th second.
Yet again all three replicates for the Crackers with 15% Wakame (Figure 25) indicated
crunchy as the dominant attribute initially followed by sweet with fishy (Cracker G and
I) being dominant towards the final stage of the eating process up to 28 seconds.
Cracker H highlighted saltiness as the dominant attribute towards the final eating
process. On average over 83 % had completed chewing by the 36th second.
The Wakame Cracker with 20% added (Figure 25) had mixed attributes within each
replicate. Cracker J displayed that hard was the dominant attribute at the initial eating
stage followed by sticky. Whereas Cracker K highlighted crunchy, hard then fishy as
dominant attributes throughout the eating process and Cracker L showed crunchy
followed by fishy as dominant attributes. On average over 73% had completed
chewing by the 37th second.
Crunchy followed by sweet were dominant attributes observed in the replicates M and
N with 5% Sea Spaghetti (Figure 26) with Cracker O having just crunchy as a dominant
attribute throughout the eating process. On average over 85% had completed chewing
by the 35th second.
In addition, Crunchy followed by sweet were also dominant attributes with the 10%
Sea Spaghetti Crackers P and R (Figure 26). Halfway through the eating process
fishy was a dominant attribute appearing in Cracker Q and saltiness in Cracker R.
On average over 82% had completed chewing by the 34th second.

Maximising seaweed concentration by considering different matrixes in food products and consumer sensory techniques. Katrina Ross
59 | P a g e
All the Crackers with 15% Sea Spaghetti (Figure 27) had crunchy as the dominant
attribute at the beginning of the eating process with fishy Crackers S and T and salty
in the middle. On average over 68% had completed chewing by the 38th second.
Figure 27 also highlights the attributes specified with the addition of 20% Sea
Spaghetti to a cracker. Again crunchy, salty and fishy were the dominant attributes.
On average over 72% had completed chewing by the 38th second.
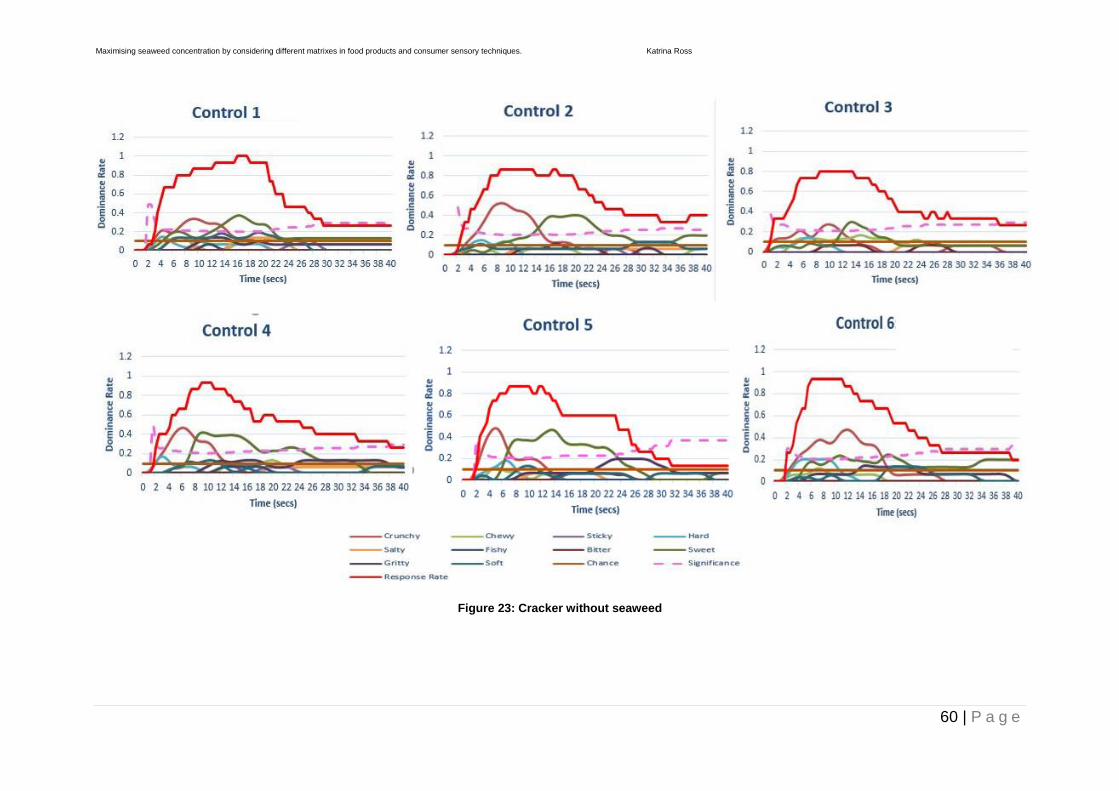
Maximising seaweed concentration by considering different matrixes in food products and consumer sensory techniques. Katrina Ross
60 | P a g e
Figure 23: Cracker without seaweed
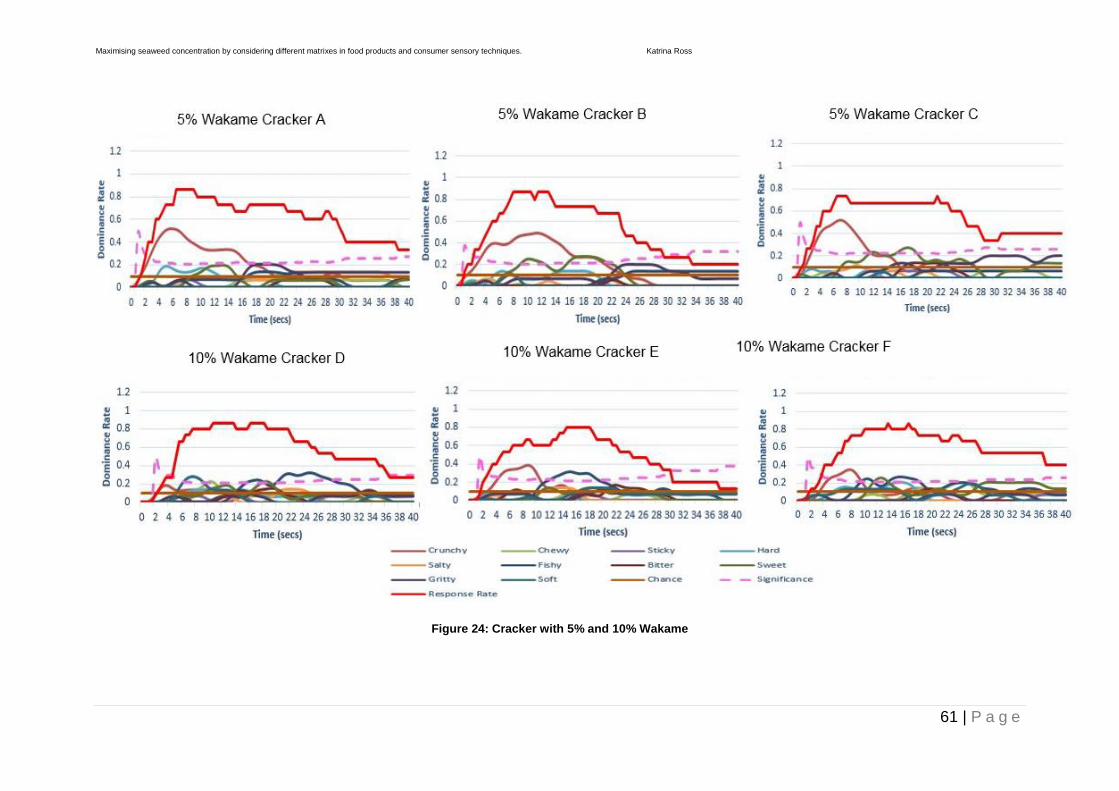
Maximising seaweed concentration by considering different matrixes in food products and consumer sensory techniques. Katrina Ross
61 | P a g e
Figure 24: Cracker with 5% and 10% Wakame
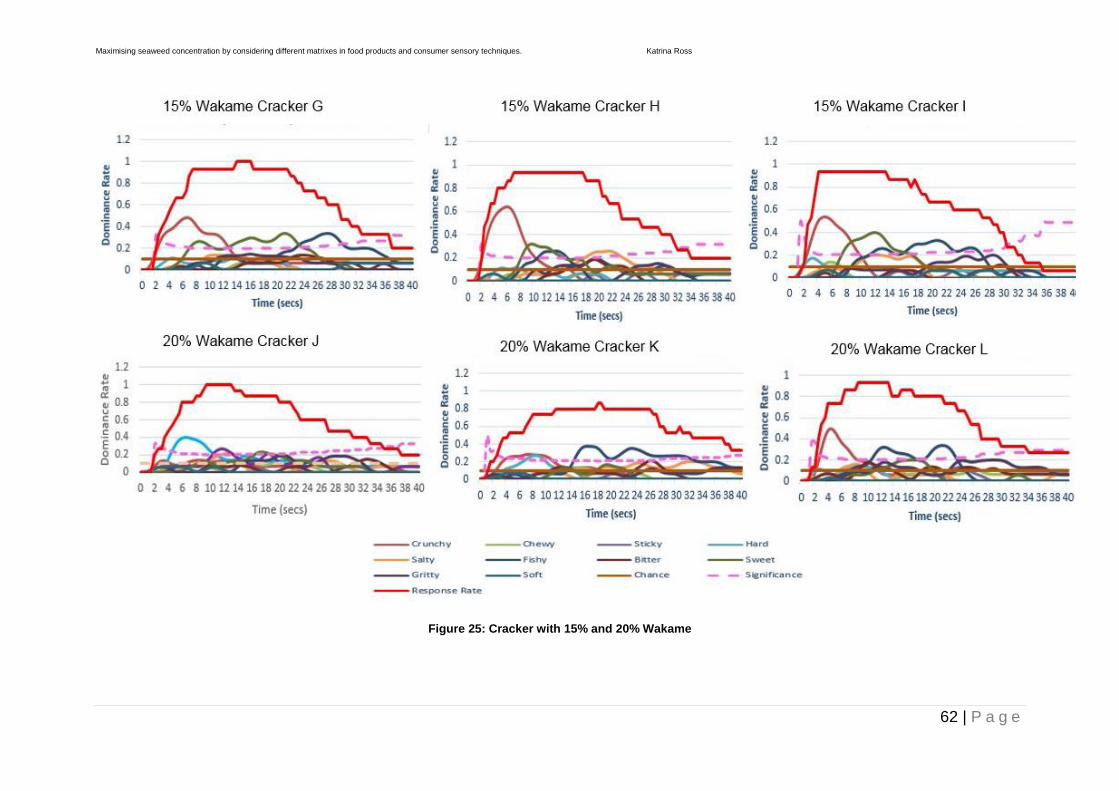
Maximising seaweed concentration by considering different matrixes in food products and consumer sensory techniques. Katrina Ross
62 | P a g e
Figure 25: Cracker with 15% and 20% Wakame
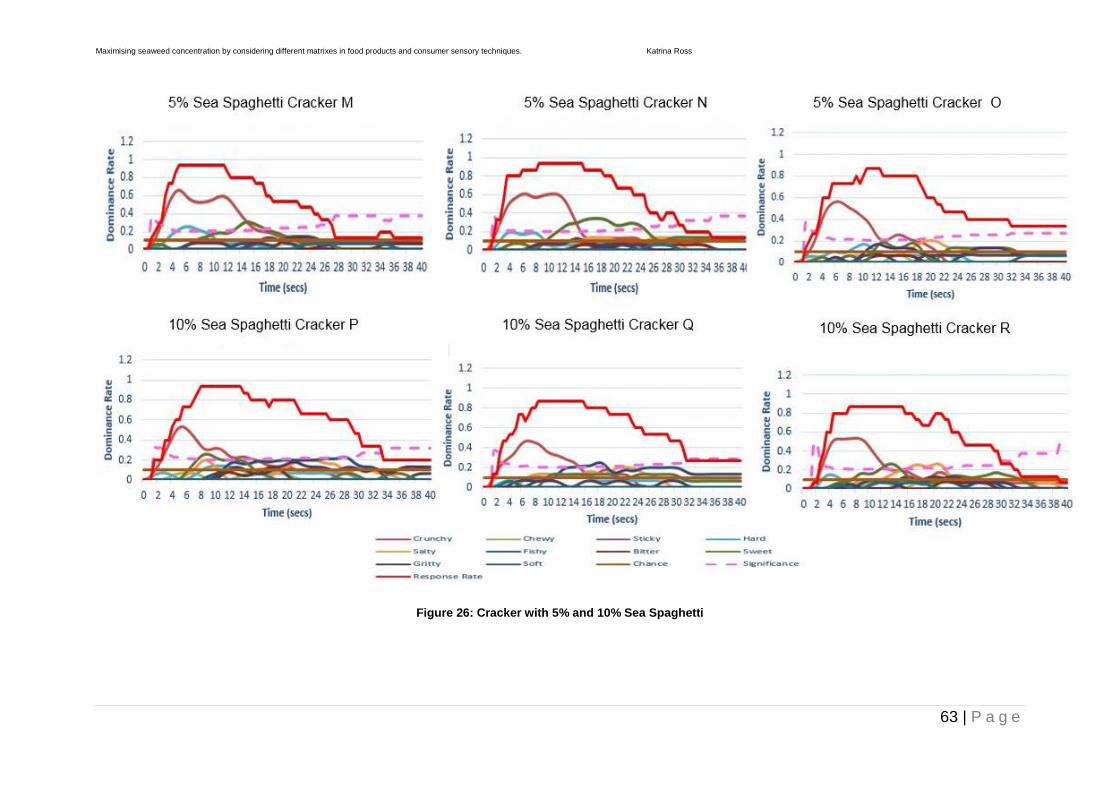
Maximising seaweed concentration by considering different matrixes in food products and consumer sensory techniques. Katrina Ross
63 | P a g e
Figure 26: Cracker with 5% and 10% Sea Spaghetti
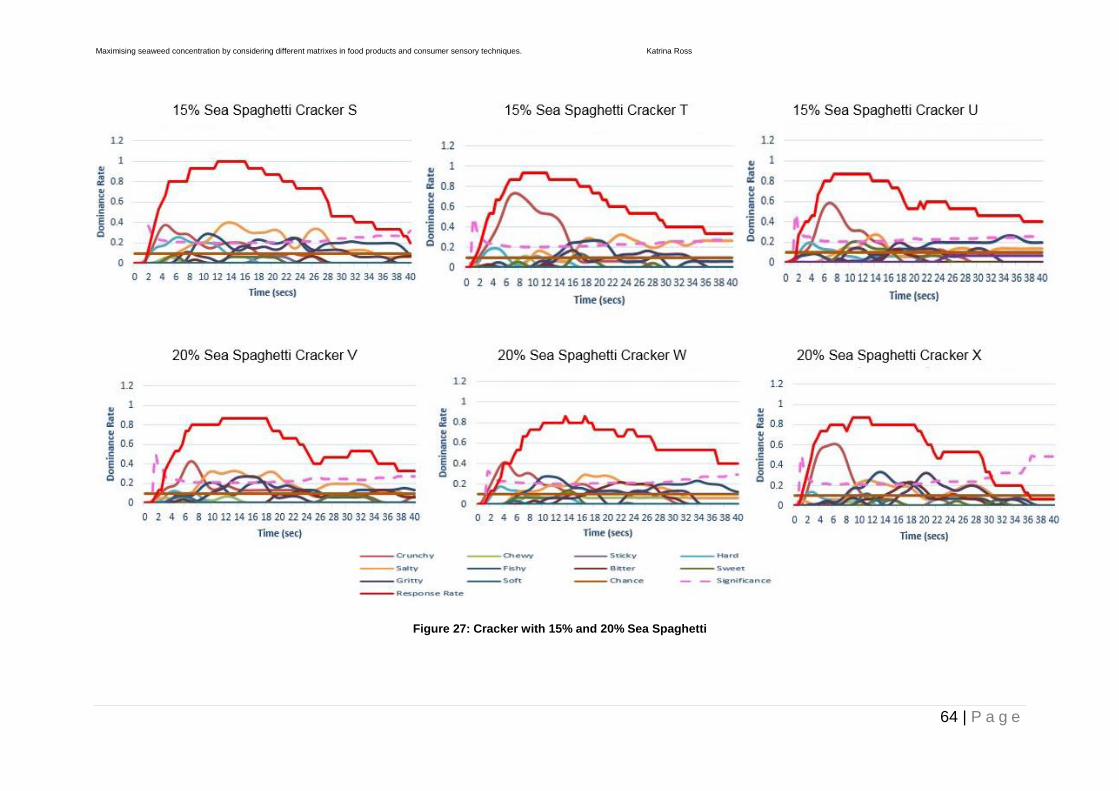
Maximising seaweed concentration by considering different matrixes in food products and consumer sensory techniques. Katrina Ross
64 | P a g e
Figure 27: Cracker with 15% and 20% Sea Spaghetti
Maximising seaweed concentration by considering different matrixes in food products and consumer sensory techniques. Katrina Ross
65 | P a g e
6. Discussion
6.1 Rehydration Results
In this study, it was observed that Kelp was the toughest seaweed that required the
highest strength to burst through each sample. Followed by Sea Spaghetti, Sugar
Kelp, Wakame and lastly Dulse. Previous studies have shown that Wakame has a 30-
40% water holding capacity, which was similar to the figures presented here, other
seaweeds (Mitsuishi Kombu (kelp) Laminaria angustata, and hijiki Hizikia fusiformis)
water holding capacity was around 10-20% water, which is similar to the seaweed
samples in this study (Suzuki et al., 1996).
Additionally, the temperature of the water influences the rehydration kinetics and the
equilibrium moisture content of the rehydrated product (Krokida and Philippopoulos,
2005), but the water temperature was controlled during this experiment. Similarly, the
taste of seaweed changes especially when soaked in water and flavoured liquids,
which may affect the flavour of the final product (Nussinovitch, Amos, and Madoka
2013).
It is speculated that this could be due to alginate and the species tested are known to
be a rich source of these, a high molecular weight polysaccharide that forms viscous
colloidal solutions or gels in water leading to the use of kelp derivatives as bulk
laxatives. (Kim and Bhatnagar, 2011). The high cellulose and variation in content of
Kelp may explain why Kelp became tougher over time as rehydrated. It has been
shown to improve fat and water binding properties of certain products, these include
meat, patties (Choi et al., 2012 and Oh and Lim, 2011) and sausages (Kim et al.,
2010).
While some of the seaweeds contained softer tissues, Kelp was to some degree more
calcified and contained robust complex carbohydrates. For this reason, it required
Maximising seaweed concentration by considering different matrixes in food products and consumer sensory techniques. Katrina Ross
66 | P a g e
more force to burst through its tough texture. This toughness and that kelp contains
high levels of iodine and sodium, a reduction in the acceptability among the consumers
was seen (Molis et al., 2015). Other environmental factors including water
temperature, salinity, waves, sea current and depth of immersion also alter the
composition of Laminarin pre-harvest; in addition, these factors are also believed to
influence the bio functional activity of Laminarin species (Rioux et al., 2010).
It is evident that the results from the rehydration trials would distinguish which
seaweed would be best for a rehydrated seaweed salad. Kelp, Sea Spaghetti and
Sugar Kelp were too tough and based on availability and cost Wakame was deemed
the most appropriate species to be used for the new product development of the
salads.
6.2 Milling
In terms of the milling overall, the M head was the most consistent in size when
comparing the dried and rehydrated seaweed samples. The M head reduced the size
of the midrib section of Wakame seaweed when compared to the A and K heads which
had a higher percentage left in the sieve over 2 mm. Understanding the role of
seaweed in the products, it was deduced that the M head would be used for the salads
and pesto once rehydrated. The M head was able to reduce the impact of the mid rib
of the Wakame, which through assessment by the researcher deemed the main
structure of the seaweed to give a chewy texture.
For the crisps and crackers products, the seaweed milled under 1 mm sized milled
product would be deemed appropriate for use in these products from a manufacturing
point of view (set by the manufacturers of the crisps). Another significant area was
the determination of particle size distribution in seaweed products. Particle sizes have
been seen to influence specific properties of products directly such as its taste,
extraction behaviour, solubility and colour (Postman, 2016). Like many other food
products, seaweed exists in a particulate form; distribution of the size of the particles
affects the appearance and the taste of the products. Thus, when designing food
products understanding the effect of particle sizes can influence consumer
Maximising seaweed concentration by considering different matrixes in food products and consumer sensory techniques. Katrina Ross
67 | P a g e
acceptability (Jiménez and Sánchez-Muniz 2010). During the NPD process, the
seaweed pieces under 3 mm were too small and often lost in the salads. When using
seaweed in products, producers must have a greater understanding of the size of
ingredient particles and particle shape. The shape and size of the particle affect the
taste and mouthfeel of food.
6.3 Rehydrated Products
The texture between all salads differed in acceptability and were rated considerably
lower in the 40 % Seaweed salads (4.0, 3.0, 3.0) than the 20 % seaweed salads (7.0
6.0, 5.0).Overall, the 20 % seaweed salads were more acceptable to the consumer
than the 40 % salads as less chewy in texture. The structure of the Wakame had
issues with the inner mid rib through the plant, which once rehydrated added to the
chewy texture. To reduce the chewy texture within the salad product the seaweed
was milled to a smaller size and further reduced by using less seaweed. Peteiro and
Freire (2012) demonstrates the structure of the Wakame seaweed species with the
midrib (Figure 28). The distinct mid rib growths throughout the middle of the Wakame
species and can reach 1.5 to 2 m in length (Marlin, 2018). It can be a chewy part of
the whole seaweed plant and by reducing to a size makes it more manageable for
eating. Mouritsen (2009) recommended that cooking is required for Wakame to
overcome the chewy texture, which may be considered for further new product
development. Cooking was not an option for this type of salad product, as the flavour
and texture would be affected.
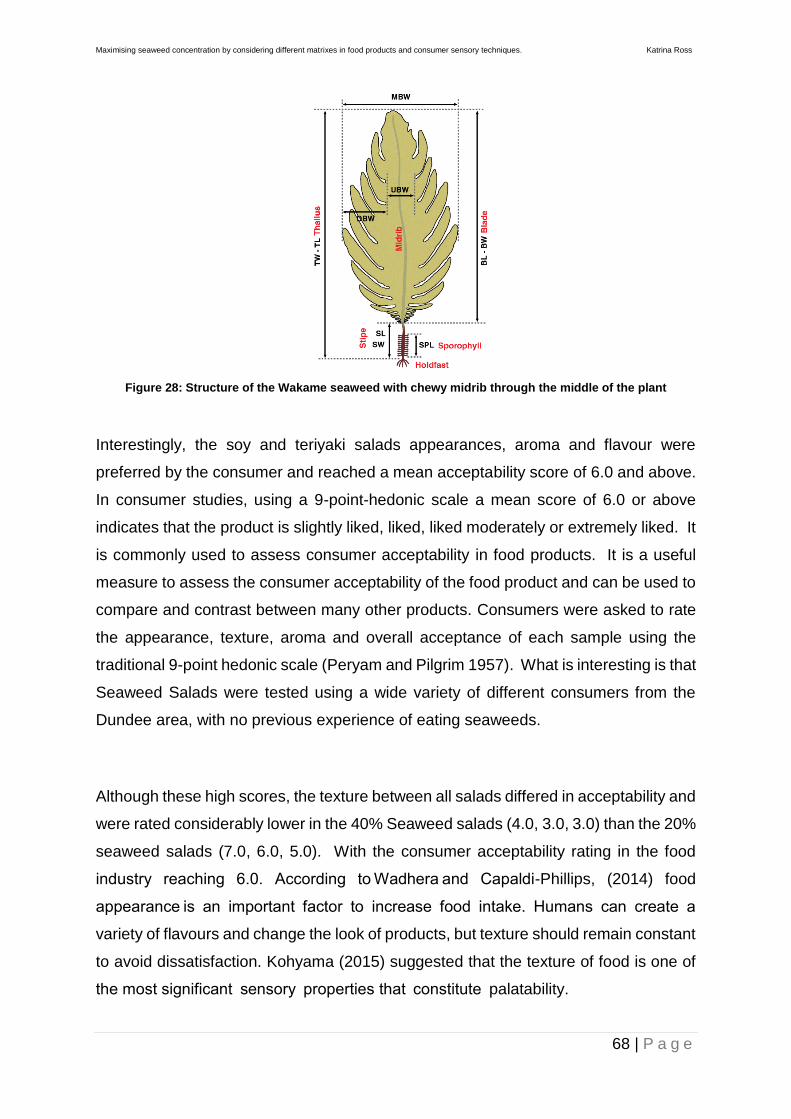
Maximising seaweed concentration by considering different matrixes in food products and consumer sensory techniques. Katrina Ross
68 | P a g e
Figure 28: Structure of the Wakame seaweed with chewy midrib through the middle of the plant
Interestingly, the soy and teriyaki salads appearances, aroma and flavour were
preferred by the consumer and reached a mean acceptability score of 6.0 and above.
In consumer studies, using a 9-point-hedonic scale a mean score of 6.0 or above
indicates that the product is slightly liked, liked, liked moderately or extremely liked. It
is commonly used to assess consumer acceptability in food products. It is a useful
measure to assess the consumer acceptability of the food product and can be used to
compare and contrast between many other products. Consumers were asked to rate
the appearance, texture, aroma and overall acceptance of each sample using the
traditional 9-point hedonic scale (Peryam and Pilgrim 1957). What is interesting is that
Seaweed Salads were tested using a wide variety of different consumers from the
Dundee area, with no previous experience of eating seaweeds.
Although these high scores, the texture between all salads differed in acceptability and
were rated considerably lower in the 40% Seaweed salads (4.0, 3.0, 3.0) than the 20%
seaweed salads (7.0, 6.0, 5.0). With the consumer acceptability rating in the food
industry reaching 6.0. According to Wadhera and Capaldi-Phillips, (2014) food
appearance is an important factor to increase food intake. Humans can create a
variety of flavours and change the look of products, but texture should remain constant
to avoid dissatisfaction. Kohyama (2015) suggested that the texture of food is one of
the most significant sensory properties that constitute palatability.
Maximising seaweed concentration by considering different matrixes in food products and consumer sensory techniques. Katrina Ross
69 | P a g e
Lime, Chilli and Coconut salads at 40 % seaweed scored a lower rating than other
products within this consumer testing, this may be a flavour issue and combined with
a textural issue. In the 20 % seaweed salad Lime, Chilli and Coconut scoring for all
attributes was consistently higher than the 40 % (ranging from 6.0-5.0 for the 20 %
seaweed salad and 3.0-5.0 for the 40 % seaweed salad). The 40% Lime, Chilli and
Coconut salad and 40% Teriyaki salad were rated the lowest for texture (3.0) and the
40% Soy, Mirin and Ginger salad rated 4.0 for texture.
Freezing is one of the oldest methods of food preservation preventing microbial growth
for longer storage and allowing for flexibility in manufacture and supply (Evans, 2008).
Water is removed from the food matrix with freezing to form ice crystals where the
water activity becomes lower and is akin to drying. These ice crystals could potentially
reduce the quality of the food product once thawed due to the structures mechanical
damage, denature of proteins or limited re-absorption of water during the thawing
process. For pesto, on the other hand, most consumers preferred them frozen or
freshly rehydrated with the higher fat versions. The biological make up and structure
of the pesto is less prone to damage from freezing allowing for a strong comparability
of the fresh product. Preference for higher fat foods is apparently mediated by
metabolic, sensory and sociocultural (Katz, 2008) and a universal human trait
(Drewnowski, 1997).
Texture appeared to be an issue with the seaweed salads, however with the seaweed
pesto for the low-fat version, the high fat version, high fat frozen version and medium
fat version were rated 5.0, 6.0, 6.0, 6.0 respectively. It appeared that the flavour
reduced the overall impression of the low-fat pesto product fat rated 3.0. This could
possibly be the seaweed or the reduced fat in the product.
This experiment shows that there is no difference in acceptance between the higher
fat version and the frozen higher fat version of Seaweed pesto. This is good for the
food industry as the frozen product can have a longer shelf life with no difference to
quality when thawed.
Maximising seaweed concentration by considering different matrixes in food products and consumer sensory techniques. Katrina Ross
70 | P a g e
6.4 Dried Seaweed Food Products
The addition of 1 mm milled dried seaweed into a crisp product had little variation of
overall acceptability across the four different flavours, however the lime, chili and
coconut appeared to rate highest in overall acceptability (5.24). None of the flavours
of seaweed crisps reached the consumer acceptable rating of mean score of above
6.0. Texture was shown to be a complementary attribute for acceptability, where all
products reached a consumer acceptability rating of 6.0 or above, while the lime, chili
and coconut and Thai sweet chilli were the standout flavours that also reached 6.0 or
above in acceptability by the consumers for flavour.
The new product development involved the use of a twin screwed extruder, which can
alter the flavour of the product when cooked at high temperatures. Prior to extrusion
a considerable number of flavour volatiles incorporated to the mixture are normally lost
during expansion due to steam distillation (Bhandari et al., 2001)
Therefore, the flavour mix with oil was introduced after the extrusion process. Altan et
al., (2008) found that product responses on a response surface methodology were
affected by temperature and pomace level. Their work showed that varying the levels
of grape pomace in an extruded barley snack altered the texture of the final product
and showed that that 2 to 10 % of pomace had higher preference levels for
appearance, taste, texture and overall acceptability using a 7-point hedonic scale.
Seaweeds however, showed that 5 % in a corn matrix was the preferred texture as
seen by the textural acceptability of rating 6 or above for all crisp products.
6.5 Temporal Dominance of Sensations
Food products are subjected to numerous chemical and physical characteristics during
salivation and mastication (Galmarini et al., 2016). Similarly, the taste, aroma, texture
and flavour also change and for this reason, the conventional static sensory methods
requiring consumers to average their dynamic sensations in many times miss out
some significant information on the food product (Meillon et al., 2009). Thus, Temporal
Dominance of Sensations (TDS) is commonly used to cater to such anomalies
Maximising seaweed concentration by considering different matrixes in food products and consumer sensory techniques. Katrina Ross
71 | P a g e
(Castura et al., 2016). This method is rather significant as it may provide new insights
into several taste combinations (Kawasaki et al., 2016). In this case, TDS seems to be
somewhat ambiguous as it gives out numerous results for the cracker products
presented before the panellist.
In this trial, it was apparent that the fortification of seaweed in the crackers interferes
with the texture and alters negatively the acceptability of the natural cracker. However,
an excessive amount of seaweed was detrimental where an increase in fishiness and
sweetness gave a perceived negative response. In this study, the small number of
participants caused a large variation in the data where different participants gave
different responses.
While studies conducted showed that the inclusion of seaweed in food products
increased the consumers’ intention to purchase it, it did not necessarily lead to greater
acceptability by the consumers. Oral processing of foods is one of the first steps of
food consumption and are of great importance to the intake of the food product itself
during digestion and absorption. Also providing the sensory attributes necessary to
please the consumer and this can affect the overall opinion of the food product. Food
products undertake a variation of biochemical and physical changes during
mastication and later digestion. Starting from the first bite, to oral manipulation
including mastication and transportation, until bolus formation and swallowing. At the
completion of oral processing of foods these physical and biochemical changes such
as the use of amylase to breakdown simple sugars mean that the consumed food is
very different from the food before it was ingested. (Wang and Chen, 2017).
During the first stage of the oral processing of the control samples, crunchy was the
initial dominant attribute followed by sweetness. Sweetness and crunchiness where
the main attributes for the cracker with 5 % Wakame, which was the percentage of this
seaweed species, favoured the most. This could be due to the intense fishiness and
sweetness recorded when the percentage of seaweed increased. Those seaweeds
which were over 5 % added to the cracker showed attributes intenseness of bitter and
fishy and were considered by the consumer to be a reason for scoring these lower in
this acceptability trial.
Maximising seaweed concentration by considering different matrixes in food products and consumer sensory techniques. Katrina Ross
72 | P a g e
The initial attribute at the first stage of oral processing with the Sea Spaghetti Crackers
was crunchy. Sweetness was then distinguished with a 5 % addition to the cracker.
There was some ambiguity with the dominant attributes with the addition of 10 % Sea
Spaghetti with the addition of 15 % being most favourable. During the mastication and
transportation phase until bolus formation, the salty attribute was selected as
dominant. Interestingly consumers rated this cracker more positively as the
percentage of seaweed increased, compared to the Wakame cracker, which was
opposite. TDS may be a very useful mechanism to understand which species of
seaweed should be used in which food matrix and requires further study to fully
understand its role in selecting species and food matrixes. There may be some
ambiguity in the dominance of attributes as stated from Oliver et al., (2018) where
findings suggest that the lack of training on the description of terms, alongside the
limitations of the methodology to overlook all attributes other than those dominant.
6.6 Upscaling of Seaweed Products
The 20% salads are currently being scaled up in a factory South of England and
available to purchase online. The seaweed crisps are being mass produced at a snack
factory in Ireland and now available through Ocado, Real Foods, Whole Foods and
smaller retail outlets in Scotland. Small recipe trials for the popcorn, crackers, pasta
and sauces continue at the development stage with the intention of scaling up in the
near future.
Maximising seaweed concentration by considering different matrixes in food products and consumer sensory techniques. Katrina Ross
73 | P a g e
7. Conclusion and Future Work
This novel research investigated a combination of consumer techniques such as TDS
and consumer trials in relation to seaweed products. The sensory technique TDS
enabled an understanding of the sensory changes that occur during oral processing
(Cadena and Bolini, 2011). This will benefit the seaweed company during the new
product development stage, identifying attributes that are acceptable to the consumer.
Given the results of the study, it was evident that the quantity, species and
characteristics of seaweed in food products had different attributes that significantly
affected consumer preferences. The study also investigates the acceptability of
several products that contained significant amounts of seaweed. In this instance,
consumers seemed to prefer lower concentrations in a salad, which contained not only
high-quality nutrients from the seaweed but had specific textures, primarily attributed
to the swallowing process experienced by the consumer. While seaweed continues to
be an alien venture to many consumers, those who bravely explored seemed to have
a have interest in trying new products especially those familiar to them such as salads,
pesto, crackers and crisps.
There are, however, several limitations to this study that could be addressed in future
work. For instance, the study fails to offer products that have a higher concentration
of 40 % seaweed. In addition, the results are only a manifestation of participants
located in the Dundee area. These may differ if the consumer trials were performed
in a more multicultural demographic such as Manchester or London. The rehydration
trials were only completed with a small-scale group of individuals working within the
food innovation department, albeit trained personnel. Future work could include a
consumer trail for the rehydration of seaweed on up to 60 participants. In addition,
more species could have been tested in the food products, but Wakame and Sea
Spaghetti were chosen due to commercial practises within the industry and availability.
Food matrixes can influence the overall acceptability of food products, and the addition
or fortification of food products on this has been well researched. Seaweed, high in
fibre, and high in other nutrients, can be added to food products in various

Maximising seaweed concentration by considering different matrixes in food products and consumer sensory techniques. Katrina Ross
74 | P a g e
percentages. TDS and other consumer studies are a useful mechanism to determine
the balance between seaweed addition and consumer acceptability. The products
produced in this research project were demonstrated as acceptable at lower
concentrations of seaweed with the maximum contained in the crisps at 30 %. This
study will help New Wave Foods Ltd promote seaweed into the food market with a
range of successful healthier products.
Maximising seaweed concentration by considering different matrixes in food products and consumer sensory techniques. Katrina Ross
75 | P a g e
8. References
Altan, A., McCarthy, K.L. and Maskan, M., 2008. Twin-screw extrusion of barley–grape
pomace blends: Extrudate characteristics and determination of optimum processing
conditions. Journal of Food Engineering, 89(1), pp.24-32.
Ares, G., Jaeger, S.R., Antúnez, L., Vidal, L., Giménez, A., Coste, B., Picallo, A. and
Castura, J.C., 2015. Comparison of TCATA and TDS for dynamic sensory
characterization of food products. Food Research International, 78, pp.148-158.
Bäckström, A., Pirttilä-Backman, A.M. and Tuorila, H., 2004. Willingness to try new
foods as predicted by social representations and attitude and trait scales. Appetite,
43(1), pp.75-83.
Brayden, W.C., Noblet, C.L., Evans, K.S. and Rickard, L., 2018. Consumer
preferences for seafood attributes of wild-harvested and farm-raised products.
Aquaculture Economics & Management, pp.1-21.
Cadena, R.S. and Bolini, H.M.A., 2011. Time–intensity analysis and acceptance test
for traditional and light vanilla ice cream. Food Research International, 44(3), pp.677-
683.
Castura, J.C. and Li, M., 2016. Using TDS dyads and other dominance sequences to
characterize products and investigate liking changes. Food quality and preference, 47,
pp.109-121.
Chang, H.C. and Wu, L.C., 2008. Texture and quality properties of Chinese fresh egg
noodles formulated with green seaweed (Monostromanitidum) powder. Journal of food
science, 73(8).
Chenlo, F., Arufe, S., Díaz, D., Torres, M.D., Sineiro, J. and Moreira, R., 2018. Air-
drying and rehydration characteristics of the brown seaweeds, Ascophylum nodosum
and Undariapinnatifida. Journal of Applied Phycology, 30(2), pp.1259-1270.
Maximising seaweed concentration by considering different matrixes in food products and consumer sensory techniques. Katrina Ross
76 | P a g e
Choi, Y.S., Choi, J.H., Han, D.J., Kim, H.Y., Kim, H.W., Lee, M.A., Chung, H.J. and
Kim, C.J., 2012. Effects of Laminaria japonica on the physico-chemical and sensory
characteristics of reduced-fat pork patties. Meat science, 91(1), pp.1-7.
Cofrades, S., López-López, I., Solas, M.T., Bravo, L. and Jiménez-Colmenero, F.,
2008. Influence of different types and proportions of added edible seaweeds on
characteristics of low-salt gel/emulsion meat systems. Meat Science, 79(4), pp.767-
776.
Cox, S. and Abu‐Ghannam, N., 2013. Enhancement of the phytochemical and fibre
content of beef patties with Himanthaliaelongata seaweed. International Journal of
Food Science & Technology, 48(11), pp.2239-2249.
Cox, S., Abu-Ghannam, N., and Gupta, S., 2012. Effect of processing conditions on
phytochemical constituents of edible Irish seaweed Himanthaliaelongata. Journal of
Food Processing and Preservation, 36(4), pp.348-363.
Di Monaco, R., Miele, N.A., Volpe, S., Masi, P. and Cavella, S., 2016. Temporal
Dominance of sensations and dynamic liking evaluation of polenta sticks. British Food
Journal, 118(3), pp.749-760.
Dijksterhuis, G. and Eilers, P., 1997. Modelling time-intensity curves using prototype
curves. Food Quality and preference, 8(2), pp.131-140.
Djaeni, M. and Sari, D.A., 2015. Low temperature seaweed drying using dehumidified
air. Procedia Environmental Sciences, 23, pp.2-10.
Earle, R. and Anderson, A. eds., 2001. Food product development: Maximizing
success. CRC Press.
FAO (Food and Agriculture Organization of the United Nations). 2017. The state of
world fisheries and aquaculture. Available from: http://www.fao.org/fishery/en.
[Accessed Jan 23, 2017]
Maximising seaweed concentration by considering different matrixes in food products and consumer sensory techniques. Katrina Ross
77 | P a g e
Ferraces-Casais, P., Lage-Yusty, M.A., de Quirós, A.R.B. and López-Hernández, J.,
2012. Evaluation of bioactive compounds in fresh edible seaweeds. Food Analytical
Methods, 5(4), pp.828-834.
Foster, K.D., Grigor, J., Cheong, J.N., Yoo, M.J., Bronlund, J.E. and Morgenstern,
M.P., 2011. The role of oral processing in dynamic sensory perception. Journal of
Food Science, 76(2).
Galmarini, M.V., Visalli, M. and Schlich, P., 2017. Advances in representation and
analysis of mono and multi-intake Temporal Dominance of Sensations data. Food
Quality and Preference, 56, pp.247-255
Giovanni, M.E. and Pangborn, R.M., 1983. Measurement of taste intensity and degree
of liking of beverages by graphic scales and magnitude estimation. Journal of Food
Science, 48(4), pp.1175-1182.
Gresham, G., Hafer, J. and Markowski, E., 2006. Inter-functional Market Orientation
Between Marketing Departments and Technical Departments in the Management of
the New Product Development Process. Journal of Behavioural & Applied
Management, 8(1).
Grigor, J.M., Brennan, C.S., Hutchings, S.C. and Rowlands, D.S., 2016. The sensory
acceptance of fibre‐enriched cereal foods: a meta‐analysis. International journal of
food science & technology, 51(1), pp.3-13.
Gupta, S., Rajauria, G. and Abu‐Ghannam, N., 2010. Study of the microbial diversity
and antimicrobial properties of Irish edible brown seaweeds. International journal of
food science & technology, 45(3), pp.482-489.
Maximising seaweed concentration by considering different matrixes in food products and consumer sensory techniques. Katrina Ross
78 | P a g e
Gutow, L., Eckerlebe, A., Giménez, L. and Saborowski, R., 2015. Experimental
evaluation of seaweeds as a vector for microplastics into marine food webs.
Environmental science & technology, 50(2), pp.915-923.
Hafting, J.T., Critchley, A.T., Cornish, M.L., Hubley, S.A. and Archibald, A.F., 2012.
On-land cultivation of functional seaweed products for human usage. Journal of
applied phycology, 24(3), pp.385-392.
Hough, G., Sánchez, R.H., De Pablo, G.G., Sánchez, R.G., Villaplana, S.C., Gimenez,
A.M. and Gambaro, A., 2002. Consumer acceptability versus trained sensory panel
scores of powdered milk shelf-life defects. Journal of dairy science, 85(9), pp.2075-
2080.
Huotilainen, A., Pirttilä-Backman, A.M. and Tuorila, H., 2006. How innovativeness
relates to social representation of new foods and to the willingness to try and use such
foods. Food Quality and Preference, 17(5), pp.353-361.
Ji, C.‐F. & Ji, Y.‐B. (2014). Laminarin‐induced apoptosis in human colon cancer LoVo
cells. Oncology Letters, 7, 1728–1732.
Ji, Y.B., Ji, C.F. & Zhang, H. (2012). Laminarin induces apoptosis of human colon
cancer LOVO cells through a mitochondrial pathway. Molecules, 17, 9947–9960.
Jiménez-Escrig, A. and Sánchez-Muniz, F.J., 2000. Dietary fibre from edible
seaweeds: chemical structure, physicochemical properties and effects on cholesterol
metabolism. Nutrition Research, 20(4), pp.585-598.
Kadam, S.U., Tiwari, B.K. and O’Donnell, C.P., 2015. Effect of ultrasound pre-
treatment on the drying kinetics of brown seaweed Ascophyllum nodosum. Ultrasonics
sonochemistry, 23, pp.302-307.
Maximising seaweed concentration by considering different matrixes in food products and consumer sensory techniques. Katrina Ross
79 | P a g e
Kadam, S.U., Tiwari, B.K. and O'Donnell, C.P., 2015. Extraction, structure and
biofunctional activities of laminarin from brown algae. International Journal of Food
Science & Technology, 50(1), pp.24-31.
Katz, D.L., 2009. School-based interventions for health promotion and weight control:
not just waiting on the world to change. Annual review of public health, 30, pp.253-
272.
Kawasaki, H., Sekizaki, Y., Hirota, M., Sekine-Hayakawa, Y. and Nonaka, M., 2016.
Analysis of binary taste-taste interactions of MSG, lactic acid, and NaCl by temporal
dominance of sensations. Food quality and preference, 52, pp.1-10.
Keyimu, X.G., 2013. The Effects of Using Seaweed on the Quality of Asian Noodles.
Food Processing & Technology, 4, pp.216.
Lawless, H.T. &Heymann, H., 2010. Sensory Evaluation of Food: Principles and
Practices. London, Springer.
Le Révérend, F.M., Hidrio, C., Fernandes, A. and Aubry, V., 2008. Comparison
between temporal dominance of sensations and time intensity results. Food Quality
and Preference, 19(2), pp.174-178.
Leach, E.J. and Noble, A.C., 1986. Comparison of bitterness of caffeine and quinine
by a time–intensity procedure. Chemical senses, 11(3), pp.339-345.
López-López, I., Cofrades, S., Yakan, A., Solas, M.T. and Jiménez-Colmenero, F.,
2010. Frozen storage characteristics of low-salt and low-fat beef patties as affected by
Wakame addition and replacing pork backfat with olive oil-in-water emulsion. Food
Research International, 43(5), pp.1244-1254.
MacArtain, P., Gill, C.I., Brooks, M., Campbell, R. and Rowland, I.R., 2007. Nutritional
value of edible seaweeds. Nutrition reviews, 65(12), pp.535-543.
MacFie, H. ed., 2007. Consumer-led food product development. Elsevier.
Maximising seaweed concentration by considering different matrixes in food products and consumer sensory techniques. Katrina Ross
80 | P a g e
Meillon, S., Urbano, C. and Schlich, P., 2009. Contribution of the Temporal Dominance
of Sensations (TDS) method to the sensory description of subtle differences in partially
dealcoholized red wines. Food Quality and Preference, 20(7), pp.490-499
Meiselman, H.L., 2013. The future in sensory/consumer research: evolving to a better
science. Food Quality and Preference, 27(2), pp.208-214.
Meyners, M. and Pineau, N., 2010. Statistical inference for temporal dominance of
sensations data using randomization tests. Food Quality and Preference, 21(7),
pp.805-814.
Miyata, T. and Wakamatsu, H., 2015. Irrational reputational damage on wakame
seaweed in Sanriku district after the Fukushima nuclear disaster: revealed preference
by auction experiment. Fisheries science, 81(5), pp.995-1002.
Molis, M., Scrosati, R.A., El‐Belely, E.F., Lesniowski, T.J. and Wahl, M., 2015. Wave‐
induced changes in seaweed toughness entail plastic modifications in snail traits
maintaining consumption efficacy. Journal of Ecology, 103(4), pp.851-859.
Moon, S.Y. and Li-Chan, E.C., 2004. Development of solid-phase microextraction
methodology for analysis of headspace volatile compounds in simulated beef flavour.
Food chemistry, 88(1), pp.141-149.
Moskowitz, H.R., Beckley, J.H. and Resurreccion, A.V., 2012. Sensory and consumer
research in food product design and development. John Wiley & Sons.
Mouritsen, O. and Styrbæk, K., 2017. Mouthfeel: how texture makes taste. Columbia
University Press.
Nesvadba, P. and Evans, J.A., 2008. Frozen Food Science and Technology.
Maximising seaweed concentration by considering different matrixes in food products and consumer sensory techniques. Katrina Ross
81 | P a g e
Nussinovitch, A. and Hirashima, M., 2013. Cooking innovations: Using hydrocolloids
for thickening, gelling, and emulsification. CRC Press.
Oztop, M.H., Sahin, S. and Sumnu, G., 2007. Optimization of microwave frying of
potato slices by using Taguchi technique. Journal of Food Engineering, 79(1), pp.83-
91.
Peyvieux, C. and Dijksterhuis, G., 2001. Training a sensory panel for TI: a case study.
Food Quality and Preference, 12(1), pp.19-28.
Pineau, N., Schlich, P., Cordelle, S., Mathonnière, C., Issanchou, S., Imbert, A.,
Rogeaux, M., Etiévant, P. and Köster, E., 2009. Temporal Dominance of Sensations:
Construction of the TDS curves and comparison with time–intensity. Food Quality and
Preference, 20(6), pp.450-455.
Pineau, N., Schlich, P., Cordelle, S., Mathonnière, C., Issanchou, S., Imbert, A.,
Prabhasankar, P., Ganesan, P. and Bhaskar, N., 2009b. Influence of Indian brown
seaweed (Sargassum marginatum) as an ingredient on quality, biofunctional, and
microstructure characteristics of pasta. Food Science and Technology International,
15(5), pp.471-479.
Prabhasankar, P., Ganesan, P., Bhaskar, N., Hirose, A., Stephen, N., Gowda, L.R.,
Hosokawa, M. and Miyashita, K., 2009a. Edible Japanese seaweed, wakame
(Undariapinnatifida) as an ingredient in pasta: Chemical, functional and structural
evaluation. Food Chemistry, 115(2), pp.501-508.
Prescott, J., 2004. Effects of added glutamate on liking for novel food flavours.
Appetite, 42(2), pp.143-150.
Rioux, L.E., Turgeon, S.L. and Beaulieu, M., 2010. Structural characterization of
laminaran and galactofucan extracted from the brown seaweed
Saccharinalongicruris. Phytochemistry, 71(13), pp.1586-1595.
Maximising seaweed concentration by considering different matrixes in food products and consumer sensory techniques. Katrina Ross
82 | P a g e
Rogeaux, M., Etiévant, P. and Köster, E., 2009. Temporal dominance of sensations:
Construction of the TDS curves and comparison with time–intensity. Food Quality and
Preference, 20(6), pp.450-455.
Roohinejad, S., Koubaa, M., Barba, F.J., Saljoughian, S., Amid, M. and Greiner, R.,
2017. Application of seaweeds to develop new food products with enhanced shelf-life,
quality and health-related beneficial properties. Food Research International, 99,
pp.1066-1083.
Ruperez, P. and Saura-Calixto, F., 2001. Dietary fibre and physicochemical properties
of edible Spanish seaweeds. European Food Research and Technology, 212(3),
pp.349-354.
Schlich, P., 2017. Temporal Dominance of Sensations (TDS): a new deal for temporal
sensory analysis. Current Opinion in Food Science, 15, pp.38-42.
Scottish Enterprise, 2017. Seaweed: Scotland's underused superfood?. Available
from: https://www.scottish-enterprise.com/knowledge-hub/articles/insight/seaweed-
scotlands-underused-superfood[Assessed: 3rd February 2018]
Shepherd, R., 1989. Handbook of the psychophysiology of human eating. John Wiley.
Singh-Ackbarali, D. and Maharaj, R., 2014. Sensory evaluation as a tool in determining
acceptability of innovative products developed by undergraduate students in food
science and technology at the University of Trinidad and Tobago. Journal of
Curriculum and Teaching, 3(1), p.10.
Teas, J., 1982. The dietary intake of Laminaria, a brown seaweed, and breast cancer
prevention. Nutrition and cancer, 4(3), pp.217-222.
Tibbetts, S.M., Milley, J.E. and Lall, S.P., 2016. Nutritional quality of some wild and
cultivated seaweeds: Nutrient composition, total phenolic content and in vitro
digestibility. Journal of Applied Phycology, 28(6), pp.3575-3585.
Maximising seaweed concentration by considering different matrixes in food products and consumer sensory techniques. Katrina Ross
83 | P a g e
Tiwari, B.K. and Troy, D.J., 2015. Seaweed sustainability–food and nonfood
applications. In Seaweed Sustainability (pp. 1-6).
Van Buuren, T., Gao, Y., Tiedje, T., Dahn, J.R. and Way, B.M., 1992. Evidence for
quantum confinement in porous silicon from soft x‐ray absorption. Applied physics
letters, 60(24), pp.3013-3015.
Vidigal, M.C., Minim, V.P., Simiqueli, A.A., Souza, P.H., Balbino, D.F. and Minim, L.A.,
2015. Food technology neophobia and consumer attitudes toward foods produced by
new and conventional technologies: A case study in Brazil. LWT-Food Science and
Technology, 60(2), pp.832-840.
Wan, X., Woods, A.T., Jacquot, M., Knoeferle, K., Kikutani, M. and Spence, C., 2016.
The Effects of Receptacle on the Expected Flavour of a Coloured Beverage: Cross‐
Cultural Comparison among French, Japanese, and Norwegian Consumers. Journal
of Sensory Studies, 31(3), pp.233-244.
Wolkers, H., Barbosa, M., Kleinegris, D.M., Bosma, R. and Wijffels, R.H., 2011.
Microalgae: the green gold of the future. Propress, Wageningen, Belanda.
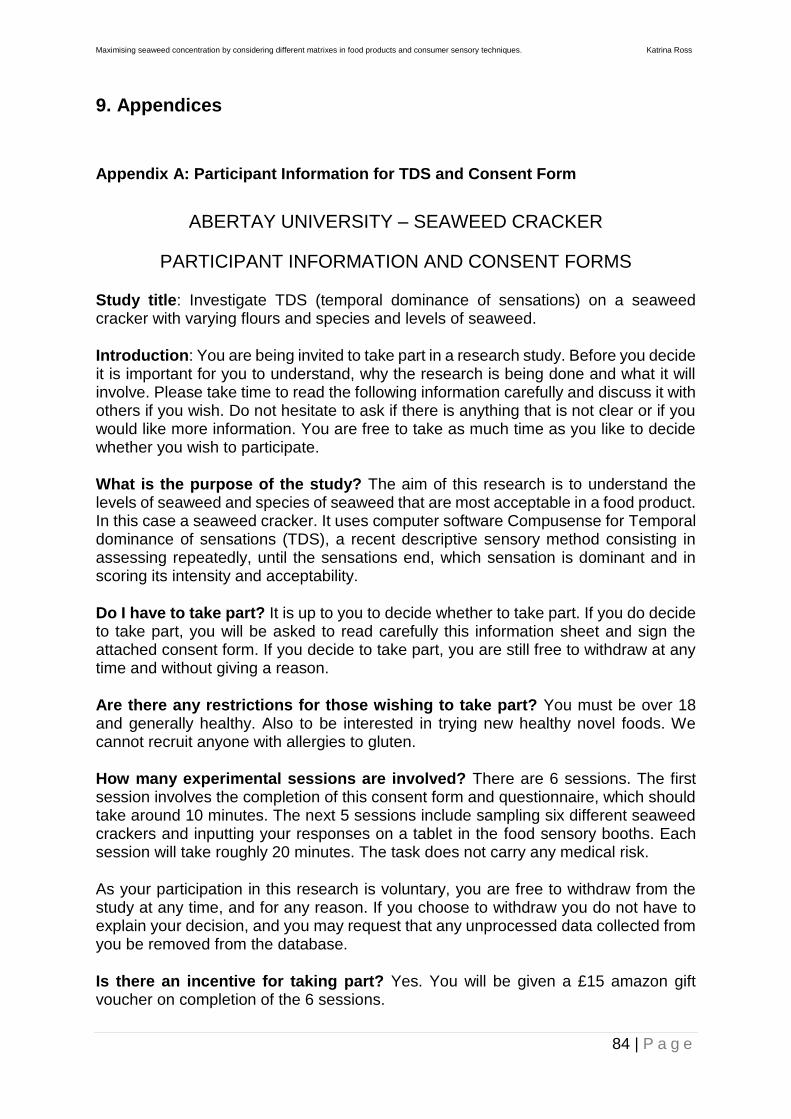
Maximising seaweed concentration by considering different matrixes in food products and consumer sensory techniques. Katrina Ross
84 | P a g e
9. Appendices
Appendix A: Participant Information for TDS and Consent Form
ABERTAY UNIVERSITY – SEAWEED CRACKER
PARTICIPANT INFORMATION AND CONSENT FORMS
Study title: Investigate TDS (temporal dominance of sensations) on a seaweed cracker with varying flours and species and levels of seaweed.
Introduction: You are being invited to take part in a research study. Before you decide it is important for you to understand, why the research is being done and what it will involve. Please take time to read the following information carefully and discuss it with others if you wish. Do not hesitate to ask if there is anything that is not clear or if you would like more information. You are free to take as much time as you like to decide whether you wish to participate.
What is the purpose of the study? The aim of this research is to understand the levels of seaweed and species of seaweed that are most acceptable in a food product. In this case a seaweed cracker. It uses computer software Compusense for Temporal dominance of sensations (TDS), a recent descriptive sensory method consisting in assessing repeatedly, until the sensations end, which sensation is dominant and in scoring its intensity and acceptability.
Do I have to take part? It is up to you to decide whether to take part. If you do decide to take part, you will be asked to read carefully this information sheet and sign the attached consent form. If you decide to take part, you are still free to withdraw at any time and without giving a reason.
Are there any restrictions for those wishing to take part? You must be over 18 and generally healthy. Also to be interested in trying new healthy novel foods. We cannot recruit anyone with allergies to gluten.
How many experimental sessions are involved? There are 6 sessions. The first session involves the completion of this consent form and questionnaire, which should take around 10 minutes. The next 5 sessions include sampling six different seaweed crackers and inputting your responses on a tablet in the food sensory booths. Each session will take roughly 20 minutes. The task does not carry any medical risk.
As your participation in this research is voluntary, you are free to withdraw from the study at any time, and for any reason. If you choose to withdraw you do not have to explain your decision, and you may request that any unprocessed data collected from you be removed from the database.
Is there an incentive for taking part? Yes. You will be given a £15 amazon gift voucher on completion of the 6 sessions.
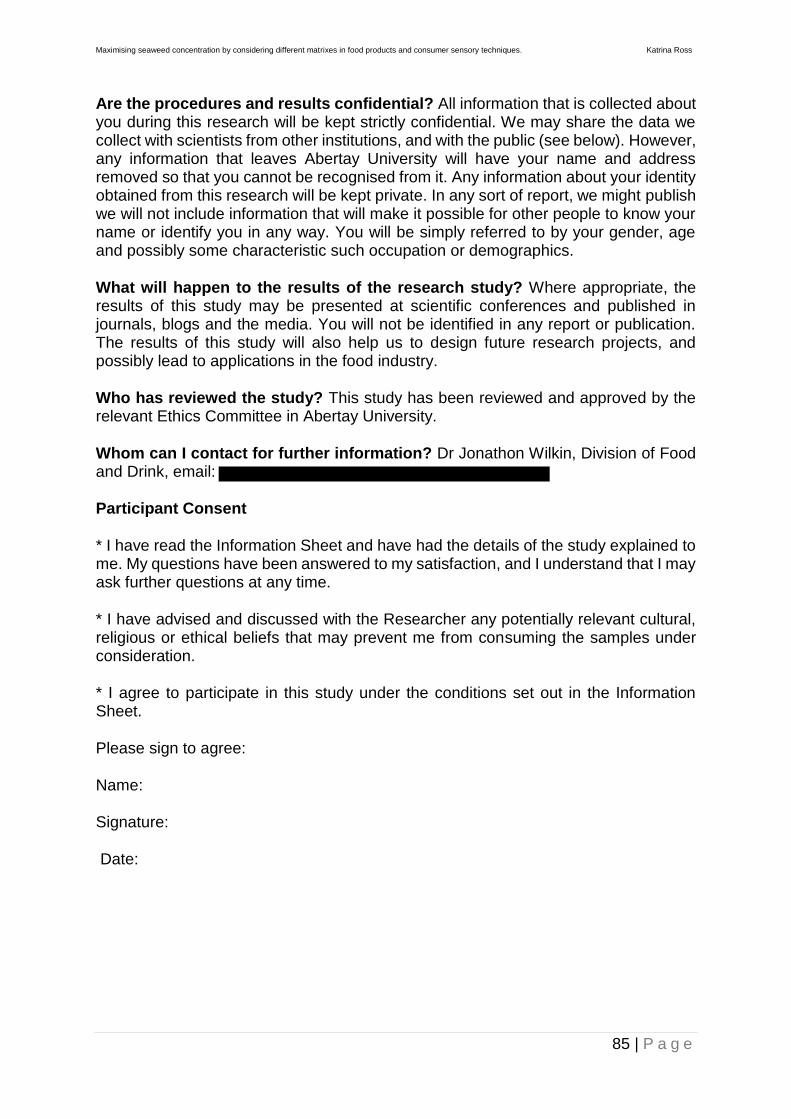
Maximising seaweed concentration by considering different matrixes in food products and consumer sensory techniques. Katrina Ross
85 | P a g e
Are the procedures and results confidential? All information that is collected about you during this research will be kept strictly confidential. We may share the data we collect with scientists from other institutions, and with the public (see below). However, any information that leaves Abertay University will have your name and address removed so that you cannot be recognised from it. Any information about your identity obtained from this research will be kept private. In any sort of report, we might publish we will not include information that will make it possible for other people to know your name or identify you in any way. You will be simply referred to by your gender, age and possibly some characteristic such occupation or demographics.
What will happen to the results of the research study? Where appropriate, the results of this study may be presented at scientific conferences and published in journals, blogs and the media. You will not be identified in any report or publication. The results of this study will also help us to design future research projects, and possibly lead to applications in the food industry.
Who has reviewed the study? This study has been reviewed and approved by the relevant Ethics Committee in Abertay University.
Whom can I contact for further information? Dr Jonathon Wilkin, Division of Food and Drink, email:
Participant Consent
* I have read the Information Sheet and have had the details of the study explained to me. My questions have been answered to my satisfaction, and I understand that I may ask further questions at any time.
* I have advised and discussed with the Researcher any potentially relevant cultural, religious or ethical beliefs that may prevent me from consuming the samples under consideration.
* I agree to participate in this study under the conditions set out in the Information Sheet.
Please sign to agree:
Name:
Signature:
Date: